Annual Report 2020 - Alfa Laval
160
Preserving solar energy to brighten gloomy days Annual Report 2020
-
Upload
khangminh22 -
Category
Documents
-
view
7 -
download
0
Transcript of Annual Report 2020 - Alfa Laval
Preserving solar energy
to brighten gloomy days
Annual Report 2020
ABOUT ALFA LAVAL
Alfa Laval in brief 3
President’s comments 6
2020 in brief 8
Purpose, business concept and goals 10
Strategic priorities 12
Customers 14
Products 16
Service 18
Key technologies 20
Heat transfer 21
Separation 22
Fluid handling 23
Division overview 24
Food & Water 26
Energy 32
Marine 38
Operations 44
Employees 46
Sustainability and reporting 48
UN Sustainable Development Goals
and Alfa Laval 51
The share 52
CORPORATE GOVERNANCE
Introduction by the Chairman of the Board 56
Corporate Governance Report 2020 57
Board of Directors and auditors 64
President and Group management 66
Board of Directors’ report on internal control 68
Auditor’s statement on the
Corporate Governance Report 70
FINANCIAL STATEMENTS
Board of Directors’ Report 72
Consolidated cash flows 86
Comments to the consolidated cash flows 87
Consolidated comprehensive income 88
Comments to the consolidated
comprehensive income 89
Consolidated financial position 92
Comments on the consolidated
financial position 94
Changes in consolidated equity 94
Comments on changes
in consolidated equity 95
Parent company cash flows 96
Parent company income 96
Parent company financial position 97
Changes in parent company equity 98
Notes to the financial statements 99
Accounting principles 99
Objectives, policies and processes
for managing capital 107
Financial risks 108
Operational risks 112
Notes 118
Auditor’s report 152
Ten-year overview 156
Definitions 158
Financial information 159
Annual General Meeting 159
Contents

Alfa Laval is a world-leading, global provider of first-rate
products in the areas of heat transfer, separation and fluid
handling. With these as its base, Alfa Laval aims to help
enhance the productivity and competitiveness of its
customers in various industries throughout the world.
We define their challenges and deliver sustainable products
and solutions that meet their requirements – mainly in
energy, the environment, food and the marine industry.
Alfa Laval
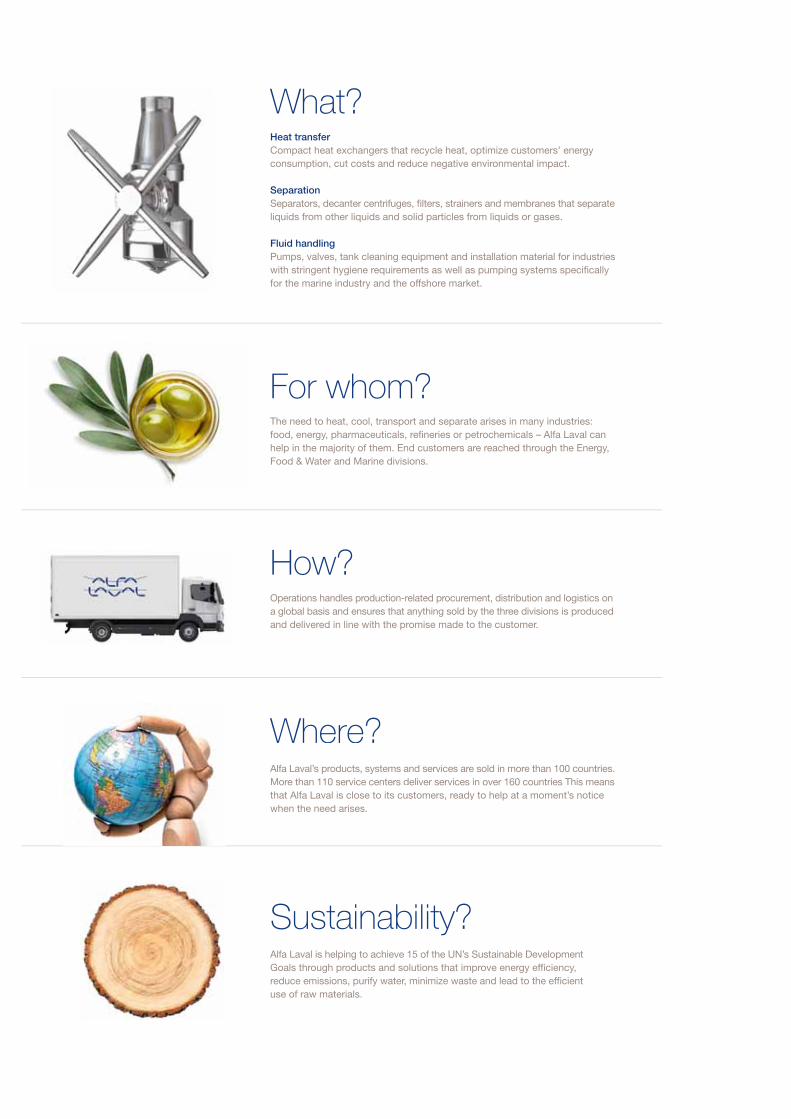
Alfa Laval is helping to achieve 15 of the UN’s Sustainable Development
Goals through products and solutions that improve energy efficiency,
reduce emissions, purify water, minimize waste and lead to the efficient
use of raw materials.
Operations handles production-related procurement, distribution and logistics on
a global basis and ensures that anything sold by the three divisions is produced
and delivered in line with the promise made to the customer.
The need to heat, cool, transport and separate arises in many industries:
food, energy, pharmaceuticals, refineries or petrochemicals – Alfa Laval can
help in the majority of them. End customers are reached through the Energy,
Food & Water and Marine divisions.
For whom?
Where?
Sustainability?
How?
Alfa Laval’s products, systems and services are sold in more than 100 countries.
More than 110 service centers deliver services in over 160 countries This means
that Alfa Laval is close to its customers, ready to help at a moment’s notice
when the need arises.
Heat transfer
Compact heat exchangers that recycle heat, optimize customers’ energy
consumption, cut costs and reduce negative environmental impact.
Separation
Separators, decanter centrifuges, filters, strainers and membranes that separate
liquids from other liquids and solid particles from liquids or gases.
Fluid handling
Pumps, valves, tank cleaning equipment and installation material for industries
with stringent hygiene requirements as well as pumping systems specifically
for the marine industry and the offshore market.
What?

5
Two renewable sources of energy that bring hope of a brighter future. They reduce the carbon
footprint dramatically and are expected to account for half the world’s electricity generation in
ten years’ time. There is only one big problem: when the sun is not shining and the wind does
not blow, no power is generated. Unless the energy can be stored effectively on a large scale.
As part-owner of a new company, Alfa Laval’s knowledge and expertise is playing an important
role in turning this challenge into reality.
Our unique and specially designed heat exchangers convert electrical energy from solar and wind
plants into thermal energy. The heat is then stored and preserved in gigantic bays of molten salt
– like a natural battery – waiting to be awakened and transformed back into electricity when
needed in the grid. So, even on grey days, the forecast looks bright.
Solar and wind

6
Alfa Laval performed well in 2020 and we remain fully committed
to our long-term strategy while leveraging the changing market
conditions. Increased investments in our technology leadership,
a stronger focus on expanding the service offering, and the
development of a more customer-oriented culture with faster
decision making continue to be our key strategic ambitions.
Strong global trends driving demand
Sustainability
We all need to gradually change our way of life for the sake of
our planet and future generations. To Alfa Laval, sustainability
is both a necessity and a business opportunity and our tech-
nologies promote a more responsible use of natural resources.
The most tangible change related to the environmental trends
was seen in the Energy division. The division´s heat transfer
technology is critical in driving energy efficiency in a wide range
of applications. Energy-efficient solutions for heat pumps and
reducing the energy consumption in energy intensive data centers
are just two applications that are growing in importance. The
increased need for renewable energy sources drives a long-
term demand for radically improved energy storage solutions.
Alfa Laval has continued to invest heavily in a new technology
for thermal energy storage and the market for larger scale
thermal energy storage is expected to gain momentum over
the next three years. Finally, the importance of hydrogen as a
fuel became evident in 2020 and is an important component
in reaching the Paris agreement. Investments into the global
infrastructure for hydrogen are expected to greatly increase over
the next ten years and Alfa Laval intends to play an important
role in this transition. During 2020, we increased our invest-
ments into fuel cells to take an early position in this market.
After many years of investments in new product platforms and
a more focused sales organisation, the results were evident in
the Food & Water division. While most of the traditional appli-
cations for the division are growing in line with the growth of
the global middle class, the division is also adjusting to signifi-
cant changes in consumer behaviour. Investments into plant-
based proteins as well as insect-based proteins are increasing.
Alfa Laval´s extraction technologies, as well as other process
equipment, are needed for cost and energy efficient production
of these proteins and have continued to see good momentum
during 2020.
Sustainability is a key focus also in the Marine division. From a
volume perspective, the applications for cleaning ballast water
and exhaust gases, PureBallast and PureSOX, dominated the
portfolio. New marine fuels to reduce the C02 impact of world
trade will continue to drive technology and new product offer-
ings for many years to come. LNG as a fuel was one of the fuel
initiatives with most traction in 2020. An important step in
making LNG a climate positive fuel in the marine industry was the
launch of PureCool a new technology to reduce the problem
of methane-slip in LNG applications.
President’s comments2020 was a remarkable year in many ways. We navigated our company in
unprecedented circumstances while seeing many global transformational trends
accelerating, with the sustainability agenda continuing to gain momentum
and high pace in the digital transformation.

7
Pre
sid
ent’s
co
mm
ents
Digitalization
During the first quarter in 2020 Alfa Laval had to adjust the global
workforce to start working remotely. More than 50 percent of
the white-collar employees have worked from home since then.
Although the changes posed challenges to the organisation,
the people, technology and infrastructure was already in
place to manage the situation and secure business continuity.
Our customers also adjusted quickly to digital interaction.
The most important area of development was in service, which
historically has required physical interaction with the customers
and the equipment. Our service organisation had already de-
veloped the required tools for connected equipment and remote
diagnostics. The number of remote diagnostics and service
hours grew from essentially zero in 2019, to more than 10,000
service hours in 2020. The change to digital service is here to stay
and will continue to grow in years to come, and Alfa Laval is
committing to developing and growing in this area going forward.
Business performance
In a year of volatility caused by the COVID-19 pandemic, Alfa
Laval proved resilient and showed a good ability to act fast. In
all, order intake declined by 10 percent compared to 2019
and amounted to 41 BSEK and total invoicing was 42 BSEK,
a decline of 11 percent compared to previous year.
Despite lower volumes, profitability remained on a high level at
17.4 percent, essentially unchanged compared to 2019. The
strong operating margin was supported by our well diversified
portfolio and aftersales exposure, but also a result of the cost
savings program launched in February focusing on short-term
savings with maximum flexibility. In total, the program reduced
fixed costs with 700 MSEK compared to 2019. At the end of
2020, a restructuring program was announced with the objective
to adjust certain businesses in the Marine and Oil & Gas sectors
to more structural changes in demand. The program is estimated
to generate annual savings of approximately 300 MSEK with full
effect from 2022.
Finally, it has been a challenging year from an operational per-
spective. I would like to express my gratitude to both our suppliers
and our customers for being able to quickly adapt to difficult
circumstances. Despite all the challenges the industrial supply
chains remained intact during 2020. May I also express my
sincere gratitude to all our committed employees for a job
well done in a challenging 2020.
Lund in February 2021
Tom Erixon
President & CEO
“ Alfa Laval performed well in
2020 and we remain fully
committed to our long-term
strategy while leveraging the
changing market conditions. ”

8
0
10,000
20,000
30,000
40,000
50,000
2019181716
SEK MILLION
32
,06
0
36
,62
8
45
,00
5
44
,11
9
39
,83
3
1) Adjusted EBITDA – Operating income before depreciation and amortization of step-
up values, adjusted for items affecting comparability.2) Adjusted EBITA – Operating income before amortization of step-up values, adjusted
for items affecting comparability.
3) Board proposal to the Annual General Meeting.4) Free cash flow is the sum of cash flow from operating and investing activities.5) Number of employees at year-end.6) Percentage change between 2019 and 2020.
2020 in brief
Net sales, SEK million
Order intake, SEK million
Return on capital employed
Net debt to EBITDA, times
Number of employees
Investments in R&DAdjusted EBITA
2.5%
Operating margin (adjusted EBITA)
Amounts in SEK million unless otherwise stated +/- %6) 2020 2019 2018 2017 2016
Order intake -10 39,833 44,119 45,005 36,628 32,060
Net sales -11 41,468 46,517 40,666 35,314 35,634
Adjusted EBITDA 1) -8 8,365 9,062 7,344 6,239 6,196
Adjusted EBITA 2) -9 7,231 7,989 6,718 5,610 5,553
Operating margin (adjusted EBITA 2)), % 17.4 17.2 16.5 15.9 15.6
Profit after financial items -31 4,977 7,221 5,896 4,371 3,325
Return on capital employed, % 19.1 23.0 22.4 17.7 15.3
Return on shareholders’ equity, % 12.7 21.3 20.3 13.9 11.8
Earnings per share, SEK -35 8.47 13.08 10.77 7.09 5.46
Dividend per share, SEK 5.50 3) 0 5.00 4.25 4.25
Equity per share, SEK 5 69.31 66.15 56.26 48.87 48.34
Free cash flow per share, SEK 4) 59 15.89 10.00 8.56 8.92 9.97
Equity ratio, % 59 47.8 43.1 40.6 39.0 38.0
Net debt to EBITDA, times 0.48 0.88 0.93 1.31 1.81
Number of employees 5) -4 16,882 17,497 17,228 16,367 16,941
Order intakeOrder intake amounted to SEK 39,833 million in 2020,
down 10 percent compared to 2019. Excluding ex-
change rate variations, order intake declined 6 percent.
SEK MILLION
0
2,000
4,000
6,000
8,000
2019181716
4,1
84
3,7
42
3,5
90
4,1
96
6,6
65
Free cash flowAlfa Laval generated a free cash flow of SEK 6,665
million (4,196) in 2020.
0
2,000
4,000
6,000
8,000
20191817160
10
20
30
40
SEK MILLION
5,5
53
5,6
10
6,7
18
7,9
89
7,2
31
%
Adjusted EBITAAdjusted EBITA amounted to SEK 7,231 million.
The adjusted EBITA margin was 17.4 percent.
41,468
39,833
19.1%
0.48
16,882
7,231
17.4%

20
20
in b
rief
– Launch of global restructuring program
– Stable demand and improved profitability
– The board proposes a dividend of SEK 5.50 for
2020 and a three-year share buy-back program of
up to 5 percent of the issued shares per year
Q1
Q3
Q2
Q4
Order intake, SEK million
Order intake, SEK million
Order intake, SEK million
Order intake, SEK million
Adjusted EBITA, SEK million
Adjusted EBITA, SEK million
Adjusted EBITA, SEK million
Adjusted EBITA, SEK million
Operating margin, %
Operating margin, % Operating margin, %
Operating margin, %
11,877
8,935
9,749
9,272
1,750
1,710
1,802
1,969
16.5
17.6
17.2
18.4
Net sales, SEK million
Net sales, SEK million
Net sales, SEK million
Net sales, SEK million
10,590
9,728
10,455
10,695
– Strong growth in new energy-efficient solutions
– Launch of short-term cost-reduction program to
address the negative effects of COVID-19
– Operational adaptations in production and the
supply chain
– Alfa Laval presented a public tender offer of EUR
11.50 per share for all of the shares in Neles
– Strong growth in Food & Water
– Positive effects from short-term cost-reduction
program
– Order intake in line with last year despite a
challenging quarter due to COVID-19
– Strong cash flow from operating activities
– Launch of Alfa Laval CultureOne™, a unique
separation system for single-use biopharma-
ceutical processing
9

10
* Excluding exchange rate variations
Financial goals
Alfa Laval is governed with the aim of realizing its business concept, while at the same time meeting the financial goals established with
regard to growth, profitability and capital utilization. By achieving or exceeding these goals, Alfa Laval creates the necessary scope for
its continued favorable development as well as generating increased value for its shareholders in the form of an annual dividend and
by boosting the value of the company.
GrowthAlfa Laval’s goal is to achieve average
annual sales growth of at least 5 percent
measured over a business cycle. This
target is regarded as realistic, viewed in
light of the prevailing business scenario
and against the backdrop of Alfa Laval’s
achievements in recent years.
Outcome 2020 Outcome 2020 Outcome 2020
ProfitabilityAlfa Laval is to achieve an operating
margin – adjusted EBITA – of 15 percent
measured over a business cycle. This
goal was established based on historical
margins, while also taking the company’s
growth ambitions into consideration.
Capital utilizationThe goal is to have a return on capital
employed of at least 20 percent, a realistic
ambition based on a combination of organic
and acquired growth.
Our purpose provides the motivational force in our daily activities. Dedicated
to outstanding customer service, an inspiring and embracing workplace,
and with sustainability in our genetic code, we define our purpose as
accelerating success for our customers, people and planet.
Based on its three key technologies – heat transfer, separation and fluid
handling – Alfa Laval offers products and solutions that are in line with its
business concept: “To optimize the performance of our customers’
processes, time and time again.” In other words, Alfa Laval aims to help
its customers become more productive, energy-efficient and competitive.
20%15%5%
Our Purpose
Business concept
-15
-10
-5
0
5
10
15
20
20191817160
5
10
15
20
20191817160
5
10
15
20
25
2019181716
-7.5%* 17.4% 19.1%

11
* As a percentage of sales
* As a percentage of sales
** Including investments in fixed assets
Financial benchmark values
In addition to the Group’s financial goals, the Board has established benchmark values for three key financial ratios, which further
specify the framework and goals for the operation of the company.
Outcome 2020 Outcome 2020 Outcome 2020
Net debt in relation to EBITDAIn the long term, net debt in relation to
EBITDA, meaning operating profit before
depreciation and amortization of step-up
values, is not to be more than 2. Although
the ratio may exceed the goal in connection
with major acquisitions, this should be
viewed as a temporary situation, since
the company’s cash flow is expected to
offset this effect.
InvestmentsThe long-term benchmark value has been,
and will continue to be, for 2 percent of
sales to go to investments. This level
creates the necessary scope for replace-
ment investments as well as certain capacity
expansions in order to match the organic
growth of the Group’s key products.
Cash flow from operating activitiesCash flow from operating activities is to
amount to 10 percent of sales, including
investments in fixed assets. This value is
lower than the goal for the operating
margin, since organic growth normally
requires an increase in working capital.
In addition, taxes are paid in an amount
corresponding to approximately 26 per-
cent of earnings before tax.
Purp
ose, b
usin
ess c
oncep
t and
go
als
<2.0 2% 10%
Sustainability goals
In addition to its financial goals, Alfa Laval also has a number of sustainability goals. These reflect the company’s ambitions with respect
to the environment, health and safety. Among other areas, these targets encompass: a reduction in the number of workplace accidents,
increased energy efficiency, a reduction in water consumption and a reduction in greenhouse gas emissions.
49 Read more about Alfa Laval’s sustainability goals on page 49. For more information about Alfa Laval’s
sustainability work, refer to the Sustainability Report available at: www.alfalaval.com
0
1
2
3
20191817160
1
2
3
4
20191817160
5
10
15
20
2019181716
0.48 3.0% 15.7%**

12
Strategic prioritiesTo achieve its vision, implement its business concept and
attain its growth, profitability and capital utilization goals,
Alfa Laval has established various strategic priorities that
encompass customer collaboration, a focus on products
and working to further strengthen the aftermarket offering.
Stra
teg
ic p
rioritie
s
13
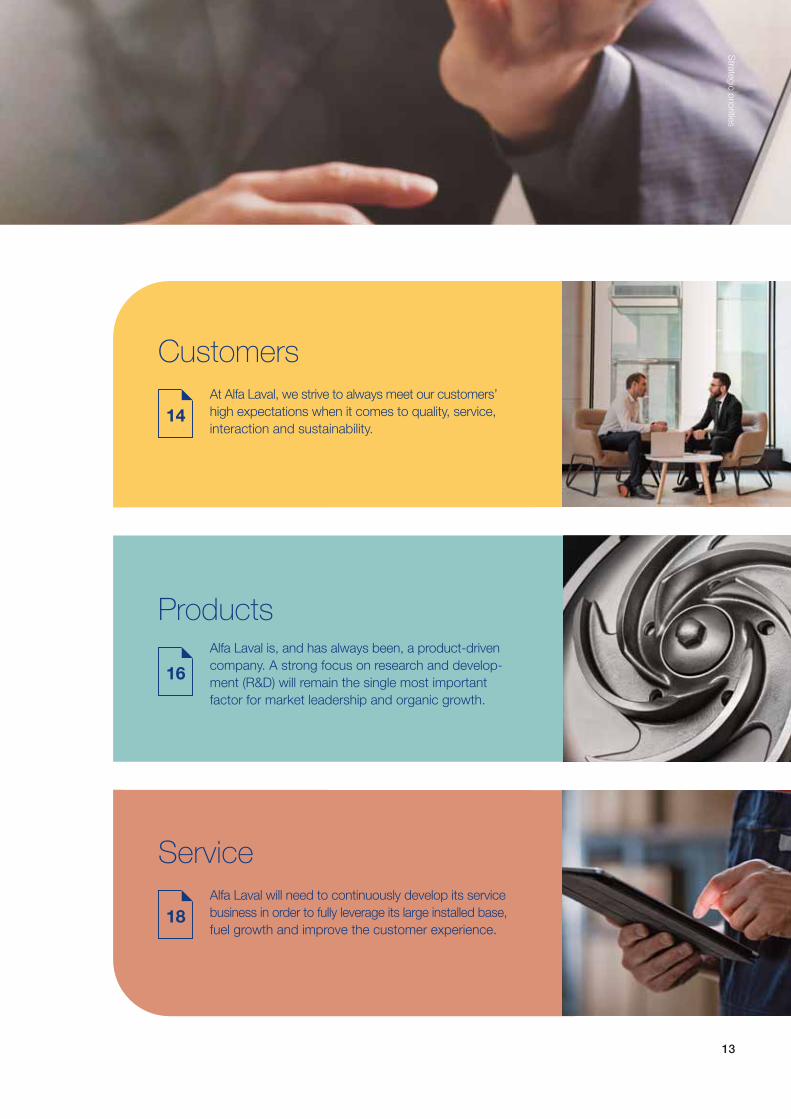
Alfa Laval is, and has always been, a product-driven
company. A strong focus on research and develop-
ment (R&D) will remain the single most important
factor for market leadership and organic growth.
At Alfa Laval, we strive to always meet our customers’
high expectations when it comes to quality, service,
interaction and sustainability.
Customers
Service
Products
16
18
14
Alfa Laval will need to continuously develop its service
business in order to fully leverage its large installed base,
fuel growth and improve the customer experience.

Hours, remote service.
+10,000
CustomersAlfa Laval strives to offer customers the best overall experience, from initial contact to
service. Products and total solutions are developed based on the customer’s needs,
which creates added value as well as favorable conditions for long-term relationships
and new business opportunities.
Alfa Laval endeavors to optimize its customers’ processes.
Naturally, the company’s products are central in this. But
customers tend to weigh other criteria as well when they
evaluate their overall experience with a supplier. They look
at the product’s quality and efficiency, of course, but also
at the seller’s service and knowledge, how easy they are
to reach and how quickly they respond with answers to
any questions. They evaluate how helpful the supplier can
be if something happens and they need to order spare
parts and service. They also look at how punctual the
supplier’s deliveries are and, in many cases, even at the
supplier’s sustainability work, to name a few examples.
Alfa Laval endeavors to be a company that is easy to do
business with. By meeting the customer’s expectations
and needs, from the initial contact through the sales pro-
cess to delivery and even in the aftermarket, the condi-
tions are created for a positive customer experience.
This makes it more likely that Alfa Laval will become their
first choice for their next procurement.
Alfa Laval works on a broad scale to simplify customer
collaboration. One aspect of this involves an organiza-
tional structure created to ensure short decision-making
paths and thus faster customer contacts. Another involves
the establishment of three standardized business models
to address customers’ differing needs, challenges and
purchasing processes.
1. Standard – sale of standardized components
through channels and online, with a focus on easy
accessibility and lead times.
2. Configured – standardized components with standard
configuration formats for adaptation to specific appli-
cations, capacities, etc.
3. Project – customized systems and solutions for cus-
tomers with specific requirements.
Artificial Intelligence (AI) troubleshooting.
Connected assets.
+450%
+300%
14

Custo
mers
There are also other ways to make things easier for cus-
tomers. Alfa Laval therefore works actively to improve
and develop its digital platforms, everything from the
company’s website and e-commerce platform to mar-
keting initiatives and social media. The goal is to reach
the customer early in the decision-making process, help
them find Alfa Laval’s website, make it easier for them
to find what they need there and even offer them a way
of configuring as well as ordering products online. Pur-
chasing patterns change and it is essential to keep up.
Existing plans to introduce digitized processes were
expedited to counteract the effects of shutdowns and
physical distancing measures related to COVID-19.
During the first half of the year, Alfa Laval accelerated the
introduction of a digital platform to support customers with
remote services. The platform enables service technicians
at the customer’s facility to create a video link to use
“merged reality” to facilitate efficient remote control.
Thanks to the digital platform and a new work method,
Alfa Laval improved access to its product and application
experts and reduced wait times for service technicians
when it comes to addressing customers’ issues. The
platform also helps Alfa Laval meet its goal of offering
customer-oriented solutions, even when travel restrictions
make it difficult, or even impossible, to deploy service
technicians to customers’ facilities. At year-end, product
and application experts had logged over 10,000 hours
of remote service to maintain customer processes.
15

16
The company’s growth rate and the tempo of its product launches
are constantly accelerating, and major initiatives have been under-
taken in the last few years. The most important of these were the
launch of two new platforms for separators and heat exchangers
and the development and implementation of several digital solutions.
These changes were made possible in large part due to a compre-
hensive analysis of the entire Group in 2016. Everything from the
company’s R&D processes to the product range and marketing
were put under the microscope and reviewed. The company’s
services offering and, not least, the rate and scope of digitization
were also enhanced. Challenging and further developing the offering
is an ongoing process, which will continue throughout all areas to
ensure the company’s competitiveness.
Life cycle analyses can help the company define and implement
methods that also take environmental aspects into consideration
during the development and design of key technologies. The am-
bition is that every new product, in addition to being more efficient,
should have a smaller impact on the environment than the product
it replaces. It is not only about the product’s own life cycle, how-
ever – it is also about developing a product or solution that can
help make the customer’s processes more resource efficient.
The rate of product launches has increased over the past few
years. Between product improvements, upgrades and entirely
new products, Alfa Laval launches approximately 100 products
annually, which is the equivalent of around two products per week.
The focus is on delivering products and services that can provide
improvements for the customer, whether in terms of energy effi-
ciency or the ability to digitally monitor product performance.
A competence center for tomorrow’s solutions
During the last few years, Alfa Laval has established international
competence and test centers in different key areas. There is a
center for high-speed separators in Tumba, Sweden as well as
several facilities in Denmark: a center for the next generation of
decanters and digital solutions in Søborg, a center for the devel-
opment of marine solutions in Aalborg and a center for membrane
filtration in Nakskov. In 2020, the Hygienic Fluid Handling Busi-
ness Unit opened a major technology-specific application and test
center in Kolding, Denmark.
In addition to competence centers, Alfa Laval has different product-
based business centers. Each center focuses on a specific product
portfolio, such as compact heat exchangers, fluid handling products
or boilers. These centers are responsible for R&D as well as further
developing existing product platforms. They are also responsible
for product strategies, pricing, sales tools and training as well as
follow-up and evaluation of product launches. Product and business
development takes place every day of the year at Alfa Laval.
Driven by developmentA constant focus on R&D is and always has been essential for Alfa Laval. This is, without a
doubt, the most important condition for the company to be able to deliver products and
solutions of the highest quality to industries around the world. The goal is clear: remain a
market leader in heat transfer, separation and fluid handling.
17
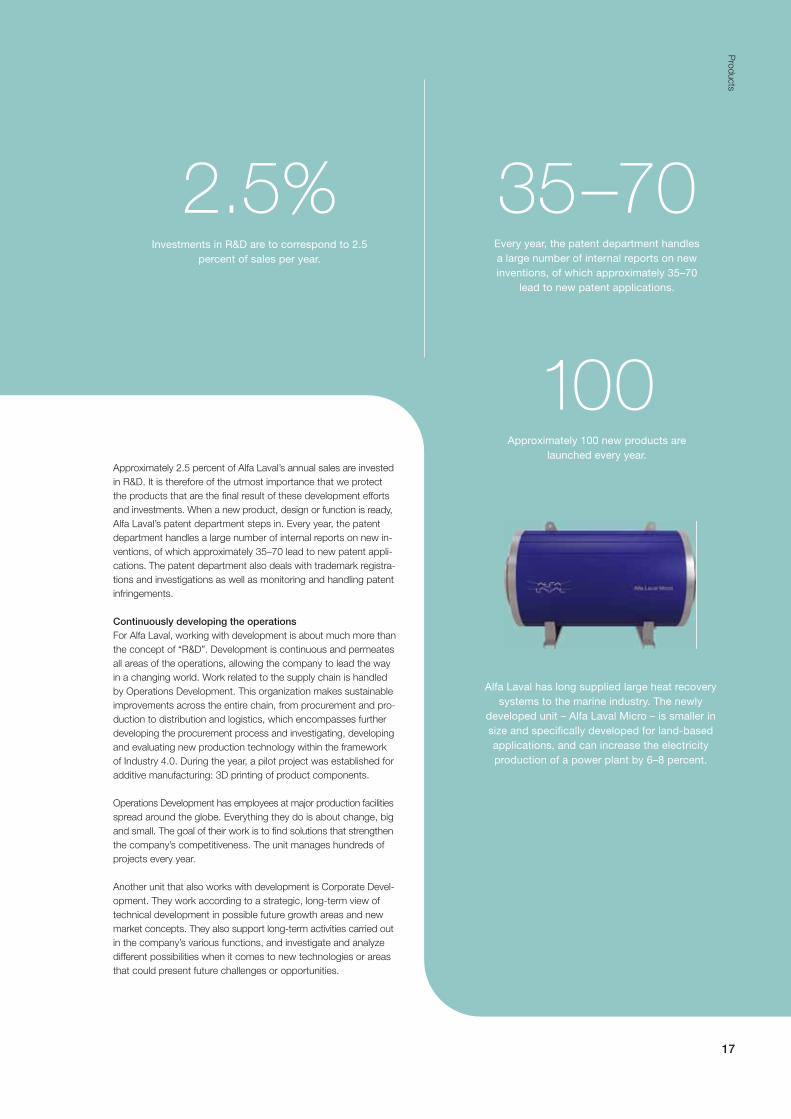
Investments in R&D are to correspond to 2.5
percent of sales per year.
Every year, the patent department handles
a large number of internal reports on new
inventions, of which approximately 35–70
lead to new patent applications.
Approximately 100 new products are
launched every year.
Pro
ducts
2.5% 35–70
100Approximately 2.5 percent of Alfa Laval’s annual sales are invested
in R&D. It is therefore of the utmost importance that we protect
the products that are the final result of these development efforts
and investments. When a new product, design or function is ready,
Alfa Laval’s patent department steps in. Every year, the patent
department handles a large number of internal reports on new in-
ventions, of which approximately 35–70 lead to new patent appli-
cations. The patent department also deals with trademark registra-
tions and investigations as well as monitoring and handling patent
infringements.
Continuously developing the operations
For Alfa Laval, working with development is about much more than
the concept of “R&D”. Development is continuous and permeates
all areas of the operations, allowing the company to lead the way
in a changing world. Work related to the supply chain is handled
by Operations Development. This organization makes sustainable
improvements across the entire chain, from procurement and pro-
duction to distribution and logistics, which encompasses further
developing the procurement process and investigating, developing
and evaluating new production technology within the framework
of Industry 4.0. During the year, a pilot project was established for
additive manufacturing: 3D printing of product components.
Operations Development has employees at major production facilities
spread around the globe. Everything they do is about change, big
and small. The goal of their work is to find solutions that strengthen
the company’s competitiveness. The unit manages hundreds of
projects every year.
Another unit that also works with development is Corporate Devel-
opment. They work according to a strategic, long-term view of
technical development in possible future growth areas and new
market concepts. They also support long-term activities carried out
in the company’s various functions, and investigate and analyze
different possibilities when it comes to new technologies or areas
that could present future challenges or opportunities.
Alfa Laval has long supplied large heat recovery
systems to the marine industry. The newly
developed unit – Alfa Laval Micro – is smaller in
size and specifically developed for land-based
applications, and can increase the electricity
production of a power plant by 6–8 percent.

18
The transformation of Alfa Laval Service got off to a good start in
2020. A combination of more digitized services and the ongoing
restructuring of in-person service points closer to the installed
base continued throughout the year in an effort to increase the
company’s physical and digital proximity to customers.
As a part of the restructuring of the company’s global organization,
Alfa Laval continued to invest time and money in improving its
proximity to its installed base. Several projects were started in the
effort to achieve the right balance between, on the one hand,
small local service centers for standard services and, on the other,
advanced service centers with leading technology to facilitate all
kinds of services, repairs and complete renovations.
During the year, Alfa Laval launched a Group-wide transition of its
service technician team to continuously improve accessibility and
skills and to reduce wait times for addressing customers’ issues
and service needs. By providing service technicians with access to
new digital processes and recruiting additional service technicians
during 2020, Alfa Laval was able to further improve its proximity
to customers as well as the customer experience. A process was
also initiated for competence development plans to increase the
service technicians’ digital and electronics expertise in order to
handle new demands from customers in pace with Alfa Laval’s
increasingly digitized product portfolio and an overall increased
use of the Internet of Things (IoT).
At the same time, sales forces across all of Alfa Laval have imple-
mented a clearer strategic and data-based focus on retaining and
developing the existing and future customer base. At the end of
the first quarter, locally adapted strategies to capitalize on the
data in Asia started to yield results, while the sales forces in other
regions adopted similar customized strategies during the rest of
the year. The introduction of a global dashboard for the installed
base led to new insights into customers’ service needs, which en-
able the service sales force to proactively contact customers with
offers of preventive services before the customers realize they
need them.
To further support the service business, Alfa Laval is continuously
expanding the number of service agreements with customers at
each new sale. The primary goal is to leverage the full value of each
new equipment sale and demonstrate the cost benefits of owning
Alfa Laval’s equipment. The secondary goal is to offer customers
the advantages of preventive maintenance and connected service
solutions, and the effect they have when it comes to continuously
improving processes and minimizing unplanned stoppages. A cam-
paign across the entire organization to sell more service agreements
led to a 25 percent increase compared to 2019.
When it comes to selling spare parts, offering times, the availability
of spare parts and accurate estimates of delivery times remain
important factors, since these have a direct impact on the cus-
tomer’s ability to maintain processes without stoppages involving
Alfa Laval’s equipment. Despite shutdowns in several countries,
Alfa Laval’s distribution center was able to maintain operations
and delivered to customers with only limited disruptions.
Intensified efforts and strategic initiatives to transform Alfa Laval’s
services businesses, combined with the dedication of the com-
pany’s employees, successfully mitigated the effects of an overall
uncertain 2020.
Digitized and data-based service improves the customer experienceDuring 2020, Alfa Laval continued to transform its sales of service and spare parts as well as
its customer service in line with its strategy to make them more digitized and data-based. The
ultimate goal of transforming the service business is for Alfa Laval to be able to fully leverage
its installed base, improve and expand the customer base and simultaneously improve the
customer experience, thereby supporting Alfa Laval’s brand.

19
Servic
e
SEK MILLION
0
2,000
4,000
6,000
8,000
10,000
12,000
14,000
2019181716
10
,57
3
10
,92
3
11
,56
8
12
,82
4
11
,77
3
Service Order intake, SEK million
Large and mature installed base that
needs to be maintained and renewed.
A combination of fast-growing markets and
established niche applications.
Installed base that is growing rapidly.
Service centers.
Long-term potential – Value of the aftermarket relative to new sales
Decanters x 1.5 Pumps and valves x 1–2.5
Separators x 4 Plate heat exchangers x 1–7
1111
222
33
44
5
6
7
More than 100 service centers with
the capacity to deliver services in
over 160 countries.
Service centers
>100
service technicians in total.
more service agreements.
Data driven sales – Users.
Data driven sales – Sessions.
700
25%
+84%
+125%

20
World-leading in three key technologiesAlfa Laval’s operations are based on three key technologies – heat transfer,
separation and fluid handling. These technologies play a key role in a
number of industrial processes and Alfa Laval commands a world-leading
position in all three areas.
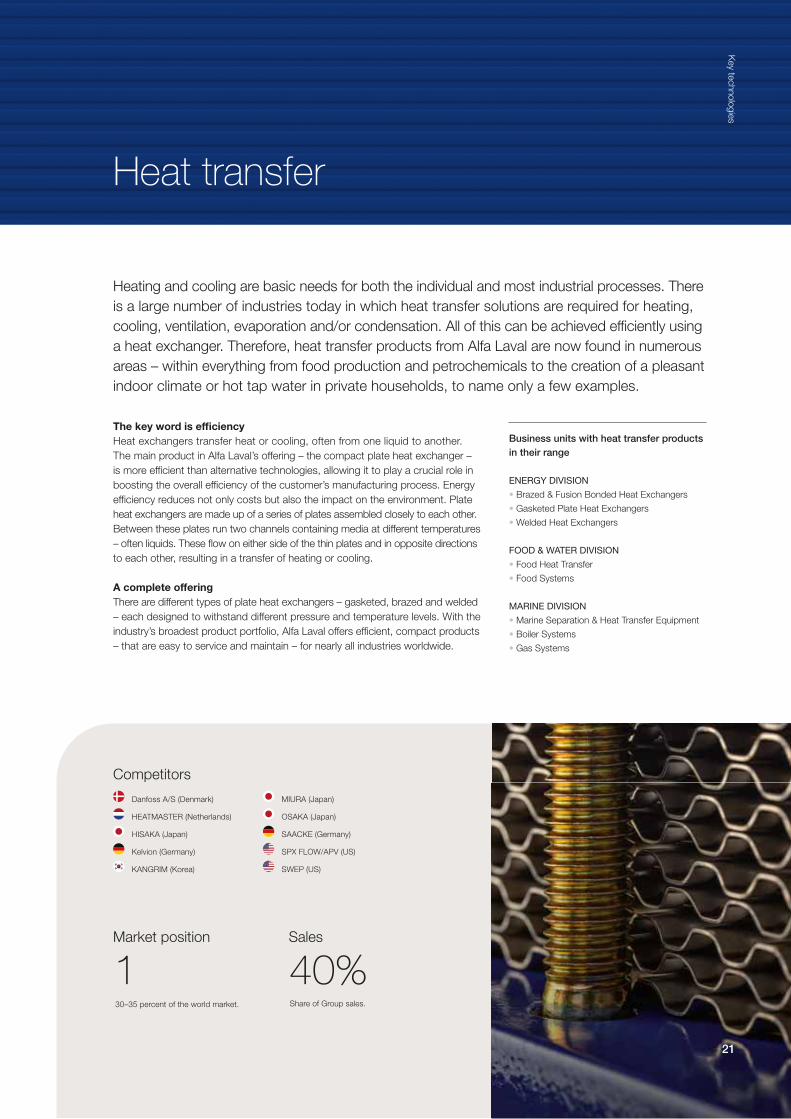
The key word is efficiency
Heat exchangers transfer heat or cooling, often from one liquid to another.
The main product in Alfa Laval’s offering – the compact plate heat exchanger –
is more efficient than alternative technologies, allowing it to play a crucial role in
boosting the overall efficiency of the customer’s manufacturing process. Energy
efficiency reduces not only costs but also the impact on the environment. Plate
heat exchangers are made up of a series of plates assembled closely to each other.
Between these plates run two channels containing media at different temperatures
– often liquids. These flow on either side of the thin plates and in opposite directions
to each other, resulting in a transfer of heating or cooling.
A complete offering
There are different types of plate heat exchangers – gasketed, brazed and welded
– each designed to withstand different pressure and temperature levels. With the
industry’s broadest product portfolio, Alfa Laval offers efficient, compact products
– that are easy to service and maintain – for nearly all industries worldwide.
Business units with heat transfer products
in their range
ENERGY DIVISION
• Brazed & Fusion Bonded Heat Exchangers
• Gasketed Plate Heat Exchangers
• Welded Heat Exchangers
FOOD & WATER DIVISION
• Food Heat Transfer
• Food Systems
MARINE DIVISION
• Marine Separation & Heat Transfer Equipment
• Boiler Systems
• Gas Systems
Heat transfer
Key te
chno
log
ies
Heating and cooling are basic needs for both the individual and most industrial processes. There
is a large number of industries today in which heat transfer solutions are required for heating,
cooling, ventilation, evaporation and/or condensation. All of this can be achieved efficiently using
a heat exchanger. Therefore, heat transfer products from Alfa Laval are now found in numerous
areas – within everything from food production and petrochemicals to the creation of a pleasant
indoor climate or hot tap water in private households, to name only a few examples.
Competitors
Market position Sales
Danfoss A/S (Denmark)
HEATMASTER (Netherlands)
HISAKA (Japan)
Kelvion (Germany)
KANGRIM (Korea)
MIURA (Japan)
OSAKA (Japan)
SAACKE (Germany)
SPX FLOW/APV (US)
SWEP (US)
1 40%30–35 percent of the world market. Share of Group sales.
21

Separation is the technology that represents the origin of the Alfa Laval we see today. The
business began in 1883, based solely on separation, and this technology remains a core fea-
ture to this day. With precision and a high degree of reliability, liquids, solid particles and gases
are separated from one another, which is a requirement in a large number of industries.
Business units with separation products in
their range
ENERGY DIVISION
• Energy Separation
FOOD & WATER DIVISION
• High Speed Separators
• Decanters
• Food Systems
MARINE DIVISION
• Marine Separation & Heat Transfer Equipment
High-speed separators and decanter centrifuges
Alfa Laval’s separation products are dominated by high-speed separators and
decanter centrifuges. Separators have high rotation speeds, are generally mounted
vertically and can separate small particles from liquids and gases. Decanter cen-
trifuges are normally mounted horizontally, operate at lower speeds and are used
to separate larger particles from liquids. They are used, for example, in the de-
watering of sludge in wastewater treatment plants. Other separation products
include membrane filters, which are the established solution for separating very
small particles, and belt filter presses, which are used for mechanical dewatering,
mainly of municipal wastewater.
Key role in a number of processes
Separators and decanter centrifuges play a crucial role in numerous industrial
processes, such as:
• food, pharmaceutical, bioengineering, chemical and petrochemical processes.
• extraction and production of crude oil, and treatment and recovery of drilling mud.
• handling and treatment of fuel and lubricants aboard vessels and at diesel/gas
power plants.
• dewatering of sludge and treatment of process water in private and municipal
facilities.
Separation
Separators
GEA (Germany)
MITSUBISHI KAKOKI KAISHA (Japan)
PIERALISI (Italy)
SPX FLOW/Seital (US)
Decanters
Flottweg (Germany)
GEA (Germany)
GUINARD/ANDRITZ (France, Austria)
PIERALISI (Italy)
Competitors
Market position Sales
1 17%25–30 percent of the world market. Share of Group sales.
22

Key te
chno
log
ies
The transportation and regulation of fluids in an efficient and safe manner is crucial to many in-
dustries. Alfa Laval focuses on fluid handling products, such as pumps and valves, for indus-
tries with stringent hygiene requirements and on pumping systems for the marine industry and
the offshore market.
Efficient and precise
The company’s pumps, valves and installation material are used in production processes
with strict hygiene requirements, such as the production of beverages, dairy products,
food and pharmaceuticals.
Pumps drive the flow of liquids, while valves are used to guide the flow by opening and
closing. For hygienic applications, Alfa Laval mainly offers centrifugal, liquid ring and rotary
lobe pumps. The most common types of valves include control valves, constant-pressure
valves, butterfly valves and diaphragm valves. The offering also includes hygienic tank
equipment ranging from mixers to cleaning equipment. Mixers can be used to mix both
high and low-viscosity fluids, such as milk, wine, juice, yoghurt, desserts and fruit drinks.
For the marine sector, Alfa Laval offers submerged, hydraulic pumping systems for
product and chemical tankers. These systems enable safe and flexible load handling,
which results in less time in port and fewer journeys without commercial loads. For the
offshore industry, the offering includes pumping systems for collecting sea water for
various onboard applications, water injection in drill holes and fire extinguishing, which
contribute to safe and efficient operation.
Business units with fluid handling
products in their range
FOOD & WATER DIVISION
• Food Systems
• Hygienic Fluid Handling
MARINE DIVISION
• Pumping Systems
Fluid handling
Competitors
Market position Sales
1 22%10–15 percent of the world market. Share of Group sales.
Bardiani Valves (Italy)
Dockweiler Edelstahl (Germany)
Fristam (Germany)
GEA (Germany)
Kieselman GmbH (Germany)
MARFLEX (Netherlands)
SPX FLOW/APV (US)
SULZER (Switzerland)
23
24
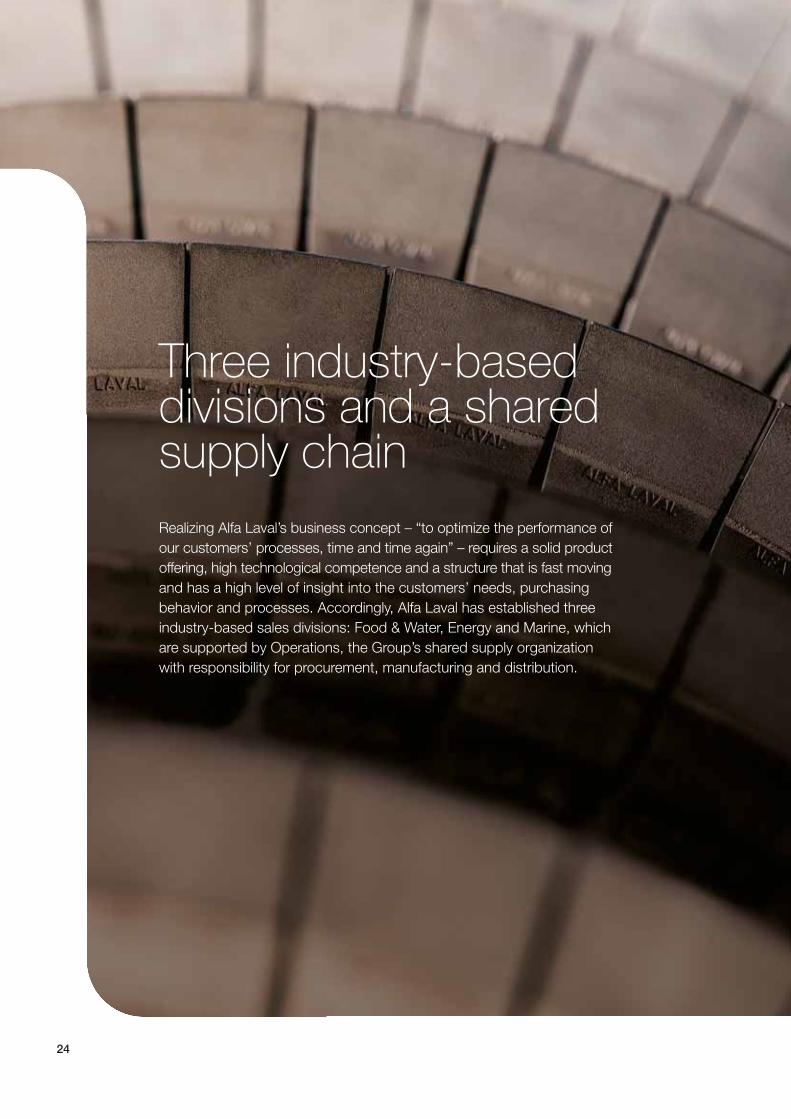
Three industry-based divisions and a shared supply chain
Realizing Alfa Laval’s business concept – “to optimize the performance of
our customers’ processes, time and time again” – requires a solid product
offering, high technological competence and a structure that is fast moving
and has a high level of insight into the customers’ needs, purchasing
behavior and processes. Accordingly, Alfa Laval has established three
industry-based sales divisions: Food & Water, Energy and Marine, which
are supported by Operations, the Group’s shared supply organization
with responsibility for procurement, manufacturing and distribution.

25
Divis
ion o
vervie
w
Food & WaterThe division targets customers in industries such as: food, pharma-
ceuticals, biotech, vegetable oils, breweries, dairy and personal
care products. In addition, it focuses on public and industrial water
treatment as well as wastewater and waste treatment.
EnergyEnergy efficiency is a focus area in order to help customers to reduce their
energy consumption, which is beneficial both from a financial and environ-
mental point of view. The division has customers in heating, ventilation and
cooling, oil and gas extraction, refineries, petrochemicals and power generation.
MarineThe division’s customers include shipowners, ship yards, manufacturers
of diesel and gas engines and companies that specialize in offshore
extraction of oil and gas.
OperationsOperations is responsible for the Group’s production-related procure-
ment, manufacturing, distribution and logistics. This centralized, co-
ordinated and global supply chain creates the necessary prerequisites
to ensure reliable access to the company’s products worldwide.
Share of Group
order intake
Share of Group
order intake
Share of Group
order intake
Operating margin
Operating margin
Operating margin
Aftermarket’s share
of the division
Aftermarket’s share
of the division
Aftermarket’s share
of the division
17.7%
15.4%
17.4%

Food & Water26

Fo
od
& W
ate
r Divis
ion
0
3,000
6,000
9,000
12,000
15,000
20191817
0
500
1,000
1,500
2,000
2,500
0
3,000
6,000
9,000
12,000
15,000
20191817
SEK MILLION SEK MILLION
Sweden, 4%Other, 2%
Other
EU, 26%Asia, 30%
Other
Europe, 6%
North America, 26%
Latin America, 6%
Sales
Sales and operating profit
Operating profit
Order intake
11,8
24
13,2
10
14,1
89
13,4
14
12,3
88
13,6
91
14,0
26
13,8
14
Nish PatelPresident, Food & Water Division
The year in brief
The division maintained a solid business level in 2020, despite un-
certain macroeconomic conditions following COVID-19. However,
business was conducted in a more digital way, which helped us
to make further progress on our digitization journey. The division
reached the end of the first strategy period since the launch of the
new organization in 2017, with several strategic goals achieved:
Product launches continued at a rapid pace in 2020, carried out
across the technological platforms within separation, decanters and
high-speed separators (HSS) as well as fluid handling. Connectivity
is now available for a significant portion of all new equipment sold,
allowing for easier and more efficient future service and monitoring.
One major breakthrough achieved by the division was the launch
of the new single-use, high-speed separator CultureOne. The
technology, which allows the HSS insert to be both replaced and
recycled, was developed for the pharma and biotech industry to
ensure compliance with strict hygienic requirements. Another milestone
was achieved in the area of hydrogenated vegetable oil (HVO) and
biodiesel, where Alfa Laval’s technology helps to reduce the consump-
tion of fossil fuel and supports the company’s sustainability targets.
Customer-centricity is our number one focus area, and close customer
cooperation around innovation is also key. The Hygienic Fluid Handling
Business Unit opened the division’s second major technology-specific
application and test center in Kolding, Denmark. Here, customers
will have the opportunity to test their food or pharma end-products
on Alfa Laval fluid handling equipment under everyday conditions
in order to validate their performance, optimize their processes
and drive innovation.
The division’s diligent work to further expand its network of sales
channels – meaning distributors and integrators – continued to pay off.
New means of marketing have been added and made even more
accessible through existing, well-functioning e-business and online
tools, all to improve customer interaction through enhancements
in speed and simplicity, thereby improving the customer experience.
More service contracts are now being signed in connection with new
equipment. The share of connected products has further increased,
creating an even bigger opportunity for after-sales and service, and
enabling preventive maintenance and uptime to be optimized. Remote
guidance, a tool developed to mitigate restrictions with respect to
physical access to customer sites during the pandemic, proved to
be a valuable contributor to service growth.
27
The Food & Water business
Offering
Alfa Laval’s three key technologies are
all included in the offering. This encom-
passes different types of heat transfer
and separation products as well as fluid
handling equipment such as pumps
and valves.
Way to market
The division’s business comprises sales
of components, configured products and
projects. This means that in addition to
direct customer sales, the division also
reaches end customers via system
builders, contractors, retailers, agents
and distributors.
Target industries
The division targets customers in indus-
tries such as food, pharmaceuticals,
biotech, vegetable oils, breweries, dairy
and personal care products, to name a
few examples. It also focuses on public
and industrial water treatment as well
as wastewater and waste treatment.
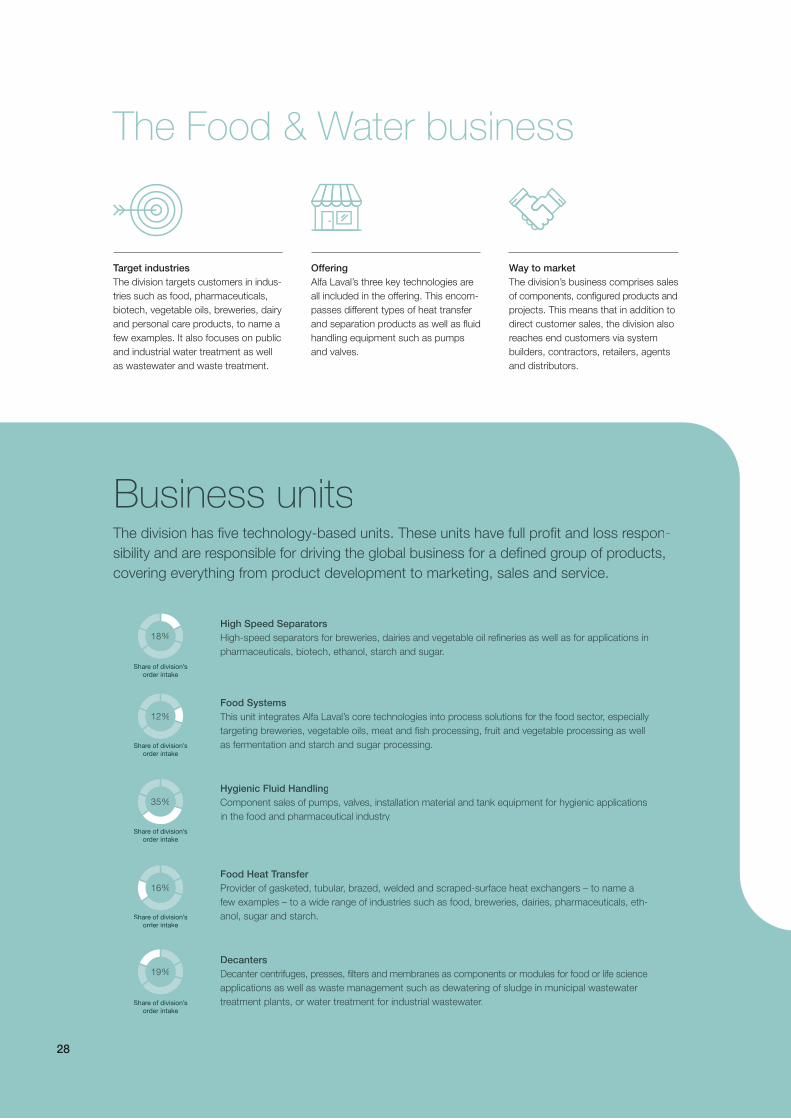
The division has five technology-based units. These units have full profit and loss respon-
sibility and are responsible for driving the global business for a defined group of products,
covering everything from product development to marketing, sales and service.
Business units
High Speed Separators
High-speed separators for breweries, dairies and vegetable oil refineries as well as for applications in
pharmaceuticals, biotech, ethanol, starch and sugar.
Share of division’s
order intake
Food Systems
This unit integrates Alfa Laval’s core technologies into process solutions for the food sector, especially
targeting breweries, vegetable oils, meat and fish processing, fruit and vegetable processing as well
as fermentation and starch and sugar processing.Share of division’s
order intake
Hygienic Fluid Handling
Component sales of pumps, valves, installation material and tank equipment for hygienic applications
in the food and pharmaceutical industry.
Share of division’s
order intake
Food Heat Transfer
Provider of gasketed, tubular, brazed, welded and scraped-surface heat exchangers – to name a
few examples – to a wide range of industries such as food, breweries, dairies, pharmaceuticals, eth-
anol, sugar and starch.Share of division’s
order intake
Decanters
Decanter centrifuges, presses, filters and membranes as components or modules for food or life science
applications as well as waste management such as dewatering of sludge in municipal wastewater
treatment plants, or water treatment for industrial wastewater.Share of division’s
order intake
28
18%
12%
35%
16%
19%

Fo
od
& W
ate
r Divis
ion
Structural growth drivers
FoodA growing number of people are joining the middle class,
urbanization is continuing at an undiminished rate and women
now account for a higher percentage of the workforce. This is
contributing to growing demand for ready-made food and the
development of more efficient supply chains with the capacity
to reduce waste.
Alfa Laval’s history began in 1883 with the development of a separator for separating
cream from milk. Since then, the company’s offering for hygienic applications in
the food industry has been expanded to include heat exchangers, pumps and
valves. These products meet the strictest hygiene requirements and can help to
optimize the use of raw materials. Alfa Laval can also help to reduce waste by
offering cooling solutions for transport and storage.
EnvironmentHuman impact on the environment is coming under greater
scrutiny, resulting in new, increasingly stringent laws. In parallel
with this, a sustainability mindset has also evolved and is
encouraging companies to voluntarily take steps that con-
tribute to environmental improvements.
Alfa Laval has a wide range of products for managing various environmental
problems. The Food & Water division offering includes decanter centrifuges to
dewater sludge in municipal wastewater treatment plants and they are also involved
in handling industrial waste and water. Within food manufacturing, Alfa Laval
offers processes and solutions that can reduce waste by increasing the yield.
p
offering cooling solutions for transport and storage.
Fo
od
&W
ate
rD
ivisio
n
middle class,
d rate and women
workforce. This is
ade food and the
with the capacity
separator for separating
ygienic applications in
hangers, pumps and
ments and can help to
p to reduce waste by
29
30
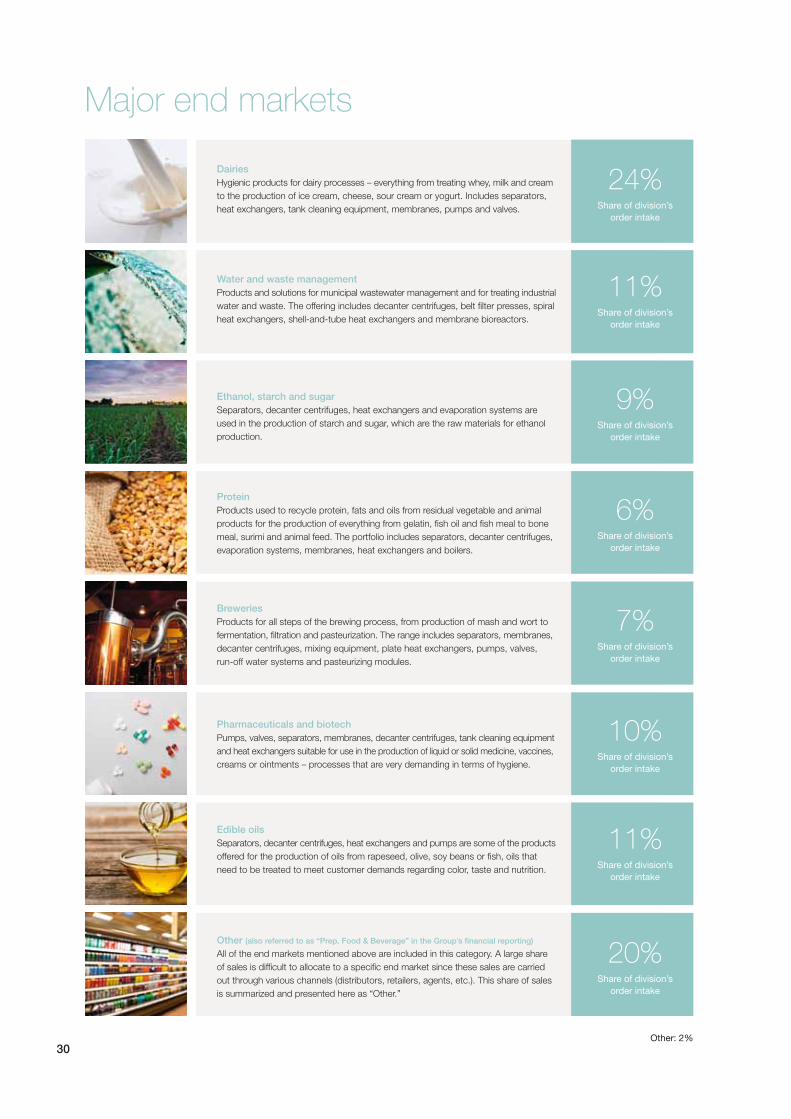
Major end markets
Dairies
Hygienic products for dairy processes – everything from treating whey, milk and cream
to the production of ice cream, cheese, sour cream or yogurt. Includes separators,
heat exchangers, tank cleaning equipment, membranes, pumps and valves. Share of division’s
order intake
Water and waste management
Products and solutions for municipal wastewater management and for treating industrial
water and waste. The offering includes decanter centrifuges, belt filter presses, spiral
heat exchangers, shell-and-tube heat exchangers and membrane bioreactors.Share of division’s
order intake
Ethanol, starch and sugar
Separators, decanter centrifuges, heat exchangers and evaporation systems are
used in the production of starch and sugar, which are the raw materials for ethanol
production.
Share of division’s
order intake
Protein
Products used to recycle protein, fats and oils from residual vegetable and animal
products for the production of everything from gelatin, fish oil and fish meal to bone
meal, surimi and animal feed. The portfolio includes separators, decanter centrifuges,
evaporation systems, membranes, heat exchangers and boilers.
Share of division’s
order intake
Breweries
Products for all steps of the brewing process, from production of mash and wort to
fermentation, filtration and pasteurization. The range includes separators, membranes,
decanter centrifuges, mixing equipment, plate heat exchangers, pumps, valves,
run-off water systems and pasteurizing modules.
Share of division’s
order intake
Pharmaceuticals and biotech
Pumps, valves, separators, membranes, decanter centrifuges, tank cleaning equipment
and heat exchangers suitable for use in the production of liquid or solid medicine, vaccines,
creams or ointments – processes that are very demanding in terms of hygiene.Share of division’s
order intake
Edible oils
Separators, decanter centrifuges, heat exchangers and pumps are some of the products
offered for the production of oils from rapeseed, olive, soy beans or fish, oils that
need to be treated to meet customer demands regarding color, taste and nutrition. Share of division’s
order intake
Other (also referred to as “Prep. Food & Beverage” in the Group’s financial reporting)
All of the end markets mentioned above are included in this category. A large share
of sales is difficult to allocate to a specific end market since these sales are carried
out through various channels (distributors, retailers, agents, etc.). This share of sales
is summarized and presented here as “Other.”
Share of division’s
order intake
24%
11%
9%
6%
7%
10%
11%
20%
Other: 2%

SUSTAINABILITY
Processes make it possible to utilize the entire fish
The earth’s population is increasing at an undiminished
rate and is expected to reach nine billion people by 2050.
Food production that is both efficient and sustainable is
essential for responsible resource management. One
company that truly takes this seriously is Pelagia in Norway,
a world-leading company specializing in pelagic fish
products. In their facility in Måløy, Norway, Pelagia uses
100 percent of the mackerel they fish, which in addition
to fillets become fish meal, oils and protein. Everything is
used to produce food and nutrition for human consump-
tion, resulting in no food waste. In the process of extracting
these high-quality fish products, Pelagia uses various
Alfa Laval equipment, including pumps, valves, heat ex-
changers, high-speed separators and decanters. Alfa
Laval is also responsible for service and maintenance of
several process lines at their facilities along the Norwe-
gian and UK coasts. The company’s service organization
works closely with Pelagia’s operating engineers, thereby
ensuring that the process lines run optimally and that a
high level of product quality is maintained. The proximity
of service and spare parts is essential, since the pelagic
season is short, and downtime or disturbances would
have severe consequences for Pelagia. The factories,
dubbed “The Promise to the Sea,” is an expression of
Pelagia’s ambition to produce food as sustainably as
possible and with great respect for the fish and the ocean.
Fo
od
& W
ate
r Divis
ion
INNOVATION
Additional innovation center strengthens focus on development
Vegetarian products, vegan cooking, alcohol-free beer
and flavorful oils are just a few examples of how trends
and taste preferences steer the daily operations of food
producers. Changing consumer trends fuel demand for
new food products, which in turn creates a need for
flexible processing equipment. Food producers are also
always looking for more efficient and sustainable processes
to get more out of their raw materials while saving water
and energy. Simply put, the food industry depends on
innovation. Alfa Laval works close to its customers – the
food producers themselves – and helps them make their
processes more sustainable while adapting and optimizing
them in the face of new conditions and needs. All of this
requires a responsive and flexible approach as well as
R&D that enables a product program that reflects current
and future needs. To increase the development rate of
new fluid handling products and solutions for the food
and pharmaceutical industries, Alfa Laval opened its
third innovation center for food and water applications in
Denmark during the year, this time in Kolding, Jylland.
(There are already similar test centers for decanters in
Søborg and for membrane filtration in Nakskov.) The
new 1,600-square-meter center in Kolding will become
a global test facility for new products where customers
will also be able to study the performance of Alfa Laval’s
equipment under real operating conditions. It will further
strengthen Alfa Laval’s global position in food and pharma-
ceuticals, which is an important growth area for the company.
31

323232
Energy
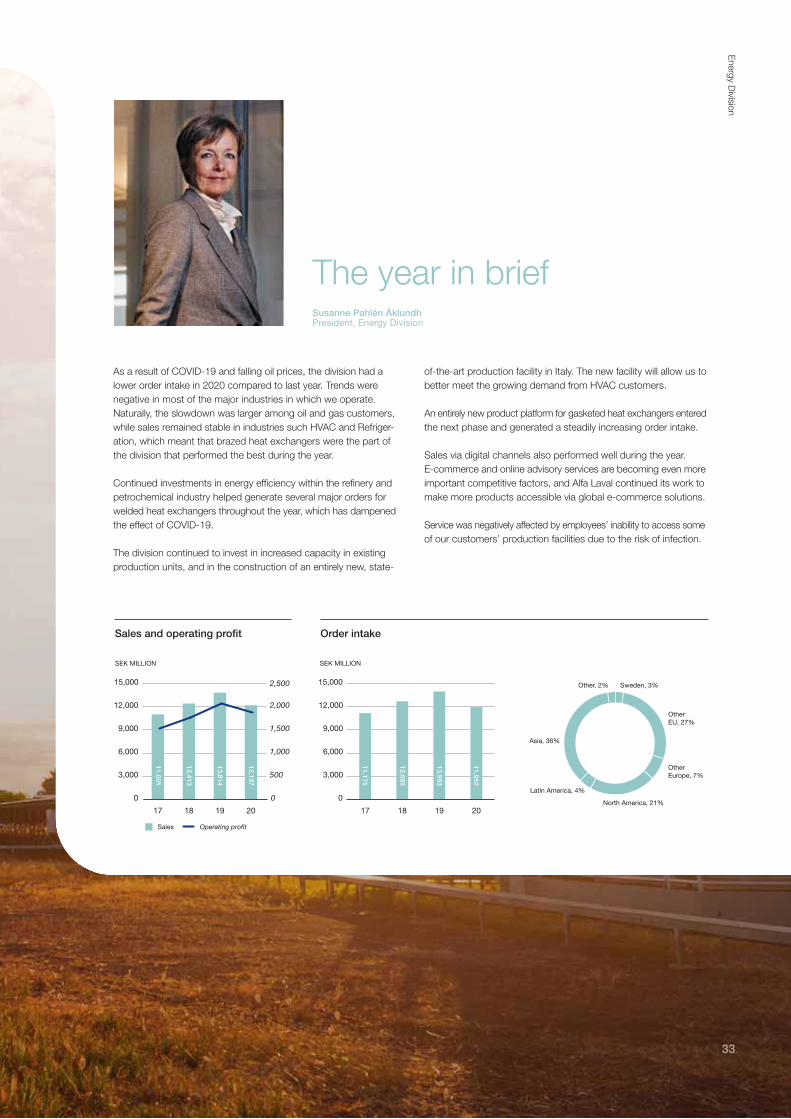
Susanne Pahlén ÅklundhPresident, Energy Division
The year in brief
0
3,000
6,000
9,000
12,000
15,000
20191817
0
500
1,000
1,500
2,000
2,500
0
3,000
6,000
9,000
12,000
15,000
20191817
SEK MILLION SEK MILLION
Sweden, 3%Other, 2%
Other
EU, 27%
Asia, 36%
Other
Europe, 7%
North America, 21%
Latin America, 4%
Sales and operating profit Order intake1
1,0
01
12
,413
13
,814
12
,187
11
,175
12
,685
13
,963
11
,952
Sales Operating profit
333333
As a result of COVID-19 and falling oil prices, the division had a
lower order intake in 2020 compared to last year. Trends were
negative in most of the major industries in which we operate.
Naturally, the slowdown was larger among oil and gas customers,
while sales remained stable in industries such HVAC and Refriger-
ation, which meant that brazed heat exchangers were the part of
the division that performed the best during the year.
Continued investments in energy efficiency within the refinery and
petrochemical industry helped generate several major orders for
welded heat exchangers throughout the year, which has dampened
the effect of COVID-19.
The division continued to invest in increased capacity in existing
production units, and in the construction of an entirely new, state-
of-the-art production facility in Italy. The new facility will allow us to
better meet the growing demand from HVAC customers.
An entirely new product platform for gasketed heat exchangers entered
the next phase and generated a steadily increasing order intake.
Sales via digital channels also performed well during the year.
E-commerce and online advisory services are becoming even more
important competitive factors, and Alfa Laval continued its work to
make more products accessible via global e-commerce solutions.
Service was negatively affected by employees’ inability to access some
of our customers’ production facilities due to the risk of infection.
Energ
y Divis
ion

The Energy business
Offering
Heat transfer is the main technology
offered, comprising everything from
gasketed plate heat exchangers for gentler
applications to different types of welded
heat exchangers for more demanding
applications. Separation technology is
the other main technology offered – both
high-speed separators and decanter
centrifuges.
Way to market
The Energy division’s business comprises
sales of components, configured prod-
ucts and projects. This means that in
addition to direct customer sales, the
division also reaches customers via
system builders, contractors, retailers,
agents and distributors.
Target industries
The division targets customers in markets
such as: oil and gas extraction, oil and
gas processing and transport, refineries,
petrochemicals and power generation.
The division also works with construction-
related applications, such as heating,
ventilation and cooling, and has an offering
for customers in the mining and metal
industries and lighter industries, to name
a few examples. Energy efficiency is a
focus area in which the division helps its
customers to reduce their energy con-
sumption, which is beneficial both from a
financial and environmental point of view.
The division has four technology-based business units. These units have full profit and
loss responsibility and are in charge of driving the global business for a defined group of
products, covering everything from product development to marketing, sales and service.
Business units
Brazed & Fusion Bonded Heat Exchangers
A majority of this business goes to applications within HVAC such as heating, ventilation, air condi-
tioning and cooling. This unit is largely driven by energy efficiency, transformation from fossil heating
and new sustainable refrigerants. Part of the business targets applications for engines, such as
cooling of engines on off-road vehicles or leisure boats, as well as cooling and cleaning of liquids in
the light manufacturing industry.
Share of division’s
order intake
Energy Separation
The business unit delivers separation solutions for the process industry and the circular economy, with
a focus on purification and recycling of industrial process flows and residual streams, production of
green chemicals and bio-fuels. The offer mainly consists of high-speed separators, decanter centri-
fuges, evaporation solutions and fresh water generators.
Share of division’s
order intake
Gasketed Plate Heat Exchangers
While this business unit is responsible for supporting all three divisions and thus has an extremely
wide product range, its focus in the Energy division is on supplying gasketed plate heat exchangers
for HVAC, cooling, engine cooling, chemical processing, oil production and power generation.Share of division’s
order intake
Welded Heat Exchangers
All types of welded heat exchangers such as compact plate heat exchangers, spiral heat exchangers,
tube heat exchangers and special air coolers. They are mainly delivered to process applications with
high pressures and temperatures in refining, petrochemicals and gas processing where the customer
has high demands on operational reliability, energy efficiency and CO2 reduction.
Share of division’s
order intake
34
22%
10%
45%
23%

Structural growth driversEnergyThe world’s energy needs are continuing to intensify – at a faster
rate in some areas of the world than others. There are two ways
to handle this challenge: increase the total energy production
and make greater use of technologies that enable more efficient
use or recycling of the energy generated.
With its compact heat exchangers at the heart of its solutions, Alfa Laval’s products
play an important role in the efforts to make the world’s industrial processes more
energy efficient. The offering encompasses products and solutions for oil and gas
extraction, power production, renewable fuels, refinement and much more.
EnvironmentHuman impact on the environment is coming under greater
scrutiny, resulting in new, increasingly stringent laws. In parallel
with this, a sustainability mindset has also evolved and is en-
couraging companies to voluntarily take steps that contribute
to environmental improvements.
Alfa Laval has a wide range of products for managing various environmental
problems. The Energy division’s efficient heat exchangers and its focus on
recovering waste heat create an opportunity for substantial energy savings
and a reduction in CO2 emissions for the customer.
Energ
y Divis
ion
g under greater
t laws. In parallel
olved and is en-
s that contribute
ous environmental
s and its focus on
al energy savings
EnergyThe world’s energy needs
rate in some areas of t
to handle this chall
and make great
use or recycl
With its c
play a
en
35
36
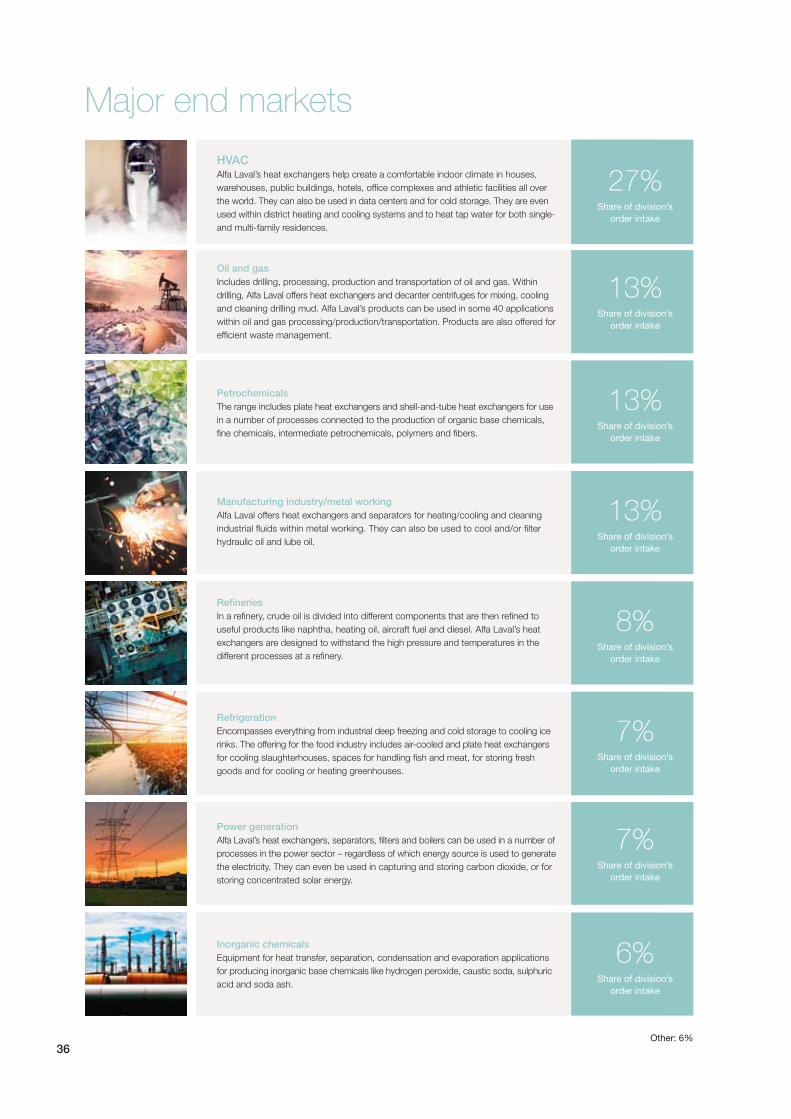
Major end markets
Other: 6%
HVACAlfa Laval’s heat exchangers help create a comfortable indoor climate in houses,
warehouses, public buildings, hotels, office complexes and athletic facilities all over
the world. They can also be used in data centers and for cold storage. They are even
used within district heating and cooling systems and to heat tap water for both single-
and multi-family residences.
Share of division’s
order intake
Oil and gas
Includes drilling, processing, production and transportation of oil and gas. Within
drilling, Alfa Laval offers heat exchangers and decanter centrifuges for mixing, cooling
and cleaning drilling mud. Alfa Laval’s products can be used in some 40 applications
within oil and gas processing/production/transportation. Products are also offered for
efficient waste management.
Share of division’s
order intake
Petrochemicals
The range includes plate heat exchangers and shell-and-tube heat exchangers for use
in a number of processes connected to the production of organic base chemicals,
fine chemicals, intermediate petrochemicals, polymers and fibers. Share of division’s
order intake
Manufacturing industry/metal working
Alfa Laval offers heat exchangers and separators for heating/cooling and cleaning
industrial fluids within metal working. They can also be used to cool and/or filter
hydraulic oil and lube oil.Share of division’s
order intake
Refineries
In a refinery, crude oil is divided into different components that are then refined to
useful products like naphtha, heating oil, aircraft fuel and diesel. Alfa Laval’s heat
exchangers are designed to withstand the high pressure and temperatures in the
different processes at a refinery.Share of division’s
order intake
Refrigeration
Encompasses everything from industrial deep freezing and cold storage to cooling ice
rinks. The offering for the food industry includes air-cooled and plate heat exchangers
for cooling slaughterhouses, spaces for handling fish and meat, for storing fresh
goods and for cooling or heating greenhouses.
Share of division’s
order intake
Power generation
Alfa Laval’s heat exchangers, separators, filters and boilers can be used in a number of
processes in the power sector – regardless of which energy source is used to generate
the electricity. They can even be used in capturing and storing carbon dioxide, or for
storing concentrated solar energy.
Share of division’s
order intake
Inorganic chemicals
Equipment for heat transfer, separation, condensation and evaporation applications
for producing inorganic base chemicals like hydrogen peroxide, caustic soda, sulphuric
acid and soda ash. Share of division’s
order intake
27%
13%
13%
13%
8%
7%
7%
6%

Energ
y Divis
ion
SUSTAINABILITY
Waste heat from data centers warms homes
YouTube, e-mails, streaming services...our digital lives
rely on powerful servers that manage all of the data
transmitted around the world. Placed in large data cen-
ters, these servers generate a lot of heat that needs to
be removed so that the servers function optimally and
without interruption. Alfa Laval has heat exchangers that
efficiently cool these servers to the right temperature.
Not only that, they can also handle the waste heat gen-
erated and convert it to district heating that can then be
used to warm homes. Smart and sustainable. Today,
waste heat from only 20 percent of our data centers is
handled this way. In other words, there is great potential
for waste heat solutions. Calculations show that by 2030
if all data centers would recover the waste heat from the
servers it could save 3,000 TWh, which corresponds to
heating 300 million European homes. The Nordic region
is well suited for these waste heat solutions, since we
have infrastructure in place in the form of an expanded
district heating network and solutions are already in-
stalled in several places. One example is a data center in
Denmark, where Alfa Laval’s heat exchangers convert all
of the 100,000 MWh of waste heat generated annually
to warm 6,900 households in the region. The most sus-
tainable heat source is the heat that is already available.
The only challenge is using it correctly.
INNOVATION
Ground-breaking experiment to study stainless steel
Stainless steel is an essential material in many of Alfa
Laval’s products: separators, fluid handling equipment
and, not least, heat exchangers. The plates in a heat ex-
changer must be able to withstand the intense pressure
of the liquids that are cooled and heated, and the thin
coating of oxide on stainless steel that protects against
corrosion is essential for the heat exchanger’s durability.
It goes without saying that the more we know about
how this oxide behaves at different temperatures, the
more efficiently we can conduct research and product
development. That is why during the year, Alfa Laval
conducted a unique and ground-breaking experiment –
together with senior researchers at Lund University – at
MAX IV in Lund, Sweden, which is the world’s most
modern synchrotron radiation facility, using the most in-
tense radiation ever generated. At this facility, researchers
can study atoms and molecules with a diameter of only
a few tenths of a nanometer, providing entirely new
knowledge about the world and how it works. And how
long is a nanometer? Well, take a strand of hair and slice
it lengthwise into 30,000 pieces...each of these layers would
be as thick as the oxide that Alfa Laval studied in the ex-
periment. For the first time ever, the thin oxide layer could
be photographed at high temperatures, thanks to the
microscope’s extremely high resolution. The study pro-
vided valuable information about the material, and the
results are now being analyzed and used in Alfa Laval’s
product development, all for the sake of ensuring the
company’s future competitiveness.
37
38
Marine

39
0
5,000
10,000
15,000
20,000
20191817
0
1,000
2,000
3,000
4,000
0
4,000
8,000
12,000
16,000
20,000
20191817
Sweden, 1%Other, 1%
Other
EU, 24%
Asia, 53%
Other
Europe, 12%
North America, 6%
Latin America, 3%
Sales and operating profit Order intake
15
,86
7
10
,80
9
13
,58
3
17
,99
3
14
,06
7
11
,45
6
17
,32
2
15
,95
3
SEK MILLION SEK MILLION
Sales Operating profit
Sameer KalraPresident, Marine Division
The year in brief
Marin
e D
ivisio
n
2020 began with expectations of growth in the marine market,
and the first quarter got off to a strong start. However, the macro-
economic trend, primarily driven by the COVID-19 pandemic, had
a negative effect on demand starting in the second quarter. At the
same time, the organization handled the rapid changes well, with-
out disruptions to the supplier chain or deliveries to customers.
The division was primarily affected by two major events in 2020:
COVID-19 and low oil prices. Travel restrictions affected portions of
new sales and aftermarket transactions due to fewer opportunities
to board vessels. During the autumn and winter, there were more
opportunities to provide service and demand began to gradually
recover. The difference in price between heavy fuel oil and fuel with
a low sulphur content reduced drastically when the price of oil fell
during the first four months of the year. This led to reduced demand
for exhaust gas cleaning systems in 2020. The low price of oil also had
a negative impact on demand in offshore, primarily towards the end
of the year. However, demand for ballast water treatment systems
remained healthy. As of 2019, legislation based on the International
Maritime Organization (IMO) convention stipulates that vessels already
in use will need to install ballast water treatment systems by 2024.
Vessel contracting has remained at relatively low levels for several
years, and this trend continued in 2020. Uncertainty increased
dramatically due to the pandemic and the deteriorating economic
outlook, which meant shipping companies delayed ordering new
vessels. The low level of vessel contracting had a negative impact
on Alfa Laval’s order intake, but this was mitigated somewhat by
the favorable mix of contracted vessels.
Alfa Laval has continued to develop its service offering and, over
the last few years, has dramatically increased the number of trained
service technicians. The company’s strong geographic reach also
made it possible to maintain good availability, despite the difficulties
with traveling during the pandemic. At the same time, the challenges
of COVID-19 also led to increased demand for connected solutions,
remote support and service agreements, primarily within environ-
mental products.
The marine industry is working to develop a joint solution for the
phase-out of fossil fuel, and this discussion gained further traction
in 2020. There is as of yet no consensus, but most expect a period
of transition fuel with lower carbon emissions. Alfa Laval aims to
be a driving force in this transition and expects that this will fuel
demand for the company’s energy-efficient solutions. Alfa Laval
looks forward to contributing to a more environmentally friendly
marine industry in the future, and our work to stay at the cutting
edge continued in 2020.

The Marine business
Offering
The offering includes heat transfer
equipment, high-speed separators and
pumping systems as well as different
environmental products such as ballast
water treatment systems.
Way to market
The division’s sales force targets cus-
tomers directly. Its customers are well
defined and limited in number – so a
direct approach is possible with a limited
sales force.
Target industries
The division’s customers include ship-
owners, ship yards, manufacturers of
diesel and gas engines and companies
that specialize in offshore extraction of
oil and gas.
The division has four technology-based business units. These units have full profit and
loss responsibility and are responsible for driving the global business for a defined group
of products, covering everything from product development to marketing, sales and service.
Business units
Pumping Systems
Cargo pumping systems for product and chemical tankers and pumping systems for utilities and
safety applications on board offshore platforms.
Share of division’s
order intake
Gas Systems
The unit supplies inert gas systems and exhaust gas scrubbers to customers in the marine industry.
Share of division’s
order intake
Boiler Systems
Boilers, heat recovery systems, gas combustion units and thermal fluid systems primarily for the marine
sector but also for engine-generated power and industrial applications on land.
Share of division’s
order intake
Marine Separation & Heat Transfer Equipment
High-speed separators, heat exchangers, ballast water treatment systems and filters are some of
the products that this unit offers to the marine industry and diesel and gas-engine manufacturers.
Share of division’s
order intake
40
31%
9%
15%
45%
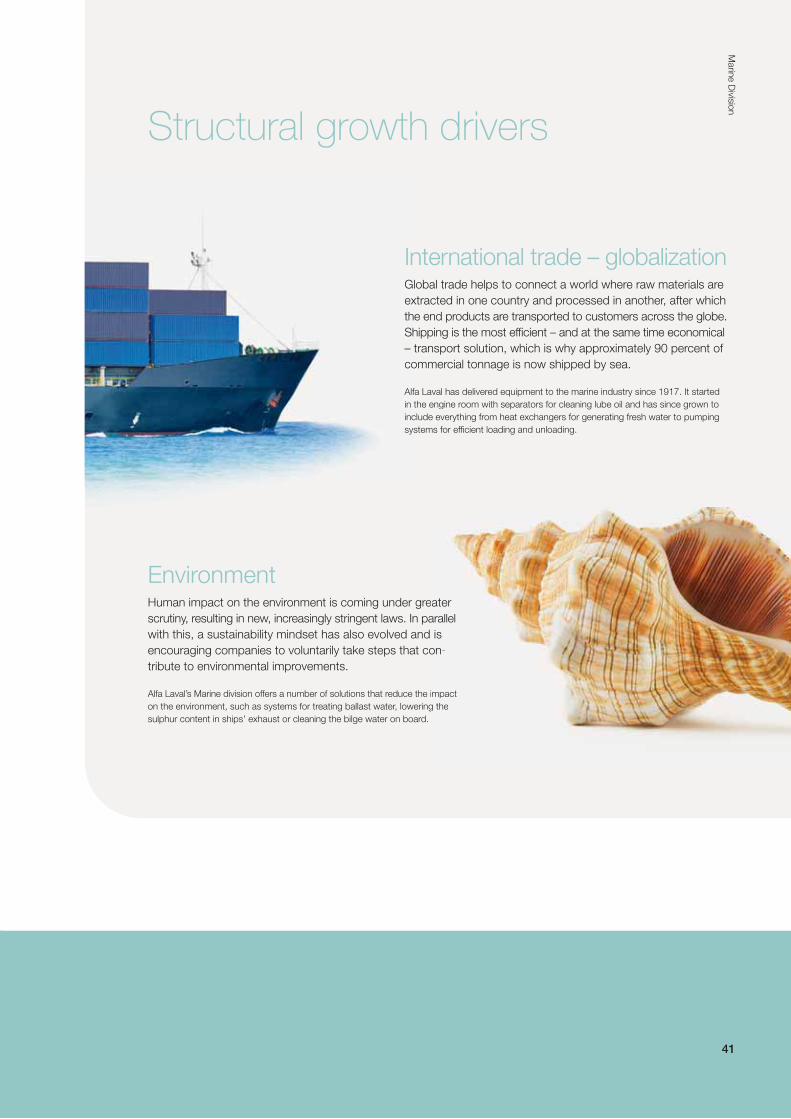
Marin
e D
ivisio
n
Structural growth drivers
International trade – globalizationGlobal trade helps to connect a world where raw materials are
extracted in one country and processed in another, after which
the end products are transported to customers across the globe.
Shipping is the most efficient – and at the same time economical
– transport solution, which is why approximately 90 percent of
commercial tonnage is now shipped by sea.
Alfa Laval has delivered equipment to the marine industry since 1917. It started
in the engine room with separators for cleaning lube oil and has since grown to
include everything from heat exchangers for generating fresh water to pumping
systems for efficient loading and unloading.
EnvironmentHuman impact on the environment is coming under greater
scrutiny, resulting in new, increasingly stringent laws. In parallel
with this, a sustainability mindset has also evolved and is
encouraging companies to voluntarily take steps that con-
tribute to environmental improvements.
Alfa Laval’s Marine division offers a number of solutions that reduce the impact
on the environment, such as systems for treating ballast water, lowering the
sulphur content in ships’ exhaust or cleaning the bilge water on board.
InternGlobal trad
extracted
the end pro
Shipping is
– transpor
commercia
Alfa Laval has
in the engine
include every
systems for e
ater
arallel
is
on-
mpact
g the
41

42
Major end markets
Offshore
The offering for oil and gas platforms includes
pumping systems for fire extinguishing or to pump
sea water for different onboard applications, inert
gas systems and emergency power generators.
Engine power
Engine-generated power is used in places that
are not connected to the power grid. It is also used
for back-up power during blackouts, to manage
peaks in demand when the power grid is not enough
or as a supplement for solar or wind energy. Alfa
Laval offers modules for fire extinguishing, sepa-
rators for cleaning crank case gases, and heat
exchangers for different cooling applications.
Shipbuilding and maritime transport
Alfa Laval has a broad offering of products and
systems for installation onboard vessels. The
offering includes systems for cleaning and treating
fuel, pumping systems for loading and unloading,
boilers, fresh water generators, inert gas systems,
systems for treating lubricants and tank cleaning
equipment.
Other: 1%
Share of division’s
order intake
8%
Share of division’s
order intake
15%
Share of division’s
order intake
76%
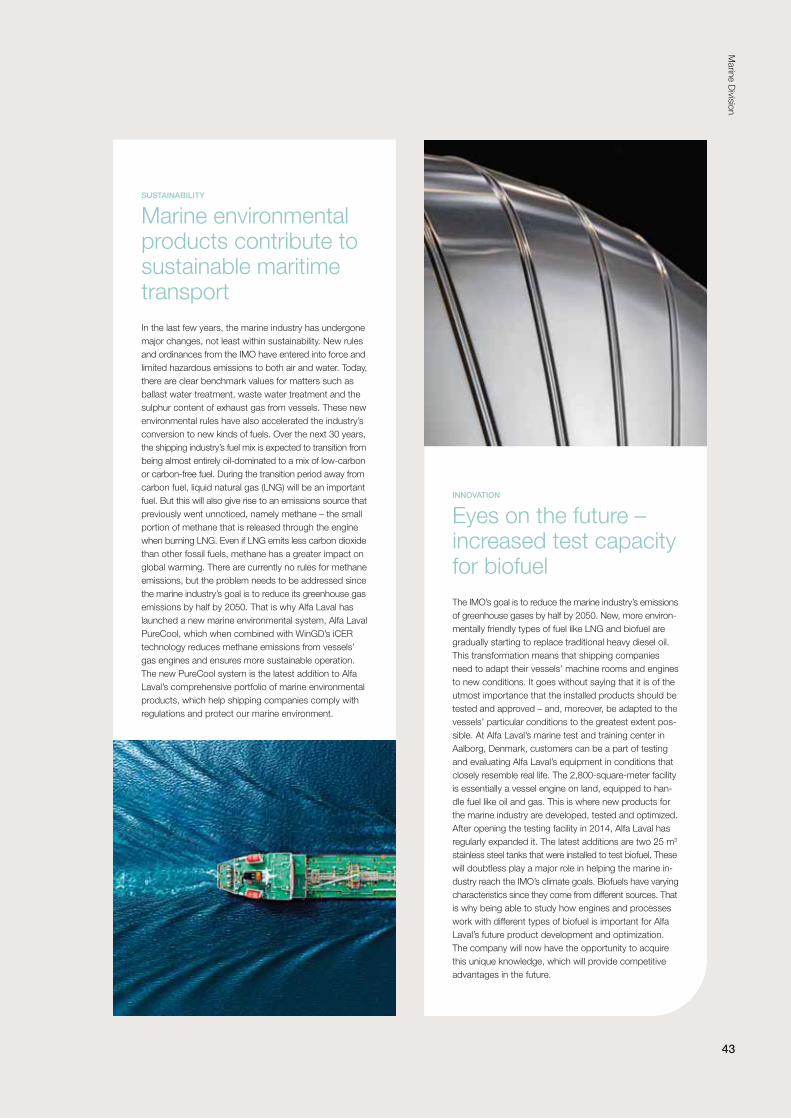
SUSTAINABILITY
Marine environmental products contribute to sustainable maritime transport
In the last few years, the marine industry has undergone
major changes, not least within sustainability. New rules
and ordinances from the IMO have entered into force and
limited hazardous emissions to both air and water. Today,
there are clear benchmark values for matters such as
ballast water treatment, waste water treatment and the
sulphur content of exhaust gas from vessels. These new
environmental rules have also accelerated the industry’s
conversion to new kinds of fuels. Over the next 30 years,
the shipping industry’s fuel mix is expected to transition from
being almost entirely oil-dominated to a mix of low-carbon
or carbon-free fuel. During the transition period away from
carbon fuel, liquid natural gas (LNG) will be an important
fuel. But this will also give rise to an emissions source that
previously went unnoticed, namely methane – the small
portion of methane that is released through the engine
when burning LNG. Even if LNG emits less carbon dioxide
than other fossil fuels, methane has a greater impact on
global warming. There are currently no rules for methane
emissions, but the problem needs to be addressed since
the marine industry’s goal is to reduce its greenhouse gas
emissions by half by 2050. That is why Alfa Laval has
launched a new marine environmental system, Alfa Laval
PureCool, which when combined with WinGD’s iCER
technology reduces methane emissions from vessels’
gas engines and ensures more sustainable operation.
The new PureCool system is the latest addition to Alfa
Laval’s comprehensive portfolio of marine environmental
products, which help shipping companies comply with
regulations and protect our marine environment.
INNOVATION
Eyes on the future – increased test capacity for biofuel
The IMO’s goal is to reduce the marine industry’s emissions
of greenhouse gases by half by 2050. New, more environ-
mentally friendly types of fuel like LNG and biofuel are
gradually starting to replace traditional heavy diesel oil.
This transformation means that shipping companies
need to adapt their vessels’ machine rooms and engines
to new conditions. It goes without saying that it is of the
utmost importance that the installed products should be
tested and approved – and, moreover, be adapted to the
vessels’ particular conditions to the greatest extent pos-
sible. At Alfa Laval’s marine test and training center in
Aalborg, Denmark, customers can be a part of testing
and evaluating Alfa Laval’s equipment in conditions that
closely resemble real life. The 2,800-square-meter facility
is essentially a vessel engine on land, equipped to han-
dle fuel like oil and gas. This is where new products for
the marine industry are developed, tested and optimized.
After opening the testing facility in 2014, Alfa Laval has
regularly expanded it. The latest additions are two 25 m3
stainless steel tanks that were installed to test biofuel. These
will doubtless play a major role in helping the marine in-
dustry reach the IMO’s climate goals. Biofuels have varying
characteristics since they come from different sources. That
is why being able to study how engines and processes
work with different types of biofuel is important for Alfa
Laval’s future product development and optimization.
The company will now have the opportunity to acquire
this unique knowledge, which will provide competitive
advantages in the future.
Marin
e D
ivisio
n
43

44
Mikael TydénPresident, Operations
Strong production and supplier structure
Operations is Alfa Laval’s group-wide organization that handles the
group’s purchasing and manufacturing and its logistics and distribution.
Operations also pursues strategic activities in the production chain,
such as optimizing the overall manufacturing footprint, automation
and digitization and sustainability matters.
Operations
Manufacturing
Alfa Laval’s production structure is based on its three key technol-
ogies and organized to provide the most even capacity utilization
possible across its production units. Products are sold within all
divisions and are therefore ultimately found in a number of different
application areas and processes. A common technological foundation
makes it possible to consolidate production to shared units –
regardless of whether the individual products are for customers in
Marine, Food & Water or Energy.
At year-end 2019, Alfa Laval had 37 major manufacturing units,
spread across Europe, Asia, the US and Latin America. During the
year, Operations experienced rapid fluctuations in order intake and
deliveries, which was a challenge in itself. On top of this, the orga-
nization continued to implement selective capacity expansions in
certain areas while efforts to concentrate certain manufacturing to
fewer sites were completed. In 2020, two major production facilities
were closed: one unit in Søborg, Denmark and another in Sarole,
India. A distribution unit in Mumbai was consolidated with a pro-
duction facility in Pune, India. In early 2020, Alfa Laval moved to an
entirely new factory in Qingdao, China. This is the world’s largest,
most state-of-the-art factory for manufacturing of products such
as boilers. From a short-term perspective – that is, in the division’s
daily work – the focus was on sustainability, lead times, quality,
productivity and cost. From a long-term perspective, the focus was
on strengthening the manufacturing process by ensuring the right
competence is in place, investing in new production technologies,
assessing opportunities related to automation, digitization and 3D
printing, and ensuring that the results lead to improvements in
health, safety and the environment.

Op
era
tions
45
US (1)
Sweden (2)
Denmark (1)
China (1)
Singapore (1)
Japan (1)
India (1)
Distribution centers, Operations
Investments by geographic
market, %
Procurement by geographic market, %
Geographic distribution of the number of
directly worked hours in production, %
1 North America 6%
2 Latin America 2%
3 Western Europe 29%
4 Central and Eastern Europe 3%
5 Asia 60%
1 North America 4%
2 Western Europe 66%
3 Central and Eastern Europe 2%
4 Asia 28%
1 North and Latin America 6%
2 Asia 25%
3 Central and Eastern Europe 5%
4 Western Europe 64%
3
2
2
1
1
4
4
52
1
3
3
4 US (6)
Brazil (2)
Sweden (4)
Norway (3)
Denmark (2)
Russia (1)
India (2)
Alfa Laval’s production includes 35 major
manufacturing units:
Production units
Korea (2)
China (4)
Japan (1)
UK (1)
France (4)
Italy (2)
Poland (1)
3
2
1
4
Transport 2020
1 Road 68%
2 Sea 24%
3 Air 6%
4 Railway 1%
Procurement
The procurement organization handles all of Alfa Laval’s needs for
direct as well as indirect materials, for all factories and distribution
centers. The largest item in the cost of goods sold is direct mate-
rials – accounting for a full 70 percent – and any improvements
possible within this area are therefore extremely valuable. The or-
ganization handles procurement of a variety of goods and raw
materials, such as aluminum, stainless steel, titanium, cast metal,
forged iron, machinery, electrical equipment and fasteners, to name
a few examples. It is also responsible for the purchase of goods
outside the manufacturing process, such as software, consulting
services, hardware, telecommunications and company cars.
When it comes to procurement, there are many parameters to
take into consideration. Cost is a factor, but it is one of many. It
must be weighed against quality, dependability, delivery capacity
and reliability; at the same time, the supplier needs to meet Alfa
Laval’s Business Principles concerning the environment, health
and safety. Alfa Laval has a platform for auditing suppliers, which
simplifies assessments so that comparable results are obtained.
Alfa Laval’s shared supply chain is a strength. The company can
consolidate the demand for metals and other products/goods for
all production units, achieve economies of scale and gain leverage
in negotiations right from the start. At the same time, the right work
method can generate considerable savings. Training and process
development are carried out on an ongoing basis to ensure a uni-
form and structured work method, regardless of where in the world
the buyer is located. This includes incorporating an ever-larger
portion of the total procurement volumes into global contracts,
which reduces the number of suppliers, reduces costs and mini-
mizes complexity.
Procurement also manages the development of existing and new
suppliers in order to optimize Alfa Laval’s current value chains and
future needs through cooperative projects and product development.
These factors must be weighed against the supplier’s technical
ability, quality, dependability, delivery capacity and reliability; at the
same time, the supplier needs to meet Alfa Laval’s Business Prin-
ciples concerning the environment, health and safety.
Distribution and logistics
Logistics and the distribution of components, spare parts and new
products include everything from order handling and inventory
management to stock picking, delivery and invoicing. It is not enough
for a product to be of high quality and in line with specifications –
it must also reach the recipient at the right time, in a secure way and
with as little impact on the environment as possible. Alfa Laval has
eight distribution centers, spread over Europe, Asia and North America.
They process over 1.2 million order lines every year. Distribution and
logistics is also responsible for Alfa Laval’s overall transport needs.
Consolidating transportation needs provides economies of scale,
from both a cost and quality perspective. But costs are only one
parameter that must be considered. The environment is another
important component. Alfa Laval actively works to reduce the
company’s freight-related CO2 emissions. In 2020, Alfa Laval con-
tinued to implement a new transportation management system
according to plan, which will enable customers to better track
their deliveries from Alfa Laval.
During 2020, Alfa Laval’s deliveries to most end markets increased
considerably, particularly towards the end of the year. Despite its
high volumes, Alfa Laval kept the share of air freight in line with 2019.
At the end of the year, 68 percent had been shipped by road,
24 percent by sea and 6 percent by air.
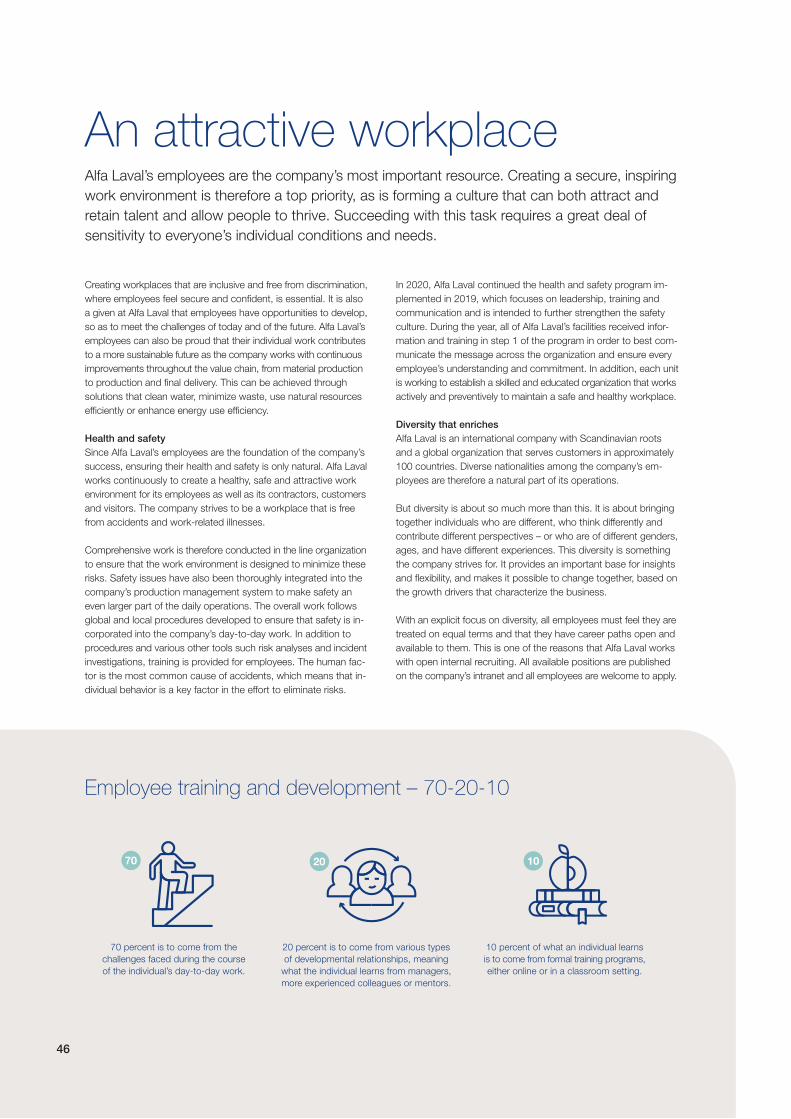
Creating workplaces that are inclusive and free from discrimination,
where employees feel secure and confident, is essential. It is also
a given at Alfa Laval that employees have opportunities to develop,
so as to meet the challenges of today and of the future. Alfa Laval’s
employees can also be proud that their individual work contributes
to a more sustainable future as the company works with continuous
improvements throughout the value chain, from material production
to production and final delivery. This can be achieved through
solutions that clean water, minimize waste, use natural resources
efficiently or enhance energy use efficiency.
Health and safety
Since Alfa Laval’s employees are the foundation of the company’s
success, ensuring their health and safety is only natural. Alfa Laval
works continuously to create a healthy, safe and attractive work
environment for its employees as well as its contractors, customers
and visitors. The company strives to be a workplace that is free
from accidents and work-related illnesses.
Comprehensive work is therefore conducted in the line organization
to ensure that the work environment is designed to minimize these
risks. Safety issues have also been thoroughly integrated into the
company’s production management system to make safety an
even larger part of the daily operations. The overall work follows
global and local procedures developed to ensure that safety is in-
corporated into the company’s day-to-day work. In addition to
procedures and various other tools such risk analyses and incident
investigations, training is provided for employees. The human fac-
tor is the most common cause of accidents, which means that in-
dividual behavior is a key factor in the effort to eliminate risks.
In 2020, Alfa Laval continued the health and safety program im-
plemented in 2019, which focuses on leadership, training and
communication and is intended to further strengthen the safety
culture. During the year, all of Alfa Laval’s facilities received infor-
mation and training in step 1 of the program in order to best com-
municate the message across the organization and ensure every
employee’s understanding and commitment. In addition, each unit
is working to establish a skilled and educated organization that works
actively and preventively to maintain a safe and healthy workplace.
Diversity that enriches
Alfa Laval is an international company with Scandinavian roots
and a global organization that serves customers in approximately
100 countries. Diverse nationalities among the company’s em-
ployees are therefore a natural part of its operations.
But diversity is about so much more than this. It is about bringing
together individuals who are different, who think differently and
contribute different perspectives – or who are of different genders,
ages, and have different experiences. This diversity is something
the company strives for. It provides an important base for insights
and flexibility, and makes it possible to change together, based on
the growth drivers that characterize the business.
With an explicit focus on diversity, all employees must feel they are
treated on equal terms and that they have career paths open and
available to them. This is one of the reasons that Alfa Laval works
with open internal recruiting. All available positions are published
on the company’s intranet and all employees are welcome to apply.
Employee training and development – 70-20-10
70 percent is to come from the
challenges faced during the course
of the individual’s day-to-day work.
10 percent of what an individual learns
is to come from formal training programs,
either online or in a classroom setting.
20 percent is to come from various types
of developmental relationships, meaning
what the individual learns from managers,
more experienced colleagues or mentors.
70 20 10
46
An attractive workplaceAlfa Laval’s employees are the company’s most important resource. Creating a secure, inspiring
work environment is therefore a top priority, as is forming a culture that can both attract and
retain talent and allow people to thrive. Succeeding with this task requires a great deal of
sensitivity to everyone’s individual conditions and needs.
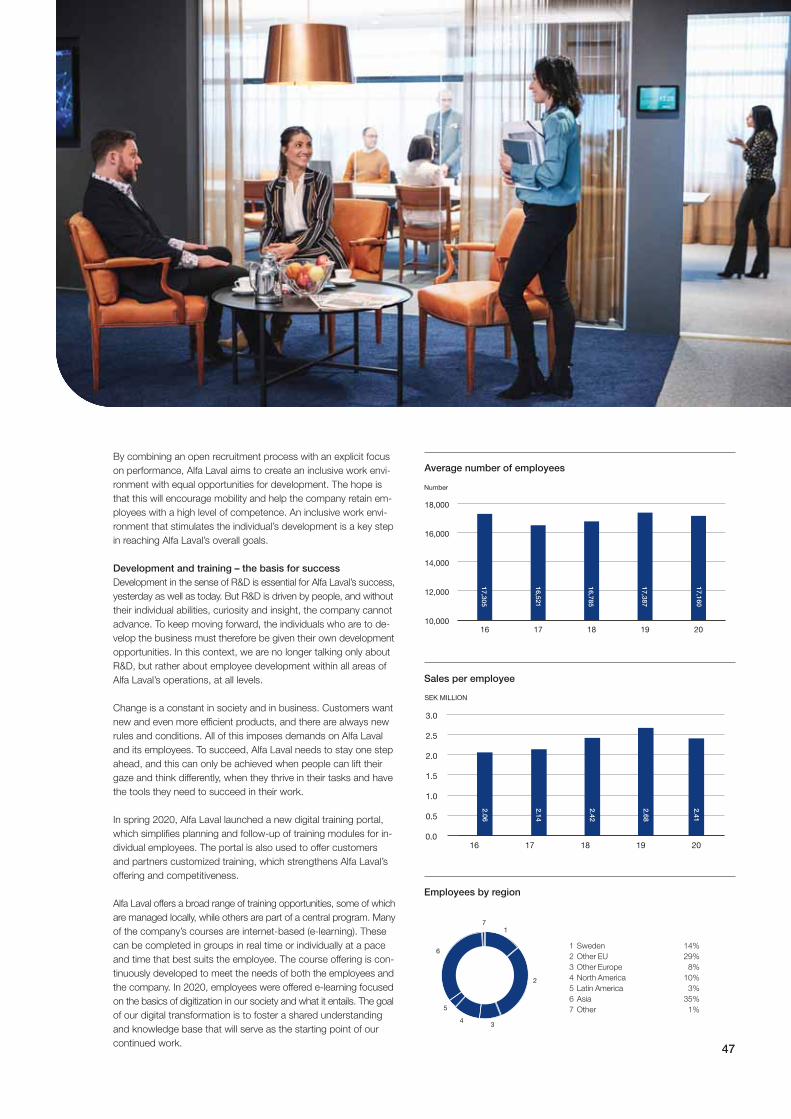
47
Average number of employees
Sales per employee
Employees by region
1
2
34
5
6
7
1 Sweden 14%
2 Other EU 29%
3 Other Europe 8%
4 North America 10%
5 Latin America 3%
6 Asia 35%
7 Other 1%
SEK MILLION
0.0
0.5
1.0
1.5
2.0
2.5
3.0
2019181716
2.0
6
2.1
4
2.4
2
2.6
8
2.4
1
Em
plo
yees
By combining an open recruitment process with an explicit focus
on performance, Alfa Laval aims to create an inclusive work envi-
ronment with equal opportunities for development. The hope is
that this will encourage mobility and help the company retain em-
ployees with a high level of competence. An inclusive work envi-
ronment that stimulates the individual’s development is a key step
in reaching Alfa Laval’s overall goals.
Development and training – the basis for success
Development in the sense of R&D is essential for Alfa Laval’s success,
yesterday as well as today. But R&D is driven by people, and without
their individual abilities, curiosity and insight, the company cannot
advance. To keep moving forward, the individuals who are to de-
velop the business must therefore be given their own development
opportunities. In this context, we are no longer talking only about
R&D, but rather about employee development within all areas of
Alfa Laval’s operations, at all levels.
Change is a constant in society and in business. Customers want
new and even more efficient products, and there are always new
rules and conditions. All of this imposes demands on Alfa Laval
and its employees. To succeed, Alfa Laval needs to stay one step
ahead, and this can only be achieved when people can lift their
gaze and think differently, when they thrive in their tasks and have
the tools they need to succeed in their work.
In spring 2020, Alfa Laval launched a new digital training portal,
which simplifies planning and follow-up of training modules for in-
dividual employees. The portal is also used to offer customers
and partners customized training, which strengthens Alfa Laval’s
offering and competitiveness.
Alfa Laval offers a broad range of training opportunities, some of which
are managed locally, while others are part of a central program. Many
of the company’s courses are internet-based (e-learning). These
can be completed in groups in real time or individually at a pace
and time that best suits the employee. The course offering is con-
tinuously developed to meet the needs of both the employees and
the company. In 2020, employees were offered e-learning focused
on the basics of digitization in our society and what it entails. The goal
of our digital transformation is to foster a shared understanding
and knowledge base that will serve as the starting point of our
continued work.
Number
10,000
12,000
14,000
16,000
18,000
2019181716
17
,16
0
17
,30
5
16
,52
1
16
,78
5
17
,38
7

48
Sustainability builds on continuous improvement and collaborationSustainability begins at home, by Alfa Laval conducting its own operations ethically, and according
to prevailing social and environmental legislation. Alfa Laval’s four business principles help by providing
clear guidelines for how they are to be continuously implemented, monitored and documented.
Alfa Laval’s business principles
Alfa Laval’s four business principles are aimed at continuously im-
proving Alfa Laval’s social, environmental and ethical work as well as
maintaining its internal and external transparency. Alfa Laval’s business
principles incorporate the “Protect, Respect and Remedy” framework
introduced in the UN Guiding Principles on Business and Human
Rights as well as the OECD Guidelines for Multinational Enterprises.
1. Social responsibility – respect for human rights is fundamental
One of our foremost priorities is to prevent the occurrence of
workplace accidents. The company has a vision of a workplace
that is free from accidents and work-related illnesses.
2. Business integrity – high ethical standards guide our conduct
The foundation for this principle is that the company is to comply
with the laws in effect where we operate. The principle covers
such areas as anti-bribery and anti-corruption (ABAC) efforts.
3. The environment – we optimize the use of natural resources
It is important that our production and service operations continuously
improve from an environmental perspective and also in minimizing
risks. Alfa Laval sets clear goals regarding energy and water con-
sumption, climate impact, chemical use and waste management.
An area that is equally as important as Alfa Laval’s internal work –
and offers infinitely greater potential – is the provision of products,
services and solutions that can optimize our customers’ use of
natural resources.
4. Transparency – our commitment to open dialogue builds trust
Alfa Laval’s ambition is to build trust through open dialogue with various
stakeholders, for example, by addressing the opportunities and
challenges within the area of sustainability. Read more about our
stakeholder dialogue and materiality analysis in our separate Sus-
tainability Report.
Sustainability as a business opportunity
Alfa Laval’s products and solutions make it possible for customers to
solve their environmental challenges and reach their own sustain-
ability goals. This achieved through solutions that clean and/or re-
use water, improve energy efficiency or ensure that industrial pro-
cesses are more resource efficient. This way sustainability becomes
a “win-win” for all parties: more efficient and sustainable processes
lead to increased profitability for customers while creating a better
environment for all of us.
Read more
Note that Alfa Laval publishes a separate Sustainability Report that complies with Swedish legal requirements, the Global Reporting Initiative
and the UN Global Compact. The report is available in English: www.alfalaval.com/about-us/sustainability
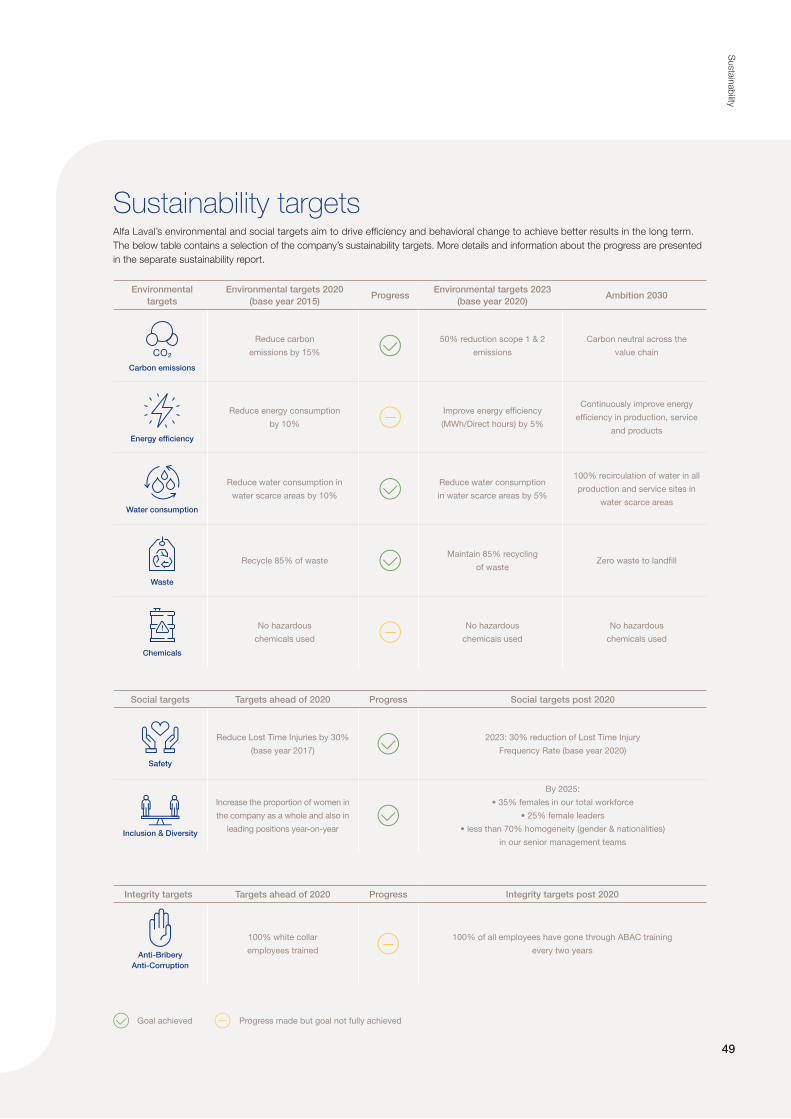
Susta
inab
ility
Sustainability targetsAlfa Laval’s environmental and social targets aim to drive efficiency and behavioral change to achieve better results in the long term.
The below table contains a selection of the company’s sustainability targets. More details and information about the progress are presented
in the separate sustainability report.
Environmental
targets
Environmental targets 2020
(base year 2015)Progress
Environmental targets 2023
(base year 2020)Ambition 2030
Carbon emissions
Reduce carbon
emissions by 15%
50% reduction scope 1 & 2
emissions
Carbon neutral across the
value chain
Energy efficiency
Reduce energy consumption
by 10%
Improve energy efficiency
(MWh/Direct hours) by 5%
Continuously improve energy
efficiency in production, service
and products
Water consumption
Reduce water consumption in
water scarce areas by 10%
Reduce water consumption
in water scarce areas by 5%
100% recirculation of water in all
production and service sites in
water scarce areas
Waste
Recycle 85% of wasteMaintain 85% recycling
of wasteZero waste to landfill
Chemicals
No hazardous
chemicals used
No hazardous
chemicals used
No hazardous
chemicals used
Social targets Targets ahead of 2020 Progress Social targets post 2020
Safety
Reduce Lost Time Injuries by 30%
(base year 2017)
2023: 30% reduction of Lost Time Injury
Frequency Rate (base year 2020)
Inclusion & Diversity
Increase the proportion of women in
the company as a whole and also in
leading positions year-on-year
By 2025:
• 35% females in our total workforce
• 25% female leaders
• less than 70% homogeneity (gender & nationalities)
in our senior management teams
Integrity targets Targets ahead of 2020 Progress Integrity targets post 2020
Anti-Bribery
Anti-Corruption
100% white collar
employees trained
100% of all employees have gone through ABAC training
every two years
Progress made but goal not fully achievedGoal achieved
49

Energy efficiency is one of the main contributors to reaching the
Paris Agreement. Energy efficiency can deliver more than 40 percent
of the greenhouse gas emissions savings over the next 20 years
according to IEA, whereof 50 percent of the energy efficiency saving
comes from the industry sector and 30 percent from buildings.
Efficiency can either be achieved by implementing innovative
technology that reduces the energy consumption compared to
existing/traditional solutions – or by adding technology to exist-
ing processes that capture and reuse waste heat for other pur-
poses. Alfa Laval has solutions for both energy savings and re-
use. Alfa Laval heat exchangers are 20 to 50 percent more
efficient than traditional (shell&tube) technology
There is still a significant untapped potential in energy efficiency to
save energy and reduce carbon emissions. Alfa Laval has the
technologies to improve energy efficiency in various industrial
processes. The technologies and solutions are proven, afford-
able and available.
Climate change has been an area of high focus and importance
to Alfa Laval’s agenda for many years. Alfa Laval has worked to
achieve its emission targets for 2020 which was to reduce carbon
emissions by 15% and reduce energy use by 10% compared
with base year 2015.
The new target is to become carbon neutral by 2030 across the
value chain. To achieve this ambition, Alfa Laval will set up targets on
a three-year basis to align with the company’s business targets.
The targets for 2023 are to reduce Scope 1 and Scope 2 emis-
sions by 50% with baseline 2020. Alfa Laval has also deepened
its analysis of scope 3 emissions and as these represent more
than 40% of the emissions, focus will shift towards these emis-
sions and how to reduce them going forward.
Achieving carbon neutrality across the value chain will require
partnerships. One example is to ensure reduction of emissions
from steel production, where Alfa Laval will have to partner with
suppliers and other industries to speed up the transition to low
emitting production processes.
Alfa Laval therefore decided to join the 1.5 Business Playbook
during 2020. Alfa Laval will continue to expand collaboration
with other companies, customers and partners, in society and
business to support the implementation of energy efficient solu-
tions – and thereby contribute to reaching the 1.5C scenario
set in the Paris Agreement.
Alfa Laval and climate:
Energy efficiency and collaboration are key
Scope 1: Covers direct emissions from owned or controlled sources
Scope 2: Indirect emissions from the generation of purchased electricity, steam, heating and cooling consumed by Alfa Laval
Scope 3: Includes all other indirect emissions that occur in Alfa Laval’s value chain
50
25 MILLION TONS YEARLY
Every year, Alfa Laval heat exchangers installed in energy efficiency applications
save 50GW which corresponds to the energy needed to heat up 10 million homes
in Europe. The energy savings also reduce the carbon emissions by 25 million
tons (yearly) which is slightly more than the emissions from the city of Paris.
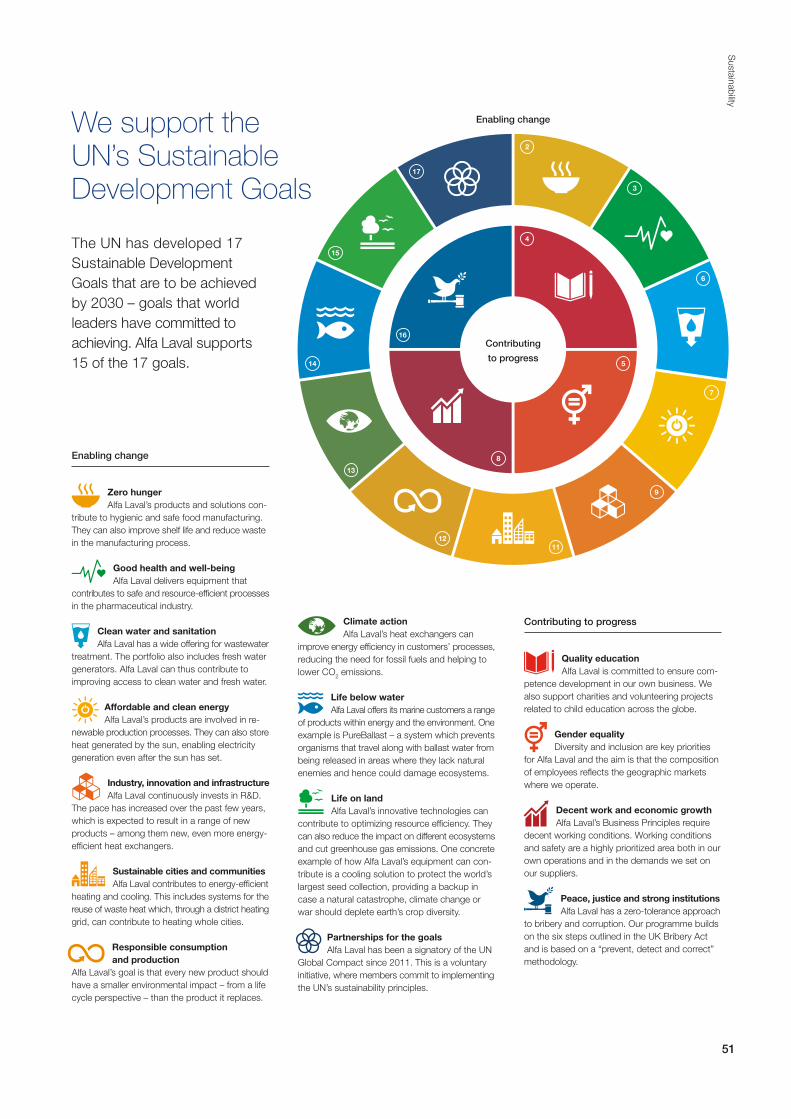
51
Susta
inab
ility
The UN has developed 17
Sustainable Development
Goals that are to be achieved
by 2030 – goals that world
leaders have committed to
achieving. Alfa Laval supports
15 of the 17 goals.
We support the UN’s Sustainable Development Goals
Enabling change
Zero hunger
Alfa Laval’s products and solutions con-
tribute to hygienic and safe food manufacturing.
They can also improve shelf life and reduce waste
in the manufacturing process.
Good health and well-being
Alfa Laval delivers equipment that
contributes to safe and resource-efficient processes
in the pharmaceutical industry.
Clean water and sanitation
Alfa Laval has a wide offering for wastewater
treatment. The portfolio also includes fresh water
generators. Alfa Laval can thus contribute to
improving access to clean water and fresh water.
Affordable and clean energy
Alfa Laval’s products are involved in re-
newable production processes. They can also store
heat generated by the sun, enabling electricity
generation even after the sun has set.
Industry, innovation and infrastructure
Alfa Laval continuously invests in R&D.
The pace has increased over the past few years,
which is expected to result in a range of new
products – among them new, even more energy-
efficient heat exchangers.
Sustainable cities and communities
Alfa Laval contributes to energy-efficient
heating and cooling. This includes systems for the
reuse of waste heat which, through a district heating
grid, can contribute to heating whole cities.
Responsible consumption
and production
Alfa Laval’s goal is that every new product should
have a smaller environmental impact – from a life
cycle perspective – than the product it replaces.
2
4
16
8
5
3
6
7
9
1112
13
14
15
17
Climate action
Alfa Laval’s heat exchangers can
improve energy efficiency in customers’ processes,
reducing the need for fossil fuels and helping to
lower CO2 emissions.
Life below water
Alfa Laval offers its marine customers a range
of products within energy and the environment. One
example is PureBallast – a system which prevents
organisms that travel along with ballast water from
being released in areas where they lack natural
enemies and hence could damage ecosystems.
Life on land
Alfa Laval’s innovative technologies can
contribute to optimizing resource efficiency. They
can also reduce the impact on different ecosystems
and cut greenhouse gas emissions. One concrete
example of how Alfa Laval’s equipment can con-
tribute is a cooling solution to protect the world’s
largest seed collection, providing a backup in
case a natural catastrophe, climate change or
war should deplete earth’s crop diversity.
Partnerships for the goals
Alfa Laval has been a signatory of the UN
Global Compact since 2011. This is a voluntary
initiative, where members commit to implementing
the UN’s sustainability principles.
Contributing to progress
Quality education
Alfa Laval is committed to ensure com-
petence development in our own business. We
also support charities and volunteering projects
related to child education across the globe.
Gender equality
Diversity and inclusion are key priorities
for Alfa Laval and the aim is that the composition
of employees reflects the geographic markets
where we operate.
Decent work and economic growth
Alfa Laval’s Business Principles require
decent working conditions. Working conditions
and safety are a highly prioritized area both in our
own operations and in the demands we set on
our suppliers.
Peace, justice and strong institutions
Alfa Laval has a zero-tolerance approach
to bribery and corruption. Our programme builds
on the six steps outlined in the UK Bribery Act
and is based on a “prevent, detect and correct”
methodology.
Enabling change
Contributing
to progress
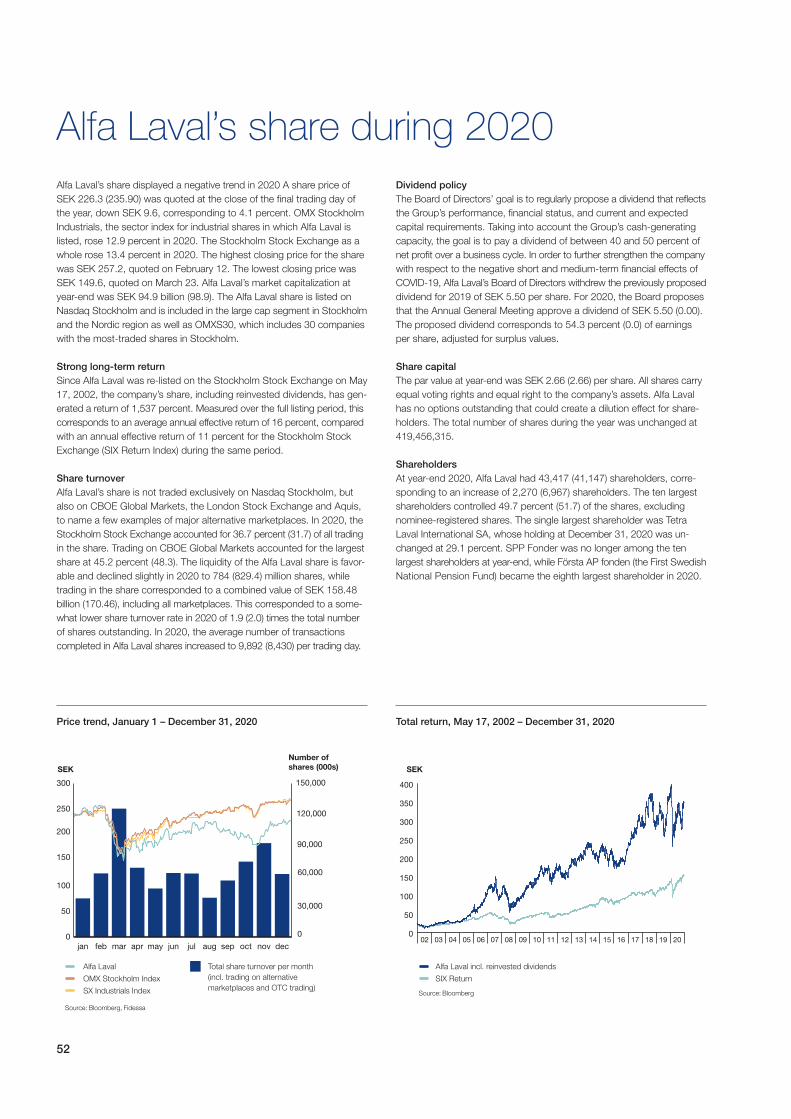
52
Price trend, January 1 – December 31, 2020 Total return, May 17, 2002 – December 31, 2020
Alfa Laval’s share during 2020
SEK SEK
Number of
shares (000s)
Alfa Laval’s share displayed a negative trend in 2020 A share price of
SEK 226.3 (235.90) was quoted at the close of the final trading day of
the year, down SEK 9.6, corresponding to 4.1 percent. OMX Stockholm
Industrials, the sector index for industrial shares in which Alfa Laval is
listed, rose 12.9 percent in 2020. The Stockholm Stock Exchange as a
whole rose 13.4 percent in 2020. The highest closing price for the share
was SEK 257.2, quoted on February 12. The lowest closing price was
SEK 149.6, quoted on March 23. Alfa Laval’s market capitalization at
year-end was SEK 94.9 billion (98.9). The Alfa Laval share is listed on
Nasdaq Stockholm and is included in the large cap segment in Stockholm
and the Nordic region as well as OMXS30, which includes 30 companies
with the most-traded shares in Stockholm.
Strong long-term return
Since Alfa Laval was re-listed on the Stockholm Stock Exchange on May
17, 2002, the company’s share, including reinvested dividends, has gen-
erated a return of 1,537 percent. Measured over the full listing period, this
corresponds to an average annual effective return of 16 percent, compared
with an annual effective return of 11 percent for the Stockholm Stock
Exchange (SIX Return Index) during the same period.
Share turnover
Alfa Laval’s share is not traded exclusively on Nasdaq Stockholm, but
also on CBOE Global Markets, the London Stock Exchange and Aquis,
to name a few examples of major alternative marketplaces. In 2020, the
Stockholm Stock Exchange accounted for 36.7 percent (31.7) of all trading
in the share. Trading on CBOE Global Markets accounted for the largest
share at 45.2 percent (48.3). The liquidity of the Alfa Laval share is favor-
able and declined slightly in 2020 to 784 (829.4) million shares, while
trading in the share corresponded to a combined value of SEK 158.48
billion (170.46), including all marketplaces. This corresponded to a some-
what lower share turnover rate in 2020 of 1.9 (2.0) times the total number
of shares outstanding. In 2020, the average number of transactions
completed in Alfa Laval shares increased to 9,892 (8,430) per trading day.
Dividend policy
The Board of Directors’ goal is to regularly propose a dividend that reflects
the Group’s performance, financial status, and current and expected
capital requirements. Taking into account the Group’s cash-generating
capacity, the goal is to pay a dividend of between 40 and 50 percent of
net profit over a business cycle. In order to further strengthen the company
with respect to the negative short and medium-term financial effects of
COVID-19, Alfa Laval’s Board of Directors withdrew the previously proposed
dividend for 2019 of SEK 5.50 per share. For 2020, the Board proposes
that the Annual General Meeting approve a dividend of SEK 5.50 (0.00).
The proposed dividend corresponds to 54.3 percent (0.0) of earnings
per share, adjusted for surplus values.
Share capital
The par value at year-end was SEK 2.66 (2.66) per share. All shares carry
equal voting rights and equal right to the company’s assets. Alfa Laval
has no options outstanding that could create a dilution effect for share-
holders. The total number of shares during the year was unchanged at
419,456,315.
Shareholders
At year-end 2020, Alfa Laval had 43,417 (41,147) shareholders, corre-
sponding to an increase of 2,270 (6,967) shareholders. The ten largest
shareholders controlled 49.7 percent (51.7) of the shares, excluding
nominee-registered shares. The single largest shareholder was Tetra
Laval International SA, whose holding at December 31, 2020 was un-
changed at 29.1 percent. SPP Fonder was no longer among the ten
largest shareholders at year-end, while Första AP fonden (the First Swedish
National Pension Fund) became the eighth largest shareholder in 2020.
Alfa Laval Alfa Laval incl. reinvested dividendsTotal share turnover per month
(incl. trading on alternative
marketplaces and OTC trading)OMX Stockholm Index SIX Return
SX Industrials Index
Source: Bloomberg, Fidessa
Source: Bloomberg
02 03 04 05 06 07 08 09 11 12 15 16 17 18 19 201413100
50
100
150
200
250
300
350
400
0
30,000
60,000
90,000
120,000
150,000
decnovoctsepaugjuljunmayaprmarfebjan0
50
100
150
200
250
300

53
The s
hare
2020 2019 2018 2017 2016
Share price at year-end, SEK 226,3 235.90 189.65 193.80 150.80
Highest paid, SEK 257,2 242.40 248.10 213.90 154.40
Lowest paid, SEK 149,6 165.05 188.50 152.60 121.30
Shareholders’ equity, SEK 69,31 66.15 56.26 48.87 48.34
Earnings per share 8,47 13.08 10.77 7.09 5.46
Dividend, SEK 5,501) 0* 5.00 4.25 4.25
Free cash flow, SEK 2) 15,89 10.00 8.56 8.92 9.97
Price change during the year, % -4,1 24.4 -2.1 29 -3
Dividend as % of EPS, % 64,9 42.0 46.4 59.9 77.8
Direct return, % 3) 2,4 2.3 2.6 2.2 2.8
Share price/shareholders’ equity, multiple 3,3 3.6 3.4 4.0 3.1
P/E ratio 4) 27 18 18 27 28
No. of shareholders 43 334 41.147 34.180 32.967 35.840
No. of
shareholders
No. of
shareholders, %
No. of
shares Holding, %
1 – 500 33,936 78.3% 4,318,408 1.0%
501 – 1,000 4,276 9.9% 3,485,710 0.8%
1,001 – 5,000 3,923 9.1% 8,836,881 2.1%
5,001 – 10,000 526 1.2% 3,916,529 0.9%
10,001 – 15,000 154 0.4% 1,918,148 0.5%
15,001 – 20.000 84 0.2% 1,544,292 0.4%
20,001 – 435 1.0% 395,436,347 94.3%
Total 43,334 419,456,315
No. of shares
Capital/voting
rights,%
Change in
holding in 2019,
percentage points
Tetra Laval International SA 122,037,736 29.1 0.0
Alecta 24,312,464 5.8 0.2
AMF Insurance and Funds 15,377,737 3.7 -1.6
Swedbank Robur Funds 11,883,626 2.8 -1.6
CBNY Norges Bank 9,637,816 2.3 -0.3
SEB Investment Management 7,521,072 1.8 -0.3
Handelsbanken Funds 7,032,268 1.7 0.5
Första AP fonden 3,742,815 0.9 0.5
Folksam 3,648,365 0.9 0.0
Livförsäkringsbolaget Skandia 3,125,758 0.8 0.2
Total ten largest shareholders 208,319,657 49.8 -2.4
No. of shares Holding, %
Financial companies 91,204,734 21.7%
Other financial companies 168,917 0.0%
Social insurance funds 8,110,132 1.9%
Government 259,453 0.1%
Municipal sector 28,682 0.0%
Trade organizations 4,023,903 1.0%
Other Swedish legal entities 6,044,800 1.4%
Shareholders domiciled abroad (legal entities
and individuals)
287,312,514 68.5%
Swedish individuals 20,839,602 5.0%
Uncategorized legal entities 1,463,578 0.3%
Ownership distribution by size at December 31, 2020
Data per share
Dividend and percentage
of adjusted EPS6)
Geographic distribution of the free float, %
of capital and voting rights8)
Share turnover on various
marketplaces 2020
Ownership categories at December 31, 2020
Ten largest shareholders at December 31, 20205)
Dividend Percentage of adjusted EPS
Source: EuroclearSource: Alfa Laval Source: Fidessa
6) Adjusted for step up amortization net of taxes.
7) Board motion to the Annual General Meeting. 8) Excluding Tetra Laval International SA (Switzerland) 29.1%.
1 CBOE Global Markets 45%
2 Nasdaq OMX 37%
3 London Stock Exchange 7%
4 Aquis 3%
5 Other 8%
1) Board motion to the Annual General Meeting.2) Free cash flow is the sum of cash flow from operating and investing activities.3) Measured as the proposed dividend in relation to closing price on the last trading day.4) Closing price on the last trading day in relation to earnings per share.
* Cancelled dividend due to uncertain market conditions as a result of COVID-19 pandemic.
Source: Euroclear
Source: Euroclear
Source: Euroclear
5) The table is adjusted for nominee-registered shares.
Source: OMX Nasdaq, Euroclear, Alfa Laval
Sweden
USA
UK
Other
0
25
50
75
100
2019181716
%
0
1
2
3
4
5
6
2019*181716
0
20
40
60
%SEK
50.1
38.6
48.054.0
4.2
5
4.2
5
4.0
0
5.5
0 7
)
1
2
3
45

54

55
Co
rpo
rate
Go
vern
ance R
ep
ort
Contents
– Corporate Governance Report
Introduction by the Chairman of the Board 56
Corporate Governance Report 2020 57
Share and ownership structure 58
Annual General Meeting 58
Annual General Meeting
for the 2019 fiscal year 58
Nominating Committee 60
Board of Directors 61
Committees 63
The company’s auditors 63
Remuneration to auditors 63
Board of Directors and auditors 64
President and Group management 66
Areas of responsibility 66
Remuneration to senior executives 66
Operational control 67
Group management meetings in 2020 68
Board of Directors’ report on internal control 68
Control environment 68
Risk assessment 68
Control structures 68
Information and communication 69
Follow-up 69
Auditor’s statement on the
Corporate Governance Report 70
56
Introduction by the Chairman of the BoardAlfa Laval
Little did I know, entering my first year as Chairman of the Alfa Laval
Board, what a different and challenging year this would be. By early
2020 employees all over the world were forced to contend with
a new normal; lockdowns, travel bans and challenges of different
kinds. Despite this Alfa Laval remained resilient and adjusted rapidly
to the new situation while maintaining employee’s safety and
customers business continuity in focus. During the year, I have been
impressed to see the strong drive on customer focus and the
competence and technology skills that the organization possesses.
Alfa Laval’s innovative technologies are dedicated to purifying,
refining, and reusing materials, promoting more responsible use
of natural resources. They contribute to improved energy efficiency
and heat recovery, better water treatment, and reduced emissions.
Alfa Laval is thereby, not only accelerating success for its customers,
but also for people and the planet, making the world a better place.
The Board of Directors is responsible for the organization and
management of the Group and for creating the conditions for
long-term profitable growth with the best interest of the company
and owners in mind. This is done by regularly assessing the Group’s
financial situation and the companies financial, legal, social, and
environmental risks, ensuring that the organization is designed
for satisfactory control.
We are committed to building a better future for our customers and
the Board is fully supportive of the company’s relentless focus on
developing and improving its product portfolio with the aim of staying
ahead and securing long-term value creation in the years ahead.
The year in brief
2020 has been a year like no other. It has been a year of unprec-
edented challenges, but also a year that offered opportunities.
In 2020, Alfa Laval continued to transform its sales of service and
spare parts as well as its customer service in line with its strategy
to make them more digitized and data based. Initiatives like digi-
talization, including connected equipment and remote diagnostics,
were accelerated to better service and support many of our cus-
tomers during a difficult year.
The ultimate goal of transforming the service business is for Alfa
Laval to be able to fully leverage its installed base, improve and
expand the customer base and simultaneously improve the cus-
tomer experience, thereby supporting the Alfa Laval brand.
The Board continued to focus on key initiatives implemented within
the framework of the company’s strategic priorities to reach its
growth, profitability, and capital utilization goals. Our efforts to
develop products and systems for a changing world, with new
demands and needs concerning energy supply, energy utilization
and food production as well as changing regulations, continued.
Product launches across the various technological platforms
continued at a rapid pace while the company worked on adjusting
its existing manufacturing capacity to meet changing demands.
This was done while accelerating connectivity, rolling out of
e-commerce solutions, and handling the rapid changes without
disruptions in the supplier chain or deliveries to customers.
All in all, despite a challenging 2020, Alfa Laval performed well.
While volumes were lower, profitability remained at a high level and
a strong cash flow put us in a good position going forward.
I would like to take this opportunity to thank my fellow Board members
for good cooperation, constructive contributions and engaged
work. I would also like to thank the Alfa Laval management and
all its employees for exceptional work during a challenging year.
Lund, February 2021
Dennis Jönsson
Chairman of the Board

57
Co
rpo
rate
Go
vern
ance R
ep
ort
Corporate Governance Report 2020Alfa Laval offers efficient and environmentally responsible products and solutions in
the areas of heat transfer, separation and fluid handling. The business is driven by clear
goals for growth, profitability and returns, at the same time as there are distinct require-
ments on Alfa Laval to act in a manner that is sustainable from a long-term perspective
for its shareholders, employees, customers, suppliers and other stakeholders.
The framework for the company’s corporate governance is based on various laws and regulations, such as the Swedish
Companies Act, the Swedish Annual Accounts Act, the rules of the stock exchange and the Swedish Corporate
Governance Code (the “Code”). These are supplemented by the company’s business principles regarding the envi-
ronment, human rights, ethics and transparency. The company’s control is also subject to internal regulations, including
governing documents with guidelines and instructions as well as procedures for control and risk management. The
work of the Board and the President is governed by formal work plans. This Corporate Governance Report aims to
describe the guidelines that are in place, the division of responsibility within the company and the interaction between
the Annual General Meeting, the Board of Directors and the President. The Report was reviewed by the company’s auditors.
57
The registered name of the company is Alfa Laval AB (publ) and the registered office of the
Board of Directors shall be in Lund Municipality in Sweden. The company’s share capital
shall amount to not less than SEK 745,000,000 and not more than SEK 2,980,000,000.
The number of shares shall be not less than 298,000,000 and not more than 1,192,000,000.
The company is listed on Nasdaq Stockholm AB. The fiscal year is the calendar year. The
objective of the company’s operations is to, directly or through subsidiaries and joint venture
companies in and outside Sweden, develop, manufacture and sell equipment and installa-
tions, primarily in the areas of separation, heat transfer and fluid handling, and to administer
fixed and movable property, and other related operations. The Articles of Association do
not include any limitations regarding the number of votes a shareholder can cast at a
General Meeting. Nor do they include any specific rules regarding the appointment and
dismissal of Board members or changes in the Articles of Association.
Alfa Laval – the company
Alfa Laval’s currently prevailing Articles
of Association were adopted at the
Annual General Meeting on April 23,
2020 and are available in their entirety
on www.alfalaval.com

58
Share and ownership structure
At December 31, 2020, Alfa Laval had
419,456,315 shares outstanding, allocated
among 43,417 shareholders according to Eu-
roclear Sweden’s share register. Alfa Laval has
only one class of shares and each share cor-
responds to one vote. Tetra Laval International
SA was the largest owner, with 29.1 percent
of the shares in Alfa Laval at year-end, and the
only owner with a stake larger than 10 percent.
The second largest owner was Alecta with 5.8
percent, followed by AMF with a holding of
3.7 percent. Legal entities accounted for
slightly more than 95 percent of the holdings,
while individuals accounted for the remainder.
From a geographic perspective, the following
five countries represented a total of 93.0 per-
cent of the shareholdings: Sweden, Switzer-
land, the US, the UK and Luxembourg. For
more information about Alfa Laval’s share,
share performance and ownership structure,
refer to the Share section on pages 52–53.
Annual General Meeting
The Annual General Meeting is the company’s
highest decision-making body in which all share-
holders are entitled to participate and each share
entitles its holder to one vote. The majority of
motions addressed at the Annual General Meeting
are decided by a simple majority. However,
certain points sometimes require a qualified
majority, for example, amendments to the
company’s Articles of Association or resolutions
to buy back shares. The Annual General
Meeting is to be held annually within six months
of the close of the fiscal year in either Lund or
Stockholm. Normally, the Annual General
Meeting takes place in late April in Lund. The
date and location are announced not later than
in conjunction with the publication of the interim
report for the third quarter. To be entitled to
participate and vote in the Annual General
Meeting, shareholders must be registered in
the share register maintained by Euroclear
Sweden AB. Any shareholder who is unable
to attend in person may participate through a
proxy with a power of attorney. Shareholders
with nominee-registered shares must have the
shares temporarily registered under their own
name. The Annual General Meeting is held in
Swedish and all documentation is available in
Swedish and English. Alfa Laval endeavors to
ensure that all Board members participate as
well as, in so far as it is possible, all members
of Group management. The company’s auditors
are always present.
Dividend and percentage
of adjusted EPS**
Total number of shareholders
Dividend Percentage of adjusted EPS
* Board motion to the Annual General Meeting.
** Adjusted for step up amortization net of taxes.
No. of shares
Capital/voting
rights,%
Change in holding in 2020,
percentage points
Tetra Laval International SA 122,037,736 29.1 0.0
Alecta 24,312,464 5.8 0.2
AMF Insurance and Funds 15,377,737 3.7 -1.6
Swedbank Robur Funds 11,883,626 2.8 -1.6
CBNY Norges Bank 9,637,816 2.3 -0.3
SEB Investment Management 7,521,072 1.8 -0.3
Handelsbanken Funds 7,032,268 1.7 0.5
Första AP fonden 3,742,815 0.9 0.5
Folksam 3,648,365 0.9 0.0
Livförsäkringsbolaget Skandia 3,125,758 0.8 0.2
Total ten largest shareholders 208,319,657 49.8 -2.4
No. of shares Holding, %
Financial companies 91,204,734 21.7%
Other financial companies 168,917 0.0%
Social insurance funds 8,110,132 1.9%
Government 259,453 0.1%
Municipal sector 28,682 0.0%
Trade organizations 4,023,903 1.0%
Other Swedish legal entities 6,044,800 1.4%
Shareholders domiciled abroad (legal entities and individuals) 287,312,514 68.5%
Swedish individuals 20,839,602 5.0%
Uncategorized legal entities 1,463,578 0.3%
Ownership categories at December 31, 2020
Ten largest shareholders at December 31, 2020*
Source: Euroclear
Source: Euroclear
* The table is adjusted for nominee-registered shares.
0
1
2
3
4
5
6
2019181716
0
20
40
60
%SEK
50.1
38.6
48.054.0
4.2
5
4.2
5
4.2
5
5.5
0*
0
10,000
20,000
30,000
40,000
50,000
2019181716
35
,84
0
32
,96
7
34
,18
0
41
,14
7
43
,41
7

59
Co
rpo
rate
Go
vern
ance R
ep
ort
Corporate governance
President and CEO
Divisions
Group Management
Staff functions
Reports
HR
Finance
Communications
Corporate Business Development
CSR
Legal
IT
Goals
Strategies
Policy documents
Business Principles
Audit
Internal audit
Audit Committee Remuneration Committee
Annual General Meeting
Board of Directors
Nominating Committee

60
The Annual General Meeting of Alfa Laval AB (publ) will be held on
Tuesday, April 27, 2021, at 4:00 p.m.
In accordance with the company’s Articles of Association, notice of the
Annual General Meeting will be inserted as an announcement in the
Swedish Official Gazette and on the company’s website not more than
six and not less than four weeks prior to the Meeting. An announcement
that notification has been issued will be placed in Dagens Nyheter. As
a service to existing shareholders, information about the Annual General
Meeting can also be sent to them by mail.
Annual General Meeting for the 2020 fiscal year
Shareholders wishing to submit proposals to the
Nominating Committee prior to the Annual General
Meeting were able to contact Alfa Laval’s Board Chairman
Dennis Jönsson, or one of the owner representatives.
Contact could also take place directly via e-mail at
[email protected]. The final day for submitting
matters to be addressed by the Annual General Meeting
was March 9, 2021.
Proposals to the Nominating Committee
– A resolution was passed that no dividend be
paid for 2019 and that the company’s profits
be carried forward.
– A resolution was passed that the number of
Board members appointed by the Meeting is
to amount to eight, with no deputies.
– A resolution was passed that fees paid to
non-executive Board members elected by the
Meeting remain unchanged at SEK 5,845,000
In addition, fees for work on the Board’s com-
mittees are to remain unchanged.
– A resolution was passed to re-elect Board
members Finn Rausing, Jörn Rausing, Ulf
Wiinberg, Henrik Lange, Heléne Mellquist and
Maria Moræus Hanssen. Dennis Jönsson and
Ray Mauritsson were elected as new Board
members. Anders Narvinger and Anna Ohlsson
Leijon declined re-election.
It was resolved that Dennis Jönsson be elected
as the new Chairman of the Board.
– A resolution was passed in favor of the
Nominating Committee’s proposal, resulting in
the re-election of Authorized Public Accountants
Staffan Landén and Karoline Tedevall as the
company’s auditors. Authorized Public Accoun-
tants Henrik Jonzén and Andreas Mast were
also elected as the company’s deputy auditors.
– A resolution was passed in favor of the
Annual General Meeting for the 2019 fiscal year
The Annual General Meeting for the 2019 fiscal
year was held at Scandic Star in Lund on April
23, 2020. As a result of the restrictions taken
to reduce the risk of spreading COVID-19, a
very limited number of people participated in
the Meeting and Anders Narvinger, Chairman
of the Board, and Finn Rausing, Chairman of
the Nominating Committee, participated via
phone. Other Board members, proposed new
members and other members of the Nominating
Committee also participated via phone. A total
of 20 people were present at the Annual
General Meeting, including shareholders, proxies,
assistants, guests and officials. In conjunction
with the Annual General Meeting, Alfa Laval’s
owners were given the option of early voting
by mail. The total number of votes represented
at the Meeting corresponded to 31 percent of
the total number of votes in the company.
Attorney Erik Sjöman was elected as the Meeting
Chairman. The minutes from the Annual General
Meeting, and all other information related to
the Meeting, are available at www.alfalaval.
com/investors/corporate-governance/.
The resolutions passed at the Meeting included
the following:
– A resolution was passed to adopt the income
statement and balance sheet as well as the
consolidated income statement and consoli-
dated balance sheet and to discharge the
Board of Directors and President from liability.
Board’s proposed guidelines for remuneration
to senior executives.
– A resolution was passed in favor of the
Board’s proposed changes to Alfa Laval AB’s
Articles of Association.
Nominating Committee
Work of the Nominating Committee
The Nominating Committee, which comprises
representatives of the largest shareholders, is
responsible for preparing and submitting motions
regarding candidates for Board members and, if
applicable, auditors. The supporting documen-
tation utilized for the Committee’s work includes
the annual evaluation of the work of the Board,
which is initiated by the Chairman of the Board.
Other key factors to be considered, against the
background of the company’s strategy, include
the type of competence required. The Nomi-
nating Committee can call upon the assistance
of external resources in its search for suitable
candidates and can also conduct interviews with
individual Board members. The Nominating
Committee is also responsible for submitting
motions in respect of remuneration to members
of the Board and its committees.
Composition for the 2021 Annual
General Meeting
The composition of the Nominating Committee
is determined in accordance with the process
approved by the Annual General Meeting. The
Chairman of the Board contacts representatives
of the institutions which, as of the end of August,
Name Representing Shareholding in Alfa Laval, %*
Jörn Rausing Tetra Laval International SA 29.2
Ramsay Brufer Alecta Pensionsförsäkring 5.6
Anders Oscarsson AMF Insurance and Funds 4.4
Jan Andersson Swedbank Robur Funds 3.3
Per Trygg SEB Funds 1.8
*As of August 31, 2020.
Composition of the Nominating Committee ahead of the Annual General Meeting for the
2020 fiscal year

61
Co
rpo
rate
Go
vern
ance R
ep
ort
are among the largest shareholders and re-
quests that they each appoint one member.
The composition is then announced in a press
release, in the third-quarter interim report and
on Alfa Laval’s website. Ahead of the 2021
Annual General Meeting, the composition of
the Nominating Committee was announced
on September 28, 2020. It was also included
in Alfa Laval’s third-quarter interim report,
which was published on October 22, 2020.
The Nominating Committee for the Annual
General Meeting for the 2020 fiscal year com-
prised the following individuals: Jörn Rausing
(Tetra Laval International SA), Ramsay Brufer
(Alecta Pensionsförsäkring), Anders Oscarsson
(AMF Insurance and Funds), Jan Andersson
(Swedbank Robur Funds) and Per Trygg (SEB
Funds). The holdings of the Nominating Com-
mittee represented 44.2 percent of the num-
ber of shares outstanding at August 31, 2020.
Chairman of the Board Dennis Jönsson was
elected as a member, Alfa Laval’s General
Counsel and Board secretary Emma Adlerton
was elected as secretary and Jörn Rausing was
elected as Chairman of the Nominating Com-
mittee. Due to Jörn Rausing’s position as a Board
member, his role as Chairman is a deviation
from the Code. The reason for this deviation is
that the Nominating Committee deemed Jörn
Rausing to be particularly well suited to lead
the work of the Committee and obtain the best
possible results for the company’s owners.
Proposals to the Nominating Committee
Shareholders wishing to submit proposals to the
Nominating Committee prior to the Annual General
Meeting were able to contact Alfa Laval’s Board
Chairman Dennis Jönsson, or one of the owner
representatives. Contact could also take place
directly via e-mail at valberedningen @alfalaval.com.
The final day for submitting matters to be ad-
dressed by the Annual General Meeting was
March 9, 2021.
Work of the Nominating Committee ahead
of the 2020 Annual General Meeting
The Nominating Committee held four minuted
meetings ahead of the Annual General Meeting
that took place in April 2020 for the 2019 fiscal
year. The Nominating Committee also conducted
discussions by phone and e-mail. The meetings
covered an evaluation of the Board’s composition,
an assessment of the potential future compe-
tence requirements of the Board and an evalu-
ation of candidates for the Board’s coming
term. As a basis for its work, the Nominating
Committee used an internal evaluation of the
work of the Board that was conducted by the
Chairman of the Board.
The reasoned statement of the Nominating
Committee ahead of the 2020 Annual General
Meeting stated that the Nominating Committee
had applied Rule 4.1 of the Swedish Corporate
Governance Code (“the Code”) as its diversity
policy when preparing its motion to the Board.
The aim of the policy is to ensure that the com-
position of the Board of Directors is appropriate
to the company’s operations, phase of develop-
ment and other relevant circumstances, and
that it is characterized by diversity and breadth
of qualifications, experience and background, and
that an even gender balance is sought after.
Ahead of the 2020 Annual General Meeting,
the Nominating Committee was tasked with
preparing proposals for a new Chairman and
another new member of Alfa Laval’s Board of
Directors. In its work, the Nominating Committee
focused particularly on identifying and proposing
Board members who together would represent
a broad range of industrial experience and ex-
perience in development areas relevant to Alfa
Laval. For the role of Chairman, the Nominating
Committee’s goal was to find a candidate with
comprehensive experience in leading international
companies similar to Alfa Laval. The Nominating
Committee’s efforts resulted in the Annual
General Meeting appointing Dennis Jönsson
as Charmain and Board member and electing
Ray Mauritsson as a new Board member.
Over the last few years, the Nominating Committee
has aimed for an even distribution of gender on
the Board, in accordance with the benchmark
level stipulated in the Swedish Corporate Gover-
nance Board. The current Board consists of two
women and six men, which represents a share
of 25 percent women. This is less than ideal and
the issue will continue to receive careful scrutiny.
At the 2020 Annual General Meeting, Anders
Narvinger was thanked for his time as Chairman
of the Board.
Board of Directors
Work and responsibilities
The Board administers the company on behalf
of the shareholders and thus bears the ultimate
responsibility for the organization and admin-
istration of the company. The work and respon-
sibilities of the Board are governed by the
Swedish Companies Act, the Swedish Board
Representation (Private Sector Employees) Act,
Alfa Laval’s Articles of Association, the Board’s
Remuneration of Board members and attendance at Board meetings
Chairman *The remuneration recognised pertains to the period between two AGMs
Name Present Remuneration*
Appointed by the AGM Anders Narvinger ** 5 –
Dennis Jönsson*** 10 1,750,000
Henrik Lange 15 585,000
Ulf Wiinberg 15 585,000
Finn Rausing 15 585,000
Jörn Rausing 14 585,000
Anna Ohlsson-Leijon** 4 –
Heléne Mellquist 12 585,000
Ray Mauritsson*** 10 585,000
Maria Moreaus Hanssen 15 585,000
Employee representatives Bror García Lantz 15 –
Susanne Jonsson 15 –
Henrik Nielsen 15 –
Total 15 5,845,000
**Declined re-election at the AGM ***Appointed after the AGM

62
own formal work plan, Nasdaq’s Rule Book for
Issuers and the Code. The Board establishes
and evaluates Alfa Laval’s overall long-term
objectives and strategies. This includes estab-
lishing business and financial plans, reviewing
and approving financial statements, adopting
guidelines, making decisions on issues relating
to acquisitions and divestments, and deciding
on major investments and significant changes
to Alfa Laval’s organization and operations. The
Board is also responsible for Alfa Laval’s business
principles, which determine how the company
and its employees are to conduct themselves in
society, taking into consideration the environment,
ethics, social responsibility and transparency.
The Board is responsible for the Corporate
Governance Report. The Board is also respon-
sible for ensuring that processes are in place
for monitoring compliance with relevant laws
and rules. The Board appoints, evaluates and
dismisses the company’s President, establishes
the instructions for the President with respect to
the Group’s daily operations and approves the
President’s commitments outside the company.
Through the Audit Committee, the Board procures
auditing services, maintains ongoing contact with
the company’s auditors and works to ensure that
a sound internal control function and formalized
procedures are in place to enable monitoring and
assessment of the company’s financial situation.
Through the Remuneration Committee, the
Board also determines salaries and remunera-
tion for the President and senior executives.
Composition
The Board of Directors is to comprise a minimum
of four and maximum of ten members, with a
maximum of four deputy members.
At the 2020 Annual General Meeting, eight
members were elected, and no deputies. The
members are elected annually for the period until
the conclusion of the next Annual General
Meeting and are to dedicate the requisite time
and diligence to the assignment as well as have
the necessary knowledge to best look after the
interests of the company and its owners. Ad-
ditionally, the trade-union organizations appoint
three employee representatives and three deputy
employee representatives. Salaried employees
in the company are invited to Board meetings
as presenters and experts. The company’s Chief
Financial Officer participates in all meetings, as
does its General Counsel, who serves as Board
secretary. For more information about the goals
regarding Board composition, refer to “Work of
the Nominating Committee ahead of the 2020
Annual General Meeting” on page 91.
Independence of Board members
All members of the Alfa Laval Board elected by
the Annual General Meeting are considered
independent of the company and its manage-
ment. All members are also considered inde-
pendent of the company’s major shareholders,
except Finn Rausing, Jörn Rausing and Dennis
Jönsson, who cannot be considered indepen-
dent due to their relationship with Tetra Laval
International SA, which owned 29.1 percent
of the shares in the company as of December
31, 2020.
The Board’s formal work plan
The work of the Board is governed by a formal
work plan that is determined annually at the
statutory meeting. This formal work plan de-
scribes the Board’s work assignments and the
division of responsibility between the Board, the
committees and the President. It also defines
the role of the Chairman of the Board and in-
cludes separate instructions for the company’s
President regarding the financial reporting to
be submitted to the Board to enable ongoing
assessment of the financial position.
Work of the Board in 2020
The Board held 15 meetings in 2020, including
eight ordinary and seven extraordinary meetings.
11 meetings were held by phone, while the other
meetings were held in Lund and Stockholm in
Sweden. The company’s President prepares an
agenda for each meeting in consultation with
the Chairman of the Board. Normal agenda items
include health and safety, earnings results, order
trends, investments, sustainability and acqui-
sitions. In addition to these, much time was
spent discussing the COVID-19 situation, the
tender offer for Neles and adapting the orga-
nization to a changing market. The Board also
focused on reviewing personnel issues.
Board training
All new Board members undergo an extensive
introduction program. In addition, a combined
training course and field trip takes place each
year. However, due to COVID-19, the trip was
canceled.
Evaluation of the Board’s work
The Chairman of the Board ensures that an
annual evaluation is conducted of the work of
the Board. The evaluation focuses on work
methods and work climate as well as its access
to and the need for particular Board competence
in order to lay the foundation for a well-functioning
and efficient Board. External resources are brought
in at regular intervals to evaluate the work of the
Board. Regardless of whether it is conducted
internally or externally, the evaluation forms a
foundation for the Nominating Committee’s work
related to the nomination of Board members and
proposed remuneration levels. In 2020, the
evaluation was conducted by the Chairman of
Board through an external evaluation and dis-
cussions with the Board members. The evaluation
followed a clear structure based on standard
models. The results were reported to the Board
and communicated to the Nominating Committee.
Responsibilities of the Chairman of the Board
The Chairman of the Board directs the work of
the Board in a manner that ensures it complies
with prevailing laws and regulations, the Code
and the Board’s formal work plan. The Chairman
must ensure that the work is well organized and
conducted efficiently, and that the Board fulfills
its tasks. In dialogue with the company’s President,
the Chairman monitors operational developments
and is responsible for ensuring that the other
members continuously receive all information
necessary for the work of the Board to be per-
formed in the most effective manner. Together
with the company’s President, the Chairman also
approves the proposed agenda for Board meet-
ings. The Chairman is responsible for ensuring
that new Board members receive an introduction
to the company and any other training agreed on
by the Chairman and the individual member within
six months from the member’s election. In addi-
tion to being responsible for evaluating the Board’s
work, the Chairman also participates in evaluation
and development matters with respect to the
Group’s senior executives. The Chairman ensures
that the Board’s decisions are executed and
represents the company in ownership issues.
Audit Committee: fees and attendance
Chairman
Name Present Remuneration
Anna Ohlsson-Leijon** 2 –
Henrik Lange 6 200,000
Heléne Mellquist 6 125,000
Dennis Jönsson* 4 125,000
Total 6 450,000
*Appointed after the AGM **Declined re-election at the AGM

63
Corp
ora
te G
ove
rnance R
eport
Remuneration of the Board
Remuneration to the Board is determined by the
Annual General Meeting based on the motions
submitted by the Nominating Committee. The
Chairman and members of the Audit Committee
and the Remuneration Committee receive sup-
plementary remuneration. No Board member is
entitled to pension payments from the company.
Committees
Alfa Laval’s Articles of Association stipulate that
there must be a Remuneration Committee and
an Audit Committee that report to the Board.
Committee members are appointed from among
the Board members for a period of one year.
Audit Committee
Areas of responsibility
The Audit Committee ensures compliance with
the principles for financial reporting and internal
control. The Committee formulates guidelines for
the company’s financial reporting and follow-up,
and has the right to determine the focus of the
internal audit. The Committee examines the
procedures for reporting and financial controls
as well as the work, qualifications and inde-
pendence of the external auditors. The Com-
mittee also follows up the effectiveness of the
internal control systems and reviews the com-
pany’s financial reports. For further information
regarding the responsibilities of the Audit
Committee, refer to “The Board of Directors’
report on internal control” on page 68.
Members and meetings in 2020
Members are appointed annually at the
Board’s statutory meeting. In 2020, the Com-
mittee comprised Henrik Lange (Chairman),
Dennis Jönsson and Heléne Mellquist with the
Group Controller serving as secretary. Six digital
meetings were held during the year. The com-
pany’s Chief Financial Officer, the Head of the
Internal Audit Function and the company’s
auditors also attend the Committee’s meetings.
The meetings addressed the following:
– financial reports and debriefing from the
external auditors,
– Group provisions and allocations,
– planning external and internal audits,
– internal control processes,
– closing down the company’s reinsurance
company,
– the financial policy and capital structure
strategy as well as the company’s enterprise
risk management plan, and
– reviewing the outcome of the self-assessment
of managers in the Group regarding internal
control points.
Remuneration Committee
Areas of responsibility
The Remuneration Committee is involved in re-
cruitment, appointments, and matters pertaining
to other conditions of employment relating to the
President and Group management. The Com-
mittee is responsible for preparing the Executive
Remuneration Policy to senior executives to be
resolved on by the Annual General Meeting and
for submitting motions to the Board of Directors
regarding the report on remuneration paid and
outstanding, which is to be prepared by the Board
each fiscal year and be presented to the Annual
General Meeting for approval. In addition, the
Committee submits proposals to the Board
on matters regarding salary and employment
terms for the President and for senior execu-
tives who report directly to the President.
Members and meetings in 2020
The Remuneration Committee is appointed
annually at the Board’s statutory meeting. The
Committee held two meetings in 2020. At the
first meeting in February 2020, the Committee
comprised Anders Narvinger (Chairman), Jörn
Rausing and Ulf Wiinberg. At the second meeting
in December 2020, the Committee comprised
Dennis Jönsson (Chairman), Jörn Rausing and
Ulf Wiinberg. Minutes are taken at all meetings
and the contents are distributed to the Board
members, except in certain cases when the
minutes are noted directly in the corresponding
Board minutes. During the year, the Remuner-
ation Committee proposed, among other things:
– The executive remuneration policy according
to Chapter 7 and 8 of the Swedish Companies
Act (Sw. Aktiebolagslagen)
– The goals for the short-term incentive (STI)
and long-term incentive (LTI) plans.
– Defined benefits pension plan obligations
was also discussed.
The company’s auditors
The auditors comprise a supervisory body ap-
pointed by the Annual General Meeting. The
assignment includes the following: auditing the
accounting and financial statements of individual
companies, evaluating the accounting policies
applied, assessing the administration of company
management, reviewing the interim report for the
third quarter and evaluating the overall presentation
in the Annual Report. The results of the audit
– the Audit Report – are communicated to share-
holders in the Annual Report and at the Annual
General Meeting. In addition, the auditors present
a statement regarding the discharge from liability
of the Board of Directors, a statement regarding
the adoption of the income statement and balance
sheet by the Annual General Meeting and a
statement regarding the Corporate Governance
Report. The Group must have a minimum of one
and maximum of two auditors, with not more than
two deputy auditors. An authorized public accoun-
tant or registered auditing firm is to be appointed
as the company’s auditor and, where applicable,
as deputy auditor. At the Annual General Meeting
on April 23, 2020, Authorized Public Accountants
Staffan Landén and Karoline Tedevall were elected
as the company’s auditors. Henrik Jonzén and
Andreas Mast were elected as deputy auditors.
According to Alfa Laval’s assessment, none of
these auditors has any relationship to Alfa Laval,
or any company related to Alfa Laval, that could
affect their independent status. In 2020, the entire
Board received a report from the company’s
external auditors on one occasion. On this
occasion, the Board met with the auditors
without the CEO or anyone from Group man-
agement being present. The Audit Committee
received separate reports on six occasions.
Remuneration to auditors
Refer to Note 7 on page 123.
Remuneration Committee: fees and attendance
Chairman *Declined re-election at the AGM **Appointed after the AGM
Name Present Remuneration
Anders Narvinger* 1 –
Dennis Jönsson** 1 50,000
Jörn Rausing 2 50,000
Ulf Wiinberg 2 50,000
Total 2 150,000

64
Dennis JönssonChairman since 2020.
Born: 1956.
Formerly President and CEO of
Tetra Pak.
Education: BSc. Econ from
Stockholm University.
Independent of the company.
Number of shares in Alfa Laval:
210,000* (–**)
Board of Directors and auditors
Finn RausingBoard member since 2000.
Born: 1955
Education: B.L., MBA from
INSEAD.
Board member: Tetra Laval
Group, DeLaval Holding AB, EQT
AB, Swede Ship Marine AB and
Excillum AB.
Independent of the company.
Number of shares in Alfa Laval:
–
Ulf WiinbergBoard member since 2013.
Born: 1958
President of X-Vax Inc. Formerly
CEO of H. Lundbeck A/S, Director
of Wyeth Pharmaceuticals, EMEA/
Canada & BioPharma, and a
number of other senior positions
in Wyeth.
Chairman of the Board: Hansa
Biopharma AB and Sigrid
Therapeutics.
Board member: UCB Pharma and
Agenus Inc.
Independent of the company and
major shareholders.
Number of shares in Alfa Laval:
20,000* (20,000**)
Jörn RausingBoard member since 2000.
Born: 1960
Head of Mergers and Acquisitions
(M&A) in the Tetra Laval Group.
Education: BSc. Econ.
Board member: Tetra Laval Group,
Ocado PLC and DeLaval Holding AB.
Independent of the company.
Number of shares in Alfa Laval:
–
Henrik LangeBoard member since 2018.
Born: 1961
Previously President and CEO of
Gunnebo AB; held several senior
positions within the SKF Group,
including Industry Division Manager
and CFO, and served as CEO of
Johnson Pump AB.
Education: BSc. Econ. from the
Gothenburg School of Business,
Economics and Law
Board member: Velux A/S, IPCO AB,
Thomas Concrete AB, Traction AB
and The German-Swedish Chamber
of Commerce.
Independent of the company and
major shareholders.
Number of shares in Alfa Laval:
4,000* (4,000**)
Appointed by the Annual General Meeting
*Holdings at December 31, 2020. **Holdings at December 31, 2019.
Maria Moraeus HanssenBoard member since 2019.
Born: 1965
Previously COO, Vice President/
CEO of Wintershall Dea Holding
GmbH and President and CEO of
DEA Deutsche Erdoel AG.
Held several executive positions in
ENGIE SA, Aker ASA, Statoil ASA
(now Equinor ASA) and Norsk
Hydro ASA.
Education: Petroleum technology
at the Norwegian University of
Science and Technology (NTNU),
and petroleum economics at IFP
School in Paris.
Board member: Schlumberger lim-
ited, Scatec ASA, Oslobygg KF
(chair) and Wastefront AS (chair)
Independent of the company and
major shareholders.
Number of shares in Alfa Laval:
–
Heléne MellquistBoard member since 2019.
Born: 1964
CEO of Volvo Penta.
Previous positions include CEO of
Rederi AB Transatlantic and a number
of senior positions at Volvo Trucks,
Volvo Buses and Volvo Penta.
Board member: Thule Group AB.
Education: Diploma in
International Economy from the
University of Gothenburg Executive
Program Stockholm School of
Economics.
Independent of the company and
major shareholders.
Number of shares in Alfa Laval:
–
Ray MauritssonBoard member since 2020.
Born: 1962
President and CEO, Axis AB.
Former positions include several
different leading positions in Axis
Communications AB and Tac
(today part of Schneider Electric).
Education: MSc. Engineering
Physics, Lund University Faculty of
Engineering. Executive MBA, Lund
University School of Economics.
Independent of the company and of
major shareholders.
Number of shares in Alfa Laval:
–

65
Co
rpo
rate
Go
vern
ance R
ep
ort
Henrik NielsenEmployee representative since
2015.
Born: 1968
Employed by Alfa Laval since 1994.
Employee representative for the
Swedish Metal Workers’ Union (IF
Metall).
Number of shares in Alfa Laval:
50* (–**)
Susanne JonssonEmployee representative since
2016.
Born: 1965
Employed by Alfa Laval since 2008.
Employee representative for
the Swedish Confederation of
Professional Associations (SACO).
Number of shares in Alfa Laval:
–
Bror García LantzEmployee representative since
2012.
Born: 1965
Employed by Alfa Laval since 1990.
Employee representative for the
Swedish Union of Clerical and
Technical Employees in Industry
(Unionen).
Number of shares in Alfa Laval:
100* (100**)
Leif NorkvistDeputy member since 2009.
Born: 1961
Employed by Alfa Laval since 1993.
Deputy employee representative for
the Swedish Metal Workers’ Union
(IF Metall).
Stefan SandellDeputy member since 2005.
Born: 1971
Employed by Alfa Laval since 1989.
Deputy employee representative for
the Swedish Organization for Managers
(Ledarna).
Johnny HulténDeputy member since 2017.
Born: 1961
Employed by Alfa Laval since 1977.
Deputy employee representative for
the Swedish Metal Workers’ Union
(IF Metall).
Staffan LandénAuthorized Public Accountant, EY.
Born: 1963
Company auditor since 2018.
Karoline TedevallAuthorized Public Accountant, EY.
Born: 1978
Company auditor since 2018.
Henrik JonzénAuthorized Public Accountant, EY.
Born: 1977
Deputy auditor since 2018.
Andreas MastAuthorized Public Accountant, EY.
Born: 1979
Deputy auditor since 2020.
Deputy employee representatives
Auditors Deputy Auditors
Employee representatives
*Holdings at December 31, 2020. **Holdings at December 31, 2019.

66
President and Group management
Jan AlldeChief Financial Officer.
Born: 1967
Employed by Alfa Laval since 2018.
Chief Financial Officer since 2018.
Former positions include several
international positions at ABB
from 1991 to 2017, most recently
as Chief Financial Officer for the
Americas.
Education: BSc. Econ from
Stockholm University.
Number of shares in Alfa Laval:
10,000* (–**)
Pascale GimenezSenior Vice President,
Human Resources.
Born: 1966
Employed by Alfa Laval since
August 1, 2018.
Former positions include Senior
Vice President of Human
Resources at various units within
Sandvik and Electrolux.
Education: Master’s degree in
marketing from ESSEC Business
School and a degree in engineering
from the Institut Supérieur Agricole
de Beauvais.
Number of shares in Alfa Laval:
–
Tom Erixon President and CEO.
Born: 1960
CEO since March 1, 2016.
Former positions include President and CEO of OVAKO AB
and President of Sandvik Coromant.
Board member: Boliden AB.
Education: MA Law from the University of Lund in Sweden and MBA Business
Administration from IESE in Spain.
Number of shares in Alfa Laval:
101,200* (81,200**)
Emma AdlertonGeneral Counsel & Secretary to
the Board of Directors.
Born: 1973
Employed by Alfa Laval since 2008.
General Counsel and Secretary
to the Board of Directors since
2015; President of Group Legal &
Sustainability. Former positions
include senior legal counsel in
the Alfa Laval Group and attorney
at law.
Education: Master Laws (LL.M),
Lund University.
Number of shares in Alfa Laval:
1,000*
Mikael TydénPresident, Operations Division.
Born: 1967
Employed by Alfa Laval since 1995.
President of the Operations
Division since January 2017.
Former positions include head of
global manufacturing and supply
of separators, decanters, hygienic
fluid handling equipment and air
heat exchangers 2005–2016.
Education: Ms. Mech. Eng.
Number of shares in Alfa Laval:
1,000* (1,000**)
Areas of responsibility Remuneration to senior executives, pensions and
severance pay/termination of employmentThe President directs the daily operations and is responsible for ensuring that the Board has access to the
necessary information and supporting documentation for its decision-making purposes. The President is
also responsible for ensuring that the company’s accounting complies with applicable laws and regulations,
and that the ethical guidelines included in Alfa Laval’s Business Principles are reflected in the conduct of
the company. The President has the support of the Group management, to which responsibilities and au-
thority are delegated. The members of Group management include a head of global sales and service, four
divisional managers and the heads of HR, Legal and Finance.
The remuneration principles for the President and other members of
Group management are determined by the Annual General Meeting. For
additional information, refer to pages 121–123 and 149–151.
*Holdings at December 31, 2020. **Holdings at December 31, 2019.

67
Co
rpo
rate
Go
vern
ance R
ep
ort
Group management held eight scheduled meetings in 2020 during which minutes were
taken. In addition, quarterly reviews were performed to discuss the business developments
in the divisions and regions. These reviews addressed the business climate, earnings, earnings
projections for the next 12 months and specific issues affecting the respective business
areas. Separate strategy meetings were also held to address, among other areas, man-
agement’s proposals concerning the future direction with regard to organic growth and growth
through acquisitions. In 2020, Group management meetings concentrated on addressing
the effects of COVID-19, risks and opportunities in individual business units, products,
application areas and geographic regions as well as the consequences for the supply chain.
Group management also addressed research, development and product launches as well
as the company’s strategies and the future direction of the individual divisions. Additional
topics of discussion included structures concerning processes, system support and the
service business as well as opportunities within digital market communications and the de-
velopment of solutions for electronic development and control of the company’s products.
Sustainability was also discussed during the meetings, with a focus on health and safety.
Joakim VilsonSenior Vice President,
Global Sales & Service.
Born: 1965
Employed by Alfa Laval since 1990.
Former positions include Executive
Vice President in charge of the
Central and Eastern Europe, Latin
America, Middle East and Africa
Regions, Head of Mid Europe
Region and Head of the Process
Industry segment.
Education: BSc. Eng.
Number of shares in Alfa Laval:
6,520* (6,520**)
Susanne Pahlén ÅklundhPresident, Energy Division.
Born: 1960
Employed by Alfa Laval since 1983.
President of the Energy Division since
2017. Former positions include
President of the Equipment Division,
Head of Mid Europe and Nordic,
and Head of the Process Industry
segment.
Board member: Trelleborg AB.
Education: BSc. Eng.
Number of shares in Alfa Laval:
10,000* (10,000**)
Nish PatelPresident, Food & Water Division.
Born: 1962
Employed by Alfa Laval since 1984.
Former positions include Executive
Vice President in charge of the
Western Europe and North America
Regions, and Head of India and the
UK.
Education: BSc. Eng.
Number of shares in Alfa Laval:
47,552* (47,552**)
Sameer KalraPresident, Marine Division.
Born: 1962
Employed by Alfa Laval since 2011.
Previously Head of the Pumping
Systems and Offshore business
units.
Education: Marine engineer and
MBA.
Number of shares in Alfa Laval:
2,000* (–**)
Operations*
Global Sales & Service*
Operational control
Group management meetings in 2020
President and CEO*
CSR
Food & Water*
HR*Corporate Business
Development
Marine*
Communications
Energy*
Finance*
Alfa Laval’s operational control model comprises a matrix in which the Group’s divisions are presented vertically, intersecting with the Group’s geographic regions, which are presented
horizontally. The Operations Division, which is responsible for production-related procurement, production, logistics and distribution, serves as a shared supply chain for the sales divisions.
*Members of Group management
ITLegal*
*Holdings at December 31, 2020. **Holdings at December 31, 2019.

68
Board of Directors’ report on internal control
Control environment
The control environment includes the internal
governance instruments adopted by the
Board for the company’s daily operations.
The control instruments comprise policy
documents, which are continuously assessed,
reviewed and updated. These documents
include, for example, the Board’s formal work
plan, the President’s instructions, reporting
instructions, the company’s finance policy,
business principles, investment policy and
communication policy.
The Board has overriding responsibility for
financial reporting, among other things, and
must therefore assess the performance
and earnings of the operations through a
package of reports including results, fore-
casts and analyses of key indicators. The
Board also reviews the company’s interim
reports and year-end report and is to meet
with the external auditors at least once a
year without the presence of the President
or other members of Group management.
The Board’s Audit Committee is tasked
with ensuring compliance with the principles
for financial reporting and internal control.
The Committee follows up the effectiveness
of the internal control system and reviews
the financial procedures to ensure that the
information can be traced back to underlying
financial systems and that it is in line with
legislation and relevant standards.
The Committee examines procedures
for reporting and financial controls as well as
addressing the company’s financial reports.
It also monitors, evaluates and discusses
significant issues related to accounting and
financial reporting. The Committee evaluates
and manages information pertaining to dis-
putes and potential improprieties, and as-
sists management with identifying and
evaluating mainly financial and similar risks
that are relevant to the operations in order
The Board is responsible for the internal control of the company, with the aim of safeguarding its assets
and thus the interests of the shareholders. Through sound internal control, the Board ensures the
reliability of Alfa Laval’s reporting and its compliance with legislation, regulations, applicable accounting
policies and the company’s Business Principles. All communication and financial reporting is to be
correct, relevant, objective and transparent.
to ensure that the focus is on managing
these risks. It also reviews the company’s
information security system and the contin-
gency plans in place to ensure delivery of
financial information.
The Audit Committee has the right to
determine the focus of the internal audit and
is responsible for ensuring the efficiency of
the function by assessing its activities, re-
sources and structure. The Committee is
also responsible for reviewing the results
and recommendations of the internal
audit to ensure that they are handled in an
appropriate manner. It is responsible for re-
viewing the internal audit plan every six
months to ensure that it addresses the rel-
evant risk areas and for ensuring that there is
suitable coordination between the internal
and external audit. The Audit Committee
holds regular meetings with the external
auditors and reviews their work, qualifications
and independence, and the results of this
review are reported to the company’s Nomi-
nating Committee on an annual basis. The
Audit Committee supports the Nominating
Committee in its work to nominate auditors
and conducts an annual review of the pro-
posed scope of the audit. Reports are pro-
vided to the Board regarding internal meetings
as well as meetings with the internal auditors,
the external auditors and various specialists
in Group management and its support
functions. The Committee is responsible for
reviewing significant results from the external
audit and the recommendations issued by the
external auditors as a result. It is also respon-
sible for establishing guidelines that ensure
the independence of the external auditors.
The President is subject to instructions
issued by the Board and is responsible for
ensuring an effective control environment.
The President is also responsible for the
ongoing control work and for ensuring that
the company’s accounting complies with
legislation and that the management of assets
is adequately performed. The President is
also responsible for ensuring that all Board
members regularly receive sufficient infor-
mation to be able to assess the company’s
financial position.
Group management is responsible for
managing and maintaining the internal con-
trol systems required to manage significant
risks in the company’s operating activities.
Management is also responsible for clearly
ensuring that all employees understand the
requirements for and the individual’s role in
maintaining sound internal control.
The internal auditors review and implement
improvements to the internal control function,
conduct internal audits – which are reported
to the Audit Committee – and propose plans
for the coming six to eight months. The
internal auditors also issue reports from
individual audits to the appropriate members
of Group management. Procedures are in
place for performing regular reviews of the
agreed actions to guarantee that specific
actions are taken following the internal audit.
These are based on an agreed schedule set
with the party responsible for the individual
activities. The Internal Audit Function com-
prises four internal auditors, internal specialist
resources and external auditors. Internal
audits encompass a broad spectrum of
functions and issues determined by the
Board. The areas audited include: compliance
with the systems, guidelines, policies and
processes established for the Group’s
business operations; the existence of systems
to ensure that financial transactions are carried
out, archived and reported in an accurate
and lawful manner; and opportunities to
improve management control, the company’s
profitability and the organization, which
may be identified during audits. In 2020,
35 internal audits were performed.
69
Co
rpo
rate
Go
vern
ance R
ep
ort
Risk assessment
Within the framework of the company’s
operating activities and review functions,
procedures are in place for risk assessments
pertaining to the financial reporting. These
procedures aim to identify and evaluate the
risks that may affect internal control. The
procedures encompass risk assessments
in conjunction with strategic planning and
acquisition activities as well as processes for
identifying amendments to the accounting
policies to ensure that they are accurately
reflected in the financial reporting.
Control structures
Control structures are in place in all areas of
the organization in order to prevent, identify
and adjust errors or deviations. They manage
the risks that the Board and management
consider to be significant to the business,
internal control and financial reporting. These
structures comprise both an organization with
clearly defined roles that enables an effective
and – from an internal control perspective
– appropriate division of responsibility, and
specific control activities that enable the
identification and timely prevention of risks
becoming a reality. Control activities also
include clearly defined decision-making
processes and a policy for decision-making
with respect to, for example, investments,
agreements, acquisitions and divestments,
earnings analyses and other forms of analytical
reviews, reconciliations, inventory-taking
and automatic controls in the IT systems.
Information and communication
The company’s regulations, guidelines and
manuals are communicated through several
internal channels and the efficiency of this
communication is monitored on an ongoing
basis. There are formal and informal infor-
mation channels that enable employees to
communicate important information to rele-
vant recipients and ultimately, if necessary,
to the Board of Directors. Clear guidelines
have also been established for external
communications, the aim of which is to
provide the most accurate and relevant
overview possible while at the same time
ensuring that all obligations are met.
Follow-up
The internal control process is mainly followed
up by two bodies: the Audit Committee
and the Internal Audit Function. The Audit
Committee establishes the principles that
apply for the company with respect to ac-
counting and financial reporting, and moni-
tors compliance with these regulations.
The Committee meets with the external
auditors to obtain information about the
focus and scope of the audit and to discuss
results and coordination of the external and
internal audits. In addition, the Committee
establishes the direction, scope and time
schedules for the work of the internal audit
team, whose audits are reported to the Audit
Committee and continuously to Group
management so that any necessary mea-
sures may be taken. The scope of the inter-
nal audit includes, among other factors,
operational efficiency, compliance with regu-
lations and guidelines, and the quality of
financial reporting from the subsidiaries.
Alfa Laval has implemented a manage-
ment testing process for key internal con-
trols over business processes in the com-
pany. The managers and key employees
evaluated their compliance through a con-
trol self-assessment test for important in-
ternal controls in these business processes
and will perform this on an annual basis.
Based on the results, the internal controls
framework will be strengthened and assist
in risk-based valuation of the business pro-
cesses at Alfa Laval.
Lund, February 2021
Board of Directors

70
Auditor’s report on the corporate governance statement
Engagement and responsibility
It is the Board of Directors who is responsible for the cor-
porate governance statement for the year 2020 on pages
55–69 and that it has been prepared in accordance with the
Annual Accounts Act.
The scope of the audit
Our examination has been conducted in accordance with
FAR’s auditing standard RevU 16 The auditor’s examination of
the corporate governance statement. This means that our
examination of the corporate governance statement is dif-
ferent and substantially less in scope than an audit conducted
in accordance with International Standards on Auditing and
generally accepted auditing standards in Sweden. We be-
lieve that the examination has provided us with sufficient
basis for our opinions.
Opinions
A corporate governance statement has been prepared.
Disclosures in accordance with chapter 6 section 6 the second
paragraph points 2-6 the Annual Accounts Act and chapter
7 section 31 the second paragraph the same law are consis-
tent with the annual accounts and the consolidated accounts
and are in accordance with the Annual Accounts Act.
To the general meeting of the shareholders of Alfa Laval AB (publ), corporate identity number 556587-8054
Lund 9 March 2021
Staffan Landén Karoline Tedevall
Authorized Public Accountant Authorized Public Accountant
Ernst & Young AB Ernst & Young AB

Financial statements
Board of Directors’ Report 72
Consolidated cash flows 86
Comments to the consolidated cash flows 87
Consolidated comprehensive income 88
Comments to the consolidated
comprehensive income 89
Consolidated financial position 92
Comments on the consolidated
financial position 94
Changes in consolidated equity 94
Comments on changes
in consolidated equity 95
Parent company cash flows 96
Parent company income 96
Parent company financial position 97
Changes in parent company equity 98
Notes to the financial statements 99
Accounting principles 99
Objectives, policies and processes
for managing capital 107
Financial risks 108
Operational risks 112
Notes 118
Auditor’s report 152
Ten-year overview 156
Definitions 158
AL_20_BAKVAGN_EN.indd 71 2021-03-25 12:41

72
Board of Directors’ ReportThe Board of Directors and the President of Alfa Laval AB (publ) hereby submit their annual report for the year of operation
January 1, 2020 to December 31, 2020.
The information in this annual report is such information that Alfa
Laval AB (publ) must publish in accordance with the Securities
Market Act. The information was made public by publishing the annual
report on Alfa Laval’s website on March 31, 2021 at 10.00 CET.
Alfa Laval AB is a public limited liability company. The seat of the
Board is in Lund and the company is registered in Sweden under
corporate registration number 556587-8054. The visiting address
of the head office is Rudeboksvägen 1 in Lund and the postal ad-
dress is Box 73, 221 00 Lund, Sweden. Alfa Laval’s website is:
www.alfalaval.com.
Financial statements
The following parts of the annual report are financial statements:
the Board of Directors’ Report, the ten-year overview, the consoli-
dated cash flows, the consolidated comprehensive income, the
consolidated financial position, the changes in consolidated equity,
the parent company cash flows, the parent company income, the
parent company financial position, the changes in parent company
equity and the notes. All of these have been audited by the auditors.
The Corporate Governance Report, which also has been reviewed
by the auditors, is to be found on page 55.
The company’s statutory sustainability report 2020 is found in the
Sustainability Report together with the risk section of the annual re-
port. These two reports constitute the statutory sustainability report
for the parent company and the consolidated Group. Acquisitions
must within three years report sustainability data according to the
Group’s routines for sustainability reporting. The separate Sustainability
Report was published at the same time as the annual report and is
to be found on Alfa Laval’s website Alfa Laval – Sustainability Reports.
Ownership and legal structure
Alfa Laval AB (publ) is the parent company of the Alfa Laval Group.
The company had 43,417 (41,147) shareholders on December 31,
2020. The largest owner is Tetra Laval International SA, Switzerland, who
owns 29.1 (29.1) percent. Next to the largest owner, there are nine
institutional investors with ownership in the range of 5.8 to 0.7 percent.
These ten largest shareholders owned 49.7 (51.7) percent of the shares.
Operations
The Alfa Laval Group is engaged in the development, production and
sales of products and systems based on three main technologies:
separation/filtration, heat transfer and fluid handling.
Alfa Laval's business is divided into three Business Divisions “Energy”,
“Food & Water” and ”Marine” that sell to external customers and are
responsible for the manufacturing of the products and one division
“Operations & Other” covering procurement and logistics as well as
corporate overhead and non-core businesses. These four divisions
constitute Alfa Laval’s four operating segments. The former “Green-
house” Division ceased to exist as per the end of 2019 when the
last operations were divested.
The customers to the Energy Division purchase products and
systems for energy applications, whereas the customers to the
Food & Water Division purchase products and systems for food
and water applications. The customers to the Marine Division pur-
chase products and systems for marine and offshore applications.
The three Business Divisions are in turn split into a number of
Business Units. The Energy Division consists of four Business Units:
Brazed & Fusion Bonded Heat Exchangers, Energy Separation,
Gasketed Plate Heat Exchangers and Welded Heat Exchangers.
The Food & Water Division consists of five Business Units: Decanters,
Food Heat Transfer, Food Systems, Hygienic Fluid Handling and High
Speed Separators. The Marine Division consists of four Business
Units: Boiler Systems, Gas Systems, Marine Separation & Heat
Transfer Equipment and Pumping Systems.
Material factors of risk and uncertainty
The main factors of risk and uncertainty facing the Group concern
the development of the COVID-19 pandemic, the price development
of metals, fluctuations in major currencies and the business cycle.
For additional information, see the sections on financial and opera-
tional risks and the section on critical accounting principles, the
section on key sources of estimation uncertainty and the section
on judgements under accounting principles.
Acquisition of businesses
On December 31, 2020 Alfa Laval has acquired Sandymount, a US-
based beverage technology company with a unique and patented
membrane technology to concentrate beer. The technology in combi-
nation with Alfa Laval’s extensive product range, will open up interesting
business opportunities for the company and enable a more sustainable
beer-delivery supply chain. Sandymount’s patented membrane tech-
nology, Revos™, in combination with Alfa Laval’s extensive product
range for beer production, will enable beer producers to deliver high
quality beer in concentrated form. The solution addresses the trans-
portation inefficiencies in beer supply where beer remains one of the
few water-laden products distributed as a ‘mostly water’ from producer
to consumer. The newly acquired company will be integrated into
the Business Unit Food Systems in the Food & Water Division.
A smaller operation, WCR Benelux BV in the Netherlands, was
acquired on July 1, 2020.
On December 18, 2018 Alfa Laval announced that it has signed an
agreement to acquire Airec – a Malmö, Sweden-based innovation com-
pany with patented technology for dimple asymmetry heat exchangers.
The new company will be integrated into the Brazed & Fusion Bonded
Heat Exchangers unit of the Energy Division. The acquired technology
represents untapped opportunities in combination with Alfa Laval’s
existing heat transfer know-how, manufacturing footprint and global
market presence. The transaction was closed on January 2, 2019.
Divestment of businesses
The operations and net assets of DSO Fluid Handling Inc in the U.S.
were divested on August 28, 2020. The divestment has resulted in a loss
of SEK -55 million that is reported as a comparison distortion item.
On December 12, 2018 Alfa Laval announced that it had signed
an agreement to sell part of its air heat exchanger business related
to commercial/industrial air heat exchangers in the Greenhouse di-
vision to the LU-VE Group. The transaction was closed on May 1,
2019. The divestment resulted in a gain of SEK 260 million that
was reported as a comparison distortion item.
The last remaining Greenhouse operation shell-and-tube Sarasota,
also known as Alfa Laval Champ, was sold to Thermal Solutions Manu-
facturing on December 31, 2019. The divestment resulted in a loss
of SEK -71 million that was reported as a comparison distortion item.
Sale of real estate
During 2020 a few minor properties in different countries have
been sold for SEK 7 (0) million with a realised result of SEK -0 (-4)
million, which has been reported in other operating costs/income.
A small property in France is empty and has been for sale for several
years. It is not expected to be sold within the next year. Five properties
in India are for sale and are expected to be sold within the next year.
The latter have therefore been classified as current assets held for
sale with SEK 55 (-) million. The fair value of the properties for sale
exceeds the book value by approximately SEK 24 (2) million.
AL_20_BAKVAGN_EN.indd 72 2021-03-25 12:41

73
Bo
ard
of D
irec
tors
’ Re
po
rt
0
2
4
6
8
10
12
14
Q420Q320Q220Q120Q419Q319Q219Q119Q418Q318Q218Q118
0
7
14
21
28
35
42
49
Orders received
BnSEK
quarter
BnSEK
12 months
Order intake per quarter Orders received rolling 12 months
Orders received amounted to SEK 39,833 (44,119) million during 2020.
Order bridge
Consolidated
SEK millions/% 2020 2019
Order intake last year 44,119 45,005
Organic 1) -5.8% -3.6%
Structural 1) -0.2% -2.1%
Currency -3.7% 3.7%
Total -9.7% -2.0%
Order intake current year 39,833 44,119
1) Change excluding currency effects.
Orders received from the aftermarket Service constituted 29.6 (29.1) percent of the Group's
total orders received for 2020.
Order bridge Service
Consolidated
SEK millions/% 2020 2019
Order intake last year 12,824 11,568
Organic 1) -4.4% 6.6%
Structural 1) -0.1% -0.4%
Currency -3.7% 4.7%
Total -8.2% 10.9%
Order intake current year 11,773 12,824
1) Change excluding currency effects.
• Organic: change excluding acquisition/divestment of businesses.
• Structural: acquisition/divestment of businesses.
• Service: Parts and service.
AL_20_BAKVAGN_EN.indd 73 2021-03-25 12:41

74
Large orders (>EUR 5 million)
Division
Order
received in
Delivery
date
Order
amount
Total per Business Unit
Business Unit 2020 2019
Scope of supply SEK millions
Energy
Welded Heat Exchangers
Alfa Laval Packinox heat exchangers to a petrochemical plant in China. Q1 2020 60
Compact heat exchangers to a refinery and petrochemical plant in China.* Q2 2021 76
Air cooler systems to a gas processing plant in the U.S. Q2 2021 160
Alfa Laval OLMI heat exchangers to a gas compression plant in Algeria. Q3 2021 75
Alfa Laval Packinox heat exchangers to a petrochemical plant in China and a
refinery in Mexico. Q3 2021/2022 130 501 950
Gasketed Plate Heat Exchangers
Compact heat exchangers to a refinery and petrochemical plant in China.* Q2 2021 19 19 –
Food & Water
Decanters
Decanters to a wastewater treatment plant in Singapore. Q4 2022 75 75 225
Food Systems
A process line to be installed in a new St1 biorefinery in Sweden. Q1 2020 60
Processing line to HollyFrontier Corporation for production of renewable
diesel in the US. Q4 2021 130 190 170
Marine
Boiler Systems – 155
Pumping Systems
Framo pumping systems to two customers in China and Singapore. Q1 2020/2021 170
Framo pumping systems to an FPSO** vessel to be built in China. Q2 2021 130
Framo pumping systems for two FPSO** vessels outside Brazil. Q3 2021 155
Framo pumping systems for three FPSO** vessels to be built in China. Q3 2021 275 730 165
Total 1,515 1,665
*One order split on two Business Units. ** FPSO = Floating Production, Storage and Offloading.
Large orders
Large orders are orders with a value over EUR 5 million. The volume of large orders is an important indicator of the demand situation and is
therefore monitored separately within Alfa Laval. A large volume of large orders normally also means a good load in the factories. During 2020
Alfa Laval has received the following large orders:
AL_20_BAKVAGN_EN.indd 74 2021-03-25 12:41

75
Bo
ard
of D
irec
tors
’ Re
po
rt
Sales bridge
Consolidated
SEK millions/% 2020 2019
Net sales last year 46,517 40,666
Organic 1) -6.6% 12.5%
Structural 1) -0.9% -2.4%
Currency -3.4% 4.3%
Total -10.9% 14.4%
Net sales current year 41,468 46,517
1) Change excluding currency effects.
Net invoicing relating to Service constituted 28.7 (26.9) percent of the Group's total net
invoicing for 2020.
Sales bridge Service
Consolidated
SEK millions/% 2020 2019
Net sales last year 12,544 11,493
Organic 1) -1.3% 4.8%
Structural 1) -0.2% -0.3%
Currency -3.6% 4.6%
Total -5.1% 9.1%
Net sales current year 11,898 12,544
1) Change excluding currency effects.
Excluding currency effects and adjusted for acquisition and divestment of businesses the
order backlog was 7.6 percent lower than the order backlog at the end of 2019.
Net sales
Net sales amounted to SEK 41,468 (46,517) million during 2020.
0
5
10
15
20
25
202020192018
0
20
40
60
80
100
17.7
5.5
23.2
16.4
5.2
21.6
15.1
3.9
19.0
For delivery during next year
For delivery later than next year
Part of last 12 months' invoicing
BnSEK %
Order Backlog December 31
AL_20_BAKVAGN_EN.indd 75 2021-03-25 12:41

76
Energy Division
Consolidated
SEK millions 2020 2019
Orders received 11,952 13,963
Order backlog* 4,740 5,214
Net sales 12,187 13,814
Operating income** 1,882 2,069
Operating margin*** 15.4% 15.0%
Depreciation and amortisation 452 467
Investments**** 352 453
Assets* 12,726 14,570
Liabilities* 5,574 5,890
Number of employees* 5,111 5,365
* At the end of the period. ** In management accounts. *** Operating income in relation to net sales. **** Excluding new leases.
Comparison figures for last year have been restated due to the organisational change described above.
Operating segments
Energy Division
The division targets customers in HVAC and refrigeration markets as well as process industries such as
chemicals, petrochemical industry and the oil & gas industry. Focus is on increased energy efficiency,
waste heat recovery and sustainable solutions.
The Energy Division consists of four Business Units: Brazed & Fusion Bonded Heat Exchangers, Energy Separation, Gasketed Plate Heat
Exchangers and Welded Heat Exchangers.
Order intake 2020 split per end market/business unit
0.0
0.5
1.0
1.5
2.0
2.5
3.0
3.5
4.0
4.5
Q420Q320Q220Q120Q419Q319Q219Q119
0
2
4
6
8
10
12
14
16
18
Quarterly development
BnSEK %
Orders received Operating marginNet sales
Operating segmentsOrganisational change
As of January 1, 2020, the product groups within Operations have been moved over to the Business Units within the Divisions. This gives
the Business Units a clearer financial consolidation as a part of a more decentralised business organisation. Due to this the comparison
figures for previous periods have been restated, which has impacted depreciation and amortisation, investments, assets, liabilities and
number of employees by division. Remaining in Operations is procurement, logistics, distribution and production development.
The depreciation and amortisation that have been moved from Operations to the Divisions in the comparison periods have not impacted
the operating income in the Divisions.
Other 6%
Chemicals 6%
Power 7%
Refrigeration 7%
Machinery & Manufacturing 13%
Refinery 8%
Petrochemicals 13%
Oil & Gas 13%
HVAC 27%
Gasketed Plate Heat Exchangers
Welded Heat Exchangers
Brazed & Fusion Bonded Heat Exchangers
Energy Separation
AL_20_BAKVAGN_EN.indd 76 2021-03-25 12:41
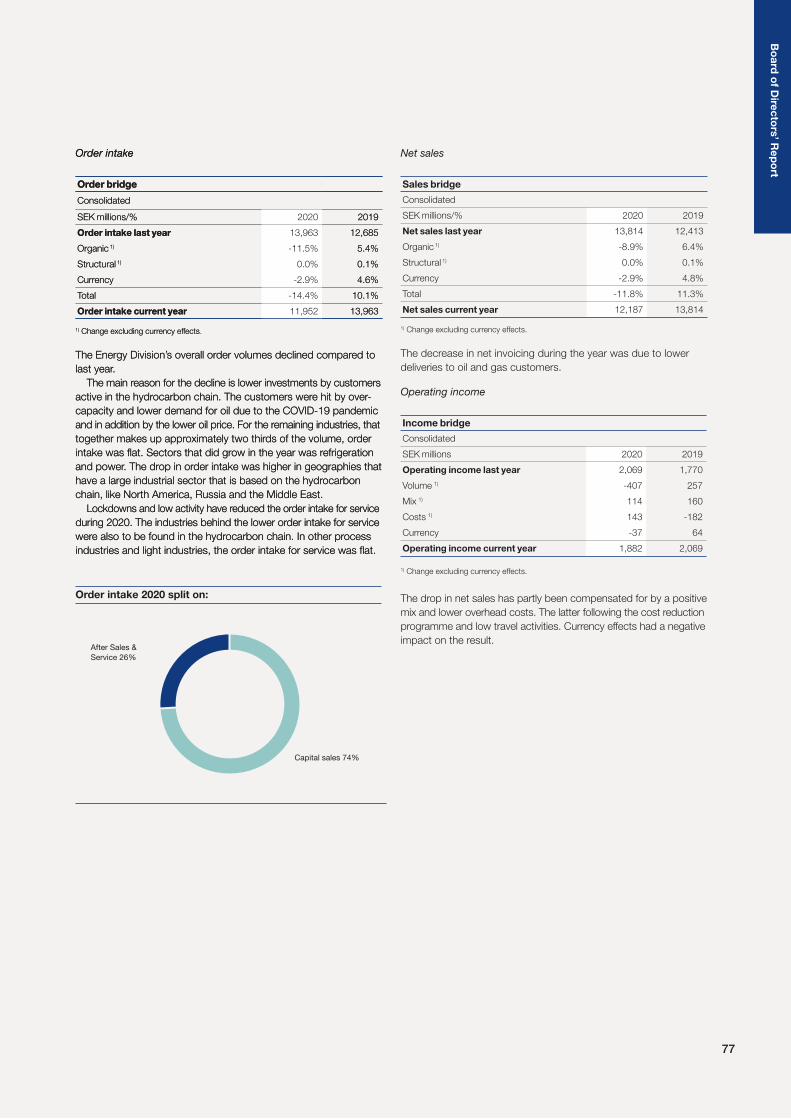
77
Order intake
Order bridge
Consolidated
SEK millions/% 2020 2019
Order intake last year 13,963 12,685
Organic 1) -11.5% 5.4%
Structural 1) 0.0% 0.1%
Currency -2.9% 4.6%
Total -14.4% 10.1%
Order intake current year 11,952 13,963
1) Change excluding currency effects
The Energy Division’s overall order volumes declined compared to
last year.
The main reason for the decline is lower investments by customers
active in the hydrocarbon chain. The customers were hit by over-
capacity and lower demand for oil due to the COVID-19 pandemic
and in addition by the lower oil price. For the remaining industries, that
together makes up approximately two thirds of the volume, order
intake was flat. Sectors that did grow in the year was refrigeration
and power. The drop in order intake was higher in geographies that
have a large industrial sector that is based on the hydrocarbon
chain, like North America, Russia and the Middle East.
Lockdowns and low activity have reduced the order intake for service
during 2020. The industries behind the lower order intake for service
were also to be found in the hydrocarbon chain. In other process
industries and light industries, the order intake for service was flat.
Order intake
Order bridge
Consolidated
SEK millions/% 2020 2019
Order intake last year 13,963 12,685
Organic 1) -11.5% 5.4%
Structural 1) 0.0% 0.1%
Currency -2.9% 4.6%
Total -14.4% 10.1%
Order intake current year 11,952 13,963
1) Change excluding currency effects.
The Energy Division’s overall order volumes declined compared to
last year.
The main reason for the decline is lower investments by customers
active in the hydrocarbon chain. The customers were hit by over-
capacity and lower demand for oil due to the COVID-19 pandemic
and in addition by the lower oil price. For the remaining industries, that
together makes up approximately two thirds of the volume, order
intake was flat. Sectors that did grow in the year was refrigeration
and power. The drop in order intake was higher in geographies that
have a large industrial sector that is based on the hydrocarbon
chain, like North America, Russia and the Middle East.
Lockdowns and low activity have reduced the order intake for service
during 2020. The industries behind the lower order intake for service
were also to be found in the hydrocarbon chain. In other process
industries and light industries, the order intake for service was flat.
Order intake 2020 split on:
Net sales
Sales bridge
Consolidated
SEK millions/% 2020 2019
Net sales last year 13,814 12,413
Organic 1) -8.9% 6.4%
Structural 1) 0.0% 0.1%
Currency -2.9% 4.8%
Total -11.8% 11.3%
Net sales current year 12,187 13,814
1) Change excluding currency effects.
The decrease in net invoicing during the year was due to lower
deliveries to oil and gas customers.
Operating income
Income bridge
Consolidated
SEK millions 2020 2019
Operating income last year 2,069 1,770
Volume 1) -407 257
Mix 1) 114 160
Costs 1) 143 -182
Currency -37 64
Operating income current year 1,882 2,069
1) Change excluding currency effects.
The drop in net sales has partly been compensated for by a positive
mix and lower overhead costs. The latter following the cost reduction
programme and low travel activities. Currency effects had a negative
impact on the result.After Sales &
Service 26%
Capital sales 74%
Bo
ard
of D
irec
tors
’ Re
po
rt
AL_20_BAKVAGN_EN.indd 77 2021-03-25 12:41

78
Food & Water Division
Consolidated
SEK millions 2020 2019
Orders received 13,814 14,026
Order backlog* 5,056 4,894
Net sales 13,414 14,189
Operating income** 2,371 2,268
Operating margin*** 17.7% 16.0%
Depreciation and amortisation 384 385
Investments**** 295 288
Assets* 11,226 12,522
Liabilities* 5,184 5,088
Number of employees* 6,215 6,410
* At the end of the period. ** In management accounts. *** Operating income in relation to net sales. **** Excluding new leases.
Comparison figures for last year have been restated due to the organisational change described above.
Operating segments
Food & Water Division
The division offers different types of products for heat transfer, separation and hygienic fluid handling
and targets customers in food, pharmaceuticals, biotech, vegetable oils, brewery, dairy and body
care products. In addition, the division focuses on public and industrial water treatment as well as
wastewater and waste treatment.
The Food & Water Division consists of five Business Units: Decanters, Food Heat Transfer, Food Systems, Hygienic Fluid Handling and
High Speed Separators.
Order intake 2020 split per end market/business unit
0.0
0.5
1.0
1.5
2.0
2.5
3.0
3.5
4.0
4.5
5.0
Q420Q320Q220Q120Q419Q319Q219Q119
0
2
4
6
8
10
12
14
16
18
20
%
Quarterly development
BnSEK
Orders received Operating marginNet sales
Other 2%
Protein 6%
Brewery 7%
Pharma & Biotech 10%
Ethanol, Starch & Sugar 9%
Edible Oil 11%
Waste & Water 11%
Prep. Food & Beverage 20%
Dairy 24%
Hygienic Fluid Handling
Decanters
High Speed Separators
Food Heat Transfer
Food Systems
AL_20_BAKVAGN_EN.indd 78 2021-03-25 12:41

79
Bo
ard
of D
irec
tors
’ Re
po
rt
Order intake
Order bridge
Consolidated
SEK millions/% 2020 2019
Order intake last year 14,026 13,691
Organic 1) 2.7% -1.8%
Structural 1) 0.0% –
Currency -4.2% 4.2%
Total -1.5% 2.4%
Order intake current year 13,814 14,026
1) Change excluding currency effects.
Excluding currency effects, the division’s order intake increased slightly
compared to last year, despite a certain reluctance among customers
to push through decisions on larger, often capacity related, invest-
ments during the pandemic. Geographically, Latin America showed
solid growth and Asia was up, not least driven by strong growth in
China. Eastern Europe showed growth across most countries.
The pharma and biotech market grew strongly, partly as a result
of the pandemic, where nations and pharma and biotech companies
reassessed their supply chains to mitigate any future vulnerability.
The waste & water sector stayed flat after a very strong 2019 that
included some very large orders. Order intake from the edible oil
industry grew, even though low commodity prices to a certain extent
impacted the tendency to invest during the pandemic. However, a
breakthrough order in the USA with the new HVO (Hydrotreated
Vegetable Oil) technology for biodiesel, laid the foundation for a new
interesting market. Order intake for dairy grew slightly and activity
level and sentiment remained positive in the industry, which combined
with increased sales activities via more channels contributed positively.
The brewery sector came in slightly below last year, being one of the
most negatively impacted industry sectors in the pandemic. Demand
in ethanol, starch & sugar contracted slightly compared to last year
where predominantly the ethanol market in North America was im-
pacted by low crude oil prices, with demand for alternative fuels
getting lower. Protein applications grew strongly, with more extended
by-product utilization and with opportunities in a changing food market
with new sources of protein. For the more wider application area prepared
food and beverage, the order intake was marginally below last year.
Demand in service increased compared to last year. Parts sales
saw a good growth, but also service offerings grew, despite access
restrictions to customer sites being a constraint during the pandemic,
something partly mitigated with new remote guidance tools.
Net sales
Sales bridge
Consolidated
SEK millions/% 2020 2019
Net sales last year 14,189 13,210
Organic 1) -1.7% 2.9%
Structural 1) 0.0% –
Currency -3.8% 4.5%
Total -5.5% 7.4%
Net sales current year 13,414 14,189
1) Change excluding currency effects.
Net sales contracted slightly compared to last year, mainly related
to the base business*, whereas net sales for service increased
somewhat.
Operating income
Income bridge
Consolidated
SEK millions 2020 2019
Operating income last year 2,268 2,110
Volume 1) -99 134
Mix 1) 172 3
Costs 1) 94 -67
Currency -64 88
Operating income current year 2,371 2,268
1) Change excluding currency effects.
Operating income increased compared to last year, despite a slight
contraction in net sales. A favourable mix more than mitigated the
drop in net sales. A positive cost development, not least from the
savings programme initiated to counter the expected impact of the
pandemic, also contributed positively. The currency effect was
negative due to the strengthening of the Swedish krona.
Order intake 2020 split on:
After Sales &
Service 31%
Capital sales 69%
* Base business and base orders refer to orders with an order value of less than EUR 0.5 million.
AL_20_BAKVAGN_EN.indd 79 2021-03-25 12:41

80
Marine Division
Consolidated
SEK millions 2020 2019
Orders received 14,067 15,953
Order backlog* 9,173 11,443
Net sales 15,867 17,993
Operating income** 2,758 3,425
Operating margin*** 17.4% 19.0%
Depreciation and amortisation 814 884
Investments**** 137 177
Assets* 24,086 27,796
Liabilities* 6,695 8,481
Number of employees* 4,489 4,702
* At the end of the period. ** In management accounts. *** Operating income in relation to net sales. **** Excluding new leases.
Comparison figures for last year have been restated due to the organisational change described above.
Operating segments
Marine Division
The division’s customers include shipowners, shipyards, manufacturers of diesel and gas engines,
as well as companies that work with offshore extraction of oil and gas. The offering includes pumping
systems, boilers, heat transfer equipment, high speed separators and several different environmental
products, including systems to clean ballast water and exhaust gases.
The Marine Division consists of four Business Units: Boiler Systems, Gas Systems, Marine Separation & Heat Transfer Equipment and
Pumping Systems.
0.0
0.5
1.0
1.5
2.0
2.5
3.0
3.5
4.0
4.5
5.0
5.5
Q420Q320Q220Q120Q419Q319Q219Q119
0
2
4
6
8
10
12
14
16
18
20
22
%
Quarterly development
BnSEK
Orders received Operating marginNet sales
Order intake 2020 split per end market/business unit
Ship Building & Shipping 76%
Other 1%
Engine Power 8%
Offshore 15%
Environmental products
Separation and heat transfer
Pumping systems
Boilers
AL_20_BAKVAGN_EN.indd 80 2021-03-25 12:41

81
Bo
ard
of D
irec
tors
’ Re
po
rt
Order intake
Order bridge
Consolidated
SEK millions/% 2020 2019
Order intake last year 15,953 17,322
Organic 1) -7.7% -10.7%
Structural 1) – –
Currency -4.1% 2.8%
Total -11.8% -7.9%
Order intake current year 14,067 15,953
1) Change excluding currency effects.
Order intake declined compared to last year due to lower demand
for all product areas except ballast water and pumping systems.
Order intake for Alfa Laval PureSOx decreased significantly com-
pared to last year. The uncertainty in the marine industry market af-
ter the first quarter contributed to a generally lower market demand
for scrubber technologies. Demand for PureBallast was, on the
other hand, unchanged compared to last year. General demand for
equipment tied to the building of new vessels was on a lower level
than last year with fewer vessels being contracted in the year. Boilers,
inert gas systems, heat exchangers, separators and freshwater
generators recorded a lower demand, whereas demand for pumping
systems increased compared to last year, mainly due to a large
number of offshore orders. Products going into the onshore engine
power applications saw a lower demand than last year.
Order intake for service developed overall negatively despite an
increased demand from the growing installed base of environmental
products. A lower level of vessel utilization and travel restrictions
for onboard service resulted in a lower demand for mainly repairs
and field service, while sales of spare parts were stable.
Net sales
Sales bridge
Consolidated
SEK millions/% 2020 2019
Net sales last year 17,993 13,583
Organic 1) -8.4% 28.5%
Structural 1) – –
Currency -3.4% 4.0%
Total -11.8% 32.5%
Net sales current year 15,867 17,993
1) Change excluding currency effects.
Net sales were lower than last year due to a lower level of deliveries
across most product groups, except mainly ballast water systems.
In addition, the decline in service for the last three quarters of the
year resulted in lower service revenues.
Operating income
Income bridge
Consolidated
SEK millions 2020 2019
Operating income last year 3,425 2,328
Volume 1) -480 1,273
Mix 1) -142 110
Costs 1) 62 -344
Currency -107 58
Operating income current year 2,758 3,425
1) Change excluding currency effects.
The operating income declined compared to last year. This was
mainly driven by a lower sales volume in both capital goods and
service and a negative mix effect from an unfavourable product mix
in capital sales and decreased service sales. Overhead costs de-
creased compared to last year due to the cost reduction programme
and decreased travelling, slightly mitigated by increased royalty
payments for PureBallast.
Order intake 2020 split on:
After Sales &
Service 31%
Capital sales 69%
AL_20_BAKVAGN_EN.indd 81 2021-03-25 12:41

82
Information about geographical areas
All comments are excluding currency effects.
Western Europe including NordicThe region showed a lower order intake than last year, mainly due
to the weak development in large orders. Energy grew in Nordic
and Food & Water experienced a good growth in Mid Europe,
Iberica and in the United Kingdom. Marine had a strong develop-
ment in pumping systems in Nordic and Benelux.
Central and Eastern EuropeThe order intake contracted compared to last year, when several
large orders were received in Energy in Russia. All three divisions
showed strong growth in the base business*.
North AmericaThe order intake for the region decreased compared to last year.
Energy was affected from the decline of the oil and gas, and refinery
industries following the drop in the oil price. Food & Water did well
in pharma & biotech, edible oil and brewery. Marine received less
orders from cruise ships influenced by travel restrictions.
Latin AmericaThe growth in Latin America was good throughout the region across
the three divisions. Energy grew in Argentina, Chile, Peru and Mexico.
Food & Water developed strongly in almost all countries in the region.
The growth in Marine was driven by Brazil, Venezuela, Colombia
and Panama. The order intake for service displayed good growth.
AsiaThe region grew compared to last year, influenced by Food &
Water and Marine. The order intake in China was flat, but with
good growth for Food & Water and Energy. South Korea, Malaysia,
Singapore and Vietnam grew strongly, while Middle East, India and
Indonesia decreased their order intake due to oil & gas, refinery &
offshore. China and South Korea showed good growth in
PureSOx.
Africa and OceaniaThe growth in the region was driven by Australia in Food & Water
and Marine. Energy had good growth in metal and chemicals in
Oceania and petrochemicals in Africa. Food & Water grew in brewery,
dairy and protein. Marine had a good development in Australia and
Africa from pumping systems.
Personnel
The parent company does not have any employees.
The Group has on average had 17,160 (17,387) employees. At the
end of December 2020, the Group had 16,882 (17,497) employees.
The employee turnover rate excluding temporary employees for 2020
is 7.5 (9.3) percent. The highest employee turnover rate in 2020
is found in management & administration and in manufacturing,
logistics & procurement.
Alfa Laval has the ambition to develop the employees on all levels
within the Group. The largest part of the competence development
takes place in the daily work when our employees continuously get
more demanding tasks as well as get the opportunity to participate
in different projects together with more experienced colleagues. Local
training and development efforts in the different factories and sales
companies around the world are equally important, for instance ALPS
(Alfa Laval Production System) that is based on the well-known
concepts of Lean and Six Sigma and also on ALPAS (Alfa Laval
Product & Application School). The ALPAS trainings are designed
and developed by the product responsible Business Unit.
Greenhouse DivisionAt the end of December 2019 all parts of the division had been di-
vested. In 2020 Greenhouse has thus ceased to exist. The historical
figures are shown below.
Greenhouse Division
Consolidated
SEK millions 2019
Orders received 105
Order backlog* 0
Net sales 444
Operating income** -30
Operating margin*** -6.8%
Depreciation and amortisation 8
Investments**** 5
Assets* 39
Liabilities* 71
Number of employees* 33
* At the end of the period. ** In management accounts. *** Operating income
in relation to net sales. **** Excluding new leases.
Operations & OtherOperations and Other covers procurement and logistics as well as
corporate overhead and non-core businesses.
Operations & Other
Consolidated
SEK millions 2020 2019
Orders received 0 72
Order backlog* 0 0
Net sales 0 77
Operating income** -629 -742
Depreciation and amortisation 339 309
Investments*** 448 414
Assets* 1,276 1,613
Liabilities* 522 564
Number of employees* 1,069 987
* At the end of the period. ** In management accounts. *** Excluding new leases.
The improved operating income during 2020 is mainly due to the
COVID-19 cost reduction program.
The order intake and net sales 2019 for Operations and Other
was relating to contract manufacturing of shell and tube heat ex-
changers for BITZER after the sale of the business to BITZER.
* Base business and base orders refer to orders with an order value of less than EUR 0.5 million.
AL_20_BAKVAGN_EN.indd 82 2021-03-25 12:41

83
Bo
ard
of D
irec
tors
’ Re
po
rt
-14%
-11%-7%
+1%
+4%
+13%
-15%
Orders received 2020
1
2
3
4
5
6
7
-6%
+2%+36%
-15%
-18%
-14%
-1%
Orders received 2019
1
2
3
4
5
6
7
1 Nordic 9%
2 Western Europe 21%
3 Central- & Eastern Europe 8%
4 Asia 37%
5 Latin America 4%
6 North America 19%
7 Africa & Oceania 2%
1 Nordic 9%
2 Western Europe 21%
3 Central- & Eastern Europe 7%
4 Asia 40%
5 Latin America 4%
6 North America 17%
7 Africa & Oceania 2%
= Compared to 2019 excluding currency effects
Compared to 2018 excluding currency effects
AL_20_BAKVAGN_EN.indd 83 2021-03-25 12:41
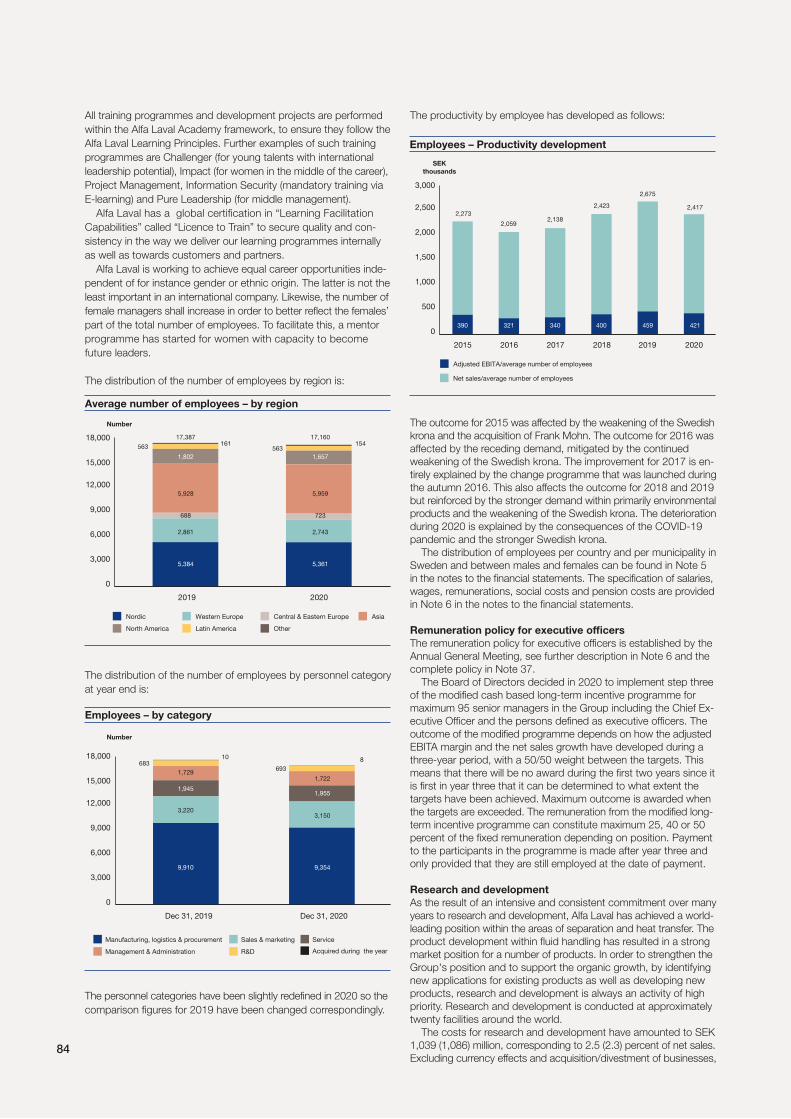
84
0
3,000
6,000
9,000
12,000
15,000
18,000
2019 2020
5,361
2,743
723
5,959
1,657
17,160
563154
5,384
2,861
688
5,928
1,802
17,387
563161
Nordic
North America
Western Europe
Latin America
Central & Eastern Europe
Other
Asia
Average number of employees – by region
Number
Dec 31, 2020Dec 31, 2019
0
3,000
6,000
9,000
12,000
15,000
18,000
3,220
1,729
1,945
9,910
68310
3,150
1,722
1,955
9,354
693
8
Manufacturing, logistics & procurement
Management & Administration
Sales & marketing
R&D
Service
Acquired during the year
Employees – by category
Number
0
500
1,000
1,500
2,000
2,500
3,000
2018 2019 20202015 2016 2017
390 321 340
2,273
2,0592,138
400 459
2,423
2,675
421
2,417
Adjusted EBITA/average number of employees
Employees – Productivity development
SEK
thousands
Net sales/average number of employees
All training programmes and development projects are performed
within the Alfa Laval Academy framework, to ensure they follow the
Alfa Laval Learning Principles. Further examples of such training
programmes are Challenger (for young talents with international
leadership potential), Impact (for women in the middle of the career),
Project Management, Information Security (mandatory training via
E-learning) and Pure Leadership (for middle management).
Alfa Laval has a global certification in “Learning Facilitation
Capabilities” called “Licence to Train” to secure quality and con-
sistency in the way we deliver our learning programmes internally
as well as towards customers and partners.
Alfa Laval is working to achieve equal career opportunities inde-
pendent of for instance gender or ethnic origin. The latter is not the
least important in an international company. Likewise, the number of
female managers shall increase in order to better reflect the females’
part of the total number of employees. To facilitate this, a mentor
programme has started for women with capacity to become
future leaders.
The distribution of the number of employees by region is:
The distribution of the number of employees by personnel category
at year end is:
The productivity by employee has developed as follows:
The outcome for 2015 was affected by the weakening of the Swedish
krona and the acquisition of Frank Mohn. The outcome for 2016 was
affected by the receding demand, mitigated by the continued
weakening of the Swedish krona. The improvement for 2017 is en-
tirely explained by the change programme that was launched during
the autumn 2016. This also affects the outcome for 2018 and 2019
but reinforced by the stronger demand within primarily environmental
products and the weakening of the Swedish krona. The deterioration
during 2020 is explained by the consequences of the COVID-19
pandemic and the stronger Swedish krona.
The distribution of employees per country and per municipality in
Sweden and between males and females can be found in Note 5
in the notes to the financial statements. The specification of salaries,
wages, remunerations, social costs and pension costs are provided
in Note 6 in the notes to the financial statements.
Remuneration policy for executive officers
The remuneration policy for executive officers is established by the
Annual General Meeting, see further description in Note 6 and the
complete policy in Note 37.
The Board of Directors decided in 2020 to implement step three
of the modified cash based long-term incentive programme for
maximum 95 senior managers in the Group including the Chief Ex-
ecutive Officer and the persons defined as executive officers. The
outcome of the modified programme depends on how the adjusted
EBITA margin and the net sales growth have developed during a
three-year period, with a 50/50 weight between the targets. This
means that there will be no award during the first two years since it
is first in year three that it can be determined to what extent the
targets have been achieved. Maximum outcome is awarded when
the targets are exceeded. The remuneration from the modified long-
term incentive programme can constitute maximum 25, 40 or 50
percent of the fixed remuneration depending on position. Payment
to the participants in the programme is made after year three and
only provided that they are still employed at the date of payment.
Research and development
As the result of an intensive and consistent commitment over many
years to research and development, Alfa Laval has achieved a world-
leading position within the areas of separation and heat transfer. The
product development within fluid handling has resulted in a strong
market position for a number of products. In order to strengthen the
Group's position and to support the organic growth, by identifying
new applications for existing products as well as developing new
products, research and development is always an activity of high
priority. Research and development is conducted at approximately
twenty facilities around the world.
The costs for research and development have amounted to SEK
1,039 (1,086) million, corresponding to 2.5 (2.3) percent of net sales.
Excluding currency effects and acquisition/divestment of businesses,
The personnel categories have been slightly redefined in 2020 so the
comparison figures for 2019 have been changed correspondingly.
AL_20_BAKVAGN_EN.indd 84 2021-03-25 12:41

85
Bo
ard
of D
irec
tors
’ Re
po
rt
the costs for research and development have decreased by 2.4
percent compared to last year.
Ethics and social responsibility
Two of Alfa Laval’s four business principles are: ”Respect for human
rights is fundamental” and ”High ethical standards guide our conduct”.
This means that Alfa Laval respects human rights and the very dif-
ferent social cultures in which the company works and supplies its
products and services and that Alfa Laval conducts its business
with honesty, integrity and respect for others.
Globalisation gives Alfa Laval new business opportunities for in-
creased sales as well as lower costs for manufacturing the products.
But when part of the supply chain is moved to countries with lower
costs the company is often confronted with ethical questions in a
more obvious manner. Health, security and working conditions for
the employees at the company’s suppliers are some of Alfa Laval’s
main topics. When Alfa Laval procures products from quickly growing
economies like China and India it is important for the company to
secure that the cost reduction opportunities are not at the expense
of those performing the work in each country. Alfa Laval regards it
as an obligation to make sure that its suppliers develop quickly if
the work, health and security conditions are not acceptable.
Alfa Laval has developed an internal training programme to
give salespeople and purchase departments knowledge on legal
business practice.
Environment
One of Alfa Laval’s four business principles is: ”Optimizing the use
of natural resources in the most efficient manner is our business.”
The company’s products make a significant contribution to reducing
the environmental impact of industrial processes and are used to
produce renewable energy.
All sites have an environmental management system in place.
More than 95 percent of the delivery value comes from production
sites with ISO 14001 certification.
The subsidiary Alfa Laval Corporate AB is involved in operational
activities that are subject to an obligation to report and compulsory
licensing according to Swedish environmental legislation. The permits
mainly relate to the manufacturing of heat exchangers in Lund and
Ronneby and the manufacturing of separators in Tumba and Eskilstuna.
The external environment is affected through limited discharges
into the air and water, through waste and noise.
The foreign manufacturing sites within the Alfa Laval Group are
engaged in operational activities with a similar effect on the external
environment. To what extent this activity is subject to an obligation to
report and/or compulsory licensing according to local environmental
legislation varies from country to country. Alfa Laval has an overall
intention to operate well within the limits that are set by local legislation.
Consequences of COVID-19
Alfa Laval has implemented a broad cost reduction program with the
objective of reducing fixed costs with SEK 1 billion on a 12-month
running basis. The program is well on track and the first financial
effects became visible as of April. An important part of the cost re-
duction program is related to the flexibility of various working hour
reduction schemes in countries like Italy, Germany, France and Sweden.
In Sweden specifically, the company has reduced the working time
with 40 percent for approximately 800 white-collar employees, be-
tween May and August. The received support for reduced working
hours in Sweden has however not been reported in the P&L but has
instead been balanced due to the uncertainty around the conditions
for the support. See Note 38 for further information.
The Board of Directors withdrew the dividend proposal for 2019
as a measure to preserve cash.
In a press release on March 17, Alfa Laval expressed concerns
regarding the business climate from the second quarter 2020 and
onwards due to the negative effects of the COVID-19 pandemic.
Alfa Laval has global and local crisis teams in place for close
monitoring and swift response to changes in the situation to secure
the health and safety of our employees.
Alfa Laval has a global footprint with 39 major manufacturing
units across Europe, Asia, the US and Latin America. The company
is a supplier to critical infrastructure industries and has permission
to continue production in countries with restrictions and lockdowns.
The company has well-established business continuity plans and a
global supply chain with alternative sourcing solutions for most
products and services and close collaboration with key suppliers.
Sourcing shortages for components due to lockdowns have not
been a critical problem during the year.
Asbestos-related lawsuits
The Alfa Laval Group was as of December 31, 2020, named as a
co-defendant in a total of 623 asbestos-related lawsuits with a total
of approximately 623 plaintiffs. Alfa Laval strongly believes the claims
against the Group are without merit and intends to vigorously contest
each lawsuit.
Based on current information and Alfa Laval’s understanding of
these lawsuits, Alfa Laval continues to believe that these lawsuits
will not have a material adverse effect on the Group’s financial con-
dition or results of operation.
Result for the parent company
The parent company's result after financial items for the full year 2020
was SEK 404 (604) million, out of which dividends from subsidiaries
SEK 413 (633) million, net interests SEK -0 (0) million, realised and
unrealised exchange rate gains and losses SEK -0 (1) million, costs
related to the listing SEK -4 (-4) million, fees to the Board SEK -8 (-8)
million, cost for annual report and annual general meeting SEK -2 (-2)
million and other operating income and operating costs the remaining
SEK 5 (-16) million. Change of tax allocation reserve has been
made with SEK 205 (-293) million. Group contributions amount to
SEK 79 (2,142) million. Tax on this year’s result amount to SEK -64
(-395) million. Net income for the year was SEK 624 (2,058) million.
Unrestricted equity for the parent company
The unrestricted equity of Alfa Laval AB (publ) was SEK 10,518
(9,893) million.
Proposed disposition of earnings
The Board of Directors propose a dividend of SEK 5.50 (-) per share
corresponding to SEK 2,307 (-) million and that the remaining in-
come available for distribution in Alfa Laval AB (publ) of SEK 8,211
(9,893) million be carried forward, see Note 40.
The Board of Directors are of the opinion that the proposed dividend
is in line with the requirements that the type and size of operations,
the associated risks, the capital needs, liquidity and financial position
put on the company.
Proposed share buy-back program
The Board of Directors will also propose the Annual General Meeting
to mandate the Board to decide on repurchase of up to 5 percent
of the issued shares with the purpose to cancel the repurchased
shares and reduce the share capital. The reduction of the share
capital will be met by a corresponding bonus issue without issuing
any new shares so that the size of the share capital is restored.
Disclosure on share related information
Paragraph 2a in chapter 6 of the Swedish Annual Accounts Act re-
quires listed companies to disclose certain information relating to
the company’s shares in the Board of Directors’ Report. This infor-
mation is found in the following paragraphs, in the “Changes in
consolidated equity” and in Note 6.
Outlook for the first quarter
In the fourth quarter and full year 2020 report issued on February 3,
2021 the President and Chief Executive Officer Tom Erixon stated:
“We expect demand in the first quarter to be about the same as in
the fourth quarter.”
Earlier published outlook (October 22, 2020): “We expect demand in the
fourth quarter to be somewhat higher than in the third quarter.”
Date for the next financial reports 2021
Alfa Laval will publish financial reports at the following dates:
Interim report for the first quarter April 27
Interim report for the second quarter July 20
Interim report for the third quarter October 26
AL_20_BAKVAGN_EN.indd 85 2021-03-25 12:41

86
Consolidated cash flows
Consolidated cash flows
SEK millions Note 2020 2019
Operating activities
Operating income 5,580 7,198
Adjustment for depreciation, amortisation and write down 2,349 2,053
Adjustment for other non-cash items 397 141
8,326 9,392
Taxes paid -1,537 -1,901
6,789 7,491
Changes in working capital:
Increase(-)/decrease(+) of receivables 1,409 -1,394
Increase(-)/decrease(+) of inventories 126 -617
Increase(+)/decrease(-) of liabilities -580 -84
Increase(+)/decrease(-) of provisions -21 -173
Increase(-)/decrease(+) in working capital 934 -2,268
7,723 5,223
Investing activities
Investments in fixed assets (Capex) -1,232 -1,337
Divestment of fixed assets 119 7
Acquisition of businesses 17 -70 -61
Divestment of businesses 125 364
-1,058 -1,027
Financing activities
Received interests and dividends 76 120
Paid interests -260 -281
Realised financial exchange gains 92 239
Realised financial exchange losses -524 -499
Dividends to owners of the parent – -2,097
Dividends to non-controlling interests 0 0
Increase(-) of financial assets -3,460 -283
Decrease(+) of financial assets 0 0
Increase of loans 2,000 3,155
Amortisation of loans -4,841 -3,299
-6,917 -2,945
Cash flow for the year -252 1,251
Cash and cash equivalents at the beginning of the year 5,594 4,295
Translation difference in cash and cash equivalents -192 48
Cash and cash equivalents at the end of the year 26 5,150 5,594
Free cash flow per share (SEK) * 15.89 10.00
Capex in relation to net sales 3.0% 2.9%
Average number of shares 419,456,315 419,456,315
* Free cash flow is the sum of cash flows from operating and investing activities.
AL_20_BAKVAGN_EN.indd 86 2021-03-25 12:41
87
Fin
an
cia
l sta
tem
en
ts
Comments to the consolidated cash flows
For further comments on certain individual
lines in the cash flow statement, reference
is made to Notes 17 and 26.
Cash flows from operating activities
The increase in cash flows from operating
activities in 2020 is explained by:
+ a large decrease in working capital and
+ lower tax payments linked to the
lower taxable income,
- mitigated by lower operating income
before depreciation and amortisation.
Cash and cash equivalents
The item cash and cash equivalents is mainly
relating to bank deposits and liquid deposits.
Cash flow
Cash flow from operating and investing ac-
tivities amounted to SEK 6,665 (4,196) million
during 2020. Out of this, acquisitions of
businesses were SEK -70 (-61) million
whereas divestments generated cash of
SEK 125 (364) million.
Adjustment for other non-cash items
Other non-cash items are mainly referring
to realised gains and losses in connection
with sale of assets. These have to be elimi-
nated since the cash impact of divestments
of fixed assets and businesses are reported
separately under cash flow from investing
activities.
Working capital
Working capital decreased by SEK 934 million
during 2020. During 2019 it instead increased
by SEK 2,268.
Investments
Investments in property, plant and equipment
amounted to SEK 1,232 (1,337) million
during 2020.
A number of structural changes within the
continued Footprint programme in the form
of new or improved buildings including move
of production and productivity increasing
investments for improved cost and availa-
bility have been completed during the year,
among others in Pune in India, Kolding in
Denmark and an entire new production facility
for brazed heat exchangers in San Bonifacio
in Italy. Examples of investments made for
the individual product groups are as follows:
Heat exchangersInvestments have been made in machines
for increased capacity and manufacturing of
new products and in productivity enhancing
equipment in San Bonifacio in Italy and Jiang
Yin in China for brazed heat exchangers.
Additional investments have been made in
Jiang Yin in China and in Lund in Sweden
in equipment to widen the product range
and increase the productivity for gasketed
heat exchangers.
High speed separatorsContinued capacity investments in machining
equipment for separators have been made
in Eskilstuna in Sweden and in Pune in India.
DecantersCapacity and productivity enhancing invest-
ments have been made in Pune in India.
Pumps and valvesCapacity and productivity enhancing invest-
ments have been made in Kolding in
Denmark.
Depreciations
Depreciation, excluding allocated step-up
values, amounted to SEK 1,134 (1,073)
million during the year.
Acquisitions and disposals
For a further analysis of the impact on the
cash flow by acquisitions and disposals,
see Note 17.
Free cash flow per share
The free cash flow per share is SEK 15.89
(10.00).
AL_20_BAKVAGN_EN.indd 87 2021-03-25 12:41

88
Consolidated comprehensive income
Consolidated comprehensive income
SEK millions Note 2020 2019
Net sales 1, 2, 3, 4, 36 41,468 46,517
Cost of goods sold 9 -27,210 -30,734
Gross profit 14,258 15,783
Sales costs 5, 6, 9 -4,125 -4,802
Administration costs 5, 6, 7, 9 -1,834 -2,092
Research and development costs 9 -1,039 -1,086
Other operating income 8 819 1,174
Other operating costs 8, 9 -2,521 -1,799
Share of result in joint ventures 34 22 20
Operating income 5,580 7,198
Dividends and other financial income and costs 10 26 32
Interest income and financial exchange rate gains 11 220 377
Interest expense and financial exchange rate losses 11 -849 -386
Result after financial items 4,977 7,221
Tax on this year's result 16 -1,372 -1,676
Other taxes 16 -25 -37
Net income for the year 3,580 5,508
Other comprehensive income:
Items that will subsequently be reclassified to net income
Cash flow hedges 744 307
Market valuation of external shares -125 0
Translation difference -2,454 632
Deferred tax on other comprehensive income 16 -76 -75
Sum -1,911 864
Items that will subsequently not be reclassified to net income
Revaluations of defined benefit obligations -432 -138
Deferred tax on other comprehensive income 16 87 11
Sum -345 -127
Comprehensive income for the year 1,324 6,245
Net income attributable to:
Owners of the parent 3,553 5,486
Non-controlling interests 27 22
Earnings per share (SEK) 8.47 13.08
Average number of shares 419,456,315 419,456,315
Comprehensive income attributable to:
Owners of the parent 1,308 6,220
Non-controlling interests 16 25
AL_20_BAKVAGN_EN.indd 88 2021-03-25 12:41

89
Comments to the consolidated comprehensive income
The gross profit has been affected negatively
by a lower sales volume and negative cur-
rency effects and positively by the mix be-
tween service and capital sales.
Sales and administration expenses
amounted to SEK 5,959 (6,894) million,
which corresponded to 14.4 (14.8) percent
of net sales. Excluding currency effects
and acquisition/divestment of businesses,
sales and administration expenses were
10.4 percent lower than last year.
The costs for research and development
have amounted to SEK 1,039 (1,086) million,
corresponding to 2.5 (2.3) percent of net
sales. Excluding currency effects and ac-
quisition/divestment of businesses, the costs
for research and development have decreased
by 2.4 percent compared to last year.
Earnings per share was SEK 8.47 (13.08) for
2020. The corresponding figure excluding
amortisation of step-up values and the
corresponding tax, was SEK 10.12 (14.96).
Compared with last year Alfa Laval has
been affected during 2020 by exchange
rate differences, both through translation
differences and through the net exposure
when trading in foreign currencies. The ef-
fect on adjusted EBITA has been calculated
to totally about SEK 180 (430) million for
2020 compared with last year. The effect
of the exchange rate variations has been
limited through exchange rate hedging and
through the distribution of the company's
financial debts in relation to its net assets in
different currencies.
For comments on the individual lines in the consolidated comprehensive income state-
ment, reference is made to Notes 1 to 16 and Notes 34, 36 and 38. For comments on the
operating segments, see Note 1.
As a basis for comments on the various main items of the consolidated comprehensive in-
come statement, please find a comparison between the last two years:
Income analysis
Consolidated
SEK millions 2020 2019
Net sales 41,468 46,517
Adjusted gross profit * 15,113 16,763
- adjusted gross margin (%) * 36.4 36.0
Expenses ** -6,748 -7,701
- in % of net sales 16.3 16.6
Adjusted EBITDA * 8,365 9,062
- adjusted EBITDA margin (%) * 20.2 19.5
Depreciation -1,134 -1,073
Adjusted EBITA * 7,231 7,989
- adjusted EBITA margin (%) * 17.4 17.2
Amortisation of step-up values -855 -980
Comparison distortion items -796 189
Operating income 5,580 7,198
* Alternative performance measures. ** Excluding comparison distortion items.
Fin
an
cia
l sta
tem
en
ts
AL_20_BAKVAGN_EN.indd 89 2021-03-25 12:41

90
0
3
6
9
12
15
Q420Q320Q220Q120Q419Q319Q219Q119Q418Q318Q218Q118
32
34
36
38
40
42
Net sales & Adjusted gross margin
BnSEK %
Net sales Adjusted gross margin in %
0.0
0.5
1.0
1.5
2.0
2.5
Q420Q320Q220Q120Q419Q319Q219Q119Q418Q318Q218Q118
14
15
16
17
18
19
Adjusted EBITA
Adjusted EBITA Adjusted EBITA margin in %
BnSEK %
The realized loss in 2020 is relating to the
divestment of the operations in DSO Fluid
Handling Inc in the U.S.
The write down of goodwill and the re-
structuring costs are part of the programme
for adapting the organisation to changing
market fundamentals that was announced
on December 16, 2020. The program is
mainly addressing structural imbalances in
specific parts of the oil & gas business as
well as parts of the Marine business. In
addition, the program will further drive the
competence shift required in light of the
accelerated pace of digitalization. The write
down of goodwill concerns oil & gas related
businesses. The total restructuring cost is
expected to amount to approximately
SEK 850 million, out of which the remaining
part is expected to be charged in the second
quarter of 2021. Approximately 600 em-
ployees mainly in Europe and North America
will be affected by the program. The program
will generate annual savings of around SEK
300 million, with full effect expected from
mid-2022.
The realised gain in 2019 was related to
the divestments of part of the air heat ex-
changer business related to commercial/in-
dustrial air heat exchangers in the Green-
house division to the LU-VE Group. The
realised loss in 2019 was relating to a real-
ised loss from the divestments of the last
remaining Greenhouse operation shell-and-
tube Sarasota, also known as Alfa Laval
Champ, to Thermal Solutions Manufacturing.
Consolidated financial net and taxes
The financial net for 2020 was SEK -191
(-172) million, excluding realised and un-
realised exchange rate losses and gains.
The main elements of costs were interest
on the debt to the banking syndicate of
SEK -5 (-3) million, interest on the bilateral
term loans of SEK -34 (-48) million, interest
on the corporate bonds of SEK -82 (-86)
million and a net of dividends, changes in
fair value and other interest income and in-
terest costs of SEK -70 (-35) million.
The net of realised and unrealised exchange
rate differences was SEK -412 (195) million.
The tax on the result after financial items
was SEK -1,397 (-1,713) million in 2020.
Comparison distortion items
Consolidated
SEK millions 2020 2019
Other operating income
Comparison distortion items:
- Realised gain on sale of businesses – 260
Other operating costs
Comparison distortion items:
- Realised loss on sale of businesses -55 -71
- Write down of goodwill -360 –
- Restructuring costs -381 –
Net comparison distortion items -796 189
In order to illustrate the quarterly development, the last 12 quarters are shown below for
four of the parameters in the income analysis:
AL_20_BAKVAGN_EN.indd 90 2021-03-25 12:41
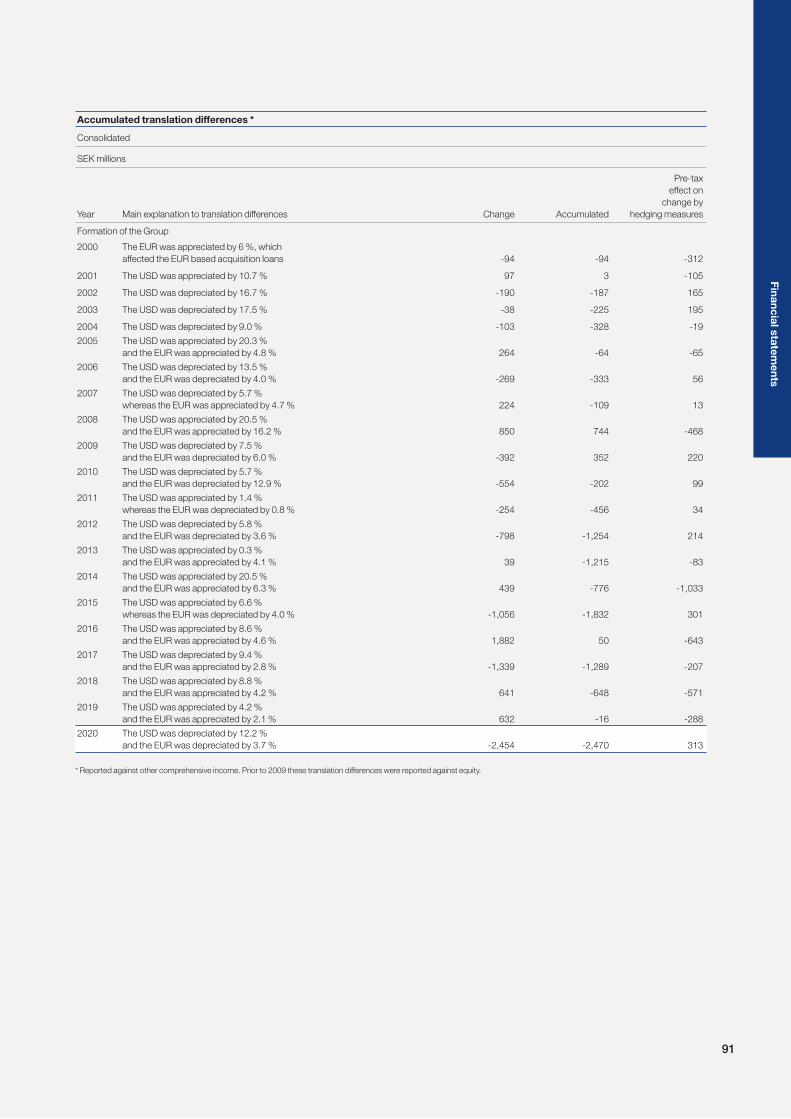
91
Accumulated translation differences *
Consolidated
SEK millions
Year Main explanation to translation differences Change Accumulated
Pre-tax
effect on
change by
hedging measures
Formation of the Group
2000 The EUR was appreciated by 6 %, which
affected the EUR based acquisition loans -94 -94 -312
2001 The USD was appreciated by 10.7 % 97 3 -105
2002 The USD was depreciated by 16.7 % -190 -187 165
2003 The USD was depreciated by 17.5 % -38 -225 195
2004 The USD was depreciated by 9.0 % -103 -328 -19
2005 The USD was appreciated by 20.3 %
and the EUR was appreciated by 4.8 % 264 -64 -65
2006 The USD was depreciated by 13.5 %
and the EUR was depreciated by 4.0 % -269 -333 56
2007 The USD was depreciated by 5.7 %
whereas the EUR was appreciated by 4.7 % 224 -109 13
2008 The USD was appreciated by 20.5 %
and the EUR was appreciated by 16.2 % 850 744 -468
2009 The USD was depreciated by 7.5 %
and the EUR was depreciated by 6.0 % -392 352 220
2010 The USD was depreciated by 5.7 %
and the EUR was depreciated by 12.9 % -554 -202 99
2011 The USD was appreciated by 1.4 %
whereas the EUR was depreciated by 0.8 % -254 -456 34
2012 The USD was depreciated by 5.8 %
and the EUR was depreciated by 3.6 % -798 -1,254 214
2013 The USD was appreciated by 0.3 %
and the EUR was appreciated by 4.1 % 39 -1,215 -83
2014 The USD was appreciated by 20.5 %
and the EUR was appreciated by 6.3 % 439 -776 -1,033
2015 The USD was appreciated by 6.6 %
whereas the EUR was depreciated by 4.0 % -1,056 -1,832 301
2016 The USD was appreciated by 8.6 %
and the EUR was appreciated by 4.6 % 1,882 50 -643
2017 The USD was depreciated by 9.4 %
and the EUR was appreciated by 2.8 % -1,339 -1,289 -207
2018 The USD was appreciated by 8.8 %
and the EUR was appreciated by 4.2 % 641 -648 -571
2019 The USD was appreciated by 4.2 %
and the EUR was appreciated by 2.1 % 632 -16 -288
2020 The USD was depreciated by 12.2 %
and the EUR was depreciated by 3.7 % -2,454 -2,470 313
* Reported against other comprehensive income. Prior to 2009 these translation differences were reported against equity.
Fin
an
cia
l sta
tem
en
ts
AL_20_BAKVAGN_EN.indd 91 2021-03-25 12:41

92
Consolidated financial position
Consolidated financial position
ASSETS
SEK millions Note 2020 2019
Non-current assets
Intangible assets 17, 18
Patents and unpatented know-how 776 1,104
Trademarks 1,301 1,954
Licenses, renting rights and similar rights 20 23
Internally generated intangible assets 107 53
Goodwill 19,080 21,112
21,284 24,246
Property, plant and equipment 17, 19
Real estate 2,878 2,948
Machinery and other technical installations 2,229 2,137
Equipment, tools and installations 801 670
Construction in progress and advances to suppliers
concerning property, plant and equipment 261 505
Right-of-use assets 2,152 2,683
8,321 8,943
Other non-current assets
Other long-term securities 13, 14, 20 1,575 141
Pension assets 27 70 70
Derivative assets 13, 14, 15 196 69
Deferred tax assets 16 1,792 1,801
3,633 2,081
Total non-current assets 33,238 35,270
Current assets
Inventories 21 9,223 10,077
Assets held for sale 19 55 –
Current receivables
Accounts receivable 13, 22, 36 5,834 7,460
Current tax assets 521 459
Other receivables 13, 23 3,213 4,019
Prepaid costs and accrued income 13, 24 419 451
Derivative assets 13, 14, 15 589 193
10,576 12,582
Current deposits
Other current deposits 13, 25 2,618 873
Cash and cash equivalents 13, 26 5,150 5,594
Total current assets 27,622 29,126
TOTAL ASSETS 60,860 64,396
AL_20_BAKVAGN_EN.indd 92 2021-03-25 12:41

93
Consolidated financial position, continued
EQUITY AND LIABILITIES
SEK millions Note 2020 2019
Equity
Attributable to owners of the parent
Share capital 1,117 1,117
Other contributed capital 2,770 2,770
Other reserves -3,803 -1,558
Retained earnings 28,824 25,271
28,908 27,600
Attributable to non-controlling interests 12 163 147
Total equity 29,071 27,747
Non-current liabilities
Liabilities to credit institutions etc 13, 29 8,043 10,600
Lease liabilities 13, 35 1,573 1,890
Provisions for pensions and similar commitments 27 2,494 2,321
Provision for deferred tax 16 1,553 1,662
Other provisions 28 681 639
Derivative liabilities 13, 14, 15 5 42
Total non-current liabilities 14,349 17,154
Current liabilities
Other current liabilities
Liabilities to credit institutions etc 13, 29 1,125 1,422
Advances from customers 4,381 4,269
Accounts payable 13 2,526 3,311
Notes payable 13 232 128
Current tax liabilities 919 947
Lease liabilities 13, 35 662 730
Other liabilities 13, 30 3,577 4,219
Other provisions 28 1,757 1,863
Accrued costs and prepaid income 13, 31 2,153 2,298
Derivative liabilities 13, 14, 15 108 308
17,440 19,495
Total current liabilities 17,440 19,495
Total liabilities 31,789 36,649
TOTAL EQUITY AND LIABILITIES 60,860 64,396
Fin
an
cia
l sta
tem
en
ts
AL_20_BAKVAGN_EN.indd 93 2021-03-25 12:41

94
Changes in consolidated equity
Comments on the consolidated financial position
For comments on the individual lines in the
statement on financial position, reference is
made to Notes 12 to 36. For comments on
the operating segments, see Note 1.
Capital employed
The average capital employed including
goodwill and step-up values amounted to
SEK 33,678 (35,550) million during the year.
Return on capital employed
The return on average capital employed in-
cluding goodwill and step-up values amounted
to 19.1 (23.0) percent during the year.
Capital turnover rate
The capital turnover rate calculated on the
average capital employed including goodwill
and step-up values amounted to 1.2 (1.3)
times for the year.
Return on equity
Net income in relation to the average equity
was 12.7 (21.3) percent during the year.
Solidity
The solidity, that is the equity in relation to
total assets, was 47.8 (43.1) percent at the
end of the year.
Changes in consolidated equity
Attributable to: Owners of the parent Non-controlling interests Total
Other reserves
SEK millionsShare
capital
Other contrib-
uted capital
Cash flow
hedges
Market valuation
of external shares
Translation
differences Revaluations
Retained
earnings Subtotal
Translation
differences
Retained
earnings Subtotal
As of December 31, 2018 1,117 2,770 -333 2 -705 -1,256 21,882 23,477 15 107 122 23,599
2019
Comprehensive income
Net income – – – – – – 5,486 5,486 – 22 22 5,508
Other comprehensive income – – 238 0 623 -127 – 734 3 – 3 737
Comprehensive income – – 238 0 623 -127 5,486 6,220 3 22 25 6,245
Transactions with shareholders
Dividends to owners of the parent – – – – – – -2,097 -2,097 – – – -2 097
Dividends to non-controlling interests – – – – – – – – – 0 0 0
As of December 31, 2019 1,117 2,770 -95 2 -82 -1,383 25,271 27,600 18 129 147 27,747
2020
Comprehensive income
Net income – – – – – – 3,553 3,553 – 27 27 3,580
Other comprehensive income – – 590 -125 -2,365 -345 – -2,245 -11 – -11 -2,256
Comprehensive income – – 590 -125 -2,365 -345 3,553 1,308 -11 27 16 1,324
Transactions with shareholders
Dividends to owners of the parent – – – – – – – – – – – –
Dividends to non-controlling interests – – – – – – – – – 0 0 0
As of December 31, 2020 1,117 2,770 495 -123 -2,447 -1,728 28,824 28,908 7 156 163 29,071
Net debt
The net debt was SEK 3,635 (8,175) million
at the end of the year.
Net debt to EBITDA
Net debt in relation to EBITDA was 0.48
(0.88) times at the end of December.
Debt ratio
The debt ratio, that is the net debt in relation
to equity, was 0.13 (0.29) times at the end
of December.
AL_20_BAKVAGN_EN.indd 94 2021-03-25 12:41

95
Specification of changes in number of shares and share capital
Year Event Date
Change in
number of shares
Total number
of shares
Change in
share capital
SEK millions
Total
share capital
SEK millions
2000 Company formation March 27, 2000 10,000,000 10,000,000 0.1 0.1
New issue of shares August 24, 2000 27,496,325 37,496,325 0.3 0.4
2002 Bonus issue of shares May 3, 2002 37,496,325 74,992,650 0.4 1
Bonus issue of shares May 16, 2002 – – 749 750
New issue of shares May 16, 2002 3,712,310 78,704,960 37 787
New issue of shares May 17, 2002 32,967,033 111,671,993 330 1,117
2008 Cancellation of repurchased shares May 27, 2008 -4,323,639 107,348,354 -43
Bonus issue of shares May 27, 2008 – 107,348,354 43 1,117
Split 4:1 June 10, 2008 322,045,062 429,393,416 – 1,117
2009 Cancellation of repurchased shares July 9, 2009 -7,353,950 422,039,466 -19
Bonus issue of shares July 9, 2009 – 422,039,466 19 1,117
2011 Cancellation of repurchased shares May 16, 2011 -2,583,151 419,456,315 -7
Bonus issue of shares May 16, 2011 – 419,456,315 7 1,117
Comments on changes in consolidated equity
The articles of association of Alfa Laval AB
(publ) state that the share capital should be
between SEK 745,000,000 and
2,980,000,000 and that the number of
shares should be between 298,000,000
and 1,192,000,000.
At January 1, 2020 the share capital of
SEK 1,116,719,930 was divided into
419,456,315 shares. Since then no changes
have been made.
The company has only issued one type
of shares and all these have equal rights.
There are no restrictions in law or in the ar-
ticles of association in the negotiability of
the shares.
The only shareholder holding more than
10 percent of the shares is Tetra Laval
International SA, Switzerland, who owns
29.1 (29.1) percent. The employees of the
company do not own any shares in the
company through company pension trusts.
No restrictions exist in how many votes
that each shareholder can represent at a
general meeting of shareholders. The com-
pany has no knowledge of any agreements
between shareholders that would limit the
negotiability of their shares.
The articles of association stipulate that
members of the Board are elected at the
Annual General Meeting. Election or dis-
charge of members of the Board is other-
wise regulated by the provisions in the
Swedish Companies Act and the Swedish
Corporate Governance Code. According to
the Companies Act changes in the articles
of association are decided at general meet-
ings of shareholders.
The senior credit facility with the banking
syndicate, the corporate bonds and the bi-
lateral term loan with Swedish Export Credit
contain conditions that give the lenders the
opportunity to terminate the loans and de-
clare them due and payable if there is a
change of control of the company through
an acquisition of more than 30 percent of
the total number of shares.
The possibilities to distribute unappropriated
profits from foreign subsidiaries are limited
in certain countries due to local legislation.
These limitations are not material. The limi-
tations relate to:
– the existence of general restrictions con-
cerning restricted equity in many countries,
– that subsidiaries in for instance China and
India cannot take up loans to pay dividends,
which limits the size of the dividends and
– rules on interest deduction limitations and
thin capitalisation in many countries, for
instance the U.S., Denmark and Norway
limit the possibilities for these countries
to increase debt to pay dividends.
Fin
an
cia
l sta
tem
en
ts
AL_20_BAKVAGN_EN.indd 95 2021-03-25 12:41
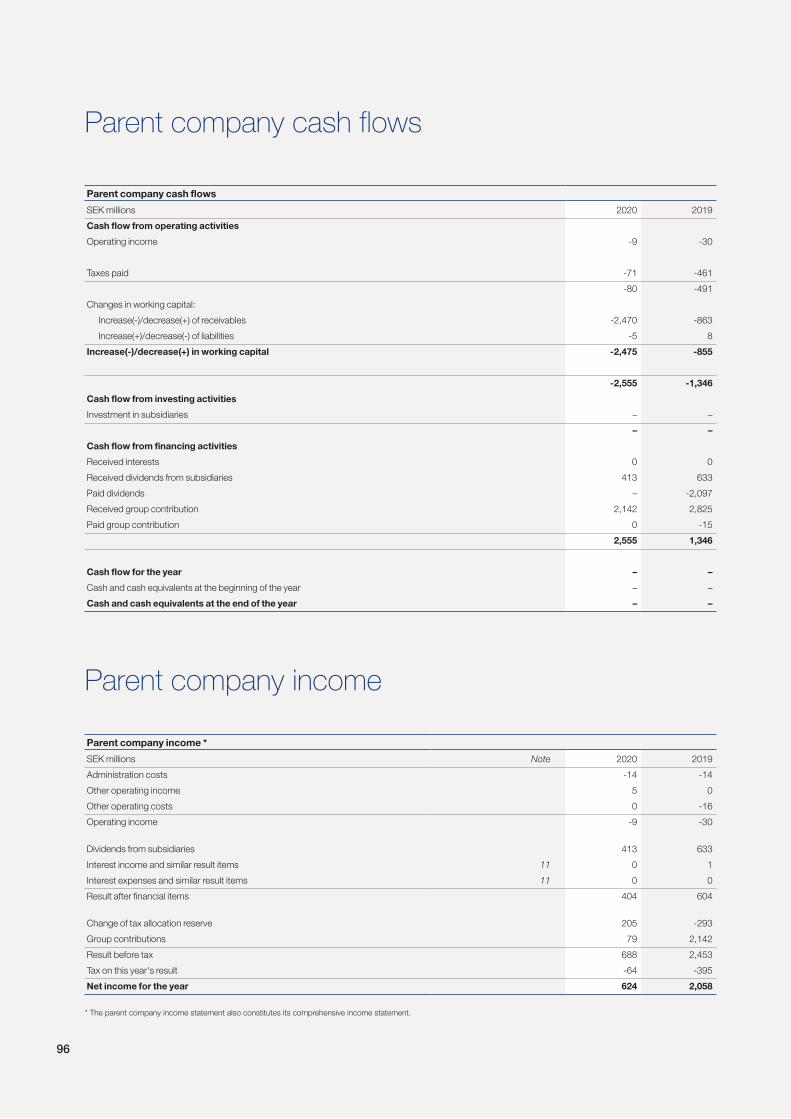
96
Parent company cash flows
Parent company cash flows
SEK millions 2020 2019
Cash flow from operating activities
Operating income -9 -30
Taxes paid -71 -461
-80 -491
Changes in working capital:
Increase(-)/decrease(+) of receivables -2,470 -863
Increase(+)/decrease(-) of liabilities -5 8
Increase(-)/decrease(+) in working capital -2,475 -855
-2,555 -1,346
Cash flow from investing activities
Investment in subsidiaries – –
– –
Cash flow from financing activities
Received interests 0 0
Received dividends from subsidiaries 413 633
Paid dividends – -2,097
Received group contribution 2,142 2,825
Paid group contribution 0 -15
2,555 1,346
Cash flow for the year – –
Cash and cash equivalents at the beginning of the year – –
Cash and cash equivalents at the end of the year – –
Parent company income
Parent company income *
SEK millions Note 2020 2019
Administration costs -14 -14
Other operating income 5 0
Other operating costs 0 -16
Operating income -9 -30
Dividends from subsidiaries 413 633
Interest income and similar result items 11 0 1
Interest expenses and similar result items 11 0 0
Result after financial items 404 604
Change of tax allocation reserve 205 -293
Group contributions 79 2,142
Result before tax 688 2,453
Tax on this year's result -64 -395
Net income for the year 624 2,058
* The parent company income statement also constitutes its comprehensive income statement.
AL_20_BAKVAGN_EN.indd 96 2021-03-25 12:41
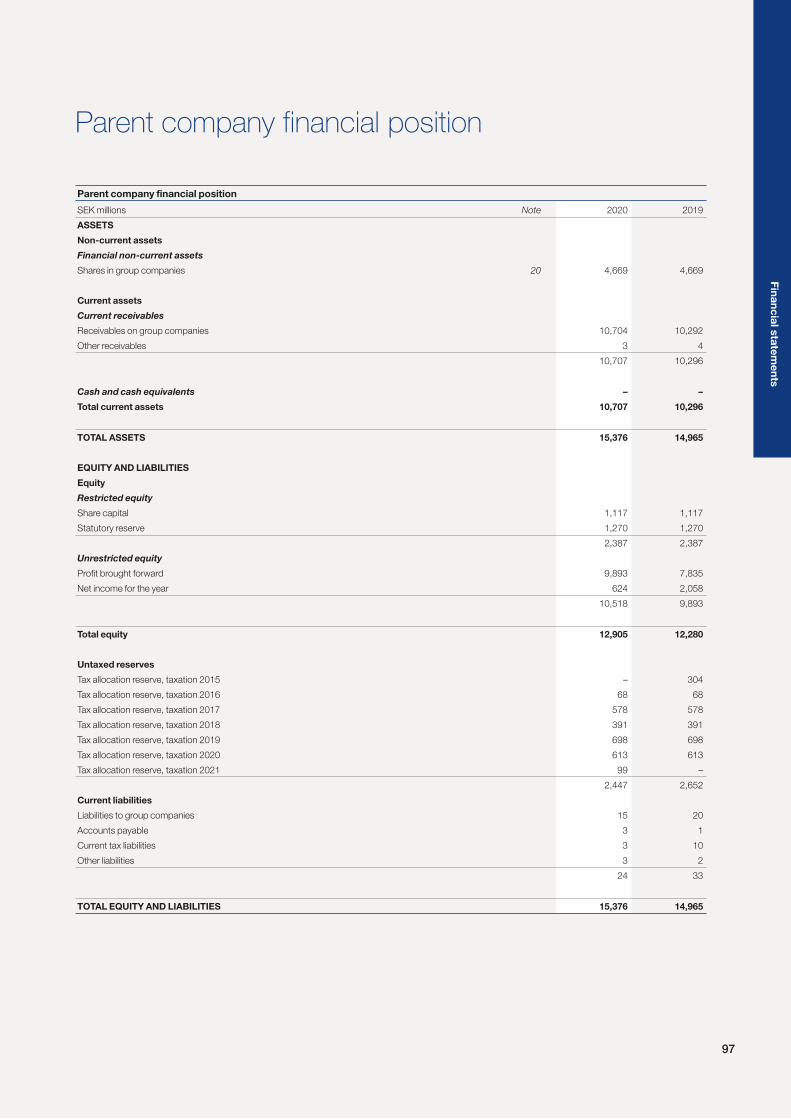
97
Parent company financial position
Parent company financial position
SEK millions Note 2020 2019
ASSETS
Non-current assets
Financial non-current assets
Shares in group companies 20 4,669 4,669
Current assets
Current receivables
Receivables on group companies 10,704 10,292
Other receivables 3 4
10,707 10,296
Cash and cash equivalents – –
Total current assets 10,707 10,296
TOTAL ASSETS 15,376 14,965
EQUITY AND LIABILITIES
Equity
Restricted equity
Share capital 1,117 1,117
Statutory reserve 1,270 1,270
2,387 2,387
Unrestricted equity
Profit brought forward 9,893 7,835
Net income for the year 624 2,058
10,518 9,893
Total equity 12,905 12,280
Untaxed reserves
Tax allocation reserve, taxation 2015 – 304
Tax allocation reserve, taxation 2016 68 68
Tax allocation reserve, taxation 2017 578 578
Tax allocation reserve, taxation 2018 391 391
Tax allocation reserve, taxation 2019 698 698
Tax allocation reserve, taxation 2020 613 613
Tax allocation reserve, taxation 2021 99 –
2,447 2,652
Current liabilities
Liabilities to group companies 15 20
Accounts payable 3 1
Current tax liabilities 3 10
Other liabilities 3 2
24 33
TOTAL EQUITY AND LIABILITIES 15,376 14,965
Fin
an
cia
l sta
tem
en
ts
AL_20_BAKVAGN_EN.indd 97 2021-03-25 12:41

98
Changes in parent company equity
Changes in parent company equity
SEK millions Share capital Statutory reserve Unrestricted equity Total
As of December 31, 2018 1,117 1,270 9,932 12,319
2019
Comprehensive income
Net income – – 2,058 2,058
– – 2,058 2,058
Transactions with shareholders
Dividends – – -2,097 -2,097
As of December 31, 2019 1,117 1,270 9,893 12,280
2020
Comprehensive income
Net income – – 624 624
– – 624 624
Transactions with shareholders
Dividends – – – –
As of December 31, 2020 1,117 1,270 10,518 12,905
The share capital of SEK 1,116,719,930 (1,116,719,930) is divided among 419,456,315 (419,456,315) shares.
AL_20_BAKVAGN_EN.indd 98 2021-03-25 12:41

99
Ac
co
un
ting
prin
cip
les
Notes to the financial statements
Accounting principles
The accounting principles mentioned below
are only the ones that are relevant for the
parent company and the consolidated group.
Basis of preparation
The consolidated financial statements have
been prepared on a historical cost basis,
except for certain financial instruments in-
cluding derivatives that are valued at fair
value. The statements are presented in
SEK millions, unless otherwise stated.
Statement of compliance
Alfa Laval applies International Financial
Reporting Standards (IFRS) as adopted by
the European Union. Furthermore, recom-
mendation RFR 1 ”Supplementary accounting
principles for consolidated groups” from the
Council for Financial Reporting in Sweden
is applied. Alfa Laval follows the Guidelines
on Alternative Performance Measures issued
by ESMA (European Securities and
Markets Authority).
The accounting and valuation principles
of the parent company comply with the
Swedish Annual Accounts Act and the rec-
ommendation RFR 2 ”Accounting for legal
entities” issued by the Council for Financial
Reporting in Sweden.
Changed/implemented accounting
principles
The company has chosen to only comment
the changed accounting principles that are
relevant for the company’s financial reporting.
During 2019 IFRS 16 was implemented.
IFRS 16 ”Leases” covers the recognition,
measurement, presentation and disclosure
of leases by both lessors and lessees.
IFRS 16 replaced IAS 17 ”Leases”.
For lessees the former classification in
operational and financial leases disappeared
and was replaced by a model where assets
and liabilities for all leasing contracts must be
recognised in the balance sheet. For leasing
contracts where the contract period is maxi-
mum 12 months or the leased asset is of low
value, there is an option to apply a practical
expedient, which Alfa Laval decided to use.
With reference to the materiality rules in
IAS 8.8, Alfa Laval chose to apply the new
rules for leases concerning buildings and
land, company cars and other vehicles,
forklifts, large servers and large printers. The
present value for other leases is estimated
to be non-material.
For lessors the rules in IAS 17 are basically
kept why a classification into operational
and financial leases like the former should
be done also going forward.
Lease contracts can include both a leas-
ing part and a service part. According to
IFRS 16, the company in these cases can
choose to separate them from each other
and thus only recognise the leasing part in
the balance sheet or capitalise the entire
contract. The choice impacts by which
amount the balance sheet will increase in
the end. Alfa Laval has chosen to exclude
the service part from the new leasing ac-
counting and it is instead expensed as before.
Alfa Laval applied the standard retro-
spectively with the cumulative effect of the
initial application recognised as an adjust-
ment to the opening balance of right-of-use
assets and lease liabilities at January 1,
2019, where the right-of-use assets were
reported at the same amount as the re-
lated lease liabilities. In connection with the
transition a practical expedient was applied
that means that the new leasing definition
is only applied on new lease contracts in-
stead of on all leasing contracts.
Right-of use assets and lease liabilities
increased by SEK 2,766 million as per
January 1, 2019 due to the initial application
of IFRS 16 Leases.
IFRS 16 means that the amount of dis-
closures concerning leases has increased.
During 2019 IFRIC 23 was implemented.
IFRIC 23 “Uncertainty over Income Tax
Treatments” clarifies how to treat uncertain
tax positions and meant no change in the
company’s treatment of this.
Alternative Performance Measures
In the annual report, alternative performance
measures are used. See page 158 for defi-
nitions. Alfa Laval follows the Guidelines on
Alternative Performance Measures issued
by ESMA (European Securities and
Markets Authority).
Critical accounting principles
IFRS 3 ”Business Combinations” means
that goodwill and intangible assets with in-
definite useful life are not amortised. They
are instead tested for impairment both an-
nually and when there is an indication. The
effect of IFRS 3 can be considerable for the
Group if the profitability within the Group or
parts of the Group goes down in the future,
since this could trigger a substantial impair-
ment write down of the goodwill according
to IAS 36 “Impairment of Assets”. Such a
write down will affect net income and
thereby the financial position of the Group.
The reported goodwill is SEK 19,080
(21,112) million at the end of the year. No
intangible assets with indefinite useful life
other than goodwill exist.
The Group has defined benefit plans,
which are reported according to IAS 19
”Employee Benefits”. This means that the
plan assets are valued at fair value and that
the present value of the benefit obligations
in the defined benefit plans is decided
through yearly actuarial calculations made
by independent actuaries. If the value of
the plan assets starts to decrease at the
same time as the actuarial assumptions in-
crease the benefit obligations the combined
effect could result in a substantial deficit.
The monetary magnitude comes from the
fact that the deficit is the difference between
two large numbers. The effect on profit and
loss however only affects other compre-
hensive income and not net income. The
risk has been limited since many of these
defined benefit schemes are closed for
new participants and replaced by defined
contribution schemes.
The Group's reporting of provisions ac-
cording to IAS 37 means that SEK 2,438
(2,502) million is reported as other provisions.
This constitutes 4.0 (3.9) percent of the
Group's assets and is important for the
assessment of the Group's financial position,
not the least since provisions normally are
based on judgements of probability and
estimates of costs and risks. If the accounting
principles for provision would be changed
sometime in the future, this could have a
substantial impact on the Group's financial
position.
Key sources of estimation uncertainty
The key source of estimation uncertainty is
related to the impairment test of goodwill,
since the testing is based on certain assump-
tions concerning future cash flows. See the
section on critical accounting principles
above for further details.
Judgements
In applying the accounting policies Manage-
ment has made various judgements, apart
from those involving estimations, that can
AL_20_BAKVAGN_EN.indd 99 2021-03-25 12:41
100
significantly affect the amounts recognised
in the financial statements. These judgements
mainly relate to:
– probability in connection with business
risks;
– the probable outcome of claims;
– the probable outcome of litigations;
– determination of percentage of completion
in contracts with customers recognised
over time;
– recoverability of accounts receivable;
– obsolescence in inventory; and
– classification of financial instruments.
Associates
The Group does not own shares in any
material companies that fulfil the definition
of an associate in IAS 28 ”Investments in
Associates”, that is where the ownership is
between 20 and 50 percent.
Borrowing costs
Borrowing costs are accounted for accord-
ing to IAS 23 ”Borrowing Costs”, which
means that the borrowing costs are
charged to the profit and loss in the period
to which they relate.
Transaction costs that arise in connec-
tion with raising a loan are capitalised and
amortised over the maturity of the loan.
The capitalised amount is reported net
against the raised loan.
Business combinations – consolidation
principles
The consolidated financial statements have
been prepared according to IFRS 3
”Business Combinations” and IFRS 10
”Consolidated financial statements”.
An entity shall be consolidated if a deci-
sive influence is present. Control (decisive
influence) is present when Alfa Laval has:
– power over the investee, which is described
as having rights to direct the activities that
significantly affect the investee’s returns;
– exposure or rights to variable returns
from the involvement in the investee; and
– the ability to use its power over the inves-
tee to affect the amount of the investor’s
returns.
A decisive influence does not need to arise
purely through ownership of shares (voting
rights). An investor can have a decisive in-
fluence over another entity without holding
the majority of the shares. An entity must
be consolidated until the day the control
ceases, even if the control is present only
during a limited period.
The consolidated financial statements in-
clude the parent company Alfa Laval AB
(publ) and the subsidiaries in which it has a
decisive influence.
The statement on consolidated financial
position has been prepared in accordance
with the purchase method, which means
that the book value of shares in the subsid-
iaries is eliminated from the reported equity
in the subsidiaries at the time of their ac-
quisition. This means that the equity in the
subsidiaries at the time of acquisition is not
included in the consolidated equity.
The difference between the purchase
price paid and the net assets of the acquired
companies is allocated to the step-up values
related to each type of asset, with any re-
mainder accounted for as goodwill.
During the first 12 months after the ac-
quisition the value of the goodwill is often
preliminary. The reason to this is that expe-
rience has shown that there is some uncer-
tainty linked to the different components of
the purchase price allocation concerning:
– primarily the calculation of the allocation
to different intangible step-up values, that
are dependent on different judgemental
questions and estimations;
– the calculation of tangible step-up values,
that are dependent on external market
valuations, which can extend in time be-
fore they can be finalised;
– adjustments of the purchase price con-
tingent on contractual terms, that are de-
pendent on the final size of the operating
capital at the acquisition date, once this
has been audited and the outcome has
been approved by the parties; and
– the final value of the acquired equity,
which is also dependent on the audit of
the acquired closing balance sheet.
Since the goodwill is a residual that emerg-
es once all other parameters in the pur-
chase price allocation have been estab-
lished, it will be preliminary and open for
changes until all other values are final.
At acquisitions where there is a goodwill
it should be stated what the goodwill is re-
lating to. Since goodwill by definition is a
residual this is not always that easy. Gener-
ally speaking, the goodwill is usually relat-
ing to estimated synergies in procurement,
logistics and corporate overheads. It can
also be claimed that the goodwill is relating
to the acquired entity’s ability to over time
recreate its intangible assets. Since the
value of the intangible assets at the time of
acquisition only can be calculated on the
assets that exist then, no value can be at-
tached to the patents etc. that the opera-
tions manage to create in the future par-
tially as a replacement for the current ones
and these are therefore referred to goodwill.
Goodwill and intangible assets with in-
definite useful life are not amortised. These
assets are instead tested for impairment both
annually and when there is an indication.
The impairment test is made according to
IAS 36 “Impairment on assets”.
Transaction costs are reported in net in-
come. If the value of an additional purchase
price is changed the change is reported in
net income. In business combinations
achieved in stages the goodwill is calculated
and valued when the acquirer obtains control
over a business. If the acquirer previously
has reported an equity interest in the com-
pany the accumulated change in value of
the holding is recognised in net income at
the acquisition date. Changes in holdings
in subsidiaries, where the majority owner
does not lose its decisive influence, are re-
ported in equity. This means that these
transactions no longer will generate goodwill
or lead to any gains or losses. In addition, the
transaction will result in a transfer between
owners of the parent and non-controlling
interests in equity. If the non-controlling in-
terest’s share of reported losses is higher
than its reported share of the equity, a neg-
ative non-controlling interest is reported.
Comparison distortion items
Items that do not have any link to the normal
operations of the Group or that are of a
non-recurring nature are classified as com-
parison distortion items. In the consolidated
comprehensive income statement these
are reported gross as a part of the most
concerned lines but are specified separately
in Note 8. To report these together with other
items in the consolidated comprehensive
income statement without this separate
reporting in a note would have given a
comparison distortion effect that would
have made it difficult to judge the develop-
ment of the ordinary operations for an out-
side viewer. Comparison distortion items
affecting operating income are reported as a
part of operating income, while comparison
distortion items affecting the result after fi-
nancial items are reported as a part of the
financial net.
Comprehensive income
Alfa Laval has chosen to report the items in
other comprehensive income as a part of
one statement over comprehensive income
instead of reporting the result down to net
income for the year in one statement and
the result below this down to comprehensive
income in a separate statement.
Other comprehensive income is referring
to items that are not transactions with share-
holders and relates to for instance cash
flow hedges, market valuation of external
shares, translation differences and revalua-
tions and deferred tax related to these.
AL_20_BAKVAGN_EN.indd 100 2021-03-25 12:41
101
Ac
co
un
ting
prin
cip
les
Disclosures of interest in other entities
Information about interests in subsidiaries,
associates, joint arrangements and uncon-
solidated structured entities must be disclosed
in accordance with IFRS 12 ”Disclosures of
interest in other entities”. The purpose with
these disclosures is to enable the users of
the financial reports to understand:
– the composition of the group;
– the effect of the interests on the financial
statements; and
– any risks with the current interests.
Substantial qualitative and quantitative dis-
closures must be made of each interest.
The disclosure requirements include the
following:
– Financial information regarding subsidiaries
with a considerable part of non-controlling
interests.
– Disclosures on the judgments and esti-
mation that have been made in judging
whether an entity shall be consolidated
or not and if an associate shall be ac-
counted for or whether a joint arrange-
ment is considered to be joint operation
or a joint venture.
– Financial disclosures on interests in ma-
terial associates and joint arrangements.
Disclosures relating to the company’s
shares
Paragraph 2a in chapter 6 of the Swedish
Annual Accounts Act requires listed com-
panies to disclose certain information relat-
ing to the company’s shares in the Board
of Directors’ Report. This information is
found at the end of the Board of Directors’
Report, in the “Changes in consolidated
equity” and in Note 6.
Employee benefits
Employee benefits are reported according
to IAS 19 ”Employee Benefits”.
The present value of the benefit obliga-
tions in the defined benefit plans is decided
through yearly actuarial calculations made
by independent actuaries. The plan assets
are valued at fair value. The net plan asset
or liability is arrived at in the following way.
+ the present value of the defined benefit
obligation at December 31
- the fair value of the plan assets at
December 31
= a net liability if positive / a net asset if
negative
If the calculation per plan gives a negative
amount, thus resulting in an asset, the
amount to be recognised as an asset for
this particular plan is the lower of the two
following figures:
– The above net negative amount.
– The present value of any economic ben-
efits available in the form of refunds from
the plan or reductions in future contribu-
tions to the plan. This is referred to as the
asset ceiling.
The items that relate to the vesting of defined
benefit pensions and gains and losses that
arise when settling a pension liability and the
financial net concerning the defined benefit
plan are reported in the income statement
above net income. Past service costs are
recognised in the income statement already
when the plan is amended or curtailed.
Actuarial gains and losses are accounted
for currently in other comprehensive income.
Changes in the obligations that relate to
changes in actuarial assumptions are ac-
counted for in other comprehensive income.
None of these actuarial items will ever be
reported in operating income but will instead
remain in other comprehensive income.
The return on plan assets is calculated
with the same interest rate as the discount
rate. The difference between the actual re-
turn on plan assets and the interest income
in the previous sentence is reported in
other comprehensive income.
The plan assets are specified on different
types of assets.
Sensitivity analysis must be made concern-
ing reasonable changes in all assumptions
made when calculating the pension liability.
The difference between short and long-
term remunerations focuses on when the
commitment is expected to be settled
rather than the link to the employee’s vest-
ing of the commitment.
Termination benefits are accounted for at
the earliest of the following - the time when
the benefit offer cannot be withdrawn, alter-
natively in accordance with IAS 37 as a part
of for instance restructuring the operations.
For Swedish entities the actuarial calcu-
lations also include future payments of
special salary tax. The Swedish tax on re-
turns from pension funds is reported cur-
rently as a cost in the profit and loss and
are not included in the actuarial calculation
for defined benefit pension plans.
The discount rate used to calculate the
obligations is determined based on the
market yields in each country at the closing
date on high quality corporate bonds with
a term that is consistent with the estimated
term of the obligations. In countries that lack
a deep market in such bonds the country’s
government bonds are used instead.
The costs for defined contribution plans
are reported in Note 6.
The Swedish ITP plan is a multi-employer
plan insured by Alecta. It is a defined benefit
plan, but since the plan assets and liabilities
cannot be allocated on each employer it is
reported as a defined contribution plan ac-
cording to item 30 in IAS 19. The construc-
tion of the plan does not enable Alecta to
provide each employer with its share of the
assets and liabilities or the information to
be disclosed. The cost for the plan is re-
ported together with the costs for other
defined contribution plans in Note 6. Alecta
reported a collective consolidation level at
December 31, 2020 of 148 (148) percent.
The collective consolidation level is defined
as the fair value of Alecta’s plan assets in
percent of the insured pension commit-
ments calculated according to Alecta’s ac-
tuarial assumptions, which are not in ac-
cordance with IAS 19. Such a surplus can
be distributed among the employers or the
beneficiaries, but there is no agreement
concerning this that enables the company
to report a receivable on Alecta.
Events after the closing date
Events after the closing date are reported
according to IAS 10 and the Swedish
Annual Accounts Act in the notes.
Fair value measurement
IFRS 13 ”Fair Value Measurement” describes
how a fair value is established when such
value is to be or may be used in accord-
ance with each IFRS standard. In accord-
ance with IFRS a fair value is defined as the
price that would be received to sell an as-
set or paid to transfer a liability in an orderly
transaction between market participants at
the measurement date (i.e. an exit price).
The standard presents elucidations on the
fair value concept including the following areas:
– Concepts such as ”highest and best use”
and ”valuation premise” are described.
These are only applicable on non-financial
assets.
– Market participants are assumed to act
in a way that maximizes the value for all
involved parties in situations where there
is no guidance concerning the calculation
of fair value in individual IFRS standards.
– The effect of so-called block discounts
(large position in relation to the market)
may never be included in the calculation
of fair value.
– Deciding fair value when the market activity
is falling.
Disclosures must be made to explain what
valuation models that are used and what
information that is used in these models
and which effects the valuation has caused
in the result.
AL_20_BAKVAGN_EN.indd 101 2021-03-25 12:41
102
Financial instruments
The reporting of financial instruments is
governed by the following four accounting
and financial reporting standards:
– IFRS 9 ”Financial Instruments”;
– IAS 32 “Financial Instruments:
Presentation”;
– IFRS 7 “Financial Instruments:
Disclosures”; and
– IFRS 13 “Fair Value Measurement”.
IFRS 9 means that the company’s business
model and the characteristics of the asset
influence the classification and measure-
ment of financial assets.
Debt instruments are all financial instru-
ments except derivatives and shares. The
company´s purpose with holding a debt in-
strument is called its business model. De-
pending on what business model a com-
pany is using for managing its debt
instruments the accounting treatment is
different. The following business models
exist in IFRS 9:
– Held to collect – the debt instrument is
held to maturity to collect the contracted
cash flows (interest and principal).
– Trading – the company trades with the
debt instruments.
– Mixed model – a mix of the two above
models.
Alfa Laval business model for managing its
debt instruments is “Held to collect”. This
classification does not mean that we occa-
sionally cannot sell debt instruments before
maturity even for large amounts or that we
regularly cannot sell many small debt in-
struments before maturity.
IFRS 9 means that financial derivatives,
holdings of bonds and external shares are
adjusted to fair value. IFRS 7 contains ex-
panded disclosure requirements related to
the significance of financial instruments for
the company’s financial position and per-
formance and the nature and extent of
risks arising from financial instruments.
IFRS 13 describes how a fair value is es-
tablished when such value is to be or may
be used in accordance with each IFRS
standard. Disclosures must be made to ex-
plain what valuation models that are used
and what information that is used in these
models and which effects the valuation has
caused in the result.
Both IFRS 9 and IFRS 7 formally contain
a considerable amount of information that
should be presented. According to IFRS
7.B3 the company however should decide
how much detail it provides in order not to
overburden the financial statements with
excessive details.
Both financial assets and financial liabilities
are classified into three different portfolios:
– Valued at fair value through profit or loss;
– Valued at fair value through other com-
prehensive income and
– Valued at amortised cost.
The classification into different portfolios re-
flects the valuation of the instruments, i.e. if
the instrument is valued at fair value or am-
ortised cost and also where in the state-
ment of consolidated comprehensive income
that the valuation to fair value is reported.
The amortised cost is normally equal to
the amount recognised upon initial recogni-
tion, less any principal repayments and plus
or minus any effective interest adjustments.
Prepaid costs, prepaid income and ad-
vances from customers are not defined as
financial instruments since they will not re-
sult in future cash flows.
Disclosures must be made on the methods
and, when a valuation technique is used,
the assumptions applied in determining the
fair value of each class of financial assets and
liabilities. The methods are to be classified
in a hierarchy of three levels:
1. Quoted prices in active markets;
2. Other inputs than quoted prices that are
directly observable (prices) or indirectly
observable (derived from prices); and
3. Unobservable market data.
The fair values of holdings of bonds are ar-
rived at using market prices according to
level 1. The effect of the measurement at
fair value is reported in net income. The fair
value adjustment of these instruments is
reflected directly on the item bonds in the
statement of financial position.
The fair values of shares in external
companies are arrived at using market
prices according to level 1 or other inputs
according to level 2. The effect of the
measurement at fair value is reported in
other comprehensive income. The fair
value adjustment of these instruments is
reflected directly on the item other long-term
securities in the statement of financial position.
The fair values of the Group’s currency
forward contracts, currency options, interest-
rate swaps, metal forward contracts and
electricity futures are arrived at using market
prices according to level 1. The fair value
changes are arrived at by comparing the
conditions of the derivative entered into
with the market price for the same instrument
at the closing date and with the same ma-
turity date. The effect of the measurement at
fair value is reported in other comprehen-
sive income if the derivative constitutes an
effective cash flow hedge and otherwise on
the concerned line above net income. The
fair value adjustment of these instruments
is reported as derivative assets or derivative
liabilities in the statement of financial position.
For each class of financial instruments
disclosures shall be made on credit risk
and an analysis of financial assets that are
past due or impaired. Within Alfa Laval credit
risk is in reality mainly related to accounts
receivable. The disclosures just mentioned
are therefore to be found in Note 22.
IFRS 9 has a model for expected credit
losses. It is a three steps model that reflects
changes in the credit risk. The steps are:
1. Recorded at inception (normally an his-
torical experience-based percentage);
2. For credit risks that have increased sig-
nificantly since initial recognition (the
credit risk has increased significantly if
the receivable is more than 30 days
overdue; otherwise based on indications
of the customer having payment difficul-
ties or financial weakness); and
3. Related to objective evidence of impair-
ment (incurred losses).
The model results in a provision for bad
debts. Only at a final loss the receivable is
written off.
Government grants
Government grants are recognised in profit
and loss over the same periods as the costs
the grants are intended to compensate for.
The grants are recognised in the income
statement as a deduction of these costs.
Group contributions to and from the
parent company
The parent company is accounting for
group contributions according to the alter-
native rule in RFR 2 issued by the Council
for Financial Reporting in Sweden. This
means that both received and given group
contributions are reported as appropria-
tions in the income statement.
Hedge accounting
Alfa Laval only applies two types of hedge
accounting: cash flow hedges and hedges
of net investments in foreign operations.
Cash flow hedgesAlfa Laval has implemented documentation
requirements to qualify for hedge account-
ing on derivative financial instruments.
The effect of the fair value adjustment of
derivatives is reported as a part of other
comprehensive income for the derivatives
where hedge accounting is made (accord-
ing to the cash flow hedging method) and
above net income only when the under-
lying transaction has been realised. Hedge
accounting requires the derivative to be
AL_20_BAKVAGN_EN.indd 102 2021-03-25 12:41

103
Ac
co
un
ting
prin
cip
les
appropriate and expected to be effective
regarding the identified risks.
For the derivatives where hedge accounting
is not made the fair value valuation is reported
above net income. The fair value adjustment
of derivatives is reported separately from
the underlying instrument as a separate
item called derivative assets/derivative lia-
bilities in the statement of financial position.
Hedges of net investments in foreign operationsIn order to finance acquisitions of foreign
operations loans are raised, if possible, in
the same currency as the net investment.
The loans thereby constitute a hedge of
the net investment in each currency.
Exchange rate differences relating to these
loans are therefore booked to other com-
prehensive income.
Income Taxes
Income taxes are reported in accordance
with IAS 12 ”Income Taxes”.
Current tax is the amount of income taxes
payable (recoverable) in respect of the tax-
able profit (tax loss) for a period. Current
tax liabilities (receivables) for the current and
prior periods are measured at the amount
expected to be paid to (recovered from)
the tax authorities, using the tax rates (and
tax laws) that have been enacted or sub-
stantively enacted by the closing date. In
essence, this means that current tax is cal-
culated according to the rules that apply in
the countries where the profit was generated.
Deferred tax liabilities are the amounts of
income taxes payable in future periods in
respect of taxable temporary differences.
Deferred tax liabilities are recognised for all
taxable temporary differences, except for
goodwill.
Deferred tax assets are the amounts of
income taxes recoverable in future periods
in respect of: (a) deductible temporary dif-
ferences; (b) the carry-forward of unused tax
losses; and (c) the carry-forward of unused
tax credits. Deferred tax assets are recog-
nised for all deductible temporary differ-
ences to the extent that it is probable (>50
percent) that taxable profit will be available
against which the deductible temporary dif-
ference can be utilised. Deferred tax assets
are recognised for the carry-forward of un-
used tax losses and unused tax credits to
the extent that it is probable (>50 percent)
that future taxable profit will be available
against which the unused tax losses and
unused tax credits can be utilised.
Deferred tax assets and liabilities are
measured at the tax rates that are expected
to apply to the period when the asset is re-
alised or the liability is settled, based on tax
rates (and tax laws) that have been enacted
or substantively enacted by the closing date.
If it is not any longer probable that sufficient
taxable profits will be available against which
a deferred tax asset can be utilised, then the
deferred tax asset is reduced accordingly.
Inventories
The Group's inventory has been accounted
for after elimination of inter-company gains.
The inventory has been valued according
to the "First-In-First-Out" (FIFO) method at
the lowest of cost or net realisable value,
taking into account obsolescence.
This means that raw material and pur-
chased components normally are valued at
the acquisition cost, unless the market price
has fallen. Work in progress is valued at the
sum of direct material and direct labour costs
with a mark-up for the product's share in
capital costs in the manufacturing and
other indirect manufacturing costs based
on a forecasted assumption on the capac-
ity utilisation in the factory. Finished goods
are normally valued at the delivery value
(i.e. at cost) from the factory if the delivery
is forthcoming. Spare parts that can be in
the inventory during longer periods of time
are normally valued at net realisable value.
Joint ventures
Joint ventures are consolidated according
to IFRS 11 ”Joint arrangements”. Joint ar-
rangements are defined as a contractual
arrangement where two or more parties
have a joint decisive influence.
It is crucial to be able to judge whether a
party has control over another party, that is
decisive influence or if it rather is a sub-
stantial or common influence. If it is the lat-
ter, then it is a so-called joint arrangement,
which could be either:
– a joint operation; or
– a joint venture.
Jointly owned assets and joint activities are
called joint operations. Each owner or party
accounts for his share of assets, liabilities,
revenues and costs.
Joint ventures are consolidated accord-
ing to the equity method. This means that
the interest is accounted for on one line in
the consolidated statement of financial po-
sition and that the share of the result is ac-
counted for on one line in the consolidated
statement of comprehensive income. It is
the net income in the joint ventures that is
booked into one line in the operating in-
come. The counter entry is an increase or
decrease of the value of shares in joint ven-
tures. Received dividends reduce the value
of the shares in joint ventures. The sales
volume and other result items and the bal-
ance items in the joint ventures will no
longer be reported in the statements over
consolidated comprehensive income and
consolidated financial position in any of the
two owner companies.
Leasing
Leasing is accounted for according to IFRS
16 ”Leases”, which covers the recognition,
measurement, presentation and disclosure
of leases by both lessors and lessees.
In connection with the transition a practi-
cal expedient has been applied that means
that the new leasing definition is only ap-
plied on new lease contracts instead of on
all leasing contracts.
Alfa Laval has decided to apply a practi-
cal expedient for leasing contracts where
the contract period is maximum 12 months
or the leased asset is of low value. With
reference to the materiality rules in IAS 8.8,
Alfa Laval has chosen to apply IFRS 16 for
leases concerning buildings and land,
company cars and other vehicles, forklifts,
large servers and large printers. The pre-
sent value for other leases is estimated to
be non-material. The leasing fees for these
leases are expensed as incurred.
Lease contracts can include both a leasing
part and a service part. According to IFRS
16, the company in these cases can choose
to separate them from each other and thus
only recognise the leasing part in the bal-
ance sheet or capitalise the entire contract.
Alfa Laval has chosen to exclude the service
part from the lease accounting and it is in-
stead expensed as before.
When Alfa Laval is the lessee, leased
assets are accounted for as right-of-use
assets and a corresponding financial payable
to the lessor in the statement on financial
position. The leasing fee to the lessor is ac-
counted for as financial cost calculated as
interest on the outstanding payable and as
amortisation of the payable. The right-of-
use asset is depreciated according to plan
in the same manner as for purchased assets.
For lessors a classification into opera-
tional and financial leases is made exactly
as under IAS 17. When Alfa Laval is the
lessor, leased assets that are classified as
financial leases are accounted for as a fi-
nancial receivable from the lessee in the
statement on financial position. The leasing
fee received from the lessee is accounted
for as financial income calculated as inter-
est on the outstanding receivable and as
amortisation of the receivable.
IFRS 16 contains a number of disclo-
sures requirements.
Levies
Levies relate to levies/taxes that govern-
mental or corresponding bodies are charg-
ing companies in accordance with laws or
regulations with exception of income taxes,
penalties and fines. IFRIC 21 ”Levies” is an
interpretation that clarifies when a liability
AL_20_BAKVAGN_EN.indd 103 2021-03-25 12:41
104
for levies is to be accounted for. The obli-
gating event that gives rise to the reporting
of a liability is the activity that triggers the
payment of the levy. IFRIC 21 only treats
the accounting for the liability side and not
whether the debit side is a cost or an as-
set. One example of a levy is the Swedish
real estate tax, which is levied on the own-
er of a property at January 1. At inception
of the year the liability is booked and a cor-
responding prepaid cost, which is then
phased as a cost over the year.
Non-current assets (tangible and
intangible)
Assets have been accounted for at cost,
net after deduction of accumulated depre-
ciation according to plan. Depreciation ac-
cording to plan is based on the assets’ ac-
quisition values and is calculated according
to the estimated useful life of the assets.
The following useful lives have been used:
Tangible:
Computer programs, comput-
ers 3.3 years
Office equipment 4 years
Vehicles 5 years
Machinery and equipment 7–14 years
Land improvements 20 years
Buildings 25–33 years
Right-of-use assets depends on
the lease term
Intangible:
Patents and unpatented
know-how 10–20 years
Trademarks 10–20 years
Licenses, renting rights and
similar rights 10–20 years
Internally generated intangible
assets 5 years
The depreciation is made according to the
straight-line method.
Any additions to the purchase price in
connection with investments in non-current
assets or acquisitions of businesses are
amortised over the same period as the
original purchase price. This means that
the time when the asset is fully depreciated
is identical regardless of when payments
are made. This is a reflection of the fact
that the estimated useful life of the asset is
the same.
Upon sale or scrapping of assets, the
results are calculated in relation to the net
book value after depreciation according to
plan. The result on sales is included in op-
erating income.
Impairment of assetsWhen there are indications that the value of
a tangible asset or an intangible asset with
a definite useful life has decreased, there is
a valuation made if it must be written down
according to IAS 36 ”Impairment of Assets”.
If the reported value is higher than the re-
coverable amount, a write down is made
that burdens net income. When assets are
up for sale, for instance items of real estate,
a clear indication of the recoverable amount
is received that can trigger a write down.
Goodwill and intangible assets with in-
definite useful life are not amortised. These
assets are instead tested for impairment
both annually and when there is an indica-
tion. The impairment test is made accord-
ing to IAS 36 ”Impairment on assets”.
The recoverable amount for goodwill and
intangible assets with indefinite useful life is
determined from the value in use based on
discounted future cash flows. For other as-
sets the recoverable amount is normally
determined from the fair value less costs to
sell based on an observable market price.
For the impairment testing of goodwill,
three of Alfa Laval’s operating segments,
the three business divisions “Energy”,
“Food & Water” and ”Marine” have been
identified as the cash-generating units
within Alfa Laval. Technically a recently ac-
quired business activity could be followed
independently during an initial period, but
acquired businesses are normally inte-
grated into the divisions at a fast rate. This
means that the independent traceability is
lost fairly soon and then any independent
measurement and testing becomes im-
practicable. The net present value is based
on the projected EBITDA figures for the
next five years, less projected investments
and changes in operating capital during the
same period and thereafter the perceived
expected average industry growth rate.
The used discount rate is the pre-tax
weighted average cost of capital (WACC).
Non-current assets and disposal
groups held for sale and discontinued
operations
The Group is applying IFRS 5 ”Non-current
Assets Held for Sale and Discontinued
Operations”. IFRS 5 specifies the account-
ing for assets and disposal groups held for
sale and the disclosures to be made for
discontinued operations.
Assets and disposal groups held for sale
are measured at the lower of carrying
amount and fair value less costs to sell, ex-
cept for deferred tax items and defined
benefit obligations. No depreciation of such
assets is made. An asset or disposal group
held for sale is an asset whose carrying
amount will be recovered basically through
a sale rather than through continuing use.
It must be available for immediate sale in
its current condition. The sale must be
highly probable, that is a decision must
have been made and an active sales effort
must have been initiated. The sale must be
expected to be finalised within one year.
Non-current assets are reclassified to cur-
rent assets and presented separately in the
statement on financial position. All assets
and liabilities relating to disposal groups
are presented separately in the statement
of financial position.
Objectives, policies and processes for
managing capital
IAS 1 ”Presentation of Financial Statements”
paragraphs 134 and 135 contain disclosure
requirements on the company’s objectives,
policies and processes for managing capital.
This information is disclosed in a separate
section after the description of the ac-
counting principles.
Other operating income and other
operating costs
Other operating income relates to for in-
stance commission, royalty and license in-
come. Other operating costs refer mainly
to restructuring costs and royalty costs.
Comparison distortion items that affect
the operating income are reported in other
operating income and other operating costs.
Provisions
The Group is applying IAS 37 ”Provisions,
Contingent Liabilities and Contingent Assets”
for the reporting of provisions, contingent
liabilities and contingent assets.
A provision is recognised when and only
when:
– there is a present legal or constructive
obligation as a result of past events;
– it is probable that a cost will be incurred
in settling the obligation; and
– a reliable estimate can be made of the
amount of the obligation.
The amount recognised as a provision is the
best estimate of the cost required to settle
the present obligation at the closing date.
In measuring the provision:
– risks and uncertainties are taken into
account;
– the provisions are discounted, where the
effect of the time value of money is material.
When discounting is used, the increase
of the provision over time is recognised
as an interest cost;
– future events, such as changes in law
and technology, are taken into account
where there is sufficient objective evidence
that they will occur; and
– gains from the expected disposal of assets
are not taken into account, even if the
AL_20_BAKVAGN_EN.indd 104 2021-03-25 12:41

105
Ac
co
un
ting
prin
cip
les
expected disposal is closely linked to the
event giving rise to the provision.
If a reimbursement of some or all of the
costs to settle a provision is expected (e.g.
through insurance contracts, indemnity
clauses or supplier’s warranties), the reim-
bursement is recognised:
– when and only when, it is virtually certain
that the reimbursement will be received if
the obligation is settled. The amount rec-
ognised for the reimbursement must not
exceed the amount of the provision; and
– as a separate asset (gross). In the con-
solidated comprehensive income state-
ment, however, the income related to the
reimbursement is netted against the cost
for the provision.
Provisions are reviewed at each closing
date and adjusted to reflect the current
best estimate. If it is no longer probable
that a payment to settle the obligation will
be incurred, the provision is reversed.
A provision must only be used for the
purpose it was originally recognised for.
Provisions are not recognised for future op-
erating losses. An expectation of future op-
erating losses is though an indication that
certain assets of the operation may be im-
paired. If a contract is onerous, the present
obligation under the contract is recognised
and measured as a provision, once the as-
sets used in order to finalize the contract
have been tested for impairment.
A provision for restructuring costs is rec-
ognised only when the general recognition
criteria are met. A constructive obligation
to restructure arises only when there is:
– a detailed formal plan for the restructuring,
identifying at least:
a) the business or part of a business
concerned;
b) the principal locations affected;
c) the location, function and approxi-
mate number of employees who will
be compensated for terminating
their services;
d) the costs that will be undertaken; and
e) when the plan will be implemented; and
– a valid expectation in those affected that
the restructuring will be carried out.
A management or board decision to re-
structure does not give rise to a construc-
tive obligation at the closing date unless
the company has, before the closing date:
– started to implement the restructuring
plan; or
– communicated the restructuring plan to
those affected by it in a sufficiently spe-
cific manner to raise a valid expectation
in them that the restructuring will happen.
When a restructuring involves the sale of
an operation, no obligation arises for the
sale until the company is committed to the
sale, i.e. through a binding sales agreement.
A restructuring provision only includes the
direct costs arising from the restructuring,
which are those that are both:
– necessarily entailed by the restructuring;
and
– not associated with the ongoing activities
of the company.
Research and development
Research costs are charged to the result in
the year in which they are incurred.
Development costs are charged to the re-
sult in the year in which they are incurred
provided that they do not fulfil the condi-
tions for instead being capitalised accord-
ing to IAS 38 ”Intangible Assets”.
Revenue recognition
Revenue from contracts with customers
and revenues from leasing are reported as
“Net sales” in the statement of consolidat-
ed comprehensive income. ”Net sales” are
referring to sales value less sales taxes,
cancellations and discounts. Contracts
with customers relate to sale of goods,
services and projects.
IFRS 15 ”Revenue from Contracts with
Customers” covers how revenue recognition
on contracts with customers shall be made.
Revenue recognition is based on five steps:
1. Identify the contract with a customer.
2. Identify the performance obligations in
the contract.
3. Determine the transaction price.
4. Allocate the transaction price to the per-
formance obligations in the contract.
5. Recognise revenue when the entity
satisfies a performance obligation.
A performance obligation is a promise in a
contract with a customer to transfer to the
customer either:
– a good or service (or a bundle of goods
or services) that is distinct; or
– a series of distinct goods or services that
are substantially the same and that have the
same pattern of transfer to the customer.
Two or more contracts entered into at or near
the same time with the same customer are
accounted for as a single contract if:
– the contracts are negotiated as a pack-
age; and/or
– the amount of consideration to be paid in
the contracts are linked to each other;
and/or
– the goods or services in the contracts are
a single performance obligation.
A contract modification is treated as a sep-
arate contract if added products or services:
– are distinct; and
– have a stand-alone selling price.
Alfa Laval shall recognise the revenue
when the performance obligation has been
satisfied by transferring control over a
promised good or service to the customer.
Performance obligations can be satisfied
either over time or at a point in time.
Alfa Laval transfers control of a good or
service over time and, therefore, satisfies a
performance obligation and recognises
revenue over time, if one of the following
criteria is met:
– the customer simultaneously receives
and consumes the benefits provided by
Alfa Laval's performance as Alfa Laval
performs. This is normally the case for
Alfa Laval’s service offerings;
– Alfa Laval creates or enhances an asset
that the customer controls as the asset is
created or enhanced. This is normally the
case when Alfa Laval performs the work
at the customer’s premises, which mainly
relates to installation/commissioning; or
– Alfa Laval's performance does not create
an asset with an alternative use to Alfa
Laval and Alfa Laval has an enforceable
right to payment for performance com-
pleted to date.
Alternative use to Alfa Laval means if Alfa
Laval can sell the equipment to another
customer. The number of engineering hours
spent by Alfa Laval on making a product or
process solution customer specific with a
unique configuration is a good indication of
whether there is an alternative use to Alfa
Laval or not. As a practical expedient, only
orders of more than EUR 1 million and with
more than 200 engineering hours are rec-
ognised over time.
In order to establish the performance over
time an output or input method is used. In
Alfa Laval output methods are more appli-
cable to service and component deliveries,
whereas input methods are more applicable
to projects and module sales. Depending
on the nature of the project, the following
methods are used:
AL_20_BAKVAGN_EN.indd 105 2021-03-25 12:41

106
Input methods:
– The proportion that the project costs in-
curred for work performed to date bear
to the estimated total project costs.
– Surveys of work performed.
Considering the type of projects that Alfa
Laval companies are involved in, the first
method is usually the preferred.
Output methods:
– Completion of a physical proportion of
the performance obligations.
If a performance obligation is not satisfied
over time it is satisfied at a point in time. To
establish the point in time when the cus-
tomer obtains control of a promised asset
and Alfa Laval satisfies a performance obli-
gation, the following control criteria must
be considered:
– Alfa Laval has a present right to payment
for the asset.
– The customer has legal title to the asset.
– The customer has physical possession of
the asset.
– The customer has the significant risks
and rewards of ownership of the asset.
– The customer has accepted the asset.
Alfa Laval uses a variety of delivery terms
depending on the customers preference,
including Ex Works. Alfa Laval’s preference
is to use DAP (Delivered At Place) or DDP
(Delivered Duty Paid) since these gives Alfa
Laval better control that the customer really
receives the goods in working order.
It is common that Alfa Laval provides a
warranty in connection with the sale. The
nature of the warranty can vary significantly
across contracts. Normally warranties pro-
vide a customer with assurance that the
related product will function as the parties
intended according to the agreed-upon
specifications. This is an assurance-type
warranty. Alfa Laval’s warranties normally
cover a 12 months’ period and are ac-
counted for as a provision.
IFRS 15 contains a number of disclosures
requirements.
Operating segments
IFRS 8 means that the reporting of operating
segments must be made according to how
the chief operating decision maker monitors
the operations, which may deviate from
IFRS. Furthermore, information according
to IFRS for the company as a whole must
be given about products and services as
well as geographical areas and information
about major customers.
The difference between the operating in-
come for the operating segments and the
operating income according to IFRS for the
company as a whole is explained by two
reconciliation items.
Alfa Laval’s operating segments are the
divisions. The chief operating decision maker
within Alfa Laval is its Board of Directors.
Transactions in foreign currencies
Receivables and liabilities denominated in
foreign currencies have been valued at
year-end rates of exchange.
Within the Group, exchange gains and
losses on loans denominated in foreign
currencies that finance acquisitions of for-
eign subsidiaries are transferred to other
comprehensive income as foreign currency
translation adjustments if the loans act as a
hedge to the acquired net assets. There
they offset the translation adjustments re-
sulting from the consolidation of the foreign
subsidiaries. In the parent company, these
exchange differences are reported above
net income.
IAS 21 ”The Effects of Changes in For-
eign Exchange Rates” covers among other
things the existence of functional curren-
cies. Almost all of Alfa Laval’s subsidiaries
are affected by changes in foreign exchange
rates for their procurement within the Group.
They do however usually sell in their local
currency and they have more or less all of
their non-product related costs and their
personnel related costs in their local cur-
rency. This means that none of Alfa Laval’s
subsidiaries qualify for the use of another
functional currency than the local currency,
with the following exception. Subsidiaries
in highly inflationary countries report their
closings in the functional hard currency
that is valid in each country, which in all
cases is USD. During 2020 Venezuela is
regarded as a highly inflationary country.
In the consolidation, the foreign subsidi-
aries have been translated using the cur-
rent method. This means that assets and
liabilities are translated at closing exchange
rates and income and expenses are trans-
lated at the year's average exchange rate.
The translation difference that arises is a
result of the fact that net assets in foreign
companies are translated at one rate at the
beginning of the year and another at year-
end and that the result is translated at av-
erage rate. The translation differences are
part of other comprehensive income.
Recently issued accounting
pronouncements
International Accounting Standards Board
(IASB) has not issued any new or revised
accounting pronouncements, which may
be applicable on Alfa Laval and are effec-
tive for fiscal years beginning on or after
January 1, 2021.
International Accounting Standards Board
(IASB) has not issued any financial report-
ing interpretation developed by the
International Financial Reporting
Interpretations Committee (IFRIC), which
may be applicable on Alfa Laval and are ef-
fective for fiscal years beginning on or after
January 1, 2021.
Otherwise Alfa Laval will further evaluate
the effects of the application of the new or
revised accounting standards or interpreta-
tions before each time of application.
AL_20_BAKVAGN_EN.indd 106 2021-03-25 12:41
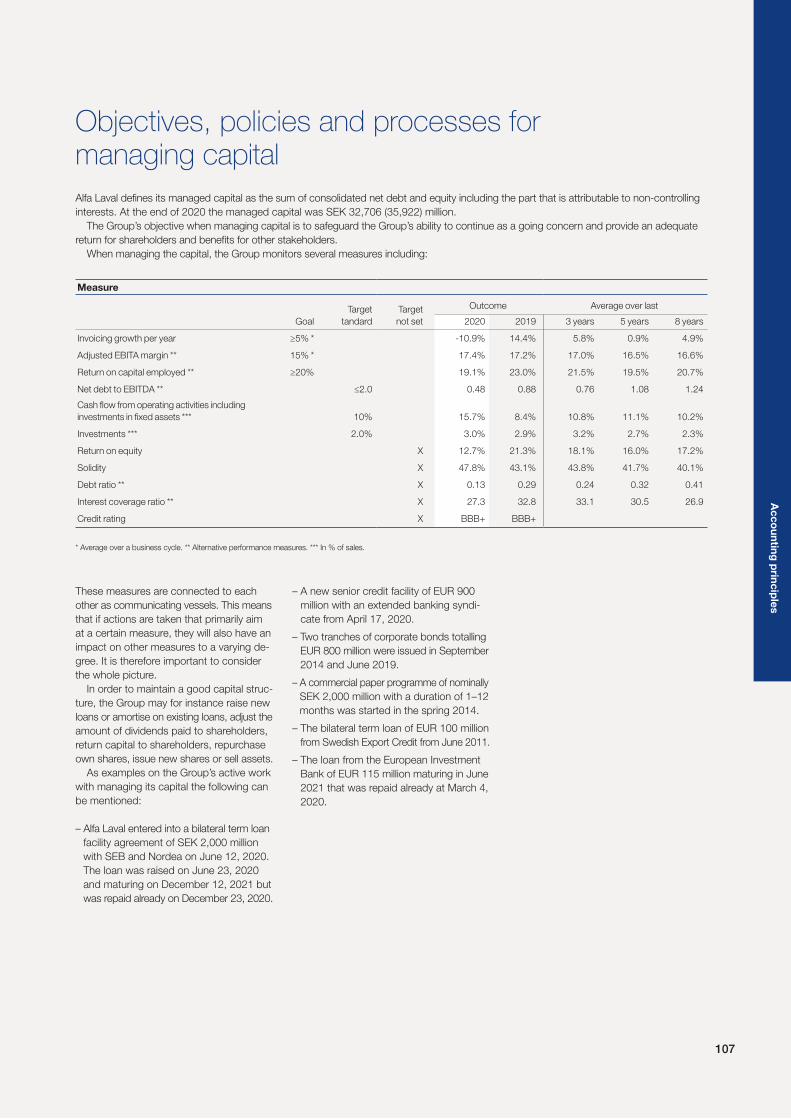
107
Objectives, policies and processes for managing capital
Alfa Laval defines its managed capital as the sum of consolidated net debt and equity including the part that is attributable to non-controlling
interests. At the end of 2020 the managed capital was SEK 32,706 (35,922) million.
The Group’s objective when managing capital is to safeguard the Group’s ability to continue as a going concern and provide an adequate
return for shareholders and benefits for other stakeholders.
When managing the capital, the Group monitors several measures including:
Measure
Goal
Target
tandard
Target
not set
Outcome Average over last
2020 2019 3 years 5 years 8 years
Invoicing growth per year ≥5% * -10.9% 14.4% 5.8% 0.9% 4.9%
Adjusted EBITA margin ** 15% * 17.4% 17.2% 17.0% 16.5% 16.6%
Return on capital employed ** ≥20% 19.1% 23.0% 21.5% 19.5% 20.7%
Net debt to EBITDA ** ≤2.0 0.48 0.88 0.76 1.08 1.24
Cash flow from operating activities including
investments in fixed assets *** 10% 15.7% 8.4% 10.8% 11.1% 10.2%
Investments *** 2.0% 3.0% 2.9% 3.2% 2.7% 2.3%
Return on equity X 12.7% 21.3% 18.1% 16.0% 17.2%
Solidity X 47.8% 43.1% 43.8% 41.7% 40.1%
Debt ratio ** X 0.13 0.29 0.24 0.32 0.41
Interest coverage ratio ** X 27.3 32.8 33.1 30.5 26.9
Credit rating X BBB+ BBB+
* Average over a business cycle. ** Alternative performance measures. *** In % of sales.
These measures are connected to each
other as communicating vessels. This means
that if actions are taken that primarily aim
at a certain measure, they will also have an
impact on other measures to a varying de-
gree. It is therefore important to consider
the whole picture.
In order to maintain a good capital struc-
ture, the Group may for instance raise new
loans or amortise on existing loans, adjust the
amount of dividends paid to shareholders,
return capital to shareholders, repurchase
own shares, issue new shares or sell assets.
As examples on the Group’s active work
with managing its capital the following can
be mentioned:
– Alfa Laval entered into a bilateral term loan
facility agreement of SEK 2,000 million
with SEB and Nordea on June 12, 2020.
The loan was raised on June 23, 2020
and maturing on December 12, 2021 but
was repaid already on December 23, 2020.
– A new senior credit facility of EUR 900
million with an extended banking syndi-
cate from April 17, 2020.
– Two tranches of corporate bonds totalling
EUR 800 million were issued in September
2014 and June 2019.
– A commercial paper programme of nominally
SEK 2,000 million with a duration of 1–12
months was started in the spring 2014.
– The bilateral term loan of EUR 100 million
from Swedish Export Credit from June 2011.
– The loan from the European Investment
Bank of EUR 115 million maturing in June
2021 that was repaid already at March 4,
2020.
Ac
co
un
ting
prin
cip
les
AL_20_BAKVAGN_EN.indd 107 2021-03-25 12:41

108
Financial risksFinancial risks are referring to financial instruments.
Financial instruments
Alfa Laval has the following financial instruments: cash and cash equivalents, deposits, trade receivables, bank loans, trade payables and
a limited number of derivative instruments to hedge primarily currency rates or interests, but also the price of metals and electricity. These
include currency forward contracts, currency options, interest-rate swaps, metal forward contracts and electricity futures. See Notes 13
and 14 for more information on these financial instruments.
Treasury policy
In order to control and limit the financial risks, the Board of the Group has established a treasury policy. The Group has an aversive attitude toward
financial risks. This is expressed in the policy. It establishes the distribution of responsibility between the local companies and the central finance
function in Alfa Laval Treasury International, what financial risks the Group can accept and how the risks should be limited.
Risk Explanation Mitigation
Financial risks
Price risk There are three different types of price risks: currency risk, interest risk and
market risk. See below.
Currency risk Due to the Alfa Laval Group’s international business activities and geographical
spread the Group is exposed to currency risks. The exchange rate move-
ments in the major currencies for the Group during the last years are pre-
sented below (SEK/foreign currency):
7
8
9
10
11
12
13
Exchange rate fluctuations – UK pounds, Euro, US dollars
GBP
JAN 18 JUNE 18 DEC 18 JUNE 19 DEC 19 JUNE 20 DEC 20
JAN 18 JUNE 18 DEC 18 JUNE 19 DEC 19 JUNE 20 DEC 20
EUR USD
0.90
1.00
1.10
1.20
1.30
1.40
1.50
Exchange rate fluctuations – Danish and Norwegian kronor
DKK NOK
0.070
0.075
0.080
0.085
0.090
0.095
Exchange rate fluctuations – Japanese yen, Korean won
JPY
JPY
JAN 18 JUNE 18 DEC 18 JUNE 19 DEC 19 JUNE 20 DEC 20
KRW
KRW
0.0065
0.0070
0.0075
0.0080
0.0085
0.0090
RisksRisks are divided into financial risks and operational risks, which are described below.
In order to handle and minimise the risks, Alfa Laval has established a comprehensive set of Group wide policies and an internal control
framework. To support the work with internal control an extensive set of minimum internal controls has been established.
During the year, managers and other key personnel have made a self assessment based on a selection of the most important minimum
internal controls.
Internal control is monitored by both internal audit and by the external auditors.
AL_20_BAKVAGN_EN.indd 108 2021-03-25 12:41

109
Ris
ks
-3,000
-2,000
-1,000
0
1,000
2,000
3,000
4,000
Before derivatives After derivatives
SEK
millions
Net transaction exposure per currency pair at December 31, 2020
for the coming 12 months
EUR/USD EUR/SEK EUR/DKK USD/NOK EUR/JPY JPY/NOK EUR/CNY
Risk Explanation Mitigation
Currency risk is divided into transaction exposure and translation exposure.
Transaction exposure
Transaction exposure relates to currency risks that arise due to exchange
rate fluctuations that affect the currency flows that are generated by the
business activities.
During 2020 Alfa Laval’s sales to countries outside Sweden amounted to
97.6 (97.9) percent of total sales.
The Group's net transaction exposure at December 31, 2020 in the most
important currencies before and after derivatives for the coming 12 months
amounts to:
The positive bars are a reflection of:
– subsidiaries in Sweden and Denmark exporting in EUR;
– subsidiaries in Norway exporting mainly in USD but also in JPY; and
– subsidiaries in China exporting in EUR.
The negative bars are a reflection of subsidiaries in the U.S. and Japan
importing in EUR.
Currency contracts for projected flows are entered into continuously during
the year. For contract-based exposures the derivatives follow the duration of
the underlying contract. This means that the company experiences the effects
from the market currency rate movements with a varying degree of delay.
If the currency rates between SEK and the most important foreign curren-
cies are changed by +/- 10 % it has the following effect on operating
income, if no hedging measures are taken:
Effect on operating income by exchange rate fluctuations excluding hedging measures
Consolidated
SEK millions 2020 2019
Exchange rate change
against SEK + 10% - 10% + 10% - 10%
USD 478 -478 567 -567
EUR 221 -221 276 -276
CNY 99 -99 141 -141
NOK -258 258 -269 269
DKK -168 168 -200 200
JPY 27 -27 41 -41
Other -52 52 -54 54
Total 347 -347 502 -502
Alfa Laval’s local sales companies normally sell
in domestic currency to local end customers
and have their local cost base in local currency.
Exports from production and logistical centres
to other Group companies are invoiced in the
exporting companies’ domestic currencies,
except for Sweden, Denmark and the UK
where the exports are denominated in EUR.
The Group is principally exposed to currency
risk from potential changes in contracted and
projected flows of payments and receipts. The
objective of foreign exchange risk management
is to reduce the impact of foreign exchange
movements on the Group’s income and
financial position.
The Group normally has natural risk coverage
through sales as well as costs in local curren-
cies. The treasury policy states that the local
companies are responsible for identifying and
hedging exchange rate exposures on all com-
mercial flows via Alfa Laval Treasury International.
Transaction exposure from firm committed
orders shall be hedged to 100 percent when
the value of the net exposure exceeds EUR
200,000. Furthermore, companies with yearly
net exposure exceeding EUR 1,000,000 must
hedge at least 50 percent of the next 12 months
net exposure concerning all uncommitted flows
and committed flows below EUR 200,000.
The total hedge must never exceed 100 per-
cent. Longer hedging contracts of 13–24
months for uncommitted exposures require
special approval.
Alfa Laval Treasury International can add to or
reduce the total hedging initiated by the local
companies in the currencies that Alfa Laval
has commercial exposure up to but not
exceeding 100 percent and down to but not
below 50 percent of the commercial exposure
for each currency in a given time period.
AL_20_BAKVAGN_EN.indd 109 2021-03-25 12:41

110
Risk Explanation Mitigation
Outstanding currency forward contracts and currency options for the
Group amounted to the following at the end of the year:
Outstanding currency forward contracts and currency options
Consolidated
Millions 2020 2019
Original
currency SEK
Original
currency SEK
Outflows:
USD -752 -6,173 -761 -7,116
EUR -287 -2,899 -532 -5,569
JPY -5,165 -411 -7,193 -619
SGD -7 -45 – –
CAD -5 -33 -9 -67
AUD -4 -26 - -
NZD -3 -17 -3 -22
RON – – -1 -1
Total -9,604 -13,394
Inflows:
NOK 4,859 4,671 5,503 5,834
SEK 3,653 3,653 5,059 5,059
CNY 1,295 1,628 1,611 2,158
DKK 456 618 400 561
GBP 6 71 13 156
SGD – – 2 15
AUD – – 10 67
RUB – – 316 48
Total 10,641 13,898
Translation exposure
Translation exposure relates to the currency risks that arise due to the
translation of the subsidiaries’ statements on financial position from local
currency to SEK.
When the subsidiaries' statements of financial position in local currency are
translated into SEK a translation difference arises that is due to the current
year being translated at a different closing rate than last year and that the
comprehensive income statement is translated at the average rate during
the year whereas the statement of financial position is translated at the
closing rate at December 31. The translation differences are reported
against other comprehensive income. The translation exposure consists of
the risk that the translation difference represents in terms of impact on
comprehensive income. The risk is largest for the currencies where the
Group has the largest net assets and where the exchange rate movements
against SEK are largest. The Group’s net assets or liabilities for the major
currencies are distributed as follows:
The assets and liabilities in EUR and DKK are seen together since the rate
for DKK is fixed against the EUR.
The translation differences are a central
responsibility and are managed by distributing
the loans on different currencies based on the
net assets in each currency and through cross
currency swaps. Loans taken in the same cur-
rency as there are net assets in the Group,
decrease these net assets and thereby
decrease the translation exposure.
These hedges of net investments in foreign
operations work in the following way. Exchange
gains and losses on loans denominated in foreign
currencies that finance acquisitions of foreign
subsidiaries are reported as a part of other
comprehensive income if the loans act as a
hedge to the acquired net assets. In other
comprehensive income they offset the transla-
tion adjustments resulting from the consolida-
tion of the foreign subsidiaries. In the Group,
net exchange differences of SEK 313 (-288)
million relating to debts in foreign currencies
have been charged to other comprehensive
income as hedges of net investments in foreign
operations. The loans that hedge net invest-
ments in foreign operations are denominated
in EUR and USD since these foreign curren-
cies have the largest impact on the statement
of financial position. Since the Group uses part
of its cash flows to amortise the loans in order
to improve the financial net, the extent of this
hedge tends to decrease over time. A change
in the net assets of the foreign subsidiary over
time can have the same effect.
-3,000
0
3,000
6,000
9,000
12,000
15,000
18,000
Net assets Net liabilities
NO
K
SE
K
CN
Y
INR
EU
R/D
KK
JP
Y
PLN
BR
L
HK
D
KR
W
CA
D
Oth
er
US
D
SEK
millions
Net assets and liabilities by currency
AL_20_BAKVAGN_EN.indd 110 2021-03-25 12:41

111
Risk Explanation Mitigation
Interest risk By interest risk is meant how changes in the interest level affect the financial
net of the Group and how the value of financial instruments vary due to
changes in market interest rates.
At December 31, 2020, the total debt portfolio of SEK 9,168 (12,022) million
was split on loans with fixed interest of SEK 8,040 (8,335) and loans with
floating interest rates of SEK 1,128 (3,687) million.
The average interest and currency duration for all loans including derivatives
was 26.1 (30.1) months at the end of 2020.
Calculated on an overall increase of market rates by 100 basis points (1
percentage unit), the interest net of the Group would change according to
the bar chart below. The reason why it is an income is that large parts of the
cash and cash equivalents and the current deposits have floating interest rates.
The Group attempts to manage the interest risk by:
– seeking a balance between floating and fixed
interest rates in the debt portfolio and
– using derivative financial instruments such as
interest rate swaps.
The high portion of loans with fixed interest rate
at December 31, 2020 meant a low interest risk.
The treasury policy states that:
– the interest rate risk is measured separately for
each main currency and for the total debt; and
– the average interest duration for the total
portfolio should be between 6 and 36 months.
The senior credit facility and the bilateral term loans
accrue interest at floating rate. At the end of 2020
the only remaining loan was accruing interest at
0.43 %. The corresponding figure for 2019 was
a range of 0.10 % – 2.73 %. The average interest
rate at the end of 2020 was 0.43 (1.25) percent.
The interest for the loan with floating interest rates
was fixed at December 15, 2020 for the remaining
term, which is the reason why no loans with
floating interest rates were hedged to fixed interest
rate at December 31, 2020. At December 31,
2019, 16 percent of the loans with floating
interest rate were hedged to fixed interest rate,
with a duration of 3.0 months. The duration
was shorter than 6 months both in 2020 and
2019 due to the upcoming maturity of loans.
0
10
20
30
40
50
60
20202019
Hedging %
of floating rates
56
20
0
5
10
15
20
25
30
SEK millions %
Interest sensitivity analysis versus hedging % of floating rates
Effect on interest costs/income
at 1% increase in market rates
Market risk Market risk is defined as the risk for changes in the value of a financial
instrument due to changed market prices. This applies only to financial
instruments that are listed or otherwise traded, which for Alfa Laval concern
bonds and other securities and other long-term securities totalling SEK
2,941 (732) million.
The market risk for these is perceived as low.
For other financial instruments, the price risk
only consists of currency risk and interest risk.
Liquidity risk and
refinancing risk
Liquidity risk is defined as the risk that the Group would incur increased
costs due to lack of liquid funds.
Refinancing risk is defined as the risk that the refinancing of maturing loans
becomes difficult or costly.
In summary the maturity structure of the loans and the loan facilities is as
follows:
Alfa Laval Treasury International is responsible
for ensuring that:
– the Group has a sufficient liquidity reserve,
including cash & bank, short-term investments
and unutilized committed credit facilities,
– maximum 50 percent of the outstanding debt
matures within the coming 12 month period and
– the remaining average credit duration of the
total debt portfolio exceeds 2 years.
The loans of the Group are mainly long-term and
only mature when the agreed loan period expires.
Since the maturity of the loans is distributed over
time the refinancing risk is reduced.
As of April 17, 2020, Alfa Laval has a new senior
credit facility with an extended banking syndicate
of EUR 900 million corresponding to SEK 9,077
million at December 31, 2020. The facility was
not utilised at December 31, 2020. It matures in
June 2022.
The commercial paper programme of SEK 2,000
million was not utilised at December 31, 2020.
The corporate bonds are listed on the Irish stock
exchange and consist of one tranche of EUR 500
million that matures in September 2022 and one
tranche of EUR 300 million that matures in June
2024, corresponding to SEK 8,040 million in total.
Alfa Laval has a bilateral term loan with Swedish
Export Credit of EUR 100 million that matures in
June 2021, corresponding to SEK 1,008 million.
The loan of USD 136 million that matured on
June 23, 2020 has been repaid.
The bilateral term loan of SEK 2,000 million with
SEB and Nordea maturing in December 2021
was repaid already at December 23, 2020.
The loan from the European Investment Bank of
EUR 115 million maturing in June 2021 was
repaid already at March 4, 2020.
Corporate bonds
Swedish Export credit
Local Facilities
Local Facilities
Senior Facility
Corporate bonds
Non committed – Utilised
Committed
Committed & Utilised
Maturity year
SEK millions
Maturity structure of Group funding
0
2,000
4,000
6,000
8,000
10,000
12,000
14,000
16,000
18,000
20,000
2023 202420222021
Ris
ks
AL_20_BAKVAGN_EN.indd 111 2021-03-25 12:41
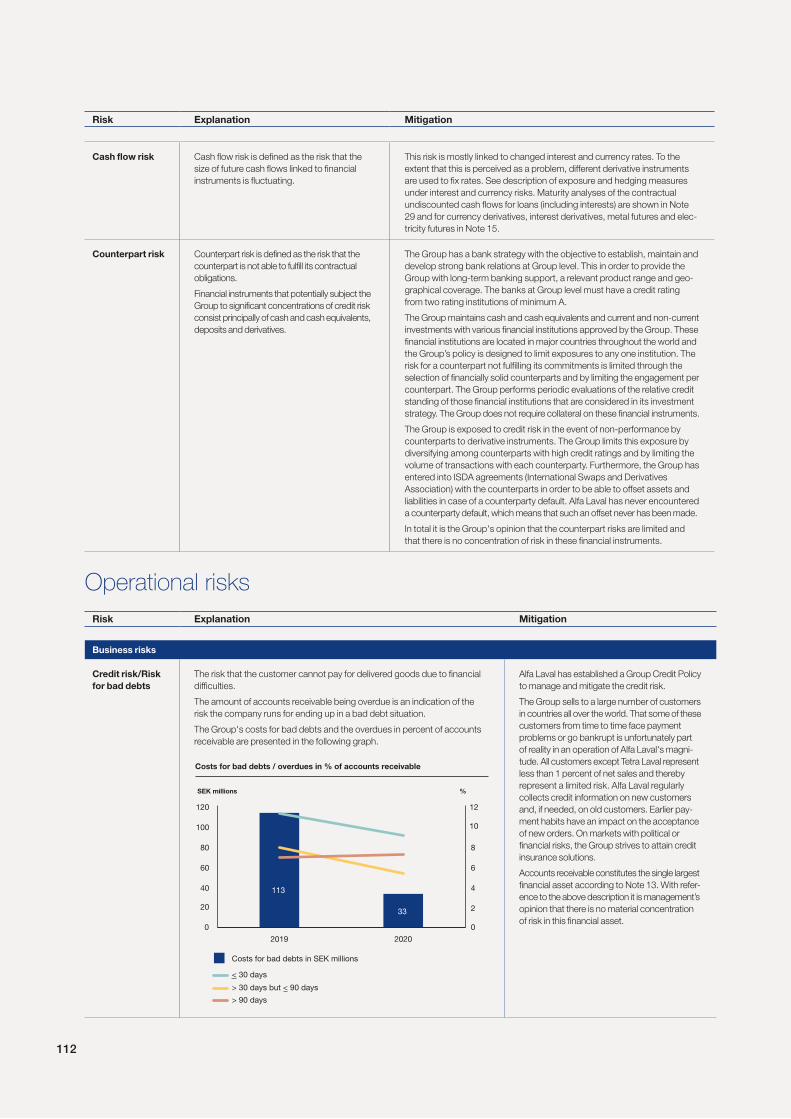
112
Operational risks
Risk Explanation Mitigation
Cash flow risk Cash flow risk is defined as the risk that the
size of future cash flows linked to financial
instruments is fluctuating.
This risk is mostly linked to changed interest and currency rates. To the
extent that this is perceived as a problem, different derivative instruments
are used to fix rates. See description of exposure and hedging measures
under interest and currency risks. Maturity analyses of the contractual
undiscounted cash flows for loans (including interests) are shown in Note
29 and for currency derivatives, interest derivatives, metal futures and elec-
tricity futures in Note 15.
Counterpart risk Counterpart risk is defined as the risk that the
counterpart is not able to fulfill its contractual
obligations.
Financial instruments that potentially subject the
Group to significant concentrations of credit risk
consist principally of cash and cash equivalents,
deposits and derivatives.
The Group has a bank strategy with the objective to establish, maintain and
develop strong bank relations at Group level. This in order to provide the
Group with long-term banking support, a relevant product range and geo-
graphical coverage. The banks at Group level must have a credit rating
from two rating institutions of minimum A.
The Group maintains cash and cash equivalents and current and non-current
investments with various financial institutions approved by the Group. These
financial institutions are located in major countries throughout the world and
the Group’s policy is designed to limit exposures to any one institution. The
risk for a counterpart not fulfilling its commitments is limited through the
selection of financially solid counterparts and by limiting the engagement per
counterpart. The Group performs periodic evaluations of the relative credit
standing of those financial institutions that are considered in its investment
strategy. The Group does not require collateral on these financial instruments.
The Group is exposed to credit risk in the event of non-performance by
counterparts to derivative instruments. The Group limits this exposure by
diversifying among counterparts with high credit ratings and by limiting the
volume of transactions with each counterparty. Furthermore, the Group has
entered into ISDA agreements (International Swaps and Derivatives
Association) with the counterparts in order to be able to offset assets and
liabilities in case of a counterparty default. Alfa Laval has never encountered
a counterparty default, which means that such an offset never has been made.
In total it is the Group's opinion that the counterpart risks are limited and
that there is no concentration of risk in these financial instruments.
Risk Explanation Mitigation
Business risks
Credit risk/Risk
for bad debts
The risk that the customer cannot pay for delivered goods due to financial
difficulties.
The amount of accounts receivable being overdue is an indication of the
risk the company runs for ending up in a bad debt situation.
The Group's costs for bad debts and the overdues in percent of accounts
receivable are presented in the following graph.
Alfa Laval has established a Group Credit Policy
to manage and mitigate the credit risk.
The Group sells to a large number of customers
in countries all over the world. That some of these
customers from time to time face payment
problems or go bankrupt is unfortunately part
of reality in an operation of Alfa Laval's magni-
tude. All customers except Tetra Laval represent
less than 1 percent of net sales and thereby
represent a limited risk. Alfa Laval regularly
collects credit information on new customers
and, if needed, on old customers. Earlier pay-
ment habits have an impact on the acceptance
of new orders. On markets with political or
financial risks, the Group strives to attain credit
insurance solutions.
Accounts receivable constitutes the single largest
financial asset according to Note 13. With refer-
ence to the above description it is management’s
opinion that there is no material concentration
of risk in this financial asset.
Costs for bad debts in SEK millions
< 30 days
> 30 days but < 90 days
> 90 days
0
20
40
60
80
100
120
20202019
33
113
0
2
4
6
8
10
12
SEK millions %
Costs for bad debts / overdues in % of accounts receivable
AL_20_BAKVAGN_EN.indd 112 2021-03-25 12:41

113
Risk Explanation Mitigation
Risk for claims The risk for the costs Alfa Laval would incur to rectify faults in products or
systems and possible costs for penalties.
The Group's net claim costs and their relation to net sales are found in the
following graph.
Alfa Laval strives to minimize these costs through
an ISO certified quality assurance. The major
risks for claim costs appear in connection with
new technical solutions and new applications.
The risks are limited through extensive tests at
the manufacturing site and at the customer site.
Costs for claims & warranty in SEK millions
Claims & warranty in % of net sales
0
100
200
300
400
500
600
20202019
422549
0
0.5
1.0
1.5
2.0
2.5
3.0
SEK millions %
Claim costs in SEK millions and in % of net sales
Economic risk
Competition The Group operates in competitive markets, which can impact the company’s
development negatively.
In order to address this competition, the
Group has for instance:
– organized the operations into divisions
based on business units in order to get a
customer focused market penetration;
– a strategy for acquisition of businesses in
order to for instance reinforce the presence
on certain markets or widen the Group’s
product offering;
– worked with creating a competitive cost level
based on its international presence; and
– worked with securing the availability of stra-
tegic metals and components in order to
maintain the ability to deliver.
Business climate In an overall economic downturn, the Group tends to be affected with a
delay of six to twelve months depending on business division. The same
applies with an economic upturn.
The fact that the Group is operating on a large
number of geographical markets and within a
wide range of business units means a diversifi-
cation that limits the effects of fluctuations in the
business climate. Historically, fluctuations in the
business climate have not generated decreas-
es in orders received by more than approxi-
mately 10–15 percent. The downturn in the
business climate in 2009 and 2010 however
meant a considerably larger decline in order
intake. This was partly due to the fact that the
decline happened abruptly from a very high
level of demand that was the culmination of a
long-lasting boom and that the price level in
connection with this peak was inflated by sub-
stantial increases in raw material prices.
Pandemics The outbreak of the COVID-19 pandemic proved to have a large impact on
the world economy and the international business climate. Lockdowns in
many regions within countries or in entire countries have during certain
periods limited Alfa Laval’s ability to visit potential customers and perform
service on site at customers but has only to a limited extent impacted the
company’s supply chain and ability to manufacture products.
Future pandemics can, depending on the rate of the spread of the infection
and the risk for severe illness and death have smaller or larger consequences
than COVID-19.
Global and local crisis management work and
obedience to advice, instructions and rules
from authorities are important to be able to short
and long term handle the consequenses of the
pandemic.
Cost reduction programmes and the flexibility in
different national work time reduction schemes
are important components to reduce costs to
match the declining revenues.
Employees outside the manufacturing have to
a large extent been able to work from home.
Travelling has been severely restricted and has to
a large extent been replaced by digital meetings.
Ris
ks
AL_20_BAKVAGN_EN.indd 113 2021-03-25 12:41

114
Year
Year
Year
0
5,000
10,000
15,000
20,000
25,000
13 14 15 16 17 18 19 20
13 14 15 16 17 18 19 20
13 14 15 16 17 18 19 20
0
2,000
4,000
6,000
8,000
10,000
0
500
1,000
1,500
2,000
2,500
3,000
USD/ton
USD/ton
USD/ton
Nickel
Copper
Aluminium
Risk Explanation Mitigation
Commodity prices The Group depends on deliveries of stainless steel, carbon steel, cop-
per and titanium etc and on electricity for the manufacture of products.
The prices in some of these markets are volatile and the supply of tita-
nium has occasionally been limited. There are a limited number of pos-
sible suppliers of titanium. The risk for severely increased prices or lim-
ited supply constitutes serious risks for the operations. The possibilities
to pass on higher input prices to an end customer vary from time to
time and between different markets depending on the competition.
The below graph below shows how much of the purchases of nickel
and copper that have been hedged during 2020 and how much of the
expected purchases during 2021 that were hedged at the end of 2020.
The graph also presents to what extent the Group’s costs for these pur-
chases during 2021 would be affected if the prices would double from
the level at December 31, 2020.
The Group is addressing this risk by securing long-
term supply commitments and through fixed prices
from the suppliers during six to twelve months and
through derivatives for metals and electricity.
For metals:
– The exposures for the coming 12 months of expected
flows must be hedged between 30–70 percent.
– In certain situations, exposures beyond 12 months
can also be hedged.
For electricity the coming 12 months’ expected expo-
sure shall be hedged between 30–90 percent and the
coming 13–24 months can be hedged up to 80 percent.
During periods of large price increases the customer
price on titanium products has been linked to Alfa
Laval’s procurement costs for titanium. Primarily in the
period 2007 to 2011 the Group experienced large
price fluctuations for many raw materials, but in par-
ticular for stainless steel, carbon steel, copper and
titanium. The price volatility for the most important
metals is presented below.
The Group uses metal futures to secure the price on
strategic metals.
Cost increase if current metal prices
increase by 100%, without hedging
Cost increase if current metal prices
increase by 100%, with hedging
Hedging 2020
Hedging 2021
0
150
300
450
600
750
CopperNickel
0
15
30
45
60
75
SEK millions %
Sensitivity analysis and metal price hedging
AL_20_BAKVAGN_EN.indd 114 2021-03-25 12:41
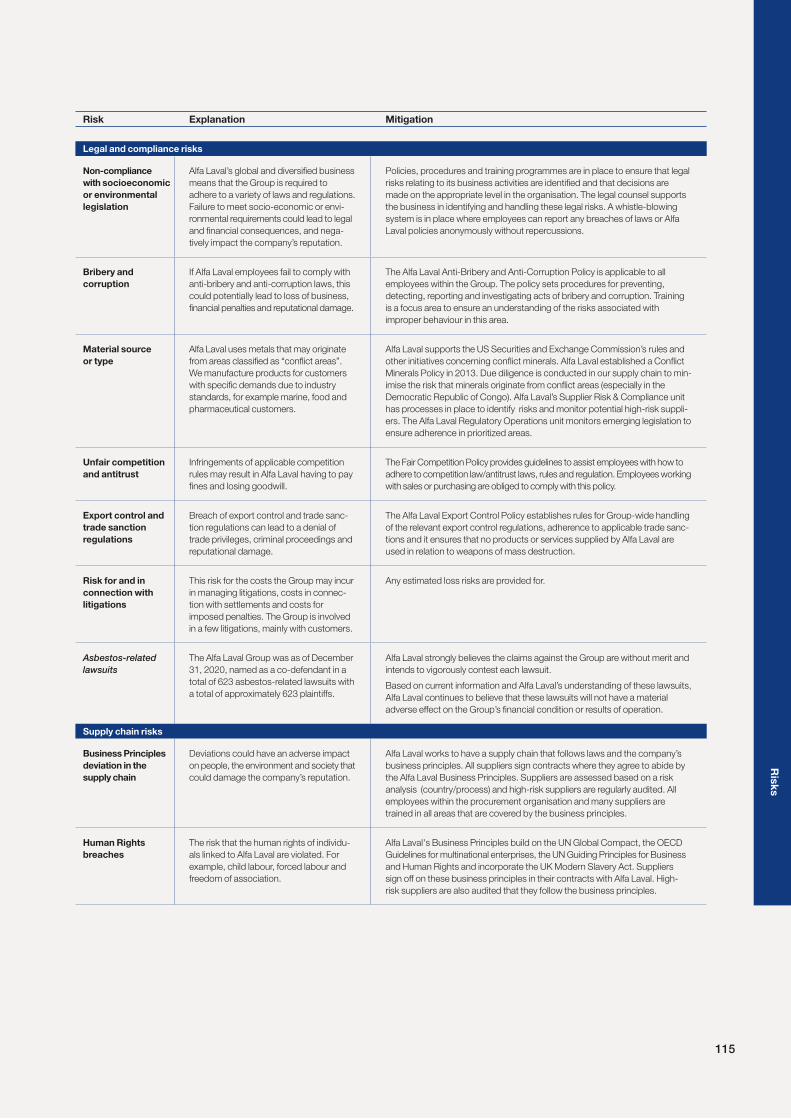
115
Risk Explanation Mitigation
Legal and compliance risks
Non-compliance
with socioeconomic
or environmental
legislation
Alfa Laval’s global and diversified business
means that the Group is required to
adhere to a variety of laws and regulations.
Failure to meet socio-economic or envi-
ronmental requirements could lead to legal
and financial consequences, and nega-
tively impact the company’s reputation.
Policies, procedures and training programmes are in place to ensure that legal
risks relating to its business activities are identified and that decisions are
made on the appropriate level in the organisation. The legal counsel supports
the business in identifying and handling these legal risks. A whistle-blowing
system is in place where employees can report any breaches of laws or Alfa
Laval policies anonymously without repercussions.
Bribery and
corruption
If Alfa Laval employees fail to comply with
anti-bribery and anti-corruption laws, this
could potentially lead to loss of business,
financial penalties and reputational damage.
The Alfa Laval Anti-Bribery and Anti-Corruption Policy is applicable to all
employees within the Group. The policy sets procedures for preventing,
detecting, reporting and investigating acts of bribery and corruption. Training
is a focus area to ensure an understanding of the risks associated with
improper behaviour in this area.
Material source
or type
Alfa Laval uses metals that may originate
from areas classified as “conflict areas”.
We manufacture products for customers
with specific demands due to industry
standards, for example marine, food and
pharmaceutical customers.
Alfa Laval supports the US Securities and Exchange Commission’s rules and
other initiatives concerning conflict minerals. Alfa Laval established a Conflict
Minerals Policy in 2013. Due diligence is conducted in our supply chain to min-
imise the risk that minerals originate from conflict areas (especially in the
Democratic Republic of Congo). Alfa Laval’s Supplier Risk & Compliance unit
has processes in place to identify risks and monitor potential high-risk suppli-
ers. The Alfa Laval Regulatory Operations unit monitors emerging legislation to
ensure adherence in prioritized areas.
Unfair competition
and antitrust
Infringements of applicable competition
rules may result in Alfa Laval having to pay
fines and losing goodwill.
The Fair Competition Policy provides guidelines to assist employees with how to
adhere to competition law/antitrust laws, rules and regulation. Employees working
with sales or purchasing are obliged to comply with this policy.
Export control and
trade sanction
regulations
Breach of export control and trade sanc-
tion regulations can lead to a denial of
trade privileges, criminal proceedings and
reputational damage.
The Alfa Laval Export Control Policy establishes rules for Group-wide handling
of the relevant export control regulations, adherence to applicable trade sanc-
tions and it ensures that no products or services supplied by Alfa Laval are
used in relation to weapons of mass destruction.
Risk for and in
connection with
litigations
This risk for the costs the Group may incur
in managing litigations, costs in connec-
tion with settlements and costs for
imposed penalties. The Group is involved
in a few litigations, mainly with customers.
Any estimated loss risks are provided for.
Asbestos-related lawsuits
The Alfa Laval Group was as of December
31, 2020, named as a co-defendant in a
total of 623 asbestos-related lawsuits with
a total of approximately 623 plaintiffs.
Alfa Laval strongly believes the claims against the Group are without merit and
intends to vigorously contest each lawsuit.
Based on current information and Alfa Laval’s understanding of these lawsuits,
Alfa Laval continues to believe that these lawsuits will not have a material
adverse effect on the Group’s financial condition or results of operation.
Supply chain risks
Business Principles
deviation in the
supply chain
Deviations could have an adverse impact
on people, the environment and society that
could damage the company’s reputation.
Alfa Laval works to have a supply chain that follows laws and the company’s
business principles. All suppliers sign contracts where they agree to abide by
the Alfa Laval Business Principles. Suppliers are assessed based on a risk
analysis (country/process) and high-risk suppliers are regularly audited. All
employees within the procurement organisation and many suppliers are
trained in all areas that are covered by the business principles.
Human Rights
breaches
The risk that the human rights of individu-
als linked to Alfa Laval are violated. For
example, child labour, forced labour and
freedom of association.
Alfa Laval's Business Principles build on the UN Global Compact, the OECD
Guidelines for multinational enterprises, the UN Guiding Principles for Business
and Human Rights and incorporate the UK Modern Slavery Act. Suppliers
sign off on these business principles in their contracts with Alfa Laval. High-
risk suppliers are also audited that they follow the business principles.
Ris
ks
AL_20_BAKVAGN_EN.indd 115 2021-03-25 12:41

116
Risk Explanation Mitigation
Production or product related risks
Risk connected
to technical
development
The risk that a competitor develops a new
technical solution that makes Alfa Laval's
products technically obsolete and there-
fore difficult to sell.
Alfa Laval makes a deliberate investment in research and development aiming
at being in the absolute frontline of technical development.
Risk for technically
related damages
The risk for the costs Alfa Laval may incur
in connection with a product delivered by
the Group breaking down and causing
damages to life and property. The main
risk in this context concerns high-speed
separators, due to the large forces that
are involved when the bowl in the separa-
tor spins with a very high number of revo-
lutions. In a breakdown the damages can
be extensive.
Alfa Laval makes extensive testing and has an ISO certified quality assurance.
The Group has product liability insurance. The number of damages is low and
few damages have occurred historically.
Health & Safety Health and safety risks such as occupa-
tional diseases and accidents. The risk
that an employee is injured or killed in a
workplace accident.
The Alfa Laval Occupational Health & Safety (OHS) Policy guides the work
together with our OHS Manual. The purpose with these is to safeguard a
healthy and safe working environment by preventing accidents, occupational
diseases and other health risks. We have a process to continuously monitor
high-risk areas in our operations, train employees and enforce changes.
Environmental risks
Major environ-
mental incident
at a site
An incident that causes a significant envi-
ronmental damage could lead to long-term
environmental impact, negative impact on
people, fines and reputational damage to
the company.
The Alfa Laval Environmental Policy is applicable to the entire Alfa Laval Group.
Environmental performance is monitored and measured through
Environmental Management Systems. The large sites are ISO 14001 certified.
Smaller sites work according to Environmental Management Systems where
risks are identified, and effective countermeasures are implemented.
Use of hazardous
chemicals
Using hazardous chemicals could lead to
severe illness or have a serious negative
impact on our environment or society.
The Alfa Laval Group Black and Grey Chemicals List is the primary tool to control
the use of chemical substances. This list compiles substances that are classi-
fied as banned, very high concern or concern. The list is based on EU legisla-
tions, such as REACH and RoHS, and global agreements such as for example
POPs and IMO. The list is updated each year to reflect any legislative changes.
Climate and water Climate change could lead to increased
costs and constrain production. Water
scarcity in the supply chain or at our sites
can constrain production. Cost of energy
or carbon emissions can increase due to
climate legislation.
Alfa Laval does not use significant amounts of energy in its production. To
continuously improve, we have targets to both increase energy efficiency and
to reduce carbon emissions. Alfa Laval production is not water intensive and
most water facilities are closed loop. The Environmental Strategy for 2020
includes targets for all three areas. Read more in the Environment chapter in
Alfa Laval’s Sustainability Report.
IT related risks
Loss of intellectual
property, financial
or personal data
Loss of intellectual property, financial or
personal data due to for instance
un authorized access to Alfa Laval's
computer systems.
Alfa Laval holds compulsory trainings on information security awareness. Policies
describe what is confidential information and how the information should be
classified. Alfa Laval’s IT agreements contain the necessary Information Security
components. Information security is also monitored in our project model – feasibility,
pre-study and project. A template is also sent at an early stage to all potential
suppliers to identify if there are any possible infringements of information security.
AL_20_BAKVAGN_EN.indd 116 2021-03-25 12:41
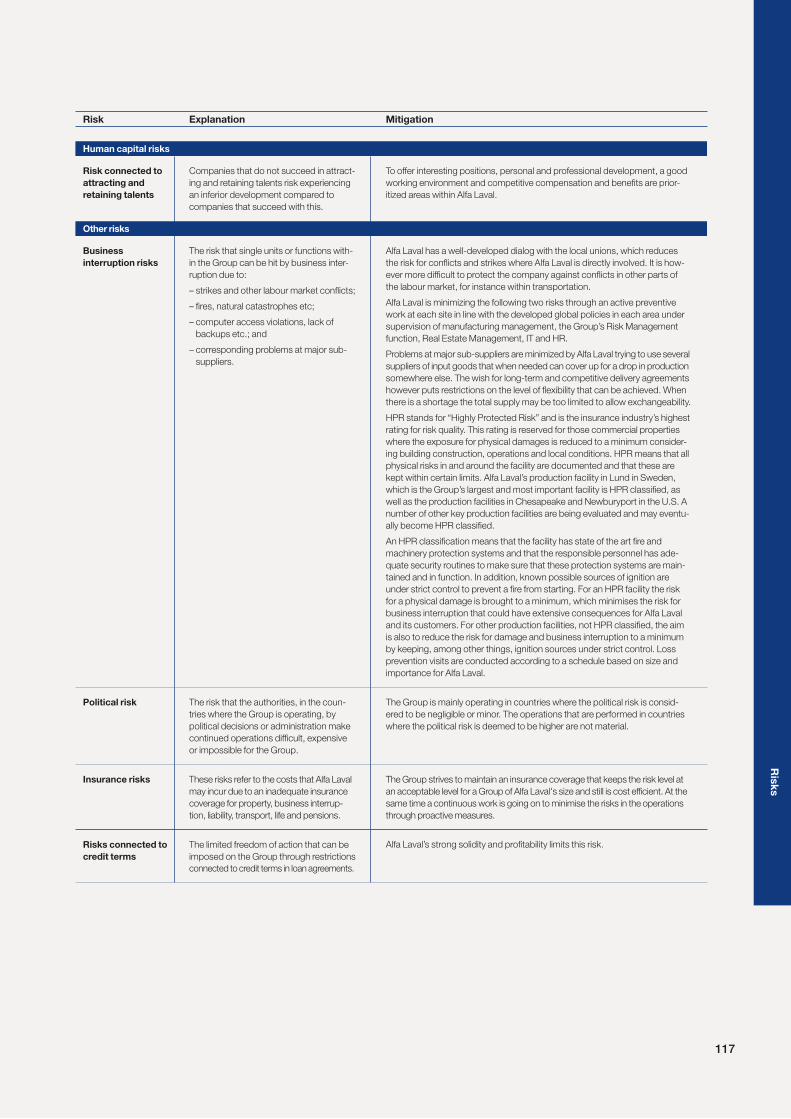
117
Risk Explanation Mitigation
Human capital risks
Risk connected to
attracting and
retaining talents
Companies that do not succeed in attract-
ing and retaining talents risk experiencing
an inferior development compared to
companies that succeed with this.
To offer interesting positions, personal and professional development, a good
working environment and competitive compensation and benefits are prior-
itized areas within Alfa Laval.
Other risks
Business
interruption risks
The risk that single units or functions with-
in the Group can be hit by business inter-
ruption due to:
– strikes and other labour market conflicts;
– fires, natural catastrophes etc;
– computer access violations, lack of
backups etc.; and
– corresponding problems at major sub-
suppliers.
Alfa Laval has a well-developed dialog with the local unions, which reduces
the risk for conflicts and strikes where Alfa Laval is directly involved. It is how-
ever more difficult to protect the company against conflicts in other parts of
the labour market, for instance within transportation.
Alfa Laval is minimizing the following two risks through an active preventive
work at each site in line with the developed global policies in each area under
supervision of manufacturing management, the Group’s Risk Management
function, Real Estate Management, IT and HR.
Problems at major sub-suppliers are minimized by Alfa Laval trying to use several
suppliers of input goods that when needed can cover up for a drop in production
somewhere else. The wish for long-term and competitive delivery agreements
however puts restrictions on the level of flexibility that can be achieved. When
there is a shortage the total supply may be too limited to allow exchangeability.
HPR stands for “Highly Protected Risk” and is the insurance industry’s highest
rating for risk quality. This rating is reserved for those commercial properties
where the exposure for physical damages is reduced to a minimum consider-
ing building construction, operations and local conditions. HPR means that all
physical risks in and around the facility are documented and that these are
kept within certain limits. Alfa Laval’s production facility in Lund in Sweden,
which is the Group’s largest and most important facility is HPR classified, as
well as the production facilities in Chesapeake and Newburyport in the U.S. A
number of other key production facilities are being evaluated and may eventu-
ally become HPR classified.
An HPR classification means that the facility has state of the art fire and
machinery protection systems and that the responsible personnel has ade-
quate security routines to make sure that these protection systems are main-
tained and in function. In addition, known possible sources of ignition are
under strict control to prevent a fire from starting. For an HPR facility the risk
for a physical damage is brought to a minimum, which minimises the risk for
business interruption that could have extensive consequences for Alfa Laval
and its customers. For other production facilities, not HPR classified, the aim
is also to reduce the risk for damage and business interruption to a minimum
by keeping, among other things, ignition sources under strict control. Loss
prevention visits are conducted according to a schedule based on size and
importance for Alfa Laval.
Political risk The risk that the authorities, in the coun-
tries where the Group is operating, by
political decisions or administration make
continued operations difficult, expensive
or impossible for the Group.
The Group is mainly operating in countries where the political risk is consid-
ered to be negligible or minor. The operations that are performed in countries
where the political risk is deemed to be higher are not material.
Insurance risks These risks refer to the costs that Alfa Laval
may incur due to an inadequate insurance
coverage for property, business interrup-
tion, liability, transport, life and pensions.
The Group strives to maintain an insurance coverage that keeps the risk level at
an acceptable level for a Group of Alfa Laval's size and still is cost efficient. At the
same time a continuous work is going on to minimise the risks in the operations
through proactive measures.
Risks connected to
credit terms
The limited freedom of action that can be
imposed on the Group through restrictions
connected to credit terms in loan agreements.
Alfa Laval’s strong solidity and profitability limits this risk.
Ris
ks
AL_20_BAKVAGN_EN.indd 117 2021-03-25 12:41

118
NotesNote 1. Operating segments
Alfa Laval's business is divided into three Business Divisions ”Energy”, ”Food
& Water” and ”Marine” that sell to external customers and are responsible
for the manufacturing of the products and one division “Operations & Other”
covering procurement and logistics as well as corporate overhead and non-
core businesses. These four divisions constitute Alfa Laval’s four operating
segments. The former ”Greenhouse” Division ceased to exist as per the end
of 2019 when the last operations were divested.
The customers to the Energy Division purchase products and systems for
energy applications, whereas the customers to the Food & Water Division
purchase products and systems for food and water applications. The cus-
tomers to the Marine Division purchase products and systems for marine
and offshore applications.
The three first Business Divisions are in turn split into a number of Business
Units. The Energy Division consists of four Business Units: Brazed & Fusion
Bonded Heat Exchangers, Energy Separation, Gasketed Plate Heat Exchangers
and Welded Heat Exchangers. The Food & Water Division consists of five
Business Units: Decanters, Food Heat Transfer, Food Systems, Hygienic
Fluid Handling and High Speed Separators. The Marine Division consists of
four Business Units: Boiler Systems, Gas Systems, Marine Separation &
Heat Transfer Equipment and Pumping Systems.
The operating segments are only responsible for the result down to and in-
cluding operating income excluding comparison distortion items and for the
operating capital they are managing. This means that financial assets and liabilities,
pension assets, provisions for pensions and similar commitments and current and
deferred tax assets and liabilities are a Corporate responsibility and not an operating
segment responsibility. This also means that the financial net and income taxes
are a Corporate responsibility and not an operating segment responsibility.
The operating segments are only measured based on their transactions
with external parties.
Organisational change
As of January 1, 2020, the product groups within Operations have been moved
over to the Business Units within the Divisions. This gives the Business Units
a clearer financial consolidation as a part of a more decentralised business
organisation. Due to this the comparison figures for previous periods have been
restated, which has impacted depreciation and amortisation, investments,
assets, liabilities and number of employees by division. Remaining in Operations
is procurement, logistics, distribution and production development.
The depreciation and amortisation that have been moved from Operations to
the Divisions in the comparison periods have not impacted the operating income
in the Divisions.
Orders received
Consolidated
SEK millions 2020 2019
Energy 11,952 13,963
Food & Water 13,814 14,026
Marine 14,067 15,953
Greenhouse – 105
Operations & Other 0 72
Total 39,833 44,119
Order backlog
Consolidated
SEK millions 2020 2019
Energy 4,740 5,214
Food & Water 5,056 4,894
Marine 9,173 11,443
Greenhouse – 0
Operations & Other 0 0
Total 18,969 21,551
Net sales
Consolidated
SEK millions 2020 2019
Energy 12,187 13,814
Food & Water 13,414 14,189
Marine 15,867 17,993
Greenhouse – 444
Operations & Other 0 77
Total 41,468 46,517
Operating income in management accounts
Consolidated
SEK millions 2020 2019
Energy 1,882 2,069
Food & Water 2,371 2,268
Marine 2,758 3,425
Greenhouse – -30
Operations & Other -629 -742
Total 6,382 6,990
Reconciliation with Group total:
Comparison distortion items -796 189
Consolidation adjustments * -6 19
Total operating income 5,580 7,198
Financial net -603 23
Result after financial items 4,977 7,221
* Difference between management accounts and IFRS.
Operating income in management accounts is very close to operating income
under IFRS. There are only two differences. Operating income in management
accounts does not include comparison distortion items nor all the consolidation
adjustments that are made in the official accounts.
Assets / Liabilities
Consolidated Assets Liabilities
SEK millions 2020 2019 * 2020 2019 *
Energy 12,726 14,570 5,574 5,890
Food & Water 11,226 12,522 5,184 5,088
Marine 24,086 27,796 6,695 8,481
Greenhouse – 39 – 71
Operations & Other 1,276 1,613 522 564
Subtotal 49,314 56,540 17,975 20,094
Corporate 11,546 7,856 13,814 16,555
Total 60,860 64,396 31,789 36,649
* Restated due to the organisational change described earlier in the note.
Corporate refers to items in the statement on financial position that are interest
bearing or are related to taxes.
Investments
Consolidated
SEK millions 2020 2019 *
Energy 352 453
Food & Water 295 288
Marine 137 177
Greenhouse – 5
Operations & Other 448 414
Total 1,232 1,337
* Restated due to the organisational change described earlier in the note.
Depreciation
Consolidated
SEK millions 2020 2019 *
Energy 452 467
Food & Water 384 385
Marine 814 884
Greenhouse – 8
Operations & Other 339 309
Total 1,989 2,053
* Restated due to the organisational change described earlier in the note.
AL_20_BAKVAGN_EN.indd 118 2021-03-25 12:41

119
No
tes
Note 2. Information about geographical areas
Countries with more than 10 percent of either net sales, non-current assets
or investments are reported separately.
Net sales
Consolidated
2020 2019
SEK millions % SEK millions %
To customers in:
Sweden 989 2.4 981 2.1
Other EU 11,205 27.0 11,811 25.4
Other Europe 3,247 7.8 3,356 7.2
USA 5,923 14.3 7,390 15.9
Other North America 946 2.3 1,062 2.3
Latin America 1,630 3.9 2,060 4.4
Africa 418 1.0 490 1.1
China 6,180 15.0 6,582 14.1
South Korea 3,456 8.3 4,210 9.1
Other Asia 6,984 16.8 8,112 17.4
Oceania 490 1.2 463 1.0
Total 41,468 100.0 46,517 100.0
Net sales are reported by country on the basis of invoicing address, which is
normally the same as the delivery address.
Non-current assets
Consolidated
2020 2019
SEK millions % SEK millions %
Sweden 2,344 7.1 2,207 6.3
Denmark 4,806 14.4 5,044 14.3
Other EU 4,046 12.2 4,209 11.9
Norway 11,172 33.6 12,847 36.4
Other Europe 117 0.4 137 0.4
USA 3,343 10.1 4,468 12.7
Other North America 130 0.4 150 0.4
Latin America 202 0.6 313 0.9
Africa 9 0.0 12 0.0
Asia 3,523 10.6 3,741 10.6
Oceania 110 0.3 130 0.4
Subtotal 29,802 89.7 33,258 94.3
Other long-term securities 1,575 4.7 141 0.4
Pension assets 70 0.2 70 0.2
Deferred tax asset 1,791 5.4 1,801 5.1
Total 33,238 100.0 35,270 100.0
Investments
Consolidated
2020 2019
SEK millions % SEK millions %
Sweden 184 14.9 228 17.1
Denmark 135 11.0 116 8.7
Italy 298 24.2 98 7.3
Other EU 74 6.0 133 10.0
Other Europe 84 6.8 67 5.0
USA 69 5.6 242 18.1
Other North America 2 0.2 3 0.2
Latin America 7 0.6 20 1.5
Africa 0 0.0 1 0.1
China 254 20.6 324 24.2
Other Asia 122 9.9 100 7.5
Oceania 3 0.2 5 0.3
Total 1,232 100.0 1,337 100.0
Note 3. Information about products
and services
Net sales by product/service
Consolidated
SEK millions 2020 2019
Own products within:
Separation 7,116 7,677
Heat transfer 16,439 18,694
Fluid handling 9,156 10,361
Marine environmental 5,170 5,802
Other 1 78
Associated products 1,338 1,569
Services 2,248 2,336
Total 41,468 46,517
The split of own products within separation, heat transfer and fluid handling
is a reflection of the current three main technologies. Marine environmental is
a new large product area basically outside the main technologies. Other is
own products outside these four product areas. Associated products are
mainly purchased products that compliment Alfa Laval’s product offering.
Services cover all sorts of service, service agreements etc.
Note 4. Information about major customers
Alfa Laval does not have any customer that accounts for 10 percent or more
of net sales. Tetra Pak within the Tetra Laval Group is Alfa Laval's single larg-
est customer with a volume representing 4.7 (5.4) percent of net sales. See
Note 33 for more information.
Note 5. Employees
Average number of employees – total
Consolidated
Number of female
employees
Total number of
employees
2020 2019 2020 2019
Parent company – – – –
Subsidiaries in Sweden (8) 576 579 2,392 2,385
Total in Sweden (8) 576 579 2,392 2,385
Total abroad (122) 3,017 2,958 14,768 15,002
Total (130) 3,593 3,537 17,160 17,387
The figures in brackets in the text column state how many companies had
employees as well as salaries and remunerations in 2020.
Average number of employees – in Sweden by municipality
Consolidated
2020 2019
Botkyrka 575 546
Eskilstuna 232 231
Lund 1,155 1,172
Ronneby 275 281
Vänersborg 98 100
Other * 57 55
Total 2,392 2,385
* “Other” refers to municipalities with less than 10 employees and also includes employees at
branch offices abroad.
1
2
3
4
5
6
7
8
9
10
11
12
13
14
15
16
17
18
19
20
21
22
23
24
25
26
27
28
29
30
31
32
33
34
35
36
37
38
39
40
AL_20_BAKVAGN_EN.indd 119 2021-03-25 12:41
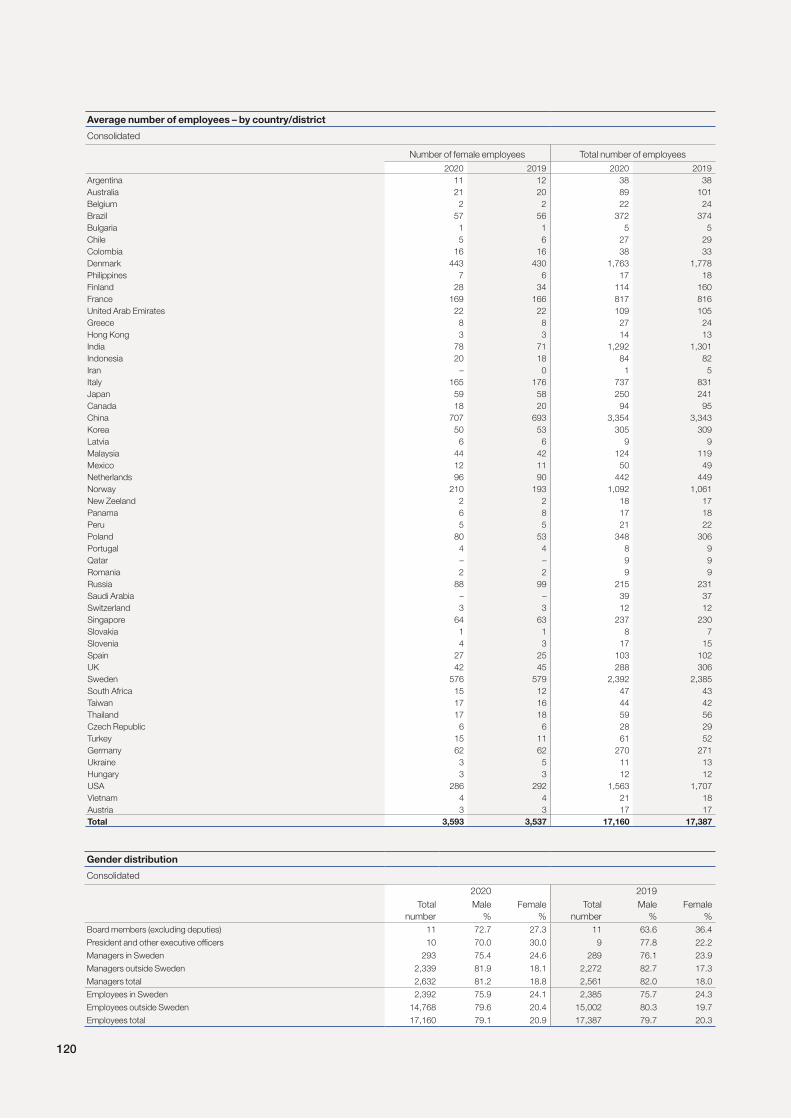
120
Average number of employees – by country/district
Consolidated
Number of female employees Total number of employees
2020 2019 2020 2019
Argentina 11 12 38 38
Australia 21 20 89 101
Belgium 2 2 22 24
Brazil 57 56 372 374
Bulgaria 1 1 5 5
Chile 5 6 27 29
Colombia 16 16 38 33
Denmark 443 430 1,763 1,778
Philippines 7 6 17 18
Finland 28 34 114 160
France 169 166 817 816
United Arab Emirates 22 22 109 105
Greece 8 8 27 24
Hong Kong 3 3 14 13
India 78 71 1,292 1,301
Indonesia 20 18 84 82
Iran – 0 1 5
Italy 165 176 737 831
Japan 59 58 250 241
Canada 18 20 94 95
China 707 693 3,354 3,343
Korea 50 53 305 309
Latvia 6 6 9 9
Malaysia 44 42 124 119
Mexico 12 11 50 49
Netherlands 96 90 442 449
Norway 210 193 1,092 1,061
New Zeeland 2 2 18 17
Panama 6 8 17 18
Peru 5 5 21 22
Poland 80 53 348 306
Portugal 4 4 8 9
Qatar – – 9 9
Romania 2 2 9 9
Russia 88 99 215 231
Saudi Arabia – – 39 37
Switzerland 3 3 12 12
Singapore 64 63 237 230
Slovakia 1 1 8 7
Slovenia 4 3 17 15
Spain 27 25 103 102
UK 42 45 288 306
Sweden 576 579 2,392 2,385
South Africa 15 12 47 43
Taiwan 17 16 44 42
Thailand 17 18 59 56
Czech Republic 6 6 28 29
Turkey 15 11 61 52
Germany 62 62 270 271
Ukraine 3 5 11 13
Hungary 3 3 12 12
USA 286 292 1,563 1,707
Vietnam 4 4 21 18
Austria 3 3 17 17
Total 3,593 3,537 17,160 17,387
Gender distribution
Consolidated
2020 2019
Total
number
Male
%
Female
%
Total
number
Male
%
Female
%
Board members (excluding deputies) 11 72.7 27.3 11 63.6 36.4
President and other executive officers 10 70.0 30.0 9 77.8 22.2
Managers in Sweden 293 75.4 24.6 289 76.1 23.9
Managers outside Sweden 2,339 81.9 18.1 2,272 82.7 17.3
Managers total 2,632 81.2 18.8 2,561 82.0 18.0
Employees in Sweden 2,392 75.9 24.1 2,385 75.7 24.3
Employees outside Sweden 14,768 79.6 20.4 15,002 80.3 19.7
Employees total 17,160 79.1 20.9 17,387 79.7 20.3
AL_20_BAKVAGN_EN.indd 120 2021-03-25 12:41
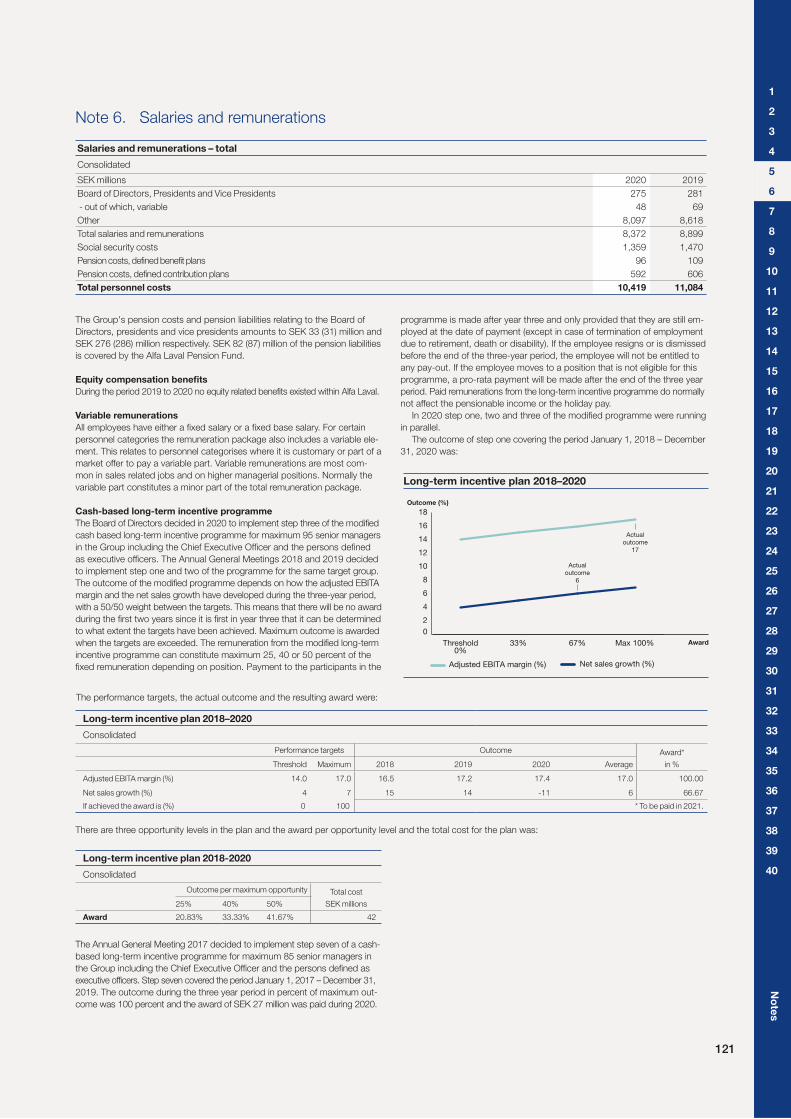
121
No
tes
Note 6. Salaries and remunerations
Salaries and remunerations – total
Consolidated
SEK millions 2020 2019
Board of Directors, Presidents and Vice Presidents 275 281
- out of which, variable 48 69
Other 8,097 8,618
Total salaries and remunerations 8,372 8,899
Social security costs 1,359 1,470
Pension costs, defined benefit plans 96 109
Pension costs, defined contribution plans 592 606
Total personnel costs 10,419 11,084
The Group's pension costs and pension liabilities relating to the Board of
Directors, presidents and vice presidents amounts to SEK 33 (31) million and
SEK 276 (286) million respectively. SEK 82 (87) million of the pension liabilities
is covered by the Alfa Laval Pension Fund.
Equity compensation benefits
During the period 2019 to 2020 no equity related benefits existed within Alfa Laval.
Variable remunerations
All employees have either a fixed salary or a fixed base salary. For certain
personnel categories the remuneration package also includes a variable ele-
ment. This relates to personnel categorises where it is customary or part of a
market offer to pay a variable part. Variable remunerations are most com-
mon in sales related jobs and on higher managerial positions. Normally the
variable part constitutes a minor part of the total remuneration package.
Cash-based long-term incentive programme
The Board of Directors decided in 2020 to implement step three of the modified
cash based long-term incentive programme for maximum 95 senior managers
in the Group including the Chief Executive Officer and the persons defined
as executive officers. The Annual General Meetings 2018 and 2019 decided
to implement step one and two of the programme for the same target group.
The outcome of the modified programme depends on how the adjusted EBITA
margin and the net sales growth have developed during the three-year period,
with a 50/50 weight between the targets. This means that there will be no award
during the first two years since it is first in year three that it can be determined
to what extent the targets have been achieved. Maximum outcome is awarded
when the targets are exceeded. The remuneration from the modified long-term
incentive programme can constitute maximum 25, 40 or 50 percent of the
fixed remuneration depending on position. Payment to the participants in the
0
2
4
6
8
10
12
14
16
18
Max 100%Threshold 0%
33% 67%
Actual
outcome
17
Actual
outcome
6
Long-term incentive plan 2018–2020
Outcome (%)
Adjusted EBITA margin (%) Net sales growth (%)
Award
programme is made after year three and only provided that they are still em-
ployed at the date of payment (except in case of termination of employment
due to retirement, death or disability). If the employee resigns or is dismissed
before the end of the three-year period, the employee will not be entitled to
any pay-out. If the employee moves to a position that is not eligible for this
programme, a pro-rata payment will be made after the end of the three year
period. Paid remunerations from the long-term incentive programme do normally
not affect the pensionable income or the holiday pay.
In 2020 step one, two and three of the modified programme were running
in parallel.
The outcome of step one covering the period January 1, 2018 – December
31, 2020 was:
Long-term incentive plan 2018–2020
Consolidated
Performance targets Outcome Award*
in %Threshold Maximum 2018 2019 2020 Average
Adjusted EBITA margin (%) 14.0 17.0 16.5 17.2 17.4 17.0 100.00
Net sales growth (%) 4 7 15 14 -11 6 66.67
If achieved the award is (%) 0 100 * To be paid in 2021.
There are three opportunity levels in the plan and the award per opportunity level and the total cost for the plan was:
Long-term incentive plan 2018-2020
Consolidated
Outcome per maximum opportunity Total cost
SEK millions25% 40% 50%
Award 20.83% 33.33% 41.67% 42
The performance targets, the actual outcome and the resulting award were:
The Annual General Meeting 2017 decided to implement step seven of a cash-
based long-term incentive programme for maximum 85 senior managers in
the Group including the Chief Executive Officer and the persons defined as
executive officers. Step seven covered the period January 1, 2017 – December 31,
2019. The outcome during the three year period in percent of maximum out-
come was 100 percent and the award of SEK 27 million was paid during 2020.
1
2
3
4
5
6
7
8
9
10
11
12
13
14
15
16
17
18
19
20
21
22
23
24
25
26
27
28
29
30
31
32
33
34
35
36
37
38
39
40
AL_20_BAKVAGN_EN.indd 121 2021-03-25 12:41

122
Salaries and remunerations to Group Management
Consolidated Group Management
Chief Executive Officer/PresidentOther executive officers
Tom Erixon
SEK thousands 2020 2019 2020 2019
Salary and remunerations
Fixed remuneration
Base salary 14,000 11,250 31,254 29,126
Voluntary salary reduction due to COVID-19 -1,167 – -1,119 –
Other benefits 1) 545 374 1,364 4,228
Variable remuneration 2)
Variable salary 4,905 6,300 6,926 9,407
Cash-based long-term incentive programme 5,063 2,944 6,900 5,027
Total salary and remuneration 23,346 20,868 45,325 47,788
Pension costs
Retirement and survivors’ pension 3) 7,015 5,649 14,649 13,114
Life, disability and health care insurance 4) 48 75 399 393
Total pension costs 7,063 5,724 15,048 13,507
Total remuneration 30,409 26,592 60,373 61,295
Proportion of fixed and variable remuneration
Fixed remuneration including fixed pension costs 67% 65% 71% 71%
Variable remuneration including variable pension costs 33% 35% 29% 29%
Number of other executive officers at year end 9 8
Variable salary (STI)
Included Yes Yes
Un-guaranteed target of base salary 30% Not set
Maximum of base salary 60% 40%
Cash-based long-term incentive programme (LTIP)
Included Yes Yes
Current year award 5) 5,834 1,688 9,457 1,933
Vested unpaid awards at December 31 5,834 5,063 9,457 5,799
Commitment for early retirement 6) No Yes
Commitment for severance pay Yes 7) Yes 8)
Commitment for retirement and survivors' pension 9) 10)
1) Value of company car, housing benefit, taxable daily allowances, holiday pay and pay-
ment for vacation taken in cash.2) Refers to what was paid during the year.3) Defined contribution based.4) Defined benefit based.5) Based on current base salary.6) From the age of 62. A defined contribution solution for early retirement with a premium of
15 percent of the pensionable salary.7) If Alfa Laval terminates his employment before the age of 61, he will receive 24 months’
remuneration, between 61 and 62 he will receive 12 months’ remuneration and from 62
he will receive 6 months’ remuneration.
8) Maximum 2 years’ salary. The commitments define the conditions that must be fulfilled in
order for them to become valid. 9) Is not included in the ITP plan. He has a defined contribution benefit comprising 50 per-
cent of the base salary. In addition, he may exchange salary and variable remunerations
for a temporary old age and family pension.10) For salaries above 30 base amounts there is a defined contribution pension solution with
a premium of 30 percent of the pensionable salary above 30 base amounts. Until May 1,
2012 the executive officers also had a special family pension that represented a supple-
ment between the old age pension and the family pension according to ITP. For the per-
sons that were executive officers on May 1, 2012 the special family pension has been
converted to a premium based supplementary retirement pension based on the premium
level in December 2011. In addition, they may exchange salary and variable remunera-
tions for a temporary old age and family pension.
Remuneration policy for executive officers
The remuneration policy for executive officers is established by the Annual
General Meeting. The complete policy is found in Note 37.
The remunerations to the Chief Executive Officer/Managing Director are
decided by the Board of Directors based on proposals from the Remuneration
Committee according to the guidelines established by the Annual General
Meeting. The remunerations to the other members of Group Management
are decided by the Remuneration Committee according to the same guide-
lines. The principle used when deciding the remunerations to executive officers
is to offer a competitive remuneration where the remuneration package is
mainly based on a fixed monthly salary, with an option for a company car
and in addition to that a variable remuneration of up to 40 percent of the sal-
ary (managing director up to 60 percent of the salary). The outcome of the
variable remuneration depends on the level of fulfilment of the established
mainly financial targets and to a limited extent also qualitative objectives.
The guidelines for pension, termination and severance pay differ between
the Chief Executive Officer/Managing Director and the other executive
officers, see the below table.
The Annual General Meeting 2017 decided to implement step seven of a cash-
based long-term incentive programme for maximum 85 senior managers in
the Group including the Chief Executive Officer and the persons defined as
executive officers.
The Board of Directors decided in 2020 to implement step three of the
modified cash based long-term incentive programme for maximum 95 senior
managers in the Group including the Chief Executive Officer and the persons
defined as executive officers. The Annual General Meetings 2018 and 2019
decided to implement step one and two of the programme for the same target
group. The outcome of the modified programme depends on how the adjusted
EBITA margin and the net sales growth have developed during a three-year period,
with a 50/50 weight between the targets. This means that there will be no award
during the first two years since it is first in year three that it can be determined to
what extent the targets have been achieved. Maximum outcome is awarded when
the targets are exceeded. The remuneration from the modified long-term incentive
programme can constitute maximum 25, 40 or 50 percent of the fixed remuneration
depending on position. Payment to the participants in the programme is
made after year three and only provided that they are still employed at the
date of payment.
AL_20_BAKVAGN_EN.indd 122 2021-03-25 12:41

123
No
tes
Remunerations to Board members *
Consolidated
SEK thousands 2020 2019
Fees by function:
Chairman of the Board 1,750 1,750
Other members of the Board 585 585
Supplement to:
Chairman of the Audit Committee 200 200
Other members of the Audit Committee 125 125
Chairman of the remuneration committee 50 50
Other members of the remuneration committee 50 50
Fees by name:
Dennis Jönsson Chairman 1,925 -
Anders Narvinger Chairman – 1,800
Henrik Lange Member 785 710
Ray Mauritsson Member 585 –
Heléne Mellquist Member 710 710
Maria Moræus Hanssen Member 585 585
Anna Ohlsson-Leijon Member – 785
Finn Rausing Member 585 585
Jörn Rausing Member 635 635
Ulf Wiinberg Member 635 635
Total 6,445 6,445
* Elected at the Annual General Meeting and not employed by the company.
The reported remunerations refer to the period between two Annual General
Meetings.
The Chairman of the Board does not have any agreement on future retire-
ment or severance pay with Alfa Laval.
The audit committee and the remuneration committee have had the following
members during the last two years:
2020 2019
Audit Committee:
Chairman Henrik Lange Anna Ohlsson-Leijon
Other member Dennis Jönsson Henrik Lange
Other member Heléne Mellquist Heléne Mellquist
Remuneration committee:
Chairman Dennis Jönsson Anders Narvinger
Other member Ulf Wiinberg Ulf Wiinberg
Other member Jörn Rausing Jörn Rausing
The members of the committees are appointed at the constituent meeting of
the Board of Directors directly after the Annual General Meeting.
During 2019 one of the other executive officers in Group Management retired
i.e. Peter Leifland as of May 1, 2019. His costs for 2019 are included in the
above table.
Board of Directors
For 2020, the Board of Directors receive a total fixed remuneration of SEK
6,445 (6,445) thousand, which is distributed among the members elected at
the Annual General Meeting that are not employed by the company. These
Directors do not receive any variable remuneration.
Note 7. Information on auditors and
auditors' fee
The line “Group auditors” in the below table is referring to the auditors elected
at Annual General Meeting of Alfa Laval AB (publ). The Annual General
Meetings 2019 and 2020 decided to elect EY as the Group's auditors for
the coming year.
Fees and expense compensation
Consolidated
SEK millions 2020 2019
Audit engagements
Group auditors 39 39
Other audit firms 0 0
Total 39 39
Audit related services
Group auditors 2 1
Other audit firms 2 1
Total 4 2
Tax services
Group auditors 8 8
Other audit firms 10 13
Total 18 21
Other services
Group auditors 1 2
Other audit firms 8 17
Total 9 19
Expenses
Group auditors 0 1
Other audit firms 0 0
Total 0 1
Total
Group auditors 50 51
Other audit firms 20 31
Total 70 82
An audit engagement includes examining the financial statements, assessing
the accounting principles used and significant estimates made by manage-
ment, as well as evaluating the overall financial statement presentation. It
also includes an examination in order to give an opinion on the Board's dis-
charge from liability. Audit related services are audit services that are outside
the audit engagement. Tax services refer to advices given in connection with
various tax matters. All other assignments are defined as other services.
Expenses refer to reimbursements of travel costs, secretarial services etc.
Note 8. Comparison distortion items
Comparison distortion items
Consolidated
SEK millions 2020 2019
Other operating income
Comparison distortion items:
– Realised gain on sale of businesses – 260
Other operating costs
Comparison distortion items:
– Realised loss on sale of businesses -55 -71
– Write down of goodwill -360 –
– Restructuring costs -381 –
Net comparison distortion items -796 189
The realized loss in 2020 is relating to the divestment of the operations in
DSO Fluid Handling Inc in the U.S.
The write down of goodwill and the restructuring costs are part of the
programme for adapting the organisation to changing market fundamentals that
was announced on December 16, 2020. The program is mainly addressing
structural imbalances in specific parts of the oil & gas business as well as
parts of the Marine business. In addition, the program will further drive the
competence shift required in light of the accelerated pace of digitalization.
The write down of goodwill concerns oil & gas related businesses. The total
restructuring cost is expected to amount to approximately SEK 850 million,
out of which the remaining part is expected to be charged in the second
quarter of 2021. Approximately 600 employees mainly in Europe and North
America will be affected by the program. The program will generate annual
savings of around SEK 300 million, with full effect expected from mid-2022.
The realised gain in 2019 was related to the divestments of part of the air
heat exchanger business related to commercial/industrial air heat exchangers
in the Greenhouse division to the LU-VE Group. The realised loss in 2019
was relating to a realised loss from the divestments of the last remaining
Greenhouse operation shell-and-tube Sarasota, also known as Alfa Laval
Champ, to Thermal Solutions Manufacturing.
1
2
3
4
5
6
7
8
9
10
11
12
13
14
15
16
17
18
19
20
21
22
23
24
25
26
27
28
29
30
31
32
33
34
35
36
37
38
39
40
AL_20_BAKVAGN_EN.indd 123 2021-03-25 12:41

124
Note 11. Interest income/expense and
financial exchange rate gains/losses
Split on type of income/expense or gain/loss
Consolidated
SEK millions 2020 2019
Interest income
Leasing 0 0
Other interest 48 88
Exchange rate gains
Unrealised 80 50
Realised 92 239
Total 220 377
Interest expenses
Leasing -78 -71
Other interest -187 -221
Exchange rate losses
Unrealised -60 -24
Realised -524 -70
Total -849 -386
In the Group, reported net exchange differences of SEK 313 (-288) million
relating to debts in foreign currencies have been charged to other compre-
hensive income. These debts finance the acquisition of shares in foreign
subsidiaries and act as a hedge to the acquired net assets. The amount is
charged with tax resulting in a net after tax impact on other comprehensive
income of SEK 248 (-226) million.
Split on type of income/expense or gain/loss
Parent company
SEK millions 2020 2019
Interest income
External companies – –
Exchange rate gains
Unrealised 0 1
Total 0 1
Interest costs
External companies 0 0
Exchange rate losses
Unrealised 0 0
Total 0 0
Note 12. Non-controlling interests
Alfa Laval has the following subsidiaries with non-controlling interests. None of these non-controlling interests are material.
Specification of subsidiaries with non-controlling interests
SEK millions, unless otherwise stated Non-controlling
interest %
Attributable to non-controlling interest
Net income Equity
Company name Country of domicile 2020 2019 2020 2019 2020 2019
Alfa Laval Aalborg Indústria e Comércio Ltda Brazil 0.5 0.5 0 0 0 0
Liyang Sifang Stainless Steel Products Co., Ltd. China 35 35 24 22 158 144
Aalborg Industries Water Treatment Pte. Ltd. * Singapore - 40 – 0 – 0
Ziepack SA France 49 49 3 0 5 3
AO Alfa Laval Potok Russia 0.0005 0.0007 0 0 0 0
Total 27 22 163 147
* Liquidated.
Note 9. Depreciation and amortisation
Split by function
Consolidated
SEK millions 2020 2019
Cost of goods sold -1,484 -1,556
Sales -151 -150
Administration -216 -221
Research and development -9 -9
Other income and costs -129 -117
Total -1,989 -2,053
Split by type of asset
Consolidated
SEK millions 2020 2019
Intangible assets
Patents and unpatented know-how -321 -373
Trademarks -505 -580
Licenses, renting rights and similar rights -5 -4
Internally generated intangible assets -3 -1
-834 -958
Tangible assets
Purchased assets
Buildings and ground installations -212 -192
Machinery -362 -339
Equipment -145 -147
-719 -678
Leased assets
Right-of-use assets real estate -350 -328
Rigth-of-use asset machinery -17 -21
Rigth-of-use asset equipment -69 -68
-436 -417
Sum tangible assets -1,155 -1,095
Total -1,989 -2,053
Note 10. Dividends and other financial
income and costs
Split by type
Consolidated
SEK millions 2020 2019
Dividends from other 0 0
Gain or loss on sale of marketable securities 71 7
Fair value changes in marketable securities -45 25
Total 26 32
AL_20_BAKVAGN_EN.indd 124 2021-03-25 12:41

125
No
tes
Financial liabilities
Consolidated
Measured at
Fair value through Amortised cost
Valuation
hierarchy level Profit or loss Other comprehensive income
SEK millions 2020 2019 2020 2019 2020 2019
Non-current liabilities
Liabilities to credit institutions etc * – – – – 8,043 10,600
Lease liabilities * – – – – 1,573 1,890
Derivative liabilities 2 1 6 4 36 – –
Current liabilities
Liabilities to credit institutions etc * – – – – 1,125 1,422
Accounts payable * – – – – 2,526 3,311
Notes payable * – – – – 232 128
Lease liabilities * – – – – 662 730
Other liabilities * – – – – 3,577 4,219
Accrued costs * – – – – 2,144 2,160
Derivative liabilities 2 50 15 58 293 – –
Total financial liabilities 51 21 62 329 19,882 24,460
* Valued at amortised cost.
Valuation hierarchy level 1 is according to quoted prices in active markets for identical assets and liabilities.
Valuation hierarchy level 2 is out of directly or indirectly observable market data outside level 1.
Note 13. Classification of financial assets and liabilities
Financial assets
Consolidated
Measured at
Fair value through Amortised cost
Valuation
hierarchy level Profit or loss Other comprehensive income
SEK millions 2020 2019 2020 2019 2020 2019
Non-current assets
Other non-current assets
Other long-term securities 1 and 2 – – 1,490 78 – –
Derivative assets 2 5 7 191 62 – –
Current assets
Current receivables
Accounts receivable * – – – – 5,834 7,460
Notes receivable * – – – – 184 218
Other receivables * – – – – 3,029 3,801
Accrued income * – – – – 96 118
Derivative assets 2 94 47 495 146 – –
Current deposits
Deposits with banks * – – – – 1,160 205
Bonds and other securities 1 1,447 650 – – – –
Debt instruments * – – – – 4 4
Other deposits * – – – – 7 14
Cash and cash equivalents * – – – – 5,150 5,594
Total financial assets 1,546 704 2,176 286 15,464 17,414
* Valued at amortised cost.
Valuation hierarchy level 1 is according to quoted prices in active markets for identical assets and liabilities.
Valuation hierarchy level 2 is out of directly or indirectly observable market data outside level 1.
Derivatives measured through other comprehensive income only relate to
cash flow hedges.
All of the financial instruments above sum up either to the corresponding
item in the statement on financial position or to the item specified in the
notes referred to in the statement on financial position. The risks linked to
these financial instruments including any concentrations of risk are pre-
sented in the sections on risks on pages 108–112.
Result of financial instruments
The result of the bonds and other current and non-current securities measured
at fair value through profit or loss is found in Note 10 as fair value changes in
securities.
The result of the derivative assets measured at fair value through profit or
loss of SEK 53 (34) million has affected exchange gains in Note 11 with SEK
53 (34) million.
The result of financial assets measured at amortised cost is presented in
Note 11 as other interest income for deposits with banks, other deposits and
cash and cash equivalents. The other financial assets measured at amortised
cost do not generate a result but only a cash-in of the principal amount.
The result of the derivative liabilities measured at fair value through profit or loss
of SEK -4 (-2) million has affected cost of goods sold with SEK -4 (-2) million.
The result of the financial liabilities measured at amortised cost is presented
in Note 11 as other interest costs for the liabilities to credit institutions etc.
The other financial liabilities measured at amortised cost do not generate a
result but only a cash-out of the principal amount.
The result of the derivative assets and liabilities measured at fair value
through other comprehensive income is reported as part of other compre-
hensive income in the consolidated comprehensive income statement.
1
2
3
4
5
6
7
8
9
10
11
12
13
14
15
16
17
18
19
20
21
22
23
24
25
26
27
28
29
30
31
32
33
34
35
36
37
38
39
40
AL_20_BAKVAGN_EN.indd 125 2021-03-25 12:41

126
Note 15. Maturity analysis of derivatives
The future undiscounted cash flows for the different types of derivatives are
shown in the following three graphs:
Note 14. Fair value of financial instruments
The fair value changes in shares in external companies are made under other
comprehensive income and amounts to SEK -125 (0) million, see the con-
solidated comprehensive income statement.
The fair value changes in marketable securities are made on the line divi-
dends and other financial income and costs in the consolidated comprehen-
sive income statement and amounts to SEK -45 (25) million, see Note 10.
The net of derivative assets and derivative liabilities in the consolidated fi-
nancial position is a net asset (net liability) of SEK 672 (-88) million, which are
specified below:
Fair value of derivatives
Consolidated
Difference between con-
tracted rate and current rate
SEK millions Currency pairs 2020 2019
Derivative assets/liabilities
Foreign exchange
forward contracts: EUR USD 77 -20
EUR SEK 197 20
EUR AUD -1 0
EUR CAD 1 -1
EUR CNY 8 47
EUR DKK 0 -1
EUR GBP 1 1
EUR JPY 1 5
EUR SGD 0 -1
USD CAD -1 -1
USD DKK 37 -21
USD SEK 1 0
USD SGD 1 1
DKK NOK 2 15
DKK SEK 2 1
NOK EUR -7 0
NOK SEK – 4
NOK USD 271 -152
CNY JPY 1 0
CNY SEK -19 -1
CNY USD 13 4
GBP SEK – -2
JPY NOK 16 -8
RUB SEK – 2
Other Other 2 0
Subtotal 603 -108
Currency options 18 7
Interest Rate Swaps – -1
Metal forward contacts 55 15
Electricity futures -4 -1
Total, corresponding to a net derivative
asset (+) or liability (-) 672 -88
For currency options and electricity futures hedge accounting has not been
applied. For foreign exchange forward contracts, interest rate swaps and
metal forward contracts hedge accounting has been applied when the
conditions for hedge accounting have been fulfilled.
The fair value adjustment of derivatives is made through other compre-
hensive income if hedge accounting can be applied and the derivatives are
effective. In all other cases the fair value adjustment is made above net in-
come. The corresponding entries are made on derivative assets and liabili-
ties and not on the underlying financial instruments in the statement on fi-
nancial position.
0
1,000
2,000
3,000
4,000
5,000
6,000
0
3
6
9
12
15
-6,000
-5,000
-4,000
-3,000
-2,000
-1,000
0
3 6 9 12 15 18 24 36 >36
Months
4,555
-4,326
2,542
-2,352
4,957
-4,756
2,256
-2,093
1,065
-937
886
-818
1,213
-1,156
13
-12
3 6 9 12 15 18 24 36 >36
Months
Positive cash flows Negative cash flows
SEK millions
SEK millions
Maturity analysis for currency derivatives
Maturity analysis for metal derivatives
Maturity analysis for electricity futures
-2.0
-1.5
-1.0
-0.5
0.0
0.5
1.0
1.5
2.0
3 6 9 12 15 18 24 36 >36
Months
SEK millions
AL_20_BAKVAGN_EN.indd 126 2021-03-25 12:41
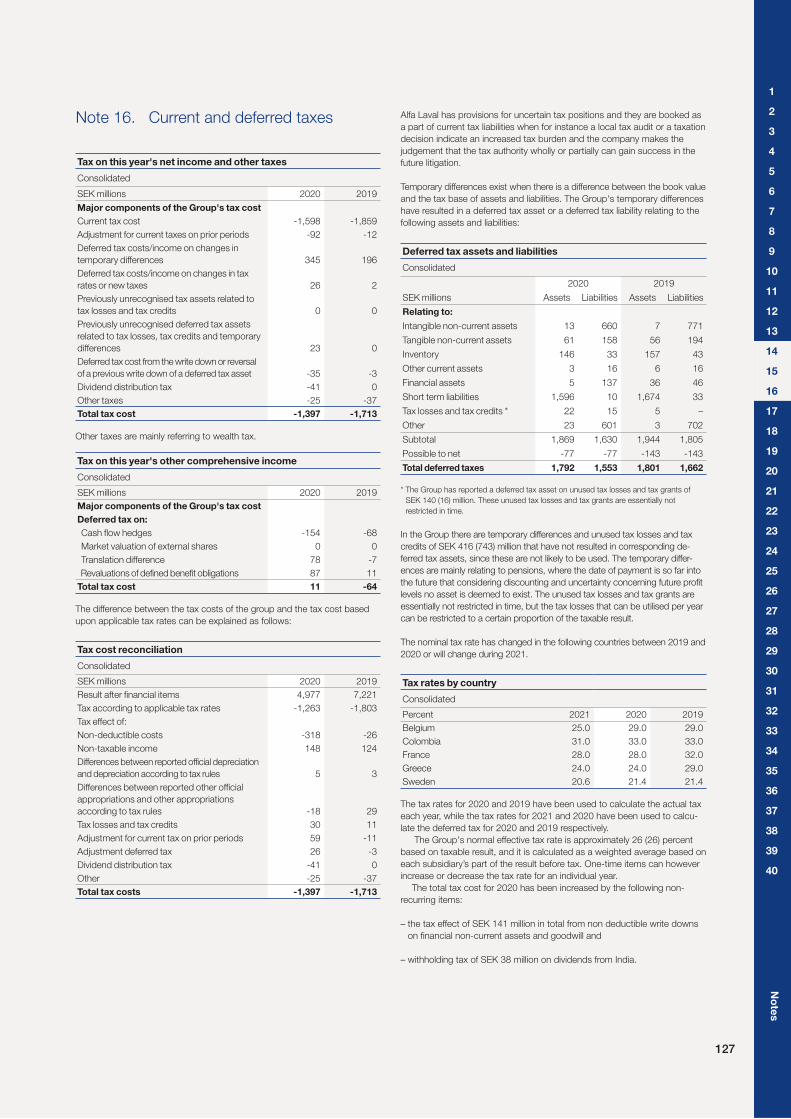
127
No
tes
Note 16. Current and deferred taxes
Tax on this year's net income and other taxes
Consolidated
SEK millions 2020 2019
Major components of the Group's tax cost
Current tax cost -1,598 -1,859
Adjustment for current taxes on prior periods -92 -12
Deferred tax costs/income on changes in
temporary differences 345 196
Deferred tax costs/income on changes in tax
rates or new taxes 26 2
Previously unrecognised tax assets related to
tax losses and tax credits 0 0
Previously unrecognised deferred tax assets
related to tax losses, tax credits and temporary
differences 23 0
Deferred tax cost from the write down or reversal
of a previous write down of a deferred tax asset -35 -3
Dividend distribution tax -41 0
Other taxes -25 -37
Total tax cost -1,397 -1,713
Other taxes are mainly referring to wealth tax.
Tax on this year's other comprehensive income
Consolidated
SEK millions 2020 2019
Major components of the Group's tax cost
Deferred tax on:
Cash flow hedges -154 -68
Market valuation of external shares 0 0
Translation difference 78 -7
Revaluations of defined benefit obligations 87 11
Total tax cost 11 -64
The difference between the tax costs of the group and the tax cost based
upon applicable tax rates can be explained as follows:
Tax cost reconciliation
Consolidated
SEK millions 2020 2019
Result after financial items 4,977 7,221
Tax according to applicable tax rates -1,263 -1,803
Tax effect of:
Non-deductible costs -318 -26
Non-taxable income 148 124
Differences between reported official depreciation
and depreciation according to tax rules 5 3
Differences between reported other official
appropriations and other appropriations
according to tax rules -18 29
Tax losses and tax credits 30 11
Adjustment for current tax on prior periods 59 -11
Adjustment deferred tax 26 -3
Dividend distribution tax -41 0
Other -25 -37
Total tax costs -1,397 -1,713
Alfa Laval has provisions for uncertain tax positions and they are booked as
a part of current tax liabilities when for instance a local tax audit or a taxation
decision indicate an increased tax burden and the company makes the
judgement that the tax authority wholly or partially can gain success in the
future litigation.
Temporary differences exist when there is a difference between the book value
and the tax base of assets and liabilities. The Group's temporary differences
have resulted in a deferred tax asset or a deferred tax liability relating to the
following assets and liabilities:
Deferred tax assets and liabilities
Consolidated
2020 2019
SEK millions Assets Liabilities Assets Liabilities
Relating to:
Intangible non-current assets 13 660 7 771
Tangible non-current assets 61 158 56 194
Inventory 146 33 157 43
Other current assets 3 16 6 16
Financial assets 5 137 36 46
Short term liabilities 1,596 10 1,674 33
Tax losses and tax credits * 22 15 5 –
Other 23 601 3 702
Subtotal 1,869 1,630 1,944 1,805
Possible to net -77 -77 -143 -143
Total deferred taxes 1,792 1,553 1,801 1,662
* The Group has reported a deferred tax asset on unused tax losses and tax grants of
SEK 140 (16) million. These unused tax losses and tax grants are essentially not
restricted in time.
In the Group there are temporary differences and unused tax losses and tax
credits of SEK 416 (743) million that have not resulted in corresponding de-
ferred tax assets, since these are not likely to be used. The temporary differ-
ences are mainly relating to pensions, where the date of payment is so far into
the future that considering discounting and uncertainty concerning future profit
levels no asset is deemed to exist. The unused tax losses and tax grants are
essentially not restricted in time, but the tax losses that can be utilised per year
can be restricted to a certain proportion of the taxable result.
The nominal tax rate has changed in the following countries between 2019 and
2020 or will change during 2021.
Tax rates by country
Consolidated
Percent 2021 2020 2019
Belgium 25.0 29.0 29.0
Colombia 31.0 33.0 33.0
France 28.0 28.0 32.0
Greece 24.0 24.0 29.0
Sweden 20.6 21.4 21.4
The tax rates for 2020 and 2019 have been used to calculate the actual tax
each year, while the tax rates for 2021 and 2020 have been used to calcu-
late the deferred tax for 2020 and 2019 respectively.
The Group's normal effective tax rate is approximately 26 (26) percent
based on taxable result, and it is calculated as a weighted average based on
each subsidiary’s part of the result before tax. One-time items can however
increase or decrease the tax rate for an individual year.
The total tax cost for 2020 has been increased by the following non-
recurring items:
– the tax effect of SEK 141 million in total from non deductible write downs
on financial non-current assets and goodwill and
– withholding tax of SEK 38 million on dividends from India.
1
2
3
4
5
6
7
8
9
10
11
12
13
14
15
16
17
18
19
20
21
22
23
24
25
26
27
28
29
30
31
32
33
34
35
36
37
38
39
40
AL_20_BAKVAGN_EN.indd 127 2021-03-25 12:41

128
Tax cost per country/district
Consolidated
2020 2019
SEK millions (unless otherwise stated)
Earnings before
tax and received
dividends Tax cost Tax percentage (%)
Earnings before
tax and received
dividends Tax cost Tax percentage (%)
Top ten countries/districts
China 1,209 -276 22.8% 1,263 -330 26.1%
Norway 1,241 -271 21.8% 1,680 -370 22.0%
Sweden 716 -183 25.6% 2,050 -401 19.6%
Netherlands 508 -178 35.1% 1,090 -289 26.5%
Denmark 404 -84 20.9% 415 -98 23.7%
India 285 -69 24.2% 425 -138 32.5%
Japan 217 -66 30.4% 165 -61 37.1%
France 112 -49 43.9% 251 -88 35.1%
Brazil 144 -49 33.8% 134 -41 30.6%
Hong Kong 65 -42 64.7% 53 -28 53.0%
Total top ten countries/districts 4,901 -1,267 25.9% 7,526 -1,844 24.5%
Other countries/districts
With a positive result 1,057 -172 16.2% 1,165 -277 23.7%
With losses -353 -24 6.7% -375 -14 3.7%
Total all countries/districts 5,605 -1,463 26.1% 8,316 -2,135 25.7%
Consolidation entries
Elimination of appropriations -50 11 22.0% -519 110 21.2%
Amortisation of step-up values -855 195 22.8% -980 190 19.4%
Write down of goodwill -360 – – – – N/A
Central provisions and consolidation adjustments 637 -140 22.0% 404 122 -30.2%
Total 4,977 -1,397 28.1% 7,221 -1,713 23.7%
The above table presents the earnings before tax and received dividends,
the tax cost and the tax percentage per country for the top ten countries/
districts separately and the others grouped under profit generating and loss-
making respectively and the consolidation entries in order to arrive at the to-
tal. The local results include appropriations. The reason why the result is be-
fore received dividends is that these mostly are non-taxable. The top ten
countries/districts are defined as the ten countries/districts with the highest
tax cost in 2020. The comparison figures 2019 are for these ten countries/
districts, although they might not have been among the ten countries/dis-
tricts with highest tax cost also in 2019.
Observe that individual companies in the top ten countries/districts and in
the group with a positive result can report losses. The group with losses can
contain individual companies with profits. Also observe that the presented
result is without correction for any non-deductible costs and non-taxable
revenues outside received tax free dividends.
Companies with losses in countries/districts without tax pooling might
have unused tax losses that have not resulted in a corresponding deferred
tax asset, since these are not likely to be used. The lack of such a deferred
tax income in these cases has an impact on the tax percentage in the con-
cerned countries/districts.
Note 17. Goodwill and step-up values – acquisition of businesses
The allocation of step-up values to tangible and intangible assets and the residual goodwill in effect means that all acquisitions are valued at market. In order
to separate out this valuation effect Alfa Laval focuses on EBITA, where any amortisation of step-up values is excluded. The development of these step-up val-
ues and any goodwill is shown in the table below.
Movement schedule
Consolidated
SEK millions
Opening
balance 2020 Acquisitions Sold
Write
down
Planned
depreciation/
amortisation
Translation
difference
Closing
balance 2020
Buildings 256 – – – -33 -15 208
Land and land improvements -72 – – – – 12 -60
Patents and unpatented know-how 1,078 41 – – -317 -85 717
Trademarks 1,954 10 – – -505 -158 1,301
Subtotal step-up values 3,216 51 – – -855 -246 2,166
Goodwill 21,112 18 -50 -360 – -1,640 19,080
Total 24,328 69 -50 -360 -855 -1,886 21,246
During 2020 the Group has not recorded any impairment losses related to step-up values.
There is no deferred tax liability calculated on the goodwill. The deferred tax liability on the other step-up values is SEK 398 (595) million.
For assets sold, net gains or losses are recognised on the cost basis including any related step-up value.
The next table shows each acquisition separately. Any later adjustments to the allocations are referred to the original year of the acquisition. The figures for
the allocations are based on the prevailing rates at the time the transactions took place and any change in exchange rates until December 31, 2020 is shown
as a translation difference. The corresponding presentation by asset type is found in Notes 18 and 19.
AL_20_BAKVAGN_EN.indd 128 2021-03-25 12:41

129
No
tes
Acquisition of businesses since 2000
Consolidated
SEK millions
Buildings
Land and land
improvements Inventory
Patents and
unpatented
know-how Trademarks Other
Total
step-up
values Goodwill TotalYear Businesses
2000 Alfa Laval Holding 1,058 -228 340 1,280 461 1,112 4,023 3,683 7,706
2002 Danish Separation Systems – – – – – – – 118 118
2003 Toftejorg 1 – – – – – 1 35 36
2005 Packinox – – 6 99 183 – 288 253 541
2006 Tranter 17 – 6 180 265 – 468 530 998
2007 AGC Engineering – – – – 12 – 12 20 32
Helpman 9 8 – 36 – – 53 4 57
Public offer Alfa Laval (India) – – – – – – – 441 441
DSO Fluid Handling – – – – 39 – 39 42 81
Fincoil – – – 233 – – 233 241 474
2008 Høyer Promix A/S – – – – – – – 16 16
Nitrile India Pvt Ltd – – – – – – – 6 6
Standard Refrigeration – – 5 166 – – 171 152 323
Pressko AG – – 1 – – – 1 69 70
Hutchison Hayes Separation – – 1 95 49 – 145 46 191
P&D's Plattvärmeväxlarservice – – – – – – – 10 10
Ageratec – – – – – – – 44 44
2009 Two providers of parts & service – – – – 291 – 291 210 501
Onnuri Industrial Machinery – – – 40 39 – 79 48 127
HES Heat Exchanger Systems – – – 83 – – 83 59 142
Public offer Alfa Laval (India) – – – – – – – 311 311
Termatrans – – – – 7 – 7 6 13
Tranter acquisitions in Latin America – – – – 20 – 20 16 36
ISO Mix – – – 22 – – 22 – 22
LHE – – – 298 297 – 595 344 939
2010 Champ Products – – – 15 14 – 29 2 31
A leading U.S. service provider – – – – 134 – 134 82 216
G.S Anderson – – – 35 – – 35 23 58
Astepo – – – 24 15 – 39 8 47
Si Fang Stainless Steel Products – – – 27 16 – 43 42 85
Definox – – – 4 5 – 9 2 11
Olmi – – 37 58 32 – 127 – 127
2011 Service company in the U.S. – – – – 150 – 150 126 276
Aalborg Industries 248 – – 430 860 – 1,538 3,630 5,168
2012 Vortex Systems – – – 148 – – 148 225 373
Ashbrook Simon-Hartley – – – 86 – – 86 55 141
Gamajet Cleaning Systems – – – 47 – – 47 37 84
Air Cooled Exchangers (ACE) – – – 585 – – 585 346 931
2013 Niagara Blower Company – – – 202 – – 202 203 405
2014 Frank Mohn AS – – 38 1,160 3,793 – 4,991 9,831 14,822
CorHex Corp – – – 15 – – 15 – 15
2015 Aftermarket company (separation) – – – – 32 – 32 24 56
K-Bar Parts LLC – – – – 16 – 16 – 16
2019 Airec – – – 60 – – 60 22 82
2020 WCR Benelux – – – – 10 – 10 3 13
Sandymount – – – 41 – – 41 15 56
Accumulated during the period
Realised -542 122 -435 – – -123 -978 -50 -1,028
Write down -6 -9 – -89 -5 – -109 -941 -1,050
Planned depreciation/amortisation -569 – – -4,943 -5,224 -993 -11,729 -612 -12,341
Translation difference -8 47 1 280 -210 4 114 -697 -583
Closing balance 208 -60 – 717 1,301 – 2,166 19,080 21,246
The acquisition of the Alfa Laval Holding AB group in connection with the acquisition by Industri Kapital of the Alfa Laval Group from Tetra Laval on August 24,
2000 is shown on the first row.
“Other” relates to step-up values from 2000 for “Machinery” of SEK 548 million and “Equipment” of SEK 452 million that have been fully depreciated or
realised, for “Research and development” of SEK 54 million and “Capital gain (Industrial Flow)” of SEK 42 million that have been fully realised and for “Con-
struction in process” of SEK 16 million that has been transferred to “Machinery”.
1
2
3
4
5
6
7
8
9
10
11
12
13
14
15
16
17
18
19
20
21
22
23
24
25
26
27
28
29
30
31
32
33
34
35
36
37
38
39
40
AL_20_BAKVAGN_EN.indd 129 2021-03-25 12:41

130
Acquisition of businesses
During 2020
On December 31, 2020 Alfa Laval has acquired Sandymount, a US-based
beverage technology company with a unique and patented membrane tech-
nology to concentrate beer. The technology in combination with Alfa Laval’s
extensive product range, will open up interesting business opportunities for
the company and enable a more sustainable beer-delivery supply chain.
Sandymount’s patented membrane technology, Revos™, in combination
with Alfa Laval’s extensive product range for beer production, will enable
beer producers to deliver high quality beer in concentrated form. The solu-
tion addresses the transportation inefficiencies in beer supply where beer re-
mains one of the few water-laden products distributed as a ‘mostly water’
from producer to consumer. The newly acquired company will be integrated
into the Business Unit Food Systems in the Food & Water Division.
The purchase price is SEK 49 million, out of which all has been paid in
cash. The costs directly linked to the acquisition (fees to lawyers, due dili-
gence and assisting counsel) come in addition to this and have amounted to
SEK 3 million, which is reported as other operating costs. Liquid assets of
SEK 0 million in the acquired company were taken over. The impact on the
cash flow is thus SEK -52 million. Out of the difference between the pur-
chase price paid and the net assets acquired SEK 41 million is allocated to
patents and un-patented know-how, while the residual SEK 15 million is al-
located to goodwill. The goodwill is relating to estimated synergies in pro-
curement, logistics and corporate overheads and the company’s ability to
over time recreate its intangible assets. The value of the goodwill is still pre-
liminary. The step-up value for patents and un-patented know-how is amor-
tised over 10 years. From the date of the acquisition the company has
added SEK - million in orders received, SEK - million in invoicing and SEK -
million in adjusted EBITA to Alfa Laval. If the company had been acquired at
January 1, 2020 the corresponding figures would have been SEK - million,
SEK - million and SEK -10 million respectively. At the end of December
2020, the company had 2 employees.
A smaller operation, WCR Benelux BV in the Netherlands, was acquired
on July 1, 2020. The purchase price is SEK 13 million, out of which SEK 10
million has been paid in cash and SEK 3 million is retained for a period of up
to 1 year. The retained part of the purchase price is contingent on certain
warranties in the contract not being triggered. The probable outcome is
SEK 3 million, which is also the fair value since the contingent consideration
is to be paid in cash. The costs directly linked to the acquisition (fees to law-
yers, due diligence and assisting counsel) come in addition to this and have
amounted to SEK 1 million, which is reported as other operating costs. Liq-
uid assets of SEK 1 million in the acquired company were taken over. The
impact on the cash flow is thus SEK -10 million. Out of the difference be-
tween the purchase price paid and the net assets acquired SEK 10 million is
allocated to the WCR trademark, while the residual SEK 3 million is allocated
to goodwill. The goodwill is relating to estimated synergies in procurement,
logistics and corporate overheads and the company’s ability to over time
recreate its intangible assets. The value of the goodwill is still preliminary. The
step-up value for the trademark is amortised over 10 years. From the date of
the acquisition the company has added SEK 11 million in orders received,
SEK 8 million in invoicing and SEK -0 million in adjusted EBITA to Alfa Laval.
If the company had been acquired at January 1, 2020 the corresponding fig-
ures would have been SEK 16 million, SEK 14 million and SEK -1 million re-
spectively. At the end of December 2020, the company had 6 employees.
All acquired assets and liabilities were reported according to IFRS at the
time of the acquisitions.
During 2019
On December 18, 2018 Alfa Laval announced that it has signed an agree-
ment to acquire Airec – a Malmö, Sweden-based innovation company with
patented technology for dimple asymmetry heat exchangers. The new com-
pany will be integrated into the Brazed & Fusion Bonded Heat Exchangers
unit of the Energy Division. The acquired technology represents untapped
opportunities in combination with Alfa Laval’s existing heat transfer know-
how, manufacturing footprint and global market presence. The transaction
was closed on January 2, 2019.
The purchase price is SEK 100 million, out of which SEK 60 million has
been paid in cash and SEK 40 million is retained for a period of 1-2 years.
The retained part of the purchase price is contingent on certain warranties in
the contract not being triggered or that certain profitability goals are fulfilled.
The outcome can be anything between SEK 0 million and SEK 40 million,
but the probable outcome is SEK 20 million, which is also the fair value since
the contingent consideration is to be paid in cash. The costs directly linked
to the acquisition (fees to lawyers, due diligence and assisting counsel)
come in addition to this and have amounted to SEK 1 million, which is re-
ported as other operating costs. The impact on the cash flow is thus SEK
-61 million. Out of the difference between the purchase price paid and the
net assets acquired SEK 60 million is allocated to patents and un-patented
know-how, while the residual SEK 22 million is allocated to goodwill. The
goodwill is relating to estimated synergies in procurement, logistics and cor-
porate overheads and the company’s ability to over time recreate its intangi-
ble assets. The value of the goodwill has been finalised in 2020. The step-up
value for patents and un-patented know-how is amortised over 10 years.
From the date of the acquisition the company has added SEK 13 million in
orders received and SEK 11 million in invoicing to Alfa Laval. At the end of
December 2019, the number of employees was 10.
All acquired assets and liabilities were reported according to IFRS at the
time of the acquisitions.
Impairment testing
Prior to a possible divestment, closure or restructuring an impairment test
has been made during 2020 concerning certain oil & gas related businesses,
which showed a need to write down the entire goodwill for these businesses.
Write down of goodwill has thus been made with SEK -360 million, which is
reported as a comparison distortion item among other operating costs. The
write down of goodwill and the restructuring costs are part of the programme
for adapting the organisation to changing market fundamentals that was
announced on December 16, 2020. The program is mainly addressing
structural imbalances in specific parts of the oil & gas business as well as
parts of the Marine business.
In addition, an impairment test has been performed at the end of 2020 in-
dicating that there is not any need to further write down the goodwill.
Three of Alfa Laval’s operating segments, the three business divisions
“Energy”, “Food & Water” and ”Marine” have been identified as the cash-
generating units within Alfa Laval. Technically a recently acquired business
activity could be followed independently during an initial period, but acquired
businesses are normally integrated into the divisions at a fast rate. This
means that the independent traceability is lost fairly soon and then any inde-
pendent measurement and testing becomes impracticable.
The recoverable amount of the cash-generating units is based on their
value in use, which is established by calculating the net present value of fu-
ture cash flows. The net present value is based on the projected EBITDA fig-
ures for the next five years, less projected investments and changes in oper-
ating capital during the same period and thereafter the perceived expected
average industry growth rate.
This projection is based on the following components:
– The projection for 2021 is based on the Group's normal 12 month revolv-
ing ”Forecast” reporting. This is based on a very large number of rather de-
tailed assumptions throughout the organisation concerning the business
cycle, volume growth, market initiatives, product mix, currency rates, cost
development, cost structure, R&D etc.
– The projection for the years 2022 till 2025 is based on Management’s gen-
eral assumptions concerning the business cycle, volume growth, market
initiatives, product mix, currency rates, cost development, cost structure,
R&D etc.
– The projection for the years 2026 and onwards is based on the perceived
expected average industry growth rate.
The assumptions used for the projections reflect past experiences or infor-
mation from external sources.
The used discount rate is the pre-tax weighted average cost of capital
(WACC) of 9.69 (9.19) percent.
There exists no reasonably possible change in a key assumption in the
impairment test that would cause the carrying amount to exceed the recoverable
amount. The reason is that the recoverable amounts with a very good margin
exceed the carrying amounts. Due to this a sensitivity analysis is not presented.
Alfa Laval does not have any intangible assets with indefinite useful lives
other than goodwill.
Goodwill has been allocated to the following cash-generating units:
Goodwill
Consolidated
SEK millions 2020 2019
Energy 2,953 3,584
Food & Water 2,371 2,637
Marine 13,756 14,891
Total 19,080 21,112
AL_20_BAKVAGN_EN.indd 130 2021-03-25 12:41

131
No
tes
Note 18. Intangible non-current assets
Patents and unpatented know-how
Consolidated
SEK millions 2020 2019
Accumulated acquisition values
Opening balance 6,393 6,171
Purchases 38 3
Acquisition of businesses 41 60
Sales/disposals -8 -9
Translation difference -952 168
Closing balance 5,512 6,393
Accumulated amortisation
Opening balance -5,289 -4,804
Sales/disposals 8 9
Reclassifications 0 0
Amortisation of step-up value -317 -367
Amortisation for the year -4 -6
Translation difference 866 -121
Closing balance -4,736 -5,289
Closing balance, net book value 776 1,104
Trademarks
Consolidated
SEK millions 2020 2019
Accumulated acquisition values
Opening balance 7,124 6,942
Acquisition of businesses 10 –
Divestment of businesses -44 –
Translation difference -591 182
Closing balance 6,499 7,124
Accumulated amortisation
Opening balance -5,170 -4,468
Divestment of businesses 44 –
Reclassifications – 6
Amortisation of step-up values -505 -580
Translation difference 433 -128
Closing balance -5,198 -5,170
Closing balance, net book value 1,301 1,954
Goodwill
Consolidated
SEK millions 2020 2019
Accumulated acquisition values
Opening balance 22,331 21,719
Goodwill in connection with acquisition
of businesses 18 22
Divestment of businesses -50 –
Translation difference -1,725 590
Closing balance 20,574 22,331
Accumulated amortisation
Opening balance -1,219 -1,182
Write down of goodwill -360 –
Translation difference 85 -37
Closing balance -1,494 -1,219
Closing balance, net book value 19,080 21,112
Licenses, renting rights and similar rights
Consolidated
SEK millions 2020 2019
Accumulated acquisition values
Opening balance 210 223
Purchases 3 1
Sales/disposals -19 -12
Reclassifications -1 -6
Translation difference -10 4
Closing balance 183 210
Accumulated amortisation
Opening balance -187 -191
Sales/disposals 19 12
Reclassifications 1 1
Amortisation for the year -5 -4
Translation difference 9 -5
Closing balance -163 -187
Closing balance, net book value 20 23
Internally generated intangible assets
Consolidated
SEK millions 2020 2019
Accumulated acquisition values
Opening balance 54 –
Acquisition of businesses – 5
Expenses 57 49
Translation difference – –
Closing balance 111 54
Accumulated amortisation
Opening balance -1 –
Amortisation for the year -3 -1
Translation difference – –
Closing balance -4 -1
Closing balance, net book value 107 53
Internally generated intangible assets are referring to capitalised IT costs and
acquired capitalised development cost related to R&D.
1
2
3
4
5
6
7
8
9
10
11
12
13
14
15
16
17
18
19
20
21
22
23
24
25
26
27
28
29
30
31
32
33
34
35
36
37
38
39
40
AL_20_BAKVAGN_EN.indd 131 2021-03-25 12:41

132
Machinery and other technical installations
Consolidated
SEK millions 2020 2019
Accumulated acquisition values
Opening balance 7,813 7,219
Purchases 365 335
Sales/disposal -389 -281
Reclassifications 304 331
Translation difference -543 209
Closing balance 7,550 7,813
Accumulated depreciation
Opening balance -5,676 -5,464
Sales/disposals 346 227
Reclassifications -8 19
Depreciation for the year -362 -339
Write down -1 -9
Translation difference 380 -110
Closing balance -5,321 -5,676
Closing balance, net book value 2,229 2,137
Equipment, tools and installations
Consolidated
SEK millions 2020 2019
Accumulated acquisition values
Opening balance 2,906 2,811
Purchases 249 153
Sales/disposal -115 -130
Reclassifications 69 2
Translation difference -183 70
Closing balance 2,926 2,906
Accumulated depreciation
Opening balance -2,236 -2,178
Sales/disposals 103 113
Reclassifications 4 34
Depreciation for the year -145 -147
Write down 0 0
Translation difference 149 -58
Closing balance -2,125 -2,236
Closing balance, net book value 801 670
Construction in progress and advances to suppliers concerning
property, plant and equipment
Consolidated
SEK millions 2020 2019
Accumulated acquisition values
Opening balance 505 634
Purchases 259 632
Reclassifications -423 -771
Translation difference -80 10
Closing balance 261 505
Closing balance, net book value 261 505
Right-of use asset real estate
Consolidated
SEK millions 2020 2019
Accumulated acquisition values
Opening balance 2,883 193
IFRS 16 adjustment – 2,463
New or adjusted leases 130 296
Sales/disposal -28 -24
Reclassifications -201 -100
Translation difference -208 55
Closing balance 2,576 2,883
Accumulated depreciation
Opening balance -392 -69
Sales/disposals 15 16
Reclassifications 81 4
Depreciation for the year -350 -328
Translation difference 45 -15
Closing balance -601 -392
Closing balance, net book value 1,975 2,491
Note 19. Property, plant and equipment
Real estate
Consolidated
SEK millions 2020 2019
Accumulated acquisition values
Opening balance 6,042 5,402
Purchases 261 164
Sales/disposal -164 -29
Write down – -24
Reclassifications 262 368
Reclassification to assets for sale -65 –
Translation difference -383 161
Closing balance 5,953 6,042
Accumulated depreciation
Opening balance -3,094 -2,819
Sales/disposals 87 25
Reclassifications -97 -5
Reclassification to assets for sale 10 –
Depreciation of step-up value -33 -33
Depreciation for the year -179 -159
Translation difference 231 -103
Closing balance -3,075 -3,094
Closing balance, net book value 2,878 2,948
Non-current assets held for sale
Within Alfa Laval these assets are normally relating to real estate.
A small property in France is empty and has been for sale for several
years. It is not expected to be sold within the next year. Five properties in In-
dia are for sale and are expected to be sold within the next year. The latter
have therefore been classified as current assets held for sale with SEK 55 (-)
million. The fair value of the properties for sale exceeds the book value by
approximately SEK 24 (2) million.
AL_20_BAKVAGN_EN.indd 132 2021-03-25 12:41
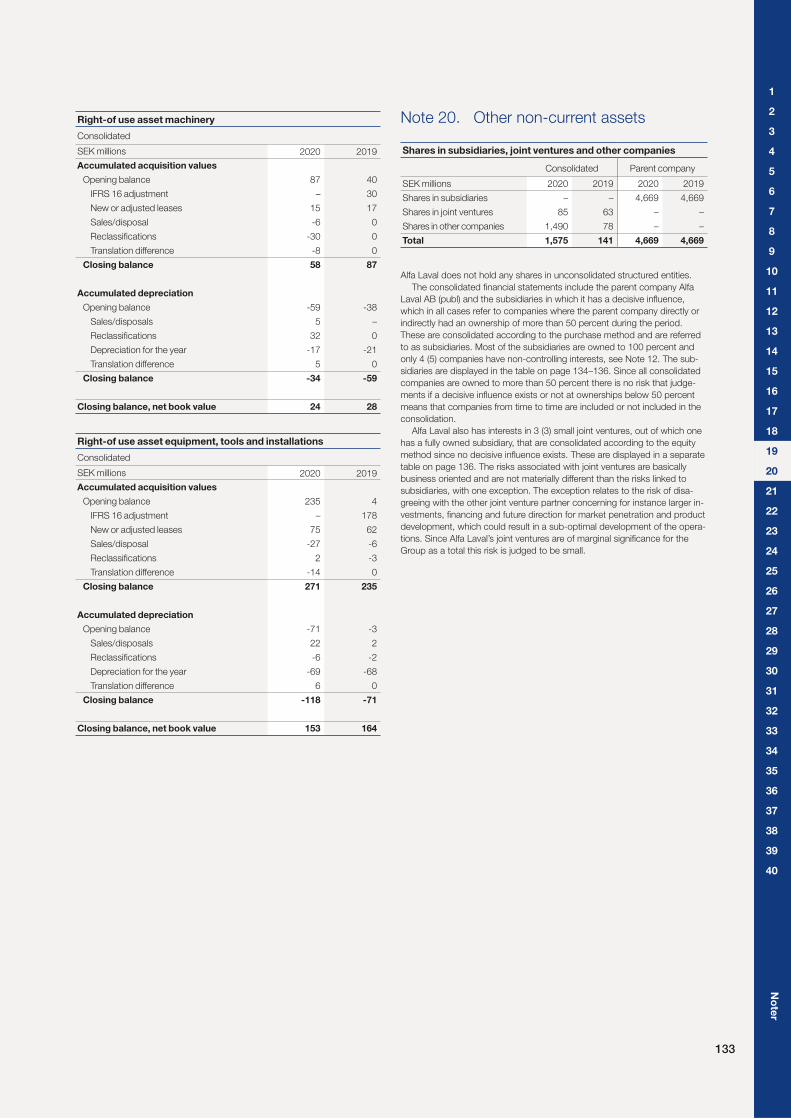
133
No
ter
1
2
3
4
5
6
7
8
9
10
11
12
13
14
15
16
17
18
19
20
21
22
23
24
25
26
27
28
29
30
31
32
33
34
35
36
37
38
39
40
Right-of use asset machinery
Consolidated
SEK millions 2020 2019
Accumulated acquisition values
Opening balance 87 40
IFRS 16 adjustment – 30
New or adjusted leases 15 17
Sales/disposal -6 0
Reclassifications -30 0
Translation difference -8 0
Closing balance 58 87
Accumulated depreciation
Opening balance -59 -38
Sales/disposals 5 –
Reclassifications 32 0
Depreciation for the year -17 -21
Translation difference 5 0
Closing balance -34 -59
Closing balance, net book value 24 28
Right-of use asset equipment, tools and installations
Consolidated
SEK millions 2020 2019
Accumulated acquisition values
Opening balance 235 4
IFRS 16 adjustment – 178
New or adjusted leases 75 62
Sales/disposal -27 -6
Reclassifications 2 -3
Translation difference -14 0
Closing balance 271 235
Accumulated depreciation
Opening balance -71 -3
Sales/disposals 22 2
Reclassifications -6 -2
Depreciation for the year -69 -68
Translation difference 6 0
Closing balance -118 -71
Closing balance, net book value 153 164
Note 20. Other non-current assets
Shares in subsidiaries, joint ventures and other companies
Consolidated Parent company
SEK millions 2020 2019 2020 2019
Shares in subsidiaries – – 4,669 4,669
Shares in joint ventures 85 63 – –
Shares in other companies 1,490 78 – –
Total 1,575 141 4,669 4,669
Alfa Laval does not hold any shares in unconsolidated structured entities.
The consolidated financial statements include the parent company Alfa
Laval AB (publ) and the subsidiaries in which it has a decisive influence,
which in all cases refer to companies where the parent company directly or
indirectly had an ownership of more than 50 percent during the period.
These are consolidated according to the purchase method and are referred
to as subsidiaries. Most of the subsidiaries are owned to 100 percent and
only 4 (5) companies have non-controlling interests, see Note 12. The sub-
sidiaries are displayed in the table on page 134–136. Since all consolidated
companies are owned to more than 50 percent there is no risk that judge-
ments if a decisive influence exists or not at ownerships below 50 percent
means that companies from time to time are included or not included in the
consolidation.
Alfa Laval also has interests in 3 (3) small joint ventures, out of which one
has a fully owned subsidiary, that are consolidated according to the equity
method since no decisive influence exists. These are displayed in a separate
table on page 136. The risks associated with joint ventures are basically
business oriented and are not materially different than the risks linked to
subsidiaries, with one exception. The exception relates to the risk of disa-
greeing with the other joint venture partner concerning for instance larger in-
vestments, financing and future direction for market penetration and product
development, which could result in a sub-optimal development of the opera-
tions. Since Alfa Laval’s joint ventures are of marginal significance for the
Group as a total this risk is judged to be small.
AL_20_BAKVAGN_EN.indd 133 2021-03-25 12:41

134
The share of capital in the below tables is in all cases the same as the share of voting rights.
The below specification of shares contains some simplifications, for instance in connection with ownership in multiple layers or when the ownership is split
on several owners or at cross-holdings. This is in order not to unnecessarily burden the presentation. A complete specification of shares can be ordered by
contacting Alfa Laval’s head office in Lund or via the Swedish Companies Registration Office (Bolagsverket).
Specification of shares in subsidiaries
Registration Number of Share of Book value
Company name number Domicile shares capital % SEK millions
Alfa Laval Holding AB 556587–8062 Lund, Sweden 8,191,000 100 4,461
Alfa Laval NV Maarssen, Netherlands 887,753 100 –
Alfa Laval Inc. Newmarket, Canada 1,000,000 67 –
Alfa Laval S.A. DE C.V. Tlalnepantla, Mexico 45,057,057 100 –
Alfa Laval S.A. San Isidro, Argentina 1,223,967 95 –
Alfa Laval Ltda Sao Paulo, Brazil 21,129,066 100 –
Framo do Brasil Ltda. Rio de Janeiro, Brazil 14,850 4.67 –
Alfa Laval SpA Santiago, Chile 2,735 100 –
Ashbrook Chile S.A. Santiago, Chile 579,999 100 –
Alfa Laval S.A. Bogota, Colombia 11,563 95 –
Alfa Laval S.A. Lima, Peru 4,346,832 100 –
Inmobililaria Tanguis S.A.C. Lima, Peru 1,499 100 –
Alfa Laval Venezolana S.A. Caracas, Venezuela 10,000 100 –
Alfa Laval Oilfield C.A. Caracas, Venezuela 203 81 –
Alfa Laval Taiwan Ltd Taipei, Taiwan 1,499,994 100 –
Alfa Laval (China) Ltd Hong Kong, China 79,999 100 –
Alfa Laval (Jiangyin) Manufacturing Co Ltd Jiang Yin, China 100 –
Alfa Laval Flow Equipment (Kunshan) Co Ltd Jiangsu, China 30 –
Alfa Laval Flow Equipment (Kunshan) Co Ltd Jiangsu, China 70 –
Alfa Laval (Shanghai) Technologies Co Ltd Shanghai, China 100 –
Wuxi MCD Gasket Co Ltd Jiang Yin, China 100 –
Tranter Heat Exchangers (Beijing) Co Ltd Beijing, China 100 –
Liyang Sifang Stainless Steel Products Co., Ltd Liyang City, China 65 –
Alfa Laval Iran Ltd Teheran, Iran 32,983 100 –
Framo Korea Ltd Busan, South Korea 5,000 25 –
Alfa Laval Philippines Inc. Makati, Philippines 72,000 100 –
Alfa Laval Singapore Pte Ltd Singapore 5,000,000 100 –
Alfa Laval (Thailand) Ltd Bangkok, Thailand 1,199,999 100 –
Alfa Laval Middle East Ltd Nicosia, Cyprus 40,000 100 –
Alfa Laval Service Operations Qatar LLC Doha, Qatar 9,800 49 –
Alfa Laval Benelux NV/SA Brussels, Belgium 98,284 100 –
Alfa Laval EOOD Sofia, Bulgaria 100 100 –
Alfa Laval Slovakia S.R.O. Bratislava, Slovakia 1 –
Alfa Laval Spol S.R.O. Prague, Czech Republic 20 –
Alfa Laval Nordic OY Espoo, Finland 20,000 100 –
Alfa Laval Nederland BV Maarssen, Netherlands 10,000 100 –
Alfa Laval Benelux BV Maarssen, Netherlands 20,000 100 –
PHE Holding AB 556306-2404 Lund, Sweden 2,500 100 –
Tranter Heat Exchangers Canada Inc. Edmonton, Canada 100 100 –
Tranter Indùstria e Comércio de Equipamentos Ltda Sao Paulo, Brazil 2,018,370 100 –
Tranter India Pvt Ltd Pune, India 3,009,999 100 –
Alfa Laval India Pvt Ltd Pune, India 1 0 –
Alfa Laval Korea Ltd Seoul, South Korea 36,400 10 –
Alfa Laval Korea Holding Company Ltd Chungnam, South Korea 13,318,600 100 –
Alfa Laval Korea Ltd Seoul, South Korea 327,600 90 –
Alfa Laval Corhex Ltd Daejeon, South Korea 50,000 100 –
LHE Co. Ltd Gim Hae, South Korea 4,104,000 90 –
LHE Co. Ltd Gim Hae, South Korea 456,000 10 –
Tranter International AB 556559-1764 Vänersborg, Sweden 100,000 100 –
Multbran AB 556662-3988 Lund, Sweden 2,723 100 –
Alfa Laval India Pvt Ltd Pune, India 1 0 –
Breezewind AB 556773-6532 Lund, Sweden 1,000 100 –
Alfa Laval India Pvt Ltd Pune, India 1 0 –
Alfa Laval Corporate AB 556007-7785 Lund, Sweden 13,920,000 100 –
Alfa Laval S.A. San Isidro, Argentina 64,419 5 –
Alfa Laval S.A. Bogota, Colombia 609 5 –
Definox (Beijing) Stainless Steel Equipment Ltd Beijing, China 100 –
Alfa Laval India Pvt Ltd Pune, India 17,832,712 100 –
Tranter India Pvt Ltd Pune, India 1 0 –
PT Alfa Laval Indonesia Jakarta, Indonesia 16,240 100 –
Alfa Laval Malaysia Sdn Bhd Shah Alam, Malaysia 10,000 100 –
Alfa Laval d.o.o. Trzin, Slovenia 0 100 –
Alfa Laval Kolding A/S Kolding, Denmark 40 100 –
Alfa Laval Nordic A/S Rödovre, Denmark 1 100 –
Alfa Laval Copenhagen A/S Söborg, Denmark 1 100 –
Alfa Laval Nakskov A/S Nakskov, Denmark 242,713 100 –
Alfa Laval Aalborg A/S Aalborg, Denmark 2,560,972 100 –
AL_20_BAKVAGN_EN.indd 134 2021-03-25 12:41

135
No
tes
Specification of shares in subsidiaries, continued
Registration Number of Share of Book value
Company name number Domicile shares capital % SEK millions
Alfa Laval Aalborg Indústria e Comércio Ltda Petrópolis, Brazil 5,969,400 99.5 –
Aalborg Industries Ltda Itu, Brazil 4,644,373 100 –
Alfa Laval Qingdao Ltd Jiaozhou City, China 100 –
Alfa Laval Aalborg Oy Rauma, Finland 3,000 100 –
Alfa Laval Nijmegen BV Nijmegen, Netherlands 182 100 –
Alfa Laval Aalborg Holding Pty Ltd North Wyong, Australia 2,875,010 100 –
Alfa Laval Aalborg Pty Ltd North Wyong, Australia 225,000 100 –
Alfa Laval Olmi SpA Suisio, Italy 500,000 100 –
Alfa Laval Italy Srl Milan, Italy 33.3 –
Alfa Laval Nordic AS Oslo, Norway 100 100 –
Framo AS Nesttun, Norway 95,347,695 100 –
Framo do Brasil Ltda. Rio de Janeiro, Brazil 303,002 95.33 –
Framo Shanghai Ltd. Shanghai, China 0 100 –
Framo Korea Ltd Busan, South Korea 15,000 75 –
Framo Singapore PTE Ltd. Singapore 1,000,000 100 –
Framo Nederland BV Spijkenisse, Netherlands 500 100 –
Framo Nippon KK Tokyo, Japan 600 100 –
Framo Fusa AS Fusa, Norway 86,236 100 –
Framo Holsnøy AS Frekhaug, Norway 25,000 100 –
Framo Flatøy AS Frekhaug, Norway 45,330 100 –
Framo Services AS Nesttun, Norway 10,000 100 –
PHE Holding AS Nesttun, Norway 45,000 100 –
Alfa Laval Nordic AB 556243-2061 Tumba, Sweden 1,000 100 –
Alfa Laval Treasury International (publ) AB 556432-2484 Lund, Sweden 50,000 100 –
Alfa Laval India Pvt Ltd Pune, India 1 0 –
Alfa Laval Europe AB 556128-7847 Lund, Sweden 500 100 –
Alfa Laval Lund AB 556016-8642 Lund, Sweden 100 100 –
Alfa Laval India Pvt Ltd Pune, India 1 0 –
Alfa Laval International Engineering AB 556039-8934 Lund, Sweden 4,500 100 –
Alfa Laval Tumba AB 556021-3893 Tumba, Sweden 1,000 100 –
Alfa Laval Oilfield C.A. Caracas, Venezuela 47 19 –
AO Alfa Laval Potok Koroljov, Russia 31,092,939 100 –
Alfa Laval Makine Sanayii ve Ticaret Ltd Sti Istanbul, Turkey 27,001,755 99 –
Alfa Laval SIA Riga, Latvia 125 100 –
Alfa Laval Australia Pty Ltd Homebush, Australia 2,088,076 100 –
Alfa Laval New Zeeland Pty Ltd Hamilton, New Zeeland 1,000 100 –
Alfa Laval Holding BV Maarssen, Netherlands 60,035,631 100 –
Alfa Laval (Pty) Ltd Isando, South Africa 2,000 100 –
Alfa Laval SA (Pty) Ltd Isando, South Africa 100 100 –
Alfa Laval Slovakia S.R.O. Bratislava, Slovakia 99 –
Alfa Laval Spol S.R.O. Prague, Czech Republic 80 –
Alfa Laval Holding SAS Saint-Priest, France 2,000,000 100 –
Alfa Laval France & North West Africa SAS Saint-Priest, France 606,700 100 –
Alfa Laval Moatti SAS Elancourt, France 24,000 100 –
Alfa Laval Spiral SAS Nevers, France 79,999 100 –
MCD SAS Guny, France 71,300 100 –
Alfa Laval Vicarb SAS Grenoble, France 200,000 100 –
Canada Inc. Newmarket, Canada 480,000 100 –
Alfa Laval Inc. Newmarket, Canada 481,600 33 –
SCI du Companil Grenoble, France 32,165 100 –
Alfa Laval Packinox SAS Paris, France 348,115 100 –
Ziepack SA Paris, France 37,701 51 –
Tranter SAS Nanterre, France 100 –
Definox SAS Clisson, France 10,000 100 –
Alfa Laval Holding GmbH Glinde, Germany 1 100 –
Alfa Laval Mid Europe GmbH Wiener Neudorf, Austria 1 100 –
Tranter Warmetauscher GmbH Guntramsdorf, Austria 100 –
Alfa Laval Mid Europe GmbH Glinde, Germany 1 100 –
Tranter GmbH Artern, Germany 1 100 –
Alfa Laval Heat Exchanger Service GmbH Frechen, Germany 1 100 –
Alfa Laval Mid Europe AG Dietlikon, Switzerland 647 100 –
Alfa Laval Single Member SA Holargos, Greece 807,000 100 –
Alfa Laval Kft Budapest, Hungary 1 100 –
Alfa Laval SpA Monza, Italy 1,992,276 99 –
Alfa Laval Italy Srl Milan, Italy 66.7 –
WCR Benelux BV Veenendahl, the Netherlands 180 100 –
Alfa Laval Polska Sp.z.o.o. Warsaw, Poland 7,600 100 –
Alfa Laval Kraków Sp.z.o.o. Krakow, Poland 80,080 100 –
Alfa Laval (Portugal) Ltd Linda–A–Velha, Portugal 1 –
Alfa Laval SRL Bucharest, Romania 38,566 100 –
Alfa Laval Iberia SA Madrid, Spain 99,999 99.999 –
1
2
3
4
5
6
7
8
9
10
11
12
13
14
15
16
17
18
19
20
21
22
23
24
25
26
27
28
29
30
31
32
33
34
35
36
37
38
39
40
AL_20_BAKVAGN_EN.indd 135 2021-03-25 12:41

136
Specification of shares in joint ventures
Company name
Registration
number Domicile
Number of
shares
Share of
capital %
Book value
SEK millions
Alfa Laval Holding AB
Alfdex AB 556647-7278 Botkyrka, Sweden 1, 000 50 66
Alfdex Kunshan Co Ltd Kunshan, China 100 12
Alfa Laval Corporate AB
AlfaWall AB 556723-6715 Botkyrka, Sweden 500 50 7
Alfa Laval Ltd
Rolls Laval Heat Exchangers Ltd Wolverhampton, UK 5,000 50 0
Total 85
Specification of shares in subsidiaries, continued
Registration Number of Share of Book value
Company name number Domicile shares capital % SEK millions
Alfa Laval (Portugal) Ltd Linda-A-Velha, Portugal 1 99 –
Alfa Laval Holdings Ltd * Camberley, UK 14,053,262 100 –
Alfa Laval Ltd * Camberley, UK 11,700,000 100 –
Tranter Ltd * Doncaster, UK 10,000 100 –
Alfa Laval Eastbourne Ltd * Eastbourne, UK 10,000 100 –
Alfa Laval Ashbrook-Simon Hartley Ltd * Newcastle-under-Lyme, UK 2 100 –
Alfa Laval Makine Sanayii ve Ticaret Ltd Sti Istanbul, Turkey 1 1 –
Alfa Laval USA Inc. Richmond, Virginia, USA 1,000 100 –
Alfa Laval US Holding Inc. Richmond, Virginia, USA 180 100 –
Alfa Laval Inc. Richmond, Virginia, USA 44,000 100 –
Alfa Laval Niagara Inc. Buffalo, New York, USA 4,000,200 100 –
Framo Houston Inc. La Porte, Texas, USA 5,000 100 –
Alfa Laval US Treasury Inc. Richmond, Virginia, USA 1,000 100 –
DSO Fluid Handling Inc. Irvington, New Jersey, USA 100 100 –
AGC Heat Transfer Inc. Bristow, Virginia, USA 1,000 100 –
Tranter Inc. Wichita Falls, Texas, USA 1,000 100 –
MCD Gaskets Inc. Richmond, Virginia, USA 1,000 100 –
Hutchison Hayes Separation Inc. Houston, Texas, USA 1,000 100 –
Definox Inc. New Berlin, Wisconsin, USA 1,000 100 –
Sandymount Technologies Corporation Woburn, Massachusetts, USA 1,000 100 –
Alfa Laval IC Disc Inc. Richmond, Virginia, USA 1,000 100 –
Alfa Laval Försäkrings AB 516406-0682 Lund, Sweden 50,000 100 –
Alfa Laval Ltda Sao Paulo, Brazil 2 0 –
Tranter Indùstria e Comércio de Equipamentos Ltda Sao Paulo, Brazil 1 0 –
Alfa Laval Benelux NV/SA Brussels, Belgium 2 0 –
Alfa Laval SpA Monza, Italy 20,124 1 –
Alfa Laval Iberia SA Madrid, Spain 1 0.001 –
Alfa Laval Ukraine Kiev, Ukraine 100 –
Alfa Laval India Pvt Ltd Pune, India 1 0 –
Alfa Laval Vietnam LLC Ho Chi Minh City, Vietnam 0 100 –
Alfa Laval KK Tokyo, Japan 1,200,000 100 208
Total 4,669
* These five companies registered in England and Wales are exempt from the Companies Act 2006 requirements relating to the audit of their individual accounts by virtue of Section
479A of the Act as Alfa Laval AB (publ) has guaranteed the subsidiary companies under Section 479C of the Act.
AL_20_BAKVAGN_EN.indd 136 2021-03-25 12:41

137
No
tes
Specification of shares in other companies
Company name Domicile Number of shares Share of capital % Book value SEK thousands
Alfa Laval US Holding Inc.
Malta Inc USA 8,000,000 13 65,665
AMI Global LLC USA 20 28,728
Alfa Laval Aalborg Indústria e Comércio Ltda
Tractebel Brazil 1,268 68
Elektrobras Brazil 7,107 92
Alfa Laval Philippines Inc.
Philippine Long Distance Telephone Philippines 820 14
Alfa Laval Nordic OY
As Oy Koivulantie 7A Finland 1 313
Helsinki Halli Finland 4 141
Framo Nederland BV
Triangle (Air) Freight Forwarders BV Netherlands 12 33 2,017
Framo Flatøy AS
Nordhordaland handverk og industrilag AS Norway 50 4 24
Glöde AS Norway 3 3 3
Alfa Laval Treasury International AB (publ)
Neles Oyj Finland 12,723,923 8.46 1,393,019
Alfa Laval Tumba AB
Smedhälsan Ekonomisk Förening Sweden 22
Alfa Laval Corporate AB
European Development Capital
Corporation (EDCC) NV Curacao 36,129 0
Multiprogress Hungary 100 3 0
Kurose Chemical Equipment Ltd Japan 180,000 11 0
Poljopriveda former Yugoslavia 0
Tecnica Argo-Industrial S.A. Mexico 490 49 0
Adela Investment Co S.A. (preference) Luxembourg 1,911 0 0
Adela Investment Co S.A. Luxembourg 1,911 0 0
Mas Dairies Ltd Pakistan 125,000 5 0
Total 1,490,106
None of these other companies with a share of capital of 20 percent or more are accounted for as associates since they are dormant or have very limited activites
and Alfa Laval does not have a significant influence according to IAS 28 item 6.
Note 21. Inventories
Type of inventory
Consolidated
SEK millions 2020 2019
Raw materials and consumables 3,199 3,364
Work in progress 1,866 2,535
Finished goods & goods for resale, new sales 2,650 2,519
Finished goods & goods for resale, spare parts 1,236 1,406
Advance payments to suppliers 272 253
Total 9,223 10,077
A considerable part of the inventory for spare parts is carried at net realisable value.
Obsolescence related to inventories amounts to and has changed as follows:
Obsolescence
Consolidated
SEK millions January 1
Translation
difference Write down
Reversal of
previous write down December 31
Year:
2019 1,243 26 294 -312 1,251
2020 1,251 -89 405 -292 1,275
The Group's inventories have been accounted for after deduction for inter-company gains in inventory due to internal sales within the Group. The inter-company
profit reserve at the end of 2020 amounts to SEK 571 (576) million.
1
2
3
4
5
6
7
8
9
10
11
12
13
14
15
16
17
18
19
20
21
22
23
24
25
26
27
28
29
30
31
32
33
34
35
36
37
38
39
40
AL_20_BAKVAGN_EN.indd 137 2021-03-25 12:41

138
Note 22. Accounts receivable
Accounts receivable with a maturity exceeding one year of SEK 122 (204) million have not been accounted for as non-current assets as they are not intended
for permanent use.
Accounts receivable are reported net of provisions for bad debts. The provision for bad debts amounts to and has changed as follows:
Bad Debts
Consolidated
SEK millions January 1
Translation
difference
New provisions
and increase of
existing provisions
Amounts
used
Unused
amounts
reversed
Change due to
discounting December 31
Year:
2019 386 10 275 -143 -162 0 366
2020 366 -32 97 -48 -64 0 319
The amount of accounts receivable being overdue is an indication of the risk the company runs for ending up in bad debts. The percentage is in relation to the
total amount of accounts receivable.
Accounts receivable - overdue
Consolidated
SEK millions 2020 % 2019 %
Overdue:
Maximum 30 days 536 9.2 837 11.2
More than 30 days but maximum 90 days 304 5.2 588 7.9
More than 90 days 425 7.3 538 7.2
Total 1,265 21.7 1,963 26.3
Provision for lifetime expected credit losses
Consolidated
Accounts and notes
receivables / Other
receivables Recorded at inception
For credit risks that
have increased
significantly since initial
recognition
Related to objective
evidence of impairment Total
SEK millions 2020 2019 2020 2019 2020 2019 2020 2019 2020 2019
Accounts and notes receivable
Undue 5,041 6,039 8 5 5 7 32 31 45 43
Overdue 1-30 days 536 837 1 1 0 0 7 3 8 4
Overdue 31-60 days 181 364 – – 4 9 3 5 7 14
Overdue 61-90 days 123 224 – – 9 3 4 20 13 23
Overdue 91-365 days 295 372 – – 50 64 66 45 116 109
Overdue >365 days 130 166 – – 59 70 40 61 99 131
Total 6,306 8,002 9 6 127 153 152 165 288 324
Other receivables
Contract assets 2,084 2,465 11 18 12 19 5 4 28 41
Financial lessor receivable 4 5 – – 1 1 2 – 3 1
Total 2,088 2,470 11 18 13 20 7 4 31 42
AL_20_BAKVAGN_EN.indd 138 2021-03-25 12:41

139
No
tes
Note 23. Other short-term receivables
Split on type and maturity
Consolidated
SEK millions 2020 2019
Notes receivable 184 218
Financial lessor receivable 4 5
Revenue recognition ahead of progress invoicing 2,056 2,424
Other receivables 969 1,372
Total 3,213 4,019
Of which, not due within one year:
Notes receivable 0 0
Other receivables 19 24
Total 19 24
Other receivables relate to a wide range of other receivables, including balanced invoicing relating to satisfied performance obligations that have not yet been in-
voiced (where the revenue recognition is ahead of the progress invoicing), VAT receivables, receivables on governments for export incitements, receivables on
personnel, rent receivables etc.
Note 24. Prepaid expenses and accrued income
Split on type
Consolidated
SEK millions 2020 2019
Prepaid expenses 323 333
Accrued income 96 118
Total 419 451
Note 25. Other current deposits
Split on type and maturity
Consolidated
SEK millions 2020 2019
Deposits with banks 1,160 205
Bonds and other securities 1,451 654
Other deposits 7 14
Total 2,618 873
Of which, not due within one year:
Deposits with banks 7 8
Other deposits 0 3
Total 7 11
Note 26. Cash and cash equivalents
The item cash and cash equivalents in the statement on financial position and in the cash flow statement is mainly relating to bank deposits and liquid deposits.
Note 27. Defined benefit obligations
The Group has defined benefit commitments to employees and former employees and their survivors. The benefits are referring to old age pension, survivor's
pension, disability pension, health care and severance pay.
The defined benefit plans are in place in Austria, Belgium, France, Germany, India, Indonesia, Italy, Japan, Mexico, the Netherlands, Norway, Philippines, South
Africa, Sweden, Switzerland, Taiwan, the United Kingdom and the United States. Most plans have been closed for new participants and replaced by defined contribution
plans for new employees. As of 2020 that also applies to the Netherlands. During 2020 the defined benefit pension plan in the US has been settled for the largest
subsidiaries through purchase of annuities.
Risks
The cost for defined benefit obligations are impacted by several factors that are outside the control of the company, such as the discount rate, the return on plan
assets, future salary increases, the development of the average length of life and the claim rates under medical plans. The size of and the development of these
costs are therefore difficult to predict. According to the IAS 19 all of these remeasurements are reported in other comprehensive income.
The following table presents how the net defined benefit liability is arrived at out of the present values of the different defined benefit plans, less the fair value of
the plan assets.
1
2
3
4
5
6
7
8
9
10
11
12
13
14
15
16
17
18
19
20
21
22
23
24
25
26
27
28
29
30
31
32
33
34
35
36
37
38
39
40
AL_20_BAKVAGN_EN.indd 139 2021-03-25 12:41

140
Total plan cost
Consolidated
SEK millions 2020 2019
Net plan cost
Current service cost -114 -111
Net interest cost/income -36 -55
Past service cost/income from plan amendments and curtailments and gains and losses on settlements 8 23
Net plan (-) cost/(+) income -142 -143
Remeasurements
Actuarial losses/gains arising from changes in demographic assumptions -59 65
Actuarial losses/gains arising from changes in financial assumptions -674 -505
Actuarial losses/gains arising from changes in experience -12 25
Return on plan assets less interest on plan assets 313 277
Change in disallowed assets due to asset ceiling – –
Other comprehensive income (OCI) -432 -138
Total plan cost -574 -281
The following table presents how the present value of the defined benefit liability has changed during the year and lists the different components of the change.
Present value of defined benefit liability
Consolidated
SEK millions 2020 2019
Present value of defined benefit liability at January 1 -7,476 -6,725
Translation difference 608 -333
Current service cost -114 -111
Interest cost -124 -185
Employee contributions -4 -5
Actuarial losses/gains arising from changes in demographic assumptions -59 65
Actuarial losses/gains arising from changes in financial assumptions -674 -505
Actuarial losses/gains arising from changes in experience -12 25
Past service cost/income from plan amendments and curtailments and gains and losses on settlements 8 23
Benefit payments 286 275
Settlement payments 697 0
(-) liability at December 31 -6,864 -7,476
The liability has the following duration and maturity:
Duration and maturity
Consolidated
2020 2019
Weighted average duration of the defined benefit obligation (years) 11 13
Maturity analysis of benefit payments (non-discounted amounts) SEK millions
maturity ≤ 1 year 206 294
maturity > 1 ≤ 5 years 1,325 1,189
maturity > 5 ≤ 10 years 1,326 1,584
maturity > 10 ≤ 20 years 2,564 2,935
maturity > 20 years 3,502 4,897
Net defined benefit liability
Consolidated
SEK millions 2020 2019
Present value of defined benefit obligation, unfunded -1,124 -1,177
Present value of defined benefit obligation, funded -5,740 -6,299
Present value of defined benefit obligation at year end -6,864 -7,476
Fair value of plan assets 4,440 5,225
Net defined benefit liability -2,424 -2,251
Less disallowed assets due to asset ceiling – –
(-) liability/(+) asset at December 31 -2,424 -2,251
The net plan cost for the defined benefit plans describes the different cost elements of the plans. The net plan cost is reported in the consolidated compre-
hensive income statement on the lines where personnel costs are reported. The interest cost/income is not part of the financial net, but instead just a way to
categorize the components of the net plan cost. All remeasurements are reported in other comprehensive income and will never be reclassified to net income.
AL_20_BAKVAGN_EN.indd 140 2021-03-25 12:41

141
No
tes
The plan assets are split on the following types of assets:
Split of plan assets
Consolidated
SEK millions 2020 2019
Cash and cash equivalents 299 328
Equity instruments 938 976
Debt instruments 1,759 2,604
Real estate 269 243
Derivatives 17 –
Investment funds 1,158 1,074
Fair value at December 31 4,440 5,225
The plan assets are in all essentials valued at quoted market prices in active markets.
The table below presents how the net defined benefit liability has changed and the factors affecting the change.
Net defined benefit liability/asset
Consolidated
SEK millions 2020 2019
Defined benefit liability/asset at January 1 -2,251 -2,081
Translation difference 199 -91
Net plan cost -142 -143
Employer contributions 155 148
Remeasurements (other comprehensive income) -432 -138
Benefit payments, unfunded plans 46 54
Settlement payments, unfunded plans 1 0
(-) liability/(+) asset at December 31 -2,424 -2,251
The gross plan assets and gross defined benefit liabilities of each plan are to be reported as a net amount. The following table shows how the net asset and the
net liability are calculated.
Gross defined benefit liability/asset
Consolidated
SEK millions 2020 2019
Assets
Fair value of plan assets 4,440 5,225
Less disallowed assets due to asset ceiling – –
4 440 5 225
Netting -4,370 -5,155
Assets in statement on financial position 70 70
Liabilities
Present value of defined benefit obligation at year end -6,864 -7,476
Netting 4,370 5,155
Provision in statement on financial position -2,494 -2,321
The following table presents how the fair value of the plan assets has developed during the year and lists the components of the change.
Fair value of plan assets
Consolidated
SEK millions 2020 2019
Fair value of plan assets at January 1 5,225 4,644
Translation difference -409 242
Employer contributions 155 148
Employee contributions 4 5
Interest on plan assets 88 130
Return on plan assets less interest on plan assets 313 277
Benefit payments -240 -221
Settlement payments -696 0
(+) asset at December 31 4,440 5,225
1
2
3
4
5
6
7
8
9
10
11
12
13
14
15
16
17
18
19
20
21
22
23
24
25
26
27
28
29
30
31
32
33
34
35
36
37
38
39
40
AL_20_BAKVAGN_EN.indd 141 2021-03-25 12:41

142
The following table presents how the defined benefit pension schemes are distributed on different countries.
Regional split
Consolidated
SEK millions unless otherwise stated
United
States
United
Kingdom
Nether-
lands Germany Norway Italy Belgium Other Total
Net defined benefit liability
Present value of the defined benefit obligation, unfunded -556 – – -189 -10 -15 – -354 -1,124
Present value of the defined benefit obligation, funded 0 -3,670 -834 – -818 – -93 -325 -5,740
Present value of the defined benefit obligation at year end -556 -3,670 -834 -189 -828 -15 -93 -679 -6,864
Fair value of plan assets 56 2,376 832 – 824 – 63 289 4,440
Net defined benefit liability -500 -1,294 -2 -189 -4 -15 -30 -390 -2,424
Less disallowed assets due to asset ceiling – – – – – – – – –
(-) liability/(+) asset -500 -1,294 -2 -189 -4 -15 -30 -390 -2,424
Net plan cost -41 -38 -10 -1 -11 0 -2 -39 -142
Remeasurements (OCI) -3 -423 9 -2 -20 – -5 12 -432
Sensitivity analysis*
Discount rate decreased by 1% point -64 -721 -194 -8 -113 – -5 -95 -1,200
Life expectancy increased by 1 year -25 -211 -35 -12 -33 – 0 -11 -327
Expected average retirement age decreased by 1 year -5 – – 0 0 – 1 -11 -15
Claim rates under medical plans increased by 1 % point -8 – – – – – – – -8
Expected rate of salary increases increased by 1% point 0 -59 – – -14 – -10 -27 -110
Medical costs increased by 1% point -27 – – – – – – -1 -28
Index for future compensation increases increased by 1% point 0 -114 -62 -20 -102 – – -2 -300
Cost for actuarial services -2 -2 0 0 -1 0 0 0 -5
Number of participants in the plans at December 31
Current employees (active members) 1,010 82 17 1 116 – 11 2,464 3,701
Current employees (only vested value for closed plans) – – 34 3 1 113 – 12 163
Former employees that are not yet pensioners 0 335 309 4 – – 55 – 703
Pensioners 695 683 110 217 396 – – 79 2,180
Total 1,705 1,100 470 225 513 113 66 2,555 6,747
Remaining service period
Average remaining service period for active members (years) 8 9 12 4 4 – 13 8 8
* How much would the present value of the defined benefit obligation at December 31 increase if the (all other things being equal):
The weighted averages for the more significant actuarial assumptions that have been used at the year-end are:
Actuarial assumptions
Consolidated
2020 2019
Discount rate (%) 1.2 2.1
Expected average retirement age (years) 64 63
Life expectancy for a 45-year-old male (years) 82 82
Life expectancy for a 45-year-old female (years) 85 85
Claim rates under medical plans (%) 5 5
Expected rate of salary/wage increase (%) 3 3
Change in health care costs (%) 5 5
Index for future compensation increases (%) 2 2
Future contributions
Consolidated
SEK millions 2021
Expected employer contributions to the plan for the next calendar year -194
Expected employer contributions for the next calendar year to multi-employer plans reported as defined contribution plans -30
AL_20_BAKVAGN_EN.indd 142 2021-03-25 12:41
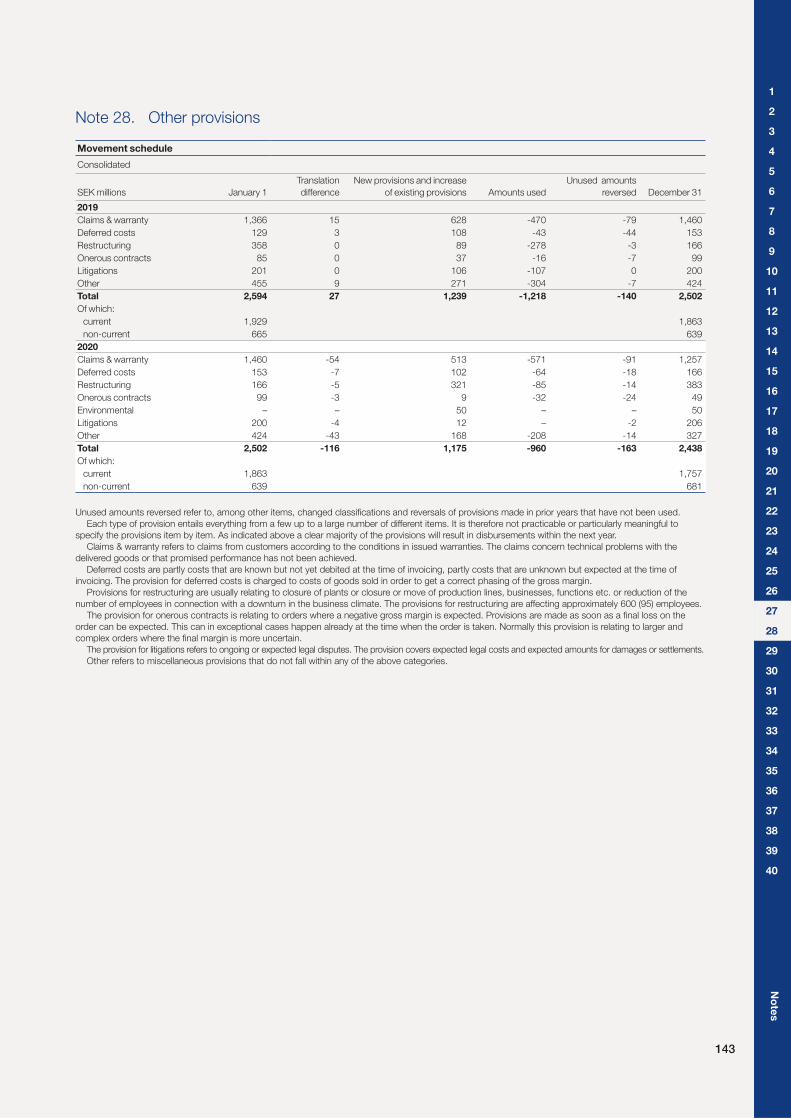
143
No
tes
Note 28. Other provisions
Movement schedule
Consolidated
SEK millions January 1
Translation
difference
New provisions and increase
of existing provisions Amounts used
Unused amounts
reversed December 31
2019
Claims & warranty 1,366 15 628 -470 -79 1,460
Deferred costs 129 3 108 -43 -44 153
Restructuring 358 0 89 -278 -3 166
Onerous contracts 85 0 37 -16 -7 99
Litigations 201 0 106 -107 0 200
Other 455 9 271 -304 -7 424
Total 2,594 27 1,239 -1,218 -140 2,502
Of which:
current 1,929 1,863
non-current 665 639
2020
Claims & warranty 1,460 -54 513 -571 -91 1,257
Deferred costs 153 -7 102 -64 -18 166
Restructuring 166 -5 321 -85 -14 383
Onerous contracts 99 -3 9 -32 -24 49
Environmental – – 50 – – 50
Litigations 200 -4 12 – -2 206
Other 424 -43 168 -208 -14 327
Total 2,502 -116 1,175 -960 -163 2,438
Of which:
current 1,863 1,757
non-current 639 681
Unused amounts reversed refer to, among other items, changed classifications and reversals of provisions made in prior years that have not been used.
Each type of provision entails everything from a few up to a large number of different items. It is therefore not practicable or particularly meaningful to
specify the provisions item by item. As indicated above a clear majority of the provisions will result in disbursements within the next year.
Claims & warranty refers to claims from customers according to the conditions in issued warranties. The claims concern technical problems with the
delivered goods or that promised performance has not been achieved.
Deferred costs are partly costs that are known but not yet debited at the time of invoicing, partly costs that are unknown but expected at the time of
invoicing. The provision for deferred costs is charged to costs of goods sold in order to get a correct phasing of the gross margin.
Provisions for restructuring are usually relating to closure of plants or closure or move of production lines, businesses, functions etc. or reduction of the
number of employees in connection with a downturn in the business climate. The provisions for restructuring are affecting approximately 600 (95) employees.
The provision for onerous contracts is relating to orders where a negative gross margin is expected. Provisions are made as soon as a final loss on the
order can be expected. This can in exceptional cases happen already at the time when the order is taken. Normally this provision is relating to larger and
complex orders where the final margin is more uncertain.
The provision for litigations refers to ongoing or expected legal disputes. The provision covers expected legal costs and expected amounts for damages or settlements.
Other refers to miscellaneous provisions that do not fall within any of the above categories.
1
2
3
4
5
6
7
8
9
10
11
12
13
14
15
16
17
18
19
20
21
22
23
24
25
26
27
28
29
30
31
32
33
34
35
36
37
38
39
40
AL_20_BAKVAGN_EN.indd 143 2021-03-25 12:41
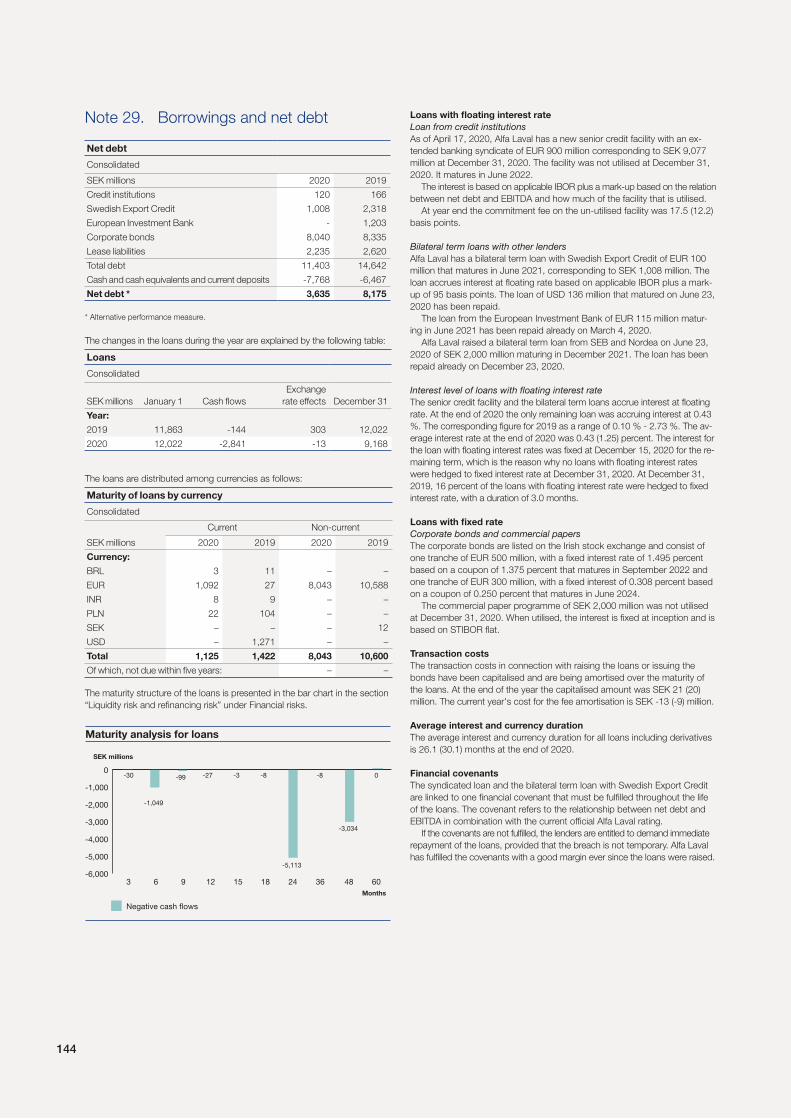
144
Note 29. Borrowings and net debt
Net debt
Consolidated
SEK millions 2020 2019
Credit institutions 120 166
Swedish Export Credit 1,008 2,318
European Investment Bank - 1,203
Corporate bonds 8,040 8,335
Lease liabilities 2,235 2,620
Total debt 11,403 14,642
Cash and cash equivalents and current deposits -7,768 -6,467
Net debt * 3,635 8,175
* Alternative performance measure.
The changes in the loans during the year are explained by the following table:
Loans
Consolidated
SEK millions January 1 Cash flows
Exchange
rate effects December 31
Year:
2019 11,863 -144 303 12,022
2020 12,022 -2,841 -13 9,168
The loans are distributed among currencies as follows:
Maturity of loans by currency
Consolidated
Current Non-current
SEK millions 2020 2019 2020 2019
Currency:
BRL 3 11 – –
EUR 1,092 27 8,043 10,588
INR 8 9 – –
PLN 22 104 – –
SEK – – – 12
USD – 1,271 – –
Total 1,125 1,422 8,043 10,600
Of which, not due within five years: – –
The maturity structure of the loans is presented in the bar chart in the section
“Liquidity risk and refinancing risk” under Financial risks.
Negative cash flows
-6,000
-5,000
-4,000
-3,000
-2,000
-1,000
0
3 6 9 12 15 18 24 36 48 60
Months
-1,049
-99-30 -27 -3 -8 -8
-5,113
0
-3,034
SEK millions
Maturity analysis for loans
Loans with floating interest rate
Loan from credit institutionsAs of April 17, 2020, Alfa Laval has a new senior credit facility with an ex-
tended banking syndicate of EUR 900 million corresponding to SEK 9,077
million at December 31, 2020. The facility was not utilised at December 31,
2020. It matures in June 2022.
The interest is based on applicable IBOR plus a mark-up based on the relation
between net debt and EBITDA and how much of the facility that is utilised.
At year end the commitment fee on the un-utilised facility was 17.5 (12.2)
basis points.
Bilateral term loans with other lendersAlfa Laval has a bilateral term loan with Swedish Export Credit of EUR 100
million that matures in June 2021, corresponding to SEK 1,008 million. The
loan accrues interest at floating rate based on applicable IBOR plus a mark-
up of 95 basis points. The loan of USD 136 million that matured on June 23,
2020 has been repaid.
The loan from the European Investment Bank of EUR 115 million matur-
ing in June 2021 has been repaid already on March 4, 2020.
Alfa Laval raised a bilateral term loan from SEB and Nordea on June 23,
2020 of SEK 2,000 million maturing in December 2021. The loan has been
repaid already on December 23, 2020.
Interest level of loans with floating interest rateThe senior credit facility and the bilateral term loans accrue interest at floating
rate. At the end of 2020 the only remaining loan was accruing interest at 0.43
%. The corresponding figure for 2019 as a range of 0.10 % - 2.73 %. The av-
erage interest rate at the end of 2020 was 0.43 (1.25) percent. The interest for
the loan with floating interest rates was fixed at December 15, 2020 for the re-
maining term, which is the reason why no loans with floating interest rates
were hedged to fixed interest rate at December 31, 2020. At December 31,
2019, 16 percent of the loans with floating interest rate were hedged to fixed
interest rate, with a duration of 3.0 months.
Loans with fixed rate
Corporate bonds and commercial papersThe corporate bonds are listed on the Irish stock exchange and consist of
one tranche of EUR 500 million, with a fixed interest rate of 1.495 percent
based on a coupon of 1.375 percent that matures in September 2022 and
one tranche of EUR 300 million, with a fixed interest of 0.308 percent based
on a coupon of 0.250 percent that matures in June 2024.
The commercial paper programme of SEK 2,000 million was not utilised
at December 31, 2020. When utilised, the interest is fixed at inception and is
based on STIBOR flat.
Transaction costs
The transaction costs in connection with raising the loans or issuing the
bonds have been capitalised and are being amortised over the maturity of
the loans. At the end of the year the capitalised amount was SEK 21 (20)
million. The current year's cost for the fee amortisation is SEK -13 (-9) million.
Average interest and currency duration
The average interest and currency duration for all loans including derivatives
is 26.1 (30.1) months at the end of 2020.
Financial covenants
The syndicated loan and the bilateral term loan with Swedish Export Credit
are linked to one financial covenant that must be fulfilled throughout the life
of the loans. The covenant refers to the relationship between net debt and
EBITDA in combination with the current official Alfa Laval rating.
If the covenants are not fulfilled, the lenders are entitled to demand immediate
repayment of the loans, provided that the breach is not temporary. Alfa Laval
has fulfilled the covenants with a good margin ever since the loans were raised.
AL_20_BAKVAGN_EN.indd 144 2021-03-25 12:41

145
No
tes
Note 30. Other current liabilities
Split by type
Consolidated
SEK millions 2020 2019
VAT liabilities, employee withholding taxes 194 201
Progress invoicing ahead of revenue recognition 795 1,452
Other non-interest bearing liabilities 2,588 2,566
Total 3,577 4,219
Note 31. Accrued costs and prepaid income
Split by type and maturity
Consolidated
SEK millions 2020 2019
Accruals for social security 402 385
Reserve for severance pay 200 206
Accrued interest expenses 26 27
Other accrued expenses 1,516 1,542
Prepaid income 9 138
Total 2,153 2,298
Of which, not due within one year:
Accruals for social security 42 37
Reserve for severance pay 120 161
Other accrued expenses 148 121
Total 310 319
Note 32. Pledged assets and contingent liabilities
Split by type
Consolidated
SEK millions 2020 2019
Pledged assets
Other pledges and similar commitments 7 10
Total 7 10
Contingent liabilities
Discounted bills 17 2
Performance guarantees 1,503 1,470
Other contingent liabilities 1,377 1,045
Total 2,897 2,517
As of December 31, 2020, the Group had sold receivables with recourse totalling SEK 17 (2) million. These are disclosed as discounted bills above.
Other contingent liabilities are among other items referring to bid guarantees, payment guarantees to suppliers and retention money guarantees.
1
2
3
4
5
6
7
8
9
10
11
12
13
14
15
16
17
18
19
20
21
22
23
24
25
26
27
28
29
30
31
32
33
34
35
36
37
38
39
40
AL_20_BAKVAGN_EN.indd 145 2021-03-25 12:41
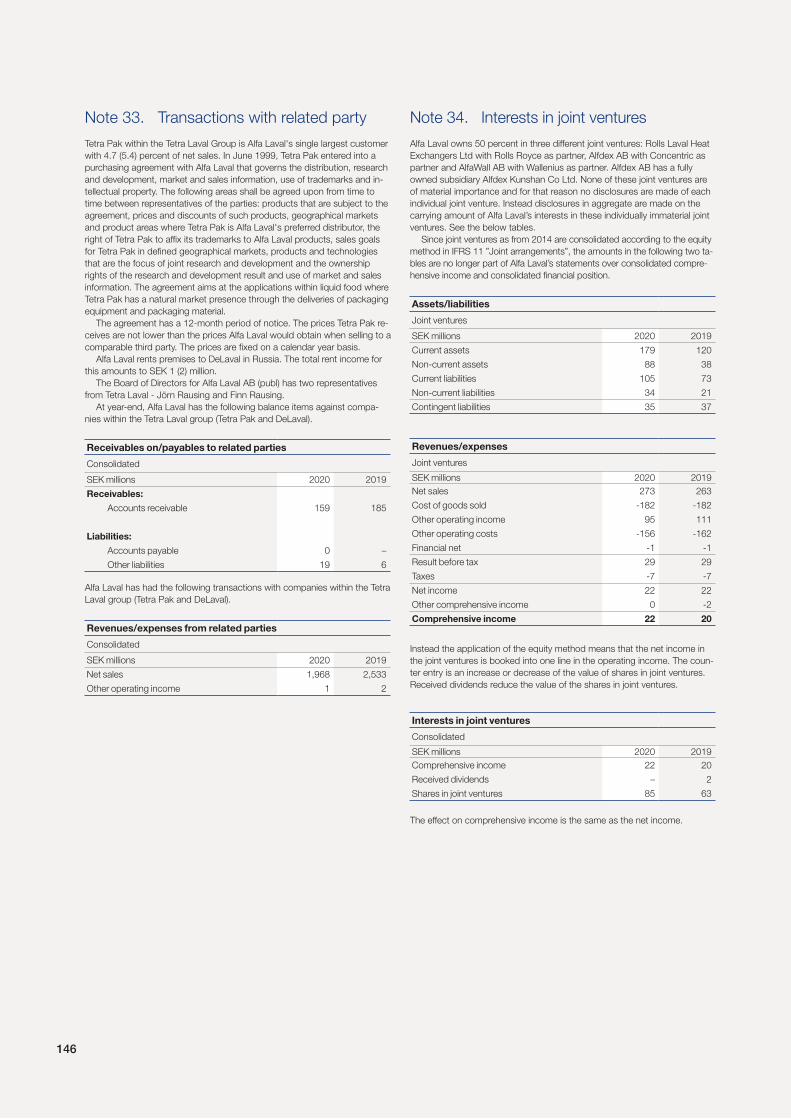
146
Note 33. Transactions with related party
Tetra Pak within the Tetra Laval Group is Alfa Laval's single largest customer
with 4.7 (5.4) percent of net sales. In June 1999, Tetra Pak entered into a
purchasing agreement with Alfa Laval that governs the distribution, research
and development, market and sales information, use of trademarks and in-
tellectual property. The following areas shall be agreed upon from time to
time between representatives of the parties: products that are subject to the
agreement, prices and discounts of such products, geographical markets
and product areas where Tetra Pak is Alfa Laval's preferred distributor, the
right of Tetra Pak to affix its trademarks to Alfa Laval products, sales goals
for Tetra Pak in defined geographical markets, products and technologies
that are the focus of joint research and development and the ownership
rights of the research and development result and use of market and sales
information. The agreement aims at the applications within liquid food where
Tetra Pak has a natural market presence through the deliveries of packaging
equipment and packaging material.
The agreement has a 12-month period of notice. The prices Tetra Pak re-
ceives are not lower than the prices Alfa Laval would obtain when selling to a
comparable third party. The prices are fixed on a calendar year basis.
Alfa Laval rents premises to DeLaval in Russia. The total rent income for
this amounts to SEK 1 (2) million.
The Board of Directors for Alfa Laval AB (publ) has two representatives
from Tetra Laval - Jörn Rausing and Finn Rausing.
At year-end, Alfa Laval has the following balance items against compa-
nies within the Tetra Laval group (Tetra Pak and DeLaval).
Receivables on/payables to related parties
Consolidated
SEK millions 2020 2019
Receivables:
Accounts receivable 159 185
Liabilities:
Accounts payable 0 –
Other liabilities 19 6
Alfa Laval has had the following transactions with companies within the Tetra
Laval group (Tetra Pak and DeLaval).
Revenues/expenses from related parties
Consolidated
SEK millions 2020 2019
Net sales 1,968 2,533
Other operating income 1 2
Note 34. Interests in joint ventures
Alfa Laval owns 50 percent in three different joint ventures: Rolls Laval Heat
Exchangers Ltd with Rolls Royce as partner, Alfdex AB with Concentric as
partner and AlfaWall AB with Wallenius as partner. Alfdex AB has a fully
owned subsidiary Alfdex Kunshan Co Ltd. None of these joint ventures are
of material importance and for that reason no disclosures are made of each
individual joint venture. Instead disclosures in aggregate are made on the
carrying amount of Alfa Laval’s interests in these individually immaterial joint
ventures. See the below tables.
Since joint ventures as from 2014 are consolidated according to the equity
method in IFRS 11 ”Joint arrangements”, the amounts in the following two ta-
bles are no longer part of Alfa Laval’s statements over consolidated compre-
hensive income and consolidated financial position.
Assets/liabilities
Joint ventures
SEK millions 2020 2019
Current assets 179 120
Non-current assets 88 38
Current liabilities 105 73
Non-current liabilities 34 21
Contingent liabilities 35 37
Revenues/expenses
Joint ventures
SEK millions 2020 2019
Net sales 273 263
Cost of goods sold -182 -182
Other operating income 95 111
Other operating costs -156 -162
Financial net -1 -1
Result before tax 29 29
Taxes -7 -7
Net income 22 22
Other comprehensive income 0 -2
Comprehensive income 22 20
Instead the application of the equity method means that the net income in
the joint ventures is booked into one line in the operating income. The coun-
ter entry is an increase or decrease of the value of shares in joint ventures.
Received dividends reduce the value of the shares in joint ventures.
Interests in joint ventures
Consolidated
SEK millions 2020 2019
Comprehensive income 22 20
Received dividends – 2
Shares in joint ventures 85 63
The effect on comprehensive income is the same as the net income.
AL_20_BAKVAGN_EN.indd 146 2021-03-25 12:41

147
No
tes
Note 35. Leasing
Leasing disclosures
Consolidated
SEK millions 2020 2019
Lessee
Financial position
Right-of-use assets 2,152 2,683
Lease liabilities 2,235 2,620
New or adjusted leases 220 375
Income statement
Depreciation -436 -417
Interest cost on lease liabilities -78 -71
Expenses
Expense for not capitalised short-term leases 64 41
Expense for not capitalised leases of low-value assets not included in above line 7 6
Expense for not capitalised leases of low-value assets according to Alfa Lavals higher materiality thresholds not included in above lines 10 12
Expense for variable lease payments not included in lease liabilities 0 1
Cash flow
Total cash outflow for all leases, including leases that are not capitalised, excluding non-lease components 593 536
Lessor
Financial position
Financial lessor receivable 4 5
Income statement
Finance income 0 0
Income from subleasing 1 0
Income from variable lease payments not included in financial lessor receivable 0 0
Lease income from operating leases 13 1
- out of which variable lease payments not dependent on an index or a rate 0 0
The leasing periods are between 1 and 25 years. The latter figure relates to a very limited number of properties. Normally the maximum leasing period is 10
years for buildings and 3–5 years for all other assets.
The weighted average incremental borrowing rate used to discount the value of the lease liabilities during 2020 is 3.26 (2.64) percent.
Maturity analysis of lease liabilities and receivables
Consolidated
Lease payments by the lessee
Finance lease payments received by
the lessor
Operating lease payments received
by the lessor
SEK millions 2020 2019 2020 2019 2020 2019
Maturity in year:
2020 N/A 444 N/A 1 N/A 4
2021 426 421 1 1 0 3
2022 395 389 1 1 0 1
2023 332 327 1 1 0 0
2024 302 297 1 1 0 0
2025 246 N/A – N/A – N/A
Later 953 1,142 – – – –
Total 2,654 3,020 4 5 0 8
Unearned finance income 0 0
Discounted unguaranteed residual value 4 5
1
2
3
4
5
6
7
8
9
10
11
12
13
14
15
16
17
18
19
20
21
22
23
24
25
26
27
28
29
30
31
32
33
34
35
36
37
38
39
40
AL_20_BAKVAGN_EN.indd 147 2021-03-25 12:41

148
Note 36. Revenue recognition from contracts with customer
Revenue recognition from contracts with customers
Consolidated
SEK millions 2020 2019
Income statement
Net sales from:
Contracts with customers 41,435 46,477
Leasing 33 40
Total net sales 41,468 46,517
Net sales from contracts with customers with a contract duration of:
≤ 1 year 36,622 42,299
> 1 year 4,813 4,178
41,435 46,477
Performance obligations towards customers satisfied:
at a point in time 34,141 40,477
over time 7,294 6,000
41,435 46,477
Additional information:
Net sales:
included in contract liability at January 1 426 1 014
from performance obligations satisfied or partially satisfied in previous periods 209 381
Amortisation of capitalised costs to obtain or fulfil contracts with external customers – –
Impairment losses – –
Assets
Accounts and notes receivables, contracts with external customers 5,985 7,449
Accounts and notes receivables, external, other 33 229
Contract assets 2,056 2,424
Capitalised costs to obtain a contract with a customer – –
Capitalised costs to fulfil a contract with a customer – –
Liabilities
Contract liabilities 5,176 5,721
Net sales per Business Division, per geography and per product is shown in Note 1, 2 and 3. Since contracts with customers account for 99.9 percent of net
sales and leasing less than 0.1 percent the figures are shown for total net sales in these notes and not separately for contracts with customers.
A contract asset is Alfa Laval's right to consideration in exchange for goods or services that Alfa Laval has transferred to a customer when that right is conditioned
on something other than the passage of time (for example, Alfa Laval's future performance). It could be balanced invoicing relating to satisfied performance obligations
that have not yet been invoiced (where the revenue recognition is ahead of the progress invoicing) and inventory linked to revenue recognised over time (like work in
progress).
A contract liability is Alfa Laval's obligation to transfer goods or services to a customer for which Alfa Laval has received consideration (or the amount is due) from
the customer. It could be advance payments and balanced invoicing relating to unsatisfied performance obligations that have been invoiced (where the progress in-
voicing is ahead of the revenue recognition).
AL_20_BAKVAGN_EN.indd 148 2021-03-25 12:41

149
No
tes
Note 37. Remuneration policy for executive officers
The executive officers, i.e. the CEO and other members of Group
Management reporting to the CEO, fall within the provisions of this policy.
The policy is forward-looking, i.e. applicable to remuneration agreed, and
amendments to remuneration already agreed, after adoption of the policy by
the annual general meeting in April 2021. This policy does not apply to any
remuneration decided or approved by the general meeting. The policy is
substantially in line with the policy adopted in 2020.
A prerequisite for the successful implementation of the company’s busi-
ness strategy and safeguarding of its long-term interests, including its sus-
tainability, is that the company is able to recruit and retain qualified person-
nel, consequently it is necessary that the company offers market competitive
remuneration.
For information regarding Alfa Laval’s business strategy, please visit http-
www.alfalaval.com/investors/in-brief/#xaa
This policy enables the company to offer the executive officers a competi-
tive total remuneration. The remuneration shall be on market terms and may
consist of the following components: fixed base salary, variable cash remu-
neration (including STI and LTIP), pension benefits and other benefits. The
components, their purpose and link to the company’s business strategy are
described below.
The decision-making process to determine, review and implement
the policy
The Board of Directors has established a Committee within the Board (the
Remuneration Committee), with the tasks of preparing, within the Board of
Directors, the policy for remuneration for executive officers. The Board of
Directors shall propose a revised policy at least every fourth year and submit
it to the general meeting. The policy shall be in force until a new policy is
adopted by the general meeting.
Unless otherwise stated herein, the Board of Directors shall resolve on
matters regarding remuneration and employment provisions for all other ex-
ecutive officers. The Committee shall continuously report to the Board of Di-
rectors. The CEO and the other executive officers shall not be present when
their respective remuneration terms are decided.
Additionally, the general meeting may – irrespective of this policy– resolve
on, among other things, share-related or share price-related remuneration.
Fixed Base Salary
Purpose and link to strategy Supports the attraction and retention of the best talents. Ensures competitiveness while controlling fixed costs to maximise efficiency.
Operational Details – Normally reviewed annually and increases will usually be effective from 1 January or following a change in responsibilities.
– The Remuneration Committee will consider, among other things, the following parameters when reviewing fixed base salary:
– Economic and salary conditions and trends.
– The individual’s performance and responsibilities.
– Base salaries and total remuneration at other companies that operate in the same markets, typically benchmarked against similar roles.
Variable Cash Remuneration
A portion of the total remuneration for the executive officers is linked to business performance so that total remuneration will increase or decrease in line with performance, thus
promoting the company’s business strategy and long-term interests.
Annual Short-Term Incentive (STI)
Purpose and link to strategy To incentivise and create focus on the delivery of annual financial and strategic criteria.
Operational Details – The performance criteria, weighting and targets are to be proposed by the Remuneration Committee annually and approved
by the Board of Directors. Targets shall be set by reference to the company’s operating plan and historical and projected per-
formance.
– The outcome of criteria for awarding STI is to be measured over a period of one year and depend on the degree of fulfilment of
predetermined targets.
– The Board of Directors shall have the possibility, under applicable law or contractual provisions, subject to the restrictions that
may apply under law or contract, to reclaim in whole or in part STI paid on incorrect grounds (so-called claw-back).
Opportunity Levels The maximum opportunity for STI can amount up to 50 percent of fixed base salary. For the CEO the maximum opportunity can
amount up to 60 percent of fixed base salary. The Remuneration Committee shall have the possibility to review the opportunity
levels in order to ensure market competitiveness.
Performance criteria The STI plan awards shall be based on mainly financial criteria. The criteria shall be designed so as to contribute to the compa-
ny’s business strategy and long-term interests.
1
2
3
4
5
6
7
8
9
10
11
12
13
14
15
16
17
18
19
20
21
22
23
24
25
26
27
28
29
30
31
32
33
34
35
36
37
38
39
40
AL_20_BAKVAGN_EN.indd 149 2021-03-25 12:41

150
Long-Term Incentive Plan (LTIP)
Purpose and link to strategy Give extra focus on the long-term value creation for the shareholders.
Operational Details – An annual grant of the LTIP, with a three-year performance period, can be decided by the Board of Directors each year.
– Payment to the participants of the program are made after year three, provided, that they are still employed at the date of payment.
– The Board of Directors shall have the possibility, under applicable law or contractual provisions, subject to the restrictions that
may apply under law or contract, to reclaim in whole or in part LTIP paid on incorrect grounds (so-called claw-back).
– In the event of a restructuring of the Company or any other extraordinary event which the Remuneration Committee considers will
affect the value of an award, the method of calculating the proportion of the maximum value of the award which will be paid to a
Participant on vesting may be adjusted in such manner as the Remuneration Committee shall determine to be fair and reasonable.
Opportunity Levels For executive officers the maximum opportunity for LTIP can amount up to 40 percent of fixed base salary for each three-year performance
period. For the CEO the maximum opportunity can amount up to 50 percent of fixed base salary for each three-year performance period.
Performance Criteria The performance criteria of the LTIP are to be related to financial targets over a business cycle, including but not necessarily limited
to, Operating margin (adjusted EBITA margin) and Net invoicing growth. Maximum outcome is awarded when the externally com-
municated long-term financial targets are clearly exceeded.
For retention or recruitment purposes or extraordinary performance beyond the individual’s ordinary tasks the Remuneration Committee based on proposal of CEO, may
decide on a specific cash remuneration. Such remuneration may not exceed an annual amount corresponding to 40 percent of fixed annual cash salary and may not be paid
more than once each year per individual.
Pension Benefits
Purpose and link to strategy Provide competitive and cost-effective pension benefits.
Operational Details – Pension benefits shall be defined contribution (premium defined) unless the individual concerned is subject to defined benefit
pension under mandatory collective agreement provisions.
– Variable cash remuneration shall not qualify for pension benefits unless the executive officer is part of mandatory collective
agreed provisions where this is stipulated.
– Early retirement may be offered selectively and only after a special decision by the Remuneration Committee, with a defined
contribution early retirement scheme.
– For executive officers governed by rules other than Swedish, pension benefits may be duly adjusted for compliance with man-
datory rules or established local practice, taking into account, to the extent possible, the overall purpose of this policy.
Opportunity Levels The pension premiums for defined contribution pension shall amount to not more than 50 percent of the pensionable salary (for
the CEO fixed annual base salary).
Other Benefits
Purpose and link to strategy Provide competitive and cost-effective benefits.
Operational Details – Other benefits may include but is not limited to life insurance, disability insurance and health care insurance and a company car
or car allowance.
– For executive officers governed by rules other than Swedish, benefits may be duly adjusted for compliance with mandatory
rules or established local practice, taking into account, to the extent possible, the overall purpose of this policy.
– Executive officers who are international assignees (for example expatriates) to or from Sweden may receive additional remu-
neration and other benefits to the extent reasonable in light of the special circumstances associated with the international
assignment arrangement, taking into account, to the extent possible, the overall purpose of this policy.
Opportunity Levels Other benefits may amount to not more than 5 percent of the fixed annual cash salary and shall be set at a level which the
Remuneration Committee considers to:
– provide the relevant level of benefit depending on role and the individual circumstances,
– be in line with comparable roles in companies with similar size and complexity in the local market, and
– be appropriate compared to the benefits offered to the wider workforce in the local market.
Termination of employment
Details – If notice of termination of employment is made by the company:
– The notice period may not exceed twelve months.
– Fixed cash salary during the period of notice and severance pay may together not exceed an amount equivalent to the
fixed cash salary for two years.
– When termination is made by the executive officer the period of notice may not to exceed six months without any right to severance pay.
– Appropriate so-called good leaver/bad leaver principles are to be applied for STI and LTIP.
– Repatriation – If the executive officer is an international assignee the company may reimburse reasonable cost for the repatria-
tion of good leavers, taking into account, to the extent possible, the overall purpose of this policy.
For executive officers governed by rules other than Swedish, payments in connection with termination may be duly adjusted for compliance
with mandatory rules or established local practice, taking into account, to the extent possible, the overall purpose of this policy.
AL_20_BAKVAGN_EN.indd 150 2021-03-25 12:41

151
No
tes
The unrestricted equity in Alfa Laval AB (publ) is SEK:
Profit brought forward 9,893,521,524
Net income 2020 624,495,774
10,518,017,298
The Board of Directors propose a dividend of SEK 5.50 (-) per share corresponding to SEK 2,307,009,733 (-) and that the remaining income
of SEK 8,211,007,565 (9,893,521,524) be carried forward.
The Board of Directors are of the opinion that the proposed dividend is in line with the requirements that the type and size of operations,
the associated risks, the capital needs, liquidity and financial position put on the company.
True and fair view
The undersigned certify that the annual report for the Group and the Parent company has been prepared in accordance with International
Financial Reporting Standards (IFRS), as adopted for use in the European Union, and generally accepted accounting principles respective-
ly, and gives a true and fair view of the financial positions and results of the Group and the Parent company, and that the Board of
Directors’ report gives a fair review of the development of the operations, financial positions and results of the Group and the Parent com-
pany and describes substantial risks and uncertainties that the Group companies face.
Lund, March 1, 2021
Dennis Jönsson Maria Moræus Hanssen Susanne Jonsson
Chairman Director Employee representative
Henrik Lange Bror García Lantz Ray Mauritsson
Director Employee representative Director
Heléne Mellquist Henrik Nielsen Finn Rausing
Director Employee representative Director
Jörn Rausing Ulf Wiinberg Tom Erixon
Director Director President and CEO
Our Auditors' Report concerning this Annual Report has been issued on March 9, 2021.
Staffan Landén Karoline Tedevall
Authorised Public Accountant Authorised Public Accountant
Note 40. Proposed disposition of earnings
Note 39. Events after the closing date
The statements on financial position and the comprehensive income statements will be adopted at the Annual General Meeting of shareholders on April 27, 2021.
Note 38. Government grants
In 2020 Alfa Laval has received SEK 61 (-) million in government grants. These have mainly been received to cover the costs for various working hour reduc-
tion schemes linked to COVID-19 in different countries. In addition, SEK 47 million has been received as support for reduced working hours in Sweden, that
has not been reported in the P&L but has instead been balanced due to the uncertainty around the conditions for the support.
Salary and employment conditions for employees
In the preparation of the Board of Directors’ proposal for this remuneration
policy, salary and employment conditions for employees of the company
have been taken into account by including information on the employees’
total income, the components of the remuneration and increase and growth
rate over time. The development of the difference between the remuneration
to executive officers and remuneration to other employees will be disclosed
in the remuneration report.
Derogation from the policy
The Board of Directors may temporarily resolve to derogate from the policy,
in whole or in part, if in a specific case there is special cause for the deroga-
tion and a derogation is necessary to serve the company’s long-term inter-
ests, including its sustainability, or to ensure the company’s financial viability.
As set out above, the Remuneration Committee’s tasks include preparing
the Board of Directors’ resolutions in remuneration-related matters. This in-
cludes any resolutions to derogate from the policy.
1
2
3
4
5
6
7
8
9
10
11
12
13
14
15
16
17
18
19
20
21
22
23
24
25
26
27
28
29
30
31
32
33
34
35
36
37
38
39
40
AL_20_BAKVAGN_EN.indd 151 2021-03-25 12:41

152
Opinions
We have audited the annual accounts and consolidated accounts
of Alfa Laval AB (publ) for the year 2020. The annual accounts and
consolidated accounts of the company are included on pages
71–151 and 156–158 in this document.
In our opinion, the annual accounts have been prepared in
accordance with the Annual Accounts Act and present fairly, in all
material respects, the financial position of the parent company as
of 31 December 2020 and its financial performance and cash flow
for the year then ended in accordance with the Annual Accounts
Act. The consolidated accounts have been prepared in accordance
with the Annual Accounts Act and present fairly, in all material re-
spects, the financial position of the group as of 31 December 2020
and their financial performance and cash flow for the year then
ended in accordance with International Financial Reporting Stand-
ards (IFRS), as adopted by the EU, and the Annual Accounts Act.
The statutory administration report is consistent with the other
parts of the annual accounts and consolidated accounts.
We therefore recommend that the general meeting of shareholders
adopts the consolidated financial position and parent company
income and financial position for the parent company and the group.
Our opinions in this report on the annual accounts and consolidated
accounts are consistent with the content of the additional report that
has been submitted to the parent company's audit committee in
accordance with the Audit Regulation (537/2014) Article 11.
Basis for Opinions
We conducted our audit in accordance with International Standards
on Auditing (ISA) and generally accepted auditing standards in Sweden.
Our responsibilities under those standards are further described in
the Auditor’s Responsibilities section. We are independent of the
parent company and the group in accordance with professional
ethics for accountants in Sweden and have otherwise fulfilled our
ethical responsibilities in accordance with these requirements. This
includes that, based on the best of our knowledge and belief, no
prohibited services referred to in the Audit Regulation (537/2014)
Article 5.1 have been provided to the audited company or, where
applicable, its parent company or its controlled companies within the EU.
We believe that the audit evidence we have obtained is sufficient
and appropriate to provide a basis for our opinions.
Auditor’s reportTo the general meeting of the shareholders of Alfa Laval AB (publ), corporate identity number 556587-8054
Report on the annual accounts and consolidated accounts
Key Audit Matters
Key audit matters of the audit are those matters that, in our profes-
sional judgment, were of most significance in our audit of the annual
accounts and consolidated accounts of the current period. These
matters were addressed in the context of our audit of, and in forming
our opinion thereon, the annual accounts and consolidated accounts
as a whole, but we do not provide a separate opinion on these
matters. For each matter below, our description of how our audit
addressed the matter is provided in that context.
We have fulfilled the responsibilities described in the Auditor’s respon-
sibilities for the audit of the financial statements section of our report,
including in relation to these matters. Accordingly, our audit included
the performance of procedures designed to respond to our assess-
ment of the risks of material misstatement of the financial statements.
The results of our audit procedures, including the procedures per-
formed to address the matters below, provide the basis for our audit
opinion on the accompanying financial statements.
AL_20_BAKVAGN_EN.indd 152 2021-03-25 12:41
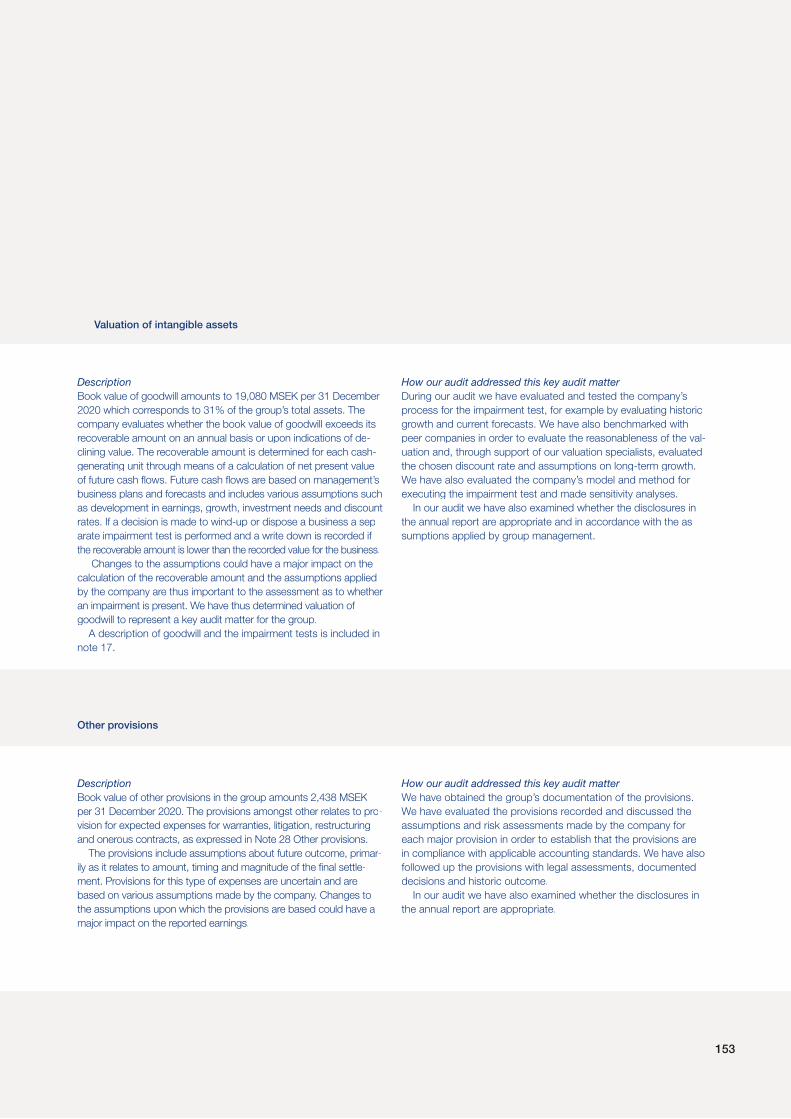
153
DescriptionBook value of other provisions in the group amounts 2,438 MSEK
per 31 December 2020. The provisions amongst other relates to pro-
vision for expected expenses for warranties, litigation, restructuring
and onerous contracts, as expressed in Note 28 Other provisions.
The provisions include assumptions about future outcome, primar-rr
ily as it relates to amount, timing and magnitude of the final settle-
ment. Provisions for this type of expenses are uncertain and are
based on various assumptions made by the company. Changes to
the assumptions upon which the provisions are based could have a
major impact on the reported earnings.
How our audit addressed this key audit matterWe have obtained the group’s documentation of the provisions.
We have evaluated the provisions recorded and discussed the
assumptions and risk assessments made by the company for
each major provision in order to establish that the provisions are
in compliance with applicable accounting standards. We have also
followed up the provisions with legal assessments, documented
decisions and historic outcome.
In our audit we have also examined whether the disclosures in
the annual report are appropriate.
Other provisions
DescriptionBook value of goodwill amounts to 19,080 MSEK per 31 December
2020 which corresponds to 31% of the group’s total assets. The
company evaluates whether the book value of goodwill exceeds its
recoverable amount on an annual basis or upon indications of de-
clining value. The recoverable amount is determined for each cash-
generating unit through means of a calculation of net present value
of future cash flows. Future cash flows are based on management’s
business plans and forecasts and includes various assumptions such
as development in earnings, growth, investment needs and discount
rates. If a decision is made to wind-up or dispose a business a sep-
arate impairment test is performed and a write down is recorded if
the recoverable amount is lower than the recorded value for the business.
Changes to the assumptions could have a major impact on the
calculation of the recoverable amount and the assumptions applied
by the company are thus important to the assessment as to whether
an impairment is present. We have thus determined valuation of
goodwill to represent a key audit matter for the group.
A description of goodwill and the impairment tests is included in
note 17.
How our audit addressed this key audit matterDuring our audit we have evaluated and tested the company’s
process for the impairment test, for example by evaluating historic
growth and current forecasts. We have also benchmarked with
peer companies in order to evaluate the reasonableness of the val-
uation and, through support of our valuation specialists, evaluated
the chosen discount rate and assumptions on long-term growth.
We have also evaluated the company’s model and method for
executing the impairment test and made sensitivity analyses.
In our audit we have also examined whether the disclosures in
the annual report are appropriate and in accordance with the as-
sumptions applied by group management.
Valuation of intangible assets
AL_20_BAKVAGN_EN.indd 153 2021-03-25 12:41

154154
Other Information than the annual
accounts and consolidated accounts
This document also contains other infor-
mation than the annual accounts and con-
solidated accounts and is found on pages
1–54. The remuneration report for the fi-
nancial year 2020 also constitutes other in-
formation. The Board of Directors and the
Managing Director are responsible for this
other information.
Our opinion on the annual accounts and
consolidated accounts does not cover this
other information and we do not express
any form of assurance conclusion regard-
ing this other information.
In connection with our audit of the an-
nual accounts and consolidated accounts,
our responsibility is to read the information
identified above and consider whether the
information is materially inconsistent with the
annual accounts and consolidated accounts.
In this procedure we also take into account
our knowledge otherwise obtained in the
audit and assess whether the information
otherwise appears to be materially misstated.
If we, based on the work performed
concerning this information, conclude that
there is a material misstatement of this other
information, we are required to report that
fact. We have nothing to report in this regard.
Responsibilities of the Board of
Directors and the Managing Director
The Board of Directors and the Managing
Director are responsible for the preparation
of the annual accounts and consolidated
accounts and that they give a fair presen-
tation in accordance with the Annual
Accounts Act and, concerning the consoli-
dated accounts, in accordance with IFRS as
adopted by the EU. The Board of Directors
and the Managing Director are also respon-
sible for such internal control as they deter-
mine is necessary to enable the prepara-
tion of annual accounts and consolidated
accounts that are free from material mis-
statement, whether due to fraud or error.
In preparing the annual accounts and
consolidated accounts, The Board of Di-
rectors and the Managing Director are re-
sponsible for the assessment of the com-
pany’s and the group’s ability to continue
as a going concern. They disclose, as ap-
plicable, matters related to going concern
and using the going concern basis of ac-
counting. The going concern basis of ac-
counting is however not applied if the
Board of Directors and the Managing Di-
rector intends to liquidate the company, to
cease operations, or has no realistic alter-
native but to do so.
The Audit Committee shall, without prej-
udice to the Board of Director’s responsi-
bilities and tasks in general, among other
things oversee the company’s financial re-
porting process.
Auditor’s responsibility
Our objectives are to obtain reasonable as-
surance about whether the annual ac-
counts and consolidated accounts as a
whole are free from material misstatement,
whether due to fraud or error, and to issue
an auditor’s report that includes our opin-
ions. Reasonable assurance is a high level
of assurance, but is not a guarantee that
an audit conducted in accordance with
ISAs and generally accepted auditing
standards in Sweden will always detect a
material misstatement when it exists.
Misstatements can arise from fraud or error
and are considered material if, individually
or in the aggregate, they could reasonably
be expected to influence the economic de-
cisions of users taken on the basis of these
annual accounts and consolidated accounts.
As part of an audit in accordance with
ISAs, we exercise professional judgment
and maintain professional skepticism
throughout the audit. We also:
– Identify and assess the risks of material mis-
statement of the annual accounts and consoli-
dated accounts, whether due to fraud or error,
design and perform audit procedures responsive
to those risks, and obtain audit evidence that is
sufficient and appropriate to provide a basis for our
opinions. The risk of not detecting a material
misstatement resulting from fraud is higher than
for one resulting from error, as fraud may involve
collusion, forgery, intentional omissions, misrep-
resentations, or the override of internal control.
– Obtain an understanding of the company’s in-
ternal control relevant to our audit in order to
design audit procedures that are appropriate in
the circumstances, but not for the purpose of
expressing an opinion on the effectiveness of
the company’s internal control.
– Evaluate the appropriateness of accounting policies
used and the reasonableness of accounting es-
timates and related disclosures made by the
Board of Directors and the Managing Director.
– Conclude on the appropriateness of the Board
of Directors’ and the Managing Director’s use of
the going concern basis of accounting in pre-
paring the annual accounts and consolidated
accounts. We also draw a conclusion, based
on the audit evidence obtained, as to whether
any material uncertainty exists related to events
or conditions that may cast significant doubt on
the company’s and the group’s ability to con-
tinue as a going concern. If we conclude that a
material uncertainty exists, we are required to
draw attention in our auditor’s report to the re-
lated disclosures in the annual accounts and
consolidated accounts or, if such disclosures
are inadequate, to modify our opinion about the
annual accounts and consolidated accounts.
Our conclusions are based on the audit evi-
dence obtained up to the date of our auditor’s
report. However, future events or conditions
may cause a company and a group to cease to
continue as a going concern.
– Evaluate the overall presentation, structure and
content of the annual accounts and consolidated
accounts, including the disclosures, and whether
the annual accounts and consolidated accounts
represent the underlying transactions and events
in a manner that achieves fair presentation.
– Obtain sufficient and appropriate audit evidence
regarding the financial information of the entities
or business activities within the group to ex-
press an opinion on the consolidated accounts.
We are responsible for the direction, supervi-
sion and performance of the group audit. We
remain solely responsible for our opinions.
We must inform the Board of Directors of,
among other matters, the planned scope
and timing of the audit. We must also in-
form of significant audit findings during our
audit, including any significant deficiencies
in internal control that we identified.
We must also provide the Board of Di-
rectors with a statement that we have
complied with relevant ethical requirements
regarding independence, and to communi-
cate with them all relationships and other
matters that may reasonably be thought to
bear on our independence, and where ap-
plicable, actions taken to eliminate threats
or related safeguards applied.
From the matters communicated with
the Board of Directors, we determine those
matters that were of most significance in
the audit of the annual accounts and con-
solidated accounts, including the most im-
portant assessed risks for material mis-
statement, and are therefore the key audit
matters. We describe these matters in the
auditor’s report unless law or regulation
precludes disclosure about the matter.
AL_20_BAKVAGN_EN.indd 154 2021-03-25 12:41

No
tes
155
Ris
ks
Ac
co
un
ting
prin
cip
les
Fin
an
cia
l sta
tem
en
tsB
oa
rd o
f Dire
cto
rs’ R
ep
ort
155
Lund March 9, 2021
Staffan Landén
Authorized Public Accountant
Karoline Tedevall
Authorized Public Accountant
Opinions
In addition to our audit of the annual ac-
counts and consolidated accounts, we
have also audited the administration of the
Board of Directors and the Managing
Director of Alfa Laval AB (publ) for the year
2020 and the proposed appropriations of
the company’s profit or loss.
We recommend to the general meeting
of shareholders that the profit be appropri-
ated in accordance with the proposal in the
statutory administration report and that the
members of the Board of Directors and the
Managing Director be discharged from liability
for the financial year.
Basis for opinions
We conducted the audit in accordance
with generally accepted auditing standards
in Sweden. Our responsibilities under those
standards are further described in the
Auditor’s Responsibilities section. We are
independent of the parent company and
the group in accordance with professional
ethics for accountants in Sweden and have
otherwise fulfilled our ethical responsibilities
in accordance with these requirements.
We believe that the audit evidence we
have obtained is sufficient and appropriate
to provide a basis for our opinions.
Responsibilities of the Board of
Directors and the Managing Director
The Board of Directors is responsible for the
proposal for appropriations of the company’s
profit or loss. At the proposal of a dividend,
this includes an assessment of whether the
dividend is justifiable considering the require-
ments which the company's and the group’s
type of operations, size and risks place on
the size of the parent company's and the
group’s equity, consolidation requirements,
liquidity and position in general.
The Board of Directors is responsible for
the company’s organization and the ad-
ministration of the company’s affairs. This
includes among other things continuous
assessment of the company’s and the
group’s financial situation and ensuring that
the company's organization is designed so
that the accounting, management of as-
sets and the company’s financial affairs
otherwise are controlled in a reassuring
manner. The Managing Director shall man-
age the ongoing administration according
to the Board of Directors’ guidelines and
instructions and among other matters take
measures that are necessary to fulfill the
company’s accounting in accordance with
law and handle the management of assets
in a reassuring manner.
Auditor’s responsibility
Our objective concerning the audit of the
administration, and thereby our opinion
about discharge from liability, is to obtain
audit evidence to assess with a reasonable
degree of assurance whether any member
of the Board of Directors or the Managing
Director in any material respect:
– has undertaken any action or been guilty
of any omission which can give rise to li-
ability to the company, or
– in any other way has acted in contraven-
tion of the Companies Act, the Annual
Accounts Act or the Articles of Association.
Our objective concerning the audit of the
proposed appropriations of the company’s
profit or loss, and thereby our opinion
about this, is to assess with reasonable
degree of assurance whether the proposal
is in accordance with the Companies Act.
Reasonable assurance is a high level of
assurance, but is not a guarantee that an
audit conducted in accordance with gener-
ally accepted auditing standards in Swe-
den will always detect actions or omissions
that can give rise to liability to the com-
pany, or that the proposed appropriations
of the company’s profit or loss are not in
accordance with the Companies Act.
As part of an audit in accordance with
generally accepted auditing standards in
Sweden, we exercise professional judg-
ment and maintain professional skepticism
throughout the audit. The examination of
the administration and the proposed ap-
propriations of the company’s profit or loss
is based primarily on the audit of the ac-
counts. Additional audit procedures per-
formed are based on our professional judg-
ment with starting point in risk and
materiality. This means that we focus the
examination on such actions, areas and re-
lationships that are material for the opera-
tions and where deviations and violations
would have particular importance for the
company’s situation. We examine and test
decisions undertaken, support for decisions,
actions taken and other circumstances that
are relevant to our opinion concerning dis-
charge from liability. As a basis for our
opinion on the Board of Directors’ pro-
posed appropriations of the company’s
profit or loss we examined the Board of Di-
rectors’ reasoned statement and a selec-
tion of supporting evidence in order to be
able to assess whether the proposal is in
accordance with the Companies Act.
Report on other legal and regulatory requirements
Staffan Landén, Ernst & Young AB, Box 7850, 103 99 Stockholm, was appointed auditor of Alfa Laval AB by the general meeting of the
shareholders on the 23rd of April 2020 and has been the company’s auditor since the 23rd of April 2018.
Karoline Tedevall, Ernst & Young AB, Box 7850, 103 99 Stockholm, was appointed auditor of Alfa Laval AB by the general meeting of the
shareholders on the 23rd of April 2020 and has been the company’s auditor since the 23rd of April 2018.
AL_20_BAKVAGN_EN.indd 155 2021-03-25 12:41

156
Ten-year overview
Ten-year overview
Consolidated
SEK millions, unless otherwise stated 2020 2019 2018 2017 2016 2015 2014 2013 * 2012 ** 2011
Profit and loss
Net sales 41,468 46,517 40,666 35,314 35,634 39,746 35,067 29,801 29,813 28,652
Comparison distortion items -796 189 151 - -1,500 0 -320 0 -51 -170
Operating income 5,580 7,198 5,831 4,589 2,989 5,717 4,667 4,353 4,396 4,691
Financial net -603 23 65 -218 336 -273 -550 -181 133 -15
Result after financial items 4,977 7,221 5,896 4,371 3,325 5,444 4,117 4,172 4,529 4,676
Taxes -1,397 -1,713 -1,359 -1,383 -1,013 -1,583 -1,149 -1,132 -1,306 -1,425
Net income for the year 3,580 5,508 4,537 2,988 2,312 3,861 2,968 3,040 3,223 3,251
Financial position
Goodwill 19,080 21,112 20,537 19,775 20,436 19,498 20,408 10,061 9,792 9,543
Other intangible assets 2,204 3,134 3,873 4,692 5,946 6,556 7,898 3,582 3,807 3,502
Property, plant and equipment 8,321 8,943 5,732 4,851 4,940 4,773 5,004 3,785 3,823 3,936
Other non-current assets 3,633 2,081 1,958 1,654 2,100 1,804 2,092 1,447 1,509 1,664
Inventories 9,223 10,077 9,253 8,424 7,831 7,405 7,883 6,312 6,176 6,148
Current receivables 10,631 12,582 11,807 8,808 8,431 8,964 9,791 7,671 8,050 7,663
Current deposits 2,618 873 617 1,208 1,075 1,021 697 605 427 483
Cash and cash equivalents 5,150 5,594 4,295 3,137 2,619 1,876 2,013 1,446 1,404 1,564
TOTAL ASSETS 60,860 64,396 58,072 52,549 53,378 51,897 55,786 34,909 34,988 34,503
Equity 29,071 27,747 23,599 20,500 20,276 18,423 17,202 16,162 14,453 15,144
Provisions for pensions etc. 2,494 2,321 2,118 2,297 2,425 1,931 2,221 1,494 1,727 852
Provisions for taxes 1,553 1,662 1,945 2,100 2,722 2,925 3,074 1,758 1,932 1,930
Other non-current liabilities 2,259 2,571 802 677 636 521 660 423 473 520
Non-current loans 8,043 10,600 8,540 11,092 12,169 12,484 16,454 3,529 5,393 5,060
Current liabilities 17,440 19,495 21,068 15,883 15,150 15,613 16,175 11,543 11,010 10,997
TOTAL EQUITY & LIABILITIES 60,860 64,396 58,072 52,549 53,378 51,897 55,786 34,909 34,988 34,503
* Restated to IFRS 11. ** Restated to the new IAS 19.
***Lease liabilities have increased by SEK 2,766 million as per January 1, 2019 due to the initial application of IFRS 16 Leases, which affects the net debt at December 31, 2019.
Changes in accounting standards
A reader of the ten-year overview should observe that accounting standards have
changed repeatedly over this period of time. The major changes are the following.
During 2019 IFRS 16 ”Leases” was implemented, which meant that right-of use
assets and lease liabilities increased by SEK 2,766 million as per January 1, 2019 in
connection with the initial application.
In 2014 IFRS 11 ”Joint arrangements” was implemented as per January 1, 2013,
which meant a restatement of the comparison figures for 2013.
In 2013 the revised IAS 19 ”Employee Benefits” was implemented as per January 1,
2012, which meant a restatement of the comparison figures for 2012.
AL_20_BAKVAGN_EN.indd 156 2021-03-25 12:41
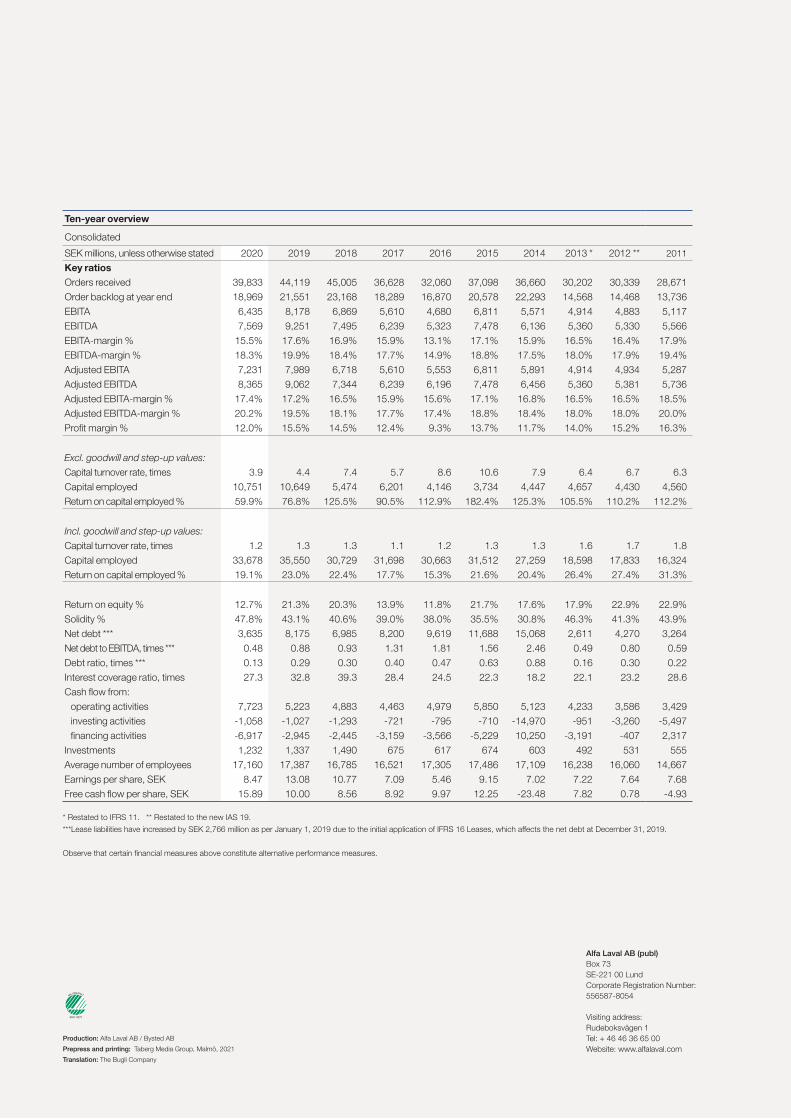
Ten-year overview
Consolidated
SEK millions, unless otherwise stated 2020 2019 2018 2017 2016 2015 2014 2013 * 2012 ** 2011
Key ratios
Orders received 39,833 44,119 45,005 36,628 32,060 37,098 36,660 30,202 30,339 28,671
Order backlog at year end 18,969 21,551 23,168 18,289 16,870 20,578 22,293 14,568 14,468 13,736
EBITA 6,435 8,178 6,869 5,610 4,680 6,811 5,571 4,914 4,883 5,117
EBITDA 7,569 9,251 7,495 6,239 5,323 7,478 6,136 5,360 5,330 5,566
EBITA-margin % 15.5% 17.6% 16.9% 15.9% 13.1% 17.1% 15.9% 16.5% 16.4% 17.9%
EBITDA-margin % 18.3% 19.9% 18.4% 17.7% 14.9% 18.8% 17.5% 18.0% 17.9% 19.4%
Adjusted EBITA 7,231 7,989 6,718 5,610 5,553 6,811 5,891 4,914 4,934 5,287
Adjusted EBITDA 8,365 9,062 7,344 6,239 6,196 7,478 6,456 5,360 5,381 5,736
Adjusted EBITA-margin % 17.4% 17.2% 16.5% 15.9% 15.6% 17.1% 16.8% 16.5% 16.5% 18.5%
Adjusted EBITDA-margin % 20.2% 19.5% 18.1% 17.7% 17.4% 18.8% 18.4% 18.0% 18.0% 20.0%
Profit margin % 12.0% 15.5% 14.5% 12.4% 9.3% 13.7% 11.7% 14.0% 15.2% 16.3%
Excl. goodwill and step-up values:
Capital turnover rate, times 3.9 4.4 7.4 5.7 8.6 10.6 7.9 6.4 6.7 6.3
Capital employed 10,751 10,649 5,474 6,201 4,146 3,734 4,447 4,657 4,430 4,560
Return on capital employed % 59.9% 76.8% 125.5% 90.5% 112.9% 182.4% 125.3% 105.5% 110.2% 112.2%
Incl. goodwill and step-up values:
Capital turnover rate, times 1.2 1.3 1.3 1.1 1.2 1.3 1.3 1.6 1.7 1.8
Capital employed 33,678 35,550 30,729 31,698 30,663 31,512 27,259 18,598 17,833 16,324
Return on capital employed % 19.1% 23.0% 22.4% 17.7% 15.3% 21.6% 20.4% 26.4% 27.4% 31.3%
Return on equity % 12.7% 21.3% 20.3% 13.9% 11.8% 21.7% 17.6% 17.9% 22.9% 22.9%
Solidity % 47.8% 43.1% 40.6% 39.0% 38.0% 35.5% 30.8% 46.3% 41.3% 43.9%
Net debt *** 3,635 8,175 6,985 8,200 9,619 11,688 15,068 2,611 4,270 3,264
Net debt to EBITDA, times *** 0.48 0.88 0.93 1.31 1.81 1.56 2.46 0.49 0.80 0.59
Debt ratio, times *** 0.13 0.29 0.30 0.40 0.47 0.63 0.88 0.16 0.30 0.22
Interest coverage ratio, times 27.3 32.8 39.3 28.4 24.5 22.3 18.2 22.1 23.2 28.6
Cash flow from:
operating activities 7,723 5,223 4,883 4,463 4,979 5,850 5,123 4,233 3,586 3,429
investing activities -1,058 -1,027 -1,293 -721 -795 -710 -14,970 -951 -3,260 -5,497
financing activities -6,917 -2,945 -2,445 -3,159 -3,566 -5,229 10,250 -3,191 -407 2,317
Investments 1,232 1,337 1,490 675 617 674 603 492 531 555
Average number of employees 17,160 17,387 16,785 16,521 17,305 17,486 17,109 16,238 16,060 14,667
Earnings per share, SEK 8.47 13.08 10.77 7.09 5.46 9.15 7.02 7.22 7.64 7.68
Free cash flow per share, SEK 15.89 10.00 8.56 8.92 9.97 12.25 -23.48 7.82 0.78 -4.93
* Restated to IFRS 11. ** Restated to the new IAS 19.
***Lease liabilities have increased by SEK 2,766 million as per January 1, 2019 due to the initial application of IFRS 16 Leases, which affects the net debt at December 31, 2019.
Observe that certain financial measures above constitute alternative performance measures.
Alfa Laval AB (publ)
Box 73
SE-221 00 Lund
Corporate Registration Number:
556587-8054
Visiting address:
Rudeboksvägen 1
Tel: + 46 46 36 65 00
Website: www.alfalaval.com
Production: Alfa Laval AB / Bysted AB
Prepress and printing: Taberg Media Group, Malmö, 2021
Translation: The Bugli Company

Alternative performance measures
An alternative performance measure is a financial
measure of historical financial performance, financial
position or cash flows, other than a financial measure
defined or specified in the financial reporting framework.
In the annual report, the following alternative perfor-
mance measures have been used (all of these alternative
performance measures relate to actual historical figures
and never to expected performance in future periods):
Measures to achieve full comparability
over time.
All of these concern the comparison distorting impact
from above all amortisation of step-up values both over
time and compared to external companies. For the same
reasons adjustments are also made for comparison
distortion items. How they are calculated is exhibited in the
Income analysis table on page 89, except for the last one.
– EBITA or Earnings Before Interests, Taxes and
Amortisation is defined as operating income before
amortisation of step-up values. This measure of result
is fully comparable over time independent of the financ-
ing costs and the amortisation of step-up values that
from time to time burden the Group.
– EBITA margin (%) is defined as EBITA in relation to
net sales and expressed in percent.
– EBITDA or Earnings Before Interest, Taxes, Depreciation
and Amortisation is defined as operating income be-
fore depreciation and amortisation of step-up values.
This measure of result is fully comparable over time
independent of the financing costs, the depreciation
and the amortisation of step-up values that from
time to time burden the Group.
– EBITDA margin (%) is defined as EBITDA in relation
to net sales and expressed in percent.
– Adjusted EBITA or Adjusted Earnings Before Interests,
Taxes and Amortisation is defined as operating income
before amortisation of step-up values, adjusted for
comparison distortion items. This measure of result
is fully comparable over time independent of the
comparison distortion items, the financing costs and
the amortisation of step-up values that from time to
time burden the Group.
– Adjusted EBITA margin (%) is defined as Adjusted
EBITA in relation to net sales and expressed in percent.
– Adjusted EBITDA or Adjusted Earnings Before Interest,
Taxes, Depreciation and Amortisation is defined as
operating income before depreciation and amortisation
of step-up values, adjusted for comparison distortion
items. This measure of result is fully comparable over
time independent of the comparison distortion items,
the financing costs, the depreciation and the amorti-
sation of step-up values that from time to time burden
the Group.
– Adjusted EBITDA margin (%) is defined as Adjusted
EBITDA in relation to net sales and expressed in percent.
– Adjusted gross profit is defined as gross profit ex-
cluding amortisation of step-up values. This measure
of result is fully comparable over time independent of
the amortisation of step-up values that from time to
time burden the Group.
– Adjusted gross margin (%) is defined as Adjusted gross
profit in relation to net sales and expressed in percent.
– Earnings per share, excluding amortisation of
step-up values and the corresponding tax is de-
fined as net income attributable to the owners of the
parent, excluding amortisation of step-up values and
the corresponding tax divided by the average num-
ber of shares. The net income attributable to the
owners of the parent is presented in the consolidat-
ed comprehensive income statement and the amor-
tisation of step-up values is exhibited in the Income
analysis table on page 89, while the corresponding tax
is SEK 191 (235) million. This key figure is fully com-
parable over time independent of the amortisation of
step-up values that from time to time burden the Group.
Measures to show how the Group is
funded and manages its capital:
– Return on capital employed (%) is defined as EBITA
in relation to average capital employed, calculated
on 12 months’ revolving basis and expressed in per-
cent. Capital employed is defined as total assets less
liquid funds, other long-term securities, accrued interest
income, operating liabilities and other non-interest-
bearing liabilities, including tax and deferred tax, but
excluding accrued interest costs. The measure shows
how well the capital that is used in the operations is
managed.
– Net debt is defined as interest-bearing liabilities in-
cluding interest-bearing pension liabilities and capi-
talised financial leases less liquid funds. The calculation
of net debt is exhibited in the Net debt table in Note 29.
The measure shows the net financial indebtedness.
– Net debt to EBITDA, times is defined as Net debt
in relation to EBITDA, calculated on 12 months’ re-
volving basis and expressed as a multiple of EBITDA.
This is one of the covenants of Alfa Laval’s loans and
an important key figure when reviewing the proposed
dividend. EBITDA or Earnings Before Interest, Taxes,
Depreciation and Amortisation is defined as operating
income before depreciation and amortisation of
step-up values.
– Debt ratio, times is defined as Net debt in relation
to equity at the end of the period and expressed as
a multiple of the equity. This is another measure of
how the Group is funded.
– Interest coverage ratio, times is defined as
EBITDA plus financial net increased by interest costs
in relation to interest costs. Expressed as a multiple
of interest costs. Gives an expression for the Group’s
ability to pay interest. The reason EBITDA is used as
the starting point is that this forms the starting point
for a cash flow perspective on the ability to pay inter-
est. Financial items classified as comparison distort-
ing are excluded from the calculation.
Definitions of other performance measures
Net sales
Revenues from goods sold and services performed
that are part of the ordinary operations of the Group,
after deduction for given discounts, value added tax
and other tax directly linked to the sales.
Comparison distortion items
Items that do not have any link to the normal operations
of the Group or that are of a non-recurring nature, where
a reporting together with other items in the consolidated
comprehensive income statement would have given a
comparison distortion effect that would have made it
difficult to judge the development of the ordinary oper-
ations for an outside viewer.
Orders received
Incoming orders during the year, calculated in the same
way as net sales. The orders received give an indication
of the current demand for the Group’s products and
services, that with a varying delay appear in net sales.
Order backlog at year-end
Incoming orders that not yet have been invoiced. The
order backlog at the end of the year is equal to the
sum of the order backlog at the beginning of the year
plus the orders received during the year less the net
sales for the year. It gives an indication of how the net
sales can be expected to develop in the future.
Profit margin %
Result after financial items in relation to net sales, ex-
pressed in percent.
Capital turnover rate, times
Net sales in relation to average capital employed, ex-
pressed as a multiple of capital employed. Shown ex-
cluding and including goodwill, step-up values and the
corresponding deferred tax liability.
Capital employed
Average total assets less liquid funds, other long-term
securities, accrued interest income, operating liabilities
and other non-interest-bearing liabilities, including tax
and deferred tax, but excluding accrued interest costs.
Shown excluding and including goodwill and step-up
values and the corresponding deferred tax liability.
Shows the capital that is used in the operations. The
capital employed for the Group differs from the net
capital for the operating segments concerning taxes,
deferred taxes and pensions.
Return on equity %
Net income for the year in relation to average equity,
expressed in percent.
Solidity %
Equity in relation to total assets, expressed in percent.
Cash flow from operating activities
Shows the Group’s cash flow from operating activities,
that is the cash flow generated in the daily operational
activities.
Cash flow from investing activities
Shows the Group’s cash flow from investing activities,
i.e. the cash flow generated by mainly the Group’s in-
vestments in fixed assets, divestments and acquisi-
tions of businesses and divestments of real estate.
Cash flow from financing activities
Shows the Group’s cash flow from financing activities,
that is mainly dividends, increase and amortisation of
loans and the cash flow components of the financial net.
Investments
Investments represent an important component in the
cash flow for the Group. The level of investments dur-
ing a couple of years gives a picture of the capacity
build up in the Group.
Average number of employees
The costs that are related to the number of employees
represent a large part of the total costs for the Group.
The development of the average number of employ-
ees over time in relation to the development of the net
sales therefore gives an indication of the cost rationali-
sation that is taking place.
Earnings per share
Net income for the year attributable to the equity holders
of the parent divided by the average number of shares.
Free cash flow per share
The sum of cash flows from operating and investing
activities for the year divided by the average number of
shares. This represents the cash flow available for in-
terest payments, amortisation and dividends to investors.
Alternative performance measures and definitions
Alfa Laval uses a number of channels to provide information about the company’s
operations and financial development. The website – www.alfalaval.com/investors
– is updated continuously with annual reports, quarterly reports, press releases
and presentations. Annual reports are also sent to those shareholders who have
notified the company that they wish to receive a copy. Conference calls with
analysts, investors and the media are arranged by Alfa Laval in conjunction with
the publication of the company’s quarterly reports. A capital markets day is or-
ganized each year, during which representatives from the financial market are
offered more in-depth information regarding the company’s operations. In addition,
representatives of Group management meet with analysts, investors and jour-
nalists on an ongoing basis to ensure that they have correct and current information.
Pursuant to the company’s agreement with Nasdaq Stockholm, information
that could have an effect on the share price and that is not yet publicly known
is never disclosed in conjunction with these types of meetings or contacts.
Alfa Laval employs a so-called silent period of three weeks prior to the publi-
cation of a quarterly report. The President and Chief Financial Officer do not
meet or speak to representatives from the financial market during this period.
Financial information
Financial information during 2021
Alfa Laval will publish quarterly reports on
the following dates in 2021:
Year-end report 2020 February 3
First-quarter report April 27
Second-quarter report July 20
Third-quarter report October 26
Shareholder information
Johan Lundin
Head of Investor Relations
Tel: +46 46 36 74 82
e-mail: [email protected]
Analysts tracking Alfa Laval
Annual General Meeting 2021
The Annual General Meeting of Alfa Laval AB (publ) will be held on Tuesday,
April 27, 2021, at 4:00 p.m. In accordance with the company’s Articles of
Association, notice of the Annual General Meeting will be inserted as an an-
nouncement in the Swedish Official Gazette and on the company’s website
not more than six and not less than four weeks prior to the Meeting. An an-
nouncement that notification has been issued will be placed in Dagens Ny-
heter. As a service to existing shareholders, information about the Annual
General Meeting can also be sent to them by mail. The following information
concerning the Meeting does not constitute legal notice.
Notification of participation
In light of the extraordinary situation as a result of the COVID-19 pandemic,
Alfa Laval AB’s Annual General Meeting 2021 will be conducted by advance
voting with the support of temporary legislation. A physical meeting with the
opportunity to attend in person or through a representative will thus not be
held. To be entitled to participate and vote at the meeting, a shareholder must
be listed as a shareholder in the share register maintained by Euroclear Sweden
AB regarding conditions on 19 April 2021 and register for the meeting no later
than 26 April 2021. A shareholder registers at the meeting by submitting an
advance vote according to the instructions contained in the summons. To be
entitled to participate in the meeting, shareholders whose shares are registered
with a nominee must have the shares registered in their own names so that
the shareholder is entered in the share register as of April 19, 2021. Such
registration may be temporary (so-called voting rights registration) and is re-
quested from the trustee in such time in advance as the trustee determines.
Notification of participation shall be made to:
– Alfa Laval AB, Group Staff Legal,
Box 73, SE-221 00 Lund, Sweden
– E-mail: [email protected]
– Website: www.alfalaval.com
– Tel: +46 46 36 74 00 or +46 46 36 65 00.
Shareholders must state their name, personal identity number and tele-
phone number on the notice of participation. If participation is by proxy, a
power of attorney or authorization must be submitted to the company prior
to the Meeting.
Meeting program
4:00 p.m. Start of Meeting
Dividend
The Board of Directors and the President propose that a dividend of SEK
5.50 per share be distributed to shareholders. The proposed record date for
the dividend is Thursday, April 29, 2021. If the Annual General Meeting ap-
proves the proposal, the dividend is expected to be distributed by Euroclear
Sweden AB on Tuesday, May 4, 2021. The record date and dividend pay-
ment date may be postponed due to the technical procedures required for
the execution of the payment.
ABG Sundal Collier
Karl Bokvist
Tel: +46 8 5662 8633
ALPHAVALUE
Luis Pereira
Tel: +33 1 70 61 10 65
Bank of America Merrill Lynch
Madhvendra Singh
Tel: +44 20 7995 6105
Barclays Capital
Lars Brorson
Tel: +44 20 3134 1156
Carnegie
Johan Wettergren
Tel: +46 8 5886 87 43
Citi Investment Research
Klas Bergelind
Tel: +44 207 986 4018
Commerzbank
Malte C. Schulz
+44 20 747 59353
Credit Suisse
Max Yates
Tel: +44 20 7883 8501
Danske Bank
Johan Sjöberg
Tel: +46 8 68 805 35
DNB
Mattias Holmberg
Tel: +46 8 473 48 14
Goldman Sachs International
Daniela Costa
Tel: +44 20 7774 8354
JP Morgan
Andrew Wilson
Tel: +44 20 7742 6332
Kepler Cheuvreux
Johan Eliason
Tel: +46 8 723 51 63
Morgan Stanley
Robert J. Davies
Tel: +44 20 7425 2057
Morningstar
Denise Molina
Tel: +31 20 797 0010
Nordea
Andreas Koski
Tel: +46 10 157 02 29
Pareto Securities
Anders Roslund
Tel: +46 8 402 52 88
RBC Capital Markets
Sebastian Kuenne
Tel: +44 20 742 98932
SEB
Fredrik Agardh
Tel: +46 8 522 298 06
UBS
Sven Weier
Tel: +49 69 1369 8278
100002995-1-EN 2103
This is Alfa Laval
Alfa Laval is active in the areas of Energy, Marine, and
Food & Water, offering its expertise, products, and service
to a wide range of industries in some 100 countries. The
company is committed to optimizing processes, creating
responsible growth, and driving progress – always going
the extra mile to support customers in achieving their
business goals and sustainability targets.
Alfa Laval’s innovative technologies are dedicated to
purifying, refining, and reusing materials, promoting more
responsible use of natural resources. They contribute to
improved energy efficiency and heat recovery, better
water treatment, and reduced emissions. Thereby, Alfa
Laval is not only accelerating success for its customers,
but also for people and the planet. Making the world
better, every day. It’s all about Advancing better™.
How to contact Alfa Laval
Up-to-date Alfa Laval contact details for all countries are
always available on our website at www.alfalaval.com