Annual Report 2019 - ROCKWOOL Technical Insulation
132
Annual Report 2019 Resilient by nature
-
Upload
khangminh22 -
Category
Documents
-
view
0 -
download
0
Transcript of Annual Report 2019 - ROCKWOOL Technical Insulation

Annual Report2019
Resilient by nature


40 Our people
42 Risk management
44 Corporate governance
48 Remuneration report
56 Shareholder information
60 Financial performance
67 Consolidatedfinancialstatements
119 Parentcompanyfinancialstatements
04 ROCKWOOL Group at a glance
08 Message from the Chairman and CEO
10 The ROCKWOOL purpose and strategy
13 Our business model
14 Market review, outlook 2020
20 Business updates
32 Sustainability
38 Business integrity
Overview
ROCKWOOL Group Annual Report 2019 3
Financial statementsFinancial performanceBusiness updatesMarket review/outlookOverview

3 000
2 500
2 000
1 500
1 000
500
020192018201720162015
Net sales(EURm)ROCKWOOL Group
at a glance
11 700Highly-skilled individuals
37%Women in white-collar positions
68Nationalities worldwide
Fire resistant acoustic ceiling tiles and systems
Fire safe stone wool insulation
Fire resistant façade cladding, roofdetailing,soffitsandfascia
Stone wool growing media and technology
Storm water management, vibration and sound dampening
Employees by region
We release the natural power of stone to enrich modern living
5Brands:
39Countries where we are present
46Manufacturing facilities
Sales growth
2.2%In local currencies
EBIT
372 EURmUp 9% compared to last year Asia:
1 000
Russia: 1 200
North America: 1 300
Europe: 8 200
4ROCKWOOL Group Annual Report 2019
Overview Business updates Financial performanceMarket review/outlook Financial statements

World leader with local insight
AustriaBelarusBelgiumBulgariaCanadaChinaCroatiaCzech RepublicDenmarkGermanyEstoniaFinlandFranceHungaryIndiaItalyKoreaLatviaLithuaniaMalaysia
MexicoNorwayPhilippinesPolandRomaniaRussian FederationSingaporeSlovakiaSpainSwedenSwitzerlandThailandThe NetherlandsTurkeyUkraineUnited Arab EmiratesUnited KingdomUnited States of AmericaVietnam
Manufacturing facilities Salesoffices
We create sustainable solutions to protect life, assets, and the environment today and tomorrow.
5ROCKWOOL Group Annual Report 2019
Overview Business updates Financial performanceMarket review/outlook Financial statements

Five-year overview
2019(DKKm)
2019EURm
2018EURm
2017EURm
2016EURm
2015EURm
Income statement itemsNet sales 20,705 2,757 2,671 2,374 2,202 2,208EBITDA 4,090 548 507 417 389 *322Depreciation, amortisation and write-downs 1,311 176 166 159 160 187EBIT 2,779 372 341 258 229 *135Financial items -39 -5 -7 -11 -7 -4Profit before tax 2,740 367 335 275 225 133Profit for the year 2,125 285 265 214 166 91
Balance sheet itemsNon-current assets 13,635 1,825 1,468 1,383 1,409 1,446Current assets 6,493 869 963 781 591 559Total assets 20,128 2,694 2,431 2,164 1,999 2,005Equity 15,825 2,118 1,877 1,684 1,536 1,367Non-current liabilities 1,195 160 121 122 128 119Current liabilities 3,108 416 433 358 336 519Net interest-bearing cash / (debt) 1,583 212 375 241 116 -93Net working capital 1,846 247 198 190 175 162Invested capital 14,105 1,889 1,542 1,452 1,433 1,467Gross investment in plant, property and equipment 2,936 393 220 123 92 167
Cash flowCash flow from operating activities 3,001 402 408 332 326 297Investments and acquisitions 2,984 400 212 165 89 201Free cash flow 12 2 196 167 237 97
OthersR&D costs 306 41 38 32 32 32Number of patents granted 235 235 268 201 280 165Number of full-time employees (year-end) 11,691 11,691 11,511 11,046 10,414 10,601
RatiosEBITDA margin 19.9% 19.9% 19.0% 17.6% 17.7% *14.6%EBIT margin 13.5% 13.5% 12.8% 10.8% 10.4% *6.1%Payout ratio 33.3% 33.3% 33.3% 33.3% 33.3% 37.1%ROIC 21.7% 21.7% 22.8% 17.9% 15.8% *9.1%Return on equity 14.3% 14.3% 14.9% 13.3% 11.5% 6.8%Equity ratio 78.5% 78.5% 77.1% 77.5% 76.8% 68.2%Leverage ratio -0.39 -0.39 -0.74 -0.58 -0.29 0.28Financial gearing -0.10 -0.10 -0.20 -0.14 -0.08 0.07
* Adjusted with redundancy costs of EUR 15 million from the Busi-ness Transformation Programme and write-downs in Asia of EUR 21 million, EBITDA for 2015 was EUR 337 million with an EBITDA margin of 15.3%, EBIT for 2015 was EUR 172 million with an EBIT margin of 7.8% and ROIC amounted to 11.6%.
For definitions of key figures, ratios and exchange rates see p. 114.
6ROCKWOOL Group Annual Report 2019
Overview Business updates Financial performanceMarket review/outlook Financial statements

Net sales Growth (reported)
3,000
2,500
2,000
1,500
1,000
500
0
15%
12%
9%
6%
18%
3%
0%2015 2016 2017 2018 2019
EBIT EBIT margin
200
300
400
100
0 2015 2016 2017 2018 2019
16%
12%
8%
4%
0%
Maintenance Capacity Acquisitions
400
300
200
100
0 2015 2016 2017 2018 2019
Invested capital ROIC
2,200
1,800
1,400
1,000
16%
12%
24%
20%
2015 2016 2017 2018 20198%
600
Highlights 2019
EBIT
372 EURmUp 9% compared to last year
Sales growth
2.2%in local currencies
Investments in new capacity
271 EURm
ROIC
21.7%Down from 22.8% last year
Net sales & sales growth(EURm)
EBIT & EBIT margin(EURm)
Investments(EURm)
ROIC & Invested capital(EURm)
7ROCKWOOL Group Annual Report 2019
Financial statementsFinancial performanceBusiness updatesMarket review/outlookOverview
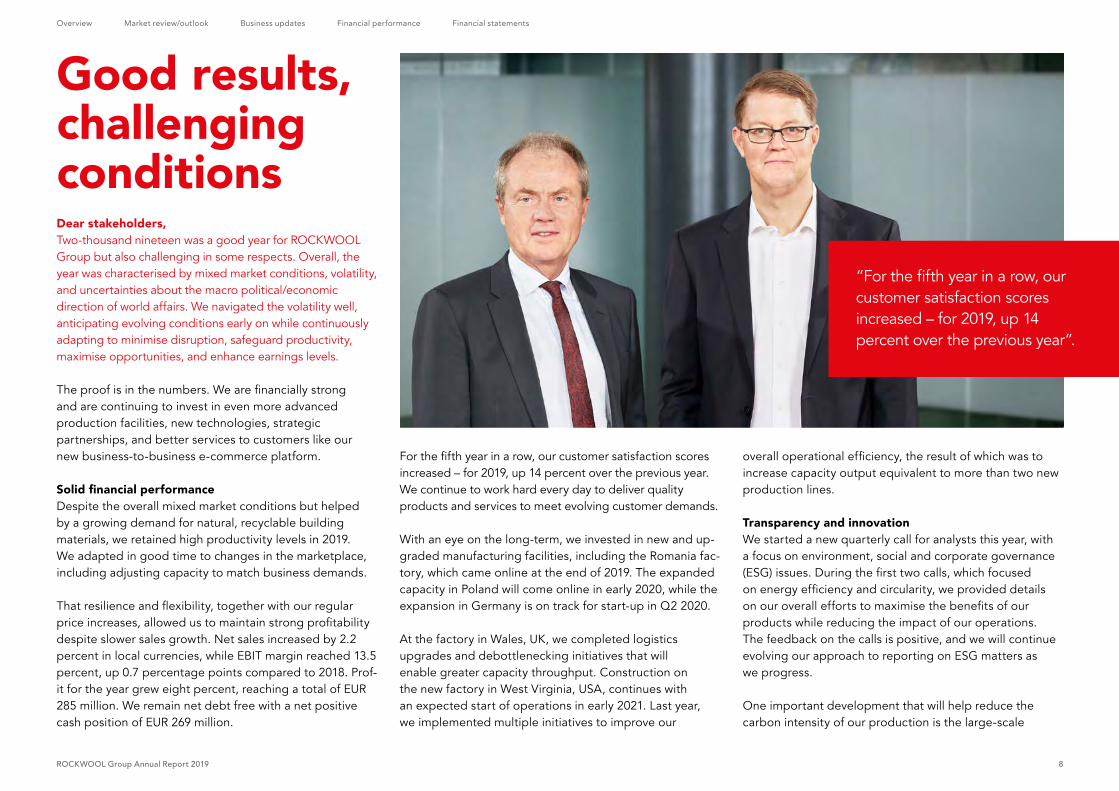
Dear stakeholders,Two-thousand nineteen was a good year for ROCKWOOL Group but also challenging in some respects. Overall, the year was characterised by mixed market conditions, volatility, and uncertainties about the macro political/economic direction of world affairs. We navigated the volatility well, anticipating evolving conditions early on while continuously adapting to minimise disruption, safeguard productivity, maximise opportunities, and enhance earnings levels.
The proof is in the numbers. We are financially strong and are continuing to invest in even more advanced production facilities, new technologies, strategic partnerships, and better services to customers like our new business-to-business e-commerce platform.
Solid financial performanceDespite the overall mixed market conditions but helped by a growing demand for natural, recyclable building materials, we retained high productivity levels in 2019. We adapted in good time to changes in the marketplace, including adjusting capacity to match business demands.
That resilience and flexibility, together with our regular price increases, allowed us to maintain strong profitability despite slower sales growth. Net sales increased by 2.2 percent in local currencies, while EBIT margin reached 13.5 percent, up 0.7 percentage points compared to 2018. Prof-it for the year grew eight percent, reaching a total of EUR 285 million. We remain net debt free with a net positive cash position of EUR 269 million.
“For the fifth year in a row, our customer satisfaction scores increased – for 2019, up 14 percent over the previous year”.
For the fifth year in a row, our customer satisfaction scores increased – for 2019, up 14 percent over the previous year. We continue to work hard every day to deliver quality products and services to meet evolving customer demands.
With an eye on the long-term, we invested in new and up-graded manufacturing facilities, including the Romania fac-tory, which came online at the end of 2019. The expanded capacity in Poland will come online in early 2020, while the expansion in Germany is on track for start-up in Q2 2020.
At the factory in Wales, UK, we completed logistics upgrades and debottlenecking initiatives that will enable greater capacity throughput. Construction on the new factory in West Virginia, USA, continues with an expected start of operations in early 2021. Last year, we implemented multiple initiatives to improve our
overall operational efficiency, the result of which was to increase capacity output equivalent to more than two new production lines.
Transparency and innovation We started a new quarterly call for analysts this year, with a focus on environment, social and corporate governance (ESG) issues. During the first two calls, which focused on energy efficiency and circularity, we provided details on our overall efforts to maximise the benefits of our products while reducing the impact of our operations. The feedback on the calls is positive, and we will continue evolving our approach to reporting on ESG matters as we progress.
One important development that will help reduce the carbon intensity of our production is the large-scale
Good results, challenging conditions
8ROCKWOOL Group Annual Report 2019
Overview Business updates Financial performanceMarket review/outlook Financial statements

electric melting technology pilot project we are trialling in Moss, Norway. Once operational, expected in H2 2020, this innovative new technology is expected to reduce the factory’s carbon emissions by 80 percent and waste going to landfill by up to 95 percent. We look forward to applying the learnings from this development project across other areas of the business as part of our overall strategy to reduce our carbon footprint.
During the year we opened our highly energy-efficient new laboratory next to the headquarters building, which will enable us to test and develop new products and processes using industry-leading equipment and technology. We also accelerated the rollout of Rockflow, a specially engineered stone wool product that helps urban areas combat flooding caused by sudden heavy rain storms. Rockflow is a cost-effective way for cities to protect residents and valuable infrastructure from the increasing likelihood of urban flooding (see pp. 28-29).
Energy efficiency is the futureThe strategic direction of our company is driven largely by two megatrends – urbanisation and climate change. Every year brings a greater focus on how we handle the challenges and opportunities related to each. We know that a vital component of both megatrends is the energy efficiency of buildings. Cities account for around 70 percent of the world’s energy use and CO2 emissions, most of which comes from buildings.
We also know that deep building renovations would achieve much of the energy efficiency gains needed to meet the Paris climate goals. Of course, knowing it isn’t enough. Action is required from all parties – government, business, citizens – through ambitious legislation, partnerships, innovation, and the everyday decisions individual citizens make.
The release of the EU Commission’s Green Deal framework in December is an encouraging development, the focus being the commitment to achieve a climate-neutral EU by
2050. This goes hand-in-hand with commitments from the European Investment Bank to provide up to 75 percent co-financing on building renovation projects, a particularly strong incentive for private capital to invest.
The business case for cities to renovate is a strong one. Together with C40 and leading cities like Copenhagen, Milan and New York, ROCKWOOL has developed a tool to help cities quantify the environmental, economic, and social benefits of large-scale deep renovation. This big picture view is already helping city leaders make the case for investing in reno vation. The results from the three pilot cities are encouraging, and we look forward to developing the tool further and taking it to more cities.
Stronger togetherCrucial in the fight against climate change, circularity is particularly relevant in the construction industry, which consumes more than 40 percent of all global resources annually and produces one-third of the world’s waste. Taking advantage of stone wool’s natural durability and recyclability, ROCKWOOLs business model has many circular attributes, including products made from natural material mixed with upcycled materials from other industries.
To further develop our circular business model, we entered an important new partnership in 2019 with the Ellen MacArthur Foundation Circular Economy 100, which is leading efforts to gradually shift the prevailing economic model toward one that consumes and wastes less. We’re also accelerating our collaborations across the construction sector to increase the number of countries where we offer reclaimed waste services.
SafetySadly, we had a fatality in February when a sub-contractor fell through a floor opening where he was working at the Romanian factory construction site. An investigation of the incident revealed that we need stricter oversight of work at heights in our facilities. It also showed that the worker did not follow several safety protocols for working at heights.
Meeting our target for zero fatalities requires ensuring safe behaviour and work conditions must be a full-time job for all of us. On the positive side, we significantly reduced lost time incidents, which is an important indicator of increased focus on safety in the workplace.
The year ahead As we start the new decade, we anticipate continued volatility affecting several key markets as well as the overall construction sector, where we foresee flat growth in new residential and modest growth for non-residential activities. Steady progress in other markets and increased demand for naturally fire-resistant, recyclable stone wool products should help smooth out overall volatility. We will implement reasonable price increases, mainly to cover inflation and to support new investments in technology and digitalisation.
Financially, we forecast low single-digit sales growth in local currencies for 2020, with an EBIT margin of around 12 percent and investments excluding acquisitions of around EUR 400 million. As ever, we will remain agile to adapt to market opportunities and uncertainties.
During the coming year, we will adjust the company’s cap-ital structure via a share buy-back programme, totalling up to EUR 80 million.
We want to thank our hard-working, highly-committed employees for their contribution to the Group’s success as well as our customers, whose loyalty we will work hard to earn throughout the year.
Henrik Brandt Jens BirgerssonChairman CEO
9ROCKWOOL Group Annual Report 2019
Overview Business updates Financial performanceMarket review/outlook Financial statements

At the pinnacle of ROCKWOOL’s strategy is our corporate purpose: to release the natural power of stone to enrich modern living. This reflects our purpose’s unifying nature, conveying that stone is our core raw material and the bed-rock on which our business is based.
And while the stone we use may be millions of years old, what we do with it is cutting-edge. Every day, ROCKWOOL’s creative and entrepreneurial employees are developing and applying new technologies and innovations to release the potential of stone to enrich modern living.
As we look to the future, stone wool and the products we make with it will play an increasingly significant role in addressing two of the megatrends influencing virtually every aspect of modern society – urbanisation and climate change.
Every week, about 1.5 million people move to urban environments. By 2030, there will be an estimated 43 megacities around the globe with more than 10 million inhabitants. And by 2050, the earth’s population is expected to be close to 10 billion, nearly 70 percent of whom will live in cities.
The combination of more people living in more densely populated urban areas and the worsening consequences
The ROCKWOOL purpose and strategy
The ROCKWOOL business strategy is driven by a passion for creating solutionsthatconnectglobaltrendswithprofitablebusinessopportunitiesbycreating superior solutions to protect life, assets, and the environment, and to create comfortable, healthy, and attractive spaces. In other words, by enriching modern living.
of climate change will increase the demand for modern housing and energy. At the same time, the world must feed its growing population using fewer resources, while also managing the effects of more frequent extreme weather events, particularly in urban environments.
The ROCKWOOL business strategy is driven by a passion for creating solutions that connect these global trends with profitable business opportunities by creating superior solutions to protect life, assets, and the environment, and to create comfortable, healthy, and attractive spaces. In other words, by enriching modern living.
Our aspiration is to grow faster than the market overall by offering superior products and services, strengthening our brand, building long-term customer relations, and driving an operationally effective business across all segments and geographies where we are active.
As our business is inherently capital intensive, we focus on exploiting our natural strengths to balance risks, which includes a differentiated approach across selected geographies.
In North America, for example, we are expanding our production capacity to capture significant growth opportunities within all major business areas.
In Europe, we will grow faster than the market by launching new products and services, while improving our customer-facing activities and the productivity of our production platform. We will expand capacity where needed to meet steadily growing demand in and near core markets and enhance our geographic coverage and customer service level.
In Asia, the approach is different, in that we will develop and grow our business selectively where there is a clear demand for our premium quality offerings.
At ROCKWOOL, everything we do is based on releasing the natural power of stone to enrich modern living. Profita-bly offering solutions to address the challenges created by enduring global megatrends will help ensure our success-ful future growth.
10ROCKWOOL Group Annual Report 2019
Overview Business updates Financial performanceMarket review/outlook Financial statements

Megatrends
80%
1 000 years 230 billion m2
The proportion of global GDP (~EUR 75 trillion) generated in cities.
Estimated new construction added through 2060, equal to one Paris every week.
How long it takes to grow 2-3 centimetres of fertile top soil.
2/3Proportion of countries without mandatory building energy codes.
CircularityThe construction sector consumes more than 40 percent of global resources annually and produces one-third of global waste. Shifting to a circular economic model would have a positive impact on the environment.
Climate changeCities account for around 70 percent of the world’s energy use and CO2 emissions. A total of three billion m2 of buildings built in 2018 had no mandatory energy performance requirements.
Resource scarcityOne-third of the world’s top soil is moderately to highly degraded. If current rates of degradation continue, it could be gone in 60 years. To satisfy future global food needs, alternatives to traditional farming are needed.
UrbanisationBillions of people – especially in Asia and Africa – will be seeking opportunities in cities over the coming decades, impacting global economics, demographics and society.
11ROCKWOOL Group Annual Report 2019
Overview Business updates Financial performanceMarket review/outlook Financial statements

The
strengths of stone
What do we mean when we say our purpose "is to release the natural power of stone to enrich modern living"? So far,wehaveidentified7strengthsthatareinherentintheproperties of stone wool that give it extraordinary ver-satility. Seven reasons why we believe the world's most abundant resource can be engineered to create uniquely useful and exciting solutions for our customers.
And by applying these 7 strengths to everything we do, we passionately believe that we can address some of the biggest challenges facing our world. We’re sure that there are even more strengths of stone to be discovered. And when we discover them, we’ll turn those strengths into new products that improve the quality of life of everyone who experiences them. That’s why these 7 strengths lie at the heart of every ROCKWOOL product.
There is something truly remarkable about the natural power of stone.
Robustness Increased performance
and greater stability with lower costs
Water properties
Engineered to repel or absorb water
Circularity Reusable and
recyclable material
Aesthetics Match performance
with aesthetics
Fire- resilience
Withstand temperatures above 1000°C
Acoustic capabilities Block, absorb or enhance sounds
Thermal properties
Save energy by maintaining optimum indoor
temperature and climate
12ROCKWOOL Group Annual Report 2019
Financial statementsFinancial performanceBusiness updatesMarket review/outlookOverview
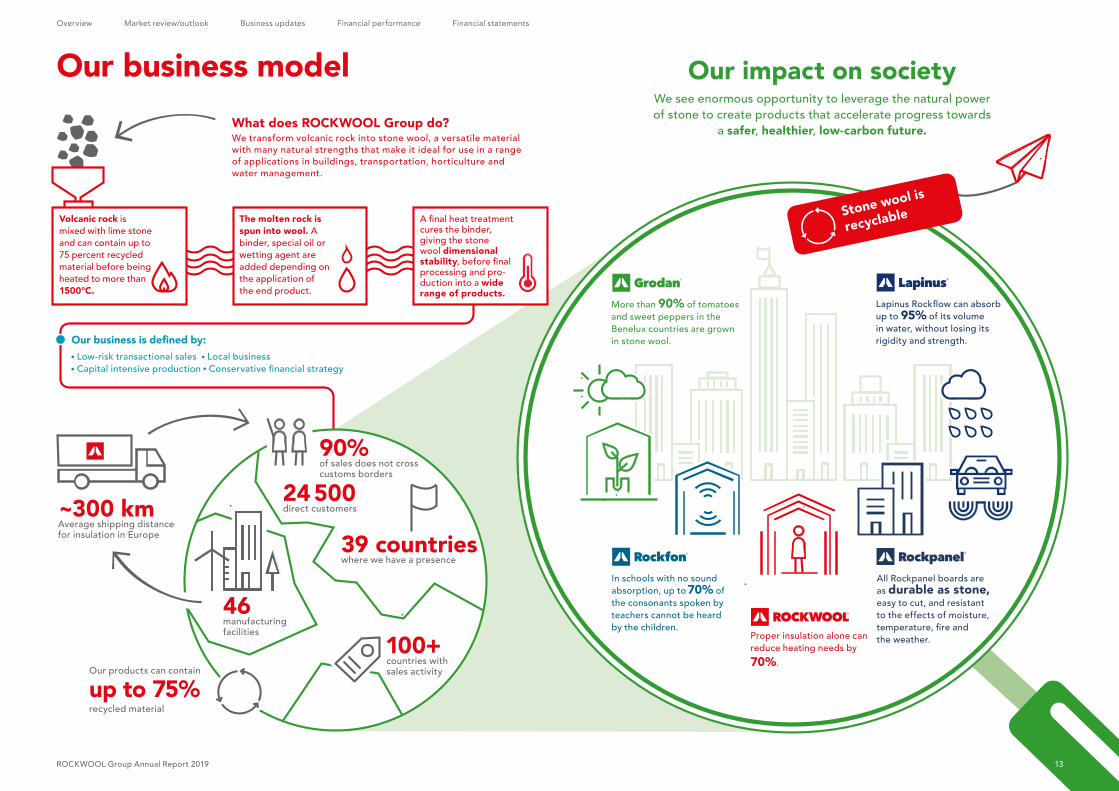
Our business model
Stone wool is
recyclable
What does ROCKWOOL Group do? We transform volcanic rock into stone wool, a versatile material with many natural strengths that make it ideal for use in a range of applications in buildings, transportation, horticulture and water management.
Volcanic rock is mixed with lime stone and can contain up to 75 percent recycled material before being heated to more than 1500°C.
Afinalheattreatmentcures the binder, giving the stone wool dimensional stability,beforefinalprocessing and pro-duction into a wide range of products.
Our impact on society We see enormous opportunity to leverage the natural power of stone to create products that accelerate progress towards
a safer, healt hier, low-carbon future.
All Rockpanel boards are as durable as stone, easy to cut, and resistant to the effects of moisture, temperature,fireand the weather.
In schools with no sound absorption, up to 70% of the consonants spoken by teachers cannot be heard by the children.
LapinusRockflowcanabsorbup to 95% of its volume in water, without losing its rigidity and strength.
More than 90% of tomatoes and sweet peppers in the Benelux countries are grown in stone wool.
Proper insulation alone can reduce heating needs by 70%.
The molten rock is spun into wool. A binder, special oil or wetting agent are added depending on the application of the end product.
24 500 direct customers
46 manufacturing facilities
39 countries where we have a presence
~300 km Average shipping distance for insulation in Europe
Our products can contain
up to 75%
recycled material
100+ countries with sales activity
90% of sales does not cross customs borders
Low-risk transactional sales Local business Capital intensive production Conservativefinancialstrategy
Our business is defined by:
ROCKWOOL Group Annual Report 2019 13
Overview Business updates Financial performanceMarket review/outlook Financial statements

Market review, outlook 2020
Most central and northern European markets performed well, while main eastern European markets, after a record high demand previously, were down – with the noteworthy exception of Russia, which continued to develop positively throughout 2019.
In North America, we saw a steady development in sales, driven by a growing demand for non-combustible building insulation and horticultural growing solutions.
China and many southeast Asian markets declined or grew at a slower pace. However, continued urbanisation and expected tightening of building regulations will be sub-stantial growth drivers for ROCKWOOL in these markets going forward.
Overall, construction growth in 2019 was largely positive in most key regions, but the level of growth has been losing speed, and the construction business in several countries is expected to show slightly negative or slow growth in 2020.
In 2019, we experienced mixed market conditions particu-larly in the insulation business. Key markets such as France, the United Kingdom, Russia and North America remained buoyant for ROCKWOOL, while Germany, eastern Europe and Asia slowed. Overall, global growth decelerated to the slowest pace since the Eurozone crisis with trade tensions and other geopolitical uncertainties negatively affecting the business climate for ROCKWOOL.
A growing demand for stone wool insulation nonetheless supported good growth for ROCKWOOL Group across other key markets. This has been most apparent in the United Kingdom, where regulation and increasing aware-ness of fire safety has driven demand and in France where the focus on energy efficiency to support climate initiatives to reduce CO2 emissions have spurred the renovation and thereby insulation of buildings.
14ROCKWOOL Group Annual Report 2019
Overview Business updates Financial performanceMarket review/outlook Financial statements

Future growth drivers for Insulation segmentInsulation demand has outperformed construction output per annum in the last 15 years, and we believe that sales of our stone wool products should grow on average at least one percentage point faster in our core markets than the market overall. Energy efficiency requirements and other regulation have been driving this development. We anticipate these factors will continue to push demand for insulation, as social and government commitments to reduce emissions to sustainable levels are converted to policies, regulations and funding support programmes.
Governments and cities are increasingly putting in place regulations intended to help accomplish the global goals for reducing greenhouse gas emissions agreed to at the 2015 COP21 in Paris. Insulation demand should benefit from such regulation for both new buildings and renovation projects.
The increased focus on climate change has elevated awareness as well as consumer and customer attention on sustainability and circularity of building materials. Since our products are made from basalt stone and recycled materials and because our stone wool is recyclable, we are in a good position to benefit from this trend.
Meanwhile, continuing urbanisation both in emerging and developed markets represents a big opportunity for ROCKWOOL.
Cities account for around 70 percent of the world’s energy use and CO2 emissions, and therefore play a big role in the efforts to fight climate change. The use of insulation and other ROCKWOOL products in the construction and retrofitting of buildings is in this context an important means to that end.
As the global economic expansion slows, renovation offers cities a way to create multiple benefits, including jobs and energy savings for residents (pp. 36-37) while also delivering on climate promises.
Protecting residents against noise pollution they experience in densely populated cities is another growth opportunity. Whether it’s between walls of attached buildings or rooms within buildings, acoustic comfort contributes to human health and wellbeing.
ROCKWOOL is also pleased to see that fire safety is re-ceiving greater attention among regulators and architects. The continued tightening of building regulation across the globe is a growth driver for ROCKWOOL products. The fire-resistant properties of stone wool insulation help prevent fires from spreading, which is especially important in urban and other population-dense areas. As society puts greater focus on circularity, the fact that our stone wool is a natural product and can be recycled is another advantage in the market.
The strength of stone wool in Systems segmentAll businesses in the Systems segment performed well during 2019, which lifted growth for the year to double-digits and improved the EBIT margin.
Our acoustic tile business under the Rockfon brand, which offers superior acoustic performance, continued pursuing growth opportunities in the European and North American markets. During the year we entered into a legal settlement related to Rockfon in North America, positively affecting results by around EUR 10 million.
The introduction of a new range of high-quality façade panels supported a satisfactory growth for Rockpanel in the main markets in Benelux. Successful market penetra-tion in more markets in Europe contributed to the good performance.
Lapinus stone wool offerings designed for reducing vibrations, noise and dust continued to gain support. While the friction-related business slowed down, the innovative water management solution under the Rock-flow product line contributed to positive development for the year.
15ROCKWOOL Group Annual Report 2019
Overview Business updates Financial performanceMarket review/outlook Financial statements

400 EURm
Investments excl. acquisitions around
The benefits of our Grodan products supporting sustain-able growing methods gained further traction during the year with growth in all markets. We see a greater aware-ness and interest in pesticide-free growing environments and experienced healthy growth in all markets including Russia and North America.
Outlook 2020At the start of a new decade, we are preparing ourselves for another year of volatility especially around the large market in Germany and the non-residential segment in eastern Europe and Asia. Continued governmental incentives in France for energy efficiency is vital for the 2020 growth plan as is the conversion to stone wool solutions in the UK market.
Overall, we see the same level of uncertainties affecting the construction markets as in the second half of 2019, which is confirmed by a less optimistic forecast from Euroconstruct, with a flat new housing market and a modest growth limited to non-residential activities.
If trade tensions were to ease, it could contribute to a recovery of growth in Asia and part of the European industrial sector, especially Germany.
The release of the European Commission’s Green Deal framework in December is an encouraging development aimed at achieving a climate-neutral EU by 2050. Together with the European Investment Bank’s co-financing commit-ments (up to 75 percent on building renovation projects), EU member states are expected to announce more de-tailed energy efficiency plans, which over time could help accelerate the renovation of building stocks and increase the demand for insulation.
Stone wool production capacity in Europe has increased, both from our own opening of new stone wool manufacturing lines as well as from other stone wool producers. While we are confident about long-term
EBIT margin around
12%
Sales growth
Outlook 2020
Low single-digitin local currencies
16ROCKWOOL Group Annual Report 2019
Overview Business updates Financial performanceMarket review/outlook Financial statements

demand for stone wool products, we recognise that the additional availability of stone wool in the coming year could increase competition in certain market segments and geographies.
We forecast low single-digit sales growth in local curren-cies for 2020, with growth opportunities for France, the United Kingdom and North America as well as Systems segment, though still with some uncertainties for markets in Germany, eastern Europe and Asia.
The focus for our operational excellence programme will be on productivity. At the same time, we have several new manufacturing lines, which will improve productivity and optimise our logistics footprint.
With a significant number of new production lines coming online, the level of depreciation will increase for 2020. We estimate the increased depreciation will affect EBIT margin by around one percentage point.
Inflation on input costs was reduced during the second half of 2019, and we forecast a similar picture for the coming year.
All in all, we predict an EBIT margin of around 12 percent, which is comparable to 2019, when adjusting for additional depreciation and start-up costs in Germany and costs in connection with the melter conversion in Norway.
Investment level excluding acquisitions will remain high during 2020 at around EUR 400 million. The main investments include capacity expansion in Germany, which will come online during the second quarter and the new factory in the United States, planned to open in early 2021. We will also invest in new capacity for the Systems segment, digital tools, factory automation, and increase investments to support our commitments towards our SDG sustainability goals.
17ROCKWOOL Group Annual Report 2019
Overview Business updates Financial performanceMarket review/outlook Financial statements

ROCKWOOL Group Annual Report 2019 18
Financial statementsFinancial performanceBusiness updatesMarket review/outlookOverview
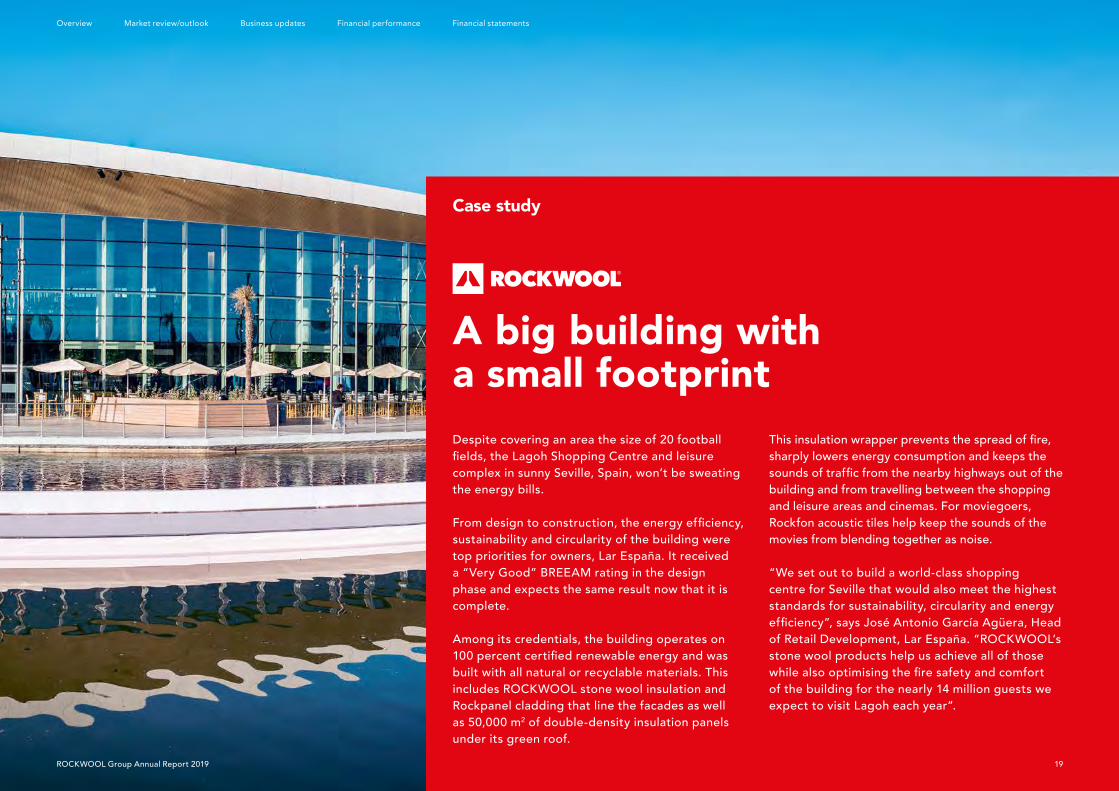
Case study
Despite covering an area the size of 20 football fields,theLagohShoppingCentreandleisurecomplex in sunny Seville, Spain, won’t be sweating the energy bills.
Fromdesigntoconstruction,theenergyefficiency,sustainability and circularity of the building were top priorities for owners, Lar España. It received a “Very Good” BREEAM rating in the design phase and expects the same result now that it is complete.
Among its credentials, the building operates on 100percentcertifiedrenewableenergyandwasbuilt with all natural or recyclable materials. This includes ROCKWOOL stone wool insulation and Rockpanel cladding that line the facades as well as 50,000 m2 of double-density insulation panels under its green roof.
Thisinsulationwrapperpreventsthespreadoffire,sharply lowers energy consumption and keeps the soundsoftrafficfromthenearbyhighwaysoutofthebuilding and from travelling between the shopping and leisure areas and cinemas. For moviegoers, Rockfon acoustic tiles help keep the sounds of the movies from blending together as noise.
“We set out to build a world-class shopping centre for Seville that would also meet the highest standards for sustainability, circularity and energy efficiency”,saysJoséAntonioGarcíaAgüera,Headof Retail Development, Lar España. “ROCKWOOL’s stone wool products help us achieve all of those whilealsooptimisingthefiresafetyandcomfortof the building for the nearly 14 million guests we expect to visit Lagoh each year”.
A big building with a small footprint
19ROCKWOOL Group Annual Report 2019
Financial statementsFinancial performanceBusiness updatesMarket review/outlookOverview

Overall, we saw a satisfactory demand for our thermally efficient and fire-safe stone wool insulation and a clear need for constructing new energy efficient buildings and renovating the existing building stock to mitigate climate change and achieve the UN climate-related goals.
In 2019, ROCKWOOL Building Insulation showed modest growth compared to 2018. We saw mixed market conditions across countries and our different insulation applications.
On one hand, we saw solid growth in South West Europe driven by demand for energy efficiency improvements supported by reg-ulatory schemes. France is a good example, where powerful policies are driving energy efficiency and increasing the role of energy renovation. In the United Kindowm, we also saw an increasingly strong public demand for non-combustible insulation. At the same time, we saw declining or negative growth rates for instance in Germany, due to low Insulation solutions
ROCKWOOLoffersfire-resilient,thermally-efficient,highlydurable, and recyclable stone wool insulation.
economic activity and a tight labour market, and in Eastern Europe and Asia, where the uncertainty in the commercial marketplace was affected in particular by the project business. The construction markets in North America and Russia continued to grow, but geopolitical uncertainties and trade tensions led to slower growth rates in Asia in 2019 compared to what we have seen in recent years.
Within Technical Insulation we saw higher uncertainty in the process industry, particularly in Europe and Asia, leading to a less favourable development in this business area, while again in 2019 we saw significant growth in the sandwich panel market, where the conversion to non-combustible insulation continues.
Proper insulation alone can reduce heating needs by
70%
Business updateInsulation segment
ROCKWOOL Group Annual Report 2019 20
Overview Business updates Financial performanceMarket review/outlook Financial statements

Case study
It may resemble a futuristic spacecraft, but the stunning VTB Arena has taken great care to preserve its ties to history. The reconstructed and refurbished home of FC Dynamo Moscow, one of Russia’s most storied football clubs, is built on top of the original 1928 stadium’s perimeter wall, with a statue of legendary goalkeeper, Lev Yashin, gracing the main entrance.
The stadium, part of the spectacular project referred to as VTB Arena Park, is much more than a world-class football stadium. The 300,000 m2 pro-ject also includes the Dynamo hockey rink—next door and under the same roof as the football—as well as a park, shopping and entertainment centre, officeandapartmentbuildings,five-starhotel,andan underground parking garage with 1,600 spaces.
The project’s size and prestige—it has received several design awards—required that only the best materialscouldbeconsidered,withfiresafety,
energyefficiency,thermalinsulationandnoisereduction high on the list of the owners’ priorities.
As a primary supplier, ROCKWOOL is proud to have a variety of its stone wool products installed across all VTB Arena Park spaces. This includes more than 130,000 m2 of several types of stone woolinsulationinthefloors,wallsandroof.Inaddition, 70,000 m2 of stone wool technical insu-lation cover heating pipes and ductwork, ensuring thebuilding’sutilityinfrastructureisfire-safeanddoesn’t leak precious heat energy used to keep visitors warm in Russia’s cold winters.
“If you look at the diversity of the spaces in this complex, combined with the millions of people expected to use them each year, helping the ownersachieveahighleveloffiresafety,energyefficiencyandcomfortisquiterewarding,especiallyfor such an important project like this”, says Marina Potoker, Managing Director, ROCKWOOL Russia.
A gem in the heart of Moscow
21ROCKWOOL Group Annual Report 2019
Overview Business updates Financial performanceMarket review/outlook Financial statements

We provide customers with indoor acoustic solutions for ceilings and walls. Our ceiling systems combine stone wool acoustic tiles with suspension grid systems and accesso-ries that are a fast and simple way to create beautiful, comfortable spaces. Our stone wool-based products are easy to install, durable and significantly improve indoor acoustic comfort.
Rockfon grew revenue during the year in Europe and North America. Growth was driven by broader product differentiation, including new colours and designs for our grids and tiles as well as greater outreach to specifiers and high service levels to distributors and contractors. To maintain momentum, we are expanding our pro-duction capacity by adding a high-volume, high-speed production line at our existing facility in Cigacice, Poland.
The development of the U.S.-based pro-duction line has progressed, supporting a shorter and faster supply chain and helping facilitate growth above the market rate. The high-performance stone wool portfolio, combined with offerings in metal and wood ceilings, continues to gain recognition in the architect and design community.
Overall, we are encouraged by the growing interest in our acoustic ceiling tiles and sound absorbing solutions. To respond to customer requests, we have also strengthened the digital marketing and product design competencies within our organisation.
Business updateSystems segment
of American diners surveyed by Zagat
Noise was the top complaint among
24% Ceiling solutionsRockfon ceiling solutions improve acoustic performance and indoor climates, while resisting humidity and inhibiting mould growth.
ROCKWOOL Group Annual Report 2019 22
Overview Business updates Financial performanceMarket review/outlook Financial statements

Case study
As remarkable as they will be when they’re completed in 2023, the most impressive feature of the new World Trade Centre buildings in Brussels might be how they are built.
Circularity and sustainability were dual aims of the Belgian government when it commissioned the ren-ovation of the nearly 50-year old towers in the heart of Brussels. This called for the reuse or recycling of as much of the existing building and materials as possible and where new materials were needed, they should be recyclable. The result will be impressive: Of all the materials that will be used to build the new towers, 63 percent will come from the old buildings themselves. And of the total material not used, 95 percent will be recycled.
In Brussels, a symbol of circularityThe new buildings will be exemplars of circular design, energyefficiency,firesafetyandgoodacoustics.Thesecharacteristics will be key to the buildings’ multi-purpose use,includingofficespacefor3,900governmentemploy-ees, hotel rooms and apartments as well as public spaces onthegroundfloor.
Even before ROCKWOOL can help the building deliver on these performance traits with its stone wool products, it has a key role in achieving the customer’s circularity goals by removing 35,000 m2 of existing Rockfon acoustic ceiling tiles and 70 tons of ROCKWOOL stone wool building insulation. All of it will be recycled at ROCKWOOL’s factory in Roermond, the Netherlands, where it will be used to make new stone wool products.
23ROCKWOOL Group Annual Report 2019
Financial statementsOverview Market review/outlook Business updates Financial performance

We are the global leader in the supply of innovative, sustainable stone wool growing media solutions for the professional horticulture industry. Based on Precision Growing principles, these solutions are used to cultivate a variety of crops. Compared to soil-based methods, our solutions produce higher yields per square metre, require far less water and fertiliser and create the possibility to use little or no pesticides. We also offer customer-specific advice and tailor-made analytic tools, facilitating the sustainable production of healthy, safe, and fresh food produce.
Two-thousand nineteen was a good year for Grodan, with demand growing for our products in all markets. The new production facility in Elabuga, Russia, which opened in 2018 scaled up in 2019 per plan and helped us meet this demand.
Precision GrowingPrecision Growing is a highly efficientformofgrowingfocused on using minimum input materials to generate maximum output.
Meanwhile, our greenhouse management software, e-Gro, is catching on in the market and has received some prestigious recognition, including a “Best Concept” award at the GreenTech Innovation conference in the Netherlands. Furthermore, new crops, like lettuce, were added to our portfolio of crop-specific growing media.
greater yield per m2 in stone wool
15-40%Compared to soil, growers get
Business updateSystems segment
ROCKWOOL Group Annual Report 2019 24
Overview Business updates Financial performanceMarket review/outlook Financial statements

Case study
Business is good for Antoni de Bruin. The Dutch-man recently doubled the size of his sweet pepper company, ACB Agro, in Klazienaveen, the Nether-lands, from three to six hectares. And with the help of a suite of Grodan technology, he’s now expand-ing into consulting for other growers.
Like his parents before him, de Bruin grows his sweet peppers in Grodan stone wool instead ofsoilorothergrowingmedia,findingiteasierto manage with better quality produce, higher yields and a lower environmental impact. The big difference between the generations is the younger de Bruin’s use of technology.
Antoni started using Grodan’s GroSens water and nutrient metres a few years ago to precisely man-age the irrigation of his pepper crop. More recently he’s moved his whole operation on to Grodan’s greenhouse management software platform, e-Gro.
With one dashboard, e-Gro lets Antoni see a complete picture of his peppers, from root zone irrigation information to greenhouse climate data, harvest and crop data and more. All of this in real-time from anywhere he can connect to the internet. “I can check how my crops are doing from my phone or computer, and even change settings if I need to”, says de Bruin.
This freedom has allowed him to develop another business, consulting to other growers in Germany and Canada. “I learn a lot about my own business from getting out and meeting with other growers and I couldn’t do both without Grodan’s technology. Growing and consulting reinforce each other and I believe that my customers appreciate the combination”.
The internet of peppers
ROCKWOOL Group Annual Report 2019 25
Business updates Financial statementsFinancial performanceOverview Market review/outlook

We manufacture board material mostly used in ventilated constructions, for façade cladding, roof detailing, soffits and fascia. Our cladding and other boards are robust and flexible, and fit perfectly with modern architectural trends such as organic shapes and sustainability, while also providing cost efficiency and short installation times.
In early 2019, Rockpanel launched a fire safety awareness campaign across Europe, designed to increase the appreciation of the important role that non-combustible products, like the ones offered by Rockpanel, play in the marketplace.
A shortage of labour to refurbish at-risk buildings and insufficiently ambitious national regulations on the use of non-combustibles in some markets are limiting factors. Fortunately, we see more stakeholders getting involved in this transition, which we expect to gain momentum.
Rockpanel also intensified its focus on online marketing and digitalisation in 2019, resulting in strong growth in incoming leads. As a result, we also expanded our sales department to follow up on these opportunities and serve customers better.
After successful entry into Sweden in 2019, we are looking for more opportunities to expand. We also launched our new concealed fixing system in our high-end segment, Rockpanel Premium, which are products that offer customers all the design and technical possibilities of Rockpanel in one product.
Design freedomWhether shape, colour, engraving or even bending the boards, design freedom is at the heart of Rockpanel facades.
Business updateSystems segment
All Rockpanel boards are as durable as stone, easy to cut, and resistant to the effects of mois-ture, temperature and the weather
ROCKWOOL Group Annual Report 2019 26
Overview Business updates Financial performanceMarket review/outlook Financial statements

Case study
Named one of London’s “best places to live” for thelastfiveyearsbytheSundayTimes,theBer-mondseyneighbourhoodisafineexampleofthecity’s transformation in recent years.
Once a rundown part of the city, residential and commercialbuildingswithpoorenergyefficiencyandinsufficientfiresafetyperformancearebeingrenovated or demolished and replaced, making the neighbourhood more attractive for residents and saferagainsttheriskoffire.
The Eyot House apartment building in the Ber-mondsey Spa area is a good example of this trans-formation. The Hyde Group, a housing association leading much of the neighbourhood’s well-publi-cised rejuvenation, asked Rockpanel to completely replace the external façade of the seven-story building for safety and design reasons.
From down-and-out to dashingPertheUnitedKingdom’s2018firesafetyregula-tions, developed in the wake of the Grenfell Tower tragedy, all buildings over 18 metres tall must have exterior cladding systems made of non-combus-tible materials.
Importantly, all residents could stay in their homes during the renovation of the building, limiting discomfort and disruption to their lives and helping the owner avoid relocation costs.
“Rockpanelwasspecifiedastheonlynon-aluminium,firesafeA2-ratedproductabletomeetourdesignbrief,beinglight,flexibleandagreataesthetic choice in terms of colour and surface finish”,saysDanielAssander,designerandcontractadministrator of the project from Martin Arnold consultancy.
27ROCKWOOL Group Annual Report 2019
Overview Business updates Financial performanceMarket review/outlook Financial statements

We develop and supply versatile and innovative, fire-safe stone wool-based products used in a wide range of applications, such as friction and water management, train tracks, coatings, gaskets and fences. With more than a quarter-century track record, we help global industries improve quality of life by developing solutions that address noise and dust reduction, vibration control, and storm water management.
The market for precision-engineered stone wool products remained strong in 2019. Our noise-reduction fences and vibration control mats in train tracks continued building on their strong position in existing and new markets.
In 2019, the Rockflow product line for urban storm water management was formally launched, with multiple projects already installed in Denmark and the Netherlands.
As cities expand their footprints and populations, the risk of urban flooding caused by more frequent and severe rain storms is growing. Rockflow can be an important tool for cities to help protect people and infrastructure from urban flooding caused by storms.
The market for Lapinus car brake pad products was soft in 2019, tracking the global trends in the automotive industry.
of its volume in water, without losing its rigidity and strength
LapinusRockflow can absorb up to
95%
Business updateSystems segment
Precision engineering Lapinus precision-engineered stone wool solutions contribute to reducing vibration, noise, dust and to better water management.
ROCKWOOL Group Annual Report 2019 28
Overview Business updates Financial performanceMarket review/outlook Financial statements

Case study
The newly renovated Langelands Plads square doesn’t look like a critical piece of Copenhagen’s anti-floodingdefences.Andthat’stheintention.
The square, located in Frederiksberg on the border with Copenhagen municipality, is one of 300 so-called “dual use” projects Copenhagen has prioritised over the next 20 years to adapt existing parks, playgrounds and other spaces so that they also help protectagainstfloodingcausedbyextremerains.It’sa key part of what the city refers to as its Cloudburst Management Plan.
Expanding sewers is one part of the plan, but the main focus is on projects like Langelands Plads that create spaces to help keep excess storm water fromreachingsewersinthefirstplacewhilealsoimproving quality of life for residents – and in the long-term, bolstering property values and city tax revenues.
Rain, rain, come this wayHow? Underneath the surface of Langelands Plads and surrounding roads is 400 m3ofRockflow,abufferof specially engineered stone wool, with connections to a system of pipes, drains and gullies that lead the water to the sewer.
Heavy rains are quickly absorbed and gradually discharged over the following 24-hours into the sewer system (or soil in some cases). The stone wool in a Rockflowsystemcanabsorb95percentofitsvolumein water. (Note: stone wool made for insulation pur-poses does the opposite, it repels water.)
“Before, we talked about once-in-a-hundred-years rain events, but those can happen three times a year now”, says Ole Larsen, Director of CALL Copenhagen, an organisation advising the city of Copenhagen and others in Denmark on climate adaptation and green growth.“Rockflowgivesusbetteropportunitiestobuild a sustainable city that is climate ready”, he says.
ROCKWOOL Group Annual Report 2019 29
Overview Business updates Financial performanceMarket review/outlook Financial statements

Cities, nature and an exciting platform to celebrate both
On 28 February 2020, SailGP, the world’s fastest sailing competition kicks off in Sydney harbour, featuring a team from Denmark, proudly presented by ROCKWOOL.
Entering its second season, SailGP is a sailing race like no other. The fan-centric, inshore race events take place in iconic harbours around the world, including Sydney, San Francisco, New York, Cowes, UK and Copenhagen with more to be announced.
The Denmark SailGP team will join six other national teams competing in identical F50 catamarans. These lightweight, ultrafast vessels are engineered for intense racing and will reach speeds above 50 knots (nearly 100 km/h) in competi-tion for the sport’s largest monetary prize, USD 1 million.
An optimistic view Long before they got to the top of the racing world, many of these sailors learned the ropes and rigging in a bathtub-shaped dinghy called an Optimist.
“Sustainability is at the heart of our business, with all our productscontributing positively toward achieving UN Sustainable Develop-ment Goals. As a sustainable sport, sailing is a perfect fit for the ROCKWOOL brand. We’re proud to bring a Danish team to SailGP and believe the competition will help inspire a new generation of sailing enthusiasts”.
Jens Birgersson, CEO, ROCKWOOL
30ROCKWOOL Group Annual Report 2019
Overview Business updates Financial performanceMarket review/outlook Financial statements

2020 Season Events– Sydney, AU 28-29 February – San Francisco, USA 2-3 May – New York,USA12-14June– Cowes, UK 14-15 August– Copenhagen, DK 11-12 September– More events to be announced
Denmark SailGP team led by helmsman, Nicolai Sehested (centre), includes (L-R) Hans-Christian Rosendahl (grinder), Lars-PeterRosendahl(grinder),TomJohnson(wingtrimmer),RasmusKøstner(flightcontroller),MartinKirkerterp(grinder).
If you think about a young sailor looking out at the vast, unpredictable expanse that is our planet’s oceans, the name seems appropriate. Well, we too are optimistic. Not just about the Danish team’s chances. About our world, about society’s ability to rise to meet our biggest challenges—and our company’s role in overcoming them.
Because unlike the young sailor, society already has much of the knowledge and solutions for success, we just need to use them. Through our stone wool products and com-mitments to the United Nations Sustainable Development Goals, we are helping to reduce energy consumption and emissions in buildings, improve indoor health and well-being, enable cities to fight urban flooding and profes-sional horticulturists to grow food more productively and efficiently.
Our involvement with Denmark SailGP team gives us an excellent platform to build awareness around the impor-tance of sustainability and the connection among urban living, outdoor recreation and the important role of stone wool in enriching modern living.
“The addition of the Danish team adds a lot of excitement. Denmark has achieved remarkable success in Olympic sailing and will now compete at the top level in high tech, foiling, wing-sailed catamarans. It’s a great development for Danish sailing”.
Russell Coutts, CEO of SailGP, five-time America’s Cup winner, Olympic gold medalist
31ROCKWOOL Group Annual Report 2019
Overview Business updates Financial performanceMarket review/outlook Financial statements

SustainabilityAcross the full range of our products and operations, ROCKWOOL is dedicated to sustainability. We strive to increase our positive impact in society and on people’s lives by maximising the use and benefits of using our products while minimising our operational footprint. We also recognise that operating with integrity and as a responsible business is equally important and underpins everything we do.
The United Nations Sustainable Development Goals (SDGs) help steer ROCKWOOL’s ambitions. The Group is committed to 10 of the 17 SDGs, pursuing those goals where we can have the greatest impact and where they are most aligned with our business competencies.
We have developed impact metrics to track our contri-butions to the SDGs, which includes setting non-financial goals reflecting key material issues within the company’s operations that help drive improvements in our environ-mental and safety performance.
We will continue to report on progress toward achieving our 2030 goals as well as several intermediate goals for 2022 in the 2019 Sustainability Report.
In other words, ROCKWOOL is committed to delivering excellent long-term investment performance along-side environmental stewardship, ensuring that business decisions have a positive impact going beyond financial performance.
ROCKWOOL Group Annual Report 2019 32
Overview Business updates Financial performanceMarket review/outlook Financial statements

Climate change and energy efficiency Our products help save energy and combat climate change on a large scale and we will continue to work to increase positive climate impact even more, through new product innovation.
We are committed to reducing the carbon intensity of our production and have set a goal to reduce carbon intensity by 20 percent by 2030 compared to 2015.
In addition to capital investments, we focus on leadership, training, knowledge-sharing and awareness programmes to create a culture of continuous improvement in energy efficiency that will facilitate reaching our CO2 goal.
Part of our decarbonisation commitment is to use, where feasible, less carbon-intensive fuels in ROCKWOOL pro-duction facilities. In May 2019, we announced a project to install electric melter technology at our production facility in Moss, Norway. The innovation project, a EUR 34 million investment, is in partnership with Enova, a public company owned by Norway’s Ministry of Climate and Environment.
Once it begins operations in H2 2020, CO2 emissions from the Moss facility are expected to decline 80 percent. It will be the largest electric melting furnace in the Group thus far and is expected to provide valuable learnings and experience for ROCKWOOL as we continue efforts to decarbonise operations.
In 2019, ROCKWOOL signed on as a supporter for the Task Force on Climate-related Financial Disclosures (TCFD) recommendations. We live up to these recommendations by disclosing climate-related risks, opportunities, targets and emissions to CDP and have initiated quarterly ESG calls with investment analysts to facilitate dialogue about those risks and opportunities, among other things.
We also have a goal to improve energy efficiency in our non-renovated office buildings by 75 percent by 2030, compared to 2015. This is an ambitious but necessary goal that we are on our way to achieving. The deep renovation of our office in Gladbeck, Germany, designed to improve energy efficiency by more than 80 percent, is one exam-ple of an investment approved to support this goal and shows how our products can significantly improve energy efficiency of older buildings.
Renovation is our preferred approach to reaching our energy efficiency targets. Deep renovation of our offices will reduce the use of resources and carbon emissions associated with demolition and new build. In some instances, the economic payback of a deep renovation may not be attractive, but we might choose to pursue it anyway because of the many other benefits it creates, such as creating healthier and safer work environments or achieving broader sustainability goals.
Environmental managementWe continuously aim to minimise the impacts of our processes on people and the environment. When we are
building new production facilities or expanding existing ones, we use state-of-the-art abatement technology.
We conduct internal audits, and as part of our ISO certi-fications we are externally audited to improve the safety, health and environmental performance and awareness across the Group.
By the end of 2019, 80 percent of our stone wool produc-tion facilities had at least one external certification within safety, health, environment or energy management and several were certified across all areas.
Water and wasteWe have a goal to reduce waste from operations going to landfill by 85 percent by 2030 compared to 2015. In 2019, four new recycling plants were installed at our Asian and Russian factories. These investments are driving a signifi-cant reduction in the waste sent to landfill.
The new electric melter in Moss, Norway will also have a significant effect on this target with an estimated reduc-tion of up to 95 percent in waste to landfill for this site.
We are implementing more systematic water management at all factories. In 2019, work continued with water map-ping and installation of additional water metres. This will help drive progress on our Group Sustainability goal in 2030 to reduce water consumption per tonne of product by 20 percent compared to 2015.
33ROCKWOOL Group Annual Report 2019
Overview Business updates Financial performanceMarket review/outlook Financial statements

Reclaimed waste ROCKWOOL has a goal to offer recycling services for our products in 30 countries by 2030. We are also tracking our performance against an interim goal to have product recycling services in 15 countries by 2022.
In 2018, we took a significant step forward, as we de-ployed product recycling programmes in five additional countries, bringing the total number of countries with a product recycling service programme to 10. In 2019, we began preparations to expand recycling services in additional countries.
Stakeholder engagementROCKWOOL’s factories are essential to the Group’s success, as is maintaining constructive, positive relations in the communities around our facilities. This applies for greenfield and existing facilities. Our factories create local employment and investment in the host communities, and we always work to create and maintain positive relations with community members, their representatives, and other stakeholders.
Health and SafetyAs an international industrial company, there is an inherent level of safety risk for all our employees, whether at pro-duction sites, in our offices or while traveling. We take the management of this risk seriously and continuously work to create safe and healthy work places and conditions for all employees and people working with us across the world.
We have a goal of zero fatalities for people working with and for us and have an ambition to incrementally reduce the Lost Time Incident (LTI) rate by 10 percent every year. In 2019, we reduced our LTI rate by 17 percent.
Sadly, in February, we experienced a fatal accident at the construction site for a new production facility in Roma-nia. An employee from a local sub-contractor died in a fall from height. Following this accident, we increased supervision of subcontractors by direct personnel from ROCKWOOL, focusing on the daily contractor manage-ment process and sharing the findings with all production facilities.
This is the second consecutive year we had a fatality following an accidental fall. In 2019, we put extra efforts into increasing awareness of our standards for working at heights and roof protection. All production facilities have created action plans for ensuring implementation of the standards, and an increased focus will be placed on working at heights during safety audits.
In March 2020, ROCKWOOL Group will publish its Group Sustainability Report with detailed information on the Group’s sustainability performance.
Please go to www.rockwoolgroup.com/sustainability for more information.
Sustainable operationsWhile we make the most significant positive impact on sustainable development through the use of our products, it is just as important for us to achieve this while operating in a responsible and sustainable way.
We have five operational goals across energy, climate, wa-ter, waste and safety to track our performance and keep us accountable to our customers, colleagues and communities. Our sixth goal, on reclaimed waste, is to set up recycling services in even more countries. Together, these six goals have been designed to drive progress on the SDGs by reducing the negative impact from operations on material issues.
100 timesthe carbon emitted and energy consumed in its production*
* including upstream emissions from extraction and transportation of raw materials
During the lifetime of its use, the building insulation we sold in 2019 will save more than
34ROCKWOOL Group Annual Report 2019
Overview Business updates Financial performanceMarket review/outlook Financial statements

Reclaimed waste
Our goal: Increase the number of countries to 30 where we offer recycling services for our products by 2030.
Energy efficiency
Our goal: Increaseenergyefficiencywithinown (non-renovated)officesby75%by2030.
Landfill waste
Our goal: Reducelandfillwastefromourmanufacturingfacilities by 85% by 2030.
10%Reduce Lost Time Incident (LTI) frequency rate, annually
20%Reduction of water consumption by 2030
5 30The number of countries fromfiveto30
85%
Safety, health and wellbeing
Our goal: Reduce Lost Time Incident (LTI) frequency rate by 10% and ensure 0 fatalities annually.
Water consumption
Our goal: Reduce water consumption intensity within our manufacturing facilities by 20% by 2030.
CO2 emissions
Our goal: Reduce CO2 intensity from our manufacturing facilities by 20% by 2030.
CO220% by 2030by 2030
75%by 2030
35ROCKWOOL Group Annual Report 2019
Overview Business updates Financial performanceMarket review/outlook Financial statements

Bending the curve on carbon emissionsThe global imperative to act on climate change has never been more important. Cities are on the front lines – both as a source and as a key solution to a substantial part of the climate challenge.
Although urban areas occupy only about three percent of the world’s land surface, their carbon footprint is enormous and continues to grow as more people move to cities. Cities account for around 70 percent of the world’s energy use and CO2 emissions, most of it from buildings.1 Reducing and decarbonising the energy consumption of new and existing buildings is therefore critical for tackling the climate challenge.
The role of energy efficiency With growing populations and rising incomes, global primary energy use will likely double in this century.2 Effective management of the built environment is thus becoming increasingly important in reducing CO2 emissions.
For cities, it’s an opportunity to lead a rapid transition toward more energy-efficient and climate-friendly buildings and make a major contribution to achieving the Paris Agreement’s climate goals.
There are solutions readily available – the most important of which is energy renovation. Optimising the energy efficiency of existing buildings could provide up to 55 percent of GHG emission reductions needed to put cities on a 1.5°C pathway through 2030.3
Three different cities, one common solution While there is huge potential across all urban environments
to drastically improve energy efficiency, the specific challenges facing individual cities can vary substantially. Take New York City, Copenhagen and Milan. Each is very different in terms of size, building stock and the main challenges related to urbanisation.
What they have in common is they each see energy renovation of their building stock as a major part of the climate solution. And, municipal leaders in these cities realise that in addition to energy and climate benefits, there are also multiple social and economic benefits to building renovation – they just need help calculating them.
Counting the benefits of renovationThat’s where we come in. ROCKWOOL and the C40 have developed a toolkit that enables cities to calculate the environmental, social and economic benefits of energy renovation – and to show that renovating for energy efficiency is highly cost-effective.
With this tool, urban stakeholders can make a stronger case for energy renovation, facilitate a better dialogue with partners to unlock funding, and more rapidly scale up energy renovation actions.
Particularly when preparing city-led renovation programmes, the additional positive benefits can be instrumental in gaining buy-in from multiple public and private stakeholders.
Our hope is that the toolkit will contribute to accelerating building renovation rates in C40 cities and elsewhere – to the benefit of local populations as well as the global environment.
Cities cover of Earth’s land surface but account for
of energy use and CO2 emissions
~70%Small foot, big print
~3%
ROCKWOOL Group Annual Report 2019 36
Overview Business updates Financial performanceMarket review/outlook Financial statements

1 000+Jobscreated
42%GHG emissions
New York pilotRenovation of
23 schools
42%Energy costs per year
1 www.c40.org/why_cities 2 ROCKWOOL, Putting renovation on the agenda 3 www.c40.org/researches/mckinsey-center-for-business-and-environment
What if we renovated entire cities?Milan, New York and Copenhagen. Three iconic and very different cities that share a common goal: reducing their environmental impact while continuing to be attractive places to live, work and play.
All three cities tested the ROCKWOOL/C40 renovation toolkit to investigate what deep renovation could accomplish in terms of economic, social and environmental benefits. The data from these pilots was then extrapolated to estimate what the impacts would be at a larger scale.
These early results are encouraging. And the ‘what if’ scenarios of large scale investments indicate the potential economic, social and environmental impacts of energy renovation in these cities are substantial.
To learn more about the pilots conducted in these cities and the results, the full report will be available in March via this link: www.c40knowledgehub.org/s/article/The-Multiple-Benefits-of-Deep-Retrofits-A-toolkit-for-cities.
up to 50 000 Jobscreated
318 000 tCO2GHG emissions avoided per year
USD 100mEnergy cost savings per year
What if?Renovation of 700 schools
37ROCKWOOL Group Annual Report 2019
Financial statementsFinancial performanceBusiness updatesMarket review/outlookOverview

In 2019, we initiated the process of replacing our existing whistleblower system. Increased requirements in relation to data privacy and the use of new technologies warranted the replacement of the existing setup.
Our Code of Conduct serves as our most important instrument to communicate and provide guidance on ROCKWOOL Group’s way of doing business with integrity. The Code of Conduct includes Group policies related to anti-corruption, gifts and hospitality, conflict of interest, competition law, data privacy, human rights and labour rights, health and safety, and environment.
Beginning 2019, approximately 6,000 targeted employees concluded the new Code of Conduct e-learning. The focus of the e-learning was on ethical behaviour in the work-place, anti-corruption (including our new gift and hospital-ity policy), conflict of interest and how to report concerns. The e-learning programme was well-received by employ-ees and will be repeated in 2020/21.
Also in 2019, as part of the Code of Conduct awareness programme, face-to-face training in competition law
was organised by local ROCKWOOL companies in local languages. The awareness training complemented the competition law e-learning concluded in 2018.
Tackling corruptionROCKWOOL Group has zero tolerance towards any kind of fraud, corruption, bribery and facilitation payments. The anti-corruption policy also applies to suppliers, agents and other third-parties. In 2019 a new policy on the use of agents was adopted. The focus was on compliance in relation to U.S. Foreign Corrupt Practices Act and the UK Bribery Act. Use of agents and compliance with the policy will form part of the internal audits.
In 2018, the Group adopted a new policy and manual on gifts and hospitality. It concerns the appropriate use of gifts and hospitality and respecting the required approval levels. In 2019 a new gift and hospitality register was launched. Use of gifts and hospitality over a certain amount requires registration and approval by relevant management level. The register allows monitoring and reporting to the Integrity Committee on the use of gifts and hospitality in the Group.
The 2018 initiative concerning anti-corruption and bribery training in four high-risk countries was completed in Q1 2019. It involved face-to-face training of employees in
sales, marketing, procurement, finance, HR, and other departments.
Whistleblower systemAll employees are encouraged and required to report knowledge or suspicion of non-compliance with the ROCKWOOL Code of Conduct to management, the Group Integrity Officer or through the whistleblower procedure. We do not accept any form of negative employment consequences for employees reporting in good faith actual or suspected non-compliance.
Business integrity
As part of the enrolment package, new employees are asked to complete the Code of Conduct e-learning to focus attention from the outset on the importance of the Code of Conduct.
38ROCKWOOL Group Annual Report 2019
Overview Business updates Financial performanceMarket review/outlook Financial statements

In 2019 a total of 13 cases were reported, compared to 15 in 2018. All reported integrity and whistleblower cases are investigated.
The reported cases involved fraud, bribery, unethical behaviour or were related to SHE (safety, health and environment). Of the 13 cases, nine resulted in corrective actions ranging from dismissal of employees to changes in internal procedures.
In relation to bribery, the two reported cases were attempts to bribe ROCKWOOL employees and were
reported by the targeted employees themselves. This indicates that the focus on anti-corruption training has increased awareness. The new whistleblower system will simplify reporting of whistleblower cases for both employees and third parties and allow reporting of cases in local language via the web or mobile app.
The Management and our Group Integrity Officer continue to promote and increase the awareness and knowledge of business ethics and the whistleblower arrangement in ROCKWOOL Group, using tools like the new e-learning course.
The Audit Committee is informed about all integrity and whistleblower cases. To create awareness of unethical behaviour and underline the Group’s zero-tolerance policy, a summary of integrity cases is communicated to all employees on Group intranet to make sure that we learn from past mistakes and breaches.
Respecting human rightsIn 2019 we continued to scrutinise our internal processes with respect to due diligence of human rights in our supply chain.
Supply chain due diligence We acknowledge there is a risk connected with the categories and countries we engage with in terms of compliance with international, national and local laws and guidelines relating to employment, environmental and manufacturing practices as well as ethics and bribery, particularly in relation to sustainable sourcing.
ROCKWOOL’s Supplier Code of Conduct is designed to mitigate this risk by explaining our expectations to the suppliers. Furthermore, ROCKWOOL Group expects our suppliers to enforce the same guidelines within their supply chain.
Before becoming an approved supplier, new potential ROCKWOOL Group suppliers must register in our online
supplier portal and either accept the ROCKWOOL Supplier Code of Conduct or upload their own code of conduct for our review and approval.
During 2019, we evaluated the sustainability risk related to three overall areas: human rights and labour rights; environment; and anti-corruption and bribery across the countries in which we currently operate and the type of materials and services we procure. This has resulted in a risk matrix that we will use for assessing new suppliers as well as to re-assess existing suppliers.
We expect to implement the new risk matrix in the existing population of suppliers within the identified high-risk categories in 2020.
Privacy and data protectionPrivacy compliance is essential to gaining and maintaining the trust of our employees, customers and suppliers. A global data privacy organisation with a regional presence ensures support and governance.
To enable our employees to act in accordance with their daily work requirements, our privacy compliance programme includes a privacy policy, a privacy manual and a handbook with guidelines for selected business areas as well as specialised templates and privacy notices. Additional e-learning has been targeted at employees in functions with highest potential risk.
39ROCKWOOL Group Annual Report 2019
Overview Business updates Financial performanceMarket review/outlook Financial statements

Our peopleAttracting and retaining talentsAttracting and retaining the right employees with the right skills and mindset continues to be a focus area for ROCKWOOL Group. During 2019, we initiated several projects to further develop our ability to do just that, including updating the recruitment process and tools. Open positions are now posted at the Group website, and in 2020 we will ensure that we have a global on-boarding process that supports the business in promoting
the company culture, history and knowledge and further enables internal talent development. In addition, we are now globally aligned on our internal and external Employer Brand positions, including on the messaging we use to attract future employees and retain existing ones.
Engaging our employeesWe are continuously striving to improve the engagement level of our employees. In 2019, we implemented a new way of conducting our annual Employee Engagement Survey, which enabled leaders across the Group to gain a better understanding of the engagement status and how to further improve this.
The areas covered in the survey include: satisfaction and motivation, loyalty, immediate manager, senior manage-ment, co-operation, working conditions, job content, remuneration, learning and development and safety. New in 2019 was the fact that all employees — office-based as well as production-based — answered the same question-naire online. The participation ratio across the Group was at an all-time high.
The areas where we scored high in comparison to the external benchmarks are Loyalty, Reputation and Job content. Immediate manager scores vary substantially, with a big proportion of our employees being satisfied with their immediate manager, while still leaving room for improvement in the lowest quartile of managers.
We can see that across the Group, we are slightly below the external High-Performance Norm benchmarks, though with some very positive and encouraging scores in certain areas of the organisation.
Developing our people In ROCKWOOL, we offer targeted learning and develop-ment opportunities to our employees. In 2019, we nom-inated the third group of participants in the Operational Excellence Programme, now a well-established Group pro-gramme supporting the development of the next genera-tion of ROCKWOOL leaders. During the year, we also intro-duced changes to our performance management process, adding greater flexibility, including creating opportunities to adapt goals and provide more frequent feedback.
Reigniting The ROCKWOOL WayAs a new decade begins, we have updated and relaunched the same strong values foundation that has brought us to the present to carry us through the years to come. The ROCKWOOL Way is based on our management principles #iRockGlobalGoals Idea Challenge 2019:
600 ideas, 8 awards and a lot of positive energy
40ROCKWOOL Group Annual Report 2019
Overview Business updates Financial performanceMarket review/outlook Financial statements

and our four values: Ambition, Integrity, Responsibility and Efficiency, while safeguarding a balanced management approach that leads to good, sustainable results.
Supporting our employeesWe are committed to provide equal opportunities, promote diversity, and work against all forms of discrimination among our employees. Promoting and raising awareness of policies and procedures is important and can be challenging in a global, culturally diverse organisation.
Reflecting the global nature of our company, 11,700 ROCKWOOL employees work in 39 countries.
Women in management It is our ambition to have a diverse working environment, and we are continuously working to increase diversity in management teams as well as Group functions.
As the industry has traditionally been male dominated, our primary focus has been to increase the number of women in different levels of management. While the gender split across the Group has been relatively stable the last few years with a 18/82 ratio of females to males, the proportion of females is higher at executive and middle management levels.
In 2018, Group Management set a target for 2020 of 25 to 35 percent female leaders in executive and middle management positions. In 2019, 27 percent of leaders in executive and middle management positions were women, the same as in 2018. Further, 29 percent of newly hired middle managers were women, on par with the level in 2017 after a peak year (39 percent) in 2018.
To support increased diversity among our leaders, we are maintaining several Group policies including, for example, a non-tolerance clause on harassment, and a whistleblower channel allowing all employees to anonymously initiate any type of discrimination or harassment case. In 2019, we have also further developed our recruitment process globally to strengthen the opportunities for internal candidates to search and apply for career opportunities across the Group, which supports equal opportunity to be considered for openings.
Additionally, we have a target (also for ROCKWOOL A/S, in Denmark) to have at least one shareholder-elected female member of the Board of Directors by end 2020. In 2019, the ROCKWOOL Board of Directors had only male members elected by the shareholders, as there was no change in the year. ROCKWOOL A/S had one female member of the Board.
41ROCKWOOL Group Annual Report 2019
Financial statementsFinancial performanceBusiness updatesMarket review/outlookOverview

Systems and processes The Board of Directors is responsible for ensuring that the Group’s risk exposure is consistent with the targeted risk profile and evaluates that appropriate awareness and management processes are in place. Managing the risk process is part of the Chief Financial Officer’s area of responsibility and includes providing regular updates to the Audit Committee and Board of Directors.
All managing directors of our subsidiaries and Group functional heads must ensure that a risk review within their areas of responsibility is conducted at least once a year; and that risks are discussed, described, scored for severity and likelihood, and quantified in terms such as predicted financial impact.
Appropriate mitigating actions for identified risks are pro-posed by the company or Group function and studiously evaluated to ensure effective risk management at Group level. The Group has an Enterprise Risk Management (ERM) Committee, consisting of members from business area and Group functions. The committee is responsible for reviewing and updating the internal risk management framework and for implementing related processes.
Deep-dives into the Group’s top risks are selected by the Audit Committee and presented by the risk owner for the Risk Committee, Group Management and finally to the Audit Committee and the Board. With these systems and processes, the Group identifies and mitigates, though cannot always eliminate, risks. The objective is to ensure that any residual risks are at an acceptable level.
Risks IT securityLike all other companies, ROCKWOOL Group is exposed to potential breaches of our IT infrastructure.
With increased digitalisation of business processes, the Group is vulnerable to disruptions of operations and is increasingly engaged in the protection of data and intellectual property.
IT security has a high priority within the Group. Key objectives include preventing digital theft of intellectual property; limiting and quickly rectifying operational dis-ruptions; and protecting the rights of external and internal data subjects. Also high on the IT security agenda is the protection of consumers against misinformation or misuse of ROCKWOOL brands.
Finally, we strive to safeguard shareholders against value-destroying cyber-attacks on ROCKWOOL brands and products or on ROCKWOOL Group’s and its partners’ value-delivery systems.
Group IT focuses on mitigating risks based on our own assessments as well as external IT auditors’ findings, and dedicated tests of specific IT areas done by external experts. Part of this mitigation includes heightening IT security, testing disaster-recovery plans and improving data flow and network activity monitoring.
Competition law complianceGuided by our ethical values and Code of Conduct,
Managing risk is a natural part of doing business in the Group.
Risk management
42ROCKWOOL Group Annual Report 2019
Overview Business updates Financial performanceMarket review/outlook Financial statements

ROCKWOOL Group competes in a fair manner on prices, quality, customer service, innovative products and more. The Group is committed to complying with national and international competition and antitrust laws.
A variety of measures are continuously provided to rele-vant employees to equip them with sufficient knowledge to make business decisions in accordance with applicable competition and antitrust laws as well as internal policies.
Our compliance programme includes a competition law compliance manual, interactive training seminars, and internal audits. In 2019, training seminars were arranged worldwide based on training material prepared by Group Legal Affairs. Approximately 1,600 employees participated in this training.
New employees must complete an e-learning programme as part of the onboarding, with a dedicated content, including training and guidance on compliance. Existing employees will be offered new e-learning every second year.
Corruption and briberyThe ERM Committee has mapped the risk of fraud, corruption, and bribery as well as initiated mitigation measures related to high-risk countries. The mapping is based on inputs from local management and previous incidents, combined with public sources related to these risks. Mitigating measures in high-risk countries involve e-learning, face-to-face training, and an increased emphasis on the risk of fraud, corruption, and bribery.
Financial risks As an international business, ROCKWOOL Group has exposure to typical financial risks related to currency and interest rate fluctuations, liquidity and credit risks. Please refer to note 4.2 for further information on these risks.
43ROCKWOOL Group Annual Report 2019
Overview Business updates Financial performanceMarket review/outlook Financial statements

Corporate governance at ROCKWOOL Group regulates the interaction among shareholders, the Board of Direc-tors, and Group Management, with the aim to ensure optimal operational performance while at the same time securing an appropriate level of accountability and trans-parency of our business practices.
OrganisationThe supervision and management of ROCKWOOL Group is divided among the Annual General Meeting (AGM) of shareholders, the Board of Directors (with well-defined committees), and Group Management.
The Annual General Meeting The Annual General Meeting is the supreme body of the corporate governance structure and elects the Board of Directors as well as independent auditors. The Annual General Meeting approves any changes to the articles of association and to the capital structure, including any issuance of new shares. The company is not aware of shareholder agreements containing pre-emption rights or restrictions on voting rights. There is an agreement among members of the founding Kähler family to meet regularly to discuss their interests in the company, including items at AGMs, but there is no requirement for them to vote jointly.
The Board of DirectorsThe Board of Directors outlines the overall purpose and strategy of the company and ensures that the business development is on track toward agreed short- and long-term goals. The majority of the members of the Board of
Directors are non-executive members in accordance with the Danish Companies Act.
The Board of Directors today consists of nine members. Six are elected by shareholders at the AGMs for a period of one year and may be re-elected. Of these, four mem-bers, including the chairman, are deemed independent per the Danish Recommendations on Corporate Govern-ance. Three members are elected by employees, for a period of four years, pursuant to the Danish Companies Act. The next election is in 2022.
The Board of Directors conducts an annual evaluation facil-itated by an external consultancy firm. Based on this year’s evaluation, the Board concluded that its present composi-tion is appropriate and sufficient for it to perform its tasks. As for the special competences of each Board member, reference is made to the CVs listed on the website, www.rockwoolgroup.com/about-us/people.
Group Management The CEO, together with his Group Management team, is responsible for the day-to-day management, strategy execution and timely reporting to the Board of Directors. The team currently consists of nine executives, of which the CEO and CFO are the registered directors with the Danish Business Authority.
Board Chairmanship and CommitteesThree substructures have been established by the Board of Directors.
Corporate governanceThe Chairmanship The Board of Directors has established a Chairmanship consisting of the Chairman and the two Deputy Chairmen. They prepare the Board meetings and undertake several functions of a nomination committee.
Audit Committee The Board of Directors has appointed an Audit Committee consisting of three members. The majority of its members are independent. The Audit Committee monitors account-ing and audit policies plus conditions which, if determined by the Board of Directors or the Audit Committee, should be subject to thorough evaluation. Further, the Audit Committee evaluates internal control and risk systems.
Remuneration Committee The Board of Directors has appointed a Remuneration Committee consisting of three of its members, the majority of whom are independent.
The Remuneration Committee ensures that ROCKWOOL Group maintains and that the Board of Directors adopts a Remuneration Policy concerning the remuneration of the company’s Board of Directors and Registered Directors.
The remuneration policy and any material change thereto shall be submitted to the shareholders for approval at least every four years. A revised Remuneration Policy, which replaces the existing policy and guidelines for incentive-based remuneration, will be submitted for approval at the 2020 Annual General Meeting.
44ROCKWOOL Group Annual Report 2019
Overview Business updates Financial performanceMarket review/outlook Financial statements

The Remuneration Committee: – Evaluates and makes recommendations for the
remuneration of the Board of Directors, which are subject to approval by the shareholders at the AGM.
– Is authorised by the Board of Directors to approve remuneration for Registered Directors and the rest of Group Management.
– Ensures that the company maintains Group-level variable pay schemes that support the business’ success and value creation, short- and long-term.
– Prepares an annual Remuneration Report outlining the remuneration paid to the Board of Directors and Registered Directors.
As of the AGM in 2021, the Remuneration Report will be subject to a non-binding advisory vote from the shareholders.
Internal control Control environmentROCKWOOL Group considers strong internal control to be an essential management tool. The control environ-ment in ROCKWOOL Group is based on clear guidelines and accountability and a continuous effort to maintain an appropriate control environment with due consideration of materiality and risk.
The entire structure of the Group is designed based on the Group’s commercial activities with a clear segregation of management responsibilities.
All Group policies are approved by Group Manage-ment and assigned to one Group Management member overseeing implementation throughout the line organisa-tion. Policies and manuals have been adopted within all essential areas of operation, legal compliance and financial reporting.
Control activitiesMinimum requirements of internal controls are stipulated in ROCKWOOL Group Standards, based on the risks identified. The control activities include procedures for authorisation, approval, reconciliation and separation of functions. The control system includes both manual and automated controls.
The local management teams are responsible for ensuring that the control environment in each local entity is sufficient to meet local and Group requirements.
Information and communicationROCKWOOL Group has established standardised in-formation and reporting systems to identify, collect and communicate relevant information and reports on an ongoing basis and on all levels to facilitate an effective, reliable workflow. In addition, an in-depth business review is performed each quarter with participation of relevant members of Group Management.
The Group’s position on risk management and changes in the reporting requirements is regularly communicated at financial meetings for the local finance directors, through the Group intranet and dialogue.
MonitoringThe internal control systems in relation to the presentation of financial statements are monitored at various levels e.g. monthly reports to Group Management on segments and markets and by regular control visits to the local entities. In addition, the Group’s Integrity Committee consisting of the CEO, CFO, a member of Group Management, the Group General Counsel and Group Integrity Officer, monitor integrity compliance and launch appropriate new initiatives to constantly improve compliance. The Integrity Committee furthermore reports on integrity issues to the Audit Committee.
RecommendationsAs a Danish listed company, we are guided by the recommendations issued by the Danish Committee on Corporate Governance. The company is generally in compliance with such recommendations but has, in four cases, chosen to differ as described below. The variations are generally due to company-specific views on the recommendations to optimise value for its shareholders.
The company complies with recommendation 3.1.5. The company’s Board of Directors will, however, not exclude that a situation can arise, where the Board of Directors may wish to constitute itself with a former member of the company’s management as Chairman or Deputy Chairman.
ROCKWOOL Group publishes its statutory report on Corporate Governance for the financial year 2019 cf. the Danish Financial Statements Act §107b on the company’s website, including a detailed description of
45ROCKWOOL Group Annual Report 2019
Overview Business updates Financial performanceMarket review/outlook Financial statements

the Board of Directors’ consideration regarding all the recommendations. The statutory report on Corporate Governance can be found at www.rockwoolgroup.com/about-us/corporate-governance/.
ExceptionsTo a broad extent, the company is following the Committee on Corporate Governance’s recommendations, except for the following four sub-recommendations, where the compa-ny has assessed that its present set-up is more appropriate:
3.1.3RecommendationThe Committee recommends that the selection and nomination of candidates for the Board of Directors be carried out through a thoroughly transparent process approved by the overall Board of Directors.
ExplanationThe Board of Directors has authorised the Chairmanship to nominate qualified candidates to the Board of Directors. The Board of Directors will then evaluate the candidates before it recommends them for election at the Annual General Meeting.
3.3.2RecommendationThe Committee recommends that the management report includes information about the number of shares, options, warrants and similar in the company, and other Group companies, owned by each member of the Board of Directors, as well as changes in the portfolio of the member of the securities mentioned that have occurred during the financial year.
ExplanationThe company considers the portfolio of shares, options warrants and similar in the company of each member of the Board of Directors to be a private matter, and it is the company’s judgement that disclosure of such information will not add additional value for shareholders and other stakeholders. Board member remuneration does not include share-based elements.
3.4.6RecommendationThe Committee recommends that the Board of Directors establish a nomination committee.
ExplanationThe Board of Directors has not established a nomination committee. Instead, the Chairmanship performs duties recommended concerning the candidates for the Board of Directors.
The Board of Directors selects candidates to the positions as CEO and other Registered Directors based on their qualifications.
4.2.3RecommendationThe Committee recommends that the company prepares a remuneration report that includes information on the total remuneration received by each member of the Board of Directors and the executive board from the company and other companies in the Group and associated companies for the last three years, including information on the most important content of retention and resignation arrangements and that the correlation between the remuneration and company strategy and relevant related goals be explained.
ExplanationThe remuneration of each member of the Group Management is seen to be a private matter and it is the company’s judgement that disclosure of the remuneration paid to each individual member of Group Management will not add additional value for shareholders and other stakeholders.
The remuneration of the members of the Board of Directors and committees is available on p. 48 and our website.
46ROCKWOOL Group Annual Report 2019
Overview Business updates Financial performanceMarket review/outlook Financial statements

Responsible tax We acknowledge that tax is an important part of society and an equally important part of responsible corporate citizenship. Tax matters and risks as well as our tax policy are governed by the Board of Directors and discussed on a regular basis with the Audit Committee.
Tax matters are operationally managed and monitored by the CFO and the Group Tax department in close relation-ship with the financial management of ROCKWOOL Group subsidiaries.
The aim of our tax policy is to reflect and support our business by ensuring a sustainable tax rate, mitigating tax risks and complying with rules and regulations in the jurisdictions in which we operate.
In all tax matters, we apply the same values and integrity as in our general Code of Conduct by making sure that our primary focus is the ordinary operation of the Group. We only adopt tax positions that are defendable under full disclosure.
We are committed to being a responsible tax payer and avoid aggressive tax planning. We have a clear and trans-parent corporate structure with no contrived entities or structures.
There are many transactions among ROCKWOOL Group companies, and the transfer pricing policy for these trans-actions is driven by the activities undertaken and the value created in each part of our businesses. The key compo-nent in our profit allocation is our transfer pricing setup and methods in which we are committed to the principle of paying tax where value is created.
We acknowledge that international tax matters are in-creasingly complex and we are committed to assigning the necessary resources to ensure compliance with relevant tax laws and regulations.
ROCKWOOL Group is at the same time committed to being as transparent about its tax matters as can reason-ably be expected and we pursue an open dialogue and relationship with tax authorities as a proactive approach to handle uncertainties.
For example, we have applied for bilateral advance pricing agreements between Denmark and four key countries and once these are established our ambition is to expand this to other key markets.
An advance pricing agreement is an up-front agreement between the tax authorities in two or more countries, cov-ering the pricing methodologies for five tax years, thereby determining the level of taxable income for the countries in question. In addition to an open dialogue with tax authorities, we also participate and engage in tax matters through industry associations and other external bodies.
From time to time, ROCKWOOL Group is allocated differ-ent types of tax incentives. Tax incentives are government measures that are intended to influence business deci-sion-making or to encourage businesses to invest by re-ducing the amount of tax they have to pay. Several of the territories in which we operate offer incentives of various kinds and we seek to use these incentives where they are aligned with our business and operational objectives.
47ROCKWOOL Group Annual Report 2019
Overview Business updates Financial performanceMarket review/outlook Financial statements

Remuneration report
Remuneration of the Board of Directors and Group Man-agement is based on the principles in our Remuneration Policy for the Board of Directors, Group Management and Senior Executives of ROCKWOOL International A/S and the separate General Guidelines for Incentive-Based Remuneration of Group Management of ROCKWOOL International A/S both approved at the Annual General Meeting on 6 April 2016. The guidelines are designed to ensure that remuneration for the target group is aligned to the company strategy and goals. In 2019, no revisions were made to the remuneration structures for executives.
Remuneration of the Board of DirectorsBoard members receive a fixed annual base fee as approved at the Annual General Meeting each year. Members of the Board of Directors are not offered pension arrangements or any type of incentive-based remuneration.
An increase in the fees for the Board of Directors was ap-proved at the Annual General Meeting in April 2019. The purpose of the increase was to align the remuneration of the board members with other Danish LargeCap compa-nies. The previous update of the Board fees was approved at the Annual General Meeting in 2016.
Remuneration of Group ManagementThe remuneration package of Group Management in-cludes base salary; variable pay in the form of short-term incentive schemes (annual bonus) and long-term incentive schemes (stock options or restricted share units); pension and other benefits, such as company car, free phone and internet.
The short-term variable part of the total remuneration (annual cash bonus) is dependent on achievement of financial targets for the Group as well as the relevant business area for Group Management members with profit and loss responsibility.
Annual Board fees (DKK) 2019
Chairman 1,080,000
Deputy Chairmen 720,000
Other members 360,000
Supplement for Audit Committee Chairman 300,000
Supplement for Audit Committee members 180,000
Supplement for Remuneration Committee members 90,000
The long-term variable part of the total remuneration (stock options/restricted share units) is dependent on continuous service to the company.
The variable annual bonus can give up to maximum 40 percent of the base salary for all Group Management members. The long-term incentive programme is set to 20 percent of the base salary for Group Management, 30 percent for the CEO. Both vehicles are subject to a clawback in cases where an incentive payout was made based on data which proved to be materially inaccurate.
Share-based paymentsOn 8 April 2019, the Restricted Share Units (RSUs) granted in April 2016 vested. At the time of vesting, the share price was DKK 1,566.
In 2019, a Restricted Share Unit allocation with a total fair value of EUR 2.3 million was granted after approval by the Board of Directors in accordance with the General Guide-lines for Incentive-Based Remuneration of Group Manage-ment of ROCKWOOL International A/S. Similar to previous years, the RSUs were allocated to a group of 68 employees in leading positions including Group Management and are subject to a vesting period of three years. After the vesting period the shares are transferred to the participants, subject to continued employment with the ROCKWOOL Group in the vesting period.
48ROCKWOOL Group Annual Report 2019
Overview Business updates Financial performanceMarket review/outlook Financial statements

Value of RSU grant in 2019
At grant date* At year-end
(EUR)
Value per
share
Total value
(EURm)
Value per
share
Total value
(EURm)
Group Management 213 1.0 212 1.0
Registered Directors 213 0.5 212 0.5
*) The value at grant date is equal to the share price of the ROCKWOOL B share at the date of grant adjusted for expected dividend.
Other terms and conditionsThe terms and conditions in the employment contracts for Group Management are considered common practice for Danish listed companies with regards to terms of pension, insurances, notice and non-competition. The non-Danish Group Management members’ terms and conditions are considered common practice for executives in the relevant countries.
The aggregate notice period and severance pay for the Registered Directors do not exceed 24 months. No early retirement or other special pension schemes are in place for the Registered Directors.
** Registered Directors in ROCKWOOL International A/S are the CEO and CFO.
* For an overview of Group Management members please refer to p. 55.
Aggregate remuneration Group Management*
EURm 2019
Change to last year 2018
Change to last year 2017
Salaries 4.4 2% 4.3 4% 4.2
Annual bonus 1.5 7% 1.4 17% 1.2
Annual granted RSUs (value at year-end) 1.0 11% 0.9 -30% 1.2
Pension 0.6 0% 0.6 8% 0.6
Social security and other benefits 0.3 -9% 0.4 -15% 0.4
Total remuneration 7.8 3% 7.6 -1% 7.6
Aggregate remuneration Registered Directors**
EURm 2019
Change to last year
2018
Change to last year
2017
Salaries 1.9 5% 1.8 6% 1.7
Annual bonus 0.7 6% 0.7 31% 0.5
Annual granted RSUs (value at year-end) 0.5 12% 0.4 -28% 0.6
Pension 0.2 5% 0.2 7% 0.2
Social security and other benefits 0 -2% 0 -1% 0
Total remuneration 3.3 6% 3.1 4% 3.0
49ROCKWOOL Group Annual Report 2019
Overview Business updates Financial performanceMarket review/outlook Financial statements

The year in pictures
Talking sustainability at New York Climate Week
CEO Jens Birgersson with Mark Chambers, Director, Mayor’s Office of Sustainability, New York.
Solid progress: New factory in Ranson, West Virginia
Norway’s PM visits next generation factory in Moss, Norway
ROCKWOOL sponsors Denmark’s entry into SailGP 2020 (L-R: Sir Russell Coutts, Jonas Høgh-Christensen, Nicolai Sehested, Jens Birgersson)
Grodan team launches e-Gro, software platform for growers
50ROCKWOOL Group Annual Report 2019
Overview Business updates Financial performanceMarket review/outlook Financial statements

Winning the “Business Climate Prize” at the ZERO Conference in Norway
Newest factory and members of the ROCKWOOL family in, Ploiesti, Romania
Celebrating the expansion of our factory in Malkinia, Poland
Launch of the award-winning 7 Strengths of Stone video series
51ROCKWOOL Group Annual Report 2019
Overview Business updates Financial performanceMarket review/outlook Financial statements

BoardofDirectors(fromLtoR):SørenKähler,RenéBinderRasmussen,ConnieEnghusTheisen, Carsten Bjerg, Henrik Brandt, Christian Westerberg,AndreasRonken,ThomasKähler,JørgenTang-Jensen.
Board of Directors
52ROCKWOOL Group Annual Report 2019
Overview Business updates Financial performanceMarket review/outlook Financial statements

Henrik BrandtChairmanElected to the Board: 2017
Other positions related to the companyMember of the Chairmanship, Chairman of the Remuneration Committee.
Positions in other Danish companiesChairman of the Boards of Toms Gruppen A/S, Intervare A/S (nemlig.com A/S), Danish Bake Holding ApS (“Ole & Steen”) and Fritz Hansen A/S. Vice Chairman of the Board of Scandinavian Tobacco Group A/S*. Member of the Board of Gerda and Victor B. Strands Fond.
Other positions Member of the Board of Ferd Holding AS, Norway.
Henrik Brandt participated in all Board and Remuneration Committee meetings during 2019.
Carsten BjergFirst Deputy ChairmanElected to the Board: 2011
Other positions related to the companyMember of the Chairmanship, Chairman of the Audit Committee, Member of the Remuneration Committee.
Positions in other Danish companiesChairman of the Boards of Hydrema Holding ApS, Arminox Investment A/S (and one fully owned subsidiary), Bjerringbro-Silkeborg Håndbold A/S, Bogballe Investment A/S (and one fully owned subsidiary), Ellegaard Investment I ApS (and one fully owned subsidiary), CapHold Guldager ApS (and one fully owned subsidiary), Robco Engineering Investment A/S (and one fully owned subsidiary), and PCH Investment A/S.
Member of the Boards of Vestas Wind Systems A/S*, Agrometer Investment A/S (and three fully owned subsidiaries), TCM Group A/S* (and one fully owned subsidiary).
Carsten Bjerg participated in all Board, Audit and Remuneration Committee meetings during 2019.
Søren KählerSecond Deputy ChairmanElected to the Board: 2013
Other positions related to the companyMember of the Chairmanship, Member of the Remuneration Committee, Member of the Audit Committee, Member of the Board of the ROCKWOOL Foundation, Member of the Kähler Family Meeting.
Positions in other Danish companiesChairman of the Board of A/S Saltbækvig.
Other positions Member of the Board of the Foundation Sagnlandet Lejre.
Søren Kähler participated in all Board, Audit and Remuneration Committee meetings during 2019.
Thomas KählerSenior Vice President, Head of Systems Division, ROCKWOOL International A/SElected to the Board: 2008
Other positions related to the companyMember of Group Management, and Senior Vice President, Head of Systems Division, Member of the Kähler Family Meeting.
Other positions Member of the Advisory Board of Kraka, Denmark.
Thomas Kähler participated in all Board meetings during 2019.
Andreas RonkenCEO of Alfred Ritter GmbH & Co. KGElected to the Board: 2016
Other positionsMember of Advisory Board of Melitta Group GmbH & KG, Minden, Germany.
Andreas Ronken participated in all but one Board meeting during 2019.
Jørgen Tang-JensenElected to the Board: 2017
Other positions related to the companyMember of the Audit Committee.
Positions in other Danish companiesMember of the Boards of Coloplast A/S*, VKR Holding A/S, VILLUM FONDEN and Maj Invest Holding A/S (and two fully owned subsidiaries).
Jørgen Tang-Jensen participated in all but one Board and Audit Committee meetings during 2019.
René Binder Rasmussen District Manager, ROCKWOOL NordicsElected to the Board: 2018
René Binder Rasmussen participated in all Board meetings during 2019.
Connie Enghus Theisen Director Stakeholder Engagement, ROCKWOOL International A/SElected to the Board: 2006
Other positions Member of the Advisory Committee of AktivPLUS, Germany.
Connie Enghus Theisen participated in all Board meetings during 2019.
Christian Westerberg Design Manager, ROCKWOOL International A/SElected to the Board: 2018
Other positions related to the company Member of the Board of the ROCKWOOL Foundation.
Christian Westerberg participated in all Board meetings during 2019.
* Listed companies
For further information about independence and competencies of the board members, please refer to www.rockwoolgroup.com.
53ROCKWOOL Group Annual Report 2019
Overview Business updates Financial performanceMarket review/outlook Financial statements

Group ManagementGroupManagement(fromLtoR):JensBirgersson, Henrik Frank Nielsen, Volker Christmann,KimJungeAndersen,CamillaGrönholm, Gilles Maria, Mirella Vitale, ThomasKähler,BjørnRiciAndersen.
54ROCKWOOL Group Annual Report 2019
Overview Business updates Financial performanceMarket review/outlook Financial statements

Jens Birgersson President and Chief Executive Officer (CEO)
Member of the Registered Directors (in Danish: Direktionen).
Member of Group Management: 2015
Other positionsChairman of the Board of Randers Reb International A/S, Denmark and member of the Board of dormakaba Group, Switzerland.
Kim Junge AndersenSenior Vice President, Chief Financial Officer (CFO)
Member of the Registered Directors (in Danish: Direktionen).
Member of Group Management: 2016
Other positionsMember of the Board of FORCE Technology, Denmark.
Bjørn Rici Andersen Senior Vice President, Group Operations & Technology
Member of Group Management: 2018
Volker ChristmannSenior Vice President, Head of Insulation Central Europe
Member of Group Management: 2015
Other positions related to the company Member of the Board of the ROCKWOOL Foundation.
Other positionsVice President, FMI Fachverband Mineralwolleindustrie e.V., Germany (association of mineral wool industry). Member of the Board of FIW Forschungsinstitut für Wärmeschutz, Germany (research institute for thermal protection). Vice President of BUVEG Bundesverband energieeffiziente Gebäudehülle e.V., Germany (federal association of energy-efficient building envelope). Member of the Board of H+H International A/S, Denmark.
Camilla GrönholmSenior Vice President, Group Human Resources
Member of Group Management: 2012
Thomas KählerSenior Vice President, Head of Systems Division
Member of Group Management: 2015
Other positions related to the company Member of the Board of Directors and the Kähler Family Meeting.
Other positionsMember of the Advisory Board of Kraka, Denmark.
Gilles Maria Senior Vice President, Head of Insulation South West Europe and Insulation Asia
Member of Group Management: 2007
Henrik Frank NielsenSenior Vice President, Head of Insulation North East Europe & Russia
Member of Group Management: 2007
Other positionsChairman of the Board of Betterhome ApS, Denmark.
Mirella VitaleSenior Vice President, Group Marketing, Communications and Public Affairs
Member of Group Management: 2016
Other positionsMember of the Board, CLEAN.
55ROCKWOOL Group Annual Report 2019
Overview Business updates Financial performanceMarket review/outlook Financial statements

ROCKWOOL B OMX C25 Euro 600 Constructions & Materials
2500
2000
1500
1000
500
3000
01/01 2019
01/02 2019
01/03 2019
01/04 2019
01/05 2019
01/06 2019
01/07 2019
01/08 2019
01/09 2019
01/10 2019
01/11 2019
01/12 2019
Shareholder informationROCKWOOL sharesROCKWOOL International A/S is listed on NASDAQ Copenhagen in two share classes; ROCKWOOL A and ROCKWOOL B. Each A share carries 10 votes, while each B share carries one vote.
Both the A and B shares are included in the NASDAQ OMX Large Cap and the B share is a part of NASDAQ OMX C25. In addition to NASDAQ Copenhagen, the company’s shares are traded on several other equity exchanges, e.g. Bats, Turquoise and CHI-X.
In 2019, the ROCKWOOL B share price decreased by seven percent. The ROCKWOOL A share increased by one percent.
Trading of sharesBy the end of 2019, both shares had decreased in price by an average of three percent, compared to the end of 2018. That compares with a 23 percent increase in the benchmark index ‘STOXX® Europe 600 Construction & Materials’ and a 26 per-cent increase in the Danish OMX C25 index during 2019.
The official share price at 31 December 2019 was DKK 1,585 (B-share) and 1,439 (A-share). The combined market capitalisation at the end of the year was DKK 33,072 million.
The ROCKWOOL Foundation (23%)
Own shares (0.3%)Private investors with less than 5% (45%) Institutional investors with less than 5% (26%)
Other shareholders with more than 5% (6%)
The ROCKWOOL Foundation (28%)Private investors with less than 5% (49%)
Institutional investors with less than 5% (6%)
Other shareholders with more than 5% (17%)
Votes per shareholder category (%)
Ownership per shareholder category (%)
Share price development 2019(DKK)
56ROCKWOOL Group Annual Report 2019
Overview Business updates Financial performanceMarket review/outlook Financial statements

DistributionIt is ROCKWOOL International A/S’s policy to pay out a stable dividend that is at least one-third of the net profit after tax. The intention is that the net debt should be maximum of one time the EBITDA, with due regard to the company’s long-term financing requirements.
After assessing the outlook for the economic cycle, investment plans, and structural business opportunities, and considering the dividend policy, the company can further decide to initiate share buy-backs to adjust the capital structure.
At the Annual General Meeting on 1 April 2020, the Board of Directors will propose a dividend of DKK 32.00 per share for the financial year 2019 (2018: DKK 29.90). This is equal to one-third of the net profit after tax for 2019, and will be paid out in DKK. The dividend payment occurs three banking days after the Annual General Meeting.
Further, the company will on 6 February 2020 initiate a share buy-back programme up to an amount of EUR 80 million, to be completed within the following 12 months, remaining within the authority granted by the Annual General Meeting to purchase up to 10 percent of the shares and assuming that this mandate will be extended at the Annual General Meeting on 1 April 2020. The shares will be purchased in accordance with the Safe Harbour Regulation and will cover both A-shares and B-shares. At the Annual General Meeting in 2021, the Board of Directors will propose that the shares purchased under this programme be cancelled.
2019 2019 2018 2017 2016 2015
(EUR) DKK DKK DKK DKK DKK
Stock market informationEarnings per share 13 97 91 73 57 31Dividend per share 4.3 32.0 29.9 24.1 18.8 11.5Cash flow per share 18 136 140 114 112 103Book value per share 96 720 638 569 518 463Share capital (million) 29 220 220 220 220 220Price per A share 193 1,439 1,430 1,594 1,192 944Price per B share 212 1,585 1,697 1,752 1,247 963Market cap (million) 4,426 33,072 34,168 36,367 26,449 20,580Number of own shares 72,894 72,894 75,865 206,840 275,855 391,835Number of A shares of DKK 10 (10 votes) 11,231,627 11,231,627 11,231,627 11,231,627 11,231,627 11,231,627Number of B shares of DKK 10 (1 vote) 10,743,296 10,743,296 10,743,296 10,743,296 10,743,296 10,743,296
Share data at a glance
Share class A BIndex OMX Large Cap OMX C25/Large CapSector Building materials Building materialsISIN code DK0010219070 DK0010219153Short code ROCK A ROCK BNominal size DKK10 DKK10Number of shares 11,231,627 10,743,296Voting rights per share 10 1Share price year-end DKK 1,439 DKK 1,585Proposed dividend per share DKK 32.00 DKK 32.00Payout ratio of net profit after tax 33% 33%
This share buy-back programme is in addition to the com-pany’s regular share purchase to cover for the Restricted Share Unit incentive scheme for Group Management and senior executives.
OwnershipThe company had 24,520 registered shareholders on 31 December 2019. By the end of 2019, 18 percent of the shares were owned by shareholder deposits located outside Denmark. In terms of voting capital, six percent was located outside Denmark. See p. 56 for an overview of ownership.
57ROCKWOOL Group Annual Report 2019
Overview Business updates Financial performanceMarket review/outlook Financial statements

Financial Calendar 2020
5 February Annual Report for 2019
1 April Annual General Meeting
13 May Reportonthefirstquarter of 2020
20 August Reportonthefirsthalf-year of 2020
25 NovemberReportonthefirstnine months of 2020
ROCKWOOL Group Annual Report 2019 58
Overview Business updates Financial performanceMarket review/outlook Financial statements

Investor Relations activitiesAs a listed company, ROCKWOOL International A/S has a defined policy for its activities related to ROCKWOOL shares. The aim is to:– Ensure that the capital market has
an accurate picture of the earnings potential of ROCKWOOL shares by communicating relevant, correct, balanced, and timely information;
– Ensure that the company complies with all relevant rules and regulations as laid out in the NASDAQ Copenhagen Rules for issuers of shares, as well as applica-ble Danish legislation for publicly-listed companies;
– Ensure fair and transparent rules for the trading of ROCKWOOL shares by the company itself and by persons considered to be ‘insiders’;
– Communicate ROCKWOOL Group values so the capital market perception is of an honest, accessible, reliable, and responsible company;
– Maintain broad coverage by both do-mestic and foreign equity analysts;
– Remain committed to being knowledge-able, responsive and proactive in our investor communication to maintain a fair balance between expectations and performance.
Shareholders can communicate with and receive information from ROCKWOOL International A/S through various channels:– The shareholder portal where one can
view shareholdings; register or change whether one wishes to receive the invitation to the Annual General Meet-ing electronically or by letter; order admission cards to the Annual General Meeting;
– The Annual General Meeting;– Financial communication, such as
investor audio casts, presentations and stock exchange releases;
– Regular environment, social and corporate governance (ESG) conference calls.
Our website provides general information on ROCKWOOL Group, the performance of ROCKWOOL Group shares, news from the company, financial calendar and much more. A free service allows subscribers to receive instant e-mail alerts when the company publishes new information.
Announcements to NASDAQ Copenhagen in 2019 can be found on: www.rockwoolgroup.com/investors/stock-exchange-announcements/.
The Investor Relations team can be contacted at: [email protected].
For a list of shareholders holding more than five percent of the share capital or the votes, please refer to p. 129.
Investment banks following the ROCKWOOL shares:ABG Sundal CollierBarclaysCarnegieDanske EquitiesExane BNP ParibasHandelsbankenHSBCJyske MarketsMorgan StanleyNordeaSEBSydbank
Analysts’ contact details, recommenda-tions and consensus can be found on the investor website: www.rockwoolgroup.com/investors/.
Annual General MeetingThe upcoming Annual General Meeting will take place on 1 April 2020 and is host-ed in Roskilde, Denmark. The meeting can be followed live on our website or viewed after the meeting has taken place.
The agenda will be distributed 3-5 weeks prior to the meeting to shareholders who have registered their choice of either electronic or printed communication at
our shareholder portal. The agenda will be published on our website.
The agenda will include:1. The Board of Directors’ report on the
company’s activities during the past financial year;
2. Presentation of the Annual Report 2019 with the auditors’ report;
3. Adoption of the Annual Report and discharge of liability for Group Manage-ment and the Board of Directors;
4. Approval of Board of Directors’ remuneration;
5. Allocation of profits or cover of losses according to the adopted accounts;
6. Election of members to the Board of Directors;
7. Appointment of auditors;8. Proposals, if any, by the Board of
Directors or shareholders.
Shares must be registered by name in order to vote. Shareholders can submit proposals to the Board of Directors for the agenda six weeks prior to the general meeting.
59ROCKWOOL Group Annual Report 2019
Overview Business updates Financial performanceMarket review/outlook Financial statements

Financial performanceSales growth of 2.2 percent in a volatile market with strong profitability achieving an EBIT margin of 13.5 percent. Especially Systems segment showed strong performance in 2019.
Group performanceIn 2019, ROCKWOOL Group was faced with continued mixed market conditions across countries and businesses. Overall, positive market conditions were seen in the con-struction sector although global growth flattened. Both residential and non-residential segments in the construc-tion market were affected, especially in the German and Eastern European markets. In contrast, infrastructure and renovation markets showed stronger growth supported by energy efficiency initiatives that increased demand for our non-combustible insulation products.
Net sales reached EUR 2,757 million, a growth of 2.2 percent in local currencies, which is in line with the latest announced expectation. Foreign exchange rates had a positive impact of 1.0 percentage point on net sales, pri-
Net sales developmentGrowth EURm
Net sales 2018 2,671Growth in local currencies 2.2% 59Currency translation adjustment 1.0% 27Net sales 2019 3.2% 2,757
marily due to the U.S. dollar and Russian rouble, resulting in sales growth of 3.2 percent in reported figures for 2019.
The year started with higher sales growth within the Insula-tion segment in Western Europe and in Systems segment, but in the latter part of the year, market conditions in the Insulation segment weakened especially in Germany, Asia and Eastern Europe except Russia.
As sales slowed down after first quarter, we aligned capacity at our factories to match the slower market demand and thereby preserved or even improved productivity at our factories.
Sales price development, product mix and lately input costs on raw materials were favourable in 2019, while infla-tion on logistic costs remained high. Due to high pressure on the factories last year, 2019 was a year with increased maintenance activities.
Compared to the outlook announced in the Annual Report 2018, sales growth slowed down more than expected, while the earnings level exceeded expectations due to factors explained above.
Regional sales developmentSales in Western Europe reached EUR 1,659 million, an increase of 4.5 percent in local currencies and 4.6 percent in reported figures. We achieved growth in many key markets, where especially the United Kingdom and France performed well due to increased demand for non-combustible insulation products and energy efficiency incentives driving an increase in renovation while net sales in Germany declined from a record high level in 2018.
EBIT developmentGrowth EURm Margin
EBIT 2018 341 12.8%Increased earnings from operations 7.6% 25 0.7%Currency translation adjustment 1.5% 6 -EBIT 2019 9.1% 372 13.5%
Sales in Eastern Europe reached EUR 494 million, down 4.9 percent in local currencies and 3.8 percent in reported figures. Russia performed well but sales in most of the other countries in the region decreased due to slow down in the industrial segment and increased competition in several markets in the region.
In the rest of the world, sales reached EUR 604 million, a growth of 2.2 percent in local currencies, while reported growth was 5.6 percent due to positive currency impact from the U.S. dollar. North America performed well, while key markets in Asia declined mainly due to general economic circumstances in the region and thereby fewer projects.
Group profitabilityIn 2019, sales price increases were introduced in markets where business demands and conditions allowed this. The sales price increases counterbalanced the negative impact from the increase in input and logistic costs including higher costs for warehouses during 2019. In Q4, we saw a positive effect from lower input costs on raw materials.
60ROCKWOOL Group Annual Report 2019
Overview Business updates Financial performanceMarket review/outlook Financial statements

60
80
100
120
40
12.0%11.7%
2.1%4.2%
6.2%
2019 2018
800
600
700
500
400 Q1 Q2 Q3 Q4
13.2%14.0%14.1%
11.6%
2019 2018
Q1 Q2 Q3 Q4
14.7%
12.9%
14.1%13.1% 10.3%0.7%
13.6%
Quarterly sales & sales growth (reported) (EURm)
EBIT & EBIT margin(EURm)
Operational efficiency improved as we continued prioritisation of cost savings activities during the year. This entailed a focus on driving efficiency, while still investing in new competencies, digitalisation and growth initiatives, which helped to deliver improved profitability for the Group.
Compared to 2018, Group profitability was negatively impacted by pre-start-up costs for the new factories in Germany, Romania and the United States amounting to around EUR 12 million.
EBITDA increased eight percent to EUR 548 million with an EBITDA margin of 19.9 percent, an improvement compared to 2018 of 0.9 percentage points. EBITDA was positively impacted by a settlement of a legal case in Rockfon North America of EUR 10 million in April 2019 and by the accounting reclassification from the new IFRS 16 lease standard of EUR 18 million. Like-for-like, the EBITDA margin decreased 0.2 percentage points primarily due to the pre-start-up costs.
In 2019 depreciation amounted to EUR 176 million, an increase of EUR 10 million compared 2018 due to investments in new capacity and digital solutions and the reclassification of lease costs from IFRS 16.
EBIT improved significantly and reached a high of EUR 372 million, resulting in an EBIT margin of 13.5 percent. This was in line with the trend during the year and at the top of the latest guidance, however with an improved impact from lower inflation on input costs.
Compared to the outlook announced in February 2019, EBIT margin ended better due to fewer operational constraints, pricing improvements and the settlement of a legal case in Rockfon North America of EUR 10 million.
Net financial costs amounted to EUR 5 million, a decrease of EUR 2 million compared to 2018. The decrease is mainly related to unrealised currency fluctuations and less impact from changes in fair value of phantom shares. During 2019, the level of borrowing and interest costs stayed low as the Group remained cash positive.
Tax for the year amounted to EUR 82 million compared to EUR 70 million in 2018. The effective tax rate increased to 22.4 percent (2018: 21.0 percent) mainly due to higher withholding taxes on dividends and lower adjustments to tax assets.
Profit after tax for the Group totalled EUR 285 million, an improvement of EUR 20 million and is considered a satisfactory result for the year.
Profit after tax in the parent company totalled EUR 274 million, a decrease of EUR 13 million mainly due to higher tax for the year.
Strongprofitabilitydue to pricing acumen and factory performance
61ROCKWOOL Group Annual Report 2019
Overview Business updates Financial performanceMarket review/outlook Financial statements

292
2019 2018
16
18
Q1 Q2 Q3 Q4
24
20
22
23
2122
19
22 2222
14
23
2019 2018
200
100
0Q1 Q2 Q3 Q4
500
400
300222
400
14189
172
4878
Return on invested capital (ROIC)(%)
Acc. investments excl. acquisitions(EURm)
Cash flow and investmentsAt the end of 2019, the Group had a net cash positive po-sition, amounting to EUR 269 million, down EUR 111 million as higher investments consumed more cash in 2019. In addition, the Group had unused committed credit facilities of EUR 428 million by year-end.
Cash flow from operating activities was EUR 402 million against EUR 408 million in 2018, showing a stable inflow of cash from the operation. The cash flow was positively impacted by higher operating profit while the negative change in net working capital was higher compared to 2018. The tax payments increased significantly due to increased withholding tax payments and an overall im-proved earnings structure.
Net working capital over annualised net sales was 9.0 percent, a increase of 1.6 percentage points from 2018 (7.4 percent). Net working capital amounted to EUR 247 million compared to EUR 198 million in 2018. The increase mainly stems from a lower level of payables from reduced production activity over the holiday period and timing in payments, which more than offset the positive impact from inventory and trade receivables.
Capital expenditure reached EUR 400 million in line with our latest expectation, which is an increase of EUR 178 mil-lion compared to 2018 excluding acquisitions and the sale of listed securities in Flumroc amounting to EUR 18 million in 2018. The largest individual investments in 2019 relate to ongoing factory projects in the United States (West Virginia) and Romania as well as the expansion in Germany. The new Romanian factory is now operational and running as expected.
Free cash flow amounted to EUR 2 million, a decrease of EUR 194 million compared to 2018, primarily due to higher investments and higher tax payments.
Cash flow from financing activities ended at negative EUR 120 million, an increased negative impact of EUR 66 million, stemming from increased dividends, a low level of sale of own shares and the new lease instalments from IFRS 16.
Invested capitalReturn on invested capital decreased slightly in 2019, mainly due to higher investments and right-of-use assets from the new IFRS 16 lease standard, reaching 21.7 per-cent compared to 22.8 percent in 2018. Invested capital amounted to EUR 1,889 million compared to EUR 1,542 million in 2018.
At the end of 2019, total assets were EUR 2,694 million, an increase of EUR 263 million compared to 2018.
EquityEquity of the Group totalled EUR 2,118 million as of 31 December 2019 compared to EUR 1,877 million in 2018, corresponding to an equity ratio of 78 percent. Equity was mainly affected by the profit for the year, dividend and exchange rate adjustments.
The proposed dividend for 2019 is DKK 32.00 per share, up DKK 2.10 per share compared to 2018.
62ROCKWOOL Group Annual Report 2019
Overview Business updates Financial performanceMarket review/outlook Financial statements

Business segmentsSales in the Insulation segment reached EUR 2,077 million, which is a slight decrease of 0.3 percent in local currencies but an increase of 0.6 percent in reported currencies. The sales decrease came from the building insulation busi-ness in Eastern Europe and Asia and was partly offset by an increase in Western Europe and the sandwich panel business.
The Insulation segment’s EBIT reached EUR 269 million with an EBIT margin of 11.3 percent, stable compared to 2018 as operational efficiency compensated the pre-start-up costs for the new factories in Germany, Romania and the United States.
The Systems segment’s sales amounted to EUR 680 mil-lion, which is an increase of 10.5 percent in local currencies and 12.1 percent in reported figures. The growth was driven by all business areas within Systems segment, and especially Grodan performed well.
The Systems segment generated an EBIT of EUR 103 million with an EBIT margin of 15.1 percent, up 2.7 per-centage points compared to 2018. Excluding the positive impact from the Rockfon North America legal case settle-ment, EBIT margin was 13.7 percent, up 1.3 percentage points, with all business units contributing positively.
Key figures Insulation segmentEURm Q4 2019 Q4 2018 FY 2019 FY 2018External net sales 517 529 2,077 2,065EBIT 70 63 269 266EBIT margin 11.5% 10.4% 11.3% 11.5%
Key figures Systems segmentEURm Q4 2019 Q4 2018 FY 2019 FY 2018External net sales 198 180 680 606EBIT 24 20 103 75EBIT margin 12.0% 11.1% 15.1% 12.4%
63ROCKWOOL Group Annual Report 2019
Overview Business updates Financial performanceMarket review/outlook Financial statements

2019 2018
EURm Q1 Q2 Q3 Q4 Q1 Q2 Q3 Q4
Income statementNet sales 641 695 706 715 603 667 692 709
Operating income 644 705 707 717 605 667 693 717
Raw material and production material costs 203 238 240 248 198 223 237 251Delivery costs and indirect costs 92 100 95 94 82 95 98 110Other external costs 61 52 55 50 57 56 59 60Personnel costs 168 171 175 183 156 161 161 171
Operating costs 524 561 565 575 493 535 555 592
EBITDA 120 144 142 142 112 132 138 125Depreciation, amortisation and write-downs 43 42 43 48 42 41 41 42
EBIT 77 102 99 94 70 91 97 83
Income from investments in associated companies 0 0 0 0 0 0 0 1Financial items -4 -2 -2 3 -1 -5 -2 1
Profit before tax 73 100 97 97 69 86 95 85
Tax on profit for the period 16 21 20 25 15 17 19 19
Profit for the period 57 79 77 72 54 69 76 66
EBITDA margin 18.8% 20.7% 20.1% 19.9% 18.6% 19.9% 19.8% 17.6%
EBIT margin 12.0% 14.7% 14.1% 13.2% 11.6% 13.6% 14.0% 11.7%
Statement of comprehensive incomeProfit for the period 57 79 77 72 54 69 76 66Exchange rate adjustments of foreign subsidiaries 35 -1 20 -1 -16 3 2 -11Change in pension obligation - - - -10 - - - 1Hedging instruments, value adjustments 0 0 0 -3 1 1 0 -2Tax on comprehensive income 0 0 0 4 0 0 0 1
Total comprehensive income 92 78 97 62 39 73 78 55
Global sales developmentIn Q4 2019, ROCKWOOL Group generated sales of EUR 715 million, a decrease of 0.6 percent in local currencies compared to Q4 2018. Foreign exchange rates had a positive impact of 1.3 percentage points, mainly derived from the strengthened Russian rouble, British pound and Canadian dollar. This brings the sales growth to 0.7 percent in reported figures.
Increase in sales prices across the businesses had together with product mix a positive impact on growth during the quarter. The general market development in the Insulation segment was difficult with mixed market conditions across countries and businesses. Systems segment ended the year with record high sales and profit.
Regional sales developmentWestern Europe saw growth of 0.2 percent in local currencies in Q4 2019 compared to Q4 2018, as net sales in the quarter ended at EUR 422 million. The German market was under pressure with a general slow down in the economy. We con-tinued strong performance in France and the United Kingdom driven by focus on energy efficiency and fire safety.
In Q4 2019, net sales in Eastern Europe decreased to EUR 131 million, a decrease of 8.2 percent in local currencies, while re-ported figures decreased 5.3 percent compared to Q4 2018. Most countries in the region, except Russia, decreased caused by a lack of large industrial projects.
Sales in North America, Asia and other countries reached EUR 162 million in Q4 2019, equal to a growth of 4.5 percent in lo-cal currencies compared to Q4 2018. In reported figures, sales in Q4 2019 grew 7.2 percent. Net sales in North America was moderate in the Insulation segment, while Systems segment performed very well in the quarter.
Quarterly follow-up
64ROCKWOOL Group Annual Report 2019
Overview Business updates Financial performanceMarket review/outlook Financial statements

Group profitabilityEBITDA in Q4 2019 reached EUR 142 million, a growth of 13.6 percent with an EBITDA margin of 19.9 percent compared to 17.6 percent in Q4 2018. The improvement was mainly driven by higher sales prices, lower input costs and higher growth in Systems segment.
EBIT in Q4 2019 reached EUR 94 million, a growth of 12.9 percent compared to Q4 2018. EBIT margin ended at 13.2 percent, 1.5 percentage points above Q4 2018. We maintained close attention to market conditions, adjusting capacity as needed to sustain good productivity.
Business segmentsExternal sales in Q4 2019 in Insulation segment amount-ed to EUR 517 million, a decrease of 3.5 percent in local currencies (2.3 percent in reported figures) compared to Q4 2018, due to the difficult markets in Eastern Europe and Asia. Also the sandwich panel business had a slow quarter.
EBIT in Insulation segment reached EUR 70 million equal to an EBIT margin of 11.5 percent, up 1.1 percentage points compared to Q4 2018, driven by pricing and operational effeciency.
Systems segment presented a strong Q4 2019, which con-tributed to record high net sales and EBIT for the full year. Quarterly net sales reached EUR 198 million, an increase in local currency of 8.0 percent (9.6 percent in reported figures) compared to Q4 2018.
EBIT in Systems segment reached EUR 24 million in Q4 2019, an increase of 22 percent and an EBIT margin of 12.0 percent compared to 11.1 percent in Q4 2018.
Quarterly follow-up
2019 2018
EURm Q1 Q2 Q3 Q4 Q1 Q2 Q3 Q4
Cash flow statementEBIT 77 102 99 94 70 91 97 83Adjustments for depreciation, amortisation and write-downs 43 42 42 49 42 41 41 42Other adjustments 0 1 3 2 2 5 2 -16Change in net working capital -88 -18 72 -5 -79 -25 39 43
Cash flow from operations before financial items and tax 32 127 216 140 35 112 179 152
Cash flow from operating activities -6 110 193 105 -2 101 162 147
Cash flow from investing activities and acquisitions -78 -94 -120 -108 -33 -38 -52 -89Cash flow from operating and investing activities (free cash flow) -84 16 73 -3 -35 63 110 58
Cash flow from financing activities -6 -94 3 -23 2 -67 4 7
Change in cash available -90 -78 76 -26 -33 -4 114 65
Segment reportingInsulation segment:External net sales 486 533 541 517 468 520 548 529Internal net sales 65 68 79 92 55 62 61 84EBIT 55 67 77 70 55 70 78 63EBIT margin 10.0% 11.2% 12.4% 11.5% 10.5% 12.0% 12.8% 10.4%
Systems segment:External net sales 155 162 165 198 135 147 144 180EBIT 22 34 23 24 15 21 19 20EBIT margin 14.0% 21.2% 14.0% 12.0% 11.4% 13.9% 13.1% 11.1%
Geographical split of external net sales:Western Europe 396 423 418 422 366 397 403 420Eastern Europe including Russia 103 124 136 131 101 126 148 139North America, Asia and others 142 148 152 162 136 144 141 150
Total external net sales 641 695 706 715 603 667 692 709
65ROCKWOOL Group Annual Report 2019
Overview Business updates Financial performanceMarket review/outlook Financial statements

ROCKWOOL Group Annual Report 2019 66
Overview Market review/outlook Business updates Financial statementsFinancial performance

Consolidatedfinancialstatements
68 Income statement and Statement of comprehensive income
69 Balance sheet – Assets
69 Balance sheet – Equity and liabilities
70 Cashflowstatement
71 Statement of changes in equity
73 Notes
67Consolidatedfinancialstatements
Overview Market review/outlook Business updates Financial performance Financial statements

Income statement1January–31December
EURm Note 2019 2018
Net sales 1.1 2,757 2,671Other operating income 1.2 16 11Operating income 2,773 2,682Raw material costs and production material costs 929 909Delivery costs and indirect costs 381 385Other external costs 218 232Personnel costs 1.3 697 649Operating costs 2,225 2,175EBITDA 548 507Depreciation, amortisation and write-downs 2.4, 2.5 176 166EBIT 372 341Income from investments in associated companies 0 1Financial income 4.1 5 5Financial expenses 4.1 10 12Profit before tax 367 335Tax on profit for the year 5.1 82 70Profit for the year 285 265
Attributable to:Non-controlling interests 0 0Shareholders of ROCKWOOL International A/S 285 265
285 265
Earnings per share of DKK 10 (EUR 1.3) 4.6 13.01 12.14Earnings per share of DKK 10 (EUR 1.3), diluted 4.6 12.98 12.09
Statement of comprehensive income1January–31December
EURm Note 2019 2018Profit for the year 285 265Items that will not be reclassified to the income statement:Actuarial gains and losses of pension obligations 2.6 -10 1Tax on other comprehensive income 3 1
Items that may be subsequently reclassified to the income statement:Exchange rate adjustments of foreign subsidiaries 53 -22Hedging instruments, value adjustments -3 0Tax on other comprehensive income 1 -0Total other comprehensive income 44 -20Comprehensive income for the year 329 245
Attributable to:Non-controlling interests 0 0Shareholders of ROCKWOOL International A/S 329 245
329 245
68Consolidated financial statements
Overview Business updates Financial performanceMarket review/outlook Financial statements

Balance sheet – AssetsAs at 31 December
EURm Note 2019 2018Goodwill 97 95Software 13 13Customer relationships 43 49Other intangible assets 21 19Intangible assets under construction 18 13Total intangible assets 2.1 192 189Buildings and sites 643 608Plant and machinery 444 444Other operating equipment 20 15Prepayments and tangible assets under construction 399 160Total tangible assets 2.2 1,506 1,227Right-of-use assets 2.3 52 -Shares in associated companies 6 5Long-term deposits and receivables 15 1Deferred tax assets 5.3 54 46Total financial assets 75 52Non-current assets 1,825 1,468
Inventories 3.1 236 238Trade receivables 3.2, 4.2 275 274Other receivables 4.2 54 42Prepayments 15 18Income tax receivable 5.2 14 5Cash 4.2, 4.3 275 386Current assets 869 963
Total assets 2,694 2,431
Balance sheet – Equity and liabilitiesAs at 31 December
EURm Note 2019 2018Share capital 4.5 29 29Foreign currency translation -104 -157Proposed dividend 94 88Retained earnings 2,096 1,912Hedging -1 1Equity attributable to shareholders of ROCKWOOL International A/S 2,114 1,873Non-controlling interests 4 4Total equity 2,118 1,877
Deferred tax liabilities 5.3 43 51Pension obligations 2.6 62 53Lease liabilities 2.3 34 -Provisions 2.7 17 15Bank loans and other loans 4.2 4 2Non-current liabilities 160 121
Short-term portion of bank loans and other loans 4.2 1 3Bank debt 4.2, 4.3 6 6Trade payables 4.2 196 209Lease liabilities 2.3 18 -Provisions 2.7 9 7Income tax payable 5.2 29 34Other payables 4.2 157 174Current liabilities 416 433Total liabilities 576 554
Total equity and liabilities 2,694 2,431
69Consolidated financial statements
Overview Business updates Financial performanceMarket review/outlook Financial statements

Cash flow statement
Accounting policies
The consolidated cash flow statement is compiled using the indirect method on the basis of EBIT. The cash flow statement shows flows from operating, investing and financing activities for the year, as well as cash and cash equivalents at the beginning and at the end of the year.
Cash flows from operating activities comprises operating profit before financial items adjusted for non-cash items and changes in working capital. Cash flows from investing activities comprise payments relating to acquisition and sale of companies, intangible and tangible assets and other asset investments.
Cash flows from financing activities comprise proceeds from borrow-ings, repayment of lease liabilities, instalments of debt, payment of dividends, payments and proceeds for sale of own shares, trans-actions with non-controlling interests and increases of the share capital.
Cash available includes cash less short-term bank debt.
EURm Note 2019 2018EBIT 372 341Adjustments for depreciation, amortisation and write-downs 2.4 176 166Adjustments of non-cash operating items 3.3 6 -7Changes in net working capital 3.3 -39 -22Cash flow from operations before financial items and tax 515 478Finance income etc. received 5 5Finance costs etc. paid -5 -12Taxes paid -113 -63Cash flow from operating activities 402 408Payments for tangible assets -379 -204Proceeds from sale of tangible assets 0 1Payments for intangible assets -21 -19Proceeds from sale of listed equities - 18Acquisition and additions of subsidiaries and associated companies - -8Cash flow from investing activities -400 -212Cash flow from operating and investing activities (free cash flow) 2 196Dividend paid -87 -70Dividend paid to non-controlling interests -0 -0Payments for own shares -2 -3Proceeds from sale of own shares 0 23Transactions with non-controlling interests - -3Instalments of lease liabilities 2.3 -17 -Increase in non-current receivables -14 0Proceeds from borrowings 4 -Instalments of non-current debt -4 -1Cash flow from financing activities -120 -54Changes in cash available -118 142Cash available 1/1 380 243Exchange rate adjustments 7 -5Cash available 31/12 4.3 269 380Unutilised, committed credit facilities 31/12 428 428
Individual items in the cash flow statement cannot be directly deduced from the consolidated balance sheet.
70Consolidated financial statements
Overview Business updates Financial performanceMarket review/outlook Financial statements

Statement of changes in equity
Accounting policies
Dividend is included as a liability at the time of adoption by the Annual General Meeting. Dividend that is expected to be paid for the year is shown separately in the equity.
Sale and purchase of, as well as dividends on own shares are recognised under retained earnings in the equity. The reserve for foreign currency translation consists of exchange rate differences that occur when translating the foreign subsidiaries’ financial statements from their functional currency into EUR.
Hedging adjustments comprise changes in the fair value of hedging transactions that qualify for recognition as cash flow hedges and where the hedged transaction has not yet been realised.
Non-controlling interests Non-controlling interests are recognised at the minority’s share of the net assets. The difference between the costs and the non-controlling interests’ share of the total carrying amount including goodwill is transferred from the minority interests’ share of the equity to the equity belonging to the shareholders of ROCKWOOL International A/S.
Shareholders of ROCKWOOL International A/S
EURmShare
capital
Foreign currency
translationProposed dividend
Retained earnings Hedging Total
Non-controlling
interestsTotal
equity
Equity 1/1 2019 29 -157 88 1,912 1 1,873 4 1,877Profit for the year - - 94 191 - 285 0 285Other comprehensive income - 53 - -7 -2 44 0 44Comprehensive income for the year - 53 94 184 -2 329 0 329Sale and purchase of own shares - - - -2 - -2 - -2Expensed value of RSUs issued - - - 1 - 1 - 1Dividend paid to the shareholders - - -88 1 - -87 0 -87Equity 31/12 2019 29 -104 94 2,096 -1 2,114 4 2,118
Equity 1/1 2018 29 -135 71 1,711 1 1,677 7 1,684Profit for the year - - 88 177 - 265 0 265Other comprehensive income - -22 - 2 -0 -20 0 -20Comprehensive income for the year - -22 88 179 -0 245 0 245Sale and purchase of own shares - - - 20 - 20 - 20Expensed value of RSUs issued - - - 1 - 1 - 1Transactions non-controlling interests - - - - - - -3 -3Dividend paid to the shareholders - - -71 1 - -70 -0 -70Equity 31/12 2018 29 -157 88 1,912 1 1,873 4 1,877
71Consolidated financial statements
Overview Business updates Financial performanceMarket review/outlook Financial statements

72Consolidatedfinancialstatements
Financial statementsFinancial performanceBusiness updatesMarket review/outlookOverview

Notescontent
Note 1Operating profit
1.1 Net sales and segmented accounts 75
1.2 Other operating income 761.3 Personnel costs 771.4 Long-term incentive programmes 77
Note 2Invested capital
2.1 Intangible assets 812.2 Tangible assets 832.3 Right-of-use assets 852.4 Depreciation, amortisation
and write-downs 872.5 Impairment tests 872.6 Pension obligations 892.7 Provisions 92
Note 3Net working capital
3.1 Inventories 943.2 Trade receivables 953.3 Othercashflownotes 96
Note 4Capital structure and financing
4.1 Financial income and Financial expenses 984.2 Financial risks and instruments 994.3 Cash available 1014.4 Own shares 1024.5 Share capital 1024.6 Earnings per share 103
Note 5Other
5.1 Taxonprofitfortheyear 1055.2 Income tax receivable
and payable 1065.3 Deferred taxes 1065.4 Auditor’s fee 1085.5 Commitments and
contingent liabilities 1085.6 Related parties 1095.7 New and changed standards
and general accounting policies 1105.8 Group companies 112
73Consolidatedfinancialstatements
Financial statementsFinancial performanceBusiness updatesMarket review/outlookOverview

Note 1Operating profit
Reported sales growth
+3.2%Average number of FTEs
11,646
1.1 Net sales and segmented accounts 751.2 Other operating income 761.3 Personnel costs 771.4 Long-term incentive programmes 77
Sales per business segment
Insulation Systems
2019
25%
75%
2018
23%
77%
Consolidatedfinancialstatements 74
Overview Market review/outlook Business updates Financial performance Financial statements

Business segments and sales reporting
Insulation segment Systems segment EliminationsROCKWOOL
Group
EURm 2019 2018 2019 2018 2019 2018 2019 2018External net sales 2,077 2,065 680 606 - 2,757 2,671Internal net sales 304 262 - - -304 -262 - -EBIT 269 266 103 75 - - 372 341EBIT margin 11.3% 11.5% 15.1% 12.4% - - 13.5% 12.8%
Financial items and income from associated companies - - - - - - -5 -6
Tax on profit for the year - - - - - - 82 70Profit for the year - - - - - - 285 265Goods transferred at a point in time 2,077 2,065 680 606 - - 2,757 2,671Non-current asset investments 395 233 20 25 - - 415 258
Accounting policies
1.1 Net sales and segmented accounts
Net salesThe Group produces and sells a range of fire resilient stone wool in-sulation products, including solutions for ceiling systems, ventilated facades, friction and water management and stone wool substrate solutions for the professional horticultural. Sales are recognised when control of the products has transferred to the customer, being when the products are delivered to the customer and the risk has been transferred.
The products are often sold with retrospective volume discounts based on aggregate sales over a 12-month period. Revenue from these sales is recognised based on the price specified in the contract, net of the estimated volume discounts. Accumulated experience is used to estimate and provide for the discounts, using the expected value method.
The sales include no element of financing as the sales are made with credit terms of normally 30-60 days consistent with market practice.
A receivable is recognised when the products are delivered as this is the point in time that the consideration is unconditional because only the passage of time is required before the payment is due.
Segmented accountsGroup Management has determined the business segments for the purpose of assessing business performance and allocating resources. Primarily segments are based on products and thermal performance, as Systems segment is primarily defined as non-thermal insulation products. Nearly all external sales consist of sales of products.
Segmental data is stated for business areas and geographical areas. The split by business areas is in accordance with the Group’s internal reporting.
ROCKWOOL Group operates in two business segments based on products: Insulation segment and Systems segment. The information is based on the management structure and internal management reporting to Group Management and constitutes the reportable segments.
Headquarters costs are allocated to the business segments based on allocation keys used in the internal management reporting. These allocation keys are reassessed annually based on planned activity in
Notes
The segmental data is presented according to the same principle as the consolidated financial statements. The segmental EBIT includes net sales and expenditure including non-recurring expenditure operationally related to the segment.
the segments. Intangible and tangible assets and related amortisation/depreciation are not fully allocated to business segments as all stone wool production is done in the Insulation segment. Financial income and expenses, and income taxes are managed at Group level and are not allocated to business segments.
Internal net sales from the Insulation segment to the Systems segment are at arms’ length prices. The Insulation segment includes among others interior building insulation, façade insulation, roof insulation and industrial and technical insulation. The Systems seg-ment includes acoustic ceilings, cladding boards, engineered fibres, noise and vibration control, and horticultural substrates.
In 2019 and in 2018 a write-down of software under construction was recognised affecting both segments. For additional information please refer to note 2.4.
Comments
75Consolidated financial statements
Overview Business updates Financial performanceMarket review/outlook Financial statements

1.1 Net sales and segmented accounts (continued)
Notes
Other operating incomeEURm 2019 2018Other income 16 10Gain/loss from sale of assets 0 1Total 16 11
1.2 Other operating income
Geographical segments
Net salesIntangible and tangible assets
EURm 2019 2018 2019 2018Western Europe 1,659 1,586 770 594Eastern Europe and Russia 494 514 416 367North America, Asia and others 604 571 512 455Total 2,757 2,671 1,698 1,416
The geographical net sales information is based on the location of the customers, while the information regarding the geographical assets distribution is based on the physical placement of the assets.
The domestic sale in Denmark is in the range of 2-3% (2018: 2-3%) of the Group’s net sales. The domestic intangible and tangible assets in Denmark amount to EUR 168 million (2018: EUR 145 million).
No customers exceed 10% of the Group’s net sales neither this year nor last year. In Germany, France and the United States net sales amounts to between 10-20% of the Group’s total net sales in 2019, while only for Germany and France in 2018. In no other country do the net sales exceed 10% of the Group’s total net sales.
Intangible and tangible assets in the United States, Poland and Germany exceed 10% of the Group's total intangible and tangible assets in 2019, while only for the United States and Poland in 2018.
Comments
Comments
Other operating income includes among others received compensation, refunds, and gain/loss from sale of assets.
76Consolidated financial statements
Overview Business updates Financial performanceMarket review/outlook Financial statements

1.3 Personnel costs
Notes
Personnel costsEURm 2019 2018Wages and salaries 590 544Expensed value of RSUs issued 1 2Pension costs 27 28Other social security costs 79 75Total 697 649Average number of employees 11,646 11,416
The above items include to Board of Directors and Group Management:Remuneration to Group Management 6 6Value of RSUs issued or fair value adjusted to Group Management 1 3Pension costs to Group Management 1 1Board of Directors’ remuneration 1 1Total to Board of Directors and Group Management 9 11Hereof remuneration to Registered Directors 3 3Hereof value of RSUs issued or fair value adjusted to Registered Directors 0 3Hereof pension costs to Registered Directors 0 0Total to Registered Directors 3 6
Remuneration of Group Management (key management personnel) complies with the principles of the Group's Remuneration policy.
The variable part of the total remuneration (bonus and restricted share units (RSUs)) is dependent on achievement of individual targets and targets for the Group's financial performance, as approved by the Remuneration committee. The variable annual bonus can give up to 40% of the base remuneration. The long-term incentive programme (RSUs) is set to 20% of the base remuneration for Group Management and 30% for the CEO.
No termination costs is included in the remuneration in neither 2019 nor 2018.
Comments
1.4 Long-term incentive programmes
Two different share-based incentive programmes have been established: A stock option programme and a restricted share programme (RSUs). Both programmes are classified as equity based, as they settle in shares. Due to local rules, a minor part of both programmes are given as phantom shares and is classified as cash-based, as they settle in cash. The programmes are offered to Group Management and other senior executives. The incentive programmes are part of the variable part of the remuneration and follows the Group’s Remuneration policy. Participation in the
Accounting policies programmes are at the Remuneration Committees discretion and no individual has a contractual right to participate or receive any guaranteed benefit.
Stock optionsOn issuing of stock options, the fair value of the options is assessed using the Black & Scholes formula at the time of grant and is recog-nised in personnel costs in the income statement and in equity over the 3-year vesting period.
A part of the stock options are given as phantom shares (cash-based programme) and are adjusted to fair value through financial expenses in the income statement against a related provision.
Restricted Share Units (RSUs)When RSUs are issued, the value of the RSUs at grant date is recog-nised in personnel cost in the income statement and in equity over the 3-year vesting period. On initial recognition of the RSUs, the number of RSUs expected to vest is estimated. Subsequently, the estimate is revised so the total cost recognised is based on the actual number of RSUs vested. The fair value of RSUs is determined based on the quoted share price at grant adjusted for expected dividend payout (based on historic dividend payout ratio). The participants are compensated for any dividend payment by receiving additional RSUs.
A minor part of the RSUs are given as phantom shares (cash-based programme) and are adjusted to fair value through financial expenses in the income statement against a related provision.
77Consolidated financial statements
Overview Business updates Financial performanceMarket review/outlook Financial statements

1.4 Long-term incentive programmes (continued)
Notes
Stock optionsNo stock options have been granted since 2015. The outstanding options are all exercisable and fully vested at the end of the reporting period.
The average share price at exercise in 2019 was EUR 214 (2018: EUR 303).
No stock options have expired in neither 2019 nor 2018.
Comments Stock option programmeStock options outstanding at year-end have the following exercise periods and exercise prices:
Time of grant Exercise periodExercise price
(DKK)
Number of stock options
2019
Number of stock options
2018
2012 01.09.2015 - 31.08.2020 515 7,625 8,250
2013 23.09.2016 - 22.09.2021 900 8,800 8,800
2015 20.03.2018 - 19.03.2023 769 18,500 20,175
34,925 37,225
Of the number of options 2,350 belongs to Registered Directors and 32,575 to other senior executives in 2019. In 2018, 2,350 belonged to Registered Directors and 34,875 to other senior executives.
Development in outstanding stock options2019 2018
Number of stock options
Average exercise price
(EUR)Number of
stock options
Average exercise price
(EUR)
Outstanding stock options 1/1 37,225 100 177,450 102Exercised 2,300 127 140,225 164Outstanding stock options 31/12 34,925 100 37,225 100
78Consolidated financial statements
Overview Business updates Financial performanceMarket review/outlook Financial statements

Restricted Share UnitsRestricted Share Units (RSUs) will be subject to a vesting period of three years. After the vesting period the shares are transferred to the participants without payment, subject to continued employment with ROCKWOOL Group in the vesting period.
The RSUs represent the employees right to shares but do not carry voting rights nor have any tangible value before the RSUs are exer-cised and become actual B shares of ROCKWOOL International A/S. The terms of the share incentive may provide that shares may be settled in cash in which case, the related provision equals the share price at the time of vesting.
The estimated fair value of RSUs granted was EUR 2 million (2018: EUR 2 million) at grant date.
EUR 2 million was expensed in 2019 relating to the RSUs (2018: EUR 2 million), of which EUR 1 million was recognised in personnel costs and EUR 1 million in finance expenses (fair value of phantom shares).
Cash-settled programmesThe cash-settled programmes consists of phantom shares granted during the years 2012-2019.
The employees granted the phantom shares participate on terms and conditions similar to those applying to the share options and the RSUs.
The outstanding stock options from 2012-2015 include 2,350 phantom options (2018: 3,000). The outstanding RSUs from 2017-2019 include 7,652 phantom shares (2018: 8,259).
The total intrinsic value of the phantom stock options/RSUs at year-end amounts to EUR 1 million (2018: EUR 2 million), which is recognised as a liability.
Comments
1.4 Long-term incentive programmes (continued)
Notes
Restricted share units (RSUs)RSUs outstanding at year-end have the following vesting dates:
Time of grant Vesting dateNumber of RSUs 2019
Number of RSUs 2018
2016 08.04.2019 - 13,353
2017 07.04.2020 12,103 12,197
2018 12.04.2021 8,633 8,591
2019 24.05.2022 10,221 -
30,957 34,141Weighted average remaining contractual life of the outstanding RSUs at year-end (Year) 1.2 1.1
Of the number of RSUs 6,659 belong to Registered Directors and 24,298 to other senior executieves. In 2018, 7,273 belonged to Registered Directors and 26,868 to other senior executives.
Development in number of outstanding RSUs2019 2018
Outstanding RSUs 1/1 34,141 26,202Granted 11,018 8,876Vested 13,971 -Forfeited 231 937Outstanding RSUs 31/12 30,957 34,141
The average share price the day following the vesting date was EUR 210.
79Consolidated financial statements
Overview Business updates Financial performanceMarket review/outlook Financial statements

Note 2Invested capital
2.1 Intangible assets 812.2 Tangible assets 832.3 Right-of-use assets 852.4 Depreciation, amortisation
and write-downs 872.5 Impairment tests 872.6 Pension obligations 892.7 Provisions 92
Capital expenditure
400 EURmUp EUR 178 million compared to last year
Consolidatedfinancialstatements 80
Financial statementsFinancial performanceBusiness updatesMarket review/outlookOverview

The costs of research activities are carried as expenditure in the year in which they are incurred. The costs of development projects which are clearly defined and identifiable, and of which the potential tech-nical and commercial exploitation is demonstrated, are capitalised to the extent that they are expected to generate future revenue. Other development costs are recognised on an ongoing basis in the income statement under operating costs.
Intangible assets, apart from goodwill, are stated at cost less accumulated amortisation and write-downs.
Amortisation of the following intangible assets is made on a straight-line basis over the expected future lifetime of the assets, which is:
Development projects: 2-10 yearsPatents: up to 20 yearsSoftware: 2-4 yearsTrademarks: up to 20 yearsCustomer relationships: 10-15 years
Goodwill arisen from acquisition of enterprises and activities is stated at cost. The carrying amount of goodwill is allocated to the Group’s cash-generating units at the acquisition date. Identification of inde-pendent cash-generating units is based on business structure and lev-el of internal control of cash flow. Acquired CO2 rights are capitalised under intangible assets. Granted CO2 rights are not capitalised.
Goodwill is tested annually for impairment and the book value of other assets is reviewed on indications of impairment. When testing for impairment, the value is written down to the estimated net sales price or the value in use, if greater.
Intangible assets under construction are also tested for impairment annually.
Accounting policies Intangible assets
EURm Goodwill Software
Customer relation-
ships
Other intangible
assets
Intangible assets under
construc-tion Total
Cost:Accumulated 1/1 2019 126 72 69 54 21 342Exchange rate adjustments 2 -2 3 1 1 5Additions for the year - 9 - 6 7 22Transfer of assets under construction - 9 8 -8 -9 -Disposals for the year - -3 - -1 - -4Accumulated 31/12 2019 128 85 80 52 20 365
Amortisation and write-downs:Accumulated 1/1 2019 31 59 20 35 8 153Exchange rate adjustments 0 0 2 0 0 2Amortisation for the year - 8 8 3 - 19Write-down for the year - - - - 2 2Transfers - 8 7 -7 -8 -Disposals for the year - -3 - - - -3Accumulated 31/12 2019 31 72 37 31 2 173
Net book value 31/12 2019 97 13 43 21 18 192
During the year R&D costs amounting to EUR 41 million (2018: EUR 38 million) have been expensed.
2.1 Intangible assets
Notes
81Consolidated financial statements
Overview Business updates Financial performanceMarket review/outlook Financial statements

2.1 Intangible assets (continued)
Notes
Goodwill is allocated to cash generating units (CGUs) in Insulation segment at an amount of EUR 41 million (2018: EUR 39 million) and to CGUs in Systems segment at an amount of EUR 56 million (2018: EUR 56 million).
Goodwill has been impairment tested in 2019 and 2018 for the identified CGUs, which for both years have not lead to any value adjustments.
The impairment test of goodwill is based on current and future results for the CGUs to where the results are allocated. Most of the goodwill in the Group is related to the acquisition of Flumroc in 2017, Chicago Metallic in 2013 and CSR in 2010 and they are performing according to plan.
Please refer to note 2.5 for further details.
In 2019 a write-down of EUR 2 million of assets under construction was recognised affecting both segments due to lower benefits and utilisation compared to the original expectation.
In 2018, a write-down of intangible assets under construction was recognised, amounting to EUR 8 million, due to a lower revenue stream compared to the original expectation. The value of the asset was written down to the net present value of future cash flows.
The net book value of other intangible assets includes brands amounting to EUR 11 million (2018: EUR 12 million) and development projects amounting to EUR 1 million (2018: EUR 3 million).
Comments Intangible assets
EURm Goodwill Software
Customer relation-
ships
Other intangible
assets
Intangible assets under
construc-tion Total
Cost:Accumulated 1/1 2018 119 63 65 54 17 318Exchange rate adjustments 4 -0 2 -0 -0 6Additions for the year - 3 - 0 16 19Transfer of assets under construction - 12 - - -12 -Disposals for the year 0 -6 - - - -6Acquisition of subsidiary 3 - 2 -0 - 5Accumulated 31/12 2018 126 72 69 54 21 342
Amortisation and write-downs:Accumulated 1/1 2018 31 59 15 30 - 135Exchange rate adjustments 0 -0 0 0 - -0Amortisation for the year - 6 6 5 - 17Write-down for the year - - - - 8 8Disposals for the year - -6 -1 - - -7Accumulated 31/12 2018 31 59 20 35 8 153
Net book value 31/12 2018 95 13 49 19 13 189
82Consolidated financial statements
Overview Business updates Financial performanceMarket review/outlook Financial statements

2.2 Tangible assets
Notes
Tangible assets are stated at cost less accumulated depreciation and impairment losses. The cost of technical plant and machinery manufactured by the Group comprises the acquisition cost, expend-iture directly related to the acquisition, engineering hours, including indirect production costs and borrowing costs.
Depreciation is carried out on a straight-line basis, based on current assessment of their useful lives and scrap value.
The expected lifetimes are:Buildings: 20-40 yearsPlant and machinery: 5-15 yearsOther operating equipment: 3-10 years
On sale or scrapping of assets, any losses or gains are included under other operating income for the year.
Investment grants are deducted in the cost of the equivalent tangible assets. The investment grants are recognised as income on a straight-line basis over the expected lives of the related assets as reduced depreciation expense.
Accounting policies
The expected lifetime for tangible assets is determined based on past experience and expectations for future use of the assets. Especially the estimated lifetime of plant and machinery is linked to uncertainty due to varying utilisation and the significant amount of maintenance costs. Reassessments of the expected future lifetime are made in connection with changes in production structures.
Critical estimates and judgements
Tangible assets
EURmBuildings and sites
Plant and machinery
Otheroperating
equipment
Prepayments and tangible assets under construction Total
Cost:Accumulated 1/1 2019 1,021 1,972 95 160 3,248Exchange rate adjustments 27 45 4 1 77Additions for the year 1 4 1 387 393Transfer of assets under construction 47 84 18 -149 -Disposals for the year -2 -21 -4 - -27Accumulated 31/12 2019 1,094 2,084 114 399 3,691
Depreciation and write-downs:Accumulated 1/1 2019 413 1,528 80 - 2,021Exchange rate adjustments 10 38 2 - 50Depreciation for the year 30 92 16 - 138Disposals for the year -2 -18 -4 - -24Accumulated 31/12 2019 451 1,640 94 - 2,185
Net book value 31/12 2019 643 444 20 399 1,506Hereof investment grants -10 -2 - - -12
When there is an indication of a reduction in the profitability of an asset, an impairment test is performed for the assets in question and write-downs are made, if necessary.
The recoverable amounts of the assets and cash-generating units are determined based on value-in-use calculations and fair value
less cost to sell. These calculations require the use of estimates as they are based on budgets, business plans and projections for 5 years and take into account previous experience and represent Management’s best estimate of future developments. Key parameters are growth in sales margin, discount rate and future growth expectations. Please refer to note 2.5.
83Consolidated financial statements
Overview Business updates Financial performanceMarket review/outlook Financial statements

Of the total net book value of buildings and sites, EUR 114 million (2018: EUR 111 million) represent sites not subject to depreciation.
Accumulated capitalised interests amounting to EUR 4 million (2018: EUR 4 million) are included in the cost of tangible assets. There is no additional capitalised interest neither this year nor last year..
For the recognised investment grants the conditions are fulfilled or are expected to be fulfilled. Some of the received investment grants are subject to repayment obligations provided that the attached conditions are not fulfilled within a number of years.
The Group’s investment grants are for the main part received in Poland, Spain, France, the United Kingdom, Germany and the United States. The investment grants are in most cases linked to expansion of the Group including the amount of investment in tangible assets and the creation of jobs - and is given as cash or loans. Only limited contingent liabilities exist. For a description of impairment tests on tangible assets see note 2.5.
Contractual obligations for the purchase of tangible assets at 31 December 2019 amount to EUR 134 million (2018: EUR 141 million).
Comments
2.2 Tangible assets (continued)
Notes
Tangible assets
EURmBuildings and sites
Plant and machinery
Otheroperating
equipment
Prepayments and tangible assets under construction Total
Cost:Accumulated 1/1 2018 1,002 1,966 92 55 3,115Exchange rate adjustments -15 -28 -4 -1 -48Additions for the year 7 13 1 199 220Transfer of assets under construction 22 59 13 -94 -Acquisition of subsidiary 8 4 - 2 14Disposals for the year -3 -42 -7 -1 -53Accumulated 31/12 2018 1,021 1,972 95 160 3,248
Depreciation and write-downs:Accumulated 1/1 2018 397 1,495 69 - 1,961Exchange rate adjustments -9 -26 -1 - -36Depreciation for the year 28 96 17 - 141Disposals for the year -3 -37 -5 - -45Accumulated 31/12 2018 413 1,528 80 - 2,021
Net book value 31/12 2018 608 444 15 160 1,227Hereof investment grants -10 -3 -0 - -13
84Consolidated financial statements
Overview Business updates Financial performanceMarket review/outlook Financial statements

2.3 Right-of-use assets
Notes
The Group’s portfolio of leases covers leases of office buildings, warehouses and other equipment such as cars and forklifts. Leases for offices and other buildings have lease terms between 2-22 years, warehouses between 3-10 years while car and forklift leases generally have lease terms between 3-5 years. The Group also has a few long-term site leases with lease terms up to 99 years.
Extension and termination options are included in a number of property and equipment leases across the Group. These are used to maximise operational flexibility in terms of managing the assets used in the Group’s operations. The majority of extension and ter-mination options held are exercisable only by the Group and not by the respective lessor. For building leases, the determination of lease terms are generally based on contract terms, however for contracts with prolongation or termination options, strategic importance of e.g. location is also taken into consideration.
Contracts may contain both lease and non-lease components. The Group allocates the consideration in the contracts to the lease and non-lease components based on their relative stand-alone prices. The Group has elected to exclude non-lease components from the measurement of its lease liabilities, except from those relating to cars. Non-lease components, except from those relating to cars, are expensed as operational costs.
Accounting policiesRoU assets and lease liabilities are initially measured at present value basis. Lease liabilities include the net present value of the following lease payments:– Fixed payments (including in-substance fixed payments), less any
lease incentive receivable– Variable lease payments that are based on an index or a rate, initial-
ly measured using the index or rate as at the commencement date– Amounts expected to be payable by the Group under residual
value guaranties– The exercise price of a purchase option if the Group is reasonably
certain to exercise that option– Payments of penalties for terminating the lease, if the lease term
reflects the Group exercising the option.
If the lease contract contains an extension or purchase option that the Group considers reasonably certain to be exercised, these are included in the measurement of the liability.
To measure the lease liability at an amount equal to the net present value of the lease payments, a discount rate is used. For this pur-pose, the Group generally uses its incremental borrowing rate (IBR).
The IBR is calculated per main country/region per asset type. The length of the lease terms for the different asset types has also been taken into consideration. The IBR level in Europe is 3-7 percent p.a., in Russia around 12 percent p.a., in North America 5-6 percent p.a. while the level in Asia is 5-15 percent p.a.
RoU assets are measured at cost comprising the following:– The amount of the initial measurement of lease liability– Any lease payments made at or before the commencement date
less any lease incentives received– Any initial direct costs– Restoration costs.
RoU assets are depreciated on a straight-line basis over the shorter of the expected lease term and the asset’s useful life. If the Group is reasonably certain to exercise a purchase option, the right-of-use asset is depreciated over the underlying asset’s useful life. RoU assets are tested for impairment whenever there is an indication that the assets may be impaired. RoU assets and lease liabilities are presented separately in the balance sheet.
Lease payments are allocated between principal and finance cost. The finance cost is charged to profit or loss over the lease term so as to produce a constant periodic rate of interest on the remaining balance of the liability for each period.
Payments associated with short-term leases (with a lease term of 12 months or less) and leases of low value assets (e.g. computer, printers and photocopying machines) are recognised on a straight line basis as a cost in the income statement.
85Consolidated financial statements
Overview Business updates Financial performanceMarket review/outlook Financial statements

2.3 Right-of-use assets (continued)
Leases in the income statementEURm 2019 2018Depreciation of right-of-use assetsOffices, other buildings and sites 2 - Warehouses 6 - Forklifts 1 - Cars 6 - Other assets 2 - Total depreciation of right-of-use assets 17 -Interest expense (included in financial expenses) 2 - Expense relating to short-term leases (included in operating costs) 8 - Expense relating to lease of low-value assets (included in operating costs) 0 - Expense relating to variable lease payments not included in lease liability (included in operating costs) 5 -
The total cash outflow for leases in 2019 was EUR 32 million, of which EUR 17 million is classified as cash flow from financing activities and EUR 15 million is classified as cash flow from operating activities.
Right-of-use assets and lease liabilities in the balance sheet
EURm 20191 January
2019*
Right-of-use assets:Offices, other buildings and sites 10 11Warehouses 25 8Forklifts 2 3Cars 14 13Other assets 1 2Total right-of-use assets 52 37
Lease liabilities:Current 18 13Non-current 34 24Total lease liabilities 52 37
* In the previous years the Group only recognised right-of-use assets and lease liabilities in relation to leases that were classified as “finance leases” under IAS 17 Leases. Additions to the right-of-use assets during the 2019 financial year were EUR 36 million.
Notes
86Consolidated financial statements
Overview Business updates Financial performanceMarket review/outlook Financial statements

Notes
Depreciation, amortisation and write-downsEURm 2019 2018Amortisation of intangible assets 19 17Write-down of intangible assets 2 8Depreciation of tangible assets 138 141Depreciation of right-of-use assets 17 -
Total 176 166
In 2019 a write-down of EUR 2 million of intangible assets under construction was recognised affecting both segments due to lower benefits and utilisation compared to the original business plan.
Also in 2018 a write-down of intangible assets under construction was recognised amounting to EUR 8 million due to a lower revenue stream compared to the original expectation.
Comments
2.4 Depreciation, amortisation and write-downs
When there is an indication of a reduction in the profitability of an asset, an impairment test is performed for the assets in question and write-downs are made, if necessary.
For goodwill, annual impairment tests are made. The recoverable amounts of the assets and cash-generating units (CGUs) have been determined based on value-in-use calculations. When testing for impairment, the value is written down to the estimated recoverable amount, if lower than the carrying amount.
Other assets are tested for impairment when there are indications of change in the structural profitability.
Accounting policies
2.5 Impairment tests
Impairment test of goodwillEURm 2019
CGUsNet book value,
GoodwillDiscount
rateGrowth rate
(budget period) Headroom
Chicago Metallic Corporation (Rockfon) 57 8.9% 2-5% LargeHECK Wall Systems 6 7.6% 0%* MinorCSR 8 10.7% 6%* LargeFlumroc 15 7.3% 2% LargeKEWO 4 10.8% 5%* LargeOther 7 7-10% 0-8% LargeTotal 97
* Weighted average growth rate due to large spread in the period.
87Consolidated financial statements
Overview Business updates Financial performanceMarket review/outlook Financial statements

Notes
When preparing impairment tests, estimates are used to calculate the future value. Significant estimates are made when assessing long-term growth rates and profitability. In addition, an assessment is made of the reasonable discount rate.
Changes in the growth rate in the budget period or discount rate may result in significantly different values. The assessments are made based on budgets, business plans and projections for 5 years and take into account previous experience and represent Manage-ment’s best estimate of future developments.
Key parameters are growth in sales, margin, discount rate and future growth expectations.
Critical estimates and judgements Impairment test of goodwillEURm 2018
CGUsNet book value,
GoodwillDiscount
rateGrowth rate
(budget period) Headroom
Chicago Metallic Corporation (Rockfon) 56 8.6% 2-12% LargeHECK Wall Systems 6 7.4% 3-5% MinorCSR 8 10.6% 1-5% LargeFlumroc 14 7.0% 2-3% LargeKEWO 3 KEWO is recently acquiredOther 8 7.4-9.7% 0-4% LargeTotal 95
Management has performed the yearly impairment test of the carrying amount of goodwill. In addition, impairment test of other assets has also been made, where indication of reduction of value was found. In the impairment test, the carrying amount of the assets is compared to the discounted value of the future cash flows. The assessment of future cash flows is typically based on 5-year man-agement reviewed budgets and business plans, where the last year is used as a normalised terminal year. Net sales, raw material prices, discount rate and future growth assumptions constitute the most material parameters in the calculation.
The average growth rate in the terminal period is set to 0.5% similar to last year. The weighted average growth rate in the budget period is estimated to be between 0-6% depending on the businesses.
The high growth rates are used in countries where we historically have seen steep increases after a slow period. Gross margins are based on
Comments
average values the last 3 years and adjusted over the budget period for efficiency improvements and expected raw material inflation based on past actual price movements and future market conditions. Future investment is derived from the historic investment level to secure a smooth operation of the factories and the capacity utilisation is based on the current situation including investment plans. The discount rate calculation is based on the specific circumstances of the Group and the operating segments and is derived from the weighted average cost of capital (WACC).
2019The impairment test for 2019 has not shown a need for write-downs or reversals of write-downs recognised previous years. During 2019 HECK Wall Systems has been monitored closely. HECK Wall Systems follows the expectations and market outlook outlined in the impair-ment test last year. The net present value of HECK Wall Systems amounts to EUR 28 million in 2019, which gives a headroom of EUR 1 million to the net book value. The main driver is conversion to stone wool products and this has shown good progress.
2018The impairment tests for 2018 has not shown a need for write-downs or reversals of the write-downs recognised previous years. During 2018 HECK Wall Systems has been monitored closely. HECK Wall Systems follows the expectations and market outlook outlined in the
impairment test last year. The main driver is conversion to stone wool products and this has shown good progress.
Sensitivity analysisAs part of the preparation of impairment tests, sensitivity analyses are prepared on the basis of relevant risk factors and scenarios that management can determine within reasonable reliability. Sensitiv-ity analyses are prepared by altering the estimates with a range of probable outcomes.
2019The sensitivities have been assessed as follows, all other things being equal; an increase in the discount rate of 1%, a decrease in the growth rate of 1% p.a. and an increase of input costs of 1% p.a. The write-down in HECK Wall Systems would have been EUR 3-6 million if the discount rate was to increase 1% or the growth was 1% lower.
We consider the chosen scenarios as the most realistic why none of the impairment tests have given rise to adjustment of the value.
2018The sensitivities have been assessed as follows, all other things being equal; an increase in the discount rate of 1%, a decrease in the growth rate of 1% p.a. and an increase of input costs of 1% p.a. The write-down in HECK Wall Systems would have been EUR 3-4 million if the discount rate was to increase 1% or the growth was 1% lower.
2.5 Impairment tests (continued)
88Consolidated financial statements
Overview Business updates Financial performanceMarket review/outlook Financial statements

2.6 Pension obligations
Notes
Pension payments concerning defined contribution plans are recog-nised on an ongoing basis in the income statement.
Defined benefit plans are stated at the net present value at the balance sheet date and included in the consolidated financial state-ments. Adjustments of the plans are carried out on a regular basis in accordance with underlying actuarial assessments. Actuarial gains or losses for defined benefit plans are recognised in full in the period in which they occur in other comprehensive income. The actuarial assessment is carried out every year.
Funded benefit plans have assets placed in trustee-administered pension funds, which are governed by local regulations and practice in each country.
The payments to the pension funds are based on the usual actuarial assessments and are recognised in the income statement after ma-turity. Provided that the actuarial assessments of pension obligations show noticeable excess solvency or insolvency in relation to the pen-sion fund’s assets, the difference is entered to the balance sheet and the future payments are adjusted accordingly. With regard to these schemes, the actuarial assessment is also carried out every year.
Accounting policies
The present value of defined benefit pension obligations depends on a number of factors that are determined on an actuarial basis using a number of assumptions. Any changes to these assumptions
will impact the carrying amount of pension obligations. The discount rate and other key assumptions are based in part on the current market conditions.
Critical estimates and judgements
Pension costs for the yearEURm 2019 2018Defined contribution plansPension costs for the year, total 22 22
Defined benefit plansPension costs 4 5Interest costs 3 4Interest income -2 -3Curtailments/settlements -0 -0
Pension costs for the year, total 5 6
Net value of defined benefit pension plansEURm 2019 2018 2017 2016 2015Present value of pension liabilities 247 217 227 160 150Fair value of plan assets -185 -164 -174 -92 -96Net value of pension plans 31/12 62 53 53 68 54
89Consolidated financial statements
Overview Business updates Financial performanceMarket review/outlook Financial statements

2.6 Pension obligations (continued)
Notes
A number of the Group’s employees and former employees participate in pension schemes. The pension schemes are primarily defined contribution plans. However, defined benefit plans are also used, mainly in Switzerland, the United Kingdom and Germany. The plans in the United Kingdom and Germany are closed for new entries.
Under a defined benefit plan the Group carries the risk associated with the future development in e.g. interest rates, inflation, salaries, mortality and disability.
Defined benefit plans typically guarantee the employees a retire-ment benefit based on the final salary at retirement.
The pension benefit plans in the United Kingdom and Switzerland have assets placed in independent pension funds. The remaining plans are unfunded, where the main part relates to Germany. For these plans the retirement benefit obligations amount to approximately 22% (2018: 22%) of the total gross liability.
Except for the Swiss and UK plans, the mentioned defined benefit plans are not subject to regulatory requirements regarding minimum funding.
The granted pension payments of the mentioned defined benefit plans are based upon the salary of the participating employees during the period of employment. The Group’s contributions are derived from the split of the pension premium between the employee and employer.
The actuarial assessment of the pension obligation is based on assumptions specific to each country. The latest actuarial calculation is prepared by authorised experts. The valuation of the assets is based on the composition and the expectations to the economic development. The assumptions used are weighted averages:
Comments
Actuarial assumptions2019 2018
Increase in salaries and wages 1.4% 1.4%Discount rate 1.0% 1.8%Remaining life expectancy at the time of retirement (years) 25.8 25.7
Development in the present value of the defined benefit obligationEURm 2019 2018Balance 1/1 217 227Exchange rate adjustments 7 2Pension costs 5 6Interest costs 3 4Settlements -0 -0Actuarial gains/losses from changes in demographic assumptions -0 -0Actuarial gains/losses from changes in financial assumptions 28 -9Actuarial gains/losses from changes in experience -3 -1Benefits paid -10 -12Other adjustments - 0Total 31/12 247 217
90Consolidated financial statements
Overview Business updates Financial performanceMarket review/outlook Financial statements

The following payments are expected contributions to the defined benefit plan obligation:
Expected contributionsEURm 2019 20180-1 year 6 51-5 years 27 25Falling due after 5 years 43 44Total 76 74
The expected duration of the defined benefit plan obligation is 26 years (2018: 26 years) at year end.
Sensitivity analysisAssumptions Discount rate Salary increase Life expectancy
-0.5% +0.5% -1.0% +1.0% -1 year +1 year
EURm2019 - Impact on obligation 21 -19 -3 3 -6 72018 - Impact on obligation 18 -17 -3 2 -5 6
The sensitivity analysis above has been determined based on a method that extrapolates the impact on the defined benefit obligation as a result of reasonable changes in key assumptions.
2.6 Pension obligations (continued)
Notes
Development in the fair value of the plan assetsEURm 2019 2018Balance 1/1 164 174Exchange rate adjustments 7 2Interest income 2 3Return on plan assets 15 -9Employer’s contribution 4 3Plan participants 1 1Benefits paid -8 -10
Other adjustments - 0Total 31/12 185 164
Plan assets in major categories2019 2018
Assets quoted in active markets:Equities in European markets 35% 34%Bonds in European markets 37% 38%Assets unquoted:Cash 10% 10%Other 18% 18%
91Consolidated financial statements
Overview Business updates Financial performanceMarket review/outlook Financial statements

2.7 Provisions
Notes
Provisions are recognised where a legal or constructive obligation has been incurred as a result of past events and if it is probable it will lead to an outflow of financial resources and if the size of the liability can be measured on a reliable basis. The provision is calculated as the amount expected to be paid to settle the obligation.
Accounting policies ProvisionsEURm 2019 2018Provision for employees 1/1 11 15Exchange rate adjustments 0 0Additions for the year 4 6Used during the year -2 -10Reversed during the year -1 -0Total 31/12 12 11Provisions for claims and legal proceedings 1/1 4 5Exchange rate adjustments 0 -0Additions for the year 3 3Used during the year -1 -2Reversed during the year -2 -2Total 31/12 4 4Other provisions 1/1 7 6Exchange rate adjustments 0 -0Additions for the year 5 4Used during the year -1 -2Reversed during the year -1 -1Total 31/12 10 7
Total provisions 26 22
Specification of provisions:Non-current liabilities 17 15Current liabilities 9 7Total provisions 26 22
Provisions relate primarily to jubilee obligations and retirement benefits, fair value provision for phantom shares, restructuring, warranties and ongoing disputes, lawsuits, etc.
As at 31 December 2019 other provisions include a provision of EUR 4 million (2018: EUR 2 million) for restructuring measures. This provision is expected to be utilised within 1 year.
Comments
92Consolidated financial statements
Overview Business updates Financial performanceMarket review/outlook Financial statements

Note 3Net working capital
3.1 Inventories 943.2 Trade receivables 953.3 Othercashflownotes 96
Net working capital in % of net sales
9.0%Increased compared to 7.4% in 2018
Consolidatedfinancialstatements 93
Financial statementsFinancial performanceBusiness updatesMarket review/outlookOverview

3.1 Inventories
Notes
Inventories are valued at the lowest value of historical cost calculated as a weighted average or the net realisation value.
The cost of finished goods and work in progress include the direct costs of production materials and wages, as well as indirect production costs such as personnel costs, maintenance costs and depreciation of plant and machinery.
Accounting policies
Movement in inventory write-downsEURm 2019 2018Inventory before write-downs 250 250
Write-downs: Write-downs 1/1 -12 -10Change in the year -2 -2Write-downs 31/12 -14 -12
Inventories 31/12 236 238
InventoriesEURm 2019 2018Raw materials and consumables 108 104Work in progress 10 9Finished goods 118 125Inventories 31/12 236 238
Raw materials and consumables include the net amount of the spare part inventory of EUR 25 million (2018: EUR 28 million).
The net amount consists of a cost price of EUR 82 million (2018: EUR 80 million) and a write-down of spare part inventory of EUR 57 million (2018: EUR 52 million).
Comments
94Consolidated financial statements
Overview Business updates Financial performanceMarket review/outlook Financial statements

3.2 Trade receivables
Notes
Trade receivable are measured at amortised cost less allowance for bad debt based on the expected credit loss model.
The Group applies the simplified approach to measure expected credit losses, which uses a lifetime expected loss allowance for all trade receivables.
To measure the expected credit losses, trade receivables have been grouped based on shared credit risk characteristics and the days past due.
The expected loss rates are based on the payment profiles of sales over a period of 60 months before 1 January 2019 and the corre-sponding historical credit losses experienced within this period. The historical loss rates are adjusted to reflect current and forward-look-ing information on macroeconomic factors affecting the ability of the customers to settle the receivables.
The costs of allowance for bad debts and realised losses during the year are included in other external costs.
Accounting policies Trade receivablesEURm 2019 2018Trade receivables before allowance for bad debts (maximum credit risk) 288 289
Allowance for bad debts 1/1 -15 -15Impact from new expected credit loss model - -0Exchange rate adjustments 0 0Movements during the year 0 -1Realised losses during the year 2 1Allowance for bad debts 31/12 -13 -15Trade receivables 31/12 275 274
Allowance for bad debts based on the expected credit loss model
EURmExpected loss rate
Gross carrying amount
Allowance for bad debt
Total 2019
Current 0.1% 264 0 264More than 30 days past due 2% 10 0 10More than 60 days past due 40% 1 0 1More than 90 days past due 100% 13 -13 0Total 31/12 2019 288 -13 275
Allowance for bad debts based on the expected credit loss model
EURmExpected loss rate
Gross carrying amount
Allowance for bad debt
Total 2018
Current 0.1% 266 -0 266More than 30 days past due 2% 7 -0 7More than 60 days past due 40% 2 -1 1More than 90 days past due 100% 14 -14 0Total 31/12 2018 289 -15 274
95Consolidated financial statements
Overview Business updates Financial performanceMarket review/outlook Financial statements

3.3Othercashflownotes
Notes
Adjustments of non-cash operating itemsEURm 2019 2018Provisions 5 -7Expensed value of RSUs issued 1 1Gain/loss on sale of intangible and tangible assets 0 -1
Total adjustments 6 -7
Changes in net working capitalEURm 2019 2018Change in inventories 7 -42Change in trade receivables 4 -18Change in other receivables -7 -3Change in trade payables -27 31Change in other payables -16 10Change in net working capital -39 -22
96Consolidated financial statements
Overview Business updates Financial performanceMarket review/outlook Financial statements

Note 4 Capital structure and financing
4.1 Financial income and Financial expenses 984.2 Financial risks and instruments 994.3 Cash available 1014.4 Own shares 1024.5 Share capital 1024.6 Earnings per share 103
Equity ratio
78.5%Compared to 77.1% last year
Net cash position
269 EURmDown from EUR 380 million last year
Earnings per share
13.0 EURUp 0.9 EUR from last year
97Consolidatedfinancialstatements
Overview Market review/outlook Business updates Financial performance Financial statements

Financial income and Financial expenses comprise interest income and interest costs, interest costs compiled from lease liabilities, real-ised and unrealised foreign exchange gains and losses, as well as fair value adjustments of cash-settled share-based incentive programmes which are offset against other liabilities.
Financial income and Financial expenses also include adjustments to fair value hedges, and income and costs relating to cash flow hedges transferred from other comprehensive income on realisation of the hedged items.
Accounting policies Financial incomeEURm 2019 2018Interest income 2 2Foreign exchange gains 3 3Total 5 5Hereof:Financial income on financial assets at amortised cost 2 0
Financial expensesEURm 2019 2018Interest expenses etc. 7 5Interest expenses lease liabilities 2 -Fair value adjustment phantom shares 1 4Foreign exchange losses 0 3
Total 10 12Hereof: Financial expenses on financial liabilities at amortised cost 5 3
4.1 Financial income and Financial expenses
Notes
98Consolidated financial statements
Overview Business updates Financial performanceMarket review/outlook Financial statements

Derivative financial instruments are initially recognised in the balance sheet at cost price and are subsequently measured at fair value. Derivative financial instruments are recognised in other receivables and other payables.
Changes to the fair value of derivative financial instruments, which meet the conditions for hedging the fair value of a recognised asset or liability, are recognised in the income statement together with any changes in the fair value of the hedged asset or liability.
Changes to the fair value of derivative financial instruments, which meet the conditions for hedging future cash flow, are recognised in other comprehensive income provided the hedge has been effective. Hedge effectiveness is determined at the inception of the hedge relationship, and through periodic prospective effectiveness assessments to ensure that an economic relationship exists between the hedged item and hedging instrument. The accumulated value adjustment related to these hedge transactions is transferred from other comprehensive income when the position is realised, and is included in the value of the hedged position e.g. the adjustment follows the cash flow.
For derivative financial instruments, which do not qualify as hedging instruments, changes to the fair value are recognised on an ongoing basis in the income statement as financial income or financial expenses.
Accounting policies
4.2 Financial risks and instruments
Notes
Categories of financial assets and liabilitiesEURm 2019 2018
Financial assets:Financial instruments for hedging of future cash flows 1 1Financial assets at fair value through other comprehensive income 1 1Trade receivables 275 274Other receivables and receivables from associated companies 54 42Cash 275 386Financial assets at amortised costs 604 702
Financial liabilities:Fair value hedges 0 4Financial liabilities at fair value through income statement 0 4Financial instruments for hedging of future cash flows 3 5Financial liabilities at fair value through other comprehensive income 3 5Bank loans incl. short-term 5 5Bank debt 6 6Trade payables 196 209Other payables 154 165Financial liabilities at amortised costs 361 385
The carrying value of the Group’s financial assets and liabilities measured at amortised cost are assessed to be a reasonable approximation of fair value.
Other receivables and receivables from associated companies
Other receivables and receivables from associated companies fall due as follows:
EURm 2019 2018
< 1 year 54 421-5 years - -> 5 years - -
Total 54 42
99Consolidated financial statements
Overview Business updates Financial performanceMarket review/outlook Financial statements

4.2 Financial risks and instruments (continued)
Notes
A sensitivity analysis is made for the Group’s result and equity based on the underlying currency transactions. The financial instruments included in the sensitivity analysis are cash, receivables, payables, current liabilities and financial investments without taking hedging into consideration. The result of the sensitivity analysis cannot be directly transferred to the fluctuations on translating the financial result and equity of sub sidiaries into EUR.
The impact on the net sales of the difference between average rate and year-end rate amounts to EUR 15 million (2018: EUR -11 million) for the 5 largest currencies (USD, RUB, CAD, PLN and GBP), which is a change of 0.5% (2018: -0.4%).
The Group’s policy is not to hedge exchange rate risks in long-term investments in subsidiaries. When relevant, external investment loans and Group loans are, as a general rule, established in the local currency of the company involved, while cash at bank and in hand are placed in local currency.
Comments Sensitivity analysisEffect in EURm EBITDA
5% change in exchange rate 2019 2018USD (+/-) 8-12 7-10RUB (+/-) 3-5 2-3CAD (+/-) 0-1 1-2PLN (+/-) 2-3 2-3GBP (+/-) 4-5 3-5
EquityUSD (+/-) 10-16 7-10RUB (+/-) 10-15 10-15CAD (+/-) 6-9 5-8PLN (+/-) 10-15 9-14GBP (+/-) 5-7 3-5
The Group’s listed equity securities, taken over as part of the acquisition of Flumroc AG, were sold during 2018.
As a consequence of ROCKWOOL Group’s extensive international activities, the Group’s income statement and equity are subject to a number of financial risks. The Group manages these risks in the following categories:
– Exchange rate risk, – Interest rate risk– Liquidity risk– Credit risk
The Group’s policy is to identify and hedge significant financial risks on an ongoing basis. This is the responsibility of the individual com-panies in which financial risks might arise and overall supported by the Group’s treasury department. The parent company continuously monitors the Group’s financial risks in accordance with a framework determined by Group Management and/or the Board of Directors.
Exchange rate riskAs a consequence of the Group’s structure, net sales and expend-iture in foreign currency are to a significant degree set off against each other, so that the Group is not exposed to major exchange rate risks.
Commercial exchange rate risks in the companies, which cannot be set off are hedged on a continuous basis, to the extent that they may significantly affect the results of the individual company in a negative direction, using currency loans, currency deposits and/or financial derivatives. Exchange rate risks are hedged in the indi-vidual companies. The Group’s hedging reserve is disclosed under “Statement of changes in equity” with an insignificant amount.
The Group’s net sales and expenditures will be subject to exchange rate fluctuations on translation into EUR.
In the few countries with ineffective financial markets loans can be raised and surplus liquidity placed in DKK, EUR or USD, subject to the approval of the Group’s finance function.
Most Group loans, that are not established in DKK or EUR, are hedged in via forward agreements, currency loans and cash pools or via the SWAP market.
Interest rate riskCurrently the Group does not have any significant interest-bearing debt or assets. The Group’s policy is that necessary financing of investments should primarily be affected by raising 5 to 7 year loans at fixed or variable interest rates.
Drawings on credit facilities at variable interest rates generally match the funds, and all Group loans are symmetrical in terms of interest rates. Consequently, changes in interest rates will not have a significant effect on the result of the Group.
100Consolidated financial statements
Overview Business updates Financial performanceMarket review/outlook Financial statements

4.2 Financial risks and instruments (continued)
Notes
Liquidity riskThe current surplus and deficit liquidity in the Group’s companies is set off, to the extent that this is profitable, via the parent company acting as intra-Group bank and via cash pool systems. When considered appropriate, underlying cash pool systems are established in foreign companies.
To the extent that the financial reserves are of an appropriate size, the parent company also acts as lender to the companies in the Group.
To ensure adequate financial reserves as defined by the Board of Directors, investment loans can be raised on a continuous basis to partly cover new investments and to refinance existing loans. The parent company has made guarantees for some credit facilities and loans. The parent company has issued ownership clauses and/or deed of postponements in connection with intercompany loans.
The parent company ensures on an ongoing basis that flexible, unutilised committed credit facilities of an adequate size are established with Investment Grade credit-rated banks. The Group’s
financial reserves also consist of cash at bank and in hand, and unused overdraft facilities.
Credit riskDue to the considerable customer spread in terms of geographical location and numbers, the credit risk is fundamentally limited. To a minor degree, when considered necessary, insurance or bank guarantees are used to hedge outstanding receivables.
As a consequence of the international diversification of the Group’s activities there are business relations with a number of different banks in Europe, North America and Asia. To minimise the credit risk on placement of funds and on entering into agreements on derived financial instruments, only major, financially sound institutions are used.
Customer credit risks are assessed considering the financial position, past experience and other factors. Individual risk limits are set based on internal and external ratings. For impairment of trade receivable please refer to note 3.2.
Cash availableEURm 2019 2018Cash 275 386Bank debts 6 6Cash available 31/12 269 380
4.3 Cash available
No customer exceeds 10% of the Group’s net sales neither this year nor last year.
Categories of financial instrumentsFinancial assets and liabilities at fair value are related to foreign exchange rate forward contracts, foreign exchange rate swaps or interest rate swaps all of which have been valued using a valuation technique with market observable inputs (level 2).
The Group is using no other valuation technique. The Group enters into derivative financial instruments with financial institutions.
Derivatives valued using valuation techniques with market observable inputs are mainly foreign exchange forward contracts. The most frequently applied valuation techniques include forward pricing models using present value calculations. The models incorporate various inputs including the credit quality of counterparties and foreign exchange spot rates.
101Consolidated financial statements
Overview Business updates Financial performanceMarket review/outlook Financial statements

4.4 Own shares
4.5 Share capital
Notes
ROCKWOOL International A/S has a reserve of own shares recog-nised in retained earnings. The shares are bought back to meet obligations under the company’s equity-based stock option and restricted share unit programmes.
Each A share of a nominal value of DKK 10 (EUR 1.3) carries 10 votes, and each B share of a nominal value of DKK 10 (EUR 1.3) carries 1 vote. The total share capital has been unchanged for the last 19 years.
The share capital has been fully paid up. No shareholder is under an obligation to allow his shares to be redeemed whether in whole or in part. The shares are negotiable instruments, and all shares shall be freely transferable.
Accounting policies Own sharesEUR 2019 2018
Number of shares
Average purchase/ sales price
% of share capital
Number of shares
Average purchase/ sales price
% of share capital
Own shares 1/1 75,865 0.4 206,840 1.0Purchase 9,700 217 0.0 9,250 241 0.0Sale/awards 12,671 127 0.1 140,225 164 0.6Own shares 31/12 72,894 0.3 75,865 0.4
Own shares are acquired and sold in connection with hedging of the Group’s stock option and restricted share unit programmes etc. Own shares are purchased based on authorisation from the General Assembly.
Share capitalEURm 2019 2018A shares - 11,231,627 shares of DKK 10 each (EUR 1.3) 15 15B shares - 10,743,296 shares of DKK 10 each (EUR 1.3) 14 14Total 29 29
Comments
102Consolidated financial statements
Overview Business updates Financial performanceMarket review/outlook Financial statements

Notes
Earnings per shareEURm 2019 2018Profit for the year attributable to shareholders of ROCKWOOL International A/S 285 265
Average number of shares ('000) 21,975 21,975Average number of own shares ('000) 74 141Average number of outstanding shares ('000) 21,901 21,834Dilution effect of stock options ('000) 52 86Average number of diluted shares ('000) 21,953 21,920
Earnings per share 13.01 12.14Earnings per share, diluted 12.98 12.09
4.6 Earnings per share
103Consolidated financial statements
Overview Business updates Financial performanceMarket review/outlook Financial statements

Note 5Other
5.1 Taxonprofitfortheyear 1055.2 Income tax receivable
and payable 1065.3 Deferred taxes 1065.4 Auditor’s fee 1085.5 Commitments and
contingent liabilities 1085.6 Related parties 1095.7 New and changed standards
and general accounting policies 1105.8 Group companies 112
Effective tax rate in 2019
22.4%Number of subsidiariesin the Group
59
Consolidatedfinancialstatements 104
Overview Market review/outlook Business updates Financial performance Financial statements

The parent company is taxed jointly with all Danish subsidiaries. Income subject to joint taxation is fully distributed. Tax on profit for the year, which includes current tax on profit for the year as well as changes to deferred tax, is recognised in the income statement.
In the course of conducting business globally, transfer pricing disputes, etc. with tax authorities may occur, and Management judge-ment is applied to assess the possible outcome of such disputes. The most probable outcome is used as the measurement method, and Management believes, that the provision made for uncertain tax po-sitions not yet settled with local tax authorities is adequate. However, the actual obligation may deviate and is dependent on the result of litigations and settlements with the relevant tax authorities.
Tax on changes in other comprehensive income is recognised directly under other comprehensive income.
Accounting policies Tax on profit for the yearEURm 2019 2018Current tax for the year 90 85Change in deferred tax -3 -7Adjustment to valuation of tax assets -6 -8Withholding taxes 3 1Adjustment in current and deferred tax in previous years -2 -1Total 82 70
Reconciliation of effective tax rate2019 2018
Danish tax rate 22.0% 22.0%Deviation in non-Danish subsidiaries' tax compared to Danish tax percentage 2.1% 2.4%Withholding tax adjustment 0.8% 0.4%Permanent differences 0.0% 0.1%Effect on change in income tax rates 0.1% -0.3%Adjustment to valuation of tax assets -2.0% -3.0%Initial recognition of tax credit -0.5% -0.8%Other deviations -0.1% 0.2%Effective tax rate 22.4% 21.0%
5.1Taxonprofitfortheyear
Notes
105Consolidated financial statements
Overview Business updates Financial performanceMarket review/outlook Financial statements

Income tax receivable and payableEURm 2019 2018Balance 1/1 29 14Exchange rate adjustments -0 0Acquisition of subsidiary - 0Current tax for the year 93 85Payments during the year -109 -62Adjustment in respect of prior years 2 -2Current tax for the year recognised in other comprehensive income 0 -6Total 31/12 15 29
Income tax is recognised as follows:Income tax receivable 14 5Income tax payable 29 34Total 31/12 15 29
5.2 Income tax receivable and payable
Notes
Provisions for deferred tax are calculated on all temporary differences between accounting and taxable values, calculated using the balance-sheet liability method.
Deferred tax provisions are also made to cover the re-taxation of losses in jointly taxed foreign companies previously included in the Danish joint taxation.
Accounting policies
5.3 Deferred taxes
Deferred tax assets are recognised when it is probable, that the assets will reduce tax payments in coming years and they are assessed at the expected net realisable value.
Deferred tax is stated according to current tax regulations. Changes in deferred tax as a consequence of changes in tax rates are recog-nised in the income statement.
106Consolidated financial statements
Overview Business updates Financial performanceMarket review/outlook Financial statements

The Group is subject to income taxes in numerous jurisdictions. Significant judgement is required in determining provision for uncertain tax positions or the recognition of a deferred tax asset.
A tax asset is recognised if it is assessed, that the asset can be utilised in a foreseeable future based on strong indications, that sufficient future profits are available to absorb the temporary differences including the Group's future tax planning.
The valuation of tax assets related to losses carried forward is done on a yearly basis and is based on expected positive taxable income within the next 3-5 years.
Critical estimates and judgements Deferred taxesEURm 2019 2018Deferred taxes, net 1/1 5 12Exchange rate adjustments 1 1Acquisition of subsidiary - 1Change in deferred tax recognised in profit and loss -7 -6Adjustment to valuation of tax assets -6 -8Deferred tax for the year recognised in other comprehensive income for the year -4 5Deferred tax, net 31/12 -11 5
Deferred tax is recognised in the balance sheet as follows:Deferred tax assets 54 46Deferred tax liabilities 43 51Deferred tax, net 31/12 -11 5
Deferred tax relates to:Non-current assets 10 37Current assets -5 -5Non-current liabilities -14 -24Current liabilities -5 -4Tax loss carried forward -1 -3Re-taxable amounts 4 4Deferred tax, net 31/12 -11 5
5.3 Deferred taxes (continued)
Notes
Tax assets expire as followsEURm 2019 2018
Recognised assets
Unrecognised assets
Recognised assets
Unrecognised assets
Within 1 year of balance sheet date - 2 - 1Within 1-5 years of balance sheet date - 5 0 6After 5 years of balance sheet date 11 30 11 13Do not expire 43 5 35 5Total 54 42 46 25
Tax assets not recognised amount to EUR 42 million (2018: EUR 25 million). The tax assets have not been recognised as they have arisen in subsidiaries, that have been loss-making for some time and there is no evidence of recoverability in the near future.
Deferred tax assets and liabilities are offset in the consolidated balance sheet, if the Group has a legally enforceable right to set off and the deferred tax assets and liabilities relate to the same legal tax entity/consolidation. Of the total deferred tax assets recognised, EUR 1 million (2018: EUR 3 million) relate to tax loss carry forwards.
Comments
107Consolidated financial statements
Overview Business updates Financial performanceMarket review/outlook Financial statements

5.4 Auditor’s fee
Notes
Comments Fees to auditors elected at the Annual General MeetingEURm 2019 2018Statutory audit 1 1Other opinions 0 0Tax consultancy 1 0Other services 0 1Total 2 2
Fees for services in addition to the statutory audit of the financial statements which were provided by the statutory auditor Price-waterhouseCoopers Statsautoriseret Revisionspartnerselskab to the Group amounted to less than EUR 1 million in both 2019 and 2018.
Services in addition to the statutory audit of the financial statements comprise tax services relating to transfer pricing, as well as other general accounting consultancy services.
5.5 Commitments and contingent liabilities
For the Group, commitments comprise EUR 4 million (2018: EUR 5 million). Contingent liabilities amount to EUR 8 million (2018: EUR 5 million). Contractual obligations for purchase of tangible assets are mentioned in note 2.2.
Comments
Lease commitments expire within the following periods as from the balance sheet date:
Contractual undiscounted future cash flowsEURm 2019 2018
IFRS 16 lease liabilities
Operational leasecommitments
Within 1 year 20 19Between 1 and 5 years 30 26After 5 years 10 5Total 60 50
Provisions for legal proceedings are recognised, if they are certain or probable at the balance sheet date, and if the size of the liability can be measured on a reliable basis. Legal proceedings for which no reliable estimate can be made are disclosed as contingent liabilities.
Accounting policies
The Group is engaged in a few legal proceedings. It is expected that the outcome of these legal proceedings will not impact the Group’s financial position in excess of what has been provided for in the balance sheet as at 31 December 2019 (as well as at 31 December 2018).
In 2018, lease costs included in the income statement for the Group amounted to EUR 24 million.
108Consolidated financial statements
Overview Business updates Financial performanceMarket review/outlook Financial statements

Notes5.6 Related parties
Transactions with related parties
The income statement and balance sheet include the following transactions with other companies in the Group:
EURm 2019 2018
Transactions with associated companies:Net sales to associated companies 16 15Dividend from associated companies 1 1Receivable from associated companies - -
The Group’s related parties comprise the Company’s shareholder the ROCKWOOL Foundation, the Company’s Board of Directors and Management and associated companies. Apart from dividends no transactions were carried out with the shareholders during the year. For transactions with the Board of Directors and Group Management please refer to note 1.3 and note 1.4.
Comments
109Consolidated financial statements
Overview Business updates Financial performanceMarket review/outlook Financial statements

Notes
The Annual Report for ROCKWOOL International A/S has been prepared in accordance with International Financial Reporting Standards (IFRS) as adopted by the EU and further requirements in the Danish Financial Statements Act.
The financial year for the Group is 1 January – 31 December 2019.
5.7.1 New and changed standards and interpretations
The following EU adopted standards and interpretations with relevance for the Group were implemented with effect from 1 January 2019:
– IFRS 16: Lease (effective date 1 January 2019)
Several other amendments and interpretations apply for the first time in 2019, but have no impact on the consolidated financial state-ments of the Group. The Group has not early adopted any stand-ards, interpretations or amendments that have been issued but are not yet effective.
Impact from IFRS 16 “Lease”The Group adopted IFRS 16 using the modified retrospective method under which the effect of the implementation is included in the opening equity as of 1 January 2019 without adjustment of comparative figures.
The standard has replaced IAS 17, and requires that lease contracts previously classified as operational leases are recognised in the balance sheet as a right-of-use (RoU) asset with the corresponding lease liability. In the income statement, the lease cost under oper-ating costs are replaced by depreciation of the leased asset and an interest expense for the lease liability. The impact on profit for the period is neutral over time, but a timing effect does occur due to frontloading of interest expenses.
In addition, the cash flow will be impacted as part of the current lease payments will be moved from operating activities to cash flow from financing activities (instalments).
5.7 New and changed standards and general accounting policies
Lease liability bridgeEURm 2019Lease liability reported per 31 December 2018 50- Short-term leases not recognised as a liability -11- Low value leases not recognised as a liability -0- Non-lease components not included in liabilities -1+/- Adjustments as a result of a different treatment of extension and termination options 1+ Contracts not included in operational lease commitments 31 December 2018 4+/- Other differences -2Undiscounted lease liability recognised as at 1 January 2019 41
Discounted using incremental borrowing rate at the date of initial application:Lease liability recognised as at 1 January 2019 37Of which are:Current lease liabilities 13Non-current lease liabilities 24Total 37
On adoption, lease liabilities related to leases previously classified as operating leases under the principle of IAS 17 Leases, were meas-ured at the present value of the remaining lease payments, discount-ed using the incremental borrowing rate as of 1 January 2019.
The Group has elected to use the recognition exemption for lease contracts that, at the commencement date, have a lease term of 12 months or less for all classes of underlying assets, as well as the exemption for lease contracts for which the underlying asset is of low value (“low-value assets”), e.g. computers, printing and photocopying machines etc.
Further, the Group has elected to exclude any initial direct costs from the measurement of the right-of-use asset at the date of initial appli-cation, as well as hindsight has been used in determining the lease term of contracts that contains extension and/or termination options.
The incremental borrowing rate (IBR) is calculated per main country/region per asset type. The length of the lease terms for the different
asset types has also been taken into consideration. The weighted av-erage IBR applied to the lease liabilities on 1 January 2019 was 4.3%.
The change in the accounting policy affected the following items in the balance sheet on 1 January 2019:– Right-of-use assets, increase by EUR 37 million– Lease liabilities, increase by EUR 37 million.
New and changed standards and interpretation not yet entered into forceEU adopted standards and amendments issued by IASB with effec-tive date after 31 December 2019 and therefore not implemented, comprise:
– Amendments to IFRS 3: Business Combinations (effective date 1 January 2020).
It is assessed that the amendments to IFRS 3 might have an impact on the future recognition and measurement for the Group accounts.
110Consolidated financial statements
Overview Business updates Financial performanceMarket review/outlook Financial statements

5.7.2 General accounting policies
Group AccountsThe consolidated financial statements comprise ROCKWOOL International A/S and the entities in which the company and its subsidiaries hold the majority of the voting rights.
The consolidated financial statements have been prepared as a con-solidation of the parent company’s and the individual subsidiaries’ financial statements, determined according to the Group’s account-ing policies, and with elimination of dividends, internal revenue and expenditure items, internal profits as well as intercompany balances and intercompany shareholdings.
Besides shares, capital investments in subsidiaries include long-term loans to subsidiaries if such loans constitute an addition to the shareholding.
Translation of foreign currencyThe Annual Report has been presented in Euro (EUR) which is the Group’s presentation currency. Each company in the Group deter-mines its own functional currency.
Transactions in foreign currency are translated using the exchange rate at the transaction date or a hedged rate. Monetary items in for-eign currency are translated using the exchange rates at the balance sheet date. Accounts of foreign subsidiaries are translated using the exchange rates at the balance sheet date for balance sheet items, and the periodic average exchange rates for items of the income statement.
All exchange rate adjustments are recognised in the income state-ment under financial items, apart from the exchange rate differences arising on:
– Conversion of equity in subsidiaries at the beginning of the financial year using the exchange rates at the balance sheet date
– Conversion of the profit for the year from average exchange rates to exchange rates at the balance sheet date
– Conversion of long-term intercompany balances that constitute an addition to the holding of shares in subsidiaries
– Conversion of the forward hedging of capital investments in subsidiaries
– Conversion of capital investments in associated and other companies
– Profit and loss on effective derivative financial instruments used to hedge expected future transactions
These value adjustments are recognised directly under other comprehensive income.
Critical estimates and judgementsIn preparing the consolidated financial statements, Management makes various accounting estimates and assumptions that form the basis of the presentation, recognition and measurement of the Group’s assets and liabilities. The most significant accounting estimates and judgements are presented below.
In applying the Group’s accounting policies, Management make judgements that may significantly influence the amounts recognised in the consolidated financial statements. When determining the carrying amount of some assets and liabilities it requires Management to make judgments, estimates and assumptions concerning future events.
The judgements, estimates and assumptions are based on historical experience and other factors, and are considered by Management as reasonable in the circumstances, but are inherently uncertain and unpredictable and therefore the actual outcome may differ from these estimates. Management considers critical estimates and judgements under the following items as significant to the consolidated financial statements:
– Impairment testing (note 2.5)– Expected lifetime for tangible assets (note 2.2)– Deferred tax assets and uncertain tax positions (note 5.3)– Pension obligations (note 2.6)
5.7 New and changed standards and general accounting policies (continued)
Notes
111Consolidated financial statements
Overview Business updates Financial performanceMarket review/outlook Financial statements

Country % Shares ownedParent companyROCKWOOL International A/S
SubsidiariesInsulationROCKWOOL Handelsgesellschaft m.b.H. Austria 100ROCKWOOL B.V.B.A. Belgium 100Etablissements Charles Wille et cie SA Belgium 100ROCKWOOL Bulgaria Ltd. Bulgaria 100ROXUL Inc. Canada 100ROCKWOOL Firesafe Insulation (Jiangsu) Co., Ltd. China 100ROCKWOOL Firesafe Insulation (Guangzhou) Co. Ltd. China 94.84ROCKWOOL Adriatic d.o.o. Croatia 100ROCKWOOL a.s. Czech Republic 100ROCKWOOL A/S Denmark 100ROCKWOOL EE OÜ Estonia 100ROCKWOOL Finland OY Finland 100ROCKWOOL France S.A.S France 100Deutsche ROCKWOOL GmbH & Co. KG Germany 100HECK Wall Systems GmbH Germany 100ROCKWOOL Mineralwolle GmbH Flechtingen Germany 100ROCKWOOL Operations GmbH & Co.KG Germany 100ROCKWOOL Limited Great Britain 100ROCKWOOL Building Materials Ltd. Hong Kong 100ROCKWOOL Hungary Kft. Hungary 100ROXUL ROCKWOOL Insulation India Ltd. India 100ROXUL ROCKWOOL Technical Insulation India Pvt. Ltd. India 100ROCKWOOL Italia S.p.A. Italy 100ROCKWOOL Korea Co. Ltd. Korea 100SIA ROCKWOOL Latvia 100ROCKWOOL UAB Lithuania 100ROCKWOOL Malaysia Sdn. Bhd. Malaysia 94.84Breda Confectie B.V. the Netherlands 100ROCKWOOL B.V. the Netherlands 100A/S ROCKWOOL Norway 100ROCKWOOL Polska Sp. z o.o. Poland 100FAST Sp. z o.o. Poland 100
5.8 Group companies
Notes
112Consolidated financial statements
Overview Business updates Financial performanceMarket review/outlook Financial statements

5.8 Group companies (continued)
NotesCountry % Shares owned
SubsidiariesInsulation (continued)ROCKWOOL Romania s.r.l. Romania 100LLC ROCKWOOL Russia 100LLC ROCKWOOL-NORTH Russia 100LLC ROCKWOOL-Ural Russia 100LLC ROCKWOOL-VOLGA Russia 100ROCKWOOL Building Materials (Singapore) Pte Ltd. Singapore 100ROCKWOOL Slovensko s.r.o. Slovakia 100ROCKWOOL Peninsular S.A.U. Spain 100ROCKWOOL AB Sweden 100Flumroc AG Switzerland 100PAMAG Engineering AG Switzerland 100ROCKWOOL GmbH Switzerland 100ROCKWOOL Limited Thailand 94.84ROCKWOOL Insaat ve Yelitim Sistemleri San. Ve Tic. Ltd. Sti. Turkey 100ROCKWOOL Middle East FZE UAE 100LLC ROCKWOOL Ukraine Ukraine 100ROXUL USA Inc. United States 100SystemsChicago Metallic (Shenzhen) Co., Ltd. China 100ROCKWOOL Rockfon GmbH Germany 100Chicago Metallic (Asia Pacific) Ltd. Hong Kong 100Chicago Metallic (Malaysia) Sdn. Bhd. Malaysia 100Other subsidiariesROCKWOOL Beteiligungs GmbH Germany 100ROCKWOOL Verwaltungs GmbH Germany 100CMC Productos Perlitas s de rl de cv Mexico 100Servicios Pearl de Mexico s de rl de cv Mexico 100ROCKWOOL Global Business Service Center Sp. Z.o.o. Poland 100Meilco Holding AG Switzerland 100Associated companiesBetterhome ApS Denmark 33RESO SA France 20
The German subsidiaries DEUTSCHE ROCKWOOL GmbH & Co. KG and ROCKWOOL Operations GmbH & Co. KG, which have legal form of partnership, make use of the exemptions provided by section 264b of the German Commercial Code (HGB).
113Consolidated financial statements
Overview Business updates Financial performanceMarket review/outlook Financial statements

Definition of key figures and ratios
EBITDAEarnings before depreciation, write-downs,amortisations, financial items and tax
EBITEarnings before financial items and tax
Net working capital (NWC)Trade receivables, other receivables and other current operating assets less trade payables, other payables and other current operational liabilities adjusted for investment payables
Invested capitalNWC + intangible assets, tangible assets and right-of-use assets less non-interest bearing liabilities and investment payables
Net interest bearing debtCash less bank loans and other loans less bank debt less lease liabilities
EBITDA margin (%)EBITDANet sales
x 100%
EBIT margin (%)EBITNet sales
x 100%
Earnings per share of DKK 10 (EUR 1.3)Profit for the year after non-controlling interestsAverage number of outstanding shares
Diluted earnings per share of DKK 10 (EUR 1.3)Profit for the year after non-controlling interestsDiluted average number of outstanding shares
Cash flow per share of DKK 10 (EUR 1.3)Cash flows from operating activitiesAverage number of outstanding shares
Dividend per share of DKK 10 (EUR 1.3)Proposed dividend for the yearNumber of shares at the end of the year
Book value per share of DKK 10 (EUR 1.3)Equity end of the year after non-controlling interestsNumber of shares at the end of the year
Return on invested capital (ROIC)EBITAverage invested capital including goodwill
x 100%
Return on equity (%)Profit for the year after non-controlling interestsAverage equity excluding non-controlling interests
x 100%
Equity ratio (%)Equity end of the year excl. non-controlling interestsTotal equity and liabilities at the end of the year
x 100%
Payout ratio (%)Proposed dividend for the yearProfit for the year after non-controlling interests
x 100%
Leverage ratioNet interest-bearing debtEBITDA
Financial gearingNet interest-bearing debtEquity end of the year
Market capNumber of outstanding shares x share price
Growth in local currencyGrowth rates excluding currency impact, as both periods are using the same exchange rates.
RATIOSThe ratios have been calculated in accordance with www.keyratios.org/ issued by CFA Society Denmark. The ratios mentioned in the five-year summary are calculated as described in the definitions above.
EXCHANGE RATEAverage DKK/EUR2019 7.462018 7.452017 7.442016 7.452015 7.46
Accounts of foreign subsidiaries are translated using the exchange rates at the balance sheet date for balance sheet items, and the periodic average exchange rates for items of the income statement.
114ROCKWOOL Group Annual Report 2019
Overview Business updates Financial performanceMarket review/outlook Financial statements

Management’s statement
The Board of Directors and the Registered Directors have today considered and adopted the Annual Report of ROCKWOOL International A/S for the financial year 1 January - 31 December 2019.
The Consolidated financial statements have been prepared in accordance with International Financial Reporting Standards as adopted by the EU and further requirements in the Danish Financial Statements Act, and the parent company financial statements have been prepared in accordance with the Danish Financial Statement Act. Management's review has been prepared in accordance with the Danish Financial Statement Act.
In our opinion the consolidated financial statements and the parent company financial statements give a true and fair view of the
Hedehusene, 5 February 2020
Registered Directors
Jens Birgersson CEO
Kim Junge Andersen CFO
Board of Directors
Henrik Brandt Chairman
Thomas Kähler
René Binder Rasmussen
Carsten Bjerg First Deputy Chairman
Andreas Ronken
Connie Enghus Theisen
Søren Kähler Second Deputy Chairman
Jørgen Tang-Jensen
Christian Westerberg
Group’s and the parent company’s financial position at 31 December 2019 and of the results of the Group’s and the parent company’s operations and cash flows for the financial year 1 January - 31 December 2019.
In our opinion the Management’s review includes a true and fair account of the development in the operations and financial circumstances of the Group and the parent company, of the results for the year and of the financial position of the Group and the parent company, as well as a description of the more significant risks and elements of uncertainty facing the Group and the parent company.
We recommend that the Annual Report be approved at the Annual General Meeting.
115ROCKWOOL Group Annual Report 2019
Overview Business updates Financial performanceMarket review/outlook Financial statements

Independent auditor’s reportTo the shareholders of ROCKWOOL International A/S
Key audit matterImpairment of intangible and tangible assetsIntangible and tangible assets might be impaired due to for example increased competition in local markets, changes in the global economy and changes in the strategy of the Group.
We focused on this area as the determination of whether or not an impairment charge for intangible and tangible assets was necessary involves significant estimates and judgements made by Management, including especially:
– estimation of future cash flows and the key assumptions underlying Management’s expectations;
– discount rates applied in discounting future cash flows; and– long-term growth rates
Reference is made to notes 2.1, 2.2, 2.4 and 2.5 to the Consolidated Financial Statements.
How our audit addressed the key audit matterWe tested the impairment tests prepared by Management and evaluated the reasonableness of estimates and judgements made by Management in preparing these.
Our audit procedures included assessing the Group’s impairment model.
Special focus was given to the key drivers of the future cash flows, including growth in net revenues, cost inflation and efficiency improvements, as well as the discount rates and long-term growth rates applied.
We tested the reliability of Management’s estimates by comparing budgeted figures to actual figures for the past years and evaluated the discount rates and long-term growth rates applied.
Moreover, we examined sensitivity analyses performed over changes in discount rates, revenue growth and efficiency improvements.
Our opinionIn our opinion, the Consolidated Financial Statements give a true and fair view of the Group’s financial position at 31 December 2019 and of the results of the Group’s operations and cash flows for the financial year 1 January to 31 December 2019 in accordance with In-ternational Financial Reporting Standards as adopted by the EU and further requirements in the Danish Financial Statements Act.
Moreover, in our opinion, the Parent Company Financial Statements give a true and fair view of the Parent Company’s financial position at 31 December 2019 and of the results of the Parent Company’s operations for the financial year 1 January to 31 December 2019 in accordance with the Danish Financial Statements Act.
Our opinion is consistent with our Auditor’s Long-form Report to the Audit Committee and the Board of Directors.
What we have auditedThe Consolidated Financial Statements of ROCKWOOL International A/S for the financial year 1 January to 31 December 2019 (pp. 67-113) comprise income statement and statement of comprehensive income, balance sheet, cash flow statement, statement of changes in equity and notes, including summary of significant accounting policies.
The Parent Company Financial Statements of ROCKWOOL Interna-tional A/S for the financial year 1 January to 31 December 2019 com-prise income statement, balance sheet, statement of changes in equity and notes, including summary of significant accounting policies.
Collectively referred to as the “Financial Statements”
Basis for opinionWe conducted our audit in accordance with International Standards on Auditing (ISAs) and the additional requirements applicable in Den-mark. Our responsibilities under those standards and requirements are further described in the Auditor’s responsibilities for the audit of the Financial Statements section of our report.
We believe that the audit evidence we have obtained is sufficient and appropriate to provide a basis for our opinion.
IndependenceWe are independent of the Group in accordance with the International Ethics Standards Board for Accountants’ Code of Ethics for Professional Accountants (IESBA Code) and the additional requirements applicable in Denmark. We have also fulfilled our other ethical responsibilities in accordance with the IESBA Code.
To the best of our knowledge and belief, prohibited non-audit services referred to in Article 5(1) of Regulation (EU) No 537/2014 were not provided.
AppointmentWe were first appointed auditors of ROCKWOOL International A/S on 9 April 2014 for the financial year 2014. We have been reappointed annually by shareholder resolution for a total period of uninterrupted engagement of 6 years including the financial year 2019.
Key audit mattersKey audit matters are those matters that, in our professional judgement, were of most significance in our audit of the Financial Statements for 2019. These matters were addressed in the context of our audit of the Financial Statements as a whole, and in forming our opinion thereon, and we do not provide a separate opinion on these matters.
116ROCKWOOL Group Annual Report 2019
Overview Business updates Financial performanceMarket review/outlook Financial statements

Statement on Management’s ReviewManagement is responsible for Management’s Review (pp. 3-66 and p. 114).
Our opinion on the Financial Statements does not cover Management’s Review, and we do not express any form of assurance conclusion thereon.
In connection with our audit of the Financial Statements, our responsibility is to read Management’s Review and, in doing so, consider whether Management’s Review is materially inconsistent with the Financial Statements or our knowledge obtained in the audit, or otherwise appears to be materially misstated.
Moreover, we considered whether Management’s Review includes the disclosures required by the Danish Financial Statements Act.
Based on the work we have performed, in our view, Management’s Review is in accordance with the Consolidated Financial Statements and the Parent Company Financial Statements and has been prepared in accordance with the requirements of the Danish Financial Statements Act. We did not identify any material misstatement in Management’s Review.
Management’s responsibilities for the Financial StatementsManagement is responsible for the preparation of consolidated financial statements that give a true and fair view in accordance with International Financial Reporting Standards as adopted by the EU and further requirements in the Danish Financial Statements Act and for the preparation of parent company financial statements that give a true and fair view in accordance with the Danish Financial Statements Act, and for such internal control as Management determines is necessary to enable the preparation of financial statements that are free from material misstatement, whether due to fraud or error.
In preparing the Financial Statements, Management is responsible for assessing the Group’s and the Parent Company’s ability to continue as a going concern, disclosing, as applicable, matters related to going concern and using the going concern basis of accounting unless Management either intends to liquidate the Group or the Parent
Company or to cease operations, or has no realistic alternative but to do so.
Auditor’s responsibilities for the audit of the Financial StatementsOur objectives are to obtain reasonable assurance about whether the Financial Statements as a whole are free from material misstatement, whether due to fraud or error, and to issue an auditor’s report that includes our opinion. Reasonable assurance is a high level of assurance, but is not a guarantee that an audit conducted in accordance with ISAs and the additional requirements applicable in Denmark will always detect a material misstatement when it exists. Misstatements can arise from fraud or error and are considered material if, individually or in the aggregate, they could reasonably be expected to influence the economic decisions of users taken on the basis of these Financial Statements.
As part of an audit in accordance with ISAs and the additional requirements applicable in Denmark, we exercise professional judgement and maintain professional scepticism throughout the audit. We also:
– Identify and assess the risks of material misstatement of the Financial Statements, whether due to fraud or error, design and perform audit procedures responsive to those risks, and obtain audit evidence that is sufficient and appropriate to provide a basis for our opinion. The risk of not detecting a material misstatement resulting from fraud is higher than for one resulting from error, as fraud may involve collusion, forgery, intentional omissions, misrepresentations, or the override of internal control.
– Obtain an understanding of internal control relevant to the audit in order to design audit procedures that are appropriate in the circumstances, but not for the purpose of expressing an opinion on the effectiveness of the Group’s and the Parent Company’s internal control.
– Evaluate the appropriateness of accounting policies used and the reasonableness of accounting estimates and related disclosures made by Management.
(continued)
– Conclude on the appropriateness of Management’s use of the going concern basis of accounting and based on the audit evidence obtained, whether a material uncertainty exists related to events or conditions that may cast significant doubt on the Group’s and the Parent Company’s ability to continue as a going concern. If we conclude that a material uncertainty exists, we are required to draw attention in our auditor’s report to the related disclosures in the Financial Statements or, if such disclosures are inadequate, to modify our opinion. Our conclusions are based on the audit evidence obtained up to the date of our auditor’s report. However, future events or conditions may cause the Group or the Parent Company to cease to continue as a going concern.
– Evaluate the overall presentation, structure and content of the Financial Statements, including the disclosures, and whether the Financial Statements represent the underlying transactions and events in a manner that achieves fair presentation.
– Obtain sufficient appropriate audit evidence regarding the financial information of the entities or business activities within the Group to express an opinion on the Consolidated Financial Statements. We are responsible for the direction, supervision and performance of the group audit. We remain solely responsible for our audit opinion.
Independent auditor’s report
117ROCKWOOL Group Annual Report 2019
Overview Business updates Financial performanceMarket review/outlook Financial statements

We communicate with those charged with governance regarding, among other matters, the planned scope and timing of the audit and significant audit findings, including any significant deficiencies in internal control that we identify during our audit.
We also provide those charged with governance with a statement that we have complied with relevant ethical requirements regarding independence, and to communicate with them all relationships and other matters that may reasonably be thought to bear on our independence, and where applicable, related safeguards.
Hellerup, 5 February 2020
PricewaterhouseCoopers Statsautoriseret Revisionspartnerselskab CVR no 3377 1231
Torben JensenState Authorised Public Accountantmne18651
Rune KjeldsenState Authorised Public Accountantmne34160
(continued)
Independent auditor’s report
From the matters communicated with those charged with governance, we determine those matters that were of most significance in the audit of the Financial Statements of the current period and are therefore the key audit matters. We describe these matters in our auditor’s report unless law or regulation precludes public disclosure about the matter or when, in extremely rare circumstances, we determine that a matter should not be communicated in our report because the adverse consequences of doing so would reasonably be expected to outweigh the public interest benefits of such communication.
118ROCKWOOL Group Annual Report 2019
Overview Business updates Financial performanceMarket review/outlook Financial statements

Financial statements for ROCKWOOL International A/S
120 Income statement
121 Balance sheet
122 Statement of shareholders’ equity
123 Notes
119Parentcompanyfinancialstatements
Financial statementsFinancial performanceBusiness updatesMarket review/outlookOverview

Income statement – ROCKWOOL International A/S1January–31DecemberEURm Note 2019 2018
Net sales 2.1 402 269Costs of raw material and consumables 134 61Other external costs 110 99Gross profit 158 109Personnel costs 2.2 58 47Depreciation, amortisation and write-downs 3.1, 3.2 24 13Operating profit / EBIT 76 49Income from investments in subsidiaries 2.3 226 251Financial income 4.1 10 5Financial expenses 4.1 11 11Profit before tax 301 294Tax on profit for the year 5.1 27 7Profit for the year 274 287
120Parent company financial statements
Overview Business updates Financial performanceMarket review/outlook Financial statements

Balance sheet – ROCKWOOL International A/SAssets – as at 31 December Equity and liabilities – as at 31 DecemberEURm Note 2019 2018Completed development projects 13 13Acquired patents, licenses and trademarks 21 20Development projects in progress 9 12Intangible assets 3.1 43 45Land and buildings 21 14Other fixtures and fittings, tools and equipment 7 4Prepayments and property, plant and equipment in progress 1 3Property, plant and equipment 3.2 29 21Investment in subsidiaries 1,821 1,665Receivables from subsidiaries 204 46Fixed assets investments 3.3 2,025 1,711Fixed assets 2,097 1,777Inventories - 8Contract work in progress 3.4 17 28Receivables from subsidiaries 270 252Tax receivables 7 4Other receivables 27 19Prepayments 5 6Receivables 326 309Cash 126 257Current assets 452 574Assets 2,549 2,351
EURm Note 2019 2018Share capital 29 29Revaluation reserve according to the equity method 43 1Reserve for development costs 22 25Retained earnings 1,909 1,724Proposed dividend 94 88Shareholders’ equity 2,097 1,867Deferred tax 5.2 5 6Other provisions 3 2Provisions 8 8Trade payables 24 19Payables to subsidiaries 402 430Other payables 18 27Current liabilities 444 476Liabilities 452 484Liabilities and shareholders’ equity 2,549 2,351
121Parent company financial statements
Overview Business updates Financial performanceMarket review/outlook Financial statements

Statement of shareholders’ equity, ROCKWOOL International A/S
EURmShare
capital
Revaluation reserve
according to the equity method
Reserve for develop-
ment costsRetained earnings
Proposed dividend
Totalequity
Shareholders’ equity 1/1 2019 29 1 25 1,724 88 1,867Exchange rate adjustments - - - -1 - -1Profit for the year - -4 - 184 94 274Development costs for the year - - -3 3 - -Currency revaluation of investments in subs - 53 - - - 53Other adjustments - -7 - - - -7Expensed value of RSUs issued - - - 0 - 0Sale and purchase of own shares - - - -2 - -2Dividend paid to the shareholders - - - 1 -88 -87Shareholders’ equity 31/12 2019 29 43 22 1,909 94 2,097
EURmShare
capital
Revaluation reserve
according to the equity method
Reserve for develop-
ment costsRetained earnings
Proposed dividend
Totalequity
Shareholders’ equity 1/1 2018 29 - 18 1,116 71 1,234Adjustment to opening balance due to changes in accounting principles - 77 - 341 - 418Restated shareholders’ equity 1/1 2018 29 77 18 1,457 71 1,652Exchange rate adjustments - - - -3 - -3Profit for the year - -80 - 279 88 287Development costs for the year - - 7 -7 - -Currency revaluation of investments in subs - -16 - - - -16Other adjustments - 20 - -24 - -4Expensed value of RSUs issued - - - 1 - 1Sale and purchase of own shares - - - 20 - 20Dividend paid to the shareholders - - - 1 -71 -70Shareholders’ equity 31/12 2018 29 1 25 1,724 88 1,867
122Parent company financial statements
Overview Business updates Financial performanceMarket review/outlook Financial statements

Notes for ROCKWOOL International A/S
1 1.0 Accounting policies 124
2 2.1 Net sales 125 2.2 Personnel costs 125 2.3 Income from investments in subsidiaries 125
3 3.1 Intangible assets 126 3.2 Property, plant and equipment 126 3.3 Fixed assets investments 127 3.4 Contract work in progress 127
4 4.1 Financial income and Financial expenses 128 4.2Proposeddistributionofprofit 128 4.3 Derivatives 128
5 5.1Taxonprofitfortheyear 129 5.2 Deferred tax 129 5.3 Auditor’s fee 129 5.4 Commitments and contingent liabilities 129 5.5 Related parties 129
123Parentcompanyfinancialstatements
Financial statementsFinancial performanceBusiness updatesMarket review/outlookOverview

1.0 Accounting policies
Note 1
The financial statements of ROCKWOOL International A/S have been prepared in accordance with the Danish Financial Statements Act (accounting class D).
The Financial statements for 2019 are presented in EUR.
Changes in accounting policiesThe accounting policies have been changed compared to last year, as the parent company is applying the Danish Financial Statements Act instead of IFRS as was the case in 2018.
Prior to the transition to the Danish Financial Statements Act, the parent company has changed the accounting policy for measurement of investments in subsidiaries from the cost price method to the equity value method. As a result hereof, the 2018 comparative figures have been adjusted, resulting in an adjusted profit for the year of EUR 287 million (previously EUR 481 million) and adjusted equity of EUR 1,867 million (previously EUR 1,662 million) at 31 December 2018.
When changing accounting policy to the Danish Financial Statements Act, the company has elected to use the carrying value of subsidiaries as deemed cost for subsidiaries under the Danish Financial Statements Act as per 1 January 2018 i.e. the company have not amortised goodwill before that date. From 1 January 2018 goodwill which forms part of the carrying value of subsidiaries have been amortised and recognised as part of income from subsidiaries.
The accounting policies are the same as for the consolidated financial statements with the adjustments described below. For a description of the Group’s accounting policies, please refer to the consolidated financial statements.
Recognition and measurement in generalIncome is recognised in the income statement as earned.
All costs incurred in generating the year’s revenue are also recognised in the income statement, including depreciation, amortisation and impairment losses.
Value adjustments of financial assets and liabilities measured at fair value or amortised cost are also recognised in the income statement.
Assets are recognised in the balance sheet when it is considered probable that future economic benefits will flow to the company and the value of the asset can be measured on a reliable basis. Liabilities are recognised in the balance sheet when they are considered probable and can be measured on a reliable basis. At initial recognition, assets and liabilities are measured at cost. Assets and liabilities are subsequently measured as described below for each item.
Net salesThe company produces and sells machinery and consultancy service under fixed price contracts. The projects typically include one deliverable. Revenue from the projects is recognised over time based on the progress and is based on the price of the projects. As the work is done at the customer's site, control is transferred along with the progress of the project. Recognition is based on the actual costs spent relative to the total estimated costs for the project, as this method is estimated to reflect the transfer of control. The credit terms are normally end of month plus 20 days.
Royalty is received for the use of the ROCKWOOL brand and technology. Royalty is based on the level of sales in the subsidiaries and recognised when earned according to the terms in the agreement.
Intangible assetsThe accounting policies for intangible assets follow those of the Group with the exception of goodwill, which is amortised over a period of 10 years using the straight-line method.
An amount equal to the total capitalised development costs after tax is recognised under Shareholders’ equity in the Reserve for development costs.
Fixed assets investmentsInvestments in subsidiaries are recognised initially at cost and measured subsequently using the equity method. The company’s share of the equity of subsidiaries, based on the fair value of the identifiable net assets on the acquisition date, minus or plus unrealised intercompany profits or losses, with addition of any residual value of goodwill, is recognised under Investments in subsidiaries in the balance sheet.
If the shareholders’ equity of subsidiaries is negative and ROCKWOOL International A/S has a legal or constructive obligation to cover the company’s negative equity, a provision is recognised. Net revaluation of investments in subsidiaries is recognised under Shareholders’ equity in the Revaluation reserve according to the equity method. The reserve is reduced by payments of dividends to the parent company and adjusted to reflect other changes in the equity of subsidiaries.
The proportionate share of the net profits of subsidiaries less goodwill amortisation is recognised under Income from investments in subsidiaries in the income statement. Goodwill in subsidiaries is amortised over a period of 10 years using the straight-line method.
Receivables from subsidiariesReceivables from subsidiaries are recognised at amortised costs and are subsequently measured after deduction of allowance for losses based on an individual assessment.
LeasesLeases in which a significant portion of the risks and rewards of ownership are retained by the lessor are classified as operating leases. Payments made under operating leases are charged to the income statement on a straight-line basis over the period of the lease.
DividendThe dividend proposed for the financial year is shown as a separate item under Shareholders’ equity.
Cash flow statementROCKWOOL International A/S has in accordance with the Danish Financial Statements Act, Section 86 (4) not prepared separate cash flow state ments. Please refer to the consolidated cash flow statements.
References to notes to the consolidated financial statements for the following notes, see information in the consolidated financial statements:– Own shares – see note 4.4– Share capital – see note 4.5
124Parent company financial statements
Overview Business updates Financial performanceMarket review/outlook Financial statements

EURm 2019 2018Revenue from projects 160 85Royalties and other fees 242 184Total 402 269
EURm 2019 2018Share of net profit/(loss) 236 229 Amortisation of goodwill -10 -9Reversal of write-down of shares and receivables in subsidiaries - 31Total 226 251
2.1 Net sales
2.2 Personnel costs
Reference is made to note 1.3 and 1.4 to the consolidated financial statements concerning remuneration of the Board of Directors and the Registered Directors.
EURm 2019 2018Wages and salaries 52 42Expensed value of RSUs issued 1 1Pension costs 5 4Other social security costs 0 0Total 58 47Average number of employees in ROCKWOOL International A/S 428 369
Note 22.3 Income from investments in subsidiaries
125Parent company financial statements
Overview Business updates Financial performanceMarket review/outlook Financial statements

EURm
Completed development
projects
Acquired patents,
licenses and trademarks
Development projects
in progress2019Total
2018Total
Cost:Accumulated 1/1 66 48 12 126 117Exchange rate adjustments 0 0 0 0 0Additions for the year 9 6 6 21 16Transfer of development projects in progress 7 - -7 - -Disposals for the year -3 -1 -2 -6 -7Accumulated 31/12 79 53 9 141 126Amortisation and write-downs:Accumulated 1/1 53 28 - 81 77Exchange rate adjustments 0 0 - 0 0Amortisation for the year 16 4 - 20 10Disposals for the year -3 0 - -3 -6Accumulated 31/12 66 32 - 98 81Net book value 31/12 13 21 9 43 45
3.1 Intangible assets
Note 3
EURmLand and buildings
Other fixtures and
fittings, tools and
equipment
Prepayments and property,
plant and equipment in
progress2019 Total
2018 Total
Cost:Accumulated 1/1 30 13 3 46 43Exchange rate adjustments 0 1 0 1 -0Additions for the year 0 0 11 11 4Transfer of property, plant and equipment in progress 8 5 -13 - -Disposals for the year -1 -1 0 -2 -1Accumulated 31/12 37 18 1 56 46
Depreciation and write-downs:Accumulated 1/1 16 9 - 25 23Exchange rate adjustments 0 0 - 0 -0Depreciation for the year 1 3 - 4 3Disposals for the year -1 -1 - -2 -1Accumulated 31/12 16 11 - 27 25Net book value 31/12 21 7 1 29 21
3.2 Property, plant and equipment
Of the total net book value of land and buildings, EUR 1 million (2018: EUR 1 million) represent land not subject to depreciation.
Completed development projects and development projects in progress mainly comprise software development.
Comments
Comments
126Parent company financial statements
Overview Business updates Financial performanceMarket review/outlook Financial statements

EURm
2019Investments in
subsidiaries
Receivables from
subsidiaries Total
Cost:Accumulated 1/1 1,664 46 1,710Exchange rate adjustments -1 0 -1Additions for the year 115 162 277Reductions/disposals for the year - -4 -4Accumulated 31/12 1,778 204 1,982
Value adjustments:Accumulated 1/1 1 - 1Exchange rate adjustments 53 - 53Share of net profit 236 - 236Amortisation of goodwill -10 - -10Dividends received -230 - -230Other adjustments -7 - -7Accumulated 31/12 43 - 43Net book value 31/12 1,821 204 2,025
EURm
2018Investments in
subsidiaries
Receivables from
subsidiaries Total
Cost:Accumulated 1/1 1,438 56 1,494Exchange rate adjustments -5 0 -5Additions for the year 254 7 261Reductions/disposals for the year -23 -17 -40Accumulated 31/12 1,664 46 1,710
Value adjustments:Accumulated 1/1 -343 -36 -379Effect of changes in accounting principles 418 - 418Restated value adjustments 1/1 75 -36 39Exchange rate adjustments -14 0 -14Share of net profit 229 - 229Amortisation of goodwill -9 - -9Reversal write-downs previous years - 31 31Disposals for the year 23 5 28Dividends received -300 - -300Other adjustments -3 - -3Accumulated 31/12 1 - 1Net book value 31/12 1,665 46 1,711
3.3 Fixed assets investments
Note 3
3.4 Contract work in progressEURm 2019 2018Sales values of work performed 209 77 Invoiced on account -192 -49 Contract work in progress, net 17 28
Recognised as follows:Contract work in progress (assets) 17 28 Prepayments received, contract work in progress - -
127Parent company financial statements
Overview Business updates Financial performanceMarket review/outlook Financial statements

EURm 2019 2018Interest income 0 1Interest income from subsidiaries 1 1Foreign exchange gains 9 3Financial income 10 5
EURm 2019 2018Interest expenses etc. 3 4Interest expenses to subsidiaries 6 3Fair value adjustment phantom shares 1 4Foreign exchange losses 1 0
Financial expenses 11 11
4.1 Financial income and Financial expenses
Note 4
4.2ProposeddistributionofprofitEURm 2019 2018Proposed distribution of profitProposed dividend to shareholders 94 88Revaluation reserve according to equity method -4 -80Retained earnings 184 279
Total profit 274 287
Reference is made to note 4.2 to the consolidated financial statements concerning derivatives.
The policy is not to hedge exchange rate risks in long-term investments in subsidiaries.
When relevant, external investment loans and Group receivables are, as a general rule, established in the local currency of the company involved, while cash at bank and in hand are placed in the local currency.
In the few countries with ineffective financial markets loans can be raised and surplus liquidity placed in DKK, EUR or USD, subject to the approval of the parent company’s finance function.
Most Group receivables that are not established in DKK or EUR are hedged via forward agreements, currency loans and cash pools or via the SWAP market.
To ensure adequate financial reserves as defined by the Board of Directors, investment loans can be raised on a continuous basis to partly cover new investments and to refinance existing loans. Guarantees has been made for some credit facilities and loans. Please refer to note 3.3 for further specification of the receivables.
Ownership clauses have been issued and/or deed of postponements in connection with intercompany receivables. Please refer to note 5.4.
Comments
4.3 Derivatives
128Parent company financial statements
Overview Business updates Financial performanceMarket review/outlook Financial statements

EURm 2019 2018Current tax for the year 15 8Change in deferred tax 1 -3Withholding taxes 8 1Adjustment in current and deferred tax in previous years 3 1Total 27 7
5.1 Taxonprofitfortheyear
EURm 2019 2018Deferred tax 1/1 6 4Change in deferred tax recognised in profit and loss -1 -1Deferred tax for the year recognised in equity 0 3Deferred tax 31/12 5 6
5.2 Deferred tax
Note 5
5.3 Auditor’s feeFees to auditors elected at the Annual General Meeting consist of:EURm 2019 2018Statutory audit 0 0Other opinions 0 0Tax consultancy 1 0Other services 0 1Total 1 1
Reference is made to note 5.4 to the consolidated financial statements concerning fees to statutory auditor.
5.4 Commitments and contingent liabilities
The are no contingent liabilities neither this year nor last year.
For certain receivables amounting to EUR 80 million (2018: EUR 146 million) deeds of postponement have been given.
Comments
Operational lease commitments expire within the following periods as from the balance sheet date:EURm 2019 2018Within 1 year 1 1Between 1 and 5 years 0 0After 5 years - -Total 1 1
ROCKWOOL International A/S has registered the following shareholders holding more than 5% of the share capital or the votes:
2019
Share capital Votes
ROCKWOOL Foundation, DK-1360 Copenhagen K 23% 28%15. Juni Fonden, DK-2970 Hoersholm 6% 10%Dorrit Eegholm Kähler, DK-2830 Virum 4% 6%
5.5 Related parties
129Parent company financial statements
Overview Business updates Financial performanceMarket review/outlook Financial statements

The ROCKWOOL® trademarkThe ROCKWOOL trademark was initially registered in Denmark as a logo mark back in 1936. In 1937, it was accompanied with a word mark registration; a registration which is now extended to more than 60 countries around the world.
The ROCKWOOL trademark is one of the largest assets in ROCKWOOL Group, and thus well protected and defended by us throughout the world.
ROCKWOOL Group’s primary trademarks:ROCKWOOL®
Rockfon®
Rockpanel®
Grodan® Lapinus®
Additionally, ROCKWOOL Group owns a large number of other trademarks.
DisclaimerThe statements on the future in this report, including expected sales and earnings, are associated with risks and uncertainties and may be affected by factors influencing the activities of the Group, e.g. the global economic environment, including interest and exchange rate developments, the raw material situation, production and distribution-related issues, breach of contract or unexpected termination of contract, price reductions due to market-driven price reductions, market acceptance of new products, launches of competitive products and other unforeseen factors. In no event shall ROCKWOOL International A/S be liable for any direct, indirect or consequential damages or any other damages whatsoever resulting from loss of use, data or profits, whether in an action of contract, negligence or other action, arising out of or in connection with the use of information in this report. © ROCKWOOL International A/S 2020 All rights reserved
Required reporting referring to the Danish Financial Statement Act §99a and §99b can be found on p. 13 and pp. 32-47. Photography creditsCover (Lucas Gallone)Inside cover (Sushil Nash)P. 8 (Jon Norddahl)P. 14-15 (Adam Mørk)P. 16 (Shutterstock / Zhangyang)P. 17 (Shutterstock / Zhangyang)P. 18,19 (Curro Moreno-Aurioles Martin)P. 20,21 (Sergei Bobylev\TASS via Getty Images) P. 22,23 (Befimmo)P. 24,25 (Gerard-Jan Vlekke)P. 26,27 (Peter Smith)P. 28,29 (Jesper Schwartz)P. 30,31 (SailGP)P. 52 (Jon Norddahl)P. 54 (Jon Norddahl)
Design and productionKontrapunkt A/S
Released5 February 2020
ISSNISSN 1904-8653 (print)ISSN 1904-8661 (online)