
ANNUAL REPORT 2015 OF J.P. MORGAN AG
62
ANNUAL REPORT 2015 OF J.P. MORGAN AG
-
Upload
khangminh22 -
Category
Documents
-
view
1 -
download
0
Transcript of ANNUAL REPORT 2015 OF J.P. MORGAN AG

ANNUAL REPORT 2015 OF J.P. MORGAN AG

INDICATORS J.P. MORGAN AG
€m 2015 2014 2013 2012
Net Revenue 136.4 118.7 105.7 100.1
Net interest income 29.7 13.6 13.9 10.0
Net commission income 73.4 63.3 59.8 50.1
Total expenses 119.3 105.3 89.7 77.6
Income before Tax and extraordinary items 17.1 13.5 16.1 22.5
Net income 8.1 10.9 9.8 22.5
Equity 629 621 611 275
Return on Equity (RoE) 1.30% 1.80% 2.21% 8.16%
Return on Investment 0.06% 0.08% 0.09% 0.14%
Cost-Income Ratio 87.46% 88.71% 84.78% 77.55%
Pre-tax profit margin 12.55% 11.37% 15.22% 22.45%
Tier 1 capital ratio 88.9% 115.13% 87.90% 37.80%
Total capital ratio 114.3% 143.92% 112.70% 71.90%
hIGh vALUE PAyMENTS > PAGE 3: TREASURy SERvICES
€BN Monthly data
1,400
1,300
1,200
1,100
1,000
900
800
700
600
500
400
300
200
100
2012 2013 2014 2015
ASSETS UNDER CUSTODy > PAGE 4: INvESTOR SERvICES
€BN Monthly data
350
300
250
200
150
100
50
2012 2013 2014 2015
1,00
0 tr
ansa
ctio
ns

CONTENT
Annual Report 2015
Management Report 2
Assurance by the Management Board 25
Balance Sheet of J.P. Morgan AG, Frankfurt am Main 28
Income Statement
of J.P. Morgan AG, Frankfurt am Main 32
Notes of J.P. Morgan AG, Frankfurt am Main 34
Auditor’s Report 54
Report of the Supervisory Board 56
2 ManageMent RepoRt
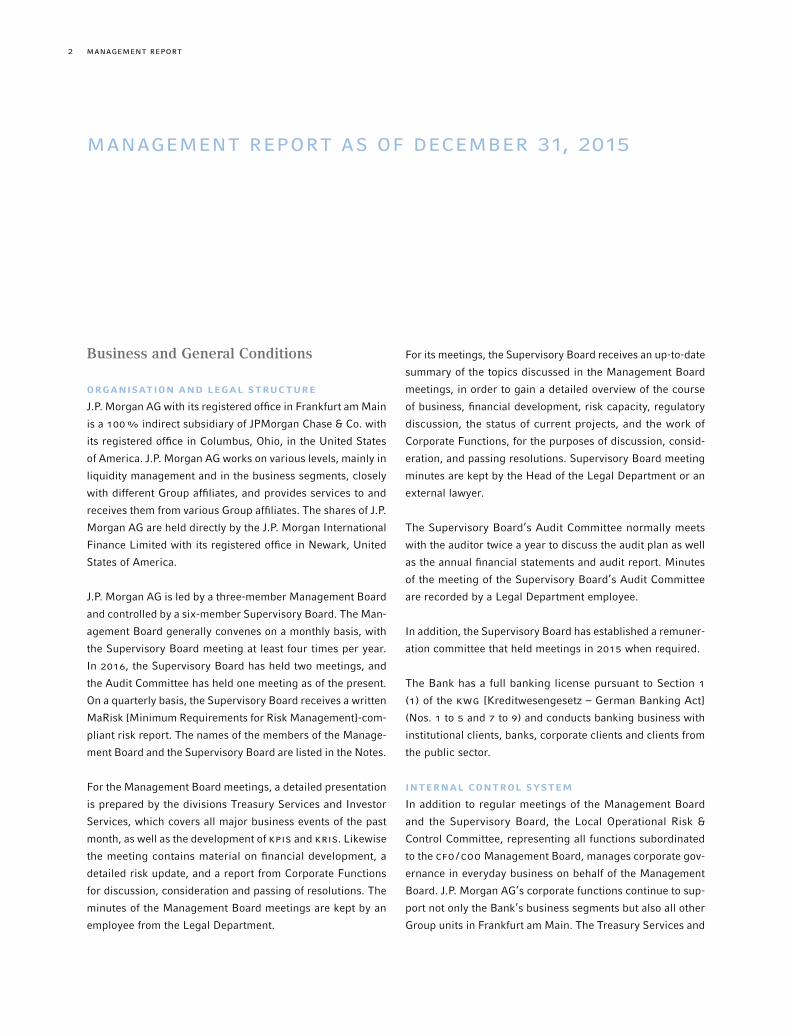
For its meetings, the Supervisory Board receives an up-to-date
summary of the topics discussed in the Management Board
meetings, in order to gain a detailed overview of the course
of business, financial development, risk capacity, regulatory
discussion, the status of current projects, and the work of
Corporate Functions, for the purposes of discussion, consid-
eration, and passing resolutions. Supervisory Board meeting
minutes are kept by the Head of the Legal Department or an
external lawyer.
The Supervisory Board’s Audit Committee normally meets
with the auditor twice a year to discuss the audit plan as well
as the annual financial statements and audit report. Minutes
of the meeting of the Supervisory Board’s Audit Committee
are recorded by a Legal Department employee.
In addition, the Supervisory Board has established a remuner-
ation committee that held meetings in 2015 when required.
The Bank has a full banking license pursuant to Section 1
(1) of the KWG [Kreditwesengesetz – German Banking Act]
(Nos. 1 to 5 and 7 to 9) and conducts banking business with
institutional clients, banks, corporate clients and clients from
the public sector.
INTERNAL CONTROL SySTEM
In addition to regular meetings of the Management Board
and the Supervisory Board, the Local Operational Risk &
Control Committee, representing all functions subordinated
to the CFO /COO Management Board, manages corporate gov-
ernance in everyday business on behalf of the Management
Board. J.P. Morgan AG’s corporate functions continue to sup-
port not only the Bank’s business segments but also all other
Group units in Frankfurt am Main. The Treasury Services and
Business and General Conditions
ORGANISATION AND LEGAL STRUCTURE
J.P. Morgan AG with its registered office in Frankfurt am Main
is a 100% indirect subsidiary of JPMorgan Chase & Co. with
its registered office in Columbus, Ohio, in the United States
of America. J.P. Morgan AG works on various levels, mainly in
liquidity management and in the business segments, closely
with different Group affiliates, and provides services to and
receives them from various Group affiliates. The shares of J.P.
Morgan AG are held directly by the J.P. Morgan International
Finance Limited with its registered office in Newark, United
States of America.
J.P. Morgan AG is led by a three-member Management Board
and controlled by a six-member Supervisory Board. The Man-
agement Board generally convenes on a monthly basis, with
the Supervisory Board meeting at least four times per year.
In 2016, the Supervisory Board has held two meetings, and
the Audit Committee has held one meeting as of the present.
On a quarterly basis, the Supervisory Board receives a written
MaRisk [Minimum Requirements for Risk Management]-com-
pliant risk report. The names of the members of the Manage-
ment Board and the Supervisory Board are listed in the Notes.
For the Management Board meetings, a detailed presentation
is prepared by the divisions Treasury Services and Investor
Services, which covers all major business events of the past
month, as well as the development of KPIs and KRIs. Likewise
the meeting contains material on financial development, a
detailed risk update, and a report from Corporate Functions
for discussion, consideration and passing of resolutions. The
minutes of the Management Board meetings are kept by an
employee from the Legal Department.
MANAGEMENT REPORT As OF DECEMBER 31, 2015

3ManageMent RepoRt
SEGMENTS AND ESSENTIAL PRODUCTS AND
PROCESSES
J.P. Morgan AG is an integral part of the global J.P. Morgan
Group and forms the backbone of the J.P. Morgan Group’s
operations in Germany. The full integration of the Bank into
J.P. Morgan’s global Treasury Services and Investor Services
segments of the Group’s Corporate & Investment Bank plays
a crucial role, as it provides us with the necessary interna-
tional network to deliver client services that do justice to J.P.
Morgan’s mission “First class business in a first class way”.
In 2015, the Bank continued to concentrate on its core busi-
ness, in order to fulfil its roles, based in Frankfurt am Main,
as € clearing provider of the Group, custodian bank and as a
global custodian for the German investment market.
Thus, in 2015 we focussed on efficiency enhancements in our
operating processes in order, on the one hand, to improve the
residual risk profile on the basis of improved control processes
and, on the other, to optimise interaction with our custom-
ers, as well. The development of our KPIs and KRIs as well
as individual feedback from our customers encourage us to
continue in this way in 2016, as well.
Treasury Services
J.P. Morgan AG is globally responsible for the € Clearing Oper-
ations division. In the coming years, in view of an increasing
unification of the European payment transactions and due
to our high investments in technology, we expect to deliver
our leading global technology and our client service in the
mass payment market centrally from J.P. Morgan AG and in
close cooperation with our sister companies both to corpo-
rate clients and to financial institutions throughout Europe.
We are continually expanding our top position as a € clearer
in TARGET2 and EBA by offering improved features to our
Investor Services segments are each managed by one Member
of the Board (Front Office) and controlled by a Member of the
Management Board (CFO /COO).
In addition to the key controlling variables of net interest
income and net commission income, a conservative risk policy
that in particular limits the possible credit and counterparty
risk, provides the basis for successful management of J.P.
Morgan AG by the Management Board. Methods and proce-
dures for evaluating risk-bearing capacity, the risk profile of
J.P. Morgan AG, as well as individual occurrences of risk are
discussed on behalf of the Management Board in J.P. Morgan
AG’s risk committee.
All aspects of the business segments are transparently cov-
ered by a wide-ranging set of scorecards and controlled in
particular by the means of trend analysis and key performance
indicators on a monthly basis in meetings of the Business
Forum, comprised of Sales, Operations and control functions,
with the inclusion of the regional business control officers
of the Group. Additionally, treasury activities are discussed
and monitored in a monthly Asset & Liability Committee. The
Management Board is thus enabled to identify changes or
risks in the business performance in a timely manner and
to make appropriate decisions and implement the necessary
measures.
Moreover, comprehensive reports on all data representing
loan utilisation, overdrafts, condition of collateral and key
COREP figures are produced on a daily basis by the Finance
and Credit Division for the Management Board. These reports
are continuously being developed to meet the increasing regu-
latory requirements.

4 ManageMent RepoRt
company is promptly supported and is in conformity with the
statutory regulations, supervisory provisions and contractual
conditions, as well as safeguarding the underlying assets of
the investment funds.
Through the controls carried out by J.P. Morgan AG as well
as independent controls of the investment management com-
pany (KVG) – especially the monitoring of legality (control of
the instructions of the KVG), control of the share price and
net asset values calculated by the KVG, investment compli-
ance monitoring, the obligation to verify asset ownership,
monitoring of cash flows, controls in the framework of deposi-
tory management (inter alia monitoring of sub-custodians),
controls relating to unit trades and returns, as well as the
control of collateral – we ultimately ensure that the KVG has
appropriate and coherent procedures and processes (includ-
ing, among others, appropriate valuation principles for asset
values of investment funds) available to it and that they are
continuously applied with regard to the respective invest-
ment funds.
In addition to services in connection with safekeeping and set-
tlement of transactions, a comprehensive range of products,
additional services, and above all, client reporting is provided.
In our function as a custodian for investment funds, we notice
that institutional investors (e. g. insurance companies and pen-
sion funds) are very flexible in the search for returns and
consider, as well as implement, alternative investment solu-
tions. In the low-interest environment, infrastructure loans
and financing form a wide field with a broad range of appli-
cations. In this regard, the search for solutions for a suitable
investment strategy reveals a heightened interest in so-called
infrastructure debts. As permissible asset items, such invest-
ments can be acquired in principle for an investment fund,
multinational corporate clients and financial institutions both
domestically and abroad.
On the basis of these infrastructure services, our sales teams
offer highly advanced solutions in the areas of cash, treasury
and trade finance management for corporate clients, insur-
ance companies, asset managers, and financial institutions.
Advanced technology and expansion of the Group’s locations
within the scope of the Global Corporate Banking concept
enable our sales teams to offer ever more comprehensive
global cash management solutions that provide notable
advantages in the management of liquidity, particularly for
our international clients. Together with our highly developed
service concept, this allowed us to continue to grow with
selected, international target clients, above all in global cash
management and in trade finance management.
Investor Services
In J.P. Morgan Group’s global business area of Investor Ser-
vices, J.P. Morgan AG of Frankfurt am Main acts as a fully-
licensed and regulated custodian, which has been offering
global custody and custodian bank services to institutional
clients in Germany since 1995. In this function, J.P. Morgan
AG is currently providing custodial services to 168 investment
funds with more than 800 segments (individually managed
portfolios) for its client base, with a value of € 168 billion.
In addition to the safekeeping and servicing of assets and
the maintenance of an up-to-date inventory (with regard to
custodial and non custodial assets ), as well as settlement
services for transactions, one of our core functions is the pro-
vision of various oversight functions to protect the relevant
investment assets and the interests of the underlying investor.
As part of our control functions, we ensure as a depositary
bank that the ongoing activity of the investment management

5ManageMent RepoRt
Based on our global responsibility for the € Clearing Opera-
tions division resting with the core team in Frankfurt am Main,
as well as teams in sister companies of the Group in Mumbai
(India) and in Manila (Philippines), J.P. Morgan AG services
clients from various countries where the J.P. Morgan Group
operates. In its function as € Clearer in TARGET2 and EBA, J.P.
Morgan AG is among the largest providers of payment services
in Germany in terms of the volume of payments settled daily.
In the Investor Services area we currently offer our services
as a custodian bank and depository primarily to special funds
according to the Investment Act and Alternative Investment
Funds (AIF), subject to the KAGB, in addition to direct invest-
ments by institutional clients (especially insurance companies,
pension provision institutions, pension funds, and church
institutions), corporate clients and public sector clients in
Germany. This also includes subsidiaries or branches based
in Germany whose parent companies have their headquar-
ters in other countries. J.P. Morgan AG is one of the leading
depository /custodian banks in Germany.
Thanks to the strong product and technology leadership of
the J.P. Morgan Group, J.P. Morgan AG is able to win various
important mandates /clients in the Investor Services sector,
emphasising the commitment of J.P. Morgan AG and the J.P.
Morgan Group to client-oriented and innovative product solu-
tions, using economies of scale of standardised processes.
The strong capital base of J.P. Morgan AG as well as its mem-
bership of the voluntary deposit protection scheme has been
received positively among our clients, underlining the Group’s
commitment to J.P. Morgan AG and the German office.
KEy LEGAL AND ECONOMIC INFLUENCE FACTORS
The legal and regulatory environment in 2015 was stable.
The focus was on the implementation of EU initiatives, but
and are very interesting for institutional investors due to their
long maturities. As a custodian, J.P. Morgan AG has embraced
this strategic orientation and the challenges arising from it,
in particular in the assessment, the representation and the
property inspection, in order to help clients make the appro-
priate investments.
A similar growth potential in so-called alternative assets can
be observed in the area of Private Equity. For this class of
investments, J.P. Morgan offers comprehensive end-to-end
solutions for administration as well as in regard to the report-
ing system on the Private Equity and Real Estate Platform
(PeReS), which can be connected with the appropriate deposi-
tary function. Mandates won in the past successfully substan-
tiate the claim to be perceived as a multifunctional service
provider by our client base.
Within the J.P. Morgan Group, the execution of OTC derivatives
subject to clearing is offered through central counterparties
(so-called CCPs). Clients are supported in observing and com-
plying with regulatory provisions efficiently and adequately.
The opportunity to select J.P. Morgan as a clearing member
provides a good chance to influence business activities in a
positive manner.
MARKETS AND COMPETITIvE POSITION
In Treasury Services, there is a need to differentiate between
relationship management and our function as global operat-
ing hub for € clearing operations. In relationship manage-
ment, J.P. Morgan AG is responsible for institutional clients,
banks, corporate clients and public sector clients primarily
based in Germany or Austria. In the area of banking, this
includes subsidiary companies based in Germany or Austria
whose parent companies have their headquarters in other
countries.

6 ManageMent RepoRt
The underlying features of J.P. Morgan AG’s remuneration
system are presented in a separate Remuneration Report
which can be found at the following website: http: / /www.
jpmorgan.com/ investor relations /sEC & Other Fillings /Basel
Pillar 3 Disclosures /germany
BUSINESS DEvELOPMENT
2015 was a year of consolidation for J.P. Morgan AG, with
an economic development that was satisfactory nevertheless.
Our final result continued to suffer under the continued low-
interest-rate policy of the central banks, but the net commis-
sion income especially was nevertheless able to be increased
through price increases in Treasury Services in comparison
with the previous year, while the result in Investor Services
was able to be maintained at the good level of the previous
year.
Overall, the net interest and commission income of 2015
turned out markedly stronger than expected as compared to
the planning for the fiscal year.
Unfortunately, due to increased Group-internal project and
administrative costs as well as the unfavourable development
of the UsD exchange rate, we experienced an increase in
expense of around 13%, which placed a lasting burden on
the operative result in both segments.
The balance sheet total as at December 31, 2015 fell by
14% as compared with the balance sheet date assessment of
December 31, 2014; however, this should not be interpreted
as an indicator of the decline of the business activities, but
rather as the expression of optimised Treasury Management
within the J.P. Morgan Group.
had no significant impact on the core business and customer
relationships of J.P. Morgan AG.
At the centre of the dialogue with customers was again the
placement of excess liquidity in view of the continued negative
interest rate policy of the European Central Bank, on the one
hand, and in view of the efforts of the Group to reduce the
so-called “Non-Operating Deposits”. On this point, we would
also like to make reference to the publications of JPMorgan
Chase & Co. available on its website.
Topics that occupy us already today with a look to coming
years include, inter alia, implementation projects such as the
implementation of the extended requirements as to the tasks
and duties of the custodian that the BaFin (German Federal
Financial Supervisory Authority) published in October 2015,
but also pioneering innovations.
PERSONNEL DEvELOPMENT
The number of employees of J.P. Morgan AG increased in
2015 from 262 to an average of 268, in contrast to the previous
year. In 2015, the turnover rate was 9%; it thus declined in
contrast to the rate of 12% for 2014. 20% of the total number
of employees made use of flexible work arrangements, as in
the previous year.
In line with our business concept, we continue to put the
highest emphasis on the qualitative selection of new hires
and continued training and education programs for our staff.
The J.P. Morgan AG human resources policy focuses on the
highest level of quality and diversity among employees, and
is simultaneously committed to adjusting to the needs of our
employees.
7ManageMent RepoRt
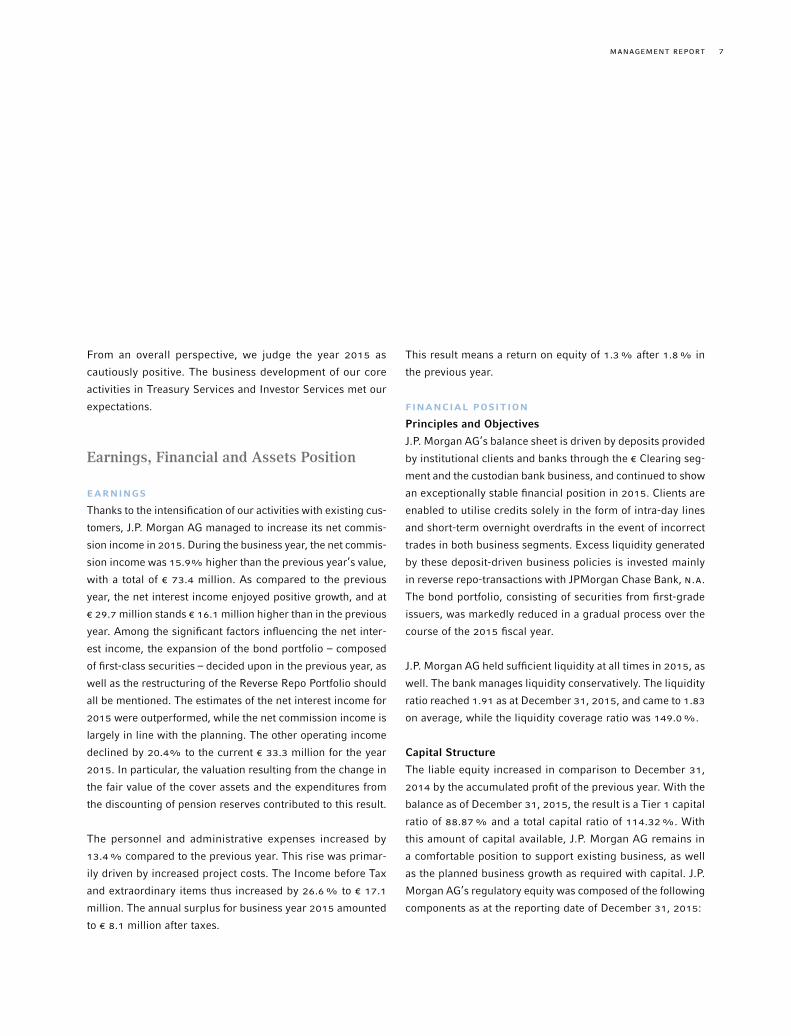
This result means a return on equity of 1.3% after 1.8% in
the previous year.
FINANCIAL POSITION
Principles and Objectives
J.P. Morgan AG’s balance sheet is driven by deposits provided
by institutional clients and banks through the € Clearing seg-
ment and the custodian bank business, and continued to show
an exceptionally stable financial position in 2015. Clients are
enabled to utilise credits solely in the form of intra-day lines
and short-term overnight overdrafts in the event of incorrect
trades in both business segments. Excess liquidity generated
by these deposit-driven business policies is invested mainly
in reverse repo-transactions with JPMorgan Chase Bank, N.A.
The bond portfolio, consisting of securities from first-grade
issuers, was markedly reduced in a gradual process over the
course of the 2015 fiscal year.
J.P. Morgan AG held sufficient liquidity at all times in 2015, as
well. The bank manages liquidity conservatively. The liquidity
ratio reached 1.91 as at December 31, 2015, and came to 1.83
on average, while the liquidity coverage ratio was 149.0%.
Capital Structure
The liable equity increased in comparison to December 31,
2014 by the accumulated profit of the previous year. With the
balance as of December 31, 2015, the result is a Tier 1 capital
ratio of 88.87% and a total capital ratio of 114.32%. With
this amount of capital available, J.P. Morgan AG remains in
a comfortable position to support existing business, as well
as the planned business growth as required with capital. J.P.
Morgan AG’s regulatory equity was composed of the following
components as at the reporting date of December 31, 2015:
From an overall perspective, we judge the year 2015 as
cautiously positive. The business development of our core
activities in Treasury Services and Investor Services met our
expectations.
Earnings, Financial and Assets Position
EARNINGS
Thanks to the intensification of our activities with existing cus-
tomers, J.P. Morgan AG managed to increase its net commis-
sion income in 2015. During the business year, the net commis-
sion income was 15.9% higher than the previous year’s value,
with a total of € 73.4 million. As compared to the previous
year, the net interest income enjoyed positive growth, and at
€ 29.7 million stands € 16.1 million higher than in the previous
year. Among the significant factors influencing the net inter-
est income, the expansion of the bond portfolio – composed
of first-class securities – decided upon in the previous year, as
well as the restructuring of the Reverse Repo Portfolio should
all be mentioned. The estimates of the net interest income for
2015 were outperformed, while the net commission income is
largely in line with the planning. The other operating income
declined by 20.4% to the current € 33.3 million for the year
2015. In particular, the valuation resulting from the change in
the fair value of the cover assets and the expenditures from
the discounting of pension reserves contributed to this result.
The personnel and administrative expenses increased by
13.4% compared to the previous year. This rise was primar-
ily driven by increased project costs. The Income before Tax
and extraordinary items thus increased by 26.6% to € 17.1
million. The annual surplus for business year 2015 amounted
to € 8.1 million after taxes.

8 ManageMent RepoRt
Financial and Non-financial Performance Indicators
FINANCIAL PERFORMANCE INDICATORS
Financial performance indicators, defined for internal control
of J.P. Morgan AG, comprise in particular absolute KPIs (Key
Performance Indicators) such as the net interest income, net
commission income, and Income before Tax and extraordi-
nary items. In addition, return on equity, cost-income ratio,
and the pre-tax profit margin are used to measure perfor-
mance. The KPIs are derived directly from the information
in the balance sheet and the income statement in the annual
financial statement, and for the current and previous financial
years amount to the following:
€m 2015 2014
Net Revenue 136.4 118.7
Net interest income 29.7 13.6
Net commission income 73.4 63.3
Total expenses 119.3 105.3
Income before Tax and extraordinary items 17.1 13.5
Net income 8.1 10.9
Equity 629 621
Return on equity (RoE) (Net income/average equity) 1.3% 1.8%
Return on Investment (Net income/ balance sheet total) 0.06% 0.08%
Cost-income ratio (total expenses / net revenue) 87.46% 88.71%
Pre-tax profit margin (income from regular business activity /net revenue) 12.55% 11.37%
Tier 1 capital ratio 88.9% 115.13%
Total capital ratio 114.3% 143.92%
Tier 1: € 649 million share capital, reserves and
funds for general banking risks
Upper Tier 2: € 0 million
Lower Tier 2: € 186 million subordinated loan
Total Tier 2: € 186 million
Off-Balance Sheet Business
Within the division of Trade Finance, the credit risks in the
form of contingent liabilities taken on J.P. Morgan AG’s own
books continue to be for the most part directly collateralised
within the Group. For issuances made by J.P. Morgan AG,
we hold total return swaps with JPMorgan Chase Bank, N.A.,
for hedging purposes, as well as for hedging of interest rate
change risks from the rate swaps securities portfolio.
ASSET SITUATION
The receivables from our clients decreased slightly, due to a
lower utilisation of short-term overdraft loans and through a
lower utilisation of available liquidity as at the reporting date,
by € 9 million to € 222 million, and deposits decreased by
€ 491 million to € 6,244 million as at the reporting date. The
receivables of the credit institutions increased due to the high
treasury activities by € 48 million to € 9,900 million (of which,
credit with central banks of € 1,961 million). By contrast, lia-
bilities had fallen by € 1,477 million to € 5,369 million on the
balance sheet date. The balance sheet total of J.P. Morgan AG
thus declined, reaching € 12,516 million as at the reporting
date. The total capital ratio as per December 31, 2015 was
114.32, amounting to an average of 131.63 for the year 2015.
The securities portfolio with first-class debtor securities
was markedly reduced over the course of the financial year,
decreasing gradually in comparison with December 31, 2014
by € 1,027 million to a book value of € 359 million. There were
no significant changes after the balance sheet date.

9ManageMent RepoRt
the UsD exchange rate over the course of 2015, as intra-Group
transactions in UsD are a major factor with around 40% of
the total expenditure.
The return on equity (ROE) fell from 1.8% in the previous
year to 1.3%, and thus lay under 2% as forecast. The Tier 1
and total equity capital ratios fell as expected in comparison
with December 31, 2014 due to the changes, but neverthe-
less continued to remain in an extremely comfortable range.
NON-FINANCIAL PERFORMANCE INDICATORS
Non-financial performance indicators are guided by the role
of J.P. Morgan AG as a transaction bank in € payment trans-
actions and as a Global Custodian. Along with the actual vol-
umes settled by J.P. Morgan AG for its clients, we focus on
the degree of automation and the actual losses from opera-
tive errors. In addition, we measure the fluctuation rate as an
indicator of stability of our operative platform from the point
of view of employees.
2015 2014
Number of payment instructions – High Value (TARGET2 & EBA EURO1) 4.5 million 4.2 million
Number of payment instructions – Low Value (sTEP2 only) 71 million 132 million
Straight-through processing rate 98.42% 98.35%
Assets under Custody (in € billions) 287 274
Customer satisfaction – Custodian bank (Internal Score) 3,727 2,751
Operative losses (in € millions) 0.6 0.2
Fluctuation rate 9% 12%
Gender Diversity 35% 36%
The non-financial performance indicators that describe the
transaction volumes of J.P. Morgan AG show a stable environ-
The notable increase in the net interest income of around
119% in comparison with the previous year can primarily be
attributed to the development of the bond portfolio consisting
of first-class securities, the restructuring of the reverse repo
portfolio, as well as the positive net interest income from for-
eign currency holdings.
The development of the net commission income was like-
wise positive, although the earnings of the custodian bank
remained stable at a high level and the increase in commis-
sion earnings arising from payment transactions was able to
be achieved essentially through price increases for Group-
internal services. Additional earnings from customer acquisi-
tions did not play a significant role in either segment in 2015.
The payment volumes through TARGET2 in 2015 exceeded the
previous year’s value by 6.9%; we were able to observe a simi-
lar trend in relation to EBA EURO1 as the second high-value
payment channel of J.P. Morgan AG in € payment transactions.
The growth of the custodian bank even amounted to – as meas-
ured by the assets under custody – over 8%, such that the
negative impacts of an ever-strengthening price pressure were
able to be cushioned.
The net revenues goal of € 133 million could be slightly out-
performed despite the unsatisfactory development in the pen-
sions area with € 136.4 million.
As compared with the timeframe for the previous year, the
operational result thus improved by around 26.6% to € 17.1
million in comparison with the previous year.
The cost-income ratio could – despite this positive trend – only
be reduced insignificantly from 88.71% to 87.46%. This is
primarily to be attributed to the unfavourable development of

10 ManageMent RepoRt
ment with a further improvement of the degree of automation
in payment transactions at an already very high level. Although
our settlement volume in low-value clearing declined notably
in 2015 in comparison with the previous year, this is the result
of a controlled consolidation and risk strategy in regard to our
customer portfolio.
In the area of custodian banking, we were able to achieve a
marked increase in customer satisfaction. This positive devel-
opment is also reflected in the increased value of the assets
that our customers have entrusted to us as a custodian. After
a heightened number of client complaints in the previous year,
during which we were temporarily unable to do justice to the
J.P. Morgan business principle of “Excellent Client Service,”
our decisive measures to meet the expectations of our cus-
tomers or even to exceed them have had a sustainable effect.
From an operations perspective, the goal continues to be
greater automatisation, which goes hand-in-hand with effi-
ciency enhancement and cost savings, as well as with the
reduction of sources of error.
The operating losses thus remained within an acceptable
framework in 2015, as well, even if we lagged behind our
ambitious goals. “Operational excellence” remains our guid-
ing principle, and is connected with our efforts to achieve
constant improvement in our technology platform, the internal
control systems and the ongoing training of our employees. It
is important to us that we analyse operational errors in detail
and draw the necessary consequences here for the future. It is
for this reason that we have a particularly strong commitment
to an open “risk and error culture”.
We see the low fluctuation rate in a financial centre like Frank-
furt with intensified competition for “talent” likewise as a result
of our efforts to constantly improve the working environment
as well as the development opportunities of our employees.
One of our priorities continues to decisively implement the
goals of a “great team & winning culture”.
In 2016 we expect an increase in the number of payment
instructions in the High Value field and Assets under Cus-
tody. By contrast, we expect a decrease in the Low Value
field. The Straight Through Processing Rate and Customer
Satisfaction should increase modestly. We expect a rise in
the fluctuation rate.
BUSINESS PRINCIPLES “hOW WE DO BUSINESS”
J.P. Morgan AG is completely integrated into the corporate
culture of JPMorgan Chase & Co, whose guiding principles are
convincingly described by the four pillars of the Group-wide
business principles:
– Exceptional Client Service
– Operational Excellence
– A Commitment to Integrity, Fairness and Responsibility
– A Great Team and Winning Culture
For further details please visit the website of JPMorgan
Chase & Co.:
http: / /www.jpmorganchase.com / corporate / About-JPMC /
business-principles.htm
Relationships with Related Companies and Persons
With regard to the related companies of J.P. Morgan AG, we
have identified our parent company JPMorgan Chase Bank,
N.A., as well as J.P. Morgan International Finance Ltd. We

11ManageMent RepoRt
global economic dynamic will lose the relatively unified pic-
ture that it has had in past years, such that a heterogeneous
picture with great regional difference will emerge. Here the
fall in the oil price and the overall declining prices for com-
modities, as well as shifts in exchange rate relations and the
geopolitical environment, continue to play a decisive role.
Also over the next years we expect to see a continuation of
the trend towards professionalising cash management in com-
panies, pension funds and insurers, with the goal of further
integration of the value-added chain in the liquidity manage-
ment of a company for continued income optimisation. In
view of the negative interest environment, which in our opin-
ion will not significantly change in 2016, and in view of the
expansive monetary policy, the opportunity for banks to raise
“non-operating liquidity” of customers, and the income and
risk targets of our customers, will continue to be the focus of
the dialogue between banks and customers.
In view of banks’ continued high investment needs and the
increasing costs of appropriately implementing regulatory
requirements, we observe early tendencies toward consoli-
dation on the market, which could result in new opportuni-
ties for us to grow organically. The leading global position of
our parent company as well as the worldwide investments in
the technology behind our business will continue to assist us
in reinforcing our competitive position on the market. With
the phased implementation of Target2Securities (T2S), we
observe already today as well as in future a further shift in
the competitive environment that will continue in the coming
years. Here, J.P. Morgan AG will play a significant role as a
Group-internal service provider in € payment transactions.
Here, we see opportunities for the growth of net commission
income in Treasury Services of up to 10%, but also risks that
could lead to a decline of 5% in the net commission income,
consider the members of the Management Board and the
Supervisory Board of J.P. Morgan AG and their family mem-
bers as related persons.
The following financial transactions are carried out with
related companies:
− Money market transactions, investing and borrowing money
− Transactions in Total Return Swaps
− Reverse Repos
− Nostro accounts
− Provision of subordinated capital
− Purchasing and supplying corporate services
All transactions have been closed on normal market terms.
J.P. Morgan AG received appropriate compensation for every
legal transaction with associated companies that were known
to J.P. Morgan AG at the time at which the legal transactions
were undertaken. There are no transactions conducted with
related persons.
Outlook
SIGNIFICANT OPPORTUNITIES AND RISKS FOR ThE
UPCOMING FINANCIAL yEARS
Our outlook from recent years substantially retains its validity
for the coming year:
In regard to economic development in Germany, we proceed
from sustained, albeit weaker, positive development of the
gross domestic product, borne by an expansive monetary
policy and supported by a sustainable rise in productivity. We
expect an economic situation characterised by weak growth
and an increasing deflationary pressure in the euro area. The

12 ManageMent RepoRt
We see further risks in the political destabilisation of some
countries or regions, which could lead to a clear deterioration
of the market situation, with potential negative effects on the
solvency of our clients, and resulting sustained losses.
EXPECTATIONS FOR ThE BANK’S FUTURE
PERFORMANCE
Thanks to our consistent conservative risk policy, we do not
expect any risk-related losses for the next two years, as well.
For 2016, we expect an increase in the net commission income
in Investor Services, but also in Treasury Services thanks to
the acquisition of new customers in the high-value segment.
In regard to the net interest income, we expect a slight fall in
net interest income due to the marked reduction in holdings
in our securities portfolio.
Thanks to sustained disciplined cost management, we expect
that the costs will remain on the level of the previous year, so
that the planned result – without considering the effects from
pension obligations – will lie at € 13 million.
ASSUMPTIONS
These expectations are based on the assumptions of a stable
political situation in Germany and in Europe, with successful
crisis management and a stagnating economic performance
of the European countries in the next two years. Germany
will thus – on the basis of the published Economic Research
Report of the J.P. Morgan Group – nevertheless in contrast
with the previous year with an expected GDP growth of 1.9%
– no longer bear a prominent position in the euro area as a
motor of growth. We likewise proceed under the assumption
that Great Britain will not exit the European Union.
although the risks due to Group-wide interdependence are
rather to be considered low.
The trend for the large institutional investors to adapt their
investments to the altered image of an economy which is
becoming more and more global and the resulting demand
for Global Custodian services will be sustained in 2016, as
well. This could result in growth opportunities for the custo-
dian banking business that could exceed a growth of 5% of
the assets under custody.
The Global Corporate Banking Organisation, which has been
built up in the last few years and which provides us with a
strongly expanded presence in the core markets around the
world, has made a substantial contribution here in intensifying
customer proximity, developing customer-specific solutions,
and realising cross-selling opportunities.
We view the disproportionate regulation of the financial mar-
kets as presenting continued risk for our business; however,
we continue to assume that regulators worldwide will develop
and implement a coordinated and measured concept for the
regulation. Above all, we see here a further encumbrance by
an intensification of control tasks and reporting requirements,
which must be compensated by cost savings in the operational
divisions in order not to impair the income situation of J.P.
Morgan AG in a lasting manner.
Possibilities of passing on these costs to our customers are
only possible to a limited extent in view of the increasing price
pressure in the transactional business with many competitors.
The question of liquidity costs in particular will be a topic in
the coming years that we will discuss with our customers.

13ManageMent RepoRt
the Tier 1 capital ratio and the total capital ratio to be
unchanged in the current financial year.
FINANCIAL SOLvENCy
J.P. Morgan AG is solvent at all times owing to the business
model-driven structure of our balance sheet. In addition, the
Bank manages a high liquidity ratio (1.95 as at 12 /31 /2015),
and operates a very strictly limited maturity transformation
to achieve an additional interest rate margin. With a liquidity
coverage ratio of 149.0% as at December 31, 2015, this also
lies markedly above the minimum ratio of 60% that has been
mandatory since October 2015.
Risk Report
MANAGEMENT & CONTROLLING
The Management Board of the “Back Office” is responsible for
risk management at J.P. Morgan AG, with regular reporting to
the general management, as well as to J.P. Morgan AG’s Super-
visory Board. J.P. Morgan AG classifies a risk as a potential
loss or a failure to realise a profit due to internal or external
factors, and manages these in the context of risk management.
J.P. Morgan AG’s control system is composed of the busi-
ness areas (“First Line of Defence”), the control functions
and Internal Auditing:
– First Line of Defence: It lies within the responsibility of the
business areas to develop and implement effective internal
controls. This includes the identification and addressing of
risks and acting within a robust controlling environment.
– Control functions: Risk Management, Accounting & Con-
trolling, Compliance and Legal each have clearly defined
With regard to the world economy, we assume that the
dynamic development of the past years of emerging econo-
mies will further cool down in 2016 due to the continuing low
price of oil, the persistent geopolitical uncertainties and falling
domestic demand in certain important emerging economies,
thus exerting a negative influence on the economic develop-
ment in the established industrialised countries.
Moreover, we assume that the ECB will maintain its negative-
interest policy in 2016, as well, and that it will continue in
2017. In addition, we made the assumption that the average
trend of the euro with respect to the Us dollar will remain on
average at the level of the beginning of 2016.
DEvELOPMENT OF SEGMENTS
In the planning calculation for the next years, for Investor
Services, we assume an average growth of total revenues
of 5% p.a. for the years 2016 and 2017, while for Treasury
Services we expect a slight fall in total revenues in 2016 as
a result of conservative planning of the net interest income,
but this trend will be reversed again in 2017 with a growth of
4% thanks to the acquisition of new customers. Overall, we
assume an average growth of the net commission income of
4.1% p.a. for 2016 and 2017.
In 2016, we expect net revenues amounting to € 124 million
according to the planning in comparison with € 136.4 million
in the previous year, although the difference is to be explained
by a one-off effect due to the sale of the securities portfolio
in the previous year.
Thus, in 2016, the return on equity will be markedly below
2%, the profit margin is expected to be 5%, and the cost-
income ratio will remain constantly high at 95%. We expect

14 ManageMent RepoRt
concrete and operational using policies, guidelines and work-
ing instructions. The completeness and suitability of the risk
strategy is reviewed during the annual risk assessment (or
during as needed ad-hoc risk assessments). This ensures that
the risk strategy takes all relevant risks faced by J.P. Morgan
AG into consideration.
The classification of individual risk categories as a relevant
risk is based on whether the occurrence of the risk could have
a serious negative effect on J.P. Morgan AG’s risk-bearing
capability.
As per the risk inventory, in 2015 the following risk categories
are significant for J.P. Morgan AG:
– Credit risk,
– Market risk,
– Interest rate risks of the banking book,
– Business risk,
– Liquidity risk,
– Pension risk and
– Operational risks.
The analysis also defines the risk appetite by allocating the
available risk covering potential to the individual risk catego-
ries. This facilitates compliance with the limits, and allows for
the monitoring of that compliance throughout the financial year.
The following principles also apply for the risk management
and monitoring:
− There are clearly defined organisational structures and doc-
umented processes for all risk affected business areas, from
which the responsibilities and competencies of all functions
involved are derived.
duties but also work together closely in order to monitor
and supervise business activities.
– Internal Auditing: Internal Auditing acts independently of
the business areas and control functions of J.P. Morgan AG.
It reviews the effectiveness of corporate management, of
internal controls and of risk management. In addition, an
annual assessment of the early risk identification and inter-
nal monitoring system is carried out by the independent
auditor.
Independent control functions are in charge of the operational
implementation of the risk control and monitoring, taking into
account the Group-wide infrastructure and policies. They
report directly to the Management Board “Back Office” as
the Chief Risk Officer (CRO).
These include, in particular, the Market and Credit Risk Offi-
cer for the risk monitoring of credit and market price risks,
the Risk Governance Officer as risk controller, the Treasury
& Credit Control for the monitoring of liquidity and market
price risks, and the Location Control Officer for monitoring
the operational risks.
RISK STRATEGy AND RISK MANAGEMENT
The risk strategy is derived directly from J.P. Morgan AG’s
business strategy. It is defined by the general management
of J.P. Morgan AG and is approved each year by the Super-
visory Board.
The risk strategy defines how J.P. Morgan AG will manage the
risks it has taken as part of its business activities. By limiting
and managing the risks, risk-bearing capability and liquidity
are ensured at all times. The risk strategy covers all main
risks and is, if necessary, further specified for individual risk
categories in the form of partial risk strategies and then made

15MANAGEMENT REPORT
For its sessions, the Supervisory Board receives a current
summary of the topics discussed in the meetings of the Man-
agement Board, including a summary of the risk report.
RISK-BEARING CAPABILITy AND STRESS TESTING
The risk-bearing capability analysis is a core component of the
overall bank control of J.P. Morgan AG, with the goal of guar-
anteeing a suitable risk profile and adequate capital at all times.
J.P. Morgan AG decided on a Going-Concern approach, whereby
it could continue the core business activities even if all items
of the defined risk covering potential were consumed through
exposure to risks. The confidence level of 95% corresponds to
the underlying assumptions of the Going-Concern approach;
risk coverage potential and the economic capital model are
configured accordingly. The observation period lasts one year.
As a secondary control circuit, a Gone-Concern approach is
observed in parallel, with a confidence level of 99.91%.
According to the risk inventory credit risks, market risks, oper-
ational risks, pension risks, business risks and interest rate
risks in the banking book are quantified as relevant risk cat-
egories in the context of the risk-bearing capacity calculation.
Liquidity risks are a part of the stress testing.
The risk cover potential essentially consists of J.P. Morgan AG’s
retained earnings, the § 340g HGB reserve for general banking
risks, accumulated profits, the profits achieved in the financial
year as well as the planned profits of the following years. The
quantification of the business risk, which is primarily meant to
delineate planning uncertainty, is deducted from this.
In fiscal year 2015, as well, we further developed the risk-
bearing capacity concept of J.P. Morgan AG. This primarily
concerns the revised definition of the risk cover potential for
− There is a clear segregation of duties between Front Office
and Back Office in order to avoid potential conflicts of inter-
est.
− For the risk identification, measuring, aggregating, manag-
ing, monitoring and communicating of the risk categories,
suitable procedures are defined and implemented at J.P.
Morgan AG, including the Group-wide infrastructure.
− Appropriate limits for all significant risk categories have
been adequately defined and are effectively controlled.
RISK MEASUREMENT AND REPORTING
Risk measurement and reporting take place in J.P. Morgan
AG according to risk category on a daily (credit, market and
liquidity risk), monthly (operational and earnings risks) or
quarterly cycle (pension risks). The risk-bearing capacity is
analysed monthly.
In addition to regulatory limits, the Management Board at
J.P. Morgan AG defined a series of early-warning indicators,
which are monitored daily and in a timely manner. Indicators
and risk limits include, among others, renovation indicators,
credit limits, investment limits, bidding limits, position limits
as well as the minimum liquidity of J.P. Morgan AG, and are
clearly documented. These also consider the concentration
risk with respect to other J.P. Morgan entities.
For its monthly sessions, the Management Board receives a
detailed overview of the development of the business areas,
information on financial trends, a detailed risk report as well
as a report from the Corporate Functions. The scope of the
quarterly risk report extends considerably beyond the monthly
reporting and presents the risk situation in more detail.

16 ManageMent RepoRt
daily basis and is shown in the table above (all figures given in
million €). The economic capital requirement pursuant to the
Going-Concern and Gone-Concern approaches is additionally
calculated by Risk Governance on a monthly basis. In 2016, as
well, we will work continuously on the further development of
the risk-bearing capacity concept, although we expect further
method-related adjustments on the basis of the regulatory
implementation of the sREP concept.
RISK CATEGORIES
Credit risk
Credit risk refers to the risk of loss arising from the default of
a customer, client or counterparty.
Based on J.P. Morgan AG’s core business segments, credit
risk is the most significant risk:
– on the one hand, credit default risk, which arises primarily
through the drawing of overdrafts to customers who main-
tain their payment transaction accounts in the € clearing or
the custodian banking function at J.P. Morgan AG,
the Going-Concern approach, the consideration of the inter-
est-rate risk from the banking book, the further development
of the calculation of the concentration risk, as well as the sepa-
rate treatment of pension risk as complementary components
in the risk-bearing capacity concept.
The quantification of the capital requirement for the occurring
risks takes place through internal, institute-specific calcula-
tion approaches. The calculation of the risk-bearing capability
takes place on a quarterly basis. As per December 31, 2015
utilisation stood at 61.2% As part of the integrated stress test-
ing, the risk-bearing capability was guaranteed at any time.
For verification of the risk bearing capability, stress scenarios
are defined for each risk category. These engage with each
other as part of integrated macroeconomic stress scenarios.
They are analysed in part on a monthly, otherwise quarterly
basis. The risk-bearing capability concept and the stress tests
are validated annually, building on the risk inventory.
The regulatory capital requirement for the individual risk cat-
egories is monitored by the Regulatory Reporting Team on a
Regulatory Economic
€M 12 /31 /2014 06 /30 /2015 12 /31 /2015 12 /31 /2014 06 /30 /2015 12 /31 /2015
Type of risk
Credit risk 25.8 19.6 35.7 15.7 17.3 12.6
Operational risk 15.2 16.2 16.2 4.6 20.1 15.0
Market risk 4.6 7.0 3.6 17.5 5.6 5.3
IRBB – – – – – 27.8
Pension risk – – – 25.0 25.0 –
Capital requirement 45.7 42.8 55.5 62.8 68.0 60.7
Risk coverage pool 821.3 833.8 834.2 141.9 152.1 99.2

17ManageMent RepoRt
Procedures for intensified loan management as well as the
treatment of problematic loans exist but continued not to
require application during the financial year 2015. For the
year 2016, as well, we expect no defaults, for which reason
no provisions for losses on loans were formed that would be
necessary in the case of an expected loss resulting from the
default of a customer.
J.P. Morgan AG uses an unexpected loss model with a con-
fidence level of 95% (99.91% in Gone-Concern) to calcu-
late the economic capital requirement. As the basis for the
Exposure at Default (EAD) the client’s drawing behaviour is
estimated for the payment transactions accounts on the basis
of historical data, or otherwise market value positions per the
reporting date are taken into consideration. EAD, Probability of
Default (PD), and Loss Given Default (LGD) are the important
input parameters for the risk model. In addition, concentration
risks are quantified for all relevant portfolios on the basis of
the Herfindahl Hirschman Index.
A series of different scenarios are considered within the scope
of the credit risk stress test that assume that client ratings,
income from securities, drawing behaviour, portfolio concen-
trations or correlations could significantly worsen over the
course of time. There is thus a regular validation of the stress
tests and their results.
J.P. Morgan AG uses the credit risk standard approach (KsA)
for the regulatory quantification of the credit risk.
Daily monitoring of counterparty default risk at the individual
client level is done by Treasury & Credit Control, using the
Group-wide credit limit control system, which records individ-
ual limits and utilisation at account level and /or at the level of
single borrower units. The system does not allow unauthorised
– on the other, counterparty risk, particularly with respect to
other Group companies in the context of Treasury activities
of J.P. Morgan AG.
Depending on the credit rating of the client, the allocation of
overdraft facilities is also accompanied by the implementation
of defined risk-mitigation steps (e. g., the provision of collat-
eral). Risk reduction strategies are deployed in the same way
with respect to other Group companies.
Within the division of Trade Finance, the credit risks in the
form of contingent liabilities taken on J.P. Morgan AG’s own
books continue to be for the most part directly collateralised
within the Group. There are no significant call risks.
On the basis of J.P. Morgan AG’s business model as a Group-
wide service provider in € payment transactions, but also as
a custodian bank with a focus on special funds, concentration
risks exist that are likewise taken into account in J.P. Morgan
AG’s risk-bearing capacity concept. Here, we expect no sig-
nificant changes in the coming year.
Since J.P. Morgan AG does not run an active trading book,
issuer risk, replacement risk, and settlement risk play an
extremely minor role.
By means of its credit risk strategy, which is derived from the
general business and risk strategy, the Management Board
defines the risk profile in regard to its clients and credit prod-
ucts. Moreover, structural organisation and processes for risk
steering, potential measures to minimise risk and risk report-
ing are defined more closely in the Group-wide policies and
in the J.P. Morgan AG MaRisk Guidelines. The Management
Board makes credit decisions on the basis of the clearly defined
separate responsibilities for “Front Office” and “Back Office”.
18 ManageMent RepoRt
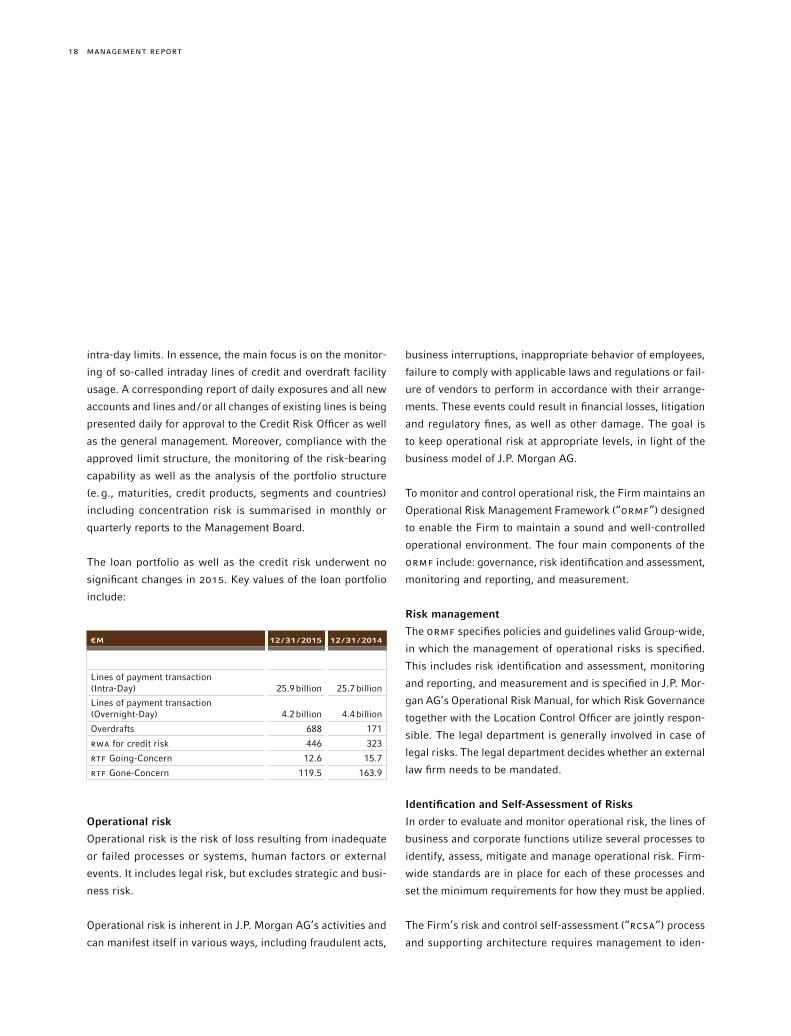
business interruptions, inappropriate behavior of employees,
failure to comply with applicable laws and regulations or fail-
ure of vendors to perform in accordance with their arrange-
ments. These events could result in financial losses, litigation
and regulatory fines, as well as other damage. The goal is
to keep operational risk at appropriate levels, in light of the
business model of J.P. Morgan AG.
To monitor and control operational risk, the Firm maintains an
Operational Risk Management Framework (“ORMF”) designed
to enable the Firm to maintain a sound and well-controlled
operational environment. The four main components of the
ORMF include: governance, risk identification and assessment,
monitoring and reporting, and measurement.
Risk management
The ORMF specifies policies and guidelines valid Group-wide,
in which the management of operational risks is specified.
This includes risk identification and assessment, monitoring
and reporting, and measurement and is specified in J.P. Mor-
gan AG’s Operational Risk Manual, for which Risk Governance
together with the Location Control Officer are jointly respon-
sible. The legal department is generally involved in case of
legal risks. The legal department decides whether an external
law firm needs to be mandated.
Identification and Self-Assessment of Risks
In order to evaluate and monitor operational risk, the lines of
business and corporate functions utilize several processes to
identify, assess, mitigate and manage operational risk. Firm-
wide standards are in place for each of these processes and
set the minimum requirements for how they must be applied.
The Firm’s risk and control self-assessment (“RCsA”) process
and supporting architecture requires management to iden-
intra-day limits. In essence, the main focus is on the monitor-
ing of so-called intraday lines of credit and overdraft facility
usage. A corresponding report of daily exposures and all new
accounts and lines and/or all changes of existing lines is being
presented daily for approval to the Credit Risk Officer as well
as the general management. Moreover, compliance with the
approved limit structure, the monitoring of the risk-bearing
capability as well as the analysis of the portfolio structure
(e. g., maturities, credit products, segments and countries)
including concentration risk is summarised in monthly or
quarterly reports to the Management Board.
The loan portfolio as well as the credit risk underwent no
significant changes in 2015. Key values of the loan portfolio
include:
€M 12 /31 /2015 12 /31 /2014
Lines of payment transaction (Intra-Day) 25.9billion 25.7billion
Lines of payment transaction (Overnight-Day) 4.2billion 4.4billion
Overdrafts 688 171
RWA for credit risk 446 323
RTF Going-Concern 12.6 15.7
RTF Gone-Concern 119.5 163.9
Operational risk
Operational risk is the risk of loss resulting from inadequate
or failed processes or systems, human factors or external
events. It includes legal risk, but excludes strategic and busi-
ness risk.
Operational risk is inherent in J.P. Morgan AG’s activities and
can manifest itself in various ways, including fraudulent acts,

19ManageMent RepoRt
Key values for operational risk are:
€M 12 /31 /2015 12 /31 /2014
Losses arising from operational risks 0.6 0.2
Regulatory capital requirement 203 190
RTF Going-Concern 15.0 20.6
RTF Gone-Concern 28.2 38.7
Personnel Risks
Human Resource risks are those associated with the employ-
ment of staff for example, the cost of employment, health
and safety issues; over-reliance on key individuals and inad-
equate succession planning; the cost and reputational dam-
age of litigation by employees and /or arising from employee
misconduct; and the risks associated with inappropriate com-
pensation practices. Personnel risks fall under the definition
of operational risks and are addressed in the ORMF.
IT Risks
The systems used by J.P. Morgan AG are a part of the IT infra-
structure of the J.P. Morgan Group. IT risks form a part of the
operational risks and are addressed in the ORMF.
Process Risks
Process risk means the risk of loss resulting from inadequate
or failed internal processes. Process risks form a part of the
operational risks and are addressed in the ORMF.
Extensive business continuity planning is intended to guaran-
tee the orderly operation of critical processes in order to safe-
guard J.P. Morgan AG against damages threatening its exis-
tence. The threat scenarios considered include the unavail-
ability of employees, the breakdown of support systems, and
tify material inherent operational risks, assess the design
and operating effectiveness of relevant controls in place to
mitigate such risks, and evaluate residual risk. Action plans
are developed for control issues that are identified, and busi-
nesses are held accountable for tracking and resolving issues
on a timely basis. Risk Management performs an indepen-
dent challenge of the RCsA program including residual risk
results.
Risk Monitoring and Reporting
Operational risk management and control reports provide
information, including actual operational losses, self-assess-
ment results and the status of issue resolution to the lines of
business and senior management. In addition, key control
indicators and operating metrics are monitored against tar-
gets and thresholds. The purpose of these reports is to enable
management to maintain operational risk at appropriate levels
and enable prompt escalation. A summary of the results is
presented to the Management Board as part of the quarterly
MaRisk reports.
J.P. Morgan AG’s Operational Risk Capital for the risk-bear-
ing capability is derived from the firm’s Advanced Model
Approach (AMA) regulatory capital model. This is modelled
on loss events specific to J.P. Morgan.
Information from the institutionalised loss event database, the
qualitative results from the regular Control Self Assessments,
the definitions of the risk-based Outsourcing Controlling, the
results from the Internal Audit, as well as the Control Testing
by the Compliance Department and the Location Control Offi-
cer as well as by other Group-wide control functions are then
used within the framework of the scenario analysis (Stress
Test) at product level.
20 ManageMent RepoRt
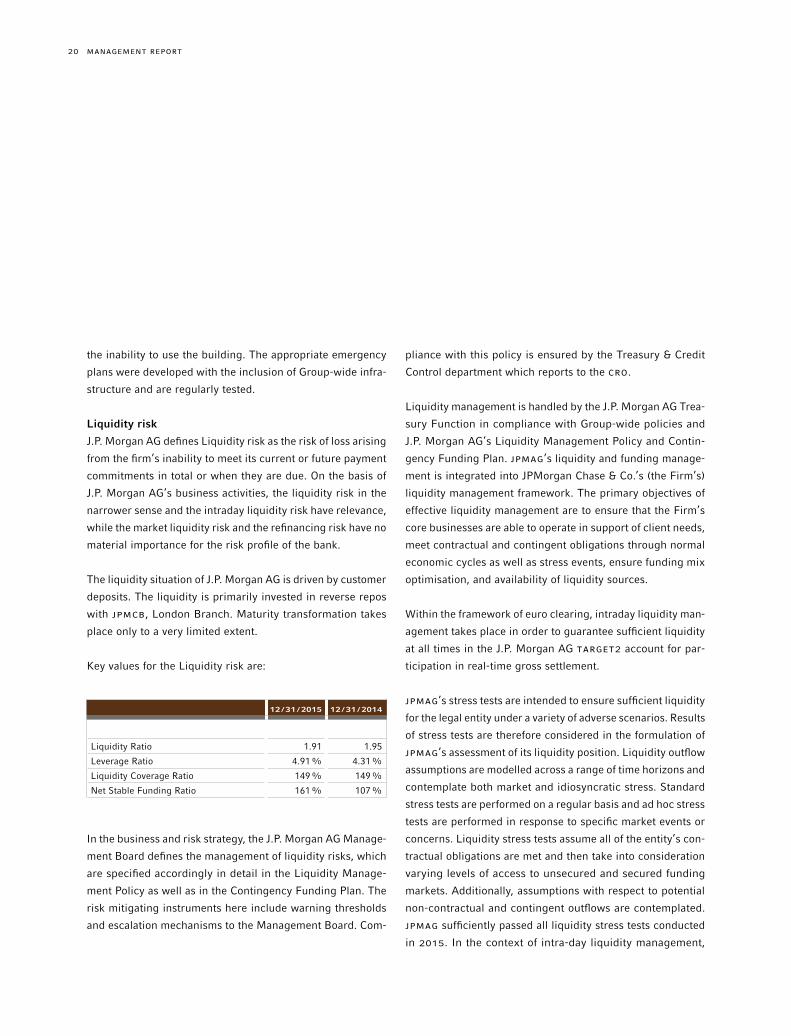
pliance with this policy is ensured by the Treasury & Credit
Control department which reports to the CRO.
Liquidity management is handled by the J.P. Morgan AG Trea-
sury Function in compliance with Group-wide policies and
J.P. Morgan AG’s Liquidity Management Policy and Contin-
gency Funding Plan. JPMAG’s liquidity and funding manage-
ment is integrated into JPMorgan Chase & Co.’s (the Firm’s)
liquidity management framework. The primary objectives of
effective liquidity management are to ensure that the Firm’s
core businesses are able to operate in support of client needs,
meet contractual and contingent obligations through normal
economic cycles as well as stress events, ensure funding mix
optimisation, and availability of liquidity sources.
Within the framework of euro clearing, intraday liquidity man-
agement takes place in order to guarantee sufficient liquidity
at all times in the J.P. Morgan AG TARGET2 account for par-
ticipation in real-time gross settlement.
JPMAG’s stress tests are intended to ensure sufficient liquidity
for the legal entity under a variety of adverse scenarios. Results
of stress tests are therefore considered in the formulation of
JPMAG’s assessment of its liquidity position. Liquidity outflow
assumptions are modelled across a range of time horizons and
contemplate both market and idiosyncratic stress. Standard
stress tests are performed on a regular basis and ad hoc stress
tests are performed in response to specific market events or
concerns. Liquidity stress tests assume all of the entity’s con-
tractual obligations are met and then take into consideration
varying levels of access to unsecured and secured funding
markets. Additionally, assumptions with respect to potential
non-contractual and contingent outflows are contemplated.
JPMAG sufficiently passed all liquidity stress tests conducted
in 2015. In the context of intra-day liquidity management,
the inability to use the building. The appropriate emergency
plans were developed with the inclusion of Group-wide infra-
structure and are regularly tested.
Liquidity risk
J.P. Morgan AG defines Liquidity risk as the risk of loss arising
from the firm’s inability to meet its current or future payment
commitments in total or when they are due. On the basis of
J.P. Morgan AG’s business activities, the liquidity risk in the
narrower sense and the intraday liquidity risk have relevance,
while the market liquidity risk and the refinancing risk have no
material importance for the risk profile of the bank.
The liquidity situation of J.P. Morgan AG is driven by customer
deposits. The liquidity is primarily invested in reverse repos
with JPMCB, London Branch. Maturity transformation takes
place only to a very limited extent.
Key values for the Liquidity risk are:
12 /31 /2015 12 /31 /2014
Liquidity Ratio 1.91 1.95
Leverage Ratio 4.91% 4.31%
Liquidity Coverage Ratio 149% 149%
Net Stable Funding Ratio 161% 107%
In the business and risk strategy, the J.P. Morgan AG Manage-
ment Board defines the management of liquidity risks, which
are specified accordingly in detail in the Liquidity Manage-
ment Policy as well as in the Contingency Funding Plan. The
risk mitigating instruments here include warning thresholds
and escalation mechanisms to the Management Board. Com-

21ManageMent RepoRt
market price risks are done by the Treasury and Credit Control
division. Daily adherence to limits and the impacts on the risk
capacity are summarised in reports to the Management Board
on a monthly and quarterly basis.
Value at Risk (in US $)
T$ 12 /31 /2015 12 /31 /2014
Reporting date 182 1,773
60-day trend 180 2,129
One-year average 187 1,937
Interest rate risks of the banking book
Since J.P. Morgan AG has no active trading book, interest rate
risks arise essentially in the treasury management of € liquid-
ity, shown separately in the risk profile as IRRBB (Interest
rate risks of the banking book). The interest rate risk in the
banking book (IRRBB) is defined as the interest rate risk that
is produced by the traditional banking transactions of the
company (transactions recognised on an accrual basis in the
balance sheet and balance-sheet-neutral transactions). These
transactions include the granting of credit, the granting of
credit lines, the deposit business and the issuance of bonds
(referred to in summary as non-trading activities) as well as
the impacts of the CIO Investment Portfolio and other related
CIO Treasury activities.
In order to quantify the IRRBB, J.P. Morgan AG uses the result
of the interest rate shock specified by the banking supervisory
authorities of + /–200 basis points currently.
To calculate interest rate change risk for its investment book,
J.P. Morgan AG likewise uses the price value of a basis point
interest approach. Exceeded limits are generally escalated to
the Management Board. In addition to the year-end value, the
J.P. Morgan AG performs a series of simulations in which a
changed payment pattern on the part of market participants
and clients is assumed.
Market price risk
J.P. Morgan AG defines Market risk as the potential for adverse
changes in the value of the Firm’s assets and liabilities result-
ing from changes in market variables such as interest rates,
foreign exchange rates, equity prices, commodity prices,
implied volatilities or credit spreads. Given J.P. Morgan AG’s
business activities, credit spread risks as well as exchange-rate
risks have an impact, if a limited one, while interest rate risks
in the trading book, share price and commodity price risks
have no importance whatsoever for the Bank’s risk profile.
Market price risks additionally arise from a portfolio of fixed-
interest rate securities of public issuers. The so-called Strate-
gic Investment Portfolio, which was created in 2014 and had
holdings amounting to € 1.4 billion at the end of 2014, still
had, as a result of a decision of the Management Board to
prematurely reduce its holdings and achieve an extraordinary
income, holdings amounting to € 359 million as at December
31, 2015. The changed influence on the risk profile of J.P.
Morgan AG can be read from the almost constant value-at-
risk, which is determined in order to quantify market price
risks, in a situation of markedly fallen portfolio volumes. The
value-at-risk approach is based on the historical simulation
with a 95% confidence level and one-day holding period.
The scope for managing market price risks is defined by the
Management Board in the business and risk strategy and
defined more closely in the Asset Limits and the Triggers
Policy. Risk positions may only be employed within approved
limits; these positions are valued and accordingly monitored
on an ongoing basis. Daily monitoring and the reporting of

22 ManageMent RepoRt
Business risk
J.P. Morgan AG defines Business risk as any risk arising from
changes in its business, including: the acute risk to earnings
posed by falling or volatile income; and the broader risk of a
firm’s business model or strategy proving inappropriate due
to macroeconomic, geopolitical, industry, regulatory or other
factors; or its remuneration policy. Regular plan monitoring
and if necessary the appropriate adjustments ensure that
these deviations are minimised.
Reputation risk
The outstanding reputation of J.P. Morgan is an invaluable,
but fragile asset in the interaction with its client base, but
also in its interaction with other market participants as well
as governmental regulators and authorities.
In this context, J.P. Morgan AG stresses the importance of
Compliance, Risk Management, the Legal Department, Finan-
cial Control and Internal Audit, and the necessity of their
active representation in various governance meetings in order
to ensure compliance with internal J.P. Morgan procedures
and /or regulatory requirements. It also ensures that these
units are involved as soon as possible in any escalation pro-
cesses with clients.
Summarising Presentation
The conservative risk policy and the solid capital resources
ensure the very comfortable risk position of J.P. Morgan AG
going forward.
The quantification of the capital requirement for the occurring
risks takes place through internal, institute-specific calcula-
tion approaches. The calculation of the risk bearing capability
takes place on a quarterly basis. As per 31 December 2015
table below also shows the maximum, minimum and aver-
age values (always absolute values) of a basis point interest
approach for the market risk.
$Basis point interest
approach
12 /31 /2015 1,347
Minimum 2015 25
Maximum 2015 16,698
Average 2015 2,530
Currency risks arise to a very limited extent from the settlement
of foreign currency payments on behalf of clients who hold a
payment transaction or deposit account with J.P. Morgan AG
and from intra-Group settlements in Us $. To limit the currency
risks, only limits for the spot position are thus defined.
Pension risk
J.P. Morgan AG defines Pension risk as the risk caused by
contractual or other liabilities to or with respect to a pension
scheme (whether established for its employees or those of
a related company or otherwise). Pension risk is driven by
market and demographic risk where the pension scheme may
be unable to meet future expected benefit payments.
Pension risk is thus the potential necessity of increasing pen-
sion reserves. The pension risks are determined on the basis
of a VaR model but are considered in an additional calculation
in the quantification of the risk-bearing capacity. If the VaR
should exceed the excess of planned pension assets, this posi-
tion would be deducted from the risk cover potential.
23ManageMent RepoRt
ments – create an annual review and audit plan based on
the results of the risk assessment of the operational risks,
particularly in order to ensure the effectiveness of the defined
controlling measures.
The Internal Audit department of J.P. Morgan AG is an inte-
gral component of Group auditing and reports directly to the
Chairperson of the Management Board. It is responsible for
the review of the business operations at J.P. Morgan AG based
on a risk-oriented audit approach, which covers all activities
and processes at J.P. Morgan AG and thus the outsourced
activities as well. The Group auditing department of JPMorgan
Chase Bank, N.A., London, is generally involved when this
type of audit is performed.
DEFINITION OF LIMITS
In addition to regulatory limits, the Management Board at
J.P. Morgan AG defined a series of early-warning indicators,
which are monitored daily and in a timely manner. These lim-
its are defined in the Limit and Trigger Guidance and include,
among others, renovation indicators, credit limits, investment
limits, bidding limits, as well as the minimum liquidity of J.P.
Morgan AG.
The risk-based framework of J.P. Morgan AG is approved by
the Management Board and updated on a regular basis. It
defines roles and responsibilities as well as escalation proce-
dures in the event that critical threshold values are exceeded
or fallen short of, or that defined limits are breached.
ChANGE PROCESSES
The introduction of new products and the expansion of busi-
ness into new markets occurs in line with the Group-wide
“New Business Initiative Policy”. Under the responsibility
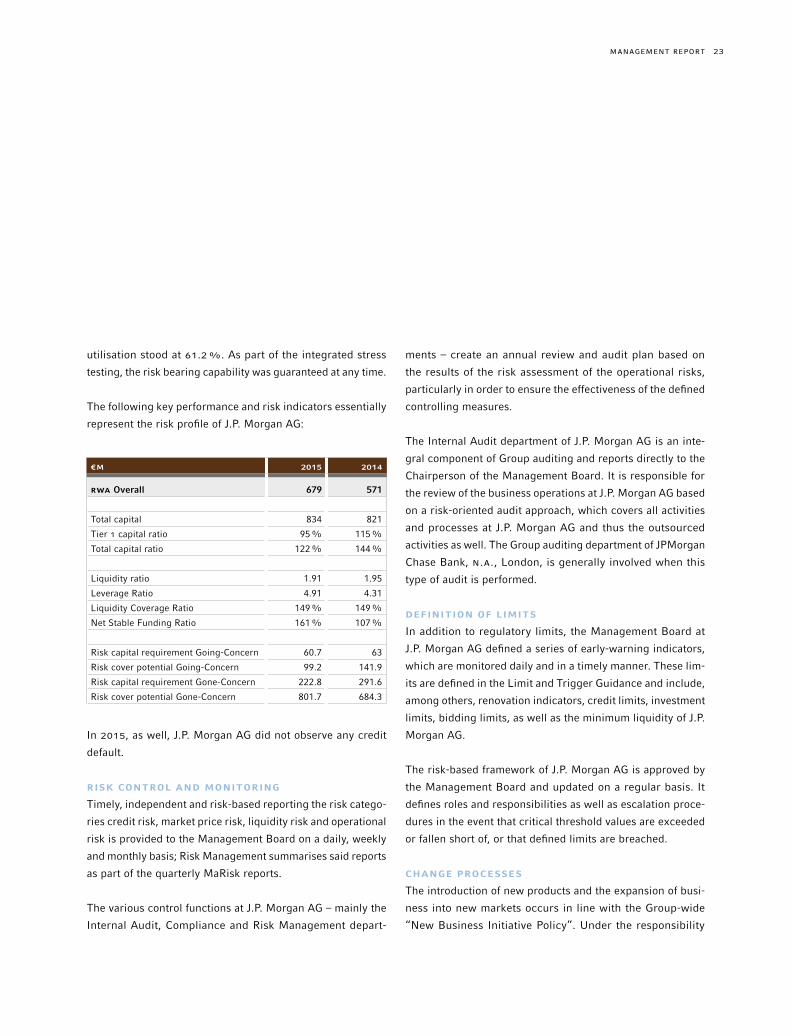
utilisation stood at 61.2%. As part of the integrated stress
testing, the risk bearing capability was guaranteed at any time.
The following key performance and risk indicators essentially
represent the risk profile of J.P. Morgan AG:
€M 2015 2014
RWA Overall 679 571
Total capital 834 821
Tier 1 capital ratio 95% 115%
Total capital ratio 122% 144%
Liquidity ratio 1.91 1.95
Leverage Ratio 4.91 4.31
Liquidity Coverage Ratio 149% 149%
Net Stable Funding Ratio 161% 107%
Risk capital requirement Going-Concern 60.7 63
Risk cover potential Going-Concern 99.2 141.9
Risk capital requirement Gone-Concern 222.8 291.6
Risk cover potential Gone-Concern 801.7 684.3
In 2015, as well, J.P. Morgan AG did not observe any credit
default.
RISK CONTROL AND MONITORING
Timely, independent and risk-based reporting the risk catego-
ries credit risk, market price risk, liquidity risk and operational
risk is provided to the Management Board on a daily, weekly
and monthly basis; Risk Management summarises said reports
as part of the quarterly MaRisk reports.
The various control functions at J.P. Morgan AG – mainly the
Internal Audit, Compliance and Risk Management depart-

24 ManageMent RepoRt
process covering all the Bank’s activities, during which the
balance sheet as at that date and the income statement are
examined to assess and confirm their correct presentation
and risks. Moreover, in all instances the four-eye principle
is applied, along with technical controls, mainly by software-
controlled audit mechanisms. Furthermore, qualified staff
members with due expertise and specialist functions such as
Financial Control & Tax take part in the process-integrated
monitoring and control functions.
The Management Board and the Supervisory Board (in par-
ticular the Audit Committee) as well as the internal audit
department are involved in the internal monitoring system in
the form of process-independent audit measures. The audit
of the annual financial statements constitutes a key element
of process-independent monitoring.
With a view to the accounting, the risk management system is
geared to identify, evaluate and communicate risks from faulty
bookkeeping, accounting, and reporting in a timely manner.
IT USE
The software used in the Bank to input accounting processes
is made up of the IT systems used throughout the Group. The
orderly functioning of the programs and interfaces utilised is
regularly assessed and confirmed. As part of the examination
of our IT, the group auditors check the due operation of the
accounting-related applications at all computer centre loca-
tions. The complete IT system, including that for accounting,
is secured against unauthorised access.
KEy REGULATIONS AND CONTROL ACTIvITIES TO
ENSURE DUE, ORDERLy AND RELIABLE ACCOUNTING
The internal control system’s structure and measures ensure
that business transactions are entered swiftly and completely
of the “Back Office” Management Board in its role as CRO,
an analysis takes place of the potential risks, the design of
the operative processes, their regulatory impacts, and their
impact on J.P. Morgan AG’s risk capacity. If the product
involves an expansion of trading activities, the CRO shall also
ensure there is a sufficient test phase prior to introduction in
real production.
Integrating various functions such as Financial Control, Tax,
Legal, Compliance Internal Review and Risk as coordinated
by the CRO guarantees a review of the planned product launch
independent of the trading function. This committee docu-
ments its findings along with a recommendation for approval,
which are then submitted for discussion to the general man-
agement. Only after approval is the initiative integrated into
real production at J.P. Morgan AG.
Internal control system
GENERAL REMARKS
Please refer to the explanations provided in the risk report for
a presentation of the risks and the measures for limiting risks.
The internal control system (ICs) and the risk management
system, which cover the J.P. Morgan AG accounting process,
focus on the guidelines, procedures and measures taken to
ensure the efficacy, economic viability and orderliness of the
accounting as well as guaranteeing adherence to the key stat-
utory regulations. The internal control system consists of two
areas, Control and Monitoring. In organisational terms, the
Financial Control & Tax division is responsible for the control.
The monitoring measures consist of elements integrated into
the process and external, independent elements. Among other
things, the integrated measures include a monthly control

25
Assurance by the Management Board
We hereby assure that to the best of our knowledge and in
line with the applicable accounting principles for financial
reporting, this report offers a fair picture of the Bank’s assets,
financial / liquidity and earnings situation that corresponds to
the facts and that the course of business, the business results
and the Bank’s position are presented in such a way as to
convey a true and fair picture, and that the material opportu-
nities and risks of the Bank’s presumable future performance
in the remainder of the current business year are described.
Frankfurt am Main, April 18, 2016
J.P. Morgan AG
Frankfurt am Main
The Management Board
BURKHARD KüBEL-sORGER sTEFAN BEHR
MICHELLE GRUNDMANN
in line with the statutory and the internal regulations and that
assets and liabilities are accurately calculated, valued and car-
ried in the annual financial statements. The booking docu-
mentation provides a reliable information base and a clear
paper trail.
The regulations of the Financial Accounting Standards Board
are applied within the J.P. Morgan Group as uniform valua-
tion and accounting principles according to Us-GAAP, supple-
mented and commented on by the Group’s “Accounting Poli-
cies” section. Here, again, stipulations are made with regard
to the intra-Group settlement policies. As part of the prepara-
tion of the individual financial statements of J.P. Morgan AG,
a reconciliation statement is prepared from Us-GAAP to the
annual financial statements in accordance with the German
Commercial Code. Here, local work directives cover the details
of the formal requirements and the tangible data for the indi-
vidual financial statements.
Pursuant to the country-specific reporting under § 26a Para.
1 S. 2 KWG, J.P. Morgan AG has neither foreign branch offices
nor subsidiaries in this sense.
MANAGEMENT REPORT AssURANCE By THE MANAGEMENT BOARD

26

2727
Financial statements 2015 of J.P. Morgan AG
FINANCIAL sTATEMENTs
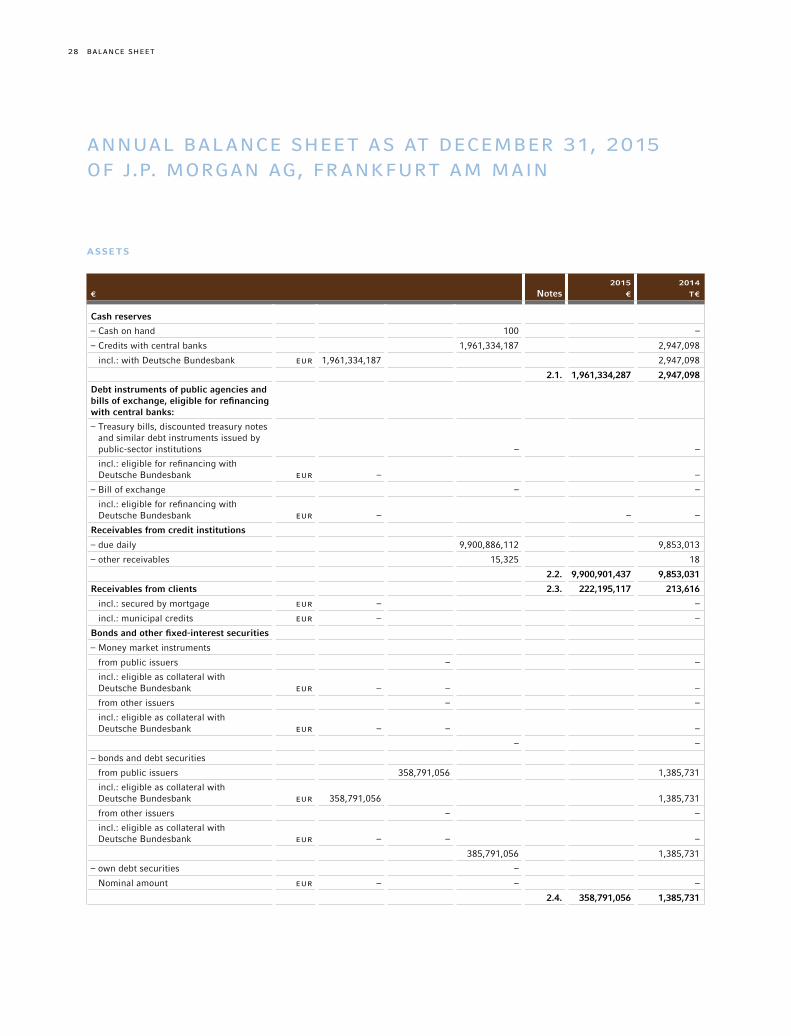
28
ASSETS
€
Notes2015
€2014
T€
Cash reserves
– Cash on hand 100 –
– Credits with central banks 1,961,334,187 2,947,098
incl.: with Deutsche Bundesbank EUR 1,961,334,187 2,947,098
2.1. 1,961,334,287 2,947,098
Debt instruments of public agencies and bills of exchange, eligible for refinancing with central banks:
– Treasury bills, discounted treasury notes and similar debt instruments issued by public-sector institutions – –
incl.: eligible for refinancing with Deutsche Bundesbank EUR – –
– Bill of exchange – –
incl.: eligible for refinancing with Deutsche Bundesbank EUR – – –
Receivables from credit institutions
– due daily 9,900,886,112 9,853,013
– other receivables 15,325 18
2.2. 9,900,901,437 9,853,031
Receivables from clients 2.3. 222,195,117 213,616
incl.: secured by mortgage EUR – –
incl.: municipal credits EUR – –
Bonds and other fixed-interest securities
– Money market instruments
from public issuers – –
incl.: eligible as collateral with Deutsche Bundesbank EUR – – –
from other issuers – –
incl.: eligible as collateral with Deutsche Bundesbank EUR – – –
– –
– bonds and debt securities
from public issuers 358,791,056 1,385,731
incl.: eligible as collateral with Deutsche Bundesbank EUR 358,791,056 1,385,731
from other issuers – –
incl.: eligible as collateral with Deutsche Bundesbank EUR – – –
385,791,056 1,385,731
– own debt securities –
Nominal amount EUR – – –
2.4. 358,791,056 1,385,731
ANNUAL BALANCE sHEET As AT DECEMBER 31, 2015 OF J.P. MORGAN AG, FRANKFURT AM MAIN
BALANCE sHEET
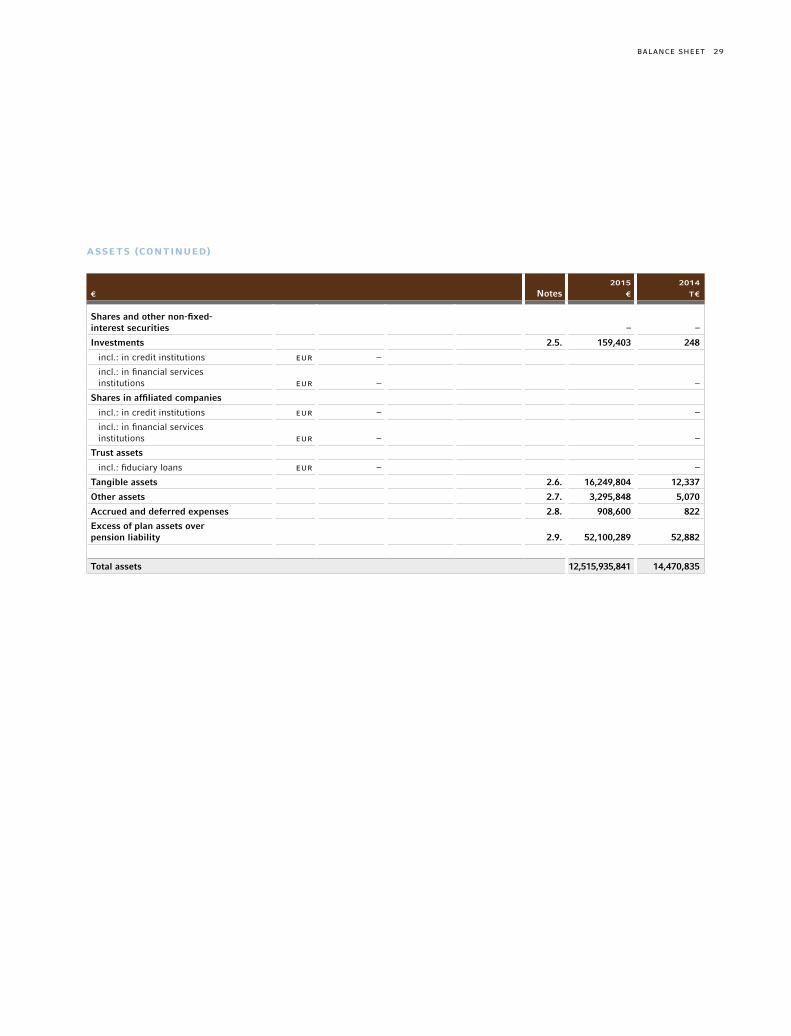
29
ASSETS (CONTINUED)
€
Notes2015
€2014
T€
Shares and other non-fixed- interest securities – –
Investments 2.5. 159,403 248
incl.: in credit institutions EUR –
incl.: in financial servicesinstitutions EUR – –
Shares in affiliated companies
incl.: in credit institutions EUR – –
incl.: in financial servicesinstitutions EUR – –
Trust assets
incl.: fiduciary loans EUR – –
Tangible assets 2.6. 16,249,804 12,337
Other assets 2.7. 3,295,848 5,070
Accrued and deferred expenses 2.8. 908,600 822
Excess of plan assets overpension liability 2.9. 52,100,289 52,882
Total assets 12,515,935,841 14,470,835
BALANCE sHEET

30
LIABILITIES
€
Notes2015
€2014
T€
Liabilities to credit institutions
– due daily 2,927,128,274 2,722,110
– with agreed maturity or notice period 2,442,223,728 4,124,539
2.11. 5,369,352,002 6,846,649
Liabilities to clients
– savings deposits
with agreed notice period of three months – –
with agreed notice period of more than three months – –
– –
– other liabilities
due daily 6,193,442,209 6,516,766
with agreed maturity or notice period 50,447,101 218,348
6,243,889,310 2.12. 6,243,889,310 6,735,114
Securitised liabilities
– issued debt instruments – –
– other securitised liabilities – –
–
incl.: money market instruments EUR – –
incl.: acceptances and promissory notes outstanding EUR – –
Trust liabilities – –
incl.: fiduciary loans EUR – –
Other liabilities 2.13. 13,666,582 10,501
Deferred income 63,679 77
Provisions
– Provisions for pensions and similar obligations – –
– Tax provisions 4,475,295 2,436
– Other provisions 12,923,057 12,311
2.14. 17,398,352 14,747
Subordinated liabilities 2.15. 185,604,492 185,880
Profit participation right – –
incl.: maturity after less than two years EUR – – –
BALANCE sHEET
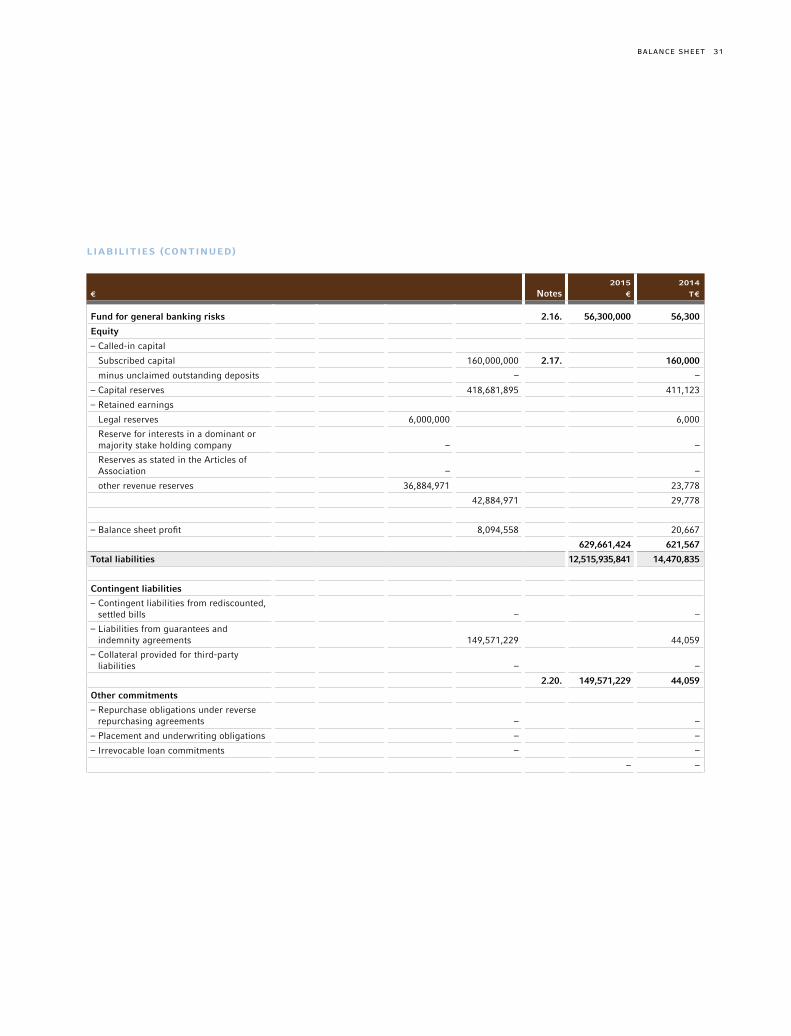
31
LIABILITIES (CONTINUED)
€
Notes2015
€2014
T€
Fund for general banking risks 2.16. 56,300,000 56,300
Equity
– Called-in capital
Subscribed capital 160,000,000 2.17. 160,000
minus unclaimed outstanding deposits – –
– Capital reserves 418,681,895 411,123
– Retained earnings
Legal reserves 6,000,000 6,000
Reserve for interests in a dominant or majority stake holding company – –
Reserves as stated in the Articles of Association – –
other revenue reserves 36,884,971 23,778
42,884,971 29,778
– Balance sheet profit 8,094,558 20,667
629,661,424 621,567
Total liabilities 12,515,935,841 14,470,835
Contingent liabilities
– Contingent liabilities from rediscounted, settled bills – –
– Liabilities from guarantees and indemnity agreements 149,571,229 44,059
– Collateral provided for third-party liabilities – –
2.20. 149,571,229 44,059
Other commitments
– Repurchase obligations under reverse repurchasing agreements – –
– Placement and underwriting obligations – –
– Irrevocable loan commitments – –
– –
BALANCE sHEET

32
FOR ThE PERIOD FROM JANUARy 1, 2015, UNTIL DECEMBER 31, 2015
€
Notes2015
€2014
T€
Interest income from
– lending and money-market transactions 22,655,441 14,596
– less negative interest arising from lending and money-market transactions –5,965,790 16,689,651
– fixed-income securities and debt register claims 13,600,177 19,053
– less negative interest arising from debt register claims – 13,600,177
– Total interest income 30,289,828 33,649
Interest expenses from
– lending and money-market transactions 2,601,445 5,150
– less positive interest arising from lending and money-market transactions –11,217,968 –8,616,520
– fixed-income securities and debt register claims 9,183,116 14,921
– less positive interest arising from debt register claims – –
– Total interest expenses –566,596 20,071
3.1. 29,723,232 13,577
Current income from
– equities and other non-fixed-income securities – –
– investments 24,546 4
– shares in affiliated companies – –
24,546 4
Commissions income 74,640,279 64,959
Commissions expenses 1,271,471 1,634
3.2. 73,368,808 63,325
Net income from trading portfolio – –
Other operating income 3.3. 33,272,916 41,804
General administrative expenses
– Personnel expenses
Wages and salaries 26,246,318 25,216
– Social security contributions and expenses for pension provisions and benefits 3,356,539 29,602,857 6,031
incl.: for retirement benefits EUR 463,929 3,196
– other administrative expenses 83,027,187 67,405
3.4. 112,630,044 98,653
INCOME sTATEMENT OF J.P. MORGAN AG, FRANKFURT AM MAIN
INCOME sTATEMENT

33
FOR ThE PERIOD FROM JANUARy 1, 2015, UNTIL DECEMBER 31, 2015 (CONTINUED)
€
Notes2015
€2014
T€
Depreciation, amortisation and valuation adjustments of intangible and tangible fixed assets 2.6. 2,190,142 2,871
Other operating expenses 3.5. 4,451,131 3,794
Depreciation and value adjustments in respect of receivables and specific securities and allocations to provisions for credit risks – 3.7.
Income from allocations to receivables and specific securities as well as allocations to loan transaction accruals – 3.6. 127
– 127
Depreciation, amortisation and write-downs of equity investments, shares in affiliated companies and securities classified as fixed assets – –
Income from reversals of investments, shares in affiliated companies and securities classified as fixed assets – –
– –
Income before Tax and extraordinary items 17,118,185 13,520
Extraordinary income – –
Extraordinary expenses – –
Extraordinary result – –
Taxes on income and revenue 9,011,024 2,631
including changes in deferred taxes: EUR –
Other taxes, not indicated under other operating expenses 12,603 13
3.8. –9,231,906 –2,645
Profit transferred on the basis of profit pooling, profit and loss transfer, or partial profit transfer agreements – –
Annual net profit 8,094,558 10,875
Profit / loss carried forward 0 9,792
Retained profit 8,094,558 20,667
INCOME sTATEMENT
Notes34 NOTEs
1. General remarks
1.1. GENERAL PRINCIPLES
J.P. Morgan AG, Frankfurt am Main, is a registered stock corporation under German law active
in Germany in the main segments of transaction banking, securities custody and deposit and
loan business.
The J.P. Morgan AG annual financial statement has been prepared according to the regulations
of the German Commercial Code and the Decree on Accounting for Banks and Financial Service
Providers.
The structure of the balance sheet and the income statement is unchanged as compared to the
prior year. For the profit and loss statement, the recognition of negative interest was expanded
on in net interest income.
1.2. ChANGED ACCOUNTING AND vALUATION METhODS
The accounting and valuation methods adopted in the 2015 annual financial statements were
used as for the previous year.
1.3. FOREIGN CURRENCy CONvERSION
Foreign-currency receivables and liabilities have been converted using the European Central Bank
reference rates applicable at the reporting date. Transactions denominated in foreign currency
are translated at the end-of-month rate for the month in which the business was transacted.
Exchange gains / losses are reported in profit or loss under other income.
J.P. MORGAN AG, FRANKFURT AM MAIN NOTEs TO THE ANNUAL FINANCIAL sTATEMENT 2015

Notes 35
2. Key accounting and valuation principles and explanations
2.1. CASh RESERvES
T€ 12 /31 /2015 12 /31 /2014
Cash reserves 1,961,334 2,947,098
Cash on hand – –
Credit with central banks 1,961,334 2,947,098
incl.: with Deutsche Bundesbank 1,961,334 2,947,098
Liquid funds are reported at nominal value. As at the reporting date, there is € 100 in liquid funds
in the cash on hand, and liquidity was invested with Deutsche Bundesbank.
2.2. RECEIvABLES FROM CREDIT INSTITUTIONS
T€ 12 /31 /2015 12 /31 /2014
Receivables from credit institutions 9,900,901 9,853,031
incl.: receivables from affiliated companies 9,808,418 9,826,389
Breakdown by remaining maturity:
a) due daily 9,900,886 9,853,013
b) other receivables 15 18
1. up to three months, 15 18
2. more than three months to one year, – –
3. more than one year to five years, – –
4. more than five years – –
Receivables from banks are reported at the nominal value or at the lower cost of acquisition plus
accrued interest.
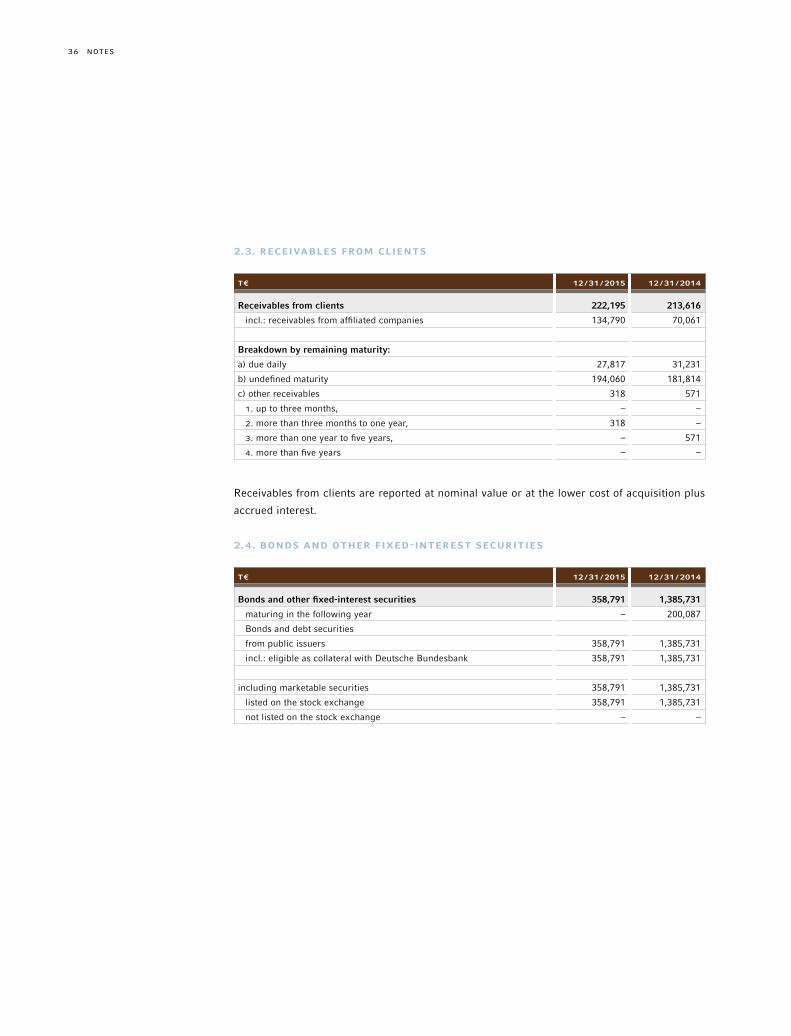
Notes36
2.3. RECEIvABLES FROM CLIENTS
T€ 12 /31 /2015 12 /31 /2014
Receivables from clients 222,195 213,616
incl.: receivables from affiliated companies 134,790 70,061
Breakdown by remaining maturity:
a) due daily 27,817 31,231
b) undefined maturity 194,060 181,814
c) other receivables 318 571
1. up to three months, – –
2. more than three months to one year, 318 –
3. more than one year to five years, – 571
4. more than five years – –
Receivables from clients are reported at nominal value or at the lower cost of acquisition plus
accrued interest.
2.4. BONDS AND OThER FIXED-INTEREST SECURITIES
T€ 12 /31 /2015 12 /31 /2014
Bonds and other fixed-interest securities 358,791 1,385,731
maturing in the following year – 200,087
Bonds and debt securities
from public issuers 358,791 1,385,731
incl.: eligible as collateral with Deutsche Bundesbank 358,791 1,385,731
including marketable securities 358,791 1,385,731
listed on the stock exchange 358,791 1,385,731
not listed on the stock exchange – –
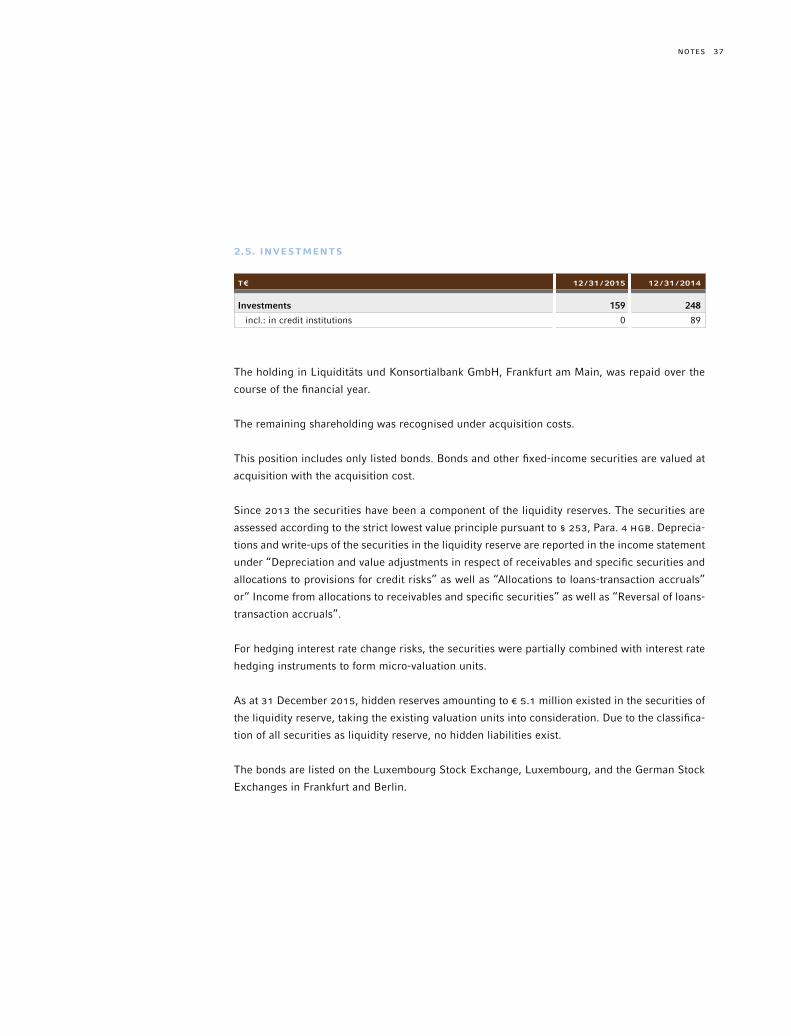
Notes 37
2.5. INvESTMENTS
T€ 12 /31 /2015 12 /31 /2014
Investments 159 248
incl.: in credit institutions 0 89
The holding in Liquiditäts und Konsortialbank GmbH, Frankfurt am Main, was repaid over the
course of the financial year.
The remaining shareholding was recognised under acquisition costs.
This position includes only listed bonds. Bonds and other fixed-income securities are valued at
acquisition with the acquisition cost.
Since 2013 the securities have been a component of the liquidity reserves. The securities are
assessed according to the strict lowest value principle pursuant to § 253, Para. 4 HGB. Deprecia-
tions and write-ups of the securities in the liquidity reserve are reported in the income statement
under “Depreciation and value adjustments in respect of receivables and specific securities and
allocations to provisions for credit risks” as well as “Allocations to loans-transaction accruals”
or“ Income from allocations to receivables and specific securities” as well as “Reversal of loans-
transaction accruals”.
For hedging interest rate change risks, the securities were partially combined with interest rate
hedging instruments to form micro-valuation units.
As at 31 December 2015, hidden reserves amounting to € 5.1 million existed in the securities of
the liquidity reserve, taking the existing valuation units into consideration. Due to the classifica-
tion of all securities as liquidity reserve, no hidden liabilities exist.
The bonds are listed on the Luxembourg Stock Exchange, Luxembourg, and the German Stock
Exchanges in Frankfurt and Berlin.

Notes38
2.6. ChANGE IN FIXED ASSETS
T€Other equipment and office
equipmentTechnical equipment and
machinery Total
Cumulative acquisition costs as at 01 / 01 /2015 10,521 2,690 13,211
Additions 6,687 74 6,761
Disposals –835 –6 –841
Cumulative acquisition costs as at 12 /31 /2015 16,373 2,758 19,131
Scheduled depreciation in the current year 1,653 542 2,194
Cumulated depreciation as at 12 /31 /2015 1,913 968 2,881
Residual value as at 12 /31 /2015 14,460 1,790 16,250
Residual value as at 12 /31 /2014 10,079 2,258 12,337
Tangible assets are valued at acquisition cost minus scheduled straight-line depreciation. The
value of the used parts of buildings amounts to € 11.4 million, while that of operating and busi-
ness equipment amounts to € 4.8 million.
2.7. OThER ASSETS
T€ 12 /31 /2015 12 /31 /2014
Other assets 3,296 5,070
This is mainly sales tax receivables in the amount of € 1.0 million, as well as tax receivables from
corporate tax of € 0.3 million, as well as € 0.5 million from the fair value of reinsurance policies
and receivables from payment transaction services in the amount of € 0.8 million.

Notes 39
2.8. ACCRUED AND DEFERRED EXPENSES
T€ 12 /31 /2015 12 /31 /2014
Accrued and deferred expenses 909 822
Accrued and deferred expenses include T€ 907 for the monthly pension payments already made
in 2015 for accounting reasons.
2.9. EXCESS OF PLAN ASSETS OvER PENSION LIABILITy
In line with § 246 Para. 2 S. 2 HGB, assets that serve to cover debts from pension obligations
and similar long-term obligations were netted against the liabilities. The excess carrying value
of the balance is then entered under the item for “Positive consolidation difference from asset
offsetting”. The actuarial report was calculated using the mortality tables of Prof. Dr. Klaus
Heubeck 2005 G.
The evaluation was carried out in accordance with the accepted principles of actuarial mathemat-
ics using the so-called “Projected Unit Credit Method” (PUC method).
T€ 12 /31 /2015 12 /31 /2014
Valuation parameters (BilMoG [Bilanzrechtsmodernisierungsgesetz – German Accounting Law Modernisation Act])
Pension obligations:
Actuarial interest rate 3.89% 4.53%
Future increase of benefits 3.00% 3.00%
Increase of pension 1.75% 2.00%
In order to account for fluctuation, age-specific and gender-specific fluctuation probabilities were used
Mercer Standard
Mercer Standard
Partial retirement:
Actuarial interest rate 3.89% 4.54%
Future increase of benefits 3.00% 3.00%
Increase of pension 0.00% 0.00%
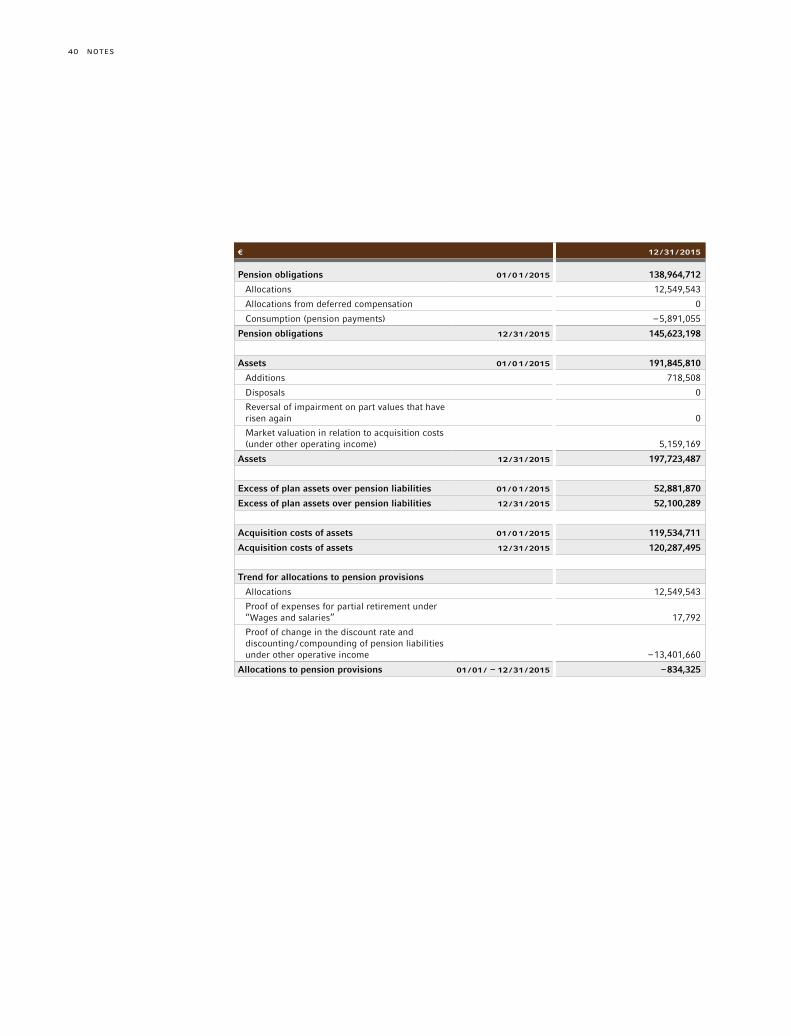
Notes40
€ 12 /31 /2015
Pension obligations 01 / 01 /2015 138,964,712
Allocations 12,549,543
Allocations from deferred compensation 0
Consumption (pension payments) –5,891,055
Pension obligations 12 /31 /2015 145,623,198
Assets 01 / 01 /2015 191,845,810
Additions 718,508
Disposals 0
Reversal of impairment on part values that have risen again 0
Market valuation in relation to acquisition costs (under other operating income) 5,159,169
Assets 12 /31 /2015 197,723,487
Excess of plan assets over pension liabilities 01 / 01 /2015 52,881,870
Excess of plan assets over pension liabilities 12 /31 /2015 52,100,289
Acquisition costs of assets 01 / 01 /2015 119,534,711
Acquisition costs of assets 12 /31 /2015 120,287,495
Trend for allocations to pension provisions
Allocations 12,549,543
Proof of expenses for partial retirement under“Wages and salaries” 17,792
Proof of change in the discount rate and discounting /compounding of pension liabilities under other operative income –13,401,660
Allocations to pension provisions 01 /01 / – 12 /31 /2015 –834,325

Notes 41
2015
Asset investment measures pursuant to § 285 No. 26
– Special Institutional Funds JPMC I Universal Fund
Legal basis: Risk management approach:
Basis of the calculation: Market value (NAV) of assets
Reinvestment: Capitalisation funds
§ 253 Para. 3 S. 4:No amortisation,
as valued according to § 246 Para. 2 HGB
Term: No restriction on the daily return
Valuation as per §§ 168, 278 KAGB [Capital Investment Act] or comparable foreign law as at balance sheet date: T€ 175,380; shares 1,093,811
Capital assets:Not eligible for listing on the stock exchange /
unlisted
– Mutual funds JPMorgan Funds – Global Unconstrained Equity
Legal basis: Luxembourg law
Basis of the calculation: Market value (NAV) of assets
Reinvestment: Capitalisation funds
§ 253 Para. 3 S. 4:No amortisation,
as valued according to § 246 Para. 2 HGB
Term: No restriction on the daily return
Valuation as per §§ 168, 278 KAGB [Capital Investment Act] or comparable foreign law as at balance sheet date: T€ 222,700; shares 14,404,080
Capital assets:Not eligible for listing on the stock exchange /
unlisted
All pension assets are held to hedge pension benefits granted to employees. The primary invest-
ment target of the funds is to cover long term the financial obligations.
The fund unit prices are calculated as follows: A net asset value (NAV) is allocated to each share
class – this is the value of the assets of a share class minus the liabilities for that class. The NAV
is then divided by the total number of current shares belonging to that share class to arrive at
the unit price.

Notes42
2.10. OThER ACCOUNTING AND vALUATION METhODS
Other assets are valued under consideration of the strict lowest value principle.
Expenses and income deferrals have been formed and allocated to the respective balance sheet
item.
Liabilities are carried at the sums repayable and securitised liabilities are held at their nominal
value.
Appropriate provisions have been made for uncertain liabilities, including imminent losses in
the amount of T€ 300.
Interest driven business, in the banking book, was valued using the periodical approach (p&l
based method) for loss free valuation. In accordance with this method, it was not required to
form a threatened loss reserve.
The amount barred from distribution in accordance with § 268 Para. 8 HGB comes to € 77.6 mil-
lion as at December 31, 2015. Free reserves within the meaning of § 268 Para. 8 HGB amounted
to € 455.6 million.
Provisions were valued at the settlement amount, factoring in expected increases in prices and
costs.
Provisions with a remaining term of more than one year have been discounted / revalued at the
average market interest rates as calculated and announced by Deutsche Bundesbank (§ 253 Para.
2 HGB). Income and expenses from discounting and revaluing were entered not netted, depend-
ing on whether the provisions were made for loan business or for non-banking business, under
the interest income/ interest expense item (§ 277 Para. 5 HGB) or in other operating income/
expenses (§ 340a Para. 2 in conjunction with § 277 Para. 5 HGB).
Deferred taxes are calculated for temporary differences between the commercial valuations of
assets, liabilities and deferred income and their taxable value and tax loss. The underlying tem-
porary differences are mainly due to different valuations of securities, pension obligations and
the valuation of plan assets and provisions and lead to a net deferred tax asset (surplus). For
the calculation of deferred taxes, a corporate income tax rate including solidarity surcharge of
15.825% and an industrial tax rate of 16.10% were assumed. The right available under § 274,
Para. 1, S. 2, HGB for activation of deferred taxes is not exercised.
Valuation units were set up for registered bonds, bearer bonds and debentures issued that are
hedged by total return swaps (TRs) against market price risk. Moreover, parts of the fixed-interest
securities were combined with interest rate swaps as a hedge into a valuation unit.

Notes 43
The TRs and the interest rate swaps were combined at a single transaction level with the underly-
ing transactions in a clear hedging relationship and their effectiveness was tested.
Owing to the clear hedging relationship, the transactions involved are Micro-Hedges that rep-
resent an efficient and perfect hedging relationship for the entire term. The fair values covered
by the Total Return Swaps in relation to the underlying liabilities are calculated using customary
valuation models. Efficiency is measured by using the dollar offset method, or with the use of
suitable statistical procedures such as regression analysis.
The fair value of all Total Return Swaps as at December 31, 2015 was T€ –4,846. The value of the
Interest Rate Swaps as at the reporting date came to T€ –14,951. Valuation was carried out using
internal valuation procedures. The Group uses valuation procedures to establish the fair value of
financial instruments where prices quoted in active markets are not available. Therefore, where
possible, parameter inputs to the valuation procedures are based on observable data derived
from prices of relevant financial instruments traded in an active market. The use of these models
involves some level of management estimation and judgment, the degree of which will depend on
the price transparency for the financial instrument and its market and the instrument’s complexity.
The term of the individual TRs matches that of the liabilities hedged and was as follows as at
December 31, 2015:
T€Total Return
Swaps Liabilities
Total Return Swaps Overview (Nominal)
Maturity
2016 15,526 15,526
2017 – –
2018 25,000 25,000
2020 – –
2022 10,000 10,000
In total, 5 valuation units were formed, and 5 Total Return Swaps established to cover 5 liability
items.

Notes44
The term structure of the Interest Rate Swaps in connection with bonds is presented in the fol-
lowing table:
T€Interest Rate
Swaps Bonds
Interest Rate Swap overview (nominal)
Maturity
2022 – –
2023 – –
2024 160,000 160,000
2025 – 200,000
The effective portion of the valuation units formed is presented according to the freezing method.
2.11. LIABILITIES TO CREDIT INSTITUTIONS
T€ 12 /31 /2015 12 /31 /2014
Liabilities to credit institutions 5,369,352 6,846,649
incl.: liabilities to affiliated companies 4,322,329 5,091,628
Maturity structure:
a) due daily 2,927,128 2,722,110
b) with agreed maturity or notice period 2,442,224 4,124,539
1. up to three months, 2,342,224 3,833,356
2. more than three months to one year, – 41,183
3. more than one year to five years, – –
4. more than five years 100,000 250,000
The JPMorgan Chase Bank, N.A., London Branch, has furnished a cash security of € 500 million
to secure granted lines of credit, as well as a cash security of € 100 million to secure transac-
tions with derivatives.
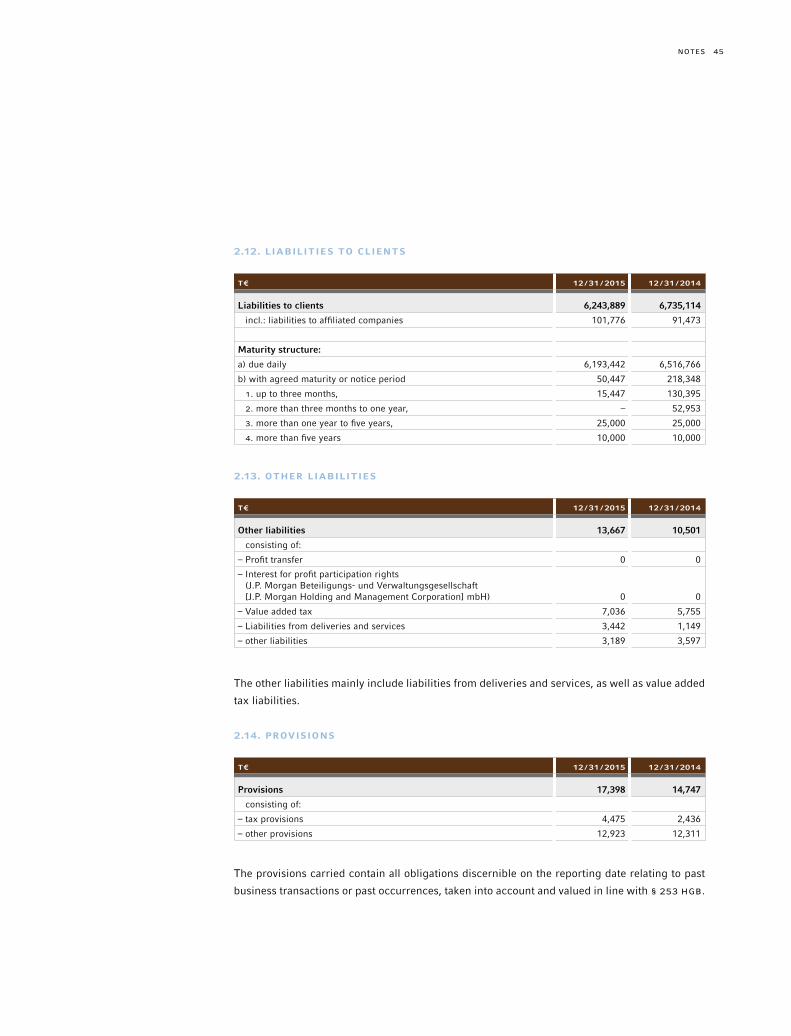
Notes 45
2.12. LIABILITIES TO CLIENTS
T€ 12 /31 /2015 12 /31 /2014
Liabilities to clients 6,243,889 6,735,114
incl.: liabilities to affiliated companies 101,776 91,473
Maturity structure:
a) due daily 6,193,442 6,516,766
b) with agreed maturity or notice period 50,447 218,348
1. up to three months, 15,447 130,395
2. more than three months to one year, – 52,953
3. more than one year to five years, 25,000 25,000
4. more than five years 10,000 10,000
2.13. OThER LIABILITIES
T€ 12 /31 /2015 12 /31 /2014
Other liabilities 13,667 10,501
consisting of:
– Profit transfer 0 0
– Interest for profit participation rights (J.P. Morgan Beteiligungs- und Verwaltungsgesellschaft [J.P. Morgan Holding and Management Corporation] mbH) 0 0
– Value added tax 7,036 5,755
– Liabilities from deliveries and services 3,442 1,149
– other liabilities 3,189 3,597
The other liabilities mainly include liabilities from deliveries and services, as well as value added
tax liabilities.
2.14. PROvISIONS
T€ 12 /31 /2015 12 /31 /2014
Provisions 17,398 14,747
consisting of:
– tax provisions 4,475 2,436
– other provisions 12,923 12,311
The provisions carried contain all obligations discernible on the reporting date relating to past
business transactions or past occurrences, taken into account and valued in line with § 253 HGB.

Notes46
Provisions for anniversaries contained in the figure were calculated using an actuarial report
and on the basis of the mortality tables of Prof. Dr. Klaus Heubeck 2005 G and in line with the
valuation method as per § 253 Para. 1 HGB.
Other provisions consist for the most part of provisions regarding personnel expenditure and
asset retirement obligations for the leased office building.
2.15. SUBORDINATED LIABILITIES
T€ 12 /31 /2015 12 /31 /2014
Subordinated liabilities 185,604 185,880
incl.: subordinated liabilities to affiliated companies 185,604 185,880
The subordinated capital posted at the end of the financial year 2015 comprises a subordinate
loan of € 150,000,000 taken out on December 21, 2009, as well as another subordinate loan of
€ 35,790,432, which was transferred to J.P. Morgan AG within the scope of the merger between
J.P. Morgan Beteiligungs- und Verwaltungsgesellschaft mbH and J.P. Morgan AG.
Interest payments are made quarterly starting on December 21, 2009 or for the capital gained
within the context of the merger, on a semi-annual basis. Interest to be paid is calculated on the
basis of the respective three-month EURIBOR (European InterBank Offered Rate) or rather six-
month EURIBOR interest rate. The subordinated capital to the amount of € 150,000,000 is due on
December 21, 2009. The subordinated loan to the amount of € 35,790,000 has no term with an
option for termination at any time with a notice period of two years. In the event of insolvency, all
remaining lenders will be serviced in order of priority. There are no early repayment obligations.
The subordinated liabilities meet the requirements of § 10 Para. 5a of KWG [Kreditwesengesetz
– German Banking Act].
2.16. FUND FOR GENERAL BANKING RISKS
T€ 12 /31 /2015 12 /31 /2014
Status as of 01 / 01 /2015 56,300 56,300
Additions – –
Disposals – –
Status as of 12 /31 /2015 56,300 56,300
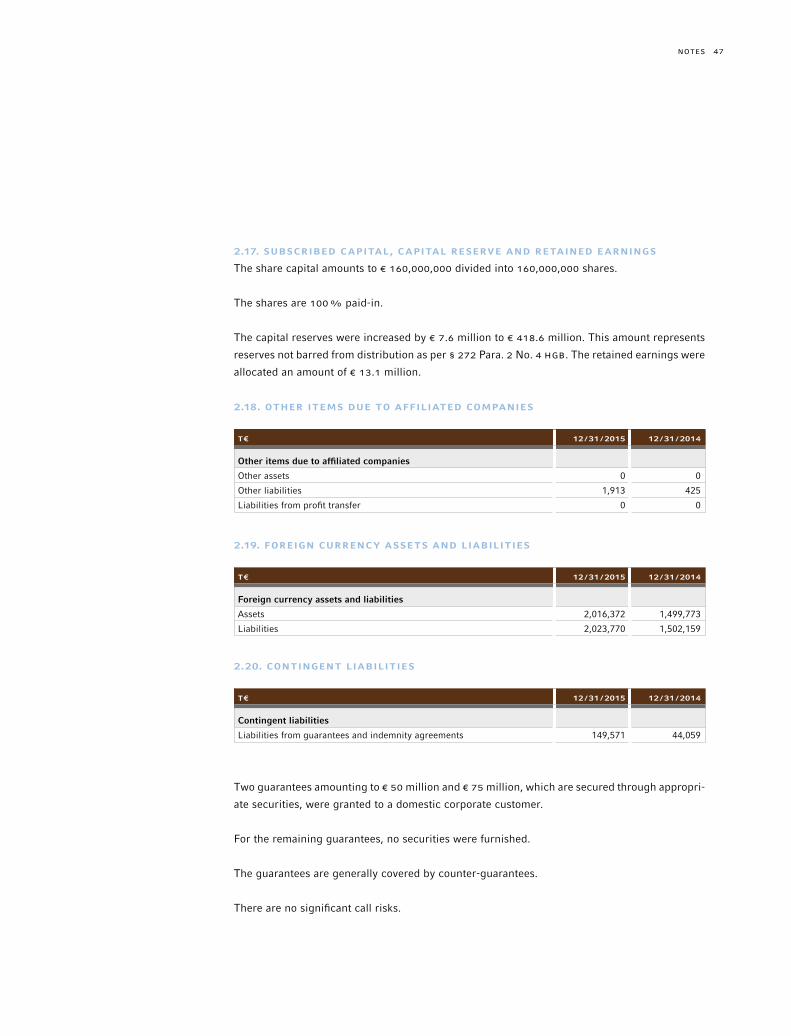
Notes 47
2.17. SUBSCRIBED CAPITAL, CAPITAL RESERvE AND RETAINED EARNINGS
The share capital amounts to € 160,000,000 divided into 160,000,000 shares.
The shares are 100% paid-in.
The capital reserves were increased by € 7.6 million to € 418.6 million. This amount represents
reserves not barred from distribution as per § 272 Para. 2 No. 4 HGB. The retained earnings were
allocated an amount of € 13.1 million.
2.18. OThER ITEMS DUE TO AFFILIATED COMPANIES
T€ 12 /31 /2015 12 /31 /2014
Other items due to affiliated companies
Other assets 0 0
Other liabilities 1,913 425
Liabilities from profit transfer 0 0
2.19. FOREIGN CURRENCy ASSETS AND LIABILITIES
T€ 12 /31 /2015 12 /31 /2014
Foreign currency assets and liabilities
Assets 2,016,372 1,499,773
Liabilities 2,023,770 1,502,159
2.20. CONTINGENT LIABILITIES
T€ 12 /31 /2015 12 /31 /2014
Contingent liabilities
Liabilities from guarantees and indemnity agreements 149,571 44,059
Two guarantees amounting to € 50 million and € 75 million, which are secured through appropri-
ate securities, were granted to a domestic corporate customer.
For the remaining guarantees, no securities were furnished.
The guarantees are generally covered by counter-guarantees.
There are no significant call risks.

Notes48
3. Explanatory Notes to the Income Statement
3.1. NET INTEREST INCOME
T€ 01/ 01/ – 12/31/2015 01/ 01/ – 12/31/2014
Interest income (net) 29,723 13,577
Interest income from: 30,289 33,649
a) Lending and money-market transactions 22,655 14,596
less negative interest arising from lending and money-market transactions –5,966 0
b) Fixed-income securities and debt register claims 13,600 19,053
Interest expenses: –566 20,071
a) Lending and money-market transactions 2,601 5,150
less negative interest arising from lending and money-market transactions –11,218 0
b) Fixed-income securities and debt register claims 9,183 14,921
The net interest income rose by 119% in comparison with the equivalent period, whereby the
large holding of customer deposits connected with negative interest decisively led to a net inter-
est surplus from lending and money-market transactions in the reporting period. The remaining
increase is primarily to be attributed to reverse repo transactions, which led to an increase in
interest earnings of T€ 7,935 to T€ 10,790. The positive balance of interest from bonds rose in
comparison with the previous year by T€ 934.
3.2. NET COMMISSION INCOME
T€ 01/ 01/ – 12/31/2015 01/ 01/ – 12/31/2014
Commission income (net) 73,369 63,325
The net commission income increased by 15.9% in comparison to the previous year. In particular,
increasing income from payment transactions contributed positively to this increase.

Notes 49
3.3. OThER OPERATING INCOME
T€ 01/ 01/ – 12/31/2015 01/ 01/ – 12/31/2014
Other operating income 33,273 41,804
including:
– Services rendered for Group entities 27,208 32,522
– Miscellaneous other operating income 6,065 9,282
The decrease in other operating income of 20.4% as compared to the previous year can primarily
be attributed to the negative valuation result in the amount of T€ –8,267 (2014: T€ 7,689) from
changes in the fair value and income from the assets, the change in the calculatory interest rate
and effects of discounting /compounding of pension liabilities. A positive effect was achieved from
the sale of securities from the liquidity reserve amounting to T€ 11,349. Further, other income
included services to companies of the Group.
3.4. GENERAL ADMINISTRATIvE EXPENSES
T€ 01/ 01/ – 12/31/2015 01/ 01/ – 12/31/2014
General administrative expenses 112,630 98,653
incl.:
Personnel expenses 29,603 31,248
– Wages and salaries 26,246 25,216
– Social security contributions and expenses for pension provisions and benefits 3,357 6,032
• of which for retirement 464 3,196
other administrative expenses 83,027 67,405
The increase in general administrative expenses results mainly from increased expenses on
services to companies of the Group.
3.5. OThER OPERATING EXPENSES
T€ 01/ 01/ – 12/31/2015 01/ 01/ – 12/31/2014
Other operating expenses 4,451 3,794
The other operational expenses primarily include intra-Group expenses for the administration
and sale of securities from the liquidity reserve.

Notes50
3.6. INCOME FROM ALLOCATION TO RECEIvABLES AND CERTAIN SECURITIES AS
WELL AS FROM REvERSAL OF ACCRUALS IN ThE LENDING BUSINESS
T€ 01/ 01/ – 12/31/2015 01/ 01/ – 12/31/2014
Income from allocations 0 127
As at the reporting date, no earnings from write-ups had been recorded.
3.7. DEPRECIATION AND vALUE ADJUSTMENTS IN RESPECT OF RECEIvABLES AND
SPECIFIC SECURITIES AND ALLOCATIONS TO PROvISIONS FOR CREDIT RISKS
T€ 01/ 01/ – 12/31/2015 01/ 01/ – 12/31/2014
Write-offs of securities in the liquidity reserve 0 0
On the reporting date there were no expenses arising from the evaluation of the debt securities
based on the strict lowest value principle.
3.8. TAX ON INCOME AND REvENUE AND OThER TAXES
T€ 01/ 01/ – 12/31/2015 01/ 01/ – 12/31/2014
Taxes 9,024 2,644
Industrial tax 4,554 1,351
Corporate tax 4,457 1,280
Other 13 13
In the fiscal year out-of-period tax expenses in the amount of € 13,000 were recorded.

Notes 51
4. Other data
Market value on 12 /31 /2015 Market value on 12 /31 /2014 Market value on 12 /31 /2013
T€ positive negative positive negative positive negative
Total Return Swaps 4,104 8,950 14,205 13,651 35,834 56,247
Interest Rate Swaps – 14,951 – 117,104 – –
Forward transactions which were not yet settled at the reporting date consisted of Total Return
Swaps and Interest Rate Swaps. The Total Return Swaps and Interest Rate Swaps were concluded
to hedge against market risks.
4.1. RELATIONS WITh AFFILIATED COMPANIES
The sole shareholder of J.P. Morgan AG is J.P. Morgan International Finance Limited, Newark /
Delaware, UsA. A dependency report pursuant to § 312 AktG [Aktiengesetz – German Stock
Corporations Act] is issued.
J.P. Morgan Chase & Co, J.P. Morgan Chase Bank, National Association, J.P. Morgan International
Inc and Bank One International Holdings Corporation informed us by their letter of February
18, 2016 that there exists an indirect stake of 100%. J.P. Morgan International Finance Limited
informed us by its letter of February 18, 2016 that there exists an indirect stake of 100%.
The consolidated annual financial statements for the smallest and largest group of companies is
disclosed by JPMorgan Chase & Co., New York, whose shares are traded on the New York Stock
Exchange and on some European and Asian exchanges. The consolidated annual financial state-
ments can be obtained on request from J.P. Morgan AG, Frankfurt am Main.
The Bank is a member of the Deposit Protection Fund of the Association of German Banks.
4.2. NUMBER OF EMPLOyEES
On average for the year there were 268 employees, distributed as follows:
Number 12 /31 /2015 12 /31 /2014
Yearly average 268 262
Distribution of employees
Authorised signatories 10 13
Authorised officers 108 123
Commercial employees 150 126
Employees sent overseas are not included in this chart.
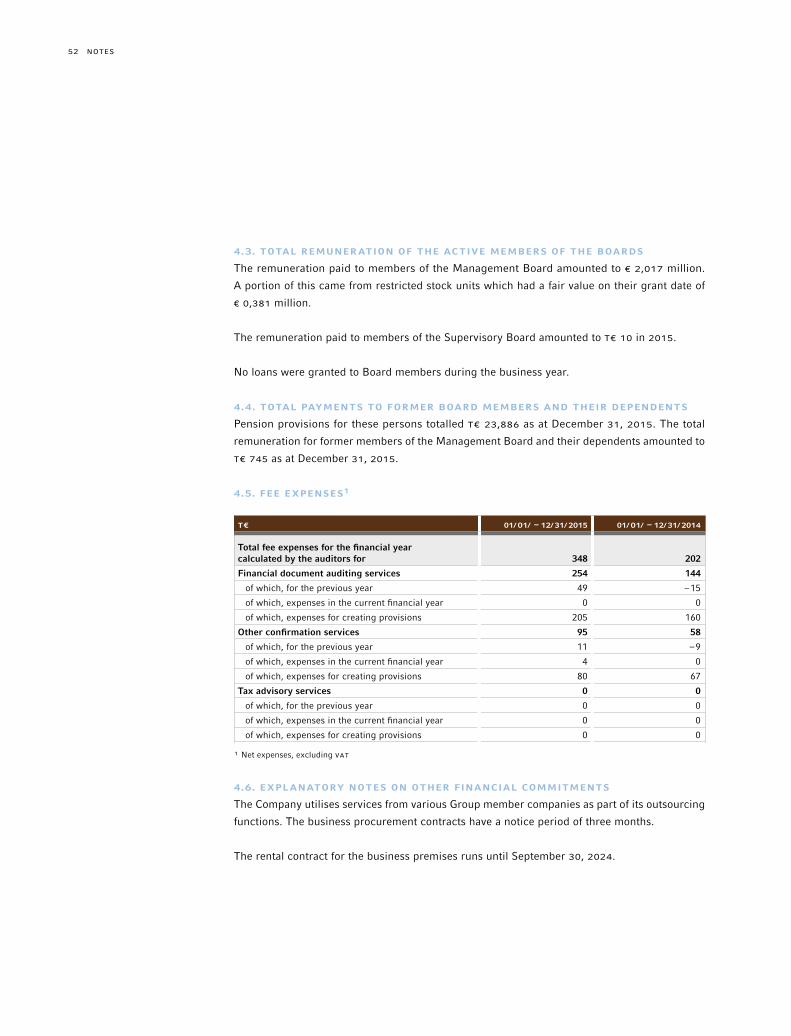
Notes52
4.3. TOTAL REMUNERATION OF ThE ACTIvE MEMBERS OF ThE BOARDS
The remuneration paid to members of the Management Board amounted to € 2,017 million.
A portion of this came from restricted stock units which had a fair value on their grant date of
€ 0,381 million.
The remuneration paid to members of the Supervisory Board amounted to T€ 10 in 2015.
No loans were granted to Board members during the business year.
4.4. TOTAL PAyMENTS TO FORMER BOARD MEMBERS AND ThEIR DEPENDENTS
Pension provisions for these persons totalled T€ 23,886 as at December 31, 2015. The total
remuneration for former members of the Management Board and their dependents amounted to
T€ 745 as at December 31, 2015.
4.5. FEE EXPENSES¹
T€ 01/ 01/ – 12/31/2015 01/ 01/ – 12/31/2014
Total fee expenses for the financial year calculated by the auditors for 348 202
Financial document auditing services 254 144
of which, for the previous year 49 –15
of which, expenses in the current financial year 0 0
of which, expenses for creating provisions 205 160
Other confirmation services 95 58
of which, for the previous year 11 –9
of which, expenses in the current financial year 4 0
of which, expenses for creating provisions 80 67
Tax advisory services 0 0
of which, for the previous year 0 0
of which, expenses in the current financial year 0 0
of which, expenses for creating provisions 0 0
¹ Net expenses, excluding VAT
4.6. EXPLANATORy NOTES ON OThER FINANCIAL COMMITMENTS
The Company utilises services from various Group member companies as part of its outsourcing
functions. The business procurement contracts have a notice period of three months.
The rental contract for the business premises runs until September 30, 2024.

Notes 53
Management Board
Burkhard Kübel-SorgerChairperson of the Management Board, Managing Director, J.P. Morgan AG
Michelle GrundmannManaging Director, J.P. Morgan AG
Stefan BehrManaging Director, J.P. Morgan AG
Supervisory Board
Mark S. GarvinChairperson, Managing Director, J.P. Morgan Europe Limited, London
Frédéric P. MouchelVice Chairperson, Managing Director, JPMorgan Chase Bank N.A., London Branch
Melanie MartinManaging Director, JPMorgan Chase Bank N.A., London Branch
Dorothee Blessing (from 15 September, 2015)Regional Head Germany /Austria /Switzerland & Vice Chairman Investment Banking EMEA
Martin Wiesmann (until 9. September, 2015)Senior Country Officer Germany, Managing Director, J.P.Morgan Securities plc Frankfurt Branch
Thomas FreiseEmployee Representative, J.P. Morgan AG
Christoph FickelEmployee Representative, J.P. Morgan AG
Frankfurt am Main, April 18, 2016
J.P. Morgan AG
Frankfurt am Main
The Management Board
BURKHARD KüBEL-sORGER sTEFAN BEHR MICHELLE GRUNDMANN

54
AUDITOR’s REPORT
We have audited the annual financial statements comprising the balance sheet, the income
statement, the notes to the financial statements, together with the bookkeeping system, and the
management report of J.P. Morgan AG, Frankfurt am Main, for the business year from January
1 to December 31, 2015. The maintenance of the books and records and the preparation of the
annual financial statements and management report in accordance with German commercial
law are the responsibility of the Company’s Management Board. Our responsibility is to express
an opinion on the annual financial statements, together with the bookkeeping system, and the
management report based on our audit.
We conducted our audit of the annual financial statements in accordance with Section 317 HGB,
and the generally accepted standards for the audit of financial statements established by IDW
(Institut der Wirtschaftsprüfer [Institute of Public Auditors in Germany]). Those standards require
that we plan and perform the audit such that misstatements materially affecting the presenta-
tion of the net assets, financial position and results of operations in the annual financial state-
ments in accordance with the principles of proper accounting and in the management report are
detected with reasonable assurance. Knowledge of the business activities and the economic and
legal environment of the Company, as well as expectations as to possible errors were taken into
consideration in the determination of the audit procedures. The effectiveness of the accounting-
related internal control system and the evidence supporting the disclosures in the books and
records, the annual financial statements and the management report are examined primarily
on a test basis within the framework of the audit. The audit includes assessing the accounting
principles used and significant estimates made by the Management Board, as well as evaluating
the overall presentation of the annual financial statements and management report. We believe
that our audit provides a reasonable basis for our opinion.
Our audit did not give rise to any cause for objection.
AUDITOR’s REPORT
55
In our opinion based on the findings of our audit, the annual financial statements comply with
the legal requirements and give a true and fair view of the net assets, financial position and
results of operations of the Company in accordance with the principles of proper accounting. The
management report is consistent with the annual financial statements and as a whole provides
a suitable view of the Company’s position and suitably presents the opportunities and risks of
future development.
Frankfurt am Main, April 18, 2016
PricewaterhouseCoopers
Stock Company
Audit Company
CHRIsTOPH LEHMANN PPA. FATIH AGIRMAN
Auditor Auditor
AUDITOR’s REPORT
56
SUPERvISION AND CONTROL
The Supervisory Board monitored the Management Board continuously throughout the year
on the basis of written and oral reports and performed its duties in accordance with the law.
Important matters of business management were examined by the Supervisory Board in regard
to the Bank’s economic situation, the business policy, liquidity, capital and risk management.
Moreover, the Supervisory Board was informed in detail on the risk management by means of
the quarterly MaRisk reports.
PERSONNEL ChANGES IN ThE MANAGEMENT BOARD
No personnel changes took place in the Management Board during fiscal year 2015.
PERSONNEL ChANGES IN ThE SUPERvISORy BOARD
In fiscal year 2015 the Supervisory Board was composed of the following persons: Mark S. Garvin
(Chairperson), Frédéric Mouchel (Vice Chairperson), Martin Wiesmann, Melanie Martin, as well
as Dorothee Blessing with Christoph Fickel and Thomas Freise as employee representatives.
In the 2015 fiscal year, Mr Martin Wiesmann stepped down on September 9, 2015. Ms Dorothee
Blessing was newly appointed to the Supervisory Board as at September 15, 2015.
AUDIT COMMITTEE
On April 25, 2016, the Audit Committee discussed the annual financial statements and the audit
report for the financial year, and on November 17, 2015 the audit plan.
The Audit Committee is responsible for checking the accounting process, the effectiveness of the
internal control system, the effectiveness of the risk management system and the effectiveness
of the internal audit system as well as the statutory audit, particularly the independence of the
auditor and any additional services performed by the auditor.
On the basis of the recommendation of the Audit Committee (§ 124, Para. 3, S. 2 AktG) it was
proposed at the Annual General Meeting to elect PricewaterhouseCoopers AG, Frankfurt am
Main, as statutory auditor for the Annual Financial Statements and the Management Report for
the 2016 financial year.
REPORT OF THE sUPERVIsORy BOARD
REPORT OF THE sUPERVIsORy BOARD

57
ANNUAL FINANCIAL STATEMENT
The Annual Financial Statement and the Management Board Report for the 2015 Financial Year
have been examined by the auditing firm selected at the Annual General Meeting, Pricewater-
houseCoopers AG, Frankfurt am Main. The auditing firm issued an unqualified audit opinion.
The Annual Financial Statements and the Management Report were discussed and reviewed with
the auditors by the Audit Committee during the meeting on April 25, 2016. Based on the final
result of the Audit Committee’s investigation, the Supervisory Board did not raise any objections.
Financial statements and the Management Report per December 31, 2015 presented by the Man-
agement Board were approved by the Supervisory Board today. The Annual Financial Statements,
as submitted by the Management Board, are hereby approved and established.
The Supervisory Board would like to express its sincere gratitude to the Management Board and
all employees of the Bank for their dedication and joint hard work.
April 26, 2016
The Supervisory Board
FRéDéRIC P. MOUCHEL
Vice Chairperson
REPORT OF THE sUPERVIsORy BOARD

58
PUBLIShER
J.P. Morgan AG, Frankfurt am Main
Taunustor 1
60310 Frankfurt am Main
LAyOUT /DESIGN
HEIsTERs & PARTNER, Corporate & Brand Communication, Mainz, Germany
IMPRINT
Koch. Prepress Print Media GmbH, Wiesbaden, Germany
IMPRINT

3

J.P. Morgan AG, Frankfurt am Main
Taunustor 1
60310 Frankfurt am Main