Non-Voluntary Return? The Politics of Return to Afghanistan: The Politics of Return to Afghansitan
Upload
khangminh22Category
view
0download
0
Annual Information Return 2018
for
Public Domain

Table of Contents
Section 1 – The Board’s Overview 1 PC15 Monitoring Plan Output 2 Financial performance measures 3 Efficiencies 4 Competition
Section 2 – The Annual Information return Key outputs
1 Water service – 1 2 Water service – 2 3 Sewerage service – 1 3a Sewerage service – 2 4 Customer service – 1 5 Customer service – 2 5a Complaints data for the Consumer Council
Bad debt
6a Information for the bad debt Notified Item
Non financial measures
7 Water properties and population 8 Water metering and large users 9 Water quality 10 Water delivered 10a (i) Security of Supply Index - planned levels of service 10a (iii) Security of Supply Index - critical period 11 Water mains activity 12 Water explanatory factors 13 Sewerage properties and population 14 Sewage collected 15 Sewage treatment 16 Sewer activity summary
Sewerage explanatory factors
17a Disaggregated sewerage service explanatory factors 17b Sewage treatment works: large works 17c Sewage treatment works: numbers 17d Sewage treatment works: loads 17f Sewage treatment works: costs 17g Sludge treatment and disposal
Regulatory accounts - historical cost accounting
18 Profit and loss account 18c Statement of total recognised gains and losses 18d Analysis of dividends and interest charges 19 Balance sheet 19a Analysis of borrowings due after more than one year
Regulatory accounts - current cost accounting
21 Activity costing analysis - water service 22 Activity costing analysis - sewerage service 23 Analysis of turnover and operating income 25 Analysis of fixed assets by asset type 28 Cash flow statement 29 Reconciliation of operating profit to net cash flow from operating activities

Financial measures
30 Capital Investment – Summary Report and General Guidance 32 Analysis of fixed asset additions and asset maintenance by asset type 33 Depreciation charge by asset type 34 Analysis of non-infrastructure fixed asset additions by life categories 35 Capital investment – public expenditure statement 36 Capital investment – gross capital investment summary 36a Capital investment – expenditure comparison by service and purpose 37 Capital investment – capital grants and contributions 38 Capital investment – additional opex from capex 40 Capital Investment Monitoring
Outputs
40a Nominated outputs delivered by PC13 capital projects and programmes of work
Health and safety
41 Health and safety – policy and performance
PPP
42 PPP costs and activity 43 PPP reporting - operational costs
Overall performance assessment (OPA)
44 OPA input data
Carbon accounting
45 Energy consumption and greenhouse gas accounting
Serviceability
46 Serviceability return
Development Outputs
47 Development Outputs
Social and Environmental Guidance priorities for Water and Sewerage Services (2015-21)
48 Social and Environmental Guidance priorities for Water and Sewerage Services (2015-21)
Section 3 – Level of Service Methodologies DG2 Low Pressure DG3 Supply Interruptions DG5 Flooding DG6 Response to Billing Contacts DG7 Response to Written Complaints DG8 Bills for Metered Customers DG9 Telephone Contact
Section 4 – Customer Research Appendix

Annual Information Return 2018 Section 1
Board’s Overview

Annual Information Return 2018 Board’s Statement Section 1 - Board’s Overview Page 1 of 4
Board’s Statement In support of Northern Ireland Water’s Annual Information Return (AIR), its board of directors is required by the Utility Regulator to prepare a statement on the compilation of AIR, explaining that it has satisfied itself as to the accuracy and completeness of the information provided.
The directors consider that the AIR provides a true and fair view of the state of affairs of NI Water for the financial year 2017/18. With respect to the preparation of the AIR, subject to any departure and explanation described in the commentary, the directors confirm:
suitable accounting policies have been selected and applied consistently; judgements and estimates that have been made are reasonable and prudent; UK Accounting Standards and applicable law (UK Generally Accepted Accounting
Practice) have been followed, subject to any material departures disclosed andexplained in the financial statements.
The directors are responsible for keeping adequate accounting records that are sufficient to show and explain the company’s transactions and disclose with reasonable accuracy at any time the financial position of the company and enable them to ensure that its financial statements comply with the Companies Act 2006.
The directors who held office at the date of approval of this Board’s Statement confirm that, so far as they are each aware, there is no relevant audit information of which the company’s auditors are unaware and each director has taken all reasonable steps they should have taken as a director to make themselves aware of any relevant audit information and to establish that the company’s auditors are aware of that information.
The Board’s Statement sets out how NI Water’s Board has satisfied itself that the information provided in the AIR is as reliable, accurate and complete as is reasonably practicable.
Processes and Internal Systems of Control The AIR has been compiled in accordance with NI Water’s AIR Completion Manual, which ensures clear ownership of AIR data, evidence of peer review and procedural documentation covering the compilation processes were followed in completing the AIR submission.
The AIR Completion Manual details roles, responsibilities and governance procedures, and provides guidance and templates for the completion of AIR methodologies, data tables and company commentaries.
Project Governance The AIR project was coordinated by the Regulation Manager and representatives (senior managers) from relevant functional areas, i.e. those functions which contribute data to the AIR submission.

Annual Information Return 2018 Board’s Statement Section 1 - Board’s Overview Page 2 of 4
The Regulation Manager ensured: 1. information was disseminated to and from functional working groups;2. coordination of cross-functional working groups;3. adherence to the AIR submission programme;4. implementation of Reporter’s recommendations.
Senior managers from across NI Water were responsible for: ensuring that the Utility Regulator’s AIR reporting requirements were
understood and followed; ensuring that relevant AIR line methodologies were updated in line with the
reporting requirements; coordinating the population of data tables and the drafting of associated
company commentaries in accordance with line methodologies and reportingrequirements in compliance with the AIR programme;
ensuring that relevant line methodologies, data tables and companycommentaries were reviewed and approved in accordance with the AIRCompletion Manual’s roles and responsibilities matrix.
In order to maintain accuracy, consistency and a clear audit trail, roles and responsibilities for each element of the AIR submission were defined for the three key components of the AIR submission, namely:
line methodologies, data tables, and company commentaries.
Population of data tables and drafting of associated company commentaries was in accordance with the Utility Regulator’s AIR reporting requirements. In addition, company-specific methodologies (line methodologies), explaining how raw data is collected, processed and input to the data tables, were updated and adhered to when populating data tables and drafting company commentaries.
Authors, reviewers and approvers of line methodologies, data tables and company commentaries were designated for all data in the AIR submission. To ensure consistency of reporting for AIR, every item of data provided in the AIR tables had a designated author, reviewer and approver. In all cases, the approver was an appropriate senior manager.
Independent Review Audit plans were developed by the Reporter and external Auditor. The Reporter’s audit plan was developed in accordance with the Utility Regulator’s Reporter Protocol and AIR reporting requirements, and was agreed with NI Water and the Utility Regulator.
Audits were undertaken by the company’s Auditor and the Reporter in May and June. Feedback from the Reporter and Auditor was used to amend the tables and commentaries where appropriate.
The complete AIR was endorsed by NI Water’s Executive Committee and Board on 16th and 24th July 2018 respectively.

Annual Information Return 2018 Board’s Statement Section 1 - Board’s Overview Page 3 of 4
Board Involvement In summary, the involvement of NI Water’s Board in the completion of the AIR included:
Reviewing monthly company business performance updates; Considering the findings of the Reporter and Auditor as presented in June 2018; Reviewing, commenting on and approving the Board’s Overview; Reference to NI Water’s Executive Committee and senior management team to
verify corporate information; Executive Directors received regular reports on progress and reviewed, challenged,
commented and influenced the content of the AIR.
The following measures help to ensure that the AIR complies with the Utility Regulator’s reporting requirements and provides some assurance with respect to material assumptions and judgements included in the AIR commentaries:
Clear accountability at senior management level for the ownership of all elements ofthe AIR. NI Water has established an accountability trail from the informationproviders to the line owners through to heads of function.
Every item of data in AIR has a designated author, reviewer and approver. Every provider of data produces a written methodology documenting the method
used for the derivation of the data reported. Every item of financial data is prepared and reviewed by separate individuals and
reconciled to the chart of accounts. Every item of financial data is reviewed against the Utility Regulator’s guidance by a
separate individual to the preparer and reviewer. This includes undertaking cross-checks of tables to ensure consistency.
Before each item of data is included in the AIR it is reviewed and approved bysenior management in the data provider’s business area.
NI Water facilitates access to allow the Reporter and Auditor to review all relevantinformation required to discharge their duties.
The Board receives regular presentations during the course of the year on keyperformance indicators, regulatory performance and key issues reported in the AIR.
The Auditor presents to NI Water’s audit committee and the Reporter presents tothe Board at the conclusion of the AIR audit process.
Directors may challenge the production and content of the AIR to satisfy themselvesthat their duties are fulfilled.
In any case of uncertainty regarding data, commentary or line methodology, NIWater seeks advice and clarification from the Utility Regulator, the Reporter or theAuditor as appropriate.

Annual Information Return 2018 Board’s Statement Section 1 - Board’s Overview Page 4 of 4
Directors’ Endorsement NI Water’s board believes that it has developed and applied processes, governance and systems of internal control sufficient to meet its obligations for the provision of information contained in the Annual Information Return.
Each director is satisfied that: a) so far as he/she is aware, there is no relevant audit information of which NI Water’s
auditors or reporters are unaware;b) He/she has taken all reasonable steps as a director to make himself/herself aware
of any relevant audit information and to establish that NI Water’s auditors andreporters are aware of the information.
For and on behalf of NI Water:
Sara Venning Chief Executive, Northern Ireland Water
Dr Leonard J. P. O’Hagan CBE Chairman, Northern Ireland Water

NORTHERN IRELAND WATER LIMITED - ANNUAL INFORMATION RETURN
ANNUAL RETURN - BOARD'S OVERVIEWTABLE A - WATER SERVICE - KEY OUTPUTS AND SERVICE DELIVERY (TOTAL)
1 2 3 4 5 6 7 8 9REPORTING REPORTING REPORTING REPORTING REPORTING REPORTING REPORTING REPORTING REPORTING
DESCRIPTION UNITS DP YEAR YEAR YEAR YEAR YEAR YEAR YEAR YEAR YEAR2012-13 2013-14 2014-15 2015-16 2016-17 2017-18 2018-19 2019-20 2020-21
A Consumer Service 1 DG2 Properties at risk of low pressure removed from the risk register by company action nr 0 297 132 186 171 40 1752 DG2 Properties receiving pressure below the reference level at end of year nr 0 1420 1257 1082 900 862 7113 DG3 Supply interruptions > 12hrs (unplanned and unwarned) % 2 0.32 0.14 3.10 0.10 0.06 0.104 DG3 Supply interruptions (overall performance score) nr 2 1.98 0 97 11.72 1.14 0.66 0.815 DG6 % billing contacts dealt with within 5 working days % 2 100.09 99 92 99.97 99 96 99.98 99.976 DG7 % written complaints dealt with within 10 working days % 2 99.78 99.72 99.96 99 87 100.00 99.877 DG8 % metered customers received bill based on a meter reading % 2 98.73 99.11 99.11 99 23 99.52 99.678 Call Handling Satisfaction nr 2 4.54 4 63 4.65 4 599 DG9 % calls not abandoned % 2 98.45 98.40 97.99 99.43 99.54 99.5110 DG9 % calls not receiving the engaged tone % 2 100.00 100 00 99.99 99 92 99.97 99.9911 Overall Performance Assessment (OPA) score (11 Measures) nr 0 198 216 206 230 228 23612 Total Leakage Ml/d 0 162 167 166 162 163 16213 Security of supply index nr 0 100 100 100 100 100 10014 Percentage of NI Water's power usage derived from renewable sources % 1 13.4 33.1 51.4 39.8 35.5 36 9
B Quality Water 15a % overall compliance with drinking water regulations % 2 99.77 99 81 99.86 99 83 99.86 99.8815b % compliance at consumers tap % 2 99.63 99.74 99.78 99.74 99.77 99.8116 % iron compliance at consumers tap % 2 97.25 98 08 98.95 98.40 98.66 98.8517 % Service Reservoirs with coliforms in >5% samples nr 2 0.00 0 00 0.00 0 00 0.00 0.00
C Water Outputs18 Water mains activity - Length of new, renewed or relined mains km 0 326 226 223 117 172 12619 Completion of nominated trunk main schemes nr 0 2 0 1 2 1 020 Completion of nominated water treatment works schemes nr 0 0 0 3 1 0 0
21Completion of nominated improvements to increase the capacity of service reservoirs and clear water tanks nr 0 1 0 1 0 0 1
D Serviceability22 Water infrastructure serviceability Stable Stable Stable Stable Stable Stable23 Water non-infrastructure serviceability Stable Stable Stable Stable Stable Stable
E New Output Measures24 Number of Catchment Management Plans nr 0 3 5 3 7 3
25 Number of lead communication pipes replaced under the proactive lead replacement programme nr 0 0 401 1922 1867 1767
26 Number of school visits nr 0 138 150 209 277 257 21927 Number of other education events nr 0 35 38 59 65 64 6228 % Service Reservoirs where sample taps have been assessed and are to required % 1 0.0 0.0 72 9
TextText

NORTHERN IRELAND WATER LIMITED - ANNUAL INFORMATION RETURN
ANNUAL RETURN - BOARD'S OVERVIEWTABLE B - SEWERAGE SERVICE - KEY OUTPUTS AND SERVICE DELIVERY - WATER SERVICE (TOTAL)
1 2 3 4 5 6 7 8 9REPORTING REPORTING REPORTING REPORTING REPORTING REPORTING REPORTING REPORTING REPORTING
DESCRIPTION DP YEAR YEAR YEAR YEAR YEAR YEAR YEAR YEAR YEAR2012-13 2013-14 2014-15 2015-16 2016-17 2017-18 2018-19 2019-20 2020-21
A Consumer Service Sewerage
1DG5 Properties at risk of flooding - number removed from 2 in 10, 1 in 10 and 1 in 20 risk register by company action. nr 0 66 11 28 7 7 17
2 DG5 Properties on the 2 in 10, 1 in 10 and 1 in 20 risk register at the end of the year nr 0 193 190 179 160 156 134
B Quality Sewerage3 % of WwTWs discharges compliant with numeric consents % 1 93.3 92.0 92.4 92 8 93 6 93 54 % of total p.e. served by WwTWs compliant with numeric consents excluding upper tier failures % 1 98.8 98.0 98.4 98 6 98 9 98.75 Small WwTW compliance (works greater than or equal to 20p e. but less than 250p.e.) % 2 80.72 83 99 87.216 Number of high and medium pollution incidents attributable to NI Water nr 0 18 26 25 21 22 20
C Sewerage Outputs7 Sewerage activity - Length of sewers replaced or renovated km 0 24 25 21 17 9 158 Delivery of improvements to nominated UIDs as part of a defined programme of work nr 0 38 11 17 26 11 119 Delivery of improvements to nominated WwTWs as part of a defined programme of work nr 0 12 17 16 3 2 3
10 Small wastewater treatment works delivered as part of the rural wastewater investment programme nr 0 14 7 18 4 8 4
D Serviceability11 Sewerage infrastructure serviceability Stable Stable Stable Stable Stable Stable12 Sewerage non-infrastructure serviceability Stable Stable Stable Stable Stable Stable
E New Output Measures13 CSO and EO discharges at which event and duration monitoring equipment has been installed nr 0 0 0 014 WwTWs upgraded to comply with PPC Regulations nr 0 0 0 015 Impermeable surface water collection area removed from the combined sewerage network m2 0 28,560 54,864 119,20016 Number of sustainable WwTW solutions delivered (p.e. ≥ 250) nr 0 1 1 117 Number of sustainable WwTW solutions delivered (p.e. < 250) nr 0 0 1 0
UNITS
TextText

NORTHERN IRELAND WATER LIMITED - ANNUAL INFORMATION RETURN
ANNUAL RETURN - BOARD'S OVERVIEWTABLE C - EXPENDITURE & FINANCIAL PERFORMANCE MEASURES (TOTAL)
1 2 3 4 5 5 6 7 8REPORTING REPORTING REPORTING REPORTING REPORTING REPORTING REPORTING REPORTING REPORTING
DESCRIPTION UNITS DP YEAR YEAR YEAR YEAR YEAR YEAR YEAR YEAR YEAR2012-13 2013-14 2014-15 2015-16 2016-17 2017-18 2018-19 2019-20 2020-21
A TOTAL EXPENDITURE 1 Total operating expenditure - water service (NI Water only) £m 3 71.882 70.914 69.932 76 947 80.362 84.7651a Total operating expenditure (PPP) - water service £m 3 1.845 8 234 8.431 8 225 9.062 9 3232 Total capital expenditure (excl. adopted and nil cost assets) - water service £m 3 69.303 71.809 86.920 63.796 67.719 62 8073 Total operating expenditure - sewerage service (NI Water only) £m 3 72.113 73.300 71.330 73.126 71.950 74.7583a Total operating expenditure (PPP) - sewerage service £m 3 26.488 24.896 24.323 25 096 25.377 25 6934 Total capital expenditure (excluding adopted and nil cost assets) - sewerage service £m 3 92.709 95.548 71.881 79 692 86.551 89.721
B CURRENT COST ACCOUNTS - PROFIT & LOSS5 Total Turnover £m 3 366.398 361.313 364.407 367 287 372.854 381 099
Lines 6 & 7 not used
C CAPITAL BASE & POST TAX RETURN8 Capital Value Year - End (outturn) £m 3 1,812.80 1,948.80 2,045 50 2,133.30 2,244 90 2,396.109 Total net debt £m 3 868.158 909.323 946.748 980 545 1010.647 1079 329
10a Post tax return on capital % 2 1.12 1.05 2 96 2.57 2.60 4.5910b Pre tax return on capital % 2 1.12 1.05 2 96 2.57 2.60 4.59
D KEY FINANCIAL INDICATORS11 Cash interest cover (funds from operations; gross interest) ratio 2 3 34 3.60 3 52 3.38 3.45 3.50
12Adjusted cash interest cover (funds from operation less capital charges; gross interest) ratio 2 -0 03 0.27 0 91 0.83 0.91 1.98
13Adjusted cash interest cover (funds from operation less capital maintenance; gross interest) ratio 2 1.70 1.67 2 00 1.76 1.58 1.74
14 Funds from operations: debt ratio 2 0.15 0.13 0.13 0.12 0.12 0.1215 Retained cash flow: debt ratio 2 0.12 0.12 0.12 0.09 0.10 0.0716 Gearing: D/RCV % 2 47 89 46.66 46.74 46.24 47.46 45.8617 Gearing: D/RCV (adjusted for PPP liability) % 2 49.12 49 09 48.47 49.45 47.78

Annual Information Return 2018 Chapter 1 Section 1 - Board’s Overview Page 1 of 10
Chapter 1 PC15 Outputs Tables A and B
1.1 Improvements to Drinking Water and Environmental Quality
Drinking Water Delivery of clean, safe drinking water is central to what we do. It underpins the public health and economy of Northern Ireland. Being able to rely on and have confidence in the quality of water that we supply is a fundamental expectation of our customers. Every day we produce more than 570 million litres of clean safe drinking water in order to supply 860,000 households and businesses.
We measure the quality of drinking water at water treatment works, service reservoirs and consumers’ taps across Northern Ireland. Every year we undertake more than 200,000 water quality tests and delivered our best ever drinking water quality in 2017.
The water leaving our water treatment works and in the distribution systems contains only trace amounts of lead. Over the PC15 period, we have committed to proactive replacement of over 11,000 lead communications pipes at consumer properties in addition to lead pipe replacement under water main rehabilitation and in response to sample failures. In the first three years of PC15 we have delivered 5,556 lead pipe replacements under the proactive replacement programme against a target of 5,532.
Water Supply We look after a water supply network extending to over 26,000km in length – the same length as Northern Ireland’s entire road network. Ensuring that customers receive a near uninterrupted supply of clean safe drinking water is paramount. We achieved our targets for supply interruptions in 2017/18 despite summer flooding which caused significant damage to infrastructure in the North West and adverse winter weather conditions which caused higher levels of bursts across our network. In that context, we are pleased that no customers experienced an unplanned interruption to their supply greater than 24 hours.
At the end of February and into early March, we experienced sub-zero temperatures and snow storms. The amount of water input to the water distribution system increased by 15%. Our teams were engaged in leakage detection and repairs as well as tankering water supplies to mitigate impacts on customers. In spite of this, we managed to achieve our supply interruption targets.
NI Water experienced an increase in leakage in 2017/18 - primarily caused by this year’s bad weather from December to March. As a result, we failed to meet the PC15 target level of 159 Ml/d. Leakage reduction will continue to be given a high priority in 2018/19 to achieve the PC15 target of 153 Ml/d by 2021.
We are continuing to invest in laying new water mains to improve water supply and drinking water quality. We are also looking at new initiatives to reduce the impact of supply interruptions and improve asset serviceability.

Annual Information Return 2018 Chapter 1 Section 1 - Board’s Overview Page 2 of 10
One such initiative is the construction of a ‘calm’ network facility at our bespoke learning and development centre in Antrim, where we train our staff and contractors in best practice techniques for managing water networks. The approach aims to deliver a calmer water network that provides a reliable and resilient service through a reduction in bursts, leaks, low pressure and interruptions to supply, while improving serviceability and water quality.
Wastewater Overall wastewater compliance is at near record levels. We completed construction of a new wastewater treatment works at Ballycastle, Co Antrim, which recycles wastewater and safely returns it to the environment. The new plant now underpins growth in the tourism industry and development of Ballycastle town.
We deal with around 15,000 blockages in the sewer network each year, at a cost of around £2.5 million. It is estimated that 75% of blockages are caused by inappropriate items being put into the sewers. As part of our involvement with the 2018 Year of Infrastructure we relaunched our ‘Bag it and Bin it’ and ‘Fats, Oils and Grease’ campaigns to highlight the damage caused by disposing of inappropriate items in the sewers.
We are committed to reducing pollution incidents. Our Pollution Reduction Strategy and Action Plan has informed the development and implementation of a wide range of activities ranging from proactive sewer de-silting to focused customer education campaigns.
There is ongoing tracking and monitoring of all reported pollution incidents, with root cause investigations undertaken in each instance. Weekly updates on Pollution Incidents are carried out with the Executive Committee through the EC Performance Hub and the situation is reviewed in detail through monthly meetings of NI Water’s cross-directorate Pollution Incidents Group. In addition to in-house monitoring, there are quarterly meetings held with our Environmental Regulator, NIEA.
1.2 Delivering Service to Customers
We have been laying the foundations for a digital revolution. We have also made improvements to our website and increased our social media presence.
As part of our digital programme, over the remainder of PC15 we are investing in smart meters and smart assets to provide better information to forecast demand, predict weather events, optimise energy usage and real time monitoring of our asset performance to make remote interventions.
We will be starting to digitalise our processes such as electronic billing and online applications for developers. Communication channels for our customers will also be broadened with the introduction of ‘chatbots’ and social media customer apps.
Keeping customers informed Over 2017/18, we introduced new ways to keep customers informed and reduce the need for customers to telephone our contact centre. More timely and accurate information is available on our website regarding planned and unplanned supply interruptions. This keeps customers more informed on the nature of the repair work and the estimated restoration time for supply.

Annual Information Return 2018 Chapter 1 Section 1 - Board’s Overview Page 3 of 10
We have also introduced proactive text message notification and updates to customers impacted by unplanned supply interruptions. Feedback from a sample of customers who have received the text messages has been positive.
We plan to increase the number of customers we survey to around 10,000 each year from 2018/19. Customers will be selected at random, soon after they contact us, so we can gather near real-time feedback about their experience – what we did well and where we can improve. We will use this data across the business to help us further improve the service we provide to all our customers.
Getting smarter Our ambition is to become one of the leading utilities in the UK in the use of smart metering. Smart metering technology presents an opportunity to reduce customer contacts, complaints and improve our reputation, and ultimately assist in the transformation into a next generation utility company.
The technology forms part of our digital strategy and has been piloted over 2017/18. We obtained great customer feedback, particularly from the Education Authority, which has responsibility for education and youth services throughout Northern Ireland.
Over 2018/19 we will be introducing further functionality that will allow those customers with smart meters to obtain high consumption alarms to mitigate leakage. Customers will also be able to sign up for direct debit payments.
1.3 Delivering Sustainable Services
Carbon Footprint NI Water is directly affected by all the main impacts of climate change: temperature change, more intense rainfall, changing rainfall patterns, and sea level rises. Some of the impacts are obvious: more frequent and severe cold weather and floods, for example. Others are more subtle, such as changes to peak demand, and lower dilution of discharges to watercourses in times of drought, which require higher levels of treatment and the associated extra energy use.
For these reasons, we need to continuously adapt and will reduce our carbon footprint. The majority of our carbon emissions are from grid electricity, with the remaining emissions being attributed to areas such as sludge emissions and transport.
The annual carbon emissions resulting from activities of the company have decreased by 10%, decreasing from 118,783 t/CO2e in 2016/17 to 106,816 t/CO2e in 2017/18. This equates to 0.176 tonnes of carbon dioxide equivalent per million litres of treated water in 2017/18 (2016/17: 0.207 tCO2e/Ml) and 0.611 tonnes of carbon dioxide equivalent per million litres of treated wastewater in 2017/18 (2016/17: 0.574 tCO2e/Ml). The annual carbon emissions resulting from the purchase of electricity have decreased by 13%, decreasing from 118,269 t/CO2e in 2016/17 to 103,307 t/CO2e in 2017/18. Renewable Energy Our business operations are relatively intensive, requiring large amounts of energy for pumping, water treatment and wastewater treatment. Renewable energy generation helps

Annual Information Return 2018 Chapter 1 Section 1 - Board’s Overview Page 4 of 10
offset the impacts of increased energy prices, lowers our carbon footprint and increases revenue by reselling renewable energy to the grid.
As the largest user of electricity in Northern Ireland, we are committed to increasing our electricity consumption from renewable sources from around 13% currently to 40% in 2020/21.
We completed our first solar farm to supply electricity to the Dunore water treatment works in South Antrim. Dunore is our third largest site in terms of energy consumption, accounting for 7% of the company’s annual usage. The £7m project involved work on a 33 acre site and produces a peak output of 5 megawatts (enough electricity to power 1,500 homes). The solar farm saves over £0.5m annually in our energy costs and reduces our carbon footprint by 2,000 tonnes. As well as meeting the energy needs of the Dunore treatment works, the farm also enables us to contribute spare capacity to the grid.
‘Source to Tap’ INTERREG VA Project A major €5.3M cross-border project was launched in December to improve water quality in rivers and lakes in the Erne and Derg catchment areas. These provide water that serves parts of counties Fermanagh, Tyrone, Donegal, Cavan, Leitrim and Longford.
The Derg and Erne drinking water catchments are predominantly rural in nature. The main land uses are forestry, farming and peatland. Certain types of land use management can cause materials such as sediments and herbicides to run off the land and drain into the raw water which NI Water abstracts for drinking water.
High concentrations of herbicides and variations in colour and turbidity cause increased capital and operational costs to treat and remove these materials. Therefore, it is more cost effective for us to identify these pressures at source and keep our rivers and lakes clean.
NI Water secured the funding from the European Union’s INTERREG VA Programme, the Department for Agriculture, Environment and Rural Affairs (DAERA) in Northern Ireland and the Department for Housing, Planning and Local Government (DHPLG) in Ireland. The funding is managed by the Special EU Programmes Body (SEUPB) and will run from 2017 to 2021.
NI Water is leading a partnership, which includes Irish Water, The Rivers Trust, Ulster University, Agri Food and Bioscience Institute (AFBI) and East Border Region. The partners will work together to test pilots for how to protect raw water quality at source across both jurisdictions.
Cooperation Across Borders for Biodiversity (CABB) INTERREG VA Project NI Water has been working in partnership with the Royal Society for the Protection of Birds and Moors for the Future on the CABB Project. The project is supported by the European Union’s INTERREG VA Programme, managed by the Special EU Programmes Body. The objective of CABB is to bring about the recovery of protected habitats (raised and blanket bog) and priority species (breeding waders and marsh fritillary) on a cross-border and cross-country basis. The project has been awarded €4.6m of EU funding for projects

Annual Information Return 2018 Chapter 1 Section 1 - Board’s Overview Page 5 of 10
in Scotland, N Ireland and the Republic of Ireland. CABB will contribute to delivering the EC Birds and Habitats Directives and Biodiversity Strategies in each of the three countries.
The NI Water aspect of the project will restore the entire Dungonnell catchment, a special area of conservation which has been damaged by artificial drainage channels and overgrazing. Altogether, 444ha of blanket bog will be restored through grazing management and by blocking 38.4km of artificial drains. This will contribute to improving the blanket bog habitat to support biodiversity while improving the quality of raw water supplied to Dungonnell WTW. The requirement for chemical treatment to remove colour from peat stained raw water will be reduced, leading to cost and energy savings.
1.4 Health and Safety
We focus on ‘Zero Harm’, through appropriate training, strong management, senior management safety visibility and good contract management. This includes demonstration of and commitment to best practice not only by those within NI Water but also by our contractor partners.
We plan to develop and improve safety health and wellbeing in the workplace with introduction of possible new IT and technical solutions which will assist all staff in assessing, monitoring and managing risk, thereby keeping our staff, contractors and customers safe.
During 2017/18, we had six reportable incidents which resulted in more than three days’ absence from work, and this was within our corporate H&S target of not more than seven incidents. Each lost time incident at NI Water is reviewed by both our SHE Team and our Health & Safety Focus Group with a view to seeking new learning and safety improvement.
In early 2018 NI Water was awarded ‘Commended in the Water Industry’ in one of the Competitive Sector categories of the annual ROSPA Occupational Safety & Health Awards. This was a most encouraging result, reflecting continual business and safety improvement across our business.
The table below indicates our annual safety performance on ‘Reportable Incidents’ since 2002.

Annual Information Return 2018 Chapter 1 Section 1 - Board’s Overview Page 6 of 10
1.5 PC15 Funding
NI Water has been subject to public expenditure capital budget reductions in the first three years of PC15. The Project Alpha acquisition in 2017/18 further reduced gross capital expenditure. Although the impact of these budget adjustments has been somewhat mitigated by lower than expected inflation, there has been a budget reduction in real terms.
At the end of 2017/18 the cumulative gross capital expenditure is approximately £6.4m less than the Final Determination allocated for the delivery of defined PC15 outputs.
This real terms gross capital budget reduction in the first three years of PC15 has led to some delay to capital output delivery.
NI Water continues to make the case for certainty of funding and a medium-term financial settlement to enable price limits and service targets/outputs set in the PC15 Final Determination to prevail. If funding levels drop below the minimum required to deliver all of the defined PC15 outputs within the PC15 period, a further process will be undertaken to agree changes to PC15 Final Determination targets.

Annual Information Return 2018 Chapter 1 Section 1 - Board’s Overview Page 7 of 10
1.6 PC15 Targets for 2017/18
Due to funding uncertainty at the start of 2017/18 and the then upcoming PC15 Mid-Term Review, adjusted outputs for 2017/18 were not formally agreed with the Utility Regulator and other key stakeholders.
NI Water shared draft adjusted outputs with the Utility Regulator on 14 September 2017 based on DfI’s indicative allocation – these outputs formed the basis of 2017/18 annual targets reflected in Q1 update to ORG. Outputs were adjusted further at January Monitoring Round (Oct/Nov 2017) when our 2017/18 budget allocation was confirmed and account was taken of Project Alpha acquisition and Dunore Solar Farm. This formed the basis of further quarterly updates to ORG.
In the PC15 Mid-Term Review (Feb 2018), the Utility Regulator stated:
Based on reasonable forward planning scenarios for capital investment, NI Water shouldhave sufficient capital budget to deliver all of its defined PC15 outputs within the PC15 6year period. But it is unlikely to allow investment in additional necessary qualityimprovements, which may need to be deferred to the PC21 period. The reduction inexpenditure in line with inflation is being passed on to consumers through RPI+K price capregulation and the PC15 outputs are being delivered.
Our overall conclusion is that the PC15 Final Determination targets remain valid andshould be used for planning and performance reporting for the rest of the PC15period… We expect NI Water to continue to focus on the delivery of these priorityrequirements, notwithstanding the variations to annual budgets which may occur.
Tables 1.1 and 1.2 below which provide a tabular summary of NI Water’s delivery of services and outputs. Since adjusted outputs were not formally agreed with the Utility Regulator for 2017/18, the PC15 Year 3 Final Determination targets are also included.
As can be seen, the real terms gross capital budget reduction in the first three years of PC15 has led to some delay to capital output delivery. However, NI Water still achieved or outperformed against the majority of PC15 final determination targets for 2017/18. Subject to funding, NI Water anticipates meeting all targets by the end of PC15.
All adjusted output targets (which take account of budget reductions) have been achieved, with the exception of two targets:
1. Leakage:NI Water experienced an increase in leakage in 2017/18 - primarily caused by thisyear’s bad weather from December to March. As a result, we failed to meet thePC15 target level of 159 Ml/d. Leakage reduction will continue to be given a highpriority in 2018/19 to achieve the PC15 target of 153 Ml/d by 2021.

Annual Information Return 2018 Chapter 1 Section 1 - Board’s Overview Page 8 of 10
2. Installation of CSO and EO monitoring equipment:Our initial adjusted target to install discharge monitoring equipment at 58CSOs/EOs in 2016/17 was not achieved, which has resulted in the 2017/18cumulative target also being missed.
NI Water has adopted a cautious approach to the installation of new technologywhich has first to be proven to function adequately. To this end, during 2016/17 weidentified and procured equipment necessary for trials at 10 CSOs and 20wastewater pumping stations. These trials concluded in 2017/18 and we plan toinstall all necessary monitoring equipment in the PC15 period.

Annual Information Return 2018 Chapter 1 Section 1 - Board’s Overview Page 9 of 10
Table 1.1 – 2017/18 Targets and Outputs: Customer Service and Water
Units Adjusted Outputs Target
FD Target
2017/18 Outturn
DG2 Properties at risk of low pressure removed from the risk register by company action * nr 357 357 386
DG2 Properties receiving pressure below the reference level at end of year nr 775 775 711
DG3 Supply interruptions > 12hrs (unplanned and unwarned) % 0.17 0.17 0.10
DG3 Supply interruptions (overall performance score) nr 1.03 1.03 0.81 DG6 % billing contacts dealt with within 5 working days % 99.90 99.90 99.97 DG7 % written complaints dealt with within 10 working days % 99.50 99.50 99.87 DG8 % metered customers received bill based on a meter reading % 99.00 99.00 99.67
DG9 % Calls not abandoned % 99.00 99.00 99.51 DG9 % calls not receiving the engaged tone % 99.90 99.90 99.99 Overall Performance Assessment (OPA) score (11 Measures) nr 224 224 236
Total Leakage Ml/d 159 159 162 Security of supply index nr 100 100 100 Percentage of NI Water's power usage derived from renewable sources % 30.0 30.0 36.9
% overall compliance with drinking water regulations % 99.79 99.79 99.88 % compliance at consumers tap % 99.69 99.69 99.81 % iron compliance at consumers tap % 97.10 97.10 98.85 % Service Reservoirs with coliforms in >5% samples % 0.00 0.00 0.00 Water mains activity - Length of new, renewed or relined mains * km 357 403 415
Completion of nominated trunk main schemes * nr 3 2 1 3 Completion of nominated water treatment works schemes * nr 1 1 1 Completion of nominated improvements to increase the capacity of service reservoirs and clear water tanks * nr 1 2 2 1
Water infrastructure serviceability Text Stable Stable Stable Water non-infrastructure serviceability Text Stable Stable Stable Number of Catchment Management Plans * nr 13 20 13 Number of lead communication pipes replaced under the proactive lead replacement programme * nr 5,432 5,532 5,556
Number of school visits * nr 528 528 753 Number of other education events * nr 171 171 191 % Service Reservoirs where sample taps have been assessed and are to required standard * % 70 100 73
* PC15 cumulative target / outturn
1 Includes 1 PC13 carry‐over trunk main (Castor Bay – Belfast) added to Final Determination target 2 Includes 1 additional SR (Monaclough) added to Final Determination target via Change Control

Annual Information Return 2018 Chapter 1 Section 1 - Board’s Overview Page 10 of 10
Table 1.2 – 2017/18 Targets and Outputs: Sewerage
Units Adjusted Outputs Target
FD Target
2017/18 Outturn
DG5 Properties at risk of flooding - number removed from the 2 in 10, 1 in 10 and 1 in 20 risk register by company action * nr 31 38 31
DG5 Properties on the 2 in 10, 1 in 10 and 1 in 20 risk register at the end of the year nr 155 130 134
% of WwTWs discharges compliant with numeric consents % 93.2 93.2 93.5 % of total p.e. served by WwTWs compliant with numeric consents excluding upper tier failures % 98.3 98.3 98.7
Small WwTW compliance (works greater than or equal to 20p.e. but less than 250p.e.) % 86.60 89.58 87.21
Number of high and medium pollution incidents attributable to NI Water nr 26 26 20
Sewerage activity - Length of sewers replaced or renovated * km 32 34 41 Delivery of improvements to nominated UIDs as part of a defined programme of work * nr 47 67 1 50 2
Delivery of improvements to nominated WwTWs as part of a defined programme of work * nr 8 14 3 9 4
Small wastewater treatment works delivered as part of the rural wastewater investment programme * nr 13 21 5 16
Sewerage infrastructure serviceability Text Stable Stable Stable Sewerage non-infrastructure serviceability Text Stable Stable Stable CSO and EO discharges at which event and duration monitoring equipment has been installed * nr 58 173 0
WwTWs upgraded to comply with PPC Regulations * nr 0 0 0 Impermeable surface water collection area removed from the combined sewerage network * m2 87,000 90,000 202,624
Number of sustainable WwTW solutions delivered (p.e. ≥ 250) * nr 2 2 3
Number of sustainable WwTW solutions delivered (p.e. < 250) * nr 1 0 1
* PC15 cumulative target / outturn
1 Includes 19 UIDs (net) added to 2017/18 Final Determination target via Change Control 2 Includes 2 PC15 UIDs completed in PC13 3 Includes 3 WwTW added to Final Determination target: 2 PC13 carry‐over (Artigarvan, Castle Archdale) + Loup (via Change Control) 4 Includes Annacloy WwTW: delivered in PC13 5 Excludes 1 WwTW (Loup) removed from Final Determination target via Change Control

Annual Information Return 2018 Board's Overview
Chapter 2 Financial Performance Measures Table C
2.1 Financial Performance
Section 1 Chapter 2 Page 1 of 5
The financial performance section refers to NI Water (the Group) unless otherwise indicated.
s ummary St t t f C a emen o h ompre ens1ve ncome Year to 31 Year to 31
March 2018 March 2017 (£m) (£m)
Revenue 431.8 422.4 Results from operating activities 156.6 166.4 Net finance charges (62.1) (63.5) Profit before income tax 94.5 102.9 Income tax expense (18.1) (6.6) Profit for the year 76.4 96.3 Other comprehensive income/(expenditure) net of income tax 41.2 (46.6) Total comprehensive income for the period 117.6 49.7
Revenue Domestic consumers are not charged directly for water and sewerage services. As a result, NI Water is dependent on Government subsidy for around 67% of its funding. The customer subsidy from Government covered the full domestic charge and this arrangement will remain in place in 2017/18.
Revenue was £431.8m for the year to 31 March 2018 (2017: £422.4m). Included in revenue was £311.5m (2017: £305.0m) received from Dfl, being subsidy of £290.5m (2017: £284.4m) and road drainage charges of £21.0m (2017: £20.6m).
Sources of revenue 2017/18 (£m)
Customer income: 76.3
Road drainage from Dfl: 21.0
Transfer of assets from customers: 312
Connectt0n and , - � infrastructure
charges: 9.6
Other third party contributions: 3.2

Annual Information Return 2018 Section 1 Chapter 2 Board’s Overview Page 2 of 5
2.2 Costs (capital and operating) against expectations
Operating activities Operating expenses in 2017/18 of £276.2m (2017: £256.8m) increased from last year. The increase primarily resulted from higher costs of staff and power offset in part by lower hired and contracted services. In addition in 2017/18 there was a write-down on acquisition of £9.8m to recognise the effective settlement of the pre-existing PPP contract between NI Water Limited and Dalriada Water Limited.
Results from operating activities before interest for the year was £156.6m (2017: £166.4m).
Finance income and costs The net finance costs are primarily due to interest on our borrowings of £44.7m (2017: £43.6m) and on our Public Private Partnership (PPP) liabilities of £17.0m (2017: £19.8m) and net finance costs on the pension fund of £1.6m (2017: £0.2m) partly offset by £1.1m fair value increase of derivatives and bank interest received of £0.1m (2017: £0.1m). The effect of the consolidation of Group reduced net finance costs by £1.3m in 2018.
Taxation The tax charge for the year was £18.1m (2017: £6.6m arising from reduction in corporation tax rate). The effective tax rate for the year to 31 March 2018 was (£19.1m) (2017: 6.4%).
Distributions The Board will consider a proposal to declare a dividend of £26.5m in July 2018 (2017: £24.5m).
Capital Structure The Statement of Financial Position at 31 March 2018 is summarised below.
Total assets increased by 5.0% to £3,074m (2017: £2,928m). Our net debt figure was £1,283.6m at 31 March 2018 (2017: £1,218.6m). Gearing (the ratio of net debt to equity and net debt) was 47.9% (2017: 48.4%).

Annual Information Return 2018 Board's Overview
Summary Statement of Financial Position Yearto 31 March
2018 (£m) Total non-current assets 3,022.6 Total current assets 51.9 Total Assets 3,074.5
Equity 1,393.9 Total non-current liabilities 1,543.5 Total current liabilities 137.1 Total liabilities 1,680.6 Total equity and liabilities at 31 March 3,074.5
Liquidity
Section 1 Chapter 2 Page 3 of 5
Year to 31 March 2017 (£m)
2,887.3 41.0
2,928.3
1,300.8 1,484.4
143.1 1,627.5 2,928.3
Operating activities generated a net cash inflow of £201.8m (2017: £212.6m). Net cash outflows of £168.9m (2017: £147.8m) related to investing activities. Net financing activities created a cash outflow of £24.2m (2017: £64.3m).
Our working capital requirements are met from a committed working capital facility of £20m and from available positive cash balances. Interest is accrued on the working capital facility at floating interest rates based on London Inter-bank Offered Rates (LIBOR).
Investing activities included the acquisition of property, plant and equipment of £160.9m (2017: £149.0m), acquisition of subsidiaries net of cash acquired of £9.7m (2017: £nil), proceeds from the sale of property, plant and equipment of £1.5m (2017: £1.1 m) and interest received of £0.1 m (2017: £0.1 m).
Pension funding The pension scheme was valued at a liability of £22.8m at 31 March 2018 (2017: liability of £66.0m). This was made up of a total market value of assets of £233.4m (2017: £239.7m) less actuarial value of liabilities £256.2m (2017: £305.7m). The decrease in the liability has been driven primarily by the effects of changes to demographic and financial assumptions including lower inflation.
Capital We have invested £2.1 billion in Northern Ireland's water and sewerage infrastructure since our formation in 2007/08.
Around £153m of capital investment was delivered during 2017/18. The company spent around £92m in 2017/18 on maintaining the current assets. Around a further £61m was spent to deliver quality enhancements, improve service and accommodate growth. Investment of £163m is planned for 2018/19.
2.3 PPP contracts
Kinnegar Wastewater Treatment Works A contract with Coastal Clear Water Ltd was signed on 30 April 1999 for the provision of sewage treatment, which covered the upgrading of the Kinnegar WwTW with a capital cost in the region of £11 million. The contract is for 25 years with an end date of 30 April 2024. The cost and net book value of assets included in Property, Plant and Equipment at 31 March 2018 is £12.0m and £5.56m respectively (2017: £12.0m and £5.91m). The amount included in PPP Creditors at 31 March 2018 is £3.02m (2017: £3.38m).

Annual Information Return 2018 Section 1 Chapter 2 Board’s Overview Page 4 of 5
Alpha A contract with Dalriada Water Limited was signed on 30 May 2006 for the provision ofbulk drinking water supplies. This has a capital cost in the region of £111 million. Theservice provision commenced roll-out from November 2008. The contract is for 25 yearswith an end date of 29 May 2031. The cost and net book value of assets included inProperty, Plant and Equipment at 31 March 2018 is £120.36m and £87.24m respectively(2017: £119.24m and £89.79m). The amount included in PPP Creditors at 31 March 2018is £88.00m (2017: £90.38m).
On 20 November 2017, the Group subscribed 100% of the shares and voting interests inNI Water Clear Limited, which acquired 100% of the shares and voting interests in bothDalriada Water Holdings Limited (dormant) and NI Water Alpha Limited. Dalriada WaterHoldings Limited owns 100% of the shares and voting interests in Dalriada Water Limited.
With the acquisition by the Group of Dalriada Water Limited during 2017/18 the PPP creditor at group level is eliminated on consolidation.
Omega A contract with Glen Water Limited was signed on 6 March 2007 for the provision ofsewage treatment / sludge disposal at six sites with a capital cost in the region of £132million. The contract is for 25 years with an end date of 5 March 2032. The cost and net book value of assets included in Property, Plant and Equipment at 31 March 2018 is£144.99m and £106.78m respectively (2017: £142.08m and £108.03m). The amountincluded in PPP Creditors at 31 March 2018 is £112.69m (2017: £114.49m).
On Balance Sheet Alpha £k
Opex 9,323
Interest 6,406
Total P&L Impact 15,729
Capital Repayment 2,376
Life Cycle Maintenance 1,516
Total Balance Sheet Impact 3,892
Total PPP Payments 19,621
Effective Interest Rate used to calculate Alpha finance charge 3.57%
Off Balance Sheet Omega (£k) Kinnegar (£k)
Opex 23,464 2,229
Residual Interest 3,454 282
Total PPP Payments 26,918 2,511
Estimated Residual Value at End of Contract Alpha £84m Omega £113.5m Kinnegar £5.98m

Annual Information Return 2018 Section 1 Chapter 2 Board’s Overview Page 5 of 5
2.4 Regulatory Capital Value (RCV)
The Regulatory Capital Value (RCV) has been developed for regulatory purposes and represents the capital base established for the purposes of setting price limits.
In line with Regulatory Accounting Guideline (RAG) 1.04, this note is compiled using figures assumed in setting prices during the Price Control (PC) process. Figures in 2017/18 are therefore consistent with figures contained within the Water and Sewerage Service Price Control 2015-2021 (PC15) published by the Utility Regulator in December 2014.
Within the RCV, the prior year balance and in year capital expenditure have been indexed by the average Retail Price Index (RPI) over the year to March.
At 31 March 2018
At 31 March 2017
£m £m
Prior Year Closing RCV 2,244.9 2,133.3 Indexation and other adjustments 84.0 45.7
Opening RCV 2,328.9 2,179. 0
Capital expenditure 132.8 129.3
Infrastructure renewals expenditure 25.7 25.0 Infrastructure renewals charge (25.7) (25.0) Grants & contributions (6.5) (6.3) Depreciation (including capital grants) (57.8) (55.9) Disposal of assets (1.3) (1.2)
Closing RCV (pre regulatory adjustments) 2,396.1 2,244.9 Regulatory adjustments ‐ ‐
Closing RCV 2,396.1 2,244.9
Average RCV 2,320.5 2,189.1

Annual Information Return 2018 Section 1 Chapter 3 Board’s Overview Page 1 of 3
Chapter 3 Efficiencies
The PC15 period will see NI Water close the remaining gap to the most efficient companies by 80%. We have made good progress so far and are on track to meet this target. We believe our strong performance to date greatly reduces the scope for further efficiency in PC21.
The current arrangements for the governance of NI Water as both a regulated Government Company and a Non-Departmental Public Body bring with it certain challenges, such as the short, medium and longer-term operational and capital funding requirements. The current system of setting the capital programme within the Utility Regulator’s price setting process does not align with the annual cycle of public sector funding.
We have had to adjust PC15 Final Determination output targets to reflect a shortfall in public expenditure in the first three years of PC15. NI Water is an asset intensive business and long-term planning is essential to improve services for customers today while investing to safeguard services for future customers. The uncertainty over medium term investment planning adds complexity and inefficiency to capital investment delivery and makes it increasingly difficult for us to maintain momentum to complete our programmes of work.
The Company is continuing to work closely with DfI and the Utility Regulator to make the case for certainty of funding and a medium term financial settlement to underpin the six-year PC15 Final Determination. In the meantime, NI Water ensures that the implications on the delivery of our services as a consequence of funding constraints, are fully analysed, managed, delivered and communicated to the public in a clear and responsive manner.
Some of the measures we have taken over 2017/18 to deliver a reduction in day to day running costs are set out below.
Dunore Solar Farm As noted in Chapter 1, we completed our first solar farm to supply electricity to the Dunore water treatment works. Dunore is our third largest site in terms of energy consumption, accounting for 7% of the company’s annual usage.
The £7m project produces a peak output of 5MW, saving over £0.5m annually in energy costs. As well as meeting the energy needs of the Dunore treatment works, the farm also enables us to contribute spare capacity to the grid.
Alpha PPP Acquisition Project Alpha was a 25 years Design, Build, Finance and Operate (DBFO) contract to provide bulk drinking water supplies of up to 396 Ml/d (60% of NI Water’s demand) until May 2031.
It is anticipated that the acquisition of the Alpha companies in 2017/18 will deliver a number of important financial benefits over the remaining 14 years of the contract period. We estimate that non-domestic customers will pay £11.5m less in water charges, while the amount of subsidy required by NI Water will reduce by £45.5m. It will also secure £48.5m in Resource DEL savings, £13.8m of which will be realised over the next 4 years.

Annual Information Return 2018 Section 1 Chapter 3 Board’s Overview Page 2 of 3
Instrumentation, Automation and Telemetry (ICAT) NI Water has commenced implementation of its Instrumentation, Automation and Telemetry (ICAT) strategy, with new technology already installed at over 30 service reservoirs during 2016/17 and a further 39 sites during 2017/18.
Whilst this programme of work is primarily focused on improving service reservoir resilience, we also anticipate operational savings.
Business Improvement Initiatives
1. Production Linesa. The second phase of the Customer Service Centre design was implemented
to align the Bretland and Gelvin Grange sites with our Water and Wastewateroperations to improve service and lower employee/contractor costs.
b. Detailed analysis of expenditure by activity has enabled greater control ofMeridian contractor expenditure and increased levels of capitalisation.
c. In addition to the Dunore Solar Farm, actions to drive lower energy costs andhigher income have resulted from the optimisation of a number of majorWastewater Treatment Works, investment in small scale solar at a total of 55sites and new commercial arrangements for access to NI Water’s standbygenerators at periods of peak demand.
2. Capital Efficienciesa. Of a range of initiatives to deliver enhanced levels of efficiency the most
impactful has been the creation of the Capital Programme ManagementOffice (CPMO). This has proved highly effective in managing risk to lowerproject expenditure.
b. Network modelling which was previously undertaken by expensive externalresources on a consultancy basis has now been insourced to enhance NIWater’s capability and realise savings.
c. Work to ensure the creation of the planned Integrated Partnerships, essentialfor the next phase of capital efficiencies, has made strong progress with theprocurement process now underway.
3. Customer Experience / Digitala. Delivering a channel of choice for NI Water’s customers has been identified
as a priority and the investment in digital to reduce telephone contacts hasgathered momentum throughout the last year and is now extending. This hasand will continue to see service standards increase and costs for callhandling reduce as more customers opt to transact quickly and easily via theweb and Interactive Voice Response (IVR).
b. Digital technology now underpins the Situational Awareness capability thatenables the Customer Service Centre to more effectively and efficientlymanage “grouped events” to drive service and lower costs by reducing thenumber of truck rolls.
4. Commerciala. The use of Category Management in the procurement of goods and services
in new areas such as Fleet and Chemicals is proving effective at deliveringbetter value. Building on the successes of this year, further training andmentoring of staff in these new ways of working has already begun inanticipation of the scope of Category Management widening.

Annual Information Return 2018 Section 1 Chapter 3 Board’s Overview Page 3 of 3
Innovation Day Innovation was the topic of the day at the first innovation event run in Northern Ireland for the water sector in September 2017. NI Water created an opportunity for companies and entrepreneurs to have a chance to pitch their ideas to key influencers in the water industry. The informative and interactive event was attended by many industry experts such as John Joyce, Chief Economist at the Stockholm Water Institute and Richard Kirk from the Institution of Civil Engineers.
Innovation is key to driving efficiency and improving service and our customers and stakeholders both demand and expect it. The quality and creativity of the presentations were first class, showcasing the wealth of talent and expertise available to drive forward the Northern Ireland economy. The event focused on smart networks, lowering total asset lifecycle costs and advanced information technology. Three companies were selected to work with NI Water with the view to furthering their idea or product, which will be subject to the full tendering process.
Supply Chain Efficiencies NI Water is moving to a more collaborative approach with our supply chain via the creation of a number of integrated partnerships to supersede the existing frameworks for delivering our capital investment programme.
The partnering approach focuses on appointing a reduced number of key framework contractors who will work more closely with NI Water, be involved earlier in the scoping and design stages of solution development, and share greater risk and reward.
We held an open day to brief interested parties on the procurement process, which was attended by over 100 representatives from the supply chain. Briefings have also been held with the Construction Employers Federation and the Association for Consultancy and Engineering.

Annual Information Return 2018 Section 1 Chapter 4 Board’s Overview Page 1 of 1
Chapter 4 Competition
There are no developments to report in respect of inset appointment proposals, common carriage or water supply licensing proposals. NI Water has made no requests for common carriage or wholesale water supplies.

Annual Information Return 2018 Section 2
Tables and Commentary

Annual Information Return 2018 Section 2 Chapter 1 Page 1 of 10
Chapter 1 - Promoting the Efficient Use of Water
This report examines a range of water efficiency activities undertaken by the Northern Ireland Water for household and non-household customers over the course of this reporting period. The company is committed to promoting and improving water efficiency for all its customers.
These efforts have included using the methods that have been successful to date i.e. education schemes, distribution of water saving devices and working in partnership with other organisations on new projects, and by designing and introducing new strategies.
The Water Education Team (WET) consists of two full time employees who visit schools, community and specialist groups and organisations, and work in partnership with stakeholders and other partners. 60% of the Educator’s time is spent promoting water efficiency.
The key elements of our strategy are as follows: 1. Efficient use of water in the home
a) ensuring no leaks from taps, toilets, pipe joints etc.b) cistern displacement devices used where necessaryc) efficient use of domestic appliances e.g. full load for washing machine,
dishwasherd) selecting water saving option on appliancese) use of shower rather than bath, and using shower timer to reduce time spent in
the showerf) shower head and water tap aerators are recommended
2. Efficient use of water in the gardena) awareness of the amount of water used through garden hoses and sprinklersb) encouraging use of water gun if using a hosec) encourage the use of water buttsd) use water retaining gels for plant containerse) encourage use of mulchf) plant drought resistant plants
WET have attended a variety of external public events:- Balmoral Agricultural Show (May) Coleraine 50+ forum (July) Music on the Park-Silent Valley (July) Men’s SHED, Limavady (August) Men’s SHED-Dungiven (August) Men’s SHED-Ballykelly (August) Music on the Park-Silent Valley (August) Millisle Community Group (September) Irish Football Association event (October) Girdwood Community Hub (October) Banbridge Senior Citizens Club (October) Chest, Heart & Stroke events (October and January) Ballylagan Men’s Group (November) Randalstown Seniors Group (November) Beersbridge Elim Church Winter Even (December)

Annual Information Return 2018 Section 2 Chapter 1 Page 2 of 10
Consumer Parliament (March) Glenbrook Sure Start (March)
Events that were attended on request: Northern Ireland Environment Agency event (August) Invest NI Innovation day (September) W5 Lego STEM event (December) Winter Information Event – Belfast City Council (December) LACP Event (December)
Staff who attended these events promoted the practice of water conservation by means of distributing leaflets, promotional items and giving advice on using water wisely.
Staff who attended these events promoted the practice of water conservation by means of distributing leaflets, promotional items and giving advice on using water wisely. During this reporting year, NI Water treatment sites have been utilised as an academic resource by Queens University Belfast, Ulster University, South Eastern Regional College, Northern Regional College and North West Regional College. These visits provide students with an insight into the water treatment processes.
NI Water attended and participated in the global LEGO STEM Event. NI Water staff were involved as judges at this prestige event judging on creative ways of saving water. Eco schools from around Northern Ireland had taken part as the event promoted the importance of water conservation and how our future water users can play a major role in preserving this valuable resource through imaginative initiatives.
The WET promotes water efficiency at NI Water’s Education Centres at the Heritage Centre and Silent Valley where sessions take place in alternating weeks. Specific classroom talks on conservation are given to primary school children supporting the Eco Schools initiative or at their request. Monthly educational visits to the Wastewater and Water Treatment Centres for both schools and the general public are organised by the team.
We have seen demand continue for Key Stage 3 classroom visits, through the Home Economics, Geography and science departments over the last reporting period. We do expect this growth to continue into the new school term.
A variety of water efficiency promotional items are used whilst delivering all the above talks which include:
Water-butt leaflets Waterwise Leaflet Promotional and educational leaflets School water audits Interactive games encouraging conservation Save-a-Flush Shower timers (5mins) Water cycle poster (teacher’s aide)
Water efficiency leaflets are available for download from the NI Water website along with a printable poster “Stop those drips”.

Annual Information Return 2018 Section 2 Chapter 1 Page 3 of 10
Household 1. Cistern Displacement Devices (CDD’s)These can be requested by the customer directly through NI Water’s Customer Service Centre (CSC) or from the Education Team. For 2017/18 NI Water has distributed 778 CDD’s at school visits, community talks, shows and at the request of an organisation. All teachers were also issued with a sample. Community Groups receiving presentations on conservation also received a save-a-flush.
The calculation for the water savings achieved in 2017/18 report year is as follows
S*O*F*(D*I) = Savings in litres
S= Savings per flush, O= Occupancy rate, F= Flushing frequency per person per day, D= Number distributed, I= Installation rate.
Values derived from the Ofwat Water Efficiency Targets were used to estimate the number of CDD’s installed. Using the Ofwat Efficiency Report the volume displaced per flush was recorded as 2.5 l/per flush and flushes per person per day as recorded as five. This figure is the average savings per flush achieved through the installation of save-a-flush, which are the CDD distributed by NI Water. An installation rate of 70% was due to the distribution method used i.e. through requests, schools and community groups. Occupancy rate was 2.5 from NISRA
Calculation:
2.5*2.5*5*(778*0.7) = 17,018.75 l/per day = 0.0170187 Ml/d
2. Distribution of Water ButtsDuring this reporting period, NI Water distributed water butts to community groups, schoolsand allotment groups. The total for this year is 34.
The calculation for the water savings achieved in 2017/18 report year is as follows:
S=V*F*1*N
S= savings per butt, V=volume of water butt, F= fills per year I= instillation rate, N= number of Water butts Using the Ofwat Efficiency Report the volume (190L) is company based (NI Water) and the fills per year is estimated at 6 and the installation rate is 100%.
Calculation:
190*6*1*34 = 38,760 l per year:
38,760/365 days = 106.19178 l per day = 0.0001061 Ml/day
3. Household Water AuditsDuring 2017/18 the self-water audit for domestic households, which can be accessed through the company’s website, have been 261 hits to the online audit. An advantage of the website self-water audit is that as soon as the customer completes the form the information is emailed directly to WET and this data can then be collated in a spreadsheet to accumulate water usage across NI Water’s customer base.

Annual Information Return 2018 Section 2 Chapter 1 Page 4 of 10
Domestic Self-Water Audit Packs Over the report year 2017/18 WET continued its conservation campaign “Spread the Word” to distribute self-audits to the parents of schoolchildren. There were 602 audits disseminated during all schools visited by the Team, the Principal then forwarded these NI Water Domestic Water Audits to the families of the children. A school returning 75% completed audits received a water saving pack including a water butt. The school with the highest percentage of returns also receive a cash prize.
To calculate the savings achieved through this initiative it is necessary to make assumptions on the savings achieved (Ofwat Water Efficiency Targets). The percentage acted upon is assumed to be 70%. It has been assumed that completed audit achieved savings of 10 litres per property per day.
D*A*S = Savings in litres
D = Number water audits carried out by company, A = Likelihood acted upon, S = Savings in litres per water audit.
From the figures supplied by IT division of the Corporate Affairs Team, 261 hits have been recorded for observations of the online water audit.
To calculate the savings achieved through this initiative it is necessary to make assumptions on the savings achieved (Ofwat Water Efficiency Targets). The percentage acted upon is assumed at 10% saving 10 litres per property per day:
Calculation: 261* 0.10* 10 = 261 l/per day = 0.000261 Ml/d
The number of audits distributed was 602 through Spread the Word
Calculation:
602* 0.70*10 = 4214 l/per day = 0.004214 Ml/d
4. Shower TimersOver the reporting year, 2696 shower timers were distributed at schools, shows, events and presentations by NI Water staff. The installation rate of these can be assumed at 23% (Ofwat Water Efficiency Targets) a saving of 5 litres per property per day can also be assumed. The calculation for the savings achieved in 2017-18 report year is as follows:
D*I*S = Savings in litres
D = Number of shower timers distributed, I = Likelihood installed, S = Savings in litres per property per day.
Calculation: 2696* 0.23* 5 = 3100.40 l/per day = 0.0031004 Ml/d
D*I *S= Savings in litres
5. Gel Bags35 gel bags were distributed as part of the allotment group talks and shows. Using the Ofwat Water Efficiency Targets a saving of 0.1 litres per property per day can also be assumed. Installation percentage would be 25% due to their distributed method
The calculation for the savings achieved in 2017/18 report year is as follows:

Annual Information Return 2018 Section 2 Chapter 1 Page 5 of 10
D*I *S= Savings in litres
D = Number of gel bags distributed, I = Likelihood installed, S = Savings in litres per property per day.
Calculation 35*0.25*0.1= 0.875 l/per day= 0.0000008 Ml/d
6. Trigger GunsNine trigger guns were distributed through allotment talks and at staff water efficiencystands.
Using the Ofwat Water Efficiency Targets a saving of 2 litres per property per day can also be assumed and 100% installation if requested i.e. at staff stands or through CRC.
The calculation for the savings achieved in 2017/18 report year is as follows:
D*I *S= Savings in litres
D = Number of trigger guns distributed, I = Likelihood installed, S = Savings in litres per property per day.
Calculation 9*1* 2 = 18 l/per day= 0.000018 Ml/d
7. Water Audits Completed by CompanyNo audits were completed in the homes of customers 2017/18
Presently in Northern Ireland domestic customers do not pay for their water and wastewater services and customers are not metered. Therefore, the only way to help foster change in attitude and behaviour is by demonstrating to the customer how they can financially benefit i.e. save money, for example by reducing, the number of showers they have in a week orhaving a shower instead of a bath or the number of times the washing machine and ordishwasher is used.
Non-household NI Water operates a larger user discount scheme which is dependent on the commitment of the customer to water efficiency. The customer will have to provide evidence of promoting water efficiency; this may be through changes in procedure, installing water saving devices, installation of recycling plants and the review of water efficiency by an independent industry expert. (www.niwater.com/largeusertariff.asp)
The NI Water website is updated and reviewed on a regular basis. The site has been developed to encourage water efficiency within the commercial customer sector. The areas included are:
Why Save Water? What is Normal Water Use? What is a Water Balance? Water Efficient Plumbing Appliances?
The website is accessible to all customers with internet access enabling them to source information to assist them in making decisions about water efficiency.

Annual Information Return 2018 Section 2 Chapter 1 Page 6 of 10
8. Water AuditsDuring 2017/18 reporting period, 602 Water Audits for Schools were distributed by WET through Teachers Packs.
To calculate the savings achieved through this initiative it is necessary to make assumptions on the savings achieved (Ofwat Water Efficiency Targets). The percentage acted upon is assumed at 20% saving 10 litres per property per day:
D*A*S = Savings in litres
D = Number water audits carried out by company, A = Likelihood acted upon,
S = Savings in litres per water audit.
Calculation: 602*0.20*10 = 1204 l/per day = 0.001204 Ml/d
No Commercial Audits were distributed during this reporting period. The document is available on line as an advice leaflet for business customers titled “Advice for Business Customers” with an additional document “Business Water Audit”. Due to cost restrictions, these leaflets have not been published but are easily available on the NI Water website.
Savings and Costs These savings have been achieved by adding together
Household-Water Efficiency Methods Non Household-Water Efficiency Methods Other Water Efficiency Methods
Leakage: No savings or costs are sustained by NI Water through supply pipes being repaired, as NI Water does not operate a free/subsidised repair/replacement scheme. If NI Water repairs any leaking supply pipes, this will only happen after a leakage notice has been issued and the customer has failed to carry out sufficient work to rectify the problem. NI Water will then repair the supply pipe and any cost will be then charged to the customer.
Water Efficiency Methods The majority of NI Water’s other Water Efficiency Methods are education based. As already mentioned NI Water has a dedicated Water Education Team (WET) consisting of two full time employees. These Education Officers deliver presentations to a variety of community and youth groups, organise/attend external events as well as attending educational establishments at all levels. Conservation classroom presentations are delivered weekly and we work in conjunction with the Eco Schools Award scheme. The double decker Waterbus, a mobile education classroom provides presentations, displays, experiments, quiz, demonstrations, multimedia and computer facilities. This mobile classroom aims to make children aware of a range of water issues such as the water cycle, water for health, water sources, water/wastewater cleaning and water efficiency. The Waterbus programmes has been designed for Key Stage 2 (P5-P7) and we work closely within the revised curriculum. The service has been well received by Education Authority (EA) and we have reached 18,863 pupils during 2017-18 delivering NI water’s key message on water conservation. NI Water has a Wastewater Heritage Centre site at Duncrue Street, Belfast. This location provides an insight into the history of water supply and removal of waste along with the importance and techniques of wastewater management. We consider contact with schoolchildren to be the vital link with parents, bringing news and promotional items home and encouraging them to become water efficient and to be aware of the value of water

Annual Information Return 2018 Section 2 Chapter 1 Page 7 of 10
management. Key Stage 3 talks by NI Water’s Education Team have also continued during this reporting period. One of the recommendation from last year’s report was for NI Water to consider an additional resource to assist with expanding the educational programme and promoting the efficient use of water including the KS3 area. At present this is being considered and in the meantime we are availing of other resources within NI Water such as Environmental Champions to help assist in meeting the ever increasing demand.
New interactive Education & the Community section on NIWater.com Education And The Community - Northern Ireland Water
We have launched an updated Education & Community section with rich, informative content focused on informing water users about our key messages.
The extensive new interactive content is used to not only educate users but also to position NI Water as a key stakeholders in the community, addressing important water use issues with a slightly more informal tone of voice.
The content is primarily targeted at school pupils with an animated design but is equally accessible by adults. It has been benchmarked against other leading water companies’ equivalent sections and has been built with future proofing in mind by using non-native code platforms.
Main interactive sections Bag It & BinBag it And Bin it - Northern Ireland Water
Scrolling content building on the key “Bag it and Bin it” message and the importance of not flushing the “dirty dozen” down the toilet.
Water Saving Calculator – How much water do you use?Why Save Water? - Northern Ireland Water
The calculator is designed to provoke awareness and thought on how much water households are wasting.
Silent ValleySilent Valley - Northern Ireland Water
This sub section sells Silent Valley as a visitor destination for families, groups andschools:
- Image Gallery- Walking trails map- How to get there - embedded Google map for users to find directions from
their address- Visitor information, downloads, podcasts.
NI Water has dedicated website pages with advice on household and commercial water efficiency. Included in these pages is a domestic self- water audit, which allows domestic customers to calculate their average daily consumption per resident. This audit has the added benefit of doing calculations automatically and provides NI Water with completed audits instantly once the customer has submitted it. The website also includes guidance on

Annual Information Return 2018 Section 2 Chapter 1 Page 8 of 10
the types of appliances that could be installed into houses and business, which would help them to be more efficient in the future.
NI Water’s Winter Preparation Campaign generated 84 media items between 1 September 2017 and the 28 February 2018 NI Water has highlighted throughout this past year the issue of water efficiency and in particular the potential for frozen pipes as part of its winter preparation campaign.
The Frozen Pipes Can Flood Homes / Insulate Your Pipes message featured in 32 articles and generated a PR Value of £ 37,796.15. Sixty nine percent of these articles were classed as Prime Positive. This message was very prominent throughout the period, with the phrases (or parts of the phrases) featuring in a significant number of headlines. In addition to these references within the text of articles the Insulate Your Pipes message also registered visually with the phrase appearing on a sign held up by some of the participants at the launch of the Winter Campaign.
The message “water continues to ‘flo’ freely through our pipes all winter long” featured in 30 articles and generated a PR Value of £35,441.27. All these articles were classed as Prime Positive. This message was very prominent throughout the period, with the word “flo” featuring in number of headlines.
The NI Water character “Flo” was mentioned in 30 articles (36% of the total).
The Winter Campaign Launch resonated strongly in the media, totalling 22 articles and producing a PR Value of £28,969.52. This was four more articles than last year and produced a PR Value that was 28% higher. All this coverage drew on the press release which contained quotes from the Lord Mayor of Belfast Nuala McAllister and NI Water’s Sara Venning. A photograph of the two (with other stakeholder representatives) at the launch at Belfast City Hall also featured in most of the articles.
The freezing weather conditions were the subject of 22 articles and produced a PR Value of £43,090.54. Most of these articles covered the warnings issued by various public bodies in relation to the Beast from the East snow storm. Several articles also covered the appeal from NI Water for people to be on the lookout for burst pipes in the wake of the freezing conditions.
Protecting pipes appeared in 19 items and produced a PR Value of £13,474.88. Among these items were two articles on the upgrade of facilities in the Newry region which featured quotes from Ronan Larkin of NI Water.
Education Visits were the subject of 12 articles and produced a PR Value of £8,870.47. These articles featured various NI Water representatives visiting schools and community groups and continued quotes and/or photographs.
The Utilities Winter Readiness Campaign was the subject of 9 articles and produced a PR Value of £6,762.34. Much of this coverage was driven by a press release which contained quotes from John McKinstry, Chair of the Joint Utilities Working Group. An accompanying photograph of Sara Venning of NI Water with representatives of other utility companies was included in most of the articles. These articles were classed Significant Positive as NI Water was featured prominently but not exclusively.
The Watersafe website address featured in 30 articles (36% of the total).

Annual Information Return 2018 Section 2 Chapter 1 Page 9 of 10
This media coverage generated a PR Value of £101,167.75. All the coverage was positive, of which 52% was Prime Positive.
Efficiency Method Total Cost Savings per Ml/ day Household Measurable Methods Cistern Devices (0.57p each) 778 443.46 0.0170187 Water butts (£38.16 each) 34 1,297.44 0.0001061 Self-audit (Spread the Word)(0.04p each) 602 24.08 0.0042140 Self-audit (On Line) 261 0.0002610 Total 1,764.98 0.0215998
Other Measurable Methods Shower timers (£1.10 each) 2696 3,100.40 0.0031004 Gel Bags (£4.75 each) 35 166.25 0.0000008 Trigger Guns (£4.83 each) 9 43.47 0.0000180 Shower Heads (£27.90 each) 0 0.00 0.0000000 Education Depart (UKWIR) 56,759.16 0.4795450 Total 60,069.28 0.4795450
Leaflets How water wise are you (0.10peach) 14570 1,457.00 Freezing Pipe (0.017p each) 7544 1,282.48 Total leaflets 2,739.48
PR items Bookmark- “Flo” kids (0.07p each) 17491 1224.37 Game: Snakes and Ladders (0.18p each) 594 106.92 Stop Tags (0.43p each) 23416 10,068.88 Tap cover (£4.66 each) 0 0.00 Ice scraper (0.73p each) 581 424.13 Thermometer (0.76p each) 734 557.84 Total PR 12,382.14
Non Household School Audits(0.19p each) 602 114.38 0.001204
Total 0.5023488
NI Water has a large range of leaflets that promote water efficiency, the distribution of these may also lead to increased water savings but at present these savings cannot be calculated, but the costs for this year is £2,739.48
The calculation of costs due to staffing has been calculated using accepted methodology from the AIR12 return.
Assumed Savings Household-Water Efficiency Methods = 0.0215998 Other Water Efficiency Methods = 0.4795450 Non Household-Water Efficiency Methods = 0.0012040

Annual Information Return 2018 Section 2 Chapter 1 Page 10 of 10
The total recorded savings are = 0.5023488 Ml/d
The work of the Education Department has continued to significantly improve NI Water’s water efficiency figure. This can be demonstrated through the behavioural chance activity which has led to our customers becoming more efficient in their use of water and the UKWIR method is now being used to quantify the water saving benefits for “softer measures” (2010 Reporters recommendation 1, (document reference)T1niw.R10 P1 S2).
The UKWIR spreadsheet WR25 “Estimating water saving calculator for baseline water efficiency” has been used. These activities have been apportioned between Medium and High Levels of engagement. This is summarised in the following table:
Level of Engagement Ml/day High 0.476 Medium 0.029 Totals 0.505
Using the UKWIR Methodology, which as previously mentioned was recommended by the Reporter, has resulted in a general improvement in water efficiency measurement for the company.
Year Assumed Savings 2009/10 0.048 Ml/day 2010/11 0.216 Ml/day 2011/12 0.264 M/l day 2012/13 0.227 M/l day 2013/14 0.219 Ml/day 2014/15 0.304 Ml/day 2015/16 0.299 Ml/day 2016/17 0.517 MI/day 2017/18 0.502 Ml/day
NI Water as in previous years concentrated on the activity of the Waterbus which attributes to a continued high level of engagement and also a high level of savings for this element.

NORTHERN IRELAND WATER LIMITED - ANNUAL INFORMATION RETURN
ANNUAL INFORMATION RETURN - TABLE 2 KEY OUTPUTSWATER SERVICE - 2 (TOTAL)
DESCRIPTION UNITS DP2012-13 CG 2013-14 CG 2014-15 CG 2015-16 CG 2016-17 CG 2017-18 CG 2018-19 CG 2019-20 CG 2020-21 CG
A DG2 PROPERTIES RECEIVING PRESSURE/FLOW BELOW REFERENCE LEVEL1 Total connected properties at year end 000 1 818.0 A2 825 0 B2 828.1 A2 839.7 A2 852.4 A2 863.0 A22 Properties below reference level at start of year nr 0 1,748 B3 1,420 B3 1,257 B3 1,082 B3 900 B3 862 B33 Properties below reference level at end of year nr 0 1,420 B3 1,257 B3 1,082 B3 900 B3 862 B3 711 B34 Properties receiving low pressure but excluded from DG2 nr 0 0 B3 0 B3 0 B3 0 B3 0 B3 0 B34a DG2 Properties with pressure below a surrogate level of 7.5m at end of year nr 0 176 B2 169 B2 137 B2 126 B2 124 B2 103 B24b DG2 Properties at risk of low pressure removed from the risk register by company action nr 0 297 B3 132 B3 186 B3 171 B3 40 B3 175 B34c Average capex cost of permanent solutions to DG2 problems £000/prop 1 0.8 C4 9.1 C4 8.2 B2 13.9 B2 26 8 B2 9.8 B2
B DG3 PROPERTIES AFFECTED BY SUPPLY INTERRUPTIONS(i) UNPLANNED INTERRUPTIONS
5 More than 3 hours nr 0 53,458 B3 41,412 B3 112,653 B3 105,235 A3 90,094 A3 108,386 A36 More than 6 hours nr 0 10,487 B3 6,742 B3 43,767 B3 8,699 A3 5,128 A3 6,097 A37 More than 12 hours nr 0 2,607 B3 1,195 B3 25,693 B3 841 A3 494 A3 861 A38 More than 24 hours nr 0 1,554 B3 12 B3 13,788 B3 32 A3 0 A3 0 A3
(ii) PLANNED AND WARNED INTERRUPTIONS9 More than 3 hours nr 0 50,096 B3 35,468 B3 47,216 B3 33,929 A3 35,484 A3 38,225 A310 More than 6 hours nr 0 20,674 B3 18,454 B3 19,127 B3 13,767 A3 13,247 A3 14,809 A311 More than 12 hours nr 0 0 B3 0 B3 44 B3 0 A3 0 A3 0 A312 More than 24 hours nr 0 0 B3 0 B3 0 B3 0 A3 0 A3 0 A3
(iii) INTERRUPTIONS CAUSED BY THIRD PARTIES13 More than 3 hours nr 0 1,778 B3 2,452 B3 4,710 B3 4,739 A3 12,691 A3 4,078 A314 More than 6 hours nr 0 561 B3 121 B3 974 B3 476 A3 842 A3 1,145 A315 More than 12 hours nr 0 1 B3 33 B3 1 B3 0 A3 30 A3 193 A316 More than 24 hours nr 0 0 B3 0 B3 0 B3 0 A3 0 A3 0 A3
(iv) UNPLANNED INTERRUPTIONS (OVERRUNS OF PLANNED INTERRUPTIONS)17 More than 6 hours nr 0 311 B3 1,004 B3 2,521 B3 1,141 A3 1,611 A3 1,630 A318 More than 12 hours nr 0 60 B3 20 B3 16 B3 159 A3 417 A3 1,107 A319 More than 24 hours nr 0 0 B3 5 B3 0 B3 140 A3 0 A3 0 A3
C POPULATION20 Population (winter) (total) 000 2 1,842.61 C2 1,850.54 C2 1,862.72 C2 1,874.73 C2 1,887.10 C2 1,896.46 C2
D DG4 RESTRICTIONS ON USE OF WATER21 % population - hosepipe restrictions % 1 0.0 A1 0 0 A1 0.0 A1 0.0 A1 0 0 A1 0.0 A122 % population - drought orders % 1 0.0 A1 0 0 A1 0.0 A1 0.0 A1 0 0 A1 0.0 A123 % population - sprinkler/unattended hosepipe restrictions % 1 0.0 A1 0 0 A1 0.0 A1 0.0 A1 0 0 A1 0.0 A1
YEAR REPORTING
YEAR REPORTING
YEAR REPORTING
YEAR
1 2REPORTING
YEAR
9REPORTING REPORTING
YEAR YEAR YEAR
7REPORTING
YEAR
843 5 6REPORTINGREPORTING

Annual Information Return 2018 Section 2 Chapter 2 Page 1 of 34
Table 2 – Key Outputs - Water Service 2
Line 1- Total Connected Properties at Year End Northern Ireland Water’s (NIW) property data is provided via a data download of the property database tables held within the RapidXtra billing system. The data is then manipulated within Microsoft SQL to produce the Rapid Property Summary Report.
Our AIR18 methodology has remained consistent with previous years – using the automated tool to populate Table 2 figures (this was first introduced in AIR12 - Rapid Property Summary as the input).
The difference between the AIR17 and the AIR18 figures is 10,589. The breakdown can be explained as follows:
1) New Connections during the 2017/18 reporting year2) Added as a result of a customer contact. i.e. septic tank empty request, no water
complaint, blocked sewer etc.3) Removal of duplicates/properties as a result of data quality initiatives
In addition to the above, further data quality requirements have been built into the new CBC Contract. They cover all aspects of the property life cycle (creating, amending and demolishing properties) and data degradation will be monitored/measured throughout. These system validations have been split into 4 delivery phases. The functionality for Phases 1-3 have been delivered, with the functionality for the Post Phase 3 data validations due to be delivered within the next database release/upgrade in August 2018. Off-system data cleanse is required before some of the system validation rules can be applied.
Annex A details the Line Methodology followed for each of the figures calculated in Table 2.
Line 2 – Properties below the reference level at start of year The number of properties on the Register at the start of the year was 862, as reported in line 3 of the AIR17 submission.
Line 3 – Properties below the reference level at end of year As per the regulatory guidance, as issued and directed by NIAUR, this line includes properties within a 10m height of service reservoirs, there are currently 79 DG2 properties located within 10m of the supplying SR. It should be noted that NI Water will not be able to provide such properties with adequate pressure through normal hydraulics; however they will be included in the DG2 register. The final number of properties recognised as being below the reference level at year end is 711.
The year-end figure is the direct result of removals due to Company Action and better information as well additions identified throughout the year. Throughout this process a surrogate pressure of 15m head in the adjacent water main has been adopted as the reference level. All properties removed from the Register during the reporting period are supported by a report and appropriate logged data. The removals process is as per NI Water’s methodology and is consistent with previous AIR submissions.
The reductions arising from capital schemes are captured within reports received following the completion of water main rehabilitation or infrastructure improvements. In total NI Water processed 4 DG2 investigation (DIR) reports resulting in 175 properties being removed from the DG2 register due to company action in AIR18, see Table 1 and scheme summaries below.

Annual Information Return 2018 Section 2 Chapter 2 Page 2 of 34
Regular updates of DG2 properties continue to be uploaded onto the CARtoMAP system ensuring that this information is readily available throughout the company. This has proved to be of particular benefit to the Contact Centre to assist in the handling of low pressure complaints.
Table 1 Company Action Removal Scheme DG2 Properties Removed Omagh phase 2 26 MIMP South – DIR1 111 Isabella/Loughrans Tower 14 Lough Ross 24 Total 175
Omagh DIR – Omagh Phase 2 work package consists of a total area of 324km2 within the town of Omagh and the surrounding Mid Tyrone Area. The area contained 33 DG2 properties. As a result of low pressure a number of mains lengths were rehabilitated, Of the DMA’s where properties were removed the main length was in the region of 301km. This Rehab resulted in the removal of 26 properties from the register.
Isabella DIR – This work package covers a small area of 1.5km2 in Co. Down, South East of Downpatrick, on the coast. Property numbers supplied are around 241 and there is in the region of 6km of water mains length. Following successful Water mains rehabilitation this allowed the removal of all 5 properties from the register.
Loughrans Tower DIR – This DMA is located in Co. Down. There are around 338 properties in the DMA with 9 DG2 properties. The water mains length is in the region of 5 km and the DMA area is approximately 0.3km2. Following a successful rehab operation a total of 9 properties were removed from the register.
Lough Ross DIR –This work package covers an area of around 256km², mainly to the south west of the country in Co. Armagh. There are 13 DMAs within the package area with a total of 7962 properties supplied from a total of 600km of mains. Following successful Water Mains Rehabilitation in the area a total of 24 properties were removed from the register.
Southern Work Packages – As a result of network modelling and associated rehabilitation schemes since 2010 a number of DG2 properties were removed from the register. Recent analysis and logging of the remaining DG2 properties in the area determined that a further 111 properties from 117 on the register could be removed. After investigation it was established that there were 8 DMAs affected with a total area of 87km2 and mains length of 260km. A review of the network and supply regime to these DMAs indicate that no further network or infrastructure changes have been made since the completion of these rehabilitation schemes. It is therefore concluded that the removal of 111 properties from the register can be attributed to Company Action.
During AIR18 there were no instances of DG2 Properties being removed as a result of Better Information following investigation and logging, meaning all removals were completed as a result of operational improvements in the network. There were a number of additions made to the register this year following information received from colleagues regarding a total of 24 properties suffering from low pressure within multiple DMA’s to the East and South of the country. The DMAs affected are Ballyvaston,

Annual Information Return 2018 Section 2 Chapter 2 Page 3 of 34
Blaney Road, Cairn Hill, Trunk Ballysillan Lower Outlet and Trunk Carran Hill Outlet. These DMAs cover an area of 124km2 and have a mains length of 45km in total. Following logging the 24 properties were added to the register.
The total DG2 movements during the year are summarised in Table 3 below.
Table 3 Year Start 862 Additions due to Better Information 24 Removals due to Company Action 175 Removals due to Better Information 0 DG2 Properties Remaining 711
Line 4 – Properties receiving low pressure but excluded from DG2 As per NIAUR direction, properties within 10m are no longer excluded from the DG2 Register. Therefore there are currently zero properties that are justifiably covered by the exclusions as per the current guidance notes. It should be noted that NI Water will not be able to provide such properties with adequate pressure through normal hydraulics.
Line 4a – DG2 properties with pressure below a surrogate level of 7.5m at end of year A query of the DG2 register confirms that 103 properties experience a pressure below the 7.5m surrogate level.
Line 4b – DG2 properties at risk of low pressure removed from the risk register by Company Action Calculation of the total number of properties removed as a direct result of Company Action is generally achieved by adding the properties identified by removal reports resulting from both Rehabilitation schemes and Infrastructure improvements.
Table 4 Removals Due to Company Action Number Rehabilitation Schemes 175 Infrastructure Improvements 0 Total 175
The final number of properties removed due to Company Action is recorded in Table 4 above as 175. This number alongside an exceedance of 11 on the AIR17 target means that NIW has surpassed the cumulative PC15 Target of 357 by 29.
Lag in Confirming Removal from Register There is a time lag of approximately one year between the completion of the construction phase of a Work Package and confirmation that properties can be removed from the register, in general. There will be a longer lag in areas where there are multiple phases in a Work Package under construction, or a neighbouring Work Package that has a significant effect on the normal operation of the system. In general, the PPRA report for a multi-phase Work Package will be completed one year after the final phase of the Work Package is constructed.
Work Packages awaiting PPRA Documentation listing the Work Packages awaiting the completion of PPRA reports identifies a number of DG2 properties to be removed during 2017/18 using predicted

Annual Information Return 2018 Section 2 Chapter 2 Page 4 of 34
pressure from Hydraulic Modelling. The actual pressure will be confirmed by logging before formal removal of properties from the register. Table 5 below lists the Work Packages and the predicted number of properties identified for removal.
Table 5 Work Package Name No. of Props to be Removed
Killylane 7
Ballyhoy Armagh 44
Portavoe 33
Corvanaghan 1
Total 85
Removals Pending The total number of properties planned for removal during the 18/19 reporting year from work packages awaiting PPRA is 85.
Work Packages Outstanding
Table 6 Work Packages Outstanding No. of Props to be Removed
WPS Schemes 73 Total 73
There are currently outstanding Work Packages to be completed with the possibility of removal in the 18/19 reporting year. This includes the implementation of a number of Water Pumping Stations detailed in table 6. The completion of these packages would bring the total removals during the 18/19 year to 158. Any removals (Planned or outstanding) however are subject to the completion of rehabilitation works, collation of pressure data and submission of completed reports.
The cumulative PC15 target going into 18/19 is 516; minus the 29 which had has surpassed that target to date means an AIR18 removal target of 130.
Line 4c - Average Capex Cost of Permanent Solutions to Removing DG2 Properties from the Register Over the 3 years of the PC 15 period the total target removals were 357 properties and NIW has proactively removed 390 properties from the DG2 register, which means we are 33 ahead of the PC 15 target This is broken down as follows:-
2015-16 Target removal 92. Actual number removed 171 (which was a combination of 2 Killylane, 32 Lisburn, 37 Ballintemple, 69 Altmore, 21 Castledona and 10 The Glens). This left a carryover into 2016-17 of 79

Annual Information Return 2018 Section 2 Chapter 2 Page 5 of 34
2016-17 Target removal 108. There were 79 carried forward and a further 44 removed (22 Ballygowan, 10 South Ph1, 5 Ballysillan, 3 MIMP south and 4 Rasharkin.) This left a carryover into 2017-18 of 15.
2017-18 Target removal 157. There were 15 carried forward and a further 175 removed. (26 Omagh, 24 Lough Ross, 5 Isabella, 9 Loughrans Tower, 4 Rathfriland, 5 Royal Ascot, 35 Loughgall, 4 Drumadd, 9 Eagralougher, 17 Rathmore Rd, 27 Belfast Rd and 10 Moyglass Enniskillen.) This has given a carryover into 2018-19 of 33.
This is the seventh year that the company has reported this figure and it will allow the benchmarking of NI Water costs. The UR Final Determination Document indicated an average cost per property removed, which appears to be based on historic figures from England and Wales, but the appropriateness of this comparison without a factor to account for the much longer length of main per property in Northern Ireland needs further discussion.
The variability of cost per property removed as outlined in the table below is reflective of:
a) The method of delivery of the Water Mains Rehabilitation Programme. Workpackages have multiple drivers and assignment of costs to DG2 removal may rely onthe use of the Enhancement part of the CIDA allocation for the schemes below ratherthan directly attributable costs.
The scheme costs and number of properties removed from the register are reportedfor each WP where a PPRA report was produced. The costs are for mains, with theprimary justification for rehabilitation listed as “Hydraulic”, which were generallyreplaced with a larger size of main. These mains may have a secondary structural orwater quality driver also but there was no cost reduction for asset maintenance orquality enhancement applied.
This matches the approach used for CIDA allocation at CIP A1 stage where the CIDAapplication is applied using the primary driver for each scheme.
b) Individual projects designed solely to remove DG2 properties have been focused onand identified by NIW. These Projects are easier to analyse and cost due to the factthat they are focused solely on DG2 removal.
PPRA reports covering Lough Ross, Omagh Phase2, Loughrans Tower, Isabella, Royal Ascot, Rathfriland, Loughgall, Drumadd, Eagralougher, Rathmore Rd Bangor, Belfast Rd Bangor and Moyglass Enniskillen were produced during 2017-18 which removed a total of 175 properties from the register. These are detailed in the Table below.
Table 7
WP Title DG2 Properties Removed Total Cost
Cost Per Removal
Lough Ross 24 £306,624.42 £12.78K Omagh Phase 2 26 £323,477.90 £12.44K Loughrans Tower 9 £22,494.09 £2.50K Isabella 5 £69,632.52 £13.93K Royal Ascot 5 £45,979.89 £9.19K Rathfriland 4 £46,852.15 £11.71K

Annual Information Return 2018 Section 2 Chapter 2 Page 6 of 34
WP Title DG2 Properties Removed Total Cost
Cost Per Removal
Loughgall (MIMP South Workpackage) 35 Incl below Drumadd (MIMP South Workpackage) 4 Incl below Eagralougher (MIMP South Workpackage) 9 £688,432.16 £19.67 Rathmore Road Bangor 17 £85,473.49 £5.03K Belfast Road Bangor 27 £87,615.10 £3.24K Moyglass Enniskillen 10 £40,647.91 £4.06K Carried Forward Surplus from 2016-2017 15 TOTAL Pro Active NIW DG2 Removals 2017-2018
190 against 157 target £1,717,229.91
Average Cost per DG2 Removal £9,812.74
Therefore the average overall cost of removing a DG2 property from the register is obtained by dividing the total cost £1,717,229.5 by the total number of properties 175 removed in total (This means a total of 190 declared /accumulated for this year, utilising the Asset Delivery Capital Budget as there was 15 carried forward from last year).
Average cost per DG2 removal in the AIR 18 Reporting Period is = £9,812.74 Comment -The reduced figure for this year may be because of the extra analysis work carried out in May 2018 by the Asset Performance Team to further clarify the elements of Workpackages that were focused on DG 2 removal. Confidence Grade is B2 as this involved a process of some retrospective allocation of costs to the DG2 removals from some Workpackages with multiple drivers.
Workpackage Descriptions Lough Ross WP 71 The Lough Ross work package is split into two distinct areas which cover predominately rural areas in South Armagh, including the towns of Crossmaglen and Cullyhanna. Together the work package boundaries cover a total area of 270km² with approximately 7,697 properties and over 505km of water mains. The work package consists of 11 DMAs, 10 of which involved pipework rehabilitation under WMRF.
Omagh Phase 2 JN512 Omagh Phase 2 Work Package consists of a total area of 324km2 within the town of Omagh and the surrounding mid-Tyrone area. According to the most recent NI Water DG2 register the area contains 33 DG2 properties; in response a number of mains were rehabilitated as part of the Omagh Phase 2 Work Package. Proposed work includes 32.6km of new mains and 3.7km of abandoned mains
Loughrans Tower and Isabella Loughrans Tower and Isabella were completed as part of South Down Zone which consists of mainly rural and some small settlements between the towns of Castlewellan and Strangford covering a total area of 153km2. The area supplies an estimated 6,879 properties and contains 328.3km of mains. . Proposed works includes 51km of new mains and 12km of abandoned mains.
Royal Ascot Royal Ascot was part of JT252 Lisburn North Rural Phase 2 Zone. This Zone consists mainly of Lisburn and the surrounding areas to the east and north-west, covering a total area of 31.3km².The area supplies an estimated 9,761 properties and contains 132.7km of mains. Proposed work includes 18.1km of new mains and 1.2km of abandoned mains.

Annual Information Return 2018 Section 2 Chapter 2 Page 7 of 34
Rathfriland Rathfriland was completed as part of South Down Zone which consists of mainly rural and some small settlements between the towns of Castlewellan and Strangford covering a total area of 153km2. The area supplies an estimated 6,879 properties and contains 328.3km of mains. . Proposed works includes 51km of new mains and 12km of abandoned mains.
Loughgall, Drumadd and Eagralougher Loughgall, Drumadd and Eagralougher were all completed as part of MIMP South Zone. MIMP South Zone extends across the southern part of Northern Ireland, incorporating the towns of Newry, Banbridge, Armagh, Craigavon and Dungannon. The work package comprises mains which burst during the 2 freeze thaw periods and single source schemes to improve security of supply. The zone covers a total area of 2,702km2. The area impacted by proposed works covers several DMA’s across the zone. Proposed works includes 23.3km of new mains and 2.3km of abandoned mains.
Rathmore Road Bangor and Belfast Road Bangor These two areas were completed as part of the JS219 North Down Work Package.
Moyglass Enniskillen This was completed as part of the JP680 South Phase 1 Zone. The zone encompasses a total area of 714 km² to the north and west of Enniskillen Town and its surrounding environs in County Fermanagh. Proposed work includes 23.1km of new mains.
Further Work Packages to be reviewed next year A spreadsheet listing the Work Packages awaiting completion of PPRA reports was produced and it identifies the estimated number of DG2 properties to be removed during 2018/19 using predicted pressure from Hydraulic Modelling. The actual pressure will be confirmed by logging before formal removal of properties from the register. The table below lists the Work Packages and the predicted number of properties identified to date for removal. (This may rise with further investigation throughout the year)
Table 8 Work Package Name No of properties to be removed Portavoe Tower 33 Ballyhoy Armagh 44 Killylane 7 Clonvaraghan Rd Castlewellan 1 WPS Schemes 73 TOTAL 158 against 159 target
Removals Pending It should be noted that there are currently 158 properties identified for removal from the register in 2018/19 to a target of 159 in the plan following the submission of PPRA Reports.
However the 2017/18 target was for the removal of 157 DG2 properties and the actual achieved removals surpassed this figure leaving NIW 33 DG2 removals ahead of last year’s target.

Annual Information Return 2018 Section 2 Chapter 2 Page 8 of 34
The totals therefore are 158 planned for next year against a 126 (i.e. 157 – 33) target to get NIW up to the planned cumulative target for end of next year.
These removals are subject to the completion of: rehabilitation work, identification of specific DG2 schemes, and collation of pressure data and submission of completed reports. In previous years, .These reviews are ongoing.
Confidence Grade Line 4c The confidence grade for this line has remained at B2 this year, this has been achieved by The Asset Delivery Team and the Asset Performance Team working together to improve the granularity of the returns and to improve the accuracy of the methodology and figures, and taking cognisance of guidance from the reporter.
This output was achieved by making use of the scheme approval analysis that identifies the contribution from each of the investment drivers (structural improvements, water quality, operational issues (leakage) and hydraulic drivers (DG2).Also there are several dedicated DG2 schemes that are more easily analysed as the purpose of these schemes is DG2 removal only.
Lines 5-19 - DG3 Properties Affected by Supply Interruptions The rules governing the recording and collation of data for the DG3 Register are explained in the Levels of Service Methodology. DG3 procedures were established and implemented by NI Water in April 2007.
Note: This commentary includes figures based on a Total Connected Properties at Year End figure of 862,988 as confirmed by CSD Services in AIR18 Table 2 Line 1.
Significant year on year changes in reported figures including an explanation of any factors that may have influenced the figures
Unplanned, Unwarned Interruptions
AIR DG3 Properties Affected 2015/16 2016/17
2017/18 (inc. Aug severe
flooding)
2017/18 (exc. Aug severe
flooding) Table 2: Line 5 More than 3 hours 105,235 90,094 108,386 104,696 Table 2: Line 6 More than 6 hours 8,699 5,128 6,097 4,643 Table 2: Line 7 More than 12 hours 841 494 861 190 Table 2: Line 8 More than 24 hours 32 0 0 0
The 2017/18 outturns in the above table are reported, including and excluding the impact of the severe flooding event of August 2017. The event is discussed in detail in the section of the commentary dealing with Major Incidents in the Report Year. With the impact of the flooding event included, all outturns have increased except for the ‘more than 24 hours’ outturn. With the impact of the flooding event excluded, only the ‘more than 3 hours’ outturn has increased.
In 2017/18, 108,386 properties experienced an unplanned, unwarned interruption that lasted more than 3 hours, 18,292 (20%) more properties than the previous year. This increase was due in part to the severe flooding event but also, to the cold weather experienced at the start of March 2018, to the winter weather experienced in December 2017 and to several events that occurred outside normal working hours in May 2017. The following table provides a summary of the events that affected performance.

Annual Information Return 2018 Section 2 Chapter 2 Page 9 of 34
The six events in the table account for 23,352 properties, 21.5% of the total outturn for this measure. Had it not been for the six events, the outturn would have been less than the 2016/17 outturn of 90,094 and less than the 2015/16 outturn of 105,235.
The impact of the adverse weather of March 2018 (7,937 properties) was estimated by ignoring all unplanned interruptions for the period 2nd to 9th March and using a typical value in their place, based on average performance in 2014/15, 2015/16 and 2016/17.
The impact of the adverse weather of December 2017 (6,794 properties) was estimated by ignoring all unplanned interruptions for the period 1st to 31st December and using a typical value in their place, based on average performance in 2014/15 and 2015/16.
Month ‘No Water’ Complaints Unplanned, Unwarned >3hrs (Props)
Dec 17 1,904 14,299 Dec 16 1,473 6,811 Dec 15 1,452 7,504
15/16 & 16/17 Ave. 1,463 7,158 Percentage Increase 30% 100%
When compared to the average for the previous two years, December 2017 saw a 30% increase in ‘no water’ complaints received and a 100% increase in properties affected by unplanned, unwarned interruptions greater than 3 hours.
All three May events occurred outside normal working hours. The event occurred at 05:02 and affected properties in Cloughey DMA. For further details of the remaining May events and the adverse weather event of March 2018, please refer to the section on Major incidents in the Report Year. In 2017/18 and with the impact of the severe flooding event included, 6,097 properties experienced an unplanned, unwarned interruption that lasted more than 6 hours. With the impact of the flooding event excluded, the outturn reduced to 4,643 properties and would have been the lowest for this measure since the Company began making regulatory returns in 2007/08.
A total of 1,369 properties in Londonderry were affected by the flooding event, 22.5% of the total outturn for this measure. A further 69 properties in Omagh and 16 properties in Magherafelt were affected by the incident.
DG3 ID Location Date >3hrs
118754 Burst main, Newtownards 11/05/17 1,979
128801 Burst main, , Feeny 18/05/17 452 138869 Two non–concurrent bursts,
Hillsborough 27/05/17 1625 138942 875 Various Severe Flooding Event 22/08/17 3,690
Various Winter weather December 2017 6,794
Various Cold Weather Event March 2018 7,937
TOTAL 23,352

Annual Information Return 2018 Section 2 Chapter 2 Page 10 of 34
In 2017/18 and with the impact of the August severe flooding event included, 861 properties experienced an unplanned, unwarned interruption that lasted more than 12 hours. With the impact of the flooding event excluded, the outturn reduced to 190 properties and would have been the lowest for this measure since the Company began making regulatory returns in 2007/08.
A total of 645 properties in Londonderry were affected by the flooding event, 75% of the total outturn for this measure. A further 26 properties in Omagh were affected by the incident.
For the second year in succession, no properties experienced an unplanned, unwarned interruption that lasted more than 24 hours.
Planned and Warned Interruption Events DG3 Interruption
Events 2015/16 2016/17 2017/18
More than 3 hours 289 450 354 More than 6 hours 129 221 108 More than 12 hours 0 0 0 More than 24 hours 0 0 0
The table above relates to annual numbers of planned and warned interruption events.
In 2017/18, 354 planned and warned interruptions lasted more than 3 hours of which 168 related to the Water Mains Rehabilitation Programme (WMRP). During the same period, 108 planned and warned interruptions lasted more than 6 hours of which 81 were associated with mains rehabilitation.
The decrease in outturns over the last year under the Water Mains Rehabilitation Programme reflects the Company’s policy to minimise interruption to its customers’ water supply and is also consistent with a decrease in the meterage installed under the WMRP, i.e. the water main distribution meterage installed in 2017/18 was 126km compared to163km in 2016/17 and 112km in 2015/16.
Properties Affected by Planned and Warned Interruption Events
AIR DG3 Properties Affected 2015/16 2016/17 2017/18
Table 2: Line 9 More than 3 hours 33,929 35,484 38,225 Table 2: Line 10 More than 6 hours 13,767 13,247 14,809 Table 2: Line 11 More than 12 hours 0 0 0 Table 2: Line 12 More than 24 hours 0 0 0
The table above relates to annual numbers of properties affected by planned and warned interruption events.
This year’s increases in the overall numbers of properties affected by NI Water cannot be attributed to the ongoing Water Mains Rehabilitation Programme, as the table below indicates the WMRP has had a continuous decrease in properties interrupted for more than 3 and 6 hours. This is due to continuous improvement in planning, control and reporting of the WMRP to minimise interruption to our customers’ water supply.

Annual Information Return 2018 Section 2 Chapter 2 Page 11 of 34
Properties Affected by Planned and Warned Interruption Events Attributed to WMRP Time Band 2015/16 2016/17 2017/18
More than 3 hours Properties 23,663 20,828 14,863
Events 188 332 168 Properties per Event 126 63 88
More than 6 hours Properties 11,136 10,119 7,076
Events 106 202 81 Properties per Event 105 50 87
The table above relates to planned and warned interruptions associated with the Water Mains Rehabilitation Programme.
This year’s increase in the number of properties affected per event for planned and warned interruptions lasting more than 3 hours and more than 6 hours is related to interruptions associated with the completion of work packages under the old Water Main Rehabilitation Framework (WMRF) in densely populated urban areas.
For the third year in succession, no properties experienced a planned and warned interruption lasting more than 12 hours. Whenever possible, NI Water tries to avoid planned and warned interruptions exceeding 12 hours.
No properties have been affected by a planned and warned interruption lasting more than 24 hours since the Company began making regulatory returns in 2007/08.
Interruptions caused by Third Parties
AIR DG3 Properties Affected 2015/16 2016/17 2017/18
Table 2: Line 13 More than 3 hours 4,739 12,691 4,078 Table 2: Line 14 More than 6 hours 476 842 1,145 Table 2: Line 15 More than 12 hours 0 30 193 Table 2: Line 16 More than 24 hours 0 0 0
Last year, NI Water reported a sharp rise in the number of properties affected by an unplanned interruption caused by a third party lasting more than 3 hours. The rise was consistent with an increase in the number of events informing this measure, 42 in 2016/17 compared to 25 in 2014/15 and 34 in 2015/16.
This year’s outturn of 4,078 is similar to the 2015/16 outturn of 4,739. The outturn number of 30 events is also similar.
Two events in the year involved more than 500 properties, accounting for 1,205 properties (29.5%) of the outturn. The most significant event occurred on 20 July 2017 when a gas contractor damaged a main in Portadown. 666 properties in Ballyoran DMA were affected by the incident.
The AIR18 outturn for properties affected by an unplanned interruption lasting more than 6 hours caused by a third party was 1,145 properties, 303 properties (36%) higher than the AIR17 outturn. The associated number of events was 6 in 2017/18 compared to 11 in 2015/16 and 6 in 2016/17. The most significant event occurred in March 18 when a building contractor damaged a main in Ballyclare. 477 properties were affected by the incident.

Annual Information Return 2018 Section 2 Chapter 2 Page 12 of 34
In 2017/18, 193 properties experienced an unplanned interruption lasting more than 12 hours caused by a third party compared to 30 in 2016/17 and 0 in 2015/16. This year’s outturn was related to a burst HPPE trunk main at on 10th August. The incident was the subject of Upward Report 018.
For the seventh year in succession, no properties experienced an unplanned interruption lasting more than 24 hours caused by a third party.

Annual Information Return 2018
Unplanned Interruptions (Overruns of Planned Interruptions)
AIR DG3 Properties 2015/16 2016/17 Affected Table 2: Line 17 More than 6 hours 1 141 1 611 Table 2: Line 18 More than 12 hours 159 417 Table 2: Line 19 More than 24 hours 140 0
Section 2 Chapter 2 Page 13 of 34
2017/18
1,630 1,107
0
This year, the outturn number of properties affected by an overrun of a planned and warned interruption lasting more than 6 hours (1,630) was similar to the 2016/17 outturn of 1,611. However, there was a decrease in the number of interruption events informing this measure, 18 in 2016/17 compared to 11 in 2017/18.
Of the 11 events, the most significant involved an overrun of planned and warned mains rehabilitation work to a 315mm trunk main in Antrim in December 2017. The work was planned to take place during an eleven-hour period from 20:00 to 07:00 to minimise disruption but the supply was not restored until 09:45. The work was carried out during a period of wintery weather. A total of 1,104 properties experienced the overrun.
2015/16 2016/17 2017/18
Planned Planned Planned Planned Planned Planned Which % Which % Which % >6hrs Overran >6hrs Overran >6hrs Overran
Events 141 12 8.51 238 18 7.14 390 11 2.82
Properties 14,908 1,141 7.65 14,858 1,611 10.84 16,439 1,630 9.92
The table above provides a summary of the outturn numbers of planned and warned interruption events in the last 3 years, including those that overran and the corresponding numbers of affected properties. The change in outturns reflects a decrease in the percentage of events that overran although the overall number of properties affected by an overrun has remained the same.
In 2017 /18, 1,107 properties experienced an overrun of a planned and warned interruption lasting more than 12 hours. Three events were responsible although two of the events involved only one and two properties respectively. As described above, the remaining event related to an overrun of planned and warned mains rehabilitation work to a 315mm trunk main in Antrim in December 2017. A total of 1,104 properties experienced the overrun.
For the second year in succession, no properties experienced an overrun of a planned and warned interruption lasting more than 24 hours.

Annual Information Return 2018 Section 2 Chapter 2 Page 14 of 34
Additional information on performance against alternative standards
NI Water has three Key Performance Indicators relating to Supply Interruptions (DG3):-
Number of properties experiencing unplanned, unwarned interruptions (expressed as a percentage of households) in excess of: 1a) 6 hours, 1b) 12 hours, 1c) 24 hours. KPIs 1a and 1c were first introduced in April 2007.
The following table provides details of the outturns for the last three years together with the corresponding yearend targets.
Interrupt Category
15/16 Outturn
15/16 KPI Target
16/17 Outturn
16/17 KPI Target
17/18 Outturn
17/18 KPI Target
(Props) (%) (Props) (%) (Props) (%) (Props) (%) (Props) (%) (Props) (%) >6 hrs 8,699 1.04 7,223 0.860 5,128 0.602 7,148 0.839 6,097 0.706 7,073 0.820 >12 hrs 841 0.10 1,500 0.179 494 0.058 1,450 0.170 861 0.100 1,400 0.162 >24 hrs 32 0.004 80 0.010 0 0.000 80 0.009 0 0.000 80 0.009
Note 1: Percentage outturns are based on total connected properties as follows: 839,710 (AIR16); 852,399 (AIR17); 862,988 (AIR18)
The outturns for properties affected by unplanned, unwarned interruptions confirm that NI Water has achieved all three DG3 KPI targets, despite some very challenging circumstances during the 2017/18 reporting year. In August 2017, heavy rainfall in the North West of the province caused the River Faughan to overflow its banks. A number of NI Water sites were flooded and there was significant damage to infrastructure. Bridges collapsed and roads and water mains were washed away. This winter, heavy snowfall and cold temperatures in various parts of Northern Ireland caused an increased number of burst mains. The >6hr outturn of 0.706% (6,097 properties) was 0.113% (976 properties) within the full year target. The >12hr outturn of 0.100% (861 properties) was 0.062% (539 properties) within the full year target. No properties experienced an unplanned interruption lasting more than 24 hours.
In 2016/17, NI Water also achieved all three DG3 KPI targets.
In 2015/16, the DG3 >6hr KPI target was missed. There were a number of contributory factors including a trunk main burst in November which was difficult to locate and repair due to poor weather conditions and health and safety considerations. In January, there were a number of difficult repairs in rural areas with no options to rezone.

Annual Information Return 2018 Section 2 Chapter 2 Page 15 of 34
Properties which suffered an interruption to supply where NI Water considers that customers would not have noticed the loss of service, for example because it occurred at night
Assumption: For the purposes of reporting on this requirement of the commentary, NI Water has considered only those interruptions lasting longer than 3 hours and has assumed that ‘night’ falls between the hours of 12 midnight and 7am.
The following table provides a summary of those interruption records in 2017/18 whose Interruption Start Date/Time and Supply Restored Date/Time fell within the hours of 12 midnight and 7am.
Interrupt Type
Interrupt No.
Interruption Start Supply Restored Duration
Properties Affected
Date Time Date Time >0hrs
>3hrs
>6hrs
1 Unplanned Event 231753; DG3 169992 25/10/17 00:05 25/10/17 03:45 3 Hrs 40 Mins 5 5 0
2 Unplanned Event 180655; DG3 139148 05/07/17 01:00 05/07/17 05:00 4 Hrs 0 Mins 32 32 0
3 Unplanned Event 231133; DG3 169526 24/08/17 01:55 24/08/17 06:30 4 Hrs 35 Mins 169 169 0
4 Planned CAD005 06/10/17 01:00 06/10/17 04:45 3 Hrs 45 Mins 11 11 0
5 Unplanned Event 233392; DG3 171263 10/03/18 00:30 10/03/18 04:15 3 Hrs 45 Mins 52 52 0
Both Customer Field Services and the Leakage function are responsible for interruptions to supply that are of a relatively short duration. Interruptions lasting less than 1 hour are not, as a rule, recorded by NI Water. Routine step tests are carried out at night to reduce the impact of loss of supply to customers and normally last no longer than 3 hours.
4 unplanned interruption records and 1 planned and warned interruption record have been identified where customers would not have noticed the loss of service because it occurred at night. All 5 of the interruptions lasted 6 hours or less. The number of properties affected by unplanned interruptions was 258 representing 0.24% of the total number of properties that experienced an unplanned interruption lasting more than 3 hours in 2017/18. The number of properties affected by planned and warned interruptions was 11 representing 0.03% of the total number of properties that experienced a planned and warned interruption lasting more than 3 hours in 2017/18.
Unplanned: (258 / 108,386) x 100 = 0.24% Planned and Warned: (11 / 38,225) x 100 = 0.03%
NI Water reported in its AIR17 commentary that there were 7 unplanned interruptions and 1 planned and warned interruptions where customers would not have noticed the loss of service because it occurred at night. The number of properties affected by unplanned interruptions was 538 representing 0.6% of the total number of properties experiencing unplanned interruptions lasting more than 3 hours in 2016/17. The number of properties affected by planned and warned interruptions was 1,925, representing 5.42% of the total number of properties experiencing planned and warned interruptions lasting more than 3 hours in 2016/17.

Annual Information Return 2018 Section 2 Chapter 2 Page 16 of 34
Number of overruns of planned and warned interruptions lasting between 3 and 6 hours
The following table provides a summary of the 5 overruns of planned and warned interruptions lasting between 3 and 6 hours in 2017/18.
Interrupt. No. Month Duration Properties Affected
Duration Of Overrun > 0 hrs > 3 hrs
1 EP024 Apr 17 3 Hrs 40 Mins 2 2 0 Hrs 40 Mins
2 Event 170221; DG3 ID 128825 May 17 3 Hrs 30 Mins 58 58 2 Hrs 15 Mins
3 Event 170258; DG3 ID 138874 May 17 3 Hrs 55 Mins 29 29 0 Hrs 20 Mins
4 CAD003 Feb 18 5 Hrs 35 Mins 102 102 0 Hrs 5 mins
5 Event 243605; DG3 ID 171441 Mar 18 5 Hrs 30 Mins 4 4 0 Hrs 30 Mins
In 2017/18, there were 5 overruns of planned and warned interruptions lasting between 3 and 6 hours. The number of properties affected by these interruptions was: 2 + 58 + 29 + 102 + 4 = 195
This number is small compared to the number of properties that experienced a planned and warned interruption of between 3 and 6 hours (23,310).
T2: L9 = 38,107; T2: L10 = 14,797; 38,107 - 14,797 = 23,310
NI Water reported in its AIR17 commentary that there were 10 overruns of planned and warned interruptions lasting between 3 and 6 hours. The number of properties affected by these overruns was 298.

Annual Information Return 2018 Section 2 Chapter 2 Page 17 of 34
Number of properties affected by interruptions caused by loss of electrical supply
Interrupt. No. Date of Incident Duration
Properties Affected Interruption Type Comments > 0
Hrs> 3Hrs
> 6Hrs
> 12Hrs
> 24Hrs
Event 159794; DG3 ID 118517 07/04/17 6 Hrs 0 Mins 18 18 0 0 0 Planned &
Warned Planned
power outage Event 159850; DG3 ID 118521 07/04/17 3 Hrs 24 Mins 14 14 0 0 0 Unplanned,
Unwarned Electricity
supply failure Event 160085; DG3 ID 118716 07/05/17 5 Hrs 17 Mins 30 30 0 0 0 Unplanned,
Unwarned Electricity
supply failure Event 160140; DG3 ID 118790 17/05/17 7 Hrs 45 Mins 38 38 38 0 0 Planned &
Warned Planned
power outage Event 180493; DG3 ID 139025 17/06/17 3 Hrs 43 Mins 473 473 0 0 0 Unplanned,
Unwarned Power outage
Event 180486; DG3 ID 139022 17/06/17 3 Hrs 15 Mins 376 376 0 0 0 Unplanned,
Unwarned Electricity
supply failure Event 200753; DG3 ID 139229 18/07/17 3 Hrs 38 Mins 93 93 0 0 0 Unplanned,
Unwarned Power outage
Event 231192; DG3 ID 169584 04/09/17 8 Hrs 0 Mins 6 6 6 0 0 Planned &
Warned Planned
power outage Event 231272; DG3 ID 169620 08/09/17 4 Hrs 50 Mins 201 201 0 0 0 Unplanned,
Unwarned Electricity
supply failure Event 231559; DG3 ID 169861 10/10/17 5 Hrs 45 Mins 14 14 0 0 0 Planned &
Warned Planned
power outage Event 231642; DG3 ID 169909 16/10/17 6 Hrs 24 Mins 3 3 3 0 0 Unplanned,
Unwarned Electricity
supply failure Event 231647; DG3 ID 169910 17/10/17 5 Hrs 0 Mins 4 4 0 0 0 Unplanned,
Unwarned Electricity
supply failure Event 231654; DG3 ID 169917 17/10/17 3 Hrs 7 Mins 333 333 0 0 0 Unplanned,
Unwarned Electricity
supply failure Event 231793; DG3 ID 170035 01/11/17 8 Hrs 23 Mins 21 21 21 0 0 Planned &
Warned Planned
power outage Event 231783; DG3 ID 170037 01/11/17 11 Hrs 5 Mins 8 8 8 0 0 Planned &
Warned Planned
power outage Event 231869; DG3 ID 170089 08/11/17 3 Hrs 50 Mins 38 38 0 0 0 Unplanned,
Unwarned Electricity
supply failure
Event 232261; DG3 ID 170385 08/12/17
4 Hrs 12 Mins 33 33 0 0 0 Unplanned, Unwarned
Planned power outage
6 Hrs 36 Mins 1 1 1 0 0 Unplanned, Unwarned
Planned power outage
Event 232924; DG3 ID 170901 04/02/18 3 Hrs 10 Mins 480 480 0 0 0 Unplanned,
Unwarned Electricity
supply failure Event 243575; DG3 ID 171417 28/03/18 5 Hrs 0 Mins 21 21 0 0 0 Planned &
Warned Planned
power outage Event 243591; DG3 ID 171431 29/03/18 5 Hrs 0 Mins 15 15 0 0 0 Planned &
Warned Planned
power outage
Event 243605; DG3 ID 171441 30/03/18 5 Hrs 30 Mins 4 4 0 0 0
Overrun of Planned &
Warned
Planned power outage

Annual Information Return 2018 Section 2 Chapter 2 Page 18 of 34
The table on the previous page provides a summary of the 9 records in 2017/18 relating to unplanned, unwarned water supply interruptions caused by electricity supply failures lasting more than 3 hours. Also included are 13 records relating to planned electricity supply outages, 11 of which resulted in planned and warned water supply interruptions and 2 of which resulted in unplanned water supply interruptions, each with durations of more than 3 hours.
No incidents were of particular significance in terms of duration and no properties experienced an interruption of more than 12 hours.
The most significant incident in terms of numbers of properties affected was when an electricity supply failure at Killaney Lower Water Pumping Station on 4th February 2018 caused 480 properties in Clogher to lose their water supply for 3 hours 10 minutes.
On 17th June 2017, 376 properties in Lurganville experienced an interruption of 3 hours 15 minutes as a result of power outages in Greater Belfast, Lisburn and Ballynahinch areas.
On 16th October 2017, the Met Office issued an Amber Warning for strong winds associated with Storm Ophelia throughout Northern Ireland. 340 properties experienced an interruption of more than 3 hours.
Percentage impact of interruptions caused by loss of electrical supply on annual outturns
>3 Hrs >6 Hrs >12 Hrs >24 HrsNumber of Properties Affected by Unplanned, Unwarned Water Supply Interruptions caused by Electricity Supply Failures
1,479 3 0 0
Number of Properties Affected by Unplanned, Unwarned Interruptions 108,386 6,097 861 0
Percentage Impact 1.36% 0.05% 0.00% 0.00%
The impact of the electricity supply failures was greatest on the >3hr outturn, accounting for 1.36% of the total number of properties affected by unplanned interruptions. The 2016/17 percentage was 3.86%.
Percentage impact of interruptions caused by loss of electrical supply on target compliance
>6 Hrs >12 Hrs >24 HrsPercentage of Connected Properties Affected by Electricity Supply Failures 0.000% 0.000% 0.000%
KPI Target 0.820% 0.162% 0.009% Percentage of Annual Target 0.000% 0.000% 0.000%
The impact of the electricity supply failures on KPI target compliance was negligible. The 2016/17 percentage was 0.881% of the >6hr annual target.

Annual Information Return 2018 Section 2 Chapter 2 Page 19 of 34
Major incidents during the report year that NI Water believes adversely affected its DG3 performance
The following table provides a summary of the 39 supply interruption incidents during 2017/18 that lasted more than 3 hours and were mentioned in the Company’s Upward Reports. For full details of these incidents, please refer to the Upward Reports.
Ref Interrupt No. Date Description of Incident Duration >0hrs >3hrs >6hrs >12hrs >24hrs Category
001 Event 159911; DG3 118582 13/04/17 Burst main, , Stewartstown 3 hrs 50 mins 68 68 0 0 0 3
002 Event 159902; DG3 118568 12/04/17 Burst main, , Cookstown 5 hrs 30 mins 162 162 0 0 0 3
003 Event 159934; DG3 118593 19/04/17 Burst main, , Enniskillen 5 hrs 10 mins 175 175 0 0 0 3
004 Event 159954; DG3 118614 19/04/17 Replacement fitting,
Dungiven 4 hrs 5 mins 97 97 0 0 0 3
005 Event 160013; DG3 118663 28/04/17 Burst main, , Irvinestown
15 hrs 35 mins 18 18 18 18 0 3 11 hrs 20 mins 243 243 243 0 0
4 hrs 35 mins 1,021 1,021 0 0 0
006 Event 160074; DG3 118709 05/05/17 Burst main, , Cookstown 4 hrs 29 mins 68 68 0 0 0 3
007 Event 160099; DG3 118725 08/05/17 Burst main, Armoy 4 hrs 53 mins 457 457 0 0 0 3
008 Event 160112; DG3 118735 09/05/17 Burst main, Cookstown 3 hrs 20 mins 100 100 0 0 0 3
009 Event 160135; DG3 118756 11/05/17 Burst main due to vandalism,
Cookstown 3 hrs 35 mins 30 30 0 0 0 3
010 Event 170194; DG3 128801 19/05/17 Burst main, , Feeny Max.
13 hrs 15 mins 460 452 452 25 0 3
011 Event 170279; DG3 138869 27/05/17 Water supply failure, ,
Hillsborough
Max. 11 hrs 45 mins 1,675 1,625 153 0 0
3 Event 180379; DG3 138942
Max. 9 hrs 20 mins 1,260 875 213 0 0


Annual Information Return 2018 Section 2 Chapter 2 Page 22 of 34
Ref Interrupt No. Date Description of Incident Duration >0hrs >3hrs >6hrs >12hrs >24hrs Category
032 Event 232094; DG3 170258 27/11/17 Burst main, Ballymoney 5 hrs 41 mins 2,224 2,224 0 0 0 3
033 Event 232377; DG3 170477 16/12/17 Burst main, Enniskillen 8 hrs 12 mins 333 333 333 0 0 Precautionary
034 Event 232468; DG3 170558 27/12/18 Burst main, d,
Poyntzpass 4 hrs 13 mins 20 20 0 0 0 3
035 Event 233021; DG3 170984 08/02/18 Burst main, Armagh 5 hrs 55 mins 90 90 0 0 0 3
036 Event 233012; DG3 170975 10/02/18 Burst main, Newcastle 5 hrs 57 mins 360 360 0 0 0 Precautionary
037 Event 233070; DG3 171028 15/02/18 Burst main, Antrim 8 hrs 31 mins 118 118 118 0 0 3 6 hrs 45 mins 181 181 181 0 0
038 Event 233176; DG3 171096 26/02/18 Burst main, , Belfast 3 hrs 50 mins 1,736 1,736 0 0 0 3
039 Various 28/02 to 09/03/18 Cold Weather Event Various 10,431 10,431 76 3 0
In previous years, NI Water assumed a monthly target allowance of one seventeenth of the full year target from April to October and a monthly target allowance of two seventeenths of the full year target from November to March. The allowance was doubled from November to March to account for freeze-thaw conditions and an associated rise in the numbers of bursts. Following a review of recent annual performance profiles, the decision was taken in 2017/18 to opt for a straight-line target profile i.e. the same monthly target allowance every month.

Annual Information Return 2017 Section 2 Chapter 2 Page 23 of 34
The 2017/18 KPI targets are listed below as percentages and numbers of total connected properties, together with the corresponding monthly target allowances.
KPI 2017/18 Target Monthly Target Allowance Apr to Mar
% Properties % Properties >6hrs 0.820 7,073 0.068 589 >12hrs 0.162 1,400 0.014 117 >24hrs 0.009 80 0.001 7
In order to determine the unplanned interruption events that had the greatest negative impact on performance in 2017/18, the Company compared the monthly actuals with the three KPI target profiles and identified 3 instances where a target was exceeded (including and excluding the severe flooding event of August 2017). These instances are highlighted in bold text in the table below.
May Aug (inc. flooding event)
Aug (exc. flooding event)
>6 hour Actual 1,274 2,125 671 Target 589 589 589
>12 hour Actual 100 740 69 Target 117 117 117
>24 hour Actual 0 0 0 Target 7 7 7
The Company then reviewed its DG3 Register and identified the incidents responsible for the underperformance. The incidents are summarised below.
Major Incidents In May 2017, the >6hr in-month actual was 1,274 properties compared to an in-month target of 589. Although the overall number of unplanned interruption events exceeding 6 hours was not particularly high (10 in total), 5 of the events occurred outside normal working hours and accounted for the majority of properties affected.
Of the 10 events that accounted for May’s underperformance, the 2 events described below were the most significant.
Burst main, , Feeny (Ref: IMS Event ID 170194; DG3 ID 128801) The first incident related to a burst trunk main at , Feeny on 18th May. The event occurred at 22:30 and although rezoning was possible, it was 12:15 the following day before all properties had their supplies restored. As a result of this incident, 427 properties in Fincairn, Claudy and Trunk Caugh Hill Ardinarive DMAs experienced an unplanned interruption of more than 6 hours and a further 25 properties experienced an unplanned interruption of more than 12 hours. This incident was the subject of Upward Report 010.
The impact of this incident in terms of percentages of connected properties affected was 0.052% >6hrs and 0.003% >12hrs.

Annual Information Return 2017
Two non-concurrent bursts on 12" main, ad, Hillsborough
Section 2 Chapter 2 Page 24 of 34
(Refs: IMS Event ID 170279; DG3 ID 138869 and IMS Event ID 180379; DG3 ID 138942) The second incident involved two non-concurrent bursts on a 12" main - in Hillsborough on Saturday 27th May. Notification of the first burst was received at05:22 in the morning and the road had to be closed to enable the burst to be located. Therepairs were extensive and prolonged. Some properties affected by the second burst did not have their supplies restored until 02:00 on Sunday 28th. As a result of this incident, 366 properties in Legacurry OMA experienced an unplanned interruption of more than 6 hours. This incident was the subject of Upward Report 011.
The impact of this incident in terms of percentages of connected properties affected was 0.042% >6hrs.
In August 2017, the >6hr in-month actual was 2,125 properties compared to an in-month target of 589. The >12hr in-month actual was 740 compared to an in-month target of 117.
August 2017 - Category 2 Major Incident - Severe Weather & Flooding in North West of Northern Ireland According to the Met Office, 'August 2017 was a rather wet month in the west of the province, with 128% of average rainfall overall. On 22nd, it turned very wet in the afternoon with heavy rain and thunderstorms producing a total of 61.6 mm at Lough Fea (County Londonderry).'
On 22nd August, torrential rainfall, coupled with extended thunder and lightning storms, led to flash flooding and power outages across large parts of Northern Ireland. The North West of the province bore the worst of the weather with Londonderry, Omagh and Magherafelt Field Manager areas all experiencing interruptions relating to the incident.
The River Faughan overflowed its banks causing major damage to infrastructure. Bridges, roads and water mains were washed away and some NI Water sites were flooded. NI Water worked quickly to restore supplies to customers by rezoning affected areas and by laying 'overland pipes'. Alternative water supplies (bottled water) was delivered to Critical Care Customers and to the two Council Incident Centres in Eglinton and Drumahoe.
Many WTW's were initially affected by the storms but the power was quickly restored. Flooding caused extensive damage to Faughan Raw Water Pumping Station (RWPS), which is the sole source of raw water to Carmoney WTW outside Eglinton village. As emergency repairs were undertaken to the RWPS, the raw water quality was poor and would have presented a serious challenge to the treatment process. Contingency plans were activated to supplement supplies from Caugh Hill and Ballinrees. An old landfill site at Mobuoy, adjacent to the River Faughan, was also flooded. NI Water and NIEA increased raw water monitoring to check for any risk of contamination.
This incident was the subject of Upward Report 021.

Annual Information Return 2017 Section 2 Chapter 2 Page 25 of 34
The following table provides a summary of the individual interruptions that occurred and the associated numbers of properties affected by the severe flooding incident.
Event ID DG3 ID FM Area Duration >0hrs >3hrs >6hrs >12hrs >24hrs231113 169505 Omagh 5 Hrs 2 Mins 113 113 0 0 0
231121 169508 Omagh 11 Hrs 53 Mins 18 18 18 0 0 3 Hrs 48 Mins 60 60 0 0 0
231117 169509 Omagh 4 Hrs 41 Mins 65 65 0 0 0 231124 169510 Omagh 3 Hrs 52 Mins 168 168 0 0 0 231119 169513 Omagh 4 Hrs 10 Mins 81 81 0 0 0
231116 169516 Omagh 12 Hrs 57 Mins 26 26 26 26 0 10 Hrs 19 Mins 25 25 25 0 0 3 Hrs 41 Mins 447 447 0 0 0
231128 169521 Omagh 4 Hrs 54 Mins 170 170 0 0 0 231165 169544 Magherafelt 10 Hrs 36 Mins 16 16 16 0 0 231402 169707 Londonderry 1 Hr 58 Mins 282 0 0 0 0 231403 169708 Londonderry 10 Hrs 56 Mins 186 186 186 0 0 231405 169709 Londonderry 4 Hrs 55 Mins 105 105 0 0 0
231408 169711 Londonderry 14 Hrs 11 Mins 272 272 272 272 0 11 Hrs 10 Mins 206 206 206 0 0 5 Hrs 50 Mins 152 152 0 0 0
231409 169712 Londonderry 5 Hrs 19 Mins 248 248 0 0 0 231461 169759 Londonderry 13 Hrs 11 Mins 373 373 373 373 0 231487 169777 Londonderry 3 Hrs 38 Mins 387 387 0 0 0
231488 169778 Londonderry 8 Hrs 27 Mins 332 332 332 0 0
231490 169780 Londonderry 3 Hrs 28 Mins 123 123 0 0 0 231494 169783 Londonderry 5 Hrs 51 Mins 117 117 0 0 0
3,972 3,690 1,454 671 0
The impact of this incident in terms of percentages of connected properties affected was 0.168% >6hrs and 0.078% >12hrs.
With the impact of the severe flooding event excluded, the percentages would have been 0.078% >6hrs and 0.008% >12hrs and >6hrs performance would still have been outside the in-month target forecast of 0.068%.
August’s underperformance was also attributed to a separate incident involving a burst main. The incident is described below.
Burst main, Claudy (Ref: IMS Event ID 210970; DG3 ID 149406) The incident related to a burst main at , Claudy on 10th August. The burst was difficult to locate and two 9-metre lengths of asbestos cement pipe had to be replaced. As a result of this incident, 357 properties experienced an unplanned interruption of more than 6 hours and a further 69 properties experienced an unplanned interruption of more than 12 hours.
The impact of this incident in terms of percentages of connected properties affected was 0.049% >6hrs and 0.008% >12hrs.

Annual Information Return 2017 Section 2 Chapter 2 Page 26 of 34
Although NI Water does not have a KPI target relating to unplanned interruptions lasting more than 3 hours, it is apparent from the 2017/18 outturn that the severe winter weather of March 2018 had a significant impact on performance relating specifically to the >3hrs time band.
28th February to 9th March 2018 – Major Incident – Cold Weather Event According to the Met Office, ‘March 2018 began with an exceptionally cold easterly flow and widespread snow showers, and daytime temperatures failed to reach freezing in some places. It was bitterly cold and very windy on the 1st, with an overnight minimum of -7.0 °C at Trassey Slievenaman (County Down), and a maximum of only -1.0 °C at Killylane (County Antrim). Trassey Slievenaman recorded 30 cm of lying snow on the 3rd and 4th. The mean temperature for March was provisionally 1.9 °C below the long-term average.’
Max. Temp. °C Min. Temp. °C Mean. Temp. °C Days Air Frost Mar 18 7.3 0.6 3.9 11 Mar 17 11 3.5 7.2 4.5 Mar 16 9.7 2.4 6 4.3
During the period 28th February to 9th March 2018, Northern Ireland experienced a prolonged period of cold weather. Initially, there was widespread snow, particularly on high ground with temperatures not rising too much above freezing during the day. From 2nd to 9th March, there was a significant increase in the numbers of interruptions caused by burst mains as the impact of the thaw took hold. The following table shows the figures for February and March.
Properties Affected by Unplanned Interruptions for More than 3 hours
Cause of Interruption 1st to 27th Feb 28th Feb 1st Mar 2nd Mar 3rd to
9th Mar 10th to
31st Mar Airlock in Main 36 0 0 0 439 0 Broken/Jammed/Misaligned Fitting 0 0 0 0 38 0 Bursts Main/Main Repair 13,640 95 95 151 8,686 4,705 Electricity Supply Failure 480 0 0 0 0 0 Low SR 0 0 0 15 0 0 New Mains Tie In 198 0 0 0 0 0 Other 686 0 0 265 826 764 PRV Maintenance 0 0 0 0 0 2,127 Pump Equipment Failure 0 0 0 0 21 287 Replacement Fitting 101 0 0 0 38 53 Service Pipe Repair 15 0 0 0 0 0 Water Supply Failure 0 0 0 0 0 32 TOTAL 15,156 95 95 431 10,010 7,968 2016/17 TOTALS 4,572 6,741

Annual Information Return 2017 Section 2 Chapter 2 Page 27 of 34
Unplanned Interruption Events lasting More than 3 hours
Cause of Interruption 1st to 27th Feb 28th Feb 1st Mar 2nd Mar 3rd to
9th Mar 10th to
31st Mar Airlock in Main 1 0 0 0 1 0 Broken/Jammed/Misaligned Fitting 0 0 0 0 1 0 Bursts Main/Main Repair 56 2 2 4 31 44 Electricity Supply Failure 1 0 0 0 0 0 Low SR 0 0 0 1 0 0 New Mains Tie In 1 0 0 0 0 0 Other 5 0 0 1 3 2 PRV Maintenance 0 0 0 0 0 1 Pump Equipment Failure 0 0 0 0 1 1 Replacement Fitting 2 0 0 0 0 3 Service Pipe Repair 1 0 0 0 0 0 Water Supply Failure 0 0 0 0 0 1 TOTAL 68 2 2 6 37 52 2016/17 TOTALS 55 48
Only 76 properties experienced an interruption of more than 6 hours during this time.
Only 3 properties experienced an interruption of more than 12 hours during this time.
This incident was the subject of Upward Report 039.
Justification of the assigned confidence grades including an explanation for any changes in confidence grades from previous years The AIR09 Reporter recommended the use of consistent confidence grades across all lines relating to DG3. In 2015/16, NI Water increased its DG3 confidence grade from ‘B3’ to ‘A3’ because it was the first full year in which the Incident Management System (IMS) had been used by the Company in place of the Operations Management Information System (OMIS) to capture data relating to supply interruptions. The new system has now captured three complete years’ worth of data and again, the decision has been taken to assign a confidence grade of ‘A3’ across all lines relating to DG3.
In September 2016, the Company tested and implemented an updated version of IMS, the first major update of the system since its launch on 4 July 2014. The modifications improved the usability and functionality of the system and enabled more time to be spent on improving the accuracy of the information. In 2017/18, the system underwent a further series of upgrades.
Justification of Reliability Band ‘A’ IMS is regarded as a better system than OMIS and has the following benefits:
Improved customer response times Improved consistency of methodology across all work streams Improved accuracy of information through:
o the recording of start times by Work Controllers/Telemetry Operatorso the recording of individual start and restoration times for each property as
opposed to each evento the recording of times to the nearest minute
Improved utilisation of other key systems e.g. the GIS as a source of address information Improved auditability of information through query, change and approval status tracking

Annual Information Return 2017 Section 2 Chapter 2 Page 28 of 34
Better management of approval chains through the automatic generation of e-mailedreminders
Improved report generation Improved accessibility and sharing of information across the business Enhanced effectiveness of the DG3 Register through the capture of additional
information such as pipe material and diameter and the GIS co-ordinates of bursts
IMS is working exactly as it should by ensuring the capture of a greater number of interruption events and a greater number of affected properties associated with those events. All interruption events are fully documented to a consistent standard. Every interruption record includes the category, cause, key dates and times, address details, and property counts necessary to meet the regulatory reporting requirements of a DG3 Register. The cause of interruptions is identified by experienced field staff or contractors.
Justification of Accuracy Band ‘3’ The ‘no water’ complaints are an invaluable, independent source of information that when compared with the numbers of properties affected by unplanned, unwarned interruptions, can be used to validate and verify associated annual trends.
A relationship exists between the number of properties affected by a supply interruption event and the number of ‘no water’ complaints received, with more affected properties than complaints because not everyone complains. In 2015, the Company looked at a sample of 23 unplanned interruption events that had lasted more than 6 hours and found that although the ratio of ‘no water’ complaints to affected properties varied for each event, 10% of customers on average tended to complain.
The following table lists the outturn numbers of ‘no water’ complaints for the last four years, together with the numbers of properties affected by unplanned interruptions lasting more than 3 hours, including those caused by a third party.
2013/14 2015/16 2016/17 2017/18 ‘No Water’ Complaints 28,128 21,775 22,066 21,711 Properties Affected 43,864 109,974 102,785 108,774 Complaint Percentage 64.1% 19.8% 21.5% 20.0%
When the call data and OMIS data for 2013/14 is compared, i.e. 28,128 complaints versus 43,864 properties affected by unplanned interruptions lasting more than 3 hours, including those caused by a third party, the complaint percentage is 64%. This percentage is much higher than the percentage derived from the sample and points to a shortfall in the number of properties affected and hence, an inaccuracy in the OMIS data.
When the call data and IMS data for 2015/16 and 2016/17 is compared, the complaint percentages are 20% and 21% respectively. These percentages are more consistent with the percentage derived from the sample but are higher because interruption events with a duration of 3 hours or less are excluded. The analysis proves that the IMS data is more accurate than the OMIS data.
When the call data and IMS data for 2017/18 is compared, i.e. 21,711 complaints versus 108,774 properties, the complaint percentage is 20%. This percentage is similar to the 2015/16 and 2016/17 percentages and confirms that the accuracy of the IMS data is consistent.

Annual Information Return 2017 Section 2 Chapter 2 Page 29 of 34
The conclusion is that the accuracy of the data has improved with the introduction of IMS and that the outturns are now more reflective of the actual numbers of properties affected by unplanned interruptions lasting more than 3 hours.
Audit Checks NI Water carries out a number of audit checks aimed at ensuring that the data in its Annual Information Return is both reliable and accurate and that the confidence grade is justified. The audit checks ensure that affected properties have been reported under the correct category of interruption and that reporting is in accordance with the regulatory guidance and definitions.
During the year, Networks Water generated a total of 1,217 records of interruptions lasting more than 3 hours (some relating to the same events). All records were checked for accuracy and completeness by the Customer Field Managers. Following the extraction of data to spreadsheets, checks were carried out by CSD Services to ensure that the data remained consistent with IMS and that no records had been inadvertently deleted or duplicated during migration between worksheets.
During the year, Capital Asset Delivery generated a total of 186 records of interruptions lasting more than 3 hours compared to 362 records in 2016/17. A random sample of 48 records, averaging 4 per month, was checked against the corresponding Interruption Record Sheets to ensure that the details had been accurately transcribed. This represents 26% of records.
Throughout 2017/18, the Company has continued to review its records of ‘no water’ complaints when determining the details of supply interruptions. And the Company has carried out checks to ensure consistency between IMS and the Upward Reporting process relating to unplanned interruption events lasting more than 3 hours.
AIR17 Reporter Recommendation Following AIR17, the Reporter made the following recommendation in relation to DG3:
We recommend the Company continues to monitor the warning notification process by its contractors for planned and warned interruptions. Throughout 2017/18, NI Water continued to carry out sample checks to confirm that its Mains Rehab contractors were providing customers with at least 48 hours warning in advance of planned and warned interruptions to supply.
The Company also undertook an additional audit process which involved a review of a random sample of Loss of Supply (LoS) notices, generated by Water Distribution contractors and returned to NI Water by Royal Mail.
During 2017/18, a random sample of 700 LoS notices were reviewed. In the majority of cases, the difference between the date of non-delivery (as confirmed by Royal Mail) and the planned start date on the associated LoS notice was at least 2 days. Where the difference was less than 2 days, in all but two cases there was evidence that other properties associated with the same interruption had received sufficient warning and the non-delivery date may not therefore have represented the first attempt by Royal Mail to deliver the LoS notice. Of the two remaining cases, the properties were demolished according to the Company’s metering and billing system and would not have had an associatedurs.


Annual Information Return 2017 Section 2 Chapter 2 Page 31 of 34
The estimated number of non-resident visitor nights in 2017 =
(9,197,080 / 77.67) x 100 = 11,841,100
The above estimate has been used in place of an accurate alternative.
Assumption: The regulatory guidance for AIR Table 2 Line 20 does not define the meaning of ‘winter’. For the purposes of this calculation, the winter months are deemed to be the six months in the year with the lowest percentage bed-spaces sold i.e. January, February, March, April, November and December. The percentage bed-spaces sold during the winter is the summation of the percentages for these six months.
Based on the table of percentages of bed-spaces sold per month in 2017, the percentage of bed spaces sold during the winter was
6.06 + 6.40 + 6.97 + 8.38 + 6.94 + 6.97 = 41.71%
Assumption: There is a direct relationship between bed-spaces sold and non-resident visitor nights.
The estimated number of non-resident winter visitor nights in 2017 =
(11,841,100 / 100) x 41.71 = 4,939,035
According to AIR18: Table 7: Line 17, the baseline resident population was 1,869.17 x 103.
Using the baseline resident population and the estimated number of non-resident winter visitor nights above, the winter population was estimated as follows:
Estimated average non-resident winter visitors per night = 4,939,035 / (31 + 28 + 31 + 30 + 30 + 31) = 27,287
Population (winter) = 1,869,170 + 27,287 = 1,896,457.
Changes in Methodology In order to calculate the winter population, the annual number of visitor nights is required for the year in question. NI Water normally bases the calculation of winter population on a calendar year because of known delays in the publication of tourism statistics and the non-availability of data for Q4 of the financial year around the time that AIR is completed.
The AIR18 calculation was due to have been based on the 2017 calendar year. However, according to NISRA’s publication schedule, the 2017 NI Annual Tourism Statistics Report was not due to be published until 7th June 2018 (at the latest) and the only available information at the time of completing AIR was the number of visitor nights in Q1 to Q3.
When this issue has arisen in the past, an alternative methodology has been used involving the assumption that there is a direct relationship between the occupancy of hotels and guesthouses/B&Bs and visitor nights. As the number of bed spaces sold was available for all twelve months of 2017, then knowing the percentage of total bed spaces sold in Q4 of 2017, the number of visitor nights in Q1 to Q3 was factored up accordingly.

Annual Information Return 2017 Section 2 Chapter 2 Page 32 of 34
Significant year on year changes in reported figures including an explanation of any factors that may have influenced the figures
AIR16 Confidence Grade AIR17 Confidence
Grade AIR18 Confidence Grade
1,874.73 x 103 C2 1,887.10 x 103 C2 1,896.46 x 103 C2
Last year, the Company reported a Table 2 Line 20 outturn of 1,887.10 x 103. The Company also recalculated the AIR16 outturn as 1,865.06 x 103 using updated data for the entire twelve-month period of 2016.
Based on the AIR17 outturn, the estimated winter population has increased by 9.36 x 10³ (0.50%). This slight increase can be attributed to changes in the component figures that make up this figure.
The estimated number of hotel bed-spaces sold in 2017 (3,607,593) was higher than the estimate for 2016 (3,470,444). The estimated number of guesthouse and B&B bedspaces sold in 2017 (741,889) was higher than the revised estimate for 2016 (669,819). And the estimated number of non-resident visitor nights in 2017 (11,841,100) was higher than the estimate for 2016 (11,365,623).
Despite the absence of information relating to Q4 of 2017, a comparison of the Q1 to Q3 statistics for 2016 and 2017 reveals an increase in tourism and hence, an increase in winter population.
Visitor Nights (2016 - Q1 to Q3)
Visitor Nights (2017 - Q1 to Q3)
GB Visitors 4,339,966 4,343,852 RoI Visitors 642,814 771,425 Visitors from outside UK & RoI 3,558,930 4,081,803 All Visitors (excluding NI) 8,541,710 9,197,080
The statistics show that external visitors are on average staying longer, leading to an increase in overall visitor nights in the first nine months of 2017. The increase has been driven largely by increases in visitors from Republic of Ireland and overseas.
Confidence Grade Population (winter) is an estimate based on several sources of information:
1. The NISRA publications ‘Hotel-excel-dec’ and ‘GH-BB-excel-dec’ provide only anestimate of the monthly numbers of bed-spaces sold, based on the extrapolation of datafor a representative sample group of establishments.
2. The NISRA publication ‘Microdata for online Q1 2011 to Q3 2017’ provides only anestimate of the quarterly numbers of non-resident visitor nights, based on samplesurveys. The estimate therefore has an associated degree of sampling error, determinedboth by the sample design and by the sample size. Sample surveys include the NorthernIreland Passenger Survey (NIPS) conducted by the Northern Ireland Statistics andResearch Agency (NISRA), the Survey of Overseas Travellers (SOT) conducted onbehalf of Fáilte Ireland and the Household Travel Survey (HTS) conducted by CentralStatistics Office (CSO).

Annual Information Return 2017 Section 2 Chapter 2 Page 33 of 34
NI Water has assigned a confidence grade of C2 to account for known deficiencies in the reliability and accuracy of the reported figure. Although there have been changes in the methodology, data confidence is still believed to be comparable to previous years.
The “2” has been assigned because even if all visits occurred in the winter, the difference in the calculated winter population would only be 38,133 (+2.01%). (See calculation below)
11,841,100 / (31 + 28 + 31 + 30 + 30 + 31) = 65,420 non-resident visitors 1,869,170 + 65,420 = 1,934,590 residents + non-resident visitors 1,934,590 - 1,896,457 = 38,133 (38,133 / 1,896,457) x 100 = 2.01%
Lines 21-23 - DG4 Restrictions on use of water Hosepipe restrictions are defined as applying to those area(s) where legal notification has been published restricting the use of hand held hosepipes. This will normally be via notifications in the press that the use of hosepipes is banned.
Drought Orders: The population affected by Drought Orders shall include all areas where Drought Orders under Part V Chapter 1 and Schedule 5 of the Water and Sewerage Services (NI) Order 2006 have been approved by the Minister and implemented by the company.
Sprinkler/unattended hosepipe restrictions are defined as applying to those area(s) where legal notification has been published restricting the use of sprinklers/unattended hosepipes. This will normally be via notifications in the press that the use of sprinklers/unattended hosepipes is banned.
Outturns and Confidence Grades There were no hosepipe restrictions, drought orders or sprinkler/unattended hosepipe restrictions in 2017/18 and therefore, the percentage population experiencing DG4 Restrictions on Use of Water is 0.0% for Lines 21, 22 and 23.
Therefore, no timetables for hosepipe restrictions have been prepared and the recording template has a Nil return.
The reliability assessments of “A” are based on the established procedures for the making of any order to prohibit or restrict the use of water. The accuracy assessments of “1” are a reflection that no orders were made during the reporting year.
Future Reporting Northern Ireland Water has now developed a series of revised DG4 procedures which clarifies the reporting requirements and definitions and the responsibilities of those involved in the reporting process. The following documents outline in more detail the monitoring and recording processes that are now applied:
1. NIW – DG4 Procedures May 20182. Drought Order Process Guidelines v.93. DG4 – Recording of Affected Populations and Durations for AIR 18.

Annual Information Return 2017
Annex A - Line Methodology for Table 2
Line 1 -Total Connected Properties at Year End
Section 2 Chapter 2 Page 34 of 34
The total number of properties (domestic and non-domestic) connected to the distribution system at the end of the 2017/2018 reporting year. This includes properties which are connected but not billed (for example, temporarily unoccupied) but excludes properties which have been permanently disconnected (for example logical demolitions).
This figure is calculated from the Rapid Property Summary for AIR18 (dated 3 p t March, 18) as attached.
RPS March YE 2018.xlsx
Total Connected properties at Year End
Extant Property Total less Domestic no water / well water Domestic sewerage only
Non-domestic no water/ well water
Non-domestic sewerage only
Non-domestic measured - not charged (test meters)
Non-domestic site meters
Non-domestic trade effluent
Non-domestic unmeasured - not charged
Invalid Classification
Total Connected Properties at Year End
AIR18
895331
9973 6
9274
19
477
14852
81
652
9
862988

NORTHERN IRELAND WATER LIMITED - ANNUAL INFORMATION RETURN
ANNUAL INFORMATION RETURN - TABLE 3 KEY OUTPUTSSEWERAGE SERVICE - INTERNAL FLOODING (TOTAL)
DESCRIPTION UNITS DP2012-13 CG 2013-14 CG 2014-15 CG 2015-16 CG 2016-17 CG 2017-18 CG 2018-19 CG 2019-20 CG 2020-21 CG
A DG5 ANNUAL FLOODING SUMMARY1 Number of domestic properties connected to sewerage system 000 1 623 3 A2 628.3 B2 630.03 A2 638.1 A2 648.6 A2 657 9 A2
(I) OVERLOADED SEWERS2 Properties flooded in the year (overloaded sewers) nr 0 189 B3 6 B2 28 B2 3 B2 3 B2 0 B23 Flooding incidents in the year (overloaded sewers) nr 0 189 B3 6 B2 29 B3 4 B2 3 B2 0 B24 Flooding incidents (overloaded sewers attributed to severe weather) nr 0 181 B3 5 B2 3 B4 1 B2 2 B2 0 B24a Properties flooded in the year attributed to severe weather nr 0 181 B3 5 B2 3 B5 1 B2 2 B2 0 B25 Props. where flooding limited to uninhabited cellars only (o/loaded sewers) nr 0 0 B3 0 B2 0 B6 0 B2 0 B2 0 B2
(ii) OTHER CAUSES6 Properties flooded in the year (other causes) nr 0 41 B3 55 B2 52 B2 38 B2 47 B2 33 B27 Properties which have flooded more than once in the last ten years (other causes) nr 0 15 B3 26 B2 8 B2 11 B2 21 B2 20 B28 Flooding incidents (other causes - equipment failures) nr 0 15 B3 14 B2 2 B2 1 B2 1 B2 0 B29 Flooding incidents (other causes - blockages) nr 0 22 B3 36 B2 38 B2 34 B2 38 B2 26 B210 Flooding incidents (other causes - collapses) nr 0 4 B3 5 B2 12 B2 3 B2 8 B2 7 B211 Props. where flooding limited to uninhabited cellars only (other causes) nr 0 0 B3 0 B2 0 B2 0 B2 0 B2 0 B2
B DG5 PROPERTIES ON THE AT RISK REGISTER(i) SUMMARY
12 2 in 10 register at end of year nr 0 30 B3 62 B2 60 B2 59 B2 61 B2 57 B213 1 in 10 register at end of year nr 0 10 B3 8 B2 8 B2 7 B2 6 B2 4 B214 Total 1 in 10 and 2 in 10 properties on the register at end of year nr 0 40 B3 70 B2 56 B2 66 B2 67 B2 61 B215 1 in 20 register at end of year nr 0 153 B3 120 B3 108 B2 94 B2 89 B2 73 B215a Potential risk of property flooding identified requiring further investigation to assess at risk category nr 0 0 B2 0 B2 0 B2 1 B2 2 B2 0 B216 Props. on the register which have not flooded in the past 10 yrs (excl. severe weather) nr 0 32 B3 33 B3 23 B2 22 B2 27 B2 26 B217 Properties which have not flooded internally but suffer restricted toilet use (RTU) nr 0 0 B2 0 B2 0 B2 0 B2 0 B2 0 B2
(iii) ANNUAL CHANGES TO 2 IN 10 & 1 IN 10 REGISTERS22 Removed by company action nr 0 1 B3 3 B2 18 B2 3 B2 3 B2 6 B223 Removed because of better information nr 0 2 B3 0 B2 0 B2 2 B2 1 B2 0 B224 Added because of better information (actually flooded) nr 0 16 B3 33 B2 0 B2 3 B2 3 B2 0 B225 Added because of better information (modelled) nr 0 0 A1 0 B2 4 B2 0 B2 2 B2 0 B226 Average capex cost of permanent solutions to 1 in 10 & 2 in 10 DG5 problems £000/prop 1 168 8 B3 233.7 B2 68 5 B2 230.0 B2 32.8 B2 184 5 B2
(v) ANNUAL CHANGES TO THE 1 IN 20 REGISTER30 Removed by company action (1 in 20) nr 0 65 B3 8 B2 10 B2 4 B2 4 B2 11 B231 Removed because of better information (1 in 20) nr 0 24 B3 45 B2 16 B2 11 B2 1 B2 5 B232 Added because of better information (actually flooded - 1 in 20) nr 0 53 B3 3 B2 25 B2 1 B2 0 B2 0 B233 Added because of better information (modelled - 1 in 20) nr 0 0 A1 17 B3 4 B2 0 B2 0 B2 0 B234 Average capex cost of permanent solutions to 1 in 20 DG5 problems £000/prop 1 45.1 B3 143.6 B2 80 9 B2 272.9 B2 38.8 B2 216 6 B2
5REPORTING
YEAR REPORTING
YEAR REPORTING
YEAR
431REPORTING
YEAR
2REPORTING
YEAR
6REPORTING
YEAR
7REPORTING
YEAR
8 9REPORTING REPORTING
YEAR YEAR

Annual Information Return 2018 Section 2 Chapter 3 Page 1 of 8
Table 3 - Key Outputs – Sewerage Service – Internal Flooding
Line 1 – Number of Domestic Properties Connected to the Sewerage System Northern Ireland Water’s (NIW) property data is provided via a data download of the property database tables held within the RapidXtra billing system. The data is then manipulated within Microsoft SQL to produce the Rapid Property Summary Report.
Our AIR18 methodology has remained consistent with previous years – using the automated tool to populate Table 3 figures (this was first introduced in AIR12 - Rapid Property Summary as the input).
The difference between the AIR17 and the AIR18 figure is 9309. The breakdown can be explained as follows;
1) New Connections during the 2017/18 reporting year2) As a result of a customer contact. i.e. septic tank empty request, no water complaint,
blocked sewer, updating of standing data e.g. removal of services etc. Within thiscategory there are 2 scenarios:
(a) The adding of properties NI Water allegedly did not know about and theadding of duplicates as the customers address could not be found onRapid. For example, Rapid may hold the site number but when thecustomer contacts NI Water they quote the verified postal address whichis different, therefore creating a duplicate
(b) Another scenario - The street name may have changed from the time ofNew Connection to that of customer contact – street names can change inthe early stages of site development
3) Removal of duplicates/properties as a result of data quality initiatives
In addition to the above, further data quality requirements have been built into the new CBC Contract. They cover all aspects of the property life cycle (creating, amending and demolishing properties) and data degradation will be monitored/measured throughout. These system validations have been split into 4 delivery phases. The functionality for Phases 1-3 have been delivered, with the functionality for the Post Phase 3 data validations due to be delivered within the next database release/upgrade in August 2018. Off-system data cleanse is required before some of the system validation rules can be applied.
Annex A details the methodology followed for the figure calculated in Table 3 Line 1.
Internal sewer flooding Objective/Aim To maintain a verifiable DG5 register with the aim to provide an auditable method for identifying the specific properties which are affected by flooding or are at risk of flooding and the cause of flooding.
Internal Flooding Process In line with the regulators instructions, an end-to-end review of the internal flooding process has been carried out. This process went live in April 2012. Wastewater Business Unit (WWBU) carries out extensive robust investigations to determine the cause of every individual internal flooding incident. Any internal flooding that does not fall into these Flooding Other Causes (FOC) categories is passed to Asset Performance for them to carry out full Hydraulic Capacity evaluations and record them under the appropriate sections of the register. The evidence gathered is brought to an expert panel (the DG5 Panel) who examine the evidence presented for each incident and govern the addition of

Annual Information Return 2018 Section 2 Chapter 3 Page 2 of 8
properties to and removal of properties from the register. All properties where actual internal flooding has occurred are recorded in the appropriate sections of the DG5 register i.e. In the Excluded section: FOC due to Blockages, Collapses, Equipment Failure orSevere Weather, or on the register in the 1:20, 1:10 or 2:10 Sections.
The register is held on an Oracle database represented on the Corporate Asset Register as GIS layer on CARtomap. Although the Internal Flooding process is now in place, the process itself continues to be refined.
Problems as yet Undiscovered A process has been established to allow problems as yet unreported to be included in the register through field managers flooding incident reports (FIR). In addition flooding incident field investigations now include concentric circle surveys to pick up unreported flooding and modeling provided by Drainage Area Plan consultant.
Assumptions For the purpose of AIR17, NIW has assumed that a single incident includes recorded complaints from the same property on the same day or within three days. ‘3 days’ was chosen on the basis that a noticeable volume of repeat calls tend to be received within three days of an incident occurring. There is then a much longer passing of time before calls are again received from the same locality, suggesting that the original incident has passed and that the calls relate to a different incident.
An incident of internal flooding is assumed to be where a property has been flooded internally. If two adjacent properties are flooded at the same time they are classed as two properties and two incidents.
Where a single property floods internally on two separate occasions then this is recorded as one property and two incidents.
Calculation Process - Lines 2 to 11,15a & 17 Data gathering and calculation is as described below.
Sources/Primary Process Lines 2 – 11, 15a & 17 Properties and flooding incidents A download of internal flooding records was obtained from the Ellipse system for the period April 2017 to March 2018 on a month by month basis. Investigations were carried out for each reported incident and those properties found not to be flooded after investigation, using information from the Sewer Maintenance Contractor, Flood Incident Report (FIR) Forms, Field Manager reports, Customer Field Manager reports, modelling provided by Drainage Area Plan consultant and contacting the Customers directly, were removed. The remaining properties were recorded as Flooding Incidents.
Sources/Secondary Process 1. Wastewater Business Unit (WWBU) carries out further investigations to determine the
cause of every internal flooding incident.2. WWBU assess the information held on customer report, Flood Incident Report (FIR),
along with photographic evidence, closure details provided by the contractor andmodelling provided by Drainage Area Plan consultant.
3. WWBU determines if the cause of the flooding incident was hydraulic incapacity orflooding other cause, i.e. Blocked Sewer, Equipment Failure, Collapsed Sewer or


Annual Information Return 2018
Annex A - Line Methodology for Table 3
Section 2 Chapter 3 Page 5 of 8
Line 1 - Number of Domestic Properties Connected to the Sewerage System The total number of domestic properties (including voids) connected to the sewerage system at the end of the reporting year (31 st March 2018).
This figure is based on the 31 st March 2018 Rapid Property Summary for AIR18, as attached.
RPS March YE 2018.xlsx
The figure is the total domestic properties (gross) connected for sewerage (including site meters, as these are not being billed)
Domestic Properties Connected to the End March 2018 Sewerage System
Total Gross Household Sewerage 657,882 Properties

Annual Information Return 2018 Section 2 Chapter 3 Page 6 of 8
Annex B – Incident Report Form Contractor
Northern Ireland Water – Flooding Incident Report
Work Order Ref No: 05471378 Name:
Location:
Date: 23/08/2017 Arrival time: 07:30:00
1) Conversation with Home Occupier: No Access Refused: No
2) Photographs Taken: No
3) Internal Flooding: NoMain Sewer Lateral Sewer
Adjacent properties flooded Attached garages flooded Basements/Cellar flooded Restricted Toilet use Kitchen Hallway Living room Dining room Shop/integral store Downstairs bathroom
4) External Flooding: NoMain Sewer Lateral Sewer
Public road/footpath Public area Agricultural land Curtilage Detached garage flooded Detached shed or store flooded
5) Comments on cause of reported incident: (Select only one category below)Blockage Collapsed sewer Defective road gulley Defective private drain M&E equipment failure Further investigation by NIW required Other:
6) Clean up operations:Not Required Further Action Required Completed
7) Previous History:Yes No Not Aware
8) Weather Conditions:Dry OR Wet : Heavy Medium Light
Comments: Especially for Flooded jobs or Follow on jobs Major flooding incident capacity issue. River burst banks ‐ rivers agency issue.

Annual Information Return 2018 Section 2 Chapter 3 Page 7 of 8
Northern Ireland Water – Flooding Incident Report
Work Order Ref No: 05637616 Name: y
Location:
Date: 10/12/2017 Arrival time: 15:45:00
9) Conversation with Home Occupier: Yes Access Refused: No
10) Photographs Taken: Both
11) Internal Flooding: YesMain Sewer Lateral Sewer
Adjacent properties flooded Attached garages flooded Basements/Cellar flooded Restricted Toilet use Kitchen Hallway Living room Dining room Shop/integral store Downstairs bathroom
12) External Flooding: NoMain Sewer Lateral Sewer
Public road/footpath Public area Agricultural land Curtilage Detached garage flooded Detached shed or store flooded
13) Comments on cause of reported incident: (Select only one category below)Blockage Collapsed sewer Defective road gulley Defective private drain M&E equipment failure Further investigation by NIW required Other:
14) Clean up operations:Not Required Further Action Required Completed
15) Previous History:Yes No Not Aware
16) Weather Conditions:Dry OR Wet : Heavy Medium Light
Comments: Especially for Flooded jobs or Follow on jobs Cleared‐excessive wipes being used‐internal flooding in hallway‐clean up

Annual Information Return 2018 Section 2 Chapter 3 Page 8 of 8

NORTHERN IRELAND WATER LIMITED - ANNUAL INFORMATION RETURN
ANNUAL INFORMATION RETURN - TABLE 3A KEY OUTPUTSSEWERAGE SERVICE - EXTERNAL FLOODING (TOTAL)
DESCRIPTION UNITS DP2012-13 CG 2013-14 CG 2014-15 CG 2015-16 CG 2016-17 CG 2017-18 CG 2018-19 CG 2019-20 CG 2020-21 CG
A ANNUAL FLOODING SUMMARY(I) OVERLOADED SEWERS
1 Areas flooded externally in the year (overloaded sewers) nr 0 225 D6 92 D6 117 D6 23 D6 20 D6 15 D62 Curtilege flooding incidents in the year (overloaded sewers) nr 0 97 D6 70 D6 86 D6 17 D6 16 D6 11 D63 Highway flooding incidents (overloaded sewers) nr 0 32 D6 23 D6 26 D6 6 D6 4 D6 4 D64 Other flooding incidents (overloaded sewers) nr 0 96 D6 22 D6 20 D6 0 D6 0 D6 0 D65 Total flooding incidents (overloaded sewers) nr 0 225 D6 115 D6 132 D6 23 D6 20 D6 15 D66 External flooding incidents (overloaded sewers attributed to severe weather) nr 0 29 D6 1 D6 14 D6 6 D6 3 D6 3 D6
6a Areas flooded externally attributed to severe weather nr 0 29 D6 1 D6 14 D6 6 D6 3 D6 3 D6(ii) OTHER CAUSES
7 Areas flooded externally in the year (other causes) nr 0 3,212 D6 3,348 D6 4,379 D6 3,889 D6 3,819 D6 3,466 D68 Areas which have flooded more than once in the last 10 years (other causes) nr 0 N/C N/C N/C N/C N/A N/C9 Flooding incidents (other causes - equipment failure) nr 0 19 D6 23 D6 25 D6 19 D6 8 D6 3 D6
10 Flooding incidents (other causes - blockages) nr 0 3,526 D6 3,293 D6 4,269 D6 3,773 D6 3,543 D6 3,155 D611 Flooding incidents (other causes - collapses) nr 0 31 D6 73 D6 85 D6 97 D6 268 D6 308 D6
B AREAS ON THE 1:10, 2:10, 1:20 AT RISK REGISTER(I) SUMMARY
12 2 in 10 register at end of year nr 0 0 D6 190 D6 212 D6 226 D6 232 D6 237 D613 1 in 10 register at end of year nr 0 213 D6 7 D6 20 D6 20 D6 20 D6 20 D614 1 in 20 register at end of year nr 0 0 D6 16 D6 84 D6 86 D6 87 D6 87 D615 Total on the 1:10, 2:10, 1:20 register at end of year nr 0 213 D6 213 D6 316 D6 332 D6 339 D6 344 D615a Potential risk of property flooding identified requiring further investigation to assess at risk category nr 0 N/C 0 D6 N/C N/C N/A N/C
(iii) ANNUAL CHANGES TO 1:10, 2:10, 1:20 REGISTER20 Removed by company action (external only) nr 0 0 A1 0 A1 0 A1 0 A1 1 A1 0 B221 Removed by company action (external linked) nr 0 0 A1 0 A1 0 A1 0 A1 0 A1 2 B222 Removed because of better information nr 0 0 A1 113 A1 0 A1 0 A1 0 A1 2 B223 Added because of better information (actually flooded) nr 0 213 A1 113 A1 103 A1 16 A1 7 A1 9 B224 Added because of better information (modelled) nr 0 0 A1 0 A1 0 A1 0 A1 1 A1 0 B225 Transferred from external to internal register nr 0 0 A1 0 A1 0 A1 0 A1 0 A1 0 B2
5REPORTING
YEAR REPORTING
YEAR REPORTING
YEAR
431REPORTING
YEAR
2REPORTING
YEAR
6REPORTING
YEAR
7REPORTING
YEAR
8 9REPORTING REPORTING
YEAR YEAR

Annual Information Return 2018 Section 2 Chapter 3a Page 1 of 2
Table 3a - Key Outputs – Sewerage Service – External Flooding Introduction The processing of external flooding incidents has continued as it did in year 2016-17. The in-house resource devoted to this processing and analysis continues to be extremely limited. As a consequence, the process continues to be heavily dependent upon the accuracy of the information provided by the external maintenance contractor. Throughout the year, analysis of external flooding incidents is based upon monthly spreadsheets and Flooding Incident Report sheets, submitted by the external maintenance contractor. Each incident which is classified by the contractor as potentially ‘hydraulic’ – i.e. which does not have an ‘other cause’ identified - is subject to an investigation by the Asset Performance section. The investigation will either recommend that the incident is confirmed as hydraulic, or recommend that the incident is excluded. Each incident is classified by the contractor as affecting one of curtilage, highways or ‘other’. An analysis is carried out to define the total number of areas affected. Those incidents classified by the contractor as ‘other causes’ are defined, (by the contractor), as due to one of ‘equipment failure’, blockage or collapse. Lines 1-11 - Annual Flooding Summary The analysis of external flooding incidents is summarised in the spreadsheet ‘Reported External Flooding for 2017-18’; the figures within Table 3a have been transferred from that spreadsheet. The total number of ‘overloaded sewers’ incidents for the year 2017-18 was 15 The total number of ‘other causes’ incidents has decreased from 3819 in 2016/2017 to 3466, in 2017/2018. As there is reliance upon the information supplied by the external contractor, a low confidence grade, of D6, continues to be attached. Line 8 – Areas which have flooded more than once in the last 10 years (other causes) This line cannot be populated as the processing of external incidents has only been properly executed for five years. Lines 12-25 - At Risk Register The total number of areas, on the Register at the start of year 2017/18 was 339. The processing of external flooding incidents has continued as it did in year 2016/17, resulting in 9 areas being added to the Register, in the assigned categories (2 in 10, 1 in 10, 1 in 20). Four areas have been removed by company action under an operations scheme. This brings the total number of areas on the Register to 344. Capital schemes which address external flooding only, are in general, not funded – hence only 2 properties were removed by company action.
18 Kenmare Park, Londonderry BT48 0DE (2 in 10) 17 Killary Road, Londonderry BT48 0DE (2 in 10)
Two properties were also removed because of better information.

Annual Information Return 2018 Section 2 Chapter 3a Page 2 of 2
16 Kenmare Park, Londonderry BT48 0DE (2 in 10) 19 Kenmare Park, Londonderry BT48 0DE (2 in 10)
As the primary input to the register is the processing of annual flooding incidents, the same confidence grade (D6) is assigned.

NORTHERN IRELAND WATER - ANNUAL INFORMATION RETURN
ANNUAL INFORMATION RETURN - TABLE 4 KEY OUTPUTSCUSTOMER SERVICE - 1 (TOTAL)
DESCRIPTION UNITS DP2012-13 CG 2013-14 CG 2014-15 CG 2015-16 CG 2016-17 CG 2017-18 CG 2018-19 CG 2019-20 CG 2020-21 CG
A DG6 RESPONSE TO BILLING CONTACTS - GENERAL1 Total billing contacts nr 0 77,051 B2 78,463 B2 75,545 B2 75,490 B2 77,698 B2 71,409 B22 Number dealt with within 5 working days nr 0 77,118 B2 78,398 B2 75,520 B2 75,462 B2 77,679 B2 71,386 B23 Number dealt with in more than 10 working days nr 0 26 B2 30 B2 9 B2 11 B2 4 B2 5 B24 DG6 Percentage dealt with within 5 working days % 2 100 09 B2 99.92 B2 99 97 B2 99.96 B2 99 98 B2 99.97 B25 Percentage dealt with in more than 10 working days % 2 0.03 B2 0.04 B2 0.01 B2 0.01 B2 0 01 B2 0.01 B2
B CONNECTED PROPERTIES6 Number of properties connected for water supply only nr 0 152,771 A2 155,064 B2 157,260 A2 160,991 A2 163,246 A2 164,695 A27 Number of properties connected for water and sewerage services nr 0 665,189 A2 669,910 B2 670,800 A2 678,719 A2 689,153 A2 698,293 A28 Number of properties connected for sewerage services only nr 0 25 A2 24 B2 25 A2 24 A2 25 A2 25 A2
5REPORTING
YEAR REPORTING
YEAR REPORTING
YEAR
431REPORTING
YEAR
2REPORTING
YEAR
6REPORTING
YEAR
7REPORTING
YEAR
8 9REPORTING REPORTING
YEAR YEAR

Annual Information Return 2018 Section 2 Chapter 4 Page 1 of 7
Table 4 – Customer Service 1
Lines 1 - 5 - DG6 – Response to Billing Contacts This was the eleventh year of non-domestic billing by Northern Ireland Water (NIW). Following decision of Northern Ireland Executive, domestic charges continued to be deferred for 2017/18 charging year.
No material changes, other than tariff changes, were made to billing in 2017/18.
The chart below shows the DG6 received volumes during 16/17 – 17/18.
Chart 1 – DG6 Billing Contacts Received 2017/18
The increased volume during quarter one was due to the annual bill run whereby unmeasured bills were issued for the start of April with recovery notices being issued as per policy, 28 days later where bills remained unpaid. This reflects the normal profile expected following the annual bill run.
Top Reasons for Customer Contact Table 1 lists the top 5 reasons for billing contacts in 2016/17
Debit / Credit Card Payment 28% Promise Of Payment 9% Checking Payment Recd 7% High Cons Advice Given 5% Disputd Liab Supply 5%
Table 1 – Top 5 DG6 contact types 2017/18
Debit/credit card payments and promises to pay remain the top reasons for billing contacts due to continued focus on debt collection activities during the year. These would be seen as “wanted” contacts.

Annual Information Return 2018 Section 2 Chapter 4 Page 2 of 7
Reporting Method The source data for DG6 Table 4 (Lines 1 to 5) is reported using the submitted methodology stated for DG6.
Monthly reports for DG6 (received and closed) are run by Echo and independently validated by the NIW MI & Data Team. On the first working day of each month, the DG6 reports are run for both the current and previous months to accurately update received and closed figures on a retrospective basis to support the annual reconciliation. Variances are queried with NIW Account Services and Echo and resolved as they arise.
Responses For DG6 reporting purposes, the date of resolution of the item or date of the substantive response/holding response is used as the closure date. If a customer has a billing-related query that leads to a recalculated bill, the date of the response (verbal or written) explaining the reason for the bill is used as date and timestamp of the response. The recalculated bill is generated overnight and issued under separate cover.
No current plans to reduce the holding response period during AIR 18.
NB The majority of DG6 contacts that cannot be resolved within 5 days require a site visit by a Meter Query Technician (MQT). It is not unusual that the requirement for remedial meter maintenance work is identified during these site visits. The 40 day period should allow time for an initial site visit to be performed by a MQT, any routine meter maintenance work requested and completed, the resolution confirmed and the final response drafted and issued to the customer.
However, in certain circumstances, especially where a site visit is not required, a 40-day hold may not be required and a shorter period is given in the holding response.
Re-categorisation between Regulatory Categories NIW has procedures in place for instances where written contacts are changed from one DG category to another e.g. DG6 to DG7. The process document, “Account Services - Re-categorisation of written contacts”, is embedded as Document 1 for reference purposes.
NIW_Re-categorisation of written conta Document 1 - Re-categorisation of written contacts Open contacts can be re-categorised using Rapid screen wccm11 (Contact Amendments), and closed contacts can be re-categorised using Rapid screen wccm91 (Close Date Maintenance).
There are a number of stages at which the categorisation of a billing contact can be reviewed after it has been scanned, logged & indexed.
Whilst not exhaustive, the main activities during which the categorisation of contacts is regularly checked are:
Agent Review - it is the responsibility of the Account Services Agent to ensure thateach contact they are handling is closed in line with reporting guidelines. On initialreview, they should ensure that the contact has been correctly categorised in line with

Annual Information Return 2018 Section 2 Chapter 4 Page 3 of 7
the DG/Contact definitions. If incorrect, it is their responsibility to ensure that the contact is updated on Rapid accordingly. If unsure, they should seek guidance from their line manager.
The MI & Data Team within CSD Services perform monthly sampling on 50 randomlyselected closed DG6 Telephone and Written contacts. Any discrepancies found whencarrying out the Telephone sampling are reported and escalated to Echo as part ofNIWs response to the Monthly Business Review Pack.
Written sampling results are sent to the Contacts & Complaints & Executive Mail (C& C&EM) Team Managers (TMs) for review. It is the responsibility of the C & C&EMTMs to ensure that any agreed exceptions which require re-categorisation areretrospectively updated on Rapid.
C & C&EM Coaching – TMs perform coaching using sampling of closed contacts. Itis the responsibility of the TMs to ensure that any contacts identified through thisprocess that require re-categorisation are updated on Rapid.
Email and Faxes Systems remained in place to ensure that the receipt date of email/fax contacts is recorded as the date it is delivered to the company with the following working day being recorded as Day 1.
Payment Cards NIW does not issue payment cards to non-domestic customers.
DG6 Volumes Year-on-year DG6 received volumes from 2013/14 to 2017/18 is displayed in Chart 2.
Chart 2 - DG6 received 2013/14 to 2017/18
The total received volume for 2017/18 is 71,409. This is a decrease of 6,289 on 2016/17 total.
End of Year (Contacts not dealt with at end of year) Based on data extracted on 11.04.18
205 DG6 contacts received during 17/18 were open; the oldest open DG6 contact received during 17/18 was 49 working days old;

Annual Information Return 2018 Section 2 Chapter 4 Page 4 of 7
204 DG6 contacts received during 17/18 were open for more than 5 working days,each pending completion of agreed actions as outlined in substantive holdingresponses;
The average age of an open DG6 contact received during 17/18 was 29 workingdays.
Self Service Platform On 9th February 2015, NIW announced the provision of additional web-based services for customers. The services are aimed predominantly at non-domestic customers who have an account with NIW and make it easier for them to pay bills online and check their accounts. The service also allows domestic customers with septic tanks to order their tank to be ‘de-sludge’.
Once registered, customers are able to: view their account balance; view the payment plan of individual schedules; view bill and payment history; view desludging request history; process a new desludging request; pay a bill; and Manage their account details.
Northern Ireland Water’s (NIW) property data is taken from the RapidXtra billing system and manipulated within Microsoft SQL to produce the Rapid Property Summary Report.
Line 6 – Number of Properties Connected for Water Supply Only AIR17 figure - 163246 AIR18 figure - 164695
There has been a net increase of circa 1449 properties during the 17/18 year, which are connected only for water.
As with Table 2, Table 3, Table 7 & Table 13 we have identified that properties can be added to/removed from the billing system via the methods below:-
1. New Connections during the 2017/18 reporting year. The figures are based on areport received from the Customer Connections Team
2. As a result of a customer contact. i.e. septic tank empty request, no water complaint,blocked sewer, updating of standing data e.g. removal of services etc. Within thiscategory there are 2 scenarios:
(a) The adding of properties NI Water allegedly did not know about and the addingof duplicates as the customers address could not be found on Rapid. Forexample, Rapid may hold the site number but when the customer contacts NIWater they quote the verified postal address which is different, thereforecreating a duplicate
(b) Another scenario - The street name may have changed from the time of NewConnection to that of customer contact – street names can change in the earlystages of site development.
3. Removal of duplicates as a result of data quality initiatives
In addition to the above, further data quality requirements have been built into the new CBC Contract. They cover all aspects of the property life cycle (creating, amending and demolishing properties) and data degradation will be monitored/measured throughout.

Annual Information Return 2018 Section 2 Chapter 4 Page 5 of 7
These system validations have been split into 4 delivery phases. The functionality for Phases 1-3 have been delivered, with the functionality for the Post Phase 3 data validations due to be delivered within the next database release/upgrade in August 2018. Off-system data cleanse is required before some of the system validation rules can be applied.
Line 7 – Number of Properties Connected for Water and Sewerage Services AIR17 figure – 689153 AIR18 figure – 698293
There has been a net increase of circa 9140 properties connected for water and sewerage services during the 17/18 year – refer to Line 6 commentary for further detail.
Line 8 - Number of Properties Connected for Sewerage Services Only AIR17 figure – 25 AIR18 figure - 25
The number of properties connected for sewerage only has remained the same during the 17/18 reporting year.
Annex A details the methodology followed for the figures calculated in Table 4 Lines 6-8.


NORTHERN IRELAND WATER LIMITED - ANNUAL INFORMATION RETURN
ANNUAL INFORMATION RETURN - TABLE 5 KEY OUTPUTSCUSTOMER SERVICE - 2 (TOTAL)
DESCRIPTION UNITS DP2012-13 CG 2013-14 CG 2014-15 CG 2015-16 CG 2016-17 CG 2017-18 CG 2018-19 CG 2019-20 CG 2020-21 CG
A DG7 RESPONSE TO WRITTEN COMPLAINTS1 Total written complaints nr 0 3,173 B2 2,505 B2 2,364 B2 2,269 B2 2,375 B2 2,274 B22 Number dealt with within 10 working days nr 0 3,166 B2 2,498 B2 2,363 B2 2,266 B2 2,375 B2 2,271 B23 Percentage dealt with within 10 working days % 2 99.78 A1 99.72 A1 99.96 A1 99.87 A1 100.00 A1 99.87 B24 Number dealt with in more than 20 working days nr 0 1 B2 2 B2 0 B2 2 B2 0 B2 3 B25 Percentage dealt with in more than 20 working days % 2 0.03 A1 0.08 A1 0.00 A1 0.09 A1 0 00 A1 0.13 B2
B DG8 BILLS FOR METERED CUSTOMERS6 Total metered accounts nr 0 110,164 A1 115,227 A1 118,732 A1 123,763 A1 127,807 A1 128,705 A17 Metered accounts excluded from indicator nr 0 42,688 A1 47,784 A1 51,214 A1 55,875 A1 59,428 A1 60,060 A1
(I) NO. OF CUSTOMERS WITH METERED ACCOUNTS RECEIVING AT LEAST ONE BILL DURING YEAR BASED ON METER READING
8 Company readings nr 0 66,557 A1 66,775 A1 66,855 A1 67,319 A1 68,025 A1 68,400 A19 Company or customer readings (or both) nr 0 66,622 A1 66,840 A1 66,916 A1 67,366 A1 68,051 A1 68,420 A1
(ii) NUMBER OF CUSTOMERS WITH METERED ACCOUNTS RECEIVING
10 Estimated bills only nr 0 550 A1 433 A1 548 A1 426 A1 270 A1 184 A111 No bills received during the report year nr 0 304 A1 170 A1 54 A1 96 A1 58 A1 41 A112 Unread by company for 2 years nr 0 310 A1 186 A1 164 A1 207 A1 173 A1 90 A1
C DG9 TELEPHONE CONTACT13 Total calls received on customer contact lines nr 0 219,399 A2 226,881 A2 230,847 A2 210,487 A2 217,023 A2 212,095 A214 All lines busy nr 0 0 A2 0 A2 32 A2 159 A2 63 A2 18 A215 Total of calls not abandoned nr 0 216,006 A2 223,256 A2 226,204 A2 209,284 A2 216,015 A2 211,061 A216 Call Handling Satisfaction nr 2 4.54 A1 4.63 A1 4.65 A1 4.59 A117 Total telephone complaints nr 0 73,158 A2 74,316 A2 76,536 A2 61,316 A2 62,866 A2 57,940 A2
D SPECIAL ASSISTANCE REGISTER18 Customers on the special assistance register nr 0 2,675 A2 2,903 A2 3,084 A2 3,163 A2 2,017 A1 2,096 A1
E CUSTOMER SATISFACTION MEASURES19 Total contacts nr 0 257,866 A2 250,753 A220 Unwanted contacts nr 0 110,197 A2 105,964 A221 Unwanted contacts as a % of total contacts % 2 42.73 A222 First Point of Contact Resolved (FPOCR) % 1 66.5 A2 65 8 A223 Customer advocacy measure nr 0 27 A1 31 A124 Omnibus survey question 1 nr 1 80.3 A1 92.4 A125 Omnibus survey question 2 nr 1 11.2 A1 8 2 A1
5REPORTING
YEAR REPORTING
YEAR REPORTING
YEAR
431REPORTING
YEAR
2REPORTING
YEAR
6REPORTING
YEAR
7REPORTING
YEAR
8 9REPORTING REPORTING
YEAR YEAR


Annual Information Return 2018 Section 2 Chapter 5 Page 2 of 18
There are a number of factors which may have influenced a lower number of Charges & Billing complaints. These include:
the ongoing work being undertaken as part of the Metering & Billing project which seeks to improve metering data;
the appointment of a Customer Service Manager within the Metering & Billing function who seeks to proactively resolve issues likely to escalate; and
the change to the retrospective billing policy which reduced the typical backdated bill period from 6 six years to 18 months.
However, the reduction in complaints within this category cannot be categorically attributed to any single factor. As is typical, the complaints in the Charges & Billing category this reporting period stem from a variety of reasons, some of which are summarised below:
Over three hundred complaints were recorded as being from customers disputing liability for charges.
Over one hundred complaints were recorded as being about leakage allowances or high consumption.
End of Year (Contacts not dealt with at end of year) Based on data extracted on 3 May 2018, no DG7 contacts received during 17/18 complaints remained open. Petitions No DG7 contacts were received which could be described as petitions. CCNI Written Complaints Assessment There was no formal CCNI Written Complaints Assessment held during the reporting period. E-mail and Faxes Systems remained in place to ensure that the receipt date of email/fax contacts is recorded as the date it is delivered to the company with the following working day being recorded as Day 1. 1,819, or 79.99%, of the total DG7 received volume were recorded with a document type of “email”. 1 DG7 contact was recorded as having a document type of “fax”. Self-Service Portal The “Contact Us” section of the online self-service portal allows customers to submit complaints on completion of an online form. The resulting complaints are received as emails and reported as such. The link as is below: https://selfservice.Nothern Ireland Waterater.com/ContactForm#Complaint Complaints about Contractors The process which supports the recording of written complaints received directly by PPP concessionaires (or other contractors working on NI Water’s behalf) remained in place throughout 17/18.

Annual Information Return 2018 Section 2 Chapter 5 Page 3 of 18
No complaints of this nature were recorded via this process during the reporting period. Complaints about HVCA There was 1 written complaint recorded as being related to the High Volume Call Answering system. NI Direct There were no complaints received through NI Direct in respect to the company’s call centre or field staff responses to flooding incidents. Telephone Complaints Complaints received via telephone are reported as DG9 telephone complaints, not DG7. Billing telephone complaints are reported as DG6. Date of Receipt Written complaints are date-stamped per the date of receipt. Date of Dispatch The date of dispatch refers to the date on which a response is sent to the customer. The date of dispatch is recorded as the date closed. Response Time This is the number of working days between receipt of a contact by Northern Ireland Water up to and including the day of dispatch of a response. For the purpose of this calculation, the day of receipt (provided it is a working day) is counted as day zero and the next working day as day one. When an email or fax is received after 16:00 it will be scanned, logged and indexed on the next working day. The date of receipt recorded will match the actual date of receipt. The reported date of receipt for emails/faxes received outside of normal operating hours is the actual date on which the complaint was delivered to the company. For example, if an email is received on a Saturday, this is recorded as day zero. The next working day (normally the Monday) would be counted as day one. If an email is received on a Sunday then this is recorded as date of receipt (day zero) and (normally) Monday as day one. Substantive Holding Reply This is defined as a response to a written complaint which advises the customer that Northern Ireland Water needs to undertake additional investigations or other actions before being able to provide a full response. A holding response is considered substantive if it advises the customer what further action needs to be taken in order to fully respond, when this will be done and when they will receive a further communication from Northern Ireland Water. Items remain open until all actions have been completed but will be closed back to the date of the holding response for reporting purposes when said actions have been completed. When a date by which investigations or further actions will be complete cannot be given, we will give the date by which we will contact the customer again. Holding responses can be issued in writing or provided verbally by telephone.

Annual Information Return 2018 Section 2 Chapter 5 Page 4 of 18
Repeat Contact Where a complaint has been responded to and results in a period of correspondence each written contact is treated as, and reported as, a separate complaint. No complaints have been excluded from DG7 where Northern Ireland Water consider the complaint has been dealt with as far as they we able. Consumer Council for Northern Ireland (CCNI) Complaints received in writing via CCNI will be logged as complaints and recorded in DG7 figures. All complaints from CCNI are received in writing by email. CCNI enquiries and follow-up questions are not recorded as complaints. Changes to original categorisation Open contacts can be re-categorised using Rapid screen wccm11 (Contact Amendments), and closed contacts can be re-categorised using Rapid screen wccm91 (Close Date Maintenance). There are a number of stages at which the categorisation of a written contact can be reviewed after it has been scanned, logged & indexed. Whilst not exhaustive, the main activities during which the categorisation of contacts is regularly checked are:
Agent Review - it is the responsibility of the Complaints & Executive Mail Team Agent to ensure that each written contact they are handling is closed in line with reporting guidelines. On initial review, they should ensure that the contact has been correctly categorised in line with the DG/Contact definitions. If incorrect, it is their responsibility to ensure that the contact is updated on Rapid accordingly. If unsure, they should seek guidance from their line manager.
MI & Data Team Sampling – the MI & Data Team within CSD Services performs monthly sampling on closed DG6, DG7 and non-reportable contacts. The sampling results are sent to the Customer Service Delivery Manager, Complaints & Executive Mail Team Manager & Supervisor for review. It is the responsibility of the Complaints & Executive Mail Team Manager & Supervisor to ensure that any agreed exceptions which require re-categorisation are retrospectively updated on Rapid.
Line Management checks – Complaints & Executive Mail Team Manager & Supervisor perform coaching using sampling of closed contacts. It is the responsibility of the Complaints & Executive Mail Team Manager & Supervisor to ensure that any contacts identified through this process which require re-categorisation are updated on Rapid.
Exclusions A total of 167 written customer complaints have been excluded from DG7 reporting during 17/18 for a variety of exclusion reasons as per the Level of Service Methodology. Activity linked to one specific campaign greatly contributed to this volume:
Portavoe Reservoir – 139 complaints generated in relation to objections to the sale of one of Northern Ireland Water’s assets; the disused Portavoe Reservoir. The complaints are mainly identical in content with the exception of the name and email address – these were sent by email to Sara Venning (CEO) and Len O’Hagan (Chairman), generated by a campaign website. It is noteworthy that a further 657 of these complaints were received in the previous reporting year.

Annual Information Return 2018 Section 2 Chapter 5 Page 5 of 18
The Utility Regulator was sighted on this campaign and the associated complaints. Agreement was reached that these should be excluded from DG7 reporting. Confidence Grades The confidence grades assigned to lines 1, 2 and 4 as shown below, remain the same as those assigned to the 2016/17 performance figures. The confidence grades assigned to lines 3 and 5 have been changed from A1 to B2 as they are based on Lines 2 and 4 respectively which themselves have confidence grades of B2. 1 Total written complaints B2 2 Number dealt with within 10 working days B2 3 Percentage dealt with within 10 working days B2 4 Number dealt with in more than 20 working days B2 5 Percentage dealt with in more than 20 working days B2
Lines 6-12 DG8 – Bills for metered customers The 17/18 outturn for DG8 was 99.67% of meters read and billed. This was against a target of 99%. Although the company was well ahead of target within the first 6 cycles, achieving the target of 99%. The target for 17/18 remains fixed at 99%. DG8 Meters Read and Billed Performance (%)
Cumulative increase in DG8 reads throughout the course of the 17/18 year. The graph is based on actual meter reads out of the total meter stock base.
As can be seen from graph 1.0, within the first read cycle, 99.07% of the meters contributing to the DG8 target were read, against an internal company target of 90.00%. Within the second half of the year the continuing targeted approach and skip management has resulted in a significant improvement in the number of skips of 114 for 2017/18 from 328 for 2016/17, this has been due to a number of factors including;
Continued focus on reducing skips by managing in month, with proactive management of meter maintenance to ensure meters are replaced asap.
Proactive engagement with customers to get access to meters to get actual read. Proactive identification of in month new meter uploads which are required to be read
and billed. As part of the metering strategy pilot of 1200 AMR’s and 26 eloggers have been installed on meters during 17/18. This technology will monitored over the coming year to ensure it is fit


Annual Information Return 2018 Section 2 Chapter 5 Page 7 of 18
For 17/18 the total meters excluded has risen by 633 compared to the total exclusion reported in 16/17. Confidence Grades The confidence grade is assigned based on the system driven DG8 summary reports extracted from RapidXtra, the reports are analysed in Rapid to create DG8 Meter Summary Analysis reports and does not require any manual manipulation. Rapid automatically categories each account based on its status using the most current and up to date data. The confidence grades assigned to lines 6-12, as shown below, remain the same as those assigned to the 2016/17 performance figures:
6 Total Meter Accounts A1 7 Metered accounts excluded from indicator A1 8 Company readings A1 9 Company or customer readings (or both) A1
10 Estimated bills only A1 11 No bills received during the report year A1 12 Unread by company for 2 years A1
Lines 13 – 17- DG9 Telephone Contact DG9 Introduction During the reporting year a total of 212,095 calls were made to the advertised Company telephone numbers. Graph 1 shows a comparison against the previous year (2016/17) and against our target level of calls for the year and the 5 year average. Telephone Contacts Received
The deployment of an High Volume Call Answering (HVCA) solution in NI Water is unique in the water industry, providing an enhanced customer experience and improved incident management when compared to other water companies in UK and on a par with other utilities in Northern Ireland i.e. Power NI. HVCA was available to handle overflow calls for customers reporting faults on the Waterline.

Annual Information Return 2018 Section 2 Chapter 5 Page 8 of 18
Calls received in the winter period were lower in comparison to previous years, due mainly to milder weather conditions. Line 14 - All Lines Busy There were 18 instances of All lines busy during the reporting year 17/18. A considerable reduction in the number received during 16/17, due to an investigation by BT which determined that the vast majority of engaged calls coming through were due to network congestion. BT now remove any engaged calls they deem not to be legitimate from the monthly upload. HVCA The High Volume Call Answering (HVCA) system was driven from the events in winter 2010-11, where prolonged sub-zero temperatures during December 2010, followed by a sudden thaw on 26th December 2010, caused extensive disruption of supplies (due mainly to bursts on customer supply pipes) and huge increase in customer contacts to the NI Water Customer Relations Centre. Since the 5th March 2013 the HVCA system has been deployed in Agent First Mode, which means all calls to the Waterline are still diverted to the Cable and Wireless Network IVR system. The caller is presented with the menu selection and depending on the option selected and if a CRC agent available, passed to a CRC call Agent. If no Agents are available then the caller will enter into the HVCA call routing plan to have their issue logged. Lines 15 - Calls Abandoned There were 1,034 calls abandoned on the CallMedia system during the year leading to a reportable Company performance of 99.51% of ‘calls not abandoned’, which exceeded the 99% target set for the year. All calls abandoned on HVCA are now classified as answered due to agreement with the Regulator and CCNI. However, for monthly Business and annual Regulatory reporting purposes all calls handled by HVCA continue to be analysed and reported as answered or abandoned using the agreed hang up location methodology. NI Water is able to classify each hang up location as either ‘answered’ if the caller has reached a point in the call flow at which they can hear a salient message or ‘abandoned’ as HVCA has 226 distinct hang up locations allowing for detailed analysis of where the customer call ended and what messages the customer was presented with. There were an additional 994 abandoned on the HVCA system and the details on calls abandoned, including and excluding the HVCA system, are set out in Table 1 in Annex A. As reported previously to the Regulator, 38.57% of all calls transferred to the HVCA system are being abandoned due primarily to customers hanging up on hearing the automated system and redialling in the likelihood that they will be answered by an agent.

Annual Information Return 2018 Section 2 Chapter 5 Page 9 of 18
Calls Abandoned 2017 – 2018
Line 17 - Telephone Complaints Telephone complaints cover any telephone call from a customer or a customer's representative (e.g. Citizens Advice Bureau, solicitor) alleging that an action or inaction of the Company, or a service or lack of service provided by NI Water or agent/contractor has fallen below his/her expectation. General statements of complaint are also counted. Customers may complain unfairly or unjustifiably; nevertheless, such calls are classed as complaints. Some complaints may be frivolous or vexatious, nevertheless these are reported. As a general policy, the Company records telephone calls about the following water service issues as complaints: no water, lack of pressure, leaks, taste and odour, discoloration and hard water (except for simple enquires e.g. dishwater settings). Telephone calls about the following wastewater services are also recorded as complaints: sewer flooding other than those received through NI Direct/blockages, collapsed sewers/manholes, smells from sewage treatment works/pumping stations and flies from sewage treatment works. Telephone complaint volumes have decreased to 57,940, a slight decrease compared with the 62,866 received during 2016/17 reporting period. This reduction can mainly be attributed to the new text messaging pilot which proactively sends SMS messages to customer who had the potential for a supply interruption, this message also included an estimated time of restoration for the interruption. There has also been a drive with the Customer Relations Centre to reduce call volumes, an initiative from this was the addition of the ‘Estimated time of restoration’ for supply interruptions to the NI Water website. Line 18 – Customers on the Critical Care Register The Critical Care Register offers a range of free additional services to customers who are older, have a disability, a serious medical condition or require extra help when experiencing an interruption to their Water Supply. A bespoke CorVu report has been created in conjunction with NI Water code of Practice - “Priority Services for Domestic Services” to report on Critical Customers. The report has been created with predefined filters to only return customers registered against the special needs listed below:


Annual Information Return 2018 Section 2 Chapter 5 Page 11 of 18
During presentations in 2017 to all the new eleven "super" councils NI Water took the opportunity to promote our customer care scheme. NI Water also continue to work closely with other Utilities through CCNI and NIAUR to ensure a common approach to promoting Customer Care schemes. An annual Newsletter is produced every November and is sent out to customer currently on the Critical Care Register, to remind customers of the service available and also for them to inform other potential critical customers of the service available. It is worth noting that requests to be added or removed from the register can be received following the distribution of this newsletter. Customer Satisfaction Measures Lines 19 to 21 – Total Contacts and Unwanted Contacts Total contacts refers to the number of Telephone (Billing) and Operational telephone contacts the company has received from Customers during the reporting year 17/18. During the reporting year 250,753 telephone contacts where received. The figure is obtained from the all received and calculated using the original CMS contacts logged within Rapid. The table below illustrates the monthly breakdown of the total telephone contacts received for 2017/18:
Month Recd Grand Total
April 18698 May 25195 June 22501 July 18896
August 22577 September 19992
October 20313 November 21548 December 16206 January 21145 February 19436
March 24246 Grand Total 250753
During the reporting year 17/18 a total of 250,753 contacts where received, 105,964 of those contacts where unwanted. An Unwanted phone contact definition is the number of phone contacts received from customers that are ‘unwanted’ from the customer’s point of view. This includes a contact about an event or action that has caused the customer unnecessary aggravation (however mild). It also includes repeat or chase calls by the customer to the company. This is determined by the subject matter of the call. The table below illustrates the breakdown of Wanted and Unwanted contacts received in 17/18:
Month Recd Unwanted Wanted Grand Total
April 7655 11043 18698 May 10376 14819 25195 June 9360 13141 22501

Annual Information Return 2018 Section 2 Chapter 5 Page 12 of 18
Month Recd Unwanted Wanted Grand Total July 7556 11340 18896
August 9791 12786 22577 September 7697 12295 19992
October 7661 12652 20313 November 8965 12583 21548 December 7371 8835 16206 January 9356 11789 21145 February 8884 10552 19436
March 11292 12954 24246 Grand Total 105964 144789 250753
Based on the total unwanted telephone contacts received by the company, 24,205 are relating to Sewerage Services and 46,813 are relating to Water Services. The top Sewerage Service unwanted contact for 17/18 is ‘Blocked Sewer Inc Cleanup & Disinfect’, with a total of 12,815 (12%) of unwanted customer contacts. The top Water Service unwanted contact for 17/18 is ‘No Water Complaint’, with a total of 21,706 (20%) of unwanted customer contacts. Following AIR 17 there was a recommendation for a sample to be taken of Wanted & Unwanted Contacts to confirm that these were being logged correctly. A sample of 50 Wanted & 50 Unwanted closed contacts is currently taken at month end, any anomalies in the categorisation is fed back to the relevant team for training purposes. Line 22 – First Point of Contact During the reporting year 65.76% of contacts where resolved at First Point of Contact, this is a slight reduction compared to 66.52% reported for 16/17. When a contact requires an action and this action is completed at first point of contact and there is no repeat contact from the same property on the same issue within a 90 day period then it shall be counted as ‘First Point of contact resolution’. First point of contact resolution is reported as a percentage derived from the expression of FPOCR against the number of Contacts. The dataset is an analyses of Original CMS code data from the Diamond and CorVu reports, the following will be excluded from the count:
Outbound CMS Non – Reportable CMS logged to Switchboard customer Numbers
A total of 267,060 contacts where resolved at FPOC:
Line 23 – Customer Advocacy measure Customer advocacy is an annual satisfaction score assessed by Allto (McCallum Layton), an independent market research company. Allto carry out quarterly surveys (Waves) of customers who have contacted the company for any reason. The objective of the research
FPOCR Category Count Metering & Billing 87870 Other Activities 27916 Sewerage Services 79732 Water Services 71542 Grand Total 267060

Annual Information Return 2018 Section 2 Chapter 5 Page 13 of 18
is to capture the views of those customers who have had dealings with the company, not only through the main contact centre but to any part of the business. Customers are asked “Likelihood of recommending Northern Ireland Water 1-10?” The score is calculated using Net Promoter Score methodology based on results from the following statement; if people could choose their water company how likely would you be to recommend your water company to a friend or colleague where 1 is ‘not at all likely to recommend‘ and 10 is ‘extremely likely to recommend’.
Not likely at all
Extremely likely
Don’t Know
1 2 3 4 5 6 7 8 9 10 X Likelihood of
recommending
water
company
Customer Advocacy is calculated: Promoter % - Detractor % The survey is based on a sample of resolved contacts only (from telephone and written channels) in relation to both billing and operational areas. Allto will issue an email in advance to notify which week’s data will be required. The sample data set is obtained from a bespoke CorVu report entitled ‘SIM Resolved Contacts Query LIVE with date prompt’ which was created by NIW . Due to field configuration and system limitations within Rapid, there is no current field that will report the ‘Resolution Date’. The closed date field is often populated with the date a holding letter is issued, which is typically within 5/10 working days and aligns with DG6/7 SLAs, however the contact may have been open for longer. The actual closed date field can include the last date a contact was amended, therefore not necessarily the actual date of resolution. The Closed Date and Actual Closed Date are aligned to give the Resolution Date. PC15 Interim Customer Views Research For 17/18 in place of the Omnibus Survey, an Interim PC15 Research Customer Views Survey was carried out, as part of the regulatory requirement to return at mid-point of Price Control 15 (PC15) to determine if customer views and priorities had changed. Research specification NI Water sought to commission a research study to confirm if the customer priorities in relation to the services provided by NI Water remain valid or if there are any significant changes to be considered at midpoint of PC15 period (31st March 2018). According to the terms of reference, the objectives of the project were as follows:
To investigate consumer views of water, sewerage and customer services and the areas they want NI Water to prioritise and improve;
To provide qualitative, quantitative and actionable data that can be used to inform and prioritise NI Water’s investment planning;
To understand how consumers think service delivery can be improved and by when; To assess levels of satisfaction and opinion of NI Water, possibly repeating questions
that have previously been used where continuity may add further value;

Annual Information Return 2018 Section 2 Chapter 5 Page 14 of 18
To provide views and actionable data to inform NI Water’s strategic direction for Customer Services;
To use existing intelligence on customer complaint/contact information, regulatory annual information returns.
Methodology Following a formal tendering process Kantar Millward Brown was commissioned in June 2017 by Northern Ireland Water to carry out research to assess current views relating to water services. 1,000+ domestic consumers and 250 non-domestic consumers throughout Northern Ireland participated in this research programme. Research was conducted amongst both Northern Ireland consumers and businesses. The methodology consisted of the following elements: Domestic customer research
Ad hoc survey amongst 1026 households. Non-domestic customer research
Ad hoc survey conducted amongst 250 businesses. Domestic customer research In order to access a robust and fully representative sample of consumers, we deployed a face-to-face ad hoc household survey. All interviews were conducted face-to-face amongst a sample of 1026 adults aged 16+. In total 60 sampling points (spread over 100 electoral wards) were drawn using a stratified random sampling method to ensure that the sample was fully representative in terms of region. Within each sampling point, demographic quotas are set on the basis of age and social class characteristics for males and females. All fieldwork was conducted between the 5th July and 3rd August 2017 by executive interviewers using specialist Handheld Assisted Personal Interviewing (HAPI) devices. The HAPI system ensures that data is collected in an effective and precise fashion. Non-domestic customer research A telephone methodology was also implemented for the main body of research with businesses. This approach was considered the most economical and efficient method of conducting research amongst large numbers of businesses in Northern Ireland. All interviewing was carried out by Millward Brown’s executive telephone interviewers from their dedicated in-house CATI telephone centre. Every business in Northern Ireland had an equal opportunity of being contacted for interview. Quota controls were put in place to ensure that the sample was fully representative of the marketplace in terms of company size, location and industry sector. To accurately reflect the demographic profile of small Northern Ireland businesses the sample was weighted at analysis stage using the latest Inter Departmental Business Register (IDBR) data. Line 24 Omnibus survey question 1 As was done previously in the benchmark survey conducted in 2014, consumers were asked about their ‘satisfaction with the services’ provided by NI Water, their opinion of NI Water and levels of trust that NI Water is being effectively monitored.

Annual Information Return 2018 Section 2 Chapter 5 Page 15 of 18
Overall satisfaction with NI Water has significantly improved amongst domestic consumers, increasing from 80% in 2014 to 93% in 2017. Uplift can similarly be seen, and indeed is more stark, amongst the non-domestic market, increasing from 58% to 90% in the same period. In terms of favourability non-domestic consumers have a more positive impression, although both customer groups increase significantly compared to 2014. Over four fifths (81%) of domestic consumers and almost 9 in 10 (88%) of non-domestic consumer said they have a favourable impression of NI Water. This compares to 63% and 51% seen respectively in the benchmark wave. Almost four fifths of households (78%) and businesses (82%) trust that NI Water is being effectively monitored. This represents a significant improvement on this metric since the 2014 benchmark when domestic and non-domestic customers scored 65% and 45% respectively. Amongst the domestic consumer sample, views in relation to satisfaction with services tend not to vary by gender or socio-economic group, but to improve with age of respondent with the 65+ age group being most satisfied (see Figure 4.1.2 where this sub-sample scores a net satisfaction1 figure of 95%). Satisfaction with services too varies little by area, however those in urban locations (44%) [Particularly Belfast, 47%] were more likely to ‘strongly agree’ that they are satisfied with the services they receive. Those with a disability were slightly less likely to express satisfaction overall with water services, scoring a net satisfaction figure of 85% compared to 91% amongst those without a disability. There was little difference in satisfaction by housing tenure, although the most favourable top box score (‘strongly agree’) can be seen amongst those residing in Northern Ireland Housing Executive properties (45%). Amongst the non-domestic sample larger businesses were more likely to agree that they are satisfied with services received from NI Water, where businesses with 11+ employees score in excess of 90% in terms of net satisfaction. Moreover, manufacturing/construction businesses were typically more satisfied (net satisfaction 88% compared with 81% amongst service industry businesses). The overall score achieved was 92.4. Line 25 Omnibus survey question 2 In place of the Omnibus Survey, an Interim PC15 Research piece was carried out by Millward Brown, as previously agreed with the regulator. The question within the research for this line remained the same in that Customers were asked ‘how likely they would be to recommend NI Water Company to a friend or colleague if they could choose a different provider’. As per the table below the score was calculated based on the overall average which returns a score between 0-10. Of the 1026 domestic customers surveyed the average was 8.23 and of the 250 commercial customers surveyed the average was 7.85. The overall score achieved was 8.2.

Annual Information Return 2018 Section 2 Chapter 5 Page 16 of 18
NI Direct Flood Line NI Direct Floodline (FIL) was launched on 30 January 2009, as a single contact telephone number for customers in the event of a flooding incident. This telephone number is not one of NIW’s advertised PACC numbers and is provided through a separate Call Centre managed by NI Direct. NI Direct operate as a ‘triage’ service, taking the details of the incident from the customer and directing their issue to the relevant agency for appropriate action. Following a change in supplier within NI Direct during 2012/13, the integrated interface between FIL and NI Water systems was severed creating a gap in the process which NI Water were forced to bridge. This resulted in FIL contacts being received by e-mail and manually logged onto the NI Water CRC system by agents. The new FIL contract went live on 1st December 2012, and following some initial manual logging the automated connection went live on 9th July 2013 between the FIL CRM and Rapid, in order to ensure that customer contacts relevant to NIW are logged on Rapid and work orders processed via Ellipse where necessary. During the reporting period circa 428 work orders were received by the Company from FIL. Confidence Grades Call volume data is derived using a combination of telephony systems, the HVCA system for automated calls and Call Media that draws information from the Avaya system for agent handled calls. In March 2014, the Telephony supplier changed from Cable & Wireless to BT. This switch was relatively seamless, with only a minor impact on lines busy due to the technical handover and these calls were excluded for reporting purposes As per methodology, the process of reconciliation between the telephony systems is largely manual, as calls transferring from CallMedia are deemed to be received in HVCA; however the confidence grade assigned to the data remains at ‘A2’, as per the AIR guidance.

Annual Information Return 2018 Section 2 Chapter 5 Page 17 of 18
Call Handling Satisfaction retains the confidence grade of ‘A2’ as it is conducted independently and the results are provided to NI Water by Allto.

Annual Information Return 2018 Section 2 Chapter 5 Page 18 of 18
Table 1: HVCA (2017/18) Annex A Calls received/answered to HVCA
Details YTD Apr-17 May-17 Jun-17 Jul-17 Aug-17 Sep-17 Oct-17 Nov-17 Dec-17 Jan-18 Feb-18 Mar-18
Total calls received (HVCA) 2577 142 230 288 52 235 167 144 130 113 147 613 316
Total calls answered (HVCA) 1583 78 149 164 32 135 87 86 77 69 103 405 198
% Calls transferring to HVCA based on total calls received
Ave 1.10% 0.82% 0.98% 1.38% 0.30% 1.11% 0.91% 0.76% 0.64% 0.74% 0.73% 3.30% 1.38%
Abandoned on HVCA
Details YTD Apr-17 May-17 Jun-17 Jul-17 Aug-17 Sep-17 Oct-17 Nov-17 Dec-17 Jan-18 Feb-18 Mar-18 Total of Abandoned Calls (Call Media) 1034 86 99 102 43 105 70 97 56 39 89 152 96
Total of Abandoned Calls (HVCA) 994 64 81 124 20 100 80 58 53 44 44 208 118
Total of Abandoned Calls 2028 150 180 226 63 205 150 155 109 83 133 360 214 % Calls Abandoned (Including HVCA)
Ave/Total 0.96% 0.95% 0.90% 1.18% 0.40% 1.07% 0.90% 0.90% 0.61% 0.59% 0.74% 2.12% 0.74%
% Calls Abandoned (Excluding HVCA)
Ave/Total 0.49% 0.54% 0.49% 0.53% 0.27% 0.55% 0.42% 0.56% 0.31% 0.28% 0.49% 0.90% 0.90%
% Calls Abandoned (HVCA) Ave/Total 38.57% 45.07% 35.22% 43.06% 38.46% 42.55% 47.90% 40.28% 40.77% 38.94% 29.93% 33.93% 37.34%

NORTHERN IRELAND WATER LIMITED - ANNUAL INFORMATION RETURN
ANNUAL INFORMATION RETURN - TABLE 5A KEY OUTPUTSCUSTOMER COMPLAINTS DATA FOR CONSUMER COUNCIL FOR NORTHERN IRELAND (TOTAL)
DESCRIPTION UNITS DP2012-13 CG 2013-14 CG 2014-15 CG 2015-16 CG 2016-17 CG 2017-18 CG 2018-19 CG 2019-20 CG 2020-21 CG
A TOTAL WRITTEN COMPLAINTS1 Total written complaints nr 0 3,173 B2 2,505 B2 2,364 B2 2,269 B2 2,375 B2 2,274 B22 Number dealt with within 10 working days nr 0 3,166 B2 2,498 B2 2,363 B2 2,266 B2 2,375 B2 2,271 B23 Number dealt with in more than 20 working days nr 0 1 B2 2 B2 0 A1 2 B2 0 B2 3 B2B CATEGORY OF WRITTEN COMPLAINTS
(i) Charges and Bills4 Total written complaints about charging and billing issues nr 0 1,567 B2 839 B2 906 B2 890 B2 935 B2 699 B25 Total written complaints about charging and billing issues escalated to second stage review nr 0 381 B2 149 B2 124 B2 92 B2 87 B2 72 B2
(ii) Water Service 6 Total written complaints about water service issues nr 0 448 B2 552 B2 555 B2 505 B2 600 B2 616 B27 Total written complaints about water service issues escalated to second stage review nr 0 71 B2 52 B2 52 B2 33 B2 29 B2 51 B2
(iii) Sewerage Service8 Total written complaints about sewerage service issues nr 0 689 B2 493 B2 434 B2 487 B2 533 B2 579 B29 Total written complaints about sewerage service issues escalated to second stage review nr 0 82 B2 42 B2 31 B2 29 B2 43 B2 73 B2
(iv) Metering 10 Total written complaints about metering issues nr 0 123 B2 133 B2 107 B2 104 B2 75 B2 91 B211 Total written complaints about metering issues escalated to second stage review nr 0 25 B2 28 B2 11 B2 4 B2 5 B2 9 B2
(v) Other activities12 Total written complaints about other service issues or activities nr 0 346 B2 488 B2 362 B2 283 B2 232 B2 289 B213 Total written complaints about other service issues or activities escalated to second stage review nr 0 82 B2 124 B2 51 B2 18 B2 14 B2 22 B2C OTHER CUSTOMER RESPONSE MEASURES14 Number of holding responses issued nr 0 695 B4 351 B4 294 B4 413 B2 326 B4 286 B415 Consumer Council investigations nr 0 27 B2 40 B2 28 B2 34 B2 30 B2 23 B2
5REPORTING
YEAR REPORTING
YEAR REPORTING
YEAR
431REPORTING
YEAR
2REPORTING
YEAR
6REPORTING
YEAR
7REPORTING
YEAR
8 9REPORTING REPORTING
YEAR YEAR


Annual Information Return 2018 Section 2 Chapter 5a Page 2 of 2
complaint. Second stage complaints have not been analysed to determine whether they would be deemed upheld or unjustified by the Company. Sampling audits were performed throughout the year to ensure accuracy of categorisation. Other Customer Measures Within the PC10 Final Determination, stakeholders agreed to introduce monitoring systems to allow reporting of: the number and frequency of repeat complaints; and the number and frequency of holding responses.
Whilst there is no data line to report on repeat complaints, those complaints reported as having been escalated to second stage review could be interpreted as representing the number of repeat written complaints. Monitoring systems have been in place throughout the reporting period to support reporting on the number holding responses issued throughout 17/18. System-based report data was used to derive the number of holding responses issued between 01/04/17 and 31/03/18. The figure reported in Line 14 is the total recorded number of holding responses issued to customers during 17/18 owing to pending investigations linked to open DG7 contacts which were received in 17/18. It does not include holding responses issued within 17/18 in relation to DG7 contacts received in the previous reporting year. The reported figure does not represent the number of singular DG7 contacts for which one or more holding response was issued. In cases where the investigations were ongoing by the expiry date of the initial holding response, a further holding response will have been issued.

NORTHERN IRELAND WATER LIMITED - ANNUAL INFORMATION RETURN
ANNUAL INFORMATION RETURN - TABLE 6A BAD DEBT OUTSTANDING REVENUE AND BREAKDOWN OF CUSTOMER SERVICES OPERATING EXPENDITURE (TOTAL)
DESCRIPTION UNITS DP2012-13 CG 2013-14 CG 2014-15 CG 2015-16 CG 2016-17 CG 2017-18 CG 2018-19 CG 2019-20 CG 2020-21 CG
A REVENUE OUTSTANDING - MEASURED HOUSEHOLDSLines 1 to 14 not used
B REVENUE OUTSTANDING - UNMEASURED HOUSEHOLDSLines 15 to 28 not used
C REVENUE OUTSTANDING - MEASURED NON HOUSEHOLDS29 Total revenue outstanding < 48 months (measured non households) £m 3 7.972 A2 8.260 A2 8.739 A2 7.220 A2 7.305 A2 7.009 A230 Number of measured non households with outstanding revenue < 48 months nr 0 15,348 A2 14,570 A2 14,645 A2 17,091 A2 11,715 A2 11,517 A231 Revenue outstanding < 3 months (measured non households) £m 3 6.891 A2 7.189 A2 7.525 A2 5.530 A2 5.376 A2 5.611 A232 Number of measured non households with outstanding revenue < 3 months nr 0 10,588 A2 10,053 A2 10,415 A2 10,405 A2 7,992 A2 8,576 A233 Revenue outstanding 3 - 12 months (measured non households) £m 3 0.952 A2 0.928 A2 0.960 A2 0.758 A2 1.100 A2 0.629 A234 Number of measured non households with outstanding revenue 3 - 12 months nr 0 2,925 A2 3,108 A2 2,815 A2 4,889 A2 2,368 A2 1,906 A235 Revenue outstanding 12 - 24 months (measured non households) £m 3 0.012 A2 0.039 A2 0.088 A2 0.435 A2 0.446 A2 0.362 A236 Number of measured non households with outstanding revenue 12 - 24 months nr 0 1,049 A2 911 A2 992 A2 1,142 A2 922 A2 737 A237 Revenue outstanding 24 - 36 months (measured non households) £m 3 0.117 A2 0.104 A2 0.166 A2 0.497 A2 0.383 A2 0.407 A238 Number of measured non households with outstanding revenue 24 - 36 months nr 0 786 A2 498 A2 423 A2 656 A2 433 A2 298 A239 Revenue outstanding 36 - 48 months (measured non households) £m 3 0.000 0.000 0.000 0.000 0.00040 Number of measured non households with outstanding revenue 36 - 48 months nr 0 0 0 0 0 041 Revenue outstanding > 48 months (measured non households) £m 3 0.000 0.000 0.000 0.000 0.00042 Number of measured non households with outstanding revenue > 48 months nr 0 0 0 0 0 0
D REVENUE OUTSTANDING - UNMEASURED NON HOUSEHOLDS43 Total revenue outstanding < 48 months (unmeasured non households) £m 3 0.402 A2 2.627 A2 2.566 A2 2.604 A2 2.647 A2 2.600 A244 Number of unmeasured non households with outstanding revenue < 48 months nr 0 1,542 A2 10,114 A2 9,302 A2 9,664 A2 8,881 A2 8,679 A245 Revenue outstanding <3 months (unmeasured non households) £m 3 0.111 A2 2.349 A2 2.350 A2 2.282 A2 2.351 A2 2.211 A246 Number of unmeasured non households with outstanding revenue < 3 months nr 0 155 A2 8,826 A2 8,591 A2 8,224 A2 8,102 A2 8,056 A247 Revenue outstanding 3 -12 months (unmeasured non households) £m 3 0.025 A2 0.165 A2 0.070 A2 0.154 A2 0.132 A2 0.203 A248 Number of unmeasured non households with outstanding revenue 3 - 12 months nr 0 256 A2 697 A2 195 A2 190 A2 256 A2 160 A249 Revenue outstanding 12-24 months (unmeasured non households) £m 3 0.241 A2 0.005 A2 0.116 A2 0.113 A2 0.116 A2 0.126 A250 Number unmeasured non households with outstanding revenue 12 - 24 months nr 0 894 A2 184 A2 448 A2 662 A2 366 A2 326 A251 Revenue outstanding 24-36 months (unmeasured non households) £m 3 0.025 A2 0.108 A2 0.030 A2 0.055 A2 0.048 A2 0.060 A252 Number of unmeasured non households with outstanding revenue 24 - 36 months nr 0 237 A2 407 A2 68 A2 588 A2 157 A2 137 A253 Revenue outstanding 36 -48 months (unmeasured non households) £m 3 0.000 0.000 0.000 0.000 0.00054 Number of unmeasured non households with outstanding revenue 36 - 48 months nr 0 0 0 0 0 055 Revenue outstanding >48 months (unmeasured non households) £m 3 0.000 0.000 0.000 0.000 0.00056 Number of unmeasured non households with outstanding revenue > 48 months nr 0 0 0 0 0 0
E REVENUE WRITTEN OFF57 Amount of revenue written off from measured households £m 3
57a Amount of revenue written off from measured non-households £m 3 1.094 A2 0.844 A2 0.666 A2 1.237 A2 0.341 A2 0.474 A258 Amount of revenue written off from unmeasured households £m 3
58a Amount of revenue written off from unmeasured non-households £m 3 0.173 A2 0.094 A2 0.110 A2 0.083 A2 0.045 A2 0.056 A2
F CUSTOMER SERVICES OPERATING EXPENDITURE59 General customer services operating expenditure Total £m 3 6.418 A2 6.767 A2 6.284 A2 6.337 A2 6.898 A2 6.453 A2i Employment costs £m 3 3.673 A2 3.408 A2 3.188 A2 3.501 A2 3.972 A2 3.933 A2ii Hired and contracted costs £m 3 3.139 A2 3.392 A2 3.188 A2 3.018 A2 2.876 A2 2.593 A2iii Other £m 3 0.611 A2 0.739 A2 0.819 A2 0.738 A2 0.985 A2 0.951 A2iv Adjustments £m 3 -1.005 B3 -0.772 B3 -0.911 B3 -0.920 B3 -0.935 A2 -1.024 A260 Outstanding revenue collection operating expenditure (households) £m 3
60a Outstanding revenue collection operating expenditure (non households) £m 3 2.118 DX 2.269 DX 2.242 DX 1.934 DX 1.950 A2 2.098 A261 Donations to charitable trusts assisting customers in debt (households) £m 362 Operating expenditure due to vulnerable household customers £m 363 Total customer services operating expenditure £m 3 8.536 A2 9.036 A2 8.526 A2 8.271 A2 8.848 A2 8.551 A2
1
YEAR REPORTING
YEAR
4REPORTING
2REPORTING
YEAR
3REPORTING
YEAR
5REPORTING
YEAR
6REPORTING
YEAR
7REPORTING
YEAR
8 9REPORTING REPORTING
YEAR YEAR
Annual Information Return 2018 Section 2 Chapter 6a Page 1 of 8
Table 6a – Bad Debt Overview The company operates a partnership with an external service provider (Echo) for customer contact and billing. Customer Services Delivery Directorate works closely with the supplier on all billing matters including debt recovery, designations of customers for write off of debt and estimation of the level of bad debt provisioning to be put in place for potential future write-offs. The service provider furnishes monthly information for non-domestic measured water and trade effluent income, cash, write-offs, VAT and closing debtor balances to the company from the billing system (RapidXtra). This information is used to produce the monthly management accounts. The figures in Table 6a are derived from this information. The figures contained within the table are clarified below: Box A – Revenue Outstanding – Measured Households For the year ended 31 March 2018 NI Water had no actual revenue from households as this is received by way of a subsidy from Department for Infrastructure (“DfI”). There was £1.57m due to NIW from DfI for subsidy at 31 March 2018. This figure varies to the Statutory Accounts as Septic Tank subsidy is not reported in AIR as it is classified as non-appointed income under UKGAAP. Box B – Revenue Outstanding – Unmeasured Households As above, income is received by way of a subsidy from DfI. Box C – Revenue Outstanding – Measured Non-Households Revenue outstanding from non-households is the amount of revenue relating to measured water, measured sewerage and trade effluent charges that had been billed in the year but not collected at 31 March 2018. At 31 March 2018 the closing trade debtor balance was £7.009m. Trade Debtors decreased this year largely due to the settlement of outstanding billing queries. The debtor balance reported figure is made up of various GL codes and is calculated as measured water and sewerage debtors (including Trade Effluent debtors) less unreconciled receipts, bad debt provision and provision for discount. The bad debt provision is £2.156m and is made up of the following:
£0.173m for debt over 4 years £0.097m for debt 3 - 4 years £0.324m for debt 2 – 3 years £0.748m for debt 1 – 2 years £0.683m for debt 90 – 365 days £0.131m for debt less than 90 days
There is one GL code for measured water and sewerage debtors. At year end the GL debtor balance (gross of credit balances) was approx. £2.1m less than the detailed debtors listing provided by Echo. This was due to the following:
Future system adjustments (£1.7m) Other adjustments (£0.4m)

Annual Information Return 2018 Section 2 Chapter 6a Page 2 of 8
Row 29 – Total Revenue Outstanding < 48 months - Measured Non Households The total amount of revenue at the end of 2017/18 outstanding from measured non households for less than 48 months. Balance as at 31 March 2018 was £7.009m. Row 30 – Number of Measured Non-Households with Outstanding Revenue < 48 months The number of measured non households with revenue outstanding for less than 48 months at 31 March 2018 was 11,517. The number of households has been adjusted in line with the decrease in debtors taking account of anticipated future system adjustments and other adjustments of £2.1m. The £2.1m is approximately 15% of total outstanding debtors at 31 March 2018 of £13.9m. An assumption was made to apply a 15% reduction across all measured revenue age groups up to 36 months. Row 31 – Revenue Outstanding < 3 months (Measured Non Households) The total amount of revenue at the end of 2017/18 that has been outstanding from measured non households for less than 3 months. Balance as at 31 March 2018 was £5.611m. Row 32 – Number of Measured Non-Households with Outstanding Revenue < 3 months The number of measured non households at end of 2017/18, with revenue outstanding for less than 3 months. As at 31 March 2018 this totalled 8,576. Row 33 – Revenue Outstanding 3-12 months (Measured Non Households) The total amount of revenue at the end of 2017/18 that has been outstanding from measured non households for at least 3 months but less than 12 months. Balance as at 31 March 2018 was £0.629m. Row 34 – Number of Measured Non-Households with Outstanding Revenue 3-12 months The number of measured non households at end of 2017/18 with revenue that has been outstanding for at least 3 months but less than 12 months. At 31 March 2018 this totalled 1,906. Row 35 – Total Revenue Outstanding 12-24 months (Measured Non Households) The total amount of revenue at the end of 2017/18 outstanding from measured non households for at least 12 months but less than 24 months. At 31 March 2018 this totalled £0.362m. Row 36 – Number of Measured Non-Households with Outstanding Revenue 12-24 months The number of measured non households at end of 2017/18 with revenue that has been outstanding for at least 12 months but less than 24 months. At 31 March 2018 this totalled 737. Row 37 – Total Revenue Outstanding 24-36 months (Measured Non Households) The total amount of revenue at the end of 2017/18 outstanding from measured non households for at least 24 months but less than 36 months. At 31 March 2018 this totalled £0.407m.

Annual Information Return 2018 Section 2 Chapter 6a Page 3 of 8
Row 38 – Number of Measured Non-Households with Outstanding Revenue 24-36 months The number of measured non households at end of 2017/18 with revenue that has been outstanding for at least 24 months but less than 36 months. At 31 March 2018 this totalled 298. Row 39 – Number of Measured Non-Households with Outstanding Revenue 36-48 months The number of measured non households at end of 2017/18 with revenue that has been outstanding for at least 36 months but less than 48 months. Once the bad debt provision is applied there are no debtors greater than 36 months. Therefore at 31 March 2018 this row and all remaining rows in box C are zero. Box D – Revenue Outstanding – Unmeasured Non-Households Revenue outstanding from non-households is the amount of revenue relating to unmeasured water and sewerage charges that had been billed in the year but not collected at 31 March 2018.
At 31 March 2018 the closing trade debtor balance was £2.600m (31 March 2017, £2.647m).
The debtor balance reported figure is made up of unmeasured water and sewerage debtors less bad debt provision. The bad debt provision is £0.086m and is made up of the following:
£0.007m for debt over 4 years £0.004m for debt 3 - 4 years £0.013m for debt 2 – 3 years £0.030m for debt 1 – 2 years £0.027m for debt 90 – 365 days £0.005m for debt less than 90 days
Row 43 – Total Revenue Outstanding < 48 months - Unmeasured Non Households The total amount of revenue at the end of 2017/18 outstanding from unmeasured non households for less than 48 months. Balance at 31 March 2018 was £2.600m. Row 44 – Numbers of Unmeasured Non-Households with Outstanding Revenue < 48 months The number of unmeasured non households at the end of 2017/18 with revenue that has been outstanding for less than 48 months. Total at 31 March 2018 was 8,679. Row 45 – Revenue Outstanding < 3 months - Unmeasured Non Households The total amount of revenue at the end of 2017/18 outstanding from unmeasured non households for less than 3 months. Balance at 31 March 2018 was £2.211m. Row 46 – Numbers of Unmeasured Non-Households with Outstanding Revenue < 3 months The number of unmeasured non households at the end of 2017/18 with revenue outstanding for less than 3 months. Total at 31 March 2018 was 8,056.

Annual Information Return 2018 Section 2 Chapter 6a Page 4 of 8
Row 47 – Revenue Outstanding 3-12 months - Unmeasured Non Households The total amount of revenue at the end of 2017/18 outstanding from unmeasured non households for at least 3 months but less than 12 months. Balance at 31 March 2018 was £0.203m. Row 48 – Numbers of Unmeasured Non-Households with Outstanding Revenue 3-12 months The number of unmeasured non households at end of 2017/18 with revenue outstanding for at least 3 months but less than 12 months. Total at 31 March 2018 was 160. Row 49 – Revenue Outstanding 12-24 months - Unmeasured Non Households The total amount of revenue at the end of 2017/18 outstanding from unmeasured non households for at least 12 months but less than 24 months. Balance at 31 March 2018 was £0.126m. Row 50 – Numbers of Unmeasured Non-Households with Outstanding Revenue 12-24 months The number of unmeasured non households at end of 2017/18 with revenue outstanding for at least 12 months but less than 24 months. Total at 31 March 2018 was 326. Row 51 – Revenue Outstanding 24-36 months - Unmeasured Non Households The total amount of revenue at the end of 2017/18 outstanding from unmeasured non households for at least 24 months but less than 36 months. Balance at 31 March 2018 was £0.060m. Row 52 – Numbers of Unmeasured Non-Households with Outstanding Revenue 24-36 months The number of unmeasured non households at end of 2017/18 with revenue outstanding for at least 24 months but less than 36 months. Total at 31 March 2018 was 137. Row 53 – Revenue Outstanding 36-48 months - Unmeasured Non Households The total amount of revenue at the end of 2017/18 outstanding from unmeasured non households for at least 36 months but less than 48 months. Once the bad debt provision is applied there are no debtors greater than 36 months. Therefore at 31 March 2018 this row and all remaining rows in box D are zero. Box E – Revenue Written Off Bad debt write-offs The bad debt write off policy is detailed below. As with all other customer data the company receives monthly figures for bad debt write-offs. The figure for the year is £0.530m (2016/17, £0.386m). Authorisation of bad debt write-off With regard to writing off bad debts the service provider has authorisation to write off in accordance with the financial delegations.


Annual Information Return 2018 Section 2 Chapter 6a Page 6 of 8
Allocation of High, Medium and Low A review of the total debtors (debit balances) was carried out in March 2018. Account balance and aged debt taken into consideration when applying risk of default. Data was filtered by VAT SIC code and the following steps were taken: Top customers were reviewed by name. All public sector accounts reviewed e.g. Health Trusts, Education Boards, Schools - <30
days Low; if >30days, Med. Agricultural customers grouped and reviewed - >£5K reviewed individually and set to
HIGH. £1k to £5k reviewed individually and set to HIGH if debt > 180 days, or MED if <180 days. DD customers low.
Retail customers grouped and reviewed. Hotels, bars and restaurants reviewed - Final account no forwarding address – high risk. Charities, voluntary groups, housing associations, churches grouped and reviewed. Construction companies, quarries grouped and reviewed. Accounts with STD VAT code reviewed individually, direct debit payers on MED (these
accounts are mainly new customers who have not yet completed VAT questionnaire, so we can't be sure of activity).
Manufacturers grouped and reviewed by name (high value) and activity (lower value). Food processors grouped and reviewed. Unmeasured customers in sic code 6 classified as HIGH. Unmeasured customers in sic code 8 (Banks and professional services) classified as
LOW or MED. Banks all at MED risk. All final accounts classified as HIGH risk. VAT code:
1 Energy as low unless debt greater than £180 days then med. 2 Minerals - <30 days med. > 30 days high. 3 Metal Goods and Engineering - DD - Low. >180 days High 4 Other manufacturing - >180 days high if not Key account or DD. 5 Construction < 30 days med. > 30 days high 6 Distribution/Catering <30 days Med. > 30 days High 7 Transport > 60 days High. <60 days med 8 Banking & Finance - DD Low 9 Other services:- - DD Low, >£1k, Med - Std Vat Rate unknown > 180 days high. - DD Med unless final a/c <180 days, if >£1k high. - Domestic Property - > 180 days high, <180days and <£100 low.
- Redundant zero Vat - Med. Mitigation accounts set as HIGH RPA accounts set as HIGH. Reduction in Provision NIW provides against aged debt through the bad debt provision, applying a methodology based on age profile and industry. It is recognised that a proportion of the old debt will not
Provision0-30 days
31-60 days
61-90 days
91-120 days
121-150 days
151-180 days
180-365 days
1 - 2 years
2 - 3 years
3 - 4 years
4+ years
High 5% 5% 10% 10% 35% 65% 80% 100% 100% 100% 100%Medium 2% 2% 2% 2% 20% 35% 65% 100% 100% 100% 100%Low 1% 1% 1% 1% 10% 20% 30% 50% 75% 100% 100%

Annual Information Return 2018 Section 2 Chapter 6a Page 7 of 8
in fact be written off as bad debt but will be eliminated via negative system adjustments and thus be a reduction in income rather than a bad debt expense. Using the monthly analysis of system adjustments carried out, an estimate of the future system adjustments was made for measured water and measured sewerage only. This was done on the basis of the adjustments in previous months, resulting in an estimate of £1.7m of future system adjustments. Bad Debt Provision Summary The following is a summary of the bad debt provision at 31 March 2018 and 31 March 2017:
2018 2017 £m £m Measured water & sewerage
1.821 2.455
Unmeasured water & sewerage
0.086 0.350
Trade effluent 0.335 0.169 Total 2.242 2.974
Subsidy NI Water received £270.6m subsidy in relation to household customers in 2017/18 with nothing outstanding from DfI at 31 March 2018. NI Water received £15.59m subsidy in relation to non-household customers and at 31 March 2018 an amount of £1.57m was outstanding from DfI. The total subsidy for non-households for the year ended 31 March 2018 was £17.16m. This figure varies to the Statutory Accounts as Septic Tank subsidy is not reported in AIR as it is classified as non-appointed income under UKGAAP. Lines 59 to 63 – Customer Services Operating Expenditure Line 59 – General customer services operating expenditure The line 59 total of £6.453m in AIR18 is a £0.45m decrease (6.45%) against the costs of £6.898m in AIR17. This arises for the following reasons:
Employment costs (decrease of £0.04m (1%)). Hired and contracted costs (decrease of £0.28m (9%)). Other costs (decrease of £0.03m (4%)).
Line 60 – Outstanding revenue collection operating expenditure (households) As NI Water has no actual revenue from households, there is no revenue outstanding from households and therefore no operating expenditure for outstanding revenue collection. Line 60a – Outstanding revenue collection operating expenditure (non-households) The calculation of this figure was based on the split of the Gross Service Charge from Echo (Northern Ireland) Ltd. In addition, an estimate of some internal NIW collection costs was included. Line 61 – Donations to charitable trusts assisting customers in debt (households): There were no donations to charitable trusts assisting customers in debt in the year.

Annual Information Return 2018 Section 2 Chapter 6a Page 8 of 8
Line 62 – Operating expenditure due to vulnerable household customers Household customers in Northern Ireland currently do not pay for water and sewerage services; therefore, NI Water issues no bills to ‘vulnerable household customers’. Line 63 – Total customer services operating expenditure This agrees to the total of table 21, line 13 and table 22, line 12.

NORTHERN IRELAND WATER LIMITED - ANNUAL INFORMATION RETURN
ANNUAL INFORMATION RETURN - TABLE 7 NON FINANCIAL MEASURESWATER PROPERTIES & POPULATION (TOTAL)
DESCRIPTION UNITS DP2012-13 CG 2013-14 CG 2014-15 CG 2015-16 CG 2016-17 CG 2017-18 CG 2018-19 CG 2019-20 CG 2020-21 CG
A PROPERTIES1 Household properties connected during the year 000 3 4.154 B2 3.611 B2 4 224 B2 5.461 B2 6.327 B2 7.267 B22 Non-household properties connected during the year 000 3 0.195 B2 0.204 B2 0.26 B2 0.366 B2 0.319 B2 0.349 B2
B BILLING3 Households billed unmeasured water 000 3 681.095 A2 688.832 B2 694 934 A2 703.772 A2 717.015 A2 729.388 A24 Households billed measured water (external meter) 000 3 0.000 A1 0.000 A1 0 000 A1 0.000 A1 0.000 A1 0.000 A15 Households billed measured water (not external meter) 000 3 0.000 A1 0.000 A1 0 000 A1 0.000 A1 0.000 A1 0.000 A16 Households billed water 000 3 681.095 A2 688.832 B2 694 934 A2 703.772 A2 717.015 A2 729.388 A27 Household properties (water supply area) 000 3 721.698 A2 729.182 B2 734 976 A2 743.090 A2 755.769 A2 767.888 A28 Non-households billed unmeasured water 000 3 10.896 A2 10.271 A2 9 589 A2 8.861 A2 8.602 A2 8.623 A29 Non-households billed measured water 000 3 69.158 A2 69.567 A2 69 645 A2 69.813 A2 70.150 A2 70.417 A210 Non-households billed water 000 3 80.054 A2 79.838 A2 79 234 A2 78.674 A2 78.751 A2 79.040 A211 Non-household properties (water supply area) 000 3 92.466 A2 92.286 A2 91 541 A2 90.796 A2 90.286 A2 89.806 A212 Void properties 000 3 53.015 A2 52.798 B2 52 350 A2 51.439 A2 50.288 A2 49.266 A2
C POPULATION13 Population - households billed unmeasured water 000 2 1,709.66 B2 1,718.73 B2 1,731.65 B2 1,747.72 B2 1,759.07 B2 1,766.56 B214 Population - households billed measured water 000 2 0.00 A1 0.00 A1 0.00 A1 0 00 A1 0.00 A1 0.00 A115 Population - non-households billed unmeasured water 000 2 7.11 B3 6.78 B3 6.49 B3 4.47 B3 4.40 B3 4.44 B316 Population - non-households billed measured water 000 2 102.7 B3 102.28 B3 102.4 B3 98 08 B3 98.11 B3 98.17 B317 Population - total 000 2 1,819.47 B2 1,827.79 B2 1,840.54 B2 1,850 27 B2 1,861.58 B2 1,869.17 B2
8REPORTING
YEAR
9REPORTING
YEAR
6REPORTING
YEAR
7REPORTING
YEAR
5REPORTING
YEAR REPORTING
YEAR REPORTING
YEAR
41 2 3REPORTING
YEAR REPORTING
YEAR

Annual Information Return 2018 Section 2 Chapter 7 Page 1 of 11
Table 7 – Water Properties and Population Introduction Table 7 focuses on the number of properties and population connected to the public water supply system. It extends to 17 lines, set out in three blocks:
Block A Properties (Lines 1 & 2). Reports properties connected during the year. Block B Billing (Lines 3-12). Includes a breakdown of all measured and unmeasured
household and non-household properties billed by the company. The property numbers should be the average for the reporting year.
Block C Population (Lines 13-17). This records the population within each of the measured and unmeasured household and non-household categories. The population numbers should be the average for the reporting year.
In keeping with the Utility Regulator guidance, lines 6, 10 and 17 are calculated lines, being the sum of their equivalent lines within the table. Blocks are completed by the CSD Services - CS MI & Data (Blocks A & B) and Leakage DMU (Block C) teams. The information in this table is used in a number of core corporate calculations such as the water balance calculation and in tariff, charging analysis and determination (water delivered unit cost). Definition of ‘Billed’ Properties Domestic customers were originally due to be charged for water and sewerage charges from April 2007. However, this was deferred in April 2007 and has not been implemented since. There are no apparent plans for charges to be implemented during 2018/19. NI Water is subsidised for these domestic customers by Department for Regional Development (DRD) (note: DRD is the now Department for Infrastructure DFI) In April 2008, NI Water extended the charging in the non-domestic sector to include unmeasured non-households in addition to the measured non-household customer base. These charges are based on the NAV of the non-household property, derived from annual information provided by Land and Property Services (LPS). As per previous AIR submissions, for clarity, where reference is made in Table 7 to ‘billed’ household and ‘billed’ non-household, this is taken as the provision of water services to customers whether they are billed directly (non-domestic customers) or payment is made through subsidy by DFI (domestic customers). Classification of Farms As per Utility Regulator guidelines, farms were reclassified as billed non-households for AIR09 – this has remained for AIR18. This classification remains for AIR 18 and farms are included in the billed non-households. Previously, in AIR08, farms had been classified and reported as ‘billed’ households on the principle of their status and allocation of ‘domestic allowance’. Data Sources, Data Validation and Data Quality Projects The primary source of information for the new connections and property data in Table 7 is the customer-billing database, RapidXtra. Customer/Property information is updated through;
‘business as usual’ customer contacts, such as new connection requests, move in/move outs, or


Annual Information Return 2018 Section 2 Chapter 7 Page 3 of 11
creating a duplicate. The street name may also have changed from the time of New Connection to that of customer contact – street names can change in the early stages of site development).
3. Removal of properties as a result of data quality initiatives. a. Duplicate properties b. Reclassifications of properties that were recorded in error
4. Change in occupancy status – movement from void/vacant to occupied and vice-versa.
In addition to the above, further data quality requirements have been built into the new CBC Contract. They cover all aspects of the property life cycle (creating, amending and demolishing properties) and data degradation will be monitored/measured throughout. These system validations have been split into 4 delivery phases. The functionality for Phases 1-3 have been delivered, with the functionality for the Post Phase 3 data validations due to be delivered within the next database release/upgrade in August 2018. Off-system data cleanse is required before some of the system validation rules can be applied. No Water/Well Water No Water / Well Water and demolished properties are not included in the Table 7 property count, however, their exclusion does impact on the number of reported ‘supplied’ properties. Not all properties are connected to the public water supply system, but some will have a septic tank and will look to NI Water to avail of the free annual septic tank desludging service. During 17/18 the household no water/well water category increased by 11 and the non-household by 503. Throughout 18/19 we will continue to sample check the No Water/Well Water category to ensure properties are truly not connected for water. The Metering & Billing Project are currently aligning our data with LPS and on some occasions are adding properties that are not connected for water - this project is due to run until 2019. We are currently reviewing this category to ascertain if it would be worthwhile separating the No Water properties from the Well Water properties. Site Metered Properties As part of the ongoing data checks, NIW has been confirming the number of site-metered properties, which are multiple properties being charged through a single meter, such as business parks and industrial estates. To ensure that these properties are not double counted, they are not included in Table 7 non-domestic property counts (although NIW retain this information for customer record and charging purposes). There are 1744 domestic properties (an increase of 914 during 17/18) classified as site meters and there will be further investigation and analysis to be completed during 2018/2019 to ensure these are classified correctly. As above, the Metering & Billing project through their alignment with LPS data are adding additional site meter properties to Rapid. Overall, the number of non-domestic site meters has increased by circa 338 during 2017/18. This has resulted from categorisation movements in year such as measured water to site


Annual Information Return 2018 Section 2 Chapter 7 Page 6 of 11
to the population of farms. The number of farms has been determined from the company’s Rapid system and the occupancy rate is obtained from NISRA https://www.nisra.gov.uk/sites/nisra.gov.uk/files/publications/HHP12 Table4.xls It should be noted that there was a significant change in the communal population from AIR15 to AIR17 and the average household occupancy rate from 2.45 to 2.53. This is the first publication from NISRA since the 2011 census regarding these figures. The communal population for AIR18 is 24,886 compared to 32,612 as used in AIR15. The farm population is 30,748 x 2.53 = 77,731. Therefore with the addition of the communal population, the non-household population is 102.62 (x1000). The connected household population is the difference between the non-household population and the overall connected population. This gives the household population a figure of 1766.56 (x1000) (Line 13). The confidence grade for this line is a B2. This line remains the dominant figure within Section C of Table 7. The population for non-household measured/unmeasured was derived from the percentage split between measured (not including farms) and unmeasured non-household properties and applied against the NHH communal population. The total farm population (77,731) has been classed as measured. The communal population (24,498) is split based on 8,623 unmeasured customers (17.85%) and 39,688 measured customers which excludes farms (82.15%). This therefore provides a population for measured NHH of 98.17 (x1000) (Line 16) and an unmeasured NHH population of 4.44 (x1000) (Line 15). Line 17 is calculated by summing Line 13 + Line 14 + Line 15 + Line 16. This gives a figure of 1869.17 (x1000) which is the total connected population. It is recognised that the primary means of determining population numbers is from data published by NISRA. Bearing this in mind NI Water, as in previous years, has endeavoured to populate a confidence grade against the various lines. The Reporter has previously stated that in doing so the company has made a reasonable effort to assign appropriate confidence grades and accepts that NI Water has no influence over the methodology adopted by NISRA.


NORTHERN IRELAND WATER LIMITED - ANNUAL INFORMATION RETURN
ANNUAL INFORMATION RETURN - TABLE 8 NON FINANCIAL MEASURESWATER METERING (TOTAL)
DESCRIPTION UNITS DP2012-13 CG 2013-14 CG 2014-15 CG 2015-16 CG 2016-17 CG 2017-18 CG 2018-19 CG 2019-20 CG 2020-21 CG
A HOUSEHOLD METER INSTALLATION1 Selective meters - installed nr 0 3,078 B3 3,030 B3 3,787 B3 5,218 B3 1,395 B3 0 B32 Meter optants installed nr 0 0 A1 0 A1 0 A1 0 A1 0 A1 0 A13 Meters installed - external meter with existing or new boundary box nr 0 3,078 B3 3,031 B3 3,787 B3 5,218 B3 1,395 B3 0 B34 Meters installed - external meter without boundary box nr 0 0 A1 0 A1 0 A1 0 A1 0 A1 0 A15 Meters installed - internal meter nr 0 0 A1 0 A1 0 A1 0 A1 0 A1 0 A16 No. of meter installation requests outstanding for greater than three months nr 0 0 A1 0 A1 0 A1 0 A1 0 A1 0 A1
B NON HOUSEHOLD METER INSTALLATION7 Selective meters - installed nr 0 692 B2 458 B2 509 B2 473 B2 449 B2 601 B2
7a Number of non household meters renewed nr 0 4,653 B2 6,772 B2 6,044 B2 9,830 B2 9,671 B2 3,156 B28 Meter optants installed nr 0 45 B2 23 B2 18 B2 20 B2 57 B2 61 B29 Meters installed - external meter with existing or new boundary box nr 0 638 B2 396 B2 472 B2 469 B2 452 B2 614 B2
10 Meters installed - external meter without boundary box nr 0 17 B2 22 B2 37 B2 22 B3 38 B3 37 B311 Meters installed - internal meter nr 0 82 B2 62 B2 18 B2 2 B2 16 B2 11 B212 No. of meter installation requests outstanding for greater than three months nr 0 10 B2 8 B2 1 B2 2 B2 6 B2 4 B2
C WATER DEMAND AT RECENTLY METERED NON-HOUSEDHOLD PROPERTIES13 Average water billed - selective metered properties l/prop/d 2 363.53 B3 520.74 B3 449 68 B3 384 09 B3 532.55 B3 580.74 B3
5REPORTING
YEAR REPORTING
YEAR REPORTING
YEAR
431REPORTING
YEAR
2REPORTING
YEAR
6REPORTING
YEAR
7REPORTING
YEAR
8 9REPORTING REPORTING
YEAR YEAR

Annual Information Return 2018 Section 2 Chapter 8 Page 1 of 3
Table 8 – Non Financial Measures – Water Metering Regulations made in 2016 removed the Art 81 obligation on NI Water to meter newly connected domestic premises. The company never installed meters at existing domestic premises or at the request of domestic customers (including those over 60 years of age) given the deferral of charging by the Northern Ireland Assembly (NIA) in March 2007. The company did not exercise its power to meter domestic properties upon change in occupancy or ownership for the same reasons as stated above. For these reasons the company has entered zero in lines 2, 4, 5 and 6 of section A table 8. Information is however provided in lines 1 and 3. Line - 1 Selective meter’s installed NI Water no longer installs meters at newly connected domestic premises for reasons stated above, no domestic premises had meters fitted in the reporting year. Line 3 - Meters Installed – external meter with existing boundary box All newly connected domestic properties are provided with a boundary box at or as close to the boundary as possible when connected to the water main. As such all new domestic properties have the capability to have a water meter fitted. NI Water no longer installs meters at newly connected domestic premises for reasons stated above, no domestic premises had meters fitted in the reporting year. Lines 7-12 - Non household meter installation NIW installs water meters at newly connected non-domestic premises as per the obligation associated with Article 81 of The Water and Sewerage Services (Northern Ireland) Order 2006. The company in an attempt to increase its meter penetration where permissible is continuing to install meters across its non-domestic revenue generating customer base, providing it is technically possible to do so. Line 7 - Selective meters installed Meters installed at the behest of NI Water include those properties selected because they are new non-domestic connections or fall into the selective category. The total selective meter installs for the year was 601. New connections accounted for 37 large and 279 small diameter installations, the other 285 installations are classed as selectives performed by the metering contractor and NIW staff. Line 7a - Number of non-household meters renewed NIW has a reactive meter maintenance section within the MCT and reactively replaces meters and street furniture associated with meters. The maintenance activities are driven by reports generated by the meter readers, meter query technicians and project teams. All Meter Maintenance Requests (MMR’s) are logged on a local database and channelled through a maintenance process. The MMR’s are forwarded to the maintenance contractor who has a maximum of 28 days to complete the replacement or remedial work and return the associated data. The returned data is processed by the MCT and meter exchanges are notified to the individual who requested the job, the CSC (for billing purposes) and the Corporate Asset Register (for asset management reasons). The meter maintenance process is an end to end process managed by the metering section using a corporate process flow

Annual Information Return 2018 Section 2 Chapter 8 Page 2 of 3
system known as Savvion linked to the corporate billing system. During the reporting year NIW meter maintenance section replaced 1425 meters through the MMR process. NIW also had a Proactive Meter Exchange (PME) programme which was designed to target a number of small diameter meters exchanges each year. The meters selected for exchange are those deemed to be 17 years of age or more and where possible those meters with a whole life consumption reading >8000m3. During the reporting year, NIW exchanged 272 meters under the PME programme. An additional 480 meters were replaced through an Engineering and Procurement contract for water mains rehabilitation. Other teams within NI Water replaced a total of 979 meters during the course of their activities and investigations. The total number of meters replaced by NIW in the reporting year combining all of the above work streams was 3156 meters. Line 8 - Meter optants installed NIW will install meters at existing non-domestic premises when a customer requests a meter and providing it is technically possible to do so. An optants process is in operation and has been communicated across the company to include the Customer Services Centre (CSC). If an unmeasured customer contacts the company and requests the option to have their premises billed as a measured (metered) property and it is determined following a survey to be possible, a meter will be installed. It is the company preference to install meters externally in boundary boxes or in chambers however if this is not technically possible an internal meter will be considered. The total number of non-domestic meter optants for the reporting year was 61. Line 9 - Meters installed – external meter with existing boundary box NI Water continues to actively install external meters across a number of metering work streams which includes optants and other selective non-domestic customer properties. While the majority of these are fitted in existing boundary boxes which essentially entails screwing in a meter, other installations can only be completed with the replacement of the boundary box. This involves replacing legacy stop tap boxes often referred to as ‘Toby’ boxes and replacing them with modern proprietary boundary box units. The total number of non-domestic meters installed within this category was 614. Line 10 - Meters installed – external meter without boundary box NI Water Developer Services Team (DS) is responsible for coordinating new non-domestic water connections and meter installations >32mm diameter. These large connections by the nature of their size require a chamber constructed to facilitate the meter and valves installations, these totalled 37 in the reporting year. Line 11- Meters installed – internal meters NI Water’s preference is to install meters externally when possible. Internal installations are only considered and undertaken when the possibility of an external installation has been discounted because of engineering difficulties, shared supplies or an inability to capture the total volume of water entering a property. Internal meters have been installed across the selective and optant metering programmes. The total number of internal non-domestic meter installations completed this reporting year was 11.


NORTHERN IRELAND WATER LIMITED COMPANY - ANNUAL INFORMATION RETURN
ANNUAL INFORMATION RETURN - TABLE 9 NON FINANCIAL MEASURESWATER QUALITY (TOTAL)
DESCRIPTION UNITS DP2012-13 CG 2013-14 CG 2014-15 CG 2015-16 CG 2016-17 CG 2017-18 CG 2018-19 CG 2019-20 CG 2020-21 CG
A WATER TREATMENT AND DISTRIBUTIONLines 1 to 5 not used
B6 Raw water deterioration Ml/d 3 23.100 A2 3 654 A2 3.559 A2 15.364 A2 15.322 A2 44 561 A27 Conditioning water supplies to reduce plumbosolvency Ml/d 3 563 648 A2 562 851 A2 560.429 A2 562.876 A2 571.703 A2 570 584 A28 Reducing the risk from Cryptosporidium Ml/d 3 0 000 A1 0 000 A1 0.000 A1 0.000 A1 0.000 A1 0 000 A19 Other Ml/d 3 22 952 A2 0.000 A1 106.441 A2 0.000 A1 0.000 A1 0 000 A1
2REPORTING
YEAR
5REPORTING
YEAR REPORTING
YEAR REPORTING
YEAR
43
DISTRIBUTION INPUT COVERED BY WORK PROGRAMMES AGREED WITH DWI
8 9REPORTING REPORTING
YEAR YEAR
6REPORTING
YEAR
7REPORTING
YEAR
1REPORTING
YEAR

Annual Information Return 2018 Section 2 Chapter 9 Page 1 of 4
Table 9 – Water Quality Background – Year on Year The perceived quality of water supplied by NI Water to customers has risen slightly over the last number of years:
NI Water now assesses compliance using % Overall Compliance across customer tap, WTWs, SRs and Authorised Supply Points rather than Mean Zonal Compliance. Under this means of assessment, NI Water’s compliance has risen slightly from 99.86% in 2016 to 99.88% in 2017 (figure assessed by NI Water - waiting for confirmation from DWI).
The Drinking Water OPA (based on turbidity, iron, manganese, faecal coliforms, Total Trihalomethanes (THM) and aluminium at customer tap) decreased from 99.50% in 2015 to 99.13% in 2016, but has upturned to 99.49% in 2017 due largely to a number of THM exceedances in 2016
The percentage compliance measured at Water Treatment Works (WTWs) increased slightly from 99.89% in 2015 to 99.95% in 2016, but has dropped slightly to 99.93% in 2017.
The percentage compliance measured at Service Reservoir (SR) increased from 99.93% in 2015 to 99.95% in 2016 and has remained at 99.95% for 2017.
Please note a total re-zoning exercise was carried out for 2009 based on more accurate DMA data. The new 2009 and 2010 Water Supply Zones were not contiguous with the previous zones, and as such were given new codes and names, with the codes reflecting the leakage supply areas, and the names reflecting the supplying WTW / SR and the major conurbation in the zonal area. Following some small WTWs being taken out of service in 2010, some further zones were created for 2011 with new codes and names as before. For 2014 onwards some zonal boundaries were moved to more closely match leakage operational boundaries. The previous method of compliance assessment (Mean Zonal Compliance) gave undue emphasis on individual exceedances in small zones. The % Overall Compliance methodology treats all exceedances with the same emphasis. Line 6 – Raw water deterioration The data used for the estimation of average flow at WTWs in Table 9 lines 6-9 was supplied from operations leakage metering. For this return the Distribution Input was calculated as the average daily flow from the various individual sites or amalgamation of associated readings obtained from leakage metering. In accordance with the guidance, sites that were out of service at the end of the reporting period (the calendar year) will have been excluded and would be listed here. During 2010 - 2015 exceedances of MCPA were detected at Belleek, Seagahan and Carran Hill WTWs. A programme of enhanced monitoring for MCPA has been setup for these sites. Other sites had a similar enhanced monitoring for MCPA in place which has since been lifted.
Site Name
Ml/d Raw Water
Deterioration Comment Belleek 1.582 Enhanced sampling programme Carran Hill 5.156 Enhanced sampling programme Seagahan 9.857 Enhanced sampling programme
Total: 16.596

Annual Information Return 2018 Section 2 Chapter 9 Page 2 of 4
DWI is content with the above enhanced programme and the sites have not been included in the calculations. Authorised Departures are no longer likely to be used as regulatory instruments against NIW by DWI. Enforcement Orders (including “Consideration of Provisional Enforcement Orders”, “Provisional Enforcement Orders” and “Regulation Notices”) are now the methodology by which NIW is regulated by DWI. A CPEO for Derg WTW was closed in 2016, being replaced by a PEO due to contravention of the Regulatory Standard for the pesticide MCPA. A further CPEO for Ballinrees WTW was opened in 2017 for the pesticide MCPA. Including these 2 sites, the volume for Raw Water deterioration is therefore 44.561 Ml/d. Line 7 – Conditioning water supplies to reduce Plumbosolvency NI Water, as required by DWI following discussion with the Health Authorities, has put in place orthophosphoric acid dosing to control plumbosolvency in the distribution system. The average initial dose rate was approximately 1 mg/l following propensity testing. The level of dosing is reviewed annually against compliance with existing and future lead standards, with DWI being informed as to the proposed dosing rates. DWI has the opportunity to query the proposed dose rates. Following the annual review, some of the dose rates for 2017 were reduced with most however remaining at the same levels.
Site Name Average Dosed Water (ML/d)
Altnahinch 8.877 Ballinrees 29.071 Belleek 1.582 Carmoney 18.363 Carran Hill 5.156 Castor Bay 104.310 Caugh Hill 18.007 Clay Lake 3.308 Derg 15.489 Dorisland 15.856 Drumaroad 89.424 Dungonnell 7.703 Dunore Point 110.978 Fofanny 35.354 Forked Bridge 15.772 Glenhordial 3.859 Killyhevlin 23.961 Killylane 12.180 Lough Bradan 5.303 Lough Fea 10.860 Lough Macrory 10.437 Moyola 14.877 Seagahan 9.857 Total: 570.584

Annual Information Return 2018 Section 2 Chapter 9 Page 3 of 4
Line 8 – Reducing the risk from Cryptosporidium DWI approved Cryptosporidium risk assessments were previously carried out on all sources annually and showed effective barriers existed at all NI Water’s treatment works. These risk assessments are now incorporated into annual revisions of the treatment works and supply systems Drinking Water Safety Plans (DWSP) which are submitted to DWI under regulation 26. Under the current guidance, which requires that this should be assessed against sites with “legally binding instruments”, NI Water has no sites which fall into this category. The return for this line is therefore 0 Ml/d. Line 9 – Other There were no other legal instruments in place during 2016, therefore the return for this line is 0 Ml/d (see appendix). Confidence Grades Confidence grades used in returns are based on OFWAT guidance documentation.


NORTHERN IRELAND WATER LIMITED - ANNUAL INFORMATION RETURN
ANNUAL INFORMATION RETURN - TABLE 10 NON FINANCIAL MEASURESWATER DELIVERED (TOTAL)
DESCRIPTION UNITS DP2012-13 CG 2013-14 CG 2014-15 CG 2015-16 CG 2016-17 CG 2017-18 CG 2018-19 CG 2019-20 CG 2020-21 CG
A WATER DELIVERED - VOLUMES1 Billed measured household Ml/d 2 0 00 0.00 0 00 0.00 0 00 0.002 Billed measured non-household Ml/d 2 121.44 125.79 120.17 118.03 120 58 122.023 Billed measured Ml/d 2 121.44 125.79 120.17 118.03 120 58 122.024 Billed unmeasured household Ml/d 2 297.41 285.52 292 36 294.86 302.76 304.825 Billed unmeasured non-household Ml/d 2 6 87 6.07 5 82 5.28 5.17 5.146 Billed unmeasured Ml/d 2 304 28 291.59 298.18 300.14 307 93 309.96
B WATER DELIVERED - COMPONENTS7 Estimated water delivered per unmeasured non-household l/prop/d 2 630 51 C4 591.01 B4 606 98 B4 595.87 B4 601 02 B4 596.08 B47a Estimated water delivered per unmeasured household l/prop/d 2 436 66 B3 414.50 B3 420.70 B3 418.97 B3 422 25 B3 417.91 B38 Per capita consumption (unmeas'd h'hold - excl s/pipe leakage) l/h/d 2 149 98 B3 145.53 B3 148.42 B3 148.42 B3 151 89 B3 152.35 B39 Per capita consumption (meas'd h'hold - excl s/pipe leakage) l/h/d 2 0 00 0.00 0 00 0.00 0 00 0.0010 Underground supply pipe leakage (unmeas'd households) l/prop/d 2 60 20 51.22 50 87 50.38 49 62 48.9211 Underground supply pipe leakage (ext. metered households) l/prop/d 2 30.10 25.61 25.44 25.19 24 81 24.4612 Underground supply pipe leakage (other metered h'holds) l/prop/d 2 60 20 51.22 50 87 50.38 49 62 48.9213 Underground supply pipe leakage (void properties) l/prop/d 2 60 20 51.22 50 87 50.38 49 62 48.9214 Meter under-registration (measured households) Ml/d 2 0 00 0.00 0 00 0.00 0 00 0.0015 Meter under-registration (measured non-households) Ml/d 2 9 29 9.70 9 21 8.52 8 22 7.8116 Distribution system operational use Ml/d 2 2 36 2.39 2 51 3.05 2 93 3.5117 Water taken legally unbilled Ml/d 2 14.79 15.16 17.10 16.80 16.40 17.5718 Water taken illegally unbilled Ml/d 2 0 51 0.48 0.43 0.38 0 68 0.6619 Water taken unbilled Ml/d 2 15 30 15.64 17 53 17.18 17 08 18.2320 Water delivered (potable) Ml/d 2 441 02 433.02 435 88 435.35 445 59 450.2121 Water delivered (non-potable) Ml/d 2 0 00 0.00 0 00 0.00 0 00 0.0022 Water delivered (non-standard rates: potable) Ml/d 2 0 00 0.00 0 00 0.00 0 00 0.0023 Water delivered (non-standard rates: non-potable) Ml/d 2 0 00 0.00 0 00 0.00 0 00 0.0024 Distribution losses Ml/d 2 115.44 127.31 126 08 122.08 123 52 122.5225 Total leakage Ml/d 2 161.75 B4 167.21 B3 165 99 B3 161.99 B3 163.43 B3 162.43 B326 Distribution input Ml/d 2 558 82 B2 562.72 B2 564.47 B2 560.48 B2 572 04 B2 576.24 B227 Bulk supply imports Ml/d 2 0 00 0.00 0 00 0.00 0 00 0.0028 Bulk supply exports Ml/d 2 0 85 1.09 0 80 0.73 0 34 0.4429 Water treated at own works to own customers Ml/d 2 557 97 561.63 563 67 559.75 571.70 575.8030 Overall water balance CG B2 A1 A1 A2 B2 B2
C SECURITY OF SUPPLY31 Security of supply index - company's planned levels of service nr 0 100 100 100 100 100 10032 Not used
5REPORTING
YEAR
41REPORTING
YEAR
2REPORTING
YEAR
3REPORTING
YEAR REPORTING
YEAR YEAR YEAR YEAR
9REPORTING
YEAR
6 7 8REPORTING REPORTING REPORTING

Annual Information Return 2018 Section 2 Chapter 10 Page 1 of 19
Table 10 – Non Financial Measures - Water Delivered Introduction NI Water continues to follow the methodology as described in Chapter 10 of the Northern Ireland Authority for Utility Regulation (NIAUR) AIR18 Reporting Requirements and Definitions manual March 2018. In doing so it has adhered to the methodologies for estimating the water balance set out in the Demand Forecasting Methodology report produced by NERA on behalf of UKWIR. As a result of the Sustainable Economic Level of Leakage (SELL) study in PC13 as the method of deriving company leakage targets, NI Water has challenged themselves with the setting of a 12 Ml/d target reduction over the six year period of PC15, namely, 165 Ml/d to 153 Ml/d. For AIR15, the final reporting year of the PC13 period, NI Water reported a reconciled leakage figure of 165.99 Ml/d which was approximately 1 Ml/d above target and subsequently established a 15/16 target of 3 Ml/d reduction in reconciled leakage to bring the PC15 programme back to profile. For AIR17, NI Water reported a reconciled leakage figure of 163.43 Ml/d. For AIR18, the pre-MLE bottom up leakage figure of 160.09 Ml/d equated to a decrease of 0.84 Ml/d from AIR17. For AIR18, a household night use update was implemented which resulted in a reduction of BU leakage of 3.48 Ml/d. It is proposed that this parameter is calculated at the end of each reporting year and applied retrospectively. It is considered that the update of this parameter on an annual basis reflects a more accurate reported leakage calculation. In summary, the outputs of this water balance are that the Integrated Flow Method of leakage assessment has given a figure of 173.37 Ml/d for total leakage and the Minimum Night Flow Method has provided a figure of 160.09 Ml/d. When the resulting imbalance between the two methods of 13.28 Ml/d is compared to the Distribution Input figure of 577.62 Ml/d (pre-MLE), it provides a percentage discrepancy of 2.30%. This remains within the 5% tolerance set to enable a Maximum Likelihood Estimation method to be applied, using the squares method, and produces a reconciled leakage figure of 162.42 Ml/d. This figure is approximately 3.4 Ml/d behind the PC15 profiled leakage target of 159.00 Ml/d. Demand Analysis During the 2017/18 reporting year there has been an increase in the distribution input of 0.8% from a pre-MLE value of 573.23 Ml/d in AIR17 to 577.62 Ml/d in AIR18. The graph in Fig 1 below illustrates the monthly distribution input in AIR16, AIR17 & AIR18 and highlights a marked month on month increase in demand profile compared to the benign AIR16 DI. On comparison, the year-to-date DI average for AIR18 was less than AIR17 until mid-December 2017 when an outbreak of leakage was experienced from which recovery was challenging and prolonged and further compounded by an early March 2018 event. Fig. 2 shows AIR18 having a similar profile to AIR17 in regards to sunshine observations however, recorded rainfall was 30% greater than in AIR17. In the main, the rainfall was comparable for Q1 through to Q3 however, Q4 in AIR18 experienced a 73% increase in precipitation than the previous year’s Q4.

Annual Information Return 2018 Section 2 Chapter 10 Page 2 of 19
This, when observed with the prolonged negative weekly average ground temperature (fig. 3) from early November 2017 correlate to the initial DI increases in November followed by reported leakage increases in December. Although greater detection resources were maintained in order to recover from the previous year’s reconciled leakage increase, NRR analysis for 2017/18 indicates that NRR has been the highest since the 2010/11 winter freeze/thaw event for Q3 & Q4. This has challenged the leakage resource and management and has affected NI Water’s ability to reduce leakage to pre-AIR17 levels.
Fig 1
Fig 2

Annual Information Return 2018 Section 2 Chapter 10 Page 3 of 19
Fig 3
Fig 4 Data Quality NI Water has remained committed to improve data quality throughout the PC10 and PC13 periods and will continue this commitment throughout PC15.

Annual Information Return 2018 Section 2 Chapter 10 Page 4 of 19
With Netbase embedded as NI Water’s leakage reporting tool, the UKWIR 20th Percentile calculation of Bottom Up leakage remains as reported in AIR17 commentary and in keeping with the Reporter’s recommendations the Bottom Up error estimation is 10%. As reported in AIR17, DMA operability decreased from 78% in AIR15 to 73% in AIR16 which was impacted by a continuing telemetry outstation upgrade project and the Netbase update regarding continuously logged users. NI Water was focussed on recovering operability to prior year levels and reports a DMA operability value of 75% for March 2018. NI Water is focussed on the continued improvement of operability however continues to be impacted by infrastructure upgrades, improvements and recent winter events. Trunk Mains & Service Reservoirs With an aspiration towards the use of company specific calculations for all key aspects of the water balance, NI Water continue to build on their trunk main and service reservoir leakage calculation through the primary use of flow balance assessments. In AIR15, NI Water completed the assessment of trunk main and service reservoir leakage based on flow meter balances, finding that 50% of the trunk main flow balance calculated leakage occurred within 10% of the trunk main flow balance audits. Although NI Water accepts that there may be leakage within these audits, the company is undertaking a number of proactive steps to identify and resolve issues. NI Water considers it prudent to fully investigate the audits with perceived leakage to understand the resource economics and uncertainty associated with flow balances for trunk mains and service reservoirs. NI Water is partnered with other E&W water companies regarding a continued project facilitated by WRc for determining uncertainties on large diameter upstream meters. Gross Measured Consumption As part of the annual tariff submission to the Utility Regulator, NI Water is required to submit the Principle Statement Information Capture System. One of the consistency checks in this submission is to compare the billed measured non-household volume (Table 10 Line 2) with the Principle Statement and for these volumes to reconcile to within 1%. Similar to previous years, reconciliation of both the Gross Measured Consumption Report and Principle Statement has closed to 0%. HDF In preparation for the PC15 submission, NI Water commissioned an SELL assessment to determine company leakage targets for submission years AIR16 to AIR21. As part of this review, HDF was assessed based on 2012/13 data and, as a result, it was deemed appropriate to update the HDF for AIR14 to 23.2. As part of continuing data enhancements, NI Water have commenced work on the development of a pressure model utilising Netbase, the comprehensive pressure managed area study (2500+ PMAs) and permanent pressure monitoring points (1500+ pressure points). This model will allow NI Water to calculate HDF on a more regular basis and it is envisaged that the reported HDF will be introduced during the PC15 period. An interim HDF value will be calculated as part of the current SELL.

Annual Information Return 2018 Section 2 Chapter 10 Page 5 of 19
Meter Under Registration It should be noted that the NIAUR has determined that, during the PC15 period, the non-household meter under registration (NHH MUR) figure shall reduce from 8.33%, which was derived for AIR10 by WRc utilising the NI Water meter age profile and meter sample tests, to 5.5% which is understood to be the current NHH MUR average for E&W companies. This reduction in NHH MUR is planned to be implemented linearly over the six years of the PC15 period, however it is proposed that a company specific MUR study will be commissioned during PC15. NI Water has acknowledged a risk to the water balance calculation in applying an unsubstantiated MUR figure which is moving the company away from the excellent work undertaken over recent years in terms of developing company specific data. For AIR17, NHH MUR has been updated to 6.92%. NI Water initiated both a non-household consumption MUR study and PCC monitor MUR study during AIR17. Leakage Capital Investment The PC15 leakage business plan clearly identified a number of key areas of capital investment to replace and improve our network/assets as well as the ongoing improvement in data availability and quality. The upgrade of DMA meters from GSM logger technology to telemetry status remains a priority project thus providing access to continuous data to assist leakage management, NI Water and the customer. At present 90% of all DMA sites are now monitored directly through telemetry with the remaining returning data via GSM loggers. This work is proposed to continue in the PC15 period. This has increased data availability and quality to enhance leakage monitoring, targeting and reporting as well as being available during major incidents. During 2017/18 projects were carried out to replace existing PRV stock that are operational across the network and to design, install and commission new PRV sites to optimise leakage reduction. This has resulted in 31 PRV replacements and 22 new PRV installations during the year. DMA optimisation continues to play an important role within the success of the function. In 2017/18 the resolution of High Volume DMAs has played a key part in this. The underlying objective has been initially to investigate the unique factors that cause these DMAs to behave in such a manner and subsequently to provide an engineering solution where possible to reduce leakage. As work has continued in regards to High Volume DMA studies, DMA optimisation and data quality improvements has resulted in excess of 190 infrastructure improvement schemes being identified and installed as part of the overall capital improvement programme. For reference, the table below states the variables/parameters which may impact upon the variance in individual water balance component calculations.

Annual Information Return 2018 Section 2 Chapter 10 Page 6 of 19
AIR17 AIR18 HDF (hrs) 23.2 23.2 UNHH consumption (m3/yr) 190.60 191.54 PCC MUR (%) 7.39 7.39 HH occupancy (nr) 2.53 2.53 NHH MUR (%) 7.39 6.92 SPL (Ml/d) 39.91 39.91 HH night use allowance (l/p/hr) 2.42 2.64 NHH night use allowance (l/p/hr) Dynamic
(19.81) Dynamic (20.22)
Per Capita Consumption (l/hd/d) 136.70 136.62 Projects regarding the review and analysis of the parameters listed in the table above continues with consideration and strategic planning required regarding the application and impact of updates in light of new and evolving water industry leakage reporting guidance. Line 1 – Billed Measured Household There are no billed measured households and the value is therefore zero. Line 2 – Billed Measured Non-Household The reported value for water delivered to non-households has increased from 120.59 Ml/d in AIR17 to 122.02 Ml/d in AIR18. In AIR15, after a full review, the Gross Measured Consumption Report (GMCR) was revised, amended and recoded to reflect the changes in data handling and the evolution of the metering and property company datasets which resulted in the variance between the GMCR and the Principle Statement calculations closing within the recommended 1%. For AIR18, the variance between GMCR and the Principle Statement has been calculated and closes to 0%. The GMCR is used to derive the billed measured non-household consumption as stated in Table 10 Line 2. Similar to AIR17, the GMCR utilises metering data from the RAPID billing system. This volume does not include test meters that are not billed, trade effluent volumes, free supplies or NI Water supplies which are included under water taken unbilled. A non-household meter under-registration (MUR) value of 6.92% has been added to billed measured non-household use. It should be noted that the NIAUR has determined that, during the PC15 period, the non-household meter under registration (NHH MUR) figure shall reduce from 8.33%, which was derived for AIR10 by WRc utilising the NI Water meter age profile and meter sample tests, to 5.5% which is understood to be the current NHH MUR average for E&W companies. This reduction in NHH MUR is planned to be implemented linearly over the six years of the PC15 period, however it is proposed that a company specific MUR study will be commissioned during PC15. NI Water initiated non-household consumption MUR study during AIR17. It is expected that this project should conclude during AIR19. No allowance for underground supply pipe leakage has been added to this value as the measured non-households are all externally metered and therefore the billed consumption already includes underground supply pipe leakage (however, the figure for underground

Annual Information Return 2018 Section 2 Chapter 10 Page 7 of 19
supply pipe leakage for measured non-households has been estimated and is part of total leakage in other lines of the table). The confidence limit of 10% on this component has not been changed and is still considered to be appropriate. Line 3 – Billed Measured This is the summation of lines 1 and 2. Line 4 – Billed Unmeasured Household The reported value for Billed Unmeasured Household volume for AIR18 is 304.42 Ml/d. This figure represents an increase from the AIR17 value of 302.87 Ml/d. The net effect of an increased population combined with a slight decrease in calculated PCC has resulted in a similar reported figure to AIR17. The Billed Unmeasured Household volumes have been calculated by multiplying the average PCC figure for NI Water by the unmeasured household population. The method and sources of information are consistent with previous AIR returns. Similarly the source of the PCC figure is generated from the NI Water domestic consumption monitor. The household population figure is sourced from the Northern Ireland Statistics and Research Agency (NISRA) 2016. Adjustments are made to this household population figure to account for:
Non-Household Population – Sourced from the most recent NISRA 2016 based population projections in alignment with Table 7.
Unconnected Properties Population – The number of unconnected properties has been provided within NI Water by Rapid. The population of unconnected properties is determined by multiplying the assessed average occupancy from the NIHE Housing Condition Survey report by the number of unconnected properties.
Farm Population – The population of farms is included as non-household use. The population is calculated as the number of farms multiplied by the average occupancy rate from NISRA. The number of farms is sourced from RAPID (NI Water’s Billing System). The assessment takes into consideration farm properties that became void during 2017/18 but will have billed consumption associated with them.
PCC Night Use Allowance Assessment Underground Supply Pipe leakage has been applied to the billed unmeasured household volume component of this calculation. A meter under registration factor of 7.39% has been applied to this total volume. This percentage was assessed by WRc for AIR10 and is specific to NI Water’s domestic consumption monitor meters and has remained constant. NI Water initiated PCC monitor MUR study during AIR17. It is expected that this project should conclude during AIR19.
During the reporting year work has continued to maintain the reliability of this value:
A comprehensive door to door survey of approximately 30% of the Domestic Consumption Monitor Areas (21% of total PCC properties). The data from the 2017/18 surveys has been input into the AIR18 consumption monitor assessment. The overall occupancy rate is 2.39 for AIR18 and is unchanged from the AIR17 occupancy rate. The NISRA occupancy rate for Northern Ireland is 2.53 for 2017/18.
A figure of 1.5% continues to be applied to allow for the ‘Hawthorne Effect’ and is consistent with previous AIR submissions.

Annual Information Return 2018 Section 2 Chapter 10 Page 8 of 19
Use of company specific MUR value as determined by WRc.
The confidence limit of 10% on this component has not been changed and is considered to be appropriate. A sensitivity analysis of the billed unmeasured household calculation in relation to the NISRA published household occupancy rates concluded that the impact of published occupancy rate was not significant. Line 5 – Billed Unmeasured Non-Household The reported value for Billed Unmeasured Non-Household for AIR18 is 5.14 Ml/d. The value reported in AIR17 was 5.01 Ml/d. NI Water has continued with a programme of meter installation of unmeasured non-household properties. The assessed unmeasured non-household figure for AIR18 is 191.54 m3/prop/yr, which is an increase compared to a figure of 190.60 m3/prop/yr for AIR17. As these unmeasured non-households have an allowance that has been estimated from metered non-households then underground supply pipe leakage has not been included in this figure. A non-household company specific MUR value of 6.92% was applied for AIR18. The confidence limit of 15% on this component has not been changed and is considered to be appropriate.
Line 6 – Billed Unmeasured This is the summation of lines 4 and 5. Lines 7 to 30 – Water Delivered Components Line 7 – Estimated Water Delivered Per Unmeasured Non–Household The post MLE figure for estimated water delivered per unmeasured non-household for AIR18 is 596.08 l/prop/d. The figure reported for AIR17 was 600.58 l/prop/d.
The allowance for unmeasured non-household properties for AIR18 is 191.54 m3/prop/yr. The calculated figure for AIR17 was 190.60 m3/prop/yr. Line 7a – Estimated Water Delivered Per Unmeasured Household The post MLE figure for estimated water delivered per unmeasured household for AIR18 is 417.91 l/prop/d. The figure reported for AIR17 was 412.28 l/prop/d.
Line 8 – Per Capita Consumption (Unmeasured Household – Excluding Supply Pipe Leakage) The post MLE PCC figure for AIR18 is 152.35 l/hd/d. The figure reported for AIR17 was 151.92 l/hd/d. NI Water continues to employ domestic consumption monitors set up specifically to monitor unmeasured household consumption. These sites are small (average size of 48 properties), permanently bounded, monitored for leakage, and flows into them are recorded by meters. The average PCC figure (pre MUR) has been calculated as 136.64 l/hd/d. This assessment is based on 12 months consumption data from 1 April 2017 to 31 March 2018. This compares to a figure of 136.70 l/hd/d for AIR17.

Annual Information Return 2018 Section 2 Chapter 10 Page 9 of 19
A company specific MUR value of 7.39% has been used for unmeasured PCC. This figure has been provided by WRc as a result of a project commissioned by NI Water and is specific to NI Water’s domestic consumption monitor meters. A company specific domestic consumption monitor MUR study has been initiated and it is expected that this study should be completed by the end of the AIR19 reporting period. Line 9 – Per Capita Consumption (Measured Household - Excluding Supply Pipe Leakage) There are no measured household supplies in NI Water; therefore no value has been input against this line. Lines 10 to 13 – Underground Supply Pipe Leakage For PC13, NI Water engaged their Leakage Management Services consultant, RPS, to review the underground supply pipe assessment which has resulted in the reduction of total supply pipe leakage to 39.91 Ml/d from 46.31 Ml/d during PC10. This accounts for approximately 24% of total leakage. The total volume of Underground Supply Pipe Leakage was assessed using the recommended methodology contained in the UKWIR report ‘Towards Best Practice for the Assessment of Supply Pipe Leakage’ and based on 2012/13 company data. As SPL has remained constant at 39.91 Ml/d throughout the PC15 period, it is required to adjust the ‘per property’ assessed underground supply pipe unit values on an annual basis due to increasing property numbers. Therefore, the assessed SPL unit values of 52.49 & 26.25 l/prop/d, for unmeasured and measured properties respectively, require adjustment as they have been calculated using 2012/13 base year data resulting in a total SPL of 39.91 Ml/d. The SPL assessment will remain unchanged for the duration of the PC15 period as agreed with NIAUR, therefore the adjusted AIR18 unit values are 48.92 l/prop/d for unmeasured, other households and void properties, with a value of 24.46 l/prop/d being calculated for externally measured non-households. Work previously undertaken, utilising Ofwat published data, indicated that the majority of the water companies in England and Wales estimate the underground supply pipe leakage on externally measured properties to be approximately half that of internally measured and other properties. NI Water has continued to adopt this assumption. In NI Water, the unmeasured non-household use is based on the measured non-household use. Therefore this assumption will also be applied to the unmeasured non-household. The SPL calculation for NI Water is detailed in the NI Water Assessment of Leakage from Customer Supply Pipes (carried out by RPS) and has be reassessed in parallel with the AIR17 commissioned SELL study. It should be noted that the trend over recent reporting years has shown that the number of unreported customer side leakage defects, resulting in the issue of a Leak Notice, has continued to increase since the last SPL review utilising 2012/13 base data. In AIR18 leak notices increased by 20% from the previous year.

Annual Information Return 2018 Section 2 Chapter 10 Page 10 of 19
Lines 14 to 15 – Meter Under-Registration It should be noted that the NIAUR has determined that, during the PC15 period, the non-household meter under registration (NHH MUR) figure shall reduce from 8.33%, which was derived for AIR10 by WRc utilising the NI Water meter age profile and meter sample tests, to 5.5% which is understood to be the current NHH MUR average for E&W companies. This reduction in NHH MUR is proposed to be implemented linearly over the six years of the PC15 period. NI Water initiated both a non-household consumption MUR study and PCC monitor MUR study during AIR17. It is expected that this project should conclude during AIR19. NI Water has acknowledged a risk to the water balance calculation in applying an unsubstantiated MUR figure which is moving the company away from the excellent work undertaken over recent years in terms of developing company specific data. For AIR17, NHH MUR has reduced to 6.92%. Furthermore the MUR value applied to the unmeasured household consumption remains at 7.39%. Line 16 – Distribution System Operational Use The reported value of Distribution System Operational Use (DSOU) for AIR18 is 3.51 Ml/d. The value reported for AIR17 was 2.93 Ml/d. This calculation is consistent with the AIR16 methodology. The confidence limit of 25% on this component has not been changed and is considered appropriate. Lines 17 to 19 – Water Taken Unbilled The reported Water Taken Unbilled figure of 18.23 Ml/d in AIR18 is an increase from the value of 17.09 Ml/d in AIR17. As a result of the findings and subsequent amendments to the gross measured consumption report, as discussed within the Data Quality section of this commentary, an element of billed measured NHH consumption reported in AIR17 has been transferred into the water taken unbilled component of the water balance. The methodology used to estimate each category within Water Taken Unbilled remains consistent with AIR17 with the addition of the ‘NHH property review project’ category which estimates the consumption currently not captured as billed measured non-household but the likely consumption billed after surveying is completed. Line 20 – Water Delivered (Potable) All potable water supplied by NI Water is calculated as the sum of lines 3, 6 and 19.

Annual Information Return 2018 Section 2 Chapter 10 Page 11 of 19
Line 21 – Water Delivered (Non-Potable) There are no non-potable supplies to NI Water customers. Line 22 – Water Delivered (Non-Standard Rates: Potable) There are no non-standard rates for potable supplies to NI Water customers. Line 23 – Water Delivered (Non-Standard Rates: Non-Potable) There are no non-standard rates for non-potable supplies to NI Water customers. Line 24 – Distribution Losses Distribution Losses for NI Water are calculated by subtracting Lines 16 (DSOU) and 20 (Water Delivered) from Line 26 (Distribution Input). Distribution Losses for AIR18 are estimated to be 122.52 Ml/d. This is a decrease on the AIR17 figure of 123.53 Ml/d. Line 25 – Total Leakage Total leakage is the sum of distribution losses and underground supply pipe leakage. The reported figure for total leakage for AIR18 is 162.43 Ml/d. The reported figure for AIR17 was 163.43 Ml/d. Total leakage is also calculated using an MNF methodology. For AIR18 the reported pre MLE MNF method leakage is 160.49 Ml/d. The figure reported for AIR17 was 161.33 Ml/d and equates to a decrease in BU leakage of 0.84 Ml/d. NI Water has an extensive DMA network (approx. 1090 DMAs) covering 98% of all properties in Northern Ireland. Approximately 90% of these DMAs are now monitored with electromagnetic meters with a direct link to the company telemetry system. The remaining DMAs are monitored through mechanical meters using GSM flow loggers. Whilst GSM loggers have an automatic link to the company’s telemetry system they do not have the facility to provide real-time data but provide a 24 hour daily download. DMA minimum night flow (MNF) continues to be determined using a 20th percentile method. Minimum night flows are recorded on a daily basis. The company specific night use allowance for households has been updated from 2.42 l/prop/hr to 2.64 l/prop/hr. It is proposed to review the household night use figure on an annual basis and applied retrospectively to the reported leakage calculation. The methodology to derive the household night use figure has not changed.
The measured non-household night use allowance figure for AIR13 was 8 l/prop/hr as documented in ‘Managing Leakage’, however as stated in the AIR14 commentary, Netbase has become the leakage reporting tool for AIR14 onwards which utilises an integrated night use model embedded within Netbase which was developed based on the best practice as outlined in the UKWIR Report ‘Estimating Legitimate Non-Household Night Use Allowances’ for AIR10. This model was calibrated using approximately 1000 customer datasets and dynamically assesses night use based on consumption and consumer industry type. The equivalent industry weighted measured non-household night use figure for AIR18 is approximately 20 l/prop/hr. It is proposed to review the non-household night use assessment through the initiation of a representative consumption logging programme during AIR19. This will be consistent with current industry best practice.

Annual Information Return 2018 Section 2 Chapter 10 Page 12 of 19
According to the guidance provided the reporting requirements for this line calculates total leakage by adding Distribution Losses (line 24) to the various calculated SPL components for MHH, UHH, MNHH, UNHH & voids. The SPL figure was reassessed for the PC13 period as 39.91 Ml/d. It was proposed that SPL would be reassessed during the PC15 period and as part of an SELL study. The reported SPL using 2015/16 base data is 43.64 Ml/d. As agreed with NIAUR for the inclusion of stable data during a PC reporting period, total customer SPL remains at 39.91 Ml/d, however it should be noted that the trend over recent reporting years shows that the number of unreported customer side leakage defects, resulting in the issue of a Leak Notice, has increased by 20% since the last SPL review utilising 2012/13 base data. Similarly, NI Water’s service reservoir leakage and trunk main leakage remains constant at 4.53 Ml/d and 13.66 Ml/d respectively. NI Water has continued to develop a company specific assessment for both trunk main and service reservoir leakage based on a flow balance methodology. This is consistent with the recommendations of the Reporter and Utility Regulator. NI Water continues to investigate potential leakage within these audits and is undertaking a number of proactive steps to identify and resolve leakage issues. However, NI Water consider it prudent to fully investigate the audits with perceived leakage to understand the resource economics and uncertainty associated with flow balances for trunk mains and service reservoirs. Further work is required to refine NI Water’s estimate and methodology particularly in relation to meter uncertainty. NI Water have engaged with other England & Wales water companies along with Scottish Water with a view of undertaking a joint research project into large diameter meter uncertainties in conjunction with WRc. In addition, NI Water will review the recently published UKWIR report “Leakage Upstream of District Meters”, and will assess trunk main and service reservoir leakage with a view to meet best practice. A 10% error estimate has been applied to BU Leakage in the MLE calculation following the implementation of Netbase for PC13. This reflects the continued improvement in data quality resulting in the reduction of the error estimate from 15% reported in AIR13. Line 26 – Distribution Input The distribution input figure for AIR18 has been calculated as a post MLE figure of 576.24 Ml/d. The distribution figure for AIR17 was 572.02 ML/d. The company specific confidence interval for distribution input for AIR17 remains at 2.1% and is unchanged from AIR17. The method of reporting and calculating the company distribution input figure remains consistent in that it is based on a definitive number of input meters. As in previous years, NI Water has continued with an annual programme of calibration of DI meters. In line with the guidance provided, details of the distribution input for each of the PPP Water Treatment Works site is as follows

Annual Information Return 2018 Section 2 Chapter 10 Page 13 of 19
pre-MLE
(Ml/d) post-MLE
(Ml/d) Ballinrees 29.53 29.48 Castor Bay 117.95 117.74 Dunore Point 110.00 109.81 Moyola 14.94 14.91 Total 272.42 271.94
Line 27 to 28 – Bulk Supply Imports / Exports There are no bulk imports of water to NI Water. There is one small import from the Republic of Ireland which supplies 3 properties. There are 74 small exports to the Republic of Ireland. These exports are predominately individually metered customers and these meters are read and billed through RAPID in a category known as cross border supplies. This figure is included in the metered non-household consumption category. The post MLE volume amounts to 0.44 Ml/d and includes an MUR adjustment of 6.92%. Line 29 – Water Treated At Own Works to Own Customers With the exception of the 74 small exports above, all water treated at its own works is used by NI Water’s own customers. The post MLE distribution input volume amounts to 576.24 Ml/d and deducting the cross border exports the volume of water treated at NI Water’s own works to its own customers is 575.80 Ml/d.


Annual Information Return 2018 Section 2 Chapter 10 Page 16 of 19
Addendum to Table 10 Achieving Leakage Target by AIR21
The Company met with the Reporter on Wednesday 13th June 2018 to discuss the AIR18 Leakage return, during which it was asked to provide further commentary on what the Company was doing to achieve the PC15 leakage target of 153 Ml/d by 31st March 2021 (AIR21), on the basis that the AIR18 outcome was reported as 162.43 Ml/d. The Company agreed to provide such in the form of this Addendum to the AIR18 paperwork as follows, which is a summary of the more detailed discussion with the Reporter. Restated AIR18 out-turn Given previous and in-year performance, and having initially reported the AIR18 draft leakage figure of 165.35 Ml/d, the Company has been reviewing the various components of the Water Balance to ensure that each provided an updated value. As mentioned to the Reporter, one of these was the Household Night Use (HHNU) figure, a company specific figure calculated at 2.42 l/prop/hr in PC13, which has been reassessed at 2.64 l/prop/hr during the SELL 2016 study utilising the same methodology. The impact of applying this parameter is very significant and when applied to the reconciled leakage it would reduce the AIR18 leakage figure to 162.43 Ml/d. We believe that this should be applied as it is a company specific figure and is consistent with best practice. Leakage Workshops/Meetings Quarterly workshops comprising key members of staff (including the Director of Customer Service Delivery) have been held since Summer 2016, the most recent of which (8th workshop) took place on 21st June 2018. The purpose of this workshop is to consider current leakage performance, trends and initiatives, and to provide strategic direction and focus to the leakage teams with a view to achieving leakage targets. Additional Targeted Reporting There has been significant and further progress in the development of targeted reports. One such report was presented to the Reporter which identifies the changes in leakage for the top 10 DMAs in the week, month and against Minimum Achieved Leakage (MAL). The reporting developments provide opportunity for focussed leakage detection and better toolset for leakage detection teams.

Annual Information Return 2018 Section 2 Chapter 10 Page 17 of 19
NRR NRR in AIR17 and AIR18 has been calculated at values above the SELL planning NRR and correlates directly with the reactive nature of leakage detection experienced over the last two years. Although NRR has increased, it should be noted that defect flow rates have reduced which in turn impacts the strategy of leakage targeting (greater number of smaller leaks). Typically, weekly leakage increases are the summation of small increases experienced across a large number of DMAs.
Analysis of reactive DMAs in conjunction with the number and type of defects, calculated NRR, man-hrs spent, leakage levels, AZNP, topography, etc. has resulted in a pilot number of DMAs undergoing extensive investment in multiple pressure management installations. Post-analysis of these pilot schemes has resulted in the DMAs becoming more stable and minimising leakage intervention. This analysis has been extended out to other DMAs and we will be reviewing and prioritising appropriate investment. Pressure Management Pressure management analysis and intervention is focused on reducing reactive leakage increases therefore concentrating NI Water’s leakage resource to proactively reduce leakage.

Annual Information Return 2018 Section 2 Chapter 10 Page 18 of 19
Existing pressure reduced and pumping PMAs are being analysed and optimised for leakage and HDF. Innovation & Technology Drones are being trialled both internally and by contractor to determine the effectiveness of locating leakage within DMAs of varying characteristics. The deployment of noise loggers has been trialled at a pilot level over the last year and as a tool to assist in the follow up of DMA step tests. Initial analysis has been positive and proved successful. The procurement and deployment strategy of noise loggers within the network are under consideration. Analysis of leakage outbreaks vs temperature shows a direct correlation with the rate of change of ground temperature. NI Water’s flow and pressure logger supplier have recently added a temperature logging functionality. We will be looking, with others within UK Water Industry, to see how the further use of technology can support leakage detection techniques. Customer Supply Pipe Leakage (CSPL) The AIR18 commentary highlighted the increasing number of leaks on customer supply pipes and leak notices issued to advise customers. A recent SELL study has determined that CSPL has increased from the currently reported 39.91 Ml/d to 43.64 Ml/d. The Company is currently commencing a review of the approach of other water utilities to customer supply pipe repair policy, such as the provision of a discretionary service for free or assisted pipe repair following an assessment of the property. The feasibility of this approach is being considered to determine the implications of adopting a revised policy in terms of costs, resource requirements, responsibility, etc. for the Company and the potential benefits for leakage. HDF A programme of works has commenced to calculate a fully dynamic HDF value. Incorporated within this programme are parallel studies to review pressure reducing and pump regimes in order to refine HDF values and to determine bespoke N1 infrastructure values. Smart Metering NI Water are currently deploying a number of Smart meters on to their billed customers. Suppliers are being consulted as to the frequency and method of data return. Smart metered data will be utilised within the leakage calculation to refine the NHHNU model in near real-time, for seasonal analysis and customer side leakage awareness. MUR As noted in the main commentary, NIAUR has determined that, during the PC15 period, the non-household meter under registration (NHH MUR) figure shall reduce from 8.33% to 5.5% which is understood to be the current NHH MUR average for E&W companies. NI Water have commissioned WRc to review NHH MUR and PCC MUR which is due to complete for AIR19.

Annual Information Return 2018 Section 2 Chapter 10 Page 19 of 19
It is considered appropriate to apply bespoke NI Water MUR values when available rather than a notional E&W average. Mains Rehabilitation Analysis of bursts and mains cohorts indicates that there is a prevalence of bursts on PVC mains (42%) and on mains greater than 50 years of age (25% of mains stock). With this analysis, it is proposed that network models and rehabilitation scheme generation are appropriately influenced. Resources NI Water has increased its leakage detection resource as well as putting in place a new detection contract from March 2018. In addition to maintaining the current levels of inhouse leakage detection teams, we have increased our investment in external leakage detection, which totalled nearly £2.0m. It is our intention to continue with this level of investment in 2018/19. This is an increase in expenditure of approximately £0.8m from 2016/17. Dynamic factors NI Water has remained committed to improve data quality throughout the Price Control periods and will continue this commitment throughout PC15 and beyond. NI Water’s aspiration is to develop a fully dynamic suite of water balance parameters which continue to align with best practice guidance and consistency reporting. Distribution Input Over the last 15 years, DI has decreased by 19% from 714 Ml/d to 576 Ml/d. A meter study in 2010 determined that meter uncertainty was 2.13% however, a proprietary investigation regarding the review of meter uncertainty indicates that a number of DI meters are now inappropriately sized. Since the 2010 study, DI has decreased by 9% and DI meter sizes have not changed for over 15 years. As DI is a fundamental component of the water balance calculation, it is deemed appropriate to investigate and install adequately sized metering. In addition, NI Water will continue in its partnership with other E&W companies through commissioned WRc projects determining meter uncertainty of large diameter upstream meters. It is considered that resizing DI meters will reduce the calculated Distribution Input figure and therefore leakage. Property Numbers Property numbers are a fundamental component of the leakage calculation and both Leakage DMU and CS Data teams have been working closely with external providers of property data (such as Land & Property Services – LPS) to reconcile datasets and compare property numbers, property type and occupancy status on a DMA by DMA basis.

NORTHERN IRELAND WATER LIMITED - ANNUAL INFORMATION RETURN
ANNUAL INFORMATION RETURN - TABLE 10A NON FINANCIAL MEASURESSECURITY OF SUPPLY INDEX - PLANNED LEVEL OF SERVICE (TOTAL)
1 2 3 4 5 6 7 8 9 10 11 12 13 14
North 55.08 50.00 0.00 75.28 74.61 29.80 4.73 25.07 31.33 257.123 0.00 0.000West 86.44 0.00 0.00 63.62 63.05 22.82 4.89 17.93 26.17 166.953 0.00 0.000Central 11.86 19.00 0.00 26.05 25.81 4.81 1.98 2.83 10.10 73.261 0.00 0.000East 146.51 207.00 0.00 259.82 257.51 93.69 19.47 74.22 26.57 943.826 0.00 0.000South 70.17 127.00 0.00 158.05 156.64 39.11 13.00 26.11 15.27 428.007 0.00 0.000Total 370.05 403.00 0.00 582.82 577.62 1869.170 0.000 100.000
Zonal index(%age deficit2x % populationaffected x 100)
Security ofsupplyindex
Surplus/deficit(Ml/d)
Percentagesurplus/ deficit(Ml/d)
Zonalpopulation
Percentage oftotal populationwith headroom
deficit
Dry yeardistributioninput (Ml/d)
Reportingyear
distributioninput (Ml/d)
Dry yearavailable
headroom(Ml/d)
Targetheadroom
(Ml/d)
Waterresource
zone
WAFU(EA definition)
(Ml/d)
Bulk imports(Ml/d)
Bulk exports(Ml/d)

Annual Information Return 2018 Section 2 Chapter 10a (i) Page 1 of 4
Table 10a (i) – Non Financial Measures - Security of Supply Index – Planned level of service
NI Water published its Water Resource Management Plan (WRMP) in 2012 which covers the period 2010-2035. The Security of Supply Index (SoSI) calculated for AIR18 is based on Ofwat’s letter RD 03/02, and is formulated from the information presented in the WRMP.
The WRMP has adopted the latest methodology for producing water resource management plans. There has been no change in the reported SOSI from AIR17. For 2017/18 the SoSI remains 100. This is mainly due to the following reasons:
The Water Available for Use has risen slightly due the additional capacity from the River Strule Abstraction (11.6Ml/d) in the West WRZ. The Distribution Input (DI) has increased slightly from last year. In 2016/17 the total average DI was 573.23 Ml/day, this has risen by 0.77% to 577.62 in 2017/18, and this is based on the Post Maximum Likelihood Estimation (MLE) figure.
There are also a number of other factors that influence the AIR18 SoSI calculation. These include:
There is a significant interaction between South and East water resource zones(WRZs). The WRMP indicates it is likely that circa 20Ml/d from Castor Bay is actuallyused within the East WRZ. This reallocation of Water Available for Use (WAFU)between East and South is believed to be a more accurate reflection of the actualsituation on the ground.
The Water Available for Use (WAFU) across Northern Ireland has risen slightly from358.68Ml/d in 2016/17 to in 370.05Ml/d in 2017/18. This is mainly due to theadditional capacity from the River Strule Abstraction (11.6Ml/d) in the West WRZbrought online in 2017/18.
Outage allowance for NI Water WTWs remains at 2% as indicated in the WRMP forthe period 2010-2035.
For this calculation, it has been assumed that the bulk imports from the PPP WTWsare available at the contracted volumes as set out in the WRMP.
The total population figure used within the SoSI calculation has been confirmed to correspond with the population figure used in AIR 18 Table 7.
As part of the Reporters Recommendations for AIR18 he stated that ‘Recommend as part of the WMRP update the Company continues to investigate if data exists to further refine the normal year uplift.’
NI Water has completed the Draft 2017 Water Resource and Supply Resilience Plan (WR&SRP), which is currently awaiting ministerial sign-off. Some of the WR&SRP outputs have been used in the calculation of the ‘dry year uplift factor.’ The ‘dry year uplift factor’ refers to the % uplift that should be applied to average demand (Ml/d) in a normal weather year to estimate the average demand (Ml/d) in a dry weather year. Three approaches were assessed:
Increased Summer Demand Increased Summer PCC Monthly weather-demand modelling
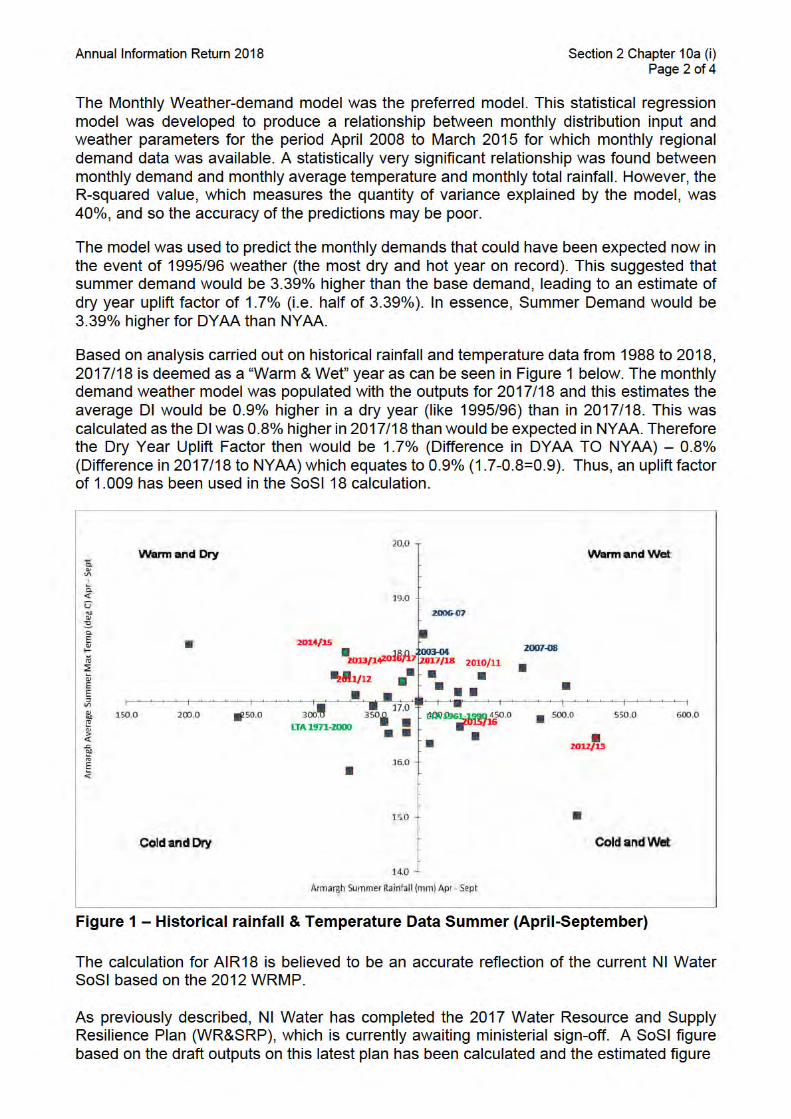

Annual Information Return 2018 Section 2 Chapter 10a (i) Page 3 of 4
is 100. There have been changes to a number of the inputs in the calculation, based on the Draft 2017 WR&SR Plan, these are detailed below:
1. The 2017 WR&SR Plan has seen the creation of two additional WRZs, increasingfrom 5 WRZs to 7 WRZs:
a. The 2012 West WRZ has been split into two zones, the West WRZ and theSouth West WRZ. The reason for this split is the lack of connectivity acrossthe new WRZ boundary resulting in differing levels of risk between the zones.
b. The 2012 South and East WRZs have been split into 3 zones (South, East andNorth East) which better reflect the operation of the supply system.
c. Supply to Belfast has been combined into the new East WRZ as there isextensive interconnectivity in this area.
d. The selection of the North East/East resource zone boundary is based on thelimited connectivity between the Water Supply Zones (WSZs) along thisboundary. The exception is the bulk transfer from Dunore Point WTW, in theNorth East Zone, to Hydepark Service Reservoir (SR), in the Eastern Zone.However, as this provides a distinct and measured boundary point this wasconsidered an appropriate border.
e. The selection of the South/East boundary is based on the lack ofinterconnectivity between the WSZs along this line. While both zones havesupplies from Castor Bay WTW, they both have their own dedicated trunkmains direct from the WTW.
f. Rathlin Island has been included in the North WRZ as in the event of a watershortage on Rathlin, water from the North WRZ is tankered in to meet theshortfall.
2. The latest Water Available for Use (WAFU) figure has increased from the 2012 planby 12.08Ml/d to 773.77Ml/d and changes detailed below.
a. Table 1 on page 4, shows the comparison of the 2017 WR&SR Plan BaselineDO estimates with the results from the WRMP 2012. Overall, the total DO forNorthern Ireland appears to have had little change from the previousassessment. The WR&SR Plan Baseline DO estimate (using DYAA LoS) forNorthern Ireland has been calculated as 814.5 Ml/d, which is around a 25Ml/d increase from the 789.2 Ml/d overall DO from the previous planassessment. In order to facilitate the comparison between the twoassessments, the WRZs have been based on the WRMP 2012 WRZboundaries. Therefore, the South, East and North East WRZs DO estimateshave been combined to compare to the WRMP 2012 East and South WRZDO estimates. The DO results from West WRZ and South West WRZ havealso been combined in order to compare to the West WRZ estimates of theWRMP 2012.
Table 1: Comparison of 2017 WR&SR Plan and 2012 WRMP Baseline DO Estimates
WRZ (based on WRMP 2012 WRZs)
WRMP 2012 DO (Ml/d)
WR&SR Plan DO (DYAA) (Ml/d)
Comments
North 115.6 113
South and East 553.4 590
Camlough WTW has been decommissioned.
Differences in constraints including Drumaroad WTW capacity.

Annual Information Return 2018 Section 2 Chapter 10a (i) Page 4 of 4
WRZ (based on WRMP 2012 WRZs)
WRMP 2012 DO (Ml/d)
WR&SR Plan DO (DYAA) (Ml/d)
Comments
Lough Island Reavy modelled as a permanent source for Fofanny WTW.
Hydrological differences due to length of record and revised inflow sequences.
Central 31.1 32.5 Slight increase in Lough Fea output.
West 89.1 79 The differences are likely mostly due to different assumptions made on the license restrictions at the Derg/Strule.
NI Total 789.2 814.5
b. The outage allowance for NI Waters WTWs has increased from 2%, used inthe previous plan, to 5%. This was based on the available data for analysis,expert opinion as part of the 2017 WR&SR Plan, and benchmarked against areview of UK water companies’ data that showed that outage ranges from 2%to 8%.
3. The dry year uplift factor has decreased in the latest plan from 7% in 2012 to 1.7%.As described previously the 2017 WR&SR Plan figure was obtained from applyingthe monthly demand-weather model, developed as part of the 2017 WR&SR Planprocess, to the dry weather year 1995/96.

Annual Information Return 2018 Section 2 Chapter 10a (iii) Page 1 of 1
Table 10a (iii) – Non Financial Measures - Security of Supply Index – Critical Period (TOTAL)
The security of supply index has been calculated based on the outputs from the Water Resource Management Plan (WRMP) 2012.
In previous years, the assumption by NI Water was that a SOSI – Critical Period has not been required. The previous justification has been that:-
The supplies available to NI Water are dominated by abstractions from Lough Neagh, which can be considered an infinite hydrological storage resource. In addition, recent demand data does not suggest that there is a strong peak demand driver in Northern Ireland. For these reasons, it is not appropriate or necessary to consider the critical period scenario for Northern Ireland, because this is not the primary driver for investment to maintain the supply demand balance. On this basis, there has been no need for NI Water to develop a SOSI calculation for a critical period.
As part of the Reporters Recommendations for AIR15, he stated- Recommend the Company reassess the need for a Critical Period SOSI during its preparation of WRMP17.
As highlighted in AIR16 and AIR17 as part of the 2017 WRMP, critical periods were included within the analysis and it was felt a critical period SOSI should be available for AIR18. However there has been further slippage in the delivery of the draft plan and as consequence it will be AIR19 before the outputs could be used for the development of a critical period SOSI.

NORTHERN IRELAND WATER LIMITED - ANNUAL INFORMATION RETURN
ANNUAL INFORMATION RETURN - TABLE 11 NON FINANCIAL MEASUREWATER SERVICE ACTIVITIES (NI Water Only
DESCRIPTION UNITS DP2012-13 CG 2013-14 CG 2014-15 CG 2015-16 CG 2016-17 CG 2017-18 CG 2018-19 CG 2019-20 CG 2020-21 CG
A ASSET BALANCE AT APRIL 11 Total length of mains km 2 26,499 03 B3 26,700.79 B3 26,710.55 B3 26,712.44 B3 26,728.83 B3 26,778.15 B3
B CHANGES DURING REPORT YEAR2 Mains renewed km 2 285.42 A2 202.31 A2 164 91 A2 105 24 A2 161.29 A2 120 55 A23 Mains relined km 2 0 00 A1 0.00 A1 0 00 A1 0.00 A1 0.00 A1 0 00 A14 Mains cleaned (total) km 2 683.75 B3 1,096.52 B2 1,189.50 B2 1,191 68 B3 1,665.69 B3 2,008 61 B36 New mains km 2 89 05 B2 50.40 B2 118 24 B2 76.51 B2 75.22 B2 92.43 B2
6a Total length of new, renewed or relined mains km 2 374.47 252.72 A2 283.15 A2 181.75 B2 236.51 A2 212 98 A2
6bLength of new, renewed or relined mains delivered under the watermain rehabilitation programme km 2 326.41 226.13 A2 222 66 A2 116 92 A2 172.27 A2 126 00 A2
7 Mains abandoned and other changes km 2 357 29 A2 214.62 A2 208.09 A2 105 51 A2 167.55 A2 124 24 A2
8aLead communication pipes replaced as a consequence of water quality sample failures nr 0 20 B2 15 B2 37 B2 44 B2 43 B2
8bLead communication pipes replaced as a consequence of customers notifying NI Water that they are replacing their lead supply pipe nr 0 617 B2 566 B2 703 B2 599 B2 574 B2
8cOpportunistic lead communication pipes replacement undertaken under the watermain rehabilitation programme or during burst service pipe repairs nr 0 1239 A2 2747 A2 660 B2 1801 A2 76 B3
8dLead communication pipes replaced under the proactive lead replacement programme nr 0 0 A1 401 B2 1,922 B2 1,867 A2 1,767 A2
9 Total lead communication pipes replaced nr 0 1,271 B3 1,876 B3 3,729 B2 3,322 B2 4,311 A2 2,460 A210 Communication pipes replaced - other nr 0 8,566 B3 8,790 B3 7,469 B3 3,915 B3 5,608 B2 3,769 B211 Mains bursts per 1000km nr 0 93 B3 86 B3 85 B3 74 B3 80 B3 91 B3
C ASSET BALANCE AT MARCH 3112 Total length of mains km 2 26,700.79 B3 26,710 55 B3 26,712.44 B3 26,728 83 B3 26,778.15 B3 26,837.45 B3
D DISTRIBUTION STUDIES13 Cumulative number of distribution zone studies completed nr 0 71 A1 71 A1 71 A1 71 A1 71 A1 71 A114 Distribution zone studies ongoing nr 0 0 A1 0 A1 0 A1 0 A1 0 A1 0 A115 Total distribution zones identified for study nr 0 71 A1 71 A1 71 A1 71 A1 71 A1 71 A116 Cumulative % distribution zone studies completed % 1 100 A1 100 A1 100 A1 100.0 A1 100 0 A1 100 0 A117 Percentage population/properties - completed studies % 1 100 0 A1 100.0 A1 100 0 A1 100.0 A1 100 0 A1 100 0 A1
E WATER QUALITY COMPLIANCE MEASURES18 % overall compliance with drinking water regulations % 2 99.77 99.81 99 86 99.83 A2 99.86 A2 99 88 A219 % compliance at consumers tap % 2 99 63 99.74 99.78 99.74 A2 99.77 A2 99 81 A220 % iron compliance at consumers tap % 2 97 25 98.08 98 95 98.40 A2 98.66 A2 98 85 A221 % Service Reservoirs with coliforms in >5% samples % 2 0 00 0.00 A1 0 00 A1 0.00 A1 0.00 A1 0 00 A2
F NOMINATED WATER SERVICE OUTPUTS 22 Completion of nominated trunk main schemes nr 0 2 A1 0 A1 1 A1 2 A1 1 A1 0 A123 Completion of nominated water treatment works schemes nr 0 0 A1 0 A1 3 A1 1 A1 0 A1 0 A1
24Completion of nominated improvements to increase the capacity of service reservoirs and clear water tanks nr 0 1 A1 0 A1 1 A1 0 A1 0 A1 1 A1
G ADDITIONAL WATER SERVICE OUTPUT MEASURES25 Number of Catchment Management Plans nr 0 3 A1 5 A1 3 A1 7 A1 3 A126 Number of school visits nr 0 138 150 209 277 A1 257 A1 219 A127 Number of other education events nr 0 35 38 59 65 A1 64 A1 62 A1
28% Service Reservoirs where sample taps have been assessed and are to required standard % 1 0.0 A1 0 0 A1 72.9 A2
5REPORTING
YEAR REPORTING REPORTING
YEAR YEAR
431REPORTING
YEAR
2REPORTING
YEAR
8 9REPORTING REPORTING
YEAR YEAR
6REPORTING
YEAR
7REPORTING
YEAR


Annual Information Return 2018 Section 2 Chapter 11 Page 4 of 17
Sub Programme 23e: Appraisal of NI Water Infrastructure at Railways, DRD Road and Pipe Bridges (Water)
JI 048 Resilience of Pipelines Crossing Northern Ireland Railways Track This Project involves the slip lining, (insertion of a smaller pipe inside the existing pipe), to rehabilitate the pipeline. This work is not funded out of Watermains Rehabilitation. In this period 430m (0.43km) of pipeline under railway tracks were slip lined.
The total reported in the summary table above for non-nominated trunk mains, (which are not funded under the Watermains Rehabilitation Budget but funded from Sub Programmes 23c and 23e), is 10.98km. Line 2 - Mains renewed (km)
Line Description Units DP AD AD CG
CSD CSD CG
Total Overall CG
2 Mains renewed km 2 119.38 A2 1.17 B3 120.55 A2
Asset Delivery
The Asset Delivery team has continued its method of reporting on renewed mains in line 2 to comply with the Regulator’s Annual Information Return reporting requirements and definitions manual.
The Asset delivery Figure is made up of 108.4km of Watermains Rehabilitation and 10.98km (108.395km) of Trunk Main Rehabilitation= 119.38km
This figure does not include first time services Asset Delivery is the primary contributor to this information The confidence grade is A2
CSD Networks Water
CSD Networks Water has continued to manage some smaller schemes, for example, social housing redevelopments and minor mains diversions or realignments.
The confidence grade is B3 Future Reporting for Networks Water will continue to develop the established process for monthly reporting using MWM as a source for base information. The CSD mains renewal work is usually very low volume as is the case here. Overall Line Confidence Grade is A2 - The overall confidence grade is A2 due to the fact that the Asset Delivery return is 99 % of the total. The EP/Asset Delivery total contributes to the total WM Rehab progress, see summary comment at the beginning of this commentary. Line 3 - Mains relined (km) At present this activity is not carried out either by Networks Water or by Asset Delivery and the Confidence Grade is A1 as the total is zero. To ensure VFM and continuity is achieved, NIW have withheld the review of spray lining techniques until the award of the new framework. It is anticipated that a WP of spray lining will be considered in 18/19 as the new Framework is now awarded, to test the viability and value of this technique.

Annual Information Return 2018 Section 2 Chapter 11 Page 5 of 17
Overall Line Confidence Grade is A1 as the return is zero for Asset Delivery and CSD Networks Water. There has been no change in the current mains relined figures in PC 15 as this methodology is not currently used within NIW. The Asset Delivery Team are continuing to review the value for money from the delivery of mains relining. Line 4 - Mains cleaned (km)
Line Description Units CSD CSD CG Total Overall CG 4 Mains cleaned
(total) km 2,008.61 B3 2,008.61 B3
This work is carried out by CSD Networks Water, the Asset Delivery team has no involvement in this activity. Detailed data for the reporting period was collated by the Water Business Unit using MWM system reports. As directed by the Regulator, repeat flushing of the same length of main has been discounted. Work Orders are automatically generated at various frequencies and sent to the Field Operators. This information is captured on the MWM system. The recorded units are the total number of reactive fire hydrant flushing jobs plus the count of flushing MST’s active on the Ellipse system, minus those flushing MST’s which have not been performed a minimum of once in the report year. This has been converted from units to km using a revised factor of 0.297km per flushing. Calculation - 2017 -2018 information return is made up as follows: 6763 no. flushings x 0.297 km per flush = 2 008.61kms. This comprises a total count of 6685 no. flushing MST’s in Ellipse, minus 398no. flushing MSTs identified as not having been carried out in the report year, plus 476 no. reactive flushing jobs completed. For AIR18, Maintenance Scheduled tasks (MST’s), as part of the planned flushing programme, have continued to be implemented. The programme has been amended from the previous year only in that some frequencies of flushing have been reduced but locations remain generally the same. Some MST’s have been removed due to the on-going mains rehabilitation programme and others added as a consequence of repeat customer complaints or water quality sample failures.
Confidence Grade B3 Although the total no. of reactive flushing jobs (476no.) may contain some repeat flushings, at the same location these are considered to be minimal and the Company considers the data collated for this line to be continually improving. There is a slight increase in the completed no. of reactive flushing’s which may be linked to the slight increase in the number of burst main repairs carried out and increasing customer awareness of water quality standards. The number of flushing MST’s not carried out has increased noticeably from AIR 17 but this is primarily down to staffing issues in certain Field Manager areas as well as other tasks being given a higher priority.

Annual Information Return 2018 Section 2 Chapter 11 Page 6 of 17
Line 6 - New mains (km) Line Description Units DP AD AD
CG CSD CSD
CG Total Overall CG
6 New mains km 2 7.60 A2 74.83 B2 92.43 B2 Asset Delivery All Asset Delivery information is compiled from Asset Delivery contract management information monthly returns. This is an accurate measurement of the actual lengths of water mains laid, renovated or replaced, compiled from contractor’s on-site records. The information is collated from each individual contract on a monthly basis and aggregated into an overall annual figure. The figure for 17/18 = 17.601km = 17.6km to two decimal places. Asset Delivery Confidence Grade is A2. This figure is obtained from Monthly Reports in Captrax and aggregated into an annual return. CSD Networks Water Data for the period April 17 – March 18 was collated by Field Managers using system reports, which when checked and confirmed, were transferred onto a spreadsheet managed by the Water Business Unit. This figure primarily includes data for new mains laid in new housing developments throughout the year. CSD Networks Water is the sole contributor for new mains laid in new housing developments. Asset Delivery is the primary contributor for new mains (replacement upsizing). CSD Networks Confidence Grade is B2. The total new mains figure of 92.43 km is made up of 17.6 km of New Mains WMRP with 0 km of New Strategic Trunk Mains) and 74.83 km of first time services. Overall Line Confidence Grade is B2 -This figure is arrived at by considering that there is a 20:80 split in the total favouring CSD. It is reasonable therefore to state that the CG assessment is B2 The EP/Asset Delivery total contributes to the total WM Rehab progress. Line 6a: Total Length of new, renewed or relined Mains (km) Line Description Units DP AD AD CG CSD CSD
CG Total Overall
CG
6a New renewed or relined mains
Km 2 136.98 A2 76.00 B2 212.98 A2
This is the calculated sum of Lines 2, 3 and 6 the Asset Delivery Total (108.40km plus 17.6km plus 10.98km of Trunk Main Rehab) =126km. The CSD Total (1.17km plus 74.83km) = 76km. Overall Line Confidence Grade is A2 as Asset Delivery contribution is 60% of the total therefore the A2 Confidence Grade predominates.

Annual Information Return 2018 Section 2 Chapter 11 Page 7 of 17
Line 6b - Length of new, renewed or relined mains delivered under the Water Main Rehabilitation Programme (km) Line Description Units DP AD AD CG Total Overall CG 6b New renewed or relined
mains under WMRP Km 2 126.00 A2 126.00 A2
AD has continued its method of reporting on new mains in line 6 to comply with the Regulator’s Annual Information Return reporting requirements and definitions manual. The figure of 126km is derived from the Asset Delivery totals of 108.4km renewed and 17.6km of new mains. Relining was not utilised as a watermains rehabilitation technique during this period. Overall Line Confidence Grade is A2 as reporting is from Asset Delivery Team from CPMR and Asset Delivery are the only contributors to this line. Line 7 - Mains abandoned and other changes (km) Line Description Units DP AD AD CG CSD CSD
CG Total Overall
CG
7
Mains abandoned and Other Changes
Km 2 122.89 A2 1.35 B3 124.24 A2
Asset Delivery The PC15 year 3 results for sub-programme 8 indicates 98% of mains renewed are subsequently abandoned which is a similar percentage of rehabilitated mains, based on historical data.
Total mains installed = 108.4 + 17.6 = 125.996 km Abandoned Mains = 122.894 km
Asset Delivery Confidence Grade is A2. CSD Networks Water Data for April 17 – March 18 was collated by Field Managers, confirmed and input onto a spread sheet managed by the Water Business Unit who collate the data for the annual reporting period. Asset Delivery is the primary contributor to this information but Networks Water has taken some ownership of smaller schemes, in particular social housing redevelopments and minor mains diversions. CSD Networks Water Confidence Grade is B3. Overall Line Confidence Grade is A2 as 98% of this return is from Asset Delivery. Comment - The PC15 year 3 results for sub-programme 8 indicates 98% of mains renewed are subsequently abandoned which is a similar percentage of rehabilitated mains, based on historical data. Line 8a: Lead Communication pipes replaced – as a consequence of water quality sample failures (no.) Line Description Units CSD Total Overall CG 8a Lead Communications Pipes replaced as
consequence of WQ Sample Failures Nr 43 43 B2

Annual Information Return 2018 Section 2 Chapter 11 Page 8 of 17
The CSD Networks Water Business Unit collates information from Customer Field Managers using system reports, which, when checked and confirmed, was input onto a spreadsheet, collated data for the reporting period April 17 – March 18. This is managed by the Water Business Unit, which collates the data for the annual reporting period. Overall Line Confidence Grade is B2. Comparison to PC 13 year 2 Output – The CSD total is the same as last year’s output This figure continues to be minimal compared to the figures submitted for Line 8b. Line 8b - Lead Communication pipes replaced – as a consequence of customers replacing their lead supply pipe (no.) Line Description Units CSD Total Overall CG
8b Lead Communications Pipes replaced as consequence of Customers notifying of supply pipe change
Nr 574 574 B2
Data for the reporting period April 17 – March 18 was collated from Customer Field Managers using system reports which, when checked, confirmed, and input onto a spreadsheet. The total submitted for AIR 18 is comparable to that submitted for AIR17 and AIR 16. There is no set target for this line. Overall Confidence Grade is B2 as the return is exclusively from CSD. Line 8c - Lead Communication Pipes replaced – Opportunistic (no.) Line Description Units AD AD
CG CSD CSD
CG Total Overall CG
8c Opportunistic Lead Communications Pipes replaced
Nr 13 A2 63 B3 76 B3
Asset Delivery The PC15 year 3 for sub programme 8 results showed 13 nr lead communication pipes replaced as part of opportunistic lead replacement programme. The Asset Delivery figure for Opportunistic Lead communications pipes is significantly less than last year’s figure of 1753 .This may be due to the rural nature of this year’s Work packages. This Asset Delivery figure for Opportunistic Lead Communications pipes is significantly less than last year’s figure of 1753 .This may be due to the increased rural nature of this year’s Work packages, (see urban-rural watermains rehabilitation outturn split table under Line 10 comment below). CSD Networks Water Data for the reporting period April 17 – March 18 was collated by the Water Business Unit using MWM system reports run on a monthly basis by Field Manager area for selected Standard Jobs. When checked and confirmed the data was input onto a spreadsheet managed by the Business Unit. This figure reported for AIR 18 for CSD is comparable to the last two years. This can be a complex issue to analyse on some Work Orders to ascertain if a full communication pipe replacement has taken place and if lead was a factor.

Annual Information Return 2018 Section 2 Chapter 11 Page 9 of 17
CSD Networks Water Confidence Grade is B3. Overall Line Confidence Grade is B3 using the CSD figure of B3 due to the 20:80 split in data dominance for this line between Asset Delivery and CSD. Line 8d - Lead Communication pipes replaced – Proactive lead replacement programme (no.) Line Description Units AD Total Overall CG 8d Lead Communications Pipes replaced under
proactive programme Nr 1,767 1,767 A2
The PC15 year 1 sub programme 23 results showed 1,767nr lead pipes replaced as a result of the implementation of the proactive lead replacement programme. Overall NIW has exceeded the FD cumulative target of 5,532nr (i.e. 1,844 annual target x 3). The 3 year target is therefore exceeded as the number of lead communications pipe replacements respectively from AIR16, 17 and 18 is: 1,922 + 1,867 + 1,767 =AIR 18 Total of 5,556nr. Overall Confidence Grade is A2 due to the fact that all of this data was sourced from the Asset Delivery Team whose CG is A2 for this line. Line 9 - Total Lead Communication Pipes Replaced – Sum of 8a, 8b, 8c and 8d (no.) Line Description Units AD AD
CG CSD CSD
CG Total Overall CG
9
TOTAL Lead Communications Pipes replaced
Nr 1780 A2 680 B2 2460 A2
Asset Delivery This is the calculated sum of Lines 8a, 8b, 8c and 8d Calculation - The Asset Delivery Total is 1,767 + 13= 1,780 Asset Delivery Water Confidence Grade is A2. CSD Networks Water This is the calculated sum of Lines 8a, 8b, 8c and 8d Calculation - The CSD Total is 43+574=63 = 680 this is comparable to last year’s figure. CSD Networks Water Confidence Grade is B2. Overall Line Confidence Grade is A2 as 70% of this return is from the Asset Delivery Team. Line 10 - Communication pipes replaced – other (no.) Number of communication pipes (all types of materials but excluding lead) replaced for other reasons (e.g. at the customer’s request or due to Rehab of the watermain) Line Description Units AD AD CG CSD CSD
CG Total Overall
CG
10 Communications Pipes replaced (other)
Nr 2336.00 A2 1,413 B3 3 769 B2


Annual Information Return 2018 Section 2 Chapter 11 Page 11 of 17
The number of mains repairs carried out by Networks Water function due to non-proactive leakage detection methods was 1394.
The number of mains repairs carried out due to proactive leakage detection methods was 1116. Confidence Grade B3 The number of bursts for Networks Water has been captured for the complete year using base information on a monthly basis from MWM reporting systems. Individual Work Orders have been analysed and duplicates and non-mains repairs extracted. This year’s figure has increased slightly from AIR 17 but the following comments continue to be a factor:
Mains rehabilitation schemes continue to have a positive impact in reducing the no. of defects with older iron mains being replaced
Pressure Management Schemes in targeted areas including new installations, replacements and relocations of pressure reducing / sustaining valves.
Continuing detail has been paid to the classification of mains repairs as opposed to communication pipe repairs or replacements.
There is a significant increase in the figures across the four months from December through to March compared to AIR 17. During this four month period there were several instances of negative temperatures followed by sharp rises resulting in a noticeable increase in the number of defects. This resulted in elevated burst numbers through both proactive leakage detection and those reported by customers. The winter period, on the whole, has been markedly more severe than the previous 3 – 4 years.
Line 12 - Total length of mains 31st March 2018 This figure has been extracted from the Corporate Asset Register. There has been no change to the structure of the data reported on this year from the previous years that would directly affect the total provided. The confidence grade of the data will remain the same as the previous year. There have been no significant improvements in data quality since the AIR17 reports. Any new data will have adhered to the NIW Code of Practice for the submission of asset data ensuring that data quality levels have been maintained throughout the year. As per the reporters recommendation during the AIR14 audit this figure includes trunk mains that are marked as “Out of Service” on the Corporate Asset Register. This recommendation was made as although these mains are currently out of service they are not abandoned and could potentially come back into service in the future. Lines 13 to 17- Distribution studies Lines 13 to 17 reflect the reporting requirements for the Zonal Study Methodology that has traditionally been employed by NIW to highlight and prioritise investment in the Water Network. This methodology involved, identifying Zones which were then: intensively examined, hydraulically modelled, site checked and discussed in detail with NIW Managers. The output of this exercise was a prioritised list of Network Rehabilitation and Rationalisation schemes.


Annual Information Return 2018 Section 2 Chapter 11 Page 16 of 17
Reporting Year 2010 2011 2012 2013 2014 2015 2016 2017 % Overall Compliance 99.87 99.84 99.77 99.81 99.86 99.83 99.86 99.88
Line 19 - % Compliance at consumers tap (including supply points) NI Water is assessed for its overall performance by % Compliance at customer tap including authorised supply points.
Reporting Year 2010 2011 2012 2013 2014 2015 2016 2017 % Compliance at consumer tap (including supply points)
99.81 99.73 99.63 99.74 99.78 99.74 99.77 99.81
Line 20 - % Iron compliance at consumers tap
Reporting Year 2010 2011 2012 2013 2014 2015 2016 2017 % Iron compliance at consumer tap
97.98 98.27 97.25 98.08 98.95 98.40 98.66 98.85
Line 21 - % Service reservoirs with coliforms in >5% samples NI Water has continued to report 0 for this metric, having had 0 service reservoirs with >5% exceedances over the last number of years. There is an ongoing service reservoir cleaning programme to maintain this. For 2017 all PC15 targets were met. Line 22 - Completion of nominated trunk main schemes No projects of this type were profiled to achieve Beneficial Use in Year 3 (2017/18). The confidence for this line was assessed as A1: this is based on review of CPMR approvals and financial details contained within CPMR. Line 23 - Completion of nominated water treatment works schemes No Water Treatment Works scheme identified in the PC15 Programme achieved Beneficial in Year 3 (2017/18). The confidence grade for this line was determined using the reporting guidance and was assessed as A1 following review of CPMR approvals and financial details contained within CPMR. Line 24 - Completion of nominated improvements to increase the capacity of service reservoirs and clear water tanks One Clear Water Tank identified as an additional output for PC15 achieved Beneficial Use in Year 3 (2017/18) of the programme.
JC385 Monaclogh SR Achieved beneficial use in 2017/18 The confidence was assessed as A1 following review of CPMR approvals and financial details contained within CPMR.

Annual Information Return 2018 Section 2 Chapter 11 Page 17 of 17
Water Treatment Work Name
Catchment Management Study Target Delivery Date
Killylane 2013/14 31/03/2014 Dorisland 2013/14 31/03/2014 Clay Lake 2013/14 31/03/2014 Derg (Inc Strule) 2014/15 31/03/2015 Lough Braden 2014/15 31/03/2015 Caugh Hill 2014/15 31/03/2015 Carmoney 2014/15 31/03/2015 Seagahan 2014/15 31/03/2015 Altnahinch 2015/16 31/03/2016 Drumaroad (inc Silent Valley, Annalong & Lough Island Reavey)
2015/16 31/03/2016
Fofanny 2015/16 31/03/2016 Dunore Point 2016/17 31/03/2017 Castor Bay 2016/17 31/03/2017 Moyola 2016/17 31/03/2017 Ballinrees 2016/17 31/03/2017 Lough Macrory 2016/17 31/03/2017 Lough Fea 2016/17 31/03/2017 Glenhordial 2016/17 31/03/2017 Carron Hill 2017/18 31/03/2018 Rathlin 2017/18 31/03/2018 Dungonnell 2017/18 31/03/2018 Killyhevlin 2018/19 31/03/2019 Belleek 2018/19 31/03/2019
*PC15 outputs have all been met to date and are on target for the remainder of the PC15 period. Line 26 - Number of school visits There were 219 Schools visited during this reporting period. Line 27 - Number of other education events There were 62 other education events attended during this reporting period. Line 28 - % Service Reservoirs where sample taps have been assessed and are to required standard 212 sample taps were installed during this reporting period. This is 72.9% of the total of 291 to be addressed. The sample tap contract was awarded in 16/17 with delays due to the development and award of New Frameworks, in addition delays were partly caused by the approval process required on the design before the manufacture of the sample tap points could commence. The full delivery of 100% taps (291No.) is expected by June /July 2018. Confidence Grade A2


Annual Information Return 2018 Section 2 Chapter 12 Page 1 of 14
Table 12 – Water Explanatory Factors
Water sources & treatment types – NI Water only Changes to Sources since AIR17 NI Water (Only) had the following 32 sources in service for part or all of AIR18, including in total: - boreholes (1nr), impounding reservoirs (22 nr), and rivers & loughs (9 nr). There is no net change in the total number of sources from AIR17 to AIR18.
Changes to treatment types since AIR17 The treatment type totals in service for part or all of AIR18, have not changed since AIR17, and include - simple disinfection (SD) (1nr); simple disinfection plus simple physical treatment (W1) (0 nr); single stage complex physical or chemical treatment (W2) (0 nr); more than one stage of complex treatment (W3) (8 nr); more than one stage of complex treatment, capturing processes with very high operating costs (W4) (10 nr).
Changes to proportional distribution input since AIR17 The distribution input increased slightly from AIR17 to AIR18. The reasoning for the latter is considered to be due to loss of water and increased leakages resulting from the flooding in the North West, which resulted in bridges, and hence watermains, being washed away and other weather related incidents. The distribution input from the PPP WTWs increased because of the latter, and also due to water quality issues experienced at Drumaroad WTW. There was also an increase in distribution input from NIW impounding reservoirs, and reduction from rivers and loughs, due to the breach on the intake pipe from Glenedra River as a result of the flooding event. This source feeds Caugh Hill WTW.
The following table shows changes which have occurred with reference to source types and treatment types since AIR17.
Location AIR17 Source Type
Treatment Type
WTW In Service during AIR 18
Sources In Service at 31st Mar 2017
Sources In Service at 31st Mar 2018
An Rathlin Borehole SD Yes Yes Yes Killylane Imp. Reservoir W3 Yes Yes Yes Dungonnell Imp. Reservoir W3 Yes Yes Yes Altnahinch Imp. Reservoir W3 Yes Yes Yes Lough Fea Imp. Reservoir
(listed as a Lough for AIR15 – classified as IR in June 2015)
W3 Yes Yes Yes
Drumaroad 2No Imp. Reservoirs (Ben Crom IR & Silent Valley IR)
W3 Yes Yes - 2No. sources
Yes - 2No. sources
Caugh Hill Imp. Reservoir - Altnaheglish IR & River (Glenedra)
W3 Yes Yes – 2No. sources
Yes – 2No. sources
Glenhordial Imp. Reservoir W3 Yes Yes Yes Lough Bradan 2 No - Lough
Bradan Imp. W4 Yes Yes - 2No
sources Yes - 2No sources

Annual Information Return 2018 Section 2 Chapter 12 Page 2 of 14
Location AIR17 Source Type
Treatment Type
WTW In Service during AIR 18
Sources In Service at 31st Mar 2017
Sources In Service at 31st Mar 2018
Reservoir, and Lough Lee
Dorisland 7No Imp. Reservoirs – (Dorisland IR, Lough Mourne IR, Copeland IR, Lower South Woodburn IR, Upper South Woodburn IR, Middle South Woodburn IR and North Woodburn IR)
W4 Yes Yes - 7No. sources
Yes - 7No. sources
Lough Macrory 1No Imp. Reservoir & 1No Lough (Lough Fingrean IR & Lough Macrory- Lough
W4 Yes Yes - 2No. sources
Yes - 2No. sources
Clay Lake Imp. Reservoir W4 Yes Yes Yes Fofanny 3No Imp.
Reservoir (Lough Island Reavey, Fofanny, Spelga)
W4 Yes Yes – 3No. sources
Yes – 3No. sources
Seagahan Imp. Reservoir W4 Yes Yes Yes Camlough Lough – No
longer used since 30/3/16
N/A No No No – Last day of production at Camlough WTW was 30/3/16
Killyhevlin Lough W4 Yes Yes Yes Carran Hill Lough W4 Yes Yes Yes Belleek Lough W3 Yes Yes Yes Carmoney River W4 Yes Yes Yes Derg River W4 Yes Yes– 2No
sources (River Strule introduced April 2016, and River Derg)
Yes– 2No sources

Annual Information Return 2018 Section 2 Chapter 12 Page 3 of 14
Location AIR17 Source Type
Treatment Type
WTW In Service during AIR 18
Sources In Service at 31st Mar 2017
Sources In Service at 31st Mar 2018
Total 19 32 32
1. Caugh Hill WTWCaugh Hill WTWs is fed directly and independently by 2 sources Altnaheglish IR and Glenadra River. The works can also be fed by Kerlins Burn, but this has only been used in drought events and has not been used since 1995. Telemetry information for 17/18 indicates that 2.9% of the raw water into the WTWs came from Glenedra River during the AIR18 period. The Distribution Input for Caugh Hill has therefore been split in the ratio of 97:3 between the IR and the River, for the computation of the proportional distribution input for Lines 1 to 3. The AIR18 draw off from Glenedra River is lower than that for AIR17 as a breach on the feed pipe from Glenedra, following the storm in North West in August 2018, resulted in the intake being out of operation to allow repairs to take place. All of the raw water was sourced from Bannagher Dam from approx. August 2017, and was only brought back into operation within the last 2 months
The draw off from Glenedra River is based on quantity & quality available. When the river is in normal condition the inlet valve is open fully to take as much water as possible from this source. However when there is a flood or a period of inclement weather & the water quality deteriorates the inlet valve is throttled back to reduce the inlet from this source. The normal percentage draw off is difficult to estimate as the raw water quality changes frequently and the NI Water throughput has been reduced significantly over the years with the introduction of the Balinrees source. With water quality issues of two years ago Glenedra intake was reduced as the colour instrument on which the valve control was based proved unreliable and the percentage draw off would be down on normal. Based on the figures over the years the Glenedra flow could be as high as 10-30 % of the plant throughput.
2. Fofanny WTWFofanny WTWs is fed directly and independently by 3 sources Lough Island Reavy IR, Spelga IR and Fofanny IR. NIW is listing these three sources for Fofanny WTWs, for AIR18.
3. Lough Bradan WTWLough Bradan WTWs is fed directly by Lough Lee (lough) and Lough Bradan Impounding Reservoir. Lough Lee is therefore being reported as a source. For AIR18, according to the Plant Manager, 60% of the total WTWs’ raw water comes from Lough Lee (and 40% from Lough Bradan IR) and enters into the pipework between Lough Braden IR and the WTWs. Any extra coming from Lough Lee would backup into Lough Bradan IR and would vary depending on rain fall amounts.
Although telemetry information was available for AIR17 to determine the split of the raw water coming from Lough Lee and Lough Bradan IR, such information is not available for AIR18 as data points were not carried forward following the outstation upgrade.
4. Camlough WTWCamlough WTWs was taken out of service on 31/3/16, with the last day of production on 30/3/16. The new Castor Bay to Newry Trunk Main was laid to enable the abandonment of Camlough WTW. Hence the Castor Bay supply area had been extended to cover the catchment previously supplied by Camlough WTW. Hence Camlough WTWs and

Annual Information Return 2018 Section 2 Chapter 12 Page 4 of 14
Camlough Lake do not feature in the AIR18 figures respectively for treatment types and water sources.
5. Lough Fea WTWLough Fea WTWs is fed by Lough Fea, which is classified as an Impounding Reservoir.
6. Lough Macrory WTWLough Macrory WTW is fed directly by Lough Macrory (lough). Lough Fingrean IR overflows naturally into Lough Macrory, with the water being pumped on to the WTW. Approximately 90% of the water in Lough Macrory originates from Fingrean IR. As in AIR17, NIW is listing Lough Macrory and Fingrean IR as two sources for Lough Macrory WTW for AIR18.
7. Belleek & Killyhevlin WTWsAlthough both Belleek WTW and Killyhevlin WTW are supplied by the same source i.e. Lough Erne, NI Water is counting Lough Erne as a source for each of the works, due to its size, in line with the approach to Lough Neagh as depicted in the NIAUR AIR13 Chapter 12 guidance.
8. Drumaroad WTWDrumaroad WTW is fed directly by Silent Valley IR. It can receive occasional supply from Lough Island Reavy IR, to compensate Silent Valley water during operational maintenance or Drought Management. However this IR is not being reported against Drumaroad as it is reported against Fofanny WTW. Silent Valley is supplied by Ben Crom IR. Silent Valley IR and Ben Crom IR collect raw water from the Mourne Mountains’ catchment area. NIW is listing Silent Valley IR and Ben Crom IR as two sources for Drumaroad WTW.
9. Dorisland WTWDorisland WTW is fed directly by Dorisland IR. However Dorisland IR is fed through a system of 6 IRs namely, Lough Mourne IR, Copeland IR, Lower South Woodburn IR, Upper South Woodburn IR, Middle South Woodburn IR and North Woodburn IR.
The above consists of six man made dams and one natural lake (Lough Mourne). Raw water from all dams can be mixed in many different combinations depending on storage and water quality. NI Water seeks to balance water level in each IR by controlling inlet and outlet valves. The Woodburn IRs can be used all year round. However Lough Mourne and Copeland IRs are used only in winter months due to challenges with algae. These IRs are important to NI Water from the point of view that they can be individually isolated and water diverted to waste, in the event of a pollution incident.
Following a number of years raw water deterioration due to the presence of MCPA, (a herbicide approved product used for rush control) NI Water installed GAC Filtration at this site to ensure the water quality parameters we achieve. This latest investment at this plant has been operational since April 2015.
10. Derg WTWThe main source for Derg WTW has been the River Derg. The River Strule has also been feeding the works from April 2016, contributing approximately 43% of the raw water which is pumped to the Derg WTW Inlet, during AIR18. NIW is listing River Strule and River Derg as two sources for Derg WTW, for AIR18, as the works receives water directly from the two sources.

Annual Information Return 2018 Section 2 Chapter 12 Page 5 of 14
11. Dungonnell WTWThe OSEC plant has been taken out of service and temporary hypo dosing commenced on 27th March 2017 to complete water disinfection. A base maintenance project to remove the OSEC plant and install bulk hypo tanks was planned for 2017/18 delivery, but has not yet started. There is no change to the treatment type.
12. Altnahinch WTWThe OSEC plant has been taken out of service and temporary hypo dosing commenced on 14th November 2016 to complete water disinfection. A base maintenance project to remove the OSEC plant and install bulk hypo tanks has been completed during AIR18. There is no change to the treatment type.
Capacities of NIW’s impounding reservoirs (22No) The table below depicts the capacities of the 22 NIW Only Impounding Reservoirs which were in service during the AIR18 period. Ballinrees IR and Altikeeragh IR which are operated by PPP are not included in the table.
Raw Water Source – IRs Total Capacity(ML) Head WTWs Altnahinch IR 1270 ALTNAHINCH WTW
Altnaheglish IR 2273 CAUGH HILL WTW
Clay Lake IR 1895 CLAY LAKE WTW
Lough Mourne IR 2621 DORISLAND WTW Copeland IR 607 DORISLAND WTW Lower South Woodburn IR 487 DORISLAND WTW Upper South Woodburn IR 1669 DORISLAND WTW Middle South Woodburn IR 2135 DORISLAND WTW North Woodburn IR 372 DORISLAND WTW Dorisland IR 302 DORISLAND WTW
Ben Crom IR 7721 DRUMAROAD WTW Silent Valley IR 13276 DRUMAROAD WTW
Dungonnell IR 1090 DUNGONNEL WTW
Lough Island Reavy IR 9091 FOFANNY WTW Spelga IR 3327 FOFANNY WTW Fofanny IR 395 FOFANNY WTW
Glenhordial IR 100 GLENHORDIAL WTW
Killylane IR 1363 KILLYLANE WTW
Lough Bradan IR 611 LOUGH BRADEN WTW
Lough Fingrean IR 746 LOUGHMACRORY WTW
Lough Fea IR 539 LOUGH FEA
Seagahan IR 2220 SEAGAHAN

Annual Information Return 2018 Section 2 Chapter 12 Page 6 of 14
The Water Supply Business Unit continues to keep the status of WTW and Boreholes up to date and liaises with NIW’s Asset Information Centre to ensure that this information is aligned with GIS. Any anomalies with information held on GIS, compared to that held by the Water Supply Business Unit, are identified and steps are taken to realign the data.
The table below summarises NIW’s position, at 31st March 2018, regarding all borehole sites. This information was taken directly off NIW’s Corporate Asset Register.
Status Descriptor AIR17 Count
AIR18 Count
In Service All sites that are currently in operation. Includes those that are maintained by either Operations or M&E
1 1
OOS Abandoned
Any site that is no longer in use and not planned to be returned to service. This may include facilities that are still in physical existence
56 54
Disposed Any site which no longer belongs to NIW as it has been sold off
1 2
The count of one for borehole site ‘in service’, as shown in the table above, refers to Rathlin Island, at which there are 2 boreholes in service. Lough Carn One and Lough Carn Three boreholes are also in service but are not listed in the table above as they feed into Lough Carn, (and on into Lough Fingrean IR and Lough Macrory WTW) which is not counted as a source.
With reference to the ‘Disposed’ borehole sites, as shown in the table above, the Alcrossagh Boreholes which were disposed of in AIR17, do not feature in the count for AIR18. Balmoral Park and Cabragh Road boreholes were disposed of in AIR18
With ref to the UR’s Guidance, regarding the ‘proportion of water taken from Lough Neagh that is included within Block A of each table and identify which source type’. – the PPP sources Castor Bay, Moyola and Dunore extract from Lough Neagh, with no extraction by NIW sources.
The following table identifies the proportion of water taken from Lough Neagh (which is classified as a ‘River Abstraction’ source) within Block A and B of Table 12:
Table 12 Block Proportion of water extracted from Lough Neagh - NIW Only
Proportion of water extracted from Lough Neagh –PPP Only
Proportion of water extracted from Lough Neagh - Total
A 0% 0.892 0.420 B – with reference to Treatment Type W4
0% 0.935 0.739
Line 5 - Average pumping head – NIW only / PPP only / Total The NIW ‘Total’ AIR18 Average Pumping Head is 121.03m.hd with a confidence grade of B4, an increase of 1.45m.hd from AIR17 (119.58m.hd).

Annual Information Return 2018 Section 2 Chapter 12 Page 7 of 14
Summary In previous returns the Average Pumping Head (APH) calculation has centred on using completed Detailed Zonal Study (DZS) area data. With the completion of the DZS Project, this has now become redundant as an information source. Thus NIW have been investigating alternative data sources, principally Telemetry, for updating and improved confidence. Data sourced from NIW telemetry system, Telemweb, had been included in the APH calculation from AIR12. For AIR18 the use of data from telemetry has continued to be used and has been expanded with 76% of pumpset returns based fully or in part on telemetry data.
For AIR18, NIW had 369 pumpsets in service. Of these 252 are based on flow and/or lift data from telemetry. 55 of the 369 have no / incomplete data, no return has been made for these pumpsets.
Reporter recommendations for previous returns stated pumpsets with a significant contribution to the overall calculation be targeted (say flow x lift >50m.h). There are 95 pumpsets with an individual contribution greater than or equal to 50m.h. Of these 92 are based on flow and / or lift data from telemetry.
The daily flow total for individual pumpsets is 1566.53Ml/d. Of this 1555.0/d is based on telemetry data. Thus 99.2% of flow is based on data relative to the reporting year. Similarly the total lift for individual pumpsets is 17507.03m, of which 5847.47m is based on telemetry data, equating to 33.4% of lift based on data relative to the reporting year.
The Average Pumping Head figure has increased by 1.45m.hd from AIR17. Distribution pumpsets have contributed an increase of 0.3m.hd to the overall figure, Water Supply a decrease of 0.2m.hd and PPP an increase of 1.47m.hd. One pumpset is no longer in service and with this removed from the calculation reduces the overall figure by 0.13m.hd. The increase can be attributed mainly to the change in supply zones, with Dunore supply zone being extended to serve an area supplied by Drumaroad/Silent Valley in AIR17. The table below lists pumpsets whose contribution to the overall AIR18 APH figure has changed by 0.5m.hd or greater from its corresponding contribution in AIR17. These 8 pumpsets represents 1.06m.hd increase. The changes are explained in more detail further in the commentary.
Pumpsets whose contribution to the overall AIR18 APH figure has changed by 0.5m.hd or greater from AIR17
Name AIR17 Individual APH
Contribution to Overall
AIR17 APH Figure
AIR18 Individua
l APH
Contribution to Overall
AIR18 APH Figure
Contributing
difference from
AIR17/AIR18
Dunore WTW HL (Hydepark & Ballyrobin)
10537.25
18.382 12300.05
21.294 -2.91
Dunore RWPS 4512 7.871 5264 9.113 -1.24River Bann RWPS 3199.03 5.581 2802.69 4.852 0.73 Castor Bay 2 WPS 3173.73 5.537 2707.74 4.688 0.85 Castor Bay WPS 2431.25 4.241 1951.25 3.378 0.86 Drumaroad-Dunmore WPS
5360.49 9.351 5042.33 8.729 0.62

Annual Information Return 2018 Section 2 Chapter 12 Page 8 of 14
Name AIR17 Individual APH
Contribution to Overall
AIR17 APH Figure
AIR18 Individua
l APH
Contribution to Overall
AIR18 APH Figure
Contributing
difference from
AIR17/AIR18
Carnbane Tandragee Rd WPS (Camlough/Newry West)
153.18 0.267 483.64 0.837 0.57
Lough Island Reavy Fofanny RWPS
2130.39 3.716 1801.42 3.119 0.60
Distribution pump data in master pump table In keeping with the Reporters view that given the good progress made in recent returns with data from Telemetry being obtained at 76% of pumpsets, the rollout programme should continue. The report created to provide data from Telemweb only produces information from the date pumpsets are added. Some telemetry data for pumpsets may not be data based on the full reporting year but will be based on a minimum of 3 months. For future returns, the report will provide data for the whole reporting period.
For pumpsets with no telemetry data currently available, calibrated network models (Current Average Daily Demand Models) constructed by a framework of Consultants performing Detailed Zonal Studies (DZS) in various study areas across Northern Ireland continues to be the data source. Pumpsets based solely on DZS data makes up 23% of the return.
1no distribution pumpset was removed from service during the AIR18 reporting period. • Mullaghans Bridge 1 WPS
No data was available for previous returns for the following pumpsets. Telemetry data is now available to allow a return to be made against them for AIR18.
• Brackagh Lane WPS
Where mean lift and average ADD flow cannot be obtained from a suitable calibrated network model / or telemetry, no estimation of these parameters has been included for distribution pumps in the Master Pump Table.
Changes to distribution pumpsets have contributed 0.3m.hd to the overall increase from AIR17. The main contributors are listed in the table below:-
Name AIR17Individual
APH
Contribution to Overall
AIR17 APH Figure
AIR18Individual APH
Contribution to Overall
AIR18 APH Figure
Contributing
difference from
AIR17/AIR18
Carnbane Tandrage Rd WPS (Camlough/Newry West)
153.18 0.267 483.64 0.837 0.57

Annual Information Return 2018 Section 2 Chapter 12 Page 9 of 14
Camlough WTW was removed from service during AIR17. As a result the network Carnbane WPS serves has been extended to include Newry West SR. This has resulted in an increase in the pump lift.
Supply pump data in master pump table Abstraction pumps, treatment process pumps and WTW outlet pumps have not generally been included in the DZS network models. Therefore, local NI Water supply personnel have provided data from a variety of sources, listed below, for the determination of mean lift and average current flow for each pump supplying the distribution zones.
• Telemetry (Telemweb),• Direct readings of dials from pump sites,• Record Drawings for pump lift, and• NIW Total Flow Calculations for WTW in NI.
As with distribution pumpsets, the use of telemetry data has been sought for Supply pumpsets, with all but 2 of the 44 Supply pumpsets based on flow and / or lift data obtained from Telemweb.
Telemetry data has become available for Strule RWPS that provides raw water to Derg WTW, and is included in the calculation.
Changes to Supply pumpsets have contributed a decrease of 0.2m.hd to the overall change from AIR17. The main contributors are listed in the table below:-
Name AIR17 Individual APH
Contribution to Overall
AIR17 APH Figure
AIR18 Individua
l APH
Contribution to Overall
AIR18 APH Figure
Contributing
difference from
AIR17/AIR18
Drumaroad-Dunmore WPS
5360.49 9.351 5042.33 8.729 0.62
Lough Island Reavy Fofanny RWPS
2130.39 3.716 1801.42 3.119 0.60
Drumaroad-Dunmore WPS-The supply zone served by Drumaroad WTW has been reduced over AIR18 which was transferred over to Dunore WTW. This corresponded with increases in the individual APH for the HL pumps from Dunore (PPP).
Lough Island Reavy Fofanny RWPS – AIR17 saw an increase in flow from Lough Island Reavy due to Drought Management Planning. Over AIR18 with the drought risk reducing the demand from Lough Island Reavy has reduced accordingly.
Distribution Input (DI) The Company DI by Supply Source (577.62Ml/d) has been provided by the Company’s Leakage Data Management Unit, as has the PPP Only DI (272.42Ml/d) and the NIW Only DI (305.2Ml/d), obtained by adding the relevant Water Supply sources.
PPP pump data in master pump table Flow and lift information has been provided by the PPP Concessionaire through Contracts Management Section and have provided the following commentary:

Annual Information Return 2018 Section 2 Chapter 12 Page 10 of 14
The Average pumping head – total (Line 5) has been calculated in accordance with the calculation described in the Guidance.
Dalriada installed pressure gauges for manual readings at each of the Delivery Points (with the obvious exception of the 2 gravity feed points at Ballinrees) as listed below:
• Moyola HLP• Ballinrees HLP (Moys)• Magheraliskmisk HLP (CB1)• Ballydougan HLP (CB2)• Forked Bridge (FB)• Crewe Hill HLP (FB2)• Dunore Point HLP (DP1 & DP2)
In conjunction with the updated average flows has produced an updated average pumping head calculation when applied to the agreed formula for Average Pumping Head.
Lift (m) – The marginally differing figures supplied for the current reporting period (2017/18) from the last submission (2016/17) is due to the fact that these Lift figures continue to be derived from the pressure gauges on High Lift and for Interstage or Low Lift taken from the quoted values that are physically stamped on each pump. This procedure has enabled these figures to be consistent with last year’s approach. This has demonstrated an Increase in overall calculated Average Pumping Head.
Average to Supply (Ml/d) Note that the average flows represent updated figures for the 2017/18 year. These have been derived from dispatch records over the past year which record - via a series of frequently calibrated flowmeters at each Delivery Point on site - the volumes dispatched to NIW in accordance with the dispatch requests received and also from on-site records and SCADA trends of interstage volumes. Also the Lift has been shown for each interstage process at each site. Therefore, in conjunction with the updated average flows this has produced an average pumping head calculation when applied to the agreed formula for Average Pumping Head.
Changes to PPP pumpsets have contributed 1.47m.hd increase to the overall figure from AIR17. The main contributors to the change are:
Name AIR17 Individual APH
Contribution to Overall
AIR17 APH Figure
AIR18 Individual
APH
Contribution to
Overall AIR18 APH
Figure
Contributing difference
from AIR17/AIR18
Dunore RWPS
4512 7.871 5264 9.113 1.24
Dunore WTW HL
(Hydepark & Ballyrobin)
10537.25
18.382 12300.05 21.294 2.91
River Bann RWPS
3199.03 5.581 2802.69 4.852 -0.73

Annual Information Return 2018 Section 2 Chapter 12 Page 11 of 14
Name AIR17 Individual APH
Contribution to Overall
AIR17 APH Figure
AIR18 Individual
APH
Contribution to
Overall AIR18 APH
Figure
Contributing difference
from AIR17/AIR18
Castor Bay 2 WPS
3173.73 5.537 2707.74 4.688 -0.85
Castor Bay WPS
2431.25 4.271 1951.25 3.378 -0.86
Dunore – the supply zone for Dunore has increased and extended into the Silent Valley/Drumaroad supply zone. This corresponds with a decrease in individual APH from the HL pumps from Drumaroad WTW. Castor Bay (Forked Bridge) – this supply zone has been reduced with water from Dunore making up the shortfall; Castor Bay 2 (Magheraliskmisk) – this supply zone has been reduced with water from Silent Valley/Drumaroad making up the shortfall
There is a slight discrepancy between the PPP APH figure (155.89m.hd) calculated by the PPP Concessionaire and the figure calculated by NIW (154.29m.hd). The discrepancy has occurred with the PPP DI figure used, 269.67Ml/D by PPP, 272.42Ml/D NIW. The NIW PPP DI figure is based on data provided by the Company’s Leakage Data Management Unit as indicated above.
PPP only and NIW only ‘Average Pumping Head’ calculations Average Pumping Head is by definition the amount of pumping required to transport an average ML of water from abstraction at source to supply the customer through the Distribution Network.
The UR AIR14 Guidance for Table 12 has requested an ‘Average Pumping Head’ to be calculated for NIW only and PPP only. It should be noted that it is NIW’s interpretation that the true definition (as stated above) of Average Pumping Head is not being reflected through the splitting up of the overall NIW Average Pumping Head value.
The NIW only and PPP only ‘Average Pumping Heads’ are 91.34m.hd and 154.29m.hd respectively. The PPP only value is in relation to the Pumping Head within the works. PPP WTWs do not have specific Distribution Networks, and therefore the water is extracted, treated and then exits the works into the NIW Distribution Network. Within the Distribution Network, PPP water then mixes with NIW water, therefore making it impossible for NIW and PPP flows to be truly separated for use in PPP only and NIW only average pumping head calculations. Hence the value of 154.29m.hd calculated for PPP only is more in relation to the Pumping Head within the works.
However the UR AIR14 guidance document for Table 12 states ‘Average Pumping Head should be calculated for ‘NI Water only’, ‘PPP only’ and the ‘total company’. Different denominators should be used to calculate the average pumping head for each table (i.e. ‘NI Water only’, ‘PPP’ and ‘Total’) reflecting the amount of water entering supply from NI Water treatment works, PPP treatment works and in total, respectively. There is no requirement for the sum of the NI Water and PPP pumping head figures to equal the total company APH. The numerator for the ‘NI Water only’ calculation should reflect pumping from NI Water

Annual Information Return 2018 Section 2 Chapter 12 Page 12 of 14
treatment works and all NI Water distribution system pumping. The numerator for the ‘PPP’ calculation should reflect only pumping associated with the PPP concession.’
NIW has complied with this request and has provided separate Average Pumping Head values for NIW only, PPP only and the Company ‘total’. The respective distribution input values, associated with NIW only, PPP only and Company ‘total’ sources have been used as denominators to calculate the respective Average Pumping Head values.
The issue, outlined above, as posed by NIW in previous returns regarding the proportioning of the Average Pumping Head between NIW Only and PPP Only, is further exacerbated through the AIR14 approach, as requested by the UR. The use of the PPP source related DI, as a denominator to calculate the PPP Average Pumping Head, indicates the amount of pumping required to transport an average ML of water from abstraction at source to the ‘exit’ gate of the WTWs. However the use of the NIW Only source related DI, as a denominator for the NIW Only Average Pumping Head, indicates the amount of pumping required to transport an average ML of NIW Only water from abstraction at source to supply the customer through the Distribution Network, in addition to the pumping required to transport an average ML of PPP Only water from the ‘exit’ gate of the PPP WTWs through the NIW Distribution Network.
A confidence grade of ‘B4’ has been allocated to these values of 91.34m.hd and 154.29m.hd for the ‘Average Pumping Head’ for NIW only and PPP only respectively.
With ref to the UR’s Guidance, regarding the ‘proportion of water taken from Lough Neagh that is included within Block A of each table and identify which source type’. – the PPP sources Castor Bay, Moyola and Dunore extract from Lough Neagh, with no extraction by NIW sources.
Data shortcomings Calibrated hydraulic network models used in the data collection of pump lift and head have been built by a framework of DZSC’s over a period of more than five years. Thus, models used have various calibration days.
Leakage reduction and changes to the system subsequent to the field test and model construction have not been taken into account. New pumps or pumps not field tested / modelled will also have no data available from DZSC’s.
NI Water distribution input for WTW’s/sources in NI are current 2017/18 figures which may not absolutely match pump data available from the older network models but this represents the best combination available.
The report set up to provide telemetry data from Telemweb has been available since November 2012. The report created to provide data from Telemweb only produces information from the date telemetry points are added. Some telemetry data for pumpsets may not be based on the full reporting year but will be based on a minimum of 3 months. For future returns, the report will provide data for the whole reporting period.
Data relating to lift from telemetry is limited. Where flow data only is available from telemetry, lift data from the DZS model has been used. These may not be an absolute match but represents the best combination available.
55 of the 369 as having an ‘in service’ operational status during AIR18 period have no or incomplete data, no return has been made for these pumpsets. As the majority of these

Annual Information Return 2018 Section 2 Chapter 12 Page 13 of 14
pumpsets are distribution booster sets, it is anticipated, if full data were available, it would have minimal impact on the overall figure.
Confidence grade The Confidence Grade is B4 as per the Reporter recommendations from AIR17 submission.
Improvements from AIR17 Shortcomings highlighted in previous returns included the age of data from network models and as such subsequent leakage reduction and network changes would not have been taken into account. This is being addressed with the increasing use of Telemetry data. Telemetry data is relevant to the current reporting year with flow data more in line with the DI figure. With over 99% of flow and 33% of lift now based on data relevant to the reporting period, data quality continues to increase.
Future improvements Continue the interrogation of Telemweb for relevant data.
Average Pumping Head result comparison from 2008 to 2018 DI Ml/d Sum
(flow x lift) Average Pumping
Head (m.hd)
2008 Assessment 284.459 31655.54 111.28 2009 Assessment 420.93 47845.27 113.67 2010 Assessment 609.62 84470.31 138.57 2011 Assessment 627.5 100446.95 161.82 2012 Assessment 585.09 91225.01 155.90 2013 Assessment 559.37 78170.54 139.7 2014 Assessment 562.4 75211.22 133.73 2015 Assessment 564.92 64740.9 114.6 2016 Assessment 561.62 62697.39 111.64 2017 assessment 573.23 68539.45 119.57 2018 Assessment 277.62 70,092.1 121.03
Line 13 - Potable mains This figure has been extracted from the Corporate Asset Register. There has been no change to the structure of the data reported on this year from the previous years that would directly affect the total provided. The confidence grade of the data will remain the same as the previous year. There have been no significant improvements in data quality since the AIR17 reports. Any new data will have adhered to the NIW Code of Practice for the submission of asset data ensuring that data quality levels have been maintained throughout the year.
As per the reporters recommendation during the AIR14 audit this figure includes trunk mains that are marked as “Out of Service” on the Corporate Asset Register. This recommendation was made as although these mains are currently out of service they are not abandoned and could potentially come back into service in the future.

Annual Information Return 2018 Section 2 Chapter 12 Page 14 of 14
PPP Lines 1- 4 Column 1 only – Number of sources (PPP) The PPP Water sources have remained consistent over the reporting period for AIR18 as they were with AIR17. In accordance with AIR17, NI Water has included the River Bann intake as an additional source to Ballinrees WTW. The reasoning used is, that there exists the potential to source the WTW directly from the River Bann rather than purely directing this source from the Ballinrees Impounding Reservoir. NI Water has also included the Altikeeragh IR as a source for Ballinrees WTW as it supplied a proportion of the water for Ballinrees WTW during the period 2017-18 as it did in 2016-17.
Line 5 Column 4 only – Average pumping head (PPP) The reported data is solely due to the average flows called by the Company from its PPP sites, it has varied from last year’s average flows.

NORTHERN IRELAND WATER LIMITED - ANNUAL INFORMATION RETURN
ANNUAL INFORMATION RETURN - TABLE 13 NON FINANCIAL MEASURESSEWERAGE PROPERTIES & POPULATION (TOTAL
DESCRIPTION UNITS DP2012-13 CG 2013-14 CG 2014-15 CG 2015-16 CG 2016-17 CG 2017-18 CG 2018-19 CG 2019-20 CG 2020-21 CG
A PROPERTIES1 Households properties connected during the year 000 3 3.455 B2 3.108 B2 2.627 B2 4.076 B2 0.177 B2 6.385 B22 Non-households properties connected during the year 000 3 0.123 B2 0.106 B2 0.13 B2 0.198 B2 0 041 B2 0.178 B2
B BILLING3 Households billed unmeasured sewage 000 3 586.127 A2 591.043 B2 594.525 A2 599.994 A2 609.753 A2 619.835 A24 Households billed measured sewage 000 3 0.000 A1 0.000 A1 0.000 A1 0.000 A1 0.000 A1 0.000 A15 Households billed sewage 000 3 586.127 A2 591.043 B2 594.525 A2 599.994 A2 609.753 A2 619.835 A26 Non-households billed unmeasured sewage 000 3 9.250 A2 8.706 A2 8.132 A2 7.513 A2 7.314 A2 7.354 A27 Non-households billed measured sewage 000 3 23.014 A2 23.347 A2 23.56 A2 23.809 A2 24.343 A2 24.820 A28 Non-households billed sewage 000 3 32.250 A2 32.053 A2 31.692 A2 31.322 A2 31.657 A2 32.174 A29 Void properties 000 3 44.637 A2 44.479 B2 44.164 A2 43.463 A2 42 551 A2 41.741 A2
C POPULATION10 Total connected population 000 3 1,512.024 B3 1,514.925 B3 1,521.776 B3 1,529.734 B3 1536.699 B3 1544.413 B3
3 5REPORTING
YEAR REPORTING
YEAR REPORTING
YEAR
41REPORTING
YEAR
2REPORTING
YEAR
8 9REPORTING REPORTING
YEAR YEAR
6REPORTING
YEAR
7REPORTING
YEAR

Annual Information Return 2018 Section 2 Chapter 13 Page 1 of 11
Table 13 – Sewerage Properties and Population (Non-financial measures) Introduction Table 13 focuses on the number of properties and population connected to the public sewerage supply system. It extends to 10 lines, set out in three blocks:
Block A Properties (Lines 1 & 2). Reports properties connected during the year. Block B Billing (Lines 3-12). Includes a breakdown of all measured and unmeasured
household and non-household properties billed by the company. The property numbers should be the average for the reporting year.
Block C Population (Lines 13-17). This records the population within each of the measured and unmeasured household and non-household categories. The population numbers should be the average for the reporting year.
The information in this table is used in tariff and charging analysis and determination (sewerage unit cost). Definition of ‘Billed’ Properties Domestic customers were originally due to be charged for water and sewerage charges from April 2007. However, this was deferred in April 2007 and has not been implemented since. There are no apparent plans for charges to be implemented during 2018/19. NI Water is subsidised for these domestic customers by Department for Regional Development (DRD) (note: DRD is the now Department of Infrastructure DFI). In April 2008, NI Water extended the charging in the non-domestic sector to include unmeasured non-households in addition to the measured non-household customer base. These charges are based on the NAV of the non-household property, derived from annual information provided by Land and Property Services (LPS). Northern Ireland Water introduced sewerage charging to include non-households, phased in at 50%. Volumes returned to sewer are assumed to be 95%, based on standard industry figures, unless the customer challenges this assumption, whereupon they can apply for a non-return to sewer allowance which will be investigated and determined by NIW. For clarity, where reference is made in Table 13 to ‘billed’ household and ‘billed’ non-household, this is taken as the provision of water services to customers whether they are billed directly (non-domestic customers) or payment is made through subsidy by DFI (domestic customers). Classification of Farms As with Table 7 (Water) - per Utility Regulator guidelines, farms were reclassified as billed non-households for AIR09 – this has remained for AIR18. Previously, in AIR08, farms had been classified and reported as ‘billed’ households on the principle of their status and allocation of ‘domestic allowance’. Data Sources, Data Validation and Data Quality Projects As with Table 7 (Water), the key source of information for the new connections and property data is the customer billing database, RapidXtra. Customer information is updated through;
‘business as usual’ customer contacts, such as new connection requests, move in/move outs, or
through Data Quality initiatives/Projects and/or


Annual Information Return 2018 Section 2 Chapter 13 Page 5 of 11
Confidence Grades We have kept the confidence grades consistent with those of AIR17. During the reviews mentioned in the company commentary above, we will retain evidence to support any change in confidence grades. Whilst the quality of data will improve, the method of extraction and reporting remained consistent. The automated tool (developed during AIR12) to populate the base property tables has remained in place for AIR18.


NORTHERN IRELAND WATER LIMITED - ANNUAL INFORMATION RETURN
ANNUAL INFORMATION RETURN - TABLE 14 NON FINANCIAL MEASURESSEWAGE COLLECTED (TOTAL)
DESCRIPTION UNITS DP2012-13 CG 2013-14 CG 2014-15 CG 2015-16 CG 2016-17 CG 2017-18 CG 2018-19 CG 2019-20 CG 2020-21 CG
A SEWAGE - VOLUMES1 Volume unmeasured household sewage Ml/d 2 243.14 B3 232.74 B3 237.61 A2 238 81 A2 244.60 B2 244.35 A22 Volume unmeasured non-household sewage Ml/d 2 5.53 B3 4 89 B3 4.69 A2 4 25 A2 4.18 B2 4.16 A23 Volume unmeasured sewage Ml/d 2 248.67 B3 237 63 B3 242 3 A2 243.06 A2 248.78 B2 248.51 A24 Volume measured household domestic sewage Ml/d 2 0.00 A1 0 00 A1 0.00 A1 0 00 A1 0.00 A1 0.00 A15 Volume measured non - household domestic sewage Ml/d 2 35.9 B3 36 65 B3 39.11 B3 38.72 B3 41.50 A2 39.21 A26 Volume trade effluent (excluding Roads Drainage) Ml/d 2 34.12 B2 41.73 B2 48.49 B2 49 96 B2 49.00 B2 52.19 B27 Volume waste water returned Ml/d 2 318.69 B3 316.01 B3 329.90 B3 331.74 B3 339.28 B3 339.91 B28 Volume of Roads Drainage returned Ml/d 2 175.80 CX 175 80 CX 175.80 CX 175 80 CX 175.80 CX 175.80 CX
5REPORTING
YEAR REPORTING
YEAR REPORTING
YEAR
431REPORTING
YEAR
2REPORTING
YEAR
6REPORTING
YEAR
7REPORTING
YEAR
8 9REPORTING REPORTING
YEAR YEAR

Annual Information Return 2018 Section 2 Chapter 14 Page 1 of 4
Table 14 – Non Financial Measures - Sewage Collected (Total)
Line 1 – Volume Unmeasured Household Sewage This is calculated by assuming a 95% return to sewer of volume delivered to households factored by the percentage of the number of households billed for water against the number of households billed for sewerage services.
Sources AIR Table 10 Line 4 – Billed unmeasured household (Ml/d) AIR Table 13 Line 3 – Households billed unmeasured sewage AIR Table 7 Line 3 – Households billed unmeasured water
Volume of unmeasured = AIR Table 10 Line 4 X 0.95 X AIR Table 13 Line 3 household sewage (Ml/d) AIR Table 7 Line 3
It is worth noting that water Billed unmeasured household volume includes the MLE adjustment, meter under registration and supply pipe leakage.
The Billed Unmeasured Household volumes have been calculated by multiplying the average PCC figure for NI Water by the unmeasured household population. The source of the PCC figure is the NI Water domestic consumption monitor. The household population figure is sourced from the Northern Ireland Statistics and Research Agency (NISRA).
Underground Supply Pipe leakage has been applied to the billed unmeasured household volume component of this calculation.
A meter under registration factor of 6.92% has been applied to this total volume. This percentage has been provided by WRc, as a result of a project initiated by NI Water, and is specific to NI Water’s domestic consumption monitor meters.
The AIR18 volume reported for unmeasured household sewage is 244.35 Ml/d. The volume reported in AIR17 was 244.60 Ml/d.
Line 2 - Volume Unmeasured Non-Household Sewage This is calculated by assuming a 95% return to sewer of volume delivered to non-households factored by the percentage of the number of non-households billed for water against the number of non-households billed for sewerage services.
Sources AIR Table 10 Line 5 – Billed unmeasured non-household (Ml/d) AIR Table 13 Line 6 – Non-households billed unmeasured sewage AIR Table 7 Line 8 – Non-households billed unmeasured water
Volume of unmeasured = AIR Table 10 Line 5 X 0.95 X AIR Table 13 Line 6 Non-household sewage (Ml/d)
AIR Table 7 Line 8
It is worth noting that water Billed unmeasured non-household volume includes the MLE adjustment, meter under registration and supply pipe leakage.

Annual Information Return 2018 Section 2 Chapter 14 Page 2 of 4
The reported value for Billed Unmeasured Non-Household for AIR18 is 5.14 Ml/d. The value reported in AIR17 was 5.01 Ml/d.
The AIR18 volume reported for unmeasured non-household sewage is 4.16 Ml/d. The volume reported in AIR17 was 4.18 Ml/d.
Line 5 - Volume Measured Non-Household Domestic Sewerage The reported sewerage figure was based on actual billed sewerage discharge April 17 to March 18. The discharge volumetric information was derived directly from:
The monthly ‘Reconciling’ Reports Apr17-Mar17 - detailing actual billed seweragedischarge m3.
The DfI Domestic Allowance Subsidy Assurance Report Apr17 – Mar18 – detailingactual domestic sewerage allowance applied per bills.
Monthly FN12 Transaction Reports Apr17 – Mar18 – detailing Bad Debt Write-Offby Charge Type.
The calculated sewerage discharge volume was 14,313,073 m3 converted to mega litres per day of 39.21 Ml/d.
Sewerage volume is 6% (834.091m3 | 2.29 Ml/d) lower than last year.
The reduction in sewerage volume can be categorised as follows; 400,000 m3 – reduction in retrospective billing linked to the ongoing ‘Achieving
Customer Excellence’ (ACE) programme of work.
The ACE programme is a customer focused programme incorporating a number ofprojects to improve the integrity and completeness of customer accountconfiguration and subsequent billing.
o Following agreement with DfI, CCNI and Utility Regulator, NIW retrospectivebilling policy was amended from 6 Years to 18 months.
o The ‘In-Year’ impact of the Sewerage Account Configuration Review hasdecreased from 400,000 m3 in 2016-17, which included a large retrospectiveelement, to 100,000 m3 in 2017-18.
300,000 m3 – reduction due to the Laundrette Trade Effluent Consent Project.Laundrette sewerage discharge previously classified and billed as ‘standardsewerage’ volume is now classified and billed as ‘trade effluent’ volume.The reduction in billed sewerage volume will be offset by a corresponding increasein trade effluent volume.
100,000 m3 – underlying reduction in billed sewerage volume.
This line has been allocated a confidence grade of A2 as it has an element of manual manipulation of raw data from Rapid report to derive the full year discharge m3.
Line 6 - Volume Trade Effluent Sources The names of individual traders were taken from Primary Source of Trade Effluent Customers (PSTEC). This database is updated by NIW on a regular basis. The chargeable volume of each trader was supplied by our Billing Section in Metered Accounts Management. Where no volumes were available, the consented volumes were used. This applied to 43 traders out of 579 assessed. The total number of traders has increased from 551 in AIR17 to 579 in AIR18.


Annual Information Return 2018 Section 2 Chapter 14 Page 4 of 4
Line 7 – Volume of Waste Water Returned This line is a calculation of the figures from lines 3, 4, 5 and 6. The components of this calculation received confidence grades of A2, A1 and B2 respectively. As B2 was the lowest confidence grade for a component, this line has been allocated a confidence grade of B2.
Line 8 – Volume of Road Drainage returned In line with the proposed methodology, we carried out the following steps: 1. Based on information provided by Road Service, determined the surface area of all
roads and footpaths in urban areas (i.e. within the 40mph speed limit) as follows: Urban road surface area 39,264,486 m². Urban footway surface area 17,022,987 m². Total urban road & footway surface area 56,287,473 m².
2. Obtained Northern Ireland average annual rainfall data from the Met Office over the last10 years – 1.14m.
3. Using the above, calculated the annual volume of rain falling on these surfaces andhence the run-off from roads & footpaths discharged to NIW sewers and storm drains.
56,287,473 x 1.14 = 64,167,719m3 (175.80 MLD)4. From data extracted from NIW’s network information management system (NIMS) for
the largest 105 urban areas in Northern Ireland (i.e. all areas with greater than 1,000population) we determined the following:
Aggregate length of combined sewers = 4,378km Aggregate length of stormwater sewers = 4,317 km
Both of these figures were adjusted to allow for those stormwater sewers which –rather than discharging to a watercourse – are connected into the combined system.
Applying the assumption that the sewer lengths represent a ‘proxy’ estimate of road lengths, this yields an approximate 50:50 split between areas draining to combined systems and those draining to separate systems.
5. Using points 3 and 4 the volumes of Road Drainage returned are calculated as follows: Volume returned to combined sewer = 87.9 MLD Volume returned to storm sewer = 87.9 MLD Total Volume returned to sewer = 175.80 MLD

NORTHERN IRELAND WATER LIMITED - ANNUAL INFORMATION RETURN
ANNUAL INFORMATION RETURN - TABLE 15 NON FINANCIAL MEASURESSEWAGE TREATMENT (NIW Only)
DESCRIPTION UNITS DP2012-13 CG 2013-14 CG 2014-15 CG 2015-16 CG 2016-17 CG 2017-18 CG 2018-19 CG 2019-20 CG 2020-21 CG
A SEWAGE - LOADS1 Trade effluent load receiving secondary treatment (BOD/year) tonnes 1 3,778.6 B2 3,880.2 B2 5,322 6 B2 5,005 0 B2 4,378.9 B2 4,595.0 B22 Total load receiving secondary treatment (BOD/year) tonnes 1 39,183.9 C3 39,160.6 C3 38,946.1 C3 38,977 2 C3 38,552.9 C3 39,123.7 C33 Total load receiving primary treatment only (BOD/year) tonnes 1 286.6 C3 273.9 C3 210 8 C3 211 2 C3 211.0 C3 212.2 C34 Total load receiving preliminary treatment only (BOD/year) tonnes 1 691.5 C3 634.4 C3 634.4 C3 669 9 C3 670.0 C3 389.7 C35 Total load entering sewerage system (BOD/year) tonnes 1 40,312.8 C5 40,213.4 C5 39,929.7 C5 39,991 8 C3 39,561.2 C3 39,850.2 C36 Equivalent population served (resident) 000 2 1,806.82 C5 1,802.63 C5 1,789.68 C5 1,792.79 C3 1,773.11 C3 1,785.8 C37 Equivalent population served (resident) (numerical consents) 000 2 1,742.90 C5 1,740.19 C5 1,727.76 C5 1,731.65 C3 1,712 28 C3 1,724.8 C3
B SEWERAGE - SERVICE FACILITIES8 Number of sewage treatment works nr 0 1,018 A2 1,015 A2 1,016 A2 1,015 A2 1,015 A2 1,015.0 A29 Treatment capacity available (BOD5/day) tonnes 1 132.4 D3 133.4 D3 134 2 D3 134.1 D3 134.2 D3 135.0 D3
C SEWAGE - SLUDGE DISPOSAL14 Percentage unsatisfactory sludge disposal % 2 0 00 A1 0.00 A1 0.00 A1 0.00 A1 0 00 A1 0 00 A115 Total sewage sludge produced ttds 1 32 B2 32.491 B2 33 5 B2 33.7 B2 37.2 B2 35.7 B216 Total sewage sludge transferred to PPP ttds 1 31.3 A2 31.7 A2 32 6 A2 32 9 A2 36.4 A2 34.9 A217 Total sewage sludge disposal by NI Water ttds 1 0.8 B2 0.8 B2 0.9 B2 0 8 B2 0.8 B2 0.8 B2
4REPORTING
YEAR
5 6 7 8 9REPORTING REPORTING REPORTING
1 2 3REPORTINGREPORTING REPORTING
YEAR YEAR YEAR REPORTING REPORTING
YEAR YEAR YEAR YEAR YEAR

NORTHERN IRELAND WATER LIMITED - ANNUAL INFORMATION RETURN
ANNUAL INFORMATION RETURN - TABLE 15 NON FINANCIAL MEASURESSEWAGE TREATMENT (PPP Only)
DESCRIPTION UNITS DP2012-13 CG 2013-14 CG 2014-15 CG 2015-16 CG 2016-17 CG 2017-18 CG 2018-19 CG 2019-20 CG 2020-21 CG
A SEWAGE - LOADS1 Trade effluent load receiving secondary treatment (BOD/year) tonnes 1 1,040.6 B2 1,082.3 B2 1,117.7 B2 1,094.1 B2 1,232.3 B2 1,418.4 B22 Total load receiving secondary treatment (BOD/year) tonnes 1 6,594.9 B3 7,209.1 B3 7,031 9 B3 7,153 2 B3 7,360.2 B3 6,909.8 B33 Total load receiving primary treatment only (BOD/year) tonnes 1 0.0 A1 0.0 A1 0.0 A1 0 0 A1 0.0 A1 0.0 A14 Total load receiving preliminary treatment only (BOD/year) tonnes 1 0.0 A1 0.0 A1 0.0 A1 0 0 A1 0.0 A1 0.0 A15 Total load entering sewerage system (BOD/year) tonnes 1 6,594.9 C5 7,209.1 C5 7,031 9 B2 7,153 2 B2 7,133.2 B2 6,909.8 B26 Equivalent population served (resident) 000 2 301.14 B2 329.18 B3 321.09 B3 326.41 B3 325.72 B3 315.5 B37 Equivalent population served (resident) (numerical consents) 000 2 301.14 B2 329.18 B3 321.09 B3 326.41 B3 325.72 B3 315.5 B3
B SEWERAGE - SERVICE FACILITIES8 Number of sewage treatment works nr 0 6 A1 6 A1 6 A1 6 A1 6 A1 6 A19 Treatment capacity available (BOD5/day) tonnes 1 30.4 B3 30.4 A2 30.4 A2 30.4 A2 30.4 A2 30.4 A2
C SEWAGE - SLUDGE DISPOSAL14 Percentage unsatisfactory sludge disposal % 2 0 00 A2 0.00 A1 0.00 A1 0.00 A1 0 00 A1 0 00 A115 Total sewage sludge produced ttds 1 6.3 B2 6.4 A2 6.7 B3 5.7 B3 5.9 B3 6.0 B316 Total sewage sludge received from NI Water ttds 1 31.3 A2 31.7 A2 32 6 A2 32 9 A2 36.4 A2 34.9 A217 Total sewage sludge disposal ttds 1 37.6 B2 38.1 A2 39 3 B2 38 6 B2 42.3 B2 40.9 B2
4REPORTING
YEAR YEAR
1REPORTING
2REPORTING
3REPORTING
YEAR
5 6 7 8 9
YEAR YEAR YEAR YEAR YEAR YEAR REPORTING REPORTING REPORTING REPORTING REPORTING

NORTHERN IRELAND WATER LIMITED - ANNUAL INFORMATION RETURN
ANNUAL INFORMATION RETURN - TABLE 15 NON FINANCIAL MEASURESSEWAGE TREATMENT (Total)
DESCRIPTION UNITS DP2012-13 CG 2013-14 CG 2014-15 CG 2015-16 CG 2016-17 CG 2017-18 CG 2018-19 CG 2019-20 CG 2020-21 CG
A SEWAGE - LOADS1 Trade effluent load receiving secondary treatment (BOD/year) tonnes 1 4,819.2 B2 4,962.6 B2 6,440 3 B2 6,099.1 B2 5,611.2 B2 6,013.4 B22 Total load receiving secondary treatment (BOD/year) tonnes 1 45,778.8 C3 46,369.7 C3 45,978 0 C3 46,130.4 C3 45,913.1 C3 46,033.5 C33 Total load receiving primary treatment only (BOD/year) tonnes 1 286.6 C3 273 9 C3 210 8 C3 211.2 C3 211.0 C3 212.2 C34 Total load receiving preliminary treatment only (BOD/year) tonnes 1 691.5 C3 634.4 C3 634.4 C3 669.9 C3 670.0 C3 389.7 C35 Total load entering sewerage system (BOD/year) tonnes 1 46,907.7 C5 47,422 5 C5 46,961 6 C5 47,145.0 C3 46,694.4 C3 46,759.9 C36 Equivalent population served (resident) 000 2 2,107.96 C5 2,131.81 C5 2,110.77 C5 2,119 20 C3 2,098 83 C3 2,101.4 C37 Equivalent population served (resident) (numerical consents) 000 2 2,044.04 C5 2,069.37 C5 2,048.85 C5 2,058 06 C3 2,038 00 C3 2,040.3 C3
B SEWERAGE - SERVICE FACILITIES8 Number of sewage treatment works nr 0 1,024 A2 1,021 A2 1,022 A2 1,021 A2 1,021 A2 1,021.0 A29 Treatment capacity available (BOD5/day) tonnes 1 162.8 D3 163.8 D3 164 6 D3 164.5 D3 164.6 D3 165.4 D3
C SEWAGE - SLUDGE DISPOSAL14 Percentage unsatisfactory sludge disposal % 2 0.00 A2 0.00 A1 0.00 A1 0 00 A1 0 00 A1 0.00 A115 Total sewage sludge produced ttds 1 38.4 B2 38.9 A2 40 2 B2 39.4 B2 43.1 B2 41.70 B216 Not used ttds 117 Total sewage sludge disposal ttds 1 38.4 B3 38.9 A2 40 2 B2 39.4 B2 43.1 B2 41.70 B2
YEAR
1REPORTING
43REPORTING
YEAR
2REPORTINGREPORTING
YEAR YEAR YEAR YEAR
8 9REPORTING REPORTING REPORTING REPORTING REPORTING
5 6 7
YEAR YEAR YEAR


Annual Information Return 2018 Section 2 Chapter 15 Page 3 of 27
pitches only. No deduction has been made for commuters as such information has not been captured.
The loads reported in this table are the sums of the loads received by each WWTWs or outfall in each particular category, and hence include the proportion of PE allocated to hotels, and caravan and tent pitches therefore loads reported in this table include the non-resident population. The method for computing loads from NIW only WWTWs is the same as was implemented for AIR17, there has been no inclusion of re-circulated sludge/sludge liquors in the loads reported.
Trade effluent information was obtained from NIW’s Trade Effluent Section, for each individual consented trader, which enabled easy conversion to PEs. The COD: BOD conversion factor of 2:1 was not used as more accurate flow based information was available to the Trade Effluent Section.
The Water and Sewerage Services (NI) Order 2006 designated that the discharge from hospitals, nursing homes & clinics should no longer be considered as Trade Effluent, therefore for AIR18 these have been removed from the Trade Effluent Submission. For the majority of hospitals a certain percentage of hospital discharges has been included due to discharges from x-ray departments and bathing pools. The AIR11 Trade Information, for nursing homes and clinics, has been maintained for AIR18 in order to allow for this proportion of the influent entering the WWTWs. Similarly the PEs for the hospitals has been factored up to 100% of their total discharge to give a more accurate figure of load discharging to the sewerage network.
In AIR13 it was reported that flow & load information was validated for Belfast and a figure of 365,000 PE was agreed. This figure has been updated for AIR18 with the latest trade information giving a new figure of 365,139 PE. However it should be noted that there are a number of projects currently being carried out for NIW that are investigating the PEs discharging to Belfast and early indications would suggest the equivalent PE discharging to the WWTWs is much higher than currently stated. The main projects involved are:
Belfast WwTW Appraisal Study (which includes a full 12 month flow and loadstudy). The study is due to be completed in the Spring of 2018 ,
Glenmachan Sewers Project, and Compliance with the Surface Water (Shellfish) Regs (NI) – Belfast Lough.
The outcomes of these projects are likely to influence the PE for Belfast for AIR19.
NIW has information pertaining to septic tank imports to its WWTWs. In summary of the 17 WWTWs that are septic tank imports centres four receive the sludge at the head of the inlet works and the remaining 13 receive it via sludge reception centres
For AIR18 conversion factors, received from our scientific staff, were used to convert the septic tank imports to PEs for the 4 WWTWs where imports are discharged directly to the inlet works.
Allowance at the other 13 WWTWs is not being made as there is no way of computing the PE of the supernatant return as a result of the septic tank imports.
The WWTWs where this sludge was discharged at the head of the works were Belfast, Glenstall, Limavady and Lisburn (New Holland). A conversion was used to get an equivalent PE which was adopted for these sites for AIR13.

Annual Information Return 2018 Section 2 Chapter 15 Page 4 of 27
An assumption of 1% dry solids was made for Suspended Solid (SS) loading and an equivalent PE based on 60g of SS solids per PE was used
PE Calculation
NIW CAR Name
Site Car Id
Total Volume m3/Yr
Total Volume m3/day
SS Loading (Assume 1% Dry Solids)
m3/day
SS Loading kg/day
PE (SS/0.06)
Belfast 345 2460.5 6.74 0.07 67.41 1124 Glenstall 1109 6434.025 17.63 0.18 176.27 2938 Limavady 3162 255.356 0.70 0.01 7.0 117 Lisburn (New
Holland) 329 12095.037 33.14 0.33 331.37 5523
NIW has also information pertaining to Sludge Imports to its WWTWs however due to the fact that the supernatant return is metered at only a small number of WWTWs, it would appear that these meters require verification and perhaps calibration. Therefore no allowance is being made for PE resulting from sludge imports at these works.
The Reporters Report on AIR09 recommended that NIW correct possible overestimation of total WWTW loads due to the inclusion of offices/commercial premises. The majority of the residential and non-residential element of PEs used to calculate tables 17c and 17d was based on Pointer information from MapInfo. However it should be noted that the non-residential element of Pointer is made up of both commercial and unknown properties. At this present time it is not known what proportion of the unknowns are actually residential and which are non-residential and therefore it has been decided to include both elements when calculating the PEs for the band sizes. It is difficult to estimate the proportion of load at a WWTW due to commuters, or the load which should be deducted from/added to a particular WWTW due to population commuting out of/into the catchments. Hence no allowance to WWTWs loads has been made either way for Table 17d.
The table below gives a breakdown of the total load received by the company in ‘000 tonnes of BOD per annum, by each component used to build up the reported data. Please note the total equates to Line 5 (minor discrepancy due to rounding up of fractions).
Components used in build-up of Total Load Total PE 000 tonnes of BOD
per annum Residential 1,246,298 27,293.92 Non-Residential 222,983 4,883.33 Hotels 4,123 90.3 Nursery School 1,257 27.52 Playschool 1,067 23.38 Primary School 30,860 675.83 Secondary School 30,477 667.44 Trade PE 101,852 2,230.57 Large (>7500m3) Consumers 122,530 2,683.4 Caravan Parks 29,677 649.92

Annual Information Return 2018 Section 2 Chapter 15 Page 5 of 27
Components used in build-up of Total Load Total PE 000 tonnes of BOD
per annum Sludge Import / Export / Supernatant (Sludge Import to Inlet of Works – to 4 WWTWs 9702 PE) 28,520 624.59 Total (Line 5) 1,819,644 39,850.19
Confidence Grades The confidence grades of the data in lines 2 - 4 remain as C3.
The Reporter recommended in AIR14 and in AIR15 (Recommendation No 28/Reporter’s Report Reference Table 15 Lines 2-9 S7) that NI Water consider increasing the confidence grades for lines 5 – 7 from C5 to C3. Following discussions with the Reporter, the confidence grades for these lines in AIR16 have been amended to reflect this recommendation.
The confidence grades of the data in lines 8 and 9 remain as in AIR15, due to the confidence in the other information associated with the population of these lines.
The AIR 14 Reporter also recommended that NI Water should consider increasing the confidence grade for PPP Works (line 5) from C5 to B2. The latter was duly carried out for AIR15.
Line 2 - Total load receiving secondary treatment The table below shows the changes in WWTWs receiving secondary treatment since AIR17 for Line 2. NB. Change in PE (-Ve AIR18 PE Higher).
Name of Works CAR Site ID
PE Change Comments
Aghanloo (1) S02989 -6PE updated with AIR18 Trade
Information
Aghinlig (WWTW) S02554 -79A population study was carried out for this site and reviewed
and adopted for AIR18.
Annsborough S02687 -149 PE updated with AIR18 Trade Information
Antrim (WWTW) S01422 345 PE updated with AIR18 Trade Information
Ardglass (WWTW) S00268 136 PE updated with AIR18 Trade Information
Ballycastle (WWTW) S01071 -12797
Works upgraded with beneficial use for AIR18 which
resulted in a treatment category change.
PE updated with AIR18 Trade Information
Ballyclare S01467 36 PE updated with AIR18 Trade Information
Ballykelly (L/Derry) S03016 32 PE updated with AIR18 Trade
Information
Ballymacawley S02560 1 PE updated with AIR18 Trade Information
Ballymena (WWTW) S01456 4573 PE updated with AIR18 Trade Information

Annual Information Return 2018 Section 2 Chapter 15 Page 6 of 27
Name of Works CAR Site ID
PE Change Comments
Ballyvoy S01177 24 A population study was carried out for this site and reviewed
and adopted for AIR18.
Banbridge (WWTW) S02102 1044 PE updated with AIR18 Trade Information
Belfast (WWTW) S00345 -4537PE updated with AIR18 Trade
and septic tank import information
Bonnanaboigh S03031 -54A population study was carried out for this site and reviewed
and adopted for AIR18.
Bushmills (WWTW) S01178 -2 PE updated with AIR18 Trade Information
Carnanbane S03037 1 A population study was carried out for this site and reviewed
and adopted for AIR18.
Carrickfergus (WWTW) S00261 66 PE updated with AIR18 Trade Information
Coalisland S02828 97 PE updated with AIR18 Trade Information
Cookstown (WWTW) S01582 -1577 PE updated with AIR18 Trade Information
Corkill (Fermanagh) S03059 -6A population study was carried out for this site and reviewed
and adopted for AIR18.
Creevangar S03068 12
Works upgraded with beneficial use for AIR18 which
resulted in a treatment category change
Culmore (WWTW) S03071 -4853PE updated with AIR18 Trade
Information
Derryhale S02570 -148 PE updated with AIR18 Trade Information
Dervock (WWTW) S01102 -1 PE updated with AIR18 Trade Information
Donaghmore (WWTW) S02840 -44 PE updated with AIR18 Trade Information
Donemana S03103 -382A population study was carried out for this site and reviewed
and adopted for AIR18.
Donnybrewer S03080 141 PE updated with AIR18 Trade Information
Douglas Bridge S03082 -14A population study was carried out for this site and reviewed
and adopted for AIR18.
Downpatrick (WWTW) S00771 -52 PE updated with AIR18 Trade Information
Draperstown S01615 -2 PE updated with AIR18 Trade Information
Dromara (WWTW) S00316 -3 PE updated with AIR18 Trade Information

Annual Information Return 2018 Section 2 Chapter 15 Page 7 of 27
Name of Works CAR Site ID
PE Change Comments
Dromore (Down) S02127 -242 PE updated with AIR18 Trade Information
Dromore (Tyrone) S03083 -2 PE updated with AIR18 Trade Information
Drumenny S03088 23 A population study was carried out for this site and reviewed
and adopted for AIR18.
Dungannon S02850 1688 PE updated with AIR18 Trade Information
Dungiven S03101 28 PE updated with AIR18 Trade Information
Dunmurry S00346 103 PE updated with AIR18 Trade Information
Edenreagh Road(39-41) S04094 33
Works upgraded with beneficial use for AIR18 which
resulted in a treatment category change
Enniskillen S03218 283 PE updated with AIR18 Trade Information
Ervey Road S03107 16
Works upgraded with beneficial use for AIR18 which
resulted in a treatment category change
Fivemiletown (WWTW) S03113 -709A population study was carried out for this site and reviewed
and adopted for AIR18.
Glenstall S01109 -123 PE updated with AIR18 Trade Information
Grange (Taylorstown) S01442 -7 PE updated with AIR18 Trade Information
Greenisland (WWTW) S00263 915 PE updated with AIR18 Trade Information
Hilltown (WWTW) S02701 -4 PE updated with AIR18 Trade Information
Irvinestown S03137 -1 PE updated with AIR18 Trade Information
Keady (Armagh) S02553 -3 PE updated with AIR18 Trade Information
Kesh (WWTW) S03140 5 PE updated with AIR18 Trade Information
Kilkeel (WWTW) S00313 -396 PE updated with AIR18 Trade Information
Killinchy (WWTW) S00252 1665 PE updated with AIR18 Trade Information
Killybaskey S01581 -12A population study was carried out for this site and reviewed
and adopted for AIR18.
Killygonlan (WWTW) S02043 -4 PE updated with AIR18 Trade Information
Kilrea S01156 -8 PE updated with AIR18 Trade Information

Annual Information Return 2018 Section 2 Chapter 15 Page 8 of 27
Name of Works CAR Site ID
PE Change Comments
Larne (WWTW) S02044 -100 PE updated with AIR18 Trade Information
Limavady (WWTW) S03162 54 PE updated with AIR18 Trade
and septic tank import information
Lisburn (New Holland) S00329 -2888PE updated with AIR18 Trade
and septic tank import information
Lisnaskea (WWTW) S03171 -357 PE updated with AIR18 Trade Information
Longfield (Eglinton) S03173 -162A population study was carried out for this site and reviewed
and adopted for AIR18.
Maghera (L/Derry) S01629 68 PE updated with AIR18 Trade Information
Magherafelt (WWTW) S01621 302 PE updated with AIR18 Trade Information
Magherahoney S01117 14 A population study was carried out for this site and reviewed
and adopted for AIR18.
Markethill S02591 -74A population study was carried out for this site and reviewed
and adopted for AIR18.
Mayboy S01163 -51A population study was carried out for this site and reviewed
and adopted for AIR18.
Moneymore (WWTW) S01589 2 PE updated with AIR18 Trade Information
Moneyreagh (WWTW) S00337 -1 PE updated with AIR18 Trade Information
Mountnorris S02248 -3 PE updated with AIR18 Trade Information
Moy (WWTW) S02859 -591 PE updated with AIR18 Trade Information
Newmills (WWTW) S02852 -2 PE updated with AIR18 Trade Information
Newry (WWTW) S02685 -2281A population study was carried out for this site and reviewed
and adopted for AIR18.
Newtownbreda (WWTW) S00342 -10 PE updated with AIR18 Trade Information
Newtownbutler (WWTW) S03200 -1 PE updated with AIR18 Trade Information
North Coast (WWTWs) S04150 -518 PE updated with AIR18 Trade Information
Old Green S01448 -90A population study was carried out for this site and reviewed
and adopted for AIR18.
Omagh (WWTW) S03999 -346 PE updated with AIR18 Trade Information
Pomeroy (WWTW) S01593 1 PE updated with AIR18 Trade Information

Annual Information Return 2018 Section 2 Chapter 15 Page 9 of 27
Name of Works CAR Site ID
PE Change Comments
Riverside(16-20) S02029 12 Rationalisation of Riverside (16-20) to Portglenone WwTW
Rock Cottages S02172 6 A population study was carried out for this site and reviewed
and adopted for AIR18.
Strabane S03223 -1752A population study was carried out for this site and reviewed
and adopted for AIR18.
Swatragh (WWTW) S01637 1 PE updated with AIR18 Trade Information
Tamnamore (WWTW) S02862 -3 PE updated with AIR18 Trade Information
Tandragee S02174 342 PE updated with AIR18 Trade Information
Trillick (WWTW) S03231 4 PE updated with AIR18 Trade Information
Tullyroan S02600 -8 PE updated with AIR18 Trade Information
Warrenpoint (WWTW) S02720 -2490A population study was carried out for this site and reviewed
and adopted for AIR18.
Whitehouse S00265 -185 PE updated with AIR18 Trade Information
TOTAL -26,053 Change in Line 2 since AIR17
The change in PE equates to an increase in load of 570.57t BOD/yr (i.e. 26,053 x 60 for 60g/hd/day /1000/1000 x 365) from AIR17 to AIR18, allowing for rounding up and down and conversions.
Difference between AIR18 and AIR17 values (to 2 decimal places): Line 2 for AIR17- 38552.87 Line 2 for AIR 18 - 39123.74 Total Difference - 570.87
Note – The difference in the above totals are due to rounding of values.
Line 3 - Total load receiving primary treatment only The table below shows the changes in WWTWs receiving primary treatment only since AIR17 for Line 3. NB. Change in PE (-Ve AIR18 PE Higher).
Name of Works CAR ID PE Change Comments
Cornamuck S03061 6 A population study was carried out for this site and reviewed and adopted for AIR18.
Creevangar S03068 -12Works upgraded with beneficial use for AIR18 which resulted in a treatment category change
Edenreagh Road(39-41) S04094 -33Works upgraded with beneficial use for AIR18 which resulted in a treatment category change

Annual Information Return 2018 Section 2 Chapter 15 Page 10 of 27
Name of Works CAR ID PE Change Comments
Ervey Road S03107 -16Works upgraded with beneficial use for AIR18 which resulted in a treatment category change
St Johns Terrace (Kilcoo) S02717 1
A population study was carried out for this site and reviewed and adopted for AIR18.
Total -54 Change in Line 3 PE since AIR17
The change in PE equates to an increase in load of 1.17t BOD/yr (i.e. 54 x 60 for 60g/hd/day /1000/1000 x 365) from AIR17 to AIR18, allowing for rounding up and down and conversions.
Difference between AIR18 and AIR17: Line 3 for AIR16 - 211.00 Line 3 for AIR 17 - 212.19 Total Difference - 1.19
Note – The difference in the above totals are due to rounding of values
Line 4 - Total load receiving preliminary treatment only The table below shows the changes in WWTWs receiving preliminary only since AIR17 for Line 4. NB. Change in PE (-Ve AIR18 PE Higher).
Name of Works CAR ID PE Change Comments
Ballycastle (WWTW) S01071 12797 Works upgraded with beneficial use for AIR18
which resulted in a treatment category change Total 12797 Change in Line 4 PE since AIR16
The change in PE equates to an increase in load of 284.23t BOD/yr (i.e. x 60 for 60g/hd/day /1000/1000 x 365) from AIR17 to AIR18, allowing for rounding up and down and conversions.
Difference between AIR18 and AIR17: Line 4 for AIR17 - 669.95 Line 4 for AIR 18 - 389.69 Total Difference - 280.26
Line 5 - Total load entering sewerage system The table below shows the changes in WWTWs since AIR17 that affects load entering the system for Line 5. NB. Change in PE (-Ve AIR18 PE Higher).
Name of Works CAR ID PE Change Comments Aghanloo (1) S02989 -6 PE updated with AIR18
Trade Information
Aghinlig (WWTW) S02554 -79
A population study was carried out for this site and reviewed and adopted for AIR18.

Annual Information Return 2018 Section 2 Chapter 15 Page 11 of 27
Name of Works CAR ID PE Change Comments Annalong (WWTW) S00300 126 PE updated with AIR18
Trade Information
Annsborough S02687 -149 PE updated with AIR16 Trade Information
Antrim (WWTW) S01422 345 PE updated with AIR18 Trade Information
Ardglass (WWTW) S00268 136 PE updated with AIR18 Trade Information
Ballyclare S01467 36 PE updated with AIR18 Trade Information
Ballykelly (L/Derry) S03016 32 PE updated with AIR18 Trade Information
Ballymacawley S02560 1 PE updated with AIR18 Trade Information
Ballymena (WWTW) S01456 4573 PE updated with AIR18 Trade Information
Ballyvoy S01177 24
A population study was carried out for this site and reviewed and adopted for AIR18.
Banbridge (WWTW) S02102 1044 PE updated with AIR18 Trade Information
Belfast (WWTW) S00345 -4537PE updated with AIR18 Trade and septic tank import information
Bonnanaboigh S03031 -54
A population study was carried out for this site and reviewed and adopted for AIR18.
Bushmills (WWTW) S01178 -2 PE updated with AIR18 Trade Information
Carnanbane S03037 1
A population study was carried out for this site and reviewed and adopted for AIR18.
Carrickfergus (WWTW) S00261 66 PE updated with AIR18 Trade Information
Coalisland S02828 97 PE updated with AIR18 Trade Information
Cookstown (WWTW) S01582 -1577 PE updated with AIR18 Trade Information
Corkill (Fermanagh) S03059 -6
A population study was carried out for this site and reviewed and adopted for AIR18.
Cornamuck S03061 6
A population study was carried out for this site and reviewed and adopted for AIR18.
Culmore (WWTW) S03071 -4853PE updated with AIR18 Trade Information
Derryhale S02570 -148 PE updated with AIR18 Trade Information
Dervock (WWTW) S01102 -1 PE updated with AIR18 Trade Information

Annual Information Return 2018 Section 2 Chapter 15 Page 12 of 27
Name of Works CAR ID PE Change Comments Donaghmore (WWTW) S02840 -44 PE updated with AIR18
Trade Information
Donemana S03103 -382
A population study was carried out for this site and reviewed and adopted for AIR18.
Donnybrewer S03080 141 PE updated with AIR18 Trade Information
Douglas Bridge S03082 -14
A population study was carried out for this site and reviewed and adopted for AIR18.
Downpatrick (WWTW) S00771 -52 PE updated with AIR18 Trade Information
Draperstown S01615 -2 PE updated with AIR18 Trade Information
Dromara (WWTW) S00316 -3 PE updated with AIR18 Trade Information
Dromore (Down) S02127 -242 PE updated with AIR18 Trade Information
Dromore (Tyrone) S03083 -2 PE updated with AIR18 Trade Information
Drumenny S03088 23
A population study was carried out for this site and reviewed and adopted for AIR18.
Dungannon S02850 1688 PE updated with AIR18 Trade Information
Dungiven S03101 28 PE updated with AIR18 Trade Information
Dunmurry S00346 103 PE updated with AIR18 Trade Information
Enniskillen S03218 283 PE updated with AIR18 Trade Information
Fivemiletown (WWTW) S03113 -709
A population study was carried out for this site and reviewed and adopted for AIR18.
Glenstall S01109 -123 PE updated with AIR18 Trade Information
Grange (Taylorstown) S01442 -7 PE updated with AIR18 Trade Information
Greenisland (WWTW) S00263 915 PE updated with AIR18 Trade Information
Hilltown (WWTW) S02701 -4 PE updated with AIR18 Trade Information
Irvinestown S03137 -1 PE updated with AIR18 Trade Information
Keady (Armagh) S02553 -3 PE updated with AIR18 Trade Information
Kesh (WWTW) S03140 5 PE updated with AIR18 Trade Information
Kilkeel (WWTW) S00313 -396 PE updated with AIR18 Trade Information
Killinchy (WWTW) S00252 1665 PE updated with AIR18 Trade Information

Annual Information Return 2018 Section 2 Chapter 15 Page 13 of 27
Name of Works CAR ID PE Change Comments
Killybaskey S01581 -12
A population study was carried out for this site and reviewed and adopted for AIR18.
Killygonlan (WWTW) S02043 -4 PE updated with AIR18 Trade Information
Kilrea S01156 -8 PE updated with AIR18 Trade Information
Larne (WWTW) S02044 -100 PE updated with AIR18 Trade Information
Limavady (WWTW) S03162 54 PE updated with AIR18 Trade and septic tank import information
Lisburn (New Holland) S00329 -2888PE updated with AIR18 Trade and septic tank import information
Lisnaskea (WWTW) S03171 -357 PE updated with AIR18 Trade Information
Longfield (Eglinton) S03173 -162
A population study was carried out for this site and reviewed and adopted for AIR18.
Maghera (L/Derry) S01629 68 PE updated with AIR18 Trade Information
Magherafelt (WWTW) S01621 302 PE updated with AIR18 Trade Information
Magherahoney S01117 14
A population study was carried out for this site and reviewed and adopted for AIR18.
Markethill S02591 -74
A population study was carried out for this site and reviewed and adopted for AIR18.
Mayboy S01163 -51
A population study was carried out for this site and reviewed and adopted for AIR18.
Moneymore (WWTW) S01589 2 PE updated with AIR18 Trade Information
Moneyreagh (WWTW) S00337 -1 PE updated with AIR18 Trade Information
Mountnorris S02248 -3 PE updated with AIR18 Trade Information
Moy (WWTW) S02859 -591 PE updated with AIR18 Trade Information
Newmills (WWTW) S02852 -2 PE updated with AIR18 Trade Information
Newry (WWTW) S02685 -2281
A population study was carried out for this site and reviewed and adopted for AIR18.
Newtownbreda (WWTW) S00342 -10 PE updated with AIR18 Trade Information
Newtownbutler (WWTW) S03200 -1 PE updated with AIR18 Trade Information

Annual Information Return 2018 Section 2 Chapter 15 Page 14 of 27
Name of Works CAR ID PE Change Comments North Coast (WWTWs) S04150 -518 PE updated with AIR18
Trade Information
Old Green S01448 -90
A population study was carried out for this site and reviewed and adopted for AIR18.
Omagh (WWTW) S03999 -346 PE updated with AIR18 Trade Information
Pomeroy (WWTW) S01593 1 PE updated with AIR18 Trade Information
Rock Cottages S02172 6
A population study was carried out for this site and reviewed and adopted for AIR18.
St Johns Terrace (Kilcoo) S02717 1 A population study was carried out for this site and reviewed and adopted for AIR18.
Strabane S03223 -1752
A population study was carried out for this site and reviewed and adopted for AIR18.
Swatragh (WWTW) S01637 1 PE updated with AIR18 Trade Information
Tamnamore (WWTW) S02862 -3 PE updated with AIR18 Trade Information
Tandragee S02174 342 PE updated with AIR18 Trade Information
Trillick (WWTW) S03231 4 PE updated with AIR18 Trade Information
Tullyroan S02600 -8 PE updated with AIR18 Trade Information
Warrenpoint (WWTW) S02720 -2490
A population study was carried out for this site and reviewed and adopted for AIR18.
Whitehouse S00265 -185 PE updated with AIR18 Trade Information
Total -13,195 Change in Line 5 PE since AIR17
The change in PE equates to an increase in load of 288.97t BOD/yr (i.e. 13,195 x 60 for 60g/hd/day /1000/1000 x 365) from AIR17 to AIR18, allowing for rounding up and down and conversions.
Difference between AIR18 and AIR17: Line 5 for AIR17 - 39561.15 Line 5 for AIR 18 - 39850.19 Total Difference - 289.04
Note – The difference in the above totals are due to rounding of values.
Line 6 - Equivalent population served (resident) The table below shows the changes in WWTWs since AIR17 that affects equivalent population served (resident) for Line 6.

Annual Information Return 2018 Section 2 Chapter 15 Page 15 of 27
Name of Works CAR ID PE Change Comments
Aghanloo (1) S02989 -6 PE updated with AIR18 Trade Information
Aghinlig (WWTW) S02554 -79A population study was carried out for this site and reviewed and adopted for AIR18.
Annalong (WWTW) S00300 125 PE updated with AIR18 Trade Information
Annsborough S02687 -149 PE updated with AIR16 Trade Information
Antrim (WWTW) S01422 345 PE updated with AIR18 Trade Information
Ardglass (WWTW) S00268 136 PE updated with AIR18 Trade Information
Ballyclare S01467 37 PE updated with AIR18 Trade Information
Ballykelly (L/Derry) S03016 32 PE updated with AIR18 Trade Information
Ballymacawley S02560 1 PE updated with AIR18 Trade Information
Ballymena (WWTW) S01456 4573 PE updated with AIR18 Trade Information
Ballyvoy S01177 24 A population study was carried out for this site and reviewed and adopted for AIR18.
Banbridge (WWTW) S02102 1044 PE updated with AIR18 Trade Information
Belfast (WWTW) S00345 -4537 PE updated with AIR18 Trade and septic tank import information
Bonnanaboigh S03031 -54A population study was carried out for this site and reviewed and adopted for AIR18.
Bushmills (WWTW) S01178 -2 PE updated with AIR18 Trade Information
Carnanbane S03037 1 A population study was carried out for this site and reviewed and adopted for AIR18.
Carrickfergus (WWTW) S00261 67 PE updated with AIR18 Trade Information
Coalisland S02828 96 PE updated with AIR18 Trade Information
Cookstown (WWTW) S01582 -1577 PE updated with AIR18 Trade Information
Corkill (Fermanagh) S03059 -6A population study was carried out for this site and reviewed and adopted for AIR18.
Cornamuck S03061 6 A population study was carried out for this site and reviewed and adopted for AIR18.

Annual Information Return 2018 Section 2 Chapter 15 Page 16 of 27
Name of Works CAR ID PE Change Comments
Culmore (WWTW) S03071 -4853PE updated with AIR18 Trade Information
Derryhale S02570 -148 PE updated with AIR18 Trade Information
Dervock (WWTW) S01102 -1 PE updated with AIR18 Trade Information
Donaghmore (WWTW) S02840 -45 PE updated with AIR18 Trade Information
Donemana S03103 -382A population study was carried out for this site and reviewed and adopted for AIR18.
Donnybrewer S03080 140 PE updated with AIR18 Trade Information
Douglas Bridge S03082 -14A population study was carried out for this site and reviewed and adopted for AIR18.
Downpatrick (WWTW) S00771 -52 PE updated with AIR18 Trade Information
Draperstown S01615 -2 PE updated with AIR18 Trade Information
Dromara (WWTW) S00316 -3 PE updated with AIR18 Trade Information
Dromore (Down) S02127 -242 PE updated with AIR18 Trade Information
Dromore (Tyrone) S03083 -2 PE updated with AIR18 Trade Information
Drumenny S03088 23 A population study was carried out for this site and reviewed and adopted for AIR18.
Dungannon S02850 1688 PE updated with AIR18 Trade Information
Dungiven S03101 29 PE updated with AIR18 Trade Information
Dunmurry S00346 103 PE updated with AIR18 Trade Information
Enniskillen S03218 283 PE updated with AIR18 Trade Information
Fivemiletown (WWTW) S03113 -632A population study was carried out for this site and reviewed and adopted for AIR18.
Glenstall S01109 -124 PE updated with AIR18 Trade Information
Grange (Taylorstown) S01442 -7 PE updated with AIR18 Trade Information
Greenisland (WWTW) S00263 915 PE updated with AIR18 Trade Information
Greysteel (WWTW) S03123 1 PE updated with AIR18 Trade Information

Annual Information Return 2018 Section 2 Chapter 15 Page 17 of 27
Name of Works CAR ID PE Change Comments
Hilltown (WWTW) S02701 -5 PE updated with AIR18 Trade Information
Irvinestown S03137 -1 PE updated with AIR18 Trade Information
Keady (Armagh) S02553 -3 PE updated with AIR18 Trade Information
Kesh (WWTW) S03140 4 PE updated with AIR18 Trade Information
Kilkeel (WWTW) S00313 -396 PE updated with AIR18 Trade Information
Killinchy (WWTW) S00252 1665 PE updated with AIR18 Trade Information
Killybaskey S01581 -12A population study was carried out for this site and reviewed and adopted for AIR18.
Killygonlan (WWTW) S02043 -4 PE updated with AIR18 Trade Information
Kilrea S01156 -8 PE updated with AIR18 Trade Information
Larne (WWTW) S02044 -101 PE updated with AIR18 Trade Information
Limavady (WWTW) S03162 54 PE updated with AIR18 Trade and septic tank import information
Lisburn (New Holland) S00329 -2888 PE updated with AIR18 Trade and septic tank import information
Lisnaskea (WWTW) S03171 -358 PE updated with AIR18 Trade Information
Longfield (Eglinton) S03173 -162A population study was carried out for this site and reviewed and adopted for AIR18.
Maghera (L/Derry) S01629 69 PE updated with AIR18 Trade Information
Magherafelt (WWTW) S01621 302 PE updated with AIR18 Trade Information
Magherahoney S01117 14 A population study was carried out for this site and reviewed and adopted for AIR18.
Markethill S02591 -75A population study was carried out for this site and reviewed and adopted for AIR18.
Mayboy S01163 -51A population study was carried out for this site and reviewed and adopted for AIR18.
Moneymore (WWTW) S01589 3 PE updated with AIR18 Trade Information
Moneyreagh (WWTW) S00337 -1 PE updated with AIR18 Trade Information
Mountnorris S02248 -3 PE updated with AIR18 Trade Information

Annual Information Return 2018 Section 2 Chapter 15 Page 18 of 27
Name of Works CAR ID PE Change Comments
Moy (WWTW) S02859 -591 PE updated with AIR18 Trade Information
Newmills (WWTW) S02852 -2 PE updated with AIR18 Trade Information
Newry (WWTW) S02685 -2244A population study was carried out for this site and reviewed and adopted for AIR18.
Newtownbreda (WWTW) S00342 -10 PE updated with AIR18 Trade Information
Newtownbutler (WWTW) S03200 -1 PE updated with AIR18 Trade Information
North Coast (WWTWs) S04150 -518 PE updated with AIR18 Trade Information
Old Green S01448 -90A population study was carried out for this site and reviewed and adopted for AIR18.
Omagh (WWTW) S03999 -346 PE updated with AIR18 Trade Information
Pomeroy (WWTW) S01593 1 PE updated with AIR18 Trade Information
Rock Cottages S02172 6 A population study was carried out for this site and reviewed and adopted for AIR18.
St Johns Terrace (Kilcoo) S02717 1 A population study was carried out for this site and reviewed and adopted for AIR18.
Strabane S03223 -1674A population study was carried out for this site and reviewed and adopted for AIR18.
Swatragh (WWTW) S01637 2 PE updated with AIR18 Trade Information
Tamnamore (WWTW) S02862 -3 PE updated with AIR18 Trade Information
Tandragee S02174 342 PE updated with AIR18 Trade Information
Trillick (WWTW) S03231 4 PE updated with AIR18 Trade Information
Tullyroan S02600 -8 PE updated with AIR18 Trade Information
Warrenpoint (WWTW) S02720 -2220A population study was carried out for this site and reviewed and adopted for AIR18.
Whitehouse S00265 -184 PE updated with AIR18 Trade Information
Total -12,739 Change in Line 6 PE since AIR17
NB. Change in PE (-Ve AIR18 PE Higher); Difference between totals is due to rounding.
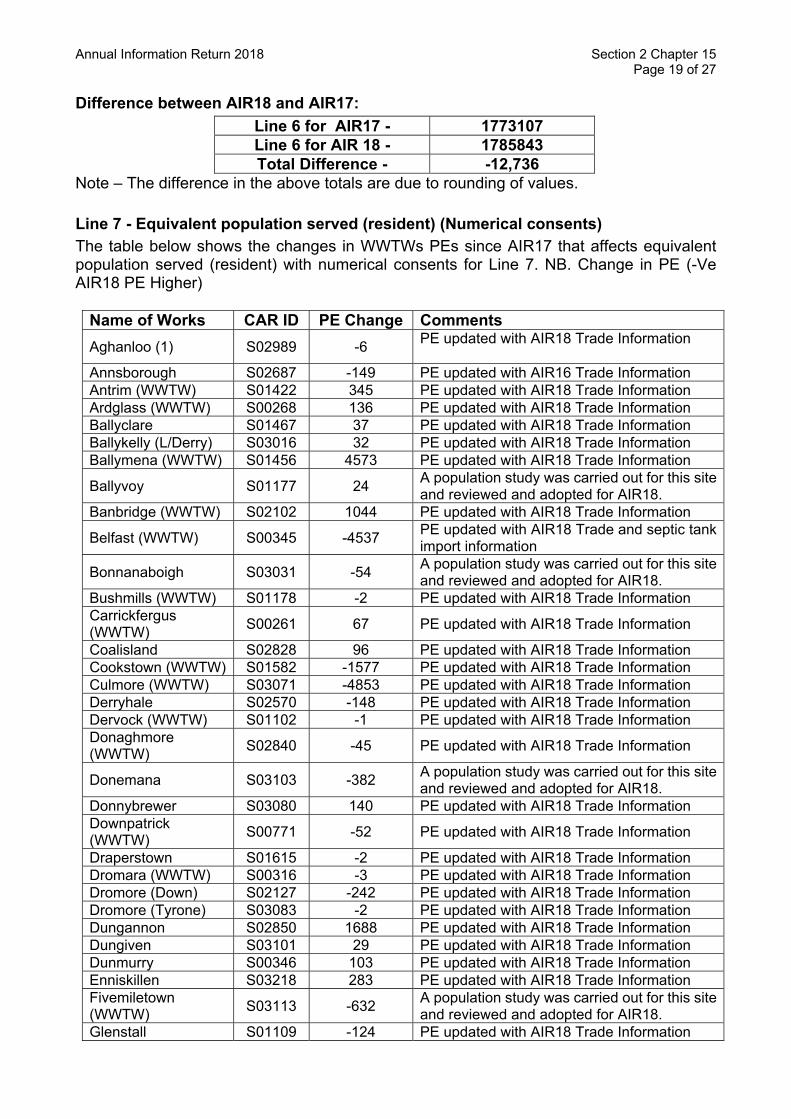
Annual Information Return 2018 Section 2 Chapter 15 Page 19 of 27
Difference between AIR18 and AIR17: Line 6 for AIR17 - 1773107 Line 6 for AIR 18 - 1785843 Total Difference - -12,736
Note – The difference in the above totals are due to rounding of values.
Line 7 - Equivalent population served (resident) (Numerical consents) The table below shows the changes in WWTWs PEs since AIR17 that affects equivalent population served (resident) with numerical consents for Line 7. NB. Change in PE (-Ve AIR18 PE Higher)
Name of Works CAR ID PE Change Comments Aghanloo (1) S02989 -6 PE updated with AIR18 Trade Information
Annsborough S02687 -149 PE updated with AIR16 Trade Information Antrim (WWTW) S01422 345 PE updated with AIR18 Trade Information Ardglass (WWTW) S00268 136 PE updated with AIR18 Trade Information Ballyclare S01467 37 PE updated with AIR18 Trade Information Ballykelly (L/Derry) S03016 32 PE updated with AIR18 Trade Information Ballymena (WWTW) S01456 4573 PE updated with AIR18 Trade Information
Ballyvoy S01177 24 A population study was carried out for this site and reviewed and adopted for AIR18.
Banbridge (WWTW) S02102 1044 PE updated with AIR18 Trade Information
Belfast (WWTW) S00345 -4537 PE updated with AIR18 Trade and septic tank import information
Bonnanaboigh S03031 -54 A population study was carried out for this site and reviewed and adopted for AIR18.
Bushmills (WWTW) S01178 -2 PE updated with AIR18 Trade Information Carrickfergus (WWTW) S00261 67 PE updated with AIR18 Trade Information
Coalisland S02828 96 PE updated with AIR18 Trade Information Cookstown (WWTW) S01582 -1577 PE updated with AIR18 Trade Information Culmore (WWTW) S03071 -4853 PE updated with AIR18 Trade Information Derryhale S02570 -148 PE updated with AIR18 Trade Information Dervock (WWTW) S01102 -1 PE updated with AIR18 Trade Information Donaghmore (WWTW) S02840 -45 PE updated with AIR18 Trade Information
Donemana S03103 -382 A population study was carried out for this site and reviewed and adopted for AIR18.
Donnybrewer S03080 140 PE updated with AIR18 Trade Information Downpatrick (WWTW) S00771 -52 PE updated with AIR18 Trade Information
Draperstown S01615 -2 PE updated with AIR18 Trade Information Dromara (WWTW) S00316 -3 PE updated with AIR18 Trade Information Dromore (Down) S02127 -242 PE updated with AIR18 Trade Information Dromore (Tyrone) S03083 -2 PE updated with AIR18 Trade Information Dungannon S02850 1688 PE updated with AIR18 Trade Information Dungiven S03101 29 PE updated with AIR18 Trade Information Dunmurry S00346 103 PE updated with AIR18 Trade Information Enniskillen S03218 283 PE updated with AIR18 Trade Information Fivemiletown (WWTW) S03113 -632 A population study was carried out for this site
and reviewed and adopted for AIR18. Glenstall S01109 -124 PE updated with AIR18 Trade Information

Annual Information Return 2018 Section 2 Chapter 15 Page 20 of 27
Name of Works CAR ID PE Change Comments Grange (Taylorstown) S01442 -7 PE updated with AIR18 Trade Information
Greenisland (WWTW) S00263 915 PE updated with AIR18 Trade Information
Hilltown (WWTW) S02701 -5 PE updated with AIR18 Trade Information Irvinestown S03137 -1 PE updated with AIR18 Trade Information Keady (Armagh) S02553 -3 PE updated with AIR18 Trade Information Kesh (WWTW) S03140 4 PE updated with AIR18 Trade Information Kilkeel (WWTW) S00313 -396 PE updated with AIR18 Trade Information Killinchy (WWTW) S00252 1665 PE updated with AIR18 Trade Information Killygonlan (WWTW) S02043 -4 PE updated with AIR18 Trade Information Kilrea S01156 -8 PE updated with AIR18 Trade Information Larne (WWTW) S02044 -101 PE updated with AIR18 Trade Information
Limavady (WWTW) S03162 54 PE updated with AIR18 Trade and septic tank import information
Lisburn (New Holland) S00329 -2888 PE updated with AIR18 Trade and septic tank
import information Lisnaskea (WWTW) S03171 -358 PE updated with AIR18 Trade Information Maghera (L/Derry) S01629 69 PE updated with AIR18 Trade Information Magherafelt (WWTW) S01621 302 PE updated with AIR18 Trade Information
Markethill S02591 -75 A population study was carried out for this site and reviewed and adopted for AIR18.
Moneymore (WWTW) S01589 3 PE updated with AIR18 Trade Information
Moneyreagh (WWTW) S00337 -1 PE updated with AIR18 Trade Information
Mountnorris S02248 -3 PE updated with AIR18 Trade Information Moy (WWTW) S02859 -591 PE updated with AIR18 Trade Information Newmills (WWTW) S02852 -2 PE updated with AIR18 Trade Information
Newry (WWTW) S02685 -2244 A population study was carried out for this site and reviewed and adopted for AIR18.
Newtownbreda (WWTW) S00342 -10 PE updated with AIR18 Trade Information
Newtownbutler (WWTW) S03200 -1 PE updated with AIR18 Trade Information
North Coast (WWTWs) S04150 -518 PE updated with AIR18 Trade Information
Omagh (WWTW) S03999 -346 PE updated with AIR18 Trade Information Pomeroy (WWTW) S01593 1 PE updated with AIR18 Trade Information
Strabane S03223 -1674 A population study was carried out for this site and reviewed and adopted for AIR18.
Swatragh (WWTW) S01637 2 PE updated with AIR18 Trade Information Tamnamore (WWTW) S02862 -3 PE updated with AIR18 Trade Information
Tandragee S02174 342 PE updated with AIR18 Trade Information Trillick (WWTW) S03231 4 PE updated with AIR18 Trade Information Warrenpoint (WWTW) S02720 -2220 A population study was carried out for this site
and reviewed and adopted for AIR18. Whitehouse S00265 -185 PE updated with AIR18 Trade Information
Total -12,497 Change in Line 7 PE since AIR17

Annual Information Return 2018 Section 2 Chapter 15 Page 21 of 27
Difference between AIR18 and AIR17: Line 7 for AIR17 - 1,712,277 Line 7 for AIR 18 - 1,724,769
Total Difference - -12,492 Note – The difference in the above totals are due to rounding of values.
Line 8 - Number of sewage treatment works The number of WWTWs of 1015, on this line differs from the total of 1023 as shown in Table 17c, as the former does not include the screened outfalls (2 No.) and the unscreened outfalls (6 No.), as per the definition for this line.
The table below shows the changes in numbers of WWTWs since AIR17 for Line 8.
Name of Works CAR ID Change in Nr of STWs Comments
Net Reduction 0
Difference between AIR18 and AIR17: Line 8 for AIR17 - 1,015 Line 8 for AIR 18 - 1,015 Total Difference - 0
Line 9 – Treatment capacity available The table below shows the changes in Treatment Capacity Available at WWTWs since AIR17 for Line 9. NB. Change in PE (-Ve AIR18 PE Higher).
Name of Works CAR ID PE Change Comments Ardgarvan (WWTW) S02987 -47 Upgraded during AIR18 under
RWwIP.
Ballycastle (WWTW) S01071 -13563 Capital upgrade with beneficial use achieved during AIR18
Bresagh S00332 -10 Upgraded during AIR18 under RWwIP.
Carnanbane S03037 30 Upgraded during AIR18 under RWwIP.
Clabby (WWTW) S03051 -479 Capital upgrade with beneficial use achieved during AIR18
Cornamuck S03061 7 Upgraded during AIR18, completed by CSDD.
Creevangar S03068 -4 Upgraded during AIR17 under RWwIP.
Drumsurn S03100 -277Capital upgrade with beneficial use during AIR15 but design PE update missed
Edenreagh Road(39-41) S04094 -32 Upgraded during AIR18, completed by CSDD.
Ervey Road S03107 -25 Upgraded during AIR18, completed by CSDD.
Glenabbey (WWTW) S03119 11 Upgraded during AIR18, completed by CSDD.

Annual Information Return 2018 Section 2 Chapter 15 Page 22 of 27
Name of Works CAR ID PE Change Comments Mullans (Antrim) S01118 -250 Capital upgrade with beneficial use
achieved during AIR18
Oliver Plunket Park S02284 -50 Upgraded during AIR178 under RWwIP.
Total -14,689 Change in Line 9 PE since AIR17
The change in PE equates to an increase in load of 0.88t BOD/day (i.e. 14,689 x 60 for 60g/hd/day /1000/1000) from AIR17 to AIR18.
Difference between AIR18 and AIR17: Line 9 for AIR17 - 134.15 Line 9 for AIR 18 - 135.03 Total Difference - 0.88
Note – The difference in the above totals are due to rounding of values
Confidence Grade The confidence grade for line 8 remains as A2 (as for AIR15). There may still be a number of small WWTWs which are perhaps under the ownership of the NI Housing Executive or have become private due to customers perhaps installing their own private septic tanks or converting 2 houses into 1. Hence a small reduction in confidence grade i.e. A2 is viewed as necessary to reflect this uncertainty, especially as 698 WWTWs (excluding tourist PE) are listed as having a PE of less than 100.

Annual Information Return 2018 Section 2 Chapter 15 Page 23 of 27
Lines 2-7 – Sewage loads PPP Only Line 2 - Total load receiving secondary treatment The total loads receiving secondary treatment have changed to reflect the load discharged from the NI Water sewer network to the PPP works.
Line 6 - Equivalent population served (resident) The change in the Equivalent Population Served (resident) receiving treatment reflects the change in load received from the NIW Catchments.
Line 7 - Equivalent population served (resident) (Numerical consents) As all the PPP WwTW’s have numerical consents, the change reflects the same change in Line 6 above for the same reasons.
Lines 14- 17 Sewage – Sludge Disposal NIW Only Line 14 – Percentage unsatisfactory sludge disposal Northern Ireland Water (NIW) continues to have zero unsatisfactory sludge disposals. NIW has again assigned a confidence grade of A1 to percentage unsatisfactory sludge disposal as the total is zero.
Line 15 – Total sewage sludge produced Sewage cake is produced from 8Nr. NIW sites and transported to PPP Contractor for incineration. Liquid sludge is also transported to the PPP Contractor (Ballynacor & Duncrue Street, Belfast) where the Contractor measures and processes same for disposal (including Belfast WwTW Indigenous).
For the purpose of AIR 18 submission Table 15 (NIW Only) relates to sewage sludge produced for 2017/18 (tds) as recorded by PPP and monthly by Ww Area Sludge Officers (reconciled using the SLS) and presented in the monthly Sludge Management Report (copy attached) along with an estimated quantity of WwTW & WwPS grit & screenings which are routinely removed as part of the sewage treatment process and disposed of separately under Tender C821 (Collection, Transportation and Disposal of Waste by skip). The total estimated quantity of grit and screenings removed as part of the sewage treatment process and disposed of under Tender C821 has been collated for the period of 2017/18.
Line 16 - Total sewage sludge received from NI Water Northern Ireland Water is contracted to transfer all sewage liquid and cake to PPP. Sewage cake is produced from 8Nr. NIW sites and transported to PPP Contractor for incineration. Liquid sludge is also transported to the PPP Contractor (Ballynacor & Duncrue Street, Belfast) where the Contractor measures and processes same for disposal (including Belfast WwTW Indigenous). That element of the sewage treatment production is combined for the Total T15 submission. This data is also submitted through PPP reporting in T42
NI Water, in accordance with AIR17 Reporter’s Recommendation 29 (also Refers to Recommendation 24) continues to ensure the reported T15 L14-17 liquid and cake sludge quantities are a single corporate record of data for sludge production at any WwTW, irrespective of whether the WwTW is operated by NIW or a PPP contractor.
NI Water, in accordance with AIR17 Reporter Recommendations (25 & 26), has continued to monitor and investigate monthly sludge volume variations due to operational reasons. NI

Annual Information Return 2018 Section 2 Chapter 15 Page 24 of 27
Water continues to monitor for variance (AIR18 1.69%) between NI Water cake figure and that of the NI Water contractor, comparisons are only considered for operational confidence and not replacement data for the corporate sludge production.
In relation to AIR17 Reporter’s Recommendation 27 NI Water acknowledges that whilst there continues to be occasional issues with quantity and quality of centrate returns these have been well reduced in frequency allowing a more stable operation on site. No measurement facility has been deemed necessary but is still under consideration.
Line 17 - Total sewage sludge disposal Northern Ireland Water disposes the same amount of sludge as that produced, Line 15. NIW remains committed to compliance with the requirements of the “Safe Sludge Matrix”. A total of 97.8 % of sewage sludge to PPP during 2017/18, The total estimated quantity of grit and screenings removed as part of the sewage treatment process and disposed of separately under Tender C821 (Collection, Transportation and Disposal of Waste by skip) has been collated and disposed to landfill in 2017/18.
NIW has assigned a confidence grade of (B2) to sludge disposal (NIW Only) as the company has systems in place to record the volumes and the measured percentage dry solids.
PPP only Line 5 - Total load entering sewerage system The information has been separated out of the ‘NIW Only’ figure for the PPP related catchments and recorded in this cell to readily consider PPP Catchments to PPP Treatment Works. This information was not provided by the PPP Contractors as they do not operate these catchments. The AIR 18 value computed by APT is 315,512PE or 6909.75 tonnes BOD/year.
Line 14 – Percentage unsatisfactory sludge disposal No change – the PPP Contractor has confirmed that all sludges were disposed of through authorised routes.
Line 15 - Total sewage sludge produced The changes in sludge produced data reflect the loads delivered to the PPP contractor from the NI Water sewer network, outside the PPP contractor’s control. There are minor additions for Screenings and Grit which were initially reported in AIR13 and subsequently in AIR submissions since by the Contractors.
The variations are tabulated below;
The changes in sludge production, shown below in graphical form, records data for Omega reflect a probable combination of
PPP Production AIR18 AIR17 AIR16 AIR15 AIR14 AIR13 AIR12 AIR11 AIR10 Armagh WWTW 0.534 0.605 0.535 0.579 0.547 0.535 0.570 0.759 0.840 Richhill WWTW 0.068 0.071 0.071 0.063 0.071 0.065 0.066 0.213 0.210 Ballynacor WWTW 1.882 1.739 1.564 2.269 2.007 2.069 3.330 2.468 2.290 Ballyrickard WWTW 1.246 1.293 1.064 1.337 1.126 1.158 1.225 1.627 1.717 NDA WWTW 1.629 1.656 1.818 1.633 1.920 1.628 1.559 1.753 1.654 Kinnegar WWTW 0.331 0.302 0.501 0.668 0.643 0.726 0.823 0.792 0.700 Omega Screenings/Grit 0.233 0.206 0.083 0.083 0.088 0.106 Kinnegar Screenings/Grit 0.035 0.058 0.049 0.057 0.047 0.022 Totals 5.958 5.930 5.685 6.689 6.449 6.309 7.573 7.612 7.411


Annual Information Return 2018 Section 2 Chapter 15 Page 26 of 27
Line 17 - Total sewage sludge disposal In AIR17 the Omega Contractor reported a disposal of 42.2 ttds [42.229 ttds] sludge disposed of. This year (AIR18) the reported figure is 40.9 ttds [40.856 ttds]. However, last year [AIR17] the Reporter made a recommendation that the Incinerator Returns be deducted from the Total Sludge Disposal collation. The Incinerator returns have been estimated to be 1.660 ttds [Confidence Grade for this estimation would be approx. C4 at best], which could make this actual disposal figure 39.196 ttds, but this figure can’t be used to compare variances as the Incinerator Returns were not collated for the previous year [AIR17].
The variance of 1.373 ttds [3.638 ttds AIR17] is considered to be a combination of: (i) Timing of data capture (sludges being collected and receipted for disposal)(ii) Accurate measurement and records demanded under the Omega contract(iii) Variations in quantities of sludge produced across PPP and NIW STWs.(iv) Reporting of Screenings and Grit, and modification to accuracy where
possible.(v) Reporter requirement that the total Sludge Disposal calculation is adjusted to
remove the Incinerator Return Loading which is essentially a double count,has not impacted on this as it has not been included.
Specific Commentary Requirements: Assumptions Made:
o 60g/h/d as per NIAUR requirementso Skips weights (Screenings and Grit) are recorded in wet tonnes. An assumption
based on long term averages of (39%DS Screenings and 65%DS Grit) Dry Solidscontent has been used to convert wet tonnes into TDS. Apart from Kinnegarwhere the %DS is assessed for each skip weight.
o BOD loading is based on the measured influent sample result of loading applied to the
WWTW processes; therefore there is no need to include a calculation for recirculatedSludge/Sludge liquors in Lines 1-7. It is not a calculated load from desktop analysis ofPopulation, as required by the Regulator Guidance Notes. However, PPP Managementteam have been instructed to proceed on the basis of measured BOD and PE calculatedfrom measured BOD (rather than desktop calculation) as it has been advised this is theReporter and Regulators preferred method of establishing PE and BOD.
Sludge production is based on the records of actual sludge imported to treatment ordisposal centres. This is confirmed from the Contractors records of sludge from bothweighbridge / Waste Management Notes records (for sludge cake) and sludge loggerrecords (for liquid sludge).
The PE figures have only been established on the basis of the BOD5 loads recorded bythe end of the year and represent the load received for the AIR18 Reporting Period. Theyhave not therefore been notified to NIEA, as any such notifications relate to calendaryears.
As the PPP contractors do not control septage, trade effluent nor manage connectionsof domestic population, they are unable to build up the loads on this basis. The loads aretherefore determined in accordance with the Table 15 Line 2 Methodology, based on 52treated effluent BOD5 sample results per year. This is contrary to the requirements of theGuidance Notes, and is not consistent with how NI Water only data is constructed; butPPP Management Team has been advised that this is the Reporter and the Regulator’spreferred method of calculation. The PPP only data remains unchanged. The

Annual Information Return 2018 Section 2 Chapter 15 Page 27 of 27
recirculated sludge/sludge liquors in Lines 1-7 are consistent with the methodology presented in AIR’s 10-17.
Total Table Line 14 - Percentage unsatisfactory sludge disposal No change – the PPP Contractor has confirmed that all sludges were disposed of through authorised routes.
Line 15 - Total sewage sludge produced The changes to the sludges produced are reflected in the commentary to Line 17 below.
Line 17 - Total sewage sludge disposal In AIR17 the PPP Contractors reported a disposal of 43.0 ttds sludge disposed of. This year (AIR18) the reported figure is 41.7 ttds.
In AIR17 the Company disposed of 0.8 ttds relating to grit/screenings sludge. This year (AIR18) the reported figure is 0.8 ttds [0.802 ttds].
In total, AIR17 reported 43.0 ttds [43.073 ttds] of sludge disposed of by all parties. In this reporting year (AIR18) the figure is 41.7 ttds [41.658 ttds].
The variance of 1.415 ttds [3.679 ttds AIR17] is considered to be a combination of: (i) A variation in total tonnage of sludge disposed of by the Omega contractor
from NIW, Kinnegar and Omega WWTWs in combination.(ii) Variation in sludges derived for PPP Contractor grit and screenings, providing
a further potential for variance.

NORTHERN IRELAND WATER LIMITED - ANNUAL INFORMATION RETURN
ANNUAL INFORMATION RETURN - TABLE 16 NON FINANCIAL MEASURESSEWERAGE SERVICE ACTIVITIES (NIW Only)
DESCRIPTION UNITS DP YEAR YEAR 2012-13 CG 2013-14 CG 2014-15 CG 2015-16 CG 2016-17 CG 2017-18 CG 2018-19 CG 2019-20 CG 2020-21 CG
A ASSET BALANCE AT APRIL 11 Total length of sewers km 2 15,090.35 B3 15,254.37 B3 15,410.44 B3 15,581.51 B3 15,625.13 B3 15,777.29 B32 Total length of "critical" sewers km 2 3,656.86 C3 3,716.68 C3 3,732.98 C3 3,760.85 C3 3,839.64 C3 3,860.69 C3
B CHANGES DURING REPORT YEAR3 New "critical" sewers km 2 33.50 C3 24.68 C3 19.54 C3 36.44 C3 1.49 C3 2.75 C34 "Critical" sewers - inspection by CCTV/man entry km 2 51.79 C4 48.98 C4 35.98 C4 71.62 C4 91.44 C4 151.69 C45 "Critical" sewers - renovated km 2 1.41 B2 0.99 B2 1.87 B2 1.26 B2 4.65 B2 2.49 B26 "Critical" sewers - replaced km 2 1.04 B2 3.32 B2 5.09 B2 5.32 B2 1.48 B2 2.76 B27 Abandoned "critical" sewers and other changes km 2 0.00 B2 1.48 B2 0.50 B2 0.00 B2 0.16 B2 0.00 B28 New "non-critical" sewers km 2 145.40 C3 172.22 C3 130.22 C3 110.60 C3 117.07 C3 117.78 C39 "Non-critical" sewers - renovated km 2 2.31 B2 2.93 B2 1.95 B2 2.71 B2 2.53 B2 3.88 B2
10 "Non-critical" sewers - replaced km 2 19.29 B2 18.08 B2 11.89 B2 7.80 B2 0.63 B2 5.98 B211 Abandoned "non-critical" sewers and other changes km 2 0 B2 0.36 B2 0.60 B2 0.11 B2 0.29 B2 0.18 B2
11a Total length of sewers replaced or renovated km 2 24.05 25.32 B2 20.80 B2 17.09 B2 9.29 B2 15.11 B212 Sewer collapses per 1,000km nr 1 73.6 B3 72.7 B3 85.7 B3 78.5 B6 79.1 B3 75.8 B313 Sewer blockages per 1,000km nr 1 1,363.6 B3 1,172.1 B3 1,073.6 B3 1,023.4 B3 998.6 B3 905.8 B3
13a Number of sewer blockage clearance which exceeds 6 hours nr 0 1,250 B3 1,104 A2 2,640 B4 4,199 A2 4,285 A2 3,362 A113b Number of sewer blockage clearance which exceeds 12 hours nr 0 849 B3 645 A2 1,832 B4 3273 A2 3,625 A2 2,586 A113c Number of sewer blockage clearance which exceeds 24 hours nr 0 444 B3 203 A2 276 B4 555 A2 708 A2 390 A1
C ASSET BALANCE AT MARCH 3114 Total length of sewers km 2 15,254.37 B3 15,410.44 B3 15,581.51 B3 15,625.13 B3 15,777.29 B3 15,890.63 B315 Total length of "critical" sewers km 2 3,716.68 C3 3,732.98 C3 3,760.85 C3 3,839.64 C3 3,860.69 C3 3,892.98 C3
D INTERMITTENT DISCHARGES16a Number of unsatisfactory intermittent discharges excluding CSOs (NIEA) nr 0 197 C2 190 C2 159 C2 151 C2 147 C2 143 C216b Number of unsatisfactory intermittent discharges CSOs (NIEA) nr 0 318 C2 312 C2 288 C2 270 C2 263 C2 255 C217a Number of intermittent discharges excluding CSOs nr 0 1,675 B3 1,732 B3 1,751 B3 1,760 B3 1,762 C2 1,766 C217b Number of CSOs nr 0 779 B3 802 B3 802 B3 800 B3 796 C2 788 C2
E DRAINAGE AREA PLANS18 Cumulative number of drainage area plans completed nr 0 71 A1 71 A1 58 A1 58 A1 58 A1 79 A119 Number of drainage area plan studies in progress at the report end of the report year nr 0 1 A1 8 A1 8 A1 8 A1 14 A1 23 A120 Total sewerage drainage areas nr 0 256 A2 254 A2 251 A2 250 A2 250 A2 250 A221 Cumulative % drainage area plan studies completed % 1 27.7 A2 28.0 A2 23.1 A2 23.2 A2 23.2 A2 31.6 A222 % population/properties covered by completed studies % 1 53.3 B3 53.2 B3 50.7 B3 50.4 B3 50.2 B3 87.2 B2
F SEWAGE TREATMENT COMPLIANCE MEASURES23 % WwTW discharges compliant with numeric consents % 1 93.1 91.8 A1 92.17 A1 92.6 A1 93.4 A1 93.4 A124 % of total p.e. served by WwTWs compliant with numeric consents % 1 97.9 94.5 C5 96.45 C5 97.5 A1 93.9 A1 98.1 A1
24a % of total p.e. served by WwTWs compliant with numeric consents excluding upper tier failures % 1 98.5 97.6 C5 98.15 C5 98.3 A1 98.7 A1 98.4 A1
25 Small WwTW compliance (works greater than or equal to 20 p.e. but less than 250 p.e. % 2 80.72 A1 83.99 A1 87.21 A1
G NOMINATED SEWERAGE SERVICE OUTPUTS 26 Delivery of improvements to nominated UIDs as part of a defined programme of work nr 0 38 B3 11 A2 17 A2 26 A2 11 A1 11 A127 Delivery of improvements to nominated WWTWs part of a defined programme of work nr 0 12 B3 17 A2 16 A2 3 A2 2 A1 3 A128 Small WwTWs delivered as part of the rural wastewater investment programme nr 0 14 7 A2 18 A2 4 A2 8 A2 4 A2
H ADDITIONAL SEWERAGE SERVICE OUTPUTS
29 CSO and EO discharges at which event and duration monitoring equipment has been installed nr 0 0 B2 0 B2 0 B2
30 WwTWs upgraded to comply with PPC Regulations nr 0 0 A1 0 A1 0 A1
31 Impermeable surface water collection area removed from the combined sewerage network m2 0 28,560 B2 54,864 B2 119,200 B2
32 Number of sustainable WwTW solutions delivered (p.e. ≥ 250) nr 0 1 A1 1 A2 1 A233 Number of sustainable WwTW solutions delivered (p.e. < 250) nr 0 0 A1 1 A2 0 A2
4REPORTING
YEAR
1REPORTING
YEAR
32 6 7 8 9REPORTING REPORTING REPORTING REPORTING REPORTING
5
YEAR YEAR YEAR YEAR REPORTING REPORTING
YEAR


Annual Information Return 2018 Section 2 Chapter 16 Page 2 of 21
Lines 7 and 11 - sewers abandoned These lines had a return of 0.18 km which is lower from the AIR17 figure of 0.45 km.
Lines 12-13c – Sewer collapses and blockages General NIW collate the number of sewer blockages and sewer collapses from the draft invoices provided by the contractor and approved by the relevant Field Managers. As result of further refinement at NIW’s request the contractor now, (end of March 2015), accurately records on their invoices what section within the sewer the blockage occurred (e.g. main, lateral or private). NIW are now in a good position for AIR18 to report on whether collapses or blockages have occurred in a private lateral, public lateral or public main sewer. The data is collected for both main and lateral sewers but the return only requires the totals for collapses and blockages. NIW does not distinguish between collapses and essential repairs to sewers; they are all collated together for AIR figures. The total number of rising main failures added to the total number of gravity sewer collapses provides the number of sewer repairs for table 46 line 44. During the reporting year there were as follows
12 Rising Main Failures Repaired 1115 Gravity Main Sewers Repaired 77 Gravity Lateral Sewers Repaired 1204 Total number of sewer repairs
13691 Main Sewer Blockages 702 Lateral Sewer Blockages 14393 Total Number of sewer blockages
Of the 14393 sewer blockages, for 17/18 reporting year there were 27 incidents of actual internal flooding.
All FOC's attributed to 20 Blockages 7 Collapses 0 Equipment Failure
NIW are now more proactive in their approach to repeat blockages, as part of their annual performance objectives all the Field Managers (FM) have been tasked to make a 3% reduction in the number of blocked sewers and the AIR return figure is evidence of this success rate. This reduction is being targeted by NIW Customer Field Managers (CFM) using the resource of designated field technicians to carry out CCTV investigations on sewers that have repeat blockage complaints, any faults found are remedied, thus reducing the number of repeat incidents. NIW have now generated a new standard job that enables the contractor, when he is attending a blocked sewer, to carry out a CCTV to locate and mark any suspected defects in the pipe, these can then be repaired and this prevents further repeat blockages and a reduction in the total number of blockages annually. Repeat blockages are recorded on the draft invoices, from the contractor, as they are not paid unless the original blockage was more than 14 days prior to the reoccurrence. These blockages are discounted from the blockage numbers. This has helped reduce the number of sewer blockage complaints by 5.83% on last year’s total.
NIW now run a monthly report in the Ellipse system that confirms the length of time a sewer blockage job took to be completed. WWBU now collate a list of all the work order numbers on the blockage drafts which are not “full rate” blockage clearance jobs and these jobs are excluded from the above-mentioned Ellipse data. Due to the fact that the Ellipse system calculates the length of time a job takes from the time the work request is raised until the

Annual Information Return 2018 Section 2 Chapter 16 Page 3 of 21
work request is closed all jobs exceeding 24 hours are investigated as all follow-on jobs are included in the time the work request is open. These jobs are then reported in the correct category according to the length of time the blockage job actually took to be completed.
• The number of rising main failures and the number of gravity sewer collapses aresummated to give the total number of sewer collapses.
• The total number of sewer collapses is divided by the total length of sewers at 31March 2018 to give the number of sewer collapses per kilometre.
• The number of sewer collapses per kilometre is multiplied by 1000 to give the numberof sewer collapses per 1,000km.
Table 16 line 12 has been calculated using the figure reported for table 46 Lines 32 and 33 and the total length of sewers figure reported for Table 16 line 14.
Reported blockages which could not be identified or required no action when investigated on site are recorded on the blockage draft invoices as attendance only and are only paid an attendance rate therefore they are not counted in the blockage numbers for the AIR return.
Line 13 - Sewer Blockages per 1,000 Km • The number of sewer blockages is divided by the total length of sewers at 31 March
2018 to give the number of sewer blockages per kilometre.• The number of sewer blockages per kilometre is multiplied by 1000 to give the
number of sewer blockages per 1,000km.
Table 16: line 13 has been calculated using the figure reported for table 46 Line 36 and the total length of sewers figure reported for Table 16 line 14
Lines 13a, 13b and 13c - Number of blockage clearance which exceeds 6, 12 & 24 hours NIW now run a monthly Ellipse report that confirms the length of time a sewer blockage job took to be completed. WWBU now collate a list of all the work order numbers on the blockage drafts, which have not been paid the “full rate” for blockage clearance and these jobs are excluded from the above-mentioned Ellipse data. Due to the fact that the Ellipse system calculates the length of time a job takes from the time the work request is raised until the work request is closed all jobs exceeding 24 hours are investigated as all follow-on jobs are included in the time the work request is open. These jobs are then reported in the correct category according to the length of time the blockage job actually took.
Confidence Grading – Lines 12, 13, 13a, 13b & 13c Because NIW are using data from checked and paid invoices (B2) and total length of sewers (B3), the confidence grade for the AIR18 L12 & L13 is B3. NIW expects this to consolidate as we move forward into AIR19 as report building continues with the single Sewer Maintenance Contractor.
Because NIW are using an Ellipse report (minus work orders that are not full rate blockage clearance jobs), to gather the information for Lines 13, 13b & 13c and this is being manually confirmed, these lines have been given a confidence grade of A1 for AIR18.
Line 14 – Total length of sewers There has been no change to the structure of the data reported on this year from the previous years that would directly affect the totals provided. The same queries have been used to extract the data from the Corporate Asset Register and have been checked to ensure that they are still relevant. The confidence grade of the data will remain the same as

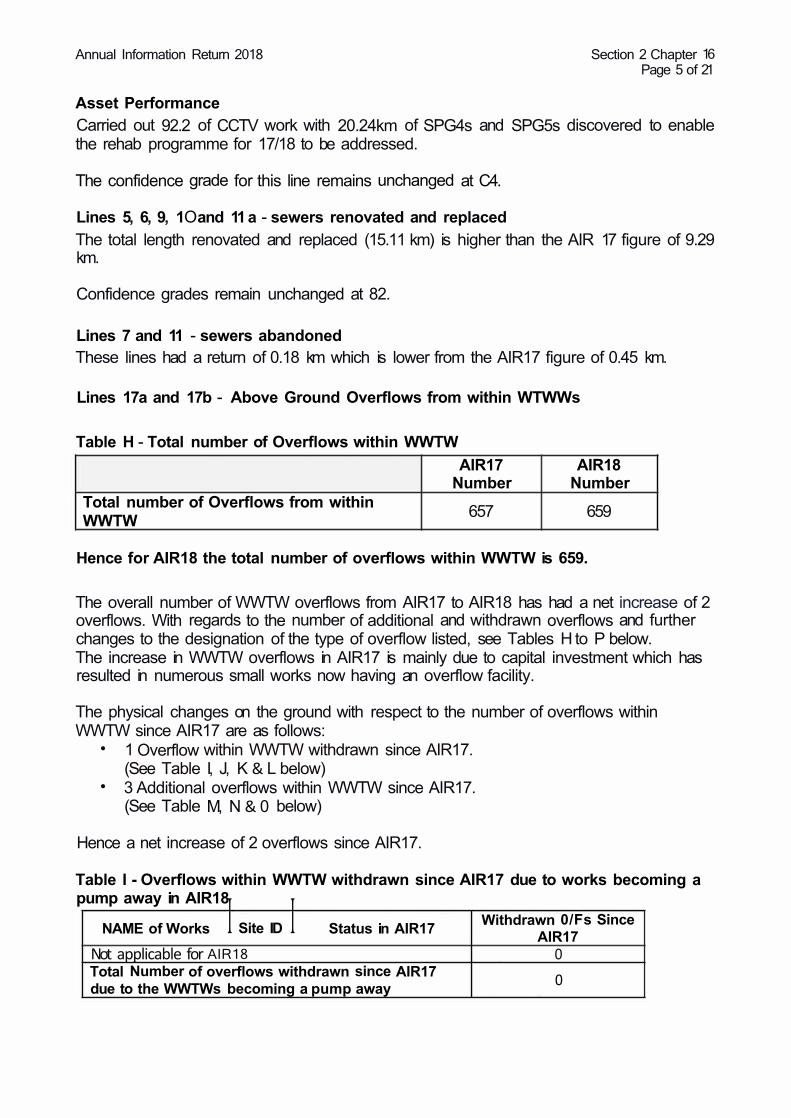
Annual Information Return 2018
Asset Performance
Section 2 Chapter 16 Page 5 of 21
Carried out 92.2 of CCTV work with 20.24km of SPG4s and SPG5s discovered to enable the rehab programme for 17/18 to be addressed.
The confidence grade for this line remains unchanged at C4.
Lines 5, 6, 9, 1 O and 11 a - sewers renovated and replaced The total length renovated and replaced (15.11 km) is higher than the AIR 17 figure of 9.29 km.
Confidence grades remain unchanged at 82.
Lines 7 and 11 - sewers abandoned These lines had a return of 0.18 km which is lower from the AIR17 figure of 0.45 km.
Lines 17a and 17b - Above Ground Overflows from within WTWWs
Table H - Total number of Overflows within WWTW AIR17 AIR18
Number Number Total number of Overflows from within 657 659 WWTW
Hence for AIR18 the total number of overflows within WWTW is 659.
The overall number of WWTW overflows from AIR17 to AIR18 has had a net increase of 2 overflows. With regards to the number of additional and withdrawn overflows and further changes to the designation of the type of overflow listed, see Tables H to P below. The increase in WWTW overflows in AIR17 is mainly due to capital investment which has resulted in numerous small works now having an overflow facility.
The physical changes on the ground with respect to the number of overflows within WWTW since AIR17 are as follows:
• 1 Overflow within WWTW withdrawn since AIR17.(See Table I, J, K & L below)
• 3 Additional overflows within WWTW since AIR17.(See Table M, N & 0 below)
Hence a net increase of 2 overflows since AIR17.
Table I - Overflows within WWTW withdrawn since AIR17 due to works becoming a pump away in AIR18
NAME of Works I Site ID I Status in AIR17 Withdrawn 0/Fs Since AIR17
Not applicable for AIR18 0 Total Number of overflows withdrawn since AIR17 0 due to the WWTWs becoming a pump away

Annual Information Return 2018 Section 2 Chapter 16 Page 6 of 21
Table J - Overflows within WWTW withdrawn since AIR17 due to works being upgraded
NAME of Works Site ID Status in AIR18
Changes to Overflows for AIR18
Withdrawn O/Fs Since
AIR17
Clabby S03051 Works Upgraded 3 DWF -1
Total Number of overflows withdrawn since AIR17 due to the works being upgraded -1
Table K – Withdrawn Overflows within WWTWs due to incorrect designation in AIR17
NAME of Works Site ID Status in AIR18 Withdrawn O/Fs Since AIR17
Not Applicable for AIR18 0 Total of Withdrawn Overflows due to incorrect designation
in AIR17 0
Table L– Summary of the total number of Overflows withdrawn since AIR17 Total of overflows withdrawn since AIR17 due to the works becoming a pump away
0
Total of overflows withdrawn since AIR17 due to the works being upgraded
-1
Total of Withdrawn Overflows due to incorrect designation in AIR16
0
Combined Total Number of overflows within WWTW withdrawn since AIR17
-1
Table M - Additional overflows within WWTW since AIR17 due to WWTW upgrades
NAME of Works Site ID Status in AIR18
Changes to Overflows for AIR18
Additional O/Fs Since
AIR17
Bresagh S00332 Works upgraded 1 additional FFT O/F 1
Oliver Plunkett Park
S02284 Works upgraded 1 additional FFT O/F 1
Clabby S03051 Works Upgraded 1 additional FA O/F 1
Total Number of additional overflows since AIR17 due to WWTW being upgraded 3
Table N - Additional overflows within WWTW due to incorrect designation in AIR17
NAME of Works
CAR ID Status in AIR18
Changes in Overflows for AIR18 from Process
Info
Additional O/Fs Since
AIR17 Not Applicable for AIR18 0 0
Totals Number of additional overflows within WWTW due to incorrect designation in AIR17 0

Annual Information Return 2018 Section 2 Chapter 16 Page 7 of 21
Table O – Summary of additional overflows within WWTW since AIR17 Total Number of additional overflows since AIR17 due to works being upgraded 3
Totals Number of additional overflows within WWTWs due to incorrect designation in AIR18 0
Combined Total: of Additional overflows within WWTWs since AIR17
3
For AIR18, 1 overflow has been withdrawn (see Table J) and 3 additional overflows (see Table M) due to works being upgraded have now been included. This equates to a net increase of 2 additional overflows since AIR17.
Table P – Summary of Overflow type within WWTW
Overflow Type AIR17
Overflows from
WWTW
AIR17 Overflows -
Totals
AIR18 Overflows
from WWTW
AIR18 Overflows -
Totals
Difference between AIR17 & AIR18
Formula "A" O/Fs only 171
199
171
200 1 Formula "A" O/Fs (which also
act as PS E/O) 19 20
(addition of Clabby)
Formula "A" O/Fs with Storm (which also act as PS E/O) 9 9
FFT O/Fs only 103
332
105 (addition of
Bresagh and Oliver Plunkett
Park) 334 2 FFT O/Fs (which also act as PS
E/O) 16 16
FFT O/Fs with Storm Retention 203 203
FFT O/Fs with Storm Retention (which also act as PS E/O 10 10
3 DWF 15 15 14
(removal of Clabby)
14 -1
Additional Overflows-storm 6
111
6
111 0 Additional Overflows-other
structures 6 6
Additional Overflows-pumping station E/O 99 99
Total No of WWTWs Overflows 657 657 659 659 2
Since AIR16 the Asset Performance Team has continued to review their WWTW overflow summary information from Water Order Consent (WOC) applications.

Annual Information Return 2018 Section 2 Chapter 16 Page 8 of 21
This provides further refinement and greater confidence in the designation of overflow type. Therefore for the purpose of these lines APT has not endeavored to use A/C data due to the on-going A/C process of subscribing WOC information across onto GIS.
Comparison between AIR16& AIR17 – CSOs in the Sewerage System The number of CSOs in the sewerage system has decreased since AIR17 i.e. (796 in AIR17 – 788 in AIR18). The final reported number is 788, 830 minus 42 Dual, Duplicates and Bifurcation assets which are not reported upon.
This improved figure in CSOs is due to on-going improvements in our data capturing process. When the process has been rectified, there will be a significant improvement in data quality, GIS network data, and the addition of CSOs which had previously been unidentified or unconsented.
1. BackgroundNI Water had a programme of Drainage Area Studies which commenced in 1995. The programme related to those drainage areas with residential population greater than one thousand. The status of the networks within the programme is summarised in the schedule below.
Each Drainage Area Study has used the full investigation procedure set out in the Sewerage Rehabilitation Manual, 4th Edition (WRc), including a CCTV survey targeted at surveying all critical sewers within the network.
More recently, networks with less than 5000 population have been subject to a scoping-study which seeks to identify the needs within the network, and allows a decision to be made as to whether a full DAS is justified.
It has been NI Water practice to review each Study on a 5-year cycle and, if necessary, to commission an update of the Study. A number of updates of older studies have been completed and others have commenced.
2. Current studiesFollowing studies are being carried out for Model Build and Verification:
• Millisle• Newry• Bangor• Seahill• Dungannon• Bushmills/Portballintrea• Greenisland• Kinnegar• Moy• Kilkeel• Portrush• Portstewart• Downpatrick• Killyleagh• Belfast• Omagh• Cookstown


Annual Information Return 2018 Section 2 Chapter 16 Page 13 of 21
Changes carried forward for AIR 18 1. For AIR 18 data the base for the WWTW in service aligns with the compliance figures
of the KPI outturn and NIEA compliance assessment, which reports on all works inservice at the start of the calendar year.
2. The PE data used to populate this table are the PE’s derived by the AssetManagement Section (Performance Team – Above Ground) for the AIR 16 Return.These same PE’s were also used to calculate the number of audit samples requiredper site for the 2017 reporting year and agreed with (NIEA).
3. Only WWTW serving greater than 250PE with numeric standards are included. Noqualifying works were excluded from the assessment, with all regulatory sampleshaving been sampled and analysed for the regulatory parameters.
4. The list of WWTW for AIR 18 contains a number of works which have crossedsampling thresholds. Table 1, which indicates the sampling frequencies associatedwith WWTW PE’s, is provided below.
Table 4 – Sampling Frequency Table PE Sampling Frequency <250 PE 0 250 – 4,999 PE 12 5,000 – 49,999 PE 24 >50,000 PE 48
If the PE of a WWTW causes a difference in sampling frequency, NIEA require evidence to justify the change. Evidence is required in the form of results of a flow and load survey or daily inlet sample results for a period of preferably one year but no less than six months. Table 5 indicates the WWTW affected by sampling frequency threshold changes and is provided overleaf.
Table 5 – Sampling Frequency Threshold Changes
Works Name PE used in AIR15
PE Supplied by Asset Management
Threshold Being Crossed
Ballymena 113,825 69,915 100,000 Dunmurry 53,605 46,243 50,000 Dromore (Tyrone) 2032 1917 2,000 Dundrum 2243 1674 2,000
The 2012 sample scheduling PE data, which was agreed with NIEA in November 2011, has been applied to the works in Table 5, in the absence of flow and load data.
5. Only NI Water operated WWTW are included in assessment.
How the compliance is measured Line 23 – Percentage of WWTW discharges compliant with numeric consents The WOC specifies the number of samples to be taken per year and the parameters which have to be determined. A WWTW may fail if the required numbers of samples are not taken or the full range of parameter’s are not determined.
Compliance for each WWTW was assessed on a parameter basis over a calendar year using the Look-Up Tables (LUT) of the Urban Waste Water Treatment Regulations (NI) 1995. This statistically derived methodology permits a certain number of exceedances, based on the number of samples taken, for each parameter included in the WOC e.g. where

Annual Information Return 2018 Section 2 Chapter 16 Page 14 of 21
24 samples are taken, three exceedances of each parameter are permitted. When this number of exceedances is surpassed a WWTW is deemed to fail. Table 3 in Appendix 1 details the relevant section of the Look-Up Table.
A number of WWTW have an additional clause in the consent known as an Upper Tier Limit (UTL) on the sanitary parameters of Biological Oxygen Demand (BOD, Suspended Solids (SS) and Ammonia (NH4). One exceedance of this standard will lead to the WWTW failing for the year.
The WOC standards are contained in the Laboratory Information Management System (LIMS) and the audit sample results are automatically assessed against the standard. LIMS generates a standard report listing all WWTW with numeric standards and indicating the number of exceedances and whether the works has passed or failed. The LIMS report is accessed through:
Sample Manager/ Reporting / Sewage Reports / NIEA Monthly Reports / All sites
A small number of WWTW have nutrient standards, nitrogen and/or phosphorus, although these are assessed on an annual average. While LIMS calculates a running average, which is displayed in the report referred to previously, it does not have the facility to compare this against a standard. This requires that the average is compared manually on an ongoing basis with the WOC standard. All standards can be viewed on SharePoint.
Exceedances can be discounted from compliance assessment should NI Water be able to demonstrate to NIEA that, at the time of the exceedance, a works was not under normal operating conditions. The definitions of abnormal operating conditions are given in Appendix 2 but NIEA may permit discounts under other conditions e.g. skewing of performance through too many samples being lifted in a short period caused by the rescheduling of samples. Should a sample be discounted it must be replaced by another sample taken on the same day of the week. A replacement sample when entered on LIMS will register automatically on the compliance report.
NIEA can also issue interim time banded standards during capital upgrades of a WWTW. This is a more relaxed standard applicable for a specified period over which construction work may disrupt the normal treatment processes. When this time banded standard is entered in LIMS it is taken account in the production of the compliance report.
At monthly intervals (for the KPI, Board and CSDD/MT) and at the end of the calendar year, the number of WWTW which have passed their numeric WOC was calculated as a percentage of the total number of works to determine the compliance with the target.
Line 23 Calculations – Taken from AIR 18 Calculation Spreadsheet No. of NI Water Only WWTW’s = 226 No. of failing NI Water Only works = 15 No. of passing NI Water Only works = 211
211/226 x 100 = 93.36% Reported to one decimal place = 93.4%

Annual Information Return 2018 Section 2 Chapter 16 Page 15 of 21
Line 24 – Percentage of Total PE Served by WWTW’s Compliant with Numeric Consents The PE served by compliant WWTW was calculated as a percentage of the PE served by the total number of WWTW. As referred to above it should be noted that Upper Tier Limits (UTL) were applied in determining this compliance. The figure reported is based on the total population.
Line 24 Calculations – Taken from AIR 18 Calculation Spreadsheet PE of failing NI Water Only works = 35254 Total PE of NI Water Only works = 1808627 PE of passing NI Water Only works = 1773373
1773373 / 1808627 x 100 = 98.05 Reported to one decimal place = 98.1%
Line 24a – Percentage of total PE served by WwTWs compliant with numeric consents excluding upper tier failures The PE served by compliant WWTW was calculated as a percentage of the PE served by the total number of WWTW. As referred to above it should be noted that Upper Tier Limits (UTL) were not applied in determining this compliance. The figure reported is based on the total population.
Line 24a Calculations – Taken from AIR 18 Calculation Spreadsheet PE of failing NI Water Only works (Exc UT) = 28873 Total PE of NI Water Only works = 1808627 PE of passing NI Water Only works = 1779754
1779754 / 1808627 x 100 = 98.40 Reported to one decimal place = 98.4%
The data reported in this table was new for AIR16. As more information is developed in future AIR reporting cycles, further commentary can be developed on emerging trends for these measures. The application of confidence grade A1 to lines 24 and 24a is considered appropriate as these lines are reporting a percentage of total consented PE values, the values of which are agreed with NIEA. The change from C5 to A1 was made in response to the Reporter’s recommendation in AIR15 commentary that a much higher confidence grade should be applied to these lines.
Line 25 - Small WwTW compliance (works greater than or equal to 20 p.e. but less than 250 p.e.) A new compliance measure has been introduced for PC15 for small works in the band 20 – 249 population equivalent (pe). This measure is directly linked to delivery of small works under the Rural Wastewater Improvement Project (RWIP) project. All sites to be upgraded under RWIP are agreed with NIEA. The starting position for compliance projections throughout PC15 was based on NIEA’s assessment of works as passing or failing in calendar year 2013. Compliance was projected to improve year on year through delivery of works agreed with NIEA for upgrade via the RWIP project.

Annual Information Return 2018 Section 2 Chapter 16 Page 16 of 21
Line 26 - Delivery of improvements to nominated UIDs as part of a defined programme of work NI Water has established the process for the identification, monitoring and review of UIDs. This included linking CAR and FD identifiers, developing CPMR to hold all relevant UID information and introducing review steps for all potential UIDs identified. In addition, NIEA have full visibility of the programme and sign off individual outputs within overall schemes: consequently, UIDs are claimed on a rolling basis rather than waiting for overall scheme completion.
The PC15 Final Determination indicated a target of 56 UID improvements for the 6-year period, with 5 of these profiled for delivery in 2017/18. None of these PC15 FD nominated outputs profiled for 2017/18 were delivered between 01 April 2017 and 31 March 2018. 7 PC15 FD UIDs which had been profiled for delivery in 2015/16 were delivered between 01 April 2017 and 31 March 2018. It is important to note however that NI Water delivered 2 PC13 UIDs in 2017/18 which had originally been profiled for 2014/15. A further 2 additional UIDs were identified and delivered during 2016/17: these were not included in the PC15 FD and were not PC13 carry-over. 11 UIDs in total were delivered during 2017/18.
Confidence Grades NI Water has maintained improvements in the reporting process and the cross checking process for this line which were initially implemented for the AIR14 submission. Improvements in the management of Beneficial Use dates were implemented in January 2016. For 2017/18, the confidence grades for this line was determined using the reporting guidance and assessed as A1 – based on sound, time specific data captured relevant to each individual UID.
UIDs Delivered during the third year of PC15 – AIR18 Period
Catchment UID Address FD Ref. Project ID Comments Operationa
l Date Armagh WWTW
Newry Road SPS UID010 KF330
CSO set to pass forward Formula A, 6mm screen fitted, Increase Storage
19/05/2017
Armagh WWTW
Milford SPS UID008 KF396 6mm screen fitted, Increase Storage
04/08/2017
North Coast WWTW
Ballysally CSO UID040 KC415 6mm screen fitted, Increase Storage
16/06/2017
Culmore WWTW
Bleachgreen WwPS
UID420 KL524 6mm screen fitted, Increase Storage
30/06/2017
North Down WWTW
Castle Park CSO 07
UID023 KS877 29/01/2018
North Down WWTW
13 Rugby Avenue CSO 8A
UID179 KS877 Abandoned 29/01/2018
North Down WWTW
11 Brunswick Road CSO 8B
UID180 KS877 Abandoned 29/01/2018
North Down WWTW
104 Abbey street CSO 8E
UID181 KS877 Abandoned 29/01/2018
North Down WWTW
114 Abbey street CSO 8E
UID182 KS877 29/01/2018

Annual Information Return 2018 Section 2 Chapter 16 Page 17 of 21
Catchment UID Address FD Ref. Project ID Comments Operationa
l Date North Down WWTW
Abbey Park CSO 9
UID184 KS877 29/01/2018
Milltown WWTW
Muckamore WwPS
UID389 KA260 Increase Storage 04/04/2017
Line 27 – Delivery of improvements to WwTW through nominated schemes as part of a defined programme of work 3 WwTW nominated outputs were delivered between 01 April 2017 and 31 March 2018. Ballycastle, Clabby and Mullans are all PC15 outputs.
Confidence Grades NI Water has maintained improvements in the reporting process and the cross checking process for this line which were initially implemented for the AIR14 submission. Improvements in the management of Beneficial Use dates were implemented in January 2016. For 2017/18, the confidence grades for this line was determined using the reporting guidance and assessed as A1 – based on sound, time specific data captured relevant to each individual WwTW.
WwTWs Delivered during the second year of PC15 – AIR17 Period Project Name Project
Code Beneficial Use Date
Comments
Ballycastle WwTW KC296 31/12/2017 Clabby WwTW KP586 28/03/2018 Mullans WwTW KA239 29/03/2018
Line 28 - Investment in improvements to small wastewater treatment works as part of the Rural Wastewater Investment Programme Four small wastewater treatment works achieved Beneficial Use during 2017/18. Details of the actual works and year delivered are listed below.
CAR Site Reference
Project title Year claimed
Outstanding outputs
S02284 Oliver Plunkett 2017/18 S00332 Bresagh 2017/18 S02987 Ardgarvan 2017/18 S03037 Carnabane 2017/18
The confidence grades for this line were determined using the reporting guidance and were assessed as A2, based on the evidence within the methodology and the visibility of programme as defined within the ‘Project Sites’ section on CPMR.
Line 29 - CSO Monitoring NI Water has adopted a cautious approach to the installation of new technology which has first to be proven to function adequately. To this end, during 2016/17 we identified and procured equipment necessary for trials at 10 CSOs and 20 wastewater pumping stations. It is anticipated that these trials will conclude in 2017/18. We plan to install all necessary monitoring equipment in the PC15 period.

Annual Information Return 2018 Section 2 Chapter 16 Page 18 of 21
Line 30 – WWTW’s upgraded to comply with PPC Regulations A new compliance measure was introduced for AIR16 for Wastewater Treatment Works upgraded to comply with PPC Regulations. There are currently 28 qualifying works reported for this measure. In agreement with NIEA the PPC permit for Sion Mills WwTW was surrendered in May 2017 as the site was treating significantly less sludge than the PPC permitted daily limit of 49.3 m3/d and a PLC inhibitor was installed.
Improvement works have been carried out a number of sites under the PC15 Year 1 Base Maintenance Programme. These improvement works include PPC compliance measures such as odour abatement unit media replacement, sludge thickener replacements, refurbishment of sludge import screens, replacement of odour control unit blowers, replacement of sludge holding tanks, additional sludge cake conveyors as back up to the duty system and replacement of poly dosing pumps.
Odour modelling is required to demonstrate what impact, if any, each installation is having on the surrounding environment. Given the cost associated with odour modelling, NIEA has set out their priorities for completion of odour modelling. This requires 23 odour modelling assessments to be undertaken, with 5 sites being assessed by NIEA as not requiring odour modelling.
An Odour Modelling plan has been prioritised and agreed with NIEA.
Upon completion of the odour modelling, NI Water and NIEA will be in a position to assess each site and determine if the PPC Regulations are satisfied, or if additional investment is required to comply. If so, a work programme will be developed, in conjunction with NIEA, to deliver the necessary improvements to meet PPC Compliance for each site. Until such times, all 23 sites are assessed as non-compliant at this stage.
For the 5 sites not requiring odour modelling NI Water will progress all site documentation, such as site specific management plans, accident management plans and odour management plans to obtain sign-off by NIEA.

Annual Information Return 2018 Section 2 Chapter 16 Page 19 of 21
NI Water Odour Modelling Implementation Plan
WwTW NIEA Priority Import site
Phase 1 Target Completion
Date
Phase 1 Actual Completion
Date
Phase 2 Olfactory Study (If required)
Target date
Phase 2 Target Completion
Date
Phase 2 Actual Completion
Date
Financial Year Completion date
BRAG Status
Dungannon (Moygashel)
1 Yes Nov-16 Nov-16 Aug/September 16 Nov-16 Nov-16 2016/17 Complete
New Holland (Lisburn) 1 Yes Nov-16 Nov-16 Aug/September 16 Nov-16 Nov-16 2016/17 Complete
Carrickfergus 1 No Nov-16 Nov-16 Aug/September 16 Nov-16 Nov-16 2016/17 Complete
Whitehouse 1 No Nov-16 Nov-16 Aug/September 16 Nov-16 Nov-16 2016/17 Complete
Newcastle 3 No Mar-17 Mar-17 Aug/September 16 Mar-17 Mar-17 2016/17 Complete
Culmore 2 Yes Jun-17 31/05/2017 Oct-17 Dec-17 Jan-18 2017/18 Complete
Ballymena (Tullygarley)
2 Yes Jun-18 Summer 18 TBC 2018/19 Potential Delay
Antrim 2 Yes Jun-17 31/05/2017 Not required Not required Not required 2017/18 Complete
Dunmurry 2 Yes Jun-17 31/05/2017 Not required Not required Not required 2017/18 Complete
Cookstown 2 Yes Jun-17 31/07/2017 Oct-17 Dec-17 Jan-18 2017/18 Complete
Glenstall (Ballymoney) 2 Yes Jun-17 31/07/2017 Not required Not required Not required 2017/18 Complete
Limavady 2 Yes Oct-17 02/11/2017 Not required Not required Not required 2017/19 Complete
Downpatrick 2 Yes Dec-17 31/07/2017 Not required Not required Not required 2017/18 Complete
North Coast 3 No Nov-17 15/11/2017 Not required Not required Not required 2017/19 Complete
Enniskillen 3 No Apr-18 Summer 18 TBC 2018/19 On Target
Omagh 3 No Apr-18 Summer 18 TBC 2019/20 On Target
Banbridge 3 No TBC Summer 18 TBC 2019/20 On Target
Larne 3 No Nov-17 17/11/2017 Not required Not required Not required 2017/19 Complete
Tandragee 3 No TBC Summer 18 TBC 2019/20 On Target
Magherafelt 3 No Oct-17 02/11/2017 Summer 18 TBC 2020/21 On Target
Waringstown 3 No TBC Summer 18 TBC 2020/21 On Target
Greenisland 3 No Apr-18 Summer 18 TBC 2020/21 On Target
Ballyclare WwTW 3 No Apr-18 Summer 18 TBC 2020/21 On Target
Newry N/A Yes N/A N/A N/A N/A N/A N/A Complete
Strabane N/A Yes N/A N/A N/A N/A N/A N/A Complete
Newtownbreda N/A No N/A N/A N/A N/A N/A N/A Complete
Dromore N/A No N/A N/A N/A N/A N/A N/A Complete
Lisnaskea N/A No N/A N/A N/A N/A N/A N/A Complete


Annual Information Return 2018 Section 2 Chapter 16 Page 21 of 21
APPENDIX 1 Table 3 – Permitted Exceedances
No of Samples Permitted Exceedances 4-7 1
8-16 2 17-28 3 29-40 4 41-53 5
APPENDIX 2 NORMAL OPERATING CONDITIONS UNUSUAL SITUATIONS AND NORMAL LOCAL CLIMATIC CONDITIONS
1. THE REGULATIONS’ TERMINOLOGY1.1 The term "normal operating conditions" is used in paragraph 4(b) of Part II of Schedule
3; the phrase "unusual situations such as those due to heavy rain" is used in paragraph 5 of Part II of Schedule 3; "normal local climatic conditions" are referred to in regulation 4(4)(a).
2. INTERPRETATION2.1 In order to assist in interpreting the weather conditions that might be considered to be
abnormal or unusual; a definition of exceptional weather conditions is given below, together with an example of what might be considered to be other kinds of abnormal or unusual operating conditions.
2.2 The abnormal conditions set out below include capital works construction and periods of industrial action. Both are being considered by the Regulatory Committee, along with other possible exceptions suggested by other Member States. An amendment to this guidance note will be issued in the light of any guidance from the Regulatory Committee.
2.3 Definitions 2.3.1 For the purpose of this registered standard / consent the works shall be deemed to
have been under ‘normal operating conditions’ except during a period when the following apply:
a. ‘Unusual weather conditions’ which shall include the following:i) low ambient temperature as evidenced by effluent temperature of 5oC or
less, or by the freezing of mechanical equipment in the works;ii) significant snow deposits;iii) fluvial flooding;iv) weather conditions causing unforeseen loss of power to the works which
could not be ameliorated by the reasonable provision and operation ofstandby generator facilities.
b. A reduction in the level of treatment due to periods of industrial action or acts ofvandalism that could not have been reasonably prevented.
c. When the Regulator has issued a variation of the registered standard forreasons such as construction of capital works.

NORTHERN IRELAND WATER LIMITED - ANNNUAL INFORMATION RETURN
ANNUAL INFORMATION RETURN - TABLE 17a SEWERAGE EXPLANATORY FACTORSSEWERAGE SUB - AREA EXPLANATORY FACTORS (TOTAL)
DESCRIPTIONCG CG CG CG CG CG CG CG CG
SEWERAGE SUB AREASA GENERAL
Area name:-1 Annual average resident connected population 000 1 1,512.0 C32 Annual average non-resident population 000 1 32.4 C33 Volume of sewage collected (daily average) Ml/d 1 399.9 B24 Total connected properties nr 0 698,318 A25 Area of Sewerage District km2 0 13520 B2
B SEWERAGE DATA6 Total length of sewer km 0 15891 B3
C Costs7 Sewerage: Direct Costs £000 0 13,0208 Sewerage: Power Costs £000 0 4,0159 Sewerage: Service Charges £000 0 110 Sewerage: General & Support Expenditure £000 0 7,96211 Sewerage: Functional Expenditure £000 0 20,982
AREA 7 AREA 8 Total
7 8 9
UNITS AREA 1 AREA 2 AREA 3 AREA 4DP AREA 5 AREA 6
1 2 3 4 5 6

Annual Information Return 2018 Section 2 Chapter 17a Page 1 of 6
Table 17a Sewerage Explanatory Factors- Sewerage Sub-Area Explanatory Factors
Line 1 - Annual average resident connected population (Total) The guidance for Table 17a includes the following text:
“Companies must check that the following data are consistent. Companies must explain in the commentary any reasons why this data is not consistent. Annual average resident connected population in table 17a (line 1, 'total' column)
plus annual average non-resident population in table 17a (line 2, 'total' column)should equal the total connected population in table 13 (line 10)”
NI Water has not calculated the Total Annual Average Resident Connected Population independently of the Total Annual Average Non-Resident Population and the Total Connected Population. Instead, the Company has used the consistency check (above) to derive the Total Annual Average Resident Connected Population.
According to AIR18: Table 13: Line 10, the total connected population (comprisingresident and non-resident population) is 1,544.413 x 103
According to AIR18: Table 17a: Line 2, the annual average non-resident populationis 32.441 x 10³
By calculation, the annual average resident connected population= 1,544.413 x 103 - 32.441 x 103 = 1,511.972 x 103
Significant year on year changes in reported figures including an explanation of any factors that may have influenced the figure
AIR16 CG AIR17 CG AIR18 CG 1,500.4 x 103 C3 1,505.6 x 103 C3 1,512.0 x 103 C3
The estimated annual average resident sewerage connected population has increased from 1,505.6 x 103 in AIR17 to 1,512.0 x 103 in AIR18, an increase of 6.4 x 10³ (0.43%).
Confidence Grade There are two figures associated with the calculation of AIR18: Table 17a: Line 1: Column 9. The first figure is derived from AIR18: Table 13: Line 10 and was allocated a confidencegrade of B3. The second figure is derived from AIR18: Table 17a: Line 2: Column 9 and wasallocated a confidence grade of C3. Since the lower of the two confidence grades is C3, aconfidence grade of C3 has been allocated to Table 17a: Line 1: Column 9.
Line 2 - Column 9 - Annual average non-resident population (Total) AIR16 CG AIR17 CG AIR18 CG
29.4 x 10³ C3 31.1 x 10³ C3 32.4 x 10³ C3
NI Water has included holiday and tourist population connected to the sewerage system, averaged over the year.
NI Water has not included any allowance for daily commuters or day visitors.
Changes in Methodology Each year, NI Water reviews all of the latest tourism publications and adopts a methodology which best utilises the information available at the time.


Annual Information Return 2018 Section 2 Chapter 17a Page 3 of 6
Based on the AIR17 outturn, the estimated annual average non-resident sewerage population has increased by 1.4 x 10³ (4.47%). This increase can be attributed to an increase in the number of non-resident visitor nights. The 2017 estimate was 11,841,100 compared to the 2016 estimate of 11,365,623.
Despite the absence of information relating to Q4 of 2017, a comparison of the Q1 to Q3 statistics for 2016 and 2017 reveals an increase in tourism and hence, an increase in winter population.
Visitor Nights (2016 - Q1 to Q3)
Visitor Nights (2017 - Q1 to Q3)
GB Visitors 4,339,966 4,343,852 RoI Visitors 642,814 771,425 Visitors from outside UK & RoI 3,558,930 4,081,803 All Visitors (excluding NI) 8,541,710 9,197,080
The statistics show that external visitors are on average staying longer, leading to an increase in overall visitor nights in the first nine months of 2017. The increase has been driven largely by increases in visitors from Republic of Ireland and overseas.
Confidence Grade The annual average non-resident population is an estimate based on several sources of information: 1. The NISRA publications ‘Hotel-excel-dec’ and ‘GH-BB-excel-dec’ provide only an
estimate of the monthly numbers of bed-spaces sold, based on the extrapolation of datafor a representative sample group of establishments.
2. The NISRA publication ‘Microdata for online Q1 2011 to Q3 2017’ provides only anestimate of the quarterly numbers of non-resident visitor nights, based on samplesurveys. The estimate therefore has an associated degree of sampling error, determinedboth by the sample design and by the sample size. Sample surveys include the NorthernIreland Passenger Survey (NIPS) conducted by the Northern Ireland Statistics andResearch Agency (NISRA), the Survey of Overseas Travellers (SOT) conducted onbehalf of Fáilte Ireland and the Household Travel Survey (HTS) conducted by CentralStatistics Office (CSO).
NI Water has assigned a confidence grade of C3 to account for known deficiencies in the reliability and accuracy of the reported figure.
Line 3 – Volume of Sewerage Collected This figure has been copied from AIR18 Table 14 Line 7 – Volume Waste Water Returned.
Line 4 – Total Connected Properties Northern Ireland Water’s (NIW) property data is provided via a data download of the property database tables held within the RapidXtra billing system. The data is then manipulated within Microsoft SQL to produce the Rapid Property Summary Report.
Our AIR18 methodology has remained consistent with previous years – using the automated tool to populate Table 17a figures (this was first introduced in AIR12 - Rapid Property Summary as the input).
The difference between the AIR17 and the AIR18 figures is 9140. This can be explained by the following;

Annual Information Return 2018 Section 2 Chapter 17a Page 4 of 6
1) New Connections during the 2017/18 reporting year2) As a result of a customer contact. i.e. septic tank empty request, no water complaint,
blocked sewer, updating of standing data e.g. removal of services etc. Within thiscategory there are 2 scenarios:
(a) The adding of properties NI Water allegedly did not know about and theadding of duplicates as the customers address could not be found onRapid. For example, Rapid may hold the site number but when thecustomer contacts NI Water they quote the verified postal address whichis different, therefore creating a duplicate
(b) Another scenario - The street name may have changed from the time ofNew Connection to that of customer contact – street names can change inthe early stages of site development
3) Removal of duplicates/properties as a result of data quality initiatives
In addition to the above, further data quality requirements have been built into the new CBC Contract. They cover all aspects of the property life cycle (creating, amending and demolishing properties) and data degradation will be monitored/measured throughout. These system validations have been split into 4 delivery phases. The functionality for Phases 1-3 have been delivered, with the functionality for the Post Phase 3 data validations due to be delivered within the next database release/upgrade in August 2018. Off-system data cleanse is required before some of the system validation rules can be applied.
The overall approach and allocation process for Table 17a has not changed since AIR08. There are still some limitations and it has not been possible to fully complete the Information Returns for 2018. Work is on-going, through the Cost to Serve Project. Cost to Serve is not fully implemented and therefore could not be used for AIR18. The figures populated in Column 9 have been taken from Table 22 (NIW only).
Line 5 - Area of sewerage district The figure provided equates to the total land mass of Northern Ireland excluding major bodies of inland water. The same LPS product has been used to determine the Area of Sewerage District. There remains only one sewerage district for all of Northern Ireland. The confidence grade of the data will remain the same as the previous year.
Line 6 - Total length of sewer There has been no change to the structure of the data reported on this year from the previous years that would directly affect the totals provided. The same queries have been used to extract the data from the Corporate Asset Register and have been checked to ensure that they are still relevant. The confidence grade of the data will remain the same as the previous year. Any new data will have adhered to the NIW Code of Practice for the submission of asset data ensuring that data quality levels have been maintained throughout the year.
C Costs Line 7 – Direct Costs It is not yet possible to split the costs into areas. A total figure has been supplied in Column 9 which agrees to the direct sewerage costs in Table 22, column 1 line 9. See Table 22 commentary. Direct Costs have increased by circa £0.5M from AIR17.
The main reason for this was increased power costs (see below), Hired and Contracted Services and Materials and Consumables.

Annual Information Return 2018 Section 2 Chapter 17a Page 5 of 6
Line 8 – Power Costs The figure for Power costs agrees to Table 22, line 2 column 1. See Table 22 commentary. Power costs have increased by £0.1M from AIR17 mainly due to increased energy tariffs.
Line 9 – Services Charges The figure for Service Charges agrees to Table 22, line 7 column 1. They are minimal for AIR18.
Line 10 – General & Support The figure for General & Support expenditure agrees to Table 22, line 10 column 1. See Table 22 commentary and methodology. These costs have increased by almost £0.7M from AIR 17.
Line 11 – Functional Expenditure This is a calculated cell and is the total of line 7 and line 10. This figure agrees to Table 22, line 11 column 1. The costs in this line have increased by approx. £1.2m since AIR17. This is due to the combination of higher power costs and increased general and support as explained above.


NORTHERN IRELAND WATER LIMITED - ANNUAL INFORMATION RETURN
ANNUAL INFORMATION RETURN - TABLE 17b SEWERAGE EXPLANATORY FACTORSSEWAGE TREATMENT WORKS - LARGE WORKS INFORMATION DATABASE (NIW Only)
DESCRIPTION UNITS DP TOTAL 1 CG 2 CG 3 CG 4 CG 5 CG 6 CG 7 CG 8 CG 9 CG 10 CG 11 CG 12 CG 13 CG 14 CG
1 Works Name Belfast Culmore Ballymena Whitehouse North Coast Newry Lisburn Antrim Dunmurry Omagh Dungannon Newtownbreda Carrickfergus Enniskillen
A WORKS SIZE2 Population equivalent of total load received 000 0 1,175 365 C5 136 C5 66 C5 88 C5 77 C5 54 C5 73 C5 65 C5 46 C5 34 C5 78 C5 35 C5 32 C5 26 C5
B EFFLUENT CONSENT STANDARD3 Suspended solids consent mg/l 0 50 A1 50 A1 25 A1 50 A1 50 A1 50 A1 15 A1 20 A1 25 A1 50 A1 40 A1 30 A1 50 A1 30 A14 BOD5 consent mg/l 0 30 A1 30 A1 15 A1 30 A1 30 A1 30 A1 10 A1 10 A1 10 A1 30 A1 25 A1 15 A1 30 A1 20 A15 COD consent mg/l 0 125 A1 125 A1 125 A1 125 A1 125 A1 125 A1 125 A1 125 A1 125 A1 125 A1 125 A1 125 A1 125 A1 125 A16 Ammonia consent mg/l 1 10.0 A1 3.0 A1 2.5 A1 15.0 A1 2.5 A1 10.0 A1 7.0 A1 5.0 A1 10 A17 Phosphates consent mg/l 1 1.0 A1 2.0 A1 1.0 A1 2.0 A1 2.0 A1 1.0 A1 2.0 A1 1 A1
C TREATMENT CATEGORY8 Classification of Treatment Works TA2 SAS TA2 TA2 SAS SAS TA2 TA2 TA2 TA2 TA2 TA2 TA2 TA2
D COSTS9 Direct cost £000 0 6,024 1,451 499 411 323 242 411 472 349 302 285 409 281 260 32910 Power costs £000 0 3,389 1,098 272 198 206 161 247 226 174 121 93 234 120 130 11211 Service Charges £000 0 214 26 23 13 12 5 13 20 12 16 15 19 14 13 1412 General and support expenditure £000 0 3,794 453 413 237 206 90 227 348 217 276 269 329 245 234 25013 Functional expenditure £000 0 9,819 1,905 912 649 529 332 638 820 566 577 554 738 526 494 579
14 Estimated terminal pumping costs £000 0 015 Estimated sludge costs £000 0 0

Annual Information Return 2018 Section 2 Chapter 17b Page 1 of 3
Table 17b – Sewerage Explanatory Factors (NIW only) Sewage Treatment Works – Large Works Information Database
NI Water has a number of sites which fall into the Band 6 category and are to be reported within this submission.
The WWTW to be reported on for AIR17 are:
LIMS Code LIMS Name Confirmed
PE AIR15 Band
BOD WOC
BOD UWWTR
S34AG Carrickfergus WWTW 32408 Band 6 30 25 S34AK Belfast WWTW 365139 Band 6 30 25 S37AB Dunmurry WWTW 45939 Band 6 10 25 S37AA Lisburn (New Holland)
WWTW 72630 Band 6 10 25
S34AD Newtownbreda WWTW 34507 Band 6 15 25 S34AE Whitehouse WWTW 88115 Band 6 30 25 S15AO Antrim (Milltown)
WWTW 64937 Band 6 10 25
S13BE Ballymena (Tullaghgarley) WWTW 66375 Band 6 15 25
S25AC Dungannon (Moygashel) WWTW 77643 Band 6 25 25
S27AC Newry WWTW 53968 Band 6 30 25 S45IB Omagh WWTW 33591 Band 6 30 25 S43CI Culmore WWTW 135976 Band 6 30 25 S17HF North Coast WWTW 76554 Band 6 30 25 S47HK Enniskillen WWTW 25948 Band 6 20 25
No assumptions have been made for the return.
All consents reported have both BOD and SS as part of the consent as issued by Northern Ireland Environment Agency (NIEA).
There are no consents for ammonia by itself without accompanying BOD and SS consents.
The consent conditions as issued by NIEA are based on 95%ile limits. For the purposes of reporting the WOC BOD limit has been reported for all WWTW’s. It should be noted that in some instances, the UWWTR BOD limit of 25mg/l is lower, as identified in the table above.
For reference, the works in Band 5 which have the potential to be included in subsequent returns are listed here:
LIMS Code LIMS Name Confirmed
PE AIR 14 Band S36AA Downpatrick 19710 Band 5 S34AH Greenisland 11614 Band 5 S36BB Kilkeel 14497 Band 5 S36BO Newcastle 16227 Band 5 S15BS Larne 23275 Band 5 S17ED Ballycastle 12797 Band 5

Annual Information Return 2018 Section 2 Chapter 17b Page 2 of 3
LIMS Code LIMS Name Confirmed
PE AIR 14 Band S15AA Ballyclare 16316 Band 5 S17BP Ballymoney 21276 Band 5 S13CH Cookstown 21591 Band 5 S13GK Magherafelt 17151 Band 5 S27AA Banbridge 20689 Band 5 S25AB Coalisland 10010 Band 5 S27AN Tandragee 11344 Band 5 S27AD Warrenpoint 15635 Band 5 S43GI Limavady 16267 Band 5 S45JA Strabane 22745 Band 5
D Costs This table was populated in the same way as AIR17. The costs are a further breakdown by location of the Band 6 expenditure detailed in Table 17f line 6. It is populated with the information available for the year ended 31 March 2018. The Population Equivalent (PE) information used to complete this table was received from Asset Management on 5 June 2018. No PPP costs are included in this table.
Line 9 – Direct Costs Direct costs include power 521x, contractors 531x, other contractors 532x, materials 541x, chemicals 548x, cost reallocations 611x (this includes direct labours costs and & overhead charges) and service charges.
In AIR18 there are 14 works that fall into Band 6, this is the same as AIR17. Enniskillen was included in Band 6 for both years.
Direct costs have decreased by approx. £0.9M from AIR17. This is mainly due to decreased power costs (see below).
Line 10 – Power Costs Through the cost to serve project all power costs are allocated to individual sites and a report was taken from EAM to get the full year power cost per WWTW’s. The power costs have decreased in AIR18 by £0.6M mainly in Belfast WWTWs.
Belfast WWTW’s was treated separately as there is one electricity meter at Duncrue Street which includes the costs for the Belfast WWTW’s and the two Incinerators operated by PPP. The power team supplied an estimated 44:56 split between the Belfast WWTWs and the Incinerators (based on an estimated KWhr usage and a number of sub-meters) which has been used to calculate the amount relating to Sewage Treatment at Belfast WWTW’s. The split in AIR17 was 46:54 for the Belfast and Incinerators. No costs for the Incinerator have been included in this table in AIR18.
Line 11 – Service Charges There is an increase in Service Charges from AIR17 to AIR 18 by £0.1M.
Line 12 – General & Support The total general & support expenditure was taken from Table 22 line 10 column 2 (see Table 22 methodology and commentary). This figure was apportioned across all the WWTWs in this table based on the cost reallocations 611X (this includes direct labours costs

Annual Information Return 2018 Section 2 Chapter 17b Page 3 of 3
& overhead charges). This figure has increased by £0.3m since AIR17. See commentary on Table 22 for further breakdown and explanation.
Line 13 – Functional Expenditure This is a calculated line and is the total of line 9 and line 12. The total in the workings agrees to Table 22 (NIW Only) column 2 line 11. Costs have decreased since AIR17 by £0.6M mainly due to the decreased power costs as explained above.
Line 14 – Terminal Pumping Costs This information was populated in the same way as AIR17. No Power costs for Terminal Pumping Stations have been included in the table.
Line 15 – Sludge Costs Sludge treatment is a separate activity in the accounts and the direct costs are not included in line 9 to line 13.

NORTHERN IRELAND WATER LIMITED - ANNUAL INFORMATION RETURN
ANNUAL INFORMATION RETURN - TABLE 17c SEWERAGE EXPLANATORY FACTORSSEWAGE TREATMENT WORKS - NUMBERS (NIW Only)
1 2 3 4 5 6 7 8 9 10 11
PRIMARY ACTIVATED BIOLOGICAL A1 A2 B1 B2 PRELIMINARYTREATMENT SCREENED UNSCREENED
A SMALL WORKS1 Number of STWs in size band 1 nr 0 240 20 509 3 2 5 7792 Number of STWs in size band 2 nr 0 6 32 3 1 10 6 1 1 603 Number of STWs in size band 3 nr 0 1 13 47 7 12 15 7 1 1 1044 Number of STWs in size band 4 nr 0 1 15 7 1 15 2 5 3 1 505 Number of STWs in size band 5 nr 0 5 0 2 8 1 16
B LARGE WORKS6 Number of STWs in size band 6 nr 0 3 11 14
7 Total numbers of STWs nr 0 242 62 595 13 47 30 21 5 2 6 1023
C SMALL WORKS WITH AMMONIA CONSENTS8 Number of small STWs with NH3 consent (5 - 10mg/l) nr 0 449 Number of small STWs with NH3 consent (< = 5mg/l) nr 0 59
DESCRIPTION UNITS DP
TREATMENT CATEGORY
TOTALSECONDARY TERTIARY SEA OUTFALLS

NORTHERN IRELAND WATER LIMITED - ANNUAL INFORMATION RETURN
ANNUAL INFORMATION RETURN - TABLE 17c SEWERAGE EXPLANATORY FACTORSSEWAGE TREATMENT WORKS - NUMBERS (PPP Only)
1 2 3 4 5 6 7 8 9 10 11
PRIMARY ACTIVATED BIOLOGICAL A1 A2 B1 B2 PRELIMINARYTREATMENT SCREENED UNSCREENED
A SMALL WORKS1 Number of STWs in size band 1 nr 02 Number of STWs in size band 2 nr 03 Number of STWs in size band 3 nr 04 Number of STWs in size band 4 nr 0 1 15 Number of STWs in size band 5 nr 0 1 1
B LARGE WORKS6 Number of STWs in size band 6 nr 0 1 3 4
7 Total numbers of STWs nr 0 1 1 4 6
C SMALL WORKS WITH AMMONIA CONSENTS8 Number of small STWs with NH3 consent (5 - 10mg/l) nr 09 Number of small STWs with NH3 consent (< = 5mg/l) nr 0 2
TOTALDPDESCRIPTION UNITS SEA OUTFALLSTREATMENT CATEGORY
SECONDARY TERTIARY

NORTHERN IRELAND WATER LIMITED - ANNUAL INFORMATION RETURN
ANNUAL INFORMATION RETURN - TABLE 17c SEWERAGE EXPLANATORY FACTORSSEWAGE TREATMENT WORKS - NUMBERS (Total)
1 2 3 4 5 6 7 8 9 10 11
PRIMARY ACTIVATED BIOLOGICAL A1 A2 B1 B2 PRELIMINARYTREATMENT SCREENED UNSCREENED
A SMALL WORKS1 Number of STWs in size band 1 nr 0 240 20 509 3 2 5 7792 Number of STWs in size band 2 nr 0 6 32 3 1 10 6 1 1 603 Number of STWs in size band 3 nr 0 1 13 47 7 12 15 7 1 1 1044 Number of STWs in size band 4 nr 0 1 15 7 2 15 2 5 3 1 515 Number of STWs in size band 5 nr 0 5 2 9 1 17
B LARGE WORKS6 Number of STWs in size band 6 nr 0 4 14 18
7 Total numbers of STWs nr 0 242 63 595 14 51 30 21 5 2 6 1029
C SMALL WORKS WITH AMMONIA CONSENTS8 Number of small STWs with NH3 consent (5 - 10mg/l) nr 0 449 Number of small STWs with NH3 consent (< = 5mg/l) nr 0 61
TOTALDPDESCRIPTION UNITS
TREATMENT CATEGORYSECONDARY TERTIARY SEA OUTFALLS

Annual Information Return 2018 Section 2 Chapter 17c Page 1 of 5
Table 17c- Sewage Treatment Works Numbers
NIW only It should be noted that the banding of the WWTWs is based on the latest Populations Equivalents minus tourist PEs (i.e. hotels and caravan parks only as information does not exist on proportion of PE to commuters). PEs for 84 WWTWs (which were live during AIR18) have been updated.
Changes regarding WWTWs from the AIR17 period are as follows: 3 WWTWs have been upgrade and achieved beneficial use in the last financial year
– i.e. Ballycastle WwTW, Clabby WwTW and Mullans (Antrim) WwTW. 4 WWTWS had ‘turn of flow’ under the RWwIP project (including upgrades to
Bresagh and Oliver Plunket Pk WWTWs and refurbishment to Ardgarvan andCarnanbane WwTWs)
5 WWTW (Cornamuck, Creevangar, Edenreagh Rd (39-41), Ervey Rd andGlenabbey) have been replaced by CSDD in the last financial year
Drumsurn WwTW was upgraded during AIR15 but the updating of the design PEwas overlooked. This has been updated for AIR18.
There is no net change in the number of WWTWs from AIR17 reporting, with 1023 WWTW live on 31st March 2018.
The total number of WWTWs in Table 17c line 7 is the total of all works in this table i.e. 1,023 including the screened outfalls (2 No.) and the unscreened outfalls (6 No). The number of WWTWs in Table 15 line 8 is 1,015 as the screened and unscreened outfalls are not to be included in the total for this line.
The UR Chapter 17c guidance also requests the following cross check to be carried out, which has been completed:
The number of large WWTWs in each treatment category in table 17c (line 6, columns1-10) should equal the corresponding total number of large WWTWs reported in table17b (line 8) – which for AIR18 is 14 No WWTWs.
It should be noted that the AIR18 PEs, used to populate tables 17c and 17d, were forwarded to others within the organisation who are responsible for the population of tables 17b and 17f, which should ensure consistency of reporting.
The Reporters report for AIR09 recommended that the difference in the total population used to calculate the size bands and the population given in Table 13 Line 10 should be investigated and consideration given to a harmonised approach. The table below shows the AIR18 comparison between the two figures.
Total Residential Population used to Calculate Table 17c for AIR18 1,246,298 Total Population connected to the sewerage system based on Table 13 Line 10 1,544,413
Difference 298,115
As can be seen there is a difference of 298,115. However the Table 17c information does not include the residential population within PPP catchments. An exercise was carried out during February 2012 to establish a Theoretical Desktop pe for the PPP sites and these have been updated with the latest AIR18 Trade PE. The non-residential aspect of these PEs

Annual Information Return 2018 Section 2 Chapter 17c Page 2 of 5
have been subtracted from the overall AIR18 PPP PE (based on the reported AIR18 PPP BOD Load and divided by 60g/head/day).
Name of WWTWs
Equivalent Population (From PPP
Section)
Non-Residential pe held against PPP
Catchments (Includes Non-Residential,
Trade, Schools, Large Water Consumers,
Caravan Parks)
Residential Population (Based on PPP Equivalent
Population. Includes
Residential Homes)
North Down WWTW 63,700 9,474 54,226
Armagh WWTW 14,133 7,357 6,776
Richhill WWTW 1,933 196 1,737
Newtownards (Ballyrickard) 46,700 16,865 29,835
Ballynacor WWTW 118,067 64,255 53,812
Kinnegar 70,979 31,374 39,605 Total 315,512 129,521 185,991
As can be seen the residential population for the PPP sites is now approximated to be 185,991. If this is added to the 17c figure (1,246,297) then the total is 1,432,288 which is 112,125 less than the figure held in Table 13. However the Table 13 Line 10 residential figure includes nursing homes and tourist population. Nursing homes are included in the Trade PE so if this element (7821) and the AIR18 tourist population for both NIW sites (33,800 pe) and PPP sites (1,964) are included this gives a revised figure of 1,475,873 which is 68,540 pe less than the figure held in Table 13, approximately 4.4%of a difference.
It should be noted that the Residential PE for most of the NIW WWTWs has been derived from GIS pointer data and that inaccuracies do exist in that some residential properties are labelled as commercial or industrial, and visa-versa.
The AIR11 Reporter’s Report stated ‘The Asset Performance team collates all information into the central spreadsheet from which Band Size for each WwTW can be assessed and any changes highlighted. The size banding of each works is added manually. For AIR12, we consider this process should be automated, for the avoidance of any misrepresentation.’ Hence NIW has incorporated a means within the central spreadsheet to automate this process.
The Reporters report for AIR09 recommended that a consistent approach for population figures used in the 17 series tables should be adopted. The population figures used in Table 17c are the same as in 17d. These figures have also been supplied to the other parts of the business which populate Tables 17a, 17b & 17f etc., so population figures should be consistent.
With reference to the WWTWs in Size Band 1: the number of WWTWs with a PE less than or equal 100 (excluding tourist PE) is
698, and


Annual Information Return 2018 Section 2 Chapter 17c Page 5 of 5
drops in PE which cross UWWTD boundaries i.e. 2000pe, 50,000pe and 100,000pe. These flow and load studies were not identified in the PC15 Business Plan submission and given the reduction in funding over the first 3 years of PC15 they are not currently prioritised for inclusion in the capital works programme.
WWTWs Site ID AIR18
Actual PE
Actual PE recognised
by NIEA Ballymena (WWTW) S01456 66,375 113825
Dromore (Tyrone) S03083 1919 2032
Dunmurry S00346 45,939 53605
PPP Lines 1-6 There are no changes to the PPP sewage works treatment categories.
Line 9 There are no changes to the PPP sewage works treatment categories
Specific required commentary; There are no doubts about the classification of any of the PPP works. The data is consistent with the data provided on Table 15 Line 8 (PPP Only) table. Based on the calculated loads treated at the PPP sewage works in the AIR 18
Reporting period, there are no size band 1 PPP works on which to provide extradetail.

NORTHERN IRELAND WATER LIMITED - ANNUAL INFORMATION RETURN
ANNUAL INFORMATION RETURN - TABLE 17d SEWERAGE EXPLANATORY FACTORSSEWAGE TREATMENT WORKS - LOADS (NIW Only)
1 2 3 4 5 6 7 8 9 10 11
PRIMARY ACTIVATEDSLUDGE BIOLOGICAL A1 A2 B1 B2 PRELIMINARY
TREATMENT SCREENED UNSCREENED
A SMALL WORKS1 Load received by STWs in size band 1 kg BOD5/day 0 141 85 1,399 62 25 32 1,744 C32 Load received by STWs in size band 2 kg BOD5/day 0 137 691 61 18 216 138 248 69 1,580 C33 Load received by STWs in size band 3 kg BOD5/day 0 91 1,019 2,694 432 817 994 455 42 55 6,599 C34 Load received by STWs in size band 4 kg BOD5/day 0 350 3,490 1,414 130 4,208 323 1,212 778 186 12,092 C35 Load received by STWs in size band 5 kg BOD5/day 0 4,813 1,783 8,819 1,029 16,444 C3
B LARGE WORKS6 Load received by STWs in size band 6 kg BOD5/day 0 16,285 54,434 70,719 C3
7 Total loads rec'd (daily average all size bands) kg BOD5/day 0 581 25,830 6,199 2,406 68,296 1,596 2,860 1,068 255 87 109,179 C3
C SMALL WORKS WITH AMMONIA CONSENTS8 Load rec'd by small STW w. NH3 consent (5 - 10mg/l) kg BOD5/day 0 5,1609 Load rec'd by small STW w. NH3 consents (< = 5mg/l) kg BOD5/day 0 14,064
DESCRIPTION CGUNITS DP
TREATMENT CATEGORY
TOTALSECONDARY TERTIARY SEA OUTFALLS

NORTHERN IRELAND WATER LIMITED - ANNUAL INFORMATION RETURN
ANNUAL INFORMATION RETURN - TABLE 17d SEWERAGE EXPLANATORY FACTORSSEWAGE TREATMENT WORKS - LOADS (PPP Only)
1 2 3 4 5 6 7 8 9 10 11
PRIMARY ACTIVATEDSLUDGE BIOLOGICAL A1 A2 B1 B2 PRELIMINARY
TREATMENT SCREENED UNSCREENED
A SMALL WORKS1 Load received by STWs in size band 1 kg BOD5/day 02 Load received by STWs in size band 2 kg BOD5/day 03 Load received by STWs in size band 3 kg BOD5/day 04 Load received by STWs in size band 4 kg BOD5/day 0 116 116 B35 Load received by STWs in size band 5 kg BOD5/day 0 848 848 B3
B LARGE WORKS6 Load received by STWs in size band 6 kg BOD5/day 0 4,259 13,708 17,967 B3
7 Total loads rec'd (daily average all size bands) kg BOD5/day 0 4,259 116 14,556 18,931 B3
C SMALL WORKS WITH AMMONIA CONSENTS8 Load rec'd by small STW w. NH3 consent (5 - 10mg/l) kg BOD5/day 09 Load rec'd by small STW w. NH3 consents (< = 5mg/l) kg BOD5/day 0 964
CG
TREATMENT CATEGORY
TOTALSECONDARY TERTIARY SEA OUTFALLSUNITS DPDESCRIPTION

NORTHERN IRELAND WATER LIMITED - ANNUAL INFORMATION RETURN
ANNUAL INFORMATION RETURN - TABLE 17d SEWERAGE EXPLANATORY FACTORSSEWAGE TREATMENT WORKS - LOADS (Total)
1 2 3 4 5 6 7 8 9 10 11
PRIMARY ACTIVATEDSLUDGE BIOLOGICAL A1 A2 B1 B2 PRELIMINARY
TREATMENT SCREENED UNSCREENED
A SMALL WORKS1 Load received by STWs in size band 1 kg BOD5/day 0 141 85 1,399 62 25 32 1,744 C32 Load received by STWs in size band 2 kg BOD5/day 0 137 691 61 18 216 138 248 69 1,580 C33 Load received by STWs in size band 3 kg BOD5/day 0 91 1,019 2,694 432 817 994 455 42 55 6,599 C34 Load received by STWs in size band 4 kg BOD5/day 0 350 3,490 1,414 246 4,208 323 1,212 778 186 12,208 C35 Load received by STWs in size band 5 kg BOD5/day 0 4,813 0 1,783 9,667 1,029 17,292 C3
B LARGE WORKS6 Load received by STWs in size band 6 kg BOD5/day 0 20,544 68,142 88,686 C3
7 Total loads rec'd (daily average all size bands) kg BOD5/day 0 581 30,089 6,199 2,522 82,852 1,596 2,860 1,068 255 87 128,110 C3
C SMALL WORKS WITH AMMONIA CONSENTS8 Load rec'd by small STW w. NH3 consent (5 - 10mg/l) kg BOD5/day 0 5,1609 Load rec'd by small STW w. NH3 consents (< = 5mg/l) kg BOD5/day 0 15,028
CGDESCRIPTION UNITS DP
TREATMENT CATEGORY
TOTALSECONDARY TERTIARY SEA OUTFALLS

Annual Information Return 2016 Section 2 Chapter 17d Page 1 of 12
Table 17d - Sewage Treatment Works Loads NIW only It should be noted that the banding of the WWTWs is based on the latest Population Equivalent minus tourist PEs (i.e. hotels and caravan parks only as information does not exist on proportion of PE to commuters). PEs for 84 WWTWs (which were live during AIR18) have been updated. The allowance for the tourist population, which has been deducted for the purposes of band size determination, has been the proportion of PE allocated to hotels, and caravan and tent pitches only. No deduction has been made for commuters as such information has not been captured. The loads reported in this table are the sums of the loads received by each WWTWs or outfall in each particular category, and hence include the proportion of PE allocated to hotels, and caravan and tent pitches. Hence the loads reported in this table include the non-resident population. 1,023 WWTWs were reported on in Table 17d for AIR17. There have been no additions or reductions in the number of WWTWs being reported from AIR17 to AIR18.
Trade effluent information was obtained from NIW’s Trade Effluent Section, for each individual consented trader, which enabled easy conversion to PEs. The COD: BOD conversion factor of 2:1 was not used as more accurate flow based information was available to the Trade Effluent Section. The Water and Sewerage Services (NI) Order 2006 designated that the discharge from hospitals, nursing homes & clinics should no longer be considered as Trade Effluent, therefore for AIR18 these have been removed from the Trade Effluent Submission. For the majority of hospitals a certain % of hospital discharges has been included due to discharges from x-ray departments and bathing pools. The AIR11 Trade Information, for nursing homes and clinics, has been maintained for AIR18 in order to allow for this proportion of the influent entering the WWTWs. Similarly the PEs for the hospitals has been factored up to 100% of their total discharge to give a more accurate figure of load discharging to the sewerage network. In AIR13 it was reported that flow & load information was validated for Belfast and a figure of 365,000Pe was agreed. This figure has been updated for AIR18 with the latest trade information giving a new figure of 365,139PE. However it should be noted that there are a number of projects currently been carried out for NIW that are investigating the PEs discharging to Belfast and early indications would suggest the equivalent PE discharging to the WWTWs is much higher than currently stated. The main projects involved are:
Belfast WwTW Appraisal Study (which includes a full 12 month flow and load study). The study is due to be completed shortly,
Glenmachan Sewers Project, and Compliance with the Surface Water (Shellfish) Regs (NI) – Belfast Lough.
The outcomes of these projects are likely to influence the PE for Belfast for AIR19. The total number of WWTWs in Table 17c line 7 is the total of all NIW only works in this table i.e. 1,023 including the screened outfalls (2 No.) and the unscreened outfalls (6 No.).

Annual Information Return 2016 Section 2 Chapter 17d Page 2 of 12
The Reporters Report on AIR09 recommended that NIW correct possible overestimation of total WWTW loads due to the inclusion of offices/commercial premises. The majority of the residential and non-residential element of PEs used to calculate tables 17c and 17d was based on Pointer information from MapInfo. However it should be noted that the non-residential element of Pointer is made up of both commercial and unknown properties. At this present time it is not known what proportion of the unknowns are actually residential and which are non-residential and therefore it has been decided to include both elements when calculating the PEs for the band sizes. It is difficult to estimate the proportion of load at a WWTW due to commuters, or the load which should be deducted from/added to a particular WWTW due to population commuting out of/into the catchments, which that WWTW serves. Hence no allowance to WWTWs loads has been made either way for Table 17d. The confidence grades of the data in lines 1 - 7 remain as C3 as stated in AIR17. The AIR11 Reporter’s report stated ‘We suggest that NI Water consider comparing the results from the ongoing programme of flow and load surveys against the previous assumptions for each site to determine if there is a statistically significant difference which should be extrapolated into the larger population of WwTW sites.’ There was some analysis on this within the AIR13 commentary however it was concluded that there was not a large enough sample to justify extrapolating the differences. Since AIR13 only one additional Flow & Load PE has been adopted and this was for Kilkeel WWTWs and therefore the sample is still not large enough to extrapolate. The reporter also recommended in AIR11 that significant variances in load of WWTWs (i.e. greater than 15%) should be investigated. Below is a table detailing these sites and the reason for the change in PEs. There are 13 no. WWTWs included in the table.
Name of Works CAR ID
AIR17 Actual
PE
AIR18 Actual
PE
Difference* *(-ve
indicates AIR18 figure
larger)
Comments
Aghinlig (WWTW) S02554 146 225 -79
A population study was carried out for this site
and reviewed and adopted for AIR18.
Bonnanaboigh S03031 219 273 -54
A population study was carried out for this site
and reviewed and adopted for AIR18.
Cornamuck S03061 27 21 6
A population study was carried out for this site
and reviewed and adopted for AIR18.
Donemana S03103 813 1195 -382
A population study was carried out for this site
and reviewed and adopted for AIR18.

Annual Information Return 2016 Section 2 Chapter 17d Page 3 of 12
Name of Works CAR ID
AIR17 Actual
PE
AIR18 Actual
PE
Difference* *(-ve
indicates AIR18 figure
larger)
Comments
Drumenny S03088 98 75 23
A population study was carried out for this site
and reviewed and adopted for AIR18.
Fivemiletown (WWTW) S03113 2145 2854 -709
A population study was carried out for this site
and reviewed and adopted for AIR18.
Longfield (Eglinton) S03173 108 270 -162
A population study was carried out for this site
and reviewed and adopted for AIR18.
Magherahoney S01117 100 86 14
A population study was carried out for this site
and reviewed and adopted for AIR18.
Mayboy S01163 184 235 -51
A population study was carried out for this site
and reviewed and adopted for AIR18.
Moy (WWTW) S02859 3179 3770 -591 PE updated with AIR18 Trade Information
Old Green S01448 17 107 -90
A population study was carried out for this site
and reviewed and adopted for AIR18.
Tullyroan S02600 37 45 -8 PE updated with AIR18 Trade Information
Warrenpoint (WWTW) S02720 14871 17361 -2490
A population study was carried out for this site
and reviewed and adopted for AIR18.
*(-ve indicates AIR17 figure larger) It should be highlighted that for AIR14 NIW re-assessed the treatment categories for a number of sites. This followed a query from NIW with OFWAT as to the definition of what constitutes a tight consent. At this time it was confirmed that a company is given a tight consent if it has a Suspended Solids consent of less than or equal to 30mg/l AND a BOD of less than or equal to 20mg/l. Also a company is given a tight consent if its ammonia consent is less than or equal to 5mg/l. The AIR definition on treatment categories states that Tertiary A2 can be defined as Works with a secondary activated sludge process whose treatment methods also include nutrient control using physico-chemical and biological methods. Likewise Tertiary B2 can be defined as Works with a secondary biological process whose treatment methods also include nutrient control using physico-chemical and biological methods. NIW has historically oversized secondary assets to meet tight ammonia consents and it is now felt that this falls within the definition of Tertiary Treatment described above i.e. nutrient control using physico-chemical and biological methods. In total NIW re-designated the treatment category for 33 WWTWs based on this definition for AIR14, changing 22 WWTWs

Annual Information Return 2016 Section 2 Chapter 17d Page 4 of 12
from Sec Act to Ter A2 & 11 from Sec Bio to Ter B2. The treatment categories for these sites remain unchanged, following a review of the ammonia consents and treatment methods for AIR17. NIW has a number of WWTWs (Belfast, Whitehouse and Carrickfergus) which have a total nitrogen (TN) standard in place, which is applicable to marine discharges, as opposed to an ammonia standard which is applied to freshwater discharges. Treatment category TA2 is applicable to these WWTWs as nutrient control is in place through the biological process. The total load of 109,178.6kg BOD/day from all NIW (only) WWTWs reconciles with the Total load entering sewerage system (BOD/year) of 39,850.19t BOD/year, from Table 15 line 5. The Total load receiving primary treatment in table 17d (line 7, column 1) of 581.3kg BOD/day is consistent (allowing for rounding up/down and conversions) with total load receiving primary treatment in table 15 (line 3) of 212.19t BOD/yr. The Total load receiving secondary and tertiary treatment in table 17d (line 7, sum of columns 2–7) i.e. 107,188.3kg BOD/day is consistent (allowing for rounding up/down and conversions) with total load receiving secondary treatment in table 15 (line 2) i.e. 39,123.74 t BOD/yr. The Total load receiving preliminary treatment in table 17d (line 7, column 8) of 1067.7kg BOD/day is consistent (allowing for rounding up/down and conversions) with total load receiving preliminary treatment in table 15 (line 4) (both include non-resident population) of 389.71t BOD/yr. The table below depicts changes in PEs at WWTWs from AIR17 to AIR18. The following table depicts how PE changes have occurred at WWTWs during the last financial year.
Name of Works CAR ID AIR17 Actual PE
AIR18 Actual PE
Difference*
AIR17 Band
AIR18 Band
Band Size
Change
Aghanloo (1) S02989 697 703 -6 Band 3 Band 3 Aghinlig (WWTW) S02554 146 225 -79 Band 1 Band 1 Annalong (WWTW) S00300 3222 3096 126 Band 4 Band 4 Annsborough S02687 5882 6031 -149 Band 4 Band 4 Antrim (WWTW) S01422 65282 64937 345 Band 6 Band 6 Ardglass (WWTW) S00268 2866 2730 136 Band 4 Band 4 Ballyclare S01467 16352 16316 36 Band 5 Band 5 Ballykelly (L/Derry) S03016 3651 3619 32 Band 4 Band 4 Ballymacawley S02560 22 21 1 Band 1 Band 1 Ballymena (WWTW) S01456 70948 66375 4573 Band 6 Band 6
Ballyvoy S01177 288 264 24 Band 2 Band 2 Banbridge (WWTW) S02102 21733 20689 1044 Band 5 Band 5
Belfast (WWTW) S00345 360602 365139 -4537 Band 6 Band 6 Bonnanaboigh S03031 219 273 -54 Band 1 Band 2 Y Bushmills (WWTW) S01178 5542 5544 -2 Band 4 Band 4

Annual Information Return 2016 Section 2 Chapter 17d Page 5 of 12
Name of Works CAR ID AIR17 Actual PE
AIR18 Actual PE
Difference*
AIR17 Band
AIR18 Band
Band Size
Change
Carnanbane S03037 42 41 1 Band 1 Band 1 Carrickfergus (WWTW) S00261 32474 32408 66 Band 6 Band 6
Coalisland S02828 10107 10010 97 Band 5 Band 5 Cookstown (WWTW) S01582 20014 21591 -1577 Band 5 Band 5
Corkill (Fermanagh) S03059 18 24 -6 Band 1 Band 1
Cornamuck S03061 27 21 6 Band 1 Band 1 Culmore (WWTW) S03071 131123 135976 -4853 Band 6 Band 6 Derryhale S02570 1136 1284 -148 Band 3 Band 3 Dervock S01102 969 970 -1 Band 3 Band 3 Donaghmore (WWTW) S02840 1938 1982 -44 Band 3 Band 3
Donemana S03103 813 1195 -382 Band 3 Band 3 Donnybrewer S03080 5370 5229 141 Band 4 Band 4 Douglas Bridge S03082 196 210 -14 Band 1 Band 1 Downpatrick (WWTW) S00771 19657 19710 -52 Band 5 Band 5
Draperstown S01615 3252 3254 -2 Band 4 Band 4 Dromara S00316 1382 1385 -3 Band 3 Band 3 Dromore (Down) S02127 7480 7722 -242 Band 4 Band 4 Dromore (Tyrone) S03083 1917 1919 -2 Band 3 Band 3 Drumenny S03088 98 75 23 Band 1 Band 1 Dungannon S02850 79331 77643 1688 Band 6 Band 6 Dungiven S03101 4773 4745 28 Band 4 Band 4 Dunmurry S00346 46042 45939 103 Band 6 Band 6 Enniskillen S03218 26231 25948 283 Band 6 Band 6 Fivemiletown (WWTW) S03113 2145 2854 -709 Band 4 Band 4
Glenstall S01109 21153 21276 -123 Band 5 Band 5 Grange (Taylorstown) S01442 565 572 -7 Band 3 Band 3
Greenisland (WWTW) S00263 12529 11614 915 Band 5 Band 5
Hilltown (WWTW) S02701 2054 2058 -4 Band 4 Band 4 Irvinestown S03137 2679 2680 -1 Band 4 Band 4 Keady (Armagh) S02553 4568 4571 -3 Band 4 Band 4 Kesh (WWTW) S03140 2684 2679 5 Band 3 Band 3 Kilkeel (WWTW) S00313 14101 14497 -396 Band 5 Band 5 Killinchy (WWTW) S00252 4640 2975 1665 Band 4 Band 4 Killybaskey S01581 103 115 -12 Band 1 Band 1 Killygonlan (WWTW) S02043 1303 1307 -4 Band 3 Band 3
Kilrea S01156 2555 2563 -8 Band 4 Band 4

Annual Information Return 2016 Section 2 Chapter 17d Page 6 of 12
Name of Works CAR ID AIR17 Actual PE
AIR18 Actual PE
Difference*
AIR17 Band
AIR18 Band
Band Size
Change
Larne (WWTW) S02044 23175 23275 -100 Band 5 Band 5 Limavady (WWTW) S03162 16321 16267 54 Band 5 Band 5 Lisburn (New Holland) S00329 69742 72630 -2888 Band 6 Band 6
Lisnaskea (WWTW) S03171 6483 6840 -357 Band 4 Band 4
Longfield (Eglinton) S03173 108 270 -162 Band 1 Band 2 Y Maghera (L/Derry) S01629 6750 6682 68 Band 4 Band 4 Magherafelt (WWTW) S01621 17453 17151 302 Band 5 Band 5
Magherahoney S01117 100 86 14 Band 1 Band 1 Markethill S02591 2510 2585 -74 Band 4 Band 4 Mayboy S01163 184 235 -51 Band 1 Band 1 Moneymore (WWTW) S01589 2828 2826 2 Band 4 Band 4
Moneyreagh S00337 2386 2387 -1 Band 4 Band 4 Mountnorris S02248 889 892 -3 Band 3 Band 3 Moy (WWTW) S02859 3179 3770 -591 Band 4 Band 4 NewMills (WWTW) S02852 725 727 -2 Band 3 Band 3 Newry (WWTW) S02685 56605 58886 -2281 Band 6 Band 6 Newtownbreda (WWTW) S00342 34497 34507 -10 Band 6 Band 6
Newtownbutler (WWTW) S03200 1289 1290 -1 Band 3 Band 3
North Coast (WWTWs) S04150 76036 76554 -518 Band 6 Band 6
Old Green S01448 17 107 -90 Band 1 Band 1 Omagh (WWTW) S03999 33245 33591 -346 Band 6 Band 6 Pomeroy (WWTW) S01593 980 979 1 Band 3 Band 3 Rock Cottages S02172 21 15 6 Band 1 Band 1 St Johns Terrace (Kilcoo) S02717 30 29 1 Band 1 Band 1
Strabane S03223 22191 23943 -1752 Band 5 Band 5 Swatragh (WWTW) S01637 719 718 1 Band 3 Band 3 Tamnamore (WWTW) S02862 614 617 -3 Band 3 Band 3
Tandragee S02174 11686 11344 342 Band 5 Band 5 Trillick (WWTW) S03231 611 607 4 Band 3 Band 3 Tullyroan S02600 37 45 -8 Band 1 Band 1 Warrenpoint (WWTW) S02720 14871 17361 -2490 Band 5 Band 5
Whitehouse S00265 87930 88115 -185 Band 6 Band 6 Total -13,196
*(‐ve indicates AIR18 figure larger)

Annual Information Return 2016 Section 2 Chapter 17d Page 7 of 12
The change in PE equates to an increase in load of 791.8kg BOD/day (i.e. 13,196 x 0.06 for 60g/hd/day) from AIR17 to AIR18 Difference between AIR18 and AIR17 for the total load entering WWTWs as shown in Table 17d - column 11, row 7
Total Load Received at WWTWs for AIR17 - 108387 Total Load Received at WWTWs for AIR 18 - 109179 Total Difference - 792
The differences between the above totals is due to rounding. The interpretation of the treatment categories is as below:-
AIR16 Treatment Category
Highest Form of Treatment at WWTWs Treatment Category Abbreviation
Primary Primary Settlement Septic Tank Prim Secondary Activated Sludge (Whether followed by Final settlement or not)
Oxidation Ditch Extended Aeration Activated Sludge SAF BAF MBR SBR
Sec Act
Secondary Biological (Whether followed by Final settlement or not)
Biological Filter RBC RBC Package Bioclere Package ; Reed Bed (If used as secondary treatment stage)
Sec Bio
Tertiary A1 Secondary Activated Sludge processes whose treatment methods also include prolonged settlement in conventional lagoons or raft lagoons, irrigation over grassland, constructed wetlands, root zone treatment (where used as a tertiary stage), drum filters, microstrainers, slow sand filters, tertiary nitrifying filters, Lockertex screens, gravel clarifiers, wedge wire clarifiers or Clariflow installed in humus tanks, where used as a tertiary treatment stage;
Ter A1
Tertiary A2 Secondary Activated Sludge processes whose methods also include phosphorous reduction, rapid-gravity sand filters, moving bed filters, pressure filters, nutrient control using physico-chemical and biological methods, disinfection, hard COD and colour removal and MBRs where used as a tertiary treatment stage;
Ter A2

Annual Information Return 2016 Section 2 Chapter 17d Page 8 of 12
AIR16 Treatment Category
Highest Form of Treatment at WWTWs Treatment Category Abbreviation
Tertiary B1 Secondary Biological processes whose treatment methods also include prolonged settlement in conventional lagoons or raft lagoons, irrigation over grassland, constructed wetlands, root zone treatment (where used as a tertiary stage), drum filters, microstrainers, slow sand filters, tertiary nitrifying filters, Lockertex screens, gravel clarifiers, wedge wire clarifiers or Clariflow installed in humus tanks, where used as a tertiary treatment stage;
Ter B1
Tertiary B2 Secondary Biological processes whose methods also include phosphorous reduction, rapid-gravity sand filters, moving bed filters, pressure filters, nutrient control using physico-chemical and biological methods, disinfection, hard COD and colour removal and MBRs where used as a tertiary treatment stage;
Ter B2
Sea Outfalls
Where a load is discharged to sea having received only Preliminary treatment (including Grit removal and screenings conditioning) or simple screening (Bar Screen) or no screening or no treatment (Includes Retention Tanks)
Sea Out Prel Sea Out Screen Sea Out Unscreen
Changes in Line 8 - Small works with ammonia consent (between 5 and 10) from AIR17 to AIR18.
Name of Works CAR ID
AIR17 Actual
PE
AIR18 Actual
PE
PE Change
* Comments
Derryhale S02570 1136 1284 -148 PE updated with AIR18 Trade Information
Donaghmore (WWTW) S02840 1938 1982 -44 PE updated with AIR18 Trade
Information
Draperstown S01615 3252 3254 -2 PE updated with AIR18 Trade Information
Dromore (Tyrone) S03083 1917 1919 -2 PE updated with AIR18 Trade
Information Hilltown
(WWTW) S02701 2054 2058 -4 PE updated with AIR18 Trade Information
Kesh (WWTW) S03140 2684 2679 5 PE updated with AIR18 Trade Information
Lisnaskea (WWTW) S03171 6483 6840 -357 PE updated with AIR18 Trade
Information Maghera (L/Derry) S01629 6750 6682 68 PE updated with AIR18 Trade
Information
Markethill S02591 2510 2585 -74
A population study was carried out for this site and reviewed and
adopted for AIR18. PE updated with AIR18 Trade Information
Mountnorris S02248 889 892 ‐3 PE updated with AIR18 Trade Information

Annual Information Return 2016 Section 2 Chapter 17d Page 9 of 12
Name of Works CAR ID
AIR17 Actual
PE
AIR18 Actual
PE
PE Change
* Comments
Strabane S03223 22191 23943 ‐1752 A population study was carried out for this site and reviewed and adopted for AIR18. PE updated with AIR18 Trade
Information Swatragh (WWTW) S01637 719 718 1 PE updated with AIR18 Trade
Information Total -2,314
*(-ve Indicates AIR18 PE Higher) The change in PE equates to an increase in load of 138.84 kg/d (i.e. 2314 x 0.06 for 60g/hd/day) from AIR17 to AIR18, for line 8.
Total Load rec’d by small WWTWs with NH3 consents (5-10mg/l) for AIR17- 5021 Total Load rec’d by small WWTWs with NH3 consents (5-10mg/l) for AIR18- 5160 Total Difference – 139
Changes in Line 9 - Small works with ammonia consent (between 0 and 5) from AIR17 to AIR18.
Name of Works CAR ID AIR17 Actual PE
AIR18 Actual PE
PE Change* Comments
Annsborough S02687 5882 6031 -149
PE updated with AIR18
Trade Information
Ballyclare S01467 16352 16316 36
PE updated with AIR18
Trade Information
Ballyvoy S01177 288 264 24
A population study was carried out for this site
and reviewed
and adopted for AIR18.
Banbridge (WWTW) S02102 21733 20689 1044
PE updated with AIR18
Trade Information
Coalisland S02828 10107 10010 97
PE updated with AIR18
Trade Information

Annual Information Return 2016 Section 2 Chapter 17d Page 10 of 12
Name of Works CAR ID AIR17 Actual PE
AIR18 Actual PE
PE Change* Comments
Cookstown (WWTW) S01582 20014 21591 -1577
PE updated with AIR18
Trade Information
Downpatrick (WWTW) S00771 19657 19710 -52
PE updated with AIR18
Trade Information
Dromara (WWTW) S00316 1382 1385 -3
PE updated with AIR18
Trade Information
Dromore (Down) S02127 7480 7722 -242
PE updated with AIR18
Trade Information
Dungiven S03101 4773 4745 28
PE updated with AIR18
Trade Information
Grange (Taylorstown) S01442 565 572 -7
PE updated with AIR18
Trade Information
Irvinestown S03137 2679 2680 -1
PE updated with AIR18
Trade Information
Keady (Armagh) S02553 4568 4571 -3
PE updated with AIR18
Trade Information
Killinchy (WWTW) S00252 4640 2975 1665
PE updated with AIR18
Trade Information
Limavady (WWTW) S03162 16321 16267 54
PE updated with AIR18
Trade Information
Magherafelt (WWTW) S01621 17453 17151 302
PE updated with AIR18
Trade Information
Moneymore (WWTW) S01589 2828 2826 2
PE updated with AIR18
Trade Information
Moneyreagh (WWTW) S00337 2386 2387 -1
PE updated with AIR18
Trade Information

Annual Information Return 2016 Section 2 Chapter 17d Page 11 of 12
Name of Works CAR ID AIR17 Actual PE
AIR18 Actual PE
PE Change* Comments
Newtownbutler (WWTW) S03200 1289 1290 -1
PE updated with AIR18
Trade Information
Pomeroy (WWTW) S01593 980 979 1
PE updated with AIR18
Trade Information
Stoneyford Beeches One WwTW S05705 695
695 (but for L9, 0
for AIR18) 695
NIEA view the
treatment process
(**ICW) as new
technology and a pilot process.
Compliance will not be
assess during 2018
Tandragee S02174 11686 11344 342
PE updated with AIR18
Trade Information
Castle Archdale Country Park (WWTW) S05877 849
849 (but for L9, 0
for AIR18) 849
NIEA view the
treatment process
(**ICW) as new
technology and a pilot process.
Compliance will not be
assess during 2018
Total 3103 *(-ve Indicates AIR18 PE Higher) **(Integrated Constructed Wetland) The change in PE equates to an increase in load of 186.2kg/d (i.e. 3103 x 0.06 for 60g/hd/day) from AIR17 to AIR18 for line 9.
Total Load rec’d by small WWTWs with NH3 consents (0-5mg/l) for AIR17-
14250.6
Total Load rec’d by small WWTWs with NH3 consents (0-5mg/l) for AIR18-
14064.2
Total Difference - 186.4

Annual Information Return 2016 Section 2 Chapter 17d Page 12 of 12
PPP Lines 1 – 7 The variation in load data from AIR 17 is solely due to the variation in influent loads received by the same PPP works from the NI Water catchments over the AIR 18 Period. While in some cases there has been little difference, the North Down WwTW has experienced an 18% reduction in averaged Daily BOD over the entire year. This issue has been rechecked and the calculations verified. The prevailing rainfall will not enable an explanation as the AIR18 period experienced 1241.5mm of rainfall while the AIR17 period experienced 958.3mm and the 100 year average [AREAL series] for Northern Ireland is 1100mm. The Contractor has reported there were no apparent operational reasons for the reduction. Line 9 The variation in load data is due to the variation in influent loads received by the Richhill STW and Armagh STW over the AIR18 Period. Specific company commentary;
There have been no changes to the number of PPP operated STW’s in each Treatment Category
There are currently the following Capital Works Project plans which could close, or divert flows arriving to, PPP operated works.
There are currently a number of Capital Works Projects proposed in PPP catchments; KI607 NI Long Term Sludge Strategy KI601 Strategic Sewerage Network Modelling, Bathing Waters Excluding
Belfast Lough KR576 Belfast WWTW PLC Upgrade KR599 Belfast WwTW – Appraisal study KS872 Bangor DAP Work Package 1: Carnalea Stream UID KS873 Bangor DAP Work Package 2: Rathmore Stream UIDs KS874 Bangor DAP Works Package 3 - Belfast Lough UIDs KS879 Bangor DAP Work Package 4: Bangor Marina UIDs KS958 Bangor DAP Wks Pkge 5 Clandeboye Stream UIDs Phase II KS875 Bangor DAP Works Package 6: Lukes Point WWPS UID KS878 Bangor DAP Works Package 7: Orlock, Sandeel, Seacliff Road &
Orlock Caravan Park WWPSs – UID KR480 Holywood Sewer Network Improvements KR640 Holywood Sewer Network Improvements- Phase 2 KR443 Sydenham WWPS Remedial Works KR444 Sydenham WWPS Strategic Investigations KF330 Armagh DAP Stage 1 KF396 Milford WWPS, Armagh, Upgrade KS914 Scrabo Road, Newtownards, WWPS Upgrade KS901 Movilla Street, Newtownards, Replacement Sewer KS850 Quarry Heights, Newtownards, Foul and Storm Sewer Extension KR568 Loughries PS Newtownards (Diversion into Ballyrickard). KG189 Cornakinnegar Road, Lurgan Foul & Storm Sewer Extension KG184 Portadown Drainage Area Network Improvements - Obins Street and
Park Road KG203 Portadown DAP (Storage at Seagoe WWPS). KI515 DG5 Minor Works – Bullays Hill PS Lurgan KG184 Portadown Drainage Area Network Improvements KI561 Donaghadee Base Maintenance – Flooding KS930 Millisle DAP

NORTHERN IRELAND WATER LIMITED - ANNUAL INFORMATION RETURN
ANNUAL INFORMATION RETURN - TABLE 17f SEWERAGE EXPLANATORY FACTORSSEWAGE TREATMENT WORKS - COSTS (NIW Only)
1 2 3 4 5 6 7 8 9 10 11
PRIMARY ACTIVATEDSLUDGE BIOLOGICAL A1 A2 B1 B2 PRELIMINARY
TREATMENT SCREENED UNSCREENED
A SMALL WORKS1 Direct costs of STWs in size band 1 £000 3 56.453 67.855 548.207 17.835 19.849 6 957 717.1552 Direct costs of STWs in size band 2 £000 3 70.346 320.888 38.026 12.481 88.643 54.911 88.538 39.347 713.1813 Direct costs of STWs in size band 3 £000 3 12.862 498.881 952.799 179.956 398.430 301.298 197.076 12.432 8 039 2,561.7734 Direct costs of STWs in size band 4 £000 3 21.495 768.995 303.782 32.922 1,268.927 41.451 203.251 74.558 3.451 2,718.8325 Direct costs of STWs in size band 5 £000 3 610.364 294.438 1,617.670 229.076 2,751.548
B LARGE WORKS6 Direct costs of STWs in size band 6 £000 3 1,152.258 4,872.150 6,024.408
C ALL WORKS7 Total direct costs of STWs - all sizes £000 3 90.810 3,168.699 2,125.675 545.342 8,169.658 449.227 704.163 175.528 42.798 14 996 15,486.8968 Sludge Treatment and Disposal Adjustments £000 39 Sewage Treatment: Direct costs £000 3 90.810 3,168.699 2,125.675 545.342 8,169.658 449.227 704.163 175.528 42.798 14 996 15,486.89610 Sewage Treatment: Power costs £000 3 6.167 1,696.802 506.603 263.671 4,601.408 99.697 219.028 59.866 -0.688 0 535 7,453.08911 Sewage Treatment: service charges £000 3 7.517 139.004 144.282 25.937 297.390 33.414 37.677 10.611 3.484 1 287 700.60412 Sewage Treatment: General and Support £000 3 133.565 2,469.890 2,563.662 460.862 5,284.151 593.711 669.462 188.549 61.898 22 874 12,448.62513 Sewage Treatment: Functional Expenditure £000 3 224.375 5,638.589 4,689.337 1,006.204 13,453.809 1,042.938 1,373.625 364.077 104.695 37.871 27,935.521
DESCRIPTION UNITS DP
TREATMENT CATEGORY
TOTALSECONDARY TERTIARY SEA OUTFALLS


Annual Information Return 2018 Section 2 Chapter 17f Page 1 of 3
Table 17f - Sewage Treatment Works (NIW only)
An updated Population Equivalent (PE) database with treatment type by WWTW’s was sent from Asset Management on the 5 June 2018 which was used to populate Line 1-13. No PPP sites are included in this table. Ballycastle WWTW’s falls into Band 5 – Line 5. Ballycastle does not have a separate W finance location however with the further implementation of Cost to Serve the costs can be separately identified. Enniskillen is included in Band 6 for AIR18, it was also included in Band 6 in AIR17.
Table 17f has been completed based on the figures available at for the year ended 31 March 2018 for sewage treatment – Activity 510 less M & E expenditure which is treated as general & support.
A Small Works Line 1-4 – Size band 1-4 Each WWTW’s was assigned a finance location code, W or X. W codes are for a specific works and X codes include the costs of a number of small works. Nearly 90% of the costs can be directly allocated to WWTW’s through the further implementation of Cost to Serve and the remaining direct costs are apportioned across the appropriate WWTW’s based on PE or direct labour.
Direct Costs include power 521x, contractors 531x, other contractors 532x, materials 541x, chemicals 548x, cost reallocations 611x (this includes direct labours costs and & overhead charges) and service charges.
Through the cost to serve project all power costs are allocated to individual sites and a report was taken from EAM to get the full year power cost per WWTW’s. There is one electric meter at each site and all the power costs are coded to each individual works to sewage treatment. The Field Managers responsible for each WWTW’s estimated the percentage use for sludge treatment and sewage treatment at each WWTW’s. This was multiplied by the Power costs at the site to calculate the portion relating to sewage treatment.
The type of treatment at each WWTW’s was provided by Asset Management and this was used to assign costs to Column 1-10.
In total the costs have increased in Lines 1-4 from AIR17 by circa £0.3M.
Line 5 – Size band 5 Direct costs for sewage treatment, at each location in Size Band 5, were recorded and matched to the appropriate type of treatment. The costs against this line have increased by circa £0.1M from AIR17.
B Large Works Line 6 – Size band 6 This line agrees with Line 9 in Table 17b. No PPP sites have been included. The costs have decreased from AIR17 by circa £0.9M. See Table 17b commentary.
C All Works Line 7 – Total Direct Costs This is a calculated line and it’s the total of Line 1-6. This figure agrees with Table 22, Column 2 Line 9.

Annual Information Return 2018 Section 2 Chapter 17f Page 2 of 3
The total direct costs have decreased since AIR17 by circa £0.6M. This is primarily due to a decrease in costs at the Band 6 sites.
Line 8 – Sludge Treatment & Disposal Adjustment These costs are not included in the total of Line 7 therefore this line is zero.
Line 9 – Direct Costs This line is equal to Line 7 and is the total direct costs for each type of treatment. This figure agrees with Table 22, Column 2 Line 9.
Line 10 – Power Costs Through the cost to serve project all power costs are allocated to individual sites and a report was provided by the Energy Finance Business Partner for the full year power cost per WWTW’s. This figure agrees with Table 22, Column 2 Line 2.
Line 11 – Service Charges £0.7M of environmental regulatory charges are included in Sewage, this is an increase of £0.2M from AIR17.
Line 12 – General & Support The Total General & Support expenditure was taken directly from Table 22 (NIW only) Line 10 Column 2 (see Table 22 commentary) and apportioned across the locations based on direct costs.
This figure has increased by £0.2M from AIR17. Overall General and Support costs have increased in AIR18 and the apportionment of costs to Sewage Treatment has increased. See commentary on Table 22 for further breakdown and explanation.
Line 13 – Functional Expenditure This is a calculated line and is the total of Line 9 and Line 12. The total agrees to Table 22 (NIW Only) Column 2 Line 11. The total costs have decreased from AIR17 by circa £0.03M for all the reasons mentioned under the lines above. Refer to Table 22 commentary for further explanation.

Annual Information Return 2018 Section 2 Chapter 17f Page 3 of 3
PPP Only Lines 1- 3 – Size bands 1- 3 There are no PPP sites sized within these categories. Therefore, this is a nil return for these size bands.
Line 4 – Size band 4 Direct costs associated with Richhill (TA1) include power costs only derived from the Oracle system using the appropriate location code.
Line 5 – Size band 5 Direct costs associated with Armagh (TA2) include power costs only derived from the Oracle system using the appropriate location code.
Line 6 – Size band 6 No costs are reported for Kinnegar (SAS) direct costs as Kinnegar power costs are part of the Concessionaire’s payment to the Operating Company.
Costs for North Down, Ballyrickard and Ballinacor (all TA2) include power costs only derived from the Oracle system using appropriate location codes.
Line 9 - Direct costs This refers to power only. See comments on Line 10 below.
Line 10 - Power Kinnegar (SAS) remains unreported as power costs are not incurred by NIW directly but through the Concessionaire payments.
Power costs have reduced from AIR16 as a result of reduced tariffs in 2016/17 and lower wastewater volumes.
The total of this line reconciles to table 22 line 2 column 2.
Line 12 – General & support General and support costs have been calculated using all staff and overhead costs for the contracts management team together with PPP related professional managed service costs – PPP Professional Advisors. Costs have been attributed to schemes in accordance with management’s estimated time spent by each member of staff on each contract, with such costs spread equally on schemes therein. Professional Advisors costs are attributable to a contract by invoice. General and support costs have been allocated to facilities on a straight line basis according to the number of facilities in each scheme.
The total on this line reconciles to table 22 line 10 column 2.

NORTHERN IRELAND WATER LIMITED - ANNUAL INFORMATION RETURN
ANNUAL INFORMATION RETURN - TABLE 17g SEWERAGE EXPLANATORY FACTORSSLUDGE TREATMENT AND DISPOSAL INFORMATION (NIW Only)
4 9
CG CG CG CG CG CG CG CG CG CG
1 Resident population served 000 1 1,478.1 C3 33.9 C3 1,512.0 C32 Amount of sewage sludge ttds 1 34 9 A2 0.8 B2 35.7 B2
3 Sludge treatment: direct costs £000 3 3,258.716 3,258.7164 Sludge disposal: direct costs £000 3 2,186.161 193.437 2,379.5985 Sludge treatment & disposal: direct costs £000 3 2,186.161 193.437 3,258.716 5,638.3136 Sludge treatment & disposal: power costs £000 3 2,440 656 2,440.6567 Sludge treatment & disposal: service charges £000 3 264 246 264 2468 Sludge treatment & disposal: general & support exp. £000 3 2,478.323 170 829 2,649.1529 Sludge treatment & disposal: functional expenditure £000 3 4,664.484 193.437 3,429 544 8,287.465
FARMLANDADVANCEDDESCRIPTION UNITS DP
FARMLANDUNTREATED
FARMLANDCONVENTIONAL
6 8 101 2 3 5 7LAND
RECLAMATION OTHER TOTALINCINERATION TO PPP LANDFILL COMPOSTED

Annual Information Return 2018 Section 2 Chapter 17g Page 1 of 2
Table 17g - Sewerage explanatory factors - sludge treatment and disposal information
The methodology has not changed from AIR17. All Sludge is transported and disposed of at the Incinerator or another PPP site.
The costs in Table 17g are populated with the information available for the year ended 31 March 2018.
Line 1 - Resident population served The resident population served is that reported in T17a:L1 as required in the Utility Regulator’s guidance documentation.
Lines 1.5 & 1.6 have been estimated using a pro-rata value based on the total sewage sludge disposal data from SLS and the WW Sludge Management monthly report. The pro-rata population figures have been assigned CGs of C3 accordingly based on the C3 CG of the base population data.
Line 2 – Amount of sewage sludge This is the total sewage sludge produced (NIW Only) for 2017/18 (tds) as recorded by PPP and monthly by Ww Area Sludge Officers (reconciled using the SLS) and presented in the monthly Sludge Management Report along with an estimated quantity of WwTW & WwPS grit & screenings removed as part of the treatment process and disposed of under Tender C821.
Line 2.5 has been based on the total sewage sludge disposal (NIW Only) data from SLS and the WW Sludge Management monthly report.
Line 2.6 is an estimated quantity of WwTW’s & WwPS`s grit & screenings removed as part of the treatment process and disposed of under Tender C821.
Line 3 – Sludge Treatment: Direct Costs Expenditure has been input in Column 9. These costs have increased by £1.4M from AIR17.
Sludge treatment costs for WWTW’s are coded using activity 621 and can be separately identified to populate Column 9.
Power costs in AIR18 do not include the Incinerator or any PPP sites.
Line 4 - Sludge Disposal: Direct Costs Columns 5 and 6 have been populated on this line. The direct costs have increased by £0.3M from AIR17.
Line 5 - Sludge Treatment & Disposal: Direct Costs This is a calculated line and is the total of line 3 and line 4. The figure agrees with Table 22 (NIW only) column 3 line 9. Costs have increased by circa £1.7M from AIR17, (see below).
Line 6 – Sludge Treatment & Disposal: Power Costs Power costs associated with Sludge Treatment are used to populate Column 9. Power costs have been allocated to every site through cost to serve. There is only one electric metre at each WWTW’s so an estimate was received for each WWTW’s from the wastewater field mangers so that a split could be calculated at each works between sludge and sewage

Annual Information Return 2018 Section 2 Chapter 17g Page 2 of 2
treatment at the sites where both activities occur. The power team supplied a split between the Incinerators and Belfast WWTW’s which was used apportion a cost to the works. The split for this in AIR17 was 46:54 and in AIR18 is 44:56 for the Belfast and Incinerators (based on an estimated KWhr usage and a number of sub-meters). No costs for the Incinerator have been included in this table in AIR18.
Line 7 - Sludge treatment & disposal: Service Charges The Service Charges figure is approx. £0.3m in AIR18 and this is similar to what the costs were in AIR17. PPC (Pollution Prevention Control) Permits are included as Sludge Treatment and therefore included in Column 9. The Service Charges figure agrees to Table 22, Line 7 Column 3.
Line 8 - Sludge treatment & disposal: General & Support This figure was taken directly from Table 22 (NIW only) Column 3 Line 10 and apportioned across the columns in Table 17g based on direct labour costs. This is following the same methodology as AIR17. Overall General and Support costs have increased from AIR17. See Table 22 commentary. A detailed breakdown of general & support is included in the commentary for Table 21 & 22.
Line 9 – Sludge treatment & disposal: Functional Expenditure This is a calculated line and is the total of Line 5 and Line 8. Total costs have increased by £2.6M due to the reasons given above.

NORTHERN IRELAND WATER LIMITED - ANNUAL INFORMATION RETURN
ANNUAL INFORMATION RETURN - TABLE 18 REGULATORY ACCOUNTS (HISTORICAL COST ACCOUNTING)PROFIT AND LOSS ACCOUNT FOR YEAR ENDING 31 MARCH
1 2 3 4 5 6 7 8 9
DESCRIPTION UNITS DP 2012-13 2013-14 2014-15 2015-16 2016-17 2017-18 2018-19 2019-20 2020-21
1 Turnover £m 3 366.398 361.313 364.407 367.287 372.851 381.0992 Operating costs (excluding HCD) £m 3 -202.316 -209.933 -205.450 -207.727 -210.758 -219 2313 Historical cost depreciation £m 3 -44.871 -48.580 -47.523 -54.364 -55.773 -56.4184 Operating income £m 3 0.334 0.276 0.525 0.799 0.656 1.035
5 Operating profit £m 3 119.545 103.076 111.959 105.995 106.976 106.4856 Other income £m 3 0.000 0.000 0.000 0.000 0 000 0.0007 Net interest receivable less payable £m 3 -55.067 -48.580 -51.957 -53.609 -53.804 -56 253
8 Profit on ordinary activities before taxation £m 3 64.478 54.496 60.002 52.386 53.172 50.2329 Current tax £m 3 0.000 0.000 -0.017 -0.017 -0 012 -0.00910 Deferred tax £m 3 -24.872 13.798 -24.037 2.536 -6.430 -18 286
11 Profit on ordinary activities after taxation £m 3 39.606 68.294 35.948 54.905 46.730 31.93712 Extraordinary items £m 3 0.000 0.000 0.000 0.000 0 000 0.000
13 Profit for the year £m 3 39.606 68.294 35.948 54.905 46.730 31.93714 Dividends £m 3 -26.587 -21.391 -21.562 -22.888 -21.510 -21.153
15 Retained profit for the year £m 3 13.019 46.903 14.386 32.017 25 220 10.784

Annual Information Return 2018 Section 2 Chapter 18 Page 1 of 6
Table 18 – HC Profit and Loss account for the year ending 31 March 2018
Results of unappointed activities are shown separately in the published regulatoryaccounts.
There are no exceptional charges or income. There are no minority interests. PPP charges for 2017/18 can be analysed as follows:
Gross Charge
Residual interest credit
Lease repayment
Capital maintenance
HC Depreciation
Net P&L
Charge
£m £m £m £m £m £m * 19.621 - (2.376) (1.516) 3.442 19.171
26.917 (3.454) - - - 23.463 2.512 (0.282) - - - 2.230
Total 49.050 (3.736) (2.376) (1.516) 3.442 44.864 * includes lease interest of £6.406m – shown in line 7 of Table 18.
PPP elements of line 2 ‘Operating Costs’ are £35.016m.Additionally within Line 3 ‘HCD’ there are depreciation costs for the Project of £3.442m.
The Current and Deferred tax charge
Factors affecting the tax charge for the current period The company adopted International Financial Reporting Standards (IFRS) for the first time in its statutory accounts for the year end 31st March 2011. The regulatory accounts will continue to be produced under ‘Old’* UK generally accepted accounting policies (UK GAAP). However as the corporation tax computation for the company will be based on the IFRS statutory accounts it has been agreed with the Regulator that the tax charge and provision in the regulatory accounts should be the same as those shown in the statutory accounts.
*’Old’ UKGAAP - this is UK GAAP in existence prior to the introduction of FRS100, FRS101 and FRS102
The income tax expense in the statutory accounts for the period is £18.108m which is lower than the charge based on the standard rate of corporation tax in the UK (19%). The differences are explained below:
Reconciliation of effective tax rate £m Profit for the year 85.329 Income tax expense 18.108 Profit before income tax 103.437 Income tax using the Company’s domestic tax rate (19%) 19.653 Reduction in tax rate (2.026) Non-deductible expenses 0.210 Other timing differences - Adjustment to prior years 0.192 Group relief not chargeable 0.079
18.108

Annual Information Return 2018 Section 2 Chapter 18 Page 2 of 6
The statutory accounts income tax expense of £18.108m can be shown as follows:
Tax recognised in profit and loss £m
Current tax expense Current year (0.183)
Adjustment for prior years 0. 005(0.178)
Deferred Tax (Origination)/ reversal of timing differences 20.123 Adjustment to prior years 0.189 Reduction in tax rate (2.026)
18.286
Tax charge on profit on ordinary activities (18.108)
This statutory income tax expense of £18.108m under IFRS is shown in the Regulatory Accounts as follow:
Appointed activities
Unappointed activities
Total
£m £m £m Current tax - (0.178) (0.178) Deferred tax 18.286 - 18.286 Total 18.286 (0.178) 18.108
The statutory accounts deferred tax expense of £18.286m is wholly allocated to appointed activities since the temporary tax timing differences associated with the deferred tax charge reside only in the appointed part of the business.
The statutory current tax credit of £0.178m relates to a carry back of losses to 2017 against three specific income streams - interest receivable (wholly appointed - see Commentary to Table 18d), aerial site income (unappointed activity) and rental income (unappointed activity). The current tax charge has been allocated as follows:
Income stream
Income £m
Current tax credit £m
Unappointed £m
Interest Receivable
0.070 (0.014) (0.014)
Aerial sites 0.346 (0.065) (0.065) Rental Income
0.494 (0.099) (0.099)
Total 0.910 (0.178) (0.178)
The statutory deferred tax liability at 31st March 2018 is £217.766m. Table 19 shows a deferred tax liability on the appointed balance sheet of £221.641m (with zero balance at 31st March 2018 for unappointed activities). This liability under UKGAAP reconciles to the IFRS based statutory accounts balance at 31st March 2018 of £217.766m as the IFRS Accounts are required to show the deferred tax asset of £3.875m associated with the pension liability within the deferred tax balance rather than the UKGAAP approach of showing this amount

Annual Information Return 2018 Section 2 Chapter 18 Page 3 of 6
separately within the pension account. The statutory balance of £217.766m can be summarised as follows:
2018 2018 2018 £m £m £m
Excluding Pension Pension Total
Opening liability 202.263 (11.217) 191.046
Current year deferred tax charge/(credit) to profit and loss account 19.378 (1.092) 18.286
Current year deferred year tax charge to the Statement of Total Recognised Gains and Losses 0.000 8.434 8.434 Closing liability 221.641 (3.875) 217.766
The UKGAAP approach (FRS 17) aspect of deferred tax is shown separately in the Regulatory Accounts and rolled up into the balance shown within the pension asset on the balance sheet as follows:
2018 £m
Benefit obligation at end of year (256.192) Fair value of plan assets at end of year 233.403
Net liability (22.789) Less deferred tax 3.875
Pension liability after deferred tax (18.914)
The actuarial assumptions underpinning the valuation of the NIW defined benefit scheme assets and liabilities can be shown as follows:
Weighted average assumptions used to determine benefit obligations at:
31-Mar-18 31-Mar-17Discount rate 2.65% 2.60%
Rate of compensation increase
2.00% for the next 4 years, 3.00% thereafter
2.10% forthe next 4years,3.10%thereafter
Rate of increase in pensions in payment 3.05% 3.10% Rate of increase in pensions in deferment 3.05% 3.10% Inflation RPI 3.00% 3.10% Inflation CPI 2.00% 2.10%


Annual Information Return 2018 Section 2 Chapter 18 Page 5 of 6
Interest Interest received and payable can be summarised as follows:
£m £m Interest received Bank Interest 0.052 Cash Pooling 0.115 Total Interest received 0.167 Interest Payable:
On bonds held as security
(0.048)
On all other loans (48.365) On PPP finance lease (6.406) On Pension Fund (1.600) Total Interest Payable (56.419) Net Interest (56.252)
Capitalisation of costs During 2017/18 £13.970m of costs were capitalised from the profit and loss account. This can be broken down as follows:
Cost £m Staff Costs 11.669 Labour charge 0.223 Temporary staff 0.056 Consultants - Overheads capitalised 2.022 Total 13.970
The majority of costs capitalised relate to staff costs and overheads. These costs relate to the NIW staff who spend their time on capital projects e.g. Engineering Procurement or Asset Management staff. These costs will add to the value of the completed asset.
Comparison to prior year and PC15 A comparison to 2016/17 and to PC15 can be shown as follows:
Actual Actual PC15 2017 - 2018 2016 - 2017 2017 - 2018 £m £m £m
Sales 381.099 372.851 385.765 Expenditure (274.614) (265.875) (278.423) Net Operating Profit
106.485 106.976 107.342
Operating Margin
27.9% 28.7% 27.8%
Interest payable (56.253) (53.804) (61.301) Tax charge (18.295) (6.442) (8.319) Profit for the year 31.937 46.730 37.722 Net Profit Margin 8.38% 12.5% 9.8%
Explanation of variances on sales, operating profit and interest payable are outlined in the commentary to Table 20.

Annual Information Return 2018 Section 2 Chapter 18 Page 6 of 6
Systems and controls The company uses the Oracle financial system to produce monthly and annual accounting information. The Oracle General Ledger produces a trial balance and the detailed accounts are summarised to produce the year end statutory accounts. A series of spreadsheets are then used to analyse appointed and non-appointed sales and costs to produce the financial information for the Regulatory Accounts and AIR Tables.
The company is progressing a major project to develop a costing system. In terms of regulatory reporting the main tables requiring costing information are Tables 21 and 22 and the commentaries for these tables detail how an interim costing solution is being used to populate these tables until the new costing system is in place.
This new costing solution is also intended to provide better information for the allocation of costs to non-appointed activities (which is currently based on a set of high level costing assumptions).
Internal Controls The company continues to place great emphasis on internal financial controls throughout the organisation.

NORTHERN IRELAND WATER LIMITED - ANNUAL INFORMATION RETURN
ANNUAL INFORMATION RETURN - TABLE 18c REGULATORY ACCOUNTS (HISTORICAL COST ACCOUNTING)STATEMENT OF TOTAL RECOGNISED GAINS AND LOSSES
1 2 3 4 5 6 7 8 9
DESCRIPTION UNITS DP 2012-13 2013-14 2014-15 2015-16 2016-17 2017-18 2018-19 2019-20 2020-21
A CAPITAL EXPENDITURE CATEGORIES1 Profit for the year £m 3 13.019 46.903 14.386 32.017 25.220 10.7842 Actuarial gains/losses on post employment plans £m 3 -11.535 8 012 -11.081 4.294 -46.621 41.1803 Other gains and losses £m 3 0.000 0 000 0.000 0.000 0.000 0 0004 Total recognised gains and losses for the year £m 3 1.484 54.915 3.305 36.311 -21.401 51 964

Annual Information Return 2018 Section 2 Chapter 18c Page 1 of 1
Table 18c – STRGL (HCA)
Line 2 shows £41.180m of actuarial losses on post-employment plans.
Line 3 is nil as there are no other recognised gains or losses for the year.
Although the Regulatory Accounts are based on ‘old’ UKGAAP (see commentary to Table 18) the actuarial loss noted above of £41.180m is taken from the IFRS statutory accounts.Similar to last year the application of the amended version of IAS 19 (Employee Benefits)has led to the UKGAAP and IFRS approaches on accounting for pension costs beingdifferent. The IFRS approach was used in the Regulatory Accounts for the following reasons:
The primary difference in IFRS and ‘old’ UKGAAP in this area arises in the allocationof pension costs as an expense to the profit and loss account or directly to reserves.If the actuarial loss had been calculated in line with ‘old’ UKGAAP rather than IFRSthe actuarial gain charged directly to reserves (through the STRGL) there would havebeen no overall balance sheet impact on either the profit and loss account reservesor on the pension asset of following IFRS as opposed to ‘old’ UKGAAP.
Adopting this approach avoided the additional costs of requesting the companyactuary to provide year end pension disclosures for both statutory accounts andregulatory accounts purposes.

NORTHERN IRELAND WATER LIMITED - ANNUAL INFORMATION RETURN
ANNUAL INFORMATION RETURN - TABLE 18d REGULATORY ACCOUNTS (HISTORICAL COST ACCOUNTING)ANALYSIS OF DIVIDENDS AND INTEREST CHARGES FOR YEAR
1 2 3 4 5 6 7 8 9
DESCRIPTION UNITS DP 2012-13 2013-14 2014-15 2015-16 2016-17 2017-18 2018-19 2019-20 2020-21
A DIVIDEND ANALYSIS1 Dividends in respect of a financial re-organisation £m 3 0.000 0 000 0.000 0 000 0.000 0.0002 Other ordinary dividends £m 3 -26.587 -21 391 -21.562 -22 888 -21.510 -21.1533 Total dividends £m 3 -26.587 -21 391 -21.562 -22 888 -21.510 -21.153
B INTEREST ANALYSIS4 Interest receivable/payable on intercompany balances £m 3 0.000 0 000 0.000 0 000 0.000 0.1155 Interest receivable/payable in respect of a financial re-organisation £m 3 0.000 0 000 0.000 0 000 0.000 0.0006 Indexation element of index-linked bonds £m 3 0.000 0 000 0.000 0 000 0.000 0.0007 Preference share dividends £m 3 0.000 0 000 0.000 0 000 0.000 0.0008 Other interest receivable £m 3 0.134 0.112 0.079 0 096 0.070 0.0529 Other interest payable £m 3 -44.137 -41.459 -45.367 -46 604 -47.111 -48.414
10 Other finance charges - post employment costs £m 3 0.849 -0 300 0.155 -0.400 -0.200 -1.60011 Other finance charges £m 3 -11.913 -6 933 -6.824 -6.701 -6.562 -6.40612 Total net interest £m 3 -55.067 -48 580 -51.957 -53 609 -53.803 -56.253


NORTHERN IRELAND WATER LIMITED - ANNUAL INFORMATION RETURN
ANNUAL INFORMATION RETURN - TABLE 19 REGULATORY ACCOUNTS (HISTORICAL COST ACCOUNTING)BALANCE SHEET AS AT 31 MARCH (TOTAL)
1 2 3 4 5 6 7 8 9
DESCRIPTION UNITS DP 2012-13 2013-14 2014-15 2015-16 2016-17 2017-18 2018-19 2019-20 2020-21
A FIXED ASSETS1 Tangible fixed assets £m 3 1907 525 1994.848 2073.392 2139.613 2201.787 2262.4822 Investment - loan to group company £m 3 0.000 0.000 0.000 0.000 0 000 0 0003 Investment - other £m 3 0.106 0.091 0.091 0.091 0 091 0 0914 Total fixed assets £m 3 1907 631 1994.939 2073.483 2139.704 2201 878 2262 573
B CURRENT ASSETS5 Stocks £m 3 2.379 2.021 2.269 2.368 2 347 2.4696 Debtors £m 3 28 824 27.167 30.759 29.832 30 386 62.4287 Cash £m 3 9.102 1.637 0.792 2.015 0.412 0.7238 Short term deposits £m 3 5.300 0.600 0.020 1.000 2 501 2 5089 Infrastructure renewals prepayment £m 3 3.341 0.050 0.000 0.000 0 000 3 573
10 Total current assets £m 3 48 946 31.475 33.840 35.215 35 646 71.701
C CREDITORS AMOUNTS FALLING DUE WITHIN ONE YEAR11 Overdrafts £m 3 0.000 0.000 0.000 0.000 0 000 0 00012 Infrastructure renewals accrual £m 3 0.000 0.000 -0.702 -5.844 -0 921 0 00013 Creditors £m 3 -118 022 -124.404 -132.752 -131.139 -136 204 -129.19514 Borrowings £m 3 0.000 0.000 0.000 0.000 0 000 0 00015 Corporation tax payable £m 3 0.000 0.000 0.000 -0.189 -0.189 0 22816 Ordinary share dividends payable £m 3 0.000 0.000 0.000 0.000 0 000 0 00017 Preference share dividends payable £m 3 0.000 0.000 0.000 0.000 0 000 0 00018 Total creditors £m 3 -118 022 -124.404 -133.454 -137.172 -137 314 -128 967
19 Net current assets £m 3 -69.076 -92.929 -99.614 -101.957 -101 668 -57 266
D CREDITORS AMOUNTS FALLING DUE AFTER MORE THAN ONE YEAR20 Borrowings £m 3 -882 560 -911.560 -947.560 -983.560 -1013 560 -1082 56021 Other creditors £m 3 -96.187 -95.302 -93.773 -91.751 -89 305 -87 36022 Total creditors £m 3 -978.747 -1,006.862 -1,041.333 -1,075.311 -1,102 865 -1,169 920
E PROVISION FOR LIABILITIES AND CHARGES23 Deferred tax provision £m 3 -187.416 -173.693 -197.982 -195.465 -202 263 -221 64124 Deferred income - grants and contributions £m 3 -19.456 -19.785 -21.969 -22.301 -23 070 -25.76925 Post employment asset / (liabilities) £m 3 -4.123 2.784 -9.304 -5.880 -54.767 -18 91526 Other provisions £m 3 -9.589 -10.315 -5.837 -5.035 -4 886 -4.739
F PREFERENCE SHARE CAPITAL27 Preference share capital £m 3 0.000 0.000 0.000 0.000 0 000 0 000
28 Net assets employed £m 3 639 224 694.139 697.444 733.755 712 359 764 323
G CAPITAL AND RESERVES29 Called up share capital £m 3 500 000 500.000 500.000 500.000 500 000 500 00030 Share premium £m 3 0.000 0.000 0.000 0.000 0 000 0 00031 Profit and loss account £m 3 -32.466 22.449 25.754 62.065 40 669 92 63332 Other reserves £m 3 171 690 171.690 171.690 171.690 171 690 171 69033 Capital and reserves £m 3 639 224 694.139 697.444 733.755 712 359 764 323

Annual Information Return 2018 Section 2 Chapter 19 Page 1 of 4
Table 19 – HC Balance Sheet as at 31 March 2018
The balance sheet in the published regulatory accounts includes a separate analysis of unappointed activities.
The retained profit for the year is £10.784m (post dividend).
The P&L reserves in the Balance Sheet increased by £51.964m and this movement can be shown as follows:
Retained profit for the year £10.784m Pension scheme actuarial gain net of deferred tax £41.180m
Movement in P&L Account £51.964m
The company has adopted International Financial Reporting Standards (IFRS) in its statutory accounts for the year end 31st March 2018. The regulatory accounts will continue to be produced under ‘Old’* UK generally accepted accounting policies (UK GAAP). As the corporation tax computation for the company will be based on the IFRS statutory accounts it has been agreed with the Regulator that the tax charge and provision in the regulatory accounts should be the same as those shown in the statutory accounts.
*’Old’ UKGAAP - this is UK GAAP in existence prior to the introduction of FRS100, FRS101 and FRS102
No minority interests exist.
The elements of PPP included in the table are as follows:
Line 1 - Tangible Fixed Assets Total
£m £m £m £m Gross 120.109 * 28.914 4.060 153.083 Acc. Deprec (31.010) - - (31.010) NBV 89.099 28.914 4.060 122.073
* Includes the original capital value of the NIW assets transferred to and utilised by the concessionaire and subsequent additions of capital maintenance.
Line - 13 Creditors falling due within one year Other PPP expense
Total
£m £m £m £m £m Lease obligation due < 1 yr
2.650 - - - 2.650
Accruals 1.644 15.130 0.232 - 17.006 Total 4.294 15.130 0.232 - 19.656

Annual Information Return 2018 Section 2 Chapter 19 Page 2 of 4
Line 21 - Other creditors falling due after more than one year
£m Lease obligation due > 1 yr 85.350
Line 26 - Other provisions
£m Provisions 1.000
Significant features and movements Fixed Assets Increase of £61m in line with in year additions of £189m, capital contributions of £41m, HC depreciation of £82m, disposals of £1.035m and a movement from an infrastructure accrual of £0.921m to an infrastructure prepayment of £3.573m.
Debtors Increased by £32.042m from £30.386m to £62.428m (105.45%). This is primarily due to:
Measured, unmeasured and TE debtors decreased by £0.7m Measured, unmeasured and TE bad debt provision decreased by £0.7m Accrued income from measured and TE customers increased by £1.5m. VAT receivable debtors increased by £0.2m. DfI Subsidy debtor increased by £0.2m Other Prepayments increased by £0.1m PPP Capital maintenance decreased by £0.2m Intercompany debtor cash pooling from the companies during
the year of £29.312m
Cash and Short term deposits Cash has increased by £0.311m from £0.412m to £0.723m (75.49%) and Short term deposits have increased by £0.007m from £2.501m to £2.508m (0.28%).
The cashflow statement in Table 28 illustrates the uses of these cash and deposit monies in contributing to meeting the non opex expenditure needs for the year. This can be summarised as follows:
Non opex expenditure Capex £174.082m Net Interest paid £ 53.840m Dividend paid £ 21.153m PPP Lease payments £ 2.376m Increase in cash £ 0.311m Increase in deposit monies £ 0.007m Total £251.769m
Funded by: Generated from operations £182.769m Loans £ 69.000m Total £251.769m

Annual Information Return 2018 Section 2 Chapter 19 Page 3 of 4
Deferred tax The deferred tax balance has increased from £202.263m to £221.641m. An explanation for this has been included in the commentary to Table 18.
Borrowings > 1 year Borrowings have increased by £69m from £1,013.560m to £1,082.560m. The additions to capital expenditure during the year were £189m. The increase in borrowings were used to partly fund these additions to capital expenditure with the balance of capital being financed through capital contributions and working capital.
Post-employment asset/ (liabilities) The Pension liability of £54.767m decreased to a Pension liability of £18.914m (a change in value of (65.5%)).
This can be shown as follows: £m
Opening balance at 1.4.17 (54.767)
Current Service Costs (13.500) Administration Costs (1.000) Past Service Costs (1.500) Contributions 11.181 Finance Cost (1.600) Actuarial Gain 49.614 Increase in Deferred tax asset on liability (7.342) Closing balance 31.3.18 (18.914)
Other provisions Decreased from £4.886m to £4.739m (3.01%).
This decrease of £0.147m can be summarised as follows: £m
Decrease in holiday pay provision (0.159) Increase in PL/EL 0.012 Total (0.147)
PPP – Infrastructure renewals charge (IRC) and expenditure (IRE) – Capital Maintenance
The table below summarises the IRC, IRE and capital maintenance during 2017/18 in relation to the PPP projects:
Total £m £m £m £m
IRE - - - - IRC - - - - Capital maintenance 1.756 - - 1.756

Annual Information Return 2018 Section 2 Chapter 19 Page 4 of 4
Alpha is treated as ‘on balance sheet’ and an amount of the unitary charge for Alpha is deemed to be related to the carrying out of capital maintenance by the operator. For 2017-18 this is confirmed by the operator to be £1.756m. This amount is credited to the Profit and Loss account and debited to Alpha fixed assets.
This capital maintenance is assumed to be 100% non-infrastructure and there are no infrastructure additions to Alpha in 2017-18 (2016-17: nil). There has therefore been no apportionment of IRC in 2017-18 (2016-17: nil).
are treated as ‘off balance sheet’ and the additions in year relate to the residual interest asset with no related IRE, IRC or capital maintenance aspects.

NORTHERN IRELAND WATER LIMITED- ANNUAL INFORMATION RETURN
ANNUAL INFORMATION RETURN - TABLE 19a ANALYSIS OF BORROWINGS DUE AFTER MORE THAN ONE YEAR (HISTORICAL COST ACCOUNTING)BALANCE SHEET AS AT 31 MARCH
1 2 3 4 5 6 7 8 9
DESCRIPTION YEARS TO MATURITY PRINCIPAL SUM Years to maturity
x principle sum REAL COUPON NOMINAL INTEREST RATE
FULL YEAR EQUIVALENT
NOMINAL INTEREST COST
FULL YEAR EQUIVALENT REAL CASH INTEREST PAYMENT
CARRYING VALUE
years £m £m % % £m £m £m0dp 3dp 3dp 2dp 2dp 3dp 3dp 3dp
A BORROWINGS IN HEDGING RELATIONSHIPSA1 Fixed rate instruments1~
50
A2 Floating rate instruments51"
100
A3 Index linked instruments101
"150
TOTAL FOR HEDGING INSTRUMENTS
B BORROWINGS DESIGNATED AT FAIR VALUE THROUGH PROFIT AND LOSSB1 Fixed rate instruments151
"200
B2 Floating rate instruments201
"250
B3 Index linked instruments251
"300
TOTAL FOR BORROWINGS DESIGNATED AT FAIR VALUE THROUGH PROFIT AND LOSS
C OTHER BORROWINGSC1 Fixed rate instruments301 Capital loan note issued under GBP £1.2802bn Fixed Coupon Unsecured Loan note instrument 2027 9 627.560 5648.040 1.95% 5.25% 32.947 32.947 627.560302 Capital loan note issued under GBP £1.2802bn Fixed Coupon Unsecured Loan note instrument 2027 9 20.000 180.000 1.73% 5.03% 1.006 1.006 20.000303 Capital loan note issued under GBP £1.2802bn Fixed Coupon Unsecured Loan note instrument 2027 9 20.000 180.000 1.59% 4.89% 0.978 0.978 20.000304 Capital loan note issued under GBP £1.2802bn Fixed Coupon Unsecured Loan note instrument 2027 9 20.000 180.000 1.18% 4.48% 0.896 0.896 20.000305 Capital loan note issued under GBP £1.2802bn Fixed Coupon Unsecured Loan note instrument 2027 9 10.000 90.000 1.83% 5.13% 0.513 0.513 10.000306 Capital loan note issued under GBP £1.2802bn Fixed Coupon Unsecured Loan note instrument 2027 9 10.000 90.000 1.86% 5.16% 0.516 0.516 10.000307 Capital loan note issued under GBP £1.2802bn Fixed Coupon Unsecured Loan note instrument 2027 9 10.000 90.000 1.97% 5.27% 0.527 0.527 10.000308 Capital loan note issued under GBP £1.2802bn Fixed Coupon Unsecured Loan note instrument 2027 9 20.000 180.000 1.75% 5.05% 1.010 1.010 20.000309 Capital loan note issued under GBP £1.2802bn Fixed Coupon Unsecured Loan note instrument 2027 9 5.000 45.000 1.50% 4.80% 0.240 0.240 5.000310 Capital loan note issued under GBP £1.2802bn Fixed Coupon Unsecured Loan note instrument 2027 9 15.000 135.000 1.09% 4.39% 0.659 0.659 15.000311 Capital loan note issued under GBP £1.2802bn Fixed Coupon Unsecured Loan note instrument 2027 9 7.000 63.000 0.20% 3.50% 0.245 0.245 7.000312 Capital loan note issued under GBP £1.2802bn Fixed Coupon Unsecured Loan note instrument 2027 9 10.000 90.000 0.07% 3.37% 0.337 0.337 10.000313 Capital loan note issued under GBP £1.2802bn Fixed Coupon Unsecured Loan note instrument 2027 9 15.000 135.000 0.32% 3.62% 0.543 0.543 15.000314 Capital loan note issued under GBP £1.2802bn Fixed Coupon Unsecured Loan note instrument 2027 9 18.000 162.000 0.38% 3.68% 0.662 0.662 18.000315 Capital loan note issued under GBP £1.2802bn Fixed Coupon Unsecured Loan note instrument 2027 9 8.000 72.000 0.34% 3.64% 0.291 0.291 8.000316 Capital loan note issued under GBP £1.2802bn Fixed Coupon Unsecured Loan note instrument 2027 9 8.000 72.000 0.06% 3.36% 0.269 0.269 8.000317 Capital loan note issued under GBP £1.2802bn Fixed Coupon Unsecured Loan note instrument 2027 9 5.000 45.000 -0.08% 3.22% 0.161 0.161 5.000318 Capital loan note issued under GBP £1.2802bn Fixed Coupon Unsecured Loan note instrument 2027 9 20.000 180.000 -0.24% 3.06% 0.612 0.612 20.000319 Capital loan note issued under GBP £1.2802bn Fixed Coupon Unsecured Loan note instrument 2027 9 10.000 90.000 -0.17% 3.13% 0.313 0.313 10.000320 Capital loan note issued under GBP £1.2802bn Fixed Coupon Unsecured Loan note instrument 2027 9 24.000 216.000 -0.08% 3.22% 0.773 0.773 24.000321 Capital loan note issued under GBP £1.2802bn Fixed Coupon Unsecured Loan note instrument 2027 9 5.000 45.000 0.69% 3.99% 0.200 0.200 5.000322 Capital loan note issued under GBP £1.2802bn Fixed Coupon Unsecured Loan note instrument 2027 9 8.000 72.000 0.80% 4.10% 0.328 0.328 8.000323 Capital loan note issued under GBP £1.2802bn Fixed Coupon Unsecured Loan note instrument 2027 9 5.000 45.000 0.65% 3.95% 0.198 0.198 5.000324 Capital loan note issued under GBP £1.2802bn Fixed Coupon Unsecured Loan note instrument 2027 9 11.000 99.000 0.61% 3.91% 0.430 0.430 11.000325 Capital loan note issued under GBP £1.2802bn Fixed Coupon Unsecured Loan note instrument 2027 9 5.000 45.000 0.56% 3.86% 0.193 0.193 5.000326 Capital loan note issued under GBP £1.2802bn Fixed Coupon Unsecured Loan note instrument 2027 9 5.000 45.000 0.42% 3.72% 0.186 0.186 5.000327 Capital loan note issued under GBP £1.2802bn Fixed Coupon Unsecured Loan note instrument 2027 9 5.000 45.000 0.61% 3.91% 0.196 0.196 5.000328 Capital loan note issued under GBP £1.2802bn Fixed Coupon Unsecured Loan note instrument 2027 9 5.000 45.000 -0.15% 3.15% 0.158 0.158 5.000329 Capital loan note issued under GBP £1.2802bn Fixed Coupon Unsecured Loan note instrument 2027 9 5.000 45.000 -0.10% 3.20% 0.160 0.160 5.000330 Capital loan note issued under GBP £1.2802bn Fixed Coupon Unsecured Loan note instrument 2027 9 8.000 72.000 -0.50% 2.80% 0.224 0.224 8.000331 Capital loan note issued under GBP £1.2802bn Fixed Coupon Unsecured Loan note instrument 2027 9 3.000 27.000 -0.69% 2.61% 0.078 0.078 3.000332 Capital loan note issued under GBP £1.2802bn Fixed Coupon Unsecured Loan note instrument 2027 9 13.000 117.000 -0.64% 2.66% 0.346 0.346 13.000333 Capital loan note issued under GBP £1.2802bn Fixed Coupon Unsecured Loan note instrument 2027 9 5.000 45.000 -0.24% 3.06% 0.153 0.153 5.000334 Capital loan note issued under GBP £1.2802bn Fixed Coupon Unsecured Loan note instrument 2027 9 8.000 72.000 -0.38% 2.92% 0.234 0.234 8.000335 Capital loan note issued under GBP £1.2802bn Fixed Coupon Unsecured Loan note instrument 2027 9 5.000 45.000 -0.63% 2.67% 0.134 0.134 5.000336 Capital loan note issued under GBP £1.2802bn Fixed Coupon Unsecured Loan note instrument 2027 9 5.000 45.000 -0.82% 2.48% 0.124 0.124 5.000337 Capital loan note issued under GBP £600m Fixed Coupon Unsecured Loan note instrument 2034 16 5.000 80.000 -0.35% 2.95% 0.148 0.148 5.000338 Capital loan note issued under GBP £600m Fixed Coupon Unsecured Loan note instrument 2034 16 5.000 80.000 -0.90% 2.40% 0.120 0.120 5.000339 Capital loan note issued under GBP £600m Fixed Coupon Unsecured Loan note instrument 2034 16 5.000 80.000 -0.59% 2.71% 0.136 0.136 5.000340 Capital loan note issued under GBP £600m Fixed Coupon Unsecured Loan note instrument 2034 16 5.000 80.000 -0.69% 2.61% 0.131 0.131 5.000341 Capital loan note issued under GBP £600m Fixed Coupon Unsecured Loan note instrument 2034 16 10.000 160.000 -0.87% 2.43% 0.243 0.243 10.000342 Capital loan note issued under GBP £600m Fixed Coupon Unsecured Loan note instrument 2034 16 28.000 448.000 -0.88% 2.42% 0.678 0.678 28.000343 Capital loan note issued under GBP £600m Fixed Coupon Unsecured Loan note instrument 2034 16 12.000 192.000 -0.69% 2.61% 0.313 0.313 12.000344 Capital loan note issued under GBP £600m Fixed Coupon Unsecured Loan note instrument 2034 16 5.000 80.000 -0.75% 2.55% 0.128 0.128 5.000345 Capital loan note issued under GBP £600m Fixed Coupon Unsecured Loan note instrument 2034 16 5.000 80.000 -0.72% 2.58% 0.129 0.129 5.000346 Capital loan note issued under GBP £600m Fixed Coupon Unsecured Loan note instrument 2034 16 5.000 80.000 -0.89% 2.41% 0.121 0.121 5.000347 Capital loan note issued under GBP £600m Fixed Coupon Unsecured Loan note instrument 2034 16 6.000 96.000 -0.73% 2.57% 0.154 0.154 6.000348 Capital loan note issued under GBP £600m Fixed Coupon Unsecured Loan note instrument 2034 16 8.000 128.000 -0.81% 2.49% 0.199 0.199 8.000
C2 Floating rate instruments351
"400
C3 Index linked instruments401
"450
TOTAL FOR OTHER BORROWINGS 1082.560 49.335 49.335 1082.560
D TOTALS 1082.560 10436.040 49.335 49.335 1082.560
E RPI assumption 3.3%
F ANALYSISF INDICATIVE INTEREST RATES
F1 Nominal interest 4.6%F2 Cash interest 4.6%
G INDICATIVE DEBT PORTFOLIO BREAKDOWNG1 Floating rate debt as percentage of total debt 0G2 Fixed rate debt as percentage of total debt 100.0%G3 Index linked debt as percentage of total debt 0G4 Fixed rate debt and index linked debt as percentage of total debt 100.0%G5 Weighted average years to maturity 10

Annual Information Return 2018 Section 2 Chapter 19a Page 1 of 1
Table 19a – Analysis of Borrowings due after more than One Year
At 31 March 2018 NIW borrowings related to Capital Loan Notes issued under two loan note agreements; £1,280,200,000 Fixed Coupon Unsecured Loan note 2027 & £600m Fixed Coupon Unsecured Loan note 2034.
The Loan notes were issued under £600m Fixed Coupon Unsecured Loan Note 2034 facility in the period from April 2017 to 31 March 2018 as the £1,280,200,000 Fixed Coupon Unsecured Loan note 2027 facility expired on 31 March 2016.
Both facilities provide finance for capital investment only.
The loan note subscription agreements provide that the loan notes in issue before 31 March 2010 carry a fixed rate of interest of 5.25%. Loan notes issued after this date carry fixed interest rates based on a margin of 0.85% above the reference gilt rate published by FTSE- Tradeweb on the date of issue of the loan note. FTSE-Tradeweb prices are the successor prices to those produced by the UK HM Government Debt Management Office (UK DMO) up until 21 July 2017 when the UK DMO ceased producing reference prices for gilts.
In 2017/18 Capital loan notes were accounted for as held to maturity borrowings.
In addition to the capital loan note instrument NIW had a committed facility available as a £20m overdraft which is available to March 2021. That facility was not utilised during 2017/18.

NORTHERN IRELAND WATER LIMITED - ANNUAL INFORMATION RETURN
ANNUAL INFORMATION RETURN - TABLE 21 REGULATORY ACCOUNTS (HISTORIC COST ACCOUNTING)ACTIVITY COSTING ANALYSIS - WATER SERVICE (NIW Only)
1 2 3
DESCRIPTION UNITS DP
SERVICE ANALYSIS - WATERA DIRECT COSTS1 Employment costs £m 3 4.066 8 535 12.6002 Power £m 3 4.368 3 387 7.7553 Agencies £m 3 0.000 0.000 0.0004 Hired and contracted services £m 3 2.577 7.268 9.8465 Associated companies £m 3 0.000 0.000 0.0006 Materials and consumables £m 3 4.142 0.576 4.7197 Service charges £m 3 0.648 0.000 0.6488 Bulk supply imports £m 3 0.000 0.000 0.0009 Other direct costs £m 3 0.019 0 040 0.05910 Total direct costs £m 3 15.820 19.806 35.62611 General and support expenditure £m 3 9.851 10.724 20.57512 Functional expenditure £m 3 25.671 30.530 56.201
B OPERATING EXPENDITURE13 Customer services £m 3 4.56814 Scientific services £m 3 1.51315 Other business activities £m 3 0.49216 Total business activities £m 3 6.57317 Rates £m 3 8.60618 Doubtful debts £m 3 0.07119 Exceptional items £m 3 0.00020 Total opex less third party services £m 3 71.45121 Third party services - opex £m 3 0.008
21a PPP Unitary Charges (Opex element) £m 322 Total operating expenditure £m 3 71.459
22a Payment by concessionaire to operator £m 3
C OPEX)23 Reactive and planned maintenance infrastructure £m 3 0.000 8.751 8.75124 Reactive and planned maintenance non-infrastructure £m 3 1.367 4.909 6.277
D CAPITAL MAINTENANCE 25 Infrastructure renewals charge (excluding third party services) £m 3 14.679 0 000 14.67926 Historical cost depreciation (allocated) £m 3 8.983 7.817 16.80027 Amortisation of deferred credits £m 3 -0.35428 Amortisation of intangible assets £m 3 0.00029 Business activities historical cost depreciation (non-allocated) £m 3 0.04030 Capital maintenance excluding third party services £m 3 31.16531 Third party services - historical cost depreciation £m 3 0.00032 Third party services - infrastructure renewals charge £m 3 0.00033 Total capital maintenance £m 3 31.16534 Total operating costs £m 3 102.624
WATERRESOURCES
& TREATMENT
WATERDISTRIBUTION
WATERSERVICE
TOTAL


NORTHERN IRELAND WATER LIMITED - ANNUAL INFORMATION RETURN
ANNUAL INFORMATION RETURN - TABLE 22 REGULATORY ACCOUNTS (HISTORIC COST ACCOUNTING)ACTIVITY COSTING ANALYSIS - SEWERAGE SERVICE (NIW Only)
1 2 3 4
DESCRIPTION UNITS DP
SERVICE ANALYSIS - SEWERAGEA DIRECT COSTS1 Employment costs £m 3 3 928 4.786 0 319 9.0322 Power £m 3 4 015 7.453 0 920 12.3893 Agencies £m 3 0 000 0.000 0 000 0.0004 Hired and contracted services £m 3 4 815 1.901 2 088 8.8045 Associated companies £m 3 0 000 0.000 0 000 0.0006 Materials and consumables £m 3 0 260 0.640 0 526 1.4267 Service charges £m 3 0 001 0.701 0 264 0.9658 Other direct costs £m 3 0 001 0.006 0 000 0.0089 Total direct costs £m 3 13 020 15.487 4.117 32.624
10 General and support expenditure £m 3 7 962 12.449 2.488 22.89811 Functional expenditure £m 3 20 982 27.936 6 605 55.523
B OPERATING EXPENDITURE12 Customer services £m 3 3.98313 Scientific services £m 3 1.23114 Other business activities £m 3 0.42915 Total business activities £m 3 5.64216 Rates £m 3 8.83717 Doubtful debts £m 3 -0.23618 Exceptional items £m 3 0.00019 Total opex less third party services £m 3 69.76620 Third party services - opex £m 3 0.00020a PPP Unitary Charges (Opex element) £m 321 Total operating expenditure £m 3 69.766
21a Payment by concessionaire to operator £m 3
C OPEX)22 Reactive and planned maintenance infrastructure £m 3 2 601 0.000 0 000 2.60123 Reactive and planned maintenance non-infrastructure £m 3 8.431 2.251 0 000 10.682
D CAPITAL MAINTENANCE 24 Infrastructure renewals charge (excluding third party services) £m 3 11 078 0 000 11.07825 Historical cost depreciation (allocated) £m 3 0 955 34.447 0.739 36.14126 Amortisation of deferred credits £m 3 -0.71327 Amortisation of intangible assets £m 3 0.00028 Business activities historical cost depreciation (non-allocated) £m 3 0.00029 Capital maintenance excluding third party services £m 3 46.50630 Third party services - historical cost depreciation £m 3 0.00031 Third party services - infrastructure renewals charge £m 3 0.00032 Total capital maintenance £m 3 46.50633 Total operating costs £m 3 116.272
SEWERAGE SEWAGETREATMENT
SLUDGETREATMENT& DISPOSAL
SEWERAGESERVICETOTAL


Annual Information Return 2018 Section 2 Chapter 21 & 22 Page 1 of 16
Tables 21 & 22 Activity Costing Analysis – Water & Sewerage Service
The costs in Tables 21 & 22 are populated with the updated information available at 29th May 2017 for the year ended 31st March 2018.
Allocation of costs between expenditure types Expenditure is classified as capital expenditure if it satisfies the following criteria: (as per FR15 Capitalisation Guidelines).
It exceeds the threshold limit set at £1,000 (Note: land has a capital threshold of zero)and,
It was used for one or more of the following purposes:1. Initial construction or purchase of a fixed asset (e.g. land, buildings, vehicles,
plant, computers);2. Extension of a fixed asset which increases its size or operating capacity;3. Improvement of a fixed asset beyond the assets original condition on
construction or acquisition;4. To substantially extend the original life of a fixed asset;5. To renew or replace an existing fixed asset; and6. Contributions paid to another body towards the cost of work that would be fixed
asset expenditure were it undertaken by NI Water, provided that the resultantownership of the assets is vested in NI Water.
Some items, individually, may be valued at less than £1,000 but because they form part of an operational configuration, they should be capitalised; for example workstations, which comprise a monitor, keyboard, central processor, mouse and printer, should be capitalised.
Cost includes own work capitalised comprising the direct costs of materials, labour and applicable overheads. Interest costs relating to the acquisition of fixed assets have not been capitalised in AIR18. This is consistent with past years.
Fixed assets comprise: Infrastructure assets
Infrastructure assets comprise a network of systems consisting of mains and sewers,impounding and pumped raw water storage reservoirs, sludge pipelines and seaoutfalls. The infrastructure renewals charge for infrastructure assets is included inTables 21 and 22 and is the estimated level of annual expenditure required tomaintain the operating capability of the network, which is based on the Company’sAsset Management Plan.
Other assetsOther assets comprise:a) Land and non-operational buildings,b) Operational assets (consisting of sites used for water and wastewater treatment,pumping or storage where not classified as infrastructure); andc) Vehicles, mobile plant and equipment.
Allocation of costs between service areas All costs entered to NI Water’s Oracle General Ledger (GL) have a 5-segment coding combination (account, cost centre, service activity, location and project). For the purpose of Tables 21 & 22 Opex costs from the General Ledger have been allocated between Water and Sewerage services and between service areas within the Water and Sewerage activities by mapping NI Water’s Oracle General Ledger to the tables using the coding structure.


Annual Information Return 2018 Section 2 Chapter 21 & 22 Page 4 of 16
Negative Opex NIW generate income from the sale of electricity and Renewable Obligation Certificates (ROCs) by way of water turbine and solar installations. In 2017/18, this income amounted to £0.4m, which is consistent with AIR17.
Employment Costs Staff costs for total NI Water come to circa £53.9M as detailed below has increased from AIR17 (£49.75M). These costs include the £1.5M VER\VS and ill-health costs outlined above. Only circa £21.6M is included in Employment Costs (Line 1) in Tables 21 & 22 (AIR17 circa £21.4M).
The table below provides the reconciliation between these amounts: Description Amount Table 21/22 location Industrial Wages £16.7M
Salaries £33.1M
Temporary Staff £1.3M
Other Costs of Employment £1.78M
Staff Expenses £1.1M
Total NI Water staff costs £53.9M Less:
Customer Services (£4.0M) Customer Services
Scientific Services (£1.5M) Scientific Services
Regulation (£0.5M) Other Business Activities
Unallocated (£26.2M) General & Support
Total Employment Costs £21.6M £12.6M Table 21 and £9.0M Table 22
The unallocated amount of circa £26.2M is included in General & Support and has been apportioned between Table 21 and 22, across each of the columns, based on total direct costs, with the exception of M&E Employment costs which are allocated on the basis of a split provided by the business.
Total NI Water staff costs have increased by approximately £4.4M from AIR17 due to an increase in Wages of £0.1M, Salaries of £3.3M and Temporary Staff of £0.1M and Other Costs of Employment of £0.9M.
Wages and Salaries have increased due to the annual inflationary pay rise, a NIC increase and £1.7M accrued to the NIW Pension Scheme to reflect the outcome of the triennial evaluation carried out in 2017/18, (this has been included in Atypical Costs – see below.) The increase in Other Employment Costs is due to the increase in Ill Health retirements in 2017/18.
Hired & Contracted Hired and Contracted Services of circa £17.5M in Table 21 and Table 22 are split out in the table below. The corresponding charge in the AIR17 was circa £17.5M

Annual Information Return 2018 Section 2 Chapter 21 & 22 Page 5 of 16
Hired & Contracted Services: Table 21 Table 22 TOTAL Operational Contractors £9.4M £8.7M £18.1M Other Contractors £0.4M £0.1M £0.5M Consultants £0.0M £0.0M £0.0M TOTAL £9.8M £8.8M £18.6M
Within the Operational Contractors costs of £9.4M in Table 21, circa £2.5M relates to the cost of contractors for Water Treatment with the balance being the cost for the hire of plant and contractors to facilitate the maintenance of the networks. This is an increase of £1.3M from AIR17 which will be explained in Table 21 Line 4 below. Within the Operational Contractors cost of £8.7M in Table 22, circa £2.0M is for the cost of the various Sludge Disposal Routes, circa £4.8M is for the maintenance of the Sewerage network and the balance relates to the costs of Sewage Treatment (including the costs of Skip Hire etc.). The cost of Sewage Treatment has decreased by £0.6M from AIR17. The Cost of the maintenance of the Sewerage Network has increased by £0.5M from AIR17. This will be explained in Table 21 Line 4 below.
There is no spend on Consultants Fees within Hired and Contracted in AIR18.
General & Support Costs General & Support costs have increased by circa £3.1M from AIR17 (£40.7M) to AIR18 (£43.8M).
Description Amount Table 21/22 location Unallocated Employment Costs
£26.2M Included in General & Support (Removed from Employment Costs)
Unallocated Power £0.6M Included in General & Support (Removed from Power Costs)
Unallocated Hired & Contracted Costs
£6.9M Included in General & Support (Removed from Hired & Contracted)
Unallocated Materials & Consumables
£1.3M Included in General & Support (Removed from Materials & Consumables)
Unallocated Other Direct Costs
£4.3M Included in General & Support (Removed from Other Direct Costs)
V&P Repairs £0.5M General & Support
Mobile V&P Charges £1.9M General & Support
Other £2.1M General & Support
Total £43.8M £20.7M Table 21 and £23.1M Table 22
General & Support costs were apportioned across Table 21 & Table 22 based on either the total direct costs allocated to each column or in the case of the M&E Function based on a split as supplied by the Function. Service Activities are mapped to the NIAUR service areas in Appendix 2. This approach was consistently applied to both AIR18 and AIR17. See the Allocation of costs between service areas section at the start of the commentary.
The main differences from AIR17 are in Unallocated Employment Costs (£4.6M increase) Unallocated Hired & Contracted Costs (£0.9M decrease) and Unallocated Materials & Consumables (£0.5M decrease).

Annual Information Return 2018 Section 2 Chapter 21 & 22 Page 6 of 16
The increase in Unallocated Employment Costs have been explained under Employment Costs. Unallocated Hired & Contracted Costs have decreased mainly in Operational Contractors (£2.0M) due to improved allocation at source. The decrease in Unallocated Other Direct Costs is mainly due to Legal and Professional Fess (£1.4M) due to the decrease in legal costs relating to Project Clear and a specific legal case in 2016-17.

Annual Information Return 2018 Section 2 Chapter 21 & 22 Page 7 of 16
Table 21 – NI Water Total Table 21 Total Expenditure in AIR18 has increased by circa £3.1M from AIR17 to AIR18. This is mainly driven by a number of substantial increases in Power £1.1M, Hired and Contracted Services of £1.3M and Materials and Consumables £0.7M various other variances which are explained on a line by line basis below:
Line 1: Employment costs have increased by circa £0.1M from AIR17. This is due tothe annual inflationary pay rise.
Line 2: Power costs include electricity costs, fuel costs for power generation and costsfor the CRC Energy Efficiency Scheme. Overall the costs have increased by £1.1Mfrom AIR17. The main reason for this is due to increased energy tariffs.Power costs include related to PPP.
Line 3: Agencies – there are no costs in this line. Line 4: Hired and Contracted Services have increased by circa £1.3M from AIR17.
The increase has been driven by a decrease in Water Resources & Treatment (WRT)of £0.2M and an increase of £1.4M in Water Distribution (WD). The main reason forthe increase in WD was expenditure on additional leakage detection resources.
Line 5: Associated companies – there are no costs in this line. Line 6: Materials & Consumables have increased from AIR17 by £0.7M. This is
mainly within WRT in Chemicals £0.3M due to increase in consumption and pricesrises and Materials and Equipment £0.2M due to additional civils work at numerousplants and site maintenance.
Line 7: Service Charges – the costs are £0.8M with the majority of the costs in WRTfor abstraction licences. These are consistent with AIR17. Service Charges includecirca for PPP.
Line 8: Bulk Supply imports – there are no costs in this line. Line 9: Other Direct Costs are immaterial and in line with AIR17. Line 10: Total Direct Costs – this is a calculated line and is the total of Line 1-9. AIR18
direct costs are £3.1M higher than AIR17. This is driven by the increase in Powercosts, Hired and Contracted and Materials and Consumables as detailed above.
Line 11: General & Support expenditure has increased by circa £1.4M from AIR17 toAIR18. The reason for the increase in the costs in Table 21 is the increase in theoverall General & Support expenditure (as already discussed) combined with thechanges in allocation.
i) The percentages used are calculated on the total of Direct Costs for General& Support Pot 1 & 2 which have remained in line with AIR17. However General& Support Pot 3 M&E has changed marginally from AIR17. WRT has remainedin line while WD has decreased from 18.1% to 15.8% resulting in a totaldecrease for Table 21 of circa 2.3%. See the Allocation of costs betweenservice areas section at the start of the commentary. Service Activities aremapped to the NIAUR service areas in Appendix 2.
ii) The NI Water total costs are immaterial for PPP. Line 12: This is the calculated total line for functional expenditure which has increased
by £4.6M from AIR18 as a result of the increase in Total Direct Costs as alreadydiscussed above and in General & Support Costs as explained in Line 11 above. Line12 includes of costs associated with PPP (AIR17 ).
B - Operating Expenditure Line 13: Customer Services costs are in line with AIR17 in Table 21. Customer
Services costs are apportioned based on the percentage of direct costs from Table21 & 22 and are broadly in line with the split in previous years. In AIR18 thepercentage split was calculated at 53.4% Table 21 and 46.6% Table 22. In AIR17 thepercentage split was 52.5% and 47.5% between Table 21 & 22 respectively.

Annual Information Return 2018 Section 2 Chapter 21 & 22 Page 8 of 16
Line 14: Scientific Services costs have increased marginally by £0.1M from AIR17.Scientific Services costs have been split using the same percentage basis asCustomer Services as detailed above in line 13.
Line 15: Other Business Activities – Regulatory costs have remained in line withAIR17. These costs are apportioned on the same basis as Line 13 and Line 14.
Line 16: Total Business Activities – this is a calculated line and is the total of Line 13,14 and 15. The increase from AIR17 of circa £0.5M is driven by the increases asdetailed above.
Line 17: Local authority rates have remained in line with AIR17. Rates include circa relating to PPP sites.
Line 18: Doubtful debts have decreased by £0.2M from AIR17 due to theimprovement of Debtors Days. The doubtful debts have split between Table 21 andTable 22 on a specific line by line basis, consistent with what was done in AIR17.
Line 19: Exceptional items– there are no costs in this line. Line 20: Total Opex less third party services – this is a calculated line and is the total
of line 12,16,17,18 and 19. This has increased by circa £5.3M from AIR17 driven bythe increases in the costs as detailed above.
Line 21: Third party services are immaterial. Line 21a: Total PPP Unitary Charge has increased by circa from the AIR17
charge at in AIR18. See Table 42 commentary for details. Line 22: Total operating expenditure, this is a calculated line and is the total of line
20, 21 and 21a. This line has increased by £4.7M from AIR18 due to the increase inthe costs as discussed. This agrees to Table 35 line 24.Total operating expenditure includes circa relating to PPP (AIR17 ).
Line 22a: This figure is in line with AIR17 and can vary from year to year dependingupon volumes of water dispatched, changes in the volumetric charge, deductionsincurred and indexation. See Table 42 commentary for details.
C Reactive & Planned Maintenance Line 23: Infrastructure, this figure has increased by circa £1.0M from AIR17. This is
as a result of an increase on spend on all the activities that feed into this line in WD.The increase is a combination of increased activity and rates.
Line 24: Non-infrastructure, this figure has increased by circa £0.9M from AIR17.This is as a result of an increase on spend on all the activities that feed into this linein WRT and WD. The increase is a combination of increased activity and rates.
Leakage costs Operating costs relating to leakage have increased from £5.6M in AIR17 to £6.1M in AIR18. This is due to additional resources deployed to reduce Leakage. Capital expenditure has remained consistent from AIR17 to AIR18. .

Annual Information Return 2018 Section 2 Chapter 21 & 22 Page 9 of 16
Table 22 – NI Water Total A - Direct Costs Total Expenditure in Table 22 has increased by circa £3.2M from AIR17 to AIR18. This is mainly driven by an increase in General & Support Costs of £1.7M and Power costs of £1.3M and various other variances which are explained on a line by line basis below:
Line 1: Employment costs are in line with AIR17. Line 2: Power costs include electricity costs and fuel costs for power generation and
costs for the CRC Energy Efficiency Scheme. Overall the costs have increased by£1.3M in AIR18 from AIR17. The main reason for this is due to increased energytariffs.
In AIR18 the Wastewater Field Managers provided a percentage estimate of powercosts between Sewage Treatment and Sludge Treatment at each of the WWTWswhere there are both activities. These percentages were applied to the power coststo calculate the costs for each activity. This is the same rationale as AIR17.
There is one electricity meter at Duncrue Street which includes the costs for theBelfast WWTWs and the Incinerators which are operated by PPP. The power teamsupplied an estimated 44:56 split between the Belfast WWTWs and the Incinerators(based on an estimated KWhr usage and a number of sub-meters) which has beenused to calculate the amount relating to Sewage Treatment at Belfast and SludgeTreatment at the Incinerators. In AIR17 the estimated split was 46:54.
Power costs include for PPP (AIR17 ). Line 3: Agencies – there are no costs in this line. Line 4: Hired and Contracted services are in line with AIR17. Line 5: Associated companies– there are no costs in this line. Line 6: Materials & Consumables have increased marginally by £0.2M from AIR17. Line 7: Service Charges – increased by £0.2M from AIR17. The vast majority of these
fees relate to NIEA Discharge Consents. Line 8: Other Direct Costs are immaterial. Line 9: Total Direct Costs – this is a calculated line and is the total of lines 1-8. AIR18
direct costs are £1.6M higher than AIR17. This is driven by the increase in Powercosts, Materials and Consumables and Service Charges as detailed above.
Line 10: General & Support expenditure has increased by circa £1.7M from AIR17 toAIR18. The reason for the increase in the costs in Table 22 is the increase in theoverall General & Support expenditure (as already discussed).
i) The percentages used are calculated on the total of Direct Costs for General& Support Pot 1 & 2 which have remained in line with AIR17. Service Activitiesare mapped to the NIAUR service areas in Appendix 2. See the Allocationof costs between service areas section at the start of the commentary. TheNI Water Total costs include circa for PPP. This is consistent withAIR17.
Line 11: This is the calculated total line for Functional Expenditure which hasincreased by £3.3M. This increase is driven by the increase in Power costs andGeneral & Support Costs as discussed above. Line 11 includes costs of associated with PPP (AIR17 ).
B - Operating Expenditure Line 12: Customer Services costs have decreased by circa £0.2M compared to AIR17
in Table 22. Customer Services costs are apportioned based on the percentage ofdirect costs from Table 21 & 22. In AIR18 the percentage split was calculated at


Annual Information Return 2018 Section 2 Chapter 21 & 22 Page 11 of 16
(£1.2M)). These costs have been included in general and support costs and employment costs in Tables 21 and 22 on the basis outlined in the cost allocation section above.
The total employer pension contributions for the year were £11.2M (AIR17 £9.9M) including £0.3M relating to payment of 2016/17 past service costs and £1.7m of cost accrued to NIW pension scheme to reflect the outcome of the triennial evaluation carried out in 2017.
These costs have been included in general and support costs and employment costs in Tables 21 and 22. Pension costs for those employees who can be directly attributed to service or business activities will be mapped directly to these areas via the wages and salaries codes as outlined in the cost allocation methodology. Pension costs that relate to either employees not engaged directly on service/business activities or that relate to past service costs (i.e. VER provision) will be apportioned to activities in line with the treatment of general and support expenditure as detailed in the cost methodology.
Pension costs and finance charges associated with employees involved with unappointed activities have not been specifically excluded from pension figures within the profit and loss account. However as noted in the costing section above an estimate of the costs of unappointed activities has been adjusted for during the costs allocation process and it has been assumed that an element of this allocation would cover pension costs.
The pension fund at 31st March 2018 has remained in a liability position.
Further disclosures on pensions are contained in the statutory accounts which are based on the company's actuarial report at 31st March 2018.
Third party costs Third party costs remain negligible in AIR18 and relate primarily to services recharged to third parties. The associated income is reported in Table 23 as third party income.
Infrastructure Renewals Charge (IRC See Commentary for Table 33.


Annual Information Return 2018 Section 2 Chapter 21 & 22 Page 15 of 16
Appendix 1 – Expense group mapping Expense Group Desc Table 21 & 22 mapping511X Industrial Wages Employment513X Other Wage Costs Employment514X Other Costs of Employment Employment515X Salaries Employment516X Non-Industrial Expenses Employment517X Temporary Support Staff Employment611X Cost Reallocations Employment612X N/A Employment613X N/A Employment614X N/A Employment521X Power Power531X Operational Contractors Hired and Contracted 532X Other Contractors Hired and Contracted 534X Out sourcing Hired and Contracted 538X Consultants Fees Hired and Contracted 541X Materials and Equipment Materials & consumables544X Non Operations Materials Materials & consumables547X Stock Adjustments Materials & consumables548X Chemicals Materials & consumables5562 & 5565 Environmental Regulator & Crown Estates Service Charges536X Office and Computer Services Other direct costs537X Legal and other professional fees Other direct costs551X Accommodation Other direct costs553X Insurance - Premiums Other direct costs553Y Insurance - Claims Other direct costs554X Public Liability Other direct costs555X Employer's Liability Other direct costs616X N/A Other direct costs695X Management Task Other direct costs759X Overheads Capitalised Other direct costs518X Staff Training & Hospitality General & support533X V&P repairs General & support539X Audit General & support546X Mobile V&P Charges General & support552X Communication General & support556X Other Grants and Subscriptions General & support557X Advertising and Publicity General & support641X Intra Departmental Notionals General & support651X Inter Departmental Notionals General & support772X Bad Debts Doubtful debts775X Discount Allowed Customer services558X Rates Rates5561 Regulatory Costs Other Business Activities534Y PPP PPP unitary charge

Annual Information Return 2018 Section 2 Chapter 21 & 22 Page 16 of 16
Appendix 2 – Service activity mapping NIW Service Activity Service Activity description Table 21/22 Mapping310 Pumping (Inc Highlift at WTW)311 Service Resv Wat Tower Tanks312 Service Resv cleaning313 Distribution and Water Operations320 Repair and Maintenance (Mains Repair)321 Repair and Maintenance (Service Repair)322 Repair and Maintenance (Hydrant & Valve Repairs)323 R&M (NIFRS Hydrant & Valve Repairs)324 Repair and Maintenance (Mains Cleansing)326 Repair and Maintenance (Lead Replacement)331 Repair and Maintenance of 'Street Furniture' (Water)340 Leakage - Monitoring Water - Distribution341 Leakage - Detection342 Hydrant & Valve Repairs as identified by343 Service Repairs as identified by active 344 Mains Repairs as identified by active Le351 Consumer Meter Repair & Maintenance360 Investigations362 Customer Contacts excluding meter query363 Regulatory Plumbing Inspection380 'In House' Investigations and Attendance385 Health & Safety - Networks391 Networks Function Activity -Query399 Networks Stores920 Connection (Water)110 Impounding Reservoir111 Loughs112 River Intakes113 Boreholes,Springs & Wells120 Repairs & Maint A/duct/Main140 Recreation & Amenity150 Water Treatment Water - Resource & Treatment151 Water Sludge Treatment152 Water Sludge Disposal185 Health & Safety - Supply190 Supply Function Activity191 Supply Function Activity - Query822 Instrumental Control Activity M & E Water Supply410 Repair & Maintenance of Sewers411 Blockage412 Desilting413 Inspection of Sewers414 Repair and Maintenance of 'Street Furniture' (Sewerage)415 Sewerage Tankering430 Pumping (Foul & Combined) Sewerage - Sewerage431 Pumping (Surface Water)460 'In House' Investigations and Attendance462 Rodent Control940 Rechargeable (Sewerage)950 Connection (Sewerage)510 Sewage Treatment Sewerage - Sewage Treatment591 Waste Water Function Activity - Query620 Sludge Treatment - Tankering Between Works621 Sludge Treatment630 Sludge Disposal to Agricultural Land Transportation631 Instrumental Control Activity M & E WasteWater632 Sludge Cake Transportation to Landfill633 Sludge Cake Disposal to Landfill Sewerage - Sludge Treatment635 Sludge Logger Maintenance (Contract)636 Incinerator Sludge Treatment637 Sludge Disposal Tankering from Strategic Collection Centres to Dewatering Centres638 Sludge Cake Disposal to Incinerator639 Incinerator Ash Disposal to Landfill640 Private Septic Tank Desludging710 General711 Customer Services (Meter Read & Customer Queries) Customer Services712 Disconnection / Reconnection714 Consumer Meters Repair And Maintenance790 Customer Services Function Activity730 Water Analysis731 Sewerage General732 Labs Water & Sewerage General Scientific Services733 Sampling734 Labs Sewage Sampling003 Rates DRC - Water Rates013 Rates DRC - Sewerage910 Rechargeable Work Third Party Opex000 Default021 GAE023 Invest to Save Revenue810 Vehicle & Plant Maintenance811 Vehicle & Plant Accident Repair Overhead Pot 1 - General812 Garage Overheads813 Roads Service820 Telemetry890 TMG Function Activity050 Ops & Maint General (Water) Overhead Pot 2 - Water055 Ops & Maint General (Sewerage)585 Health & Safety - WW590 Waste Water Function Activity Overhead Pot 2 - Sewerage735 Trade Effluent821 Radio & Monitoring Wastewater390 Networks Function Activity Overhead Pot 3 - Networks Water & Sewerage

NORTHERN IRELAND WATER LIMITED - ANNUAL INFORMATION RETURN
ANNUAL INFORMATION RETURN - TABLE 23 REGULATORY ACCOUNTS ANALYSIS OF TURNOVER AND OPERATING INCOME
changed colours as Ofwat JR09 tables 1 2 3 4 5 6 7 8 9 10 11 12 13 14 15 16 17 18 19 20 21 22 23 24 25 26 27 28 29
DESCRIPTION UNITS DP SUBSIDY SUBSIDYWATER INCLUDED SEWERAGE INCLUDED
A TURNOVER1 Unmeasured - household £m 3 121.195 143.905 265.100 122.139 138.161 260.300 126.574 135.825 262.399 125.277 138.923 264.200 123.828 141.172 265.000 124.853 145.747 270.600 124.853 145.747 A22 Unmeasured - non- household £m 3 2.211 2.766 4.977 2.049 2.545 4.594 1.762 2.102 3.864 1.829 2.125 3.954 2.041 2.401 4.442 1.891 2.203 4.094 0.925 1.075 A23 Unmeasured £m 3 123.406 146.671 270.077 124.188 140.706 264.894 128.336 137.927 266.263 127.106 141.048 268.154 125.869 143.573 269.442 126.744 147.950 274.694 125.778 146.822 A24 Measured - household £m 3 0.000 0.000 0.000 0.000 0.000 0.000 0.000 0.000 0.000 0.000 0.000 0.000 0.000 0.000 0.000 0.000 0.000 0.000 0.000 0.000 A25 Measured - non- household £m 3 38.751 22.144 60.895 38.465 24.148 62.613 39.872 26.168 66.040 39.955 24.739 64.694 41.096 27.518 68.614 42.541 26.865 69.406 9.258 5.906 A26 Measured £m 3 38.751 22.144 60.895 38.465 24.148 62.613 39.872 26.168 66.040 39.955 24.739 64.694 41.096 27.518 68.614 42.541 26.865 69.406 9.258 5.906 A27 Trade effluent £m 3 4.326 4.326 3.889 3.889 3.561 3.561 4.557 4.557 4.278 4.278 4.777 4.777 0.000 0.000 A2
7a Roads Drainage Revenue £m 3 0.000 20.911 20.911 20.049 20.049 19.154 19.154 20.030 20.030 20.596 20.596 21.047 21.047 0.000 0.000 A28 Large user and special agreement £m 3 5.354 4.290 9.644 5.243 4.041 9.284 5.136 3.711 8.847 4.980 4.286 9.266 4.980 4.105 9.085 5.517 4.811 10.328 0.000 0.000 A29 Revenue grants £m 3 0.000 0.000 0.000 0.000 0.000 0.000 0.000 0.000 0.000 0.000 0.000 0.000 0.000 0.000 0.000 0.000 0.000 0.000 0.000 0.000 A2
10 Non potable water large user and special agreements £m 3 0.000 0.000 0.000 0.000 0.000 0.000 0.000 0.000 0.000 0.000 0.000 0.000 0.000 0.000 A211 Rechargeable works £m 3 0.093 0.093 0.186 0.092 0.092 0.184 0.056 0.056 0.112 0.065 0.065 0.130 0.064 0.064 0.128 0.055 0.055 0.110 0.000 0.000 A212 Bulk supplies/inter company payments £m 3 0.000 0.000 0.000 0.000 0.000 0.000 0.000 0.000 0.000 0.000 0.000 0.000 0.000 0.000 0.000 0.000 0.000 0.000 0.000 0.000 A213 Other appointed business (third party) £m 3 0.172 0.187 0.359 0.162 0.238 0.400 0.191 0.239 0.430 0.196 0.260 0.456 0.368 0.343 0.711 0.403 0.334 0.737 0.000 0.000 A214 Third party services (excluding non-potable water) £m 3 0.265 0.280 0.545 0.254 0.330 0.584 0.247 0.295 0.542 0.261 0.325 0.586 0.432 0.407 0.839 0.458 0.389 0.847 0.000 0.000 A215 Other sources (excluding large users, third parties and special agreements £m 3 0.000 0.000 0.000 0.000 0.000 0.000 0.000 0.000 0.000 0.000 0.000 0.000 0.000 0.000 0.000 0.000 0.000 0.000 0.000 0.000 A216 Total turnover £m 3 167.776 198.622 366.398 168.150 193.163 361.313 173.591 190.816 364.407 172.302 194.985 367.287 172.377 200.477 372.854 175.260 205.839 381.099 135.036 152.728 A2
B OPERATING INCOME17 Not used18 Exceptional items £m 3 0.000 0.000 0.000 0.000 0.000 0.000 0.000 0.000 0.000 0.000 0.000 0.000 0.000 0.000 0.000 0.000 0.000 0.000 A219 Other operating income £m 3 0.000 0.000 0.000 0.000 0.000 0.000 0.000 0.000 0.000 0.000 0.000 0.000 0.000 0.000 0.000 0.000 0.000 0.000 A220 Total operating income £m 3 -0.133 -0.170 -0.303 0.208 0.000 0.208 0.255 0.233 0.488 -0.083 0.174 0.091 0.523 -0.034 0.489 0.000 0.000 0.000 A2
C WORKING CAPITAL ADJUSTMENT21 Not used
D REVENUE CORRECTION MECHANISM22 Net revenue movement out of the tariff basket £m 3 0.000 0.000 0.000 0.000 0.000 0.000 0.000 0.000 0.000 0.000 0.000 0.000 0.000 0.000 0.000 0.000 0.000 0.000 0.000 0.000 A2
2012-13WATER
SERVICESSEWERAGE SERVICES
APPOINTED BUSINESS
2015-16WATER
SERVICESSEWERAGE SERVICES
APPOINTED BUSINESS
2013-14WATER
SERVICESSEWERAGE SERVICES
APPOINTED BUSINESS
2014-15WATER
SERVICESSEWERAGE SERVICES
APPOINTED BUSINESS
2016-17WATER
SERVICESSEWERAGE SERVICES
APPOINTED BUSINESS
2018-19WATER
SERVICESSEWERAGE SERVICES
APPOINTED BUSINESSCG
2017-18WATER
SERVICESSEWERAGE SERVICES
APPOINTED BUSINESS
2019-20WATER
SERVICESSEWERAGE SERVICES
APPOINTED BUSINESS
2020-21WATER
SERVICESSEWERAGE SERVICES
APPOINTED BUSINESS

Annual Information Return 2018 Section 2 Chapter 23 Page 1 of 21
Table 23 – Analysis of turnover and operating income
Working Capital Adjustment The commentary to Table 27 outlines the methodology for the Working Capital Adjustment.
Monthly Non-domestic Income Monitoring Process The process for monitoring income is laid out in the flow diagram in Appendix A.
By 3.00pm on the third working day (Day 3) of each month, NI Water’s billing partner, Echo Managed Services Ltd (Echo), e-mails to NI Water a spreadsheet which includes details of summary billed income, accrued income, cash, bad debt write-off and debtor information, as well as the general ledger postings for the month. In addition, the following reports are provided at that time:
Bank reconciliation; Aged debt analysis; Listing of all refunds; Listing of all transactions; Accrued income details; Cash received listing; List of returned payments.
Billed income comes in the form of both invoices (first-time round billing, arising from a meter reading or an estimate) and system adjustments (adjustments made to a previously invoiced bill). The transaction listing, mentioned above, is reviewed by both Finance & Regulation (F&R) and Billing & Revenue (B&R) to analyse the system adjustments made in the month and to understand better any budget/forecast variances in the month.
During Day 4, NI Water performs the general ledger posting on to Oracle and then assesses and posts the following:
The amount of income on “N-stop” i.e. invoices held back for a variety of reasons, tobe recognised in the accounts;
Any adjustments to the accrued income (see Appendix H); and The amount of provision to be made against the accrued income (based on those
items of accrued income greater than 210 days old).
A draft income summary is prepared showing income to date across the five income categories (measured water, measured sewerage, unmeasured water, unmeasured sewerage and trade effluent) for both the month and the year to date, together with comparative figures for the budget and the latest forecast. An initial meeting between F&R and B&R is held on the afternoon of Day 4 to ascertain high-level reasons for any budget/forecast variances in the month.
A written report is then prepared by the F&R Business Partner on the income and debt performance (including commentary on the level of provisions held), in advance of the Monthly Accounts meeting held with the Director of F&R (which normally occurs on the morning of working day 5 in the month).
On Day 5, Echo finalises the Day 5 data, and is saved on to an NI Water Public drive. This contains a number of detailed spreadsheets, such as VAT reports and suspense account (see Appendix B).

Annual Information Return 2018 Section 2 Chapter 23 Page 2 of 21
On Day 8, the final income meeting is held between F&R and B&R, at which the variance analysis is discussed in greater depth. The final income summary is then sent out to all relevant staff, including the Director of F&R and the Director of Customer Services Delivery (CSD).
A short commentary on the total NI Water income for the month is prepared for the Board to be included in the monthly Finance Report (though this may be completed in advance of the Day 8 meeting, depending on the date of the Board Meeting in the month).
NI Water also analyses billed income each month by volume and consumption, in what is termed the “Actuals Report”. A monthly meeting between F&R and B&R is held to review this, though always some time after the Day 8 meeting.
Movements in Income against PC15 Following on from the monitoring process detailed above, the 2017/18 year-end position of income against PC15 submission was as follows:
The above table includes both appointed and un-appointed income.
Income
ActualIncome2017/18
£m
PC15Income2017/18
£mVariance
£m
Subsidy:Domestic phasing subsidy - water 124.9 127.5 (2.6)Domestic phasing subsidy - sewerage 145.7 150.0 (4.3)Non-domestic phasing subsidy - water 0.9 1.1 (0.2)Non-domestic phasing subsidy - sewerage 1.1 1.2 (0.1)Domestic allowance - water 9.3 8.6 0.7 Domestic allowance - sewerage 5.9 4.6 1.3 Septic tank subsidy 2.7 2.7
Total subsidy 290.5 293.0 (2.5)
Non-domestic income:Measured water 38.8 37.3 1.5 Measured sewerage 22.6 23.4 (0.8)Unmeasured water 1.0 1.1 (0.1)Unmeasured sewerage 1.1 1.2 (0.1)Trade effluent 7.9 6.7 1.2
Total non domestic income 71.4 69.7 1.7
Road drainage income 21.0 22.4 (1.4)
Other regulated income 1.0 0.7 0.3 Other non-regulated income 3.9 0.0 3.9
TOTAL INCOME 387.8 385.8 2.0


Annual Information Return 2018 Section 2 Chapter 23 Page 5 of 21
Specific reasons for the £2.5m increase over budget are: During 2017/18, the level of allowances arising from the Metering and Billing
project was not as great as had been expected; hence the £0.4m negative varianceagainst budget for the water domestic allowance subsidy.
With measured water non-domestic income: Back-billing from the Metering and Billing project has been around £0.3m
less than the £0.5m budgeted. In 2017/18, £0.1m from new customers, such as
There have been consumption increases for some of the larger customerse.g. .
General overall increase in consumption arising the low rainfall experiencedin late 2016/17 and the first half of 2017/18.
Measured sewerage: There was a £0.5m provision set up during the year for the laundrette
project. In 2017/18, £0.2m from new customers, such as
Increased consumption of around £0.2m e.g. and other borewell users, .
For unmeasured income, income was very close to budget. Back-billing from theMetering and Billing project has been around £0.3m less than the £0.5m budgeted.
For trade effluent income, there has been: There was £0.2m accrued to income arising from customers with a
laundrette function about to be billed trade effluent, rather than measuredsewerage.
A £0.5m release of the provision for ; this was fully provided at AIR17, but cash of £0.4m was received during AIR18.

Annual Information Return 2018 Section 2 Chapter 23 Page 6 of 21
Movements in Income between 2017/18 and 2016/17 The table below details the income for the year ended 31 March, for both 2018 and 2017:
The above table includes both appointed and un-appointed income.
The income has increased by £9.0m, due to: An increase in the subsidy for domestic properties of £5.6m, which reflects the
second year of the PC15 Final Determination. A £0.4m rise in the level of the rateable allowances being claimed by customers,
arising mainly from the Metering and Billing project. For measured water, there was only a 1% tariff increase (equivalent to around
£0.4m). Furthermore:o There have been consumption increases for some of the larger customers
e.g. . o General overall increase in consumption arising the low rainfall experienced
in late 2016/17 and the first half of 2017/18. For measured sewerage, there was a 2% increase against 2016/17 (2%),
equivalent to approximately £0.4m. Again, as in the analysis against budget, thebig movements against the previous year were:
o In 2016/17, £0.6m of income from the Retro Sewerage EPIC project.
Income
ActualIncome2017/18
£m
ActualIncome2016/17
£m Variance
£m
Subsidy:Domestic phasing subsidy - water 124.9 123.8 1.1 Domestic phasing subsidy - sewerage 145.7 141.2 4.5 Non-domestic phasing subsidy - water 0.9 0.9 0.0 Non-domestic phasing subsidy - sewerage 1.1 1.1 0.0 Domestic allowance - water 9.3 9.2 0.1 Domestic allowance - sewerage 5.9 5.6 0.3 Septic tank subsidy 2.7 2.6 0.1
Total subsidy 290.5 284.4 6.1
Non-domestic income:Measured water 38.8 36.9 1.9 Measured sewerage 22.6 23.2 (0.6)Unmeasured water 1.0 1.1 (0.1)Unmeasured sewerage 1.1 1.4 (0.3)Trade effluent 7.9 7.1 0.8
Total non domestic income 71.4 69.7 1.7
Road drainage income 21.0 20.6 0.4
Other 4.9 4.1 0.8
TOTAL INCOME 387.8 378.8 9.0


Annual Information Return 2018 Section 2 Chapter 23 Page 9 of 21
Within the £0.7m fall in debtors there was: A fall of £1.5m in debit balances, largely due to increased cash received during the
year from the likes of and the . A fall of £0.3m in credit balances; A fall of £0.3m in referred bills, again due to the release of the
bills A fall of £0.1m in the mixed supply debt written off.
There was a decrease in the bad debts provision, largely due to:
The reduction in debtors, as mentioned above, especially within debt > 6 monthsold.
The accounts for 2017/18 including a “year-end adjustment” of £0.1m, whichincreased the provision.
Accrued Income There are two reports which Echo uses for accrued income, both in the form of Excel spreadsheets included within the Day 3 data: the E039 Accrual Detail report (formerly called the Dynamic Consumption Report (DCR)), and a separate report for Trade Effluent, which is an excel spreadsheet model. Measured customers are billed either every month (mainly larger customers) or every six months, in arrears, and income needs to be accrued for them for a period of up to six months. Therefore, there are seven “bill frequency” periods:
Monthly Jan/Jul six monthly Feb/Aug six monthly Mar/Sep six monthly Apr/Oct six monthly May/Nov six monthly Jun/Dec six monthly
The E039 report takes information directly from the RAPID system, and is based on the latest reading date (as opposed to billing date) and the average consumption of previous bills. If estimated readings have been made, these are used in the calculation. If there is not the necessary information available, the report will use the industry average consumption (for the industry sector which the customer has been assigned to). Any system adjustments made to the original bill meter reading will automatically over-ride the original bill, and it will be system adjustment readings which are used for the calculation of the accrual. Accruals for trade effluent income are based on an excel spreadsheet model built by Xansa. This takes billing data from 1 April of the previous year i.e. close to 2 years of data when March accrual is being calculated, and a year is shut down at the start of April each year. The model contains a price tariff % to either increase or decrease the accrual, depending on the % uplift/reduction in prices from the previous year. The other parameter which has been built into the model is that the report will not create an accrual, if either:
A monthly customer has not been billed for 3 months; or A six monthly customer has not been billed for 500 days;


Annual Information Return 2018 Section 2 Chapter 23 Page 11 of 21
Combined Storm Water Total Split of sewers for run off from roads and footpaths
50.35% 49.65% 100%
Total volume of Water (cubic metres)
32,325,198 31,874,802 64,200,000
Mogden Formula element R+V R Cost of Element £0.4449 / m3 £0.2091 / m3
Cost of Run off £14,381,480 £6,665,021 £21,046,501
Non-tariff Basket Income There is no net income movement out of the tariff basket for either water or sewerage.
Other Income Other income was £4.9m for the 2017/18 year, against a budget of £4.1m, largely as a result of a rise (£0.8m) in miscellaneous income, being the settlement of claims arising from major incidents.
The increase in sundry income from the 2016/17 figure is also largely due to this factor.

Annual Information Return 2018 Section 2 Chapter 23 Page 12 of 21
Appendix A - Monthly Process for Monitoring Income
Fina
nce
Dire
ctor
Fina
ncia
l Ac
coun
tsM
anag
emen
t Ac
coun
ts
Cus
tom
er
Serv
ice
Del
iver
y Directorate
Echo
Boar
d/Ex
ecut
ive
Com
mitt
ee

Annual Information Return 2018 Section 2 Chapter 23 Page 13 of 21
Appendix B – Day 3 & Day 5 Data received from Echo
Along with the actual summary Day 3 report, Echo also send: Bank reconciliation as at the end of the month; Aged debt reports as at the end of the month, by SIC code, industry code, etc.; An accrued income report, by meter reference, as at the end of the month. List of all income-related transactions in the month; List of refunds for the month; List of returned payments for the month; List of all cash payments, aged, for the month; and List of accounts on “n-stop”, as at the end of the month.
On Day 5, Echo send: VAT reports for the month; Consumption reports; and List of cash received transactions in the suspense account, as at the end of the
month.


Annual Information Return 2018 Section 2 Chapter 23 Page 15 of 21
Appendix D – Reconciliation of Debtors account on Oracle NORTHERN IRELAND WATER LIMITED AS AT 31 MARCH 2018Summary of Debtors
Water & Sewerage Debtors GL code 1210 Mar-18Opening Balance £8,962,942.74Take on Bills/New Bills- TOTAL £6,587,096.53
Take on Bills/New Bills- Sewerage 1,558,865.74Take on Bills/New Bills- Water 2,495,137.93
Take on Bills/New Bills- VAT 153,083.22
Annual Billing 2,304,536.66Annual Billing - VAT 75,472.98
Discounts 0.00
System Adjustments- Total £1,133,235.29
System Adjustments- Sewerage 374,667.33
System Adjustments- Water 699,376.18
System Adjustments- VAT 59,191.78
Manual Adjustments- Total -£50,556.28
Manual Adjustments- Sewerage (31,998.56)
Manual Adjustments- Water (18,478.34)Manual Adjustments- VAT (79.38)
Write Off Adjustments Total £95.03
Write Off Adjustments- Sewerage (1.87)Write Off Adjustments- Water 97.10Write Off Adjustments- VAT (0.20)
NIWS Bad Debt Authorised Write Off- Total -£83,771.10
NIWS Authorised Write Off- Sewerage (16,153.30)
NIWS Authorised Write Off- Water (64,575.22)
NIWS Authorised Write Off- VAT (3,042.58)Net Cash (6,064,254.22)Refunds 130,076.91
Water & Sewerage GL code 1210 Closing Balance £10,614,864.90
CheckMetered & Unmetered Water & Sewerage Debtors £10,614,864.90(As per Echo)Per Tb GL code 1210 8,490,756.38
Variance £2,124,108.52
Due toVariance (Oct = w/off Income 0708 in Oct08)Referred Bills NOT Recognised NET (93,010.33)
Write-off of mixed supply debt > 3 years (340,800.00)
System Adjustment Reduction (1,550,000.00)Various MS Adjustments (140,000.00)
Unknown -£298.19
Trade Effluent Debtors GL code 1213Opening Balance £1,590,654.98Take on Bills/New Bills 629,762.94
Referred BillsAnnual BillingSystem Adjustments £39,533.39Manual Adjustments -£1,664.26Write Off AdjustmentsNIWS Authorised Bad Debt Write Off -£74,708.17Net Cash -£1,013,981.46Refunds £0.00 Trade Effluent GL code 1213 Closing Balance £1,169,597.42Variance -£14.05Per Trial Balance general ledger code 1213 1,169,611
Due toTrade EffluentReferred Bills
Total Opening Balance GL code 1213 & 1210 £10,553,597.72Take on Bills/New Bills £4,912,322.81Annual Billing £2,304,536.66Discounts £0.00System Adjustments £1,172,768.68Manual Adjustments -£52,220.54Write Off Adjustments £95.03NIWS Authorised Bad Debt Write Off -£158,479.27Net Cash -£7,078,235.68
Refunds £130,076.91Total Closing Balance GL code 1213 & 1210 £11,784,462.32Balance as per FN012 Summary £11,783,992.73Difference £469.59
Echo Debtor Ledger £11,757,742.98Balance as per FN012 Summary £11,783,992.73Suspense Ac FN012 Summary £46,672.79Difference -£72,922.54
Prepared ByDate
Reviewed ByDate

Annual Information Return 2018 Section 2 Chapter 23 Page 16 of 21
Appendix E – Reconciliation of Accrued Income Account NIW Accrued Income
Mar-18
Per EchoMeasured Water 8,015MW Accrued Income AdjMeasured Sewerage 5,417Trade Effluent 805
Accrued income 14,236
Accrued income adjustmentsVoids not billed in unmeasured 0Additional TE Accrual re 30DCR Provision -284DCR Further -500Accrued Income provision -158Increase in provision -110Industry average adj -63Income prov adj -80Future System Adjustments -620BackBilled Income Provision -700Retro Sewerage EPIC Provision -50M&B Provision -170July '16 Provision -100
0Void back-billing -125
provision 0-15
0 Provision 0
Accrued Income Phasing Adjustment 00
Laundrette project -240Accrued income posted 11,051
Per TB (1420/1423) 11,051
Difference 0
Miscellanous accrued Income 417Interest Received Accrual 1
Total Accrued Income 11,469
Signed:

Annual Information Return 2018 Section 2 Chapter 23 Page 17 of 21
Appendix F – Reconciliation of Meters 2017/18 ‐ Meter Reconciliation Analysis
Meters to be read Apr May Jun Jul Aug Sep Oct Nov Dec Jan Feb MarEstimated 166 228 100 119 96 179 162 221 139 147 111 154
No Read 1,102 737 503 513 589 626 717 733 499 973 574 627
Read 12,371 13,188 10,519 10,797 11,609 13,029 12,292 13,220 10,494 10,815 12,347 12,441
Total Meters 13,639 14,153 11,122 11,429 12,294 13,834 13,171 14,174 11,132 11,935 13,032 13,222
No Reads to be investigated ‐ Code Red
13 17 12 40 15 17 21 11 11 9 5 31
Meters to be billed Apr May Jun Jul Aug Sep Oct Nov Dec Jan Feb MarBillable Meters 12,916 13,406 10,624 10,929 11,704 13,201 12,461 13,418 10,638 11,440 12,446 12,608
Non‐Billable Meters 723 747 498 500 590 633 710 756 494 495 586 614
Total Meters 13,639 14,153 11,122 11,429 12,294 13,834 13,171 14,174 11,132 11,935 13,032 13,222Total Meters Billed 12,415 13,268 10,511 10,774 11,568 13,087 12,337 13,283 10,524 10,815 12,303 12,482
Meters to be investigated
501 138 113 155 136 114 124 135 114 625 143 126
Billable Meters 12,916 13,406 10,624 10,929 11,704 13,201 12,461 13,418 10,638 11,440 12,446 12,608
Meters to be investigated ‐ Code Red
22 18 19 48 20 21 25 9 14 13 15 22
Apr May Jun Jul Aug Sep Oct Nov Dec Jan Feb MarEstimated reads as % of Total Meters to be read
1% 2% 1% 1% 1% 1% 1% 2% 1% 1% 1% 1%
No Reads as a % of Total Meters to be read
8% 5% 5% 4% 5% 5% 5% 5% 4% 8% 4% 5%
Read Meters as % of Total Meters to be read
91% 93% 95% 94% 94% 94% 93% 93% 94% 91% 95% 94%
Total Meters 100% 100% 100% 100% 100% 100% 100% 100% 100% 100% 100% 100%
Code Red as % of Meters to be investigated
1% 2% 2% 8% 3% 3% 3% 2% 2% 1% 1% 5%
Estimated % (Excl 'No Reads') 1% 2% 1% 1% 1% 1% 1% 2% 1% 1% 1% 1%
Apr May Jun Jul Aug Sep Oct Nov Dec Jan Feb MarBillable Meters as % of Total Meter Records
95% 95% 96% 96% 95% 95% 95% 95% 96% 96% 96% 95%
Non ‐ Billable Meters as % of Total Meter Records
5% 5% 4% 4% 5% 5% 5% 5% 4% 4% 4% 5%
Total Meters 100% 100% 100% 100% 100% 100% 100% 100% 100% 100% 100% 100%Meters Billed as a % of Billable Meters
96% 99% 99% 99% 99% 99% 99% 99% 99% 95% 99% 99%
Meters to be investigated as a % of Billable Meters
4% 1% 1% 1% 1% 1% 1% 1% 1% 5% 1% 1%
Billable Meters 100% 100% 100% 100% 100% 100% 100% 100% 100% 100% 100% 100%
Code Red as % of Meters to be investigated
4% 13% 17% 31% 15% 18% 20% 7% 12% 2% 10% 17%

Annual Information Return 2018 Section 2 Chapter 23 Page 18 of 21
Appendix G – Reconciliation of invoices and system adjustments as at 31 March 2017
Trans Rpt GL Posting VarianceMeasured Water 3,181,741 3,181,741 0 Measured Sewerage 1,898,252 1,898,252 0
Unmeasured Water 1,059,942 1,059,942 0 Unmeasured Sewerage 1,242,263 1,242,263 (0)
TE 667,632 667,632 0
Sub‐total 8,049,830 8,049,830 (0)
Discount 4 4 (0)VAT 287,668 287,668 0
TOTAL 8,337,502 8,337,502 0

Annual Information Return 2018 Section 2 Chapter 23 Page 19 of 21
Appendix H – Accrued Income Adjustments at 31 March 2017
Custome Meter R C sto e / Co a Na e Industry Pipe Si Read F Accrual Read H Water vo Water vo Sewera Sewerag Water S Water Vo Total Water Sewerag Sewerag Total Sew Total ac Total accru Total AccruPer DCR 93509 8 808332 Activ ty Re20mm/.75 Six Monthl 171 READING 5,09 30 0 30 £31 £5,200 £5,231 £0 £0 £0 £31 £5,200 £5,231Correction 93509 8 808332 Activ ty Re20mm/.75 Six Monthl 171 READINGS 855 5 0 5 £31 £873 £904 £0 £0 £0 £31 £873 £904
Var ance (£4 327) Var ance £0 Var ance (£4,327)
Customer RMeter Ref C sto e / Co any Name Industry C Pipe Size Read FreqAccrual DaRead HistoWater volu Water volu Sewerage Sewerage Water Sta Water VolumTotal Water C Sewerage Sewerage V Total Sewer Total accruTotal accrual Total AccrualPer DCR 6502512 2170 Food Man 25mm/1.0 Six Monthl 86 IND AVE 2,705 31 0 31 £26 £2,76 £2,790 £0 £0 £0 £26 £2,76 £2,790Correction 6502512 2170 Food Man 25mm/1.0 Six Monthl 86 IND AVE 7,740 90 0 90 £26 £7,910 £7 936 £0 £0 £0 £26 £7,910 £7,936
Var ance £5 145 Var ance £0 Var ance £5,145
Customer RMeter Ref Customer / Company Name Industry C Pipe Size Read FreqAccrual DaRead HistoWater volu Water volu Sewerage Sewerage Water Sta Water VolumTotal Water C Sewerage Sewerage V Total Sewer Total accruTotal accrual Total AccrualPer DCR 86867 3 1389705 Food Man 25mm/1.0 Six Monthl 61 IND AVE 1,919 31 1,823 31 £19 £1,996 £2,01 £22 £3 099 £3,121 £ 0 £5,095 £5,135Correction 86867 3 1389705 Food Man 25mm/1.0 Six Monthl 61 IND AVE 61 1 58 1 £19 £63 £82 £22 £99 £120 £ 0 £162 £202
Var ance (£1 932) Var ance (£3 001) Var ance (£4,933)
Customer RMeter Ref C sto e / Co a Na e Industry C Pipe Size Read FreqAccrual DaRead HistoWater volu Water volu Sewerage Sewerage Water Sta Water VolumTotal Water C Sewerage Sewerage V Total Sewer Total accruTotal accrual Total AccrualPer DCR 26070 1392099 Hospitals 75mm/3.0 Six Monthl 121 IND AVE 3,6 30 3, 62 30 £213 £3,788 £ ,001 £2 7 £5 883 £6,131 £ 60 £9,671 £10,131Correction 26070 1392099 Hospitals 75mm/3.0 Six Monthl 121 IND AVE 1,210 10 1,150 10 £213 £1,258 £1 470 £2 7 £1 953 £2 201 £ 60 £3,211 £3,671
Var ance (£2 530) Var ance (£3 930) Var ance (£6,460)
Customer RMeter Ref C sto e / Co a Na e Industry C Pipe Size Read FreqAccrual DaRead HistoWater volu Water volu Sewerage Sewerage Water Sta Water VolumTotal Water C Sewerage Sewerage V Total Sewer Total accruTotal accrual Total AccrualPer DCR 9206805 53825 Army Base75mm/3.0 Six Monthl 182 IND AVE 5,765 32 5, 77 32 £317 £5,996 £6,313 £369 £9 311 £9,680 £686 £15,307 £15,993Correction 9206805 53825 Army Base75mm/3.0 Six Monthl 182 IND AVE 182 1 173 1 £317 £189 £506 £369 £294 £663 £686 £483 £1,169
Var ance (£5 806) Var ance (£9 017) Var ance (£14,823)
Customer RMeter Ref Customer / Company Name Industry C Pipe Size Read FreqAccrual DaRead HistoWater volu Water volu Sewerage Sewerage Water Sta Water VolumTotal Water C Sewerage Sewerage V Total Sewer Total accruTotal accrual Total AccrualPer DCR 9 19906 286673 Pubs/Wine20mm/.75 Six Monthl 165 READING 2 ,956 151 23,708 151 £30 £25,861 £25,890 £35 £ 0,157 £ 0,193 £65 £66,018 £66,083Correction 9 19906 286673 d Pubs/Wine20mm/.75 Six Monthl 165 READINGS 990 6 941 6 £30 £1,026 £1 056 £35 £1 593 £1 628 £65 £2,619 £2,684
Var ance (£24 835) Var ance (£38 564) Var ance (£63,399)
Customer RMeter Ref C sto e / Company Name Industry C Pipe Size Read FreqAccrual DaRead HistoWater volu Water volu Sewerage Sewerage Water Sta Water VolumTotal Water C Sewerage Sewerage V Total Sewer Total accruTotal accrual Total AccrualPer DCR 3207179 665 10 Food Man 20mm/.75 Six Monthl 23 IND AVE 723 31 687 31 £ £660 £665 £5 £1 025 £1,030 £9 £1,686 £1,695Correction 3207179 665 10 Food Man 20mm/.75 Six Monthl 23 IND AVE 46 2 44 2 £ £42 £46 £5 £65 £70 £9 £107 £116
Var ance (£618) Var ance (£960) Var ance (£1,578)
Customer RMeter Ref Customer / Company Name Industry C Pipe Size Read FreqAccrual DaRead HistoWater volu Water volu Sewerage Sewerage Water Sta Water VolumTotal Water C Sewerage Sewerage V Total Sewer Total accruTotal accrual Total AccrualPer DCR 9 1682 7 7 7 Food Man 25mm/1.0 Six Monthl 31 IND AVE 975 31 926 31 £9 £996 £1,006 £11 £1 5 7 £1,558 £20 £2,5 3 £2,56Correction 9 1682 7 7 7 Food Man 25mm/1.0 Six Monthl 31 IND AVE 31 1 29 1 £9 £32 £41 £11 £49 £60 £20 £81 £101
Var ance (£965) Var ance (£1 498) Var ance (£2,462)
Customer RMeter Ref C sto e / Company Name Industry C Pipe Size Read FreqAccrual DaRead HistoWater volu Water volu Sewerage Sewerage Water Sta Water VolumTotal Water C Sewerage Sewerage V Total Sewer Total accruTotal accrual Total AccrualPer DCR 7801393 38932 Farms Do 15mm/.50 Six Monthl 52 READING 2,235 3 0 3 £9 £2,295 £2,305 £0 £0 £0 £9 £2,295 £2,305Correction 7801393 38932 Farms Do 15mm/.50 Six Monthl 52 READINGS 780 15 0 15 £9 £801 £810 £0 £0 £0 £9 £801 £810
Var ance (£1 494) Var ance £0 Var ance (£1,494)
Customer RMeter Ref C sto e / Co a Na e Industry C Pipe Size Read FreqAccrual DaRead HistoWater volu Water volu Sewerage Sewerage Water Sta Water VolumTotal Water C Sewerage Sewerage V Total Sewer Total accruTotal accrual Total AccrualPer DCR 9079877 367338 Other Lod 50mm/2.0 Six Monthl 137 READING 11,255 82 10,692 82 £120 £11,705 £11,826 £1 1 £18,176 £18,317 £261 £29,882 £30,1 3Correction 9079877 367338 Other Lod 50mm/2.0 Six Monthl 137 READINGS 685 5 651 5 £120 £712 £833 £1 1 £1 106 £1 247 £261 £1,819 £2,080
Var ance (£10 993) Var ance (£17 070) Var ance (£28,063)
Customer RMeter Ref Customer / Company Name Industry C Pipe Size Read FreqAccrual DaRead HistoWater volu Water volu Sewerage Sewerage Water Sta Water VolumTotal Water C Sewerage Sewerage V Total Sewer Total accruTotal accrual Total AccrualPer DCR 880 260 30871 g Food Man 50mm/2.0 Monthly 15 IND AVE 72 31 8 31 £13 £ 83 £ 96 £15 £7 8 £763 £29 £1,231 £1,259Correction 880 260 30871 Food Man 50mm/2.0 Monthly 15 IND AVE 15 1 14 1 £13 £15 £29 £15 £24 £39 £29 £39 £68
Var ance (£467) Var ance (£724) Var ance (£1,191)
Customer RMeter Ref C sto e / Co a Na e Industry C Pipe Size Read FreqAccrual DaRead HistoWater volu Water volu Sewerage Sewerage Water Sta Water VolumTotal Water C Sewerage Sewerage V Total Sewer Total accruTotal accrual Total AccrualPer DCR 83 591 18770 Food Man 50mm/2.0 Monthly 15 IND AVE 72 31 72 31 £13 £ 83 £ 96 £15 £0 £15 £29 £ 83 £511Correction 83 591 18770 Food Man 50mm/2.0 Monthly 15 IND AVE 1,050 70 998 70 £13 £1,073 £1 087 £15 £0 £15 £29 £1,073 £1,102
Var ance £591 Var ance £0 Var ance £591
Customer RMeter Ref C sto e / Co a Name Industry C Pipe Size Read FreqAccrual DaRead HistoWater volu Water volu Sewerage Sewerage Water Sta Water VolumTotal Water C Sewerage Sewerage V Total Sewer Total accruTotal accrual Total AccrualPer DCR 9396 9 761001 Food Man 20mm/.75 Six Monthl 121 IND AVE 3,806 31 3,616 31 £22 £3,890 £3,911 £26 £6 0 0 £6,066 £ 8 £9,930 £9,977Correction 9396 9 761001 Food Man 20mm/.75 Six Monthl 121 IND AVE 121 1 115 1 £22 £124 £146 £26 £192 £218 £ 8 £316 £363
Var ance (£3 766) Var ance (£5 848) Var ance (£9,614)
Customer RMeter Ref C sto e / Company Name Industry C Pipe Size Read FreqAccrual DaRead HistoWater volu Water volu Sewerage Sewerage Water Sta Water VolumTotal Water C Sewerage Sewerage V Total Sewer Total accruTotal accrual Total AccrualPer DCR 9 23007 1391 69 Food Man 15mm/.50 Six Monthl 103 IND AVE 3,2 0 31 0 31 £19 £3,311 £3,330 £0 £0 £0 £19 £3,311 £3,330Correction 9 23007 1391 69 Food Man 15mm/.50 Six Monthl 103 IND AVE 1,030 10 0 10 £19 £1,053 £1 071 £0 £0 £0 £19 £1,053 £1,071
Var ance (£2 259) Var ance £0 Var ance (£2,259)
Customer RMeter Ref C sto e / Co a y Name Industry C Pipe Size Read FreqAccrual DaRead HistoWater volu Water volu Sewerage Sewerage Water Sta Water VolumTotal Water C Sewerage Sewerage V Total Sewer Total accruTotal accrual Total AccrualPer DCR 8 66 90 303305 Energy pro100mm/ . Monthly 11 IND AVE 298 27 0 27 £35 £310 £3 5 £0 £0 £0 £35 £310 £3 5Correction 8 66 90 303305 Energy pro100mm/ . Monthly 11 IND AVE 660 60 0 60 £35 £686 £721 £0 £0 £0 £35 £686 £721
Var ance £376 Var ance £0 Var ance £376
Customer RMeter Ref Customer / Company Name Industry C Pipe Size Read FreqAccrual DaRead HistoWater volu Water volu Sewerage Sewerage Water Sta Water VolumTotal Water C Sewerage Sewerage V Total Sewer Total accruTotal accrual Total AccrualPer DCR 9 037 6 629997 Hotels 20mm/.75 Six Monthl 117 READING 5,1 8 ,891 £21 £5,287 £5,309 £25 £8 211 £8,236 £ 6 £13, 98 £13,5 5Correction 9 037 6 629997 Hotels 20mm/.75 Six Monthl 117 READINGS 585 5 556 5 £21 £601 £622 £25 £933 £958 £ 6 £1,534 £1,580
Var ance (£4 687) Var ance (£7 278) Var ance (£11,965)
Customer RMeter Ref C sto e / Co a Na e Industry C Pipe Size Read FreqAccrual DaRead HistoWater volu Water volu Sewerage Sewerage Water Sta Water VolumTotal Water C Sewerage Sewerage V Total Sewer Total accruTotal accrual Total AccrualPer DCR 53003 301270 Business s15mm/.50 Six Monthl 13 READING 00 31 380 31 £0 £ 16 £ 16 £0 £6 6 £6 6 £0 £1,062 £1,062Correction 53003 301270 Business s15mm/.50 Six Monthl 13 READINGS 26 2 25 2 £0 £27 £27 £0 £42 £42 £0 £69 £69
Var ance (£389) Var ance (£604) Var ance (£993)
Customer RMeter Ref Customer / Company Name Industry C Pipe Size Read FreqAccrual DaRead HistoWater volu Water volu Sewerage Sewerage Water Sta Water VolumTotal Water C Sewerage Sewerage V Total Sewer Total accruTotal accrual Total AccrualPer DCR 9 06 0 793 25 Supermark25mm/1.0 Six Monthl 83 READING 2,515 30 2,389 30 £25 £2,569 £2,59 £30 £3 988 £ ,018 £55 £6,557 £6,612Correction 9 06 0 793 25 Supermark25mm/1.0 Six Monthl 83 READINGS 249 3 237 3 £25 £254 £280 £30 £395 £424 £55 £649 £704
Var ance (£2 314) Var ance (£3 593) Var ance (£5,908)
Customer RMeter Ref C sto e / Co a Name Industry C Pipe Size Read FreqAccrual DaRead HistoWater volu Water volu Sewerage Sewerage Water Sta Water VolumTotal Water C Sewerage Sewerage V Total Sewer Total accruTotal accrual Total AccrualPer DCR 9 36379 131997 Bu lding Su20mm/.75 Six Monthl 0 READING 1,206 30 0 30 £7 £1,25 £1,261 £0 £0 £0 £7 £1,25 £1,261Correction 9 36379 131997 Bu lding Su20mm/.75 Six Monthl 0 READINGS 120 3 0 3 £7 £125 £132 £0 £0 £0 £7 £125 £132
Var ance (£1 129) Var ance £0 Var ance (£1,129)
Customer RMeter Ref C sto e / Company Name Industry C Pipe Size Read FreqAccrual DaRead HistoWater volu Water volu Sewerage Sewerage Water Sta Water VolumTotal Water C Sewerage Sewerage V Total Sewer Total accruTotal accrual Total AccrualPer DCR 12011 13 6 32 Water and 100mm/ . Monthly 26 READING 2,072 80 1,968 80 £82 £2,1 0 £2,222 £95 £3 322 £3, 17 £177 £5, 62 £5,639Correction 12011 13 6 32 Water and 100mm/ . Monthly 26 READINGS 780 30 741 30 £82 £806 £888 £95 £1 251 £1 346 £177 £2,056 £2,234
Var ance (£1 335) Var ance (£2 071) Var ance (£3,406)
Customer RMeter Ref Customer / Company Name Industry C Pipe Size Read FreqAccrual DaRead HistoWater volu Water volu Sewerage Sewerage Water Sta Water VolumTotal Water C Sewerage Sewerage V Total Sewer Total accruTotal accrual Total Accrual
otal Accrual Adj (£63 734) (£94 158) (£157 892)

Annual Information Return 2018 Section 2 Chapter 23 Page 20 of 21
Appendix I – Calculation of Road Drainage Charges The calculation of Road Drainage charges was prepared on the following basis:
i The total urban road and footway surface area was obtained (Source Roads Service), a. Urban road surface area = 39.3million m2
b. Urban footway surface area = 17.0million m2
c. Total Urban road & footway surface area = 56.3million m2
ii The average annual rainfall in Northern Ireland over the last 10 years wasobtained (Source: Met Office).
Average annual rainfall = 1.14m iii The average volume of rain and therefore the run-off from roads and footpaths
discharged into NIW sewers and storm drains was calculated as follows:
56.3million m2 x 1.14m = 64.2million m3
NIW’s network information management system (NIMS) indicated that for the largest 105 urban areas in N Ireland the length of combined sewers and the length of stormwater sewers was split as detailed in the following table. These figures were adjusted to allow for those storm water sewers which rather than discharging into a watercourse were connected into the combined system.
Km % of total Combined sewers 4,378 50.35% Storm water sewers 4,317 49.65% Total 8,695 100.00%
The unit costs of R & V applied were obtained using the Trade Effluent Mogden Formula as per the table below:
Mogden Formula element Cost (£) Per cubic metre
Application
R (Reception) 0.2091 Run off into Storm water sewers
V (Volumetric) 0.2359 Run off into Combined sewers
R+V 0.4449


NORTHERN IRELAND WATER LIMITED - ANNUAL INFORMATION RETURN
ANNUAL INFORMATION RETURN - TABLE 25 REGULATORY ACCOUNTS (HISTORIC COST ACCOUNTING)ANALYSIS OF FIXED ASSETS BY ASSET TYPE (TOTAL)
1 2 3 4 5 6 7 8 9
A GROSS REPLACEMENT COST1 Gross replacement cost at 1 April £m 3 658.937 423.916 37.946 1,120.799 932.097 886.159 50.441 1,868.697 2,989.4962 AMP adjustment £m 3 0.000 0.000 0.000 0.000 0.000 0.000 0.000 0.000 0.0003 Not used4 Disposals £m 3 0.000 -0.157 -0.755 -0.912 0.000 -0.010 -0.984 -0.994 -1.9065 Additions £m 3 9.229 36.127 2.278 47.634 46.855 63.127 1.406 111.388 159.0226 Gross replacement cost at 31 March £m 3 668.166 459.886 39.469 1,167.521 978.952 949.276 50.863 1,979.091 3,146.612
B DEPRECIATION7 Depreciation at 1 April £m 3 1.293 106.271 24.924 132.488 0.000 199.880 33.508 233.388 365.8768 AMP adjustment £m 3 0.000 0.000 0.000 0.000 0.000 0.000 0.000 0.000 0.0009 AMP adjustment - gross MEA revaluation £m 3 0.000 0.000 0.000 0.000 0.000 0.000 0.000 0.000 0.000
10 lives £m 3 0.000 0.000 0.000 0.000 0.000 0.000 0.000 0.000 0.00011 Not used12 Disposals £m 3 0.000 -0.096 -0.570 -0.666 0.000 0.000 -0.738 -0.738 -1.40413 Charge for year £m 3 0.000 17.289 2.993 20.282 0.000 33.465 2.676 36.141 56.42314 Depreciation at 31 March £m 3 1.293 123.464 27.347 152.104 0.000 233.345 35.446 268.791 420.895
15 Net book amount at 31 March £m 3 666.873 336.422 12.122 1,015.417 978.952 715.931 15.417 1,710.300 2,725.71716 Net book amount at 1 April £m 3 657.644 317.645 13.022 988.311 932.097 686.279 16.933 1,635.309 2,623.620
DESCRIPTION UNITS DP OTHER TANGIBLE ASSETS
SUBTOTAL
WATER SERVICE SEWERAGE SERVICE
TOTALINFRASTRUCTURE
ASSETSOPERATIONAL ASSETS OTHER TANGIBLE
ASSETSSUBTOTAL INFRASTRUCTURE
ASSETSOPERATIONAL ASSETS

Annual Information Return 2018 Section 2 Chapter 25 Page 1 of 2
Table 25 – Analysis of Fixed Assets by Asset Type (Total)
The following asset categories have been analysed in the table as follows: ‘Infrastructure assets’ include infrastructure assets only.
Operational assets’ include land, buildings and civils ‘Other tangible assets’ include surplus land, buildings and civils, mobile plant and IT.
Gross Book Value at 1 April and Depreciation at 1 April The total opening balances for gross book value and depreciation at 1 April 2017 have been brought forward from the total closing balances for gross book value and depreciation at 31 March 2017. The analysis across asset categories is based on analysis within the fixed asset register.
AMP Adjustment There was no AMP adjustment during the year.
Impairment There was no impairment required of surplus lands, buildings and civils during the year.
Disposals Disposals during the year mainly consisted of surplus land, buildings, civils, mobile plants (lorries and vans) and fixed plant assets. All disposals have depreciation in the month of disposal.
Decommissioned Assets A number of assets (NBV £185,598.39) were decommissioned during the year. Decommissioned assets are assets which are no longer in use but still have a net book value (NBV) value at the time. In order to account for this, the assets are fully depreciated in year to bring the NBV down to nil.
Additions Additions consisted of capital expenditure incurred during the year plus adopted sewers and sewage pumping stations and PPP assets (see below). When the assets created by the capital expenditure are commissioned they are put onto the fixed asset register and depreciation commences the following month.
In accordance with the regulatory accounting guidelines, fixed asset additions are stated gross of capital contributions but net of IRE. This gives rise to the reconciliation with the capital works programme and statutory accounts below:

Annual Information Return 2018 Section 2 Chapter 25 Page 2 of 2
£’000 Total expenditure in CWP (incl.) Operations) 150,277 Add: Water and sewer connections 4,101 Add: Capital maintenance Omega and Kinnegar 1,539 Add: adopted assets – infrastructure 30,025 Add: adopted assets – non-infrastructure 1,120 Less: de-capitalised assets 15 Add: capitalised interest 5,361 Less: expenditure classified as opex under IFRS (1,188) Total additions per statutory accounts 191,249 Less Capital maintenance Omega and Kinnegar (1,539) Add back: IRE treated as opex repairs under IFRS 1,188 Less: interest capitalised (5,361) Less: IRE (30,250) Add: PPP residual interest 3,736 Total additions per regulatory accounts 159,023
PPP Assets Additions During the year, there were on-balance sheet additions to PPP assets. Therefore, there was an element in the table relating to PPP assets totalling to relating to the capital maintenance fund.
There is also additional residual interest for PFI Kinnegar asset and Omega asset with an historical cost of which is included in Table 25 under operational civil. The total residual interest at 31 March 2018 is (31 March 2017: ).
Depreciation Charge for Year Historical cost depreciation charge during the year was calculated based on the opening GBV at 1 April 2017. Additions and disposals during the year were taken into account in calculating the depreciation charge.
Commentary All assets were analysed to each of their respective asset categories and service activities to identify the water and sewerage services. The management and general service activity assets, with a GBV of £32,476,170.88 (16/17: £31,241,682.66) as at 31 March 2018, could not be readily identified as water and sewerage services and have been split as per IFM: Water 41% and Sewerage 59%.
Table 25 has also been adjusted to include only the appointed business and exclude the unappointed business relating to vehicle maintenance carried out for third parties. This has been adjusted through Water Services – Other Assets.

NORTHERN IRELAND WATER LIMITED - ANNUAL INFORMATION RETURN
ANNUAL INFORMATION RETURN - TABLE 28 REGULATORY ACCOUNTSCASH FLOW STATEMENT FOR YEAR ENDING 31 MARCH (TOTAL
1 2 3 4 5 6 7 8 9
DESCRIPTION UNITS DP 2012-13 2013-14 2014-15 2015-16 2016-17 2017-18 2018-19 2019-20 2020-21
1 Net cashflow from operating activities £m 3 181.015 190 580 195.707 170 228 182.677 182.769
A RETURN ON INVESTMENTS & SERVICING OF FINANCE2 Interest received £m 3 0.134 0.114 0.080 0 092 0.074 0.1033 Interest paid £m 3 -42.208 -43.723 -45.339 -46 568 -46.945 -47.5374 Interest in finance lease rentals £m 3 -11.913 -6 933 -6.824 -6.701 -6.562 -6.4065 Non-equity dividends paid £m 3 0.000 0 000 0.000 0 000 0.000 0.0006 Net cashflow from returns on investments & servicing of finance £m 3 -53.987 -50 542 -52.083 -53.177 -53.433 -53.840
B TAXATION 7 Taxation (paid)/received £m 3 0.000 0 000 -0.017 0 000 0.000 0.000
C CAPITAL EXPENDITURE AND FINANCIAL INVESTMENT8 Gross cost of purchase of fixed assets £m 3 -130.590 -135 971 -134.620 -115 602 -128.215 -158.2789 Receipts of grants and contributions £m 3 5.757 6 586 7.333 7 980 11.550 12.910
10 Infrastructure renewals expenditure £m 3 -31.368 -30.118 -31.557 -20.144 -20.145 -30.25011 Disposal of fixed assets £m 3 1.177 1.164 1.046 1 693 1.096 1.53612 Movements on long term loans to group companies £m 3 0.000 0 000 0.000 0 000 0.000 0.00013 Net cashflow from investing activities £m 3 -155.024 -158 339 -157.798 -126 073 -135.714 -174.082
D ACQUISITIONS AND DISPOSALS14 Acquisitions and disposals £m 3 0.000 0 000 0.000 0 000 0.000 0.000
E EQUITY DIVIDENDS15 Equity dividends paid £m 3 -26.587 -21 391 -21.562 -22 887 -21.510 -21.153
F MANAGEMENT OF LIQUID RESOURCES16 Net cashflow from management of liquid resources £m 3 -5.300 4.700 0.580 -0 980 -1.501 -0.007
17 Net cashflow before financing £m 3 -59.883 -34 992 -35.173 -32 889 -29.481 -66.313
G FINANCING18 Capital in finance lease rentals £m 3 -3.675 -1.473 -1.672 -1 888 -2.122 -2.37619 New bank loans taken out £m 3 75.000 29 000 36.000 36 000 30.000 69.00020 Repayment of bank loans £m 3 0.000 0 000 0.000 0 000 0.000 0.00021 Proceeds from share issues £m 3 0.000 0 000 0.000 0 000 0.000 0.00022 Net cash inflow from financing £m 3 71.325 27 527 34.328 34.112 27.878 66.624
23 Increase/(decrease) in cash in the year £m 3 11.442 -7.465 -0.845 1 223 -1.603 0.311

Annual Information Return 2018 Section 2 Chapter 28 Page 1 of 2
Table 28 – Cashflow statement
Significant movements from last period
Line 1 - Net cashflow from operating activities This has increased by £0.092m (0.05%). The reconciliation of operating profit to net cashflow from operating activities is shown in Table 29.
This is summarised in Table 29 as follows:
1 Current cost operating profit £m 106.485 2 Working capital adjustment £m - 3 Movement in working capital £m (5.910) 4 Depreciation £m 56.418 5 Current cost profit on sale of fixed assets £m (1.035) 6 Infrastructure renewals charge £m 25.757 7 Other non-cash profit and loss items £m 1.054 8 Net cash flow from operating activities £m 182.769
Line 3 – Interest paid Interest paid has increased by 1.26% from £46.945m to £47.537m. This is consistent with an additional loan drawdown of £69m in 2017-2018. The balance on loans can be summarised as follows:
At 1 April 2007 £150m At 31 March 2008 £307.56m (average for year £228.78m) At 31 March 2009 £457.56m (average for year £382.56m) At 31 March 2010 £627.56m (average for year £542.56m) At 31 March 2011 £737.56m (average for year £682.56m) At 31 March 2012 £807.56m (average for year £772.56m) At 31 March 2013 £882.56m (average for year £845.06m) At 31 March 2014 £911.56m (average for year £897.06m) At 31 March 2015 £947.56m (average for year £929.56m) At 31 March 2016 £983.56m (average for year £965.56m) At 31 March 2017 £1,013.56m (average for year £998.56m) At 31 March 2018 £1,082.56m (average for the year £1,048.06m)
Line 4 - Interest in finance lease rentals The Alpha project during 2017-2018 gave rise to (2017: ) interest payable on the associated finance lease. This decrease arises as an element of the unitary charge paid to the concessionaire is allocated by NIW to reducing the principal on the lease (see Line 18).
Line 8 - Gross cost of purchase of fixed assets These have increased by £0.937m (0.73%). This is consistent with capital expenditure plans for 2017-18 and the movement in capital creditors across the period. Purchase of subsidiaries of 29.126m has been included within purchase of fixed assets.

Annual Information Return 2018 Section 2 Chapter 28 Page 2 of 2
Line 10 - Infrastructure Renewals Expenditure IRE for 2017-2018 compared to 2016-2017 can be shown as follows:
IRE 2017-2018
2016-2017
Increase/(Decrease) in period
Increase/(Decrease) in period
£m £m £m % Water 17.015 19.497 (2.482) (12.7%) Sewerage 13.235 10.434 2.801 26.8% Total 30.250 29.931 0.319 1.1%
Line 16 - Net cashflow from management of liquid resources Management of liquid resources represents the movement in monies held on short-term deposit accounts.
Monies on deposit have increased by £0.007m from the end of 2016-2017 to the end of 2017-2018 with a consequent decrease in cashflow. The balance on deposit at the end of 31st March 2018 is £2.508m.
Line 18 - Capital in finance lease rentals. An amount of was made in payment against the Alpha PPP finance lease.
Line 19 - New bank loans taken out In 2017-2018 £69m of additional loan notes were drawn down from DfI. These new loans were required to part finance the ongoing capital expenditure programme with the balance of capital expenditure financed by working capital.
PPP The elements of PPP included in the cashflow are as follows:
The PPP aspect to lines 4 and 18 in Table 28 are outlined in ‘significant movements from last period’ in this commentary.
Included in Line 8: Gross cost of purchase of fixed assets in Table 28 is in respect of capital maintenance additions for Alpha PPP paid for via the unitary payments. All other capital expenditure for Alpha is accounted for through the repayment of the finance lease.

NORTHERN IRELAND WATER LIMITED - ANNUAL INFORMATION RETURN
ANNUAL INFORMATION RETURN - TABLE 29 REGULATORY ACCOUNTS (HISTORIC COST ACCOUNTINGRECONCILIATION OF OPERATING PROFIT TO NET CASH FLOW FROM OPERATING ACTIVITIES (TOTAL
1 2 3 4 5 6 7 8 9
DESCRIPTION UNITS DP 2012-13 2013-14 2014-15 2015-16 2016-17 2017-18 2018-19 2019-20 2020-21
1 Historical cost operating profit £m 3 19.872 19.799 59.111 53.738 56 925 106.4852 Not used3 Movement in working capital £m 3 0.595 8.388 12.045 -9.675 -1 670 -5 9104 Receipts from other income £m 3 0.000 0.000 0.000 0 000 0 000 0 0005 Depreciation £m 3 150.895 135.458 104.185 110.522 110 854 56.4186 Historical cost profit on sale of fixed assets £m 3 -0.303 -0.208 -0.488 -0 091 0.489 -1 0357 Infrastructure renewals charge £m 3 30.761 33.409 32.309 25.286 25 008 25.7578 Other non-cash profit and loss items £m 3 -18.164 -4.265 -10.615 -8 036 -5 897 1 0549 Net cash flow from operating activities £m 3 181.015 190.580 195.707 170 228 182 677 182.769

Annual Information Return 2018 Section 2 Chapter 30 Page 1 of 28
Chapter 30 – Capital investment Summary Report Introduction This chapter provides a consolidated report on Capital investment which draws on Chapters 32, 35, 26, 36a and 40 and associated tables. PPP No PPP expenditure is reported in these tables. There was no Capital spend in 2017/18 relating to PPP that is not included within the unitary charge payments. In relation to Capital additions the only Capital not included in this table is the PPP Alpha Capital maintenance charge of . Capital investment driver allocation (Service categorisation and purpose allocation) The Capital Investment Driver Allocation (CIDA) methodology has remained consistent as per recent PC10/PC13 years. NI Water captures Service Categorisation, Life Categories (as reported in Table 34) and Purpose Allocation within our CIDA data capture. This data is captured within CPMR at project level and used for CIM (Table 40) and the other related AIR tables. Based upon the PC15 query responses on CIDA allocation NI Water have revised the CIDA allocation manual during 2017/18 to reflect the revisions. These are being integrated into the capital projects. A CIDA training programme should be delivered during the next financial year to ensure project managers and consultants, maintain an understanding of the CIDA allocation process. This will enable new staff to be trained and current staff to have a refresher. No apportionment has taken place during the analysis and table population stage as this was completed by Project Managers at the initiation of the project, and reviewed at appropriate gateways for EP projects. During 2017/18 all CIM (Table 40) information has been reported directly from CPMR without the detailed manual assessment required in previous years. For the related AIR Tables M & G spend has been reported from CPMR, but Operational Capital has had to be analysed manually as per previous years as the data on CPMR is not in a format that allows for robust reporting. Further refinements have been delayed to allow for more automation for the completion of the tables. As a result the same process used in AIR 17 has been adopted for AIR 18. Assets Adopted at Nil Cost Sewer adoptions paid by third parties of £45.960m are included in column 4, line 7 of Table 32 within Sewerage infrastructure enhancements. Sewerage Pumping Stations paid by third parties of £6.730m are included in Col 5, line 12 within Sewerage non infrastructure enhancements. All of the investment reported in block D of Table 36 is reported as ‘Supply Demand Balance: New Development’.
The calculation of gross asset valuation for adopted sewerage assets is based on the unit costs derived from NI Water sewer framework rates. The unit costs are applied by diameter banding and total lengths laid. The costs include pipe laying, pipe supply, laterals, manholes and compensation.

Annual Information Return 2018 Section 2 Chapter 30 Page 2 of 28
Total Asset Additions reconciliations Total asset additions – Water Service – Check to Table 25 line 5 col 4.
For AIR 18 the reported numbers in these two tables are as follows: Table 25 – £47.634m Table 36 – £46.197m
The main variances in the above two figures are explained as follows: a) PPP Alpha Capital maintenance of is not included in Table 36 b) £9k included in Table 25 relates to Decapitalised projects in 2017/18
Total asset additions – Sewerage Service – Check to Table 25 line 5 Col 8. For AIR 18 the reported numbers in these two tables are as follows: Table 25 – £111.634m Table 36 – £110.405m
The main variances in the above two figures are explained as follows:
c) PPP Omega and PPP Kinnegar residual asset additions were not included in Table 36.
d) £7k included in Table 25 relates to Decapitalised projects in 2017/18
Expenditure to reduce leakage The table below provides a breakdown of the leakage expenditure in 2017/18. This includes the purpose allocations which have followed the principle as set out in PC10 Final Determination. It should be noted that the figures reported include Leakage repair costs. These are completed by the Water Networks function, but the Leakage and Water Networks are now part of the Water Production Function. The opex costs reported in the table are the total opex costs relating to Leakage. This is comprised of Leakage Function staff costs and leakage repair costs incurred by both the Leakage and Water Network function.
Activity
2017/18 actual spend per category £m
Purpose allocation
Leakage detection costs - opex 4.700 OPEX Leakage repair costs - opex 1.500 OPEX Leakage detection costs - capex 0.307 Base Leakage infra replacement repair costs - capex 0.665 Base Leakage detection equip 0.042 Base Leakage software upgrades and developments 0.000 Base New leakage technology 0.000 Base DMA studies 0.428 Base Trunk Main studies 0.026 SDB Growth DMA optimisation 0.103 SDB Growth Water balance asset data assessments 0.071 Base ELL reviews 0.001 Base Pressure Management 0.421 SDB Growth PRV replacements 0.229 Base GSM Loggers/Meter studies/Meter replacement 0.807 Base Other 0.000 Base Total (OPEX) 6.200
Total (Capex) 3.098
Total Leakage investment 9.298

Annual Information Return 2018 Section 2 Chapter 30 Page 3 of 28
Capital programme variance The Capital programme for 2017/18 when compared to the PC15 final determination has under delivered in the ‘Water Service’ but delivered in the ‘Sewerage Service’. It is important to note however that NI Water was not funded to deliver the PC15 Final Determination and produced an adjusted budget which reflected the reduced funding allocation. This adjusted budget reduced PE funding by £9.3m (once other funding considerations are taken into consideration), from £164.5m to £155.2m The main reasons for variance in 2017/18 are as follows:
a) The largest variances are found in Sub programme 12 (Sewerage Maintenance, Flooding and DG5) and Sub programme 16 (Wastewater treatment (new starts). One of the largest overspends has occurred in Sub-programme 16 where spending on Dungannon WwTW was accelerated in the programme resulting in approximately £3.5m of an overspend. The overspend in sub programme 12 has been the result of additional sewer rehabilitation work identified during DAP investigations and has resulted in an overspend of around £5m. This overspend is being assessed and expenditure in subsequent years shall be moderated in line with PC15 budgets.
b) Sub programme 8 was adjusted to accommodate in year capital works programme changes (e.g. Dunore Solar) which resulted in an underspend of around £8m. Sub programme 4 had a large underspend due to ongoing investigations into the solution required at Caugh Hill WTW, this resulted in an underspend of around £5m.
Year 3 saw the PC15 overspend in base maintenance reducing with an in year baseline of £90.5m against an actual figure of £77.6m and will continue to be addressed as PC15 proceeds. Energy efficiency and renewable energy schemes A summary of Energy efficiency and renewable energy schemes is included in Annex A at the end of this document.

Annual Information Return 2018 Section 2 Chapter 30 Page 4 of 28
2017/18 Q4 Capital Investment Monitoring Return (Table 40) Company Baseline A PC15 baseline is included in this CIM submission. The PC15 capital baseline is a detailed listing of projects and programmes of work, the costs and outputs from which have been presented to the Utility Regulator through the Price Control process. The baseline is expressed in 2012/13 prices, post efficiency.
Capital Expenditure Commentary This submission is completed primarily using CPMR with full reconciliation completed to ORACLE. The following is a summary of CAPEX expenditure in 2017/18 (excluding contributions) at the end of Q4 as per ORACLE and reconciled to the CIM submission shown in money of the day.
£m Total Gross capital expenditure as per ORACLE 152.622 Capital works programme expenditure 109.557 Operations Capital from CPMR 22.419 M & G capital from CPMR 6.691 Capitalised Salaries and overheads 13.957 Rounding from ORACLE to CAPTRAX/CPMR -0.002 Reconciled Total 152.622
During the period (April 2017 – March 2018) there has been Capital income in the form of Grants and Contributions totalling to £12.557m. This figure is not included on the CIM submission. Inflation Assumptions The project costs reported in the ‘current actual or projected’ portion of the CIM are in current prices. All project costs are captured in nominal prices as no inflation assumptions are applied within CPMR. Capital expenditure within the Final Determination was inflated by RPI which was linked to projections made by the Office for Budgetary Responsibility (OBR) in March 2014. This allowed 3.4% RPI annually through the six year period. Table 2 shows actual RPI in 2015-16 and OBR forecast figures for the years 2017-18 to 2020-21 (based on Mar 18 economic and fiscal outlook). This shows a reduction in inflation levels from that assumed in the PC15 FD. NI Water continue to monitor the OBR view of RPI. Inflation (RPI) projections 2015/16 2016/17 2017/18 2018/19 2019/20 2020/21 PC15 FD assumed Indices
266.800 275.871 285.250 294.949 304.977 315.346
3.4% 3.4% 3.4% 3.4% 3.4% 3.4% Current actual and projected indices (OBR Mar 2017)
259.433 264.992 275.326 284.687 293.513 302.612
1.08% 2.14% 3.90% 3.40% 3.10% 3.10%

Annual Information Return 2018 Section 2 Chapter 30 Page 5 of 28
Reconciliation with Table 36
Table 36 - Water service nominal expenditure
Gross Capital expenditure - Water Service T36 £m
CIM £m
Variance £m
Variance %
1 MNI (gross of grants and contributions) 23.543 22.285 -1.258 -5.65
2 Infrastructure renewals expenditure (gross)
19.497 20.710 1.213 5.86
3 Capex: Total quality enhancement programme
14.177 14.238 0.060 0.42
4 Capital expenditure - customer service 3.175 2.949 -0.226 -7.66
5 Capital expenditure - supply demand balance
7.393 7.304 -0.089 -1.22
6 Gross Capital expenditure - Water Service
67.786 67.485 -0.301 -0.45
Table 36 - Sewerage service nominal expenditure Gross Capital expenditure - Sewerage Service
T36 £m
CIM £m
Variance £m
Variance %
7 MNI (gross of grants and contributions) 46.247 45.999 -0.248 -0.54
8 Infrastructure renewals expenditure (gross)
10.434 10.628 0.194 1.82
9 Capex: Total quality enhancement programme
13.559 13.872 0.313 2.26
10 Capital expenditure: customer service
5.359 5.322 -0.038 -0.71
11
Capital expenditure supply demand balance
10.951 11.027 0.076 0.69
12
Gross Capital expenditure - Sewerage Service
86.551 86.848 0.297 0.34
The above table shows the comparison between the CIM (Table 40) and Table 36. Assets adopted at NIL cost reported in Table 36 have been excluded from this comparison. The variances shown arise because the data held for population of the AIR tables has direct links between the asset type, service area and investment driver. Where there are complex projects this detail is required to provide an accurate analysis of the expenditure. The summary detail on the CIM does not give a full transparency of this detail as the direct link between asset type, service area and investment area is lost but does give a reasonable interpretation of the investment. In addition direct comparison is difficult as Capitalised Salaries and overheads are a single line on the CIM which has had a service allocation and purpose allocation applied based on the rest of the programme. For AIR 17 the Capital salaries and overheads were applied by examining each of the three elements of the programme namely, CWP, M & G and Operations Capital and assigning Salaries and Overheads against each of these programmes before combining into a single line. Whilst still not exact it more closely reflects the way salaries are allocated to individual projects. Within AIR the Capitalised Salaries and overhead information is included within individual project costs.

Annual Information Return 2018 Section 2 Chapter 30 Page 6 of 28
Sixteen Box Summary 2017/18 Current Actual Projected 16 box summary showing expenditure £m (nominal)
Quality Enhancement
Base Service provision
Enhanced service levels
Supply Demand Balance
Totals
Water Infrastructure 5.34 16.76 0.80 6.18 29.07 Water Non-Infrastructure 2.39 20.07 10.43 2.29 35.18 Sewerage Infrastructure 5.79 10.42 5.11 5.88 27.21 Sewerage Non-Infrastructure
10.47 43.23 2.92 4.55 61.16
Totals 23.99 90.48 19.26 18.89 152.62 2017/18 Current Actual Projected 16 box summary in percentages
Quality Enhancement
Base Service provision
Enhanced service levels
Supply Demand Balance
Totals
Water Infrastructure 3.5% 11.0% 0.5% 4.0% 19.0% Water Non-Infrastructure 1.6% 13.2% 6.8% 1.5% 23.1% Sewerage Infrastructure 3.8% 6.8% 3.4% 3.9% 17.8% Sewerage Non-Infrastructure
6.9% 28.3% 1.9% 3.0% 40.1%
Totals 15.7% 59.3% 12.6% 12.4% 100.0% 2017/18 Baseline 16 box summary showing expenditure £m (2012/13 prices)
Quality Enhancement
Base Service provision
Enhanced service levels
Supply Demand Balance
Totals
Water Infrastructure 12.00 12.81 1.14 10.56 36.51 Water Non-Infrastructure 6.81 22.17 2.80 4.02 35.80 Sewerage Infrastructure 5.73 9.83 3.84 4.70 24.10 Sewerage Non-Infrastructure
7.65 32.83 5.22 4.19 49.88
Totals 32.19 77.63 13.00 23.47 146.29 2017/18 Baseline Projected 16 box summary in percentages
Quality Enhancement
Base Service provision
Enhanced service levels
Supply Demand Balance
Totals
Water Infrastructure 8.2% 8.8% 0.8% 7.2% 25.0% Water Non-Infrastructure 4.7% 15.2% 1.9% 2.7% 24.5% Sewerage Infrastructure 3.9% 6.7% 2.6% 3.2% 16.5% Sewerage Non-Infrastructure
5.2% 22.4% 3.6% 2.9% 34.1%
Totals 22.0% 53.1% 8.9% 16.0% 100.0%

Annual Information Return 2018 Section 2 Chapter 30 Page 7 of 28
PC15 16 box FD baseline (2012/13 prices): Expenditure across the PC15 programme £m
Quality Enhancement
Base Service provision
Enhanced service levels
Supply Demand Balance
Totals
Water Infrastructure 72.24 78.15 6.98 54.95 212.32 Water Non-Infrastructure 27.20 125.28 16.71 34.13 203.32 Sewerage Infrastructure 36.92 59.48 21.08 27.60 145.08 Sewerage Non-Infrastructure
61.03 201.49 20.54 33.58 316.64
Totals 197.39 464.40 65.32 150.26 877.36 PC15 16 box summary: Baseline expenditure by percentage across the PC15 programme
Quality Enhancement
Base Service provision
Enhanced service levels
Supply Demand Balance
Totals
Water Infrastructure 8.23% 8.91% 0.80% 6.26% 24.20% Water Non-Infrastructure 3.10% 14.28% 1.90% 3.89% 23.17% Sewerage Infrastructure 4.21% 6.78% 2.40% 3.15% 16.54% Sewerage Non-Infrastructure
6.96% 22.97% 2.34% 3.83% 36.09%
Totals 22.50% 52.93% 7.44% 17.13% Variance on Nominated Outputs (2012/13 prices) Figure 1 illustrates the movement in the PC15 nominated output projects: this is based on the PC15 FD baseline and assumes a fully funded Final Determination budget with catch-up. In 2014/15 a number of nominated projects were delayed and carried into PC15. In addition, PE reductions have had an impact in PC15 year 1 and 2. The variance showing in 2021/22 is due to spend on KF350 Dungannon WWTW and KR489 Glenmachan Strategic Project Phase 1a Sicily & Marguerite Park Flood Alleviation. In summary, a negative variance of £37m incurred from 2014/15 to 2017/18 must be addressed from 2018/19 to 2020/21: To date this has reduced to £30m however NI Water must continue to ensure sustained focus on delivery as the catch-up from 2018/19 to 2020/21 will require significant effort. Figure 1: Variance on Nominated Outputs

Annual Information Return 2018 Section 2 Chapter 30 Page 8 of 28
CIM summary Table Code Title Baseline £m
(2012/13 prices)
Current actual or projected 2015/16 £m (nominal)
Current actual or projected 2015/16 £m (2012/13 prices using latest OBR RPI forecast)
0 Staff Salaries and on-costs 11.20 13.96 12.40 1 Base maintenance (Water) 6.06 8.33 7.40 2 Base maintenance (sewerage) 20.85 24.87 22.10 3 Water resources 0.72 2.03 1.80 4 Water treatment works 7.41 2.67 2.37 5 Water trunk mains 4.36 -0.08 -0.07 6 Service reservoirs and clear
water tanks 0.76 1.17 1.04
7 Service reservoir rehabilitation 3.19 3.61 3.21 8 Water mains rehabilitation 17.72 11.11 9.88 9 Leakage 2.55 2.42 2.15 10 Ops capital Water 6.13 8.05 7.15 12 Sewerage Maintenance, UIDs,
Flooding 14.48 21.88 19.44
15 Wastewater treatment (carryover) 0.00 -0.08 -0.07 16 Wastewater treatment (new
starts) 7.99 12.88 11.45
17 Small wastewater treatment works
1.87 1.36 1.21
18 Ops capital Sewerage 7.24 10.90 9.69 19 Meter installation and
maintenance 3.65 1.05 0.93
20 Management and general 10.25 17.63 15.67 23 Minor watermain repairs,
requisitions, road schemes and public realm
3.97 5.49 4.87
24 Minor sewer repairs, requisitions, road schemes and public realm
3.40 3.40 3.02
98 Additional Outputs Programme (Enhancement)
11.84 0.00 0.00
99 PC15 balancing line (Base) 0.67 0.00 0.00 Total Excluding additional outputs 11.20 152.64 135.65 Total Including additional outputs 146.29 152.64 135.65

Annual Information Return 2018 Section 2 Chapter 30 Page 9 of 28
Nominated Outputs Refer to Table 40a and associated commentary for full detail on nominated outputs over Year 3 of the PC15 period. Water Beneficial Use was claimed on the following CWTs during 2017/18:
Ref Scheme Name
Quarter claimed
1 JC385 Monaclogh SR 17/18 Q1 Sewerage Beneficial Use was claimed on the following UIDs during 2017/18:
Ref UID Scheme UID Name
Quarter claimed
1 UID389 KA260 Muckamore WwPS 17/18 Q1 2 UID010 KF330 Newry Road SPS 17/18 Q1 3 UID040 KC415 Ballysally CSO Upgrade 17/18 Q2 4 UID008 KF396 Milford WwPS 17/18 Q2 5 UID420 KL524 Bleachgreen WwPS 17/18 Q2 6 UID023 KS887 Castle Park CSO 07 17/18 Q4 7 UID179 KS887 13 Rugby Avenue CSO 8A 17/18 Q4 8 UID180 KS887 11 Brunswick Road CSO 8B 17/18 Q4 9 UID181 KS887 104 Abbey Street CSO 8F 17/18 Q4 10 UID182 KS887 114 Abbey Street CSO 8E 17/18 Q4 11 UID184 KS887 UID184 Abbey Park CSO 9 17/18 Q4
Beneficial Use was achieved at the following Waste Water Treatment Works:
Ref Scheme Site
Quarter claimed
1 KP586 Clabby Wwtw 17/18 Q4 2 KC296 Ballycastle WwTW 17/18 Q4 3 KA239 Mullans WwTW (Antrim) 17/18 Q4
Beneficial Use was achieved at the following Waste Water Treatment Works from the Rural WwTW Programme:
Scheme Site CAR ID Quarter claimed KI542 Oliver Plunkett S02284 17/18 Q2 KI542 Bresagh WwTW S00332 17/18 Q3 KI542 Carnanbane WwTW S03037 17/18 Q3 KI542 Ardgarvan WwTW S02987 17/18 Q4


Annual Information Return 2018 Section 2 Chapter 30 Page 11 of 28
Annex A 1. Purpose and background
This Annex A is a report on capital projects associated with the NI Water Energy Efficiency programme for inclusion in the NI Water Annual Information Return (AIR 17) Chapter 30. This report was first requested in 2016, at which time the Utility Regulator specifically outlined reporting elements for inclusion as follows: “Energy efficiency and renewable energy schemes” 3.13 The commentary should identify the total invested in energy efficiency and renewable energy schemes and the allocation of this investment by purpose. 3.14 The PC15 final determination included funding for a range of energy efficiency and renewable energy schemes proposed by the company intended to contribute cumulative energy reductions of around 12GWhr by the end of the PC15 period. This expenditure is spread across a range of investment categories within the capital expenditure tables. The company should summarise progress on delivery of energy efficiency and renewable energy savings through these schemes in a specific section within the consolidated report on capital investment. This should include an estimation of the cumulative energy reductions delivered against PC15 estimates and an explanation of how they have been derived. Explanations for any variance to original delivery plans should be provided. 3.15 In the PC15 final determination we noted that confirmation of the scope, costs and benefits for the sub-meter schemes were subject to the completion of a feasibility study and that NI Water needed to demonstrate that the investment was beneficial and confirm this to the Utility Regulator before embarking on wide spread sub-metering. Progress on this issue should also be addressed in this section of the consolidated report.”
2. Context
The PC15 Final Determination includes capital funding of £9.0m for a range of energy efficiency and renewable energy schemes that were proposed by NI Water to contribute cumulative energy reductions of 12GWh by the end of the PC15 period. Since the PC15 energy efficiency and renewable energy action plan was first drafted, the energy landscape and NI Water’s roll in it has changed. Decarbonisation, decentralisation and digitalisation are rapidly transforming electricity grids, alongside continuing technological advances in energy storage and the electrification of transportation and heat. In addition, Government policy changes in 2015, particularly the closure of the Renewables Obligation, negatively impacted the investment profile of renewable energy generation projects. These dramatic and unforeseen changes to policy instruments, together with rapid changes to the electricity grid, necessitated that NI Water strategically review the PC15 Final Determination to ensure that best value for money is achieved.


Annual Information Return 2018 Section 2 Chapter 30 Page 13 of 28
Funding available for EP017 was allocated for the purpose of investing in renewable energy during PC15. Within the PC15 Business Plan, NI Water proposed to develop a single wind turbine at the North Coast WwTW. The business case for this project was deemed viable as the kWh generation could be consumed within the WwTW (at the North Coast WwTW) and would receive an income from the Governments Renewable Obligation Certificates (ROCS) incentive scheme. After two unsuccessful planning applications, the balanced of this proposed expenditure was reallocated to the installation of Solar Photo Voltaic Systems. Multiple Sites - Solar Photo Voltaic (<150kW each) Capital Requested in DD Business Plan: £0 Current Assessment of Funding Required: £1.54m NI Water installed approximately 8MW of Solar PV systems during PC15 to date. 57 installations have occurred across NI Waters Asset base (throughout Northern Ireland) during PC15. Funding for these installations was provided from EP017 and BE017. Dunore WTW - Solar Photo Voltaic (5MW) Capital Requested in DD Business Plan: £0 Current Assessment of Funding Required: £7.53 NI Water were previously seeking to take advantage of land adjacent to Dunore Water Treatment Works to procure renewable energy through a private wire Power Purchase Agreement (“PPA”). The land had planning permission for a 46MW solar farm, which would enable NI Water to utilise existing connection offers from NIE Networks. This opportunity concluded unsuccessfully when the tenderer withdrew their BAFO. An alternative 5MW project was subsequently identified whereby NI Water would lease the land from the landowner, buy the development rights for the site and award the design and build contract through an existing framework. Legal opinion confirmed that this project could be viewed as a lands transaction and was therefore compliant with the Utility Contract Regulations (UCRs). In addition, albeit under a challenging timeframe, the project could reasonably expect to qualify for ROCs if completed before 31 march 2018. Following ECI approval, NI Water constructed the 5MW Solar PV array at Dunore Point WTW during the 2017/18 FY. The project was completed in advance of the closure of the ROC grace period deadline. Benefits from this windfarm will start accruing during the 2018/19 FY and are estimated at £560k and 2,000 tCO2 per annum. Delivery of this project has received favourable public recognition and helped achieve a number of strategic objectives for NI Water, including:
Reduce the cost per kWh of electricity supply at major energy consuming sites Reduce the net cost paid for electricity used at major consuming sites Reduce the longer term cost of electricity and volatility in electricity pricing at major
consuming sites Increase NI Water’s use of renewable energy to mitigate the effects of climate change
Funding for this installation was provided from JA312. JI041 Hydro power from raw water Capital Requested in DD Business Plan: £0.439m Current Assessment of Funding required £0.051m

Annual Information Return 2018 Section 2 Chapter 30 Page 14 of 28
Within the PC15 business plan (after a feasibility exercise), ten potential hydro schemes were identified for delivery at eight sites. This envisaged programme of work was impacted by the withdrawal of the incentive scheme from central Government and NIE Networks connection process. A further feasibility assessment is underway to re-examine these projects to determine their viability at five sites, taking into account the following issues:
1. Silent Valley: A NIE grid connection was applied for in 2017 but cannot be progressed further as NIE Networks has confirmed that there is currently no export capacity available and reinforcement costs are prohibitive.
2. Dorisland WTW: A connection application was submitted to NIE Networks in 2015, but cannot be progressed further as NIE Networks has confirmed that there is currently no capacity available and reinforcement costs are prohibitive.
3. Altnaheglish (Caugh Hill): A connection application was submitted to NIE Networks in 2015, but cannot be progressed further as NIE Networks has confirmed that there is currently no export capacity available and reinforcement costs are prohibitive.
4. and 5. Two existing Hydro electricity generators are being evaluated for refurbishment and the design solutions are underway. Repurposing for potential application within a pumped storage scheme is also under consideration.
JI040 Recovering Energy from the water distribution System Capital Requested in DD Business Plan: £1.350m Current Assessment of Funding Required during PC15: £1.484m Due to technical and connection uncertainties around this initiative, NI Water focused on sites with potentially attractive payback periods. Within the PC15 programme, NI Water planned to conduct a trial to assess the viability of generating electricity from Pressure Relief Valves in the water network. Due to technical difficulties, withdrawal of the government incentive schemes and NIE connection issues this project has been withdrawn for implementation during the PC15 period. 3.1.1.2. Renewable Generation via Power Purchase Agreements (PPAs) Within the PC15 Energy Efficiency programme, PPAs have been identified as a credible efficiency measure. Under a PPA, a third party would fund and deliver the solution (e.g. a wind turbine). It is envisaged NI Water would enter into contracts to purchase the electricity generated at a rate below that available from the main electricity suppliers (from the grid), for a defined period e.g. 10 – 15 year duration. Such arrangements would contribute to renewable energy targets and should deliver an Opex cost saving over the contract duration. Following submission and approval of an Outline Business Case, the Energy Team are progressing with market engagement to determine the business benefits of entering into Corporate PPA arrangements that include both ‘private wire’ and virtual/synthetic PPAs to inform the development of a Final Business Case. This Final Business Case is expected to be reviewed in Q4 18/19. Both DfI and SIB were consulted during development of the Outline Business Case and are expected to be involved in the development of the Final Business Case. 3.1.2. Clean Water Initiatives Clean Water initiatives identified within NI Waters Energy Efficiency Programme for PC15 include: JI069 WPS Pump Efficiency

Annual Information Return 2018 Section 2 Chapter 30 Page 15 of 28
Capital Requested in DD Business Plan: £1.286m (JI069 and JI075 combined) Current Assessment of Funding Required during PC15: £0.879m Five WPS had control optimisation or pumps replaced as part of this project during the 2016/17 and 2017/18 FY’s. The benefits associated with these upgrades amounts to £47k. JI075 - WPS Pump Efficiency Phase 2 of this Water Pumping programme is being developed taking into account the learnings of Phase 1 (under JI069). Energy audits are being completed at two WPS sites to assist in identifying further WPS efficiencies – these audits were funded under JI075. JI071 – Electrical Sub-meters (water) Capital Requested in DD Business Plan: £0.488m Current Assessment of Funding Required: £0.007m Sub-metering is viewed as an important enabler for energy efficiency. Trials have been conducted at one Water site and one Wastewater site (KI545). NI Water are currently receiving the data from this trial however there needs to be a reasonable period to collect this data to enable trend analysis to be undertaken and evaluated. Advances in sensor and communication technology have also caused NI Water to strategically review how optimal sub-metering may be cost effectively achieved in compliance with the NIS Directive. This is covered in more detail in section 3.3 of this report. JI032 – Buildings, water treatment sites - water regulation compliance & energy efficiency Capital Requested in DD Business Plan: £0.741m Current Assessment of Funding Required: £0.216m The Energy element of the PC15 Business Plan included funding for NI Water to place energy efficiency measures into buildings at its operational sites to improve energy efficiency. This work (mainly heating and lighting) has been undertaken during 17/18 with further sites being identified in the 18/19 FY. Anticipated benefits in 18/19 (awaiting final reports) is estimated at circa £60k based on work completed in 17/18 FY. The level of investment and subsequent benefits are anticipated to be lower than the initial business case. WD083 Seasonal Time of Day (STOD) Capital Requested in DD Business Plan: £0m Current Assessment of Funding Required: £0.272m This programme of work moved electricity use from peak consumption periods to off peak consumption periods at 17 WPS during 2015/16 and 2016/17. Although the main driver for Time of Day pumping was to reduce the appu (average price per unit per kW) rate (i.e. a £Cash benefit) the analysis from this investment has concluded there has also been some savings due to reduced consumption (kWh). This is evidenced by more efficient pumping regimes (for these sites), that have provided reduced consumption and cost savings. Expenditure during 2015/16 (£59k) and 2016/17 (£30K) on this project produced a cost saving of c. £40k during this same period. STOD savings in 18/19 amounted to £4k. Water Energy Audits NI Water are undertaking Energy Audit surveys at a number of Clean Water sites (WTW and Water Pumping Stations) to assist in identifying further energy efficiency opportunities. These audits will be completed in Q2 18/19 with an outline programme developed for funding and delivery in Q3.

Annual Information Return 2018 Section 2 Chapter 30 Page 16 of 28
3.1.3. Wastewater Initiatives KI514 – Buildings, wastewater treatment sites - water reg. compliance & energy efficiency Capital Requested in DD Business Plan: £0.79m Current Assessment of Funding Required: £0.193m The Energy element of the PC15 Business Plan included funding for NI Water to place energy efficiency measures into buildings at its operational sites to improve energy efficiency. This work (mainly heating and lighting type work) was undertaken at 5 Wastewater sites and will complete in Q1 18/19, with benefits realisation during 2017/18 and 2018/19. The level of investment and subsequent benefits are anticipated to be lower than the initial business case with circa £30k of benefits forecast in 18/19 FY. KI517 Energy efficiency at wastewater pumping stations Capital Requested in DD Business Plan: £0.021m Current Assessment of Funding Required: £0.003m Appraisals were performed at wastewater pumping stations to identify where potentially highly cost effective energy efficiency measures could be delivered. NI Water has assessed the appraisals and concluded that energy efficiency opportunities at these WwPS are not economically viable purely on energy efficiency. NI Water are however looking at other alternatives in regards to energy efficiency measures for pumping in Wastewater. KI553 - Energy efficiency at wastewater pumping stations Capital Requested in DD Business Plan: £0m Current Assessment of Funding Required: £0m Appraisals were performed at wastewater pumping stations to identify where potential more marginal energy efficiency measures could be delivered. NI Water has assessed the appraisals and concluded that energy efficiency opportunities at these WwPS are not economically viable purely on energy efficiency. NI Water are however looking at other alternatives in regards to energy efficiency measures for pumping in Wastewater. KI545 – Electrical Sub-meters (wastewater) Capital Requested in DD Business Plan: £0.651m Current Assessment of Funding Required: £0.01m Sub-metering is viewed as an important enabler for energy efficiency. Trials have been conducted at one Water site and one Wastewater site (KI545). NI Water are currently receiving the data from this trial however there needs to be a reasonable period to collect this data to enable trend analysis to be undertaken and evaluated. Advances in sensor and communication technology have also caused NI Water to strategically review how optimal sub-metering may be cost effectively achieved in compliance with the NIS Directive. This is covered in more detail in section 3.3 of this report. PL005 Process Optimisation of WwTW Capital Requested in DD Business Plan: £0 Current Assessment of Funding Required: £0.235m BN048 Process Optimisation of WwTW Capital Requested in DD Business Plan: £0 Current Assessment of Funding Required: £0.1m Within the PC15 Energy Efficiency Delivery Programme, under PL005, £240K of Capital has been allocated and within BN048 (a further £100K) to fund a process optimisation project at a number of Waste Water Treatment Works (WwTW) across NI Water. The work optimises energy usage within the wastewater treatment processes and utilises a Programmable Logic

Annual Information Return 2018 Section 2 Chapter 30 Page 17 of 28
Controller (PLC) at each WwTW where the technology is applicable. In general, optimisation modifications have been focused within a number of areas namely the site’s capacity, flow/loading, historic energy consumption, process variables (flow management, Dissolved Oxygen (DO), Mixed Liquors (MLSS), RAS, SAS) and regulatory requirements. This programme of work across circa 40 large WwTW (a combined total) has produced in year consumption reductions of 957,683 kWh in 2015/16 and a further 1,176,603 kWh reduction in 2016/17. During 2017/18 FY 7 WwTW were optimised with £41k of energy benefits being delivered in year. There are a further 6 Wastewater sites to optimise in 18/19 FY and the introduction of improved process control technology is being explored through a pilot at WwTW sites to establish the improved site performance and energy benefits that this technology may deliver. Wastewater Energy Audits NI Water are undertaking Energy Audit surveys at a number of Wastewater sites (WwTW and Wastewater Pumping Stations) to assist in identifying further energy efficiency opportunities. These audits will be completed in Q2 18/19 with an outline programme of developed for funding and delivery in Q3. 3.1.4. PPP There were two PPP projects being considered under energy efficiency. The first was investment in a Variable Speed Drive and a pump refurbishment programme with the Alpha contractor. This initiative was considered under NI Water governance and due to the nature of the contract, it was determined that this project was not a viable at this stage. The second project was with the Omega contractor where control improvements were being considered at Donaghadee Pumping Station and a number of other locations. This project has been completed with £4k of savings being realised from this project in 2017/18. 3.1.5. Negative Opex NI Water currently generates revenue from existing electricity generation assets:
• Raw Water Turbines at Silent Valley and Oaklands • Sale of ROCs • Participation in an Aggregated Generation Unit with fixed standby generation • Exporting electricity to the grid
This revenue is considered “unregulated” and has not been treated as “negative opex” in the UR’s Corrected Ordinary Least Squares (COLS) econometric and unit cost models used for PC10, PC13 and PC15 determinations. The UR is currently developing a new methodology for the assessment of NI Water’s efficiency gap to inform the upcoming PC21. NI water are hopeful that the new methodology will allow revenue from energy generation to be treated as negative expenditure in line with the approach adopted by Ofwat in England and Wales. 3.1.6. Not Defined as Energy Efficiency Capital KR627 and KS974 Energy Efficiency to Inlet and Primary Effluent Pumps, Return Activated Sludge Pumps. (Screw Pumps) Capital Requested in DD Business Plan: £0 Current Assessment of Funding Required: £1.54m

Annual Information Return 2018 Section 2 Chapter 30 Page 18 of 28
Energy efficiency improvements to screw pumps is a further project identified as a key driver to assist NI Water reduce electricity consumption. NI Water have commenced a programme of work at Screw Pumps to reduce consumption (kWh) at a number of sites. This includes the six Inlet Screw Pumps, the three Pre-Treatment Effluent Screw pumps (PEPs) and the three Return Activated Sludge Pumps (RAS) at Belfast WwTW. The benefits realisation from this work is currently being undertaken, however energy usage through the half hour meter data has shown no clear energy reduction on site at present. 3.1.7. Additional PC15 Energy Efficiency Activity and Projects Mindful of the need to stay cognisant of and respond accordingly to changes in the energy landscape, on February 24th 2018 the NI Water Executive Committee approved the NI Water Energy Sustainability and Resilience Strategy (ESRS) and Energy Action Plan (EAP) to collectively embed energy ‘best practice’ within the business. The ESRS is an overarching strategy document. The EAP is a live document that is used to capture energy related ideas and innovation from within the business. These saving opportunities are assessed and prioritised to inform the Energy Efficiency delivery programme on an ongoing basis. Specific ESRS activities scheduled for delivery through the PC15 period, include:
Achieve ISO 50001 accreditation. ISO 50001 is an internationally recognised energy management Standard (EnMs) that is aligned with ISO 14001 (a suite of environmental standards that NI Water has already attained). Encompassing existing and planned energy management activity within an internationally recognised energy management standard will embed energy management into NI Water’s business processes and drive continual improvement.
Conduct general sustainability and energy awareness training through a suite of eLearning modules and tools that have been specifically mapped to the competence, training and awareness requirements of ISO 50001.
Deploy a Metering, Monitoring & Targeting system that will; detect avoidable energy waste, target energy efficiency activity; provide feedback for staff, improve budget setting, enable benchmarking, and quantify savings. NI Water has considerable energy and process data but not all of the data sets are yet centralised or capable of being indexed to one another. Work is underway to address this.
Undertake a series site surveys using a risk assessed technical evaluation process, underpinned by measurement, analysis and business case metrics to inform further PC15 optimisation activity and the PC21capital programme.
Optimise NI Water energy income potential by; fully understanding Capacity & DS3 payment income structures; working with NIEN and the Utility Regulator to harness more NI water generating capacity; enhancing existing commercial arrangements for the third party management of these income related services; and by exploring the potential to stack revenue streams through the use of technological innovation.
Contract for the supply of a significant proportion of NI Water’s energy requirements via Corporate Power Purchase Agreements (CPPA), in particular those that are behind the meter (sometimes referred to as ‘private wire’). CPPAs are relatively new to Northern Ireland but well established in GB, where large electricity users increasingly buy renewable energy via supply contracts negotiated for periods lasting 10 to 15 years. These contracts are attractive because they cut CO2 emissions, provide price certainty and security of supply and are commercially competitive.
As in the case of the Dunore Solar Farm project, NI Water are working closely with the Strategic Investment Board (SIB) in their review of NI Public Sector arrangements for

Annual Information Return 2018 Section 2 Chapter 30 Page 19 of 28
managing and procuring electricity, including CPPAs. The company anticipates being fully aligned with this strategy and playing an important role in the implementation of it. Within the Energy Efficiency programme, there are three energy efficiency projects (JI041 Hydro and Sub-metering in Water JI071 and Wastewater KI545) with capital investment estimates against them that are based on the original Business Cases. As indicated, there are delivery risks associated with these projects and this may release capital for other energy efficiency projects. NI Water are currently seeking to identify energy efficiency projects that are viable and are undergoing trials and pilots in several areas. Business Cases will be brought forward seeking capital when the outcome of the trials and pilots are concluded.

Annual Information Return 2018 Section 2 Chapter 30 Page 20 of 28
Reporting requirement 3.5 3.15 In the PC15 Final Determination we noted that confirmation of the scope, costs and benefits for the sub-meter schemes were subject to the completion of a feasibility study and that NI Water needed to demonstrate that the investment was beneficial and confirm this to the Utility Regulator before embarking on wide spread sub-metering. Progress on this issue should also be addressed in this section of the consolidated report.”
3.2. NI Water Response Sub-metering pilots have been conducted at two sites - Antrim WwTW (KI545) and Brick Row WPS (JI071). These projects do not seek to deliver any direct energy reductions, rather their purpose is to quantify the full range of benefits and costs with which to inform the business case for further implementation. Due to technical data retrieval difficulties, the data verification exercise for these pilot sites is still in progress. In an attempt to minimise costs, NI Water’s in-house IT section have been developing bespoke IT architecture systems with which to retrieve the data. Since identifying these projects in PC13 and conducting pilots in PC15, sensor, communications and cybersecurity innovation and compliance requirements have developed that will need to be considered in any future sub-metering business case. 3.3. NIS Directive The UK is in the process of implementing the EU directive on the security of Networks and Information Systems (known as the NIS Directive). Under the NIS Directive, NI Water are categorised as an Operator of Essential Services (OES) within the drinking water supply and distribution subsector, the definition for which is; supply of potable water to 200,000 or more people. During the NIS Directive implementation period, OES, such as NI Water, have to take appropriate and proportionate security measures to manage risks to their network and information systems and are required to notify serious incidents to the relevant national authority. With implementation of the NIS Directive underway, NI Water are strategically reviewing sub metering provision with a view towards compliance and cross cutting work streams under way; including the Digital Strategy and Business Analytics. 3.3.1. Industry 4.0 Industry 4.0 is a name for the current trend of automation and data exchange in manufacturing technologies. It includes cyber-physical systems, the Internet of things, cloud computing and cognitive computing. Industry 4.0 is commonly referred to as the fourth industrial revolution. Industry 4.0 creates what has been called a "smart factory". Within the modular structured smart factories, cyber-physical systems monitor physical processes, create a virtual copy of the physical world and make decentralised decisions. This is consistent with NI Water’s digital and data analytics aspirations and obligations under the NIS Directive. NI Water Energy Team are investigating a trial of IoT technology, including an Industry 4.0 gateway, to collect energy data remotely through wireless sensors. This relatively new

Annual Information Return 2018 Section 2 Chapter 30 Page 21 of 28
technology makes it easier, more cost effective and secure to collect energy data with which to make informed decisions. This technology will be trialled in Q2 18/19. 4. Conclusion The PC15 Draft Determination Energy Efficiency programme outlined a requirement for approximately £9.0m of capital investment (nominal terms). NI Water’s 2016 response identified that the water regulations compliance elements of the clean and wastewater (“Buildings, water treatment sites - water regulation compliance & energy efficiency”) projects were excluded. As a result, the baseline requirements for the Energy Efficiency programme were reduced to £7.43m.
NI Water has invested £0.98m in 2015/16, £1.54m in 2016/17 and £7.48m in 2017/18. NI Water is seeing encouraging results from these investments. Overall electricity consumption within NI Water has out turned at 290GW in 17/18. Up to 31 March 2018, the benefits summary from the energy efficiency projects invested in during PC15 are as follows:
Energy reduction (GWh/a) 15-16 16-17 17-18 Totals From Renewables 0.01 0.3 0.46 0.77 From Energy efficiency 0.96 1.4 1.0 3.36 Total 0.97 1.7 1.46 4.13
5. Next steps & actions The PC15 Energy Efficiency programme has been impacted by changes to the NIE Networks connection process and incentive mechanisms for renewable energy generation (e.g. ROCs). Whilst these issues impacted the programme as originally conceived, NI Water is pro-actively seeking alternative saving opportunities through a wide range of initiatives, including those outlined in section 3.1.7

Annual Information Return 2018 Section 2 Chapter 30 Page 22 of 28
6. Appendices Appendix 1 - Detailed list of investment in energy efficiency and renewable energy schemes and the allocation of this investment by purpose
Type of project
Project code Project title
Capital funding as requested in DD PC15 BP (£m)
Current assessment of funding required (£m)
Included in Annex 6 baseline? Note Q B E G
Renewable JI040
Recovering energy within the water distribution system 1.350 1.484 Y
The viability of this initiative was dependent on obtaining ROCs, with only 4 sites viable for ROCs. Updated profile reflects current expenditure incurred. 0 0 100 0
Renewable JI041 Hydro power from raw water 0.439 0.051 Y
The viability of delivering all 10 Hydro Turbines was dependent on obtaining ROCs. 5 Hydro sites are still being considered for viability but grid connections will be difficult to obtain. 0 0 100 0
Renewable EP017
Electricity generation from wind power or alternative green energy solution 2.176 1.247 Y
46 sites were completed before the 3 ROCs deadline of 30 Sept 16. Further extensions at Westland and New Holland WwTW also occurred in March 17 before the 2 ROCs deadline. 3 more sites were added prior to March 2018 end of ROCs deadline. 0 0 100 0


Annual Information Return 2018 Section 2 Chapter 30 Page 24 of 28
Type of project
Project code Project title
Capital funding as requested in DD PC15 BP (£m)
Current assessment of funding required (£m)
Included in Annex 6 baseline? Note Q B E G
Cleanwater JI069
WPS Pump Efficiency Capital Investment Phase 1 1.286 0.502 Y
This project has completed with benefits realisation in 16/17 and 17/18. 0 100 0 0
Cleanwater JI075
WPS Pump Efficiency Capital Investment Phase 2 0.000 0.377 Y
NI Water are taking time to take stock of the output of JI069 and WPS analysis before proceeding with phase 2. 0 100 0 0
Cleanwater JI071 Electrical Sub-meters (water) 0.488 0.007 Y
Spend profile broadly tracking PC15 baseline, but final form of delivery will depend on outcome of trends from data and success of data verification. 0 0 100 0
Cleanwater WD083 Time of day pumping 0.000 0.243 N
Time of Day pumping was not included in the PC15 baseline. While not delivering any reductions in kWh, it does deliver more efficient pumping practices and reduce overall costs.
Wastewater KI514
Buildings, wastewater treatment sites - water reg. compliance & 0.790 N/A Y 65 35 0 0


Annual Information Return 2018 Section 2 Chapter 30 Page 26 of 28
Type of project
Project code Project title
Capital funding as requested in DD PC15 BP (£m)
Current assessment of funding required (£m)
Included in Annex 6 baseline? Note Q B E G
Pumping Stations
Wastewater KI553
Energy efficiency at wastewater pumping stations 0.000 0.000 Y 0 100 0 0
Wastewater KI545
Electrical Sub-meters (wastewater) 0.651 0.01 Y
Spend profile broadly tracking PC15 baseline, but final form of delivery will depend on outcome of outcome of trends from data and success of data verification. 0 0 100 0
Wastewater PL005
Energy Efficiency - Process Optimisation 0.000 0.253 N
Although not included in the scope of energy projects identified in Annex 6, this is a valuable project which has been successfully delivered during PC15. 0 55 45 0
Wastewater BN048
Energy Efficiency - Process Optimisation 0.000 0.1 N
Although not included in the scope of energy projects identified in Annex 6, this is a valuable project which has been successfully delivered during PC15. 0 100 0 0


NORTHERN IRELAND WATER LIMITED - ANNUAL INFORMATION RETURN
ANNUAL INFORMATION RETURN - TABLE 32 FINANCIAL MEASURESANALYSIS OF FIXED ASSET ADDITIONS AND ASSET MAINTENANCE BY ASSET TYPE (HISTORIC COST ACCOUNTING) (NIW Only)
1 2 3 4 5 6 7
DESCRIPTION UNITS DP
A NIW ADDITIONS -NEW ASSETS (ENHANCEMENT)1 Water resource facilities £m 3 0.125 0.145 0.270 0.2702 Water treatment works £m 3 0.737 0.737 0.7373 Water distribution mains £m 3 9.200 -0.019 9.181 9.1814 Service reservoirs and water towers £m 3 2.720 2.720 2.7205 Pumping stations £m 3 0.687 0.687 0.6876 Water management and general £m 3 0.231 10.379 10.610 10.6107 Sewerage £m 3 45.960 0.476 46.436 46.4368 Sea outfalls and headworks £m 3 0.103 -0.014 0.090 0.0909 Sewage treatment works £m 3 8.705 8.705 8.70510 Sludge treatment works £m 3 1.408 1.408 1.40811 Sludge disposal £m 3 0.000 0.000 0.000 0.00012 In-line pumping stations £m 3 6.730 6.730 6.73013 Terminal pumping stations £m 3 0.171 0.171 0.17114 Sewerage management and general £m 3 3.230 0.781 4.011 4.01115 Total infrastructure additions (Enhancement) £m 3 9.557 9.557 49.294 49.294 58 85116 Total non-infrastructure additions (Enhancement) £m 3 14.648 14.648 18.258 18.258 32 90617 Total additions (Enhancement) £m 3 9.557 14.648 24.205 49.294 18.258 67.552 91.757
B NIW BASE SERVICE PROVISION18 Water resource facilities £m 3 1.582 0.258 1.840 1.84019 Water treatment works £m 3 6.990 6.990 6.99020 Water distribution mains £m 3 13.504 1.814 15.318 15 31821 Service reservoirs and water towers £m 3 4.188 4.188 4.18822 Pumping stations £m 3 2.668 2.668 2.66823 Water management and general £m 3 1.524 6.074 7.598 7.59824 Sewerage £m 3 9.708 0.139 9.848 9.84825 Sea outfalls and headworks £m 3 0.002 0.000 0.002 0.00226 Sewage treatment works £m 3 29.293 29.293 29 29327 Sludge treatment works £m 3 0.337 0.337 0.33728 Sludge disposal £m 3 0.000 0.000 0.000 0.00029 In-line pumping stations £m 3 9.053 9.053 9.05330 Terminal pumping stations £m 3 1.281 1.281 1.28131 Sewerage management and general £m 3 0.750 2.751 3.502 3.50232 Total infrastructure renewals (Base) £m 3 16.609 16.609 10.461 10.461 27 07033 Total non-infrastructure expenditure (Base) £m 3 21.992 21.992 42.854 42.854 64 84634 Total expenditure (Base service provision) £m 3 16.609 21.992 38.602 10.461 42.854 53.314 91 916
WATER SERVICE SEWERAGE SERVICETOTALINFRASTRUCTURE
ASSETSNON-INFRASTRUCTURE
ASSETSSUBTOTAL INFRASTRUCTURE
ASSETSNON-INFRASTRUCTURE
ASSETS SUBTOTAL

Annual Information Return 2018 Section 2 Chapter 32 Page 1 of 1
Table 32 – Analysis of Fixed Asset Additions and Asset Maintenance by Asset Type (Current Cost Accounting)
Refer to Chapter 30 for detailed commentary on this table. There are no reconciling items to report.

NORTHERN IRELAND WATER LIMITED - ANNUAL INFORMATION RETURN
ANNUAL INFORMATION RETURN - TABLE 33 FINANCIAL MEASURES (HISTORIC COST ACCOUNTING)DEPRECIATION CHARGE BY ASSET TYPE (NIW Only)
1 2 3 4 5 6 7 8 9 10 11 12 13 15 15 16 17 18 19 20 21 22 23 24 25 26 27
DESCRIPTION UNITS DP
A DEPRECIATION CHARGE FOR THE YEAR1 HCD as at 31 March of the year £m 3 80.086 47.905 33.476 38.517 16.635 B3 66.802 83.520 66.627 67.861 35.670 B3 146.888 131.425 100.103 106.378 52.305 B32 HCD on additions (enhancement assets) post 1 April 2014 £m 3 0.113 B3 0.272 B3 0.385 B33 HCD on additions (MNI assets) post 1 April 2014 £m 3 0.712 B3 1.376 B3 2.088 B34 Total depreciation charge for the year £m 3 0.825 B3 1.648 B3 2.473 B35 Total depreciation charged £m 3 80.086 47.905 33.476 38.517 16.635 16.839 B3 66.802 83.520 66.627 67.861 35.670 36.141 B3 146.888 131.425 100.103 106.378 52.305 52.980 B3
1 2 3 4 5 6 7 8 9 10 11 12 13 14 15 16 17 18 19 20 21 22 23 24 25 26 27
DESCRIPTION UNITS DP
B EXPENDITURE AND PROVISION6 Infrastructure renewals expenditure £m 3 22.593 22.391 23.055 11.134 11.134 17.015 B2 8.775 7.727 8.502 9.010 9.010 13.235 B2 31.368 30.118 31.557 20.144 20.144 30.250 B27 Infrastructure renewals charges £m 3 19.902 23.935 22.488 14.410 14.410 14.679 C5 10.859 9.474 9.821 10.876 10.876 11.078 C5 30.761 33.409 32.309 25.286 25.286 25.757 C58 Infrastructure renewals prepayment/ (accrual) £m 3 12.134 10.590 11.157 7.881 7.881 19.462 C5 -10.312 -12.059 -13.378 -15.244 -15.244 -17.408 C5 1.822 -1.469 -2.221 -7.363 -7.363 2.054 C5
2017-18
2017-18
2015-16
2015-16
2015-16
2015-162014-152013-14
2014-15
CG 2014-15 CG 2014-15 CG2013-14 2017-18 2013-14
2013-14 2013-14 2017-182014-15
2018-19
2014-15
2018-19 2019-20
CG CG 2018-19 2019-20 2020-212019-20
2020-21
2012-13
2012-13
2012-13
2012-13
2012-13
2012-13
Water Service Sewerage Service Total
Water Service Sewerage Service Total
2018-19 2019-20 2020-21
2018-19 2019-20 2020-21
2013-14 2015-16
2017-182015-16
CG
2019-20
2016-17
2016-17
2016-17
2016-17
2016-17
2016-172020-21
2017-18 2020-212018-19

NORTHERN IRELAND WATER LIMITED- ANNUAL INFORMATION RETURN
ANNUAL INFORMATION RETURN - TABLE 33 FINANCIAL MEASURES (HISTORIC COST ACCOUNTING)DEPRECIATION CHARGE BY ASSET TYPE (PPP Only)
1 2 3 4 5 6 7 8 9 10 11 12 13 14 15 16 17 18 19 20 21 22 23 24 25 26 27
DESCRIPTION UNITS DP
A DEPRECIATION CHARGE FOR THE YEAR1 HCD as at 31 March of the year £m 3 4.007 4.033 4.082 4.146 3.407 B3 0.000 0.000 0.000 0.000 0.000 B3 4.007 4.033 4.082 4.146 3.407 B32 HCD on additions (enhancement assets) post 1 April 2014 £m 3 0.000 B3 0.000 B3 0.000 B33 HCD on additions (MNI assets) post 1 April 2014 £m 3 0.036 B3 0.000 B3 0.036 B34 Total depreciation charge for the year £m 3 0.036 B3 0.000 B3 0.036 B35 Total depreciation charged £m 3 4.007 4.033 4.082 4.146 3.407 3.442 B3 0.000 0.000 0.000 0.000 0.000 0.000 B3 4.007 4.033 4.082 4.146 3.407 3.442 B3
1 2 3 4 5 6 7 8 9 10 11 12 13 14 15 16 17 18 19 20 21 22 23 24 25 26 27
DESCRIPTION UNITS DP
B EXPENDITURE AND PROVISION6 Infrastructure renewals expenditure £m 3 0.000 0.000 0.000 0.000 0.000 0.000 B2 0.000 0.000 0.000 0.000 0.000 0.000 B2 0.000 0.000 0.000 0.000 0.000 0.00 B27 Infrastructure renewals charges £m 3 0.000 0.000 0.000 0.000 0.000 0.000 C5 0.000 0.000 0.000 0.000 0.000 0.000 C5 0.000 0.000 0.000 0.000 0.000 0.00 C58 Infrastructure renewals prepayment/ (accrual) £m 3 1.519 1.519 1.519 1.519 1.519 1.519 C5 0.000 0.000 0.000 0.000 0.000 0.000 C5 1.519 1.519 1.519 1.519 1.519 1.519 C5
2015-16
2015-16
2015-16
2015-16
2018-19 2019-20 2020-212017-18
2014-15 CG 2014-15 CG 2014-15 CG
2014-15
2018-192013-14 2017-18
2018-192014-15 CG CG2017-182013-14 2017-18 2013-14 2014-15
2019-20 2020-21
2015-16
2015-16
2016-17
2016-17
Water Service Sewerage Service Total
Water Service Sewerage Service Total
2013-14
2019-20
2018-19 2019-20 2020-212017-182013-14
2018-19 2019-20 2020-21 2013-14
2017-18 Actual2018-19
CG2020-21
Actual2019-20
Actual2020-21
2012-13 2016-17
2016-17
2016-17
2016-172012-13
2012-13
2012-13
2012-13
2012-13

NORTHERN IRELAND WATER LIMITED- ANNUAL INFORMATION RETURN
ANNUAL INFORMATION RETURN - TABLE 33 FINANCIAL MEASURES (HISTORIC COST ACCOUNTING)DEPRECIATION CHARGE BY ASSET TYPE (Total)
1 2 3 4 5 6 7 8 9 10 11 12 13 14 15 16 17 18 19 20 21 22 23 24 25 26 27
DESCRIPTION UNITS DP
A DEPRECIATION CHARGE FOR THE YEAR1 HCD as at 31 March of the year £m 3 84.093 51.938 37.558 42.663 20.042 B3 66.802 83.520 66.627 35.670 35.670 B3 150.895 135.458 104.185 110.524 55.712 B32 HCD on additions (enhancement assets) post 1 April 2014 £m 3 0.113 B3 0.272 B3 0.385 B33 HCD on additions (MNI assets) post 1 April 2014 £m 3 0.748 B3 1.376 B3 2.124 B34 Total depreciation charge for the year £m 3 0.861 B3 1.648 B3 2.509 B35 Total depreciation charged £m 3 84.093 81.938 37.558 42.663 20.042 20.281 B3 66.802 83.520 66.627 35.670 35.670 36.141 B3 150.895 135.458 104.185 110.524 55.712 56.422 B3
1 2 3 4 5 6 7 8 9 10 11 12 13 14 15 16 17 18 19 20 21 22 23 24 25 26 27
DESCRIPTION UNITS DP
B EXPENDITURE AND PROVISION6 Infrastructure renewals expenditure £m 3 22.593 22.391 23.055 11.134 11.134 17.015 B2 8.775 7.727 8.502 9.010 9.010 13.235 B2 31.368 30.118 31.557 20.144 20.144 30.250 B27 Infrastructure renewals charges £m 3 19.902 23.935 22.488 14.410 14.410 14.679 C5 10.859 9.474 9.821 10.876 10.876 11.078 C5 30.761 33.409 32.309 25.286 25.286 25.757 C58 Infrastructure renewals prepayment/ (accrual) £m 3 13.653 12.109 12.676 9.400 9.400 20.981 C5 -10.321 -12.059 -13.378 -15.244 -15.244 -17.408 C5 3.341 0.050 -0.702 -5.844 -5.844 3.573 C5
2015-16
2015-16
2018-19 2019-20
2018-19 2019-20
2012-13
2012-132013-14 2017-18 2013-14 2017-182014-15 CG 2014-15 CG
2017-182015-16
2015-16
2015-16
2015-16
2016-17
2016-17
CG2014-15 2014-15 2014-15
CG2013-14
2017-18
2017-18
2013-142012-13 2013-14 2017-182016-17
2016-17 Actual2018-19
Actual2019-20
Actual2020-21
Water Service Sewerage Service Total
Water Service Sewerage Service Total
2018-19 2019-20 2020-21
2020-212012-13
CG 2012-13
2012-13 2014-15
2013-14CG 2020-21
2020-21
2018-19 2019-20 2016-17
2016-17
2020-21
2018-19 2019-20


Annual Information Return 2018 Section 2 Chapter 33 Page 2 of 3
Table 33 has also been adjusted to include only the appointed business and exclude the unappointed business relating to vehicle maintenance carried out for third parties
During the year, decommissioned assets with a net book value (NBV) of £185,598.39 were included within the current year depreciation charge.
Water (17/18) Sewerage (17/18)
Total (17/18)
HC Depreciation in year £20,120,139.15 £36,116,561.59 £56,236,700.74 Accelerated Depreciation
£161,294.70 £24,303.69 £185,598.39
Total (2017/2018) £20,281,433.85 £36,140,865.28 £56,422,299.13
Water (16/17) Sewerage (16/17)
Total (16/17)
HC Depreciation in year
£19,063,445.57 £35,159,861.53 £54,223,307.10
Accelerated Depreciation
£978,708.52 £509,881.91 £1,488,590.43
Total (2016/2017) £20,042,154.09 £35,669,743.44 £55,711,897.53
The total depreciation charge for 17/18 (£56,422k) is £710k higher than 16/17 (£55,712k). Normal decommissioning in the course of the business amounted to £186k for the year, compared to £1.5m in 2016/17. Also, 17/18 included a full year’s depreciation of the Alpha PPP asset; which was higher than the previous year.
Infrastructure Renewals accounting The IRC calculation for 17/18 is based on the final determination arising from PC15. The Regulator determined that the IRC and IRE will be the same for the six year period of PC15. The projected IRE forms part of the PC15 capital expenditure plans.
The difference between the actual out-turn IRE and the IRC is treated as an accrual or prepayment.
2017-2018 IRC The IRC for 2017-18 based on PC15 can be summarised as follows:
Water - £14.679m Sewerage - £11.078mTotal - £25.757m
The out-turn IRE for 2017-2018 can be shown as follows: Water - £17.015m Sewerage - £13.235mTotal - £30.250m

Annual Information Return 2018 Section 2 Chapter 33 Page 3 of 3
The accrual at 31 March 2018 can be shown as follows:
W S Total TOTAL TOTAL TOTAL
£m £m £m
IRE 17.015 13.235 30.250 IRC (14.679) (11.078) (25.757)
In year (accrual) 2.337 2.157 4.493
c/f prepayment / (accrual) 18.644 (19.565) (0.921)
Cumulative prepayment / (accrual) 20.981 (17.408) 3.573
At the end of the year to 31 March 2018 a prepayment balance of £3.573m was evident. This balance arose as the in-year prepayment of £4.493m for 2017-18 was added to the cumulative brought forward accrual balance of £0.921m, which existed at 31st March 2017.
In line with the underlying principles of infrastructure renewals accounting it is anticipated that the cumulative level of IRE and IRC should broadly match over the longer term. The water prepayment and sewerage accrual at 31st March 2018 will be monitored to ensure that the level of IRC charged in the future to the profit and loss account is appropriate given actual levels of IRE.
PPP Alpha PPP has not given rise to any IRE for this year and therefore no IRC has been allocated to the PPP services.
The Statutory accounts are prepared under IFRS and infrastructure renewals accounting is not applied. Infrastructure depreciation is charged in the statutory accounts and the value of this differs from the IRC in the regulatory accounts.

NORTHERN IRELAND WATER LIMITED ANNUAL INFORMATION RETURN
ANNUAL INFORMATION RETURN TABLE 34 FINANCIAL MEASURES (CURRENT COST ACCOUNTING)ANALYSIS OF NON INFRASTRUCTURE FIXED ASSET ADDITIONS BY LIFE CATEGORIES NI WATER ONLY
1 2 3 4 5 6 7 8 9 10 11 12 13 14 15 16 17 18
DESCRIPTION UNITS DP
ACCOUNTING FIXED ASSET ADDITIONS
ANON INFRASTRUCTURE ASSET ADDITIONS (ENHANCEMENT) BY ASSET LIFE
1 Very Short £m 3 0.108 0.702 0.135 0.077 0.199 0.032 B3 -0.005 0.473 0.088 0.071 0.156 -0.001 B22 Short £m 3 2.457 3.136 2.779 1.154 2.954 2.858 B2 3.923 3.506 4.763 4.272 1.908 2.049 B23 Medium £m 3 2.610 2.425 7.433 2.279 1.536 7.662 B2 10.142 9.775 9.873 4.251 6.604 6.082 B24 Medium long £m 3 0.000 0.383 0.014 0.000 0.000 -0.003 B2 0.000 0.000 0.010 0.002 0.001 0.012 B25 Long £m 3 2.640 1.566 4.926 2.715 2.094 3.405 B2 14.217 13.256 10.907 6.455 9.202 9.578 B26 Land £m 3 0.000 0.000 0.007 0.000 0.009 0.695 B2 0.102 0.050 0.021 0.261 0.340 0.538 B27 Land Disposals £m 3 -0.111 -0.351 -0.066 -0.164 -0.166 -0.128 B2 -0.160 -0.190 -0.079 -0.251 -0.120 -0.114 B28 Total £m 3 7.704 7.861 15.229 6.061 6.626 14.520 B2 28.219 26.870 25.583 15.060 18.091 18.144 B2
BNON INFRASTRUCTURE ASSET ADDITIONS (BASE SERVICE) BY ASSET LIFE
9 Very Short £m 3 2.119 1.948 0.950 1.705 2.044 1.504 B2 1.916 1.886 2.390 0.811 1.780 1.143 B210 Short £m 3 3.285 5.839 3.416 4.524 4.585 4.186 B2 4.859 6.151 5.762 4.545 4.560 4.781 B211 Medium £m 3 6.817 3.874 7.652 10.926 12.066 11.994 B2 24.145 30.514 14.642 22.828 25.713 23.372 B212 Medium long £m 3 0.000 0.134 0.506 0.380 0.481 0.149 B2 0.000 0.250 0.137 0.092 0.164 0.084 B213 Long £m 3 3.688 5.029 5.366 5.701 4.368 4.159 B2 10.338 12.185 7.153 14.523 14.031 13.473 B214 Total £m 3 15.909 16.825 17.891 23.235 23.543 21.992 B2 41.258 50.986 30.084 42.799 46.247 42.854 B2
CNON INFRASTRUCTURE ADDITIONS AVERAGE LIFE (YEARS)Lines 15-19 not used years 0
2018 19 2019 202016 17 CG
Water Service Sewerage Service
2020 212015 16 2015 162016 172012 13 2017 182013 14 2013 142018 19 2017 182014 15 2014 15CG 2012 132019 20 2020 21


Annual Information Return 2018 Section 2 Chapter 34Page 1 of 6
Table 34 – Financial Measures (Current Cost Accounting) - Analysis of Non-Infrastructure Fixed Asset Additions by Life Categories
Commentary and methodology All the capital expenditure tables have been populated using project data extracted from the company’s core project control system (CPMR), as well as ORACLE (Financial management system).
Internal training and mentoring has been ongoing with key staff mainly with Engineering Procurement, Operations, Asset Management, PPP and Finance and Regulation directorates. This training has been delivered to external consultants where requested each year since 2010/11. Further training will be provided in future to provide refresher training for existing staff.
Methodology NIW Table Capital expenditure is analysed in 3 separate streams as follows:
a) Capital Works Programme delivered by Engineering Procurement Directorateb) Operations Capitalc) Management & General (M & G).
The methodology is explained in detail under these 3 areas as follows.
Capital works programme Capital investment driver allocation (CIDA) processes have continued as per previous years.
a) CAPTRAX – CAPTRAX continues to be reconciled on a monthly basis with ORACLEso the final reports can be run directly from CAPTRAX. Two CIDA reports aregenerated from CAPTRAX as follows:
CIDA non lands – This reports the accrual in 2017/18 against each project,excluding land acquisition, with a full CIDA output.
CIDA lands – This reports the accrual in 2017/18 against land acquisition andthe associated CIDA output.
b) CWP AIR reporting Model – The model developed in Excel for AIR09 and subsequentyears has been adopted for AIR18 reporting. The model takes the outputs from theabove reports from CAPTRAX and completes the tables 32, 34, & 36, 36a with theCWP element of Capital expenditure.
Costs are apportioned between infrastructure and non-infrastructure according to the process outlined in the CIDA manual.
NI Water continually review their existing processes regarding the application of CIDA and seek to ensure compliance and consistency. No major control weaknesses were identified during 2017/18.
M & G As commenced in AIR14 CPMR M&G has been used to report M & G investment directly from the system in a similar way to the Capital Works Programme. A single report provides all the information from the CPMR system.
Operating capital This area captures all Capital expenditure which is not managed via the CWP or included within M & G. For all Capital projects not on the CWP (herein referred to Operating Capital

Annual Information Return 2018 Section 2 Chapter 34Page 2 of 6
expenditure) the CIDA information has been captured at project level within CPMR Coptrax. This has been used in AIR18 for completion of Table 40. Unfortunately the system needs further refinement to enable reporting information for Tables 32, 34, 36 and 36a accurately as there are a significant number of contracts within each project with combinations of a number of service areas, asset types and financial categories. For reporting in AIR18, each of the contacts was verified manually in order to ensure that accurate information was used for the population of the AIR tables in a similar manner to recent years. This approach uses the Asset In Course of Construction (AICC) database and ORACLE as data sources.
Table population Data used in the population of the table is based on data extracted from the company’s core systems and no assumptions are made in the allocation of project expenditure to the lines in the tables for all the expenditure with CIDA directly attributed. The small rounding figure of £24k of CWP expenditure (due to CATPRAX rounding finance to the nearest £k), is apportioned in each table in equal portions to the allocated expenditure.
Process diagrams below show the process for completing the tables.

Annual Information Return 2018 Section 2 Chapter 34 Page 3 of 6
Merging inputs Stage
Input Stage
Outputs Stage
Monthly transfer of Oracle financial information to CAPTRAX (Capital Works Programme Management Database)
CAPTRAX Financial Tables Information for each project
Projects with more than 1 investment driver. CIDA captured via 1st principle calculations.
Projects with single driver. CIDA entered directly to CAPTRAX
CAPTRAX CIDA tables for each project
CIDA Report excluding land acquisition
CIDA Costs allocated to tables
Financial Inputs Capital Investment Driver
Allocation (CIDA)
Output from spreadsheet = input CAPTRAX
CIDA Report for land acquisition
Process for completion of Capex Financial tables for all CWP Expenditure (Similar for M & G)

Annual Information Return 2018 Section 2 Chapter 34 Page 4 of 6
Process for Completion of Capex financial tables for Operating Capital
Financial Inputs Capital Investment Driver Allocation
(CIDA)
Oracle Financial Accounting System
CIDA allocations captured for projects on Financial Approval Project Form and stored on the AICC Register
Analysis of all expenditure merging costs with CIDA percentages
CIDA model to allocate Costs to tables

Annual Information Return 2017 Section 2 Chapter 34 Page 5 of 6
Asset lives The last comprehensive review of asset lives was completed as part of NIAMP2 in 2001. An interim review was completed in 2011/12 following the reporter recommendations in AIR11 and 8 new financial categories have been added to list used in NI Water. Any further changes will be processed as they occur. Asset lives on historic projects have not been amended to reflect new asset life categories. The new financial categories added and in use from April 2012 are as follows:
Table 1: New financial categories Financial Category Definition Life in years Fences All fences around sites 40 Meters Domestic Water Meters 17 Batteries Batteries for loggers, toughbooks
etc. 4
Filter Media Media in Biological filters, Sand filters etc.
20
MBR Membranes MBR membranes 5 Rotating Biological Filters
RBC package plants 20
Kiosks All kiosk type structures including small control kiosks and prefabricated control buildings
20
Steel Tanks All Steel tanks for storage and processes
40
Following reporter review of the PC15 plan a change initiated for AIR16 has been continued in AIR18. This change applies to the life for Meters which have been changed to 17 years to align with PC15 Business plan assumptions. Expenditure for meters has been moved from Short life to Medium life for AIR 16 report. No changes have been made to previous years’ data in respect of Meter expenditure reporting.
The above categories have been added to CPMR/Captrax for CIDA allocation. The availability of the financial category is dependent on the asset type selected so for example MBR membranes are only available for selection within WwTW. The definitions have also been uploaded within the selection process, as a reminder to the project manager when selections are being made.
Individual judgements on asset lives are not made during this annual process of AIR collation.
Methodology PPP table Figures for PPP Alpha Capital maintenance have been taken directly from the PPP Model and apportioned between Fixed Plant and Civils as per the PPP Model. This is the same process as adopted since AIR09.
PPP - Omega No PPP OMEGA capital has been reported in the AIR18 financial tables for the following reasons:
The Capital Cost split between Civils and M & E has been extracted from the PPPModel. This does not distinguish between infra and non infra elements and unlikeALPHA no valid assumptions can be made to define individual projects as some ofthe projects contain both infra and non infra elements.

Annual Information Return 2017 Section 2 Chapter 34 Page 6 of 6
QBEG information has been captured on each project within OMEGA in a similarbasis as was captured for the SBP submission which includes backlog base. In orderto maintain consistency within all the tables we have not populated any of theOMEGA capital expenditure within the tables.
PPP - Kinnegar No PPP Kinnegar residual interest finance has been populated as NIW have no information on either the QBEG or the Asset Life categories for this project.
NIW Table The asset lives adopted for Regulatory reporting are consistent with those in the Fixed Asset Register (FAR). The links for reporting purposes are outlined in the Capital investment Driver allocation manual.
The last comprehensive review of asset lives was completed as part of NIAMP2 in 2001. An interim review was completed in 2011/12 and new financial categories have been added to NI Water systems for application from April 2012.
Expenditure is charged to individual projects and these are assigned individual asset lives for regulatory reporting.
This table is consistent with the analysis in Table 32. All expenditure reported in Table 34 is in outturn prices, gross of grants and contributions.
PPP Table The expenditure of on this table relates to the Capital Maintenance element of PPP Alpha expenditure for 2017/18. The is reported in Section B of the table and is split using the Asset lives split assumed in the PPP Model. There is no PPP Capital on Sewerage.
Land Disposal NI Water has updated the figures in the former years for this line. The reason for the correction was due to incorrect understanding of the definition. In prior years the figures reported were the actual disposal receipts rather than the HCA book value. The HCA book value is determined from the Fixed Asset Register based upon the Asset Mgt plan completed in 2001. The figures stated are the HCA book values for all disposals in the stated year.
Assets fully depreciated but still in use at year-end The total current cost Gross Book Value (GBV) of assets on the fixed asset register at 31st March 18 with zero Net Book Value (NBV) is £80,389,953.08.
Confidence Grades Confidence grades have been assigned to the elements of Table 34 based on guidance received from the Reporter in AIR11:
“the Company should apply a confidence grade of B2 for most lines, with B3 for the smaller numbers (where a single misallocation could be more significant).”


Annual Information Return 2018 Section 2 Chapter 35 Page 4 of 5
Post-acquisition (£2,252.8m)£3,088.9m full year actual expenditure by Alpha less £1,257.4m for pre-acquisitionperiod£421k spend by NI Water on transitional capital expenditure for Alpha – largely ICT,networks, telecoms etc.
Line 4 – Residual interest in off-balance sheet PPP This represents the element of the Omega and Kinnegar PPP unitary payments which is allocated against residual interest in the relevant year.
For Regulatory accounting purposes, Omega & Kinnegar assets are held off-balance sheet. Each year a portion of the unitary charge is debited against a ‘residual interest asset’ on the balance sheet with the aim of building up an asset which can be transferred to NI Water at end of the PPP contract term. The value of this asset would equal the forecast residual value of the relevant assets at the time of transfer.
Values for residual interest are sourced directly from the original contractors’ financial models. The breakdown between Omega & Kinnegar is shown below.
2017/18 Kinnegar Residual Interest Omega Residual Interest Total
Entries to this line reconcile directly to AIR17 Table 42 line 15.
Line 5 – IFRS infrastructure renewals charge adjustment This line represents a transfer of expenditure which is treated differently under IFRS and our current Regulatory Accounting Guidelines, RAG’s.
DfI have adopted IFRS and require certain types of repair, which we currently classify as capital expenditure under the RAG’s, to be reported as operational expenditure under IFRS and therefore under PE reporting.
The table summarises expenditure currently decapitalised under IFRS.
Actual 2017-18
£ IFRS Adjustment on De-capitalised Repairs
- LN098102 - Leakage Detection SE 183,202 LN099102 - Leakage Detection NW 122,135 LN101102 - Repair of Defects identified as a result of leakage detection activities 393,314 LN110109 - High Volume DMA's SE (Consultants' fees) 111,620 LN110110 - High Volume DMA's NW (Consultants' fees) 109,498 LN136102 - Active Leakage Control SE 160,957 LN137102 - Active Leakage Control NW 107,305 TOTAL 1,188,031

Annual Information Return 2018 Section 2 Chapter 35 Page 5 of 5
Line 6 – Further adjustments Represents additional funding required for Project Clear. DoF/DfI provided £21.880m additional funding with NI Water funding the remainder from the initial capital allocation.
Line 7 – Capital grants and contributions This represents the total of capital grants and contributions received in nominal prices.
Entries to this line are consistent with AIR17 Table 37 line 17.
Line 8 – Capital grants and contributions transferred to deferred credits An element of the capital grants and contributions received is assumed to relate to non-infrastructure assets with an associated useful life. Adoption of the financial ‘matching’ principle, i.e. the process of linking revenue to associated costs means that we must match the amortisation of the contribution against the depreciation charge on the assets over their useful economic life.
We currently assume 30% of infrastructure charges relate to non-infrastructure and is transferred to a deferred capital contribution account and released to the P&L over a 20 year period.
We have also received and deferred a number of capital grants in 2017/18. These are being released over a period of 60 years. As noted above, a different approach has been adopted in PE for these grants.
Entries to this line are consistent with AIR17 Table 37 line 18.
Line 9 – NI Water gross capital expenditure Represents gross capital expenditure as per AIR17 Table 36.

NORTHERN IRELAND WATER LIMITED - ANNUAL INFORMATION RETURN
ANNUAL INFORMATION RETURN - TABLE 36 FINANCIAL MEASURESCAPITAL INVESTMENT - GROSS CAPITAL INVESTMENT SUMMARY
1 2 3 4 5 6 7 8 9REPORTING REPORTING REPORTING REPORTING REPORTING REPORTING REPORTING REPORTING REPORTING
DESCRIPTION UNITS DP YEAR YEAR CG YEAR CG YEAR CG YEAR CG YEAR CG YEAR CG YEAR CG YEAR CG2012-13 2013-14 2014-15 2015-16 2016-17 2017-18 2018-19 2019-20 2020-21
A Water service1 Non-infrastructure maintenance (gross of grants and contributions) £m 3 15.909 16.825 B3 17 891 B3 23.235 B2 23 543 B3 21.992 B32 Infrastructure renewals expenditure (gross) £m 3 22.593 22.391 B3 23 055 B3 11.133 B2 19.497 B3 16.687 B33 Capital expenditure - quality enhancement programme £m 3 9.972 14.396 B3 21 913 B3 14.646 B2 14.177 B3 7.347 B34 Capital expenditure - customer service £m 3 3.126 3.262 B3 2 616 B3 1.194 B2 3.175 B3 11.304 B35 Capital expenditure - supply demand balance £m 3 17.782 15.049 B3 21.478 B3 13.791 B2 7 393 B3 5.554 B35a Capex - new development £m 3 8.323 4.777 B3 4 628 B3 5.258 B2 4.721 B3 3.045 B35b Capex - growth £m 3 0.244 0.309 B3 0 634 B3 0.051 B3 0 016 B3 -0.012 B35c Capex - security of supply £m 3 9.214 9.842 B3 16 099 B3 8.436 B2 2 625 B3 2.486 B35d Capex - free meters £m 3 0.000 0.121 B3 0.117 B3 0.046 B3 0 031 B3 0.034 B36 Gross capital expenditure - water service £m 3 69.382 71.923 B3 86 953 B3 63.999 B2 67.786 B3 62.885 B3
B Sewerage Service7 Non-infrastructure maintenance (gross of grants and contributions) £m 3 41.258 50.986 B3 30 084 B3 42.799 B2 46 247 B3 42.854 B38 Infrastructure renewals expenditure (gross) £m 3 8.775 7.727 B3 8 502 B3 9.010 B2 10.434 B3 10.475 B39 Capital expenditure - quality enhancement programme £m 3 21.626 21.238 B3 15.179 B3 13.851 B2 13 559 B3 16.305 B310 Capital expenditure - customer service £m 3 2.899 3.955 B3 4.137 B3 4.406 B2 5 359 B3 7.518 B311 Capital expenditure - supply demand balance £m 3 18.318 11.736 B3 14 043 B3 9.626 B2 10 951 B3 12.584 B311a Capex - new development £m 3 17.871 11.579 B3 14 013 B3 9.626 B2 10 951 B3 12.578 B311b Capex - sewage treatment £m 3 0.447 0.158 B3 0 030 B3 0.000 B3 0 000 B3 0.007 B312 Gross capital expenditure - sewerage service £m 3 92.876 95.643 B3 71 945 B3 79.692 B2 86 551 B3 89.735 B3
C Gross capital expenditure total13 Gross capital expenditure total £m 3 162.258 167.566 B3 158 898 B3 143.691 B2 154 337 B3 152.620 B3
D Adopted assets, nil cost assets £m 314 Water service assets adopted at nil cost £m 3 0.000 0.000 B3 0 000 B3 0.000 B3 0 000 B3 0.000 B315 Water service assets adopted in return for an payment £m 3 0.000 0.000 B3 0 000 B3 0.000 B3 0 000 B3 0.000 B316 Sewerage service asset adopted at nil cost £m 3 48.233 59.566 B3 48.406 B3 32.724 B2 32 071 B3 31.145 B317 Sewerage service assets adopted in return for a payment. £m 3 0.000 0.000 B3 0 000 B3 0.000 B3 0 000 B3 0.000 B318 Total adopted assets and nil cost assets £m 3 48.233 59.566 B3 48.406 B3 32.724 B3 32 071 B3 31.145 B3
E Infrastructure renewals expenditure (net)19 Water service infrastructure renewals expenditure (net) (NIW only) £m 3 22.514 22.277 B3 23 022 A2 10.930 B2 19.430 A2 16.609 A220 Sewerage service infrastructure renewals expenditure (net) (NIW only) £m 3 8.609 7.632 B3 8.438 A2 9.010 B2 10.434 A2 10.461 A221 Total infrastructure renewals expenditure (net) (NIW only) £m 3 31.123 29.909 B3 31.460 A2 19.941 B2 29 864 A2 27.070 A2
F Total asset additions22 Water service total asset additions £m 3 46.788 49.532 B3 63 898 B3 52.866 B2 48 289 B3 46.197 B323 Sewerage service total asset additions £m 3 132.334 147.482 B3 111 849 B3 103.406 B2 108.188 B3 110.405 B324 Total asset additions £m 3 179.122 197.014 B3 175.747 B3 156.272 B2 156.477 B3 156.603 B3

Annual Information Return 2018 Section 2 Chapter 36 Page 1 of 1
Table 36 - Capital Investment - Gross Capital Investment Summary
Refer to Chapter 30 for detailed commentary on this table. There are no reconciling items to report.

NORTHERN IRELAND WATER LIMITED - ANNUAL INFORMATION RETURN
ANNUAL INFORMATION RETURN - TABLE 36A FINANCIAL MEASURESCAPITAL INVESTMENT - GROSS CAPITAL INVESTMENT VARIANCE
1 2 3 4 5 6 7 8 9 10 11 12 13 14 15 16 17 18 19 20 21 22 23 24 25 26 27 28
REPORTING REPORTING REPORTING REPORTING REPORTING REPORTING TOTAL REPORTING REPORTING REPORTING REPORTING REPORTING REPORTING TOTAL REPORTING REPORTING REPORTING REPORTING REPORTING REPORTING TOTAL REPORTING REPORTING REPORTING REPORTING REPORTING REPORTING TOTALDESCRIPTION UNITS DP YEAR YEAR YEAR YEAR YEAR YEAR TO DATE YEAR YEAR YEAR YEAR YEAR YEAR TO DATE YEAR YEAR YEAR YEAR YEAR YEAR TO DATE YEAR YEAR YEAR YEAR YEAR YEAR TO DATE
2015-16 2016-17 2017-18 2018-19 2019-20 2020-21 PC15 2015-16 2016-17 2017-18 2018-19 2019-20 2020-21 PC15 2015-16 2016-17 2017-18 2018-19 2019-20 2020-21 PC15 2015-16 2016-17 2017-18 2018-19 2019-20 2020-21 PC15
A Water service1 Non-infrastructure maintenance (gross of grants and contributions) £m 3 23.235 23.543 21.992 0.000 0.000 0.000 68.771 22.576 23.060 23.673 0.000 0.000 0.000 69.309 -0.659 -0.483 1.680 0.000 0.000 0.000 0.539 -2.9 -2.1 7.1 0.0 0.0 0.0 0.82 Infrastructure renewals expenditure (gross) £m 3 11.133 19.497 16.687 0.000 0.000 0.000 47.318 14.012 14.313 14.693 0.000 0.000 0.000 43.018 2.879 -5.184 -1.994 0.000 0.000 0.000 -4.300 20.5 -36.2 -13.6 0.0 0.0 0.0 -10.03 Capital expenditure - quality enhancement programme £m 3 14.646 14.177 7.347 0.000 0.000 0.000 36.170 13.810 14.106 19.365 0.000 0.000 0.000 47.282 -0.835 -0.071 12.018 0.000 0.000 0.000 11.112 -6.0 -0.5 62.1 0.0 0.0 0.0 23.54 Capital expenditure - customer service £m 3 1.194 3.175 11.304 0.000 0.000 0.000 15.673 4.036 4.123 3.707 0.000 0.000 0.000 11.866 2.842 0.947 -7.597 0.000 0.000 0.000 -3.808 70.4 23.0 -204.9 0.0 0.0 0.0 -32.15 Capital expenditure - supply demand balance £m 3 13.791 7.393 5.554 0.000 0.000 0.000 26.738 14.109 14.411 15.309 0.000 0.000 0.000 43.830 0.318 7.018 9.755 0.000 0.000 0.000 17.092 2.3 48.7 63.7 0.0 0.0 0.0 39.06 Gross capital expenditure - water service £m 3 63.999 67.786 62.885 0.000 0.000 0.000 194.670 68.544 70.013 76.748 0.000 0.000 0.000 215.305 4.545 2.227 13.863 0.000 0.000 0.000 20.635 6.6 3.2 18.1 0.0 0.0 0.0 9.6
B Sewerage Service7 Non-infrastructure maintenance (gross of grants and contributions) £m 3 42.799 46.247 42.854 0.000 0.000 0.000 131.900 36.143 36.918 37.899 0.000 0.000 0.000 110.960 -6.656 -9.329 -4.955 0.000 0.000 0.000 -20.940 -18.4 -25.3 -13.1 0.0 0.0 0.0 -18.98 Infrastructure renewals expenditure (gross) £m 3 9.010 10.434 10.475 0.000 0.000 0.000 29.919 10.575 10.802 11.089 0.000 0.000 0.000 32.466 1.565 0.368 0.614 0.000 0.000 0.000 2.547 14.8 3.4 5.5 0.0 0.0 0.0 7.89 Capital expenditure - quality enhancement programme £m 3 13.851 13.559 16.305 0.000 0.000 0.000 43.715 20.380 20.817 14.489 0.000 0.000 0.000 55.686 6.529 7.258 -1.815 0.000 0.000 0.000 11.971 32.0 34.9 -12.5 0.0 0.0 0.0 21.510 Capital expenditure - customer service £m 3 4.406 5.359 7.518 0.000 0.000 0.000 17.283 8.802 8.991 10.080 0.000 0.000 0.000 27.873 4.396 3.632 2.561 0.000 0.000 0.000 10.590 49.9 40.4 25.4 0.0 0.0 0.0 38.011 Capital expenditure - supply demand balance £m 3 9.626 10.951 12.584 0.000 0.000 0.000 33.161 8.016 8.188 8.474 0.000 0.000 0.000 24.678 -1.610 -2.764 -4.110 0.000 0.000 0.000 -8.483 -20.1 -33.8 -48.5 0.0 0.0 0.0 -34.412 Gross capital expenditure - sewerage service £m 3 79.692 86.551 89.735 0.000 0.000 0.000 255.978 83.917 85.715 82.031 0.000 0.000 0.000 251.663 4.225 -0.836 -7.704 0.000 0.000 0.000 -4.315 5.0 -1.0 -9.4 0.0 0.0 0.0 -1.7
C Gross capital expenditure total13 Gross capital expenditure total £m 3 143.691 154.337 152.620 0.000 0.000 0.000 450.648 152.461 155.728 158.779 0.000 0.000 0.000 466.968 8.770 1.391 6.159 0.000 0.000 0.000 16.320 5.8 0.9 3.9 0.0 0.0 0.0 3.5
D CAPITAL CONTRIBUTIONS NET OF DEFERRED CREDITS14 Capital contributions for new connections £m 3 7.782 11.483 13.917 0.000 0.000 0.000 33.182 4.174 4.263 4.431 0.000 0.000 0.000 12.868 -3.608 -7.220 -9.486 0.000 0.000 0.000 -20.314 -86.4 -169.3 -214.1 0.0 0.0 0.0 -157.915 Other capital contributions £m 3 0.203 0.067 0.092 0.000 0.000 0.000 0.362 1.226 1.253 1.300 0.000 0.000 0.000 3.779 1.023 1.186 1.208 0.000 0.000 0.000 3.417 83.4 94.7 92.9 0.0 0.0 0.0 90.416 Total capital contributions net of deferred credits £m 3 7.985 11.550 14.009 0.000 0.000 0.000 33.544 5.400 5.516 5.731 0.000 0.000 0.000 16.647 -2.585 -6.034 -8.278 0.000 0.000 0.000 -16.897 -47.9 -109.4 -144.4 0.0 0.0 0.0 -101.5
E TOTAL CAPITAL EXPENDITURE (NET)17 Total capital expenditure (net) £m 3 135.706 142.787 138.611 0.000 0.000 0.000 417.104 147.061 150.212 153.048 0.000 0.000 0.000 450.321 11.355 7.425 14.437 0.000 0.000 0.000 33.217 7.7 4.9 9.4 0.0 0.0 0.0 7.4
PC15 OUTTURN (£M) PC15 FINAL DETERMINATION (£M) PC15 VARIANCE FROM FD (£M) PC15 VARIANCE FROM FD (%)

Annual Information Return 2018 Section 2 Chapter 36a Page 1 of 1
Table 36a – Capital Investment – Expenditure comparison by service and purpose
Refer to Chapter 30 for detailed commentary on this table. There are no reconciling items to report.

NORTHERN IRELAND WATER LIMITED - ANNUAL INFORMATION RETURN
ANNUAL INFORMATION RETURN - TABLE 37 FINANCIAL MEASURESCAPITAL INVESTMENT - CAPITAL GRANTS AND CONTRIBUTIONS
1 2 3 4 5 6 7 8 9
DESCRIPTION UNITS DP 2012-13 2013-14 2014-15 2015-16 2016-17 2017-18 2018-19 2019-20 2020-21
A Water Service - Maintenance grants and contributions1 MNI - grants and contributions. £m 3 0 000 0.000 0 000 0 000 0.000 0.0002 Infrastructure renewals grants and contributions. £m 3 0.079 0.114 0 033 0.203 0.067 0.0783 Total maintenance grants and contributions £m 3 0.079 0.114 0 033 0 203 0.067 0.078
B Water Service - Enhancement grants and contributions4 Infrastructure charge receipts - new connections £m 3 1.127 1.272 1.426 1 800 2.284 2.5615 Enhancement requisitions, grants and contributions £m 3 2.031 2.054 2 387 2 553 4.038 3.339
6Other categories of capital grants and contributions to be added by NI Water £m 3 0 000 0.000 0.000 0.000 0.000 0.000
7 Total enhancement capital grants and contributions £m 3 3.158 3.326 3 813 4 353 6.322 5.900
C Water Service - Deferred credits8 Capital grants and contributions transferred to deferred credits £m 3 0 500 0.382 0 666 0 545 0.685 0.768
D Sewerage Service - Maintenance grants and contributions9 MNI - grants and contributions. £m 3 0 000 0.000 0 000 0 000 0.000 0.00010 Infrastructure renewals grants and contributions. £m 3 0.166 0.095 0 064 0.000 0.000 0.01411 Total maintenance grants and contributions £m 3 0.166 0.095 0 064 0.000 0.000 0.014
E Sewerage Service - Enhancement grants and contributions12 Infrastructure charge receipts - new connections £m 3 0.911 1.036 1.195 1.515 1.997 2.28013 Enhancement requisitions, grants and contributions £m 3 1.443 2.015 2 226 1.914 3.164 5.737
14Other categories of capital grants and contributions to be added by NI Water £m 3 0 000 0.000 0.000 0.000 0.000 0.000
15 Total enhancement capital grants and contributions £m 3 2.354 3.051 3.421 3.429 5.161 8.017
F Sewerage Service - Deferred credits16 Capital grants and contributions transferred to deferred credits £m 3 0.404 0.311 0 359 0.454 0.599 0.684
G Totals for the Water and Sewerage Services17 Total enhancement capital grants and contributions £m 3 5.757 6.586 7 331 7 985 11.550 14.00918 Total capital grants and contributions transferred to deferred credits £m 3 0 904 0.693 1 025 0.999 1.284 1.452

Annual Information Return 2018 Section 2 Chapter 37 Page 1 of 3
Table 37 – Capital Investment - Capital Grants and Contributions
Line 1 – Water service MNI – grants and contributions Nil for 2017-18.
Line 2 – Water service maintenance grants and contributions This line shows £0.078m and represents contributions from developers towards the cost of watermains diversions.
Line 4 – Water service infrastructure charge receipts - new connections This line shows £2.561m and represents the receipts from developers for water infrastructure charges. This is stated gross prior to accounting for the element that is deemed to contribute to non-infrastructure expenditure.
Line 5 – Water service enhancement requisitions, grants and contributions This line can be summarised as follows: New water connections £ 2.927m Water requisitions £ 0.209m Grants £ 0.203m Total Line 5 £ 3.339m
Line 6 – Water service other categories of capital grants and contributions Nil for 2017-18.
Line 8 – Water service deferred credits This line shows £0.768m and represents:
(i) the element of the receipts from developers for water infrastructure charges thatare deemed to contribute to non-infrastructure expenditure.
This is calculated as follows: Line 4 £2.561m x 30% = £0.768m
The 30% used in this calculation is based on an estimate of the future capital expenditure that relates to non-infrastructure growth.
Line 9 – Sewerage service MNI – grants and contributions Nil for 2017-18.
Line 10 – Sewerage service - maintenance grants and contributions This line shows £0.014m and represents contributions from developers towards the cost of realignment of sewers.
Line 12 – Sewerage service - Infrastructure charge receipts - new connections This line shows £2.280m and represents the receipts from developers for sewerage infrastructure charges. This is stated gross prior to accounting for the element that is deemed to contribute to non-infrastructure expenditure.
Line 13 – Sewerage service - enhancement requisitions, grants and contributions This can be summarised as follows:

Annual Information Return 2018 Section 2 Chapter 37 Page 2 of 3
New sewerage connections £1.830m Sewerage requisitions £2.000m Sewers for adoption –application fees £0.938m Grants £0.969m Total Line 13 £5.737m
Line 14 – Sewerage service - other categories of capital grants and contributions Nil for 2017-18.
Line 16 – Sewerage service deferred credits This line shows £0.684m and represents the element of the receipts from developers for sewerage infrastructure charges that are deemed to contribute to non-infrastructure expenditure.
This is calculated as follows: Line 12 £2.280m x 30% = £0.684m
The 30% used in this calculation is based on an estimate of the future capital expenditure that relates to non-infrastructure growth.
Comparison of 2017-18 to PC15* The following table shows a comparison of the actual contributions for 2017-18 compared to PC15.
2017-18 2017-18 2017-18 2017-18 Actual PC15 Variance Variance
£m £m £m % Water Infrastructure – base 0.1 0.0 0.1 100.0% Infrastructure charges - gross 2.6 1.5 1.1 73.3% Connections 2.9 2.3 0.6 26.1% Requisitions 0.2 0.1 0.1 100.0% Grants 0.2 0.0 0.2 200.0% Total 6.0 3.9 2.1 53.85% Included in the gross Infrastructure charges above the non infrastructure element - 30%
0.8 0.5 0.3 60.0%
Sewerage Infrastructure – base 0.0 0.0 0.0 N/A Infrastructure charges – gross 2.3 1.2 1.1 91.7% Connections 1.8 1.0 0.8 80.0% Requisitions 2.0 0.1 1.9 1900.0% Sewers for adoption 0.9 0.5 0.4 80.0% Grants 1.0 0.0 1.0 1000.0% Total 8.0 2.8 5.2 185.7% Included in the gross Infrastructure charges above the non infrastructure element - 30%
0.7 0.3 0.4 133.3%
Total contributions 14.0 6.7 7.3 109.0% Which includes: non-infrastructure contributions
1.5 0.8 0.7 87.5%
*This table is rounded to one decimal place to reflect the presentation of these figures in the PC15 submission.

Annual Information Return 2018 Section 2 Chapter 37 Page 3 of 3
Note: no base infrastructure contributions or new grants were assumed in PC15.
The level of activity around developer contributions is very difficult to project.
The Developers Services Team has made the following observations in regards to the current status of the new development market.
The development market has been relatively depressed over the past eight years with few developments brought to completion since 2009. However the development sector is now showing signs of strengthening with NIW noting an increase of approximately 30% in the activity in the sector over the last two years which is consistent with a recent NHBC UK Report. However the trend shows a smaller average number of units being constructed per development which will impact on all the associated developer contributions.

NORTHERN IRELAND WATER LIMITED - ANNUAL INFORMATION RETURN
ANNUAL INFORMATION RETURN - TABLE 38 FINANCIAL MEASURESCAPITAL INVESTMENT - ADDITIONAL OPEX FROM CAPEX
1 2 3 4 5 6 7 8 9
DESCRIPTION UNITS DP 2012-13 2013-14 2014-15 2015-16 2016-17 2017-18 2018-19 2019-20 2020-21
A OPEX from CAPEX1 Additional OPEX arising from Water Service projects £m 3 0 215 0.004 0.027 0.026 0.0222 Additional OPEX arising from Sewerage Service projects £m 3 1.483 0.403 0.003 -0.021 0.0253 Total additional OPEX £m 3 1 698 0.407 0.030 0.005 0.047

Annual Information Return 2018 Section 2 Chapter 38 Page 1 of 1
Table 38 - Capital investment - additional opex from capex
A list of sites with CAR ID’s is obtained and the Opex costs for 2017/18 are calculated for these sites through various reports.
The Opex from Capex costs have been calculated by taking the difference between the total 2017/18 costs and the 2016/17 costs.
Line 1 Additional OPEX arising from water service projects The total of water pumping stations and water treatment plants has been used to populate Line 1 in Table 38 which is £0.022M.
Line 2 - Additional OPEX arising from sewerage service projects The total of the sewage pumping stations and the wastewater treatment works have been used to populate Line 2 in Table 38 which is a reduction of £0.025M.
Line 3 - Total additional OPEX The total figure is £0.046M.

T A WAT M T - A A MAT T
A A MAT T - TA 4 A TA V TM TA TA V TM T M T - M
A A MAT T 2 7-
m a e s
e )
So t Re C M Submiss on Re e ence
o ect D Re e ence o ect Name C oject
e oda ent
oject IDSubsti ute
o ect ID
ma y Asset
Ca ego y
C 0 og amme
Regula o y S gn O Requi ed
Base ine A Date
Base ine o ect
App oval Date
Base ne Sta t on S te Da e
Base ine Bene cial Use
Date
Basel ne Regulato y
sign-o Da e
Base ine Comp e ion o Const uct on
Date
Base ine End o
Main enance e od Date
Base ine Se vice A locat on Wate
n ast uc u e
Base ine Se vice Al oca ion Wate
Non-n ast uc u e
Base ine Se v ce A locat on Sewe age
In ast uctu e
Basel ne Se v ce Al oca ion
Sewe age Non-In ast uctu e
Basel ne CA EX 20 0-
£m
Base ine CA EX 20 -
2 £m
Basel ne CA EX 20 2-
3 £m
Base ne CA EX 20 3-
4 £m
Base ine CA EX 20 4-
5 £m
Basel ne CA EX 20 5-
6 £m
Base ine CA EX 20 6-
7 £m
Basel ne CA EX 20 7-
8 £m
Base ine u pose A locat on Qual ty
Base ine u pose Al oca ion Base
Base ine u pose A locat on ES
Basel ne u pose Al oca ion G ow h
Cu ent Actual o o ected
A Da e
Cu ent Ac ua o ojected
oject App oval Date
Cu ent Actual o o ected Sta t on Si e
Date
Cu ent Ac ua o ojected
Bene cial Use Da e
Cu ent Actual o o ected Regu ato y
sign-o Da e
Cu ent Actual o ojec ed
Comple ion o Const uc ion
Date
Cu ent Actual o o ected
End o Maintenance
e iod Date
Cu ent Actual o ojec ed Se v ce
A locat on Wa e In ast uctu e
Cu ent Actual o o ec ed Se v ce
A locat on Wa e Non-
n ast uc u e
Cu ent Actual o o ec ed Se v ce
A locat on Sewe age
n ast uc u e
Cu ent Actual o o ec ed Se v ce
A locat on Sewe age Non-
n ast uc u e
Cu ent Actual o o ected CA EX ea to date £m
Cu ent Actual o ojec ed
CA EX 20 0- £m
Cu ent Actual o o ected
CA EX 20 -2 £m
Cu ent Actual o ojec ed
CA EX 20 2-3 £m
Cu ent Ac ual o o ected
CA EX 20 3-4 £m
Cu ent Actual o o ec ed
CA EX 20 4-5 £m
Cu ent Ac ual o ojected
CA EX 20 5-6 £m
Cu ent Actual o o ec ed
CA EX 20 6-7 £m
Cu ent Ac ual o ojected
CA EX 20 7-8 £m
Cu ent Actual o o ec ed u pose
Al oca ion Qua i y
Cu ent Actual o o ec ed u pose
A location Base
Cu ent Actual o o ected u pose
Al oca ion ES
Cu ent Actual o ojected u pose
A locat on G owth
Cu ent Ac ual o ojected RE
Al oca ion Wate
Cu ent Ac ual o ojected RE Al oca ion Sewe age
Nom na ed Output
2 3 4 5 6 7 8 9 0 2 3 4 5 6 7 8 9 20 2 22 23 24 25 26 27 28 29 36 37 38 39 40 4 42 43 44 45 46 47 48 49 50 5 52 53 54 55 56 57 58 59 66 67 68 69 70 7 72
A T a a a ex e e e e 7 99 2 9 24 949 4 9 47 7 4 4 2 2 2 7 7 47 92 9 4 79 7 4 7 4 27 2 2
SOR
CIM
_Sub
I_oj
ect_
D
I_oj
ect_
Nam
e
I_C
_e
od
I_AR
EN_
ojec
t_D
I_SU
BSI
UE_
oec
t_D
I_i_
Asse
t_C
at
I_C
0_og
I_R
eg_S
gno
BM
_A
BM
_o
ect_
App
oval
BM
_SoS
BM
_BU
BM
_RSO
BM
_CoC
BM
_EoM
BSA_
WI%
BSA_
WN
I%
BSA_
SI%
BSA_
SNI%
B_C
apex
_20
0-_£
m
B_C
apex
_20
-2_
£m
B_C
apex
_20
2-3_
£m
B_C
apex
_20
3-4_
£m
B_C
apex
_20
4-5_
£m
B_C
apex
_20
5-6_
£m
B_C
apex
_20
6-7_
£m
B_C
apex
_20
7-8_
£m
BA_
Q%
BA_
B%
BA_
E%
BA_
G%
CAM
_A
CAM
_oj
ecAp
pov
al
CAM
_SoS
CAM
_BU
CAM
_RSO
CAM
_CoC
CAM
_EoM
CAS
A_W
I%
CAS
A_W
NI%
CAS
A_SI
%
CAS
A_SN
I%
CA
_Cap
ex_
D_£
m
CA
_Cap
ex_2
00-
_£m
CA
_Cap
ex_2
0-
2_£m
CA
_Cap
ex_2
02-
3_£m
CA
_Cap
ex_2
03-
4_£m
CA
_Cap
ex_2
04-
5_£m
CA
_Cap
ex_2
05-
6_£m
CA
_Cap
ex_2
06-
7_£m
CA
_Cap
ex_2
07-
8_£m
CA
A_Q
%
CA
A_B%
CA
A_E%
CA
A_G
%
CA
_IR
E_W
%
CA
_IR
E_S%
NO
M_O
upu
t
1 2017_18 Q KS887 Ba lycranbeg WWTW 02 KS111 09 16 NIEA 01 0 2013 31/12/2013 30/03/201 30/03/2015 0 0 5 95 0.0 7 0.00 0.126 0.66 0.0 6 0.172 0.000 0.000 26 0 30 0 /0 /201 1 /0 /201 03/11/201 31/03/2015 28/08/2015 0 0 5 95 0.036 0 000 0.000 0 000 0.000 0 873 0.201 0 091 0.036 0 68 0 32 0 5 082 2017_18 Q KR388 Ba lywal er WwTW Interim Solution 01 KS113 09 15 NIEA 1 03 2008 0 /09/2012 0 /09/2012 0 /09/2013 0 0 0 0 0.000 0.000 0.000 0.000 0.000 0.000 0.000 0.000 0 0 0 0 09/01/2008 1 /01/2008 1 /03/2008 03/09/2012 2 /0 /2009 0 0 96 0.01 0 013 -0.00 0 013 0.012 0 012 0.030 0 026 0.01 36 39 0 25 0 1 093 2017_18 Q KS927 Whitechurch Road Ballywa ter Sewage Scheme 00 KS113 07 2 DRD 0 0 70 30 0.000 0 000 0.000 0 000 0.035 -0 010 0.001 0 000 0.000 100 0 0 0 0 0 01
2017_18 Q KS939 Central Promenade, Newcast e CSO Upgrade (Pattons Bridge 03 KS8 8 07 12 NIEA 0 0 100 0 0.000 0.000 0.000 0.000 0.000 0.017 0.000 0.000 100 0 0 0 29/01/2016 29/02/2016 07/03/2016 2 /03/2016 0 0 100 0 -0.002 0 000 0.000 0 000 0.000 0 015 0.2 7 0 000 -0.002 100 0 0 0 0 0 035 2017_18 Q JA26 Crosskennan SR, Antrim, Water Pumping Station. 00 05 06 DWI 26 02 2010 12/0 /2010 31 05 2010 28/0 /2011 28/0 /2011 27/0 /2012 0 0 0 0 0.000 0.000 0.000 0.000 0.000 0.000 0.000 0.000 0 0 0 0 26/02/2010 12/0 /2010 31/05/2010 28/0 /2011 10/10/2011 0 100 0 0 0.000 0 8 7 0.127 0 000 -0.001 0 000 0.002 0 000 0.000 0 53 0 7 0 06 2017_18 Q JA271 Ki lylane WTW 02 06 01 DWI 01 0 2013 31/12/2013 31/03/201 31/03/2015 0 100 0 0 0.061 0.003 0.000 0.922 0.13 0.000 0.000 0.000 0 100 0 0 08/07/2013 13/08/2013 29/01/201 05/12/201 25/03/2015 1 /09/2015 0 100 0 0 0.000 0 061 0.003 0 000 0.228 1 005 0.001 0 000 0.000 0 100 0 0 0 0 087 2017_18 Q JA289 Lylehi l WPS Templepatr ck Si e Security Improvements 00 05 01 DRD 13/11/2013 19/11/2013 06/01/201 10/06/2015 29/05/2015 0 100 0 0 0.000 0 000 0.000 0 000 0.011 0 062 0.058 0 000 0.000 0 100 0 0 0 0 018 2017_18 Q JA290 Ki lylane Duno e East Phase 1 00 03 08 DRD 05/08/2013 06/08/2013 18/02/2013 23/03/2017 08/12/201 89 11 0 0 -0.128 0 000 0.000 0 267 1.953 0 715 0.003 0.156 -0.128 10 6 0 5 0 019 2017_18 Q JA300 A31 Magherafe t By-Pass, Wa ermain Diversions 00 03 23 DRD 27/05/2015 29/05/2015 100 0 0 0 -0.002 0 000 0.000 0 000 0.000 0 015 0.061 0 005 -0.002 0 9 0 6 9 0 01
10 2017_18 Q JA306 Carr ckfergus Road, Larne, Water Quality Schemes. 00 03 08 02/03/2015 0 /03/2015 16/03/2015 23/02/2016 100 0 0 0 0.000 0 000 0.000 0 000 0.000 0 368 0. 65 0 003 0.000 69 25 6 0 25 0 0111 2017_18 Q JA308 A6 Cas ledawson to Randalstown 00 03 23 06/01/2017 09/01/2017 58 0 2 0 0.199 0 000 0.000 0 000 0.000 0 000 0.0 9 0 089 0.199 0 69 0 31 1 28 0112 2017_18 Q JA310 WI M Phase 2 Dunore East WP 06 03 08 100 0 0 0 0.000 0 000 0.000 0 000 0.000 0 000 0.000 0 200 0.000 0 60 0 0 60 0 0113 2017_18 Q JA311 WI M Phase 2 Dunore Point WP 06 03 08 30/06/2016 0 /07/2016 21/07/2016 100 0 0 0 1.105 0 000 0.000 0 000 0.000 0 000 0.000 1. 22 1.105 62 38 0 0 38 0 011 2017_18 Q JA312 Dunore Point WTW Renewable Energy 06 06 20 16/10/2017 31/10/2017 09/08/2017 20/03/2018 0 100 0 0 7.058 0 000 0.000 0 000 0.000 0 000 0.000 0.169 7.058 0 0 100 0 0 0 0115 2017_18 Q JA313 Antrim North WI M 2.1 Work Package 06 03 08 100 0 0 0 0. 50 0 000 0.000 0 000 0.000 0 000 0.000 0 0 5 0. 50 59 1 0 0 1 0 0116 2017_18 Q JA31 Antrim South WIIM 2.1 Work Package 06 03 08 100 0 0 0 0.005 0 000 0.000 0 000 0.000 0 000 0.000 0 0 5 0.005 5 5 0 10 5 0 0117 2017_18 Q JA315 Belraugh WPS 06 05 01 05/03/2018 13/03/2018 50 50 0 0 0.030 0 000 0.000 0 000 0.000 0 000 0.000 0 000 0.030 0 100 0 0 50 018 2017_18 Q JA319 Dor s and Wtw treatabil ty recommended improvements. 06 02 0 0 100 0 0 0.035 0 000 0.000 0 000 0.000 0 000 0.000 0 000 0.035 100 0 0 0 0 019 2017_18 Q JA321 Donegore SR Rehab itation 06 0 07 0 100 0 0 0.000 0 000 0.000 0 000 0.000 0 000 0.000 0 000 0.000 0 100 0 0 0 020 2017_18 Q JB671 Glenlough Pumping Sta ion & Pumping Main 01 03 01 DWI 60 0 0 0 0.000 0.000 0.000 0.2 8 0.000 0.000 0.000 0.000 0 20 0 80 16/02/2015 18/02/2015 01/08/2016 27/02/2018 15/12/2017 0 100 0 0 0.505 0 000 0.000 0 000 0.021 0 000 0.006 0 218 0.505 0 0 0 100 0 0 0121 2017_18 Q JB692 Rathlin Island SR rat onal sation 00 03 06 DRD 05/08/2013 12/08/2013 01/09/201 23/06/2015 30/03/2015 08/12/2015 0 100 0 0 0.000 0 000 0.000 0 005 0.015 0 205 0.016 0 002 0.000 0 0 100 0 0 022 2017_18 Q JB693 Car and to Cookstown Stra eg c Trunk Main 0 03 05 DRD 31/03/2021 100 0 0 0 0.000 0.000 0.000 0.000 0.000 0.000 0.000 0.000 0 0 0 100 16/03/2015 18/03/2015 15/09/2015 21/09/2016 100 0 0 0 0.000 0 000 0.000 0 000 0.015 0 0 7 1. 91 0 222 0.000 0 0 0 100 0 0 0223 2017_18 Q JB69 Tully Rehab Work Packages. 03 03 08 DRD 13/05/201 21/05/201 09/09/2013 29/06/2015 30/03/2015 100 0 0 0 -0.001 0 000 0.000 0 000 0.080 1 237 0.081 0 030 -0.001 66 0 30 66 0 012 2017_18 Q JB695 Buckna WPS Upgrade - Ballymena F ow Optimisat on 03 05 01 DRD 30/11/2016 05/12/2016 01/11/2017 0 100 0 0 0.26 0 000 0.000 0 000 0.006 -0 002 0.015 0 020 0.26 0 100 0 0 0 0 0125 2017_18 Q JB70 Desertcreat Road/ Lindsayv lle Road, Cooks own, Rep acemen00 03 08 DWI 100 0 0 0 0.000 0 000 0.000 0 000 0.003 0 022 0.00 0 000 0.000 100 0 0 0 0 0 0126 2017_18 Q JB706 A26 Dualling: Gla ryford o A (Drones Road) Junc ion - Wate00 03 23 DRD 30/03/2015 01/0 /2015 100 0 0 0 0.010 0 000 0.000 0 000 0.016 -0 002 0.115 0 018 0.010 0 9 0 6 9 0 0127 2017_18 Q JB709 Lough Fea CWB Capac ty Increase 06 0 06 DWI 30/09/2019 33 67 0 0 0.000 0.000 0.000 0.000 0.000 0.000 0.000 0.000 0 2 0 58 28/01/2016 02/02/2016 0 100 0 0 0.113 0 000 0.000 0 000 0.000 0 038 0.000 0 076 0.113 0 0 0 100 0 0 0228 2017_18 Q JB713 Replacement Watermains 201 /15 - Reactive, Bund e 1 03 03 08 DWI 2 /09/201 03/10/201 27/10/201 29/06/2015 100 0 0 0 -0.060 0 000 0.000 0 000 0.000 0 385 0.021 0 0 0 -0.060 100 0 0 0 0 0 0129 2017_18 Q JB717 Cra gyhi l Bungalows, Larne, Lead Supply Pipe Replacement P00 03 23 30/09/201 03/10/201 01/12/201 30/03/2015 17/0 /2015 100 0 0 0 0.000 0 000 0.000 0 000 0.000 0 0 8 0.000 -0 008 0.000 100 0 0 0 0 0 0130 2017_18 Q JB723 Moyola WTW to Mullaghaboy SR Trunk Main Rep acement 06 03 23 100 0 0 0 0.103 0 000 0.000 0 000 0.000 0 000 0.000 0 02 0.103 0 100 0 0 100 0 0131 2017_18 Q JB72 Ki lylane WTW o Crosshi l SR Trunk Main Replacement (part)06 03 23 28/10/2016 01/11/2016 05/12/2016 01/09/2017 23/01/2018 100 0 0 0 0.677 0 000 0.000 0 000 0.000 0 000 0.000 1.111 0.677 0 100 0 0 100 0 0132 2017_18 Q JB725 WI M Phase 2 Lough Fea WP 06 03 08 17/10/2016 2 /10/2016 31/10/2016 100 0 0 0 1.217 0 000 0.000 0 000 0.000 0 000 0.000 0 963 1.217 37 62 1 0 62 0 0133 2017_18 Q JB726 WI M Phase 2 Moyola Magherafe t WP 06 03 08 20/09/2017 03/10/2017 22/02/2018 31/01/2020 100 0 0 0 0.199 0 000 0.000 0 000 0.000 0 000 0.000 0.180 0.199 32 68 0 0 68 0 013 2017_18 Q JB727 WI M Phase 2 Altnahinch Bushmi ls WP 06 03 08 1 /10/2016 17/10/2016 01/07/2016 100 0 0 0 1.090 0 000 0.000 0 000 0.000 0 000 0.000 0 575 1.090 0 60 0 0 60 0 0135 2017_18 Q JB729 Bonneytober SR Rehab l tat on 06 0 07 0 100 0 0 0.000 0 000 0.000 0 000 0.000 0 000 0.000 0 000 0.000 0 100 0 0 0 0 0136 2017_18 Q JB732 Ki lylane o Crosshi l SR TM Rep acement Stage , including 1 06 03 23 100 0 0 0 0.091 0 000 0.000 0 000 0.000 0 000 0.000 0 000 0.091 0 60 0 0 60 0 0137 2017_18 Q JB733 INTERREG VA co-operating across borders for Biodiversity(CA06 01 03 02/01/2018 05/01/2018 0 100 0 0 0.028 0 000 0.000 0 000 0.000 0 000 0.000 0 000 0.028 100 0 0 0 0 0 0738 2017_18 Q JB735 Central Zone Res lience 06 01 23 100 0 0 0 0.012 0 000 0.000 0 000 0.000 0 000 0.000 0 000 0.012 10 0 20 70 0 039 2017_18 Q JC385 Monac ogh SR Capacity Extens on 06 0 06 DWI 25 10 2010 0 0 0 0 0.000 0.000 0.000 0.000 0.000 0.000 0.000 0.000 0 0 0 0 25/10/2010 19/11/2010 01/08/2016 26/06/2017 31/10/2017 0 100 0 0 0.509 0 007 0.00 0 018 -0.017 0 000 0.000 0 803 0.509 0 0 0 100 0 0 00 2017_18 Q JC386 Cra gpark SR Capac ty Ex ension 06 0 06 DWI 0 0 0 0 0.000 0.000 0.000 0.000 0.000 0.000 0.000 0.000 0 0 0 0 0 100 0 0 0.000 0 000 0.000 0 000 0.003 0 000 0.000 -0 003 0.000 0 0 0 100 0 01 2017_18 Q JC387 Lagavara SR Capacity Extens on 06 0 06 DWI 0 0 0 0 0.000 0.000 0.000 0.000 0.000 0.000 0.000 0.000 0 0 0 0 50 50 0 0 0.000 0 000 0.000 0 000 0.003 0 000 0.000 -0 003 0.000 0 10 0 90 10 02 2017_18 Q JC391 Marine Apartments, Ba lycast e, W/main ext. 00 03 23 DRD 22/10/2012 25/10/2012 07/05/2013 30/07/2013 28/05/2013 100 0 0 0 0.000 0 000 0.000 0 000 0.008 0 000 0.000 0 002 0.000 0 0 0 100 0 0 013 2017_18 Q JC397 Kilraugh s Road Ballymoney Water Main Replacement 03 03 23 DRD 30/06/201 09/07/201 03/11/201 29/06/2015 100 0 0 0 0.000 0 000 0.000 0 000 0.000 0 275 0.000 -0 050 0.000 100 0 0 0 0 0
2017_18 Q JC399 WI M Phase 2 Ba linrees Limavady WP 06 03 08 20/09/2017 03/10/2017 100 0 0 0 0.061 0 000 0.000 0 000 0.000 0 000 0.000 0 207 0.061 70 30 0 0 30 0 015 2017_18 Q JC 00 WI M Phase 2 Altnahinch Bushmi ls 2 WP 06 03 08 0 /07/2016 0 /07/2016 21/07/2016 100 0 0 0 0.820 0 000 0.000 0 000 0.000 0 000 0.000 1 515 0.820 57 37 6 0 37 0 016 2017_18 Q JC 01 Royal Portrush - Open 2019 Watermains 06 03 23 100 0 0 0 0.000 0 000 0.000 0 000 0.000 0 000 0.000 0 000 0.000 10 50 10 30 50 07 2017_18 Q JD3 3 Ba lybo len Road Ahogh ll - Wa ermain Extens on 08 100 0 0 0 -0.001 0 000 0.000 0 000 0.000 0 000 0.000 0 000 -0.001 0 0 0 100 0 08 2017_18 Q JF007 Seagahan Zone Watermain Improvements 00 03 08 26 0 2006 1 01 2008 29/09/2008 29/09/2008 29/09/2009 0 0 0 0 0.000 0.000 0.000 0.000 0.000 0.000 0.000 0.000 0 0 0 0 26/0 /2006 100 0 0 0 0.000 0 000 0.138 0 027 0.000 0 000 0.027 0 000 0.000 11 89 0 0 89 0 019 2017_18 Q JF606 WI M Phase 2 Clay Lake Keady WP 06 03 08 0 /07/2016 0 /07/2016 21/07/2016 100 0 0 0 0. 70 0 000 0.000 0 000 0.000 0 000 0.000 1 55 0. 70 17 83 0 0 83 0 01
50 2017_18 Q JF607 Dor s and Impounding Reservior 06 02 03 100 0 0 0 0.079 0 000 0.000 0 000 0.000 0 000 0.000 0 006 0.079 20 80 0 0 80 051 2017_18 Q JF608 Cra gavon W IM 2.1 Work Package 06 03 08 100 0 0 0 0.0 0 0 000 0.000 0 000 0.000 0 000 0.000 0 000 0.0 0 27 69 0 69 0 0152 2017_18 Q JF610 Southern Zone Resi ience 06 01 23 100 0 0 0 0.011 0 000 0.000 0 000 0.000 0 000 0.000 0 000 0.011 10 0 20 70 0 053 2017_18 Q JG035 Ba lydougan to Newry Main Link Reinforcement 02 03 05 DWI 01 10 2009 26/10/2009 07 12 2009 28/08/2015 28/02/2015 28/02/2016 82 18 0 0 5.022 5.651 3.382 1.105 3.559 3.238 0.000 0.000 0 0 96 01/10/2009 26/10/2009 28/08/2015 82 18 0 0 0.0 0 5 022 5.787 3 2 0.2 5 2 059 2.916 0.106 0.0 0 0 1 95 0 0 025 2017_18 Q JG036 Castor Bay to Dungannon Strategic Trunk Mains 01 03 05 DWI 11 12 2008 23/12/2008 1 09 2009 2 /05/2011 2 /05/2011 23/05/2012 0 0 0 0 0.000 0.000 0.000 0.000 0.000 0.000 0.000 0.000 0 0 0 0 11/12/2008 23/12/2008 03/06/2013 2 /05/2011 23/07/2012 90 10 0 0 -0.063 6 3 9 3.025 -0 352 0.017 0.1 6 0.183 0 000 -0.063 0 33 0 67 27 0 1155 2017_18 Q JG079 Legahory Cra gavon, Replacement Watermains 00 03 08 DWI 100 0 0 0 0.000 0 000 0.000 0 000 0.005 0 015 0.000 -0 007 0.000 100 0 0 0 0 0 0156 2017_18 Q JG080 Cranny Lane, Por adown Wate main Ext 00 03 23 DRD 12/06/201 2 /06/201 100 0 0 0 0.000 0 000 0.000 0 000 0.009 0 009 0.002 0 000 0.000 0 0 0 100 0 0 0157 2017_18 Q JG082 Derryo a Br dge Road, Craigavon, Replacement Watermain 00 03 23 DRD 100 0 0 0 0.000 0 000 0.000 0 000 0.001 0 002 0.003 0 000 0.000 0 100 0 0 100 0 0158 2017_18 Q JG08 Seagoe Refurbishment 06 15 20 01/10/2015 05/10/2015 02/11/2015 07/03/2016 31/03/2016 0 /0 /2016 0 50 0 50 -0.003 0 000 0.000 0 000 0.000 0 000 0.626 0 000 -0.003 0 100 0 0 0 0 0159 2017_18 Q JG085 M l ennium Way, Lurgan ( New Road Construction) 00 03 23 03/02/2016 29/02/2016 75 0 25 0 0.000 0 000 0.000 0 000 0.000 0 000 0.010 0 030 0.000 0 100 0 0 75 25 0160 2017_18 Q JG087 Castor Bay WTW to Ballydougan SR Upgrade 00 03 05 DWI 80 20 0 0 0.030 0 000 0.000 0 000 0.000 0 000 0.000 0 000 0.030 0 7 1 92 0 0 1061 2017_18 Q J 003 Water Mains Rehab l tat on, New and Rep acement incl FTS 00 03 08 DWI 0 0 0 0 0.000 0.000 0.000 0.000 0.000 0.000 0.000 0.000 0 0 0 0 07/01/2013 1 /01/2013 89 11 0 0 0.000 0 000 0.000 0. 2 -0.08 0 000 0.000 0 000 0.000 26 3 27 38 062 2017_18 Q JF592 Granvi le Dungannon Invest NI Watermain Extens on 00 JI003 03 23 DRD 0 0 0 0 0.000 0.000 0.000 0.000 0.000 0.000 0.000 0.000 0 0 0 0 03/02/201 10/02/201 01/06/2015 18/12/2015 86 1 0 0 0.000 0 000 0.000 0 000 0.000 0 000 0.88 0.1 3 0.000 0 79 0 21 65 0 0163 2017_18 Q JR Newtownabbey Zone Watermain Improvements Phase 3 00 JI003 03 08 UR 17/12/2013 19/12/2013 06/01/201 26/01/2015 100 0 0 0 -0.220 0 000 0.000 0 000 0.250 0 895 0.011 0 000 -0.220 93 0 0 7 0 0 016 2017_18 Q J 005 Base Maintenance (Water) 00 02 01 UR 1 86 0 0 0.000 0.000 0.000 2.628 3.7 5 0.000 0.000 0.000 13 87 0 0 0 100 0 0 0.000 0 000 0.000 0 000 0.000 0 000 0.000 0 000 0.000 0 100 0 0 0 065 2017_18 Q JF581 Clay Lake - Remed al Work 00 JI005 02 01 UR 19 02 2010 2 /02/2010 06 0 2011 28/09/2012 28/09/2012 28/09/2013 0 0 0 0 0.000 0.000 0.000 0.000 0.000 0.000 0.000 0.000 0 0 0 0 19/02/2010 2 /02/2010 21/03/2011 01/10/2013 26/08/2013 0 100 0 0 0.000 0 002 2.289 1 033 -0.1 2 0.113 0.132 -0 001 0.000 0 100 0 0 0 0 0166 2017_18 Q J 020 Assessment of requirements at WTWs to opera e effectively in 00 JI005 02 01 DRD 0 100 0 0 0.000 0.000 0.000 0.000 0.000 0.000 1.016 0.970 0 100 0 0 23/11/2015 23/11/2015 0 100 0 0 1.983 0 000 0.000 0 006 0.027 0 01 0.036 0 368 1.983 0 100 0 0 0 0 0267 2017_18 Q JN 82 Ki lymore Road, Gortin Pumping Station 00 JI005 03 01 16 08 2007 17/08/2007 10 12 2007 23/05/2008 23/05/2008 23/05/2009 0 0 0 0 0.000 0.000 0.000 0.000 0.000 0.000 0.000 0.000 0 0 0 0 16/08/2007 17/08/2007 10/12/2007 20/06/2011 23/02/2009 71 29 0 0 -0.015 0 000 -0.009 0 000 0.000 0 000 0.000 0 000 -0.015 0 0 0 100 0 068 2017_18 Q JR367 Service Reservoir Enhanced Security 01 JI005 0 07 UR 28 01 2008 13/10/2010 13/10/2010 13/10/2011 0 0 0 0 0.000 0.000 0.000 0.000 0.000 0.000 0.000 0.000 0 0 0 0 20/11/2007 17/12/2007 07/12/2009 12/10/2010 02/12/2013 0 100 0 0 0.000 0 21 0.177 0 000 0.002 0 059 0.0 0 000 0.000 100 0 0 0 0 0 0169 2017_18 Q JR 60 Gravity II, McVe ghs well to Old Park SR. 02 JI005 03 05 DRD 08 07 2011 30/11/201 30/12/201 30/12/201 100 0 0 0 0.000 0.000 0.000 1. 92 1.288 0.000 0.000 0.000 0 0 0 100 13/12/2013 13/12/2013 01/01/201 28/11/201 02/12/201 23/06/2015 100 0 0 0 -0.011 0 000 0.000 0 000 1.628 3 398 0.033 -0 001 -0.011 0 0 0 100 0 0 0870 2017_18 Q JS297 Bloody Br dge Water Pumping Stat on & New Link Main or Ma 00 JI005 03 23 DRD 22 02 2012 1 /03/2012 26 09 2011 28/09/2012 28/09/2012 28/09/2013 0 0 0 0 0.000 0.000 0.000 0.000 0.000 0.000 0.000 0.000 0 0 0 0 22/02/2012 1 /03/2012 26/09/2011 30/0 /2012 2 /09/2012 75 25 0 0 -0.001 0 000 0.110 0 013 0.000 0 001 0.000 0 000 -0.001 0 0 0 100 0 071 2017_18 Q J 006 Panel Engineers Recommendat on 00 01 03 DWI 100 0 0 0 0.000 0.000 0.000 1.522 0.208 0.000 0.000 0.000 0 100 0 0 100 0 0 0 0.000 0 000 0.000 0 000 0.000 0 000 0.000 0 000 0.000 0 100 0 0 100 072 2017_18 Q JB662 Panel Engineer Recommenda ions - North Phase 1 00 JI006 01 03 DWI 15 02 2011 25/02/2011 1 12 2011 28/05/2012 28/05/2012 28/05/2013 0 0 0 0 0.000 0.000 0.000 0.000 0.000 0.000 0.000 0.000 0 0 0 0 15/02/2011 25/02/2011 22/07/2013 23/10/2015 22/09/2015 100 0 0 0 -0.00 0 025 0.7 8 0 256 0.589 0 901 0.3 0 007 -0.00 0 100 0 0 100 0 0973 2017_18 Q JR 20 Panel Engineer Recommenda ions - East Phase 1 00 JI006 01 03 DWI 15 02 2011 28/02/2011 2 10 2011 22/06/2012 22/06/2012 22/06/2013 0 0 0 0 0.000 0.000 0.000 0.000 0.000 0.000 0.000 0.000 0 0 0 0 15/02/2011 28/02/2011 10/06/2013 19/05/2015 22/0 /2015 100 0 0 0 -0.001 0.12 1.03 0.1 2 0.769 0 856 0.067 0 021 -0.001 0 100 0 0 100 0 097 2017_18 Q J 007 WTW Effluent Qual ty 00 02 0 DWI 0 100 0 0 0.000 0.000 0.000 0.000 0.000 0.0 3 0.000 0.000 100 0 0 0 28/10/2015 17/11/2015 0 /01/2016 01/03/2017 03/10/2017 0 100 0 0 0.006 0 000 0.000 0 003 0.007 0 003 0.0 7 0.122 0.006 100 0 0 0 0 0 0175 2017_18 Q J 010 SEMD Surveys PC10 Water 01 02 0 UR 0 0 0 0 0.000 0.000 0.000 0.000 0.000 0.000 0.000 0.000 0 0 0 0 30/05/201 20/06/201 01/03/2018 12/0 /2019 0 100 0 0 0.0 1 0 000 0.000 0 000 0.067 0 071 0.535 0 007 0.0 1 100 0 0 0 0 0 0176 2017_18 Q J 015 Enhanced S te Security 01 06 0 UR 30 08 2012 01/0 /2013 01/0 /2013 01/0 /201 0 0 0 0 0.000 0.000 0.000 0.000 0.000 0.000 0.000 0.000 0 0 0 0 23/02/2012 28/02/2012 30/08/2012 11/09/2013 12/09/2013 0 100 0 0 -0.030 0 000 0.037 1 681 1.517 0.152 0.001 -0 032 -0.030 100 0 0 0 0 077 2017_18 Q J 017 Capital Investment - WPS Pump Eff c ency 01 05 01 UR 31 03 2011 28/03/201 28/03/201 28/03/2015 0 0 0 0 0.000 0.000 0.000 0.000 0.000 0.000 0.000 0.000 0 0 0 0 29/11/2010 12/01/2011 0 100 0 0 0.000 0 020 0.022 0 018 0.01 0 000 0.000 0 000 0.000 0 100 0 0 0 078 2017_18 Q J 069 WPS Pump Ef iciency Capital Investment Phase 1 00 JI017 05 01 DRD 0 100 0 0 0.000 0.000 0.000 0.000 0.000 0.393 0. 00 0.388 0 100 0 0 22/07/201 31/07/201 10/02/2015 28/02/2017 0 100 0 0 0.007 0 000 0.000 0 000 0.030 0 053 0. 32 0 06 0.007 0 100 0 0 0 0 0179 2017_18 Q J 02 M MP West (Major Inc dent Mi igation Project West Region) Fr 00 03 08 DRD 30/03/201 93 7 0 0 0.000 0. 3 2.080 1.567 0.000 0.000 0.000 0.000 0 81 0 19 16/10/2012 2 /10/2012 05/09/2011 1 /02/201 21/07/201 9 6 0 0 -0.00 0 000 0. 3 1 386 1.770 0 0 9 0.001 -0 0 6 -0.00 0 66 1 33 66 0 0880 2017_18 Q J 025 M MP South (Major Inc dent Mi igation Project South Region) F00 03 08 DRD 05 12 2011 08/12/2011 07 09 2011 18/06/2013 18/06/2013 18/06/201 9 6 0 0 0.000 0.202 0.993 0.751 0.000 0.000 0.000 0.000 0 91 0 9 05/12/2011 08/12/2011 07/09/2011 2 /01/201 25/09/2013 100 0 0 0 0.098 0 000 0.202 1 056 0.661 0 235 0.000 0 002 0.098 0 91 0 9 91 0 0881 2017_18 Q J 026 MIMP North (Major Incident Mit ga ion Project No th Region) F00 03 08 DRD 30/03/2015 99 1 0 0 0.000 0.1 1 0.00 1.091 0. 9 0.000 0.000 0.000 15 80 1 12/12/2012 20/12/2012 02/06/2011 18/08/201 18/09/201 100 0 0 0 -0.00 0 000 0.1 1 0. 28 1.037 0.135 0.0 0 0 000 -0.00 30 65 0 5 65 0 0882 2017_18 Q J 027 M MP Cent al Major Incident M tigat on Project Central Reg on00 03 08 DRD 30/03/201 100 0 0 0 0.000 0.167 1.062 1.119 0.000 0.000 0.000 0.000 0 91 9 0 15/10/2012 25/10/2012 05/05/2011 28/03/201 26/06/201 100 0 0 0 -0.066 0 000 0.167 0 890 0.356 0. 91 0.001 0 000 -0.066 0 99 0 1 99 0 0883 2017_18 Q J 028 M MP East (Major Inc dent Mit ga ion Project East Reg on) Fre 00 03 08 DRD 30/03/2015 99 1 0 0 0.000 0.187 0.008 1.87 0.958 0.000 0.000 0.000 0 98 0 2 12/12/2012 20/12/2012 0 /08/2011 09/02/2015 28/08/201 100 0 0 0 0.000 0 000 0.187 0 331 1.967 0 3 3 0.066 0 000 0.000 0 95 0 5 95 0 088 2017_18 Q J 029 Service Reservoir Assessmen s - Site Access 00 0 01 UR 0 100 0 0 0.000 0.000 0.000 0.000 0.000 0.000 0.000 0.679 0 100 0 0 17/02/201 21/02/201 0 100 0 0 -0.00 0 000 0.000 0 000 0.050 0 082 0.688 0 09 -0.00 0 50 0 50 0 0 0185 2017_18 Q J 031 Offices & Depots Water Regu ation Compliance & Energy Eff c01 06 20 DRD 0 0 0 0 0.000 0.000 0.000 0.000 0.000 0.000 0.000 0.000 0 0 0 0 01/10/2015 09/10/2015 0 100 0 0 0.000 0 000 0.000 0 000 0.010 0 015 0.026 0 026 0.000 0 100 0 0 0 0 0186 2017_18 Q J 032 Water Treatment Sites - Water Regu ation Compliance & Energ01 02 01 DRD 0 100 0 0 0.000 0.000 0.000 0.000 0.000 0.851 0.8 6 0.000 62 38 0 0 2 /06/201 17/07/201 0 100 0 0 0.1 3 0 000 0.000 0 00 0.028 0 000 0.022 0 028 0.1 3 89 11 0 0 0 0 0187 2017_18 Q J 035 Impounding Reservoir Future Use Assessment 00 01 03 DRD 0 0 0 0 0.000 0.000 0.000 0.000 0.000 0.000 0.000 0.000 0 0 0 0 22/01/2018 22/01/2018 100 0 0 0 0.000 0 000 0.000 0 000 0.016 0 05 0.002 0 000 0.000 0 100 0 0 100 088 2017_18 Q J 037 Flood Resil ence at NIW Water Supply S tes - Appra sal Study 02 02 01 DRD 0 0 0 0 0.000 0.000 0.000 0.000 0.000 0.000 0.000 0.000 0 0 0 0 15/05/201 21/05/201 0 /0 /2017 31/03/2016 25/05/2017 0 100 0 0 -0.013 0 000 0.000 0 006 0.025 0 000 0.006 0.118 -0.013 0 100 0 0 0 0 0189 2017_18 Q J 038 Service Reservoir Security Phase 1 02 0 07 DRD 09 05 2013 20/12/2016 20/12/2016 20/12/2017 0 100 0 0 0.000 0.000 0.0 8 1.8 1.238 0.652 0.6 8 0.6 100 0 0 0 0 /03/201 13/03/201 03/05/2016 31/01/2018 0 100 0 0 0.98 0 000 0.000 0 003 0.082 0. 6 0. 92 1 356 0.98 100 0 0 0 0 0 0190 2017_18 Q J 039 Water Supply West - Turbidity Mon tor Upgrade 00 02 01 DRD 15/05/201 30/05/201 02/03/2015 19/06/2015 26/08/2016 0 100 0 0 0.000 0 000 0.000 0 00 0.013 0 350 0.093 -0 003 0.000 0 100 0 0 0 0 0191 2017_18 Q J 0 0 Recovering Energy Within the Water D stribution Sys em 00 02 01 DRD 0 100 0 0 0.000 0.000 0.000 0.000 0.000 0. 16 0. 13 0. 11 0 0 100 0 0 100 0 0 0.000 0 000 0.000 0 000 0.025 0 015 0.003 -0 002 0.000 0 0 100 0 0 0 0192 2017_18 Q J 0 1 Hydro Power from Raw Water - Feasibil ty Study 00 02 01 DRD 0 100 0 0 0.000 0.000 0.000 0.000 0.000 0.000 0. 0 0.000 0 0 100 0 0 /03/2015 06/03/2015 0 100 0 0 0.030 0 000 0.000 0 000 0.023 0 026 0.009 0 001 0.030 0 0 100 0 0 0 0193 2017_18 Q J 0 3 Lough Bradan WTW & A taveedan SR Sludge Lagoons 00 02 01 DRD 0 0 0 0 0.000 0.000 0.000 0.000 0.000 0.000 0.000 0.000 0 0 0 0 03/09/2015 07/09/2015 23/12/2015 31/01/2017 28/07/2017 20/06/2017 0 100 0 0 0.002 0 000 0.000 0 000 0.008 0 000 0.003 0 000 0.002 0 100 0 0 0 0 019 2017_18 Q J 0 6 WP13 High Priority Water Mains Ph1 00 03 08 DRD 27/08/2013 29/08/2013 01/02/2013 31/08/2015 26/12/201 100 0 0 0 -0.007 0 000 0.000 0 019 0.63 0 635 0.23 0 001 -0.007 59 25 11 5 25 0 0195 2017_18 Q J 0 7 High Pr ority Watermains Phase 2 Work Package. 00 03 08 DRD 19/08/2013 29/08/2013 1 /02/2013 31/12/201 26/06/201 100 0 0 0 -0.191 0 000 0.000 0 020 0.702 0 252 0.001 0 000 -0.191 52 8 0 0 8 096 2017_18 Q J 0 8 Appra sal of NIW infrastructure at Railways, DRD Road & Pipe 00 03 23 DRD 22/05/2017 2 /05/2017 80 0 20 0 1. 03 0 000 0.000 0 000 0.018 0 012 0. 93 1 697 1. 03 0 100 0 0 80 20 0197 2017_18 Q J 050 Service Reservoir Rehab (Paren ) 00 0 07 DWI 0 100 0 0 0.000 0.000 0.553 2. 1.987 2.575 2.560 2.5 0 100 0 0 0 100 0 0 0.000 0 000 0.000 0 000 0.000 0 000 0.000 0 000 0.000 0 100 0 0 0 098 2017_18 Q JA309 Tully Hi l South SR Rehabil tat on 00 JI050 0 07 05/02/2016 05/02/2016 22/08/2016 15/12/2016 15/12/2016 0 100 0 0 0.000 0 000 0.000 0 000 0.000 0 000 0.000 0 0 0 0.000 0 100 0 0 0 0 0199 2017_18 Q JB722 Gortac ady SR Rehabi itation 00 JI050 0 07 02/02/2016 02/02/2016 31/01/2017 28/03/2017 20/03/2017 23/05/2017 0 100 0 0 0.000 0 000 0.000 0 000 0.000 0 000 0.000 0 017 0.000 0 100 0 0 0 0 01
100 2017_18 Q JB728 Mormeal North SR Rehabil ta ion 06 JI050 0 07 1 /11/2016 1 /11/2016 05/07/2017 08/09/2017 31/10/2017 0 100 0 0 0.061 0 000 0.000 0 000 0.000 0 000 0.000 0 000 0.061 0 100 0 0 0 0 01101 2017_18 Q JC398 North Garvagh SR Refurbishment 06 JI050 0 07 1 /11/2016 1 /11/2016 12/09/2017 21/03/2018 30/03/2018 0 100 0 0 0.081 0 000 0.000 0 000 0.000 0 000 0.000 0 000 0.081 0 100 0 0 0 0 01102 2017_18 Q JF603 Benraw SR Rehabi itation 00 JI050 0 07 18/01/2016 18/01/2016 20/06/2016 2 /08/2016 09/02/2017 0 100 0 0 -0.001 0 000 0.000 0 000 0.000 0 000 0.000 0 0 2 -0.001 0 100 0 0 0 0 01103 2017_18 Q JF60 Castlehi l SR Refurbishment 06 JI050 0 07 1 /11/2016 1 /11/2016 27/09/2017 19/03/2018 05/02/2018 0 100 0 0 0.169 0 000 0.000 0 000 0.000 0 000 0.000 0 000 0.169 0 100 0 0 0 0 0110 2017_18 Q JF605 Seagahan CWB Refurbishment 06 JI050 0 07 1 /11/2016 1 /11/2016 1 /06/2017 30/0 /2018 0 100 0 0 0.1 2 0 000 0.000 0 000 0.000 0 000 0.000 0 000 0.1 2 0 100 0 0 0 0 01105 2017_18 Q JG078 Ba lydougan Command 2B 3A 3B SR Rehabi itation 00 JI050 0 07 DRD 25/0 /201 02/05/201 02/06/201 02/12/2015 30/07/2015 16 12/2015 0 100 0 0 0.000 0 000 0.000 0 000 0.000 0 639 0.330 0 000 0.000 0 100 0 0 0 0 01106 2017_18 Q JG083 Ba lyvally Old SR Rehabil tat on 06 JI050 0 07 10/03/2015 10/03/2015 10/12/2015 15/0 /2016 18/03/2016 09 09/2016 0 100 0 0 0.001 0 000 0.000 0 000 0.000 0 000 0.072 -0 016 0.001 0 100 0 0 0 0 01107 2017_18 Q JG086 Cleomack SR Rehabi itation 06 JI050 0 07 11/11/2016 11/11/2016 11/05/2017 27/10/2017 30/03/2018 0 100 0 0 0.092 0 000 0.000 0 000 0.000 0 000 0.000 0 000 0.092 0 100 0 0 0 0 01108 2017_18 Q J 009 Service Reservoir Rehab 00 JI050 0 07 DWI 0 0 0 0 0.000 0.000 0.000 0.000 0.000 0.000 0.000 0.000 0 0 0 0 2 /01/2013 30/01/2013 0 100 0 0 0.069 0 000 0.000 0 003 0.105 0.100 0.091 0.100 0.069 0 100 0 0 0 0 01109 2017_18 Q JB710 Ki lylane CWB Refurb shment 03 JI009 0 07 0 /08/201 22/09/201 08/12/201 15/05/2015 30/06/2015 0 100 0 0 0.000 0 000 0.000 0 000 0.000 0.127 0.152 -0 027 0.000 0 100 0 0 0 0 01110 2017_18 Q JF597 Doochrock West SR Rehabil ta ion 00 JI009 0 07 DRD 0 /07/201 17/07/201 08/12/201 21/0 /2015 21/0 /2015 20 11 2015 0 100 0 0 0.000 0 000 0.000 0 000 0.000 0 067 0.108 -0 02 0.000 0 100 0 0 0 0 01111 2017_18 Q JL758 Reservoir Rehab li at on Programme Phase 3 00 JI009 0 07 DWI 02 02 2009 09/02/2009 06 0 2009 18/05/2009 18/05/2009 18/05/2010 0 0 0 0 0.000 0.000 0.000 0.000 0.000 0.000 0.000 0.000 0 0 0 0 02/02/2009 09/02/2009 0 100 0 0 0.000 0 011 -0.050 0 000 0.000 0 000 0.010 0 000 0.000 0 100 0 0 0 0 01112 2017_18 Q JR 81 Ba lyrid ey New SR Rehabi itation 03 JI009 0 07 0 /08/201 22/09/201 01/12/201 30/03/2015 31/03/2015 0 100 0 0 0.000 0 000 0.000 0 000 0.000 0 255 0.0 0 0 000 0.000 0 100 0 0 0 0 01113 2017_18 Q JR 82 Muldersle gh Hill SR Rehabil ta ion 03 JI009 0 07 0 /08/201 22/09/201 18/11/201 30/03/2015 31/03/2015 20 11 2015 0 100 0 0 0.000 0 000 0.000 0 000 0.000 0.130 0.022 -0 021 0.000 0 100 0 0 0 0 0111 2017_18 Q JV866 Deehommed High Level SR Rehabi itation 03 JI009 0 07 0 /08/201 22/09/201 09/03/2015 27/05/2015 08/05/2015 0 100 0 0 0.000 0 000 0.000 0 000 0.000 0 0 0.0 3 0 000 0.000 0 100 0 0 0 0 01115 2017_18 Q JL777 Carmoney WTW - Old CWT Outlet Pipewo k 00 JI050 0 07 DRD 02/09/2015 02/09/2015 01/0 /2015 09/05/2016 06/05/2016 21 07 2016 0 100 0 0 -0.001 0 000 0.000 0 000 0.000 0 009 0.137 -0 001 -0.001 0 100 0 0 0 0 01116 2017_18 Q JL779 Carmoney CWB 1 and 2 Refurb shment 03 JI050 0 07 26/11/201 15/01/2015 18/0 /2016 21/10/2016 21/10/2016 05 09 2017 0 100 0 0 0.000 0 000 0.000 0 000 0.000 0 000 0.000 0 259 0.000 0 100 0 0 0 0 01117 2017_18 Q JL780 Carmoney CWB 3 and Refurb shment 03 JI050 0 07 26/11/201 15/01/2015 07/11/2016 19/10/2017 29/09/2017 0 100 0 0 0.113 0 000 0.000 0 000 0.000 0 000 0.000 0 210 0.113 0 100 0 0 0 0 01118 2017_18 Q JL782 Tamneymo e SR Rehabi itation 06 JI050 0 07 1 /11/2016 1 /11/2016 0 /0 /2017 31/10/2017 29/09/2017 0 100 0 0 0.215 0 000 0.000 0 000 0.000 0 000 0.000 0 000 0.215 0 100 0 0 0 0 01119 2017_18 Q JN522 Omagh Phase 2 Serv ce Reservoir Inner Works 0 JI050 03 07 03/02/2015 03/02/2015 01/06/2015 31/07/2015 02/10/2015 0 100 0 0 0.001 0 000 0.000 0 000 0.000 0 000 0.065 0 000 0.001 0 100 0 0 0 0 01120 2017_18 Q JN523 Ki lybrack 1 SR Rehabi itation 00 JI050 0 07 10/03/2015 30/0 /2015 18/01/2016 29/0 /2016 06/05/2016 25/11/2016 0 100 0 0 0.000 0 000 0.000 0 000 0.000 0 000 0.135 0 003 0.000 0 100 0 0 0 0 01121 2017_18 Q JN52 Brookeborough Sr Rehab li ation 00 JI050 0 07 10/03/2015 10/03/2015 22/07/2015 18/11/2015 30/10/2015 21/11/2016 0 100 0 0 0.000 0 000 0.000 0 000 0.000 0 000 0.083 0 000 0.000 0 100 0 0 0 0 01122 2017_18 Q JN525 Bo era SR Rehab li at on 00 JI050 0 07 10/03/2015 10/03/2015 0 100 0 0 0.000 0 000 0.000 0 000 0.000 0 000 0.0 5 0 000 0.000 0 100 0 0 0 0 01123 2017_18 Q JN531 Barravey SR Rehab li at on 00 JI050 0 07 02/02/2016 02/02/2016 2 /10/2016 16/02/2017 23/02/2017 23/05/2017 0 100 0 0 0.000 0 000 0.000 0 000 0.000 0 000 0.000 0 028 0.000 0 100 0 0 0 0 0112 2017_18 Q JN533 Glenchu l SR Refurbishment 06 JI050 0 07 11/11/2016 11/11/2016 07/06/2017 30/10/2017 15/09/2017 0 100 0 0 0.083 0 000 0.000 0 000 0.000 0 000 0.000 0 000 0.083 0 100 0 0 0 0 01125 2017_18 Q JN536 Ki lyc ogher No.2 Sr Refurb shment 06 JI050 0 07 11/11/2016 11/11/2016 23/11/2017 02/03/2018 12/02/2018 0 100 0 0 0.10 0 000 0.000 0 000 0.000 0 000 0.000 0 000 0.10 0 100 0 0 0 0 01126 2017_18 Q JN5 0 Lough Bradan CWB Rehabi itation 06 JI050 02 07 11/11/2016 11/11/2016 06/08/2018 30/11/2018 0 100 0 0 0.000 0 000 0.000 0 000 0.000 0 000 0.000 0 000 0.000 0 100 0 0 0 0 01127 2017_18 Q JP686 Rathmore SR Rehab litation 00 JI050 0 07 09/0 /2015 09/0 /2015 20/07/2015 20/10/2015 30/10/2015 01/11/2016 0 100 0 0 0.000 0 000 0.000 0 000 0.000 0 000 0.051 0 000 0.000 0 100 0 0 0 0 01128 2017_18 Q JP689 Derrylin SR Rehabi itation 00 JI050 0 07 18/01/2016 18/01/2016 06/02/2017 26/0 /2017 29/03/2017 0 100 0 0 -0.001 0 000 0.000 0 000 0.000 0 000 0.000 0 051 -0.001 0 100 0 0 0 0 01129 2017_18 Q JR 76 L snabreeny Road SR1 and SR2 Rehabi ita ion 03 JI050 0 07 DRD 25/11/2015 10/12/2015 0 /01/2016 28/10/2016 18/11/2016 0 100 0 0 0.000 0 000 0.000 0 000 0.000 0 000 0.191 0 312 0.000 0 100 0 0 0 0 01130 2017_18 Q JR 86 Breda SR Rehabi itation 00 JI050 0 07 27/0 /2015 30/0 /2015 12/10/2015 02/06/2016 31/05/2016 01/08/2016 0 100 0 0 0.000 0 000 0.000 0 000 0.000 0 000 0.518 0 081 0.000 0 100 0 0 0 0 01131 2017_18 Q JR 91 Ba lygrainey SR Rehabi itation 00 JI050 0 07 18/01/2016 26/01/2016 13/06/2016 1 /12/2016 27/01/2017 01/06/2017 0 100 0 0 0.003 0 000 0.000 0 000 0.000 0 000 0.000 0.181 0.003 0 100 0 0 0 0 01132 2017_18 Q JR 92 Ba lyhowne SR Rehabi itation 00 JI050 0 07 18/01/2016 18/01/2016 06/06/2016 26/0 /2017 0 /05/2017 15/06/2017 0 100 0 0 0.0 6 0 000 0.000 0 000 0.000 0 000 0.000 0 068 0.0 6 0 100 0 0 0 0 01133 2017_18 Q JR500 Ba lywonard No.1 SR Rehab li ation 06 JI050 0 07 1 /11/2016 1 /11/2016 0 /0 /2017 20/10/2017 28/08/2017 0 100 0 0 0.278 0 000 0.000 0 000 0.000 0 000 0.000 0 000 0.278 0 100 0 0 0 0 0113 2017_18 Q JV857 Newry West SR Rehab li at on 03 JI050 0 07 DRD 11/11/2013 13/11/2013 0 100 0 0 0.000 0 000 0.000 0 000 0.000 0 000 0.000 0.1 0 0.000 0 100 0 0 0 0 01135 2017_18 Q JV869 Senrty Hill SR Rehabil ta ion 00 JI050 0 07 09/0 /2015 09/0 /2015 02/11/2015 15/12/2015 18/0 /2016 11/08/2016 0 100 0 0 0.000 0 000 0.000 0 000 0.000 0 000 0.028 0 000 0.000 0 100 0 0 0 0 01136 2017_18 Q JV872 Ba linl ss Upper SR Rehabi itation 00 JI050 0 07 12/11/2015 12/11/2015 0 100 0 0 0.000 0 000 0.000 0 000 0.000 0 000 0.000 0 000 0.000 0 100 0 0 0 0 01137 2017_18 Q JV873 Newtown SR Rehabi itation 00 JI050 0 07 18/01/2016 18/01/2016 10/08/2016 09/12/2016 12/01/2017 0 100 0 0 0.000 0 000 0.000 0 000 0.000 0 000 0.000 0 031 0.000 0 100 0 0 0 0 01138 2017_18 Q JV875 Sturgan SR Rehabil ta ion 00 JI050 0 07 02/02/2016 02/02/2016 12/09/2016 13/02/2017 20/02/2017 23/05/2017 0 100 0 0 -0.001 0 000 0.000 0 000 0.000 0 000 0.000 0 033 -0.001 0 100 0 0 0 0 01139 2017_18 Q JV876 Baby on Hill SR Rehabil tat on 00 JI050 0 07 05/02/2016 05/02/2016 06/06/2016 08/07/2016 01/07/2016 08/08/2016 0 100 0 0 -0.001 0 000 0.000 0 000 0.000 0 000 0.000 0 021 -0.001 0 100 0 0 0 0 011 0 2017_18 Q JV877 Camlough Derry Beg CWB Rehab litation 00 JI050 0 07 05/02/2016 05/02/2016 19/12/2016 09/05/2017 12/0 /2017 25/05/2017 0 100 0 0 0.00 0 000 0.000 0 000 0.000 0 000 0.000 0 075 0.00 0 100 0 0 0 0 011 1 2017_18 Q JV878 Camly New SR Rehabi itation 00 JI050 0 07 08/02/2016 08/02/2016 16/08/2016 23/09/2016 23/09/2016 18/01/2017 0 100 0 0 -0.001 0 000 0.000 0 000 0.000 0 000 0.000 0 038 -0.001 0 100 0 0 0 0 011 2 2017_18 Q JV879 Drumnahare SR Rehabi ita ion 00 JI050 0 07 16/02/2016 29/02/2016 0 100 0 0 0.000 0 000 0.000 0 000 0.000 0 000 0.000 0 000 0.000 0 100 0 0 0 0 011 3 2017_18 Q JV882 Tullymurry Newry SR Rehab li at on 06 JI050 0 07 1 /11/2016 1 /11/2016 27/11/2017 15/12/2017 30/03/2018 0 100 0 0 0.0 1 0 000 0.000 0 000 0.000 0 000 0.000 0 000 0.0 1 0 100 0 0 0 0 011 2017_18 Q JV883 M ll Road SR Rehabi ita ion 06 JI050 0 07 11/11/2016 11/11/2016 22/01/2018 12/0 /2018 0 100 0 0 0.039 0 000 0.000 0 000 0.000 0 000 0.000 0 000 0.039 0 100 0 0 0 0 011 5 2017_18 Q J 051 Watermains Rehab li ation, New and Rep acement incl FTS - P00 03 08 DRD 01/03/2013 11/03/2013 89 11 0 0 -0.088 0 000 0.000 0 000 1.7 2 1 872 1.811 0 038 -0.088 26 3 27 38 0 011 6 2017_18 Q J 052 WTWs Five Treatab lity Appraisal Studies 03 02 0 DWI 31/12/2020 0 100 0 0 0.000 0.000 0.000 0.000 0.000 0.2 7 0.000 0.000 100 0 0 0 0 100 0 0 0.126 0 000 0.000 0 000 0.112 0 075 0.376 0 068 0.126 100 0 0 0 0 0 021 7 2017_18 Q J 053 Water Mains Rehab l tat on (Planned) 03 03 08 UR 31/03/201 9 6 0 0 0.000 0.000 0.000 17.01 21.785 0.000 0.000 0.000 37 7 3 13 9 6 0 0 0.000 0 000 0.000 0 000 0.000 0 000 0.000 0 000 0.000 30 51 3 16 7 01 8 2017_18 Q JA210 Tardree Zone WM Imps 02 JI053 03 08 DRD 15 06 2009 23/06/2009 12 08 2009 27/0 /2011 27/0 /2011 26/0 /2012 0 0 0 0 0.000 0.000 0.000 0.000 0.000 0.000 0.000 0.000 0 0 0 0 15/06/2009 23/06/2009 97 3 0 0 -0.020 2 081 1.117 0 550 0.351 0 009 0.019 0 005 -0.020 1 21 3 35 20 0 011 9 2017_18 Q JA283 A8 Bel ast to Larne Dual Carr ageway – Water main & sewer re00 JI053 03 23 DRD 31/01/2013 05/02/2013 90 0 10 0 -0.013 0 000 0.000 0 006 0.121 0.137 0.01 0 06 -0.013 0 100 0 0 90 10 01150 2017_18 Q JB 58 Dunore West Zone Watermain Improvements 00 JI053 03 08 02 0 2010 22/0 /2010 11 06 2010 07/08/2012 07/08/2012 07/08/2013 0 0 0 0 0.000 0.000 0.000 0.000 0.000 0.000 0.000 0.000 0 0 0 0 02/0 /2010 22/0 /2010 11/06/2010 07/08/2012 19/07/2013 100 0 0 0 -0.077 2 598 0.511 -0 023 0.122 0 020 0.000 0 003 -0.077 9 6 7 20 6 0151 2017_18 Q JB 60 Moyola Zone Watermain Improvements 00 JI053 03 08 02 0 2010 26/0 /2010 20 09 2010 13/03/2012 13/03/2012 13/03/2013 0 0 0 0 0.000 0.000 0.000 0.000 0.000 0.000 0.000 0.000 0 0 0 0 02/0 /2010 26/0 /2010 20/09/2010 13/03/2012 30/06/201 95 5 0 0 -0.06 1 568 2.55 0 726 0.180 0.135 0.018 -0 001 -0.06 18 19 60 3 17 0 01152 2017_18 Q JB679 The Glens Zone Watermain Improvements 00 JI053 03 08 UR 16 09 2011 20/09/2011 26 09 2011 21/12/2012 21/12/2012 21/12/2013 0 0 0 0 0.000 0.000 0.000 0.000 0.000 0.000 0.000 0.000 0 0 0 0 16/09/2011 20/09/2011 26/09/2011 28/03/2013 25/03/2013 0 /11/201 76 2 0 0 -0.001 0 000 0.1 8 0 719 -0.050 0 000 0.009 -0 052 -0.001 12 6 20 58 0 01153 2017_18 Q JB680 Dungonnell Zone Watermain Improvemen s 00 JI053 03 08 UR 05 07 2011 06/07/2011 25 03 2011 30/11/2012 30/11/2012 30/11/2013 0 0 0 0 0.000 0.000 0.000 0.000 0.000 0.000 0.000 0.000 0 0 0 0 05/07/2011 06/07/2011 02/0 /2012 06/03/2013 06/06/201 98 2 0 0 -0.001 0 000 2. 79 0 973 0.060 0 003 0.017 0 000 -0.001 12 66 16 6 66 0 0115 2017_18 Q JB687 Cookstown Phase 2 Watermain Improvements 00 JI053 03 08 UR 16 09 2011 20/09/2011 03 05 2011 21/12/2012 21/12/2012 21/12/2013 0 0 0 0 0.000 0.000 0.000 0.000 0.000 0.000 0.000 0.000 0 0 0 0 16/09/2011 20/09/2011 03/05/2011 01/08/201 18/12/2012 0 /11/201 93 7 0 0 0.051 0 000 1.653 1 9 5 0.131 0 072 0.00 0 00 0.051 3 62 21 1 58 0 01155 2017_18 Q JB688 Cookstown Phase 3 Watermain Improvements 00 JI053 03 08 UR 17 10 2011 19/10/2011 27 05 2011 15/0 /2013 15/0 /2013 15/0 /201 0 0 0 0 0.000 0.000 0.000 0.000 0.000 0.000 0.000 0.000 0 0 0 0 17/10/2011 19/10/2011 27/05/2011 08/10/2013 12/0 /2013 0 /11/201 93 7 0 0 0.002 0 000 2.217 1 517 0.038 0 02 0.001 0 000 0.002 0 69 25 6 66 0 01156 2017_18 Q JC3 9 Portba lintrae Zone Wm Improvements 00 JI053 03 08 26 09 2007 08/10/2007 05 11 2007 15/09/2008 15/09/2008 15/09/2009 0 0 0 0 0.000 0.000 0.000 0.000 0.000 0.000 0.000 0.000 0 0 0 0 26/09/2007 08/10/2007 05/01/2009 03/03/2010 26/07/2010 100 0 0 0 0.000 0 036 -0.031 -0 006 0.037 0 000 0.000 -0 001 0.000 67 27 6 0 27 0 01157 2017_18 Q JC350 Ba lycast e Zone Wm Improvements 00 JI053 03 08 26 02 2009 20/03/2009 06 0 2009 28/0 /2011 28/0 /2011 27/0 /2012 0 0 0 0 0.000 0.000 0.000 0.000 0.000 0.000 0.000 0.000 0 0 0 0 26/02/2009 20/03/2009 100 0 0 0 0.000 1 303 0.062 -0 020 0.001 -0 053 0.007 0 000 0.000 27 32 32 9 32 0 01158 2017_18 Q JC351 Ba lynahone Zone Wm Improvements 00 JI053 03 08 26 09 2007 08/10/2007 21 0 2007 29/09/2008 29/09/2008 29/09/2009 0 0 0 0 0.000 0.000 0.000 0.000 0.000 0.000 0.000 0.000 0 0 0 0 26/09/2007 08/10/2007 100 0 0 0 0.000 0 019 0.0 1 0 000 -0.027 0 000 0.010 0 000 0.000 17 6 77 0 6 0 01159 2017_18 Q JC388 Rasharkin Zone Wa ermain Improvements Phase 2 00 JI053 03 08 UR 19 05 2011 01/06/2011 19 01 2011 01/06/2012 01/06/2012 01/06/2013 0 0 0 0 0.000 0.000 0.000 0.000 0.000 0.000 0.000 0.000 0 0 0 0 19/05/2011 01/06/2011 02/0 /2012 26/03/2013 27/02/2013 0 /11/201 95 5 0 0 -0.051 0 277 1.800 0 300 -0.055 -0 002 0.030 0 000 -0.051 52 31 8 9 31 0 01160 2017_18 Q JF593 Altmore Phase 2 Wa ermain Rehabilation 00 JI053 03 08 DRD 11/06/2013 2 /06/2013 10/12/2012 30/09/201 25/08/201 100 0 0 0 -0.032 0 000 0.000 0 276 1.867 0 7 0 0.065 -0 058 -0.032 32 22 37 9 22 0 01161 2017_18 Q JL693 Citys de Zone Watermain Improvements 00 JI053 03 08 18 07 2005 19/06/2006 19/06/2006 19/06/2007 0 0 0 0 0.000 0.000 0.000 0.000 0.000 0.000 0.000 0.000 0 0 0 0 100 0 0 0 -0.0 0 0 000 0.010 0 000 0.000 0 000 0.000 0 000 -0.0 0 0 100 0 0 100 0162 2017_18 Q JL699 Limavady Zone Watermain Improvements 00 JI053 03 08 0 11 2008 21/11/2008 29 12 2008 12/01/2011 12/01/2011 12/01/2012 0 0 0 0 0.000 0.000 0.000 0.000 0.000 0.000 0.000 0.000 0 0 0 0 0 /11/2008 21/11/2008 29/12/2008 03/03/2010 15/11/2010 100 0 0 0 0.000 0 2 0 0.000 0 000 0.000 0 000 0.002 0 000 0.000 75 25 0 0 25 0 01163 2017_18 Q JN355 North Tyrone Zone Watermain Improvements 00 JI053 03 08 12 03 2008 21/03/2008 11 08 2008 12/01/2011 12/01/2011 12/01/2012 0 0 0 0 0.000 0.000 0.000 0.000 0.000 0.000 0.000 0.000 0 0 0 0 12/03/2008 21/03/2008 11/08/2008 11/01/2011 29/06/2009 100 0 0 0 0.000 0 025 -0.027 -0 001 0.000 0 000 0.000 0 001 0.000 1 99 0 0 99 0 0116 2017_18 Q JN 30 Al eyhi l Zone Wm Improvements 00 JI053 03 08 01 0 2010 26/0 /2010 2 06 2010 13/01/2012 13/01/2012 12/01/2013 0 0 0 0 0.000 0.000 0.000 0.000 0.000 0.000 0.000 0.000 0 0 0 0 01/0 /2010 26/0 /2010 2 /06/2010 12/01/2012 20/09/2012 01/07/2015 100 0 0 0 -0.013 2 336 0. 3 0 768 0.0 0 0 002 0.000 0 000 -0.013 13 60 5 22 60 0 01165 2017_18 Q JN505 Omagh Wa ermain Improvements 00 JI053 03 08 UR 17 10 2011 19/10/2011 02 08 2011 30/05/2013 30/05/2013 30/05/201 0 0 0 0 0.000 0.000 0.000 0.000 0.000 0.000 0.000 0.000 0 0 0 0 17/10/2011 19/10/2011 02/08/2011 26/03/2013 26/03/2013 100 0 0 0 -0.001 0 000 0.8 0. 09 0.169 0 000 0.029 0 000 -0.001 25 75 0 0 75 0 01166 2017_18 Q JR321 Breda North Zone Wate main Improvemen s 00 JI053 03 08 02 0 2010 26/0 /2010 15 06 2010 1 /08/2012 1 /08/2012 1 /08/2013 0 0 0 0 0.000 0.000 0.000 0.000 0.000 0.000 0.000 0.000 0 0 0 0 02/0 /2010 26/0 /2010 01/03/2010 27/11/2012 06/11/2012 27/11/2012 98 2 0 0 0.000 2 87 0.996 0 76 0.200 0 000 0.000 -0.150 0.000 25 6 7 6 0167 2017_18 Q JR 37 South Bel ast Urban 00 JI053 03 08 07 09 2010 27/09/2010 10 11 2011 05/12/2011 05/12/2011 05/12/2011 0 0 0 0 0.000 0.000 0.000 0.000 0.000 0.000 0.000 0.000 0 0 0 0 07/09/2010 27/09/2010 10/11/2011 19/09/2011 19/01/2012 05/12/2011 100 0 0 0 0.000 0. 32 0.278 0 092 -0.052 0 000 0.00 0 000 0.000 0 100 0 0 100 0 01168 2017_18 Q JR 38 Newtownabbey Zone Watermain Improvemen s Phase 1 00 JI053 03 08 UR 03 06 2011 07/06/2011 01 02 2011 27/02/201 27/02/201 27/02/2015 0 0 0 0 0.000 0.000 0.000 0.000 0.000 0.000 0.000 0.000 0 0 0 0 03/06/2011 07/06/2011 01/02/2011 27/08/201 2 /06/201 97 3 0 0 -0.03 0 087 0.996 1 067 0.761 0 02 0.001 0 000 -0.03 95 0 1 0 0 01169 2017_18 Q JR 39 Carr ckfergus Zone Watermain Improvements Phase 1 00 JI053 03 08 UR 19 05 2011 01/06/2011 19 01 2011 16/11/2012 16/11/2012 16/11/2013 0 0 0 0 0.000 0.000 0.000 0.000 0.000 0.000 0.000 0.000 0 0 0 0 19/05/2011 01/06/2011 01/0 /2013 26/07/2013 30/10/2013 93 7 0 0 -0.083 0 265 1.863 0 770 0.065 0 2 0 0.0 5 0 051 -0.083 38 35 6 21 35 0 01170 2017_18 Q JR 0 Newtownabbey Zone Watermain Improvemen s Phase 2 00 JI053 03 08 UR 05 07 2011 06/07/2011 02 02 2011 11/07/2012 11/07/2012 11/07/2013 0 0 0 0 0.000 0.000 0.000 0.000 0.000 0.000 0.000 0.000 0 0 0 0 05/07/2011 06/07/2011 02/02/2011 27/08/201 02/02/2011 98 2 0 0 -0.085 0.162 1. 20 1. 08 1. 98 0 211 0.132 0 000 -0.085 92 5 1 2 5 0 01171 2017_18 Q JR 1 Ba lys llan Zone Watermain Improvements 00 JI053 03 08 UR 05 07 2011 06/07/2011 19 01 2011 31/01/2013 31/01/2013 31/01/201 0 0 0 0 0.000 0.000 0.000 0.000 0.000 0.000 0.000 0.000 0 0 0 0 05/07/2011 06/07/2011 19/01/2011 1 /01/201 26/03/201 98 2 0 0 -0.0 6 0 2 7 2.160 2 062 1.207 -0 003 0.010 0 000 -0.0 6 55 0 1 5 0172 2017_18 Q JR 2 Ba lywonard Zone Watermain Improvemen s 00 JI053 03 08 UR 22 0 2011 06/05/2011 17 01 2011 25/07/2012 25/07/2012 25/07/2013 0 0 0 0 0.000 0.000 0.000 0.000 0.000 0.000 0.000 0.000 0 0 0 0 22/0 /2011 06/05/2011 02/0 /2012 08/01/201 28/10/2013 87 13 0 0 -0.260 0 077 1.090 0 630 0.833 0 06 0.236 0 000 -0.260 9 76 6 9 67 0 01173 2017_18 Q JR 50 Queensfort Road Watermain Upgrade 00 JI053 03 08 DRD 20 02 2012 27/02/2012 0 0 2012 25/0 /2012 25/0 /2012 25/0 /2013 0 0 0 0 0.000 0.000 0.000 0.000 0.000 0.000 0.000 0.000 0 0 0 0 20/02/2012 27/02/2012 0 /0 /2012 03/07/2012 25/0 /2012 100 0 0 0 0.005 0 000 0.000 0 01 0.003 -0 003 0.000 0 000 0.005 0 0 0 100 0 017 2017_18 Q JR 53 Ba lygomar in North Phase 1 Watermain Improvements 00 JI053 03 08 UR 0 0 0 0 0.000 0.000 0.000 0.000 0.000 0.000 0.000 0.000 0 0 0 0 07/10/2013 16/10/2013 01/0 /2012 29/06/2015 30/03/2015 100 0 0 0 -0.027 0 000 0.109 0 018 0.705 1 586 0.0 0 000 -0.027 72 22 1 5 22 0 01175 2017_18 Q JR 5 Ba lygomar in South Phase 1 Water Mains Improvements 00 JI053 03 08 UR 0 0 0 0 0.000 0.000 0.000 0.000 0.000 0.000 0.000 0.000 0 0 0 0 07/10/2013 21/10/2013 01/0 /2012 31/03/2015 100 0 0 0 -0.289 0 000 0.116 0 025 0.731 1 965 0.225 0 000 -0.289 7 51 0 2 51 0 01176 2017_18 Q JR 55 Whiterock Phase 1 Watermains Improvements 00 JI053 03 08 UR 0 0 0 0 0.000 0.000 0.000 0.000 0.000 0.000 0.000 0.000 0 0 0 0 08/10/2013 16/10/2013 01/06/2011 30/03/2015 25/03/2015 01/07/2015 100 0 0 0 0.001 0 000 0.156 -0 01 0.807 0 992 0.001 0 017 0.001 52 0 0 01177 2017_18 Q JS226 Downpatrick Zone WM Imps 00 JI053 03 08 21 07 2009 03/08/2009 07 06 2010 26/01/2012 26/01/2012 26/01/2012 0 0 0 0 0.000 0.000 0.000 0.000 0.000 0.000 0.000 0.000 0 0 0 0 21/07/2009 03/08/2009 08/06/2010 13/05/2011 26/03/2013 26/01/2012 98 2 0 0 0.000 1. 20 -0.026 0 061 0.000 0 000 0.002 0 000 0.000 16 55 25 55 0 01178 2017_18 Q JS227 South Down Zone WM Imps 00 JI053 03 08 21 07 2009 03/08/2009 27 09 2011 13/03/2012 13/03/2012 13/03/2013 0 0 0 0 0.000 0.000 0.000 0.000 0.000 0.000 0.000 0.000 0 0 0 0 21/07/2009 03/08/2009 27/09/2010 12/03/2012 19/09/2011 01/07/2015 97 3 0 0 0.000 2 903 0.138 0.110 0.001 0 000 0.021 0 000 0.000 36 58 2 57 0 01179 2017_18 Q JS229 Mourne Coast Zone Wa ermain Improvements 00 JI053 03 08 21 07 2009 03/08/2009 07 06 2010 26/01/2012 26/01/2012 26/01/2012 0 0 0 0 0.000 0.000 0.000 0.000 0.000 0.000 0.000 0.000 0 0 0 0 21/07/2009 03/08/2009 08/06/2010 02/08/2011 26/03/2013 26/01/2012 99 1 0 0 -0.00 1 95 0.118 0.160 -0.001 -0 089 0.002 0 000 -0.00 35 3 28 3 3 0 01180 2017_18 Q JS293 North Down Bangor Phase 2 Watermain Improvements 00 JI053 03 08 UR 17 10 2011 19/10/2011 02 08 2011 26/03/2013 26/03/2013 26/03/201 0 0 0 0 0.000 0.000 0.000 0.000 0.000 0.000 0.000 0.000 0 0 0 0 17/10/2011 19/10/2011 02/08/2011 27/08/201 23/0 /2013 100 0 0 0 -0.031 0 000 0.318 1 81 0.367 0 000 0.050 0 000 -0.031 8 86 0 6 86 0 01181 2017_18 Q JT252 L sburn North Rural Phase 2 Wa ermain Improvements 00 JI053 03 08 UR 03 11 2011 08/11/2011 02 08 2011 2 /06/2013 2 /06/2013 2 /06/201 0 0 0 0 0.000 0.000 0.000 0.000 0.000 0.000 0.000 0.000 0 0 0 0 03/11/2011 08/11/2011 02/08/2011 1 /03/201 2 /06/201 93 7 0 0 0.000 0 000 0.823 1 013 0.165 0.176 0.072 0 000 0.000 0 61 0 39 61 0 01182 2017_18 Q JV02 Ba lintemp e Zone Watermain Improvemen s 00 JI053 03 08 17 11 2011 18/11/2011 23 05 2011 06/05/2013 06/05/2013 06/05/201 0 0 0 0 0.000 0.000 0.000 0.000 0.000 0.000 0.000 0.000 0 0 0 0 17/11/2011 18/11/2011 23/05/2011 08/10/2013 06/05/2013 90 10 0 0 -0.030 0 015 3.296 3 75 0.9 6 0 213 0.017 0 000 -0.030 23 7 9 21 3 0 01183 2017_18 Q JV025 Lough Ross Zone Watermain Improvements 00 JI053 03 08 02 0 2010 26/0 /2010 06 09 2010 30/07/2012 30/07/2012 30/07/2013 0 0 0 0 0.000 0.000 0.000 0.000 0.000 0.000 0.000 0.000 0 0 0 0 02/0 /2010 26/0 /2010 06/09/2010 27/11/2012 13/02/2012 100 0 0 0 -0.027 1 299 .67 0.129 0.081 0 005 0.000 0 000 -0.027 2 51 5 2 51 0
e A a e e e v e s A a e A a e e a a x e e e m m e e a ) e A a e e se A a %) e A a e e %)e e a ase e M es e a es ase e e v e s A a ase e x e e e m 2 2- es) ase e se A a e A a e e M es e a es

m a e s
e )
So t Re C M Submiss on Re e ence
o ect D Re e ence o ect Name C oject
e oda ent
oject IDSubsti ute
o ect ID
ma y Asset
Ca ego y
C 0 og amme
Regula o y S gn O Requi ed
Base ine A Date
Base ine o ect
App oval Date
Base ne Sta t on S te Da e
Base ine Bene cial Use
Date
Basel ne Regulato y
sign-o Da e
Base ine Comp e ion o Const uct on
Date
Base ine End o
Main enance e od Date
Base ine Se vice A locat on Wate
n ast uc u e
Base ine Se vice Al oca ion Wate
Non-n ast uc u e
Base ine Se v ce A locat on Sewe age
In ast uctu e
Basel ne Se v ce Al oca ion
Sewe age Non-In ast uctu e
Basel ne CA EX 20 0-
£m
Base ine CA EX 20 -
2 £m
Basel ne CA EX 20 2-
3 £m
Base ne CA EX 20 3-
4 £m
Base ine CA EX 20 4-
5 £m
Basel ne CA EX 20 5-
6 £m
Base ine CA EX 20 6-
7 £m
Basel ne CA EX 20 7-
8 £m
Base ine u pose A locat on Qual ty
Base ine u pose Al oca ion Base
Base ine u pose A locat on ES
Basel ne u pose Al oca ion G ow h
Cu ent Actual o o ected
A Da e
Cu ent Ac ua o ojected
oject App oval Date
Cu ent Actual o o ected Sta t on Si e
Date
Cu ent Ac ua o ojected
Bene cial Use Da e
Cu ent Actual o o ected Regu ato y
sign-o Da e
Cu ent Actual o ojec ed
Comple ion o Const uc ion
Date
Cu ent Actual o o ected
End o Maintenance
e iod Date
Cu ent Actual o ojec ed Se v ce
A locat on Wa e In ast uctu e
Cu ent Actual o o ec ed Se v ce
A locat on Wa e Non-
n ast uc u e
Cu ent Actual o o ec ed Se v ce
A locat on Sewe age
n ast uc u e
Cu ent Actual o o ec ed Se v ce
A locat on Sewe age Non-
n ast uc u e
Cu ent Actual o o ected CA EX ea to date £m
Cu ent Actual o ojec ed
CA EX 20 0- £m
Cu ent Actual o o ected
CA EX 20 -2 £m
Cu ent Actual o ojec ed
CA EX 20 2-3 £m
Cu ent Ac ual o o ected
CA EX 20 3-4 £m
Cu ent Actual o o ec ed
CA EX 20 4-5 £m
Cu ent Ac ual o ojected
CA EX 20 5-6 £m
Cu ent Actual o o ec ed
CA EX 20 6-7 £m
Cu ent Ac ual o ojected
CA EX 20 7-8 £m
Cu ent Actual o o ec ed u pose
Al oca ion Qua i y
Cu ent Actual o o ec ed u pose
A location Base
Cu ent Actual o o ected u pose
Al oca ion ES
Cu ent Actual o ojected u pose
A locat on G owth
Cu ent Ac ual o ojected RE
Al oca ion Wate
Cu ent Ac ual o ojected RE Al oca ion Sewe age
Nom na ed Output
2 3 4 5 6 7 8 9 0 2 3 4 5 6 7 8 9 20 2 22 23 24 25 26 27 28 29 36 37 38 39 40 4 42 43 44 45 46 47 48 49 50 5 52 53 54 55 56 57 58 59 66 67 68 69 70 7 72
A T a a a ex e e e e 7 99 2 9 24 949 4 9 47 7 4 4 2 2 2 7 7 47 92 9 4 79 7 4 7 4 27 2 2
SOR
CIM
_Sub
I_oj
ect_
D
I_oj
ect_
Nam
e
I_C
_e
iod
I_AR
EN_
ojec
t_D
I_SU
BSI
UE_
oec
t_ID
I_i_
Asse
t_C
at
I_C
0_og
I_R
eg_S
igno
BM
_A
BM
_o
ect_
App
oval
BM
_SoS
BM
_BU
BM
_RSO
BM
_CoC
BM
_EoM
BSA_
WI%
BSA_
WN
I%
BSA_
SI%
BSA_
SNI%
B_C
apex
_20
0-_£
m
B_C
apex
_20
-2_
£m
B_C
apex
_20
2-3_
£m
B_C
apex
_20
3-4_
£m
B_C
apex
_20
4-5_
£m
B_C
apex
_20
5-6_
£m
B_C
apex
_20
6-7_
£m
B_C
apex
_20
7-8_
£m
BA_
Q%
BA_
B%
BA_
E%
BA_
G%
CAM
_A
CAM
_o
ecAp
pov
al
CAM
_SoS
CAM
_BU
CAM
_RSO
CAM
_CoC
CAM
_EoM
CAS
A_W
I%
CAS
A_W
NI%
CAS
A_SI
%
CAS
A_SN
I%
CA
_Cap
ex_
D_£
m
CA
_Cap
ex_2
00-
_£m
CA
_Cap
ex_2
0-
2_£m
CA
_Cap
ex_2
02-
3_£m
CA
_Cap
ex_2
03-
4_£m
CA
_Cap
ex_2
04-
5_£m
CA
_Cap
ex_2
05-
6_£m
CA
_Cap
ex_2
06-
7_£m
CA
_Cap
ex_2
07-
8_£m
CA
A_Q
%
CA
A_B%
CA
A_E%
CA
A_G
%
CA
_IR
E_W
%
CA
_IR
E_S%
NO
M_O
upu
t
e A a e e e v e s A a e A a e e a a x e e e m m e e a ) e A a e e se A a %) e A a e e %)e e a ase e M es e a es ase e e v e s A a ase e x e e e m 2 2- es) ase e se A a e A a e e M es e a es
18 2017_18 Q JV707 Drumnahare Dist Imps 00 JI053 03 08 01 06 2000 01/10/2001 01/10/2001 01/10/2002 0 0 0 0 0.000 0.000 0.000 0.000 0.000 0.000 0.000 0.000 0 0 0 0 2 /09/2010 19/0 /2011 27/05/2011 100 0 0 0 0.000 0 015 -0.015 0 000 0.000 0 000 0.020 0 000 0.000 0 100 0 0 0 0 01185 2017_18 Q JV8 1 Fofanny Banbridge Zone Watermain Improvements Phase 2 00 JI053 03 08 UR 2 05 2011 01/06/2011 12 01 2011 16/05/2012 16/05/2012 16/05/2013 0 0 0 0 0.000 0.000 0.000 0.000 0.000 0.000 0.000 0.000 0 0 0 0 2 /05/2011 01/06/2011 12/01/2011 06/03/2013 16/10/2013 92 8 0 0 0.050 0.1 2 2.105 -0 213 0.520 0 098 0.016 0 000 0.050 5 71 1 10 71 0 01186 2017_18 Q JV8 WP101 Newry Phase2 00 JI053 03 08 DWI 03 11 2011 08/11/2011 02 08 2011 21/06/2013 21/06/2013 21/06/201 0 0 0 0 0.000 0.000 0.000 0.000 0.000 0.000 0.000 0.000 0 0 0 0 03/11/2011 08/11/2011 02/08/2011 29/06/2015 2 /06/201 100 0 0 0 -0.007 0 000 1.3 6 2 560 0.886 0.107 0.23 0 018 -0.007 32 9 0 19 9 0 01187 2017_18 Q J 05 Water Mains New and Renewed including FTS. (Unp anned) 06 03 23 UR 99 0 1 0 0.000 0.000 0.000 3. 7 2.733 0.000 0.000 0.000 15 62 0 23 100 0 0 0 0.000 0 000 0.000 0 000 0.000 0 000 0.000 0 000 0.000 15 62 0 23 62 0188 2017_18 Q JA291 Ba lyc are Road Glengorm ey Wa ermains Upgrade 00 JI05 03 08 DRD 01/07/2013 16/07/2013 01/08/2013 29/08/201 19/12/2013 0 /11/201 100 0 0 0 -0.017 0 000 0.000 0 000 0.29 0 010 0.003 0 030 -0.017 0 0 0 100 0 0 01189 2017_18 Q JC293 Ba linrees Central Zone Watermain Imp ovements 00 JI05 03 23 22/0 /2005 27 07 2009 28/01/2010 28/01/2010 28/01/2011 0 0 0 0 0.000 0.000 0.000 0.000 0.000 0.000 0.000 0.000 0 0 0 0 22/0 /2005 27/07/2009 27/01/2010 15/11/2010 100 0 0 0 0.000 0.182 -0.001 0 003 0.000 0 000 0.000 -0 002 0.000 8 17 1 7 17 0 01190 2017_18 Q JC31 Fairv ew Lane, Ar iclave - Wa ermain Ext 01 JI05 03 23 02 08 2010 05/08/2011 05/08/2011 0 /08/2012 0 0 0 0 0.000 0.000 0.000 0.000 0.000 0.000 0.000 0.000 0 0 0 0 01/10/2010 16/08/2011 01/10/2010 100 0 0 0 -0.001 0 03 -0.005 0 000 0.000 0 000 0.000 0 000 -0.001 0 0 0 100 0 0191 2017_18 Q JC396 Chatham Road, Armoy, Watermain Replacement. 00 JI05 03 08 DWI 05/08/201 12/08/201 30/09/201 01/07/2015 01/07/2015 100 0 0 0 -0.038 0 000 0.000 0 000 0.000 0 080 0.001 0 000 -0.038 100 0 0 0 0 0192 2017_18 Q JF600 Carrive Rd Qu lly Rd Mul aghbawn Watermain Replacement 03 JI05 03 08 DWI 16/07/201 17/07/201 0 /08/201 30/03/2015 01/07/2015 100 0 0 0 0.000 0 000 0.000 0 000 0.000 0 356 0.007 0 000 0.000 88 0 0 12 0 0 01193 2017_18 Q J 023 A5 Western Transpo t Corr dor 00 JI05 03 23 DRD 0 0 0 0 0.000 0.000 0.000 0.000 0.000 0.000 0.000 0.000 0 0 0 0 90 0 10 0 0.025 0 000 0.010 0 000 0.000 -0 010 0.000 0 000 0.025 0 100 0 0 90 10 0119 2017_18 Q JN 95 Creggan Road Carrickmore Watermain Extens on 00 JI05 03 23 0 08 2008 03/07/2009 07 12 2009 22/01/2010 22/01/2010 22/01/2011 0 0 0 0 0.000 0.000 0.000 0.000 0.000 0.000 0.000 0.000 0 0 0 0 0 /08/2008 03/07/2009 07/12/2009 21/01/2010 0 /01/2010 100 0 0 0 -0.001 -0 003 0.000 0 000 0.000 0 000 0.000 0 000 -0.001 0 0 0 100 0 0195 2017_18 Q JR 7 M llmount Vi lage Dundonald Water Main Upgrades 00 JI05 03 23 DRD 0 /06/2015 0 /06/2015 100 0 0 0 -0.020 0 000 0.000 0 000 0.003 0 008 0.019 0 000 -0.020 0 0 0 100 0 0 01196 2017_18 Q JS307 Drumarden Road Po taferry 03 JI05 03 08 DRD 2 /09/201 03/10/201 30/10/201 03/0 /2017 100 0 0 0 -0.005 0 000 0.000 0 000 0.000 0 200 0.020 0 020 -0.005 7 93 0 0 93 0 01197 2017_18 Q J 058 Recreational Si es Appraisa s or Pub ic Access 0 06 03 0 /02/2016 05/02/2016 0 100 0 0 0.097 0 000 0.000 0 000 0.039 0 038 0.000 0 275 0.097 0 100 0 0 0 0 01198 2017_18 Q J 059 Water Tower Reports demolit on of seven 03 0 07 DRD 0 100 0 0 0.000 0 000 0.000 0 000 0.015 0 002 0.002 0 000 0.000 0 100 0 0 0 0 01199 2017_18 Q J 061 Impounding Reservoirs On-s te Act on Plans. (Reservoi s B ll) 03 01 03 DRD 0 100 0 0 0.000 0.000 0.000 0.000 0.000 0.078 0.1 7 0.081 0 100 0 0 22/01/2018 22/01/2018 0 100 0 0 0.000 0 000 0.000 0 000 0.010 0 071 0.000 0 000 0.000 0 100 0 0 0 0 01200 2017_18 Q J 062 Lead Pipe Replacement Programme 03 03 23 DWI 100 0 0 0 0.000 0.000 0.000 0.000 0.000 0.92 0.919 0.913 100 0 0 0 13/03/201 25/03/201 100 0 0 0 -0.1 6 0 000 0.000 0 000 0.000 0. 93 0.10 0 000 -0.1 6 100 0 0 0 0 0 01201 2017_18 Q J 063 Inspec ion of Air Valves 03 03 08 0 /03/201 13/03/201 100 0 0 0 0.000 0 000 0.000 0 000 0.000 0 010 0.001 0 000 0.000 0 100 0 0 100 0 01202 2017_18 Q J 065 PC13 Base Main enance Water Treatment Wo ks - North/ Eas 03 02 01 DRD 27/06/201 22/07/201 02/11/2015 0 100 0 0 0.029 0 000 0.000 0 000 0.005 0 021 1.960 1.18 0.029 0 100 0 0 0 0 01203 2017_18 Q J 066 PC13 Base Maintenance Water Treatment Wo ks - South/ Wes03 02 01 DRD 27/06/201 22/07/201 0 100 0 0 0.088 0 000 0.000 0 000 0.005 0 020 1.527 1.1 0 0.088 0 100 0 0 0 0 0120 2017_18 Q J 067 Supply, insta lation and commissioning of Telemetry Scanning 00 03 08 DRD 19/11/2013 29/11/2013 0 100 0 0 -0.029 0 000 0.000 0 000 0.080 -0 026 0.001 0 029 -0.029 0 100 0 0 0 0 01205 2017_18 Q J 068 PC13 Base Maintenance Water Pumping Stat ons 03 05 01 DRD 02/11/2016 0 /11/2016 0 100 0 0 -0.003 0 000 0.000 0 000 0.017 0 0 2 0.003 0 000 -0.003 0 100 0 0 0 0 01206 2017_18 Q J 071 Sub Metering at Se ected Clean Water Si es 06 06 01 DRD 0 100 0 0 0.000 0.000 0.000 0.000 0.000 0. 60 0.000 0.000 0 0 100 0 0 100 0 0 0.000 0 000 0.000 0 000 0.006 0 0 6 0.007 0 000 0.000 0 0 100 0 0 0 01207 2017_18 Q J 072 PC15 Water Mains Rehab l tat on Framework 06 03 08 UR 96 0 0 -0.001 0 000 0.000 0 000 0.000 0 000 0.067 0 000 -0.001 50 3 2 1 32 0 01208 2017_18 Q J 073 PC15 Water Mains Minor Works Framework. 06 03 23 UR 9 6 0 0 -0.001 0 000 0.000 0 000 0.000 0 000 0.031 0 000 -0.001 30 51 3 16 7 0 01209 2017_18 Q J 07 Watermains Rehab li ation, New & Replacement Incorpora ing 06 03 08 UR 23/02/2016 29/02/2016 9 6 0 0 2.379 0 000 0.000 0 000 0.000 0 000 0.000 1 983 2.379 30 51 3 16 7 0 01210 2017_18 Q J 075 WPS Pump Ef iciency Capital Investment Phase 2 00 05 01 10 90 0 0 0.006 0 000 0.000 0 000 0.000 0 019 0.037 0 000 0.006 0 100 0 0 10 0 01211 2017_18 Q J 076 Replacement Watermains 201 /15 - Reactive, Bund e 2 03 03 08 2 /11/201 27/11/201 05/01/2015 03/08/2015 31/03/2016 100 0 0 0 0.000 0 000 0.000 0 000 0.000 0 216 0.108 0 011 0.000 56 0 0 56 0 01212 2017_18 Q J 077 Source To Tap 03 01 03 0 100 0 0 0.000 0.000 0.000 0.000 0.000 0.605 0.601 0.598 11 8 38 13/03/2015 18/03/2015 0 100 0 0 0.0 2 0 000 0.000 0 000 0.000 0 011 0.050 0 000 0.0 2 0 0 50 50 0 0 01213 2017_18 Q J 078 PC15 Service Reservoir Rehabi itation (Parent Code) 00 0 07 0 100 0 0 0.000 0 000 0.000 0 000 0.000 0 000 0.000 0 000 0.000 0 100 0 0 0 0 0121 2017_18 Q J 079 PC15 Abstract on Moni oring 00 01 03 0 100 0 0 0.000 0.000 0.000 0.000 0.000 0.0 7 0.0 6 0.0 6 27 11 27 36 0 100 0 0 0.082 0 000 0.000 0 000 0.000 0 000 0.0 6 0 037 0.082 27 10 27 36 0 0 01215 2017_18 Q J 080 PC15 Service Reservoir Sample Taps 00 0 07 0 100 0 0 0.000 0.000 0.000 0.000 0.000 0. 80 0. 77 0.000 0 100 0 0 29/0 /2016 03/05/2016 0 100 0 0 0.815 0 000 0.000 0 000 0.000 0 000 0.0 0 0 081 0.815 32 68 0 0 0 0 01216 2017_18 Q J 081 PC15 - PSCEMD (Water) 00 02 0 0 100 0 0 0.000 0.000 0.000 0.000 0.000 0.000 0.919 0.913 100 0 0 0 22/02/2018 22/02/2018 0 100 0 0 0.000 0 000 0.000 0 000 0.000 0 000 0.000 0 033 0.000 100 0 0 0 0 0 01217 2017_18 Q J 082 PC15 Lead Communica ion Pipe Replacement Programme 00 03 23 DWI 21/08/2015 2 /08/2015 100 0 0 0 1.03 0 000 0.000 0 000 0.000 0 000 1. 22 1 629 1.03 100 0 0 0 0 0 01218 2017_18 Q J 083 PC15 Trunk Main Rehab litation P ogramme (Parent) 00 03 23 90 10 0 0 0.000 0.000 0.000 0.000 0.000 1.05 1. 29 1. 20 0 60 6 3 90 10 0 0 0.000 0 000 0.000 0 000 0.000 0 000 0.000 0 000 0.000 0 63 2 35 53 0 01219 2017_18 Q JV880 Camly Command SR Refurb shment 06 JI078 0 07 18/08/2016 18/08/2016 0 /10/2016 17/01/2017 02/02/2017 15/02/2017 0 100 0 0 0.000 0 000 0.000 0 000 0.000 0 000 0.000 0.160 0.000 0 100 0 0 0 0 01220 2017_18 Q JF601 Ardglena Grove Area Dungannon Watermain Rea ignment 06 JI083 03 23 15/01/2016 15/01/2016 01/03/2016 30/03/2016 01/0 /2016 100 0 0 0 -0.018 0 000 0.000 0 000 0.000 0 000 0.1 8 0 015 -0.018 0 100 0 0 100 0 01221 2017_18 Q JR 8 Gravity 1 / Antrim Rd Trunk Main valve rep acements 06 JI083 03 23 11/08/2015 1 /09/2015 05/10/2015 2 /11/2017 31/03/2017 100 0 0 0 0.076 0 000 0.000 0 000 0.000 0 000 0.175 0 032 0.076 0 100 0 0 100 0 01222 2017_18 Q JR 87 Grea er Belfast Trunkmain Valve Replacement 06 JI083 03 23 07/06/2016 09/06/2016 05/09/2016 10/03/2017 31/03/2017 100 0 0 0 -0.013 0 000 0.000 0 000 0.000 0 000 0.103 0 608 -0.013 0 100 0 0 100 0 01223 2017_18 Q J 08 Water Treatment Works Treatabil ty Study 06 02 01 0 100 0 0 0.000 0.000 0.000 0.000 0.000 0.151 0.150 0.186 69 31 0 0 0 100 0 0 0.178 0 000 0.000 0 000 0.000 0 000 0.000 0.101 0.178 70 30 0 0 0 0 0122 2017_18 Q J 086 PC15 Public Realm & Roads (Water) 00 03 23 100 0 0 0 0.000 0.000 0.000 0.000 0.000 1.036 1.030 1.02 0 100 0 0 100 0 0 0 0.000 0 000 0.000 0 000 0.000 0 000 0.000 0 000 0.000 0 100 0 0 100 0 01225 2017_18 Q J 087 PC15 Watermains Rehab li ation WP1 - Fo fany/North Lisburn 00 03 08 0 /06/2015 16/06/2015 02/02/2015 100 0 0 0 -0.020 0 000 0.000 0 000 0.000 0 087 1.775 0. 55 -0.020 5 6 0 0 6 0 01226 2017_18 Q J 088 PC15 Watermains Rehab li ation WP 2: Fo ked Br dge Dunmur00 03 08 03/11/2015 05/11/2015 01/09/2015 31/03/2016 100 0 0 0 0.137 0 000 0.000 0 000 0.000 0 000 0.696 1 000 0.137 97 3 0 0 3 0 01227 2017_18 Q J 089 PC15 Watermains Rehab li ation WP 3: Ki lylane 00 03 08 07/05/2015 12/05/2015 02/02/2015 30/0 /2018 92 8 0 0 -0.102 0 000 0.000 0 000 0.000 0 0 5 1.929 0 520 -0.102 78 5 13 3 0 01228 2017_18 Q J 090 PC15 Watermains Rehab li ation WP : Ba lymena Ph1 00 03 08 19/06/2015 22/06/2015 0 /02/2015 23/03/2017 100 0 0 0 -0.197 0 000 0.000 0 000 0.000 0 0 0 1. 23 0 335 -0.197 96 0 0 0 01229 2017_18 Q J 092 PC15 Watermains Rehab li ation WP 6: Dungonnell 00 03 08 07/05/2015 12/05/2015 02/02/2015 100 0 0 0 0.005 0 000 0.000 0 000 0.000 0 080 1.685 0.176 0.005 86 1 0 0 1 0 01230 2017_18 Q J 093 PC15 Watermains Rehab li ation WP 7: Carr ckfergus 00 03 08 03/11/2015 05/11/2015 01/09/2015 31/03/2016 100 0 0 0 0.556 0 000 0.000 0 000 0.000 0 000 0.588 1 607 0.556 66 3 0 0 3 0 01231 2017_18 Q J 09 PC15 Watermains Rehab li ation WP 8: Be fast South Ph1 00 03 08 03/11/2015 05/11/2015 01/09/2015 31/03/2016 86 1 0 0 -0.105 0 000 0.000 0 000 0.000 0 000 0.623 1 651 -0.105 73 22 5 0 13 0 01232 2017_18 Q J 096 PC15 Watermains Rehab li ation WP 10: Belfast North 00 03 08 03/11/2015 05/11/2015 01/09/2015 30/11/2017 100 0 0 0 0.563 0 000 0.000 0 000 0.000 0 000 0.702 1 202 0.563 90 10 0 0 10 0 01233 2017_18 Q J 098 PC15 Watermains Rehab li ation WP 12: Wate mains Re- ining00 03 08 100 0 0 0 0.000 0 000 0.000 0 000 0.000 0 000 0.000 0 000 0.000 50 3 2 1 3 0 0123 2017_18 Q J 099 WI M Networks Workpackages Deve opment and Veri ication 0 06 20 30/0 /2015 0 /06/2015 100 0 0 0 -0.006 0 000 0.000 0 000 0.000 0 000 0.133 0 023 -0.006 0 100 0 0 100 0 01235 2017_18 Q JI100 PC15 Capital Maintenance Planning 0 06 20 01/05/2015 22/06/2015 100 0 0 0 0.069 0 000 0.000 0 000 0.000 0 000 0.259 0 06 0.069 0 95 5 0 95 0 01236 2017_18 Q JI101 PC15 Service Reservoir Cond tion Assessmen s. 0 0 20 25/06/2015 26/06/2015 0 100 0 0 -0.002 0 000 0.000 0 000 0.000 0 000 0.028 0 02 -0.002 0 100 0 0 0 0 01237 2017_18 Q JI102 PC15 PPRA Review of EP Water Mains Rehab Work Package 0 03 20 01/05/2015 03/07/2015 100 0 0 0 0.011 0 000 0.000 0 000 0.000 0 000 0.065 -0 001 0.011 30 60 7 3 60 0 01238 2017_18 Q JI10 PC15 Year 1 Base Maintenance - Ch orine Dosing Si es 00 0 01 11/0 /2016 18/0 /2016 02/01/2017 0 100 0 0 0.602 0 000 0.000 0 000 0.000 0 002 0.0 0 290 0.602 10 90 0 0 0 0 01239 2017_18 Q JI105 WTW Condi ion Assessments 00 02 01 0 100 0 0 -0.025 0 000 0.000 0 000 0.000 0.150 0.015 0 035 -0.025 0 100 0 0 0 0 012 0 2017_18 Q JI106 SR ByPass Schemes Phase 2 00 03 06 0 100 0 0 0.183 0 000 0.000 0 000 0.000 0 000 0.035 0 009 0.183 0 0 100 0 0 0 012 1 2017_18 Q JI108 PC15 Year 1- Asset Peformance Miscel aneous Solu ions Dev 06 06 20 10/08/2015 1 /09/2015 100 0 0 0 -0.006 0 000 0.000 0 000 0.000 0 000 0.071 0 008 -0.006 0 100 0 0 100 0 012 2 2017_18 Q JI109 Castor Bay Outage Feasibi ity Studies 06 03 0 100 0 0 0 0.0 5 0 000 0.000 0 000 0.000 0 000 0.000 0 000 0.0 5 0 0 0 100 0 02 3 2017_18 Q JI110 Impounding Reservoir Audits. 06 01 03 100 0 0 0 0.103 0 000 0.000 0 000 0.000 0 000 0.000 0 010 0.103 0 100 0 0 100 0 012 2017_18 Q JI111 PC15 Base Maintenance (Water) Parent 06 01 01 0 100 0 0 0.000 0.000 0.000 0.000 0.000 3.558 3. 1 3. 21 0 100 0 0 100 0 0 0 0.000 0 000 0.000 0 000 0.000 0 000 0.000 0 000 0.000 0 100 0 0 0 0 012 5 2017_18 Q JI112 PC15 Watermains Rehab liation Parent 06 03 08 96 0 0 0.000 0.000 0.000 0.000 0.000 17.937 17.829 17.722 9 35 2 1 96 0 0 0.000 0 000 0.000 0 000 0.000 0 000 0.000 0 000 0.000 9 35 2 1 0 0 012 6 2017_18 Q JI113 PC15 Addit onal enhancement output Parent 0 98 32. 890689 18 8972862 20.7293722 27.88 2727 0.000 0.000 0.000 0.000 0.000 .811 10.776 11.837 8 0 16 36 32. 890689 18.8972862 20 7293722 27 88 2727 0.000 0 000 0.000 0 000 0.000 0 000 0.000 0 000 0.000 8 0 16 36 0 02 7 2017_18 Q JI11 PC15 FTS (Wa er) Parent EP 06 03 23 100 0 0 0 0.000 0.000 0.000 0.000 0.000 0.6 7 0. 13 0.320 0 0 0 100 100 0 0 0 0.000 0 000 0.000 0 000 0.000 0 000 0.000 0 000 0.000 0 0 0 100 0 0 012 8 2017_18 Q JI115 PC15 Appra sal of NIW infrastructure at Railways, DRD Road &06 03 23 100 0 0 0 0.000 0.000 0.000 0.000 0.000 0.589 0.293 0.291 0 100 0 0 100 0 0 0 0.000 0 000 0.000 0 000 0.000 0 000 0.000 0 000 0.000 0 100 0 0 0 0 012 9 2017_18 Q JI117 WTW Resil ence Improvement 00 02 0 08/09/2016 08/09/2016 0 100 0 0 0.000 0 000 0.000 0 000 0.000 0 000 0.055 0 015 0.000 15 85 0 0 0 0 01250 2017_18 Q JI118 Service Reservoir Cond tion Assessment(PC15 Year 2) 00 0 07 09/06/2016 10/06/2016 0 100 0 0 0.172 0 000 0.000 0 000 0.000 0 000 0.000 0 053 0.172 0 100 0 0 0 0 01251 2017_18 Q JI119 Capital Maintenance Planning: Trunk Main Condit on Grading (00 03 05 09/06/2016 21/07/2016 03/10/2016 31/03/2017 100 0 0 0 -0.001 0 000 0.000 0 000 0.000 0 000 0.000 0 3 2 -0.001 0 95 5 0 95 0 01252 2017_18 Q JI120 WI M Networks Work Packages & Ver ficat on(PC15 Year 2) 00 06 20 09/06/2016 21/07/2016 100 0 0 0 -0.001 0 000 0.000 0 000 0.000 0 000 0.000 0 090 -0.001 0 100 0 0 100 0 01253 2017_18 Q JI121 Hydraulic Model Rebuilds & Project Management(PC15 Year 200 06 20 0 /05/2016 10/06/2016 100 0 0 0 0.013 0 000 0.000 0 000 0.000 0 000 0.000 0 512 0.013 0 60 7 33 60 0 0125 2017_18 Q JI122 PPRA's for Rehab Wo k Packages 2016 17 06 03 20 08/06/2016 21/07/2016 100 0 0 0 0.023 0 000 0.000 0 000 0.000 0 000 0.000 0 019 0.023 30 60 7 3 60 0 01255 2017_18 Q JI123 NIW H s oric Esta e Cond tion Assessments 06 06 03 0 100 0 0 0.000 0 000 0.000 0 000 0.000 0 000 0.000 0 081 0.000 100 0 0 0 0 0 01256 2017_18 Q JI126 PC15 Year 3 WPS Base Maintenance 06 05 01 19/07/2017 01/08/2017 0 100 0 0 0.759 0 000 0.000 0 000 0.000 0 000 0.000 0 005 0.759 0 100 0 0 0 0 01257 2017_18 Q JI127 WI M Networks Workpackages and Verif ca ion 2017-2018 06 06 20 27/03/2017 13/0 /2017 100 0 0 0 0.072 0 000 0.000 0 000 0.000 0 000 0.000 0 000 0.072 0 100 0 0 100 0 01258 2017_18 Q JI128 Clean Water Network Hydrau ic Model Rebu lds and Ad -Hoc 06 06 20 27/03/2017 16/05/2017 100 0 0 0 0. 68 0 000 0.000 0 000 0.000 0 000 0.000 0 000 0. 68 0 100 0 0 100 0 01259 2017_18 Q JI129 M sce laneous Risk and Consequence Upda e and C ean Wate06 06 20 18/12/2017 16/01/2018 100 0 0 0 0.030 0 000 0.000 0 000 0.000 0 000 0.000 0 000 0.030 0 100 0 0 100 0 01260 2017_18 Q JI130 Service Reservoir Cond tion Assessments 2017-2018 and beyo06 0 20 21/03/2018 27/03/2018 0 100 0 0 0.000 0 000 0.000 0 000 0.000 0 000 0.000 0 000 0.000 0 100 0 0 0 0 01261 2017_18 Q JI131 PPRA's for Rehab Wo k Packages 06 03 20 100 0 0 0 0.000 0 000 0.000 0 000 0.000 0 000 0.000 0 000 0.000 0 100 0 0 100 0 01262 2017_18 Q JI132 Trunk / Strategic Main Invest ga ion 2017-2018 06 03 20 13/10/2017 2 /10/2017 100 0 0 0 0.2 0 0 000 0.000 0 000 0.000 0 000 0.000 0 000 0.2 0 0 95 5 0 95 0 01263 2017_18 Q JI133 DG3 Management Improvements 06 06 08 0 100 0 0 0.06 0 000 0.000 0 000 0.000 0 000 0.000 0 005 0.06 0 0 100 0 0 0 0126 2017_18 Q JI13 Update to Standa dised Engineering Drawings 06 06 20 15/08/2017 03/10/2017 0 100 0 0 0.092 0 000 0.000 0 000 0.000 0 000 0.000 0 000 0.092 0 100 0 0 0 0265 2017_18 Q JI135 Leakage Invest ga ions to inform WIIM Work Package deve op 06 06 01 100 0 0 0 0. 57 0 000 0.000 0 000 0.000 0 000 0.000 0 000 0. 57 0 100 0 0 100 0266 2017_18 Q JI136 Deve opment and Implementa ion of Risk-Based Cond tion Ass06 10 01 30/10/2017 16/01/2018 0 51 0 9 0.000 0 000 0.000 0 000 0.000 0 000 0.000 0 000 0.000 0 100 0 0 0 0 01267 2017_18 Q JI137 CMP - Deteriorat on and Risk & Re iabil ty Modelling for PC21 06 1 20 1 /06/2017 16/06/2017 50 0 50 0 0.120 0 000 0.000 0 000 0.000 0 000 0.000 0 000 0.120 0 0 100 0 0 0 01268 2017_18 Q JI1 3 Clean Water Network Hydrau ic Model Rebu lds and Ad -Hoc A06 06 20 100 0 0 0 0.000 0 000 0.000 0 000 0.000 0 000 0.000 0 000 0.000 0 100 0 0 100 0 01269 2017_18 Q JL713 Ki lyhevlin to Lough Bradan Link Watermain 02 03 05 DWI 0 0 0 0 0.000 0.000 0.000 0.000 0.000 0.000 0.000 0.000 0 0 0 0 99 1 0 0 -0.001 0 006 0.06 0 032 0.01 -0 003 0.0 5 -0 027 -0.001 0 0 0 100 0 0 03270 2017_18 Q JL715 Caugh Hill, Carmoney to Strabane St ategic Link Watermain 02 03 05 DWI 31/01/2019 89 11 0 0 0.000 0.000 0.000 0.000 0.000 0.000 1.089 .363 0 0 0 100 89 11 0 0 0.238 0 021 -0.008 0 016 0.076 0 036 0.100 0 0 5 0.238 0 0 0 100 0 0 02271 2017_18 Q JL750 Ba linrees o Limavady/Londonderry Supply Augmenta ion 01 03 05 DWI 08 12 2009 05/01/2010 22 02 2010 30/09/2011 30/09/2011 29/09/2012 0 0 0 0 0.000 0.000 0.000 0.000 0.000 0.000 0.000 0.000 0 0 0 0 08/12/2009 05/01/2010 100 0 0 0 0.000 0 3 5 0.150 0 016 0.008 0 002 0.000 0 001 0.000 0 25 0 75 25 0272 2017_18 Q JL768 Caugh Hill WTW FAS S orage 00 02 0 DRD 29/10/2013 31/10/2013 28/11/201 01/02/2016 26/12/201 0 /0 /2016 0 100 0 0 0.000 0 000 0.000 0 003 0.012 0.152 0.368 0 001 0.000 0 0 0 100 0 0 01273 2017_18 Q JL769 Glenedra Water In ake Refurb shment & Access Road Repair 00 01 03 DRD 11/0 /201 28/0 /201 28/11/201 31/03/2016 25/05/2015 16/01/2017 0 100 0 0 -0.001 0 000 0.000 0 00 0.027 0 021 0.322 0 015 -0.001 0 100 0 0 0 0 0127 2017_18 Q JL770 Caugh Hill WTW - Upgrade of Wash Water Treatment Facil ties02 02 0 DRD 0 100 0 0 0.000 0.000 0.000 0.000 0.000 0.000 1.252 2.887 0 100 0 0 12/02/2016 19/02/2016 03/0 /2017 0 100 0 0 2.198 0 000 0.000 0 005 0.022 0 010 0.006 0.132 2.198 0 72 28 0 0 0 01275 2017_18 Q JL772 WTW - Trea ab lity Appraisal of Caugh Hi l WTW 00 02 0 DRD 31/01/2019 0 100 0 0 0.000 0.000 0.000 0.000 0.000 0.000 0.000 3.607 88 12 0 0 0 100 0 0 0.1 6 0 000 0.000 0 005 0.059 0 007 0.00 0 009 0.1 6 89 11 0 0 0 0 02276 2017_18 Q JL773 Carmoney WTW DAF process Optimisat on 00 02 0 DWI 0 100 0 0 0.000 0.000 0.000 0.000 0.000 0.000 0.000 0.000 0 100 0 0 0 100 0 0 -0.005 0 000 0.000 0 003 0.02 0 0 9 0.067 0 005 -0.005 0 100 0 0 0 0 01277 2017_18 Q JL77 Faughan PS - Bandscreen upgrade 00 05 01 1 /0 /201 28/0 /201 03/11/201 06/01/2016 29/01/2016 0 100 0 0 0.000 0 000 0.000 0 000 0.009 0 3 6 0.09 -0 001 0.000 0 100 0 0 0 0 01278 2017_18 Q JL781 A29 Ki lytoney Realignment, Watermain Divers ons 00 03 23 05/12/201 11/12/201 100 0 0 0 -0.007 0 000 0.000 0 000 0.000 0 03 0.013 0 000 -0.007 0 100 0 0 100 0 01279 2017_18 Q JL785 A6 Dungiven Drumahoe 06 03 23 DRD 89 6 5 0 0.0 5 0 000 0.000 0 000 0.000 0 000 0.000 0 030 0.0 5 0 100 0 0 89 5 01280 2017_18 Q JL786 Carmoney Wtw Trea ab l ty Recommended Improvements 06 02 0 0 100 0 0 0.010 0 000 0.000 0 000 0.000 0 000 0.000 0 000 0.010 100 0 0 0 0 0281 2017_18 Q JL787 Faughan RWPS Res lience Scheme 06 05 01 0 100 0 0 0.215 0 000 0.000 0 000 0.000 0 000 0.000 0 000 0.215 0 100 0 0 0 0282 2017_18 Q JL788 Creggan SR Overf ow 00 0 01 0 100 0 0 0.001 0 000 0.000 0 000 0.000 0 000 0.000 0 000 0.001 0 100 0 0 0 0283 2017_18 Q JL789 Carmoney WTW Abstract on Point Review 06 01 03 0 100 0 0 0.019 0 000 0.000 0 000 0.000 0 000 0.000 0 000 0.019 0 0 0 60 0 028 2017_18 Q JL790 Northern WRZ Res lience 06 01 03 100 0 0 0 0.0 0 0 000 0.000 0 000 0.000 0 000 0.000 0 000 0.0 0 10 0 20 70 0 0285 2017_18 Q JL791 Caugh Hill CWB Rehabi ita ion 06 0 07 0 100 0 0 0.000 0 000 0.000 0 000 0.000 0 000 0.000 0 000 0.000 0 100 0 0 0 0286 2017_18 Q JN390 Lough Bradan WTWs Upgrade 01 02 0 DWI 31 03 2009 27/0 /2009 31 08 2009 03/03/2011 03/03/2011 02/03/2012 0 0 0 0 0.000 0.000 0.000 0.000 0.000 0.000 0.000 0.000 0 0 0 0 31/03/2009 27/0 /2009 01/0 /201 02/03/2011 30/07/2012 0 100 0 0 -0.3 3 1 536 0.210 0 020 0.1 7 0 000 0.010 -0 655 -0.3 3 51 9 0 0 0 0287 2017_18 Q JN 83 Glenhordial WTW expansion of ex sting sludge plant 06 02 0 0 100 0 0 0.000 0.000 0.000 0.000 0.000 0.338 0.000 0.000 0 100 0 0 0 100 0 0 -0.00 0 000 0.000 0 002 0.013 0 005 0.009 0 01 -0.00 7 93 0 0 0 0 01288 2017_18 Q JN508 Lough Bradan WTW Upgrade Part 2 02 02 0 DWI 0 100 0 0 0.000 0 000 0.000 0 000 0.000 0 000 0.000 0 000 0.000 35 0 0 25 0 0 01289 2017_18 Q JN509 Derg WTW - Upgrade of F lters and Chemical Dosing 06 02 0 DRD 0 100 0 0 0.000 0.000 0.000 0.000 0.000 0.000 0.000 0.000 0 100 0 0 02/11/2016 0 /11/2016 0 100 0 0 0. 96 0 000 0.000 0 010 0.003 0 013 0. 71 0 0 5 0. 96 38 51 0 11 0 0 01290 2017_18 Q JN510 Strule River Omagh Trunk Wa er Main Repair 00 03 23 100 0 0 0 -0.001 0 000 0.000 0 000 0.000 0 000 0.007 0 000 -0.001 0 100 0 0 100 0 01291 2017_18 Q JN511 South / South East Zonal Study South East Phase 1 Work Pac 03 03 08 DRD 1 /02/201 21/02/201 03/03/201 20/02/2015 23/03/2015 88 12 0 0 -0.080 0 000 0.000 0 000 0.510 2 025 0.023 0 010 -0.080 32 56 0 12 56 0 01292 2017_18 Q JN512 Omagh Phase 2 Watermain Rehab 03 03 08 UR 0 /03/201 10/03/201 02/09/2013 30/10/2015 30/03/2015 100 0 0 0 0.121 0 000 0.000 0 000 0. 20 1 895 0.618 -0 05 0.121 19 7 0 7 7 0 01293 2017_18 Q JN51 Castletown/Koram WPS Upgrade 06 03 23 DRD 10/08/2016 12/08/2016 05/12/2016 26/01/2018 01/12/2017 65 35 0 0 0.339 0 000 0.000 0 000 0.000 0 015 0.005 0 306 0.339 0 7 9 12 0 0129 2017_18 Q JN528 Crawfords Hi l Mains Rep acement 00 03 08 100 0 0 0 0.000 0 000 0.000 0 000 0.000 0 000 0.015 -0 015 0.000 0 100 0 0 100 0 01295 2017_18 Q JN529 Co ebrook Park Road Mains Replacement 00 03 08 16/03/2016 18/03/2016 15/02/2016 29/07/2016 100 0 0 0 -0.033 0 000 0.000 0 000 0.000 0 000 0.030 0.197 -0.033 0 100 0 0 100 0 01296 2017_18 Q JN530 Toura Road Mains Replacement 00 03 08 16/03/2016 18/03/2016 03/0 /2017 100 0 0 0 -0.039 0 000 0.000 0 000 0.000 0 000 0.030 0 09 -0.039 0 100 0 0 100 0 01297 2017_18 Q JN532 Be leek Meenac oybane Strateg c Main Replacement. 06 03 23 28/10/2016 01/11/2016 07/11/2016 18/08/2017 78 22 0 0 0.588 0 000 0.000 0 000 0.000 0 000 0.000 0 903 0.588 0 8 0 16 68 0 01298 2017_18 Q JN53 WI M Phase 2 Loughmacrory WP 06 03 08 17/10/2016 17/10/2016 01/08/2016 100 0 0 0 1.311 0 000 0.000 0 000 0.000 0 000 0.000 0 692 1.311 11 89 0 0 89 0 01299 2017_18 Q JN535 WI M Phase 2 Lough Braden Drumquin WP 06 03 08 0 /07/2016 0 /07/2016 21/07/2016 100 0 0 0 1.382 0 000 0.000 0 000 0.000 0 000 0.000 1 399 1.382 1 86 0 0 86 0 01300 2017_18 Q JN538 Derg WTW MCPA PEO Undertakings 06 02 0 0 100 0 0 0.020 0 000 0.000 0 000 0.000 0 000 0.000 0 283 0.020 95 5 0 0 0 0 03301 2017_18 Q JN5 1 PC15 Year 3 WTW Cap tal Maintenance - West Region 06 02 01 0 /08/2017 09/08/2017 0 100 0 0 0.781 0 000 0.000 0 000 0.000 0 000 0.000 0 000 0.781 0 100 0 0 0 0 01302 2017_18 Q JN5 Doochrock o Drumkeeran Watermain Upg ades 06 03 23 100 0 0 0 0.082 0 000 0.000 0 000 0.000 0 000 0.000 0 002 0.082 0 70 0 30 70 0 01303 2017_18 Q JN5 5 Al eyhi l o Doochrock Watermain 06 03 23 02/11/2017 08/11/2017 0 /09/2017 100 0 0 0 0.605 0 000 0.000 0 000 0.000 0 000 0.000 0 002 0.605 0 39 0 61 39 0 0130 2017_18 Q JN5 6 Tyrone South WIIM 2.1 Work Package 06 03 08 100 0 0 0 0.000 0 000 0.000 0 000 0.000 0 000 0.000 0 000 0.000 1 8 0 51 8 0 01305 2017_18 Q JN5 7 Tyrone North WIIM 2.1 Work Package 06 03 08 100 0 0 0 0.150 0 000 0.000 0 000 0.000 0 000 0.000 0 000 0.150 9 88 0 3 88 0 01306 2017_18 Q JN5 8 Fe managh South W M 2.1 Work Package 06 03 08 100 0 0 0 0.225 0 000 0.000 0 000 0.000 0 000 0.000 0 000 0.225 1 66 0 33 66 0 01307 2017_18 Q JN5 9 Tyrone West WIIM 2.1 Work Package 06 03 08 100 0 0 0 0.070 0 000 0.000 0 000 0.000 0 000 0.000 0 000 0.070 5 9 0 1 9 0 01308 2017_18 Q JN550 Lough Fea o Kinsgm l s TM Replacement (Part) 06 03 23 100 0 0 0 0.078 0 000 0.000 0 000 0.000 0 000 0.000 0 000 0.078 0 100 0 0 100 0 01309 2017_18 Q JN551 Cornamuck Road Rea ignment 00 03 23 DRD 100 0 0 0 0.010 0 000 0.000 0 000 0.000 0 000 0.000 0 000 0.010 0 100 0 0 100 0310 2017_18 Q JN553 Western WRZ Resi ience 06 01 03 100 0 0 0 0.018 0 000 0.000 0 000 0.000 0 000 0.000 0 000 0.018 10 0 20 70 0 0311 2017_18 Q JN555 Gortin Road, Omagh - Road W dening 06 03 23 100 0 0 0 0.023 0 000 0.000 0 000 0.000 0 000 0.000 0 000 0.023 0 9 0 6 9 0312 2017_18 Q JP631 Ki lyhevlin C ear Water Tank 02 0 06 DWI 30/09/2017 0 100 0 0 0.000 0.000 0.009 0.018 0.000 0.851 2.815 0.756 0 35 0 65 08/06/2016 16/06/2016 0 100 0 0 0.218 0 000 0.000 0 000 0.000 0 000 0.000 0.19 0.218 0 3 0 66 0 0 02313 2017_18 Q JP650 Ki lyhevlin WTW Imp ovements to sludge settlement sys em 0 02 0 18/10/2013 28/10/2013 0 100 0 0 0.000 0 000 0.000 0 006 0.029 0 060 0.01 0 010 0.000 95 0 5 0 0 0 0331 2017_18 Q JP653 Ennisk llen New Hospi al Watermain Ext 00 03 23 16/01/2008 25/02/2008 1 /0 /2008 11/06/201 02/08/2010 100 0 0 0 0.000 0 000 0.000 0 003 0.000 0 000 0.003 0 000 0.000 0 0 0 100 0 0 01315 2017_18 Q JP669 Ki lyhevlin WTW - GAC 00 02 0 DWI 01 06 2013 30/09/201 01/02/2015 01 02 2016 0 100 0 0 0.000 0.000 0.037 1.890 1.792 0. 39 0.000 0.000 100 0 0 0 08/07/2013 19/07/2013 11/03/201 31/03/2015 27/07/2015 16/02/2017 0 100 0 0 -0.105 0 000 0.000 0 008 0.717 3 777 0.331 0 070 0.105 100 0 0 0 0 0 08316 2017_18 Q JP680 South / South East Zonal Study South Phase 1 Work Package 03 03 08 DRD 13/05/201 21/05/201 16/06/201 31/08/2015 30/09/2015 100 0 0 0 0.000 0 000 0.000 0 000 0.273 1 782 0.132 -0 001 0.000 8 6 0 6 6 0 01317 2017_18 Q JP683 Ha lc aig road, Enn ski len WM Ext 00 03 23 DRD 15/09/201 25/09/201 09/11/201 30/03/2015 100 0 0 0 0.000 0 000 0.000 0 000 0.000 0 011 0.000 -0 011 0.000 0 0 0 100 0 0 01318 2017_18 Q JP685 Ki lyhevlin WTW Hypo Storage Tank Rep acement 03 02 01 0 /08/2015 05/08/2015 18/01/2016 27/03/2017 29/07/2016 0 100 0 0 -0.015 0 000 0.000 0 000 0.000 0 012 0.3 3 0.176 -0.015 0 100 0 0 0 0 01319 2017_18 Q JP688 PC15 Year 2 WTW Base Maintenance – West Region 00 02 01 05/03/2016 09/03/2016 0 100 0 0 1.1 1 0 000 0.000 0 000 0.000 0 000 0.005 1 755 1.1 1 0 100 0 0 0 0 01320 2017_18 Q JP690 Syon in WPS to Dungoran SR 150mm DI Watermain Replacem06 03 23 28/10/2016 01/11/2016 07/11/2016 05/0 /2017 07/11/2017 65 35 0 0 0.18 0 000 0.000 0 000 0.000 0 000 0.000 0 61 0.18 0 90 0 10 65 0 01321 2017_18 Q JP691 Fermanagh North WIIM 2.1 Work Package 06 03 08 100 0 0 0 0.000 0 000 0.000 0 000 0.000 0 000 0.000 0 000 0.000 35 65 0 0 65 0 01322 2017_18 Q JP693 Ki lyhevlin Wtw treatabi ity recommended improvements. 06 02 0 0 100 0 0 0.035 0 000 0.000 0 000 0.000 0 000 0.000 0 000 0.035 100 0 0 0 0 0323 2017_18 Q JP69 Rathmore SR Bel eek reroute out et 06 03 23 100 0 0 0 0.015 0 000 0.000 0 000 0.000 0 000 0.000 0 000 0.015 0 100 0 0 100 032 2017_18 Q JP695 Upgrade of Ki lyhevlin WTW's 06 02 0 0 100 0 0 0.020 0 000 0.000 0 000 0.000 0 000 0.000 0 000 0.020 20 0 0 0 0 0325 2017_18 Q JP696 PC15 Year WTW Base Maintenance – West Region 06 02 01 0 100 0 0 0.000 0 000 0.000 0 000 0.000 0 000 0.000 0 000 0.000 0 100 0 0 0 0326 2017_18 Q JR3 2 Strategic Link - Castor Bay to Bel ast 01 03 05 DWI 01 06 2013 30/12/201 28/02/2015 28/02/2016 85 15 0 0 0.1 7 0.277 0. 3 7.982 9. 32 0.978 0.000 0.000 0 1 0 59 08/10/2012 15/10/2012 01/0 /2013 30/09/2015 30/09/2015 85 15 0 0 0.085 0.1 7 0.28 0 259 5.10 12 295 2.929 -0. 65 0.085 0 0 0 60 3 0 02327 2017_18 Q JR3 8 Dunore to Hydepa k Pumping Main Replacement 01 03 05 17 10 2005 13/01/2012 13/01/2012 12/01/2013 0 0 0 0 0.000 0.000 0.000 0.000 0.000 0.000 0.000 0.000 0 0 0 0 17/10/2005 12/01/2012 29/10/2007 100 0 0 0 -0.397 0 000 0.2 1 0 011 -1.27 0 0 2 0.010 0 000 -0.397 0 100 0 0 0 0328 2017_18 Q JR3 9 Installation of DCVs at Vulnerable Si es Accross NI 0 0 100 0 0 0.000 0 000 0.000 0 000 0.000 0 000 0.000 0 000 0.000 100 0 0 0 0 0329 2017_18 Q JR 9 Oldpark Watermain Imp ovements 00 03 08 UR 0 0 0 0 0.000 0.000 0.000 0.000 0.000 0.000 0.000 0.000 0 0 0 0 07/10/2013 16/10/2013 08/08/2011 01/07/2015 30/03/2015 01/07/2015 100 0 0 0 -0.050 0 000 0.136 -0 013 0. 01 1. 12 0.001 0 000 -0.050 66 3 0 0 3 0330 2017_18 Q JR 61 Ba lystockard Quarry main repair 00 03 05 DRD 31 01 2012 07/02/2012 25 07 2011 08/02/2012 08/02/2012 29/02/2012 0 0 0 0 0.000 0.000 0.000 0.000 0.000 0.000 0.000 0.000 0 0 0 0 31/01/2012 07/02/2012 25/07/2011 07/02/2012 01/08/2011 28/02/2012 100 0 0 0 0.000 0 000 0.155 -0 001 0.000 0 000 0.000 0 000 0.000 0 100 0 0 100 0331 2017_18 Q JR 63 Dor s and WTW - GAC Feasib l ty Study 01 02 0 DRD 31/03/2015 0 100 0 0 0.000 0.000 0.000 0.292 3. 29 0.525 0.000 0.000 100 0 0 0 20/06/2013 27/06/2013 31/01/201 27/03/2015 31/07/2015 0 100 0 0 -0.026 0 000 0.000 0 008 0. 89 . 69 0.2 -0 0 9 -0.026 100 0 0 0 0 0 08332 2017_18 Q JR 6 Carr ckfergus Phase 3 Watermains Improvemen s 00 03 08 DRD 1 /05/2013 22/05/2013 31/05/2013 1 /01/2015 29/08/201 99 1 0 0 -0.110 0 000 0.000 0 000 1.789 0. 55 0.076 0 000 -0.110 77 10 10 3 10 0 01333 2017_18 Q JR 65 Frenchpark Raw Water Conduit Appraisal Study 00 01 03 DWI 100 0 0 0 0.000 0.000 0.000 0.000 0.000 0.069 0.000 0.000 0 100 0 0 28/05/2015 29/05/2015 100 0 0 0 -0.009 0 000 0.000 0 005 0.011 0 000 0.096 0 011 -0.009 0 100 0 0 100 0 0133 2017_18 Q JR 66 McVeigh's Well Rationalisat on of Pipework 00 03 08 UR 1 /02/2013 19/02/2013 27/06/2012 09/10/201 25/08/201 100 0 0 0 -0.016 0 000 0.000 0 070 0.256 0. 99 0.000 0 000 -0.016 0 13 0 87 13 0335 2017_18 Q JR 69 Whiteabbey Upper Serv ce Reservoir Outlet Pipe Rep acemen 00 0 07 DWI 11/01/2018 11/01/2018 11/06/2015 19/06/2015 19/06/2015 0 100 0 0 0.000 0 000 0.000 0 000 0.000 0 000 0.001 0 000 0.000 0 100 0 0 0 0 01336 2017_18 Q JR 80 Warwicks Row Carrickfergus Watermain Extension 00 03 23 DRD 1 /11/201 20/11/201 12/12/201 17/02/2015 100 0 0 0 -0.007 0 000 0.000 0 000 0.000 0 01 0.001 0 000 -0.007 0 0 0 100 0 0 01337 2017_18 Q JR 85 Former Visteon Factory - watermain extension 00 03 23 100 0 0 0 -0.007 0 000 0.000 0 000 0.000 0 000 0.007 0 000 -0.007 0 0 0 100 0 0 01338 2017_18 Q JR 88 Dunanney SR Building Improvements 00 0 07 08/02/2016 08/02/2016 0 /01/2017 26/0 /2017 31/08/2017 05/03/2018 0 100 0 0 0.082 0 000 0.000 0 000 0.000 0 000 0.020 0 055 0.082 0 100 0 0 0 0 01339 2017_18 Q JR 90 West and House, Reception and AD Bu lding Upgrade 06 15 20 23/01/2018 23/01/2018 13/11/2017 05/01/2018 15/12/2017 09/01/2018 0 100 0 0 0.0 3 0 000 0.000 0 000 0.000 0 000 0.017 -0 007 0.0 3 0 100 0 0 0 0 013 0 2017_18 Q JR 9 WI M Phase 2 Be fast Ballygomartin No th WP 06 03 08 100 0 0 0 0.050 0 000 0.000 0 000 0.000 0 000 0.000 0 070 0.050 0 60 0 0 60 0 013 1 2017_18 Q JR 99 Dor s and Aquaduct Survey 06 01 03 0 100 0 0 0.000 0 000 0.000 0 000 0.000 0 000 0.000 0.178 0.000 0 100 0 0 0 0 013 2 2017_18 Q JR50 Lough Island Reavy Scour uti isation, Drought Management 06 01 03 100 0 0 0 0.028 0 000 0.000 0 000 0.000 0 000 0.000 0 000 0.028 100 0 0 0 0 0 013 3 2017_18 Q JR505 Stockmans Way TM Replacement Appraisal 06 03 23 100 0 0 0 0.015 0 000 0.000 0 000 0.000 0 000 0.000 0 000 0.015 0 100 0 0 100 0 013 2017_18 Q JR508 PC15 Year WTW Base Maintenance – East Region 06 02 01 0 100 0 0 0.000 0 000 0.000 0 000 0.000 0 000 0.000 0 000 0.000 0 100 0 0 0 03 5 2017_18 Q JS179 Ba lykine Grav ty Distribution 01 0 06 DWI 05 05 1993 23/06/1993 05 0 2010 20/0 /2011 20/0 /2011 19/0 /2012 0 0 0 0 0.000 0.000 0.000 0.000 0.000 0.000 0.000 0.000 0 0 0 0 05/05/1993 23/06/1993 05/0 /2010 20/0 /2011 30/05/2011 0 100 0 0 -0.013 1 09 0.133 0 005 0.000 0 000 0.000 0 000 -0.013 0 0 0 100 0 03 6 2017_18 Q JS220 Bangor Outer Zone Watermain Improvements 00 03 08 1 01 2008 22/09/2008 22/09/2008 22/09/2009 0 0 0 0 0.000 0.000 0.000 0.000 0.000 0.000 0.000 0.000 0 0 0 0 1 /01/2008 21/03/2012 23/02/2009 99 1 0 0 0.000 0 000 -0.010 0 000 0.000 0 000 0.005 0 000 0.000 37 21 36 6 21 0 013 7 2017_18 Q JS27 Drumaroad WTW Clear Water Tank 01 02 06 DWI 31/03/2021 0 100 0 0 0.000 0.000 0.019 0.055 0.108 0.000 0.000 0.000 0 0 0 100 13/06/2017 30/06/2017 13 87 0 0 0.15 0 000 0.000 0 000 0.028 0 000 0.012 0 005 0.15 0 18 9 73 0 023 8 2017_18 Q JS299 Seas de Road, K llyleagh, Watermain Extension. 00 03 23 DRD 08/0 /2013 16/0 /2013 03/06/2013 0 /11/2013 16/09/2013 100 0 0 0 0.001 0 000 0.000 0 000 0.001 0 000 0.000 0 000 0.001 0 0 0 100 0 03 9 2017_18 Q JS306 Mourne Wall Towers 03 01 03 20/03/201 25/03/201 07/0 /201 31/07/201 26/05/201 0 100 0 0 0.000 0 000 0.000 0 000 0.008 0 058 0.002 0 000 0.000 0 100 0 0 0 0350 2017_18 Q JS309 Ardview Road K llinchy Wa ermain Replacement 00 03 23 16/12/201 18/12/201 26/01/2015 29/06/2015 100 0 0 0 -0.010 0 000 0.000 0 000 0.000 0.110 0.010 0 000 -0.010 100 0 0 0 0 0 01351 2017_18 Q JS310 Manse Road Ba lygowan water main rep acement 0 03 23 18/05/2015 27/05/2015 01/07/2015 27/03/2015 01/07/2015 100 0 0 0 -0.010 0 000 0.000 0 000 0.000 0 010 0.0 2 0 000 -0.010 0 100 0 0 100 0 01352 2017_18 Q JS311 Sampsons Stone, SR, Scour Pipe Diversion. 06 0 07 27/06/2016 28/06/2016 0 100 0 0 0.00 0 000 0.000 0 000 0.000 0 000 0.017 0 075 0.00 0 100 0 0 0 0 01353 2017_18 Q JS312 PC15 Year 2 WTW Base Maintenance – East Region 00 02 01 05/03/2016 09/03/2016 0 100 0 0 0.615 0 000 0.000 0 000 0.000 0 000 0.005 1 950 0.615 0 100 0 0 0 0 0135 2017_18 Q JS315 Russell Quarter SR Scour/Overflow arrangement. 06 0 01 0 100 0 0 0.000 0 000 0.000 0 000 0.000 0 000 0.000 0 000 0.000 0 100 0 0 0 0 01355 2017_18 Q JT255 L sburn Public Realm 00 03 23 DRD 0 0 0 0 0.000 0.000 0.000 0.000 0.000 0.000 0.000 0.000 0 0 0 0 20/09/2012 15/10/2012 03/0 /2013 27/08/201 09/0 /201 02 09/201 60 0 0 0 0.000 0 000 0.000 0 029 1.077 -0.123 0.001 0 000 0.000 0 97 0 3 60 37356 2017_18 Q JT256 L sburn South Rural Phase 1 & Dunmurry wa ermain improvem00 03 08 DRD 17/10/201 21/10/201 12/09/2013 26/02/2016 20/08/2015 29/02/2016 100 0 0 0 -0.09 0 000 0.000 0 000 0.298 1 322 0. 36 0 073 -0.09 1 8 0 2 8 0 01357 2017_18 Q JT260 Boomers Dam Flood Attenuation 06 01 03 100 0 0 0 0.000 0 000 0.000 0 000 0.000 0 000 0.003 0 000 0.000 0 100 0 0 100 0 01358 2017_18 Q JT261 PC15 Year 3 WTW Cap tal Maintenance - East Region 06 02 01 0 /08/2017 09/08/2017 0 100 0 0 0.507 0 000 0.000 0 000 0.000 0 000 0.000 0 000 0.507 0 100 0 0 0 0 01359 2017_18 Q JT262 Lurgan Moi a W IM 2.1 Wo k Package 06 03 08 100 0 0 0 0.000 0 000 0.000 0 000 0.000 0 000 0.000 0 000 0.000 77 23 0 0 23 0 01360 2017_18 Q JT26 Leathemstown R Scour Valve, Reservoir Scour valve Fault 06 0 07 0 100 0 0 0.021 0 000 0.000 0 000 0.000 0 000 0.000 0 000 0.021 0 100 0 0 0 0 01361 2017_18 Q JV830 Crieve Service Reservoir 01 0 06 DWI 16 01 2012 13/02/2012 30 06 2013 01/01/2015 30/03/2015 30/03/2016 0 100 0 0 0.001 0.02 0.089 0. 65 0.603 0.613 0.000 0.000 0 35 0 65 16/01/2012 13/02/2012 02/06/201 27/03/2015 05/10/2015 20/09/2016 0 100 0 0 0.003 0 001 0.025 0 09 0.0 9 0 73 0.687 0 000 0.003 0 3 0 66 0 0 08362 2017_18 Q JV853 Camlough Impounding Reservoir Dam Survey. (Condit on Asse00 01 03 DRD 100 0 0 0 0.000 0.000 0.000 0.000 0.000 0.61 0.610 0.000 0 100 0 0 29/01/2015 30/01/2015 02/05/2016 16/06/2017 16/06/2017 100 0 0 0 0.307 0 000 0.000 0 000 0.0 0 352 0. 50 1 865 0.307 0 100 0 0 100 0 01363 2017_18 Q JV85 Si ent Va ley recreat onal acil ties appraisal 06 01 03 31/10/2016 02/11/2016 100 0 0 0 0.927 0 000 0.000 0 000 0.006 0 012 0.00 0 016 0.927 0 95 5 0 95 0 0136 2017_18 Q JV856 Newry Publ c Realm Phase 2 00 03 23 DRD 06/01/201 1 /01/201 20/01/201 29/08/201 26/05/201 100 0 0 0 -0.001 0 000 0.000 0 000 0.211 0 068 0.002 0 000 -0.001 0 100 0 0 100 0 01365 2017_18 Q JV859 Watermain Improvements, Newry, Phase 3 03 03 08 DRD 17/01/201 10/02/201 2 /02/201 30/01/2015 26/05/201 01/07/2015 100 0 0 0 -0.038 0 000 0.000 0 000 0.100 0 288 0.001 0 000 -0.038 13 77 0 10 77 0 01366 2017_18 Q JV870 Si ent Va ley Project PH3 00 01 03 0 100 0 0 0.000 0 000 0.000 0 000 0.000 0 000 0.001 0 000 0.000 100 0 0 0 0 0 01367 2017_18 Q JV871 Newry Depot premises upgrade 06 15 20 29/01/2016 29/01/2016 15/03/2018 0 50 0 50 0.052 0 000 0.000 0 000 0.000 0 000 0.030 0 025 0.052 0 100 0 0 0 0 01368 2017_18 Q JV881 WI M 1 Phase 2 Carran Hi l Crossmag en WP 06 03 08 1 /10/2016 17/10/2016 0 /07/2016 100 0 0 0 1. 05 0 000 0.000 0 000 0.000 0 000 0.000 0 62 1. 05 26 69 5 0 69 0 01369 2017_18 Q JV885 Lough Ross Raw Water Pumping Stat on 06 02 01 0 100 0 0 0.015 0 000 0.000 0 000 0.000 0 000 0.000 0 000 0.015 0 100 0 0 0 0 01370 2017_18 Q JV886 Banbr dge South Armagh WIIM 2.1 Work Package 06 03 08 100 0 0 0 0.000 0 000 0.000 0 000 0.000 0 000 0.000 0 000 0.000 17 5 0 29 5 0 01371 2017_18 Q JV887 Newry West WPS, ire damage 06 06 01 21/08/2017 25/08/2017 02/10/2017 0 100 0 0 0.0 9 0 000 0.000 0 000 0.000 0 000 0.000 0 003 0.0 9 0 100 0 0 0 0 01372 2017_18 Q JZ005 Water Resource and Supply Resi ience Plan 06 01 03 DRD 31/03/2017 50 50 0 0 0.000 0.000 0.000 0.000 0.000 0.32 0.322 0.000 0 0 0 100 20/10/201 22/10/201 100 0 0 0 0.105 0 000 0.000 0 000 0.000 0 002 0.182 0 305 0.105 10 60 10 20 60 0 02

m a e s
e )
So t Re C M Submiss on Re e ence
o ect D Re e ence o ect Name C oject
e oda ent
oject IDSubsti ute
o ect ID
ma y Asset
Ca ego y
C 0 og amme
Regula o y S gn O Requi ed
Base ine A Date
Base ine o ect
App oval Date
Base ne Sta t on S te Da e
Base ine Bene cial Use
Date
Basel ne Regulato y
sign-o Da e
Base ine Comp e ion o Const uct on
Date
Base ine End o
Main enance e od Date
Base ine Se vice A locat on Wate
n ast uc u e
Base ine Se vice Al oca ion Wate
Non-n ast uc u e
Base ine Se v ce A locat on Sewe age
In ast uctu e
Basel ne Se v ce Al oca ion
Sewe age Non-In ast uctu e
Basel ne CA EX 20 0-
£m
Base ine CA EX 20 -
2 £m
Basel ne CA EX 20 2-
3 £m
Base ne CA EX 20 3-
4 £m
Base ine CA EX 20 4-
5 £m
Basel ne CA EX 20 5-
6 £m
Base ine CA EX 20 6-
7 £m
Basel ne CA EX 20 7-
8 £m
Base ine u pose A locat on Qual ty
Base ine u pose Al oca ion Base
Base ine u pose A locat on ES
Basel ne u pose Al oca ion G ow h
Cu ent Actual o o ected
A Da e
Cu ent Ac ua o ojected
oject App oval Date
Cu ent Actual o o ected Sta t on Si e
Date
Cu ent Ac ua o ojected
Bene cial Use Da e
Cu ent Actual o o ected Regu ato y
sign-o Da e
Cu ent Actual o ojec ed
Comple ion o Const uc ion
Date
Cu ent Actual o o ected
End o Maintenance
e iod Date
Cu ent Actual o ojec ed Se v ce
A locat on Wa e In ast uctu e
Cu ent Actual o o ec ed Se v ce
A locat on Wa e Non-
n ast uc u e
Cu ent Actual o o ec ed Se v ce
A locat on Sewe age
n ast uc u e
Cu ent Actual o o ec ed Se v ce
A locat on Sewe age Non-
n ast uc u e
Cu ent Actual o o ected CA EX ea to date £m
Cu ent Actual o ojec ed
CA EX 20 0- £m
Cu ent Actual o o ected
CA EX 20 -2 £m
Cu ent Actual o ojec ed
CA EX 20 2-3 £m
Cu ent Ac ual o o ected
CA EX 20 3-4 £m
Cu ent Actual o o ec ed
CA EX 20 4-5 £m
Cu ent Ac ual o ojected
CA EX 20 5-6 £m
Cu ent Actual o o ec ed
CA EX 20 6-7 £m
Cu ent Ac ual o ojected
CA EX 20 7-8 £m
Cu ent Actual o o ec ed u pose
Al oca ion Qua i y
Cu ent Actual o o ec ed u pose
A location Base
Cu ent Actual o o ected u pose
Al oca ion ES
Cu ent Actual o ojected u pose
A locat on G owth
Cu ent Ac ual o ojected RE
Al oca ion Wate
Cu ent Ac ual o ojected RE Al oca ion Sewe age
Nom na ed Output
2 3 4 5 6 7 8 9 0 2 3 4 5 6 7 8 9 20 2 22 23 24 25 26 27 28 29 36 37 38 39 40 4 42 43 44 45 46 47 48 49 50 5 52 53 54 55 56 57 58 59 66 67 68 69 70 7 72
A T a a a ex e e e e 7 99 2 9 24 949 4 9 47 7 4 4 2 2 2 7 7 47 92 9 4 79 7 4 7 4 27 2 2
SOR
CIM
_Sub
I_oj
ect_
D
I_oj
ect_
Nam
e
I_C
_e
iod
I_AR
EN_
ojec
t_D
I_SU
BSI
UE_
oec
t_ID
I_i_
Asse
t_C
at
I_C
0_og
I_R
eg_S
igno
BM
_A
BM
_o
ect_
App
oval
BM
_SoS
BM
_BU
BM
_RSO
BM
_CoC
BM
_EoM
BSA_
WI%
BSA_
WN
I%
BSA_
SI%
BSA_
SNI%
B_C
apex
_20
0-_£
m
B_C
apex
_20
-2_
£m
B_C
apex
_20
2-3_
£m
B_C
apex
_20
3-4_
£m
B_C
apex
_20
4-5_
£m
B_C
apex
_20
5-6_
£m
B_C
apex
_20
6-7_
£m
B_C
apex
_20
7-8_
£m
BA_
Q%
BA_
B%
BA_
E%
BA_
G%
CAM
_A
CAM
_o
ecAp
pov
al
CAM
_SoS
CAM
_BU
CAM
_RSO
CAM
_CoC
CAM
_EoM
CAS
A_W
I%
CAS
A_W
NI%
CAS
A_SI
%
CAS
A_SN
I%
CA
_Cap
ex_
D_£
m
CA
_Cap
ex_2
00-
_£m
CA
_Cap
ex_2
0-
2_£m
CA
_Cap
ex_2
02-
3_£m
CA
_Cap
ex_2
03-
4_£m
CA
_Cap
ex_2
04-
5_£m
CA
_Cap
ex_2
05-
6_£m
CA
_Cap
ex_2
06-
7_£m
CA
_Cap
ex_2
07-
8_£m
CA
A_Q
%
CA
A_B%
CA
A_E%
CA
A_G
%
CA
_IR
E_W
%
CA
_IR
E_S%
NO
M_O
upu
t
e A a e e e v e s A a e A a e e a a x e e e m m e e a ) e A a e e se A a %) e A a e e %)e e a ase e M es e a es ase e e v e s A a ase e x e e e m 2 2- es) ase e se A a e A a e e M es e a es
373 2017_18 Q JZ006 Hydraulic Model Rebuilds and Project Managment 2015-2016 06 06 20 30/0 /2015 0 /06/2015 100 0 0 0 -0.011 0 000 0.000 0 000 0.000 0 000 0.312 0 036 -0.011 0 100 0 0 100 0 0137 2017_18 Q JZ007 Asset Per ormance CCTV Surveys 2015/16 06 07 12 UR 30/06/2015 03/08/2015 0 0 100 0 0.000 0 000 0.000 0 000 0.000 0 000 0.028 0 000 0.000 0 100 0 0 0 100 01375 2017_18 Q KA158 M l town, Antrim WwTW 01 09 15 NIEA 30 07 2007 12/02/2010 12/02/2010 02/12/2011 0 0 0 0 0.000 0.000 0.000 0.000 0.000 0.000 0.000 0.000 0 0 0 0 27/02/2007 05/03/2007 30/07/2007 11/02/2010 28/02/2011 02/12/2011 0 0 15 85 0.000 1 033 0.371 -0 001 -0.001 -0 016 0.020 0 000 0.000 8 32 0 20 0 5 09376 2017_18 Q KA191 Black Cave & Upper Roddens Sewage Imps, Larne 01 13 12 NIEA 10 02 2011 15/03/2012 15/03/2012 15/03/2013 0 0 0 0 0.000 0.000 0.000 0.000 0.000 0.000 0.000 0.000 0 0 0 0 01/05/2006 15/03/2012 31/01/2011 0 0 1 86 -0.00 0 015 0.309 0 01 0.000 0 025 0.003 0 000 -0.00 72 15 0 13 0 0 09377 2017_18 Q KA201 Ba lyeaston Sewage System Upgrade 01 12 12 NIEA 22 10 2010 19/11/2010 07 02 2011 02/10/2012 02/10/2012 02/10/2013 0 0 0 0 0.000 0.000 0.000 0.000 0.000 0.000 0.000 0.000 0 0 0 0 22/10/2010 19/11/2010 07/02/2011 2 /02/2012 23/0 /2012 0 0 30 70 0.000 0 078 0.086 0 087 0.006 -0 001 0.000 -0 003 0.000 30 5 0 25 0 28378 2017_18 Q KA239 Mul ans WWTW (Antrim) Feasibil ty Study 0 1 16 NIEA 31/03/2021 0 0 0 100 0.000 0.000 0.000 0.000 0.000 0.000 0.000 0.000 3 27 0 30 02/12/2015 03/12/2015 18/09/2017 29/03/2018 29/09/2017 0 0 0 100 1.11 0 000 0.006 0 007 0.007 0 00 0.031 0 065 1.11 25 2 0 33 0 0 02379 2017_18 Q KA251 Umry Lodge CSO, Antrim 00 07 12 NIEA 0 0 0 0 0.000 0.000 0.000 0.000 0.000 0.000 0.000 0.000 0 0 0 0 0 0 0 60 0.000 0 000 0.000 0 009 0.012 0 000 0.000 0 000 0.000 100 0 0 0 0 0 03380 2017_18 Q KA252 Glynn WWPS, Relocation of Overflow Pipe 00 12 02 DRD 0 0 0 0 0.000 0.000 0.000 0.000 0.000 0.000 0.000 0.000 0 0 0 0 05/02/201 10/02/201 0 /08/201 19/02/2015 27/02/2015 01/07/2015 0 0 0 100 0.000 0 000 0.000 0 003 0.006 0 0 6 0.001 0 000 0.000 56 0 0 0 0 01381 2017_18 Q KA255 Antrim Road, Templepatrick, Storm Sewer Extens on 00 07 2 DRD 0 0 100 0 0.000 0 000 0.000 0 000 0.000 0 000 0.000 0 000 0.000 0 0 0 100 0 0 01382 2017_18 Q KA256 Larne WWTW's Feasibil ty Study 0 09 16 NIEA 0 0 0 100 0.000 0.000 0.000 0.000 0.000 0.009 0.000 0.000 3 27 0 30 0 0 0 100 -0.039 0 000 0.000 0 000 0.0 3 0 03 0.018 0 000 -0.039 26 0 30 0 0 03383 2017_18 Q KA257 Victo ia Road, Ba lyc are, Foul Sewer Extension 00 07 2 DRD 31/03/201 1 /0 /201 09/06/201 07/07/201 30/06/201 20/11/201 0 0 100 0 0.000 0 000 0.000 0 000 0.000 0 023 0.001 0 000 0.000 0 0 0 100 0 0 0138 2017_18 Q KA258 Antrim LDC Addi ional Fire Escape 03 15 20 12/10/2015 15/10/2015 25/01/2016 28/03/2016 0 /0 /2016 0 0 0 100 -0.003 0 000 0.000 0 000 0.003 -0 003 0.215 0 001 -0.003 0 100 0 0 0 0 01385 2017_18 Q KA259 Doagh WWPS Rep acement 03 12 02 NIEA 12/02/2016 19/02/2016 0 0 0 100 0.06 0 000 0.000 0 000 0.002 0 013 0.000 0 3 9 0.06 70 18 0 12 0 0 01386 2017_18 Q KA260 Muckamore WWPS Upgrade 06 12 12 NIEA 11/12/2015 1 /12/2015 31/10/2016 2 /03/2017 28/0 /2017 0 0 0 100 0.00 0 000 0.000 0 000 0.003 0 017 0.001 0. 33 0.00 73 16 0 11 0 0 06387 2017_18 Q KA261 M l town Road WWPS Upgrade 06 12 12 NIEA 0 /12/2015 10/12/2015 0 /07/2016 19/05/2017 31/03/2017 02/08/2017 0 0 0 100 0.029 0 000 0.000 0 000 0.002 0 022 0.000 0.187 0.029 55 20 0 25 0 0 06388 2017_18 Q KA262 Islandreagh WWPS Upgrade 06 12 12 NIEA 19/09/2016 22/09/2016 0 0 0 100 0.031 0 000 0.000 0 000 0.001 0 013 0.000 0 000 0.031 0 8 0 12 0 0 06389 2017_18 Q KA263 Dunadry WWPS Upgrade 06 12 12 NIEA 20/10/2016 2 /10/2016 0 0 0 100 0.017 0 000 0.000 0 000 0.00 0 011 0.00 0 019 0.017 52 35 0 13 0 0 06390 2017_18 Q KA26 Ba lyc are WWTW - Membrane Base Maintenance 03 09 02 09/10/201 15/10/201 15/08/201 30/01/2015 30/03/2015 0 0 0 100 0.000 0 000 0.000 0 000 0.000 1 325 0.005 0 000 0.000 0 100 0 0 0 0 01391 2017_18 Q KA270 Ne llsbrook WwPS Upgrade Appraisal 06 12 12 29/07/2016 01/08/2016 0 0 0 100 0.000 0 000 0.000 0 000 0.000 0 000 0.028 0 010 0.000 5 36 0 10 0 0 03392 2017_18 Q KA275 Abbots Road Whi eabbey 06 07 2 0 0 100 0 0.000 0 000 0.000 0 000 0.000 0 000 0.000 0 000 0.000 0 0 0 100 0 0 01393 2017_18 Q KA276 Gortgole Road, Portglenone 06 07 2 0 0 100 0 0.000 0 000 0.000 0 000 0.000 0 000 0.000 0 000 0.000 0 0 0 100 0 0 0139 2017_18 Q KA279 Townparks south Wwps Antrim 06 12 12 0 0 0 100 0.010 0 000 0.000 0 000 0.000 0 000 0.000 0 000 0.010 0 53 0 7 0 0 03395 2017_18 Q KA280 Martins own WwTW Inlet Wet Well Bu lding MCC & sys ems re06 09 02 0 0 0 100 0.027 0 000 0.000 0 000 0.000 0 000 0.000 0 000 0.027 0 100 0 0 0 0396 2017_18 Q KA281 2 G overstown Road Toomebr dge, S orm sewer . 06 07 2 0 0 100 0 0.000 0 000 0.000 0 000 0.000 0 000 0.000 0 000 0.000 0 0 0 100 0 0 01397 2017_18 Q KA28 Randa s own TPS(S01 25) Screen under capac ty. 06 12 02 0 0 0 100 0.009 0 000 0.000 0 000 0.000 0 000 0.000 0 000 0.009 0 0 0 60 0 0 05398 2017_18 Q KA287 Carnbank, Temp epatr ck, Sewage scheme 06 07 2 0 0 100 0 0.000 0 000 0.000 0 000 0.000 0 000 0.000 0 000 0.000 0 0 0 100 0 0399 2017_18 Q KA288 Clements Ha l Ballyc are, foul sewer 06 07 2 0 0 100 0 0.001 0 000 0.000 0 000 0.000 0 000 0.000 0 000 0.001 0 0 0 100 0 0
00 2017_18 Q KB269 Toome (Creagh) Sewerage Scheme 01 09 15 NIEA 07 09 2009 2 /01/2011 2 /01/2011 2 /01/2012 0 0 0 0 0.000 0.000 0.000 0.000 0.000 0.000 0.000 0.000 0 0 0 0 17/06/2009 03/08/2009 0 0 10 90 -0.007 3.138 0.225 -0 001 -0.001 0 000 0.000 0 000 -0.007 23 21 0 56 001 2017_18 Q KB287 Swat agh Wastewater Treatment Works 03 09 16 NIEA 27 02 2012 29/03/2013 29/03/2013 29/03/201 0 0 0 100 0.013 0. 98 1.050 0.0 6 0.000 0.000 0.000 0.000 36 35 0 29 26/10/2011 28/10/2011 28/02/2012 21/03/2013 26/03/2013 0 0 0 100 0.000 0 013 0.510 1 339 0.080 -0 031 0.001 0 000 0.000 36 35 0 29 0 002 2017_18 Q KB31 Gul aduff WwTW 01 09 16 NIEA 01 01 2013 01/11/201 19/0 /201 19/0 /201 0 0 19 81 0.006 0.0 0 0.032 1.120 0. 0.000 0.000 0.000 39 0 0 21 19/12/2011 0 /01/2012 11/02/2013 16/12/2013 30/06/201 0 0 19 81 0.000 0 006 0.0 1 0 502 1.09 0.13 0.010 0 003 0.000 39 0 0 21 0 7 0803 2017_18 Q KB316 Desertmar in WwTW 00 09 16 0 0 0 0 0.000 0.000 0.000 0.000 0.000 0.000 0.000 0.000 0 0 0 0 0 0 0 100 0.000 0 000 0.002 0 015 0.010 0 003 0.000 0 000 0.000 16 26 0 58 0 0 030 2017_18 Q KB 00 Mul anahoe Road Ardboe Foul Sewer 00 07 2 19 06 2008 09/07/2008 06 10 2008 29/12/2008 29/12/2008 29/12/2009 0 0 0 0 0.000 0.000 0.000 0.000 0.000 0.000 0.000 0.000 0 0 0 0 19/06/2008 09/07/2008 0 0 100 0 0.000 0 000 0.022 0 000 -0.035 0 000 0.013 0 000 0.000 0 0 0 100 0 0 0105 2017_18 Q KB 13 Dunnamore Road, Dunnamore Storm Sewer Ext 00 07 2 21/05/2008 05/08/2008 0 0 100 0 0.000 0 000 0.000 0 01 -0.013 0 001 0.002 0 000 0.000 0 0 0 100 0 0 0106 2017_18 Q KB 36 Whitehead, Ballystruder & Ba lyca ry Rationa isat on 01 08 15 NIEA 07 0 2008 15/12/2011 15/12/2011 1 /12/2012 0 0 0 0 0.000 0.000 0.000 0.000 0.000 0.000 0.000 0.000 0 0 0 0 30/0 /2009 18/05/2009 0 0 80 20 -0.005 0 531 6.576 0 078 0.023 0.11 0.019 0 000 -0.005 90 0 0 10 0 0 0907 2017_18 Q KB 59 Maghera WWTW Upgrade Phase 2 01 09 16 NIEA 1 01 2013 28/01/2015 28/06/2013 28/06/201 0 0 0 100 0.000 0.038 0.033 0.516 1.590 0.000 0.000 0.000 57 28 0 15 05/01/2012 10/01/2012 0 /02/201 0 0 0 100 0.000 0 000 0.039 0. 2 0.9 1 0 200 0.010 -0 007 0.000 57 28 0 15 0 0 0808 2017_18 Q KB 7 Ba lyronan WWTW Feasibi ity Study 06 1 16 NIEA 0 0 0 0 0.000 0.000 0.000 0.000 0.000 0.000 0.000 0.000 0 0 0 0 19/10/2016 08/11/2016 0 0 0 100 0.062 0 000 0.006 0 008 0.011 0 001 0.000 0 015 0.062 5 33 0 62 0 0 0309 2017_18 Q KB 75 Derrycrin WWTW Feasibi ity Study 06 1 16 NIEA 0 0 0 0 0.000 0.000 0.000 0.000 0.000 0.000 0.000 0.000 0 0 0 0 28/06/2016 0 /07/2016 0 0 0 100 0.010 0 000 0.006 0 005 0.012 0 000 0.020 0 057 0.010 32 53 0 15 0 0 0310 2017_18 Q KB 76 Ki lygonlan (Mu lanahoe)WwTW Upgrade 06 1 16 NIEA 0 0 0 0 0.000 0.000 0.000 0.000 0.000 0.000 0.000 0.000 0 0 0 0 0 0 0 100 0.027 0 000 0.005 0 008 0.011 0 005 0.006 0 012 0.027 5 15 0 0 0 0 0311 2017_18 Q KB 81 Chambre Park WwPS 00 12 02 DRD 0 0 0 0 0.000 0.000 0.000 0.000 0.000 0.000 0.000 0.000 0 0 0 0 07/06/2013 17/06/2013 01/0 /201 2 /10/201 31/03/2017 18/10/2017 0 0 0 100 0.000 0 000 0.003 0 002 0.026 0 028 0.001 0 016 0.000 0 100 0 0 0 0 0112 2017_18 Q KB 82 Chapel Hi l WwPS Upgrade 00 12 02 DRD 0 0 0 0 0.000 0.000 0.000 0.000 0.000 0.000 0.000 0.000 0 0 0 0 07/06/2013 17/06/2013 01/0 /201 20/02/2015 31/03/2017 18/10/2017 0 0 0 100 0.000 0 000 0.003 0 002 0.027 0 028 0.001 0 01 0.000 0 100 0 0 0 0 0113 2017_18 Q KB 83 Moor ie d WWTW Feasibi ity Study. 06 1 16 NIEA 0 0 0 0 0.000 0.000 0.000 0.000 0.000 0.000 0.000 0.000 0 0 0 0 11/05/2017 16/05/2017 0 0 0 100 0.000 0 000 0.003 0 007 0.005 0 000 0.000 0 003 0.000 5 52 0 3 0 0 031 2017_18 Q KB 90 Maloon WWPS, Cookstown, Access Improvements 00 12 02 DRD 0 0 0 0 0.000 0.000 0.000 0.000 0.000 0.000 0.000 0.000 0 0 0 0 0 0 0 100 0.000 0 000 0.000 0 005 -0.001 0 001 0.001 0 000 0.000 0 100 0 0 0 0 0115 2017_18 Q KB 91 Por glenone WWPS Access Road Culver ing and Upgrading of00 05 02 DRD 0 0 85 15 0.000 0 000 0.000 0 000 0.000 0 008 0.002 0 000 0.000 0 100 0 0 0 85 0116 2017_18 Q KB 92 Gortalowry Park Cookstown Sewer Network Misconnect ons 01 07 12 NIEA 0 0 0 0 0.000 0.000 0.000 0.000 0.000 0.000 0.000 0.000 0 0 0 0 06/03/201 13/03/201 0 0 100 0 -0.001 0 000 0.000 0 033 0.000 0 023 0.001 0 002 -0.001 0 100 0 0 0 100 0117 2017_18 Q KB 9 Moneymore WWTW Phase 2 Base Maintenance 00 09 02 DRD 0 0 0 0 0.000 0.000 0.000 0.000 0.000 0.000 0.000 0.000 0 0 0 0 19/11/2012 22/11/2012 30/11/2012 31/03/201 30/05/201 12/01/2015 0 0 0 100 0.000 0 000 0.000 0 033 0.172 0 006 0.001 0 000 0.000 0 100 0 0 0 018 2017_18 Q KB 96 Garvagh WWTW s Phase 2 Base Main enance 00 09 02 DRD 0 0 0 0 0.000 0.000 0.000 0.000 0.000 0.000 0.000 0.000 0 0 0 0 19/11/2012 22/11/2012 30/11/2012 18/12/201 26/09/201 12/01/2015 0 0 0 100 0.000 0 000 0.000 0 063 0.278 0 071 0.002 0 000 0.000 0 100 0 0 0 019 2017_18 Q KB 98 Grange (Taylo stown) WWTWs Phase 2 Base Maintenance 00 09 16 DRD 0 0 0 100 0.000 0 000 0.000 0 00 0.002 0 000 0.000 0 000 0.000 0 100 0 0 0 0 0320 2017_18 Q KB 99 Gortatray WWTWs Phase 2 Base Maintenance 00 09 02 DRD 0 0 0 0 0.000 0.000 0.000 0.000 0.000 0.000 0.000 0.000 0 0 0 0 19/11/2012 22/11/2012 30/11/2012 09/10/2013 28/03/201 13/03/201 0 0 0 100 0.000 0 000 0.000 0 016 0.0 3 0 000 0.001 0 000 0.000 0 100 0 0 0 0 0121 2017_18 Q KB505 Toome Road Ballymena Out of Sewer Flooding 00 07 12 DRD 28/11/2013 17/12/2013 28/0 /201 20/02/2015 18/02/2015 2 /08/2015 0 0 100 0 0.000 0 000 0.000 0 000 0.000 0 233 0.009 0 000 0.000 0 100 0 0 0 100 0122 2017_18 Q KB507 Ba lymena WWTW ABS H gh Speed Blowers Upgrade 00 09 02 DRD 15/05/201 19/05/201 31/01/201 05/01/2016 25/06/2015 05/01/2016 0 0 0 100 0.000 0 000 0.000 0 000 0.010 0 288 0.211 0 000 0.000 0 100 0 0 0 0 0123 2017_18 Q KB508 Stewartstown WWTWs Appraisal 0 09 16 NIEA 02/08/2016 02/08/2016 0 0 0 100 0.000 0 000 0.000 0 000 0.025 0 000 0.007 0 000 0.000 26 0 30 0 0 032 2017_18 Q KB511 Ahoghill WWPS Rep acement 03 12 12 NIEA 01/06/2016 01/06/2016 10/10/2016 18/01/2017 31/03/2017 0 0 0 100 0.006 0 000 0.000 0 000 0.000 0 013 0.001 0 212 0.006 20 51 0 29 0 0 0325 2017_18 Q KB515 Ba lymoney Road(No.285) DG5 Solutions Study 06 07 12 UR 11/08/2015 19/08/2015 28/03/2016 31/08/2016 29/0 /2016 0 0 100 0 0.005 0 000 0.000 0 000 0.000 0 01 0.0 0.1 0.005 0 0 100 0 0 0 0126 2017_18 Q KB519 Moneyneany WWTW Base Maintenance Phase 3 05 09 02 DRD 23/09/201 2 /09/201 03/10/201 12/03/2015 07/09/2015 0 0 0 100 0.000 0 000 0.000 0 000 0.000 0. 88 0.010 0 000 0.000 0 63 0 37 0 0 0127 2017_18 Q KB522 Ba lymena Flooding Study - Toome Rd 00 07 12 DRD 0 0 100 0 0.073 0 000 0.000 0 000 0.000 0 000 0.058 0 055 0.073 0 50 50 0 0 50 0128 2017_18 Q KB52 20&22 Old Antrim Road, Ba lymena Flood Allev at on 06 07 12 UR 1 /10/2016 25/10/2016 07/08/2017 0 0 100 0 0.123 0 000 0.000 0 000 0.000 0 000 0.012 0 011 0.123 0 0 100 0 0 0 0129 2017_18 Q KB526 Magherafelt Town Centre Stormwater Management Project 06 07 12 DRD 0 0 100 0 0.000 0 000 0.000 0 000 0.000 0 000 0.012 0 016 0.000 0 75 15 10 0 75 0130 2017_18 Q KB532 59 Market Road, Ba lymena, Storm Sewer 00 07 2 03/02/2017 01/03/2017 0 0 100 0 0.0 0 000 0.000 0 000 0.000 0 000 0.000 0 002 0.0 0 0 0 100 0 0 0131 2017_18 Q KB53 Raceview Road, Broughshane Storm Sewer 00 07 2 0 0 100 0 0.000 0 000 0.000 0 000 0.000 0 000 0.000 0 000 0.000 0 0 0 100 0 0 0132 2017_18 Q KB535 PC15 Year 3 WwTW Cap tal Maintenance – North Region 06 09 02 27/01/2017 02/02/2017 0 0 0 100 6.970 0 000 0.000 0 000 0.000 0 000 0.000 0 0 9 6.970 15 85 0 0 0 0 0133 2017_18 Q KB537 39 & 5-51 Castle Street, Ba lymena, Storm sewer extens on 06 07 2 0 0 100 0 0.000 0 000 0.000 0 000 0.000 0 000 0.000 0 000 0.000 0 0 0 100 0 03 2017_18 Q KB5 0 Fishers own Cargan-Bankrupt Development site 06 07 2 0 0 0 100 0.001 0 000 0.000 0 000 0.000 0 000 0.000 0 000 0.001 0 0 0 100 0 035 2017_18 Q KB5 1 B01 993 C ew Road/S at on Road Maghera, Foul & Sto m ext 06 07 2 0 0 100 0 0.000 0 000 0.000 0 000 0.000 0 000 0.000 0 000 0.000 0 0 0 100 0 036 2017_18 Q KB5 2 1 Parkmore Drive Ba lymena, Storm Sewer Extens on 06 07 2 0 0 100 0 0.000 0 000 0.000 0 000 0.000 0 000 0.000 0 000 0.000 0 0 0 100 0 037 2017_18 Q KC296 Ba lycast e WwTW 06 09 16 NIEA 01/01/2017 0 0 10 90 0.010 0.006 0.07 0.000 0.269 3.625 5.5 0.000 85 10 0 6 09/06/201 03/07/201 0 0 10 90 0.952 0 010 0.006 0 0 0 0.121 0 278 1.287 3 625 0.952 85 9 0 6 0 0 0238 2017_18 Q KC299 Bushmi ls Portbal int ae WwTW 01 09 15 NIEA 18 02 2009 06/12/2010 06/12/2010 05/09/2012 0 0 0 0 0.000 0.000 0.000 0.000 0.000 0.000 0.000 0.000 0 0 0 0 27/11/2007 17/12/2007 18/02/2009 06/12/2010 23/02/2011 0 /09/2012 0 0 96 -0.008 0 850 0.033 -0 010 0.003 0 000 0.000 0 000 -0.008 38 21 7 3 0 039 2017_18 Q KC302 Ba lintoy WwTW 01 09 16 NIEA 31/01/2017 0 0 0 100 0.000 0.000 0.000 0.000 0.000 0.000 0.000 1.096 56 19 0 25 07/12/2015 10/12/2015 19/06/2017 26/06/2018 0 0 0 100 1.017 0 019 -0.025 0 065 -0.00 0 023 0.062 0 052 1.017 7 1 0 25 0 0 02
0 2017_18 Q KC 15 Ba lysally CSO Co eraine - Works Package 00 07 12 NIEA 0 0 100 0 0.000 0.000 0.000 0.000 0.000 1.077 0.000 0.000 100 0 0 0 21/11/201 25/11/201 0 0 100 0 0.606 0 053 0.038 0 0 6 0.0 0 0 3 9 0.0 1 0 375 0.606 100 0 0 0 0 0 021 2017_18 Q KC 27 Ba lyvoy WWTW Feasibi ity Study 06 1 16 NIEA 0 0 0 0 0.000 0.000 0.000 0.000 0.000 0.000 0.000 0.000 0 0 0 0 15/09/2016 15/09/2016 0 0 0 100 0.027 0 000 0.005 0 008 0.013 0 000 0.000 0 008 0.027 2 26 0 50 0 0 032 2017_18 Q KC 31 M l town Road, Ballymoney, Foul Sewer Extension 00 07 2 DRD 0 0 0 0 0.000 0.000 0.000 0.000 0.000 0.000 0.000 0.000 0 0 0 0 03/10/2012 16/10/2012 07/10/2015 30/10/2015 19/10/2015 21/11/2016 0 0 100 0 0.000 0 000 0.001 0 008 0.000 0 001 0.037 -0 00 0.000 0 0 0 100 0 0 013 2017_18 Q KC 8 North Coast WWTW Phase 2 Base Maintenance 00 09 02 DRD 0 0 0 0 0.000 0.000 0.000 0.000 0.000 0.000 0.000 0.000 0 0 0 0 19/11/2012 22/11/2012 30/11/2012 01/12/201 25/07/201 12/01/2015 0 0 0 100 0.000 0 000 0.000 0 0 8 0.158 0 073 0.001 0 000 0.000 0 100 0 0 0 0
2017_18 Q KC 50 Macosquin WwTW PC15 00 09 16 DRD 0 0 0 0 0.000 0.000 0.000 0.000 0.000 0.000 0.000 0.000 0 0 0 0 0 0 0 100 -0.065 0 000 0.000 0 002 0.000 -0 002 0.089 -0 008 -0.065 30 70 0 0 0 0 035 2017_18 Q KC 56 Station Co tages Dervock Storm Sewer 00 07 2 DRD 08/07/2013 19/07/2013 03/02/201 31/03/201 03/02/201 03/11/201 0 0 100 0 -0.003 0 000 0.000 0 000 0.026 0 000 0.002 0 000 -0.003 0 0 0 100 0 0 016 2017_18 Q KC 59 Kilrea WWTWs Appraisal 0 09 16 NIEA 0 0 0 100 -0.005 0 000 0.000 0 000 0.025 0 000 0.000 0 008 -0.005 26 0 30 0 0 037 2017_18 Q KC 60 Hopef eld Road, Portrush, Storm Sewer Extension 00 07 2 DRD 22/05/2015 02/06/2015 31/03/2016 0 0 100 0 0.000 0 000 0.000 0 000 0.000 0 000 0.000 0 000 0.000 0 0 0 100 0 0 018 2017_18 Q KC 63 Ba lybogy WwTWs Appra sal for Upgrade or replacement 0 09 16 NIEA 31/01/2021 0 0 0 100 0.000 0.000 0.000 0.000 0.000 0.000 0.000 0.000 3 27 0 30 0 0 0 100 0.011 0 000 0.000 0 000 0.020 0 010 0.008 0 016 0.011 26 0 30 0 0 029 2017_18 Q KC 6 Bushmi ls & Portballintrae Drainage Area Plan Network Improv 0 07 12 NIEA 0 0 100 0 0.000 0 000 0.000 0 000 0.000 0 000 0.000 0 000 0.000 80 20 0 0 0 20 10
50 2017_18 Q KC 67 Ba lycairn CSO , Co eraine, Upgrade. 03 07 12 NIEA 15/03/2016 22/03/2016 0 0 100 0 0.000 0 000 0.000 0 000 0.000 0 000 0.002 0 000 0.000 100 0 0 0 0 0 0351 2017_18 Q KC 70 65-67 Coleraine Rd Ports ewart Storm Sewer 00 07 2 0 0 100 0 0.000 0 000 0.000 0 000 0.000 0 000 0.000 0 000 0.000 0 0 0 100 0 0 0152 2017_18 Q KC 72 PC15 Yr 2 WwTW Base Maintenance North region 06 09 02 23/02/2016 29/02/2016 0 0 0 100 0.119 0 000 0.000 0 000 0.000 0 000 0.189 278 0.119 0 100 0 0 0 0 0153 2017_18 Q KC 73 56 Knock Road, Ballymoney Storm Sewer Ext. 00 07 2 0 0 100 0 0.000 0 000 0.000 0 000 0.000 0 000 0.000 0 000 0.000 0 0 0 100 0 0 015 2017_18 Q KC 7 Dunluce Road, F ood Al eviation 06 07 12 UR 0 0 100 0 0.002 0 000 0.000 0 000 0.000 0 000 0.000 0 000 0.002 0 0 60 0 0 0 0155 2017_18 Q KC 75 55 Mountsandel Road Co eraine Sto m Sewer 00 07 2 0 0 100 0 0.000 0 000 0.000 0 000 0.000 0 000 0.000 0 000 0.000 0 0 0 100 0 0 0156 2017_18 Q KC 76 Rathmoy e House, Mary St eet, Ba lycast e S orm Sewer 00 07 2 0 0 100 0 0.000 0 000 0.000 0 000 0.000 0 000 0.000 0 000 0.000 0 0 0 100 0 0 0157 2017_18 Q KC 77 Ba lycairn WwPs Screw pump No2 06 12 02 08/12/2016 19/12/2016 11/10/2016 20/09/2017 16/02/2018 0 0 0 100 0.06 0 000 0.000 0 000 0.000 0 000 0.000 0.100 0.06 0 100 0 0 0 0 0158 2017_18 Q KC 79 Main Street, Ballyke ly - Replacement S orm Sewer 06 07 2 0 0 100 0 0.017 0 000 0.000 0 000 0.000 0 000 0.000 0 009 0.017 0 100 0 0 0 100 0159 2017_18 Q KC 81 PC15 Year WwTW Base Maintenance – North Reg on 06 09 02 05/01/2018 16/01/2018 0 0 0 100 0.0 0 0 000 0.000 0 000 0.000 0 000 0.000 0 000 0.0 0 0 100 0 0 0 060 2017_18 Q KC 82 Ballymena Rd Ballymoney, Storm Sewer Extension Requisi io 06 07 2 0 0 100 0 0.000 0 000 0.000 0 000 0.000 0 000 0.000 0 000 0.000 0 0 0 100 0 061 2017_18 Q KC 83 Corrymee a Community, sewer Extension 06 07 2 0 0 50 50 0.000 0 000 0.000 0 000 0.000 0 000 0.000 0 000 0.000 0 0 0 100 0 062 2017_18 Q KD999 Sewer Maintenance 02 0 0 100 0 0.000 0 000 0.000 0 000 0.000 0 000 0.000 0 000 0.000 0 100 0 0 0 063 2017_18 Q KF012 Moygashel WwTW 01 07 15 NIEA 12 01 2009 02/0 /2010 02/0 /2010 02/0 /2011 0 0 0 0 0.000 0.000 0.000 0.000 0.000 0.000 0.000 0.000 0 0 0 0 1 /11/2008 19/11/2008 12/01/2009 02/0 /2010 29/03/2010 0 0 80 20 0.000 0 215 0.158 -0 2 7 0.000 0 000 0.001 0 000 0.000 100 0 0 0 0 0 096 2017_18 Q KF01 Clare V llage Sewerage Scheme 00 07 12 07/08/2006 23 07 2007 26/0 /2010 26/0 /2010 26/0 /2011 0 0 0 0 0.000 0.000 0.000 0.000 0.000 0.000 0.000 0.000 0 0 0 0 07/08/2006 23/07/2007 23/11/2009 02/03/2009 0 0 73 27 0.000 0 001 0.012 0 000 0.000 0 000 0.026 0 000 0.000 36 0 0 6 0 0 0165 2017_18 Q KF027 Benburb/Mi ltown - RBC Instal at ons West & South 01 09 15 NIEA 2 03 2008 07/01/2010 07/01/2010 07/01/2011 0 0 0 0 0.000 0.000 0.000 0.000 0.000 0.000 0.000 0.000 0 0 0 0 2 /03/2008 06/01/2010 29/03/2010 0 0 10 90 -0.006 0 2 0 0.006 0 000 0.000 0 000 0.000 0 000 -0.006 6 11 0 25 0 066 2017_18 Q KF028 Keady WwTW 01 09 16 NIEA 13 09 2010 12/03/2012 12/03/2012 12/03/2013 0 0 0 0 0.000 0.000 0.000 0.000 0.000 0.000 0.000 0.000 0 0 0 0 21/0 /2010 07/05/2010 02/0 /2012 29/11/2012 09/09/2013 0 0 2 98 0.000 2 733 2.251 0 601 0.019 0 015 0.001 0 000 0.000 21 6 0 33 0 167 2017_18 Q KF052 Greenfields-Ballinahonemore, 01 07 2 0 /09/2006 01/09/2008 0 0 100 0 0.000 0 000 0.000 0 007 0.000 0 010 0.007 0 000 0.000 0 100 0 0 0 100 0168 2017_18 Q KF070 Eg ish (Dungannon) WwTW upgrade 06 09 16 NIEA 0 0 0 100 0.000 0.000 0.000 0.032 0.080 0.000 0.000 0.000 5 0 0 55 13/09/2016 20/09/2016 0 0 0 100 0.000 0 000 0.000 0 000 0.000 0 000 0.030 0 073 0.000 5 51 0 0 0 0369 2017_18 Q KF319 Annaghmore WwTWs 01 09 15 NIEA 21 09 2009 27/09/2010 27/09/2010 27/09/2011 0 0 0 0 0.000 0.000 0.000 0.000 0.000 0.000 0.000 0.000 0 0 0 0 21/07/2009 06/08/2009 21/09/2009 10/12/2009 15/11/2010 0 0 20 80 -0.015 0 3 7 0.009 0 009 -0.001 0 000 0.000 0 000 -0.015 3 17 0 0 0 370 2017_18 Q KF33 Churchv ew, Armagh Rd, Moy WWPS Upg ade 00 12 02 UR 0 0 0 0 0.000 0.000 0.000 0.000 0.000 0.000 0.000 0.000 0 0 0 0 0 /12/2012 11/12/2012 09/01/2017 31/03/2017 0 0 0 100 0.016 0 000 0.011 0 002 -0.001 0 000 0.007 0 095 0.016 86 0 10 0 0 0171 2017_18 Q KF3 6 Robinsonstown WWTW Feasibi ity Study. 06 1 16 NIEA 1 01 201 01/01/2020 31/03/2015 31/03/2016 0 0 0 100 0.000 0.00 0.000 0.212 0.995 0.000 0.000 0.000 3 27 0 30 0 0 0 100 0.016 0 000 0.00 0 020 -0.008 0 000 0.01 0 020 0.016 26 0 30 0 0 0272 2017_18 Q KF3 9 Poyn zpass WWTW Feasibi ity Study 06 1 16 NIEA 0 0 0 0 0.000 0.000 0.000 0.000 0.000 0.000 0.000 0.000 0 0 0 0 0 0 0 100 -0.006 0 000 0.010 0 03 0.011 0 015 0.000 0 010 -0.006 26 0 30 0 0 0373 2017_18 Q KF350 Dungannon WWTW Feasibi ity Study. 00 1 16 DRD 01/01/2021 0 0 0 100 0.000 0.000 0.000 0.000 0.000 0.000 0.000 0.7 3 3 27 0 30 0 0 0 100 1.589 0 000 0.0 3 0 005 0.000 0 000 0.000 0 000 1.589 26 0 30 0 0 027 2017_18 Q KF351 Carr ckaness Road, Benbu b Storm Sewer Extension 00 07 2 DRD 0 0 0 0 0.000 0.000 0.000 0.000 0.000 0.000 0.000 0.000 0 0 0 0 08/05/201 12/05/201 0 0 100 0 0.000 0 000 0.003 0 000 -0.001 0 001 0.001 0 000 0.000 0 0 0 100 0 0 0175 2017_18 Q KF366 Hami tonsbawn WWTW (Pump Installation) 00 09 02 DRD 23 05 2012 29/05/2012 20 08 2012 20/02/2013 20/02/2013 20/02/201 0 0 0 0 0.000 0.000 0.000 0.000 0.000 0.000 0.000 0.000 0 0 0 0 23/05/2012 29/05/2012 07/01/2013 02/06/201 23/12/2013 01/07/2015 0 0 0 100 0.000 0 000 0.000 0 01 0.0 -0 008 0.005 0 001 0.000 0 100 0 0 0 0 0176 2017_18 Q KF370 Moy WWTWs Phase 2 Base Main enance 00 09 02 DRD 0 0 0 0 0.000 0.000 0.000 0.000 0.000 0.000 0.000 0.000 0 0 0 0 19/11/2012 22/11/2012 30/11/2012 1 /01/2015 28/03/201 1 /01/2015 0 0 0 100 0.000 0 000 0.000 0 22 0.567 0 283 0.001 0 000 0.000 2 7 2 0 0 0 0177 2017_18 Q KF373 Dungannon WWTW Hea th & Safety Issues 00 09 02 DRD 09/02/2015 16/02/2015 22/06/2015 28/03/2016 30/11/2017 0 0 0 100 -0.00 0 000 0.000 0 000 0.000 0 030 0.30 0 001 -0.00 51 9 0 0 0 0 0178 2017_18 Q KF375 Mountnorris WWTW Feasibil ty Study 0 09 16 NIEA 0 0 0 100 0.000 0 000 0.000 0 000 0.025 -0 003 0.000 0 000 0.000 26 0 30 0 0 0379 2017_18 Q KF376 Moy WWTW Appra sal Study 0 09 16 NIEA 0 0 0 100 0.003 0 000 0.000 0 000 0.015 0 000 0.000 0 008 0.003 26 0 30 0 0 0380 2017_18 Q KF377 Knockmoy Park Area Coalisland WwPS Replacement 00 12 12 DRD 0 0 0 100 0.000 0.000 0.000 0.000 0.000 0.003 0.000 0.000 0 0 0 100 15/12/201 17/12/201 28/09/2015 23/03/2017 31/03/2015 0 0 0 100 0.000 0 000 0.000 0 000 0.005 0 033 0.268 0 238 0.000 0 0 0 100 0 0 0381 2017_18 Q KF378 Clonmore Road, Clonmore Sewerage Scheme 00 07 12 DRD 16/06/2016 17/06/2016 0 0 0 100 0.013 0 000 0.000 0 000 0.00 0 003 0.002 -0 001 0.013 5 0 0 6 0 0 0182 2017_18 Q KF379 Darkley WWTW Feasibi ity Study 0 09 16 NIEA 0 0 0 100 -0.010 0 000 0.000 0 000 0.025 -0 020 0.017 0 009 -0.010 26 0 30 0 0 0383 2017_18 Q KF380 Cabragh WWTW Feasibil ty Study 0 09 16 NIEA 0 0 0 100 0.000 0 000 0.000 0 000 0.025 -0 013 0.006 0 011 0.000 28 0 28 0 0 038 2017_18 Q KF381 Aughnacloy WWTW Feasibil ty Study 0 09 16 NIEA 0 0 0 100 0.000 0 000 0.000 0 000 0.025 -0 013 0.002 0 007 0.000 26 0 30 0 0 0385 2017_18 Q KF383 Ki lyman St eet Moy Storm Sewer Extens on 00 07 2 DRD 22/05/2015 02/06/2015 02/11/2015 30/11/2015 30/11/2015 12/02/2016 0 0 100 0 0.000 0 000 0.000 0 000 0.000 0 000 0.013 0 000 0.000 0 0 0 100 0 0 0186 2017_18 Q KF387 Dre incourt , Armagh, Sewer Network Upgrade. 03 07 12 0 0 100 0 0.166 0 000 0.000 0 000 0.000 0 000 0.005 0 020 0.166 0 100 0 0 0 100 0187 2017_18 Q KF388 Ki lymaddy Hi l, Dungannon Storm sewer 00 07 2 DRD 0 0 100 0 0.000 0 000 0.000 0 000 0.000 0 000 0.000 0 000 0.000 0 0 0 100 0 0 0188 2017_18 Q KF391 Drumman More / Me l font WWPS Upgrade 06 12 12 UR 0 0 35 65 0.002 0 000 0.000 0 000 0.000 0 002 0.012 0 006 0.002 30 30 0 0 0 0 0189 2017_18 Q KF396 M lford WWPS, Armagh, Upgrade. 06 12 12 NIEA 19/01/2017 20/01/2017 30/01/2017 31/10/2017 0 0 0 100 0.208 0 000 0.000 0 000 0.000 0 000 0.018 0 287 0.208 63 33 0 0 0 0390 2017_18 Q KF397 Ki lylea Road WWPS, A magh, Upgrade. 06 12 12 NIEA 0 0 0 100 0.001 0 000 0.000 0 000 0.000 0 000 0.016 0 033 0.001 65 35 0 0 0 0 0391 2017_18 Q KF398 PC15 Year 2 WWTW Base Maintenance – South Reg on 06 09 02 02/03/2016 03/03/2016 0 0 0 100 0.000 0 000 0.000 0 000 0.000 0 000 0.020 5 079 0.000 0 100 0 0 0 0 0192 2017_18 Q KF 00 Fellows Hall Rd, K llylea Foul Sewer 00 07 2 0 0 100 0 0.000 0 000 0.000 0 000 0.000 0 000 0.000 0 000 0.000 0 0 0 100 0 0 0193 2017_18 Q KF 02 Rear of 11-13 Lurgan Rd, Banbrdige Foul Sewer 00 07 2 0 0 100 0 0.000 0 000 0.000 0 000 0.000 0 000 0.000 0 002 0.000 0 0 0 100 0 0 019 2017_18 Q KF 03 Keenaghan wwps upgrade 06 07 02 0 0 0 100 0.026 0 000 0.000 0 000 0.000 0 000 0.000 0 002 0.026 0 100 0 0 0 0 0195 2017_18 Q KF 0 Moy Road, Dungannon former Oaklin Hotel Si e) 00 07 2 0 0 100 0 0.000 0 000 0.000 0 000 0.000 0 000 0.000 0 000 0.000 0 0 0 100 0 0 0196 2017_18 Q KF 05 Annagh New Wwps,Restoration of assets 06 07 02 0 0 0 100 0.000 0 000 0.000 0 000 0.000 0 000 0.000 0 000 0.000 0 100 0 0 0 097 2017_18 Q KF 06 Dungannon WwTW emergency Capital Works. 06 09 02 05/07/2017 10/07/2017 29/01/2018 0 0 0 100 3.818 0 000 0.000 0 000 0.000 0 000 0.000 0 000 3.818 0 100 0 0 0 0 0198 2017_18 Q KF 08 PC15 Year WwTW Base Maintenance – South Region 06 09 02 05/01/2018 16/01/2018 0 0 0 100 0.000 0 000 0.000 0 000 0.000 0 000 0.000 0 000 0.000 0 100 0 0 0 099 2017_18 Q KG0 1 Maghaberry WwTW 06 09 16 0 0 0 0 0.000 0.000 0.000 0.000 0.000 0.000 0.000 0.000 0 0 0 0 13/09/2016 15/09/2016 01/06/2017 15/10/201 0 0 0 100 2.07 0 000 0.022 0 019 0.020 0 035 0.029 0 076 2.07 0 88 0 12 0 0 0
500 2017_18 Q KG068 Kiln Road SPS Upgrade [Lurgan] 00 12 02 UR 11 06 2009 02/07/2009 05 10 2009 25/02/2010 25/02/2010 25/02/2011 0 0 0 0 0.000 0.000 0.000 0.000 0.000 0.000 0.000 0.000 0 0 0 0 11/06/2009 02/07/2009 05/10/2009 2 /02/2010 25/10/2010 0 0 0 100 -0.001 0 015 0.000 0 001 0.000 0 000 0.000 0 000 -0.001 0 100 0 0 0 0501 2017_18 Q KG121 Upper Edward Street Newry 00 07 12 NIEA 02 02 2009 09/02/2009 0 05 2009 25/02/2010 25/02/2010 25/02/2011 0 0 0 0 0.000 0.000 0.000 0.000 0.000 0.000 0.000 0.000 0 0 0 0 02/02/2009 09/02/2009 0 /05/2009 03/08/2009 0 0 100 0 0.000 -0 003 -0.003 0 001 0.000 0 000 0.001 0 000 0.000 0 100 0 0 0 100 01502 2017_18 Q KG153 Gil ord Road Por adown Sewerage Upgrades 01 07 12 NIEA 07 02 2008 11/02/2008 29 09 2008 1 /06/2011 1 /06/2011 13/06/2012 0 0 0 0 0.000 0.000 0.000 0.000 0.000 0.000 0.000 0.000 0 0 0 0 07/02/2008 11/02/2008 29/09/2008 10/08/2010 26/03/2012 0 0 85 15 -0.015 -0 091 0.235 0 053 0.000 0 000 0.000 0 000 -0.015 72 27 0 1 0 2503 2017_18 Q KG157 Maghaberry Flood Al ev at on Projects 01 07 11 NIEA 26 02 2009 23/0 /2009 22 06 2009 27/05/2010 27/05/2010 27/07/2010 0 0 0 0 0.000 0.000 0.000 0.000 0.000 0.000 0.000 0.000 0 0 0 0 26/02/2009 23/0 /2009 22/06/2009 27/05/2010 2 /05/2010 26/07/2010 0 0 100 0 -0.01 0 288 -0.002 0 016 0.000 0 000 0.000 0 000 -0.01 0 28 65 7 0 2850 2017_18 Q KG183 Por adown Drainage Area Network Improvements - Meadow L 00 07 12 NIEA 30 09 201 01/01/2015 01/03/2015 01/03/2016 0 0 93 7 0.000 0.000 0.000 0.623 1.903 0.116 1. 0 0.930 62 31 0 7 30/05/2016 0 0 93 7 0.053 0 000 0.000 0 000 0.000 0 000 0.000 0 000 0.053 63 30 0 7 0 28 02505 2017_18 Q KG18 Por adown Drainage Area Network Improvements - Obins Stre 00 07 12 NIEA 15 12 2010 12/01/2011 01 0 2011 11/09/2012 11/09/2012 11/09/2013 0 0 0 0 0.000 0.000 0.000 0.000 0.000 0.000 0.000 0.000 0 0 0 0 15/12/2010 12/01/2011 01/0 /2011 03/05/2013 01/10/2012 20 0 80 0 0.000 0 000 0.96 0 376 -0.026 -0 012 0.006 0 000 0.000 65 29 5 1 10 19 01506 2017_18 Q KG191 Dobbin WWPS - Feasib l ty Study 01 12 02 DRD 0 0 0 0 0.000 0.000 0.000 0.000 0.000 0.000 0.000 0.000 0 0 0 0 03/06/2016 06/06/2016 0 0 0 100 0.000 0 000 0.000 0 005 -0.001 0 000 0.000 0 003 0.000 0 100 0 0 0 0 01507 2017_18 Q KG192 Donaghc oney WWPS - Feasib lity Study 00 12 12 NIEA 0 0 0 0 0.000 0.000 0.000 0.000 0.000 0.000 0.000 0.000 0 0 0 0 12/05/201 16/05/201 29/06/2015 1 /12/2016 03/02/2017 0 0 0 100 0.000 0 000 0.000 0 003 0.008 0 005 0.168 0 083 0.000 0 0 0 100 0 0 03508 2017_18 Q KG19 Garland Avenue, Lurgan Sewer Ex ension 00 07 2 DRD 0 0 0 0 0.000 0.000 0.000 0.000 0.000 0.000 0.000 0.000 0 0 0 0 15/10/2012 25/10/2012 0 0 100 0 0.000 0 000 0.000 0 005 0.008 0 001 0.001 0 000 0.000 0 0 0 100 0 0509 2017_18 Q KG197 Warings own WWTWs Phase 2 Base Main enance 00 09 02 DRD 0 0 0 0 0.000 0.000 0.000 0.000 0.000 0.000 0.000 0.000 0 0 0 0 16/11/2012 22/11/2012 30/11/2012 31/10/201 29/11/2013 03/11/201 0 0 0 100 0.000 0 000 0.000 0.120 0. 79 0 026 0.001 0 000 0.000 7 77 16 0 0 0510 2017_18 Q KG198 Hunters Mill, Annesborough Road, Lurgan, Storm Sewer Exten00 07 2 DRD 0 0 100 0 0.000 0 000 0.000 0 002 0.007 0 000 0.000 0 001 0.000 0 0 0 100 0 0 01511 2017_18 Q KG200 Warings own WWTW's Feasib lity Study 0 09 16 NIEA 0 0 0 100 -0.013 0 000 0.000 0 000 0.023 0 000 0.018 0 013 -0.013 26 0 30 0 0 03512 2017_18 Q KG202 Aghagal on WWTW - MBBR Tr al 03 09 16 NIEA 0 0 0 100 0.000 0.000 0.000 0.000 0.000 0.229 0.017 0.000 1 86 0 0 10/03/201 13/03/201 0 /05/2015 31/03/2015 29/06/2015 0 0 0 100 0.077 0 000 0.000 0 000 0.010 1 057 0.200 0.100 0.077 15 85 0 0 0 0 01513 2017_18 Q KG203 Por adown DAP (Storage at Seagoe WWPS) 06 07 12 NIEA 0 0 100 0 -0.007 0 000 0.000 0 000 0.002 0 033 0.009 0 005 -0.007 70 30 0 0 0 30 0151 2017_18 Q KG205 Seagoe Depot Generator Store 00 15 20 DRD 27/05/2015 29/05/2015 0 50 0 50 -0.003 0 000 0.000 0 000 0.001 0 00 0.1 3 0 007 -0.003 0 100 0 0 0 0 01515 2017_18 Q KG210 Garvaghy Road, Portadown, Trunk Sewer and Syphons Base M00 07 12 0 0 100 0 -0.006 0 000 0.000 0 000 0.000 0 00 0.001 0 016 -0.006 0 100 0 0 0 100 01516 2017_18 Q KG21 Tandragee Road, Lu gan - Foul Sewer 00 07 2 0 0 100 0 0.000 0 000 0.000 0 000 0.000 0 000 0.000 0 000 0.000 0 0 0 100 0 0 01517 2017_18 Q KG215 Mahon Ave / Ripley Terrace S orm Sewer, Portadown 06 07 12 03/02/2017 01/03/2017 0 0 100 0 0.02 0 000 0.000 0 000 0.000 0 000 0.000 0 009 0.02 0 0 100 0 0 0 01518 2017_18 Q KG217 PC15 Year 3 WwTW Cap tal Maintenance - South Region 06 09 02 07/02/2017 10/02/2017 0 0 0 100 1.779 0 000 0.000 0 000 0.000 0 000 0.000 0 020 1.779 0 100 0 0 0 0 01519 2017_18 Q KG219 2 Stat on Road Scarva B025533 00 07 2 0 0 100 0 0.000 0 000 0.000 0 000 0.000 0 000 0.000 0 000 0.000 0 0 0 100 0 0 01520 2017_18 Q KG221 Church Brae, Ardmore Rd, Lurgan R sing Main, Foul Sewer 06 07 2 0 0 100 0 0.000 0 000 0.000 0 000 0.000 0 000 0.000 0 000 0.000 0 0 0 100 0 0521 2017_18 Q KG222 Lurgan Road, Moira Storm Sewer Extens on 06 07 2 0 0 100 0 0.001 0 000 0.000 0 000 0.000 0 000 0.000 0 000 0.001 0 0 0 100 0 0522 2017_18 Q KG225 Drumcree Road, SPS 06 07 2 0 0 50 50 0.000 0 000 0.000 0 000 0.000 0 000 0.000 0 000 0.000 0 0 0 100 0 0523 2017_18 Q KI 6 Sewerage Rehab. New and Replacement incl. FTS 00 07 12 NIEA 0 0 71 29 0.000 0.000 0.000 0.000 0.000 0.009 0.000 0.000 3 7 15 19/12/2012 08/01/2013 0 0 71 29 -0.03 0 000 0.000 0.105 0.185 0.125 0.08 0 002 -0.03 5 33 7 15 0 23 0152 2017_18 Q JV867 Mourne Conduit Survey 00 JI083 06 03 100 0 0 0 -0.011 0 000 0.000 0 000 0.000 0 000 0.0 9 0 000 -0.011 0 100 0 0 100 0 01525 2017_18 Q KA25 Nut s Corner Road, Crum in, Storm Sewer Extens on 00 KI 6 07 2 DRD 08/09/201 17/09/201 22/02/2016 30/03/2016 17/05/2016 0 0 100 0 0.000 0 000 0.000 0 000 0.000 0 000 0.055 -0 013 0.000 60 0 0 0 0 0 01526 2017_18 Q KB506 Hi lmount Crescent Tobermore Storm Sewer 00 KI 6 07 2 DRD 25/07/2013 06/08/2013 13/0 /2015 01/06/2015 17/0 /2015 23/06/2015 0 0 100 0 0.000 0 000 0.000 0 000 0.000 0 000 0.011 0 000 0.000 0 0 0 100 0 0 01527 2017_18 Q KC 55 Ashley Drive Ba lymoney S orm Sewer 00 KI 6 07 2 DRD 17/10/2013 28/10/2013 06/01/201 28/02/201 10/02/201 28/02/201 0 0 100 0 -0.001 0 000 0.000 0 000 0.0 2 0 001 0.006 0 000 -0.001 0 0 0 100 0 0 01528 2017_18 Q KC 57 Ba lymacrea Road Portrush Foul Sewer Extension 00 KI 6 07 2 DRD 21/10/2013 28/10/2013 19/05/201 28/11/201 09/06/201 18/11/2015 0 0 100 0 0.000 0 000 0.000 0 000 0.000 0 086 0.005 0 000 0.000 0 0 0 100 0 0 01529 2017_18 Q KF371 Roskeen Road, Moygashel, Dungannon, Foul Pumping Main a 00 KI 6 07 2 DRD 25/07/2013 06/08/2013 0 0 100 0 0.000 0 000 0.000 0 001 0.001 0 000 0.000 0 000 0.000 0 0 0 100 0 0 01530 2017_18 Q KF37 Wood awn Park, Dungannon S orm & Foul sewer 00 KI 6 07 2 DRD 21/10/2013 28/10/2013 10/02/201 29/08/201 30/06/201 03/11/201 0 0 100 0 -0.005 0 000 0.000 0 000 -0.032 0 066 0.002 0 000 -0.005 0 0 0 100 0 0 01531 2017_18 Q KG199 Breagh Rd, Portadown - Storm Sewer 00 KI 6 07 2 DRD 25/09/2013 0 /10/2013 0 0 100 0 0.000 0 000 0.000 0 000 0.000 0 000 0.012 0 000 0.000 0 0 0 100 0 0 01532 2017_18 Q KL51 Clooney Park West, LDerry Storm Sewer Ext 00 KI 6 07 2 DRD 28/0 /201 12/05/201 20/05/201 28/11/201 1 /07/201 0 0 100 0 0.000 0 000 0.000 0 000 -0.002 0.160 0.001 -0 016 0.000 0 0 0 100 0 0 01533 2017_18 Q KN651 Bridge Street WWPS, Strabane - Feasib l ty Study 00 KI 6 13 12 DRD 0 0 0 0 0.000 0.000 0.000 0.000 0.000 0.000 0.000 0.000 0 0 0 0 01/02/2016 02/02/2016 28/11/2016 30/0 /2018 0 0 0 100 0.973 0 000 0.000 0 000 0.015 0 005 0.01 0 872 0.973 37 2 30 9 0 0 0353 2017_18 Q KN652 L smourne Place Strabane Foul Sewer Ex ension or Invest NI 00 KI 6 07 2 DRD 0 0 0 0 0.000 0.000 0.000 0.000 0.000 0.000 0.000 0.000 0 0 0 0 21/10/2013 28/10/2013 03/03/201 0 /0 /2017 2 /02/201 18/10/2017 0 0 100 0 -0.001 0 000 0.000 0 001 0.035 0 03 0.003 -0 005 -0.001 0 0 0 100 0 0 01535 2017_18 Q KP685 Main street Be coo S orm sewer ext 00 KI 6 07 2 DRD 11/10/2013 21/10/2013 2 /0 /201 30/09/201 2 /02/201 02 11 201 0 0 100 0 -0.002 0 000 0.000 0 000 0.000 0 023 0.001 0 000 -0.002 0 0 0 100 0 0 01536 2017_18 Q KR551 Andersonstown Road Bel ast Storm Sewer Extension. 00 KI 6 07 2 DRD 10/07/2013 19/07/2013 30/01/201 16/12/2013 17 11 201 0 0 100 0 0.000 0 000 0.000 0 000 0.03 0 000 0.007 -0 001 0.000 0 1 0 99 0 1 01537 2017_18 Q KR553 The Cairn/Goldenview Downview - Greenisland Foul & storm s 00 KI 6 07 2 DRD 05/12/201 05/12/201 0 0 100 0 -0.001 0 000 0.000 0 000 0.000 0 000 0.038 0 000 -0.001 0 0 0 100 0 0 01538 2017_18 Q KR567 Brokerstown Road, L sburn Storm Sewer 00 KI 6 07 2 DRD 15/11/2016 15/11/2016 0 0 100 0 0.050 0 000 0.000 0 000 0.000 0 000 0.000 0 000 0.050 0 0 0 100 0 0 01539 2017_18 Q KI 69 Base Maintenance (Sewerage) 00 09 02 UR 0 0 11 89 0.000 0.000 0.000 8.315 .171 0.000 0.000 0.000 0 85 0 15 0 0 0 100 0.000 0 000 0.000 0 000 0.000 0 000 0.000 0 000 0.000 0 100 0 0 0 05 0 2017_18 Q KS375 Downpatrick 00 KI 6 12 12 NIEA 0 0 0 0 0.000 0.000 0.000 0.000 0.000 0.000 0.000 0.000 0 0 0 0 0 0 0 100 0.000 0 000 0.000 0 000 0.00 -0 001 0.003 0 0 3 0.000 0 100 0 0 0 0 015 1 2017_18 Q KA196 Glenarm Sewage Pumping Sta ion 00 KI 69 13 02 11 02 2009 20/02/2009 23 03 2009 31/03/2010 31/03/2010 31/03/2011 0 0 0 0 0.000 0.000 0.000 0.000 0.000 0.000 0.000 0.000 0 0 0 0 11/02/2009 20/02/2009 23/03/2009 30/03/2010 08/03/2010 0 0 0 100 0.000 0 000 0.001 0 056 0.000 -0 017 0.000 0 01 0.000 66 18 8 8 0 0 015 2 2017_18 Q KA216 Carnlough WWPS Septicity Dosing 00 KI 69 12 02 UR 02 03 2010 19/03/2010 29 07 2011 15/03/2012 15/03/2012 15/03/2013 0 0 0 0 0.000 0.000 0.000 0.000 0.000 0.000 0.000 0.000 0 0 0 0 02/03/2010 19/03/2010 01/0 /2011 15/03/2012 30/03/2012 0 0 0 100 -0.00 -0 001 0.305 0 023 -0.001 0 0 3 0.003 0 000 -0.00 0 100 0 0 0 0 015 3 2017_18 Q KA231 Tully Road, G enarm, Screen House Refurb shment. 00 KI 69 09 02 UR 17 01 2011 31/01/2011 29 07 2011 0 /09/2012 0 /09/2012 0 /09/2013 0 0 0 0 0.000 0.000 0.000 0.000 0.000 0.000 0.000 0.000 0 0 0 0 17/01/2011 31/01/2011 02/0 /2012 30/03/2012 30/03/2012 0 0 0 100 0.000 0 000 0.280 0 013 -0.001 0 0 0.020 0 000 0.000 0 100 0 0 0 0 015 2017_18 Q KA2 2 Ba lyc are WWTW Upgrade 00 KI 69 09 02 DRD 10 06 2011 21/06/2011 09 01 2012 28/09/2012 28/09/2012 28/09/2013 0 0 0 0 0.000 0.000 0.000 0.000 0.000 0.000 0.000 0.000 0 0 0 0 10/06/2011 21/06/2011 01/0 /2013 25/03/2013 29/09/201 12 10 2016 0 0 0 100 -0.023 0 000 0.859 0 87 0.258 0 200 0.073 -0 005 -0.023 0 100 0 0 0 0 015 5 2017_18 Q KA2 5 Ne lsbrook WWPS Upgrade 00 KI 69 12 02 DRD 0 0 0 0 0.000 0.000 0.000 0.000 0.000 0.000 0.000 0.000 0 0 0 0 26/10/2012 07/11/2012 03/06/2013 27/02/2015 25/08/201 01 07 2015 0 0 0 100 0.000 0 000 0.006 0 002 0.055 0.135 0.00 0 000 0.000 0 100 0 0 0 0 015 6 2017_18 Q KA2 7 Crumlin Town WWPS Upgrade - Feasibi ity Study 00 KI 69 12 12 DRD 0 0 0 0 0.000 0.000 0.000 0.000 0.000 0.000 0.000 0.000 0 0 0 0 15/12/2017 29/12/2017 0 0 0 100 0.079 0 000 0.001 0 003 0.000 0 000 0.008 0 016 0.079 5 17 0 29 0 0 065 7 2017_18 Q KB 60 M&E Capital Maintenance Tu lygarley WWTW 01 KI 69 09 02 19 11 2010 23/11/2010 1 09 2011 1 /09/2012 1 /09/2012 1 /09/2013 0 0 0 0 0.000 0.000 0.000 0.000 0.000 0.000 0.000 0.000 0 0 0 0 19/11/2010 23/11/2010 0 0 0 100 0.000 0 275 2.977 1 060 0.00 0 001 0.005 0 000 0.000 0 100 0 0 0 0 015 8 2017_18 Q KB 61 M&E Capital Maintenance - Larne WWTW 01 KI 69 09 02 UR 19 11 2010 23/11/2010 15 02 2011 09/05/2012 09/05/2012 09/05/2013 0 0 0 0 0.000 0.000 0.000 0.000 0.000 0.000 0.000 0.000 0 0 0 0 19/11/2010 23/11/2010 01/0 /2011 15/03/2012 15/09/201 28 10 201 0 0 0 100 0.000 0.16 1.105 0 031 0.0 0 053 0.003 0 000 0.000 0 100 0 0 0 0 015 9 2017_18 Q KB 78 Devenagh Bu n WWPS - Feasibil ty Study 00 KI 69 07 12 DRD 0 0 0 0 0.000 0.000 0.000 0.000 0.000 0.000 0.000 0.000 0 0 0 0 06/09/2016 07/09/2016 0 0 0 100 1.077 0 000 0.007 0 003 0.000 0 029 0.003 0 202 1.077 66 27 0 7 0 0 01550 2017_18 Q KB 85 Knockloughrim WWTW Feasibil ty Study 02 KI 69 09 16 NIEA 0 0 0 0 0.000 0.000 0.000 0.000 0.000 0.000 0.000 0.000 0 0 0 0 0 0 0 100 0.000 0 000 0.010 0 012 0.000 0 000 0.000 0 003 0.000 26 0 30 0 0 03551 2017_18 Q KC 29 Rasharkin WWTW Upgrade 00 KI 69 09 02 DRD 07 06 2011 10/06/2011 28 11 2011 31/07/2012 31/07/2012 31/07/2013 0 0 0 0 0.000 0.000 0.000 0.000 0.000 0.000 0.000 0.000 0 0 0 0 07/06/2011 10/06/2011 11/11/2011 18/12/2012 20/09/2013 0 0 0 100 0.000 0 000 0.223 0 507 0.038 -0 00 0.001 0 000 0.000 0 100 0 0 0 0 01552 2017_18 Q KC 3 Dervock WWTW Feasib lity Study 06 KI 69 1 16 NIEA 0 0 0 0 0.000 0.000 0.000 0.000 0.000 0.000 0.000 0.000 0 0 0 0 0 0 0 100 -0.003 0 000 0.005 0 008 0.015 0 001 0.000 0 003 -0.003 7 1 0 52 0 0 03553 2017_18 Q KC 35 L scolman WWTW Upgrade 00 KI 69 09 02 DRD 05 09 2011 07/09/2011 12 09 2011 30/03/2012 30/03/2012 30/03/2013 0 0 0 0 0.000 0.000 0.000 0.000 0.000 0.000 0.000 0.000 0 0 0 0 05/09/2011 07/09/2011 30/11/2012 18/03/201 25/07/201 0 0 0 100 -0.001 0 000 0.010 0 051 0.365 0 011 0.001 0 000 -0.001 9 91 0 0 0 0 0155 2017_18 Q KC 36 Armoy WWTW Feasib lity Study 06 KI 69 1 16 NIEA 0 0 0 0 0.000 0.000 0.000 0.000 0.000 0.000 0.000 0.000 0 0 0 0 0 0 0 100 -0.003 0 000 0.003 0 000 0.001 0 000 0.000 0 003 -0.003 11 50 0 39 0 0 03555 2017_18 Q KC 38 Moss-side WWTW Feasibil ty Study 02 KI 69 09 16 NIEA 0 0 0 0 0.000 0.000 0.000 0.000 0.000 0.000 0.000 0.000 0 0 0 0 0 0 0 100 -0.003 0 000 0.003 0 002 0.000 0 000 0.000 0 003 -0.003 12 39 0 9 0 0 03556 2017_18 Q KC 0 Strand Road WWPS and Network Appra sal Study 00 KI 69 12 12 DRD 0 0 0 0 0.000 0.000 0.000 0.000 0.000 0.000 0.000 0.000 0 0 0 0 0 0 0 100 0.016 0 000 0.000 0 013 0.025 0 072 0.033 0 071 0.016 0 36 12 12 0 0 03557 2017_18 Q KC 1 Eastburn C escent, Ballymoney, Foul Sewer 00 KI 69 07 12 DRD 08 12 2011 27/01/2012 27/01/2012 26/01/2013 0 0 0 0 0.000 0.000 0.000 0.000 0.000 0.000 0.000 0.000 0 0 0 0 21/11/2011 29/11/2011 08/12/2011 28/11/2012 26/01/2012 0 0 100 0 0.000 0 000 0.096 -0 01 -0.020 0 002 0.001 0 000 0.000 0 100 0 0 0 100 01558 2017_18 Q KF025 Tamnamore Mullenaki l/C ontyclay - RBC Installations West & 01 KI 69 09 02 UR 01 09 200 31/03/2008 31/03/2008 31/03/2009 0 0 0 0 0.000 0.000 0.000 0.000 0.000 0.000 0.000 0.000 0 0 0 0 01/09/200 0 /05/2011 26/03/2008 0 0 17 83 0.001 0 0 5 -0.018 0 000 0.001 -0 012 0.000 0 009 0.001 0 35 26 39 0 10 01559 2017_18 Q KF320 Bush WwTWs 01 KI 69 07 16 NIEA 07 09 2009 0 /06/2010 0 /06/2010 0 /06/2011 0 0 0 0 0.000 0.000 0.000 0.000 0.000 0.000 0.000 0.000 0 0 0 0 2 /07/2009 30/07/2009 07/09/2009 03/06/2010 23/07/2012 0 0 62 38 -0.006 0 056 0.017 0 025 0.000 0 000 0.000 0 000 -0.006 100 0 0 0 0 0560 2017_18 Q KF329 Ardress WWPS Proposed Replacement. 03 KI 69 12 16 NIEA 21 03 2011 16/09/2011 16/09/2011 15/09/2012 0 0 0 0 0.000 0.000 0.000 0.000 0.000 0.000 0.000 0.000 0 0 0 0 15/12/2010 12/01/2011 07/03/2011 27/08/201 23/09/2013 0 0 36 6 0.000 0 055 0.368 0 205 0.101 0 019 0.036 0 000 0.000 17 37 0 6 0 13561 2017_18 Q KF331 Grange Park, Dungannon WWPS Upgrade 00 KI 69 12 02 UR 31 05 2011 10/06/2011 01 0 2011 31/03/2015 31/03/2015 30/03/2016 0 0 0 0 0.000 0.000 0.000 0.000 0.000 0.000 0.000 0.000 0 0 0 0 31/05/2011 10/06/2011 01/0 /2011 13/06/2013 07/07/201 13/06/2013 0 0 18 82 0.000 0 009 0.030 0.117 0.016 0 023 0.001 0 000 0.000 65 0 31 0 11 01

m a e s
e )
So t Re C M Submiss on Re e ence
o ect D Re e ence o ect Name C oject
e oda ent
oject IDSubsti ute
o ect ID
ma y Asset
Ca ego y
C 0 og amme
Regula o y S gn O Requi ed
Base ine A Date
Base ine o ect
App oval Date
Base ne Sta t on S te Da e
Base ine Bene cial Use
Date
Basel ne Regulato y
sign-o Da e
Base ine Comp e ion o Const uct on
Date
Base ine End o
Main enance e od Date
Base ine Se vice A locat on Wate
n ast uc u e
Base ine Se vice Al oca ion Wate
Non-n ast uc u e
Base ine Se v ce A locat on Sewe age
In ast uctu e
Basel ne Se v ce Al oca ion
Sewe age Non-In ast uctu e
Basel ne CA EX 20 0-
£m
Base ine CA EX 20 -
2 £m
Basel ne CA EX 20 2-
3 £m
Base ne CA EX 20 3-
4 £m
Base ine CA EX 20 4-
5 £m
Basel ne CA EX 20 5-
6 £m
Base ine CA EX 20 6-
7 £m
Basel ne CA EX 20 7-
8 £m
Base ine u pose A locat on Qual ty
Base ine u pose Al oca ion Base
Base ine u pose A locat on ES
Basel ne u pose Al oca ion G ow h
Cu ent Actual o o ected
A Da e
Cu ent Ac ua o ojected
oject App oval Date
Cu ent Actual o o ected Sta t on Si e
Date
Cu ent Ac ua o ojected
Bene cial Use Da e
Cu ent Actual o o ected Regu ato y
sign-o Da e
Cu ent Actual o ojec ed
Comple ion o Const uc ion
Date
Cu ent Actual o o ected
End o Maintenance
e iod Date
Cu ent Actual o ojec ed Se v ce
A locat on Wa e In ast uctu e
Cu ent Actual o o ec ed Se v ce
A locat on Wa e Non-
n ast uc u e
Cu ent Actual o o ec ed Se v ce
A locat on Sewe age
n ast uc u e
Cu ent Actual o o ec ed Se v ce
A locat on Sewe age Non-
n ast uc u e
Cu ent Actual o o ected CA EX ea to date £m
Cu ent Actual o ojec ed
CA EX 20 0- £m
Cu ent Actual o o ected
CA EX 20 -2 £m
Cu ent Actual o ojec ed
CA EX 20 2-3 £m
Cu ent Ac ual o o ected
CA EX 20 3-4 £m
Cu ent Actual o o ec ed
CA EX 20 4-5 £m
Cu ent Ac ual o ojected
CA EX 20 5-6 £m
Cu ent Actual o o ec ed
CA EX 20 6-7 £m
Cu ent Ac ual o ojected
CA EX 20 7-8 £m
Cu ent Actual o o ec ed u pose
Al oca ion Qua i y
Cu ent Actual o o ec ed u pose
A location Base
Cu ent Actual o o ected u pose
Al oca ion ES
Cu ent Actual o ojected u pose
A locat on G owth
Cu ent Ac ual o ojected RE
Al oca ion Wate
Cu ent Ac ual o ojected RE Al oca ion Sewe age
Nom na ed Output
2 3 4 5 6 7 8 9 0 2 3 4 5 6 7 8 9 20 2 22 23 24 25 26 27 28 29 36 37 38 39 40 4 42 43 44 45 46 47 48 49 50 5 52 53 54 55 56 57 58 59 66 67 68 69 70 7 72
A T a a a ex e e e e 7 99 2 9 24 949 4 9 47 7 4 4 2 2 2 7 7 47 92 9 4 79 7 4 7 4 27 2 2
SOR
CIM
_Sub
I_oj
ect_
D
I_oj
ect_
Nam
e
I_C
_e
iod
I_AR
EN_
ojec
t_D
I_SU
BSI
UE_
oec
t_ID
I_i_
Asse
t_C
at
I_C
0_og
I_R
eg_S
igno
BM
_A
BM
_o
ect_
App
oval
BM
_SoS
BM
_BU
BM
_RSO
BM
_CoC
BM
_EoM
BSA_
WI%
BSA_
WN
I%
BSA_
SI%
BSA_
SNI%
B_C
apex
_20
0-_£
m
B_C
apex
_20
-2_
£m
B_C
apex
_20
2-3_
£m
B_C
apex
_20
3-4_
£m
B_C
apex
_20
4-5_
£m
B_C
apex
_20
5-6_
£m
B_C
apex
_20
6-7_
£m
B_C
apex
_20
7-8_
£m
BA_
Q%
BA_
B%
BA_
E%
BA_
G%
CAM
_A
CAM
_o
ecAp
pov
al
CAM
_SoS
CAM
_BU
CAM
_RSO
CAM
_CoC
CAM
_EoM
CAS
A_W
I%
CAS
A_W
NI%
CAS
A_SI
%
CAS
A_SN
I%
CA
_Cap
ex_
D_£
m
CA
_Cap
ex_2
00-
_£m
CA
_Cap
ex_2
0-
2_£m
CA
_Cap
ex_2
02-
3_£m
CA
_Cap
ex_2
03-
4_£m
CA
_Cap
ex_2
04-
5_£m
CA
_Cap
ex_2
05-
6_£m
CA
_Cap
ex_2
06-
7_£m
CA
_Cap
ex_2
07-
8_£m
CA
A_Q
%
CA
A_B%
CA
A_E%
CA
A_G
%
CA
_IR
E_W
%
CA
_IR
E_S%
NO
M_O
upu
t
e A a e e e v e s A a e A a e e a a x e e e m m e e a ) e A a e e se A a %) e A a e e %)e e a ase e M es e a es ase e e v e s A a ase e x e e e m 2 2- es) ase e se A a e A a e e M es e a es
562 2017_18 Q KF35 Dernagh WWPS Upgrade 00 KI 69 07 02 DRD 0 0 0 0 0.000 0.000 0.000 0.000 0.000 0.000 0.000 0.000 0 0 0 0 12/11/2012 1 /11/2012 31/01/201 15/08/201 25/07/201 1 /01/2015 0 0 0 100 0.000 0 000 0.003 0 03 0.503 0.181 0.005 0 000 0.000 6 85 3 6 0 0 01563 2017_18 Q KF355 Marketh ll WWTW feasib lity 06 KI 69 1 16 NIEA 0 0 0 0 0.000 0.000 0.000 0.000 0.000 0.000 0.000 0.000 0 0 0 0 0 0 0 100 0.018 0 000 0.016 -0 00 0.009 0 000 0.000 0 012 0.018 26 0 30 0 0 0356 2017_18 Q KF359 Bromp on Park WWPS and Derryhale WWPS Feasib lity Study02 KI 69 12 12 DRD 0 0 0 0 0.000 0.000 0.000 0.000 0.000 0.000 0.000 0.000 0 0 0 0 22/07/2015 22/07/2015 0 0 0 100 -0.006 0 000 0.012 0 007 0.006 -0 001 0.061 0 000 -0.006 21 61 0 18 0 0 03565 2017_18 Q KF362 Annvale SPS Upgrade - Feasibi ity Study 00 KI 69 07 12 DRD 0 0 0 0 0.000 0.000 0.000 0.000 0.000 0.000 0.000 0.000 0 0 0 0 21/03/2016 2 /03/2016 0 0 0 100 0.022 0 000 0.023 0 011 0.035 0 010 0.005 0 033 0.022 10 51 0 39 0 0 03566 2017_18 Q KG1 0 Waringfield SPS Upgrade 01 KI 69 12 12 UR 0 0 0 0 0.000 0.000 0.000 0.000 0.000 0.000 0.000 0.000 0 0 0 0 26/0 /2017 28/0 /2017 0 0 17 83 0.07 -0 001 0.008 0 007 -0.005 0 001 0.007 0 003 0.07 58 20 0 22 0 11 03567 2017_18 Q KG180 Knockshane WWPS, Lurgan Upgrade. 01 KI 69 12 02 UR 1 02 2012 0 0 0 0 0.000 0.000 0.000 0.000 0.000 0.000 0.000 0.000 0 0 0 0 1 /02/2012 23/02/2012 25/03/2013 07/02/201 18/11/2013 03/11/201 0 0 50 50 0.000 0 008 0.008 0 063 0.191 0 001 0.001 0 000 0.000 51 0 5 0 27 01568 2017_18 Q KI 9 Base Maintenance WWTW North IWWWP 00 KI 69 09 02 DRD 20 05 2011 25/05/2011 05 09 2011 31/10/2012 31/10/2012 31/10/2013 0 0 0 0 0.000 0.000 0.000 0.000 0.000 0.000 0.000 0.000 0 0 0 0 20/05/2011 25/05/2011 05/09/2011 18/12/2012 17/12/2012 23/01/201 0 0 0 100 0.000 0 000 0.652 0 823 0.008 0 010 0.002 0 000 0.000 0 100 0 0 0 0 01569 2017_18 Q KI501 Pumping Sta ion Maintenance - R McCrea 00 KI 69 12 02 DRD 0 0 0 0 0.000 0.000 0.000 0.000 0.000 0.000 0.000 0.000 0 0 0 0 19/11/2012 21/11/2012 30/11/2012 29/11/2013 07/03/201 13/03/201 0 0 0 100 0.000 0 000 0.000 0.1 0 0.6 6 0 001 0.003 0 000 0.000 10 80 10 0 0 0 01570 2017_18 Q KI502 Pumping Sta ion Maintenence - A Reilly 00 KI 69 12 02 DRD 0 0 0 0 0.000 0.000 0.000 0.000 0.000 0.000 0.000 0.000 0 0 0 0 19/11/2012 22/11/2012 30/11/2012 30/03/2015 31/10/201 0 0 0 100 0.006 0 000 0.000 0 208 1.723 0.155 0.027 0 000 0.006 9 86 5 0 0 0 01571 2017_18 Q KI503 Pumping Sta ion Maintenance - B McNeill 00 KI 69 12 02 DRD 0 0 0 0 0.000 0.000 0.000 0.000 0.000 0.000 0.000 0.000 0 0 0 0 21/11/2012 28/11/2012 30/11/2012 30/03/2015 25/07/201 0 0 0 100 0.002 0 000 0.000 0 279 1.028 0.175 0.006 0 000 0.002 11 79 10 0 0 0 01572 2017_18 Q KI50 Sewer Structural Rehab ltation Package 00 KI 69 07 12 DRD 0 0 0 0 0.000 0.000 0.000 0.000 0.000 0.000 0.000 0.000 0 0 0 0 0 0 100 0 0.000 0 000 0.000 0 000 0.000 0 000 0.000 0 000 0.000 0 100 0 0 0 100 01573 2017_18 Q KI505 SewerStructural Rehabi itation Package 3 00 KI 69 07 12 DRD 0 0 0 0 0.000 0.000 0.000 0.000 0.000 0.000 0.000 0.000 0 0 0 0 0 0 100 0 0.117 0 000 0.000 0 000 0.000 0 021 0.030 0 085 0.117 0 100 0 0 0 100 0157 2017_18 Q KL 2 Magheramason WwTWs 06 KI 69 1 16 30 06 2013 31/10/201 31/01/2015 31/01/2016 0 0 0 100 0.000 0.00 0.012 0. 33 1.0 8 0.15 0.000 0.000 0 31 0 69 26/07/2013 05/08/2013 01/12/201 0 0 0 100 -0.007 0 000 0.00 0 01 0.082 1 282 0.20 -0 083 -0.007 0 30 0 70 0 0 08575 2017_18 Q KL 68 Strathfoy e, Londonderry Siphon In et Screen 00 KI 69 07 12 UR 23 02 2012 06/03/2012 26 03 2012 31/08/2012 31/08/2012 31/08 2013 0 0 0 0 0.000 0.000 0.000 0.000 0.000 0.000 0.000 0.000 0 0 0 0 23/02/2012 06/03/2012 01/0 /201 27/03/2013 31/03/2017 16/01/2018 0 0 56 0.002 0 072 0.106 1 293 0.092 0.182 0.198 0 050 0.002 8 92 0 0 0 02576 2017_18 Q KL 85 Tobermore WWTW Upgrade 00 KI 69 09 02 DRD 07 06 2011 10/06/2011 17 10 2011 31/07/2012 31/07/2012 31/07/2013 0 0 0 0 0.000 0.000 0.000 0.000 0.000 0.000 0.000 0.000 0 0 0 0 07/06/2011 10/06/2011 17/10/2011 28/01/2013 31/03/201 1 /05/201 0 0 0 100 0.000 0 000 0.105 0 279 0.011 -0 006 0.001 0 000 0.000 0 100 0 0 0 0 01577 2017_18 Q KL 86 Bonnanabo gh WWTW Upgrade 00 KI 69 09 16 DRD 07 06 2011 10/06/2011 30 09 2011 30/03/2012 30/03/2012 30/03/2013 0 0 0 0 0.000 0.000 0.000 0.000 0.000 0.000 0.000 0.000 0 0 0 0 07/06/2011 10/06/2011 0 0 0 100 0.000 0 000 0.001 0 001 0.002 0 016 0.001 0 000 0.000 0 100 0 0 0 0578 2017_18 Q KL 87 Nixons Corner, Londonderry WWTW 06 KI 69 1 16 NIEA 30 06 2013 30/09/201 28/12/201 28/12/2015 0 0 0 100 0.000 0.029 0.010 1.2 5 0.278 0.000 0.000 0.000 0 0 0 20 26/07/2013 05/08/2013 01/09/201 30/01/2015 30/03/2015 0 0 6 9 -0.028 0 000 0.030 0 010 0.090 1.115 0.596 0 027 -0.028 23 32 0 5 0 2 08579 2017_18 Q KL 88 Aghanloo WWTW Feasibil ty Study. 06 KI 69 1 16 NIEA 0 0 0 0 0.000 0.000 0.000 0.000 0.000 0.000 0.000 0.000 0 0 0 0 0 0 0 100 -0.003 0 000 0.00 0 013 0.007 0 000 0.000 0 003 -0.003 11 50 0 39 0 0 03580 2017_18 Q KL 89 Ba lykelly WWTW Feasibil ty 06 KI 69 1 16 NIEA 31/03/2017 0 0 0 100 0.000 0.000 0.000 0.000 0.000 1. 09 1.906 0.000 3 27 0 30 27/05/2015 29/05/2015 0 0 0 100 1.028 0 000 0.005 0 01 0.030 0 066 0.269 0 221 1.028 32 68 0 0 0 0 02581 2017_18 Q KL 93 Art garvan WWTW 06 KI 69 1 16 NIEA 01 05 2013 19/01/2015 30/03/2015 30/03/2016 0 0 21 79 0.000 0.016 0.009 1.171 0. 8 0.017 0.000 0.000 32 2 0 09/08/2013 19/08/2013 07/0 /201 30/03/2016 23/05/2016 0 0 21 79 -0.039 0 000 0.016 0 009 0.017 0. 22 0.157 0 226 -0.039 32 23 0 5 0 5 02582 2017_18 Q KL 9 Strathfoy e Sewerage Syphons Upgrade. 00 KI 69 07 12 DRD 0 0 0 0 0.000 0.000 0.000 0.000 0.000 0.000 0.000 0.000 0 0 0 0 0 0 100 0 0.000 0 000 0.000 0 052 0.09 0 052 0.050 0 038 0.000 0 100 0 0 0 100 01583 2017_18 Q KL 95 Bova ly WWPS Upgrade 00 KI 69 12 12 DRD 0 0 0 0 0.000 0.000 0.000 0.000 0.000 0.000 0.000 0.000 0 0 0 0 0 0 0 100 0.000 0 000 0.007 0 000 0.000 0 000 0.013 0 013 0.000 0 56 0 0 0 0358 2017_18 Q KN636 Erganagh WWPS Rep acement 00 KI 69 12 12 DRD 0 0 0 0 0.000 0.000 0.000 0.000 0.000 0.000 0.000 0.000 0 0 0 0 03/06/201 20/06/201 05/10/2015 30/03/2017 21/03/2016 30/03/2017 0 0 0 100 -0.003 0 000 0.007 0 028 0.007 0 00 0.302 0.127 -0.003 0 32 0 68 0 0 03585 2017_18 Q KN639 Castle Archdale WWPS Upgrade 00 KI 69 12 02 DRD 0 0 0 0 0.000 0.000 0.000 0.000 0.000 0.000 0.000 0.000 0 0 0 0 19/11/2012 21/11/2012 30/11/2012 11/10/2013 25/10/2013 19/03/201 0 0 0 100 0.000 0 000 0.001 0. 10 0.11 -0 001 0.001 0 000 0.000 5 80 11 0 0586 2017_18 Q KN6 0 Dromore, Tyrone, WWTW Feasib lity Study. 06 KI 69 1 16 NIEA 30 09 201 19/01/2015 23/03/2015 23/03/2015 0 0 0 100 0.000 0.006 0.027 0.8 8 2.267 0.000 0.000 0.000 0 0 0 20 26/07/2013 05/08/2013 01/12/201 0 0 0 100 -0.010 0 000 0.006 0 022 0.059 0 89 0.226 0 000 -0.010 70 10 0 20 0 0 08587 2017_18 Q KP585 Garrison WwTWs 06 KI 69 09 16 0 0 0 0 0.000 0.000 0.000 0.000 0.000 0.000 0.000 0.000 0 0 0 0 0 0 0 100 0.000 0 000 0.000 0 000 0.023 0 01 0.008 0 015 0.000 0 0 0 100 0 0 03588 2017_18 Q KP669 Clabby Road WWPS Feasibil ty Study 00 KI 69 12 12 DRD 0 0 0 0 0.000 0.000 0.000 0.000 0.000 0.000 0.000 0.000 0 0 0 0 21/07/201 31/07/201 05/10/2015 30/06/2016 30/06/2016 20/10/2016 0 0 0 100 -0.005 0 000 0.001 0 009 0.00 0 008 0.559 0 078 -0.005 1 5 10 0 0 03589 2017_18 Q KP671 Drumgallon WWPS Upgrade. 00 KI 69 07 12 DRD 0 0 0 0 0.000 0.000 0.000 0.000 0.000 0.000 0.000 0.000 0 0 0 0 06/09/2016 07/09/2016 0 0 0 100 0.027 0 000 0.000 0 010 0.00 0 000 0.000 0 0 1 0.027 57 23 0 20 0 0 03590 2017_18 Q KP672 Tempo WWTW Feasibil ty Study 06 KI 69 1 16 NIEA 01 0 2013 01/09/2013 01/12/2013 01/12/201 0 0 0 100 0.000 0.006 0.016 0.30 0.0 5 0.000 0.000 0.000 0 0 0 20 09/08/2013 10/09/2013 30/06/201 06/01/2015 26/01/2015 0 0 0 100 0.000 0 000 0.006 0 017 0.067 0 821 0.010 0 015 0.000 27 33 0 0 0 0 08591 2017_18 Q KP673 Be leek WWTW Feasib lity 06 KI 69 1 16 NIEA 0 0 0 0 0.000 0.000 0.000 0.000 0.000 0.000 0.000 0.000 0 0 0 0 0 0 0 100 0.000 0 000 0.012 0 00 0.008 0 000 0.000 0 000 0.000 26 0 30 0 0 03592 2017_18 Q KP675 Tamlaght WWTW Upgrade 06 KI 69 09 16 DRD 0 0 0 100 -0.017 0 000 0.000 0 000 0.000 0 000 0.000 0 017 -0.017 26 0 30 0 0 03593 2017_18 Q KP676 Fivemi etown WWTW Feasibi ity Study 06 KI 69 1 16 NIEA 0 0 0 0 0.000 0.000 0.000 0.000 0.000 0.000 0.000 0.000 0 0 0 0 0 0 0 100 0.020 0 000 0.008 0 010 0.010 0 000 0.000 0 012 0.020 26 0 30 0 0 0359 2017_18 Q KR390 Cloughy WwTW Interim Solut on 01 KI 69 09 02 UR 09 01 2008 1 /01/2008 18 03 2008 26/05/2009 26/05/2009 26/05/2010 0 0 0 100 0.000 0.000 0.000 0.000 0.000 0.006 0.000 0.000 3 1 0 65 09/01/2008 1 /01/2008 18/03/2008 03/09/2012 09/06/2009 0 0 0 100 0.000 0 006 0.010 0 011 0.007 0 010 0.007 -0 007 0.000 3 1 0 65 0 0 01595 2017_18 Q KR 38 Glenmachan Street WWPS refurbishment 06 KI 69 13 02 UR 0 0 0 0 0.000 0.000 0.000 0.000 0.000 0.000 0.000 0.000 0 0 0 0 2 /06/2016 27/06/2016 0 0 0 100 1.322 0 010 0.001 0.171 0.000 0 000 0.000 0 238 1.322 0 100 0 0 0 0 01596 2017_18 Q KR 3 Sydenham WWPS Remedial Works 01 KI 69 13 02 UR 25 08 2011 26/08/2011 19 09 2011 21/12/2012 21/12/2012 21/12/2013 0 0 0 0 0.000 0.000 0.000 0.000 0.000 0.000 0.000 0.000 0 0 0 0 25/08/2011 26/08/2011 19/09/2011 30/10/2015 26/06/2015 0 0 0 100 -0.018 0 001 0.365 1 56 0.785 0 883 0.311 0 005 -0.018 0 80 20 0 0 0 01597 2017_18 Q KR Sydenham WWPS Strategic Invest gations 06 KI 69 07 12 UR 0 0 0 0 0.000 0.000 0.000 0.000 0.000 0.000 0.000 0.000 0 0 0 0 0 0 56 0.115 0 008 0.157 0 583 0.331 0 026 0.005 0 000 0.115 2 58 0 0 0 1 10598 2017_18 Q KR 5 DG5 - South Parade, Belfast 01 KI 69 07 12 0 0 0 0 0.000 0.000 0.000 0.000 0.000 0.000 0.000 0.000 0 0 0 0 02/07/2013 2 /07/2013 01/0 /2013 12/06/201 28/0 /201 0 0 100 0 -0.001 0 000 0.000 0 018 0.196 0 0 5 0.000 0 001 -0.001 0 3 66 0 0 3599 2017_18 Q KR 69 Meadowbank Park / Reavi le, Dundonald F ood Al eviation 00 KI 69 07 12 NIEA 0 0 0 0 0.000 0.000 0.000 0.000 0.000 0.000 0.000 0.000 0 0 0 0 20/01/201 12/02/201 01/0 /2011 27/02/2015 02/07/2015 0 0 100 0 -0.001 0 00 0.005 0 002 0.000 0 2 1 0.000 -0 003 -0.001 0 100 0 0 0 100 01600 2017_18 Q KR 86 M&E Capital Maintenance Wh tehouse WWTW 01 KI 69 09 02 UR 17 01 2011 21/01/2011 31 10 2011 30/11/2012 30/11/2012 30/11/2013 0 0 0 0 0.000 0.000 0.000 0.000 0.000 0.000 0.000 0.000 0 0 0 0 17/01/2011 21/01/2011 31/10/2011 13/12/2012 10/12/2012 0 0 0 100 -0.010 0 012 1.671 1.172 0.000 -0 009 0.000 0 000 -0.010 0 100 0 0 0 0601 2017_18 Q KR501 Carr ckfergus WWTW Upgrade 00 KI 69 09 02 DRD 01 01 2013 15/09/2013 15/12/2013 15/12/201 0 0 0 100 0.000 0.037 0.1 9 0.795 0.000 0.000 0.000 0.000 0 100 0 0 07/06/2011 10/06/2011 01/0 /2013 31/03/201 28/05/201 0 0 0 100 -0.009 0 000 0.038 0.175 0.73 0 391 0.037 0 033 -0.009 20 80 0 0 0 0 08602 2017_18 Q KR502 Greenisland WWTW's Refurb shment 00 KI 69 09 02 DRD 07 06 2011 10/06/2011 02 09 2011 30/03/2012 30/03/2012 30/03/2013 0 0 0 0 0.000 0.000 0.000 0.000 0.000 0.000 0.000 0.000 0 0 0 0 07/06/2011 10/06/2011 02/09/2012 30/03/2015 28/05/201 0 /07/2016 0 0 0 100 -0.030 0 000 0.031 0 071 0.551 0.159 0.071 0 003 -0.030 0 100 0 0 0 0 01603 2017_18 Q KR50 Por aferry Road, N,Ards WWPS Upgrade 00 KI 69 12 12 DRD 0 0 0 100 0.000 0.000 0.000 0.000 0.000 0.000 0.000 0.939 53 7 0 0 0 0 0 100 0.013 0 000 0.000 0 030 0.082 0 001 0.066 0 002 0.013 28 58 0 1 0 0 0260 2017_18 Q KR510 Tullynak ll Road WWTW Feasib lity 06 KI 69 1 16 NIEA 0 0 0 100 0.000 0.005 0.007 0.171 0.000 0.000 0.000 0.000 60 25 0 15 0 0 100 0 0.000 0 000 0.005 0 002 0.000 0 000 0.001 0 000 0.000 60 25 0 15 0 25 03605 2017_18 Q KS273 Comber Rd/Porta erry Rd Newtownards SPS 01 KI 69 12 02 UR 22 10 2008 0 /11/2008 08 12 2008 03/03/2010 03/03/2010 20/07/2011 0 0 0 0 0.000 0.000 0.000 0.000 0.000 0.000 0.000 0.000 0 0 0 0 22/10/2008 0 /11/2008 08/12/2008 02/03/2010 22/02/2010 19/07/2011 0 0 0 100 0.000 0 010 -0.030 0 001 0.000 0 000 0.001 0 000 0.000 0 100 0 0 0 0 01606 2017_18 Q KS301 Dundrum WwTW 00 KI 69 09 02 01 0 2008 22/01/2010 22/01/2010 22/01/2011 0 0 0 0 0.000 0.000 0.000 0.000 0.000 0.000 0.000 0.000 0 0 0 0 19/07/2010 22/01/2010 30/09/2013 0 0 0 100 -0.002 0 000 -0.010 0 007 0.158 0 000 0.000 0 000 -0.002 31 69 0 0 0 0607 2017_18 Q KS382 Crossgar Sewage Pumping Station Imp ovements 00 KI 69 12 02 UR 07 09 2011 1 /09/2011 13 08 2012 30/05/2013 30/05/2013 30/05/201 0 0 0 0 0.000 0.000 0.000 0.000 0.000 0.000 0.000 0.000 0 0 0 0 07/09/2011 1 /09/2011 01/0 /2013 11/06/2015 26/06/201 0 0 0 100 -0.001 0 010 0.061 0 71 0. 55 0 091 0.000 0 003 -0.001 0 100 0 0 0 0 01608 2017_18 Q KS890 Coney Island DAS 00 KI 69 07 12 DRD 0 0 0 0 0.000 0.000 0.000 0.000 0.000 0.000 0.000 0.000 0 0 0 0 0 0 100 0 0.002 0 000 0.017 0 001 0.002 0 000 0.001 0 002 0.002 0 100 0 0 0 100 01609 2017_18 Q KS892 Ki lyleagh WWTW Upgrade 00 KI 69 09 02 DRD 07 06 2011 10/06/2011 16 09 2011 30/03/2012 30/03/2012 30/03/2013 0 0 0 0 0.000 0.000 0.000 0.000 0.000 0.000 0.000 0.000 0 0 0 0 07/06/2011 10/06/2011 16/09/2011 03/11/201 30/03/2012 0 0 0 100 0.000 0 000 0.597 0 01 0.075 0.181 0.02 0 001 0.000 0 100 0 0 0 0 01610 2017_18 Q KS899 Strang ord Sewer Network Salinity Reduction 00 KI 69 07 12 0 0 0 0 0.000 0.000 0.000 0.000 0.000 0.000 0.000 0.000 0 0 0 0 0 0 100 0 0.003 0 000 0.026 0 006 0.000 -0 007 0.000 0 001 0.003 0 100 0 0 0 100 01611 2017_18 Q KV01 Castlewel an WwTW 01 KI 69 09 02 UR 06 06 2005 01 01 2006 19/08/2010 19/08/2010 19/08/2010 0 0 0 0 0.000 0.000 0.000 0.000 0.000 0.000 0.000 0.000 0 0 0 0 06/06/2005 02/0 /2012 19/08/2010 16/12/2013 19/08/2010 0 0 7 93 -0.007 0 019 0.00 -0 001 0.080 0 000 0.000 0 000 -0.007 58 13 0 29 0 0612 2017_18 Q KV089 Dunbar Road Banbr dge SPS Upgrade 01 KI 69 12 02 UR 16 08 2009 03/09/2009 01 0 2011 31/03/2015 31/03/2015 30/03/2016 0 0 0 0 0.000 0.000 0.000 0.000 0.000 0.000 0.000 0.000 0 0 0 0 16/08/2009 03/09/2009 02/07/2012 18/06/2013 10/02/201 23/10/201 0 0 0 100 0.000 0 007 0.003 0 078 0.02 0 000 0.000 0 001 0.000 0 100 0 0 0 0613 2017_18 Q KV15 Newry Road Sewage Pumping Station, Warrenpoint Upgrade 00 KI 69 13 12 NIEA 05 09 2008 1 /01/201 1 /01/201 1 /01/2015 0 0 38 62 0.000 0.080 1.293 1. 1 0.000 0.000 0.000 0.000 1 3 16 0 05/08/2011 12/08/2011 09/11/2012 26/05/201 27/06/201 23/11/2015 0 0 38 62 -0.001 0 000 0.082 1 010 2.70 0 505 0.001 0 000 -0.001 1 3 16 0 0 7 0861 2017_18 Q KI 71 SEMD Surveys PC10 Wastewater 01 09 16 UR 0 0 0 0 0.000 0.000 0.000 0.000 0.000 0.000 0.000 0.000 0 0 0 0 15/01/2018 15/01/2018 0 0 0 100 0.000 0 000 0.000 0 000 0.100 -0 001 0.010 0 000 0.000 100 0 0 0 0 0 01615 2017_18 Q KI 82 MBR Plants - Long Term Solutions 01 09 02 UR 0 0 0 0 0.000 0.000 0.000 0.000 0.000 0.000 0.000 0.000 0 0 0 0 0 0 0 100 0.037 0 000 0.130 0.115 -0.001 0 070 0.001 0 000 0.037 0 65 0 35 0 0 01616 2017_18 Q KI 87 Backsyphonage R sks at N W S tes. 01 09 16 UR 0 30 0 70 0.000 0.000 0.000 0.000 0.000 0.589 0.390 0.388 0 100 0 0 1 /11/2016 1 /11/2016 0 30 0 70 -0.26 0 000 0.000 0 006 0.039 0 000 0.023 1 071 -0.26 0 0 100 0 0 0 01617 2017_18 Q KI 88 Removal of Inlet Screens and Ins al at on of Sol d Hand ing Pum00 12 02 UR 20 05 2011 07/06/2011 31 10 2011 28/03/201 28/03/201 28/03/2015 0 0 0 0 0.000 0.000 0.000 0.000 0.000 0.000 0.000 0.000 0 0 0 0 20/05/2011 07/06/2011 30/10/2011 09/10/201 28/09/201 16/01/2015 0 0 0 100 0.000 0 000 0.050 1. 11 2.021 0 301 0.008 0 002 0.000 13 81 6 0 0 0 01618 2017_18 Q KI507 WWTW - Assessment of requirements at WWTWs for Freeze T00 09 02 DRD 0 0 0 100 0.000 0.000 0.000 0.000 0.000 0.072 0.000 0.000 0 100 0 0 0 0 0 100 0.000 0 000 0.000 0 000 0.000 0 000 0.000 0 000 0.000 0 100 0 0 0 0 01619 2017_18 Q KI508 UWWTW MCERT compl ance 05 09 16 DRD 28 06 2013 01/12/201 28/03/2015 28/03/2016 0 0 0 100 0.000 0.028 0.001 0.092 0.807 0.759 0.000 0.000 100 0 0 0 28/05/2012 31/05/2012 0 /09/201 25/03/2016 31/03/2016 0 0 0 100 0.000 0 000 0.029 -0 003 0.069 1.131 1.729 0 000 0.000 100 0 0 0 0 0 02620 2017_18 Q KI509 Appra sal of DG5 at risk regis er ocat ons Phase 2 00 07 12 UR 0 0 0 0 0.000 0.000 0.000 0.000 0.000 0.000 0.000 0.000 0 0 0 0 0 0 100 0 -0.002 0 000 0.015 0 027 0.000 0 008 0.003 0 007 -0.002 0 0 100 0 0 0 01621 2017_18 Q KI512 Western Area Telemetry Needs 00 12 20 DRD 0 0 0 0 0.000 0.000 0.000 0.000 0.000 0.000 0.000 0.000 0 0 0 0 21/07/201 31/07/201 0 0 0 100 0.01 0 000 0.000 0 01 0.015 0 015 0.507 0 0 8 0.01 0 0 0 100 0 0 01622 2017_18 Q KI513 Telemet y Ins al at on at WwPS 00 12 20 DRD 0 0 0 0 0.000 0.000 0.000 0.000 0.000 0.000 0.000 0.000 0 0 0 0 21/07/201 31/07/201 30/11/2015 31/03/2016 31/03/2017 0 0 0 100 0.002 0 000 0.000 0 005 0.010 0 007 0.371 0.158 0.002 0 0 0 100 0 0 01623 2017_18 Q KI51 WwTWs-Water Regulation Comp iance & Energy Efficiency Pr 01 09 02 DRD 0 0 0 100 0.000 0.000 0.000 0.000 0.000 0.7 0.000 0.000 70 30 0 0 0 0 0 100 0.001 0 000 0.000 0 005 0.010 0 008 0.023 0 061 0.001 71 29 0 0 0 0 0162 2017_18 Q KI515 DG5 Feasibil ty Report- Minor Works 00 07 12 NIEA 0 0 0 0 0.000 0.000 0.000 0.000 0.000 0.000 0.000 0.000 0 0 0 0 28/11/2017 05/12/2017 0 0 100 0 0.167 0 000 0.000 0 012 0.000 0 082 0.021 0 020 0.167 0 0 60 0 0 0 01625 2017_18 Q KI516 Small WWTW Year 3 Programme PC10 - 2012/13 00 09 17 NIEA 01 06 2012 29/03/2013 29/03/2013 29/03/201 0 0 0 0 0.000 0.000 0.000 0.000 0.000 0.000 0.000 0.000 0 0 0 0 12/12/2011 16/12/2011 07/10/2012 2 /01/201 30/03/201 19/03/201 0 0 0 100 0.000 0 000 0.000 3 331 1.2 1 -0 005 0.00 0 000 0.000 10 0 0 50 0 0626 2017_18 Q KI517 Appra sal of Energy Eff c ency at Waste Wa er Pumping Station00 12 02 DRD 0 0 0 100 0.000 0.000 0.000 0.000 0.000 0.020 0.000 0.000 0 100 0 0 15/05/201 19/05/201 0 0 100 0 0.000 0 000 0.000 0 010 0.029 0 000 0.003 0 000 0.000 0 100 0 0 0 0 01627 2017_18 Q KI519 Wastewater Pumping Sta ions Overf ow Monitoring Programme00 12 12 UR 0 0 0 0 0.000 0.000 0.000 0.000 0.000 0.000 0.000 0.000 0 0 0 0 03/08/2016 0 /08/2016 0 0 0 100 0.013 0 000 0.000 0 012 0.00 0 01 0.001 0 208 0.013 0 0 100 0 0 0 01628 2017_18 Q KI521 Sewer Structural Rehab li at on Package 5 00 07 12 DRD 0 0 0 0 0.000 0.000 0.000 0.000 0.000 0.000 0.000 0.000 0 0 0 0 0 0 100 0 0.000 0 000 0.000 0 000 0.000 0 000 0.000 0 000 0.000 0 100 0 0 0 100 01629 2017_18 Q KI526 Comp iance with the Quality of Bathing Wa er Regu at ons (NI) 00 09 16 DRD 0 0 0 0 0.000 0.000 0.000 0.000 0.000 0.000 0.000 0.000 0 0 0 0 15/08/2016 15/08/2016 0 0 0 100 -0.012 0 000 0.000 0 002 0.066 0.10 0.061 0 058 -0.012 26 0 30 0 0 09630 2017_18 Q KI527 Si e Drainage & or Chemical Storage Diagrams for WwTWs & 00 09 02 DRD 1 /12/2016 15/12/2016 0 0 0 100 0.319 0 000 0.000 0 000 0.000 0 000 0.000 0 050 0.319 0 100 0 0 0 0 01631 2017_18 Q KI528 Phase 2 - Aeration Op imisation E ficiency Programme 00 07 02 DRD 05/06/2013 17/06/2013 25/10/2013 30/03/2015 27/03/2015 02/02/2017 0 0 0 100 0.001 0 000 0.000 0 000 0.0 0 0 503 0.032 0 009 0.001 0 100 0 0 0 0 01632 2017_18 Q KI529 Appra sal of DG5 at-Risk Register Locations (M tigat on Phase 00 07 12 DRD 0 0 100 0 -0.009 0 000 0.000 0 000 0.030 -0 009 0.0 6 0 03 -0.009 0 0 100 0 0 0 01633 2017_18 Q KI530 Comp iance with Sur ace Waters (She lf sh (C ass ficat on)(Am 02 09 12 NIEA 15/08/2016 15/08/2016 0 0 6 9 0.000 0 000 0.000 0 000 0.023 0 037 0.080 0 010 0.000 100 0 0 0 0 0 0163 2017_18 Q KI531 Appra sal of DG5 At-R sk Register Locat ons (Mi igation Phase 00 07 12 DRD 0 0 100 0 0.000 0 000 0.000 0 000 0.022 -0 015 0.000 0 000 0.000 0 0 100 0 0 0 01635 2017_18 Q KI532 Bangor & Holywood Public Realm CCTV Survey 00 07 2 DRD 19/03/201 25/03/201 07/0 /201 2 /10/201 22/09/201 0 0 100 0 -0.005 0 000 0.000 0 000 0.103 0 305 0.003 0 002 -0.005 0 100 0 0 0 100 01636 2017_18 Q KI533 In eg ated Pollution Prevent on Control at Wastewater Treatme03 02 16 0 0 0 100 0.000 0 000 0.000 0 000 0.000 0 019 0.019 0 0 2 0.000 0 100 0 0 0 0637 2017_18 Q KI53 Telemet y Aud t Actions. 00 07 02 DRD 26/03/2013 03/0 /2013 0 0 0 100 -0.012 0 000 0.000 0 005 0.336 0.165 0.001 0 000 -0.012 0 100 0 0 0 0 01638 2017_18 Q KI536 PC15 Sewer Rehab ltation Unplanned 00 07 12 10/12/201 15/12/201 0 0 71 29 2.076 0 000 0.000 0 000 0.000 0 000 0.265 1 529 2.076 5 33 7 15 0 23 01639 2017_18 Q KI537 Sewerage Rehabil ta ion (P anned) 03 07 12 UR 0 0 100 0 0.000 0.000 0.000 5.20 3.562 0.683 3.916 3.706 0 100 0 0 0 0 100 0 0.000 0 000 0.000 0 000 0.000 0 000 0.000 0 000 0.000 0 100 0 0 0 100 016 0 2017_18 Q KW830 Tandragee WwTW 01 KI 69 09 02 UR 26 09 2005 27/05/2010 27/05/2010 27/05/2011 0 0 0 0 0.000 0.000 0.000 0.000 0.000 0.000 0.000 0.000 0 0 0 0 26/09/2005 27/05/2010 21/09/2009 0 0 0 100 0.000 -0. 09 -0.001 0 000 0.000 0 000 0.005 0 000 0.000 50 0 0 50 0 0 016 1 2017_18 Q KA1 3 Aldergrove Sewerage Scheme 00 KI537 07 12 NIEA 11 09 2008 01/10/2008 20 10 2008 15/06/2009 15/06/2009 15/06/2010 0 0 0 0 0.000 0.000 0.000 0.000 0.000 0.000 0.000 0.000 0 0 0 0 11/09/2008 01/10/2008 20/10/2008 23/06/2010 16/08/2010 0 0 100 0 0.000 0 076 -0.00 0 003 0.032 0 013 0.013 0 000 0.000 0 33 33 3 0 33 016 2 2017_18 Q KA213 Sewers Structural Rehabi itation Package 1 (M ll own, Ki lynees00 KI537 07 12 NIEA 16/12/2013 19/12/2013 0 0 100 0 0.98 0 000 0.000 0 000 0.012 0.16 0.328 1.153 0.98 0 100 0 0 0 100 016 3 2017_18 Q KA222 Granger s Mi l, Muckamore, Wastewater Pumping Main Reloca00 KI537 07 12 NIEA 19 11 2010 12/01/2011 07 03 2011 11/07/2011 11/07/2011 10/07/2012 0 0 0 0 0.000 0.000 0.000 0.000 0.000 0.000 0.000 0.000 0 0 0 0 19/11/2010 12/01/2011 0 0 100 0 -0.00 0 011 0.105 0 001 -0.003 -0 005 0.000 0 000 -0.00 0 100 0 0 0 1006 2017_18 Q KA22 Drumsough Road Randalstown,Sewarage Scheme. 00 KI537 09 12 NIEA 0 0 0 0 0.000 0.000 0.000 0.000 0.000 0.000 0.000 0.000 0 0 0 0 30/06/2015 20/07/2015 0 0 53 7 0.003 0 009 -0.003 0 005 0.016 0 002 0.009 0 010 0.003 81 19 0 0 0 10 016 5 2017_18 Q KA233 Blackcave Catchment, Larne - Networks Repairs 00 KI537 07 12 UR 30 09 2011 05/10/2011 28 11 2011 06/03/2012 06/03/2012 06/03/2013 0 0 0 0 0.000 0.000 0.000 0.000 0.000 0.000 0.000 0.000 0 0 0 0 30/09/2011 05/10/2011 06/05/2013 30/09/2015 28/10/2013 0 0 100 0 -0.01 0 002 0.071 0.12 0.293 0 033 0.028 0 061 -0.01 0 100 0 0 0 100 016 6 2017_18 Q KA23 Glenavy Road Crumlim WWPS S te Investigat on 06 KI537 07 12 NIEA 0 0 0 0 0.000 0.000 0.000 0.000 0.000 0.000 0.000 0.000 0 0 0 0 20/0 /2016 21/0 /2016 0 0 13 87 0.06 0 000 0.019 0 002 -0.003 0 003 0.009 0 036 0.06 60 19 0 21 0 036 7 2017_18 Q KA2 8 Ba lyga ly Sewer Rehab l tat on 00 KI537 07 12 DRD 0 0 0 0 0.000 0.000 0.000 0.000 0.000 0.000 0.000 0.000 0 0 0 0 28/05/201 09/06/201 2 /06/201 01/03/2016 23/03/2015 08/03/2016 0 0 8 52 -0.025 0 000 0.003 0 003 0.01 0 503 0.11 0 007 -0.025 62 26 12 0 0 21 016 8 2017_18 Q KB353 Maghera Area Sewers 00 KI537 07 2 NIEA 19 07 200 17 03 2008 06/01/2012 06/01/2012 05/01/2013 0 0 0 0 0.000 0.000 0.000 0.000 0.000 0.000 0.000 0.000 0 0 0 0 19/07/200 17/03/2008 06/01/2012 25/08/2008 0 0 7 93 0.000 -0 036 -0.003 0 051 -0.051 0 000 0.005 0 000 0.000 0 26 0 7 0 016 9 2017_18 Q KB387 Church Street, Cooks own 00 KI537 07 12 NIEA 02 02 2009 31/03/2009 31/03/2009 31/03/2010 0 0 0 0 0.000 0.000 0.000 0.000 0.000 0.000 0.000 0.000 0 0 0 0 02/02/2009 29/0 /2010 1 /06/2010 0 0 100 0 -0.001 0 005 -0.001 0 001 0.000 0 000 0.000 0 000 -0.001 20 30 10 0 0 30650 2017_18 Q KB 09 L ssan Road Cookstown Replacement S orm Sewer 00 KI537 07 12 NIEA 06 01 2009 28/01/2009 05 01 2009 18/03/2010 18/03/2010 18/03/2011 0 0 0 0 0.000 0.000 0.000 0.000 0.000 0.000 0.000 0.000 0 0 0 0 06/01/2009 28/01/2009 05/01/2009 18/03/2010 19/0 /2010 0 0 100 0 0.000 -0 023 0.00 0 011 0.000 0 000 0.005 0 000 0.000 0 0 0 60 0 0 01651 2017_18 Q KB 23 West and Rd, Cookstown - SPS Upgrade 00 KI537 07 12 NIEA 0 0 0 0 0.000 0.000 0.000 0.000 0.000 0.000 0.000 0.000 0 0 0 0 0 0 8 52 0.001 0 000 -0.002 0 000 0.000 -0 002 0.000 0 001 0.001 68 1 0 18 0 9 03652 2017_18 Q KB 72 26 Ba lyscu lion Road Bel aghy DG5 at Risk Register 00 KI537 07 12 DRD 0 0 0 0 0.000 0.000 0.000 0.000 0.000 0.000 0.000 0.000 0 0 0 0 16/12/2013 19/12/2013 0 0 93 7 0.000 0 000 0.033 0 016 0.00 0 01 0.001 0 000 0.000 0 20 80 0 0 20 01653 2017_18 Q KB 86 Galgorm WWPS Upgrade - Feasibil ty Study 06 KI537 12 12 DRD 0 0 0 100 0.000 0.000 0.000 0.000 0.000 0.000 0.000 0.000 7 32 0 21 08/09/2016 12/09/2016 0 0 0 100 1.052 0 000 0.000 0 020 0.000 0 026 0.0 6 0. 19 1.052 8 32 0 20 0 0 0265 2017_18 Q KC 25 Donaghbrook, Ba lymoney - Flooding Al ev at on 00 KI537 07 12 NIEA 0 0 100 0 0.000 0.000 0.000 0.000 0.000 0.180 0.000 0.000 0 100 0 0 0 0 100 0 0.061 0 000 0.000 0 003 0.059 0 006 0.028 0 010 0.061 0 0 100 0 0 0 01655 2017_18 Q KF037 Annagher Sewage Pumping S ation and Rising Main 00 KI537 13 12 NIEA 05 0 2012 01/05/2012 01 02 2013 30/0 /201 31/10/201 31/10/2015 0 0 32 68 0.000 0.087 0.118 2.337 0.179 0.000 0.000 0.000 25 0 31 05/0 /2012 01/05/2012 28/02/2013 19/02/2015 28/08/2015 0 0 35 65 0.000 0 000 0.089 0 300 1.579 0 853 0.095 0 000 0.000 1 38 0 21 0 17 08656 2017_18 Q KF076 Gorestown Road Sewerage Scheme 00 KI537 12 12 NIEA 29 08 2007 06/09/2007 10 03 2008 21/08/2012 21/08/2012 21/08/2013 0 0 0 0 0.000 0.000 0.000 0.000 0.000 0.000 0.000 0.000 0 0 0 0 29/08/2007 06/09/2007 10/03/2008 15/12/2009 29/09/2008 0 0 18 82 0.000 0 012 -0.035 0 00 0.000 -0 00 0.003 0 000 0.000 0 8 0 92 0 0 01657 2017_18 Q KF330 Armagh DAP S age 1 00 KI537 07 12 NIEA 2 11 2011 29/11/2011 01 07 2011 1 /10/2013 1 /10/2013 1 /10/201 0 0 80 20 0.130 0.123 0.06 1.6 1. 3 1.620 0.051 0.000 25 37 0 37 2 /11/2011 29/11/2011 06/10/201 19/0 /2017 28/07/2017 0 0 80 20 0.100 0.130 0.126 0 0 1 0.017 0 726 0.915 1 598 0.100 26 36 0 38 0 30 02658 2017_18 Q KG129 Loughgall Road Por adown S orm and Foul Sewer Extensions 00 KI537 07 2 NIEA 0 0 100 0 0.000 0 000 0.000 0 000 0.000 0 000 0.000 0 000 0.000 0 0 0 100 0 0 01659 2017_18 Q KG173 Por adown DAP Stage 1 00 KI537 07 02 0 0 0 0 0.000 0.000 0.000 0.000 0.000 0.000 0.000 0.000 0 0 0 0 0 0 93 7 0.005 0 0 0 0.087 0 008 0.0 2 0 002 0.005 0 022 0.005 0 100 0 0 0 93 01660 2017_18 Q KG177 Por adown DAP Stage 2 00 KI537 07 12 NIEA 0 0 100 0 0.000 0.000 0.000 0.000 0.000 0.000 0.000 2.791 29 31 29 10 0 0 100 0 -0.005 0 00 0.019 0 05 -0.001 0 003 0.011 0 000 -0.005 30 30 30 10 0 30 07661 2017_18 Q KG182 Martins Yard Gilford Pipe Bridge Condit on Survey 00 KI537 07 2 NIEA 02 03 2011 10/03/2011 20 06 2011 19/09/2012 19/09/2012 19/09/2013 0 0 0 0 0.000 0.000 0.000 0.000 0.000 0.000 0.000 0.000 0 0 0 0 02/03/2011 10/03/2011 27/07/2015 06/11/2015 25/09/2015 11/12/2015 0 0 100 0 0.000 0 002 0.019 0 008 0.001 0 00 0.07 0 000 0.000 0 100 0 0 0 100 01662 2017_18 Q KG185 Oak Grange, Waringstown F ood A leviation 01 KI537 1 12 DRD 0 0 0 0 0.000 0.000 0.000 0.000 0.000 0.000 0.000 0.000 0 0 0 0 0 0 0 100 0.000 0 000 0.012 0 023 -0.001 0 00 0.001 0 000 0.000 0 36 12 12 0 0 01663 2017_18 Q KL 3 Londonderry DAP: Duke Street Work package 00 KI537 07 12 NIEA 09 11 2009 16/11/2009 06 0 2009 10/02/2012 10/02/2012 09/02 2013 0 0 0 0 0.000 0.000 0.000 0.000 0.000 0.000 0.000 0.000 0 0 0 0 09/11/2009 16/11/2009 06/0 /2009 02/12/2011 17/09/2012 6 0 3 51 -0.007 3 282 0.987 0 023 0.052 0 030 0.000 0 000 -0.007 68 17 13 2 366 2017_18 Q KL 7 Londonderry DAP: Foyle Road Work Package: CSO Rationalis00 KI537 07 12 NIEA 15 11 2010 19/11/2010 26 09 2011 01/10/2012 01/10/2012 01/10/2013 0 0 0 0 0.000 0.000 0.000 0.000 0.000 0.000 0.000 0.000 0 0 0 0 15/11/2010 19/11/2010 0 0 52 8 -0.016 0 307 1.073 0 837 -0.171 -0 001 0.000 0 000 -0.016 62 25 13 0 0 1665 2017_18 Q KL 51 Londonderry DAP: Strathfoyle & Drumahoe Work package: CS00 KI537 07 12 NIEA 07 07 2011 11/07/2011 09 01 2012 25/09/2012 25/09/2012 25/09/2013 0 0 0 0 0.000 0.000 0.000 0.000 0.000 0.000 0.000 0.000 0 0 0 0 07/07/2011 11/07/2011 09/01/2012 2 /09/2012 01/10/2012 03/11/201 0 0 99 1 -0.003 0 017 0.6 6 0. 66 -0.020 0 006 0.000 0 000 -0.003 61 17 18 0 17666 2017_18 Q KL 57 Londonderry DAP: S orm Screening 01 KI537 07 12 NIEA 19 03 2009 20/03/2009 30 03 2009 27/10/2009 27/10/2009 27/10/2010 0 0 0 0 0.000 0.000 0.000 0.000 0.000 0.000 0.000 0.000 0 0 0 0 19/03/2009 20/03/2009 30/03/2009 03/12/2009 31/10/2011 0 0 6 36 -0.006 0 019 0.002 0 003 0.000 0 000 0.000 0 000 -0.006 100 0 0 0 0 0667 2017_18 Q KL 60 Foyle Springs, Derry Flood Al evia ion 00 KI537 07 12 NIEA 0 0 100 0 0.000 0.000 0.000 0.000 0.000 0.312 0.000 0.000 8 0 92 0 16/12/2013 19/12/2013 0 0 100 0 0.001 0 002 0.000 0 003 0.002 0 082 0.119 0 263 0.001 8 0 92 0 0 0 01668 2017_18 Q KL 69 Maydown WWPS Rep acement. 00 KI537 12 12 UR 06 07 2011 15/07/2011 09 01 2012 26/10/2012 26/10/2012 26/10/2013 0 0 0 0 0.000 0.000 0.000 0.000 0.000 0.000 0.000 0.000 0 0 0 0 06/07/2011 15/07/2011 0 0 21 79 0.000 0 023 0.102 0.12 0.005 0 010 0.013 0 000 0.000 0 32 0 68 0 6 01669 2017_18 Q KL500 Dernaf aw Combined Sewer Network Invest ga ion 00 KI537 07 12 DRD 0 0 0 0 0.000 0.000 0.000 0.000 0.000 0.000 0.000 0.000 0 0 0 0 0 0 100 0 0.000 0 000 0.000 0 005 0.02 0 000 0.000 0 000 0.000 0 100 0 0 0 100 01670 2017_18 Q KN1 3 Castlederg 00 KI537 07 12 NIEA 0 0 0 0 0.000 0.000 0.000 0.000 0.000 0.000 0.000 0.000 0 0 0 0 0 0 100 0 0.001 0 0 7 0.087 -0 016 -0.003 0 005 0.016 0 001 0.001 0 0 100 0 0 0 01671 2017_18 Q KN595 Brookmount Road - Hunters Cresent Sewer Replacement 00 KI537 07 12 NIEA 0 02 2010 15/02/2010 01 06 2010 27/07/2012 27/07/2012 27/07/2013 0 0 0 0 0.000 0.000 0.000 0.000 0.000 0.000 0.000 0.000 0 0 0 0 0 /02/2010 15/02/2010 0 0 100 0 -0.008 1.1 2 0.133 0 236 -0.011 -0 007 0.002 0 000 -0.008 15 9 68 8 0 9 01672 2017_18 Q KO128 Ba lyroney Road, Rathfr land, Storm Sewer 00 KI537 07 12 27 10 2011 27/10/2011 05 01 200 0 0 0 0 0.000 0.000 0.000 0.000 0.000 0.000 0.000 0.000 0 0 0 0 27/10/2011 27/10/2011 05/09/2005 0 0 100 0 0.00 0 000 0.002 0 000 0.000 0 000 0.000 0 000 0.00 0 100 0 0 0 0673 2017_18 Q KR203 Kensing on Gardens Flood Re ief 00 KI537 07 12 NIEA 29 09 2008 27/11/2008 09 03 2009 08/01/2010 08/01/2010 08/01/2011 0 0 0 0 0.000 0.000 0.000 0.000 0.000 0.000 0.000 0.000 0 0 0 0 29/09/2008 27/11/2008 09/03/2009 07/01/2010 07/12/2009 0 0 100 0 -0.001 0 010 0.006 0 001 0.000 0 000 0.000 0 000 -0.001 0 0 100 0 0 067 2017_18 Q KR 02 Joymount Carrick DAP Phase 1 00 KI537 07 12 NIEA 13 03 2009 26/03/2009 07 0 2009 1 /0 /2010 1 /0 /2010 1 /0 /2011 0 0 0 0 0.000 0.000 0.000 0.000 0.000 0.000 0.000 0.000 0 0 0 0 13/03/2009 26/03/2009 07/0 /2009 30/09/2011 26/0 /2011 0 0 6 36 0.000 0.18 0.0 3 -0 021 0.001 0 000 0.001 0 000 0.000 0 35 52 13 0 30 01675 2017_18 Q KR 17 Ormeau Avenue Sewerage upgrade for pollution resolu ion 00 KI537 1 12 NIEA 30 06 2013 01/01/2015 01/01/2015 01/01/2016 0 0 100 0 0.002 0.057 0.031 0.763 0.920 1.576 0.000 0.000 69 31 0 0 20/09/2017 03/10/2017 11/12/2017 21/03/2017 26/06/2020 0 0 89 11 1.055 0 002 0.058 0 030 0.02 0 055 0.000 0 25 1.055 60 12 25 3 0 12 02676 2017_18 Q KR 32 Beechmount Avenue Gortfin Street Hydraul c Upgrade 00 KI537 07 12 NIEA 03 12 2010 12/01/2011 31 03 2011 11/01/2012 11/01/2012 10/01/2013 0 0 0 0 0.000 0.000 0.000 0.000 0.000 0.000 0.000 0.000 0 0 0 0 03/12/2010 12/01/2011 18/11/2010 02/12/2011 18/11/2010 0 0 90 10 -0.002 0 0 8 0.917 0 032 0.000 -0 001 0.000 0 000 -0.002 5 55 0 0 0 55677 2017_18 Q KR 39 M l is e DAP Stage 2 00 KI537 07 12 NIEA 22 02 2011 02/03/2011 30 09 2013 01/01/2015 01/03/2015 01/03/2016 0 0 92 8 0.16 0.291 0.055 0.553 0.896 0.000 0.000 0.000 50 27 23 0 22/02/2011 02/03/2011 29/11/2012 0 0 92 8 -0.011 0.16 0.298 0.117 0.079 0 038 0.001 0 000 -0.011 50 27 23 0 0 19 08678 2017_18 Q KR 0 Ba lywal er DAP Stage 1 00 KI537 07 12 NIEA 02 02 2010 09/02/2010 15 03 2010 01/10/2010 01/10/2010 01/10/2010 0 0 0 0 0.000 0.000 0.000 0.000 0.000 0.000 0.000 0.000 0 0 0 0 02/02/2010 09/02/2010 15/03/2010 30/09/2010 27/09/2010 30/09/2010 0 0 100 0 -0.002 0 215 0.003 0 002 0.000 0 000 0.000 0 000 -0.002 80 20 0 0 0 20679 2017_18 Q KR 52 Baroda Street / O meau Park, Be fast CSO 00 KI537 07 12 NIEA 07 08 2009 1 /08/2009 07 09 2009 07/09/2011 07/09/2011 06/09/2012 0 0 0 0 0.000 0.000 0.000 0.000 0.000 0.000 0.000 0.000 0 0 0 0 07/08/2009 1 /08/2009 07/09/2009 07/09/2011 05/09/2011 0 0 79 21 -0.001 0 2 3 0.506 0 000 0.000 0 000 0.000 0 000 -0.001 58 22 0 20 0 15680 2017_18 Q KR 56 Drumg ass Park, L sburn Road, Belfast. Storm Seperation. 00 KI537 07 12 NIEA 17 02 2011 01/03/2011 08 08 2011 20/01/2012 20/01/2012 19/01/2013 0 0 0 0 0.000 0.000 0.000 0.000 0.000 0.000 0.000 0.000 0 0 0 0 17/02/2011 01/03/2011 08/08/2011 29/10/2012 16/01/2012 0 0 100 0 -0.003 0 007 0.187 0 010 0.006 0 060 0.005 0 000 -0.003 0 100 0 0 0 100 01681 2017_18 Q KR 57 Ladybrook, Be fast Sewer Inves igation (Structural) 00 KI537 07 12 NIEA 03 12 2010 12/01/2011 05 03 2012 21/12/2012 21/12/2012 21/12/2013 0 0 0 0 0.000 0.000 0.000 0.000 0.000 0.000 0.000 0.000 0 0 0 0 03/12/2010 12/01/2011 05/03/2012 28/03/2013 26/05/201 12/03/201 0 0 100 0 0.000 0 018 0.180 0 686 0.038 0 005 0.003 0 000 0.000 0 100 0 0 0 100 01682 2017_18 Q KR 73 Hamel Drive F ood A leviation East Be fast 00 KI537 07 12 NIEA 08 10 2010 0 /11/2010 17 01 2011 23/06/2011 23/06/2011 23/06/2011 0 0 0 0 0.000 0.000 0.000 0.000 0.000 0.000 0.000 0.000 0 0 0 0 08/10/2010 0 /11/2010 0 0 100 0 0.000 0.109 0.038 -0 001 0.000 0 000 0.000 -0 003 0.000 0 0 100 0 0 0683 2017_18 Q KR 80 Holywood Sewer Network Improvements 00 KI537 07 12 NIEA 19 01 2012 23/01/2012 15 01 2013 01/01/2015 01/01/2015 01/01/2016 0 0 5 6 0.133 0.065 0.100 1.272 1.676 2.736 0.00 0.000 93 7 0 0 19/01/2012 23/01/2012 01/08/201 16/12/2016 29/06/2016 09/03/2017 0 0 65 35 -0.019 0.133 0.067 0.126 0.222 1. 36 3. 16 0 833 -0.019 100 0 0 0 0 0 0268 2017_18 Q KR 89 Glenmachan Stra eg c Project Phase 1a Sicily & Marguerite Pa00 KI537 07 12 UR 0 0 100 0 0.000 0.000 0.000 0.000 0.000 . 78 .580 1.210 0 0 100 0 0 /05/2016 10/05/2016 0 0 100 0 -0.002 0 000 0.002 -0 001 0.000 0 05 0.200 0 012 -0.002 2 0 98 0 0 0 02685 2017_18 Q KR52 Roddens C escent Sewer Upgrades (DG5) 00 KI537 07 12 NIEA 0 0 0 0 0.000 0.000 0.000 0.000 0.000 0.000 0.000 0.000 0 0 0 0 21/07/201 31/07/201 03/10/201 30/03/2015 27/02/2015 0 0 100 0 0.013 0 000 0.000 0 003 -0.003 0 3 0.052 0 031 0.013 0 0 60 0 0 0 01686 2017_18 Q KS337 Carnesure Park, Comber Foul Sewer Rep acement 00 KI537 07 12 NIEA 0 06 2007 30/06/2009 30/06/2009 30/06/2010 0 0 0 0 0.000 0.000 0.000 0.000 0.000 0.000 0.000 0.000 0 0 0 0 0 /06/2007 19/0 /2011 30/07/2007 0 0 100 0 -0.005 0 000 0.003 0 008 0.005 0 000 0.000 0 000 -0.005 0 8 26 26 0 26 01687 2017_18 Q KS362 Station Road, Crossgar Replacement Sewer 00 KI537 07 12 NIEA 22 01 2007 13/02/2007 18 02 2008 25/02/2010 25/02/2010 08/06/2010 0 0 0 0 0.000 0.000 0.000 0.000 0.000 0.000 0.000 0.000 0 0 0 0 22/01/2007 13/02/2007 18/02/2008 25/02/2010 07/01/2008 08/06/2010 0 0 100 0 -0.002 0 005 -0.001 0 000 0.000 0 000 0.000 0 000 -0.002 0 100 0 0 0 100688 2017_18 Q KS372 Market Street SPS Upgrade, Downpatr ck 00 KI537 07 12 NIEA 16 01 2007 05/02/2007 03 09 2012 28/02/201 28/02/201 28/02/2015 0 0 57 3 0.80 0.038 0.553 1.21 0.0 0 0.003 0.000 0.000 6 25 0 11 16/01/2007 05/02/2007 01/0 /201 18/02/2016 26/02/2016 08/0 /2016 0 0 53 7 0.025 0 80 0.039 0 016 0.736 1 630 0.121 0 003 0.025 85 8 0 7 0 3 02689 2017_18 Q KS373 Church Street SPS Upg ade, Downpatrick 00 KI537 07 12 NIEA 01 05 2009 16/06/2009 16 01 2012 22/0 /2013 22/0 /2013 22/0 /201 0 0 0 0 0.000 0.000 0.000 0.000 0.000 0.000 0.000 0.000 0 0 0 0 01/05/2009 16/06/2009 16/01/2012 06/05/2013 29/07/2013 23/10/201 0 0 80 20 0.000 0 0 5 0.761 1 2 8 0.021 0 000 0.002 0 000 0.000 66 27 0 7 0 11 01690 2017_18 Q KS37 Hunter s Mi l S orm Attenuation and Network Improvemen s, Do00 KI537 07 12 NIEA 0 0 0 0 0.000 0.000 0.000 0.000 0.000 0.000 0.000 0.000 0 0 0 0 30/10/2012 01/11/2012 01/10/2013 19/02/2015 23/03/2015 02/10/2017 0 0 88 12 -0.020 0 016 0.028 0 0 5 0.716 0 880 0.12 0 031 -0.020 8 12 1 3 0 12 08691 2017_18 Q KS377 Downs Road Cas le Park Sewer Upgrade/ A tenua ion 00 KI537 07 12 NIEA 17 09 2007 20/09/2007 30 09 2010 03/02/2012 03/02/2012 02/02/2013 0 0 0 0 0.000 0.000 0.000 0.000 0.000 0.000 0.000 0.000 0 0 0 0 17/09/2007 20/09/2007 30/09/2010 23/01/2012 26/01/2012 01/05/2013 0 0 82 18 -0.001 1 57 0.812 -0 017 0.029 0 000 0.000 0 000 -0.001 72 16 0 12 0 9692 2017_18 Q KS378 Burren River SPS Upgrades & Networks Improvements 01 KI537 07 12 NIEA 21 07 2008 23/07/2008 29 09 2008 20/0 /2010 20/0 /2010 12/11/2010 0 0 0 0 0.000 0.000 0.000 0.000 0.000 0.000 0.000 0.000 0 0 0 0 21/07/2008 23/07/2008 29/09/2008 05/0 /2010 11/11/2010 0 0 83 17 0.000 0 020 0.002 0 000 0.000 0 000 0.003 0 000 0.000 63 22 9 6 0 18 01693 2017_18 Q KS379 Murlough SPS Upgrade & Network Improvements 00 KI537 07 12 NIEA 11 12 2009 21/12/2009 26 0 2010 03/11/2011 03/11/2011 03/11/2011 0 0 0 0 0.000 0.000 0.000 0.000 0.000 0.000 0.000 0.000 0 0 0 0 11/12/2009 21/12/2009 26/0 /2010 29/0 /2011 11/0 /2011 03/11/2011 0 0 88 12 -0.006 0 930 0.073 -0 003 0.000 0 000 0.000 0 000 -0.006 63 20 0 17 0 1869 2017_18 Q KS807 Kilkeel Harbour SPS and Sewerage Improvemen s 00 KI537 07 12 NIEA 12 06 2009 09/07/2009 11 10 2010 26/03/2012 26/03/2012 26/03/2013 0 0 0 0 0.000 0.000 0.000 0.000 0.000 0.000 0.000 0.000 0 0 0 0 12/06/2009 09/07/2009 0 0 96 -0.017 0 205 0.261 0 029 0.008 0 000 0.000 0 000 -0.017 60 0 0 0 0 38695 2017_18 Q KS809 Carrowdore Sewer Replacement 00 KI537 07 12 NIEA 20 11 2007 03/12/2007 27 10 2008 18/10/2011 18/10/2011 17/10/2012 0 0 0 0 0.000 0.000 0.000 0.000 0.000 0.000 0.000 0.000 0 0 0 0 20/11/2007 03/12/2007 27/10/2008 13/01/2011 30/03/2009 0 0 100 0 -0.012 0 003 -0.002 0 012 0.000 0 000 0.000 0 000 -0.012 0 77 0 23 0 77696 2017_18 Q KS812 Greyabbey DAP Phase 1 01 KI537 07 12 NIEA 18 07 2011 01/08/2011 10 10 2011 2 /09/2012 2 /09/2012 2 /09/2013 0 0 0 0 0.000 0.000 0.000 0.000 0.000 0.000 0.000 0.000 0 0 0 0 18/07/2011 01/08/2011 10/10/2011 2 /09/2012 27/05/2013 25/0 /2013 0 0 66 3 0.000 0 021 0.601 0 618 0.01 0 000 0.005 0 000 0.000 38 15 0 7 0 15 01697 2017_18 Q KS83 Sewers Structural Rehabi itation Package 2 00 KI537 07 12 NIEA 0 0 0 0 0.000 0.000 0.000 0.000 0.000 0.000 0.000 0.000 0 0 0 0 16/12/2013 19/12/2013 0 0 100 0 1.013 0 000 0.03 0 020 0.052 0 039 0. 00 1. 19 1.013 0 100 0 0 0 100 01698 2017_18 Q KS835 South Street, Newtownards WWPS Refurb shment 00 KI537 12 12 NIEA 03 12 2010 12/01/2011 08 11 2010 16/11/2012 16/11/2012 16/11/2013 0 0 0 0 0.000 0.000 0.000 0.000 0.000 0.000 0.000 0.000 0 0 0 0 03/12/2010 12/01/2011 08/12/2010 28/01/2013 15/05/2013 02/08/2013 0 0 13 87 -0.019 0 066 0.562 0 902 -0.002 -0 001 0.000 0 000 -0.019 52 8 0 0 0 13699 2017_18 Q KS839 Gransha Road, Bangor, Trunk Sewer rep acement. 00 KI537 07 12 NIEA 20 06 2011 15/07/2011 19 09 2011 25/11/2011 25/11/2011 2 /11/2012 0 0 0 0 0.000 0.000 0.000 0.000 0.000 0.000 0.000 0.000 0 0 0 0 20/06/2011 15/07/2011 19/09/2011 28/08/201 27/08/201 0 0 100 0 0.000 0 000 0.001 0 000 0.000 0.172 0.013 0 000 0.000 20 80 0 0 0 80 01700 2017_18 Q KS8 0 Cra gdarragh Rd To Seahi l Rd Sewer Rep acement 00 KI537 07 12 NIEA 21 06 2010 28/06/2010 30 07 2012 2 /02/2012 2 /02/2012 23/02/2013 0 0 0 0 0.000 0.000 0.000 0.000 0.000 0.000 0.000 0.000 0 0 0 0 21/06/2010 28/06/2010 09/01/2012 22/02/2013 02/12/2013 0 0 100 0 -0.008 0 000 0.006 0.191 0.000 0 001 0.000 0 000 -0.008 0 100 0 0 0 100701 2017_18 Q KS8 2 Kilkeel DAP Phase 1 00 KI537 07 12 NIEA 0 0 0 0 0.000 0.000 0.000 0.000 0.000 0.000 0.000 0.000 0 0 0 0 0 0 100 0 0.073 0 005 0.051 0 015 -0.01 0 000 0.000 0 016 0.073 0 0 15 5 0 0 03702 2017_18 Q KS8 6 High Street, Ardglass Sewer Realignment 00 KI537 07 12 NIEA 0 0 0 0 0.000 0.000 0.000 0.000 0.000 0.000 0.000 0.000 0 0 0 0 12/12/2012 21/12/2012 05/08/2013 15/11/2013 16/09/2013 13/01/201 0 0 100 0 0.000 0 000 0.000 0 002 0.032 0 000 0.001 0 000 0.000 0 100 0 0 0 100 01703 2017_18 Q KS867 Copeland Road, Comber, Tank Sewer 01 KI537 07 12 NIEA 0 0 0 0 0.000 0.000 0.000 0.000 0.000 0.000 0.000 0.000 0 0 0 0 06/12/2012 11/12/2012 01/09/201 30/10/201 29/12/201 0 0 100 0 0.011 0 001 0.002 0 002 0.000 0.18 0.023 -0 006 0.011 11 0 89 0 0 0 0170 2017_18 Q KS872 Bangor DAP Work Package 1: Carna ea Stream UID 01 KI537 07 12 NIEA 0 0 30 70 0.000 0.000 0.000 0.000 0.000 0.000 0. 80 0.000 100 0 0 0 15/11/2016 21/11/2016 0 0 30 70 0.709 0 000 0.000 0 065 -0.022 0 008 0.060 0.139 0.709 100 0 0 0 0 0 02705 2017_18 Q KT 03 Drumbeg Drive, L sburn WWPS Enhancement 01 KI537 07 12 NIEA 21 09 2012 27/09/2012 01 12 2012 30/09/201 30 09 201 30/09/201 30/0 /2015 0 0 85 15 0.000 0.023 0.238 1.296 1. 3 0.000 0.000 0.000 76 2 0 0 21/09/2012 27/09/2012 01/0 /201 18/08/201 25/08/201 25/11/201 0 0 0 100 0.000 0 000 0.02 0.131 1.756 1 02 0.010 0 000 0.000 76 2 0 0 0 0 08706 2017_18 Q KT 11 Edgewa er WWPS H&S Upgrade - Feasib lity Study 00 KI537 12 12 DRD 0 0 0 0 0.000 0.000 0.000 0.000 0.000 0.000 0.000 0.000 0 0 0 0 13/11/2012 1 /11/2012 30/11/2012 26/09/2013 29/11/2013 13/03/201 0 0 0 100 0.000 0 000 0.000 0 013 0.077 0 000 0.001 0 000 0.000 2 82 16 0 0 0 09707 2017_18 Q KV063 Newry Sewerage Networks Improvemen s 00 KI537 07 12 NIEA 19 03 2007 08/07/2008 08/07/2008 08/07/2009 0 0 0 0 0.000 0.000 0.000 0.000 0.000 0.000 0.000 0.000 0 0 0 0 0 0 100 0 -0.003 0.11 0.238 -0 002 0.000 0 000 0.013 0 000 -0.003 21 6 0 15 0 15 11708 2017_18 Q KV07 Cambrook SPS to Green Road 00 KI537 07 12 NIEA 15 09 2008 17/11/2008 19 01 2009 0 /02/2010 0 /02/2010 0 /02/2010 0 0 0 0 0.000 0.000 0.000 0.000 0.000 0.000 0.000 0.000 0 0 0 0 15/09/2008 17/11/2008 19/01/2009 23/11/2009 23/11/2009 03/02/2010 12 0 88 0 -0.006 -0 026 -0.001 0 011 0.000 0 000 0.000 0 000 -0.006 0 100 0 0 12 88709 2017_18 Q KV121 Camlough Road Newry S orm and Foul Sewer 00 KI537 07 12 NIEA 15 0 2011 06/05/2011 13 11 2010 26/01/2012 26/01/2012 18/07/2012 0 0 0 0 0.000 0.000 0.000 0.000 0.000 0.000 0.000 0.000 0 0 0 0 15/0 /2011 06/05/2011 25/11/2011 12/09/2011 17/07/2012 0 0 100 0 -0.011 0 000 0.100 0 001 0.000 0 000 0.000 0 000 -0.011 0 100 0 0 0 100710 2017_18 Q KV1 3 Monaghan Street Sewerage Sys em Investigat on 00 KI537 07 12 NIEA 0 0 0 0 0.000 0.000 0.000 0.000 0.000 0.000 0.000 0.000 0 0 0 0 0 0 100 0 0.000 0 000 0.000 0 000 0.000 0 000 0.000 0 000 0.000 0 100 0 0 0 100711 2017_18 Q KV1 5 Charlo te Street/Newry Road Warrenpoint Proposed Sewer Im00 KI537 07 12 NIEA 10 09 2008 15/09/2008 2 11 2008 25/01/2012 25/01/2012 25/01/2012 0 0 0 0 0.000 0.000 0.000 0.000 0.000 0.000 0.000 0.000 0 0 0 0 10/09/2008 15/09/2008 2 /11/2008 01/12/2009 02/11/2009 25/01/2012 0 0 100 0 0.000 0 002 -0.003 0 000 0.003 0 00 0.001 0 000 0.000 0 0 100 0 0 0 01712 2017_18 Q KV1 7 Main Street/Dromore Street, Rathfr land Sewer Replacement 01 KI537 07 12 UR 19 10 2010 19/11/2010 20 06 2011 02/11/2011 02/11/2011 25/01/2012 0 0 0 0 0.000 0.000 0.000 0.000 0.000 0.000 0.000 0.000 0 0 0 0 19/10/2010 19/11/2010 20/06/2011 30/09/2011 03/10/2011 25/01/2012 0 0 100 0 -0.001 0 006 0.150 -0 003 0.000 0 000 0.000 0 000 -0.001 0 100 0 0 0 100713 2017_18 Q KV161 Castlewel an DAP Stage 1 00 KI537 07 12 NIEA 01 06 2013 31/03/201 31/03/201 31/03/2015 0 0 100 0 0.000 0.005 0.023 0.221 0.000 0.000 0.000 0.000 90 0 0 10 16/11/2012 21/11/2012 11/11/2013 28/03/201 30/0 /201 22/05/2015 0 0 77 23 -0.002 0 000 0.005 0 011 0.110 0 0 8 0.001 0 000 -0.002 100 0 0 0 0 0 0871 2017_18 Q KV171 Ra lway Drain, Newry – Desi ting, cond tion survey & associa e 01 KI537 07 2 NIEA 0 0 0 0 0.000 0.000 0.000 0.000 0.000 0.000 0.000 0.000 0 0 0 0 0 0 100 0 -0.007 0 00 0.011 0 001 0.000 0 000 0.000 0 080 -0.007 0 100 0 0 0 100 01715 2017_18 Q KV172 St Judes Gardens, Rostrevor F ood Al evia ion 00 KI537 07 12 NIEA 03 05 2012 10/05/2012 03 05 2011 21/01/2013 21/01/2013 21/01/201 0 0 0 0 0.000 0.000 0.000 0.000 0.000 0.000 0.000 0.000 0 0 0 0 19/09/2013 19/09/2013 28/10/2013 09/10/201 27/03/2015 30/06/2015 0 0 100 0 0.002 0 000 0.019 0 009 0.562 0.1 5 0.060 0 000 0.002 0 0 100 0 0 0 01716 2017_18 Q KI538 Sewerage New and Renewed including FTS. (Unplanned) 03 07 2 UR 0 0 99 1 0.000 0.000 0.000 3.559 3. 50 0.000 0.000 0.000 3 19 0 78 05/07/2013 16/07/2013 0 0 100 0 0.070 0 000 0.000 0 000 0.17 0 615 0.653 0.118 0.070 3 19 0 78 0 19 01717 2017_18 Q KV199 Dublin Road New y Out of Sewer Flooding 00 KI537 07 12 NIEA 0 0 100 0 0.000 0.000 0.000 0.000 0.000 0.0 5 0.000 0.000 0 100 0 0 13/10/2015 26/10/2015 0 0 100 0 0.000 0 000 0.000 0 000 0.015 0 017 0.006 0 000 0.000 0 100 0 0 0 100 01718 2017_18 Q JR 00 A2 Shore Road Re-a ignment - G eenisland 00 KI538 07 2 NIEA 20 05 2008 28/05/2008 03 11 2008 20/0 /2011 20/0 /2011 19/0 /2012 0 0 0 0 0.000 0.000 0.000 0.000 0.000 0.000 0.000 0.000 0 0 0 0 20/05/2008 28/05/2008 0 0 100 0 0.001 0 013 0.000 0 020 0.198 0.173 0.068 0 003 0.001 0 100 0 0 0 100 01719 2017_18 Q KA197 The P ains, Burns de Road, Doagh, Foul Sewer Extension 00 KI538 07 2 NIEA 10 08 2010 20/08/2010 21 09 2010 16/11/2010 16/11/2010 18/02/2011 0 0 0 0 0.000 0.000 0.000 0.000 0.000 0.000 0.000 0.000 0 0 0 0 10/08/2010 20/08/2010 21/09/2010 15/11/2010 21/09/2010 17/02/2011 0 0 100 0 0.000 0 055 -0.001 0 000 0.000 0 000 0.000 -0 002 0.000 0 0 0 100 0 0 01720 2017_18 Q KA228 Birch H ll Road Antrim Foul & Sto m Sewer Extensions 00 KI538 07 2 NIEA 0 0 0 0 0.000 0.000 0.000 0.000 0.000 0.000 0.000 0.000 0 0 0 0 30/11/2016 15/12/2016 0 0 100 0 0.000 0 001 -0.001 0 000 0.002 0 002 0.015 0 000 0.000 0 0 0 100 0 0 01721 2017_18 Q KA237 Steeple Road, Antrim, Foul and Storm Sewer Extens ons 00 KI538 07 2 NIEA 20 05 2011 27/05/2011 17 07 2011 2 /05/2012 2 /05/2012 2 /05/2013 0 0 0 0 0.000 0.000 0.000 0.000 0.000 0.000 0.000 0.000 0 0 0 0 20/05/2011 27/05/2011 17/07/2011 23/05/2012 25/03/2012 0 0 100 0 0.000 0 001 0.167 0 055 -0.020 0 000 0.015 -0 001 0.000 0 0 0 100 0 0 01722 2017_18 Q KA238 131 Doagh Road Ballyclare Storm Sewer Extension 00 KI538 07 2 DRD 08 02 2012 1 /02/2012 28 07 2011 31/05/2012 31/05/2012 31/05/2013 0 0 0 0 0.000 0.000 0.000 0.000 0.000 0.000 0.000 0.000 0 0 0 0 08/02/2012 1 /02/2012 18/05/2015 06/10/2015 06/10/2015 22/0 /2016 0 0 100 0 -0.001 0 000 0.003 0 000 0.000 0 001 0.092 0 005 -0.001 0 0 0 100 0 0 01723 2017_18 Q KA2 3 Shore Road, Glynn, Larne, Sto m Sewer and Foul Pumping Ma00 KI538 07 2 DRD 0 0 0 0 0.000 0.000 0.000 0.000 0.000 0.000 0.000 0.000 0 0 0 0 0 0 100 0 0.000 0 000 0.000 0 015 0.001 0 002 0.000 0 001 0.000 0 0 0 100 0 0 0172 2017_18 Q KA2 9 M llmount, Randa s own, Waste Wa er Pumping Station 00 KI538 07 2 DRD 0 0 0 0 0.000 0.000 0.000 0.000 0.000 0.000 0.000 0.000 0 0 0 0 0 0 10 90 0.000 0 000 0.010 0 003 -0.001 0 000 0.000 0 000 0.000 0 0 0 100 0 0 01725 2017_18 Q KA265 Station road, Antrim Storm & Foul Sewer Ext 00 KI538 07 2 DRD 21/05/2016 06/06/2016 22/06/2016 26/08/2016 02/12/2016 0 0 100 0 -0.002 0 000 0.000 0 000 0.000 0 000 0.000 0.1 6 -0.002 0 0 0 100 0 0 01726 2017_18 Q KB 52 Cushendall Road, (172-178),Ba lymena Storm Sewer Extens o 00 KI538 07 2 NIEA 0 0 0 0 0.000 0.000 0.000 0.000 0.000 0.000 0.000 0.000 0 0 0 0 10/01/2013 16/01/2013 01/07/2013 16/08/2013 26/08/2013 03/11/201 0 0 100 0 0.000 0 001 0.000 0 000 0.109 0 000 0.008 0 000 0.000 0 70 0 30 0 70 01727 2017_18 Q KB 55 75-85 Cushendall Road, Ballymena, Storm and Foul Sewer Ex 00 KI538 07 2 NIEA 0 0 0 0 0.000 0.000 0.000 0.000 0.000 0.000 0.000 0.000 0 0 0 0 22/08/201 17/09/201 31/08/2015 22/10/2015 25/09/2015 19/11/2015 0 0 100 0 0.000 0 003 -0.001 0 000 0.000 0 002 0.0 5 0 000 0.000 0 0 0 100 0 0 01728 2017_18 Q KB 57 Long ie d Road , Desertmartin, Storm Sewer Extension 00 KI538 07 2 NIEA 13 10 2010 10/11/2010 16 05 2011 20/10/2011 20/10/2011 20/10/2011 0 0 0 0 0.000 0.000 0.000 0.000 0.000 0.000 0.000 0.000 0 0 0 0 13/10/2010 10/11/2010 16/05/2011 20/10/2011 11/07/2011 20/10/2011 0 0 100 0 0.000 0 00 0.031 -0 007 0.000 0 000 0.000 -0 001 0.000 0 0 0 100 0 0 01729 2017_18 Q KB 70 Sevensprings, Ba lyhamp on Rd, Larne Storm Sewer 00 KI538 07 2 NIEA 28 09 2011 03/10/2011 01 03 2011 29/02/2012 29/02/2012 28/02/2013 0 0 0 0 0.000 0.000 0.000 0.000 0.000 0.000 0.000 0.000 0 0 0 0 28/09/2011 03/10/2011 09/02/2015 2 /0 /2015 2 /0 /2015 08/07/2015 0 0 100 0 0.000 0 000 0.005 0 000 -0.001 0 068 0.093 0 000 0.000 0 0 0 100 0 0 01730 2017_18 Q KB 73 Moneymore Road, Magherafelt: Foul & Storm Sewer Extens on00 KI538 07 2 DRD 0 0 0 0 0.000 0.000 0.000 0.000 0.000 0.000 0.000 0.000 0 0 0 0 0 0 100 0 0.000 0 000 0.005 0 000 -0.002 0 000 0.000 0 000 0.000 0 0 0 100 0 0 01731 2017_18 Q KB501 Fernisky Road, Ke ls - Storm Sewer 00 KI538 07 2 DRD 11/06/2013 16/07/2013 07/01/201 27/08/201 2 /03/201 03/11/201 0 0 100 0 0.000 0 000 0.000 0 000 -0.056 0 082 0.012 0 000 0.000 0 0 0 100 0 0 01732 2017_18 Q KB50 Cloneen, C ew Rd Maghera S orm Culvert Repl 00 KI538 07 2 DRD 22/08/201 17/09/201 0 0 100 0 0.000 0 000 0.000 0 000 0.000 0 000 0.072 0 000 0.000 0 0 0 100 0 0 01733 2017_18 Q KB509 Station Road Annaghmore Road Cas ledawson Storm Sewer e00 KI538 07 2 DRD 11/09/2015 11/09/2015 18/03/201 29/01/2016 15/01/2016 18/05/2016 0 0 100 0 -0.003 0 000 0.000 0 000 0.000 0 000 0.130 0 000 -0.003 0 88 0 12 0 88 0173 2017_18 Q KB510 Agharan Road Newm lls Storm sewer Extens on 00 KI538 07 2 DRD 11/06/2015 11/06/2015 30/11/2015 31/03/2016 0 0 100 0 -0.001 0 000 0.000 0 000 0.000 0 000 0.097 0 000 -0.001 0 0 0 100 0 0 01735 2017_18 Q KB513 Desertmar in Road, Tullynagee Road, Moneymore, Storm and 00 KI538 07 2 DRD 0 /08/2015 0 /08/2015 01/09/2015 18/12/2015 2 /12/2015 18/05/2016 0 0 100 0 0.001 0 000 0.000 0 000 -0.002 0 000 0.071 0 000 0.001 0 0 0 100 0 0 01736 2017_18 Q KB516 Ba lyronan Road Maghera elt Sto m Sewer Extension 00 KI538 07 2 DRD 27/11/201 27/11/201 20/07/2015 21/08/2015 28/08/2015 18/11/2015 0 0 100 0 0.000 0 000 0.000 0 000 0.000 0 000 0.0 8 0 000 0.000 0 0 0 100 0 0 01737 2017_18 Q KB517 ONei l Park Ballymaguigan Foul & Storm Sewer Extens on 00 KI538 07 2 DRD 03/02/2015 03/02/2015 0 0 100 0 -0.003 0 000 0.000 0 000 0.000 0 000 0.026 0 001 -0.003 0 0 0 100 0 0 01738 2017_18 Q KB518 Mul aghboy Crescent Magherafe t Foul Sewer Extension 00 KI538 07 2 DRD 05/08/201 12/08/201 17/11/201 03/12/201 20/0 /2015 16/12/201 0 0 100 0 0.000 0 000 0.000 0 000 0.000 0 0 8 0.009 0 000 0.000 0 0 0 100 0 0 01739 2017_18 Q KB520 Coolreaghs Road Cookstown Storm Sewer Extens on 00 KI538 07 2 DRD 0 0 100 0 0.000 0 000 0.000 0 000 0.000 0 000 0.000 0 000 0.000 0 0 0 100 0 07 0 2017_18 Q KB523 157 Larne Road, Ballymena Foul Sewer Ext. 00 KI538 07 2 06/06/2016 06/06/2016 11/09/2017 29/09/2017 27/09/2017 01/02/2018 0 0 100 0 0.029 0 000 0.000 0 000 0.000 0 000 0.000 0 000 0.029 0 0 0 100 0 0 017 1 2017_18 Q KC 13 Glebe Road, Rasharkin - Sewage Scheme 00 KI538 07 2 NIEA 18 08 2009 20/08/2009 20 10 2009 0 /10/2012 0 /10/2012 0 /10/2013 0 0 0 0 0.000 0.000 0.000 0.000 0.000 0.000 0.000 0.000 0 0 0 0 18/08/2009 20/08/2009 20/10/2009 26/02/2010 13/0 /2010 0 0 100 0 -0.003 0 013 -0.007 0 00 0.000 0 000 0.000 0 000 -0.003 0 0 0 100 0 07 2 2017_18 Q KC 65 L snab agh Road, Harpur's Hi l, Coleraine Foul Sewer 00 KI538 07 2 DRD 23/09/201 03/10/201 10/03/2015 20/0 /2015 17/0 /2015 0 0 100 0 0.000 0 000 0.000 0 000 0.000 0 0 6 0.001 0 000 0.000 0 0 0 100 0 0 017 3 2017_18 Q KC 68 Hazelbank Rd, Coleraine Foul Sewer Ex ension 00 KI538 07 2 12/11/2015 12/11/2015 0 0 100 0 0.000 0 000 0.000 0 000 0.000 0 000 0.000 0 015 0.000 0 0 0 100 0 0 017 2017_18 Q KC 69 Society Street Co eraine Storm Sewer Extension 00 KI538 07 2 0 /08/2015 0 /08/2015 13/06/2016 22/07/2016 0 0 100 0 0.001 0 000 0.000 0 000 0.000 0 000 0.000 0 022 0.001 0 0 0 100 0 0 017 5 2017_18 Q KF32 Crossdened Row, Keady S orm Sewer Ex ension 00 KI538 07 2 NIEA 2 08 2011 26/08/2011 02 01 2012 27/01/2012 27/01/2012 26/01/2013 0 0 0 0 0.000 0.000 0.000 0.000 0.000 0.000 0.000 0.000 0 0 0 0 2 /08/2011 26/08/2011 0 0 100 0 0.000 0 009 0.000 0 000 0.000 0 001 0.02 -0 001 0.000 0 0 0 100 0 0 017 6 2017_18 Q KF332 Stewarts Hi l, Armagh, Foul & Storm Sewer Extens on 00 KI538 07 2 NIEA 0 0 0 0 0.000 0.000 0.000 0.000 0.000 0.000 0.000 0.000 0 0 0 0 0 0 100 0 0.000 0 005 -0.002 0 00 0.000 0 001 0.000 0 000 0.000 0 0 0 100 0 0 017 7 2017_18 Q KF3 3 Annaghmakeown Road Cast ecau ie d S orm Sewer Ex ension 00 KI538 07 2 NIEA 20 02 2012 21/02/2012 16 0 2012 29/06/2012 29/06/2012 05/09/2012 0 0 0 0 0.000 0.000 0.000 0.000 0.000 0.000 0.000 0.000 0 0 0 0 20/02/2012 21/02/2012 02/07/2012 28/06/2012 02/07/2012 0 /09/2012 0 0 100 0 -0.003 0 001 0.006 0 0 3 0.001 0 000 0.000 0 000 -0.003 0 0 0 100 0 07 8 2017_18 Q KF3 5 Ki luney Road, Armagh, Foul and Sto m Sewer Extensions 00 KI538 07 2 NIEA 0 0 0 0 0.000 0.000 0.000 0.000 0.000 0.000 0.000 0.000 0 0 0 0 15/09/201 21/10/201 0 /07/2016 25/10/2016 19/10/2016 28/03/2017 0 0 100 0 -0.002 0 000 0.003 0 007 0.000 0 030 0.012 0 075 -0.002 0 25 0 75 0 25 017 9 2017_18 Q KF382 Rock Rd, Armagh S orm Sewer Extension 00 KI538 07 2 DRD 29/08/201 17/09/201 27/02/201 18/12/2015 28/0 /2016 0 0 100 0 0.000 0 000 0.000 0 000 0.000 0 000 0.190 -0 019 0.000 0 0 0 100 0 0 01750 2017_18 Q KF38 Old Cau field Rd Storm Sewer Ex ension, Cast ecaulf eld, Dung00 KI538 07 2 DRD 1 /01/2015 1 /01/2015 02/02/2015 13/05/2015 15/09/201 18/05/2015 0 0 100 0 0.000 0 000 0.000 0 000 0.000 0 000 0.032 0 000 0.000 0 0 0 100 0 0 01

m a e s
e )
So t Re C M Submiss on Re e ence
o ect D Re e ence o ect Name C oject
e oda ent
oject IDSubsti ute
o ect ID
ma y Asset
Ca ego y
C 0 og amme
Regula o y S gn O Requi ed
Base ine A Date
Base ine o ect
App oval Date
Base ne Sta t on S te Da e
Base ine Bene cial Use
Date
Basel ne Regulato y
sign-o Da e
Base ine Comp e ion o Const uct on
Date
Base ine End o
Main enance e od Date
Base ine Se vice A locat on Wate
n ast uc u e
Base ine Se vice Al oca ion Wate
Non-n ast uc u e
Base ine Se v ce A locat on Sewe age
In ast uctu e
Basel ne Se v ce Al oca ion
Sewe age Non-In ast uctu e
Basel ne CA EX 20 0-
£m
Base ine CA EX 20 -
2 £m
Basel ne CA EX 20 2-
3 £m
Base ne CA EX 20 3-
4 £m
Base ine CA EX 20 4-
5 £m
Basel ne CA EX 20 5-
6 £m
Base ine CA EX 20 6-
7 £m
Basel ne CA EX 20 7-
8 £m
Base ine u pose A locat on Qual ty
Base ine u pose Al oca ion Base
Base ine u pose A locat on ES
Basel ne u pose Al oca ion G ow h
Cu ent Actual o o ected
A Da e
Cu ent Ac ua o ojected
oject App oval Date
Cu ent Actual o o ected Sta t on Si e
Date
Cu ent Ac ua o ojected
Bene cial Use Da e
Cu ent Actual o o ected Regu ato y
sign-o Da e
Cu ent Actual o ojec ed
Comple ion o Const uc ion
Date
Cu ent Actual o o ected
End o Maintenance
e iod Date
Cu ent Actual o ojec ed Se v ce
A locat on Wa e In ast uctu e
Cu ent Actual o o ec ed Se v ce
A locat on Wa e Non-
n ast uc u e
Cu ent Actual o o ec ed Se v ce
A locat on Sewe age
n ast uc u e
Cu ent Actual o o ec ed Se v ce
A locat on Sewe age Non-
n ast uc u e
Cu ent Actual o o ected CA EX ea to date £m
Cu ent Actual o ojec ed
CA EX 20 0- £m
Cu ent Actual o o ected
CA EX 20 -2 £m
Cu ent Actual o ojec ed
CA EX 20 2-3 £m
Cu ent Ac ual o o ected
CA EX 20 3-4 £m
Cu ent Actual o o ec ed
CA EX 20 4-5 £m
Cu ent Ac ual o ojected
CA EX 20 5-6 £m
Cu ent Actual o o ec ed
CA EX 20 6-7 £m
Cu ent Ac ual o ojected
CA EX 20 7-8 £m
Cu ent Actual o o ec ed u pose
Al oca ion Qua i y
Cu ent Actual o o ec ed u pose
A location Base
Cu ent Actual o o ected u pose
Al oca ion ES
Cu ent Actual o ojected u pose
A locat on G owth
Cu ent Ac ual o ojected RE
Al oca ion Wate
Cu ent Ac ual o ojected RE Al oca ion Sewe age
Nom na ed Output
2 3 4 5 6 7 8 9 0 2 3 4 5 6 7 8 9 20 2 22 23 24 25 26 27 28 29 36 37 38 39 40 4 42 43 44 45 46 47 48 49 50 5 52 53 54 55 56 57 58 59 66 67 68 69 70 7 72
A T a a a ex e e e e 7 99 2 9 24 949 4 9 47 7 4 4 2 2 2 7 7 47 92 9 4 79 7 4 7 4 27 2 2
SOR
CIM
_Sub
I_oj
ect_
D
I_oj
ect_
Nam
e
I_C
_e
iod
I_AR
EN_
ojec
t_D
I_SU
BSI
UE_
oec
t_ID
I_i_
Asse
t_C
at
I_C
0_og
I_R
eg_S
igno
BM
_A
BM
_o
ect_
App
oval
BM
_SoS
BM
_BU
BM
_RSO
BM
_CoC
BM
_EoM
BSA_
WI%
BSA_
WN
I%
BSA_
SI%
BSA_
SNI%
B_C
apex
_20
0-_£
m
B_C
apex
_20
-2_
£m
B_C
apex
_20
2-3_
£m
B_C
apex
_20
3-4_
£m
B_C
apex
_20
4-5_
£m
B_C
apex
_20
5-6_
£m
B_C
apex
_20
6-7_
£m
B_C
apex
_20
7-8_
£m
BA_
Q%
BA_
B%
BA_
E%
BA_
G%
CAM
_A
CAM
_o
ecAp
pov
al
CAM
_SoS
CAM
_BU
CAM
_RSO
CAM
_CoC
CAM
_EoM
CAS
A_W
I%
CAS
A_W
NI%
CAS
A_SI
%
CAS
A_SN
I%
CA
_Cap
ex_
D_£
m
CA
_Cap
ex_2
00-
_£m
CA
_Cap
ex_2
0-
2_£m
CA
_Cap
ex_2
02-
3_£m
CA
_Cap
ex_2
03-
4_£m
CA
_Cap
ex_2
04-
5_£m
CA
_Cap
ex_2
05-
6_£m
CA
_Cap
ex_2
06-
7_£m
CA
_Cap
ex_2
07-
8_£m
CA
A_Q
%
CA
A_B%
CA
A_E%
CA
A_G
%
CA
_IR
E_W
%
CA
_IR
E_S%
NO
M_O
upu
t
e A a e e e v e s A a e A a e e a a x e e e m m e e a ) e A a e e se A a %) e A a e e %)e e a ase e M es e a es ase e e v e s A a ase e x e e e m 2 2- es) ase e se A a e A a e e M es e a es
751 2017_18 Q KF385 Coalisland Road Dungannon S orm Sewer Ex ension 00 KI538 07 2 21/11/201 21/11/201 0 /01/2016 22/0 /2016 13/10/201 07/07/2016 0 0 100 0 0.000 0 000 0.000 0 000 0.000 0 000 0.021 0 005 0.000 0 0 0 100 0 0 01752 2017_18 Q KF386 Old Omagh Road Phase 1, Ballygawley Storm Sewer 00 KI538 07 2 DRD 28/10/201 05/11/201 0 0 100 0 0.000 0 000 0.000 0 000 0.000 0 020 0.001 -0 001 0.000 0 0 0 100 0 0 01753 2017_18 Q KF392 8-20 S oans Street Dungannon Storm Sewer Extens on 00 KI538 07 2 2 /05/2016 2 /05/2016 09/01/2017 22/02/2017 31/03/2017 05/05/2017 0 0 100 0 0.000 0 000 0.000 0 000 0.000 0 000 0.000 0.131 0.000 0 0 0 100 0 0 0175 2017_18 Q KG118 Crumlin Road Storm Sewer Extens on 00 KI538 07 2 NIEA 10 09 2008 15/09/2008 01 12 2008 16/11/2010 16/11/2010 16/11/2011 0 0 0 0 0.000 0.000 0.000 0.000 0.000 0.000 0.000 0.000 0 0 0 0 10/09/2008 15/09/2008 01/12/2008 15/11/2010 16/02/2009 0 0 100 0 0.000 0 005 -0.001 0 005 0.000 0 000 0.005 0 000 0.000 0 0 0 100 0 0 01755 2017_18 Q KG168 Lyndale Manor Portadown Foul Sewer Extens on 00 KI538 07 2 NIEA 20 08 2009 03/09/2009 03 11 2009 20/01/2010 20/01/2010 16/03/2010 0 0 0 0 0.000 0.000 0.000 0.000 0.000 0.000 0.000 0.000 0 0 0 0 20/08/2009 03/09/2009 03/11/2009 19/01/2010 19/01/2010 16/03/2010 0 0 100 0 -0.003 0 003 0.002 -0 00 0.000 0 000 0.000 0 000 -0.003 0 0 0 100 0 0756 2017_18 Q KG17 Lake Street Lurgan, Foul & S orm Sewer Ex ensions 00 KI538 07 2 NIEA 27/11/201 27/11/201 09/02/2015 30/03/2015 06/03/2015 21/0 /2016 0 0 100 0 0.000 0 000 0.000 0 000 0.000 0 066 0.000 -0 015 0.000 0 0 0 100 0 0 01757 2017_18 Q KG189 Cornakinnegar Road, Lurgan Foul & Sto m Sewer Extension 00 KI538 07 2 DRD 0 0 0 0 0.000 0.000 0.000 0.000 0.000 0.000 0.000 0.000 0 0 0 0 09/01/2013 16/01/2013 23/09/2015 30/03/2016 20/05/2016 13/10/2016 0 0 100 0 -0.003 0 000 0.002 0 010 -0.015 0 001 0.2 3 0 000 -0.003 0 0 0 100 0 0 01758 2017_18 Q KG201 Derrytrasna Road, Lurgan, Foul Pumping Main Extension 00 KI538 07 2 DRD 08/09/201 17/09/201 29/0 /2016 30/06/2016 0 0 100 0 0.000 0 000 0.000 0 000 0.000 0 000 0.000 0 037 0.000 0 0 0 100 0 0 01759 2017_18 Q KG20 Princess Way, Portadown, S orm Sewer Extension 00 KI538 07 2 DRD 17/08/2015 17/08/2015 0 0 100 0 0.000 0 000 0.000 0 000 0.010 0 000 0.037 0 000 0.000 63 37 0 0 0 37 01760 2017_18 Q KG206 Drumnagroon, Kernan Hill Rd, Craigavon Foul & Storm Sewer 00 KI538 07 2 11/06/2015 16/06/2015 0 0 100 0 -0.01 0 000 0.000 0 000 0.000 0 000 0.089 0 000 -0.01 0 0 0 100 0 0 01761 2017_18 Q KG207 Obins Street Portadown Storm Sewer Extens on 00 KI538 07 2 DRD 0 /0 /2017 0 /0 /2017 0 0 100 0 0.020 0 000 0.000 0 000 0.000 0 000 0.000 0 000 0.020 0 0 0 100 0 0 01762 2017_18 Q KG209 L snisky Lane, Por adown Foul Sewer Extension 00 KI538 07 2 07/03/2017 13/0 /2017 19/06/2017 19/10/2017 31/03/2016 08 01 2018 0 0 100 0 0.18 0 000 0.000 0 000 0.000 0 000 0.000 0 000 0.18 0 0 0 100 0 0 01763 2017_18 Q KL376 Glengall agh Pumping Station and Pumping Main 00 KI538 07 2 NIEA 16 0 2007 15/0 /2006 15/0 /2006 15/0 /2007 0 0 0 0 0.000 0.000 0.000 0.000 0.000 0.000 0.000 0.000 0 0 0 0 0 0 78 22 -0.00 0 0 3 0.015 0 00 0.006 0 000 0.000 0 016 -0.00 0 0 0 100 0 0 0176 2017_18 Q KL 72 Chapel Road, Dungiven, Foul Sewer Extension 00 KI538 07 2 NIEA 26 09 2011 03/10/2011 23 01 2012 22/02/2012 22/02/2012 21/02/2013 0 0 0 0 0.000 0.000 0.000 0.000 0.000 0.000 0.000 0.000 0 0 0 0 26/09/2011 03/10/2011 23/01/2012 03/02/2012 06/02/2012 0 0 100 0 -0.001 0 001 0.009 0 000 0.002 0 000 0.000 0 000 -0.001 0 0 0 100 0 0 01765 2017_18 Q KL 7 Gracef eld Road Maghe afelt S orm Sewer Ex ension 00 KI538 07 2 DRD 28 06 2011 0 /07/2011 0 0 2011 09/09/2011 09/09/2011 08/09/2012 0 0 0 0 0.000 0.000 0.000 0.000 0.000 0.000 0.000 0.000 0 0 0 0 28/06/2011 0 /07/2011 0 0 100 0 0.000 0 001 0.001 0 000 0.001 0 001 0.01 0 000 0.000 0 0 0 100 0 0 01766 2017_18 Q KL 77 Steelstown Road, Londonderry, Foul and Storm Sewer Extens 00 KI538 07 2 NIEA 19 0 2012 01/05/2012 11 06 2012 05/09/2012 05/09/2012 05/09/2013 0 0 0 0 0.000 0.000 0.000 0.000 0.000 0.000 0.000 0.000 0 0 0 0 19/0 /2012 01/05/2012 11/06/2012 31/08/2012 27/08/2012 0 0 100 0 0.008 0 001 0.002 0 0 8 0.000 0 000 0.001 0 000 0.008 0 0 0 100 0 0 01767 2017_18 Q KL 79 Circu ar Road, Derry Storm sewer extens on 00 KI538 07 2 DRD 0 0 0 0 0.000 0.000 0.000 0.000 0.000 0.000 0.000 0.000 0 0 0 0 21/11/2012 11/12/2012 0 /03/2013 31/01/201 28/10/2013 03/11/201 0 0 100 0 -0.007 0 000 0.015 0 050 0. 85 -0 016 0.000 0 001 -0.007 0 22 0 78 0 22768 2017_18 Q KL519 Cu da f Gardens, Derry Storm Sewer Extens on 00 KI538 07 2 DRD 05/06/201 20/06/201 18/03/201 12/12/201 28/11/201 05/01/2016 0 0 100 0 0.000 0 000 0.000 0 000 0.000 0 033 0.018 0 000 0.000 0 0 0 100 0 0 01769 2017_18 Q KL520 37 Limavady Road, Derry Storm Sewer Ext 00 KI538 07 2 DRD 18/02/2016 18/02/2016 0 /0 /2016 17/06/2016 31/03/2016 26/08/2016 0 0 100 0 0.000 0 000 0.000 0 000 0.000 0 000 0.000 0 087 0.000 0 0 0 100 0 0 01770 2017_18 Q KL529 St Peter' s H gh School Re-Development F&S Sewer 00 KI538 07 2 0 /08/2015 0 /08/2015 0 0 100 0 -0.00 0 000 0.000 0 000 0.000 0 000 0.070 0 000 -0.00 0 0 0 100 0 0 01771 2017_18 Q KN610 Drumlegagh S orm Sewer Extens on 00 KI538 07 2 NIEA 13 11 2008 25/11/2008 20 07 2009 25/09/2009 25/09/2009 25/09/2010 0 0 0 0 0.000 0.000 0.000 0.000 0.000 0.000 0.000 0.000 0 0 0 0 13/11/2008 25/11/2008 20/07/2009 16/11/2010 28/09/2009 0 0 100 0 -0.003 0 012 -0.006 0 000 0.000 0 000 0.000 0 000 -0.003 0 0 0 100 0 0772 2017_18 Q KN627 Meadowvale, Dublin Rd, N'townstewart, Foul Sewer Extension 00 KI538 07 2 DRD 0 0 0 0 0.000 0.000 0.000 0.000 0.000 0.000 0.000 0.000 0 0 0 0 03/07/2015 03/07/2015 0 0 100 0 0.000 0 000 0.003 0 000 0.001 0 003 0.036 0 005 0.000 0 0 0 100 0 0 01773 2017_18 Q KN6 5 Derry Road, Strabane. 00 KI538 07 2 DRD 0 0 0 0 0.000 0.000 0.000 0.000 0.000 0.000 0.000 0.000 0 0 0 0 22/02/2013 01/03/2013 02/0 /2012 18/11/2013 21/10/2013 06 01 201 0 0 100 0 0.001 0 000 0.000 0 007 0.006 -0 002 0.000 0 000 0.001 0 0 0 100 0 077 2017_18 Q KN660 L snaragh Road Donemana Foul sewer Extens on 00 KI538 07 2 DRD 15/0 /201 12/05/201 09/06/201 20/02/2015 21/07/201 18 11 2015 0 0 100 0 0.000 0 000 0.000 0 000 0.002 0 068 0.006 0 000 0.000 0 0 0 100 0 0 01775 2017_18 Q KP60 Empire Mea s Ltd, Dernawi t Road Rosslea Sewage Pumping M00 KI538 07 2 NIEA 18 0 2011 0 /05/2011 06 06 2011 2 /08/2011 2 /08/2011 2 /08/2011 0 0 0 0 0.000 0.000 0.000 0.000 0.000 0.000 0.000 0.000 0 0 0 0 18/0 /2011 0 /05/2011 06/06/2011 2 /08/2011 18/07/2011 2 /08/2011 0 0 100 0 -0.001 0 00 0.028 0 001 0.000 0 000 0.000 0 000 -0.001 0 0 0 100 0 0776 2017_18 Q KP667 Aghadrumsee New Primary School Foul & Storm Sewer Ex en 00 KI538 07 2 DRD 21 11 2011 25/11/2011 09 01 2012 23/09/2011 23/09/2011 22/09/2012 0 0 0 0 0.000 0.000 0.000 0.000 0.000 0.000 0.000 0.000 0 0 0 0 21/11/2011 25/11/2011 0 0 100 0 -0.001 0 000 0.02 0 003 0.000 0 000 0.000 0 000 -0.001 0 0 0 100 0 0777 2017_18 Q KP678 Coa Road, Enn skil en Storm Sewer Ext. 00 KI538 07 2 DRD 0 0 0 0 0.000 0.000 0.000 0.000 0.000 0.000 0.000 0.000 0 0 0 0 03/09/201 17/09/201 0 0 100 0 0.001 0 000 0.00 0 00 0.000 0 005 0.000 -0 001 0.001 0 0 0 100 0 0 01778 2017_18 Q KR361 Carrowreagh Road Dundonald Storm Sewer 00 KI538 07 2 NIEA 12 03 2009 2 /03/2009 21 05 2012 2 /09/2012 2 /09/2012 2 /09/2013 0 0 0 0 0.000 0.000 0.000 0.000 0.000 0.000 0.000 0.000 0 0 0 0 12/03/2009 2 /03/2009 0 /01/2011 2 /09/2012 26/11/2013 0 0 100 0 -0.005 0 003 0.01 0 610 0.071 0 007 0.002 0 000 -0.005 0 0 0 100 0 0 01779 2017_18 Q KR397 Brooke Ha l, Cairnsh ll Be fast Foul Sewer Ex ension 00 KI538 07 2 NIEA 0 0 0 0 0.000 0.000 0.000 0.000 0.000 0.000 0.000 0.000 0 0 0 0 16/12/2013 19/12/2013 02/06/201 12/12/201 28/11/201 0 /02/2015 0 0 100 0 0.000 0 001 -0.001 0 000 0.000 0 080 0.002 0 000 0.000 0 0 0 100 0 0 01780 2017_18 Q KR 22 Mersey Street, Belfast Storm Sewer 00 KI538 07 2 NIEA 05 08 2011 25/08/2011 05 05 2008 05/0 /2012 05/0 /2012 05/0 /2013 0 0 0 0 0.000 0.000 0.000 0.000 0.000 0.000 0.000 0.000 0 0 0 0 23/05/201 03/06/201 28/07/201 11/12/2015 30/01/2015 0 05/2016 0 0 100 0 0.000 0 001 0.000 0 000 0.003 0 272 0.937 0 059 0.000 0 28 38 3 0 28 01781 2017_18 Q KR 29 York Street, Be fast Inte change 00 KI538 07 2 NIEA 0 0 0 0 0.000 0.000 0.000 0.000 0.000 0.000 0.000 0.000 0 0 0 0 0 0 100 0 0.007 0 000 0.009 0 000 0.012 0 068 0.00 0 009 0.007 0 100 0 0 0 100 01782 2017_18 Q KR 58 287 Ballygomartin Road, Bel ast Foul Sewer Extension. 00 KI538 07 2 NIEA 0 05 2010 07/05/2010 1 06 2010 12/11/2010 12/11/2010 19/05/2011 0 0 0 0 0.000 0.000 0.000 0.000 0.000 0.000 0.000 0.000 0 0 0 0 0 /05/2010 07/05/2010 1 /06/2010 17/01/2011 19/05/2011 0 0 100 0 -0.001 0.123 0.000 0 001 0.000 0 000 0.000 0 000 -0.001 0 0 0 100 0 0783 2017_18 Q KR 63 Circu ar Road Bel ast, Storm Sewer Extension 00 KI538 07 2 NIEA 19 07 2010 06/08/2010 06/08/2010 06/08/2011 0 0 0 0 0.000 0.000 0.000 0.000 0.000 0.000 0.000 0.000 0 0 0 0 0 /05/2010 13/05/2010 23/0 /2012 0 0 100 0 0.000 0 000 0.000 0 000 0.000 0 000 0.000 0 000 0.000 0 0 0 100 0 0 0178 2017_18 Q KR 90 Donegal Avenue Wh tehead Foul Sewer Ex ension 00 KI538 07 2 NIEA 07 07 2011 11/07/2011 0 0 2011 01/09/2011 01/09/2011 31/08/2012 0 0 0 0 0.000 0.000 0.000 0.000 0.000 0.000 0.000 0.000 0 0 0 0 07/07/2011 11/07/2011 0 0 100 0 0.015 0 000 0.001 0 000 0.000 0 000 0.000 0 002 0.015 0 0 0 100 0 0 01785 2017_18 Q KR 93 Ba lyrobert Road Ballyclare S orm Sewer Extension 00 KI538 07 2 NIEA 0 0 0 0 0.000 0.000 0.000 0.000 0.000 0.000 0.000 0.000 0 0 0 0 08/09/201 17/09/201 01/06/2015 11/12/2015 27/11/2015 25 01 2016 0 0 100 0 -0.008 0 000 0.002 0 000 0.000 0 000 0.06 0 000 -0.008 0 0 0 100 0 0 01786 2017_18 Q KR509 Carr ckfergus Publ c Realm Sewers 00 KI538 07 2 DRD 02 0 2012 06/0 /2012 09 09 2011 31/05/2012 31/05/2012 31/05/2013 0 0 0 0 0.000 0.000 0.000 0.000 0.000 0.000 0.000 0.000 0 0 0 0 02/0 /2012 06/0 /2012 0 0 100 0 0.000 0 000 0.099 0.109 0.001 0 002 0.015 0 000 0.000 0 100 0 0 0 100 01787 2017_18 Q KR533 Springfield Crescent, Belfast, Storm Sewer Extension 00 KI538 07 2 DRD 0 0 0 0 0.000 0.000 0.000 0.000 0.000 0.000 0.000 0.000 0 0 0 0 08/05/2013 22/05/2013 10/02/201 29/0 /201 18/0 /201 20 08 2015 0 0 100 0 -0.003 0 000 0.000 0 003 0.010 0 017 0.003 0 000 -0.003 0 0 0 100 0 0 01788 2017_18 Q KR571 Drumbeg Road Storm Sewer Extens on 03 KI538 07 2 DRD 19/06/2015 19/06/2015 05/10/2015 18/11/2015 30/10/2015 15 12 2015 0 0 100 0 0.000 0 000 0.000 0 000 0.000 0 000 0.021 0 000 0.000 0 0 0 100 0 0 01789 2017_18 Q KR573 M ll Road. Newtownabbey, Storm Sewer Extension 00 KI538 07 2 DRD 21/11/201 21/11/201 13/0 /2015 12/06/2015 18 11 2015 0 0 100 0 0.000 0 000 0.000 0 000 0.000 0 000 0.078 0 000 0.000 0 0 0 100 0 0 01790 2017_18 Q KR57 Antrim Road, Glengormley, S orm & Foul Sewer Ex ension 00 KI538 07 2 DRD 06/03/201 13/03/201 28/0 /201 27/08/201 19/06/201 20 11 201 0 0 100 0 -0.00 0 000 0.000 0 000 0.005 0 060 0.000 0 000 -0.00 0 0 0 100 0 0791 2017_18 Q KR577 165 Groomsport Rd, Bangor - Storm Sewer Upg ade 00 KI538 07 2 DRD 0 /0 /2017 0 /0 /2017 0 0 100 0 0.01 0 000 0.000 0 000 0.000 0 000 0.000 0 000 0.01 0 0 0 100 0 0 01792 2017_18 Q KR578 Ferry Quarter, Shore Road, Strangford foul and storm sewer 00 KI538 07 2 DRD 01/09/201 17/09/201 01/12/201 12/06/2015 31/03/2015 22/12/2015 0 0 100 0 0.000 0 000 0.000 0 000 0.000 0 020 0.00 0 000 0.000 0 0 0 100 0 0 01793 2017_18 Q KR582 Torrens Park Belfast Storm Sewer 00 KI538 07 2 DRD 11/08/201 05/09/201 0 0 100 0 0.000 0 000 0.000 0 000 -0.005 0 099 0.005 0 000 0.000 0 0 0 100 0 0 0179 2017_18 Q KR583 Victo ia Road, Be fast - Foul Sewer Extens on and Storm Sepa 00 KI538 07 2 DRD 06/10/201 08/10/201 21/11/2016 16/05/2017 20/01/2017 31/08/2017 0 0 100 0 -0.005 0 000 0.000 0 000 -0.007 0 0 6 0.110 0.105 -0.005 0 0 0 100 0 0 01795 2017_18 Q KR58 Glenv lle Rd, Newtownabbey - Storm Sewer 00 KI538 07 2 DRD 09/09/201 17/09/201 0 0 100 0 -0.00 0 000 0.000 0 000 0.000 0 033 0.002 0 000 -0.00 0 0 0 100 0 0 01796 2017_18 Q KR587 Glenwell Rd, Newtownabbey S orm Sewer 00 KI538 07 2 DRD 12/01/2017 12/01/2017 0 0 100 0 0.000 0 000 0.000 0 000 0.000 0 000 0.000 0 022 0.000 0 0 0 100 0 0 01797 2017_18 Q KR590 Ba lygowan Road Be fast Storm Sewer Extension 00 KI538 07 2 DRD 19/0 /2016 19/0 /2016 0 /07/2016 19/09/2016 26/08/2016 06/02/2017 0 0 100 0 0.001 0 000 0.000 0 000 0.000 0 000 0.000 0.125 0.001 0 0 0 100 0 0 01798 2017_18 Q KR591 137-1 1 Ormeau Road Bel ast Storm Sewer Extension 00 KI538 07 2 DRD 0 /08/2015 0 /08/2015 0 /07/2016 31/08/2016 26/08/2016 15/12/2017 0 0 100 0 -0.001 0 000 0.000 0 000 0.000 0 000 0.000 0 0 3 -0.001 0 0 0 100 0 0 01799 2017_18 Q KR592 QUB Med cal Centre University Terrace Storm Sewer Extens o 00 KI538 07 2 DRD 05/02/2015 16/02/2015 06/06/2016 23/06/2016 0 /07/2016 12/12/2016 0 0 100 0 -0.001 0 000 0.000 0 000 0.000 0 000 0.000 0 0 7 -0.001 0 0 0 100 0 0 01800 2017_18 Q KR593 Glenmachan Street Belfast Storm Sewer for McDona ds 00 KI538 07 2 DRD 10/09/201 17/09/201 01/12/201 12/12/201 01/09/201 20/0 /2015 0 0 100 0 0.000 0 000 0.000 0 000 0.000 0 030 0.00 0 000 0.000 0 0 0 100 0 0 01801 2017_18 Q KR597 Ba lynure Road, Ballyclare S orm Sewer Extension 00 KI538 07 2 DRD 0 /08/2015 0 /08/2015 20/06/2016 11/11/2016 0 0 100 0 -0.001 0 000 0.000 0 000 0.000 0 000 0.000 0.157 -0.001 0 0 0 100 0 0 01802 2017_18 Q KR607 Galway Park & Galway Drive, Dundonald Storm Sewer 00 KI538 07 2 23/09/2015 23/09/2015 07/03/2016 19/0 /2016 22/0 /2016 26/10/2017 0 0 100 0 -0.002 0 000 0.000 0 000 0.000 0 000 0.0 3 0 01 -0.002 0 0 0 100 0 0 01803 2017_18 Q KR609 Former Visteon S te Bel ast Foul & Storm Sewer Extension 00 KI538 07 2 DRD 09/02/2017 01/03/2017 0 0 100 0 0.00 0 000 0.000 0 000 0.000 0 000 0.000 0 000 0.00 0 0 0 100 0 0 0180 2017_18 Q KR613 Si e at 9-11 Ballycraigy Rd, Foul and S orm Sewer 00 KI538 07 2 0 0 100 0 0.000 0 000 0.000 0 000 0.000 0 000 0.000 0 000 0.000 0 0 0 100 0 0 01805 2017_18 Q KR615 530 Shore Road, Belfast 00 KI538 07 2 2 /07/2015 2 /07/2015 0 0 100 0 0.000 0 000 0.000 0 000 0.000 0 000 0.000 0 000 0.000 0 0 0 100 0 0 01806 2017_18 Q KR616 172 North Road, Carr ckfergus Storm Sewer Ext. 00 KI538 07 2 0 /08/2015 0 /08/2015 18/07/2016 13/10/2016 26/08/2016 60 0 0 0 -0.013 0 000 0.000 0 000 0.000 0 000 0.000 0.117 -0.013 0 20 0 0 20 0 01807 2017_18 Q KS3 7 Crossgar Road, Ba lynahinch Sto m Sewer 00 KI538 07 2 NIEA 23 07 2009 02/09/2009 05 09 2011 11/06/2012 11/06/2012 11/06/2013 0 0 0 0 0.000 0.000 0.000 0.000 0.000 0.000 0.000 0.000 0 0 0 0 23/07/2009 02/09/2009 11/07/2011 11/06/2012 03/06/2013 0 0 100 0 -0.010 0 009 0.2 9 0 055 -0.009 0 000 0.000 0 000 -0.010 0 0 0 100 0 0808 2017_18 Q KS387 Manse Road, Seaforde Storm Sewer Extens on 00 KI538 07 2 NIEA 09 0 2009 27/0 /2009 01 02 2011 25/02/2011 25/02/2011 25/02/2012 0 0 0 0 0.000 0.000 0.000 0.000 0.000 0.000 0.000 0.000 0 0 0 0 09/0 /2009 27/0 /2009 01/02/2011 22/02/2011 0 0 100 0 0.003 0 00 0.000 0 000 0.000 0 000 0.000 0 000 0.003 0 0 0 100 0 0809 2017_18 Q KS82 Sprinf e d Road, Portavogie Storm Sewer Extension 00 KI538 07 2 NIEA 20 07 2009 03/08/2009 21 07 2009 09/10/2009 09/10/2009 09/10/2010 0 0 0 0 0.000 0.000 0.000 0.000 0.000 0.000 0.000 0.000 0 0 0 0 20/07/2009 03/08/2009 0 0 100 0 0.001 0 000 0.002 0 000 0.003 0 000 0.000 0 000 0.001 0 0 0 100 0 0 01810 2017_18 Q KS838 Downpatrick Street Crossgar, Storm sewer. 00 KI538 07 2 NIEA 02 03 2011 15/03/2011 08 0 2011 09/02/2012 09/02/2012 08/02/2013 0 0 0 0 0.000 0.000 0.000 0.000 0.000 0.000 0.000 0.000 0 0 0 0 02/03/2011 15/03/2011 08/0 /2011 08/02/2012 27/01/2012 0 0 100 0 -0.001 0 003 0.213 -0 013 0.008 -0 001 0.000 0 000 -0.001 0 8 76 16 0 8811 2017_18 Q KS850 Quar y Heights, Newtowna ds, Foul and Storm Sewer Extensio00 KI538 07 2 NIEA 0 0 0 0 0.000 0.000 0.000 0.000 0.000 0.000 0.000 0.000 0 0 0 0 31/10/2013 0 /11/2013 22/01/201 18/03/201 09/0 /201 0 0 100 0 -0.01 0 003 0.000 0 000 0.16 -0 029 0.000 0 000 -0.01 0 0 0 100 0 0812 2017_18 Q KS851 Main Street, C oughey, Pumping main, Foul and Storm Sewer 01 KI538 07 2 NIEA 11 09 2012 21/09/2012 06 09 2010 28/12/2012 28/12/2012 28/12/2013 0 0 0 0 0.000 0.000 0.000 0.000 0.000 0.000 0.000 0.000 0 0 0 0 11/09/2012 21/09/2012 06/05/2013 30/07/2013 27/05/2013 0 0 100 0 0.000 0 003 0.002 0 001 0.078 0 017 0.003 0 001 0.000 0 0 0 100 0 0 01813 2017_18 Q KS85 Green Road, Con ig. Storm Sewer Extension. 00 KI538 07 2 NIEA 0 0 0 0 0.000 0.000 0.000 0.000 0.000 0.000 0.000 0.000 0 0 0 0 06/07/2015 07/07/2015 17/10/2015 09/03/2017 31/03/2016 0 0 99 1 -0.283 0 006 0.000 0 000 0.01 0 000 0.720 0 53 -0.283 0 0 0 100 0 0 0181 2017_18 Q KS876 Old Bel ast Road, Bangor - Storm Sewer Extens on 00 KI538 07 2 NIEA 0 0 0 0 0.000 0.000 0.000 0.000 0.000 0.000 0.000 0.000 0 0 0 0 18/12/2012 21/12/2012 13/0 /2015 28/07/2015 29/06/2015 28/07/2015 0 0 100 0 0.000 0 001 0.001 0 002 -0.003 0 002 0.099 0 000 0.000 0 10 0 90 0 10 01815 2017_18 Q KS893 Magheraknock Road Ballynahinch S orm Sewer Extension 00 KI538 07 2 DRD 0 01 2012 12/01/2012 07 05 2012 27/07/2012 27/07/2012 27/07/2013 0 0 0 0 0.000 0.000 0.000 0.000 0.000 0.000 0.000 0.000 0 0 0 0 0 /01/2012 12/01/2012 07/05/2012 23/07/2012 0 0 100 0 0.000 0 000 0.003 -0 002 0.000 0 000 0.001 0 000 0.000 0 0 0 100 0 0 01816 2017_18 Q KS895 Ardnava ley Comber Sewer Pumping Main Ex ension 00 KI538 07 2 DRD 20 07 2012 17/08/2012 15 10 2012 22/03/2013 22/03/2013 22/03/201 0 0 0 0 0.000 0.000 0.000 0.000 0.000 0.000 0.000 0.000 0 0 0 0 20/07/2012 17/08/2012 01/0 /2013 27/08/201 27/08/201 20/07/2015 0 0 9 6 -0.00 0 000 0.005 0 008 0.239 0 077 0.005 0 006 -0.00 76 2 0 0 0 18 01817 2017_18 Q KS92 Anns ie d C ose, K llyleagh Storm Sewer Ex ension. 00 KI538 07 2 DRD 29/07/2013 06/08/2013 0 0 100 0 0.000 0 000 0.000 0 002 0.000 0 000 0.000 0 000 0.000 0 0 0 100 0 0 01818 2017_18 Q KS93 Moss Road, Ba lygowan, Pumping S ation Rationalisat on 00 KI538 07 2 DRD 18/08/201 2 /09/201 01/12/201 27/02/2015 09/08/2016 0 0 100 0 -0.001 0 000 0.000 0 000 0.000 0 058 0.000 0 000 -0.001 0 0 0 100 0 0819 2017_18 Q KS935 Co lege Ave/ Shandon Drive, Bangor - S orm Sewer Requisit o 00 KI538 07 2 DRD 27/08/201 17/09/201 0 /06/2018 27/05/2016 0 0 100 0 0.000 0 000 0.000 0 000 0.000 0 000 0.000 0 000 0.000 0 0 0 60 0 0 01820 2017_18 Q KS9 7 L ttle En er, Comber - Foul Sewer Extension 00 KI538 07 2 0 /08/2015 0 /08/2015 0 0 100 0 0.000 0 000 0.000 0 000 0.000 0 000 0.000 0 000 0.000 0 0 0 100 0 0 01821 2017_18 Q KS951 Chester Avenue Bangor S orm Sewer Extension 00 KI538 07 2 27/10/2015 27/10/2015 29/01/2016 17/03/2016 0 0 100 0 -0.005 0 000 0.000 0 000 0.000 0 000 0.019 0 000 -0.005 0 0 0 100 0 0 01822 2017_18 Q KS952 Quo le Crescent, Downpatr ck, Foul and Storm Sewer Rep ace 00 KI538 07 12 06/06/2017 16/06/2017 0 /09/2017 23/02/2018 0 0 100 0 0.523 0 000 0.000 0 000 0.000 0 000 0.000 0 000 0.523 0 100 0 0 0 100 01823 2017_18 Q KS956 M llbrook, Ba lynahinch, Storm Sewer Extension 00 KI538 07 2 22/12/2015 22/12/2015 0 0 100 0 0.002 0 000 0.000 0 000 0.000 0 000 0.000 0 020 0.002 0 0 0 100 0 0 0182 2017_18 Q KS960 Adj 189 Donaghadee Rd, Bangor - Foul Sewer 00 KI538 07 2 29/0 /2016 29/0 /2016 0 0 100 0 -0.001 0 000 0.000 0 000 0.000 0 000 0.000 0 028 -0.001 0 0 0 100 0 0 01825 2017_18 Q KT382 McKeown Street L sburn Environmen al Improvemen s 00 KI538 07 12 NIEA 0 0 100 0 0.000 0 000 0.000 0 000 0.000 0 000 0.000 0 000 0.000 0 100 0 0 0 100 01826 2017_18 Q KT389 Magheralave Road L sburn, Foul Sewer Extension 00 KI538 07 2 NIEA 16 07 2009 03/08/2009 2 08 2009 09/10/2009 09/10/2009 09/10/2010 0 0 0 0 0.000 0.000 0.000 0.000 0.000 0.000 0.000 0.000 0 0 0 0 16/07/2009 03/08/2009 07/03/2016 09/03/2017 31/03/2016 0 0 100 0 -0.002 0 000 -0.001 0 000 0.000 0 000 0.077 0 050 -0.002 0 0 0 100 0 0 01827 2017_18 Q KT39 Mount Eagles, Stewarts own Road, L sburn. 00 KI538 07 2 NIEA 15 11 2010 12/01/2011 01 0 2011 06/06/2011 06/06/2011 05/06/2012 0 0 0 0 0.000 0.000 0.000 0.000 0.000 0.000 0.000 0.000 0 0 0 0 15/11/2010 12/01/2011 01/0 /2011 19/05/2011 03/06/2011 0 0 100 0 -0.005 0 011 0.056 -0 001 0.000 0 000 0.000 0 000 -0.005 0 0 0 100 0 0828 2017_18 Q KT396 Blaris Road Lisburn Storm Sewer Extension 00 KI538 07 2 NIEA 0 0 0 0 0.000 0.000 0.000 0.000 0.000 0.000 0.000 0.000 0 0 0 0 0 0 100 0 0.000 0 00 0.00 -0 00 0.002 0 000 0.001 0 000 0.000 0 0 0 100 0 0 01829 2017_18 Q KT 00 W llow Gardens Dunmurry Sewer Extension 00 KI538 07 2 NIEA 0 0 0 0 0.000 0.000 0.000 0.000 0.000 0.000 0.000 0.000 0 0 0 0 01/07/2016 01/07/2016 0 0 100 0 0.0 1 0 002 0.000 0 005 -0.002 0 000 0.000 0 012 0.0 1 0 0 0 100 0 0 01830 2017_18 Q KT 07 Creevy Road, Lisburn S orm Sewer Ex ension 00 KI538 07 2 DRD 0 0 0 0 0.000 0.000 0.000 0.000 0.000 0.000 0.000 0.000 0 0 0 0 28/0 /201 02/05/201 0 0 100 0 0.000 0 000 0.00 0 000 0.000 0 012 0.00 -0 001 0.000 0 0 0 100 0 0 01831 2017_18 Q KT 17 Mount Eagles, Lisburn, Foul Sewer 00 KI538 07 2 DRD 25/07/2013 05/08/2013 09/12/2013 29/01/201 09/12/2013 23/10/201 0 0 100 0 -0.002 0 000 0.000 0 000 0.0 7 0 003 0.000 0 000 -0.002 0 0 0 100 0 0832 2017_18 Q KT 18 Dromore Road, H llsborough Pumping Stat on 00 KI538 12 2 DRD 01/07/2015 10/07/2015 0 0 0 100 0.108 0 000 0.000 0 000 0.000 0 000 0.001 0 000 0.108 0 0 0 100 0 0 01833 2017_18 Q KT 20 Knockbracken Road New ownards Foul Sewer Ext 00 KI538 07 2 2 /07/2015 2 /07/2015 23/03/2017 16/01/2017 0 0 100 0 -0.001 0 000 0.000 0 000 0.000 0 000 0.000 0 062 -0.001 0 0 0 100 0 0 0183 2017_18 Q KV129 Old Newry Road, Banbr dge Foul Sewer Ext 00 KI538 07 2 NIEA 0 0 0 0 0.000 0.000 0.000 0.000 0.000 0.000 0.000 0.000 0 0 0 0 08/01/2016 08/01/2016 30/08/2016 16/09/2016 26/09/2016 05 12 2016 0 0 100 0 -0.001 0 001 0.000 0 000 0.000 0 000 0.000 0 027 -0.001 0 0 0 100 0 0 01835 2017_18 Q KV1 2 Chancel ors Road, Newry Foul Sewage Pumping Main Ex ens 00 KI538 07 2 NIEA 16 09 2010 19/11/2010 1 03 2011 02/11/2011 02/11/2011 02/11/2011 0 0 0 0 0.000 0.000 0.000 0.000 0.000 0.000 0.000 0.000 0 0 0 0 16/09/2010 19/11/2010 1 /03/2011 30/03/2011 28/03/2011 02/11/2011 0 0 100 0 -0.001 0 015 0.002 -0 001 0.000 0 000 0.000 0 000 -0.001 0 0 0 100 0 0836 2017_18 Q KV151 Carr ckdesland, Burren Foul Sewer Extens on 00 KI538 07 2 NIEA 02 07 2009 07/07/2009 31 08 2009 22/02/2010 22/02/2010 12/11/2010 0 0 0 0 0.000 0.000 0.000 0.000 0.000 0.000 0.000 0.000 0 0 0 0 02/07/2009 07/07/2009 31/08/2009 0 /07/2011 11/11/2010 0 0 100 0 0.000 0 006 0.002 0 001 0.000 0 000 0.001 0 000 0.000 0 0 0 100 0 0 01837 2017_18 Q KV152 Abbey Grammar School S orm Sewer Extension 00 KI538 07 2 NIEA 21 0 2009 05/05/2009 06 07 2009 15/11/2010 15/11/2010 15/11/2011 0 0 0 0 0.000 0.000 0.000 0.000 0.000 0.000 0.000 0.000 0 0 0 0 21/0 /2009 05/05/2009 06/07/2009 15/11/2010 31/08/2009 0 0 100 0 0.000 0 002 -0.002 0 007 0.000 0 000 0.007 0 000 0.000 0 0 0 100 0 0 01838 2017_18 Q KV156 Crieve Road, Newry Foul & Storm Sewer Ex ensions 00 KI538 07 2 NIEA 16 08 2010 08/09/2010 31 10 2011 17/02/2012 17/02/2012 16/02/2013 0 0 0 0 0.000 0.000 0.000 0.000 0.000 0.000 0.000 0.000 0 0 0 0 16/08/2010 08/09/2010 31/10/2011 03/08/2012 06/08/2012 21/12/2012 0 0 100 0 0.000 0 001 0.092 0 027 -0.001 0 000 0.00 0 000 0.000 0 0 0 100 0 0 01839 2017_18 Q KV166 Upper Dromore Road, War enpoint - Upgrade of Storm Sewer. 00 KI538 07 2 NIEA 13 06 2011 30/06/2011 22 08 2011 26/01/2012 26/01/2012 25/01/2013 0 0 0 0 0.000 0.000 0.000 0.000 0.000 0.000 0.000 0.000 0 0 0 0 13/06/2011 30/06/2011 22/08/2011 1 /10/2011 28/11/2011 0 0 100 0 0.000 0 006 0.1 7 -0 001 0.000 0 000 0.002 0 000 0.000 0 0 0 100 0 0 018 0 2017_18 Q KV170 Glassdrumman Road, Anna ong, Foul Sewer Extension 00 KI538 07 2 NIEA 02 12 2011 08/12/2011 01 0 2013 10/06/2013 10/06/2013 10/06/201 0 0 0 0 0.000 0.000 0.000 0.000 0.000 0.000 0.000 0.000 0 0 0 0 02/12/2011 08/12/2011 0 0 100 0 0.001 0 003 0.001 0 000 0.037 0 002 0.000 0 000 0.001 0 0 0 100 0 08 1 2017_18 Q KV203 Scarva Street Loughbrickland Pumping Main 00 KI538 07 2 DRD 2 /07/2015 2 /07/2015 16/01/2015 0 0 100 0 0.016 0 000 0.000 0 000 0.000 0 000 0.000 0 000 0.016 0 0 0 100 0 0 018 2 2017_18 Q KV205 Courtney H ll, Newry, Storm Sewer Extension 00 KI538 07 2 DRD 27/11/201 27/11/201 30/06/2015 16/10/2015 21 12/2015 0 0 100 0 0.000 0 000 0.000 0 000 0.011 0 000 0.09 0 000 0.000 72 28 0 0 0 28 018 3 2017_18 Q KV208 Laurel Grove Newry Foul Sewer Extens on 00 KI538 07 2 DRD 17/09/201 25/09/201 0 0 100 0 0.001 0 000 0.000 0 000 0.000 0 000 0.031 0 001 0.001 0 0 0 100 0 0 018 2017_18 Q KV212 Percy Lodge, Dromo e Storm Sewer 00 KI538 07 2 DRD 27/07/2015 27/07/2015 0 0 100 0 0.001 0 000 0.000 0 000 0.000 0 000 0.009 -0 002 0.001 0 0 0 100 0 0 018 5 2017_18 Q KV213 Calmor View, L s ea - Storm Sewer Extension. 00 KI538 07 2 29/11/201 29/11/201 0 0 100 0 0.000 0 000 0.000 0 000 0.000 0 038 0.005 0 000 0.000 0 0 0 100 0 0 018 6 2017_18 Q KV21 Tollymore Rd, Newcastle Foul & Storm Sewer 00 KI538 07 2 07/07/2015 07/07/2015 30/05/2016 2 /06/2016 01/07/2016 08 12 2016 0 0 100 0 0.000 0 000 0.000 0 000 0.000 0 000 0.000 0 057 0.000 0 0 0 100 0 0 018 7 2017_18 Q KV215 26 Crossgar Road, Saint ie d foul and storm sewer 00 KI538 07 2 16/06/2015 16/06/2015 2 /08/2015 12/01/2016 25/09/2015 25 01 2016 0 0 100 0 0.000 0 000 0.000 0 000 0.000 0 000 0.039 0 000 0.000 0 0 0 100 0 0 018 8 2017_18 Q KV216 St Josephs Primary, Newry, Storm Sewer. 00 KI538 07 2 10/11/2015 10/11/2015 0 0 100 0 0.000 0 000 0.000 0 000 0.000 0 000 0.000 0 000 0.000 0 0 0 100 0 0 018 9 2017_18 Q KV218 Old Road Mayobr dge Foul & Storm Sewer 00 KI538 07 2 DRD 06/07/2015 06/07/2015 0 0 100 0 0.000 0 000 0.000 0 000 0.000 0 000 0.030 0 000 0.000 0 0 0 100 0 0 01850 2017_18 Q KI539 PC15 Projects - Cluster of Septic Tanks causing Pollut on 0 09 16 NIEA 0 0 100 0 0.000 0 000 0.000 0 000 0.008 0 000 0.00 0 000 0.000 100 0 0 0 0 0 01851 2017_18 Q KI5 0 Wastewater treatment works be onging o bankrupt developers 0 07 17 NIEA 0 0 0 100 0.000 0 000 0.000 0 000 0.016 0 006 0.015 0 002 0.000 0 0 0 100 0 0 01852 2017_18 Q KI5 1 Sewerage Infrastructure Appraisal(s) for adoption from bankrup0 07 2 NIEA 0 0 0 100 0.000 0 000 0.000 0 000 0.006 0 021 0.011 0 002 0.000 0 0 0 100 0 0 01853 2017_18 Q KI5 2 Small Rural WWTW Programme PC13 00 09 17 NIEA 0 0 0 100 0.000 0.000 0.000 .9 2 1.837 0.000 0.000 0.000 10 0 0 50 08/07/2013 19/07/2013 03/01/201 31/03/2015 27/03/2015 07/09/2015 0 0 0 100 -0.079 0 000 0.000 0 000 0.673 3 752 0.97 0. 35 -0.079 10 0 0 50 0 0 0885 2017_18 Q KI5 3 Pump Away Scheme Removal Appra sal 00 05 02 DRD 15/01/2018 15/01/2018 0 0 0 100 0.000 0 000 0.000 0 000 0.030 0 018 0.000 -0 022 0.000 0 100 0 0 0 0 01855 2017_18 Q KI5 Non UWWTW MCert Compliance 0 09 16 NIEA 0 0 0 100 0.000 0.000 0.000 0.000 0.000 0.277 0.368 0.365 100 0 0 0 0 0 0 100 -0.022 0 000 0.000 0 000 0.000 0 060 0.065 0 000 -0.022 100 0 0 0 0 0 01856 2017_18 Q KI5 5 Sub Metering at selected WwTW 00 07 02 DRD 0 0 0 100 0.000 0.000 0.000 0.000 0.000 0.229 0.1 0.225 0 0 100 0 0 0 0 100 -0.001 0 000 0.000 0 000 0.009 0 066 0.012 0 000 -0.001 0 0 100 0 0 0 01857 2017_18 Q KI5 7 CSO Mon toring PC15 0 07 12 UR 0 0 0 100 0.000 0.000 0.000 0.000 0.000 0.873 0.867 0.862 100 0 0 0 03/08/2016 0 /08/2016 0 0 39 61 0.115 0 000 0.000 0 000 0.003 0 03 0.015 0.19 0.115 0 0 100 0 0 0 01858 2017_18 Q KI5 9 Non-Infrastructure Major Works 0 09 16 0 30 0 70 0.036 0 000 0.000 0 000 0.000 0 019 0.015 0 0 2 0.036 3 26 0 31 0 0 01859 2017_18 Q KI551 FTS and Minor Sewerage - Professional Services (PC15) 00 07 2 10/07/201 17/07/201 0 0 87 13 0.961 0 000 0.000 0 000 0.000 0 000 0. 32 0 661 0.961 0 17 0 83 0 15 01860 2017_18 Q KV222 Ca seal Court, Ba lyho land, Newry, Storm Sewer Extension. 00 KI538 07 2 0 /08/2015 0 /08/2015 0 0 100 0 0.000 0 000 0.000 0 000 0.000 0 000 0.026 0 000 0.000 0 0 0 100 0 0 01861 2017_18 Q KA271 Lylehi l Road, Temp epatr ck, Foul Sewer Ex ension. 00 KI551 07 2 13/10/2017 13/10/2017 0 0 100 0 0.000 0 000 0.000 0 000 0.000 0 000 0.000 0 000 0.000 0 0 0 100 0 0 01862 2017_18 Q KA272 Hi lhead Road, Ballyclare Foul & Sto m Sewer 00 KI551 07 2 26/02/2016 26/02/2016 0 0 100 0 0.026 0 000 0.000 0 000 0.000 0 000 0.000 0 082 0.026 0 0 0 100 0 0 01863 2017_18 Q KA27 Clare Park, Clare Road, Ballycastle Foul Sewer Ext 00 KI551 07 2 23/08/2017 23/08/2017 0 /09/2017 2 /11/2017 0 0 100 0 0.138 0 000 0.000 0 000 0.000 0 000 0.000 0 000 0.138 0 0 0 100 0 0 0186 2017_18 Q KA277 The Old Station Dunadry S orm sewer 00 KI551 07 2 0 /10/2017 0 /10/2017 21/11/2017 19/01/2018 19/01/2018 0 0 100 0 0.020 0 000 0.000 0 000 0.000 0 000 0.000 0 000 0.020 0 0 0 100 0 0 01865 2017_18 Q KA278 The Square, Ballyclare 06 KI551 07 2 09/01/2018 09/01/2018 0 0 100 0 0.000 0 000 0.000 0 000 0.000 0 000 0.000 0 000 0.000 0 0 0 100 0 0 01866 2017_18 Q KA282 Ki limorr e Bel aghy Rd Dunloy, Foul sewer extens on. 06 KI551 07 2 18/09/2017 18/09/2017 05/12/2017 23/01/2018 0 0 100 0 0.035 0 000 0.000 0 000 0.000 0 000 0.000 0 000 0.035 0 0 0 100 0 0867 2017_18 Q KA283 Birch H ll Road, Antrim, Foul & Storm Sewer Ex ension. 06 KI551 07 2 21/02/2018 21/02/2018 0 0 100 0 0.000 0 000 0.000 0 000 0.000 0 000 0.000 0 000 0.000 0 0 0 100 0 0868 2017_18 Q KA285 B031 28 Lands Opp 1 2 Upper Road G eenisland, Foul sewe 06 KI551 07 2 0 0 100 0 0.001 0 000 0.000 0 000 0.000 0 000 0.000 0 000 0.001 0 0 0 100 0 0869 2017_18 Q KA286 Ferrard Meadow Antrim Foul Sewer 00 KI551 07 2 0 0 100 0 0.002 0 000 0.000 0 000 0.000 0 000 0.000 0 000 0.002 0 0 0 100 0 0870 2017_18 Q KB527 Tobermore Rd, Maghera elt Storm Sewer 00 KI551 07 2 20/01/2016 20/01/2016 0 0 100 0 -0.001 0 000 0.000 0 000 0.000 0 000 0.000 0 015 -0.001 0 0 0 100 0 0 01871 2017_18 Q KB528 Trostan Avenue, Ba lymena, Foul Sewer Extension. 00 KI551 07 2 12/01/2017 12/01/2017 03/0 /2017 07/0 /2017 26/09/2017 0 0 100 0 0.005 0 000 0.000 0 000 0.000 0 000 0.000 0 000 0.005 0 0 0 100 0 0 01872 2017_18 Q KB529 Castle Tower Special School, Trostan Avenue, Ballymena 00 KI551 07 2 01/10/2016 01/10/2016 06/03/2017 07/0 /2017 1 /0 /2017 05/09/2017 0 0 100 0 -0.007 0 000 0.000 0 000 0.000 0 000 0.000 0 065 -0.007 0 0 0 100 0 0 01873 2017_18 Q KB530 Ba lymena Showgrounds S C. F&S sewer extens on 00 KI551 07 2 17/11/2016 17/11/2016 0 0 100 0 0.027 0 000 0.000 0 000 0.000 0 000 0.000 0 000 0.027 0 0 0 100 0 0 0187 2017_18 Q KB531 Glenravel Rd Cargan Ballymena F&S sewer ext. 00 KI551 07 2 28/11/2016 28/11/2016 0 0 100 0 0.020 0 000 0.000 0 000 0.000 0 000 0.000 0 000 0.020 0 0 0 100 0 0 01875 2017_18 Q KB533 Old own Road, Bellaghy Foul Sewer 00 KI551 07 2 0 0 100 0 0.000 0 000 0.000 0 000 0.000 0 000 0.000 0 000 0.000 0 0 0 100 0 0 01876 2017_18 Q KB536 Sourh ll Road Ba lymena Storm Sewer 00 KI551 07 2 19/12/2017 19/12/2017 0 0 100 0 0.000 0 000 0.000 0 000 0.000 0 000 0.000 0 000 0.000 0 0 0 100 0 0877 2017_18 Q KB538 297-303 Ballymoney Rd Ballymena, S orm sewer ex ension 06 KI551 07 2 28/09/2017 28/09/2017 0 0 100 0 0.01 0 000 0.000 0 000 0.000 0 000 0.000 0 000 0.01 0 0 0 100 0 0878 2017_18 Q KB5 3 Ba lee Drive Ballymena, Foul & S orm Sewer Extens on Requis06 KI551 07 2 0 0 100 0 0.000 0 000 0.000 0 000 0.000 0 000 0.000 0 000 0.000 0 0 0 100 0 0879 2017_18 Q KC 71 Laurel Hi l, Coleraine, Storm Sewer Extens on 00 KI551 07 2 01/07/2016 01/07/2016 0 0 100 0 0.000 0 000 0.000 0 000 0.000 0 000 0.000 0 0 1 0.000 0 0 0 100 0 0 01880 2017_18 Q KC 78 The Cloisters, Bushm lls 06 KI551 07 2 16/08/2017 16/08/2017 26/02/2018 30/03/2018 0 0 100 0 0.05 0 000 0.000 0 000 0.000 0 000 0.000 0 000 0.05 0 0 0 100 0 0 01881 2017_18 Q KC 80 B02260 Coleraine Ente prise zone project, Sewer pumping m 06 KI551 07 2 19/12/2017 19/12/2017 05/02/2018 28/03/2018 0 0 100 0 0.07 0 000 0.000 0 000 0.000 0 000 0.000 0 000 0.07 0 0 0 100 0 0882 2017_18 Q KF393 The Ho lows, Lurgan - Storm Sewer Requistion 00 KI551 07 2 10/12/2015 10/12/2015 0 0 100 0 0.000 0 000 0.000 0 000 0.000 0 000 0.000 0 018 0.000 0 0 0 100 0 0 01883 2017_18 Q KF39 Co ebrooke Rd Fivemi etown S orm Sewer 00 KI551 07 2 01/07/2016 01/07/2016 0 0 100 0 0.020 0 000 0.000 0 000 0.000 0 000 0.000 0 000 0.020 0 0 0 100 0 0 0188 2017_18 Q KF395 Favour Royal Road, Augher Foul Sewer 00 KI551 07 2 09/12/2015 09/12/2015 0 0 100 0 0.000 0 000 0.000 0 000 0.000 0 000 0.022 0 003 0.000 0 0 0 100 0 0 01885 2017_18 Q KF399 3A The Square, Moy Foul Sewer Ext. 00 KI551 07 2 20/07/2016 03/08/2016 0 0 100 0 0.000 0 000 0.000 0 000 0.000 0 000 0.000 0 02 0.000 0 0 0 100 0 0 01886 2017_18 Q KF 01 Southern Regional College, Banbr dge Storm Sewer 00 KI551 07 2 30/08/2017 30/08/2017 0 /06/2018 0 0 100 0 0.000 0 000 0.000 0 000 0.000 0 000 0.000 0 000 0.000 0 0 0 100 0 0 01887 2017_18 Q KF 07 Sa ter Grange Rd, Armagh - S orm Sewer Ex ension 06 KI551 07 2 0 0 100 0 0.000 0 000 0.000 0 000 0.000 0 000 0.000 0 000 0.000 0 0 0 100 0 0888 2017_18 Q KG211 Edward St, Po tadown Foul & S orm Sewer. 00 KI551 07 2 1 /10/2016 1 /10/2016 0 0 100 0 0.000 0 000 0.000 0 000 0.000 0 000 0.000 0 000 0.000 0 0 0 100 0 0 01889 2017_18 Q KG212 Armagh Rd, Portadown, Foul Sewer Requisi ion 00 KI551 07 2 2 /06/2017 2 /06/2017 27/10/2017 09/02/2018 26/01/2018 0 0 100 0 0.170 0 000 0.000 0 000 0.000 0 000 0.000 0 000 0.170 0 0 0 100 0 0 01890 2017_18 Q KG216 Mounthall Grange, C onmaka e Rd, Storm Sewer 00 KI551 07 2 19/02/2018 19/02/2018 0 0 100 0 0.001 0 000 0.000 0 000 0.000 0 000 0.000 0 001 0.001 0 0 0 100 0 0 01891 2017_18 Q KG218 8-10 Lurgan Road, Crumlin 06 KI551 07 2 27/10/2017 27/10/2017 0 0 100 0 0.030 0 000 0.000 0 000 0.000 0 000 0.000 0 000 0.030 0 0 0 100 0 0 01892 2017_18 Q KG22 So itude Demense, Lurgan, Storm & Foul Sewer 06 KI551 07 2 0 0 100 0 0.000 0 000 0.000 0 000 0.000 0 000 0.000 0 000 0.000 0 0 0 100 0 0893 2017_18 Q KL53 Sion Mi ls Stable Block Foul Sewer 00 KI551 07 2 26/11/2015 26/11/2015 0 0 100 0 -0.001 0 000 0.000 0 000 0.000 0 000 0.021 -0 003 -0.001 0 0 0 100 0 0 0189 2017_18 Q KL535 Northland Road, Londonderry, S orm and Foul Sewer Extensio00 KI551 07 2 01/07/2016 03/08/2016 0 0 100 0 0.036 0 000 0.000 0 000 0.000 0 000 0.000 0 065 0.036 0 0 0 100 0 0 01895 2017_18 Q KL5 0 Foyle Co lege, Limavady Road, Derry S orm Sewer 00 KI551 07 2 15/11/2016 15/11/2016 23/01/2017 07/0 /2017 05/05/2017 0 0 100 0 0.019 0 000 0.000 0 000 0.000 0 000 0.000 0.120 0.019 0 0 0 100 0 0 01896 2017_18 Q KL5 Carmoney Court, Eglinton Storm Sewer 00 KI551 07 2 06/11/2017 06/11/2017 20/11/2017 11/01/2018 0 0 100 0 0.05 0 000 0.000 0 000 0.000 0 000 0.000 0 000 0.05 0 0 0 100 0 0 01897 2017_18 Q KL5 6 Dalys Brae, Drumahoe 06 KI551 07 2 06/09/2017 06/09/2017 13/12/2017 16/02/2018 16/02/2018 0 0 100 0 0.065 0 000 0.000 0 000 0.000 0 000 0.000 0 000 0.065 0 0 0 100 0 0 01898 2017_18 Q KL5 7 Be t Road, Altnagelvin, Foul Sewer rep acement 06 KI551 07 2 2 /01/2018 2 /01/2018 12/02/2018 28/03/2018 0 0 100 0 0.105 0 000 0.000 0 000 0.000 0 000 0.000 0 000 0.105 0 0 0 100 0 0 01899 2017_18 Q KL5 8 B010 99 Nixons Corner Braehead Londonderry, Foul sewer 06 KI551 07 2 13/0 /2018 13/0 /2018 0 0 100 0 0.000 0 000 0.000 0 000 0.000 0 000 0.000 0 000 0.000 0 0 0 100 0 0900 2017_18 Q KL550 Coneyvi le Coney Rd Culmore L'Derry, Foul & Storm Sewer Ex06 KI551 07 2 0 0 100 0 0.000 0 000 0.000 0 000 0.000 0 000 0.000 0 000 0.000 0 0 0 100 0 0901 2017_18 Q KN669 Omagh IPS Foul & Storm 00 KI551 07 2 23/08/2017 23/08/2017 27/01/2018 0 0 100 0 0.0 3 0 000 0.000 0 000 0.000 0 000 0.000 0 000 0.0 3 0 0 0 100 0 0 01902 2017_18 Q KN670 B02 99 Gaelscoil na gCrann school) Omagh 06 KI551 07 2 0 0 100 0 0.002 0 000 0.000 0 000 0.000 0 000 0.000 0 000 0.002 0 0 0 100 0 0903 2017_18 Q KN672 Greenan Road Tril ick, Foul pumping main. 06 KI551 07 2 0 0 100 0 0.000 0 000 0.000 0 000 0.000 0 000 0.000 0 000 0.000 0 0 0 100 0 090 2017_18 Q KN675 Academy 61 Derry Rd, Storm Sewer Extension 06 KI551 07 2 0 0 100 0 0.000 0 000 0.000 0 000 0.000 0 000 0.000 0 000 0.000 0 0 0 100 0 0905 2017_18 Q KR511 Ravenhi l Road Bel ast - Storm Sewer Ex ension 00 KI551 07 2 DRD 0 0 0 0 0.000 0.000 0.000 0.000 0.000 0.000 0.000 0.000 0 0 0 0 0 0 100 0 0.002 0 000 0.005 0 012 -0.001 0 000 0.001 0 000 0.002 0 0 0 100 0 0 01906 2017_18 Q KR555 Lapwing, Newtownards - Article 11 Enforcement Site 00 KI551 07 2 DRD 05/08/201 17/09/201 21/11/2016 27/01/2017 10/02/2017 0 0 100 0 -0.008 0 000 0.000 0 000 0.005 0 000 0.000 0.10 -0.008 0 0 0 100 0 0 01907 2017_18 Q KR612 Olympia Le sure Centre Windsor Park Storm Sewer Requ s tion00 KI551 07 2 23/06/2016 27/06/2016 19/09/2016 12/05/2017 19/05/2017 0 0 100 0 0.226 0 000 0.000 0 000 0.000 0 000 0.000 0 5 0.226 0 39 0 61 0 39 01908 2017_18 Q KR617 Glen Road, Bel ast - Storm Sewer Ex ension 00 KI551 07 2 26/02/2016 02/03/2016 0 0 100 0 0.000 0 000 0.000 0 000 0.000 0 000 0.000 0 000 0.000 0 0 0 100 0 0 01909 2017_18 Q KR621 Co lege Avenue, Be fast, Storm Sewer Extens on. 00 KI551 07 2 0 0 100 0 0.000 0 000 0.000 0 000 0.000 0 000 0.000 0 000 0.000 0 0 0 100 0 0 01910 2017_18 Q KR626 Ba lydu f Road, Newtownabbey Storm Sewer Ext 00 KI551 07 2 16/08/2016 16/08/2016 0 0 100 0 0.000 0 000 0.000 0 000 0.000 0 000 0.000 0 015 0.000 0 0 0 100 0 0 01911 2017_18 Q KR638 Ravara Gardens, Bangor Foul Sewer 00 KI551 07 2 22/11/2016 22/11/2016 0 0 100 0 0.01 0 000 0.000 0 000 0.000 0 000 0.000 0 000 0.01 0 0 0 100 0 0 01912 2017_18 Q KR639 Prince Andrew Way, Carr ckfe gus Foul Sewer 00 KI551 07 2 23/11/2016 23/11/2016 0 0 100 0 -0.001 0 000 0.000 0 000 0.000 0 000 0.000 0 022 -0.001 0 0 0 100 0 0 01913 2017_18 Q KR6 1 336-3 O dpark Road, Belfast F&S sewer req. 00 KI551 07 2 29/06/2017 29/06/2017 21/08/2017 08/09/2017 02/03/2018 0 0 100 0 0.030 0 000 0.000 0 000 0.000 0 000 0.000 0 000 0.030 0 0 0 100 0 0 0191 2017_18 Q KR6 3 Fashoda St, Bel ast Storm Sewer Requisition. 00 KI551 07 2 1 /02/2017 1 /02/2017 0 0 100 0 0.001 0 000 0.000 0 000 0.000 0 000 0.000 0 000 0.001 0 0 0 100 0 0 01915 2017_18 Q KR6 2-2 Shore Road Green sland Sto m Sewer 00 KI551 07 2 10/10/2017 10/10/2017 0 0 100 0 0.027 0 000 0.000 0 000 0.000 0 000 0.000 0 000 0.027 0 0 0 100 0 0 01916 2017_18 Q KR6 9 Durham Street, Bel ast Storm Sewer Extension. 00 KI551 07 2 0 /07/2017 0 /07/2017 02/07/2018 0 0 100 0 0.000 0 000 0.000 0 000 0.000 0 000 0.000 0 000 0.000 0 0 0 100 0 0 01917 2017_18 Q KR650 Brookha l Foul Sewer Ex ension 00 KI551 07 2 28/06/2017 28/06/2017 31/07/2017 1 /09/2017 01/11/2017 0 0 100 0 0.102 0 000 0.000 0 000 0.000 0 000 0.000 0 000 0.102 0 0 0 100 0 0 01918 2017_18 Q KR651 Castle St, Comber - foul and s orm sewer requ s tion 00 KI551 07 2 03/05/2017 03/05/2017 0 0 100 0 0.026 0 000 0.000 0 000 0.000 0 000 0.000 0 001 0.026 0 0 0 100 0 0 01919 2017_18 Q KR652 Templepatr ck Road, Ballyclare Foul Sewer 00 KI551 07 2 0 0 100 0 0.000 0 000 0.000 0 000 0.000 0 000 0.000 0 000 0.000 0 0 0 100 0 0 01920 2017_18 Q KR65 Brookmount Street, Belfast - Storm Sewer Extension 00 KI551 07 2 18/09/2017 18/09/2017 31/01/2018 30/03/2018 0 0 100 0 0.02 0 000 0.000 0 000 0.000 0 000 0.000 0 000 0.02 0 0 0 100 0 0 01921 2017_18 Q KR655 2- Cheston Street, Car ickfergus storm sewer 00 KI551 07 2 0 0 100 0 0.000 0 000 0.000 0 000 0.000 0 000 0.000 0 000 0.000 0 0 0 100 0 0 01922 2017_18 Q KR657 Glenbryn Park, Be fast - Storm Sewer 00 KI551 07 2 10/10/2017 10/10/2017 27/11/2017 17/01/2018 0 0 100 0 0.061 0 000 0.000 0 000 0.000 0 000 0.000 0 000 0.061 0 0 0 100 0 0 01923 2017_18 Q KR658 Fi zroy Ave, Be fast S orm Sewer Ex ension 00 KI551 07 2 05/09/2017 05/09/2017 0 0 100 0 0.052 0 000 0.000 0 000 0.000 0 000 0.000 0 000 0.052 0 0 0 100 0 0 0192 2017_18 Q KR660 113 Bangor Rd, Newtowna ds Storm Sewer Requ s tion 00 KI551 07 2 15/11/2017 15/11/2017 26/02/2018 29/03/2018 0 0 100 0 0.0 7 0 000 0.000 0 000 0.000 0 000 0.000 0 000 0.0 7 0 0 0 100 0 0 01925 2017_18 Q KR661 Woodburn Primary School Carrick ergus 06 KI551 07 2 31/08/2017 31/08/2017 0 /06/2018 0 0 100 0 0.000 0 000 0.000 0 000 0.000 0 000 0.000 0 000 0.000 0 0 0 100 0 0 01926 2017_18 Q KR666 St Bernade te P/School Belfast Storm Sewer 00 KI551 07 2 27/10/2017 27/10/2017 0 0 100 0 0.05 0 000 0.000 0 000 0.000 0 000 0.000 0 000 0.05 0 0 0 100 0 0 01927 2017_18 Q KS916 Flying Horse Rd, Downpatr ck Sewer Extens on 00 KI551 07 2 DRD 0 0 0 0 0.000 0.000 0.000 0.000 0.000 0.000 0.000 0.000 0 0 0 0 27/01/201 10/02/201 20/02/2017 2 /02/2017 03/03/2017 02 05 2017 0 0 100 0 0.000 0 000 0.000 0 002 0.002 -0 001 0.000 0 013 0.000 0 0 0 100 0 0 01928 2017_18 Q KS959 Saul Rd, Downpatrick S orm Sewer Extens on 00 KI551 07 2 0 0 100 0 0.000 0 000 0.000 0 000 0.000 0 000 0.000 0 000 0.000 0 0 0 100 0 0 01929 2017_18 Q KS961 Cronstown Road, Newtownards, Sto m Sewer Upgrade 00 KI551 07 2 07/0 /2016 07/0 /2016 0 0 100 0 -0.001 0 000 0.000 0 000 0.000 0 000 0.000 0 012 -0.001 0 0 0 100 0 0 01930 2017_18 Q KS963 Skipperstone Road, Bangor, Foul & Storm Sewer Requ s tion 00 KI551 07 2 08/03/2017 08/03/2017 07/07/2017 0 0 100 0 0.065 0 000 0.000 0 000 0.000 0 000 0.000 0 009 0.065 0 0 0 100 0 0 01931 2017_18 Q KS967 1 High Bangor Rd, Donaghadee - Foul Sewer Requ s tion. 00 KI551 07 2 20/12/2016 23/12/2016 13/02/2017 0 0 100 0 0.037 0 000 0.000 0 000 0.000 0 000 0.000 0 028 0.037 0 0 0 100 0 0 01932 2017_18 Q KS969 Glenford Grove, Newtownards - Foul & Storm Sewer Extens on00 KI551 07 2 07/12/2016 07/12/2016 0 0 100 0 0.000 0 000 0.000 0 000 0.000 0 000 0.000 0 000 0.000 0 0 0 100 0 0 01933 2017_18 Q KS970 SEC-1833 Hunters Mill, Downpatrick Art11 00 KI551 07 2 0 0 100 0 0.001 0 000 0.000 0 000 0.000 0 000 0.000 0 000 0.001 0 0 0 100 0 0 0193 2017_18 Q KS973 North Rd, Newtownards Storm Sewer Extens on 06 KI551 07 2 16/0 /2018 16/0 /2018 0 0 100 0 0.000 0 000 0.000 0 000 0.000 0 000 0.000 0 000 0.000 0 0 0 100 0 0 01935 2017_18 Q KT 2 Hi lsborough Rd, Dromara Sto m Sewer 00 KI551 07 2 07/07/2017 07/07/2017 0 0 100 0 0.000 0 000 0.000 0 000 0.000 0 000 0.000 0 000 0.000 0 0 0 100 0 0 01936 2017_18 Q KT 26 Derr aghy Rd, Lisburn - S orm Sewer Extension 00 KI551 07 2 2 /0 /2017 2 /0 /2017 12/03/2018 16/0 /2018 0 0 100 0 0.038 0 000 0.000 0 000 0.000 0 000 0.000 0 000 0.038 0 0 0 100 0 0 01937 2017_18 Q KT 27 Lurgan Road, Moira - Storm Sewer Extension 00 KI551 07 2 18/05/2017 18/05/2017 0 0 100 0 0.025 0 000 0.000 0 000 0.000 0 000 0.000 0 000 0.025 0 0 0 100 0 0 01938 2017_18 Q KT 29 Windmi l Lane, Ballynahinch Storm Sewer Requisit on 00 KI551 07 2 11/08/2017 11/08/2017 0 0 100 0 0.016 0 000 0.000 0 000 0.000 0 000 0.000 0 000 0.016 0 0 0 100 0 0 01939 2017_18 Q KT 30 Hu ls Lane Lisburn storm sewer extens on 00 KI551 07 2 10/08/2017 10/08/2017 12/03/2018 16/0 /2018 0 0 100 0 0.037 0 000 0.000 0 000 0.000 0 000 0.000 0 000 0.037 0 0 0 100 0 0 01

m a e s
e )
So t Re C M Submiss on Re e ence
o ect D Re e ence o ect Name C oject
e oda ent
oject IDSubsti ute
o ect ID
ma y Asset
Ca ego y
C 0 og amme
Regula o y S gn O Requi ed
Base ine A Date
Base ine o ect
App oval Date
Base ne Sta t on S te Da e
Base ine Bene cial Use
Date
Basel ne Regulato y
sign-o Da e
Base ine Comp e ion o Const uct on
Date
Base ine End o
Main enance e od Date
Base ine Se vice A locat on Wate
n ast uc u e
Base ine Se vice Al oca ion Wate
Non-n ast uc u e
Base ine Se v ce A locat on Sewe age
In ast uctu e
Basel ne Se v ce Al oca ion
Sewe age Non-In ast uctu e
Basel ne CA EX 20 0-
£m
Base ine CA EX 20 -
2 £m
Basel ne CA EX 20 2-
3 £m
Base ne CA EX 20 3-
4 £m
Base ine CA EX 20 4-
5 £m
Basel ne CA EX 20 5-
6 £m
Base ine CA EX 20 6-
7 £m
Basel ne CA EX 20 7-
8 £m
Base ine u pose A locat on Qual ty
Base ine u pose Al oca ion Base
Base ine u pose A locat on ES
Basel ne u pose Al oca ion G ow h
Cu ent Actual o o ected
A Da e
Cu ent Ac ua o ojected
oject App oval Date
Cu ent Actual o o ected Sta t on Si e
Date
Cu ent Ac ua o ojected
Bene cial Use Da e
Cu ent Actual o o ected Regu ato y
sign-o Da e
Cu ent Actual o ojec ed
Comple ion o Const uc ion
Date
Cu ent Actual o o ected
End o Maintenance
e iod Date
Cu ent Actual o ojec ed Se v ce
A locat on Wa e In ast uctu e
Cu ent Actual o o ec ed Se v ce
A locat on Wa e Non-
n ast uc u e
Cu ent Actual o o ec ed Se v ce
A locat on Sewe age
n ast uc u e
Cu ent Actual o o ec ed Se v ce
A locat on Sewe age Non-
n ast uc u e
Cu ent Actual o o ected CA EX ea to date £m
Cu ent Actual o ojec ed
CA EX 20 0- £m
Cu ent Actual o o ected
CA EX 20 -2 £m
Cu ent Actual o ojec ed
CA EX 20 2-3 £m
Cu ent Ac ual o o ected
CA EX 20 3-4 £m
Cu ent Actual o o ec ed
CA EX 20 4-5 £m
Cu ent Ac ual o ojected
CA EX 20 5-6 £m
Cu ent Actual o o ec ed
CA EX 20 6-7 £m
Cu ent Ac ual o ojected
CA EX 20 7-8 £m
Cu ent Actual o o ec ed u pose
Al oca ion Qua i y
Cu ent Actual o o ec ed u pose
A location Base
Cu ent Actual o o ected u pose
Al oca ion ES
Cu ent Actual o ojected u pose
A locat on G owth
Cu ent Ac ual o ojected RE
Al oca ion Wate
Cu ent Ac ual o ojected RE Al oca ion Sewe age
Nom na ed Output
2 3 4 5 6 7 8 9 0 2 3 4 5 6 7 8 9 20 2 22 23 24 25 26 27 28 29 36 37 38 39 40 4 42 43 44 45 46 47 48 49 50 5 52 53 54 55 56 57 58 59 66 67 68 69 70 7 72
A T a a a ex e e e e 7 99 2 9 24 949 4 9 47 7 4 4 2 2 2 7 7 47 92 9 4 79 7 4 7 4 27 2 2
SOR
CIM
_Sub
I_oj
ect_
D
I_oj
ect_
Nam
e
I_C
_e
iod
I_AR
EN_
ojec
t_D
I_SU
BSI
UE_
oec
t_ID
I_i_
Asse
t_C
at
I_C
0_og
I_R
eg_S
igno
BM
_A
BM
_o
ect_
App
oval
BM
_SoS
BM
_BU
BM
_RSO
BM
_CoC
BM
_EoM
BSA_
WI%
BSA_
WN
I%
BSA_
SI%
BSA_
SNI%
B_C
apex
_20
0-_£
m
B_C
apex
_20
-2_
£m
B_C
apex
_20
2-3_
£m
B_C
apex
_20
3-4_
£m
B_C
apex
_20
4-5_
£m
B_C
apex
_20
5-6_
£m
B_C
apex
_20
6-7_
£m
B_C
apex
_20
7-8_
£m
BA_
Q%
BA_
B%
BA_
E%
BA_
G%
CAM
_A
CAM
_o
ecAp
pov
al
CAM
_SoS
CAM
_BU
CAM
_RSO
CAM
_CoC
CAM
_EoM
CAS
A_W
I%
CAS
A_W
NI%
CAS
A_SI
%
CAS
A_SN
I%
CA
_Cap
ex_
D_£
m
CA
_Cap
ex_2
00-
_£m
CA
_Cap
ex_2
0-
2_£m
CA
_Cap
ex_2
02-
3_£m
CA
_Cap
ex_2
03-
4_£m
CA
_Cap
ex_2
04-
5_£m
CA
_Cap
ex_2
05-
6_£m
CA
_Cap
ex_2
06-
7_£m
CA
_Cap
ex_2
07-
8_£m
CA
A_Q
%
CA
A_B%
CA
A_E%
CA
A_G
%
CA
_IR
E_W
%
CA
_IR
E_S%
NO
M_O
upu
t
e A a e e e v e s A a e A a e e a a x e e e m m e e a ) e A a e e se A a %) e A a e e %)e e a ase e M es e a es ase e e v e s A a ase e x e e e m 2 2- es) ase e se A a e A a e e M es e a es
9 0 2017_18 Q KT 31 Strawberry Hi l Ballynahinch Road Lisburn 00 KI551 07 2 2 /10/2017 2 /10/2017 0 0 100 0 0.000 0 000 0.000 0 000 0.000 0 000 0.000 0 000 0.000 0 0 0 100 0 0 019 1 2017_18 Q KT 32 52-58 Main Street Glenavy, storm sewer ex ension. 06 KI551 07 2 DRD 20/11/2017 20/11/2017 0 0 100 0 0.05 0 000 0.000 0 000 0.000 0 000 0.000 0 000 0.05 0 0 0 100 0 0 019 2 2017_18 Q KT 33 125 Old Dundona d Road Dundonald , Foul & Storm sewer ext 06 KI551 07 2 0 0 100 0 0.000 0 000 0.000 0 000 0.000 0 000 0.000 0 000 0.000 0 0 0 100 0 0 019 3 2017_18 Q KT 3 Drumnakelly Wwps, Storm sewer extens on 06 KI551 07 2 27/03/2018 27/03/2018 0 0 100 0 0.000 0 000 0.000 0 000 0.000 0 000 0.000 0 000 0.000 0 100 0 0 0 100 019 2017_18 Q KV197 Monteith Road Annac one Foul & Sto m Sewer Extensions 00 KI551 07 2 DRD 0 0 0 0 0.000 0.000 0.000 0.000 0.000 0.000 0.000 0.000 0 0 0 0 1 /03/2018 1 /03/2018 0 0 100 0 0.000 0 000 0.000 0 003 -0.001 0 001 0.000 0 000 0.000 0 0 0 100 0 0 019 5 2017_18 Q KV226 Dromore Street, Banbridge Foul Sewer Extens on 00 KI551 07 2 18/05/2017 18/05/2017 0 0 100 0 0.017 0 000 0.000 0 000 0.000 0 000 0.000 0 000 0.017 0 0 0 100 0 0 019 6 2017_18 Q KV229 Ben Crom P ace, K lkeel - S orm Sewer Ex ension 00 KI551 07 2 08/12/2016 08/12/2016 13/02/2017 2 /02/2017 03/05/2017 0 0 100 0 0.001 0 000 0.000 0 000 0.000 0 000 0.000 0 026 0.001 0 0 0 100 0 0 019 7 2017_18 Q KI55 Energy Eff c ency at WwTW s Screw Pumps 00 09 02 0 0 0 100 0.003 0 000 0.000 0 000 0.000 0 020 0.010 0 020 0.003 0 100 0 0 0 0 019 8 2017_18 Q KI555 Stormwater Seperat on Programme for PC15 0 07 12 DRD 0 0 100 0 0.000 0 000 0.000 0 000 0.000 0 000 0.000 0 000 0.000 0 100 0 0 0 100 019 9 2017_18 Q KI556 Small Rural WWTW Programme - PC15(2015-2021) 0 09 17 NIEA 0 0 0 100 0.000 0.000 0.000 0.000 0.000 1.895 1.88 1.872 10 1 0 9 0 /02/2016 05/02/2016 03/0 /2017 31/03/2021 0 0 0 100 1. 0 0 000 0.000 0 000 0.000 0 030 0.126 2 025 1. 0 10 0 0 50 0 0 02950 2017_18 Q KI557 PC15 Year 1 WWTW Base Maintenance – West Reg on 06 09 02 06/01/2015 08/01/2015 0 0 0 100 0.030 0 000 0.000 0 000 0.000 0 000 3.703 0.163 0.030 0 100 0 0 0 0 01951 2017_18 Q KI558 Engineering Spec ficat ons Standards. 0 15 20 29/07/2015 29/07/2015 10 25 25 0 -0.019 0 000 0.000 0 000 0.000 0 025 0.160 0 206 -0.019 0 100 0 0 10 25 01952 2017_18 Q KI559 PC15 Year 1 WWTW Base Maintenance - East Region 06 09 02 06/01/2015 08/01/2015 06/0 /2015 26/05/2017 0 0 0 100 0. 1 0 000 0.000 0 000 0.000 0 0 0 .991 2 673 0. 1 0 100 0 0 0 0 01953 2017_18 Q KI560 PC15 Year 1 WWTW Base Maintenance – South Reg on 06 09 02 06/01/2015 08/01/2015 0 0 0 100 -0.006 0 000 0.000 0 000 0.000 0 0 0 .86 0 091 -0.006 0 100 0 0 0 0 0195 2017_18 Q KI561 PC15 Year 1 WWTW Base Maintenance – North Region 06 09 02 06/01/2015 08/01/2015 0 0 0 100 -0.088 0 000 0.000 0 000 0.000 0 2 9 .819 0 219 -0.088 0 100 0 0 0 0 01955 2017_18 Q KI562 PC15 Year 1 WwPS Base Maintenance 06 12 02 09/03/2015 10/03/2015 0 0 0 100 0.005 0 000 0.000 0 000 0.000 0 033 3.988 1.108 0.005 0 100 0 0 0 0 01956 2017_18 Q KI563 Base Main enance Assoc ated o DG5 Investigations 00 07 12 27/11/201 01/12/201 02/11/2015 30/03/2016 30/09/2016 0 0 100 0 0.036 0 000 0.000 0 000 0.000 0 069 0.772 0.11 0.036 0 30 70 0 0 30 01957 2017_18 Q KI56 Appra sal of DG5 At-R sk Register Locat ons (Mi igation Phase 0 07 12 DRD 0 0 100 0 0.02 0 000 0.000 0 000 0.000 0 000 0.000 0 015 0.02 0 0 100 0 0 0 01958 2017_18 Q KI565 PC15 PSCEMD (Sewerage) 00 09 16 0 0 0 100 0.000 0.000 0.000 0.000 0.000 0.185 0.18 0.000 100 0 0 0 0 0 0 100 0.00 0 000 0.000 0 000 0.000 0 000 0.000 0 000 0.00 100 0 0 0 0 0 01959 2017_18 Q KI568 Po lu ed Stormwa er Ou fall Solut ons - Phase 2 00 07 12 0 0 100 0 0.000 0 000 0.000 0 000 0.000 0 000 0.000 0 000 0.000 0 100 0 0 0 100 01960 2017_18 Q KI571 Asset Resil ence Phase 3-Coastal Wastewater Treatment Wor 06 09 02 0 0 0 100 0.050 0 000 0.000 0 000 0.000 0 000 0.002 0 012 0.050 100 0 0 0 0 0 01961 2017_18 Q KI573 DG5 Programme - Parent Code 06 07 12 UR 0 0 100 0 0.000 0.000 0.000 0.000 0.000 0.000 0.000 1. 98 0 15 71 1 09/06/2016 10/06/2016 0 0 100 0 0.106 0 000 0.000 0 000 0.000 0 000 0.000 0.180 0.106 0 0 100 0 0 0 01962 2017_18 Q KI57 PC15 Base Maintenance (Sewerage) Parent 06 09 02 0 0 0 100 0.000 0.000 0.000 0.000 0.000 18.906 18.792 18.679 0 100 0 0 0 0 0 100 0.000 0 000 0.000 0 000 0.000 0 000 0.000 0 000 0.000 0 100 0 0 0 0 01963 2017_18 Q KI575 PC15 (Sub Programme 12) Bathing Wa er and She lf sh Water 06 07 12 0 0 100 0 0.000 0.000 0.000 0.000 0.000 1.189 1.182 1.502 100 0 0 0 0 0 100 0 0.000 0 000 0.000 0 000 0.000 0 000 0.000 0 000 0.000 100 0 0 0 0 0 0196 2017_18 Q KI576 PC15 (Sub Programme 16) Bathing Wa er and She lf sh Water 06 09 16 0 0 0 100 0.000 0.000 0.000 0.000 0.000 0. 20 0. 17 0. 15 100 0 0 0 0 0 0 100 0.000 0 000 0.000 0 000 0.000 0 000 0.000 0 000 0.000 100 0 0 0 0 0 01965 2017_18 Q KI577 PC15 UID Programme Parent 06 07 12 0 0 52 8 0.000 0.000 0.000 0.000 0.000 0.000 0.000 0.000 59 31 0 10 0 0 52 8 0.000 0 000 0.000 0 000 0.000 0 000 0.000 0 000 0.000 59 31 0 10 0 0 01966 2017_18 Q KI578 PC15 Appra sal of NIW infrastructure at Railways, DRD Road &06 07 2 0 0 100 0 0.000 0.000 0.000 0.000 0.000 0.295 0.293 0.291 0 100 0 0 0 0 100 0 0.000 0 000 0.000 0 000 0.000 0 000 0.000 0 000 0.000 0 100 0 0 0 0 01967 2017_18 Q KI580 PC15 Base maintenance balancing line 06 0 99 16 8290195 26 976 15 12.8071115 3.387 537 0.000 0.000 0.000 0.000 0.000 3.91 1.261 0.666 0 100 0 0 17 27 13 3 0.000 0 000 0.000 0 000 0.000 0 000 0.000 0 000 0.000 0 100 0 0 0 0 01968 2017_18 Q KI581 PC15 FTS (Sewe age) Parent EP 06 07 2 0 0 100 0 0.000 0.000 0.000 0.000 0.000 2.51 2. 99 2.576 0 0 0 100 0 0 100 0 0.000 0 000 0.000 0 000 0.000 0 000 0.000 0 000 0.000 0 0 0 100 0 0 01969 2017_18 Q KI582 PC15 Public Realm (Sewerage) Parent EP 06 07 2 0 0 100 0 0.000 0.000 0.000 0.000 0.000 0.535 0.532 0.529 0 100 0 0 0 0 100 0 0.000 0 000 0.000 0 000 0.000 0 000 0.000 0 000 0.000 0 100 0 0 0 0 01970 2017_18 Q KI583 PC15 Implementation of PC13 Odour & IPPC Strategy 06 10 16 UR 0 0 0 100 0.000 0.000 0.000 0.000 0.000 0.752 0.7 6 0.739 20 0 80 0 1 /06/2016 16/06/2016 0 0 0 100 1.153 0 000 0.000 0 000 0.000 0 000 0.0 0. 25 1.153 20 0 80 0 0 0 01971 2017_18 Q KI58 PC15 Review of Sludge, IPPC and Odour Strategies 06 10 02 UR 0 0 0 100 0.000 0.000 0.000 0.000 0.000 0.000 0.000 0.000 0 100 0 0 0 0 0 100 0.000 0 000 0.000 0 000 0.000 0 000 0.000 0 000 0.000 0 100 0 0 0 0 01972 2017_18 Q KI585 Wastewater Marine Investment Scoping Study 06 09 16 0 0 50 50 0.021 0 000 0.000 0 000 0.000 0 000 0.055 0 091 0.021 100 0 0 0 0 0 01973 2017_18 Q KI586 PC15 Year 2 WwPS Base Maintenance 06 12 02 29/01/2016 02/02/2016 0 0 0 100 0.689 0 000 0.000 0 000 0.000 0 000 0.070 3 732 0.689 0 100 0 0 0 0 0197 2017_18 Q KI589 CMP Project : Improving Capab lity in Capi al Main enance P a 06 15 20 UR 1 /12/2017 16/01/2018 25 25 25 25 0.03 0 000 0.000 0 000 0.000 0 000 0.000 0 099 0.03 0 0 100 0 0 0 01975 2017_18 Q KI591 Pi ch Fibre Sewer Replacement 06 07 12 0 0 100 0 0.118 0 000 0.000 0 000 0.000 0 000 0.000 0.179 0.118 0 100 0 0 0 100 01976 2017_18 Q KI592 Samp ing and Analysis for WwTW PC15 00 1 20 0 0 0 100 0. 20 0 000 0.000 0 000 0.000 0 000 0.000 0.1 0 0. 20 50 0 50 0 0 0977 2017_18 Q KI593 Independent Review of Annsborough WwTW Pollut on Inciden 06 1 20 0 30 0 70 0.013 0 000 0.000 0 000 0.000 0 000 0.000 0 015 0.013 0 100 0 0 0 0 01978 2017_18 Q KI59 PC15 Year 3 WwPS Base Maintenance 06 12 02 20/02/2017 21/02/2017 0 0 0 100 2.8 7 0 000 0.000 0 000 0.000 0 000 0.000 0 030 2.8 7 0 100 0 0 0 0 01979 2017_18 Q KI595 Fi e Safety Regu at on Compl ance 06 15 20 17/07/2017 01/08/2017 27/11/2017 0 50 0 50 0.158 0 000 0.000 0 000 0.000 0 000 0.000 0 033 0.158 0 100 0 0 0 0 01980 2017_18 Q KI596 CSO Mon toring Within Shell ish and Bathing Water Areas 06 07 12 0 0 0 100 0.0 0 0 000 0.000 0 000 0.000 0 000 0.000 0 000 0.0 0 0 0 100 0 0 0 01981 2017_18 Q KI597 Marine Model ing, Bathing Wa ers (WwTW and Sewerage Syst06 09 16 0 0 50 50 0.000 0 000 0.000 0 000 0.000 0 000 0.000 0 000 0.000 100 0 0 0 0 0 01982 2017_18 Q KI598 Marine Model ing, She lf sh Wa ers Excluding Belfast Lough (W06 09 16 0 0 50 50 0.130 0 000 0.000 0 000 0.000 0 000 0.000 0 000 0.130 100 0 0 0 0 0 01983 2017_18 Q KI599 Marine Model ing, She lf sh Wa ers Including Belfast Lough (W 06 09 16 27/02/2018 08/03/2018 0 0 50 50 0.008 0 000 0.000 0 000 0.000 0 000 0.000 0 000 0.008 100 0 0 0 0 0 0198 2017_18 Q KI601 Strategic Sewerage Network Mode ling, Bathing Waters Exclud06 07 12 02/06/2017 16/06/2017 0 0 100 0 0.180 0 000 0.000 0 000 0.000 0 000 0.000 0 000 0.180 100 0 0 0 0 0 01985 2017_18 Q KI603 Strategic Sewerage Network Mode ling, Shellf sh Waters Exclu 06 07 12 02/06/2017 16/06/2017 0 0 100 0 0.612 0 000 0.000 0 000 0.000 0 000 0.000 0 000 0.612 100 0 0 0 0 0 01986 2017_18 Q KI60 Strategic Sewerage Network Mode ling, Shellf sh and Bathing W06 07 12 02/06/2017 16/06/2017 0 0 100 0 0.697 0 000 0.000 0 000 0.000 0 000 0.000 0 000 0.697 100 0 0 0 0 0 01987 2017_18 Q KI607 NI Long Term Sludge Stra egy 06 11 02 0 0 0 100 0.0 8 0 000 0.000 0 000 0.000 0 000 0.000 0 000 0.0 8 0 100 0 0 0 0 01988 2017_18 Q KI608 Programme and Cost Management 06 15 20 0 50 50 0 0.263 0 000 0.000 0 000 0.000 0 000 0.000 0 000 0.263 0 0 100 0 0 0 01989 2017_18 Q KI609 Integrated Delivery Serv ces. 06 15 20 0 50 50 0 0.552 0 000 0.000 0 000 0.000 0 000 0.000 0 000 0.552 0 0 100 0 0 0990 2017_18 Q KI610 Asset Per ormance Service 06 1 20 15/08/2017 17/10/2017 30 0 22 8 0.035 0 000 0.000 0 000 0.000 0 000 0.000 0 000 0.035 0 100 0 0 30 22 01991 2017_18 Q KI613 PC21 Preparedness and Assistance in Cost Setting 06 07 20 50 0 50 0 0.030 0 000 0.000 0 000 0.000 0 000 0.000 0 000 0.030 0 100 0 0 50 50 01992 2017_18 Q KI61 PC15 Year WWPS Base Maintenance 06 12 02 25/01/2018 30/01/2018 0 0 0 100 0.030 0 000 0.000 0 000 0.000 0 000 0.000 0 000 0.030 0 100 0 0 0 0993 2017_18 Q KI616 GRP Feasib lity study 06 15 02 0 30 0 70 0.021 0 000 0.000 0 000 0.000 0 000 0.000 0 000 0.021 0 100 0 0 0 099 2017_18 Q KL3 5 Donnybrewer WwTW 01 09 15 NIEA 31 03 2009 15/12/2009 15/12/2009 15/12/2010 0 0 0 0 0.000 0.000 0.000 0.000 0.000 0.000 0.000 0.000 0 0 0 0 20/02/2009 27/02/2009 31/03/2009 06/01/2010 21/08/2012 0 0 0 100 -0.002 0.110 0.100 0 016 -0.001 0 000 0.000 0 000 -0.002 67 20 0 13 0 0995 2017_18 Q KL350 Benone Area Sewerage 01 09 16 NIEA 12 12 2011 31/10/2013 31/12/2013 31/12/201 0 0 18 82 0.25 1.306 .0 0.9 5 0.000 0.000 0.000 0.000 6 18 0 36 05/06/2009 11/06/2009 01/0 /201 16/09/2013 26/09/201 0 0 18 82 -0.220 0 25 1.337 558 1.356 0 027 0.12 0 000 -0.220 6 18 0 36 0 3 08996 2017_18 Q KL386 Gortnahey WwTW 05 09 16 01 0 2011 30/03/201 30/06/201 30/06 2016 0 0 0 100 0.000 0.010 0.050 1.277 0.025 0.000 0.000 0.000 5 39 0 16 30/07/2012 21/08/2012 12/08/2013 2 /07/201 27/11/201 26/03/2015 0 0 0 100 0.000 0 000 0.010 0. 33 0.933 0 216 0.013 -0 005 0.000 5 39 0 16 0 0 08997 2017_18 Q KL39 Drumsurn WwTW 06 09 16 01 07 2011 28/02/2015 31/03/2015 30 03 2016 0 0 0 100 0.000 0.00 0.036 0.092 1.215 0.000 0.000 0.000 15 67 0 18 30/07/2012 21/08/2012 03/02/201 16/12/201 16/02/2015 0 0 0 100 -0.00 0 000 0.00 0 0 7 0. 11 0 970 0.028 0 000 -0.00 15 67 0 18 0 0 08998 2017_18 Q KL 28 Londonderry Sewer Imps Stage 2 - Duke St PS G oup Scheme01 07 11 NIEA 11 01 2010 25/01/2010 03 05 2010 28/03/2011 28/03/2011 27/03/2012 0 0 0 0 0.000 0.000 0.000 0.000 0.000 0.000 0.000 0.000 0 0 0 0 11/01/2010 25/01/2010 03/05/2010 28/03/2011 26/09/2011 0 0 100 0 -0.001 0 770 0.328 -0 037 0.000 0 000 0.000 0 000 -0.001 53 5 37 5 0 5999 2017_18 Q KL 9 Londonderry DAP: Strathfoyle & Drumahoe Work package: Dru01 07 11 NIEA 17 09 2009 25/09/2009 01 06 2009 02/09/2010 02/09/2010 31/03/2011 0 0 0 0 0.000 0.000 0.000 0.000 0.000 0.000 0.000 0.000 0 0 0 0 17/09/2009 25/09/2009 01/06/2009 02/09/2010 20/06/2011 31/03/2011 0 0 63 37 -0.001 0. 53 0.0 3 -0 011 0.000 0 000 0.000 0 000 -0.001 12 3 20 25 0 31
1000 2017_18 Q KL 50 Londonderry DAP: Strathfoyle & Drumahoe Work package: Ca 01 07 11 NIEA 06 11 2009 16/11/2009 1 12 2009 01/07/2010 01/07/2010 31/03/2011 0 0 0 0 0.000 0.000 0.000 0.000 0.000 0.000 0.000 0.000 0 0 0 0 06/11/2009 16/11/2009 1 /12/2009 01/07/2010 28/06/2010 31/03/2011 0 0 83 17 -0.002 0 2 9 0.006 0 002 0.000 0 000 0.000 0 000 -0.002 25 11 52 12 0 91001 2017_18 Q KL 55 Londonderry DAP: Sewers Rehab Phase1 01 07 12 NIEA 13 01 2010 27/01/2010 08 02 2010 03/10/2011 03/10/2011 02/10/2012 0 0 0 0 0.000 0.000 0.000 0.000 0.000 0.000 0.000 0.000 0 0 0 0 13/01/2010 27/01/2010 08/02/2010 28/05/2012 0 0 100 0 -0.002 0 799 1.872 0.119 -0.008 0 000 0.000 0 000 -0.002 5 57 33 5 0 571002 2017_18 Q KL 56 Londonderry DAP: Sewers Rehab Phase2 01 07 11 NIEA 09 11 2009 16/11/2009 01 03 2010 28/03/2011 28/03/2011 27/03/2012 0 0 0 0 0.000 0.000 0.000 0.000 0.000 0.000 0.000 0.000 0 0 0 0 09/11/2009 16/11/2009 01/03/2010 28/03/2011 28/03/2011 0 0 100 0 -0.001 0 992 0.050 -0 0 0.000 0 000 0.000 0 000 -0.001 5 68 22 5 0 681003 2017_18 Q KL 73 M&E Capital Maintenance - Culmore WWTW 01 09 02 UR 21 06 2011 0 /07/2011 03 10 2011 25/09/2012 25/09/2012 25/09/2013 0 0 0 0 0.000 0.000 0.000 0.000 0.000 0.000 0.000 0.000 0 0 0 0 21/06/2011 0 /07/2011 03/10/2011 2 /09/2012 15/10/2012 0 0 0 100 0.000 0 015 1.16 0.137 -0.001 0 001 0.008 0 000 0.000 0 100 0 0 0 0 01100 2017_18 Q KL 80 Faughan Crescent WWPS, Londonderry. Pumping station and 01 12 12 NIEA 0 0 0 0 0.000 0.000 0.000 0.000 0.000 0.000 0.000 0.000 0 0 0 0 0 0 20 80 -0.008 0 000 0.006 0 009 0.007 -0 002 0.003 0 00 -0.008 0 12 0 88 0 1 031005 2017_18 Q KL 81 Dungiven WWTW Inlet Sewer Hydraulic Assessment Upgrade.00 07 16 0 0 0 0 0.000 0.000 0.000 0.000 0.000 0.000 0.000 0.000 0 0 0 0 0 0 0 60 -0.005 0 000 0.026 0 019 -0.005 0 000 0.000 0 000 -0.005 0 100 0 0 0 0 011006 2017_18 Q KL 82 Tamnaherin WWTW Feasib lity Study 0 09 16 NIEA 30 01 2012 28/02/2013 28/02/2013 28/02/201 0 0 0 0 0.000 0.000 0.000 0.000 0.000 0.000 0.000 0.000 0 0 0 0 30/11/2011 09/12/2011 30/01/2012 28/01/2013 21/10/2013 0 /11/201 0 0 0 100 -0.001 0 000 0.376 1 025 -0.001 0 000 0.0 3 0 007 -0.001 31 32 0 37 0 01007 2017_18 Q KL 96 Feeny WwTW Replacement of Secondary Treatment 05 09 16 DRD 03 12 2012 01/12/2013 31/03/201 30/03/2015 0 0 0 100 0.000 0.000 0.038 1.385 0.026 0.000 0.000 0.000 30 37 0 33 30/07/2012 21/08/2012 03/12/2012 29/07/201 12/03/2015 26/03/2015 0 0 0 100 -0.006 0 000 0.000 0 581 0. 99 0. 03 0.05 -0 059 -0.006 30 36 0 3 0 0 081008 2017_18 Q KL503 Benone Upgrade of Vacuum Sewerage Network & Foul Vacuu 00 07 12 DRD 0 0 78 22 0.000 0.000 0.000 0.000 0.000 0.000 0.000 0.000 27 17 0 56 0 0 1 59 0.06 0 000 0.000 0 000 0.000 0 000 0.016 0.106 0.06 0 38 17 5 0 15 011009 2017_18 Q KL50 Londonderry DAP : Buncrana Road Work Package, S age 2 02 07 12 NIEA 0 0 6 5 0.000 0.000 0.000 0.000 0.000 0.0 3 0.000 0.000 68 32 0 0 06/12/2013 17/12/2013 0 /09/2013 09/03/2017 31/08/2015 12/10/2017 0 0 6 5 0.011 0 000 0.000 0 029 0.078 0 230 0.669 0 778 0.011 69 31 0 0 0 26 021010 2017_18 Q KL505 Ard Na Smo l, Dungiven, Storm Sewer Extens on 00 07 2 DRD 0 0 0 0 0.000 0.000 0.000 0.000 0.000 0.000 0.000 0.000 0 0 0 0 1 /12/2012 21/12/2012 0 0 100 0 -0.002 0 000 0.000 0 008 0.019 0 000 0.000 0 000 -0.002 0 0 0 100 0 01011 2017_18 Q KL506 Donnybrewer WWTW's Phase 2 Base Maintenance 00 09 02 DRD 0 0 0 0 0.000 0.000 0.000 0.000 0.000 0.000 0.000 0.000 0 0 0 0 19/11/2012 21/11/2012 29/03/2013 28/03/201 27/06/201 03/11/201 0 0 0 100 0.000 0 000 0.000 0.13 0.536 0.1 8 0.022 0 000 0.000 0 100 0 0 0 0 011012 2017_18 Q KL511 Foyle Street, Londonderry Feasib ity Study 00 07 12 DRD 0 0 100 0 0.07 0 000 0.000 0 000 0.000 0 000 0.000 0 000 0.07 0 100 0 0 0 100 011013 2017_18 Q KL512 Benone WWTW Mode ling of Out all Discharge 02 08 16 0 0 0 100 0.000 0.000 0.000 0.000 0.000 0.027 0.000 0.000 0 100 0 0 0 0 0 100 -0.037 0 000 0.000 0 000 0.000 0 030 0.015 0 000 -0.037 0 100 0 0 0 0 01101 2017_18 Q KL515 Dernaf aw WWTWs Feasib lity Study 0 09 16 NIEA 0 0 0 100 -0.028 0 000 0.000 0 000 0.025 0 012 0.009 0 012 -0.028 0 69 0 31 0 0 031015 2017_18 Q KL516 Queens Quay CSO Extens on 00 07 12 DRD 0 0 100 0 0.010 0 000 0.000 0 000 0.000 0 000 0.000 0 000 0.010 0 100 0 0 0 1001016 2017_18 Q KL518 Ba lynagard, Derry, Culmore Trunk Sewer Stabil zation 00 07 12 DRD 0 0 100 0 0.018 0 000 0.000 0 000 0.000 0 000 0.000 0 000 0.018 0 100 0 0 0 1001017 2017_18 Q KL521 Clooney WwPS Upgrade Magil igan 06 12 12 DRD 16/06/2016 17/06/2016 21/11/2016 30/11/2017 0 0 0 100 0.110 0 000 0.000 0 000 0.000 0 010 0.000 0 261 0.110 8 71 0 21 0 0 031018 2017_18 Q KL52 Bleachg een WWPS, Londonderry, Upgrade/Replacement 0 12 12 NIEA 11/12/2015 1 /12/2015 0 0 0 100 0.152 0 000 0.000 0 000 0.000 0 010 0.003 0.151 0.152 38 62 0 0 0 0 061019 2017_18 Q KL525 Dunfield Terrace, Londonderry, Drop Shaft Rehab liation. 00 07 02 0 0 100 0 0.01 0 000 0.000 0 000 0.000 0 000 0.000 0 000 0.01 0 100 0 0 0 1001020 2017_18 Q KL527 Manorwood WWPS Replacement 06 07 12 12/02/2016 19/02/2016 0 0 0 100 0.019 0 000 0.000 0 000 0.000 0 007 0.018 0 255 0.019 0 20 0 0 0 0 061021 2017_18 Q KL530 Lough Foy e Sustainab e Water Qua ity Improvement Project (L03 09 16 0 0 50 50 0.311 0 000 0.000 0 000 0.000 0 000 0.085 0 030 0.311 69 21 0 10 0 10 011022 2017_18 Q KL533 Cot age Row , Eg in on, WWPS, Upgrade/Replace. 06 12 12 02/10/2017 03/10/2017 0 0 35 65 0.000 0 000 0.000 0 000 0.000 0 000 0.012 0 000 0.000 0 56 0 0 19 031023 2017_18 Q KL537 Glencaw Park, Derry, Flood Al ev at on Feasibi ity Study 06 07 12 UR 0 0 100 0 0.011 0 000 0.000 0 000 0.000 0 000 0.000 0 013 0.011 0 30 70 0 0 30 01102 2017_18 Q KL538 Shee in Park Flood Al ev at on 06 07 12 UR 01/09/2016 02/09/2016 03/10/2016 23/03/2017 07/0 /2017 0 0 100 0 -0.007 0 000 0.000 0 000 0.000 0 000 0.000 0 072 -0.007 0 0 60 0 0 0 011025 2017_18 Q KL539 Cra gavon Bridge PM Enhancement 06 07 02 0 0 100 0 0.008 0 000 0.000 0 000 0.000 0 000 0.000 0 000 0.008 0 100 0 0 0 1001026 2017_18 Q KL5 1 L snafin wwps 06 12 02 0 0 0 100 0.02 0 000 0.000 0 000 0.000 0 000 0.000 0 017 0.02 31 65 0 0 0 011027 2017_18 Q KL5 2 Ba lymagor y Wwps 06 12 02 0 0 0 100 0.010 0 000 0.000 0 000 0.000 0 000 0.000 0 01 0.010 0 100 0 0 0 0 011028 2017_18 Q KL5 3 Limavady Catchment Upgrade To Address New Deve opment 06 07 12 0 0 100 0 0.0 5 0 000 0.000 0 000 0.000 0 000 0.000 0 000 0.0 5 0 50 0 50 0 50 031029 2017_18 Q KL5 5 9 Bayview Terrace, Londonderry 06 07 2 DRD 0 0 100 0 0.000 0 000 0.000 0 000 0.000 0 000 0.000 0 000 0.000 0 0 0 100 0 0 011030 2017_18 Q KN155 Bready 01 09 2 03/09/2013 21/09/2015 0 0 25 75 0.037 0 000 0.000 0 000 0.000 0 000 0.197 -0.11 0.037 100 0 0 0 0 0 011031 2017_18 Q KN57 Ba lybrack Road Foul Sewer Ex ension 00 07 2 02 11 2009 12/02/2010 12/02/2010 12/02 2010 0 0 0 0 0.000 0.000 0.000 0.000 0.000 0.000 0.000 0.000 0 0 0 0 02/11/2009 12/02/2010 25/01/2010 12/02/2010 0 0 100 0 -0.007 0 001 -0.005 0 007 0.000 0 000 0.000 0 000 -0.007 0 0 0 100 0 01032 2017_18 Q KN596 BALLYMAGORRY WwTWs 06 1 16 01 0 2013 19/01/2015 28/03/2015 28 03 2016 0 0 0 100 0.000 0.019 0.006 1.097 0.726 0.151 0.000 0.000 32 2 0 09/08/2013 19/08/2013 30/03/2015 0 0 0 100 0.010 0 000 0.019 0 005 0.092 2 023 0.2 6 0.117 0.010 32 23 0 5 0 0 081033 2017_18 Q KN599 Donaghmore WwTW Upgrade 06 1 16 NIEA 01 0 2012 30/09/201 31/12/201 31 12 2015 0 0 0 100 0.000 0.016 0.013 1.790 1.328 0.010 0.000 0.000 15 31 0 5 25/07/2013 05/08/2013 01/10/201 0 0 0 100 -0.0 2 0 000 0.016 0 01 0.089 1 71 0.651 0 029 -0.0 2 15 30 0 55 0 0 08103 2017_18 Q KN622 Omagh WWTW - Nutrient Reduct on 01 09 16 NIEA 25 07 2011 30/03/2012 30/03/2012 30 03 2013 0 0 0 0 0.000 0.000 0.000 0.000 0.000 0.000 0.000 0.000 0 0 0 0 16/05/2011 18/05/2011 25/07/2011 25/02/2013 26/03/2012 0 0 0 100 0.000 0 000 0.190 0 016 0.060 0 001 0.00 0 000 0.000 100 0 0 0 0 01035 2017_18 Q KN628 Carr ckmore WWPS Upgrade Including Replacement of Pumpi 00 12 02 0 0 0 0 0.000 0.000 0.000 0.000 0.000 0.000 0.000 0.000 0 0 0 0 12/03/2013 03/0 /2013 02/09/2013 27/08/201 16/12/2013 0 0 38 62 -0.003 0 000 0.012 0 010 0.223 0 000 0.002 0 00 -0.003 3 1 0 3 0 8 011036 2017_18 Q KN630 Drumquin WWTW Feasib lity Study 02 09 16 NIEA 0 0 0 0 0.000 0.000 0.000 0.000 0.000 0.000 0.000 0.000 0 0 0 0 0 0 0 100 0.000 0 000 0.020 0 005 0.000 0 000 0.000 0 020 0.000 23 57 0 20 0 0 031037 2017_18 Q KN6 7 Lough Macrory WWTW- Feasibil ty Study 06 1 16 NIEA 0 0 0 0 0.000 0.000 0.000 0.000 0.000 0.000 0.000 0.000 0 0 0 0 0 0 0 100 0.000 0 000 0.000 0 012 0.016 -0 001 0.000 0 020 0.000 2 52 0 2 0 0 031038 2017_18 Q KN655 Mountfield WWTW's Appra sal Study 0 09 16 NIEA 11/03/2016 15/03/2016 0 0 0 100 -0.022 0 000 0.000 0 000 0.025 0 000 0.015 0 0 5 -0.022 37 6 0 17 0 0 031039 2017_18 Q KN656 Castle Archdale WWTW 0 09 16 NIEA 0 0 0 100 0.000 0.000 0.000 0.000 0.000 0.122 0.000 0.000 0 8 0 16 18/03/201 25/03/201 2 /11/201 21/03/2016 28/02/2018 0 0 0 100 -0.063 0 000 0.000 0 000 0.027 0.133 0. 56 0.172 0.063 0 83 0 17 0 0 0210 0 2017_18 Q KN657 Victo a Bridge WWTWs Feasibil ty Study 0 09 16 NIEA 02/08/2016 02/08/2016 0 0 0 100 0.000 0 000 0.000 0 000 0.023 0 000 0.002 -0 003 0.000 26 0 30 0 0 0310 1 2017_18 Q KN658 Ardstraw WWTW Feasib lity Study 0 09 16 NIEA 02/08/2016 02/08/2016 0 0 0 100 -0.003 0 000 0.000 0 000 0.025 0 000 0.000 0 000 0.003 26 0 30 0 0 0310 2 2017_18 Q KN661 Beragh Sto m Pumping Station Des gn 03 12 12 DRD 09/10/201 15/10/201 03/11/201 01/12/2015 17/0 /2015 08/03/2016 0 0 0 100 -0.003 0 000 0.000 0 000 0.012 0 322 0.167 0 000 0.003 0 0 100 0 0 0 0110 3 2017_18 Q KN666 Berryh ll Rd, A igarvan, Sewer Remed at on 06 07 12 26/01/2016 28/01/2016 0 /07/2016 30/11/2016 30/11/2016 0 0 100 0 -0.0 5 0 000 0.000 0 000 0.000 0 006 0.012 0 228 0.0 5 0 8 86 6 0 8 0110 2017_18 Q KN667 Strathroy Link Road, Omagh 00 03 23 03/07/2017 01/08/2017 99 0 1 0 0.119 0 000 0.000 0 000 0.000 0 000 0.016 0 000 0.119 0 100 0 0 99 1 0110 5 2017_18 Q KN668 Ki lynure Wood, Ennisk llen S orm sewer 00 07 2 28/11/2016 15/12/2016 06/02/2017 31/03/2017 0 0 100 0 0.00 0 000 0.000 0 000 0.000 0 000 0.000 0 063 0.00 0 0 0 100 0 0 0110 6 2017_18 Q KN671 Drumnak lly Road Omagh Foul & Storm Sewer 00 07 2 0 0 100 0 0.000 0 000 0.000 0 000 0.000 0 000 0.000 0 000 0.000 0 0 0 100 0 010 7 2017_18 Q KN673 B016820 Moun ainv ew Drive Lisnaskea 00 07 2 0 0 100 0 0.000 0 000 0.000 0 000 0.000 0 000 0.000 0 000 0.000 0 0 0 100 0 010 8 2017_18 Q KN67 Crevanagh Rd Omagh, Storm sewer ex ension requis tion. 06 07 2 0 0 100 0 0.000 0 000 0.000 0 000 0.000 0 000 0.000 0 000 0.000 0 0 0 100 0 010 9 2017_18 Q KO170 Lough Road, Lurgan 01 07 2 25/07/2006 05/09/2012 25/11/2008 0 0 100 0 0.000 0 000 0.000 0 002 0.000 0 000 0.002 0 000 0.000 90 0 0 10 0 0 011050 2017_18 Q KP299 Ennisk llen WwTW 01 09 15 NIEA 05 11 2007 11/02/2010 11/02/2010 11 02 2011 0 0 0 0 0.000 0.000 0.000 0.000 0.000 0.000 0.000 0.000 0 0 0 0 25/10/2005 05/11/2007 06/05/2009 15/06/2009 0 0 0 100 -0.063 0 317 0.077 -0 003 0.000 0 000 0.000 0 000 -0.063 0 3 0 26 0 01051 2017_18 Q KP350 Ba lina eck - RBC Insta lations West & South 01 07 2 UR 05 02 2007 1 /07/2008 1 /07/2008 1 /07 2009 0 0 0 0 0.000 0.000 0.000 0.000 0.000 0.000 0.000 0.000 0 0 0 0 05/02/2007 02/11/2012 16/03/2009 0 0 67 33 0.000 0 009 0.036 0 000 0.000 0 000 0.038 0 000 0.000 3 20 0 77 0 15 011052 2017_18 Q KP586 Clabby WwTWs 06 1 16 30 06 2013 30/09/2015 31/12/201 31/12/2015 0 0 0 100 0.000 0.012 0.023 0.7 7 0.762 0. 21 2.189 0.000 3 27 0 30 07/02/2017 1 /02/2017 02/01/2018 28/03/2018 30/03/2018 0 0 21 79 1.8 5 0 000 0.012 0 02 0.000 0 000 0.050 0.106 1.8 5 5 15 0 0 0 0 021053 2017_18 Q KP668 L snarrick WWTW Feasib lity Study 06 09 16 NIEA 1 03 201 28/02/2015 30/0 /2015 30/0 /2016 0 0 0 100 0.000 0.012 0.019 0.055 1.039 0.000 0.000 0.000 0 0 0 20 18/01/2013 2 /01/2013 01/12/201 0 0 0 100 -0.015 0 000 0.012 0 020 0.058 0 665 0.012 0 000 -0.015 30 30 0 0 0 0 08105 2017_18 Q KP677 Tamlaght Road WWPS, Omagh, Feasibi ity Study 00 12 12 DRD 0 0 0 0 0.000 0.000 0.000 0.000 0.000 0.000 0.000 0.000 0 0 0 0 0 0 0 100 0.0 6 0 000 0.005 0 009 -0.003 0 008 0.003 0 003 0.0 6 0 36 12 12 0 0 031055 2017_18 Q KP680 Rossory WWPS Upgrade Feasibi ity Study 00 07 12 DRD 0 0 0 0 0.000 0.000 0.000 0.000 0.000 0.000 0.000 0.000 0 0 0 0 0 0 0 100 0.000 0 000 0.000 0 025 0.016 0.119 0.001 0 000 0.000 0 36 12 12 0 0 031056 2017_18 Q KP68 Dannys Mi l Road Enn ski len Sewer Rehab l tat on 00 07 12 DRD 0 0 0 0 0.000 0.000 0.000 0.000 0.000 0.000 0.000 0.000 0 0 0 0 30/10/2012 05/11/2012 01/10/2012 30/01/2013 11/08/201 02/11/201 0 0 100 0 -0.002 0 000 0.000 0 050 0.020 0 271 0.003 0 000 -0.002 0 100 0 0 0 100 011057 2017_18 Q KP687 Monea WWTWs Appra sal 0 09 16 NIEA 0 0 0 100 0.087 0 000 0.000 0 000 0.035 0 000 0.005 0 010 0.087 0 35 0 65 0 0 031058 2017_18 Q KP689 Ba lygaw ey WWTWs Feasibi ity Study 0 09 16 NIEA 0 0 0 100 -0.009 0 000 0.000 0 000 0.01 0 011 0.000 0 011 -0.009 26 0 30 0 0 031059 2017_18 Q KP693 Tu lynagarn WWPS Feasib lity Study 00 12 12 DRD 03/08/2016 0 /08/2016 28/11/2016 15/12/2017 0 0 0 100 0.096 0 000 0.000 0 000 0.003 0 017 0.000 0. 37 0.096 38 17 0 5 0 0 031060 2017_18 Q KP695 Rossory WWPS, Pumping Main Extension and Replacement. 06 07 12 07/05/2015 12/05/2015 29/06/2015 30/06/2016 15/08/2016 0 0 100 0 -0.003 0 000 0.000 0 000 0.000 0 000 0. 90 0.133 -0.003 0 100 0 0 0 100 011061 2017_18 Q KP696 Ennisk llen DAP Stage 06 07 12 UR 0 0 78 22 0 0 0 0 0 0 0 0 26.7330785 16.830 223 0 56. 36 992 0 0 85 15 0 0 0 0 0 0 0 0 0 0 35 51 1 0 30 011062 2017_18 Q KP697 PC15 Year 2 WWTW Base Maintenance – West Reg on 06 09 02 2 11 2 19 0 0 0 100 0.206 0 0 0 0 0 0 05 3 598 0.206 0 100 0 0 0 0 011063 2017_18 Q KP698 PC15 Year 3 WwTW Cap tal Main enance - West Region 06 09 02 2725 2727 0 0 0 100 2.877 0 0 0 0 0 0 0.0 2.877 0 100 0 0 0 0 01106 2017_18 Q KP699 South West Co lege(O d Erne Hospital S te), Foul & Storm sew06 07 2 0 0 100 0 0 0 0 0 0 0 0 0 0 0 0 0 100 0 01065 2017_18 Q KP700 PC15 Year WwTW Base Maintenance – West Region 06 09 02 3105 3116 0 0 0 100 0 0 0 0 0 0 0 0 0 0 97 0 3 0 01066 2017_18 Q KR310 Newtownbreda WwTW 01 09 15 NIEA 0116 039 039 0759 0 0 0 0 0 0 0 0 0 0 0 0 0 0 0 0 39885 39912 0269 0917 1802 1107. 02 0 0 0 100 0 3 056 2.0 7 0.137 0.31 0 008 0 -0 002 0 73 12 0 15 0 0 091067 2017_18 Q KR313 L sbarnet WwTW 01 09 15 NIEA 39521 0235 0235 1152 0 0 0 0 0 0 0 0 0 0 0 0 0 0 0 0 39302 39311 39521 023 0592 1152. 88 0 0 22 78 0 0 238 -0.002 -0 006 0 0 0 -0 002 0 32 15 0 53 0 7 091068 2017_18 Q KR323 L goniel Sewerage Scheme 00 07 12 39262 39 79 39 79 398 0 0 0 0 0 0 0 0 0 0 0 0 0 0 0 0 39262 39535 0 0 100 0 0 0 0.00 -0 001 0 0 0.015 0 0 0 56 0 0 56 011069 2017_18 Q KR 09 Moneyreagh WwTW 05 07 16 NIEA 1176 1 60 1 60 1825 0 0 60 0 0 0 0 30 8832 0.76626 0 0 0 0 67 0 0 33 1096 1100 2 71 1628 2188 188 . 23 0 0 60 0 0.025 0 0 0.36 1.605 -0 019 0.001 0 0 2 0.025 67 0 0 33 0 0 081070 2017_18 Q KR 1 Montgomery Rd, Flood Al evia ion 01 07 12 NIEA 0 97 0501 0560 1121 1121 1 86 0 0 0 0 0 0 0 0 0 0 0 0 0 0 0 0 0 97 0501 0560 1026 099 0 0 100 0 0.007 0.183 1.518 -0 071 -0.016 0 0 0 0.007 61 8 31 0 0 81071 2017_18 Q KR 2 Glenmachan Street WWPS St ategic Invest ga ions 00 1 02 UR 0 0 0 0 0 0 0 0 0 0 0 0 0 0 0 0 0 0 0 100 0.03 0 002 0.005 0.27 0. 7 0.166 0.006 0 0 03 0 36 12 12 0 0 011072 2017_18 Q KR 8 Sa ety improvements on out of service pumping sta ions in Bel 00 12 02 UR 0 0 0 0 0 0 0 0 0 0 0 0 0 0 0 0 2233 2235 2310 30 2 2 5 0 0 0 100 0.01 0 0 0 0.037 0 00 0.6 7 0.133 0.01 0 100 0 0 0 0 011073 2017_18 Q KR 9 East Belfast CSOs Screenings 01 07 12 NIEA 2736 0 0 0 0 0 0 0 0 0 0 0 0 0 0 0 0 0 0 50 50 0 0 001 -0.001 0 0 0 0 0 0 100 0 0 0 0 0 03107 2017_18 Q KR500 Glenmachan Stra eg c Project Phase 1b Greystown Avenue & 00 07 12 DRD 230 2306 3131 3861 0 0 100 0 0.839 0 0 0 0 0 0.108 0 056 0.839 0 9 91 0 0 9 011075 2017_18 Q KR507 Commerc al Way, Newtownabbey DG5 At-R sk-Register 00 07 12 UR 0 0 0 0 0 0 0 0 0 0 0 0 0 0 0 0 0 0 100 0 0 0 0.007 0 007 0 0 002 0.015 0 00 0 0 0 100 0 0 0 011076 2017_18 Q KR512 Bank Square, Bel ast, Environmental Improvements Scheme 00 07 12 DRD 1106 1130 1183 1229 1229 159 0 0 0 0 0 0 0 0 0 0 0 0 0 0 0 0 1106 1130 1183 12 3 1225 1318.376 66 0 3 0 0 0 0.013 0 089 -0.002 0 0 0 007 0 0 100 0 0 66 3 011077 2017_18 Q KR519 M llbay WWPS F ow Survey 00 07 12 NIEA 0 0 0 0 0 0 0 0 0 0 0 0 0 0 0 0 2506 2509 28 9 2999 3189 0 0 60 0 0.669 0 0.033 0.01 0.12 0 0 2 0 05 0 082 0.669 0 60 0 0 0 0 031078 2017_18 Q KR523 2 -30 Red ort Drive, Ca ickfergus, DG5 Study. 00 07 12 UR 0 0 0 0 0 0 0 0 0 0 0 0 0 0 0 0 18 1 1851 1939 1978 2062 2265. 7 0 0 100 0 -0.037 0 0 0 002 0.003 0 201 0 0 0.037 0 0 100 0 0 01079 2017_18 Q KR527 Greenisland WWTW Effluent D scha ge Pipe - Feasibil ty Study00 09 02 DRD 0 0 100 0 0 0 0 0 0 0 0 0 025 0 0 100 0 0 0 100 011080 2017_18 Q KR529 Park Parade, Ormeau Embankment, Bel ast, Storm Sewer Ext 00 07 2 DRD 0 0 0 0 0 0 0 0 0 0 0 0 0 0 0 0 1955 1961 2009 216 2132 2212.619 0 0 100 0 -0.00 0 0.001 0 006 -0.001 0.105 0.069 -0 002 -0.00 90 10 0 0 0 10 011081 2017_18 Q KR530 Be fast WWTW Base Maintenance - Phase 2 00 09 02 DRD 10 0 1053 13 1 1992 1992 2357 0 0 0 100 0 0 0 0800318 1.01 3086 2 956837 0 0 0 0 100 0 0 10 0 1053 17 6 0 0 0 100 0 0 0 0. 9 1.69 0.1 1 0.003 0 0 0 100 0 0 0 0 081082 2017_18 Q KR531 Park Road, Be fast Sewer Replacement 00 07 12 DRD 0 0 0 0 0 0 0 0 0 0 0 0 0 0 0 0 1688 1698 1792 2018 1911 2187.503 0 0 100 0 0 0 0 0 025 0.056 0 92 0.002 0 0 0 100 0 0 0 100 011083 2017_18 Q KR53 Carrowdore WWTW - Phase 2 Base Maintenance 00 09 02 DRD 0 0 0 0 0 0 0 0 0 0 0 0 0 0 0 0 1226 1227 12 3 1536 19 3 1717.801 0 0 0 100 0 0 0 0 037 0.20 0 028 0.00 0 0 2 70 28 0 0 0 01108 2017_18 Q KR535 New Holland WWTW's Phase 2 Base Maintenance 00 09 02 DRD 0 0 0 0 0 0 0 0 0 0 0 0 0 0 0 0 1226 1227 12 3 2020 18 8 2020. 17 0 0 0 100 0 0 0 0 039 0. 22 0 3 2 0.008 -0 001 0 50 37 13 0 0 0 011085 2017_18 Q KR536 Newtownbreda WWTW's Phase 2 Base Maintenance 00 09 02 DRD 0 0 0 0 0 0 0 0 0 0 0 0 0 0 0 0 1229 1235 12 3 1726 1726 19 6.608 0 0 0 100 0 0 0 0.12 0.952 0.1 1 0.005 0 0 0 98 2 0 0 0 011086 2017_18 Q KR538 Dunmurry WWTW's Phase 2 Base Maintenance 00 09 02 DRD 0 0 0 0 0 0 0 0 0 0 0 0 0 0 0 0 1229 1235 12 3 195 1607 195 .667 0 0 0 100 0 0 0 0.15 0.95 0 315 0 01 0 0 0 88 12 0 0 0 011087 2017_18 Q KR539 Moneyreagh WWTWs Phase 2 Base Maintenance 00 09 02 DRD 0 0 0 100 -0.001 0 0 0 002 0.008 0 0.006 0 006 -0.001 0 100 0 0 0 0 011088 2017_18 Q KR5 0 M ll Rd, Newtownabbey Foul and Storm Sewer 00 07 2 DRD 0 0 0 0 0 0 0 0 0 0 0 0 0 0 0 0 1855 1899 2030 2093 2037 2 93.505 0 0 100 0 0 0 0 0 003 0.001 0 035 0.005 0 0 0 0 0 100 0 0 011089 2017_18 Q KR5 2 Cyprus Avenue, Bel ast Sewer Rehabil tat on 00 07 12 DRD 0 0 0 0 0 0 0 0 0 0 0 0 0 0 0 0 1229 1235 1352 169 1569 1712.381 0 0 100 0 0 0 0 0 05 0.03 0 0.001 0 0 0 100 0 0 0 100 011090 2017_18 Q KR5 3 Ebor Street, Storm Sewer 00 07 2 DRD 1255 126 1309 13 7 1358 13 7.663 0 0 100 0 0 0 0 0 067 -0.01 -0 001 0.001 0 0 0 0 0 100 0 0 011091 2017_18 Q KR5 9 Net lehill Road, Lisburn - Storm Sewer 00 07 2 DRD 1771 1775 1820 1880 18 8 1963.682 0 0 100 0 0 0 0 0 003 0.005 0 035 0.003 0 0 0 0 0 100 0 0 011092 2017_18 Q KR556 Comp iance with The Surface Waters (She lf sh)(Classifica ion)02 09 16 NIEA 2597 2597 0 0 0 100 0 0 0 0 0.025 0 017 0.058 0 0 100 0 0 0 0 0 011093 2017_18 Q KR557 Brians Well Road, Poleglass Foul Sewer Extension 00 07 2 DRD 155 1563 16 5 1795 1673 1883.612 0 0 100 0 -0.001 0 0 0 0.0 3 -0 002 0 0 -0.001 0 0 0 100 0 0109 2017_18 Q KR560 Orchardvi le and Finaghy Road North, Be afst Sewer Rehabil ta00 07 12 DRD 170 1716 1821 19 3 1816 0 0 100 0 -0.006 0 0 0 0.012 0 057 0.026 0 -0.006 0 100 0 0 0 100 011095 2017_18 Q KR561 Orchardvi le WWPS Appraisal of Pumped Overflow and Inlet S 00 07 12 DRD 0 0 100 0 0 0 0 0 0 0.5720 7 0 0 0 100 0 0 0 0 100 0 0 0 0 0 0 0 008 0.001 0 0 0 100 0 0 0 100 011096 2017_18 Q KR562 Sicily Park Bel ast Sewer Diversions from S orm Culvert 00 07 12 DRD 0 0 100 0 0.006 0 0 0 0.105 -0 002 0.001 0 0.006 0 100 0 0 0 100 011097 2017_18 Q KR568 Loughries WWTWs Appraisal 0 09 16 NIEA 0 0 0 100 -0.00 0 0 0 0.025 0 0.005 0 005 -0.00 5 35 0 20 0 0 031098 2017_18 Q KR570 Sydenham WWPS Appraisal 03 13 02 DRD 3116 3116 0 0 0 100 0 0 0 0 0.129 0.113 0.121 0 09 0 0 36 12 12 0 0 011099 2017_18 Q KR576 Be fast WWTW PLC Upgrade 03 09 02 DRD 2885 2888 3122 0 0 0 100 0. 3 0 0 0 0.035 0.02 0.0 1 0 059 0. 3 0 90 10 0 0 0 011100 2017_18 Q KR579 22 Upper Lisburn Rd, Be fast Storm Sewer 00 07 2 0 0 100 0 0 0 0 0 -0.005 0 0 0 0 0 0 0 100 0 0 011101 2017_18 Q KR581 163-165 G en Road Be fast S orm Sewer Extension 00 07 2 DRD 1719 1723 0 0 100 0 0 0 0 0 0 0 0 0 0 0 0 0 100 0 0 011102 2017_18 Q KR586 Maryvi le Avenue, Belfast, DG5 Appraisal 06 07 12 UR 0 0 100 0 0 0 0 0 0 0.1058068 0 0 0 51.5129017 8. 870983 0 3137 31 0 0 0 100 0 0.02 0 0 0 0 0 008 0.00 0 018 0 02 0 0 100 0 0 0 011103 2017_18 Q KR588 Ravenhi l Avenue, Be fast, Sewer Upgrades 06 07 12 UR 0 0 100 0 0.027 0 0 0 0 0 02 0.023 0 0.027 0 10 90 0 0 10 01110 2017_18 Q KR59 Springwell Park, Groomsport 00 07 12 0 0 100 0 0 0 0 0 0 0.0 511 2 0 0 0 100 0 0 2 12 2 19 30 5 0 0 100 0 0.17 0 0 0 0 0 016 0.001 0 01 0.17 0 23 0 77 0 23 011105 2017_18 Q KR599 Be fast WwTW Appraisal Study 06 09 16 NIEA 0 0 0 100 0.239 0 0 0 0 0 0 07 0 265 0.239 26 0 30 0 0 011106 2017_18 Q KR600 North Queen Street, S orm Sewer Ex ension 00 07 2 DRD 0 0 100 0 0 0 0 0 0 0 0 0 0 0 0 0 100 0 0 011107 2017_18 Q KR605 Upper New ownards Road, Bel ast, Sewer Upgrade to Address0 07 12 UR 2760 2765 2891 32 5 0 0 100 0 2. 2 0 0 0 0 0 011 0.059 0.178 2. 2 13 5 82 0 0 5 011108 2017_18 Q KR606 Eastleigh Dale Pasadena Gardens, Belfast, Sewer Upgrade fo 06 07 12 UR 0 0 100 0 0.0 9 0 0 0 0 0 0.013 0 031 0.0 9 0 9 91 0 0 9 011109 2017_18 Q KR608 Ravenhi l Road, Be fast, Trunk Sewer Inves igations and Emer 05 07 12 2131 2132 2095 2582 26 3 0 0 100 0 -0.001 0 0 0 0 0 027 0 77 0.17 -0.001 0 100 0 0 0 100 011110 2017_18 Q KR610 32 Crum in Rd, Belfast - Storm Sewer Ext 00 07 2 0 0 100 0 0 0 0 0 0 0 0 0 0 0 0 0 100 0 0 011111 2017_18 Q KR61 Greencas le WwPS - Pumping Main Breach 03 07 2 2020 2020 0 0 100 0 -0.001 0 0 0 0 0 205 0.023 0 -0.001 0 100 0 0 0 100 011112 2017_18 Q KR618 152 - 15 Larne Rd, Carrick ergus 00 07 2 0 0 100 0 0 0 0 0 0 0 0 0 0 0 0 0 100 0 0 011113 2017_18 Q KR619 Sydenham WWPS Screen appraisal 06 13 02 275 2755 3053 3326 0 0 0 100 0.3 0 0 0 0 0 0 01 0 019 0.3 0 100 0 0 0 0 01111 2017_18 Q KR622 McClintock Street, Be fast, S orm Sewer Extension 00 07 2 2923 2926 0 0 100 0 0.05 0 0 0 0 0 0 0 0 05 0 9 0 51 0 9 011115 2017_18 Q KR623 Queens Bridge, Belfast, Siphons Upgrade. 06 07 12 3189 3199 0 0 100 0 0.162 0 0 0 0 0 0.011 0.115 0.162 0 100 0 0 0 100 011116 2017_18 Q KR62 East Befast, Back Drainage Study. 06 07 12 0 0 100 0 0.02 0 0 0 0 0 0 01 0 013 0 02 0 100 0 0 0 100 011117 2017_18 Q KR625 Wastewater Her tage and Educa ion Centre 06 1 20 0 50 0 50 0 0 0 0 0 0 0.016 0 0 0 0 60 0 0 0 011118 2017_18 Q KR627 PC15 Year 2 WWTW Base Maintenance – East Region 06 09 02 2 95 2500 0 0 0 100 0. 29 0 0 0 0 0 0 3.87 0. 29 0 79 0 21 0 0 011119 2017_18 Q KR628 6 2 Saintfield Rd, Carryduff Storm Sewer Extens on 00 07 2 0 0 100 0 0 0 0 0 0 0 0 0 0 0 0 0 100 0 0 011120 2017_18 Q KR629 M lebush Park, Carr ckfergus F ood A leviation 06 07 12 UR 0 0 100 0 0.003 0 0 0 0 0 0 0 0.003 0 0 100 0 0 0 011121 2017_18 Q KR631 Crawfordsburn Way, Newtownards - Storm Sewer Extension 00 07 2 2790 2838 0 0 100 0 0.056 0 0 0 0 0 0 0 0.056 0 0 0 100 0 0 011122 2017_18 Q KR632 Sydenham Park Avenue WWPS Replacement 06 13 12 NIEA 0 0 0 100 -0.001 0 0 0 0 0 0 0 001 -0.001 75 25 0 0 0 0 101123 2017_18 Q KR633 East Belfast In egrated Catchment Model ing 06 1 20 0 0 100 0 0.012 0 0 0 0 0 0 0 0.012 0 100 0 0 0 100 01112 2017_18 Q KR63 Harberton Park / Kings Ha l Storm Sewer Ex ension 00 07 2 0 0 100 0 0 0 0 0 0 0 0.00 0 00 0 0 0 0 100 0 0 011125 2017_18 Q KR635 Upper H gh own Road Newtownabbey S orm Sewer 00 07 2 0 0 100 0 0 0 0 0 0 0 0 0 001 0 0 0 0 100 0 0 011126 2017_18 Q KR6 0 Holywood Sewer Network Improvements- Phase 2 06 07 12 2536 2537 2569 2720 2803.676 0 0 100 0 -0.002 0 0 0 0 0 0 0 819 -0.002 100 0 0 0 0 0 021127 2017_18 Q KR6 2 Laganbank Sewer Invest ga ion, Belfast 00 07 12 0 0 100 0 0.001 0 0 0 0 0 0 0 026 0.001 0 100 0 0 0 100 011128 2017_18 Q KR6 5 Sludge Disposal Strategy: Market Appraisal 06 11 12 3115 3115 0 0 0 100 0 0 0 0 0 0 0 0 0 8 0 0 100 0 0 0 0 01

m a e s
e )
So t Re C M Submiss on Re e ence
o ect D Re e ence o ect Name C oject
e oda ent
oject IDSubsti ute
o ect ID
ma y Asset
Ca ego y
C 0 og amme
Regula o y S gn O Requi ed
Base ine A Date
Base ine o ect
App oval Date
Base ne Sta t on S te Da e
Base ine Bene cial Use
Date
Basel ne Regulato y
sign-o Da e
Base ine Comp e ion o Const uct on
Date
Base ine End o
Main enance e od Date
Base ine Se vice A locat on Wate
n ast uc u e
Base ine Se vice Al oca ion Wate
Non-n ast uc u e
Base ine Se v ce A locat on Sewe age
In ast uctu e
Basel ne Se v ce Al oca ion
Sewe age Non-In ast uctu e
Basel ne CA EX 20 0-
£m
Base ine CA EX 20 -
2 £m
Basel ne CA EX 20 2-
3 £m
Base ne CA EX 20 3-
4 £m
Base ine CA EX 20 4-
5 £m
Basel ne CA EX 20 5-
6 £m
Base ine CA EX 20 6-
7 £m
Basel ne CA EX 20 7-
8 £m
Base ine u pose A locat on Qual ty
Base ine u pose Al oca ion Base
Base ine u pose A locat on ES
Basel ne u pose Al oca ion G ow h
Cu ent Actual o o ected
A Da e
Cu ent Ac ua o ojected
oject App oval Date
Cu ent Actual o o ected Sta t on Si e
Date
Cu ent Ac ua o ojected
Bene cial Use Da e
Cu ent Actual o o ected Regu ato y
sign-o Da e
Cu ent Actual o ojec ed
Comple ion o Const uc ion
Date
Cu ent Actual o o ected
End o Maintenance
e iod Date
Cu ent Actual o ojec ed Se v ce
A locat on Wa e In ast uctu e
Cu ent Actual o o ec ed Se v ce
A locat on Wa e Non-
n ast uc u e
Cu ent Actual o o ec ed Se v ce
A locat on Sewe age
n ast uc u e
Cu ent Actual o o ec ed Se v ce
A locat on Sewe age Non-
n ast uc u e
Cu ent Actual o o ected CA EX ea to date £m
Cu ent Actual o ojec ed
CA EX 20 0- £m
Cu ent Actual o o ected
CA EX 20 -2 £m
Cu ent Actual o ojec ed
CA EX 20 2-3 £m
Cu ent Ac ual o o ected
CA EX 20 3-4 £m
Cu ent Actual o o ec ed
CA EX 20 4-5 £m
Cu ent Ac ual o ojected
CA EX 20 5-6 £m
Cu ent Actual o o ec ed
CA EX 20 6-7 £m
Cu ent Ac ual o ojected
CA EX 20 7-8 £m
Cu ent Actual o o ec ed u pose
Al oca ion Qua i y
Cu ent Actual o o ec ed u pose
A location Base
Cu ent Actual o o ected u pose
Al oca ion ES
Cu ent Actual o ojected u pose
A locat on G owth
Cu ent Ac ual o ojected RE
Al oca ion Wate
Cu ent Ac ual o ojected RE Al oca ion Sewe age
Nom na ed Output
2 3 4 5 6 7 8 9 0 2 3 4 5 6 7 8 9 20 2 22 23 24 25 26 27 28 29 36 37 38 39 40 4 42 43 44 45 46 47 48 49 50 5 52 53 54 55 56 57 58 59 66 67 68 69 70 7 72
A T a a a ex e e e e 7 99 2 9 24 949 4 9 47 7 4 4 2 2 2 7 7 47 92 9 4 79 7 4 7 4 27 2 2
SOR
CIM
_Sub
I_oj
ect_
D
I_oj
ect_
Nam
e
I_C
_e
iod
I_AR
EN_
ojec
t_D
I_SU
BSI
UE_
oec
t_ID
I_i_
Asse
t_C
at
I_C
0_og
I_R
eg_S
igno
BM
_A
BM
_o
ect_
App
oval
BM
_SoS
BM
_BU
BM
_RSO
BM
_CoC
BM
_EoM
BSA_
WI%
BSA_
WN
I%
BSA_
SI%
BSA_
SNI%
B_C
apex
_20
0-_£
m
B_C
apex
_20
-2_
£m
B_C
apex
_20
2-3_
£m
B_C
apex
_20
3-4_
£m
B_C
apex
_20
4-5_
£m
B_C
apex
_20
5-6_
£m
B_C
apex
_20
6-7_
£m
B_C
apex
_20
7-8_
£m
BA_
Q%
BA_
B%
BA_
E%
BA_
G%
CAM
_A
CAM
_o
ecAp
pov
al
CAM
_SoS
CAM
_BU
CAM
_RSO
CAM
_CoC
CAM
_EoM
CAS
A_W
I%
CAS
A_W
NI%
CAS
A_SI
%
CAS
A_SN
I%
CA
_Cap
ex_
D_£
m
CA
_Cap
ex_2
00-
_£m
CA
_Cap
ex_2
0-
2_£m
CA
_Cap
ex_2
02-
3_£m
CA
_Cap
ex_2
03-
4_£m
CA
_Cap
ex_2
04-
5_£m
CA
_Cap
ex_2
05-
6_£m
CA
_Cap
ex_2
06-
7_£m
CA
_Cap
ex_2
07-
8_£m
CA
A_Q
%
CA
A_B%
CA
A_E%
CA
A_G
%
CA
_IR
E_W
%
CA
_IR
E_S%
NO
M_O
upu
t
e A a e e e v e s A a e A a e e a a x e e e m m e e a ) e A a e e se A a %) e A a e e %)e e a ase e M es e a es ase e e v e s A a ase e x e e e m 2 2- es) ase e se A a e A a e e M es e a es
1129 2017_18 Q KR6 6 761 Upper N'ards Road, Belfast Storm Sewer 00 07 2 0 0 100 0 0 0 0 0 0 0 0 0 0 0 0 0 100 0 0 011130 2017_18 Q KR6 7 Ba lyrobert Bangor Wwps Upgrade 06 12 02 0 0 0 100 0.068 0 0 0 0 0 0 0.03 0.068 0 100 0 0 0 0 011131 2017_18 Q KR6 8 Greencas le Wwps s orm screens 06 07 02 0 0 0 100 0 0 0 0 0 0 0 0 0 0 100 0 0 0 01132 2017_18 Q KR653 Upper Lisburn Rd, Be fast Storm Sewer Extension 00 07 2 0 0 100 0 0 0 0 0 0 0 0 0 0 0 0 0 100 0 0 011133 2017_18 Q KR656 Holywood A and B wwps 06 12 02 0 0 0 100 0.017 0 0 0 0 0 0 0 008 0.017 0 100 0 0 0 0 01113 2017_18 Q KR659 Glenv ew Rd, Holywood - Foul Sewer Extension 06 07 2 0 0 100 0 0.001 0 0 0 0 0 0 0 0.001 0 0 0 100 0 0 011135 2017_18 Q KR662 3 and 1 Belfast Road, Antrim Storm sewer 00 07 2 0 0 100 0 0 0 0 0 0 0 0 0 0 0 0 0 100 0 0 011136 2017_18 Q KR663 Holywood Road, Newtownards, F ood Al evia ion 06 07 20 0 0 100 0 0 0 0 0 0 0 0 0 0 0 100 0 0 0 1001137 2017_18 Q KR665 Gilnahirk Road F ood A leviation 06 07 12 0 0 100 0 0 0 0 0 0 0 0 0 0 0 0 100 0 0 01138 2017_18 Q KR667 Cooks Cove Wwps 06 12 12 0 0 0 100 0.0 0 0 0 0 0 0 0 0 0 1 3 0 16 0 0 031139 2017_18 Q KR668 Structural survey of Belfast Stormwa er Tunnel 06 07 20 0 0 100 0 0.1 0 0 0 0 0 0 0 0.1 0 100 0 0 0 100 0111 0 2017_18 Q KR671 Henderson Avenue Flood Allev at on 06 1 12 0 0 100 0 0 0 0 0 0 0 0 0 0 0 50 50 0 0 5011 1 2017_18 Q KR672 Fortwil iam Oakmount storm pumping station, Inves igation 06 1 20 0 0 100 0 0 0 0 0 0 0 0 0 0 0 100 0 0 0 10011 2 2017_18 Q KR673 Be fast Stree s Ahead (Royal Avenue) 06 07 2 0 0 100 0 0.121 0 0 0 0 0 0 0 0.121 0 100 0 0 0 10011 3 2017_18 Q KR675 263-285 Beersbr dge Rd, Foul and Storm Sewer new 06 07 2 0 0 100 0 0.001 0 0 0 0 0 0 0 0.001 0 0 0 100 0 011 2017_18 Q KR676 The Ards House, Bel ast Rd, Newtownards Sewage Scheme. F06 07 2 0 0 100 0 0 0 0 0 0 0 0 0 0 0 0 0 100 0 011 5 2017_18 Q KR677 Moyard Park, Be fast - Storm Sewer Extens on 06 07 2 0 0 100 0 0.001 0 0 0 0 0 0 0 0.001 0 0 0 100 0 011 6 2017_18 Q KR679 Abbey View Gr, New ownards Rd, Bangor Storm Sewer 00 07 2 0 0 100 0 0 0 0 0 0 0 0 0 0 0 0 0 100 0 011 7 2017_18 Q KR680 Castle Park, Bangor - Storm Sewer. 00 07 2 0 0 100 0 0.001 0 0 0 0 0 0 0 0.001 0 0 0 100 0 011 8 2017_18 Q KR682 PC15 Year WwTW Base Maintenance – East Region 06 09 02 3105 3116 0 0 0 100 0 0 0 0 0 0 0 0 0 0 100 0 0 0 011 9 2017_18 Q KR683 Sydenham WwPM Repair at Airport Road, Holywood Exchang 06 07 12 0 0 100 0 0.1 0 0 0 0 0 0 0 0.1 0 100 0 0 0 1001150 2017_18 Q KR68 Shore Road Newtownabbey F&S Ex ension 00 07 2 0 0 100 0 0 0 0 0 0 0 0 0 0 0 0 0 100 0 01151 2017_18 Q KR685 288 Beersbr dge Road Belfast, Storm Sewer Extension 06 07 2 0 0 100 0 0 0 0 0 0 0 0 0 0 0 0 0 100 0 01152 2017_18 Q KS111 Ards South, Portavogie, Ba lyhalbert, Cloughey,Ki kistown 05 07 16 NIEA 2825 0 0 85 15 0 0 0 0 0 0 092 2 1 92 1211 0 80 0 0 20 0695 0763 3 65 0 0 85 15 0.26 0 0 7 0.00 0 026 -0.001 0 058 0 01 0.06 0.26 80 0 0 20 0 0 021153 2017_18 Q KV235 Pound Hill, Dromore - S orm Sewer Extens on 06 KI551 07 2 3186 3186 0 0 100 0 0 0 0 0 0 0 0 0 0 0 0 0 100 0 0115 2017_18 Q KI605 Storm water separation pilot study phase 2 06 KI555 07 12 0 0 100 0 0.078 0 0 0 0 0 0 0 0.078 0 100 0 0 0 100 011155 2017_18 Q JN 88 Aghyaran Road Booster S at on JR3 9 08 39821 39869 0 100 0 0 -0.001 0 0 0 0 0 0 0 -0.001 0 0 100 0 0 01156 2017_18 Q KS113 Ards No th, Carrowdore, Ba lywal er, Ballyhaskin 06 09 16 NIEA 0273 3830 39 79 398 0 0 56 0 0 0.0195316 0 011 331 0.3688395 0 0089601 0 0 2.2268771 63 289088 18.910856 0 17.800056 0 0 56 0.063 0.0 0.02 0 023 0 03 0 061 0.011 0 012 0.063 6 18 0 18 0 10 021157 2017_18 Q KR389 Ba lyhalbert WwTW Interim Solution 01 KS111 09 15 NIEA 01 7 0900 0900 1265 0 0 0 0 0 0 0 0 0 0 0 0 0 0 0 0 39517 39518 0917 1729 1 21 0 0 53 7 0 2. 09 0.687 3 679 -0.0 9 -0 057 0.005 0 0 53 0 0 7 0 0 091158 2017_18 Q KR391 Por avog e WwTW Interim Solution 01 KS111 07 15 NIEA 01 7 1177 1177 15 2 0 0 0 0 0 0 0 0 0 0 0 0 0 0 0 0 3951 39518 01 7 1176 13 188 . 22 0 0 5 6 0 1 083 0. 69 0 609 -0.065 0 001 0.008 0 0 0 0 0 60 0 0 091159 2017_18 Q KS216 Dunmore Sewerage - EC Comp iance 03 07 16 NIEA 0189 0872 0872 1237 0 0 0 0 0 0 0 0 0 0 0 0 0 0 0 0 35382 35 61 0189 072 1512 0 0 51 9 -0.007 0.111 0.039 0 016 0.00 0 0 0 -0.007 0 9 0 91 0 01160 2017_18 Q KS22 Downpatrick WwTW 01 09 15 NIEA 39636 0162 0162 0527 0 0 0 0 0 0 0 0 0 0 0 0 0 0 0 0 39636 0161 029 0 0 0 100 0 0.125 -0.07 0 023 0.001 0 0.001 0 0 2 2 0 16 0 0 091161 2017_18 Q KS225 Ardglass WwTW 01 09 15 NIEA 3873 1207 1365 2007 2097 2372 0 0 0 100 0.229 -0.0 7852 0.119095 1.3693166 1. 291381 0 0 0 1 15 0 1730 2083 1995 0 0 0 100 0.009 0 229 -0.0 9 0 555 2 78 0 579 0.23 0 268 0.009 1 15 0 0 0 081162 2017_18 Q KS235 Ba lygowan WwTW 03 09 16 NIEA 0612 279 0329 069 0 0 57 3 0 0 0 0 0 0 0. 3608 1.076 6 8 72.7729328 5.295 98 1 0 21 9315688 2699 2709 0 0 71 29 0.059 0 022 0.03 0 026 0.036 0 056 0.012 0 0 6 0.059 0 78 0 22 0 56 021163 2017_18 Q KS326 Commons Road, Ballykinlar Storm Sewer 00 07 2 0035 02 0 02 0 0605 0 0 0 0 0 0 0 0 0 0 0 0 0 0 0 0 39933 39951 0035 0239 0203 0 0 51 9 0 0 -0.002 0 00 0 0 0.002 0 0 0 9 0 91 0 0 01116 2017_18 Q KS328 De invi la Lane Dund um Storm Sewer 00 07 2 NIEA 0070 06 8 06 8 1013 0 0 0 0 0 0 0 0 0 0 0 0 0 0 0 0 39885 39899 0070 1207 06 0 0 100 0 0 0 009 -0.007 0 015 -0.001 0 0.013 0 0 0 26 0 7 0 26 011165 2017_18 Q KS389 Ba lymartin & B ackrock WwTWs 05 09 16 NIEA 209 2 60 2551 2916 0 0 0 100 0.009 0.0078126 0 0152 2 0.0 610 9 0 0. 320877 0 0 7 .627 3 2 8. 5701 08 0 16 9155517 1229 123 209 0 0 60 0 -0.013 0 009 0.008 0 02 0.3 3 0 761 0 71 0 0 3 -0.013 72 1 0 1 0 10 021166 2017_18 Q KS8 Ba lyhornan Outfall Screen . 05 09 16 NIEA 1275 15 7 1608 1973 0 0 6 9 0 03 -0.028321 0 07 3153 0.5 95708 0 0 0 0 97 3 0 0 006 0072 1 28 1639 1729 0 0 6 9 0.005 0.03 -0.029 0 062 0.597 0 031 0 0 0.005 97 3 0 0 0 01167 2017_18 Q KS8 8 Newcastle Waste Water Treatment Works 01 09 16 NIEA 0889 1505 1505 1870 0 0 0 100 0.35 1.599638 988651 1.2900161 0 0 0 0 95 5 0 0 0506 0555 0917 1617 1722 2 96.36 0 0 0 100 0 0 35 1.638 5. 6 2.679 0 0.001 0 0 77 23 0 0 0 0 081168 2017_18 Q KS873 Bangor DAP Work Package 2: Rathmore Stream UIDs 01 07 12 NIEA 1730 2005 2005 2370 0 0 100 0 0 0 0 0190552 0 0 358 0 5 0 0 0 90 10 0 0 29 7 0 0 100 0 0.003 0 0 0.02 -0.002 0 007 0.007 0 0.003 100 0 0 0 0 0 021169 2017_18 Q KS87 Bangor DAP Works Package 3 - Be fast Lough U Ds 01 07 12 NIEA 0 0 30 70 0 0 0 0 0 0 1 0550218 0.5922282 100 0 0 0 0 0 30 70 0.039 0 0 0 072 -0.02 0 027 0.002 0 00 0.039 100 0 0 0 0 0 021170 2017_18 Q KS875 Bangor DAP Works Package 6: Lukes Point WWPS UID 01 07 12 NIEA 1365 1912 2007 2372 0 0 0 100 0 0 0 0562128 1.5085535 0. 61 58 0 0 0 90 10 0 0 1 29 1 2 1597 1878 1912 0 0 0 100 -0.002 0 0 0 059 1.107 0 571 0.037 0 007 -0.002 88 12 0 0 0 0 081171 2017_18 Q KS877 Bangor DAP Works Package 5 - Clandeboye Stream UIDs 01 07 12 NIEA 16 2023 2023 2388 0 0 100 0 0 0 0 0838 29 0.2213037 2.167 51 1.6157295 0 723039 0 100 0 0 0 2 0 2 0 2583 29 7 3028 0 0 13 87 1. 63 0 0 0 088 -0.003 0.131 0.103 1 585 1. 63 8 16 0 0 0 3 021172 2017_18 Q KS879 Bangor DAP Work Package : Bangor Marina UIDs 01 07 12 NIEA 16 2023 2023 2388 0 0 75 25 0 0 0 061929 0.027663 1 3368 89 0 0 0 70 30 0 0 1 29 1 2 1603 1878 1908 0 0 0 100 0 0 0 0 065 1.0 3 0 256 0.016 0 0 100 0 0 0 0 0 081173 2017_18 Q KS880 Kirkistown North WwPS Refurbishment 01 12 12 DRD 1226 1227 12 3 1729 1726 19 6.609 0 0 0 100 0 0 0 0 032 0.198 0 0.001 0 0 26 70 0 0 0117 2017_18 Q KS881 Cloughey South WwPS Refurbishment 01 12 02 DRD 1806 1837 1670 2093 235 . 51 0 0 0 100 0 0 0 0 0.006 0 3 6 0.00 0 001 0 0 100 0 0 0 0 011175 2017_18 Q KS900 WwPS Upgrades at Groomsport, K llinchy & Cra gavad 00 12 12 DRD 1229 123 12 3 195 1789 195 .676 0 0 0 100 0 0 0 0 096 0.593 0 071 0.001 0 0 12 7 1 0 0 0 081176 2017_18 Q KS902 Dundrum DAP, UIDs Upgrades. 02 07 12 NIEA 1729 2023 2093 2093 0 0 100 0 0 0.0039063 0 01 291 0.07 69 0. 032051 0. 810822 0 89 0585 0 79.0138393 20.9861607 0 0 273 0 0 100 0 0.018 0 0.00 0 027 0.0 3 0 025 0.061 0 00 0.018 70 30 0 0 0 30 021177 2017_18 Q KS903 Anna ong DAP UIDs, Upgrades. 02 07 12 NIEA 0 0 0 0 0 0 0 0 0 0 0 0 0 0 0 0 0 0 22 78 0 0 0.005 0 0 1 -0.003 0 0.011 0 01 0 85 15 0 0 0 2 061178 2017_18 Q KS905 Kilmore & Annac oy WwTW 06 1 16 NIEA 133 2369 1671 1671 0 0 0 100 0 0.0126955 0 03 299 0.9036567 0 0.912559 0 0 0 53.5086551 0 6. 913 9 1708 1716 1918 2073 2366 0 0 6 9 0.0 8 0 0.013 0 033 0.036 1. 51 0.729 0 092 0.0 8 0 53 0 7 0 3 021179 2017_18 Q KS908 Ki linchy WWTW - Feasib lity Study 06 1 16 NIEA 0 0 0 100 0 0.00 8829 0 0323938 0.0331956 0 0 0 0 0 100 0 0 0 0 0 100 -0.006 0 0.005 0 01 0.0 0 008 0.001 0 008 -0.006 3 26 0 0 0 0 031180 2017_18 Q KS909 DG5 157a & 155 Groomsport Road Bangor Addit onal Stud es 00 07 12 NIEA 0 0 0 0 0 0 0 0 0 0 0 0 0 0 0 0 21 2 2151 2289 2383 2398 0 0 100 0 0 0 0 0.01 0 01 0 0.257 0 015 0 0 0 100 0 0 0 011181 2017_18 Q KS912 Greyabbey WWPS Catchment F ow and Loading Survey. 01 07 12 DRD 0 0 0 0 0 0 0 0 0 0 0 0 0 0 0 0 0 0 0 100 0 0 0 0 029 -0.005 0 0.001 0 0 0 36 12 12 0 0 011182 2017_18 Q KS913 Upper Crescent WWPS Upgrade 00 13 12 DRD 0 0 0 0 0 0 0 0 0 0 0 0 0 0 0 0 20 8 2051 0 0 0 100 0.00 0 0 0.02 0.00 0 002 0.06 0 016 0.00 81 19 0 0 0 0 031183 2017_18 Q KS91 Scrabo Road, Newtownards, WWPS Upgrade 02 12 12 NIEA 0 0 0 0 0 0 0 0 0 0 0 0 0 0 0 0 2052 2053 0 0 0 100 0 0 0 0 018 0.005 0 002 0.068 0 001 0 78 22 0 0 0 0 03118 2017_18 Q KS918 Greyabbey WWTW 00 09 16 DRD 286 0 0 38 62 0 0 0 0 0 0 0 0 0 100 0 0 0 0 0 100 0 0 0 0 006 0 -0 001 0 0 0 0 100 0 0 0 0 021185 2017_18 Q KS921 Kircubbin WWTW Phase 2 Base Main enance 00 09 02 DRD 177 1778 0 0 0 100 0 0 0 0 002 0.012 0.01 0.001 0 0 0 100 0 0 0 01186 2017_18 Q KS926 Primacy Road, Bangor, Foul and S orm Sewer Ex ensions 00 07 2 DRD 0 0 0 0 0 0 0 0 0 0 0 0 0 0 0 0 0 0 100 0 0 0 0 0 0 0 0 0 0 0 0 0 100 0 0 011187 2017_18 Q KS930 M l is e DAP Stage 2, Phase 2 02 07 12 NIEA 0 0 17 83 0 0 0 0 0 1.192 85 0 0 9.5768 81 7.5068668 2.91628518 0 1900 1906 0 0 17 83 0.065 0 0 0 0 0 061 0 66 0 072 0.065 5 6 0 0 0 13 021188 2017_18 Q KS933 Kircubbin DAP CSO Upgrade 0 07 12 NIEA 0 0 100 0 0.01 0 0 0 0 0 0 0.02 0 01 90 10 0 0 0 10 101189 2017_18 Q KS937 Annsborough WWPS Upgrade 06 07 12 NIEA 0 0 0 0 0 0 0 0 0 0 0 0 0 0 0 0 20 8 2051 2310 2559 0 0 85 15 0 0 0 0 0 0 006 0.133 0.02 0 90 10 0 0 0 10 021190 2017_18 Q KS938 Grange Road Kilkeel Out of Sewer Flooding Feasib lity Study 03 07 12 DRD 2 12 2 19 0 0 59 1 0.02 0 0 0 0.00 0 012 0.016 0.10 0.02 0 100 0 0 0 59 011191 2017_18 Q KS9 Glenard Road New ownards Foul Sewer Extension 00 07 2 DRD 21 6 2157 2 6 2527 2356 0 0 100 0 0 0 0 0 0 0 0 0 0 7 0 0 0 0 100 0 0 011192 2017_18 Q KS9 6 Mourneview, Newcastle, Flood Al evia ion 0 07 12 UR 0 0 100 0 0.259 0 0 0 0 0.01 0.033 0.02 0.259 0 50 50 0 0 50 011193 2017_18 Q KS955 Green Road, Ardglass, Foul and Storm Sewer. 00 07 2 0 0 100 0 0 0 0 0 0 0 0 0 0 0 0 0 100 0 0 01119 2017_18 Q KS958 Bangor DAP Works Package 5 Clandeboye Stream U Ds Phas03 07 12 NIEA 0 0 0 0 0 0 0 0 0 0 0 0 0 0 0 0 2033 2038 2058 3035 3126 0 0 35 65 0.112 0 0 0 0 0 26 1.301 0.132 0.112 100 0 0 0 0 0 021195 2017_18 Q KS962 Dundrum WwTW 06 09 16 UR 3100 0 0 1 59 0 0 0 0 0 0 0 9762151 0.9373657 0 100 0 0 303 30 7 3059 0 0 0 100 1.1 6 0 0 0 0 0 0.035 0 1.1 6 0 100 0 0 0 0 021196 2017_18 Q KS96 106 Greencastle Road, Kilkeel, S orm Sewer Extension 00 07 2 2781 2795 0 0 100 0 0 0 0 0 0 0 0 0 001 0 0 0 0 100 0 0 011197 2017_18 Q KS965 Ki lyleagh Rd, Crossgar Foul Sewer Extension 00 07 2 2773 2795 0 0 100 0 0.0 8 0 0 0 0 0 0 0 0.0 8 0 0 0 100 0 0 011198 2017_18 Q KS968 Saint ie d Road, Ba loo Storm Sewer 00 07 2 2781 2795 0 0 100 0 0.018 0 0 0 0 0 0 0 001 0.018 0 0 0 100 0 0 011199 2017_18 Q KS971 Cot on Wwps 06 12 02 0 0 0 100 0.006 0 0 0 0 0 0 0 00 0.006 0 100 0 0 0 0 011200 2017_18 Q KS972 Ba lystockart, Comber - Network Investigat on 06 07 20 0 0 100 0 0.02 0 0 0 0 0 0 0 022 0.02 0 0 100 0 0 0 011201 2017_18 Q KS97 PC15 Year 3 WwTW Cap tal Maintenance - East Region 06 09 02 2699 2709 0 0 0 100 1.801 0 0 0 0 0 0 0 777 1.801 0 100 0 0 0 0 011202 2017_18 Q KS978 Foul Sewer Extension - Adjacent Rockfield Pk, Portaferry 06 07 2 0 0 100 0 0 0 0 0 0 0 0 0 0 0 0 0 100 0 01203 2017_18 Q KS979 8 Talbot Street New ownards, Storm Sewer Ex ension 06 07 2 0 0 100 0 0 0 0 0 0 0 0 0 0 0 0 0 100 0 0120 2017_18 Q KT11 Hi lsborough WwTW 01 12 16 NIEA 0995 2091 2091 2 57 0 0 17 83 0 0.023 379 0.8098 6 0.5025 38 0 0 0 0 0 35 0 65 39972 0058 0973 1716 1820 2178. 72 0 0 17 83 -0.003 0 0.02 0 287 1.202 0 031 0.012 0 003 -0.003 0 35 0 65 0 7 081205 2017_18 Q KT126 Stoneyford WwTW 06 09 16 NIEA 1672 2091 0 0 0 100 0.012 0.0556651 0 06383 9 0.0922099 0 7678817 0 0 0 31 38 0 31 0836 08 0 1701 1971 2359 0 0 12 88 0.0 0 012 0.057 0 01 0.216 1. 2 0.0 2 0 055 0 0 26 37 0 37 0 081206 2017_18 Q KT391 L sburn DAP Stage 1 00 07 12 NIEA 1 55 2005 2005 2370 0 0 100 0 0 0.00 8829 0 0219135 0.9682036 0 8960113 1.1551867 0 0 69.137109 20.9861607 0 9.87672991 1782 1793 2 22 0 0 100 0 0.181 0 0.005 0 005 0.073 0 273 0. 39 0.138 0.181 70 20 0 10 0 20 021207 2017_18 Q KT398 M ll Street/Br dge Street ,Hi den ,Lisburn, Storm Sewer Extensi 00 07 2 NIEA 062 0633 0 95 0786 0786 1151 0 0 0 0 0 0 0 0 0 0 0 0 0 0 0 0 062 0633 2800 2825 2825 2978. 16 0 0 100 0 -0.00 0 002 0.001 0 0 0 0.002 0 0 1 -0.00 0 0 0 100 0 0 011208 2017_18 Q KT 02 Dunmurry WWTW Sludge Fac lity 05 10 16 DRD 0988 2023 2082 2 8 0 0 0 100 0 0 0.1238588 1.675 53 1 7920227 0 0 0 23 71 0 6 091 0918 1730 1716 3033 0 0 0 100 0.159 0 0 0. 3 3.7 2 0.2 0.008 0 021 0.159 23 71 0 6 0 0 081209 2017_18 Q KT 12 Ba lynahinch Public Realm Sewer & Watermain Rehabi itation 00 07 2 DRD 0 0 0 0 0 0 0 0 0 0 0 0 0 0 0 0 1197 1218 1323 15 8 1568 68 0 32 0 -0.001 0 0 0 068 0.723 -0 0 8 0 0 -0.001 0 100 0 0 68 321210 2017_18 Q KT 13 Orchard Annah lt WWPS - Feasib lity Study 00 12 02 DRD 0 0 0 0 0 0 0 0 0 0 0 0 0 0 0 0 1226 1227 12 3 1653 12 3 19 6.613 0 0 0 100 0 0 0 0 013 0.056 0 0 -0 001 0 2 86 12 0 0 0 011211 2017_18 Q KT 16 Annahilt WWTW Phase 2 Base Maintenance 00 09 02 DRD 0 0 0 0 0 0 0 0 0 0 0 0 0 0 0 0 1226 1227 12 3 1729 1607 195 .669 0 0 0 100 0 0 0 0 032 0.117 0 039 0.005 0 0 2 98 0 0 0 0 011212 2017_18 Q KT 21 Station Road, Lambeg, Sewer Upgrade (DG5) 03 07 12 UR 2038 2039 0 0 100 0 -0.001 0 0 0 0 0.03 0 0 -0.001 0 0 100 0 0 0 091213 2017_18 Q KT 22 Longstone St, Lisburn Storm Sewer Extension 00 07 2 0 0 100 0 0 0 0 0 0 0 0 0 0 0 0 0 100 0 0 01121 2017_18 Q KT 23 Mossvale Rd, Dromore Foul Sewer Requ s tion 00 07 2 2781 2795 2919 300 2958 3152.515 0 0 100 0 0.0 1 0 0 0 0 0 0 0 0.0 1 0 0 0 100 0 0 011215 2017_18 Q KT 25 St Jame s Park, Hi lsborough Storm Sewer 00 07 2 0 0 100 0 0 0 0 0 0 0 0 0 0 0 0 0 100 0 0 011216 2017_18 Q KT 28 Ba lymacash Road, Lisburn, F ood A leviation 06 07 12 UR 2717 2723 2797 0 0 100 0 -0.006 0 0 0 0 0 0 0 0 -0.006 0 0 100 0 0 0 011217 2017_18 Q KT 35 Graham Garden s Lisburn - S orm Sewer Ex ension 06 07 2 0 0 100 0 0 0 0 0 0 0 0 0 0 0 0 0 100 0 01218 2017_18 Q KT 37 The Brae, Ballygown Storm Sewer Extens on. 06 07 2 0 0 100 0 0 0 0 0 0 0 0 0 0 0 0 0 100 0 01219 2017_18 Q KV013 Rostrevor Sewerage Scheme 00 12 12 NIEA 39230 0802 0802 1167 0 0 0 0 0 0 0 0 0 0 0 0 0 0 0 0 35572 35676 39230 0801 39629 0 0 30 70 0 0.01 0 0 006 0 0 0.006 0 0 62 35 0 3 0 3 011220 2017_18 Q KV06 Lurganare WwTW 01 07 15 NIEA 01 7 0 52 0 52 0817 0 0 0 0 0 0 0 0 0 0 0 0 0 0 0 0 0093 0100 01 7 0 51 0 8 0 0 65 35 0 0 01 0.006 -0 061 0 0 0 -0 005 0 53 0 0 7 0 0 091221 2017_18 Q KV079 McShanes Road, Bessbrook Foul Sewer Extens on 00 07 2 39539 0933 0933 1298 0 0 0 0 0 0 0 0 0 0 0 0 0 0 0 0 39 63 39 70 39539 39875 0 0 100 0 0 0 -0.003 0 002 0 0 0.002 0 0 0 0 0 100 0 0 011222 2017_18 Q KV09 Whyte Acres, Banbr dge SPS Upgrade 00 12 02 UR 0123 0133 0182 0295 0295 0660 0 0 0 0 0 0 0 0 0 0 0 0 0 0 0 0 0123 0133 0182 029 0266 19 6.5 9 0 0 0 100 -0.002 0 002 -0.003 -0 005 -0.001 0 0 0 -0.002 0 100 0 0 0 01223 2017_18 Q KV122 High Street, Gil ord Sewer Rep acement 00 07 12 39706 0933 0933 1298 0 0 0 0 0 0 0 0 0 0 0 0 0 0 0 0 395 2 39590 39706 39822 39818 0 0 100 0 0 0 -0.002 0 0 0 0.003 0 0 0 100 0 0 0 100 01122 2017_18 Q KV125 Forkhill WWTW 01 09 16 NIEA 0581 1 2 1 70 1712 0 0 0 100 0.231 0. 5118 0 9880121 0. 075676 0 0 0 0 6 39 0 15 0563 057 0917 1361 1785 0 0 0 100 -0.001 0 231 0. 62 1 388 0.161 0 08 0 0 -0.001 6 39 0 15 0 01225 2017_18 Q KV178 Cranfield WwTW Feasibi ity Study 03 1 16 NIEA 0 0 30 70 0 0.0166019 0.023819 0.018 2 0 0 0 0 0 100 0 0 0 0 0 100 -0.012 0 0.017 -0 008 0 02 0.05 0 0 012 -0.012 26 0 30 0 0 031226 2017_18 Q KV182 Carran H ll WTW & Creamery Road Sewer Ex ension 00 07 2 DRD 0 0 0 0 0 0 0 0 0 0 0 0 0 0 0 0 0 0 100 0 0 0 0.002 0 002 0 0 0 0 0 0 100 0 0 0 100 011227 2017_18 Q KV186 Kilkeel WWTW Feasib lity Study 06 1 16 NIEA 0 0 0 100 0 0.0029297 0 0 66852 0.0230525 0 0 0 0 0 100 0 0 0 0 0 100 -0.01 0 0.003 0 017 0 06 -0 001 0 0.01 -0 01 3 26 0 0 0 0 031228 2017_18 Q KV189 M l turn WWPS - Feasib lity Study 00 12 02 DRD 0 0 0 0 0 0 0 0 0 0 0 0 0 0 0 0 1226 1227 12 3 1729 19 6.61 0 0 0 100 -0.001 0 0 0.05 0.117 0 011 0 0 -0.001 0 100 0 0 0 01229 2017_18 Q KV19 Banbr dge WWTW's Phase 2 Base Maintenance 00 09 02 DRD 0 0 0 0 0 0 0 0 0 0 0 0 0 0 0 0 1813 1837 2205 2 89 2580 2850. 61 0 0 0 100 -0.013 0 0 0 005 0.001 0 0 3 0 67 0 -0.013 0 100 0 0 0 0 011230 2017_18 Q KV196 Hi ltown WWTW Phase 2 Base Main enance 00 09 02 DRD 0 0 0 0 0 0 0 0 0 0 0 0 0 0 0 0 1226 1227 1730 1773 1726 19 9. 5 0 0 0 100 0.005 0 0 0 052 0 27 0 003 0.005 0 0.005 1 5 1 0 0 0 011231 2017_18 Q KV200 Drumsesk Was ewater Header Tank - Feasib lity Study 00 07 12 DRD 0 0 100 0 0.012 0 0 0 0.00 0 012 0.001 0 001 0.012 0 100 0 0 0 100 011232 2017_18 Q KV201 Moneyslane WWTWs Appraisal 0 09 16 NIEA 0 0 0 100 -0.018 0 0 0 0.025 0 0 0 029 -0.018 37 60 0 3 0 0 031233 2017_18 Q KV202 Meigh WWTW Feasibi ity Study 0 09 16 NIEA 0 0 0 100 -0.003 0 0 0 0.025 0 0 0 003 -0.003 8 2 0 28 0 0 03123 2017_18 Q KV207 Whyte Acres - Banbr dge 00 07 12 DRD 26 7 2657 2968 3062 0 0 100 0 0.125 0 0 0 0 0 005 0.001 0.01 0.125 0 100 0 0 0 100 011235 2017_18 Q KV217 Car ingford Lough Sustainab e Water Qua ity Improvement Pro 06 09 16 0 0 50 50 0.235 0 0 0 0 0 0 09 0 025 0.235 69 21 0 10 0 10 011236 2017_18 Q KV219 Newpoint WWPS Screen upgrade 0 13 12 2 93 2500 2695 3035 0 0 0 100 0.88 0 0 0 0 0 00 0 01 1.101 0 88 0 60 0 0 0 0 011237 2017_18 Q KV220 Warrenpoint Flooding Investigat ons 00 07 12 0 0 100 0 0.082 0 0 0 0 0 003 0.1 2 0 016 0.082 0 100 0 0 0 100 011238 2017_18 Q KV223 Carnagat Road Newry Foul & Storm Sewer Requisi ion 00 07 2 0 0 100 0 0 0 0 0 0 0 0 0 0 0 0 0 100 0 0 011239 2017_18 Q KV22 The S opes Rathfriland Wwps appraisal 06 12 12 2667 2668 0 0 0 100 0 0 0 0 0 0 0.008 0 007 0 20 25 0 55 0 0 0312 0 2017_18 Q KV225 Newpoint TPS Fi e - Odour Cont ol 00 13 02 230 2352 2 53 3011.533 0 0 0 100 0 0 0 0 0 0 0.117 0 012 0 0 100 0 0 0 0 0112 1 2017_18 Q KV228 Chapel View, Car an Rd SS Crossmag en 00 07 2 0 0 10 90 0 0 0 0 0 0 0 0 0 0 52 0 8 0 6 0112 2 2017_18 Q KV230 Cranfield Catchment , K lkeel Storm Seperat on 00 07 12 0 0 100 0 0.0 1 0 0 0 0 0 0 0 058 0.0 1 0 80 0 20 0 80 0112 3 2017_18 Q KV231 75 Kilkeel Rd, Annalong S orm Sewer Extension 00 07 2 0 0 100 0 0 0 0 0 0 0 0 0 0 0 0 0 100 0 0 0112 2017_18 Q KV232 115-117 Main st, Newcas le Storm Sewer Extens on 00 07 2 0 0 100 0 0 0 0 0 0 0 0 0 0 0 0 0 100 0 0 0112 5 2017_18 Q KV233 Canal St, New y - Storm Sewer Extens on 06 07 2 0 0 100 0 0 0 0 0 0 0 0 0 0 0 0 0 100 0 012 6 2017_18 Q KV23 School Road, Ba lymartin-Storm sewer Extension 06 07 2 0 0 100 0 0 0 0 0 0 0 0 0 0 0 0 0 100 0 012 7 2017_18 Q KZ002 Capital Works Programme Procurement 01 1 02 UR 1177 0 0 0 0 0 0 0 0 0 0 0 0 0 0 0 0 1177 25 25 25 25 0.019 0 001 0 0 0.087 -0 001 0.0 6 0 057 0.019 0 100 0 0 25 25 0112 8 2017_18 Q KZ007 Storm Water Separation 06 07 12 2090 211 0 0 100 0 -0.015 0 0 0 0 0 006 0 05 0 019 -0.015 0 100 0 0 0 100 0112 9 2017_18 Q KZ008 Wastewater Networks Model ing/Surveys 06 1 20 2172 2187 0 0 100 0 1.239 0 0 0 0 0 0.375 1 056 1.239 35 30 21 1 0 30 011250 2017_18 Q AM086 CAR FME Server 00 15 20 2 51 2 51 0 50 0 50 0 0 0 0 0 0 0.021 0 0 0 0 100 0 0 0 01251 2017_18 Q AM089 Posit onal Improvement (OSNI) 0 15 20 172 1726 0 50 0 50 0 0 0 0 0 0 083 0.138 0 0 0 100 0 0 0 0 01252 2017_18 Q AM090 Cost Base and Capex Comparative Eff c ency 03 15 20 UR 1 3 1 25 25 25 25 0 0 0 0 0.158 0.09 0.00 0 0 0 100 0 0 25 25 01253 2017_18 Q AM093 PC15 M&G Parent 06 15 20 0 6 8 6 0 0 0 0 0 10.55917 10.3087 8 10 2 6895 0 63. 15 795 36.58 5205 0 0 6 8 6 0 0 0 0 0 0 0 0 0 0 63 37 0 0 0 0125 2017_18 Q AM09 Corpora e GIS Project 06 15 20 2583 2583 0 50 0 50 0.179 0 0 0 0 0 0 0.27 0.179 0 100 0 0 0 0 01255 2017_18 Q AM096 West and - Main Building K tchen / Coffee Lounge Extension 15 20 282 282 0 100 0 0 0.137 0 0 0 0 0 0 0 005 0.137 0 100 0 0 0 0 01256 2017_18 Q AP036 CCTV Surveys Asset Pe formance 2011 - 2012 00 07 02 DRD 0786 0793 0 0 100 0 0 0 0.13 0.152 0 0 0.008 0 0 0 100 0 0 0 100 01257 2017_18 Q AP055 Condi ion Assessment 05 06 20 1206 1213 100 0 0 0 0 0 0 0 0. 98 0 061 0.017 -0 00 0 0 100 0 0 100 0 01258 2017_18 Q AP059 Netownbreda MBV 02 1 20 DRD 1306 1311 0 0 100 0 0 0 0 0 015 0.065 0 015 0.002 0 0 0 100 0 0 0 100 01259 2017_18 Q AP066 Carr ck MBV 03 1 20 DRD 1319 1327 0 0 100 0 0.02 0 0 0 0.093 0.02 0.027 0 029 0 02 0 100 0 0 0 100 01260 2017_18 Q AP08 Provision of Interim Bridging Serv ces (Prev ously KI522) 00 06 20 DRD 1320 1327 100 0 0 0 0 0 0 0 298 -0.0 2 0 0.005 0 0 0 100 0 0 100 0 01261 2017_18 Q AP089 Network Model Updates 03 06 20 DRD 1297 130 100 0 0 0 0 0 0 0 0. 69 0.18 0.038 0 0 0 100 0 0 100 0 01262 2017_18 Q AP093 Sewer network models- Cushendall,Ba lykelly, Dungiven 03 1 20 1 59 1 71 0 0 100 0 0 0 0 0 0.0 7 0 091 0.001 0 0 0 100 0 0 0 100 01263 2017_18 Q AP09 Service Reservoir Cond tion Assessments Pilot Study 05 06 20 1355 1359 0 100 0 0 0 0 0 0.02 0. 22 0.127 0.001 0 0 0 100 0 0 0 0 0126 2017_18 Q AP096 Base Maintenance Pr or tisat on 03 15 20 1386 1387 0 0 20 0 0 0 0 0 0.058 0 0.001 0 0 0 100 0 0 0 20 01265 2017_18 Q AP100 PC13 Network Mode ling Support Services 03 06 20 1 2 1 25 100 0 0 0 -0.001 0 0 0 0.012 0.117 0.01 0 -0.001 0 100 0 0 100 0 01266 2017_18 Q AP101 Storm Analysis Reports 03 1 20 1 52 1 53 0 0 100 0 0 0 0 0 0.006 0 003 0.001 0 0 0 100 0 0 0 100 01267 2017_18 Q AP102 Provision of PPRA Reports 03 03 20 1 95 1 98 100 0 0 0 0 0 0 0 0.226 0 029 -0 01 0 0 0 100 0 0 100 0 01268 2017_18 Q AP103 Invest ga ion of Po lu ed Stormwater Out al s 03 07 20 1500 1502 0 0 100 0 0 0 0 0 0.157 0 03 0.001 0 0 0 100 0 0 0 100 01269 2017_18 Q AP105 Larne MBV 03 1 20 1528 1538 0 0 100 0 0 0 0 0 0.035 0 092 0.001 0 0 0 100 0 0 0 100 01270 2017_18 Q AP106 Drainage A ea Study Specif cation rev s on 03 1 20 1 95 1 98 0 0 100 0 0 0 0 0 0.015 0 011 0.00 0 0 0 100 0 0 0 100 01271 2017_18 Q AP107 Sewer Network Mode ling Support 03 1 20 1500 1502 0 0 100 0 0 0 0 0 0.033 0 063 0.022 0 0 0 100 0 0 0 100 01272 2017_18 Q AP111 Larne Network Inves igation 03 1 20 1 77 1 85 0 0 100 0 0 0 0 0 0.012 0.02 0.002 0 0 0 100 0 0 0 100 01273 2017_18 Q AP11 Deve opment of PC15 Lead Pipe Replacement P ogramme 0 06 23 DWI 18 1 18 5 100 0 0 0 -0.001 0 0 0 0 0.17 0.056 0 006 -0.001 100 0 0 0 0 0 0127 2017_18 Q AP120 Asset Per ormance CCTV surveys - 1 /15 03 1 20 1739 17 3 0 0 100 0 0 0 0 0 0 0 2 9 0.00 0 0 0 100 0 0 0 100 01275 2017_18 Q AP122 Invest ga ion of polluted s ormwater outfa ls - phase 1 05 07 12 0 0 100 0 0 0 0 0 0 0. 70 296 0. 5 9163 0. 83053 0 100 0 0 1869 1869 0 0 100 0 0 0 0 0 0 0 097 0 0 0 0 100 0 0 0 100 01276 2017_18 Q AP128 Trunk Main Condit on Assessment 1 /15 03 03 20 1856 1862 100 0 0 0 -0.002 0 0 0 0 0 2 2 0.022 0 -0.002 0 100 0 0 100 0 01277 2017_18 Q AP130 Hydraulic Review Verif cation of Water Netwo k Schemes 03 03 20 DRD 18 18 5 100 0 0 0 0 0 0 0 0 0. 15 0.183 -0 005 0 0 100 0 0 100 0 01278 2017_18 Q AP1 2 Provision of Pressure Logging Equipment 06 06 20 238 238 0 100 0 0 -0.001 0 0 0 0 0 0 02 0 008 -0.001 0 100 0 0 0 0 01279 2017_18 Q AP1 3 SR and CWB Risk and Consequence Model Update 06 06 20 20 7 20 7 0 100 0 0 0 0 0 0 0 0 006 0.016 -0 001 0 0 0 100 0 0 0 01280 2017_18 Q AP150 Provision of F ow Monitoring Equipment 00 1 20 2 30 2 30 0 0 0 100 -0.001 0 0 0 0 0 0 0 0 2 -0.001 0 100 0 0 0 0 01281 2017_18 Q BC006 Meter reconci iation phase 2 01 06 20 DRD 1078 1080 0 100 0 0 0 0 0 0 215 0.013 0 019 0.001 0 0 0 0 100 0 0 0 01282 2017_18 Q BC007 Debt and Collec ions phase 2 01 06 20 DRD 1079 1087 0 100 0 0 0 0 0 0.173 0.009 0 0.011 0 0 0 0 100 0 0 0 01283 2017_18 Q BC009 CS Da a Qual ty Programme 05 15 20 1519 1529 0 50 0 50 0 0 0 0 0.26 0 265 -0 01 0 0 0 0 100 0 0 0 0128 2017_18 Q BC010 Digital Customer Phase 1 03 15 20 15 0 15 1 0 100 0 0 0 0 0 0 0 06 0 015 0.002 0 0 0 0 100 0 0 0 01285 2017_18 Q BC013 CBC Imp emen at on 0 15 20 1792 1792 0 50 0 50 0.111 0 0 0 0 1. 72 0.831 0 535 0.111 0 0 100 0 0 0 01286 2017_18 Q BC01 Meter to Bill Improvement 06 06 20 DRD 1892 1899 0 50 0 50 -0.001 0 0 0 0 0 399 0.031 0 -0.001 0 50 50 0 0 0 01287 2017_18 Q BE006 Vehicle GPS 01 15 20 DRD 1170 1180 0 9 0 51 0 0 0 0.195 0 0 0 -0 001 0 0 100 0 0 0 0 01288 2017_18 Q BE012 Monthly Pay and Orac e Enhancemen s 06 15 20 2 2 2 81 25 25 25 25 -0.01 0 0 0 0 0 0.132 0.118 -0.01 0 0 100 0 0 0 01289 2017_18 Q BE016 Plant Purchasing Project (Sho t Term Strategy) 06 06 20 2236 2236 0 100 0 0 0 0 0 0 0 0 0.061 0 063 0 0 100 0 0 0 0 01290 2017_18 Q BE017 Energy M&G 06 09 02 2306 2306 0 9 0 91 -0.002 0 0 0 0 0 0.197 0 012 -0.002 0 55 5 0 0 0 01291 2017_18 Q BE020 Addit onal Solar Installations 0 20 0 50 0 50 0.2 8 0 0 0 0 0 0 0 0.2 8 0 0 0 100 0 0 01292 2017_18 Q BI121 Contractor Ellipse Interface 02 1 20 0882 0886 0 9 0 51 0 0 0.06 0 007 0 0 0.008 0 0 0 0 100 0 0 0 01293 2017_18 Q BI139 SCaMP (Sustainab e Catchment Management Plan) Mournes 00 01 20 0569 0569 0 100 0 0 0 0 01 0.097 0.08 0.105 0.185 0.013 0 0 100 0 0 0 0 0 0129 2017_18 Q BI151 DG2 Stage 2 20 100 0 0 0 -0.001 0 0 0 0 0 0 0 -0.001 0 0 100 0 0 0 01295 2017_18 Q BI152 Nisrans automated inter ace 01 15 20 0828 0837 0 70 0 30 0 0 0 3 -0.006 0 0 0 0.017 0 0 0 100 0 0 0 0 01296 2017_18 Q BI156 Optimal Control & management System site surveys 00 1 20 0 0 0 100 0 0 0 0 0 0 0.006 0 0 0 0 100 0 0 0 01297 2017_18 Q BI226 Sustainable Local Power 01 06 20 0830 0837 0 100 0 0 0 0 0.02 0 0 2 0 0 -0 02 0 0 0 100 0 0 0 0 01298 2017_18 Q BI231 AGGREGATED GENERATION 01 15 20 0862 0863 0 50 0 50 0 0 0 0 032 0.017 0 0.006 0 0 0 100 0 0 0 0 01299 2017_18 Q BI232 Installation of Sub E ectricity Meters - Pilot Study @ K llyhev in 01 06 20 08 7 0856 0 100 0 0 0 0 0.02 0 0.00 0 0.001 0 0 0 100 0 0 0 0 01300 2017_18 Q BI2 0 Deve opment of ICAT Standards 03 15 20 1653 1655 0 50 0 50 0 0 0 0 0.039 0.156 0.01 0 0 0 0 100 0 0 0 01301 2017_18 Q BI2 9 Test and Deve opment Telemetry System 01 06 20 126 1281 0 50 0 50 0 0 0 0.101 0.009 0 0.009 0 0 0 100 0 0 0 0 01302 2017_18 Q BI250 ANSWER Agr cu tural Need for Sustainable Wi low Effluent Re03 09 20 NIEA 1276 1277 0 0 0 100 -0.002 0 0 0 001 0.007 -0 006 0.005 0 -0.002 0 0 100 0 0 0 01303 2017_18 Q BI25 Network D stribution Systems Control (NDCS) Phase 1 03 0 20 1683 1688 0 100 0 0 0 0 0 0 0 0.1 5 0.008 0 0 0 90 10 0 0 0 0130 2017_18 Q BI259 Network D stribution control system p lot s tes. 01 0 20 126 127 0 100 0 0 0 0 0 0 025 0.001 0 0.006 0 0 0 0 100 0 0 0 01305 2017_18 Q BI272 Project Manager for the Property Address Cleansing Project Ph01 06 20 1278 1278 0 100 0 0 0 0 0 0 022 0.00 0 0.005 0 0 0 100 0 0 0 0 01306 2017_18 Q BI280 ICAT Programme Manager - Level 3 03 1 20 1870 1877 0 50 0 50 0 0 0 0 0.039 0 069 0.001 0 0 0 0 100 0 0 0 01307 2017_18 Q BI282 ILMS Schne der Hardware & Software Support 03 03 20 1530 1538 0 100 0 0 0 0 0 0 0.015 0 0.008 0 0 0 0 100 0 0 0 01308 2017_18 Q BI287 PC15 Innovat on Programme Projects 06 15 20 0 50 0 50 0 0 0 0 0 0 0 0 0 0 50 50 0 0 0 01309 2017_18 Q BI291 MCC rep acement at Killyclogher SR 03 0 20 1619 1623 0 100 0 0 0 0 0 0 0.006 0 0.007 0 0 0 100 0 0 0 0 01310 2017_18 Q BI295 Sludge Dens ty Moni oring Using Coreo l s Flowmeters 03 02 20 167 1677 0 100 0 0 0 0 0 0 0 03 0 0.002 0 0 0 100 0 0 0 0 01311 2017_18 Q BI301 i WATCH (Inte ligent Water Automation, Telemetry and Contro 06 03 20 2201 2205 0 100 0 0 -0.008 0 0 0 0 0 0.0 0 -0.008 0 72 28 0 0 0 01312 2017_18 Q BI303 Use of thermal and near infrared camera's in conjunct on with a06 15 20 2332 2332 0 100 0 0 -0.001 0 0 0 0 0 0.006 0 -0.001 0 0 100 0 0 0 01313 2017_18 Q BI305 Revision of Sewers or Adoption (N.I ) 06 1 20 2397 2397 0 0 100 0 0 0 0 0 0 0 0 0 035 0 0 100 0 0 0 100 0131 2017_18 Q BI308 Remote Intake control p lot 06 06 20 0 100 0 0 0 0 0 0 0 0 0 0 0 0 10 90 0 0 0 01315 2017_18 Q BT00 Telemet y Radio Digital Upgrade 00 15 20 0605 0626 0 9 0 51 -0.008 0 1.29 0 2 0.093 0 0 0 005 -0.008 0 100 0 0 0 0 01316 2017_18 Q BT005 Scada Services Prov sion 00 15 20 0 16 0 1 0 23 0 77 0 0 208 0.168 0.167 0.065 0 065 0.001 0 0 3 26 10 30 0 0 01317 2017_18 Q BT012 Document Management 01 15 20 0626 0627 0 50 0 50 -0.001 0 0 0 0 0 0 0 -0.001 0 0 100 0 0 0 0

m a e s
e )
So t Re C M Submiss on Re e ence
o ect D Re e ence o ect Name C oject
e oda ent
oject IDSubsti ute
o ect ID
ma y Asset
Ca ego y
C 0 og amme
Regula o y S gn O Requi ed
Base ine A Date
Base ine o ect
App oval Date
Base ne Sta t on S te Da e
Base ine Bene cial Use
Date
Basel ne Regulato y
sign-o Da e
Base ine Comp e ion o Const uct on
Date
Base ine End o
Main enance e od Date
Base ine Se vice A locat on Wate
n ast uc u e
Base ine Se vice Al oca ion Wate
Non-n ast uc u e
Base ine Se v ce A locat on Sewe age
In ast uctu e
Basel ne Se v ce Al oca ion
Sewe age Non-In ast uctu e
Basel ne CA EX 20 0-
£m
Base ine CA EX 20 -
2 £m
Basel ne CA EX 20 2-
3 £m
Base ne CA EX 20 3-
4 £m
Base ine CA EX 20 4-
5 £m
Basel ne CA EX 20 5-
6 £m
Base ine CA EX 20 6-
7 £m
Basel ne CA EX 20 7-
8 £m
Base ine u pose A locat on Qual ty
Base ine u pose Al oca ion Base
Base ine u pose A locat on ES
Basel ne u pose Al oca ion G ow h
Cu ent Actual o o ected
A Da e
Cu ent Ac ua o ojected
oject App oval Date
Cu ent Actual o o ected Sta t on Si e
Date
Cu ent Ac ua o ojected
Bene cial Use Da e
Cu ent Actual o o ected Regu ato y
sign-o Da e
Cu ent Actual o ojec ed
Comple ion o Const uc ion
Date
Cu ent Actual o o ected
End o Maintenance
e iod Date
Cu ent Actual o ojec ed Se v ce
A locat on Wa e In ast uctu e
Cu ent Actual o o ec ed Se v ce
A locat on Wa e Non-
n ast uc u e
Cu ent Actual o o ec ed Se v ce
A locat on Sewe age
n ast uc u e
Cu ent Actual o o ec ed Se v ce
A locat on Sewe age Non-
n ast uc u e
Cu ent Actual o o ected CA EX ea to date £m
Cu ent Actual o ojec ed
CA EX 20 0- £m
Cu ent Actual o o ected
CA EX 20 -2 £m
Cu ent Actual o ojec ed
CA EX 20 2-3 £m
Cu ent Ac ual o o ected
CA EX 20 3-4 £m
Cu ent Actual o o ec ed
CA EX 20 4-5 £m
Cu ent Ac ual o ojected
CA EX 20 5-6 £m
Cu ent Actual o o ec ed
CA EX 20 6-7 £m
Cu ent Ac ual o ojected
CA EX 20 7-8 £m
Cu ent Actual o o ec ed u pose
Al oca ion Qua i y
Cu ent Actual o o ec ed u pose
A location Base
Cu ent Actual o o ected u pose
Al oca ion ES
Cu ent Actual o ojected u pose
A locat on G owth
Cu ent Ac ual o ojected RE
Al oca ion Wate
Cu ent Ac ual o ojected RE Al oca ion Sewe age
Nom na ed Output
2 3 4 5 6 7 8 9 0 2 3 4 5 6 7 8 9 20 2 22 23 24 25 26 27 28 29 36 37 38 39 40 4 42 43 44 45 46 47 48 49 50 5 52 53 54 55 56 57 58 59 66 67 68 69 70 7 72
A T a a a ex e e e e 7 99 2 9 24 949 4 9 47 7 4 4 2 2 2 7 7 47 92 9 4 79 7 4 7 4 27 2 2
SOR
CIM
_Sub
I_oj
ect_
D
I_oj
ect_
Nam
e
I_C
_e
iod
I_AR
EN_
ojec
t_D
I_SU
BSI
UE_
oec
t_ID
I_i_
Asse
t_C
at
I_C
0_og
I_R
eg_S
igno
BM
_A
BM
_o
ect_
App
oval
BM
_SoS
BM
_BU
BM
_RSO
BM
_CoC
BM
_EoM
BSA_
WI%
BSA_
WN
I%
BSA_
SI%
BSA_
SNI%
B_C
apex
_20
0-_£
m
B_C
apex
_20
-2_
£m
B_C
apex
_20
2-3_
£m
B_C
apex
_20
3-4_
£m
B_C
apex
_20
4-5_
£m
B_C
apex
_20
5-6_
£m
B_C
apex
_20
6-7_
£m
B_C
apex
_20
7-8_
£m
BA_
Q%
BA_
B%
BA_
E%
BA_
G%
CAM
_A
CAM
_o
ecAp
pov
al
CAM
_SoS
CAM
_BU
CAM
_RSO
CAM
_CoC
CAM
_EoM
CAS
A_W
I%
CAS
A_W
NI%
CAS
A_SI
%
CAS
A_SN
I%
CA
_Cap
ex_
D_£
m
CA
_Cap
ex_2
00-
_£m
CA
_Cap
ex_2
0-
2_£m
CA
_Cap
ex_2
02-
3_£m
CA
_Cap
ex_2
03-
4_£m
CA
_Cap
ex_2
04-
5_£m
CA
_Cap
ex_2
05-
6_£m
CA
_Cap
ex_2
06-
7_£m
CA
_Cap
ex_2
07-
8_£m
CA
A_Q
%
CA
A_B%
CA
A_E%
CA
A_G
%
CA
_IR
E_W
%
CA
_IR
E_S%
NO
M_O
upu
t
e A a e e e v e s A a e A a e e a a x e e e m m e e a ) e A a e e se A a %) e A a e e %)e e a ase e M es e a es ase e e v e s A a ase e x e e e m 2 2- es) ase e se A a e A a e e M es e a es
1318 2017_18 Q BT021 Enhancement program for End of Life equiptments 7 Ethernet 01 15 20 0828 083 0 0 0 60 0 0 0.295 0.138 0.226 0 0.033 0 0 0 100 0 0 0 0 01319 2017_18 Q BT023 HVCA Imp emen at on Project 01 15 20 1031 1037 0 50 0 50 -0.01 0 0 0 335 0 0 0.021 0 -0 01 0 0 100 0 0 0 01320 2017_18 Q BT026 Business Serv ces O fice S gnage Requirements 15 20 3111 3117 0 50 0 50 0.01 0 0 0 0 0 0 0 0 01 0 0 100 0 0 0 01321 2017_18 Q CE00 SME support or Capi al Efficiency Portfolio 06 15 20 2397 2397 25 25 25 25 0.382 0 0 0 0 0 0 01 0 225 0.382 0 0 100 0 0 0 01322 2017_18 Q CE006 In sourcing Network Mode ling Into Stra eg c C ient 20 2760 2871 0 10 0 10 0.039 0 0 0 0 0 0 0 0.039 30 0 20 50 0 0 01323 2017_18 Q CO001 Commerc al Exce lence 20 0 50 0 50 0 0 0 0 0 0 0 0 0 0 100 0 0 0 0 0132 2017_18 Q CS001 Customer Connections 02 06 20 0808 0815 0 50 0 50 0 0 0.103 0.126 0.013 0.05 -0 05 0 0 0 0 100 0 0 0 01325 2017_18 Q CS007 Account Services Case Mgmt 01 15 20 DRD 0870 0892 0 100 0 0 0 0 0.031 0 0 8 0.025 0.03 0.017 0 0 0 100 0 0 0 0 01326 2017_18 Q CS008 Se f Serv ce Phase 2 01 1 20 DRD 0870 0892 0 60 0 0 0 0 0.13 0. 63 0.158 0 00 0.002 0 0 0 0 100 0 0 0 01327 2017_18 Q CU001 1CEX1 Metering & B lling 06 0 20 2360 2373 0 100 0 0 0.955 0 0 0 0 0 0.19 0 726 0.955 0 0 100 0 0 0 01328 2017_18 Q CU002 PC15 ICAT Delivery - Omagh / Cookstown Area 0 BE01 06 20 2 11 2 11 0 100 0 0 0.102 0 0 0 0 0 0 0 851 0.102 0 72 28 0 0 0 01329 2017_18 Q CU003 PC15 ICAT Delivery - Bel ast Area 06 BE01 0 20 2933 2933 0 100 0 0 0.609 0 0 0 0 0 0 0 0.609 0 71 29 0 0 0 01330 2017_18 Q CU00 PC15 ICAT Delivery - Newry Area 20 0 100 0 0 0 0 0 0 0 0 0 0 0 0 71 29 0 0 0 01331 2017_18 Q CU005 PC15 ICAT Delivery - Enn ski len Area 20 0 100 0 0 0 0 0 0 0 0 0 0 0 0 71 29 0 0 0 01332 2017_18 Q CU006 PC15 ICAT Delivery - Ards / Bangor Area 06 0 20 3187 3187 0 100 0 0 0 0 0 0 0 0 0 0 0 0 73 27 0 0 0 01333 2017_18 Q CU007 PC15 ICAT Delivery - Derry / Co eraine Area 06 0 20 3187 3188 0 100 0 0 0 0 0 0 0 0 0 0 0 0 73 27 0 0 0 0133 2017_18 Q CU008 PC15 ICAT Delivery - Pilot Stud es 20 0 100 0 0 0 0 0 0 0 0 0 0 0 0 71 29 0 0 0 01335 2017_18 Q CU011 Service Incen ive Mechanism (SIM) Improvements 06 15 20 2530 25 2 0 50 0 50 0.021 0 0 0 0 0 0 0 0.021 0 0 100 0 0 0 01336 2017_18 Q CU012 IVR 06 15 20 2891 2891 0 50 0 50 0.002 0 0 0 0 0 0 0 0.002 0 0 100 0 0 0 01337 2017_18 Q CU013 Se f Serv ce Web Enhancements 06 15 20 2891 2891 0 50 0 50 0.02 0 0 0 0 0 0 0 0 02 0 0 100 0 0 0 01338 2017_18 Q CU01 Knowledge Centre 06 15 20 30 7 30 7 0 50 0 50 0.011 0 0 0 0 0 0 0 0.011 0 0 100 0 0 0 01339 2017_18 Q CU015 Digital Cl ent Side Support 06 15 20 3111 3112 0 50 0 50 0.01 0 0 0 0 0 0 0 0 01 0 0 100 0 0 0 013 0 2017_18 Q CU016 Customer Interface Renewal 15 20 0 50 0 50 0 0 0 0 0 0 0 0 0 0 0 60 0 0 0 013 1 2017_18 Q CU017 ESRI Network Schema ics 15 20 3067 3067 0 100 0 0 0.015 0 0 0 0 0 0 0 0.015 0 0 100 0 0 0 013 2 2017_18 Q EP013 Capitalisat on of Estates Maintenance 00 15 20 0715 076 0 50 0 50 0 0 0.136 0.121 0.1 7 0 002 0.001 0 0 0 100 0 0 0 0 013 3 2017_18 Q EP017 Elect ic ty generation from wind power or a ternative green ene 06 09 02 0 0 0 100 0 0 0 0 0 0 0 1.9 5 573 0 0 100 0 0 23 0 1 0 20 0 80 0.017 0.08 -0.0 5 0 028 0 05 0 051 0.003 1.173 0.017 0 0 100 0 0 0 013 2017_18 Q EP031 In el igent Pump Manager IWWF West Region 02 EP0 6 12 20 DRD 1199 1200 0 0 0 100 0 0 0 0.186 0.0 1 0 012 0.001 0 0 0 100 0 0 0 0 013 5 2017_18 Q EP037 Climate Change Mi igation - Reducing Em ssions 02 15 20 22 8 22 9 0 50 0 50 -0.002 0 0 0 001 0.0 1 0 003 0.096 0 06 -0.002 0 100 0 0 0 0 013 6 2017_18 Q EP038 Addit onal Accommoda ion and Upgrades at West and House 00 1 20 DRD 0 50 0 50 0.003 0 0 0 005 0.015 0 013 0 0 007 0.003 0 100 0 0 0 0 013 7 2017_18 Q EP039 NIW Contaminated Land Remed al Project 06 15 20 0 50 0 50 0 0 -0.002 0 0.033 0 0.001 0 0 0 100 0 0 0 0 013 8 2017_18 Q EP0 0 Ba lycast e Depot - Remediation of Contaminat on. 01 15 20 NIEA 0 60 0 0 0 0 0 0 0.017 -0 002 0 0 0 0 100 0 0 0 0 013 9 2017_18 Q EP0 3 Capital Maintenance 13/1 & 1 /15 03 15 20 1 39 1 9 0 50 0 50 0 0 0 0 0.236 0.17 0.008 0 0 0 100 0 0 0 0 01350 2017_18 Q EP0 5 Ennisk llen Area: Provision of M P Faci it es 03 06 20 DRD 1568 1571 0 100 0 0 0 0 0 0 0.015 0 09 0.009 0 0 0 100 0 0 0 0 01351 2017_18 Q EP052 CPMR imps PC15 06 11 20 2151 2153 0 50 0 50 0.065 0 0 0 0 0 0.085 0 055 0.065 0 50 50 0 0 0 01352 2017_18 Q EP053 Estates management PC15 06 15 20 2095 2097 0 50 0 50 0.061 0 0 0 0 0 0.108 0 088 0.061 0 100 0 0 0 0 01353 2017_18 Q EP056 CALM Network Faci ity 20 3083 3090 0 100 0 0 0.132 0 0 0 0 0 0 0 0.132 0 0 100 0 0 0 0135 2017_18 Q ER002 Purachse of Automatic Sampling Machines for TE Charging an06 1 20 0 0 0 100 0 0 0 0 0 0 0 0 0 0 100 0 0 0 0 01355 2017_18 Q FR01 Oracle E-business suite minor enhancements during PC13 03 15 20 1596 16 1 0 50 0 50 -0.001 0 0 0 0 05 0 075 0.001 0 -0.001 0 0 100 0 0 0 01356 2017_18 Q FR015 Capital allowance review 05 15 20 1725 1726 0 50 0 50 0 0 0 0 0.088 0 078 0.027 0 0 0 100 0 0 0 0 01357 2017_18 Q FR017 Computer Associa es upgrade related to new Orac e E-busines05 15 20 2206 2277 0 50 0 50 0 0 0 0 0 0.01 0.029 0 0 0 0 100 0 0 0 01358 2017_18 Q FR018 Enhancements to the Oracle E-Business Suite and Assoc ated 06 15 20 22 8 2277 0 50 0 50 0 0 0 0 0 0 0.088 0 0 0 100 0 0 0 0 01359 2017_18 Q FR020 16/17 Enhancement o Oracle E-Bus Suite and Assoc ated Sys06 15 20 2 79 2559 0 50 0 50 -0.005 0 0 0 0 0 0 0.157 -0.005 0 100 0 0 0 0 01360 2017_18 Q FR021 M gration of Oracle EBS & OBIEE to new OVM/Linux hardwar 06 15 20 2712 2807 0 50 0 50 0.275 0 0 0 0 0 0 0.1 0.275 0 100 0 0 0 0 01361 2017_18 Q FR022 17/18 Minor enhancements to the Oracle E-business suite and 06 15 20 0 50 0 50 0.0 3 0 0 0 0 0 0 0 0.0 3 0 0 100 0 0 0 01362 2017_18 Q FR025 18/19 Oracle Minor Enhancements 20 0 50 0 50 0 0 0 0 0 0 0 0 0 0 100 0 0 0 0 01363 2017_18 Q HR002 Creation of Interface between NI Water’s payroll and Capita Em03 15 20 1992 1992 0 50 0 50 0 0 0 0 0 0.176 0.002 0 0 0 100 0 0 0 0 0136 2017_18 Q HR005 Payro l Changes in re at on to CARE 2015 pens on introduc ion06 15 20 2236 2256 0 50 0 50 0 0 0 0 0 0 0 09 0 0 0 100 0 0 0 0 01365 2017_18 Q HR006 Oracle OLM Change Request 06 15 20 2233 2256 0 50 0 50 0 0 0 0 0 0 0 01 0 0 0 0 100 0 0 0 01366 2017_18 Q HR007 Oracle 2016 enhancements 06 15 20 0 50 0 50 0 0 0 0 0 0 0 0 0 0 0 100 0 0 0 01367 2017_18 Q IA001 Data Analytics Solution 06 15 20 2 31 2 31 0 50 0 50 0 0 0 0 0 0 0 0 007 0 0 0 100 0 0 0 01368 2017_18 Q IT002 Provision and support of corporate AutoCAD MAP 3D Licenses00 1 20 07 2 07 6 0 9 0 51 0 0 0.051 0 0 0 0 5 0 0 059 0 0 100 0 0 0 0 01369 2017_18 Q IT00 PC Refresh Programme 01 06 20 0779 0781 0 51 0 9 -0.001 0 1.105 0.36 0 0 0 -0 00 -0.001 0 100 0 0 0 0 01370 2017_18 Q IT010 ICT – Telemetry Base Maintenance 02 15 20 1228 1232 0 50 0 50 0.127 0 0 0 039 0.052 0 392 1.552 1.116 0.127 0 100 0 0 0 0 01371 2017_18 Q IT017 Upgrade Programme for the Protection of Lightning Protec ion 01 15 20 1116 112 0 73 0 27 -0.001 0 0 0 0 0 0 0 -0.001 0 100 0 0 0 0 01372 2017_18 Q IT038 MWM Toughbook Refresh Project 03 15 20 1516 1519 0 51 0 9 -0.00 0 0 0 0.877 0 059 0 05 -0 009 -0.00 0 0 100 0 0 0 01373 2017_18 Q IT039 Mob le Work Management MWM) Contract Renewal 03 15 20 1326 1332 0 51 0 9 0 0 0 0 0.128 0 0 -0 019 0 0 100 0 0 0 0 0137 2017_18 Q IT0 3 In ormat on Flows 2 03 15 20 1555 1562 0 50 0 50 0 0 0 0 0.026 0 008 0.002 0 0 0 100 0 0 0 0 01375 2017_18 Q IT0 Crit cal Security Contro s 03 15 20 1 91 1 93 0 50 0 50 -0.00 0 0 0 0 0 0 0 -0.00 0 100 0 0 0 0 01376 2017_18 Q IT050 Telecoms Infrastructure Improvement 03 15 20 1618 162 0 50 0 50 0 0 0 0 0.095 0 015 0 -0 003 0 0 100 0 0 0 0 01377 2017_18 Q IT052 In ernet Web Server Refresh 03 15 20 1520 1523 0 100 0 0 -0.008 0 0 0 0 0 0 0 -0.008 0 100 0 0 0 0 01378 2017_18 Q IT053 Windows Servers & Storage Array (2013) 03 15 20 15 3 1550 0 50 0 50 -0.003 0 0 0 0 0 0 0 -0.003 0 100 0 0 0 0 01379 2017_18 Q IT055 MC2 Imp emen at on 03 15 20 DRD 160 1610 0 51 0 9 -0.006 0 0 0 0.60 1 998 0.615 0 035 -0.006 0 100 0 0 0 0 01380 2017_18 Q IT056 Sl eve Ga lion mast si e refurbishment 06 15 20 2171 2178 0 100 0 0 -0.003 0 0 0 0 0 0.087 0.152 -0.003 0 100 0 0 0 0 01381 2017_18 Q IT068 Si e SCADA Upgrade 03 1 20 1687 1688 0 9 0 51 0 0 0 0 0.706 0.1 1 0 -0 002 0 0 100 0 0 0 0 01382 2017_18 Q IT069 ICT Base Maintenance 05 15 20 1772 1772 0 50 0 50 -0.003 0 0 0 0 0 637 0.029 0 001 -0.003 0 100 0 0 0 0 01383 2017_18 Q IT070 EMCI 03 15 20 1767 1772 0 9 0 51 0 0 0 0 0 0 02 0 -0 008 0 0 0 100 0 0 0 0138 2017_18 Q IT071 MC1 Exit P an 03 15 20 1808 1809 0 50 0 50 0 0 0 0 0 0.11 0 05 -0 022 0 0 0 100 0 0 0 01385 2017_18 Q IT072 Implementation of PCI DSS 0 15 20 1809 1810 0 55 0 5 -0.009 0 0 0 0 0 037 0.0 8 0 0 5 -0.009 0 0 100 0 0 0 01386 2017_18 Q IT073 EMCI Phase 2 0 15 20 189 189 0 9 0 51 0 0 0 0 0 0 262 0.001 -0 002 0 0 0 100 0 0 0 01387 2017_18 Q IT076 ICT Base Maintenance 15/16 06 15 20 21 6 2150 0 50 0 50 -0.023 0 0 0 0 0 0.576 0 0 6 -0.023 0 100 0 0 0 0 01388 2017_18 Q IT077 SCADA Serv ces Prov s on 06 15 20 2118 2118 0 9 0 51 0.057 0 0 0 0 0 0.057 0.17 0.057 0 9 51 0 0 0 01389 2017_18 Q IT082 Telemet y Server Hardware Rep acement 03 15 20 2069 2072 0 50 0 50 0 0 0 0 0 0 005 0.033 0 0 0 100 0 0 0 0 01390 2017_18 Q IT08 End of L e Hardware and Software upgrade – Db Autho se inv03 15 20 2076 2076 0 50 0 50 -0.009 0 0 0 0 0 0 0 -0.009 0 100 0 0 0 0 01391 2017_18 Q IT085 M crosoft Ente prise Agreement 06 15 20 2102 2102 0 50 0 50 0.2 5 0 0 0 0 0 0.777 0 0.2 5 0 100 0 0 0 0 01392 2017_18 Q IT086 ICT Base Maintenance 06 15 20 2517 2523 0 50 0 50 0.02 0 0 0 0 0 0 0 673 0.02 0 100 0 0 0 0 01393 2017_18 Q IT087 Addit onal Blades and Finance Netbackup Licenses 06 15 20 239 239 0 50 0 50 0 0 0 0 0 0 0.119 0 0 0 100 0 0 0 0 0139 2017_18 Q IT089 Corpora e Wifi 06 15 20 2 31 2 31 0 50 0 50 -0.002 0 0 0 0 0 0 0 327 -0.002 0 0 100 0 0 0 01395 2017_18 Q IT090 Mob le Phone Refresh 2016 06 15 20 2 85 2 88 0 50 0 50 0 0 0 0 0 0 0 0 0 1 0 30 30 20 20 0 0 01396 2017_18 Q IT091 Desk op & Laptop Refresh 06 15 20 2682 2682 0 50 0 50 -0.006 0 0 0 0 0 0 0. 12 -0.006 0 100 0 0 0 0 01397 2017_18 Q IT093 CSD Dashboa d 06 15 20 2695 2695 0 51 0 9 0 0 0 0 0 0 0 0 038 0 0 100 0 0 0 0 01398 2017_18 Q IT09 ICT Base Maintenance 17 18 06 15 20 2859 2859 0 50 0 50 0.137 0 0 0 0 0 0 0 0.137 0 100 0 0 0 0 01399 2017_18 Q IT095 Desk op Hardware Refresh 06 15 20 2788 3006 0 50 0 50 0. 07 0 0 0 0 0 0 0 0. 07 0 100 0 0 0 0 01 00 2017_18 Q IT099 Telemet y Ou station Refresh Project - Phase 2 06 15 20 2797 2802 0 50 0 50 0.996 0 0 0 0 0 0 0 011 0.996 0 100 0 0 0 0 01 01 2017_18 Q IT101 ICT Telemetry and Telecoms Base Main enance 06 15 20 2892 2892 0 50 0 50 0.265 0 0 0 0 0 0 0 0.265 0 100 0 0 0 0 01 02 2017_18 Q IT102 MC2 XRM Pi ot 06 15 20 2872 2873 0 50 0 50 0.0 5 0 0 0 0 0 0 0 0.0 5 0 100 0 0 0 0 01 03 2017_18 Q IT105 Mob le Phone Refresh 2018 06 15 20 0 50 0 50 0 0 0 0 0 0 0 0 0 0 100 0 0 0 0 01 0 2017_18 Q IT106 ICT Base Maintenance 18/19 20 0 50 0 50 0 0 0 0 0 0 0 0 0 0 100 0 0 0 0 01 05 2017_18 Q IT107 Data Centre Refresh 20 0 50 0 50 0 0 0 0 0 0 0 0 0 0 100 0 0 0 0 01 06 2017_18 Q LC001 Si ent Va ley Park Enhancement 01 06 20 1292 1310 0 100 0 0 0 0 0 0 059 -0.003 -0 066 0.005 0 0 0 100 0 0 0 0 01 07 2017_18 Q NA00 Labo atory Capi al Equipment 01 15 20 0589 0589 0 9 0 51 0 0.106 0.003 0 0 0 0.001 -0 001 0 0 100 0 0 0 0 01 08 2017_18 Q NA006 NIAMP Project Support 02 15 20 1 17 1 21 25 25 25 25 0 0 0 0.02 0.568 0 35 0.002 0 0 0 100 0 0 25 25 01 09 2017_18 Q NA018 LIMS Server Upgrade 06 15 20 2668 2670 0 50 0 50 0.007 0 0 0 0 0 0 0 067 0.007 0 100 0 0 0 0 01 10 2017_18 Q NA020 Remote Samp er Hardware Refresh 03 15 20 1558 1569 0 50 0 50 -0.002 0 0 0 0.069 0 061 0.00 0 -0.002 0 100 0 0 0 0 01 11 2017_18 Q NA025 Upgrade of LIMS AQC Module to AqcTools 05 15 20 19 7 19 9 0 50 0 50 0 0 0 0 0 0 029 0.001 0 002 0 0 100 0 0 0 0 01 12 2017_18 Q NA035 Purchase of Automatic Sampling Equipment and Batter es 06 1 20 2786 2786 0 0 0 100 -0.001 0 0 0 0 0 0 0.02 -0.001 0 100 0 0 0 0 01 13 2017_18 Q OP0 1 Meter Reading Hand Held Uni s & Software 05 06 20 169 169 0 100 0 0 0 0 0 0 0.216 0 079 0.016 0 0 0 70 30 0 0 0 01 1 2017_18 Q OP0 2 TMG - F eet Purchases 13/1 03 15 20 DRD 1536 15 0 0 62 0 38 0 0 0 0 1.885 0 0.006 0 0 0 100 0 0 0 0 01 15 2017_18 Q OP0 8 Toughbook Refresh Project – Crad e purchase & instal at on 03 15 20 DRD 1577 1582 0 50 0 50 0 0 0 0 0. 5 0 098 0.0 7 -0 032 0 0 0 100 0 0 0 01 16 2017_18 Q OP058 M&E Stores Rat onal sa ion 06 15 20 2666 2675 0 30 0 70 0.179 0 0 0 0 0 0 0 0.179 0 100 0 0 0 0 01 17 2017_18 Q OP060 TMG Fleet Purchases - 15/16 06 15 20 2227 223 0 62 0 38 0 0 0 0 0 0 0.816 -0 005 0 0 100 0 0 0 0 01 18 2017_18 Q OP061 Emergency Planning 15 16 06 15 20 2268 2269 0 100 0 0 -0.001 0 0 0 0 0 0.058 0 -0.001 0 100 0 0 0 0 01 19 2017_18 Q OP063 Emergency Emergency Ho ding line 16/17 06 15 20 2660 2662 0 100 0 0 0 0 0 0 0 0 0 0.02 0 0 100 0 0 0 0 01 20 2017_18 Q OP06 TMG - Vehicle & Plant Rep acemen s 16/17 06 15 20 2555 2556 0 62 0 38 0 0 0 0 0 0 0 1 791 0 0 100 0 0 0 0 01 21 2017_18 Q OP065 Lone Worker Refresh 06 15 20 2662 2662 0 50 0 50 0 0 0 0 0 0 0 0 012 0 0 100 0 0 0 0 01 22 2017_18 Q OP067 TMG - V&P Requirements (17 18) 06 15 20 3116 3116 0 60 0 0 0.59 0 0 0 0 0 0 0 0 59 0 100 0 0 0 0 01 23 2017_18 Q OP068 TMG - V&P Requirements (18 19) 20 0 50 0 50 0 0 0 0 0 0 0 0 0 0 100 0 0 0 0 01 2 2017_18 Q PL001 Ops Contracts Mater al Testing 06 15 20 2258 2258 0 100 0 0 -0.001 0 0 0 0 0 0.001 0 001 -0.001 0 100 0 0 0 0 01 25 2017_18 Q PL002 2PL2 Wastewater PL Phase 1 06 15 20 2380 2380 0 0 0 100 0 0 0 0 0 0 0.088 0 0 0 0 100 0 0 0 01 26 2017_18 Q PL005 Energy Eff c ency - Process Optim sation 06 15 20 2382 2382 0 0 0 100 0.00 0 0 0 0 0 0.176 0 072 0.00 0 55 5 0 0 0 01 27 2017_18 Q PL006 Repair & Maintenance Rev ew Project 06 06 20 2916 2927 0 100 0 0 0.067 0 0 0 0 0 0 0 0.067 0 100 0 0 0 0 01 28 2017_18 Q QC011 Labo atory Capi al Equipment 12/13 01 15 20 0935 09 2 0 51 0 9 0 0 0 0 071 0 0 0.00 0 0 0 100 0 0 0 0 01 29 2017_18 Q QC012 Labo atory Equipment 13/1 & 1 /15 03 15 20 DWI 1 30 1 37 0 51 0 9 0 0 0 0 0.223 0 23 0.022 0 087 0 0 100 0 0 0 0 01 30 2017_18 Q QC015 Defibr llators for NIW depots & Hubs 03 06 20 1 91 1 98 0 50 0 50 0 0 0 0 0.015 0 0.003 0 0 0 0 100 0 0 0 01 31 2017_18 Q QC018 Labo atory Capi al 15 16 06 15 20 2159 2159 0 51 0 9 -0.001 0 0 0 0 0 0.0 6 0 00 -0.001 0 100 0 0 0 0 01 32 2017_18 Q QC019 2015 16 SCAMP NI (Sustainab e Ca chment A ea Managemen06 06 03 2132 2135 0 100 0 0 -0.002 0 0 0 0 0 0.15 0 001 -0.002 30 20 0 10 0 0 01 33 2017_18 Q QC020 Watson Mar ow pump - Cryp o 06 15 20 2109 2109 0 100 0 0 0 0 0 0 0 0 0.002 0 0 0 100 0 0 0 0 01 3 2017_18 Q QC021 2016 17 SCAMP NI (Sustainab e Ca chment A ea Managemen06 06 03 2 75 2 76 0 100 0 0 -0.015 0 0 0 0 0 0 0 207 -0.015 30 20 0 10 0 0 01 35 2017_18 Q QC022 Labo atory Capi al 16 17 06 06 20 2579 2579 0 51 0 9 0.003 0 0 0 0 0 0 0 0 1 0.003 0 100 0 0 0 0 01 36 2017_18 Q QC023 Labo atory Capi al 17 18 06 06 20 2818 2823 0 51 0 9 0.039 0 0 0 0 0 0 0 0.039 0 100 0 0 0 0 01 37 2017_18 Q QC02 2017 18 SCAMP NI (Sustainab e Ca chment A ea Managemen06 06 03 2725 2739 0 100 0 0 0.199 0 0 0 0 0 0 0 0.199 0 30 50 20 0 0 01 38 2017_18 Q QC026 Labo atory Capi al 18 19 20 0 51 0 9 0 0 0 0 0 0 0 0 0 0 100 0 0 0 0 01 39 2017_18 Q QC027 2018 19 SCAMP NI Projects 03 316 3167 0 100 0 0 0 0 0 0 0 0 0 0 0 0 30 50 20 0 0 01 0 2017_18 Q BN051 PC15 Ops Capital (Sewerage) BSP & SDB Parent 06 07 18 0 0 23 77 7.3268691 7 2829079 7.2392105 0 91. 836271 0 8.51637295 23 77 91 91 1 2017_18 Q CF11 Installation of wa er meters and separat ons Baseline 06 03 19 0 100 0 0 3 779818 3 708672 3.6 59526 0 88.62 68 0 11 3753156 100 89 111 2 2017_18 Q LN13 Leakage Parent PC15 06 03 09 5 55 0 0 2.6868816 2 6871512 2.55 10 9 0 79.9866 63 0 20 0133537 5 55 80 201 3 2017_18 Q WS121 Ops Capital (Water) BSP & SDB Parent PC15 06 03 10 56 0 0 6.199965 6.1627652 6.1257886 .8 577735 52.5113819 0 2 6 28 07 56 5 52 31 2017_18 Q CS020 Capitalised Sa aries and On-Costs 00 00 29 12 11 8 11.283935 11.216232 11 202815 23.1896065 57. 85721 3.86 93 2 15. 597377 18.6962751 23.0659026 17.7650 3 0. 72779 13 9566 6 11.5 3 11 72 37 12. 6 12.31827 13.9566 6 16.0 58 53 59. 55587 12.8939828 11.60 58 51 5 2017_18 Q Leakage-Detec ion 00 03 09 100 0 0 0 0. 8 0.538 0 5 1 0.56 0 51 0. 8 0 100 0 01 6 2017_18 Q Leakage-Repairs 00 03 09 100 0 0 0 0.309 0.229 0 229 0.309 0 309 0.309 0 100 0 01 7 2017_18 Q Leakage-Other 00 03 09 50 50 0 0 1.629 2. 2 2 309 1.895 1 872 1.629 0 80 0 201 8 2017_18 Q Water Supply 00 02 10 0 100 0 0 1.206 1 9736 1. 25 1.80 1 7 1.206 0 100 0 01 9 2017_18 Q Wastewater 00 09 18 0 0 62 38 3.901 .191 3 693 .792 851 3.901 0 100 0 01 50 2017_18 Q Customer Field Services 00 03 19 0 100 0 0 1.0 5 2.301 2. 77 3 25 2 7 7 1.0 5 0 98 0 21 51 2017_18 Q DSCT-Water 00 03 10 100 0 0 0 2.17 1. 19 1 211 1 33 1 716 2.17 0 0 0 1001 52 2017_18 Q DSCT-Sewerage 00 07 18 0 0 100 0 0.25 0. 6 0 561 0.357 0.10 0 25 0 0 0 1001 53 2017_18 Q M & E 00 09 18 0 1 0 99 5.069 6.9229018 6 298 6.56 6 52 5.069 0 100 0 01 5 2017_18 Q Networks Water 00 03 10 52 8 0 0 1.885 2.3002856 2.171 2.299 2. 16 1.885 0 100 0 01 55 2017_18 Q Lead Pipe 00 03 10 100 0 0 0 0.37 0.331 0 368 0. 21 0 281 0 37 100 0 0 01 56 2017_18 Q Cost of connections sewerage 00 07 18 0 0 100 0 1 678761 0.6770196 0 827 0.951 0 919 1.678761 0 0 0 1001 57 2017_18 Q Cost of connnect ons wa er 00 03 10 100 0 0 0 2.3763018 1.73955 6 1 787 1.722 2.102 2.3763018 0 0 0 1001 58 2017_18 Q Cost of watermains rel gnment 00 03 10 100 0 0 0 0.0 28581 0.1100535 0 0 5 0.082 0 013 0.0 28581 0 100 0 01 59 2017_18 Q Cost of Sewer real gnment 00 07 18 0 0 100 0 0.0027857 0.096359 0 018 0 0 015 0.0027857 0 100 0 0

Annual Information Return 2018 Section 2 Chapter 40 Page 1 of 1
Table 40 – Capital Investment Monitoring (CIM)
Refer to chapter 30 for detailed commentary.
The data reported in this table reconciles to the other AIR Tables. The table has been populated following the column definitions. Capitalised Salaries have been allocated by examining each of the 3 main investment
areas as follows:o Capital works Programmeo Management and Generalo Operations Capital
The total Capitalised Salaries and overheads were pro-rated against each project on the CIM to arrive at a Salaries and overheads allocation for the single line on the CIM (Table 40) using the same method as applied in AIR 15.
The variance between Table 40 (Q4 CIM) and other associated AIR tables is reportedin Chapter 30. The main reason for variance is on complex projects which contain ablend of infra and non infra as well as a blend of purpose allocations which does notallow for creating a robust 16 component summary. The AIR tables data is morereliable than table 40 for accuracy.
Total Asset Additions reconciliations Total asset additions – Water Service – Check to Table 25 line 5 col 4.
For AIR 17 the reported numbers in these two tables are as follows:Table 25 – £47.634mTable 36 – £46.197m
The main variances in the above two figures are explained as follows: a) PPP Alpha Capital maintenance of k is not included in Table 36 b) £9k included in Table 25 relates to Decapitalised projects in 2017/18
Total asset additions – Sewerage Service – Check to Table 25 line 5 Col 8.For AIR 17 the reported numbers in these two tables are as follows:Table 25 – £111.634mTable 36 – £110.405m
The main variances in the above two figures are explained as follows: c) PPP Omega and PPP Kinnegar residual asset additions were not
included in Table 36. d) £7k included in Table 25 relates to Decapitalised projects in 2017/18
Note: NI Water has complied with the column definitions in respect of the baseline and current actual or projected milestone dates in Table 40. The milestones dates are relevant, sequential and relate to the PC15 outputs.

NORTHERN IRELAND WATER LIMITED - ANNUAL INFORMATION RETURN
ANNUAL INFORMATION RETURN - TABLE 40ANOMINATED OUTPUTS DELIVERED BY PC15 CAPITAL PROJECTS AND PROGRAMMES OF WORK
Project ID Reference Project Name PC13
Programme
PI Project ID PI Project Name PI PC13 Prog 2010-11 2011-12 2012-13 2013-14 2014-15 2015-16 2016-17 2017-18 2018-19 2019-20 2020-21 2013-14 2014-15 2015-16 2016-17 2017-18 2018-19 2019-20 2020-21 UID Status
1 2 3 4 5 6 7 8 9 10 11 12 13 14 15 16 17 18 11 12 13 14 15 16 17 18Water Treatment Base Maintenance
JA271 Killylane WTW 1 31/12/2014 7 nr 1 1Water Treatment Works
JN390 Lough Bradan WTWs Upgrade 4 02/03/2011 7 nr 1JL723 Carmoney Water Treatment Works Upgrade 4 30/03/2011 7 nr 1JP669 Killyhevlin WTW - Enforcement Order 4 31/03/2015 7 nr 1 1JR463 Dorisland WTW GAC plant 4 27/03/2015 7 nr 1 1JI052 Glenhordial Treatability 4 30/09/2015 29/01/2016 29/01/2016 7 nr 1 1JI052 Dorisland Treatability 4 31/12/2020 n/a 31/03/2020 7 1 1JI052 Killyhelvin Treatability 4 31/12/2020 n/a 31/03/2020 7 1 1JL772 Caugh Hill Treatability 4 31/01/2019 n/a 31/03/2020 7 1 1
Trunk MainsJR416 CTM Extension - Barnetts Park to Purdysburn 5 29/11/2010 6 nr 1JG036 Castor Bay to Dungannon Strategic Trunk Mains 5 24/05/2011 6 nr 1JG035 Ballydougan to Newry Main Link Reinforcement Phase 1 5 04/12/2012 6 nr 1JG035 Ballydougan to Newry TM - Phase 2A 5 17/12/2012 6 nr 1JR460 Gravity II McVeighs Well to Oldpark SR 5 30/11/2014 6 nr 1 1JG035 Ballydougan to Newry TM - Phase 2B 5 28/08/2015 31/03/2016 31/03/2016 6 nr 1 1JR342 Castor Bay to Belfast TM 5 27/03/2015 08/05/2015 08/05/2015 6 nr 1 1JB693 Carland to Cookstown Trunkmain 5 31/03/2021 n/a 31/03/2017 21/09/2016 6 1 1JL715 Carmoney to Strabane Strategic Link Watermain 5 31/01/2019 n/a 31/01/2020 6 1 1
Service ReservoirsJB665 Tullaghans SR, Dunloy, New Reservoir 6 13/08/2010 8 nr 1JC381 Altnahinch WTP, Ballymoney, New CWB. 6 10/11/2010 8 nr 1JC378 Glenlough SR, Ballymoney, New SR 6 20/12/2010 8 nr 1JR151 West Belfast/ North Lisburn (Crew Hill) 6 18/01/2011 8 nr 1JB648 Dungonnell Command Service Reservoir 6 31/03/2011 8 nr 1JF583 Carland Service Reservoir 6 11/04/2011 8 nr 1JS179 Ballykine Gravity Distribution 6 20/04/2011 8 nr 1JV827 Tullyhappy SR 6 09/12/2011 8 nr 1JB649 Tully SR 6 06/12/2012 8 nr 1JV830 Crieve SR 6 27/03/2015 8 nr 1 1JS274 Drumaroad WTW Clear Water Tank 6 31/03/2021 n/a 31/03/2021 8 1 1JP631 Killyhelvin Clear Water Tank 6 30/09/2017 n/a 29/03/2019 8 1 0 0 1JB709 Lough Fea CWB 6 30/09/2019 n/a 8 1 1
Monaclogh SR (additional output in 16/17 draft adjusted outputs submission) 6 n/a n/a 01/08/2017 8 1Major Incident Mitigation Water Main Projects
JI024 MIMP West (Major Incident Mitigation Project West Region) Freeze Thaw Improvements 8 14/02/2014 15 nr 1 1JI025 MIMP South (Major Incident Mitigation Project West Region) Freeze Thaw Improvements 8 24/01/2014 15 nr 1 1JI027 MIMP Central (Major Incident Mitigation Project Central Region) Freeze Thaw Improvements 8 28/03/2014 15 nr 1 1JI028 MIMP East (Major Incident Mitigation Project East Region) Freeze Thaw Improvements 8 09/02/2015 15 nr 1 1JI026 MIMP North (Major Incident Mitigation Project North Region) Freeze Thaw Improvements 8 18/08/2014 15 nr 1 1
Unsatisfactory Intermittent DischargesKR403 Whitehouse DAP Phase 1 11 13/04/2010 12 nr 3KR402 Joymount WWPS 11 01/06/2010 12 nr 1KR400 Lukes Point DAP Phase 1 11 23/06/2010 12 nr 1KL450 Londonderry DAP : Strathfoyle & Drmahoe Work Package : Caw WWPS 11 01/07/2010 12 nr 1KB428 Draperstown DAP 11 02/07/2010 12 nr 2KG153 Gilford Road, Portadown, Sewerage Upgrades 11 10/08/2010 12 nr 3KL449 Londonderry DAP : Strathfoyle & Drmahoe Work Package : Drumahoe Old WWPS 11 02/09/2010 12 nr 1KR440 Ballywalter DAP Phase 1 11 30/09/2010 12 nr 1KL445 Londonderry DAP: Victoria road Work Package - UID's 11 11/10/2010 12 nr 1 1KL448 Londonderry DAP : Victoria Road Work Package : CSO Rationalisation 11 29/10/2010 12 nr 3KL428 Londonderry Sewer Imps Stage 2 - Duke St PS Group Schemes - UID's 11 28/03/2011 12 nr 3KR441 Montgomery Rd, Flood Alleviation - UID's 11 27/04/2012 12 nr 4KS807 Kilkeel Harbour SPS and Sewerage Improvements - UID's 12 04/06/2012 12 nr 2KS379 Murlough SPS Upgrade & Network Improvements - UID's 12 29/04/2011 12 nr 8 1KR452 Baroda Street/Ormeau Park, Belfast CSO 12 07/09/2011 12 nr 2KT138 Beechlawn SPS Hillsborough Upgrade - UID's 12 30/11/2011 12 nr 1KL443 Londonderry DAP Duke Street Work Package - UID's 12 02/12/2011 12 nr 4KR432 Beechmount Avenue/Gortfin Street Belfast Hydraulic Upgrade. - UID's 12 02/12/2011 12 nr 4KL444 Londonderry DAP, Buncrana Road, Work Package Stage 1- UID's 12 07/05/2012 12 nr 2KL446 Londonderry DAP, Duke Street Work Package, Flood Alleviation 12 13/12/2011 12 nr 3KS377 Downs Road/Castle Park Sewer Upgrade/ Attenuation - UID's 12 23/01/2012 12 nr 4KC404 Coleraine DAP Phase 1 - UID's 12 31/01/2012 12 nr 5KR434 Annadale Flats, Belast 12 30/03/2012 12 nr 4KS878 Bangor DAP Work Package 7: WWPS - UID'S 12 28/03/2012 12 nr 3KA201 Ballyeaston, Sewerage System Upgrade 12 23/04/2012 12 nr 1KL447 Londonderry DAP: Foyle Road Work Package: CSO Rationalisation - UID's 12 24/09/2012 12 nr 10KS373 Church Street, SPS Upgrade, Downpatrick - UID's 12 06/05/2013 12 nr KS373 UID046 Meadowlands CSO3 12 06/05/2013 12 nr 1 1 KS373 UID047 Church Street CSO1 12 06/05/2013 12 nr 1 1 KS373 UID048 Scotch Street CSO4 12 06/05/2013 12 nr 1 1 KS373 UID049 Scotch Street CSO11 12 06/05/2013 12 nr 1 1 KS373 UID050 Rathkeltair Terr CSO12 12 06/05/2013 12 nr 1 1KS835 South Street Newtownards WWPS Refurbishment - UID'S 12 28/01/2013 12 nr 1KG184 Portadown Drainage Area Network Improvements - Obins Street and Park Road - UID's 12 31/08/2012 12 nr 4KR488 Linen Gardens Belfast CSO Screening - UID's 12 01/01/2014 12 nr 1 1KN595 Brookmount Road, Hunters Cresent, Omagh 12 31/05/2011 12 nr 5KS812 Greyabbey DAP Phase 1 - UID's 12 24/09/2012 12 nr 2KV014 Castlewellan DAP - UIDs 12 19/08/2010 12 nr 2KG178 Annaghanoon Road WWPS, Waringstown 12 05/09/2011 12 nr 1KL451 Londonderry DAP, Strathfoyle + Drumahoe Package: CSO Abandonments - UID's 12 24/09/2012 12 nr 3KR439 Millisle DAP 1 12 29/11/2012 12 nr 1KV063 Newry Rehab 12 05/09/2011 12 nr 1KV159 Water Street/Horners Lane Rostrevor 12 24/06/2011 12 nr 1KN646 Winters Lane, CSO Upgrade - UID 12 27/03/2013 12 nr 1KT415 Glenmore WwPS Lisburn CSO upgrade 12 12 nr KT415 UID065 Glenmore SPS CSO 22 12 25/06/2013 12 nr 1 1KS939 Central Promenade, Newcastle CSO Upgrade (Pattons Bridge) 12 12 nr KS939 UID259 Pattons Bridge (Blackrock WwPS 12 31/03/2016 24/03/2016 24/03/2016 12 nr 1 1 PC13KV154 Newry Road SPS Warrenpoint - UID's 12 12 nr KV154 UID095 Newry Road TPS CSO 12 14/01/2014 12 nr 1 1 KV154 UID234 Drumsesk Road Header Tank CSO 12 14/01/2014 12 nr 1 1KS372 Market Street SPS Upgrade, Downpatrick - UID's 12 12 nr KS372 UID044 Market Street SPS Upgrade, Downpatrick - UID's 12 18/12/2015 18/02/2016 18/02/2016 12 nr 1 1 PC13KF037 Annagher Sewage Pumping Station and Rising Main - UID's 12 12 nr KF037 UID245 Annagher SPS 12 28/03/2014 12 nr 1 1 KF037 UID246 Campbells Garage WwPS CSO 12 28/03/2014 12 nr 1 1 KF037 UID247 Washing bay Road WwPS CSO 12 28/03/2014 12 nr 1 1 KF037 UID359 Canal Quay WWPS (not required) 12 x 12 nr 1 xKV161 Castlewellan DAP Stage 1 - UIDs 12 12 nr KV161 UID033 Mill Hill CSO 04 12 31/03/2014 12 nr 1 1 KV161 UID031 Ballylough CSO 04 12 31/03/2014 12 nr 1 1
PC15 Current Actual/ Forecast
A BProject Information Project Outputs
Quality Regulator Date(if appropriate)
BU Date per FD(if
appropriate)
BU Date per 15/16 MP
(if appropriate)
BU Date per 16/17 MP
(if appropriate)
Projected BU Date
(if appropriate)
PC13 Output
Ref Code
OutputUnits
PC10 PC13 in PC15FD PC15 FD Baseline PC13 Actual

Project ID Reference Project Name PC13
Programme
PI Project ID PI Project Name PI PC13 Prog 2010-11 2011-12 2012-13 2013-14 2014-15 2015-16 2016-17 2017-18 2018-19 2019-20 2020-21 2013-14 2014-15 2015-16 2016-17 2017-18 2018-19 2019-20 2020-21 UID Status
1 2 3 4 5 6 7 8 9 10 11 12 13 14 15 16 17 18 11 12 13 14 15 16 17 18
PC15 Current Actual/ Forecast
A BProject Information Project Outputs
Quality Regulator Date(if appropriate)
BU Date per FD(if
appropriate)
BU Date per 15/16 MP
(if appropriate)
BU Date per 16/17 MP
(if appropriate)
Projected BU Date
(if appropriate)
PC13 Output
Ref Code
OutputUnits
PC10 PC13 in PC15FD PC15 FD Baseline PC13 Actual
KV161 UID036 Annesborough Park CSO 01 12 31/03/2014 12 nr 1 1KS937 Annesborough Park WWPS Upgrade 12 12 nr KS937 UID032 Annesborough Park WwPS 12 31/10/2016 30/09/2016 30/06/2016 12 nr 1 1 PC15 FDKT403 Drumbeg Drive, Lisburn WWPS Enhancement 12 12 nr KT403 UID070 Maralin Ave CSO 02 12 30/09/2014 12 nr 1 1KS875 Bangor DAP Works Package 6: Lukes Point WWPS UIDs 12 12 nr KS875 UID189 Bangor DAP Works Package 6: Lukes Point WWPS UIDs 12 30/09/2014 12 nr 1 1KT391 Lisburn DAP Stage 1 - UID's 12 12 nr KT391 UID066 Waterside 2 CSO 07 12 12/03/2015 12 nr 1 1 KT391 UID067 B Hilden PS CSO 13B 12 30/03/2015 12 nr 1 1 KT391 UID068 Hilden PS CSO 13A 12 31/03/2015 30/10/2015 22/02/2016 15/10/2015 12 nr 1 1 PC13 KT391 UID069 Antrim St CSO 25 12 22/02/2016 31/08/2016 30/10/2016 22/08/2016 12 nr 1 1 PC15 FD KT391 UID072 New Holland WWT (not required) 12 01/01/2015 12 nr 1 x PC15 FD KT391 UID073 Duncans Rd CSO 15 (not required) 12 01/01/2015 12 nr 1 x PC15 FD KT391 UID074 Laws Yard CSO 14 12 22/02/2016 30/10/2015 22/02/2016 30/10/2015 12 nr 1 1 PC15 FD KT391 UID221 Waterside 1 CSO 01 12 12/03/2015 12 nr 1 1 KT391 UID222 Linenhall Street CSO 03 12 30/03/2015 12 nr 1 1 PC15 FD KT391 UID223 Antrim Street CSO 05 12 22/02/2016 31/10/2016 20/09/2017 30/06/2019 12 nr 1 1 PC15 FD KT391 UID224 Clonevin Park CSO 10 12 22/02/2016 09/09/2015 22/02/2016 09/09/2015 12 nr 1 1 PC15 FD KT391 UID225 Sprucefield WWPS Screen CSO 20 12 30/03/2015 12 nr 1 1 KT391 UID226 Antrim Road CSO 24 + flooding 12 22/02/2016 30/10/2015 22/02/2016 30/10/2015 12 nr 1 1 PC15 FD KT391 UID227 Bow Street CSO 26 12 22/02/2016 30/10/2015 22/02/2016 22/03/2016 12 nr 1 1 PC15 FD KT391 UID228 Ballynahinch Rd 2 CSO 27 12 18/03/2015 12 nr 1 1 KT391 UID229 Grand Street Screen CSO 28 12 31/03/2015 30/10/2015 22/02/2016 20/11/2015 12 nr 1 1 PC13 KT391 UID423 Eglantine WWPS CSO 16 12 30/03/2015 12 nr 0 1 KT391 UID424 Culcavy WWPS CSO 17 12 30/03/2015 12 nr 0 1 KT391 UID425 Ballinderry WWPS CSO 23 12 30/03/2015 12 nr 0 1 KT391 UID421 Edgewater WWPS 12 31/03/2015 04/09/2015 22/02/2016 04/09/2015 12 nr 1 1 PC13 KT391 UID422 Hoggs Weir CSO 04 12 n/a 30/10/2015 30/10/2015 30/10/2015 12 nr 1 PC15 NewKS873 Bangor DAP Work Package 2: Rathmore Stream UIDs 12 12 nr KS873 UID013 Westburn Cresc. CSO 3A 12 01/03/2015 31/03/2016 27/04/2017 31/03/2019 12 nr 1 1 PC13 KS873 UID014 Crawfordsburn Rd CSO 03B 12 01/03/2015 29/04/2016 22/05/2017 31/03/2019 12 nr 1 1 PC13 KS873 UID015 Crawfordsburn Rd CSO 03C 12 01/03/2015 29/04/2016 09/05/2017 31/03/2019 12 nr 1 1 PC13KR480 Holywood Sewer Catchment Investigations - UIDs 12 12 nr KR480 UID218 Palace Barracks CSO 110 12 31/12/2015 29/06/2016 30/11/2016 07/09/2016 12 nr 1 1 PC15 FD KR480 UID219 Jackson Road CSO 52 12 06/10/2014 12 nr 1 1KR640 Holywood Sewer Network Improvements- Phase 2 12 12 nr KR640 UID220 Strathearn Court CSO 53 12 31/12/2015 29/06/2016 31/10/2017 20/12/2016 12 nr 1 1 PC15 FDKS930 Millisle DAP Stage 2 Phase 2 12 12 nr KS930 UID076 Millisle SPS CSO 02 12 18/01/2016 31/03/2016 30/03/2017 12/12/2018 12 nr 1 1 PC15 FDKR417 Ormeau Avenue Sewer investigation and feasibility study for pollution resolution - UID's 12 12 nr KR417 UID191 Cromac Street CSO 95 12 31/03/2017 30/06/2016 31/06/2018 31/03/2020 12 nr 1 1 PC15 FD KR417 UID192 Outside Holiday Inn CSO97 12 31/03/2017 30/06/2016 31/06/2018 31/03/2020 12 nr 1 1 PC15 FD KR417 UID193 Dublin Road Cinema CSO 96 12 31/03/2017 30/06/2016 31/06/2018 31/03/2020 12 nr 1 1 PC15 FD KR417 UID194 Bankmore Street / Dublin Road CSO 81 12 31/03/2017 30/06/2016 31/06/2018 31/03/2020 12 nr 1 1 PC15 FD KR417 UID265 Sandy Row CSO 94 12 31/03/2017 30/06/2016 31/06/2018 31/03/2020 12 nr 1 1 PC15 FDKG183 Portadown Drainage Area Network Improvements - Meadow Lane and Bann Street - UID's 12 12 nr KG183 UID081 Meadow Lane CSO 06 12 30/09/2017 27/03/2017 04/05/2018 31/03/2020 12 nr 1 1 PC15 FD KG183 UID082 Meadow Lane CSO 07 12 31/03/2017 27/03/2017 25/05/2018 31/03/2020 12 nr 1 1 PC15 FD KG183 UID083 Portmore Street CSO 08 12 30/09/2017 27/03/2017 28/09/2018 31/03/2020 12 nr 1 1 PC15 FD KG183 UID085 Clonavon Avenue CSO 11 12 30/09/2017 27/03/2017 28/09/2018 31/03/2020 12 nr 1 1 PC15 FD KG183 UID233 Meadow Lane WWPS CSO 32 12 31/03/2017 27/03/2017 06/04/2018 31/03/2020 12 nr 1 1 PC15 FD KG183 UID086 Meadow Lane CSO 12 12 30/09/2017 27/03/2017 06/04/2018 31/03/2020 12 nr 1 1 PC15 FDKF330 Armagh DAP Stage 1 - UID's 12 12 nr KF330 UID001 Scotch Street CSO. 2 12 31/03/2016 22/02/2016 31/03/2016 25/03/2016 12 nr 1 1 PC15 FD KF330 UID002 Scotch Street. CSO 1 12 31/03/2016 18/12/2015 31/03/2016 25/03/2016 12 nr 1 1 PC15 FD KF330 UID003 Courthouse 1 CSO 12 31/03/2015 30/11/2015 31/03/2016 30/11/2015 12 nr 1 1 PC13 KF330 UID005 The Mall East CSO 12 31/03/2016 31/05/2016 31/03/2017 14/10/2016 12 nr 1 1 PC15 FD KF330 UID006 English St CSO. Scheme 2 12 31/03/2015 31/07/2016 10/03/2017 21/01/2017 12 nr 1 1 PC13 KF330 UID007 Drumcairn SPS. Scheme 3 12 31/03/2015 30/03/2015 12 nr 1 1 KF330 UID431 Ballycrummy WWPS 12 30/03/2015 12 nr 0 1 KF330 UID430 Longstone WWPS 12 30/03/2015 12 nr 0 1 KF330 UID010 Newry Road SPS 12 31/03/2016 29/04/2016 31/03/2017 28/04/2017 12 nr 1 1 PC15 FD KF330 UID173 Mall West CSO 12 31/03/2016 30/11/2015 31/03/2016 23/03/2016 12 nr 1 1 PC15 FD KF330 UID175 Alexender Road CSO 12 31/03/2015 13/11/2015 31/03/2016 13/11/2015 12 nr 1 1 PC13 KF330 UID176 Gillis Lane CSO 12 31/03/2015 30/03/2015 12 nr 1 1KF396 UID008 Milford SPS 12 31/03/2015 30/03/2018 30/04/2019 04/08/2017 12 nr 1 1 0 PC13KF397 UID009 Killylea SPS 12 31/03/2015 30/03/2018 30/03/2020 31/03/2020 12 nr 1 1 PC13KS879 Bangor DAP Work Package 4: Bangor Marina UIDs 12 12 nr KS879 UID018 Somerset Ave. CSO 11 12 27/08/2014 12 nr 1 1 KS879 UID019 Bridge St CSO 13 12 27/08/2014 12 nr 1 1 KS879 UID020 Quay St CSO 14 12 27/08/2014 12 nr 1 1 KS879 UID021 Tennyson CSO 10 12 27/08/2014 12 nr 1 1 KS879 UID022 Queens parade CSO 12 12 27/08/2014 12 nr 1 1KS877 Bangor DAP Works Package 5 - Clandeboye Stream UIDs 12 12 nr KS877 UID023 Castle Park CSO 07 12 31/12/2015 27/10/2016 29/01/2018 31/03/2018 12 nr 1 1 PC15 FD KS877 UID179 13 Rugby Avenue CS0 8A 12 31/03/2015 27/10/2016 29/01/2018 31/03/2018 12 nr 1 1 PC13 KS877 UID180 11 Brunswick Road CSO 8B 12 31/03/2015 27/10/2016 29/01/2018 31/03/2018 12 nr 1 1 PC15 FD KS877 UID181 104 Abbey Street CSO 8F 12 31/12/2015 27/10/2016 29/01/2018 31/03/2018 12 nr 1 1 PC15 FD KS877 UID182 114 Abbey Street CSO 8E 12 31/12/2015 27/10/2016 29/01/2018 31/03/2018 12 nr 1 1 PC15 FD KS877 UID183 Railway View Street CSO 8G (not required) 12 31/03/2015 27/10/2016 29/01/2018 31/03/2018 12 nr 1 x PC13 KS877 UID184 Abbey Park CSO 9 12 31/12/2015 27/10/2016 29/01/2018 31/03/2018 12 nr 1 1 PC15 FD KS877 UID263 57 Belfast Road CSO 8C 12 31/03/2015 27/10/2016 29/01/2018 21/03/2017 12 nr 1 1 PC13 KS877 UID264 17 Belfast CSO 8D 12 31/03/2015 27/10/2016 29/01/2018 21/03/2017 12 nr 1 1 PC13KS958 Bangor DAP Works Package 5 Clandeboye Stream UIDs Phase 2 12 12 nr KS958 UID185 Avonlea Park CSO 6 12 31/03/2015 30/10/2015 31/03/2016 30/03/2016 12 nr 1 1 PC13 KS958 UID186 Rosemary Crescent / Inglewood Pk CSO 5 12 31/03/2015 30/10/2015 31/03/2016 30/03/2016 12 nr 1 1 PC13 KS958 UID187 Clandeboye Road CSO 5B 12 31/03/2015 30/10/2015 31/03/2016 30/03/2016 12 nr 1 1 PC13 KS902 Dundrum DAP, UID Upgrades - UID's 12 12 nr KS902 UID237 Parochial House CSO 02 12 31/12/2016 21/08/2017 29/06/2018 31/03/2020 12 nr 1 1 PC15 FD KS902 UID238 Main Street CSO 04 12 31/12/2016 21/08/2017 29/06/2018 31/03/2020 12 nr 1 1 PC15 FD KS902 UID239 Flynn's WWPS CSO 05 12 31/12/2016 21/08/2017 05/04/2019 31/03/2020 12 nr 1 1 PC15 FDKT114 Hillsborough WWTW 16 12 nr KT114 UID071 Magherageery PS CSO 18 16 18/03/2014 12 nr 1 1KS848 Newcastle WwTW 16 12 nr KS848 UID 260 Harbour WwPS 16 09/12/2013 12 nr 1 1KR501 Carrickfergus WWTW Upgrade 2 12 nr KR501 UID272 Carrickfergus CSO 2 19/03/2015 12 nr 1 1KL468 Strathfoyle, Londonderry Syphon Inlet Screen 12 12 nr KL468 UID114 Caw Park CSO 023 12 23/05/2014 31/03/2016 31/03/2016 21/03/2016 12 nr 1 1 PC13 KL468 UID380 Gransha Park WwPS No. 2 12 23/05/2014 31/03/2016 31/03/2016 22/03/2016 12 nr 1 1 PC13KC415 Coleraine 12 12 nr KC415 UID043 Screen Road CSO 12 31/03/2016 30/03/2015 12 nr 1 1 PC15 FD KC415 UID040 Ballysally CSO 12 31/03/2016 30/11/2016 31/03/2017 31/03/2018 12 nr 1 1 PC15 FDKA248 Ballygally Sewer Rehabilitation 12 12 nr KA248 UID190 Brustin Lee WWPS 12 30/03/2015 12 nr 1 1 KA248 UID319 Croft Manor WWPS 12 30/03/2015 12 nr 1 1 KA248 UID320 Ballygalley Slipway WWPS 12 30/03/2015 12 nr 1 1 KA248 UID321 Ballygalley North WWPS 12 30/03/2015 12 nr 1 1

Project ID Reference Project Name PC13
Programme
PI Project ID PI Project Name PI PC13 Prog 2010-11 2011-12 2012-13 2013-14 2014-15 2015-16 2016-17 2017-18 2018-19 2019-20 2020-21 2013-14 2014-15 2015-16 2016-17 2017-18 2018-19 2019-20 2020-21 UID Status
1 2 3 4 5 6 7 8 9 10 11 12 13 14 15 16 17 18 11 12 13 14 15 16 17 18
PC15 Current Actual/ Forecast
A BProject Information Project Outputs
Quality Regulator Date(if appropriate)
BU Date per FD(if
appropriate)
BU Date per 15/16 MP
(if appropriate)
BU Date per 16/17 MP
(if appropriate)
Projected BU Date
(if appropriate)
PC13 Output
Ref Code
OutputUnits
PC10 PC13 in PC15FD PC15 FD Baseline PC13 Actual
KA248 UID322 Ballygalley Coast Road CSO 12 30/03/2015 12 nr 1 1KI488 Removal of Inlet Screens and Installation of Solid Handling Pumps 02 12 nr KI488 UID400 Braeside WWPS 02 01/08/2013 12 nr 1 1 KI488 UID401 Cloughy Road WWPS 02 01/09/2013 12 nr 1 1 KI488 UID402 Old Mill Race WWPS 02 01/08/2013 12 nr 1 1 KI488 UID403 Glen Park WWPS 02 01/09/2013 12 nr 1 1 KI488 UID404 Kerries Glen 02 01/01/2014 12 nr 1 1 KI488 UID405 Carnesure Terrace WWPS 02 01/04/2014 12 nr 1 1 KI488 UID406 Hillside WWPS 02 01/10/2013 12 nr 1 1 KI488 UID407 Chimera Wood WWPS 02 01/12/2013 12 nr 1 1 KI488 UID408 Ballystockart WWPS 02 01/11/2014 12 nr 1 1 KI488 UID409 Milltown WWPS 02 01/10/2014 12 nr 1 1 KI488 UID419 Ratalla WWPS 02 01/04/2013 12 nr 1 1KS374 Hunter's Mill Storm Attenuation and Network Improvements 12 12 nr KS374 UID045 Downpatrick - Stream St CSO 12 19/02/2015 12 nr 1 1 KS374 UID124 Hunters Mill Attenuation Stream Street CSO2 12 19/02/2015 12 nr 1 1KA251 Umry Lodge CSO 12 12 nr KA251 UID394 Clotworthy House CSO 12 22/01/2014 12 nr 1 1KT139 River Road SPS Upgrade 02 12 nr KT139 UID276 River Road WWPS 02 09/04/2014 12 nr 1 1KS867 Copeland Road, Comber, Tank Sewer 12 12 nr KS867 UID343 Copeland Road CSO 61 12 30/10/2014 12 nr 1 1KA252 Glynn WWPS 02 12 nr KA252 UID398 Glynn WWPS 02 19/02/2015 12 nr 1 1KS900 WwPS Upgrades at Groomsport, Killinchy & Craigavad 12 12 nr KS900 UID410 Glencraig WWPS 12 01/05/2014 12 nr 0 1KF354 Dernagh WWPS Upgrade 02 12 nr KF354 UID416 Dernagh WWPS 02 01/09/2014 12 nr 1 1KN644 Greenbridge WWPS Upgrade 02 12 nr KN644 UID417 Greenbridge WWPS 02 14/11/2013 12 nr 1 1KF360 Blackwater Town WWPS Upgrade 02 12 nr KF360 UID418 Blackwatertown WWPS 02 31/03/2014 12 nr 1 1KN628 Carrickmore WWPS Upgrade 02 12 nr KN628 UID427 Carrickmore WWPS 02 27/08/2014 12 nr 0 1KL504 Londonderry DAP : Buncrana Road Work Package, Stage 2 12 12 nr KL504 UID273 Knockalla New WWPS 12 31/03/2015 29/02/2016 31/08/2016 13/09/2016 12 nr 1 1 PC13 KL504 UID274 Upper Galliagh Road WWPS 12 31/03/2015 31/03/2016 31/03/2016 31/03/2016 12 nr 1 1 PC13 KL504 UID275 Glen Road CSO 12 31/03/2015 24/04/2015 24/04/2015 24/04/2015 12 nr 1 1 PC13 KL504 UID433 Fairview Knockalla CSO 12 n/a 21/03/2016 21/03/2016 12 nr 1 PC15 NewKS872 Bangor DAP Work Package 1 12 12 nr KS872 UID011 Carnalea Golf Club CSO 1 12 30/09/2018 30/07/2018 31/03/2019 31/03/2020 12 nr 1 0 1 PC15 FD KS872 UID012 KillaneyWWPS 3 12 30/09/2018 30/07/2018 31/03/2019 31/03/2020 12 nr 1 0 1 PC15 FD KS872 UID177 Killaire WWPS 1 12 30/09/2018 30/07/2018 31/03/2016 31/03/2016 12 nr 1 1 PC15 FDKS874 Bangor DAP Works Package 3 12 12 nr KS874 UID016 Maxwell CSO 4 12 30/09/2016 03/06/2019 29/03/2019 31/03/2020 12 nr 1 0 1 PC15 FD KS874 UID017 Stricklands Glen WWPS 12 30/09/2016 03/06/2019 29/03/2019 31/03/2020 12 nr 1 0 1 PC15 FD KS874 UID178 Brompton Road SPS (PS06) 12 30/09/2016 03/06/2019 29/03/2019 31/03/2020 12 nr 1 0 1 PC15 FDKG177 Portadown DAP Stage 2 12 12 nr KG177 UID090 Annagh Catchment CSO 20 12 31/12/2018 04/12/2017 30/09/2020 31/03/2022 12 nr 1 x PC15 FD KG177 UID091 Annagh SPS CSO 20 12 31/12/2018 04/12/2017 03/04/2020 31/03/2022 12 nr 1 x PC15 FD KG177 UID092 Chambers Park CSO 01 12 31/12/2018 04/12/2017 12 nr 1 x PC15 FD KG177 UID093 Ballynacor CSO21 12 31/12/2018 04/12/2017 03/04/2020 31/03/2022 12 nr 1 x PC15 FDKR489 Glenmachan Strategic Project Phase 1a 12 12 nr KR489 UID411 Balmoral Avenue CSO63 12 31/03/2016 19/06/2017 12 nr 1 x PC15 FD KR489 UID412 Balmoral Court CSO54 12 31/03/2016 19/06/2017 12 nr 1 x PC15 FD KR489 UID413 Lisburn Road Golf Club CSO58 12 31/03/2017 19/06/2017 12 nr 1 x PC15 FD KR489 UID414 Park Royal CSO57 12 31/03/2017 19/06/2017 12 nr 1 x PC15 FD KR489 UID415 Priory Park CSO55 12 30/09/2017 19/06/2017 30/09/2017 12 nr 1 x PC15 FDKR504 Portaferry Road, N,Ards WWPS Upgrade 12 12 nr KR504 UID351 Portaferry Road WWPS 12 31/03/2019 31/03/2017 31/08/2017 31/03/2019 12 nr 1 1 PC15 FDKB486 Galgorm WWPS Upgrade 12 12 nr KB486 UID399 Galgorm Raphael WWPS 12 30/09/2016 31/03/2017 20/03/2018 20/03/2018 12 nr 1 0 1 PC15 FDKS903 Annalong DAP 12 12 nr KS903 UID266 Halfway House CSO 12 n/a 31/03/2016 21/03/2016 21/03/2016 12 nr 1 PC15 New KS903 UID267 Marine Park CSO 12 n/a 31/03/2016 21/03/2016 21/03/2016 12 nr 1 PC15 NewKL527 Manorwood WWPS Replacement 12 12 nr KL527 UID432 Manorwood WWPS 12 31/10/2016 01/12/2016 12 nr 1 PC15 NewKL524 Bleachgreen WWPS, Londonderry, Upgrade/Replacement 12 12 nr KL524 UID420 Bleachgreen WWPS 12 30/04/2017 60/06/2017 12 nr 1 0 PC15 NewKA260 Muckamore WWPS Upgrade 12 12 nr KA260 UID389 Muckamore WwPS 12 04/04/2017 04/04/2017 12 nr 1 PC15 NewKA261 Milltown Road WWPS Upgrade 12 12 nr KA261 UID388 Milltown Road WWPS Upgrade 12 21/03/2017 12 nr 1 PC15 NewKA247 Crumlin Town WWPS Upgrade 12 12 nr KA247 UID387 Crumlin Town WWPS Upgrade 12 01/03/2020 12 nr 1 PC15 NewKA262 Islandreagh WWPS Upgrade 12 12 nr KA262 UID391 Islandreagh WWPS Upgrade 12 30/03/2019 12 nr 1 PC15 NewKA263 Dunadry WWPS Upgrade 12 12 nr KA263 UID390 Dunadry WWPS Upgrade 12 30/03/2019 12 nr 1 PC15 New
Wastewater Treatment WorksKT102 Dunmurry WwTW Modifications 15 19/03/2012 13 nr 1KB436 Whitehead, Ballystruder & Ballycarry Rationalisation 15 16/02/2012 13 nr 1KR389 Ballyhalbert WwTW Interim Solution 15 28/03/2013 13 nr 1KA195 Mullaghboy WWTW 15 04/04/2011 13 nr 1KR391 Portavogie WwTW Interim Solution 15 24/09/2012 13 nr 1KS253 Drumaness WwTW 15 31/08/2010 13 nr 1KB282 Magherafelt WwTW 15 28/03/2011 13 nr 1KT125 Hook's Corner WwTW 15 28/03/2011 13 nr 1KL393 Ballymonie WwTW 15 18/03/2011 13 nr 1KB269 Toome (Creagh) Sewerage Scheme 15 22/03/2011 13 nr 1KS307 Loughries WWTW 15 25/01/2011 13 nr 1KB281 Maghera WwTW 15 03/02/2011 13 nr 1KL363 Feeny WwTW 15 25/11/2011 13 nr 1KR310 Newtownbreda WwTW 15 04/02/2011 13 nr 1KG145 Derrytrasna WwTW Upgrade 15 29/11/2010 13 nr 1KB333 Cargan WwTW 15 30/11/2010 13 nr 1KC284 Cloughmills WwTW 15 30/11/2010 13 nr 1KB322 Martinstown WwTW 15 13/12/2010 13 nr 1KF005 Coalisland WwTW 15 01/12/2010 13 nr 1KC299 Bushmills + Portballintrae WwTW 15 06/12/2010 13 nr 1KB279 Stewartstown WwTW Improvements 15 10/11/2010 13 nr 1KB284 Coagh WwTW Improvements 15 10/11/2010 13 nr 1KL300 Dungiven WwTW 15 10/11/2010 13 nr 1KV064 Lurganare WwTW 15 30/09/2010 13 nr 1KN533 Rousky Sewerage Scheme 15 09/09/2010 13 nr 1 0KB278 Moneymore STW Imps 15 18/08/2010 13 nr 1KS224 Downpatrick WwTW 15 14/12/2009 13 nr 1KF319 Annaghmore WwTWs 15 27/09/2010 13 nr 1KS225 Ardglass WWTW 15 20/03/2015 13 nr 1 1

Project ID Reference Project Name PC13
Programme
PI Project ID PI Project Name PI PC13 Prog 2010-11 2011-12 2012-13 2013-14 2014-15 2015-16 2016-17 2017-18 2018-19 2019-20 2020-21 2013-14 2014-15 2015-16 2016-17 2017-18 2018-19 2019-20 2020-21 UID Status
1 2 3 4 5 6 7 8 9 10 11 12 13 14 15 16 17 18 11 12 13 14 15 16 17 18
PC15 Current Actual/ Forecast
A BProject Information Project Outputs
Quality Regulator Date(if appropriate)
BU Date per FD(if
appropriate)
BU Date per 15/16 MP
(if appropriate)
BU Date per 16/17 MP
(if appropriate)
Projected BU Date
(if appropriate)
PC13 Output
Ref Code
OutputUnits
PC10 PC13 in PC15FD PC15 FD Baseline PC13 Actual
KT377 New Holland WwTW 16 28/03/2011 13 nr 1KS374 Darragh Cross WwTW 16 07/09/2010 13 nr 1KC338 Causeway/Aird (New Pumping Station) 16 23/08/2011 13 nr 1KC416 Glenstall WwTW - Nutrient Reduction 16 25/02/2013 13 nr 1KN622 Omagh WwTW - Nutrient Reduction 16 25/02/2013 13 nr 1KL465 Limavady WwTW - Nutrient Reduction 16 25/02/2013 13 nr 1KF329 Ardress WWPS Upgrade 16 31/03/2012 13 nr 1KS857 Glassdrumman WWTW 16 23/12/2011 13 nr 1KS216 Dunmore Sewerage - EC Compliance 16 30/06/2011 13 nr 1KF320 Bush WwTW 16 03/06/2010 13 nr 1KF028 Keady Wwtw 16 29/11/2012 13 nr 1KL482 Tamnaherin Wwtw 16 28/01/2013 13 nr 1KV105 Newry WwTW Extension Phase 1 16 28/01/2013 13 nr 1KF060 Brockagh Terrace/Mountjoy WtWT 16 13/08/2012 13 nr 1KV125 Forkhill WwTW 16 28/03/2013 13 nr 1KV045 Mullaghbane WwTW 16 28/03/2013 13 nr 1KB287 Swatragh WwTW 16 21/03/2013 13 nr 1KB314 Gulladuff WwTW 16 16/12/2013 13 nr 1 1KT114 Hillsborough WWTW 16 18/03/2014 13 nr 1 1KS848 Newcastle WwTW 16 09/12/2013 13 nr 1 1KR501 Carrickfergus WWTW Upgrade 2 31/03/2014 13 nr 1 1KR530 Belfast WwTW Base Maintenance Phase 2 2 18/03/2014 13 nr 1 1KN631 Strabane WWTW's Refurbishment 2 20/12/2013 13 nr 1 1KL350 Benone Area Sewerage 16 16/09/2013 13 nrKL350 Decommission Benone WwTW & construct WwPS 16 16/09/2013 13 nr 1 1KL350 Decommission Drumavelly WwTW & construct WwPS 16 16/09/2013 13 nr 1 1KL350 Decommission Aughil WwTW & construct WwPS 16 16/09/2013 13 nr 1 1KL350 Decommission MoD WwTW & construct WwPS 16 16/09/2013 13 nr 1 1KL350 Decommission NIPS WwTW & construct WwPS 16 16/09/2013 13 nr 1 1KL350 Provision of new Magilligan WwTW 16 16/09/2013 13 nr 1 1KP672 Tempo WwTW 16 06/01/2015 13 nr 1 1KS844 Ballyhornan Outfall - NIEA Enforcement 16 31/12/2013 13 nr 1 1KL424 Magheramason Wwtw 16 20/03/2015 13 nr 1 1KR409 Moneyreagh WwTW (Storm Pumping station) 16 12/12/2013 13 nr 1 1KP586 Clabby Wwtw 16 30/09/2015 31/03/2017 31/03/2017 30/03/2018 13 nr 1 1KN599 Donaghmore Wwtw 16 19/03/2015 13 nr 1 1KL487 Nixon’s Corner 16 30/01/2015 13 nr 1 1KL386 Gortnahey Wwtw 16 24/07/2014 13 nr 1 1KS389 Ballymartin & Blackrock WwTWs 16 13 nrKS389 Ballymartin WwTW 16 31/03/2015 13 nr 0 1KS389 Blackrock WwTW 16 31/03/2016 31/03/2016 30/06/2016 20/10/2016 13 nr 1 1KS355 Ballynahinch Wwtw 16 21/03/2014 13 nr 1 1KS905 Kilmore & Annacloy WwTW 16 13 nrKS906 Kilmore WwTW 16 10/03/2015 13 nr 1 1KS907 Annacloy WwTW 16 11/03/2015 13 nr 1 1KS887 Ards South (Ballycranbeg WwTW load reduction) 16 31/03/2015 13 nr 1 1KL496 Feeny WwTW - Replacement Secondary Treatment 16 08/08/2014 13 nr 1 1KF346 Robinsonstown WwTW 16 01/01/2020 30/06/2019 31/03/2018 31/03/2021 13 nr 1 1KN596 Ballymagory WWTW 16 30/03/2015 13 nr 1 1KL493 Artigarvin WwTW 16 31/03/2015 21/12/2015 21/12/2015 13 nr 1 1KN640 Dromore (Tyrone) WWTW 16 20/03/2015 13 nr 1 1KT402 Dunmurry WWTW Sludge Facility 16 18/03/2014 13 nr 1 1KB459 Maghera WwTW: Phase 2 16 04/02/2014 13 nr 1 1KL394 Drumsurn Wwtw 16 16/12/2014 13 nr 1 1KP668 Lisnarrick Wwtw 16 01/12/2014 13 nr 1 1KT126 Stoneyford Wwtw 16 28/11/2014 13 nr 1 1KI508 UWWTR MCERT compliance 16 31/03/2016 31/01/2016 31/01/2016 13 nr 1 1 1KC296 Ballycastle WwTW 16 01/01/2017 30/12/2017 31/03/2018 31/12/2017 13 nr 1 1KN656 Castle Archdale WwTW 16 31/03/2015 30/03/2016 30/03/2016 13 nr 1 1KG202 Aghagallon WwTW 16 31/03/2015 13 nr 1 1
Waringsford 16 30/09/2014 13 nr 0 1KC302 Ballintoy WwTW 16 31/03/2018 31/01/2017 31/01/2018 29/03/2019 13 1 0 1KS235 Ballygowan/Moneyreagh WwTW 16 13 KS235 Ballygowan WwTW 16 31/03/2018 28/02/2017 31/03/2020 13 1 0 0 1KS235 Moneyreagh WwTW 16 31/03/2018 28/02/2017 31/03/2020 13 1 0 0 1KS111 Ards South - Cloughey 16 31/03/2017 n/a 31/03/2019 31/03/2020 13 1 0 1KL489 Ballykelly WwTW 16 31/03/2017 n/a 30/10/2018 31/03/2020 13 1 0 1
Dundrum WwTW 16 31/12/2017 n/a 31/03/2019 13 1 0 1KS113 Ards North - Carrowdore, Ballywalter, Ballyhaskin 16 13KS113 Carrowdore WwTW 16 31/03/2021 n/a 31/03/2021 13 1 1KS113 Ballywalter WwTW 16 31/03/2021 n/a 31/03/2021 13 1 1KS113 Ballyhaskin WwTW 16 31/03/2021 n/a 31/03/2021 13 1 1KF350 Dungannon WwTW 16 01/01/2021 01/01/2021 31/03/2021 13 1 1KC463 Ballybogy WwTW 16 31/01/2021 31/01/2021 31/03/2021 13 1 1KA239 Mullans WwTW (Antrim) 16 31/03/2021 n/a 30/09/2017 29/03/2018 13 1 1 0
Greyabbey WwTW 16 31/03/2021 31/03/2021 31/03/2021 13 1 1Maghaberry WwTW (additional output in 16/17 draft adjusted outputs submission) 16 02/04/2018 29/03/2019 13 1The Loup 16 15/03/2017 13 1Small Wastewater Treatment WorksSmall Wastewater Treatment Works - PC10 Programme >250pe to be detailed
KI486 Annahugh WwTW 17 2010/2011 13 nr 1KI486 Galbally WwTW 17 2010/2011 13 nr 1KI486 Maghery WwTW 17 2010/2011 13 nr 1KI486 Montieth WwTW 17 2011/2012 13 nr 1KI486 Orritor WwTW 17 2011/2012 13 nr 1KI486 Garvaghy WwTW 17 2011/2012 13 nr 1KI486 Donagheady WwTW 17 2010/2011 13 nr 1KI486 Attical Tullyframe WwTW 17 2011/2012 13 nr 1KI486 Donagh WwTW 17 2011/2012 13 nr 1 0 0KI486 Glack WwTW 17 2012/2013 13 nr 1KI486 Teemore WwTW 17 2011/2012 13 nr 1
Small Wastewater Treatment Works - PC10 Programme <250pe to be detailed 17 2010-2013 14 nr 11 23 14Small Wastewater Treatment Works - PC13 Programme <250pe to be detailed 17 2013-2015 14 nr 7 18 7 8 7 8 7 8 7 18Small Wastewater Treatment Works - PC15 Programme <250pe to be detailed 17 2015-2021 14 nr 4 8 4 10
BP T4.1 Water Outputs 2010-11 2011-12 2012-13 2013-14 2014-15 2015-16 2016-17 2017-18 2018-19 2019-20 2020-21 2013-14 2014-15 2015-16 2016-17 2017-18 2018-19 2019-20 2020-2119 Completion of nominated trunk main schemes 6 2 0 2 0 2 1 0 0 1 0 1 0 1 2 1 0 0 1 020 Completion of nominated water treatment works schemes 7 2 0 0 0 3 1 0 0 1 0 2 0 3 1 0 0 0 3 021 Completion of nominated improvements to increase the capacity of service reservoirs and clear water tanks 8 5 3 1 0 1 0 0 1 0 1 1 0 1 0 0 1 0 2 1
BP T4.2 Sewerage Outputs 2010-11 2011-12 2012-13 2013-14 2014-15 2015-16 2016-17 2017-18 2018-19 2019-20 2020-21 2013-14 2014-15 2015-16 2016-17 2017-18 2018-19 2019-20 2020-218 Delivery of improvements to nominated UIDs as part of a defined programme of work 12 20 43 38 25 59 27 16 5 8 0 0 28 39 26 11 11 8 22 09 Delivery of improvements to nominated WwTWs as part of a defined programme of work 13 29 14 13 17 18 3 4 4 0 1 7 17 18 3 2 3 3 4 7
10 Small wastewater treatment works delivered as part of the rural wastewater investment programme 14 11 23 14 7 18 7 8 7 8 7 8 7 18 4 8 4 10 0 0

Annual Information Return 2018
Table 40a – Nominated Outputs
The following tables identify those PC15 nominated outputs delivered during the programme. The information aligns with that claimed in the relevant AIR Tables and also endeavours to update the status of the nominated outputs yet to complete.
The information is presented by Sub-Programme and reflects the layout as submitted in Table 40a.
NIW project Code
Project title Year claimed
Outstanding outputs/ comments
Sub programme 1 – Base Maintenance Water N/A N/A N/A Sub programme 4 – WTW JI052 Glenhordial Treatability 2015/16
JI052 Dorisland Treatability JI052 Killyhelvin Treatability JL772 Caugh Hill Treatability Sub programme 5 – Trunkmains JG035 Ballydougan to Newry TM –
Phase 2B 2015/16
JB693 Carland to Cookstown Trunkmain
2016/17
JL715 Carmoney to Strabane Strategic Link Watermain
See note b
JR342 Castor Bay to Belfast TM 2015/16 See note a Sub programme 6 – Service Reservoirs and Towers JS274 Drumaroad WTW Clear Water
Tank JP631 Killyhelvin Clear Water Tank JB709 Lough Fea CWB
Note: a) Castor Bay to Belfast TM – this was a PC13 output. Whilst the trunk main pipeline
was complete by the end of March 2015, the new pumps associated with thescheme could not be installed by the PPP contractor without first emptying theMagheraliskmisk service reservoir. This could not be done due to the risk ofindustrial action. Once the risk of industrial action had ended, the new pumps wereinstalled and the trunk main achieved beneficial use by May 2015. This wasincluded in AIR 16 as a PC15 output.
b) Carmoney to Strabane Strategic Link Watermain – the scope and start date of thisscheme will be informed by the conclusions of the Water Resource and SupplyResilience plan.

Annual Information Return 2018
Summary (Sub programme 12 – UIDs)
UID performance 2017/18 The table below presents UID performance during 2017/18. UID delivery 2017/18 PC15 FD UIDs delivered in 2017/18 7 PC13 UIDs delivered in 2017/18 21 Non PC15 baseline UIDs delivered in 2017/18 22 Total 11
Complete PC15 UID programme
Category of output
Number of UIDs in category
PC15 scope
Outside PC15
PC15 baseline, delivery in PC15 43
PC15 baseline, cannot claim 3 PC15 baseline, delivery in PC21 8 PC15 baseline, delivered in PC13 2
New, added to PC15 11 PC13 carryover, delivery in PC15 24
PC13 carryover, cannot claim 1 Totals 80 12
1 This will be added to PC15 outputs through a forthcoming Change Control. 2 This will be added to PC15 outputs through a forthcoming Change Control.

Annual Information Return 2018 Section 2 Chapter 40a Page 3 of 12
NIW Project Code
Nominated outputs
reference Title
Delivery year (as stated in PC15 FD)
Current Actual/
Forecast BU
PC15 FD Baseline
Nom. Output?
Revised PC15 Nom.
Output? Change description
KA260 UID389 Muckamore WwPS 2017/18 NO YES Was part of original DAP - had been land issues when the PC15 baseline was set but these were subsequently resolved.
KA261 UID388 Milltown Road WWPS Upgrade 2016/17 NO YES
Was part of original DAP - had been land issues when the PC15 baseline was set but these were subsequently resolved.
KA247 UID387 Crumlin Town WWPS Upgrade 2019/20 NO YES Will assist with completion of Antrim DAP
KA262 UID391 Islandreagh WWPS Upgrade 2018/19 NO YES Was part of original DAP - had been land issues when
the PC15 baseline was set.
KA263 UID390 Dunadry WWPS Upgrade 2018/19 NO YES Was part of original DAP - had been land issues when
the PC15 baseline was set.
KB486 UID399 Galgorm Raphael WWPS 2016/17 2018/19 YES YES
KC415 UID040 Ballysally CSO 2015/16 2017/18 YES YES KC415 UID043 Screen Road CSO 2015/16 2014/15 YES YES Delivered during PC13 KF330 UID001 Scotch Street CSO. 2 2015/16 2015/16 YES YES KF330 UID002 Scotch Street. CSO 1 2015/16 2015/16 YES YES KF330 UID003 Courthouse 1 CSO 2014/15 2015/16 NO YES Originally PC13, delivery in PC15 KF330 UID005 The Mall East CSO 2015/16 2016/17 YES YES
KF330 UID006 English St CSO. Scheme 2 2014/15 2016/17 NO YES Originally PC13, delivery in PC15
KF330 UID010 Newry Road SPS 2015/16 2017/18 YES YES KF330 UID173 Mall West CSO 2015/16 2015/16 YES YES KF330 UID175 Alexender Road CSO 2014/15 2015/16 NO YES Originally PC13, delivery in PC15 KF396 UID008 Milford SPS 2014/15 2019/20 NO YES Originally PC13, delivery in PC15 KF397 UID009 Killylea SPS 2014/15 2019/20 NO YES Originally PC13, delivery in PC15

Annual Information Return 2018 Section 2 Chapter 40a Page 4 of 12
NIW Project Code
Nominated outputs
reference Title
Delivery year (as stated in PC15 FD)
Current Actual/
Forecast BU
PC15 FD Baseline
Nom. Output?
Revised PC15 Nom.
Output? Change description
KG177 UID090 Annagh Catchment CSO 20 2018/19 PC21 YES NO
Modelling has highlighted issues - constraints regarding flows. This scheme has an interdependence with Meadow Lane which must be addressed first.
KG177 UID091 Annagh SPS CSO 20 2018/19 PC21 YES NO Modelling has highlighted issues - constraints regarding flows. This scheme has an interdependence with Meadow Lane which must be addressed first.
KG177 UID092 Chambers Park CSO 01 2018/19 N/A YES NO
The area of Chambers Park WwPS and CSO manhole was acquired by ASDA to erect their new store. ASDA designed their site drainage to cater for all flows previously running toward Chambers Park WwPS. The new sewers carry these flows to the new (as yet unadopted) pumping station to the rear of the ASDA site. The pipework was sized to accommodate all flows without the need to retain the existing CSO.
On 22/09/2016, NIEA stated that NI Water could not claim this UID.
KG177 UID093 Ballynacor CSO21 2018/19 PC21 YES NO Modelling has highlighted issues - constraints regarding flows. This scheme has an interdependence with Meadow Lane which must be addressed first.
KG183 UID081 Meadow Lane CSO 06 2017/18 2020/21 YES YES
KG183 UID082 Meadow Lane CSO 07 2016/17 2020/21 YES YES
KG183 UID083 Portmore Street CSO 08 2017/18 2020/21 YES YES
KG183 UID085 Clonavon Avenue CSO 11 2017/18 2020/21 YES YES
KG183 UID086 Meadow Lane CSO 12 2017/18 2020/21 YES YES

Annual Information Return 2018 Section 2 Chapter 40a Page 5 of 12
NIW Project Code
Nominated outputs
reference Title
Delivery year (as stated in PC15 FD)
Current Actual/
Forecast BU
PC15 FD Baseline
Nom. Output?
Revised PC15 Nom.
Output? Change description
KG183 UID233 Meadow Lane WWPS CSO 32 2016/17 2020/21 YES YES
KL468 UID114 Caw Park CSO 023 2014/15 2015/16 NO YES Originally PC13, delivery in PC15
KL468 UID380 Gransha Park WwPS No. 2 2014/15 2015/16 NO YES Originally PC13, delivery in PC15
KL504 UID273 Knockalla New WWPS 2014/15 2016/17 NO YES Originally PC13, delivery in PC15
KL504 UID274 Upper Galliagh Road WWPS 2014/15 2015/16 NO YES Originally PC13, delivery in PC15
KL504 UID275 Glen Road CSO 2014/15 2015/16 NO YES Originally PC13, delivery in PC15
KL504 UID433 Fairview Knockalla CSO 2015/16 NO YES
Was discovered during delivery of related UID273 – was spilling and was endorsed by NIEA. A pumping station was originally in place but was one pump - pump was removed, benched and manhole constructed. It was only during upgrade of new pumping station that overflow was located. Costs associated with this UID were incurred through the delivery UID273.
KL524 UID420 Bleachgreen WWPS 2018/19 NO YES
Was not identified in DAP but a large number of NIEA pollution incidents were recorded against this site discharging to the River Faughan. Driven and requested by NIEA: pressure also raised by Loughs Agency due to heavy pollution incidents. Had been raised to highest priority by NIEA.

Annual Information Return 2018 Section 2 Chapter 40a Page 6 of 12
NIW Project Code
Nominated outputs
reference Title
Delivery year (as stated in PC15 FD)
Current Actual/
Forecast BU
PC15 FD Baseline
Nom. Output?
Revised PC15 Nom.
Output? Change description
KL527 UID432 Manorwood WWPS 2016/17 NO YES
NIEA recognised that this WwPS was problematic and approved that this was a legitimate and UID and that it should be addressed during PC15. NIEA had identified spillage from overflow of WwPS to the Ardnabrocky Burn.
KR417 UID191 Cromac Street CSO 95 2016/17 2019/20 YES YES
KR417 UID192 Outside Holiday Inn CSO97 2016/17 2019/20 YES YES
KR417 UID193 Dublin Road Cinema CSO 96 2016/17 2019/20 YES YES
KR417 UID194 Bankmore Street / Dublin Road CSO 81 2016/17 2019/20 YES YES
KR417 UID265 Sandy Row CSO 94 2016/17 2019/20 YES YES
KR480 UID218 Palace Barracks CSO 110 2015/16 2016/17 YES YES
KR489 UID411 Balmoral Avenue CSO63 2015/16 PC21 YES NO
Changes to the design of scheme KR489 (Sicily Park) mean that this UID will not be addressed through that particular project. This UID may be included within the scope of a different project at a later date.
KR489 UID412 Balmoral Court CSO54 2015/16 PC21 YES NO
Changes to the design of scheme KR489 (Sicily Park) mean that this UID will not be addressed through that particular project. This UID may be included within the scope of a different project at a later date.

Annual Information Return 2018 Section 2 Chapter 40a Page 7 of 12
NIW Project Code
Nominated outputs
reference Title
Delivery year (as stated in PC15 FD)
Current Actual/
Forecast BU
PC15 FD Baseline
Nom. Output?
Revised PC15 Nom.
Output? Change description
KR489 UID413 Lisburn Road Golf Club CSO58 2016/17 PC21 YES NO
Changes to the design of scheme KR489 (Sicily Park) mean that this UID will not be addressed through that particular project. This UID may be included within the scope of a different project at a later date.
KR489 UID414 Park Royal CSO57 2016/17 PC21 YES NO
Changes to the design of scheme KR489 (Sicily Park) mean that this UID will not be addressed through that particular project. This UID may be included within the scope of a different project at a later date.
KR489 UID415 Priory Park CSO55 2017/18 PC21 YES NO
This UID may be included within the redefined scope of scheme KR489 (Sicily Park) but will not achieve Beneficial Use during PC15. Project KR489 is primarily a DG5 project with only a small fraction of the budget used to address UIDs. The project was 100% Enhanced Service Levels in the PC15 baseline.
KR504 UID351 Portaferry Road WWPS 2018/19 2019/20 YES YES
KR640 UID220 Strathearn Court CSO 53 2015/16 2016/17 YES YES
KS372 UID044 Market Street SPS Upgrade, Downpatrick - UID's
2014/15 2015/16 NO YES Originally PC13, delivery in PC15
KS872 UID011 Carnalea Golf Club CSO 1 2018/19 2019/20 YES YES
KS872 UID012 Killaney WWPS 3 2018/19 2018/19 YES YES KS872 UID177 Killaire WWPS 1 2018/19 2015/16 YES YES
KS873 UID013 Westburn Cresc. CSO 3A 2014/15 2018/19 NO YES Originally PC13, delivery in PC15

Annual Information Return 2018 Section 2 Chapter 40a Page 8 of 12
NIW Project Code
Nominated outputs
reference Title
Delivery year (as stated in PC15 FD)
Current Actual/
Forecast BU
PC15 FD Baseline
Nom. Output?
Revised PC15 Nom.
Output? Change description
KS873 UID014 Crawfordsburn Rd CSO 03B 2014/15 2018/19 NO YES Originally PC13, delivery in PC15
KS873 UID015 Crawfordsburn Rd CSO 03C 2014/15 2018/19 NO YES Originally PC13, delivery in PC15
KS874 UID016 Maxwell CSO 4 2016/17 2018/19 YES YES
KS874 UID017 Stricklands Glen WWPS 2016/17 2018/19 YES YES
KS874 UID178 Brompton Road SPS (PS06) 2016/17 2018/19 YES YES
KS877 UID023 Castle Park CSO 07 2015/16 2017/18 YES YES
KS877 UID179 13 Rugby Avenue CS0 8A 2014/15 2017/18 NO YES Originally PC13, delivery in PC15
KS877 UID180 11 Brunswick Road CSO 8B 2015/16 2017/18 YES YES
KS877 UID181 104 Abbey Street CSO 8F 2015/16 2017/18 YES YES
KS877 UID182 114 Abbey Street CSO 8E 2015/16 2017/18 YES YES
KS877 UID183 Railway View Street CSO 8G (not required)
2014/15 N/A NO NO
Although initially identified as a UID, subsequent modelling indicated that it did not spill with sufficient frequency to be categorised in this manner. There is no financial impact due to the removal of this UID from scope.
KS877 UID184 Abbey Park CSO 9 2015/16 2017/18 YES YES
KS877 UID263 57 Belfast Road CSO 8C 2014/15 2016/17 NO YES Originally PC13, delivery in PC15
KS877 UID264 17 Belfast CSO 8D 2014/15 2016/17 NO YES Originally PC13, delivery in PC15

Annual Information Return 2018 Section 2 Chapter 40a Page 9 of 12
NIW Project Code
Nominated outputs
reference Title
Delivery year (as stated in PC15 FD)
Current Actual/
Forecast BU
PC15 FD Baseline
Nom. Output?
Revised PC15 Nom.
Output? Change description
KS902 UID237 Parochial House CSO 02 2016/17 2019/20 YES YES
KS902 UID238 Main Street CSO 04 2016/17 2019/20 YES YES
KS902 UID239 Flynn's WWPS CSO 05 2016/17 2019/20 YES YES
KS903 UID266 Halfway House CSO 2015/16 NO YES Had potential to pollute Annalong Harbour – delivery endorsed by NIEA. UID advanced following Cross party Councillor complaints regarding discharges.
KS903 UID267 Marine Park CSO 2015/16 NO YES Had potential to pollute Annalong Harbour – delivery endorsed by NIEA. UID advanced following Cross party Councillor complaints regarding discharges.
KS930 UID076 Millisle SPS CSO 02 2015/16 2020/21 YES YES
KS937 UID032 Annesborough Park WwPS 2015/16 2016/17 YES YES
KS939 UID259 Pattons Bridge (Blackrock WwPS 2014/15 2015/16 NO YES Originally PC13, delivery in PC15
KS958 UID185 Avonlea Park CSO 6 2014/15 2015/16 NO YES Originally PC13, delivery in PC15
KS958 UID186 Rosemary Crescent / Inglewood Pk CSO 5 2014/15 2015/16 NO YES Originally PC13, delivery in PC15
KS958 UID187 Clandeboye Road CSO 5B 2014/15 2015/16 NO YES Originally PC13, delivery in PC15
KT391 UID068 Hilden PS CSO 13A 2014/15 2015/16 NO YES Originally PC13, delivery in PC15 KT391 UID069 Antrim St CSO 25 2015/16 2016/17 YES YES

Annual Information Return 2018 Section 2 Chapter 40a Page 10 of 12
NIW Project Code
Nominated outputs
reference Title
Delivery year (as stated in PC15 FD)
Current Actual/
Forecast BU
PC15 FD Baseline
Nom. Output?
Revised PC15 Nom.
Output? Change description
KT391 UID072 New Holland WWT 2015/16 N/A YES NO
Investigations established that this was not a network UID – it is located within the boundary of the site: this was not a KT391 UID. This was incorrectly carried through into the PC15 outputs.
KT391 UID073 Duncans Rd CSO 15 2015/16 N/A YES NO
Investigation during DAS discovered that no CSO exists at this location: it was established that this was not a UID - was a bifurcation.This was incorrectly carried through into the PC15outputs.
KT391 UID074 Laws Yard CSO 14 2015/16 2015/16 YES YES
KT391 UID222 Linenhall Street CSO 03 2015/16 2014/15 YES YES Delivered during PC13
KT391 UID223 Antrim Street CSO 05 2015/16 2019/20 YES YES
KT391 UID224 Clonevin Park CSO 10 2015/16 2015/16 YES YES
KT391 UID226 Antrim Road CSO 24 + flooding 2015/16 2015/16 YES YES
KT391 UID227 Bow Street CSO 26 2015/16 2015/16 YES YES
KT391 UID229 Grand Street Screen CSO 28 2014/15 2015/16 NO YES Originally PC13, delivery in PC15
KT391 UID421 Edgewater WWPS 2014/15 2015/16 NO YES Originally PC13, delivery in PC15
KT391 UID422 Hoggs Weir CSO 04 2015/16 NO YES Was identified in DAP but was not included in baseline list of PC15 UIDs

Annual Information Return 2018 Section 2 Chapter 40a Page 11 of 12
Sub-programme 15 and 16 WwTW NI Water project Code
Project title Year claimed
Outstanding outputs/ comments
KP586 Clabby WwTW 2017/18 KS389 Blackrock WwTW 2016/17 KS907 Annacloy WwTW 2014/15 See note a KF346 Robinsonstown WwTW KL493 Artigarvin WwTW 2015/16 See note b KI508 UWWTR MCERT
compliance 2015/16
KC296 Ballycastle WwTW 2017/18 KN656 Castle Archdale WwTW 2015/16 See note c KC302 Ballintoy WwTW KS235 Ballygowan WwTW KS235 Moneyreagh WwTW KS111 Ards South - Cloughey KL489 Ballykelly WwTW KS962 Dundrum WwTW KS113 Carrowdore WwTW KS113 Ballywalter WwTW KS113 Ballyhaskin WwTW KF350 Dungannon WwTW KC463 Ballybogy WwTW KA239 Mullans WwTW (Antrim) 2017/18
Greyabbey WwTW Maghaberry WwTW See note e
KC427 Ballyvoy WwTW The Loup 2016/17 See note d
Notes a) Land issues necessitated combined Kilmore/ Annacloy solution. It is significant to
note that Annacloy WwTW was originally scheduled to deliver during PC15 but wassuccessfully delivered during PC13.
b) Artigarvin was originally a PC13 output but a review of the delivery approachdelayed completion until 2015/16.
c) Castlearchdale WwTW was added to PC13 scope through change control butcarried through into PC15: re-profiling into PC15 was due to the requirement for awildlife survey.
d) The Loup was initially included in the scope of the Rural Wastewater TreatmentWorks programme. The actual PE of the site has exceeded the 250 PE thresholdand a Change Control has re-designated it as a Sub Programme 16 output.
e) Maghaberry WwTW was added to PC15 scope through a change control.

Annual Information Return 2018 Section 2 Chapter 40a Page 12 of 12
Sub programme 17 – Small Wastewater Treatment Works
CAR Site Reference
Project title Year claimed
Outstanding outputs
S00320 Drumlough 2016/17 S01462 Glenoe WwTW 2016/17 S04118 Trench Road 2016/17 S02111 Acton 2016/17 S02276 McKinley Park 2016/17 S01160 Longs Glebe 2016/17 S01622 Kilross 2016/17 S02593 Milltown (Aghory) 2016/17 S02284 Oliver Plunkett 2017/18 S00332 Bresagh 2017/18 S02987 Ardgarvan 2017/18 S03037 Carnabane 2017/18

NORTHERN IRELAND WATER LIMITED - ANNUAL INFORMATION RETURN
ANNUAL INFORMATION RETURN- TABLE 41 KEY OUTPUTSHEALTH & SAFETY INFORMATION (NIW only)
DESCRIPTION UNITS DP2012-13 CG 2013-14 CG 2014-15 CG 2015-16 CG 2016-17 CG 2017-18 CG 2018-19 CG 2019-20 CG 2020-21 CG
A OCCUPATIONAL ILL HEALTH1 Employee total nr 0 1,304 A2 1,250 A2 1,240 A2 1,230 A2 1,246 A2 1,261 A22 Total days lost due to sickness, accident and occupational ill health nr 0 9,081 A2 9,962 A2 9,767 A2 10,395 A2 10,188 A2 11,268 A23 Total days lost - rate per 1000 employees nr 2 6,963 96 A2 7,969.60 A2 7,876.61 A2 8,451.22 A2 8,176 57 A2 8,935.77 A24 Number of incidents of occupational ill health nr 0 137 A2 142 A2 131 A2 134 A2 135 A2 143 A25 Incidents of occupational ill health - rate per 1000 employees nr 2 105 06 A2 113.60 A2 105.65 A2 108.94 A2 108 35 A2 113.40 A2
B RIDDOR REPORTS6 Total RIDDOR incidents nr 0 10 A1 6 25 5 A1 7 A1 4 A1 6 A17 RIDDOR - rate per 1000 employees nr 2 7 67 A1 4.80 A1 4.03 A1 5.69 A1 3 21 A1 4.76 A18 3-day accident rate per 1000 employees nr 2 7 67 A1 4.80 A1 5 A1 5.68 A1 3 21 A1 4.76 A19 Major/fatal accident rate per 1000 employees nr 2 0 00 A1 0.00 A1 0.00 A1 0.00 A1 0 00 A1 0.00 A1
C AND INCIDENCE OF OCCUPATIONAL ILL HEALTH10 Contractors' employees total nr 0 No data No data NA NA NA N/a11 Total days lost due to sickness, accident and occupational ill health nr 0 No data No data NA NA NA N/a12 Total days lost - rate per 1000 employees nr 2 No data No data No data No data13 Number of incidents of occupational ill health nr 0 No data No data NA NA NA N/a14 Incidents of occupational ill health - rate per 1000 employees nr 2 No data No data No data No data
D CONTRACTORS' RIDDOR REPORTS15 Total RIDDOR incidents nr 0 6 B2 6 B2 5 BX 7 BX 9 BX 6 BX16 RIDDOR - rate per 1000 contractors' employees nr 2 No data No data No data No data17 3-day accident rate per 1000 contractors' employees nr 0 No data No data NA NA NA N/a18 Major/fatal accident rate per 1000 contractors' employees nr 2 0 00 B2 0 00 B2 0.00 A2 0.00 A2 0 00 A2 0.00 A2
5REPORTING
YEAR
41REPORTING
YEAR
2REPORTING
YEAR
3REPORTING
YEAR REPORTING
YEAR
6REPORTING
YEAR
7REPORTING
YEAR
8 9REPORTING REPORTING
YEAR YEAR

Annual Information Return 2018 Section 2 Chapter 41 Page 1 of 4
Table 41 – Health and Safety Information (NI Water only)
Lines 1 - 5 - Lost time In 2017/18 financial year NI Water lost a total of 11268 working days due to sickness which was equivalent to 8.9 working days lost per employee. The KPI attendance in 17/18 was 96.5% and NI Water delivered an actual rate of 95.9%, 0.6% below the target.
HR Advisors, in conjunction with Line Managers, continue to manage employee absence cases that meet the sick absence trigger points to highlight the importance of good attendance and corrective action taken where appropriate.
Human Resources work in partnership with Line Managers, the NI Water Employee Support Officer, Independent Occupational Health, Inspire (our Employee Assistance Programme provider) and employees to assist those on long term sick to return to work and to facilitate reasonable adjustments where required.
Absence reporting is undertaken by the Human Resources Department on a weekly basis to update Senior Management on current Absence levels. (This information is also reported on in more detail on a monthly basis). Senior Management are advised of the actual absence rate against NI Water’s KPI for Attendance. A more meaningful analysis has been included in the reporting, mainly a line graph depicting comparison of % attendance over the current and previous 2 years. Previously this was reported as days lost. A further addition on the report is highlighting the top 3 reason for absence in the reporting month and also year to date. These changes were made to highlight trends.
Our attendance rate has decreased from 96.3% in 16/17 to 95.9% in 17/18. There was an increase in staff absence due to Cold/Flu/Respiratory illnesses. 1097 working days were lost to these illnesses during 2017/18). (Compared to 724 working days during 2016/17). The increase 17/18 in Cold/Flu/Respiratory absences may be attributed to the greater incidence of flu epidemics during the winter of 17/18 than the previous winter. The Flu vaccine was offered to all employees and 252 employees took up the offer, approximately 20% of the workforce.
There were no deaths in service this year. There were 4 medical retirements after periods of long-term absences.
Frontline Operatives attended yearly medical assessments for Hand Arm Vibration, Audio and working in confined spaces. NI Water also provided medical assessment for driving and HGV which is currently carried out by Independent Occupational Health.
Psychiatric/psychological absences remain the highest reason for days lost due to sickness in 2017/18 at 20.2%, however this is a decrease from 2016/17 when the percentage of total working days lost due to Psychiatric/psychological illness was 25.1%. There are a number of Health and Wellbeing initiatives that were continued during 2017/2018, which are as follows:
Introduction of the flu vaccine on a yearly basis during autumn/winter seasons sinceOctober 2016.
Health and Wellbeing training delivered by Inspire (Managing Mental Health in theWorkplace, Building Emotional Resilience, Dealing with Difficult Situations,Mindfulness). These sessions continued throughout 2017 from the previousfinancial year.

Annual Information Return 2018 Section 2 Chapter 41 Page 2 of 4
A Mental Health week took place in October 2017 to promote awareness of Mentalhealth illnesses
Dedicated Workplace Counselling on site though Inspire Workplaces, WellbeingChampions representing employee views on wellbeing and providing input to ourthe Health and Wellbeing programme
Mental Health First Aid training provided to over 60 employees, and the introductionof a network of 12 Specialist Mental Health First Aiders who help colleaguesexperiencing mental health problems
Health awareness campaigns though our dedicated ‘Wellbeing Works intranetwellbeing site, poster campaigns and targeted employee communications
Provision of facilities for mindfulness, yoga, keep-fit classes, slimming clubs,company choir and sports teams
NI Water’s reason for absence reporting differs to the occupational reasons as listed by the Utility Regulator. Our current reporting systems do not specifically record Hand Arm Vibration or work related reasons for absence. In addition to this, work related stress is recorded under the general heading of anxiety/stress/depression.
Due to our failure to meet our KPI, improving attendance remains of high importance to both EC and Board along with further developing and implementing a continued programme of initiatives to improve the health and well-being for all our staff.
Line 6 – Total RIDDOR (and >3 Lost Day) Incidents The NI Water procedure for reporting of all incidents is set out in H&S Procedure PRO 008 within the NI Water Health & Safety Manual, (rev. October 2014). All incidents and near misses must be reported to line management as soon as practical, and at least within 24 hours of any incident. An electronic Risk Management and Reporting System (DATIX) is utilised for recording and tracking of all incidents and has been in place since April 2009.
It is the relevant Line Manager’s responsibility to ensure all incident details are recorded and managed within the DATIX system.
DATIX entries are monitored by NI Water’s Safety, Health and Environment (SHE) Team with statistical safety performance and trends presented monthly by the Head of Safety, at H&S Focus Group, Executive Committee and Board for consideration and discussion.
There were 6 RIDDOR (greater than) >3 Lost Day reportable incidents within NI Water during 2017/18, all of which resulted in more than 3-day work activity-related absences.
Datix Ref Date of Incident
Brief Description Incident Category
Underlying / Root Cause
RIDDOR Classification
NIW2445 10/04/17 Back injury whilst removing a lorry wheel in garage workshop.
Reportable Failure to use equipment provided.
> 3 day absence
NIW2451 28/04/17 Head injury sustained when young person fell from 1.6m Control Kiosk
Reportable Trespass/Site Security.
Member of Public hospitalised
overnight NIW2501 07/06/17 Shoulder Strain while carrying out
valving operations. Spindle slipped. Reportable Spindle of the valve
key came off the top of the crown head on valve.
> 3 day absence
NIW2605 20/09/17 Back & head injury resulting fall from a fixed ladder.
Reportable Failure to recognise risk and follow safety
procedures. > 3 day absence
NIW2646 20/10/17 Cut to arm resulting in tendon damage Reportable Failure to use due care & attention.
> 3 day absence
NIW2682 27/11/17 Slip on wet grass, resulted in broken ankle.
Reportable Failure to use due care & attention.
Fracture & > 3 day absence

Annual Information Return 2018 Section 2 Chapter 41 Page 3 of 4
NB: NI Water reports all over 3 day incidents under the RIDDOR (Northern Ireland) Regulations, whilst mainland GB reports on over 7 day absences, in line with recent legislative changes affecting only GB.
Line 7 – RIDDOR Rate per 1000 employees The DATIX process, as described for Line 6 above, provides the total number of RIDDOR (>3 day) incidents, whilst the denominator, the total number of employees, has been calculated by the Human Resources (HR) Directorate as 1260. This gives the RIDDOR Rate per 1000 employees as 4.76 for 2017/18.
Line 8 – Greater than (>) 3 day Incident Rate per 1000 employees As all RIDDOR incidents refer to incident-related absence (ref. line 6 commentary), the information in Line 8 mirrors that of Line 7.
Line 9 – Major Fatal Incident Rate per 1000 employees The information gathering process is again as described for Line 6 above. No fatal injuries occurred during 2017/18.
Lines 10 – 14 - Contractor Lost Time Incidents Contractors continue to be managed and directly engaged on a wide range of work activities, projects and contracts on behalf of NI Water. However, core activity, from a Health and Safety perspective relates only to the assistance given by contractors in relation to the provision of water and sewerage services and includes contractors engaged in the construction of new works (ref. line 15 commentary). NI Water has, throughout 2017/18 been engaged in a continuing process of change, regarding the numbers of contractors assisting in asset delivery and improvement of this core activity, as efficiency measures continue to be put in place,
Given the changing nature of contract provision as outlined above and the variety of work undertaken, NI Water has no available methodology for calculating and determining accurately the number of contractors’ staff engaged in all core related activities and this is unlikely to change in the short term.
Line 15 – Contractors’ RIDDOR Reports The Northern Ireland public regards all work related with water and sewerage services, including design and build work, to be closely associated with NI Water. NI Water, in turn, recognises its own duty of care to all of its contractors as a Client organisation when they are carrying out work and therefore sees its duty as one of leadership. NI Water therefore maintains a record of monitoring on all contractor and subcontractor reported incidents, which includes all incidents relating to transient workers. NI Water encourages and requires the reporting of all near-miss incidents involving contractors to facilitate a shared learning experience, in line with NI Water’s ‘Zero Harm’ ambition.
All Contractor and subcontractor incidents are recorded on DATIX and for 2017/18 the total number of RIDDOR related incidents reported to NI Water by all contractors was 6 with a one further reported incident being regarded as Dangerous Occurrence but where no harm or injury resulted, (see table). This was a decrease in reports on last year when 9 incidents were recorded. Contractor performance continues to be monitored by NI Water’s H&S Focus Group, by Executive Committee and by Board at their monthly meetings. On a Quarterly basis Risk Committee also consider and review safety performance, recent incidents and trend analysis of both NI Water staff and contractor performance.

Annual Information Return 2018 Section 2 Chapter 41 Page 4 of 4
Datix Ref Date of Incident Brief Description RIDDOR Classification
NIW2461 04/05/2017 Moving site excavator made contact with overhead power line. No injury or harm resulted.
Dangerous Occurrence
NIW2559 04/08/2017 Dumper driver thrown from moving dumper and suffered broken leg. Fracture & > 3 days
NIW2580 12/06/2017 Operative suffered fractured finger requiring stitches when helping place security fencing at work area. > 3 day absence
NIW2724 28/11/2017 Operative suffered injury to shin when hinged coverlid fell forward str king his leg. Infection resulted from injury. > 3 day absence
NIW2785 30/01/2018 Operative got foot partially trapped under track of moving site excavator. Suffered bruising of ankle and foot. > 3 day absence
NIW2819 09/03/2018 Electrician working from stepladder suffered minor electric shock leading to a fall. > 3 day absence
NIW2838 20/03/2018 Operative stumbled in grass verge str king his face against a tree branch, which required stitches. > 3 day absence
Lines 16 - 17 – Contractor RIDDOR and >3 Day Incident Rates Information is not collected for this line, as NI Water has no available methodology for calculating and determining accurately the numbers of direct contractor employees working on all NI Water contracts. Incident Rates therefore become difficult to calculate.
Line 18 – Contractor Major Fatal Incident Rate per 1000 employees There were no major or fatal incidents connected with NI Water contractors or sub-contractors, including transient workers, during 2017/18. This allows this rate to be calculated as zero.


Annual Information Return 2018 Section 2 Chapter 42 Page 1 of 14
Table 42 – PPP Reporting Preface The Company highlights that on the 20 November 2017 a newly formed hold company subsidiary, NIW Clear Ltd, acquired sole ownership of both the Alpha PPP Contractor (Dalriada Water Ltd) and the Alpha PPP Operating Company (Kelda Water Services Alpha Ltd). These entities were acquired through a competitive bid process conducted by the previous owners, Kelda Water Services Ltd, which commenced in December 2016, following Kelda’s announced sale of all their UK PPP/PFI water and energy commitments in September 2016. Post-acquisition, the contractual arrangements between the parties, including the senior lenders, has remained in place. There are no plans to collapse the Alpha PPP contract.
The reporting arrangements in Table 42 below remain unaffected by the acquisition and subsequent continuation of the existing commercial arrangements.
Line 4 & Line 5 No change.
Note: As the atypical expenditure, efficiencies, performance deductions (Omega) and residual interest (Omega) were not divisible by site the cross tots on lines 9,10, 11, 12, 15, 17, 18 and 20 will not agree to the figures in the total column – the figures included in the total columns are correct for each concession.
Line 7 - Unitary charge capacity The Unitary Charge Capacity Charge applies to Alpha only. The data used is derived from the invoices received from the Contractor, which separates the Unitary Charge Capacity Charge from the Unitary Variable Charge and the relevant Unitary Charge Performance Deductions, all in accordance with the Payment Mechanism Schedule of the Contract. Costs on this line have increased by an inflationary amount from 2016/17.
Line 8 - Unitary charge variable The Unitary Charge Variable Charge applies to all three PPP Contracts. The data used is derived from the invoices received from the Contractor which set out the Unitary Charge Variable Charge claimed. There are no payments in respect of the Ballynacor Sludge Facility and the Duncrue St Sludge Facility, rather a payment in respect of the Sludge Disposal Services. In total, costs on this line have increased by 5.6% from 2016/17 driven by a combination of inflation and flow variations in the year. In terms of flow variations, the movements are as follows:
Alpha DI – increased by 4.8% (272.4 ML/D vs 259.9 ML/D in AIR17) Omega WwTW – flows increased by 19.2% (33.9 Mm3 vs 28.4 Mm3 in AIR17) Omega SDS – volume reduced by 3.4% (40.6k TDS vs 42.0k TDS in AIR17)
Line 9 - Unitary charge deductions By contract definition, where the PPP Contractors invoice to an amount higher than the amount payable in accordance with the relevant Payment Mechanisms, the variance becomes a disputed amount. The Company recognises the disputed amount as an outstanding liability until such time as the Parties choose to have the dispute determined, or agree an amount for payment with credit note issued for closure as appropriate.

Annual Information Return 2018 Section 2 Chapter 42 Page 2 of 14
Alpha The Alpha Contractor, through engagement, invoices to the agreed amount which includes the relevant Performance Deductions. These Deductions are in accordance with the Payment Mechanism for failure events identified and can be separated by Facility (Scheme) as per the Payment Mechanism. Performance deductions in 2017/18 were £0.339m, an increase of £0.051m on the 2016/17 amount of £0.288m.
Omega No credits for performance deductions have been received in the 2017/18 year.
Kinnegar No credits for performance deductions at Kinnegar have been received in the 2017/18 year.
Line 10 - Atypical expenditure Alpha
£m Quality Monitoring Change credit EIB Step-down Refund in respect of reorganisation costs Total
As a result of the Quality Monitoring Change to the Contract an amount is deducted fromthe Alpha monthly invoice to reflect the reduced costs from lab services being carried outin house by NIW. The deduction amounted to £0.457m in 2017/18.
In 2017/18 a reduction of £0.112m was realised in the unitary charge tariffs resultingfrom the EIB step-down. This was a pre-set change in the 45% finance provided by EIB,conditional upon achieving operational performance and Special Purpose Company(SPC) debt cover ratio targets.
An agreement is in place to provide for a change in unitary charge arising from the lowernumber of TUPE transferees than that anticipated at financial close. The parties haveagreed to reflect the variance in semi-annual Project Costs as per the Financial Modelby making adjustments in the monthly invoice at the end of each Semi Annual Period.To this extent the repayments made in 2017/18 were £0.080m.
Kinnegar £nil There was no atypical expenditure relating to Kinnegar in 2017/18
Omega £m
Performance Deductions Re-Accrued Performance Deductions Released North Down & Ards Disinfection Change Supplemental 4 agreement Change in calibration frequency Out of spec sludges (2017/18) Total
£0.084m in relation to re-accrual of performance deductions which were previouslyaccepted and credit notes received.


Annual Information Return 2018 Section 2 Chapter 42 Page 7 of 14
Whilst the Contractor initially disputed the sums due, they finally conceded Company’s valuation of such historical and future payments in September 2013.
The cost of this mandatory change is approximately (indexed) every semi-annual period until contract expiry in 2032. Omega: Duncrue St Weighbridge Calibration Change
The weighbridge is integral to the determination of tonnes dry solid sludge for disposaland thus payment. The weighbridge is calibrated weekly and has never been outsidecalibration since first used in March 2010. The parties have agreed a cost reductionmeasure reducing the calibration to every 3 months. The cost saving to the Contractoris and is shared 50:50 with the Company. The arrangements have beenin effect since 3 December 2013.
Omega: Duncrue St Condensor ChangeAn Authority Change issued in advance of Service Commencement in 2009 to deal witha defective existing asset. Whilst the work was completed in 2009 the costs were onlyagreed in late 2013, with payment by the Company in 2014/15
Omega Small Works NDA Access ChangeA Change to pay for securing alternative access road at North Down Ards; a legacyfrom Water Service Deed of purchase of NDA lands in 2005 where the seller had theright to close up existing NDA access and provide alternative access and a Deed ofEasement. Work is complete and payment has been made.
Richill DWF ChangeThe DWF into Richill WWTW is lower than anticipated at commercial close, resulting inan unjust negative payment to the contractor at low flows due to a pre-agreed constantvalue for 0.8DWF. The parties have agreed an alternative value for the constant in thepayment mechanism.
Donaghadee PS ICA ChangeThe Contractor offered and the Company accepted an energy saving change in thecontrol of Donaghadee PS. The Company invested in the project which has apayback in terms of electricity costs of <2 years. The project was delivered at the startof the AIR18 period.
Ballynacor WwTW Increased Capacity for Trade EffluentAt contract formation in 2007, the Company purchased a headroom for Trade Effluentof 500,000kg COD at Ballynacor WwTW for the term of the Contract. In 2016 theCompany granted a Trade Effluent Discharge Consent to a trader in the BallynacorCatchment which, in aggregate with all other active consents, has resulted in thepurchased headroom being exceeded. This has triggered the Company’s contractualliability to extend the treatment capacity. The parties are in discussion as to the mostappropriate means of dealing with the fact that NIW now requires increased TradeEffluent capacity for the remaining term of the Contract.
Kinnegar Supplemental Agreement 2This commercial agreement resolved historical disputed payments, along with affectinga new odour model for the works, and creating new contractor obligations in terms ofregulatory reporting and sampling consistent with current Company obligations notenvisaged at the time of procurement.
Kinnegar Clause 10 PaymentA Variation was required in relation to the provision of the Holywood C Pumping Stationby NI Water E&P, requiring part of the Leased Premises being returned to Companyoccupation, and the reimbursement of the Contractors costs with altering the necessary

Annual Information Return 2018 Section 2 Chapter 42 Page 8 of 14
sewerage infrastructure. These costs amounted to This value was paid to the Contractor on 30th January
2015. Alpha Deed of Variation No.3
Amended and restated the contract in respect of all previous changes and correctionsmade to date.
Alpha Contractor Notice of Change (June 2012)Reduced the scope of service (i.e. frequency and range of analytical tests) to achievecost reduction in Unitary charge for the remaining contract period (Deriving peryear reduction in Company costs).
Alpha Contractor Change: Standby Generator Capacity for NI Power GridA contract change has been put in place to allow the Contractor to make the sitegenerators at two WTW’s available to an Aggregated Generation Unit (AGU) companyin return for an ‘availability charge’. The annual availability charge is estimated to beworth up to , with 50% of this revenue being netted off the Unitary Chargepayable by NIW for the period of the AGU agreement (currently 5 years).
Alpha: Authority Change – Castor Bay to Belfast Pumping Station Upgrade.To support the increased output to Magheraliskmisk arising from the Castor Bay toBelfast Strategic link main project.
Sale of Kelda’s ownership of the Contractor / Operating CompanyIn September 2016, Kelda indicated it was looking to sell all its UK PPP/PFI investmentsand operations. It invited several parties, including NIW, to bid for the Alpha PPPcompanies; Dalriada Water (the Alpha PPP Contractor) and KWSA (the Alpha PPPOperating Company).
On 19 November 2017, NIW clear Ltd (a subsidiary holding company of NIW Ltd)acquired ownership of Dalriada Water and KWSA (now renamed NIW Alpha ltd) fromKelda.
The Alpha PPP contract remains in place and the Company continues to pay UnitaryCharge tariffs for the volume of water provided by the Contractor, Dalriada Water Ltd.The Contractor continues to engage the services of the Operating Company (NIW AlphaLtd) for service delivery and continues to service the senior debt liabilities with thelenders. The contract commitments between the parties remain unaltered at the point ofnew ownership.
Contractual Performance Failures during AIR17 Period o Alpha Performance Deductions: 2017/18 Water Quantity failures can be referenced (on a monthly basis) in the Payment
Calculation Schedule Tab 5 spreadsheet under the column heading ‘CRF’ foreach Facility. (The Company has provided a supporting CD with all 12 monthlyPayment Calculation Schedules for the AIR year). Total deductions:
[AIR17 period total deductions ]. Water Quality Failures can be referenced on Payment Calculation Tab 9 under
the column headed ‘QRF’ for each Facility (The Company has provided asupporting CD with all 12 monthly Payment Calculation Schedules for the AIRyear).Further details of the exact water quality parameter failed result can bereferenced on the monthly Exceedance Reports derived from the Company’sLIMS system (The Company has provided a supporting CD will all 12 LIM’s


Annual Information Return 2018 Section 2 Chapter 42 Page 10 of 14
Line 21 - Distribution input Data has been updated to reflect the methodology in Table 10 Line 26, where the variance in demand from the PPP sites placed by the Company, along with the variation in total water into distribution delivered by the Company contrive to give a new calculated figure for the individual sites and the Alpha contract as a whole. As a reassurance, the Ballinrees WTW Distribution Input for AIR17 was 10,740 Ml while the Distribution Input for AIR18 was 10,743 Ml which results in the same Average DI for both periods at 29.43 Mld. Please refer to Line 27 for further commentary on Ballinrees APH.
Line 21a – Water treatment works capacity There has been no change to the minimum required capacity of the Alpha WTW under the contract.
Line 22- Length of mains This data has not changed since AIR 17.
Lines 23 – 24 - Turbidity Background – Year on Year During the period 2005 to date, a number of non-compliant water treatment works (WTWs) and small sources have either been completely replaced with new works, or else taken out of service as and when a replacement supply is available. During 2008, 5 existing major WTWs were replaced/upgraded as part of the Alpha PPP project. This contributed to the closure during 2009 of 6 non-compliant small water treatment works/sources.
During 2010 a further 2 non-compliant small water treatment works/sources were also closed. However, these were temporarily reinstated during the 2010-11 freeze/thaw incident to supplement strained water supplies.
During 2011 a further 3 non-compliant small water treatment works/sources were also closed.
During 2016 one further non-compliant small water treatment works was also closed.
At the end of 2016, the WTWs in service have now stabilised with 19 NIW sites and 5 PPP.
The guidance now requires that the PPP sites are solely assessed in this table.
The calculations were carried using the following data criteria: Only scheduled audit final water samples lifted to meet Water Supply regulatory
requirements during the calendar year were used, and using accredited laboratoryanalyses rather than onsite analyses.
Only those WTWs which had more than 11 months’ worth of data or had temporaryout of service gaps were included. This led to no PPP sites being excluded.
2017 PPP WTW Included in calculations WTW Code WTW Name Turbidity 95 %ile >= 0.5 NTU W1301P Moyola PPP 0.151 0 W1701P Ballinrees PPP 0.195 0 W2308P Castor Bay PPP 0.279 3 W3301P Dunore Point PPP 0.226 0 W3315P Forked Bridge PPP 0.236 2

Annual Information Return 2018 Section 2 Chapter 42 Page 11 of 14
Line 25 – Source type This data had changed in AIR13 to reflect the NI Water opinion that Ballinrees WTW should define three sources i.e. Ballinrees IR, Altikeeragh IR and an intake from the River Bann. All other WTW defined Sources remain unchanged from AIR 15. The changes have been reflected in Table 12.
Line 26 – Treatment type No change to the data since AIR17.
Line 27 – Average pumping head The APH for ‘Alpha Total’ and ‘Water Services Total’ has complied with the requirements of Table 42 Line 27 guidance notes, wherein the Company use the PPP Distribution Input utilised in AIR18. The static heads at the receiving reservoirs remain unchanged each year, therefore the only changeable head input is the dynamic head as a result of the volumes pumped. The dynamic head is confirmed each year during pump efficiency tests across a range of flows to determine the figure to be used for AIR reporting purposes. This year, as a result of the acquisition of the business, there was limited resources to complete the dynamic pumping head calculation for the site. As highlighted there has been a step change in flow at Dunore Point – however we have used the previous year’s dynamic head figure for the purposes of AIR reporting. While the DI for Ballinrees WTW has remained roughly the same as for AIR17 the B2 average flow has reduced from 7.78 Ml/d to 7.29 Ml/d [pumped flow to Break Pressure Tank at Moys – 117m head lift] The reduction in B2 flow contributes less to the overall head at site and was compensated by increased flows at B1 and B3. The % of Pumped Flow had reduced from 26.5% [AIR17] to 24.7% [AIR18].
Lines 28 – 29 – Sewerage data No Change from AIR17 data.
Line 30 – population equivalent of total load received Variation in calculated PE stems from variation in the measured sewage loads delivered to the sites by the Company, being the only variable part of the PE calculation.
Line 31 - Load received by STW's Variation in calculated load stems from variation in the measured sewage loads delivered to the sites through the Company’s sewer network.
Lines 32 – 36 - Consents There have been no material changes to the Water Order Consents.
Line 37 - Classification of treatment works No change to the treatment Facility classifications since AIR17
Line 38 - Size band of sewage treatment works No change to the treatment Facility size banding since AIR17
Line 39 - Total sludge imported from NI Water From the 31 March 2010 the Omega Contractor has assumed responsibility for disposal of all NI Water sludges. The total Sludge imported from NI Water operated WWTW is recorded as 34.898 TTDS for the AIR18 period (last year the figure was 36.357 TTDS).


Annual Information Return 2018 Section 2 Chapter 42 Page 14 of 14
Lines 49 - Sludge disposed of from site to - Composted A full year service resulted in 0.000 TTDS arising from the Contractor’s choice of alternative compliant disposal.
Lines 50 - Sludge disposed of from site to - Land Reclamation A full year service resulted in 0.183 TTDS arising from the Contractor’s choice of alternative compliant disposal routes. AIR17 reported a disposal of 0.225 TTDS.
Lines 51 - Sludge disposed of from site to - Other (Willow Coppice) A full year service resulted in 0.000 TTDS arising from the Contractor’s choice of alternative compliant disposal routes. AIR17 reported a disposal of 0.000 TTDS.


Annual Information Return 2018 Section 2 Chapter 43 Page 3 of 3
Kinnegar Kinnegar rates charge was taken directly from the rates bill.
Omega The rates figure for each of the Omega sites was taken directly from the rates bills. The bill for the Duncrue site was allocated between PPP and NIW in line with the total area of the site occupied by PPP. PPP occupy 15% of the Duncrue site. The Ballynacor site rates have been split on a 65:35 wastewater to sludge split.
Line 13 - Estimated terminal pumping costs This line reflects the power costs associated with Seagoe, Bullay’s Hill (Ballynacor facility) and Briggs Rock, Millisle and Donaghadee (North Down Facility). These were derived from the Oracle system using the location code for each site.
Line 14 - Sludge costs This line reflects the costs associated with the PPP sludge facilities at Duncrue Street and Ballynacor. It totals the costs included at line 5, 10, 11 and 12.

NORTHERN IRELAND WATER LIMITED - ANNUAL INFORMATION RETURN
ANNUAL INFORMATION RETURN - TABLE 44 OPA INPUT DATAOVERALL PERFORMANCE ASSESSMENT
DESCRIPTION UNITS DP2012-13 CG 2013-14 CG 2014-15 CG 2015-16 CG 2016-17 CG 2017-18 CG 2018-19 CG 2019-20 CG 2020-21 CG
A WATER SUPPLYDG2 PROPERTIES RECEIVING PRESSURE/FLOW BELOW REFERENCE LEVEL
1 Total connected properties at year end nr 0 817,960 A2 824,974 B2 828,060 A2 839,710 A2 852,399 A2 862,988 A22 Properties below reference level at end of year nr 0 1,420 B3 1,257 B3 1,082 B3 900 B3 862 B3 711 B33 % of total properties at risk of low pressure (OPA Low pressure value) % 2 0.17 B3 0.15 B3 0.13 B3 0.11 B3 0.10 B3 0.08 B3
DG3 PROPERTIES AFFECTED BY UNPLANNED INTERRUPTIONS4 More than 6 hours nr 0 10,487 B3 6,742 B3 43,767 B3 8,699 A3 5,128 A3 6,097 A35 More than 12 hours nr 0 2,607 B3 1,195 B3 25,693 B3 841 A3 494 A3 861 A36 More than 24 hours nr 0 1,554 B3 12 B3 13,788 B3 32 A3 0 A3 0 A37 Total connected properties at year end nr 0 817,960 A2 824,974 B2 828,060 A2 839,710 A2 852,399 A2 862,988 A28 OPA supply interruption value nr 2 1.98 B3 0.97 B3 11.72 B3 1.14 A3 0.66 A3 0.81 A3
DRINKING WATER QUALITY9 % iron compliance at consumers tap % 2 97.36 A1 98.28 A2 98.90 A2 98.40 A2 98.66 A2 98.85 A210 % manganese compliance at consumers tap % 2 99.83 A1 99.79 A2 99.82 A2 99.89 A2 99.84 A2 99.90 A211 % aluminium compliance at consumers tap % 2 99.59 A1 99.60 A2 99.80 A2 99.25 A2 99.36 A2 99.79 A212 % turbidity compliance at consumers tap % 2 99.70 A1 99.84 A2 99.85 A2 99.73 A2 99.95 A2 100.00 A213 % faecal coliforms compliance at consumers tap % 2 99.89 A1 99.86 A2 99.99 A2 99.98 A2 100.00 A2 99.94 A214 % trihalomethanes compliance at consumers tap % 2 97.50 A1 98.50 A2 99.00 A2 99.74 A2 96.94 A2 98.48 A215 Average overall compliance figure (Drinking Water Quality OPA value) nr 2 98.98 A1 99.31 A2 99.56 A2 99.50 A2 99.13 A2 99.49 A2
B SEWERAGE SERVICEDG5 SEWER FLOODING - OVERLOADED
16 Flooding incidents in the year (overloaded sewers) nr 0 189 B2 6 B2 29 B2 4 B2 3 B2 0 B217 Flooding incidents (overloaded sewers attributed to severe weather) nr 0 181 B2 5 B2 3 B2 1 B2 2 B2 0 B218 Number of domestic properties connected to sewerage system 000 1 623.3 A2 628.3 B2 630.0 A2 638.1 A2 648.6 A2 657.9 A219 % of domestic properties flooded by overloaded sewers (Overloaded sewers OPA value) % 4 0.0013 B2 0.0002 B2 0.0041 B3 0.0005 B3 0.0002 B2 0.0000 B2
DG5 SEWER FLOODING - OTHER CAUSES20 Flooding incidents (other causes - equipment failures) nr 0 15 B2 14 B2 2 B2 1 B2 1 B2 0 B221 Flooding incidents (other causes - blockages) nr 0 22 B2 36 B2 38 B2 34 B2 38 B2 26 B222 Flooding incidents (other causes - collapses) nr 0 4 B2 5 B2 12 B2 3 B2 8 B2 7 B223 Number of domestic properties connected to sewerage system 000 1 623.3 A2 628.3 B2 630.0 A2 638.1 A2 648.6 A2 657.9 A224 % of domestic properties flooded by other causes (Other causes OPA value) % 4 0.0066 B2 0.0088 B2 0.0083 B3 0.0060 B3 0.0072 B2 0.0050 B2
DG5 PROPERTIES ON THE FLOODING REGISTER25 2 in 10 register at end of year nr 0 30 B2 62 B2 60 A2 59 B2 61 B2 57 B226 Problems solved due to ESL funding nr 0 20 A1 3 B2 5 A2 3 B2 3 B2 6 B227 1 in 10 register at end of year nr 0 10 B2 8 B2 8 A2 7 B2 6 B2 4 B228 Number of domestic properties connected to sewerage system 000 1 623.3 A2 628.3 B2 630.0 A2 638.1 A2 648.6 A2 657.9 A229 % of domestic properties considered to be at risk of flooding by sewage (At risk OPA value) % 4 0.0088 B2 0.0110 B2 0.0110 A2 0.0103 B2 0.0103 B2 0.0099 B2
C SECURITY OF SUPPLYDG4 HOSEPIPE RESTRICTIONS
30 Hosepipe retrictions (OPA value) % 0 0 A1 0 A1 0 A1 0 A1 0 A1 0 A1LEAKAGE
31 Leakage (Target) nr 2 168.00 169.00 165.00 163.00 161.00 159.0032 Leakage (Actual) nr 2 161.75 B4 167.21 B3 165.99 B3 161.99 B3 163.43 B3 162.43 B333 % of leakage target not met (Leakage OPA value) nr 2 0.00 B4 0.00 A1 0.00 B3 0.00 B3 0.49 B3 0.99 B3
SECURITY OF SUPPLY - ABSOLUTE PERFORMANCE
34 Security of supply index – company’s actual based on planned level of service (Absolute performance OPA value) nr 0 100 A2 100 A2 100 A2 100 A2 100 A2 100 A2SECURITY OF SUPPLY - PERFORMANCE AGAINST TARGET
35 Security of supply index - planned (target) levels of service nr 0 97 A2 97 A2 100 A2 100 A2 100 A2 100 A236 Security of supply index - company's actual based on planned level of service nr 0 100 A2 100 A2 100 A2 100 A2 100 A2 100 A237 % of target not met (Performance against target OPA value) % 2 0.00 A2 0.00 A2 0.00 A2 0.00 A2 0.00 A2 0.00 A2
D CUSTOMER SERVICEDG6 - RESPONSE TO BILLING CONTACTS
38 Number dealt with within 5 working days nr 0 77,118 B2 78,398 B2 75,520 B2 75,462 B2 77,679 B2 71,386 B239 Total billing contacts nr 0 77,051 B2 78,463 B2 75,545 B2 75,490 B2 77,698 B2 71,409 B240 % of billing contacts answered within 5 working days (DG6 OPA value) % 2 100.09 B2 99.92 B2 99.97 B2 99.96 B2 99.98 B2 99.97 B2
DG7 - RESPONSE TO WRITTEN COMPLAINTS41 Total written complaints nr 0 3,173 B2 2,505 B2 2,364 B2 2,269 B2 2,375 B2 2,274 B242 Number dealt with within 10 working days nr 0 3,166 B2 2,498 B2 2,363 B2 2,266 B2 2,375 B2 2,271 B243 % of written complaints answered within 10 working days (DG7 OPA value) % 2 99.78 A1 99.72 A1 99.96 A1 99.87 A1 100.00 A1 99.87 B2
DG8 - BILLING METERED CUSTOMERS44 Company or customer readings (or both) nr 0 66,622 A1 66,840 A1 66,916 A1 67,366 A1 68,051 A1 68,420 A145 Total metered accounts nr 0 110,164 A1 115,227 A1 118,732 A1 123,763 A1 127,807 A1 128,705 A146 Metered accounts excluded from indicator nr 0 42,688 A1 47,784 A1 51,214 A1 55,875 A1 59,428 A1 60,060 A147 % of metered accounts which have meter based bills (DG8 OPA value) % 2 98.73 A1 99.11 A1 99.11 A1 99.23 A1 99.52 A1 99.67 A1
DG9 TELEPHONE CONTACT 48 Total of calls not abandoned nr 0 216,006 A2 223,256 A2 226,204 A2 209,284 A2 216,015 A2 211,061 A249 Total calls received on customer contact lines nr 0 219,399 A2 226,881 A2 230,847 A2 210,487 A2 217,023 A2 212,095 A250 % calls not abandoned (0.25 of DG9 OPA value) % 2 98.45 A2 98.40 A2 97.99 A2 99.43 A2 99.54 A2 99.51 A251 All lines busy nr 0 0 A2 0 A2 32 A2 159 A2 63 A2 18 A252 % calls not engaged (0.25 of DG9 OPA value) % 2 100.00 A2 100.00 A2 99.99 A2 99.92 A2 99.97 A2 99.99 A253 Call Handling Satisfaction - not used nr 2 4.54 A1 4.63 A1 4.65 A1 4.59 A1
E ENVIRONMENTAL PERFORMANCEPOLLUTION INCIDENTS
54 Number of High & Medium category pollution incidents (Sewage) nr 0 18 A1 26 A1 25 A1 21 A1 22 A1 20 A155 Equivalent population served (resident) 000 2 2,107.96 C5 2,131.81 C5 2,110.77 C5 2,119.20 C3 2,098.83 C3 2,101.35 C3
56Number of High and Medium sewage incidents per million resident population equivalent (pe) served (H&M sewage incidents OPA value) nr 2 8.54 C5 12.20 C5 11.84 C5 9.91 C5 10.48 C5 9.52 C3
57 Number of Low category pollution incidents (Sewage) nr 0 163 A1 188 A1 136 A1 117 A1 114 A1 109 A1
58Number of Low sewage incidents per million resident population equivalent (pe) served (Low sewage incidents OPA value) nr 2 77.33 C5 88.19 C5 64.43 C5 55.21 C5 54.32 C5 51.87 C3
59 Number of High & Medium category pollution incidents (Water) nr 0 0 A1 0 A1 0 A1 0 A1 0 A1 0 A160 Winter population 000 2 1,842.61 C2 1,850.54 C2 1,862.72 C2 1,874.73 C2 1,887.10 C2 1,896.46 C2
61Number of High and Medium water incidents per million resident population served (H&M water incidents OPA value) nr 2 0.00 C5 0.00 C5 0.00 C5 0.00 C5 0.00 C5 0.00 C3SEWAGE - SLUDGE DISPOSAL
62 Percentage unsatisfactory sludge disposal (Sludge disposal OPA value) % 2 0.00 A2 0.00 A1 0.00 A1 0.00 A1 0.00 A1 0.00 A1SEWERAGE SERVICE - BREACH OF CONSENT
63 WWTW Discharge consent % compliance (WWTW compliance OPA value) % 2 1.10 C5 1.89 C5 1.54 C5 1.38 C5 1.08 C5 1.33 C5
4REPORTING
YEAR
1REPORTING
YEAR
2REPORTING
YEAR
3REPORTING
YEAR REPORTING
YEAR
6REPORTING
YEAR
5 7REPORTING
YEAR
8 9REPORTING REPORTING
YEAR YEAR

NORTHERN IRELAND WATER LIMITED - ANNUAL INFORMATION RETURN
ANNUAL INFORMATION RETURN - TABLE 45 KEY OUTPUTS
ENERGY CONSUMPTION AND GREENHOUSE GAS ACCOUNTING
DESCRIPTION UNITS DPCG CG CG
A ELECTRICITY CONSUMPTION1 Grid electricity purchased (excluding renewable energy) MW.hr 0 105,504 A2 80,934 A2 186,438 A22 Grid electricity purchased - renewable energy MW.hr 0 102,208 A2 5,206 A2 107,414 A23 Non-renewable electricity generated and used MW.hr 0 0 A2 0 A2 0 A24 Renewable electricity generated and used MW.hr 0 1,255 A2 148 A2 1,402 A25 Total electricity consumption MW.hr 0 208,967 A2 86,288 A2 295,255 A26 Non-renewable electricity generated and exported to the grid MW.hr 0 0 A2 0 A2 0 A27 Renewable electricity generated and exported to the grid MW.hr 0 1,025 A2 0 A2 1,025 A28 Total renewable enegry generated MW.hr 0 2,280 A2 148 A2 2,428 A2
B GROSS ANNUAL OPERATIONAL GHG EMISSIONS
B.1 Scope 1 Emissions9 Direct emissions from burning fossil fuels (including natural gas CHP generation on site) t.CO2 e 0 3,251.45 C3 2,796.76 A2 6,048 21 B310 Process and fugitive emissions t.CO2 e 0 3,181.43 C3 5,052.71 A2 8,234.14 B311 Transport: company owned or leased vehicles t.CO2 e 0 2,604.79 A2 267 04 A2 2,871 83 A2
B.2 Scope 2 Emissions12 Total grid energy used (including CHP electricity purchased). t.CO2 e 0 67,076.72 A2 36,229 94 A2 103,306 66 A2
B.3 Scope 3 Emissions13 Business travel on public transport and private vehicles used for company business t.CO2 e 0 594 50 A2 16 50 A2 611 00 A214 Outsourced activities (if not included in Scope 1 or 2) Energy and other t.CO2 e 0 0 00 A2 12,760 50 A2 12,760 50 A215 Not used16 Not used
17 Gross operational emissions t.CO2 e 0 76,708 89 A2 57,123.45 A2 133,832 34 A2
C Net annual operational emissions18 Exported renewables (generated on-site and exported) t.CO2 e 0 -279 38 A2 0 00 A2 -279 38 A219 Green tariff electricity purchased t.CO2 e 0 -35,261.78 A2 -1,134 21 A2 -36,395 99 A2
20 Net operational emissions t.CO2 e 0 41,167.73 B3 55,989 24 A2 97,156 97 B3
D ANNUAL OPERATIONAL GHG INTENSITY RATIO VALUES21 Operational GHG per Ml of treated water t.CO2 e/Ml 0 0.127 B3 0.271 A2 0.176 A222 Operational GHG per Ml of sewage treated (flow to full treatment) t.CO2 e/Ml 0 0.487 B3 0.701 A2 0.611 B323 Operational GHG per Ml of sewage treated (based on water distribution input) t.CO2 e/Ml 0 0.302 B3 0.435 B3 0.379 B3
E RENEWABLE INCENTIVES24 Revenue from renewable energy sales and incentives £000 3 158.788 A2 0.000 A2 158.788 A2
NIW PPP NIW Total
1 2 3


Annual Information Return 2018 Section 2 Chapter 2 Page 3 of 5
Line 24 Renewable Incentives This section provides data relevant to Company income from renewable electricity sales and associated incentives such as ROC revenue.
Confidence Grades Confidence grades have been assigned for each line of data and these are based on the criteria set out in the Introduction to the Annual Information Return Reporting Requirements and guidance within the UK Water Industry Carbon Accounting Workbook 12.0
Processing rules and Emissions Conversion Factors: The Company has provided output data within Table 45 as calculated using the Water UK Carbon Accounting Workbook Version 12.0 (March 2018) for greenhouse gas emissions associated with the provision of water, wastewater, sludge disposal, administrative function and transport in its AIR18 return.
Data sources for the AIR18 return have been generated from supplier’s monthly consumption figures associated with the use of electricity, gas and other fuels where data is attainable. Estimations have only been used where there is deemed material impact and enough historical information is available with which to estimate quantities.
All energy conversions have been derived from the Carbon Accounting Workbook 12.0 and are aligned to the DECC/Defra guidelines using the relevant emissions factor for kg of CO2 per measured unit of energy. The calculations are carried out within locked cells in the Carbon Accounting Workbook 12.0
Gross operational emissions reported in Table 45 are the company’s total carbon emissions resulting from operational activities.
Nett operational emissions reported in Table 45 are a calculation of gross operational emissions taking into account emissions reductions for on-site renewable energy that is exported and renewable energy that has been purchased.
The t.CO2e/ML GHG intensity output figure for treated water emissions includes all carbon emissions from the abstraction, treatment and distribution of water, associated administrative and transport emissions divided by the volume of treated water.
The t.CO2e/ML GHG intensity output figure for treated waste water includes all carbon emissions from waste water pumping, waste water treatment, sludge treatment and disposal, and associated administrative and transport emissions divided by the volume of waste water treated.
The GHG intensity figures for treated water and waste water for the calculations above have been derived from the volumes of water and waste water as reported in tables 10 and 14 of the Company’s AIR18 data.
AssumptionsThe Company has assumed that the boundary for data collection is any activity associated with the operation of the appointed business. This will include all areas where the company has direct management responsibility such as the PPP concessions.
Additional Commentary The Company can provide details of planned future work in carbon accounting, carbon management, mitigation and adaptation. This development is linked to the Company’s

Annual Information Return 2018 Section 2 Chapter 2 Page 4 of 5
developing climate change strategy and in particular it is aligned to Company reporting under the new UK Government Legislation, the Carbon Reduction Commitment Energy Efficiency Scheme.
Assistance to the Auditor and Reporter The Company has assisted the Auditor to enable informed judgments about the validity of energy usage and carbon emissions return data.
The Company has assisted the Auditor to confirm that the reporting methodology has been applied correctly and has assisted in the audit process as required to confirm that:
the Company has adhered to the correct carbon accounting boundaries; the Company has used appropriate greenhouse gas conversion factors; the Company has appropriate and documented systems, management responsibly
and sign off, for its carbon accounting submissions; the Company can validate the assumptions made and the reasons behind any
omissions; and
The Company will assist the Reporter to enable informed judgments about the validity and necessity of returned data.
Omissions The following areas have been omitted from the AIR18 submission due to inability to source or lack of access to data.
Supply chain, embedded and 'short cycle' emissions or those from non-appointedbusiness activities have not been included in the return.
Outsourced activities from call centres and maintenance contractors. Emissions from leakage/maintenance of refrigerant gases from refrigeration and air
conditioning equipment.
The GHG emissions associated with the omissions above are believed to be a very small part of the overall GHG emissions reported and as such have no material impact on the data provided.
The GHG omissions above will be addressed in year to enable a fuller return for AIR18 reporting only if deemed in further discussion to have a material impact on the emissions level.
Green Purchased Electricity Adjustment Green Tariffs are electricity tariffs marketed as having environmental credentials. Defra/BEIS (formally DECC) recognise as green those tariffs which comply with the ‘Good Quality’ Criteria specified on pages 51 and 52 of the ‘Defra/DECC’s Guidance on How to Measure and Report your GHG Emissions’ published in Sept 2009.
The company has evidence verified by Capture Carbon to support the 103,527,115 kWhrs recorded in CAW 12.0 sourced from 100% renewable electricity generation for the period 01.04.17 to 31.03.18. The renewable electricity generation is verified by Renewable Energy Guarantees of Origin (REGOs) issued by the UK Office of Gas and Electricity Markets (Ofgem).
The company for AIR13 to AIR16 purchased green energy by the same principal though did not have the appropriate evidence to support the green energy as being verified by REGOs.


NORTHERN IRELAND WATER LIMITED - ANNUAL INFORMATION RETURN
ANNUAL INFORMATION RETURN - TABLE 46 SERVICEABILITYSERVICEABILITY RETURN
1 2 3 4 5 6 7 8 9 10 11 12 13 14 15 16 17REPORTING REPORTING REPORTING REPORTING REPORTING REPORTING REPORTING REPORTING REPORTING REPORTING REPORTING REPORTING REPORTING REPORTING REPORTING REPORTING REPORTING
DESCRIPTION UNITS DP YEAR YEAR YEAR YEAR YEAR YEAR YEAR YEAR YEAR YEAR YEAR YEAR YEAR YEAR YEAR YEAR YEAR2004-05 2005-06 2006-07 2007-08 2008-09 2009-10 2010-11 2011-12 2012-13 2013-14 2014-15 2015-16 2016-17 2017-18 2018-19 2019-20 2020-21
A WATER INFRASTRUCTURE1 Water population 000 2 1,710.06 1,735.00 1,732.85 1,748.53 1,775.11 1,790.16 1,798.48 1,808.82 1,819.47 1,827.79 1,840.54 1,850.27 1,861.58 1,869.17 2 Total connected properties at year end 000 1 786.1 794.7 800.0 804.4 798.7 806.4 810.4 818.0 825.0 828.1 839.7 852.4 863.0 3 Total length of mains km 2 27,114.59 25,972.00 26,067.07 26,349.22 26,435.45 26,441.81 26,499.03 26,700.79 26,710.55 26,712.44 26,728.83 26,778.15 26,837.45 4 Number of mains bursts (incl Active leakage) nr 0 5,054 3,611 3,764 3,910 3,634 2,665 2,474 2,299 2,266 1,972 2,135 2,444 5 Mains bursts per 1000km nr 1 - 194.6 138.5 142.9 147.9 137.4 100.6 92.7 86.1 84.8 73.8 79.7 91.1 6 Interruptions to supply greater than 3 hours resulting from equipment failure nr 0 35,700 24,995 30,360 39,883 36,882 34,268 39,647 44,960 40,697 44,499 70,272 98,979 85,239 94,549 7 DG3 Properties affected by interruptions >12 hrs (unplanned & unwarned) nr 0 1,676 1,670 767 1,839 2,010 1,588 4,180 765 1,019 1,195 929 841 494 190 8 DG3 Percentage properties affected by interruptions >12 hrs (unplanned & unwarned) % 2 0.22 0.21 0.10 0.23 0.25 0.20 0.52 0.09 0.12 0.14 0.11 0.10 0.06 0.02 9 Number of regulatory samples taken for Iron at customer taps nr 0 1,962 1,971 1,928 2,012 2,124 2,036 1,736 1,732 1,710 1,876 1,896 1,876 1,868 1,916 10 Number of regulatory Iron samples exceeding the drinking water standard PCV nr 0 46 41 45 34 41 43 35 30 47 36 20 30 25 23 11 Number of regulatory Iron samples exceeding 75% of the drinking water standard PCV nr 0 108 72 71 64 66 76 55 50 74 62 43 54 45 48 12 Percentage of regulatory Iron samples exceeding 75% of the drinking water standard PCV % 2 5.50 3.65 3.68 3.18 3.11 3.73 3.17 2.89 4.33 3.30 2.27 2.88 2.41 2.51 13 Customer contacts (Discoloured water) nr 0 4,085 3,840 3,010 2,344 2,464 3,465 2,744 3,179 3,029 2,632 14 Customer contacts per 1000 population (Discoloured water) nr 2 - 2.30 2.15 1.67 1.30 1.35 1.90 1.49 1.72 1.63 1.41 15 Distribution losses Ml/d 2 141.90 127.76 118.74 111.38 131.49 140.55 130.66 122.02 115.44 127.31 126.08 122.08 123.55 125.44 16 Company's overall serviceability assessment for water infrastructure Text N/A Stable Stable Stable Stable Stable Stable Stable
B WATER NON-INFRASTRUCTURE17 Number of regulatory samples taken for Turbidity at operational WTWs (excluding PPP) nr 0 5,275 5,252 5,139 4,948 4,810 4,795 4,635 4,510 4,550 6,245
18Number of regulatory samples taken for Turbidity at operational WTWs which exceed 1.0 NTU (excluding PPP) nr 0 9 16 11 15 8 11 10 3 6 10
19Number of regulatory samples taken for Turbidity at operational WTWs which exceed 0.8 NTU (excluding PPP) nr 0 135 158 79 30 15 40 23 23 16 29 21 19 14 22
20Percentage of regulatory samples taken for Turbidity at operational WTWs which exceed 0.8 NTU (excluding PPP) % 2 0.28 0.76 0.45 0.46 0.33 0.60 0.45 0.42 0.31 0.35
21 Number of regulatory samples taken for THMs at customer taps nr 0 1,057 952 704 752 765 784 432 408 392 396 391 388 392 397 22 Number of regulatory THM samples exceeding the drinking water standard PCV nr 0 358 239 150 243 141 30 8 3 10 6 4 1 12 6 23 Number of regulatory THM samples exceeding 75% of the drinking water standard PCV nr 0 578 439 280 441 289 57 32 21 52 31 34 44 53 44 24 Percentage of regulatory THM samples exceeding 75% of the drinking water standard PCV % 2 54.68 46.11 39.77 58.64 37.78 7.27 7.41 5.15 13.27 7.83 8.70 11.34 13.52 11.08
25Events at WTW resulting from treatment difficulties or ineffective treatment categorised as ‘significant’ or higher nr 0 14 27 28 12 28 26 15 23 24 15 12
26 Number of regulatory samples taken at Service Reservoirs for coliform bacteria nr 0 18,258 18,232 17,914 17,581 17,408 17,429 16,966 16,862 16,690 16,118 15,640 15,433 15,213 14,996
27Number of regulatory samples taken for coliform bacteria at Service Reservoirs exceeding the drinking water standard PCV nr 0 59 86 68 43 22 24 8 22 27 26 17 20 15 15
28Percentage of regulatory samples taken for coliform bacteria at Service Reservoirs exceeding the drinking water standard PCV % 2 0.32 0.47 0.38 0.24 0.13 0.14 0.05 0.13 0.16 0.16 0.11 0.13 0.10 0.10
29 Unplanned (reactive) maintenance % 1 96.4 97.4 98.3 99.0 98.5 30 Company's overall serviceability assessment for water non-infrastructure Text N/A Stable Stable Stable Stable Stable Stable Stable
C SEWERAGE INFRASTRUCTURE31 Total length of sewers km 2 13,911.23 14,263.62 14,319.50 14,465.23 14,745.61 14,904.68 15,090.35 15,254.37 15,410.44 15,581.51 15,625.13 15,777.29 15,890.63 32 Total number of rising main failures nr 0 25 25 37 26 41 16 11 9 5 12 33 Total number of gravity sewer collapses nr 0 1,368 988 1,229 1,191 1,081 1,104 1,325 1,218 1,243 1,192 34 Total number of sewer collapses nr 0 677 1,393 1,013 1,266 1,217 1,122 1,120 1,336 1,227 1,248 1,204 35 Sewer collapses per 1,000km nr 1 - 47.3 96.3 68.7 84.9 80.6 73.6 72.7 85.7 78.5 79.1 76 36 Total number of sewer blockages nr 0 16,912 28,010 26,409 26,230 24,444 20,801 18,062 16,729 15,991 15,755 14,393 37 Sewer blockages per 1,000km nr 1 - 1,181.0 1,936.4 1,791.0 1,759.8 1,619.8 1,363.6 1,172.1 1,073.6 1,023.4 998.6 906 38 sewers) nr 0 38 34 30 14 14 17 11 15 13
39Number of H, M and L pollution incidents from sewer network (CSOs, rising mains and foul sewers) nr 0 244 221 199 137 149 126 86 102 96
40 Properties flooded in the year (other causes) nr 0 366 23 5 28 23 41 55 52 38 47 33 41 Areas flooded externally in the year (other causes) nr 0 4,283 7,968 6,872 1,314 Not reported 3,212 3,348 4,379 3,889 3,819 3,466 42 Total number of equipment failures repaired nr 0 11,715 10,965 10,882 11,492 11,476 10,333 10,899 11,245 9,986 9,883 9,262 43 Number of pumping station emergency overflows triggered by equipment failure nr 0 21 18 22 15 8 9 44 Number of sewer repairs nr 0 1,013 1,266 1,217 1,122 1,120 1,336 1,227 1,248 1,204 45 Company's overall serviceability assessment for sewerage infrastructure Text N/A Stable Stable Stable Stable Stable Stable Stable
D SEWERAGE NON-INFRASTRUCTURE46 % WwTW discharges not compliant with numeric consents % 1 20.0 18.0 16.0 16.0 12.0 12.0 11.7 6.9 6.9 8.2 7.8 7.4 6.6 6.6
47% of total p.e. served by WwTWs not compliant with numeric consents excluding upper tier failures % 2 37.00 33.20 23.10 15.50 9.80 8.60 5.08 4.80 1.68 2.40 1.85 1.71 1.31 1.60
48Number of BOD, SS and Ammonia sample results recorded for compliance reporting at WwTWs with numeric consents nr 0 11,234 11,251 11,461 11,524 9,088 8,747 8,585 8,863 9,161 8,938 8,528 8,738 7,027 7,369
49Number of BOD, SS and Ammonia compliance sample results which exceeded their numeric consent value nr 0 652 817 444 297 363 333 361 279 302 370 299 276 283 290
50Percentage of BOD, SS and Ammonia compliance sample results which exceeded their numeric consent value % 2 5.80 7.26 3.87 2.58 3.99 3.81 4.21 3.15 3.30 4.14 3.51 3.16 4.03 3.94
51Number of WwTWs with one or more compliance sample result (BOD, SS or Ammonia) exceeding the numeric consent value nr 0 104 132 115 99 103 98 102 91 76 87 60 55 44 51
52 Small WwTW compliance (works greater than or equal to 20p.e. but less than 250p.e.) % 2 72.64 76.87 80.72 83.99 87.21 53 Unplanned (reactive) maintenance % 1 94.5 96.4 97.8 97.6 98.2 54 Company's overall serviceability assessment for sewerage non-infrastructure Text N/A Stable Stable Stable Stable Stable Stable Stable


Annual Information Return 2018 Section 2 Chapter 46 Page 4 of 22
detection and those reported by customers. The winter period, on the whole, has been markedly more severe than the previous 3 – 4 years.
This Serviceability Indicator is considered as Stable (with two slight increases in the last two years). This trend needs to be monitored and would be a concern if the trend continues upwards in AIR 19 to see if the trend is due to deterioration or increase Leakage activity.
Secondary Indicators Line 6 – Interruptions to Supply > 3hrs resulting from Equipment failure
The AIR18 outturn has been calculated using the same methodology previously used to calculate the outturns for AIR 8 to AIR 17. In the AIR 17 period, 14% fewer properties were affected than in the AIR 16, period this decrease was mainly due to a reduction in the number of interruption events involving more than 2,000 properties.
The final figure is calculated from: 94 549 nr divided by 862 988 (The number of communications pipes) = 10.96%. The output figure is greater than last year, however the weather during the winter of 17/18 was significantly worse than 16/17.
The overall pattern here may suggest a deterioration in Network performance however, on 4 July 2014, the Company introduced the Central Incident Management System (CIMS), aimed at addressing any outstanding issues relating to the reliability of its data on supply interruptions. The new system ensures that more unplanned, unwarned interruptions are being captured than would previously have been the case and this is helping to improve the accuracy of NI Water’s return.
The decision has been taken to exclude from the assessment, all properties affected by interruptions attributed to:
proactive work, new work and third party interference and

Annual Information Return 2018 Section 2 Chapter 46 Page 5 of 22
all properties affected by planned and warned interruptions where it was notpossible to positively ascertain the precise cause of interruption from thecomments provided
all properties affected by interruptions attributed to human error all properties affected by interruptions to facilitate third parties/NI Water
contractors all properties affected by interruptions involving the ‘above ground’ infrastructure
since this is the subject of a separate assessment in Table 46
Another reason for the increase in outturn since 2014, is likely to have been the introduction of the weekly circulation of ‘no water’ complaint reports in the AIR 14 period, enabling Field Managers to determine more accurately, the times and affected properties associated with each interruption event. This is resulting in the identification of additional properties and longer durations than would possibly have been recorded for historical interruptions.
We believe the recent apparent deterioration since AIR 14 is maybe due to the transition to the (C)IMS methodology, this may require an adjustment to the reference level in PC 21. NIW do not believe that the annual figures represented in the graph indicate a deterioration in the Network but rather reflect an improved reporting methodology as:
The OMIS data consistently indicated stability. (C)IMS data shows 3 full years of stability (excluding atypical events such as August
Flooding 2017 and atypical cold weather in March 2018) Note: the Dec 2017 coldsnap impact is included.
In this period there were a significant number of single events with large outages. of2000 properties or so .(See the detailed Commentary for Lines 6,7 and 8)
Bearing in mind the above issues which affected the Network in this period ,the following table lists the unadjusted annual actual outturn numbers of unplanned interruption events lasting more than 3 hours, more than 6 hours and more than 12 hours in 2015/16, 2016/17 and 2017/18.
2015/16 2016/17 2017/18 More than 3 hours 781 779 803 More than 6 hours 119 95 81 More than 12 hours 17 12 9
This table further suggests stability in the network for the > 3hours category
Due to the analysis above, this indicator is considered as Stable but we will continue to monitor trends and review as necessary.


Annual Information Return 2018 Section 2 Chapter 46 Page 7 of 22
the root cause and to establish if any lessons can be learnt which could prevent a repeat occurrence of incidents in the future.
The conclusion is that although the annual outturn for Table 46: Line 8: DG3 Percentage properties affected by interruptions >12 hrs (unplanned & unwarned) continues to improve, the continuing improvement of the last couple of years may be more likely to be attributed to an improved operational focus on work practices than asset performance.
The performance for this Serviceability measure is “Stable”
Line 12 – Percentage of Iron Samples Exceeding 75% of PCV
The AIR 18 output 2.51 % Calculated from a total of 48 (similar to previous years) shows that the ongoing trend has fluctuated around the lowest control boundary for the last 4 years and is therefore Stable.

Annual Information Return 2018 Section 2 Chapter 46 Page 8 of 22
Line 14 – Number of Customer Contacts per 1000 population (Discoloured Water)
The Company has arrived at a ‘Stable’ assessment for this measure =1.41 (Calculated from the number of Customer Contacts = 2632 divided by the population figure of 1 869 170 = 0.00141 –multiplied by 1000 for this measure = 1.41)
This output suggests that this trend is Stable with the current figure just below the median point of the graph with the trend remaining between the upper and median ranges of the graph since AIR 15.
See the actual contacts numbers on this specific issue in the table below showing a reducing annual total over the past three years, in an environment of increasing customer awareness on contacting NIW through telephone and social media.
AIR 16 AIR 17 AIR 18
Total Customer Contacts in Relation to the Clean water network
62086 64764 67601
Total Customer Contacts on Water Network for Discolouration Issues 3183 3029 2632

Annual Information Return 2018 Section 2 Chapter 46 Page 9 of 22
Line 15 – Water Distribution Losses This information as an explanatory factor for mains bursts which can be monitored for potential mains bursts trends.
The Water Distribution losses total for AIR 18 =125.44 ML/day The pattern for the past 3 years has been: AIR 15 = 126.08, AIR 16 = 122.08, AIR 17 =123.55, AIR 18 = 125.44
Distribution losses have risen in AIR 18 because of an increase in reported leakage however, the output for this period is comparable to the previous 3 years level of Water Distribution Losses.
Detailed commentary regarding Leakage reporting is available in AIR 18 Table 10.
Comment –There is an increasing trend in this indicator, in the last two reporting period. The extreme weather events of the past two years have contributed to this pattern. (See more detailed commentary in Table 10).


Annual Information Return 2018 Section 2 Chapter 46 Page 11 of 22
the Serviceability of the WTW. The above graph depicts the amended reduced figure for AIR16.
Line 24 - THM Compliance - percentage of samples exceeding 75% of the drinking water standard PCV As the AIR17 figure had resulted in a significant cumulative rise above the Upper Limit for the second consecutive year, serviceability for this indicator was seen as Deteriorating. AIR18 has shown improvement from AIR17, but still remains above the Upper Limit, and therefore still Deteriorating.
AIR17 Comments for Information - However as a Secondary Indicator it does not influence the overall Serviceability assessment. It has been noted that there was a slight increase in THM > 75% of the PCV in 2016/17, which was attributed to 12no. exceedances of the THM PCV at customer taps supplied from the following WTW’s – Derg, Dungonnell, Caugh Hill, Killylane & Rathlin. The WTWs have a final water operational monitor for THMs, which acts as a proactive alarm if 50% of the PCV (50µg/l) is measured. It should be noted that mains water temperature was higher in 2016 than in previous years, which would contribute to the increase in concentration and the further exceedance to greater than 75% of the PCV.
THM Action Plans have been developed, and both THM results and the Action Plans are discussed on a monthly basis at the Water Quality Compliance Review Group.

Annual Information Return 2018 Section 2 Chapter 46 Page 12 of 22
Line 25 - Events at WTW resulting from treatment difficulties or ineffective treatment categorised as “significant” or higher “Events at WTW resulting from treatment difficulties or ineffective treatment categorised as significant or higher” has continued, for the fifth year, to perform as Stable.
Line 28 - Service Reservoirs and Water Towers Coliform Compliance – Secondary Indicator “Service Reservoirs and Water Towers Coliform Compliance” has continued to show Stable performance over recent years.

Annual Information Return 2018 Section 2 Chapter 46 Page 13 of 22
Line 29 – Unplanned Reactive Maintenance (Water Non Infra) – Percentage of Availability of Critical Assets Although this indicator is the Percentage of Availability of Critical Assets the figures in the above graph depict the non-availability of critical assets for illustrative purposes, and to maintain a consistent approach with other graphs within this document.
The figures are based on telemetry data for the critical items of plant in a failed state. As this is relatively new reported data, Reference and Limits have not been set as a larger range of data is required before Serviceability can be reasonably assessed.
The reduction of items in a failed state over recent years may be due to routine proactive maintenance and/or the prioritisation of capital investment to sites/assets where most required.

Annual Information Return 2018 Section 2 Chapter 46 Page 14 of 22
Line 45 – Company’s overall serviceability assessment for sewerage infrastructure The serviceability assessment has been designated as Stable as the trend analysis associated with the basket of serviceability indicators, used to assess serviceability for sewerage infrastructure, are all within the control limits or under the lower control limits based on the latest AIR18 information.
Wastewater Infra Serviceability Primary Indicator Line 35 – Sewer collapses per 1,000km This graph shows the number of collapses reported over the AIR return periods, which would indicate a stable output.

Annual Information Return 2018 Section 2 Chapter 46 Page 15 of 22
Secondary Indicators Line 37 – Sewer blockages per 1,000km This graph indicates the number of blockages per 1000km over the different AIR return periods, which would indicate an improvement on the output.
The reduction strategy set out by NI Water is making a positive impact in the reduction of sewer blockages. By the use of the hotspot tool, letter drops in certain catchment and an increase programme of CCTV. Is reducing the number of blockages.
Line 38 – Number of H, M pollution incidents from sewer network This graph has been submitted for information purposes only.

Annual Information Return 2018 Section 2 Chapter 46 Page 16 of 22
Line 39 - Number of H, M and L pollution incidents from sewer network This graph shows the high, medium and low pollution incidents from the sewer network over the AIR return periods for CSO’s, rising mains and foul sewers. Which would indicate a stable performance.
Line 40 – properties flooded in the year This indicator is to monitor performance and not incorporated in the serviceability assessment. We have kept the reference level and control limits from the FD for information only.

Annual Information Return 2018 Section 2 Chapter 46 Page 17 of 22
Line 41 – Areas flooded externally in the year This graph is included for information only.
Line 42 – Serviceability - Stable This graph shows the total number of sewerage equipment failures repaired. Which would indicate an improvement in performance.

Annual Information Return 2018 Section 2 Chapter 46 Page 18 of 22
Line 44 – Number of sewer repairs This graph is included for information only.

Annual Information Return 2018 Section 2 Chapter 46 Page 19 of 22
Line 54 – Company’s overall serviceability assessment for wastewater non-infrastructure The serviceability assessment has been designated as Stable as the trend analysis associated with the basket of serviceability indicators, used to assess serviceability for wastewater non-infrastructure, shows all the indicators are within or below control limits.
Primary Indicator Line 46 – Percentage of WwTW Discharges Not Compliant with Numeric Consents “Percentage of WwTW Discharges Not Compliant with Numeric Consents” has continued to show Stable performance over recent years. The regular investment from Capital Maintenance and Quality driven projects has helped maintain this Stable output.

Annual Information Return 2018 Section 2 Chapter 46 Page 20 of 22
Secondary Indicator Line 47 – Percentage of Total PE Served by WwTWs Not Compliant with Numeric Consents “Percentage of Total PE Served by WwTWs Not Compliant with Numeric Consents” has again shown Stable performance.
Line 50 – Percentage of BOD, SS and Ammonia compliance sample results which exceeded their numeric consent value Since the initial outlying figures of AIR05 & AIR06 the “Percentage of BOD, SS and Ammonia compliance sample results which exceeded their numeric consent value” has continued to perform as Stable.

Annual Information Return 2018 Section 2 Chapter 46 Page 21 of 22
Line 51 - Number of WwTWs with one or more compliance sample results (BOD, SS or Ammonia) exceeding the numeric consent value “Number of WwTWs with one or more compliance sample results (BOD, SS or Ammonia) exceeding the numeric consent value” has for the fourth consecutive year out-performed the Lower Limit. This has become evident by both the annual investment in assets and the extensive operational effort.
This has been assessed as Improving.

Annual Information Return 2018 Section 2 Chapter 46 Page 22 of 22
Line 53 – Unplanned Reactive Maintenance (Wastewater Non Infra) – Percentage of Availability of Critical Assets Although this indicator is the Percentage of Availability of Critical Assets the figures in the above graph depict the non-availability of critical assets for illustrative purposes, and to maintain a consistent approach with other graphs within this document.
The figures are based on telemetry data for the critical items of plant in a failed state. As this is relatively new reported data, Reference and Limits have not been set as a larger range of data is required before Serviceability can be reasonably assessed.
The reduction of items in a failed state over recent years may be due to the benign weather, routine proactive maintenance and/or the prioritisation of capital investment to sites/assets where most required.

Annual Information Return 2018 Section 2 Chapter 47 Page 1 of 67
Table 47 - Development Outputs
DEVELOPMENT OUPUT
1. Development of new consumer measures
Final Determination: The company shall report progress on the development of new consumer measures and satisfaction survey outlined in Section 3. 7 of the PC15 final determination.
GOVERNANCE Directorate I SRO I Project Lead I Aooroving Authority
CSDD I Des Nevin I Rod Neill I EC
Additional Details:
N/A PROJECT SUMMARY
• New consumer measures have been developed in conjunction with stakeholders as part ofthe joint CEOG/CSat working group.
• 4 new metrics were initially agreed by CEOG - 3 Quantitative and 1 Qualitative:• total contacts• first point of contact resolution (FPOCR)• repeat contacts• Net promoter score (NPS) style measure• This was then amended by the CSat group to 3 measures - 2 Quantitative and 1 Qualitative:• total contacts (which may move to unwanted contacts)• first point of contact resolution (FPOCR)• customer advocacy measure (CAM)• The trial for the new metrics was completed and reported in AIR16 .• They continue to be measured and reviewed by NIW, the UR and CSat group members .• Although there is currently 2yrs worth of data, it is insufficient to set targets (based on
trendline analysis) at the PC15 mid-term review for performance reporting during the secondhalf of PC15.
• The PC15 mid-term review may also result in further adjustments .• It is anticipated that performance targets for the new measures will now be proposed for
inclusion in the PC21 business plan and draft/final determinations.KEY MILESTONES Target Status 1. Development of new consumer measures and approval by Complete CEOG2. Complete a trial of new consumer measures 30 Sep 15 Complete 3. Complete a trial of a new consumer satisfaction survey 31 Dec 15 Complete 4. Go live with a new consumer satisfaction survey 01 Apr 16 Complete 5. Report new measures in AIR16 15Jul 16 Complete 6. Provide update for PC15 Mid-Term Review (via AIR17) 15Jul 17 Complete 7. Propose targets in PC21 Business Plan Q3 2019/20 On target
Development of new consumer measures The company shall report progress on the development of new consumer measures and satisfaction survey outlined in Section 3. 7 of the PC15 final determination. The company shall:
• Complete a trial of new consumer measures by 30 September 2015;• Go-live with new consumer measures on 1 April 2016;• Complete a trial of a new consumer satisfaction survey by 31 December 2015; and• Go live with a new consumer satisfaction survey 1 April 2016.

Annual Information Return 2018 Section 2 Chapter 47 Page 2 of 67
Activity Completed to date and its outcome Listening to our customers’ views and building these into our plans is essential for us to ensure that our customers’ needs are at the heart of our service delivery.
Customer Services has been working extensively on providing an improved customer experience. Under the auspices of the Customer Engagement Oversight Group (CEOG), Customer Services has been actively engaging with NIAUR, CCNI and DRD to develop a range of new quantitative and qualitative customer measures which are most relevant to us and our customers, including the merits (or otherwise) of the current (OPA/DG) regulatory measures.
These new measures include the development of targets and methodologies for: Reducing unwanted contacts, Resolving customer queries at first point of contact (FPOCR), industry trends show
that Customer Satisfaction increases in line with FPOCR increase, Reducing repeat contacts, by analysing and understanding the reasons for these
contacts, and Developing a solution to obtain more meaningful and timely customer satisfaction
feedback to highlight, as close to real time as possible, those areas and activities,which cause dissatisfaction for customers.
The measures above were trialled and reported on for the first time in AIR16.
The customer satisfaction measure has been further developed through the implementation of Voice of the Customer (supported by Watermelon), which will eventually replace the current Allto Survey. This survey will allow us to significantly increase the sampling of customer satisfaction above the current 800 per annum (possibly around 10,000 per annum). It is expected that Voice of the Customer data will be used for AIR 19.
CEOG is currently working on the development of PC21 Customer Research in support of the above.


Annual Information Return 2018 Section 2 Chapter 47 Page 6 of 67
Key Initiative Reason for Removal Rising Mains - The need for a specific Deterioration Model for sewers will also be assessed
This element will be superseded by the Deterioration and Risk & Reliability model
Strategic Mains - Create high-risk system schematics, to link and inform the DWSP risk assessments
Following discussion this aspect would have very little influence on DWSP and therefore can be
removed Strategic Mains - Carry out hydraulic 'critical link analysis' for high-risk systems including modelling of flood impact and review/validate at a high level against actual incident data
This initiative is no longer deemed to be required at this stage. Clean water Flooding was
considered a Service Measure but not being taken forward at this stage
Distribution Mains – Develop the risk and consequence aspect of WIIM and determine population at risk of interruption from failure of each main using critical link analysis and review/validate at a high level against actual incident data. WIIM will subsequently be developed with improved data, consequence understanding and validation.
The Risk & Consequence element of WIIM does not require to be developed at this stage as will be covered by the Deterioration and Risk & Reliability
Project
SR & CWT - Develop DWSP contingency and mitigation plans (capex / opex), by prioritised SR / CWT risk assessment score
The current DWSP do not link to Capital Maintenance needs and therefore not a relevant
initiative
Critical Sewers – Review published repair cost factors against cost of historical repairs
This element is superseded by the development of the UCD
Strategic Mains - Identify contingency plans and potential capex & opex solutions for high-risk systems based on priorities following model updating, linking to the Water Resource Supply Resilience Plan and the DWSPs
This initiative is not deemed relevant to the current Capital Maintenance Planning Process
Intervention Cost Model - Develop a model for analysing opex / capex data
A model for analysing opex/capex data is not deemed appropriate at this stage.
WWTWs > 250PE (inc STCs) – Assess, select and implement a best value planning model
This element will be superseded by the Deterioration and Risk & Reliability models and the subsequent Scenario Analysis carried out
after development of the models
WWTWs < 250 PE - Develop a simplified planning spreadsheet.
This element will be superseded by the Deterioration and Risk & Reliability models and the subsequent Scenario Analysis carried out
after development of the models
Distribution Mains – Develop the WIIM to model mitigation impacts as performance measures, linking performance and deterioration to impacts, to enable full cost benefit analysis of schemes
This initiative not required as will be covered by the Deterioration and Risk & Reliability Project
WTW – Assess, select and implement a best value planning model
This element will be superseded by the Deterioration and Risk & Reliability models and the subsequent Scenario Analysis carried out
after development of the models

Annual Information Return 2018 Section 2 Chapter 47 Page 7 of 67
Key Initiative Reason for Removal Integrated CMP Tool - Define strategic objectives for the Capital Maintenance Planning tool that incorporate regulatory, shareholder and stakeholder views in relation to priorities, risk and balancing investment These actions would all appear to link to SCIM
either directly/indirectly. Based on the agreed stepped approach an Overall Optimising tool is
not being developed in this stage.
Regulatory, shareholder and stakeholders views are directly incorporated within the Service
Measure Framework that is being used to develop models and also Cost of Failure should include outputs from Customer Willingness to pay were appropriate. These are covered in other actions.
Integrated CMP Tool - Develop a formal methodology to balance capital maintenance needs, projects and budgets Integrated CMP Tool - Review and assess existing (SCIM) and potential capital investment prioritisation tools Integrated CMP Tool - Develop and implement the appropriate capital investment prioritisation methodology or tool by March 2017
Integrated CMP Tool - Implement trial run of the prioritisation tool with available data
Top Down Methodology- Build on the PC15 top down approach (using serviceability and capital maintenance costs) to include consideration of excess opex costs incurred in maintaining service
The Risk & Reliability modelling should identify the Opex costs associated with Asset Failure and predict, if no interventions, what these are likely to
be in the future. The excess operational costs incurred in maintaining service would not currently be possible to predict given the systems available.
This element is unlikely to progress for PC21.
Top Down Methodology - Review alternative top-down benchmarks in context of the S&EG and other (ministerial) constraints to validate bottom up capital maintenance outputs
Unsure how this could be actioned in PC21 and currently not deemed relevant to the robustness of
the developed solution.
Sea Outfalls - Develop a simplified planning spreadsheet. Best Value Planning Tools Wastewater Non-Infra
This element will be superseded by the Deterioration and Risk & Reliability models and the subsequent Scenario Analysis carried out
after development of the models
Raw Water Trunk MainsBest Value Planning Tools Water Infrastructure
This element will be superseded by the Deterioration and Risk & Reliability models and the subsequent Scenario Analysis carried out
after development of the models
Raw Water Intakes and Pumping Stations - Best Value Planning Tools Water Non-Infra
This element will be superseded by the Deterioration and Risk & Reliability models and the subsequent Scenario Analysis carried out
after development of the models
The table below highlights the rationalised list of Key Initiatives with the latest update

Annual Information Return 2018 Section 2 Chapter 47 Page 8 of 67
Number Initiative Type Key Initiative Overview Delivery
Milestone Complete Latest Update
1 General
Development of a CMP High Level Roadmap and an initial framework of Key Service
Targets
Q4 16/17 Y
A high level Roadmap & PID were developed for the project and have been approved by the Project Board, this included an initial framework. Subsequently it was agreed at Dec 17 Project Board it would be an appropriate time to review the original key initiatives submitted to NIAUR. This would give an opportunity to simplify these, of which there are a 110, and would enable greater clarity to the Project Board and NIAUR.
2 General
A Capital Maintenance Planning Guide to be developed to ensure
developed models can be maintained, enhanced in the future and support future
Business Plans
Q1 18/19 On‐Going
As part of the Deterioration and Risk & Reliability Modelling Project an assessment of NI Water data is on‐going. This assessment will highlight areas were data issues/gaps and indicate what improvements should take place.
In relation to the Tactical Models these in the main are established as BAU with on‐going review/improvements were appropriate.
3 General
The Development a Service Measure Framework that links to NI Waters KPIs. The Service Measure Framework should be used shape any risk and reliability models developed
and link to the latest customer priorities where
appropriate.
Q2 19/20 Y
A Service Measure Framework based around NI Waters KPIs has been developed and reviewed/approved by the Project Board. The current Risk & Reliability Models are based around these Service Measures were appropriate.
4 General
The Development of both Capex and Opex Cost Models are required to support the PC21 Capital Maintenance Submissions. This should include proposals for
continual improvement and enhancement
Q3 18/19 On‐Going
The development of Cost Models are on‐going. To ensure the outputs are available to support Deterioration and Risk & Reliability Modelling Project additional resource has been procured to accelerate the process.
5 General
Consequence of Failure Costs linked directly to the Service Measure Framework to be developed. These are to be used to support the Risk &
Reliability Modelling.
Q3 18/19 On‐Going
Following a series of meetings with staff from across the business an initial draft of consequence of failure costs has been developed in‐house based om the Service Measures. This is currently being reviewed by the Service Provider.
6 General
Implement an annual review of serviceability performance and assess how the capital maintenance delivered in Pc15 has influenced the
indicators.
Q4 18/19 On‐Going
This is ongoing as BAU as part of the AIR process.
7 General
Where appropriate staff development should be
arranged to develop in‐house skills to ensure the continued
maintenance and enhancement of various models. This should be
balanced against outsourcing additional resources and capabilities were required.
Q2 19/20 On‐Going
As part of the Deterioration and Risk & Reliability Project there is a specific element of Knowledge Transfer. This will be delivered throughout the life of the project and will ensure NI Waters ownership of the process without an ongoing dependence on 3rd parties.

Annual Information Return 2018 Section 2 Chapter 47 Page 9 of 67
Number Initiative Type Key Initiative Overview Delivery
Milestone Complete Latest Update
8
Water Infra ‐ Raw Water Trunk Mains, Trunk Mains &
Strategic mains
Improve Asset Knowledge through available techniques such as root‐cause analysis of failure, pro‐active condition
assessment, enhanced processes for data capture
and using all relevant datasets were appropriate.
Q4 18/19 On‐Going
As BAU all bursts are linked to specific Assets The models are updated regularly to reflect the latest Carto Map data, including third party data.
A project was initiated to assess cut‐outs for condition grading of mains >300mm, however the current costs of these inspections are somewhat prohibited to advance the process as BAU.
The Deterioration and Risk & Reliability Models will identify data gaps and develop infill and elicitation techniques to improve the data. This data will subsequently fed back into Cartomap.
9
Water Infra ‐ Raw Water Trunk Mains, Trunk Mains &
Strategic mains
Assess the Likelihood & Impact of Asset failure to include consequential cost/score linked to
developed Service Measure Framework were applicable
Q4 18/19 On‐Going
The Deterioration and Risk & Reliability Project is currently ongoing and this will model the predicted failure and consequence of all Raw Water Trunk Mains, Trunk Mains & Strategic Mains. The consequence is directly linked to the Service Measure Framework and there are 10 Service Measures relating to these assets. In addition there have been ongoing improvements to the Strategic Main Tactical Models (incl Trunk Mains) including ongoing review of scores and weightings, updates with latest data were applicable.
10
Water Infra ‐ Raw Water Trunk Mains, Trunk Mains &
Strategic mains
Identify Intervention Options and Impacts/Benefits of
Approach Q4 18/19 On‐Going
Cost/Benefit exercises of the various potential approaches are being assessed for Pc21
11 Water Infra ‐ Sluice Valves
Prioritise critical sluice valves for intervention (based on risk and consequence approach) and identify capital need
Q4 18/19 On‐Going
NI Water has recently embarked on a Strategic Valve Pilot analysis. The initial Project identified 100 critical valve interventions on the top 100 critical strategic mains. The associated site work will take place in Q3 18/19. This scheme could potentially be extended dependant on the assessed cost/benefits of the pilot and the outputs could form part of the PC21 submission for additional investment.
In addition a new sluice valve layer in Car2Map and an associated app is currently being developed. This app will enable the leakage section to record the open/close status of valves on a live layer and identify those were an intervention is required.
12 Water Infra ‐ Distribution
Mains
Improve Asset Knowledge through enhanced processes
for data capture, development of cohorts were
applicable
Q4 18/19 On‐Going
All models are updated regularly to reflect the latest CartoMap data, including the latest available third party data that will improve the model outputs.
There have been ongoing improvements to WIIM and the 3rd iteration of the model has been developed and this now incorporates a scoring system which promotes mains for rehabilitation with bursts that cause significant DG3 events.
The outputs from the model are used to identify the schemes for inclusion within the Water Mains Rehab programme for which £20m is invested annually
The Deterioration and Risk & Reliability Models will identify data gaps and develop infill and elicitation techniques to improve the data. This data will subsequently fed back into Cartomap. Rather than use cohorts individual pipes or parent lengths will be modelled and this will enable the models to identify specific mains for improvement.

Annual Information Return 2018 Section 2 Chapter 47 Page 10 of 67
Number Initiative Type Key Initiative Overview Delivery
Milestone Complete Latest Update
13 Water Infra ‐ Distribution
Mains
Assess the likelihood and Impact of Asset failure to include consequential cost/score linked to
developed Service Measure Framework were applicable
Q4 18/19 On‐Going
The Deterioration and Risk & Reliability Project is currently ongoing and this will model the predicted failure and consequence of all distribution mains. The consequence is directly linked to the Service Measure Framework and there are 10 Service Measures relating to these assets. To further improve the process available network models are being used to provide additional data for use in the clean water infra deterioration and risk models which will result in significant improvements to the modelling of the mains failures / consequences over the original scope approach.
In addition there have been ongoing improvements to the Tactical Models including ongoing review of scores and weightings, updates with latest data were applicable
14 Water Infra ‐ Distribution
Mains
Identify Intervention Options and Impacts/Benefits of
Approach Q4 18/19 On‐Going
Cost/Benefit exercises of the various potential approaches are being assessed for Pc21
15
Water Infra ‐ Service
Reservoirs & CWTS
Improve Asset Knowledge through available techniques
such as integrating SR Inspections with
Cleaning/Maintenance Programme and development of robust Risk Assessments
Q4 18/19 On‐Going
In regards to the Tactical SR & CWT model the cleaning maintenance programmes have been integrated with the SR inspections as BAU. Robust Risk Assessments have been developed for data capture as part of the inspections and a review group has been established.
The DRRM project will look at CWTs as part of the WTWs aspect but does not cover SRs which are sufficiently covered by the Tactical SR & CWT models.
16
Water Infra ‐ Service
Reservoirs & CWTS
Continual development of the SR Risk and Consequence
Model including costed asset condition assessment
programme and assessment of economic level of service
risk
Q4 18/19 On‐Going
The SR Risk and Consequence models are established as BAU with on‐going improvements.
17
Water Infra ‐ Service
Reservoirs & CWTS
Identify Intervention Options and Impacts/Benefits of
Approach Q4 18/19 On‐Going
Cost/Benefit exercises of the various potential approaches are being assessed for Pc21
18
Waste Water Infra – Critical Sewers/Rising Sewers/Other Sewers/CSO & Ancillaries
Improve Asset Knowledge through enhanced processes
for data capture, the prioritising of CCTV Surveys, Sensitivity of CSO Locations,
etc.
Q4 18/19 On‐Going
In regards to the Tactical Sewer Risk and Consequence and SIIM Models, critical sewers are included within these. CSO monitoring project is ongoing which should eventually cover all CSOs within 2km of Shellfish & Bathing waters.
A Risk and Consequence Model for Rising Mains is currently under development.
CCTV surveys are being prioritised and the information is being used to feed back into models. The information is also being recorded on the corporate systems.
The Deterioration and Risk & Reliability Models will identify data gaps and develop infill and elicitation techniques to improve the data (with the exception of CSOs). This data will subsequently fed back into Cartomap.
19
Waste Water Infra – Critical Sewers/Rising Sewers/Other Sewers/CSO & Ancillaries
Assess the Likelihood & Impact of Asset failure to include consequential cost/score linked to
developed Service Measure Framework were applicable
Q4 18/19 On‐Going
The Deterioration and Risk & Reliability Project is currently ongoing and this will model the predicted failures associated with Sewers and the consequence of these failures. The consequence is directly linked to the Service Measure Framework and there are 7 Service Measures relating to these assets.
The Weightings used for the tactical models are reviewed on an annual basis
20
Waste Water Infra – Critical Sewers/Rising Sewers/Other
Identify Intervention Options and Impacts/Benefits of
Approach Q4 18/19 On‐Going
Cost/Benefit exercises of the various potential approaches are being assessed for Pc21

Annual Information Return 2018 Section 2 Chapter 47 Page 11 of 67
Number Initiative Type Key Initiative Overview Delivery
Milestone Complete Latest Update
Sewers/CSO & Ancillaries
21
Water and Wastewater Non‐Infra ‐ WTWs/Raw
Water Intakes/PS/WWTWs/WWPS/Sea Outfalls
Improve Asset Knowledge through enhanced processes
for data capture This to include improve data capture from MWM, enhanced access to corporate systems, through Business Analytics, such as
telemetry data were applicable
Q4 18/19 On‐Going
In regards to the Tactical Non‐Infra Base Maintenance a risk methodology has been developed. This captured Criticality and Time to Repair/Replace from Expert Panels.
The Asset Data Quality Sustainability group has been established to ensure the information on repair/interventions at Asset Level are being recorded correctly and feeding back to corporate systems.
Asset Performance have carried out some preliminary work with ICT to develop Asset Performance Business Analytics to assist in improved processes. A 'Data Specification' document is being developed to identify the most beneficial data to be collating.
The SCADA system has been investigated to establish how beneficial this data maybe to assist in the CMP Process. Currently there is no way to access data on a global scale and therefore will not be used to assist the PC21 submission.
The Deterioration and Risk & Reliability Models will identify data gaps and develop infill and elicitation techniques to improve the data. This data will subsequently fed back into Cartomap.
22
Water and Wastewater Non‐Infra ‐ WTWs/Raw
Water Intakes/PS/WWTWs/WWPS/Sea Outfalls
Assess the Impact of Asset failure to include
consequential cost/score linked to developed Service Measure Framework were
applicable
Q4 18/19 On‐Going
The Deterioration and Risk & Reliability Project is currently ongoing and this will model the predicted consequences associated with the failure of Non‐Infra Assets. The consequence is directly linked to the Service Measure Framework and there are upwards of 9 Service Measures relating to these assets. The Weightings used for the tactical models are reviewed on an annual basis
23
Water and Wastewater Non‐Infra ‐ WTWs/Raw
Water Intakes/PS/WWTWs/WWPS/Sea Outfalls
Identify Intervention Options and Impacts/Benefits of
Approach Q4 18/19 On‐Going
Cost/Benefit exercises of the various potential approaches are being assessed for Pc21
24
Water and Wastewater Non‐Infra ‐ WTWs/Raw
Water Intakes/PS/WWTWs/WWPS/Sea Outfalls
Review and Develop the approach to standard asset lives, include benchmarking
were possible
Q4 18/19 On‐Going
Asset Performance have carried out some preliminary work with ICT to develop Asset Performance Business Analytics to assist in improved processes and this will include Asset Lives were applicable.
As part of the outputs of the Deterioration and Risk & Reliability Model asset life information will be assessed. This will look at the Maximum/Minimum/Median age of replacement.
25 General
MEAV analysis to be carried out for PC21, to provide an
alternative top down assessment of future
replacement costs of non‐infrastructure assets
Q4 18/19 On‐Going Initial discussions taking place to establish how best to take MEAV forward.

Annual Information Return 2018 Section 2 Chapter 47 Page 12 of 67
The Next Steps The next steps in the development of NI Water’s ‘Plan for Asset Maintenance’ include:
1. The initial draft Water & Wastewater Deterioration Models to be completed by June18 and an initial draft of cost data is required at this time.
2. A series of Water & Wastewater Non-Infra workshops to be held with key CSDD staffduring June 18. The outputs of these workshops will assist in the development of theService Impact and Reliability Modelling for Non-Infra Assets.
3. Further development of the CMP methodologies and tools which currently exist withinNI Water
4. Continuation of Project Board Meetings to review progress, understand risks andendorse the key strategic decisions.

Annual Information Return 2018 Section 2 Chapter 47 Page 13 of 67
Interim update to NIAUR 1 April
High Level Roadmap to NIAUR First meeting
of CMP Project Board
Complete assessment of CMP in UK Water
Companies
Commence procurement
/develop/ build new CP models and methods
M A M J J A S O N D J F M A M J J A S O N D J F M A M J J A S O N D J F M A M J J A S O N D J F M A M J J A S O N D J F M A M J J A
2015 2016 2017 2018 2019 2020
Develop PC21 CMP Submission until April 2020
Methods & Models in place
PC21 Draft Capital
Submission
PC21 Business Plan Submission
APT continue development of existing tools and methodologies
Collect data/develop approach to data gaps for PC21 Business Plan
CMP Group monthly; CMP Project Board bimonthly; AIR update each June
APT continue development of
existing tools and
methodologies until June 2018
Refine CMP methods and models
Collect data/develop approach to data gaps for PC21 Business Plan until April 19
CMP Group monthly; CMP Project Board bimonthly; AIR update each June
Review CMP Planning Data Requirements & Commence CMP Group


Annual Information Return 2018 Section 2 Chapter 47 Page 15 of 67
For example, the number of Service Reservoirs to security hardened has changed due to decommissioning and overlap with other capital projects on the Base Maintenance Programme, the nett effect being a reduction from 54 to 53 sites requiring security hardening under this programme.
The most recent programme review indicated that: 13 Non-CNI Water Treatment Works will complete by April 2019 –previously reported
as November 2018- delay due to budgeting alignment and the rescheduling of workprogrammes on site.
53 Enhanced Service Reservoirs will complete by August 2018- previously reportedas January 2018- delay due to further work required to integrate alarm signals fromsite to a single user interface at our Alarm Receiving Centre
2 Wastewater Treatment Works, sites confirmed as Omagh Transfer Pumping Stationand Newton Stewart WWTW, delivery programme still to be confirmed but willcomplete during PC15 period
Changes to the original estimated delivery timetable reflect actual time spend on issues such as programme scheduling, in-year budgeting alignment and revising design elements in light of experience gained from previous security hardening projects.


Annual Information Return 2018 Section 2 Chapter 47 Page 17 of 67
The total nett financial savings of the total project is estimated at £1,317K over 10 years made up of reductions in base maintenance, overflows, site visits, overtime and truck rolls.
A dedicated ICAT delivery team was established in July 2016 and Phase 1 of the project consisted of the installation of ICAT technology into 50 sites at a cost of £1,032K within the Lough Fea, Moyola, Lough Braden, Loughmacrory, Lough Derg and Glenhordial supply zones.
Phase 2 Belfast supply zone, saw the installation of ICAT technology into 21 Service Reservoirs and the automation of a number of valves in the Dunore, Drumaroad and Dorisland supply areas at an expected cost of £710K. This phased commenced in July 2017 and is planned to be completed at the end of July 18.
Phase 3 of the project is divided over two geographical areas Ards and North West. The business cases for these areas were approved in January 18 and commenced in April 18.
To date feedback from Customer Services Delivery Directorate (CSDD) on these sites has been very positive. In addition other issues (eg hydraulic issues) within the network system have been identified and addressed.
Detailed baseline figures for estimating benefits in Phase 1 have been established and will be used to complete PPE stage 2 in July 19.
NI Water provided the Utility Regulator with a presentation on 13 October 2016 giving an overview of the PC15 ICAT programme.
Standardisation of the design has enabled a single, detailed user manual to be developed which covers all ICAT SR sites.
A dedicated training rig connected to telemetry and associated mimics allow staff to be trained, gain experience and familiarise themselves with the system..
NI Water have applied for Patent to protect the IP of the system and its unique controls.
Planned next steps for delivery Delivery of Phase 3 Ards and Northwest areas at a total cost of £910K during 18/19. During October 18 to December 18 Phase 4 (Enniskillen area) business case will be developed.


Annual Information Return 2018 Section 2 Chapter 47 Page 20 of 67
SELL analysis completed in June 2017 with outcome agreed. Final Executive Reporting and supplementary technical annexes to be completed July 2017.
Household night use and customer supply pipe update analysis complete. Final project reports and technical annexes to follow in July 2017.
Planned next steps for delivery Outcomes for the SELL study and the supplementary review of customer supply pipe leakage, household night use and hour-to-day values are complete with final reports and technical annexes received in July 2017.
NI Water plans to undertake a review of SELL in 2018/19 – 2019/20.


Annual Information Return 2018 Section 2 Chapter 47 Page 22 of 67
further regulations in relation to the act within the next couple of years. Previously NIW worked under the spirit of the Reservoirs Act 1975.
NI Water presently has 47 Impounding Reservoirs, in service and out of service, which are recognised by the act as being ‘controlled reservoirs’. The definition of this term now broadly includes structures and areas that are capable of holding 10,000m3 or more of water above the natural level of any part of the surrounding land. This covers SRs & CWBs, which is an important change from the 1975 act that only covered Impounding Reservoirs. Although DfI Rivers has a list of SRs and CWBs, belonging to NI Water, both the list and the process of designation between Rivers Agency and NI Water has yet to be agreed. Hence, NI Water has not reported any SRs or CWBs as ‘controlled reservoirs’ for AIR18.
A contract has been let (Aug 2017) for the Section 10 inspections of the in service and out of service Impounding Reservoirs. Inspections are now underway and will be completed by the end of June 2018, with reports due for completion by the end of August 2018
3. Completion of maintenance requirements arising from these inspections by 2020-21. Report on any material issues identified in the surveys that require immediateattention that cannot be delivered within the estimate PC15 funding.Not yet applicable
4. Plans for Delivery of the inspection requirements of the proposed Reservoir Billfor controlled reservoirsThe plans as set out in the PC15 Business Plan submission for the inspectionrequirements, for the Impounding Reservoirs, and the delivery of any maintenancerequirements arising from these inspections are still on target for 2020-21. However, it isto be noted that the extent of the maintenance requirements will not be known until theinspections are carried out. NI Water will advise the UR on any material issues identifiedin the surveys that require immediate attention that cannot be delivered within theestimated PC15 funding.

Annual Information Return 2018 Section 2 Chapter 47 Page 23 of 67
DEVELOPMENT OUPUT
8. Water mains prioritisation
Final Determination: The company shall engage with stakeholders on the development of its water mains prioritisation process to incorporate the outcome of PC15 consumer engagement including interruption to supply and dirty water complaints by 31 March 2015. The company shall provide updates on the implementation of the prioritisation annually throughout PC15. PROJECT SUMMARY • For PC15, NI Water developed a Watermains Infrastructure Investment Model (WIIM) to
identify and prioritise water network rehabilitation investment. WIIM is now operating as aBAU tool for Capital Maintenance Planning.
• The model is refreshed every two years using updated corporate datasets (e.g. burstscustomer contacts, water quality sampling exceedances, etc.) to inform the next year'sinvestment programme.
• WIIM1 incorporated dirty water complaints but not DG3 within the methodology. With theexception of DG3, there was a strong alignment between the original WIIM 1 methodologyand CEOG analysis (Note: WIIM1 refers to the initial methodology used to identify theinvestment programmes for 2015/16 and 2016/17). WIIM2 model was modified to incorporateDG3 in April 2016 and used to identify the 2017 /18 and 2018/19 investment programme.
• NI Water acknowledged the omission of DG3 data in the original WIIM1 analysis. NIAUR wasinformed of the company's intention to revise the methodology approach in a detailedresponse in September 2014.
• A formal presentation delivered to CCNI in September 2014 to provide an update of the WIIMprocess, including plans to incorporate DG3 in the WIIM2 methodology. Further formalpresentations to external stakeholders (CCNI, DWI and UR) were again undertaken recentlyto achieve buy-in to the WIIM2 methodology.
• Ongoing review of the WIIM process ensures the methodology remains focused on NI Water'scustomer promises.
KEY MILESTONES Target Status 1. DG3 incorporated into WIIM 2 March 15 Completed Apr 16 2. WIIM methodology now operating as a BAU. BAU 3. WIIM2 methodology to be communicated to key May 17 On Target stakeholders4. WIIM methodology shared with key stakeholders As required BAU when changes are made to methodology
Activity completed to date and its outcome The company shall engage with stakeholders on the development of its water mains prioritisation process to incorporate the outcome of PC15 consumer engagement including:
A. Interruption to Supply• CEOG analysis ran in parallel with development of WIIM 1 in 2014• Gap analysis established that strong alignment existed, however DG3 alignment DG3
needed to be addressed. Other than DG3, no recalibration of WIIM was required asa result of CEOG (see document 141006 WTC WIIM).
• Although it had initially been considered that issues around gee-coding historic DG3data would prevent effective incorporation of DG3 into WIIM, this was incorporatedinto the WIIM 2 procedure ,as the outages were mapped by utilising the Projectresources
• The UR was informed of the proposed approach regarding incorporation of DG3 intoWIIM in a detailed response to this and a number of related queries in September2014 (see PC15 DD Response Annex K 5 11 9 V1 .4 Watermain Rehab.doc availab,le

Annual Information Return 2018 Section 2 Chapter 47 Page 24 of 67
on request ). A formal Presentation was also delivered to CCNI in September 2014 in order to inform them of progress around WIIM and explain plans regarding incorporation of DG3 into analysis
In addition there was a further Stakeholder presentation on 10th May 2017 in whichthe WIIM 2 and the proposed WIIM 3 approach was presented and discussed
B. Dirty Water Complaints Dirty water complaints were incorporated into the model from the outset – this was
something which DWI was satisfied with from the outset of the development of WIIM. DWI, CCNI, NIAUR and DRD Water Policy were members of a group who were
invited to review the tender specification of the first WIIM contract. Engagementcontinued throughout the development of WIIM.
C. The company will provide updates on the implementation of the prioritisation annuallythroughout PC15.
The WIIM 2 methodology incorporates the “Interruption to Supply” requirement .Seeabove where the updates were provided to the external stakeholders
Improvements contained in WIIM2 (from WIIM 1 Methodology) are summarised below: Parent Length segments of water mains are now based initially on Road Junction
information, resulting in construction of a NIW corporate dataset which better modelsor represents the distribution network for ease of analysis.
Feedback from recent customer engagement has been incorporated into the WIIM2approach, ensuring that methodology is customer focused.
DG3 interruption to supply data is now captured and scored in alignment with NIWater KPIs.
Scoring matrix is better defined, containing increased weighting for issues relating toWater Quality and DWI involvement.
Unit Rates can be more easily programmed. Pipeline flushing has been incorporated. WIIM 2 has the ability to insert ad-hoc pipeline queries in relation to assessment of
high priority customer feedback issues, in conjunction with rescoring of programmeelements. Ad hoc schemes can be flagged up and separately identified from thosegenerated through ‘bottom up’ analysis.
Rather than the static list of outputs created during WIIM1, WIIM2 outputs arecaptured under a Scheme Management Tool, allowing for dynamic management ofthe overall programme. This will enable reaction to changes in regulatoryenvironment or public expenditure.
Schemes outputs are now bound into geographical work packages for delivery ratherthan leaving this to the Verification stage to allow for analysis of the makeup of theWorkpackage at an earlier stage than WIIM 1
DG2 schemes are dealt with in a separate methodology/process approach .Theongoing DG2 targets are being achieved by this methodology
Maximum WIIM 2 Scoring matrix summarised below: Scoring for each category is compiled by accruing scores from multiple drivers, with
an indication of maximum scores available in each category, shown in the table anddiagram below.

Annual Information Return 2018
WIIM2 category Water Qualitv Flushing Structural DG3 interruption supply DG2 low pressure Complaints
Maximum Score 2350 200 1100
to 400
450 200
Section 2 Chapter 47 Page 25 of 67
NOTE ON SCORING IMPACT: The chosen cut-off score (based on annual Budget and the geographical bundling required for AD integrated capital delivery) may also skew the makeup of the WO/Structural Split.
WIIM 2.2 Work Package Overview (passed to the Asset Delivery Team on the 8/11/17)
Works Package Schemes Sum of Length Sum of Scheme Count (m) Cost(£)
Carrickfergus 71 22,363 £2,876,178 Castor Bay Dungannon 50 23,669 £2,332,064 Drumaroad Ards Peninsula 57 31,117 £2,950,220 Drumaroad Bangor 67 21,985 £2,660,555 Foffany South 50 31,216 £2,561,401 Seagahan Armagh 73 29,212 £2,534,986 Total 368 159,562 £15,915,404
WIIM 2.2 Green Workpackage Overview, Further High-Level Breakdown
Justification Schemes Length Cost % Total Length Count
Water Quality 112 46,010 £4,603,978 28.8 Structural 248 109,005 £10,807,745 68.4Hydraulic (Inc. 8 4,547 £503,680 Ooerationan 2.8
• Note:DG2 Workpackages are analysed separately but some DG2 solutionsarise out of nearby rehabilitation of the network
Improvements contained in WIIM3 (from the WIIM 2 Methodology) are summarised below:
• Some manual interventions have been implemented on the DG3 analysis related tothe top 12 DG 3 issues
• Buffering to nearest main was improved by adding a verification process to allocateWater Quality and complaints data to specific mains rather than a global bufferingmap approach.
• The Watermains Infrastructure Scheme Tracker is now used to identify previousschemes and avoid double handling of work
• Other than the above ,the same matrix shown above for WIIM2 was utilised for WIIM3

Annual Information Return 2018 Section 2 Chapter 47 Page 26 of 67
Schemes Tool The Schemes Management Tool, developed under the WIIM project is held by NIW Asset Delivery Team and is available for analysis on request. The Tool has been developed to hold all vital scheme information and produce outputs as required by the end-user.

Annual Information Return 2018 Section 2 Chapter 47 Page 27 of 67
DEVELOPMENT OUPUT 9. Sustainable Catchment Management
Final Determination definition: The company shall report progress on Sustainable Catchment Management annually. The report shall set out the action the company has taken and its plans for subsequent action. The report shall identify the benefits in terms of activity, improvements in raw water quality and reduction of peak flows. PROJECT SUMMARY • Catchment Management Studies:
Aim is to undertake a scoping and planning study in each drinking water catchment,using the UKWIR framework, identifying future SCaMP projects to sustainablyimprove raw water quality. In PC15 period 21 Catchment Management Studies havebeen completed, as follows:- 2013/14 - Killylane, Dorisland and Clay Lake WTW's- 2014/15 - Derg, Lough Braden, Caugh Hill, Carmoney and Seagahan WTW's- 2015/16 - Altnahinch, Drumaroad and Fofanny WTW's- 2016/17 - Dunore Point, Castor Bay, Moyola, Ballinrees, L Macrory, L Fea and
Glenhordial WTW's- 2017/18 - Carran Hill, Rathlin and Dungonnell WTW's
• SCaMP NI Interventions:- Actions to reduce pesticides in raw water; best practice advice at agricultural
shows, rush control events, farm engagement visits, press articles and amenitysector liaison. A farm liaison officer has been temporarily employed and a the'Rush Solution Without Pollution' weed-wiping trial in Seagahan Catchment wascarried out in summer 2017. Approx 500 acres treated preventing 320 litres ofMCPA being applied in the catchment. A further weed-wiping project is plannedfor Summer 2018 in Glenhordial catchment.
- CAFRE & NIW joint trials carried out to research rush control methods withpollution monitoring. These trials are ongoing. Results will inform strategy forDAERA and NIW.
- Wildfire initiatives have been undertaken in the Mournes to carry out effectivewildfire control to prevent damage to habitats and raw water quality.
- A number of riparian planting projects have been undertaken to reduce banksideerosion and create wildlife buffer strips along watercourses to reduce diffusepollution.
- Habitat enhancement projects carried to meet environmental targets and improvewater quality.
• 'Source To Tap' INTERREG VA Project:- EU lnterreg VA funding application successful in partnership with Irish Water,
East Border Region, The Rivers Trust, Ulster University & AFBI for fundinginvolving cross border catchment projects.
- It will involve extensive 5 year SCAMP projects in cross border catchments; Dergand Erne WTW's Catchments. - Value €5.2m.
- Project will involve Land Incentive Scheme, Peat pilot project, forestry pilotproject, UKWIR Catchment analysis and large community engagement aspect todevelop community led initiatives to improve raw water quality.
- Project Manager, Finance Manager and 3 project officers have been appointed- Development of Land Incentive Scheme currently underway
• 'Cooperating Across Borders for Biodiversity' INTERREG VA project:- RSPB are lead partner and NIW are a partner, along with several others as it is
part of a wider project doing work in ROI, NI and Scotland. €175k fundingobtained by NI Water

Annual Information Return 2018 Section 2 Chapter 47 Page 28 of 67
- The project is planned from 2017 with completion by 31st Dec 2021. The projectwill be implemented in NI, ROI and Scotland, with each partner responsible forindividual elements.
- Aims to work on a cross border basis to bring about the recovery of protectedhabitats (active raised and blanket bog) and priority species (breeding wadersand marsh fritillary) at specific key sites.
- This project on Garron Plateau will involve blocking 384 73 metres drains to raisewater levels using plastic sheet piling and peat dams. Basically a restoration ofthe entire Dungonnell catchment.
- Project Launch event was held on 11th Dec 2017- Drain blocking contractor has been procured by NI Water and 173 dams
completed in Feb 2018. Work will recommence in Sept 2018 after the birdnesting season.
KEY MILESTONES Target Status 1. Completion of Catchment Management Studies as per March On
schedule 2018 Target 2. Commencement of programme for completion of SCaMP NI March On
interventions as a result of Catchment Management Studies 2018 Target
Sustainable Catchment Management (SCaMP) The NI Water strategic approach has been shaped around our identification of 8 key customer promises as detailed in the 'Our Strategy' document. The objectives of SCaMP NI are closely connected to these customer promises as follows: • We provide you with clean, safe water to drink:
The SCaMP NI program seeks to improve the quality of raw water in the environmentprior to it being extracted. This results in fewer contaminants entering the WTW's andthus improves water quality compliance and reduces the risks of water qualityexceedances in the final water.
• We seek to give you value for money:The potential benefits of catchment management for improving drinking water quality arewidely recognised and evidence is beginning to show that this is a cost-effective way toreduce the costs of treatment.
By working with others to make environmental enhancements, improve agriculturalpractices and reduce pollution run-off, we seek to improve the quality of raw water in theenvironment prior to it being extracted. This in turn helps to reduce the chemical, powerand sludge costs associated with water production.
• We adapt to deal with the effects of climate change:Reduced energy requirements for treating water will contribute to our Climate Changetargets and our aims to reduce our carbon footprint and greenhouse gas emissions.
One of the successful SCaMP NI approaches is the re-wetting of blanket bog. Thisretains water in the catchment and reduces the effects of the heavier rainfall events andflooding downstream. The restored peat acts a carbon sink, preventing the release ofCO2 into the atmosphere.
• We want to protect and enhance the natural environment:SCaMP NI environmental projects go hand in hand with our environmental objectives toenhance habitats, protect endangered species, meet legislative requirements ondesignated landholdings and also help achieve good ecological status water qualitytargets as required under the Water Framework Directive.

Annual Information Return 2018 Section 2 Chapter 47 Page 29 of 67
Preservation and restoration of bog features will provide a habitat for a wide variety of plant and animal species, enhancing biodiversity and reversing the decline of species such as hen harrier, merlin and the perennial herb marsh saxifrage.
We supply you with the water you need:SCaMP NI environmental projects such as bog restoration, pollution control or habitatrestoration help achieve a more stable and reliable water source, which in turn results ina less problematic water treatment and improved compliance.
NI Water is currently developing Catchment Management Studies for each of its activewater catchments and will follow this with catchment plans for ‘mothballed’ impoundingreservoirs. These plans will give the detail on how the catchment land will be managedgoing forward to give maximum benefit to NI Water and ensure that legislativerequirements are met.
Diffuse water pollution and insensitive land management may pollute surface and ground water supplies with substances such as nutrients, pesticides and microbial pathogens and increase colour, turbidity and suspended solids in abstracted water. These increase capital and operating costs of water treatment, increase the quantity of effluent and waste produced, and increase the carbon footprint of the industry. The aim of the Catchment Management Studies is to undertake a scoping and planning study of the catchment, using the approach advocated in the UKWIR framework for quantifying the benefits of catchment management, to establish the basis for a programme of catchment management that provides business benefit to NI Water. The outcome of this project will provide a basis for the preparation of business plans for catchment management in support of drinking water source protection and, in part, for meeting other WFD and corporate obligations for PC15 and beyond.
The Catchment Management Studies are being undertaken on a prioritised basis. The prioritisation rationale involves collating a series of details on each catchment and drivers needed to justify SCaMP projects, as follows:
PRIMARY DRIVER 1 - Protect or improve the raw water quality abstracted by NIWater (Factors considered: DWI CPEO, Algae Blooms, Colour/Turbidity, TOC,Pesticides)
PRIMARY DRIVER 2 - Protect or improve the reliability or quantity of raw waterabstracted by NI Water (Factors considered: Reliability of source, Potential toimprove reliability risk, Quantity, Drought Risk, Potential to remedy quantity risk.
PRIMARY DRIVER 3 - Reduce the risk to the quality, reliability or quantity of rawwater abstracted by NI Water (Factors considered: Tourism, Livestock Agriculture,Arable Agriculture, Forestry, Residential Dwellings, Industrial, Hydrocarbons,Rubbish / Fly tipping, Effluent, Septic Tanks.
PRIMARY DRIVER 4 - Aid NI Water in managing its land portfolio and deliver itsstatutory responsibility under national and international obligations to protect andmanage the natural environment (Factors Considered: ASSI, AONB, SPA, SAC,RAMSAR, percentage of catchment land owned by NI Water, Habitat protection orcreation, Managing lands as ‘carbon sink’, Biodiversity management, Invasivespecies management).
SECONDARY DRIVER - NI Water working with other stakeholders to improve theoverall quality of the catchments from which it draws water (Non-NI Water OwnedLand in Catchment). (Factors Considered: Habitat protection or creation, Biodiversitymanagement, improved farming practices, Recreational activities, Revenue creationfor NI Water.

Annual Information Return 2018 Section 2 Chapter 47 Page 30 of 67
Programme for delivery of Catchment Management Studies During PC15 NI Water will deliver:
23 catchment plans (live catchments) to be delivered in first 3 years of PC15. 23 catchment plans (unused catchments) to be delivered in years four to six.
NI Water is on track to meet the delivery of the catchment plans as detailed in the programme below:
Category Priority
Water Treatment
Work Name
Catchment Manageme
nt Study
Target Delivery
Date
Comments
Operational WTW's 1 Killylane 2013/14 31/03/201
4 Completed 31/03/14
Operational WTW's 2 Dorisland 2013/14 31/03/201
4 Completed 31/03/14
Operational WTW's 3 Clay Lake 2013/14 31/03/201
4 Completed 31/03/14
Operational WTW's 4 Derg (Inc
Strule) 2014/15 31/03/2015
Completed 31/03/15
Operational WTW's 5 Lough Braden 2014/15 31/03/201
5 Completed 31/03/15
Operational WTW's 6 Caugh Hill 2014/15 31/03/201
5 Completed 31/03/15
Operational WTW's 7 Carmoney 2014/15 31/03/201
5 Completed 31/03/15
Operational WTW's 8 Seagahan 2014/15 31/03/201
5 Completed 31/03/15
Operational WTW's 9 Altnahinch 2015/16 31/03/201
6 Completed 31/03/16
Operational WTW's 10
Drumaroad (inc Silent
Valley, Annalong & Lough Island
Reavey)
2015/16 31/03/2016
Completed 31/03/16
Operational WTW's 11 Fofanny 2015/16 31/03/201
6 Completed 31/03/16
Operational WTW's 12 Dunore Point 2016/17 31/03/201
7
Completed 31/03/17
Operational WTW's 13 Castor Bay 2016/17 31/03/201
7
Completed 31/03/17
Operational WTW's 14 Moyola 2016/17 31/03/201
7
Completed 31/03/17
Operational WTW's 15 Ballinrees 2016/17 31/03/201
7
Completed 31/03/17
Operational WTW's 16 Lough
Macrory 2016/17 31/03/2017
Completed 31/03/17

Annual Information Return 2018 Section 2 Chapter 47 Page 31 of 67
Category Priority
Water Treatment
Work Name
Catchment Manageme
nt Study
Target Delivery
Date
Comments
Operational WTW's 17 Lough Fea 2016/17 31/03/201
7
Completed 31/03/17
Operational WTW's 18 Glenhordial 2016/17 31/03/201
7
Completed 31/03/17
Operational WTW's 19 Carron Hill 2017/18 31/03/201
8 Completed 31/03/18
Operational WTW's 20 Rathlin 2017/18 31/03/201
8 Completed 31/03/18
Operational WTW's 21 Dungonnell 2017/18 31/03/201
8 Completed 31/03/28
Operational WTW's 22 Killyhevlin 2018/19 31/03/201
9
Being done as part of Source To Tap INTERREG VA Project - Target Catchment Characterisation Completion 31/03/19
Operational WTW's 23 Belleek 2018/19 31/03/201
9
Being done as part of Source To Tap INTERREG VA Project - Target Catchment Characterisation Completion 31/03/19
Abandoned WTW's
24 Altmore (High) 2018-19 31/03/201
9 Planned
Abandoned WTW's
25 Altmore (Low) 2018-19 31/03/2019 Planned
Abandoned WTW's
26 Ballintemple IR 2018-19 31/03/201
9 Planned
Abandoned WTW's
27 Ballydoolagh (IR) 2018-19 31/03/201
9 Planned
Abandoned WTW's
28 Ballysallagh Lower 2018-19 31/03/201
9 Planned
Abandoned WTW's
29 Ballysallagh Upper 2018-19 31/03/201
9 Planned
Abandoned WTW's
30 Ballyversall 2018-19 31/03/2019 Planned
Abandoned WTW's
31 Boomers Reservoir 2018-19 31/03/201
9 Planned
Abandoned WTW's
32 Church Road 2019-20 31/03/2020 Planned

Annual Information Return 2018 Section 2 Chapter 47 Page 32 of 67
Category Priority
Water Treatment
Work Name
Catchment Manageme
nt Study
Target Delivery
Date
Comments
Abandoned WTW's
33 Conlig Lower (IR) 2019-20 31/03/202
0 Planned
Abandoned WTW's
34 Conlig Upper 2019-20 31/03/2020 Planned
Abandoned WTW's
35 Craigahulliar 2019-20 31/03/2020 Planned
Abandoned WTW's
36 Creightons Green (IR) 2019-20 31/03/202
0 Planned
Abandoned WTW's
37 Dunalis 2019-20 31/03/2020 Planned
Abandoned WTW's
38 Killea (WTW) 2019-20 31/03/2020 Planned
Abandoned WTW's
39 Knockbreckan 2019-20 31/03/2020 Planned
Abandoned WTW's
40 Leathemstown 2020-21 31/03/202
1 Planned
Abandoned WTW's
41 Lough Cowey 2020-21 31/03/2021 Planned
Abandoned WTW's
42 Lough Money 2020-21 31/03/2021 Planned
Abandoned WTW's
43 Portavoe IR 2020-21 31/03/2021 Planned
Abandoned WTW's
44 Quolie (North) 2020-21 31/03/2021 Planned
Abandoned WTW's
45 Quolie (South) 2020-21 31/03/202
1 Planned
Abandoned WTW's
46 Stoneyford Reservoir 2020-21 31/03/202
1 Planned
Benefits of Catchment Management
NI Water manages 8,615 hectares of land. NI Water has embraced and adopted Sustainable Catchment Area Management Planning (SCaMP) and is seeking to build on the foundations of this put down in PC10 and PC13. Through the SCAMP NI approach, NI Water seeks to:
Maximise the ecosystem services gained from its land holdings Meet its obligations under environmental legislation Improve operational efficiency through innovative projects Improve raw water consistency and quality
The benefits of the SCaMP project will be realised in the long-term, but the Catchment Management Studies completed to date have recommended a number of key outputs or recommendations, which are now being implemented in the form of the SCaMP projects and resultant benefits listed below:
Benefit 1 - NI Water will, over time, have improved raw water quality arriving at its Water Treatment Works. Example Project – Seagahan Weed Wiping Trial Project

Annual Information Return 2018 Section 2 Chapter 47 Page 33 of 67
As a trial project NI Water are carrying out a weed-wiping project in Seagahan WTW drinking water catchment area in Co Armagh. NI Water is working with The Water Catchment Partnership and the farming industry as part of an innovative campaign to help reduce levels of MCPA in the Seagahan Reservoir catchment area. It is planned to offer a free weed-wiping service using Glyphosate, as an alternative to spraying MCPA, to demonstrate an alternative effective rush control method which causes less pollution.
The overall aim is to show that pesticide levels can be reduced in the reservoir without the need for more expensive water treatment processes. This can then be used as a test project to demonstrate the benefits of NI Water working together with farmers and possibly doing more of these type of initiatives in future in other areas. The project will have a Farm Liaison Officer working with farmers and land managers to manage the weed-wiping and promote better advice on handling, applying and disposing of grassland sprays, guidance on mechanical control of rushes and improving land condition to addressing the underlying causes of infestations. The project will be beneficial in comparing best techniques with other projects in N Ireland and used to inform individual aspects of the INTERREG VA Source to Tap project and other SCaMP NI projects going forward to ensure value for money in effectively reducing MCPA levels in watercourses.
The 2-year project in Summer 2017 and 2018 is managed by NI Water but will be carried out in conjunction with the Water Catchment Partnership. This involves representatives from Ulster Farmers Union, Northern Ireland Environment Agency, Department of Agriculture, Environment and Rural Affairs, College of Agriculture, Food and Rural Enterprise and the Voluntary Initiative. All of these stakeholders will input knowledge and expertise, which are vital to the success of the project and their cooperation, and assistance is appreciated and valued by NI Water. The aim of the WCP is to deliver one message incorporating the ethos from all organisations to effectively tackle the problem of pesticides in the water environment, particularly in Drinking Water catchment areas, communicating with householders and farmers to raise awareness and provide best practice guidance on grassland pesticide use.
The project has brought the following benefits for NI Water: Water Quality benefits - Ongoing water sampling of the reservoir throughout Phase 1 has shown a marked decrease in MCPA found in raw water. Analysis of the results demonstrated a MCPA residual reduction of more than 50% in the 2017 period, in comparison with the average for the previous 5 years. The graph in Appendix 2 shows average monthly MCPA levels for 2015, 2016 and 2017. A significant drop in average MCPA levels was demonstrated in 2017. April and May show the largest decrease with only a quarter of the average MCPA recorded in 2017 in comparison to 2016. Raw water MCPA levels increased slightly in August but were below the 2016 average. September MCPA results are uniform across the three years. October showed a marked decrease in MCPA levels from 2016. Detrimental weather conditions experienced in August 2017 onwards must be considered.
Project development and implementation – The trial demonstrated that NI Water have the capabilities and governance structure to allow this type of work to be carried out.
Project Promotion – The rollout event in April in the local community hall proved to be an effective tool with 60 farmers signing up from which 38 famers took advantage of the free weed-wiping trial. Promoting the project using the UFU and NI Water web pages, UFU Newsletter articles, BBC report and targeting Markethill Mart was very successful. Whilst the website was a useful tool, the project would not have been a success without the rollout event and the face-to-face engagement.

Annual Information Return 2018 Section 2 Chapter 47 Page 34 of 67
Partnership Working – NI Water worked closely with the WCP to ensure its success during project promotion, rollout event, contractor selection, field mapping and the weed-wiping. The partnership opened channels of expertise to be utilised in all areas of the project. Close liaising with the UFU and CAFRE was particularly beneficial to the success of the project.
Contractor selection – The correct contractor selection resulted in rush treatments being carried out in a professional and competent manner demonstrating best practice use of round up energy being applied through a weed-wiper. The decision to use a local contractor situated in the heart of the catchment area was beneficial, as the contractor had a working knowledge of the land and a personal relationship with the farmers.
Rush Reduction – Across the 426 acres of rush treated in the Seagahan catchment there has been a successful rush reduction between 60% and 90%. See Appendix 1 for photographs. Feedback from farmers has been very positive with zero complaints to NI Water. Rush coverage and compromising of viable grazing areas can have a direct effect on farming subsidies based on ‘eligible’ land (currently assessed under the Basic Payment Scheme (BPS)). Rush removal therefore is of great benefit to them.
Pesticide choice – The pesticide ‘Round-up Energy’ was used for the project following trials and advice from CAFRE. This proved very successful for the rush treatment as the pesticide stayed on the leaf of the rush due to the adjuvant (sticking agent). With the adverse weather conditions from July onwards, the fact that the pesticide was rain-fast in one hour was valuable.
Farm Liaison visits/contractor treatments – It was necessary and constructive for the first visit to be carried out with the farmer present allowing discussions to be carried out about the project and discuss eligibility issues. Delegating responsibility to the farmer for timing of the weed-wiping was successful as treatments were arranged with the contractor when conditions were at an optimum and no livestock were present in the treated area. Feedback from farmers and UFU has been excellent.
Benefit 2 - NI Water will, over time, reduce the risks of raw water quality incidents effecting WTW output capability Example Project 1 - Extensive areas of Forest Service lands exist within NI Water drinking water catchment areas. Forest Service felling and replanting activities require careful planning in order to avoid any detrimental impacts on raw water quality, which is abstracted for water treatment. In order to minimise risk to water quality guidelines have been agreed between NIW and Forestry Service in order to protect the raw water quality at each catchment. Work is ongoing with Forestry Service to improve tree felling and replanting techniques resulting in fewer high colour and turbidity incidents when forestry activities are carried out, particularly at Lough Bradan WTW. This improvement will be particularly evident during times of peak flows and high rainfall events.
Example Project 2 – A pilot project is being developed at Lough Bradan WTW to monitor quality at each of the individual intakes, then install online quality monitors and automatically control flows to the WTW, maximising use of technology to ensure that the best possible water quality is received at the WTW intake point. Improving the raw water quality in the water supply network and monitoring water quality at each abstraction point will allow the best quality water to be abstracted and will assist in reducing treatment costs.

Annual Information Return 2018 Section 2 Chapter 47 Page 35 of 67
Benefit 3 - NI Water will, over time, see an improvement in the reliability of water quantity from its upland sources Example Project - ‘Co-operation Across Borders for Biodiversity Project’ INTERREG VA Project NI Water have been working in partnership with Royal Society for the Protection of Birds Northern Ireland (RSPB NI) and other partners on a project funded by INTERREG VA and managed locally by the Special European Union Programmes Board (SEUPB). The project is called the ‘Co-operation Across Borders for Biodiversity’ (CABB) Project and began in 2017, with completion in late 2021.
The overall objective of the CABB project is to bring about the recovery of protected habitats (active raised and blanket bog) and priority species (breeding waders and marsh fritillary at key sites) on a cross border and cross country basis. The overall CABB project has been awarded €4.6m of EU funding for projects in Scotland, N Ireland and the Republic of Ireland. CABB will contribute to delivering the EC Birds and Habitats Directives and Biodiversity Strategies in each of the three countries and will link with strategies for climate change mitigation and adaptation and sustainable development in the three countries, as well as Programme for Government targets.
The NI Water aspect of the project will involve a €1.75k project to restore of the entire Dungonnell WTW catchment area at Garron Plateau on the Antrim Hills, which is in the catchment of Dungonnell WTW. NI Water owns 2000ha of the Garron Plateau SAC and previously 72ha of land has had drain-blocking work done. Through CABB, an additional 444ha of blanket bog will be managed by blocking 38.4km of drains. NI Water will oversee the drain blocking and aim to produce an information booklet highlighting how the work was done and the benefits delivered.
Garron Plateau is the largest expanse of intact blanket bog in Northern Ireland and it is home to protected birds of prey and rare plants such as marsh saxifrage and bog orchid. NI Water, working with the assistance of the RSPB NI and INTERREG VA aim protect and restore the peatland on the plateau, ensuring that the whole catchment is managed sustainably.
The CABB project will restore the natural hydrological conditions by blocking drains using peat, stone and sheet dams to raise the water table. This results in raising the water table and the “re-wetting” of the bog, promoting colonisation by Sphagnum moss, an essential component of a functioning bog. The creation of these peat dams reduces the water velocity in the drains and allows more settlement time. This reduces runoff and improves raw water quality and reliability by improved regulation of supply through the retention effects of the bog. This will result in cost savings at the treatment works, as the requirement for chemical treatment to remove colour from the raw water will be reduced.
Benefit 4 - NI water will work toward meeting its environmental obligations in its catchments Example Project - There is an annual plan to control invasive species, rhododendron and cotoneaster, in the Mournes catchment landholding to ensure designated land is managed and environmental obligations are met. Work is currently underway to digitally map this work and monitor the progress in controlling these invasive species.

Annual Information Return 2018 Section 2 Chapter 47 Page 36 of 67
Benefit 5 - NI Water will work with stakeholders to improve the overall condition of its catchments The Eastern Mournes Wildfire project is carried out to reduce the risk of wildfires damaging wildlife habitats and adversely affecting raw water quality from the catchment. This project was carried out with a range of stakeholders, e.g. NIFRS, NIEA, Mourne Heritage Trust, UFU, DAERA, etc. Work is currently underway to digitally map the areas affected by wildfires and monitor areas where deliberate actions have been undertaken to control wildfires.
Benefit 6 - The people of Northern Ireland will benefit from improved biodiversity in Northern Irelands Water’s land and, over time, and a reduction in the costs associated with treating raw drinking water. Example Project – Work is ongoing in liaison with the Woodland Trust to plant riparian strips along watercourses to enhance habitats, resulting in enhanced biodiversity and improved raw water quality. This improves raw water quality through buffer zones to protect from pesticide pollution, bankside erosion and livestock encroachment/excretion in the waterway. This improvement will be particularly evident during times of peak flows and high rainfall events. One example is the riparian planting project at the Glenedra River where NI Water, The Woodland Trust and The Loughs Agency co-operated to complete a riparian tree-planting project. NI Water abstract water from the Glenedra River, where water quality can frequently be poor due to bankside erosion and instability of the river. In order to improve water quality for abstraction, wildlife habitats and aquatic life, a 3.89 ha site was planted with native broadleaf trees along the banks of the river. Trees planted along riverbanks can provide many water management benefits, acting as a physical barrier, preventing pesticides drift from reaching watercourses and tree roots help stabilise riverbanks and create structural complexity in the water habitat. There is a resultant reduction in the water discolouration and sediment coming into Water Treatment Works. The cost of this type of project is small to NI Water as the other partners involved contribute significantly through internal and external funding sources.
The following SCAMP projects are planned for 2018/19: 1. Recommendations from Catchment Management Studies – Throughout the PC15
period we have engaged consultants to assess and collate information on all WTW'scatchments where raw water is abstracted for treatment. The Catchment ManagementPlans were completed using the UKWIR approach, “Quantifying the Benefits of WaterQuality Catchment Management Initiatives”. By the end of the 2017/18, financial year21 catchment studies have been completed and the 2 remaining studies will becompleted in 2018/19 as part of the INTERREG VA Source to Tap Project. Thecompletion of the Catchment Management Studies has resulted in a wide range ofrecommendations to improve raw water quality, meet DWI enforcement requirementsand enhance ecosystems/habitats, thus helping NI Water meet the environmental andwater quality customer promises. It is a requirement as part of the PC15 determinationto implement these recommendations, which it is planned to begin in 2018/19. Theserecommendations firstly need to be investigated to determine if they are feasible, andthen implemented, subject to funding and resource availability.
2. Mourne Wildfire Containment - The Silent Valley drinking water catchment area hasbeen subject to wildfires, which damaged large areas of upland heath, impacting boththe environment and water treatment costs due to the carbon run-off. NI Water, inconjunction with Mourne Heritage Trust (MHT), NIEA and NI Fire and Rescue Service(NIFRS), have commissioned a report by Wildfire Advisory Services. This paves theway for a focused and structured approach to managing wildfire outbreaks in the widerEastern Mournes area, considering practical wildfire management and emergencyresponse within the drinking water catchment. This report has been adopted and NIW

Annual Information Return 2018 Section 2 Chapter 47 Page 37 of 67
are committed to proceeding with implementation as part of the partnership. During the 2018/19 period, it is proposed to carry out controlled burns to reduce the risk to the water catchment area and consider fencing of risk areas to allow livestock grazing to sustainably manage vegetation fuel loads for fires.
3. Mourne Invasive Species Control - The expansion of invasive species such asRhododendron and Cotoneaster is of concern to upland heath land management as itcauses damage to the designated habitats and erosion, which impacts on raw waterquality. There is a legal obligation for NI Water to control these invasive species on ourlandholdings. Work has been ongoing in recent years, but the work needs to continueto further control invasive species and prevent re-colonisation. This is particularlyimportant to help ensure that native plants have the opportunity to establish within thecatchment.
4. Mournes Heathland Management - NI Water have developed a successful workingrelationship with Mourne Heritage Trust (MHT) and work together to mutual benefit inmanaging the Silent Valley catchment which is owned by NI Water. MHT have recentlybeen successful in obtaining funding of €100k annually over the next 3 years throughan INTERREG VA Northern Periphery and Arctic programme (NPA) EU fundingapplication, which was supported by NI Water. This will involve a project to carry outenvironmental enhancements work on NI Water owned land in the Mournes,maintenance on paths where works have been done, stitch in time to prevent erosion,some larger erosion work, develop a management plan and use the project to developknowledge and skills and training. This will bring in a significant value of work on ourcatchment land at minimal cost to NI Water. It is proposed that NI Water carry out somehabitat restoration work under the SCaMP NI project to add value and support the MHTproject and to help develop a ‘leverage’ ethos, whereby NI Water can contribute arelatively small amount, allowing NGO’s to attract larger funding sources.
5. Riparian Planting – The SCaMP NI team has carried out successful riparian planting ata number of catchment areas in recent years. These areas enhance biodiversity andhelp raw water quality by reducing erosion and livestock encroachment. These projectswere carried out alongside NGO’s and were able to avail of match funding. It isproposed to do more of this type of sustainable work in 2018/19 as opportunities arise.
6. Pesticide Risk Mapping - Over the past 5 years there is an increasing MCPA pesticideresidual problem at many of NI Water’s drinking water sources, which has resulted in anumber of water quality exceedances and DWI Enforcement actions. NIW have anundertaking with DWI to do catchment measures in these areas to address the problem,in the form of engagement visits or other initiatives to reduce the pesticide levels. It isnot practical to resource this engagement across the entire catchment area, so amapping exercise is needed to highlight the high-risk areas for pesticides. This will bedone by investigating land use, soil types, rainfall, proximity to watercourses and thenusing this information to specifically target the identified high-risk areas. The resultanttargeted engagement will aim to raise the profile of the risks to our drinking watersupplies from pesticide use and also to educate farmers and other landowners in bestpractice and correct methods when using pesticides or spraying.
7. Weed Wiper Trials – The innovative weed-wiping that was carried out in Seagahancatchment area in summer 2017 has been largely successful. This trial will need to becontinued in 2018, as there is an obligation in the landowner agreements. In summer2017 there have also been a number of MCPA raw and final water exceedances atGlenhordial WTW. This is the first time that Glenhordial has had an MCPA problem andthere is a risk of DWI enforcement at this site if this is repeated in 2018. It is now apriority to take pro-active catchment management action to address this and reduce therisk of further failures of the drinking water standards. It is planned to do an additionalweed-wiping trial in the Glenhordial Catchment in 2018, as part of a 4-year project toaddress this problem.

Annual Information Return 2018 Section 2 Chapter 47 Page 38 of 67
8. Farm Liaison Officer Recruitment – The farm liaison officer has been recruited on atemporary basis for the past few years to carry out farm visits to raise the profile of therisks to our drinking water supplies from pesticide use and also to educate farmers andother landowners in best practice and correct methods when using pesticides orspraying. It will be necessary to extend this post to carry out the following duties:
o Ballinrees WTWs - In July 2017, there was a Consideration of ProvisionalEnforcement Order by DWI in relation to MCPA contraventions. NIW have anundertaking to do catchment measures in this area to carry out additionalsampling at various locations on the River Bann and to carry out targetedengagement visits within the catchment area. The Farm Liaison Officer will beneeded to do this work on the ground, firstly to establish the high-risk MCPAareas in the catchment and then to identify suitable sample locations on theBann system. It will also be needed to source suitable passive samplingequipment and then carry out targeted farm engagement visits.
o Glenhordial WTW - The Farm Liaison Officer will be needed to investigate thesources of MCPA and to manage the proposed weed-wiping project.
o Seagahan WTW - The temporary SCaMP NI Farm Liaison Officer is managingthe ‘Rush Solution Without Pollution’ weed-wiping trial in SeagahanCatchment in summer 2017 & 2018. This project was successful in 2017 andthere is an agreement with landowners to continue this work in summer 2018in order to address MCPA / catchment issues.
9. Catchment plans for ‘mothballed’ impounding reservoirs. These plans will give thedetail on how the catchment land will be managed going forward to give maximumbenefit to NI Water and ensure that legislative requirements are met.

Annual Information Return 2018 Section 2 Chapter 47 Page 39 of 67
DEVELOPMENT OUPUT
10. Minimising the water quality risk from lead pipesFinal Determination: The company shall provide an annual report detailing how the implementation of its strategic lead policy and lead replacement programme is progressing. This should explain how the company is managing this actMty and targeting hotspots to maximise benefits and how it is assessing the improvements delivered by the work undertaken.
The report shall also provide details of the activity undertaken by the company, in conjunction with other stakeholders, to develop and implement a strategic risk based approach for addressing compliance issues associated with private supply pipes and domestic distribution systems.
Additional Details:
The lead replacement programme is 'Business As Usual' with analysis being undertaken by Asset Management and briefed for delivery to Engineering Procurement. To date the target number of lead replacement pipes per annum has been achieved.
PROJECT SUMMARY • Annual update on the lead pipe replacement programme is provided through the company's
AIR Return: 'AIR 16 Submission -2015-2016 Table 47 - Line 1 O - Minimising the WaterQuality Risk from Lead Pipes'.
• To better inform DFI Water Policy Unit, as part of the Long Term Water Policy Strategy, aLead Service Replacement Pilot has taken place at Craigyhill Bungalows, Lame. As part ofthe pilot the complete service pipes, including the Supply Pipes, were replaced to assess thecost and benefits of such an approach with a view to grant scheme being established. AReport on the pilot has been produced and issued to Dfl for policy consideration.
KEY MILESTONES Taraet Status 1. Annual reporting provided through the AIR Return process. Annually BAU 2. Complete pilot study for Dfl policy development. March 16 Complete 3. Develop summary document and recommendations to assist Sent to Dfl Complete Dfl in developing policy. April 18
Minimising the water quality risk from lead pipes Part 1 - Progress of the Implementation of Strategic Lead Policy and Lead Replacement Programme The NIW Lead Project comprised a desk top survey (alongside proactive targeted sampling) of available data from NI Water Corporate Systems relevant to lead services and analyse and collate information and data obtained onto Mapinfo layers (In Open Format) to compile a prioritised and costed schedule of lead replacements for PC15.
Work also included Scheme Prioritisation and Site Verification work including visual inspections and sampling work.
The methodology includes: -• Prioritise by highest exceedances and densest clusters• Desktop exercise to help focus on the areas required for further sampling
verification and review• If the network distribution pipe is considered unsuitable - pass the scheme over to
Engineering Procurement Watermains Rehabilitation Team for replacement of thedistribution main and the related communications pipes together.
• On site sampling and inspections to further verify priority areas• Ensure value for money in delivery of this work by clustering work where possible

Annual Information Return 2018 Section 2 Chapter 47 Page 40 of 67
Prioritisation The Asset Performance Networks Water Team compiled a Specification for this approach and, following a Tender exercise; Consultants were appointed to deliver the required outputs.
A quantitative, risk-focussed analysis procedure to identify lead “hotspots” across Northern Ireland was then commenced. The focus of this approach was to use available datasets in a transparent and cost effective process, which is easily repeatable or editable in the future using updated datasets or incorporating new data as it becomes available.
Taking cognisance of best industry practise and recent DWI guidance it was agreed between NIW and the Consultant, that greater emphasis be placed on using an evidence based approach, such that once the initial hotspots were prioritised, a second stage involving customer site surveys and a water quality sampling exercise be undertaken to validate the assumptions. This approach facilitates an assessment of risk based on the combination of the likelihood (probability) of occurrence and the consequence (extent and seriousness) of the failure on the quality of water received by NI Water’s consumers. The following staged approach was adopted.
1. Data Gathering and Desktop Analysis,2. Prioritisation of those hotspots based on probability of lead occurrence,
The various datasets were spatially analysed using MapInfo software to create “hotspot” areas based on combining clusters of unusually high concentrations of point data, such as water quality lead exceedances (>10µg/l) and watermains of a known age (i.e. those installed pre 1920). The digitisation of hotspot polygons allowed the large datasets to be rationalised into a manageable number of areas which contained a high probability of lead occurring. A range of polygons was initially created by spatially querying various lead indicator criteria or where lead piping was confirmed to be present. They were then manually reviewed to validate the information and edited by enlarging or enclosing each, based on similar cohorts
Assignment of a prioritisation score to each dataset was derived based on the significance of each as an indicator of the likelihood of lead occurring or its impact to public health. An iterative sensitivity analysis process was also conducted to test the robustness of each assessment criteria and understand the causal relationships between datasets. The scoring matrix assigned to each is described below.
Watermains Age Lead was used throughout Northern Ireland up until ~1975 for connecting a property to the water supply main and for internal plumbing. Lead’s availability, inherent strength, malleable nature and corrosion resistance properties meant it was favoured over other metals such as copper and brass.
Accordingly, watermains of a certain age have been assessed as a good indicator of the presence of lead and the criteria in Table 1 below were used to score the age of watermain criteria. To ensure that each polygon was assessed using its predominant watermain age type, those polygons that contained only a small % of a differing age type were discounted, by applying a rule that selected the most common type of watermain age within the polygon.


Annual Information Return 2018 Section 2 Chapter 47 Page 42 of 67
the worst performing OMA, such that any potential replacement scheme would provide water quality betterment to customers within the entire OMA, and potential neighbouring or cascading OMA. The scoring system is presented in Table 3 below.
Criteria Lead Result (µg/1)
<10 (contains 97% of WO samples)
10-20.19 (contains 1% ofWQ samples)20.20 - 38.99 (contains 1% of samples) > 39 (contains 1 % of WO samples)
(* Note The overall score= 2 x 3)
Table 3: Water Quality Results
WQ
Weighting Score Factor <2l (3)*
0 0
0.5 1
1.5 2
2.0 3
A thematic illustration of those OMA's ranked by the highest percentage of water quality failure is available on request. The output showed that the largest numbers of OMA with a higher percentage of failures are concentrated in the Greater Belfast area.
Northern Ireland Housing Executive (NIHE) Properties NIHE has endeavoured to provide an extract from its digital asset dataset, which details the ownership of properties in Northern Ireland and the age of the dwelling. Once received this data can be used to verify assumptions regarding the age of watermains and identify additional areas where lead may be present. NIHE has confirmed that it has no capital works planned in the short-term (2015) to replace kitchen or private supply pipes. Accordingly, there appears to be limited opportunity to coordinate the replacement of customer communication pipes with NIHE private supply pipes where practical, in the short term.
Watermains Rehabilitation Programme The NI Water Watermains Rehabilitation Programme Team provided detailed information in relation to the numbers of lead communications pipes replaced on each rehabilitation / replacement scheme installed between the years 2005 to 2014. Once cleansed the data provided details on some 8,150 lead pipe replacements undertaken during the Watermains Rehabilitation Programme and following a digitisation exercise the information was spatially mapped to link to the NI Water PC13 Schemes Core Maplnfo table.
92% of the WMRP schemes which involved replacement of lead communication pipes occurred in the Greater Belfast area. In contrast to the other data sources which were potential indicators of lead presence, this source confirmed that lead didn't exist and as such it wasn't possible to assign a score to each polygon. In this case the data was used to manually review each lead hotspot to,
• identify hotspots for removal following confirmation of rehabilitation (For the most partthe NI Water AIC GIS data confirmed this, though this process captured any recentlyconstructed mains that hadn't yet been returned to the NI Water AIC),
• Identify additional (neighbouring) polygons where lead was likely to be present usingsimilar water main cohorts.


Annual Information Return 2018 Section 2 Chapter 47 Page 45 of 67
The 3 year target has been achieved, as the number of lead communications pipe replacements respectively from AIR 16, 17 and 18 is: 192 2 + 1867 + 1767 = 5556nr from table 6b.
50% of the Lead Communications pipes to be replaced in PC 15 (12 796 is the PC 15 total) have been completed by March 2018
30% of the total was under construction by March 2018
15% of the total was very difficult to access or had resistance from local residents (Those on the table below which have a grey background)
5% of schemes had yet to be assigned to a Contractor by March 2018
NIW are now looking at reviewing the potential 15% shortfall above, and looking into identifying 2 000 or so new Lead Communications pipe replacements to fill the PC 15 “hopper” and also further Lead Communications pipes to start off the PC 21 requirement.
Also included below is a list of possible areas to be reviewed and sampled for PC 21 if the current methodology remains (i.e. identified as Year 7 to Year 12 replacements.

Annual Information Return 2018 Section 2 Chapter 47 Page 46 of 67
PC15 Proactive Replacement Programme Proposed by Asset Management for PC15 S T bl 11 f I t II f P - ee a e or ns a a 10n rogress
Prioritised Hotspot Works Date Water Lead Comms Cost@ Locations for PC15 Package Issued to Quality Pipes £500/pipe
Issued to E&P E&P Survey Submitted YEAR 1 Marina Park Yes Feb-15 Jan-15 356 £178,000.00
Orangefield Crescent Yes Jun-15 Jan-15 301 £150,500.00 Gilnahirk Ph1 Yes Jun-15 Feb-15 437 £218,500.00
Ulsterville Gardens Yes Jun-15 Jan-15 414 £207,000.00 Ebor Street Yes Jun-15 Feb-15 428 £214,000.00
West Wind Terrace Yes PC13 PC13 27 £13,500.00 LPRP
Victoria Gardens Yes PC13 PC13 16 £8,000.00 LPRP
Ransevyn Park Yes PC13 PC13 84 £42,000.00 LPRP
Derryvolgie Avenue Yes PC13 PC13 66 £33,000.00 LPRP
Ballycraigy Park Yes PC13 PC13 52 £26,000.00 LPRP
Victoria Court Yes PC13 PC13 79 £39,500.00 Donaghadee LPRP
TOTAL 2260 £1,130,000.00 YEAR2 R . i Road (Dh 1) Yes Seo-15 Feb-15 603 £301.500.0(]
Irwin Avenue Yes Seo-15 Mar-15 445 £222.500.0(] Morven Park (Dh1) Yes Mar-16 Feb-15 199 £99.500.00
Gilnahirk nh2 Yes Mar-16 Feb-15 434 £217.000.00 Grand Parade Yes Seo-15 Jan-15 412 £206.000.0(]
TOTAL 2093 £1.048.500.00 YEAR3 York Park No Mar-16 Dec-15 301 £150,500.00
Tates Avenue No Mar-16 Feb-15 1391 £695,500.00 Creaaah Road No Mav-16 Feb-16 449 £224,500.00
TOTAL 2141 £1,070,500.00 YEAR4 Deramore Avenue No Mar-16 Dec-15 684 £342,000.00
Roseberry Road (Ph 2) No Mar-16 Feb-15 722 £361,000.00 Willowholme Drive No Mar-16 Mar-15 445 £222,500.00
Mvrtlefield Park No Mar-16 Jan-16 204 £102,000.00 Cranmore Gardens No Mar-16 Jan-16 128 £64,000.00
TOTAL 2183 £1,091,500.00 YEARS Bramcote Street No Mar-16 Mar-15 375 £187,500.00
Beechmount Crescent No Mar-16 Dec-15 722 £361,000.00 Kirkliston Park No Mar-16 Jan-16 419 £209,500.00
Ravenscroft Avenue No Mar-16 Jan-15 493 £246,500.00 Eastleigh Crescent No Mar-16 Jan-16 90 £45,000.00
Breda Gardens No Mar-16 Jan-16 50 £25,000.00 TOTAL 2149 £1,074,500.00
YEAR6 Ainsworth Street No Mar-16 Jan-16 444 £222,000.00 Dunlambert Park No Mar-16 Mar-15 285 £142,500.00 Hay park Avenue No Mar-16 Dec-15 260 £130,000.00 Windsor Avenue No Mar-16 Feb-15 82 £41,000.00
Birch Drive No Mar-16 Feb-15 210 £105,000.00 Ormiston Crescent No Mar-16 Jan-16 151 £75,500.00
Wandsworth Parade No Mar-16 Jan-16 291 £145,500.00 Cherrvvallev Park No Mar-16 Jan-16 335 £167,500.00 Lvnnwood Park No Mar-16 Jan-16 39 £19,500.00
Schomberg Park No Mar-16 Jan-16 53 £26,500.00 TOTAL 2150 £1,075,000.00
Totals 12,976 £6,488,000.00

Annual Information Return 2018
Potential Prioritised Hotspot Locations for
Review for PC21
YEAR7 Orpen Drive
Ethel Street
Balfour Avenue
Thomas Street
Wellington Park
Milfort Avenue
Beechland Drive
TOTAL YEARS Castlereagh Street
Montgomery Road
Castledona Crescent
Portallo Street
Avoniel Road
Braeside Grove
Onslow Gardens
Ravenhill Park
Hillsborough Drive
TOTAL YEAR9 Kent Avenue
Glenbank Drive
Glenbryn Drive
Joanmount Park
Eastleigh Drive
Veryan Gardens
Thorndale Avenue
Crumlin Road
Somerton road
Kelvin Parade
TOTAL
Works Works Water Package Package Quality Issued to Issued to Survey
Asset E&P Performance
Mar-16 No To be Surveved
Mar-16 No To be Surveved
Mar-16 No To be Surveyed
Mar-16 No To be Surveyed
Mar-16 No To be Surveved
Mar-16 No To be Surveved
Mar-16 No To be Surveyed
Mar-16 No Tobe Surveyed
Mar-16 No Tobe Surveved
Mar-16 No Tobe Surveved
Mar-16 No Tobe Surveyed
Mar-16 No Tobe Surveyed
Mar-16 No Tobe Surveved
Mar-16 No Tobe Surveved
Mar-16 No Tobe Surveyed
Mar-16 No Tobe Surveyed
Mar-16 No To be Surveved
Mar-16 No To be Surveved
Mar-16 No To be Surveyed
Mar-16 No To be Surveyed
Mar-16 No To be Surveved
Mar-16 No To be Surveved
Mar-16 No To be Surveyed
Mar-16 No To be Surveyed
Mar-16 No To be Surveved
Mar-16 No To be Surveved
Section 2 Chapter 47 Page 47 of 67
Lead Comms Cost@ Pipes £500/pipe
Submitted
351 £175,500.00
567 £283,500.00
385 £192,500.00
316 £158,000.00
115 £57,500.00
167 £83,500.00
221 £110,500.00
2122 £1,061,000.00 99
£49,500.00 122
£61,000.00 479
£239,500.00 433
£216,500.00 126
£63,000.00 448
£224,000.00 215
£107,500.00 109
£54,500.00 62
£31,000.00 2093 £1,046,500.00
73 £36,500.00
185 £92,500.00
277 £138,500.00
583 £291,500.00
106 £53,000.00
263 £131,500.00
74 £37,000.00
177 £88,500.00
93 £46,500.00
170 £85,000.00
2001 £1,000,500.00

Annual Information Return 2018
YEAR Knockwood Park10
Northwick Drive
Orangefield Avenue
Cyprus Avenue
Clonlee Drive
TOTAL YEAR Cherryhill Avenue
11 Cabin Hill Gardens
Holywood Road
Ardcarn Way
Knocktern Gardens
Victoria Road
Kings Road
Strandburn Drive
Leven Park
TOTAL YEAR Abbey Ring
12 Church Avenue
Clifton Road
Lancaster Avenue
Bloomfield Road
Newtownards Road
TOTAL
Mar-16 No To be Surveved
Mar-16 No To be Surveved
Mar-16 No To be Surveyed
Mar-16 No To be Surveyed
Mar-16 No To be Surveved
Mar-16 No To be Surveved
Mar-16 No To be Surveyed
Mar-16 No To be Surveyed
Mar-16 No To be Surveved
Mar-16 No To be Surveved
Mar-16 No To be Surveyed
Mar-16 No To be Surveyed
Mar-16 No To be Surveved
Mar-16 No To be Surveved
Mar-16 No To be Surveyed
Mar-16 No To be Surveyed
Mar-16 No To be Surveved
Mar-16 No To be Surveved
Mar-16 No To be Surveyed
Mar-16 No To be Surveyed
Totals
355
818
654
95
84
2006 346
210
368
222
89
192
424
196
50
2097 535
97
301
143
612
315
2003 12,322
Section 2 Chapter 47 Page 48 of 67
£177,500.00
£409,000.00
£327,000.00
£47,500.00
£42,000.00 £1,003,000.00
£173,000.00
£105,000.00
£184,000.00
£111,000.00
£44,500.00
£96,000.00
£212,000.00
£98,000.00
£25,000.00 £1,048,500.00
£267,500.00
£48,500.00
£150,500.00
£71,500.00
£306,000.00
£157,500.00 £1,001,500.00
£6,161,000.00

Annual Information Return 2018 Section 2 Chapter 47 Page 49 of 67
DEVELOPMENT OUPUT 11. Water Meter Renewal
Final Determination: The company shall report progress against its programme of water meter renewal, targeted to deliver a uniform rate of replacement to ensure that all revenue meters are no more than 17 years old bv the end of PC15. PROJECT SUMMARY NIW in accordance with the company policy on Proactive Meter Exchanges (PME) set out its PC15 programme of replacements over a 6 year period,
• The data obtained from the Rapid corporate billing system indicated 29059 water meterswould meet the PME criteria during the period 2015-2021. These meters were across allof the billing status.
• It was envisaged that 4843 meter per year would be targeted for replacement over a 6year period
• During 15/16 NIW due to better than expected success rates decided to increase the paceof replacement and was able to exchange 6,920 meters as opposed to the planned 4843
• During 16/17 NIW was again due to better than expected success rates able to increasethe pace of replacement and was able to exchange 7,399 meters as opposed to theplanned 4843
• At the start of 17/18 NIW started to target status's other than supplied and issued 75 domestic meters for replacement. As NIW is no longer installing domestic meters seniormanagement determined that proactive replacement of domestic meters should alsocease. As a consequence of this NIW were able to replace 272 non-domestic metersbased on age profile.
• Due to the accelerated rate of replacements during 15/16 & 16/17 NIW plans to scale backreplacements for the remainder of PC15. The target of 29,058 meters included all status,PME will now only target supplied billable meters which excludes domestic non-billedcustomers.
KEY MILESTONES Target Status 1. 2015/16 4.843 6,920 2. 2016/17 9,686 14,319 3. 2017/18 14,529 14,591 4. 2018/19 19,372 5. 2019/20 24,215 6. 2020/21 29,058
• As part of its PC15 Business Plan submission, NI Water stated that the company hasa policy to proactively replace customers' meters which are > 17 years old and or havea recorded consumption of >8000m3 .
• NI Water is aware having completed research involving extracting and testing samplenumbers of customer meters that meters have the propensity to under recordconsumption as they get older. Wider water industry research also supports thisposition with many GB companies proactively replacing their meter stock from theage of 10 up to 17+ years.
• The numbers of meters matching the NI Water criteria as extracted from the companybilling system and quoted to NIAUR are detailed below.

Annual Information Return 2018
PC15 - PME Numbers Due for 2015/16 2016/17 2017/18 2018/19 2019/20 Reolacement
Install Year 1998/99 1999/00 2000/01 2001/02 2002/03 Meeting Age 11,634 1,682 2,105 2,905 3,038 Criteria
Meeting Consumption Criteria
Overall Total Proposed 4,843 4,843 4,843 4,843 4,843 Replacement Proqramme
*23,426 total = 25,076 - 1,650 ongoing PME jobs between Oct14-Mar15
Section 2 Chapter 47 Page 50 of 67
2020/21
2003/04 Total 3,712 23,426*
5,633
29,059 4,843
• Pre-empting the PC15 mid-term review and in response to the regulators T47 queryNI Water has to report the following progress.
• NI Water based on the above numbers has been more proactive in its PMEprogramme during 2015/16 than originally proposed replacing 6920 meters asreported in AIR16. Up until 17/18 the proposed number of meters has been replacedbut since it has been decided that only billable meters are eligible for PME there areonly approx. 1500 to be proactively replaced until the end of PC 15 - some of thesemay be replaced reactively on failure.
• The reason for completing more replacements is that NI Water was able to securebetter contract rates following the amalgamation of two former maintenance contractsused for metering into a single and more competitive meter installation andreplacement contract.
• he billing system has the entire customer meter stock listed against various fieldsknown as water statuses. Examples of these meter statuses are described in thetable below.
NI Water - Corporate Billin System Water Status1 Combination meter- 8 RFR - compensation
low supply2 Dom sub meter 9 RFR - no billable
name/address 3 Domestic supplied 10 RFR - shared supply 4 ORD supply 11 RFR - unable to locate 5 Free supply 12 Sub meter 6 Not supplied 13 Supplied 7 Retain For Review 14 Trade Effluent
(RFR)

Annual Information Return 2018 Section 2 Chapter 47 Page 51 of 67
NI Water has to date focused its PME programme on the water status numberscontained within the supplied category. It has now been decided that unless there isa change in legislation NIW will only be replacing billable meters
Being able to better the original anticipated profile has enabled NIW to address thepotential under recording of consumption due to the age of the meter and thusimprove the accuracy of its measured consumption.
NI Water will continue to further review its meter data associated with the other waterstatus categories. NI Water will where appropriate issue meter exchange batches tothe metering contractor through the remainder of PC15.

Annual Information Return 2018 Section 2 Chapter 47 Page 52 of 67
DEVELOPMENT OUPUT 12. Targeting sewerage 'hotspots'
Final Determination: The company shall report on its plans to target sewerage hot spots of blockage and collapse and the development of its sewerage intervention prioritisation to incorporate the outcome of PC15 consumer engagement. The company shall provide updates on the implementation of the prioritisation annually through PC15.
Additional Details:
The Sewerage Hotspot tool is now BAU activity. PROJECT SUMMARY • Hot-Spots of Blockages
- Monthly reports generated automatically to inform Asset Performance and CSDD. - Joint AP/CSDD liaison to determine and agree further root cause investigation needs.
• Sewer Collapses- Sewer collapses are repaired as and when they occur; either through CSDD intervention
or through AP for EP delivery of remedial for larger scale repair needs. • Sewer Infrastructure Investment Model (SIIM) is operating as a BAU tool to identify and
prioritise sewer Structural Grade 4s & Ss sewer lengths for consideration for rehabilitation as one of the Capital Maintenance Planning tools.
• The SIIM is refreshed annually using updated corporate datasets (e.g. collapses, blockage,out of sewer flooding, pollution, and customer contacts etc.). Annual updates are used to inform the next year's rehabilitation investment programme.
• The rehabilitation programme is risk-based and focused on individual sewer lengths classifiedas 'High Risk' and 'High Consequence'.
• Asset Performance undertakes a targeted CCTV programme and then liaises with CSDD to confirm sewer condition and agree the extent of rehabilitation required prior programmesubmission to EP.
• From April '17, the rehabilitation programme will be forwarded to EP on a quarterly basis (as opposed to annually). This will allow improved delivery programming.
• Methodology reviewed periodically as BAU to maintain best practice. Review of SIIM has commenced.
KEY MILESTONES Target Status 1. Sewer blockaae 'Hot-Soot' Reoortina Monthly BAU 2. Review SIIM methodology. June'18 BAU
Planned next steps for delivery The next steps for delivery include determining whether richer data sets and information are required in order to generate more accurate reports. The purpose being to further reduce the number of blockages across the various catchments in the Province.

Annual Information Return 2018 Section 2 Chapter 47 Page 53 of 67
DEVELOPMENT OUPUT
13. Polluted Storm Water Overflows
Final Determination: The company shall report progress on the investigation and remediation of storm-water overflows including enforcement action taken by various authorities and any remediation action undertaken.
Additional Details:
NIEA identified 47 priority catchments where there appear to be issues with misconnections. To date NI Water has investigated 24 and has been able to resolve a number of pollution issues through "quick wins". However, it has not always been possible to close out issues, as there is a gap in the legal powers available to NI Water to remedy misconnections.
PROJECT SUMMARY • A Working Group has been established comprising Dfl's Water and Drainage Policy Division
(WDPD), NI Water and NIEA have agreed a new policy for dealing with misconnections.
• WDPD, NIEA and NI Water have produced a shortened version of the good practicedocument titled "Investigation and rectification of drainage misconnections", condensing it toreflect present agreed procedures for dealing with misconnections.
• WDPD to liaise with Dfl Planning Group to establish how best to promote / educate on theproblems associated with misconnections.
• Continued development and refinement by NI Water and NIEA has strengthened theinvestigatory process and working practices.
• Where practicable NI Water has dealt with misconnections on a case-by-case basis .However, the vast majority of misconnections are related to washing machine connections.The Working Group is reviewing policy and legal aspects of correcting misconnections.
KEY MILESTONES Target Status 1. Joint Liaison Meetinas Onaoina 2. Prepare draft good practice document Nov17 3. Agree and implement good practice document Nov17
Activity completed to date and its outcome Stage 1 of this project has been completed which was the investigation of 24 catchments using CCTV techniques, dye testing and engaging with the public. Following on from these activities, NI Water has requested advice from its Shareholder on the next step to take on corrective actions. The present position on Polluted Storm Water Overflows is detailed below:
• 24 Catchments out of 47 catchments highlighted with NIEA have been surveyedregarding pollution of nearby rivers.
• The surveys highlight that most of the pollution is from private connections e.g.washing machines located in garages, which are connected to the roof gully, whichin turn discharges into a storm water sewer.
• A meeting took place in September 2016 between NIEA, NI Water and Dfl with thepurpose of developing a policy to address misconnections on private properties. Atthis meeting, NIEA highlighted that they had identified quick wins concerning someof the misconnections. However, following further investigation by NI Water it wasdetermined that these quick wins were not viable as they involved diverting stormwater into foul sewers, which did not have the necessary hydraulic capacity.

Annual Information Return 2018 Section 2 Chapter 47 Page 54 of 67
The Working Group continue to meet to establish how best to address privateconnections.
Until a policy is developed, NI Water has not conducted any further catchmentstudies. This decision was made with the agreement of NIEA (2015),
Misconnections located by NI Water on the public highway are being addressed i.e.they are being redirected to foul sewers.
NI Water is continuing to investigate and address pollution of storm water overflowswhere the misconnection is on public property with the help off NIEA.
Planned next steps for delivery The next step for delivery entails a request for clarification from DfI Water Policy Unit on the way forward: regarding potential enforcement actions.


Annual Information Return 2018 Section 2 Chapter 47 Page 56 of 67
containing tables that can quickly and easily be summarised in reports and easy to understand figures.
The basis of the Suds StudioTM analysis in Northern Ireland is the OSNI Vector mapping dataset. However, NI Water wishes to emphasise that SuDS StudioTM has been developed based on OS Master Map data, which is significantly more detailed and functional than OSNI Vector mapping. A significant amount of pre-processing of the data has therefore been required to supplement the OSNI Vector maps in an attempt to replicate the quality of information contained in OS Master Map. It is our understanding that there is a current project within OSNI to develop a polygon based mapping dataset that is similar to OS Master Map which when finished will enhance the output derived from SuDS Studio in Northern Ireland in the future.
However, based on the current situation significant pre-processing is required due to the GIS data available in Northern Ireland (plus time to acquire and purchase additional data sets) and has extended the time taken to conduct the SUDS StudioTM analyses. This in turn has resulted in the slower identification of storm water / SuDs opportunities in Northern Ireland with which to develop NI Water’s Storm Water Separation Programme of work.
Since its launch at the start of PC15, a fundamental goal of NI Water’s Storm Water Separation Programme has been to develop a robust approach for identifying priority locations across Northern Ireland. This is essential for the successful retrofitting of SuDS technologies / storm water separation infrastructure for the removal of significant volumes of storm water from the combined sewer system. Time taken in developing the system is considered well spent by NI Water and will drive a successful programme going forwards.
During 2015 and 2016, NI Water’s consultant has adapted SUDS StudioTM into a bespoke tool for identifying large surface areas in public ownership across Northern Ireland with potential for storm water separation / SuDS Technologies. This resulted in the identification of a large number of schools as potential pilot project sites with high estimated project costs and unfortunately did not yield the range of situations and catchments desired by NI Water. The four schools short-listed for separation and the recommended solutions summarised from the consultant report are presented below:
Campbell College: SuDS Studio recommends bioretention, swales and thedisconnection of downpipes. Recommendations are likely to be delivered entirelywithin the existing Campbell College boundary. Further work required to investigateground conditions, quantification of flows within SuDS features, quantification ofbenefits to the sewer system (including DG5 impacts), design development todetermine footprint and landtake, costings.
St Louise’s: SuDS StudioTM recommends bioretention and potential green roofs /disconnection of downpipes. Recommendations are likely to be delivered entirelywithin the existing St Louise’s boundary. Further work would require investigationinto ground conditions, quantification of flows within SuDS features, quantification ofbenefits to the sewer system (including DG5 impacts), design development todetermine footprint and landtake, costings. It is also to be noted about this site thatit is adjacent to an extensive area of wetland (Bog Meadows) managed by theUlster Wildlife Trust.
Ballycastle, SuDS StudioTM recommends bioretention, potential green roofs /disconnection, of downpipes and swales. Recommendations are likely to bedelivered entirely within the existing Ballycastle High School boundary. Furtherwork is required to investigate ground conditions, quantification of flows withinSuDS features, quantification of benefits to the sewer system (including DG5impacts), design development to determine footprint and landtake, costings. Other

Annual Information Return 2018 Section 2 Chapter 47 Page 57 of 67
considerations include the existing infrastructure in place on this site in that much of the system is already separately drained with only the ultimate connection point combined. As this is already, a piped system consideration should be given to continuing the piped network within Moyle Road to a suitable discharge point such as an existing storm sewer or RA culvert. Consideration will need to be given to the impact of this flow on the discharge location. Buildability constraints should be considered when determining any extension to the outfall pipeline route corridor
Dromore, SuDS StudioTM does not recommend any feasible option in this instancedue to limitations with the input data. In this instance therefore, engineeringjudgement has recommended that Disconnection of Downpipes be considered.Recommendations are likely to be delivered entirely within the existing DromoreCentral Primary School boundary. Further work is required to investigate groundconditions, quantification of flows within SuDS features, quantification of benefits tothe sewer system (including DG5 impacts), design development to determinefootprint and landtake, costings.
It is important to note that NI Water has already encountered significant stakeholder issues, notably with the Education Board, regarding the safety of SuDs (often used to enable storm water separation) which are yet to be resolved. One of these sights have now been agreed by NI Water at Clandeboye School, Bangor. NI Water is working closely with the Water and Drainage Policy Division of DfI regarding engagement with the Education Board and their legal representatives.
Subsequently NI Water initiated Phase 2 of planning NI Water’s Storm Water Separation Programme with the SUDS StudioTM tool. The tool was further modified and the initial SUDS StudioTM run identified a broader range of potential storm water separation opportunities to address the bias, which resulted in the identification of a large number of schools in Phase 1:
32 high density housing sites 61 Industrial estates and 28 potential quick win sites
Through the short listing process this was refined down to: 14 high density housing sites, 14 industrial estates and 6 potential quick win sites.
These sites were then packaged into geographically similar study areas and progressed for ground truthing connectivity checks.
Following on from the ground truthing exercise the sites which were assessed as suitable for further consideration were modelled with Infoworks to quantify the benefit that might be achieved from storm water separation / SuDS retrofit. This has allowed us to model and assess the following sites (Table 1) which are now being considered as pilot studies from Phase 2. In total, the maximum potential area, which could be removed as a result of the Phase 2 assessment, is 1,077,210 m2.
The Phase 2 opportunities mainly originate in High Density Housing areas and only one Industrial estate. Industrial estates have proven to be, on the whole, already separate systems. It should be noted that it is unlikely that the 100% separation figure modelled (total area = 1,077,210 m2) could be achieved in reality. Therefore, these figures should be

Annual Information Return 2018 Section 2 Chapter 47 Page 58 of 67
considered as an initial over estimate, which will reduce during the feasibility and implementation phases.
Furthermore, stakeholder issues will be key in determining the viability, likelihood of success and speed at which solutions can be realised. There are a number of other industrial estates and quick win sites, which are also suitable for further consideration (having been ground truthed), and these will be brought forward to NI Water in a Report. The sites and potential impermeable area removal (m2) have been presented in Table 1. It should be noted that consents are yet to be negotiated with a key stakeholder, Rivers Agency, where storm water is being separated and directed into a river or culvert.
Table 1: Phase 2 Sites identified with potential for storm water separation and SUDS solutions, including the associated potential maximum area removal values (m2).
Location Potential
Area Removal
m2
Potential Percentage Removal Options
Storm Water
Separation SuDS
Solutions Alliance Avenue / Brompton Park Area, Belfast 121,000 100% 56% Lincoln Court, Derry 76,200 100% 60% Carnhill Area, Derry 95,290 100% 55% Norglen Parade, Belfast 110,160 100% 64% Springfield Rd / Cavendish Road Area, Belfast 124,660 100% 49% St James Road, Belfast 50,860 100% 45% Tates Avenue / Donegal Rd / Dunluce Avenue Area, Belfast 461,980 100% 52% Maydown Industrial Estate, Derry 37,060 100% 39%
Significant delays in Phase 2 have been experienced in relation to the ground truthing connectivity checks being undertaken by a CCTV contractor.
As part of Phase 1 Asset Management also engaged within the NI Water Capital Works Programme requesting that stormwater separation should be considered as part of the options analysis regarding drainage solutions i.e. a business as usual process. This has yielded six projects in 2016/17 & 2017/18 and the impermeable area removal has been presented in Table 2.
Table 2 NI Water Capital Works Programme: storm water separation projects delivered in 2016/17 & 2017/18 and impermeable area removal (m2) values.
Sub Programme
Scheme Impermeable Area Removal
m2 24 PC15 Sewer Rehabilitation Unplanned 39 24 Olympia Leisure Centre Windsor Park Belfast 70,500 24 8-20 Sloans Street, Dungannon 16,460 24 Ben Crom Place Kilkeel 3,865 24 Foyle College, Limavady Road, Londonderry 82,000 24 Fitzroy Avenue, Belfast, 1,200
Total Impermeable Area Removed, m2 174,064

Annual Information Return 2018 Section 2 Chapter 47 Page 59 of 67
NI Water is endeavouring to move the Storm Water Separation Programme forward and feasibility studies for the sites identified in Phase 2 have now commenced. Once completed NI Water will be in a position to provide a more detailed programme of work which will be complemented by other NI Water Capital Works schemes containing storm water separation that arise during PC15.


Annual Information Return 2018 Section 2 Chapter 47 Page 62 of 67
enable NI Water to develop the detailed DG5 programme, populated with accurate costings and numbers of properties to be addressed in the PC21 Business Plan.

Annual Information Return 2018
DEVELOPMENT OUPUT 17. Sustainable Urban Drainage Systems (SUDS)
Final Determination:
Section 2 Chapter 47 Page 63 of 67
The company shall record information on SUDS applications and report annually on: - The number of applications received; and - The number of schemes adopted. The company shall maintain a register of its decisions on SUDs applications, highlighting the reasons any application was refused. PROJECT SUMMARY NI Water does not receive stand-alone SuDS applications. However, NI Water receives applications for future adoption of development sewers, some of which may have an integral SuDS system. • The reporting mechanism records the number of applications received and authorised for
future adoption of development sewers where SuDS is an integral part of the application.• The number of development sewers adopted with a SuDS element.• Development sewers with SuDS are not refused, rather encouraged, so this value will
invariably be 'nil'.KEY MILESTONES I Taraet I Status
1. Report on SUDs applications in AIR I Annually I BAU
Activity completed to date and its outcome NI Water does not have SUDS approval forms we have Art. 161 application forms 'Application for Agreement to Connect Sewers in a New Development' forms. Developer Services did not record adopted SUDS system for 15/16 AIR returns as it was not a requirement. For 16/17 AIR returns we will record the number of Art 161's approved which incorporate SUDS, we will record the number of adopted SUDS systems. We have updated sewer adoption forms to capture this information. Formal recording of SUDS included in adopted sewerage systems began at the start of 2016/17. A complete year's data will be available for AIR17.
2017/18 Housing sites adopted, incorporating SUDS utilising hyrobrake/vortex flow control. 23 sites. 2017/18 Housing A161 sites approved, incorporating SUDS utilising hyrobrake/vortex flow control 137 sites.

Annual Information Return 2018
DEVELOPMENT OUPUT
Section 2 Chapter 47 Page 64 of 67
18. Implementation of the PPC requirements for Odour Management
Final Determination: The company shall develop a plan for the implementation of PPG requirements for Odour Management by 31 March 2015, which shall be prioritised and agreed with NIEA. The company shall report progress against the delivery of this plan.
GOVERNANCE I Directorate I SRO I Project Lead Aooroving Authority
Asset Delivery I Paul Harper I Angela Halpennv EC Additional Details:
N/A PROJECT SUMMARY NI Water holds 29 Pollution Prevention Control (PPC) permits for WwTW sludge centres for thickening or dewatering wastewater sludges. The permits require odour modelling to be undertaken to assess the impact from the facility on the surrounding sensitive receptors. Recognising the financial impact and resources required to undertake the necessary modelling, a prioritised list was initially agreed with NIEA in June 2015.
NIEA ranked the 29 PPC sites into the following categories: - Priority 1 (4 sites),- Priority 2 (8 sites),- Priority 3 (12 sites) and- odour modelling not required (5 sites).
The modelling is divided into 2 phases.
The first phase is a library data based, screening exercise. If this exercise identifies an impact on surrounding sensitive receptors, the site will progress to the second phase, which involves collection of site-specific olfactometry data.
Whilst NIEA asked for odour modelling of Priority 1 sites to be completed in 2015/16, delays were incurred due to the time of year for undertaking the site based odour survey during the summer months, when emissions are likely to be at their highest (May/June to September). The odour modelling is now complete for all Priority 1 sites and Priority 2 sites with the exception of Ballymena WwTW which is currentlv beina uoaraded. KEY MILESTONES Taraet Status 1. Develop a plan for the implementation of PPC requirements for 31 Mar 15 Complete Odour Manaaement2. Completion of 2nd Phase odour models for priority 1 sites: 31 Dec 16 Complete Carrickferaus, New Holland, Dunaannon and Whitehouse.3. 2nd Phase odour model for the upgraded Newcastle WwTW 31 Mar 17 Complete 4. 1st Phase modelling based on library data for Priority 2 and 3 31 Mar 18 Complete sitess. Develop list of sites requiring 2nd Phase modelling 31 Mar 18 Complete 6. Undertake 2nd Phase modelling for sites identified in No. 4
above, selecting the priority 2 sites first, followed by the priority 31 Mar 19 On Target 3 sites
7. Using 2nd phase modelling develop and deliver a programme On Target of work reauired to meet PPC odour reauirements 31 Mar 21

Annual Information Return 2018 Section 2 Chapter 47 Page 65 of 67
NIW currently operates 28 WWTWs with PPC permits that fall under the regulations. A collaborative working group, the PPC Compliance Group, has been established between the NI Environment Agency (NIEA) and NIW to agree, progress and monitor the implementation of PPC requirements for Odour Management. This group meets on a quarterly basis to review actions, which have been agreed and prioritised by the group. NIW has been working closely with NIEA over the past 12 months in the development of feasibility studies and identification of outputs. The following spreadsheet details the Odour Modelling Implementation Plan and the programme of work required to meet PPC odour requirements. The sites, within the spreadsheet, have been prioritised based on:
whether an appropriate assessment has already been completed in line with theH4 guidance;
whether an assessment has already been completed, but it was not in accordancewith the H4 guidance;
whether the site is already a priority site; whether the site imports sludges from minor works or septic tank etc., as these
sites have a greater potential for odour generation; and, then further by the calculated throughputs.

Annual Information Return 2018 Section 2 Chapter 47 Page 66 of 67
NI Water Odour Modelling Implementation Plan
WwTW NIEA PriorityImport
site
Phase 1 Target Completion
Date
Phase 1 Actual Completion
Date
Phase 2 Olfactory Study (If required)
Target date
Phase 2 Target Completion
Date
Phase 2 Actual Completion
Date
Financial Year Completion date
BRAG Status
Dungannon (Moygashel)
1 Yes Nov‐16 Nov‐16 Aug/September 16 Nov‐16 Nov‐16 2016/17 Complete
New Holland (Lisburn) 1 Yes Nov‐16 Nov‐16 Aug/September 16 Nov‐16 Nov‐16 2016/17 Complete
Carrickfergus 1 No Nov‐16 Nov‐16 Aug/September 16 Nov‐16 Nov‐16 2016/17 Complete
Whitehouse 1 No Nov‐16 Nov‐16 Aug/September 16 Nov‐16 Nov‐16 2016/17 Complete
Newcastle 3 No Mar‐17 Mar‐17 Aug/September 16 Mar‐17 Mar‐17 2016/17 Complete
Culmore 2 Yes Jun‐17 31/05/2017 Oct‐17 Dec‐17 Jan‐18 2017/18 Complete
Ballymena (Tullygarley)
2 Yes Jun‐18 Summer 18 TBC 2018/19 Potential Delay
Antrim 2 Yes Jun‐17 31/05/2017 Not required Not required Not required 2017/18 Complete
Dunmurry 2 Yes Jun‐17 31/05/2017 Not required Not required Not required 2017/18 Complete
Cookstown 2 Yes Jun‐17 31/07/2017 Oct‐17 Dec‐17 Jan‐18 2017/18 Complete
Glenstall (Ballymoney) 2 Yes Jun‐17 31/07/2017 Not required Not required Not required 2017/18 Complete
Limavady 2 Yes Oct‐17 02/11/2017 Not required Not required Not required 2017/19 Complete
Downpatrick 2 Yes Dec‐17 31/07/2017 Not required Not required Not required 2017/18 Complete
North Coast 3 No Nov‐17 15/11/2017 Not required Not required Not required 2017/19 Complete
Enniskillen 3 No Apr‐18 Summer 18 TBC 2018/19 On Target
Omagh 3 No Apr‐18 Summer 18 TBC 2019/20 On Target
Banbridge 3 No TBC Summer 18 TBC 2019/20 On Target
Larne 3 No Nov‐17 17/11/2017 Not required Not required Not required 2017/19 Complete
Tandragee 3 No TBC Summer 18 TBC 2019/20 On Target
Magherafelt 3 No Oct‐17 02/11/2017 Summer 18 TBC 2020/21 On Target
Waringstown 3 No TBC Summer 18 TBC 2020/21 On Target
Greenisland 3 No Apr‐18 Summer 18 TBC 2020/21 On Target
Ballyclare WwTW 3 No Apr‐18 Summer 18 TBC 2020/21 On Target
Newry N/A Yes N/A N/A N/A N/A N/A N/A Complete
Strabane N/A Yes N/A N/A N/A N/A N/A N/A Complete
Newtownbreda N/A No N/A N/A N/A N/A N/A N/A Complete
Dromore N/A No N/A N/A N/A N/A N/A N/A Complete
Lisnaskea N/A No N/A N/A N/A N/A N/A N/A Complete

Annual Information Return 2018 Section 2 Chapter 47 Page 67 of 67
Plans for Delivery of the PPC requirements for Odour Management NI Water has initiated a project to address two major outputs agreed by the PPC Compliance Group;
1. Odour modelling prioritisation, with reference to the above prioritised spreadsheet,this project will provide odour assessment and modelling for the WWTWs assetscontained therein. The list, at present, identifies 8 WWTWs in need of odourappraisal/modelling and the priority in which they are to be completed.
2. Joint Inspection; NIW and NIEA complete a schedule of inspections of the WWTWsassets falling under the regulations. Outputs from the inspections are collated byNIEA and captured on the PPC Investment spreadsheet. The asset deficienciesidentified will be prioritised by the group. These deficiencies could prevent NIWmeeting its statutory obligation in respect of the Regulations.
3. The project will procure the odour assessment and modelling in point 1 above and the WWTW PPC site investment required, predominantly identified as capital base maintenance, associated with the asset deficiencies that are identified using the method described in point 2 above.
The above project commenced in 2016 to deliver PPC appraisal, odour modelling and assessment and will continue during the rest of the PC15 period. Civil work required as a result of the latter commenced in 2017/18, with the main investment from 2018/2019 through to 2020/21.

Social and Environmental Guidance for Water and Sewerage Services (2015‐21)
Drinking Water QualityPriority Drinking Water Directive Update on Delivery AIR RefWQ1 Maintain existing water assets and infrastructure and complete any
upgrades needed to sustain overall compliance levels.NI Water maintain assets as a BAU action within our base maintenance programme. The total base maintenance funding being invested has been maintained in line with the PC15 FD to ensure customer service is maintained. This investment includes replacements and repairs to sustain water compliance levels. Whilst this was not a nominated output the UR had set aside funding within the FD for examples like this.
Upgrades to achieve new compliance standards are prioritised from the 'Enhancement' investment programmes. This funding envelope has been reduced from the PC15 FD due to PE cuts and is delaying investment at sites including Derg WTW where Pesticides are now requiring an additional treatment process to remove.
AIR Table 11 and Table 40a
WQ2 Complete any water infrastructure and treatment upgrades necessary to address enforcement notices and other statutory obligations from the Water Supply (Water Quality) Regulations (NI) 2007 (as amended).
Water infrastructure investment (watermains rehab) is prioritised using our WIIM progress which includes for a range of issues including water quality. Any enforcement notices relating to watermains infra should they arise will be accommodated as must do investments within the watermains rehab programme which is a blend of Base Maintenance and Enhancement investments.
PC15 has to date completed the GAC installations at Dorisland and Killyhelvin WTW's which achieved beneficial use in PC13. The PC15 programme also includes for investment at Derg WTW to fit out existing filters and ensure the chemical arrangements are available to treat the river intake from the Strule. In addition a PEO ref MCPA has added a further project not funded within the PC15 FD nominated outputs. It is planned to progress this project in PC15 as an agreed additional output providing funding is guaranteed.
AIR Table 11 and Table 40a
WQ3 Identify and program any infrastructure and treatment upgrades necessary to meet new or emerging drinking water quality issues or legislative changes (e.g. Radon).
NI Water will continue to respond to emerging risk identified in the Drinking Water Safety plans and to respond to issued raised by the Drinking Water Inspectorate in its consideration of provisional enforcement orders or other enforcement action. Any resultant outputs will be agreed with stakeholders via change protocol to prioritise investment not currently funded in
Priority Water Fittings Regulations AIR RefWQ4 Effectively monitor and regulate compliance with the Water Supply
(Water Fittings) Regulations (Northern Ireland) 2009 and manage the risk of contamination or waste of public water supplies through defective water fittings.
NI Water monitor and regulate compliance with Water supply Regs as a BAU item. Information on the companies obligations and powers, guidance to householders and notification forms are available on the companies website. The company supports the national schemes for licensed or approved plumbers.

Priority Drinking Water Safety Plans and Drinking Water Protected Areas AIR RefWQ5 Continue raw water monitoring programme at abstraction sites to
manage drinking water quality risks and work with NIEA to designate Drinking Water Protected Areas to help prevent future deterioration of drinking water sources in line with WFD principles.
Raw water monitoring is in place and ongoing. Sampling frequencies are reviewed in line with regulatory requirements and on risk assessment. The is managed as BAU. DWPAs have been assigned by NIEA for our drinking water catchments in line with WFD principles. NIW worked with NIEA during this process.
AIR Table 9 Section B 6
Priority Drinking Water Safety Plans and Drinking Water Protected Areas AIR RefWQ6 Through the ongoing review of Drinking Water Safety Plans (DWSPs),
develop and implement a prioritised programme of mitigation measures to build resilience against contamination risk for all aspects of the water supply chain (from catchment through to tap) to protect public health.
As BAU we implement a prioritised investment programme to manage drinking water quality risks informed by DWSPs. This is a Core Business activity.
Priority Managing Raw Water Quality Risks AIR RefWQ7 Continue rolling out a prioritised SCAMP NI programme across all
drinking water catchments to reduce raw water contaminants through interactive stakeholder working to improve or prevent deterioration of abstracted drinking water quality (e.g. natural organic matter, pesticides) and provide for more cost‐effective treatment solutions in the future.
Catchment Management Plans being developed by NIW for all drinking water catchments. Catchment Management Plans will be completed for all live catchments in the PC15 period. Year 1, 2 & 3 targets delivered.
Continued roll out of the WCP and work with organisations such as Rivers Trust. SCAMP NI and the work with NGOs and the WCP is progressing well. In addition the Interreg VA funded Source to Tap project is ongoing and aimed at improving border catchments.
AIR Table 9 and 47
WQ8 Implement the recommendation of the Inter‐departmental Group on Wildfires to introduce Bye‐laws on NI Water’s land and work with the proposed Strategic Wildfire Forum and other stakeholders to manage the risk of wildfires within its catchments (and the risks to raw water quality).
Participation with the Inter‐departmental Group on Wildfires is ongoing and implementation of recommendations to manage the risk of wildfires within catchments are being carried out on an annual basis as agreed at the group.
AIR table 47
Priority Managing Quality Risks from the Distribution System
Continued roll out of the WCP and work with organisations such as Rivers Trust. SCAMP NI and the work with NGOs and the WCP is progressing well. In addition NI Water have secured Interreg VA funding for the Source to Tap project, aimed at improving border catchments.
AIR Ref
WQ9 Continue a maintenance programme to ensure all service reservoirs are cleaned and checked for integrity on a regular basis. The company should also ensure that for the protection of human health microbiological quality is not compromised; residual disinfection is maintained throughout the distribution system, and disinfection by‐products are kept to a minimum.
NI Water have a rolling programme of Potable water storage structures cleaning and inspection as a BAU item. The inspection programme informs the Base Maintenance investment at Potable Water storage structures which is progressing as per PC15 FD plans. All Water Quality parameters are monitored and managed within the water network as a BAU item. An action to have a number of single cells SR's cleaned during 17/18 has been successfully completed using robotic technology.
AIR Table 11 line 19
WQ10 Work with DRD, DWI and stakeholders through the PC15 planning process to develop and agree a PC15 investment programme and targets to address iron exceedances & drinking water quality complaints, in particular colour, taste & odour.
This action is complete. Stakeholder engagement took place during the development of the plan to inform the PC15 plan.

Priority Managing the Quality Risks from Lead Pipes AIR RefWQ11 Continue implementing its strategic lead policy and lead pipe
replacement programme focused on improving compliance with EU Lead standard (10μg/l).
NI Water continues to invest in lead 'communication pipe' (NI Water owned pipe, excluding private customer pipe) replacement on a prioritised basis within the funding constraints of PC15. The prioritisation is completed on a risk based approach to target the investment.
AIR Table 11 Section B 8a‐9
WQ12 Work with DRD, DWI and stakeholders to develop and implement a strategic risk based approach for addressing lead compliance issues associated with private supply pipes and domestic distribution systems
NI Water have completed a pilot replacing both private and public elements of lead service pipes. The Lead Service Pilot Project Report was issued to DfI for comment on the 25th April 2018

Drinking Water SupplyPriority Water Framework Directive AIR RefWS1 Develop, agree and implement water abstraction monitoring and
management plans with NIEA.Ongoing work with NIEA AIL team to review abstraction licences. Managed as BAU.
WS2 Implement any drinking water resource‐related measures set out in the Executive’s River Basin Management Plans.
Ongoing work with NIEA. Member of the WFD Strategic Planning and Resources Group (SPAR)
Priority Water Resource Management (& Drought) Plan AIR RefWS3 Prepare a revised Water Resource Management Plan (WRMP) to identify
the long‐term water resource management and security of supply investment needs. The WRMP should incorporate drought planning requirements, identify adaption measures in response to climate change predictions and take account of the review of water abstraction and impoundment licences. DRD will provide Guidance on this to NI Water.
NI Water have completed a draft Water Resource and Supply Resilience Project which includes for a Water Resource Management Plan, Strategic Drought Plan and a Critical Period Plan, in accordance with the guidance provided by DRD. The Draft Plan will be issued for consultation once approval is granted by DfI, with the final plan informing investment in the final PC15 years and PC21.
AIR Table 10 Section C & AIR
Table 47
WS4 Develop and implement a water supply investment programme to ensure long‐term security of supply (informed by revised WRMP).
This is included with WS3 above. AIR Table 44 Section C
Priority Water Leakage Detection & Reduction AIR RefWS5 Continue to focus on leakage detection and reduction with the aim of
achieving and maintaining the Sustainable Economic Level of Leakage18 (SELL), and driving below this if recommended in the 2017 WRMP.
The Sustainable Economic Level of Leakage (SELL) analysis has now completed and update presented to NIW EC in November.
The 2017 WRMP did not recommend going below the current SELL
AIR Table 10 and Table 44 lines
31‐33
WS6 Work with DRD and stakeholders to develop and implement policy on reducing private supply pipe leakage (e.g. in conjunction with lead supply replacement).
NI Water have limited powers to repair private supply pipe leakage. If a leak is identified a waste notice is issued which provide the customer a period of c4weeks to complete a repair. The vast majority of repairs are carried out within this period and reducing the time period would have limited benefit.
A draft report following the pilot lead replacement project has been completed and has been submitted to DfI. As suggested in last year’s report the initial outputs suggest there is limited benefit in replacing private communications pipe unless all internal lead within a property is removed.
Priority Managing Water Consumption AIR RefWS7 Continue with a programme to install meters for non‐domestic water
and sewerage customersNI Water was until December 2017 obligated to fit water meters at all newly connected premises under Article 81 of the Water and Sewerage Services Order (2006). In December 2016 the Minister made regulations removing the part of this obligation relating to Domestic premises. As such NI Water will limit the installation of water meters to non‐domestic premises going forward.
AIR Table 8 Section B
WS8 Prepare and implement a Water Demand Management Strategy (WDMS) focussed on moving towards the proposed water strategy’s long‐term target of 130 l/h/day.
This is a long term water strategy action being led by DfI. NI Water will support the development of this strategy.

Priority Managing Water Consumption AIR RefWS9 Work with DRD and other stakeholders to develop policies in respect of
water efficiency measures in homes and businesses. This includes investigating opportunities to work with other government departments, utility providers or NGOs to find mutually beneficial projects in which water efficiency can be highlighted or implemented (e.g. water efficiency and lower energy bills)
An initial meeting held with DfI and other associated stakeholders on the 23rd May 2017 to discuss this measure in relation to the LTWS. Following this discussion it was agreed that NI Water would highlight the current Education campaigns to assess if there were further opportunities.
In addition work on Demand Management options was carried out as part of the 2017 WR&SRP and once the plan has been finalised these measures will be actioned.

Environmental Protection & ImprovementPriority Urban Waste Water Treatment Directive (UWWTD) AIR RefWW1 Continue improving overall levels of compliance with Water Order
Consents(including flow compliance from 2015), the PPC Regulations and the CSO spill requirements of the UWWTD, WFD (including Priority Substances &SWD), MSFD & BWD.
The PC15 plan and FD set targets to continue improving overall levels of compliance. Despite public expenditure cuts within the mid term review period, compliance has been maintained.
AIR Table 16 Section D, E and
F
Priority Urgent Waste Water Priorities AIR RefWW2 Develop and deliver a prioritised investment programme on wastewater
treatment facilities, pumping stations and sewerage systems to meet:The PC15 plan was developed with stakeholder engagement and all WWTW enhancement projects have been prioritised in conjunction with NIEA. The PC15 plan was constrained within the funding limits set for the plan and this has resulted in a significant number of WWTW's not receiving investment during PC15. The additional PE cuts in 15/16, 16/17 and 17/18 are further reducing NI Water's ability to deliver investment at WWTW's and as a result a number of new housing developments are not receiving planning approval as the receiving WWTW has no headroom capacity. The extent of this impact was detailed in the mid term review baseline document compared to the latest plan, illustrating the number of WWTW's where potential investment could have taken place in PC15.
AIR Table 16 Section F and Table 40a
WW2a ‐ immediate development pressures (& address overloaded works) and compliance with Water Order Consents (WOCs),
Please see WW2 above AIR Table 16 Section F and Table 40a
WW2b ‐ flow monitoring requirements (in support of the introduction of flow compliance from 2015); and
Please see WW2 above AIR Table 16 Section F and Table 40a
WW2c ‐ any outstanding spill monitoring requirements needed for compliance with the UWWTD, SWD & BWD.
Please see WW2 above AIR Table 16 Section F and Table 40a
WW2d And deliver the highest priority schemes during PC15 within the funding constraints.
Please see WW2 above AIR Table 16 Section F and Table 40a
Priority Planning & Modelling AIR RefWW3 Work with DRD, NIEA and other statutory partners in response to the
Committee for Regional Development’s Inquiry into Unadopted Roads and commence a prioritised investment programme to address unsatisfactory private sewerage infrastructure and treatment facilities
This action has not progressed as no funding was included with the PC15 business plan or FD to take this forward. NI Water continue to collaborate with TNI in respect of Article 11 Enforcement sites (pre 2007) where TNI hold a single bond. NI Water has also identified potential Enforcement sites (post 2007) where separate NIW/TNI bonds apply.
WW4 Collect accurate and reliable information on wastewater treatment facilities and sewerage infrastructure to inform development of robust holistic drainage area plans (DAPs).
NI Water has agreed with NIEA a prioritised list of Drainage Area Studies for delivery during PC15. The studies will involve a comprehensive model build and verification of catchment operation for various horizons and will be used to inform both DAP capital works and WwTW upgrades. Flow and Composition studies are selectively undertaken as part of WwTW appraisals.
AIR Table 16 Section E

Priority Planning & Modelling AIR RefWW5 Ensure storm separation and sewer infiltration reduction are considered
through the DAPs and that these options are adequately explored and costed before being ruled out
As part of catchment model verification anomalies in hydraulic loading will initiate infiltration investigations. DAS catchment investigations, both reactively and proactively, target opportunities for storm water removal (separation & infiltration). Cost benefit analysis of potential capital works are examined through the Needs & Options report.
Priority Planning & Modelling AIR RefWW6 Work with DRD, NIEA and other statutory partners to develop and
implement catchment‐based solutions (from Simulated Catchment Management Modelling ‐ SIMCAT) for wastewater collection and treatment
SWELL will deliver a catchment model for Carlingford and Lough Foyle. Living With Water Programme will deliver an ecosystem model for Belfast Lough. NI Water are progressing a model for the Dundrum Catchment.
WW7 Work with DRD, NIEA and other statutory partners to develop a programme and target for installing appropriate spill monitoring systems across the sewerage network.
PC15 includes for the installation of CSO monitoring at priority sites including those required by revised Bathing Water & Shellfish Directives.
AIR Table 40a
WW8 Undertake work to develop a sustainable economic level of infiltration (SEIL) to inform sewerage investment decisions and deliver infiltration reduction works where this is assessed to be cost effective in addressing issues
NI Water currently exploring SELI methodology with other UK sewerage providers.
WW9 Develop and maintain a long‐term investment programme for the implementation of the PPC requirements for Odour Management. In the first part of PC15 NI Water should:
The PPC Compliance Group, a collaborative working group between NIEA and NIW has been established and Odour Modelling prioritisation for 23 WWTWs has been established in addition to a schedule of inspections.
WW9a ‐ assess the cost of complying with the PPC Regulations for all sites that are determined to be ‘qualifying sites’ under proposed NIEA guidance.
Project Identifier KI583 ‐ PC15 Implementation of Odour & PPC Strategy has identified a spend of £4.4 to rectify deficiencies as identified by the joint inspections.
WW9b ‐ develop and agree with NIEA a prioritised programme with the aim of achieving full compliance by the end of the PC15 period (subject to priority & funding constraints).
A prioritised programme has been agreed and this is reviewed quarterly by the PPc Compliance group.
WW9c In the second part of PC15 NI Water shall commence the delivery of this programme, with the pace determined by the relative priority of this programme, as guided by the WICG.
The initial delivery of the programme has commenced as per the prioritised programme agreed with the PPC compliance group.
Priority Longer Term Investment Priorities AIR RefWW10 Continue a prioritised long‐term maintenance and enhancement
programme on wastewater treatment facilities & pumping stations to maintain serviceability and meet:
The PC15 plan was developed with stakeholder engagement and all WWTW enhancement projects have been prioritised in conjunction with NIEA. The PC15 plan was constrained within the funding limits set for the plan and while this has effectively limited the immediate number of sites for capital intervention it has provided for an extended list of wastewater sites for longer term prioritisation with the option of promoting additional outputs as circumstances prevail.Please see WW2 for additional information.
AIR Table 16 and 40a.
WW10a
‐ development pressures (& address overloaded works) and compliance with Water Order Consents (WOCs);
Please see WW10 above
WW10 ‐ reduce pollution incidents; Please see WW10 above

Priority Longer Term Investment Priorities AIR RefWW10 ‐ comply with existing/revised Water Order Consents; and Please see WW10 aboveWW10 ‐ meet the PPC requirements. Please see WW10 above
WW11 Continue to implement a long‐term investment programme focused on providing appropriate treatment at small (>250) waste water treatment works
This RWWIP programme is progressing and is planned to achieve the upgrades during PC15 as per the plan targets.
WW12 Continue to implement a prioritised investment programme on sewage sludge treatment facilities focused on providing appropriate pollution containment and odour abatement.
Capital Maintenance Planning is ongoing at sludge treatment facilities identifying appropriate Base Maintenance on PPC and odour control. For additional information see WW9
Priority Longer Term Investment Priorities AIR RefWW13 Develop and implement a programme to bring existing wastewater
pumping stations and treatment works in to compliance with the Water Supply (Water Fitting) Regulations (Northern Ireland) 2009.
NI Water implemented a programme of work for PC15 ‐ ‘KI487 Backsyphonage Risks at NIW Sites’. The initial desktop study for the project estimated the cost of meeting the compliance at approximately £16.2 million and this figure was included in the unconstrained PC15 budget but following the identification of a constrained budget, funding for this element of work was reduced to £1.8m, and subsequently included at this funding level with the Final Determination (FD). As a consequence on a limited number of sites will be addressed in PC15.
WW14 Continue a prioritised long‐term programme of Drainage Area Plan work to:
AIR Table 16 Section E
WW14 ‐ maintain the serviceability of the sewerage system; AIR Table 16 WW14 ‐ meet development pressures (& address capacity issues);WW14 ‐ reduce sewer related flooding; and AIR Table 3WW14d
‐ reduce UIDs and pollution incidents in line with UWWTD, MSFD, BWD & SWD.
AIR Table 16 and Table 40a.
WW15 Work with DRD and NIEA to develop and implement a policy for addressing crossed connections to storm sewers focussed on the WFD’s ‘the polluter pays’ principle.
NI Water and NIEA to produce a prioritised list of misconnections and establish a protocol for keeping this up to date. NI Water and NIEA produced a misconnections leaflet to publicise the issue of misconnections to wherever appropriate.
AIR Table 47 line 13
WW16 Implement any sewerage or potable water related measures set out in the Executive’s River Basin Management Plans (RBMPs).
Please see details WS2 for further information
WW17 Continue to reduce the number of pollution incidents through effective investment and operation of the water and sewerage assets.
NI Water has developed some additional management tools now being used in PC15, which will reduce the potential number of pollution incidents. An example is the hotspotting tool which identifies areas where repeat blockages occur enabling full route cause analysis to be completed, allow for corrective action and remove the potential for future events. In addition to ongoing targeted capital maintenance and DAP works NI Water has introduced some supporting management tools which will reduce the potential number of pollution incidents. An example is the sewer hotspotting tool which identifies areas where repeat blockages occur enabling full root cause analysis to be completed, allow for corrective action and remove the potential for future events. Work in progress also includes the development of a DWF capacity mapping tool which will provide an alert of capacity exceedance from new development proposals.
AIR Table 47 line 12
NI Water has established a long list of Drainage Area Studies. Priority catchments have been agreed with NIEA and will be undertaken during PC15. Ongoing prioritisation from the long list will apply to future Price Control periods. The studies will involve a comprehensive model build and verification of catchment operation for various horizons and will be used to inform both DAP capital works and WwTW upgrades to target essential drivers e.g. flooding, pollution, headroom and serviceability.

Flood Risk Management & DrainagePriority The European Floods Directive AIR RefFRM1 Develop & implement individual sewerage and drainage measures
applicable to NI Water as set out in the Executive’s FRMPs (2015‐21).Ongoing meetings take place with River Agency when required. Within the new Risk Base approach to Needs and Options and MBVs specification part of this new specification is meetings with Rivers Agency regarding flooding and solution to address this flooding with a joint approach where possible.
FRM2 Implement the inspection and maintenance requirements of the Executive’s proposed Reservoirs Bill for controlled reservoirs.
NI Water have historically completed panel engineers inspections and subsequent required investment at our impounding reservoirs, without legislation being in place. the next round of inspections to inform PC21 is currently taking place. NI Water will continue to implement the other elements of the Reservoirs Act as the commencement orders are enacted, in particular in relation to potable water storage structures larger than 10ML.
AIR table 47 Line 7
Priority Drainage Planning & Modelling AIR RefFRM3 Contribute to the development of integrated drainage models and plans
to manage flood risk in urban areas including completing any necessary Pilot Projects (e.g. Ballyclare).
NI Water continue to participate within Living With Water Programme and particularly Work Package 9 which seeks to integrate Rivers Agency and NI Water hydraulic models contributing to the management of flood risk through the identification and provision of protection measures.
FRM4 Work with DRD, NIEA and Rivers Agency through the Stormwater Management Group (and through implementation of PPS 15 – Planning and Flood Risk) to progress and implement the utilisation of SuDS NI, design for exceedance and other policies for sustainable storm water management.
NI Water continue to attend and contribute to the Storm Water Management group to develop approach's to extend the utilisation of SuDS NI. NI Water are finalising a new 'Sewers for Adoption' manual for developers which will include for Suds design. This document will be complete by September 2018.
Table 47 line 17
Priority Urban Drainage Provision AIR RefFRM5 Consider the costs and benefits of widening the scope of Drainage Area
Studies Plans to include ‘design for exceedance’ in high flood risk areas and include an emphasis on improving sewerage records held on the Corporate Asset Register (CAR).
DFI led Storm Water Management Group are progressing a range of initiatives to promote flood mitigation in high risk areas. NI water continue to assess Design for Exceedance within new development drainage proposals.
FRM6 Contribute to the development and implementation of a prioritised Government programme of integrated drainage schemes to manage surface water flooding in urban areas (incorporating storm drains, sewers and watercourses). This includes assisting in the development of integrated flood modelling in specific locations on a case by case basis, where Stakeholders agree that this is necessary, and the apportionment of appraisal, modelling, and survey costs can be agreed in advance.
NI Water is exploring opportunities for integrated / shared solutions for the management of stormwater. Additionally, via the Living With Water Programme a work package is to progress on integrated catchment modelling combining drainage area and receiving waters.
Priority Sewer Flooding (DG5) AIR RefFRM7 Continue to address out‐of‐sewer flooding problems attributed to NI
Water’s sewerage and drainage networksNI Water are continuing to invest, as per the PC15 plan in providing engineering solutions to remove internal flooding of properties attributed to NI Water's sewerage network.
AIR Table 3 Section A

Priority Combined Sewer Separation and Infiltration Reduction AIR RefFRM8 Work with DRD, NIEA, Rivers Agency and other stakeholders to develop
and commence a long‐term storm water separation and infiltration reduction programme focussed on addressing UIDs, pollution incidents, sewer flooding, surface water flooding and providing capacity for development.
NI Water is developing a programme of storm separation projects using bespoke software to identify opportunities. The objective is to complete a range of projects e.g. urban housing, large commercial, educational campus etc. An examination of cost/benefit relationship will be used to inform a more focussed business case for PC21 projects.
Table 47 line 14
Priority Emergency Flood Response AIR RefFRM9 Contribute to the delivery of an efficient and effective coordinated
response from Government during flooding incidents (in line with PEDU).
NIW has a well‐developed Major Incident Plan that provides a fully planned reactive response to all types of emergency incident. The annual audit of NIW’s emergency planning arrangements has been completed by an independent Certifier for 2017/18, and the final Audit Report submitted to the Department for Infrastructure’s Water & Drainage Policy Division.
NIW continues to be represented on the DfI ‘Emergency Planning Steering Group’ which includes three main drainage agencies: DfI Rivers, DfI Roads and NIW. NIW has participated in the August 2017 multi‐agency flood‐response to the North West flooding and contributed to subsequent lessons learned reviews.
NIW continues to be a member of the multi‐agency ‘Flood Strategy Steering Group’ (led by DfI Rivers) and contributes to the 30 related multi‐agency ‘Regional Community Resilience Group’ forums across Northern Ireland.
NIW continues to engage with multi‐agency partners through the three, newly reconfigured, Northern Ireland ‘Local Emergency Preparedness Groups’ (EPGs) (Belfast, Southern, and Northern) and related working groups (e.g. flooding and communications working groups). During 2017/18, NIW has fully participated in further development of EPG Coastal Flood Plans and in the newly drafted Northern Ireland Severe Weather Plan.
The Company is also represented on the principal strategic emergency preparedness body for the public sector in Northern Ireland, the ‘Civil Contingencies Group (NI), and continues to keep pace with wider developments through involvement with UK water industry emergency planning groups.

Service Delivery, Improvement and Affordability
PriorityCustomer Priorities for Customer Service, Information & Communication
AIR Ref
CS1 Continue to review and improve performance in customer service quality and effectiveness through the development of better data and information systems and customer focussed processes and policies
With regard to customer data, there is a programme of projects being progressed in respect of data accuracy and data validation. In addition, there are data accuracy obligations imposed on the service provider under the CBC contract. NI Water has embarked on a series of new initiatives under it 'Digital Strategy' proposals.
CS2 Improve the accuracy, reliability, security, and consistency of billing information including enabling customers to self serve
With regard to customer data, there is a programme of projects being progressed in respect of data accuracy and data validation. In addition, there are data accuracy obligations imposed on the service provider under the CBC contract.
There is an extensive data quality programme on‐going through the ACE programme to improve the overall accuracy of the information held on NIW's corporate systems relating to various customer accounts. NIW have deployed a modern meter data management system to collect record meter reads on site and return to the corporate billing system in real‐time. We are starting deployment of automatic meter reading equipment and utilising mobile telephone technology to remotely read key meters.
CS3 Adopt any proven technology or systems that provide tangible benefits in terms of improving service performance or reducing operational costs, whilst ensuring the resilience and security of essential control and monitoring networks. (e.g. ICAT programme)
The delivery of the ICAT programme has commenced with a large number of Potable storage tanks having ICAT technology installed during PC15. This technology is to be used to control inlet flows to maximise storage, improve resilience and enable remote control during operational events. The technology will also enable system control functionality where a number of sites are grouped into an overall system to improve performance. The Omagh, Cookstown and Belfast areas are now complete and we are now focusing on the North Coast area.
Table 47 line 4
CS4 Continue improvements in handling customer queries, complaints and billing (DG6‐9).
FPCOR (First Point of Contact Resolution) functional targets have been set, these are monitored at monthly meetings to ensure improvements in handling customer queries, complaints and billing
AIR Table 4 Section A
CS5 Work with stakeholders through the Customer Measures and Satisfaction Group (CM/SAT) to develop more consumer focussed performance measures, including:
CS5a i) New consumer satisfaction (CSAT) Key Performance Indicator which gives a measure of customers’ overall satisfaction with the service provided by NI Water; and
CS5b ii) Adoption of industry best practice measures for performance on handling customer contacts for example:
CS5bi ‐ customer contact levels (through all communication channels);
CS5bii ‐ first point of contact solutions; and
CS5biii ‐ repeat contacts
We have agreed the following quantitative and qualitative measures with the CM/CAT group : Unwanted Contacts, FPOCR and Customer Advocacy score. The remainder of PC15 will be used to understand trends with a view to having hard performance measures in place for the beginning of PC21

Priority Customer Priorities for Water Service Levels AIR RefCS6 Develop quality drivers and measures for the water mains rehabilitation
programme informed by drinking water quality monitoring and customer complaints (iro colour, taste & odour).
The WIIM methodology for prioritising replacement pipelines in the distribution network , includes WQ failures as drivers for pipeline replacement.This a Core Business Activity.
For the 2017 reporting year NI Water achieved its drinking water quality targets and is on profile to achieve its targets in 2018.
AIR Table 47 line 2 and 8
CS7 Continue to reduce the number of properties that experience unplanned and unwarned interruptions to drinking water supply in excess of 3/6/12/24 hrs (DG3).
WIIM process already in place as developed for PC15 but will continue to refined. Latest WIIM review of the methodology (WIIM3) now includes better informed DG3 analysis. This is one element of the overall Capital Maintenance Planning process.
The Water Resource & Supply Resilience Plan includes a number of resilience project proposals. A DG3 strategy is being developed to inform the final years of PC15 and PC21.
AIR Table 2 Section B 5‐8
and AIR Table 47
CS8 Target areas of low pressure to increase the number of customers who benefit from at least the minimum levels of supply.
NI Water continues to invest in watermains rehab and within this sub prog properties on the DG2 register are targeted to ensure that post investment they receive the minimum levels of supply. The PC15 investment is currently on track as per the agreed investment levels.
AIR Table 2 Section A
CS9 Continue to maintain a Register (DG2) of properties at risk of receiving low pressure and reduce the number of properties on the register over the PC15 period
NI Water has by assessing pressure across its water network prepared a the DG2 register of properties at risk of receiving low pressure. Following capital investment verification is completed to determine if properties can be removed from the register.
AIR Table 2 Section A
Priority Customer Priorities for Sewerage Service Levels AIR RefCS10 Establish and maintain a Register (DG5) of properties at risk from
internal & external sewer flooding and reduce the number of properties on the register over the PC15 period.
NI Water developed a register of properties at risk of internal sewer flooding during PC10. This confidence in the data originally was low but this has improved significantly over recent years. The DG5 external register has been developing. PC15 investment is focused on removing properties from the internal flooding register.
AIR Table 3 Section B
CS11 Work with Roads Service, Rivers Agency and other relevant drainage providers to develop a register of properties at risk of surface water flooding to be actioned ‘jointly’ during PC15 and beyond. NI Water should provide the information on out‐of‐sewer flooding from sewerage and relevant drainage assets.
NI Water maintain its DG5 register of properties at risk of internal flooding. PC15 & FD include targets for the removal of properties from this list. Additionally, NI water hold information on properties at risk of external flooding.
AIR Table 3 Section B
Priority Customer Priorities for Affordability & Efficiency AIR RefCS12 Explore opportunities to reduce the cost of its existing Public Private
Partnership contracts to reduce their long‐term running costs.On going BAU. Current activities include; Project Alpha: A reduction in treated water sampling requirements complete May 2018, as an enabler to cost savings within NIW Alpha Ltd for laboratory services. Project Omega: Ongoing Facilitation process up designed to reduce increased costs/claims exposure to NIW as well as generate a reduction in NIW electricity costs associated with Duncrue St Sludge Facility. Kinnegar: No proposals significant activities at this stage as the management focus has been on stabilising operations following Administration of a number of parent companies within the Lagan Group.

Priority Customer Priorities for Affordability & Efficiency AIR RefCS13 Reduce costs by setting targets and developing and implementing action
plans to deliver operational efficiencies.BAU/Core Business. Significant input was completed during PC13 and this will be continually reviewed as part of BAU to ensure the most efficient operational regime is maintained as the supply network changes during periods of normal operation, drought and winter critical periods. PC15 is implementing the first phase of ICAT on the SR asset base. Dedicated energy efficiency team has been established and is pursuing as BAU.
Short and medium term energy efficiency targets for NI Water have been developed for the PC15 period. These are under review as challenges such as grid connections, and closure of incentive schemes, are considered.
RDI Strategy has and continues to support the identification and implementation of improved performance and efficiencies through collaborative RDI. Continued membership and participation in UKWIR projects and other water industry focused collaborative projects.
NIW have deployed a modern meter data management system to collect record meter reads on site and return to the corporate billing system in real‐time. We are deploying automatic meter reading equipment and utilising mobile telephone technology to remotely read key meters.
AIR Chapter 30

Sustainability, Climate Change and ResiliencePriority Project Appraisals AIR RefSSR1 Revise the project appraisal process to ensure that investment decisions
take account of ‘whole‐life’ costs (including the cost of the CRC Energy Efficiency Scheme) and benefits of proposed solutions. Whole life carbon costs should be factored into appraisals for projects costing over £500k (and any other projects where carbon is likely to be a material consideration). Where there is a marginal NPC difference between a solution with the lowest NPC and a solution that offers significantly lower whole life emissions, the lower emission solution should be selected.
These actions are already included as part of the Capital Appraisal process. NI Water are currently completing a full review of the appraisal process, and will refine the process to improve the overall appraisal process.
SSR2 Long‐term social, economic & environmental sustainability should be considered in all project appraisals.
NI Water are reviewing the Appraisal Report and Business Case Templates ensuring they align with the NIGEAE 10 Step approach including Step 7 – ‘Weigh up non‐monetary costs and benefits’
SSR3 Explore opportunities with Forest Service and other partners to offset existing and future energy demands (e.g. carbon offsetting through forestry, green energy production through wind turbines or wood chipping).
NI Water have explored a number of renewable investment types. Due to recent changes in ROC's a number of initiatives have not been deemed economic. Solar installations have been installed across the NI Water estate and other opportunities will be explored as they become known.
SSR4 For every WWTW site on which NI Water needs to carry out an appraisal to inform capital investment, due to base maintenance or enhancement drivers (quality, growth or service levels), the project appraisal shall assess if a more sustainable solution option is feasible, and determine any land acquisition requirements.
PC15 FD includes for sustainable solution targets. Each WWTW appraisal now examines potential sustainable solutions with examples including ICW's, Reedbeds and similar technology. During PC15 an ICW has been constructed at Castlearchdale and Stoneyford. Further pilot projects are planned with a variety of sustainable solutions to gain confidence in long performance and value for money.
AIR Table 16 section H
Priority Project Planning and Risk AIR RefSSR5 NI Water should carefully plan the early stages of project development
and consider risks to project delivery, which may include progressing trial projects and working with other stakeholders to identify solutions and secure support that these risks be accepted and managed.
Project planning and risk is managed as a BAU item on all projects.
Stakeholder engagement is important on key projects and examples demonstrating this in action include the WR&SR plan (see WS3) where a steering group has met circa every 6 weeks during the project development.
For WWTW NI uses a process selection matrix, including processes that are endorsed by stakeholders. For new processes e.g. ICW's NI Water engage with stakeholders to ensure acceptance in principle of the process.
Priority Research Development and Innovation AIR RefSSR6 Maintain and implement a Research Development and Innovation (RDI)
strategy.NI Water have an (RDI) strategy in place. The main emphasis within the strategy is that NI Water operates on a fast follower principle.
Priority Renewable Energy AIR RefSSR7 Explore opportunities to invest in renewable energy generation to
reduce running costs at existing high‐energy facilities.NI Water has invested in solar panels at 58 sites around the province, availing of incentive schemes at multiples of 4, 3 and 2 ROCS. This includes the recently completed Solar Farm at Dunore point. Private wire and corporate PPA's are also being considered. Dedicated energy efficiency team has been established and is pursuing as BAU.
AIR Chapter 30

Priority Renewable Energy AIR RefSSR8 Explore opportunities to generate renewable electricity through
innovative management of existing water and sewerage assets such as: generating hydro‐power from excess water mains pressure and installing solar panels at facilities.
NI Water has three existing hydro schemes. Business cases for a further 10 hydro schemes have been hampered by the closure of incentive schemes. These business cases are being reviewed to assess viability of hydros without ROCs. Dedicated energy efficiency team has been established and is pursuing as BAU.
AIR Chapter 30
Priority Renewable Energy AIR RefSSR9 NI Water shall seek to maintain the level of energy purchased from
external renewable sources to that achieved in the PC13 period, whilst increasing the percentage of renewable energy generated by use of its own assets and lands and contribute to achieving the Executive’s greenhouse gas emissions reduction target.
Short and medium term energy efficiency targets for NI Water have been developed for the PC15 period. These are under review as challenges associated with grid connections, and closure of incentive schemes, are considered.
AIR Table 45
Priority Sustainable Treatment & Regulation AIR RefSSR10 Where NI Water believes that a license, consent, or permit proposed or
set by NIEA is unnecessarily stringent or does not adequately consider a catchment based approach, NI Water should seek to challenge and resolve this with NIEA initially, and then if not resolved, by escalating this to the WICG for wider consideration and direction by stakeholders. The objective should be to develop more sustainable treatment solutions
This action is actively challenged for all design standards offered by NIEA under BAU. NIEA are supportive of sustainable solutions, where appropriate, and have supported a deviation from the full RBC approach for small works, below 20pe. Moneyreagh WwTW identification of infiltration and removal from the system is another example where we are working with NIEA to reassess the standards of the discharge from this site, in conjunction with hydrology team in NIEA reassessing the river flows, following rerouting of infiltration directly to the adjacent watercourse, giving a better flow in the watercourse, hence better dilution.
SSR11 Complete a number of sustainable wastewater treatment ‘pilots’ early in PC15 to compare the costs and performance of various options. Develop & commence a long‐term investment programme of sustainable wastewater treatment schemes (including the land requirements) with the core aim that this reduces NI Water’s long‐term operating costs and emissions.
Castle Archdale Integrated Constructed Wetland has come into operation and along with Stoneyford ICW and The Loop ICW which are currently undergoing performance monitoring. A further sustainable treatment pilot is not operational at Clabby WwTW, Co Fermanagh using a Phragmifilter Reed Bed System.
AIR Table 16 Section H
SSR12 Identify and secure sufficient land early in the project phase to give the option of the selection of larger footprint process solutions that typically result in lower operating costs. Consider the advanced purchase of land to accommodate future expansion of works using more sustainable solutions.
The project business case will proactively identify land purchase requirements as developed for each Price Control.
SSR13 Aim to gradually deliver year on year increases in the percentage of new WWTW investment (assessed by Population Equivalent served) delivered by ‘more sustainable solutions’ so that: By 2020/21 33% of all WWTW upgrades to works serving a PE of <2,000 are delivered by more sustainable solutions. Where viable, more sustainable WWTW solutions should also be used for works serving a PE > 2,000
Castle Archdale Integrated Constructed Wetland has come into operation and along with Stoneyford ICW which are currently undergoing performance monitoring. A further sustainable treatment pilot is not operational at Clabby WwTW, Co Fermanagh using a Phragmifilter Reed Bed System.
AIR Table 16 Section H

Priority Education & Public Awareness AIR RefSSR14 NI Water should continue to invest in education and campaigns to
promote prioritised key messages such as the importance of insulating (freeze‐thaw), using water wisely (water efficiency), bag it and bin it (preventing pollution) and measures to prevent flooding due to other causes through continued work of the water bus and school visits, and other educational means. NI Water should learn from the impact of previous campaigns and demonstrate how future campaigns will reach consumers more effectively.
Through the work of the Waterbus and school visits, all schools (both Primary and Secondary) are offered education talks on our key water efficiency messages as well as being taught about the value of water.
Communicating our key Bag it & Bin it messages and Freeze/Thaw protection via Radio/Print/Social Media. Also attending community events and delivering community and school talks. The overall objective of the strategy is to educate and increase public awareness by providing important information via all the communication channels at our disposal. Another action of the strategy was the appointment of Environmental Champions enabling the key messages to be delivered to a wider audience.
NI Water delivers our key FOG (Fat, Oil and Grease) messages to schools, community groups and businesses. We have a community outreach programme which focus on delivering education programmes and public awareness campaigns on the importance of correct disposal of FOG and highlight how this can reduce the risk of pollution.
AIR Chapter 1
SSR15 NI Water should seek to develop effective partnerships with other organisations where there are shared benefits of the campaign (such as with DSD on Lead).
NI Water work with a range of stakeholders to promote our key messages around Water Quality and the benefits of drinking tap water. These Stakeholders include, Community Groups, Schools, Education Board, Media, CCNI, Regulator, DWI, DfI to name but a few. Water for Health is one of our key campaigns and we deliver it all year round through our Education programme. Water for Health/Water Quality is part of the organisation's CSR, Communications and Education strategy and is a priority for the company.
AIR Chapter 1

Priority Preservation of Services AIR RefSSR16 Comply with the requirements of the Preservation of Services and Civil
Emergency Measures (Relevant Undertaker) (Northern Ireland) Direction 2010 and any supplementary Guidance issued by DRD. • Provide DRD with an annual audit laying out the requirements in the Direction.
Currently still on target to complete all the security hardening measures approved in the PC15 submission, by the due cut‐off date March 2021.
The PC 15 programme of work comprises:‐Security harden 52 Enhanced Service Reservoirs at a budget cost of £2,500k‐ original target completion date (June 2017) has been revised to June 2018, to take account of programming revisions and contract delivery issues.‐Security harden 13 Water Treatment Works at an updated budget cost, following competitive tendering, of £2,200k. The target date for completion has been revised from late 2018 to April 2019, due to funding constraints within the overall capital programme.‐Security harden 2 Waste Water Treatment Works at a budget cost of £400k.The 2 sites to be hardened are confirmed as Newtownstewart WwTW and Omagh (Hunters Crescent) WwPS‐ work to be completed during PC15
In November 2017 Dalriada was purchased by NI Water and now operates as a wholly owned subsidiary (NI Water Alpha), the agreed programme of security hardening work at sites they previously operated will not be impacted by this organisational change and is still on target to complete within PC15.
The 2018 PSCEMD Report carried out by the independent Certifier and submitted to DfI on 1st April , reviewed all aspects of the security hardening programme and judged progress to be satisfactory.
AIR Table 47 line 3
SSR17 Ensure: Please see SSR16 above for informationSSR17a • All CNI sites continue to meet latest security advice; and Please see SSR16 above for informationSSR17b • Implementation of a prioritised plan for securing other
identified sites to required standards.Please see SSR16 above for information
SSR18 Provide training and testing of appropriate protocols and Guidance issued under the Direction. Review and update major incident plans to reflect lessons learned
Please see SSR16 above for information
Priority Resilience AIR RefSSR19 Commence a programme of investment to improve and maintain the
resilience of the wider water and sewerage asset base and systems prioritised as follows:
There have been a number of projects across the asset base to assess resilience in relation to Freeze/Thaw, Drought and Flooding events and this includes the 2017 Water Resource and Supply Resilience Plan which includes critical period plans for both Freeze/Thaw and Drought events.WTWs and WwTWs being upgraded during PC15 to insulate key components against extreme cold. There is also programme of investment in PC15 for DG5 (Internal Flooding) & UIDs (Prevention of pollution).
SSR19a 1) Water supply Please see SSR19 above for information

Priority Resilience AIR RefSSR19b 2) Prevention of internal flooding (e.g. due to a sewer pumping
station being flooded)Please see SSR19 above for information
SSR19c 3) Prevention of pollution (e.g. due to WWTWs or SPS being flooded)
Please see SSR19 above for information

Tourism, Recreation & BiodiversityPriority Estate Management AIR RefTRB1 Contribute to the development and implementation of the NI
Biodiversity Plan.NIW have contributed to and helped develop the NI Biodiversity Plan. This is currently being implemented, complied with and reported on to NIEA.
TRB2 Develop & implement an estate management strategy to take account of: the primary water and sewerage functions; protected areas; the need to enhance biodiversity; the need to permit public access to support tourism and healthy lifestyles; and the need to increase opportunities for providing recreational amenities for interest groups.
Project created to improve site security; public safety; and enjoyment of permitted recreational activities at several locations. Work includes construction of steps and handrails; accessible fishing stands; construction of paths and walkways; construction of boardwalks; extension and repair of car parks; construction of slipway; erection of fencing and gates; installation of benches, picnic tables and bins; provision of signage; and provision of life saving equipment. Phases 1, 2 & 3 complete.
TRB3 Continue to develop partnerships (e.g. SCAMP NI) with other public, community & voluntary sector organisations to deliver sustainable catchment initiatives.
Engagement and development of partnerships with key stakeholders is being carried out on an ongoing basis as required to deliver sustainable catchment initiatives.
AIR Table 47 Line 9
TRB4 Explore opportunities for leasing NI Water land and assets for leisure, tourism and income generation where appropriate.
No locations identified as suitable.
TRB5 Adopt and implement the ‘Protocol for the Care of the Government Historic Estate’. Develop a long term plan to bring assets covered by this, where necessary, up to a suitable standard and maintain them going forward.
Specialist architect appointed to undertake Condition Assessment Reports for assets listed on NI Water's historic estate register, in line with the requirements of the Protocol. The recommendations from the survey reports will be used to collate a programme of work to ensure assets are up to a suitable standard, subject to availability of funding. A capital programme has commenced on Mourne Wall to implement repairs to areas of damage.
TRB6 Explore opportunities to celebrate the local water industries influence on the social, cultural, industrial & natural heritage of Northern Ireland.
NI Water work with a range of stakeholders to promote and celebrate the local water industry's influence on both the natural and built heritage, we do this through a joined‐up approach with like minded organisations, such as the MHT, Newry, Mourne and Down Council as well as local 'user groups' . NI Water participate in special designated events to promote the important relationship between Water, Heritage, Social and Culture. These events include‐EHOD, WED, WWD, Open Days, Specialised Lecturers etc.
AIR Chapter 1
Priority Bathing Waters & Clean Beaches AIR RefTRB7 Contribute to the implementation of the NI Marine Litter Strategy and
the protection of Bathing Waters and Shellfish Waters from pollution.NI Water continues to deliver wastewater education campaigns to highlight education and awareness for appropriate use of sewerage systems. Community engagement projects have been delivered to extend education and awareness for fats, oils and grease and sewage related debris. Compliance with water order standards at coastal works has assisted with protection of protected waters. Ballycastle WwTW being progressed, with provision of secondary treatment. LWWP will contribute to delivery of water quality improvements in Belfast Lough, whilst a capital works upgrade in Dundrum and Carrigs River investigations will contribute to identifying actions and hence assist with driving water quality improvements in Dundrum Bay.
TRB8 Put a programme in place to reduce the risk of pollution from the sewerage system during PC15, informed by the Marine Conservation Society Pollution Policy and Position Statement on CSOs
There is a programme to install CSO monitors at prioritised sites throughout PC15. The technology is at trial stage in the field, to assess suitability. Following the trial and approval to proceed to the next stage, installation will be rolled out to all CSOs within 2km for designated bathing and shellfish waters. In addition, funding has been allocated for installation of monitors at 65 No. inland CSO's and the same technology will be used for these monitors.

Priority Reservoirs AIR RefTRB9 Progress the assessment of ‘unused’ reservoirs to determine the
approach to disposal.NIW have commissioned Abandonment/Discontinuance Scoping Report to be carried out at a number of reservoirs. The Outputs of this will be available in PC15.

Annual Information Return 2018 Section 3
Level of Service Methodologies

Annual Information Return 2018 Section 3 DG2 Page 1 of 6
Northern Ireland Water
Level of Service Methodology
DG2 - Pressure of Mains Water

Annual Information Return 2018 Section 3 DG2 Page 2 of 6
This document has been laid out in accordance with the guidance provided by NIAUR in the Annual Information Return Reporting Requirements 2018: Section 7 – Levels of Service Methodology Appendix
DG2 – Pressure of mains water 1. Methods and procedures2. Extract from DG2 register
- provide an extract from DG2 register3. Sources of information4. Scope and coverage5. Assumptions and exclusions
- including any assumptions made for surrogate for the reference level.6. Other issues
- provide any further information on issues that have arisen in the report year thatimpact on your methodology for reporting in the Annual Information return.
The procedure for the investigation and recommendation for removal and addition of properties to the DG2 Register is based on the ‘DG2 NIWL Procedures April 2010’ document produced by the Leakage Data Management Unit. The objectives of the investigation are as follows:
i. Removal/Addition of DG2 entries on the register as a result of more robust data beingavailable (Better Information).
ii. Removal/Addition of DG2 entries resulting from capital works and networksimprovements (Company Action).
iii. Investigation of customer ‘Low Pressure’ complaints.
1. Methods and Procedures
DG2 Investigations (excluding Rehab modelling) The objective of a DG2 site investigation is to acquire the necessary data to allow a more detailed assessment to be carried out. The 2 key elements of this investigation are the logging of the water pressure and the gathering of accurate height data for both the logging point and DG2 property connection point. In keeping with ‘DG2 NIWL Procedures April 2010’ the following procedures are followed:
Logging points are identified within the network, which do not exceed 250m indistance from the DG2 stopcock.
The logging points are within the same DMA/PMA as the DG2 property. A unique logger ID is clearly assigned to the logging point. An accurate elevation of each logging point is provided using Real Time Kinematics
(RTK) GPS. A value of 450mm is subtracted from this elevation to allow for the depthof the FH spindle.
Logging point boundary polygons around the hydrants are digitised onto MapInfo toallow the associated properties to be assigned to the relevant logger.
A pressure log and elevation may be taken in adjoining DMAs. This is to assist inidentifying any potential for a BV change to improve the pressure at the DG2 property.
A new ferrule elevation is produced for each property using Digital Elevation Model(DEM) 2008 data. The ferrule point value associated to each property is used todetermine the height used for that property within the Total Head calculation.
To assist with the site investigation, a detailed map is produced showing the following information:

Annual Information Return 2018 Section 3 DG2 Page 3 of 6
Pointer Property data showing elevation at each property (NIW receives biannualupdates from Ordnance Survey Northern Ireland).
Water pipes, fittings i.e. SVs, Fire Hydrants (FHs) terminating nodes etc. DMAs and PMAs (where applicable). Background Vector maps. Required pressure logging points.
Reporting Following field testing and site investigation routines, all data is analysed and the findings are included within a Recommendation for Removal Report or alternatively a Recommendation for Inclusion Report.
1. The removal of entries due to robust data being available.2. The removal of genuine entries resulting from infrastructure changes.3. The provision of detailed information to support the inclusion of properties in the DG2
Register.
If the data collected verifies that properties that are in receipt of a pressure >15m, then the DG2 properties are recommended to NIW for removal. Properties removed are supported by a brief technical assessment based on pressure loggings, RTK GPS height data and other relevant factors including the required pressure logging trace/print out.
Where properties are discovered to have been positioned incorrectly within NIW GIS resulting in their inclusion in the original register, and repositioning indicated that these properties were in receipt of pressure > 15m, these DG2 properties are recommended for removal.
Those properties identified as being in receipt of a pressure <15m remain on the Register and a brief technical assessment based on pressure loggings, RTK GPS height data and other relevant factors, including the required pressure logging trace/print out, is provided. Prior to this information being provided a brief assessment is undertaken to determine if the properties could be transferred onto an adjoining DMA/PMA. This information is included within the assessment where deemed viable.
Additional properties within logging areas determined to be in receipt of pressure <15m are recommended for inclusion on the register. As above a brief technical assessment based on pressure loggings, RTK GPS height data and other relevant factors, including the required pressure logging trace/ print out, is provided. Prior to this information being provided a brief assessment is undertaken to determine if the properties could be transferred onto an adjoining DMA/ PMA. This information is included within the assessment where deemed viable.
The potential removal of properties due to networks improvements is investigated via rationalising adjacent DMA boundaries following pressure loggings as per guidelines set out in the method statement above. All networks amendments follow the removal process and the submission of final reports leads to an update of the DG2 register.
DG2 Investigations by Rehab modelling In the case of Rehabilitation schemes, PPRA reports associated with the various work packages are submitted to Asset Management Directorate for sign off and Leakage Function for processing in relation to the update of the DG2 Register. Leakage Data Management Unit on receipt of the suite of information including logger positioning site maps, accompanying logged data, PPRA reports and DG2 Investigation Reports align this data to the existing register. Checks are conducted on logged information to ensure compliance in

Annual Information Return 2018 Section 3 DG2 Page 4 of 6
terms that each logger site is within 250m of actual properties highlighted and that minimum pressures provided correlate to expected total head values. Hyperlinks are created for each set of logged data, map and report. The DG2 register is updated accordingly.
Investigation of customer ‘Low Pressure’ complaints Where low pressure complaints have been identified through the contact centre, the process of action is as follows:
Contact Centre informs customer of known network planned or unplanned events inthe area or determines if problem may be with customer supply only.
Networks’ first responder visits property to determine if pressure is a legitimatecomplaint. If pressure at property is assessed as being a potential DG2 issue, thecomplaint is passed to Leakage DMU for investigation.
Leakage DMU undertakes an investigation in accordance with ‘Methods and Procedures’ above. Additions and removals are processed accordingly. The facility has been developed for regular monthly updates of all DG2 properties to be uploaded onto the CARtoMAP system which is utilised by the Contact Centre in relation to low pressure complaints from customers.

Annual Information Return 2018
UPRN Status Status Building Date Nr
187100513 30-Nov-12 In Register 181 185292371 30-Sep-12 In Register 2 185292234 30-Sep-12 In Register 2 185292230 30-Sep-12 In Register 1 185290343 30-Sep-12 In Register 183 185778557 30-Sep-12 In Register 10 185292251 30-Sep-12 In Register 5 185292239 30-Sep-12 In Register 3 185292245 30-Sep-12 In Register 4 185292368 30-Sep-12 In Register 16 185292366 30-Sep-12 In Register 14 185292364 30-Sep-12 In Register 12 185292362 30-Sep-12 In Register 10 185292259 30-Sep-12 In Register 8 185292258 30-Sep-12 In Register 7 185292257 30-Sep-12 In Register 6 185207712 31-Aug-12 In Register 156 185207711 31-Aug-12 In Register 154 185207710 31-Aug-12 In Register 152 185207709 31-Aug-12 In Register 150 185207714 31-Aug-12 In Register 160 185207715 31-Aug-12 In Register 162
Primary_ Thorfare Town Postcode County
Ardglass Down Ardglass Down Ardglass Down Ardglass Down Ardglass Down Ardglass Down Ardglass Down Ardglass Down Ardglass Down Ardglass Down Ardglass Down Ardglass Down Ardglass Down Ardglass Down Ardglass Down Ardglass Down Donaghadee Down Donaghadee Down Donaghadee Down Donaghadee Down Donaghadee Down Donaghadee Down
OMA
Sentry Hill Loughrans Tower Loughrans Tower Loughrans Tower Sentry Hill Loughrans Tower Loughrans Tower Loughrans Tower Loughrans Tower Loughrans Tower Loughrans Tower Loughrans Tower Loughrans Tower Loughrans Tower Loughrans Tower Loughrans Tower Portavoe Donaghadee Portavoe Donaghadee Portavoe Donaghadee Portavoe Donaghadee Portavoe Donaghadee Portavoe Donaghadee
Section 3 DG2 Page 5 of 6
Pressure
13.47 14.97 13.87 14.12 13.07 14.79 13.90 14.01 13.82 14.71 14.86 14.89 14.95 14.06 13.82 13.89 7.94 8.07 8.44 8.65 7.51 7.43

Annual Information Return 2018 Section 3 DG2 Page 6 of 6
3. Sources of informationFor AIR17 the following information was used
Post Project Rehabilitation Assessment reports (PPRAs) and their associated DG2Investigative Reports (DIRs) are submitted when specific watermain rehabilitationschemes are completed and include the relevant data and reports to merit alterationsto the DG2 register.
Recommendation for Removal reports are produced on conclusion of networksimprovements to merit deductions from the DG2 register.
Recommendation for Inclusion reports are produced to substantiate the addition ofproperties to the DG2 register based on better information.
4. Scope and coverageThe ongoing maintenance of the existing DG2 register through the removal of properties due to company action via the processing of PPRA reports submitted during the reporting year. These are the direct result of work the majority of which were completed in the 2016/17 year. Similarly, additions to the company register were processed where better information became available.
5. Assumptions and exclusionsNI Water does not currently have in place a permanent pressure monitoring network and is not in a position to identify exclusions arising from intermittent network incidents or infrastructure changes. Assumptions for AIR18 are identified in the methodologies described above. A surrogate pressure of 15m has been used to identify DG2 properties.
Deviation from the conditions laid out by NIW for DG2 property investigations. Due to the rural nature of some DMAs it is not possible in some exceptional cases, i.e. groups of DG2 entries within individual DMAs, to undertake logging within 250m of the DG2 property as set out in the NIW methodology. In these instances a number of Fire Hydrants are logged to enable an accurate pressure profile of the DMA to be established.
The following alternative procedure is used: A desktop study of the DMA containing DG2 entries is undertaken. A series of FHs are identified for pressure logging. The locations are selected to
ensure that an accurate pressure profile of the DMA is established. Data loggers are fitted to log the pressures over a seven day period. All logging points are surveyed using RTK GPS; this provides accurate height data
for Total Head calculations. A value of 450mm is subtracted from the elevation toallow for the depth of the hydrant spindle.
On compilation of this data, a revised analysis is undertaken to determine the nature of supply and create a pressure profile within the DMA/PMA to determine potential DG2 entries. If the pressure profile shows that the Total Head within the DMA/PMA is sufficient to provide adequate pressure, the results from the field testing and analysis are presented as evidence for removal of the DG2 entries and a Recommendation for Removal Report is issued.
In line with previous procedures, where analysis identifies properties that are in receipt of a surrogate pressure <15m, they will remain, or be added to the Register in accordance with NIW procedure.

Annual Information Return 2018 Section 4 DG3 Page 1 of 34
Northern Ireland Water
Levels of Service Methodology
DG3 Supply Interruptions

Annual Information Return 2018 Section 4 DG3 Page 2 of 34
This document has been laid out as follows:
1.0 Objective & Aim 2.0 Reporting Requirements 3.0 Definitions 4.0 Procedure 5.0 Records 6.0 Reporting 7.0 Void Properties 8.0 ‘No Water/Low Pressure’ Complaints
Appendix A – Roles and Responsibilities Appendix B – Process Flow Diagram – Unplanned Interruptions Appendix C – Process Flow Diagram – Planned Interruptions Appendix D – Pro forma - Interruption Record Sheet Appendix E – Pointer 2.1 Specification Extracts Appendix F – CRC Call Scripts for ‘No Water/Low Pressure’ Complaints Appendix G – DG3 Interruptions to Supply Register Extract

Annual Information Return 2018 Section 4 DG3 Page 3 of 34
1.0 OBJECTIVE & AIM To identify the number of properties affected by planned and unplanned supply interruptions lasting longer than 3 hours, 6 hours, 12 hours and 24 hours.
The aim of the register is to allow verification and audit of the reported information for DG3 and to enable the identification of the properties affected. It should contain information on the timing, duration and cause of each interruption and sufficient information to enable all properties affected by interruptions lasting more than three hours to be identified. Therefore, the register should include:
properties affected (by name and location or number and street); date and time of interruption; duration of interruption and time supply restored; cause of interruption; notice given; and the name of person responsible for entering records in the system.
The DG3 Interruptions to Supply Register is compiled and held by CSD Services in Capital House.
2.0 REPORTING REQUIREMENTS The information to be reported within Table 2 of the Annual Information Return (AIR) is as follows:
2.1 Line Descriptions Line Description
5 More than 3 hours unplanned 6 More than 6 hours unplanned 7 More than 12 hours unplanned 8 More than 24 hours unplanned 9 More than 3 hours planned and warned 10 More than 6 hours planned and warned 11 More than 12 hours planned and warned 12 More than 24 hours planned and warned 13 More than 3 hours unplanned caused by third parties 14 More than 6 hours unplanned caused by third parties 15 More than 12 hours unplanned caused by third parties 16 More than 24 hours unplanned caused by third parties 17 More than 6 hours unplanned due to overrun of planned and warned 18 More than 12 hours unplanned due to overrun of planned and warned 19 More than 24 hours unplanned due to overrun of planned and warned
Note: Interruptions should be reported under each relevant time band so that the category for interruptions exceeding:
3 hours also includes all interruptions lasting more than 6 hours; 6 hours also includes all interruptions lasting more than 12 hours; and 12 hours also includes all interruptions lasting more than 24 hours.
Each interruption should be classed as a single interruption event, and should be recorded under only one of the four categories of: unplanned or unwarned, planned and warned, unplanned caused by third parties and, unplanned or unwarned due to overruns of planned

Annual Information Return 2018 Section 4 DG3 Page 4 of 34
and warned interruptions. If there are a significant number of overruns between 3 and 6 hours, the number should be reported in the commentary.
Further guidance, if required may be found in the Annual Information Return Reporting Requirements & Definitions Manual 2015, Issue 1.0 – March 2015.
3.0 DEFINITIONS 3.1 Interruption An interruption to supply is defined as the actual loss of water supply to a property, whether planned or unplanned, warned or unwarned.
Supplies may be affected by other factors, for example, lower pressure through the flushing of mains, or restrictions on use. These are also covered under the DG2 and DG4 procedures.
3.2 Start Time Determination The outage commences when the first customer contacts the contact centre (as per current methodology).
3.3 End Time Determination The outage is deemed to be fully recovered on the turning of the isolation valve. Although it is acknowledged that, on occasions, there will be a slight lag between the valve operation and all properties having their supply restored, in the majority of cases the opening of the main supplying valve will result in the end of an interruption.
Note: The time on the customer’s warning card is used to determine whether or not a planned and warned interruption overruns. It is not used to determine the End Time.
3.4 Duration The duration is the length of time for which customers are without a continuous supply of water. An interruption starts when water is unavailable from the first cold tap in a property and finishes when the supply to the last property affected by the interruption is restored to the tap.
3.5 Planned Interruption Duration Determination When calculating the duration of a planned interruption, the Start Time is taken as the time when the valve is turned off and the End Time is taken as the time when the valve is turned on (plus an allowance for mains charging if this is deemed to be necessary). This ensures that reporting is in line with the regulatory definition below:-
‘Duration is defined as the length of time for which customers are without a continuous supply of water. An interruption starts when water is unavailable from the first cold tap in a property and finishes when the supply is restored to the tap.’
If a planned and warned interruption commences before the Planned Start Time, the interruption is re-categorised as an unplanned interruption.
If a planned and warned interruption commences after the Planned Start Time, the time between the planned start and actual start is not included in the duration.
If a planned and warned interruption finishes before the Planned End Time, the time between the actual end and planned end is not included in the duration.

Annual Information Return 2018 Section 4 DG3 Page 5 of 34
If a planned and warned interruption finishes after the Planned End Time, the interruption is re-categorised as an unplanned interruption (overrun of a planned interruption).
3.6 Event Event is the term used by NI Water to describe its involvement in an abnormal occurrence in its services to customers.
3.7 Planned & Warned Interruption This is where notice of an interruption (> 3 Hours) is provided to properties affected at least 48 hours in advance of the beginning of the interruption.
3.8 Unplanned/Unwarned Interruption This is when an unplanned or a planned and unwarned interruption to supply occurs. Properties receiving less than 48 hours’ notice of a planned interruption (> 3hrs) are to be counted as ‘unplanned’ and reported under this category. Any planned interruption that is started before the planned date and time contained in the warning notice, whether this occurs within a 48 hour warning period or not, is also to be re-categorised as ‘unplanned’.
3.9 Overruns When a planned and warned interruption continues beyond the end of the warned time, for whatever reason and whether or not a customer has been advised during the shutdown that an overrun is going to occur, the interruption is described as an overrun and is reported separately.
3.10 Third party interruption A third party is defined as anyone who does not act for, or on behalf of NI Water. This category is intended to cover damage to NI Water’s mains or other equipment that directly or indirectly results in an unplanned loss of supply to enable the damage to be repaired. Where a third party interruption is not caused by a third party, but repair may be delayed by a third party, for example when a gas main runs close to a water main and needs to be isolated, the whole of the duration on the interruption must be reported as an unplanned interruption. Companies can describe this event in their commentary.
3.11 Electrical Failures Interruptions to supply caused by electricity supply failures must be reported as unplanned, unwarned interruptions, and identified in the records as caused by electrical failure to enable the details to be included in the NIAUR Return commentary.
3.12 Properties affected by more than one interruption during report year Properties, which are affected by more than one interruption during the report year, should be reported separately for each interruption. This means, for example, that a property affected by three supply interruptions would be reported three times, once for each interruption. Where properties are affected by repeat interruptions on the same day, these should only be counted separately where there is a minimum of one hour between the interruptions for the supply to be available (e.g. to refill storage tanks). When shorter gaps occur, the duration is counted from the start of the first interruption until the last restoration of supply.
4.0 PROCEDURE It should be established before any work is carried out on site, which function is responsible for the collection of information for the interruption record. In general, whichever function

Annual Information Return 2018 Section 4 DG3 Page 6 of 34
operates the valves to cut off supply at the site of an interruption is also responsible for the collection and ownership of the information.
4.1 Planned Interruptions (lasting > 3 Hours) Planned interruptions to supply arise as a result of work being carried out by different functions within the Customer Service Delivery Directorate or by functions within other NI Water Directorates. These have been identified as follows:
Planned interruptions carried out by Networks Water, Planned interruptions carried out by Leakage Services, Planned interruptions carried out by Capital Asset Delivery and, Planned interruptions carried out by Customer Field Services.
Regardless of the source of the interruption to supply, all planned interruptions must follow the procedures for giving the appropriate warnings. Each function is responsible for collecting and recording all appropriate information to be included in the DG3 Interruptions to Supply Register.
All affected properties must be notified by letter, or card drop, at least 48 hours before the shutdown, notifying them of the planned times and dates of shutdown and the restoration of supply. A minimum of 48 hours warning must be given for planned interruptions greater than 3 hours. The start of the warning occurs when the last card has been delivered or the last letter sent to the properties affected. If for example, there is estimated to be 500 properties to be warned, the card drop operation starts at 9.00am on 2nd July and finishes at say 2.00pm, then the warning period starts at 2.00pm for 48 hours and work should not start on site on the planned interruption until 2.00pm on the 4th July.
A copy of the letter of notification or the information contained on the card used in the card drop should be sent to the following for information – Customer Relations Centre Front Desk, Work Planning Unit, Telemetry Control Centre, Functional Manager and relevant Northern Ireland Fire and Rescue Service. For contact details see Appendix A.
The number of properties affected by a planned interruption should be determined by the most accurate means available at the time of:
a) planning activity;b) the interruption; orc) any subsequent more detailed investigation.
At the time of the initial assessment this is likely to be by property count or an estimate based on local knowledge. For recommendation for estimating numbers of properties, see paragraph 5.3.
4.2 Planned interruptions carried out by Networks Water or Leakage Services Field staff on site are to record all information on a paper pro forma, known as an Interruption Record Sheet (see Appendix D). The pro forma contains the raw data associated with the interruption and is retained for audit purposes. The information is also communicated to the Work Control Centre (during normal working hours) and the Telemetry Control Centre (outside normal working hours) where staff will already have opened an event on iNform - the Company’s Incident Management System (IMS) and will use the information to update/populate the remaining fields associated with the event.

Annual Information Return 2018 Section 4 DG3 Page 7 of 34
During the course of an interruption, field staff will continue to provide the WCC or TCC with regular updates on progress and the IMS event details will be updated accordingly. When the interruption has ended, the IMS event record will be closed with a status of ‘Closed – DG3 Record Required’ and the Field Manager responsible will review the details with the Field Technician and amend the information as necessary.
The following fields of information are required to enable a IMS Planned Interruption Event to be created:
Cause Warning details Planned start / finish Public narrative Incident location / areas affected
The following IMS fields should be updated during the course of a planned interruption event:
Estimated restoration time / date Actual restoration time / date Water sampler contacted Public narrative
4.3 Planned interruptions carried out by Capital Asset Delivery or Customer Field Services
Capital Asset Delivery and Customer Field Services use a combination of a paper pro forma (Appendix D) and an MS Excel spreadsheet template, known as a Contractor Return Sheet, to record the details of interruptions as the contractors that carry out the work for these departments do not have access to IMS. Each month, an appropriate member of Capital Asset Delivery or Customer Field Services will sign off the information to be recorded retrospectively on IMS. Details of the spreadsheet template can currently be obtained from CSD Services in Capital House.
IMS planned interruption events relating to Capital Asset Delivery should be created by Capital Asset Delivery staff in advance of planned interruptions taking place on site. The Warning Issued Date and Time, Planned Start Date and Time, Planned Restoration Date and Time, cause of interruption and properties affected are the only details that can be input in advance. This information will be used by staff in the CRC when providing updates to customers.
During the interruption, the contractor will record the details of the interruption, including the Actual Start Date and Time and Actual Restoration Date and Time, on an Interruption Record Sheet. The contractor will also summarise the information from the Interruption Record Sheets for each month in a Contractor Return Sheet. Contractor Return Sheets will be forwarded to Capital Asset Delivery staff who will use the details to update the IMS interruption event records. This task will be completed both monthly and retrospectively. A copy of the Contractor Return Sheets is also to be forwarded to CSD Services for incorporation in the monthly DG3 Composite Report.
4.4 Procedure for Ensuring that Customers Receive Adequate Notification in the Event of Planned and Warned Interruptions
Reference: The Water Mains Rehabilitation Framework Northern Ireland Guidance Note (GN07) - DG3 Interruptions Reporting for IMS October 2016

Annual Information Return 2018 Section 4 DG3 Page 8 of 34
For a planned interruption to be classed as planned and warned, customers must be provided with at least 48 hours’ notice in advance of the interruption to the water supply at their property. Therefore, if it is the Company’s intention to interrupt the supply at 12 Main Street from 8am to 6pm on 8th June, the warning must be communicated no later than 8am on 6th June.
Contractors have a contractual requirement to provide customers with 48 hours’ notice in advance of supply interruptions.
Guidance Note GN7 provides detailed and comprehensive guidance on the required action to be taken by contractors in relation to the notification of customers of the planned intent to interrupt the water supply. The guidance note defines the roles, responsibilities, notification periods and procedures for planned and unplanned interruptions during and after normal working hours.
Contractors should ensure familiarity and compliance with the guidance note at all times.
Formal on-site verification process to ensure customers are receiving the minimum 48 hour notification
Each month, NI Water’s WMRF Clerk of Works (CoW) will attend two notification card drops for each contractor, to witness the start of the notification period, i.e. when the last card/letter has been delivered.
The CoW will provide formal confirmation to NI Water’s Asset Delivery DG3 Compliance Team of when the last notification was delivered prior to the start of the planned interruption.
The monthly audits carried out by the CoW will be collated into a report to be reviewed at quarterly WMRF Project Board meetings.
Any instances of failure to provide the minimum 48 hours’ written notification will result in the following:
the interruption will be designated and reported as ‘unplanned’
the contractor concerned will receive a formal written warning and a non-conformance report (NCR) will be issued which could impact on reduced workallocation going forward
NI Water’s Executive Committee will be advised of any failures.
4.5 Unplanned Interruptions carried out by Networks Water or Leakage Services The event trigger for a IMS unplanned interruption event to be created is 4 ‘no water’ complaints in a single DMA within an hour, or when the WCC/TCC is informed by the Field Technician that the water is being turned off.
As defined above, unpredicted events such as mains bursts, or interruptions that are planned but where customers are not warned at least 48 hours in advance, are classified as unplanned interruptions.
Unplanned interruptions are mainly the responsibility of the Networks Water function and information should be recorded using IMS.
Following receipt of a ‘No water/Burst main’ complaint the Field Manager will investigate as soon as possible and provide ‘status updates’ to the Work Control Centre on the progress

Annual Information Return 2018 Section 4 DG3 Page 9 of 34
of remedial works. The Field Technicians on site will record all information on a paper pro forma (Appendix D) and the pro forma will be retained for audit purposes. The Field Technicians will also provide regular timely updates on the progress of such events to the Work Controllers, Duty Managers and Telemetry Operators. Details including the cause of interruption, the time the repair is commenced, the estimated restoration time and the time the repair is complete are to be recorded on IMS.
Area Managers may be made aware of interruptions other than as a result of customer calls. In such cases, the Field Managers should ensure that relevant details are passed to the WCC for processing.
Details input to IMS are to include the Interruption Start Time, as noted by the first affected customer, the time at which the supply was restored and whether or not a third party or an electrical supply failure was the cause.
The following fields of information are required to enable a IMS Unplanned Interruption Event to be created:
Time of first call Estimated restoration time Public narrative Incident location / areas affected
The following IMS fields should be updated during the course of an unplanned interruption event:
Public narrative Cause Mains type / material Repair commenced date / time Supply restored date / time All properties restored date / time Water sampler
Note: A record should be created for every burst main, even if the properties affected are zero as there is a requirement to record all bursts on DG3.
4.6 Unplanned interruptions carried out by Capital Asset Delivery or Customer Field Services
IMS unplanned interruption events relating to Capital Asset Delivery are created by WCC and TCC staff in the same way that other IMS unplanned interruption events are created. Sometimes, the contractor may be unaware that an unplanned interruption has occurred, for example, if the contractor forgets to open a valve. The IMS process ensures that such interruptions are captured by the Company. In cases where the contractor is aware of having caused an unplanned interruption, for example, a burst main, the contractor will provide details of the interruption in the Contractor Return Sheet.
4.7 Number of properties affected An estimation using practical evaluation and contouring from NIW’s GIS system will be used to give a more accurate estimate of drawdown of the system.
5.0 RECORDS Overall responsibility for DG3 records lies with the Head of Networks Water. However, the DG3 Register is compiled and held by CSD Services in Capital House.

Annual Information Return 2018 Section 4 DG3 Page 10 of 34
Interruption records relating to the Networks Water and Leakage Services functions are recorded on IMS. Interruption records relating to Capital Asset Delivery and Customer Field Services are also recorded on IMS but on a retrospective basis. As Capital Asset Delivery and CFS contractors do not have access to IMS, their details are initially recorded on an MS Excel spreadsheet template before being entered onto IMS by NI Water staff.
5.1 Interruption Recording using IMS When an event is created on IMS, the event can be one of the following:
Unplanned Interruption Planned Interruption Flooding Water Quality
IMS can be used to specify whether or not: an Unplanned Interruption event was caused by a third party a warning was issued for a Planned Interruption event the amount of warning was sufficient for a Planned Interruption event a Planned interruption event occurred during the planned time
In this way, IMS can be used to report on all four regulatory categories of interruption.
When all information has been entered onto IMS, the information is then extracted in the form of a report. A number of reports are available for selection including:
RPT1151 – Historical DG3 Interruption Records Report, RPT1152 – Historical DG3 Interruption Addresses Report, RPT1155 – ‘Live’ DG3 Unplanned Interruption Records Report RPT1156 – ‘Live’ DG3 Planned Interruption Records Report.
When a IMS interruption event record has been created and closed with the status of ‘Closed – DG3 Record Required’, it is then the responsibility of the Field Manager to review the record and to amend the details according to the information provided by the Field Technician and information obtained through the GIS polygon process. Once the Field Manager is satisfied that all amendments have been made, the record should be approved and passed to the Customer Field Manager for review and approval. The record should then be passed to the Area Manager for review and approval, to the DG3 Customer Services Coordinator for review and approval and finally, to the Head of Networks Water for review and approval. If the CFM, AM, DG3 CS Coordinator or HoF find any issues with the information, they have the option to reject the record.
Most of the information required will be able to be input directly onto the input screen and will probably not be altered. Some information e.g. house numbers and addresses will be initially estimated by the Field Technicians or the Field Manager. However more investigative work may be required to give an accurate number of houses. The interruption record can then be updated when this information becomes available. For procedures for obtaining house numbers and address see paragraph 5.3 below.
Area Managers and Field Managers are to ensure that all relevant details are recorded and input to the system as soon as possible, and any paper records or notification cards are retained for general audit purposes. On-call staff are to gather all relevant information and report to the Networks Water Area Manager as soon as possible the next working day.

Annual Information Return 2018 Section 4 DG3 Page 11 of 34
The following Audit Process is aimed at ensuring the timely completion of audit tasks and approval ahead of monthly reporting on DG3 to the Board.
DG3 / IMS Reporting / Audit Process (3rd Draft – 21 Oct 14) Action
No. Action Date
IMS Report from the Field 1 WC opens a New Event in IMS when an event trigger
is reached. The IMS Event is updated by WC throughout the
incident with information from Field Staff. WC Save the event when the incident is closed in the
field.
2 DG3 CS Coordinator sends the Weekly Rapid NoWater Complaints Report to the FM’s on a Mondaymorning for the previous week.
Every Monday morning.
3 The weekly Rapid No Water Complaints Report, listsall NIW No Water calls for the week.
FM filters the report for his own area, sorts by date andDMA which then group calls.
The FM opens the IMS / Reports / RPT1151 –Historical Report – DG3 Interruption Records.
o Enter Start Date.o Remove tick from Null box.o Enter End Dateo View Report.o Click Export Drop Down Menuo Export to Excelo Filter Report to own area.
The call groups are then checked against anappropriate DG3 Interruption Record and theTechnicians, Interruption to Supply – Site Record.
From the three reports the FM then adjusts, if required,and Save the IMS Report.
At this stage don’t Approve to allow the event toremain with the FM until all audit checks arecompleted at the end of the month.
Ongoing throughout the week/month.
4 The above process will be completed for each week ofthe month.
L4 will also check the IMS Event Report throughoutthe Month and raise queries as appropriate.
Ongoing throughout the week/month.
DG3 Reporting and Audit Process 5 DG3 CS Coordinator produces Draft DG3 KIP Report,
DG3 Reporting – 081014. Two tabs;
o Unplanned >6hr Summaryo AIR & KPI Reporting
By 1st working day of the new month.

Annual Information Return 2018 Section 4 DG3 Page 12 of 34
6 Level 4 uses the above monthly Unplanned >6hrsSummary Report to identify a number of L4 MonthlyAudit checks.
L4 meets with the Customer Field Manager to arrangethe Audit Checks.
1st working day + 1 day.
1st working day + 1 day
7 Level 5 checks the monthly Unplanned >6hrSummary report for his area against IMS Events andadjusts as necessary.
1st working day + 1 day
8 Customer FM discusses the IMS Events highlightedfor audit in action 6.
Adjusts as required.
1st working day + 3 days
9 Customer FM reports back to Level 4. L4 approves/saves the Audit Events in the IMS
system.
1st working day + 5 days
Monthly Sign Off 10 L4 emails L3 & DG3 CS Coordinator that Monthly
Audit checks have been completed.1st working day + 7 days
11 DG3 CS Coordinator produces DG3 RapidComparison Checks report.
This Zip file contains an number of reports;o Individual FM folders with DG3 ID Events
checks.o Comparison Checks Summary.
Red/Amber/Green against start/finish/No.prop
o Properties not recorded on IMS. Used to check No. of prop queries.
1st working day + 8 days
12 L4 discusses above report with Customer FM. Customer FM discussed above report with FM’s. Customer FM to the Level 4. L4 reports back to DG3 CS Coordinator.
1st working day + 10 days
13 Level 3 sings off the monthly DG3 Report for the Board. 2nd Tuesday of the new month.
The reports above can be found at G:\NetWat\DG3\Monthly Audit Process
5.2 MS Excel Spreadsheet Template – Contractor Return Sheet Planned interruptions undertaken by Capital Asset Delivery and Customer Field Services will most likely be carried out by a number of contractors. The Contractor’s Representative should gather all appropriate information on a paper pro forma (Appendix D) and then transfer this information to the Contractor Return Sheet. The Contractor Return Sheets should be collated at the end of each week/month and signed off by an appropriate member of Capital Asset Delivery or Customer Field Services staff and sent to CSD Services for

Annual Information Return 2018 Section 4 DG3 Page 13 of 34
inclusion into the DG3 Register. All pro forma should be stored by Capital Asset Delivery and Customer Field Services for Audit purposes.
Details of the Contractor Return Sheet can currently be obtained from CSD Services in Capital House.
5.3 Property numbers and Addresses It is a requirement of NIAUR that the numbers of properties and address details of properties affected by interruptions to supply exceeding 3 hours are recorded. The numbers of properties and address details should be determined by the most accurate means available at the time. This is likely to be by one of two methods.
a. Visual Property CountsIn the case of small-scale interruptions, a Field Technician may have sufficient knowledgeto determine the number of properties affected by carrying out a visual property count.Details should initially be recorded by hand on a paper pro forma including location, typeand cause of interruption, and ‘valve off’/’valve on’ times. Each week, the Field Managershould review the Interruption Record Sheets with his Field Technicians and the detailsprovided should be used to update the IMS records.
b. GIS PolygonsIn the case of large-scale interruptions, the number of properties affected by an interruptionshould be determined using a GIS polygon. A Map Redline Request should be submittedusing the IMS DG3 Interruption Details page. Then in CARtomap (the Company’s CorporateAsset Register/GIS intranet facility), a redline polygon should be drawn around the affectedarea and assigned to the IMS request which should appear in the dropdown list associatedwith the DG3 Areas Layer of the Water workspace (see Editing Menu). Back in IMS, theMap Redline Request should be updated to retrieve the address details of the propertieswithin the polygon and hence, the number of properties affected.
Field Managers should base the redline polygons on the details provided by the Field Technicians.
In the case of interruptions where rezoning is carried out, it may be necessary to obtain address details from within more than one polygon.
5.4 Records of Interruptions In general all interruptions to supply should be recorded. However there are large numbers of very short interruptions to supply carried out by Leakage Services and Customer Field Services. These interruptions are routine, inconsequential and last no longer than 30 minutes. Information about these interruptions is held by managers in Leakage Services and Customer Field Services and is therefore not required for the DG3 Interruptions to Supply Register. Discretion should however be used in all cases. If difficulties arise or there happens to be an exception to the type of routine interruption referred to above that gives rise to an interruption that lasts for more than 1 hour then, this interruption should be recorded. Guidance on which interruptions should be recorded is to be given by Leakage Services and Customer Field Services managers.
In general: Routine interruptions lasting less than 1 hour need not be recorded as part of the DG3 Interruptions to Supply Register except at the discretion of the Field Technician or Field Manager.

Annual Information Return 2018 Section 4 DG3 Page 14 of 34
All interruption records entered onto IMS are to be approved by at least the Area Manager responsible by the 1st working day + 5 days, as per the Audit Process described earlier in the document. Interruption records belonging to Capital Asset Delivery and Customer Field Services should be sent to CSD Services by the same date.
When a Field Manager approves a IMS DG3 record, an e-mail reminder isautomatically forwarded to the Customer Field Manager.
When a CFM approves a IMS DG3 record, an e-mail reminder is automaticallyforwarded to the Area Manager.
When an Area Manager approves a IMS DG3 record, an e-mail reminder isautomatically forwarded to the DG3 Customer Services Coordinator.
Automatic e-mail reminders to approve the DG3 records are sent to the DG3 Customer Services Coordinator, Head of Networks Water, Head of Networks Leakage and Capital Asset Delivery L3 on a monthly basis.
5.5 Historical records All associated documentation is to be kept for seven years.
5.6 Audit Trail The maintenance of audit trails is very important. During AIR audits the Reporter would more than likely want to investigate several interruptions and the associated documentation. It is therefore imperative that all records corresponding to individual interruption records, including pro forma, are stored locally for audit purposes.
5.7 Amendments to Information It is recognised that the details entered at the time a IMS event record is created are estimates and that it may be necessary to update the details following the GIS polygon process. The IMS Internal Narrative should be used to record the details of any amendments, over and above those that occur as a result of the normal process of updating records. All amendments to the base data contained in IMS or information changed during the course of the development of the DG3 Composite Report File, must be supported by a detailed explanation.
6.0 REPORTING 6.1 NI Water Reports IMS can be updated on a continuous basis, as and when interruption events occur, throughout the life of an ‘Active’ event, and after an event has been closed on the system and a corresponding DG3 interruption record has been registered. Monthly reports can be generated following the completion of quality assurance checks carried out by Area Managers and Customer Field Managers and the release of data by the Head of Function. These reports are used by the CSD Services function to compile a DG3 Register for each month and corresponding KPIs.
The following reports are generated by CSD Services for Management Information: Monthly DG3 Composite Report including monthly DG3 Register Monthly DG3 KPI Report Annual DG3 AIR Table 2 Lines 5 to 19 Report (as defined by the Annual Information
Return Reporting Requirements and Definitions Manual).

Annual Information Return 2018 Section 4 DG3 Page 15 of 34
6.2 Development of the DG3 Register and KPI Report As described above, interruption data for each month is extracted from the various data sources (IMS and Contractor Return Sheets) used by the various work streams (Networks Water, Leakage Services, Capital Asset Delivery and Customer Field Services) and copied to a DG3 Composite Report File held by CSD Services in Capital House.
Copies of the original records are retained in their unaltered state. The records are then sorted according to the four regulatory categories of interruption:
Unplanned Interruptions Planned and Warned Interruptions Unplanned Interruptions Caused by Third Parties Unplanned Interruptions due to Overruns of Planned and warned Interruptions
further sorted according to the four regulatory time bands: More than 3 hours More than 6 hours More than 12hours More than 24 hours
The interruption records are subject to a series of audit checks to ensure that the details of interruptions have been captured in accordance to the regulatory guidance. For further information on the development of the DG3 Register, please refer to the Line Methodology for AIR Table 2 Lines 5 to 19.
6.3 Regulatory Report The Finance & Regulation Directorate will report to Northern Ireland Authority for the Utility Regulation (NIAUR) on an annual basis.
7.0 VOID PROPERTIES Within NI Water, Asset Information Development (AID) is primarily responsible for ensuring the databases, systems, standards and processes are in place to support the Corporate Asset Register (GIS/Ellipse).
According to the definition, a void property is a type of connected property. The GIS picks up the following twelve property types, including void properties:
Approved Built Approved Derelict Approved Under Construction Candidate Built Candidate None Candidate Under Construction Historical Built Historical Derelict Historical None Historical Under Construction Provisional Built Provisional Under Construction
Unless AID is specifically asked to exclude void properties when running queries, their GIS address lists will include any of the property types listed above.

Annual Information Return 2018 Section 4 DG3 Page 16 of 34
There is a delay in updating the GIS with property status information.
Relevant extracts from the Pointer 2.1 Specification can be found in Appendix E at the back of this document (Pages 22 to 26 of 31).
8.0 ‘NO WATER/LOW PRESSURE’ COMPLAINTS Within NI Water, CRC call agents adopt a specific line of questioning with the customer to establish the cause of complaint including complaints relating to low pressure and no water.
A copy of the latest CRC call scripts for handling low pressure/no water complaints can be found in Appendix F at the back of this document (Pages 27 & 28 of 31). Provided the customer provides an accurate response to the questions asked by the call agent, the risk of wrong classification should be negated.
Appendices to the DG3 Supply Interruptions Levels of Service Methodology can be found in the follow section of the document

Annual Information Return 2018 Section 4 DG3 Page 17 of 34
Appendix A – DG3 Interruption to Supply - Roles & Responsibilities
Customer Relations Centre (Normal Hours) Log ‘no water’/ ‘burst main’ complaints into RapidXtra system; Use IMS system to provide up to date information to customers; Use ‘Operational Announcements’ functionality to share information; Adhere to agreed communication routes.
Bretland Work Control Centre (Normal Hours) Create IMS interruption event records and close with either a status of ‘Closed – DG3
Record Required’ or ‘Closed – DG3 Record Nor Required’.
Work Planning Unit Normal hours – create a Work Order and inform area supervisor immediately; Update the Ellipse System following ‘status calls’; Ensure Work Orders are closed out.
Contact details:-
Customer Service Delivery Directorate - Networks Water The Area Managers and Field Managers are responsible for the procurement of
information for DG3 within the Networks Water function.
Customer Service Delivery Directorate - Leakage Services The Area Managers and Field Managers are responsible for the procurement of
information for DG3 within the Leakage Services function.
Customer Field Services Customer Field Services is responsible for reactive meter maintenance, proactive
meter exchange and the installation of new meters. An interruption to supply to theproperty arises during the course of the installation.
Field Technicians Proactively provide regular timely updates on the progress of events (bursts, repairs
etc.) to Work Control / Duty Managers / Telemetry operators: Nature of the problem and any relevant details Time repair commenced Estimated restoration time Repair complete;
Field Technicians (continued) Provide any additional information to Field Managers to allow completion of the
corresponding DG3 record e.g. Polygon details Rezoned properties.
Field Managers Inform Customer Services and Work Planners of planned interruptions providing
details of area & number of properties affected and proposed duration of interruption; Assess extent of unplanned interruptions and organise remedial work; Inform Work Planners on completion of remedial work;


Annual Information Return 2018 Section 4 DG3 Page 19 of 34
Checks, audits and queries records signed off by Customer Field Managers; Compiles DG3 Interruptions to Supply Register based on data derived from IMS; Signs off IMS records and DG3 Interruptions to Supply Register for approval by Head
of Networks Water; Produces KPI reports for Management and AIR for Regulator.
Capital Asset Delivery Capital Asset Delivery is responsible for the rehabilitation of existing water mains and
the installation of new water mains. Interruptions to supply arise as a result ofconnecting properties to the refurbished and new water mains.
Capital Asset Delivery Planned Works Coordinator Ensure that planned works affected > x properties / lasting > x time are entered on
the system in advance; Ensure that planned works are updated if necessary (e.g. overruns, early starts); Close records at completion of events and apply appropriate DG3 status (required or
not required); Ensure that planned works affecting < x properties / lasting < x time are entered on
the system retrospectively and submitted for approval.
Networks - On-call Staff Assess extent of unplanned interruptions, update Duty Officer (if required) and
organise remedial work Inform Networks Water Area Manager of actions taken and interruption details
Head of Networks Water Final signoff of amalgamated approved IMS interruption records on a monthly basis
and release of data for reporting purposes.
Regulation & Business Performance Section Submit Annual Information Return to NIAUR.
Emergency Planning Team Declare Major Incidents on the IMS system; Interrogate reports to provide status updates as incidents develop; Complete Upwards Reports based on data provided in IMS; Close Major Incidents on IMS system.
Bronze Team – MIP Only Create and maintain event records based on the information provided by Field Staff: Interruptions to Supply (planned and unplanned) Water Quality Flooding;
Close records at completion of events and apply appropriate DG3 status (required ornot required);
Monitor open incidents for records requiring action; Interrogate reports to provide status updates as incidents develop within their Bronze
area.
Silver Team Interrogate reports to provide status updates as incidents develop.

Annual Information Return 2018 Section 4 DG3 Page 20 of 34
Appendix B – DG3 Process Flow Diagram – Unplanned or Unwarned Interruptions ‘No water’ / burst
main complaint
Call received / confirmed &
actioned
Input to Rapid Extra
Investigation carried out
Ops on-call staff
Call received / confirmed &
actioned
Closes Work Order
Telemetry indicates
interruption
Remedial works carried out
Details logged & recorded on IMS
Creates Work Order
Data checked / verified
Supporting evidence/paper records held for audit purposes
Reports generated
DG3 Register
IMS Report signed off
Is data correct / complete?
TCC
WCC
CRC
(Out of hours)
No
Yes

Annual Information Return 2018 Section 4 DG3 Page 21 of 34
Appendix B – DG3 Process Flow Diagram – Planned and Warned Interruptions
Assess needs of vulnerable /
commercial customers
Notification cards prepared & issued (<200 properties)
Planned & Warned Interruptions
Notification cards prepared & issued (<200 properties)
Work Order closed Work Order created
Work carried out
Details logged & recorded on IMS
Data checked / verified
Supporting evidence / paper records held for audit purposes
Reports generated
DG3 Register
IMS Report signed off
Is data correct / complete?
Alternative water supplies arranged
if required
CSD
WCC
Yes
No

Annual Information Return 2018 Section 4 DG3 Page 22 of 34
Appendix D – Pro forma - Interruption Record Sheet

Annual Information Return 2018 Section 4 DG3 Page 23 of 34
Appendix E – Pointer 2.1 Specification Extract (Page 12
4.21 BUILDING_STATUS
Definition The current physical status of the building.
Constraints Population of this field is mandatory.
Permitted PAO Status values are:
None, Under Construction, Built, Derelict and Demolished
Details This field reflects changes to the Building_Status.
The values in this field are system generated and when a new address sent in from a council is entered in the system, the Building_Status is set to ‘None’ and the Address_Status set to ‘Candidate’. When the council sends notification that building has commenced, the Building_Status is set to ‘Under Construction’ and the Address_Status set to ‘Provisional’. After LPS field surveyors have confirmed the exact co-ordinates for the building, the Temp_Coords field is updated and the Building_Status is set to ‘Built’ and the Address_Status set to ‘Approved’. A notification from a council that a building is derelict or demolished results in the Building_Status being updated and the Address_Status set to ‘Historical’.
Please note that depending on the purpose for which the data is being used, the user may need to filter out certain categories of Building _Status. For example, addresses for ‘Demolished’ buildings would not be required where a mail shot is planned.

Annual Information Return 2018 Section 4 DG3 Page 24 of 34
Appendix E – Pointer 2.1 Specification Extract (Page 13)

Annual Information Return 2018 Section 4 DG3 Page 25 of 34
Appendix E – Pointer 2.1 Specification Extract (Page 14)
4.22 ADDRESS_STATUS
Definition The current logical status of the address.
Constraints Permitted ADDRESS_STATUS values are: (See diagram above)
Candidate - before building starts. Planning permission has been granted but buildinghas not commenced. Created by the Local Council before building has begun.
Provisional – The Local Council has confirmed that the building is under construction. Approved – LPS add permanent co-ordinates and/or a building classification. A
Postcode may also be added however this does not affect the ADDRESS_STATUS Historical - addresses that are no longer in use due to dereliction, demolition etc. Rejected – used to indicate the deletion of an incorrect address. Population of this
field is mandatory, and is system generated.
Details The values in this field are system generated and when a new address sent in from a council is entered in the system, the Building_Status is set to ‘None’ and the Address_Status set to ‘Candidate’. When the council sends notification that building has commenced, the Building_Status is set to ‘Under Construction’ and the Address_Status set to ‘Provisional’. After LPS field surveyors have confirmed the exact co-ordinates for the building, the Temp_Coords field is updated and the Building_Status is set to ‘Built’ and the Address_Status set to ‘Approved’. A notification from a council that a building is derelict or demolished results in the Building_Status being updated and the Address_Status set to ‘Historical’.
Please note that depending on the purpose for which the data is being used, the data should be filtered on the categories of Address _Status. For example, addresses set to ‘Historical’ would not be required where a mail shot is planned.

Annual Information Return 2018 Section 4 DG3 Page 26 of 34
4.23 CLASSIFICATION
Definition The current use of the building, derived from the LPS classification.
Constraints Data in this field is system generated.
Permitted CLASSIFICATION values are shown below. These are derived from the detailed LPS list of valuation classifications.
Details There are three main classification groups:
NULL – Where the record has not yet been updated with an LPS classification. Non Domestic (formerly Commercial) – these records are prefixed with ‘ND’ Domestic (formerly Residential) – these records are prefixed with ‘DO’. Where an
individual is operating a business from a room within their home, LPS still classify thisas a Residential property.
These are subdivided into a further classification as detailed above.
When the building use of an addressable object changes, the CLASSIFICATION field will be updated to reflect this change.

Annual Information Return 2018 Section 4 DG3 Page 27 of 34
Appendix E – Pointer 2.1 Specification Extract (Page 15)
CODE CLASSIFICATION DESCRIPTION ND_agriculture Agriculture (incl farms, market gardens) ND_agriculture_other Miscellaneous Agriculture ND comm other Commercial other ND_culture Cultural (incl museums, libraries) ND_culture_other Miscellaneous Culture ND_education Education (incl school, further ed) ND_entertainment Leisure and tourism(non-sporting - cinemas etc) ND_ents_other Miscellaneous Entertainment ND_freight_other Freight (canal, dock, railway undertaking) ND health Health(incl hospital, care home, clinics) ND_hospitality Hospitality (incl hotels, b&b) ND_indust_other Miscellaneous Industry ND_industry Industry (incl factory, quarries) ND_legal Law and Order ND_office Commercial office - banks, post offices, offices ND_religious Religious establishment (incl places of worship) ND_retail Retail (shops, showrooms etc) ND_sporting Recreation (sports facilities) ND_utilities Public utilities ND_utilities_other Miscellaneous Utilities
DO_apart Domestic - Apartments/flats DO detached Domestic - detached DO_semi Domestic - Semi DO_terrace Domestic - Terrace DO_other Domestic other (incl Lock-up garages)
4.24 CREATION_DATE Definition The date when an address is first entered into the system by the Local Council.
Constraints This field will only be populated for records created after the Pointer application went live in 2005. The field is automatically populated when records are entered into the database. It does not necessarily relate to the date of building, but rather when the information was provided.
4.25 COMMENCEMENT_DATE Definition This is the date when construction on the property has begun.
Constraints This field will be populated for records created after the release of the new Pointer Product and when Local Council informs Pointer of the fact.
Details This indicates when the BUILDING_STATUS changes from ‘NONE’ to ‘UNDER CONSTRUCTION’

Annual Information Return 2018 Section 4 DG3 Page 28 of 34
Appendix F – CRC Call Script for ‘No Water’ Complaints

Annual Information Return 2018 Section 4 DG3 Page 29 of 34
Appendix F – CRC Call Script for ‘Low Pressure’ Complaints

Annual Information Return 2018 Section 3 DG3 Page 30 of 34
Appendix G – DG3 Register Extract (Unplanned Interruption Events – IMS Report RPT1184)
LastRun
Unplanned, Unwarned Interruptions
More than 3 hrs No of Properties 18,504
Event Id
Interruption Id User Friendly Interruption Status Name
Managing Function Name
Field Manager Area Name
Event Creator
DG3 Creator Interruption Type Name
Planned Warning Date Time 1
Planned Warning Type
Planned Start Date Time 1
Planned Restoration Date Time 1
Actual Start Date Time 1
Actual Supply Restored Date Time 1
Total Affected Properties Count 1
Number of Properties Affected
Number of Properties Affected 3
Number of Properties Affected 6
Number of Properties Affected 12
Number of Properties Affected 24 Property Duration
Property Duration Hours
Property Duration Minutes
Property Duration Seconds Location
Third Party Caused Interruption Third Party Other Third Party Details Interruption Cause Description
243571 171407 Registered Networks Water NW02B Unplanned Interruption N/A 27/03/2018 19 30 27/03/2018 22 35 25 25 25 0 0 0 3 Hrs 5 Mins 0 Secs 3 5 0 (UPRN 185191869) ‐ FALSE Burst Main/Main Repair233395 171266 Submitted to Customer Field Manager Networks Water NW51A Unplanned Interruption N/A 10/03/2018 10 54 10/03/2018 14 00 9 9 9 0 0 0 3 Hrs 6 Mins 0 Secs 3 6 0 (UPRN 185538652) ‐ FALSE Replacement Fitting (e.g. SV, FH)233219 171129 Submitted to Area Manager Networks Water NW52A Unplanned Interruption N/A 01/03/2018 11 18 01/03/2018 14 30 29 29 29 0 0 0 3 Hrs 12 Mins 0 Secs 3 12 0 (UPRN 185557101) ‐ FALSE Burst Main/Main Repair243482 171336 Submitted to Area Manager Networks Water NW02B Unplanned Interruption N/A 17/03/2018 08 15 17/03/2018 11 30 10 10 10 0 0 0 3 Hrs 15 Mins 0 Secs 3 15 0 (UPRN 185296755) ‐ FALSE Burst Main/Main Repair233257 171162 Registered Networks Water NW01A Unplanned Interruption N/A 04/03/2018 13 45 04/03/2018 17 00 19 19 19 0 0 0 3 Hrs 15 Mins 0 Secs 3 15 0 (UPRN 185022299) ‐ FALSE Burst Main/Main Repair243537 171379 Registered Networks Water NW01A Unplanned Interruption N/A 23/03/2018 13 00 23/03/2018 16 15 34 34 34 0 0 0 3 Hrs 15 Mins 0 Secs 3 15 0 (UPRN 185039081) ‐ FALSE Burst Main/Main Repair233345 171244 Submitted to Area Manager Networks Water NW01A Unplanned Interruption N/A 08/03/2018 09 00 08/03/2018 12 20 2394 31 31 0 0 0 3 Hrs 20 Mins 0 Secs 3 20 0 (UPRN 185039329) ‐ FALSE Burst Main/Main Repair233377 171248 Submitted to Area Manager Networks Water NW51B Unplanned Interruption N/A 09/03/2018 09 00 09/03/2018 12 20 16 16 16 0 0 0 3 Hrs 20 Mins 0 Secs 3 20 0 (UPRN 185840963) ‐ FALSE Burst Main/Main Repair233228 171137 Submitted to Area Manager Networks Water NW53A Unplanned Interruption N/A 02/03/2018 12 35 02/03/2018 16 00 265 265 265 0 0 0 3 Hrs 25 Mins 0 Secs 3 25 0 (UPRN 187130511) ‐ FALSE Other243570 171408 Submitted to Area Manager Networks Water NW02B Unplanned Interruption N/A 27/03/2018 18 05 27/03/2018 21 30 38 38 38 0 0 0 3 Hrs 25 Mins 0 Secs 3 25 0 (UPRN 185226234) ‐ FALSE Burst Main/Main Repair233473 171330 Submitted to Customer Field Manager Networks Water NW52B Unplanned Interruption N/A 16/03/2018 12 00 16/03/2018 15 29 35 35 35 0 0 0 3 Hrs 29 Mins 0 Secs 3 29 0 (UPRN 185479143) ‐ FALSE Burst Main/Main Repair233353 171237 Registered Networks Water NW03A Unplanned Interruption N/A 08/03/2018 11 00 08/03/2018 14 30 93 93 93 0 0 0 3 Hrs 30 Mins 0 Secs 3 30 0 (UPRN 185965980) ‐ FALSE Burst Main/Main Repair243552 171390 Submitted to Area Manager Networks Water NW01A Unplanned Interruption N/A 08/03/2018 15 30 08/03/2018 19 00 1822 27 27 0 0 0 3 Hrs 30 Mins 0 Secs 3 30 0 (UPRN 185039329) ‐ FALSE Burst Main/Main Repair243606 171435 Submitted to Customer Field Manager Networks Water NW52A Unplanned Interruption N/A 29/03/2018 19 15 29/03/2018 22 45 92 92 92 0 0 0 3 Hrs 30 Mins 0 Secs 3 30 0 (UPRN 185425492) ‐ FALSE Burst Main/Main Repair233323 171228 Submitted to Customer Field Manager Networks Water NW01A Unplanned Interruption N/A 07/03/2018 13 00 07/03/2018 16 30 8 8 8 0 0 0 3 Hrs 30 Mins 0 Secs 3 30 0 (UPRN 185068887) ‐ FALSE Burst Main/Main Repair233345 171244 Submitted to Area Manager Networks Water NW01A Unplanned Interruption N/A 08/03/2018 10 00 08/03/2018 13 30 2394 52 52 0 0 0 3 Hrs 30 Mins 0 Secs 3 30 0 (UPRN 185039329) ‐ FALSE Burst Main/Main Repair233415 171286 Submitted to Customer Field Manager Networks Water NW53A Unplanned Interruption N/A 13/03/2018 10 00 13/03/2018 13 30 82 82 82 0 0 0 3 Hrs 30 Mins 0 Secs 3 30 0 (UPRN 185999706) ‐ FALSE Burst Main/Main Repair243497 171354 Registered Networks Water NW02B Unplanned Interruption N/A 20/03/2018 11 15 20/03/2018 14 45 43 43 43 0 0 0 3 Hrs 30 Mins 0 Secs 3 30 0 (UPRN 185217241) ‐ FALSE Burst Main/Main Repair243552 171390 Submitted to Area Manager Networks Water NW01A Unplanned Interruption N/A 08/03/2018 14 30 08/03/2018 18 00 1822 115 115 0 0 0 3 Hrs 30 Mins 0 Secs 3 30 0 (UPRN 185039329) ‐ FALSE Burst Main/Main Repair243552 171390 Submitted to Area Manager Networks Water NW01A Unplanned Interruption N/A 08/03/2018 15 00 08/03/2018 18 30 1822 126 126 0 0 0 3 Hrs 30 Mins 0 Secs 3 30 0 (UPRN 185039329) ‐ FALSE Burst Main/Main Repair243552 171390 Submitted to Area Manager Networks Water NW01A Unplanned Interruption N/A 08/03/2018 16 00 08/03/2018 19 30 1822 11 11 0 0 0 3 Hrs 30 Mins 0 Secs 3 30 0 (UPRN 185039329) ‐ FALSE Burst Main/Main Repair243552 171390 Submitted to Area Manager Networks Water NW01A Unplanned Interruption N/A 08/03/2018 16 30 08/03/2018 20 00 1822 43 43 0 0 0 3 Hrs 30 Mins 0 Secs 3 30 0 (UPRN 185039329) ‐ FALSE Burst Main/Main Repair243574 171410 Registered Networks Water NW51A Unplanned Interruption N/A 28/03/2018 07 30 28/03/2018 11 00 13 13 13 0 0 0 3 Hrs 30 Mins 0 Secs 3 30 0 (UPRN 185501097) ‐ FALSE Burst Main/Main Repair243589 171423 Registered Networks Water NW02B Unplanned Interruption N/A 28/03/2018 18 30 28/03/2018 22 10 13 13 13 0 0 0 3 Hrs 40 Mins 0 Secs 3 40 0 (UPRN 185207002) ‐ FALSE Burst Main/Main Repair233240 171143 Registered Networks Water NW52B Unplanned Interruption N/A 03/03/2018 10 30 03/03/2018 14 10 28 28 28 0 0 0 3 Hrs 40 Mins 0 Secs 3 40 0 (UPRN 187375243) ‐ FALSE Burst Main/Main Repair233249 171153 Submitted to Area Manager Networks Water NW53A Unplanned Interruption N/A 04/03/2018 06 50 04/03/2018 10 30 38 38 38 0 0 0 3 Hrs 40 Mins 0 Secs 3 40 0 (UPRN 187373559) ‐ FALSE Broken/Jammed/Misaligned Fittin243517 171364 Submitted to Area Manager Networks Water NW52A Unplanned Interruption N/A 21/03/2018 13 17 21/03/2018 17 00 68 68 68 0 0 0 3 Hrs 43 Mins 0 Secs 3 43 0 (UPRN 185460043) ‐ FALSE Burst Main/Main Repair233345 171244 Submitted to Area Manager Networks Water NW01A Unplanned Interruption N/A 08/03/2018 09 00 08/03/2018 12 45 2394 181 181 0 0 0 3 Hrs 45 Mins 0 Secs 3 45 0 (UPRN 185039329) ‐ FALSE Burst Main/Main Repair233379 171254 Submitted to Area Manager Networks Water NW52A Unplanned Interruption N/A 09/03/2018 12 00 09/03/2018 15 45 440 440 440 0 0 0 3 Hrs 45 Mins 0 Secs 3 45 0 (UPRN 185420061) ‐ FALSE Burst Main/Main Repair233392 171263 Registered Networks Water NW02B Unplanned Interruption N/A 10/03/2018 00 30 10/03/2018 04 15 52 52 52 0 0 0 3 Hrs 45 Mins 0 Secs 3 45 0 (UPRN 185231930) ‐ FALSE Burst Main/Main Repair233454 171313 Registered Networks Water NW51A Unplanned Interruption N/A 15/03/2018 09 15 15/03/2018 13 00 49 49 49 0 0 0 3 Hrs 45 Mins 0 Secs 3 45 0 (UPRN 185539774) ‐ FALSE Other233241 171148 Submitted to Customer Field Manager Networks Water NW03A Unplanned Interruption N/A 03/03/2018 15 30 03/03/2018 19 20 756 756 756 0 0 0 3 Hrs 50 Mins 0 Secs 3 50 0 (UPRN 187155597) ‐ FALSE Burst Main/Main Repair233261 171164 Registered Networks Water NW52A Unplanned Interruption N/A 04/03/2018 14 55 04/03/2018 18 45 7 7 7 0 0 0 3 Hrs 50 Mins 0 Secs 3 50 0 (UPRN 185411609) ‐ FALSE Burst Main/Main Repair233444 171302 Submitted to Customer Field Manager Networks Water NW53A Unplanned Interruption N/A 14/03/2018 14 00 14/03/2018 17 50 86 86 86 0 0 0 3 Hrs 50 Mins 0 Secs 3 50 0 (UPRN 185661214) ‐ FALSE Burst Main/Main Repair243582 171418 Registered Networks Water NW02B Unplanned Interruption N/A 28/03/2018 11 23 28/03/2018 15 15 23 23 23 0 0 0 3 Hrs 52 Mins 0 Secs 3 52 0 (UPRN 185218723) ‐ FALSE Burst Main/Main Repair233238 171145 Submitted to Customer Field Manager Networks Water NW03A Unplanned Interruption N/A 03/03/2018 08 37 03/03/2018 12 30 315 315 315 0 0 0 3 Hrs 53 Mins 0 Secs 3 53 0 (UPRN 185620074) ‐ FALSE Burst Main/Main Repair233231 171138 Registered Networks Water NW52B Unplanned Interruption N/A 02/03/2018 13 30 02/03/2018 17 30 20 20 20 0 0 0 4 Hrs 0 Mins 0 Secs 4 0 0 (UPRN 185639422) ‐ FALSE Burst Main/Main Repair233268 171183 Registered Networks Water NW01A Unplanned Interruption N/A 05/03/2018 08 00 05/03/2018 12 00 623 623 623 0 0 0 4 Hrs 0 Mins 0 Secs 4 0 0 (UPRN 185035362) ‐ FALSE Other233356 171239 Registered Networks Water NW03B Unplanned Interruption N/A 08/03/2018 11 00 08/03/2018 15 00 78 78 78 0 0 0 4 Hrs 0 Mins 0 Secs 4 0 0 (UPRN 185251881) ‐ FALSE Burst Main/Main Repair233345 171244 Submitted to Area Manager Networks Water NW01A Unplanned Interruption N/A 08/03/2018 09 00 08/03/2018 13 00 2394 243 243 0 0 0 4 Hrs 0 Mins 0 Secs 4 0 0 (UPRN 185039329) ‐ FALSE Burst Main/Main Repair233345 171244 Submitted to Area Manager Networks Water NW01A Unplanned Interruption N/A 08/03/2018 11 00 08/03/2018 15 00 2394 62 62 0 0 0 4 Hrs 0 Mins 0 Secs 4 0 0 (UPRN 185039329) ‐ FALSE Burst Main/Main Repair233345 171244 Submitted to Area Manager Networks Water NW01A Unplanned Interruption N/A 08/03/2018 15 00 08/03/2018 19 00 2394 43 43 0 0 0 4 Hrs 0 Mins 0 Secs 4 0 0 (UPRN 185039329) ‐ FALSE Burst Main/Main Repair233480 171335 Registered Networks Water NW02B Unplanned Interruption N/A 17/03/2018 09 00 17/03/2018 13 00 715 715 715 0 0 0 4 Hrs 0 Mins 0 Secs 4 0 0 DMA ‐ C0527 ‐ Drumahoy FALSE Other243490 171345 Submitted to Customer Field Manager Networks Water NW51A Unplanned Interruption N/A 19/03/2018 13 30 19/03/2018 17 30 176 175 175 0 0 0 4 Hrs 0 Mins 0 Secs 4 0 0 (UPRN 185487204) ‐ FALSE Burst Main/Main Repair243491 171353 Submitted to Area Manager Networks Water NW01A Unplanned Interruption N/A 20/03/2018 06 00 20/03/2018 10 00 864 864 864 0 0 0 4 Hrs 0 Mins 0 Secs 4 0 0 (UPRN 185063965) ‐ FALSE Burst Main/Main Repair243542 171385 Submitted to Area Manager Networks Water NW01A Unplanned Interruption N/A 24/03/2018 11 00 24/03/2018 15 00 73 52 52 0 0 0 4 Hrs 0 Mins 0 Secs 4 0 0 (UPRN 185280735) ‐ FALSE Burst Main/Main Repair243552 171390 Submitted to Area Manager Networks Water NW01A Unplanned Interruption N/A 08/03/2018 15 00 08/03/2018 19 00 1822 270 270 0 0 0 4 Hrs 0 Mins 0 Secs 4 0 0 (UPRN 185039329) ‐ FALSE Burst Main/Main Repair243552 171390 Submitted to Area Manager Networks Water NW01A Unplanned Interruption N/A 08/03/2018 15 30 08/03/2018 19 30 1822 82 82 0 0 0 4 Hrs 0 Mins 0 Secs 4 0 0 (UPRN 185039329) ‐ FALSE Burst Main/Main Repair243564 171404 Submitted to Area Manager Networks Water NW01A Unplanned Interruption N/A 20/03/2018 12 00 20/03/2018 16 00 251 251 251 0 0 0 4 Hrs 0 Mins 0 Secs 4 0 0 (UPRN 185063965) ‐ FALSE Burst Main/Main Repair233345 171244 Submitted to Area Manager Networks Water NW01A Unplanned Interruption N/A 08/03/2018 10 00 08/03/2018 14 00 2394 38 38 0 0 0 4 Hrs 0 Mins 0 Secs 4 0 0 (UPRN 185039329) ‐ FALSE Burst Main/Main Repair233464 171324 Submitted to Area Manager Networks Water NW02B Unplanned Interruption N/A 15/03/2018 19 00 15/03/2018 23 00 214 20 20 0 0 0 4 Hrs 0 Mins 0 Secs 4 0 0 (UPRN 185312843) ‐ FALSE Burst Main/Main Repair243552 171390 Submitted to Area Manager Networks Water NW01A Unplanned Interruption N/A 08/03/2018 13 00 08/03/2018 17 00 1822 56 56 0 0 0 4 Hrs 0 Mins 0 Secs 4 0 0 (UPRN 185039329) ‐ FALSE Burst Main/Main Repair233271 171179 Submitted to Area Manager Networks Water NW51B Unplanned Interruption N/A 05/03/2018 11 06 05/03/2018 15 10 14 14 14 0 0 0 4 Hrs 4 Mins 0 Secs 4 4 0 (UPRN 185681706) ‐ FALSE Burst Main/Main Repair233253 171159 Registered Networks Water NW01A Unplanned Interruption N/A 04/03/2018 11 40 04/03/2018 15 50 36 36 36 0 0 0 4 Hrs 10 Mins 0 Secs 4 10 0 (UPRN 185039085) ‐ FALSE Burst Main/Main Repair233375 171252 Submitted to Area Manager Networks Water NW51A Unplanned Interruption N/A 09/03/2018 10 50 09/03/2018 15 00 15 15 15 0 0 0 4 Hrs 10 Mins 0 Secs 4 10 0 (UPRN 185538652) ‐ FALSE Burst Main/Main Repair233345 171244 Submitted to Area Manager Networks Water NW01A Unplanned Interruption N/A 08/03/2018 11 00 08/03/2018 15 15 2394 43 43 0 0 0 4 Hrs 15 Mins 0 Secs 4 15 0 (UPRN 185039329) ‐ FALSE Burst Main/Main Repair233266 171167 Registered Networks Water NW52B Unplanned Interruption N/A 04/03/2018 21 00 05/03/2018 01 15 21 21 21 0 0 0 4 Hrs 15 Mins 0 Secs 4 15 0 (UPRN 185697289) ‐ FALSE Burst Main/Main Repair233226 171133 Submitted to Customer Field Manager Networks Water NW51B Unplanned Interruption N/A 02/03/2018 07 00 02/03/2018 11 20 36 36 36 0 0 0 4 Hrs 20 Mins 0 Secs 4 20 0 (UPRN 185838449) ‐ FALSE Burst Main/Main Repair233232 171136 Registered Networks Water NW02B Unplanned Interruption N/A 02/03/2018 12 10 02/03/2018 16 30 23 23 23 0 0 0 4 Hrs 20 Mins 0 Secs 4 20 0 (UPRN 185215616) ‐ FALSE Burst Main/Main Repair233341 171229 Registered Networks Water NW03A Unplanned Interruption N/A 07/03/2018 14 00 07/03/2018 18 20 33 33 33 0 0 0 4 Hrs 20 Mins 0 Secs 4 20 0 (UPRN 185592326) ‐ FALSE Burst Main/Main Repair233345 171244 Submitted to Area Manager Networks Water NW01A Unplanned Interruption N/A 08/03/2018 09 00 08/03/2018 13 20 2394 115 115 0 0 0 4 Hrs 20 Mins 0 Secs 4 20 0 (UPRN 185039329) ‐ FALSE Burst Main/Main Repair233459 171316 Registered Networks Water NW53A Unplanned Interruption N/A 15/03/2018 11 00 15/03/2018 15 20 14 14 14 0 0 0 4 Hrs 20 Mins 0 Secs 4 20 0 (UPRN 185721072) ‐ FALSE Burst Main/Main Repair243544 171386 Submitted to Area Manager Networks Water NW52B Unplanned Interruption N/A 24/03/2018 20 55 25/03/2018 01 15 12 12 12 0 0 0 4 Hrs 20 Mins 0 Secs 4 20 0 (UPRN 185478182) ‐ FALSE Burst Main/Main Repair243621 171446 Submitted to Customer Field Manager Networks Water NW52A Unplanned Interruption N/A 30/03/2018 20 35 31/03/2018 00 55 478 104 104 0 0 0 4 Hrs 20 Mins 0 Secs 4 20 0 (UPRN 185962729) ‐ FALSE Burst Main/Main Repair233465 171320 Registered Networks Water NW01A Unplanned Interruption N/A 15/03/2018 16 18 15/03/2018 20 40 287 287 287 0 0 0 4 Hrs 22 Mins 0 Secs 4 22 0 (UPRN 185240999) ‐ FALSE Pump Equipment Failure 233242 171144 Registered Networks Water NW03B Unplanned Interruption N/A 03/03/2018 10 02 03/03/2018 14 25 439 439 439 0 0 0 4 Hrs 23 Mins 0 Secs 4 23 0 (UPRN 187542694) ‐ FALSE Airlock in Main233402 171277 Submitted to Customer Field Manager Networks Water NW51B Unplanned Interruption N/A 12/03/2018 08 36 12/03/2018 13 00 40 40 40 0 0 0 4 Hrs 24 Mins 0 Secs 4 24 0 (UPRN 185684322) ‐ FALSE Burst Main/Main Repair233251 171161 Registered Networks Water NW03B Unplanned Interruption N/A 04/03/2018 11 00 04/03/2018 15 30 677 677 677 0 0 0 4 Hrs 30 Mins 0 Secs 4 30 0 (UPRN 187345000) ‐ FALSE Burst Main/Main Repair233274 171174 Registered Networks Water NW03B Unplanned Interruption N/A 05/03/2018 08 00 05/03/2018 12 30 80 80 80 0 0 0 4 Hrs 30 Mins 0 Secs 4 30 0 (UPRN 185303084) ‐ FALSE Burst Main/Main Repair233345 171244 Submitted to Area Manager Networks Water NW01A Unplanned Interruption N/A 08/03/2018 09 00 08/03/2018 13 30 2394 126 126 0 0 0 4 Hrs 30 Mins 0 Secs 4 30 0 (UPRN 185039329) ‐ FALSE Burst Main/Main Repair233464 171324 Submitted to Area Manager Networks Water NW02B Unplanned Interruption N/A 15/03/2018 16 00 15/03/2018 20 30 214 40 40 0 0 0 4 Hrs 30 Mins 0 Secs 4 30 0 (UPRN 185312843) ‐ FALSE Burst Main/Main Repair243552 171390 Submitted to Area Manager Networks Water NW01A Unplanned Interruption N/A 08/03/2018 14 00 08/03/2018 18 30 1822 43 43 0 0 0 4 Hrs 30 Mins 0 Secs 4 30 0 (UPRN 185039329) ‐ FALSE Burst Main/Main Repair243552 171390 Submitted to Area Manager Networks Water NW01A Unplanned Interruption N/A 08/03/2018 14 30 08/03/2018 19 00 1822 70 70 0 0 0 4 Hrs 30 Mins 0 Secs 4 30 0 (UPRN 185039329) ‐ FALSE Burst Main/Main Repair243594 171424 Submitted to Customer Field Manager Networks Water NW02B Unplanned Interruption N/A 16/03/2018 04 30 16/03/2018 09 00 551 551 551 0 0 0 4 Hrs 30 Mins 0 Secs 4 30 0 (UPRN 185312843) ‐ FALSE Burst Main/Main Repair243499 171349 Submitted to Area Manager Networks Water NW01B Unplanned Interruption N/A 09/03/2018 12 35 09/03/2018 17 15 103 62 62 0 0 0 4 Hrs 40 Mins 0 Secs 4 40 0 (UPRN 185000825) ‐ FALSE Burst Main/Main Repair243507 171357 Submitted to Customer Field Manager Networks Water NW52A Unplanned Interruption N/A 20/03/2018 18 58 20/03/2018 23 40 38 16 16 0 0 0 4 Hrs 42 Mins 0 Secs 4 42 0 (UPRN 185404707) ‐ FALSE Replacement Fitting (e.g. SV, FH)233332 171224 Submitted to Customer Field Manager Networks Water NW03A Unplanned Interruption N/A 07/03/2018 09 17 07/03/2018 14 00 286 286 286 0 0 0 4 Hrs 43 Mins 0 Secs 4 43 0 (UPRN 185597981) ‐ FALSE Burst Main/Main Repair233345 171244 Submitted to Area Manager Networks Water NW01A Unplanned Interruption N/A 08/03/2018 09 00 08/03/2018 13 45 2394 33 33 0 0 0 4 Hrs 45 Mins 0 Secs 4 45 0 (UPRN 185039329) ‐ FALSE Burst Main/Main Repair243552 171390 Submitted to Area Manager Networks Water NW01A Unplanned Interruption N/A 08/03/2018 16 15 08/03/2018 21 00 1822 37 37 0 0 0 4 Hrs 45 Mins 0 Secs 4 45 0 (UPRN 185039329) ‐ FALSE Burst Main/Main Repair243573 171414 Registered Networks Water NW02B Unplanned Interruption N/A 28/03/2018 09 00 28/03/2018 13 45 90 90 90 0 0 0 4 Hrs 45 Mins 0 Secs 4 45 0 (UPRN 185290171) ‐ FALSE Burst Main/Main Repair243619 171443 Submitted to Customer Field Manager Networks Water NW52A Unplanned Interruption N/A 30/03/2018 11 00 30/03/2018 15 45 36 36 36 0 0 0 4 Hrs 45 Mins 0 Secs 4 45 0 (UPRN 185428254) ‐ FALSE Burst Main/Main Repair233254 171160 Registered Networks Water NW03D Unplanned Interruption N/A 04/03/2018 11 30 04/03/2018 16 15 601 601 601 0 0 0 4 Hrs 45 Mins 0 Secs 4 45 0 (UPRN 185917540) ‐ FALSE Burst Main/Main Repair243552 171390 Submitted to Area Manager Networks Water NW01A Unplanned Interruption N/A 08/03/2018 15 15 08/03/2018 20 00 1822 86 86 0 0 0 4 Hrs 45 Mins 0 Secs 4 45 0 (UPRN 185039329) ‐ FALSE Burst Main/Main Repair233462 171321 Submitted to Area Manager Networks Water NW51A Unplanned Interruption N/A 15/03/2018 13 48 15/03/2018 18 37 33 31 31 0 0 0 4 Hrs 49 Mins 0 Secs 4 49 0 (UPRN 185848159) ‐ FALSE Burst Main/Main Repair233237 171142 Registered Networks Water NW02B Unplanned Interruption N/A 03/03/2018 08 00 03/03/2018 12 55 1093 1093 1093 0 0 0 4 Hrs 55 Mins 0 Secs 4 55 0 (UPRN 185213514) ‐ FALSE Burst Main/Main Repair233471 171327 Registered Networks Water NW01A Unplanned Interruption N/A 16/03/2018 08 10 16/03/2018 13 05 2127 2127 2127 0 0 0 4 Hrs 55 Mins 0 Secs 4 55 0 (UPRN 185064585) ‐ FALSE PRV Maintenance243624 171448 Registered Networks Water NW51B Unplanned Interruption N/A 31/03/2018 15 30 31/03/2018 20 25 6 6 6 0 0 0 4 Hrs 55 Mins 0 Secs 4 55 0 (UPRN 185670211) ‐ FALSE Burst Main/Main Repair233284 171185 Submitted to Area Manager Networks Water NW52A Unplanned Interruption N/A 05/03/2018 10 34 05/03/2018 15 30 21 21 21 0 0 0 4 Hrs 56 Mins 0 Secs 4 56 0 (UPRN 185425011) ‐ FALSE Pump Equipment Failure 233325 171223 Registered Leakage Services NW03A Unplanned Interruption N/A 07/03/2018 08 00 07/03/2018 13 00 16 16 16 0 0 0 5 Hrs 0 Mins 0 Secs 5 0 0 (UPRN 185636380) ‐ FALSE Burst Main/Main Repair243552 171390 Submitted to Area Manager Networks Water NW01A Unplanned Interruption N/A 08/03/2018 14 00 08/03/2018 19 00 1822 180 180 0 0 0 5 Hrs 0 Mins 0 Secs 5 0 0 (UPRN 185039329) ‐ FALSE Burst Main/Main Repair233263 171201 Submitted to Area Manager Networks Water NW01A Unplanned Interruption N/A 04/03/2018 15 00 04/03/2018 20 00 69 19 19 0 0 0 5 Hrs 0 Mins 0 Secs 5 0 0 (UPRN 185230059) ‐ FALSE Burst Main/Main Repair233345 171244 Submitted to Area Manager Networks Water NW01A Unplanned Interruption N/A 08/03/2018 09 00 08/03/2018 14 00 2394 168 168 0 0 0 5 Hrs 0 Mins 0 Secs 5 0 0 (UPRN 185039329) ‐ FALSE Burst Main/Main Repair233345 171244 Submitted to Area Manager Networks Water NW01A Unplanned Interruption N/A 08/03/2018 12 00 08/03/2018 17 00 2394 13 13 0 0 0 5 Hrs 0 Mins 0 Secs 5 0 0 (UPRN 185039329) ‐ FALSE Burst Main/Main Repair233369 171261 Submitted to DG3 Customer Services Co Networks Water NW01B Unplanned Interruption N/A 09/03/2018 07 40 09/03/2018 12 40 132 132 132 0 0 0 5 Hrs 0 Mins 0 Secs 5 0 0 (UPRN 185000825) ‐ FALSE Burst Main/Main Repair233424 171293 Registered Networks Water NW53A Unplanned Interruption N/A 13/03/2018 12 00 13/03/2018 17 00 5 5 5 0 0 0 5 Hrs 0 Mins 0 Secs 5 0 0 (UPRN 185908043) ‐ FALSE Burst Main/Main Repair243542 171385 Submitted to Area Manager Networks Water NW01A Unplanned Interruption N/A 24/03/2018 11 30 24/03/2018 16 30 73 3 3 0 0 0 5 Hrs 0 Mins 0 Secs 5 0 0 (UPRN 185280735) ‐ FALSE Burst Main/Main Repair243559 171398 Submitted to Customer Field Manager Networks Water NW52B Unplanned Interruption N/A 26/03/2018 15 00 26/03/2018 20 00 32 32 32 0 0 0 5 Hrs 0 Mins 0 Secs 5 0 0 (UPRN 187262975) ‐ FALSE Water Supply Failure243585 171416 Submitted to Area Manager Networks Water NW01A Unplanned Interruption N/A 21/03/2018 15 00 21/03/2018 20 00 70 70 70 0 0 0 5 Hrs 0 Mins 0 Secs 5 0 0 (UPRN 185068296) ‐ FALSE Burst Main/Main Repair233464 171324 Submitted to Area Manager Networks Water NW02B Unplanned Interruption N/A 15/03/2018 16 30 15/03/2018 21 40 214 10 10 0 0 0 5 Hrs 10 Mins 0 Secs 5 10 0 (UPRN 185312843) ‐ FALSE Burst Main/Main Repair233322 171217 Submitted to Customer Field Manager Networks Water NW03A Unplanned Interruption N/A 07/03/2018 04 45 07/03/2018 10 00 452 452 452 0 0 0 5 Hrs 15 Mins 0 Secs 5 15 0 (UPRN 185336008) ‐ FALSE Burst Main/Main Repair233467 171323 Registered Networks Water NW03B Unplanned Interruption N/A 15/03/2018 18 20 15/03/2018 23 40 6 6 6 0 0 0 5 Hrs 20 Mins 0 Secs 5 20 0 (UPRN 185333700) ‐ FALSE Replacement Fitting (e.g. SV, FH)243586 171421 Submitted to Customer Field Manager Networks Water NW53A Unplanned Interruption N/A 28/03/2018 14 38 28/03/2018 20 00 182 182 182 0 0 0 5 Hrs 22 Mins 0 Secs 5 22 0 (UPRN 185889678) ‐ FALSE Burst Main/Main Repair
01/05/2018 15 21

Annual Information Return 2018 Section 3 DG3 Page 31 of 34
Appendix G – DG3 Register Extract (Unplanned Interruption Events – IMS Report RPT1184)
233248 171155 Submitted to Customer Field Manager Networks Water NW51B Unplanned Interruption N/A 04/03/2018 06 23 04/03/2018 11 50 23 20 20 0 0 0 5 Hrs 27 Mins 0 Secs 5 27 0 (UPRN 185838503) FALSE Burst Main/Main Repair233431 171295 Submitted to Customer Field Manager Networks Water NW51B Unplanned Interruption N/A 13/03/2018 16 22 13/03/2018 21 50 137 137 137 0 0 0 5 Hrs 28 Mins 0 Secs 5 28 0 (UPRN 185674072) FALSE Burst Main/Main Repair233263 171201 Submitted to Area Manager Networks Water NW01A Unplanned Interruption N/A 04/03/2018 18 00 04/03/2018 23 30 69 19 19 0 0 0 5 Hrs 30 Mins 0 Secs 5 30 0 (UPRN 185230059) FALSE Burst Main/Main Repair233345 171244 Submitted to Area Manager Networks Water NW01A Unplanned Interruption N/A 08/03/2018 09 30 08/03/2018 15 00 2394 59 59 0 0 0 5 Hrs 30 Mins 0 Secs 5 30 0 (UPRN 185039329) FALSE Burst Main/Main Repair233345 171244 Submitted to Area Manager Networks Water NW01A Unplanned Interruption N/A 08/03/2018 12 00 08/03/2018 17 30 2394 72 72 0 0 0 5 Hrs 30 Mins 0 Secs 5 30 0 (UPRN 185039329) FALSE Burst Main/Main Repair243542 171385 Submitted to Area Manager Networks Water NW01A Unplanned Interruption N/A 24/03/2018 12 00 24/03/2018 17 30 73 6 6 0 0 0 5 Hrs 30 Mins 0 Secs 5 30 0 (UPRN 185280735) FALSE Burst Main/Main Repair243622 171447 Submitted to Area Manager Networks Water NW02B Unplanned Interruption N/A 31/03/2018 05 55 31/03/2018 11 25 78 78 78 0 0 0 5 Hrs 30 Mins 0 Secs 5 30 0 (UPRN 187352058) FALSE Burst Main/Main Repair233345 171244 Submitted to Area Manager Networks Water NW01A Unplanned Interruption N/A 08/03/2018 13 00 08/03/2018 18 30 2394 22 22 0 0 0 5 Hrs 30 Mins 0 Secs 5 30 0 (UPRN 185039329) FALSE Burst Main/Main Repair243531 171374 Submitted to Area Manager Networks Water NW01A Unplanned Interruption N/A 05/03/2018 07 00 05/03/2018 12 30 40 33 33 0 0 0 5 Hrs 30 Mins 0 Secs 5 30 0 (UPRN 185230059) FALSE Burst Main/Main Repair243499 171349 Submitted to Area Manager Networks Water NW01B Unplanned Interruption N/A 09/03/2018 14 25 09/03/2018 20 00 103 21 21 0 0 0 5 Hrs 35 Mins 0 Secs 5 35 0 (UPRN 185000825) FALSE Burst Main/Main Repair233285 171181 Submitted to Customer Field Manager Networks Water NW03B Unplanned Interruption N/A 05/03/2018 13 10 05/03/2018 18 50 300 300 300 0 0 0 5 Hrs 40 Mins 0 Secs 5 40 0 (UPRN 185339938) FALSE Burst Main/Main Repair233223 171132 Submitted to Area Manager Networks Water NW53A Unplanned Interruption N/A 01/03/2018 14 20 01/03/2018 20 00 66 66 66 0 0 0 5 Hrs 40 Mins 0 Secs 5 40 0 (UPRN 185993849) 4AN FALSE Burst Main/Main Repair233233 171135 Submitted to Customer Field Manager Networks Water NW03A Unplanned Interruption N/A 02/03/2018 10 00 02/03/2018 15 40 169 72 72 0 0 0 5 Hrs 40 Mins 0 Secs 5 40 0 (UPRN 185576279) FALSE Burst Main/Main Repair233318 171216 Submitted to Area Manager Networks Water NW01A Unplanned Interruption N/A 06/03/2018 18 02 06/03/2018 23 45 200 200 200 0 0 0 5 Hrs 43 Mins 0 Secs 5 43 0 (UPRN 185063466) G FALSE Other233445 171303 Submitted to Area Manager Networks Water NW51A Unplanned Interruption N/A 14/03/2018 15 30 14/03/2018 21 15 94 1 1 0 0 0 5 Hrs 45 Mins 0 Secs 5 45 0 (UPRN 185565556) FALSE Burst Main/Main Repair233235 171141 Submitted to Area Manager Networks Water NW02B Unplanned Interruption N/A 02/03/2018 16 00 02/03/2018 21 45 15 15 15 0 0 0 5 Hrs 45 Mins 0 Secs 5 45 0 (UPRN 185213090) FALSE Low Service Reservoir243539 171388 Submitted to Customer Field Manager Networks Water NW03D Unplanned Interruption N/A 23/03/2018 13 30 23/03/2018 19 15 6 6 6 0 0 0 5 Hrs 45 Mins 0 Secs 5 45 0 (UPRN 185349220) FALSE Burst Main/Main Repair243499 171349 Submitted to Area Manager Networks Water NW01B Unplanned Interruption N/A 09/03/2018 15 00 09/03/2018 20 48 103 20 20 0 0 0 5 Hrs 48 Mins 0 Secs 5 48 0 (UPRN 185000825) FALSE Burst Main/Main Repair243638 171458 Submitted to Area Manager Networks Water NW02B Unplanned Interruption N/A 28/03/2018 03 03 28/03/2018 08 52 41 41 41 0 0 0 5 Hrs 49 Mins 0 Secs 5 49 0 (UPRN 185226216) FALSE Burst Main/Main Repair233297 171196 Submitted to Customer Field Manager Networks Water NW03B Unplanned Interruption N/A 06/03/2018 08 00 06/03/2018 13 50 21 21 21 0 0 0 5 Hrs 50 Mins 0 Secs 5 50 0 (UPRN 185331376) FALSE Burst Main/Main Repair233371 171257 Submitted to Customer Field Manager Networks Water NW03B Unplanned Interruption N/A 09/03/2018 14 30 09/03/2018 20 20 63 63 63 0 0 0 5 Hrs 50 Mins 0 Secs 5 50 0 (UPRN 185333420) FALSE Burst Main/Main Repair233391 171262 Registered Networks Water NW01A Unplanned Interruption N/A 09/03/2018 21 00 10/03/2018 02 50 194 194 194 0 0 0 5 Hrs 50 Mins 0 Secs 5 50 0 (UPRN 185172381) FALSE Burst Main/Main Repair243530 171381 Submitted to Area Manager Networks Water NW01A Unplanned Interruption N/A 23/03/2018 10 10 23/03/2018 16 00 339 339 339 0 0 0 5 Hrs 50 Mins 0 Secs 5 50 0 (UPRN 185011338) FALSE Burst Main/Main Repair243542 171385 Submitted to Area Manager Networks Water NW01A Unplanned Interruption N/A 24/03/2018 11 45 24/03/2018 17 35 73 12 12 0 0 0 5 Hrs 50 Mins 0 Secs 5 50 0 (UPRN 185280735) FALSE Burst Main/Main Repair243609 171445 Submitted to Area Manager Networks Water NW02B Unplanned Interruption N/A 30/03/2018 07 10 30/03/2018 13 00 223 191 191 0 0 0 5 Hrs 50 Mins 0 Secs 5 50 0 (UPRN 185834846) FALSE Burst Main/Main Repair243508 171365 Submitted to Area Manager Networks Water NW01A Unplanned Interruption N/A 21/03/2018 05 34 21/03/2018 11 25 469 469 469 0 0 0 5 Hrs 51 Mins 0 Secs 5 51 0 (UPRN 185068367) FALSE Burst Main/Main Repair233464 171324 Submitted to Area Manager Networks Water NW02B Unplanned Interruption N/A 15/03/2018 17 42 15/03/2018 23 35 214 36 36 0 0 0 5 Hrs 53 Mins 0 Secs 5 53 0 (UPRN 185312843) FALSE Burst Main/Main Repair233399 171270 Submitted to Area Manager Networks Water NW51B Unplanned Interruption N/A 11/03/2018 17 33 11/03/2018 23 27 148 148 148 0 0 0 5 Hrs 54 Mins 0 Secs 5 54 0 (UPRN 187181938) FALSE Burst Main/Main Repair233448 171306 Submitted to Customer Field Manager Networks Water NW02B Unplanned Interruption N/A 14/03/2018 19 15 15/03/2018 01 10 20 20 20 0 0 0 5 Hrs 55 Mins 0 Secs 5 55 0 (UPRN 185246612) FALSE Burst Main/Main Repair233345 171244 Submitted to Area Manager Networks Water NW01A Unplanned Interruption N/A 08/03/2018 09 00 08/03/2018 15 00 2394 178 178 0 0 0 6 Hrs 0 Mins 0 Secs 6 0 0 (UPRN 185039329) FALSE Burst Main/Main Repair243610 171437 Registered Networks Water NW52A Unplanned Interruption N/A 18/03/2018 06 45 18/03/2018 13 45 1 1 1 1 0 0 7 Hrs 0 Mins 0 Secs 7 0 0 (UPRN 185281264) FALSE Burst Main/Main Repair243541 171383 Registered Networks Water NW51A Unplanned Interruption N/A 24/03/2018 07 45 24/03/2018 15 00 22 22 22 22 0 0 7 Hrs 15 Mins 0 Secs 7 15 0 (UPRN 187536483) FALSE Burst Main/Main Repair233462 171321 Submitted to Area Manager Networks Water NW51A Unplanned Interruption N/A 15/03/2018 13 48 15/03/2018 21 17 33 2 2 2 0 0 7 Hrs 29 Mins 0 Secs 7 29 0 (UPRN 185848159) FALSE Burst Main/Main Repair233248 171155 Submitted to Customer Field Manager Networks Water NW51B Unplanned Interruption N/A 04/03/2018 06 23 04/03/2018 14 00 23 3 3 3 0 0 7 Hrs 37 Mins 0 Secs 7 37 0 (UPRN 185838503) FALSE Burst Main/Main Repair243485 171341 Submitted to Customer Field Manager Networks Water NW52B Unplanned Interruption N/A 18/03/2018 09 10 18/03/2018 17 15 15 15 15 15 0 0 8 Hrs 5 Mins 0 Secs 8 5 0 (UPRN 187170383) FALSE Burst Main/Main Repair233263 171201 Submitted to Area Manager Networks Water NW01A Unplanned Interruption N/A 04/03/2018 14 30 04/03/2018 23 30 69 6 6 6 0 0 9 Hrs 0 Mins 0 Secs 9 0 0 (UPRN 185230059) FALSE Burst Main/Main Repair243507 171357 Submitted to Customer Field Manager Networks Water NW52A Unplanned Interruption N/A 20/03/2018 16 20 21/03/2018 01 45 38 22 22 22 0 0 9 Hrs 25 Mins 0 Secs 9 25 0 (UPRN 185404707) FALSE Replacement Fitting (e.g. SV, FH)243490 171345 Submitted to Customer Field Manager Networks Water NW51A Unplanned Interruption N/A 19/03/2018 07 50 19/03/2018 17 30 176 1 1 1 0 0 9 Hrs 40 Mins 0 Secs 9 40 0 (UPRN 185487204) FALSE Burst Main/Main Repair243531 171374 Submitted to Area Manager Networks Water NW01A Unplanned Interruption N/A 05/03/2018 05 15 05/03/2018 15 00 40 7 7 7 0 0 9 Hrs 45 Mins 0 Secs 9 45 0 (UPRN 185230059) FALSE Burst Main/Main Repair233345 171244 Submitted to Area Manager Networks Water NW01A Unplanned Interruption N/A 08/03/2018 09 00 08/03/2018 19 15 2394 57 57 57 0 0 10 Hrs 15 Mins 0 Sec 10 15 0 (UPRN 185039329) FALSE Burst Main/Main Repair243566 171409 Submitted to Area Manager Networks Water NW02B Unplanned Interruption N/A 27/03/2018 14 35 28/03/2018 02 25 10 10 10 10 0 0 11 Hrs 50 Mins 0 Sec 11 50 0 (UPRN 185238218) FALSE Burst Main/Main Repair233293 171194 Submitted to Area Manager Networks Water NW01A Unplanned Interruption N/A 05/03/2018 20 07 06/03/2018 14 00 3 3 3 3 3 0 17 Hrs 53 Mins 0 Sec 17 53 0 (UPRN 185035369) FALSE Other
More than 6 hrs No of Properties 149
Event Id
Interruption Id User Friendly Interruption Status Name
Managing Function Name
Field Manager Area Name
Event Creator
DG3 Creator Interruption Type Name
Planned Warning Date Time 1
Planned Warning Type
Planned Start Date Time 1
Planned Restoration Date Time 1
Actual Start Date Time 1
Actual Supply Restored Date Time 1
Total Affected Properties Count 1
Number of Properties Affected
Number of Properties Affected 3
Number of Properties Affected 6
Number of Properties Affected 12
Number of Properties Affected 24 Property Duration
Property Duration Hours
Property Duration Minutes
Property Duration Seconds Location
Third Party Caused Interruption Third Party Other Third Party Details Interruption Cause Description
243610 171437 Registered Networks Water NW52A Unplanned Interruption N/A 18/03/2018 06 45 18/03/2018 13 45 1 1 1 1 0 0 7 Hrs 0 Mins 0 Secs 7 0 0 (UPRN 185281264) FALSE Burst Main/Main Repair243541 171383 Registered Networks Water NW51A Unplanned Interruption N/A 24/03/2018 07 45 24/03/2018 15 00 22 22 22 22 0 0 7 Hrs 15 Mins 0 Secs 7 15 0 (UPRN 187536483) FALSE Burst Main/Main Repair233462 171321 Submitted to Area Manager Networks Water NW51A Unplanned Interruption N/A 15/03/2018 13 48 15/03/2018 21 17 33 2 2 2 0 0 7 Hrs 29 Mins 0 Secs 7 29 0 (UPRN 185848159) FALSE Burst Main/Main Repair233248 171155 Submitted to Customer Field Manager Networks Water NW51B Unplanned Interruption N/A 04/03/2018 06 23 04/03/2018 14 00 23 3 3 3 0 0 7 Hrs 37 Mins 0 Secs 7 37 0 (UPRN 185838503) FALSE Burst Main/Main Repair243485 171341 Submitted to Customer Field Manager Networks Water NW52B Unplanned Interruption N/A 18/03/2018 09 10 18/03/2018 17 15 15 15 15 15 0 0 8 Hrs 5 Mins 0 Secs 8 5 0 (UPRN 187170383) FALSE Burst Main/Main Repair233263 171201 Submitted to Area Manager Networks Water NW01A Unplanned Interruption N/A 04/03/2018 14 30 04/03/2018 23 30 69 6 6 6 0 0 9 Hrs 0 Mins 0 Secs 9 0 0 (UPRN 185230059) FALSE Burst Main/Main Repair243507 171357 Submitted to Customer Field Manager Networks Water NW52A Unplanned Interruption N/A 20/03/2018 16 20 21/03/2018 01 45 38 22 22 22 0 0 9 Hrs 25 Mins 0 Secs 9 25 0 (UPRN 185404707) FALSE Replacement Fitting (e.g. SV, FH)243490 171345 Submitted to Customer Field Manager Networks Water NW51A Unplanned Interruption N/A 19/03/2018 07 50 19/03/2018 17 30 176 1 1 1 0 0 9 Hrs 40 Mins 0 Secs 9 40 0 (UPRN 185487204) FALSE Burst Main/Main Repair243531 171374 Submitted to Area Manager Networks Water NW01A Unplanned Interruption N/A 05/03/2018 05 15 05/03/2018 15 00 40 7 7 7 0 0 9 Hrs 45 Mins 0 Secs 9 45 0 (UPRN 185230059) FALSE Burst Main/Main Repair233345 171244 Submitted to Area Manager Networks Water NW01A Unplanned Interruption N/A 08/03/2018 09 00 08/03/2018 19 15 2394 57 57 57 0 0 10 Hrs 15 Mins 0 Sec 10 15 0 (UPRN 185039329) FALSE Burst Main/Main Repair243566 171409 Submitted to Area Manager Networks Water NW02B Unplanned Interruption N/A 27/03/2018 14 35 28/03/2018 02 25 10 10 10 10 0 0 11 Hrs 50 Mins 0 Sec 11 50 0 (UPRN 185238218) FALSE Burst Main/Main Repair233293 171194 Submitted to Area Manager Networks Water NW01A Unplanned Interruption N/A 05/03/2018 20 07 06/03/2018 14 00 3 3 3 3 3 0 17 Hrs 53 Mins 0 Sec 17 53 0 (UPRN 185035369) FALSE Other
Unplanned, Unwarned Interruptions
More than 12 hr No of Properties 3
Event Id
Interruption Id User Friendly Interruption Status Name
Managing Function Name
Field Manager Area Name
Event Creator
DG3 Creator Interruption Type Name
Planned Warning Date Time 1
Planned Warning Type
Planned Start Date Time 1
Planned Restoration Date Time 1
Actual Start Date Time 1
Actual Supply Restored Date Time 1
Total Affected Properties Count 1
Number of Properties Affected
Number of Properties Affected 3
Number of Properties Affected 6
Number of Properties Affected 12
Number of Properties Affected 24 Property Duration
Property Duration Hours
Property Duration Minutes
Property Duration Seconds Location
Third Party Caused Interruption Third Party Other Third Party Details Interruption Cause Description
233293 171194 Submitted to Area Manager Networks Water NW01A Unplanned Interruption N/A 05/03/2018 20 07 06/03/2018 14 00 3 3 3 3 3 0 17 Hrs 53 Mins 0 Sec 17 53 0 (UPRN 185035369) FALSE Other
Unplanned, Unwarned Interruptions
More than 24 hr No of Properties 0
Event Id
Interruption Id User Friendly Interruption Status Name
Managing Function Name
Field Manager Area Name
Event Creator
DG3 Creator Interruption Type Name
Planned Warning Date Time 1
Planned Warning Type
Planned Start Date Time 1
Planned Restoration Date Time 1
Actual Start Date Time 1
Actual Supply Restored Date Time 1
Total Affected Properties Count 1
Number of Properties Affected
Number of Properties Affected 3
Number of Properties Affected 6
Number of Properties Affected 12
Number of Properties Affected 24 Property Duration
Property Duration Hours
Property Duration Minutes
Property Duration Seconds Location
Third Party Caused Interruption Third Party Other Third Party Details Interruption Cause Description

Annual Information Return 2018 Section 3 DG3 Page 32 of 34
Appendix G – DG3 Register Extract (Planned & Warned Interruption, Third Party Interruption & Overrun Events – IMS Report RPT1184)
Planned and Warned Interruptions
More than 3 hrs No of Properties 3,368
Event Id
Interruption Id User Friendly Interruption Status Name
Managing Function Name
Field Manager Area Name
Event Creator
DG3 Creator Interruption Type Name
Planned Warning Date Time 1
Planned Warning Type
Planned Start Date Time 1
Planned Restoration Date Time 1
Actual Start Date Time 1
Actual Supply Restored Date Time 1
Total Affected Properties Count 1
Number of Properties Affected
Number of Properties Affected 3
Number of Properties Affected 6
Number of Properties Affected 12
Number of Properties Affected 24 Property Duration
Property Duration Hours
Property Duration Minutes
Property Duration Seconds Location
Third Party Caused Interruption Third Party Other Third Party Details Interruption Cause Description
233436 171298 Registered Networks Water NW53A Planned Interruption 08/03/2018 15:20 Card drop 14/03/2018 09:00 14/03/2018 15:00 14/03/2018 11:10 14/03/2018 14:15 9 9 9 0 0 0 3 Hrs 5 Mins 0 Secs 3 5 0 (UPRN: 185800544) ‐ FALSE Install New Fitting (e.g. SV FH)233416 171289 Registered Networks Water NW51A Planned Interruption 09/03/2018 13:00 Card drop 13/03/2018 09:00 13/03/2018 16:00 13/03/2018 12:00 13/03/2018 15:10 17 17 17 0 0 0 3 Hrs 10 Mins 0 Secs 3 10 0 (UPRN: 185560348) FALSE Install New Fitting (e.g. SV FH)233338 171222 Registered Networks Water NW02B Planned Interruption 05/03/2018 08:00 Card drop 07/03/2018 09:00 07/03/2018 16:00 07/03/2018 10:00 07/03/2018 13:20 4 4 4 0 0 0 3 Hrs 20 Mins 0 Secs 3 20 0 (UPRN: 185313916) FALSE Install New Fitting (e.g. SV FH)233346 171253 Registered Networks Water NW51A Planned Interruption 05/03/2018 10:00 Card drop 08/03/2018 23:00 09/03/2018 04:00 08/03/2018 23:00 09/03/2018 02:30 656 656 656 0 0 0 3 Hrs 30 Mins 0 Secs 3 30 0 (UPRN: 185542819) FALSE Install New Fitting (e.g. SV FH)243495 171351 Submitted to Customer Field Manager Networks Water NW03B Planned Interruption 15/03/2018 08:00 Card drop 20/03/2018 09:00 20/03/2018 16:00 20/03/2018 09:30 20/03/2018 13:00 36 36 36 0 0 0 3 Hrs 30 Mins 0 Secs 3 30 0 (UPRN: 185335812) ‐ FALSE Burst Main/Main Repair233204 171128 Submitted to Area Manager Networks Water NW52B Planned Interruption 23/02/2018 09:00 Card drop 01/03/2018 09:00 01/03/2018 15:00 01/03/2018 10:58 01/03/2018 14:45 158 158 158 0 0 0 3 Hrs 47 Mins 0 Secs 3 47 0 (UPRN: 185465917) FALSE Other243519 171405 Registered Networks Water NW52B Planned Interruption 21/03/2018 08:00 Card drop 27/03/2018 09:00 27/03/2018 16:00 27/03/2018 11:40 27/03/2018 15:30 21 21 21 0 0 0 3 Hrs 50 Mins 0 Secs 3 50 0 (UPRN: 187132788) FALSE Install New Fitting (e.g. SV FH)233333 171225 Registered Networks Water NW53A Planned Interruption 05/03/2018 08:00 Card drop 07/03/2018 09:00 07/03/2018 16:00 07/03/2018 10:30 07/03/2018 14:30 6 6 6 0 0 0 4 Hrs 0 Mins 0 Secs 4 0 0 (UPRN: 185882495) ‐ FALSE Install New Fitting (e.g. SV FH)233422 171288 Submitted to Customer Field Manager Networks Water NW53A Planned Interruption 08/03/2018 15:28 Card drop 13/03/2018 09:00 13/03/2018 16:00 13/03/2018 10:45 13/03/2018 15:00 134 134 134 0 0 0 4 Hrs 15 Mins 0 Secs 4 15 0 (UPRN: 187523224) FALSE Install New Fitting (e.g. SV FH)233210 171127 Submitted to Area Manager Networks Water NW51A Planned Interruption 26/02/2018 10:00 Card drop 01/03/2018 09:00 01/03/2018 17:00 01/03/2018 10:00 01/03/2018 14:40 125 125 125 0 0 0 4 Hrs 40 Mins 0 Secs 4 40 0 (UPRN: 185533679) FALSE Burst Main/Main Repair243592 171433 Registered Networks Water NW53A Planned Interruption 22/03/2018 15:20 Card drop 29/03/2018 09:00 29/03/2018 17:00 29/03/2018 11:00 29/03/2018 15:45 5 5 5 0 0 0 4 Hrs 45 Mins 0 Secs 4 45 0 (UPRN: 185640848) FALSE Burst Main/Main Repair233438 171301 Submitted to Customer Field Manager Networks Water NW53A Planned Interruption 09/03/2018 18:10 Card drop 14/03/2018 09:00 14/03/2018 18:00 14/03/2018 12:40 14/03/2018 17:29 6 6 6 0 0 0 4 Hrs 49 Mins 0 Secs 4 49 0 (UPRN: 185882494) ‐ FALSE Install New Fitting (e.g. SV FH)243496 171352 Registered Networks Water NW03A Planned Interruption 15/03/2018 08:00 Card drop 20/03/2018 09:00 20/03/2018 15:00 20/03/2018 09:30 20/03/2018 14:30 108 108 108 0 0 0 5 Hrs 0 Mins 0 Secs 5 0 0 (UPRN: 187181843) ‐ FALSE Install New Fitting (e.g. SV FH)243561 171399 Registered Networks Water NW03A Planned Interruption 19/03/2018 08:00 Card drop 22/03/2018 20:00 23/03/2018 06:00 22/03/2018 20:30 23/03/2018 01:30 452 452 452 0 0 0 5 Hrs 0 Mins 0 Secs 5 0 0 (UPRN: 187625517) FALSE Burst Main/Main Repair243575 171417 Registered Networks Water NW53A Planned Interruption 23/03/2018 14:12 Card drop 28/03/2018 09:00 28/03/2018 16:00 28/03/2018 09:00 28/03/2018 14:00 21 21 21 0 0 0 5 Hrs 0 Mins 0 Secs 5 0 0 (UPRN: 185665557) ‐ FALSE Other243591 171431 Registered Networks Water NW53A Planned Interruption 26/03/2018 10:45 Card drop 29/03/2018 09:00 29/03/2018 16:00 29/03/2018 10:00 29/03/2018 15:00 15 15 15 0 0 0 5 Hrs 0 Mins 0 Secs 5 0 0 (UPRN: 185794573) ‐ FALSE Other233349 171240 Registered Networks Water NW53A Planned Interruption 05/03/2018 12:30 Card drop 08/03/2018 09:00 08/03/2018 16:00 08/03/2018 09:45 08/03/2018 15:35 16 16 16 0 0 0 5 Hrs 50 Mins 0 Secs 5 50 0 (UPRN: 185791472) ‐ FALSE Burst Main/Main Repair233305 171198 Submitted to Area Manager Networks Water NW53A Planned Interruption 02/03/2018 09:32 Card drop 06/03/2018 09:00 06/03/2018 15:00 06/03/2018 09:00 06/03/2018 15:00 21 21 21 0 0 0 6 Hrs 0 Mins 0 Secs 6 0 0 (UPRN: 185801255) ‐ FALSE Install New Fitting (e.g. SV FH)243502 171362 Submitted to Area Manager Networks Water NW51A Planned Interruption 19/03/2018 07:00 Card drop 21/03/2018 08:00 21/03/2018 18:00 21/03/2018 09:00 21/03/2018 15:00 39 39 39 0 0 0 6 Hrs 0 Mins 0 Secs 6 0 0 Water Treatment Works ‐ S00931 ‐ Ballinrees Gortycavan ‐ Windyhill Road Gortycavan Coleraine London FALSE Planned Restrictions243510 171368 Registered Networks Water NW03A Planned Interruption 14/03/2018 09:00 Card drop 21/03/2018 20:00 22/03/2018 06:00 21/03/2018 20:00 22/03/2018 03:00 1137 1137 1137 1137 0 0 7 Hrs 0 Mins 0 Secs 7 0 0 (UPRN: 185583925) FALSE Install New Fitting (e.g. SV FH)233420 171291 Submitted to Customer Field Manager Networks Water NW53A Planned Interruption 08/03/2018 15:24 Card drop 13/03/2018 09:00 13/03/2018 18:00 13/03/2018 09:30 13/03/2018 17:55 382 382 382 382 0 0 8 Hrs 25 Mins 0 Secs 8 25 0 (UPRN: 185667315) FALSE Other
Planned and Warned Interruptions
More than 6 hrs No of Properties 1,519
Event Id
Interruption Id User Friendly Interruption Status Name
Managing Function Name
Field Manager Area Name
Event Creator
DG3 Creator Interruption Type Name
Planned Warning Date Time 1
Planned Warning Type
Planned Start Date Time 1
Planned Restoration Date Time 1
Actual Start Date Time 1
Actual Supply Restored Date Time 1
Total Affected Properties Count 1
Number of Properties Affected
Number of Properties Affected 3
Number of Properties Affected 6
Number of Properties Affected 12
Number of Properties Affected 24 Property Duration
Property Duration Hours
Property Duration Minutes
Property Duration Seconds Location
Third Party Caused Interruption Third Party Other Third Party Details Interruption Cause Description
243510 171368 Registered Networks Water NW03A Planned Interruption 14/03/2018 09:00 Card drop 21/03/2018 20:00 22/03/2018 06:00 21/03/2018 20:00 22/03/2018 03:00 1137 1137 1137 1137 0 0 7 Hrs 0 Mins 0 Secs 7 0 0 (UPRN: 185583925) FALSE Install New Fitting (e.g. SV FH)233420 171291 Submitted to Customer Field Manager Networks Water NW53A Planned Interruption 08/03/2018 15:24 Card drop 13/03/2018 09:00 13/03/2018 18:00 13/03/2018 09:30 13/03/2018 17:55 382 382 382 382 0 0 8 Hrs 25 Mins 0 Secs 8 25 0 (UPRN: 185667315) FALSE Other
Planned and Warned Interruptions
More than 12 hr No of Properties 0
Event Id
Interruption Id User Friendly Interruption Status Name
Managing Function Name
Field Manager Area Name
Event Creator
DG3 Creator Interruption Type Name
Planned Warning Date Time 1
Planned Warning Type
Planned Start Date Time 1
Planned Restoration Date Time 1
Actual Start Date Time 1
Actual Supply Restored Date Time 1
Total Affected Properties Count 1
Number of Properties Affected
Number of Properties Affected 3
Number of Properties Affected 6
Number of Properties Affected 12
Number of Properties Affected 24 Property Duration
Property Duration Hours
Property Duration Minutes
Property Duration Seconds Location
Third Party Caused Interruption Third Party Other Third Party Details Interruption Cause Description
Planned and Warned Interruptions
More than 24 hr No of Properties 0
Event Id
Interruption Id User Friendly Interruption Status Name
Managing Function Name
Field Manager Area Name
Event Creator
DG3 Creator Interruption Type Name
Planned Warning Date Time 1
Planned Warning Type
Planned Start Date Time 1
Planned Restoration Date Time 1
Actual Start Date Time 1
Actual Supply Restored Date Time 1
Total Affected Properties Count 1
Number of Properties Affected
Number of Properties Affected 3
Number of Properties Affected 6
Number of Properties Affected 12
Number of Properties Affected 24 Property Duration
Property Duration Hours
Property Duration Minutes
Property Duration Seconds Location
Third Party Caused Interruption Third Party Other Third Party Details Interruption Cause Description
Interruptions caused by third parties
More than 3 hrs No of Properties 854
Event Id
Interruption Id User Friendly Interruption Status Name
Managing Function Name
Field Manager Area Name
Event Creator
DG3 Creator Interruption Type Name
Planned Warning Date Time 1
Planned Warning Type
Planned Start Date Time 1
Planned Restoration Date Time 1
Actual Start Date Time 1
Actual Supply Restored Date Time 1
Total Affected Properties Count 1
Number of Properties Affected
Number of Properties Affected 3
Number of Properties Affected 6
Number of Properties Affected 12
Number of Properties Affected 24 Property Duration
Property Duration Hours
Property Duration Minutes
Property Duration Seconds Location
Third Party Caused Interruption Third Party Other Third Party Details Interruption Cause Description
233299 171193 Registered Networks Water NW03D Unplanned Interruption N/A 06/03/2018 10:00 06/03/2018 13:30 67 67 67 0 0 0 3 Hrs 30 Mins 0 Secs 3 30 0 (UPRN: 185346050) ‐ TRUE Building Co Burst Main/Main Repair243493 171350 Registered Networks Water NW02B Unplanned Interruption N/A 20/03/2018 08:44 20/03/2018 12:45 256 256 256 0 0 0 4 Hrs 1 Mins 0 Secs 4 1 0 (UPRN: 185295876) ‐ TRUE Gas Contrac Burst Main/Main Repair243572 171411 Registered Networks Water NW02B Unplanned Interruption N/A 28/03/2018 06:39 28/03/2018 11:10 54 54 54 0 0 0 4 Hrs 31 Mins 0 Secs 4 31 0 (UPRN: 185226234) TRUE Other Burst Main/Main Repair243584 171422 Submitted to Customer Field Manager Networks Water NW52A Unplanned Interruption N/A 28/03/2018 14:20 28/03/2018 21:55 477 477 477 477 0 0 7 Hrs 35 Mins 0 Secs 7 35 0 (UPRN: 185401069) ‐ TRUE Building Co Burst Main/Main Repair
Interruptions caused by third parties
More than 6 hrs No of Properties 477
Event Id
Interruption Id User Friendly Interruption Status Name
Managing Function Name
Field Manager Area Name
Event Creator
DG3 Creator Interruption Type Name
Planned Warning Date Time 1
Planned Warning Type
Planned Start Date Time 1
Planned Restoration Date Time 1
Actual Start Date Time 1
Actual Supply Restored Date Time 1
Total Affected Properties Count 1
Number of Properties Affected
Number of Properties Affected 3
Number of Properties Affected 6
Number of Properties Affected 12
Number of Properties Affected 24 Property Duration
Property Duration Hours
Property Duration Minutes
Property Duration Seconds Location
Third Party Caused Interruption Third Party Other Third Party Details Interruption Cause Description
243584 171422 Submitted to Customer Field Manager Networks Water NW52A Unplanned Interruption N/A 28/03/2018 14:20 28/03/2018 21:55 477 477 477 477 0 0 7 Hrs 35 Mins 0 Secs 7 35 0 (UPRN: 185401069) ‐ TRUE Building Contractor Burst Main/Main Repair
Interruptions caused by third parties
More than 12 hr No of Properties 0
Event Id
Interruption Id User Friendly Interruption Status Name
Managing Function Name
Field Manager Area Name
Event Creator
DG3 Creator Interruption Type Name
Planned Warning Date Time 1
Planned Warning Type
Planned Start Date Time 1
Planned Restoration Date Time 1
Actual Start Date Time 1
Actual Supply Restored Date Time 1
Total Affected Properties Count 1
Number of Properties Affected
Number of Properties Affected 3
Number of Properties Affected 6
Number of Properties Affected 12
Number of Properties Affected 24 Property Duration
Property Duration Hours
Property Duration Minutes
Property Duration Seconds Location
Third Party Caused Interruption Third Party Other Third Party Details Interruption Cause Description
Interruptions caused by third parties
More than 24 hr No of Properties 0
Event Id
Interruption Id User Friendly Interruption Status Name
Managing Function Name
Field Manager Area Name
Event Creator
DG3 Creator Interruption Type Name
Planned Warning Date Time 1
Planned Warning Type
Planned Start Date Time 1
Planned Restoration Date Time 1
Actual Start Date Time 1
Actual Supply Restored Date Time 1
Total Affected Properties Count 1
Number of Properties Affected
Number of Properties Affected 3
Number of Properties Affected 6
Number of Properties Affected 12
Number of Properties Affected 24 Property Duration
Property Duration Hours
Property Duration Minutes
Property Duration Seconds Location
Third Party Caused Interruption Third Party Other Third Party Details Interruption Cause Description
Unplanned Interruptions (Overruns of Planned Interruptions)
More than 3 hrs No of Properties 4
Event Id
Interruption Id User Friendly Interruption Status Name
Managing Function Name
Field Manager Area Name
Event Creator
DG3 Creator Interruption Type Name
Planned Warning Date Time 1
Planned Warning Type
Planned Start Date Time 1
Planned Restoration Date Time 1
Actual Start Date Time 1
Actual Supply Restored Date Time 1
Total Affected Properties Count 1
Number of Properties Affected
Number of Properties Affected 3
Number of Properties Affected 6
Number of Properties Affected 12
Number of Properties Affected 24 Property Duration
Property Duration Hours
Property Duration Minutes
Property Duration Seconds Location
Third Party Caused Interruption Third Party Other Third Party Details Interruption Cause Description
243605 171441 Submitted to Customer Field Manager Networks Water NW53A Planned Interruption 26/03/2018 15:00 Card drop 30/03/2018 09:00 30/03/2018 18:00 30/03/2018 13:00 30/03/2018 18:30 4 4 4 0 0 0 5 Hrs 30 Mins 0 Secs 5 30 0 (UPRN: 185788843) FALSE Other
Unplanned Interruptions (Overruns of Planned Interruptions)
More than 6 hrs No of Properties 0
Event Id
Interruption Id User Friendly Interruption Status Name
Managing Function Name
Field Manager Area Name
Event Creator
DG3 Creator Interruption Type Name
Planned Warning Date Time 1
Planned Warning Type
Planned Start Date Time 1
Planned Restoration Date Time 1
Actual Start Date Time 1
Actual Supply Restored Date Time 1
Total Affected Properties Count 1
Number of Properties Affected
Number of Properties Affected 3
Number of Properties Affected 6
Number of Properties Affected 12
Number of Properties Affected 24 Property Duration
Property Duration Hours
Property Duration Minutes
Property Duration Seconds Location
Third Party Caused Interruption Third Party Other Third Party Details Interruption Cause Description
Unplanned Interruptions (Overruns of Planned Interruptions)
More than 12 hr No of Properties 0
Event Id
Interruption Id User Friendly Interruption Status Name
Managing Function Name
Field Manager Area Name
Event Creator
DG3 Creator Interruption Type Name
Planned Warning Date Time 1
Planned Warning Type
Planned Start Date Time 1
Planned Restoration Date Time 1
Actual Start Date Time 1
Actual Supply Restored Date Time 1
Total Affected Properties Count 1
Number of Properties Affected
Number of Properties Affected 3
Number of Properties Affected 6
Number of Properties Affected 12
Number of Properties Affected 24 Property Duration
Property Duration Hours
Property Duration Minutes
Property Duration Seconds Location
Third Party Caused Interruption Third Party Other Third Party Details Interruption Cause Description


Annual Information Return 2018 Section 3 DG5 Page 1 of 37
Northern Ireland Water
Level of Service Methodology
DG5 Internal Flooding

Annual Information Return 2018 Section 3 DG5 Page 2 of 37
Contents
1. Introduction2. DG5 Flooding Incidents – Internal3. DG5 Properties at Risk of Flooding – Internal
Appendix A – NI WATER DG5 Internal Flooding Register Methodology

Annual Information Return 2018 Section 3 DG5 Page 3 of 37
Official - Regulatory
1. IntroductionObjective and Aim NI Water must maintain verifiable records for DG5. The aim of the records is to provide an auditable method for identifying the specific, properties which are affected by flooding, or are at risk of experiencing flooding.
As part of these records companies must maintain a DG5 register which should form a database of all properties which are at risk of experiencing sewer flooding more than once in twenty years. It will enable the identification by address of individual properties which are below the reference level and should also contain information on (for example) complaints and the results of their investigation, problems which are attributable to customers apparatus and properties which experience sewer flooding but are covered by one of the allowable exclusions.
The register must clearly identify those properties below the reference level, distinguish them from those which have flooded but are not below the reference level and provide a verifiable reason for the exclusion (e.g. flooding was a result of a blockage).
The records should include: date of incident; properties affected identified by address; cause of flooding (including source and reason, where known); action taken; name of persons completing the records; and the 'Flooding' category for reporting under DG5.
Reporting Requirements Two main outputs are required to be produced relating to internal flooding for AIR 18:
DG5 Annual Flooding Summary – properties internally flooded as a result ofoverloaded sewers and other causes.
DG5 Properties on the ‘Flooding’ register – properties at risk of flooding due tooverloaded sewers, more frequently than once in twenty years and once or twice inten years, requiring further investigation, problem status of properties on the register,annual changes to the register.
The information relating to the above is contained in Table 3 of AIR18.
2. DG5 Internal Flooding incidents – Methodology and ProceduresInternalData gathering and calculation is as described below.
Calculation Process - Lines 2 to 11,15a & 17 Data gathering and calculation is as described below in the Line- Specific Methodology Statements for Table 3: Lines 2 to 11,15a & 17.
Sources/Primary Process Lines 2 – 11, 15a & 17 Properties and flooding incidents A download of internal flooding records was obtained from the Ellipse system for the period April 2017 to March 2018 on a month by month basis.

Annual Information Return 2018 Section 3 DG5 Page 4 of 37
Investigations were carried out for each reported incident and those properties found not to be flooded after investigation, using information from the Sewer Maintenance Contractor, Flood Incident Report (FIR) Forms, Field Manager reports, modelling provided by Drainage Area Plan consultant and contacting the Customers directly, are removed. The remaining properties were recorded as Flooding Incidents.
Assumption For the purpose of AIR18, NI Water has assumed that a single incident includes recorded complaints from the same property on the same day or within three days.
‘Three days’ was chosen on the basis that a noticeable volume of repeat calls tends to be received within three days of an incident occurring. There is then a much longer passing of time before calls are again received from the same locality, suggesting that the original incident has passed and that the calls relate to a different incident.
An incident of internal flooding is assumed to be where a property has been flooded internally. If two adjacent properties are flooded at the same time they are classed as two properties and two incidents.
Where a single property floods internally on two separate occasions then this is recorded as one property and two incidents.
Sources/Secondary Process 1. Wastewater Business Unit (WWBU) carries out further investigations to determine the
cause of every internal flooding incident.2. WWBU assess the information held on customer report, Flood Incident Report (FIR),
along with photographic evidence and closure details provided by the contractor.3. WWBU determine if the cause of the flooding incident was hydraulic incapacity or
flooding other cause, i.e. Blocked Sewer, Equipment Failure or Collapsed Sewer. This isdone by a number of methods including site visits, concentric circle surveys, CustomerField Manager reports, modelling provided by Drainage Area Plan consultant, customerinterviews, field manager interviews and review of existing incident information.
4. If hydraulic incapacity is confirmed a Met Office Weather report is used to determine ifthe incident is as a result of severe weather (Line 4).
5. These properties were then recorded on a spread sheet under the appropriate categoriesfor lines 2, 3, 4, 4a, 5, 6, 8, 9, 10 and 11 using the information gathered from, the SewerMaintenance Contractor, Flooding Report Forms, Field Manager reports and contactingthe Customers directly. A folder of evidence was created for all confirmed cases and thiswas brought to the monthly DG5 panel for approval and addition to the appropriatesection of the register. At the end of the reporting year this was the data used for AIRreturns.
6. The figure for line 7 was obtained by having a report run in the DG5 Oracle Databasewhich holds the information as a DG5 layer in the GIS system.
7. The required information to populate Line 17 is extracted directly from the monthlyspread sheet completed by the contractor.
3. Internal Flooding RegisterInternal Flooding Process All internal flooding incidents are subjected to a robust investigation (See Appendix A – NI Water DG5 Internal Flooding Register Methodology). An expert panel (the DG5 Panel) examines the evidence for each incident and governs the addition of properties to, and the removal of properties from, the register. Those records that do not meet the DG5 Criteria

Annual Information Return 2018 Section 3 DG5 Page 5 of 37
are recorded in the ‘excluded’ section of the Database. All new incidents of external flooding are being investigated in a similar manner as the Internal flooding incidents.
The register is held as an Oracle database within the Corporate Asset Register – specifically as a GIS layer on CARtomap.
Methodology applied to the completion of Table 3 Lines 12-15 - the numbers have been extracted from the DG5 Oracle database
Line 16 - the number has been extracted from the DG5 Oracle database
Lines 22-25 and 30-33 - A folder is created (within the Asset Management section of the company network) for each addition, removal or transfer of a property. The lines were populated from an analysis of these folders; the analysis was cross-checked against the minutes of the monthly DG5 Panel meetings.
Lines 26 and 34 - The ‘Enhanced Service Levels’ element of the capex cost was obtained from the CAPTRAX system for each relevant project and aggregated. This total cost was then divided by the number of properties removed.
Mitigation Properties protected from the risk of flooding by mitigation measures, such as non-return valves have been added to the 1 in 20 Register (unless evidence existed to allow addition to the 1 in 10 or 2 in 10 register).
All such properties are currently the subject of four Engineering Procurement appraisal projects – which seek to identify permanent solutions at the locations.
Additions to the Register and Transfers within the Register A folder of evidence was created for all confirmed DG5 flooding properties and this was brought to the monthly DG5 panel meetings for their approval and addition to the appropriate section of the register. Similarly transfers between the register categories (2 in 10, 1 in 10 and 1 in 20 are brought to the attention of the DG5 Panel at the monthly meetings for approval.
Prioritisation of capital schemes No formal prioritisation process is applied.
All capital works projects are submitted to the NI Water Capital Investment Panel for approval before implementation.
Properties which have not flooded in the last 10 years Properties remain on the Register which have not flooded in the past 10 years (excluding severe weather).

Annual Information Return 2018 Section 3 DG2 Page 6 of 36
Appendix A NI Water DG5 Internal Flooding Register - Methodology

DG5 Internal Flooding Register - Methodology
Final v1.1
08 June 2015


Northern Ireland Water 9 DG5 Methodology Final v1.1
1 Introduction ................................................................................................................................... 11
1.1 Background ........................................................................................................................... 11
1.2 Scope and Objectives ........................................................................................................... 11
2 Definitions ...................................................................................................................................... 11
2.1 Legal Definitions ................................................................................................................... 11
2.1.1 Public and Private ..................................................................................................... 11
2.1.2 Adopted and Unadopted Sewers ............................................................................. 11
2.1.3 Third Party Responsibility ......................................................................................... 12
2.1.4 Basement Flooding.................................................................................................... 12
2.1.5 Apartment / High Rise Responsibilities .................................................................... 12
2.1.6 Sensitive Areas .......................................................................................................... 12
2.1.7 Property Classification .............................................................................................. 12
2.1.8 Temporary and Permanent Solution ........................................................................ 14
2.2 Internal Flooding Definition ................................................................................................. 14
2.2.1 Restricted Toilet Use ................................................................................................. 15
2.3 Flooding Cause Definition .................................................................................................... 15
2.3.1 Introduction .............................................................................................................. 15
2.3.2 Flooding due to Hydraulic Incapacity ....................................................................... 15
2.3.3 Other Causes Flooding .............................................................................................. 15
2.3.4 Blockages ................................................................................................................... 16
2.3.5 Collapsed Sewer ........................................................................................................ 16
2.3.6 Equipment Failure ..................................................................................................... 16
2.3.7 Third Party Causes ..................................................................................................... 16
2.3.8 Increase in Demand .................................................................................................. 17
2.4 Flooding Class Definition ...................................................................................................... 17
3 Internal Flooding Register – Governance ...................................................................................... 18
3.1 General ................................................................................................................................. 18
3.2 Governance .......................................................................................................................... 18
4 Internal Flooding Register – Business Process .............................................................................. 19
4.1 Notification of Internal Flooding Incident to Call Centre .................................................... 19
4.2 Initial Investigation by Network Sewerage Business Unit .................................................. 19
4.3 Identification of additional properties by Engineering and Procurement ......................... 19
4.4 Further Investigation by Asset Performance ....................................................................... 19
4.5 Approval of Additions by DG5 Panel ................................................................................... 20

Northern Ireland Water 10 DG5 Methodology Final v1.1
4.6 Update of Asset Information Records ................................................................................. 20
4.7 Initiation CWP Project by Asset Performance ..................................................................... 20
4.8 Approval of Removal by DG5 Panel ..................................................................................... 20
5 Internal Flooding Register – Administration, Additions and Format ........................................... 21
5.1 Rules Governing Internal Flooding Register ........................................................................ 21
5.1.1 Additions to Internal Flooding Register ................................................................... 21
5.1.2 Sources of Information ............................................................................................. 21
5.1.3 Investigations where Hydraulic Overload is suspected ........................................... 22
5.1.4 Incident Investigations .............................................................................................. 22
5.1.5 Network Review ........................................................................................................ 22
5.1.6 Sites Investigations ................................................................................................... 22
5.1.7 Customer Questionnaires ......................................................................................... 22
5.1.8 Weather Reports ....................................................................................................... 22
5.1.9 New Hydraulic Model Builds .................................................................................... 23
5.1.10 Localised Enhancements to Existing Models ............................................................ 23
5.1.11 Conversion Factors .................................................................................................... 23
5.1.12 At Risk Categories ..................................................................................................... 24
5.1.13 Timing Out ................................................................................................................. 24
5.1.14 Restricted Toilet Use ................................................................................................. 24
5.2 Format of Internal Flooding Register ................................................................................... 25
5.2.1 Record Data held on each Property.......................................................................... 25
5.2.2 Property and Incident Unique Identifiers................................................................. 25
6 Internal Flooding Register – Periodic Maintenance ..................................................................... 25
7 Internal Flooding Register – Solutions .......................................................................................... 26
7.1 Permanent Solutions ............................................................................................................ 26
7.2 Mitigation and Contingency ................................................................................................. 26
7.3 Prioritisation and Cost Benefit Analysis .............................................................................. 26
8 Internal Flooding Register – Removals ......................................................................................... 27
9 Annual Information Returns .......................................................................................................... 27
Appendix 1 – Asset Performance Customer Questionnaire ............................................................ 28
Appendix 2 – Asset Performance DG5 Determination Report ........................................................ 30
Appendix 3 – DG5 Flooding Incident Report ................................................................................... 32
Appendix 4 – Call Centre DG5 Caller Script ..................................................................................... 34

Northern Ireland Water 11 DG5 Methodology Final v1.1
10 Introduction 10.1 Background
This document provides guidance on how the successful management of the DG5 Internal Flooding Register, within Northern Ireland (NI) Water, should be carried out. Where possible, this document complies with Ofwat and Northern Ireland Authority for Utility Regulation (NIAUR) Guidance.
10.2 Scope and Objectives This document is owned by NI Water and describes the end‐to‐end business process by which a property that has experienced internal flooding is added to, and removed from the DG5 Internal Flooding Register. It will support NI Water in the development and implementation of its DG5 reporting processes and long‐term management of the Register. The purpose of this methodology is to ensure that a fully transparent, auditable process is in place for the management and maintenance of the DG5 Internal Flooding Register for NI Water in order to report to NIAUR.
11 Definitions The following definitions are to be applied when recording and reporting properties and incidents held on NI Water’s DG5 Internal Flooding Register. Northern Ireland Water is only responsible for internal flooding caused by failure of the public sewerage system. This excludes private sewers, highway drainage, gullies, land drainage, and watercourses.
11.1 Legal Definitions 11.1.1 Public and Private
Northern Ireland Water is responsible for internal flooding caused by failure of the public sewerage system. The status of a sewer (i.e. whether public or private) is depicted below.
Drains; are defined as a pipe which carries waste water (sinks, baths, toilets etc.,) and trade wastes from one property to a sewer. Northern Ireland Water has responsibility for a drain up until the point of the property boundary. The length of drain within the boundary of the property lies with the property/landowner. Public sewers; are defined as sewers serving more than a single property or, if serving a single property, sewers outside the property boundary and has been adopted, only then does responsibility lie with Northern Ireland Water.
11.1.2 Adopted and Unadopted Sewers An adopted sewer is a sewer that is vested by NI Water and maintained at its expense. An unadopted sewer is a sewer that is either privately owned or has not yet been adopted by NI Water.

Northern Ireland Water 12 DG5 Methodology Final v1.1
11.1.3 Third Party Responsibility A third party incident is one where Northern Ireland Water could take action to recover costs from those responsible. Incidents due to third party attributed to hydraulic overload of the public sewerage system are significant unconsented discharges e.g. industry, leisure, domestic (swimming pool). Where NI Water has gathered evidence that flooding of a property has occurred due to the actions of a third party, the company will attempt to recover the costs of implementing a the temporary or permanent solution.
11.1.4 Basement Flooding Customers do not have a right to connect wastewater discharges from a basement directly into the public sewerage. If a customer wishes to connect, then Northern Ireland Water will carry out investigations to confirm that by connecting the basement discharge to the public system it does not put the property at risk, because of existing conditions within the sewerage system. Written confirmation of the investigations will be given to the customer. If a customer connects without obtaining the necessary planning permissions, then they do so at their own risk. Northern Ireland Water does not accept any responsibility for any resultant flooding incident. If basement flooding occurs due to hydraulic overload (and the customer has the right to connect) then this property will be identified as impacted by internal flooding and will be added to the appropriate register.
11.1.5 Apartment / High Rise Responsibilities Incidents, which occur on the private drain, i.e. within the apartment block, are the responsibility of the residents. Should a flooding incident occur on the ground floor then those properties affected can be classed as internal flooding if appropriate. All other properties would be classed as external access flooding.
11.1.6 Sensitive Areas Sensitive areas include, schools, hospitals, children play areas, nursing homes and properties of vulnerable customers. A property’s sensitivity may have an impact on the prioritisation of when the solution to the internal flooding is implemented.
11.1.7 Property Classification For reporting purposes, the following statements relate to property classification: Buildings that are normally occupied and used for residential, commercial, public, business or industrial
purposes are included. This also includes garages that form an integral part of the property and are classed as part of the building even if the main purpose is storage.
Buildings whose prime purpose is storage or installation of domestic appliances are not classed as occupied. Detached or ‘linked‐detached’ garages i.e. those attached to a property but separated from it by an external
passageway are excluded.


Northern Ireland Water 15 DG5 Methodology Final v1.1
For DG5 reporting purposes, internal flooding refers to buildings which are normally occupied and used for residential, public, commercial, business or industrial purposes. Buildings whose prime purpose is storage or installation of domestic appliances are excluded. Refer to Section 2.1.7 for Property Classification.
11.2.1 Restricted Toilet Use
Restricted Toilet Use (RTU) occurs where there is no internal flooding but where the customer us unable to flush their toilet without a risk of causing internal flooding of the property.
11.3 Flooding Cause Definition
11.3.1 Introduction Flooding generally occurs through a combination of events and responsibility can lie with a number of different parties. Possible reasons for flooding can include:
Blocked or overloaded drainage ditches, drains and sewers overflow across roads, gardens and into property.
Hydraulic incapacity can on occasion cause sewers to backflow into a property. Rain can be so heavy that run‐off flows overland down hills and slopes. Rain soaks into the ground causing groundwater levels to rise and flood. Broken or burst water mains (normally leading to basement flooding rather than property flooding above
ground level). Customers do not always distinguish between the various causes of flooding. In order to deal with an incident efficiently, it is imperative that call centre staff ascertain the cause and mechanism of the flooding. This ensures that appropriate action can be taken and the risks to the company minimised. The cause of flooding will be determined by call centre staff asking the customer a set of pre‐set questions from a call centre script.
11.3.2 Flooding due to Hydraulic Incapacity A sewer can be classed as hydraulically incapable when the flow from a storm is unable to pass through it due to a permanent problem. Permanent problems are due to limitations in the physical characteristics of the network, generally the size of the sewer relative to flow and gradient. Properties affected by internal flooding due to hydraulic incapacity shall be placed within relevant flooding severity category unless there is evidence to prove that the flooding was due to ‘Other Causes’ or severe weather. Temporary problems are excluded and comprise of: Blockages, Collapses, Equipment Failure.
11.3.3 Other Causes Flooding ‘Other Causes’ are related to localised deficiencies and transient characteristics of the network. The main causes are:
blockages collapses equipment or operational failure
Living Area
Solum


Northern Ireland Water 17 DG5 Methodology Final v1.1
It is important that causes beyond the reasonable control of the company are identified and described especially where a claim might be pursued against a third party. If permanent improvement or temporary operational works for Northern Ireland Water causes internal flooding then this must also be recorded and the reasons given as to why it happened. The Flood Investment Planning Group is made up of Northern Ireland Water, Rivers Agency, Roads Service and Local Councils could provide a useful forum in which to establish responsibility for disputed third party flooding.
11.3.8 Increase in Demand Increase in demand is defined by Northern Ireland Water as predicted growth, which exceeds the available headroom within the network on the trigger event. Verified hydraulic models shall be used to identify properties at risk of flooding as a direct result of development/ growth based on the Local Area Plan. This analysis is generally an output from a Drainage Area Study (DAS). No other analysis on demand is carried out.
11.4 Flooding Class Definition 1 in 10; is applied to reported flooding location due to hydraulic incapacity during a rainfall event with a
return period between 5 and 10 years. 2 in 10; is applied to reported flooding location due to hydraulic incapacity during a rainfall event with a
return period of 2 in 10 years i.e. <5 years, or has actually flooded twice within a 10 year period. 1 in 20; is applied to reported flooding location due to hydraulic incapacity during a rainfall event with a
return period between 10 and 20 years. Severe Weather; locations refer to a reported flooding incident with a return period greater than 20 years. Flooding Other Causes; is applied to reported flooding locations where the cause of flooding has been
found not to be hydraulic incapacity i.e. blockages, collapses, third party or equipment failure causes. Removed due to Company Action; is applied to reported flooding locations where NI Water has constructed
a permanent solution to remove the risk of flooding Removed due to Better Information; is applied to reported flooding locations where information has been
obtained which proves that the cause of flooding was not due to incapacity in the sewer system.

Northern Ireland Water 18 DG5 Methodology Final v1.1
Internal Flooding Register – Governance
11.5 General The NI Water DG5 Internal Flooding Register contains information on internal flooding incidents caused by the hydraulic incapacity of sewers, and properties at risk of experiencing internal flooding. NI Water’s Asset Management section (AMS) is the owner of the DG5 Internal Flooding Register. The information recorded on properties affected by internal flooding or those at risk of experiencing flooding constitutes a legal register for reporting to the NIAUR. The information contained within must be verifiable and available for audit. NIAUR requires NI Water to produce an annual DG5 Report summarising the required DG5 information. NI Water is also required to maintain a DG5 Internal Flooding Register which holds information on properties at risk of flooding, once in twenty years and once or twice in ten years due to the hydraulic incapacity of sewers. NI Water must also report on each flooding category status of each property on the register and all annual changes to the register. The DG5 Internal Flooding Register will contain the information required to prepare Table 3, of the Annual Information Returns (AIR). This information can be accessed via the reporting function on the DG5 incident and property database. The DG5 Internal Flooding Register has been developed from records that date back to 1990 and the increasingly robust investigation of ‘live’ incidents from 2008 onwards.
11.6 Governance
Maintenance of the DG5 Internal Flooding Register and AIR reporting is the responsibility of AMS and the Network Sewerage Business Unit (NSBU). Clear definition of responsibility for actions, analysis and records within the DG5 Internal Flooding Register has been entrusted to the appropriate sections within NI Water. The stakeholders and their responsibilities have been defined within this methodology. This end‐to‐end DG5 business process outlined in this document, and attached in Appendix A, will ensure that responsibilities and performance measures are in place to ensure the quality of information captured and maintained is consistent at all levels through the process. The DG5 Panel has responsibility for approval of additions to and removals from the register, while also ensuring that the reporting processes and outputs remain robust enough to meet the reporting requirements of NIAUR. Responsibilities for the internal DG5 flooding reporting process will be reviewed on an annual basis and updated accordingly.

Northern Ireland Water 19 DG5 Methodology Final v1.1
12 Internal Flooding Register – Business Process
12.1 Notification of Internal Flooding Incident to Call Centre All flooding incidents are recorded through a series of different source collection methods in NI Water’s asset inventory management system. This happens by customers reporting flooding incidents via our Customer Call Centre. The call handlers will establish if the incident is the responsibility of NI Water and then confirm with the customer that the incident was indeed internal flooding and record it on NI Water’s call management system. A Caller Log is created with the incident information then passing to NI Water’s Work Control Centre staff who distributes the relevant work order to the appropriate contractor for action. This step takes no longer than one week to complete.
12.2 Initial Investigation by Network Sewerage Business Unit The NSBU will initiate the first phase of investigations once an internal flooding incident has been reported. Evidence gathered at this initial stage is passed to Asset Performance (AP) for further investigation/verification. The process that NSBU follow is outlined below;
Reported Internal Flooding Incidents are downloaded from the company’s asset inventory management systems and interrogated, with duplicates removed.
Information held on Customer Reports and Flooding Incident Reports are assessed along with photographic evidence and previous flooding records to ascertain if the reported incident is internal flooding.
NSBU to carry out further investigations to determine if the cause of flooding incident was hydraulic incapacity or due to other causes, i.e. Blocked Sewer, Equipment Failure or Collapsed Sewer. This is done by a number of methods including site visits, concentric circle surveys, customer interviews and review of existing incident information. If flooding is due to other causes, the property is placed in the excluded section of the DG5 Internal Flooding Register. (Investigation methods are outlined in Section 4.2)
If hydraulic incapacity is confirmed NSBU use a weather report to determine if the incident is as a result of severe weather. If severe weather is confirmed the property is excluded. The same weather report, along with historic records (if applicable), is used to categorise non‐severe weather incidents into one of three storm return categories – 1:20, 1:10 and 2:10. In addition properties that suffer from RTU, due to hydraulic incapacity, are also recorded. (Storm Return Categories and RTU explained in Section 4.2.10 and 4.2.11).
Once NSBU have completed the above stages a folder of evidence is compiled and forwarded to AP for further investigation/verification.
12.3 Identification of additional properties by Engineering and Procurement
In addition to the weekly flooding incident download by NSBU, Engineering and Procurement (EP) will forward a monthly report detailing any newly identified DG5 properties to NSBU for investigation. These potential DG5 properties will be identified from on‐going Capital Works Programme (CWP) Schemes. This step is completed on a monthly basis.
12.4 Further Investigation by Asset Performance
AP receives all fully investigated and categorised DG5 Properties from NSBU on a monthly basis. AP carryout further detailed investigations to verify the investigations undertaken by NSBU. Detailed investigations can include modelling, DAS, customer questionnaires, Geographical Information System (GIS) assessments and topographical surveys.
AP carryout the following investigative process;
Assess the history of flooding incidents at each property to confirm the NSBU flooding report. Historic assessments may include investigations of reported external incidents, extreme weather event records and incidents confirmed at adjacent properties.
Interview the Operational Area Field Manager (FM) to confirm that the property has a history of internal flooding. AP also seeks advice from the relevant FM as to the cause of the internal flooding to aid in further investigations.
Use GIS to assess the position of the sewer network. Carryout site topographical surveys of the sewer network and surrounding area. Interview the property owner with pre‐set questions in DG5 Internal Flooding Questionnaire.

Northern Ireland Water 20 DG5 Methodology Final v1.1
Assess existing network model, i.e. DAS, for predicted flooding to verify if property floods under specific flooding scenarios.
Once AP has completed the above stages a report will be compiled summarising the evidence gathered including recommendations. If hydraulic incapacity is confirmed the evidence will be presented to the DG5 Panel to propose adding the property to the DG5 Register.
Note; if the cause is still unknown after the course of investigations and the internal flooding is major and frequent enough to warrant a thorough investigation, then a Project Consideration Form (PCF) will be raised to propose a feasibility study.
12.5 Approval of Additions by DG5 Panel The DG5 Panel review the evidence brought before them and decide whether to add the property to the DG5 Internal Flooding Register. If the Panel members need more evidence, the property will be returned to AP for further investigation, and then re‐submitted to the Panel for consideration. This step is completed once every month.
12.6 Update of Asset Information Records
The DG5 Panel Secretary will digitise all flooding incidents approved by the DG5 Panel onto the DG5 Layer of the company’s GIS System, and update the DG5 incident and property database with the associated incident.
12.7 Initiation CWP Project by Asset Performance The DG5 Panel forward all new additions to the DG5 Internal Flooding Register to AP to initiate the CWP process. Asset Performance cross‐check existing CWP Schemes to ensure the property is not included in an on‐going project. A PCF will be created to begin the CWP process. Once the relevant section of the scheme is complete a DG5 Beneficial Use Form is sent from EP to AP, where a check against drainage area studies carried out to establish if the reported flooding has been resolved. If a resolution to the flooding is confirmed AP prepare supporting evidence to present at DG5 Panel for removal from the DG5 Internal Flooding Register
12.8 Approval of Removal by DG5 Panel
If a property is to be removed from the DG5 Internal Flooding Register due to ‘Company Action’, a Beneficial Use Form must be presented as evidence. If a property is to be removed due to ‘Better Information’ a folder of evidence must be presented outlining the reasons. This is completed once every month. This clear and strictly controlled process will govern the movement of each property as it is investigated. Each stage described above can be seen in Appendix A.

Northern Ireland Water 21 DG5 Methodology Final v1.1
13 Internal Flooding Register – Administration, Additions and Format
This section provides guidance on how properties at risk of flooding due to the hydraulic incapacity of sewers are categorised within the DG5 Internal Flooding Register.
13.1 Rules Governing Internal Flooding Register The following rules govern the DG5 Internal Flooding Register and describe how a property is added and removed from the register. Property additions and transfers must follow the appropriate procedure as described below. (Property removals are discussed in section 7).
13.1.1 Additions to Internal Flooding Register This procedure must be followed for all new flooding incidents received through the weekly NSBU download (see Section 3.2). These incidents will usually have occurred recently, although it is possible new information may cause a historic event to be reclassified. All properties that have been affected by internal flooding, caused by hydraulic incapacity, must be
reported in the DG5 Internal Flooding Register. Properties flooded due to Other Causes (Blockage, Collapse or Equipment Failure) will be placed in the ‘excluded’ section of the same register and reported in Table 3 of the AIR.
First time flooding where hydraulic Incapacity is confirmed shall be supported by weather reports and any supporting DAS data.
A property affected by internal flooding as a result of hydraulic incapacity is categorised by the severity of the rainfall event and how often flooding has been recorded.
All properties affected by flooding due to hydraulic incapacity will be investigated to ensure that each property or area flooded is accounted for within the appropriate category.
For repeat incidents, supporting meteorological data will be required only if there is significant difference in the number of properties affected within the same location or if an event is deemed to be severe. An increase in frequency will affect the prioritisation and in some instances the register category of some or all properties affected.
If the event was due to ‘Severe Weather’ the properties are placed in the ‘excluded’ section of the DG5 Internal Flooding Register.
Where a property has flooded as a result of failure of a mitigation device, it should be reported as an equipment failure.
Only if a basement has a ‘right to connect’ to the public sewerage system and has flooded can it be identified as being affected by internal flooding and categorised appropriately.
If the flooding is shown to be outside Northern Ireland Water’s responsibility (Third Party), it is excluded from the DG5 Internal Flooding Register and flagged appropriately within the exclusion register.
Properties added due to better information are placed in the DG5 Internal Flooding Register when flooding has been identified for the first time, usually as a result of network analysis, greater local knowledge or following customer contact.
13.1.2 Sources of Information
Historic information can be used with discretion in order to support or understand the full extent of a flooding incident. If properties are found to have historically flooded when carrying out a study within a catchment (e.g. DAS) then details should be captured and the appropriate information passed to NSBU. Supporting information would include:
The use of verified hydraulic models. Site and level Information. Customer interviews. Shared information between other relevant bodies e.g. Local Authorities.
Information can also include the following:
Flooding at a property being caused by blockages/ equipment failure rather than hydraulic incapacity. Acceptable supporting data would be date stamped CCTV, or static photographic evidence.
Severe weather classification – data provided by weather reports Customer Interviews Flooding shown to be caused by a Third Party.

Northern Ireland Water 22 DG5 Methodology Final v1.1
13.1.3 Investigations where Hydraulic Overload is suspected
After a flooding incident has occurred it is recorded and passed to NSBU who will carry out further investigative work to ensure that the cause, mechanism and impact of flooding is identified and analysed as soon after the event as is practicable. This process will ensure that:
The most appropriate action is taken. Where necessary a cost‐effective solution proposed. Flooding regulatory registers are maintained with accurate and up to date information.
13.1.4 Incident Investigations
Initial site investigations will be carried out by the Contractor, co‐ordinated by Networks Sewerage Section. The number of properties affected by the incident and the extent of the other external areas will be recorded regardless of the cause. If the cause cannot be attributed to ‘other causes’ i.e. through CCTV, visual inspections, jetting, customer liaison or third party, then a request for further investigation will be submitted via the work order. This request will be submitted to the Contractor, by Networks Sewerage for action.
13.1.5 Network Review This is primarily a desktop exercise to review all available information on the site and relevant assets. This will include information on the catchment through existing asset management plans, DAS, hydraulic modelling, feasibility studies, MET office data analysis, and previous cluster data if a repeat incident. If there are known operational hot spot areas then further work on capacity checks, assessment of hydraulic model predictions and historic information will be needed. A network review will only be carried out in detail where the mechanism of flooding is unclear or where the rainfall data and impact is inconsistent with other evidence.
13.1.6 Sites Investigations These are carried out as soon as is practicable after the incident happening. This is to ensure that the necessary evidence is gathered as close to the event as is practicable. Site investigations may also show that there is evidence to prove that unreported flooding has occurred. Investigations are carried out using the concentric circle methodology, where investigations will start at the property affected by internal flooding and work outwards to adjacent properties in all directions. This will ensure that all affected properties are captured and recorded, allowing the full scale of the internal flooding to be realised. This approach will be repeated for every property identified for each incident.
13.1.7 Customer Questionnaires Customers can provide useful information on the events leading up to, during and after an incident has occurred. Where appropriate a customer questionnaire should be completed.
13.1.8 Weather Reports Weather reports will only be requested if:
It is a first time flooding incident. There is low confidence in understanding the problem. It is a repeat incident and there is a significant disparity between the numbers of properties recorded by
recurring incidents. Severe weather is suspected
Use of weather reports to categorise properties
Properties will be categorised as ‘excluded due to severe rainfall’ if the weather report identifies the storm during which the internal flooding occurred as having a return period of greater than 1 in 20 years.
Properties will be placed in the 1 in 20 register if the weather report identifies the storm during which the internal flooding occurred as having a return period of 1 in 20 years or less and greater than 1 in 10
Properties will be placed in the 1 in 10 register if the weather report identifies the storm during which the internal flooding occurred as having a return period of 1 in 10 years or less and greater than 1 in 5

Northern Ireland Water 23 DG5 Methodology Final v1.1
Properties will be placed in the 2 in 10 register if the weather report identifies the storm during which the internal flooding occurred as having a return period of 1 in 5 years or less.
13.1.9 New Hydraulic Model Builds
If a hydraulic model does not exist and the extent of the problem cannot be determined from site investigations then a model may need to be commissioned. Note: Prior to any major capital investment a verified hydraulic model should be used for solution development.
13.1.10 Localised Enhancements to Existing Models Where a hydraulic model exists, then it may be necessary to carry out some localised enhancements. This process may include manhole survey, and / or dis‐aggregation of the network prior to any solution development. The validity of the enhancements to the model must be checked in that area against the original verified model.
13.1.11 Conversion Factors There are a number of situations where conversion factors must be applied when calculating the DG5 value of larger premises and buildings. Normally a single property or house is considered to constitute one DG5 property. This approach assumes the single property is of typical size, with a typical number of appliances discharging into the sewer network.
For larger premises and buildings that are likely to have more appliances a conversion factor needs to be applied for the full DG5 value of the property to be realised and prioritised accordingly. Properties that are classed as large commercial premises should have the conversion factor applied.
The DG5 value will be calculated by adding together all the loading units for all the appliances in the building and dividing this figure by 24 to produce the DG5 equivalent.
Water Fitting (See note 1) Loading Units WC Flushing Cistern 2 Wash Basin in a house 1.5 Wash Basin elsewhere 3 Bath (Tap nominal size 20mm) 10 Bath (Tap nominal size lager than 20mm) 22 Shower 3 Sink (Tap nominal size 15mm) 3 Sink (Tap nominal size larger than 15mm) 5 Spray Tap 0.5 Bidet 1.5 Domestic Appliance (subject to a minimum of 6 LU’s per house) (See note 2)
3
Communal or commercial appliance 10 Any other water fitting or outlet (including a tap – but excluding a urinal or water softener)
3
Note 1; Reference to any fitting includes reference to any plumbing, outlet, dedicated space or planning or other provision for that fitting
Worked Example – 1 Alanbrook Road, Belfast (Thales Factory)
Water Fitting No. per property Loading Unit Total WC flushing cistern 46 2 92 Wash basin in a house 0 1.5 0 Wash basin elsewhere 0 3 0

Northern Ireland Water 24 DG5 Methodology Final v1.1
Bath (tap nominal size 20 mm) 0 10 0
Bath (tap nominal size larger than 20 mm) 0 22 0
Shower 4 3 12 Sink (tap nominal size 15 mm) 70 3 210
Sink (tap nominal size larger than 15 mm) 0 5 0
Spray tap 0 0.5 0 Bidet 0 1.5 0 Domestic appliance 0 3 0 Communal or commercial appliance 0 10 84
Any other water fitting or outlet (including a tap – but excluding a urinal or water softener)
10 3 30
428
DG5 Equivalent;
428 / 24 = 17.83 (rounded up to 18 units)
13.1.12 At Risk Categories Properties are placed under one of the following three categories in the DG5 Internal Flooding Register: 1 in 10 – Frequency of flooding once in 10 years; Properties are classified here if either: The property has flooded once in 10 years from non‐severe rainfall events The property has flooded from a single event shown to be less than a 10‐year return period storm but more
than a 5‐year return period storm. (weather report required)
2 in 10 – Frequency of flooding twice in 10 years; Properties are classified here if either: The property has flooded more than once in 10 years from non‐severe rainfall events The property has flooded from an event shown to be less than 5‐year return period (weather report
required)
1 in 20 – Frequency of flooding once in 20 years; Properties are classified here if either: This is the default category for all historical flooding properties coming into the register. The property has flooded from an event shown to be less than 20 year return period but more than 10
years. (weather report required) Properties that have previously flooded and are included in the DG5 Internal Flooding Register but which have since not flooded in the last 10 years during a non‐severe rainfall event, will be placed into the 1 in 20 category.
13.1.13 Timing Out Properties can move between the different DG5 Internal Flooding Register categories, if they have not had a repeat flooding incident over a certain period of time. Properties at risk of flooding internally due to hydraulic incapacity will move between the flooding register categories on a ‘timing out’ basis, as follows:
If a ‘2 in 10’ property does not suffer repeat flooding, caused by hydraulic overload, within 6 years it will be downgraded to ‘1 in 10’.
If a ‘1 in 10’ property does not suffer repeat flooding, caused by hydraulic overload, within 11 years it will be downgraded to a ‘1 in 20’.
13.1.14 Restricted Toilet Use
RTU is an NIAUR AIR reporting requirement. Properties suffering from RTU are placed in one of the three categories discussed in Section 4.1.12, and recorded in the AIR.

Northern Ireland Water 25 DG5 Methodology Final v1.1
13.2 Format of Internal Flooding Register 13.2.1 Record Data held on each Property
The records held on each property on GIS will include at least; Date of Incident Property Address – Property Number, Street Name, Town and Postcode Grid Reference Sewer Type Asset causing flooding incident Library of Documented Evidence for addition
Field Manager Report, GIS Map, Incident Report, Ellipse Report, Met Office Report (if applicable) and Confirmation of CCTV
Library of Documented Evidence for removal DG5 Beneficial Use Form
13.2.2 Property and Incident Unique Identifiers
A DG5 incident number is used within the DG5 Internal Flooding Register and all related registers as a unique identifier to distinguish one incident from another. Structure of DG5 Property and Incident Numbers
DG5P – corporate indicator that the record is a DG5 Property 0000001 – unique seven figure number for each DG5 Property DG5I – corporate indicator that the record is a DG5 Incident 0000002 – unique seven figure number for each DG5 Incident
The generated seven figure number is unique for both DG5 Properties and Incidents and no two DG5 Properties or Incidents can have the same seven figure combination. All historic and new DG5 properties will be assigned a DG5 incident number, using the above format. DG5 Property and Incident numbers will be allocated in order of date added to the register.
14 Internal Flooding Register – Periodic Maintenance
Periodically the register should be assessed to check for the following: Properties that have been recorded as flooding but have not had a repeat flooding after 10 years will be
demoted to the 1in 20 category within the register but they are not automatically removed from the register.
Comprehensive audits of the DG5 Internal Flooding Register must be carried‐out annually (or when necessary) to ensure the information held within is accurate and reflects what has happened throughout the year.

Northern Ireland Water 26 DG5 Methodology Final v1.1
15 Internal Flooding Register – Solutions 15.1 Permanent Solutions
A permanent solution to flooding risk is dependent on the cause. Where the problem can be isolated, a quicker and cheaper permanent solution could be implemented. However, this is not always the case and a permanent solution can take several years to construct due to the solution development, design, and tendering and construction process. In some cases the cost involved to rectify a problem will far exceed the benefits. This means that where the solution cost exceeds a certain level per property then other action may need to be considered i.e. ‘Right to purchase’, ‘Mitigation’ or ‘Do nothing’ alternative. A permanent solution will enable a property to be removed from the register. Permanent solutions can fall into one of the following categories:
Sewer upsizing and flow attenuation; these types of solutions require a hydraulic model and extensive data collection and analysis to understand the extent of the problem and therefore identify the appropriate cost effective solution.
Property isolation; if a single or small number of properties are shown to be affected then where the cost of other more traditional solutions far exceed the benefit then isolation may be seen as the most appropriate long term solution.
Right to Purchase; it is not NI Water’s normal policy to purchase a customer’s property. However, where there is extreme and persistent flooding the most cost‐effective solution may be seek to purchase the at risk property.
15.2 Mitigation and Contingency
Mitigation will be considered where the costs of capital schemes are high or where permanent works are not planned in the short term. Where it is appropriate to do so, mitigation measures can offer customers some degree of protection against internal flooding from the public sewerage system i.e. reduce the frequency of incidents. Mitigation measures can be applied to either persistent internal flooding or where there is severe flooding to sensitive areas. However, mitigation measures will not enable a property to be removed from the register. Where a property has flooded as a result of failure of a mitigation device it should be reported as equipment failure. Properties with mitigating measures installed to prevent internal flooding will be defaulted into the 1:20 category of the DG5 Internal Flooding Register and will be prioritised accordingly for solution.
15.3 Prioritisation and Cost Benefit Analysis The company does not at present carry out cost benefit analysis on DG5 projects. However to allow prioritisation of schemes the process set out below is proposed.
Review of existing CWP to ensure DG5 related programmes of work are captured. Assessment of DG5 Register to develop prioritisation methodology relative to frequency and impact. Receipt and analysis of feasibility studies to compliment prioritisation matrix including cost details. Review to ensure alignment with Regulatory Reporting on AIR and CIM returns.

Northern Ireland Water 27 DG5 Methodology Final v1.1
16 Internal Flooding Register – Removals A DG5 Property can be removed from the DG5 Internal Flooding Register when one of the solutions described below has been implemented. This will usually be triggered by construction of a CWP Scheme, or new information on the causes of historic events. Removal of a property from the register can only be done through a formal business process and where there is a justifiable reason, supported by sound evidence. These properties will have supporting documentation to demonstrate that the grounds for removal have been met. This evidence will be presented to the DG5 Panel for formal removal of a property. Solutions to be considered before property removal from the register can be approved include; Permanent Solution; where a permanent solution has been constructed and is in beneficial use, the
Capital Programme Team will present a DG5 Beneficial Use Form to the DG5 Panel as a record of confirmation of the flooding scheme completion. This will include the properties to be removed and cost of solution apportioned to flood prevention. The Beneficial Use Form will be approved by the DG5 panel members, and the identified properties removed from the DG5 Internal Flooding Register. They will in turn be re‐categorised as removed due to ‘company action’. The property will remain in this category of the register indefinitely or until such a time as the property floods again.
Minor Works; where there has been evidence of asset deterioration, e.g. subsidence or through third party interference and a minor asset improvement project has been completed to rectify the flooding issues. Evidence that the flooding has been resolved will come from the appropriate FM and signed off by the DG5 Panel members.
Better information ‐ Severe weather; the event causing the property to be on the DG5 Internal Flooding Register is confirmed to have > 20 year return period (i.e. severe) and supported by appropriate meteorological or DAS investigation data.
Better information ‐ Flooding due to Third party; where investment on the sewer network would not prevent a repeat internal flooding incident and NI Water does not have responsibility for the problematic sewer the properties should be removed from the DG5 Internal Flooding Register. The details should be recorded in the AIR commentary. However, if the responsibility for the problematic sewer is shared with NI Water, then the property remains on the Register.
Better information ‐ Flooding is due to other causes; where it can be confirmed that flooding has occurred due blockage, collapse or equipment failure details will be recorded as ‘other causes’ within the excluded section of DG5 Internal Flooding Register.
Note: Mitigation will not enable a property to be removed from the register. Finally, errors can happen; Error, identified by Audit or Investigation. Where an error can be clearly shown to have occurred, then
the property can be removed. Operational improvements are an unlikely explanation for justifying removal of properties from the
register. Therefore any supporting data must be robust, for example, CCTV data. In the case of permanent solution then the property would be removed.
17 Annual Information Returns
The DG5 Internal Flooding Register will contain the information required to prepare Table 3, of AIR. The information required for the AIR will be retrieved from DG5 Internal Flooding Register.
AMS will report on internal flooding incidents due to hydraulic incapacity held in the DG5 Internal Flooding Register.
NSBU will report on internal flooding incidents due to other causes held in the ‘excluded’ section of the register
AMS and NSBU will collaborate closely when compiling the AIR for internal flooding.

Northern Ireland Water 28 DG5 Methodology Final v1.1
Appendix 1 – Asset Performance Customer Questionnaire

Northern Ireland Water 29 DG5 Methodology Final v1.1
Northern Ireland Water Asset Performance Asset Management Westland House Old Westland Road BELFAST BT14 6TE Tel: 08458 770002 Fax: Email: www.NI Waterater.com
Owner/Occupier
Your Ref
Our Ref
Date
Dear Sir/Madam SEWER FLOODING AT THE ABOVE ADDRESS I refer to your complaint of sewer flooding on, and would be very grateful if you could help me with the following pieces of information:
Was the flooding internal (e.g. in the house or attached garage) or external? What was the cause of the flooding?
Has it been resolved by Northern Ireland Water or others?
What way was it resolved (if known)?
If it is still occurring, when did it last happen?
Could you please respond by calling me on my mobile (xxx) or emailing me. Your assistance in this matter will be much appreciated. Yours faithfully, Asset Performance

Northern Ireland Water 30 DG5 Methodology Final v1.1
Appendix 2– Asset Performance DG5 Determination Report


Northern Ireland Water 32 DG5 Methodology Final v1.1
Appendix 3– DG5 Flooding Incident Report

Northern Ireland Water 33 DG5 Methodology Final v1.1
Incident Report Form Contractor APPENDIX 3 – Incident Report Form Contractor Northern Ireland Water – Flooding Incident Report Work Order Ref No: Name: Location: Date: Arrival time: 1) Internal Flooding:
Main Sewer Lateral Sewer Adjacent properties flooded Attached garages flooded Basements/Cellar flooded Restricted Toilet use Kitchen Hallway Living room Dining room Shop/integral store Downstairs bathroom
2) External Flooding: Main Sewer Lateral Sewer Public road/footpath Public area Agricultural land Curtilage Detached garage flooded Detached shed or store flooded
3) Comments on cause of reported incident: (Select only one category below)
Blockage Collapsed sewer Defective road gulley Defective private drain M&E equipment failure Other:
4) Clean up operations:
Not Required Further Action Required Completed 5) Previous History:
Yes No Not Aware 6) Weather Conditions:
Dry OR Wet : Heavy Medium Light Comments: Especially for Flooded jobs or Follow on jobs PHOTO FOR FLOODED JOBS:

Northern Ireland Water 34 DG5 Methodology Final v1.1
Appendix 4– Call Centre DG5 Caller Script


Annual Information Return 2018 Section 3 DG6 Page 1 of 7
Northern Ireland Water
Level of Service Methodology
DG6 Response to Billing Contacts

Annual Information Return 2018 Section 3 DG6 Page 2 of 7
DG6 RESPONSE TO BILLING CONTACTS
Methodology and Procedures Northern Ireland Water (NIW) has contracted out the provision of Customer Billing and Contacts (CBC) to Echo Managed Services (Echo). Echo is the provider of CBC services to NIW.
DG6 response to billing contacts (Process Summary): 1. Telephone Contact (go to step 4) or Documentation received (in Capital House)2. Documentation opened by the Echo Payment Processing Team and passed to the
NIW Customer Support Team3. Scan and Index (documentation only which is archived after scanning)4. Raise and allocate CMS contact type5. Assess and Investigate6. Update and compose response
All customer response letters are printed by NIW Contacts Team and dispatched locally. Exceptions to this include correspondence generated through DSTI which are bills (including recalculated bills) and automated recovery letters / correspondence. The process for printing and distribution of bills and other stationery on a daily basis is detailed below:
Items generated in Rapid: Information received and updated by the agent, (which automatically updates the system), may trigger the system to create an item of stationery. The agent can also take a course of action (which will manually update the system) and May also trigger an item of stationery. This may include receipt of a leakage form from the customer, Data Protection Letter, Transfer of Responsibility etc. All such contacts are recorded as closed as at the date of dispatch.
The BSA team, within Echo, reconciles numbers of bills, letters and forms and sends all relevant items of stationery created the previous day through to DSTI for printing. These are signed-off, printed, enclosed and prepared for pick-up by TNT. Currently only bills, recovery notices and letters are handled this way. For DG6 reporting purposes the date of resolution of the item or date of the substantive response is used as the closure date.
Definitions A billing contact covers any communication from a customer or their representative (on receipt of written permission from the customer as per data protection) regarding a customer account which requires a response or an action by NIW and does not constitute a written complaint. A customer’s representative may be a solicitor, Citizens Advice Bureau, local MLA, or stakeholder representative, e.g. Ulster Farmers Union or CCNI.
Billing contacts can be received by telephone, in writing, by e-mail, by fax, by personal visit or written on a piece of company correspondence, for example a bill which is returned to NIW. Offensive or abusive written contacts are not included.
A billing contact not received in writing is a DG6 event. A written communication however, may be classified as a DG6 or DG7 event. Where the content or tone of written communication indicates an element of dissatisfaction, however mildly worded or unjustified, it should be classified as a written complaint and reported under DG7.
Billing contacts include calls that are made to pay a bill as this will result in an action being taken on the customer’s account.

Annual Information Return 2018 Section 3 DG6 Page 3 of 7
Email / Faxes: When an e-mailed, faxed or hand delivered contact is received after 16:30 it will be scanned, logged and indexed on the next working day. The date of receipt recorded will match the actual date of receipt.
Emails and faxes, which can be sent at any time, that are received outside or normal operating hours shall record the receipt date as the date it was delivered to the company. For example, if an email is received on a Saturday this is recorded as day 0. The next working day (Monday) would be counted as day 1. If an email is received on a Sunday then this is recorded as date of receipt – day 0 and Monday as day 1.
Exclusions A query relating to billing for domestic customers, including the provision of meters is not a DG6 contact, as domestic customers are not billed by NIW.
For reporting purposes, other exclusions are: Written complaints (these are handled as DG7); Correspondence from banks re direct debits (clarified with NIAUR as excludable); Contacts logged in error; Freedom of Information requests; Calls relating to septic tanks and septic tank payments (these are non-appointed); Calls relating to new connections, not yet completed; and Copy correspondence from and to NIW personnel. Correspondence relating to payment processing, e.g. BACS notifications, payment
giros and remittance advice notes.
Multiple Accounts NIW received clarification from the Regulator as to how contacts from customers with multiple accounts should be logged, so as not to over or understate the DG6 position.
Therefore, for reporting purposes, a DG6 contact received; by a customer holding multiple accounts with NIW that is requesting an update to their standing account details will be recorded as 1 DG6 event on 1 account and as a non-reportable event on the remaining accounts.
End of year (contacts not dealt with at end of year As per NIAUR guidance, if a billing contact is not resolved by the time the year end report is run, the contact is included in the total number of billing contacts received for the year in which it is received.
The contacts which are open at end of year are included in the reported figures for the number dealt with within 5 working days. This is based on the assumption that a holding response has been issued within 5 working days and that the reported date of closure will, at the point of final resolution, be backdated to the date on which the holding response was issued.
It was later verified that, per the assumption above, each of those contacts still open at yearend were closed in line with the aforementioned methodology with a reported closure date within 5 working days of receipt.
Further, the response time for any open billing contacts received within the reporting year is reported to be within 5 working days based on the assumption that a substantive holding

Annual Information Return 2018 Section 3 DG6 Page 4 of 7
response has been issued for each by working day 5. On resolution of the billing contact, these billing contacts will be closed back to the date of the holding response. A sample of 60 of the 307 open DG6 contacts were checked to see if they had a holding letter issued on or before working day 5 and 100% of the 60 sampled did.
Auditing Internal Audits – This process falls within Echo’s Quality Management system and is audited several times a year under ISO9001/2000.
Performance and the achievement of Billing enquiries are recorded as per the Contact Handling Expected Service Levels which are measured monthly in accordance with Contract Schedule 2.2. Detailed monthly monitoring reports of actual performance are generated by Echo within CorVu and presented in the monthly Business Review Pack (MBRP) to NIW within 5 working days of the end of each month covering lines 1.1.1 to 1.1.9 in accordance with schedule 8.4.
Validation of DG6 figures provided by Echo are carried out monthly by NIW in accordance with Contract Schedule 2.2 and recorded in the “NIW Response to the Monthly Business Review Pack” document which is published for comment and review. Any discrepancies on monthly DG6 performance are raised with Echo and escalated.
Echo regularly performs quality reviews against contacts received to ensure contacts are dealt with correctly. Although no documentation is made available to NIW, regular reviews are carried out by Team Managers within Echo, including:
Weekly call listening; Monthly scoring based on call listening and feedback to individual agents; Coaching and feedback; and Daily monitoring of all billing contacts with team feedback when necessary.
NIW conduct monthly bill accuracy checks and report their findings to Echo by randomly selecting 100 bills issued each month and analysing them for accuracy, including:
Accuracy of standing charges, sewerage and water charges; Bill total agrees with supporting pages; Correct application of VAT; Customer details are correct; and Correct bill type is used.
Any discrepancies are logged and sent to Echo for review.
NIW Contract Office performs a call listening exercise on a monthly basis. Each month a random selection from the total calls received is made. This selection includes both billing and operational calls. Billing calls are assessed for:
For accuracy; To determine if memo contents are clear and precise; To ensure the conversation is accurately recorded on Rapid; and To ensure correct use of CMS code.
Any findings are reported back to Echo management through the Response to the MBRP.
An end to end process review is carried out by internal audit.

Annual Information Return 2018 Section 3 DG6 Page 5 of 7
Sources of information System used The telephony system comprises of a suite of Avaya products and a Call Media ACD. The Avaya switch is tightly integrated with the Call Media platform which provides CTI (Computer telephony Integration) and ACD (Automatic Call Distribution). Calls can be automatically routed to appropriately skilled agents ensuring a quality response to the customer, at first point of contact. NICE is the call logging system.
The software comprises of Call Media Enterprise Console with an integral reporting suite which distributes calls based on skills sets and SLA’s.
Written correspondence is date stamped at point of receipt by Echo (unless received after 16:30), scanned on a (Kodak i 620 scanner) and indexed. This safeguards security and minimises administration. Once correspondence is scanned it is indexed and batched with an allocated batch number. The scanned image is then available to Rapid Users.
All contacts received should be recorded on Rapid. Reports from CorVu are generated by Echo, validated by NIW, and are used to report on DG6 performance.
Actual data Actual data is extracted from the billing system RapidXtra using CorVu. CorVu ‘DG6 Received QRY (Live)’ is used to calculate the total number of DG6 contacts received (table 4, line 1) and to calculate the DG6 closed performance (table 4, lines 2-5). DG6 data analysis is produced monthly and re-run for the entire reporting year, providing the necessary information essential for the Director General’s reporting requirements.
Sampling Actual data is used to report DG6 performance (table 4, lines 1-5). Sampling is only used by NIW for data quality purposes and to provide comfort around the assumption that DG6 contacts open at year end will be closed back to a holding letter issued on or before working day 5.
Reliability All data is taken from the main billing system to ensure it is reliable and accurate.
Responses This is defined as a response to a billing contact which may be by telephone, written correspondence or personal visit. Responses will provide the following:
An explanation of NIW’s relevant policy or procedure and indicates why, in NIW’s opinion, no further action on the customers billing contact is required; or
Informs the customer when action on his/her account will be taken if action cannot be taken immediately due to circumstances beyond NIW’s control, for example customer needs to obtain clearance from third party, such as a landlord.
Whichever type of response is dispatched it must substantively answer all points raised by the customer and be recorded and date stamped.
Use of telephone The telephone is the company’s preferred method of responding to a billing enquiry. All DG6 related telephone calls should result in a CMS memo being raised and coded by the agent

Annual Information Return 2018 Section 3 DG6 Page 6 of 7
according to the individual enquiry. An audit trail of the response will be recorded on the billing system (Rapid) as a memo with a CMS type. A full record of the actual conversation and its outcomes is held on Call Media. A CMS is created on Rapid and contains information including:
CMS type; Customer name; Customer address; Telephone contact; Query details; and Action required.
Use of letters Letters are only used when it is not possible to deal with the customer by telephone, when a written reply has been requested by the customer and when it is deemed more appropriate by the agent. Telephone calls not dealt with at first point of contact are dealt with by the Echo CRC Workflow department. A CMS is created on Rapid and contains information including:
CMS type; Customer name; Customer address; Telephone contact; Query details; and Action required.
Holding letters are sometimes used but are customised by the agent. They are held within Rapid and are posted directly to the customer and not through DSTI.
Use of personal visit If a DG6 telephone contact requires a personal visit, (e.g. a meter query team site visit), the agent will raise a CMS contact. This will be transferred to the Echo CRC Workflow Team who takes ownership for resolution and closure of the contact. The Echo CRC Workflow Team agent will send a holding letter to the customer once the visit request has been raised. It is this date/time of this letter that is used for closure.
Response time This is the number of working days between receipt of a contact by NIW up to and including the day of despatch of a response. For the purpose of this calculation, the day of receipt; provided it is a working day; is counted as day zero and the next working day as day one.
Emails and faxes, which can be sent at any time, that are received outside or normal operating hours shall record the receipt date as the date it was delivered to the company. For example, if an email is received on a Saturday this is recorded as day 0. The next working day (Monday) would be counted as day 1. If an email is received on a Sunday then this is recorded as date of receipt – day 0 and Monday as day
CCNI Written billing contacts received via the Consumer Council for Northern Ireland (CCNI) office on a customer’s behalf are included.

Annual Information Return 2018 Section 3 DG6 Page 7 of 7
Holding reply This is defined as a response to a billing contact which advises the customer that NIW will need to undertake additional research or other actions before being able to respond to the customer's contact. A holding reply is counted as a substantive response if it informs the customer what further action needs to be taken to respond to the query and includes a date by which investigations or further actions will be complete and by when the customer will receive a further communication from NIW.
A holding reply will close a contact for DG6 reporting purposes but not for NIW until all actions have been taken. NIW provides a reply within 5 working days of the customer contact and a further holding letter is sent, if there is a delay in finding a resolution. The company will include the number of days in which they will contact the customer again. Enquiries and follow up questions will not be counted as a DG6 contact.
Other Issues Please refer to DG6 Company Commentary.

Annual Information Return 2018 Section 3 DG7 Page 1 of 7
Northern Ireland Water
Level of Service Methodology
DG7 Response to Written Complaints

Annual Information Return 2018 Section 3 DG7 Page 2 of 7
Methodology and Procedures Northern Ireland Water (NIW) has contracted out the provision of Customer Billing and Contacts (CBC) to Echo Managed Services. Echo Managed Services (Echo) are the provider of CBC services to NIW. Written complaints are dealt with in-house by the NIW Customer Services Centre function. The Customer Support Agents within the Complaints & Executive Mail Team scan, log & index documentation whilst Agents within the Complaints & Exec Mail Team case-manage and respond to the DG7 complaints.
The following high level process steps are followed: documentation received (in Capital House); documentation opened by Payment Processing (Echo) who separate payments &
non-customer documentation before passing the remainder to the CustomerSupport;
documentation sifted into DG6, DG7 and non-reportable categories; documentation date stamped, scanned, logged & indexed by Customer Support; CMS contact raised to the NAS Account Services inbox in RapidXtra (Customer
Billing & Contact Management System) and case raised in Savvion (BPM solution); contacts allocated to Complaints & Exec Mail Team members; Complaints & Exec Mail Team Agent assesses, investigates and case-manages
complaint as appropriate; request for information and/or action sent to relevant part of the business then; review information provided by business, update accounts, draft & issue response.
Allocation to DG7 Written complaints are recognised from all other correspondence by following the definition of a written complaint as set out in the Reporting Requirements and Definitions Manual. All incoming written correspondence is passed to Customer Support. It is then sifted and categorised as DG6, DG7 or non-reportable according to the Utility Regulator’s definitions. Following that, it is date-stamped, scanned, logged and indexed by Customer Support.
The reported response times for all written complaints are derived from the Rapid database. All written complaints, with the exception of exclusion categories detailed herein, are included in this total.
Definitions A DG7 complaint is defined as any written communication from a customer or customers’ representative (e.g. Citizens’ Advice Bureau, solicitor), alleging action or inaction, or service or lack of a service on the company’s part or that of its agent or contractor has fallen below the expectation of the customer – even if written in mild and friendly terms. This includes any expression of annoyance or dissatisfaction by the customer, or disagreement with the company.
Written complaints include letters, e-mails and faxes.
Also included are: second or subsequent complaints; general complaints; complaints that may seem unfair or frivolous; complaints received by Consumer Council for Northern Ireland and; complaints written on returned Company letters or stationery (e.g. bills).

Annual Information Return 2018 Section 3 DG7 Page 3 of 7
Should the Company receive a petition, it is classed as a DG7 contact and the Company will respond only to the customer who has sent in the petition. This will be classed as one complaint although the complaint and the response letter will be archived against the account of each customer that has signed the petition where practical.
Exclusions The following are excluded from DG7:
cheques and stubs; written DG6 billing queries; all other Company mail; complaints that are sent anonymously; complaints that are offensive or abusive; complaints referring to non-appointed activities; complaints returned alongside customer satisfaction surveys; complaints not about the services and functions of the Company (e.g. complaints
about executive salaries, advertising campaigns); complaints about the activities of other utilities (for example signage around
trenches); complaints about recreational and amenity activities not defined as duties imposed
by the Water and Sewerage Order 2006 and; public liability claims (although any related complaint should be included as normal).
End of Year (contacts not dealt with by end of year) As per UR guidance, if a complaint is not resolved by the time the year-end report is run, the complaint is included in the total number of complaints received for the year in which it is received.
Further, the response time for any open complaints received within the reporting year is reported to be within 10 working days based on the assumption that a substantive holding response has been issued for each by working day 10. On resolution of the complaint, these complaints will be closed back to the date of the holding response.
Auditing This process falls under the remit of NIW Internal Audit (IA). A “Customer Contacts and Complaints Handling” audit was undertaken during 2017/18. This resulted in no recommendations directly attributed to the handling of written complaints.
NIW MI & Data Team carry out monthly sampling to quality check that contacts are being logged correctly within the Rapid system. The checks include validation that the contact is a DG7, confirmation that the CMS codes are correct, that the date of closure is correct and that the response issued is substantive. Any areas of concern are then fed back to the relevant teams who provide a written response with agreed actions.
Each complaint also undergoes a series of quality assurance checks. The first is carried out by the Complaints & Exec Mail Team member who has the item allocated to them. They check that the item has been:
correctly categorised as DG7; coded using an appropriate CMS code; and logged to the correct account(s).

Annual Information Return 2018 Section 3 DG7 Page 4 of 7
Official - Regulatory
The Complaints & Exec Mail Team member verifies that the information received from within the business is suitable to use in response to the complaint before the response is drafted. Once the response has been drafted, it is subject to a self-assessed Quality Assurance check during which adherence to an agreed Letter Writing Checklist is tested. The Complaints & Exec Mail Team Manager/Supervisor performs further monthly sampling of contact categorisation to ensure accuracy. These additional monitoring systems check:
DG7 categorisation; CMS code; and advice code for closed complaints (existence of and; accuracy of).
Sources of Information Complaints are sorted into the relevant categories, date-stamped, scanned, logged then indexed, thus ensuring security and minimising administration. Each complaint received is scanned using the Kodak i620 scanner. At the end of each “batch” of correspondence scanned, a batch number is allocated. The images can then be seen by staff on their PC and indexing can begin. During indexing the following details are input by the operator:
property and/or customer reference; date of receipt; CMS group; CMS description; document type and; operator id.
It is at the indexing stage that the scanned items are categorised, thus allowing the description to be input above. Changes in system during the reporting year There were no changes in system during the reporting year. Actual Data Actual data is extracted from the billing system RapidXtra using CorVu. CorVu ‘DG7 Received QRY (Live)’ is used to calculate the total number of DG7 contacts received and to calculate the DG7 closed performance. DG7 data analysis is produced monthly and re-run for the entire reporting year, providing the necessary information essential for the Director General’s reporting requirements. Sampling Sampling is not used in compiling received data for DG7. Sampling is only used by NIW for data quality purposes. Reliability All data is taken from the main billing system to ensure that it is reliable and accurate. Responses Upon receipt of a complaint, we ensure that relevant action is undertaken, provide a substantive response and ensure the contact is closed on the Customer Contact Management System (Rapid).

Annual Information Return 2018 Section 3 DG7 Page 5 of 7
NIW endeavours to answer all written complaints, regardless of the sensitivity of the issue or subject raised by the customer.
Our responses do one or more of the following: provide an explanation of our policy or procedure and indicate why no further action
is required; inform the customer that action to resolve the complaint has been taken and
identifies when this action occurred; informs the customer when the action to resolve his/her complaint will be taken if it
cannot be done immediately e.g. capital works scheduled for completion monthssometime in the future;
answer all issues or questions raised by the customer.
Use of Telephone Where appropriate, telephone calls are used to respond to written complaints. Telephone calls are also used to update customers as the progress of complaints under investigation. The customer account is annotated with details of the call in these cases.
Use of Standard Letters Standard letters are not used to respond to complaints - all responses are personalised and customised.
Use of Personal Visit When a personal visit is used to respond to a written complaint, a letter confirming the content of the visit is provided to the customer. The date of the visit is used as the date of response.
NI Direct Complaints received through NI Direct are not reported.
Telephone Complaints Complaints received via telephone are reported as DG9 telephone complaints, not DG7. Billing telephone complaints are reported as DG6.
Date of Receipt Written complaints are date-stamped per the date of receipt.
Date of Dispatch The date of dispatch refers to the date on which a response is sent to the customer. The date of dispatch is recorded as the date closed.
Response Time This is the number of working days between receipt of a contact by NIW up to and including the day of dispatch of a response. For the purpose of this calculation, the day of receipt (provided it is a working day) is counted as day zero and the next working day as day one.
When an email or fax is received after 16:00 it will be scanned, logged and indexed on the next working day. The date of receipt recorded will match the actual date of receipt.

Annual Information Return 2018 Section 3 DG7 Page 6 of 7
Official - Regulatory
The reported date of receipt for emails/faxes received outside of normal operating hours is the actual date on which the complaint was delivered to the company. For example, if an email is received on a Saturday, this is recorded as day zero. The next working day (normally the Monday) would be counted as day one. If an email is received on a Sunday then this is recorded as date of receipt (day zero) and (normally) Monday as day one.
Substantive Holding Reply This defined as a response to a written complaint which advises the customer that NIW needs to undertake additional investigations or other actions before being able to provide a full response. A holding response is considered substantive if it advises the customer what further action needs to be taken in order to fully respond, when this will be done and when they will receive a further communication from NIW.
Items remain open until all actions have been completed but will be closed back to the date of the holding response for reporting purposes when said actions have been completed.
When a date by which investigations or further actions will be complete cannot be given, we will give the date by which we will contact the customer again.
Holding responses can be issued in writing or provided verbally by telephone.
Repeat Contact Where a complaint has been responded to and results in a period of correspondence each written contact is treated as, and reported as, a separate complaint.
This is done even if NIW consider the complaint has been dealt with as far as we are able.
Consumer Council for Northern Ireland (CCNI) Complaints received in writing via CCNI will be logged as complaints and recorded in DG7 figures. All complaints from CCNI are received in writing.
CCNI enquiries and follow-up questions are not recorded as complaints.
Complaints to or about Contractors Complaints made directly to contractors about work carried out on our behalf are recorded following notification to NIW through agreed process. Such complaints will be recorded even they are handled directly by the contractor.
Complaints about contractors received directly by NIW are reported even if they are referred to the contractor to deal with.
Holding Response & Frequency Monitoring systems have been in place throughout the reporting period to support recording on the number holding responses issued throughout 17/18.
System-based report data was used to derive the number of holding responses issued between 01/04/17 and 31/03/18.
In cases where the investigations were on-going by the expiry date of the initial holding response, a further holding response will have been issued.

Annual Information Return 2018 Section 3 DG7 Page 7 of 7
Based on the recorded data, we can say that one (or more) holding response was sent in relation to 275 DG7 contacts which were received in 17/18. Therefore, it can be concluded that one or more holding response was issued in relation to 12.09% of the DG7 contacts received during 17/18.
Other Issues Please refer to the DG7 Company Commentary.

Annual Information Return 2018 Section 3 DG8 Page 1 of 5
Northern Ireland Water
Level of Service Methodology
DG8 Bills for Metered Customers

Annual Information Return 2018 Section 3 DG8 Page 2 of 5
Official - Regulatory
DG8 - BILLS FOR METERED CUSTOMERS Definitions Every time a metered account is billed a reading type is updated onto the Rapid billing system (Rapid) to identify the type of reading. The reading types and estimated indicator are used to distinguish the meter reading status of each metered account, which is subsequently analysed in Rapid to create the ‘DG8 Meter Summary Analysis’ report. DG8 Reporting The Rapid ‘DG8 Meter Summary Analysis’ report ensures we correctly identify each of the reporting requirements in the sequence shown. The reading indicators are extracted from Rapid RPU005 meter consumption update screen. The ‘DG8 Meter Summary Analysis’ report extracts this information and compiles this in line with the requirements. The report is run annually at the end of the financial year, covering the period 1 April to 31 March and includes all categories requested by the Director General for the June Return reporting. A bill is only counted as issued if it is sent to the customer within the reporting year. Any bills that are sent after this date will be included in the following reporting year’s figures. Total Metered Accounts The report confirms the number of active accounts with either water or water and sewerage consumption which are metered. Company Reading and Billed If a Company reading has been taken during the within the defined annual cycle period, and a bill created against that reading, it will be included under the ‘Meters read by Company’ indicator. The exception to this is those meters that are billed outside of Rapid (trade effluent meters). Company readings are recorded by the Meter Reader (MR) via a PDA. Each day the MR will upload those accounts that have had a reading and or an abnormal reading from the PDA to Routestar/Temetra, for transfer to Rapid. The Temetra system was introduced on 26th August 2014 to replace Routestar. No Bills Received During Reporting Year Bill status is scanned for no bills issued during the reporting year and is reported under the ‘Not Billed this year’ indicator. Meters included in this category are identified as having a reading entered but the ‘bill sent’ flag set to ‘No’ Customer Readings Reading types are scanned for not receiving a bill based on a Company Reading but at least one bill based on a ‘Customer Reading’ and will be included in the ‘Meters read by Customers’ indicator.

Annual Information Return 2018 Section 3 DG8 Page 3 of 5
‘Meters Read By Customer’ represents the number and percentage of the meters read by the customer within the DG reporting year that are identified as either ‘Customer read’ or ‘Customer web reading’
The Company encourages our customers to take readings themselves so that they are aware of their usage. Customer reads can be registered for billing purposes by using the On-line facility available on our website or by calling our billing line.
Customer readings are recorded via a correspondence management system. A team member will then update the account and issue a revised bill. A customer reading type indicator will be displayed on the system. The estimated read will also be visible on the system
Estimated Only Any meters that have not satisfied any of the preceding indicators will be recorded under the ‘Meters Estimated Only’ indicator.
‘Meters Estimated Only’ represents the number and percentage of meters only estimated within the DG reporting year. The following read types are identified as estimates: Estimate Exchange Final, System Estimate, and Manual Estimate.
Unread for Two Years If no Company reading exists during a two year period, it will be reported under the ‘No Company Reading for 2 Years’ indicator.
Specifically two years back from the end date of the DG report.
Exclusions The following are excluded from the indicators:
Charged on another basis (not metered consumption) Test meters Trade-effluent meters DRD or NIW meters Fire supplies Properties occupied continuously for less than six months Complex accounts – Including combination meters i.e. the ‘low-flow’ element is
excluded. Void properties
Reading and Billing Frequency Frequency of reading:
Non-household properties are scheduled to be read twice a year. The readingschedule for each read is completed over a six month period, the 1st read cycle isApril to September and the 2nd read is October to March.
Non-household – large volume users are read and billed monthly. There are a number of meters that have been assigned a reading frequency of Annual
Read within the Rapid system. However, these meters are either DRD Supply orTest Meters which fall under the permitted exclusions and will only be read to assistbusiness requirements, as neither category generates a customer bill.
Frequency of Bill Issue: Household properties – the Company do not currently bill domestic properties

Annual Information Return 2018 Section 3 DG8 Page 4 of 5
Non-household – the Company aim to read at twice a year and bill twice yearly. Large non-household users – the Company aim to read and bill monthly.
Method of Meter Reading Before the start of each reading period, whether monthly or six monthly, details of metered accounts scheduled for reading were transferred from Rapid to Routestar between April and 25th August, and from Rapid to the Temetra system for 26th August onwards.
The accounts are then downloaded on to an electronic data storage unit (PDA) to facilitate the actual reading of the accounts by a MR in the field.
The meter reading information obtained by the MR is then transferred back to Rapid from Routestar/Temetra, which is subsequently updated upon the meter being read.
The data transfer from Routestar/Temetra to Rapid is not solely automatic and currently requires manual assistance by the MAM team.
Abnormal Readings An abnormal reading can be identified by one of two factors:
A meter reading that gives a usage that does not fall in line with previous usagepatterns, identified by the MR, billing system or customer.
A meter reading that does not correlate with previous readings taken.
The PDA unit automatically calculates the usage between a new reading and the previous reading. The MR checks the usage against the previous readings that are displayed on the PDA. If the usage appears to be abnormal the MR will enter a report onto the PDA and or use a pre-set indicator to explain why (trouble codes).
A daily ‘Rejected Readings’ report is produced through the Rapid billing system that also identifies any abnormal usage that require further investigation. Each account on the report is checked and if accepted the reading will be utilised and a bill issued. If the rejected read cannot be added, a site visit request is raised to instruct a Meter Query Technician (MQT) to investigate and provide further information.
Previous Misreads Accounts that are identified as having previously been misread are subject to re-calculation based on the most recent meter reading.
Access Denied / Meter Reading Unobtainable In such instances that the Company is unable to gain access to the meter, a skip code is entered which identifies that access was denied. If the customer does not provide a reading before the billing run a system estimate is used.
Faulty Meters Where a faulty meter is identified and a MR or MQT replaces the meter, it is recorded on an MRD (Meter Replacement Docket) which their Field Manager (FM) signs off and sends to the MAM team, and “First Read New Meter” is logged on the handheld.
If a MR or MQT cannot replace the meter, a MMR (Meter Maintenance Request) is completed which their FM signs off and sends to the Meter Maintenance (MM) team, MM then forwards the MMR to the Contactor. When the meter has been replaced, the Contractor

Annual Information Return 2018 Section 3 DG8 Page 5 of 5
advises MM of the replacement details. The old and new details will then be returned by MM on a MRD to MAM for updating on the billing system
Updating, Post Bill Issue If the Company has any disputed readings, the account will be suspended while further investigations are being made. Once the investigations are finalised, a revised bill will be issued if necessary.
Assumptions Those accounts excluded from the analysis are categorised using the definitions provided by the reporting requirements, as noted above.
Additional Information Echo, on behalf of Northern Ireland Water, are responsible for the billing activity.
Some meters are billed on a sundry schedule rather than the normal billing schedule within Rapid. These are Trade Effluent bills. Trade Effluent bills are excluded from DG8.
Sewerage only customers, if not TE customers, are charged on an unmeasured basis.

Annual Information Return 2018 Section 4 DG9 Page 1 of 7
Northern Ireland Water
Level of Service Methodology
DG9 Telephone Contact

Annual Information Return 2018 Section 4 DG9 Page 2 of 7
Definitions: Principle Advertised Customer Contact (PACC) Points For the purposes of the indicator, Principal means the main contact point(s) which customers are encouraged or directed to phone. Advertised refers to Customer Contact Points which are available in telephone directories, newspaper advertisements, Northern Ireland Water (NIW) website and NIW literature. It does not include temporary contact points which have been established to handle a specific topic. NIW PACC points include:
Billing Enquiries: 0345 877 0030 Debtline: 0345 8770 050 Waterline: 0345 744 0088 Leakline: 0800 028 2011 Text Relay (for customers with hearing difficulties): Registered users are
provided with a prefix for any NIW number they wish to ring. An MLA/ER Hotline ( ) was initiated on 21st August 2007 to provide a direct means of contact for elected representatives and council members telephoning to enquire about specific issues in their constituencies. In addition, the following dedicated campaign lines are in operation for certain sections of the community to aid NIW’s response:
Developers Line: 0345 877 0002 Emergency Services: 0345 877 0008 Telecare Quick Check: 0345 877 0080 Closed Communities: 0345 877 0007 Aged Debt: 0345 877 0003
Telephone Contact The indicator is intended to monitor incoming telephone traffic which can be regarded as originating from NIW’s customer base. All calls received to telephone lines other than principle advertised customer contact points are excluded for reporting purposes (i.e. all other business lines). Company Agent NIW has contracted out the provision of Customer Billing and Contacts (CBC) to a 3rd party provider known as Echo Managed Services (Echo). Echo is the provider of CBC services and is based in Capital House, Belfast. A company agent is defined as an employee of Echo (operating from a principle customer contact point), who operate the contact on behalf of NIW. All calls are answered directly by Customer Service Advisors who are direct employees of Echo. Office Hours The indicator covers office hours only. Office hours are defined as the hours which NIW’s PACC points are open. These are detailed below:
Billing Enquiries: Monday to Friday - 08.00 to 20.00 Saturday - 08.00 to 18.00 Sunday - 12.00 to 18.00
Debtline & Aged Debt: Monday to Friday - 08.00 to 17.00

Annual Information Return 2018 Section 4 DG9 Page 3 of 7
Waterline: 24 hours a day, 7 days a week, 365 days a year Leakline: 24 hours a day, 7 days a week, 365 days a year MLA and dedicated lines: 24 hours a day, 7 days a week, 365 days a year
Telephone Complaints Calls received about the following water service issues are expected by NIAUR to be included as a complaint:
no water; lack of pressure; leaks; taste and odour; discolouration; and hard water (except for simple enquiries, e.g., dishwasher settings).
In addition, calls received about the following wastewater service issues are also expected to be included as a complaint:
sewer flooding other than those received through NI Direct/ blockages; collapsed sewers / manholes;
smells from sewage treatment works / pumping stations; and flies from sewage treatment works.
NIW have created a series of CMS logging codes, within the RapidXtra system, to cover these issues. All telephone contacts logged by the agent using one of these codes will be included in the reported volume of telephone complaints. In addition, where a customer expresses dissatisfaction during their call, the agent has the ability to select the complaint flag which will identify the log for inclusion in the reported figures. NIW excludes from the reported figures, those telephone complaints which are:
Anonymous; About the activities of other utilities; Received through NI Direct Incident Line; and Received on telephone lines other than principle advertised customer contact points
(i.e. all other business lines).
Complaints to/about contractors Telephone complaints to contractors or other agents about work being undertaken on behalf of NIW are reported only where NIW are informed. Complaints about contractors or other agents are also reported, even if the complaint is referred to the contractor to resolve. Telephony Structure: Telephone Providers Network The supplier during the reporting year was Cable & Wireless, however all physical lines in Capital House were switched from C&W to BT on 6th March 2014, with remaining non-geographic services moved to BT on Tuesday 10th of March 2015. No issues were experienced during these switches. Cable and Wireless Network IVR NIW introduced a High Volume Call Answering (HVCA) solution to assist answering large volumes of unexpected trouble calls in December 2012. In order to facilitate the solution,

Annual Information Return 2018 Section 4 DG9 Page 4 of 7
the Cable and Wireless Network IVR was activated on the ‘Waterline’. Customers calling this line will hear the following message and be presented with further options: High Volume Call Answering (HVCA) System The HVCA system is aimed at ensuring NIW can handle large volume of calls during periods where calls can increase very quickly e.g. Major Incidents, heavy rainfall incidents, etc. This ensures that all calls are logged and customers given specific information resulting in higher levels of customer satisfaction during service interruptions. The HVCA system will recognise customers using the telephone number we hold on their customer record or it can use Voice Recognition to allow customers to speak their Post Code.
Calls will be delivered to HVCA direct from the C&W IVR menu structure when a caller selects option ‘2’. Calls delivered to this campaign will be offered to agents first in Call Media, however if an agent is not available the call will automatically divert to the HVCA Platform. The divert is controlled by the Cable and Wireless intelligent network, calls will divert on busy tone, route failure and no reply.
As each caller hangs up in the HVCA application, a Call Data Record (CDR) is created which details the caller’s activity during the call. A portion of the CDR is passed to NIW in the customer contact file for the creation of work requests through Rapid to Ellipse. Call Media Calls received on all other PACC lines and the majority of calls received on Waterline are delivered to the Call Media system for allocation to an appropriately skilled agent. If there is more than one Customer Service Agent available, the system allocates the call to the one who has been available the longest period of time. If no skilled agent is available immediately then the call will be queued until a skilled agent becomes available. The Call Media Telephony System provides an internal queuing system where callers will hear a ring tone and then a comfort message and music on hold. The use of Call Media’s skill based routing ensures that incoming calls are distributed in a way that will ensure a quality response to the customer. Call Recording All calls received in the call centre via Call Media are recorded via NICE call recording software. This software records the time of the call and the telephone number that called the centre if available. Reporting: Reporting the DG9 Position (telephony schematic attached in Appendix 1) DG9 performance is reported by the NIW MI Data Team on a monthly basis using the MI reports from both HVCA and Call Media systems. Reporting of Telephone Complaints NIW MI Data Team use Corvu to report on the volume of telephone complaints received, on a monthly basis, using the agreed Operational Original CMS transaction codes and any other call logged where a complaint flag has been selected by an agent if the customer has expressed dissatisfaction. Call Listening NIW MI Data Team listen to 10 randomly selected calls per month, check that they have

Annual Information Return 2018 Section 4 DG9 Page 5 of 7
been logged on Rapid correctly and feedback any quality issues highlighted to ECHO through the monthly response to the MBRP. Call Handling: Practices and Procedures All calls received are managed by either HVCA call routing system or Call Media and routed directly to an appropriately skilled agent based on the first available call handler. Wherever possible, an agent will deal and action a customer’s enquiry at point of contact. Where this is not possible, a message will be raised on the system for further investigation or where appropriate the customer will be transferred. All enquires are logged on RapidXtra automatically by HVCA or manually via an agent, covering the reason for the contact (contact type) and the advice given or action taken. This is the case whether or not further work is required ensuring all calls are recorded, even if they remain open for further action. Calls which require further action are logged on RapidXtra and work flowed to teams or individuals as required or passed to Ellipse for issue to mobile work management operational teams. This includes instances where further actions or NIW investigation is required in order to provide a full response to the customer. Transfers between PACC Points Agents are multi-skilled, so transfers are not generally made. Transferred calls are reported as one call. Direct Measurement/Interpolation/Extrapolation NIW measures statistics for all telephone calls received on PACC points which are delivered directly to the Call Media telephony system and to the HVCA system. Sampling, interpolation or extrapolation is not used in compiling totals. Messaging: Use and activation of IVRs (Interactive Voice Response) During business as usual an introductory message is set up and assigned to each queue, e.g. Billing Enquires Line. The message greets the customer and thanks them for calling the relevant number. It explains that an agent with be with them shortly and to note that calls are recorded to help provide quality assurance and training. If a customer telephones out of hours, the customer will receive an out of hour’s message. In the event of disaster recovery and building evacuation, a recorded message is activated which explains to customers that calls cannot be answered at the moment, please call back later. As noted above, the Cable and Wireless Network IVR tool is now being utilised on Waterline to direct customers calling in relation to New Connections, Trouble Calls, Septic Tank requests and other operational issues. This allows NIW to transfer Trouble Calls to the HVCA system in situations where calls exceed the volume of agents available in the CRC. Use and activation of message manager systems No message manager systems were used during the reporting year.

Annual Information Return 2018 Section 4 DG9 Page 6 of 7
Use and activation of answering machines Answering machines were not used during the reporting year. Company Systems: Telephony Systems comprise of a suite of Avaya products and a Call Media Automatic Call Distribution (ACD). The Avaya switch is tightly integrated with the Call Media platform which provides Computer Telephony Integration (CTI), ACD and outbound dialler functionality through three main components:
Avaya S8710 providing core telephony switching Call Media Contact Centre software providing ACD, CTI and dialler functionality NICE Call Recording; and High Volume Call Answering (HVCA), hosted service provided by Twenty First
Century Communications. Calls that arrive at the Avaya switch are routed by the Call Media ACD to appropriately skilled agents via desktop phones. Location All systems are located at Capital House, Belfast. There is currently a 240 line capacity dedicated inbound calls from NIW customers, 30 dedicated lines for outbound calls and 30 dedicated lines ring-fenced for priority lines e.g. ER Hotline, Emergency Services, etc.). The scale of the current capacity was implemented in preparation for domestic billing which was deferred in April 2007. Software Software comprises of Call Media Enterprise Console, the integral reporting suite supplied with Call Media ACD and NICE call recoding. Other Issues: Text Relay Service and Text Phone NIW has provided for a Text Relay and Textphone service to support customers with hearing difficulties. Text Relay Service is a third-party service whereby the customer rings a Text Relay operator, who in turn contacts the Customer Relations Centre via the normal customer line (Waterline/Leakline/Billing, etc.) on behalf of the customer. This is recorded as a call received on the appropriate line. Rejected Calls During the reported year calls currently rejected for any of the following reasons are not included in total calls received: The time being out of working hours The queue is too full and cannot accept any more tasks. Each queue holds 500 calls at
any one time. The task queued for the ‘Max Queue Time’ and was returned to the connector.


Annual Information Return 2018
Section 4
Customer Research Appendix

Annual Information Return 2018 Section 4 CRA Page 1 of 4
Annual Information Return 2018
Customer Research Appendix

Annual Information Return 2018 Section 4 CRA Page 2 of 4
Customer Satisfaction One of the fundamental measures concerning the level of service received by customers is customer satisfaction. NI Water measures customer satisfaction through 3 different surveys.
Customer Advocacy where Question 71 from the ‘Consumer Experience Survey’ is used In 17/18, the Interim PC15 Research Customer Views Survey was carried out, as part of
the regulatory requirement to return at the mid-point of PC15 to determine if customer views and priorities had changed. This replaced the Omnibus Survey, however Question 1 & Question 2 from the Omnibus Survey where included within the piece.
SIM, where Question 60 is used
For regulatory reporting purposes in 2017/18, only the satisfaction scores from the Customer Advocacy, Question 71 & the Interim PC15 Research Customer Views Survey are used. Customer Advocacy Measure (CAM) The Customer Advocacy measure will help NI Water to identify the level of overall satisfaction experienced by our customers from initial contact to resolution of their contact. The customer advocacy measure is an annual satisfaction score measured through the completion of the SIM ‘Consumer Experience Survey’ and assessment carried out by Allto, an independent market research company. Allto carry out quarterly surveys (Waves) of customers who have contacted the company for any reason. The score for the answer to survey question 71 (“Likelihood of recommending Northern Ireland Water 1-10?”) is the customer advocacy score. The Consumer Experience Survey (SIM) is based on a sample of 800 consumers that have had direct contact with the company to request a service or make a complaint. The sample will be split into a minimum of 200 consumers per Quarter and carried out four times a year. Allto will issue an email on the Monday after the designated 'un-notified' week requesting the previous week's data. The data set should include 'Resolved and Unresolved' contacts only (from telephone and written channels) in relation to both billing and operational areas. This data is then supplied to Allto and is password protected for data protection purposes. Data is provided based on an Excel spreadsheet containing the following fields:
Telephone Number; Date of contact (date call made to NIW);
The score is calculated using Net Promoter Score methodology based on results from the following statement; if people could choose their water company how likely would you be to recommend your water company to a friend or colleague where 1 is ‘not at all likely to recommend‘ and 10 is ‘extremely likely to recommend’. NIW achieved an overall score of 31 for the reporting year 17/18.

Annual Information Return 2018 Section 4 CRA Page 3 of 4
Interim PC15 Customer Views Research (in place of Omnibus) NI Water sought to commission a research study to confirm if the customer priorities in relation to the services provided by NI Water remain valid or if there are any significant changes to be considered at midpoint of PC15 period (31st March 2018). Following a formal tendering process Kantar Millward Brown was commissioned in June 2017 by Northern Ireland Water to carry out research to assess current views relating to water services. 1,000+ domestic consumers and 250 non-domestic consumers throughout Northern Ireland participated in this research programme. Research was conducted amongst both Northern Ireland consumers and businesses. The methodology consisted of the following elements: Domestic customer research
Ad hoc survey amongst 1026 households. Non-domestic customer research
Ad hoc survey conducted amongst 250 businesses. This replaced the Omnibus Survey, however Question 1 & Question 2 from the Omnibus Survey where included within the piece. Service Incentive Mechanism (SIM) We measure the SIM score via Question 60, which asks the customer to rate their ‘Level of Satisfaction taking everything into account.’ Like the Customer Advocacy measure, Question 60 is also within the Consumer Experience Survey (SIM), which is based on a sample of 800 consumers that have had direct contact with the company to request a service or make a complaint. The sample will be split into a minimum of 200 consumers per Quarter and carried out four times a year. Allto will issue an email on the Monday after the designated 'un-notified' week requesting the previous week's data. The data set should include 'Resolved and Unresolved' contacts only (from telephone and written channels) in relation to both billing and operational areas. This data is then supplied to Allto and is password protected for data protection purposes. Data is provided based on an Excel spreadsheet containing the following fields:
Telephone Number;

Annual Information Return 2018 Section 4 CRA Page 4 of 4
Date of contact (date call made to NIW);
Development of new measures Customer Services has been working extensively on providing an improved customer experience. Under the auspices of the Customer Engagement Oversight Group (CEOG), Customer Services has been actively engaging with NIAUR, CCNI and DRD to develop a range of new quantitative and qualitative customer measures which are most relevant to us and our customers, including the merits (or otherwise) of the current (OPA/DG) regulatory measures.
These new measures include the development of targets and methodologies for: Reducing unwanted contacts, Resolving customer queries at first point of contact (FPOCR), industry trends show
that Customer Satisfaction increases in line with FPOCR increase, Reducing repeat contacts, by analysing and understanding the reasons for these
contacts, and Developing a solution to obtain more meaningful and timely customer satisfaction
feedback to highlight, as close to real time as possible, those areas and activities,which cause dissatisfaction for customers.
The measures above were trialled and reported on for the first time in AIR16.
The customer satisfaction measure has been further developed through the implementation of Voice of the Customer (supported by Watermelon), which will eventually replace the current Allto Survey. This survey will allow us to significantly increase the sampling of customer satisfaction above the current 800 per annum (possibly around 10,000 per annum). It is expected that Voice of the Customer data will be used for AIR 19.
CEOG is currently working on the development of PC21 Customer Research in support of the above.
Copyright © 2022 FDOKUMEN