Annual and Sustainability Report 2021
148
Annual and Sustainability Report 2021 Essity Aktiebolag (publ) Under the JOBST brand, we offer compression therapy solutions that enable people with venous or lymphatic conditions to live the life they want without compromise.
-
Upload
khangminh22 -
Category
Documents
-
view
0 -
download
0
Transcript of Annual and Sustainability Report 2021

Annual and Sustainability Report 2021
Essity Aktiebolag (publ)
Under the JOBST brand, we offer compression therapy solutions that
enable people with venous or lymphatic conditions to live the life they want
without compromise.
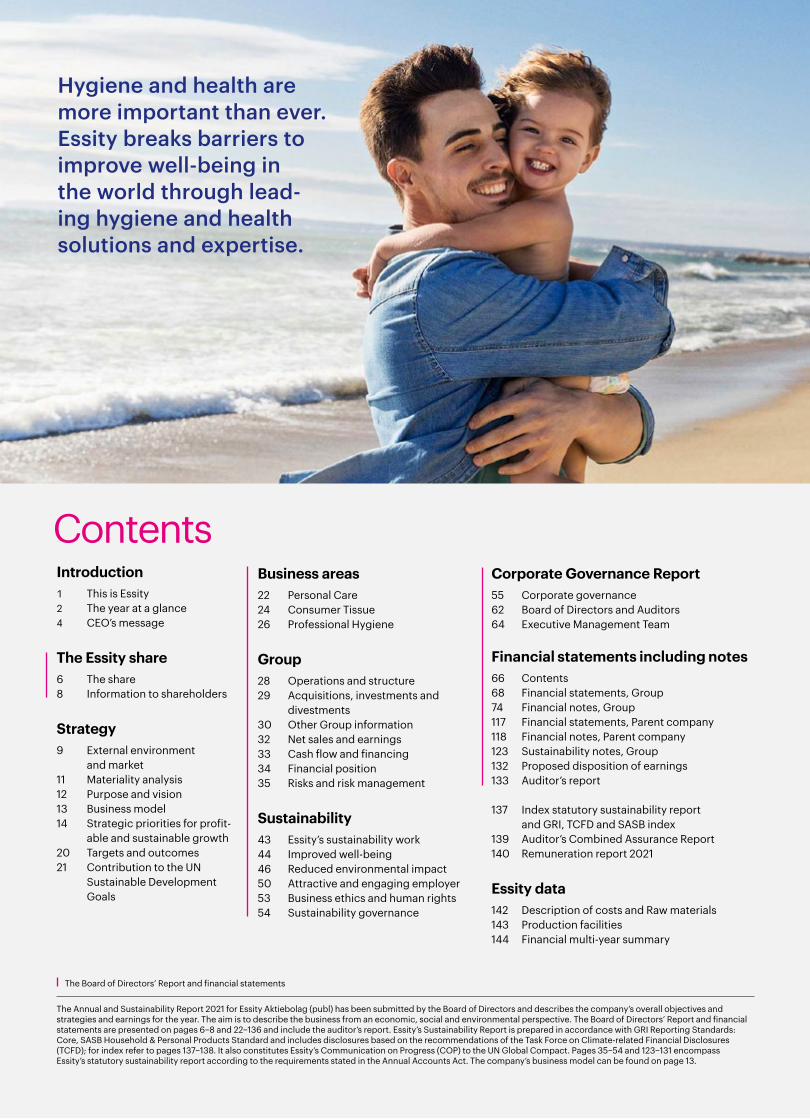
Contents
The Annual and Sustainability Report 2021 for Essity Aktiebolag (publ) has been submitted by the Board of Directors and describes the company’s overall objectives and strategies and earnings for the year. The aim is to describe the business from an economic, social and environmental perspective. The Board of Directors’ Report and financial statements are presented on pages 6–8 and 22–136 and include the auditor’s report. Essity’s Sustainability Report is prepared in accordance with GRI Reporting Standards: Core, SASB Household & Personal Products Standard and includes disclosures based on the recommendations of the Task Force on Climate-related Financial Disclosures (TCFD); for index refer to pages 137–138. It also constitutes Essity’s Communication on Progress (COP) to the UN Global Compact. Pages 35–54 and 123–131 encompass Essity’s statutory sustainability report according to the requirements stated in the Annual Accounts Act. The company’s business model can be found on page 13.
The Board of Directors’ Report and financial statements
Introduction1 This is Essity2 The year at a glance4 CEO’s message
The Essity share6 The share8 Information to shareholders
Strategy9 External environment and market11 Materiality analysis12 Purpose and vision13 Business model14 Strategic priorities for profit-
able and sustainable growth20 Targets and outcomes21 Contribution to the UN
Sustainable Development Goals
Business areas22 Personal Care24 Consumer Tissue26 Professional Hygiene
Group28 Operations and structure 29 Acquisitions, investments and
divestments30 Other Group information32 Net sales and earnings 33 Cash flow and financing34 Financial position35 Risks and risk management
Sustainability43 Essity’s sustainability work44 Improved well-being46 Reduced environmental impact50 Attractive and engaging employer53 Business ethics and human rights54 Sustainability governance
Corporate Governance Report55 Corporate governance62 Board of Directors and Auditors64 Executive Management Team
Financial statements including notes66 Contents68 Financial statements, Group74 Financial notes, Group117 Financial statements, Parent company118 Financial notes, Parent company123 Sustainability notes, Group 132 Proposed disposition of earnings 133 Auditor’s report
137 Index statutory sustainability report and GRI, TCFD and SASB index139 Auditor’s Combined Assurance Report140 Remuneration report 2021
Essity data 142 Description of costs and Raw materials143 Production facilities 144 Financial multi-year summary
Hygiene and health are more important than ever. Essity breaks barriers to improve well-being in the world through lead-ing hygiene and health solutions and expertise.

Essity is a leading global hygiene and health company that is breaking barriers to well-being. The company is listed on Nasdaq Stockholm. Sales are conducted in approximately 150 countries
under the leading global brands TENA and Tork, and other strong brands, such as JOBST, Leukoplast, Libero, Libresse, Lotus, Nosotras, Saba, Tempo, Vinda and Zewa.
Essity is active in an expanding market where favorable trends such as longer life expectancy, higher living standards and greater awareness of the importance of hygiene and health support future growth. Essity is growing its presence in emerging markets.
Successful innovations, digital transformation, strong growth in e-commerce, a leading sustain-ability work and efficiency improvements contribute to increased customer and consumer value and profitable growth.
Essity is continuing its transformation through growth, both organically and through acquisitions, within the categories and adjacent product areas with the highest profitability.
By leading in sustainability and by valuing diversity, equity and inclusion, Essity gains competitive advantages and increases value for customers, consumers, employees, society and shareholders.
Personal Care Personal Care includes the Incontinence Products, Medical Solutions, Baby Care and Feminine Care categories. The offering includes incon-tinence products, baby diapers, pads, panty liners, tampons, washable absorbent underwear, reusable menstrual cups, wet wipes, skincare products and digital solutions with sensor technology, as well as prod-ucts and services in wound care, compression therapy and orthopedics.
Consumer Tissue Consumer Tissue includes toilet paper, household towels, handkerchiefs, facial tissues, wet wipes, napkins and face masks.
Professional Hygiene Professional Hygiene includes complete hygiene solutions, including toilet paper, paper hand towels, napkins, microfiber cloths, cleaning and wiping products, soap, lotion, sanitizer, dispensers, face masks and digital solutions, such as sensor technology that enables data-driven cleaning.
Business areas
This is Essity
1Essity’s Annual and Sustainability Report 2021 Introduction
Introduction The Essity share
Strategy Business areas SustainabilityGroup Corporate Governance Report
Financial statementsincluding notes
Essity data
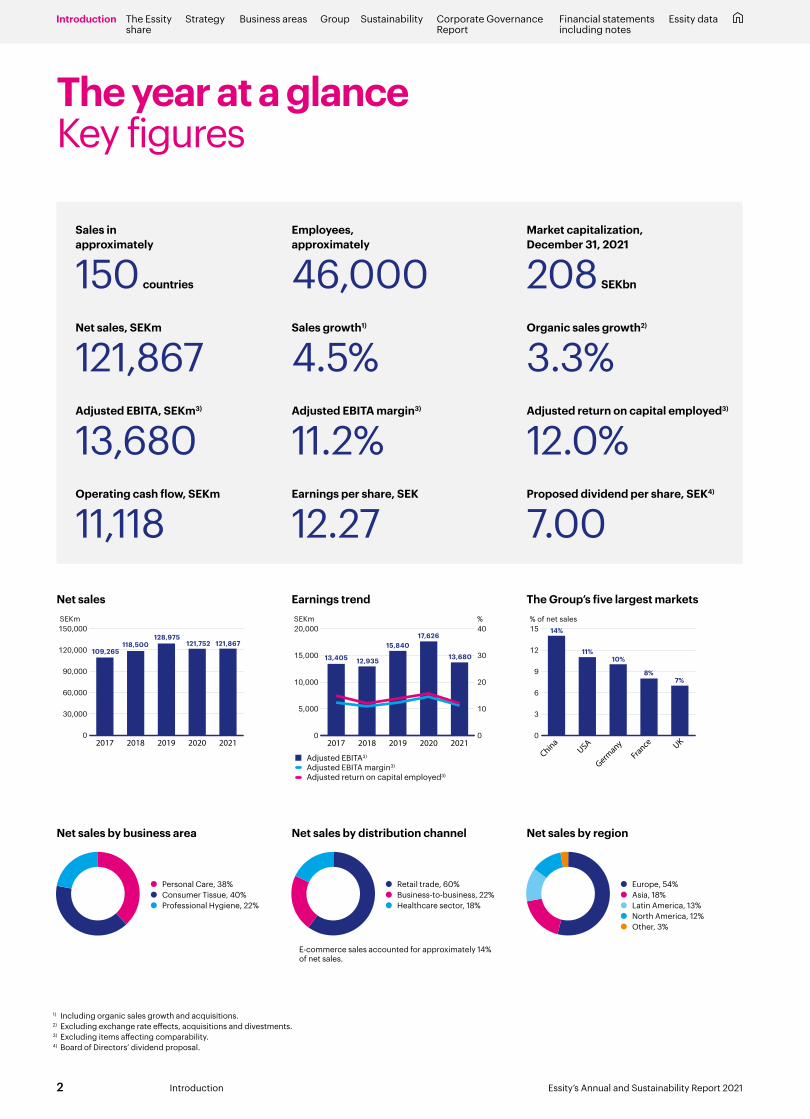
The year at a glanceKey figures
Net sales by business area
38+40+22G Personal Care, 38% Consumer Tissue, 40% Professional Hygiene, 22%
Net sales by region
54+18+13+12+3G Europe, 54% Asia, 18% Latin America, 13% North America, 12% Other, 3%
1) Including organic sales growth and acquisitions.2) Excluding exchange rate effects, acquisitions and divestments.3) Excluding items affecting comparability.4) Board of Directors’ dividend proposal.
Net sales by distribution channel
60+22+18G Retail trade, 60% Business-to-business, 22% Healthcare sector, 18%
E-commerce sales accounted for approximately 14% of net sales.
0
30,000
60,000
90,000
120,000
150,000
20212020201920182017
SEKm
109,265118,500
128,975121,752 121,867
Net sales
0
5,000
10,000
15,000
20,000
20212020201920182017
SEKm %
0
10
20
30
40
13,405 12,935
15,84017,626
13,680
Adjusted EBITA3)
Adjusted EBITA margin3)
Adjusted return on capital employed3)
Earnings trend
0
3
6
9
12
15
China
USA
Germany
France UK
14%
11%10%
8%7%
% of net sales
The Group’s five largest markets
Sales in approximately
150 countries
Employees, approximately
46,000Market capitalization, December 31, 2021
208 SEKbn
Net sales, SEKm
121,867Sales growth1)
4.5% Organic sales growth2)
3.3%Adjusted EBITA, SEKm3)
13,680Adjusted EBITA margin3)
11.2%Adjusted return on capital employed3)
12.0%Operating cash flow, SEKm
11,118Earnings per share, SEK
12.27Proposed dividend per share, SEK4)
7.00
2 Essity’s Annual and Sustainability Report 2021Introduction
Introduction The Essity share
Strategy Business areas SustainabilityGroup Corporate Governance Report
Financial statementsincluding notes
Essity data

The year at a glanceKey events
Six acquisitionsSix acquisitions were carried out during the year, which included the Australian hygiene company Asaleo Care and an increase of 45.8% in the shareholding to 95.8% in the Latin American hygiene com-pany Familia. In Medical Solutions, Essity strengthened its presence in advanced wound care and orthopedics in the USA through the acquisitions of Hydrofera as well as AquaCast Liner and the sports tape brands Coach, Elastikon and Zonas. In addition, we finalized the acquisition of the remaining shares in ABIGO Medical AB in advanced wound care.
Price increases and cost savingsEssity raised its prices in all business areas as a result of higher raw material, energy and distribution costs. Further efficiency improvements were achieved through the Manufacturing Roadmap program. Continuous cost savings during the year amounted to SEK 698m.
More reusable productsEssity has expanded its range of reusable products in, for example, Incontinence Products and Feminine Care through the launch of washable absorbent underwear under TENA Silhouette and TENA for Men and under the Libresse, Nana and Bodyform brands. The Libresse® V-Cup menstrual cup was also launched and in Professional Hygiene the Tork microfiber cloths.
New sales growth targetEssity has a new sales growth target of more than 5%, which includes both organic sales growth and acquisitions. This replaces the previous target of organic sales growth of more than 3%.
Increased e-commerce sales and higher market sharesE-commerce sales increased organically by 15.9% to about 14% of net sales. Market shares increased for approximately 70% of branded sales in the retail trade. Market shares also grew in the healthcare sector and the Professional Hygiene business.
Digital solutionsSeveral digital solutions were launched during the year. These included the TENA
Family Care App, which facilitates care of family members in the home, and Cutimed Wound Navigator, a digital wound man-agement solution. More customers are seeing the advantages of Tork Vision Cleaning, which enables cleaners to use real-time data to ensure good hygiene in professional environments.
Preparations for new division in Consumer TissueIn the Consumer Tissue business area, Essity has begun work to create the new Consumer Tissue Private Label Europe division. Approximately 1,900 employees and seven production facilities in Belgium, France, Italy and Germany will be included in the new division.
Net-zero emissions of greenhouse gases by 2050New and updated sustainability targets were adopted, including a commitment to reach net-zero greenhouse gas emissions by 2050. This includes raising the ambition level of the company’s current Science Based Targets. Other updated targets include sustainable innovations, occupa-tional safety and responsible sourcing.
Production with less climate impactSeveral new methods to achieve pro-duction free from emissions of fossil greenhouse gases were launched during the year. In Mainz-Kostheim, Germany, a pilot project was initiated with hydrogen from renewable sources, and in Lilla Edet, Sweden, natural gas is being replaced with biogas. In Kawerau, New Zealand, the drying process is using geothermal steam.
Production based on pulp from wheat straw was launched in Mannheim, Germany. The pulp produced will have lower carbon emis-sions, use less water and energy as well as fewer chemicals.
Included in CDP’s A ListThe global non-profit environmental organization CDP once again recognized Essity’s sustainability leadership. Essity was awarded a place on CDP’s A List for its work in combating deforestation, and was also recognized for its leadership in relation to climate change.
Leader in diversity workIn the UK business daily Financial Times’ annual ranking of diversity work in the business sector in 15 European countries, Essity was named “Diversity Leader” and was ranked 25th out of 15,000 companies. During the year, Essity presented new ambitions for diversity, equity and inclusion and a new Group target.
Cooperation on deforestation and biodiversityThrough the Consumer Goods Forum and its Forest Positive Coalition of Action, Essity is working together with other companies and organizations to address deforestation and promote biodiversity.
New business areas from January 1, 2022 Essity has decided on new business areas from January 1, 2022. The new business areas are Health & Medical, Consumer Goods and Professional Hygiene.
The TOM Organic brand is part of Essity’s offering in Feminine Care following the acquisition of Asaleo Care.
3Essity’s Annual and Sustainability Report 2021 Introduction
Introduction The Essity share
Strategy Business areas SustainabilityGroup Corporate Governance Report
Financial statementsincluding notes
Essity data

CEO’s message
Strong sales growth and focus on price increasesSales growth was strong during the year and net sales amounted to approximately SEK 122bn. The constant drive of our employees to change and do things better every day has helped to positively impact hygiene and health standards around the world and has strengthened Essity for the future. We continued to capture market shares and reported strong e-commerce growth. Six acquisitions were completed, of which four in Medical Solutions, one of our most profitable categories. In parallel, 2021 entailed significant challenges in our operating environment, which we addressed through strong actions. We implemented price increases and further price increases will be implemented in 2022 to offset the strong cost inflation.
Strong sales growthSales growth, including organic sales growth and acquisitions, was 4.5%, of which organic sales growth amounted to 3.3%. Net sales amounted to approximately SEK 122bn. All business areas demon-strated organic sales growth. Medical Solutions and Feminine Care had strong organic sales growth of 10.8% and 10.0%, respectively. Sales were negatively impacted by the COVID-19 pandemic and the related lockdowns and restrictions, primarily within Profes-sional Hygiene. At the same time, our hygiene and health solutions are more important than ever, and we see a rapid increase in sales when societies re-open and restrictions are lifted.
Earnings of SEK 13.7bn and higher dividendDue to the significant cost inflation, primarily for raw materials, energy and distribution, adjusted EBITA fell 22% to SEK 13,680m and the adjusted EBITA margin was 11.2%. We implemented price increases in all business areas and further increases will be imple-mented in 2022 to offset the strong cost inflation. We delivered higher volumes, a better mix and efficiency improvements that offset some of the cost inflation. The adjusted return on capital employed was 12.0%. Earnings per share were SEK 12.27. The Board of Directors proposes an 4% increase in the dividend to SEK 7.00 per share for the 2021 fiscal year.
Value-creating acquisitionsWe had a high acquisition pace. Six acquisitions were completed during the year. We now own 100% of the Australian hygiene com - pany Asaleo Care and we have increased our shareholding by 45.8% to 95.8% in the Latin American hygiene company Familia.
In Medical Solutions, we strengthened our presence in advanced wound care and orthopedics in the USA through the acquisitions of Hydrofera as well as AquaCast Liner and the sports tape brands Coach, Elastikon and Zonas. In addition, we finalized the acqui-sition of the remaining shares in ABIGO Medical AB in advanced wound care.
Higher market shares, increased e-commerce and innovationSuccessful product launches, appreciated brands and a leading position in e-commerce have helped us to increase our market shares for approximately 70% of branded sales in the retail trade. We also grew our market shares in the healthcare sector and in our Professional Hygiene operations.
E-commerce sales increased sharply during the year to approximately SEK 17bn, corresponding to about 14% of net sales.
During the year, we launched innovations with a focus on greater well-being, sustainability and digitalization under leading brands such as TENA, Tork, JOBST, Leukoplast, Libero, Libresse, Plenty, Saba, Tempo and Zewa. Demand for sustainable solutions and the willingness to pay more for these is increasing among customers and consumers. Our launches of reusable products with a lower environmental impact, such as washable absorbent underwear, were a success. We also launched a number of digital solutions during the year to improve everyday life for customers and consumers, such as Cutimed Wound Navigator, a digital solution for wound care.
Profitable growth in Asia, Latin America and Eastern EuropeWe are growing in emerging markets where market penetration of hygiene and health solutions is significantly lower than in mature markets. Growth is prioritized in markets where Essity already holds strong market positions, such as Asia, Latin America and Eastern Europe. Emerging markets’ share of Essity’s net sales and profitability has risen over time, supported by favorable mar-ket trends, a higher share of premium products, strong brands and broadening of our offerings. In 2021, emerging markets accounted for 38% of net sales and organic sales growth was 8.8%.
Sustainability, a competitive advantage Sustainability is a strategic priority for long-term profitable growth. Our initiatives contribute to a better environment while increasing Essity’s competitiveness.
During the year, we raised our ambitions and have, for example, committed to achieving net-zero emissions of greenhouse gases by 2050. The most important areas have been identified and a plan for target fulfillment drawn up for Science Based Targets 2030 and net-zero emissions by 2050. Actions will be taken throughout the value chain, from raw materials, production and distribution to used products. Fossil fuel is being replaced at
» Further price increases will be implemented in 2022 to offset the strong cost inflation.«
4 Essity’s Annual and Sustainability Report 2021Introduction
Introduction The Essity share
Strategy Business areas SustainabilityGroup Corporate Governance Report
Financial statementsincluding notes
Essity data
several of Essity’s production facilities with, for example, hydro-gen from renewable sources, biogas and geothermal steam, which have a lower environmental impact. Between 2016 and 2021, we reduced our carbon emissions under Science Based Targets, Scope 1 and 2, by 15%.
We will continue to lead in sustainability and during the year, Essity was awarded a place on the global non-profit environmental organization CDP’s A List for our work in combating deforestation, and was also recognized for our leadership in relation to climate change. One of the ways Essity works to combat deforestation is through the Consumer Goods Forum and its Forest Positive Coalition of Action, in which we, together with other companies and organizations, work to address deforestation and promote biodiversity.
Diversity, equity and inclusionAs part of our corporate culture, we value and work to increase diversity, equity and inclusion as this deepens and broadens our knowledge and experiences, which benefits customers and con-sumers. A new Group target for increased diversity was presented during the year.
We have continued to follow the daily priorities we established at the start of the COVID-19 pandemic: care for our people, con-tribute to society and secure business success.
Essity is a UN Global Compact signatory and once again was a convening partner to the United Nations Foundation’s annual Global Dialogue, on how we can work together with our custom-ers to contribute to the UN Sustainable Development Goals.
Looking aheadAs of 2022, Essity’s business areas are Health & Medical, Consumer Goods and Professional Hygiene. Based on the needs of our customers and consumers, we will expand our offering and increase the service content in each business area.
In 2022, our price increases will have a further effect and as the COVID-19 pandemic becomes endemic, I look forward to the easing of restrictions and an increase in our sales.
Together with my 46,000 colleagues, we will continue to develop Essity to improve quality of life, achieve our Group targets for growth, profitability and sustainability, and deliver increased shareholder value.
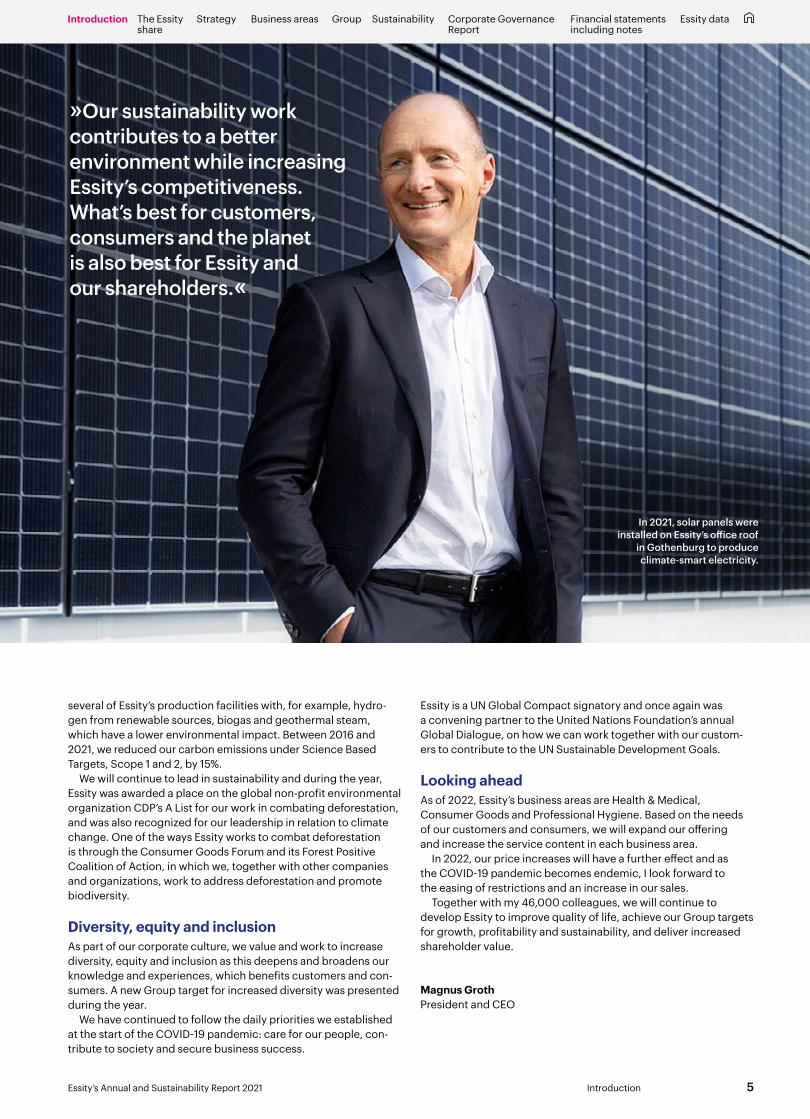
Magnus GrothPresident and CEO
»Our sustainability work contributes to a better environment while increasing Essity’s competitiveness. What’s best for customers, consumers and the planet is also best for Essity and our shareholders.«
In 2021, solar panels were installed on Essity’s office roof
in Gothenburg to produce climate-smart electricity.
5Essity’s Annual and Sustainability Report 2021 Introduction
Introduction The Essity share
Strategy Business areas SustainabilityGroup Corporate Governance Report
Financial statementsincluding notes
Essity data
The share
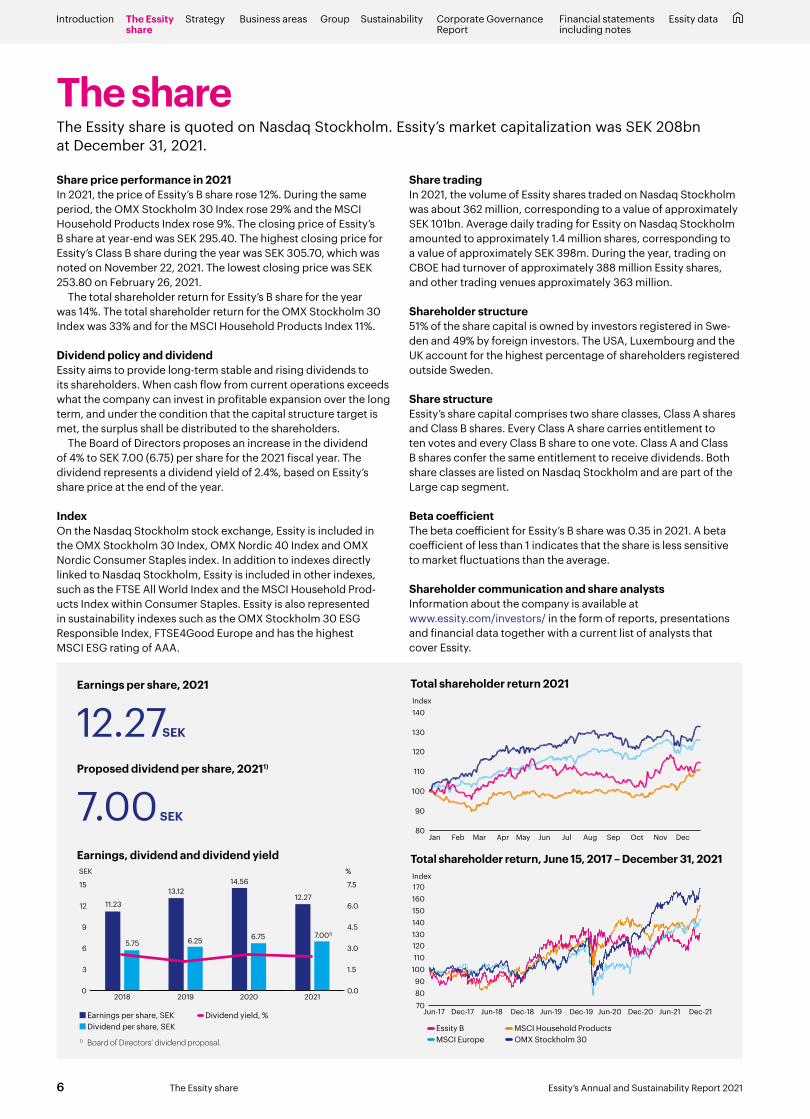
Share price performance in 2021In 2021, the price of Essity’s B share rose 12%. During the same period, the OMX Stockholm 30 Index rose 29% and the MSCI Household Products Index rose 9%. The closing price of Essity’s B share at year-end was SEK 295.40. The highest closing price for Essity’s Class B share during the year was SEK 305.70, which was noted on November 22, 2021. The lowest closing price was SEK 253.80 on February 26, 2021.
The total shareholder return for Essity’s B share for the year was 14%. The total shareholder return for the OMX Stockholm 30 Index was 33% and for the MSCI Household Products Index 11%.
Dividend policy and dividend Essity aims to provide long-term stable and rising dividends to its shareholders. When cash flow from current operations exceeds what the company can invest in profitable expansion over the long term, and under the condition that the capital structure target is met, the surplus shall be distributed to the shareholders.
The Board of Directors proposes an increase in the dividend of 4% to SEK 7.00 (6.75) per share for the 2021 fiscal year. The dividend represents a dividend yield of 2.4%, based on Essity’s share price at the end of the year.
IndexOn the Nasdaq Stockholm stock exchange, Essity is included in the OMX Stockholm 30 Index, OMX Nordic 40 Index and OMX Nordic Consumer Staples index. In addition to indexes directly linked to Nasdaq Stockholm, Essity is included in other indexes, such as the FTSE All World Index and the MSCI Household Prod-ucts Index within Consumer Staples. Essity is also represented in sustainability indexes such as the OMX Stockholm 30 ESG Responsible Index, FTSE4Good Europe and has the highest MSCI ESG rating of AAA.
Earnings, dividend and dividend yield
Essity B MSCI Europe
Total shareholder return 2021
80
90
100
110
120
130
140
DecNovOctSepAugJulJunMayAprMarFebJan
Index
Total shareholder return, June 15, 2017 – December 31, 2021
708090
100110120130140150160170
Dec-21Jun-21Dec-20Jun-20Dec-19Jun-19Dec-18Jun-18Dec-17Jun-17
Index
Earnings per share, 2021
12.27SEK Proposed dividend per share, 20211)
7.00 SEK
1) Board of Directors’ dividend proposal.
%SEK
0
3
6
9
12
15
2021202020192018
6.75 7.001)
14.5613.12
12.27
6.25
11.23
5.75
0.0
1.5
3.0
4.5
6.0
7.5
The Essity share is quoted on Nasdaq Stockholm. Essity’s market capitalization was SEK 208bn at December 31, 2021.
Share tradingIn 2021, the volume of Essity shares traded on Nasdaq Stockholm was about 362 million, corresponding to a value of approximately SEK 101bn. Average daily trading for Essity on Nasdaq Stockholm amounted to approximately 1.4 million shares, corresponding to a value of approximately SEK 398m. During the year, trading on CBOE had turnover of approximately 388 million Essity shares, and other trading venues approximately 363 million.
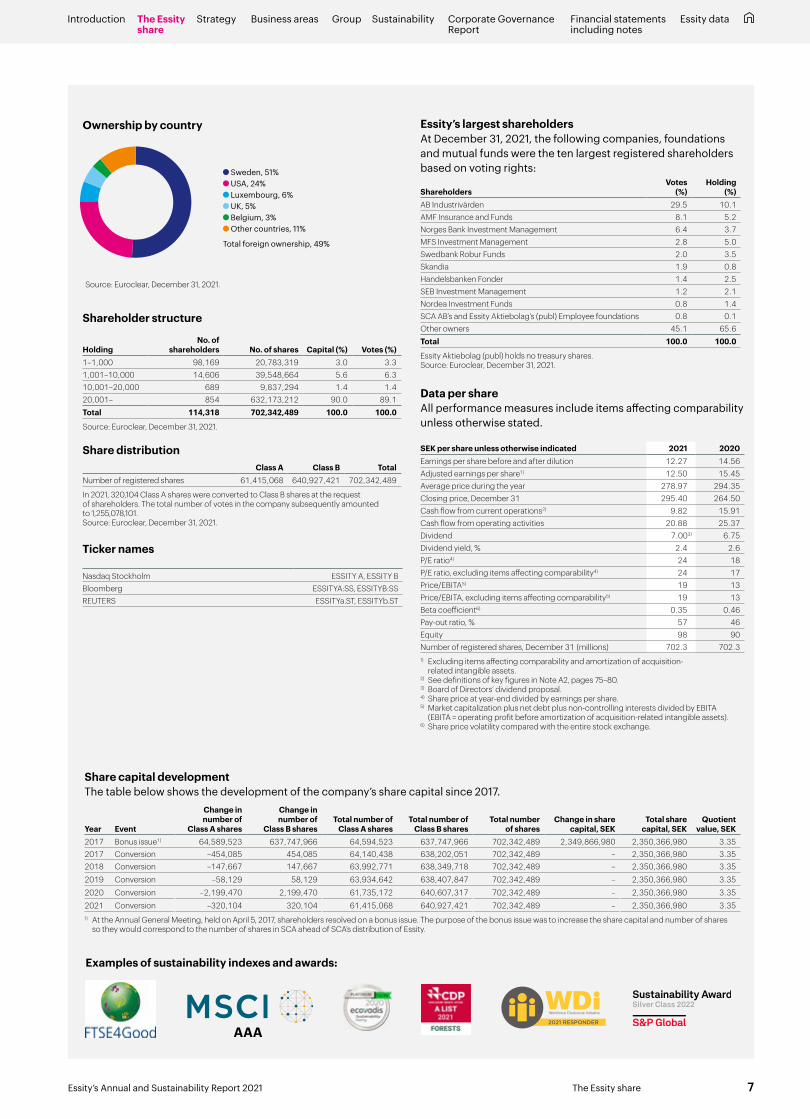
Shareholder structure51% of the share capital is owned by investors registered in Swe-den and 49% by foreign investors. The USA, Luxembourg and the UK account for the highest percentage of shareholders registered outside Sweden.
Share structureEssity’s share capital comprises two share classes, Class A shares and Class B shares. Every Class A share carries entitlement to ten votes and every Class B share to one vote. Class A and Class B shares confer the same entitlement to receive dividends. Both share classes are listed on Nasdaq Stockholm and are part of the Large cap segment.
Beta coefficientThe beta coefficient for Essity’s B share was 0.35 in 2021. A beta coefficient of less than 1 indicates that the share is less sensitive to market fluctuations than the average.
Shareholder communication and share analystsInformation about the company is available at www.essity.com/investors/ in the form of reports, presentations and financial data together with a current list of analysts that cover Essity.
MSCI Household Products OMX Stockholm 30
Earnings per share, SEK Dividend per share, SEK
Dividend yield, %
6 Essity’s Annual and Sustainability Report 2021The Essity share
Introduction The Essity share
Strategy Business areas SustainabilityGroup Corporate Governance Report
Financial statementsincluding notes
Essity data
Data per shareAll performance measures include items affecting compar ability unless otherwise stated.
SEK per share unless otherwise indicated 2021 2020Earnings per share before and after dilution 12.27 14.56Adjusted earnings per share1) 12.50 15.45Average price during the year 278.97 294.35Closing price, December 31 295.40 264.50Cash flow from current operations2) 9.82 15.91Cash flow from operating activities 20.88 25.37Dividend 7.003) 6.75 Dividend yield, % 2.4 2.6P/E ratio4) 24 18P/E ratio, excluding items affecting comparability4) 24 17Price/EBITA5) 19 13Price/EBITA, excluding items affecting comparability5) 19 13Beta coefficient6) 0.35 0.46Pay-out ratio, % 57 46Equity 98 90Number of registered shares, December 31 (millions) 702.3 702.31) Excluding items affecting comparability and amortization of acquisition-
related intangible assets.2) See definitions of key figures in Note A2, pages 75–80.3) Board of Directors’ dividend proposal.4) Share price at year-end divided by earnings per share.5) Market capitalization plus net debt plus non-controlling interests divided by EBITA
(EBITA = operating profit before amortization of acquisition-related intangible assets).6) Share price volatility compared with the entire stock exchange.
Shareholder structure
HoldingNo. of
shareholders No. of shares Capital (%) Votes (%)1–1,000 98,169 20,783,319 3.0 3.31,001–10,000 14,606 39,548,664 5.6 6.310,001–20,000 689 9,837,294 1.4 1.420,001– 854 632,173,212 90.0 89.1Total 114,318 702,342,489 100.0 100.0
Source: Euroclear, December 31, 2021.
Ticker names
Nasdaq Stockholm ESSITY A, ESSITY BBloomberg ESSITYA:SS, ESSITYB:SSREUTERS ESSITYa.ST, ESSITYb.ST
Share distributionClass A Class B Total
Number of registered shares 61,415,068 640,927,421 702,342,489
In 2021, 320,104 Class A shares were converted to Class B shares at the request of shareholders. The total number of votes in the company subsequently amounted to 1,255,078,101. Source: Euroclear, December 31, 2021.
Share capital developmentThe table below shows the development of the company’s share capital since 2017.
Year Event
Change in number of
Class A shares
Change in number of
Class B sharesTotal number of
Class A sharesTotal number of
Class B sharesTotal number
of sharesChange in share
capital, SEKTotal share
capital, SEKQuotient
value, SEK2017 Bonus issue1) 64,589,523 637,747,966 64,594,523 637,747,966 702,342,489 2,349,866,980 2,350,366,980 3.35 2017 Conversion –454,085 454,085 64,140,438 638,202,051 702,342,489 – 2,350,366,980 3.35 2018 Conversion –147,667 147,667 63,992,771 638,349,718 702,342,489 – 2,350,366,980 3.35
2019 Conversion –58,129 58,129 63,934,642 638,407,847 702,342,489 – 2,350,366,980 3.35
2020 Conversion –2,199,470 2,199,470 61,735,172 640,607,317 702,342,489 – 2,350,366,980 3.35
2021 Conversion –320,104 320,104 61,415,068 640,927,421 702,342,489 – 2,350,366,980 3.35 1) At the Annual General Meeting, held on April 5, 2017, shareholders resolved on a bonus issue. The purpose of the bonus issue was to increase the share capital and number of shares
so they would correspond to the number of shares in SCA ahead of SCA’s distribution of Essity.
Essity’s largest shareholdersAt December 31, 2021, the following companies, foundations and mutual funds were the ten largest registered shareholders based on voting rights:
ShareholdersVotes
(%)Holding
(%)AB Industrivärden 29.5 10.1 AMF Insurance and Funds 8.1 5.2 Norges Bank Investment Management 6.4 3.7 MFS Investment Management 2.8 5.0 Swedbank Robur Funds 2.0 3.5 Skandia 1.9 0.8 Handelsbanken Fonder 1.4 2.5 SEB Investment Management 1.2 2.1 Nordea Investment Funds 0.8 1.4 SCA AB’s and Essity Aktiebolag’s (publ) Employee foundations 0.8 0.1 Other owners 45.1 65.6 Total 100.0 100.0
Essity Aktiebolag (publ) holds no treasury shares.Source: Euroclear, December 31, 2021.
Sweden, 51% USA, 24% Luxembourg, 6% UK, 5% Belgium, 3% Other countries, 11%
Total foreign ownership, 49%
Source: Euroclear, December 31, 2021.
Ownership by country
Examples of sustainability indexes and awards:
AAA
51+24+6+5+3+11I
2021 RESPONDER
7Essity’s Annual and Sustainability Report 2021 The Essity share
Introduction The Essity share
Strategy Business areas SustainabilityGroup Corporate Governance Report
Financial statementsincluding notes
Essity data
Information to shareholdersAnnual General MeetingThe Annual General Meeting will take place on March 24, 2022 and will be conducted in the form of advance voting (postal voting) pursuant to the Swedish Act Temporary Exemptions to Facilitate the Execution of General Meetings, which has been proposed due to coronavirus and is expected to enter into force on March 1, 2022. Hence, shareholders will not be able to physically attend the Meeting in person or by proxy. Instead, Essity welcomes shareholders to exercise their voting rights at the Meeting by advance voting in the manner described below. Information on the resolutions passed at the Meeting will be disclosed on March 24, 2022, as soon as the outcome of the advance voting has been finally confirmed.
The notice convening the Annual General Meeting can be found on the company website www.essity.com.
Right to participateA person who wishes to participate in Essity’s Annual General Meeting by advance voting must:
• partly be listed as a shareholder in the presentation of the share register prepared by Euroclear Sweden AB concerning the circumstances on Wednesday, March 16, 2022;
• partly give notice of its intention to participate no later than Wednesday, March 23, 2022, by submitting its advance vote in accordance with the instructions under Advance voting below, so that the advance vote is received by Euroclear Sweden AB no later than that day.
For shareholders who have their shares registered through a bank or other nominee, the following applies in order to be entitled to participate in the Meeting. In addition to giving notice of partic-ipation by submitting its advance vote, such shareholder must re-register its shares in its own name so that the shareholder is listed in the presentation of the share register as of the record date Wednesday, March 16, 2022. Such re-registration may be temporary (so-called voting rights registration), and request for such voting rights registration shall be made to the nominee, in accordance with the nominee’s routines, at such a time in advance as decided by the nominee. Voting rights registrations that has been made by the nominee no later than Friday, March 18, 2022, will be taken into account in the presentation of the share register.
Advance votingShareholders can exercise their voting rights at the Annual General Meeting solely by voting in advance, so-called postal voting. A special form for advance voting must be used. The form is available on Essity’s website, www.essity.com. Submission of the form in accordance with the instructions set out below is also considered as notice of participation in the Meeting. The completed form must be received by Euroclear Sweden AB no later than Wednesday, March 23, 2022. The completed form shall be sent to Essity Aktiebo-lag (publ), “Annual General Meeting”, c/o Euroclear Sweden AB, Box 191, SE-101 23 Stockholm, Sweden. A completed form may also be submitted electronically. Electronic submission can be made either through verification with BankID in accordance with instructions at https://anmalan.vpc.se/euroclearproxy, or by sending the com-pleted form by e-mail to [email protected]. Further instructions and conditions can be found in the advance voting form.
ProxiesIf a shareholder submits its vote through a proxy, a power of attorney shall be enclosed with the form. If the shareholder is a legal entity, a registration certificate or a corresponding docu-ment for the legal entity shall be enclosed with the form. Proxy forms are available upon request and on the company’s website, www.essity.com.
Nomination Committee• Helena Stjernholm, AB Industrivärden, the Chairman
of the Nomination Committee• Anders Oscarsson, AMF and AMF Funds • Jonas Jølle, Norges Bank Investment Management• Marianne Nilsson, Swedbank Robur Funds• Pär Boman, Chairman of the Board of Essity
The Nomination Committee prepares, among other things, the proposal for election of Board members. For further information, refer to the Corporate Governance Report on pages 55–65.
DividendThe Board of Directors proposes a dividend of SEK 7.00 per share and that the record date for the dividend be Monday, March 28, 2022. Payment through Euroclear Sweden AB is expected to be made on Thursday, March 31, 2022.
Financial information 2022–2023Report Reporting period Publication dateInterim Report Jan 1–Mar 31, 2022 April 28, 2022Half-year Report Jan 1–Jun 30, 2022 July 21, 2022Interim Report Jan 1–Sep 30, 2022 October 27, 2022Year-end Report 2022 January 26, 2023Annual and Sustainability Report 2022 March 2023
Annual and sustainability reports, year-end reports, half-year reports and interim reports are published in Swedish and English (in the event of differences between the English translation and the Swedish original, the Swedish text shall prevail) and can be downloaded from Essity’s website www.essity.com.
SubscriptionsSubscription to Essity’s press releases, annual and sustainability reports, year-end reports, half-year reports and interim reports can be done by registering on the Essity website www.essity.com.
8 Essity’s Annual and Sustainability Report 2021The Essity share
Introduction The Essity share
Strategy Business areas SustainabilityGroup Corporate Governance Report
Financial statementsincluding notes
Essity data
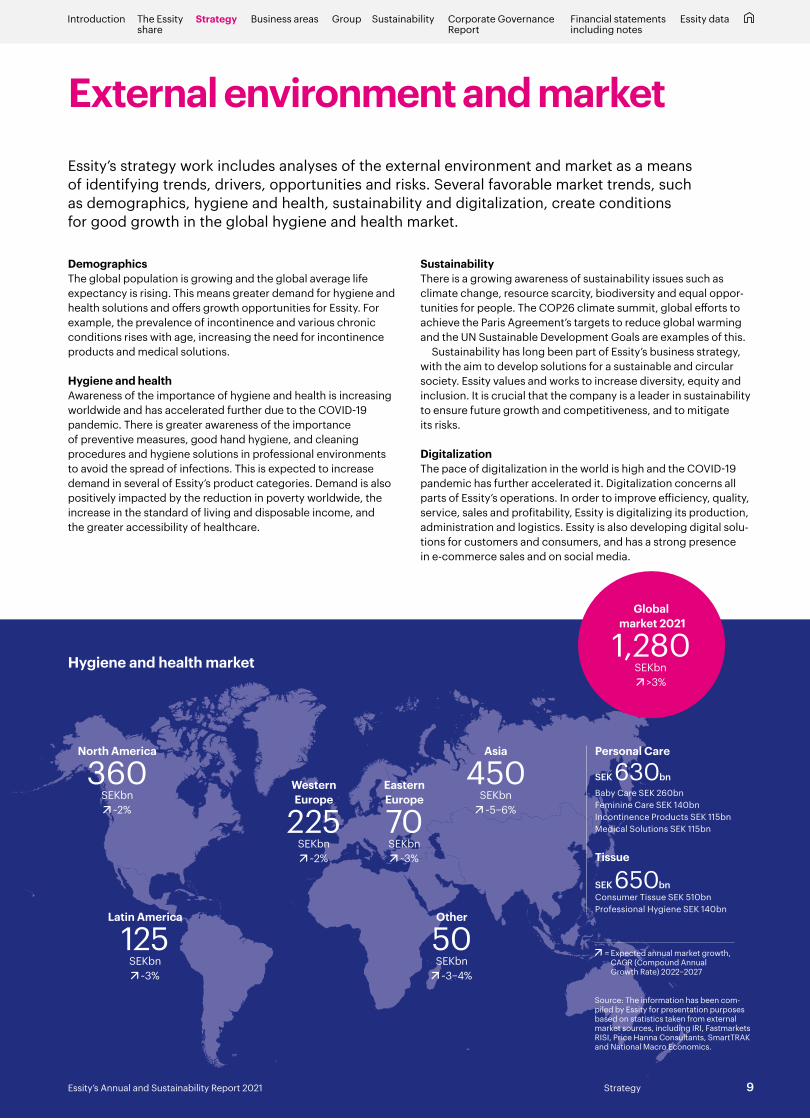
External environment and marketEssity’s strategy work includes analyses of the external environment and market as a means of identifying trends, drivers, opportunities and risks. Several favorable market trends, such as demographics, hygiene and health, sustainability and digitalization, create conditions for good growth in the global hygiene and health market.
DemographicsThe global population is growing and the global average life expectancy is rising. This means greater demand for hygiene and health solutions and offers growth opportunities for Essity. For example, the prevalence of incontinence and various chronic conditions rises with age, increasing the need for incontinence products and medical solutions.
Hygiene and health Awareness of the importance of hygiene and health is increasing worldwide and has accelerated further due to the COVID-19 pandemic. There is greater awareness of the importance of preventive measures, good hand hygiene, and cleaning procedures and hygiene solutions in professional environments to avoid the spread of infections. This is expected to increase demand in several of Essity’s product categories. Demand is also positively impacted by the reduction in poverty worldwide, the increase in the standard of living and disposable income, and the greater accessibility of healthcare.
SustainabilityThere is a growing awareness of sustainability issues such as climate change, resource scarcity, biodiversity and equal oppor-tunities for people. The COP26 climate summit, global efforts to achieve the Paris Agreement’s targets to reduce global warming and the UN Sustainable Development Goals are examples of this.
Sustainability has long been part of Essity’s business strategy, with the aim to develop solutions for a sustainable and circular society. Essity values and works to increase diversity, equity and inclusion. It is crucial that the company is a leader in sustainability to ensure future growth and competitiveness, and to mitigate its risks.
DigitalizationThe pace of digitalization in the world is high and the COVID-19 pandemic has further accelerated it. Digitalization concerns all parts of Essity’s operations. In order to improve efficiency, quality, service, sales and profitability, Essity is digitalizing its production, administration and logistics. Essity is also developing digital solu-tions for customers and consumers, and has a strong presence in e-commerce sales and on social media.
Global market 2021
1,280SEKbn
>3%
Source: The information has been com-piled by Essity for presentation purposes based on statistics taken from external market sources, including IRI, Fastmarkets RISI, Price Hanna Consultants, SmartTRAK and National Macro Economics.
Asia
450SEKbn ˜5–6%
Western Europe
225SEKbn
˜2%
Latin America
125SEKbn
˜3%
North America
360SEKbn
˜2%
Other
50SEKbn ˜3–4%
Eastern Europe
70SEKbn
˜3%
Personal Care
SEK 630bn
Baby Care SEK 260bnFeminine Care SEK 140bnIncontinence Products SEK 115bnMedical Solutions SEK 115bn
Tissue
SEK 650bn Consumer Tissue SEK 510bn Professional Hygiene SEK 140bn
= Expected annual market growth, CAGR (Compound Annual Growth Rate) 2022–2027
Hygiene and health market
Introduction The Essity share
Strategy Business areas SustainabilityGroup Corporate Governance Report
Financial statementsincluding notes
Essity data
Essity’s Annual and Sustainability Report 2021 9Strategy

Growth potential in different regions In emerging markets, market penetration of hygiene and health solutions is significantly lower than in mature markets. One exam-ple is that consumption of incontinence products in Asia is only about one fifth of that in Western Europe, and tissue consump-tion in Eastern Europe is only about one third of that in Western Europe. A number of trends are increasing demand in emerging markets, including higher living standards, urbanization and the expansion of retail trade, e-commerce and health and medical care. In emerging markets, Essity has an increased presence and many leading market positions.
Personal Care
39+23+18+9+6+5G 32+32+16+11+5+4G 34+27+22+9+4+4GProfessional HygieneConsumer Tissue
● Asia, 39%● North America, 23%● Western Europe, 18%● Latin America, 9%● Eastern Europe, 6%● Other, 5%
● North America, 32%● Asia, 32%● Western Europe, 16%● Latin America, 11%● Eastern Europe, 5%● Other, 4%
● North America, 34%● Asia, 27%● Western Europe, 22%● Latin America, 9%● Eastern Europe, 4%● Other, 4%
In 2021, the hygiene and health market in mature markets amounted to approximately SEK 670bn and in emerging markets to approximately SEK 610bn.
Incontinence ProductsNumber per person with incontinence/year
Baby CareNumber per child up to the age of 2.5/year
Feminine CareNumber per woman aged 10–54 years/year
TissueKg per capita/year
0
100
200
300
400
500
600
0
500
1,000
1,500
2,000
2,500
0
50
100
150
200
250
300
0
5
10
15
20
25
■ North America■ Western Europe■ Eastern Europe■ Latin America■ Asia
Use
Global market by region
Most of the product categories in mature markets have attained high market penetration, such as baby care and feminine care. This means growth mainly takes place through innovation and higher market shares. While market penetration in incontinence products is relatively high, it is lower in certain product segments. Favorable growth opportunities exist by raising awareness and reducing the stigma surrounding incontinence.
Essity’s market positions
Global EuropeNorth
AmericaLatin
America Asia
Incontinence Products 1 1 4 1 3
ProfessionalHygiene 1 1 2 4 3
ConsumerTissue 2 1 – 3 1
Medical Solutions 4 1 12 3 2
Baby Care 5 2 – 6 6
Feminine Care 5 3 – 1 10
Source: The information has been compiled by Essity for presentation purposes based on statistics taken from external market sources, including IRI, Fastmarkets RISI, Price Hanna Consultants, SmartTRAK and National Macro Economics.
10 Essity’s Annual and Sustainability Report 2021Strategy
Introduction The Essity share
Strategy Business areas SustainabilityGroup Corporate Governance Report
Financial statementsincluding notes
Essity data
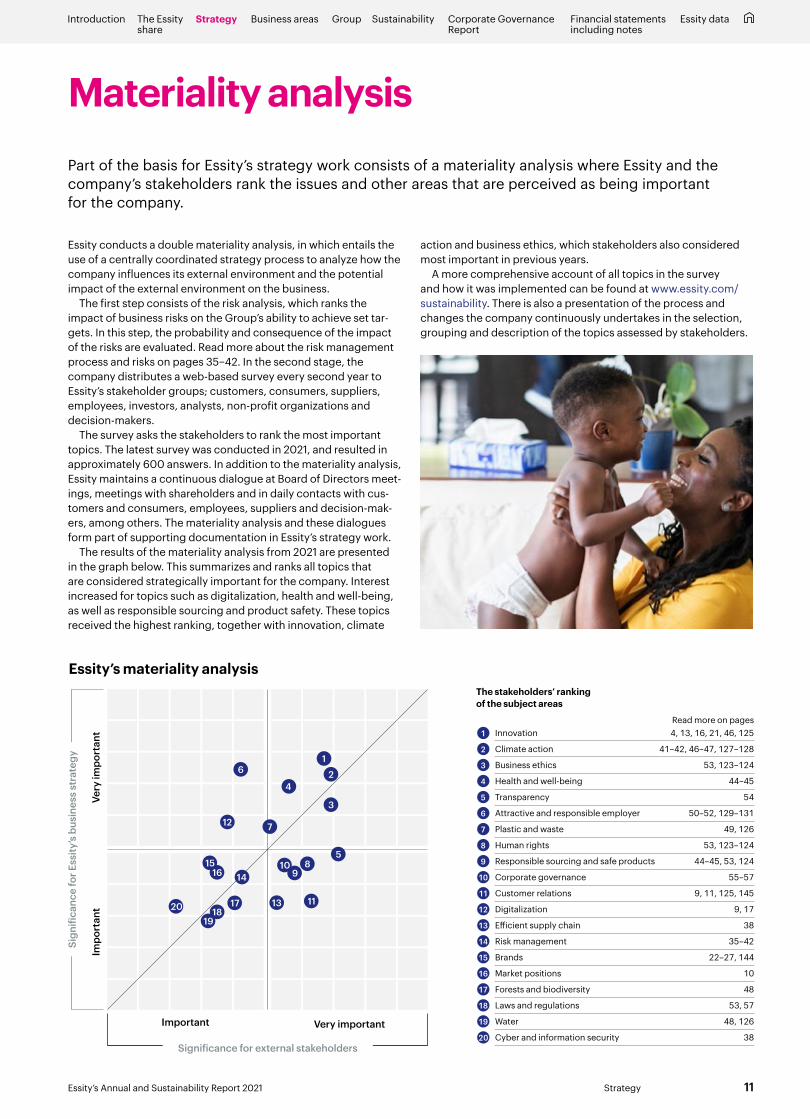
Materiality analysisPart of the basis for Essity’s strategy work consists of a materiality analysis where Essity and the company’s stakeholders rank the issues and other areas that are perceived as being important for the company.
Essity conducts a double materiality analysis, in which entails the use of a centrally coordinated strategy process to analyze how the company influences its external environment and the potential impact of the external environment on the business.
The first step consists of the risk analysis, which ranks the impact of business risks on the Group’s ability to achieve set tar-gets. In this step, the probability and consequence of the impact of the risks are evaluated. Read more about the risk management process and risks on pages 35–42. In the second stage, the company distributes a web-based survey every second year to Essity’s stakeholder groups; customers, consumers, suppliers, employees, investors, analysts, non-profit organizations and decision-makers.
The survey asks the stakeholders to rank the most important topics. The latest survey was conducted in 2021, and resulted in approximately 600 answers. In addition to the materiality analysis, Essity maintains a continuous dialogue at Board of Directors meet-ings, meetings with shareholders and in daily contacts with cus-tomers and consumers, employees, suppliers and decision-mak-ers, among others. The materiality analysis and these dialogues form part of supporting documentation in Essity’s strategy work.
The results of the materiality analysis from 2021 are presented in the graph below. This summarizes and ranks all topics that are considered strategically important for the company. Interest increased for topics such as digitalization, health and well-being, as well as responsible sourcing and product safety. These topics received the highest ranking, together with innovation, climate
action and business ethics, which stakeholders also considered most important in previous years.
A more comprehensive account of all topics in the survey and how it was implemented can be found at www.essity.com/sustainability. There is also a presentation of the process and changes the company continuously undertakes in the selection, grouping and description of the topics assessed by stakeholders.
11Essity’s Annual and Sustainability Report 2021 Strategy
Introduction The Essity share
Strategy Business areas SustainabilityGroup Corporate Governance Report
Financial statementsincluding notes
Essity data
Very
impo
rtan
tIm
port
ant
Very importantImportant
Sign
ifica
nce
for E
ssity
’s bu
sine
ss s
trat
egy
Significance for external stakeholders
Essity’s materiality analysis
Read more on pages1 Innovation 4, 13, 16, 21, 46, 125
2 Climate action 41–42, 46–47, 127–128
3 Business ethics 53, 123–124
4 Health and well-being 44–45
5 Transparency 54
6 Attractive and responsible employer 50–52, 129–131
7 Plastic and waste 49, 126
8 Human rights 53, 123–124
9 Responsible sourcing and safe products 44–45, 53, 124
10 Corporate governance 55–57
11 Customer relations 9, 11, 125, 145
12 Digitalization 9, 17
13 Efficient supply chain 38
14 Risk management 35–42
15 Brands 22–27, 144
16 Market positions 10
17 Forests and biodiversity 48
18 Laws and regulations 53, 57
19 Water 48, 126
20 Cyber and information security 38
The stakeholders’ ranking of the subject areas
2019
1817
16
11
15
12
109
6
5
4
1
2
3
7
13
814
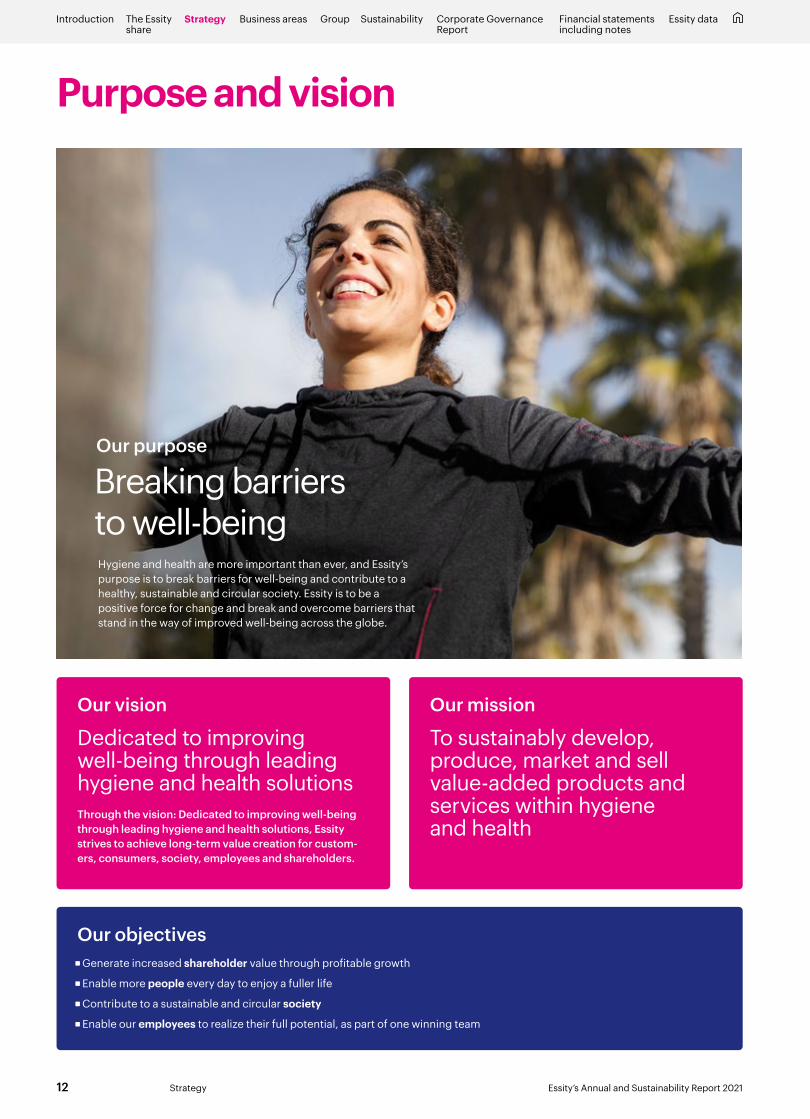
Purpose and vision
Our vision
Dedicated to improving well-being through leading hygiene and health solutionsThrough the vision: Dedicated to improving well-being through leading hygiene and health solutions, Essity strives to achieve long-term value creation for custom-ers, consumers, society, employees and shareholders.
Our mission
To sustainably develop, produce, market and sell value-added products and services within hygiene and health
Our objectives Generate increased shareholder value through profitable growth
Enable more people every day to enjoy a fuller life
Contribute to a sustainable and circular society
Enable our employees to realize their full potential, as part of one winning team
Our purpose
Breaking barriers to well-beingHygiene and health are more important than ever, and Essity’s purpose is to break barriers for well-being and contribute to a healthy, sustainable and circular society. Essity is to be a positive force for change and break and overcome barriers that stand in the way of improved well-being across the globe.
12 Essity’s Annual and Sustainability Report 2021Strategy
Introduction The Essity share
Strategy Business areas SustainabilityGroup Corporate Governance Report
Financial statementsincluding notes
Essity data

ResourcesEssity utilizes resources in the form of financial capital, where equity amounted to approximately SEK 69bn and net debt approximately SEK 55bn in 2021. Furthermore, human capital is used with approximately 46,000 employees and their expertise, skills and experience, and intellectual capital such as research and development, patents, licenses, innovation, systems and goodwill. Essity utilizes manufactured capital in the form of raw materials, facilities and infrastructure necessary for production, and relationship capital that includes Essity’s relationship with internal and external stakeholders with whom we share values, credibility and loyalty. Moreover, Essity uses natural capital in its operations, such as forest, energy and water.
Customer and consumer insightsThe starting point for Essity’s operations is customer and con-sumer insights. Through knowledge about people’s daily needs and challenges, we create an offering that improves well-being and quality of life for people every day.
Sustainable innovationsConstant innovation is crucial to steadily improve people’s hygiene, health and well-being and to contribute to a sustain-able and circular society. Essity has a global unit that works with brands, innovation and sustainability with the support of inno-vation centers in France, China, Mexico, Sweden, Germany and the USA. Research and development (R&D) costs during the year amounted to approximately SEK 1.5bn, corresponding to about 1.2% of consolidated net sales.
Responsible sourcing and sustainable manufacturingIn 2021, Essity purchased raw materials and consumables for approximately SEK 46bn. The main raw materials are pulp, recovered fiber and oil-based materials. Essity has around 90 production facilities worldwide. Work to increase efficiency at the facilities is a continuous process that includes digitalization and automation, with the aim to achieve a sustainable, efficient world-class production. Cost of goods sold amounted to approx-imately SEK 87bn, of which transport and distribution costs were approximately SEK 12bn. Essity subjects its suppliers to stringent demands and works throughout the supply chain to guarantee responsible sourcing.
Marketing and salesEssity’s marketing costs in 2021 amounted to approximately SEK 6.7bn, corresponding to 5.5% of net sales. An increasing share of marketing is conducted through digital channels. In 2021, the retail trade accounted for 60% of net sales, business-to-business for 22% and the healthcare sector for 18%.
Leading hygiene and health solutionsEssity is the global market leader in incontinence products with the TENA brand and in professional hygiene with the Tork brand. Essity also has strong brands in other product categories. More-over, Essity holds the number one or number two position within at least one product category in approximately 90 countries.
Value creation for our stakeholdersEssity generates value for shareholders through returns and divi-dends. We work to maximize shareholder value while prioritizing environmental and social issues by taking financial, environ-mental and social parameters into consideration in our business decisions. Customer and consumer value is created through our solutions by increasing well-being and improving quality of life. Value is created for employees, suppliers and society through, for example, employment, remuneration, tax, increased well-being, sustainability initiatives, and community relations.
Business model aimed at achieving profitable growth, sustainable value creation and increased well-being
Resources• Financial capital• Human capital• Intellectual capital• Manufactured
capital• Relationship
capital• Natural capital
Leading hygiene and health solutions
Marketing and sales
Responsible sourcing and sustainable manufact- uring
Sustainable innovations
Customer and consumer insights
Value creation for our stakeholders• Shareholders• Customers• Consumers• Society• Employees
Business model
13Essity’s Annual and Sustainability Report 2021 Strategy
Introduction The Essity share
Strategy Business areas SustainabilityGroup Corporate Governance Report
Financial statementsincluding notes
Essity data
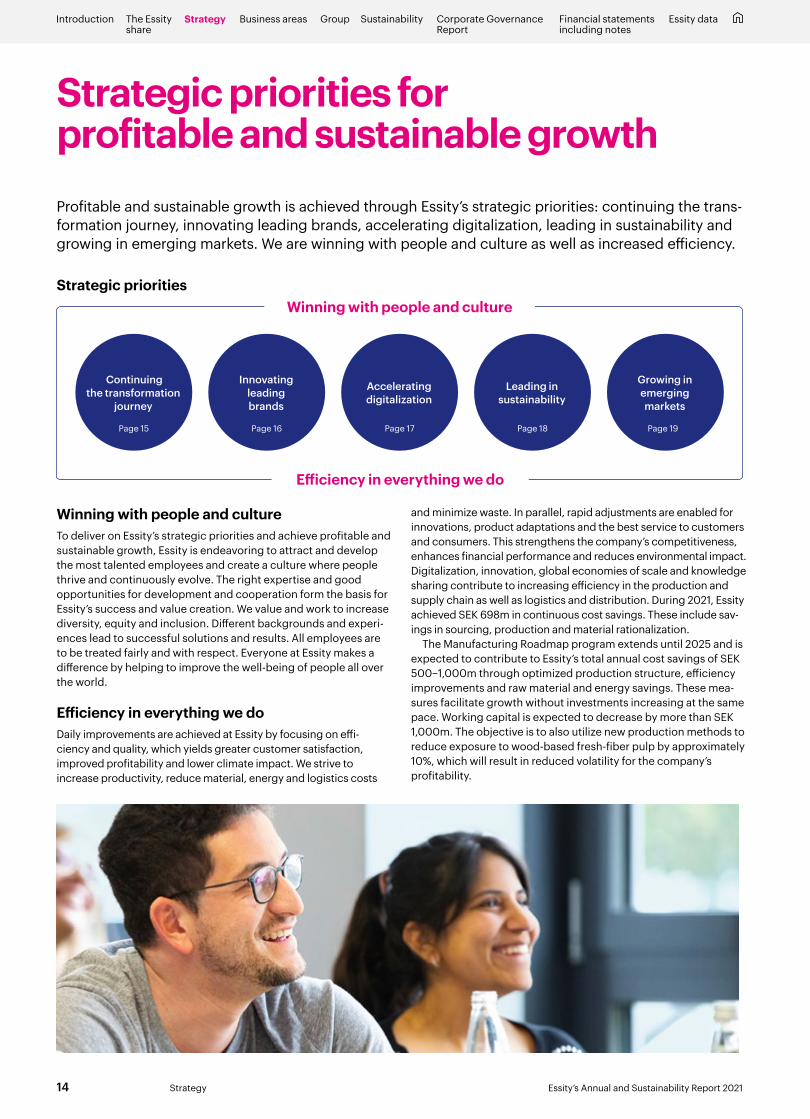
Winning with people and cultureTo deliver on Essity’s strategic priorities and achieve profitable and sustainable growth, Essity is endeavoring to attract and develop the most talented employees and create a culture where people thrive and continuously evolve. The right expertise and good opportunities for development and cooperation form the basis for Essity’s success and value creation. We value and work to increase diversity, equity and inclusion. Different backgrounds and experi-ences lead to successful solutions and results. All employees are to be treated fairly and with respect. Everyone at Essity makes a difference by helping to improve the well-being of people all over the world.
Efficiency in everything we doDaily improvements are achieved at Essity by focusing on effi-ciency and quality, which yields greater customer satisfaction, improved profitability and lower climate impact. We strive to increase productivity, reduce material, energy and logistics costs
and minimize waste. In parallel, rapid adjustments are enabled for innovations, product adaptations and the best service to customers and consumers. This strengthens the company’s competitiveness, enhances financial performance and reduces environmental impact. Digitalization, innovation, global economies of scale and knowledge sharing contribute to increasing efficiency in the production and supply chain as well as logistics and distribution. During 2021, Essity achieved SEK 698m in continuous cost savings. These include sav-ings in sourcing, production and material rationalization.
The Manufacturing Roadmap program extends until 2025 and is expected to contribute to Essity’s total annual cost savings of SEK 500–1,000m through optimized production structure, efficiency improvements and raw material and energy savings. These mea-sures facilitate growth without investments increasing at the same pace. Working capital is expected to decrease by more than SEK 1,000m. The objective is to also utilize new production methods to reduce exposure to wood-based fresh-fiber pulp by approximately 10%, which will result in reduced volatility for the company’s profitability.
Strategic priorities for profitable and sustainable growthProfitable and sustainable growth is achieved through Essity’s strategic priorities: continuing the trans- formation journey, innovating leading brands, accelerating digitalization, leading in sustainability and growing in emerging markets. We are winning with people and culture as well as increased efficiency.
Strategic priorities
Continuing the transformation
journey
Innovating leading brands
Accelerating digitalization
Leading in sustainability
Growing in emerging markets
Efficiency in everything we do
Page 16Page 15 Page 17 Page 18 Page 19
Winning with people and culture
14 Essity’s Annual and Sustainability Report 2021Strategy
Introduction The Essity share
Strategy Business areas SustainabilityGroup Corporate Governance Report
Financial statementsincluding notes
Essity data
Continuing the transformation journey
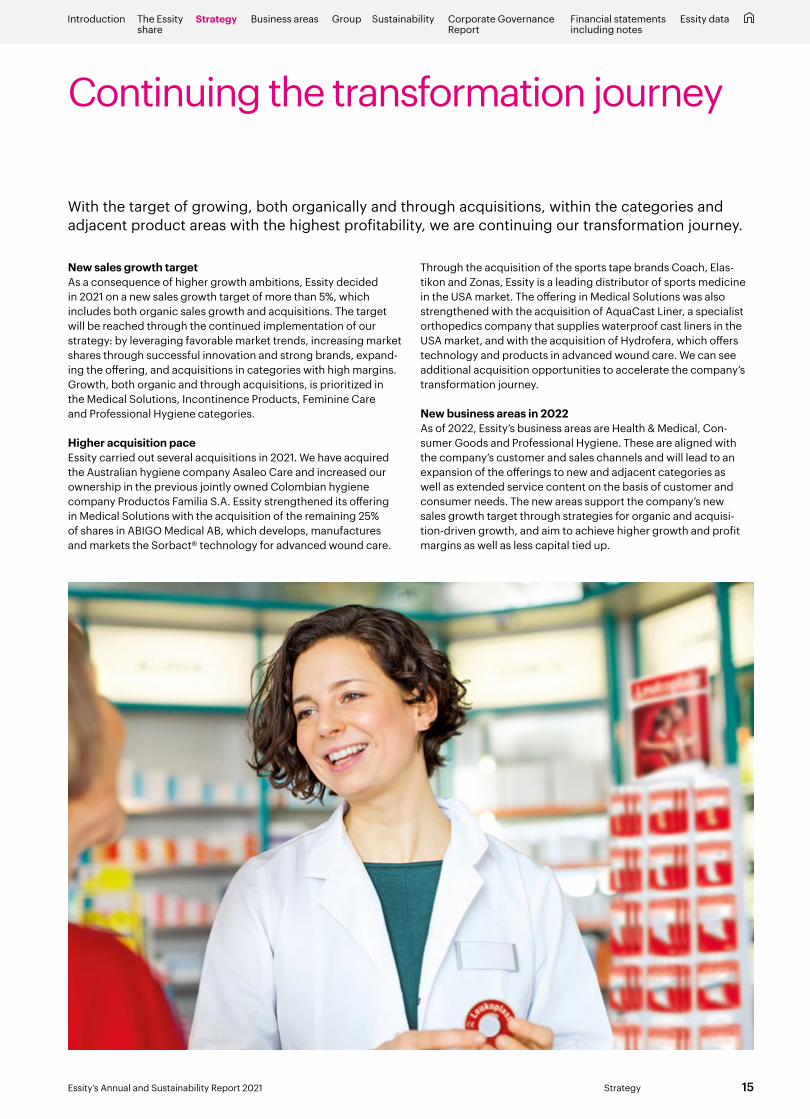
With the target of growing, both organically and through acquisitions, within the categories and adjacent product areas with the highest profitability, we are continuing our transformation journey.
New sales growth targetAs a consequence of higher growth ambitions, Essity decided in 2021 on a new sales growth target of more than 5%, which includes both organic sales growth and acquisitions. The target will be reached through the continued implementation of our strategy: by leveraging favorable market trends, increasing market shares through successful innovation and strong brands, expand-ing the offering, and acquisitions in categories with high margins. Growth, both organic and through acquisitions, is prioritized in the Medical Solutions, Incontinence Products, Feminine Care and Professional Hygiene categories.
Higher acquisition paceEssity carried out several acquisitions in 2021. We have acquired the Australian hygiene company Asaleo Care and increased our ownership in the previous jointly owned Colombian hygiene company Productos Familia S.A. Essity strengthened its offering in Medical Solutions with the acquisition of the remaining 25% of shares in ABIGO Medical AB, which develops, manufactures and markets the Sorbact® technology for advanced wound care.
Through the acquisition of the sports tape brands Coach, Elas-tikon and Zonas, Essity is a leading distributor of sports medicine in the USA market. The offering in Medical Solutions was also strengthened with the acquisition of AquaCast Liner, a specialist orthopedics company that supplies waterproof cast liners in the USA market, and with the acquisition of Hydrofera, which offers technology and products in advanced wound care. We can see additional acquisition opportunities to accelerate the company’s transformation journey.
New business areas in 2022As of 2022, Essity’s business areas are Health & Medical, Con-sumer Goods and Professional Hygiene. These are aligned with the company’s customer and sales channels and will lead to an expansion of the offerings to new and adjacent categories as well as extended service content on the basis of customer and consumer needs. The new areas support the company’s new sales growth target through strategies for organic and acquisi-tion-driven growth, and aim to achieve higher growth and profit margins as well as less capital tied up.
15Essity’s Annual and Sustainability Report 2021 Strategy
Introduction The Essity share
Strategy Business areas SustainabilityGroup Corporate Governance Report
Financial statementsincluding notes
Essity data
Innovating leading brandsSuccessful innovations and strong brands are two of Essity’s strengths and are crucial for the company’s success. Awareness of the importance of hygiene and health and also demand for sustainable solutions have increased. This has favored Essity, as during the COVID-19 pandemic we strengthened and broadened our hygiene and health offering and launched reusable products in several categories.
First choice for customers and consumersEssity’s innovations improve people’s everyday life. Our innova-tions are based on deep customer and consumer insight, which help us to develop unique and successful solutions. Over time, Essity has increased its share of branded sales that demonstrate “Product Superiority”, meaning the first choice for customers and consumers, and further strengthened our leading brands. One example is how Essity has used innovation to grow branded sales and the number of premium products in Consumer Tissue, thereby improving structural profitability and value creation in this product category.
More sustainable solutionsDuring the COVID-19 pandemic, Essity has continued to maintain a high rate of innovation in pace with the increased awareness of hygiene and health. Customers and consumers are more inter-ested in making sustainable choices and also paying a premium for these. In Incontinence Products and Feminine Care, washable absorbent underwear has been launched under brands including TENA Silhouette, TENA for Men, Bodyform, Libresse, Nana and Saba. The underwear offers the user a more sustainable alterna-
tive to disposable products. Essity has also launched Libresse® V-Cup in Feminine Care, a reusable menstrual cup. In Professional Hygiene, Tork reusable microfiber cloths were launched during the year.
Stronger market positions Essity holds the number one or number two position in approxi-mately 90% of the company’s brand positions. In 2021, our market shares increased further for approximately 70% of branded sales in the retail trade. Essity also grew its market shares in the health-care sector and in our Professional Hygiene operations. This is a result of our continued investment in innovation, high delivery reliability and high service levels, as well as strong presence within e-commerce during the COVID-19 pandemic. Moreover, our brands are strengthened through Essity’s marketing campaigns with a clear purpose to break barriers and build self-esteem. Effectively reaching and following our customers and consumers through digital channels increases the value of the investments. Together with product innovation, this creates reliable and winning brands.
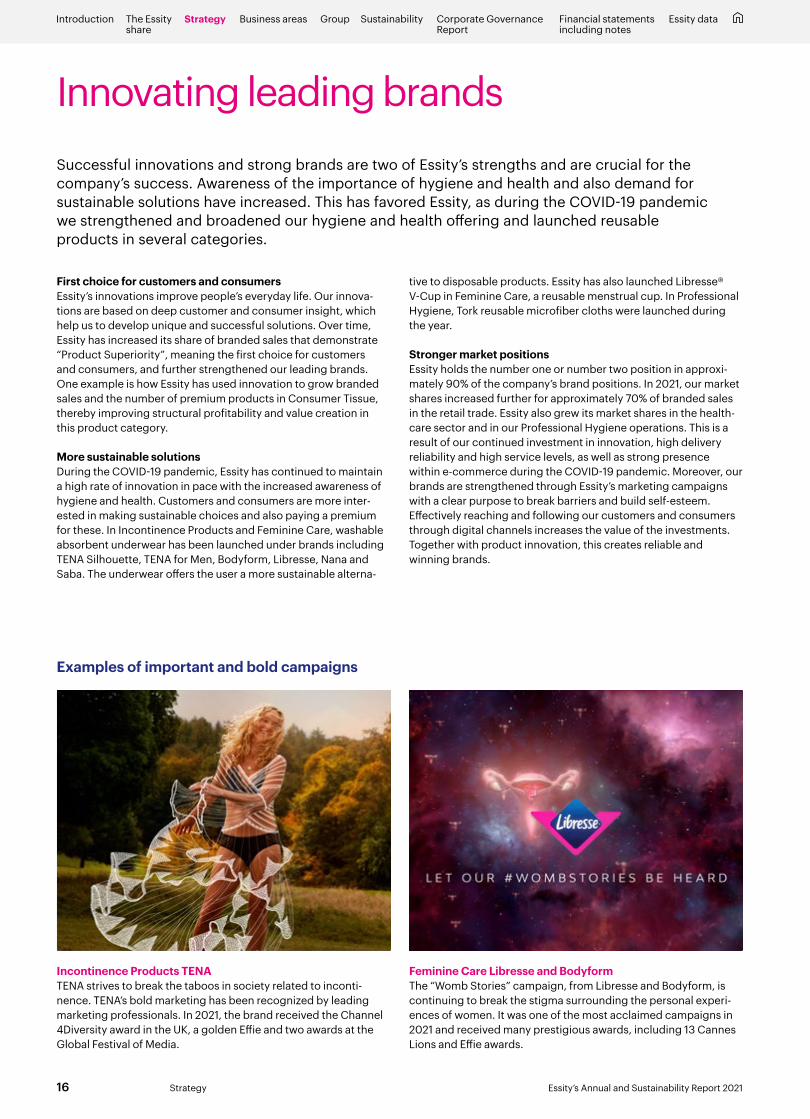
Incontinence Products TENATENA strives to break the taboos in society related to inconti-nence. TENA’s bold marketing has been recognized by leading marketing professionals. In 2021, the brand received the Channel 4Diversity award in the UK, a golden Effie and two awards at the Global Festival of Media.
Feminine Care Libresse and BodyformThe “Womb Stories” campaign, from Libresse and Bodyform, is continuing to break the stigma surrounding the personal experi-ences of women. It was one of the most acclaimed campaigns in 2021 and received many prestigious awards, including 13 Cannes Lions and Effie awards.
Examples of important and bold campaigns
16 Essity’s Annual and Sustainability Report 2021Strategy
Introduction The Essity share
Strategy Business areas SustainabilityGroup Corporate Governance Report
Financial statementsincluding notes
Essity data

Accelerating digitalizationThe aim of Essity’s digital strategy is to increase sales growth and efficiency. The strategy is based on four development areas: how we interact with customers and consumers, digital solutions and business models, efficiency improvements across the entire business, and building digital expertise in the organization.
Effective communicationThrough digital interaction with customers and consumers, we gain a better understanding of their needs, challenges and expec-tations. This helps us to develop the best solutions, campaigns and selling techniques. Digital channels are frequently used in marketing campaigns to reach the desired target audience and measure outcomes to maximize results.
Expanding e-commerce In 2021, Essity’s e-commerce sales grew 15.9% and amounted to approximately 14% of the company’s net sales. E-commerce sales take place via retailer websites, e-tailers and distributors that sell our offering. We also develop our own sales directly to consumers. Our leading TENA brand has its own online stores that offer infor-mation about incontinence and the available solutions, and allow consumers to order home delivery of products.
The rise in e-commerce sales also offers higher profitability with a better product mix as a result of increased sales of premium products and own brands.
Digital solutionsNew technology creates opportunities to deliver digital solu-tions that simplify and improve everyday life for customers and consumers. One of Essity’s digital solutions is the TENA Family Care App, which makes life easier for people who care for family members in the home, and TENA Bladder Sensor, a wearable ultra-
sound sensor that measures levels in the bladder and sends a notification when it is time to visit the bathroom. During the year, the Cutimed Wound Navigator was also launched, a digital wound management solution. The innovative mobile app registers the size and other properties of the wound. An assessment is carried out based on this data to offer the patient the most suitable care and wound care product. As a result of the COVID-19 pandemic, more of Essity’s customers want to ensure good hygiene in professional environments. Tork Vision Cleaning is one example of the development of Tork EasyCube, which makes it possible to use real-time data to ensure that professional environments and toilets are clean and that dispensers of paper, soap and hand sanitizer are filled.
Internal improvements Digitalization is also optimizing and improving Essity’s internal operations. We are continuously looking for digital solutions that can increase automation and robotization of production, distribu-tion, logistics and administration. Initiatives within “Industry 4.0” lead to improvements in quality, efficiency and sustainability, and enable data analysis for more effective control of production flows and maintenance planning, and better decision data. Another example is Essity’s digitalization of its distribution chain and the establishment of a logistics center that includes digital planning of demand, deliveries, stocks and transportation worldwide.
TENA Family Care AppTENA Family Care App has been developed to make life easier for people who care for family members in the home. The app allows family carers to plan care together with other caregivers, receive information when an incontinence product needs changing and order TENA products.
17Essity’s Annual and Sustainability Report 2021 Strategy
Introduction The Essity share
Strategy Business areas SustainabilityGroup Corporate Governance Report
Financial statementsincluding notes
Essity data
Raised ambitionsFor many years, Essity has had ambitious targets for the compa-ny’s sustainability work, for example, our Science Based Targets were approved in 2018. In 2021, new and updated sustainability targets were set that included a commitment to achieve net-zero emissions of greenhouse gases by 2050.
We also raised our ambitions for our existing Science Based Targets. Other updated targets include sustainable innovations, occupational safety and responsible sourcing. Essity values and works to increase diversity, equity and inclusion, which contributes to our success. During the year, we presented new ambitions in this area.
Strategy for target fulfillmentEssity has a clear strategy and plan for how it will achieve these targets. The most important areas have been identified for the Science Based Targets 2030 and net-zero emissions by 2050. Action will be taken throughout the value chain, from raw mate-rials, production and distribution to used products. Within raw materials for example, Essity is working to find alternatives to fresh
wood fiber pulp and to reduce the use of oil-based raw materials. At our production facility in Mannheim, Germany, pulp production has begun using wheat straw, which reduces carbon emissions compared with tissue from fresh wood fiber pulp. We are also working with solutions whereby used products become new prod-ucts. One example is Tork PaperCircle, where used paper hand towels are made into new tissue. The business model was intro-duced to additional markets and more customers in 2021. Fossil fuel is being replaced by alternatives with a smaller environmental footprint, such as hydrogen from renewable energy, biogas and geothermal steam at several of Essity’s production facilities around the world. Our continuous work to increase resource efficiency through programs for energy savings and material rationalization also helps to achieve the targets.
Essity’s sustainability agenda is determined by such factors as customer and consumer demand, our own Group targets, policies, stakeholder expectations and the UN Sustainable Devel-opment Goals. Read more about Essity’s sustainability work under Sustainability on pages 43–54.
Leading in sustainabilityFor Essity, sustainability is a strategic priority for long-term profitable growth. Our initiatives con-tribute to a better environment while increasing the competitiveness of the company. Demand for sustainable solutions and the willingness to pay more for these is increasing among customers and consumers.
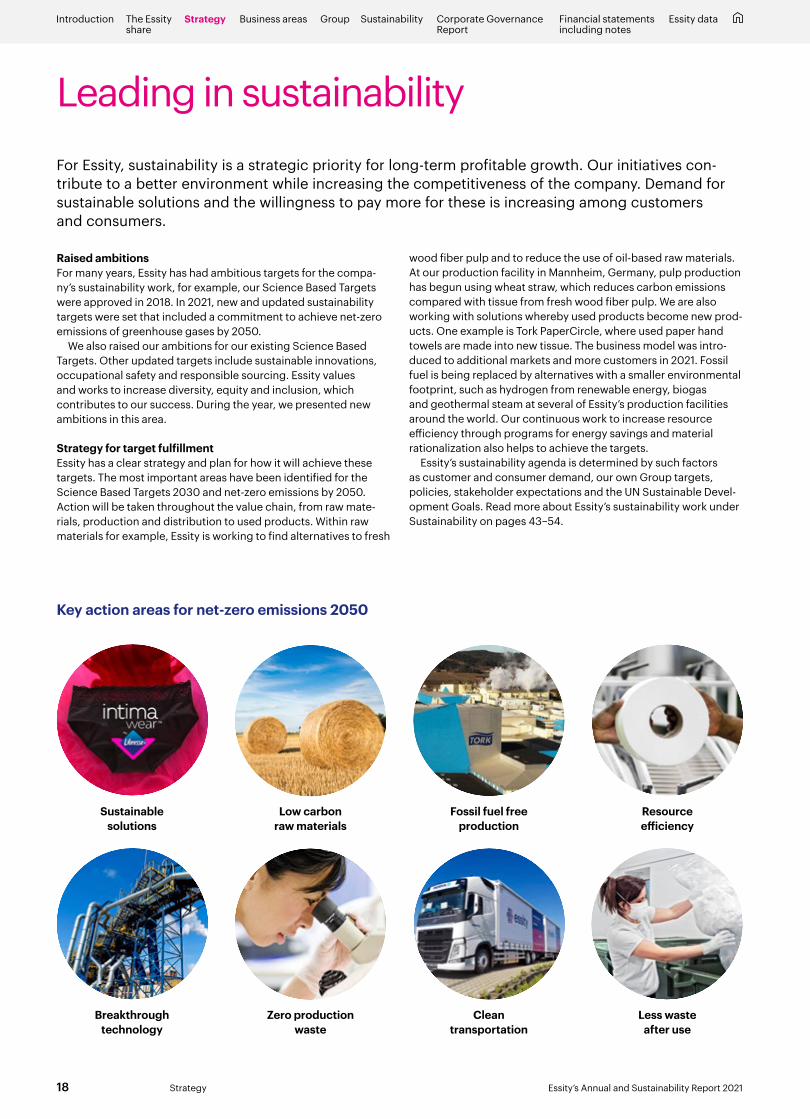
Key action areas for net-zero emissions 2050
Low carbon raw materials
Zero production waste
Breakthrough technology
Clean transportation
Fossil fuel free production
Sustainable solutions
Resource efficiency
Less waste after use
18 Essity’s Annual and Sustainability Report 2021Strategy
Introduction The Essity share
Strategy Business areas SustainabilityGroup Corporate Governance Report
Financial statementsincluding notes
Essity data
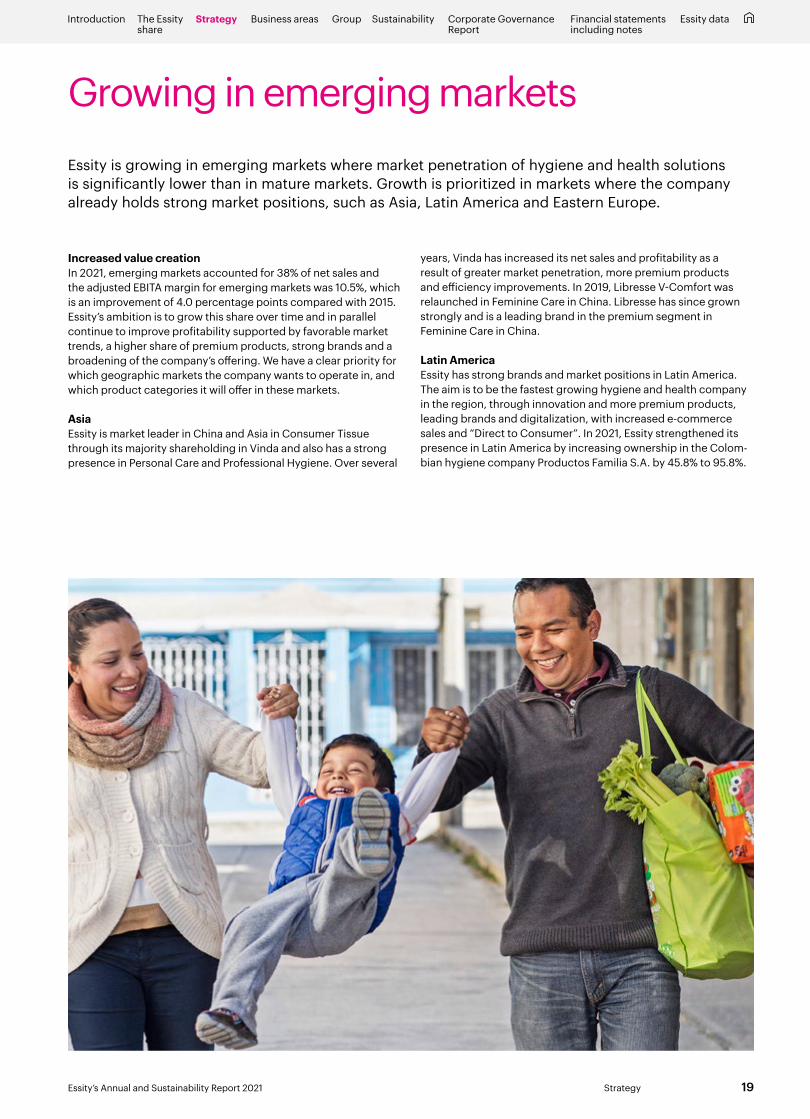
Increased value creationIn 2021, emerging markets accounted for 38% of net sales and the adjusted EBITA margin for emerging markets was 10.5%, which is an improvement of 4.0 percentage points compared with 2015. Essity’s ambition is to grow this share over time and in parallel continue to improve profitability supported by favorable market trends, a higher share of premium products, strong brands and a broadening of the company’s offering. We have a clear priority for which geographic markets the company wants to operate in, and which product categories it will offer in these markets.
AsiaEssity is market leader in China and Asia in Consumer Tissue through its majority shareholding in Vinda and also has a strong presence in Personal Care and Professional Hygiene. Over several
years, Vinda has increased its net sales and profitability as a result of greater market penetration, more premium products and efficiency improvements. In 2019, Libresse V-Comfort was relaunched in Feminine Care in China. Libresse has since grown strongly and is a leading brand in the premium segment in Feminine Care in China.
Latin AmericaEssity has strong brands and market positions in Latin America. The aim is to be the fastest growing hygiene and health company in the region, through innovation and more premium products, leading brands and digitalization, with increased e-commerce sales and “Direct to Consumer”. In 2021, Essity strengthened its presence in Latin America by increasing ownership in the Colom-bian hygiene company Productos Familia S.A. by 45.8% to 95.8%.
Growing in emerging marketsEssity is growing in emerging markets where market penetration of hygiene and health solutions is significantly lower than in mature markets. Growth is prioritized in markets where the company already holds strong market positions, such as Asia, Latin America and Eastern Europe.
19Essity’s Annual and Sustainability Report 2021 Strategy
Introduction The Essity share
Strategy Business areas SustainabilityGroup Corporate Governance Report
Financial statementsincluding notes
Essity data

Targets and outcomesFinancial targets Sustainability targets
Read more in the Sustainability section and in the sustainability notes.
Annual sales growth1)
Target: >5%
Outcome:
Science Based TargetsTarget 2030 (compared with 2016):
Outcome 2021:
Adjusted return on capital employed2)
Target: >17% by 2025
Outcome:
PackagingShare of packaging manufactured from renewable and/or recycled material
Target 2025: 85%
Outcome 2021:
In 2021, sales growth, includ-ing organic sales growth and acquisitions, amounted to 4.5%. Organic sales growth, which excludes exchange rate effects, acquisitions and divestments, amounted to 3.3%, of which volume accounted for 1.8% and price/mix for 1.5%.
In 2021, return was nega-tively impacted by significant cost inflation, mainly for raw materials, energy and distri-bution. Higher sales prices, higher volumes, a better mix and cost savings had a posi-tive impact on earnings.
Essity is striving for 100% recy-clability and 85% renewable or recycled material in the com-pany’s packaging. This target applies to both paper and plastic packaging for Essity’s brands.
Essity’s greenhouse gas emissions are divided into three different Scopes depending on origin. Scope 1 and 2 are directly linked to Essity’s produc-tion. Scope 3 reports indi-rect emissions in Essity’s value chain.
Capital Structure PolicyTarget: Maintain a solid investment grade rating
Outcome 2021:
“Solid investment grade rating”
Net debt amounted to SEK 55,433m. Net debt in relation to adjusted EBITDA2) amounted to 2.77.
1) Including organic sales growth and acquisitions.
2) Excluding items affecting comparability.
3) Board of Directors’ dividend proposal.4) Compound Annual Growth Rate.
5) Outcome in 2020.
202120202019
4.5%4.5%
–1.8%
202120202019
12.0%13.8% 15.7%
Dividend PolicyTarget: Long-term stable and rising dividends
Outcome: Dividend per share, SEK
The Board of Directors pro-poses an increase in the div-idend of 4% compared with 2020 to SEK 7.00 per share for the 2021 fiscal year.202120202019
6.25 6.75 7.003)CAGR4) 6%
–15% –9%
78%Production wasteSubject to material or energy recovery
Target 2030: 100%
Outcome 2021: Resource efficiency and the reduction of waste are important in Essity’s produc-tion facilities. The target is that all production waste will be subject to material and energy recovery by 2030, which reduces greenhouse gas emissions.64%
–35% –18%
Scope 1 and 2 Scope 35)
Scope 1 and 2 Scope 3
Fresh fiberShare of FSCTM or PEFCTM-certified fresh fiber
Target: 100%
Outcome: Through certifications such as the Forest Stewardship Coun-cil (FSC) and the Programme for the Endorsement of Forest Certification (PEFC), Essity ensures sustainable fiber sourcing, thereby preventing deforestation and promoting biodiversity.202120202019
79%95% 98%
20 Essity’s Annual and Sustainability Report 2021Strategy
Introduction The Essity share
Strategy Business areas SustainabilityGroup Corporate Governance Report
Financial statementsincluding notes
Essity data
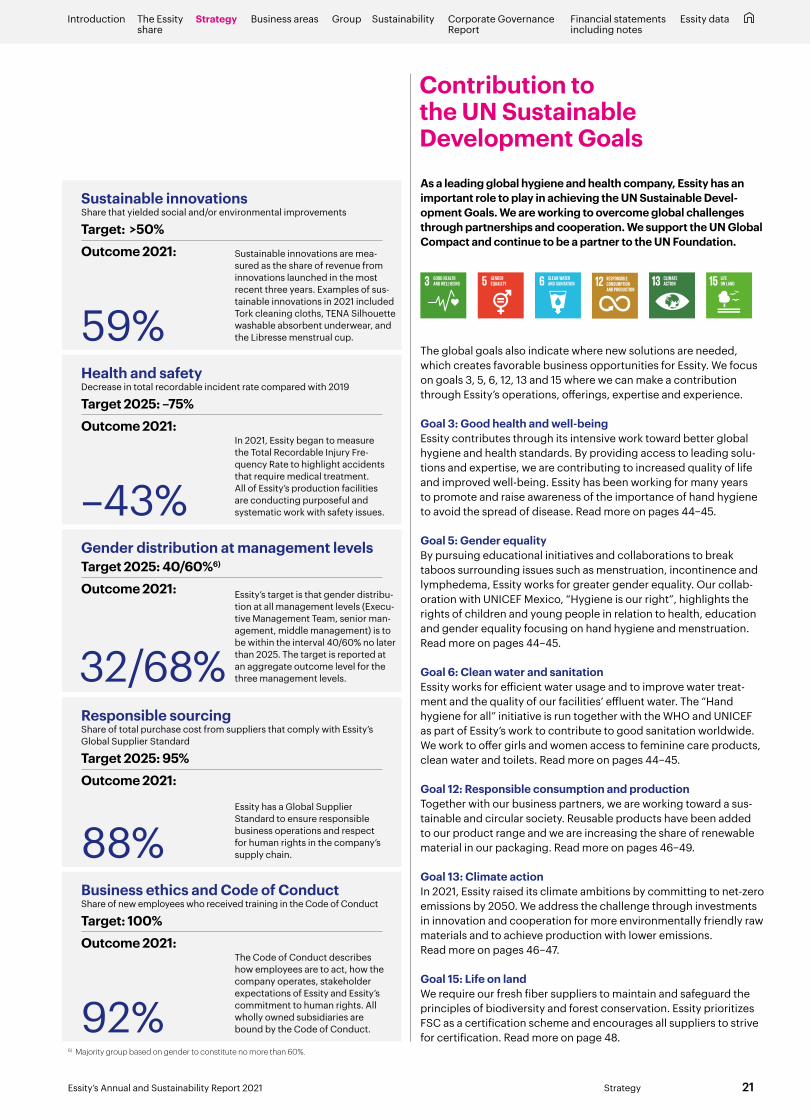
The global goals also indicate where new solutions are needed, which creates favorable business opportunities for Essity. We focus on goals 3, 5, 6, 12, 13 and 15 where we can make a contribution through Essity’s operations, offerings, expertise and experience.
Goal 3: Good health and well-beingEssity contributes through its intensive work toward better global hygiene and health standards. By providing access to leading solu-tions and expertise, we are contributing to increased quality of life and improved well-being. Essity has been working for many years to promote and raise awareness of the importance of hand hygiene to avoid the spread of disease. Read more on pages 44–45.
Goal 5: Gender equalityBy pursuing educational initiatives and collaborations to break taboos surrounding issues such as menstruation, incontinence and lymphedema, Essity works for greater gender equality. Our collab-oration with UNICEF Mexico, “Hygiene is our right”, highlights the rights of children and young people in relation to health, education and gender equality focusing on hand hygiene and menstruation. Read more on pages 44–45.
Goal 6: Clean water and sanitationEssity works for efficient water usage and to improve water treat-ment and the quality of our facilities’ effluent water. The “Hand hygiene for all” initiative is run together with the WHO and UNICEF as part of Essity’s work to contribute to good sanitation worldwide. We work to offer girls and women access to feminine care products, clean water and toilets. Read more on pages 44–45.
Goal 12: Responsible consumption and productionTogether with our business partners, we are working toward a sus-tainable and circular society. Reusable products have been added to our product range and we are increasing the share of renewable material in our packaging. Read more on pages 46–49.
Goal 13: Climate actionIn 2021, Essity raised its climate ambitions by committing to net-zero emissions by 2050. We address the challenge through investments in innovation and cooperation for more environmentally friendly raw materials and to achieve production with lower emissions. Read more on pages 46–47.
Goal 15: Life on landWe require our fresh fiber suppliers to maintain and safeguard the principles of biodiversity and forest conservation. Essity prioritizes FSC as a certification scheme and encourages all suppliers to strive for certification. Read more on page 48.
Contribution to the UN Sustainable Development Goals
As a leading global hygiene and health company, Essity has an important role to play in achieving the UN Sustainable Devel-opment Goals. We are working to overcome global challenges through partnerships and cooperation. We support the UN Global Compact and continue to be a partner to the UN Foundation.
6) Majority group based on gender to constitute no more than 60%.
Gender distribution at management levelsTarget 2025: 40/60%6)
Outcome 2021: Essity’s target is that gender distribu-tion at all management levels (Execu-tive Management Team, senior man-agement, middle management) is to be within the interval 40/60% no later than 2025. The target is reported at an aggregate outcome level for the three management levels.
Sustainable innovationsShare that yielded social and/or environmental improvements
Target: >50%Outcome 2021: Sustainable innovations are mea-
sured as the share of revenue from innovations launched in the most recent three years. Examples of sus-tainable innovations in 2021 included Tork cleaning cloths, TENA Silhouette washable absorbent underwear, and the Libresse menstrual cup.
Business ethics and Code of ConductShare of new employees who received training in the Code of Conduct
Target: 100%Outcome 2021:
The Code of Conduct describes how employees are to act, how the company operates, stakeholder expectations of Essity and Essity’s commitment to human rights. All wholly owned subsidiaries are bound by the Code of Conduct.
Responsible sourcingShare of total purchase cost from suppliers that comply with Essity’s Global Supplier Standard
Target 2025: 95%Outcome 2021:
Essity has a Global Supplier Standard to ensure responsible business operations and respect for human rights in the company’s supply chain.
Health and safetyDecrease in total recordable incident rate compared with 2019
Target 2025: –75%Outcome 2021:
In 2021, Essity began to measure the Total Recordable Injury Fre-quency Rate to highlight accidents that require medical treatment. All of Essity’s production facilities are conducting purposeful and systematic work with safety issues.
32/68%
92%
88%
59%
–43%
21Essity’s Annual and Sustainability Report 2021 Strategy
Introduction The Essity share
Strategy Business areas SustainabilityGroup Corporate Governance Report
Financial statementsincluding notes
Essity data

Personal CareOfferingEssity’s offering includes Incontinence Products, Medical Solutions, Baby Care and Feminine Care. Products are sold under brands such as Acti-move, TENA, JOBST, Leukoplast, Libero, Libresse, Nosotras, Saba and TOM Organic, and as retailer brands.
In Incontinence Products, with the globally leading brand TENA, Essity offers a broad range of incontinence products that also includes skin-care products, wet wipes, wash gloves, washable absorbent underwear and digital solutions with sensor technology. In Baby Care, Essity offers open baby diapers and pant diapers as well as baby care products such as wet wipes, shampoo, lotion and baby oil. Essity’s offering for Baby Care in Europe is sold under its own Libero and Lotus brands and as retailer brands. In Feminine Care, Essity offers a broad product portfolio that includes pads, panty liners, tampons, intimate soaps, intimate wipes, washable absorbent under-wear and reusable menstrual cups. In Medical Solutions, Essity offers products and services in wound care, compression therapy and orthope-dics.
Distribution channels are the retail trade, phar-macies, medical device stores, hospitals, distribu-tors and care institutions and e-commerce.
Market positionsEssity is the global market leader in the market for incontinence products with the TENA brand. Essity is the market leader in Europe and Latin America. Essity is the third largest player in Asia and the fourth largest in North America.
In Baby Care, Essity is the world’s fifth largest player and the second largest in Europe. Essity’s strongest market is the Nordic region, where the Libero brand is the market leader. Examples of other strong regional brands are Drypers in South East Asia and Pequeñin in South America.
In Feminine Care, Essity is the world’s fifth largest player, the third largest in Europe and the market leader in Latin America. Examples of regional brands supported by Essity’s global brand platform in Feminine Care include Libresse in the Nordic region, Russia, Eastern Europe, the Netherlands, Malaysia and China, Bodyform in the UK, Nana in France and the Middle East, Saba and Nosotras in Latin America and Libra and TOM Organic in Australasia.
In Medical Solutions, in the product catego-ries in which the company is active, Essity is the world’s fourth largest player and the market leader in Europe. Essity is the largest global player in compression therapy and the third largest player in orthopedics. In wound care, which includes acute and advanced wound care, Essity is the sixth largest player. Essity holds the number three posi-tion within acute wound care. Examples of strong brands include JOBST, Leukoplast, Cutimed, Del-ta-Cast and Actimove.
Production facilitiesAt the end of 2021, Personal Care had production at 38 sites in 26 countries.
Operations in 2021Net sales increased 1.2% to SEK 46,639m (46,095). The organic sales growth amounted to 5.0%, of
SEKm 2021 2020 %
Net sales 46,639 46,095 1
Sales growth1), % 6.4 0.3
Organic sales growth2), % 5.0 0.0
Adjusted gross margin3), % 40.2 41.4
Adjusted EBITA3) 7,098 7,161 –1
Adjusted EBITA margin3), % 15.2 15.5
Adjusted return on capital employed3), % 16.3 16.4
Operating cash flow 6,469 7,485 –14
Investments in non-current assets –1,779 –1,658 7
Average number of employees 17,971 18,298 –2
Key figuresNet sales, SEKm
46,639Sales growth1)
6.4%Organic sales growth2)
5.0%Adjusted EBITA margin3)
15.2%Adjusted return on capital employed3)
16.3%1) Including organic sales growth
and acquisitions.2) Excluding exchange rate effects,
acquisitions and divestments.3) Excluding items affecting
comparability.
Key figures
0
10,000
20,000
30,000
40,000
50,000
60,000
20212020201920182017
SEKm
40,58845,342
48,340 46,095 46,639
Net sales
0
2,000
4,000
6,000
8,000
10,000
20212020201920182017
SEKm %
0
10
20
30
40
50
5,9376,354 6,476 7,161 7,098
Adjusted EBITA3)
Adjusted EBITA margin3)
Adjusted return on capital employed3)
Earnings trend
Brands
1) Including organic sales growth and acquisitions. 2) Excluding exchange rate effects, acquisitions and divestments. 3) Excluding items affecting comparability.
22 Essity’s Annual and Sustainability Report 2021Business areas
Introduction The Essity share
Strategy Business areas SustainabilityGroup Corporate Governance Report
Financial statementsincluding notes
Essity data

Net sales by region
57+18+11+10+4G Europe, 57% Latin America, 18% Asia, 11% North America, 10% Other, 4%
Net sales by product category
46+19+18+17G Incontinence Products, 46% Medical Solutions, 19% Feminine Care, 18% Baby Care, 17%
which volume accounted for 2.7% and price/mix for 2.3%. Organic sales growth amounted to 2.8% in mature markets. In emerging markets, which accounted for 35% of net sales, organic sales growth amounted to 9.0%. Exchange rate effects reduced net sales by 4.2%. The acquisition of Asaleo Care increased net sales by 1.4%. Divest-ments reduced net sales by 1.0%.
For Incontinence Products, with Essity’s glob-ally leading TENA brand, organic sales growth amounted to 3.5%. In Medical Solutions, organic sales growth amounted to 10.8%. For Baby Care, organic sales growth amounted to –0.6%. For Feminine Care, organic sales growth amounted to 10.0%.
The adjusted gross margin decreased 1.2 percentage points to 40.2% (41.4). Higher costs for raw materials and distribution had a negative impact on the margin. The margin was positively impacted by higher volumes, higher prices, a bet-ter mix and cost savings. The adjusted EBITA mar-gin decreased 0.3 of a percentage point to 15.2% (15.5). Sales costs, excluding marketing costs, were lower also as a share of net sales. Marketing costs were higher but decreased as a share of net sales. Adjusted EBITA decreased 1% (increased 3% excluding currency translation effects, acquisi-tions and divestments) to SEK 7,098m (7,161).
During the year we have for example launched washable absorbent underwear under TENA Silhouette and TENA for Men, an upgrade of Saba® Buenas Noches® pads in Mexico, and Lotus Baby Douceur Naturelle, which was awarded the “Product of the Year” prize in France.
Essity’s Annual and Sustainability Report 2021
Introduction The Essity share
Strategy Business areas SustainabilityGroup Corporate Governance Report
Financial statementsincluding notes
Essity data
Business areas 23
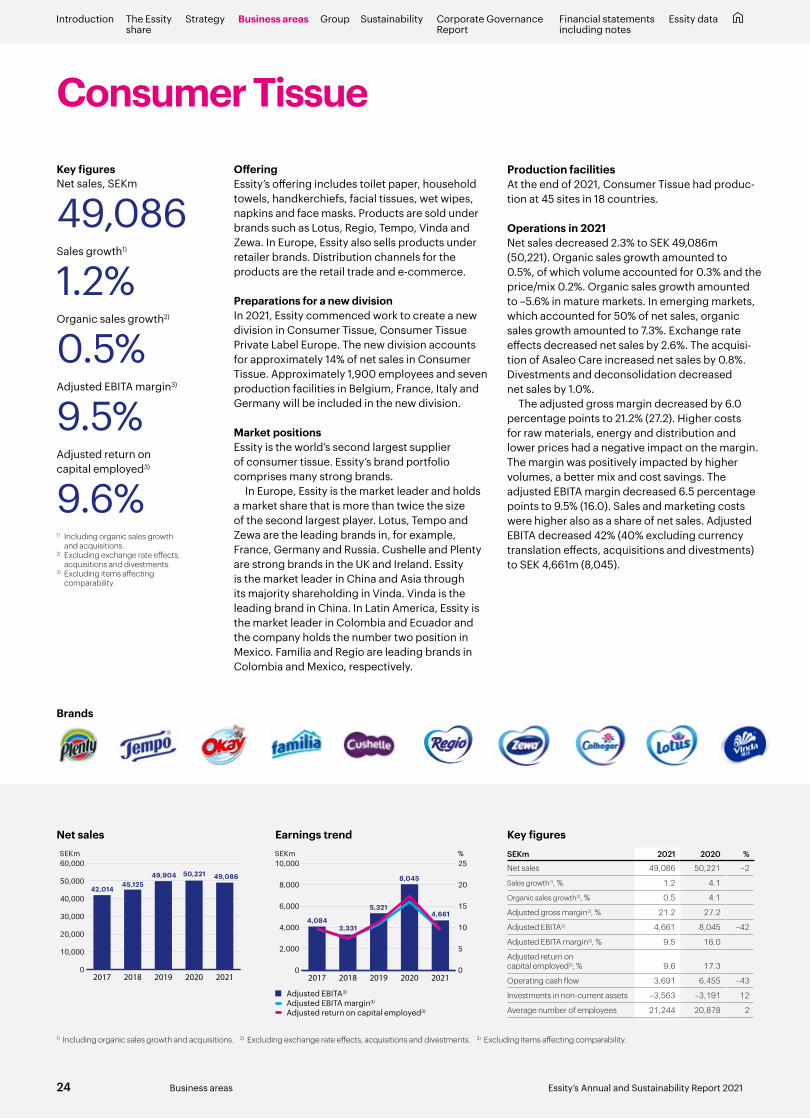
Consumer TissueOfferingEssity’s offering includes toilet paper, household towels, handkerchiefs, facial tissues, wet wipes, napkins and face masks. Products are sold under brands such as Lotus, Regio, Tempo, Vinda and Zewa. In Europe, Essity also sells products under retailer brands. Distribution channels for the products are the retail trade and e-commerce.
Preparations for a new division In 2021, Essity commenced work to create a new division in Consumer Tissue, Consumer Tissue Private Label Europe. The new division accounts for approximately 14% of net sales in Consumer Tissue. Approximately 1,900 employees and seven production facilities in Belgium, France, Italy and Germany will be included in the new division.
Market positionsEssity is the world’s second largest supplier of consumer tissue. Essity’s brand portfolio comprises many strong brands.
In Europe, Essity is the market leader and holds a market share that is more than twice the size of the second largest player. Lotus, Tempo and Zewa are the leading brands in, for example, France, Germany and Russia. Cushelle and Plenty are strong brands in the UK and Ireland. Essity is the market leader in China and Asia through its majority shareholding in Vinda. Vinda is the leading brand in China. In Latin America, Essity is the market leader in Colombia and Ecuador and the company holds the number two position in Mexico. Familia and Regio are leading brands in Colombia and Mexico, respectively.
Production facilitiesAt the end of 2021, Consumer Tissue had produc-tion at 45 sites in 18 countries.
Operations in 2021Net sales decreased 2.3% to SEK 49,086m (50,221). Organic sales growth amounted to 0.5%, of which volume accounted for 0.3% and the price/mix 0.2%. Organic sales growth amounted to –5.6% in mature markets. In emerging markets, which accounted for 50% of net sales, organic sales growth amounted to 7.3%. Exchange rate effects decreased net sales by 2.6%. The acquisi-tion of Asaleo Care increased net sales by 0.8%. Divestments and deconsolidation decreased net sales by 1.0%.
The adjusted gross margin decreased by 6.0 percentage points to 21.2% (27.2). Higher costs for raw materials, energy and distribution and lower prices had a negative impact on the margin. The margin was positively impacted by higher volumes, a better mix and cost savings. The adjusted EBITA margin decreased 6.5 percentage points to 9.5% (16.0). Sales and marketing costs were higher also as a share of net sales. Adjusted EBITA decreased 42% (40% excluding currency translation effects, acquisitions and divestments) to SEK 4,661m (8,045).
Key figures
0
10,000
20,000
30,000
40,000
50,000
60,000
20212020201920182017
SEKm
42,01445,125
49,904 50,221 49,086
Net sales
0
2,000
4,000
6,000
8,000
10,000
20212020201920182017
SEKm %
0
5
10
15
20
25
4,0843,331
5,321
8,045
4,661
Adjusted EBITA3)
Adjusted EBITA margin3)
Adjusted return on capital employed3)
Earnings trend
Key figuresNet sales, SEKm
49,086Sales growth1)
1.2%Organic sales growth2)
0.5%Adjusted EBITA margin3)
9.5%Adjusted return on capital employed3)
9.6%1) Including organic sales growth
and acquisitions.2) Excluding exchange rate effects,
acquisitions and divestments.3) Excluding items affecting
comparability.
SEKm 2021 2020 %
Net sales 49,086 50,221 –2
Sales growth1), % 1.2 4.1
Organic sales growth2), % 0.5 4.1
Adjusted gross margin3), % 21.2 27.2
Adjusted EBITA3) 4,661 8,045 –42
Adjusted EBITA margin3), % 9.5 16.0
Adjusted return on capital employed3), % 9.6 17.3
Operating cash flow 3,691 6,455 –43
Investments in non-current assets –3,563 –3,191 12
Average number of employees 21,244 20,878 2
1) Including organic sales growth and acquisitions. 2) Excluding exchange rate effects, acquisitions and divestments. 3) Excluding items affecting comparability.
Brands
24 Essity’s Annual and Sustainability Report 2021Business areas
Introduction The Essity share
Strategy Business areas SustainabilityGroup Corporate Governance Report
Financial statementsincluding notes
Essity data
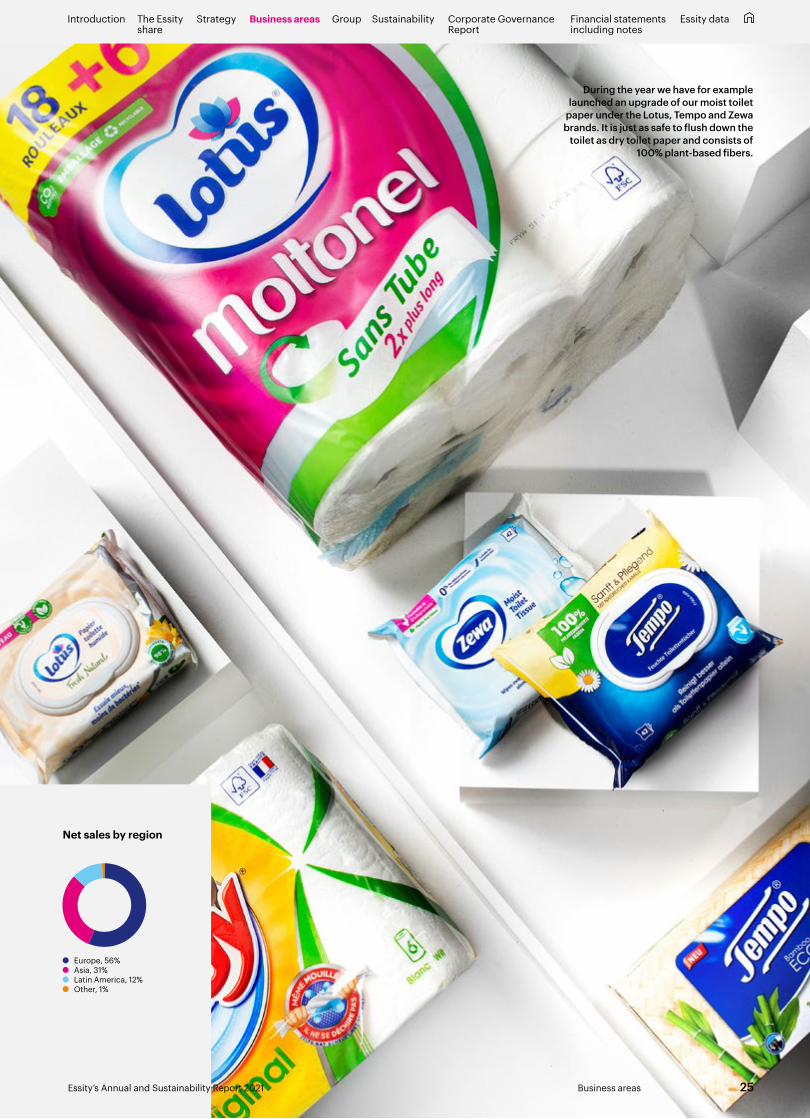
Net sales by region
56+31+12+1G Europe, 56% Asia, 31% Latin America, 12% Other, 1%
During the year we have for example launched an upgrade of our moist toilet
paper under the Lotus, Tempo and Zewa brands. It is just as safe to flush down the
toilet as dry toilet paper and consists of 100% plant-based fibers.
25Business areas
Introduction The Essity share
Strategy Business areas SustainabilityGroup Corporate Governance Report
Financial statementsincluding notes
Essity data
Essity’s Annual and Sustainability Report 2021

Professional HygieneOfferingEssity’s offering comprises complete and profes-sional hygiene solutions, including toilet paper, paper hand towels, napkins, soap, lotion, sanitizer, dispensers, cleaning and wiping products, face masks, and service and maintenance. Essity also offers digital solutions, such as sensor technology that enables data-driven cleaning.
Customers consist of companies and office buildings, universities, healthcare facilities, indus-tries, restaurants, hotels, stadiums and other pub-lic venues. Distribution channels for the products consist of distributors and e-commerce.
Market positionsEssity is the world’s largest supplier of products and services in the market for professional hygiene with the globally leading Tork brand. We are the market leader in Europe and hold a market share that is nearly three times the size of the second largest player. Essity is the second largest supplier in North America and holds a particularly strong market position in the food service seg-ment, where we estimate that the company sup-plies approximately every second napkin. Essity also has strong positions in emerging markets, such as Russia and Colombia, where we are the market leader. Essity is number three in the market in Asia through its majority shareholding in Vinda.
Production facilitiesAt the end of 2021, Professional Hygiene had production at 44 sites in 21 countries.
Operations in 2021Net sales increased 2.9% to SEK 26,143m (25,418). Organic sales growth amounted to 5.7%, of which volume accounted for 2.8% and price/mix for 2.9%. Organic sales growth amounted to 3.3% in mature markets. In emerging markets, which accounted for 21% of net sales, organic sales growth amounted to 15.0%. Exchange rate effects reduced net sales by 4.5%. The acquisition of Asaleo Care increased net sales by 1.8%. Divest-ments decreased net sales by 0.1%.
The adjusted gross margin decreased 3.6 percentage points to 23.3% (26.9). Higher costs for raw materials, energy and distribution had a negative impact on the margin. The margin was positively impacted by higher prices, higher volumes, a better mix and cost savings. The adjusted EBITA margin decreased 2.6 percentage points to 10.4% (13.0). Sales and marketing costs were lower also as a share of net sales. Adjusted EBITA decreased 18% (14% excluding currency translation effects, acquisitions and divestments) to SEK 2,710m (3,317).
Key figures
Key figuresNet sales, SEKm
26,143Sales growth1)
7.5%Organic sales growth2)
5.7%Adjusted EBITA margin3)
10.4%Adjusted return on capital employed3)
11.8%1) Including organic sales growth
and acquisitions.2) Excluding exchange rate effects,
acquisitions and divestments.3) Excluding items affecting
comparability.
SEKm 2021 2020 %
Net sales 26,143 25,418 3
Sales growth1), % 7.5 –14.16
Organic sales growth2), % 5.7 –14.6
Adjusted gross margin3), % 23.3 26.9
Adjusted EBITA3) 2,710 3,317 –18
Adjusted EBITA margin3), % 10.4 13.0
Adjusted return on capital employed3), % 11.8 14.6
Operating cash flow 2,512 3,183 –21
Investments in non-current assets –941 –1,135 –17
Average number of employees 7,060 6,909 2
0
10,000
20,000
30,000
40,000
20212020201920182017
SEKm
26,700 28,01730,731
25,418 26,143
Net sales
0
1,000
2,000
3,000
4,000
5,000
6,000
20212020201920182017
SEKm %
0
5
10
15
20
25
30
4,004 3,8414,463
3,3172,710
Adjusted EBITA3)
Adjusted EBITA margin3)
Adjusted return on capital employed3)
Earnings trend
1) Including organic sales growth and acquisitions. 2) Excluding exchange rate effects, acquisitions and divestments. 3) Excluding items affecting comparability.
Brands
26 Essity’s Annual and Sustainability Report 2021Business areas
Introduction The Essity share
Strategy Business areas SustainabilityGroup Corporate Governance Report
Financial statementsincluding notes
Essity data
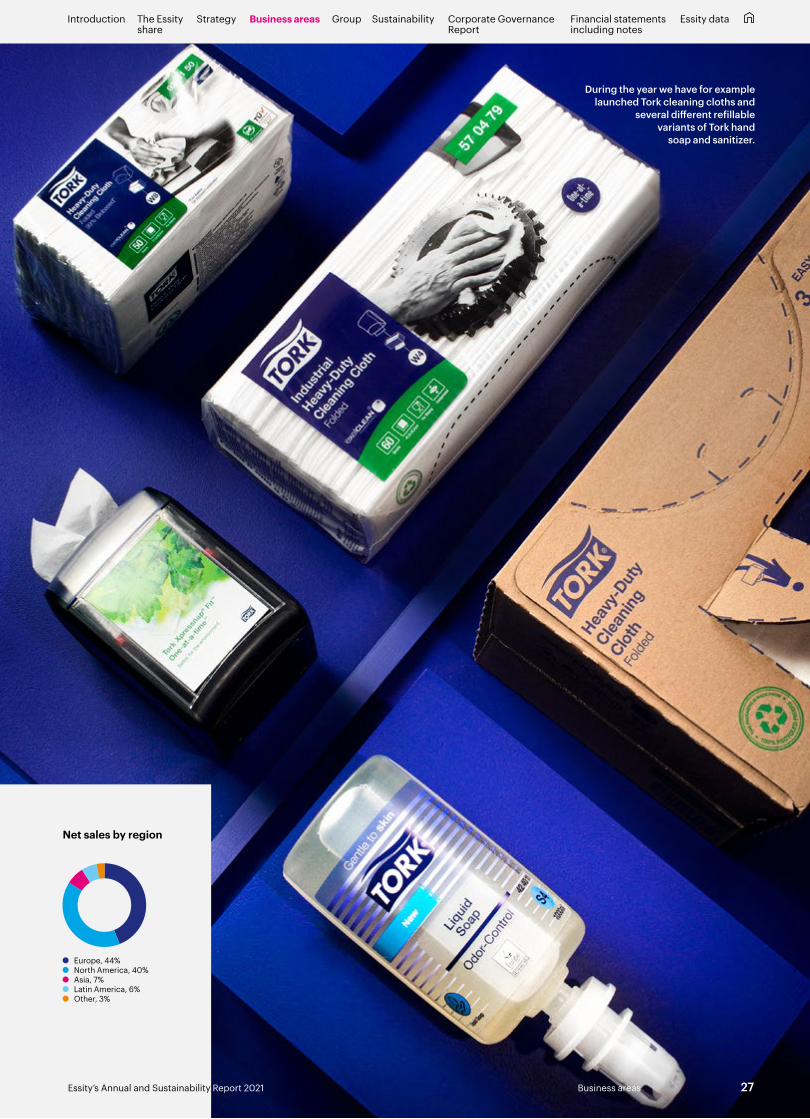
Net sales by region
44+40+7+6+3G Europe, 44% North America, 40% Asia, 7% Latin America, 6% Other, 3%
During the year we have for example launched Tork cleaning cloths and
several different refillable variants of Tork hand
soap and sanitizer.
Introduction The Essity share
Strategy Business areas SustainabilityGroup Corporate Governance Report
Financial statementsincluding notes
Essity data
Essity’s Annual and Sustainability Report 2021 Business areas 27

Up to and including 2021, Essity reported its operations according to three business areas: Personal Care, Consumer Tissue and Professional Hygiene. Personal Care comprised the product cat-egories of Incontinence Products, Medical Solutions, Baby Care and Feminine Care, and included incontinence products, baby diapers, pads, panty liners, tampons, washable absorbent under-wear, reusable menstrual cups, wet wipes, skincare products and digital solutions with sensor technology, as well as products and services in wound care, compression therapy and orthopedics. Consumer Tissue included toilet paper, household towels, hand-kerchiefs, facial tissues, wet wipes, napkins and face masks. Pro-fessional Hygiene included complete hygiene solutions, including toilet paper, paper hand towels, napkins, microfiber cloths, cleaning and wiping products, soap, lotion, sanitizer, dispensers, face masks and digital solutions, such as sensor technology that enables data-driven cleaning.
Europe is Essity’s largest market. The Group also holds strong positions in North America, Latin America and Asia. Expansion takes place through organic growth and acquisitions.
Organization Essity has the following four business units:
■ Consumer Goods, which markets and sells products in the cate-gories of consumer tissue, baby care, feminine care and inconti-nence products retail in Europe, the Middle East and Africa.
■ Health & Medical Solutions, which markets and sells products in the category of incontinence products in Europe, North America, the Middle East and Africa, and markets and sells products in the category of medical solutions in Asia, Europe, North America, the Middle East and Africa.
■ Latin America, which markets and sells products in the cate-gories of consumer tissue, baby care, incontinence products, medical solutions, feminine care and professional hygiene in Latin America.
■ Professional Hygiene, which markets and sells complete hygiene solutions as well as service and maintenance to the business area’s customer segments in Europe, North America, the Middle East and Africa.
The financial reporting of these four business units is presented under one or more of the Personal Care, Consumer Tissue or
Professional Hygiene business areas in the company’s external financial reporting.
During the year, Essity acquired all of the shares in Asaleo Care, which was listed on the Sydney Stock Exchange and markets and sells products primarily in professional hygiene as well as the cat-egories of incontinence products and feminine care in Australasia (Australia, New Zealand and some of the Pacific Islands). Following the acquisition, the business is being operated as an independent unit under the name Essity AustralAsia.
In addition to the business units, Essity has established three global units:
■ Global Brand, Innovation & Sustainability has global respon- sibility for customer and consumer brands, innovation and sustainability and public affairs.
■ Global Supply Chain has global responsibility for production, technology, logistics and distribution in relation to all product categories with the exception of Medical Solutions.
■ Global Operational Services has global responsibility for sourcing, business services, IT and digitalization.
Essity has five Group functions: ■ Communications ■ Finance ■ Human Resources ■ Legal Affairs ■ Strategy & Business Development
Essity exerts an influence on the Group company Vinda, a listed Asian hygiene company in which Essity is a majority shareholder, through board representation.
Events during the year Essity has a new sales growth target of more than 5%, which includes both organic sales growth and acquisitions. This replaces the previous target of organic sales growth of more than 3%. New and updated sustainability targets have been presented, including a commitment to develop targets to reach net-zero emissions of greenhouse gases by 2050 at the latest. This includes raising the ambition level of Essity’s current Science Based Targets. Other updated targets include sustainable innovations, occupational safety and responsible sourcing.
Operations and structure
Organization
President and CEO
Professional HygieneLatin AmericaHealth & Medical
SolutionsConsumer Goods
Global Supply Chain
Global Operational Services
Communications, Finance, Human Resources, Legal Affairs and
Strategy & Business Development
Global Brand, Innovation & Sustainability
Executive Vice President and CFOGroup functions:
Business units:
Global units:
28 Essity’s Annual and Sustainability Report 2021Group
Introduction The Essity share
Strategy Business areas SustainabilityGroup Corporate Governance Report
Financial statementsincluding notes
Essity data

Essity finalized the acquisitions of Asaleo Care, Productos Familia S.A., ABIGO Medical AB, AquaCast Liner, Hydrofera and the sports tape brands Coach, Elastikon and Zonas.
In the Consumer Tissue business area, Essity has begun work to create a new Consumer Tissue Private Label Europe division.
Essity has decided on new business areas from January 1, 2022. The business areas are Health & Medical, Consumer Goods and Professional Hygiene. Health & Medical comprises the catego-ries Incontinence Products Health Care and Medical Solutions;
Consumer Goods the categories Incontinence Products Retail, Baby Care, Feminine Care and Consumer Tissue; and Professional Hygiene the categories AfH Tissue, Skin Care and Cleaning & Wiping.
Events after year-endOn February 2, 2022, Essity announced that the company had acquired Legacy Converting, Inc., a USA-based company providing professional wiping and cleaning products.
Acquisitions, investments and divestmentsAcquisition of distribution rights to Sorbact in Australia and New ZealandOn April 6, 2021, Essity announced that it had acquired the distri-bution rights to the wound care technology Sorbact® in Australia and New Zealand from the Australian company Bayport Brands. In 2020, sales of Sorbact® in the region amounted to AUD 1.7m (approximately SEK 11m).
Acquisition of Asaleo CareOn July 1, 2021, Essity announced that it had finalized the acqui-sition of the remaining 63.8% of the shares in Asaleo Care, listed on the Australian Securities Exchange, for AUD 1.40 cash per share. The consideration implies an equity value on a 100% basis of approximately AUD 760m (approximately SEK 4.9bn) and an enterprise value of AUD 855m (approximately SEK 5.5bn). Essity AustralAsia, which is the name of the regional unit, was consol-idated into Essity’s accounts as of July 1, 2021. In 2020, Asaleo Care reported sales of AUD 419m (approximately SEK 2.7bn) and underlying EBITDA of AUD 89m (approximately SEK 574m). Asaleo Care had approximately 700 employees and three manufacturing facilities.
Acquisition of ABIGO Medical ABOn July 2, 2021, Essity announced that it had finalized the acqui-sition of the remaining 25% of the shares in ABIGO Medical AB and the company is now a wholly owned subsidiary of Essity in the Medical Solutions product category. Essity acquired 75% of ABIGO Medical in February 2020. The shares were acquired from founder and chairman of the board Jan G. Smith at a valuation of SEK 900m for 100% of the company on a debt-free basis.
Acquisition of Productos Familia S.A.On August 31, 2021, Essity finalized the acquisition of 45.8% of the shares in the Colombian hygiene company Productos Familia S.A. (“Familia”). The purchase price amounted to SEK 5,961m on a debt-free basis. Essity now owns 95.8% of Familia. Familia is headquartered in Medellín, Colombia, and has a strong presence in Latin America. The company primarily operates in Personal Care in addition to Consumer Tissue and Professional Hygiene. Familia is already consolidated in Essity’s accounts, and reported sales in 2020 of SEK 6,950m, an adjusted EBITDA of SEK 1,419m and adjusted EBITA of SEK 1,170m, equivalent to an adjusted EBITA margin of 16.8%.
Acquisition of sports tape brandsOn November 1, 2021, Essity announced that it had acquired the professional sports tape brands Coach, Elastikon and Zonas, which are established premium products in the USA market. The purchase price is not material and is not disclosed.
Acquisition of AquaCast LinerOn December 21, 2021, Essity announced that it had acquired AquaCast Liner, a specialist orthopedics company that supplies waterproof cast liners in the USA market. The purchase price is not material and is not disclosed.
Acquisition of Hydrofera On December 29, 2021, Essity announced that the company had acquired Hydrofera, which offers technology and products in advanced wound care in the USA and Canadian markets. The purchase price amounted to USD 116m (approximately SEK 1.1bn) with a potential additional earnout amount of USD 15m (approximately SEK 140m) on a cash and debt-free basis. During the first nine months of 2021, Hydrofera had net sales of USD 20.7m (SEK 176m) with EBITDA of USD 5.9m (SEK 50m), EBITA of USD 5.6m (SEK 48m), corresponding to an EBITA margin of 27.2%. Sales growth for the first nine months of 2021 amounted to 22%. In 2020, the company reported net sales of approximately USD 23.5m (SEK 216m) with EBITDA of USD 4.6m (SEK 42m) and EBITA of USD 4.3m (SEK 39m), corresponding to an EBITA margin of 18.1%. Sales growth in 2020 amounted to 13%. The acquisition is expected to contribute to Essity’s earnings per share in 2022.
Investments to reduce climate impactOn July 6, 2021, Essity announced that the company is investing approximately EUR 11m (approximately SEK 110m) in its Hon-douville tissue production facility in France. The investment will enable the extraction of 98% of the paper fibers contained in food and beverage cartons and enable Essity to recycling approxi-mately 24,000 tons of packaging annually. The improved recy-cling system will be fully operational during the first half of 2022.
On October 6, 2021, Essity announced that the company is investing in enhanced efficiency at the company’s site in Kawerau, New Zealand, which will include the world’s first tissue machine running a fully geothermal steam drying process. Together with a reduction in pulp consumption, reduced waste and elimination of the burning of natural gas on the machine, the improvements will contribute to a reduction of carbon emissions by 23% from the Kawerau site. The investment of approximately AUD 15m (approx-imately SEK 95m) is partly funded through the Government Investment in Decarbonizing Industry (GIDI) Fund, administered by EECA (Energy Efficiency and Conservation Authority) in New Zealand.
On October 27, 2021, Essity announced that it is launching a pilot project to run a paper machine CO2-free with hydrogen from renewable energy at the company’s production facility in Mainz-Kostheim, Germany. Essity’s investment in the project amounts to EUR 4m (approximately SEK 40m).
29Essity’s Annual and Sustainability Report 2021 Group
Introduction The Essity share
Strategy Business areas SustainabilityGroup Corporate Governance Report
Financial statementsincluding notes
Essity data
Other Group informationParent CompanyThe Group’s Parent company, Essity Aktiebolag (publ), is a holding company with the main task of owning and managing shares in a number of business group companies and performing Group-wide management and administrative functions. The company’s corporate registration number is 556325-5511 and it is domiciled in Stockholm, Sweden. The company’s address is PO Box 200, SE-101 23 Stockholm. In 2021, the Parent company recognized operating income of SEK 312m (265) and profit before appropri-ations and tax of SEK 2,280m (2,605). Investments in property, plant and equipment totaled SEK 1m (1) during the year. Cash and cash equivalents at year-end amounted to SEK 0m (0).
Research and development (R&D)Research and development (R&D) costs during the year amounted to SEK –1,471m (–1,559), corresponding to about 1.2% of consoli-dated net sales. R&D is coordinated and conducted from a global perspective. Product development is carried out in close cooper-ation with the local units, as well as through direct collaboration with customers.
Holdings of treasury sharesEssity Aktiebolag (publ) holds no treasury shares.
Share distributionIn 2021, 320,104 Class A shares were converted to Class B shares. The proportion of Class A shares was 8.7% at year-end.
DividendThe Board of Directors proposes an increase in the dividend of 4% to SEK 7.00 (6.75) per share or SEK 4,916m (4,741). The record date for entitlement to receive dividends is proposed as March 28, 2022 and payment is expected to be made on March 31, 2022. The Board is of the opinion that the company’s and the Group’s equity after the proposed dividend is sufficiently high in relation to the nature, scope and risks of the operations, solvency requirements, liquidity and financial position and provides scope for the com-pany and the Group to fulfill its obligations and conduct desirable investments.
Sustainability reportEssity’s statutory sustainability report, in accordance with the requirements of the Swedish Annual Accounts Act, can be found on pages 35–54 and 123–131 in the Board of Directors’ Report. The company’s business model can be found on page 13. This sustainability report for Essity Aktiebolag (publ) encompasses the entire Group. Further information on the reporting principles for sustainability can be found in Note H1, page 123.
Guidelines for remuneration of senior executivesGuidelines agreed by the most recent Annual General Meeting (AGM) can be found in Note C2 on pages 91–93. The company’s application of the guidelines can be found in the remuneration report on pages 140–141 and in Note C2.
The Board has decided to propose the following new guidelines to the 2022 AGM concerning remuneration of senior executives in the Essity Group:
“These guidelines shall govern remuneration to directors, the President, vice presidents and other senior executives. The guidelines do not include remuneration decided upon by the General Meeting.
Remuneration principlesSuccessful implementation of the company’s business strategy and the fostering of the company’s long-term interests, includ-ing its sustainability, require that the company is able, through competitive remuneration on market terms, to recruit, incentivise and retain skilled employees. The total remuneration package must therefore be on market terms and competitive on the exec-utive’s field of profession, and must be related to the executive’s responsibilities, powers and performance. The remuneration may comprise fixed salary, variable remuneration, other benefits and pension. The company’s business strategy is presented in the company’s Annual and Sustainability Report.
Variable remunerationVariable remuneration shall be based on results relative to estab-lished short-term and long-term incentive program targets, which shall contribute to the objectives established by the company or to the performance of the company’s share. Remuneration shall be aimed at promoting the company’s business strategy and
30 Essity’s Annual and Sustainability Report 2021Group
Introduction The Essity share
Strategy Business areas SustainabilityGroup Corporate Governance Report
Financial statementsincluding notes
Essity data

long-term interests, including its sustainability. Furthermore, variable remuneration shall be paid as cash remuneration and shall not be included in the basis for pension computation. The short-term element shall not exceed 100 per cent of annual fixed salary and the long-term element shall not exceed 100 per cent of annual fixed salary. The maximum variable remuneration level shall be determined per individual, taking into account the total remuneration in relation to the specific role, the local market, the terms of employment or the individual performance.
Short-term performance targets shall include either organic growth, product development, earnings, cash flow, capital effi-ciency, sustainability, return or individual targets or a combination thereof. Long-term performance targets shall include either sus-tainability, total shareholder return (TSR) or a combination thereof and – in order to create a long-term perspective – be combined with requirements for senior executives to use the compensation net of tax to invest in the Essity share with a minimum holding period of three years.
The company shall have the possibility to withhold payment of variable remuneration where necessary and possible according to law, provided there are special reasons for so doing and such a measure is necessary to meet the company’s long-term interests, including its sustainability. Furthermore, the company shall have the possibility provided by applicable law to demand repayment of any variable remuneration paid based on erroneous grounds.
Pension and other benefitsPension benefits shall be contribution-defined, and the annual premium shall not exceed 40 per cent of the fixed annual salary. The retirement age shall normally be 65.
Other, lesser benefits may include medical insurance, company car, fitness allowance as well as membership and service fees, training/education and other support.
A notice of termination period of not more than two years shall apply upon termination of the employment relationship where the termination is initiated by the company, and of not more than one year where the termination is initiated by the executive. There shall be no severance pay.
Decision-making process and reportingMatters relating to remuneration to senior executives shall be addressed by the Board’s Remuneration Committee and, with respect to the President, decided upon by the Board. The duties of the Remuneration Committee shall also include preparing Board
decisions regarding proposals for guidelines for remuneration to senior executives, performing oversight as well as monitoring and assessing the application thereof. When the Board or the Remu-neration Committee addresses and decides on remuneration- related matters, senior executives may not be present insofar as the matter relates to them. With respect to the calculation of vari-able remuneration, an audit certificate must be obtained before any decision is taken regarding payment. In the preparation of the remuneration guidelines, consideration has been given to salary and employment conditions for the company’s other employees, such as information regarding total remuneration, components of the remuneration as well as the increase in remuneration and the rate of increase over time, and the company’s equality of opportunity policy.
The Board shall prepare a remuneration report.
Application of, and deviation from the guidelinesThe Board may decide to temporarily deviate from the guidelines, wholly or in part, if there are special reasons for doing so in an individual case and deviation is necessary to satisfy the compa-ny’s long-term interests, including its sustainability. The duties of the Remuneration Committee include preparing Board decisions on remuneration issues, including decisions regarding deviations from the guidelines. With respect to employment relationships governed by rules other than Swedish rules, appropriate adjust-ments may take place with respect to pension benefits and other benefits to ensure compliance with such rules or local practice, whereupon the overarching purpose of these guidelines shall be attained as far as possible.
The guidelines shall not take precedence over mandatory terms of employment law legislation or collective agreements. Nor shall they apply to already executed agreements.
Description of significant changes compared to previous guidelinesOther than editorial changes, these guidelines have been updated with respect to the Board of Directors’ proposal on implementa-tion of a new cash-based long-term incentive program.
These guidelines shall apply from the 2022 Annual General Meeting until further notice.”
For information on the company’s calculated expenses for remu-neration of senior executives, see Note C2 on pages 91–93.
31Essity’s Annual and Sustainability Report 2021 Group
Introduction The Essity share
Strategy Business areas SustainabilityGroup Corporate Governance Report
Financial statementsincluding notes
Essity data
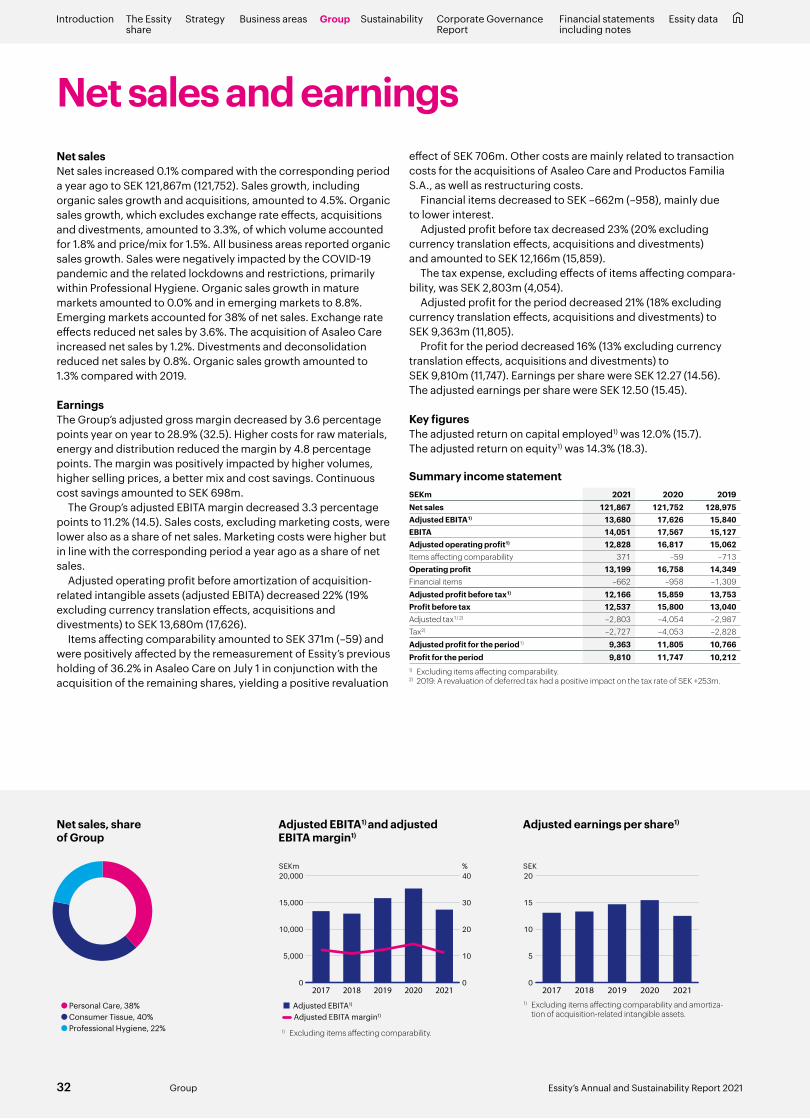
Net sales and earningsNet salesNet sales increased 0.1% compared with the corresponding period a year ago to SEK 121,867m (121,752). Sales growth, including organic sales growth and acquisitions, amounted to 4.5%. Organic sales growth, which excludes exchange rate effects, acquisitions and divestments, amounted to 3.3%, of which volume accounted for 1.8% and price/mix for 1.5%. All business areas reported organic sales growth. Sales were negatively impacted by the COVID-19 pandemic and the related lockdowns and restrictions, primarily within Professional Hygiene. Organic sales growth in mature markets amounted to 0.0% and in emerging markets to 8.8%. Emerging markets accounted for 38% of net sales. Exchange rate effects reduced net sales by 3.6%. The acquisition of Asaleo Care increased net sales by 1.2%. Divestments and deconsolidation reduced net sales by 0.8%. Organic sales growth amounted to 1.3% compared with 2019.
EarningsThe Group’s adjusted gross margin decreased by 3.6 percentage points year on year to 28.9% (32.5). Higher costs for raw materials, energy and distribution reduced the margin by 4.8 percentage points. The margin was positively impacted by higher volumes, higher selling prices, a better mix and cost savings. Continuous cost savings amounted to SEK 698m.
The Group’s adjusted EBITA margin decreased 3.3 percentage points to 11.2% (14.5). Sales costs, excluding marketing costs, were lower also as a share of net sales. Marketing costs were higher but in line with the corresponding period a year ago as a share of net sales.
Adjusted operating profit before amortization of acquisition- related intangible assets (adjusted EBITA) decreased 22% (19% excluding currency translation effects, acquisitions and divestments) to SEK 13,680m (17,626).
Items affecting comparability amounted to SEK 371m (–59) and were positively affected by the remeasurement of Essity’s previous holding of 36.2% in Asaleo Care on July 1 in conjunction with the acquisition of the remaining shares, yielding a positive revaluation
effect of SEK 706m. Other costs are mainly related to transaction costs for the acquisitions of Asaleo Care and Productos Familia S.A., as well as restructuring costs.
Financial items decreased to SEK –662m (–958), mainly due to lower interest.
Adjusted profit before tax decreased 23% (20% excluding currency translation effects, acquisitions and divestments) and amounted to SEK 12,166m (15,859).
The tax expense, excluding effects of items affecting compara-bility, was SEK 2,803m (4,054).
Adjusted profit for the period decreased 21% (18% excluding currency translation effects, acquisitions and divestments) to SEK 9,363m (11,805).
Profit for the period decreased 16% (13% excluding currency translation effects, acquisitions and divestments) to SEK 9,810m (11,747). Earnings per share were SEK 12.27 (14.56). The adjusted earnings per share were SEK 12.50 (15.45).
Key figuresThe adjusted return on capital employed1) was 12.0% (15.7). The adjusted return on equity1) was 14.3% (18.3).
Summary income statementSEKm 2021 2020 2019Net sales 121,867 121,752 128,975Adjusted EBITA1) 13,680 17,626 15,840EBITA 14,051 17,567 15,127Adjusted operating profit1) 12,828 16,817 15,062Items affecting comparability 371 –59 –713Operating profit 13,199 16,758 14,349Financial items –662 –958 –1,309Adjusted profit before tax1) 12,166 15,859 13,753Profit before tax 12,537 15,800 13,040Adjusted tax1) 2) –2,803 –4,054 –2,987Tax2) –2,727 –4,053 –2,828Adjusted profit for the period1) 9,363 11,805 10,766Profit for the period 9,810 11,747 10,2121) Excluding items affecting comparability.2) 2019: A revaluation of deferred tax had a positive impact on the tax rate of SEK +253m.
Adjusted EBITA1) and adjusted EBITA margin1)
Adjusted earnings per share1)Net sales, share of Group
1) Excluding items affecting comparability and amortiza-tion of acquisition-related intangible assets.
1) Excluding items affecting comparability.
Personal Care, 38% Consumer Tissue, 40% Professional Hygiene, 22%
38+40+22I0
5,000
10,000
15,000
20,000
20212020201920182017
SEKm %
0
10
20
30
40
0
5
10
15
20
20212020201920182017
SEK
Adjusted EBITA1)
Adjusted EBITA margin1)
32 Essity’s Annual and Sustainability Report 2021Group
Introduction The Essity share
Strategy Business areas SustainabilityGroup Corporate Governance Report
Financial statementsincluding notes
Essity data
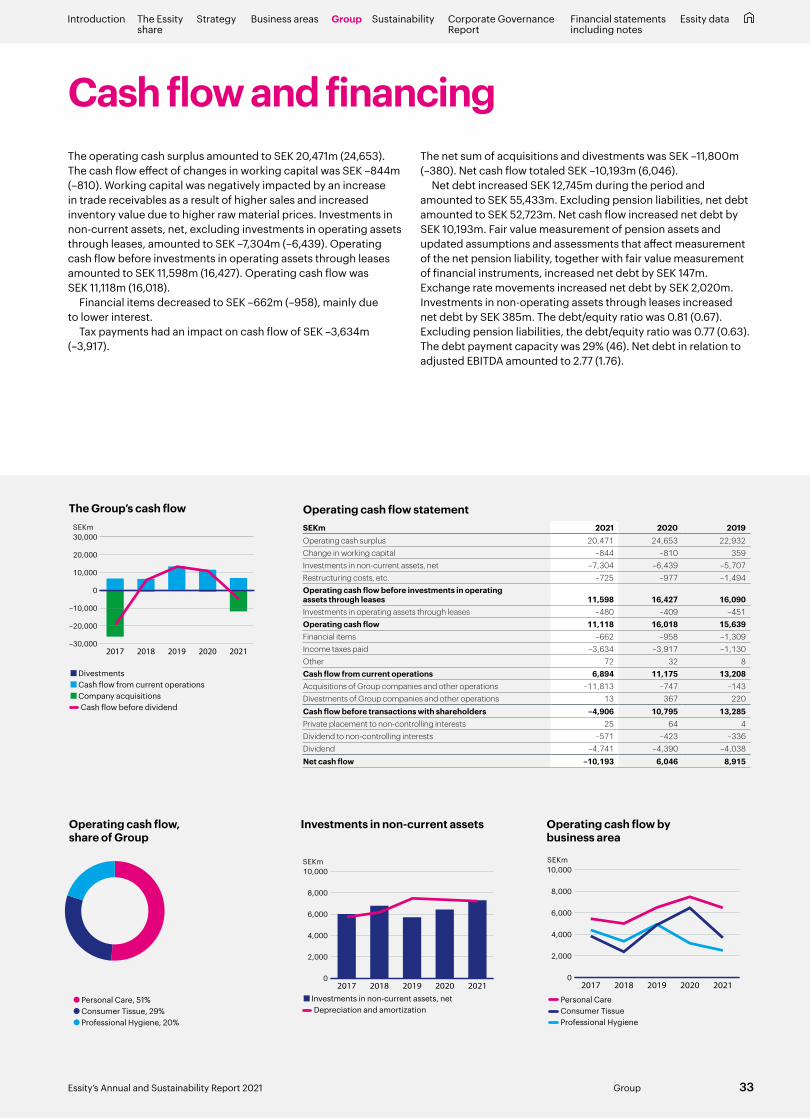
Cash flow and financingThe operating cash surplus amounted to SEK 20,471m (24,653). The cash flow effect of changes in working capital was SEK –844m (–810). Working capital was negatively impacted by an increase in trade receivables as a result of higher sales and increased inventory value due to higher raw material prices. Investments in non-current assets, net, excluding investments in operating assets through leases, amounted to SEK –7,304m (–6,439). Operating cash flow before investments in operating assets through leases amounted to SEK 11,598m (16,427). Operating cash flow was SEK 11,118m (16,018).
Financial items decreased to SEK –662m (–958), mainly due to lower interest.
Tax payments had an impact on cash flow of SEK –3,634m (–3,917).
The net sum of acquisitions and divestments was SEK –11,800m (–380). Net cash flow totaled SEK –10,193m (6,046).
Net debt increased SEK 12,745m during the period and amounted to SEK 55,433m. Excluding pension liabilities, net debt amounted to SEK 52,723m. Net cash flow increased net debt by SEK 10,193m. Fair value measurement of pension assets and updated assumptions and assessments that affect measurement of the net pension liability, together with fair value measurement of financial instruments, increased net debt by SEK 147m. Exchange rate movements increased net debt by SEK 2,020m. Investments in non-operating assets through leases increased net debt by SEK 385m. The debt/equity ratio was 0.81 (0.67). Excluding pension liabilities, the debt/equity ratio was 0.77 (0.63). The debt payment capacity was 29% (46). Net debt in relation to adjusted EBITDA amounted to 2.77 (1.76).
Operating cash flow statementSEKm 2021 2020 2019Operating cash surplus 20,471 24,653 22,932Change in working capital –844 –810 359Investments in non-current assets, net –7,304 –6,439 –5,707Restructuring costs, etc. –725 –977 –1,494Operating cash flow before investments in operating assets through leases 11,598 16,427 16,090Investments in operating assets through leases –480 –409 –451Operating cash flow 11,118 16,018 15,639Financial items –662 –958 –1,309Income taxes paid –3,634 –3,917 –1,130Other 72 32 8Cash flow from current operations 6,894 11,175 13,208Acquisitions of Group companies and other operations –11,813 –747 –143Divestments of Group companies and other operations 13 367 220Cash flow before transactions with shareholders –4,906 10,795 13,285Private placement to non-controlling interests 25 64 4Dividend to non-controlling interests –571 –423 –336Dividend –4,741 –4,390 –4,038Net cash flow –10,193 6,046 8,915
The Group’s cash flow
Operating cash flow, share of Group
Operating cash flow by business area
Investments in non-current assets
Personal Care Consumer Tissue Professional Hygiene
Investments in non-current assets, net Depreciation and amortization
Divestments Cash flow from current operations Company acquisitions
Cash flow before dividend
Personal Care, 51% Consumer Tissue, 29% Professional Hygiene, 20%
51+29+20I0
2,000
4,000
6,000
8,000
10,000
20212020201920182017
SEKm
0
2,000
4,000
6,000
8,000
10,000
20212020201920182017
SEKm
–30,000
–20,000
–10,000
0
10,000
20,000
30,000
20212020201920182017
SEKm
33Essity’s Annual and Sustainability Report 2021 Group
Introduction The Essity share
Strategy Business areas SustainabilityGroup Corporate Governance Report
Financial statementsincluding notes
Essity data

Assets and capital employedThe Group’s total assets increased 13% compared with the pre-ceding year, amounting to SEK 175,050m (154,645). Non-current assets increased SEK 12,518m compared with the preceding year to SEK 124,047m (111,529), of which property, plant and equipment amounted to SEK 58,918m (53,631) and intangible assets to SEK 59,609m (50,898).
Current assets totaled SEK 51,003m (43,116). Working capital amounted to SEK 11,157m (7,146). Capital employed was 17% higher and totaled SEK 123,934m (106,030).
EquityThe Group’s equity increased by SEK 5,165m during the period, to SEK 68,507m (63,342). Net profit for the period increased equity by SEK 9,810m. Equity decreased due to dividends to sharehold-ers of SEK 5,269m. Equity decreased net after tax by SEK 161m as a result of fair value measurement of pension assets and updated assumptions and assessments that affect the valuation of the pension liability. Fair value measurement of financial instruments increased equity by SEK 2,071m after tax. Exchange rate move-ments, including the effect of hedges of net foreign investments, after tax, increased equity by SEK 4,641m. Equity decreased by SEK 5,961m due to the acquisition of the non-controlling interest in Productos Familia S.A. Other items increased equity by SEK 34m.
FinancingThe Group’s interest-bearing gross debt amounted to SEK 54,419m (43,353) at year-end. The maturity period was 4.1 (3.1) years.
Net debt increased SEK 12,745m during the period compared with the same point in time last year and amounted to SEK 55,433m. Excluding pension liabilities, net debt amounted to SEK 52,723m. Net cash flow increased net debt by SEK 10,193m. Fair value measurement of pension assets and updated assump-tions and assessments that affect measurement of the net pension liability, together with fair value measurement of financial instru-ments, increased net debt by SEK 147m. Exchange rate move-ments increased net debt by SEK 2,020m. Investments in non- operating assets through leases increased net debt by SEK 385m.
Key figuresThe debt/equity ratio was 0.81 (0.67). Excluding pension liabilities, the debt/equity ratio was 0.77 (0.63). The visible equity/assets ratio was 34% (35). Adjusted return on capital employed and equity was 12.0% (15.7) and 14.3% (18.3), respectively. The capital turnover rate was 1.1 (1.1). At year-end, working capital amounted to 9% (6) of net sales.
Financial position
Consolidated capital employed by currency, SEKm2021 % 2020 % 2019 %
EUR 46,001 37 43,218 41 43,985 39USD 20,211 16 17,458 16 20,173 18CNY 19,904 16 17,750 17 17,376 15MXN 5,988 5 5,519 5 6,570 6GBP 5,843 5 4,794 5 5,432 5Other 25,993 21 17,291 16 20,205 17Total 123,940 100 106,030 100 113,741 100
Consolidated balance sheetSEKm 2021 2020 2019Intangible assets 59,609 50,898 55,763Property, plant and equipment 58,918 53,631 56,900Other non-current assets 5,520 7,000 7,651Total non-current assets 124,047 111,529 120,314Current assets 51,003 43,116 41,981Total assets 175,050 154,645 162,295Equity 68,507 63,342 62,801Non-current liabilities 59,648 50,230 56,214Current liabilities 46,895 41,073 43,280Total equity and liabilities 175,050 154,645 162,295Working capital 11,157 7,146 6,782Capital employed 123,940 106,030 113,741Net debt 55,433 42,688 50,940
Capital employed, share of Group
Adjusted return on capital employed and equity1)
Net debt and debt payment capacity
Adjusted return on capital employed1)
Adjusted return on equity1)
Net debt Debt payment capacity, %
1) Excluding items affecting comparability.
Personal Care, 38% Consumer Tissue, 42% Professional Hygiene, 20%
38+42+20I0
5
10
15
20
25
20212020201920182017
%
0
15,000
30,000
45,000
60,000
75,000
20212020201920182017
SEKm %
0
10
20
30
40
50
34 Essity’s Annual and Sustainability Report 2021Group
Introduction The Essity share
Strategy Business areas SustainabilityGroup Corporate Governance Report
Financial statementsincluding notes
Essity data
Based on current knowledge, the following are deemed to be the main factors that risk materially negatively impacting the operations and Essity’s ability to achieve established targets:
GDP trend and economic conditions
RiskDemand for Essity’s products is affected by general macroeconomic fluctuations and the resulting changes to customer purchasing power and consumption patterns. For example, a tighter budget situation in the public sector or among business customers influences sales in the healthcare sector and business-to-business, respectively. Sales to the retail sector, which accounts for the bulk of sales of hygiene products, may also be affected by reduced purchasing power among consumers.
Action Essity continuously works to manage the effect of cyclical fluc-tuations that arise, for example, through measures to reduce costs, increase efficiency and to create higher customer value through product innovations. Essity also works on differentia-tion to move toward product areas that are less sensitive to economic fluctuations.
Environmental impact and climate change
RiskEssity’s operations and the products used in the manufacturing pro-cess have an impact on air, water, land, biodiversity and the climate. Essity is subject to extensive environmental regulations. More strin-gent environmental requirements, remediation of the environment in connection with plant closures or breaches of permits could incur higher costs.
Read more about these risks on pages 41–42 and 46–49.
Action Essity’s strategy and sustainability targets stipulate guidelines for the Group’s measures within the environmental area. Envi-ronmental impact and the impact of climate change are part of the annual strategy process, which includes the identification, assessment and actions for managing these types of risks. Risks are managed, for example, through preventive work in the form of certified environmental management systems, environ-mental risk inspections in conjunction with acquisitions, and remediation projects in connection with plant closures. Essity has integrated a risk assessment of biodiversity into its risk management process. The use of energy, water, transport, pro-duction waste and raw materials is controlled using the com-pany’s Resource Management System (RMS). The system also enables the simulation of investments on the basis of climate aspects. The data is used for internal control and follow-up of established targets. Essity also works continuously to reduce the volume of production waste.
Read more about Essity’s actions on pages 41–42 and 46–49.
Risks and risk managementEssity is exposed to a number of strategic, operational and financial business risks, which could have a negative impact on the Group’s operations. Accordingly, it is of major importance that the company has a systematic and effective process to identify, manage and mitigate the effects of these risks.
Processes for risk managementThe responsibility for the management of business risks follows the company’s delegation scheme, from the Board of Directors to the President, and from the President to each Business Unit Pres-ident. The delegation scheme involves business risks being man-aged primarily by Essity’s business units with clear central coordi-nation and follow-up. Responsibility for certain specific risks, such as financial risks, insurable operational risks, information security, and ethics and human rights, is managed centrally.
Essity’s financial risk management is centralized. The Group’s internal bank handles financial risks and energy risks. The financial risks are managed in accordance with the Group’s finance policy, which is adopted by Essity’s Board of Directors. Together with
Essity’s energy risk policy, the finance policy constitutes a frame-work for financial risk management. The financial risks are compiled and continuously monitored. Responsibility for insurable opera-tional risks is managed by the Group’s insurance department.
Identification of business risks and risk management are a key part of the annual strategy process. Identified risks are assessed according to the likelihood of these becoming a reality and the potential impact each risk could have on the Group. This process also includes specifying who is responsible for managing the respective risk, and measures for how these shall be mitigated and followed up.
Essity has an internal audit function, which ensures up that the organization complies with the adopted policies.
35Essity’s Annual and Sustainability Report 2021 Group
Introduction The Essity share
Strategy Business areas SustainabilityGroup Corporate Governance Report
Financial statementsincluding notes
Essity data

Global health risks
RiskExtensive outbreaks of disease entail risks for Essity’s operations, not least in terms of the risks posed to our employees’ health and safety and their ability to carry out their work. Lockdowns, more stringent border security measures or other restrictions may cause disruptions at our production facilitates or in the supply chain. More extensive outbreaks of disease may also result in a temporary fall in demand for some of our products and changed consumer behavior.
Action In connection with extensive outbreaks of disease, the highest priority is to take action to safeguard the health of employees. Essity takes a series of measures adapted to the local opera-tions to reduce the risk of infection. Where necessary, the com-pany also modifies its solutions for sourcing of raw materials, storage and logistics, and has increased digital interaction.
Changes in demographics, consumer behavior and preferences
RiskChanging demographics, consumer behavior and preferences alter demand from customers and consumers. There is a risk of a decline in demand for our products if we do not successfully satisfy customer and consumer needs and adapt our innovation program, product portfolio, sales channels, brand-building activities and communication accordingly.
Action Customer and consumer insight constitute the core of Essity’s innovation work. Through knowledge about people’s daily needs and challenges, we create an offering that improves quality of life for users. We continuously analyze customer and consumer data and listen to consumers, customers, experts and opinion formers to improve our offering.
Political decisions and regulatory measures
RiskEssity conducts operations in many different countries. In some countries, the institutional structures are more established and developed, while the political, financial, legal and regulatory sys-tems in other countries are less predictable. In both cases, political changes and decisions, as well as amended legislation and regula-tions could have a negative impact on Essity’s operations in the form of higher costs or some other obstruction. In general, the regulatory requirements imposed on Essity’s operations, products and services are intensifying.
Action Essity works continuously to monitor, evaluate and anticipate changes in its business environment in the form of political decisions and amended regulations in the areas that are of importance for the business.
Essity participates in various national and international industry organizations, as well as in other types of partnerships. The aim is to gain early knowledge of, and to contribute actively with expertise and solutions to, the development of areas of significance to our operations. The public sector is both a significant customer and an important stakeholder group for Essity. The company is therefore working actively on matters relating to health and medical care, as well as care for the elderly.
Competition
RiskEssity is subject to considerable competition from other industry players offering similar products. Essity is also exposed to the risk that alternative products, solutions or business models that meet customer or consumer needs may replace Essity’s offering, which risks jeopardizing the company’s position in the market.
Action Essity’s focus on customer and consumer insight guides its innovation activities, ensuring that new products and services are attractive and competitive. Essity develops the company’s offering to meet the needs of customers and consumers in terms of the products themselves, and to ensure that they are provided in the relevant sales channels.
Read more about innovation on page 16.
36 Essity’s Annual and Sustainability Report 2021Group
Introduction The Essity share
Strategy Business areas SustainabilityGroup Corporate Governance Report
Financial statementsincluding notes
Essity data
Action Essity’s customer structure is relatively dispersed, with cus-tomers in many different geographies and areas of business. In 2021, Essity’s ten largest customers, most of them retail companies and distributors, accounted for 19.6% of net sales. The company works to maintain strong long-term customer relationships in strategic customer segments, and to build relationships with new customers. Essity is participating by increasing the share of e-commerce and also by aligning to the new and changing purchasing patterns.
Action Essity constantly monitors developments in a number of areas and addresses any legal risks that arise in cooperation with exter-nal advisers. Legal issues are often national, which means that local experts are also often engaged by Essity in various issues.
Action Essity has a program for regulatory compliance, which aims to minimize the risk of Essity taking part in or being associated with unlawful or unethical business practices or committing violations of human rights. The program is based on a Code of Conduct adopted by the Board of Directors. Within certain areas, such as corruption and competition regulations, Essity has an in-depth program for risk evaluations, audits of third parties and various training courses for employees. The imple-mentation of the regulatory compliance program is reported continuously to the Compliance Council, which includes parts of the Essity management team and where internal audit has an opportunity to take part in work.
Action Essity strives to create and maintain a balance between loss-prevention activities and insurance coverage. Essity invests continuously in loss-prevention measures. These efforts are conducted in accordance with established guidelines that include repeated risk inspections carried out by external risk engineers. Other important elements of loss-prevention activi-ties are maintenance of production plants and machinery, staff training, and orderliness. All wholly owned facilities are insured at replacement cost and for the loss of income. Within the EU, insurance is primarily conducted within the company’s own insurance company, with external reinsurance for major dam-ages. Outside the EU, Essity cooperates with market-leading insurance companies.
Action Through annual staffing, competency and succession planning, Essity ensures that employees are recruited and that these remain with the company and develop the right skills. Essity continuously strives to build a reputation for the company as an attractive employer, highlighting health and safety in the workplace, health promotion, market-based and competitive forms of employment, continuous learning and the possibility to take on new challenges in the Group. A modern and attractive corporate culture also plays a highly significant role in the recruitment of employees.
Read more about Essity’s actions on pages 50–52.
Dependence on major customers and sales channels
RiskEssity’s products are sold through retailers, pharmacies, e-com-merce, distributors and resellers. Retail represents the single largest customer category. If these players are not successful in selling Essi-ty’s products, this could have a negative impact on Essity’s earnings. In general, there is a consolidation trend in several of Essity’s sales channels and markets, particularly in the retail trade, through merg-ers and purchasing alliances, which could increase dependence on individual, large customers.
Legal risks
RiskLegal risks comprise various risks in, to some extent, diverse areas. Amended legislation, violations of laws in the operations or errors in any agreements signed by Essity, are examples of legal risks that could have negative financial implications for Essity. In certain instances, they may also entail protracted and costly legal processes.
Unethical business practices
RiskEssity works in a large number of countries and in environments where unethical business practices and violations of human rights may occur. The risk of such business practices is deemed to be very serious. The financial consequences of violations may be very severe in the form of various sanctions and fines. Violations also risk having a negative impact on the company’s reputation.
Production facilities
RiskEssity has around 90 production facilities in some 30 countries. Fires, machinery breakdowns and other types of harmful incidents in plants could lead to considerable value destruction, and loss of production and income, which ultimately, could have a negative impact on Essity’s market position.
Employees
RiskTo meet its targets, Essity is dependent on being able to recruit, retain and develop qualified and motivated employees. There is high competition for skilled employees.
37Essity’s Annual and Sustainability Report 2021 Group
Introduction The Essity share
Strategy Business areas SustainabilityGroup Corporate Governance Report
Financial statementsincluding notes
Essity data

Action Essity has a management model for IT that contains governance, standardized processes and an organization for information security. Actions within the areas of information and cyber secu-rity are carried out on the basis of continuous risk assessments. Technical protection, such as preventive, detective, responsive and restorative measures are implemented, in addition to reg-ular security training courses for each employee. Standardized procedures are in place for implementing and changing systems and IT services, as well as for daily operations. The head of Global Operational Services, who is a member of the company’s Executive Management Team, is responsible for managing IT and information security-related risks.
Action Essity manages the energy price risk related to electricity and natural gas centrally. According to Essity’s Energy Risk Policy, these price risks can be hedged for a period of up to 36 months. Exceptions are made for regulated and non-hedgeable markets. Energy prices are hedged through financial instruments and, in part, through fixed pricing in existing supply contracts.
Essity safeguards the supply of electricity and natural gas through centrally negotiated supply contracts. The portfolio of supply contracts and financial hedges is effectively spread to min-imize Essity’s counterparty risk. In 2021, Essity purchased about 5 TWh (5; 5) of electricity and about 7 TWh (7; 8) of natural gas.
The graph shows Essity’s price hedges in relation to forecast consumption of electricity and natural gas for the next three years. The graph includes financial hedges and hedging effected via supply contracts.
Action Essity enters into supply contracts of various durations that ensure the supply of key input goods. The Group has several suppliers for essentially all important input goods. In-depth col-laboration also occurs with specially selected suppliers in the development of materials and processes. Essity continuously evaluates its suppliers to ensure compliance with agreements entered into. Particular importance is placed on suppliers oper-ating in countries and industries deemed to be more vulnerable to risks. Key suppliers are assessed through ques-tionnaires, on-site visits or independent audits.
Action Fiber (pulp and recovered paper) is a significant cost, mainly in the Consumer Tissue and Professional Hygiene business areas. Essity is evaluating alternative types of fiber, such as straw from wheat as a means of diversifying fiber sourcing in the future. The cost of oil-based materials is driven by the trend in oil prices and represents a major cost in the Personal Care business area and for various packaging materials. The trend in oil prices also impacts transport costs. The impact of price movements on input goods can be delayed through purchasing agreements with fixed durations. Efficiency improvements in the company’s operations, altered product specifications and price increases are examples of measures to offset the effect of rising costs for input goods.
Essity’s costs for input goods are described on page 142.
Information and IT
RiskEssity is dependent on IT systems and information security. Disrup-tions or faults in critical systems, as well as the increasing preva-lence of cyber-attacks, may have a direct impact on production and other important business processes. Errors in financial systems may affect the company’s reporting of results.
Suppliers
RiskEssity is dependent on a large number of suppliers. A sudden loss of key input goods could result in increased costs and disruptions to the company’s production. Suppliers could also cause problems for Essity through non-compliance with applicable legislation and guidelines or by otherwise acting in an unethical manner.
Cost of input goods
RiskInput goods account for a considerable part of Essity’s total operat-ing expenses. The market price of input goods fluctuates over time and could influence Essity’s earnings positively or negatively. The price trend for a number of input goods over the past ten years is presented in the diagram below.
Highest/lowest market prices (annual average) 2011–2021 per input goods
Index
0
25
50
75
100
125
150
Recovered paper – SOP (USD)
Pulp – EUCA (USD)
Oil-based material –Propylene (SAP) (EUR)Average price for the period
Recovered paper – SOP (EUR)Pulp – NBSK (USD)
Energy price
RiskEnergy price risk is the risk that increased energy prices could adversely impact Essity’s operating profit. Essity is exposed to movements in the prices of electricity and natural gas, but the prices of other energy commodities also directly and indirectly impact Essity’s operating profit.
For further information concerning financial price hedges, see Note E6 Derivatives and hedge accounting on page 104.
Energy price hedges in relation to forecast consumption, December 31, 2021
ElectricityNatural gas
%
0
10
20
30
40
50
60
202420232022
38 Essity’s Annual and Sustainability Report 2021Group
Introduction The Essity share
Strategy Business areas SustainabilityGroup Corporate Governance Report
Financial statementsincluding notes
Essity data
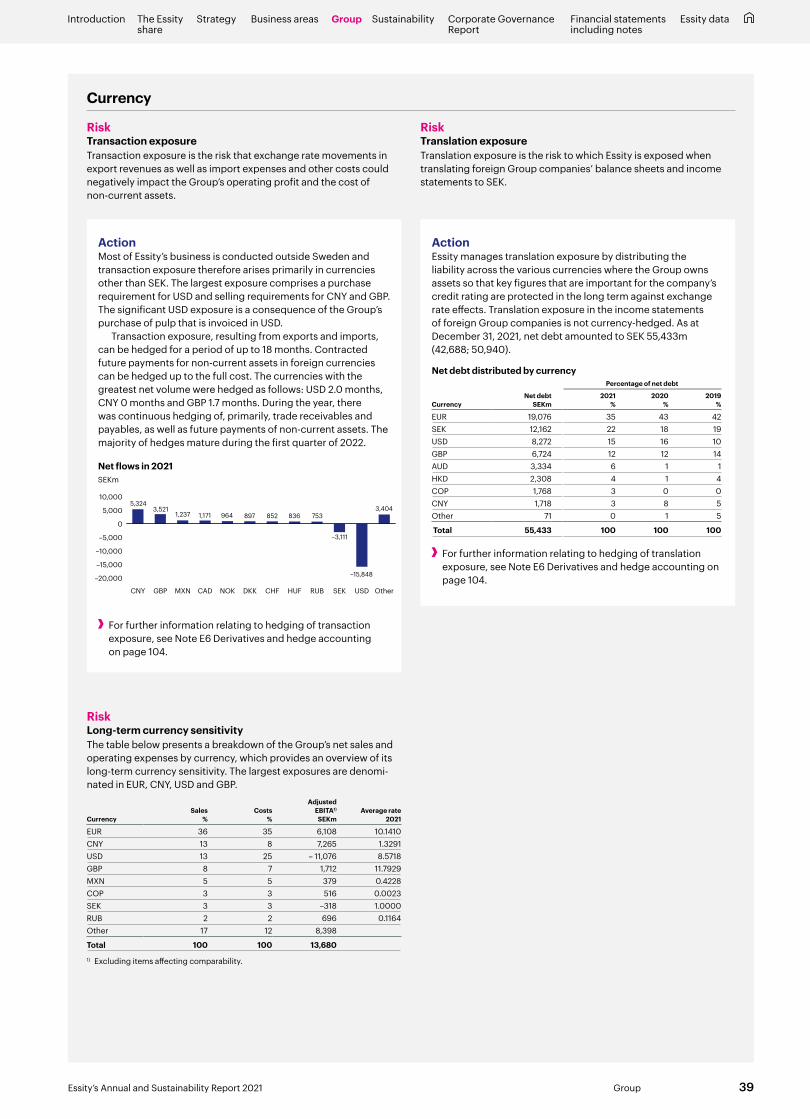
Action Most of Essity’s business is conducted outside Sweden and transaction exposure therefore arises primarily in currencies other than SEK. The largest exposure comprises a purchase requirement for USD and selling requirements for CNY and GBP. The significant USD exposure is a consequence of the Group’s purchase of pulp that is invoiced in USD.
Transaction exposure, resulting from exports and imports, can be hedged for a period of up to 18 months. Contracted future payments for non-current assets in foreign currencies can be hedged up to the full cost. The currencies with the greatest net volume were hedged as follows: USD 2.0 months, CNY 0 months and GBP 1.7 months. During the year, there was continuous hedging of, primarily, trade receivables and payables, as well as future payments of non-current assets. The majority of hedges mature during the first quarter of 2022.
Net flows in 2021
Currency
RiskTransaction exposureTransaction exposure is the risk that exchange rate movements in export revenues as well as import expenses and other costs could negatively impact the Group’s operating profit and the cost of non-current assets.
RiskTranslation exposureTranslation exposure is the risk to which Essity is exposed when translating foreign Group companies’ balance sheets and income statements to SEK.
SEKm
–20,000
–15,000
–10,000
–5,000
0
5,000
10,000
OtherUSDSEKRUBHUFCHFDKKNOKCADMXNGBPCNY
5,3243,521
1,237 1,171 964 897 852 836 7533,404
–3,111
–15,848
For further information relating to hedging of transaction exposure, see Note E6 Derivatives and hedge accounting on page 104.
Action Essity manages translation exposure by distributing the liability across the various currencies where the Group owns assets so that key figures that are important for the company’s credit rating are protected in the long term against exchange rate effects. Translation exposure in the income statements of foreign Group companies is not currency-hedged. As at December 31, 2021, net debt amounted to SEK 55,433m (42,688; 50,940).
Net debt distributed by currencyPercentage of net debt
CurrencyNet debt
SEKm2021
%2020
%2019
%
EUR 19,076 35 43 42SEK 12,162 22 18 19USD 8,272 15 16 10GBP 6,724 12 12 14AUD 3,334 6 1 1HKD 2,308 4 1 4COP 1,768 3 0 0CNY 1,718 3 8 5Other 71 0 1 5
Total 55,433 100 100 100
For further information relating to hedging of translation exposure, see Note E6 Derivatives and hedge accounting on page 104.
RiskLong-term currency sensitivityThe table below presents a breakdown of the Group’s net sales and operating expenses by currency, which provides an overview of its long-term currency sensitivity. The largest exposures are denomi-nated in EUR, CNY, USD and GBP.
CurrencySales
%Costs
%
Adjusted EBITA1) SEKm
Average rate 2021
EUR 36 35 6,108 10.1410CNY 13 8 7,265 1.3291USD 13 25 – 11,076 8.5718GBP 8 7 1,712 11.7929MXN 5 5 379 0.4228COP 3 3 516 0.0023SEK 3 3 –318 1.0000RUB 2 2 696 0.1164Other 17 12 8,398
Total 100 100 13,6801) Excluding items affecting comparability.
39Essity’s Annual and Sustainability Report 2021 Group
Introduction The Essity share
Strategy Business areas SustainabilityGroup Corporate Governance Report
Financial statementsincluding notes
Essity data
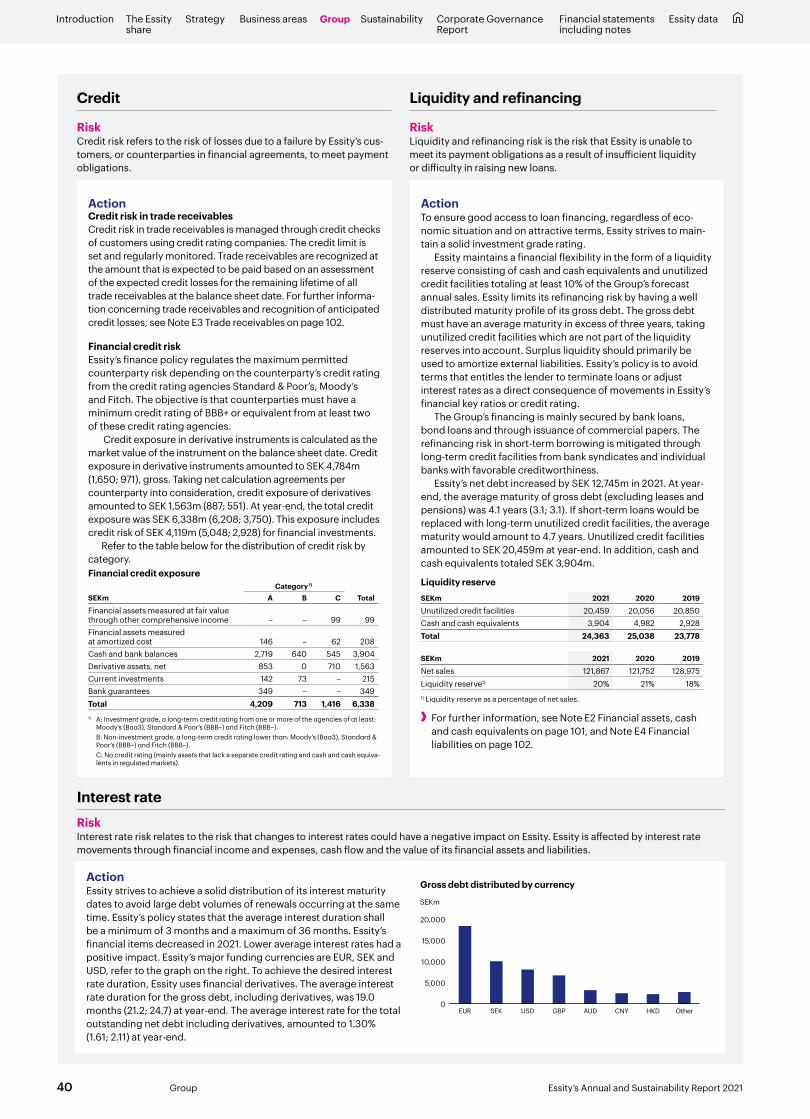
Action Credit risk in trade receivablesCredit risk in trade receivables is managed through credit checks of customers using credit rating companies. The credit limit is set and regularly monitored. Trade receivables are recognized at the amount that is expected to be paid based on an assessment of the expected credit losses for the remaining lifetime of all trade receivables at the balance sheet date. For further informa-tion concerning trade receivables and recognition of anticipated credit losses, see Note E3 Trade receivables on page 102.
Financial credit riskEssity’s finance policy regulates the maximum permitted counterparty risk depending on the counterparty’s credit rating from the credit rating agencies Standard & Poor’s, Moody’s and Fitch. The objective is that counterparties must have a minimum credit rating of BBB+ or equivalent from at least two of these credit rating agencies.
Credit exposure in derivative instruments is calculated as the market value of the instrument on the balance sheet date. Credit exposure in derivative instruments amounted to SEK 4,784m (1,650; 971), gross. Taking net calculation agreements per counterparty into consideration, credit exposure of derivatives amounted to SEK 1,563m (887; 551). At year-end, the total credit exposure was SEK 6,338m (6,208; 3,750). This exposure includes credit risk of SEK 4,119m (5,048; 2,928) for financial investments.
Refer to the table below for the distribution of credit risk by category.Financial credit exposure
Category 1)
SEKm A B C Total
Financial assets measured at fair value through other comprehensive income – – 99 99Financial assets measured at amortized cost 146 – 62 208Cash and bank balances 2,719 640 545 3,904Derivative assets, net 853 0 710 1,563Current investments 142 73 – 215Bank guarantees 349 – – 349Total 4,209 713 1,416 6,3381) A: Investment grade, a long-term credit rating from one or more of the agencies of at least:
Moody’s (Baa3), Standard & Poor’s (BBB–) and Fitch (BBB–). B: Non-investment grade, a long-term credit rating lower than: Moody’s (Baa3), Standard &
Poor’s (BBB–) and Fitch (BBB–). C: No credit rating (mainly assets that lack a separate credit rating and cash and cash equiva-
lents in regulated markets).
Action To ensure good access to loan financing, regardless of eco-nomic situation and on attractive terms, Essity strives to main-tain a solid investment grade rating.
Essity maintains a financial flexibility in the form of a liquidity reserve consisting of cash and cash equivalents and unutilized credit facilities totaling at least 10% of the Group’s forecast annual sales. Essity limits its refinancing risk by having a well distributed maturity profile of its gross debt. The gross debt must have an average maturity in excess of three years, taking unutilized credit facilities which are not part of the liquidity reserves into account. Surplus liquidity should primarily be used to amortize external liabilities. Essity’s policy is to avoid terms that entitles the lender to terminate loans or adjust interest rates as a direct consequence of movements in Essity’s financial key ratios or credit rating.
The Group’s financing is mainly secured by bank loans, bond loans and through issuance of commercial papers. The refinancing risk in short-term borrowing is mitigated through long-term credit facilities from bank syndicates and individual banks with favorable creditworthiness.
Essity’s net debt increased by SEK 12,745m in 2021. At year-end, the average maturity of gross debt (excluding leases and pensions) was 4.1 years (3.1; 3.1). If short-term loans would be replaced with long-term unutilized credit facilities, the average maturity would amount to 4.7 years. Unutilized credit facilities amounted to SEK 20,459m at year-end. In addition, cash and cash equivalents totaled SEK 3,904m.
Liquidity reserveSEKm 2021 2020 2019
Unutilized credit facilities 20,459 20,056 20,850Cash and cash equivalents 3,904 4,982 2,928Total 24,363 25,038 23,778
SEKm 2021 2020 2019
Net sales 121,867 121,752 128,975Liquidity reserve1) 20% 21% 18%1) Liquidity reserve as a percentage of net sales.
For further information, see Note E2 Financial assets, cash and cash equivalents on page 101, and Note E4 Financial liabilities on page 102.
Credit
RiskCredit risk refers to the risk of losses due to a failure by Essity’s cus-tomers, or counterparties in financial agreements, to meet payment obligations.
Liquidity and refinancing
RiskLiquidity and refinancing risk is the risk that Essity is unable to meet its payment obligations as a result of insufficient liquidity or difficulty in raising new loans.
Action Essity strives to achieve a solid distribution of its interest maturity dates to avoid large debt volumes of renewals occurring at the same time. Essity’s policy states that the average interest duration shall be a minimum of 3 months and a maximum of 36 months. Essity’s financial items decreased in 2021. Lower average interest rates had a positive impact. Essity’s major funding currencies are EUR, SEK and USD, refer to the graph on the right. To achieve the desired interest rate duration, Essity uses financial derivatives. The average interest rate duration for the gross debt, including derivatives, was 19.0 months (21.2; 24.7) at year-end. The average interest rate for the total outstanding net debt including derivatives, amounted to 1.30% (1.61; 2.11) at year-end.
Interest rateRiskInterest rate risk relates to the risk that changes to interest rates could have a negative impact on Essity. Essity is affected by interest rate movements through financial income and expenses, cash flow and the value of its financial assets and liabilities.
Gross debt distributed by currency
SEKm
0
5,000
10,000
15,000
20,000
OtherHKDCNYAUDGBPUSDSEKEUR
40 Essity’s Annual and Sustainability Report 2021Group
Introduction The Essity share
Strategy Business areas SustainabilityGroup Corporate Governance Report
Financial statementsincluding notes
Essity data
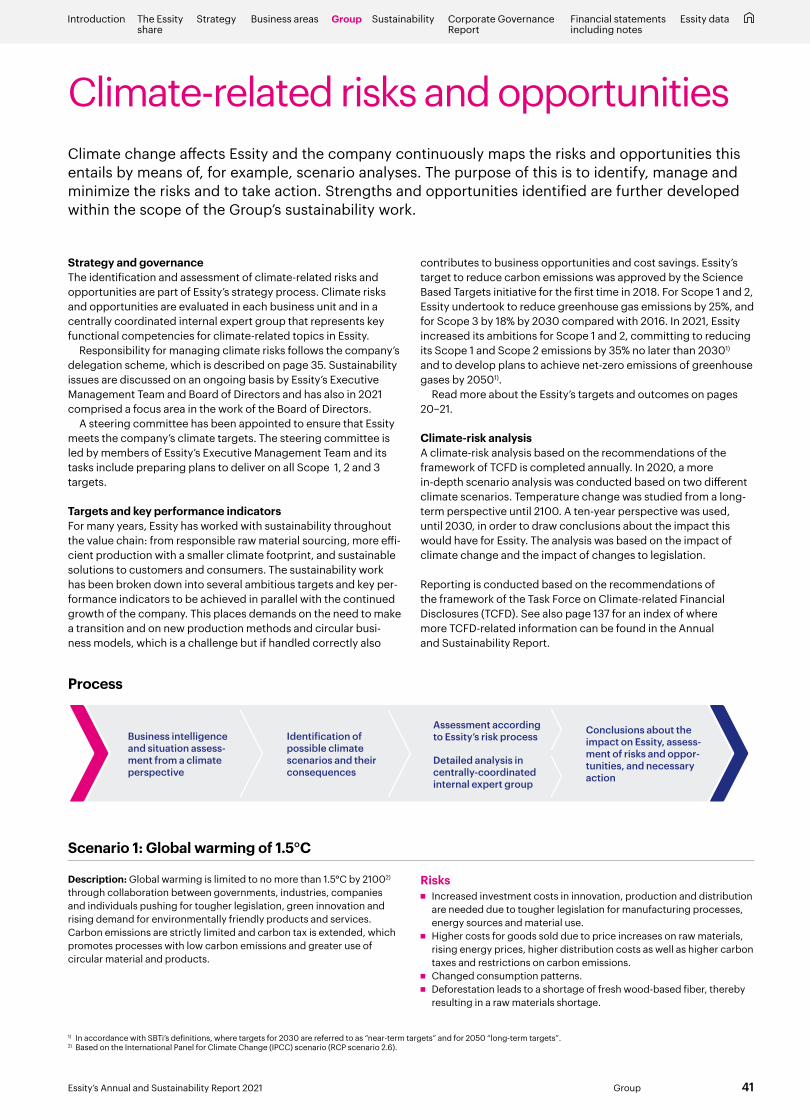
Climate-related risks and opportunitiesClimate change affects Essity and the company continuously maps the risks and opportunities this entails by means of, for example, scenario analyses. The purpose of this is to identify, manage and minimize the risks and to take action. Strengths and opportunities identified are further developed within the scope of the Group’s sustainability work.
Strategy and governanceThe identification and assessment of climate-related risks and opportunities are part of Essity’s strategy process. Climate risks and opportunities are evaluated in each business unit and in a centrally coordinated internal expert group that represents key functional competencies for climate-related topics in Essity.
Responsibility for managing climate risks follows the company’s delegation scheme, which is described on page 35. Sustainability issues are discussed on an ongoing basis by Essity’s Executive Management Team and Board of Directors and has also in 2021 comprised a focus area in the work of the Board of Directors.
A steering committee has been appointed to ensure that Essity meets the company’s climate targets. The steering committee is led by members of Essity’s Executive Management Team and its tasks include preparing plans to deliver on all Scope 1, 2 and 3 targets.
Targets and key performance indicatorsFor many years, Essity has worked with sustainability throughout the value chain: from responsible raw material sourcing, more effi-cient production with a smaller climate footprint, and sustainable solutions to customers and consumers. The sustainability work has been broken down into several ambitious targets and key per-formance indicators to be achieved in parallel with the continued growth of the company. This places demands on the need to make a transition and on new production methods and circular busi-ness models, which is a challenge but if handled correctly also
contributes to business opportunities and cost savings. Essity’s target to reduce carbon emissions was approved by the Science Based Targets initiative for the first time in 2018. For Scope 1 and 2, Essity undertook to reduce greenhouse gas emissions by 25%, and for Scope 3 by 18% by 2030 compared with 2016. In 2021, Essity increased its ambitions for Scope 1 and 2, committing to reducing its Scope 1 and Scope 2 emissions by 35% no later than 20301) and to develop plans to achieve net-zero emissions of greenhouse gases by 20501).
Read more about the Essity’s targets and outcomes on pages 20–21.
Climate-risk analysisA climate-risk analysis based on the recommendations of the framework of TCFD is completed annually. In 2020, a more in-depth scenario analysis was conducted based on two different climate scenarios. Temperature change was studied from a long-term perspective until 2100. A ten-year perspective was used, until 2030, in order to draw conclusions about the impact this would have for Essity. The analysis was based on the impact of climate change and the impact of changes to legislation.
Reporting is conducted based on the recommendations of the framework of the Task Force on Climate-related Financial Disclosures (TCFD). See also page 137 for an index of where more TCFD-related information can be found in the Annual and Sustainability Report.
Conclusions about the impact on Essity, assess-ment of risks and oppor-tunities, and necessary action
Assessment according to Essity’s risk process
Detailed analysis in centrally-coordinated internal expert group
Identification of possible climatescenarios and their consequences
Business intelligence and situation assess-ment from a climate perspective
1) In accordance with SBTi’s definitions, where targets for 2030 are referred to as “near-term targets” and for 2050 “long-term targets”.2) Based on the International Panel for Climate Change (IPCC) scenario (RCP scenario 2.6).
Process
Scenario 1: Global warming of 1.5°C
Description: Global warming is limited to no more than 1.5°C by 21002) through collaboration between governments, industries, companies and individuals pushing for tougher legislation, green innovation and rising demand for environmentally friendly products and services. Carbon emissions are strictly limited and carbon tax is extended, which promotes processes with low carbon emissions and greater use of circular material and products.
Risks ■ Increased investment costs in innovation, production and distribution
are needed due to tougher legislation for manufacturing processes, energy sources and material use.
■ Higher costs for goods sold due to price increases on raw materials, rising energy prices, higher distribution costs as well as higher carbon taxes and restrictions on carbon emissions.
■ Changed consumption patterns. ■ Deforestation leads to a shortage of fresh wood-based fiber, thereby
resulting in a raw materials shortage.
41Essity’s Annual and Sustainability Report 2021 Group
Introduction The Essity share
Strategy Business areas SustainabilityGroup Corporate Governance Report
Financial statementsincluding notes
Essity data
Actions ■ Essity has contingency plans in place in high-risk countries and
is continuously working to safeguard production and sourcing of input goods.
■ All of Essity’s production facilities and associated distribution centers (regardless of their location) are obligated to follow Essity’s loss-prevention policies, not only for fire, explosion, and machinery breakdowns but also for climate-related risks. In addi-tion to contingency plans, this may involve tangible measures such as reinforcements for roofs and doors against wind, shut-off valves for gas in the event of an earthquake, or various custom-izations to keep rapidly rising water outside of a plant or ware-house. Essity has also engaged the services of external consul-tants to model the company’s exposure to natural catastrophes where possible and is working with loss-prevention activities.
■ Reduced resource consumption, efficiency enhancements, altered product specifications and price increases.
■ See also actions under Scenario 1.
Actions ■ Investment decisions consider both financial and environmental
impact. Investments are made in state-of-the-art technology, improving process efficiency and reducing carbon emissions. Through “Industry 4.0” and the development of smart produc-tion facilities, Essity is achieving more efficient production, shorter lead times, higher quality and lower environmental impact.
■ Essity researches and invests in several ground-breaking ideas in sustainable technology in its manufacturing processes with the aim of reducing the company’s environmental impact and setting new standards for the entire industry.
■ In 2021, Essity commenced production of pulp from alternative fiber at its facility in Mannheim, Germany. The production facility produces high-quality pulp from wheat straw, using less water, energy and chemicals as well as reducing carbon emissions. This will also offer Essity access to a new source of raw materials, which may over time reduce the company’s exposure to wood-based pulp.
■ Reduced resource consumption, efficiency enhancements, altered product specifications and price increases.
Opportunities ■ Competitive advantages through Essity’s long-term and robust efforts
to achieve lower resource use, innovative green production methods and lower carbon emissions.
■ Changed consumption patterns in the form of increased demand for sustainable solutions with a smaller climate footprint, rewarding companies with a strong sustainability profile, which also attracts new employees.
■ Investments in and development of new business models in addition to green solutions attract more customers and consumers.
■ Leading hygiene and health solutions are prioritized.
Description: Global warming of 4°C in 21001), due to the failure to effectively reduce emissions and other negative environmental impacts. Extreme weather become more frequent. Sea levels continue to rise, desertification and deforestation continues. Access to key resources such as raw materials, energy, water and food declines, resulting in greater volatility and uncertainty for prices and food security.
Risks ■ Production disruptions due to extreme weather, which may result
in water shortages and excessively high water temperatures, for example.
■ Rising insurance costs and costs for reconstruction following extreme weather.
■ Increased investments required to safeguard stable production and supply chain.
■ Significantly higher cost for sold goods as resource scarcity leads to higher prices for raw materials, energy, water and distribution.
■ Deforestation leads to a shortage of fresh wood-based fiber, thereby resulting in a raw materials shortage.
■ Lower living standards and changed consumption behavior.
Opportunities ■ Competitive advantages from safeguarded production and sourcing
in regions at risk. ■ Leading hygiene and health solutions are prioritized.
Scenario 1: Global warming of 1.5°C, cont.
Scenario 2: Global warming of 4°C
■ Essity prioritizes emissions-effective transport methods for long-distance transportation. The company has a strong focus on and prioritizes vehicle types that meet the requirements of the latest environmental and emissions classes combined with the most up-to-date alternatives, such as CNG fuel and electric trucks. Essity participates in various local projects and partner-ships with customers and suppliers to jointly reduce carbon emissions from transportation.
■ The targets for carbon emission reductions were approved by the Science Based Targets initiative in 2018. To ensure that it meets the climate targets, Essity has appointed a steering com-mittee led by members of Essity’s Executive Management Team.
■ New offerings, business models and partnerships are under development in Essity that contribute to a more sustainable soci-ety and reduce the environmental impact of the company, and of customers and consumers. For example, washable absorbent underwear has been launched that facilitates reuse, the propor-tion of renewable material has increased in the company’s pack-aging, and more customers are using Tork PaperCircle®, which is the world’s first recycling service for paper hand towels.
■ Essity urges its suppliers to work in a manner that promotes increased sustainability and several of Essity’s major raw material suppliers have their own ambitious sustainability targets that are often approved by Science Based Targets initiative.
■ Essity strives to increase the use of recycled and renewable material in packaging and products.
■ Essity offers leading hygiene and health solutions to improve people’s well-being all over the world. When people fulfill the most basic needs for food and shelter, the next priority is hygiene and health. Awareness of the importance of hygiene and health is increasing globally.
■ Essity’s target for sourcing of fresh fiber means that all wood-based fresh fiber is to be FSC™ or PEFC™ certified, meaning sourced from responsibly managed forests that promote the principles of biodiversity and forest conservation.
1) Based on the International Panel for Climate Change (IPCC) scenario (RCP scenario 6–8.5).
42 Essity’s Annual and Sustainability Report 2021Group
Introduction The Essity share
Strategy Business areas SustainabilityGroup Corporate Governance Report
Financial statementsincluding notes
Essity data

Essity’s sustainability workEssity improves people’s well-being through leading solutions and expertise in hygiene and health. Sustainability is and has been high on our agenda for many years. We have achieved major progress in the field and continue to raise our ambitions. To reduce our environmental impact, we have set a commitment to reach net-zero emissions of greenhouse gases by 2050. During the year, we also set new ambitions to increase diversity, equity and inclusion.
Improved well-being Page 44
■ Hygiene and health ■ Transparency and safe products ■ More inclusive society ■ Partnerships and collaboration
Reduced environmental impact Page 46
■ Climate impact ■ Biodiversity and ecosystems ■ Recycling and less plastic use
Attractive and engaging employer Page 50
■ A culture that makes a difference and motivates
■ Building for the future ■ An inclusive workplace ■ Sustainable working environment ■ Employee relations
Business ethics and human rights Page 53
■ Code of Conduct ■ Reporting breaches ■ Risk management ■ Compliance and monitoring
Read more onTargets and outcomes ............................................................... pages 20–21Contribution to the UN Sustainable Development Goals ..page 21
Leading in sustainability ......................................................................page 18Essity’s sustainability work ............... www.essity.com/sustainability
Read about Essity’s sustainability work
Sustainability governance Page 54
■ Purpose, implementation and follow-up ■ External regulations and internal
steering documents ■ EU taxonomy ■ Sustainability indexes and rankings
43Essity’s Annual and Sustainability Report 2021 Sustainability
Introduction The Essity share
Strategy Business areas SustainabilityGroup Corporate Governance Report
Financial statementsincluding notes
Essity data

Hygiene and healthIn pace with the growth of the world’s population and rise in aver-age life expectancy, the need and demand for hygiene and health products and services are increasing. As we expand and broaden our product range, we offer more customers and consumers knowledge about and access to hygiene and health solutions, which is important to stop the spread of disease and to help improve public health.
Our products and services play an important role in improving well-being and quality of life among people at various stages of life. Many people worldwide avoid going to school or work due to menstruation or incontinence. Our solutions for incontinence, menstruation, wound care and lymphedema create the precon-ditions for people to participate more in everyday life and to live more actively.
We constantly strive to develop our solutions, including the use of digitalization. More connected solutions enable, for example, better incontinence care, custom-fitting of compression gar-ments, diagnosis of wound care and improved public hygiene solutions.
Improved well-beingHygiene and health are fundamental to people’s well-being in all phases of life, in all parts of the world. We increase access to hygiene and health solutions, develop products and services that enhance quality of life, use our expertise to drive dialogue, educate and contribute to a more inclusive society.
Transparency and safe productsOur highest priority is the well-being of our customers and con-sumers. This is why we never compromise on the safety or quality of our products. To ensure this throughout a product’s entire life cycle, we have extensive requirements and procedures in place, which our internal experts continuously improve in accordance with a certified quality system. Essity collaborates with external experts in toxicology and life science to guarantee independent reviews. Every product or product component Essity receives from third parties must also comply with Essity’s product safety and chemicals criteria according to the specifications in the company’s Global Supplier Standard. Internal business practices ensure that information that may be relevant for product safety, including complaints and feedback from consumers and custom-ers as well as quality incidents, are part of the product safety con-cept. Essity also actively participates in public debate on product safety.
44 Essity’s Annual and Sustainability Report 2021Sustainability
Introduction The Essity share
Strategy Business areas SustainabilityGroup Corporate Governance Report
Financial statementsincluding notes
Essity data
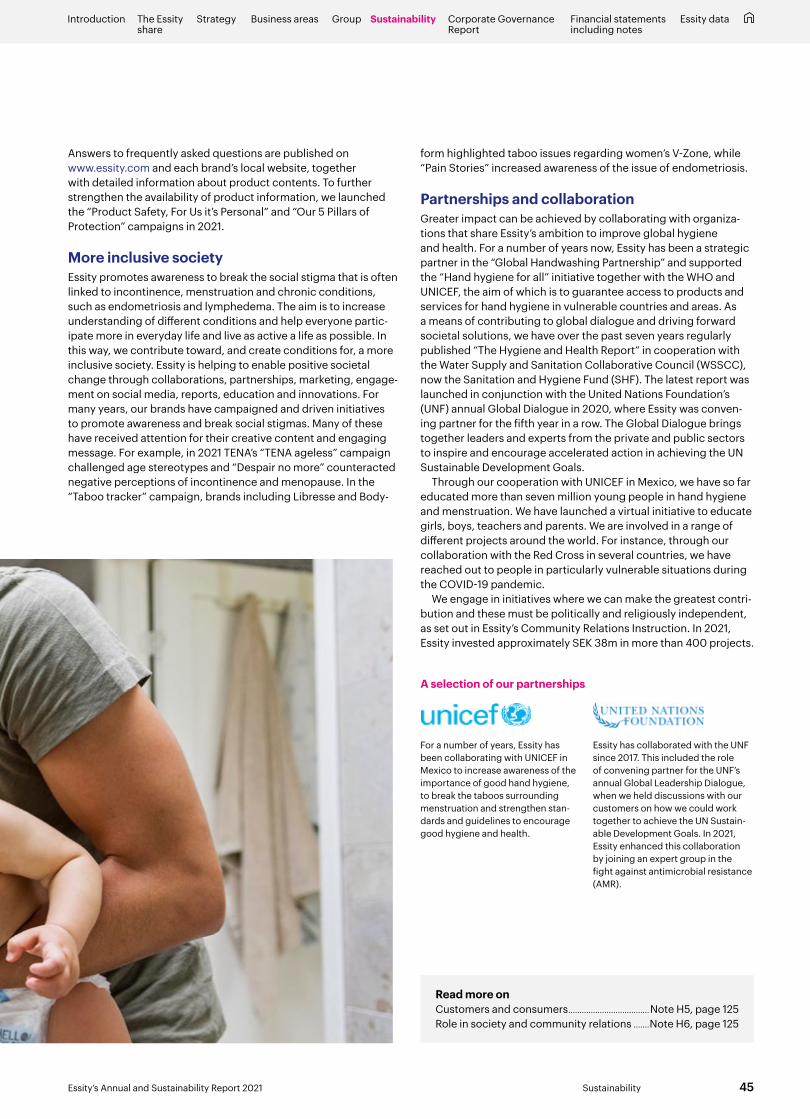
Read more onCustomers and consumers ....................................Note H5, page 125Role in society and community relations .......Note H6, page 125
Answers to frequently asked questions are published on www.essity.com and each brand’s local website, together with detailed information about product contents. To further strengthen the availability of product information, we launched the “Product Safety, For Us it’s Personal” and “Our 5 Pillars of Protection” campaigns in 2021.
More inclusive society Essity promotes awareness to break the social stigma that is often linked to incontinence, menstruation and chronic conditions, such as endometriosis and lymphedema. The aim is to increase understanding of different conditions and help everyone partic-ipate more in everyday life and live as active a life as possible. In this way, we contribute toward, and create conditions for, a more inclusive society. Essity is helping to enable positive societal change through collaborations, partnerships, marketing, engage-ment on social media, reports, education and innovations. For many years, our brands have campaigned and driven initiatives to promote awareness and break social stigmas. Many of these have received attention for their creative content and engaging message. For example, in 2021 TENA’s “TENA ageless” campaign challenged age stereotypes and “Despair no more” counteracted negative perceptions of incontinence and menopause. In the “Taboo tracker” campaign, brands including Libresse and Body-
form highlighted taboo issues regarding women’s V-Zone, while “Pain Stories” increased awareness of the issue of endometriosis.
Partnerships and collaborationGreater impact can be achieved by collaborating with organiza-tions that share Essity’s ambition to improve global hygiene and health. For a number of years now, Essity has been a strategic partner in the “Global Handwashing Partnership” and supported the “Hand hygiene for all” initiative together with the WHO and UNICEF, the aim of which is to guarantee access to products and services for hand hygiene in vulnerable countries and areas. As a means of contributing to global dialogue and driving forward societal solutions, we have over the past seven years regularly published “The Hygiene and Health Report” in cooperation with the Water Supply and Sanitation Collaborative Council (WSSCC), now the Sanitation and Hygiene Fund (SHF). The latest report was launched in conjunction with the United Nations Foundation’s (UNF) annual Global Dialogue in 2020, where Essity was conven-ing partner for the fifth year in a row. The Global Dialogue brings together leaders and experts from the private and public sectors to inspire and encourage accelerated action in achieving the UN Sustainable Development Goals.
Through our cooperation with UNICEF in Mexico, we have so far educated more than seven million young people in hand hygiene and menstruation. We have launched a virtual initiative to educate girls, boys, teachers and parents. We are involved in a range of different projects around the world. For instance, through our collaboration with the Red Cross in several countries, we have reached out to people in particularly vulnerable situations during the COVID-19 pandemic.
We engage in initiatives where we can make the greatest contri-bution and these must be politically and religiously independent, as set out in Essity’s Community Relations Instruction. In 2021, Essity invested approximately SEK 38m in more than 400 projects.
A selection of our partnerships
For a number of years, Essity has been collaborating with UNICEF in Mexico to increase awareness of the importance of good hand hygiene, to break the taboos surrounding menstruation and strengthen stan-dards and guidelines to encourage good hygiene and health.
Essity has collaborated with the UNF since 2017. This included the role of convening partner for the UNF’s annual Global Leadership Dialogue, when we held discussions with our customers on how we could work together to achieve the UN Sustain-able Development Goals. In 2021, Essity enhanced this collaboration by joining an expert group in the fight against antimicrobial resistance (AMR).
45Essity’s Annual and Sustainability Report 2021 Sustainability
Introduction The Essity share
Strategy Business areas SustainabilityGroup Corporate Governance Report
Financial statementsincluding notes
Essity data
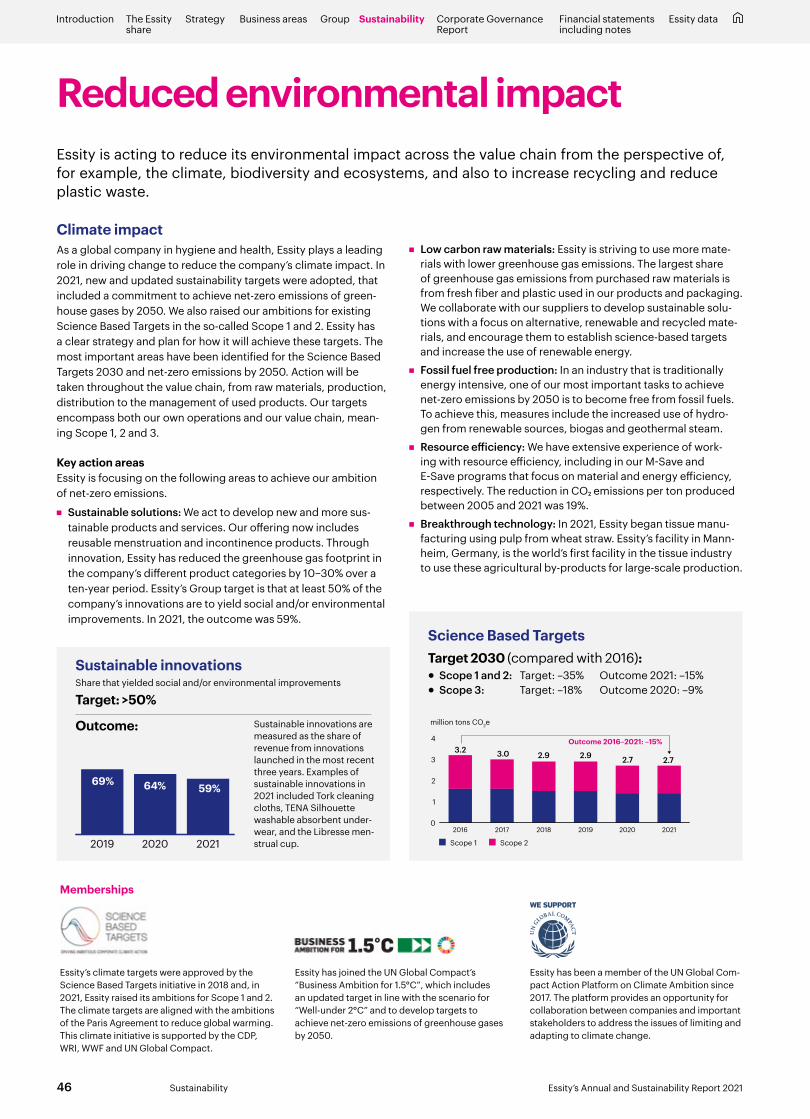
Memberships
Essity’s climate targets were approved by the Science Based Targets initiative in 2018 and, in 2021, Essity raised its ambitions for Scope 1 and 2. The climate targets are aligned with the ambitions of the Paris Agreement to reduce global warming. This climate initiative is supported by the CDP, WRI, WWF and UN Global Compact.
Essity has joined the UN Global Compact’s “Business Ambition for 1.5°C”, which includes an updated target in line with the scenario for “Well-under 2°C” and to develop targets to achieve net-zero emissions of greenhouse gases by 2050.
Essity has been a member of the UN Global Com-pact Action Platform on Climate Ambition since 2017. The platform provides an opportunity for collaboration between companies and important stakeholders to address the issues of limiting and adapting to climate change.
Climate impact As a global company in hygiene and health, Essity plays a leading role in driving change to reduce the company’s climate impact. In 2021, new and updated sustainability targets were adopted, that included a commitment to achieve net-zero emissions of green-house gases by 2050. We also raised our ambitions for existing Science Based Targets in the so-called Scope 1 and 2. Essity has a clear strategy and plan for how it will achieve these targets. The most important areas have been identified for the Science Based Targets 2030 and net-zero emissions by 2050. Action will be taken throughout the value chain, from raw materials, production, distribution to the management of used products. Our targets encompass both our own operations and our value chain, mean-ing Scope 1, 2 and 3.
Key action areas Essity is focusing on the following areas to achieve our ambition of net-zero emissions.
■ Sustainable solutions: We act to develop new and more sus-tainable products and services. Our offering now includes reusable menstruation and incontinence products. Through innovation, Essity has reduced the greenhouse gas footprint in the company’s different product categories by 10–30% over a ten-year period. Essity’s Group target is that at least 50% of the company’s innovations are to yield social and/or environmental improvements. In 2021, the outcome was 59%.
Reduced environmental impactEssity is acting to reduce its environmental impact across the value chain from the perspective of, for example, the climate, biodiversity and ecosystems, and also to increase recycling and reduce plastic waste.
■ Low carbon raw materials: Essity is striving to use more mate-rials with lower greenhouse gas emissions. The largest share of greenhouse gas emissions from purchased raw materials is from fresh fiber and plastic used in our products and packaging. We collaborate with our suppliers to develop sustainable solu-tions with a focus on alternative, renewable and recycled mate-rials, and encourage them to establish science-based targets and increase the use of renewable energy.
■ Fossil fuel free production: In an industry that is traditionally energy intensive, one of our most important tasks to achieve net-zero emissions by 2050 is to become free from fossil fuels. To achieve this, measures include the increased use of hydro-gen from renewable sources, biogas and geothermal steam.
■ Resource efficiency: We have extensive experience of work-ing with resource efficiency, including in our M-Save and E-Save programs that focus on material and energy efficiency, respectively. The reduction in CO2 emissions per ton produced between 2005 and 2021 was 19%.
■ Breakthrough technology: In 2021, Essity began tissue manu-facturing using pulp from wheat straw. Essity’s facility in Mann-heim, Germany, is the world’s first facility in the tissue industry to use these agricultural by-products for large-scale production.
Science Based TargetsTarget 2030 (compared with 2016):• Scope 1 and 2: Target: –35% Outcome 2021: –15%• Scope 3: Target: –18% Outcome 2020: –9%
Sustainable innovationsShare that yielded social and/or environmental improvements
Target: >50%
Outcome: Sustainable innovations are measured as the share of revenue from innovations launched in the most recent three years. Examples of sustainable innovations in 2021 included Tork cleaning cloths, TENA Silhouette washable absorbent under-wear, and the Libresse men-strual cup.202120202019
69% 64% 59%
million tons CO2e
0
1
2
3
4
202120202019201820172016
Scope 1 Scope 2
3.2 3.0 2.9 2.72.9 2.7
Outcome 2016–2021: –15%
46 Essity’s Annual and Sustainability Report 2021Sustainability
Introduction The Essity share
Strategy Business areas SustainabilityGroup Corporate Governance Report
Financial statementsincluding notes
Essity data

In 2021, Essity began tissue manufacturing using pulp from wheat straw at its production facility in Mannheim, Germany.
■ Zero production waste: We act to make production waste a valuable resource and reduce our greenhouse gas emissions at the same time. The target for 2030 is that all production waste will be subject to material and energy recovery. In 2021, the total amount of production waste decreased, and 64% was recycled.
■ Clean transport: When possible, we choose more sustainable modes of transport, such as sea and rail. By requesting highest emission standards we make use of the latest engine technol-ogy available. Essity also collaborates with partners to start pilot projects that involve the use of electric trucks and alternative fossil-free fuels to reduce transport emissions.
■ Less waste after use: To reduce waste and create new uses for materials included in our products and packaging, we are developing innovative solutions to reduce consumption as well as new business models for recycling. For example, to reduce waste we offer compostable tissue products and the Tork Paper-Circle recycling service has been expanded to ten markets. To address plastic recycling, Essity joined the HolyGrail 2.0 initia-tive in 2021, which uses a digital watermark to improve sorting and increase the recycling rate of plastic packaging in the EU.
To ensure that we meet the climate targets, Essity has appointed a steering committee led by members of the Executive Manage-ment Team. We are identifying the impact of climate change on Essity based on the TCFD framework, see more under Risk and risk management on pages 41–42.
How we manufacture tissue
1. The main raw materials used to manufacture tissue are FSC and PEFC certi-fied fresh fiber pulp and recovered paper. Manufacturing can also use alter-native materials, such as pulp from wheat straw, and post-consumer waste, such as used paper hand towels, paper cups and food packaging.
2. Pulp is mixed with water in the paper machine and the paper is then dried.3. The paper is wound into large reels, known as mother reels.
4. The mother reels are then converted into toilet rolls, household towels, napkins and handkerchiefs.
5. Our products create customer and consumer value and improve people’s well-being and quality of life.
1. 2. 3. 4. 5.
47Essity’s Annual and Sustainability Report 2021 Sustainability
Introduction The Essity share
Strategy Business areas SustainabilityGroup Corporate Governance Report
Financial statementsincluding notes
Essity data

Biodiversity and ecosystemsEssity respects biodiversity and ecosystems by promoting sustain-able forestry operations, reducing greenhouse gas emissions and plastic waste, and improving water use and water quality. As part of a major analysis of our impact on biodiversity, biodiversity was integrated into Essity’s overall risk management in 2021.
Reduced material use and alternative materialsAs a means of reducing wood fiber purchases, we strive to reduce material use in our solutions. We are investing in new technology to increase the possibility of utilizing a larger share of recycled and alternative materials. One step in this direction was Essity’s invest-ment in the production facility in Hondouville, France, in 2021. The investment made it possible to increase the recycling capacity for cartons and extract 98% of paper fiber in food and beverage car-tons. We are also investing in alternative renewable fibers such as wheat straw, an agricultural by-product that often remains unused.
Certification for sustainable forestry Our long-standing work with responsible fiber sourcing is an important part of our sustainability strategy to support sustainable forestry and thereby promote biodiversity. We ensure sustainable fiber sourcing through certifications such as the Forest Steward-ship Council (FSC) and the Programme for the Endorsement of Forest Certification (PEFC) and can therefore prevent deforesta-tion and promote biodiversity in the forest. Every FSC-certified forest must be assessed by an accredited FSC certification body each year. Essity works with and encourages non-certified suppli-ers and forest owners to become certified. This secures our own sourcing of certified materials while increasing the availability of certified raw materials to other users. In order to further promote responsible forestry on global, regional and national levels, Essity is supporting the development of international certification systems.
Cooperation to combat forest degradation and deforestationEssity cooperates within the framework of the Consumer Goods Forum (CGF) with leading consumer goods companies in the Forest Positive Coalition of Action initiative to combat global forest degradation and deforestation and to preserve biodiversity. In 2021, Essity took part in a project to strengthen sustainable forestry and care of forests with a high conservation value in north-western Russia, Europe’s largest connected forest area with high nature values. The purpose is to increase the uptake of sustainable forest management practices, as well as engage com-munities and other local stakeholders in a landscape planning pro-cess. In 2021, Essity played a leading role in CGF’s Forest Positive Coalition, where we worked with other global companies to strengthen forest management and prevent deforestation.
Targets and transparency In 2021, Essity was awarded a place on the global non-profit envi-ronmental organization Carbon Disclosure Project’s (CDP) A List for its efforts in combating deforestation. This was motivated by Essity’s ambitious efforts to prevent deforestation and promote responsible forestry, and its leadership in terms of objectives, actions and transparency in the environmental field. Through
CDP’s database, everyone can access information about how Essity works with fiber suppliers, industry organizations and other stakeholders, including non-profit organizations, to manage and promote sustainable forestry.
Improved water use and water quality Around the world, declining water levels are affecting people, local economies and ecosystems. This also affects Essity’s oper-ations, from access to raw materials and production facilities to the communities in which our employees and consumers live. The water risks differ around the world and we assess water-related risks and impacts individually for our production facilities, both from a geographic and operating perspective. Water is mainly needed for transporting fiber during the production process. Recirculating water that has been used in production several times helps to reduce energy use for heating and treatment of water. Most of the water is treated after use and is being dis-charged.
Environmental permits for tissue plants also include limits for typical pollutants, such as chemical oxygen demand, phosphorus and nitrogen. Essity is investing in new wastewater treatment technology to meet increasing requirements on the quality of the discharged water. This is particularly important in locations where water is a resource shared with a large number of users, such as along major rivers, where the temperature of the water released must also be carefully monitored.
Memberships
Together with other companies and organizations in CGF’s Forest Positive Coalition of Action, Essity works systematically to address deforestation and forest destruction and promote biodiversity.
Essity is one of the world’s largest suppliers of FSC-certified hygiene and health products. We work with forest certification systems, such as FSC, which ensure sustainable forestry operations and respect for environmental, climate and social values.
In 2021, Essity was again awarded a place on CDP’s A List for its work in combating deforesta-tion. CDP’s annual data collection and assessment process provides a benchmark for the transpar-ency of companies’ environmental activities.
Fresh fiberShare of FSC or PEFC-certified fresh fiber
Target: 100%
Outcome: Through certifications such as the Forest Stewardship Coun-cil (FSC) and the Programme for the Endorsement of Forest Certification (PEFC), Essity ensures sustainable fiber sourcing, thereby preventing deforestation and promoting biodiversity.202120202019
79%95% 98%
48 Essity’s Annual and Sustainability Report 2021Sustainability
Introduction The Essity share
Strategy Business areas SustainabilityGroup Corporate Governance Report
Financial statementsincluding notes
Essity data
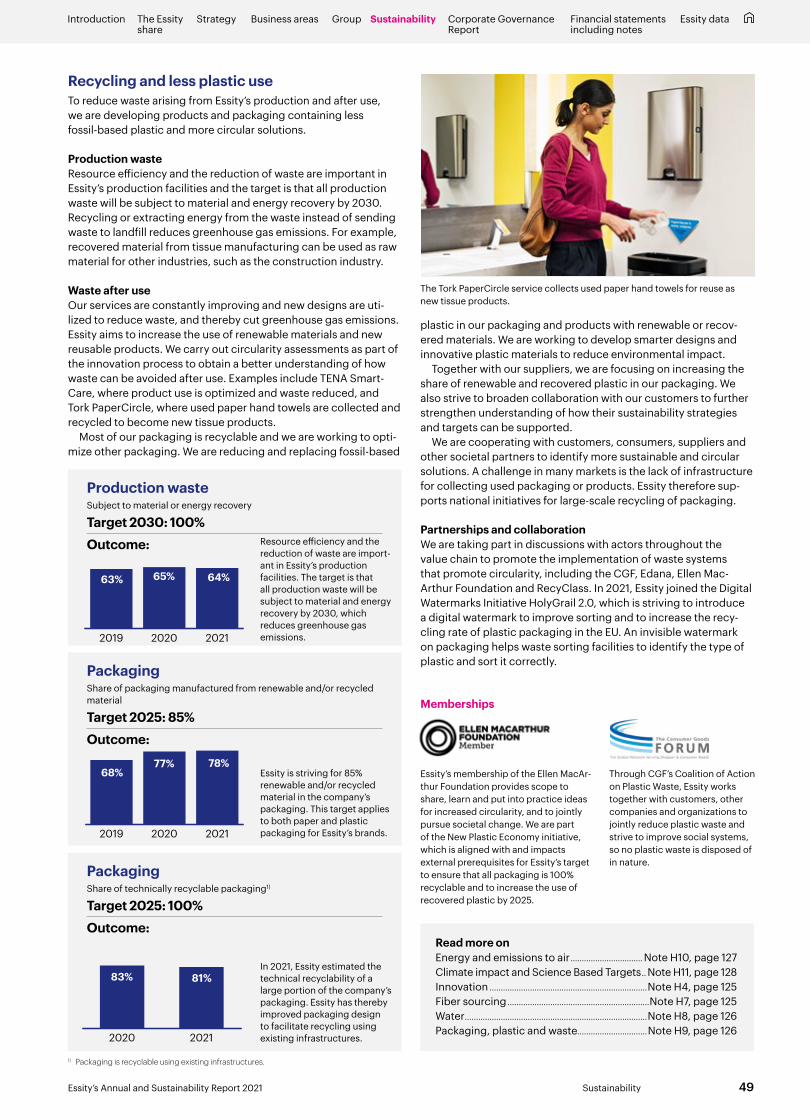
Recycling and less plastic use To reduce waste arising from Essity’s production and after use, we are developing products and packaging containing less fossil-based plastic and more circular solutions.
Production waste Resource efficiency and the reduction of waste are important in Essity’s production facilities and the target is that all production waste will be subject to material and energy recovery by 2030. Recycling or extracting energy from the waste instead of sending waste to landfill reduces greenhouse gas emissions. For example, recovered material from tissue manufacturing can be used as raw material for other industries, such as the construction industry.
Waste after useOur services are constantly improving and new designs are uti-lized to reduce waste, and thereby cut greenhouse gas emissions. Essity aims to increase the use of renewable materials and new reusable products. We carry out circularity assessments as part of the innovation process to obtain a better understanding of how waste can be avoided after use. Examples include TENA Smart-Care, where product use is optimized and waste reduced, and Tork PaperCircle, where used paper hand towels are collected and recycled to become new tissue products.
Most of our packaging is recyclable and we are working to opti-mize other packaging. We are reducing and replacing fossil-based
Read more onEnergy and emissions to air ................................ Note H10, page 127 Climate impact and Science Based Targets .. Note H11, page 128 Innovation ......................................................................Note H4, page 125Fiber sourcing ...............................................................Note H7, page 125Water .................................................................................Note H8, page 126Packaging, plastic and waste...............................Note H9, page 126
1) Packaging is recyclable using existing infrastructures.
plastic in our packaging and products with renewable or recov-ered materials. We are working to develop smarter designs and innovative plastic materials to reduce environmental impact.
Together with our suppliers, we are focusing on increasing the share of renewable and recovered plastic in our packaging. We also strive to broaden collaboration with our customers to further strengthen understanding of how their sustainability strategies and targets can be supported.
We are cooperating with customers, consumers, suppliers and other societal partners to identify more sustainable and circular solutions. A challenge in many markets is the lack of infrastructure for collecting used packaging or products. Essity therefore sup-ports national initiatives for large-scale recycling of packaging.
Partnerships and collaborationWe are taking part in discussions with actors throughout the value chain to promote the implementation of waste systems that promote circularity, including the CGF, Edana, Ellen Mac-Arthur Foundation and RecyClass. In 2021, Essity joined the Digital Watermarks Initiative HolyGrail 2.0, which is striving to introduce a digital watermark to improve sorting and to increase the recy-cling rate of plastic packaging in the EU. An invisible watermark on packaging helps waste sorting facilities to identify the type of plastic and sort it correctly.
Memberships
Essity’s membership of the Ellen MacAr-thur Foundation provides scope to share, learn and put into practice ideas for increased circularity, and to jointly pursue societal change. We are part of the New Plastic Economy initiative, which is aligned with and impacts external prerequisites for Essity’s target to ensure that all packaging is 100% recyclable and to increase the use of recovered plastic by 2025.
Through CGF’s Coalition of Action on Plastic Waste, Essity works together with customers, other companies and organizations to jointly reduce plastic waste and strive to improve social systems, so no plastic waste is disposed of in nature.
The Tork PaperCircle service collects used paper hand towels for reuse as new tissue products.
PackagingShare of packaging manufactured from renewable and/or recycled material
Target 2025: 85%Outcome:
PackagingShare of technically recyclable packaging1)
Target 2025: 100% Outcome:
Essity is striving for 85% renewable and/or recycled material in the company’s packaging. This target applies to both paper and plastic packaging for E ssity’s brands.
In 2021, Essity estimated the technical recyclability of a large portion of the company’s packaging. Essity has thereby improved packaging design to facilitate recycling using existing infrastructures.
Production wasteSubject to material or energy recovery
Target 2030: 100%Outcome: Resource efficiency and the
reduction of waste are import-ant in Essity’s production facilities. The target is that all production waste will be subject to material and energy recovery by 2030, which reduces greenhouse gas emissions.202120202019
63% 65% 64%
202120202019
68%77% 78%
20212020
81%83%
49Essity’s Annual and Sustainability Report 2021 Sustainability
Introduction The Essity share
Strategy Business areas SustainabilityGroup Corporate Governance Report
Financial statementsincluding notes
Essity data
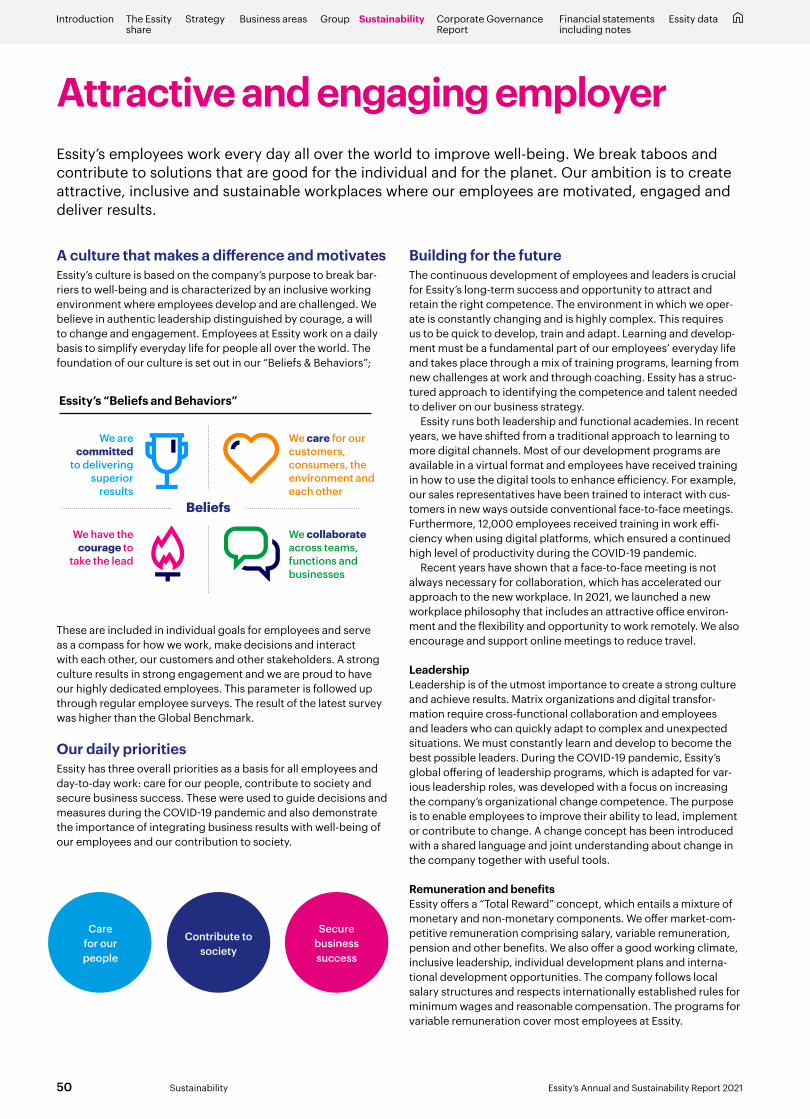
A culture that makes a difference and motivatesEssity’s culture is based on the company’s purpose to break bar-riers to well-being and is characterized by an inclusive working environment where employees develop and are challenged. We believe in authentic leadership distinguished by courage, a will to change and engagement. Employees at Essity work on a daily basis to simplify everyday life for people all over the world. The foundation of our culture is set out in our “Beliefs & Behaviors”;
Building for the futureThe continuous development of employees and leaders is crucial for Essity’s long-term success and opportunity to attract and retain the right competence. The environment in which we oper-ate is constantly changing and is highly complex. This requires us to be quick to develop, train and adapt. Learning and develop-ment must be a fundamental part of our employees’ everyday life and takes place through a mix of training programs, learning from new challenges at work and through coaching. Essity has a struc-tured approach to identifying the competence and talent needed to deliver on our business strategy.
Essity runs both leadership and functional academies. In recent years, we have shifted from a traditional approach to learning to more digital channels. Most of our development programs are available in a virtual format and employees have received training in how to use the digital tools to enhance efficiency. For example, our sales representatives have been trained to interact with cus-tomers in new ways outside conventional face-to-face meetings. Furthermore, 12,000 employees received training in work effi-ciency when using digital platforms, which ensured a continued high level of productivity during the COVID-19 pandemic.
Recent years have shown that a face-to-face meeting is not always necessary for collaboration, which has accelerated our approach to the new workplace. In 2021, we launched a new workplace philosophy that includes an attractive office environ-ment and the flexibility and opportunity to work remotely. We also encourage and support online meetings to reduce travel.
Leadership Leadership is of the utmost importance to create a strong culture and achieve results. Matrix organizations and digital transfor-mation require cross-functional collaboration and employees and leaders who can quickly adapt to complex and unexpected situations. We must constantly learn and develop to become the best possible leaders. During the COVID-19 pandemic, Essity’s global offering of leadership programs, which is adapted for var-ious leadership roles, was developed with a focus on increasing the company’s organizational change competence. The purpose is to enable employees to improve their ability to lead, implement or contribute to change. A change concept has been introduced with a shared language and joint understanding about change in the company together with useful tools.
Remuneration and benefits Essity offers a “Total Reward” concept, which entails a mixture of monetary and non-monetary components. We offer market-com-petitive remuneration comprising salary, variable remuneration, pension and other benefits. We also offer a good working climate, inclusive leadership, individual development plans and interna-tional development opportunities. The company follows local salary structures and respects internationally established rules for minimum wages and reasonable compensation. The programs for variable remuneration cover most employees at Essity.
Attractive and engaging employer Essity’s employees work every day all over the world to improve well-being. We break taboos and contribute to solutions that are good for the individual and for the planet. Our ambition is to create attractive, inclusive and sustainable workplaces where our employees are motivated, engaged and deliver results.
Care for our people
Contribute to society
Secure business success
These are included in individual goals for employees and serve as a compass for how we work, make decisions and interact with each other, our customers and other stakeholders. A strong culture results in strong engagement and we are proud to have our highly dedicated employees. This parameter is followed up through regular employee surveys. The result of the latest survey was higher than the Global Benchmark.
Our daily prioritiesEssity has three overall priorities as a basis for all employees and day-to-day work: care for our people, contribute to society and secure business success. These were used to guide decisions and measures during the COVID-19 pandemic and also demonstrate the importance of integrating business results with well-being of our employees and our contribution to society.
Essity’s “Beliefs and Behaviors”
Beliefs
We collaborate across teams, functions and businesses
We have the courage to
take the lead
We care for our customers, consumers, the environment and each other
We are committed
to delivering superior
results
50 Essity’s Annual and Sustainability Report 2021Sustainability
Introduction The Essity share
Strategy Business areas SustainabilityGroup Corporate Governance Report
Financial statementsincluding notes
Essity data
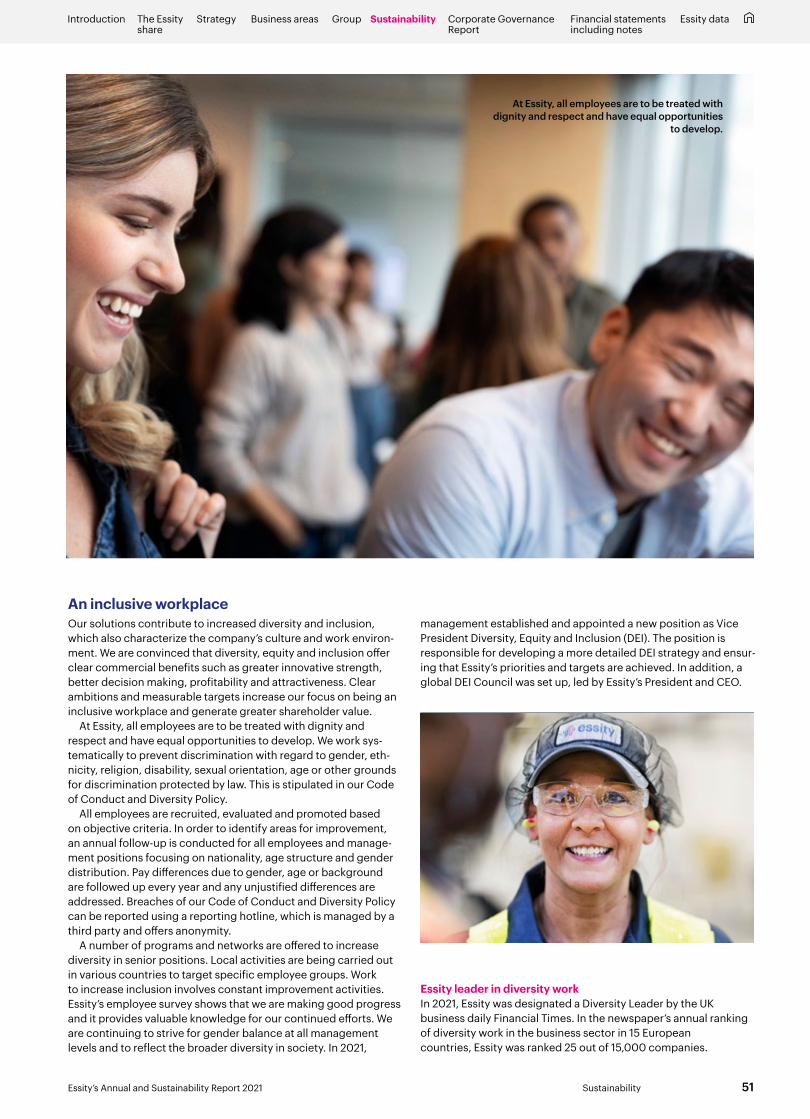
Essity leader in diversity workIn 2021, Essity was designated a Diversity Leader by the UKbusiness daily Financial Times. In the newspaper’s annual rankingof diversity work in the business sector in 15 European countries, Essity was ranked 25 out of 15,000 companies.
An inclusive workplaceOur solutions contribute to increased diversity and inclusion, which also characterize the company’s culture and work environ-ment. We are convinced that diversity, equity and inclusion offer clear commercial benefits such as greater innovative strength, better decision making, profitability and attractiveness. Clear ambitions and measurable targets increase our focus on being an inclusive workplace and generate greater shareholder value.
At Essity, all employees are to be treated with dignity and respect and have equal opportunities to develop. We work sys-tematically to prevent discrimination with regard to gender, eth-nicity, religion, disability, sexual orientation, age or other grounds for discrimination protected by law. This is stipulated in our Code of Conduct and Diversity Policy.
All employees are recruited, evaluated and promoted based on objective criteria. In order to identify areas for improvement, an annual follow-up is conducted for all employees and manage-ment positions focusing on nationality, age structure and gender distribution. Pay differences due to gender, age or background are followed up every year and any unjustified differences are addressed. Breaches of our Code of Conduct and Diversity Policy can be reported using a reporting hotline, which is managed by a third party and offers anonymity.
A number of programs and networks are offered to increase diversity in senior positions. Local activities are being carried out in various countries to target specific employee groups. Work to increase inclusion involves constant improvement activities. Essity’s employee survey shows that we are making good progress and it provides valuable knowledge for our continued efforts. We are continuing to strive for gender balance at all management levels and to reflect the broader diversity in society. In 2021,
management established and appointed a new position as Vice President Diversity, Equity and Inclusion (DEI). The position is responsible for developing a more detailed DEI strategy and ensur-ing that Essity’s priorities and targets are achieved. In addition, a global DEI Council was set up, led by Essity’s President and CEO.
At Essity, all employees are to be treated with dignity and respect and have equal opportunities
to develop.
51Essity’s Annual and Sustainability Report 2021 Sustainability
Introduction The Essity share
Strategy Business areas SustainabilityGroup Corporate Governance Report
Financial statementsincluding notes
Essity data

Sustainable working environmentOur highest priority is that everyone working at our production facilities and offices or otherwise working at or visiting Essity shall be safe and in good health. The safety, health and well-being of our employees is crucial to the success of operations and aligned with our “Beliefs & Behaviors”, and the ethical standards and require-ments expressed in our Code of Conduct.
During the COVID-19 pandemic, additional precautionary mea-sures were taken in line with recommendations from medical experts and local health authorities at our offices, production facilities and distribution centers. Essity has regularly monitored employee perception of health and well-being and offered support whenever necessary. The company strives to promote physical and mental health and well-being. We have developed new digital ways of work-ing, which include a global employee survey and other tools, training sessions and programs. These offer us a more effective and system-atic manner with which to assess, analyze and work with continuous improvements in employee health, well-being and engagement.
Essity’s target its to offer a work environment that contributes to a long-term sustainable working life. We encourage an open culture and all employees are encouraged to be aware of and take immedi-ate action against conditions, acts and behavior that increase the risk of potential accidents. In 2021, a National Safety Council survey was conducted to assess our safety culture and level of maturity in safety processes and working methods in the area of safety at our production facilities. The survey provides a basis for our strategy, and helps us to introduce effective action programs to improve safety.
We have also digitalized incident data and reporting in a shared system. This has improved the analysis and follow-up of trends, and raised awareness of risks to better prioritize preventive measures. The introduction of the term “Major Potential Incidents” provides us with information about all serious incidents and accidents at our facilities and allows us to share lessons learned worldwide.
Employee relationsEssity has a positive and constructive dialogue with employee rep-resentatives. As a global company, we experience many changes that require information and consultation with employee represen-tatives at all levels of the company. Essity recognizes the right of every employee to be a trade union member and to participate in union activities. The company meets with employee organizations at various levels on a regular basis to inform them of and discuss issues such as the company’s results, any organizational changes, health and safety and employment terms and conditions. Essity has an agreement with the industry organization IndustriAll. When there is no union representation, Essity establishes other channels where possible, such as an employee council. We also support the global partnership Global Deal, which has members from the private and public sectors. The purpose is to improve dialogue between parties in the labor market and national governments.
“Barrier Breakers”In 2021, the global “Barrier Breaker of the Year” award was launched with the purpose of spotlighting initiatives and engage-ment among Essity’s employees to break barriers for well-being. Four winners were chosen in different categories from a large number of nominations.
■ Better hygiene and health for everyone: During 2020–2021, a group of volunteer employees offered training in hygiene and health issues to parents and children in poor and disad-vantaged urban areas of Colombia. Through this collaboration with a local non-profit organization, “Hands to Create Dreams”, Essity’s employees changed the lives of many families by dis-seminating knowledge and offered them a better chance of a healthy and long life.
■ Better understanding of each other: An internal menopause policy was launched in the UK together with training sessions to help managers recognize, discuss and support employees experiencing menopausal symptoms. The initiative also included collaboration with a national TV channel that showed how Essity is breaking the stigma of menopause, and several courageous employees shared their experiences.
■ Innovation and digitalization: Modern 3D technology was used to develop a tool that enables colleagues to safely touch shared displays at Essity’s production facilities during the COVID-19 pandemic to reduce the spread of the virus.
■ A circular and sustainable society: A computer game was used to increase understanding among employees of their own environmental impact. Employees could measure their daily environmental impact, compete in being climate smart and in make sustainable choices. The initiative raised aware-ness of sustainability and led to changes in personal behavior as well as a reduction in greenhouse gas emissions.
Read more onEmployees.....................................................................Note H12, page 129Health and safety ........................................................Note H13, page 131
Health and safetyDecrease in total recordable incident rate compared with 2019
Target 2025: –75%
Outcome: In 2021, Essity began to measure the Total Recordable Injury Frequency Rate to highlight accidents that require medical treatment. All of Essity’s produc-tion facilities are conducting purposeful and systematic work with safety issues.20212020
–43%
–10%
52 Essity’s Annual and Sustainability Report 2021Sustainability
Introduction The Essity share
Strategy Business areas SustainabilityGroup Corporate Governance Report
Financial statementsincluding notes
Essity data

Code of Conduct Work with business ethics and human rights requires constant perseverance. There will always be new challenges and new ways to demonstrate a commitment. This is why we are continuously learning, listening and raising standards.
Essity’s Code of Conduct describes how employees are to act, how the company operates, stakeholder expectations of Essity and Essity’s commitment to human rights. The Code is based on international standards such as the United Nations Guiding Princi-ples on Business and Human Rights (UNGP), the ILO Core Conven-tions, the OECD Guidelines for Multinational Enterprises, the UN Global Compact Principles and related legislation.
All of Essity’s wholly owned subsidiaries are bound by the Code of Conduct. Essity expects its joint-venture companies to implement a Code of Conduct and guidelines equivalent to those stipulated in Essity’s Code of Conduct. To ensure that all of Essity’s employees comply with the Code of Conduct, it is included as a training course in all of the company’s onboarding programs. It is the responsibility of the respective line manager to ensure that the training is com-pleted. In addition to training in the Code of Conduct, there is a pro-gram for compliance with competition rules, which is mandatory for employees in particularly exposed positions. In order to address the risk of corruption, Essity has an anti-corruption program that includes due diligence programs for business partners, training programs for employees and risk analyses. Essity’s Compliance & Ethics department is responsible for the Code of Conduct training program and for the anti-corruption program.
All of our suppliers and other business partners are expected to follow principles equivalent to those included in the company’s Code of Conduct. Essity also has a Global Supplier Standard to ensure responsible business operations and respect for human rights in the company’s supply chain. This standard contains requirements concerning quality, product safety, the environment and chemicals. It also contains a Code of Conduct for Suppliers that includes Essity’s expectations as regards to human rights and employee relations, as well as health and safety. Compliance with these principles is a key factor when choosing suppliers and other business partners.
Reporting breachesEssity encourages an open and honest culture in which all em- ployees can report suspicions of violations of the Code of Conduct or legislation. Retaliation against individuals who sub-mit reports in good faith will not be accepted. Essity offers its
employees a number of internal channels to report violations of legislation or the Code of Conduct. Essity’s Code of Conduct includes a section on how the company’s whistleblower system works. All employees have access to the whistleblower system, Essity’s reporting hotline, which is managed by an external party. Essity’s reporting hotline is available 24/7 by phone or online in more than 25 languages. Where permitted by law, breaches can be reported anonymously. Essity’s Compliance & Ethics depart-ment receives all submitted reports from the whistleblower sys-tem and is responsible for ensuring that necessary action is taken. Reports are presented regularly to Essity’s Compliance Council and the Board of Directors.
Risk management Essity is potentially exposed to a number of risks given that Essi-ty’s solutions are produced in and sold in several markets around the world. Essity conducts regular assessments and risk analyses related to human rights, which comply with the UNGP. Risk analy-ses are based partly on assessments carried out by Transparency International and the Supplier Ethical Data Exchange (Sedex) tool. Corruption risks are followed up and analyzed regularly within the scope of the anti-corruption program. In 2021, about 36% of Essity’s revenue was from sales to countries with a relatively high risk of corruption. In the 2021 Sedex assessment, 98% of Essity’s production facilities received a low to medium risk classification relating to human rights and corruption.
Compliance and monitoring Systematic activities, such as audits and other monitoring pro-cesses, take place to ensure compliance.
For Essity’s own and wholly owned production facilities, compli-ance with the Code of Conduct and business practice is ensured through audits under SA8000 conducted by the Internal Audit unit. Essity’s own wholly owned production facilities that have conducted self-assessments in Sedex are available to Essity’s cus-tomers who are also part of Sedex. Customers conduct audits in accordance with SMETA at Essity’s production facilities.
Essity requires that the company’s suppliers use Sedex to con-duct a self-assessment linked to working conditions, environment, business ethics and health and safety. Suppliers of raw materials and finished products located in countries that Sedex considers high-risk countries undergo an ethical audit that focuses on areas such as human rights, employment conditions and corruption. An ethical audit may also be initiated on the basis of other indicators, such as a low rating in Sedex or a low score in Essity’s quality audits of suppliers. The preferred audit format is SMETA, which is the most widely used method in the world for social and ethi-cal audits. Many of the strategic suppliers’ production facilities located in Asia and South America are part of large multinational corporations based in Europe and the USA. This is a conscious choice by Essity to reduce the social and ethical risks within the supply chain.
Business ethics and human rights
Read more onBusiness ethics .............................................................Note H2, page 123Responsible sourcing ...............................................Note H3, page 124
We are firmly committed to our zero-tolerance approach to violations of human rights in the value chains we have control over. This also encompasses our suppliers’ employees and workplaces.
53Essity’s Annual and Sustainability Report 2021 Sustainability
Introduction The Essity share
Strategy Business areas SustainabilityGroup Corporate Governance Report
Financial statementsincluding notes
Essity data
92%of Essity’s new employees received training in Essity’s Code of Conduct
88%of Essity’s total purchase cost was from suppliers that comply with Essity’s Global Supplier Standard

Purpose, implementation and follow-upSustainability-related issues are a standing item at the company’s Board of Directors meetings and at meetings of the Executive Man-agement Team. In addition to this, sustainability topics are regularly addressed by different business units, global units and the compa-ny’s Group functions. Specific issues are also managed by a number of committees and steering groups with representatives from all of the company’s business units, which provides cross-functional and supplemental expertise to ensure a consistent approach.
The purpose of Essity’s sustainability governance is to ensure the company’s commitments to its stakeholders, including customers, consumers, employees, shareholders, suppliers, investors, decision makers and representatives from society. The company’s commit-ments are expressed in targets, strategy and priorities. The Board of Directors has established a number of sustainability targets that are regularly monitored and reported annually. We maintain an active and continuous dialogue with our stakeholders to ensure that Essity’s priorities and methods are relevant over time. Based on well-defined areas of responsibility and follow-up, the company ensures that it delivers on established sustainability targets. To tackle increasing sustainability challenges, we continuously develop our ambitions in dialogue with our stakeholders and external experts.
Since sustainability is an integrated part of Essity’s strategy and operations, the internal audit naturally also encompasses sustain-ability. Essity’s Annual and Sustainability Report is also included in our external auditor’s review. Read more on page 123.
External regulations and internal steering documents Essity’s prioritized sustainability topics, strategies and targets are a result of the company’s internal work and dialogue with its stake-holders and external experts. These are also aligned with a range of different principles and guiding frameworks. In addition to external frameworks and principles, Essity has several external certifications and ISO standards as well as internal policies and guidelines that ensure the company has well-defined management systems in place to monitor the company’s results.
Essity has developed positions in the form of position papers in which we state our views on key topics. These are available at www.essity.com/sustainability.
Guiding external frameworks and principles ■ UN Sustainable Development Goals (SDGs) ■ UN Global Compact ■ OECD Guidelines for Multinational Enterprises ■ UN Guiding Principles on Business and Human Rights ■ ILO Core Conventions
Policies and guidelines ■ Code of Conduct ■ Sustainability Policy ■ Anti-bribery and Corruption Policy ■ Fiber Sourcing Policy ■ Diversity Policy ■ Global Supplier Standard ■ Health and Safety Instruction ■ Community Relations Instruction
Sustainability governanceSustainability is incorporated throughout Essity’s operations, which is why sustainability governance forms an integrated part of the Group’s overall corporate governance.
EU taxonomy As part of the EU’s green growth strategy, the EU taxonomy came into effect in 2020. This is a classification tool for environmentally sustainable investments. Essity has analyzed its operations in order to comply with current and future disclosure requirements. The company’s sales, capital expenditure and operating expen-diture are to be reported in accordance with Nomenclature of Economic Activities (NACE) codes. The EU is yet to determine which economic activities are to be deemed environmentally sustainable under each NACE code. The same applies to addi-tional subordinate economic activities identified in the analysis of Essity’s sales, capital expenditure and operating expenditure. Most of Essity’s economic operations can be allocated to the pulp and paper industry. Essity’s sales, capital expenditure and operating expenditure are therefore not covered by the taxonomy directive for this reporting period.
Sustainability indexes and rankingsEssity voluntarily takes part in a number of rankings of the com-pany’s sustainability work, as we believe this strengthens efforts moving forward. A summary is presented below of our scores in some of the most important rankings and ratings.
Essity was awarded a “Platinum Medal” in the “2020 Ecovadis CSR Rating”.
In 2021, Essity was awarded a place on CDP’s A List for its work in combating deforestation and was mentioned as leading for its man-agement of climate change, with an A–.
Essity has been listed on the FTSE4Good global sustain-ability index since 2001.
In 2022, Essity was included in S&P Global’s Sustain-ability Yearbook for its sustainability work in 2021, and was awarded a silver medal in the Household Products category.
54 Essity’s Annual and Sustainability Report 2021Sustainability
Introduction The Essity share
Strategy Business areas SustainabilityGroup Corporate Governance Report
Financial statementsincluding notes
Essity data
Introduction The Essity share
Strategy Business areas SustainabilityGroup Corporate Governance Report
Financial statementsincluding notes
Essity data
Corporate governanceThe task of corporate governance is to ensure the company’s commitments to all of its stakeholders: shareholders, customers, suppliers, creditors, society and employees. It must be structured in a way that supports the company’s long-term strategy, market presence and competitiveness. Corporate governance shall be reliable, clear, simple and business-oriented. This Corporate Governance Report forms part of the Board of Directors’ Report for Essity’s 2021 Annual and Sustainability Report. The report has been reviewed by the company’s auditors.
Corporate governance, pages 55–65This section describes applicable regulatory rules and regulations for the Group’s corporate governance and the company’s management structure and organization. It details the Board of Directors’ responsibilities and its work during the year. It also contains a description of Essity’s internal control with regard to financial reporting. Essity applies the Swedish Corporate Gov-ernance Code without any deviations (www.corporategovernanceboard.se).
Risk management, pages 35–42Essity’s processes to identify and man-age risks are part of the Group’s strategy work and are pursued at a local and central level. The section dealing with risk management describes the most significant risks and measures taken to eliminate or limit these risks.
Sustainability, pages 43–54 and 123–131Essity’s sustainability work is an integral part of the company’s business model. The company’s statutory sustainability report forms part of the Board of Direc-tors’ Report. Sustainability work contrib-utes to a sustainable and circular soci-ety, reduces risks and costs, strengthens competitiveness, and attracts new employees and investors.
Governance at Essity1. Shares and shareholdersEssity has engaged Euroclear Sweden AB to maintain the com-pany’s shareholders’ register. On December 31, 2021, Essity had 114,318 shareholders. The five largest shareholders in terms of voting rights on this date were AB Industrivärden (29.5%), AMF Insurance and Funds (8.1%), Norges Bank Investment Manage-ment (6.4%), MFS Investment Management (2.8%) and Swedbank Robur Funds (2.0%). Essity has two listed classes of shares: Class A and Class B shares. Every Class A share represents ten votes while every Class B share represents one vote. There are no other restrictions relating to voting rights in respect of shares used by shareholders at the general shareholders meeting. The two share classes carry the same entitlement to the company’s assets and profits. Furthermore, according to the Articles of Association, owners of Class A shares are entitled to request conversion of their Class A shares to Class B shares. The 2021 Annual General Meeting (AGM) authorized the Board of Directors, for the period until the 2022 AGM, to decide on the repurchase of Class B Essity shares. Essity has not utilized this share repurchase mandate and holds no treasury shares.
2. General shareholder meetingThe general shareholder meeting is Essity’s highest decision-mak-ing body, which all of the company’s shareholders are entitled to attend, to have a matter considered and to vote for all shares held by the shareholder. The company’s Board of Directors and auditor are elected at the AGM. The AGM also resolves on the
remuneration of the Board members, determines guidelines for the remuneration of senior executives and approves the Board’s annual remuneration report.
3. Nomination CommitteeShareholders appoint members of the Nomination Committee at the AGM, or stipulate how the members shall be appointed. The Nomination Committee represents the company’s shareholders. A majority of the members shall be independent of the company and corporate management. The President and other members of corporate management may not be a member of the Nomination Committee. The main duty of the Nomination Committee is to prepare and present proposals for the AGM’s resolutions with respect to election and remuneration matters.
4. External auditorsThe company’s auditor is elected at the AGM and is responsible for reviewing Essity’s Annual and Sustainability Report and con-solidated financial statements and the Board’s and President’s administration. The auditor conducts a limited review of the company’s sustainability report and corporate governance report. The auditor submits audit reports from this review. The auditor also submits a statement concerning compliance with the com-pany’s guidelines for remuneration of senior executives. The audit is performed in accordance with the Swedish Companies Act, International Standards on Auditing (ISA) and generally accepted auditing principles in Sweden.
55Essity’s Annual and Sustainability Report 2021 Corporate Governance Report
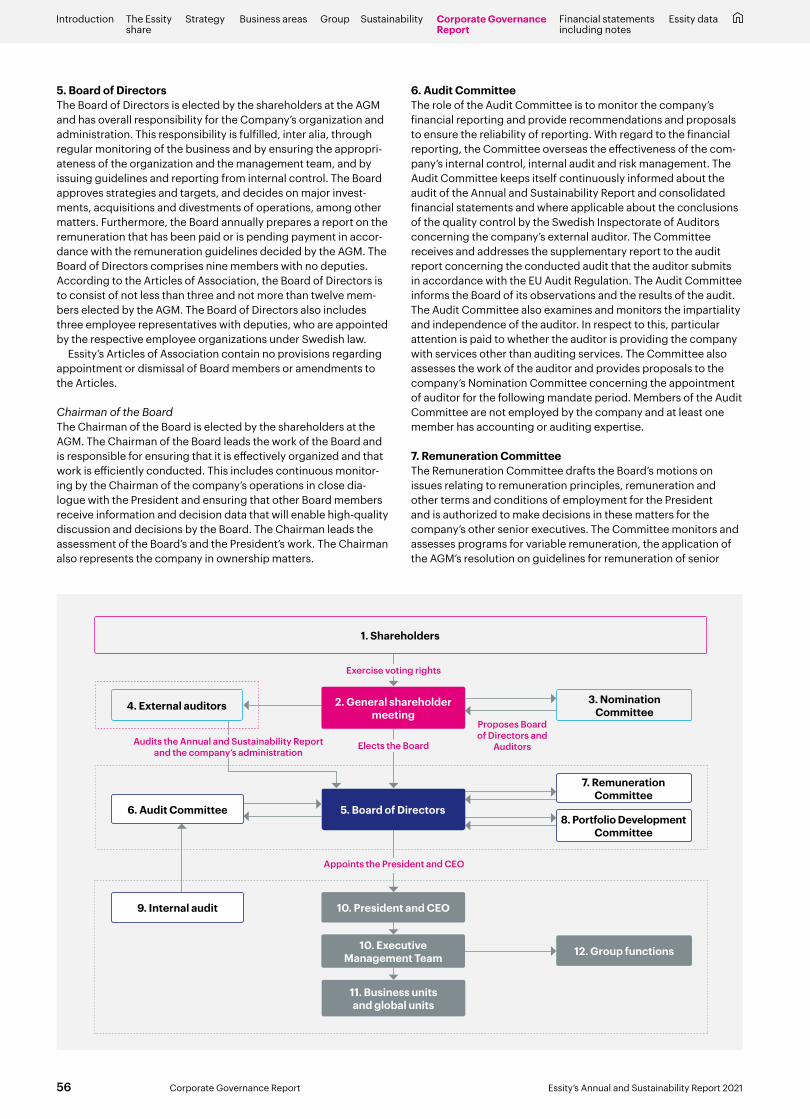
Introduction The Essity share
Strategy Business areas SustainabilityGroup Corporate Governance Report
Financial statementsincluding notes
Essity data
5. Board of DirectorsThe Board of Directors is elected by the shareholders at the AGM and has overall responsibility for the Company’s organization and administration. This responsibility is fulfilled, inter alia, through regular monitoring of the business and by ensuring the appropri-ateness of the organization and the management team, and by issuing guidelines and reporting from internal control. The Board approves strategies and targets, and decides on major invest-ments, acquisitions and divestments of operations, among other matters. Furthermore, the Board annually prepares a report on the remuneration that has been paid or is pending payment in accor-dance with the remuneration guidelines decided by the AGM. The Board of Directors comprises nine members with no deputies. According to the Articles of Association, the Board of Directors is to consist of not less than three and not more than twelve mem-bers elected by the AGM. The Board of Directors also includes three employee representatives with deputies, who are appointed by the respective employee organizations under Swedish law.
Essity’s Articles of Association contain no provisions regarding appointment or dismissal of Board members or amendments to the Articles.
Chairman of the BoardThe Chairman of the Board is elected by the shareholders at the AGM. The Chairman of the Board leads the work of the Board and is responsible for ensuring that it is effectively organized and that work is efficiently conducted. This includes continuous monitor-ing by the Chairman of the company’s operations in close dia-logue with the President and ensuring that other Board members receive information and decision data that will enable high-quality discussion and decisions by the Board. The Chairman leads the assessment of the Board’s and the President’s work. The Chairman also represents the company in ownership matters.
6. Audit CommitteeThe role of the Audit Committee is to monitor the company’s financial reporting and provide recommendations and proposals to ensure the reliability of reporting. With regard to the financial reporting, the Committee overseas the effectiveness of the com-pany’s internal control, internal audit and risk management. The Audit Committee keeps itself continuously informed about the audit of the Annual and Sustainability Report and consolidated financial statements and where applicable about the conclusions of the quality control by the Swedish Inspectorate of Auditors concerning the company’s external auditor. The Committee receives and addresses the supplementary report to the audit report concerning the conducted audit that the auditor submits in accordance with the EU Audit Regulation. The Audit Committee informs the Board of its observations and the results of the audit. The Audit Committee also examines and monitors the impartiality and independence of the auditor. In respect to this, particular attention is paid to whether the auditor is providing the company with services other than auditing services. The Committee also assesses the work of the auditor and provides proposals to the company’s Nomination Committee concerning the appointment of auditor for the following mandate period. Members of the Audit Committee are not employed by the company and at least one member has accounting or auditing expertise.
7. Remuneration CommitteeThe Remuneration Committee drafts the Board’s motions on issues relating to remuneration principles, remuneration and other terms and conditions of employment for the President and is authorized to make decisions in these matters for the company’s other senior executives. The Committee monitors and assesses programs for variable remuneration, the application of the AGM’s resolution on guidelines for remuneration of senior
10. President and CEO
6. Audit Committee
2. General shareholder meeting
1. Shareholders
4. External auditors 3. Nomination Committee
9. Internal audit
10. Executive Management Team
11. Business units and global units
12. Group functions
5. Board of Directors
7. Remuneration Committee
8. Portfolio Development Committee
Proposes Board of Directors and
Auditors
Exercise voting rights
Elects the Board
Appoints the President and CEO
Audits the Annual and Sustainability Report and the company’s administration
56 Essity’s Annual and Sustainability Report 2021Corporate Governance Report

Introduction The Essity share
Strategy Business areas SustainabilityGroup Corporate Governance Report
Financial statementsincluding notes
Essity data
executives and evaluates the applicable remuneration structure and remuneration levels in the Group. The Remuneration Commit-tee also prepares the annual remuneration report.
8. Portfolio Development CommitteeThe Portfolio Development Committee was established in Decem-ber 2021 and is tasked with preparing the Board’s deliberations and resolutions in relation to general portfolio and acquisition issues and to prepare and propose strategies relating to such issues. When deemed appropriate, the Board may, to a certain extent, delegate decision-making power in these matters to the committee.
9. Internal auditThe internal audit assists the Group in improving and protecting the organization’s value through a risk-based, independent and objective assurance and consultancy services. The internal audit reports to the Audit Committee and to the Board in relation to internal audit issues. The audit field encompasses both financial and operational aspects across all of Essity. The internal audit also provides investigations and consultancy services in connection with internal control matters and risk management.
10. President and Executive Management Team Essity’s President and CEO is responsible for and manages the day-to-day administration of the Group and follows the Board’s guidelines and instructions. The President is supported by the Executive Management Team, see pages 64–65, the work of which is led by the President. The Executive Management Team com-prises the President, five Group Function Senior Vice Presidents, four Business Unit Presidents and the Presidents of the three global units. The working procedures for the Board of Directors
Rules and regulationsCertain internal rules and regulations
■ Articles of Association ■ Working procedures of the Board of Directors, including instructions for the Audit Committee and the Remunera-tion Committee
■ Terms of reference issued by the Board to the President ■ Code of Conduct ■ Policy documents and instructions (in areas such as finance, HR, sustainability, internal control, communica-tion, pension and risk management as well as for specific issues, such as the processing of personal data, insider issues, conflicts of interest, competition law, corruption and diversity)
Certain external rules and regulations ■ The Swedish Companies Act ■ The Swedish Annual Accounts Act ■ International Financial Reporting Standards (IFRS) ■ EU Market Abuse Regulation (MAR) ■ Nasdaq Stockholm’s rules for issuers ■ Swedish Corporate Governance Code
Compliance with stock market regulationsEssity complies with rules that apply in Sweden for listed companies and was not sanctioned by Finansinspektionen, the stock exchange’s disciplinary committee or any other authority or self-regulating body for violations of the rules concerning the stock market.
More detailed information about Essity’s corporate governance is available on www.essity.com Articles of Association Swedish Code of Corporate Governance Information from the Nomination Committee ahead of the
2022 Annual General Meeting (composition, proposals and work)
Other information ahead of the 2022 AGM (notice, Board’s proposals regarding guidelines for remuneration of senior executives and report on application of the guidelines that applied for 2021, information about routines for noti-fying attendance at the AGM, etc.)
and terms of reference issued by the Board of Directors to the President detail, for example, the division of work between the Board and President. In consultation with the Chairman and Secretary of the Board, the President prepares documentation and decision data for the Board’s work.
11. Business units and global unitsEssity has four business units:
■ Consumer Goods ■ Health & Medical Solutions ■ Professional Hygiene ■ Latin America
Furthermore, Essity has three global units: ■ Global Brand, Innovation & Sustainability ■ Global Supply Chain ■ Global Operational Services
These business units and global units are described in more detail on page 28.
Essity’s business units and global units adhere to the principle of distinct decentralization of responsibility and authority. The business units and the global units have a delegated responsibility for managing and developing their respective operations through established objectives and strategies, a process that is also cen-trally coordinated. The business units are responsible for their operating results, capital and cash flow. The business and earn-ings position is followed up by the entire Executive Management Team on a monthly basis. Each quarter, business review meetings are conducted during which the management of each business unit personally meets with the President and the CFO. These meetings function as a complement to the daily monitoring of operations. Through working procedures and terms of reference, a number of issues of material significance are placed under the control of the CEO and the company’s Board of Directors.
12. Group functionsEssity has five Group functions:
■ Communications ■ Finance ■ Human Resources ■ Legal Affairs ■ Strategy & Business Development
These have Group-wide responsibility for matters within their respective fields of responsibility, and coordinate with the corre-sponding functions in the respective business area or global unit.
57Essity’s Annual and Sustainability Report 2021 Corporate Governance Report
Introduction The Essity share
Strategy Business areas SustainabilityGroup Corporate Governance Report
Financial statementsincluding notes
Essity data
Member Representative ofVotes as of
August 31, 2021 (%)Helena Stjernholm, Chairman AB Industrivärden 29.4Anders Oscarsson AMF and AMF Funds 7.9
Jonas JølleNorges Bank Investment Management 6.4
Marianne Nilsson Swedbank Robur Funds 2.1Pär Boman Chairman of the Board
Nomination Committee for the 2022 AGM
Annual General MeetingEssity held its AGM in Stockholm on Thursday, March 25, 2021. The meeting was carried out solely via advance voting (postal voting) in accordance with temporary legislation.
The AGM elected the company’s Board of Directors. Further-more, guidelines for remuneration of the President and other senior executives were adopted, see page 60 and Note C2 on pages 91–93. The Meeting also approved the Board’s remunera-tion report for 2020.
Nomination CommitteeThe Nomination Committee of Essity is tasked with making pro-posals to the AGM in respect of the election of the Chairman of the Meeting, Board of Directors, Chairman of the Board and auditor, remuneration of each Board Member (divided between the Chair-man of the Board and other Board Members), remuneration of the auditor and, where applicable, proposals for amendments to the instruction for the Nomination Committee.
At the 2020 AGM, the following instructions to the Nomination Committee were adopted to apply until further notice:
“The Nomination Committee is to comprise representatives of the four largest shareholders, who express a wish to take part in the Nomination Committee, in terms of voting rights as per the shareholders’ register maintained by the company on the final banking day of August, as well as the Chairman of the Board, who also convenes the first meeting of the Nomination Committee. The member representing the largest shareholder in terms of votes is to be appointed as Chairman of the Nomination Committee. The Chairman of the Board shall not be Chairman of the Nomination Committee. If necessary, due to subsequent ownership changes, the Nomination Committee is entitled to call on one or two addi-tional members from among the next largest shareholders in terms of voting rights. The total number of members shall be not more than seven. In the event that a member steps down from the Nomi-nation Committee before the task is completed and the Nomination Committee decides it would be beneficial for a replacement to be appointed, such a replacement is to be appointed by the same shareholder or, if this shareholder is no longer among the largest shareholders in terms of voting rights, by the next largest share-holder in terms of voting rights. Changes to the composition of the Nomination Committee are to be disclosed immediately.
The composition of the Nomination Committee is to be announced by Essity no later than six months prior to the AGM. No remuneration is to be paid to the members of the Nomination Committee. Any expenses incurred during the work of the Nom-ination Committee are to be paid by Essity. The mandate period of the Nomination Committee extends until the composition of the next Nomination Committee is disclosed. The Nomination Committee is to submit proposals relating to the Chairman of the Meeting, the Board of Directors, the Chairman of the Board, Board fees for the Chairman of the Board and each of the other Board members, including remuneration for committee work, the
company’s auditor and auditor’s fees and, to the extent deemed necessary, proposals for amendments to this instruction.”
In its work, the Nomination Committee is to consider the rules that apply to the independence of Board members, as well as the requirement of diversity and breadth with the endeavor to achieve an even gender distribution and that the selection shall be based on expertise and experience relevant to Essity.
All shareholders have had an opportunity to submit proposals to the Nomination Committee. The Nomination Committee’s pro-posal for the 2022 AGM is presented in the notice convening the AGM available on Essity’s website www.essity.com. The 2022 AGM will be held on Thursday, March 24, see page 8.
The Nomination Committee was convened on seven occasions prior to the 2022 AGM. The Chairman of the Board presented the Board evaluation and provided the Nomination Committee with information regarding Board and committee work during the year. When preparing proposals for the Board for the 2022 AGM, particular attention has been paid to the issues of diversity and an even gender distribution, and the Nomination Committee thus applied Item 4.1 of the Swedish Corporate Governance Code as its diversity policy. When preparing its proposal for the election of auditors, the Nomination Committee also gave consideration to the recommendation of the Audit Committee.
Board of Directors and composition of the Board of DirectorsEssity’s Board of Directors comprises nine members elected by the AGM. Ewa Björling, Pär Boman, Annemarie Gardshol, Magnus Groth, Torbjörn Lööf, Bert Nordberg, Louise Svanberg, Lars Rebien Sørensen and Barbara Milian Thoralfsson were elected as Board members in 2021. Pär Boman was elected as the Chairman of the Board.
The independence of Board members is presented in the table below. Essity complies with the requirements of the Swedish Corporate Governance Code that stipulate that not more than one member elected by the AGM shall be a member of corporate man-agement, that the majority of the members elected by the AGM shall be independent of the company and company management, and that not fewer than two of these shall also be independent of the company’s major shareholders. All of the AGM-elected Board members have experience of the requirements incumbent upon a listed company. Four of the Board members are women, corresponding to approximately 45% of the total number of AGM-elected Board members. The employees have appointed Susanna Lind, Örjan Svensson and Niclas Thulin as representatives to the Board for the period until and including the 2022 AGM, and their deputies Niklas Engdahl, Martin Ericsson and Andreas Larsson.
The AGM-elected Board members have broad international experience from various cultural and geographic areas and wide-reaching expertise and experience of relevance to Essity’s areas of business and products. Accordingly, the Board has – with reference to the company’s business, stage of development and general situation – a suitable composition. In addition, the Board of Directors and its committees have an even gender distribution.
Board activitiesThe Board was convened nine times, primarily in the form of vir-tual meetings due to the COVID-19 pandemic. The Board has fixed working procedures that describe in detail which ordinary agenda items are to be addressed at the various Board meetings of the year. Recurring agenda items are finances, the market situation, sustainability issues, investments and adoption of the financial reports. The Board also establishes and evaluates the company’s overall targets and strategy and decides on significant internal
Activities during the year
58 Essity’s Annual and Sustainability Report 2021Corporate Governance Report

Introduction The Essity share
Strategy Business areas SustainabilityGroup Corporate Governance Report
Financial statementsincluding notes
Essity data
Committees Attendance1)
Board of Directors Elected DependenceAudit
CommitteeRemuneration
Committee
Portfolio Development
CommitteeBoard of
Directors (9)Audit
Committee (6)Remuneration Committee (5)
Ewa Björling 2016 9/9 Pär Boman 2016 x Chairman x 9/9 6/6 5/5Maija-Liisa Friman (until March 25) 2016 2/2Annemarie Gardshol 2016 9/9 Magnus Groth 2016 9/9 Torbjörn Lööf (From March 25) 2021 7/7 Bert Nordberg 2016 x x Chairman 9/9 6/6 5/5 Louise Svanberg 2016 x 9/9 5/5Lars Rebien Sørensen 2017 8/9Barbara Milian Thoralfsson 2016 Chairman 9/9 6/6 1) Board meetings January 1–December 31, 2021.
= Dependent in relation to the company’s major shareholder, AB Industrivärden. = President of Essity, dependent in relation to the company and corporate management.
rules. Another key task is to continuously monitor the internal control of the compliance of the company and its employees with relevant internal and external rules, and that the company has well-functioning procedures for market disclosures. On a regular basis throughout the year, the Board has also dealt with reports from the Audit and Remuneration Committees and reports on strategy, market, internal audit, internal control and financial operations. The company’s auditor regularly presents a report on its audit work and these issues are discussed by the Board. The Business Unit Presidents present their respective operations and current issues affecting them.
In 2021, in addition to customary Board work, the Board of Directors continued to maintain a strong focus on digitalization, portfolio-related issues and sustainability, and closely monitored developments in light of the COVID-19 pandemic and its general impact on the company and, in particular, the markets where the company is active. The Board also focused on strategy work during the autumn.
Evaluation of the Board’s workThe work of the Board, like that of the President and the Chairman, is evaluated annually using a systematic and structured process. The purpose of this work is to obtain a sound basis for the Board’s own development work and to provide the Nomination Commit-tee with decision data for its nomination work. External expertise was used. The evaluation took the form of an anonymous ques-tionnaire and interviews as well as group and individual discus-sions. The evaluation covers such areas as the Board’s methods of work, effectiveness, expertise and the year’s work.
The Board was provided with feedback after the results were compiled. The Nomination Committee was also informed of the results of the evaluation.
Audit CommitteeThe Audit Committee comprises Chairman Barbara Milian Tho-ralfsson, Pär Boman and Bert Nordberg. The Audit Committee held six meetings during the year. In addition, members have also held meetings with internal audit, the auditors and the CFO. In its monitoring of the financial reporting, the Committee dealt with relevant accounting issues, internal auditors’ reviews, auditing work, a review of various measurement issues, such as testing of impairment requirements for goodwill, and the preconditions for the year’s pension liability calculations. The Audit Committee also prepared a recommendation to be used by the Nomination Committee when deciding on its proposal to the AGM regarding the election of auditors.
Remuneration CommitteeThe Remuneration Committee comprises Chairman Pär Boman, Bert Nordberg and Louise Svanberg. The Remuneration Committee
held five meetings in 2021. Activities mainly concerned remunera-tion and other employment terms and conditions for senior execu-tives, and current remuneration structures and remuneration levels in the Group. In addition, the Committee prepared the Board’s remuneration report relating to remuneration of senior executives.
Portfolio Development CommitteeThe Portfolio Development Committee consists of Chairman Bert Nordberg and Pär Boman. During 2021, the Committee held some discussions with the President and parts of corporate manage-ment in relation to such issues as the company’s portfolio and acquisition strategy.
Internal auditThe basis of the work of the internal audit is a risk analysis based on external and internal information carried out in close dialogue with management teams at Essity. The risk analysis forms the basis of an audit plan, which is presented to the Audit Committee together with the risk analysis. In 2021, 98 audit projects were per-formed and reported at meetings with the Audit Committee.
Work in 2021 involved follow-up of the units’ progress with pro-cess-based control, efficiency in internal governance and control, major investments, information security, sustainability and com-pliance with Essity’s policies.
External auditorThe 2021 AGM appointed the accounting firm of Ernst & Young AB as the company’s auditor for a mandate period of one year. The accounting firm notified the company that Hamish Mabon, Autho-rized Public Accountant, would be the auditor in charge. Hamish Mabon is also the auditor for SEB, Skanska AB and Assa Abloy AB. He owns no shares in the company.
In accordance with its formal work plan, the Board met with the auditor at three scheduled Board meetings in 2021. The auditor also attended each meeting of the Audit Committee. At these meetings, the auditor presented and received opinions on the focus and scope of the planned audit and delivered verbal audit and review reports. Furthermore, at the Board’s third scheduled autumn meet-ing, the auditor delivered an in-depth verbal report on the audit for the year. The working procedures specify a number of mandatory issues that must be addressed. These include matters of impor-tance that have been a cause for concern or discussion during the audit, business routines and transactions where differences of opinion may exist regarding the choice of accounting methods. The auditor shall also disclose consultancy work conducted for Essity as well as other dependencies in relation to the company and its man-agement. On each occasion, Board members have had an oppor-tunity to ask the auditors questions. Certain parts of the detailed discussion on the accounts take place without representatives of corporate management being present.
59Essity’s Annual and Sustainability Report 2021 Corporate Governance Report

Introduction The Essity share
Strategy Business areas SustainabilityGroup Corporate Governance Report
Financial statementsincluding notes
Essity data
The Board’s responsibility for internal governance and control is regulated in the Swedish Companies Act, the Annual Accounts Act and the Swedish Corporate Governance Code. The Annual Accounts Act requires that the company, each year, describes its system for internal control and risk management with respect to financial reporting. The purpose of these requirements is to create an internal framework for governance and control to reduce the risk of error in the financial reporting. Essity’s processes for inter-nal control of financial reporting is based on the model and princi-ples developed by the Committee of Sponsoring Organisations of the Treadway Commission (COSO).
Control environment A good control environment requires clarity in relation to deci-sion-making paths, powers and accountability, in addition to a corporate culture characterized by strong values and awareness among employees of their role in maintaining good internal con-trol. The Board of Directors has the overall responsibility for ensur-ing effective internal control and has, inter alia, adopted Group-wide internal rules for the purpose of establishing a foundation for a good corporate culture and to assure the quality of the financial reporting. In this context, Essity’s Code of Conduct is an important steering document in issues concerning ethics, morality and reg-ulatory compliance, and employees regularly receive information and training regarding the Code. Other significant steering doc-uments for the control environment include the Finance Policy, Internal Control Policy, Communications Policy and Information Security Policy. Essity’s Financial Reporting Manual is particularly important for the Group’s financial reporting procedures as it contains a number of specific instructions and guidelines that are specially designed to ensure the quality of the financial report-ing. Important steering documents are published in a separate database (Global Management System, GMS) that also contains a process for annual updates to the documents.
Internal control and financial reporting
GuidelinesThe 2021 AGM adopted new guidelines for remuneration of senior executives that are based on a total remuneration package com-prising a fixed salary, variable compensation and other benefits, and a pension, see Note C2 on pages 91–93.
Remuneration of the President and other senior executivesRemuneration of the President and other senior executives is presented in a separate remuneration report, which is available on
Remuneration, Management and Board of Directors
the company’s website and on pages 140–141. Furthermore, remu-neration of the President and other senior executives is described in Note C2 on pages 91–93.
Remuneration of the BoardThe total remuneration of the AGM-elected Board members amounted to SEK 9,500,000 in accordance with the AGM’s resolu-tion. See Note C3 on page 93 for further information.
Risk assessment Risks relate to material errors in the financial reporting that may arise, such as incomplete disclosures, valuation issues, the report-ing process and correctness. Risks also include loss of assets, unduly favoring a third party and misappropriation.
Risks related to the financial reporting are evaluated and moni-tored by the Board via the Audit Committee, where an annual risk assessment is conducted. The risks that are identified and may result in material errors also form the basis for internal control activities that proactively manage these risks. Clear guidelines for accountability and the division of work also form a component of risk prevention efforts. Furthermore, measures are continuously taken to improve business processes and thus reduce risks.
Control activities Significant instructions and guidelines related to financial report-ing are prepared and updated regularly by the Group Function Finance and are easily accessible on the Group’s intranet. The Group Function Finance is responsible for ensuring compliance with instructions and guidelines. Process managers at various levels within Essity are responsible for carrying out the necessary control measures with respect to financial reporting. An import-ant role is played by the business unit’s controller organizations, which are responsible for ensuring that financial reporting from each unit is correct and complete, and is conducted within the specified time. In addition, each business unit has a Finance Man-ager with responsibility for the individual business unit’s financial reporting. The company’s control activities are supported by the budgets prepared by each business unit and updated during the year through continuous forecasts. Essity has a standardized sys-tem of control measures involving processes that are significant to the company’s financial reporting. These measures include company-wide controls related to the Code of Conduct, process controls and IT controls. Self-assessments are carried out based
60 Essity’s Annual and Sustainability Report 2021Corporate Governance Report
Introduction The Essity share
Strategy Business areas SustainabilityGroup Corporate Governance Report
Financial statementsincluding notes
Essity data
on a selection of critical controls for the respective operations in order to assess the effectiveness of the internal control and gov-ernance.
Information and communication Financial reporting to the BoardThe Board’s working procedures stipulate which reports and information of a financial nature are to be submitted to the Board at each scheduled meeting. The President, together with the Chairman, ensures that the Board receives the reports required to enable the Board to continuously assess the company’s and Group’s financial position. Detailed instructions specifically outline the types of reports that the Board is to receive at each meeting.
Internal reportingAhead of each interim report, the company’s finance department prepares detailed instructions regarding deadlines, changes to accounting policies and other circumstances of significance for reporting to ensure the quality of the financial statements. Fur-thermore, the company has a process and technical system sup-port to limit the risk of price-sensitive information being leaked in conjunction with the submission of financial information ahead of the issue of interim reports.
Accounting and reporting for the majority of units is carried out by Essity’s Shared Service Center, which ensures efficient and uniform reporting.
External financial reportingThe quality of external financial reporting is guaranteed via a number of actions and procedures. The President is responsible for ensuring that all information issued, such as press releases
with financial content, presentation material for meetings with the media, owners and financial institutions, is correct and of a high quality. The responsibilities of the company’s auditors include reviewing accounting issues that are critical for the financial reporting and reporting their observations to the Audit Committee and the Board of Directors. In addition to the audit of the annual accounts, a review of the half-year report and of the company’s administration and internal control is carried out.
Monitoring activities Essity’s Board of Directors, through the Audit Committee, as well as the corporate management continuously assesses the effec-tiveness of the processes applied by the company with respect to the internal control of the financial reporting. Of particular impor-tance to this assessment are the reports submitted by the internal audit and feedback from the company’s external auditor.
The company has a structured process within the scope of its day-to-day operations for monitoring significant observations from internal control or internal audit. Such observations and the status of measures taken to address these are regularly reported to corporate management and to the Audit Committee.
The results of the self-assessment in control activities are compiled in a list of activities that require resolution. The internal control and governance department lead these monitoring activ-ities. To ensure the quality of the self-assessment, internal control conducts it own testing of control activities and reports the results to the units, the internal control and governance department, cor-porate management and the Audit Committee.
The external auditor also carries out testing of internal control and governance within the scope of its audit. The results are shared with corporate management, the internal control and gov-ernance department and the Audit Committee.
61Essity’s Annual and Sustainability Report 2021 Corporate Governance Report

Introduction The Essity share
Strategy Business areas SustainabilityGroup Corporate Governance Report
Financial statementsincluding notes
Essity data
Board of Directors and Auditors
Pär Boman (1961)Engineering and Business Administration degrees, Hon. D.B.
Chairman of the Board since 2016. Chairman of the Board of Svenska Handelsbanken AB and Svenska Cellulosa Aktiebolaget SCA, Deputy Chairman of the Board of AB Industrivärden and member of the Board of Skanska AB.2006–2015 President of Handelsbanken.Elected: 2016Independent of the company and corporate management.Own shareholdings and those of related persons, Class B shares: 5,000
Elected by the Annual General Meeting
Louise Svanberg (1958)MSc Econ
Member of the Boards of Dana Farber Cancer Institute, Boston and CERAS Health, New York. Chairman of the Swedes Worldwide organization.Previously held various management positions in EF Education First, including President 2002–2008 and Chairman of the Board 2008–2010. Former member of the Board of Svenska Cellulosa Aktiebolaget SCA.Elected: 2016Independent of the company, corporate management and Essity’s major shareholders.Own shareholdings and those of related persons, Class B shares: 28,540
Annemarie Gardshol (1967)MSc Eng.
Member of the Board of Svenska Cellulosa Aktiebolaget SCA.CEO of PostNord.Former member of the Boards of Etac AB, Bygghemma AB, Ortivus and Semcon. Former President of PostNord Sverige, PostNord Strålfors Group AB and various management positions in Gambro AB and McKinsey & Company.Elected: 2016Independent of the company, corporate management and Essity’s major shareholders.Own shareholdings and those of related persons, Class B shares: 3,200
Ewa Björling (1961)Med. Dr. Sci. and Associate Professor from Karolinska Institutet.
Chairman of the Board of Xolaris AB. Member of the boards of Biogaia AB, Mobilaris AB and MD International AB (Min Doktor).Former member of the Board of Svenska Cellulosa Aktiebolaget SCA, the Swedish National Insurance Office and the Swedish International Development Cooperation Agency (SIDA). Former Chairman of SPBI (Svenska Petroleum och Biodrivmedelsinstitutet).Minister for Trade 2007–2014, and Minister for Nordic Cooperation 2010–2014. Former researcher at Karolinska Institutet.Elected: 2016Independent of the company, corporate management and Essity’s major shareholders.Own shareholdings and those of related persons: 0
Bert Nordberg (1956)Engineer
Chairman of the Board of Vestas Wind Systems A/S. Member of the Boards of Svenska Cellulosa Aktiebolaget SCA and SAAB. Previously held various management positions in Digital Equipment Corp. and Ericsson, President of Sony Mobile Communications AB 2009–2012. Former Chairman of the Boards of Sony Mobile Communications and TDC Group A/S and member of the Boards of BlackBerry Ltd, Skistar AB, Axis AB and AB Electrolux.Elected: 2016Independent of the company, corporate management and Essity’s major shareholders.Own shareholdings and those of related persons, Class B shares: 16,800
Torbjörn Lööf (1965)Technician
Member of the Board of AB Blåkläder.Former President of Inter IKEA Group 2016–2020, Inter IKEA Systems 2013–2016 and IKEA of Sweden 2007–2013. Previously held various senior positions within IKEA since 1999. Former Chairman of the Board in a number of IKEA Group companies 2013–2016 and member of the Board of Inter IKEA Holding 2016–2020.Elected: 2021Independent of the company, corporate management and Essity’s major shareholders. Own shareholdings and those of related persons, Class B shares: 5,000
Information regarding own shareholdings and those of related persons pertains to the situation on December 31, 2021.
62 Essity’s Annual and Sustainability Report 2021Corporate Governance Report
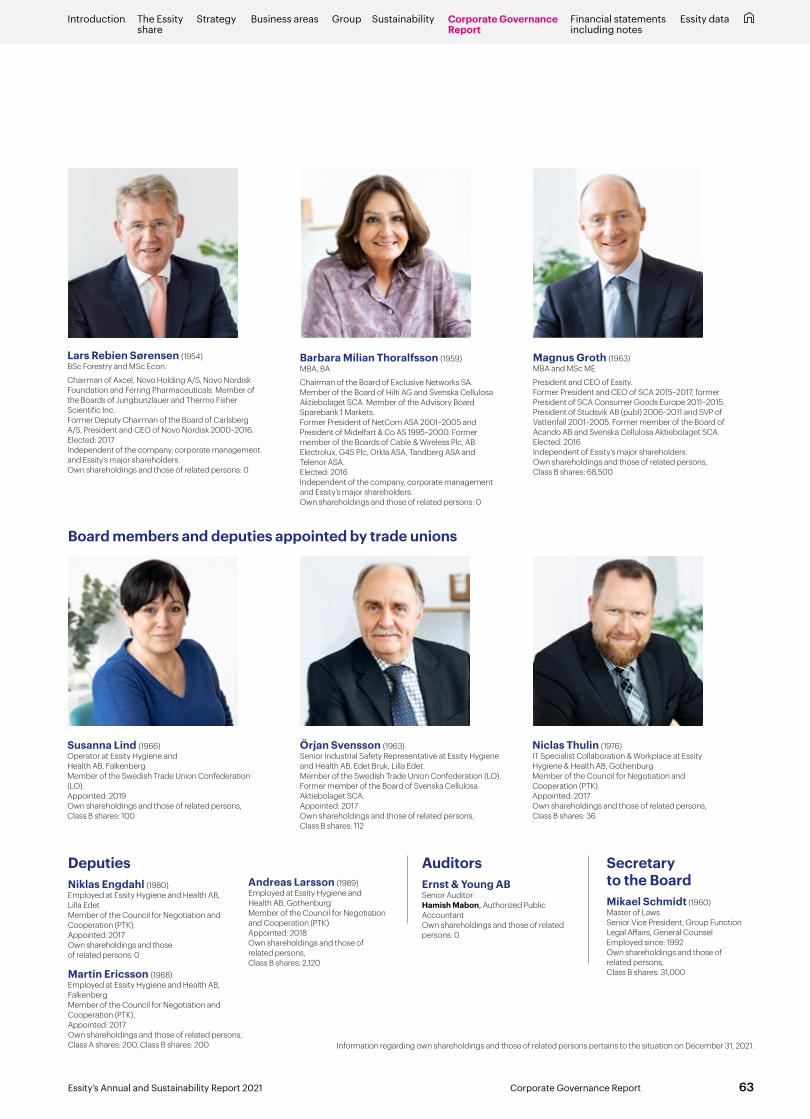
Introduction The Essity share
Strategy Business areas SustainabilityGroup Corporate Governance Report
Financial statementsincluding notes
Essity data
Lars Rebien Sørensen (1954)BSc Forestry and MSc Econ.
Chairman of Axcel, Novo Holding A/S, Novo Nordisk Foundation and Ferring Pharmaceuticals. Member of the Boards of Jungbunzlauer and Thermo Fisher Scientific Inc.Former Deputy Chairman of the Board of Carlsberg A/S, President and CEO of Novo Nordisk 2000–2016.Elected: 2017 Independent of the company, corporate management and Essity’s major shareholders.Own shareholdings and those of related persons: 0
Barbara Milian Thoralfsson (1959)MBA, BA
Chairman of the Board of Exclusive Networks SA. Member of the Board of Hilti AG and Svenska Cellulosa Aktiebolaget SCA. Member of the Advisory Board Sparebank 1 Markets. Former President of NetCom ASA 2001–2005 and President of Midelfart & Co AS 1995–2000. Former member of the Boards of Cable & Wireless Plc, AB Electrolux, G4S Plc, Orkla ASA, Tandberg ASA and Telenor ASA.Elected: 2016Independent of the company, corporate management and Essity’s major shareholders.Own shareholdings and those of related persons: 0
Board members and deputies appointed by trade unions
Susanna Lind (1966)Operator at Essity Hygiene and Health AB, FalkenbergMember of the Swedish Trade Union Confederation (LO).Appointed: 2019Own shareholdings and those of related persons, Class B shares: 100
Örjan Svensson (1963)Senior Industrial Safety Representative at Essity Hygiene and Health AB, Edet Bruk, Lilla Edet.Member of the Swedish Trade Union Confederation (LO).Former member of the Board of Svenska Cellulosa Aktiebolaget SCA.Appointed: 2017Own shareholdings and those of related persons, Class B shares: 112
Niclas Thulin (1976)IT Specialist Collaboration & Workplace at Essity Hygiene & Health AB, GothenburgMember of the Council for Negotiation and Cooperation (PTK).Appointed: 2017 Own shareholdings and those of related persons, Class B shares: 36
Magnus Groth (1963)MBA and MSc ME
President and CEO of Essity. Former President and CEO of SCA 2015–2017, former President of SCA Consumer Goods Europe 2011–2015. President of Studsvik AB (publ) 2006–2011 and SVP of Vattenfall 2001–2005. Former member of the Board of Acando AB and Svenska Cellulosa Aktiebolaget SCA.Elected: 2016Independent of Essity’s major shareholders.Own shareholdings and those of related persons, Class B shares: 68,500
Information regarding own shareholdings and those of related persons pertains to the situation on December 31, 2021.
DeputiesNiklas Engdahl (1980)Employed at Essity Hygiene and Health AB, Lilla EdetMember of the Council for Negotiation and Cooperation (PTK).Appointed: 2017 Own shareholdings and those of related persons: 0
Martin Ericsson (1968)Employed at Essity Hygiene and Health AB, FalkenbergMember of the Council for Negotiation and Cooperation (PTK).Appointed: 2017Own shareholdings and those of related persons, Class A shares: 200, Class B shares: 200
Andreas Larsson (1989)Employed at Essity Hygiene and Health AB, Gothenburg Member of the Council for Negotiation and Cooperation (PTK). Appointed: 2018 Own shareholdings and those of related persons, Class B shares: 2,120
AuditorsErnst & Young ABSenior Auditor: Hamish Mabon, Authorized Public AccountantOwn shareholdings and those of related persons: 0
Secretary to the BoardMikael Schmidt (1960)Master of Laws Senior Vice President, Group Function Legal Affairs, General CounselEmployed since: 1992Own shareholdings and those of related persons, Class B shares: 31,000
63Essity’s Annual and Sustainability Report 2021 Corporate Governance Report
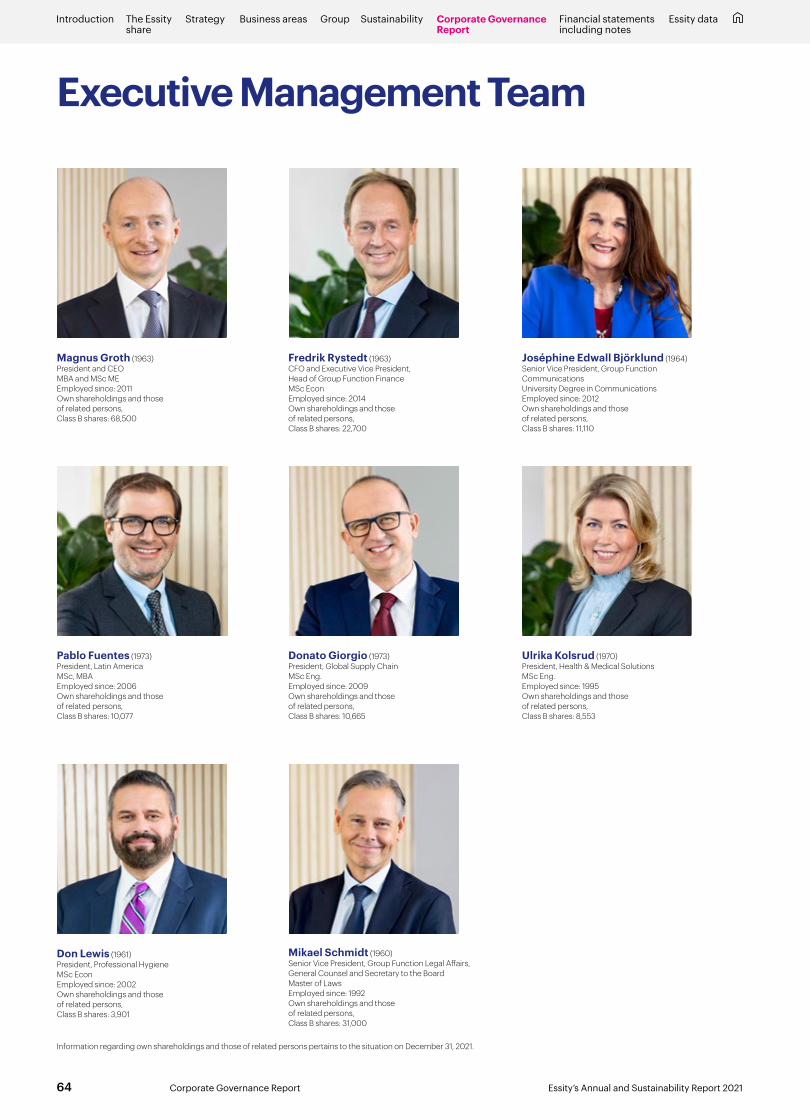
Introduction The Essity share
Strategy Business areas SustainabilityGroup Corporate Governance Report
Financial statementsincluding notes
Essity data
Magnus Groth (1963)President and CEOMBA and MSc MEEmployed since: 2011Own shareholdings and those of related persons, Class B shares: 68,500
Fredrik Rystedt (1963)CFO and Executive Vice President, Head of Group Function FinanceMSc EconEmployed since: 2014Own shareholdings and those of related persons, Class B shares: 22,700
Joséphine Edwall Björklund (1964)Senior Vice President, Group Function CommunicationsUniversity Degree in CommunicationsEmployed since: 2012Own shareholdings and those of related persons, Class B shares: 11,110
Executive Management Team
Pablo Fuentes (1973)President, Latin AmericaMSc, MBAEmployed since: 2006Own shareholdings and those of related persons, Class B shares: 10,077
Donato Giorgio (1973)President, Global Supply ChainMSc Eng.Employed since: 2009Own shareholdings and those of related persons, Class B shares: 10,665
Ulrika Kolsrud (1970)President, Health & Medical SolutionsMSc Eng.Employed since: 1995Own shareholdings and those of related persons, Class B shares: 8,553
Information regarding own shareholdings and those of related persons pertains to the situation on December 31, 2021.
Don Lewis (1961)President, Professional HygieneMSc EconEmployed since: 2002Own shareholdings and those of related persons, Class B shares: 3,901
Mikael Schmidt (1960)Senior Vice President, Group Function Legal Affairs, General Counsel and Secretary to the BoardMaster of LawsEmployed since: 1992Own shareholdings and those of related persons, Class B shares: 31,000
64 Essity’s Annual and Sustainability Report 2021Corporate Governance Report

Introduction The Essity share
Strategy Business areas SustainabilityGroup Corporate Governance Report
Financial statementsincluding notes
Essity data
Tuomas Yrjölä (1978) President, Global Brand, Innovation and SustainabilityMSc EconEmployed since: 2014Own shareholdings and those of related persons, Class B shares: 8,225
Sahil Tesfu (1982) Senior Vice President Group Function Strategy & Business DevelopmentMBA Business AdministrationEmployed since: 2021Own shareholdings and those of relatedpersons: 0
Volker Zöller (1967)President, Consumer GoodsBSc BAEmployed since: 1994Own shareholdings and those of related persons, Class B shares: 11,946
Anna Sävinger Åslund (1969)Senior Vice President, Group Function Human ResourcesBSc Human ResourcesEmployed since: 2001Own shareholdings and those of related persons, Class B shares: 7,145
Robert Sjöström (1964)President, Global Operational ServicesMSc Econ, MBAEmployed since: 2009Own shareholdings and those of related persons, Class B shares: 28,000
Information regarding own shareholdings and those of related persons pertains to the situation on December 31, 2021.
65Essity’s Annual and Sustainability Report 2021 Corporate Governance Report
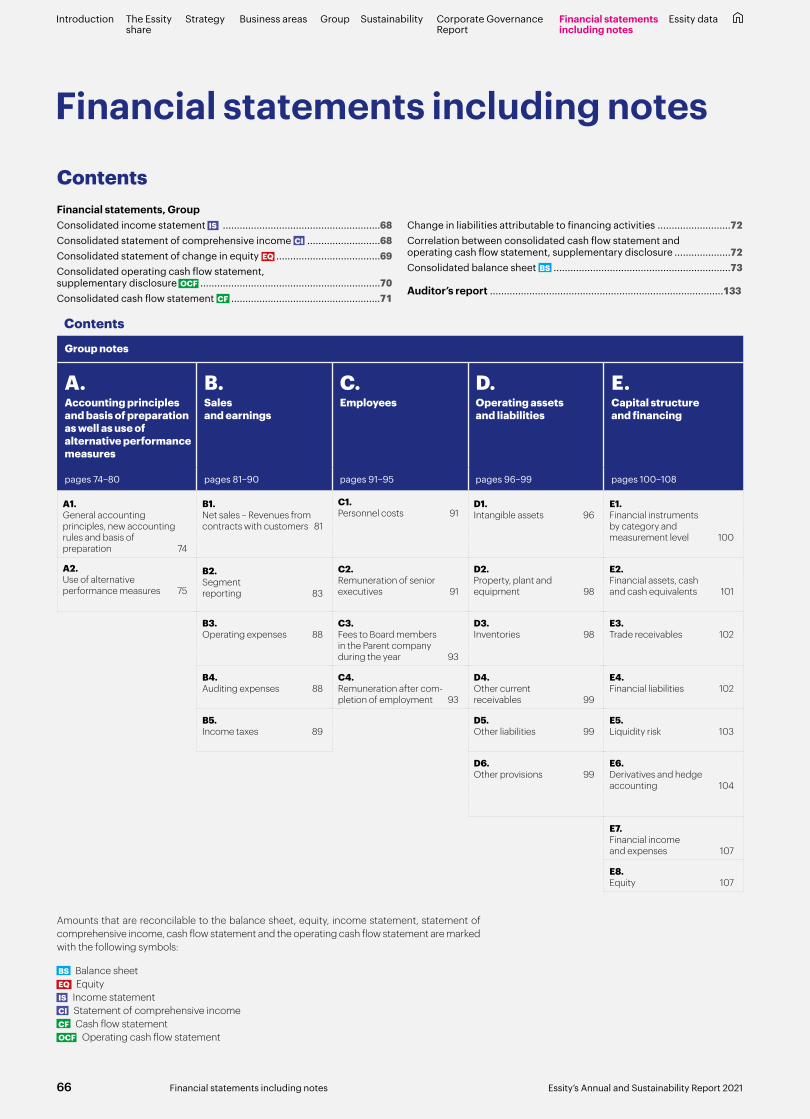
Financial statements, GroupConsolidated income statement IS ........................................................68Consolidated statement of comprehensive income CI ..........................68Consolidated statement of change in equity EQ .....................................69Consolidated operating cash flow statement, supplementary disclosure OCF ................................................................70Consolidated cash flow statement CF .....................................................71
Change in liabilities attributable to financing activities ..........................72Correlation between consolidated cash flow statement and operating cash flow statement, supplementary disclosure ....................72Consolidated balance sheet BS ...............................................................73 Auditor’s report ...................................................................................133
Financial statements including notes
Group notes Group notes, cont.
A. Accounting principles and basis of preparation as well as use of alternative performance measures
B. Sales and earnings
C. Employees
D.
Operating assets and liabilities
E. Capital structure and financing
F. Group structure
G. Other
pages 74–80 pages 81–90 pages 91–95 pages 96–99 pages 100–108 pages 109–114 pages 115–116
A1.General accounting principles, new accounting rules and basis of preparation 74
B1.Net sales – Revenues from contracts with customers 81
C1.Personnel costs 91
D1. Intangible assets 96
E1. Financial instruments by category and measurement level 100
F1. Group companies 109
G1. Non-current assets held for sale 115
A2. Use of alternative performance measures 75
B2.Segment reporting 83
C2.Remuneration of senior executives 91
D2. Property, plant and equipment 98
E2. Financial assets, cash and cash equivalents 101
F2. Jointly owned Group companies with significant non-controlling interests 110
G2. Leases 115
B3. Operating expenses 88
C3.Fees to Board members in the Parent company during the year 93
D3. Inventories 98
E3. Trade receivables 102
F3. Investments in associates and joint ventures 110
G3. Contingent liabilities and pledged assets 116
B4. Auditing expenses 88
C4.Remuneration after com-pletion of employment 93
D4. Other current receivables 99
E4. Financial liabilities 102
F4. Joint operations 112
G4. Transactions with related parties 116
B5. Income taxes 89
D5. Other liabilities 99
E5. Liquidity risk 103
F5. Shares and participations 112
G5. Events after the balance sheet date 116
D6. Other provisions 99
E6. Derivatives and hedge accounting 104
F6. Acquisitions and divestments of Group companies and other operations 112
E7. Financial income and expenses 107
E8. Equity 107
Amounts that are reconcilable to the balance sheet, equity, income statement, statement of comprehensive income, cash flow statement and the operating cash flow statement are marked with the following symbols:
BS Balance sheet EQ Equity IS Income statement CI Statement of comprehensive income CF Cash flow statement OCF Operating cash flow statement
Contents
Contents
66 Essity’s Annual and Sustainability Report 2021Financial statements including notes
Introduction The Essity share
Strategy Business areas SustainabilityGroup Corporate Governance Report
Financial statementsincluding notes
Essity data
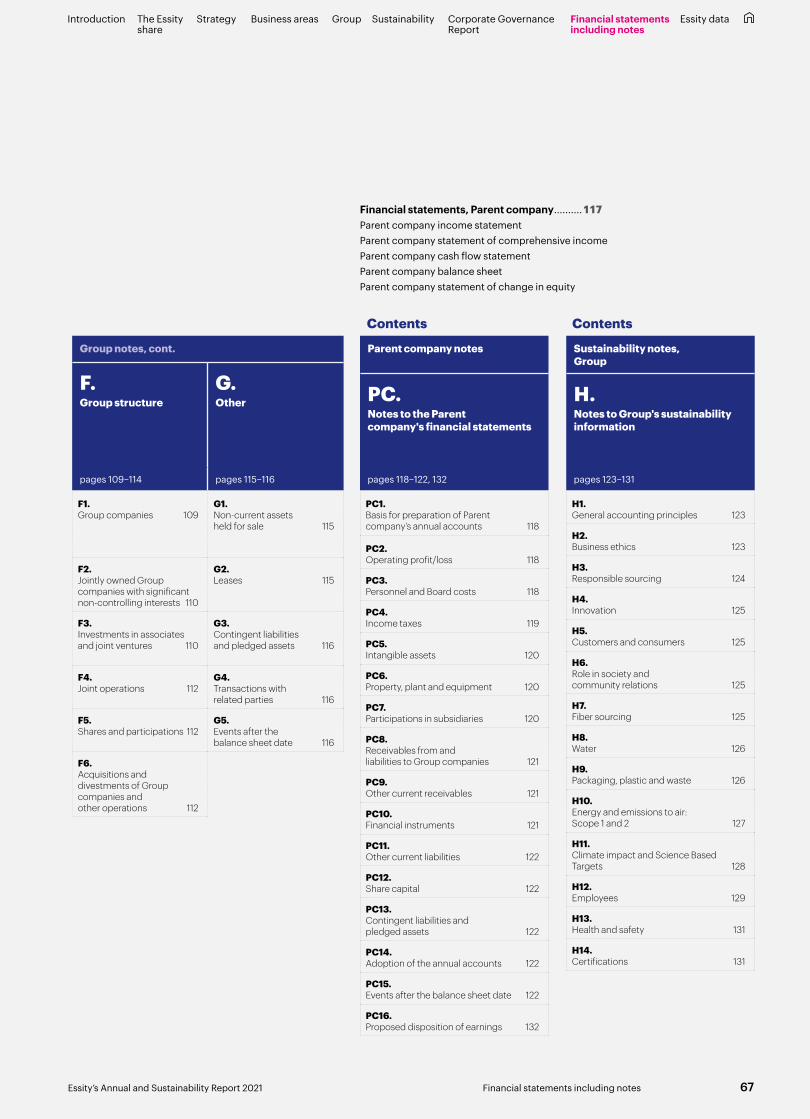
Group notes Group notes, cont.
A. Accounting principles and basis of preparation as well as use of alternative performance measures
B. Sales and earnings
C. Employees
D.
Operating assets and liabilities
E. Capital structure and financing
F. Group structure
G. Other
pages 74–80 pages 81–90 pages 91–95 pages 96–99 pages 100–108 pages 109–114 pages 115–116
A1.General accounting principles, new accounting rules and basis of preparation 74
B1.Net sales – Revenues from contracts with customers 81
C1.Personnel costs 91
D1. Intangible assets 96
E1. Financial instruments by category and measurement level 100
F1. Group companies 109
G1. Non-current assets held for sale 115
A2. Use of alternative performance measures 75
B2.Segment reporting 83
C2.Remuneration of senior executives 91
D2. Property, plant and equipment 98
E2. Financial assets, cash and cash equivalents 101
F2. Jointly owned Group companies with significant non-controlling interests 110
G2. Leases 115
B3. Operating expenses 88
C3.Fees to Board members in the Parent company during the year 93
D3. Inventories 98
E3. Trade receivables 102
F3. Investments in associates and joint ventures 110
G3. Contingent liabilities and pledged assets 116
B4. Auditing expenses 88
C4.Remuneration after com-pletion of employment 93
D4. Other current receivables 99
E4. Financial liabilities 102
F4. Joint operations 112
G4. Transactions with related parties 116
B5. Income taxes 89
D5. Other liabilities 99
E5. Liquidity risk 103
F5. Shares and participations 112
G5. Events after the balance sheet date 116
D6. Other provisions 99
E6. Derivatives and hedge accounting 104
F6. Acquisitions and divestments of Group companies and other operations 112
E7. Financial income and expenses 107
E8. Equity 107
Financial statements, Parent company ..........117Parent company income statementParent company statement of comprehensive incomeParent company cash flow statement Parent company balance sheet Parent company statement of change in equity
Parent company notes
PC. Notes to the Parent company's financial statements
pages 118–122, 132
PC1. Basis for preparation of Parent company’s annual accounts 118
PC2. Operating profit/loss 118
PC3. Personnel and Board costs 118
PC4. Income taxes 119
PC5. Intangible assets 120
PC6. Property, plant and equipment 120
PC7. Participations in subsidiaries 120
PC8. Receivables from and liabilities to Group companies 121
PC9. Other current receivables 121
PC10. Financial instruments 121
PC11. Other current liabilities 122
PC12. Share capital 122
PC13. Contingent liabilities and pledged assets 122
PC14. Adoption of the annual accounts 122
PC15. Events after the balance sheet date 122
PC16.Proposed disposition of earnings 132
Sustainability notes, Group
H. Notes to Group's sustainability information
pages 123–131
H1. General accounting principles 123
H2. Business ethics 123
H3. Responsible sourcing 124
H4. Innovation 125
H5. Customers and consumers 125
H6. Role in society and community relations 125
H7. Fiber sourcing 125
H8. Water 126
H9. Packaging, plastic and waste 126
H10. Energy and emissions to air: Scope 1 and 2 127
H11. Climate impact and Science Based Targets 128
H12. Employees 129
H13. Health and safety 131
H14. Certifications 131
Contents Contents
67Essity’s Annual and Sustainability Report 2021 Financial statements including notes
Introduction The Essity share
Strategy Business areas SustainabilityGroup Corporate Governance Report
Financial statementsincluding notes
Essity data

Consolidated income statement IS
2021 2020 2019
Note SEKm EURm1) SEKm EURm1) SEKm EURm1)
Net sales B1, B2 121,867 12,017 121,752 11,626 128,975 12,193Cost of goods sold B3 –86,628 –8,542 –82,132 –7,843 –90,876 –8,591Items affecting comparability – cost of goods sold B2, B3 –146 –14 –181 –17 –243 –23
Gross profit 35,093 3,461 39,439 3,766 37,856 3,579Sales, general and administration B3 –21,617 –2,132 –22,088 –2,109 –22,319 –2,110Items affecting comparability – sales, general and administration B2, B3 517 51 122 11 –470 –45Share of profits of associates and joint ventures B3 58 6 94 9 60 6Operating profit before amortization of acquisition-related intangible assets (EBITA) 14,051 1,386 17,567 1,677 15,127 1,430Amortization of acquisition-related intangible assets B3 –852 –84 –809 –77 –778 –73
Operating profit 13,199 1,302 16,758 1,600 14,349 1,357Financial income E7 102 10 108 10 106 10Financial expenses E7 –764 –75 –1,066 –101 –1,415 –134Profit before tax 12,537 1,237 15,800 1,509 13,040 1,233Income taxes B5 –2,727 –269 –4,053 –387 –2,828 –268Profit for the period 9,810 968 11,747 1,122 10,212 965
Earnings attributable to:Owners of the Parent company 8,620 850 10,228 977 9,216 871Non-controlling interests 1,190 117 1,519 145 996 94
Earnings per share – owners of the Parent companyEarnings per share before and after dilution effects, SEK 12.27 1.2 14.56 1.4 13.12 1.2Dividend per share, SEK 7.002) 6.75 6.25 Average number of shares before and after dilution, million 702.3 702.3 702.3
1) Translation to EUR is provided for the convenience of the reader. The following average exchange rates were used; 10.14 10.47 10.58
2) Board proposal.
Consolidated statement of comprehensive income CI
SEKm 2021 2020 2019
IS Profit for the period 9,810 11,747 10,212
Other comprehensive income for the periodItems that will not be reclassified to the income statementActuarial gains/losses on defined benefit pension plans –148 –202 482Fair value through other comprehensive income 0 3 6Income tax attributable to components in other comprehensive income –13 279 52Other comprehensive income that will not be reclassified to the income statement –161 80 540
Items that have been or may be reclassified subsequently to the income statementCash flow hedges: Result from remeasurement of derivatives recognized in equity 4,142 –9 –725 Transferred to profit or loss for the period –1,363 473 112Translation differences in foreign operations 5,480 –8,092 2,095Gains/losses from hedges of net investments in foreign operations –1,012 1,504 –168Other comprehensive income from associated companies 15 –20 –14Income tax attributable to components in other comprehensive income –539 –415 179Other comprehensive income that has been or may be reclassified subsequently to the income statement 6,723 –6,559 1,479Other comprehensive income for the period, net of tax 6,562 –6,479 2,019Total comprehensive income for the period 16,372 5,268 12,231
Total comprehensive income attributable to:Owners of the Parent company 14,294 4,588 11,006Non-controlling interests 2,078 680 1,225
By operating segment Net sales Adjusted EBITA1)
SEKm 2021 2020 2019 2021 2020 2019
Personal Care 46,639 46,095 48,340 7,098 7,161 6,746Consumer Tissue 49,086 50,221 49,904 4,661 8,045 5,321Professional Hygiene 26,143 25,418 30,731 2,710 3,317 4,463Other –1 18 0 –789 –897 –690Total 121,867 121,752 128,975 13,680 17,626 15,840
1) Excluding items affecting comparability.
68 Essity’s Annual and Sustainability Report 2021Financial statements including notes
Introduction The Essity share
Strategy Business areas SustainabilityGroup Corporate Governance Report
Financial statementsincluding notes
Essity data

Consolidated statement of change in equity EQ
SEKmShare
capital TE8:1
ReservesRetained earnings
Equity attributable to owners of the Parent
companyNon-controlling
interestsTotal
equity
Value, January 1, 2021 2,350 581 51,421 54,352 8,990 63,342 IS Profit for the period 8,620 8,620 1,190 9,810Other comprehensive income for the periodItems that will not be reclassified to the income statementActuarial gains/losses on defined benefit pension plans1) –148 –148 –148Fair value through other comprehensive income 0 0 0
TE8:2 Income tax attributable to components in other comprehensive income 0 –13 –13 –13Other comprehensive income that will not be reclassified to the income statement 0 –161 –161 – –161Items that have been or may be reclassified subsequently to the income statementCash flow hedges:
Result from remeasurement of derivatives recognized in equity 4,142 4,142 4,142 Transferred to profit or loss for the period –1,363 –1,363 –1,363 Acquired cash flow hedges 11 –11 – –Translation differences in foreign operations 4,592 4,592 888 5,480Gains/losses from hedges of net investments in foreign operations –1,012 –1,012 –1,012Other comprehensive income from associated companies 15 15 15
TE8:2 Income tax attributable to components in other comprehensive income –536 –3 –539 –539Other comprehensive income that has been or may be reclassified subsequently to the income statement 5,834 1 5,835 888 6,723
Other comprehensive income for the period, net of tax 5,834 –160 5,674 888 6,562
CI Total comprehensive income for the period 5,834 8,460 14,294 2,078 16,372Private placement to non-controlling interests 13 13 12 25Acquisition of non-controlling interests –4,042 –4,042 –1,919 –5,961Transferred to cost of hedged investments 1 1 1Revaluation effect upon acquisition of non-controlling interests –3 –3 –3
CF OCF Dividend, SEK 6.75 per share2) –4,741 –4,741 –528 –5,269
BS Value, December 31 2,350 6,416 51,108 59,874 8,633 68,507
Value, January 1, 2020 2,350 6,284 45,491 54,125 8,676 62,801 IS Profit for the period 10,228 10,228 1,519 11,747Other comprehensive income for the periodItems that will not be reclassified to the income statementActuarial gains/losses on defined benefit pension plans1) –203 –203 1 –202Fair value through other comprehensive income 3 3 3
TE8:2 Income tax attributable to components in other comprehensive income –1 280 279 – 279Other comprehensive income that will not be reclassified to the income statement 2 77 79 1 80Items that have been or may be reclassified subsequently to the income statementCash flow hedges: Result from remeasurement of derivatives recognized in equity –9 –9 –9 Transferred to profit or loss for the period 473 473 473Translation differences in foreign operations –7,252 –7,252 –840 –8,092Gains/losses from hedges of net investments in foreign operations 1,504 1,504 1,504Other comprehensive income from associated companies –20 –20 –20
TE8:2 Income tax attributable to components in other comprehensive income –419 4 –415 –415Other comprehensive income that has been or may be reclassified subsequently to the income statement –5,703 –16 –5,719 –840 –6,559
Other comprehensive income for the period, net of tax –5,701 61 –5,640 –839 –6,479
CI Total comprehensive income for the period –5,701 10,289 4,588 680 5,268Private placement to non-controlling interests 33 33 31 64Divestment of non-controlling interests – 57 57Acquisition of non-controlling interests –1 –1 –1 –2Transferred to cost of hedged investments –2 –2 –2Revaluation effect upon acquisition of non-controlling interests –1 –1 –1
CF OCF Dividend, SEK 6.25 per share3) –4,390 –4,390 –453 –4,843
BS Value, December 31 2,350 581 51,421 54,352 8,990 63,342
1) Including payroll tax.2) Dividend of SEK 6.75 per share pertains to owners of the Parent company. For the 2021 fiscal year, the Board of Directors has decided to propose a divided of SEK 7.00 per share to the Annual General Meeting.3) Dividend of SEK 6.25 per share pertains to owners of the Parent company.
69Essity’s Annual and Sustainability Report 2021 Financial statements including notes
Introduction The Essity share
Strategy Business areas SustainabilityGroup Corporate Governance Report
Financial statementsincluding notes
Essity data
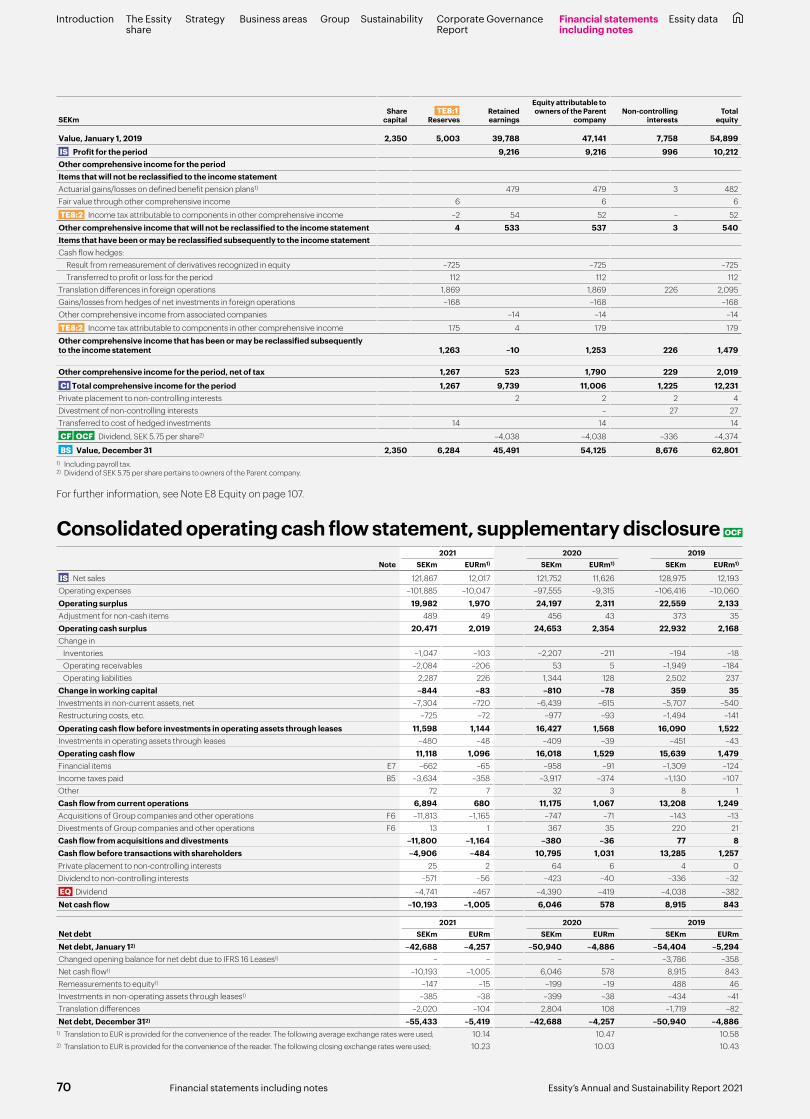
Consolidated operating cash flow statement, supplementary disclosure OCF
2021 2020 2019Note SEKm EURm1) SEKm EURm1) SEKm EURm1)
IS Net sales 121,867 12,017 121,752 11,626 128,975 12,193Operating expenses –101,885 –10,047 –97,555 –9,315 –106,416 –10,060Operating surplus 19,982 1,970 24,197 2,311 22,559 2,133Adjustment for non-cash items 489 49 456 43 373 35Operating cash surplus 20,471 2,019 24,653 2,354 22,932 2,168Change in Inventories –1,047 –103 –2,207 –211 –194 –18 Operating receivables –2,084 –206 53 5 –1,949 –184 Operating liabilities 2,287 226 1,344 128 2,502 237Change in working capital –844 –83 –810 –78 359 35Investments in non-current assets, net –7,304 –720 –6,439 –615 –5,707 –540Restructuring costs, etc. –725 –72 –977 –93 –1,494 –141
Operating cash flow before investments in operating assets through leases 11,598 1,144 16,427 1,568 16,090 1,522Investments in operating assets through leases –480 –48 –409 –39 –451 –43Operating cash flow 11,118 1,096 16,018 1,529 15,639 1,479Financial items E7 –662 –65 –958 –91 –1,309 –124Income taxes paid B5 –3,634 –358 –3,917 –374 –1,130 –107Other 72 7 32 3 8 1Cash flow from current operations 6,894 680 11,175 1,067 13,208 1,249Acquisitions of Group companies and other operations F6 –11,813 –1,165 –747 –71 –143 –13Divestments of Group companies and other operations F6 13 1 367 35 220 21Cash flow from acquisitions and divestments –11,800 –1,164 –380 –36 77 8Cash flow before transactions with shareholders –4,906 –484 10,795 1,031 13,285 1,257Private placement to non-controlling interests 25 2 64 6 4 0Dividend to non-controlling interests –571 –56 –423 –40 –336 –32
EQ Dividend –4,741 –467 –4,390 –419 –4,038 –382Net cash flow –10,193 –1,005 6,046 578 8,915 843
2021 2020 2019Net debt SEKm EURm SEKm EURm SEKm EURm
Net debt, January 12) –42,688 –4,257 –50,940 –4,886 –54,404 –5,294Changed opening balance for net debt due to IFRS 16 Leases1) – – – – –3,786 –358Net cash flow1) –10,193 –1,005 6,046 578 8,915 843Remeasurements to equity1) –147 –15 –199 –19 488 46Investments in non-operating assets through leases1) –385 –38 –399 –38 –434 –41Translation differences –2,020 –104 2,804 108 –1,719 –82Net debt, December 312) –55,433 –5,419 –42,688 –4,257 –50,940 –4,886
1) Translation to EUR is provided for the convenience of the reader. The following average exchange rates were used; 10.14 10.47 10.582) Translation to EUR is provided for the convenience of the reader. The following closing exchange rates were used; 10.23 10.03 10.43
SEKmShare
capital TE8:1
ReservesRetained earnings
Equity attributable to owners of the Parent
companyNon-controlling
interestsTotal
equity
Value, January 1, 2019 2,350 5,003 39,788 47,141 7,758 54,899 IS Profit for the period 9,216 9,216 996 10,212Other comprehensive income for the periodItems that will not be reclassified to the income statementActuarial gains/losses on defined benefit pension plans1) 479 479 3 482Fair value through other comprehensive income 6 6 6
TE8:2 Income tax attributable to components in other comprehensive income –2 54 52 – 52Other comprehensive income that will not be reclassified to the income statement 4 533 537 3 540Items that have been or may be reclassified subsequently to the income statementCash flow hedges: Result from remeasurement of derivatives recognized in equity –725 –725 –725 Transferred to profit or loss for the period 112 112 112Translation differences in foreign operations 1,869 1,869 226 2,095Gains/losses from hedges of net investments in foreign operations –168 –168 –168Other comprehensive income from associated companies –14 –14 –14
TE8:2 Income tax attributable to components in other comprehensive income 175 4 179 179Other comprehensive income that has been or may be reclassified subsequently to the income statement 1,263 –10 1,253 226 1,479
Other comprehensive income for the period, net of tax 1,267 523 1,790 229 2,019
CI Total comprehensive income for the period 1,267 9,739 11,006 1,225 12,231Private placement to non-controlling interests 2 2 2 4 Divestment of non-controlling interests – 27 27Transferred to cost of hedged investments 14 14 14
CF OCF Dividend, SEK 5.75 per share2) –4,038 –4,038 –336 –4,374
BS Value, December 31 2,350 6,284 45,491 54,125 8,676 62,8011) Including payroll tax.2) Dividend of SEK 5.75 per share pertains to owners of the Parent company.
For further information, see Note E8 Equity on page 107.
70 Essity’s Annual and Sustainability Report 2021Financial statements including notes
Introduction The Essity share
Strategy Business areas SustainabilityGroup Corporate Governance Report
Financial statementsincluding notes
Essity data
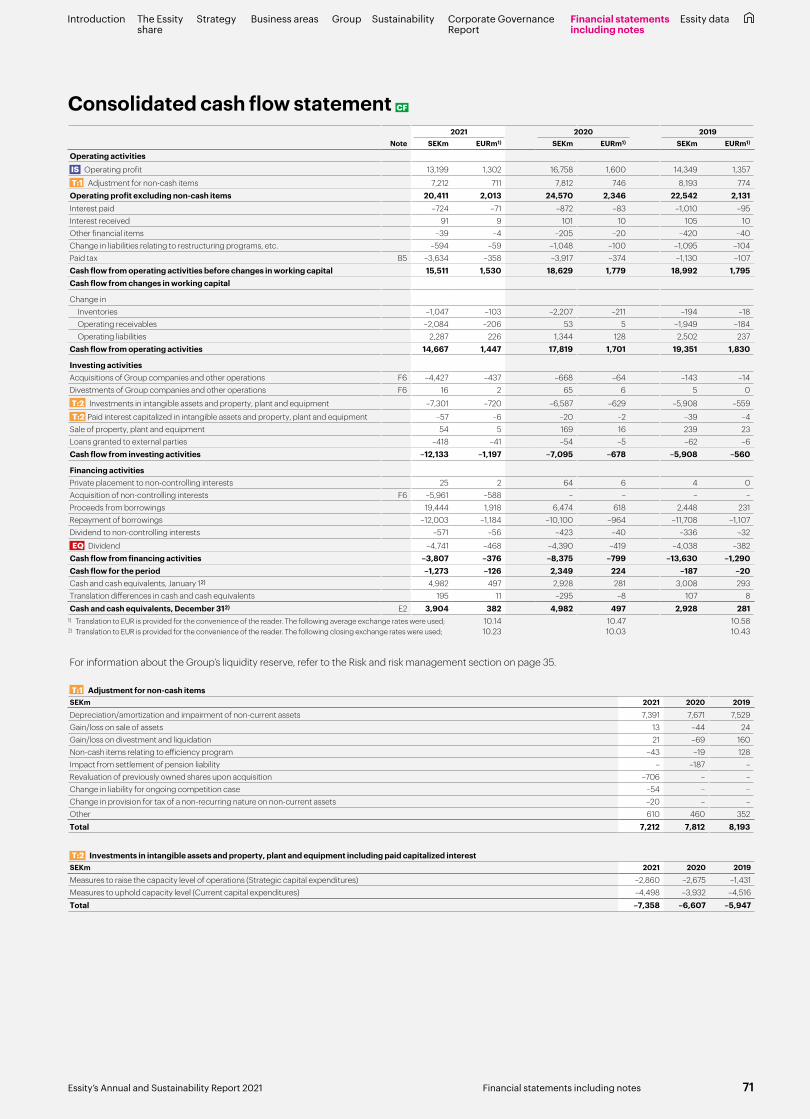
Consolidated cash flow statement CF
2021 2020 2019Note SEKm EURm1) SEKm EURm1) SEKm EURm1)
Operating activities IS Operating profit 13,199 1,302 16,758 1,600 14,349 1,357
T:1 Adjustment for non-cash items 7,212 711 7,812 746 8,193 774Operating profit excluding non-cash items 20,411 2,013 24,570 2,346 22,542 2,131Interest paid –724 –71 –872 –83 –1,010 –95Interest received 91 9 101 10 105 10Other financial items –39 –4 –205 –20 –420 –40Change in liabilities relating to restructuring programs, etc. –594 –59 –1,048 –100 –1,095 –104Paid tax B5 –3,634 –358 –3,917 –374 –1,130 –107Cash flow from operating activities before changes in working capital 15,511 1,530 18,629 1,779 18,992 1,795Cash flow from changes in working capital
Change in Inventories –1,047 –103 –2,207 –211 –194 –18 Operating receivables –2,084 –206 53 5 –1,949 –184 Operating liabilities 2,287 226 1,344 128 2,502 237Cash flow from operating activities 14,667 1,447 17,819 1,701 19,351 1,830
Investing activitiesAcquisitions of Group companies and other operations F6 –4,427 –437 –668 –64 –143 –14Divestments of Group companies and other operations F6 16 2 65 6 5 0
T:2 Investments in intangible assets and property, plant and equipment –7,301 –720 –6,587 –629 –5,908 –559
T:2 Paid interest capitalized in intangible assets and property, plant and equipment –57 –6 –20 –2 –39 –4Sale of property, plant and equipment 54 5 169 16 239 23Loans granted to external parties –418 –41 –54 –5 –62 –6Cash flow from investing activities –12,133 –1,197 –7,095 –678 –5,908 –560
Financing activitiesPrivate placement to non-controlling interests 25 2 64 6 4 0Acquisition of non-controlling interests F6 –5,961 –588 – – – –Proceeds from borrowings 19,444 1,918 6,474 618 2,448 231Repayment of borrowings –12,003 –1,184 –10,100 –964 –11,708 –1,107Dividend to non-controlling interests –571 –56 –423 –40 –336 –32
EQ Dividend –4,741 –468 –4,390 –419 –4,038 –382Cash flow from financing activities –3,807 –376 –8,375 –799 –13,630 –1,290Cash flow for the period –1,273 –126 2,349 224 –187 –20Cash and cash equivalents, January 12) 4,982 497 2,928 281 3,008 293Translation differences in cash and cash equivalents 195 11 –295 –8 107 8Cash and cash equivalents, December 312) E2 3,904 382 4,982 497 2,928 281
1) Translation to EUR is provided for the convenience of the reader. The following average exchange rates were used; 10.14 10.47 10.582) Translation to EUR is provided for the convenience of the reader. The following closing exchange rates were used; 10.23 10.03 10.43
For information about the Group’s liquidity reserve, refer to the Risk and risk management section on page 35.
T:1 Adjustment for non-cash itemsSEKm 2021 2020 2019
Depreciation/amortization and impairment of non-current assets 7,391 7,671 7,529Gain/loss on sale of assets 13 –44 24Gain/loss on divestment and liquidation 21 –69 160Non-cash items relating to efficiency program –43 –19 128Impact from settlement of pension liability – –187 –Revaluation of previously owned shares upon acquisition –706 – –Change in liability for ongoing competition case –54 – –Change in provision for tax of a non-recurring nature on non-current assets –20 – –Other 610 460 352Total 7,212 7,812 8,193
T:2 Investments in intangible assets and property, plant and equipment including paid capitalized interestSEKm 2021 2020 2019
Measures to raise the capacity level of operations (Strategic capital expenditures) –2,860 –2,675 –1,431Measures to uphold capacity level (Current capital expenditures) –4,498 –3,932 –4,516Total –7,358 –6,607 –5,947
71Essity’s Annual and Sustainability Report 2021 Financial statements including notes
Introduction The Essity share
Strategy Business areas SustainabilityGroup Corporate Governance Report
Financial statementsincluding notes
Essity data

Correlation between consolidated cash flow statement and operating cash flow statement, supplementary disclosure SEKm 2021 2020 2019
Cash flow from operating activitiesCash flow from operating activities 14,667 17,819 19,351Adjustments Investments in non-current assets, net –7,304 –6,439 –5,707 Accrued interest 10 18 17 Investments in operating assets through leases –480 –409 –451 Impact from settlement of pension liability – 187 – Other 1 –1 –2Cash flow from current operations according to consolidated operating cash flow statement 6,894 11,175 13,208
Cash flow from investing activitiesCash flow from investing activities –12,133 –7,095 –5,908Adjustments Investments in non-current assets, net 7,304 6,439 5,707 Loans granted to external parties 418 54 62 Acquisition of non-controlling interests –5,961 – – Net debt in acquired and divested companies –1,410 205 215 Paid/Non-paid financial receivable upon divestment of Group companies –18 18 – Other – –1 1Cash flow from acquisitions and divestments according to consolidated operating cash flow statement –11,800 –380 77
Cash flow for the periodCash flow for the period –1,273 2,349 –187Adjustments Repayment of borrowings 12,003 10,100 11,708 Proceeds from borrowings –19,444 –6,474 –2,448 Loans granted to external parties 418 54 62 Net debt in acquired and divested operations –1,410 205 215 Paid/Non-paid financial receivable upon divestment of Group companies –18 18 – Investments in operating assets through leases –480 –409 –451 Accrued interest 10 18 17 Impact from settlement of pension liability – 187 – Other 1 –2 –1Net cash flow according to consolidated operating cash flow statement –10,193 6,046 8,915
Change in liabilities attributable to financing activities
SEKmValue at
January 1Cash flow,
net
Acquisi-tions/
divest-ments
Transla-tion
differ-ences
Actuarial gains/losses
Effect of IFRS 16 Leases
Other changes
Value atDecember
31
2021Non-current and current financial liabilities 46,890 6,643 1,425 2,377 – – 8541) 58,189Provisions for pensions including surplus in funded pension plans 2,511 228 –15 –162 148 – – 2,710Assets for hedging financial liabilities included in cash flow from financing activities –1,387 570 – – – – – –817Total Financial liabilities including surplus in funded pension plans attributable to financing activities 48,014 7,441 1,410 2,215 148 – 854 60,082
2020Non-current and current financial liabilities 52,062 –2,655 –205 –3,102 – – 7902) 46,890Provisions for pensions including surplus in funded pension plans 3,025 –532 – 3 202 – –1873) 2,511Assets for hedging financial liabilities included in cash flow from financing activities –948 –439 – – – – – –1,387Total Financial liabilities including surplus in funded pension plans attributable to financing activities 54,139 –3,626 –205 –3,099 202 – 603 48,014
2019Non-current and current financial liabilities 54,327 –8,498 –214 1,793 – 3,786 8684) 52,062Provisions for pensions including surplus in funded pension plans 4,141 –659 –1 26 –482 – – 3,025Assets for hedging financial liabilities included in cash flow from financing activities –846 –103 – 1 – – – –948Total Financial liabilities including surplus in funded pension plans attributable to financing activities 57,622 –9,260 –215 1,820 –482 3,786 868 54,139
1) Other changes 2021 relate to change in accrued interest SEK –10m, change in liability related to financial leases in accordance with IFRS 16 of SEK 865m, of which SEK 480m relates to operating assets and SEK 385m to non-operating assets, and other items SEK –1m.
2) Other changes 2020 relate to change in accrued interest SEK –18m, change in liability related to financial leases in accordance with IFRS 16 of SEK 808m, of which SEK 409m relates to operating assets and SEK 399m to non-operating assets.
3) Other changes 2020 relate to the impact from settlement of pension liability SEK –187m.4) Other changes 2019 relate to change in accrued interest SEK –17m, change in liability related to financial leases in accordance with IFRS 16 of SEK 885m, of which SEK 451m relates to operating assets
and SEK 434m to non-operating assets.
72 Essity’s Annual and Sustainability Report 2021Financial statements including notes
Introduction The Essity share
Strategy Business areas SustainabilityGroup Corporate Governance Report
Financial statementsincluding notes
Essity data

Consolidated balance sheet BS
2021 2020 2019Note SEKm EURm1) SEKm EURm1) SEKm EURm1)
ASSETSNon-current assetsGoodwill D1 37,803 3,696 32,324 3,223 34,581 3,316Other intangible assets D1 21,806 2,132 18,574 1,852 21,182 2,031Property, plant and equipment D2 58,918 5,760 53,631 5,348 56,900 5,457Investments in associates and joint ventures F3 239 23 847 84 865 83Shares and participations F5 7 1 7 1 8 1Surplus in funded pension plans C4 1,439 141 2,817 281 2,841 273Non-current financial assets E2 412 40 738 74 694 67Deferred tax assets B5 2,012 197 1,823 182 2,539 244Other non-current assets B1 1,411 138 768 76 704 68Total non-current assets 124,047 12,128 111,529 11,121 120,314 11,540
Current assetsInventories D3 19,339 1,891 16,383 1,634 15,764 1,512Trade receivables E3 19,871 1,943 17,825 1,777 19,864 1,906Current tax assets B5 952 93 760 76 745 71Other current receivables D4 5,787 566 2,173 217 2,113 203Current financial assets E2 1,150 112 993 99 525 50Non-current assets held for sale G1 – – – – 42 4Cash and cash equivalents E2 3,904 382 4,982 497 2,928 281Total current assets 51,003 4,987 43,116 4,300 41,981 4,027Total assets B2 175,050 17,115 154,645 15,421 162,295 15,567
EQUITY AND LIABILITIES EQ Equity Owners of the Parent companyShare capital 2,350 230 2,350 234 2,350 225Reserves E8 6,416 627 581 58 6,284 603Retained earnings 51,108 4,997 51,421 5,128 45,491 4,363
Equity attributable to owners of the Parent company 59,874 5,854 54,352 5,420 54,125 5,191Non-controlling interests 8,633 844 8,990 896 8,676 832
Total equity 68,507 6,698 63,342 6,316 62,801 6,023
Non-current liabilitiesNon-current financial liabilities E4 47,443 4,639 38,202 3,810 43,079 4,131Provisions for pensions C4 4,149 406 5,328 531 5,866 563Deferred tax liabilities B5 7,574 740 6,150 613 6,545 628Other non-current provisions D6 396 39 445 44 541 52Other non-current liabilities D5 86 8 105 11 183 18Total non-current liabilities 59,648 5,832 50,230 5,009 56,214 5,392
Current liabilitiesCurrent financial liabilities E4 10,746 1,051 8,688 866 8,983 862Trade payables 18,030 1,763 14,791 1,475 15,802 1,516Current tax liabilities B5 1,576 154 2,301 229 2,432 233Current provisions D6 736 72 748 75 1,065 102Other current liabilities D5 15,807 1,545 14,545 1,451 14,998 1,439Total current liabilities 46,895 4,585 41,073 4,096 43,280 4,152Total liabilities 106,543 10,417 91,303 9,105 99,494 9,544Total equity and liabilities 175,050 17,115 154,645 15,421 162,295 15,567
Contingent liabilities and pledged assets, see Note G3 on page 116.Capital employed 123,940 12,116 106,030 10,573 113,741 10,910Net debt 55,433 5,419 42,688 4,257 50,940 4,886
1) Translation to EUR is provided for the convenience of the reader. The following closing exchange rates were used; 10.23 10.03 10.43
73Essity’s Annual and Sustainability Report 2021 Financial statements including notes
Introduction The Essity share
Strategy Business areas SustainabilityGroup Corporate Governance Report
Financial statementsincluding notes
Essity data

Introduction The Essity share
Strategy Business areas SustainabilityGroup Corporate Governance Report
Financial statementsincluding notes
Essity data
A. Accounting principles and use of alternative performance measures
A1. General accounting principles, new accounting rules and basis of preparation
Reading instructionsGeneral accounting principles AP and new accounting rules are presented below. Other accounting principles considered material by Essity are pre-sented in conjunction with the respective note.
Key assessments and assumptions KAA are presented under the respec-tive note, see use of assessments below.
Amounts that are reconcilable to the balance sheet, equity, income state-ment, statement of comprehensive income, cash flow statement and the operating cash flow statement are marked with the following symbols:
BS Balance sheet EQ Equity IS Income statement CI Statement of comprehensive income CF Cash flow statement OCF Operating cash flow statement Tx:x Reference to table in note
Company informationEssity Aktiebolag (publ), Corp. Reg. No. 556325-5511, is a public limited liabil-ity company whose shares are listed and traded on Nasdaq Stockholm (for more information, see The share on page 6).
The registered office of the company is Stockholm, Sweden, with the postal address of Box 200, SE-101 23 Stockholm, Sweden. The Group mainly conducts operations in the fields of hygiene and health.
Basis for preparationEssity’s financial statements are prepared in accordance with the Annual Accounts Act and International Financial Reporting Standards (IFRS)/Inter-national Accounting Standards (IAS), as adopted within the EU, and the Swedish Financial Reporting Board, Recommendation RFR 1, Supplementary Accounting Rules for Groups. The accounts for both the Group and the Par-ent company relate to the fiscal year that ended on December 31, 2021. Essity applies the historical cost method for measurement of assets and liabilities except for financial assets and liabilities, including derivative instruments, measured at fair value through profit or loss. Changes in assets and liabilities measured at fair value through profit or loss are recognized either in profit or loss or other comprehensive income.
In December 2018, the EU adopted a directive to complement the Trans-parency Directive entailing that listed companies in the EU whose securities are admitted to trading on a regulated market shall issue a digital annual financial report in an electronic format called ESEF (European Single Elec-tronic Format), which was developed by the European Securities and Mar-kets Authority (ESMA). The regulation requires that the annual financial report is prepared in XHTML and consolidated financial statements prepared in accordance with IFRS shall be marked up using XBRL tags.
Essity applies the ESEF regulation as of January 1, 2021.
New or amended accounting standards 2021A number of amended accounting standards published by the IASB are effective from January 1, 2021 following endorsement by the EU. Essity has applied these amendments, most of which have no impact on the Group’s financial statements and are therefore not commented on. The amendments to standards that have had some impacts on Essity relates to IFRS 9, IAS 39, IFRS 7, IFRS 4 and IFRS 16 linked to the Interest Rate Benchmark Reform.
Amendments to IFRS 9, IAS 39, IFRS 7, IFRS 4 and IFRS 16 Interest Rate Benchmark ReformThe amendments address issues that may arise when an existing interest rate benchmark is replaced with an alternative benchmark interest rate and aims to facilitate the transition. The changes also include disclosures related to the transition. Essity is monitoring all changes concerning the develop-
ment of interest rate benchmarks. The effects on the financial statements are continuously evaluated. The implementation of the changes is dependent on the development of changes in the transition from Interbank Offered Rates (IBORs) to alternative benchmark interest rates. The changes had no material impact on the Group’s earnings or financial position.
New or amended accounting standards after 2021 A number of new and amended accounting standards have not yet come into effect and have not been applied in advance in the preparation of the Group’s and the Parent company’s financial statements. The Group intends to comply with these new and amended standards when they come into force. These new standards and amendments to standards published by IASB are not expected to have any impact on the Group’s or the Parent com-pany’s financial statements.
Use of assessments KAA The preparation of financial statements in accordance with IFRS and gen-erally accepted Swedish accounting principles requires assessments and assumptions to be made that affect recognized assets, liabilities, income and expenses as well as other information disclosed.
These assumptions and estimates are often based on historical experi-ence, but also on other factors, including expectations of future events. With other assumptions and estimates, the result may be different and the actual result will seldom fully concur with the estimated result.
Uncertainty and risks have arisen as a result of the COVID-19 pandemic that may affect Essity’s sales, earnings and financial position.
In Essity’s opinion, the areas that are impacted the most by assumptions and estimates are:Taxes, B5 Income taxes, page 89Pensions, C4 Remuneration after employment, page 93Goodwill, D1 Intangible assets, page 96Provisions, D6 Other provisions, page 99Provision for doubtful receivables, E3 Trade receivables, page 102 Leases, G2 Leases, page 115Essity’s assessments and assumptions are presented in the respective notes.
Principles of consolidationThe Group’s consolidated financial statements include the Parent company and its Group companies, which comprise of subsidiaries, joint ventures, associates and joint operations. Group companies are consolidated from the date the Group exercises control or influence over the company accord-ing to the definitions and accounting policies provided in Notes F1 Group companies on page 109, F3 Investments in associates and joint ventures on page 110 and F4 Joint operations on page 112. Divested Group companies are included in the consolidated accounts until the date the Group ceases to control or exercise influence over the companies. For additional information about accounting policies regarding acquisitions of Group companies and respective non-controlling interests, see Note F6 Acquisitions and divest-ments of group companies and other operations on page 112. Intra-Group transactions have been eliminated.
Translation of foreign currencyFunctional currency and translation of foreign Group companies to the presentation currencyThe functional currency of each Essity Group company is determined on the basis of the primary economic environment in which the respective company is active which, with a few exceptions, is the country in which the individual company operates. Essity’s Parent company has Swedish kronor (SEK) as its functional currency. The consolidated financial statements of Group companies are translated to the Group’s presentation currency, which is also SEK. Assets and liabilities are translated at the closing rate, while income and expenses are translated at the average rate for the respective period. Translation differences during the period on the Group’s net assets are recognized in other comprehensive income in the translation reserve as a component of equity.
74 Essity’s Annual and Sustainability Report 2021Financial statements including notes
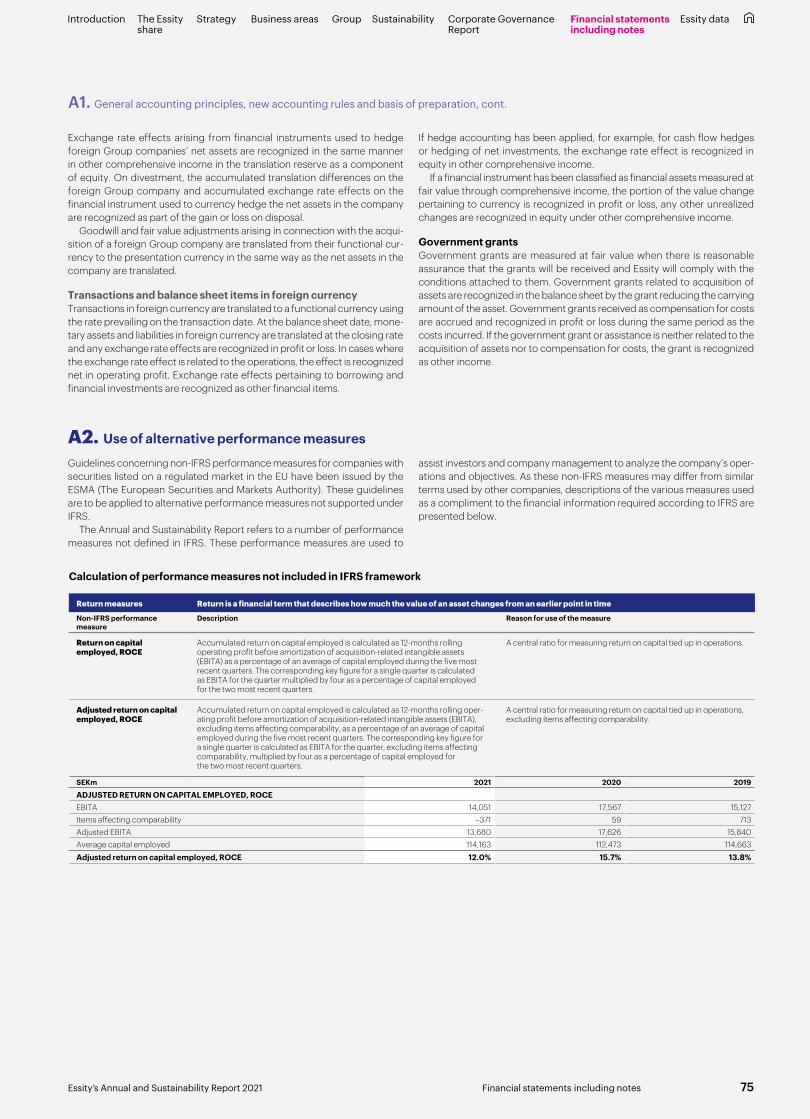
Introduction The Essity share
Strategy Business areas SustainabilityGroup Corporate Governance Report
Financial statementsincluding notes
Essity data
Exchange rate effects arising from financial instruments used to hedge foreign Group companies’ net assets are recognized in the same manner in other comprehensive income in the translation reserve as a component of equity. On divestment, the accumulated translation differences on the foreign Group company and accumulated exchange rate effects on the financial instrument used to currency hedge the net assets in the company are recognized as part of the gain or loss on disposal.
Goodwill and fair value adjustments arising in connection with the acqui-sition of a foreign Group company are translated from their functional cur-rency to the presentation currency in the same way as the net assets in the company are translated.
Transactions and balance sheet items in foreign currencyTransactions in foreign currency are translated to a functional currency using the rate prevailing on the transaction date. At the balance sheet date, mone-tary assets and liabilities in foreign currency are translated at the closing rate and any exchange rate effects are recognized in profit or loss. In cases where the exchange rate effect is related to the operations, the effect is recognized net in operating profit. Exchange rate effects pertaining to borrowing and financial investments are recognized as other financial items.
If hedge accounting has been applied, for example, for cash flow hedges or hedging of net investments, the exchange rate effect is recognized in equity in other comprehensive income.
If a financial instrument has been classified as financial assets measured at fair value through comprehensive income, the portion of the value change pertaining to currency is recognized in profit or loss, any other unrealized changes are recognized in equity under other comprehensive income.
Government grantsGovernment grants are measured at fair value when there is reasonable assurance that the grants will be received and Essity will comply with the conditions attached to them. Government grants related to acquisition of assets are recognized in the balance sheet by the grant reducing the carrying amount of the asset. Government grants received as compensation for costs are accrued and recognized in profit or loss during the same period as the costs incurred. If the government grant or assistance is neither related to the acquisition of assets nor to compensation for costs, the grant is recognized as other income.
A1. General accounting principles, new accounting rules and basis of preparation, cont.
A2. Use of alternative performance measures
Guidelines concerning non-IFRS performance measures for companies with securities listed on a regulated market in the EU have been issued by the ESMA (The European Securities and Markets Authority). These guidelines are to be applied to alternative performance measures not supported under IFRS.
The Annual and Sustainability Report refers to a number of performance measures not defined in IFRS. These performance measures are used to
assist investors and company management to analyze the company’s oper-ations and objectives. As these non-IFRS measures may differ from similar terms used by other companies, descriptions of the various measures used as a compliment to the financial information required according to IFRS are presented below.
Calculation of performance measures not included in IFRS framework
Return measures Return is a financial term that describes how much the value of an asset changes from an earlier point in time
Non-IFRS performance measure
Description Reason for use of the measure
Return on capital employed, ROCE
Accumulated return on capital employed is calculated as 12-months rolling operating profit before amortization of acquisition-related intangible assets (EBITA) as a percentage of an average of capital employed during the five most recent quarters. The corresponding key figure for a single quarter is calculated as EBITA for the quarter multiplied by four as a percentage of capital employed for the two most recent quarters.
A central ratio for measuring return on capital tied up in operations.
Adjusted return on capital employed, ROCE
Accumulated return on capital employed is calculated as 12-months rolling oper-ating profit before amortization of acquisition-related intangible assets (EBITA), excluding items affecting comparability, as a percentage of an average of capital employed during the five most recent quarters. The corresponding key figure for a single quarter is calculated as EBITA for the quarter, excluding items affecting comparability, multiplied by four as a percentage of capital employed for the two most recent quarters.
A central ratio for measuring return on capital tied up in operations, excluding items affecting comparability.
SEKm 2021 2020 2019
ADJUSTED RETURN ON CAPITAL EMPLOYED, ROCEEBITA 14,051 17,567 15,127Items affecting comparability –371 59 713Adjusted EBITA 13,680 17,626 15,840Average capital employed 114,163 112,473 114,663Adjusted return on capital employed, ROCE 12.0% 15.7% 13.8%
75Essity’s Annual and Sustainability Report 2021 Financial statements including notes
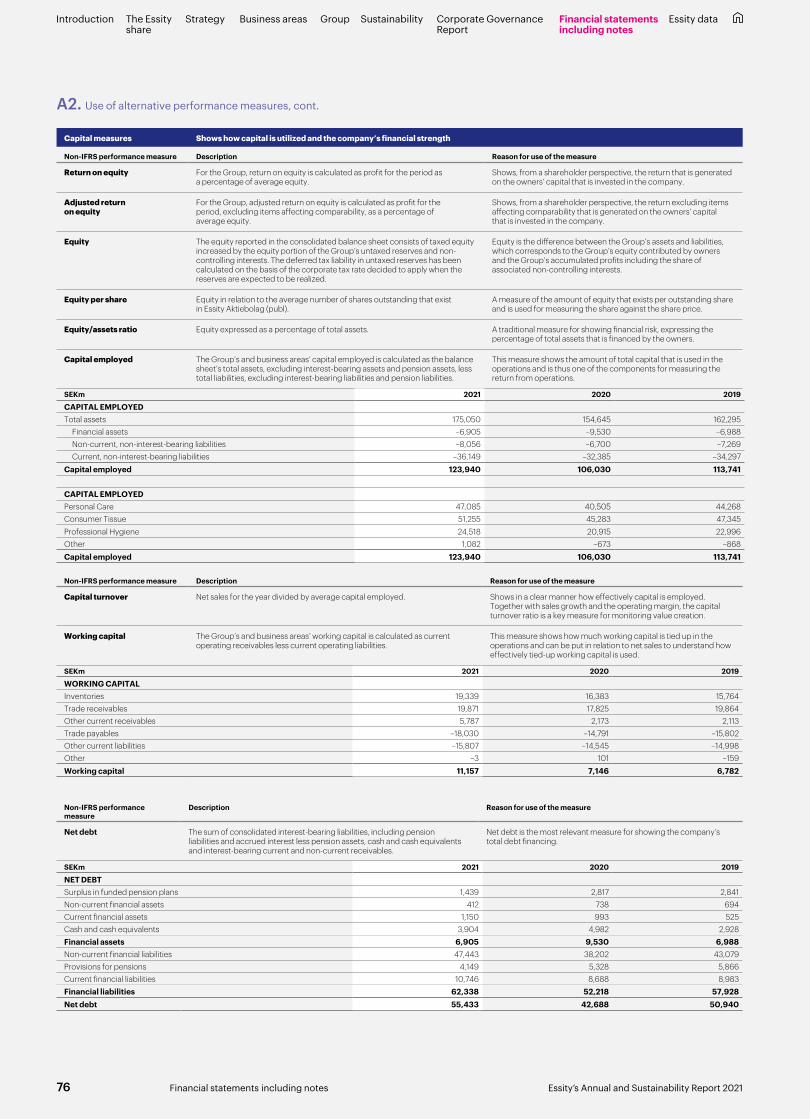
Introduction The Essity share
Strategy Business areas SustainabilityGroup Corporate Governance Report
Financial statementsincluding notes
Essity data
Capital measures Shows how capital is utilized and the company’s financial strength
Non-IFRS performance measure Description Reason for use of the measure
Return on equity For the Group, return on equity is calculated as profit for the period as a percentage of average equity.
Shows, from a shareholder perspective, the return that is generated on the owners’ capital that is invested in the company.
Adjusted return on equity
For the Group, adjusted return on equity is calculated as profit for the period, excluding items affecting comparability, as a percentage of average equity.
Shows, from a shareholder perspective, the return excluding items affecting comparability that is generated on the owners’ capital that is invested in the company.
Equity The equity reported in the consolidated balance sheet consists of taxed equity increased by the equity portion of the Group’s untaxed reserves and non-controlling interests. The deferred tax liability in untaxed reserves has been calculated on the basis of the corporate tax rate decided to apply when the reserves are expected to be realized.
Equity is the difference between the Group’s assets and liabilities, which corresponds to the Group’s equity contributed by owners and the Group’s accumulated profits including the share of associated non-controlling interests.
Equity per share Equity in relation to the average number of shares outstanding that exist in Essity Aktiebolag (publ).
A measure of the amount of equity that exists per outstanding share and is used for measuring the share against the share price.
Equity/assets ratio Equity expressed as a percentage of total assets. A traditional measure for showing financial risk, expressing the percentage of total assets that is financed by the owners.
Capital employed The Group’s and business areas’ capital employed is calculated as the balance sheet’s total assets, excluding interest-bearing assets and pension assets, less total liabilities, excluding interest-bearing liabilities and pension liabilities.
This measure shows the amount of total capital that is used in the operations and is thus one of the components for measuring the return from operations.
SEKm 2021 2020 2019
CAPITAL EMPLOYEDTotal assets 175,050 154,645 162,295 Financial assets –6,905 –9,530 –6,988 Non-current, non-interest-bearing liabilities –8,056 –6,700 –7,269 Current, non-interest-bearing liabilities –36,149 –32,385 –34,297Capital employed 123,940 106,030 113,741
CAPITAL EMPLOYEDPersonal Care 47,085 40,505 44,268Consumer Tissue 51,255 45,283 47,345Professional Hygiene 24,518 20,915 22,996Other 1,082 –673 –868Capital employed 123,940 106,030 113,741
Non-IFRS performance measure Description Reason for use of the measure
Capital turnover Net sales for the year divided by average capital employed. Shows in a clear manner how effectively capital is employed. Together with sales growth and the operating margin, the capital turnover ratio is a key measure for monitoring value creation.
Working capital The Group’s and business areas’ working capital is calculated as current operating receivables less current operating liabilities.
This measure shows how much working capital is tied up in the operations and can be put in relation to net sales to understand how effectively tied-up working capital is used.
SEKm 2021 2020 2019
WORKING CAPITALInventories 19,339 16,383 15,764Trade receivables 19,871 17,825 19,864Other current receivables 5,787 2,173 2,113Trade payables –18,030 –14,791 –15,802Other current liabilities –15,807 –14,545 –14,998Other –3 101 –159Working capital 11,157 7,146 6,782
Non-IFRS performance measure
Description Reason for use of the measure
Net debt The sum of consolidated interest-bearing liabilities, including pension liabilities and accrued interest less pension assets, cash and cash equivalents and interest-bearing current and non-current receivables.
Net debt is the most relevant measure for showing the company’s total debt financing.
SEKm 2021 2020 2019
NET DEBTSurplus in funded pension plans 1,439 2,817 2,841Non-current financial assets 412 738 694Current financial assets 1,150 993 525Cash and cash equivalents 3,904 4,982 2,928Financial assets 6,905 9,530 6,988Non-current financial liabilities 47,443 38,202 43,079Provisions for pensions 4,149 5,328 5,866Current financial liabilities 10,746 8,688 8,983Financial liabilities 62,338 52,218 57,928Net debt 55,433 42,688 50,940
A2. Use of alternative performance measures, cont.
76 Essity’s Annual and Sustainability Report 2021Financial statements including notes
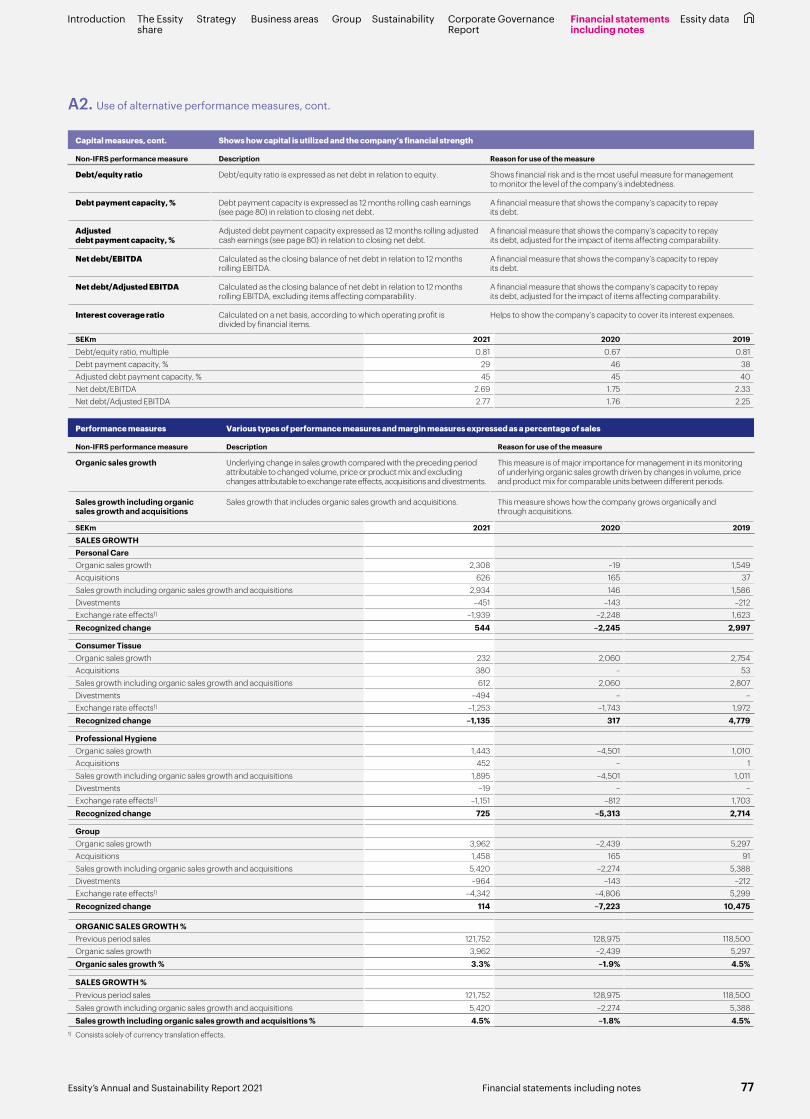
Introduction The Essity share
Strategy Business areas SustainabilityGroup Corporate Governance Report
Financial statementsincluding notes
Essity data
Performance measures Various types of performance measures and margin measures expressed as a percentage of sales
Non-IFRS performance measure Description Reason for use of the measure
Organic sales growth Underlying change in sales growth compared with the preceding period attributable to changed volume, price or product mix and excluding changes attributable to exchange rate effects, acquisitions and divestments.
This measure is of major importance for management in its monitoring of underlying organic sales growth driven by changes in volume, price and product mix for comparable units between different periods.
Sales growth including organic sales growth and acquisitions
Sales growth that includes organic sales growth and acquisitions. This measure shows how the company grows organically and through acquisitions.
SEKm 2021 2020 2019
SALES GROWTHPersonal CareOrganic sales growth 2,308 –19 1,549Acquisitions 626 165 37Sales growth including organic sales growth and acquisitions 2,934 146 1,586Divestments –451 –143 –212Exchange rate effects1) –1,939 –2,248 1,623Recognized change 544 –2,245 2,997
Consumer TissueOrganic sales growth 232 2,060 2,754Acquisitions 380 – 53Sales growth including organic sales growth and acquisitions 612 2,060 2,807Divestments –494 – –Exchange rate effects1) –1,253 –1,743 1,972Recognized change –1,135 317 4,779
Professional HygieneOrganic sales growth 1,443 –4,501 1,010Acquisitions 452 – 1Sales growth including organic sales growth and acquisitions 1,895 –4,501 1,011Divestments –19 – –Exchange rate effects1) –1,151 –812 1,703Recognized change 725 –5,313 2,714
GroupOrganic sales growth 3,962 –2,439 5,297Acquisitions 1,458 165 91Sales growth including organic sales growth and acquisitions 5,420 –2,274 5,388Divestments –964 –143 –212Exchange rate effects1) –4,342 –4,806 5,299Recognized change 114 –7,223 10,475
ORGANIC SALES GROWTH %Previous period sales 121,752 128,975 118,500Organic sales growth 3,962 –2,439 5,297Organic sales growth % 3.3% –1.9% 4.5%
SALES GROWTH %Previous period sales 121,752 128,975 118,500Sales growth including organic sales growth and acquisitions 5,420 –2,274 5,388Sales growth including organic sales growth and acquisitions % 4.5% –1.8% 4.5%
1) Consists solely of currency translation effects.
Capital measures, cont. Shows how capital is utilized and the company’s financial strength
Non-IFRS performance measure Description Reason for use of the measure
Debt/equity ratio Debt/equity ratio is expressed as net debt in relation to equity. Shows financial risk and is the most useful measure for management to monitor the level of the company’s indebtedness.
Debt payment capacity, % Debt payment capacity is expressed as 12 months rolling cash earnings (see page 80) in relation to closing net debt.
A financial measure that shows the company’s capacity to repay its debt.
Adjusted debt payment capacity, %
Adjusted debt payment capacity expressed as 12 months rolling adjusted cash earnings (see page 80) in relation to closing net debt.
A financial measure that shows the company’s capacity to repay its debt, adjusted for the impact of items affecting comparability.
Net debt/EBITDA Calculated as the closing balance of net debt in relation to 12 months rolling EBITDA.
A financial measure that shows the company’s capacity to repay its debt.
Net debt/Adjusted EBITDA Calculated as the closing balance of net debt in relation to 12 months rolling EBITDA, excluding items affecting comparability.
A financial measure that shows the company’s capacity to repay its debt, adjusted for the impact of items affecting comparability.
Interest coverage ratio Calculated on a net basis, according to which operating profit is divided by financial items.
Helps to show the company’s capacity to cover its interest expenses.
SEKm 2021 2020 2019
Debt/equity ratio, multiple 0.81 0.67 0.81Debt payment capacity, % 29 46 38Adjusted debt payment capacity, % 45 45 40Net debt/EBITDA 2.69 1.75 2.33Net debt/Adjusted EBITDA 2.77 1.76 2.25
A2. Use of alternative performance measures, cont.
77Essity’s Annual and Sustainability Report 2021 Financial statements including notes

Introduction The Essity share
Strategy Business areas SustainabilityGroup Corporate Governance Report
Financial statementsincluding notes
Essity data
Performance measures, cont. Various types of performance measures and margin measures expressed as a percentage of sales
Non-IFRS performance measure Description Reason for use of the measure
Adjusted gross profit Net sales minus cost of goods sold excluding items affecting comparability.
Gross profit shows the company’s earnings before the effects of sales, general and administration. Adjusted gross profit excludes items affecting comparability.
Operating profit before deprecia-tion, amortization and impairment of property, plant and equipment and intangible assets (EBITDA)
Calculated as operating profit before depreciation, amortization and impairment of property, plant and equipment and intangible assets.
This measure is a complement to operating profit, as it shows the cash earnings from operations.
Adjusted operating profit before depreciation, amortization and impairment of property, plant and equipment and intangible assets (EBITDA)
Calculated as operating profit before depreciation, amortization and impairment of property, plant and equipment and intangible assets excluding items affecting comparability.
This measure is a complement to operating profit, as it shows the cash earnings from operations adjusted for the impact of items affecting comparability.
Operating profit before amortization of acquisition-related intangible assets (EBITA)
Calculated as operating profit after depreciation, amortization and impairment of property, plant and equipment and intangible assets but before amortization and impairment of acquisition-related intangible assets.
The measure is a good complement to enable earnings comparisons with other companies, regardless of whether business activities are based on acquisitions or organic growth.
Adjusted operating profit before amortization of acquisition-related intangible assets (EBITA)
Calculated as operating profit after depreciation, amortization and impairment of property, plant and equipment and intangible assets but before amortization and impairment of acquisition-related intangible assets, excluding items affecting comparability.
The measure is a good complement to enable earnings comparisons with other companies, regardless of whether business activities were based on acquisitions or organic growth, and is also adjusted for the impact of items affecting comparability.
SEKm 2021 2020 2019
Operating profit before depreciation, amortization and impairment of property, plant and equipment and intangible assets (EBITDA)Operating profit 13,199 16,758 14,349 Amortization of acquisition-related intangible assets 852 809 778 Depreciation/amortization 5,424 5,618 5,815 Depreciation right-of-use assets 938 922 884 Impairment –2 125 79 Items affecting comparability, net of impairment 179 197 –27EBITDA 20,590 24,429 21,878 Items affecting comparability excluding depreciation/amortization
and impairment –550 –138 740Adjusted operating profit before depreciation, amortization and impairment of property, plant and equipment and intangible assets (EBITDA) 20,040 24,291 22,618
SEKm 2021 2020 2019
Adjusted operating profit before amortization of acquisition-related intangible assets (EBITA)Operating profit 13,199 16,758 14,349 Amortization of acquisition-related intangible assets 852 809 778Operating profit before amortization of acquisition-related intangible assets (EBITA) 14,051 17,567 15,127EBITA margin 11.5% 14.4% 11.7% Items affecting comparability, cost of goods sold 146 181 243 Items affecting comparability, sales, general and administration –517 –122 470Adjusted operating profit before amortization of acquisition-related intangible assets (EBITA) 13,680 17,626 15,840Adjusted EBITA margin 11.2% 14.5% 12.3%
A2. Use of alternative performance measures, cont.
78 Essity’s Annual and Sustainability Report 2021Financial statements including notes

Introduction The Essity share
Strategy Business areas SustainabilityGroup Corporate Governance Report
Financial statementsincluding notes
Essity data
Performance measures, cont. Various types of performance measures and margin measures expressed as a percentage of sales
Non-IFRS performance measure Description Reason for use of the measure
Items affecting comparability Under items affecting comparability, Essity includes costs in connection with acquisitions, restructuring, impairment and other specific events that are relevant when comparing earnings for one period with those of another. The item other specific events is specified in Note B3 Operating expenses on page 88.
Separate reporting of items affecting comparability between periods provides a better understanding of the company’s underlying operating activities.
Restructuring costs Costs for impairment together with headcount reductions in connection with restructuring.
This measure shows the specific costs that have arisen in connection with restructuring of a specific operation, which contributes to a better understanding of the underlying cost level in the continuing operations.
Adjusted gross margin Relates to adjusted gross profit as a percentage of net sales for the period. Adjusted gross margin is cleared of items affecting comparability and is thus a better measure than gross margin for showing the company’s margins before the effect of costs such as sales, general and administration.
EBITA margin Operating profit before amortization of acquisition-related intangible assets as a percentage of net sales for the period.
EBITA margin is a good complement to enable operating margin comparisons with other companies, regardless of whether business activities are based on acquisitions or organic growth.
Adjusted EBITA margin Operating profit before amortization of acquisition-related intangible assets, excluding items affecting comparability, as a percentage of net sales for the period.
Adjusted EBITA margin is a good complement to enable operating margin comparisons excluding items affecting comparability with other companies, regardless of whether business activities are based on acquisitions or organic growth.
Operating margin Operating profit as a percentage of net sales for the period. The operating margin is a key measure together with sales growth and capital turnover ratio for monitoring value creation.
Adjusted operating margin Operating profit, excluding items affecting comparability, as a percentage of net sales for the period.
Adjusted operating margin is a key measure together with sales growth and capital turnover ratio for monitoring value creation.
Adjusted operating profit Calculated as operating profit before financial items and tax, excluding items affecting comparability.
Adjusted operating profit is a key ratio for control of the units and provides a better understanding of earnings performance of the operations than the non-adjusted operating profit.
SEKm 2021 2020 2019
ADJUSTED OPERATING PROFITOperating profit 13,199 16,758 14,349Items affecting comparability –371 59 713Adjusted operating profit 12,828 16,817 15,062Adjusted operating margin 10.5% 13.8% 11.7%
Non-IFRS performance measure Description Reason for use of the measure
Financial net margin Net financial items divided by net sales. This measure shows the relationship between net financial items and net sales.
Adjusted profit before tax Calculated as profit before tax, excluding items affecting comparability. This is a useful measure for showing total profit for the company including financing costs, but not affected by taxes and items affecting comparability.
Adjusted tax Tax expenses for the period adjusted for tax expenses relating to items affecting comparability.
A useful measure to show the total tax expense for the period, adjusted for taxes related to items affecting comparability.
SEKm 2021 2020 2019
ADJUSTED TAXTax –2,727 –4,053 –2,828Tax relating to items affecting comparability –76 –1 –159Adjusted tax –2,803 –4,054 –2,987
Non-IFRS performance measure Description Reason for use of the measure
Adjusted profit for the period Profit for the period excluding items affecting comparability. Shows the period’s total underlying earnings capacity excluding items affecting comparability.
Net margin Profit for the period as a percentage of net sales for the year. The net margin shows the remaining share of net sales after all of the company’s costs, including income tax, have been deducted.
Earnings per share Profit for the period attributable to owners of the Parent company divided by the number of shares outstanding.
Earnings per share is a good measure of the company’s profitability and is used to determine the value of a company’s outstanding shares.
Adjusted earnings per share Adjusted earnings for the period attributable to owners of the Parent company, excluding amortization of acquisition-related intangible assets after tax divided by number of shares.
Adjusted earnings per share is a good measure of the company’s profitability and is used to determine the value of a company’s outstanding shares. The measure is a good complement to enable comparison of earnings per share with other companies, regardless of whether business activities are based on acquisitions or organic growth.
A2. Use of alternative performance measures, cont.
79Essity’s Annual and Sustainability Report 2021 Financial statements including notes

Introduction The Essity share
Strategy Business areas SustainabilityGroup Corporate Governance Report
Financial statementsincluding notes
Essity data
Cash flow performance measures
Various performance measures and costs that have impacted the company’s cash flow
Non-IFRS performance measure Description Reason for use of the measure
Cash earnings Cash earnings consist of the net of operating profit before depreciation, amortization and impairment of property, plant and equipment and intangible assets (EBITDA), financial income and expenses and income taxes.
A financial measure used when calculating the company’s debt payment capacity, see page 77.
Adjusted cash earnings Adjusted cash earnings consist of the net of adjusted operating profit before depreciation, amortization and impairment of property, plant and equipment and intangible assets (EBITDA), financial income and expenses and income taxes.
A financial measure used when calculating the company’s debt payment capacity, see page 77.
Operating cash surplus Calculated as operating profit with a reversal of depreciation, amortization and impairment of property, plant and equipment and intangible assets. Share of profits of associated companies and joint ventures, items affecting comparability and capital gains/losses are excluded.
This measure shows the cash flow generated by profit and is part of the follow-up of cash flow.
Investments in non-current assets, net
Investments in non-current assets, net, to maintain competitiveness, such as maintenance, rationalization and replacement measures or investments of an environmental nature and strategic investments in sites.
Shows the size of the capital expenditures required to maintain existing manufacturing capacity and investments in expansion and other growth measures.
Operating cash flow before investments in operating assets through leases
Operating cash flow consists of the sum of operating cash surplus and change in working capital, with deductions for net investments in non-current assets and restructuring costs.
This is an important control measure of operating activities that the units have control over themselves.
Investments in operating assets through leases
Additional right-of-use of assets directly attributable to operating activities. Mainly leases for distribution centers.
Investments in operating assets through leases is part of the follow-up of cash flow that the units have control over themselves.
Operating cash flow Consists of the sum of operating cash surplus and change in working capital, with deductions for net investments in non-current assets and restructuring costs and investments in operating assets through leases.
This is an important control measure of operating activities that the units have control over themselves.
Investments in non-operating assets through leases
Additional right-of-use of assets that are not directly attributable to operating activities, mainly leases for offices.
Investments through leases in non-operating assets that the units do not have control over themselves. These are recognized in the operating cash flow statement as an explanatory item in changes to net debt.
SEKm 2021 2020 2019
OPERATING CASH FLOWPersonal CareOperating cash surplus 8,882 9,089 8,785Change in working capital –471 236 401Investments in non-current assets, net –1,779 –1,658 –1,866Restructuring costs, etc. –89 –101 –644Operating cash flow before investments in operating assets through leases 6,543 7,566 6,676Investments in operating assets through leases –74 –81 –181Operating cash flow 6,469 7,485 6,495
Consumer TissueOperating cash surplus 7,379 10,817 8,107Change in working capital 403 –548 –553Investments in non-current assets, net –3,563 –3,191 –2,239Restructuring costs, etc. –281 –418 –251Operating cash flow before investments in operating assets through leases 3,938 6,660 5,064Investments in operating assets through leases –247 –205 –194Operating cash flow 3,691 6,455 4,870
Professional HygieneOperating cash surplus 4,782 5,479 6,589Change in working capital –705 –360 438Investments in non-current assets, net –941 –1,135 –1,402Restructuring costs, etc. –466 –677 –603Operating cash flow before investments in operating assets through leases 2,670 3,307 5,022Investments in operating assets through leases –158 –124 –84Operating cash flow 2,512 3,183 4,938
A2. Use of alternative performance measures, cont.
80 Essity’s Annual and Sustainability Report 2021Financial statements including notes
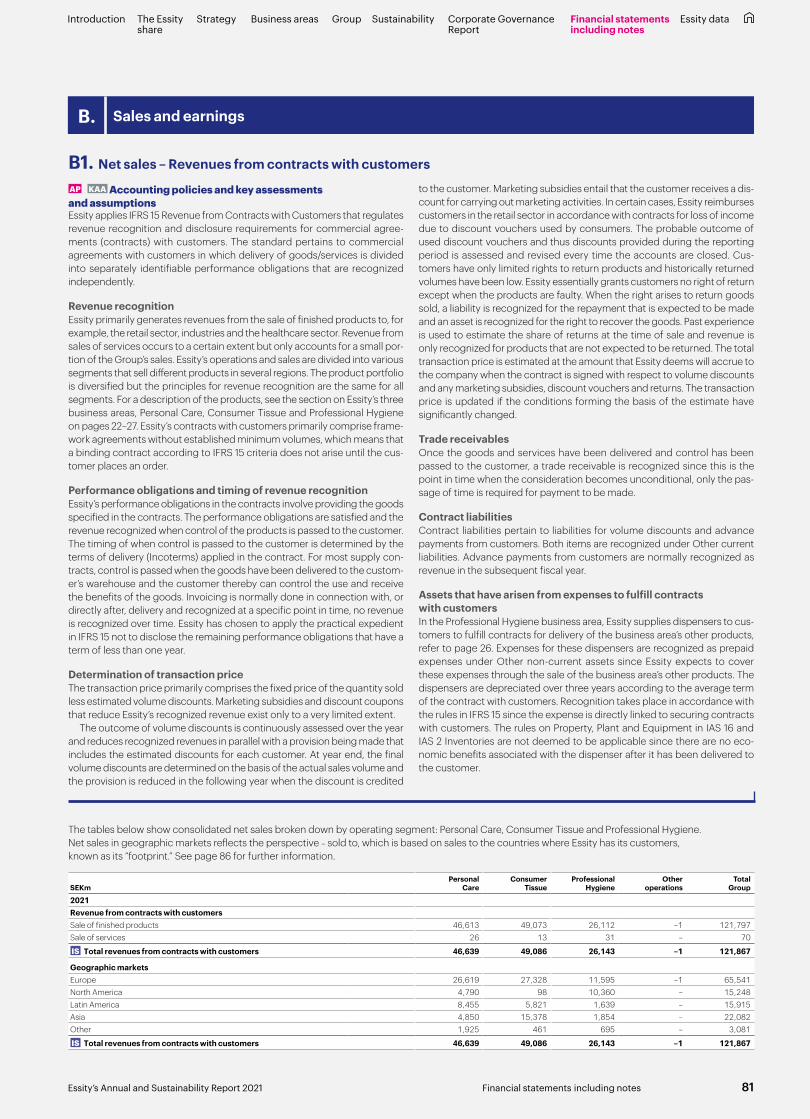
B1. Net sales – Revenues from contracts with customers
AP KAA Accounting policies and key assessments and assumptionsEssity applies IFRS 15 Revenue from Contracts with Customers that regulates revenue recognition and disclosure requirements for commercial agree-ments (contracts) with customers. The standard pertains to commercial agreements with customers in which delivery of goods/services is divided into separately identifiable performance obligations that are recognized independently.
Revenue recognitionEssity primarily generates revenues from the sale of finished products to, for example, the retail sector, industries and the healthcare sector. Revenue from sales of services occurs to a certain extent but only accounts for a small por-tion of the Group’s sales. Essity’s operations and sales are divided into various segments that sell different products in several regions. The product portfolio is diversified but the principles for revenue recognition are the same for all segments. For a description of the products, see the section on Essity’s three business areas, Personal Care, Consumer Tissue and Professional Hygiene on pages 22–27. Essity’s contracts with customers primarily comprise frame-work agreements without established minimum volumes, which means that a binding contract according to IFRS 15 criteria does not arise until the cus-tomer places an order.
Performance obligations and timing of revenue recognitionEssity’s performance obligations in the contracts involve providing the goods specified in the contracts. The performance obligations are satisfied and the revenue recognized when control of the products is passed to the customer. The timing of when control is passed to the customer is determined by the terms of delivery (Incoterms) applied in the contract. For most supply con-tracts, control is passed when the goods have been delivered to the custom-er’s warehouse and the customer thereby can control the use and receive the benefits of the goods. Invoicing is normally done in connection with, or directly after, delivery and recognized at a specific point in time, no revenue is recognized over time. Essity has chosen to apply the practical expedient in IFRS 15 not to disclose the remaining performance obligations that have a term of less than one year.
Determination of transaction priceThe transaction price primarily comprises the fixed price of the quantity sold less estimated volume discounts. Marketing subsidies and discount coupons that reduce Essity’s recognized revenue exist only to a very limited extent.
The outcome of volume discounts is continuously assessed over the year and reduces recognized revenues in parallel with a provision being made that includes the estimated discounts for each customer. At year end, the final volume discounts are determined on the basis of the actual sales volume and the provision is reduced in the following year when the discount is credited
to the customer. Marketing subsidies entail that the customer receives a dis-count for carrying out marketing activities. In certain cases, Essity reimburses customers in the retail sector in accordance with contracts for loss of income due to discount vouchers used by consumers. The probable outcome of used discount vouchers and thus discounts provided during the reporting period is assessed and revised every time the accounts are closed. Cus-tomers have only limited rights to return products and historically returned volumes have been low. Essity essentially grants customers no right of return except when the products are faulty. When the right arises to return goods sold, a liability is recognized for the repayment that is expected to be made and an asset is recognized for the right to recover the goods. Past experience is used to estimate the share of returns at the time of sale and revenue is only recognized for products that are not expected to be returned. The total transaction price is estimated at the amount that Essity deems will accrue to the company when the contract is signed with respect to volume discounts and any marketing subsidies, discount vouchers and returns. The transaction price is updated if the conditions forming the basis of the estimate have significantly changed.
Trade receivablesOnce the goods and services have been delivered and control has been passed to the customer, a trade receivable is recognized since this is the point in time when the consideration becomes unconditional, only the pas-sage of time is required for payment to be made.
Contract liabilitiesContract liabilities pertain to liabilities for volume discounts and advance payments from customers. Both items are recognized under Other current liabilities. Advance payments from customers are normally recognized as revenue in the subsequent fiscal year.
Assets that have arisen from expenses to fulfill contracts with customersIn the Professional Hygiene business area, Essity supplies dispensers to cus-tomers to fulfill contracts for delivery of the business area’s other products, refer to page 26. Expenses for these dispensers are recognized as prepaid expenses under Other non-current assets since Essity expects to cover these expenses through the sale of the business area’s other products. The dispensers are depreciated over three years according to the average term of the contract with customers. Recognition takes place in accordance with the rules in IFRS 15 since the expense is directly linked to securing contracts with customers. The rules on Property, Plant and Equipment in IAS 16 and IAS 2 Inventories are not deemed to be applicable since there are no eco-nomic benefits associated with the dispenser after it has been delivered to the customer.
B. Sales and earnings
The tables below show consolidated net sales broken down by operating segment: Personal Care, Consumer Tissue and Professional Hygiene.Net sales in geographic markets reflects the perspective – sold to, which is based on sales to the countries where Essity has its customers, known as its “footprint.” See page 86 for further information.
SEKmPersonal
CareConsumer
TissueProfessional
HygieneOther
operationsTotal
Group
2021Revenue from contracts with customersSale of finished products 46,613 49,073 26,112 –1 121,797Sale of services 26 13 31 – 70
IS Total revenues from contracts with customers 46,639 49,086 26,143 –1 121,867
Geographic marketsEurope 26,619 27,328 11,595 –1 65,541North America 4,790 98 10,360 – 15,248Latin America 8,455 5,821 1,639 – 15,915Asia 4,850 15,378 1,854 – 22,082Other 1,925 461 695 – 3,081
IS Total revenues from contracts with customers 46,639 49,086 26,143 –1 121,867
81Essity’s Annual and Sustainability Report 2021 Financial statements including notes
Introduction The Essity share
Strategy Business areas SustainabilityGroup Corporate Governance Report
Financial statementsincluding notes
Essity data

SEKmPersonal
CareConsumer
TissueProfessional
HygieneOther
operationsTotal
Group
Product categoryIncontinence Products 21,079 – – – 21,079Baby Care 8,024 – – – 8,024Feminine Care 8,378 – – – 8,378Medical Solutions 8,702 – – – 8,702Consumer Tissue – 49,086 – – 49,086Professional Hygiene – – 26,143 – 26,143Other 456 – – –1 455
IS Total revenues from contracts with customers 46,639 49,086 26,143 –1 121,867
SEKmPersonal
CareConsumer
TissueProfessional
HygieneOther
operationsTotal
Group
2020Revenue from contracts with customersSale of finished products 46,089 50,221 25,370 18 121,698Sale of services 6 – 48 – 54
IS Total revenues from contracts with customers 46,095 50,221 25,418 18 121,752
Geographic marketsEurope 26,611 29,822 11,970 18 68,421North America 4,862 34 10,087 – 14,983Latin America 8,078 5,805 1,386 – 15,269Asia 4,832 14,390 1,734 – 20,956Other 1,712 170 241 – 2,123
IS Total revenues from contracts with customers 46,095 50,221 25,418 18 121,752
Product categoryIncontinence Products 20,934 – – – 20,934Baby Care 8,650 – – – 8,650Feminine Care 7,956 – – – 7,956Medical Solutions 8,051 – – – 8,051Consumer Tissue – 50,221 – – 50,221Professional Hygiene – – 25,418 – 25,418Other 504 – – 18 522
IS Total revenues from contracts with customers 46,095 50,221 25,418 18 121,752
SEKmPersonal
CareConsumer
TissueProfessional
HygieneOther
operationsTotal
Group
2019Revenue from contracts with customersSale of finished products 48,325 49,904 30,726 0 128,955Sale of services 15 – 5 – 20
IS Total revenues from contracts with customers 48,340 49,904 30,731 0 128,975
Geographic marketsEurope 27,417 29,880 13,322 – 70,619North America 5,173 5 13,158 – 18,336Latin America 8,869 5,946 1,816 – 16,631Asia 5,007 13,902 2,178 – 21,087Other 1,874 171 257 0 2,302
IS Total revenues from contracts with customers 48,340 49,904 30,731 0 128,975
Product categoryIncontinence Products 21,205 – – – 21,205Baby Care 9,183 – – – 9,183Feminine Care 8,361 – – – 8,361Medical Solutions 8,936 – – – 8,936Consumer Tissue – 49,904 – – 49,904Professional Hygiene – – 30,731 – 30,731Other 655 – – 0 655
IS Total revenues from contracts with customers 48,340 49,904 30,731 0 128,975
B1. Revenue from contracts with customers, cont.
Trade receivables and contractual liabilitiesSEKm Note 2021 2020 2019
TE3:1 Trade receivables E3 19,871 17,825 19,864Contractual liabilities – bonuses and discounts to customers D5 6,253 6,070 6,038Contractual liabilities – advance payments from customers 110 158 157
Trade receivables increased by SEK 187m in 2021 due to acquisitions but declined by SEK 24m due to divestments. Overall, trade receivables increased SEK 2,046m in 2021 due to increased sales compared with previ-ous year and exchange rate effects.
Assets that have arisen from expenses to fulfill contracts with customersSEKm 2021 2020 2019
TE3:2 Value, January 1 587 585 538Costs for the year 374 473 408Depreciation –416 –375 –377Translation differences 62 –96 16
Value, December 31 607 587 585
82 Essity’s Annual and Sustainability Report 2021Financial statements including notes
Introduction The Essity share
Strategy Business areas SustainabilityGroup Corporate Governance Report
Financial statementsincluding notes
Essity data
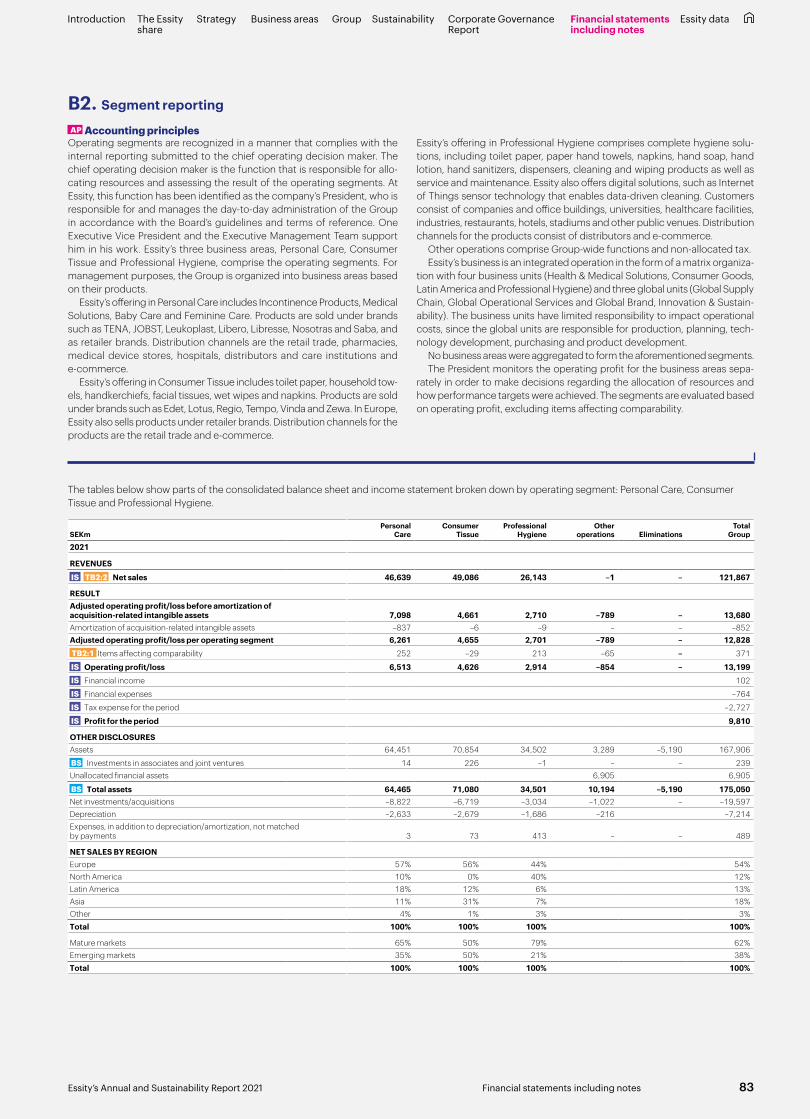
The tables below show parts of the consolidated balance sheet and income statement broken down by operating segment: Personal Care, Consumer Tissue and Professional Hygiene.
SEKmPersonal
CareConsumer
TissueProfessional
HygieneOther
operations EliminationsTotal
Group
2021
REVENUES
IS TB2:2 Net sales 46,639 49,086 26,143 –1 – 121,867
RESULTAdjusted operating profit/loss before amortization of acquisition-related intangible assets 7,098 4,661 2,710 –789 – 13,680Amortization of acquisition-related intangible assets –837 –6 –9 – – –852Adjusted operating profit/loss per operating segment 6,261 4,655 2,701 –789 – 12,828 TB2:1 Items affecting comparability 252 –29 213 –65 – 371
IS Operating profit/loss 6,513 4,626 2,914 –854 – 13,199 IS Financial income 102
IS Financial expenses –764
IS Tax expense for the period –2,727
IS Profit for the period 9,810
OTHER DISCLOSURESAssets 64,451 70,854 34,502 3,289 –5,190 167,906
BS Investments in associates and joint ventures 14 226 –1 – – 239Unallocated financial assets 6,905 6,905
BS Total assets 64,465 71,080 34,501 10,194 –5,190 175,050Net investments/acquisitions –8,822 –6,719 –3,034 –1,022 – –19,597Depreciation –2,633 –2,679 –1,686 –216 –7,214Expenses, in addition to depreciation/amortization, not matched by payments 3 73 413 – – 489
NET SALES BY REGIONEurope 57% 56% 44% 54%North America 10% 0% 40% 12%Latin America 18% 12% 6% 13%Asia 11% 31% 7% 18%Other 4% 1% 3% 3%Total 100% 100% 100% 100%
Mature markets 65% 50% 79% 62%Emerging markets 35% 50% 21% 38%Total 100% 100% 100% 100%
B2. Segment reporting
AP Accounting principlesOperating segments are recognized in a manner that complies with the internal reporting submitted to the chief operating decision maker. The chief operating decision maker is the function that is responsible for allo-cating resources and assessing the result of the operating segments. At Essity, this function has been identified as the company’s President, who is responsible for and manages the day-to-day administration of the Group in accordance with the Board’s guidelines and terms of reference. One Executive Vice President and the Executive Management Team support him in his work. Essity’s three business areas, Personal Care, Consumer Tissue and Professional Hygiene, comprise the operating segments. For management purposes, the Group is organized into business areas based on their products.
Essity’s offering in Personal Care includes Incontinence Products, Medical Solutions, Baby Care and Feminine Care. Products are sold under brands such as TENA, JOBST, Leukoplast, Libero, Libresse, Nosotras and Saba, and as retailer brands. Distribution channels are the retail trade, pharmacies, medical device stores, hospitals, distributors and care institutions and e-commerce.
Essity’s offering in Consumer Tissue includes toilet paper, household tow-els, handkerchiefs, facial tissues, wet wipes and napkins. Products are sold under brands such as Edet, Lotus, Regio, Tempo, Vinda and Zewa. In Europe, Essity also sells products under retailer brands. Distribution channels for the products are the retail trade and e-commerce.
Essity’s offering in Professional Hygiene comprises complete hygiene solu-tions, including toilet paper, paper hand towels, napkins, hand soap, hand lotion, hand sanitizers, dispensers, cleaning and wiping products as well as service and maintenance. Essity also offers digital solutions, such as Internet of Things sensor technology that enables data-driven cleaning. Customers consist of companies and office buildings, universities, healthcare facilities, industries, restaurants, hotels, stadiums and other public venues. Distribution channels for the products consist of distributors and e-commerce.
Other operations comprise Group-wide functions and non-allocated tax.Essity’s business is an integrated operation in the form of a matrix organiza-
tion with four business units (Health & Medical Solutions, Consumer Goods, Latin America and Professional Hygiene) and three global units (Global Supply Chain, Global Operational Services and Global Brand, Innovation & Sustain-ability). The business units have limited responsibility to impact operational costs, since the global units are responsible for production, planning, tech-nology development, purchasing and product development.
No business areas were aggregated to form the aforementioned segments.The President monitors the operating profit for the business areas sepa-
rately in order to make decisions regarding the allocation of resources and how performance targets were achieved. The segments are evaluated based on operating profit, excluding items affecting comparability.
83Essity’s Annual and Sustainability Report 2021 Financial statements including notes
Introduction The Essity share
Strategy Business areas SustainabilityGroup Corporate Governance Report
Financial statementsincluding notes
Essity data

B2. Segment reporting, cont.
SEKmPersonal
CareConsumer
TissueProfessional
HygieneOther
operations EliminationsTotal
Group
2020
REVENUES
IS TB2:2 Net sales 46,095 50,221 25,418 18 121,752
RESULTAdjusted operating profit/loss before amortization of acquisition-related intangible assets 7,161 8,045 3,317 –897 – 17,626Amortization of acquisition-related intangible assets –766 –6 –37 – – –809Adjusted operating profit/loss per operating segment 6,395 8,039 3,280 –897 – 16,817 TB2:1 Items affecting comparability –172 –7 –12 132 – –59
IS Operating profit/loss 6,223 8,032 3,268 –765 – 16,758 IS Financial income 108
IS Financial expenses –1,066
IS Tax expense for the period –4,053
IS Profit for the period 11,747
OTHER DISCLOSURESAssets 55,778 61,928 28,723 –729 –1,429 144,271
BS Investments in associates and joint ventures 222 506 118 1 – 847Unallocated financial assets 9,527 9,527
BS Total assets 56,000 62,434 28,841 8,799 –1,429 154,645Net investments/acquisitions –2,485 –3,396 –1,259 –455 – –7,595Depreciation –2,718 –2,675 –1,788 –168 – –7,349Expenses, in addition to depreciation/amortization, not matched by payments 2 17 439 –2 – 456
NET SALES BY REGIONEurope 58% 59% 47% 56%North America 11% – 40% 12%Latin America 17% 12% 5% 13%Asia 10% 29% 7% 17%Other 4% – 1% 2%Total 100% 100% 100% 100%
Mature markets 64% 53% 80% 63%Emerging markets 36% 47% 20% 37%Total 100% 100% 100% 100%
SEKmPersonal
CareConsumer
TissueProfessional
HygieneOther
operations EliminationsTotal
Group
2019
REVENUES
IS TB2:2 Net sales 48,340 49,904 30,731 0 128,975
RESULTAdjusted operating profit/loss before amortization of acquisition-related intangible assets 6,746 5,321 4,463 –690 – 15,840Amortization of acquisition-related intangible assets –732 –7 –39 – –778Adjusted operating profit/loss per operating segment 6,014 5,314 4,424 –690 – 15,062 TB2:1 Items affecting comparability –345 –118 –88 –162 – –713
IS Operating profit/loss 5,669 5,196 4,336 –852 – 14,349 IS Financial income 106
IS Financial expenses –1,415
IS Tax expense for the period –2,828
IS Profit for the period 10,212
OTHER DISCLOSURESAssets 60,704 64,094 32,252 3,035 –5,756 154,329
BS Investments in associates and joint ventures 226 514 123 2 – 865Unallocated financial assets 7,101 7,101
BS Total assets 60,930 64,608 32,375 10,138 –5,756 162,295Net investments/acquisitions –2,061 –2,432 –1,486 –322 – –6,301Depreciation –2,772 –2,706 –1,852 –147 – –7,477Expenses, in addition to depreciation/amortization, not matched by payments 10 31 339 –7 – 373
NET SALES BY REGIONEurope 57% 60% 43% 55%North America 11% – 43% 14%Latin America 18% 12% 6% 13%Asia 10% 28% 7% 16%Other 4% – 1% 2%Total 100% 100% 100% 100%
Mature markets 63% 53% 80% 63%Emerging markets 37% 47% 20% 37%Total 100% 100% 100% 100%
84 Essity’s Annual and Sustainability Report 2021Financial statements including notes
Introduction The Essity share
Strategy Business areas SustainabilityGroup Corporate Governance Report
Financial statementsincluding notes
Essity data
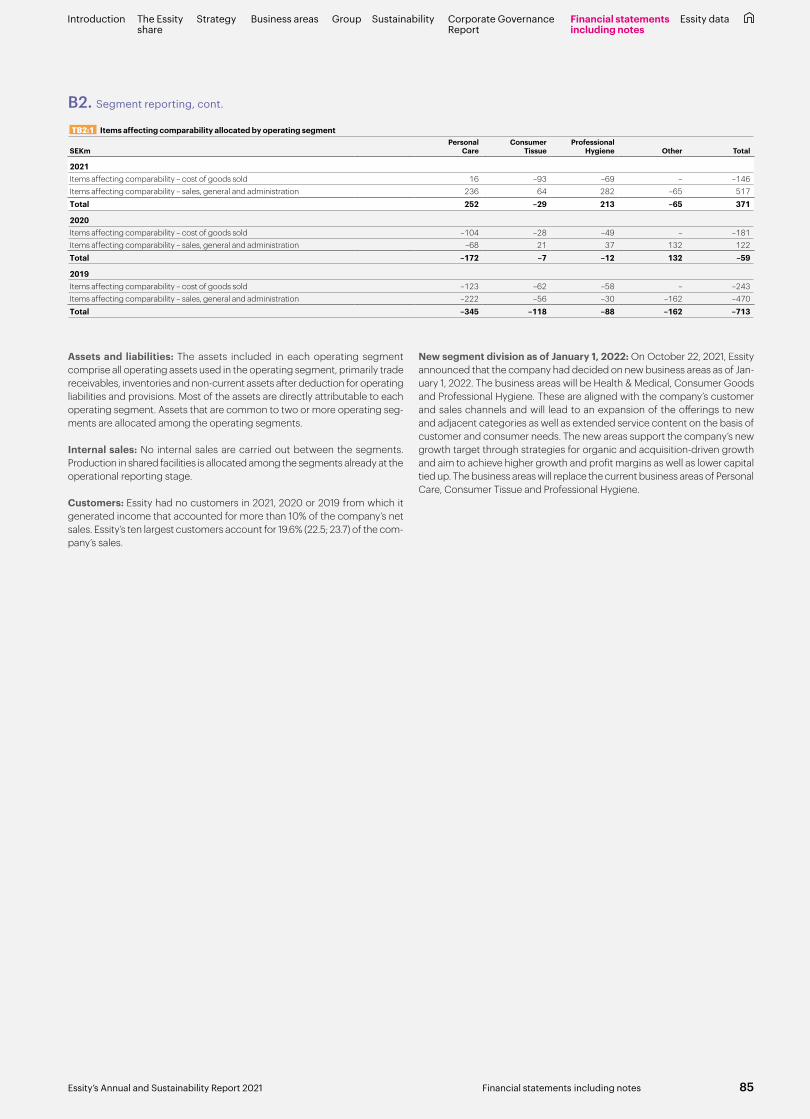
TB2:1 Items affecting comparability allocated by operating segment
SEKmPersonal
CareConsumer
Tissue Professional
Hygiene Other Total
2021Items affecting comparability – cost of goods sold 16 –93 –69 – –146Items affecting comparability – sales, general and administration 236 64 282 –65 517Total 252 –29 213 –65 371
2020Items affecting comparability – cost of goods sold –104 –28 –49 – –181Items affecting comparability – sales, general and administration –68 21 37 132 122Total –172 –7 –12 132 –59
2019Items affecting comparability – cost of goods sold –123 –62 –58 – –243Items affecting comparability – sales, general and administration –222 –56 –30 –162 –470Total –345 –118 –88 –162 –713
Assets and liabilities: The assets included in each operating segment comprise all operating assets used in the operating segment, primarily trade receivables, inventories and non-current assets after deduction for operating liabilities and provisions. Most of the assets are directly attributable to each operating segment. Assets that are common to two or more operating seg-ments are allocated among the operating segments.
Internal sales: No internal sales are carried out between the segments. Production in shared facilities is allocated among the segments already at the operational reporting stage.
Customers: Essity had no customers in 2021, 2020 or 2019 from which it generated income that accounted for more than 10% of the company’s net sales. Essity’s ten largest customers account for 19.6% (22.5; 23.7) of the com-pany’s sales.
New segment division as of January 1, 2022: On October 22, 2021, Essity announced that the company had decided on new business areas as of Jan-uary 1, 2022. The business areas will be Health & Medical, Consumer Goods and Professional Hygiene. These are aligned with the company’s customer and sales channels and will lead to an expansion of the offerings to new and adjacent categories as well as extended service content on the basis of customer and consumer needs. The new areas support the company’s new growth target through strategies for organic and acquisition-driven growth and aim to achieve higher growth and profit margins as well as lower capital tied up. The business areas will replace the current business areas of Personal Care, Consumer Tissue and Professional Hygiene.
B2. Segment reporting, cont.
85Essity’s Annual and Sustainability Report 2021 Financial statements including notes
Introduction The Essity share
Strategy Business areas SustainabilityGroup Corporate Governance Report
Financial statementsincluding notes
Essity data
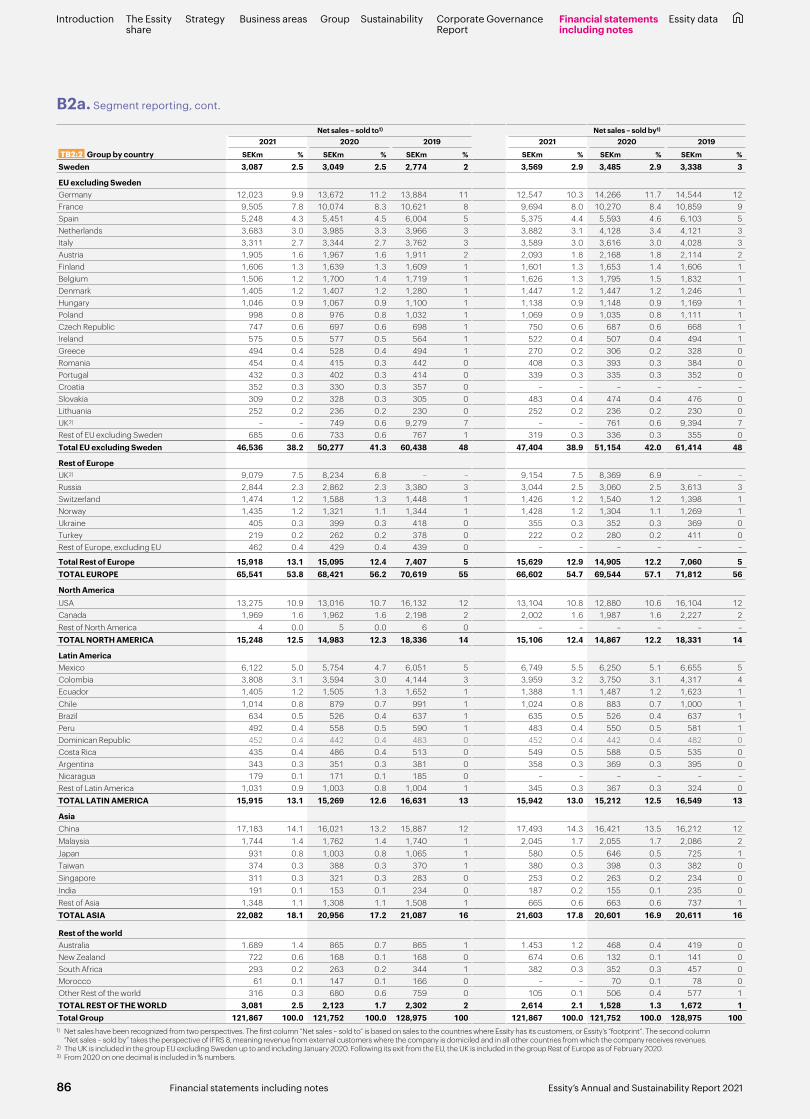
B2a. Segment reporting, cont.
Net sales – sold to1) Net sales – sold by1)
2021 2020 2019 2021 2020 2019
TB2:2 Group by country SEKm % SEKm % SEKm % SEKm % SEKm % SEKm %
Sweden 3,087 2.5 3,049 2.5 2,774 2 3,569 2.9 3,485 2.9 3,338 3
EU excluding SwedenGermany 12,023 9.9 13,672 11.2 13,884 11 12,547 10.3 14,266 11.7 14,544 12France 9,505 7.8 10,074 8.3 10,621 8 9,694 8.0 10,270 8.4 10,859 9Spain 5,248 4.3 5,451 4.5 6,004 5 5,375 4.4 5,593 4.6 6,103 5Netherlands 3,683 3.0 3,985 3.3 3,966 3 3,882 3.1 4,128 3.4 4,121 3Italy 3,311 2.7 3,344 2.7 3,762 3 3,589 3.0 3,616 3.0 4,028 3Austria 1,905 1.6 1,967 1.6 1,911 2 2,093 1.8 2,168 1.8 2,114 2Finland 1,606 1.3 1,639 1.3 1,609 1 1,601 1.3 1,653 1.4 1,606 1Belgium 1,506 1.2 1,700 1.4 1,719 1 1,626 1.3 1,795 1.5 1,832 1Denmark 1,405 1.2 1,407 1.2 1,280 1 1,447 1.2 1,447 1.2 1,246 1Hungary 1,046 0.9 1,067 0.9 1,100 1 1,138 0.9 1,148 0.9 1,169 1Poland 998 0.8 976 0.8 1,032 1 1,069 0.9 1,035 0.8 1,111 1Czech Republic 747 0.6 697 0.6 698 1 750 0.6 687 0.6 668 1Ireland 575 0.5 577 0.5 564 1 522 0.4 507 0.4 494 1Greece 494 0.4 528 0.4 494 1 270 0.2 306 0.2 328 0Romania 454 0.4 415 0.3 442 0 408 0.3 393 0.3 384 0Portugal 432 0.3 402 0.3 414 0 339 0.3 335 0.3 352 0Croatia 352 0.3 330 0.3 357 0 – – – – – –Slovakia 309 0.2 328 0.3 305 0 483 0.4 474 0.4 476 0Lithuania 252 0.2 236 0.2 230 0 252 0.2 236 0.2 230 0UK2) – – 749 0.6 9,279 7 – – 761 0.6 9,394 7Rest of EU excluding Sweden 685 0.6 733 0.6 767 1 319 0.3 336 0.3 355 0Total EU excluding Sweden 46,536 38.2 50,277 41.3 60,438 48 47,404 38.9 51,154 42.0 61,414 48
Rest of EuropeUK2) 9,079 7.5 8,234 6.8 – – 9,154 7.5 8,369 6.9 – –Russia 2,844 2.3 2,862 2.3 3,380 3 3,044 2.5 3,060 2.5 3,613 3Switzerland 1,474 1.2 1,588 1.3 1,448 1 1,426 1.2 1,540 1.2 1,398 1Norway 1,435 1.2 1,321 1.1 1,344 1 1,428 1.2 1,304 1.1 1,269 1Ukraine 405 0.3 399 0.3 418 0 355 0.3 352 0.3 369 0Turkey 219 0.2 262 0.2 378 0 222 0.2 280 0.2 411 0Rest of Europe, excluding EU 462 0.4 429 0.4 439 0 – – – – – –
Total Rest of Europe 15,918 13.1 15,095 12.4 7,407 5 15,629 12.9 14,905 12.2 7,060 5TOTAL EUROPE 65,541 53.8 68,421 56.2 70,619 55 66,602 54.7 69,544 57.1 71,812 56
North AmericaUSA 13,275 10.9 13,016 10.7 16,132 12 13,104 10.8 12,880 10.6 16,104 12Canada 1,969 1.6 1,962 1.6 2,198 2 2,002 1.6 1,987 1.6 2,227 2Rest of North America 4 0.0 5 0.0 6 0 – – – – – –TOTAL NORTH AMERICA 15,248 12.5 14,983 12.3 18,336 14 15,106 12.4 14,867 12.2 18,331 14
Latin AmericaMexico 6,122 5.0 5,754 4.7 6,051 5 6,749 5.5 6,250 5.1 6,655 5Colombia 3,808 3.1 3,594 3.0 4,144 3 3,959 3.2 3,750 3.1 4,317 4Ecuador 1,405 1.2 1,505 1.3 1,652 1 1,388 1.1 1,487 1.2 1,623 1Chile 1,014 0.8 879 0.7 991 1 1,024 0.8 883 0.7 1,000 1Brazil 634 0.5 526 0.4 637 1 635 0.5 526 0.4 637 1Peru 492 0.4 558 0.5 590 1 483 0.4 550 0.5 581 1Dominican Republic 452 0.4 442 0.4 483 0 452 0.4 442 0.4 482 0Costa Rica 435 0.4 486 0.4 513 0 549 0.5 588 0.5 535 0Argentina 343 0.3 351 0.3 381 0 358 0.3 369 0.3 395 0Nicaragua 179 0.1 171 0.1 185 0 – – – – – –Rest of Latin America 1,031 0.9 1,003 0.8 1,004 1 345 0.3 367 0.3 324 0TOTAL LATIN AMERICA 15,915 13.1 15,269 12.6 16,631 13 15,942 13.0 15,212 12.5 16,549 13
AsiaChina 17,183 14.1 16,021 13.2 15,887 12 17,493 14.3 16,421 13.5 16,212 12Malaysia 1,744 1.4 1,762 1.4 1,740 1 2,045 1.7 2,055 1.7 2,086 2Japan 931 0.8 1,003 0.8 1,065 1 580 0.5 646 0.5 725 1Taiwan 374 0.3 388 0.3 370 1 380 0.3 398 0.3 382 0Singapore 311 0.3 321 0.3 283 0 253 0.2 263 0.2 234 0India 191 0.1 153 0.1 234 0 187 0.2 155 0.1 235 0Rest of Asia 1,348 1.1 1,308 1.1 1,508 1 665 0.6 663 0.6 737 1TOTAL ASIA 22,082 18.1 20,956 17.2 21,087 16 21,603 17.8 20,601 16.9 20,611 16
Rest of the worldAustralia 1.689 1.4 865 0.7 865 1 1.453 1.2 468 0.4 419 0New Zealand 722 0.6 168 0.1 168 0 674 0.6 132 0.1 141 0South Africa 293 0.2 263 0.2 344 1 382 0.3 352 0.3 457 0Morocco 61 0.1 147 0.1 166 0 – – 70 0.1 78 0Other Rest of the world 316 0.3 680 0.6 759 0 105 0.1 506 0.4 577 1TOTAL REST OF THE WORLD 3,081 2.5 2,123 1.7 2,302 2 2,614 2.1 1,528 1.3 1,672 1Total Group 121,867 100.0 121,752 100.0 128,975 100 121,867 100.0 121,752 100.0 128,975 100
1) Net sales have been recognized from two perspectives. The first column “Net sales – sold to” is based on sales to the countries where Essity has its customers, or Essity’s “footprint”. The second column “Net sales – sold by” takes the perspective of IFRS 8, meaning revenue from external customers where the company is domiciled and in all other countries from which the company receives revenues.
2) The UK is included in the group EU excluding Sweden up to and including January 2020. Following its exit from the EU, the UK is included in the group Rest of Europe as of February 2020.3) From 2020 on one decimal is included in % numbers.
86 Essity’s Annual and Sustainability Report 2021Financial statements including notes
Introduction The Essity share
Strategy Business areas SustainabilityGroup Corporate Governance Report
Financial statementsincluding notes
Essity data

B2b. Segment reporting, cont.
Average number of employees Non-current assets1)
TB2:2 Group by country 2021Of whom
men, %Of whom
women, % 2020Of whom
men, %Of whom
women, % 2019Of whom
men, %Of whom
women, %2021
SEKm2020
SEKm2019
SEKm
Sweden 2,148 52 48 2,120 53 47 1,984 55 45 4,818 4,192 3,520
EU excluding Sweden
Germany 4,722 72 28 4,637 73 27 4,559 73 27 24,981 25,320 26,050France 2,442 66 34 2,489 67 33 2,482 68 32 7,807 7,380 7,807Netherlands 1,255 82 18 1,244 82 18 1,240 82 18 3,423 3,267 3,211Spain 1,169 74 26 1,137 76 24 1,171 75 25 3,355 3,386 3,669Slovakia 928 61 39 905 62 38 896 63 37 642 685 736Italy 900 74 26 901 75 25 883 75 25 3,756 3,313 3,439Poland 828 71 29 842 71 29 840 73 27 1,550 1,586 1,922Austria 559 80 20 581 81 19 604 81 19 813 808 864Belgium 466 80 20 482 80 20 472 81 19 657 668 700Finland 307 71 29 303 73 27 296 74 26 1,034 1,097 1,211Denmark 118 42 58 112 45 55 107 43 57 34 38 42Hungary 113 35 65 113 35 65 129 39 61 12 9 13Czech Republic 62 47 53 60 48 52 58 47 53 5 7 8Greece 45 53 47 45 53 47 46 54 46 12 14 17Romania 38 39 61 37 41 59 33 36 64 13 14 19Lithuania 27 44 56 26 46 54 24 50 50 2 3 4 Portugal 22 50 50 20 60 40 20 60 40 76 75 79Ireland 13 62 38 14 64 36 14 64 36 31 32 32Croatia 11 36 64 11 36 64 14 29 71 1 1 2 UK2) – – – 134 75 25 1,614 76 24 – – 5,742Rest of EU excluding Sweden 17 29 71 16 25 75 16 25 75 2 2 3Total EU excluding Sweden 14,042 71 29 14,109 72 28 15,518 73 27 48,206 47,705 55,570
Rest of EuropeUK2) 1,636 75 25 1,479 75 25 – – – 5,566 5,094 –Russia 1,325 62 38 1,299 62 38 1,295 61 39 1,269 1,090 1,592Turkey 114 74 26 125 77 23 134 80 20 24 39 60Norway 88 48 52 85 49 51 84 50 50 11 13 15Ukraine 67 40 60 70 43 57 71 42 58 21 5 5Switzerland 37 30 70 35 29 71 34 29 71 86 80 140Rest of Europe, excluding EU 5 100 – 5 100 – 4 100 – – – –Total Rest of Europe 3,272 68 32 3,098 68 32 1,622 61 39 6,977 6,321 1,812TOTAL EUROPE 19,462 68 32 19,327 69 31 19,124 70 30 60,001 58,218 60,902
North AmericaUSA 3,137 71 29 3,215 71 29 3,214 71 29 19,187 16,529 19,283Canada 287 65 35 286 64 36 306 65 35 588 537 598Rest of North America – – – – – – – – – – – –TOTAL NORTH AMERICA 3,424 71 29 3,501 71 29 3,520 71 29 19,775 17,066 19,881
Latin AmericaColombia 3,787 67 33 3,676 67 33 3,889 66 34 2,062 2,025 2,345Mexico 3,220 68 32 3,007 69 31 3,027 70 30 4,721 4,366 5,207Ecuador 1,048 71 29 1,086 69 31 1,163 66 34 618 542 626Brazil 521 54 46 546 58 42 606 60 40 398 411 644Chile 438 72 28 420 73 27 422 71 29 567 596 650Argentina 358 65 35 369 66 34 323 65 35 35 26 40Dominican Republic 266 67 33 266 67 33 268 66 34 224 200 236Peru 138 54 46 140 40 60 130 37 63 336 343 439Costa Rica 93 55 45 92 54 46 89 55 45 6 11 15Nicaragua – – – – – – 3 67 33 – – –Rest of Latin America 57 42 58 54 43 57 45 49 51 3 3 3TOTAL LATIN AMERICA 9,926 67 33 9,656 67 33 9,965 66 34 8,970 8,523 10,205
AsiaChina 9,863 57 43 9,493 57 43 9,287 57 43 19,249 16,309 16,906Malaysia 1,370 44 56 1,371 43 57 1,332 43 57 1,867 1,570 1,345India 324 91 9 330 91 9 389 88 12 70 70 91Taiwan 241 62 38 246 62 38 259 62 38 698 616 663Japan 122 41 59 122 41 59 134 46 54 68 68 80Singapore 37 29 71 34 29 71 33 28 72 2 3 16Rest of Asia 510 62 38 515 62 38 359 53 47 631 601 709TOTAL ASIA 12,467 57 43 12,111 56 44 11,793 56 44 22,585 19,237 19,810
Rest of the worldSouth Africa 390 43 57 404 43 57 449 41 59 635 643 791Australia 211 48 52 104 37 63 104 38 62 4,411 839 932Tunisia 173 89 11 866 89 11 887 92 8 – – 119New Zealand 166 59 41 42 24 76 43 28 72 2,112 3 6Other Rest of the world 56 71 29 73 51 49 95 63 37 38 – 17TOTAL REST OF THE WORLD 996 56 44 1,489 69 31 1,578 71 29 7,196 1,485 1,865Total Group 46,275 65 35 46,084 65 35 45,980 66 34 118,527 104,529 112,663
1) Information about non-current assets by country refers to intangible assets and property, plant and equipment according to Notes D1 and D2 and right-of-use assets according to Note G2. 2) The UK is included in the group EU excluding Sweden up to and including January 2020. Following its exit from the EU, the UK is included in the group Rest of Europe as of February 2020.
87Essity’s Annual and Sustainability Report 2021 Financial statements including notes
Introduction The Essity share
Strategy Business areas SustainabilityGroup Corporate Governance Report
Financial statementsincluding notes
Essity data
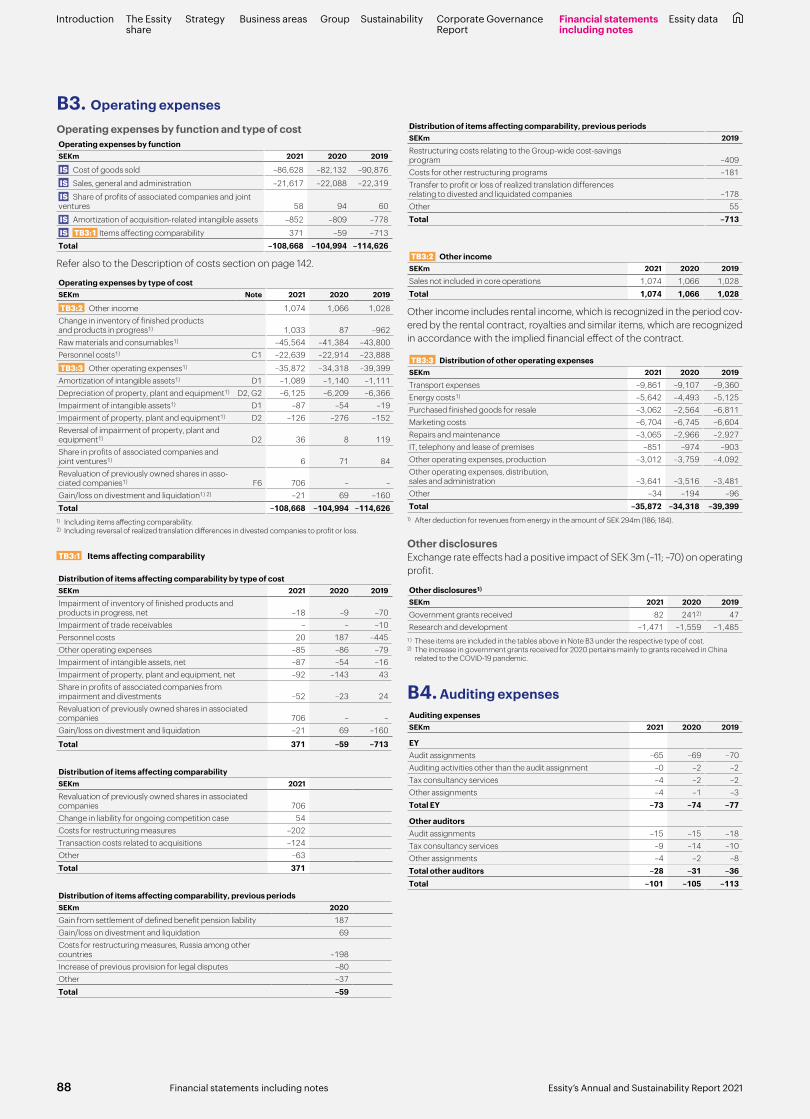
B3. Operating expenses
Operating expenses by function and type of costOperating expenses by functionSEKm 2021 2020 2019
IS Cost of goods sold –86,628 –82,132 –90,876
IS Sales, general and administration –21,617 –22,088 –22,319
IS Share of profits of associated companies and joint ventures 58 94 60
IS Amortization of acquisition-related intangible assets –852 –809 –778
IS TB3:1 Items affecting comparability 371 –59 –713Total –108,668 –104,994 –114,626
Refer also to the Description of costs section on page 142.
Operating expenses by type of costSEKm Note 2021 2020 2019
TB3:2 Other income 1,074 1,066 1,028Change in inventory of finished products and products in progress1) 1,033 87 –962Raw materials and consumables1) –45,564 –41,384 –43,800Personnel costs1) C1 –22,639 –22,914 –23,888
TB3:3 Other operating expenses1) –35,872 –34,318 –39,399Amortization of intangible assets1) D1 –1,089 –1,140 –1,111Depreciation of property, plant and equipment1) D2, G2 –6,125 –6,209 –6,366Impairment of intangible assets1) D1 –87 –54 –19Impairment of property, plant and equipment1) D2 –126 –276 –152Reversal of impairment of property, plant and equipment1) D2 36 8 119Share in profits of associated companies and joint ventures1) 6 71 84Revaluation of previously owned shares in asso-ciated companies1) F6 706 – –Gain/loss on divestment and liquidation1) 2) –21 69 –160Total –108,668 –104,994 –114,626
1) Including items affecting comparability.2) Including reversal of realized translation differences in divested companies to profit or loss.
TB3:1 Items affecting comparability
Distribution of items affecting comparability by type of costSEKm 2021 2020 2019
Impairment of inventory of finished products and products in progress, net –18 –9 –70Impairment of trade receivables – – –10Personnel costs 20 187 –445Other operating expenses –85 –86 –79Impairment of intangible assets, net –87 –54 –16Impairment of property, plant and equipment, net –92 –143 43Share in profits of associated companies from impairment and divestments –52 –23 24Revaluation of previously owned shares in associated companies 706 – –Gain/loss on divestment and liquidation –21 69 –160
Total 371 –59 –713
Distribution of items affecting comparabilitySEKm 2021
Revaluation of previously owned shares in associated companies 706Change in liability for ongoing competition case 54Costs for restructuring measures –202Transaction costs related to acquisitions –124Other –63Total 371
Distribution of items affecting comparability, previous periodsSEKm 2020
Gain from settlement of defined benefit pension liability 187Gain/loss on divestment and liquidation 69Costs for restructuring measures, Russia among other countries –198Increase of previous provision for legal disputes –80Other –37Total –59
Distribution of items affecting comparability, previous periodsSEKm 2019
Restructuring costs relating to the Group-wide cost-savings program –409Costs for other restructuring programs –181Transfer to profit or loss of realized translation differences relating to divested and liquidated companies –178Other 55Total –713
TB3:2 Other incomeSEKm 2021 2020 2019
Sales not included in core operations 1,074 1,066 1,028Total 1,074 1,066 1,028
Other income includes rental income, which is recognized in the period cov-ered by the rental contract, royalties and similar items, which are recognized in accordance with the implied financial effect of the contract.
TB3:3 Distribution of other operating expensesSEKm 2021 2020 2019
Transport expenses –9,861 –9,107 –9,360Energy costs1) –5,642 –4,493 –5,125Purchased finished goods for resale –3,062 –2,564 –6,811Marketing costs –6,704 –6,745 –6,604Repairs and maintenance –3,065 –2,966 –2,927IT, telephony and lease of premises –851 –974 –903Other operating expenses, production –3,012 –3,759 –4,092Other operating expenses, distribution, sales and administration –3,641 –3,516 –3,481Other –34 –194 –96Total –35,872 –34,318 –39,399
1) After deduction for revenues from energy in the amount of SEK 294m (186; 184).
Other disclosures Exchange rate effects had a positive impact of SEK 3m (–11; –70) on operating profit.
Other disclosures1)
SEKm 2021 2020 2019
Government grants received 82 2412) 47Research and development –1,471 –1,559 –1,485
1 ) These items are included in the tables above in Note B3 under the respective type of cost.2) The increase in government grants received for 2020 pertains mainly to grants received in China
related to the COVID-19 pandemic.
B4. Auditing expensesAuditing expensesSEKm 2021 2020 2019
EYAudit assignments –65 –69 –70Auditing activities other than the audit assignment –0 –2 –2Tax consultancy services –4 –2 –2Other assignments –4 –1 –3Total EY –73 –74 –77
Other auditorsAudit assignments –15 –15 –18Tax consultancy services –9 –14 –10Other assignments –4 –2 –8Total other auditors –28 –31 –36Total –101 –105 –113
88 Essity’s Annual and Sustainability Report 2021Financial statements including notes
Introduction The Essity share
Strategy Business areas SustainabilityGroup Corporate Governance Report
Financial statementsincluding notes
Essity data
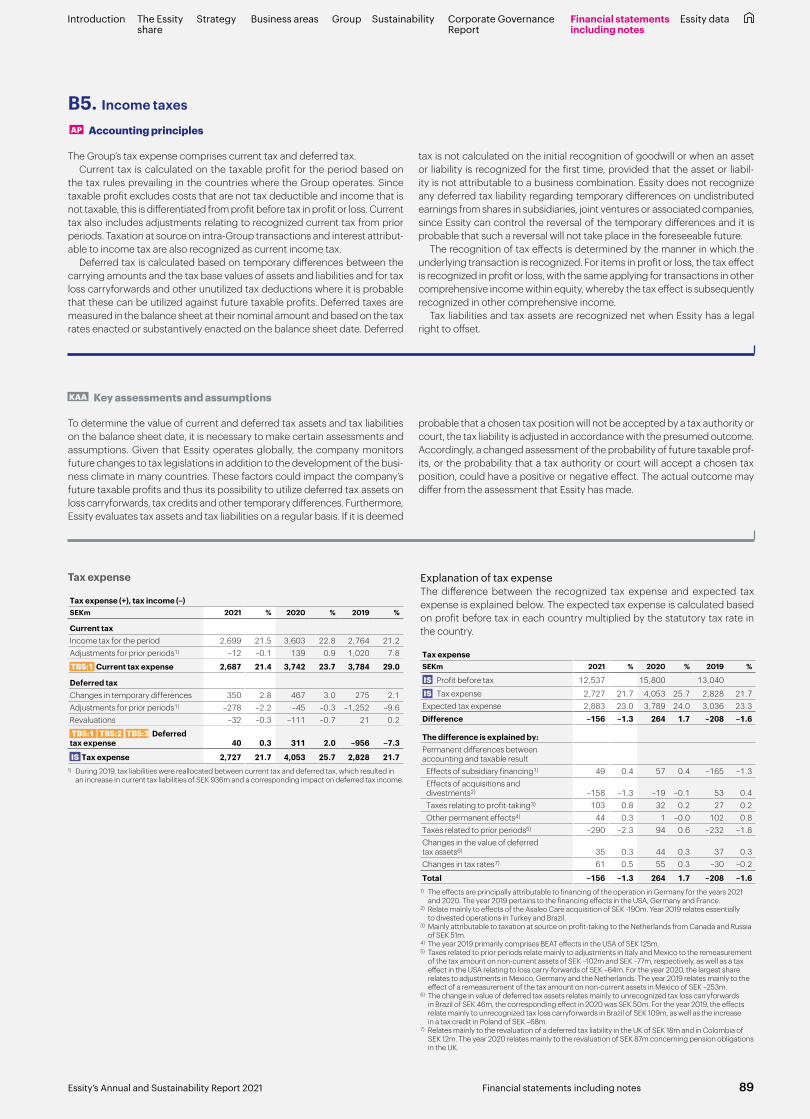
KAA Key assessments and assumptions
To determine the value of current and deferred tax assets and tax liabilities on the balance sheet date, it is necessary to make certain assessments and assumptions. Given that Essity operates globally, the company monitors future changes to tax legislations in addition to the development of the busi-ness climate in many countries. These factors could impact the company’s future taxable profits and thus its possibility to utilize deferred tax assets on loss carryforwards, tax credits and other temporary differences. Furthermore, Essity evaluates tax assets and tax liabilities on a regular basis. If it is deemed
probable that a chosen tax position will not be accepted by a tax authority or court, the tax liability is adjusted in accordance with the presumed outcome. Accordingly, a changed assessment of the probability of future taxable prof-its, or the probability that a tax authority or court will accept a chosen tax position, could have a positive or negative effect. The actual outcome may differ from the assessment that Essity has made.
Tax expense
Tax expense (+), tax income (–)SEKm 2021 % 2020 % 2019 %
Current taxIncome tax for the period 2,699 21.5 3,603 22.8 2,764 21.2Adjustments for prior periods1) –12 –0.1 139 0.9 1,020 7.8
TB5:1 Current tax expense 2,687 21.4 3,742 23.7 3,784 29.0
Deferred taxChanges in temporary differences 350 2.8 467 3.0 275 2.1Adjustments for prior periods1) –278 –2.2 –45 –0.3 –1,252 –9.6Revaluations –32 –0.3 –111 –0.7 21 0.2
TB5:1 TB5:2 TB5:3 Deferred tax expense 40 0.3 311 2.0 –956 –7.3
IS Tax expense 2,727 21.7 4,053 25.7 2,828 21.71) During 2019, tax liabilities were reallocated between current tax and deferred tax, which resulted in
an increase in current tax liabilities of SEK 936m and a corresponding impact on deferred tax income.
B5. Income taxes
AP Accounting principles
The Group’s tax expense comprises current tax and deferred tax. Current tax is calculated on the taxable profit for the period based on
the tax rules prevailing in the countries where the Group operates. Since taxable profit excludes costs that are not tax deductible and income that is not taxable, this is differentiated from profit before tax in profit or loss. Current tax also includes adjustments relating to recognized current tax from prior periods. Taxation at source on intra-Group transactions and interest attribut-able to income tax are also recognized as current income tax.
Deferred tax is calculated based on temporary differences between the carrying amounts and the tax base values of assets and liabilities and for tax loss carryforwards and other unutilized tax deductions where it is probable that these can be utilized against future taxable profits. Deferred taxes are measured in the balance sheet at their nominal amount and based on the tax rates enacted or substantively enacted on the balance sheet date. Deferred
tax is not calculated on the initial recognition of goodwill or when an asset or liability is recognized for the first time, provided that the asset or liabil-ity is not attributable to a business combination. Essity does not recognize any deferred tax liability regarding temporary differences on undistributed earnings from shares in subsidiaries, joint ventures or associated companies, since Essity can control the reversal of the temporary differences and it is probable that such a reversal will not take place in the foreseeable future.
The recognition of tax effects is determined by the manner in which the underlying transaction is recognized. For items in profit or loss, the tax effect is recognized in profit or loss, with the same applying for transactions in other comprehensive income within equity, whereby the tax effect is subsequently recognized in other comprehensive income.
Tax liabilities and tax assets are recognized net when Essity has a legal right to offset.
Explanation of tax expenseThe difference between the recognized tax expense and expected tax expense is explained below. The expected tax expense is calculated based on profit before tax in each country multiplied by the statutory tax rate in the country.
Tax expenseSEKm 2021 % 2020 % 2019 %
IS Profit before tax 12,537 15,800 13,040
IS Tax expense 2,727 21.7 4,053 25.7 2,828 21.7Expected tax expense 2,883 23.0 3,789 24.0 3,036 23.3Difference –156 –1.3 264 1.7 –208 –1.6
The difference is explained by:Permanent differences between accounting and taxable result Effects of subsidiary financing1) 49 0.4 57 0.4 –165 –1.3 Effects of acquisitions and
divestments2) –158 –1.3 –19 –0.1 53 0.4 Taxes relating to profit-taking3) 103 0.8 32 0.2 27 0.2 Other permanent effects4) 44 0.3 1 –0.0 102 0.8Taxes related to prior periods5) –290 –2.3 94 0.6 –232 –1.8Changes in the value of deferred tax assets6) 35 0.3 44 0.3 37 0.3Changes in tax rates7) 61 0.5 55 0.3 –30 –0.2
Total –156 –1.3 264 1.7 –208 –1.61) The effects are principally attributable to financing of the operation in Germany for the years 2021
and 2020. The year 2019 pertains to the financing effects in the USA, Germany and France.2) Relate mainly to effects of the Asaleo Care acquisition of SEK -190m. Year 2019 relates essentially
to divested operations in Turkey and Brazil.3) Mainly attributable to taxation at source on profit-taking to the Netherlands from Canada and Russia
of SEK 51m.4) The year 2019 primarily comprises BEAT effects in the USA of SEK 125m. 5) Taxes related to prior periods relate mainly to adjustments in Italy and Mexico to the remeasurement
of the tax amount on non-current assets of SEK –102m and SEK –77m, respectively, as well as a tax effect in the USA relating to loss carry-forwards of SEK –64m. For the year 2020, the largest share relates to adjustments in Mexico, Germany and the Netherlands. The year 2019 relates mainly to the effect of a remeasurement of the tax amount on non-current assets in Mexico of SEK –253m.
6) The change in value of deferred tax assets relates mainly to unrecognized tax loss carryforwards in Brazil of SEK 46m, the corresponding effect in 2020 was SEK 50m. For the year 2019, the effects relate mainly to unrecognized tax loss carryforwards in Brazil of SEK 109m, as well as the increase in a tax credit in Poland of SEK –68m.
7) Relates mainly to the revaluation of a deferred tax liability in the UK of SEK 18m and in Colombia of SEK 12m. The year 2020 relates mainly to the revaluation of SEK 87m concerning pension obligations in the UK.
89Essity’s Annual and Sustainability Report 2021 Financial statements including notes
Introduction The Essity share
Strategy Business areas SustainabilityGroup Corporate Governance Report
Financial statementsincluding notes
Essity data
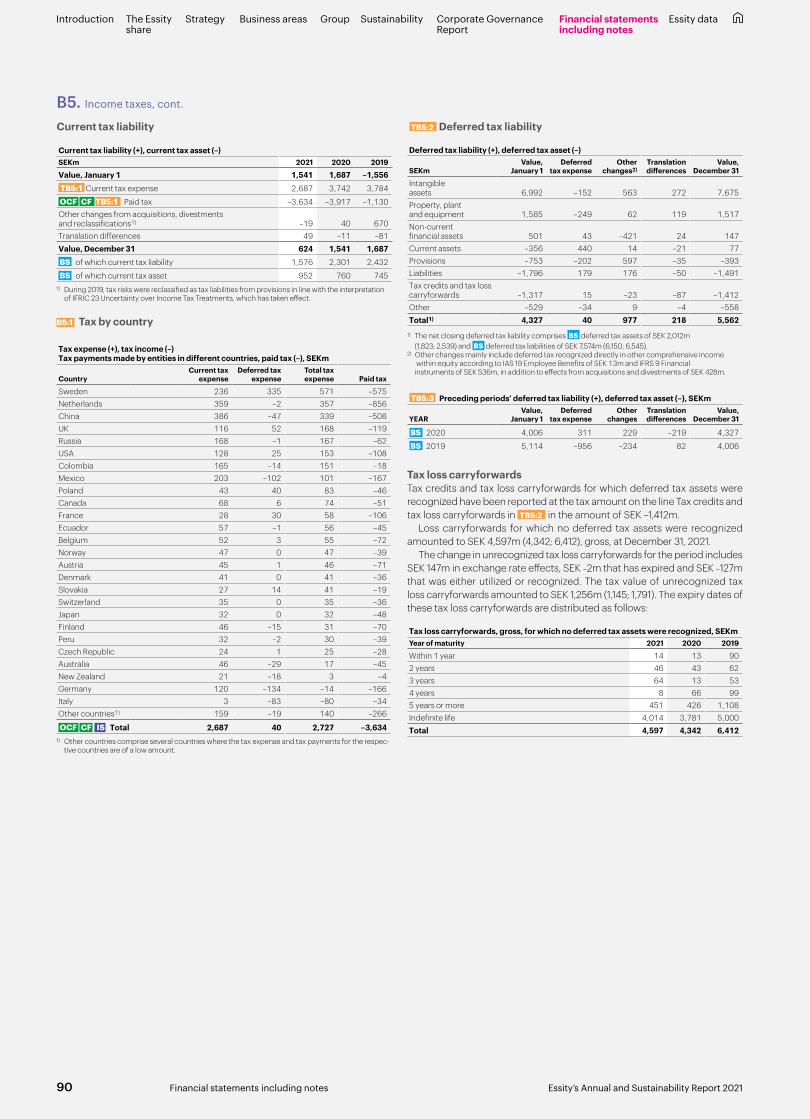
Current tax liability
Current tax liability (+), current tax asset (–)SEKm 2021 2020 2019
Value, January 1 1,541 1,687 –1,556 TB5:1 Current tax expense 2,687 3,742 3,784
OCF CF TB5:1 Paid tax –3,634 –3,917 –1,130Other changes from acquisitions, divestments and reclassifications1) –19 40 670Translation differences 49 –11 –81Value, December 31 624 1,541 1,687 BS of which current tax liability 1,576 2,301 2,432
BS of which current tax asset 952 760 7451) During 2019, tax risks were reclassified as tax liabilities from provisions in line with the interpretation
of IFRIC 23 Uncertainty over Income Tax Treatments, which has taken effect.
B5:1 Tax by country
Tax expense (+), tax income (–) Tax payments made by entities in different countries, paid tax (–), SEKm
CountryCurrent tax
expenseDeferred tax
expenseTotal tax expense Paid tax
Sweden 236 335 571 –575Netherlands 359 –2 357 –856China 386 –47 339 –508UK 116 52 168 –119Russia 168 –1 167 –62USA 128 25 153 –108Colombia 165 –14 151 –18Mexico 203 –102 101 –167Poland 43 40 83 –46Canada 68 6 74 –51France 28 30 58 –106Ecuador 57 –1 56 –45Belgium 52 3 55 –72Norway 47 0 47 –39Austria 45 1 46 –71Denmark 41 0 41 –36Slovakia 27 14 41 –19Switzerland 35 0 35 –36Japan 32 0 32 –48Finland 46 –15 31 –70Peru 32 –2 30 –39Czech Republic 24 1 25 –28Australia 46 –29 17 –45New Zealand 21 –18 3 –4Germany 120 –134 –14 –166Italy 3 –83 –80 –34Other countries1) 159 –19 140 –266
OCF CF IS Total 2,687 40 2,727 –3,6341) Other countries comprise several countries where the tax expense and tax payments for the respec-
tive countries are of a low amount.
TB5:2 Deferred tax liability
Deferred tax liability (+), deferred tax asset (–)
SEKmValue,
January 1Deferred
tax expenseOther
changes2)Translation differences
Value, December 31
Intangible assets 6,992 –152 563 272 7,675Property, plant and equipment 1,585 –249 62 119 1,517Non-current financial assets 501 43 –421 24 147Current assets –356 440 14 –21 77Provisions –753 –202 597 –35 –393Liabilities –1,796 179 176 –50 –1,491Tax credits and tax loss carryforwards –1,317 15 –23 –87 –1,412Other –529 –34 9 –4 –558Total1) 4,327 40 977 218 5,562
1) The net closing deferred tax liability comprises BS deferred tax assets of SEK 2,012m (1,823; 2,539) and BS deferred tax liabilities of SEK 7,574m (6,150; 6,545).
2) Other changes mainly include deferred tax recognized directly in other comprehensive income within equity according to IAS 19 Employee Benefits of SEK 13m and IFRS 9 Financial instruments of SEK 536m, in addition to effects from acquisitions and divestments of SEK 428m.
TB5:3 Preceding periods’ deferred tax liability (+), deferred tax asset (–), SEKm
YEARValue,
January 1Deferred
tax expenseOther
changesTranslation differences
Value, December 31
BS 2020 4,006 311 229 –219 4,327
BS 2019 5,114 –956 –234 82 4,006
Tax loss carryforwardsTax credits and tax loss carryforwards for which deferred tax assets were recognized have been reported at the tax amount on the line Tax credits and tax loss carryforwards in TB5:2 in the amount of SEK –1,412m.
Loss carryforwards for which no deferred tax assets were recognized amounted to SEK 4,597m (4,342; 6,412), gross, at December 31, 2021.
The change in unrecognized tax loss carryforwards for the period includes SEK 147m in exchange rate effects, SEK –2m that has expired and SEK –127m that was either utilized or recognized. The tax value of unrecognized tax loss carryforwards amounted to SEK 1,256m (1,145; 1,791). The expiry dates of these tax loss carryforwards are distributed as follows:
Tax loss carryforwards, gross, for which no deferred tax assets were recognized, SEKmYear of maturity 2021 2020 2019
Within 1 year 14 13 902 years 46 43 623 years 64 13 534 years 8 66 995 years or more 451 426 1,108Indefinite life 4,014 3,781 5,000Total 4,597 4,342 6,412
B5. Income taxes, cont.
90 Essity’s Annual and Sustainability Report 2021Financial statements including notes
Introduction The Essity share
Strategy Business areas SustainabilityGroup Corporate Governance Report
Financial statementsincluding notes
Essity data
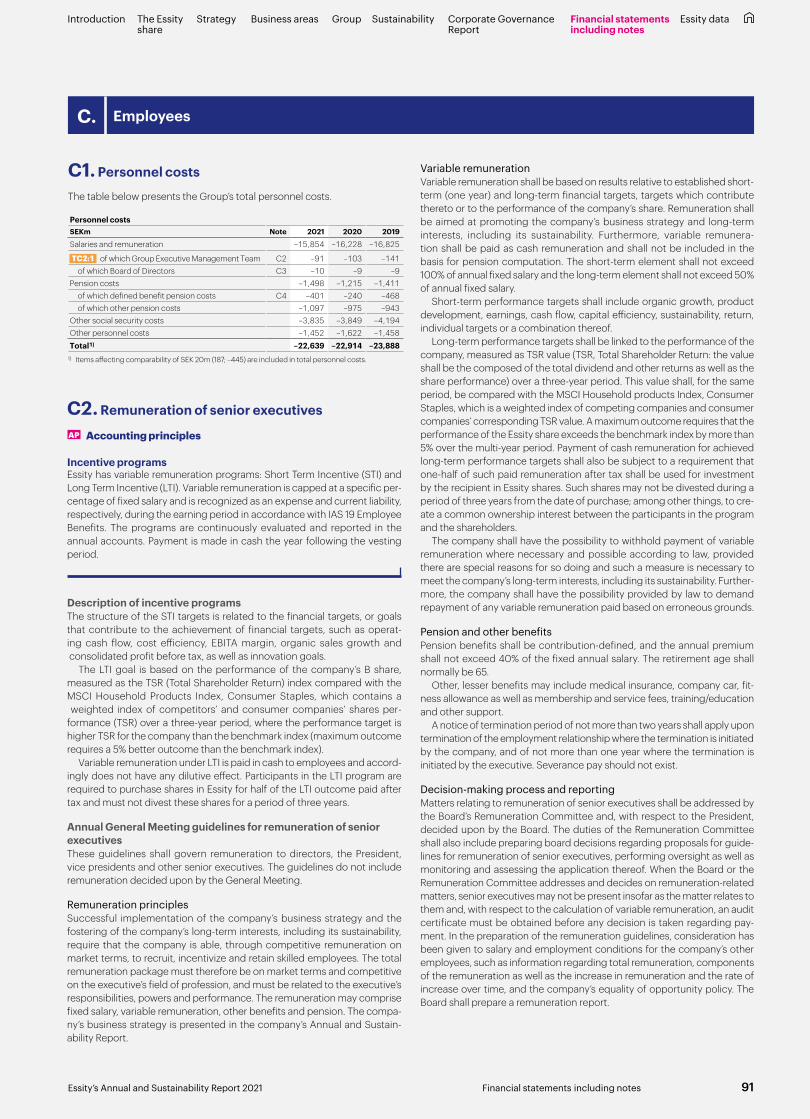
C. Employees
C1. Personnel costs
The table below presents the Group’s total personnel costs.
Personnel costsSEKm Note 2021 2020 2019
Salaries and remuneration –15,854 –16,228 –16,825
TC2:1 of which Group Executive Management Team C2 –91 –103 –141 of which Board of Directors C3 –10 –9 –9Pension costs –1,498 –1,215 –1,411 of which defined benefit pension costs C4 –401 –240 –468 of which other pension costs –1,097 –975 –943Other social security costs –3,835 –3,849 –4,194Other personnel costs –1,452 –1,622 –1,458Total1) –22,639 –22,914 –23,888
1) Items affecting comparability of SEK 20m (187; –445) are included in total personnel costs.
C2. Remuneration of senior executives
AP Accounting principles
Incentive programsEssity has variable remuneration programs: Short Term Incentive (STI) and Long Term Incentive (LTI). Variable remuneration is capped at a specific per-centage of fixed salary and is recognized as an expense and current liability, respectively, during the earning period in accordance with IAS 19 Employee Benefits. The programs are continuously evaluated and reported in the annual accounts. Payment is made in cash the year following the vesting period.
Description of incentive programsThe structure of the STI targets is related to the financial targets, or goals that contribute to the achievement of financial targets, such as operat-ing cash flow, cost efficiency, EBITA margin, organic sales growth and consolidated profit before tax, as well as innovation goals.
The LTI goal is based on the performance of the company’s B share, measured as the TSR (Total Shareholder Return) index compared with the MSCI Household Products Index, Consumer Staples, which contains a weighted index of competitors’ and consumer companies’ shares per-formance (TSR) over a three-year period, where the performance target is higher TSR for the company than the benchmark index (maximum outcome requires a 5% better outcome than the benchmark index).
Variable remuneration under LTI is paid in cash to employees and accord-ingly does not have any dilutive effect. Participants in the LTI program are required to purchase shares in Essity for half of the LTI outcome paid after tax and must not divest these shares for a period of three years.
Annual General Meeting guidelines for remuneration of senior executivesThese guidelines shall govern remuneration to directors, the President, vice presidents and other senior executives. The guidelines do not include remuneration decided upon by the General Meeting.
Remuneration principlesSuccessful implementation of the company’s business strategy and the fostering of the company’s long-term interests, including its sustainability, require that the company is able, through competitive remuneration on market terms, to recruit, incentivize and retain skilled employees. The total remuneration package must therefore be on market terms and competitive on the executive’s field of profession, and must be related to the executive’s responsibilities, powers and performance. The remuneration may comprise fixed salary, variable remuneration, other benefits and pension. The compa-ny’s business strategy is presented in the company’s Annual and Sustain-ability Report.
Variable remunerationVariable remuneration shall be based on results relative to established short-term (one year) and long-term financial targets, targets which contribute thereto or to the performance of the company’s share. Remuneration shall be aimed at promoting the company’s business strategy and long-term interests, including its sustainability. Furthermore, variable remunera-tion shall be paid as cash remuneration and shall not be included in the basis for pension computation. The short-term element shall not exceed 100% of annual fixed salary and the long-term element shall not exceed 50% of annual fixed salary.
Short-term performance targets shall include organic growth, product development, earnings, cash flow, capital efficiency, sustainability, return, individual targets or a combination thereof.
Long-term performance targets shall be linked to the performance of the company, measured as TSR value (TSR, Total Shareholder Return: the value shall be the composed of the total dividend and other returns as well as the share performance) over a three-year period. This value shall, for the same period, be compared with the MSCI Household products Index, Consumer Staples, which is a weighted index of competing companies and consumer companies’ corresponding TSR value. A maximum outcome requires that the performance of the Essity share exceeds the benchmark index by more than 5% over the multi-year period. Payment of cash remuneration for achieved long-term performance targets shall also be subject to a requirement that one-half of such paid remuneration after tax shall be used for investment by the recipient in Essity shares. Such shares may not be divested during a period of three years from the date of purchase; among other things, to cre-ate a common ownership interest between the participants in the program and the shareholders.
The company shall have the possibility to withhold payment of variable remuneration where necessary and possible according to law, provided there are special reasons for so doing and such a measure is necessary to meet the company’s long-term interests, including its sustainability. Further-more, the company shall have the possibility provided by law to demand repayment of any variable remuneration paid based on erroneous grounds.
Pension and other benefitsPension benefits shall be contribution-defined, and the annual premium shall not exceed 40% of the fixed annual salary. The retirement age shall normally be 65.
Other, lesser benefits may include medical insurance, company car, fit-ness allowance as well as membership and service fees, training/education and other support.
A notice of termination period of not more than two years shall apply upon termination of the employment relationship where the termination is initiated by the company, and of not more than one year where the termination is initiated by the executive. Severance pay should not exist.
Decision-making process and reportingMatters relating to remuneration of senior executives shall be addressed by the Board’s Remuneration Committee and, with respect to the President, decided upon by the Board. The duties of the Remuneration Committee shall also include preparing board decisions regarding proposals for guide-lines for remuneration of senior executives, performing oversight as well as monitoring and assessing the application thereof. When the Board or the Remuneration Committee addresses and decides on remuneration-related matters, senior executives may not be present insofar as the matter relates to them and, with respect to the calculation of variable remuneration, an audit certificate must be obtained before any decision is taken regarding pay-ment. In the preparation of the remuneration guidelines, consideration has been given to salary and employment conditions for the company’s other employees, such as information regarding total remuneration, components of the remuneration as well as the increase in remuneration and the rate of increase over time, and the company’s equality of opportunity policy. The Board shall prepare a remuneration report.
91Essity’s Annual and Sustainability Report 2021 Financial statements including notes
Introduction The Essity share
Strategy Business areas SustainabilityGroup Corporate Governance Report
Financial statementsincluding notes
Essity data
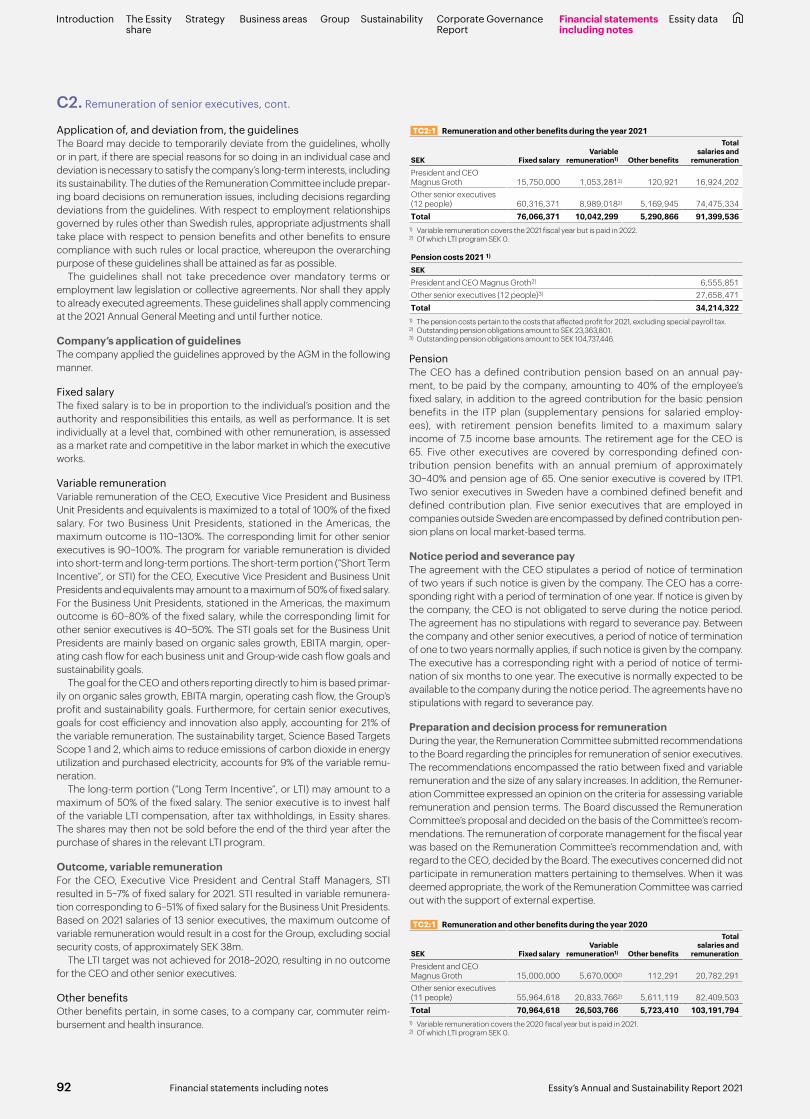
C2. Remuneration of senior executives, cont.
Application of, and deviation from, the guidelinesThe Board may decide to temporarily deviate from the guidelines, wholly or in part, if there are special reasons for so doing in an individual case and deviation is necessary to satisfy the company’s long-term interests, including its sustainability. The duties of the Remuneration Committee include prepar-ing board decisions on remuneration issues, including decisions regarding deviations from the guidelines. With respect to employment relationships governed by rules other than Swedish rules, appropriate adjustments shall take place with respect to pension benefits and other benefits to ensure compliance with such rules or local practice, whereupon the overarching purpose of these guidelines shall be attained as far as possible.
The guidelines shall not take precedence over mandatory terms or employment law legislation or collective agreements. Nor shall they apply to already executed agreements. These guidelines shall apply commencing at the 2021 Annual General Meeting and until further notice.
Company’s application of guidelinesThe company applied the guidelines approved by the AGM in the following manner.
Fixed salaryThe fixed salary is to be in proportion to the individual’s position and the authority and responsibilities this entails, as well as performance. It is set individually at a level that, combined with other remuneration, is assessed as a market rate and competitive in the labor market in which the executive works.
Variable remunerationVariable remuneration of the CEO, Executive Vice President and Business Unit Presidents and equivalents is maximized to a total of 100% of the fixed salary. For two Business Unit Presidents, stationed in the Americas, the maximum outcome is 110–130%. The corresponding limit for other senior executives is 90–100%. The program for variable remuneration is divided into short-term and long-term portions. The short-term portion (“Short Term Incentive”, or STI) for the CEO, Executive Vice President and Business Unit Presidents and equivalents may amount to a maximum of 50% of fixed salary. For the Business Unit Presidents, stationed in the Americas, the maximum outcome is 60–80% of the fixed salary, while the corresponding limit for other senior executives is 40–50%. The STI goals set for the Business Unit Presidents are mainly based on organic sales growth, EBITA margin, oper-ating cash flow for each business unit and Group-wide cash flow goals and sustainability goals.
The goal for the CEO and others reporting directly to him is based primar-ily on organic sales growth, EBITA margin, operating cash flow, the Group’s profit and sustainability goals. Furthermore, for certain senior executives, goals for cost efficiency and innovation also apply, accounting for 21% of the variable remuneration. The sustainability target, Science Based Targets Scope 1 and 2, which aims to reduce emissions of carbon dioxide in energy utilization and purchased electricity, accounts for 9% of the variable remu-neration.
The long-term portion (“Long Term Incentive”, or LTI) may amount to a maximum of 50% of the fixed salary. The senior executive is to invest half of the variable LTI compensation, after tax withholdings, in Essity shares. The shares may then not be sold before the end of the third year after the purchase of shares in the relevant LTI program.
Outcome, variable remunerationFor the CEO, Executive Vice President and Central Staff Managers, STI resulted in 5–7% of fixed salary for 2021. STI resulted in variable remunera-tion corresponding to 6–51% of fixed salary for the Business Unit Presidents. Based on 2021 salaries of 13 senior executives, the maximum outcome of variable remuneration would result in a cost for the Group, excluding social security costs, of approximately SEK 38m.
The LTI target was not achieved for 2018–2020, resulting in no outcome for the CEO and other senior executives.
Other benefitsOther benefits pertain, in some cases, to a company car, commuter reim-bursement and health insurance.
TC2:1 Remuneration and other benefits during the year 2021
SEK Fixed salaryVariable
remuneration1) Other benefits
Total salaries and
remuneration
President and CEO Magnus Groth 15,750,000 1,053,2812) 120,921 16,924,202Other senior executives (12 people) 60,316,371 8,989,0182) 5,169,945 74,475,334Total 76,066,371 10,042,299 5,290,866 91,399,536
1) Variable remuneration covers the 2021 fiscal year but is paid in 2022.2) Of which LTI program SEK 0.
Pension costs 2021 1) SEK
President and CEO Magnus Groth2) 6,555,851Other senior executives (12 people)3) 27,658,471Total 34,214,322
1) The pension costs pertain to the costs that affected profit for 2021, excluding special payroll tax.2) Outstanding pension obligations amount to SEK 23,363,801.3) Outstanding pension obligations amount to SEK 104,737,446.
PensionThe CEO has a defined contribution pension based on an annual pay-ment, to be paid by the company, amounting to 40% of the employee’s fixed salary, in addition to the agreed contribution for the basic pension benefits in the ITP plan (supplementary pensions for salaried employ-ees), with retirement pension benefits limited to a maximum salary income of 7.5 income base amounts. The retirement age for the CEO is 65. Five other executives are covered by corresponding defined con-tribution pension benefits with an annual premium of approximately 30–40% and pension age of 65. One senior executive is covered by ITP1. Two senior executives in Sweden have a combined defined benefit and defined contribution plan. Five senior executives that are employed in companies outside Sweden are encompassed by defined contribution pen-sion plans on local market-based terms.
Notice period and severance payThe agreement with the CEO stipulates a period of notice of termination of two years if such notice is given by the company. The CEO has a corre-sponding right with a period of termination of one year. If notice is given by the company, the CEO is not obligated to serve during the notice period. The agreement has no stipulations with regard to severance pay. Between the company and other senior executives, a period of notice of termination of one to two years normally applies, if such notice is given by the company. The executive has a corresponding right with a period of notice of termi-nation of six months to one year. The executive is normally expected to be available to the company during the notice period. The agreements have no stipulations with regard to severance pay.
Preparation and decision process for remunerationDuring the year, the Remuneration Committee submitted recommendations to the Board regarding the principles for remuneration of senior executives. The recommendations encompassed the ratio between fixed and variable remuneration and the size of any salary increases. In addition, the Remuner-ation Committee expressed an opinion on the criteria for assessing variable remuneration and pension terms. The Board discussed the Remuneration Committee’s proposal and decided on the basis of the Committee’s recom-mendations. The remuneration of corporate management for the fiscal year was based on the Remuneration Committee’s recommendation and, with regard to the CEO, decided by the Board. The executives concerned did not participate in remuneration matters pertaining to themselves. When it was deemed appropriate, the work of the Remuneration Committee was carried out with the support of external expertise.
TC2:1 Remuneration and other benefits during the year 2020
SEK Fixed salaryVariable
remuneration1) Other benefits
Total salaries and
remuneration
President and CEO Magnus Groth 15,000,000 5,670,0002) 112,291 20,782,291Other senior executives (11 people) 55,964,618 20,833,7662) 5,611,119 82,409,503Total 70,964,618 26,503,766 5,723,410 103,191,794
1) Variable remuneration covers the 2020 fiscal year but is paid in 2021.2) Of which LTI program SEK 0.
92 Essity’s Annual and Sustainability Report 2021Financial statements including notes
Introduction The Essity share
Strategy Business areas SustainabilityGroup Corporate Governance Report
Financial statementsincluding notes
Essity data

C4. Remuneration after completion of employment
AP Accounting principles
Defined benefit pension plansDefined benefit pension plans are characterized by the fact that payment is based on the period of employment and the employee’s salary at, or just prior to, retirement. The actuarial and investment-related risks associated with defined benefit pension plans are carried by the company.
The defined benefit obligations are calculated annually by independent actuaries using the Projected Unit Credit Method. Calculations are based on actuarial assumptions. Actuarial assumptions comprise the company’s best assessment of the variables that determine the final cost for provid-ing the benefits. The obligation is measured at the present value of the anticipated future cash flows using a discount rate (see Key assessments and assumptions below). Actuarial gains and losses (remeasurements) are recognized directly in equity under other comprehensive income in the period in which they arise. The recognized cost for the defined benefit plans includes personnel costs, as well as net interest items. Net interest items comprise the discount rate calculated on the average net pension liability for the period, taking fee and remuneration payments into consider-ation. The difference between the calculated interest income (discount rate) on the plan assets and Essity’s actual return on the plan assets is included in the remeasurement of the defined benefit net liability or net asset recog-nized in equity under other comprehensive income. Past service costs are recognized in profit or loss in the period in which they arise.
The liability recognized in the balance sheet for defined benefit pension plans is the present value of the obligation on the balance sheet date minus the fair value of the plan assets. Funded plans with net assets, meaning plans
C3. Fees to board members in the Parent company
Remuneration to non-executive Board members of Essity Aktiebolag (publ) refers to the fees approved at the AGM on March 25, 2021 for the period until the next
AGM in March 2022. No remuneration is paid to the President and CEO and other employees.
Board fee Audit Committee fee Remuneration Committee fee TotalSEK 2021 2020 2019 2021 2020 2019 2021 2020 2019 2021 2020 2019
Pär Boman (Chairman) 2,445,000 2,310,000 2,310,000 280,000 275,000 275,000 150,000 150,000 150,000 2,875,000 2,735,000 2,735,000Ewa Björling 815,000 770,000 770,000 815,000 770,000 770,000Maija-Liisa Friman 0 770,000 770,000 0 770,000 770,000Annemarie Gardshol 815,000 770,000 770,000 815,000 770,000 770,000Louise Svanberg 815,000 770,000 770,000 120,000 115,000 115,000 935,000 885,000 885,000Bert Nordberg 815,000 770,000 770,000 280,000 275,000 275,000 120,000 115,000 115,000 1,215,000 1,160,000 1,160,000Barbara Milian Thoralfsson 815,000 770,000 770,000 400,000 380,000 380,000 1,215,000 1,150,000 1,150,000
Torbjörn Lööf 815,000 0 0 815,000 0 0
Lars Rebien Sørensen 815,000 770,000 770,000 815,000 770,000 770,000
Total 8,150,000 7,700,000 7,700,000 960,000 930,000 930,000 390,000 380,000 380,000 9,500,000 9,010,000 9,010,000
with assets exceeding obligations, are recognized as a financial non-current asset provided they are not limited by the “asset ceiling” under IAS 19. Other pension plans, which are not fully funded or unfunded, are recognized as Provisions for pensions.
In certain countries, pension payments are subject to taxes or fees. In such cases, these are included in the calculation of the obligation for the defined ben-efit pension plans. These taxes or fees are recognized as an expense in profit or loss, except in cases where they are attributable to actuarial gains or losses, in which case they are recognized directly in equity under other compre-hensive income.
Defined contribution pension plansPlans where the employer’s obligation is limited to the premiums the com-pany has undertaken to pay are classified as defined contribution plans. In these plans, it is the employee who bears the investment risk, meaning the risk that the invested assets could be insufficient to generate the anticipated compensation. The Group’s payments relating to defined contribution plans are recognized as an expense during the period the employees carry out the service to which the payment relates.
Other post-retirement benefitsSome Group companies provide post-retirement healthcare benefits. The obligation and anticipated costs for these benefits have been calculated and recognized in a similar manner to the defined benefit pension plans.
Severance paySeverance pay is recognized as a payroll expense when the Group has an obligation to compensate employees whose employment was terminated early.
Pension costs 2020 1) SEK
President and CEO Magnus Groth2) 6,269,391Other senior executives (11 people)3) 17,146,081Total 23,415,472
1) The pension costs pertain to the costs that affected profit for 2020, excluding special payroll tax.2) Outstanding pension obligations amount to SEK 25,707,004.3) Outstanding pension obligations amount to SEK 95,565,302.
TC2:1 Remuneration and other benefits during the year 2019
SEK Fixed salary
Variable remunera-
tion1)Other
benefits
Total salaries and
remuneration
President and CEO Mag-nus Groth 13,800,000 13,800,0002) 110,732 27,710,732Other senior executives (11 people) 55,608,750 54,523,5523) 3,156,703 113,289,005Total 69,408,750 68,323,552 3,267,435 140,999,737
1) Variable remuneration covers the 2019 fiscal year but is paid in 2020.2) Of which LTI program SEK 6,900,000.3) Of which LTI program SEK 27,804,376.
Pension costs 2019 1) SEK
President and CEO Magnus Groth2) 5,751,678Other senior executives (11 people)3) 15,176,118Total 20,927,796
1) The pension costs pertain to the costs that affected profit for 2019, excluding special payroll tax.2) Outstanding pension obligations amount to SEK 24,062,615.3) Outstanding pension obligations amount to SEK 84,529,681.
Obligations in relation to former presidents and CEOsFor former presidents and CEOs, Essity has outstanding, non-funded obligations amounting to SEK 161m. These costs were recognized in previous years and comprise pension obligations that Essity assumed from Svenska Cellulosa Aktiebolaget in conjunction with the split of the Group.
C2. Remuneration of senior executives, cont.
93Essity’s Annual and Sustainability Report 2021 Financial statements including notes
Introduction The Essity share
Strategy Business areas SustainabilityGroup Corporate Governance Report
Financial statementsincluding notes
Essity data

Provisions for pensions and similar obligationsSEKm 2021 2020 2019
TC4:2 Defined benefit obligations 32,698 32,717 38,510
TC4:3 Fair value of plan assets –35,249 –31,260 –36,372
TC4:4 Effect of asset ceiling 5,261 1,054 887
TC4:1 Provision for pensions, net 2,710 2,511 3,025
Surpluses in funded plans recognized as financial non-current assets amounted to BS SEK 1,439m (2,817; 2,841) on the balance sheet date and provisions for pensions totaled BS SEK 4,149m (5,328; 5,866). Defined benefit obligations include obligations in an amount of SEK 2,751m (2,908; 2,889) pertaining to unfunded plans.
Essity has both defined contribution and defined benefit pension plans in a number of Group companies. The most significant defined benefit pension plans in the respective countries are described below. TC4:1 Provisions for pensions and similar obligations per country
SEKmCountry Active
Paid-up pension policies Pensioners
Total obligation
Plan assets, fair value
Effect of asset ceiling Net
Duration of obligation, years
UK 10 9,395 8,599 18,004 –22,113 4,144 35 18Sweden 1,970 1,130 1,310 4,410 –3,920 1,117 1,607 19Germany 2,443 759 1,603 4,805 –5,377 – –572 17USA 479 1,103 2,057 3,639 –3,486 – 153 12Other 1,489 4 347 1,840 –353 – 1,487 12Total 6,391 12,391 13,916 32,698 –35,249 5,261 2,710
UKThe plan is a defined benefit plan with contributions paid by the company. The plan is based on final salary and consists of retirement pension, benefi-ciaries’ pension and disability pension. The plan was closed to new partici-pants in July 2007 and closed for future accrual in September 2018. The plan is managed by an independent trust and assets are held separately, accord-ing to UK law. Surpluses in the pension fund remain in the fund’s assets. An asset ceiling has from 2021 been imposed on the surplus in the plan under the rules in IAS 19, since Essity is of the view that it will be unable to absorb the current surplus. The plan is obligated to meet the minimum funding level according to an agreement with the pension plan.
C4. Remuneration after completion of employment, cont.
Costs for the period for defined benefit plansSEKm 2021 2020 2019
Current service cost, after deduction for premiums paid by the employees –422 –428 –528Past service cost 8 –2 16Pension-tax expense –38 –41 –36Remeasurement, net 13 –11 –26Net interest income/expense –49 –34 –93Pension costs before effects of settlements –488 –516 –667Settlements – 201 70Pension costs after effects of settlements –488 –315 –597
In 2020, the Dutch pension plan was changed, resulting in it being reclassi-fied from defined benefit to defined contribution in accordance with IAS 19. Consequently, a gain from settlements of SEK 187m was recognized as an item affecting comparability.
KAA Key assessments and assumptions
The calculation of recognized expenses and provisions for defined bene-fit pension plans, where the size of the future compensation is unknown and payment will occur far in the future, is dependent on assumptions and assessments. Key assumptions and assessments include the discount rate, future salary increases, inflation and life expectancy. Essity determines the discount rate based primarily on AA-rated corporate bonds issued in the currency in which the payments will be made that match the duration of the obligations. If no such corporate bonds are available, government bonds or
mortgage bonds are used. Inflation assumptions are based on a combina-tion of central bank targets, implicit market expectations and long-term ana-lyst forecasts. Assumptions regarding salary increases are based on market expectations and market research forecasts. Key actuarial assumptions are presented in TC4:5 . The sensitivity of the recognized provision with respect to key actuarial assumptions is described in TC4:6 .
SwedenIn Sweden, the defined benefit obligation is mainly covered by the ITP2 plan and executive pensions. The ITP2 plan (supplementary pensions for salaried employees) encompasses employees born before 1979 and is a defined benefit plan that provides retirement pension based on final salary, as a percentage of various salary intervals. The ITP2 plan is safeguarded by a fund, and the company may compensate itself using any surpluses in the plan assets. The pension plans for executives are largely retirement and beneficiaries’ pension plans based on final salary and are closed to new participants and the liability largely comprises paid-up pension policies or pensions in payment. The pension plans for executives are largely unfunded and are credit-insured with PRI Pensionsgaranti.
GermanyIn Germany, the defined benefit obligation comprises a number of different pension plans offering retirement pension, beneficiaries’ pension and dis-ability pension. Plans based on final salary exist but these are closed to new participants and the benefit depends on the length of service and final salary at retirement. Defined contribution plans are also offered in which the benefit depends on provisions made by the company and, in certain plans, even by the employee during the period of service, and guaranteed return on the pro-visions. The obligations are largely financed by two different funds and the company may, in certain instances, compensate itself using any surpluses in the plan assets.
USAIn the USA, the defined benefit obligations comprise retirement pensions in which the premiums are paid by the company and the benefit is based on a standard amount per service year. Only one plan is still open for new accrual for about 200 employees. The benefits are financed via a pension fund that is obligated to meet the minimum legislated funding level. Surpluses in the pension fund can be utilized in the form of premium discounts.
94 Essity’s Annual and Sustainability Report 2021Financial statements including notes
Introduction The Essity share
Strategy Business areas SustainabilityGroup Corporate Governance Report
Financial statementsincluding notes
Essity data

TC4:2 Defined benefit obligationsSEKm 2021 2020 2019
Value, January 1 32,717 38,510 33,082Current service cost 426 429 540Interest expense 424 608 895Past service cost –8 2 –16Pension-tax expense 38 41 36Settlements and transfers –17 –57 –293Reclassification – –5,488 –Acquisitions and divestments –15 – –1Benefits paid –1,248 –1,323 –1,398Pension taxes paid –11 –11 –10Remeasurement: financial assumptions –1,907 3,345 4,668Remeasurement: demographic assumptions 169 –248 37Remeasurement: experience-based assumptions 60 –567 –538Pension taxes pertaining to remeasurement –131 –49 68Translation differences 2,201 –2,475 1,440Value, December 31 32,698 32,717 38,510
Reclassification of SEK 5,488m in 2020 pertains to the deconsolidation of the former defined benefit obligations attributable to the Dutch pension plan.
Remeasurements in the defined benefit obligations comprise changes in financial assumptions, such as changes to the discount rate, any changes in demographic assumptions and experience-based deviations. Expe-rience-based deviations include for example unexpectedly high or low employee turnover or salary increases.
TC4:3 Plan assetsSEKm 2021 2020 2019
Fair value, January 1 –31,260 –36,372 –29,648Interest income –427 –586 –818Contributions by plan participants –4 –1 –12Contributions by the employer –405 –1,048 –1,292Benefits paid, excluding settlements 1,237 1,312 1,396Benefits paid for settlements 5 54 253Reclassification – 5,301 –Return in excess of recognized interest income –2,068 –2,434 –4,881Administrative expenses for pension obligations 36 36 44Translation differences –2,363 2,478 –1,414Fair value, December 31 –35,249 –31,260 –36,372
Reclassification of SEK 5,301m in 2020 pertains to the deconsolidation of the plan assets attributable to the Dutch pension plan.
The plan assets are distributed according to the following classes of assets, 2021:
Interest-bearing securities, 53% Properties, real estate, 1%Other, 10%
Shares and mutual funds, 36%
The plan assets are distributed according to the following classes of assets, 2020:
Interest-bearing securities, 45% Properties, real estate, 4%Other, 2%
Shares and mutual funds, 49%
The plan assets are distributed according to the following classes of assets, 2019:
Interest-bearing securities, 38% Properties, real estate, 6%Other, 3%
Shares and mutual funds, 53%
At the balance sheet date 97% (94; 93) of the plan assets were traded on active markets for which market quotations were used for the valuation. As in the preceding year, no financial instruments issued by Essity are included in the fair value of plan assets at December 31, 2021.
TC4:4 Effect of asset ceilingSEKm 2021 2020 2019
Value, January 1 1,054 887 707Interest expense 52 12 16Other changes to asset ceiling 4,025 155 164Translation differences 130 – –Value, December 31 5,261 1,054 887
During 2021 the surplus in the UK pension plan was subject to an asset ceiling under the rules of IAS 19, since Essity is of the view that it will be unable to absorb the current surplus. The value at the end of the period pertaining to the effect of the asset ceiling relates to funds in the UK pension plan amount-ing to SEK 4,144m (–; –) and funds in one Swedish foundation that can be used for possible future undertakings for early retirement for certain categories of employees amounting to SEK 1,117m (1,054; 887).
TC4:5 Principal actuarial assumptionsSweden UK Germany Netherlands1) USA
2021Discount rate 1.62 1.89 0.75 N/A 2.81Expected salary increase rate 3.00 N/A 3.00 N/A N/AExpected inflation 2.00 3.25 1.75 N/A N/ALife expectancy, men2) 22 22 20 N/A 20Life expectancy, women2) 25 25 24 N/A 21
2020Discount rate 0.83 1.37 0.38 N/A 2.56Expected salary increase rate 2.75 N/A 2.75 N/A N/AExpected inflation 1.75 3.00 1.50 N/A N/ALife expectancy, men2) 22 21 20 N/A 20Life expectancy, women2) 25 24 24 N/A 21
2019Discount rate 1.40 2.07 0.96 1.07 3.16Expected salary increase rate 3.00 N/A 2.75 2.75 N/AExpected inflation 2.00 3.00 1.50 1.50 N/ALife expectancy, men2) 22 22 20 21 20Life expectancy, women2) 25 24 24 24 22
1) As of 2020, the Dutch pension plan is recognized as a defined contribution pension obligation.2) Life expectancy, expressed in years, for an individual currently aged 65.
The sensitivity of the defined benefit obligations with respect to changes in the principal actuarial assumptions is as follows:
TC4:6 Change of obligation, increased obligation (–)SEKm
Discount rate +0.25% 1,327Price inflation, including salary inflation +0.25% –1,059Life expectancy +1 year –1,483
The above sensitivity analysis is calculated by changing one assumption while the others remain constant.
Multiemployer plans Essity has obligations for disability and family pensions for salaried employ-ees in Sweden, secured through insurance with the insurance company Alecta. The company also has employees in Finland who are covered by the country’s statutory TyEL pension plan. These obligations are secured through the insurance company Varma. These benefits are reported as defined con-tribution plans, since there is no basis for allocating the obligations, plan assets and costs to the individual companies covered by the plan.
Budgeted contributionsThe budgeted contributions for the company’s defined benefit pension plans for 2022 are calculated at SEK 371m. Contributions for multiemployer plans for 2022 are calculated at SEK 40m.
C4. Remuneration after completion of employment, cont.
95Essity’s Annual and Sustainability Report 2021 Financial statements including notes
Introduction The Essity share
Strategy Business areas SustainabilityGroup Corporate Governance Report
Financial statementsincluding notes
Essity data
D1. Intangible assets
AP Accounting principles
GoodwillGoodwill arises in connection with business combinations where the consid-eration transferred exceeds the fair value of the acquired net assets. Good-will is measured at cost less accumulated impairment and is an intangible asset with an indefinite useful life. This means that goodwill is not amor-tized, but rather tested annually for impairment. All goodwill is allocated to the cash-generating units that are expected to benefit from the syner-gies from the business combination. In connection with the sale of Group companies, the remaining carrying amount of the goodwill attributable to the divested unit is included in the capital gain/loss. Goodwill that arises in acquisitions of associated companies or joint ventures is included in the carrying amount of the respective associate or joint venture.
TrademarksTrademarks can only be recognized when they have been acquired through a separate transaction or through the acquisition of an entire business that includes one or several trademarks. Trademarks are measured at cost after any accumulated amortization and accumulated impairment. Trademarks that have an indefinite useful life are not amortized, but rather tested annually for impairment along with the impairment testing of goodwill. Trademarks with a limited useful life are amortized on a straight-line basis during their anticipated useful life, which varies between 3-25 years.
Licenses, patents and similar rightsIntangible assets also include patents, licenses and other similar rights. Acquired assets of this type are measured at cost and are amortized on a straight-line basis during their anticipated useful life, which varies between 3-20 years.
Customer relationsCustomer relations are measured at fair value at the time of the acquisition. The value of these customer relations is amortized over their useful life, which is considered to be between 3-15 years.
Research and developmentResearch expenditure is recognized as an expense as incurred. Identifiable expenditure for development of new products and processes is capitalized to the extent it is expected to provide future economic benefits. In cases in which it is difficult to separate the research phase from the development phase in a project, the entire project is treated as research and expensed immediately. Development costs for packing and packaging materials are expensed directly. In general, development projects are conservatively assessed due to the difficulty in determining what will lead to commercial success. Capitalized expenditure is amortized on a straight-line basis from the date when the asset starts to be used over the estimated useful life of the asset. The amortization period is between 5–10 years.
Impairment testing Goodwill is tested annually for impairment. When testing for impairment, the assets are grouped in cash-generating units. Essity has defined three cash-generating units for impairment testing, which coincide with the operating segments Consumer Tissue, Professional Hygiene and Personal Care. The test compares the carrying amounts of the cash-generating units with the recoverable amounts. The recoverable amount of each cash-gen-erating unit is determined by discounting future cash flows in order to determine their value in use. The calculation of future cash flows is based on the strategic plans adopted by the Executive Management Team for the next three years. The carrying amount for the cash-generating unit includes goodwill, trademarks with indefinite useful lives and assets with definite useful lives, such as non-current assets, trademarks and working capital. Effects of expansion investments are excluded when calculating the value in use. The value of depreciated assets is tested for impairment when-ever there are indications that the carrying amount might not be recoverable. In cases in which the carrying amount of an asset or cash-generating unit exceeds its estimated recoverable amount, an impairment loss is recognized on the asset down to the recoverable amount. An impairment loss recog-nized earlier is reversed, if the reasons for the impairment no longer exist. The carrying amount after the reversal is limited to what it would have been had no past impairment been recognized. Impairment losses on goodwill are never reversed.
Emission allowances and costs for carbon dioxide emissionsEssity participates in the European system for emission allowances.
When emission allowances relating to carbon dioxide emissions are received from an individual EU state, they are recognized as an intangible asset and as deferred income (liability). Allowances are received free of charge and recognized at market value as of the date when the allocation is received. During the period, the intangible asset is expensed in proportion to carbon dioxide emissions made. At the same time as the deferred income is reversed by the corresponding amount thereby resulting in no net effect in profit or loss. If the emission allowances received do not cover emissions made, Essity makes a provision for the deficit valued at the market value on the balance sheet date. Sales of surplus emission allowances are recognized as income on the delivery date.
If the market price of emission allowances on the balance sheet date is less than recognized cost, any surplus emission allowances that are not required to cover emissions made are impaired to the market price applying on the balance sheet date. In conjunction with this, the remaining part of the deferred income is recognized as income by a corresponding amount and therefore no net effect occurs in profit or loss. The emission allowances are used as payment in the settlement with the state regarding liabilities for emissions.
KAA Key assessments and assumptions
In connection with the annual impairment testing of goodwill, the recover-able amount is calculated. The recoverable amount for the cash-generating units is determined by calculating value in use. Calculation of the value in use is based on the three-year strategy plans adopted by the Executive Man-agement Team, which in turn are based on assessments and assumptions. The most important assessments and assumptions pertain to forecasts for organic growth, the profit margin and the discount rate used. The discount rate used in the present value calculation of the anticipated future cash flows is the current weighted average cost of capital (WACC) established within the Group for the markets in which the cash-generating units conduct oper-ations.
Profit margin assumptions are based on current market prices and costs adjusted for anticipated price and cost changes as well as assumed pro-ductivity development. The growth assumption follows the Group’s target of annual sales growth, including organic sales growth and acquisitions, of above 5%, less acquisition-related growth, and is in line with historic outcome and expected global market growth.
The expected sustained future cash flow for periods that are beyond the planning horizon of the strategy plan are extrapolated from the final year of the strategy plan using assumed sustained growth of 2% (2; 2).
D. Operating assets and liabilities
96 Essity’s Annual and Sustainability Report 2021Financial statements including notes
Introduction The Essity share
Strategy Business areas SustainabilityGroup Corporate Governance Report
Financial statementsincluding notes
Essity data

D1. Intangible assets, cont.
GoodwillSEKm 2021 2020 2019
Accumulated costs 32,324 32,324 34,846Accumulated impairment – – –265Total 32,324 32,324 34,581
Value, January 1 32,324 34,581 33,553Company acquisitions 3,398 603 –Company divestments – –36 –15Reclassifications –7 – –Translation differences 2,088 –2,824 1,043
BS Value, December 31 37,803 32,324 34,581
Intangible assets excluding goodwill
TrademarksTechnologies, Customer
relations and similar rightsCapitalized
development costsTotal Other
intangible assetsSEKm 2021 2020 2019 2021 2020 2019 2021 2020 2019 2021 2020 2019
Accumulated costs 14,726 13,401 14,686 14,015 10,963 12,305 577 532 513 29,318 24,896 27,504Accumulated amortization –645 –506 –559 –6,773 –5,731 –5,301 –209 –180 –132 –7,627 –6,417 –5,992Accumulated impairment – – –468 –88 –86 –94 –140 –51 – –228 –137 –562Total 14,081 12,895 13,659 7,154 5,146 6,910 228 301 381 21,463 18,342 20,950
Value, January 1 12,895 13,659 13,546 5,146 6,910 7,478 301 381 360 18,342 20,950 21,384Investments3) – – – 834 459 138 38 43 58 872 502 196Sales and disposals – – –44 – –1 – –1 – – –1 –1 –44Company acquisitions 729 50 – 1,812 185 – – 1 – 2,541 236 –Company divestments – – – –2 –2 – – – – –2 –2 –Reclassifications2) 1 – 1 51 –1,161 88 2 –1 –1 54 –1,162 88Amortization1) –122 –137 –109 –932 –946 –958 –35 –57 –44 –1,089 –1,140 –1,111Impairment – – – – – –19 –87 –54 – –87 –54 –19Translation differences 578 –677 265 245 –298 183 10 –12 8 833 –987 456Value, December 31 14,081 12,895 13,659 7,154 5,146 6,910 228 301 381 21,463 18,342 20,950 TD1:1 Emission allowances, net value 343 232 232
BS Value, December 31 including emission allowances 21,806 18,574 21,182
1) Amortization of Trademarks and Customer relations is included in Sales, general and administration while amortization of Technologies and other intangible assets is included in Cost of goods sold.2) In 2020, leases for land were reclassified from other intangible assets to right-of-use asset in the amount of SEK 1,206m.3) In 2021, interest expenses were capitalized in Capitalized development costs in the amount of SEK 9m. The average interest rate used was 2%.
Impairment testing Annual testing for impairment of goodwill is carried out in the fourth quarter. The testing showed that no impairment was needed for 2021, 2020 or 2019. The WACC before tax used in the impairment testing of goodwill is presented in the table below. Sensitivity analyses show that reasonable changes to key parameters do not give rise to any impairment requirement. In addition to
annual impairment testing of the cash-generating units, outlined above under the section Impairment testing, goodwill, trademarks with indefinite useful lives and individual assets are also tested when there is an indication of an impairment need. During the period, intangible assets, attributable to the operating segment Personal Care, were impaired by SEK –87m.
Distribution by operating segmentGoodwill Trademarks WACC, before tax %
SEKm 2021 2020 2019 2021 2020 2019 2021 2020 2019
Personal Care 19,537 16,678 17,545 8,837 8,016 8,544 8.2 8.2 8.6Consumer Tissue 10,326 9,264 9,894 5,244 4,879 5,108 8.0 8.2 8.1Professional Hygiene 7,940 6,382 7,142 – – 7 6.8 6.2 7.3Total 37,803 32,324 34,581 14,081 12,895 13,659
TD1:1 Emission allowancesSEKm 2021 2020 2019
Accumulated costs 343 232 232
Value, January 1 232 232 91Emission allowances received 210 187 174Purchases 93 30 51Settlement with the government –201 –206 –84Translation differences 9 –11 0Value, December 31 343 232 232
97Essity’s Annual and Sustainability Report 2021 Financial statements including notes
Introduction The Essity share
Strategy Business areas SustainabilityGroup Corporate Governance Report
Financial statementsincluding notes
Essity data
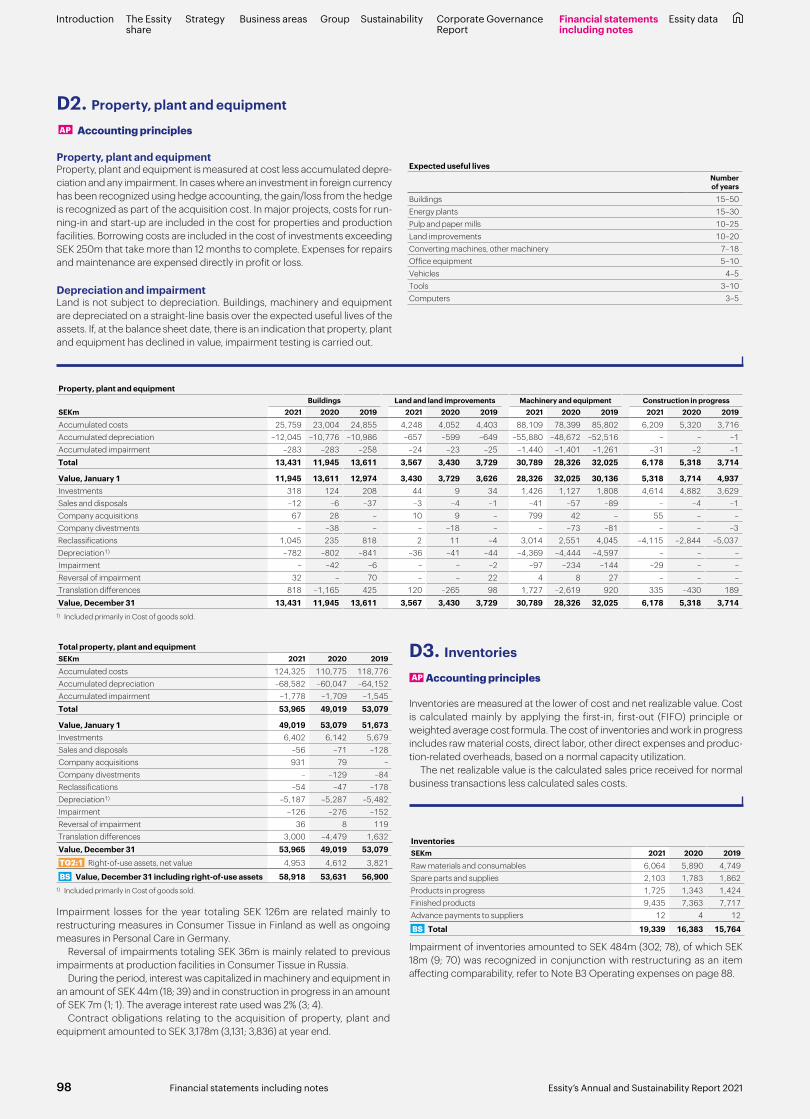
D3. Inventories
AP Accounting principles
Inventories are measured at the lower of cost and net realizable value. Cost is calculated mainly by applying the first-in, first-out (FIFO) principle or weighted average cost formula. The cost of inventories and work in progress includes raw material costs, direct labor, other direct expenses and produc-tion-related overheads, based on a normal capacity utilization.
The net realizable value is the calculated sales price received for normal business transactions less calculated sales costs.
InventoriesSEKm 2021 2020 2019
Raw materials and consumables 6,064 5,890 4,749Spare parts and supplies 2,103 1,783 1,862Products in progress 1,725 1,343 1,424Finished products 9,435 7,363 7,717Advance payments to suppliers 12 4 12
BS Total 19,339 16,383 15,764
Impairment of inventories amounted to SEK 484m (302; 78), of which SEK 18m (9; 70) was recognized in conjunction with restructuring as an item affecting comparability, refer to Note B3 Operating expenses on page 88.
D2. Property, plant and equipment
AP Accounting principles
Property, plant and equipmentProperty, plant and equipment is measured at cost less accumulated depre-ciation and any impairment. In cases where an investment in foreign currency has been recognized using hedge accounting, the gain/loss from the hedge is recognized as part of the acquisition cost. In major projects, costs for run-ning-in and start-up are included in the cost for properties and production facilities. Borrowing costs are included in the cost of investments exceeding SEK 250m that take more than 12 months to complete. Expenses for repairs and maintenance are expensed directly in profit or loss.
Depreciation and impairmentLand is not subject to depreciation. Buildings, machinery and equipment are depreciated on a straight-line basis over the expected useful lives of the assets. If, at the balance sheet date, there is an indication that property, plant and equipment has declined in value, impairment testing is carried out.
Expected useful livesNumber of years
Buildings 15–50Energy plants 15–30Pulp and paper mills 10–25Land improvements 10–20Converting machines, other machinery 7–18Office equipment 5–10Vehicles 4–5Tools 3–10Computers 3–5
Property, plant and equipmentBuildings Land and land improvements Machinery and equipment Construction in progress
SEKm 2021 2020 2019 2021 2020 2019 2021 2020 2019 2021 2020 2019
Accumulated costs 25,759 23,004 24,855 4,248 4,052 4,403 88,109 78,399 85,802 6,209 5,320 3,716Accumulated depreciation –12,045 –10,776 –10,986 –657 –599 –649 –55,880 –48,672 –52,516 – – –1Accumulated impairment –283 –283 –258 –24 –23 –25 –1,440 –1,401 –1,261 –31 –2 –1Total 13,431 11,945 13,611 3,567 3,430 3,729 30,789 28,326 32,025 6,178 5,318 3,714
Value, January 1 11,945 13,611 12,974 3,430 3,729 3,626 28,326 32,025 30,136 5,318 3,714 4,937Investments 318 124 208 44 9 34 1,426 1,127 1,808 4,614 4,882 3,629Sales and disposals –12 –6 –37 –3 –4 –1 –41 –57 –89 – –4 –1Company acquisitions 67 28 – 10 9 – 799 42 – 55 – –Company divestments – –38 – – –18 – – –73 –81 – – –3Reclassifications 1,045 235 818 2 11 –4 3,014 2,551 4,045 –4,115 –2,844 –5,037Depreciation1) –782 –802 –841 –36 –41 –44 –4,369 –4,444 –4,597 – – –Impairment – –42 –6 – – –2 –97 –234 –144 –29 – –Reversal of impairment 32 – 70 – – 22 4 8 27 – – –Translation differences 818 –1,165 425 120 –265 98 1,727 –2,619 920 335 –430 189Value, December 31 13,431 11,945 13,611 3,567 3,430 3,729 30,789 28,326 32,025 6,178 5,318 3,714
1) Included primarily in Cost of goods sold.
Total property, plant and equipmentSEKm 2021 2020 2019
Accumulated costs 124,325 110,775 118,776Accumulated depreciation –68,582 –60,047 –64,152Accumulated impairment –1,778 –1,709 –1,545Total 53,965 49,019 53,079
Value, January 1 49,019 53,079 51,673Investments 6,402 6,142 5,679Sales and disposals –56 –71 –128Company acquisitions 931 79 –Company divestments – –129 –84Reclassifications –54 –47 –178Depreciation1) –5,187 –5,287 –5,482Impairment –126 –276 –152Reversal of impairment 36 8 119Translation differences 3,000 –4,479 1,632Value, December 31 53,965 49,019 53,079 TG2:1 Right-of-use assets, net value 4,953 4,612 3,821
BS Value, December 31 including right-of-use assets 58,918 53,631 56,9001) Included primarily in Cost of goods sold.
Impairment losses for the year totaling SEK 126m are related mainly to restructuring measures in Consumer Tissue in Finland as well as ongoing measures in Personal Care in Germany.
Reversal of impairments totaling SEK 36m is mainly related to previous impairments at production facilities in Consumer Tissue in Russia.
During the period, interest was capitalized in machinery and equipment in an amount of SEK 44m (18; 39) and in construction in progress in an amount of SEK 7m (1; 1). The average interest rate used was 2% (3; 4).
Contract obligations relating to the acquisition of property, plant and equipment amounted to SEK 3,178m (3,131; 3,836) at year end.
98 Essity’s Annual and Sustainability Report 2021Financial statements including notes
Introduction The Essity share
Strategy Business areas SustainabilityGroup Corporate Governance Report
Financial statementsincluding notes
Essity data
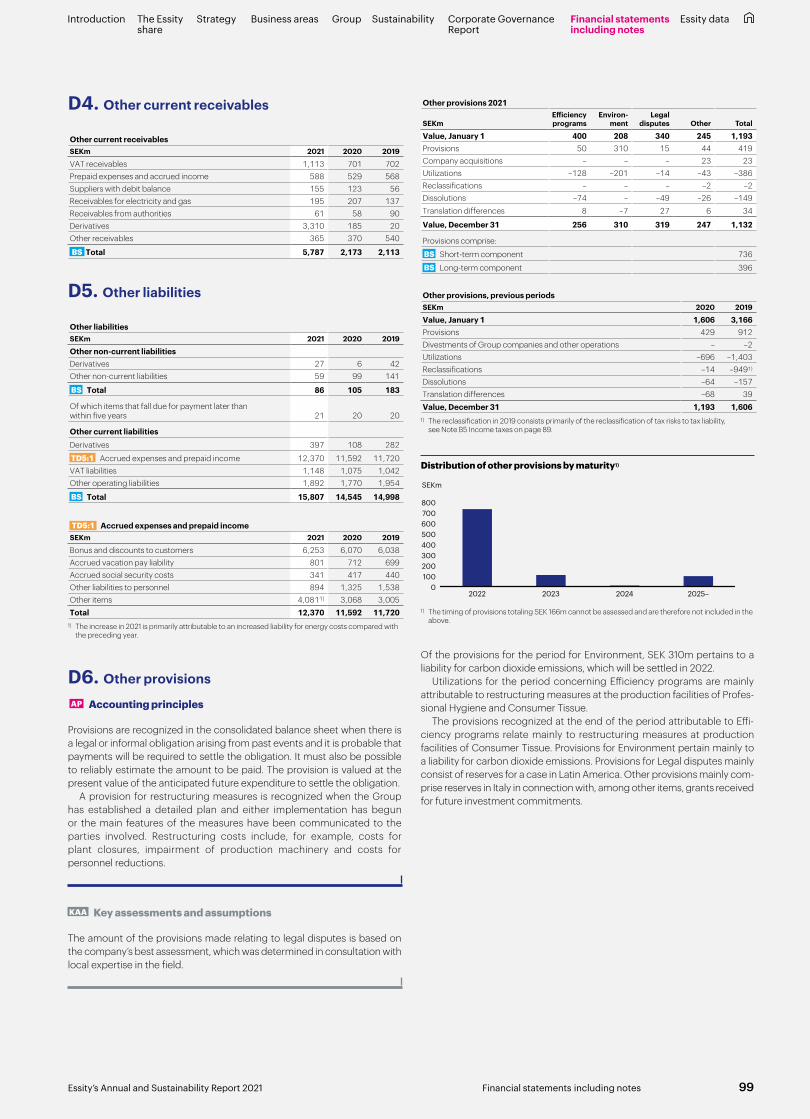
D4. Other current receivables
Other current receivablesSEKm 2021 2020 2019
VAT receivables 1,113 701 702Prepaid expenses and accrued income 588 529 568Suppliers with debit balance 155 123 56Receivables for electricity and gas 195 207 137Receivables from authorities 61 58 90Derivatives 3,310 185 20Other receivables 365 370 540
BS Total 5,787 2,173 2,113
D6. Other provisions
AP Accounting principles
Provisions are recognized in the consolidated balance sheet when there is a legal or informal obligation arising from past events and it is probable that payments will be required to settle the obligation. It must also be possible to reliably estimate the amount to be paid. The provision is valued at the present value of the anticipated future expenditure to settle the obligation.
A provision for restructuring measures is recognized when the Group has established a detailed plan and either implementation has begun or the main features of the measures have been communicated to the parties involved. Restructuring costs include, for example, costs for plant closures, impairment of production machinery and costs for personnel reductions.
KAA Key assessments and assumptions
The amount of the provisions made relating to legal disputes is based on the company’s best assessment, which was determined in consultation with local expertise in the field.
D5. Other liabilities
Other liabilitiesSEKm 2021 2020 2019
Other non-current liabilitiesDerivatives 27 6 42Other non-current liabilities 59 99 141
BS Total 86 105 183
Of which items that fall due for payment later than within five years 21 20 20
Other current liabilitiesDerivatives 397 108 282
TD5:1 Accrued expenses and prepaid income 12,370 11,592 11,720VAT liabilities 1,148 1,075 1,042Other operating liabilities 1,892 1,770 1,954
BS Total 15,807 14,545 14,998
TD5:1 Accrued expenses and prepaid incomeSEKm 2021 2020 2019
Bonus and discounts to customers 6,253 6,070 6,038Accrued vacation pay liability 801 712 699Accrued social security costs 341 417 440Other liabilities to personnel 894 1,325 1,538Other items 4,0811) 3,068 3,005Total 12,370 11,592 11,720
1) The increase in 2021 is primarily attributable to an increased liability for energy costs compared with the preceding year.
Other provisions 2021
SEKmEfficiency programs
Environ-ment
Legal disputes Other Total
Value, January 1 400 208 340 245 1,193Provisions 50 310 15 44 419Company acquisitions – – – 23 23Utilizations –128 –201 –14 –43 –386Reclassifications – – – –2 –2Dissolutions –74 – –49 –26 –149Translation differences 8 –7 27 6 34
Value, December 31 256 310 319 247 1,132
Provisions comprise:
BS Short-term component 736
BS Long-term component 396
Other provisions, previous periodsSEKm 2020 2019
Value, January 1 1,606 3,166Provisions 429 912Divestments of Group companies and other operations – –2Utilizations –696 –1,403Reclassifications –14 –9491)
Dissolutions –64 –157Translation differences –68 39Value, December 31 1,193 1,606
1) The reclassification in 2019 consists primarily of the reclassification of tax risks to tax liability, see Note B5 Income taxes on page 89.
Distribution of other provisions by maturity1)
SEKm
0100200300400500600700800
2025–202420232022
1) The timing of provisions totaling SEK 166m cannot be assessed and are therefore not included in the above.
Of the provisions for the period for Environment, SEK 310m pertains to a liability for carbon dioxide emissions, which will be settled in 2022.
Utilizations for the period concerning Efficiency programs are mainly attributable to restructuring measures at the production facilities of Profes-sional Hygiene and Consumer Tissue.
The provisions recognized at the end of the period attributable to Effi-ciency programs relate mainly to restructuring measures at production facilities of Consumer Tissue. Provisions for Environment pertain mainly to a liability for carbon dioxide emissions. Provisions for Legal disputes mainly consist of reserves for a case in Latin America. Other provisions mainly com-prise reserves in Italy in connection with, among other items, grants received for future investment commitments.
99Essity’s Annual and Sustainability Report 2021 Financial statements including notes
Introduction The Essity share
Strategy Business areas SustainabilityGroup Corporate Governance Report
Financial statementsincluding notes
Essity data
E. Capital structure and financing
E1. Financial instruments by category and measurement level
AP Accounting principles
Financial instruments recognized in the balance sheet include cash and cash equivalents, securities, other financial receivables, trade receivables, trade payables, loans and derivatives.
Current investments and derivatives are recognized on the trade date. Financial assets and loans are recognized on the settlement date. Trade receivables and trade payables are recognized in the balance sheet once the invoice has been sent or received, respectively.
Financial assets are initially recognized at cost, and transaction costs are included for certain instruments that are not measured at fair value. Financial assets are recognized in the balance sheet until the rights in the agreement have been realized or the company no longer has the rights to the asset. Financial assets measured at amortized cost are continuously reviewed according to the expected loss model to assess the need for credit loss provisions.
Financial liabilities are measured at amortized cost, except in cases where they are recognized at fair value using hedge accounting. Financial liabilities are derecognized from the balance sheet when Essity has met its commit-ments.
Essity recognizes financial instruments with a remaining maturity of less than 12 months as current assets and liabilities and those that exceed 12 months as non-current assets and liabilities.
Fair value measurementFor the financial instruments for which market quotations are available, actual prices are used for fair value measurement (Level 1). In the absence of market quotations for the instruments, Essity determines fair values with the aid of common valuation models, using quoted prices of similar assets or liabilities in active markets (Level 2).
The fair value of non-current loans measured at prevailing market interest rates is presented in Note E4 Financial liabilities on page 103. The fair value of current financial liabilities and investments is considered to correspond to the carrying amount, since a change in market interest rates does not have a significant effect on market value.
Classification and subsequent recognitionUnder IFRS 9 Financial instruments, financial assets are to be classified on the basis of the company’s business model and the purpose of contractual cash flows.
Amortized costFinancial assets held to collect contractual cash flows, and whose cash flows only consist of interest and the principal amount, are to be measured at amortized cost. The main rule is that financial liabilities are measured at amortized cost with the exception of the liabilities described in the mea-surement categories below. Since the majority of Essity’s financial assets is held to collect contractual cash flows and are held to maturity, they are recognized at amortized cost according to the effective interest method. All liabilities, excluding derivatives, and the liabilities included in a hedging relationship, are measured at amortized cost.
Fair value through comprehensive incomeFinancial assets held to collect contractual cash flows, and which only con-sist of interest and the principal amount, and to sell the asset before maturity, are measured at fair value through other comprehensive income with the option to recirculate to profit or loss. Essity did not recognize any assets in this category during the year.
For financial assets comprising an equity instrument, the company can, on initial recognition, make an irrevocable choice to recognize the asset at fair value through comprehensive income without the option of recirculation to profit or loss. Essity has an asset valued at SEK 99m recognized in this category.
Fair value through profit or lossFinancial assets that do not fulfill the requirements as stated in the cate-gories described above are to be measured at fair value through profit or loss. Financial assets and liabilities can, on initial recognition, irrevocably and under certain circumstances, be recognized at fair value through profit or loss if this leads to more relevant information. Derivatives are recognized at fair value through profit or loss. During the year, Essity did not recognize any financial assets or liabilities, except for derivatives and liabilities that are part of a hedging relationship, in this category. For more information, refer to Note E6 Derivatives and hedge accounting on page 104.
Accounting for derivatives used for hedging purposes All derivatives are initially and continuously recognized at fair value in the balance sheet. Gains and losses on remeasurement of derivatives used for hedging purposes are recognized in accordance with the accounting prin-ciples stated in Note E6 Derivatives and hedge accounting on page 104.
100 Essity’s Annual and Sustainability Report 2021Financial statements including notes
Introduction The Essity share
Strategy Business areas SustainabilityGroup Corporate Governance Report
Financial statementsincluding notes
Essity data

E1. Financial instruments by category and measurement level, cont.
Financial instruments by category and measurement level
SEKm Note
Measure-ment level 2021 2020 2019
Financial assets measured at fair value through profit or lossDerivatives – Non-current financial assets E2 2 2 90 52Derivatives – Current financial assets E2 2 372 450 302Derivatives – Other current receivables D4 2 538 31 12Total 912 571 366Financial liabilities measured at fair value through profit or lossNon-current financial liabilities E4 2 20,387 10,615 13,167Current financial liabilities E4 2 14 5,038 –Derivatives – Non-current financial liabilities E4 2 86 2 95Derivatives – Current financial liabilities E4 2 524 610 486Derivatives – Other current liabilities D5 2 25 70 48Total 21,036 16,335 13,796Loan and trade receivables measured at amortized costNon-current financial assets E2 – 25 18 20Current financial assets E2 – 620 231 155Trade receivables E3 – 19,871 17,825 19,864Cash and cash equivalents E2 – 3,904 4,982 2,928Total 24,420 23,056 22,967Financial assets measured at fair value through other comprehensive incomeNon-current financial assets E2 1 99 96 96Financial liabilities measured at amor-tized costNon-current financial liabilities E4 – 23,779 24,861 26,796Non-current lease liabilities E4 – 2,891 2,724 3,021Current financial liabilities E4 – 9,084 2,206 7,560Current lease liabilities E4 – 880 807 851Accounts payables – – 18,030 14,791 15,802Total 54,664 45,389 54,030
Derivatives used for hedge accountingNon-current financial assets E2 2 286 534 526Other non-current assets – 2 656 79 3Other current receivables D4 2 2,772 154 8Current financial assets E2 2 158 312 68Total 3,872 1,079 605
Non-current financial liabilities E4 2 300Other non-current liabilities D5 2 27 6 42Current financial liabilities E4 2 244 27 86Other current liabilities D5 2 372 38 234Total 943 71 362
These financial instruments are measured at fair value, with the exception of loans and trade receivables and financial liabilities measured at amortized cost. According to Essity’s assessment, the fair value essentially corresponds to the carrying amount, with the exception of non-current liabilities, the fair value of which is disclosed in Note E4 Financial liabilities on page 102.
Measurement levelsLevel 1: Quoted prices on an active market for identical assets or liabilities, such as shares or bonds quoted on the stock exchange.
Level 2: Other observable inputs for the asset or liability than quoted prices included in Level 1, either directly (price quotations) or indirectly (obtained from price quotations), such as forward contracts or interest rate swaps.
Financial instruments in other notes to the balance sheet2021 2020 2019
SEKm Note
Financial instru-ments
Of which
deriva-tives
Financial instru-ments
Of which
deriva-tives
Financial instru-ments
Of which
deriva-tives
AssetsFinancial assets, cash and cash equivalents E2 5,466 818 6,713 1,386 4,147 948Other non-current assets 656 656 79 79 3 3Trade receivables E3 19,871 17,825 – 19,864 –Other current receivables D4 3,310 3,310 185 185 20 20Total 29,303 4,784 24,802 1,650 24,034 971
Liabilities
Financial liabilities E4 58,189 1,154 46,890 639 52,062 667Other non-current liabilities D5 27 27 6 6 42 42
Accounts payables 18,030 14,791 – 15,802 –Other current liabilities D5 397 397 108 108 282 282Total 76,643 1,578 61,795 753 68,188 991
E2. Financial assets, cash and cash equivalents
AP Accounting principles
Cash and cash equivalents are defined as cash and bank balances as well as current investments with a maturity of less than three months from the acqui-sition date. Restricted deposits are not included in cash and cash equivalents. Loan receivables are recognized at amortized cost.
Financial assets measured at amortized cost are continuously reviewed to assess the need for credit loss provisions.
Financial assets, cash and cash equivalentsCarrying amount
SEKm 2021 2020 2019
Non-current financial assetsFinancial assets measured at fair value through other comprehensive income 99 96 96Financial assets measured at amortized cost Loan receivables, other 25 18 20Derivatives 288 624 578
BS Total 412 738 694
Current financial assetsFinancial assets measured at amortized cost Financial assets 183 165 155 Loan receivables, other 437 66 –Derivatives 530 762 370
BS Total 1,150 993 525
Cash and cash equivalentsCash and bank balances 3,284 4,074 2,315Current investments <3 months 620 908 613
BS CF Total 3,904 4,982 2,928Total financial assets, cash and cash equivalents 5,466 6,713 4,147
Financial assets measured at fair value through comprehensive income relate to an equity instrument which was irrevocably classified without any option of recirculation due to the long-term nature of the holding. The holding relates to shares in pension assets attributable to certain pension obliga-tions. These assets are not included in the normal pension calculations, as set out in Note C4 Remuneration after completion of employment on page 93. Changes in value excluding exchange gains and losses are recognized in equity under other comprehensive income, while exchange gains and losses are recognized in profit or loss.
101Essity’s Annual and Sustainability Report 2021 Financial statements including notes
Introduction The Essity share
Strategy Business areas SustainabilityGroup Corporate Governance Report
Financial statementsincluding notes
Essity data

Cash and cash equivalents at December 31, 2021 include SEK 3,115m (2,737; 1,946) that is not fully available for use by Essity or for which other limitations exist, primarily cash and cash equivalents in countries that are subject to exchange restrictions and other legal restrictions. Accordingly, it is not possible to immediately use these cash and cash equivalents in other areas of the Group, although it is normally possible to use them in the operations of the respective country. The cash and cash equivalents can also be used to repay local debts in these countries. Such liabilities in these countries amount to SEK 1,719m (1,454; 1,254).
E3. Trade receivables
AP Accounting principles
Trade receivables are measured at amortized cost after a provision is made for doubtful receivables. Provisions for doubtful receivables are made using the simplified impairment method in IFRS 9 Financial instruments for trade receivables, meaning the provision is measured at an amount that corre-sponds to the expected credit losses for the remaining terms of all outstand-ing trade receivables as per the balance sheet date.
An impairment of trade receivables due to a possible credit loss impacts Essity’s operating profit as a selling cost in profit or loss and as a reduc-tion of trade receivables by increasing the reserve for doubtful receivables in the balance sheet. When the credit loss has been confirmed, the trade receivable is written off against the provision to reserves for doubtful receiv-ables. A credit loss is regarded as confirmed when it has been determined that the customer is unable to fulfill the legal obligation to pay Essity, when debt-collection measures are no longer cost efficient, the customer’s oper-ations have ceased or the customer has been declared bankrupt and this process has ended. Essity’s trade receivables are generally current and are not discounted.
KAA Key assessments and assumptions
The measurement of the provision for doubtful receivables is based on a combination of a collective and individual assessment. The collective assessment is based on the historical confirmed credit loss level in relation to net sales in the most recent five-year period, adjusted for changes in credit risk based on current and forward-looking information regarding macroeco-nomic factors that can impact the payment capacity of customers. These adjustments are made when necessary to take into account changed credit risk due to material changes in financial stability, GDP and employment in the countries where Essity conducts the majority of its sales. Individual assess-ment of the need to impair doubtful receivables is made in cases when it has been determined that the customer is experiencing financial problems, when no payment has been received for receivables that have long fallen due or because of other significant events, such as financial crises or natural disasters.
Trade receivablesSEKm 2021 2020 2019
Trade receivables, gross 20,169 18,063 20,177Provision for doubtful receivables –298 –238 –313
BS TE3:1 Total 19,871 17,825 19,864
TE3:1 Analysis of credit risk exposure in trade receivablesSEKm 2021 2020 2019
Trade receivables net after provision for doubtful receivables 19,871 17,825 19,864Whereof: overdue < 30 days 1,432 1,316 1,615 30–90 days 669 761 775 > 90 days 364 361 404Trade receivables, overdue 2,465 2,438 2,794
E2. Financial assets, cash and cash equivalents, cont. Credit risk in trade receivables and provisions for doubtful receivablesEssity’s customer structure is dispersed, with customers in many different areas of business. In 2021, Essity’s ten largest customers accounted for 19.6% (22.5; 23.7) of Essity’s sales. The single largest customer accounted for 3.0% (2.7; 4.4) of sales. Confirmed credit losses on trade receivables in 2021 amounted to 0.02% (0.02; 0.01) of net sales. Of the outstanding trade receiv-ables on the balance sheet date 2021, the ten largest customers accounted for 22.2% (23.9; 23.2). Confirmed credit losses on trade receivables over the past five years amounted to an average of 0.02% (0.02; 0.02) of net sales. Essity’s overall assessment, despite the ongoing COVID-19 pandemic, is that the credit risk within the customer segments in the countries where Essity conducts the majority of its sales has not changed materially during 2021; recognized bad debt losses remain at a low level. However, Essity continues to monitor development of GDP, financial stability and unemployment and will increase its provision for doubtful receivables if the situation deteriorates. Only one minor adjustment was therefore made in the collective assessment (see accounting principles and key assessment and assumptions above) regarding the expected impairment requirement for doubtful receivables in the 2021 year-end accounts.
In total, the Group has collateral mainly in the form of credit insurance taken out amounting to SEK 1,056m (723; 1,251). Of this amount, SEK 4m (8; 13) relates to the category trade receivables overdue.
Provision for doubtful receivablesSEKm 2021 2020 2019
Value, January 1 –238 –313 –276Provision for expected credit losses –83 –38 –67Confirmed losses 18 25 14Decrease due to divestments 0 22 –Decrease due to reversal of provisions for expected credit losses 18 31 27Translation differences –13 35 –11Value, December 31 –298 –238 –313
The expense for the period for doubtful receivables amounted to SEK –65m (–7; –40).
E4. Financial liabilities
AP Accounting principles
The main principle for recognition of Essity’s financial liabilities is that they are initially measured at fair value, net after transaction costs, and subse-quently at amortized cost according to the effective interest method.
In cases where loans with fixed interest rates are hedged using derivatives, both the loan and the derivative are measured at fair value through a fair value hedge. Non-current loans that are subject to hedge accounting are discounted to the market interest rate without a credit spread. The cash flows from the interest rate derivatives are discounted to the market interest rate and the changes in value are recognized in profit or loss.
Financial liabilitiesSEKm 2021 2020 2019
Non-current financial liabilitiesBond issues 38,559 28,486 31,690Derivatives 386 2 95Non-current lease liabilities 2,891 2,724 3,021Other non-current loans with maturities > 1 year < 5 years 5,590 6,971 7,944Other non-current loans with maturities > 5 years 17 19 329
BS Total 47,443 38,202 43,079
102 Essity’s Annual and Sustainability Report 2021Financial statements including notes
Introduction The Essity share
Strategy Business areas SustainabilityGroup Corporate Governance Report
Financial statementsincluding notes
Essity data

Financial liabilitiesSEKm 2021 2020 2019
Current financial liabilitiesAmortization within one year 63 219 255Bond issues – 5,037 –Derivatives 768 637 572Current lease liabilities 880 807 851Loans with maturities of less than one year 8,895 1,833 7,137Accrued financial expenses 140 155 168
BS Total1) 10,746 8,688 8,983Total financial liabilities 58,189 46,890 52,062Fair value of financial liabilities excluding leases 53,925 43,947 49,106
1) Fair value of current loans is estimated to be the same as the carrying amount.
BorrowingEssity has a Euro Medium Term Note (EMTN) program with a program amount of EUR 6,000m (SEK 61,376m) for issuing bonds in the European capital market. As of December 31, 2021, a nominal EUR 3,930m (3,440; 3,134) was outstanding in public and bilateral issues with a remaining maturity of 5.2 years (3.4; 3.8).
Public bond issues
Issued Maturity
Carrying amount,
SEKm
Fair value, SEKm
Interest rate, %
Notes EUR 500m 2023 5,285 5,305 2.50Notes EUR 600m 2024 6,126 6,274 1.13Notes SEK 2,150m 2025 2,159 2,128 0.42Notes SEK 850m 2025 842 839 0.50Notes EUR 300m 2025 3,168 3,145 1.13Notes EUR 500m 2027 5,090 5,327 1.63Notes EUR 600m 2029 5,940 5,718 0.25Notes EUR 300m 2030 2,990 2,898 0.50Notes EUR 700m 2031 6,959 6,528 0.25Total 38,559 38,162
Non-current financial liabilities
Carrying amount,
SEKmFair value,
SEKm
Other non-current loans with maturities > 1 year < 5 years 5,590 5,634Other non-current loans with maturities > 5 years 17 16Total 5,607 5,650
Essity has a Swedish and a Belgian commercial paper program that can be utilized for current borrowing.
Commercial paper program1)
Program size Issued SEKm
Commercial paper SEK 15,000m –Commercial paper EUR 1,200m 2,250Total 2,250
1) Included in Loans with maturities of less than one year in the Financial liabilities table.
Essity has syndicated bank facilities to limit the refinancing risk and maintain a liquidity reserve. Contracted bilateral credit facilities with banks are used to supplement these syndicated bank facilities.
Credit facilities
Nominal MaturityTotal
SEKmUtilized
SEKmUnutilized
SEKm
Syndicated credit facilities EUR 59m 2024 602 – 602EUR 941m 2025 9,628 9,628
EUR 62m 2025 639 – 639EUR 938m 20261) 9,590 9,590
Total 20,459 20,4591) The syndicated credit facility expiring in 2026 was extended in January 2022 by EUR 938m until 2027.
The remaining EUR 62m falls due in 2025.
Maturity profile of gross debt1)
SEKm
–18,000–16,000–14,000–12,000–10,000–8,000–6,000–4,000–2,000
02,000
2028+202720262025202420232022
Commercial paperBond issuesOther loans
1) Gross debt includes accrued interest in the amount of SEK 265m.
After additions for net pension provisions and lease liabilities and with deduc-tions for cash and cash equivalents, interest-bearing receivables and equity instruments, the net debt was SEK 55,433m (42,688; 50,940). For a descrip-tion of the methods used by Essity to manage its refinancing risk, refer to the Risks and risk management section on page 35.
E5. Liquidity risk
The table below shows the Group’s liquidity risk regarding financial liabilities (including interest payments), net settled derivatives that constitute finan-cial liabilities and negative cash flows from gross settled derivatives. For a description of the methods used by Essity to manage its liquidity risk, refer to the Risks and risk management section on page 35.
Liquidity risk
SEKmLess than
1 yearBetween
1 and 3 yearsBetween
3 and 5 yearsMore than
5 years
2021Loans including interest 9,448 16,708 7,023 21,524
Net settled derivatives 1 – – –Energy derivatives 357 26 – –Lease liabilities 947 1,271 743 1,101Trade payables 17,950 80 – –Total 28,703 18,085 7,766 22,625Gross settled derivatives1) 109,124 924 680 –
2020Loans including interest 7,602 16,590 11,910 8,153Net settled derivatives 1 1 – –Energy derivatives 41 5 – –Lease liabilities 818 1,118 675 1,294Trade payables 14,785 6 – –Total 23,247 17,720 12,585 9,447Gross settled derivatives1) 59,168 2,135 104 –
2019Loans including interest 8,003 18,438 14,325 8,850Net settled derivatives 0 0 – –Energy derivatives 254 42 – –Lease liabilities 864 1,213 767 1,520Trade payables 15,795 7 – –Total 24,916 19,700 15,092 10,370Gross settled derivatives1) 60,735 1,057 591 –
1) The gross settled derivatives have, largely, corresponding positive cash flows and therefore, in the opinion of Essity, do not constitute any real liquidity risk.
103Essity’s Annual and Sustainability Report 2021 Financial statements including notes
Introduction The Essity share
Strategy Business areas SustainabilityGroup Corporate Governance Report
Financial statementsincluding notes
Essity data

E6. Derivatives and hedge accounting
AP Accounting principles
Accounting for derivatives used for hedging purposes All derivatives are initially and continuously measured at fair value in the balance sheet. Gains and losses on remeasurement of derivatives used for hedging purposes are recognized as described below. When using hedge accounting, the relationship between the hedging instrument and the hedged item is documented. Assessment of the effectiveness of the hedge is also documented, both when the transaction is initially executed and on an ongoing basis. Hedge effectiveness is the extent to which the hedging instrument offsets changes in value in a hedged item’s fair value or cash flow. The ineffective portion is recognized directly in profit or loss.
Cash flow hedgesGains and losses on remeasurement of derivatives intended for cash flow hedges are recognized in equity under other comprehensive income and reversed to profit or loss at the rate at which the hedged cash flow affects profit or loss. If a hedge relationship is interrupted and cash flow is still expected, the result is recognized in equity under other comprehensive income until the cash flow affects the result. If the hedge pertains to a bal-ance sheet item, the result is transferred from equity to the asset or liability to which the hedge relates when the value of the asset or liability is determined for the first time. In cases in which the forecast cash flow that forms the basis of the hedging transaction is no longer assessed as probable, the cumulative gain or loss that is recognized in equity under other comprehensive income is transferred directly to profit or loss. Cash flow hedges relating to energy are recognized as energy costs, that is, cost of goods sold. Cash flow hedges related to transaction exposure are recognized in consolidated net sales and expenses.
Hedges of net investments in foreign operationsGains and losses on remeasurement of derivatives intended to hedge Essity’s net investments in foreign operations are recognized in equity under other comprehensive income. The cumulative gain or loss in equity is recognized in profit or loss in the event of divestment of the foreign operation.
Fair value hedgesThe gain or loss from remeasurement of a derivative relating to fair value hedges is recognized in profit or loss together with changes in fair value of the hedged asset or liability. For Essity, this means that non-current loans that are subject to hedge accounting are discounted without a credit spread to the market interest rate and meet inherent interest rate derivatives’ dis-counted cash flows at the same interest rate.
Economic hedgesWhen Essity conducts hedges and the transactions do not meet require-ments for hedge accounting according to IFRS 9, changes in fair value of the hedging instrument are recognized directly in profit or loss.
Outstanding derivativesOf which
SEKm Total Currency1)Interest
rate Energy
2021Nominal 137,129 111,601 22,755 2,773Asset 4,784 597 286 3,901Liability 1,578 894 301 383
2020Nominal 80,489 62,251 16,514 1,724Asset 1,650 856 558 236Liability 753 706 2 45
2019Nominal 81,412 62,506 17,224 1,682Asset 971 412 545 14Liability 991 695 0 296
1) Nominal SEK 124,914m (74,475; 64,183) is outstanding before the right of set-off.
Balance sheet Essity uses financial derivatives to manage currency, interest rate and energy price risks. For a description of how Essity manages these risks, refer to the section on Risk and risk management on page 35. The table above shows the derivatives that impacted the Group’s balance sheet on December 31, 2021. For more information relating to derivatives in the balance sheet, see Note E1 Financial instruments by category and measurement level on page 100.
Offsetting of outstanding derivativesSEKm Assets Liabilities
December 31, 2021Gross amount 4,790 1,584Offsettable amount –6 –6Net amount recognized in the balance sheet 4,784 1,578ISDA agreements whose transactions are not offset in the balance sheet –1,131 –1,131Collateral paid/received –2,090 –264Net after offsetting in accordance with ISDA agreements 1,563 183
December 31, 2020Gross amount 1,710 813Offsettable amount –60 –60Net amount recognized in the balance sheet 1,650 753ISDA agreements whose transactions are not offset in the balance sheet –699 –699Collateral received –64 –Net after offsetting in accordance with ISDA agreements 887 54
December 31, 2019Gross amount 972 992Offsettable amount –1 –1Net amount recognized in the balance sheet 971 991ISDA agreements whose transactions are not offset in the balance sheet –420 –420Collateral paid – –26Net after offsetting in accordance with ISDA agreements 551 545
Profit or lossHedges pertaining to transaction exposure had an impact of SEK 118m (–37; –16) on operating profit for the period. At year-end, the net mar-ket value amounted to SEK 26m (–39; –17). Currency hedges increased the cost of non-current assets by SEK 1m (decreased: 2; increased: 14). At year-end, the net market value amounted to SEK 0m (–4; –3). Energy derivatives had an impact of SEK 1,857m (–451; –173) on operating profit for the period. Energy derivatives had an outstanding market value of SEK 3,518m (191; –282) at year-end. Derivatives impacted net interest items in an amount of SEK –19m (–169; –381). The net market value of outstanding interest rate derivatives amounted to SEK –15m (556; 545) at year-end. For further information relating to financial items, see Note E7 Financial income and expenses on page 107.
Sensitivity analysisEssity has performed sensitivity analysis calculations on the financial instru-ments’ risk at December 31, 2021 using assumptions on market movements that are regarded as reasonably possible in one year’s time. If the Swedish krona had unilaterally weakened/strengthened by 5% against all currencies, outstanding financial hedges, trade payables and trade receivables would have decreased/increased profit for the period before tax by SEK 17m (13; 8).
If the Swedish krona had unilaterally weakened/strengthened by 5%, cur-rency hedges relating to the cost of non-current assets would have increased/decreased equity by SEK 0m (1; 0). If energy prices had increased/decreased by 20%, outstanding financial hedges relating to natural gas and electricity, all other things being equal, would have decreased/increased energy costs for the period by SEK 952m (245; 174). In addition to the earnings impact, equity would have increased/decreased by SEK 211m (124; 90). However, the total energy cost for the Group would have been affected differently if the price risk related to supply contracts was taken into account.
Derivatives with hedge accountingThe various risk management strategies are presented in the Risks and risk management section on page 35. The derivatives to which hedge account-ing is applied are presented below. Essity also continuously hedges the transaction exposure and energy price risks for the risks that are recognized in the balance sheet and profit or loss. Hedge accounting is not applied in respect of these risks. For currency derivatives, the revaluation from the risks meets derivatives in the financial positions. For energy derivatives, the result is recognized in profit or loss.
104 Essity’s Annual and Sustainability Report 2021Financial statements including notes
Introduction The Essity share
Strategy Business areas SustainabilityGroup Corporate Governance Report
Financial statementsincluding notes
Essity data
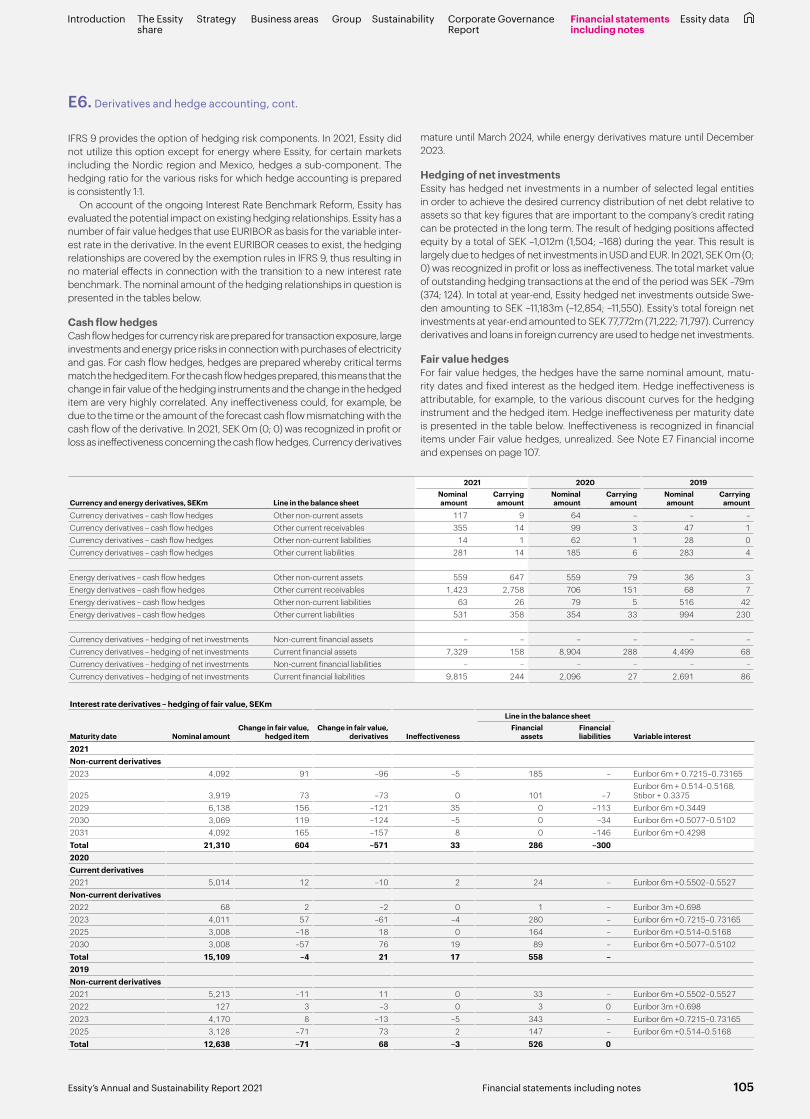
E6. Derivatives and hedge accounting, cont.
2021 2020 2019
Currency and energy derivatives, SEKm Line in the balance sheetNominal amount
Carrying amount
Nominal amount
Carrying amount
Nominal amount
Carrying amount
Currency derivatives – cash flow hedges Other non-current assets 117 9 64 – – –Currency derivatives – cash flow hedges Other current receivables 355 14 99 3 47 1Currency derivatives – cash flow hedges Other non-current liabilities 14 1 62 1 28 0Currency derivatives – cash flow hedges Other current liabilities 281 14 185 6 283 4
Energy derivatives – cash flow hedges Other non-current assets 559 647 559 79 36 3Energy derivatives – cash flow hedges Other current receivables 1,423 2,758 706 151 68 7Energy derivatives – cash flow hedges Other non-current liabilities 63 26 79 5 516 42Energy derivatives – cash flow hedges Other current liabilities 531 358 354 33 994 230
Currency derivatives – hedging of net investments Non-current financial assets – – – – – –Currency derivatives – hedging of net investments Current financial assets 7,329 158 8,904 288 4,499 68Currency derivatives – hedging of net investments Non-current financial liabilities – – – – – –Currency derivatives – hedging of net investments Current financial liabilities 9,815 244 2,096 27 2,691 86
Interest rate derivatives – hedging of fair value, SEKm Line in the balance sheet
Maturity date Nominal amountChange in fair value,
hedged itemChange in fair value,
derivatives Ineffectiveness Financial
assetsFinancial liabilities Variable interest
2021Non-current derivatives2023 4,092 91 –96 –5 185 – Euribor 6m + 0.7215–0.73165
2025 3,919 73 –73 0 101 –7Euribor 6m + 0.514–0.5168, Stibor + 0.3375
2029 6,138 156 –121 35 0 –113 Euribor 6m +0.34492030 3,069 119 –124 –5 0 –34 Euribor 6m +0.5077–0.51022031 4,092 165 –157 8 0 –146 Euribor 6m +0.4298Total 21,310 604 –571 33 286 –3002020Current derivatives2021 5,014 12 –10 2 24 – Euribor 6m +0.5502–0.5527Non-current derivatives2022 68 2 –2 0 1 – Euribor 3m +0.698 2023 4,011 57 –61 –4 280 – Euribor 6m +0.7215–0.731652025 3,008 –18 18 0 164 – Euribor 6m +0.514–0.51682030 3,008 –57 76 19 89 – Euribor 6m +0.5077–0.5102Total 15,109 –4 21 17 558 –2019Non-current derivatives2021 5,213 –11 11 0 33 – Euribor 6m +0.5502–0.55272022 127 3 –3 0 3 0 Euribor 3m +0.6982023 4,170 8 –13 –5 343 – Euribor 6m +0.7215–0.731652025 3,128 –71 73 2 147 – Euribor 6m +0.514–0.5168Total 12,638 –71 68 –3 526 0
IFRS 9 provides the option of hedging risk components. In 2021, Essity did not utilize this option except for energy where Essity, for certain markets including the Nordic region and Mexico, hedges a sub-component. The hedging ratio for the various risks for which hedge accounting is prepared is consistently 1:1.
On account of the ongoing Interest Rate Benchmark Reform, Essity has evaluated the potential impact on existing hedging relationships. Essity has a number of fair value hedges that use EURIBOR as basis for the variable inter-est rate in the derivative. In the event EURIBOR ceases to exist, the hedging relationships are covered by the exemption rules in IFRS 9, thus resulting in no material effects in connection with the transition to a new interest rate benchmark. The nominal amount of the hedging relationships in question is presented in the tables below.
Cash flow hedgesCash flow hedges for currency risk are prepared for transaction exposure, large investments and energy price risks in connection with purchases of electricity and gas. For cash flow hedges, hedges are prepared whereby critical terms match the hedged item. For the cash flow hedges prepared, this means that the change in fair value of the hedging instruments and the change in the hedged item are very highly correlated. Any ineffectiveness could, for example, be due to the time or the amount of the forecast cash flow mismatching with the cash flow of the derivative. In 2021, SEK 0m (0; 0) was recognized in profit or loss as ineffectiveness concerning the cash flow hedges. Currency derivatives
mature until March 2024, while energy derivatives mature until December 2023.
Hedging of net investmentsEssity has hedged net investments in a number of selected legal entities in order to achieve the desired currency distribution of net debt relative to assets so that key figures that are important to the company’s credit rating can be protected in the long term. The result of hedging positions affected equity by a total of SEK –1,012m (1,504; –168) during the year. This result is largely due to hedges of net investments in USD and EUR. In 2021, SEK 0m (0; 0) was recognized in profit or loss as ineffectiveness. The total market value of outstanding hedging transactions at the end of the period was SEK –79m (374; 124). In total at year-end, Essity hedged net investments outside Swe-den amounting to SEK –11,183m (–12,854; –11,550). Essity’s total foreign net investments at year-end amounted to SEK 77,772m (71,222; 71,797). Currency derivatives and loans in foreign currency are used to hedge net investments.
Fair value hedgesFor fair value hedges, the hedges have the same nominal amount, matu-rity dates and fixed interest as the hedged item. Hedge ineffectiveness is attributable, for example, to the various discount curves for the hedging instrument and the hedged item. Hedge ineffectiveness per maturity date is presented in the table below. Ineffectiveness is recognized in financial items under Fair value hedges, unrealized. See Note E7 Financial income and expenses on page 107.
105Essity’s Annual and Sustainability Report 2021 Financial statements including notes
Introduction The Essity share
Strategy Business areas SustainabilityGroup Corporate Governance Report
Financial statementsincluding notes
Essity data

E6. Derivatives and hedge accounting, cont.
Derivatives with hedge accounting1)
SEKm Asset Liability Net TaxHedge reserve
after taxRecirculated
before tax
Line in profit or loss/
balance sheet
2021Derivatives with hedge accounting in hedge reserveCash flow hedges
Energy risk 3,405 –384 3,021 –806 2,215 –1,363 3)
Currency risk 23 –15 8 –2 6 1 4)
Total 3,428 –399 3,029 –808 2,221Derivatives with hedge accounting without hedge reserveHedges of net investments in foreign operations
Currency risk2) 165 –244 –79Fair value hedges
Interest rate risk 286 –300 –14Total 3,879 –943 2,936 –808 2,221
2020Derivatives with hedge accounting in hedge reserveCash flow hedges
Energy risk 230 –38 192 –48 144 473 3)
Currency risk 3 –7 –4 1 –3 –2 4)
Total 233 –45 188 –47 141Derivatives with hedge accounting without hedge reserveHedges of net investments in foreign operations
Currency risk2) 344 –32 312Fair value hedges
Interest rate risk 558 – 558Total 1,135 –77 1,058 –47 141
2019Derivatives with hedge accounting in hedge reserveCash flow hedges
Energy risk 10 –272 –262 58 –204 112 3)
Currency risk 1 –4 –3 1 –2 14 4)
Total 11 –276 –265 59 –206Derivatives with hedge accounting without hedge reserveHedges of net investments in foreign operations
Currency risk2) 68 –87 –19Fair value hedges
Interest rate risk 526 – 526Total 605 –363 242 59 –206
1) Outstanding derivatives with hedge accounting are included in the table Outstanding derivatives.2) Derivatives before offsetting.3) Cost of goods sold.4) Cost of goods sold, Net sales and Property, plant and equipment.
The results from hedging of net investments in foreign operations are recognized in the translation reserve, refer to Note E8 Equity on page 107. The results from fair value hedges are recognized directly in profit or loss.
Hedge reserve in equityCurrency derivatives relating to hedging of transaction exposure mature mainly during the first quarter of 2022. With unchanged exchange rates, profit after tax will be affected in an amount of SEK 6m (0; 0). Currency derivatives relating to hedging of the cost of non-current assets mature until March 2024. With unchanged exchange rates, the cost of non-current assets will be unchanged (increase by 3; increase by 2) after tax. The derivatives intended to hedge energy costs in the Group mature during 2022 and 2023. With unchanged prices, the Group’s profit after tax will be affected positively in an amount of SEK 2,215m (positive 144; negative 204).
106 Essity’s Annual and Sustainability Report 2021Financial statements including notes
Introduction The Essity share
Strategy Business areas SustainabilityGroup Corporate Governance Report
Financial statementsincluding notes
Essity data
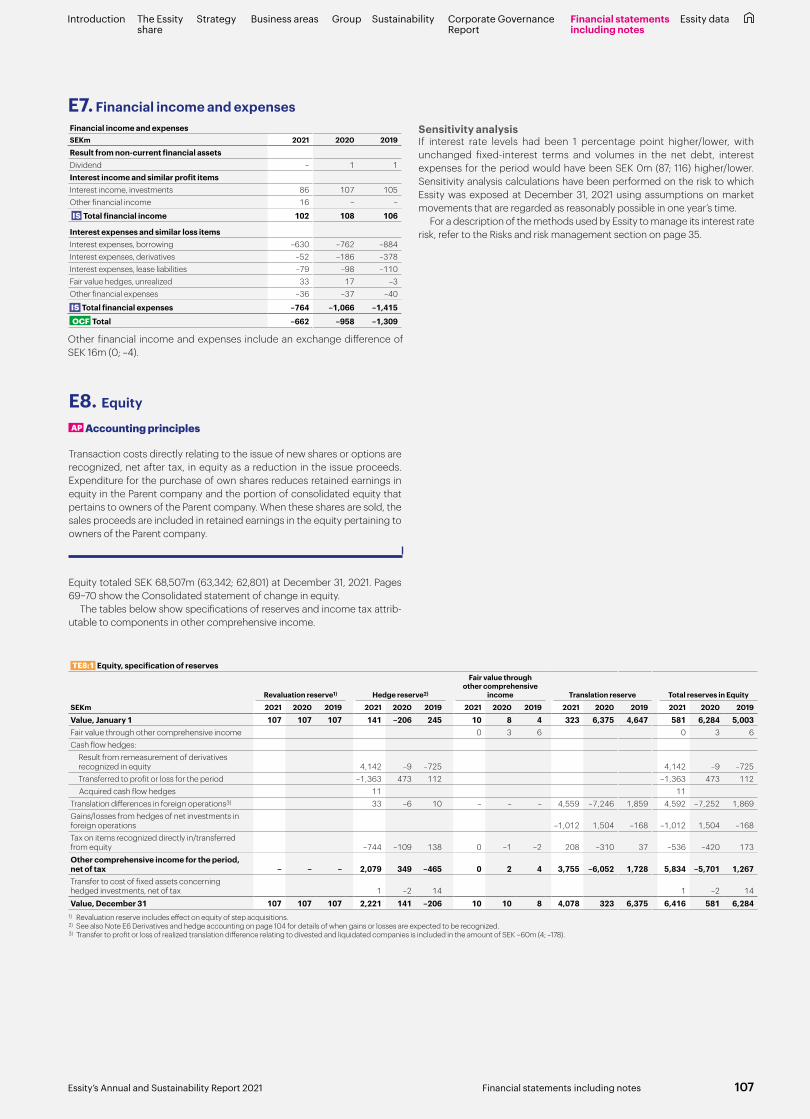
E7. Financial income and expensesFinancial income and expensesSEKm 2021 2020 2019
Result from non-current financial assetsDividend – 1 1Interest income and similar profit itemsInterest income, investments 86 107 105Other financial income 16 – –
IS Total financial income 102 108 106
Interest expenses and similar loss itemsInterest expenses, borrowing –630 –762 –884Interest expenses, derivatives –52 –186 –378Interest expenses, lease liabilities –79 –98 –110Fair value hedges, unrealized 33 17 –3Other financial expenses –36 –37 –40
IS Total financial expenses –764 –1,066 –1,415
OCF Total –662 –958 –1,309
Other financial income and expenses include an exchange difference of SEK 16m (0; –4).
Sensitivity analysisIf interest rate levels had been 1 percentage point higher/lower, with unchanged fixed-interest terms and volumes in the net debt, interest expenses for the period would have been SEK 0m (87; 116) higher/lower. Sensitivity analysis calculations have been performed on the risk to which Essity was exposed at December 31, 2021 using assumptions on market movements that are regarded as reasonably possible in one year’s time.
For a description of the methods used by Essity to manage its interest rate risk, refer to the Risks and risk management section on page 35.
TE8:1 Equity, specification of reserves
Revaluation reserve1) Hedge reserve2)
Fair value through other comprehensive
income Translation reserve Total reserves in Equity
SEKm 2021 2020 2019 2021 2020 2019 2021 2020 2019 2021 2020 2019 2021 2020 2019
Value, January 1 107 107 107 141 –206 245 10 8 4 323 6,375 4,647 581 6,284 5,003Fair value through other comprehensive income 0 3 6 0 3 6Cash flow hedges: Result from remeasurement of derivatives
recognized in equity 4,142 –9 –725 4,142 –9 –725 Transferred to profit or loss for the period –1,363 473 112 –1,363 473 112 Acquired cash flow hedges 11 11Translation differences in foreign operations3) 33 –6 10 – – – 4,559 –7,246 1,859 4,592 –7,252 1,869Gains/losses from hedges of net investments in foreign operations –1,012 1,504 –168 –1,012 1,504 –168Tax on items recognized directly in/transferred from equity –744 –109 138 0 –1 –2 208 –310 37 –536 –420 173Other comprehensive income for the period, net of tax – – – 2,079 349 –465 0 2 4 3,755 –6,052 1,728 5,834 –5,701 1,267Transfer to cost of fixed assets concerning hedged investments, net of tax 1 –2 14 1 –2 14Value, December 31 107 107 107 2,221 141 –206 10 10 8 4,078 323 6,375 6,416 581 6,284
1) Revaluation reserve includes effect on equity of step acquisitions.2) See also Note E6 Derivatives and hedge accounting on page 104 for details of when gains or losses are expected to be recognized.3) Transfer to profit or loss of realized translation difference relating to divested and liquidated companies is included in the amount of SEK –60m (4; –178).
E8. Equity
AP Accounting principles
Transaction costs directly relating to the issue of new shares or options are recognized, net after tax, in equity as a reduction in the issue proceeds. Expenditure for the purchase of own shares reduces retained earnings in equity in the Parent company and the portion of consolidated equity that pertains to owners of the Parent company. When these shares are sold, the sales proceeds are included in retained earnings in the equity pertaining to owners of the Parent company.
Equity totaled SEK 68,507m (63,342; 62,801) at December 31, 2021. Pages 69–70 show the Consolidated statement of change in equity.
The tables below show specifications of reserves and income tax attrib-utable to components in other comprehensive income.
107Essity’s Annual and Sustainability Report 2021 Financial statements including notes
Introduction The Essity share
Strategy Business areas SustainabilityGroup Corporate Governance Report
Financial statementsincluding notes
Essity data
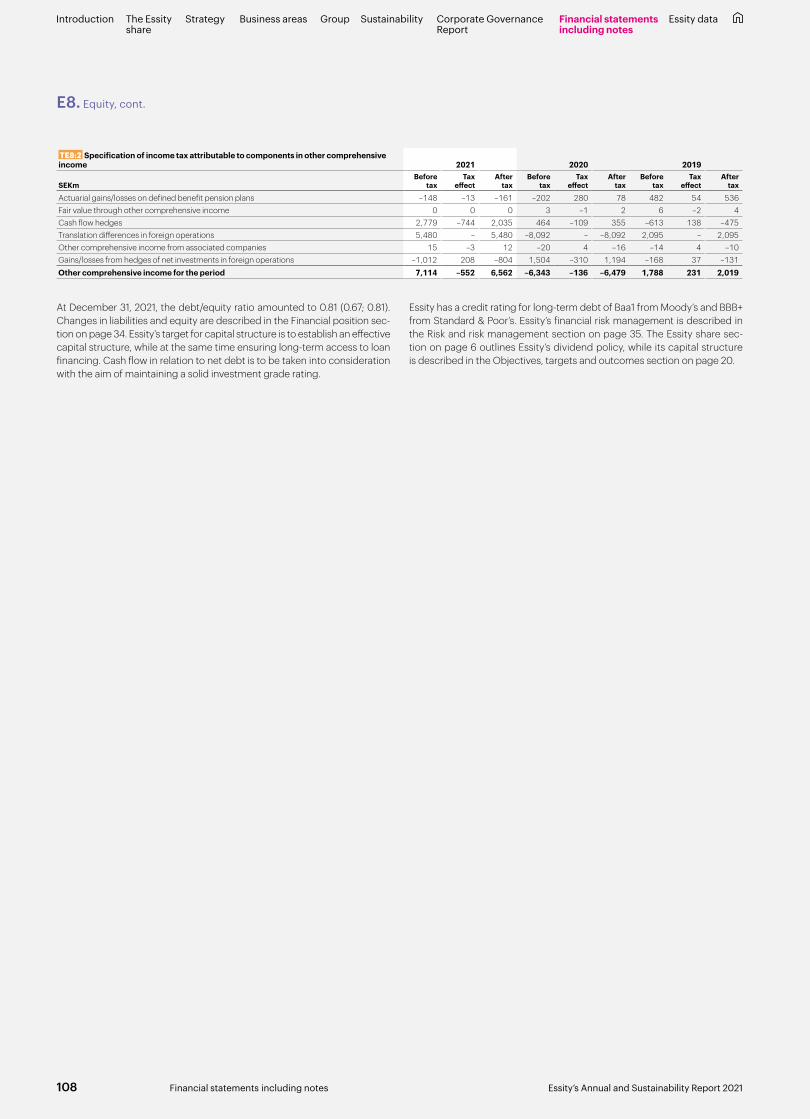
At December 31, 2021, the debt/equity ratio amounted to 0.81 (0.67; 0.81). Changes in liabilities and equity are described in the Financial position sec-tion on page 34. Essity’s target for capital structure is to establish an effective capital structure, while at the same time ensuring long-term access to loan financing. Cash flow in relation to net debt is to be taken into consideration with the aim of maintaining a solid investment grade rating.
Essity has a credit rating for long-term debt of Baa1 from Moody’s and BBB+ from Standard & Poor’s. Essity’s financial risk management is described in the Risk and risk management section on page 35. The Essity share sec-tion on page 6 outlines Essity’s dividend policy, while its capital structure is described in the Objectives, targets and outcomes section on page 20.
TE8:2 Specification of income tax attributable to components in other comprehensive income 2021 2020 2019
SEKmBefore
taxTax
effectAfter
taxBefore
taxTax
effectAfter
taxBefore
taxTax
effectAfter
tax
Actuarial gains/losses on defined benefit pension plans –148 –13 –161 –202 280 78 482 54 536Fair value through other comprehensive income 0 0 0 3 –1 2 6 –2 4Cash flow hedges 2,779 –744 2,035 464 –109 355 –613 138 –475Translation differences in foreign operations 5,480 – 5,480 –8,092 – –8,092 2,095 – 2,095Other comprehensive income from associated companies 15 –3 12 –20 4 –16 –14 4 –10Gains/losses from hedges of net investments in foreign operations –1,012 208 –804 1,504 –310 1,194 –168 37 –131Other comprehensive income for the period 7,114 –552 6,562 –6,343 –136 –6,479 1,788 231 2,019
E8. Equity, cont.
108 Essity’s Annual and Sustainability Report 2021Financial statements including notes
Introduction The Essity share
Strategy Business areas SustainabilityGroup Corporate Governance Report
Financial statementsincluding notes
Essity data
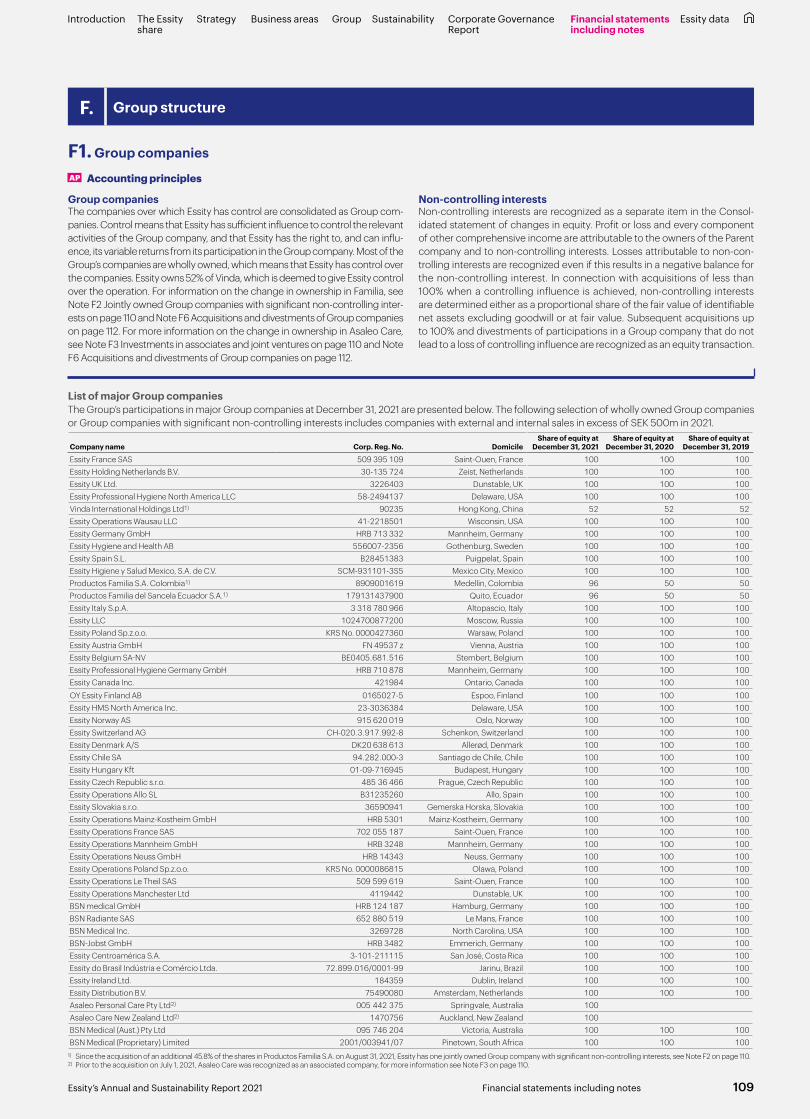
F1. Group companies
AP Accounting principles
Group companiesThe companies over which Essity has control are consolidated as Group com-panies. Control means that Essity has sufficient influence to control the relevant activities of the Group company, and that Essity has the right to, and can influ-ence, its variable returns from its participation in the Group company. Most of the Group’s companies are wholly owned, which means that Essity has control over the companies. Essity owns 52% of Vinda, which is deemed to give Essity control over the operation. For information on the change in ownership in Familia, see Note F2 Jointly owned Group companies with significant non-controlling inter-ests on page 110 and Note F6 Acquisitions and divestments of Group companies on page 112. For more information on the change in ownership in Asaleo Care, see Note F3 Investments in associates and joint ventures on page 110 and Note F6 Acquisitions and divestments of Group companies on page 112.
Non-controlling interestsNon-controlling interests are recognized as a separate item in the Consol-idated statement of changes in equity. Profit or loss and every component of other comprehensive income are attributable to the owners of the Parent company and to non-controlling interests. Losses attributable to non-con-trolling interests are recognized even if this results in a negative balance for the non-controlling interest. In connection with acquisitions of less than 100% when a controlling influence is achieved, non-controlling interests are determined either as a proportional share of the fair value of identifiable net assets excluding goodwill or at fair value. Subsequent acquisitions up to 100% and divestments of participations in a Group company that do not lead to a loss of controlling influence are recognized as an equity transaction.
F. Group structure
List of major Group companiesThe Group’s participations in major Group companies at December 31, 2021 are presented below. The following selection of wholly owned Group companies or Group companies with significant non-controlling interests includes companies with external and internal sales in excess of SEK 500m in 2021.
Company name Corp. Reg. No. DomicileShare of equity at
December 31, 2021Share of equity at
December 31, 2020Share of equity at
December 31, 2019
Essity France SAS 509 395 109 Saint-Ouen, France 100 100 100Essity Holding Netherlands B.V. 30-135 724 Zeist, Netherlands 100 100 100Essity UK Ltd. 3226403 Dunstable, UK 100 100 100Essity Professional Hygiene North America LLC 58-2494137 Delaware, USA 100 100 100Vinda International Holdings Ltd1) 90235 Hong Kong, China 52 52 52Essity Operations Wausau LLC 41-2218501 Wisconsin, USA 100 100 100Essity Germany GmbH HRB 713 332 Mannheim, Germany 100 100 100Essity Hygiene and Health AB 556007-2356 Gothenburg, Sweden 100 100 100Essity Spain S.L. B28451383 Puigpelat, Spain 100 100 100Essity Higiene y Salud Mexico, S.A. de C.V. SCM-931101-3S5 Mexico City, Mexico 100 100 100Productos Familia S.A. Colombia1) 8909001619 Medellin, Colombia 96 50 50Productos Familia del Sancela Ecuador S.A.1) 179131437900 Quito, Ecuador 96 50 50Essity Italy S.p.A. 3 318 780 966 Altopascio, Italy 100 100 100Essity LLC 1024700877200 Moscow, Russia 100 100 100Essity Poland Sp.z.o.o. KRS No. 0000427360 Warsaw, Poland 100 100 100Essity Austria GmbH FN 49537 z Vienna, Austria 100 100 100Essity Belgium SA-NV BE0405.681.516 Stembert, Belgium 100 100 100Essity Professional Hygiene Germany GmbH HRB 710 878 Mannheim, Germany 100 100 100Essity Canada Inc. 421984 Ontario, Canada 100 100 100OY Essity Finland AB 0165027-5 Espoo, Finland 100 100 100Essity HMS North America Inc. 23-3036384 Delaware, USA 100 100 100Essity Norway AS 915 620 019 Oslo, Norway 100 100 100Essity Switzerland AG CH-020.3.917.992-8 Schenkon, Switzerland 100 100 100Essity Denmark A/S DK20 638 613 Allerød, Denmark 100 100 100Essity Chile SA 94.282.000-3 Santiago de Chile, Chile 100 100 100Essity Hungary Kft 01-09-716945 Budapest, Hungary 100 100 100Essity Czech Republic s.r.o. 485 36 466 Prague, Czech Republic 100 100 100Essity Operations Allo SL B31235260 Allo, Spain 100 100 100Essity Slovakia s.r.o. 36590941 Gemerska Horska, Slovakia 100 100 100Essity Operations Mainz-Kostheim GmbH HRB 5301 Mainz-Kostheim, Germany 100 100 100Essity Operations France SAS 702 055 187 Saint-Ouen, France 100 100 100Essity Operations Mannheim GmbH HRB 3248 Mannheim, Germany 100 100 100Essity Operations Neuss GmbH HRB 14343 Neuss, Germany 100 100 100Essity Operations Poland Sp.z.o.o. KRS No. 0000086815 Olawa, Poland 100 100 100Essity Operations Le Theil SAS 509 599 619 Saint-Ouen, France 100 100 100Essity Operations Manchester Ltd 4119442 Dunstable, UK 100 100 100BSN medical GmbH HRB 124 187 Hamburg, Germany 100 100 100BSN Radiante SAS 652 880 519 Le Mans, France 100 100 100BSN Medical Inc. 3269728 North Carolina, USA 100 100 100BSN-Jobst GmbH HRB 3482 Emmerich, Germany 100 100 100Essity Centroamérica S.A. 3-101-211115 San José, Costa Rica 100 100 100Essity do Brasil Indústria e Comércio Ltda. 72.899.016/0001-99 Jarinu, Brazil 100 100 100Essity Ireland Ltd. 184359 Dublin, Ireland 100 100 100Essity Distribution B.V. 75490080 Amsterdam, Netherlands 100 100 100Asaleo Personal Care Pty Ltd2) 005 442 375 Springvale, Australia 100Asaleo Care New Zealand Ltd2) 1470756 Auckland, New Zealand 100BSN Medical (Aust.) Pty Ltd 095 746 204 Victoria, Australia 100 100 100BSN Medical (Proprietary) Limited 2001/003941/07 Pinetown, South Africa 100 100 100
1) Since the acquisition of an additional 45.8% of the shares in Productos Familia S.A. on August 31, 2021, Essity has one jointly owned Group company with significant non-controlling interests, see Note F2 on page 110.2) Prior to the acquisition on July 1, 2021, Asaleo Care was recognized as an associated company, for more information see Note F3 on page 110.
109Essity’s Annual and Sustainability Report 2021 Financial statements including notes
Introduction The Essity share
Strategy Business areas SustainabilityGroup Corporate Governance Report
Financial statementsincluding notes
Essity data

F2. Jointly owned Group companies with significant non-controlling interests
VindaVinda International Holdings Ltd. (Vinda) is one of China’s largest hygiene companies and listed on the Hong Kong stock exchange. Essity’s holding in Vinda amounts to 52%. Vinda’s market capitalization on the Hong Kong stock exchange was SEK 26,480m (26,768; 20,266) at the end of the period.
FamiliaProductos Familia S.A., Colombia (Familia) operates in the South American market and sells Personal Care, Consumer Tissue and Professional Hygiene products. On August 31, 2021, Essity increased its ownership stake in Familia from 50% to 95.8%. Already prior to this transaction, Essity was deemed to have a controlling influence of Familia since Essity had control over the activities with the most significant impact on Familia’s return. For further
information about the acquisition of the additional shares, refer to Note F6 Acquisitions and divestments of Group companies and other operations on page 112.
Financial informationFinancial information is disclosed below for both Group companies. The financial information for Familia includes only the period January to August 2021. Financial information has not been disclosed for other Group compa-nies with significant non-controlling interests since no other individual com-pany had a material impact on the Group’s earnings and financial position.
The income statements and balance sheets as shown below are included in Essity’s consolidated financial statements and consider adjustments for surplus values in connection with acquisitions.
F3. Investments in associates and joint ventures
AP Accounting principles
Joint arrangementsEssity classifies its joint arrangements as joint ventures or joint operations, which are presented in Note F4 Joint operations on page 112.
Joint venturesJoint ventures are defined as companies in which Essity together with other parties has shared control over operations. A joint venture entitles the joint owners to the net assets of the investment. Joint ventures are recognized in accordance with the equity method, meaning that a net item including the goodwill will be recognized for each joint venture in the balance sheet. A share in profits is recognized in the income statement as a component of “Share of profits of associates and joint ventures.” Share of profits is calcu-lated on the basis of Essity’s share of equity in the respective joint venture. Joint arrangements recognized in accordance with the equity method are initially measured at cost. Measurement of acquired assets and liabilities is carried out in the same way as for Group companies.
AssociatesAssociated companies are companies in which the Group exercises a signif-icant influence without the partly owned company being a Group company or a joint arrangement. Normally, this means that the Group owns between 20% and 50% of the votes. Accounting for associated companies is carried out according to the equity method and they are initially measured at cost. Valuation of acquired assets and liabilities is performed in the same manner as for Group companies and the carrying amount for associated companies includes any goodwill and other Group adjustments.
The Group’s share of profit after tax arising in the associate after the acqui-sition is recognized in the consolidated income statement in the line “Share of profits of associates and joint ventures”. Share of profits is calculated on the basis of Essity’s share of equity in the respective associate.
Group companies with significant non-controlling interests, 100% of operations1)
Vinda FamiliaSEKm 2021 2020 2019 2021 2020 2019
Condensed income statementNet sales 20,584 19,521 19,355 4,394 6,950 7,603Operating profit before amortization of acquisition-related intangible assets 2,321 2,9732) 1,889 7133) 1,1703) 1,0423)
Operating profit 2,245 2,8932) 1,882 7093) 1,1623) 1,0323)
Profit for the period 1,801 2,223 1,364 538 819 719 of which attributable to owners of the Parent company 929 1,151 709 269 410 371Other comprehensive income for the period –119 –60 62 –99 –803 191
of which attributable to owners of the Parent company –62 –31 32 –51 –409 86Comprehensive income for the period 1,682 2,163 1,426 439 16 910
of which attributable to owners of the Parent company 867 1,120 741 218 1 457 of which attributable to non-controlling interests 815 1,043 685 221 15 453Dividend to non-controlling interests 298 212 146 190 187 151
Condensed balance sheetNon-current assets 23,301 19,8882) 20,556 3,217 3,861Current assets 9,635 8,799 7,043 3,466 3,616Total 32,936 28,687 27,599 6,683 7,477
Equity attributable to owners of the Parent company 11,252 9,4172) 9,110 2,094 2,281Equity attributable to non-controlling interests 8,336 6,8532) 6,397 2,018 2,190Non-current liabilities 5,691 4,1502) 5,399 802 1,080Current liabilities 7,657 8,267 6,693 1,769 1,926Total 32,936 28,687 27,599 6,683 7,477
Cash flow from operating activities 2,918 2,371 3,031 1,274 841Cash flow from investing activities –1,940 –2,041 –1,535 –253 –254Cash flow from financing activities –704 –37 –1,625 –468 –460Cash flow for the period 274 293 –129 553 126
1) For more information about the companies, refer to the list of major Group companies on page 109.2) Amounts for Vinda regarding 2020 have been adjusted.3) For Familia, items affecting comparability in the amount of SEK –m (–; –22) are included.
110 Essity’s Annual and Sustainability Report 2021Financial statements including notes
Introduction The Essity share
Strategy Business areas SustainabilityGroup Corporate Governance Report
Financial statementsincluding notes
Essity data

F3. Investments in associates and joint ventures, cont.
Carrying amounts of investments in associates and joint venturesSEKm 2021 2020 2019
Joint venturesValue, January 1 189 181 171Net increase in joint ventures1) –12 17 8Reclassification between joint operation and joint venture 8 – –Translation differences 5 –9 2Value, December 31 190 189 181
AssociatesValue, January 1 658 684 606Company acquisitions – – 3Net change in associated companies1) –61 1 43Reclassification between associated companies and Group companies –565 – –Translation differences 17 –27 32Value, December 31 49 658 684 BS TF3:1 Value, December 31, investments in associ-ates and joint ventures 239 847 865
1) Net increase for the period includes the Group’s share of the profit after tax of joint ventures and associated companies, as well as items recognized directly in equity (both after deductions for any non-controlling interests). In addition, an adjustment is included for dividends received during the period, which amounted to SEK 8m (3; 8) for joint ventures and SEK 64m (28; –) for associated companies.
Associates and joint ventures
Asaleo Care Asaleo Care Ltd (Asaleo Care) manufactures and markets Consumer Tissue, Professional Hygiene and Personal Care products. Essity has licensed its Tork and TENA brands to Asaleo Care for sale in Australia, New Zealand and Fiji.
On July 1, 2021, Essity increased its ownership stake in Asaleo Care from 36% to 100%. On account of this, the financial information concerning Asa-leo Care below only includes the January to June 2021 period. For further information about the acquisition of the additional shares, refer to Note F6 Acquisitions and divestments of Group companies and other operations on page 112.
In 2020, the company discontinued the Baby Care operations in New Zea-land. Essity recognized the effects of these transactions as items affecting comparability. During 2019, the company divested the Consumer Tissue operations in Australia.
Bunzl & BiachBunzl & Biach GmbH (Bunzl & Biach), Vienna, is Essity’s single largest joint venture that operates in the recovered paper market and supplies raw mate-rials to Essity’s business.
TF3:1 Material investments in associates and joint ventures, 100% of operations
Joint ventures AssociatesBunzl & Biach Asaleo Care Total
SEKm 2021 2020 2019 20211) 2020 2019 2021 2020 2019
Condensed income statementNet sales 2,487 1,134 1,424 1,374 2,655 2,795 3,861 3,789 4,219Depreciation/amortization –18 –14 –13 –89 –171 –168 –107 –185 –181Operating profit/loss 39 34 30 –42 390 346 –4 424 376Interest income 0 0 0 – 1 3 0 1 3Interest expenses 0 0 0 –26 –52 –80 –26 –52 –80Other financial items 0 0 0 –1 –1 –4 –1 –1 –4Tax expense –10 –7 –9 10 –97 –73 0 –104 –82Profit/loss for the period, continuing operations 29 27 21 –59 241 192 –30 268 213Profit/loss for the period, discontinued operations – – – – –37 –9 – –37 –9Profit/loss for the period 29 27 21 –59 204 183 –30 231 204Other comprehensive income for the period – – – 43 –44 –13 43 –44 –13Comprehensive income for the period 29 27 21 –16 160 170 13 187 191
Condensed balance sheetNon-current assets 135 160 163 1,929 2,041 135 2,089 2,204Cash and cash equivalents 17 64 31 345 216 17 409 247Other current assets 502 174 167 690 969 502 864 1,136
Total assets 654 398 361 2,964 3,226 654 3,362 3,587
Non-current financial liabilities 169 90 69 932 1,114 169 1,022 1,183Other non-current liabilities 109 63 69 206 363 109 269 432Current financial liabilities 21 – – 48 9 21 48 9Other current liabilities 138 26 31 544 513 138 570 544Total liabilities 437 179 169 1,730 1,999 437 1,909 2,168Net assets 217 219 192 1,234 1,227 217 1,453 1,419Group share of net assets 106 107 94 446 444 106 553 538Surplus value 61 69 74 174 191 61 243 265Carrying amount of the companies 167 176 168 620 635 167 796 803Carrying amount of other joint ventures 23 13 13 – – 23 13 13Carrying amount of other associated companies 49 38 49 49 38 49
BS TF3:2 Carrying amount of investments in associates and joint ventures 190 189 181 49 658 684 239 847 865Market value, December 31 4,690 3,745
1) Profit/loss for the period includes costs in conjunction with Essity’s acquisition of Asaleo Care in the amount of SEK 150m.
111Essity’s Annual and Sustainability Report 2021 Financial statements including notes
Introduction The Essity share
Strategy Business areas SustainabilityGroup Corporate Governance Report
Financial statementsincluding notes
Essity data
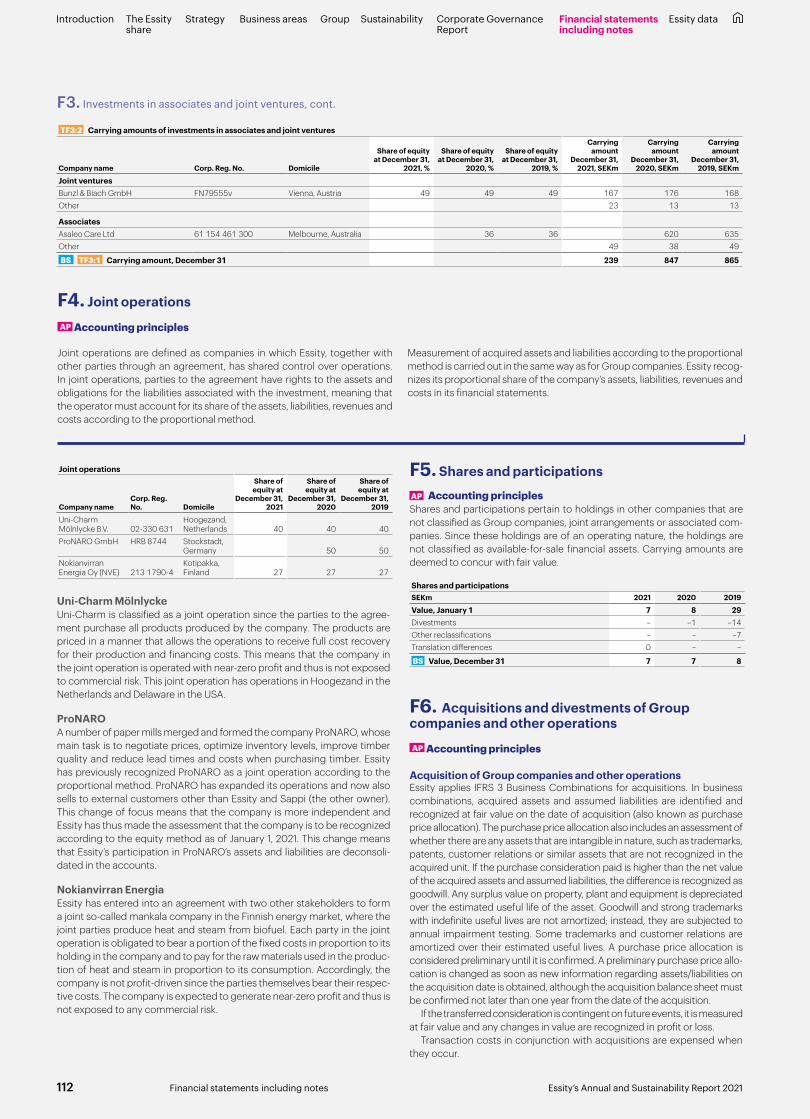
TF3:2 Carrying amounts of investments in associates and joint ventures
Company name Corp. Reg. No. Domicile
Share of equity at December 31,
2021, %
Share of equity at December 31,
2020, %
Share of equity at December 31,
2019, %
Carrying amount
December 31, 2021, SEKm
Carrying amount
December 31, 2020, SEKm
Carrying amount
December 31, 2019, SEKm
Joint venturesBunzl & Biach GmbH FN79555v Vienna, Austria 49 49 49 167 176 168Other 23 13 13
AssociatesAsaleo Care Ltd 61 154 461 300 Melbourne, Australia 36 36 620 635Other 49 38 49
BS TF3:1 Carrying amount, December 31 239 847 865
F3. Investments in associates and joint ventures, cont.
F5. Shares and participations
AP Accounting principlesShares and participations pertain to holdings in other companies that are not classified as Group companies, joint arrangements or associated com-panies. Since these holdings are of an operating nature, the holdings are not classified as available-for-sale financial assets. Carrying amounts are deemed to concur with fair value.
Shares and participationsSEKm 2021 2020 2019
Value, January 1 7 8 29Divestments – –1 –14Other reclassifications – – –7Translation differences 0 – –
BS Value, December 31 7 7 8
Joint operations
Company nameCorp. Reg. No. Domicile
Share of equity at
December 31, 2021
Share of equity at
December 31, 2020
Share of equity at
December 31, 2019
Uni-Charm Mölnlycke B.V. 02-330 631
Hoogezand, Netherlands 40 40 40
ProNARO GmbH HRB 8744 Stockstadt, Germany 50 50
Nokianvirran Energia Oy (NVE) 213 1790-4
Kotipakka, Finland 27 27 27
Uni-Charm MölnlyckeUni-Charm is classified as a joint operation since the parties to the agree-ment purchase all products produced by the company. The products are priced in a manner that allows the operations to receive full cost recovery for their production and financing costs. This means that the company in the joint operation is operated with near-zero profit and thus is not exposed to commercial risk. This joint operation has operations in Hoogezand in the Netherlands and Delaware in the USA.
ProNAROA number of paper mills merged and formed the company ProNARO, whose main task is to negotiate prices, optimize inventory levels, improve timber quality and reduce lead times and costs when purchasing timber. Essity has previously recognized ProNARO as a joint operation according to the proportional method. ProNARO has expanded its operations and now also sells to external customers other than Essity and Sappi (the other owner). This change of focus means that the company is more independent and Essity has thus made the assessment that the company is to be recognized according to the equity method as of January 1, 2021. This change means that Essity’s participation in ProNARO’s assets and liabilities are deconsoli-dated in the accounts.
Nokianvirran EnergiaEssity has entered into an agreement with two other stakeholders to form a joint so-called mankala company in the Finnish energy market, where the joint parties produce heat and steam from biofuel. Each party in the joint operation is obligated to bear a portion of the fixed costs in proportion to its holding in the company and to pay for the raw materials used in the produc-tion of heat and steam in proportion to its consumption. Accordingly, the company is not profit-driven since the parties themselves bear their respec-tive costs. The company is expected to generate near-zero profit and thus is not exposed to any commercial risk.
F4. Joint operations
AP Accounting principles
Joint operations are defined as companies in which Essity, together with other parties through an agreement, has shared control over operations. In joint operations, parties to the agreement have rights to the assets and obligations for the liabilities associated with the investment, meaning that the operator must account for its share of the assets, liabilities, revenues and costs according to the proportional method.
Measurement of acquired assets and liabilities according to the proportional method is carried out in the same way as for Group companies. Essity recog-nizes its proportional share of the company’s assets, liabilities, revenues and costs in its financial statements.
F6. Acquisitions and divestments of Group companies and other operations
AP Accounting principles
Acquisition of Group companies and other operationsEssity applies IFRS 3 Business Combinations for acquisitions. In business combinations, acquired assets and assumed liabilities are identified and recognized at fair value on the date of acquisition (also known as purchase price allocation). The purchase price allocation also includes an assessment of whether there are any assets that are intangible in nature, such as trademarks, patents, customer relations or similar assets that are not recognized in the acquired unit. If the purchase consideration paid is higher than the net value of the acquired assets and assumed liabilities, the difference is recognized as goodwill. Any surplus value on property, plant and equipment is depreciated over the estimated useful life of the asset. Goodwill and strong trademarks with indefinite useful lives are not amortized; instead, they are subjected to annual impairment testing. Some trademarks and customer relations are amortized over their estimated useful lives. A purchase price allocation is considered preliminary until it is confirmed. A preliminary purchase price allo-cation is changed as soon as new information regarding assets/liabilities on the acquisition date is obtained, although the acquisition balance sheet must be confirmed not later than one year from the date of the acquisition.
If the transferred consideration is contingent on future events, it is measured at fair value and any changes in value are recognized in profit or loss.
Transaction costs in conjunction with acquisitions are expensed when they occur.
112 Essity’s Annual and Sustainability Report 2021Financial statements including notes
Introduction The Essity share
Strategy Business areas SustainabilityGroup Corporate Governance Report
Financial statementsincluding notes
Essity data
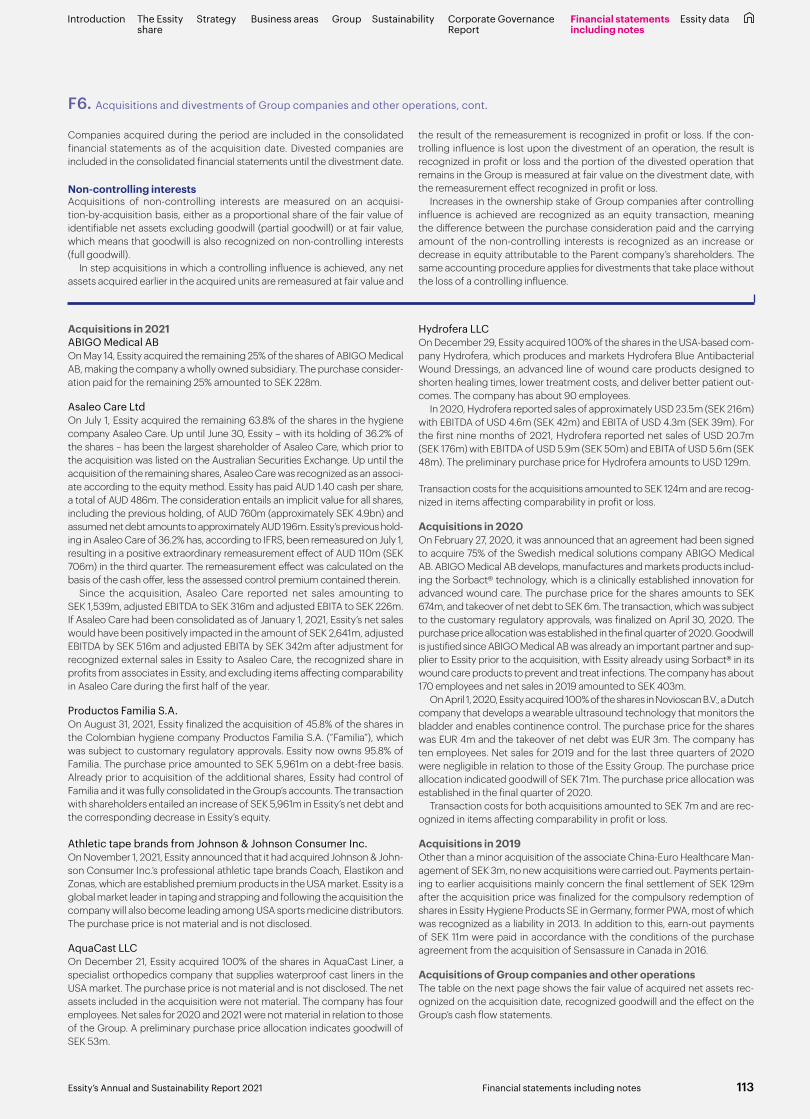
Acquisitions in 2021ABIGO Medical ABOn May 14, Essity acquired the remaining 25% of the shares of ABIGO Medical AB, making the company a wholly owned subsidiary. The purchase consider-ation paid for the remaining 25% amounted to SEK 228m.
Asaleo Care LtdOn July 1, Essity acquired the remaining 63.8% of the shares in the hygiene company Asaleo Care. Up until June 30, Essity – with its holding of 36.2% of the shares – has been the largest shareholder of Asaleo Care, which prior to the acquisition was listed on the Australian Securities Exchange. Up until the acquisition of the remaining shares, Asaleo Care was recognized as an associ-ate according to the equity method. Essity has paid AUD 1.40 cash per share, a total of AUD 486m. The consideration entails an implicit value for all shares, including the previous holding, of AUD 760m (approximately SEK 4.9bn) and assumed net debt amounts to approximately AUD 196m. Essity’s previous hold-ing in Asaleo Care of 36.2% has, according to IFRS, been remeasured on July 1, resulting in a positive extraordinary remeasurement effect of AUD 110m (SEK 706m) in the third quarter. The remeasurement effect was calculated on the basis of the cash offer, less the assessed control premium contained therein.
Since the acquisition, Asaleo Care reported net sales amounting to SEK 1,539m, adjusted EBITDA to SEK 316m and adjusted EBITA to SEK 226m. If Asaleo Care had been consolidated as of January 1, 2021, Essity’s net sales would have been positively impacted in the amount of SEK 2,641m, adjusted EBITDA by SEK 516m and adjusted EBITA by SEK 342m after adjustment for recognized external sales in Essity to Asaleo Care, the recognized share in profits from associates in Essity, and excluding items affecting comparability in Asaleo Care during the first half of the year.
Productos Familia S.A.On August 31, 2021, Essity finalized the acquisition of 45.8% of the shares in the Colombian hygiene company Productos Familia S.A. (“Familia”), which was subject to customary regulatory approvals. Essity now owns 95.8% of Familia. The purchase price amounted to SEK 5,961m on a debt-free basis. Already prior to acquisition of the additional shares, Essity had control of Familia and it was fully consolidated in the Group’s accounts. The transaction with shareholders entailed an increase of SEK 5,961m in Essity’s net debt and the corresponding decrease in Essity’s equity.
Athletic tape brands from Johnson & Johnson Consumer Inc.On November 1, 2021, Essity announced that it had acquired Johnson & John-son Consumer Inc.’s professional athletic tape brands Coach, Elastikon and Zonas, which are established premium products in the USA market. Essity is a global market leader in taping and strapping and following the acquisition the company will also become leading among USA sports medicine distributors. The purchase price is not material and is not disclosed.
AquaCast LLCOn December 21, Essity acquired 100% of the shares in AquaCast Liner, a specialist orthopedics company that supplies waterproof cast liners in the USA market. The purchase price is not material and is not disclosed. The net assets included in the acquisition were not material. The company has four employees. Net sales for 2020 and 2021 were not material in relation to those of the Group. A preliminary purchase price allocation indicates goodwill of SEK 53m.
Hydrofera LLC On December 29, Essity acquired 100% of the shares in the USA-based com-pany Hydrofera, which produces and markets Hydrofera Blue Antibacterial Wound Dressings, an advanced line of wound care products designed to shorten healing times, lower treatment costs, and deliver better patient out-comes. The company has about 90 employees.
In 2020, Hydrofera reported sales of approximately USD 23.5m (SEK 216m) with EBITDA of USD 4.6m (SEK 42m) and EBITA of USD 4.3m (SEK 39m). For the first nine months of 2021, Hydrofera reported net sales of USD 20.7m (SEK 176m) with EBITDA of USD 5.9m (SEK 50m) and EBITA of USD 5.6m (SEK 48m). The preliminary purchase price for Hydrofera amounts to USD 129m.
Transaction costs for the acquisitions amounted to SEK 124m and are recog-nized in items affecting comparability in profit or loss.
Acquisitions in 2020On February 27, 2020, it was announced that an agreement had been signed to acquire 75% of the Swedish medical solutions company ABIGO Medical AB. ABIGO Medical AB develops, manufactures and markets products includ-ing the Sorbact® technology, which is a clinically established innovation for advanced wound care. The purchase price for the shares amounts to SEK 674m, and takeover of net debt to SEK 6m. The transaction, which was subject to the customary regulatory approvals, was finalized on April 30, 2020. The purchase price allocation was established in the final quarter of 2020. Goodwill is justified since ABIGO Medical AB was already an important partner and sup-plier to Essity prior to the acquisition, with Essity already using Sorbact® in its wound care products to prevent and treat infections. The company has about 170 employees and net sales in 2019 amounted to SEK 403m.
On April 1, 2020, Essity acquired 100% of the shares in Novioscan B.V., a Dutch company that develops a wearable ultrasound technology that monitors the bladder and enables continence control. The purchase price for the shares was EUR 4m and the takeover of net debt was EUR 3m. The company has ten employees. Net sales for 2019 and for the last three quarters of 2020 were negligible in relation to those of the Essity Group. The purchase price allocation indicated goodwill of SEK 71m. The purchase price allocation was established in the final quarter of 2020.
Transaction costs for both acquisitions amounted to SEK 7m and are rec-ognized in items affecting comparability in profit or loss.
Acquisitions in 2019Other than a minor acquisition of the associate China-Euro Healthcare Man-agement of SEK 3m, no new acquisitions were carried out. Payments pertain-ing to earlier acquisitions mainly concern the final settlement of SEK 129m after the acquisition price was finalized for the compulsory redemption of shares in Essity Hygiene Products SE in Germany, former PWA, most of which was recognized as a liability in 2013. In addition to this, earn-out payments of SEK 11m were paid in accordance with the conditions of the purchase agreement from the acquisition of Sensassure in Canada in 2016.
Acquisitions of Group companies and other operations The table on the next page shows the fair value of acquired net assets rec-ognized on the acquisition date, recognized goodwill and the effect on the Group’s cash flow statements.
Companies acquired during the period are included in the consolidated financial statements as of the acquisition date. Divested companies are included in the consolidated financial statements until the divestment date.
Non-controlling interestsAcquisitions of non-controlling interests are measured on an acquisi-tion-by-acquisition basis, either as a proportional share of the fair value of identifiable net assets excluding goodwill (partial goodwill) or at fair value, which means that goodwill is also recognized on non-controlling interests (full goodwill).
In step acquisitions in which a controlling influence is achieved, any net assets acquired earlier in the acquired units are remeasured at fair value and
the result of the remeasurement is recognized in profit or loss. If the con-trolling influence is lost upon the divestment of an operation, the result is recognized in profit or loss and the portion of the divested operation that remains in the Group is measured at fair value on the divestment date, with the remeasurement effect recognized in profit or loss.
Increases in the ownership stake of Group companies after controlling influence is achieved are recognized as an equity transaction, meaning the difference between the purchase consideration paid and the carrying amount of the non-controlling interests is recognized as an increase or decrease in equity attributable to the Parent company’s shareholders. The same accounting procedure applies for divestments that take place without the loss of a controlling influence.
F6. Acquisitions and divestments of Group companies and other operations, cont.
113Essity’s Annual and Sustainability Report 2021 Financial statements including notes
Introduction The Essity share
Strategy Business areas SustainabilityGroup Corporate Governance Report
Financial statementsincluding notes
Essity data

F6. Acquisitions and divestments of Group companies and other operations, cont.
Acquisition balance sheetsSEKm 2021 2020 2019
Intangible assets 2,541 236 –Property, plant and equipment 1,074 92 –Other non-current assets – – 3Operating assets 1,178 184 –Cash and cash equivalents 185 47 –Provisions and other non-current liabilities –479 –69 –Net debt excluding cash and cash equivalents –1,425 –79 –Operating liabilities –658 –76 –Fair value of net assets 2,416 335 3Goodwill 3,398 603 –Non-transferred consideration, recognized as a liability 69 –225 –Consolidated value of share in associated companies –565 – –Revaluation of previously owned shares in associated companies –706 – –Non-controlling interests 1,919 1 –Acquisition of non-controlling interests recognized in equity attributable to owners of the Parent company 4,042 1 –Consideration transferred 10,573 715 3Consideration transferred –10,573 –715 –3Earn-out payment – – –22Settled debt pertaining to acquisitions in earlier years – – –118Cash and cash equivalents in acquired companies 185 47 –
CF Effect on Group’s cash and cash equivalents, acquisitions of Group companies and other operations –10,388 –668 –143 of which recognized as acquisitions in investing activities –4,427 –668 –143 of which recognized as acquisitions of non-controlling
interests in financing activities –5,9611) – –Acquired net debt excluding cash and cash equivalents –1,425 –79 –
OCF Acquisitions of Group companies and other opera-tions during the period, including net debt assumed –11,813 –747 –143
1) Relates to the acquisition of 45.8% of the shares in the Colombian hygiene company Productos Familia S.A. (“Familia”).
Specification of preliminary acquisition balance sheet 2021SEKm Asaleo Hydrofera Other Total
Intangible assets 1,822 495 224 2,541Property, plant and equipment 1,041 33 – 1,074Operating assets 1,092 82 4 1,178Cash and cash equivalents 159 24 2 185Provisions and other non-current liabilities –467 – –12 –479Net debt excluding cash and cash equivalents –1,416 –9 – –1,425Operating liabilities –612 –45 –1 –658Fair value of net assets 1,619 580 217 2,416Goodwill 2,756 589 53 3,398Non-transferred consideration, recognized as a liability – –141 210 69Consolidated value of share in associated companies –565 – – –565Revaluation of previously owned share –706 – – –706Non-controlling interests – – 1,919 1,919Acquisition of non-controlling interests recognized in equity attributable to owners of the Parent company – – 4,042 4,042Consideration transferred 3,104 1,028 6,441 10,573Consideration transferred –3,104 –1,028 –6,441 –10,573Cash and cash equivalents in acquired companies 159 24 2 185
CF Effect on Group’s cash and cash equiva-lents, acquisitions of Group companies and other operations –2,945 –1,004 –6,439 –10,388 of which recognized as acquisitions in investing
activities –2,945 –1,004 –478 –4,427 of which recognized as acquisitions of non-
controlling interests in financing activities – – –5,961 –5,961Acquired net debt excluding cash and cash equivalents –1,416 –9 – –1,425
OCF Acquisitions of Group companies and other operations during the period, including net debt assumed –4,361 –1,013 –6,439 –11,813
Adjustment of preliminary acquisition balance sheets 2021A purchase price allocation is considered preliminary until it is confirmed. A preliminary purchase price allocation is changed as soon as new informa-tion regarding assets/liabilities on the acquisition date is obtained, although the preliminary purchase price allocation must be confirmed not later than one year from the date of the acquisition. The preliminary purchase price allocations for Asaleo, Hydrofera and AquaCast Liner are preliminary and may be changed.
Divestments of Group companies and other operationsEssity has chosen to deconsolidate its 50% shareholding in ProNARO as of January 1, 2021 and instead recognize the company according to the equity method. Essity has previously recognized ProNARO as a joint operation according to the proportional method. The reason for this change is that ProNARO’s operation, the purpose of which is to supply Essity and its part-ner Sappi with raw materials at a lower cost by pooling timber purchases, has become more independent as the company now also sells timber to external customers. ProNARO’s recognized net sales for 2020 amounted to SEK 435m and EBITA to SEK 0m in Essity’s accounts.
In conjunction with the process concerning the acquisition of the remain-ing 25% of the shares in ABIGO Medical AB, in July 2021 Essity – in accor-dance with the terms of the agreement – divested ABIGO Medical’s pharma operations to the company’s founder Jan G. Smith for SEK 32m. In July 2021, Essity received SEK 18m in payment for previously unpaid purchase consid-eration from the divestment in 2020 of its 49% stake in Sancella Tunisia, and SEK 8m in payment for the receivable on the sales proceeds concerning the divestment of a minor operation in Medical Solutions in Brazil in 2019.
In 2021, accumulated negative translation differences of a total of SEK 60m were recirculated to profit or loss in conjunction with the revalua-tion of Essity’s previously recognized holding of 36.2% upon acquisition of Asaleo Care and the concluded liquidation of Essity’s hygiene operation in the Philippines.
The capital gain excluding reclassification of realized translation differ-ences for all divestments amounts to SEK 39m in 2021. Including reclassifi-cation of realized negative translation differences totaling SEK 60m for liqui-dated Group companies and the previous holding of 36.2% in the associate Asaleo Care, the net loss amounts to SEK 21m.
In 2020, Essity divested its share of 49% in Sancella Tunisia, a share of its Baby Care operation in Russia, a minor operation included in the Abigo acquisition, and discontinued its previously closed operation in Morocco and India.
In 2019, Essity divested its holding in the jointly owned company SCA Yildiz in Turkey and a minor operation in Medical Solutions in Brazil. Assets and liabilities included in divestments of Group companies and other operationsSEKm 2021 2020 2019
Intangible assets 2 38 59
Property, plant and equipment – 129 130
Other non-current assets –1 24 1
Operating assets 33 322 93Cash and cash equivalents 44 38 0Net debt excluding cash and cash equivalents –15 –284 –215Other non-current liabilities – – –7Operating liabilities –68 –268 –87Non-controlling interests – 57 27Gain/loss on sale1) 39 65 19Compensation received 34 121 20Less:Receivable for unpaid purchase consideration – – –15Financial receivable for unpaid purchase consideration – –18 –Cash and cash equivalents in divested companies –44 –38 0Add:Payment of receivable for previously unpaid purchase consideration 8 – –Payment of financial receivable for previously unpaid purchase consideration 18 – –
CF Impact on Group’s cash and cash equivalents, divestments of Group companies and other operations 16 65 5Less:Payment of financial receivable for previously unpaid purchase consideration –18 – –Add:Financial receivable for unpaid purchase consideration – 18 –Divested net debt excluding cash and cash equivalents 15 284 215
OCF Divestments of Group companies and other operations during the period, including net debt transferred and financial receivable for unpaid purchase consideration 13 367 220
1) Excluding reversal of realized translation differences in divested companies to profit or loss. Gain/loss on divestments is included in items affecting comparability in profit or loss.
114 Essity’s Annual and Sustainability Report 2021Financial statements including notes
Introduction The Essity share
Strategy Business areas SustainabilityGroup Corporate Governance Report
Financial statementsincluding notes
Essity data

G. Other
G1. Non-current assets held for sale
AP Accounting principles Assets are classified as held for sale if their value, within one year, is expected to be recovered through a sale and not through continued use in the opera-tions. On the reclassification date, the assets and liabilities are measured at the lower of fair value minus selling costs and the carrying amount. The assets are no longer depreciated after reclassification. Any gain from remeasurement is limited to the amount equivalent to previously made impairment charges. Gains and losses recognized on remeasurement and divestment are recog-nized in profit or loss for the period.
When an independent business segment or a significant operation within a geographic area is divested, it is classified as a discontinued operation. The divestment date, or the point in time when the operation fulfills the criteria for classification as held for sale, determines when the operation should be classified as a discontinued operation.
Profit or loss after tax from discontinued operations is recognized on a separate line in the income statement. The income statement is adjusted for the comparative period as though the discontinued operation had already been disposed of at the start of the comparative period.
Non-current assets held for sale and discontinued operationsSEKm 2021 2020 2019
Buildings – – 28Land – – 14
BS Total – – 42
Non-current assets held for sale are attributable to:• 2019: closure of a production plant in the USA
G2. Leases
AP Accounting principles
When a contract is signed it is assessed if the contract is or contains a lease. A contract is or contains a lease if:• it contains an identified asset• Essity is entitled to essentially all economic benefits arising from the use
of the identified asset• Essity is entitled to control the use of the asset
If any of the above conditions are not met, the contract is not regarded as a lease or containing a lease and is therefore classified as a service contract.
On the commencement date of the lease, meaning when the asset becomes available for use by Essity, a right-of-use asset and a financial lia-bility are recognized in the balance sheet.
The right-of-use asset is measured at cost and includes the following:• the value of the amount of the lease liability• lease payments made on or before the commencement date, after
deductions for any benefits received in conjunction with signing the lease.• initial direct fees• an estimate of expenses expected to be paid to restore the asset to the
condition as stipulated in the terms of the lease
The right-of-use asset is recognized in the balance sheet under the heading Property, plant and equipment and is depreciated on a straight-line basis over the shorter period of the asset’s anticipated useful life and the lease term. The lease term is assessed on the basis of the length of the underlying contract taking into consideration the cancellation and renewal options.
The lease liability is measured at the present value of the following lease payments:• fixed fees, less any incentive receivables• variable lease payments due to an index or rate• amounts expected to be paid in accordance with residual value guar-
antees• the exercise price for a purchase option, if Essity is reasonably certain of
exercising the option• financial penalties to be paid on termination of the lease, if the lease term
reflects that Essity will utilize this option
Lease payments are normally discounted using Essity’s incremental borrow-ing rate as the implicit rate of the lease cannot be readily determined in most cases. The incremental borrowing rate used is determined on the basis of the contract currency of the agreement and the length of the lease.
The lease liabilities are recognized under the headings Non-current finan-cial liabilities or Current financial liabilities. Lease liabilities are measured at amortized cost according to the effective interest method. The liability is remeasured when future payments are amended by index or by other means, such as a new assessment of future residual value commitments, or the exer-cise of purchase, renewal or cancellation options. When the lease liability is remeasured as described above, a corresponding adjustment of the value of the right-of-use asset is made. When making lease payments, the contribu-tion is allocated between interest expense and repayment of the lease liability. In the consolidated cash flow statement, payments pertaining to the amor-tization of lease liability are recognized in financing activities and payments pertaining to interest expenses are recognized as interest paid. In profit or loss, depreciation of the right-of-use asset is recognized in operating profit while interest expense is recognized in financial expenses.
Essity has decided to apply the exemption rules for short-term leases and leases where the underlying asset has a low value. These leases are not included in the right-of-use asset or the liability. Lease payments for these contracts are expensed on a straight-line basis over the lease term.
KAA Key assessments and assumptions
Assessments and assumptions must be used when reporting leases in accordance with IFRS 16 Leases. The two most significant assessments concern the length of the lease term and the discount rate to be used. The implicit rate of the leases cannot be readily determined and lease payments are therefore discounted over the expected lease term using Essity’s incre-mental borrowing rate. The incremental borrowing rate corresponds to what Essity would need to pay to use a loan to finance the purchase of an equivalent asset for a similar duration in the contract currency of the lease. The duration of the lease is determined as the non-cancellable lease term together with periods that may be covered by an option to extend a lease if it is reasonably certain that the contract will be renewed and periods covered by an option to terminate the lease if it is reasonably certain that a possibility to cancel the lease will not be utilized. When assessing if it is reasonably certain that a renewal option or cancellation option will be used, all relevant facts and circumstances that create economic incentives or deterrents are taken into account. The assessment of the lease term is reviewed in cases where facts and circumstances have significantly changed.
Essity enters into leases on a continuous basis for office buildings, distribu-tion centers and vehicles, such as trucks, forklifts and passenger cars.
Lease terms for properties are generally between 3–15 years, while lease terms for vehicles are generally between 3–5 years. Essity also has leases with a shorter lease term than 12 months and leases pertaining to assets of low value, such as office equipment. For these, Essity has chosen to apply the exemption rules in IFRS 16 Leases, meaning the value of these contracts is not part of the right-of-use asset or lease liability. There are no significant extension periods not taken into account in the lease liability.
115Essity’s Annual and Sustainability Report 2021 Financial statements including notes
Introduction The Essity share
Strategy Business areas SustainabilityGroup Corporate Governance Report
Financial statementsincluding notes
Essity data
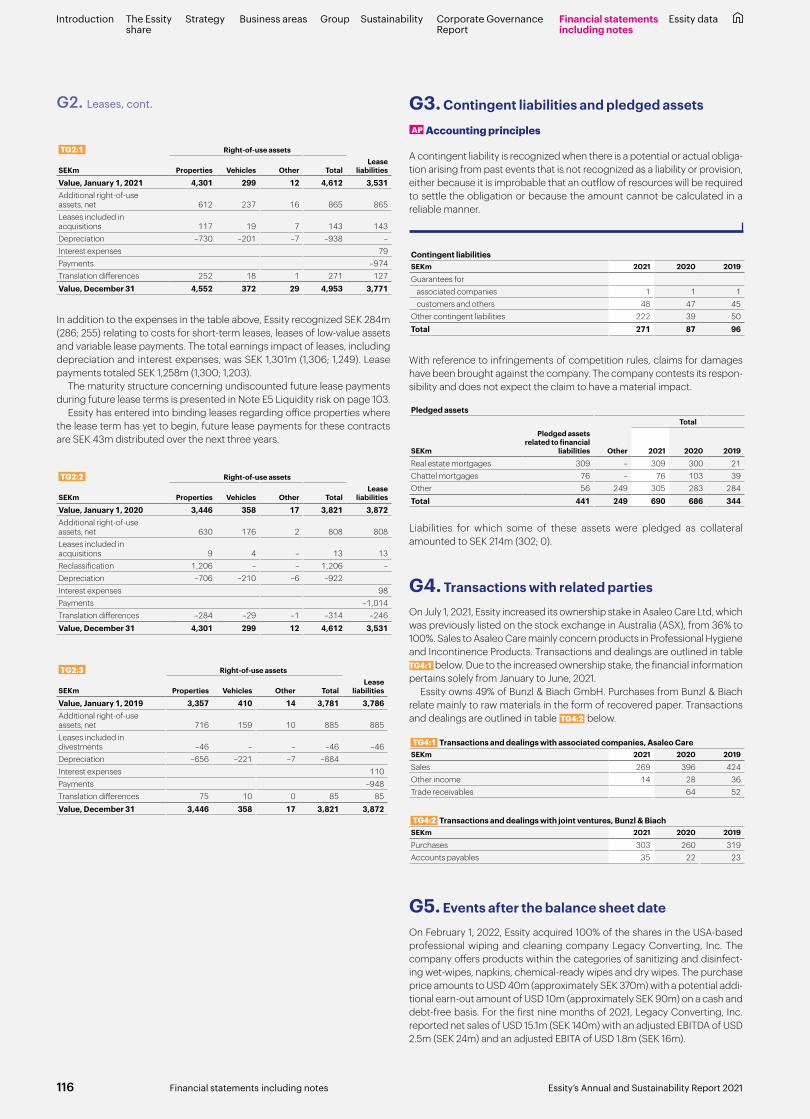
G3. Contingent liabilities and pledged assets
AP Accounting principles
A contingent liability is recognized when there is a potential or actual obliga-tion arising from past events that is not recognized as a liability or provision, either because it is improbable that an outflow of resources will be required to settle the obligation or because the amount cannot be calculated in a reliable manner.
Contingent liabilitiesSEKm 2021 2020 2019
Guarantees forassociated companies 1 1 1customers and others 48 47 45
Other contingent liabilities 222 39 50Total 271 87 96
With reference to infringements of competition rules, claims for damages have been brought against the company. The company contests its respon-sibility and does not expect the claim to have a material impact.
Pledged assets
Total
SEKm
Pledged assets related to financial
liabilities Other 2021 2020 2019
Real estate mortgages 309 – 309 300 21Chattel mortgages 76 – 76 103 39Other 56 249 305 283 284Total 441 249 690 686 344
Liabilities for which some of these assets were pledged as collateral amounted to SEK 214m (302; 0).
G4. Transactions with related parties
On July 1, 2021, Essity increased its ownership stake in Asaleo Care Ltd, which was previously listed on the stock exchange in Australia (ASX), from 36% to 100%. Sales to Asaleo Care mainly concern products in Professional Hygiene and Incontinence Products. Transactions and dealings are outlined in table TG4:1 below. Due to the increased ownership stake, the financial information pertains solely from January to June, 2021.
Essity owns 49% of Bunzl & Biach GmbH. Purchases from Bunzl & Biach relate mainly to raw materials in the form of recovered paper. Transactions and dealings are outlined in table TG4:2 below.
TG4:1 Transactions and dealings with associated companies, Asaleo CareSEKm 2021 2020 2019
Sales 269 396 424Other income 14 28 36Trade receivables 64 52
TG4:2 Transactions and dealings with joint ventures, Bunzl & BiachSEKm 2021 2020 2019
Purchases 303 260 319Accounts payables 35 22 23
G5. Events after the balance sheet date
On February 1, 2022, Essity acquired 100% of the shares in the USA-based professional wiping and cleaning company Legacy Converting, Inc. The company offers products within the categories of sanitizing and disinfect-ing wet-wipes, napkins, chemical-ready wipes and dry wipes. The purchase price amounts to USD 40m (approximately SEK 370m) with a potential addi-tional earn-out amount of USD 10m (approximately SEK 90m) on a cash and debt-free basis. For the first nine months of 2021, Legacy Converting, Inc. reported net sales of USD 15.1m (SEK 140m) with an adjusted EBITDA of USD 2.5m (SEK 24m) and an adjusted EBITA of USD 1.8m (SEK 16m).
TG2:1 Right-of-use assets
SEKm Properties Vehicles Other TotalLease
liabilities
Value, January 1, 2021 4,301 299 12 4,612 3,531Additional right-of-use assets, net 612 237 16 865 865Leases included in acquisitions 117 19 7 143 143Depreciation –730 –201 –7 –938 –Interest expenses 79Payments –974Translation differences 252 18 1 271 127Value, December 31 4,552 372 29 4,953 3,771
In addition to the expenses in the table above, Essity recognized SEK 284m (286; 255) relating to costs for short-term leases, leases of low-value assets and variable lease payments. The total earnings impact of leases, including depreciation and interest expenses, was SEK 1,301m (1,306; 1,249). Lease payments totaled SEK 1,258m (1,300; 1,203).
The maturity structure concerning undiscounted future lease payments during future lease terms is presented in Note E5 Liquidity risk on page 103.
Essity has entered into binding leases regarding office properties where the lease term has yet to begin, future lease payments for these contracts are SEK 43m distributed over the next three years.
TG2:2 Right-of-use assets
SEKm Properties Vehicles Other TotalLease
liabilities
Value, January 1, 2020 3,446 358 17 3,821 3,872Additional right-of-use assets, net 630 176 2 808 808Leases included in acquisitions 9 4 – 13 13Reclassification 1,206 – – 1,206 –Depreciation –706 –210 –6 –922Interest expenses 98Payments –1,014Translation differences –284 –29 –1 –314 –246Value, December 31 4,301 299 12 4,612 3,531
TG2:3 Right-of-use assets
SEKm Properties Vehicles Other TotalLease
liabilities
Value, January 1, 2019 3,357 410 14 3,781 3,786Additional right-of-use assets, net 716 159 10 885 885Leases included in divestments –46 – – –46 –46Depreciation –656 –221 –7 –884Interest expenses 110Payments –948Translation differences 75 10 0 85 85Value, December 31 3,446 358 17 3,821 3,872
G2. Leases, cont.
116 Essity’s Annual and Sustainability Report 2021Financial statements including notes
Introduction The Essity share
Strategy Business areas SustainabilityGroup Corporate Governance Report
Financial statementsincluding notes
Essity data
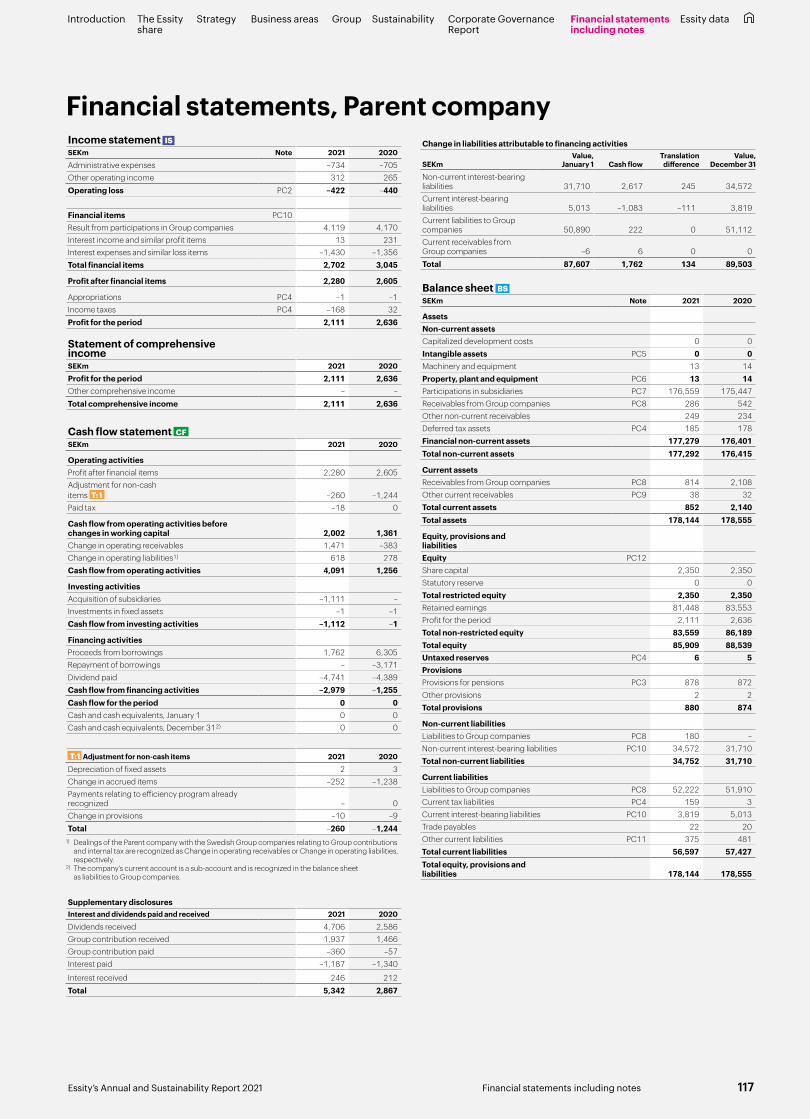
Financial statements, Parent companyIncome statement IS SEKm Note 2021 2020
Administrative expenses –734 –705Other operating income 312 265Operating loss PC2 –422 –440
Financial items PC10Result from participations in Group companies 4,119 4,170Interest income and similar profit items 13 231Interest expenses and similar loss items –1,430 –1,356Total financial items 2,702 3,045
Profit after financial items 2,280 2,605
Appropriations PC4 –1 –1Income taxes PC4 –168 32Profit for the period 2,111 2,636
Statement of comprehensive incomeSEKm 2021 2020
Profit for the period 2,111 2,636Other comprehensive income – –Total comprehensive income 2,111 2,636
Cash flow statement CF SEKm 2021 2020
Operating activitiesProfit after financial items 2,280 2,605Adjustment for non-cash items T:1 –260 –1,244Paid tax –18 0
Cash flow from operating activities before changes in working capital 2,002 1,361Change in operating receivables 1,471 –383Change in operating liabilities1) 618 278Cash flow from operating activities 4,091 1,256
Investing activitiesAcquisition of subsidiaries –1,111 –Investments in fixed assets –1 –1Cash flow from investing activities –1,112 –1
Financing activitiesProceeds from borrowings 1,762 6,305Repayment of borrowings – –3,171Dividend paid –4,741 –4,389Cash flow from financing activities –2,979 –1,255Cash flow for the period 0 0Cash and cash equivalents, January 1 0 0Cash and cash equivalents, December 312) 0 0
T:1 Adjustment for non-cash items 2021 2020
Depreciation of fixed assets 2 3Change in accrued items –252 –1,238Payments relating to efficiency program already recognized – 0Change in provisions –10 –9Total –260 –1,244
1) Dealings of the Parent company with the Swedish Group companies relating to Group contributions and internal tax are recognized as Change in operating receivables or Change in operating liabilities, respectively.
2) The company’s current account is a sub-account and is recognized in the balance sheet as liabilities to Group companies.
Supplementary disclosuresInterest and dividends paid and received 2021 2020
Dividends received 4,706 2,586Group contribution received 1,937 1,466Group contribution paid –360 –57Interest paid –1,187 –1,340
Interest received 246 212Total 5,342 2,867
Change in liabilities attributable to financing activities
SEKmValue,
January 1 Cash flowTranslation difference
Value, December 31
Non-current interest-bearing liabilities 31,710 2,617 245 34,572Current interest-bearing liabilities 5,013 –1,083 –111 3,819Current liabilities to Group companies 50,890 222 0 51,112Current receivables from Group companies –6 6 0 0Total 87,607 1,762 134 89,503
Balance sheet BS SEKm Note 2021 2020
AssetsNon-current assetsCapitalized development costs 0 0Intangible assets PC5 0 0Machinery and equipment 13 14Property, plant and equipment PC6 13 14Participations in subsidiaries PC7 176,559 175,447Receivables from Group companies PC8 286 542Other non-current receivables 249 234Deferred tax assets PC4 185 178Financial non-current assets 177,279 176,401Total non-current assets 177,292 176,415
Current assetsReceivables from Group companies PC8 814 2,108Other current receivables PC9 38 32Total current assets 852 2,140Total assets 178,144 178,555
Equity, provisions and liabilitiesEquity PC12Share capital 2,350 2,350Statutory reserve 0 0Total restricted equity 2,350 2,350Retained earnings 81,448 83,553Profit for the period 2,111 2,636Total non-restricted equity 83,559 86,189Total equity 85,909 88,539Untaxed reserves PC4 6 5ProvisionsProvisions for pensions PC3 878 872Other provisions 2 2Total provisions 880 874
Non-current liabilitiesLiabilities to Group companies PC8 180 –Non-current interest-bearing liabilities PC10 34,572 31,710Total non-current liabilities 34,752 31,710
Current liabilitiesLiabilities to Group companies PC8 52,222 51,910Current tax liabilities PC4 159 3Current interest-bearing liabilities PC10 3,819 5,013Trade payables 22 20Other current liabilities PC11 375 481Total current liabilities 56,597 57,427Total equity, provisions and liabilities 178,144 178,555
117Essity’s Annual and Sustainability Report 2021 Financial statements including notes
Introduction The Essity share
Strategy Business areas SustainabilityGroup Corporate Governance Report
Financial statementsincluding notes
Essity data
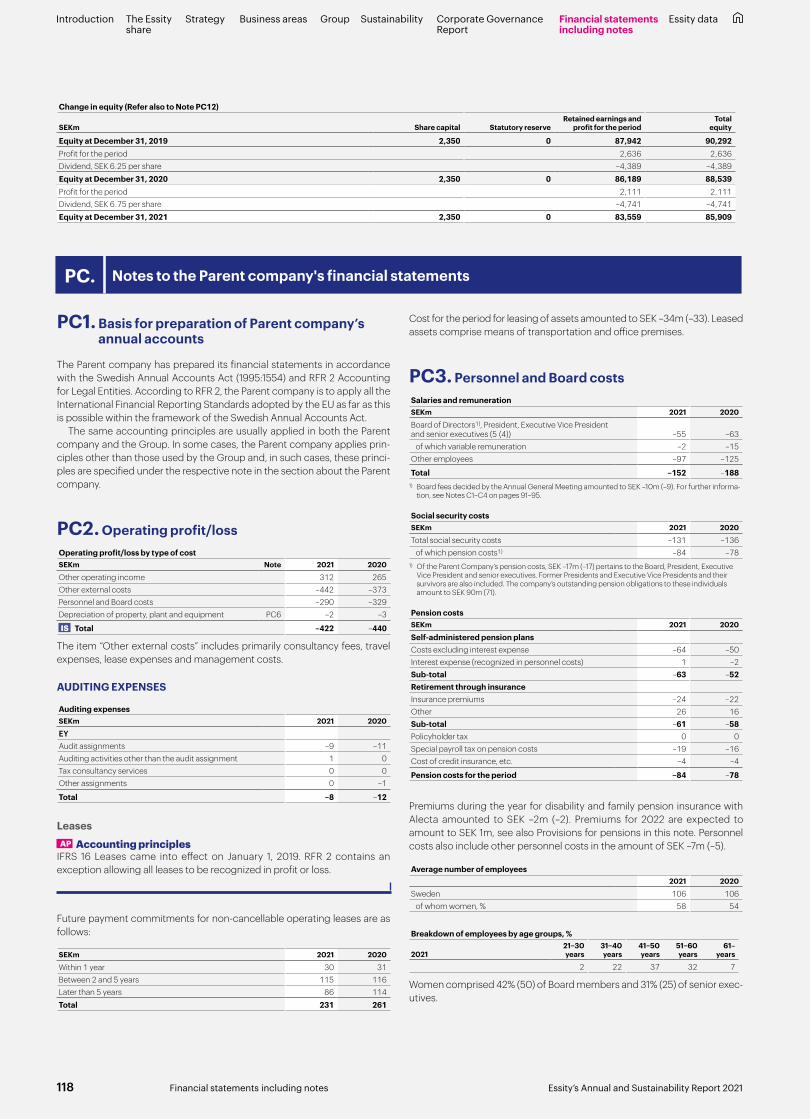
PC1. Basis for preparation of Parent company’s annual accounts
The Parent company has prepared its financial statements in accordance with the Swedish Annual Accounts Act (1995:1554) and RFR 2 Accounting for Legal Entities. According to RFR 2, the Parent company is to apply all the International Financial Reporting Standards adopted by the EU as far as this is possible within the framework of the Swedish Annual Accounts Act.
The same accounting principles are usually applied in both the Parent company and the Group. In some cases, the Parent company applies prin-ciples other than those used by the Group and, in such cases, these princi-ples are specified under the respective note in the section about the Parent company.
PC2. Operating profit/lossOperating profit/loss by type of costSEKm Note 2021 2020
Other operating income 312 265Other external costs –442 –373Personnel and Board costs –290 –329Depreciation of property, plant and equipment PC6 –2 –3
IS Total –422 –440
The item “Other external costs” includes primarily consultancy fees, travel expenses, lease expenses and management costs.
AUDITING EXPENSES
Auditing expensesSEKm 2021 2020
EYAudit assignments –9 –11Auditing activities other than the audit assignment 1 0Tax consultancy services 0 0Other assignments 0 –1
Total –8 –12
Leases AP Accounting principlesIFRS 16 Leases came into effect on January 1, 2019. RFR 2 contains an exception allowing all leases to be recognized in profit or loss.
Future payment commitments for non-cancellable operating leases are as follows:
SEKm 2021 2020
Within 1 year 30 31Between 2 and 5 years 115 116Later than 5 years 86 114Total 231 261
Cost for the period for leasing of assets amounted to SEK –34m (–33). Leased assets comprise means of transportation and office premises.
PC3. Personnel and Board costsSalaries and remunerationSEKm 2021 2020
Board of Directors1), President, Executive Vice President and senior executives (5 (4)) –55 –63 of which variable remuneration –2 –15Other employees –97 –125
Total –152 –1881) Board fees decided by the Annual General Meeting amounted to SEK –10m (–9). For further informa-
tion, see Notes C1–C4 on pages 91–95.
Social security costsSEKm 2021 2020
Total social security costs –131 –136 of which pension costs1) –84 –78
1) Of the Parent Company’s pension costs, SEK –17m (–17) pertains to the Board, President, Executive Vice President and senior executives. Former Presidents and Executive Vice Presidents and their survivors are also included. The company’s outstanding pension obligations to these individuals amount to SEK 90m (71).
Pension costsSEKm 2021 2020
Self-administered pension plansCosts excluding interest expense –64 –50Interest expense (recognized in personnel costs) 1 –2Sub-total –63 –52Retirement through insuranceInsurance premiums –24 –22Other 26 16Sub-total –61 –58Policyholder tax 0 0Special payroll tax on pension costs –19 –16Cost of credit insurance, etc. –4 –4
Pension costs for the period –84 –78
Premiums during the year for disability and family pension insurance with Alecta amounted to SEK –2m (–2). Premiums for 2022 are expected to amount to SEK 1m, see also Provisions for pensions in this note. Personnel costs also include other personnel costs in the amount of SEK –7m (–5).
Average number of employees2021 2020
Sweden 106 106 of whom women, % 58 54
Breakdown of employees by age groups, %
202121–30 years
31–40 years
41–50 years
51–60 years
61– years
2 22 37 32 7
Women comprised 42% (50) of Board members and 31% (25) of senior exec-utives.
PC. Notes to the Parent company's financial statements
Change in equity (Refer also to Note PC12)
SEKm Share capital Statutory reserveRetained earnings and
profit for the periodTotal
equity
Equity at December 31, 2019 2,350 0 87,942 90,292Profit for the period 2,636 2,636Dividend, SEK 6.25 per share –4,389 –4,389Equity at December 31, 2020 2,350 0 86,189 88,539Profit for the period 2,111 2,111Dividend, SEK 6.75 per share –4,741 –4,741Equity at December 31, 2021 2,350 0 83,559 85,909
118 Essity’s Annual and Sustainability Report 2021Financial statements including notes
Introduction The Essity share
Strategy Business areas SustainabilityGroup Corporate Governance Report
Financial statementsincluding notes
Essity data

PRI PensionsPension liabilities pertaining to PRI pensions have been secured through a common Swedish Essity pension fund. The market value of the Parent com-pany’s portion of the foundation’s assets at December 31, 2021, amounted to SEK 281m (267). In 2021, compensation was received in the amount of SEK 6m (6). The capital value of the pension obligations at December 31, 2021 amounted to SEK 191m (182). Pension payments of SEK –7m (–6) were made in 2021. In 2021, the assets exceeded pension obligations by SEK 90m (85).
Other pension obligationsThe Group’s Note C2 Remuneration of senior executives on page 91 describes the other defined benefit pension plans of the Parent company. The table below shows the change between the years.
Capital value of pension obligations relating to self-administered pension plansSEKm 2021 2020
Provisions under Pension Obligations Vesting Act 771 777Provisions outside the rules of the Pension Obligations Vesting Act 107 95
BS Value, December 31 878 872
Capital value of pension obligations under the Pension Obligations Vesting ActSEKm 2021 2020
Value, January 1 777 782Costs excluding interest expense 42 38Interest expense (recognized in personnel costs) –1 2Payment of pensions –47 –45
BS Value, December 31 771 777
Capital value of pension obligations outside the rules of the Pension Obligations Vesting ActSEKm 2021 2020
Value, January 1 95 93Costs excluding interest expense 21 12Interest expense (recognized in personnel costs) 0 0Payment of pensions –9 –10
BS Value, December 31 107 95
Out of the total pension liability in 2021 amounting to SEK 878m, SEK 107m (95) comprises a direct pension liability secured via endowment insurances. The direct pension liability is not secured in accordance with the Pension Obligations Vesting Act. Endowment insurances are reported as other non-current receivables in the balance sheet. For the remaining portion of the pension liability, external actuaries have carried out capital value calcu-lations pursuant to the provisions of the Pension Obligations Vesting Act. The discount rate is –0.1% (0.3). The defined benefit obligations are calcu-lated based on salary levels valid on the respective balance sheet dates. Next year’s expected payments for the above defined benefit pension plans amount to SEK 60m.
PC4. Income taxes
AP Accounting principlesDue to the links between accounting and taxation, the deferred tax liability on untaxed reserves is recognized in the company’s annual accounts as a component of untaxed reserves.
Tax expenseTax expense (+), tax income (–)SEKm 2021 2020
Deferred tax –7 –46Current tax 175 14
IS Total 168 –32
Explanation of tax expense The difference between the recognized tax expense and expected tax expense is explained below. The expected tax expense is calculated based on profit before tax multiplied by the current tax rate.
2021 2020Reconciliation SEKm % SEKm %
IS Profit before tax 2,279 2,604
IS Tax expense/income 168 7.4 –32 –1.2Expected tax 469 20.6 557 21.4
Difference –301 –13.2 –589 –22.6
The difference is due to:Taxes related to prior periods 0 0.0 0 0.0Non-taxable dividends from subsidiaries –969 –42.5 –555 –21.3Non-taxable Group contributions from Group companies1) 0 0.0 –283 –10.9Non-deductible Group contributions to Group companies1) 385 16.9 – –Non-deductible interest expenses 282 12.3 234 9.0Other non-taxable/non-deductible items 1 0.1 15 0.6Changed tax rate 0 0.0 0 0.0Total –301 –13.2 –589 –22.6
1) Non-taxable and non-deductible Group contributions relate to repayment from/to Group companies amounting to 79.4% (78.6) of the Group contribution.
The Parent company participates in the Group’s tax pooling arrangement and as of 2021, pays the majority of the Group’s total Swedish taxes. These are recognized as Group contributions paid and received in profit or loss. The net of paid and received Group contributions per Group company amounts to 20.6% (21.4) and represents the respective Group company’s share of the Group’s total tax expense. The gross amounts are recognized as taxable income and deductible expenses and the repayable amounts are recognized as non-taxable income and non-deductible expenses.
Current tax expense (+), tax income (–)SEKm 2021 2020
Income tax for the period 174 0Adjustments for prior periods 1 14Total 175 14
Current tax liability (+), tax asset (–)SEKm 2021 2020
Value, January 1 3 –11Current tax expense 175 14Paid tax –19 0
BS Value, December 31 159 3
Deferred tax expense (+), tax income (–)SEKm 2021 2020
Changes in temporary differences –6 –33Adjustments for prior periods –1 –13Total –7 –46
Deferred tax assets (–)
SEKmValue,
January 1Deferred tax
expenseValue,
December 31
Provisions for pensions –179 –1 –180Other 1 –6 –5
BS Total –178 –7 –185
Appropriations and untaxed reservesAccumulated depreciation in excess of plan totaling SEK 6m (5) is included in the Parent company’s untaxed reserves.
PC3. Personnel and Board costs, cont.
Provisions for pensions AP Accounting principlesThe Parent company’s provisions for pensions are secured by the regulations in the Pension Obligations Vesting Act (Tryggandelagen) and via endowment insurances. Recognition complies with the simplification rule for defined benefit pension plans in accordance with the voluntary exception in RFR 2 regarding IAS 19. The main difference compared with IAS 19 is that Swedish GAAP disregards future increases in salaries and pensions when calculating the present value of the pension obligation. This present value includes, however, a special reserve for future payments of pension supplements indexed for inflation. Both defined contribution and defined benefit plans exist in the Parent company.
119Essity’s Annual and Sustainability Report 2021 Financial statements including notes
Introduction The Essity share
Strategy Business areas SustainabilityGroup Corporate Governance Report
Financial statementsincluding notes
Essity data

PC5. Intangible assetsCapitalized development costsSEKm 2021 2020
Accumulated costs 0 0Accumulated amortization 0 0Residual value according to plan 0 0
Value, January 1 0 0Investments – –Sales and disposals – –Amortization for the period – –
BS Value, December 31 0 0
PC6. Property, plant and equipment
AP Accounting principlesEssity Aktiebolag’s property, plant and equipment are recognized in accor-dance with the Group’s accounting principles.
EquipmentSEKm 2021 2020
Accumulated costs 23 22Accumulated depreciation –10 –8Residual value according to plan 13 14
Value, January 1 14 16Investments 1 1Sales and disposals 0 0Depreciation for the period –2 –3
BS Value, December 31 13 14
PC7. Participations in subsidiaries
AP Accounting principlesEssity Aktiebolag recognizes all holdings in subsidiaries at cost after deduc-tion of any accumulated impairment losses. Impairment testing occurs annually.
Participations in subsidiariesSubsidiaries
SEKm 2021 2020
Accumulated costs 176,612 175,500Accumulated impairment –53 –53Carrying amount 176,559 175,447
Value, January 1 175,447 175,448Investments 1,391 –Divestments –279 –8Reversal of impairment – 7
BS TPC7:1 Value, December 31 176,559 175,447
During the fiscal year, the Parent company made capital contributions amounting to SEK 1,370m to Essity Group Holding B.V., of which SEK 279m relates to 25% of the shares in Essity Italy S.p.A. In addition, SEK 21m was invested in Essity Capital B.V.
TPC7:1 Essity Aktiebolag’s holdings of shares and participations in subsidiaries, December 31, 2021Company name Corp. Reg. No. Domicile No. of shares Share of equity, % Carrying amount, SEKm
Swedish subsidiaries:Fastighets- och Bostadsaktiebolaget FOBOF 556047-8520 Stockholm, Sweden 1,000 100 0Essity Försäkringsaktiebolag 516401-8540 Stockholm, Sweden 140,000 100 14Essity TC AB 556643-7298 Stockholm, Sweden 1,000 100 826
Foreign subsidiaries:Essity Group Holding B.V. 33181970 Amsterdam, Netherlands 246,347 100 175,698Essity Capital B.V. 82525897 Amsterdam, Netherlands 2,000,000 100 21Total carrying amount of subsidiaries 176,559
German Group companies that are subject to disclosure exemptions The following German companies are fully consolidated and subject to dis-closure exemptions pursuant to Sec. 264 para. 3 of the German Commercial Code (“HGB”).
1. Essity GmbH, domicile in Mannheim, Germany2. Essity Holding GmbH, domicile in Ismaning, Germany3. Essity Operations Neuss GmbH, domicile in Neuss, Germany4. Essity Operations Mannheim GmbH, domicile in Mannheim, Germany5. Essity Operations Mainz-Kostheim GmbH, domicile in Wiesbaden,
Germany
6. Essity Professional Hygiene Germany GmbH, domicile in Mannheim, Germany
7. Essity Germany GmbH, domicile in Mannheim, Germany8. Essity Operations Witzenhausen GmbH, domicile in Witzenhausen,
Germany9. Essity Hygiene Holding GmbH, domicile in Mannheim, Germany10. BSN medical GmbH, domicile in Hamburg, Germany11. BSN medical IP GmbH, domicile in Hamburg, Germany12. BSN-Jobst GmbH, domicile in Emmerich am Rhein, Germany
120 Essity’s Annual and Sustainability Report 2021Financial statements including notes
Introduction The Essity share
Strategy Business areas SustainabilityGroup Corporate Governance Report
Financial statementsincluding notes
Essity data

PC9. Other current receivablesOther current receivablesSEKm 2021 2020
TPC9:1 Prepaid expenses and accrued income 23 23Other receivables 15 9
BS Total 38 32
TPC9:1 Prepaid expenses and accrued incomePrepaid lease of premises 8 8Prepaid financial expenses 1 1Prepaid insurance premiums 0 0Other items 14 14Total 23 23
PC10. Financial instruments
AP Accounting principlesThe Parent company’s financial instruments are recognized in accordance with the Group’s accounting principles. Refer to Notes E1–E4 on pages 100–103. Hedge accounting was not applied by the Parent company.
Financial itemsSEKm 2021 2020
Result from participations in Group companiesDividends from subsidiaries 4,706 2,593Gain/loss on sales of shares in subsidiaries – –7Group contributions received from Group companies 485 1,937Group contributions paid to subsidiaries –1,072 –360Reversal of impairment of shares in subsidiaries – 7
Interest income and similar profit itemsInterest income, external 13 1Interest income, Group companies 0 230
Interest expenses and similar loss itemsInterest expenses, external –459 –485Interest expenses, Group companies –957 –847Other financial expenses1) –14 –24
IS Total 2,702 3,0451) The item other financial expenses includes financial fees and exchange rate differences. Exchange
rate differences amounted to SEK 16m (7), net.
Interest-bearing liabilities
Non-current interest-bearing liabilitiesCarrying amount Fair value
SEKm 2021 2020 2021 2020
Bond issues 32,549 27,968 32,444 29,084Other non-current loans with a term > 1 yr < 5 yrs 2,023 3,742 2,008 3,766
BS Total 34,572 31,710 34,452 32,850
Current interest-bearing liabilitiesCarrying amount Fair value
SEKm 2021 2020 2021 2020
Bond issues – 5,013 – 5,037Loans with maturities of less than one year 3,819 – 3,819 –
BS Total 3,819 5,013 3,819 5,037
Bond issues
Issued Maturity
Carrying amount,
SEKmFair value,
SEKmInterest rate
%
Notes EUR 500m 2023 5,107 5,305 2.50Notes EUR 600m 2024 6,125 6,274 1.13Notes SEK 2,150m 2025 2,159 2,128 0.42Notes SEK 850m 2025 849 839 0.50Notes EUR 300m 2025 3,066 3,145 1.13Notes EUR 500m 2027 5,090 5,327 1.63Notes EUR 300m 2030 3,038 2,898 0.50Notes EUR 700m 2031 7,115 6,528 0.25Total 32,549 32,444
Financial instruments by category
AP Accounting principlesIn 2021, the categories of financial instruments in the Parent company com-prise in accordance with IFRS 9 financial assets and liabilities measured at fair value through profit or loss and amortized cost. All of the Parent com-pany’s financial assets and liabilities measured at fair value through profit or loss are assessed according to measurement level 2. A definition is provided in Note E1, page 101. Financial assets measured at amortized cost are con-tinuously reviewed to assess the need for credit loss provisions. If there is a material need for credit loss provisions, a provision is made in accordance with the expected loss model.
PC8. Receivables from and liabilities to Group companies
Receivables from and liabilities to Group companiesSEKm 2021 2020
Non-current assetsDerivatives 286 542
BS Total 286 542
Current assetsInterest-bearing receivables – 6Financial derivatives 214 24Trade receivables 114 138Other receivables 486 1,940
BS Total 814 2,108
Non-current liabilitiesDerivatives 180 –
BS Total 180 –
Current liabilitiesInterest-bearing liabilities 51,112 50,890Financial derivatives 24 637Accounts payables 13 22Other liabilities 1,073 361
BS Total 52,222 51,910
121Essity’s Annual and Sustainability Report 2021 Financial statements including notes
Introduction The Essity share
Strategy Business areas SustainabilityGroup Corporate Governance Report
Financial statementsincluding notes
Essity data
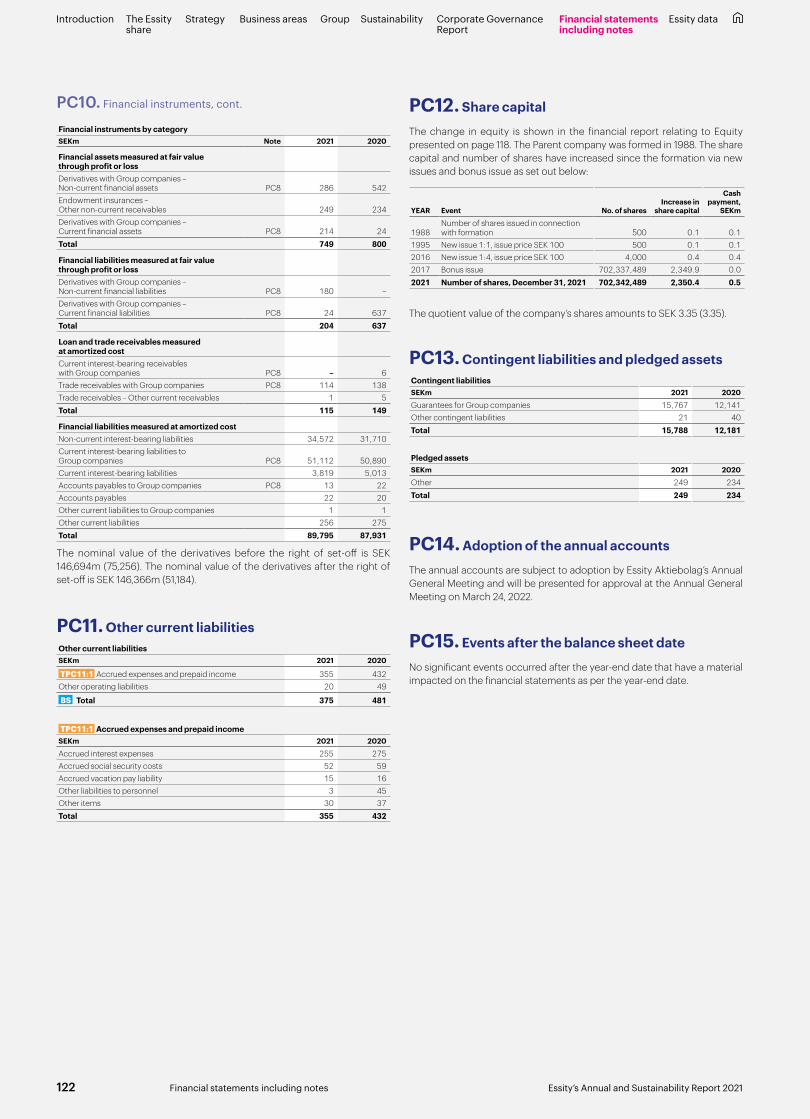
PC11. Other current liabilitiesOther current liabilitiesSEKm 2021 2020
TPC11:1 Accrued expenses and prepaid income 355 432Other operating liabilities 20 49
BS Total 375 481
TPC11:1 Accrued expenses and prepaid incomeSEKm 2021 2020
Accrued interest expenses 255 275Accrued social security costs 52 59Accrued vacation pay liability 15 16Other liabilities to personnel 3 45Other items 30 37Total 355 432
PC12. Share capital
The change in equity is shown in the financial report relating to Equity presented on page 118. The Parent company was formed in 1988. The share capital and number of shares have increased since the formation via new issues and bonus issue as set out below:
YEAR Event No. of sharesIncrease in
share capital
Cash payment,
SEKm
1988Number of shares issued in connection with formation 500 0.1 0.1
1995 New issue 1:1, issue price SEK 100 500 0.1 0.12016 New issue 1:4, issue price SEK 100 4,000 0.4 0.42017 Bonus issue 702,337,489 2,349.9 0.02021 Number of shares, December 31, 2021 702,342,489 2,350.4 0.5
The quotient value of the company’s shares amounts to SEK 3.35 (3.35).
PC13. Contingent liabilities and pledged assetsContingent liabilitiesSEKm 2021 2020
Guarantees for Group companies 15,767 12,141Other contingent liabilities 21 40Total 15,788 12,181
Pledged assetsSEKm 2021 2020
Other 249 234Total 249 234
PC14. Adoption of the annual accounts
The annual accounts are subject to adoption by Essity Aktiebolag’s Annual General Meeting and will be presented for approval at the Annual General Meeting on March 24, 2022.
PC15. Events after the balance sheet date
No significant events occurred after the year-end date that have a material impacted on the financial statements as per the year-end date.
Financial instruments by categorySEKm Note 2021 2020
Financial assets measured at fair value through profit or lossDerivatives with Group companies – Non-current financial assets PC8 286 542Endowment insurances – Other non-current receivables 249 234Derivatives with Group companies – Current financial assets PC8 214 24Total 749 800
Financial liabilities measured at fair value through profit or lossDerivatives with Group companies – Non-current financial liabilities PC8 180 –Derivatives with Group companies – Current financial liabilities PC8 24 637Total 204 637
Loan and trade receivables measured at amortized costCurrent interest-bearing receivables with Group companies PC8 – 6Trade receivables with Group companies PC8 114 138Trade receivables – Other current receivables 1 5Total 115 149
Financial liabilities measured at amortized costNon-current interest-bearing liabilities 34,572 31,710Current interest-bearing liabilities to Group companies PC8 51,112 50,890Current interest-bearing liabilities 3,819 5,013Accounts payables to Group companies PC8 13 22Accounts payables 22 20Other current liabilities to Group companies 1 1Other current liabilities 256 275Total 89,795 87,931
The nominal value of the derivatives before the right of set-off is SEK 146,694m (75,256). The nominal value of the derivatives after the right of set-off is SEK 146,366m (51,184).
PC10. Financial instruments, cont.
122 Essity’s Annual and Sustainability Report 2021Financial statements including notes
Introduction The Essity share
Strategy Business areas SustainabilityGroup Corporate Governance Report
Financial statementsincluding notes
Essity data
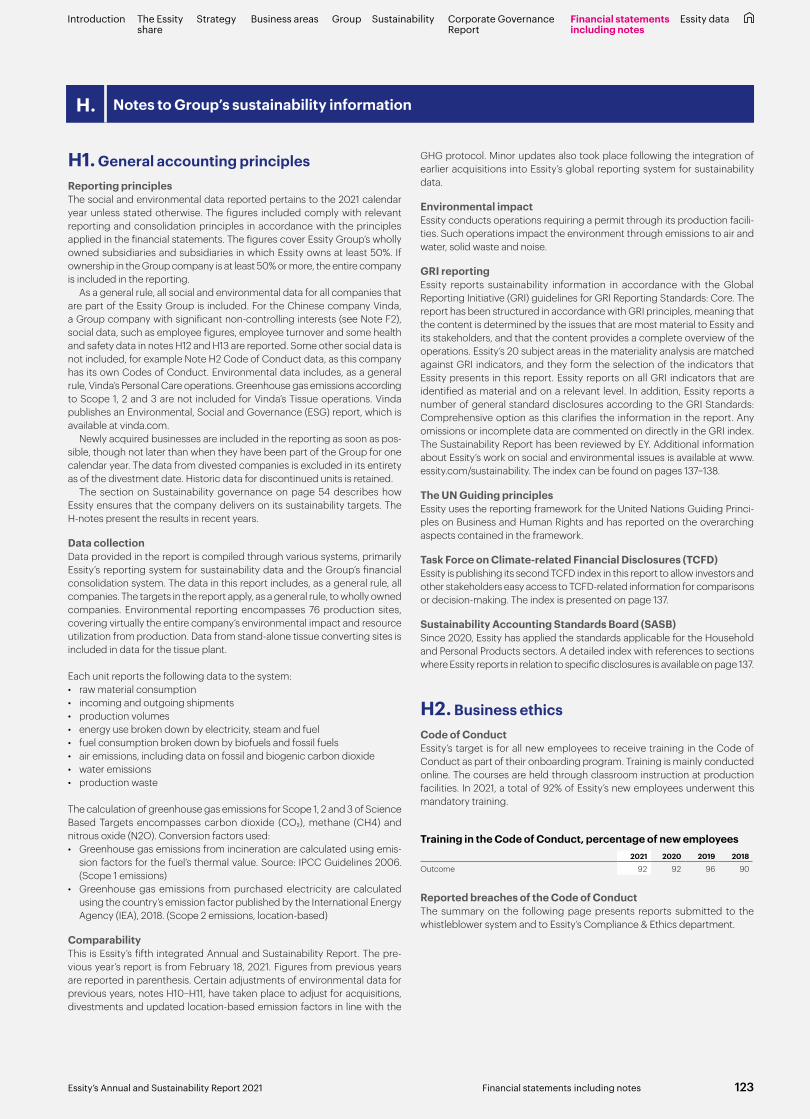
H. Notes to Group’s sustainability information
H1. General accounting principlesReporting principlesThe social and environmental data reported pertains to the 2021 calendar year unless stated otherwise. The figures included comply with relevant reporting and consolidation principles in accordance with the principles applied in the financial statements. The figures cover Essity Group’s wholly owned subsidiaries and subsidiaries in which Essity owns at least 50%. If ownership in the Group company is at least 50% or more, the entire company is included in the reporting.
As a general rule, all social and environmental data for all companies that are part of the Essity Group is included. For the Chinese company Vinda, a Group company with significant non-controlling interests (see Note F2), social data, such as employee figures, employee turnover and some health and safety data in notes H12 and H13 are reported. Some other social data is not included, for example Note H2 Code of Conduct data, as this company has its own Codes of Conduct. Environmental data includes, as a general rule, Vinda’s Personal Care operations. Greenhouse gas emissions according to Scope 1, 2 and 3 are not included for Vinda’s Tissue operations. Vinda publishes an Environmental, Social and Governance (ESG) report, which is available at vinda.com.
Newly acquired businesses are included in the reporting as soon as pos-sible, though not later than when they have been part of the Group for one calendar year. The data from divested companies is excluded in its entirety as of the divestment date. Historic data for discontinued units is retained.
The section on Sustainability governance on page 54 describes how Essity ensures that the company delivers on its sustainability targets. The H-notes present the results in recent years.
Data collectionData provided in the report is compiled through various systems, primarily Essity’s reporting system for sustainability data and the Group’s financial consolidation system. The data in this report includes, as a general rule, all companies. The targets in the report apply, as a general rule, to wholly owned companies. Environmental reporting encompasses 76 production sites, covering virtually the entire company’s environmental impact and resource utilization from production. Data from stand-alone tissue converting sites is included in data for the tissue plant.
Each unit reports the following data to the system: • raw material consumption • incoming and outgoing shipments • production volumes • energy use broken down by electricity, steam and fuel • fuel consumption broken down by biofuels and fossil fuels • air emissions, including data on fossil and biogenic carbon dioxide • water emissions • production waste
The calculation of greenhouse gas emissions for Scope 1, 2 and 3 of Science Based Targets encompasses carbon dioxide (CO2), methane (CH4) and nitrous oxide (N2O). Conversion factors used:• Greenhouse gas emissions from incineration are calculated using emis-
sion factors for the fuel’s thermal value. Source: IPCC Guidelines 2006. (Scope 1 emissions)
• Greenhouse gas emissions from purchased electricity are calculated using the country’s emission factor published by the International Energy Agency (IEA), 2018. (Scope 2 emissions, location-based)
ComparabilityThis is Essity’s fifth integrated Annual and Sustainability Report. The pre-vious year’s report is from February 18, 2021. Figures from previous years are reported in parenthesis. Certain adjustments of environmental data for previous years, notes H10–H11, have taken place to adjust for acquisitions, divestments and updated location-based emission factors in line with the
GHG protocol. Minor updates also took place following the integration of earlier acquisitions into Essity’s global reporting system for sustainability data.
Environmental impactEssity conducts operations requiring a permit through its production facili-ties. Such operations impact the environment through emissions to air and water, solid waste and noise.
GRI reportingEssity reports sustainability information in accordance with the Global Reporting Initiative (GRI) guidelines for GRI Reporting Standards: Core. The report has been structured in accordance with GRI principles, meaning that the content is determined by the issues that are most material to Essity and its stakeholders, and that the content provides a complete overview of the operations. Essity’s 20 subject areas in the materiality analysis are matched against GRI indicators, and they form the selection of the indicators that Essity presents in this report. Essity reports on all GRI indicators that are identified as material and on a relevant level. In addition, Essity reports a number of general standard disclosures according to the GRI Standards: Comprehensive option as this clarifies the information in the report. Any omissions or incomplete data are commented on directly in the GRI index. The Sustainability Report has been reviewed by EY. Additional information about Essity’s work on social and environmental issues is available at www.essity.com/sustainability. The index can be found on pages 137–138.
The UN Guiding principlesEssity uses the reporting framework for the United Nations Guiding Princi-ples on Business and Human Rights and has reported on the overarching aspects contained in the framework.
Task Force on Climate-related Financial Disclosures (TCFD)Essity is publishing its second TCFD index in this report to allow investors and other stakeholders easy access to TCFD-related information for comparisons or decision-making. The index is presented on page 137.
Sustainability Accounting Standards Board (SASB)Since 2020, Essity has applied the standards applicable for the Household and Personal Products sectors. A detailed index with references to sections where Essity reports in relation to specific disclosures is available on page 137.
H2. Business ethicsCode of ConductEssity’s target is for all new employees to receive training in the Code of Conduct as part of their onboarding program. Training is mainly conducted online. The courses are held through classroom instruction at production facilities. In 2021, a total of 92% of Essity’s new employees underwent this mandatory training.
Training in the Code of Conduct, percentage of new employees2021 2020 2019 2018
Outcome 92 92 96 90
Reported breaches of the Code of Conduct The summary on the following page presents reports submitted to the whistleblower system and to Essity’s Compliance & Ethics department.
Introduction The Essity share
Strategy Business areas SustainabilityGroup Corporate Governance Report
Financial statementsincluding notes
Essity data
123Essity’s Annual and Sustainability Report 2021 Financial statements including notes

Reports submitted to the whistleblower system and to Essity’s Compliance & Ethics department by categoryCategory1) 2021 2020 2019 2018
Regulatory breach, Fraud and Corruption 14 11 17 20Security Incidents – 2 – –Operations 4 1 6 3Sustainability – – – –Human Resources 43 45 65 58Other 3 2 – –Total 64 61 88 811) Essity’s Compliance & Ethics department allocates the submitted reports into the relevant category.
The category may be changed during the course of an investigation.
Of the total of 64 reported cases in 2021, 57 were closed and seven cases are still under investigation. Of the 14 reported cases in the Regulatory breach, Fraud and Corruption category, one person was dismissed for breaching the company’s anti-corruption policy and a further seven people were dis-missed for violations of the Code of Conduct. Of the 43 reported cases in the Human Resources category, 18 concern accusations of discrimination and harassment. None of the breaches identified were financially material.
Internal audits conducted of the Code of ConductFive audits of the Code of Conduct took place in 2021. These were mostly conducted remotely due to travel restrictions related to the COVID-19 pandemic. The audits were carried out in Gennep in the Netherlands, Gien in France, Hamburg in Germany, Harrodsburg in the USA and Uruapan in Mexico. The audit is based on the SA8000 standard and is divided into nine chapters. Roughly half of all observations were related to health and safety, such as fire drills that were not conducted on a frequent enough basis. Just under one third were related to management systems, such as the imple-mentation of a conflict of interest register or the repetition of training in the Code of Conduct. A minor share was related to working hours, where the most common problem was that personnel worked more than permitted. The remaining small portion of observations were for disciplinary measures, discrimination and remuneration. There were no observations for child labor, forced labor or freedom of association.
Internal audits conducted of business ethicsFour audits of business ethics took place in 2021. These were mostly con-ducted remotely due to travel restrictions related to the COVID-19 pandemic. The audits were carried out in Brazil, Mexico, Poland and Russia. The audits were based on Essity’s Code of Conduct and the focus by area is decided in a risk assessment prior to the audit. The observations vary but included a need to revisit parts of training in the Code of Conduct, a need to improve internal control, employment contracts and a need to increase awareness of the whistleblower channels.
An action program is in place and has commenced or will be carried out in 2022. Read more about how Essity works with business ethics on page 53.
Internal audits conducted2021 2020 2019 2018
Code of Conduct AuditsNumber of audits 5 1 4 3 Number of observations 52 7 57 44 Average number of observations per audit 10.4 7.0 14.3 14.7
Business Ethics AuditsNumber of audits 4 1 3 6 Number of observations 28 8 28 65 Average number of observations per audit 7.0 8.0 9.3 10.8
Ongoing anti-trust cases In 2021, the company was the subject of an anti-trust case, which was con-cluded during the year.
H2. Business ethics, cont. H3. Responsible sourcingDuring 2021, Essity raised the ambitions to ensure responsible business methods and respect for human rights. The new target, which is based on Essitys total purchasing cost excluding energy, is that 95% of the purchasing cost should be from suppliers that share the company’s values. The outcome in 2021 was 88%, which was in line with the target for the year.
Risk analysisEssity has an established process to perform continuous risk assessments of the company’s suppliers and sourcing categories. Approximately 55% of Essity’s strategic suppliers for raw materials and finished products are located in Europe, 36% in North and South America and 9% in Asia and Africa. Many of the strategic suppliers’ production facilities located in Asia and South America are part of large multinational corporations based in Europe and the USA. This is a conscious choice by Essity to reduce the social and ethical risks within the supply chain. Suppliers with manufacturing units located in high-risk countries, according to the Sedex definition, are exam-ined with particular care using regular ethical third-party audits with a focus on health and safety, human rights, employment conditions and corruption. At the end of 2021, Essity had a total of 932 suppliers (1,008; 929) that share data via Sedex.
Certain materials, such as cotton and wood fiber, are considered to pri-marily have risks further down in the value chain. Essity takes further mea-sures here, such as audits of subsuppliers, or chooses certified raw materials that guarantee more sustainable extraction and production.
Share of total purchase cost1) from suppliers who comply with Essity’s Global Supplier Standard
2021 2020 2019 2018
Outcome 88% 83% 77% 64%1) Excluding energy.
Geographical distribution of strategic suppliers 2021
Suppliers in North and South America, 36%Suppliers in Asia and Africa, 9%
Suppliers in Europe, 55%
Ethical audits conductedTravel restrictions related to the COVID-19 pandemic have limited the num-ber of audits conducted. During 2021, Essity evaluated the outcome from 49 ethical supplier audits, carried out in China, Mexico, Russia, South Africa, India, Sri Lanka, Brazil, Colombia, Malaysia and Estonia. Of these audits, 14 were carried out by Essity using an independent audit firm. The other 35 ethical audits, which meet Essity’s requirements, were carried out by other customers to suppliers and were approved by Essity.
Essity is informed within 24 hours in cases of critical observations. No agreements with strategic suppliers were terminated on the grounds of sustainability-related non-compliance in 2021.
Ethical audits conducted 2021 2020 2019 2018
Audits initiated by Essity1) 14 12 33 30 Audits initiated by customers2) 35 25 19 29 Total number of audits 49 37 52 59 1) Audits initiated by Essity were conducted by Essity’s independent audit firm in accordance with
SMETA’s 4-pillar format.2) Audits initiated by customers were carried out by other customers to suppliers and were approved
by Essity.
Read more about how Essity works with responsible sourcing and human rights on page 53.
Introduction The Essity share
Strategy Business areas SustainabilityGroup Corporate Governance Report
Financial statementsincluding notes
Essity data
124 Essity’s Annual and Sustainability Report 2021Financial statements including notes

H4. InnovationEssity’s target is that at least 50% of the company’s innovations are to yield social and/or environmental improvements. In 2021, 59% (64; 69) of Essity’s innovations yielded social and/or environmental improvements. This refers to the percentage of sales of innovations measured over 36 months. Varia-tions between the years are a natural result of the product categories’ various launches.
Sustainable innovationsA product assortment life cycle assessment (LCA) encompasses most of the products sold in a region. This allows Essity to measure environmental performance for innovations and gradual improvements in the company’s daily operations for entire product assortments over several years.
Lower climate impact through the use of innovation
Products in Europe YearCarbon footprint
reduction %
Incontinence Products 2008–2019TENA Flex –18TENA Pads and Liner –33TENA Comfort –19TENA Men –20TENA Pants and Underwear –33TENA Slip –20TENA Bed –11
Feminine Care 2008–2019Feminine Ultra towels –17
Baby Care 2008–2017Libero and Lotus open diaper –25Libero and Lotus pant diaper –16
Professional Hygiene Tork napkins 2011–2019 –9Tork paper hand towels 2011–2017 –18
Consumer Tissue 2011–2018Toilet paper –10Household towels –19Handkerchiefs and facial tissues 2011–2020 –8
The life cycle assessments performed by Essity have been subject to third-party reviews.
Read more about how Essity works with sustainable innovation on pages 44–49.
H5. Customers and consumers Customer surveys Essity conducts systematic customer and consumer follow-up, which includes external reports, independent surveys and global systems for feed-back. Essity places high value on opportunities for direct customer contact. Customer feedback enables Essity to offer better products and services.
Every business unit has processes to investigate customer satisfac-tion. Essity also offers expertise and support for the development of opera-tions in, for example, nursing homes and professional environments, where the company can help make a difference and create value for its customers and users.
The retail trade accounts for a significant part, 60%, of Essity’s net sales. The company uses external comparison reports in which the largest retail chains assess their suppliers based on customer service, logistics, sales support, mar-keting and product development. Consumers who purchase retail products are followed up through general brand and product recognition surveys.
Product safetyEssity ensures that all products are safe for their intended purpose through-out their entire life cycle. Essity sold no products containing substances on the California DTSC Candidate Chemicals List above 0.1%. The only excep-tion was the use of isopropyl alcohol where this is important for the prod-ucts’ functionality, for example as biocide ingredient in hand sanitizer, an important hygiene product during the COVID-19 pandemic. Essity’s sales of products containing chemicals on the REACH SVHC candidate list were below 0.1% of total sales.
Read more about how Essity works with product safety on pages 42–43.
H6. Role in society and community relationsEssity invested approximately SEK 38m (49; 38) in over 400 projects in 2021. Most of the projects, to which company employees also allocate a large number of working hours (including staff management), were related to hygiene and health.
Essity’s steering document for community relations states that Essity shall be politically and religiously neutral. The company must not make payments or product donations to political parties or candidates, or their institutions, agencies or representatives. Essity did not support any organizations or proj-ects with political or religious aims in 2021.
Read more about Essity’s role in society and community relations on pages 44–45.
Community relations (SEKm)2021
Charitable donations 28.6Commercial initiatives 4.9Community investments 4.3Total 37.8
of which cash funds 21.8 of which products 16.0
H7. Fiber sourcingEssity’s target is that all raw materials derived from wood-based fresh fiber in the company’s products and packaging are to be certified in accordance with FSC or PEFC. All wood-based fresh fiber must fulfill the FSC’s Controlled Wood standard, as a minimum, to be eligible for purchasing. Target fulfill-ment in 2021 was 98%.
Renewable raw materials, wood-based fresh fiber and recycled fiber, account for the largest share of the total volume of material in Essity’s prod-ucts. In 2021, Essity purchased 3.2 million tons of wood-based fresh fiber and 1.8 million tons of recycled fiber. Wood-based fresh fiber mainly comprises pulp, 99%, and the remainder comprises packaging, externally sourced mother reels and products manufactured by third parties. Of the sourced share of recycled fiber, 95% is used in tissue manufacturing. The remainder consists of recycled fiber, which is found in sourced packaging material and sourced mother reels.
Fiber use, pulp and recycled paper 2021 2020 2019 2018 2017
Fiber used, million tons 5.0 5.1 5.3 5.1 5.3
of which, pulp consumption 3.2 3.2 3.1 3.0 3.1 share of total fiber use, % 64 62 60 60 59
of which, recovered paper consumption 1.8 1.9 2.1 2.1 2.2 share of total fiber use, % 36 38 40 40 41
Fiber sourcing wood-based fresh fiber by certification1), %2021 2020 2019 2018 2017
FSC 63 59 57 48 39PEFC 35 36 22 29 26FSC Controlled Wood standard2) 2 5 21 23 35Total 100 100 100 100 100Target fulfillment 98 95 79 77 651) The distribution applies to sourcing by wholly owned companies. Some information about the certi-
fication status for packaging data is reported with a one or two-year delay. 2) Includes sourcing of fresh fiber to three of Essity’s facilities in 2020 and 2021 as FSC Controlled
Wood and evaluated against the standard for Controlled Wood (in accordance with Essity’s policy). Due to the COVID-19 pandemic, the facilities have not yet implemented FSC Chain of Custody at the end of 2021. A share of mother reels and packaging purchased in 2021 from suppliers was not FSC Controlled Wood.
Despite the continued adverse impact of the COVID-19 pandemic in 2021, Essity has continued to utilize recycled fiber. Operations in North and South America used 79% recycled fiber, while the proportion of recycled fiber in Europe was 33%.
In 2021, Essity acquired the Australian hygiene company Asaleo Care and increased its shareholding in the Latin American hygiene company Familia. Essity has analyzed fiber supply and presented a plan to include the compa-nies in the Essity Fiber sourcing policy in 2022.
Introduction The Essity share
Strategy Business areas SustainabilityGroup Corporate Governance Report
Financial statementsincluding notes
Essity data
125Essity’s Annual and Sustainability Report 2021 Financial statements including notes

As in 2020, restrictions due to the COVID-19 pandemic affected on-site audits in 2021. New questions concerning traceability have been added to the questionnaire, which will continue to be used, together with specific meetings.
Read more about how Essity works with fiber and biodiversity on page 48.
H9. Packaging, plastics and wasteThe packaging target for 2025 is that Essity is striving for 100% recyclability and 85% renewable or recycled material in the company’s packaging. This target applies to both paper and plastic packaging for Essity’s brands. Most of Essity’s packaging comprises corrugated board and board for paper packaging and bags and flexible plastic film from polyethylene (PE) or poly-propylene (PP) for plastic packaging. In 2021, Essity’s packaging volume for its brands amounted to 172,800 tons (171,000 tons).
The proportion of renewable or recycled materials was 78% (77; 68). Of this figure, 81% (83) was recyclable. For plastic packaging, which accounts for about 23% of total packaging volume, 7% (3) was manufactured from renew-able or recycled materials. Of this figure, the proportion of recovered plastic was 5% (2). The proportion of recyclable plastic packaging was 73% (77).
In 2021, Essity estimated the technical recyclability of a large portion of the company’s packaging. Essity has thereby improved packaging design to facilitate recycling using existing infrastructures. Essity will continue to assess the technical recyclability of the remaining packaging in 2022 and 2023. Fossil-based plastic in the company’s plastic packaging can be replaced with renewable plastic, recycled plastic or paper. When Essity develops new packaging, it assesses function, safety and environmental performance.
Read more about how Essity works with packaging on page 49.
Share of packaging manufactured from renewable or recycled material
%
0
20
40
60
80
100
Target 2025202120202019
6877 78
85
Share of technical recyclability
%
0
20
40
60
80
100
Target 2025
20212020Target 2025
20212020Target 2025
20212020
77 73
100
84 83
100
83 81
100
Plastic packaging Paper packaging Total packaging
Waste in production and after use Essity’s target is that all production waste will be subject to material and energy recovery by 2030. By reducing the amount of production waste sent to landfill and instead recycling the waste or extracting energy from it, greenhouse gas emissions can be reduced, thereby helping Essity to achieve its Science Based Targets (Scope 3). In 2021, the total volume of waste decreased. The recycling rate from Essity’s production facilities var-ies due to differences in national legislation. Volume changes in 2021 had a negative impact on the mix of material and energy recovery (–1%).
In Essity’s production process, particularly when recycled fiber is used as input goods, waste is generated in the form of ash, sludge, organic waste and plastic. The production sites work to reduce waste and to find alternative solutions for their waste. Waste that cannot be recovered, is sent to landfill or composted. In 2021, 64% (65; 63) of Essity’s waste was recovered. The target applies to wholly owned companies and the Australian hygiene company Asaleo Care and the Latin American hygiene company Familia were inte-grated in 2021. A small proportion, 0.2% or 3,080 tons, is hazardous waste, which is primarily waste oil, but also includes organic solvents, batteries and strip lights.
H8. Water Withdrawal, use and discharge of waterEssity’s reporting of water withdrawal states totals for surface water, ground-water and municipal water systems. Surface water, which represents the largest share of water withdrawal, as a general rule must be purified from dissolved and solid content before use in the production process. Most of Essity’s water is used to transport fibers during production processes. The remainder is mainly used as cooling water.
Essity’s water discharge is divided into cooling water and process water. Cooling water has simply been heated and is not contaminated in any way. Process water is treated using mechanical and biological treatment systems before it is discharged.
In 2021, six of Essity’s wholly owned paper mills were located in water-stressed areas with the risk of a water shortage. The sites accounted for 7% of Essity’s total water withdrawal, distributed between 32% from surface sources, 44% from groundwater and the remainder from recycled water or from municipal water systems. Total water withdrawal from these facilities in 2021 was 6.7 million m3, water discharges 4.5 million m3 and water con-sumption 2.2 million m3.
Any environmental incidents are registered in a central incident-reporting system. In 2021, no incidents relating to temporary exceedances of permit-ted limit values for waste water were registered. No incident was of such a magnitude that it posed a threat to an emissions permit.
Read more about how Essity works with water on page 48.
Source of water withdrawal 2021
Water from municipal water systems, 7%Ground water, 18%Surface water, 75%
Recipient of discharged water 2021
Third party, 9%Surface water, 91%
Water
Water, mm3 2021 2020 2019 2018 2017
Water withdrawal 95 94 106 104 106Water discharge 85 84 98 95 95Water consumption1) 10 10 8 9 11
Water emissions, tons
COD 6,730 6,527 6,760 7,049 7,478BOD 942 858 813 851 875Suspended solids 1,000 856 912 1,001 1,060AOX 6 4 3 3 5P 26 33 39 44 37N 127 151 187 199 2381) Water consumption is water withdrawn less water discharged.
H7. Fiber sourcing, cont.
Introduction The Essity share
Strategy Business areas SustainabilityGroup Corporate Governance Report
Financial statementsincluding notes
Essity data
126 Essity’s Annual and Sustainability Report 2021Financial statements including notes
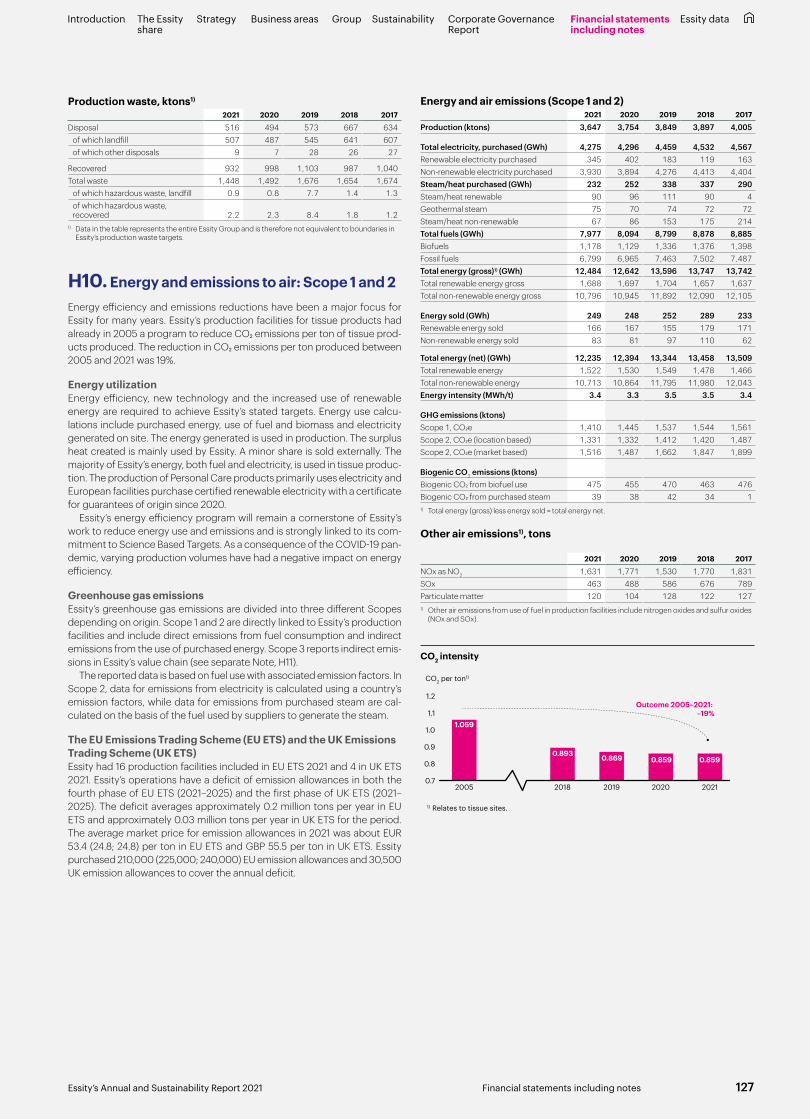
Production waste, ktons1)
2021 2020 2019 2018 2017
Disposal 516 494 573 667 634 of which landfill 507 487 545 641 607 of which other disposals 9 7 28 26 27
Recovered 932 998 1,103 987 1,040Total waste 1,448 1,492 1,676 1,654 1,674 of which hazardous waste, landfill 0.9 0.8 7.7 1.4 1.3 of which hazardous waste, recovered 2.2 2.3 8.4 1.8 1.21) Data in the table represents the entire Essity Group and is therefore not equivalent to boundaries in
Essity’s production waste targets.
H10. Energy and emissions to air: Scope 1 and 2 Energy efficiency and emissions reductions have been a major focus for Essity for many years. Essity’s production facilities for tissue products had already in 2005 a program to reduce CO2 emissions per ton of tissue prod-ucts produced. The reduction in CO2 emissions per ton produced between 2005 and 2021 was 19%.
Energy utilization Energy efficiency, new technology and the increased use of renewable energy are required to achieve Essity’s stated targets. Energy use calcu-lations include purchased energy, use of fuel and biomass and electricity generated on site. The energy generated is used in production. The surplus heat created is mainly used by Essity. A minor share is sold externally. The majority of Essity’s energy, both fuel and electricity, is used in tissue produc-tion. The production of Personal Care products primarily uses electricity and European facilities purchase certified renewable electricity with a certificate for guarantees of origin since 2020.
Essity’s energy efficiency program will remain a cornerstone of Essity’s work to reduce energy use and emissions and is strongly linked to its com-mitment to Science Based Targets. As a consequence of the COVID-19 pan-demic, varying production volumes have had a negative impact on energy efficiency.
Greenhouse gas emissions Essity’s greenhouse gas emissions are divided into three different Scopes depending on origin. Scope 1 and 2 are directly linked to Essity’s production facilities and include direct emissions from fuel consumption and indirect emissions from the use of purchased energy. Scope 3 reports indirect emis-sions in Essity’s value chain (see separate Note, H11).
The reported data is based on fuel use with associated emission factors. In Scope 2, data for emissions from electricity is calculated using a country’s emission factors, while data for emissions from purchased steam are cal-culated on the basis of the fuel used by suppliers to generate the steam.
The EU Emissions Trading Scheme (EU ETS) and the UK Emissions Trading Scheme (UK ETS)Essity had 16 production facilities included in EU ETS 2021 and 4 in UK ETS 2021. Essity’s operations have a deficit of emission allowances in both the fourth phase of EU ETS (2021–2025) and the first phase of UK ETS (2021–2025). The deficit averages approximately 0.2 million tons per year in EU ETS and approximately 0.03 million tons per year in UK ETS for the period. The average market price for emission allowances in 2021 was about EUR 53.4 (24.8; 24.8) per ton in EU ETS and GBP 55.5 per ton in UK ETS. Essity purchased 210,000 (225,000; 240,000) EU emission allowances and 30,500 UK emission allowances to cover the annual deficit.
Energy and air emissions (Scope 1 and 2)2021 2020 2019 2018 2017
Production (ktons) 3,647 3,754 3,849 3,897 4,005
Total electricity, purchased (GWh) 4,275 4,296 4,459 4,532 4,567Renewable electricity purchased 345 402 183 119 163Non-renewable electricity purchased 3,930 3,894 4,276 4,413 4,404Steam/heat purchased (GWh) 232 252 338 337 290Steam/heat renewable 90 96 111 90 4Geothermal steam 75 70 74 72 72Steam/heat non-renewable 67 86 153 175 214Total fuels (GWh) 7,977 8,094 8,799 8,878 8,885Biofuels 1,178 1,129 1,336 1,376 1,398Fossil fuels 6,799 6,965 7,463 7,502 7,487Total energy (gross)1) (GWh) 12,484 12,642 13,596 13,747 13,742Total renewable energy gross 1,688 1,697 1,704 1,657 1,637Total non-renewable energy gross 10,796 10,945 11,892 12,090 12,105
Energy sold (GWh) 249 248 252 289 233Renewable energy sold 166 167 155 179 171Non-renewable energy sold 83 81 97 110 62
Total energy (net) (GWh) 12,235 12,394 13,344 13,458 13,509Total renewable energy 1,522 1,530 1,549 1,478 1,466Total non-renewable energy 10,713 10,864 11,795 11,980 12,043Energy intensity (MWh/t) 3.4 3.3 3.5 3.5 3.4
GHG emissions (ktons) Scope 1, CO2e 1,410 1,445 1,537 1,544 1,561Scope 2, CO2e (location based) 1,331 1,332 1,412 1,420 1,487Scope 2, CO2e (market based) 1,516 1,487 1,662 1,847 1,899
Biogenic CO2 emissions (ktons)Biogenic CO2 from biofuel use 475 455 470 463 476Biogenic CO2 from purchased steam 39 38 42 34 11) Total energy (gross) less energy sold = total energy net.
Other air emissions1), tons
2021 2020 2019 2018 2017
NOx as NO2 1,631 1,771 1,530 1,770 1,831SOx 463 488 586 676 789 Particulate matter 120 104 128 122 127 1) Other air emissions from use of fuel in production facilities include nitrogen oxides and sulfur oxides
(NOx and SOx).
CO2 intensity
CO2 per ton1)
1) Relates to tissue sites.
0.7
0.8
0.9
1.0
1.1
1.2
20212020201920182005
Outcome 2005–2021: –19%
1.059
0.893 0.869 0.859 0.859
Introduction The Essity share
Strategy Business areas SustainabilityGroup Corporate Governance Report
Financial statementsincluding notes
Essity data
127Essity’s Annual and Sustainability Report 2021 Financial statements including notes
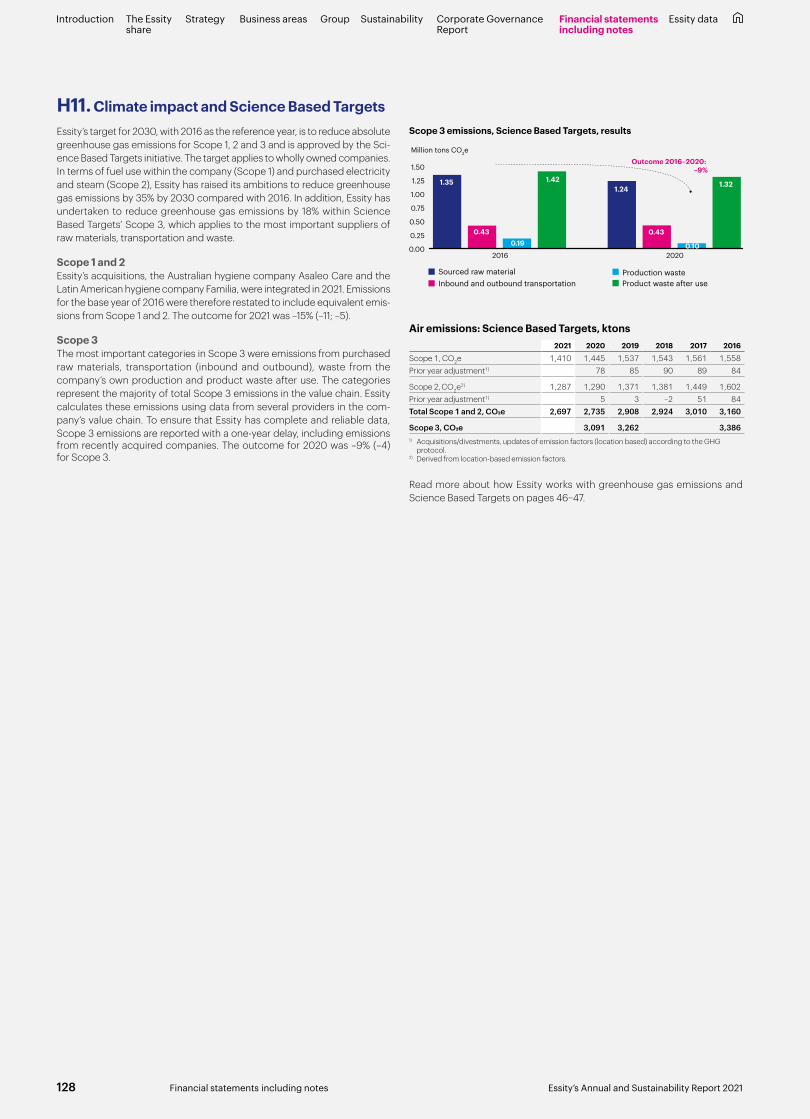
H11. Climate impact and Science Based TargetsEssity’s target for 2030, with 2016 as the reference year, is to reduce absolute greenhouse gas emissions for Scope 1, 2 and 3 and is approved by the Sci-ence Based Targets initiative. The target applies to wholly owned companies. In terms of fuel use within the company (Scope 1) and purchased electricity and steam (Scope 2), Essity has raised its ambitions to reduce greenhouse gas emissions by 35% by 2030 compared with 2016. In addition, Essity has undertaken to reduce greenhouse gas emissions by 18% within Science Based Targets’ Scope 3, which applies to the most important suppliers of raw materials, transportation and waste.
Scope 1 and 2Essity’s acquisitions, the Australian hygiene company Asaleo Care and the Latin American hygiene company Familia, were integrated in 2021. Emissions for the base year of 2016 were therefore restated to include equivalent emis-sions from Scope 1 and 2. The outcome for 2021 was –15% (–11; –5).
Scope 3The most important categories in Scope 3 were emissions from purchased raw materials, transportation (inbound and outbound), waste from the company’s own production and product waste after use. The categories represent the majority of total Scope 3 emissions in the value chain. Essity calculates these emissions using data from several providers in the com-pany’s value chain. To ensure that Essity has complete and reliable data, Scope 3 emissions are reported with a one-year delay, including emissions from recently acquired companies. The outcome for 2020 was –9% (–4) for Scope 3.
Scope 3 emissions, Science Based Targets, results
Million tons CO2e
0.00
0.25
0.50
0.75
1.00
1.25
1.50
20202016
Outcome 2016–2020: –9%
1.35
0.430.19
1.42
0.10
1.241.32
0.43
Inbound and outbound transportationProduction wasteSourced raw materialProduct waste after use
Air emissions: Science Based Targets, ktons2021 2020 2019 2018 2017 2016
Scope 1, CO2e 1,410 1,445 1,537 1,543 1,561 1,558Prior year adjustment1) 78 85 90 89 84
Scope 2, CO2e2) 1,287 1,290 1,371 1,381 1,449 1,602Prior year adjustment1) 5 3 –2 51 84Total Scope 1 and 2, CO2e 2,697 2,735 2,908 2,924 3,010 3,160
Scope 3, CO2e 3,091 3,262 3,3861) Acquisitions/divestments, updates of emission factors (location based) according to the GHG
protocol. 2) Derived from location-based emission factors.
Read more about how Essity works with greenhouse gas emissions and Science Based Targets on pages 46–47.
Introduction The Essity share
Strategy Business areas SustainabilityGroup Corporate Governance Report
Financial statementsincluding notes
Essity data
128 Essity’s Annual and Sustainability Report 2021Financial statements including notes
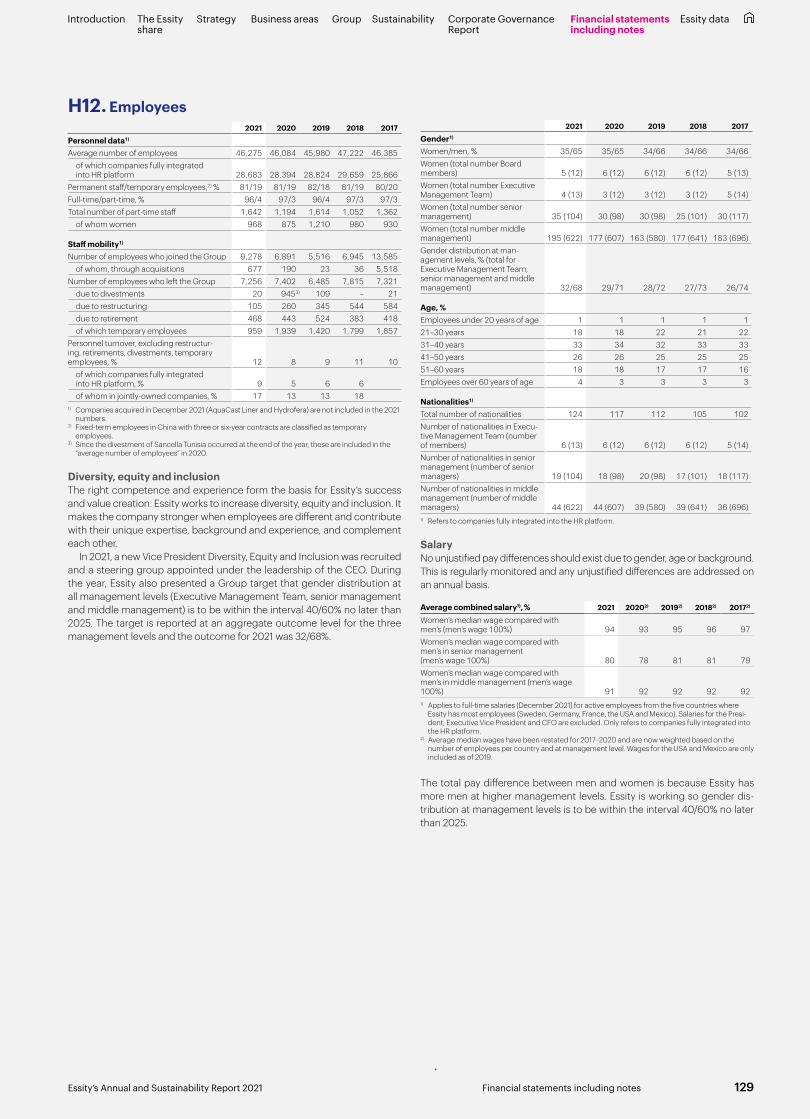
H12. Employees2021 2020 2019 2018 2017
Personnel data1)
Average number of employees 46,275 46,084 45,980 47,222 46,385 of which companies fully integrated
into HR platform 28,683 28,394 28,824 29,659 25,866 Permanent staff/temporary employees,2) % 81/19 81/19 82/18 81/19 80/20 Full-time/part-time, % 96/4 97/3 96/4 97/3 97/3 Total number of part-time staff 1,642 1,194 1,614 1,052 1,362 of whom women 968 875 1,210 980 930
Staff mobility1)
Number of employees who joined the Group 9,278 6,891 5,516 6,945 13,585 of whom, through acquisitions 677 190 23 36 5,518 Number of employees who left the Group 7,256 7,402 6,485 7,815 7,321 due to divestments 20 9453) 109 – 21 due to restructuring 105 260 345 544 584 due to retirement 468 443 524 383 418 of which temporary employees 959 1,939 1,420 1,799 1,857 Personnel turnover, excluding restructur-ing, retirements, divestments, temporary employees, % 12 8 9 11 10 of which companies fully integrated
into HR platform, % 9 5 6 6 of whom in jointly-owned companies, % 17 13 13 18 1) Companies acquired in December 2021 (AquaCast Liner and Hydrofera) are not included in the 2021
numbers.2) Fixed-term employees in China with three or six-year contracts are classified as temporary
employees. 3) Since the divestment of Sancella Tunisia occurred at the end of the year, these are included in the
“average number of employees” in 2020.
Diversity, equity and inclusionThe right competence and experience form the basis for Essity’s success and value creation. Essity works to increase diversity, equity and inclusion. It makes the company stronger when employees are different and contribute with their unique expertise, background and experience, and complement each other.
In 2021, a new Vice President Diversity, Equity and Inclusion was recruited and a steering group appointed under the leadership of the CEO. During the year, Essity also presented a Group target that gender distribution at all management levels (Executive Management Team, senior management and middle management) is to be within the interval 40/60% no later than 2025. The target is reported at an aggregate outcome level for the three management levels and the outcome for 2021 was 32/68%.
2021 2020 2019 2018 2017
Gender1)
Women/men, % 35/65 35/65 34/66 34/66 34/66 Women (total number Board members) 5 (12) 6 (12) 6 (12) 6 (12) 5 (13) Women (total number Executive Management Team) 4 (13) 3 (12) 3 (12) 3 (12) 5 (14) Women (total number senior management) 35 (104) 30 (98) 30 (98) 25 (101) 30 (117) Women (total number middle management) 195 (622) 177 (607) 163 (580) 177 (641) 183 (696) Gender distribution at man-agement levels, % (total for Executive Management Team, senior management and middle management) 32/68 29/71 28/72 27/73 26/74
Age, %Employees under 20 years of age 1 1 1 1 1 21–30 years 18 18 22 21 22 31–40 years 33 34 32 33 33 41–50 years 26 26 25 25 25 51–60 years 18 18 17 17 16 Employees over 60 years of age 4 3 3 3 3
Nationalities1)
Total number of nationalities 124 117 112 105 102 Number of nationalities in Execu-tive Management Team (number of members) 6 (13) 6 (12) 6 (12) 6 (12) 5 (14)Number of nationalities in senior management (number of senior managers) 19 (104) 18 (98) 20 (98) 17 (101) 18 (117) Number of nationalities in middle management (number of middle managers) 44 (622) 44 (607) 39 (580) 39 (641) 36 (696) 1) Refers to companies fully integrated into the HR platform.
SalaryNo unjustified pay differences should exist due to gender, age or background. This is regularly monitored and any unjustified differences are addressed on an annual basis.
Average combined salary1), % 2021 20202) 20192) 20182) 20172)
Women’s median wage compared with men’s (men’s wage 100%) 94 93 95 96 97Women’s median wage compared with men’s in senior management (men’s wage 100%) 80 78 81 81 79Women’s median wage compared with men’s in middle management (men’s wage 100%) 91 92 92 92 921) Applies to full-time salaries (December 2021) for active employees from the five countries where
Essity has most employees (Sweden, Germany, France, the USA and Mexico). Salaries for the Presi-dent, Executive Vice President and CFO are excluded. Only refers to companies fully integrated into the HR platform.
2) Average median wages have been restated for 2017–2020 and are now weighted based on the number of employees per country and at management level. Wages for the USA and Mexico are only included as of 2019.
The total pay difference between men and women is because Essity has more men at higher management levels. Essity is working so gender dis-tribution at management levels is to be within the interval 40/60% no later than 2025.
Introduction The Essity share
Strategy Business areas SustainabilityGroup Corporate Governance Report
Financial statementsincluding notes
Essity data
129Essity’s Annual and Sustainability Report 2021 Financial statements including notes
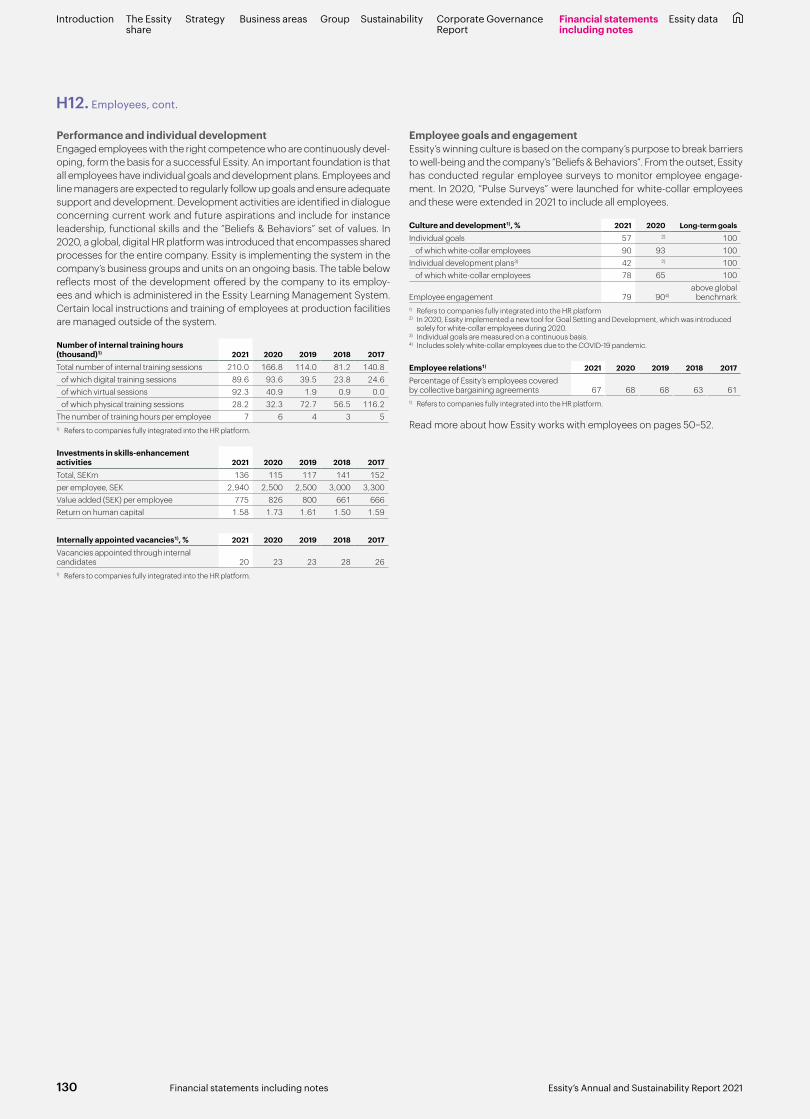
Performance and individual developmentEngaged employees with the right competence who are continuously devel-oping, form the basis for a successful Essity. An important foundation is that all employees have individual goals and development plans. Employees and line managers are expected to regularly follow up goals and ensure adequate support and development. Development activities are identified in dialogue concerning current work and future aspirations and include for instance leadership, functional skills and the “Beliefs & Behaviors” set of values. In 2020, a global, digital HR platform was introduced that encompasses shared processes for the entire company. Essity is implementing the system in the company’s business groups and units on an ongoing basis. The table below reflects most of the development offered by the company to its employ-ees and which is administered in the Essity Learning Management System. Certain local instructions and training of employees at production facilities are managed outside of the system.
Number of internal training hours (thousand)1) 2021 2020 2019 2018 2017
Total number of internal training sessions 210.0 166.8 114.0 81.2 140.8 of which digital training sessions 89.6 93.6 39.5 23.8 24.6 of which virtual sessions 92.3 40.9 1.9 0.9 0.0 of which physical training sessions 28.2 32.3 72.7 56.5 116.2 The number of training hours per employee 7 6 4 3 5 1) Refers to companies fully integrated into the HR platform.
Investments in skills-enhancement activities 2021 2020 2019 2018 2017
Total, SEKm 136 115 117 141 152 per employee, SEK 2,940 2,500 2,500 3,000 3,300 Value added (SEK) per employee 775 826 800 661 666 Return on human capital 1.58 1.73 1.61 1.50 1.59
Internally appointed vacancies1), % 2021 2020 2019 2018 2017
Vacancies appointed through internal candidates 20 23 23 28 26 1) Refers to companies fully integrated into the HR platform.
Employee goals and engagementEssity’s winning culture is based on the company’s purpose to break barriers to well-being and the company’s “Beliefs & Behaviors”. From the outset, Essity has conducted regular employee surveys to monitor employee engage-ment. In 2020, “Pulse Surveys” were launched for white-collar employees and these were extended in 2021 to include all employees.
Culture and development1), % 2021 2020 Long-term goals
Individual goals 57 2) 100 of which white-collar employees 90 93 100 Individual development plans3) 42 2) 100 of which white-collar employees 78 65 100
Employee engagement 79 904)above global
benchmark1) Refers to companies fully integrated into the HR platform2) In 2020, Essity implemented a new tool for Goal Setting and Development, which was introduced
solely for white-collar employees during 2020.3) Individual goals are measured on a continuous basis.4) Includes solely white-collar employees due to the COVID-19 pandemic.
Employee relations1) 2021 2020 2019 2018 2017
Percentage of Essity’s employees covered by collective bargaining agreements 67 68 68 63 611) Refers to companies fully integrated into the HR platform.
Read more about how Essity works with employees on pages 50–52.
H12. Employees, cont.
Introduction The Essity share
Strategy Business areas SustainabilityGroup Corporate Governance Report
Financial statementsincluding notes
Essity data
130 Essity’s Annual and Sustainability Report 2021Financial statements including notes
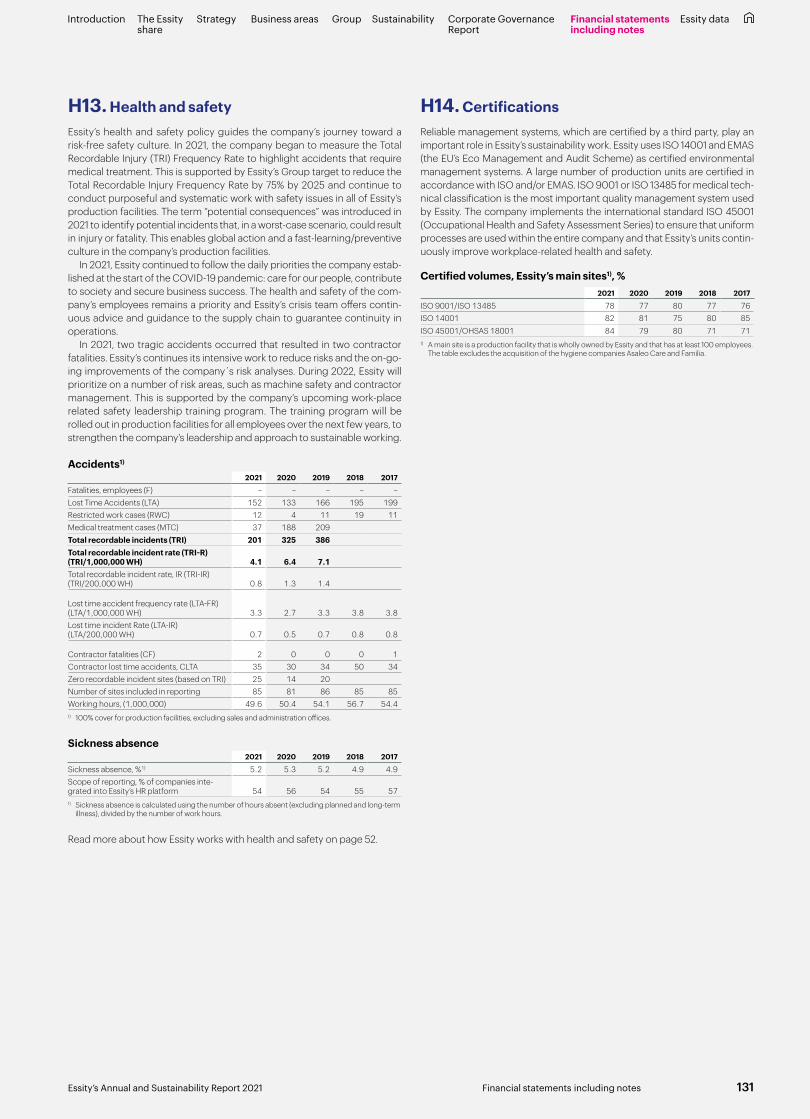
H13. Health and safetyEssity’s health and safety policy guides the company’s journey toward a risk-free safety culture. In 2021, the company began to measure the Total Recordable Injury (TRI) Frequency Rate to highlight accidents that require medical treatment. This is supported by Essity’s Group target to reduce the Total Recordable Injury Frequency Rate by 75% by 2025 and continue to conduct purposeful and systematic work with safety issues in all of Essity’s production facilities. The term “potential consequences” was introduced in 2021 to identify potential incidents that, in a worst-case scenario, could result in injury or fatality. This enables global action and a fast-learning/preventive culture in the company’s production facilities.
In 2021, Essity continued to follow the daily priorities the company estab-lished at the start of the COVID-19 pandemic: care for our people, contribute to society and secure business success. The health and safety of the com-pany’s employees remains a priority and Essity’s crisis team offers contin-uous advice and guidance to the supply chain to guarantee continuity in operations.
In 2021, two tragic accidents occurred that resulted in two contractor fatalities. Essity’s continues its intensive work to reduce risks and the on-go-ing improvements of the company´s risk analyses. During 2022, Essity will prioritize on a number of risk areas, such as machine safety and contractor management. This is supported by the company’s upcoming work-place related safety leadership training program. The training program will be rolled out in production facilities for all employees over the next few years, to strengthen the company’s leadership and approach to sustainable working.
Accidents1) 2021 2020 2019 2018 2017
Fatalities, employees (F) – – – – –Lost Time Accidents (LTA) 152 133 166 195 199Restricted work cases (RWC) 12 4 11 19 11Medical treatment cases (MTC) 37 188 209Total recordable incidents (TRI) 201 325 386Total recordable incident rate (TRI-R) (TRI/1,000,000 WH) 4.1 6.4 7.1Total recordable incident rate, IR (TRI-IR) (TRI/200,000 WH) 0.8 1.3 1.4
Lost time accident frequency rate (LTA-FR) (LTA/1,000,000 WH) 3.3 2.7 3.3 3.8 3.8Lost time incident Rate (LTA-IR) (LTA/200,000 WH) 0.7 0.5 0.7 0.8 0.8
Contractor fatalities (CF) 2 0 0 0 1Contractor lost time accidents, CLTA 35 30 34 50 34Zero recordable incident sites (based on TRI) 25 14 20Number of sites included in reporting 85 81 86 85 85Working hours, (1,000,000) 49.6 50.4 54.1 56.7 54.41) 100% cover for production facilities, excluding sales and administration offices.
Sickness absence2021 2020 2019 2018 2017
Sickness absence, %1) 5.2 5.3 5.2 4.9 4.9 Scope of reporting, % of companies inte-grated into Essity’s HR platform 54 56 54 55 57 1) Sickness absence is calculated using the number of hours absent (excluding planned and long-term
illness), divided by the number of work hours.
Read more about how Essity works with health and safety on page 52.
H14. Certifications Reliable management systems, which are certified by a third party, play an important role in Essity’s sustainability work. Essity uses ISO 14001 and EMAS (the EU’s Eco Management and Audit Scheme) as certified environmental management systems. A large number of production units are certified in accordance with ISO and/or EMAS. ISO 9001 or ISO 13485 for medical tech-nical classification is the most important quality management system used by Essity. The company implements the international standard ISO 45001 (Occupational Health and Safety Assessment Series) to ensure that uniform processes are used within the entire company and that Essity’s units contin-uously improve workplace-related health and safety.
Certified volumes, Essity’s main sites1), %2021 2020 2019 2018 2017
ISO 9001/ISO 13485 78 77 80 77 76ISO 14001 82 81 75 80 85ISO 45001/OHSAS 18001 84 79 80 71 711) A main site is a production facility that is wholly owned by Essity and that has at least 100 employees.
The table excludes the acquisition of the hygiene companies Asaleo Care and Familia.
Introduction The Essity share
Strategy Business areas SustainabilityGroup Corporate Governance Report
Financial statementsincluding notes
Essity data
131Essity’s Annual and Sustainability Report 2021 Financial statements including notes
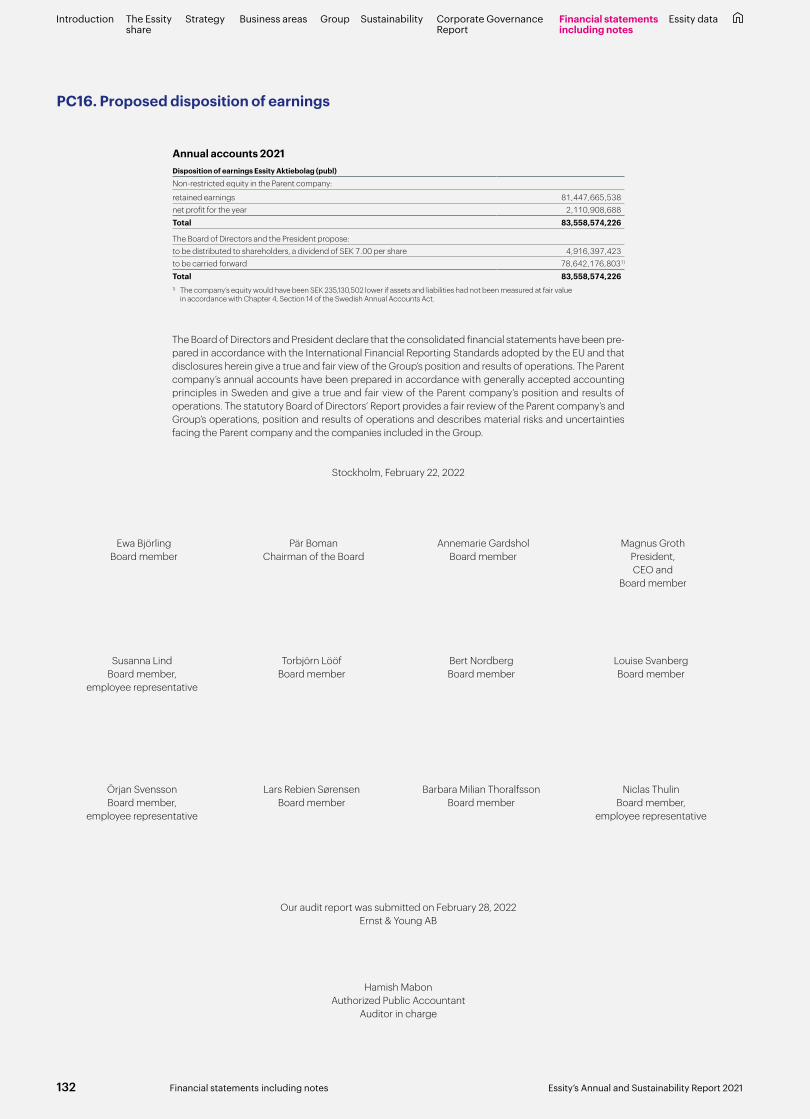
Ewa BjörlingBoard member
Pär BomanChairman of the Board
Annemarie Gardshol Board member
Magnus Groth President, CEO and
Board member
The Board of Directors and President declare that the consolidated financial statements have been pre-pared in accordance with the International Financial Reporting Standards adopted by the EU and that disclosures herein give a true and fair view of the Group’s position and results of operations. The Parent company’s annual accounts have been prepared in accordance with generally accepted accounting principles in Sweden and give a true and fair view of the Parent company’s position and results of operations. The statutory Board of Directors’ Report provides a fair review of the Parent company’s and Group’s operations, position and results of operations and describes material risks and uncertainties facing the Parent company and the companies included in the Group.
Stockholm, February 22, 2022
Our audit report was submitted on February 28, 2022Ernst & Young AB
Hamish MabonAuthorized Public Accountant
Auditor in charge
Annual accounts 2021Disposition of earnings Essity Aktiebolag (publ)
Non-restricted equity in the Parent company:
retained earnings 81,447,665,538net profit for the year 2,110,908,688Total 83,558,574,226
The Board of Directors and the President propose:to be distributed to shareholders, a dividend of SEK 7.00 per share 4,916,397,423to be carried forward 78,642,176,8031)
Total 83,558,574,2261) The company’s equity would have been SEK 235,130,502 lower if assets and liabilities had not been measured at fair value
in accordance with Chapter 4, Section 14 of the Swedish Annual Accounts Act.
PC16. Proposed disposition of earnings
Susanna Lind Board member,
employee representative
Torbjörn LööfBoard member
Bert Nordberg Board member
Louise Svanberg Board member
Örjan Svensson Board member,
employee representative
Lars Rebien SørensenBoard member
Barbara Milian ThoralfssonBoard member
Niclas ThulinBoard member,
employee representative
Introduction The Essity share
Strategy Business areas SustainabilityGroup Corporate Governance Report
Financial statementsincluding notes
Essity data
132 Essity’s Annual and Sustainability Report 2021Financial statements including notes

Auditor’s report
OpinionsWe have audited the annual accounts and consolidated accounts of Essity Aktiebolag (publ) except pages 55–65 and 123–131 for the year 2021. The annual accounts and consolidated accounts of the company are included on pages 6–8 and 22–136 in this document.
In our opinion, the annual accounts have been prepared in accordance with the Annual Accounts Act and present fairly, in all material respects, the financial position of the Parent company as of 31 December 2021 and its financial performance and cash flow for the year then ended in accordance with the Annual Accounts Act. The consolidated accounts have been pre-pared in accordance with the Annual Accounts Act and present fairly, in all material respects, the financial position of the Group as of 31 December 2021 and their financial performance and cash flow for the year then ended in accordance with International Financial Reporting Standards (IFRS), as adopted by the EU, and the Annual Accounts Act. Our opinions do not cover pages 55–65 and 123–131. The statutory administration report is consistent with the other parts of the annual accounts and consolidated accounts.
We therefore recommend that the general meeting of shareholders adopts the income statement and balance sheet for the Parent company and the Group.
Valuation of goodwill and other intangibles assets (trademarks)
Description How our audit addressed this key audit matter
The value of goodwill and other intangibles (including trademarks) with an indefinite useful life as of 31 December 2021 amounted to 51.9 billion SEK. The company performs annual impairment tests as well as whenever impairment indicators have been identified. The recoverable amount for each cash-generating unit is determined as the value in use, which is calculated based on the discounted present value of future cash flows. Key assumptions in these calculations include future growth rates, gross profit development and the discount rate applied and are presented in Note D1 (“Intangible assets”). An impairment test is a complex process and contains a high degree of judgment regarding future cash flows and other assumptions, not least because it is based on estimates of how the company´s business will be affected by future market developments and by other economic events. In addition, the underlying calculations are in themselves complex. Therefore, we have assessed valuation of goodwill and other intangibles assets with an indefinite useful life to be a key audit matter
In our audit we have evaluated and reviewed key assumptions, the appli-cation of recognized valuation practices, discount rate (referred to as WACC – “Weighted Average Cost of Capital”) and other source data that the company has applied. Our evaluation has included comparing to external data sources, such as forecasts of inflation or assessment of future market growth and by evaluating the sensitivity in the company´s valuation model. We have specifically focused on the sensitivity in the calculations and have made an independent evaluation of whether there is a risk that reasonably probable events would give raise to a situation where the value in use would be lower than the carrying amount. In order to assess the company´s historical precision in its estimates and assess-ments we have also evaluated the company´s historical estimates with actual amounts that were subsequently reported. We have as appropriate included valuation experts in the team performing our review. Finally, we have evaluated if disclosures provided in Note D1 (“Intangible assets”) in the company´s notes are appropriate, specifically with regards to the disclosure of which of the stated assumptions that are most sensitive in calculating the value in use and the sensitivity analysis for those key assumptions.
Key Audit MattersKey audit matters of the audit are those matters that, in our professional judgment, were of most significance in our audit of the annual accounts and consolidated accounts of the current period. These matters were addressed in the context of our audit of, and in forming our opinion thereon, the annual accounts and consolidated accounts as a whole, but we do not provide a separate opinion on these matters. For each matter below, our description of how our audit addressed the matter is provided in that context.
Our opinions in this report on the annual accounts and consolidated accounts are consistent with the content of the additional report that has been submitted to the Parent company’s audit committee in accordance with the Audit Regulation (537/2014) Article 11.
Basis for OpinionsWe conducted our audit in accordance with International Standards on Auditing (ISA) and generally accepted auditing standards in Sweden. Our responsibilities under those standards are further described in the Auditor’s Responsibilities section. We are independent of the Parent company and the Group in accordance with professional ethics for accountants in Swe-den and have otherwise fulfilled our ethical responsibilities in accordance with these requirements. This includes that, based on the best of our knowl-edge and belief, no prohibited services referred to in the Audit Regulation (537/2014) Article 5.1 have been provided to the audited company or, where applicable, its Parent company or its controlled companies within the EU.
We believe that the audit evidence we have obtained is sufficient and appropriate to provide a basis for our opinions.
We have fulfilled the responsibilities described in the Auditor’s responsibili-ties for the audit of the financial statements section of our report, including in relation to these matters. Accordingly, our audit included the performance of procedures designed to respond to our assessment of the risks of material misstatement of the financial statements. The results of our audit proce-dures, including the procedures performed to address the matters below, provide the basis for our audit opinion on the accompanying financial state-ments.
To the general meeting of the shareholders of Essity Aktiebolag (publ), corporate identity number 556325-5511
Report on the annual accounts and consolidated accounts
Introduction The Essity share
Strategy Business areas SustainabilityGroup Corporate Governance Report
Financial statementsincluding notes
Essity data
133Essity’s Annual and Sustainability Report 2021 Financial statements including notes
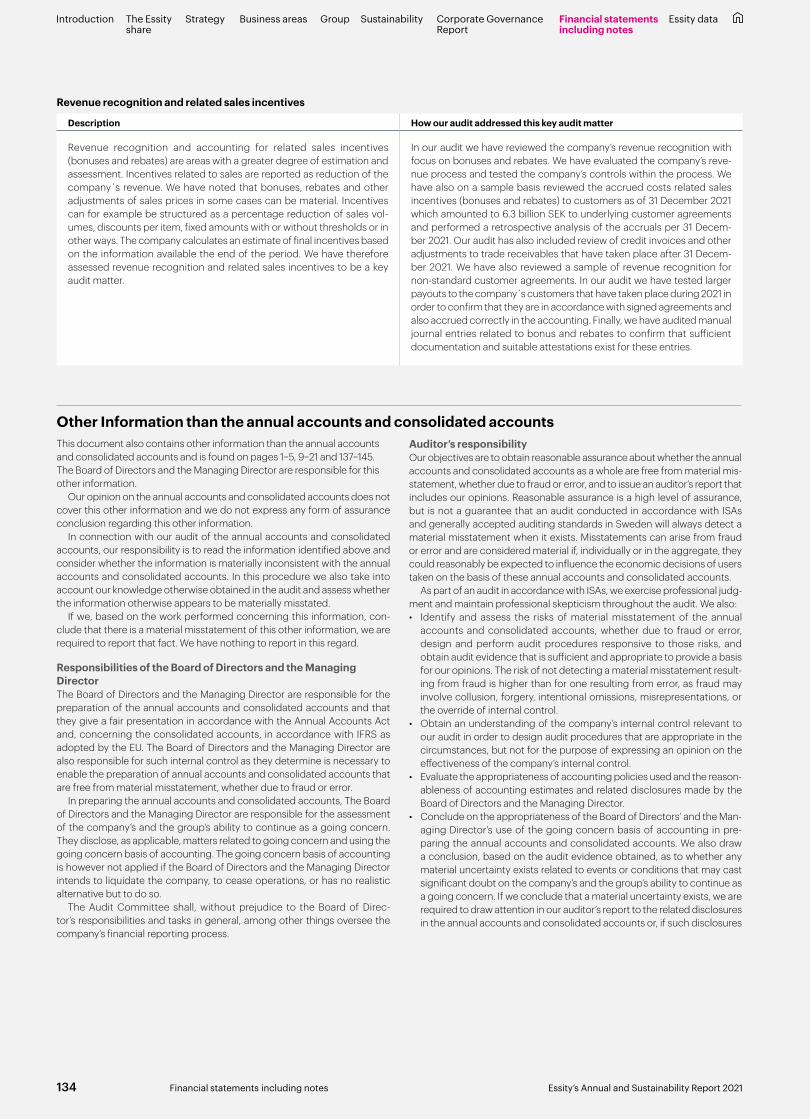
Other Information than the annual accounts and consolidated accounts
Revenue recognition and related sales incentives
Description How our audit addressed this key audit matter
Revenue recognition and accounting for related sales incentives (bonuses and rebates) are areas with a greater degree of estimation and assessment. Incentives related to sales are reported as reduction of the company´s revenue. We have noted that bonuses, rebates and other adjustments of sales prices in some cases can be material. Incentives can for example be structured as a percentage reduction of sales vol-umes, discounts per item, fixed amounts with or without thresholds or in other ways. The company calculates an estimate of final incentives based on the information available the end of the period. We have therefore assessed revenue recognition and related sales incentives to be a key audit matter.
In our audit we have reviewed the company’s revenue recognition with focus on bonuses and rebates. We have evaluated the company’s reve-nue process and tested the company’s controls within the process. We have also on a sample basis reviewed the accrued costs related sales incentives (bonuses and rebates) to customers as of 31 December 2021 which amounted to 6.3 billion SEK to underlying customer agreements and performed a retrospective analysis of the accruals per 31 Decem-ber 2021. Our audit has also included review of credit invoices and other adjustments to trade receivables that have taken place after 31 Decem-ber 2021. We have also reviewed a sample of revenue recognition for non-standard customer agreements. In our audit we have tested larger payouts to the company´s customers that have taken place during 2021 in order to confirm that they are in accordance with signed agreements and also accrued correctly in the accounting. Finally, we have audited manual journal entries related to bonus and rebates to confirm that sufficient documentation and suitable attestations exist for these entries.
This document also contains other information than the annual accounts and consolidated accounts and is found on pages 1–5, 9–21 and 137–145. The Board of Directors and the Managing Director are responsible for this other information.
Our opinion on the annual accounts and consolidated accounts does not cover this other information and we do not express any form of assurance conclusion regarding this other information.
In connection with our audit of the annual accounts and consolidated accounts, our responsibility is to read the information identified above and consider whether the information is materially inconsistent with the annual accounts and consolidated accounts. In this procedure we also take into account our knowledge otherwise obtained in the audit and assess whether the information otherwise appears to be materially misstated.
If we, based on the work performed concerning this information, con-clude that there is a material misstatement of this other information, we are required to report that fact. We have nothing to report in this regard.
Responsibilities of the Board of Directors and the Managing DirectorThe Board of Directors and the Managing Director are responsible for the preparation of the annual accounts and consolidated accounts and that they give a fair presentation in accordance with the Annual Accounts Act and, concerning the consolidated accounts, in accordance with IFRS as adopted by the EU. The Board of Directors and the Managing Director are also responsible for such internal control as they determine is necessary to enable the preparation of annual accounts and consolidated accounts that are free from material misstatement, whether due to fraud or error.
In preparing the annual accounts and consolidated accounts, The Board of Directors and the Managing Director are responsible for the assessment of the company’s and the group’s ability to continue as a going concern. They disclose, as applicable, matters related to going concern and using the going concern basis of accounting. The going concern basis of accounting is however not applied if the Board of Directors and the Managing Director intends to liquidate the company, to cease operations, or has no realistic alternative but to do so.
The Audit Committee shall, without prejudice to the Board of Direc-tor’s responsibilities and tasks in general, among other things oversee the company’s financial reporting process.
Auditor’s responsibilityOur objectives are to obtain reasonable assurance about whether the annual accounts and consolidated accounts as a whole are free from material mis-statement, whether due to fraud or error, and to issue an auditor’s report that includes our opinions. Reasonable assurance is a high level of assurance, but is not a guarantee that an audit conducted in accordance with ISAs and generally accepted auditing standards in Sweden will always detect a material misstatement when it exists. Misstatements can arise from fraud or error and are considered material if, individually or in the aggregate, they could reasonably be expected to influence the economic decisions of users taken on the basis of these annual accounts and consolidated accounts.
As part of an audit in accordance with ISAs, we exercise professional judg-ment and maintain professional skepticism throughout the audit. We also:• Identify and assess the risks of material misstatement of the annual
accounts and consolidated accounts, whether due to fraud or error, design and perform audit procedures responsive to those risks, and obtain audit evidence that is sufficient and appropriate to provide a basis for our opinions. The risk of not detecting a material misstatement result-ing from fraud is higher than for one resulting from error, as fraud may involve collusion, forgery, intentional omissions, misrepresentations, or the override of internal control.
• Obtain an understanding of the company’s internal control relevant to our audit in order to design audit procedures that are appropriate in the circumstances, but not for the purpose of expressing an opinion on the effectiveness of the company’s internal control.
• Evaluate the appropriateness of accounting policies used and the reason-ableness of accounting estimates and related disclosures made by the Board of Directors and the Managing Director.
• Conclude on the appropriateness of the Board of Directors’ and the Man-aging Director’s use of the going concern basis of accounting in pre-paring the annual accounts and consolidated accounts. We also draw a conclusion, based on the audit evidence obtained, as to whether any material uncertainty exists related to events or conditions that may cast significant doubt on the company’s and the group’s ability to continue as a going concern. If we conclude that a material uncertainty exists, we are required to draw attention in our auditor’s report to the related disclosures in the annual accounts and consolidated accounts or, if such disclosures
Introduction The Essity share
Strategy Business areas SustainabilityGroup Corporate Governance Report
Financial statementsincluding notes
Essity data
134 Essity’s Annual and Sustainability Report 2021Financial statements including notes
are inadequate, to modify our opinion about the annual accounts and consolidated accounts. Our conclusions are based on the audit evidence obtained up to the date of our auditor’s report. However, future events or conditions may cause a company and a group to cease to continue as a going concern.
• Evaluate the overall presentation, structure and content of the annual accounts and consolidated accounts, including the disclosures, and whether the annual accounts and consolidated accounts represent the underlying transactions and events in a manner that achieves fair pre-sentation.
• Obtain sufficient and appropriate audit evidence regarding the finan-cial information of the entities or business activities within the group to express an opinion on the consolidated accounts. We are responsible for the direction, supervision and performance of the group audit. We remain solely responsible for our opinions.
We must inform the Board of Directors of, among other matters, the planned scope and timing of the audit. We must also inform of significant audit find-ings during our audit, including any significant deficiencies in internal control that we identified.
We must also provide the Board of Directors with a statement that we have complied with relevant ethical requirements regarding independence, and to communicate with them all relationships and other matters that may reasonably be thought to bear on our independence, and where applicable, actions taken to eliminate threats or related safeguards applied.
From the matters communicated with the Board of Directors, we deter-mine those matters that were of most significance in the audit of the annual accounts and consolidated accounts, including the most important assessed risks for material misstatement, and are therefore the key audit matters. We describe these matters in the auditor’s report unless law or reg-ulation precludes disclosure about the matter.
Report on other legal and regulatory requirements Report on the audit of the administration and the proposed appropriations of the company’s profit or loss
OpinionsIn addition to our audit of the annual accounts and consolidated accounts, we have also audited the administration of the Board of Directors and the Managing Director of Essity Aktiebolag (publ) for the year 2021 and the pro-posed appropriations of the company’s profit or loss.
We recommend to the general meeting of shareholders that the profit be appropriated (loss be dealt with) in accordance with the proposal in the stat-utory administration report and that the members of the Board of Directors and the Managing Director be discharged from liability for the financial year.
A separate list of loans and collateral has been prepared in accordance with the provisions of the Companies Act.
Basis for opinionsWe conducted the audit in accordance with generally accepted auditing standards in Sweden. Our responsibilities under those standards are further described in the Auditor’s Responsibilities section. We are independent of the parent company and the group in accordance with professional ethics for accountants in Sweden and have otherwise fulfilled our ethical respon-sibilities in accordance with these requirements.
We believe that the audit evidence we have obtained is sufficient and appropriate to provide a basis for our opinions.
Responsibilities of the Board of Directors and the Managing DirectorThe Board of Directors is responsible for the proposal for appropriations of the company’s profit or loss. At the proposal of a dividend, this includes an assessment of whether the dividend is justifiable considering the require-ments which the company’s and the group’s type of operations, size and risks place on the size of the parent company’s and the group’s equity, con-solidation requirements, liquidity and position in general.
The Board of Directors is responsible for the company’s organization and the administration of the company’s affairs. This includes among other things continuous assessment of the company’s and the group’s financial situation and ensuring that the company’s organization is designed so that the accounting, management of assets and the company’s financial affairs otherwise are controlled in a reassuring manner. The Managing Director shall manage the ongoing administration according to the Board of Directors’
guidelines and instructions and among other matters take measures that are necessary to fulfill the company’s accounting in accordance with law and handle the management of assets in a reassuring manner.
Auditor’s responsibilityOur objective concerning the audit of the administration, and thereby our opinion about discharge from liability, is to obtain audit evidence to assess with a reasonable degree of assurance whether any member of the Board of Directors or the Managing Director in any material respect:• has undertaken any action or been guilty of any omission which can give
rise to liability to the company, or• in any other way has acted in contravention of the Companies Act, the
Annual Accounts Act or the Articles of Association.
Our objective concerning the audit of the proposed appropriations of the company’s profit or loss, and thereby our opinion about this, is to assess with reasonable degree of assurance whether the proposal is in accordance with the Companies Act.
Reasonable assurance is a high level of assurance, but is not a guarantee that an audit conducted in accordance with generally accepted auditing standards in Sweden will always detect actions or omissions that can give rise to liability to the company, or that the proposed appropriations of the company’s profit or loss are not in accordance with the Companies Act.
As part of an audit in accordance with generally accepted auditing stan-dards in Sweden, we exercise professional judgment and maintain profes-sional scepticism throughout the audit. The examination of the adminis-tration and the proposed appropriations of the company’s profit or loss is based primarily on the audit of the accounts. Additional audit procedures performed are based on our professional judgment with starting point in risk and materiality. This means that we focus the examination on such actions, areas and relationships that are material for the operations and where deviations and violations would have particular importance for the company’s situation. We examine and test decisions undertaken, support for decisions, actions taken and other circumstances that are relevant to our opinion concerning discharge from liability. As a basis for our opinion on the Board of Directors’ proposed appropriations of the company’s profit or loss we examined the Board of Directors’ reasoned statement and a selection of supporting evidence in order to be able to assess whether the proposal is in accordance with the Companies Act.
Introduction The Essity share
Strategy Business areas SustainabilityGroup Corporate Governance Report
Financial statementsincluding notes
Essity data
135Essity’s Annual and Sustainability Report 2021 Financial statements including notes

The auditor’s examination of the ESEF report
The auditor’s examination of the corporate governance statement
The auditor´s opinion regarding the statutory sustainability report
OpinionIn addition to our audit of the annual accounts and consolidated accounts, we have also examined that the Board of Directors and the Managing Direc-tor have prepared the annual accounts and consolidated accounts in a for-mat that enables uniform electronic reporting (the Esef report) pursuant to Chapter 16, Section 4(a) of the Swedish Securities Market Act (2007:528) for Essity Aktiebolag (publ) for the financial year 2021.
Our examination and our opinion relate only to the statutory requirements.In our opinion, the ESEF report [SHA256-checksum: e6533add7f4b836
a9262ef81be7907b0936611c23306f453d2c8f54a4cbaeea2] has been pre-pared in a format that, in all material respects, enables uniform electronic reporting.
Basis for opinionWe have performed the examination in accordance with FAR’s recommen-dation RevR 18 Examination of the ESEF report. Our responsibility under this recommendation is described in more detail in the Auditors’ responsibility section. We are independent of Essity Aktiebolag (publ) in accordance with professional ethics for accountants in Sweden and have otherwise fulfilled our ethical responsibilities in accordance with these requirements.
We believe that the evidence we have obtained is sufficient and appropri-ate to provide a basis for our opinion.
Responsibilities of the Board of Directors and the Managing DirectorThe Board of Directors and the Managing Director are responsible for the preparation of the Esef report in accordance with Chapter 16, Section 4(a) of the Swedish Securities Market Act (2007:528), and for such internal control that the Board of Directors and the Managing Director determine is neces-sary to prepare the Esef report without material misstatements, whether due to fraud or error.
Auditor’s responsibilityOur responsibility is to obtain reasonable assurance whether the Esef report is in all material respects prepared in a format that meets the requirements of Chapter 16, Section 4(a) of the Swedish Securities Market Act (2007:528), based on the procedures performed.
RevR 18 requires us to plan and execute procedures to achieve reason-able assurance that the Esef report is prepared in a format that meets these requirements.
The Board of Directors is responsible for that the corporate governance statement on pages 55–65 has been prepared in accordance with the Annual Accounts Act.
Our examination of the corporate governance statement is conducted in accordance with FAR´s standard RevR 16 The auditor´s examination of the corporate governance statement. This means that our examination of the corporate governance statement is different and substantially less in scope than an audit conducted in accordance with International Standards on
The Board of Directors is responsible for the statutory sustainability report on pages 35–54 and 123–131, and that it is prepared in accordance with the Annual Accounts Act.
Our examination has been conducted in accordance with FAR’s auditing standard RevR 12 The auditor´s opinion regarding the statutory sustainabil-ity report. This means that our examination of the statutory sustainability report is different and substantially less in scope than an audit conducted in accordance with International Standards on Auditing and generally accepted auditing standards in Sweden. We believe that the examination has provided us with sufficient basis for our opinion.
A statutory sustainability report has been prepared in accordance with the requirements of the Annual Accounts Act.
Reasonable assurance is a high level of assurance, but it is not a guaran-tee that an engagement carried out according to RevR 18 and generally accepted auditing standards in Sweden will always detect a material mis-statement when it exists. Misstatements can arise from fraud or error and are considered material if, individually or in aggregate, they could reasonably be expected to influence the economic decisions of users taken on the basis of the Esef report.
The audit firm applies ISQC 1 Quality Control for Firms that Perform Audits and Reviews of Financial Statements, and other Assurance and Related Services Engagements and accordingly maintains a comprehensive system of quality control, including documented policies and procedures regarding compliance with professional ethical requirements, professional standards and legal and regulatory requirements.
The examination involves obtaining evidence, through various pro-cedures, that the Esef report has been prepared in a format that enables uniform electronic reporting of the annual and consolidated accounts. The procedures selected depend on the auditor’s judgment, including the assessment of the risks of material misstatement in the report, whether due to fraud or error. In carrying out this risk assessment, and in order to design audit procedures that are appropriate in the circumstances, the auditor considers those elements of internal control that are relevant to the prepa-ration of the Esef report by the Board of Directors and the Managing Director, but not for the purpose of expressing an opinion on the effectiveness of those internal controls. The examination also includes an evaluation of the appropriateness and reasonableness of assumptions made by the Board of Directors and the Managing Director.
The procedures mainly include a technical validation of the Esef report, i.e. if the file containing the Esef report meets the technical specification set out in the Commission’s Delegated Regulation (EU) 2019/815 and a reconcil-iation of the Esef report with the audited annual accounts and consolidated accounts.
Furthermore, the procedures also include an assessment of whether the Esef report has been marked with iXBRL which enables a fair and complete machine-readable version of the consolidated statement of financial perfor-mance, financial position, changes in equity and cash flow.
Auditing and generally accepted auditing standards in Sweden. We believe that the examination has provided us with sufficient basis for our opinions.
A corporate governance statement has been prepared. Disclosures in accordance with chapter 6 section 6 the second paragraph points 2–6 of the Annual Accounts Act and chapter 7 section 31 the second paragraph the same law are consistent with the other parts of the annual accounts and consolidated accounts and are in accordance with the Annual Accounts Act.
Ernst & Young AB, Box 7850, 103 99 Stockholm, was appointed auditor of Essity Aktiebolag (publ) by the general meeting of the shareholders on the 25 March 2021 and has been the company’s auditor since the 27 May 2016.
Stockholm 28 February 2022 Ernst & Young AB
Hamish MabonAuthorized Public Accountant
Introduction The Essity share
Strategy Business areas SustainabilityGroup Corporate Governance Report
Financial statementsincluding notes
Essity data
136 Essity’s Annual and Sustainability Report 2021Financial statements including notes
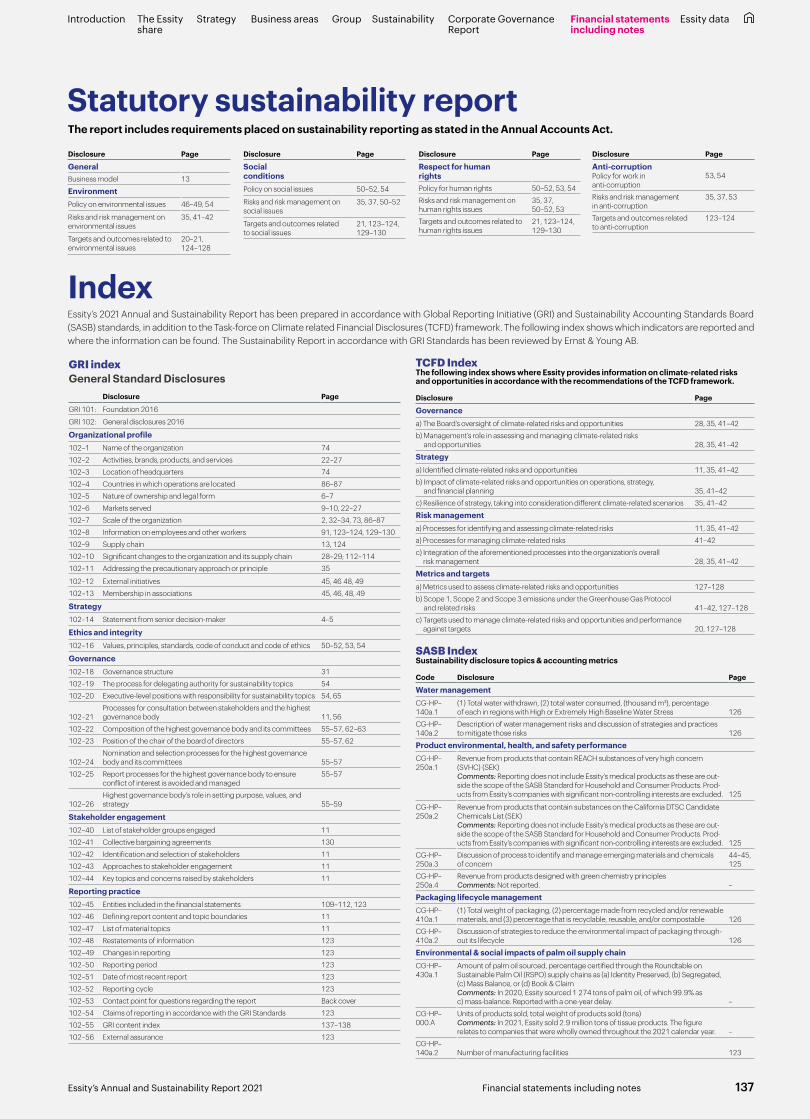
Statutory sustainability report
Index
The report includes requirements placed on sustainability reporting as stated in the Annual Accounts Act.
Essity’s 2021 Annual and Sustainability Report has been prepared in accordance with Global Reporting Initiative (GRI) and Sustainability Accounting Standards Board (SASB) standards, in addition to the Task-force on Climate related Financial Disclosures (TCFD) framework. The following index shows which indicators are reported and where the information can be found. The Sustainability Report in accordance with GRI Standards has been reviewed by Ernst & Young AB.
GRI indexGeneral Standard Disclosures
Disclosure Page
GRI 101: Foundation 2016
GRI 102: General disclosures 2016
Organizational profile102–1 Name of the organization 74
102–2 Activities, brands, products, and services 22–27
102–3 Location of headquarters 74
102–4 Countries in which operations are located 86–87
102–5 Nature of ownership and legal form 6–7
102–6 Markets served 9–10, 22–27
102–7 Scale of the organization 2, 32–34, 73, 86–87
102–8 Information on employees and other workers 91, 123–124, 129–130
102–9 Supply chain 13, 124
102–10 Significant changes to the organization and its supply chain 28–29; 112–114
102–11 Addressing the precautionary approach or principle 35
102–12 External initiatives 45, 46 48, 49
102–13 Membership in associations 45, 46, 48, 49
Strategy102–14 Statement from senior decision-maker 4–5
Ethics and integrity102–16 Values, principles, standards, code of conduct and code of ethics 50–52, 53, 54
Governance102–18 Governance structure 31
102–19 The process for delegating authority for sustainability topics 54
102–20 Executive-level positions with responsibility for sustainability topics 54, 65
102–21Processes for consultation between stakeholders and the highest governance body 11, 56
102–22 Composition of the highest governance body and its committees 55–57, 62–63
102–23 Position of the chair of the board of directors 55–57, 62
102–24Nomination and selection processes for the highest governance body and its committees 55–57
102–25 Report processes for the highest governance body to ensure conflict of interest is avoided and managed
55–57
102–26Highest governance body’s role in setting purpose, values, and strategy 55–59
Stakeholder engagement102–40 List of stakeholder groups engaged 11
102–41 Collective bargaining agreements 130
102–42 Identification and selection of stakeholders 11
102–43 Approaches to stakeholder engagement 11
102–44 Key topics and concerns raised by stakeholders 11
Reporting practice102–45 Entities included in the financial statements 109–112, 123
102–46 Defining report content and topic boundaries 11
102–47 List of material topics 11
102–48 Restatements of information 123
102–49 Changes in reporting 123
102–50 Reporting period 123
102–51 Date of most recent report 123
102–52 Reporting cycle 123
102–53 Contact point for questions regarding the report Back cover
102–54 Claims of reporting in accordance with the GRI Standards 123
102–55 GRI content index 137–138
102–56 External assurance 123
SASB IndexSustainability disclosure topics & accounting metrics
Code Disclosure Page
Water managementCG-HP–140a.1
(1) Total water withdrawn, (2) total water consumed, (thousand m³), percentage of each in regions with High or Extremely High Baseline Water Stress 126
CG-HP–140a.2
Description of water management risks and discussion of strategies and practices to mitigate those risks 126
Product environmental, health, and safety performanceCG-HP–250a.1
Revenue from products that contain REACH substances of very high concern (SVHC) (SEK) Comments: Reporting does not include Essity’s medical products as these are out-side the scope of the SASB Standard for Household and Consumer Products. Prod-ucts from Essity’s companies with significant non-controlling interests are excluded. 125
CG-HP–250a.2
Revenue from products that contain substances on the California DTSC Candidate Chemicals List (SEK) Comments: Reporting does not include Essity’s medical products as these are out-side the scope of the SASB Standard for Household and Consumer Products. Prod-ucts from Essity’s companies with significant non-controlling interests are excluded. 125
CG-HP–250a.3
Discussion of process to identify and manage emerging materials and chemicals of concern
44–45, 125
CG-HP–250a.4
Revenue from products designed with green chemistry principles Comments: Not reported. –
Packaging lifecycle managementCG-HP–410a.1
(1) Total weight of packaging, (2) percentage made from recycled and/or renewable materials, and (3) percentage that is recyclable, reusable, and/or compostable 126
CG-HP–410a.2
Discussion of strategies to reduce the environmental impact of packaging through-out its lifecycle 126
Environmental & social impacts of palm oil supply chainCG-HP–430a.1
Amount of palm oil sourced, percentage certified through the Roundtable on Sustainable Palm Oil (RSPO) supply chains as (a) Identity Preserved, (b) Segregated, (c) Mass Balance, or (d) Book & ClaimComments: In 2020, Essity sourced 1 274 tons of palm oil, of which 99.9% as c) mass-balance. Reported with a one-year delay. –
CG-HP–000.A
Units of products sold, total weight of products sold (tons) Comments: In 2021, Essity sold 2.9 million tons of tissue products. The figure relates to companies that were wholly owned throughout the 2021 calendar year. –
CG-HP–140a.2 Number of manufacturing facilities 123
TCFD IndexThe following index shows where Essity provides information on climate-related risks and opportunities in accordance with the recommendations of the TCFD framework.
Disclosure Page
Governancea) The Board’s oversight of climate-related risks and opportunities 28, 35, 41–42
b) Management’s role in assessing and managing climate-related risks and opportunities 28, 35, 41–42
Strategya) Identified climate-related risks and opportunities 11, 35, 41–42
b) Impact of climate-related risks and opportunities on operations, strategy, and financial planning 35, 41–42
c) Resilience of strategy, taking into consideration different climate-related scenarios 35, 41–42
Risk managementa) Processes for identifying and assessing climate-related risks 11, 35, 41–42
a) Processes for managing climate-related risks 41–42
c) Integration of the aforementioned processes into the organization’s overall risk management 28, 35, 41–42
Metrics and targetsa) Metrics used to assess climate-related risks and opportunities 127–128
b) Scope 1, Scope 2 and Scope 3 emissions under the Greenhouse Gas Protocol and related risks 41–42, 127–128
c) Targets used to manage climate-related risks and opportunities and performance against targets 20, 127–128
Disclosure Page
GeneralBusiness model 13
EnvironmentPolicy on environmental issues 46–49, 54
Risks and risk management on environmental issues
35, 41–42
Targets and outcomes related to environmental issues
20–21, 124–128
Disclosure Page
Social conditionsPolicy on social issues 50–52, 54
Risks and risk management on social issues
35, 37, 50–52
Targets and outcomes related to social issues
21, 123–124, 129–130
Disclosure Page
Respect for human rightsPolicy for human rights 50–52, 53, 54
Risks and risk management on human rights issues
35, 37, 50–52, 53
Targets and outcomes related to human rights issues
21, 123–124, 129–130
Disclosure Page
Anti-corruptionPolicy for work in anti-corruption
53, 54
Risks and risk management in anti-corruption
35, 37, 53
Targets and outcomes related to anti-corruption
123–124
Introduction The Essity share
Strategy Business areas SustainabilityGroup Corporate Governance Report
Financial statementsincluding notes
Essity data
137Essity’s Annual and Sustainability Report 2021 Financial statements including notes
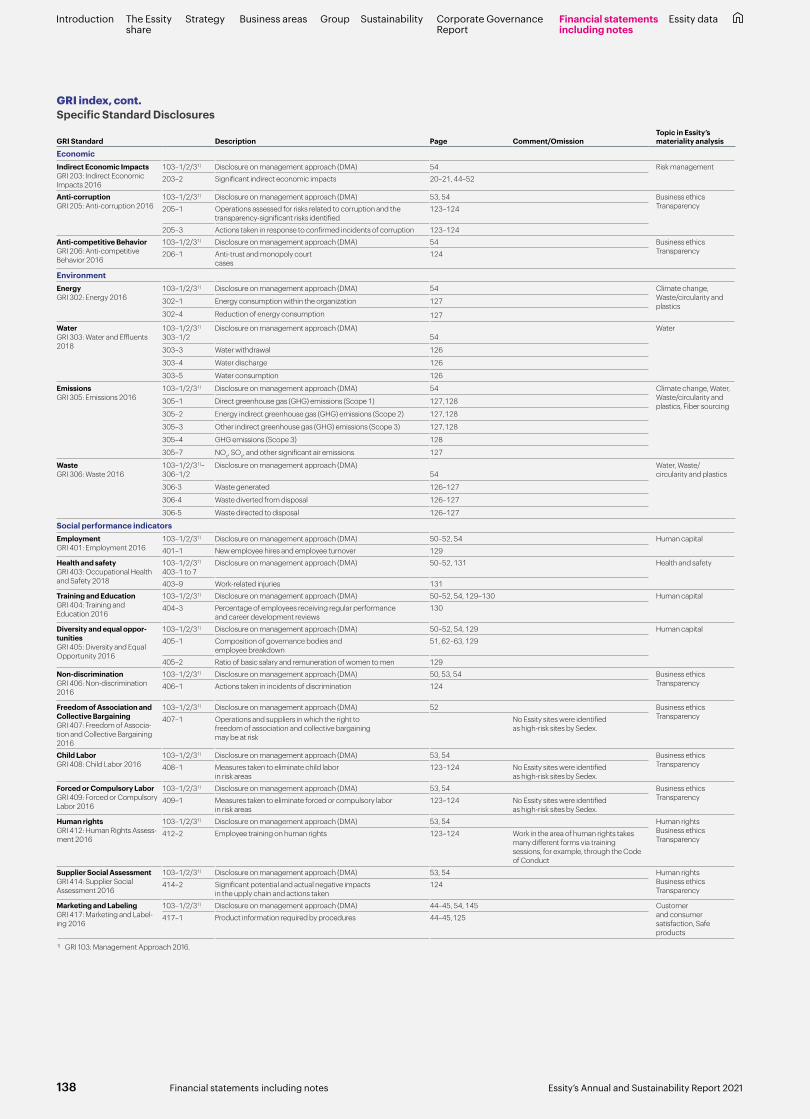
GRI index, cont.Specific Standard Disclosures
GRI Standard Description Page Comment/OmissionTopic in Essity’s materiality analysis
EconomicIndirect Economic ImpactsGRI 203: Indirect Economic Impacts 2016
103–1/2/31) Disclosure on management approach (DMA) 54 Risk management
203–2 Significant indirect economic impacts 20–21, 44–52
Anti-corruptionGRI 205: Anti-corruption 2016
103–1/2/31) Disclosure on management approach (DMA) 53, 54 Business ethicsTransparency205–1 Operations assessed for risks related to corruption and the
transparency-significant risks identified123–124
205–3 Actions taken in response to confirmed incidents of corruption 123–124
Anti-competitive BehaviorGRI 206: Anti-competitive Behavior 2016
103–1/2/31) Disclosure on management approach (DMA) 54 Business ethicsTransparency206–1 Anti-trust and monopoly court
cases124
EnvironmentEnergyGRI 302: Energy 2016
103–1/2/31) Disclosure on management approach (DMA) 54 Climate change, Waste/circularity and plastics
302–1 Energy consumption within the organization 127
302–4 Reduction of energy consumption 127
WaterGRI 303: Water and Effluents 2018
103–1/2/31)
303–1/2Disclosure on management approach (DMA)
54Water
303–3 Water withdrawal 126
303–4 Water discharge 126
303–5 Water consumption 126
EmissionsGRI 305: Emissions 2016
103–1/2/31) Disclosure on management approach (DMA) 54 Climate change, Water, Waste/circularity and plastics, Fiber sourcing
305–1 Direct greenhouse gas (GHG) emissions (Scope 1) 127,128
305–2 Energy indirect greenhouse gas (GHG) emissions (Scope 2) 127,128
305–3 Other indirect greenhouse gas (GHG) emissions (Scope 3) 127,128
305–4 GHG emissions (Scope 3) 128
305–7 NOx, SOx, and other significant air emissions 127
WasteGRI 306: Waste 2016
103–1/2/31)– 306–1/2
Disclosure on management approach (DMA)54
Water, Waste/ circularity and plastics
306-3 Waste generated 126–127
306-4 Waste diverted from disposal 126–127
306-5 Waste directed to disposal 126–127
Social performance indicatorsEmploymentGRI 401: Employment 2016
103–1/2/31) Disclosure on management approach (DMA) 50–52, 54 Human capital
401–1 New employee hires and employee turnover 129
Health and safetyGRI 403: Occupational Health and Safety 2018
103–1/2/31)
403–1 to 7Disclosure on management approach (DMA) 50–52, 131 Health and safety
403–9 Work-related injuries 131
Training and EducationGRI 404: Training and Education 2016
103–1/2/31) Disclosure on management approach (DMA) 50–52, 54, 129–130 Human capital
404–3 Percentage of employees receiving regular performance and career development reviews
130
Diversity and equal oppor-tunitiesGRI 405: Diversity and Equal Opportunity 2016
103–1/2/31) Disclosure on management approach (DMA) 50–52, 54, 129 Human capital
405–1 Composition of governance bodies and employee breakdown
51, 62–63, 129
405–2 Ratio of basic salary and remuneration of women to men 129
Non-discriminationGRI 406: Non-discrimination 2016
103–1/2/31) Disclosure on management approach (DMA) 50, 53, 54 Business ethics Transparency406–1 Actions taken in incidents of discrimination 124
Freedom of Association and Collective BargainingGRI 407: Freedom of Associa-tion and Collective Bargaining 2016
103–1/2/31) Disclosure on management approach (DMA) 52 Business ethics Transparency407–1 Operations and suppliers in which the right to
freedom of association and collective bargaining may be at risk
No Essity sites were identified as high-risk sites by Sedex.
Child LaborGRI 408: Child Labor 2016
103–1/2/31) Disclosure on management approach (DMA) 53, 54 Business ethics Transparency408–1 Measures taken to eliminate child labor
in risk areas123–124 No Essity sites were identified
as high-risk sites by Sedex.
Forced or Compulsory LaborGRI 409: Forced or Compulsory Labor 2016
103–1/2/31) Disclosure on management approach (DMA) 53, 54 Business ethics Transparency409–1 Measures taken to eliminate forced or compulsory labor
in risk areas123–124 No Essity sites were identified
as high-risk sites by Sedex.
Human rightsGRI 412: Human Rights Assess-ment 2016
103–1/2/31) Disclosure on management approach (DMA) 53, 54 Human rightsBusiness ethics Transparency
412–2 Employee training on human rights 123–124 Work in the area of human rights takes many different forms via training sessions, for example, through the Code of Conduct
Supplier Social AssessmentGRI 414: Supplier Social Assessment 2016
103–1/2/31) Disclosure on management approach (DMA) 53, 54 Human rightsBusiness ethics Transparency
414–2 Significant potential and actual negative impacts in the upply chain and actions taken
124
Marketing and LabelingGRI 417: Marketing and Label-ing 2016
103–1/2/31) Disclosure on management approach (DMA) 44–45, 54, 145 Customer and consumer satisfaction, Safe products
417–1 Product information required by procedures 44–45,125
1) GRI 103: Management Approach 2016.
Introduction The Essity share
Strategy Business areas SustainabilityGroup Corporate Governance Report
Financial statementsincluding notes
Essity data
138 Essity’s Annual and Sustainability Report 2021Financial statements including notes
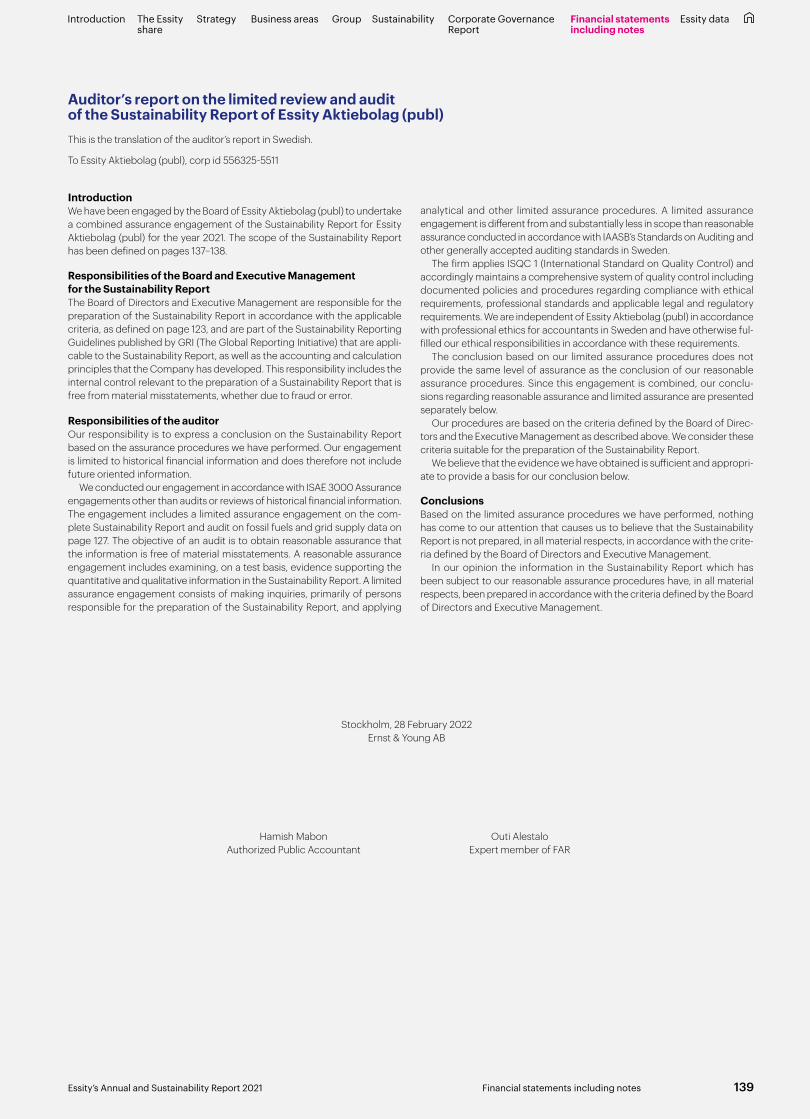
Introduction We have been engaged by the Board of Essity Aktiebolag (publ) to undertake a combined assurance engagement of the Sustainability Report for Essity Aktiebolag (publ) for the year 2021. The scope of the Sustainability Report has been defined on pages 137–138.
Responsibilities of the Board and Executive Management for the Sustainability Report The Board of Directors and Executive Management are responsible for the preparation of the Sustainability Report in accordance with the applicable criteria, as defined on page 123, and are part of the Sustainability Reporting Guidelines published by GRI (The Global Reporting Initiative) that are appli-cable to the Sustainability Report, as well as the accounting and calculation principles that the Company has developed. This responsibility includes the internal control relevant to the preparation of a Sustainability Report that is free from material misstatements, whether due to fraud or error.
Responsibilities of the auditor Our responsibility is to express a conclusion on the Sustainability Report based on the assurance procedures we have performed. Our engagement is limited to historical financial information and does therefore not include future oriented information.
We conducted our engagement in accordance with ISAE 3000 Assurance engagements other than audits or reviews of historical financial information. The engagement includes a limited assurance engagement on the com-plete Sustainability Report and audit on fossil fuels and grid supply data on page 127. The objective of an audit is to obtain reasonable assurance that the information is free of material misstatements. A reasonable assurance engagement includes examining, on a test basis, evidence supporting the quantitative and qualitative information in the Sustainability Report. A limited assurance engagement consists of making inquiries, primarily of persons responsible for the preparation of the Sustainability Report, and applying
Auditor’s report on the limited review and audit of the Sustainability Report of Essity Aktiebolag (publ) This is the translation of the auditor’s report in Swedish.
To Essity Aktiebolag (publ), corp id 556325-5511
analytical and other limited assurance procedures. A limited assurance engagement is different from and substantially less in scope than reasonable assurance conducted in accordance with IAASB’s Standards on Auditing and other generally accepted auditing standards in Sweden.
The firm applies ISQC 1 (International Standard on Quality Control) and accordingly maintains a comprehensive system of quality control including documented policies and procedures regarding compliance with ethical requirements, professional standards and applicable legal and regulatory requirements. We are independent of Essity Aktiebolag (publ) in accordance with professional ethics for accountants in Sweden and have otherwise ful-filled our ethical responsibilities in accordance with these requirements.
The conclusion based on our limited assurance procedures does not provide the same level of assurance as the conclusion of our reasonable assurance procedures. Since this engagement is combined, our conclu-sions regarding reasonable assurance and limited assurance are presented separately below.
Our procedures are based on the criteria defined by the Board of Direc-tors and the Executive Management as described above. We consider these criteria suitable for the preparation of the Sustainability Report.
We believe that the evidence we have obtained is sufficient and appropri-ate to provide a basis for our conclusion below.
Conclusions Based on the limited assurance procedures we have performed, nothing has come to our attention that causes us to believe that the Sustainability Report is not prepared, in all material respects, in accordance with the crite-ria defined by the Board of Directors and Executive Management.
In our opinion the information in the Sustainability Report which has been subject to our reasonable assurance procedures have, in all material respects, been prepared in accordance with the criteria defined by the Board of Directors and Executive Management.
Stockholm, 28 February 2022Ernst & Young AB
Hamish MabonAuthorized Public Accountant
Outi AlestaloExpert member of FAR
Introduction The Essity share
Strategy Business areas SustainabilityGroup Corporate Governance Report
Financial statementsincluding notes
Essity data
139Essity’s Annual and Sustainability Report 2021 Financial statements including notes

Remuneration report 2021Essity Aktiebolag (publ)to be presented at the 2022 Annual General Meeting (AGM)
IntroductionThis report describes how the guidelines for remuneration of senior executives of Essity AB, as adopted by the 2021 AGM, were applied in 2021. The report also provides information about the remuneration of the President and the Exec-utive Vice President and a summary of the company’s variable remuneration programs and other benefits. The report has been prepared in accordance with the Swedish Companies Act and the Swedish Corporate Governance Board’s Remuneration Rules. More information about remuneration of senior executives is available in Note C (Employees) on pages 91–95 in the Annual and Sustainability Report for 2021. Information about the work of the Remuneration Committee in 2021 is presented in the Corporate Governance Report on pages 55–65 in the Annual and Sustainability Report for 2021.
The Board’s remuneration is not covered in this report. Such remuneration is approved each year by the AGM and is reported in Note C3 on page 93 of the 2021 Annual Report.
1. Key events and key figures in 2021The President summarizes the company’s overall performance in his statement on pages 4–5 in the Annual and Sustainability Report for 2021.
2. The company’s guidelines for remuneration of senior executives: purpose, scope and deviationsThe remuneration guidelines, as unanimously adopted by the 2021 AGM, and the application of these are described on pages 91–92 of the Annual and Sus-tainability Report.
A prerequisite for the successful implementation of the company’s business strategy and the protection of its long-term interests, including its sustainability, is that the company can recruit and retain qualified staff. To this end, the com-pany must offer competitive and market-based remuneration and benefits.
According to the guidelines, total remuneration and benefits to senior exec-utives, Total Reward, is to correspond to market practice and be competitive in the senior executive’s field of profession. The remuneration is offered as fixed salary, variable remuneration, other benefits such as company car, pension and healthcare benefits.
The total remuneration is to be proportionate to the senior executive’s position and authority and the responsibility this entails based on the financial scope and business impact, as well as market complexity. Total remuneration is decided on an individual basis at a level that, in combination with the various
remuneration components, is considered to correspond to market practice and is competitive taking into account performance. For the President and the Exec-utive Vice President, a market comparison is therefore conducted with Swedish global industrial companies.
Table 1 below shows the total remuneration of senior executives in 2021 and the relationship between fixed and variable remuneration. Remuneration was not received from other Group companies.
3. Variable remunerationVariable remuneration is divided into short and long-term portions that are related to financial or non-financial targets. The criteria are designed to con-tribute to the company’s business strategy and long-term interests, including its sustainability. The sustainability targets are primarily focused on the sci-ence-based targets scope 1 and 2, which aim to reduce emissions of carbon dioxide in energy utilization and purchased electricity.
3.1 Short-term incentive programThe program aims to support the achievement of the company’s strategic busi-ness targets in the short and long term. The program’s target structure consists of organizational targets and performance targets.
The organizational targets are set at a high level in the organization, business unit or Group level, and are decided at Group level and apply for a large number employees, while the performance targets are directly linked to responsibility within an individual role.
The organizational targets consist of financial targets at Group level or busi-ness area targets and comprise operating cash flow, sales growth and operating margin.
Performance targets are financial targets or business strategic non-financial targets. The performance targets are designed to be more closely linked to an individual role.
For the President and the Executive Vice President, organizational targets comprise the Group’s adjusted operating margin, organic sales growth and operating cash flow. The performance targets for 2021 consisted of profit for the period (adjusted) and sustainability targets. The organizational targets account for 70% and the performance targets 30%. See table 2.
If the targets are met in full, short-term remuneration amounts to 50% of fixed cash salary for the President and the Executive Vice President. This remu-neration is not pensionable income.
Table 2. Outcome of the short-term program 2021 for the President and the Executive Vice PresidentName, position Target Target’s relative value Target outcome Remuneration (SEK)
Magnus Groth President and CEO
Organizational target
EBITA margin (adjusted) 17.5% 11.2% 0
Operating cash flow (adjusted1)) 17.5% SEK 9.8bn 0
Organic sales growth 35% 3.3% 344,531
Performance target
Profit for the period (adjusted) 21% SEK 9.3bn 0
Science Based Targets, Scope 1 and 2 9% –15% 708,750
Fredrik Rystedt CFO and Executive Vice President
Organizational target
EBITA margin (adjusted) 21% 11.2% 0
Operating cash flow (adjusted1)) 28% SEK 9.8bn 0
Organic sales growth 21% 3.3% 172,331
Performance target
Profit for the period (adjusted) 21% SEK 9.3bn 0
Science Based Targets, Scope 1 and 2 9% –15% 354,5101) Change in working capital is replaced with average calculated change in working capital during the year.
Table 1. Total remuneration of the President and the Executive Vice PresidentSEK Fixed remuneration Variable remuneration1)
Name, positionFiscal year Fixed salary
Other benefits and remuneration
Short-term remuneration
Long-term remuneration
Extraordinary benefits
Pension costs
Total salary and remuneration
Proportion fixed and variable
remuneration (%)
Magnus Groth President and CEO 2021 15,750,000 120,921 1,053,281 0 0 6,555,851 23,480,053 96/4
Fredrik Rystedt CFO and Executive Vice President 2021 7,878,000 60,549 526,841 0 0 2,462,785 10,928,175 95/51) Variable remuneration pertains to 2021 but is paid in 2022.
Introduction The Essity share
Strategy Business areas SustainabilityGroup Corporate Governance Report
Financial statementsincluding notes
Essity data
140 Essity’s Annual and Sustainability Report 2021Remuneration report 2021
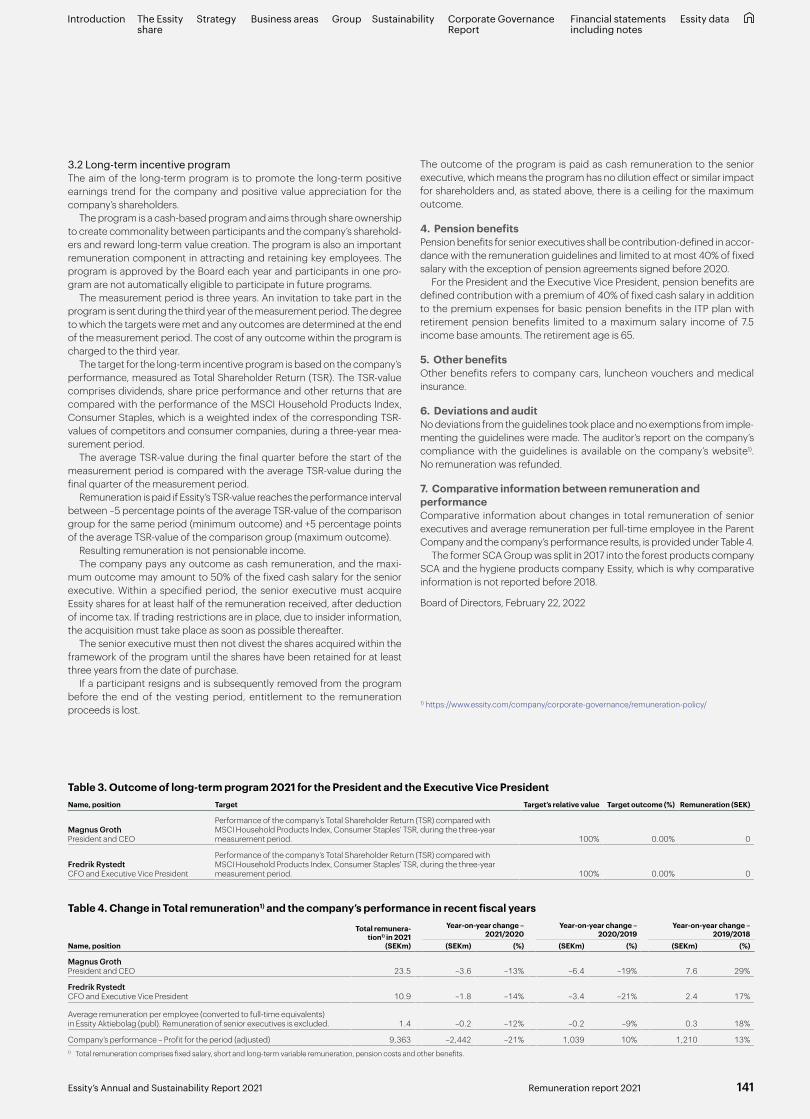
3.2 Long-term incentive programThe aim of the long-term program is to promote the long-term positive earnings trend for the company and positive value appreciation for the company’s shareholders.
The program is a cash-based program and aims through share ownership to create commonality between participants and the company’s sharehold-ers and reward long-term value creation. The program is also an important remuneration component in attracting and retaining key employees. The program is approved by the Board each year and participants in one pro-gram are not automatically eligible to participate in future programs.
The measurement period is three years. An invitation to take part in the program is sent during the third year of the measurement period. The degree to which the targets were met and any outcomes are determined at the end of the measurement period. The cost of any outcome within the program is charged to the third year.
The target for the long-term incentive program is based on the company’s performance, measured as Total Shareholder Return (TSR). The TSR-value comprises dividends, share price performance and other returns that are compared with the performance of the MSCI Household Products Index, Consumer Staples, which is a weighted index of the corresponding TSR- values of competitors and consumer companies, during a three-year mea-surement period.
The average TSR-value during the final quarter before the start of the measurement period is compared with the average TSR-value during the final quarter of the measurement period.
Remuneration is paid if Essity’s TSR-value reaches the performance interval between –5 percentage points of the average TSR-value of the comparison group for the same period (minimum outcome) and +5 percentage points of the average TSR-value of the comparison group (maximum outcome).
Resulting remuneration is not pensionable income.The company pays any outcome as cash remuneration, and the maxi-
mum outcome may amount to 50% of the fixed cash salary for the senior executive. Within a specified period, the senior executive must acquire Essity shares for at least half of the remuneration received, after deduction of income tax. If trading restrictions are in place, due to insider information, the acquisition must take place as soon as possible thereafter.
The senior executive must then not divest the shares acquired within the framework of the program until the shares have been retained for at least three years from the date of purchase.
If a participant resigns and is subsequently removed from the program before the end of the vesting period, entitlement to the remuneration proceeds is lost.
The outcome of the program is paid as cash remuneration to the senior executive, which means the program has no dilution effect or similar impact for shareholders and, as stated above, there is a ceiling for the maximum outcome.
4. Pension benefitsPension benefits for senior executives shall be contribution-defined in accor-dance with the remuneration guidelines and limited to at most 40% of fixed salary with the exception of pension agreements signed before 2020.
For the President and the Executive Vice President, pension benefits are defined contribution with a premium of 40% of fixed cash salary in addition to the premium expenses for basic pension benefits in the ITP plan with retirement pension benefits limited to a maximum salary income of 7.5 income base amounts. The retirement age is 65.
5. Other benefits Other benefits refers to company cars, luncheon vouchers and medical insurance.
6. Deviations and audit No deviations from the guidelines took place and no exemptions from imple-menting the guidelines were made. The auditor’s report on the company’s compliance with the guidelines is available on the company’s website1). No remuneration was refunded.
7. Comparative information between remuneration and performance Comparative information about changes in total remuneration of senior executives and average remuneration per full-time employee in the Parent Company and the company’s performance results, is provided under Table 4.
The former SCA Group was split in 2017 into the forest products company SCA and the hygiene products company Essity, which is why comparative information is not reported before 2018.
Board of Directors, February 22, 2022
Table 4. Change in Total remuneration1) and the company’s performance in recent fiscal years
Total remunera-tion1) in 2021
(SEKm)
Year-on-year change – 2021/2020
Year-on-year change – 2020/2019
Year-on-year change – 2019/2018
Name, position (SEKm) (%) (SEKm) (%) (SEKm) (%)
Magnus Groth President and CEO 23.5 –3.6 –13% –6.4 –19% 7.6 29%
Fredrik Rystedt CFO and Executive Vice President 10.9 –1.8 –14% –3.4 –21% 2.4 17%
Average remuneration per employee (converted to full-time equivalents) in Essity Aktiebolag (publ). Remuneration of senior executives is excluded. 1.4 –0.2 –12% –0.2 –9% 0.3 18%
Company’s performance – Profit for the period (adjusted) 9,363 –2,442 –21% 1,039 10% 1,210 13%1) Total remuneration comprises fixed salary, short and long-term variable remuneration, pension costs and other benefits.
Table 3. Outcome of long-term program 2021 for the President and the Executive Vice PresidentName, position Target Target’s relative value Target outcome (%) Remuneration (SEK)
Magnus Groth President and CEO
Performance of the company’s Total Shareholder Return (TSR) compared with MSCI Household Products Index, Consumer Staples’ TSR, during the three-year measurement period. 100% 0.00% 0
Fredrik Rystedt CFO and Executive Vice President
Performance of the company’s Total Shareholder Return (TSR) compared with MSCI Household Products Index, Consumer Staples’ TSR, during the three-year measurement period. 100% 0.00% 0
1) https://www.essity.com/company/corporate-governance/remuneration-policy/
Introduction The Essity share
Strategy Business areas SustainabilityGroup Corporate Governance Report
Financial statementsincluding notes
Essity data
141Essity’s Annual and Sustainability Report 2021 Remuneration report 2021

Description of costs
Raw materials
Essity Group Personal Care
Consumer Tissue Professional Hygiene
Energy, 5%Transport and distribution expenses, 11%Other costs of goods sold3), 22%Raw materials and consumables, 42%
Total operating expenses1): SEK 109,097mSales, general and administration2), 20%
Energy, 8%Transport and distribution expenses, 12%Other costs of goods sold, 18%Raw materials and consumables, 49%
Total operating expenses1): SEK 44,456mSales, general and administration, 13%
Energy, 1%Transport and distribution expenses, 10%Other costs of goods sold, 20%Raw materials and consumables, 40%
Total operating expenses1): SEK 40,393mSales, general and administration, 29%
Energy, 6%Transport and distribution expenses, 13%Other costs of goods sold, 33%Raw materials and consumables, 34%
Total operating expenses1): SEK 23,461mSales, general and administration, 14%
Of whichPulp 15%Recovered paper 4%Super absorbents 2%Non-woven 3%Other4) 18%Total raw materials and consumables 42%
Of whichPulp 7%Super absorbents 5%Non-woven 8%Other 20%Total raw materials and consumables 40%
Of whichPulp 26%Recovered paper 4%Other 19%Total raw materials and consumables 49%
Of whichPulp 9%Recovered paper 9%Other 16%Total raw materials and consumables 34%
1) Excluding items affecting comparability.2) Sales, general and administration include costs for marketing by 6 percentage points.3) The two largest items of Other costs of goods sold comprise personnel (10 percentage points) and depreciation/amortization (4 percentage points).4) The item Other in Raw materials and consumables includes costs for chemicals, packaging material and plastic material.
Pulp consumption Recovered paper consumption
Consumer Tissue, 80%Professional Hygiene, 8%
Personal Care, 12% Consumer Tissue, 35%Professional Hygiene, 65%
3.2 million tonsEssity’s own pulp production corresponded to 6% of the pulp consumption and is primarily related to an integrated tissue plant in Mannheim, Germany.
1.8 million tons
142 Essity’s Annual and Sustainability Report 2021Essity data
Introduction The Essity share
Strategy Business areas SustainabilityGroup Corporate Governance Report
Financial statementsincluding notes
Essity data

1) As of December 31, 2021.2) Non-woven production.
Personal Care
Production facility CountryBuenos Aires ArgentinaSpringvale AustraliaJarinu BrazilDrummondville CanadaHubei ChinaZhejiang ChinaCali ColombiaCaloto ColombiaRio Negro ColombiaSan Cristobal Dominican RepublicLasso EcuadorCairo EgyptRadiante FranceVibraye FranceEmmerich GermanyHausbruch GermanyGoa IndiaAmman JordanShah Alam 1&2 MalaysiaEcatepec MexicoReynosa MexicoAssen NetherlandsGennep NetherlandsHoogezand NetherlandsKarachi PakistanOlawa PolandVeniov RussiaGemerská Hôrka SlovakiaValls SpainAskersund SwedenFalkenberg SwedenMölnlycke SwedenPinetown South AfricaKao Hsiung TaiwanKartepe TurkeyBowling Green USAConnecticut USA
Consumer Tissue and Professional Hygiene
Production facility Country CapacityOrtmann Austria 132Stembert Belgium 75Santiago Chile 28Beijing China 30Hubei China 335Liaoning China 55Shangdong China 110Sichuan China 75Xinhui, Sanjiang China 410Yangjiang China 130Zhejiang China 245Cajica Colombia 70Medellin Colombia 30Inpaecsa Ecuador 15Lasso Ecuador 26Nokia Finland 42Gien France 145Hondouville France 55Kunheim France 52Le Theil France 65Kostheim Germany 152Mannheim Germany 283Neuss Germany 112Witzenhausen Germany 32Altopascio Italy 25Collodi Italy 42Lucca Italy 100Monterrey Mexico 67Sahagun Mexico 95
Production facility Country CapacityUruapan Mexico 40Cuijk Netherlands 52Suameer2) Netherlands 9Kawerau New Zealand 60Sovetsk Russia 91Svetogorsk Russia 65Allo Spain 120Valls Spain 137Lilla Edet Sweden 100Manchester UK 50Oakenholt UK 70Prudhoe UK 94Stubbins UK 55Tawd Mill UK 30Barton USA 180Harrodsburg USA 55Menasha USA 211Middletown USA 100South Glens Falls USA 64
Converting facilitiesSpringvale AustraliaJarinu BrazilFiji Fiji IslandsVeniov RussiaTelde SpainSkelmersdale UKGreenwich USANeenah USA
Total 4,616
Production facilities1)(Capacity is stated in thousands of tons, unless otherwise indicated, and per year)
143Essity’s Annual and Sustainability Report 2021 Essity data
Introduction The Essity share
Strategy Business areas SustainabilityGroup Corporate Governance Report
Financial statementsincluding notes
Essity data
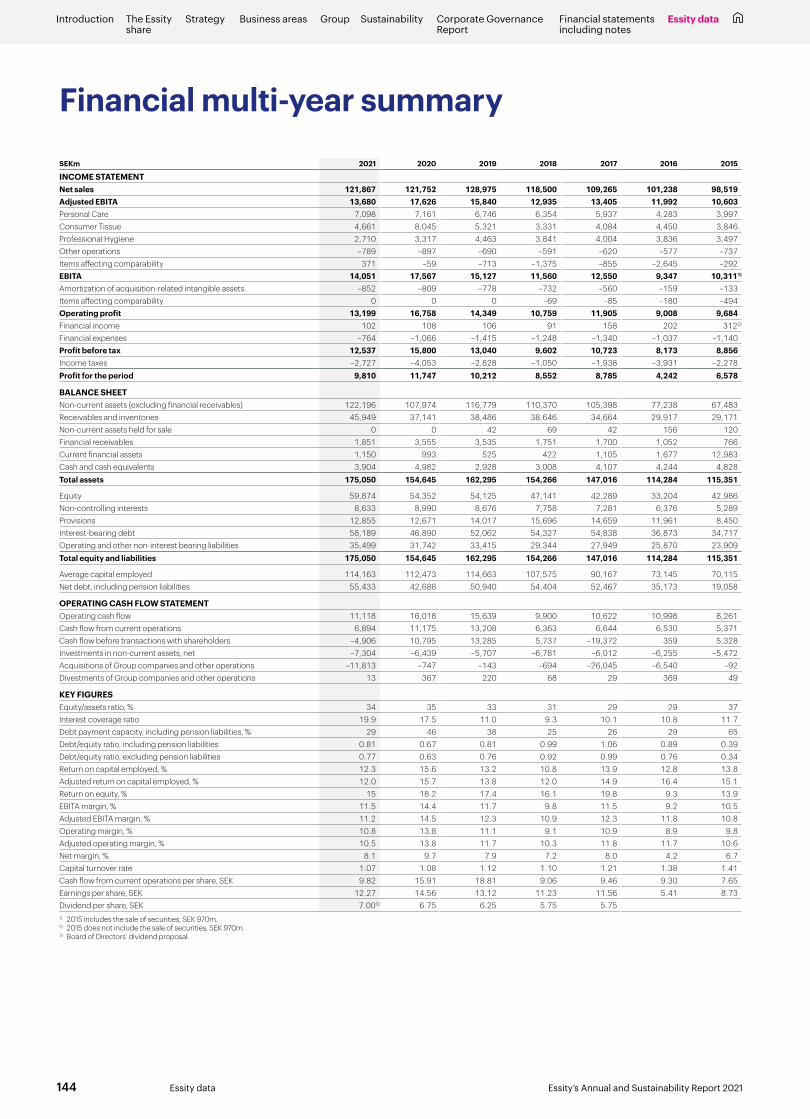
Financial multi-year summary
SEKm 2021 2020 2019 2018 2017 2016 2015
INCOME STATEMENTNet sales 121,867 121,752 128,975 118,500 109,265 101,238 98,519Adjusted EBITA 13,680 17,626 15,840 12,935 13,405 11,992 10,603Personal Care 7,098 7,161 6,746 6,354 5,937 4,283 3,997Consumer Tissue 4,661 8,045 5,321 3,331 4,084 4,450 3,846Professional Hygiene 2,710 3,317 4,463 3,841 4,004 3,836 3,497Other operations –789 –897 –690 –591 –620 –577 –737Items affecting comparability 371 –59 –713 –1,375 –855 –2,645 –292EBITA 14,051 17,567 15,127 11,560 12,550 9,347 10,3111)
Amortization of acquisition-related intangible assets –852 –809 –778 –732 –560 –159 –133Items affecting comparability 0 0 0 –69 –85 –180 –494Operating profit 13,199 16,758 14,349 10,759 11,905 9,008 9,684Financial income 102 108 106 91 158 202 3122)
Financial expenses –764 –1,066 –1,415 –1,248 –1,340 –1,037 –1,140Profit before tax 12,537 15,800 13,040 9,602 10,723 8,173 8,856Income taxes –2,727 –4,053 –2,828 –1,050 –1,938 –3,931 –2,278Profit for the period 9,810 11,747 10,212 8,552 8,785 4,242 6,578
BALANCE SHEETNon-current assets (excluding financial receivables) 122,196 107,974 116,779 110,370 105,398 77,238 67,483Receivables and inventories 45,949 37,141 38,486 38,646 34,664 29,917 29,171Non-current assets held for sale 0 0 42 69 42 156 120Financial receivables 1,851 3,555 3,535 1,751 1,700 1,052 766Current financial assets 1,150 993 525 422 1,105 1,677 12,983Cash and cash equivalents 3,904 4,982 2,928 3,008 4,107 4,244 4,828Total assets 175,050 154,645 162,295 154,266 147,016 114,284 115,351
Equity 59,874 54,352 54,125 47,141 42,289 33,204 42,986Non-controlling interests 8,633 8,990 8,676 7,758 7,281 6,376 5,289Provisions 12,855 12,671 14,017 15,696 14,659 11,961 8,450Interest-bearing debt 58,189 46,890 52,062 54,327 54,838 36,873 34,717Operating and other non-interest bearing liabilities 35,499 31,742 33,415 29,344 27,949 25,870 23,909Total equity and liabilities 175,050 154,645 162,295 154,266 147,016 114,284 115,351
Average capital employed 114,163 112,473 114,663 107,575 90,167 73,145 70,115Net debt, including pension liabilities 55,433 42,688 50,940 54,404 52,467 35,173 19,058
OPERATING CASH FLOW STATEMENTOperating cash flow 11,118 16,018 15,639 9,900 10,622 10,998 8,261Cash flow from current operations 6,894 11,175 13,208 6,363 6,644 6,530 5,371Cash flow before transactions with shareholders –4,906 10,795 13,285 5,737 –19,372 359 5,328Investments in non-current assets, net –7,304 –6,439 –5,707 –6,781 –6,012 –6,255 –5,472Acquisitions of Group companies and other operations –11,813 –747 –143 –694 –26,045 –6,540 –92Divestments of Group companies and other operations 13 367 220 68 29 369 49
KEY FIGURESEquity/assets ratio, % 34 35 33 31 29 29 37Interest coverage ratio 19.9 17.5 11.0 9.3 10.1 10.8 11.7Debt payment capacity, including pension liabilities, % 29 46 38 25 26 29 65Debt/equity ratio, including pension liabilities 0.81 0.67 0.81 0.99 1.06 0.89 0.39Debt/equity ratio, excluding pension liabilities 0.77 0.63 0.76 0.92 0.99 0.76 0.34Return on capital employed, % 12.3 15.6 13.2 10.8 13.9 12.8 13.8Adjusted return on capital employed, % 12.0 15.7 13.8 12.0 14.9 16.4 15.1Return on equity, % 15 18.2 17.4 16.1 19.8 9.3 13.9EBITA margin, % 11.5 14.4 11.7 9.8 11.5 9.2 10.5Adjusted EBITA margin, % 11.2 14.5 12.3 10.9 12.3 11.8 10.8Operating margin, % 10.8 13.8 11.1 9.1 10.9 8.9 9.8Adjusted operating margin, % 10.5 13.8 11.7 10.3 11.8 11.7 10.6Net margin, % 8.1 9.7 7.9 7.2 8.0 4.2 6.7Capital turnover rate 1.07 1.08 1.12 1.10 1.21 1.38 1.41Cash flow from current operations per share, SEK 9.82 15.91 18.81 9.06 9.46 9.30 7.65Earnings per share, SEK 12.27 14.56 13.12 11.23 11.56 5.41 8.73Dividend per share, SEK 7.003) 6.75 6.25 5.75 5.751) 2015 includes the sale of securities, SEK 970m.2) 2015 does not include the sale of securities, SEK 970m.3) Board of Directors’ dividend proposal.
144 Essity’s Annual and Sustainability Report 2021Essity data
Introduction The Essity share
Strategy Business areas SustainabilityGroup Corporate Governance Report
Financial statementsincluding notes
Essity data

This Annual and Sustainability Report was produced by Essity in collaboration with Hallvarsson & Halvarsson. Photos: Juliana Fälldin, Lena Granefelt, Peter Hoelstad and Essity. Printing: Göteborgstryckeriet 2022. Translation: The Bugli Company.
Follow Essity:
Essity actively strives to build awareness of the company’s brand and communicate Essity’s transformation journey. A strong brand is important to strengthen Essity’s position in relation to customers, consumers, shareholders, current and potential employees, and other stakeholders.
Essity’s purpose is to break barriers to well-being and we are pursuing a range of global and local initiatives to raise awareness and standards for hygiene and health. By gathering insights, sharing stories, cooperating with partners and educating millions of people, Essity provides knowledge and promotes a public dis-cussion about topics such as menstruation, incontinence, hand hygiene, lymphedema and endometriosis.
The company has a strong presence in social media. Digital campaigns help to build awareness and relevance about Essity. In 2021, Essity launched two seasons of the “Essential Talks” podcast. The podcast addresses topics where Essity makes a difference to increase well-being for people in all phases of life. The podcast has attracted international attention through “The Drum Award”. Thanks to global and local partnerships, Essity reaches more peo-ple and together we can make a bigger difference. In collaboration with UNICEF in Mexico and the Global Handwashing Partnership,
The Essity brandThe name Essity stems from the words “essentials” and “necessities”. Hygiene and health are the essence of well-being. As a leading global hygiene and health company, we offer products and services that are essentials and necessities in everyday life. That is why we are called Essity.
we are for example educating young people about the importance of hand hygiene and issues regarding menstruation. Our local col-laborations with the Red Cross in several countries was particularly important during the COVID-19 pandemic.
For many years, Essity has been conveying partner to the UN Foundation’s annual Global Dialogue, to which we have invited customers. The collaboration has developed during the year to pro-mote awareness of antimicrobial resistance (AMR). The company’s expertise in infection prevention and the healthcare of tomorrow played an important part in Essity’s participation at the World Expo Dubai.
Sustainability and digitalization have a key role in Essity’s brand work. The company regularly shares content on new, sustainable solutions and the transition of the value chain to achieve net-zero emissions by 2050. In 2021, The Green Response Report was launched. The report shows the growth in interest for sustainable solutions during the COVID-19 pandemic and it received wide-spread attention in the media.
In 2021, several initiatives were launched with the purpose of spot-lighting stories, activities and engagement among Essity’s employ-ees to break barriers for well-being and increase gender equality.

Breaking Barriers to Well-being
essity.com
Essity Aktiebolag (publ)PO Box 200, SE-101 23 Stockholm, SwedenVisiting address: Klarabergsviadukten 63Tel +46 8 788 51 00Corp. Reg. No.: 556325-5511