Annual and Sustainability Report 2019 - AFRY
150
Annual and Sustainability Report 2019 ÅF PÖYRY AB (PUBL) Making Future
-
Upload
khangminh22 -
Category
Documents
-
view
0 -
download
0
Transcript of Annual and Sustainability Report 2019 - AFRY

Annual and Sustainability Report 2019 ÅF PÖYRY AB (PUBL)
Making Future

Who we areOur visionProviding leading solutions for generations to come Making Future
Our missionWe create sustainable engineering and design solutions
Our core valuesWe are brave, devoted team players
At a glanceAFRY is an international engineering, design and advisory company. We support our clients to progress in sustain-ability and digitalisation. We are 17,000 devoted experts within the fields of infrastructure, industry and energy, operating across the world to create sustainable solutions for future generations.
We create sustainable solutions that respond to global trends:
Changing energy marketsGradual shift away from fossil fuelsEnergy storage optionsReliable distribution and transmission
Transition to bioeconomyA key component in the global shift towards circular economyNew materials aided by digitalisation Long term sustainable developmentCarbon neutrality for generations to come
Industrial digitalisationOptimisation of logistics and process flows Increased productivityReduced resource and energy use
Future mobilitySafer trafficLower environmental impactAutonomous vehicles
Smart cities and infrastructureSustainable urban development Intelligent buildingsMore efficient transportation

The scope of the sustainability report, which also covers ÅF Pöyry’s statutory sustainability report as required by Chapter 6 of the Swedish Annual Accounts Act, is found on page 118. It follows the guidelines of the GRI Standards, Core level, and is externally reviewed.
Cover photo:Kai Piippo, Head of DesignTirham Shakila, Economist
Introduction 2 The year in brief 4 Comments from the CEO 6 Objectives and outcomes*
Value creation 10 Megatrends 12 Strategy for the future14 Value creation*18 Powerful growth drivers
Operations 26 Divisions
Pillars of the strategy34 Growth38 Business model40 Operational excellence42 Attractive employer*
AFRY as an investment 48 Five reasons to invest 50 The share
Financial statements 54 Administration report**59 Risks** 63 Contents, financial statements** 64 Consolidated financial statements** 69 Parent financial statements** 74 Notes** 112 Auditor’s report
Other information 118 Sustainability notes* 129 Auditor’s statement 130 Chairman’s report 131 Corporate governance report 136 Board of Directors 138 Group management 140 Five-year summary 142 Alternative performance measures 143 Definitions 144 Calendar 2020
About the report* General review of sustainability information ** Reviewed financial information
Contents

Introduction 2 The year in brief 4 Comments from the CEO 6 Objectives and outcomes*
Value creation 10 Megatrends 12 Strategy for the future14 Value creation*18 Powerful growth drivers
Operations 26 Divisions
Pillars of the strategy34 Growth38 Business model40 Operational excellence42 Attractive employer*
AFRY as an investment 48 Five reasons to invest 50 The share
Financial statements 54 Administration report**59 Risks** 63 Contents, financial statements** 64 Consolidated financial statements** 69 Parent financial statements** 74 Notes** 112 Auditor’s report
Other information 118 Sustainability notes* 129 Auditor’s statement 130 Chairman’s report 131 Corporate governance report 136 Board of Directors 138 Group management 140 Five-year summary 142 Alternative performance measures 143 Definitions 144 Calendar 2020
About the report* General review of sustainability information ** Reviewed financial information

AFRY is a leading engineering and design company in the Nordics, with nearly 17,000 employees globally. Through the acquisition and integration of Pöyry in 2019, we have strengthened our international platform and gained a stronger, broader position in the market. We create sustainable solutions for the future together with our clients, who work mainly in infrastructure, industry and energy.
In times of increased globalisation, urbanisation, digitalisation and climate change, the need for sustainable solutions is greater than ever. At AFRY, we are driving this transformation. Together with our clients, we can influence many aspects of society through sustainable solutions that reduce climate impact.
With our new AFRY brand, launched at the end of 2019, we are strengthening our position in our core markets of Sweden, Norway, Denmark, Finland and Switzerland and internationally in the energy and process industries, for example. It is key for the company to attract talent and we strive to be among the most attractive employers for engineers, researchers, designers and consultants.
Introduction
Annual and Sustainability Report 20191

Successful integration of Pöyry In 2019 earnings were stable and adjusted organic growth was 2.1 percent. The integration of Pöyry and the realisation of cost synergies were accomplished faster than planned. To increase profitability, we have raised our ambitions for cost synergies and implemented efficiency improvements for 2020.
Key ratios2019 2018
Net sales, SEK m 19,792 13,975
EBITA excl. items affecting comparability, SEK m 1,731 1,268
EBITA margin excl. items affecting comparability, % 8.7 9.1
EBITA, SEK m 1,368 1,243
EBITA margin, % 6.9 8.9
Profit after net financial items, SEK m 1,039 1,103
Basic earnings per share, SEK 8.07 10.98
Net debt, SEK m1 4,424 3,455
Net debt/EBITDA, rolling 12 months, times1 3.0 2.5
Net debt-equity ratio, %1 47.2 63.2
Total number of employees2 16,348 10,928
Capacity utilisation, % 75.8 77.2
1) Excluding effects of IFRS 16 Leases 20192) Pöyry was consolidated on 28 February 2019
– Net sales increased by 41.6 percent to SEK 19,792 million (13,975) and adjusted organic growth was 2.1 percent.
– If Pöyry had been consolidated on 1 January 2018, combined net sales would have increased by 5.3 per-cent to SEK 20,827 million (19,773) and the correspond-ing EBITA margin would have been 8.7 percent (8.7).
– The platform acquisition of Pöyry was implemented in line with our strategy of international growth and long-term value creation.
– Two new rights issues were completed, which were fully subscribed.
– Cost synergies amounted to SEK 218 million, thus exceeding the target of SEK 180 million.
– The Board of Directors proposes there shall be no distribution of dividend, given the development of the COVID-19 outbreak.
– Our clients choose AFRY for challenging assignments and during the year we initiated projects with Oatly, St1, Rottneros, Arla Foods, Metsä Fibre and others.
– The new common brand AFRY was launched in November.
– In the latest survey from Universum, the company was named the second-best employer by engineering graduates in Sweden.
– The total percentage of women and the percentage of female managers amounted to 26.6 and 20.5 percent, respectively.
– AFRY was included in the Bloomberg Gender Equality Index for 2019, which shows the company's commit-ment to work with gender equality and to promote women in the workplace.
2 Annual and Sustainability Report 2019
INTRODUCTIONThe year in brief

Net sales Dividend per share
0
5,000
10,000
15,000
20,000
2015 2016 2017 2018 2019
SEK m
0
500
1,000
1,500
2,000
2015 2016 2017 2018 2019
SEK m %
0.0
2.5
5.0
7.5
10.0
0
1.00
2.00
3.00
4.00
5.00
2015 2016 2017 2018 20192
SEK
2) The Board of Directors propose for the AGM 2020 that there shall be no distribution of dividend given the development of the COVID-19 outbreak.
Number of countries with projects
>100Number of employees 2019
16,348Number of countries with offices
>40
EBITA/EBITA margin1
1) Excl. items affecting comparability.
Net sales by industry segment
Net sales per customer offering
Infrastructure 20% Energy and Power 19% Process Industries 15% Buildings 14% Automotive and Mobility 9% Life Science, Food & Pharma 6% Telecoms 4% Manufacturing 4% Management Consulting 4% Other 3% Defence 2%
Projects 70% Services 30%
Net sales by divisionNet sales by region
AFRY around the world
Infrastructure 38% Industrial & Digital Solutions 29% Process Industries 15% Energy 15% Management Consulting 3%
Nordics 75% Rest of Europe 18% Asia 3% Other 4%
Number of employees
0
5,000
10,000
15,000
20,000
2015 2016 2017 2018 2019
3 Annual and Sustainability Report 2019
Countries with projects

It was an eventful 2019 and I am proud of what we have achieved together with our clients and employees. During the year we completed the acquisition of Pöyry, which means that we have created a leading engineering and design company in the Nordics and have expanded our international platform. The integration of Pöyry has been successful and has gone faster than planned in a number of areas. During the integration, we managed to maintain a strong focus on our clients and delivered stable results.
Leading position in sustainabilityIn recent years, we have seen a clear shift in engagement and demand for sustainable development. The realign-ment of priorities to reduce climate impact, as well as global trends in urbanisation and digitalisation, continue to drive developments in society forward. Delivering sustainable solutions and guiding our clients’ transition to a more sustainable business model is at the heart of our business. The combination of ÅF and Pöyry has strengthened our ability to solve complex issues from a holistic perspective. Our sustainability initiatives took a clear step forward during this year. Together, we have worked to fully integrate our sustainability strategy into our business strategy, and we have also participated in the UN Global Climate Conference in Madrid where we met with clients, partners and policy makers to discuss sustainable solutions. We continue to comply with the UN Global Compact, which includes principles of human rights, labour rights, environment and anti-corruption. We continue our work with the goal of taking a leading position in sustainability and clarifying our offerings.
Stable performanceWe saw stable growth in 2019 with combined net sales of SEK 21 billion, corresponding to growth of 5.3 per-cent. Reported growth was as much as 41.6 percent. Profit improved during the year and our combined EBITA, excluding items affecting comparability, amounted to SEK 1,809 million (1,716), with an EBITA margin at last year’s level of 8.7 percent (8.7).
Continued focus on fortifying our position and increasing efficiencyI am pleased with the high-paced integration of Pöyry, which, among other things, has contributed to SEK 218 million in cost synergies, thereby exceeding the target of SEK 180 million. This is reflected in the strong margin increase in the fourth quarter and will strengthen our profitability going forward.
We will continue to pursue cost optimisation and effi-ciency measures in 2020, with the goal of achieving addi-tional savings of SEK 120 million. Alongside this we have an investment programme to improve our systems plat-form, including the implementation of a new ERP system.
The combined figures are presented as though consolidation of Pöyry took place on 1 January 2018.
Increased costs due to the investment programme are expected to have a negative impact on profitability of around SEK 50-70 million in 2020. The improvements to our operating platform will allow us to be even more offensive in developing our offering and delivering projects and services based on our collective expertise.
Stronger balance sheet We also carried out two well-received new share issues at the beginning of the year to finance part of the Pöyry acquisition. Strong cash flow in the second half of the year has strengthened the capital structure and gradu-ally reduced net debt in relation to EBITDA, thus laying the foundation for further acquisitions in 2020.
Performance among the divisionsThe market was generally stable in most of our segments and geographical areas during the year, however perfor-mance was slightly weaker in some segments.
In the Infrastructure Division, general demand in our main markets remained stable, but we saw weaker profitability due to project completions and political uncertainty in Denmark during the year.
The Industrial & Digital Solutions Division was affected by the slowdown in the automotive industry, but it was good to see that volume stabilised towards the end of the year. Meanwhile, several segments showed strong demand, for example the defence industry and food & pharma.
The Process Industries Division performed well during the year and the general market outlook for the division was good, supported by the megatrend of replacing fossil-based materials with biomaterials.
In the Energy Division, demand increased during the year, especially in the nuclear power segment, but there have been some delays in investment decisions. In the fourth quarter, the planned repositioning was carried out with a streamlining of the sales structure, fewer subsidiaries and the sale or closure of underperforming units, with the aim of raising the division’s margin in 2020.
The Management Consulting Division performed well and the core markets remained stable. The key industry driv-ers are the solid transaction volume across the sectors, as well as the ongoing transition of the energy sector.
During the year, we signed several contracts with new cli-ents, and I am particularly proud of our new collaboration with Rottneros to optimise their operations, which aligns with our strategy of offering our clients more packaged digital and end-to-end solutions. I also wish to highlight a project for Oatly in the Netherlands for delivery of two new processing plants and an engineering assignment for a new renewable fuel production unit for St1 in Sweden.
4 Annual and Sustainability Report 2019
INTRODUCTIONComments from the CEO

“ Delivering sustainable solutions and guiding our clients’ transition to a more sustainable business model is at the heart of our business.”
One of the most attractive employersOne of our key issues is to attract and develop talent, where we will continue to be one of the most attractive employers for engineers, researchers, designers and consultants. The merger with Pöyry has made us an even more attractive employer and I am very pleased that in the latest survey from Universum we are ranked as the second-best employer among those with engineering degrees in Sweden. We are continuing our efforts to strengthen our position as one of the most attractive employers on the market. I would like to thank all our employees around the world for their strong efforts and great dedication during the year.
New common brandLast autumn, we took the next natural step after the merger by launching AFRY as our common brand, with a focus on sustainable solutions. With a new brand and offering, we can bolster our position in our core mar-kets and grow internationally in the energy and process industries, for example. The new brand forms a new common platform for the entire company.
OutlookSo far, 2020 has been characterised by the development of the COVID-19 outbreak and the market situation is uncertain and difficult to assess. We have taken sev-eral steps to remain well positioned in the future and to minimise risks. We have a broad exposure to several industries and markets, and historically this has made the company less volatile in challenging times.
Despite the current uncertain market situation, we see continued good demand for sustainable solutions driven by megatrends such as digitalisation, urbanisation and climate change. We look forward to continued great collaboration with our customers, partners, shareholders and employees during 2020.
Stockholm, March 2020
Jonas GustavssonPresident and CEO
5 Annual and Sustainability Report 2019
A clear vision Our strategy will create added value through continued strong growth and improved profitability in an increasingly competitive market. The financial targets and the non-financial targets are important elements for adhering to the strategy.
6 Annual and Sustainability Report 2019
INTRODUCTIONObjectives and outcomes
Helena Paulsson, Head of Urban Development

Growth
10 percent annual growth including add-on acquisitions.
Net debt1
Net debt/EBITDA 2.5.
Dividend1
50 percent of profit after tax.
0
10
20
30
40
50
2015 2016 2017 2018 2019
%
0.0
0.5
1.0
1.5
2.0
2.5
3.0
2015 2016 2017 2018 2019
times
0
20
40
60
80
100
2015 2016 2017 2018 2019
%
1) Excl. items affecting comparability. 1) The Board of Directors propose for the AGM 2020 that there shall be no distribution of dividend given the development of the COVID-19 outbreak.
Target 10% Target 10% Target 2.5 times Policy 50%
1) Including IFRS 16
If Pöyry had been consolidated as from 1 January 2018, net debt/EBITA exclud-ing the effect of IFRS 16 and excluding items affecting comparability would have been 2.2.
EBITA margin1
10 percent over a business cycle.
0
2
4
6
8
10
2015 2016 2017 2018 2019
%
Financial targetsFinancial targetsThe financial targets are continuously evaluated based on market conditions and changes in the company. The financial targets apply over a business cycle. – Annual growth of 10 percent. The target includes
add-on acquisitions. Larger platform acquisitions will also be made.
– An EBITA margin of 10 percent (excluding items affecting comparability) over a business cycle.
– Net debt in relation to EBITDA of 2.5.
Dividend policyDividend policy The Board of Directors has adopted a dividend policy according to which the dividend corresponds to approx-imately 50 percent of profit after tax excluding capital gains.
Non-financial targets Focus on sustainabilityNon-financial targets are key elements of the company’s strategy. Developing sustainable solutions, conducting business responsibly and being an attractive employer drive the business forward.
Non-financial targets:– Engineering and design solutions that contribute to
the UN’s 17 Sustainable Development Goals.– Increased employee engagement.– Leadership must be characterised by a high degree of
trust in immediate supervisors.– An increased proportion of female employees, 30 per-
cent at all levels by 2020.– Zero tolerance for discrimination.– Higher customer satisfaction.– Halve the company’s carbon dioxide emissions per
employee by 2030 compared to the 2016 base year.– Prior to tendering, risk assessments based on the
UN Global Compact’s ten principles must always be carried out for new clients, business transactions and markets.
Read more about the outcome and how AFRY works with the non-financial targets in the sustainability notes on page 118.
7 Annual and Sustainability Report 2019

8 Annual and Sustainability Report

Our sustainable solutions in infrastructure, industry and energy address some of today’s major trends – smart cities and infrastructure, future mobility, industrial digitalisation, a changing energy market and the transition to bioeconomy.
During the year, we successfully implemented our strategy, focusing on developing our business model, increasing growth and strengthening our profitability.
Value creation
9 Annual and Sustainability Report 2019

Climate changeIn recent decades, the focus has been on climate change, adapting society to climate change and especially on finding a path to carbon neutrality. Climate change means that periods of extreme weather are becoming more common. In the future, challenges arising from reduced groundwater levels and extreme weather will thus become increasingly crucial to deal with. These new conditions increase demand for sustainable solutions that reduce climate impact, use resources more effi-ciently and adapt society to a changing climate.
Urbanisation, globalisation, digitalisation and climate change are strong drivers behind our current and future business. These megatrends lead to major societal changes that affect people and businesses in different ways. We are driving this transformation by creating leading sustainable solutions in infrastructure, industry and energy, and we can influence many aspects of society together with our clients.
Megatrends are strong drivers for sustainable solutions for clients
10 Annual and Sustainability Report 2019
VALUE CREATIONMegatrends

DigitalisationDigitalisation, or the connected society, means that IT solutions are becoming increasingly cen-tral to projects in all three sectors: infrastructure, industry and energy. This is crucial for things such as connected vehicles and intelligent, energy- efficient buildings, and for large-scale energy and transport systems. Increased digitalisation leads to more efficient use of resources, which means a more sustainable society.
Urbanisation and globalisation
One of the clearest trends is urbanisation, which contin-ues to be strong in the industrialised world and an even stronger force in emerging countries where the popu-lation is growing while industrialisation and prosperity are increasing. The demand for sustainable solutions is increasing as cities grow. There is demand for everything from improved transport solutions, reduced climate impact and resource management to better quality of life. Globalisation, in turn, means that companies espe-cially are facing increasingly fierce competition and price pressure with new business models required to move up the value chain.
Read more about our sustainable solutions on pages 18-22.
11 Annual and Sustainability Report 2019

Our strategy ensures that AFRY remains competitive, leverages its full potential, grows profitably and creates value for stakeholders. At the same time, we will continue to strengthen our appeal as an employer to develop and attract the very best talent. Our strategy is based on four pillars: growth, business model, operational excellence and attractive employer.
12 Annual and Sustainability Report 2019
VALUE CREATIONStrategy for the future
Karolina Pamp-Sandgren, Strategist, Combined Mobility

Priorities for 2020
– Facilitate continued effective integration of Pöyry.
– Continue revenue and cost synergies and efficiency measures to improve profitability.
– Ensure that the company remains well-positioned and has operational and financial strength in light of the development of the COVID-19 outbreak.
– Strengthen base in core markets and develop leading positions internationally in selected segments.
– Focus on growth and improving efficiency in all divisions.
– Invest in IT to drive efficiency and integrate our various business units.
– Strengthen position in sustainability.
– Retain position as one of the most attractive employers.
Achieved in 2019
– Pöyry acquisition completed and successful integration.
– Implementation of new divisional structure – five divisions.
– New Group management structure.
– Increased value creation through cost and revenue synergies.
– Repositioning of Division Energy.
– Sustainability strategy fully integrated into business strategy.
– Attended UN Climate Conference, COP25, in Madrid.
– AFRY launched as new common brand.
– Employees – continued strong employer brand, from fourth to second place in Universum's survey.
Our vision
Providing leading solutions for generations to come
Making Future
Drivers
Smart cities and infrastructure
Future mobility
Industrial digitalisation
Changing energy markets
Transition to bioeconomy
Our strategy
Growth:International expansion into leading positions
Value creation:Business model shift todeliver higher value
Operations:Operational excellence
People:Best in classpeople practices
Who we are How we win
Our core values
We are:BraveDevotedTeam players
Our mission
We create sustainable engineering and design solutions
13 Annual and Sustainability Report

Our long-term value creation We work to meet the current needs of society, but also the needs of future generations for sustainable solutions. We create value for our clients, employees, owners, suppliers and society, in both the short and long term. This is described in our value creation model.
14 Annual and Sustainability Report 2019
VALUE CREATIONValue creation

Human capital– Nearly 17,000 employees in
projects in over 100 countries– Engineering and design know-
ledge with sustainability in focus– Partner network of 30,000
engineers and specialists
Structural capital– Knowledge bank and project
references– Strong brand and employer
brand– Working methods and know-
ledge transfer systems
Social and relational capital– Long-term, good relationships
with clients, owners, research-ers, universities and technical colleges
Financial capital– SEK 14,403 million in equity
and loans– Strong cash flow and balance
sheet
Manufactured capital– Offices in more than 40
countries– System support for our
processes
Energy and fuel– 17 GWh of heating and cooling
and 21 GWh of electricity for offices
– Fuel for 101,000,000 km of business trips by car and air
Business model
AFRY is an international engi-neering, design and advisory company. We support our clients to progress in sustainability and digitalisation. We are 17,000 devoted experts within the fields of infrastructure, industry and energy, operating across the world to create sustainable solu-tions for future generations.
Read more about our business model on page 38.
Sustainable engineering and design solutions in– Smart cities and infrastructure– F uture transport solutions– Industrial digitalisation– Changing energy markets– Transition to bioeconomy
Growth– Increased net sales – Positive results
Healthy, gender-equal and engaged employees– 2.8% sick leave in Sweden– 26.6% female employees
Environmental impact– Emissions of 21,491 tonnes CO2
and 1,315 kg CO2 per employee from business travel and energy consumption, respectively
Sustainable development of suppliers– Supplier sustainability review
criteria– Increased knowledge and
experience
Clients– Satisfied clients
Employees– SEK 10,018 million in employee
wages and benefits
Partner network– About 1,400 active
sub-consultants
Shareholders– Dividend policy: 50% of profits
after tax
Suppliers– About SEK 2,400 million in
purchases from suppliers
Society– Nearly 17,000 jobs and lively
local communities– SEK 1,983 million in income tax
and employer contributions
Humanity– Contributions to the UN’s 17
Sustainable Development Goals
What we do What we create
Value for stakeholders
Sustainable solutions for future generations
PROJECTS SERVICES
Solutions
Concepts
Products
What we need
Reinvestment of financial capital, growth, knowledge, experience and references
15 Annual and Sustainability Report 2019

AFRY’s contribution to the Sustainable Development Goals
No povertyImpact is achieved through estab-lishing a robust infrastructure with basic public services such as access to safe drinking water, adequate sanitation, clean and affordable electricity, safe trans-port, waste management and health care, as well as protecting ecosystems, developing sustain-able cities and combating climate change.
Examples include ensuring compliance with AFRY’s Code of Conduct when assignments are carried out, and the examples given for the other goals.
Targets 1.1, 1.4, 1.5
Affordable and clean energyImpact is achieved through access to modern energy for all, an increased share of renewable energy throughout the world, energy conservation, and the expansion or upgrading of energy infrastructure and technology in developing countries.
Examples include the design of passive buildings with self-gen-erated electricity from solar cells, an advisory role in several World Bank–funded projects for expand-ing production of renewable elec-tricity, and national electrification strategies in developing countries.
Targets 7.1, 7.2, 7.3, 7.B
Climate actionImpact is achieved mainly through improved resilience and adaptability to climate-related disasters, as well as integrated climate change actions in policy and planning.
Examples include scenario-based climate risk analyses and climate risk prevention for municipalities, the electrification of the transport sector and the design of renew-able electricity production.
Targets 13.1, 13.2
Zero hungerImpact is achieved through assignments that involve provid-ing access to safe and nutritious food for all, as well as sustainable food production systems and resilient farming practices.
Examples include the devel-opment of innovative salmon farming, quality assurance of food and pharmaceutical production, and a public sector strategy for circularity in agriculture.
Targets 2.1, 2.4
Decent work and economic growthImpact is mainly via higher economic productivity achieved through technological upgrades and innovation, improving resource efficiency in consump-tion and production, and by protecting workers’ rights and promoting a safe and secure workplace.
Examples include the develop-ment of circular business strate-gies, supplier responsibility, and support for occupational health and safety in the construction sector.
Targets 8.2, 8.4, 8.8
Life below waterImpact is achieved by reducing pollution in the seas, protecting and restoring ecosystems, and conserving coastal and marine areas.
Examples include remediation of the seafloor when developing a new town district, development of a strategy for transitioning to circular material flows and packaging design, and design and implementation of innovative salmon farming.
Targets 14.1, 14.2, 14.5
AFRY’s value creation and contribution to society respond to global trends, utilise the opportunities pre-sented by digitalisation and meet climate challenges. Our assignments establish values related to energy efficiency, renewable energy, resource efficiency, safe workplaces, improved health and safety, streamlined production processes, circular resource flows, increased accessibility, safe and inclusive societies, and improved air and water quality. These values are reflected in Agenda 2030 and the UN’s 17 Sustainable Development Goals, and since Agenda 2030 was launched, AFRY has worked systematically to understand how our business and offering impact the goals and to support business development.
Understanding our impactOne of AFRY’s non-financial targets is to develop engi-neering and design solutions that contribute to the UN’s 17 Sustainable Development Goals (SDGs). We have analysed the 17 SDGs and their 169 targets based on our offering and business, and the analysis shows that we contribute to all 17 of the SDGs. Of the 169 targets, we have identified 52 as relevant based on our ability to have a positive impact.
The SDGs are interconnected and achieving the Agenda 2030 goals also involves several conflicting goals. To address the difficult challenges we face, the UN emphasises that an integrated approach is central to meeting these challenges. AFRY works to maximise sustainable values in assignments to create, develop and implement solutions that build a more sustainable society. We aim to ensure a holistic perspective in our assignments that minimises negative impact and maxi-mises positive values.
16 Annual and Sustainability Report 2019
VALUE CREATIONValue creation

Good health and well-beingImpact is achieved through assignments related to combating communicable diseases, reducing the number of road traffic deaths and injuries, and reducing the number of diseases and deaths due to harmful chemicals and pollutants.
Examples are assignments in medical technology and phar-maceutical production, digital-isation solutions for health care, traffic planning and analysis for increased traffic safety, and prod-uct safety in relation to chemicals legislation.
Targets 3.3, 3.4, 3.6, 3.9
Industry, innovation and infrastructureImpact is achieved by creating sustainable, resilient and inclu-sive infrastructures, upgrading industry and infrastructure for increased sustainability, research and technological capacity in the industrial sector, and increased access to information and com-munication technology for all.
Examples are digitalisation of industry and research projects on the sustainable transport systems of the future.
Targets 9.1, 9.4, 9.5, 9.C
Life on landImpact is achieved by maintain-ing, restoring and ensuring the sustainable use of terrestrial and freshwater ecosystems, protect-ing biodiversity and natural habi-tats, and integrating ecosystems and biodiversity into national and local management.
Examples include design that min-imises the environmental impact of urban development and the design of residential areas with urban ecosystem services.
Targets 15.1, 15.5, 15.9
Quality educationImpact is achieved through increasing access to education and professional training for vulnerable persons, particularly as relates to relevant technological and professional skills.
Examples include partnerships where AFRY’s specialists are engaged to provide instructor-led courses in technology. Within AFRY’s programme Immigrated Engineers, engineers born outside of Sweden are coached in the relevant technical knowledge needed to eventually become an employee.
Targets 4.4, 4.5
Reduced inequalitiesImpact is achieved in the context of promoting social, economic and political inclusion, ensuring equal rights for all and eradicating discrimination.
Examples include ensuring compliance with AFRY’s Code of Conduct when assignments are performed, as well as urban plan-ning and design geared towards mixed-use housing with different leasing arrangements that coun-teract segregation and promote inclusion.
Targets 10.2, 10.3
Peace, justice and strong institutionsImpact linked to promoting legal certainty and ensuring access to justice, combating corruption and bribery, building transparent institutions and ensuring respon-sive, inclusive and representative decision-making.
Examples include ensuring compli-ance with AFRY’s Code of Conduct when assignments are performed, as well as assignments in sustain-able supply chain management.
Targets 16.3, 16.5, 16.6, 16.7
Gender equalityImpact aims to eradicate discrim-ination against women and girls and to ensure the full participa-tion of women in leadership and decision-making.
Examples are urban planning projects with a clear gen-der-equality perspective and AFRY’s own processes aimed at increasing diversity, increasing the number of women at all levels and counteracting discrimination during assignments and in our own operations.
Targets 5.1, 5.5
Sustainable cities and communitiesImpact is achieved through sus-tainable transport systems for all, inclusive and sustainable urban-isation, reduced environmental impact from cities, and safe and inclusive green spaces for all.
Examples include the use of Agenda 2030 in the urban plan-ning process, a digital visuali-sation process for urban devel-opment, and the integration of ecosystem services and green spaces in urban environments.
Targets 11.2, 11.3, 11.6, 11.7
Partnerships for the goalsImpact is achieved through a strengthened global partnership for sustainable development by exchanging knowledge, expertise and technology and by developing new ways to measure progress.
Examples include the develop-ment of urban planning methods based on Agenda 2030, process support for collaboration between different societal stakeholders and partnerships for instruc-tor-led technology training.
Targets 17.16, 17.17, 17.19
Clean water and sanitationImpact is achieved mainly through improved water quality, sewage treatment, increased recycling and reuse, and efficient water use and secure supply.
Examples include water and sanitation solutions, circular flows of water for industry, and analysis and action plans for contaminated land.
Targets 6.3, 6.4
Responsible consumption and productionImpact is achieved through solutions for reduced food waste, responsible management of chemicals and wastes, support for companies in their sustainability practices and sustainability reporting, and public education on sustainable lifestyles.
Examples include consultancy services for circular business models, sustainability consulting and reporting for industry, and the design of a digital portal for waste management.
Targets 12.3, 12.4, 12.5, 12.6, 12.8
17 Annual and Sustainability Report 2019

Our clients are increasingly looking for solutions and pro-cesses that ensure the least possible climate impact.
Part of the solution is to apply a Nordic approach, inter-disciplinary collaborations, industrial excellence and digital solutions to guide the densification and develop-ment for the cities of the future. This is further explained in AFRY’s book Predicting the Unpredictable – A Nordic Approach to Shaping Future Cities.
When shaping cities of the future, we must know the preferences of the future generation. We asked more than 5,000 young people in six European countries about their attitudes toward life in the city, and the results show that 62 percent of them care about sustainability when choosing where to live, and that only 12 percent would choose a life in a city with more than one million inhabitants.
Through cutting-edge expertise and innovative solu-tions, we help to influence the development of many public urban development projects both in the Nordics and internationally – from the design of roads and public transport to the creation of tomorrow’s hospitals, housing, lighting and acoustics.
We see an increase in digitalisation in traditional infra-structure services: increasingly connected traffic, more functions, and demands for flexibility and security in
buildings. This trend provides scope for innovation and the opportunity to offer the full breadth of our expertise through new business models and services. Our experts in IoT, AI and automation are at the heart of increased efficiency, in traffic systems as well as buildings.
AFRY contributes to the UN’s goal for sustainable cities and communities (SDG 11) and to combating climate change and its consequences (SDG 13). Our assignments establish values like efficient and renewable energy use, resource efficiency, safe workplaces and residences, accessibility, and improved air and water quality. To encourage sustainable solutions in the industry, AFRY is also a member of networks like Viable Cities, Closer and Green Cities.
Smart cities and infrastructure
The ever-growing city of Växjö in Sweden wants to develop a former military area called Bäckaslöv to extend the city centre. It will be a new urban district that includes housing, schools and shops adjacent to Växjö’s forests and meadows, and will provide excellent opportunities for more sustainable urban development. The new district will be linked to a
1,200-metre-long walkway that forms the backbone of the area. By gathering various skills, we have been able to include many important perspectives and design sustainable, cross-functional solutions. One example is adding biochar to the plant beds, which produces nutrients for the trees and improves the soil’s ability to absorb and store CO2.
A future sustainable city centre in Växjö
Powerful driversIn line with our strategy of delivering sustainable solutions, we have identified five strong drivers for our business: smart cities and infrastructure, future transport solutions, industrial digitalisation, a changing energy market and the transition to a bioeconomy. Each business area has a strategy to drive business development linked to one or more of these drivers.
Annual and Sustainability Report 201918
VALUE CREATIONPowerful drivers

AFRY contributes to solutions for sustainable transpor-tation, improved traffic flows, road safety and reduced pollution. Altered travel patterns, changed logistics needs and electrification of infrastructure and vehicles are driving the pace of development in future mobility.
AFRY offers world-class vehicle development, leads the development of smart cities, provides in-depth exper-tise in digital solutions and experience with an industrial process mindset.
The development of future transport solutions will increas-ingly involve collaboration. With our knowledge from different sectors and industries, AFRY is well equipped to combine skills and industry expertise, and to create inno-vative and efficient solutions for tomorrow’s mobility.
The increased need for flexible transport solutions brings more and more business opportunities for AFRY as an engineering and design company, and the market is constantly evolving. For businesses and authorities, the company is investigating new models for flexible mobility with minimal climate impact. In cross-sectoral collabo-rations, we are finding new ways to use real-time data for greater efficiency and safety. As the automotive market undergoes a paradigm shift to meet the need for sustain-able transportation, AFRY supports international clients’ development in connected services, electromobility and the design of autonomous vehicles.
AFRY contributes to the UN’s goal for sustainable cities and communities (SDG 11) and to combating climate change and its consequences (SDG 13). We do this through our innovations in various transport systems and vehicles that connect systems, communities and people. This leads to more efficient energy and resource use while creating safer and securer environments.
Future mobility
During the year, AFRY helped Region Västerbotten develop a solution for the sustainable transport of visitors and food along Route 363 at Vindelälven/Juhtatdahka. Sustainably trans-porting people and foods that require an unbroken refrigeration chain is a challenge in this area.
In-depth interviews, ethno-graphic studies and collaborative design formed the basis for the Vindelälvsbussen bus solution, a sustainable travel experience for visitors, and Cool Move, a service that guarantees qualitative and safe food transport. The next step is a pilot study.
Design to solve transport challenges in Västerbotten
19 Annual and Sustainability Report 2019

AFRY helps digitalise the industrial sector, where innova-tive solutions based on information technology generate profits along the entire value chain. Robotics, automa-tion, cloud services, AI and the Internet of Things are some of the technologies we work with in Industry 4.0. One example during the year was the growing interest in value-creating solutions that utilise the new possibilities of 5G technology.
We have a major advantage as a supplier when industry becomes digitalised; few other players have such deep domain knowledge in combination with digitalisation expertise. We operate across a wide range of industrial projects – from product development, process develop-ment and logistics solutions to efficiency improvements in material flows.
We help development-intensive industries transition to completely new production methods. By applying digi-talisation and smart technology we connect machines,
Industrial digitalisation
Real Digital Twin is a concept that is a major cost saver when installing and rebuilding produc-tion lines; for example, it can result in enormous cost savings of up to 75 percent when commissioning and ramping up production. Real Digital Twin is about creating a complete virtual environment where you can design and test a production line with both hard-
Real Digital Twin
systems and processes, resulting in a more efficient use of energy and resources.
AFRY also participates in the design and development of many different types of products and services used daily: household appliances, mobile telephony, web services, packaging and vehicles. Our size and breadth facilitate end-to-end solutions and multidisciplinary projects where such things as expertise in automation, industrial IT, interaction design and supply chain man-agement are combined to link clients’ business systems and production.
AFRY contributes to the UN’s goal for industry, inno-vation and infrastructure (SDG 9), and to combating climate change and its consequences (SDG 13). One way we do this is to take advantage of the possibilities of dig-italisation to analyse and optimise production and flows. We also create smart designs to raise awareness and guide sustainable behaviour.
can improve the productivity of their production facilities. Collaborating with AFRY means that we can offer our custom-ers comprehensive technical expertise and solutions in this area,” said Göran Persson, Head of Siemens Digital Industries in Sweden.
ware and software. The virtual environment, or the digital twin, is then used for further development with the possibility to add things like AI, operator training and maintenance as well as to enable interconnection of digital flows for producing companies. “Our customers are increasingly looking for a system perspective when it comes to how digital tools
20 Annual and Sustainability Report 2019
VALUE CREATIONPowerful drivers

AFRY thinks innovatively about how energy should be produced. In the future, electricity production is expected to move from traditional power generation to be more decentralized, and the challenge of storing energy eco-nomically should be solved. This will require a robust, efficient energy infrastructure system to be built over the next few years. We are driven by our desire to ensure access for everyone to modern forms of affordable, reliable and sustainable energy.
Within energy, AFRY has a strong global focus. We have a local presence in 32 locations in Europe, Asia, Middle East, Africa and Latin America. We execute projects in more than 80 countries. Our skills span across the energy sector – from hydro, thermal, heat and power, nuclear power, transmission and distribution and renewable energy. Securing the energy supply and transforming energy sources into renewable options poses a major challenge. AFRY is in a prime position to provide sus-tainable technological solutions to nations still relying heavily on non-renewable energy. Our global expertise,
Changing energy markets
With a growing population of over 100 million people, the need for clean energy technologies and renewable energy sources are of great interest to the Philippines. Around 30% of the nation’s energy currently comes from renewable sources. One of these is biomass fuelled energy, which is slowly becoming more popular with tech-nological advancements, and plays a vital role for the energy supply for the Philippines. One such resource is sugar cane field residue, a
biomass that remains on the fields after the sugar cane has been harvested. This once neglected material, historically burned in the open fields for disposal, is now going to be put to good use. North Negros Biopower Inc. (NNBP) will be among the first to use sugar cane field residues for its 25 MW Biomass Power Plant located in the municipality of Manapla, on the island of Negros, in the Philippines. NNBP is a Philippine company registered with the
Department of Energy and is part of the BioPower Philippines group, which include two other biomass fuelled power plants. It is devel-oped by Bronzeoak Philippines and financed by the ThomasLloyd Group. AFRY is very active in the bioen-ergy sector around the world, but especially in the Philippines. With deep knowledge of the challenges involved in implementing bioenergy projects, AFRY is executing the engineering, procurement and
construction (EPC) of NNBP, which includes the design, procurement of all components, construction, erection and commissioning and testing of the entire power plant project. The EPC delivery follows AFRY’s unique EPC+ System Methodology approach. Our involvement in this project further strengthens the Philippine’s efforts to increase its energy supply from renewable sources, helping the country further its sustainable development.
Increasing the use of sustainable energy sources in the Philippines
and especially our Nordic experience allows us to share sustainable practices by implementing tried and tested successful examples. In so doing, AFRY strives to help its energy clients accelerate their transformation towards this sustainable development scenario.
With our broad expertise we offer energy clients a wide range of services in energy market analysis, power generation, life-cycle assessments of investments, and independent assessments and audits. By combining smart energy technology with digitalisation, AFRY can also help to link energy systems with communities. In order to strengthen our offering to meet the new needs of a changing energy market, we have adapted our strategy and global-local model.
To this end, AFRY contributes to the UN’s Sustainable Development Goal for affordable and clean energy (SDG 7) by helping provide access to affordable, reliable, sustainable and renewable energy and combat climate change and its consequences (SDG 13).
21 Annual and Sustainability Report 2019

AFRY is facilitating the global shift towards fossil free society, carbon neutrality and smart systems. As indus-tries change at an unprecedented rate and our world becomes infinitely more connected, AFRY is designing solutions for the complex challenges and opportunities that are arising for our clients and stakeholders. Transition from plastics to bio-based solutions, opera-tional excellence to enable efficient use of raw materials, digitalisation for process efficiency, new bio-smart strategies and enhanced products are all important elements. Bioeconomy is a platform that works both alone as well as supporting non-renewable materials and energy platforms in the global transition. AFRY supports sustainable success with a global per-spective that spans industries across global regions, from energy, process industries and manufacturing to architecture and design. Our deep industry expertise helps clients to make the most of business opportunities in a sustainable way. We help select viable options and design and implement responsible alternatives that are sustainable now and robust against future changes.
Transition to bioeconomy
AFRY was chosen to coordinate the Finnish government initia-tive “climate neutral Finland 2035” that spans across all key export industries. In collaboration
with clients in the industry and AFRY experts our Management Consulting team is creating and combining three main elements (sectoral “technology menus”,
global handprints of export tech-nology and products and, finally, GHG reduction scenarios) into a national roadmap.
Climate neutral Finland 2035
We are seeing an increase in our clients’ and stakehold-ers’ needs to identify and design alternative energy solutions and create practical and actionable road-maps to a fossil free future, for example within process industries and transportation, just to name a few. These trends and themes call for our deep industry expertise and highly developed business logic, modeling and design capabilities.
AFRY contributes to the UN’s global goal for ensuring responsible consumption and production (SDG 12) and combating climate change and its consequences (SDG 13). Our advisory and services support our clients in fighting climate change through sustainable solutions - in energy production, process industry, transportation and housing; by allowing more efficient use of resources through operational efficiency and design of recycling concepts and facilities; as well as improved forestry and reforestation to support businesses and communities for global well-being. Our own thought leadership is enhanced by picking the right partners to sharpen our foresight and introduce unique solutions for our core sectors.
22 Annual and Sustainability Report 2019
VALUE CREATIONPowerful drivers

23 Annual and Sustainability Report 2019

24 Annual and Sustainability Report 2019

The platform acquisition of Pöyry was completed in 2019 in line with the company’s strategy, which focuses on growth, increased value creation and international expansion in selected segments.
Following the acquisition, business is conducted in five divisions: Infrastructure, Industrial & Digital Solutions, Process Industries, Energy and Management Consulting. The divisions create sustainable solutions in the infrastructure, industry and energy sectors for clients from both the private and public sectors.
Operations
25 Annual and Sustainability Report 2019

Infrastructure Division
The Infrastructure Division offers technical solutions for buildings and transport infrastructure as well as for water, sustainability and the environment. The division also operates in the fields of architecture and design. One of the division’s strengths is its in-depth knowledge of sustainable, high-tech solutions. Clients are mainly found in the property and urban development markets.
The marketMarket development for rail-borne traffic and green mobility solutions drives the transport infrastructure business. An increasingly electrified, digitally connec-ted infrastructure and new patterns of mobility in urban environments are increasing demand for end-to-end solutions.
The rise of digitalisation is penetrating the property market in the Northern and Central European markets. There is great demand for high-tech solutions for energy conservation, flexibility and security in both office buil-dings and sport and healthcare facilities.
Within the division, architects operate under their own brands with operations throughout Scandinavia. During the year we launched Efterklang, specialising in sound and vibration, and Light Bureau, specialising in lightening, with assignments all over the world.
When municipalities, cities and industries set their sights on Agenda 2030 and ambitious sustainability goals, we are equipped with circular economics, material use, environmental impact assessments and strategic water consulting. European water treatment plants need to modernise their filtration systems, and our water experts are involved in some of the largest projects.
The Tampere region is growing at a rapid pace, and with that comes congestion and traffic challenges, especially in the city centre. Tramways are a safe and user-friendly means of transport for all age groups. One step towards more sustainable and accessible mobility in the city is the expan-sion of the tramway network, where the company works
together with YIT, NRC Group Finland and Sweco to design and build a 0.7 km long extension of the new tramway. The project, awarded by Tampere Tramway Ltd. and the City of Tampere, is an addition to a longer commitment and includes the new tramway, the completion of a tramway turnout, a new stop and an underground switchgear.
Sustainable mobility in focus – tramway in Tampere
Head of Division: Malin Frenning
Operations in: Nordics and Central Europe
Employees at year-end: 6,337
Share of net sales: 38%
EBITA margin: 8.9%
InfrastructureFacts
Tam
pereen R
aitio
tie Oy
26 Annual and Sustainability Report 2019
OPERATIONSDivisions

Industrial & Digital Solutions Division
The Industrial & Digital Solutions Division conducts engineering operations in product development, produc-tion systems, IT and defence technology. The technical capabilities include project management, industrial design, mechanical product development, automation and quality assurance to digitalisation services aimed at developing and connecting systems and products.
The marketIndustrial companies today are encountering ever increasing global competition with higher demands on productivity, quality and work environment. At the same time, sustainability topics are climbing higher up the agenda.
In the long term, there is a great need to renew product programmes and services to meet market expectations for electric drive systems, as well as connected and autonomous vehicles. Nevertheless, the need for cost savings and reprioritisation of research and development programmes have affected demand from clients in the automotive industry during the year.
In the manufacturing industry, growing global com-petition and demand for continued efficiency measu-res make our automation and digitalisation services attractive.
Demand for engineering services and new project invest-ments in food & pharma is favourable. AFRY has grown stronger and gained greater international presence by helping clients adapt their production, streamline and launch new products on the market at an ever-increasing rate. The pace of development in telecoms is good with increased needs in 5G development.
AFRY delivers two new process lines to Oatly’s production plantin Vlissingen, the Netherlands. It is an a turnkey solution that includes an expansion of the process to double the current capacity of
the plant. AFRY is responsible for project management, process and electrical design, installation and commissioning.
New process lines for Oatly
Head of Division: Robert Larsson
Operations in: Nordics
Employees at year-end:3,831
Share of net sales: 29%
EBITA margin: 8.4%
Industrial & Digital SolutionsFacts
Oa
tly
27 Annual and Sustainability Report 2019

OPERATIONSDivisions
Process Industries Division
The Process Industries Division provides engineering and consulting services, project management and implemen-tation services to clients in the process industry, mainly in the forest, chemical and biorefining industries and the metal and mining industries.
The marketThe whole process industry sector is searching and developing solutions to solve the challenges related to overall efficiency, sustainability and digitalisation. Megatrends are promoting growth in the pulp and paper segment, partly through growth in e-commerce and packaging, and partly through the replacement of plas-tic. New investments are being made in all sectors with major investments in bioproduct mills, some of which have been started, especially in Latin America, Finland and Russia. New projects in cardboard and tissue as well as conversions of existing plants to cardboard are being planned and implemented, mainly in Central Europe and North America. New investments are also being made in the chemicals and biorefining sector with the transition from fossil-based industries to bio-based solutions. The metal and mining sector is active in the Nordics and Latin America, where several investment projects are under-way or are in the development phase.
Digitalisation in mining is high on companies agenda. Clients in the process industry sectors are looking for new solutions for improving efficiency, safety and pro-ductivity and many are ready to increase investments in digitalisation. Improving health and safety are also priority areas for the process industry sector, which is reflected in the demand for smart solutions.
Reduced use of fossil fuels – Metsä Fibre
Head of Division: Nicholas Oksanen
Operations in: Nordics, South America, North America, Central Europe and Asia
Employees at year-end: 3,156
Share of net sales: 15%
EBITA margin: 10.6%
Process IndustriesFacts
AFRY has received an order from Metsä Fibre, which is part of the Metsä Group, for feasibility studies at Metsä Fibre’s plants in Kemi and Rauma in Finland. AFRY
supports Metsä Fibre in this stra-tegically important assignment aimed at reducing the use of fossil fuels and increasing the produc-tion of renewable energy.
28 Annual and Sustainability Report 2019

Annual and Sustainability Report 201929

OPERATIONSDivisions
Energy Division
The Energy Division provides international engineering and consulting services to clients in over 80 countries. The Division has expertise in the generation, transmission and distribution of all types of electricity generated from various energy sources, such as water, coal, gas, bio- and waste fuel, nuclear power and wind and solar renewable energy sources, and holds a leading global position in hydropower.
The marketThe global energy sector is in a state of transformation. Significant changes are taking place in technology, politics and market conditions. Energy generation by traditional power plants is complemented by decentrali-sed energy production, a greater demand for renewable forms of energy and digitalisation are trends driving the industry. At the same time, existing power plants are being refurbished, to prolong their life-time. The power grid is being strengthened and expanded to cope with increased energy consumption, and decentralised power generation. Environmental concerns have increased on a global basis both among political decision makers, and consumers. The requirement to transition to sustaina-ble, renewable energy generation is gaining momentum, also addressing the difficult transition challenge in the balancing of energy efficiency, reliability and cost of electricity supply.
There have been some delays in project investment decisions during the year in certain business areas due to global uncertainties. However, some of these tensions eased during the last weeks of the year resulting in more positive signals that our Energy sector clients are ready to reactivate their strategic investment plans.
AFRY has been retained by Masdar, one of the Middle East’s largest renewable energy deve-lopers. Our role is to act as lead technical advisor for a solar PV project worth over USD 1 billion in
Dubai with a capacity of 800 MW. As advisors, we will be involved during the planning, design and operational phase until the end of 2022.
Solar cell project in Dubai
Head of Division: Richard Pinnock
Operations in: Business is conducted out of 32 offices across three continents and projects are being executed in more than 80 countries
Employees at year-end: 2,071
Share of net sales: 15%
EBITA margin: 7.2%
EnergyFacts
30 Annual and Sustainability Report 2019

Management Consulting Division
The Management Consulting Division provides strategic and operational advisory services across the value chain, underpinned by in-depth expertise and market insights. Core services encompass a wide range of consulting services and include corporate and business strategies; resource, technology and investment strategies and more. Clients are in the energy sector, the forest industry and bio-based industries.
The marketDuring the year, there has generally been heavy demand for services in the division’s core markets.
Main drivers are stable transaction volume in all sectors together with the ongoing transformation of the energy sector, which must meet the Paris Agreement’s goal of reducing carbon dioxide emissions. Digitalisation also has a major impact.
In the bioeconomy sector, demand for packaging and pulp services is still good in terms of changing purcha-sing behaviour and a general population increase. The market for biofuels and biomaterials is evolving, leading to demand for associated consulting services.
During the year, AFRY helped Innogy, one of Europe’s largest energy companies, with their corporate foresight and corpo-rate strategy project “Future of Infrastructures 2030 / 2050” where Innogy’s goal was to get
a clear future picture of the increasingly converging energy, water, telecommunications, and transportation infrastructures, to derive resulting strategic implica-tions and new long-term business opportunities.
In the bioeconomy sector, AFRY was commissioned to undertake a Vendor Commercial and Technical Due Diligence of Solidus Solutions as part of an M&A transaction. Solidus is a leading fibre-based sustainable packaging producer in Europe, operating across seven countries in Europe, producing
and converting a diverse range of paperboard products. The subsequ-ent guidance provided an indepen-dent view of all relevant aspects of the business, such as demand outlook, competition, pricing, com-petitiveness, asset quality, invest-ment history, capex programmes, and improvement potential.
Strategy process for one of Europe’s largest energy companies
Advising leading sustainable packaging manufacturers
Head of Division: Roland Lorenz
Operations in: Business is conducted at 17 offices on three continents
Employees at year-end: 400
Share of net sales: 3%
EBITA margin: 13.7%
Management ConsultingFacts
Annual and Sustainability Report 201931

Tirham Shakila, Economist
32 Annual and Sustainability Report 2019

Our strategy is based on four pillars: growth, business model, operational excellence and attractive employer. Our goal is to grow 10 percent annually in existing core markets and internationally through organic growth and acquisitions in line with our strategy. With the strategic acquisition of Pöyry, we have created a leading engineering and design company in the Nordics.
During the year, we developed the business model to offer more concepts and end-to-end solutions, which helps us enter the process at an early stage.
Meanwhile, we continue to increase efficiency and are working to be as sustainable as possible, with business ethics and the choice of partners, clients and projects being significant aspects of this effort.
For us to grow in line with our strategy, we need brave and devoted team players. That is why we give our employees room to grow and attract new talent by offering interesting and attractive career opportunities.
Pillars of the strategy
33 Annual and Sustainability Report 2019

GrowthOur goal is to grow 10 percent annually in existing core markets and internationally in selected segments through organic growth and acquisitions in line with the company’s strategy. To strengthen AFRY’s position out-side Sweden, we are building the brand in several selected countries. Our core markets are Sweden, Norway, Denmark, Finland and Switzerland.
The Pöyry acquisition With the strategic platform acquisition of Pöyry that was completed in 2019, we now have a greater international presence and the right conditions in which to profitably increase the pace of internationalisation in selected segments. The acquisition strengthened the company’s position in the process industry through Pöyry’s paper and pulp operations and its mining and petrochemical operations, primarily in the Nordics, Southeast Asia, North America and Brazil. In energy, we have become a strong international player in all segments, with opera-tions primarily in the Nordics, the rest of Europe and Asia. Revenue synergies from the acquisition are expected to be achieved by winning new projects based on combined expertise, size and our geographical footprint across all divisions. Other areas in which revenue synergies are expected are cross-selling between Sweden and Finland, economies of scale in the forest industry, mining indus-try, petrochemicals and bioeconomy, growth in Finnish and Swiss infrastructure business and digitalisation projects in Finland.
Two types of acquisitions are appealing: Add-on acquisitions. Complement our current business in selected areas and geographies. Platform acquisitions. Give us the opportunity to take the next step in our development.
We prioritise substantial acquisitions that power up our offering in sustainable solutions, move us up in the value
International expansion into leading positions We compete offensively in the Nordics, but also in the international arena. We prioritise acquisitions that move us up in the value chain or contribute with important elements such as niche expertise and market position. With the strategic acquisition of Pöyry, we have created a leading engineering and design company in the Nordics.
chain or contribute with important elements such as niche expertise and market position.
Acquisitions for the year Pöyry, International. The platform acquisition strength-ens AFRY’s position in several segments such as the process industry and the energy segment, and the new Group has a greater international presence.AF-Incepal, Spain. The acquisition complements AFRY’s position and expertise in the pulp and paper industry and strengthens the global offering in paper, cardboard and tissue. Sonny Svenson, Sweden. The acquisition is aligned with the strategy to expand the offer in buildings and strengthens the company’s position in the Swedish his-toric building sector. CTT Electronics, Sweden. The acquisition strengthens AFRY’s offering in product development, maintenance and support for clients in the defence industry.Cervino Consulting, Sweden. The acquisition will make AFRY an even more complete supplier of engineering and design solutions in all areas of defence.
New common brandIn November 2019, the new AFRY brand was launched. With a new common brand and offering, the company will strengthen its position in its core markets of Sweden, Norway, Denmark, Finland and Switzerland and grow internationally in areas such as energy and the process industry.
Strategic focus
– Grow geographically in core markets. – Create international growth in selected niches. – Expand within international investment projects.
34 Annual and Sustainability Report 2019
PILLARS OF THE STRATEGYGrowth

Thea Collett, Senior Lighting Designer Rune Berg, Project Manager, Buildings
35 Annual and Sustainability Report 2019

36 Annual and Sustainability Report 2019
PILLARS OF THE STRATEGYGrowth

Our history goes way back: ÅF was founded in 1895 and Pöyry in 1958. The merger made us a leading engineering and design company in the Nordics and a global player in our industry with nearly 17,000 employees and proj-ects in over 100 countries. With combined expertise, greater scale, more resources and committed, highly educated employees, we are expected to contribute to clients’ continued development and meet the need for advanced sustainable solutions in increasingly complex assignments.
We are proud of our history and look forward to our continuing journey with a strong focus on sustainable solutions. We have brought the best of both ÅF and Pöyry together in the new AFRY brand, which was launched in November 2019.
Position in sustainabilityIn times of increased globalisation, urbanisation, digital-isation and climate change, the need for new sustainable solutions is greater than ever. At AFRY, we are driving the transformation and, together with our clients, can influence many aspects of society through solutions that reduce climate impact.
Attractive employerWith a new common brand and offering, we can bolster our position in our core markets of Sweden, Norway, Denmark, Finland and Switzerland and grow internation-ally in the energy and process industries, for example. A key issue for the company is to attract future talent, where we will continue to be one of the most attractive employers for engineers, researchers, designers and consultants.
Background of the new brandAs part of the branding work, a survey was conducted of all ÅF and Pöyry employees who were under 30 years of age. In-depth interviews with students in our main markets were also conducted, all to ensure a brand that is attractive to future generations.
AFRY launched as new common brandSince the beginning of 2019, ÅF and Pöyry have been a joint company with projects in over 100 countries. In November, the new common brand AFRY was launched.
The design of the new logo and identity was carried out in close collaboration with chief architect Thomas Sandell together with design experts within the com-pany. The iconic ÅF logo is highly recognisable in the new AFRY logo, but in a clean and modern layout. The brand gives a feeling of mobility, creativity, construction and design while symbolising leading solutions for future generations.
Successful launchThe internal launch was carried out in several steps. First, all managers were involved via internal leadership con-ferences and then the brand was launched simultane-ously for our nearly 17,000 employees in offices around the world via a live webcast. The internal launch was followed by an external campaign.
SandellSandberg, Koncept, InUse, Gottlieb Paludan Architechts, Advansia, Efterklang and Light Bureau are endorsed brands in AFRY’s brand portfolio.
The legal name is ÅF Pöyry AB. The new AFRY brand is a combination of the letters in ÅF and Pöyry: AF+RY.
37 Annual and Sustainability Report 2019

Business modelDuring the year, we developed the business model to offer concepts and end-to-end solutions to a greater extent. This allows us to enter the process early on and help the client choose solutions that create benefi-cial economic, environmental and social values. In this way, we can more successfully address sustainability concerns in client assignments. Our business model is divided into two client offerings, Projects and Services.
ProjectsAFRY’s offering for major projects and end-to-end solu-tions. In such projects, we act as a partner to the client, leading and running the entire project. Project examples include building and implementing new production facili-ties and helping clients reduce costs, increase productiv-ity or gain a foothold in new areas and markets. In 2019, the proportion of projects increased from 60 percent to 70 percent due to increasing demand from our clients for end-to-end solutions and Pöyry having a larger propor-tion of projects.
Expanded business model for greater client valueOur business model strengthens clients’ long-term competitiveness. This is achieved by delivering projects, cross-functional and packaged solutions, concepts and selected products that respond to global trends, leverage the opportunities provided by digitalisation and respond to climate challenges.
PILLARS OF THE STRATEGYBusiness model
60%Projects
40%Services
70%Projects
30%Services
PROJECTS SERVICES
PRODUCTS
CONCEPTS
SOLUTIONS
EPC+
Turnkey projects
Fixed price projects
Time & material projects
Operating “Satellites”
Aftermarket – 24/7
Professional teams
Professional services
ÅF 2018 AFRY 2019
ServicesAFRY offers professional solutions when the client needs external specialist expertise or human resources. This might involve delivering complete teams with different skillsets who work towards a specific goal or running a satellite operation tailored to the client. We continuously develop our services offering.
Products, concepts and solutionsClients increasingly demand solutions that combine cross-functional skills in addition to functional and con-cept solutions. In these cases, AFRY can unite the latest technology and design with deep domain and process knowledge in infrastructure, industry and energy to offer world-class solutions in smart cities and infrastructure, industrial digitalisation, future mobility, a changing energy market and the transition to a bioeconomy. Through our new Future Cities platform, we gather all our skills to offer a complete end-to-end solution for developing the sustain-able cities of the future. This adds value for clients while
Business model
38 Annual and Sustainability Report 2019

enabling us to advance our position as an international engineering and design company.
Specialist expertise AFRY has unparalleled breadth and depth when it comes to specialist expertise, represented partly by our nearly 17,000 qualified employees and partly by our unique network of about 30,000 engineers and specialists. This combination puts us in an ideal position to offer a tai-lor-made team for each assignment.
To strengthen the sustainability skills of all new employ-ees, they must attend the mandatory introductory course “Welcome to AFRY” which includes a workshop on sustainability. During the year, an updated web course in sustainability is also being launched that all employees must attend.
Sustainable solutions with overall responsibility Our sustainable solutions are important for our clients, ourselves and society. The products and services we deliver aim to create sustainable value for our clients, help our business stay profitable and make a positive impact on society. The product’s or project’s sustain-ability impact is determined primarily in the design and concept phase. Through the acquisition of some of the Nordic region’s most high-profile design and architec-tural firms, we can contribute in the early phases of a project and deliver greater value to the client.
Strategic focus
– Balanced mix of projects and services. – Develop cross-functional solutions that respond to societal
trends. – Invest in and develop conceptual solutions and products. – Optimise the service business.
Management of sustainable solutions is done through AFRY’s project model, cross-functional teams of experts and investments in early participation in the design and concept phase. The project model is important because that is where we create the conditions for optimising the positive and negative impact of the project. Through the introductory workshop on sustainability and man-datory sustainability training, AFRY increases knowl-edge and raises awareness of sustainability and value creation. This could mean avoiding negative impacts by choosing the right solutions and materials or developing solutions that have positive effects on people and the environment. However, the sustainability performance of AFRY’s deliverables is closely linked to what the client defines and orders.
Annual and Sustainability Report 201939

Integrated business strategy The merger with Pöyry has made us a very competitive player in the European market with a strong platform for international growth. Pöyry’s focus on paper & pulp and energy complements our offerings in the automotive industry, advanced manufacturing and food & pharma, for example. Digital solutions are at the heart of both companies’ respective operations and are expected to be a key competence that can be utilised in all divisions. Thorough knowledge, expertise and international reach are expected to enable AFRY to deliver a more compre-hensive offering and have the capacity and know-how to do so at an international level. This will create value for clients and shareholders and will ultimately contribute to sustainable communities.
During the year, we fully integrated our sustainability strategy with the business strategy, which identifies sus-tainability as the platform for our innovation and growth and clarifies the focus on sustainability at all levels. This reduces our business risks, generates new product ideas, increases revenue and adds value to our brand.
Financial control To ensure satisfied clients and competitive prices, AFRY constantly strives to make its operations more efficient and cost-effective. This is done in each business area and is monitored through various performance indica-tors, such as quality in project implementation, measure-ment of client satisfaction, capacity utilisation and cost trends. All business areas in each of the five divisions have full responsibility for profitability. This means inter-national full responsibility for clients, sales and delivery in each area. The business areas are then measured according to financial and non-financial performance indicators with the support of the Balanced Scorecard.
Synergies and efficiencyThe merger with Pöyry has resulted in significant bene-fits for the merged company. Size and economies of scale are becoming increasingly important in the industry in which we operate regarding things such as development of our own offerings and solutions and recruitment of qualified employees.
Operational excellenceWe continue to improve efficiency and strengthen our capacity. Meanwhile, we are also working to be as sustainable as possible, with business ethics and the choice of partners, clients and projects being essential aspects of this effort.
Cost synergies amounted to SEK 218 million as of 31 December 2019, thus exceeding the target of SEK 180 million. For 2020, the company has set the target for further savings at an annual rate of SEK 120 million. Alongside this the company has an investment pro-gramme to improve its systems platform, including the implementation of a new ERP system. Increased costs due to the investment programme are expected to have a negative impact on profitability of around SEK 50–70 million in 2020. In addition, there is potential for revenue synergies such as increased competitiveness for various assignments, size and scale advantages in core coun-tries, the application of combined expertise in comple-mentary areas and a joint international presence. Both companies share a Nordic industrial heritage and have great similarities in terms of corporate culture.
Pricing AFRY strengthens its clients’ competitiveness by creat-ing cost-effective solutions and concepts. We strive for pricing that is based more on the value we deliver to cli-ents rather than on how many hours we have spent on the project. This is intended to contribute to higher perceived value for clients and increased profitability.
Business ethics By taking responsibility for how AFRY runs its business, we have also become part of the solution for a more sustainable future. This instils greater trust among our employees, clients, partners, suppliers, investors and others affected by us and strengthens our brand and our business. The foundations of our business ethics are summarised in the company’s Code of Conduct, which was updated during the year to clarify objectives, accountability and values. In a manifestation of our efforts, AFRY has been a member of the UN Global Compact for several years.
Our employees have the main responsibility for com-plying with business ethics. They gain knowledge of the company’s business ethics and what they contain through an onboarding process and training. The Code of Conduct, whistle-blower policy and procedures within the Sustainability Risk Assessment process are monitored in the internal audit procedure and reported to the Audit Committee and Group management. Any
40 Annual and Sustainability Report 2019
PILLARS OF THE STRATEGYOperational excellence

non-conformances found via internal and external audits are corrected.
AFRY also takes active responsibility for selecting part-ners, clients and projects. We seek to act as a role model and source of inspiration to our partners and clients. We accept responsibility for delivering sustainable solutions, as expressed in our vision: Providing leading solutions for generations to come. To the extent possible, AFRY guides its clients in a sustainable direction and requires them to respect our Code of Conduct. If that does not work, we end the collaboration.
IT security As an international engineering and design company, AFRY takes a holistic view of information and IT security management. We preserve confidentiality, privacy and access to all important information to maintain our com-petitiveness, uphold our reputation and comply with laws and agreements. Our industry is built on trust and clients expect robust protection against external IT threats. The company is therefore focusing more than ever on information and IT security, both internally and on-site with clients. Security efforts, which are based on shared responsibility and trust, are integrated throughout the organisation, from individual employees to processes and systems.
Data privacy People are the key to the company’s success, which is based on their trust in us. Accordingly, it is vital to the company that our actions are guided by the principle “your data is our responsibility”. Last year, we established a global system for protecting and managing data con-fidentiality and personal information, in accordance with the EU General Data Protection Regulation (GDPR).
Energy efficiency and the environment AFRY will lead the way through high energy efficiency and low environmental impact. We have an environmen-tal management system certified to ISO 14001 that ensures systematic environmental efforts. Our environ-mental impact is mainly due to client impact, business travel and energy use in office premises. We calculate carbon dioxide emissions from business trips and energy use in offices annually and the goal is to halve emissions per employee by 2030 compared to the base year 2016. We work continuously with activities and tracking to achieve that target.
In 2019, AFRY’s total emissions amounted to 21,491 tonnes of CO₂. Recalculated per employee, emissions amounted to 1,315 kg CO₂/employee, which is 2 per-cent lower than the base year 2016. Emissions per employee from business travel by air increased slightly compared with the previous year, which is explained by continued international expansion and thus increased air travel. Read more on page 122. AFRY’s vehicle policy was updated in 2018 with the aim of transitioning to a fossil-free, safe, clean and quiet vehicle fleet by 2027. This means that the emissions limit will be reduced by 13 grams CO₂ on average per year starting from the base level of 120 grams CO₂ in 2019.
Strategic focus
– Simplify and focus the organisation. – Adjust financial control. – Optimise pricing and sourcing. – Generate ethical engagement and commitment. – Common platforms to ensure cost-effectiveness.
70%Private sector
30%Public sector
Clients
Ten largest clients in 20191
Swedish Transport AdministrationVolvo GroupScaniaEricssonVattenfallBillerudKorsnäsNegros Island Biomass GroupSwedish Defence Materiel Administration (FMV)GEAstraZeneca
1) The largest clients who have allowed publication of their names.
Marilyn Bellefine, HR Consultant Frode Steinsvik, Section Manager, Culture and Sport facility and safety
41 Annual and Sustainability Report 2019

Lisa Anger, Digital Strategist Rodrigo Pencheff, Lighting Engineer
42 Annual and Sustainability Report 2019
PILLARS OF THE STRATEGYAttractive employer

Digital and efficient employee processesThe goal is to deliver efficient and value-adding pro-cesses and tools to managers and employees, with a high degree of self-service functionality. Continued digitalisation is an important part of the HR strategy and several projects aimed at improving the employee experi-ence were in focus during the year. An example is the development of a common system for HR administration and personnel data.
Collaborative culture and brave leadershipAFRY believes that leadership is about creating long-term sustainable profits by developing both the business and our employees. In 2019, culture and leadership were even more in focus and laid the foundation for a success-ful integration of ÅF and Pöyry.
It will take brave leadership and the right corporate cul-ture to execute the new company’s strategy. A new lead-ership philosophy has been devised, and to ensure that it permeates everything we do, several activities are being conducted. Leadership criteria have been developed and leadership training and the processes for individual per-formance management have been updated.
Good leadership – firmly rooted in our corporate culture and strategy – is a foundation for strong client relation-ships and a committed workforce. We take a structured, long-term approach to identifying managerial talent and planning for advancement and succession in various leadership roles.
Gender equality, diversity and inclusionAs a fast-growing company, AFRY is constantly look-ing for a variety of talent who can contribute innovative thinking to our clients and society. We are convinced that a diversified workplace makes a company more
Attractive employerFor AFRY to grow in line with our vision and strategy, we need brave and dedicated team players. That is why we give our employees room to grow and attract new talent by offering interesting and attractive career opportunities.
competitive. The company actively pursues the promo-tion of diversity and inclusion to develop our procedures to attract and recruit new managers and employees, to ensure fair and gender-neutral pay and to educate and train managers in inclusive leadership. This work involves preparing concrete action plans for greater diversity. There are two focus areas:– More women. The company has an overall objective of
creating a better gender balance among both consul-tants and managers. An interim target is that the pro-portion of female employees should reach 30 percent by 2020. At the end of 2019, the figure was 26.6 percent and among new recruits it was 28.7 percent. AFRY con-ducts several different projects to improve the gender balance.
– More newly immigrated engineers. The company has been offering a trainee programme since 2016 aimed at engineers who have recently immigrated to Sweden as a way of bringing valuable skills to the company. Our two diversity coaches are working with the Swedish Public Employment Service to find the right candidates and provide support to new trainees and their manag-ers. By the end of the year, AFRY had hired a total of 244 newly immigrated engineers.
Diversity issues affect all aspects of AFRY and have an impact on the corporate culture through leadership and collaboration. This, in turn, affects both our clients and society at large as we can contribute smart solutions to major societal challenges.
Structures that create and reinforce bias are found everywhere, including within AFRY. Here we can make a difference through education, cultural exchanges and the way we lead.
Diversity, equal opportunity and inclusion are gov-erned by structured procedures, policies and tools in all employee-related areas. Communication is an important tool and we spotlight role models and teach by example. This leads to a general boost in skills among managers and employees and ensures that fewer decisions are made subjectively.
Strategic focus
– Digital and efficient employee processes. – Collaborative culture and brave leadership.– Growth-friendly. – Development of our employees.
43 Annual and Sustainability Report 2019

AFRY was included in the Bloomberg Gender EqualityIndex for 2019, which represents a commitment towork with gender equality issues and to promote women in the workplace.
Working environment, health and safetyA healthy and safe work environment is a prerequisite for being an attractive employer and contributes to sustain-able results and long-term relationships.
The Group requires that our operations comply with both local legal requirements and common standards to ensure a good working environment that promotes employee health and prevents illness and accidents.
GrowthRecruitment and inductionAFRY is growing rapidly. More than 3,600 new people were employed during the year. A rate of growth that demands an effective and well-functioning recruitment process. Each manager is responsible for their recruit-ment plan and the people they recruit, with support pro-vided by the HR organisation. In Sweden alone by the end of the year, the company had about 40 recruiters looking for interesting candidates, processing them and ensuring the recruitment process is a positive experience.
To give candidates a clear picture of AFRY, we created a candidate portal and an onboarding app with useful and inspiring information. The company participates in Tekniksprånget, a national initiative in Sweden with the aim of stimulating interest in engineering education. Those accepted are offered a four-month internship. A total of 2,563 young people applied during the year, of whom 616 were seeking a placement with AFRY. More than half of them were women.
Retain and develop talentAFRY needs engineers in virtually all fields. To be able to offer clients what they want, we not only need to recruit the right people, we must also be able to retain and develop them. Talent management is about finding the right individuals and making sure they end up in the right place with good conditions for doing their jobs. But it is also about how the leadership and procedures of the company generate enthusiasm and a good corpo-rate culture. A culture that permeates the daily lives of individual managers, thus affecting all employees and, by extension, all the interests of the company.
Employee turnover is affected by business cycles and market trends. The expectations that both employees and potential employees have about the company as an employer are influenced by prevailing trends. The lack of skills in society at large has a significant impact on the range of available talent.
We guide talent management at the company through Group-wide processes, policies and system support. Managers have access to guidelines, tools and templates with support from HR. Guidance reduces the risk of arbi-trariness, facilitates efficient work methods for manag-ers and ensures a minimum level of talent management.
Development of our employeesThanks to the size of the company, we can offer our employees many interesting career and development opportunities, ranging from managerial and special-ist roles to project managers and business developers. A breadth that is becoming increasingly important to highlight. In the future, we will also facilitate job rotation so even more people can test new roles and functions. During the year, the service for those who want to work abroad was also developed.
Much of our employees’ skills development occurs on the job. Since sustainability is at the heart of our client offering, we are working to increase understanding and knowledge of sustainability topics. In addition, all our employees have access to AFRY Academy, a proprietary education platform with many courses.
To maintain enthusiasm and increase motivation, it is important for employees and managers to have ongoing conversations about performance and development. Managers are supported in this context by a simplified, interactive tool for performance reviews. All employees must have at least one performance review per year.
The company also conducts at least one employee survey every year. The 2019 survey focused on the approach to the integration of ÅF and Pöyry and on the status of the change work linked to the merger of the companies. The feedback reflected that the integration and change work generally went according to plan. For more information about our employee survey see page 124.
Employer brandAFRY has long been working deliberately to build a strong employer brand, and this effort remains high on the agenda. To strengthen the brand, AFRY is marketed through digital campaigns, visits to universities and internal ambassadors and communication.
On Universum’s career barometer among young practis-ing engineers, ÅF solidified its position as one of the top companies when we placed second in 2019.
As part of the integration of ÅF and Pöyry, we continued to internationalise AFRY Future Talent, our Group-wide programme for talented aspiring engineers. The aim is for students to get to know the company and get involved as ambassadors at their universities.
44 Annual and Sustainability Report 2019
PILLARS OF THE STRATEGYAttractive employer

Number of employees 2015-2019
Gender distribution 2019
Gender distribution 2019
Consultants Women 25.0% Men 75.0%
New hires Women 29.0% Men 71.0%
Managers Women 20.5% Men 79.5%
Total workforce Women 27.3% Men 72.7%
Administrative staff Women 72.1% Men 27.9%
Our three core values
– Brave. We want to make a difference and think big and outside the box. We challenge each other and make bold decisions. Always taking a stand for what we believe in.
– Devoted. We have a unique combination of expertise and we are all passionate within our fields. We share our knowledge and are driven by our curiosity to grow and learn more.
– Team players. We collaborate to seize new opportunities. We believe in the power of differences and we challenge, support and bring out the best in each other.
0
5,000
10,000
15,000
20,000
2015 2016 2017 2018 2019
Gender distribution among permanent employees.
Annual and Sustainability Report 201945

Rodrigo Pencheff, Lighting Engineer Petri Vasara, Dr.Tech., Vice President
46 Annual and Sustainability Report 2019

Through the merger with Pöyry, we have become a global player in our industry and broadened our portfolio, which contributes to stability over economic fluctuations and improved risk diversification.
Our growth journey in recent years has been significant with a doubling of net sales since 2015 and we have delivered stable results. Future shareholder value is based on organic and acquired growth.
The merger has also made us a more attractive employer and our ability to attract the best employees is crucial in the long term.
AFRY as an investment
47 Annual and Sustainability Report 2019

1. A changing world is increasing the need for our solutions AFRY creates sustainable solutions covering a broad spectrum of expertise areas and client segments. Combining these enables us to provide solutions in engi-neering, design and digitalisation that few other consult-ing companies can match. This makes us an attractive partner as industry is being digitalised or as we build smart cities to be sustainable in the long term.
2. Diversification for low cyclicality Our extensive portfolio equips AFRY to deliver the end-to-end solutions that are in demand and create value for clients. This also generates stability across fluctuations in the economy and better spreads risk. The company has a strong local position in core markets and is aiming to be the international leader in selected segments including the process industry, energy, automotive and lighting.
3. Successful agenda for growth and stable financial performanceAFRY grows both organically and through acquisitions and its target is to achieve annual growth of 10 percent. Growth strengthens and broadens our client offering, while acquisitions have helped us identify and realise cost synergies. We have a clear agenda for growth and have demonstrated that we can grow profitably. Our target is to achieve an EBITA margin of at least 10 percent over a business cycle. In 2019, we achieved total growth of 42 percent with the acquisition of Pöyry and an adjusted EBITDA margin of 8.7 percent.
4. Attractive employerIn the long term, our ability to attract and develop the best employees is crucial. The company provides excel-lent development opportunities and interesting assign-ments for clients who want to be ahead of the crowd. Being an attractive employer ensures that we can recruit talented employees who want to join us in creating lead-ing solutions, which in turn strengthens our client offering and competitiveness.
5. Long-term value creationDuring the period 2015-2019, our share return was 95 per-cent compared to 44 percent for OMX Stockholm PI. We represent long-term, sustainable development that adds value for shareholders, clients, employees and society.
Five reasons to investAFRY is a stable company with historically good returns and profitable growth. Future shareholder value is based on organic and acquired growth and continued synergies and efficiency throughout the company.
Net sales EBITA margin1
Net sales and EBITA margin
0
5,000
10,000
15,000
20,000
2015 2016 2017 2018 2019
SEK m %
0
5
10
15
20
1) Excl. items affecting comparability
48 Annual and Sustainability Report 2019
AFRY AS AN INVESTMENTFive reasons to invest
2015 2016 2017 2018 2019
ÅF Pöyry B OMXSPI
507090
110130150170190210230250
Price trend 2015-2019

49 Annual and Sustainability Report 2019

The shareOver the last five-year period, 2015–2019, the ÅF Pöyry B share’s return was 95 percent compared with 44 percent for OMX Stockholm PI.
Development of share capital
ÅF acquired Pöyry PLC in February 2019 and since then the share is traded under the name ÅF Pöyry B (AF B). ÅF Pöyry’s B share has been listed on Nasdaq Stockholm since January 1986. Since 2 January 2017, the share has been trading on the Nasdaq Stockholm Large Cap, the exchange list for companies with a market capitalisation exceeding EUR 1 billion. At year-end, the market capital-isation, including A shares, was SEK 24,521 million (12,411).
Price trend and share turnoverAt the end of 2019, the ÅF Pöyry B share price was 218.60 SEK (160.40). The return on the share, that is, the share price development, was 53 percent during the year, while the OMX Stockholm PI index was 30 percent. Over the last five-year period, 2015–2019, the ÅF Pöyry B share’s return was 95 percent compared with 44 percent for OMX Stockholm PI. The diagram on the next page shows the share price development for ÅF Pöyry B compared to the index.
In 2019, a total of 63 million shares (32) were traded on Nasdaq Stockholm for an aggregate value of SEK 12,117 million (6,172).
YearQuota value Change
Change in number of shares Total number of shares Total shares Share capital
A shares B shares A shares B shares Quantity SEK thousand
2010 5 Split 2:1 804,438 16,225,063 1,608,876 32,450,126 34,059,002 170,295
2012 5 Non-cash issue 5,985,915 1,608,876 38,436,041 40,044,917 200,225
2013 5 Cancellation -558,782 1,608,876 37,877,259 39,486,135 197,431
2014 5 Cancellation -383,650 1,608,876 37,493,609 39,102,485 195,513
2014 2.5 Split 2:1 1,608,876 37,493,609 3,217,752 74,987,218 78,204,970 195,513
2015 2.5 Cancellation -967,869 3,217,752 74,019,349 77,237,101 193,093
2015 2.5 Conversion of staff convertibles 828,192 3,217,752 74,847,541 78,065,293 195,163
2016 2.5 Conversion of staff convertibles 848,660 3,217,752 75,696,001 78,913,733 197,284
2017 2.5 Cancellation -835,488 3,217,752 74,860,513 78,078,265 195,195
2017 2.5 Conversion of staff convertibles 183,600 3,217,752 75,044,113 78,261,865 195,654
2018 2.5 Cancellation -1,650,213 3,217,752 73,393,900 76,611,652 191,529
2018 2.5 Conversion of staff convertibles 765,051 3,217,752 74,158,951 77,376,703 193,442
2019 2.5 Private placements 1,072,584 33,556,411 4,290,336 107,715,362 112,005,698 280,014
2019 2.5 Cancellation -738,345 4,290,336 106,977,017 111,267,353 278,168
2019 2.5 Conversion of staff convertibles 906,775 4,290,336 107,883,792 112,174,128 280,435
The average turnover per trading day was 255,160 shares (127,531), corresponding to SEK 48 million (25). The share was traded on all trading days.
Dividend policy and dividendThe Board of Directors has adopted a dividend policy according to which the dividend corresponds to approx-imately 50 percent of consolidated profit after tax excluding capital gains. For the 2019 financial year the Board of Directors proposes that no dividends be paid given the COVID-19 outbreak.
Changes in the number of shares In 2019, two rights issues were completed to finance part of the repayment of debt financing for the acquisition of Pöyry PLC. In March, the company issued 6,576,866 new B shares and in April, 28,052,129 new A and B shares. In 2019, conversion of shares as per the 2015 and 2016 staff convertible programmes increased the number of B shares by 906,775. The Group had no holdings in own shares at the end of the financial year.
50 Annual and Sustainability Report 2019
AFRY AS AN INVESTMENTThe share

Long-term communication with the stock marketThe company has an ongoing long-term communication strategy towards the capital market, and interest in the share remained strong in 2019. The CEO and CFO have held numerous meetings with investors and analysts, primarily in Stockholm, and have given presentations at investment seminars. In addition, there are regular online conferences with investors, analysts and the media when interim reports are published. In May 2019, a capital market day was held at the company’s head office.
Name Company
Viktor Lindeberg Carnegie
Erik Elander Handelsbanken
Ola Södermark Kepler Cheuvreux
Carl Ragnerstam Nordea
Johan Dahl Danske Bank
Dan Johansson SEB
31 Dec 2019Number of
shareholders Holding, %
Sweden 14,132 69.6
USA 46 10.0
Luxembourg 8 6.1
Norway 40 4.7
Finland 109 3.5
UK 16 3.1
Rest of world 275 2.4
Anonymous ownership 0.6
Owner Holding, % Votes, % A shares B shares
The ÅForsk Foundation 10.9 33.6 4,274,336 7,942,837
SEB Fonder 10.1 7.5 0 11,376,522
Handelsbanken Fonder 8.0 5.9 0 8,939,129
Swedbank Robur Fonder 6.1 4.5 0 6,845,010
Corbis S.A. 5.9 4.4 0 6,568,026
Didner & Gerge Fonder 4.3 3.2 0 4,854,034
EQT 3.6 2.7 0 4,000,000
Norges Bank 3.3 2.4 0 3,678,809
Fjärde AP-fonden 2.9 2.1 0 3,215,188
Mondrian Investment Partners Ltd 2.8 2.1 0 3,172,804
Total ten largest shareholders 57.8 68.5 4,274,336 60,592,359
Total other 42.2 31.5 16,000 47,291,433
Total shares 100.00 100.00 4,290,336 107,883,792
Source: Modular Finance
31 Dec 2019Number of
shareholders Holding, %
1-500 10,785 1.1
501-5,000 3,343 4.4
5,001- 498 94.0
Anonymous ownership 0.5
Total 14,626 100.0
Analyst
Key ratios per share
Shareholders in Sweden and abroad
Ten largest shareholders, 31 December 2019
Ownership by holding
SEK 2019 2018 2017 2016 2015
Share price 31 December 218.60 160.40 180.90 167.00 143.75
Basic earnings 8.07 10.98 9.58 9.32 7.81
Diluted earnings 7.99 10.76 9.39 9.14 7.63
Equity attributable to shareholders in the parent 83.51 70.42 64.30 60.19 54.46
Dividend yield, percent1 0.0 3.1 2.8 2.7 2.6
Dividend2 0.00 5.00 5.00 4.50 3.75
Market capitalisation, SEK million 24,521 12,411 13,988 12,978 11,153
1) Based on proposed dividend.2) Proposed dividend.
0
2
4
6
8
10
Jan Apr May Jun Aug Sep Nov DecMarFeb Jul Oct
ÅF Pöyry B OMXSPI Volume
100
130
160
190
220
250
Number, millionSEK
Price trend and volume 2019
51 Annual and Sustainability Report 2019

52 Annual and Sustainability Report 2019

Financial statements
53 Annual and Sustainability Report 2019

Net sales and profit Net sales for the year totalled SEK 19,792 million (13,975). Growth was 41.6 percent (10.4). Organic growth was 1.7 percent (6.3). When adjusted for calendar effects, underlying organic growth amounted to 2.1 percent (5.6).
Adjusted for items affecting comparability, EBITA totalled SEK 1,731 million (1,268) and the EBITA margin was 8.7 percent (9.1). EBITA was SEK 1,368 million (1,243) and the EBITA margin was 6.9 percent (8.9). Items affecting comparability amounted to SEK 364 million (25) and concern transaction costs related to the acquisition of Pöyry PLC, integration costs and repositioning the Energy Division.
Operating profit (EBIT) totalled SEK 1,276 million (1,203). The dif-ference between EBIT and EBITA consists entirely of acquisition-re-lated non-cash items: amortisation of acquisition-related assets amounting to SEK 211 million (41) and the change in estimates of future contingent considerations amounting to SEK 119 million (2).
Profit after financial items amounted to SEK 1,039 million (1,103). Net financial items totalled SEK -237 million (-99). Interest expense rose due to more borrowing and an increase in the average credit term in the loan portfolio. Net financial items was also charged with one-off financing costs linked to the takeover bid to acquire all shares issued and outstanding in Pöyry PLC for SEK 32 million (15). Net financial items was charged with discount rates related to con-tingent considerations, which do not affect cash flow, amounting to SEK 16 million (16) and interest expenses of SEK 60 million (-) related to leases in accordance with the new IFRS 16 standard. Profit after tax amounted to SEK 821 million (850). Basic earnings per share were SEK 8.07 (10.98). Tax for the year amounted to SEK 219 million (253), which corresponds to an effective tax rate of 21.0 percent (22.9).
Acquisitions and divestments Five businesses were acquired during the year (including Pöyry) and they are expected to contribute sales of about SEK 6,300 million. See Note 3.
Cash flow and financial position Consolidated net debt including IFRS 16 Leases totalled SEK 7,203 million (3,455) at the end of the year. Consolidated net debt excluding IFRS 16 Leases amounted to SEK 4,424 million (3,455) at year-end and SEK 3,455 million (2,631) at the start of the year, which means an accumulated increase in net debt of SEK 969 million (823).
Cash flow from operating activities reduced net debt by SEK 1,473 million (874). Net debt increased through dividends paid of SEK 560 million (387), share buy-backs of SEK 164 million (177), investments in non-current assets of SEK 197 million (121) and considerations paid, including contingent considerations, of SEK 5,201 million (374) but decreased due to the proceeds of the new share issue of SEK 3,967 million.
The acquisition of Pöyry was fully financed through credit facil-ities from Skandinaviska Enskilda Banken AB (publ) and Svenska Handelsbanken AB (publ). Debt financing consisted of a bank loan of EUR 81 million, a bridge facility of EUR 182 million and a bridge facility of SEK 3,644 million. To finance part of the repayment of the debt financing for the acquisition, ÅF issued 6,576,866 new Class B private placement shares on 21 February, generating proceeds of approximately SEK 1,210 million for the company which was sub-sequently used to reduce the bridge facility in March 2019. During the first quarter, ÅF Pöyry had a bond loan of SEK 500 million that matured on 21 March 2019. In the short term, ÅF Pöyry AB refinanced the bond loan through existing credit facilities within ÅF Pöyry AB’s
other financing. Pöyry redeemed its EUR 30 million hybrid bond on 25 March 2019.
On 27 March, the Board of Directors of ÅF Pöyry resolved on a rights issue of approximately SEK 2,777 million. The rights issue was fully subscribed in April 2019 and ÅF Pöyry has subsequently repaid the remaining bridge facility of SEK 2,434 million using proceeds from the rights issue. In June, ÅF Pöyry increased its MTN pro-gramme and commercial paper programmes to SEK 5,000 million and SEK 2,000 million respectively and issued bonds within its MTN programme for a total amount of SEK 2,000 million to repay the remaining bridge facility of EUR 182 million.
Consolidated cash and cash equivalents totalled SEK 997 million (239) at the end of the period and unused credit facilities amounted to SEK 2,297 million (7,841). Equity per share was SEK 83.51 (70.42). The equity ratio amounted to 38.4 percent (41.4). Equity amounted to SEK 9,369 million (5,465).
If Pöyry had been consolidated as from 1 January 2018 (combined operations), net debt/EBITA excluding the effect of IFRS 16 and excluding items affecting comparability would have been 2.2.
Parent company Parent company operating income for the full year 2019 totalled SEK 972 million (831) and relates chiefly to internal services within the Group. Profit after net financial items was SEK 300 million (684). Cash and cash equivalents totalled SEK 133 million (32) and gross investment in non-current assets was SEK 92 million (56). The increase relates mainly to investments in a new ERP system.
SustainabilityIn accordance with Chapter 6, Section 11 of the Swedish Annual Accounts Act, ÅF Pöyry has elected to prepare the statutory sus-tainability report separately. The scope of the statutory sustainabil-ity report, which also refers to ÅF Pöyry’s Sustainability Report, is given on page 118. ÅF Pöyry has no licensable operations.
EmployeesThe average number of FTEs was 14,680 (10,037). The total number of employees at the end of the period was 16,348 (10,928). For more information on employees, see Note 6.
The shareThe ÅF Pöyry share is listed on Nasdaq Stockholm Large Cap. The share price at the end of the reporting period was SEK 218.60 (160.40). Class A shares carry 10 votes per share and Class B shares carry 1 vote per share. There were two private placements in 2019. To finance part of the repayment of debt financing for the acquisi-tion of Pöyry PLC, ÅF Pöyry issued 28,052,129 new directed A and B shares in the second quarter and 6,576,866 new directed B shares in the first quarter.
The number of shares at 31 December 2019 was 112,174,128. There are no restrictions on the transferability of shares due to statutory provisions, articles of association or, as far as the company is aware, in shareholder agreements.
Guidelines for remuneration of senior executivesThe guidelines adopted for 2019 by the Annual General Meeting (AGM) are set out in Note 6. The Board of Directors proposes that the Annual General Meeting 2020 resolves to adopt the following guidelines for remuneration to senior executives.
The remuneration guidelines include the CEO and the Group
Administration report The Board of Directors and the CEO of ÅF Pöyry AB (publ), corporate identity number 556120-6474, herewith submit their annual report and consolidated financial statements for the 2019 financial year. ÅF Pöyry AB is the parent of the Group. The registered office is in Stockholm.
54 Annual and Sustainability Report 2019
FINANCIAL STATEMENTSAdministration report

Executive Management (“senior executives”). The guidelines shall apply to remuneration that is being agreed upon, and to changes made to already agreed remuneration, after the guidelines have been adopted by the 2020 Annual General Meeting. The guidelines do not cover remuneration decided by the General Meeting. The purpose of these remuneration guidelines is to provide a structure to ensure that remuneration to senior executives is in line with the company's long-term strategy. For information on the company's business strategy see afry.com.
The compensation guidelines are based on the following basic principles:– Offering competitive remuneration to attract and retain senior
executives with the right expertise. The remuneration levels and the composition of the remuneration components are regularly compared to the levels of comparable companies operating in the same market areas as ÅF Pöyry to ensure competitive remunera-tion.
– Offering long-term incentive programmes with a focus on busi-ness strategy, long-term goals and sustainability aspects related to finance, the environment and employees.
– Annual evaluation of individual results and target achievement versus the company's financial results.
The General Meeting may - regardless of these guidelines - decide on share and share price related remuneration. However, the remuneration guidelines establish certain guiding principles for the selection of long-term incentive programmes (LTIs) to ensure the link to long-term value for shareholders. In this way, the remuneration guidelines contribute to the company's long-term value creation and results.
The remuneration guidelines provide for the ability to set financial and non-financial short-term incentive structures (STIs) contain-ing social and environmental aspects in order to further contribute to sustainability and compliance with the company's core values: brave, devoted team players.
The remuneration guidelines provide management with an incen-tive to create an innovative and performance-oriented culture, thereby helping to achieve the company's goal of creating sustain-able technology and design solutions for future generations.
Decision-making processes for establishing, reviewing and imple-menting the guidelines The Board has established a Remuneration Committee. The com-mittee's tasks include preparing the Board's decision on proposals for guidelines for remuneration to senior executives. The Board of Directors shall draw up proposals for new guidelines at least every four years and submit for resolution at the AGM. The guidelines shall apply until new guidelines have been adopted by the AGM. The Remuneration Committee shall also monitor and evaluate programmes for variable remuneration for senior executives, the application of guidelines for remuneration to senior executives, and applicable remuneration structures and remuneration levels in the company. – In order to avoid conflicts of interest, the Remuneration Commit-
tee consists only of members of the Board who are independent of the company and the management
– ÅF Pöyry handles remuneration through well-defined processes and ensures that in the treatment of and decisions in remunera-tion-related matters, the CEO or other senior executives do not attend, insofar as they are affected by the questions.
RemunerationRemuneration to senior executives consists of fixed salary, pension and other benefits as well as short and long-term cash incentive programmes. In addition, the Annual General Meeting can - inde-pendently of these guidelines - decide on long-term incentive programmes.
Fixed salaryThe fixed salary is set according to local market practice and in accordance with the levels in the country where the individual is employed. The fixed salary is reviewed annually in connection with the performance evaluation and taking into account the context of the labour market.
Short-term incentive programmes (STI)The size of short-term cash incentive programmes can vary from 0 per cent to 60 per cent of annual fixed salary. Target components, weighting and target levels are determined annually by the Board
of Directors to ensure that they support the business strategy. The target components, weighting and target levels can vary from year to year to reflect business priorities and they usually balance the group's financial goals (currently EBITA, EBITA margin and organic growth on own and parent unit) and nonfinancial targets. Details of target components, weighting and target levels and how they sup-port the business strategy are reported in the annual remuneration report.
Following the end of the year, the Board of Directors reviews the performance and determines to what extent each of the goals has been achieved to determine the final level of disbursement. For financial targets, the assessment shall be based on the financial data that has most recently been made public. The Board of Direc-tors has discretion to adjust the STI outcome in special circum-stances to improve the alignment of pay with value creation for shareholders, and to ensure the outcome is a fair reflection of the company’s performance.
Further cash-based variable remuneration may be paid out under extraordinary circumstances, given that such extraordinary arrangements only are done on an individual level either to recruit or retain executives, or as remuneration for extraordinary efforts beyond the person’s ordinary assignment. Such remuneration may not exceed 50 per cent of the executive’s annual fixed salary. Deci-sions regarding such remuneration shall be made by the Board of Directors at the proposal from the Remuneration Committee.
Long-term incentive programmes (LTIP)The Board of Directors finds it important to offer long term incentive programmes in order to attract and retain key individuals, as well as to share the success of the Company’s growth.
The long term incentive programmes that can be offered are share or share price-related programmes, convertible debenture programmes and/or long term Cash-programmes – all 3-year plans. Decisions regarding share or share price-related programmes shall be made by the General Meeting.
Details regarding all programmes and how they support the busi-ness strategy will be disclosed in the annual Remuneration Report. Following the end of the programme, the Board of Directors reviews the performance and determines the extent to which each of the targets have been achieved, to determine the final pay-out level.
The remuneration from a long term cash based incentive pro-gramme can range from 0 per cent to 50 per cent of annual fixed salary.
PensionsPension arrangements reflect the relevant market practice and may evolve year on year. Senior executives participate in the pension pro-grams reflecting the market practice in the country of employment, but defined contribution pension plans with premiums are preferred. Pension benefits shall not be dependent on future employment and may not exceed 50 per cent of the executive’s annual fixed salary.
Other benefitsBenefits will be provided in line with appropriate levels indicated by local market practice in the country of employment and may evolve year on year. Other benefits may include company car, private health and life insurance, business travel insurance and liability insurance. Such benefits may not exceed 10 per cent of the executive’s annual fixed salary.
In respect of pension benefits and other benefits under employ-ment relationships that are governed under other rules that Swedish, due adjustments may be made to comply with mandatory rules or standing local practise, whereby the overall purpose of these guide-lines however shall be satisfied as far as possible.
Additional benefits and allowances may be offered in certain circumstances such as relocation in accordance with the company’s international transfers policy.
CEO is eligible to participate in programs which may be offered to other employees at any given point such as for example service years awards, birthday remembrance, etc. Further information regarding the benefits provided in any given year will be provided in the annual Remuneration Report.
Termination and severance payThe notice period for the CEO is 12 months when notice of termina-tion is given by the company and 6 months if given by the CEO. In the event that the company gives notice, the CEO shall receive a sev-erance payment corresponding to up to 12 months’ salary. For other senior executives, the notice period shall not be longer than that of
55 Annual and Sustainability Report 2019

Division Infrastructure
Net sales for the full year amounted to SEK 7,670 million (5,955). Growth was 28.8 percent, of which 5.5 percent was organic. When adjusted for calendar effects, organic growth amounted to 5.7 per-cent. If consolidation of Pöyry had been on 1 January 2018, com-bined total growth would have been 8.9 percent.
For the full year, EBITA totalled SEK 685 million (637) and the EBITA margin was 8.9 percent (10.7). For combined operations, EBITA and the EBITA margin were SEK 702 million (717) and 8.9 percent (9.9), respectively.
The division’s markets are displaying a continued stable rate of investment in the transport infrastructure, property and water seg-ments, particularly in Switzerland but also in Sweden, Norway and Finland. Profitability was adversely affected by project completions and political uncertainty in Denmark during the year. The division continues to maintain a clear focus on improving efficiency and strengthening profitability.
The buildings segment continues to show high levels of activity and the merger with Pöyry is also strengthening the division’s build-ings offer in Finland. However, the slowdown in housing construction in Sweden has affected demand in architecture. Demand for the division’s services is being fuelled by the need to modernise and upgrade digital solutions, and sustainability adaptations.
The transport infrastructure market is strong in the division’s core markets and intensive tendering is underway for major infrastruc-ture investments. In transport infrastructure, the trend is towards green procurement. During the year, one of ÅF Pöyry’s commissions was to do a feasibility study for a new tramway line and city bus in Gothenburg.
Demand in the water segment remains good where the need to modernise existing water treatment plants is driving demand for ÅF Pöyry’s services, and extensive investments are expected in all the division’s markets.
The company has consolidated its position in security advisory services through the acquisition of Norwegian firm One World, which became part of subsidiary Advansia after the year-end. The fourth quarter saw the launch of the Light Bureau and Efterklang brands to promote our lighting design offering and boost the company’s leading position in acoustics.
2019 2018
Net sales, SEK m 7,670 5,955
Share of net sales, % 38 43
EBITA, SEK m 685 637
EBITA margin, % 8.9 10.7
Average number of full-time employees (FTEs) 5,729 4,445
Pöyry was consolidated on 28 February 2019
Division Infrastructure, share of total net sales
38 %
Key ratios
the CEO’s. In respect of employment relationships that are governed under other rules than Swedish, due adjustments may be made to comply with mandatory rules or standing local practise, whereby the overall purpose of these guidelines however shall be satisfied as far as possible.
The Board of Directors has a discretionary right to decide whether pay-outs shall be made under ongoing incentive programmes for individuals who leave their employment and how pay-outs shall be handled in connection with leave of absence. Any assessments made shall be accounted for in the annual Remuneration Report.
Salary and employment benefits for employees In the Remuneration Committee’s and the Board of Directors’ preparation of the proposal for these guidelines for remuneration, including its reasonableness and limits, the salary and employment benefits for the company’s employees have been taken into account by considering the employees’ total compensation, the compen-sation’s components and the salary increase and rate of growth over time. Any development in the gap between the remuneration for senior executives and remuneration for other employees will be described in the annual Remuneration Report.
Right to demand repayment and deviate from the guidelines The Board of Directors has the right to stall payment or demand repayment of pay-outs under short-term and long-term incentive programmes in exceptional circumstances or in case incorrect finan-cial results have been reported. Any decisions regarding this (incl. how circumstances are defined and what steps are taken) will be explained in the annual Remuneration Report.
The Board of Directors may decide to momentarily deviate from these guidelines, in whole or partly, if there is particular cause and necessary to do so in order to safeguard the company’s long-term objectives, including sustainability objectives, or to safeguard the company’s financial viability. As stated above, it is part of the Remuneration Committee’s work to prepare the Board of Directors’ decisions regarding remuneration, including any deviation from these guidelines.
Corporate governance ÅF Pöyry prepares its Corporate Governance Report as a separate document from the statutory annual report. Please see page 131.
Expectations for 2020 Given the development of the COVID-19 outbreak, the market situ-ation is uncertain and difficult to assess. The extent to which this will affect ÅF Pöyry's operations depends on how the situation develops. See Note 30. However, in the long term, the company sees stable demand for the company’s competence and delivery capacity within industry and a good level of investments in infrastructure in our core markets. The energy market is assessed as stable, while demand is being driven in other regions by higher energy use per capita. The ongoing digital-isation is expected to lead to good demand for embedded systems and IT in the industrial, energy and infrastructure markets.
Proposed appropriation of profits Non-restricted profits of SEK 8,669,936,817 are at the disposal of the AGM. The Board of Directors and CEO propose that these profits be appropriated as follows:
To be carried forward 8,669,936,817
Total 8,669,936,817
56 Annual and Sustainability Report 2019
FINANCIAL STATEMENTSAdministration report

Division Industrial & Digital Solutions
Net sales for the full year amounted to SEK 5,805 million (5,782). Growth was 0.4 percent, of which -1.0 percent was organic. Adjusted for calendar effects, organic growth amounted to -0.6 percent.
For the full year, EBITA amounted to SEK 486 million (525) and the EBITA margin was 8.4 percent (9.1).
The year was affected by a slowdown in the automotive industry. However, it can be noted that client activity levels increased slightly towards the end of the year, and with that, demand for product development services, albeit from low levels. Demand is driven by choices linked to the technological transition and in some cases to cost savings. Due to the reduced volume, especially in the automo-tive industry, the division has focused on efficiency and ongoing cost measures. In the long term, there is still a great need to renew product programmes and services to meet market expectations for electric drive systems, as well as connected and autonomous vehicles.
In the manufacturing industry, the general economic turmoil has contributed to extended decision-making processes. Increasing global competition and a continuing need for efficiency improve-ments make services in digitalisation and automation attractive. Towards the end of the year, a pattern of several smaller projects was noted in the manufacturing industry, and an increase in larger projects was seen in the water and sewer sector.
Developments in food & pharma continued to be favourable, with a persistently healthy level of activity and appetite for investment among our clients.
The year saw stable demand from the defence sector. The acqui-sition of Cervino Consulting has made the division a more compre-hensive supplier of engineering and design solutions in all areas of defence.
Demand has been good in the development of telecoms equip-ment, with a greater focus on developments related to 5G. Caution was noted on the operator side.
The market for digitalisation services has been mixed, with increased growth in AI, for example, and a strong market in Norway where the division won several framework agreements, while cost-cutting programmes have affected investments in certain industries.
New technology, new business models and new ecosystems are pivotal for the company’s future competitiveness. The combination of industry know-how and technical expertise makes the division an attractive partner for digitalisation in all sectors.
2019 2018
Net sales, SEK m 5,805 5,782
Share of net sales, % 29 41
EBITA, SEK m 486 525
EBITA margin, % 8.4 9.1
Average number of full-time employees (FTEs) 3,800 3,748
Pöyry was consolidated on 28 February 2019
Division Industrial & Digital Solutions,share of total net sales
29 %
Division Process Industries
For the full year, net sales were SEK 3,047 million (811). Total growth was 275.5 percent, of which 13.0 percentage points was organic. When adjusted for calendar effects, organic growth amounted to 14.0 percent. If consolidation of Pöyry had been on 1 January 2018, combined total growth would have been 8.9 percent.
For the full year, EBITA was 323 (91) and the EBITA margin was 10.6 percent (11.2). For combined operations, EBITA and the EBITA margin were SEK 371 million (328) and 10.8 percent (10.4), respectively.
The general market outlook in the division’s sectors is good, although decision-making is slower in major investment projects. Megatrends are promoting growth in the pulp and paper segment, partly through growth in e-commerce and packaging, and partly through the replacement of plastic. The replacement of fossil-based materials increases the consumption of bio-based fuels and chemi-cals, which promotes the chemical and bio-refining sector. More raw materials are needed, which can be seen in the form of increased activity in the mining and metal sector.
New investments are being made in all sectors. Large invest-ments in bioproduct plants are planned in Finland, South America and Russia while several projects are in progress in South America. New projects in cardboard and tissue as well as the conversion of existing plants to cardboard are being planned and implemented, mainly in Central Europe and North America. The mining and metals sector is actively investing in the Nordics and South America. New investments in biofuels and battery chemicals are commencing in the Nordic region, which promotes sustainability goals. The level of investment in maintenance has been stable and will increase with new and ageing assets.
Sustainability and efficiency are high priorities for the process industry. The use of side and waste streams and the development of new technologies promote these goals.
Improving health and safety is also a priority area for the process industry sector, which is reflected in the demand for smart solutions.
Clients are increasingly asking for digital solutions to increase their competitiveness. The division has supported clients in the process industry with the digitalisation concept AFRY Smart Site, which integrates various data sources including operational data to improve efficiency and competitiveness. It is mainly newly con-structed facilities that will be developed with data integration, but existing facilities will also move towards digitalisation.
2019 2018
Net sales, SEK m 3,047 811
Share of net sales, % 15 6
EBITA, SEK m 323 91
EBITA margin, % 10.6 11.2
Average number of full-time employees (FTEs) 2,680 688
Pöyry was consolidated on 28 February 2019
Division Process Industries,share of total net sales
15 %
Key ratios Key ratios
57 Annual and Sustainability Report 2019

Division Management Consulting
Net sales for the full year amounted to SEK 668 million (-). If consol-idation of Pöyry had been on 1 January 2018, combined total growth would have been -2.1 percent.
For the full year, EBITA amounted to SEK 92 million (-) and the EBITA margin was 13.7 percent (-). For combined operations, EBITA and the EBITA margin were SEK 103 million (106) and 13.1 percent (13.2), respectively.
General demand for services in the main markets was stable during the year.
The main drivers remain strong in the energy and bio-industry sector. In the energy sector, demand for strategic and operational services related to the ongoing energy transition to meet the Paris Agreement’s goal of reducing carbon dioxide emissions remains stable in all markets.
In the bio-industry sector, demand for consulting services in packaging and tissue is still good considering changing purchasing behaviours and general population growth. The markets for biofuel and biomaterials are evolving, leading to demand for associated consulting services.
The volumes of mergers and acquisitions within the sectors lead to stable demand for transaction-related services.
2019 2018
Net sales, SEK m 668 —
Share of net sales, % 3 —
EBITA, SEK m 92 —
EBITA margin, % 13.7 —
Average number of full-time employees (FTEs) 300 —
Pöyry was consolidated on 28 February 2019
Division Management Consulting, share of total net sales
3 %
Key ratios
Division Energy
Net sales for the full year amounted to SEK 3,001 million (1,559). Growth was 92.5 percent, of which -3.4 percent was organic. Adjusted for calendar effects, organic growth amounted to -2.4 percent. If consolidation of Pöyry had been on 1 January 2018, com-bined total growth would have been 7.6 percent.
For the full year, EBITA amounted to SEK 215 million (72) and the EBITA margin was 7.2 percent (4.6). For combined operations, EBITA and the EBITA margin were SEK 238 million (191) and 7.3 percent (6.2), respectively.
There have been some delays in investment decisions in some segments, such as hydro. This is a consequence of the ongoing trade negotiations between China and the US and the uncertainty surrounding Brexit. However, some of these tensions eased during the final weeks of the year, which led to more positive signals that clients in the energy sector are prepared to reactivate their strategic investment plans.
Developments in thermal & renewables were stable during the year in Central Europe, the Nordics and the Middle East. In Asia, ther-mal was affected by the lack of detail design work and other project delays. Positive signals are being noted after several adjustment measures taken in the third quarter.
In the nuclear segment, total results were strong, especially in the Nordics and Central Europe. The business area won a significant order during the year in Hungary for the new construction project Paks II.
Performance was weaker in transmission & distribution, especially in the Nordics and Central Europe, and clients have postponed their investment decisions due to a more uncertain market climate.
Profitability in contracting was strong especially during the fourth quarter as a major EPC+ project in the Philippines is approaching the final phase. In the first quarter of 2020, the project will be completed so contracting revenues are expected to be lower in 2020 and will also have an impact on the entire division.
In the fourth quarter, extensive work was begun to more clearly position the division. A global/local business model is being imple-mented, which includes streamlining the sales structure, fewer sub-sidiaries where certain projects are completed and closing or selling underperforming units. The negative impact on earnings amounted to SEK 105 million in the fourth quarter.
2019 2018
Net sales, SEK m 3,001 1,559
Share of net sales, % 15 10
EBITA, SEK m 215 72
EBITA margin, % 7.2 4.6
Average number of full-time employees (FTEs) 1,885 992
Pöyry was consolidated on 28 February 2019
Division Energy, share of total net sales
15 %
Key ratios
58 Annual and Sustainability Report 2019
FINANCIAL STATEMENTSAdministration report
58

Risks The Group’s risk management model has been implemented to meet the strategic, operational and financial risks linked to the Group’s operations. In 2019, the Group continuously assessed and monitored risk trends, which helped the Group to cope with both changes in the market and changes resulting from the company’s strong growth.
Type of risk Risk description Risk management
Market, strategy and business risks
Competition and market trends
Changes in the economic cycle, structural changes and changes in market trends are events which challenge the Group at regular intervals, demanding watchfulness and initiative at several levels and throughout the organisation. In addition, the Group faces challenges from several major international play-ers as well as various small and medium-sized local competitors in each market.
The Group manages the risks linked to the economic cycle, struc-ture and market trends by trading in multiple markets and in areas which have different business cycles, and which are affected in individual ways by structural changes and fluctuating market trends. The Group is also flexible internally and utilises its resources to best meet the needs of the moment. The company also carries out regular assessments of the current competitive situation in each local market and at appropriate levels within the business.
Reputation The Group’s brand and reputation are central to gaining the trust of the company’s stakeholders, such as clients, employ-ees, suppliers, partners and shareholders. Negative publicity about the company’s operations or an incident within the Group’s operations may affect the brand and thus have a neg-ative impact on the company’s operations and financial results.
Clear communication and active branding strengthen trust and relationships with the company’s stakeholders. The Group has a well-established function for communication as well as policies for employees such as the Code of Conduct and an external communi-cation policy.
Acquisitions and divestments
Acquisitions are a key part of the Group’s growth strategy. Upon acquisition, it is important to retain key personnel and to have a well-functioning and efficient integration process to ensure there is no negative impact on operations.
Divestments are a tool for repositioning and adapting the Group’s operations to the current strategy and geographical home market.
Getting to know the management and clarifying roles and respon-sibilities reduces the risk of losing key employees. To minimise the risks of integration, an acquisition and integration process with defined roles and responsibilities has been implemented. Acqui-sition decisions are made within Group management and by the Board of Directors. An annual review of recent acquisitions over a certain limit is carried out by the Group’s Board of Directors.
It can be difficult to separate the divested business unit from the remaining operations’ processes and systems. It is therefore of the utmost importance to plan and structure the divestment process. Divestment decisions are made within Group management and by the Board of Directors.
Another risk is that the buyer may return with a guarantee claim on the divested business. This risk is minimised by allowing the buyer to carry out a due diligence process before taking over and limiting the scope and size of the guarantees in the transfer agreement.
Changes in capacity utilisation and price per hour
The Group has a relatively high proportion of engineers work-ing within its clients’ organisations, providing expertise and detailed knowledge. It is essential to monitor the operation’s financial performance continuously, since every percentage point change in capacity utilisation and price per hour has an impact on consolidated profit. Every percentage point change in capacity utilisation affects consolidated profit by about plus/minus SEK 230 million. An increase in the price per hour of one percent, with unchanged capacity utilisation, improves the Group’s annual profit by around SEK 175 million.
The Group has effective systems for sales support and manag-ing expertise to ensure sustainable business relationships and successful matching of expertise with the notified needs. Regular follow-up and analysis are done to catch trends early.
Risk associated with partners, subcontractors and sub-consultants
The Group’s continued growth, both in respect of supplying professional engineers and complete project organisations, is leading to an increasing need for subcontractors with specialist expertise as well as subcontractors that can supply specific project planning services. The Group is exposed to risk both when the company arranges an assignment and where partners are working in the Group’s name as subcontractors in a project assignment.
The Group has a process and support system for evaluating and qualifying partners and subcontractors in order to ensure the right skills and conditions are in place to safeguard quality deliver-ies. Business partner criteria are defined in line with the Group’s sustainability policy. The Group’s insurance also covers the work of subcontractors. In 2020, a code of conduct for the Group’s subcon-tractors will also be rolled out.
59 Annual and Sustainability Report 2019

Type of risk Risk description Risk management
Market, strategy and business risks
Talent management As competition for qualified employees increases, so too does the pressure on the Group to present itself as an attrac-tive employer. For an engineering and consulting company to achieve its objectives, it is essential that employees are motivated and have appropriate skills and knowledge. There is always a risk that highly competent employees may leave the Group to join competitors or clients or set up their own busi-nesses. There is also a risk that we will not be able to recruit new qualified employees to fill existing and future needs.
There is a strong focus on recruitment and induction activities. To retain and motivate employees of the right calibre, the Group invests in continual professional development, skills develop-ment and management training (via AFRY Academy, for example). Individual development plans are formulated at each employee’s annual performance review. Employee surveys are carried out to ascertain how satisfied employees are with their work situation.
To attract new employees, the Group has a solid organisation for outreach recruitment and works actively to strengthen the employer brand, for example through marketing activities in social media, information targeted to students and participation in job fairs.
Financial risk exposure in Project operations
Large assignments with great responsibility also increase risk exposure financially in the project result. A fixed-price contract may involve an increased risk if the time required to complete the assignment is not correctly estimated, which can lead to reduced margins.
The systems for sales support, managing expertise and internal training provide a basis for creating competent project organisa-tions and achieving sustainable business relationships.The Group’s Project/Assignment process implements procedures that include calculation, inspection, tendering and contract reviews, risk analysis, identification of the project’s most important sus-tainability aspects, project planning, verification and validation of delivery.
Steering committees are formed to monitor project progress, results, invoicing, cash handling and risks. The Group conducts internal audits annually to ensure that the process and procedures are complied with and function as intended.
Delivery accord-ing to customer requirements and expectations
The technical engineering services that the Group supplies form the basis for the development of products, systems, buildings, infrastructure and industry. The Group has a major responsibility to supply services and/or functions which meet clients’ requirements and expectations as to quality, perfor-mance and scheduling, and which follow applicable legislation and the 10 principles of the UN Global Compact.
A management system has been implemented for internal control, management, follow-up and continual improvement of operations.
The system has been certified under ISO 9001:2015 (quality), ISO 14001:2015 (environment) and OHSAS 18001:2007 (occu-pational health and safety) and is accessible to all employees via the intranet. The sales and delivery processes support operational activities in meeting and ensuring compliance with customer requirements, legal requirements and the UN Global Compact. These processes are tailor-made for different technical areas. Implementation of the management system is continuously moni-tored through the internal audit program.
The Group has comprehensive insurance coverage for the Group’s operations and property. It includes general liability insur-ance, product liability insurance and consultant liability insurance.
IT It is crucial that the Group’s IT infrastructure is operationally reliable since unplanned outages can entail loss of income.
The Group ensures that it has the appropriate IT resources by utilising internal expertise and by outsourcing. Procedures and agreements govern development, backup, deviation management and support. The Group ensures system ownership and administra-tion and checks continuously to ensure that the available resources are adequate and are assigned the necessary expertise.
Security risks related to the Group’s personnel, information and reputation
The Group’s operations and assets may entail global risks such as terrorism, crime, natural disasters and cyberattacks, as well as health-related risks.
In some of the countries in which the Group conducts busi-ness, the political situation can be unpredictable, the infra-structure can be challenging, and operations can be subject to heightened security risks.
Increased global cyber crime poses a risk to the information assets of the Group’s clients, partners and suppliers. The risks can lead to negative consequences, such as financial penalties, legal sanctions and damage to the brand and competitiveness.
The Group addresses these risks by imposing clear policies on management responsibility and control models to integrate risk management into operations with greater focus on transparency and systematic procedural work. Due to the merger with Pöyry, the Group is now also reviewing and creating harmonised risk manage-ment processes, risk tools and plans for managing incidents, crises, continuity and disruptions.
The Group continuously develops the global information security management system for application in a rapidly changing digital business landscape. The management system is based on ISO-27001 and was developed to be seamlessly integrated with the Group’s support and business processes. In 2020, the Group will also release a compulsory course to all employees that will sharpen their awareness in the areas of information and cyber security and complement their training on the Code of Conduct.
60 Annual and Sustainability Report 2019
FINANCIAL STATEMENTSRisks

Type of risk Risk description Risk management
Responsible business
Increased demand for responsible and sustainable operations
The Group’s presence in a global energy, industry and infra-structure market gives rise to sustainability risks in areas such as human rights, working conditions, the environment and anti-corruption.
The Group reduces its exposure to risks related to sustainability through its internal Code of Conduct, and a clearly regulatory sustainability policy.
To ensure compliance with the ten principles of the UN Global Compact, a systematic process for risk assessment before ten-dering based on the principles has been instituted. Based on the risk assessment, an in-depth analysis may be performed including recommendations for actions if so required.
The whistle-blowing function enables every Group employee to report potential deviations with complete confidentiality.
The Group has ISO 9001 (quality), ISO 14001 (environment) and OHSAS 18001 (occupational health and safety) certification and has procedures to ensure compliance with legal requirements.
In the autumn of 2019, work was initiated to further develop governance, risk and compliance (GRC) to fortify the Group’s risk management and to better manage the conditions inherent in a stronger international presence. Examples of initiatives include the appointment of a new Chief Compliance and Ethics Officer and a Group-level risk manager who reports to the Executive Vice President and Group General Counsel, who are part of Group Management, harmonisation of risk management processes and tools, a review of the risk assessment for tenders based on the ten principles of the UN Global Compact and the rollout of an eLearning course on the Code of Conduct to all employees in the Group.
Risk of corruption The Group operates in more than 40 countries and participates in projects in more than 100 countries. The risks of corruption are higher in some markets. The Group has identified sales, pur-chasing, gifts and client activities as the greatest risk areas.
Risks linked to corruption are identified in the framework of the risk assessment process as described above and the Group uses, among other things, Transparency International’s corruption index to assess corruption risk. Group employees must comply with its anti-corruption framework. Employees must receive anti-corruption training within the framework of the mandatory induction course, sustainability training and managerial training programmes. Prior to assignments at risk for exposure to corruption, consultants are expected to participate in the project on anti-corruption issues, current legislation and the Group’s anti-corruption framework.
Human rights violations
The risk of human rights violations in the context of the Group’s own activities is relatively small. The question is more relevant within the context of certain assignments such as hydroelectric projects and mining operations, where displace-ment of people or conflicts with indigenous peoples may occur.
Risks related to human rights are identified within the context of the risk assessment process as above. When applicable, the results of the Environmental and Social Impact Assessment (ESIA) are used as the basis for project planning. The Group also applies interna-tional standards such as the UN Guiding Principles on Business and Human Rights.
Negative impact on the climate and environment
Negative environmental impact due to the Group’s operations is found mainly within the framework of business travel, energy consumption in office premises and purchasing. There is also risk of negative environmental impact within the framework of the Group’s assignments. The Group’s own operations are not considered to be particularly exposed to effects of environ-mental damage and climate change, as it does not engage in manufacturing or distribution.
The Group quantifies its carbon emissions from business travel and energy consumption in office premises on an annual basis and carries out regular activities aimed at reducing them.
The precautionary principle is applied through the risk assess-ment process, which also ensures identification of risks related to the environment within the framework of assignments.
The negative environmental impact associated with the Group’s assignments must be minimised and the positive impact maxi-mised. This is controlled through the Group’s project model and training for new employees, among other things. The parts of opera-tions and the projects that are particularly exposed to environmen-tal risks have separate procedures for minimising environmental impact.
The Group assesses suppliers with which it has general agreements in accordance with criteria that reflect the ten princi-ples of the UN Global Compact.
Financial risks
Financing and liquidity risks
The financing risk faced by the Group is the risk of not being able to raise new loans or refinance existing ones on accept-able terms. The Group is also exposed to liquidity risk, which is defined as the risk that it will not be able to meet its immediate payment obligations.
Responsibility for the Group’s financial transactions and risks is handled centrally by the parent’s Treasury Department, which implements the policy set by the Board of Directors. There is a procedure in place to ensure the availability of appropriate lines of credit whenever necessary. The Group’s policy is that the company shall have a net debt in relation to EBITDA of 2.5 over time.
In accordance with the current policy, the Group is to have cash and cash equivalents and unused credit facilities that together correspond to at least six percent of annual sales.
Interest rate risk Interest rate risk is the risk that changes in interest rates may have a negative impact on the Group’s net interest income/expense and cash flow.
The Group’s exposure to interest rate risk relates chiefly to out-standing external loans. Under the current policy, the Group raises loans both at fixed and variable interest. If necessary, the Group can use interest rate swaps to achieve the desired average duration.
A change of one percentage point in market rates during the next 12 months would have an effect of SEK 21 million on the Group’s interest expenses.
61 Annual and Sustainability Report 2019

Type of risk Risk description Risk management
Financial risks, continued
Exchange rate risk Exchange rate risk refers to changes in exchange rates which have a negative impact on the consolidated income state-ment, balance sheet and cash flow.
Exchange rate risk can be split into transaction exposure and translation exposure. Transaction exposure is the net of operating and financial inflows and outflows in foreign currencies.
Translation exposure consists of the net assets and profit/loss of foreign subsidiaries in foreign currency.
Transaction exposure is relatively limited in the Group compared with net sales, as most sales and expenses are invoiced in local currencies. Under current policy, payment flows in foreign currencies are hedged when the future payment flow is anticipated to exceed EUR 100,000.
The Group’s largest operational transaction exposures involve the currency pairs EUR/SEK, USD/CHF and EUR/HUF. An unhedged currency fluctuation of 10 percent in these currencies would affect the Group’s operating profit/loss by approximately SEK 13 million, SEK 13 million and SEK 11 million respectively on an annual basis. An unhedged currency fluctuation of 10 percent in all currencies would affect the Group’s operating profit/loss by SEK 60 million on an annual basis.
The Group generates income and expenses in foreign currencies and is therefore exposed to exchange rate fluctuations against the Group’s presentation currency, SEK. An isolated increase in the exchange rate for SEK with a five percent profit denominated in a cur-rency other than SEK would have an impact of SEK 38 million on profit/loss for the period. The estimate is based on circumstances prevailing in 2019 and is expressed on an annual basis. Profit/loss in subsidiaries is translated to SEK based on the average rate for the period in which the profit/loss arises.
In line with current policy, the Group does not hedge translation expo-sure. In connection with major acquisitions, the translation exposure may be hedged by raising loans in the same currency as corresponding net assets. In connection with the acquisition of Pöyry in 2019, ÅF Pöyry AB raised a loan of SEK 1,856 million denominated in EUR.
Credit risk The Group’s commercial and financial transactions give rise to credit risks in respect of counterparties. Credit risk or counterparty risk is the risk of loss if the counterparty does not fulfil its obligations.
The credit risk consists of outstanding accounts receivable and ren-dered but unbilled consulting assignments.
This risk is limited by the Group having a credit policy. All new clients are vetted for creditworthiness and project services are invoiced on a pay-as-you-go basis to minimise the cumulative credit risk. In addition, prepayments are applied to certain major projects to reduce credit risk.
The Group’s ten largest clients, which account for a total of 20 per-cent of Group sales, are all large multinational companies or publicly owned institutions and enterprises. The remaining 80 percent of net sales is spread over many clients.
Intangible non-current assets
The Group’s intangible assets arise primarily from acquired businesses. These acquired intangible assets consist of goodwill, as it is mainly human capital in the form of employee skills that constitutes the value of consulting companies. Goodwill testing is carried out annually or when there are indications that an impairment loss has arisen. If future tests regarding a sustained reduction in the goodwill value would lead to impairment, it could have a material adverse effect on consolidated profit and financial position.
At each reporting occasion, it is determined whether there are indications that the asset has decreased in value. If so, the asset’s recoverable amount is calculated. An impairment test is based on key assumptions such as growth rate and margin, which are subject to thorough analysis.
Risks related to compliance with laws and regulations
Regulatory risks The Group’s operations are regulated in several different jurisdictions. Changes in laws and regulations, or viola-tions of existing laws and regulations could have a material adverse effect on the Group’s operations, financial position or results.
To prevent risks and ensure that the Group complies with applica-ble laws and regulations, there is an internal legal department that assists the business with legal advice, helps prepare procedures and governing documents, and is involved in the follow-up of the business’ compliance with these matters. The legal department has in-house lawyers in the Group’s largest markets and hires external advisers if needed. The Group has also appointed a new Chief Compliance and Ethics Officer and a Group Risk Officer who reports to the Executive Vice President and Group General Counsel, who are members of Group management.
Disputes There is a risk that disputes may arise while doing business. They can arise, for example, from disagreements with a client about the terms that apply to an assignment. Disputes may also arise in conjunction with the acquisition of operations.
To prevent disputes, tenders and contracts are examined carefully to ensure that there are no uncertainties in terms of content and conditions. Verifications during an assignment are part of the Project/Assignment process, as are procedures for handling alterations and additions. Authorisation rules are defined such that certain tenders and contracts are always reviewed by a lawyer.
Tax risks The Group conducts its operations through subsidiaries in several different countries. Business is conducted in com-pliance with the company’s understanding or interpretation of applicable tax laws, tax treaties, other tax regulations and the requirements of the relevant tax authorities. Amended laws, treaties and other regulations can affect the Group’s tax position as would the tax authority’s questioning of the Group’s interpretation of applicable tax laws.
To prevent risks and ensure that the Group conducts its operations in compliance with the company’s understanding or interpretation of applicable tax laws, tax treaties, other tax regulations and require-ments from the relevant tax authorities, there is an internal tax department that develops procedures and monitors compliance with them.
Data protection and privacy
The new EU Data Protection Regulation took effect on 25 May 2018. The new regulation governs how the Group handles EU citizens’ personal data, whether it is the Group’s employees, partners or clients. Violations of this regulation could have a material adverse effect on the Group’s busi-ness, financial position, reputation or profit.
The Group’s data protection is a key area that is being continuously developed to integrate and support internal operations and our client offering. In 2018, the Group established a global system for protect-ing and managing data confidentiality and personal information, in accordance with the EU General Data Protection Regulation. In 2020, the Group will release a compulsory course to all employees that will sharpen their awareness in the areas of information and cyber security, including data protection. Also in 2020, the Group will initiate further development of the internal data protection procedures.
62 Annual and Sustainability Report 2019
FINANCIAL STATEMENTSRisks

63 Annual and Sustainability Report 2019
Financial statements and notes
Financial statements
64 Consolidated income statement 65 Statement of consolidated comprehensive income 65 Consolidated balance sheet67 Statement of change in consolidated equity68 Statement of consolidated cash flows69 Parent income statement69 Parent statement of comprehensive income70 Parent balance sheet72 Statement of change in parent equity73 Statement of cash flows for parent
Notes
74 Note 1. Accounting policies 79 Note 2. Segment reporting81 Note 3. Acquisition of operations82 Note 4. Other operating income83 Note 5. Fees and reimbursement of auditors’
expenses83 Note 6. Employees and personnel costs85 Note 7. Other operating expenses86 Note 8. Acquisition-related items86 Note 9. Items affecting comparability 86 Note 10. Net financial items86 Note 11. Appropriations86 Note 12. Earnings per share and number of shares88 Note 13. Financial assets and liabilities94 Note 14. Intangible assets95 Note 15. Property, plant and equipment96 Note 16. Leases96 Note 17. Participations in associates and
joint arrangements 98 Note 18. Prepaid expenses and accrued income98 Note 19. Equity99 Note 20. Pension obligations101 Note 21. Other provisions101 Note 22. Taxes103 Note 23. Accrued expenses and prepaid income103 Note 24. Operating leases103 Note 25. Pledged assets, contingent liabilities
and contingent assets104 Note 26. Related party transactions104 Note 27. Group companies108 Note 28. Untaxed reserves108 Note 29. Statement of cash flows109 Note 30. Events after end of reporting period109 Note 31. Critical estimates and judgements110 Note 32. Information on parent

1 January – 31 December (SEK million) Note 2019 2018
Net sales 2 19,792 13,975
Purchases of services and materials -4,408 -3,547
Other external costs 5, 16, 24 -1,608 -1,073
Personnel costs 6 -11,782 -7,996
Other operating income 4 27 0
Other operating expenses 7 0 -1
Profit attributable to participations in associates 17 4 0
EBITDA 2,024 1,358
Depreciation/amortisation and impairment of non-current assets1 14, 15, 16 -657 -115
EBITA 1,368 1,243
Acquisition-related items2 8 -91 -40
Operating profit (EBIT) 2, 9 1,276 1,203
Profit/loss from financial items
Financial income 10 179 26
Financial expenses 10, 16 -416 -125
Net financial items -237 -99
Profit after financial items 1,039 1,103
Tax 22 -219 -253
Profit for the period 821 850
Attributable to:
Shareholders in the parent 821 850
Non-controlling interest 0 0
821 850
Attributable to the parent’s shareholders 12
Basic earnings per share (SEK) 8.07 10.98
Diluted earnings per share (SEK) 7.99 10.76
1) Depreciation/amortisation and impairment of non-current assets refers to property, plant and equipment and intangible assets excluding intangible assets related to acquisitions.
2) Acquisition-related items are defined as depreciation/amortisation and impairment of acquisition-related intangible assets including goodwill, revaluation of contingent considerations and gains/losses on divestment of companies and operations.
Consolidated income statement
FINANCIAL STATEMENTSConsolidated financial statements
64 Annual and Sustainability Report 2019

1 January – 31 December (SEK million) 2019 2018
Profit for the period 821 850
Items which will be classified to profit or loss
Translation differences for foreign operations for the period 81 87
Changes in hedge reserve 14 2
Changes in fair value reserve 5 15
Tax -4 0
Items which will not be classified to profit or loss
Revaluation of defined-benefit pension plans -97 -31
Tax 18 6
Other comprehensive income 16 79
Comprehensive income for the period 837 929
Attributable to:
Shareholders in the parent 837 929
Non-controlling interest 0 0
837 929
As at 31 December (SEK million) Note 2019 2018
Non-current assets
Intangible assets 2, 14 13,355 7,166
Property, plant and equipment 2, 15 587 571
Right-of-use assets 2, 16 2,619 —
Participations in associates 17 22 0
Financial investments 13 13 673
Non-current receivables 13 23 4
Deferred tax asset 22 252 17
Total non-current assets 16,872 8,432
Current assets
Accounts receivable 13 4,146 3,105
Revenue generated but not invoiced 13 1,602 1,096
Current tax assets 22 123 13
Other receivables 386 144
Prepaid expenses and accrued income 18 249 179
Cash and cash equivalents 29 997 239
Total current assets 7,502 4,776
Total assets 24,375 13,208
Statement of consolidated comprehensive income
Consolidated balance sheet
65 Annual and Sustainability Report 2019

As at 31 December (SEK million) Note 2019 2018
EQUITY AND LIABILITIES
Equity 19
Share capital 280 193
Other contributed capital 4,824 953
Reserves 322 227
Profits brought forward including profit for the period 3,941 4,076
Equity attributable to shareholders in the parent 9,367 5,449
Non-controlling interest 1 16
Total equity 9,369 5,465
Liabilities
Loans and credit facilities 13 4,799 2,865
Lease liabilities 16 2,162 —
Provisions for pensions 20 387 141
Other provisions 21 107 15
Deferred tax liabilities 22 537 233
Other liabilities 13 246 464
Total non-current liabilities 8,239 3,718
Loans and credit facilities 13 235 688
Lease liabilities 16 617 —
Other provisions 21 101 58
Work invoiced but not yet carried out 1,711 368
Accounts payable 869 854
Current tax liability 22 111 59
Accrued expenses and prepaid income 23 2,134 1,231
Other liabilities 13 989 770
Total current liabilities 6,767 4,026
Total liabilities 15,006 7,744
Total equity and liabilities 24,375 13,208
For information about the Group’s pledged assets and contingent liabilities, see Note 25.
Balance sheet, cont.
Net debt 2019 2018
Loans and credit facilities 5,034 3,553
Net pension liability 387 141
Cash and cash equivalents -997 -239
4,424 3,455
FINANCIAL STATEMENTSConsolidated financial statements
66 Annual and Sustainability Report 2019

Equity attributable to shareholders in the parent
SEK millionShare
capital
Other contributed
capital Reserves
Retained profit incl.
profit for the period Total
Non-controlling
interest Total equity
Equity brought forward 1 Jan 2018 196 1,015 124 3,637 4,972 17 4,989
Changed accounting policy (IFRS 9) -2 -2 -2
Adjusted equity at start of period 196 1,015 124 3,635 4,970 17 4,987
Profit for the period 850 850 0 850
Other comprehensive income 103 -24 79 0 79
Comprehensive income for the period — — 103 826 929 0 929
Dividends -387 -387 -387
Conversion of convertible bonds into shares (2015 programme) 2 101 103 103
Value of conversion option (2018 programme) 13 13 13
Tax on value of conversion option (2018 programme) -3 -3 -3
Share buy-backs/sales -177 -177 -177
Cancellation of shares -4 4 — —
Transactions related to non-controlling interest 2 2 -2 —
Share plans 0 0 0
Equity carried forward 31 Dec 2018 193 953 227 4,076 5,449 16 5,465
Equity brought forward 1 Jan 2019 193 953 227 4,076 5,449 16 5,465
Profit for the period 821 821 0 821
Other comprehensive income 95 -79 16 0 16
Comprehensive income for the period — — 95 742 837 0 837
Dividends -560 -560 0 -560
Rights issue 87 3,880 3,967 3,967
Conversion of convertible bonds into shares 2 145 147 147
Value of conversion option (2019 programme) 11 11 11
Tax on value of conversion option (2019 programme) -3 -3 -3
Share buy-backs/sales -164 -164 -164
Cancellation of shares -2 2 — —
Repayment of hybrid bond -331 -331 -331
Transactions related to non-controlling interest 14 14 -14 —
Equity carried forward 31 Dec 2019 280 4,824 322 3,941 9,367 1 9,369
For supplementary information, see Note 19.
Statement of change in consolidated equity
67 Annual and Sustainability Report 2019

1 January – 31 December (SEK million) Note 2019 2018
Operating activities 29
Profit after financial items 1,039 1,103
Adjustment for items not included in cash flow 880 47
Of which IFRS 16 Leases 520 —
Income tax paid -284 -256
Cash flow from operating activities before changes in working capital 1,635 894
Cash flow from changes in working capital
Change in operating receivables 99 -239
Change in operating liabilities 259 218
Cash flow from operating activities 1,993 874
Investing activities
Acquisition of property, plant and equipment -136 -110
Disposal of property, plant and equipment 7 4
Acquisition of intangible assets -67 -15
Acquisition of operations 3 -4,891 -335
Divestment of operations 1 —
Contingent considerations paid and step acquisitions -310 -39
Acquisition/Disposal of financial assets 106 -658
Cash flow from investing activities -5,290 -1,153
Financing activities
Rights issue 3,967 —
Borrowings 3,035 1,285
Amortisation of loans -1,881 -416
Dividend paid -560 -387
Share buy-backs/sales -164 -177
Repayment of hybrid bond -331 —
Payout, convertible programme 0 0
Cash flow from financing activities 4,066 306
Cash flow for the period 769 26
Opening cash and cash equivalents 239 223
Exchange difference in cash and cash equivalents -11 -10
Closing cash and cash equivalents 997 239
1 January – 31 December (SEK million) 2019 2018
Opening balance 3,455 2,631
Cash flow from operating activities -1,993 -874
Investments 197 121
Acquisitions and contingent considerations/options 5,201 374
Dividend 560 387
Share buy-backs/sales, own shares 164 177
Acquisition of Pöyry PLC shares — 657
IFRS 16 Leases 3,299 —
Rights issue -3,967 —
Repayment of hybrid bond 331 —
Other -44 -19
Closing balance 7,203 3,455
Statement of consolidated cash flows
Change in consolidated net debt
FINANCIAL STATEMENTSConsolidated financial statements
68 Annual and Sustainability Report 2019
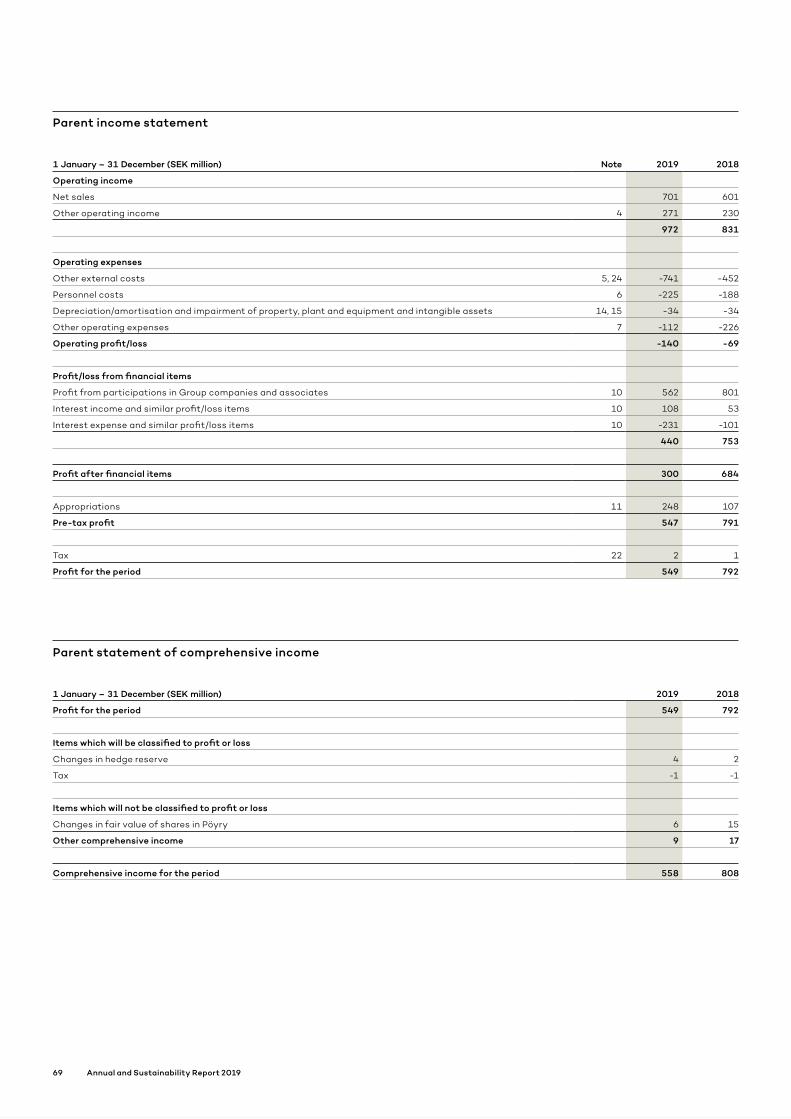
1 January – 31 December (SEK million) Note 2019 2018
Operating income
Net sales 701 601
Other operating income 4 271 230
972 831
Operating expenses
Other external costs 5, 24 -741 -452
Personnel costs 6 -225 -188
Depreciation/amortisation and impairment of property, plant and equipment and intangible assets 14, 15 -34 -34
Other operating expenses 7 -112 -226
Operating profit/loss -140 -69
Profit/loss from financial items
Profit from participations in Group companies and associates 10 562 801
Interest income and similar profit/loss items 10 108 53
Interest expense and similar profit/loss items 10 -231 -101
440 753
Profit after financial items 300 684
Appropriations 11 248 107
Pre-tax profit 547 791
Tax 22 2 1
Profit for the period 549 792
Parent income statement
1 January – 31 December (SEK million) 2019 2018
Profit for the period 549 792
Items which will be classified to profit or loss
Changes in hedge reserve 4 2
Tax -1 -1
Items which will not be classified to profit or loss
Changes in fair value of shares in Pöyry 6 15
Other comprehensive income 9 17
Comprehensive income for the period 558 808
Parent statement of comprehensive income
69 Annual and Sustainability Report 2019

As at 31 December (SEK million) Note 2019 2018
Non-current assets
Intangible assets 14 61 12
Property, plant and equipment 15 155 137
Financial assets
Participations in Group companies 27 8,521 2,099
Receivables from Group companies 26 4,745 4,045
Non-current receivables 0 673
Total non-current assets 13,483 6,967
Current assets
Current receivables
Accounts receivable 1 21
Receivables from Group companies and associates 26 2,215 1,693
Other receivables 537 765
Prepaid expenses and accrued income 18 121 151
Total current receivables 2,875 2,630
Cash and bank balances 29 133 32
Total current assets 3,007 2,662
Total assets 16,490 9,629
Parent balance sheet
70 Annual and Sustainability Report 2019
FINANCIAL STATEMENTSFinancial statements, parent company

As at 31 December (SEK million) Note 2019 2018
EQUITY AND LIABILITIES
Equity 19
Restricted equity
Share capital 280 193
Statutory reserve 47 47
Non-restricted equity
Share premium reserve 4,741 870
Fair value reserve 19 10
Profit brought forward 3,361 3,130
Profit for the period 549 792
Total equity 8,997 5,041
Untaxed reserves 28 82 57
Provisions
Provisions for pensions and similar obligations 20 16 17
Deferred tax liability 22 5 5
Other provisions 21 79 230
Total provisions 100 252
Non-current liabilities
Bond loan 13 3,200 2,340
Staff convertible 13 342 487
Liabilities to credit institutions 13 1,255 —
Other liabilities 13 5 1
Total non-current liabilities 4,803 2,828
Current liabilities
Staff convertible 13 197 26
Liabilities to credit institutions 13 37 565
Accounts payable 153 152
Liabilities to Group companies 26 1,952 615
Current tax liability 22 1 5
Other liabilities 13 63 17
Accrued expenses and prepaid income 23 104 72
Total current liabilities 2,508 1,451
Total equity and liabilities 16,490 9,629
Parent balance sheet, cont’d.
71 Annual and Sustainability Report 2019

Restricted equity Non-restricted equity
SEK millionShare
capitalStatutory
reserve
Share premium
reserveFair value
reserve
Profit brought forward
Profit for the period Total equity
Equity brought forward 1 Jan 2018 196 47 932 -7 2,832 685 4,685
Profit for the period 792 792
Other comprehensive income 17 17
Comprehensive income for the period — — — 17 — 792 808
Appropriations 685 -685 —
Dividends -387 -387
Conversion of convertible bonds into shares 2 101 103
Value of conversion option (2018 programme) 13 13
Tax on value of conversion option (2018 programme) -3 -3
Share buy-backs/sales -177 -177
Cancellation of shares -4 4 —
Share plans 0 0
Equity carried forward 31 Dec 2018 193 47 870 10 3,130 792 5,041
Equity brought forward 1 Jan 2019 193 47 870 10 3,130 792 5,041
Profit for the period 549 549
Other comprehensive income 9 9
Comprehensive income for the period — — — 9 — 549 558
Appropriations 792 -792 0
Dividends -560 -560
Rights issue 87 3,880 3,967
Conversion of convertible bonds into shares 2 145 147
Value of conversion option (2019 programme) 11 11
Tax on value of conversion option (2019 programme) -3 -3
Share buy-backs/sales -164 -164
Cancellation of shares -2 2 —
Equity carried forward 31 Dec 2019 280 47 4,741 19 3,361 549 8,997
For supplementary information, see Note 19.
Statement of change in parent equity
72 Annual and Sustainability Report 2019
FINANCIAL STATEMENTSFinancial statements, parent company

1 January – 31 December (SEK million) Note 2019 2018
Operating activities 29
Profit after financial items 300 684
Adjustment for items not included in cash flow -421 -3
Income tax paid -3 -3
Cash flow from operating activities before changes in working capital -124 678
Cash flow from changes in working capital
Change in operating receivables -186 -286
Change in operating liabilities 1,367 290
Cash flow from operating activities 1,057 682
Investing activities
Acquisition of property, plant and equipment -46 -50
Disposal of property, plant and equipment 0 1
Acquisition of intangible assets -55 -9
Acquisition of financial assets – -652
Acquisition of subsidiaries -5,763 -287
Divestment of subsidiary 11 —
Shareholders’ contribution made -26 —
Contingent considerations/options paid -79 -1
Cash flow from investing activities -5,957 -998
Financing activities
Rights issue 3,967 —
Borrowings 3,027 1,278
Amortisation of loans -1,268 -388
Dividend paid -560 -387
Share buy-backs -164 -177
Conversion proceeds 0 0
Cash flow from financing activities 5,001 326
Cash flow for the period 101 10
Opening cash and cash equivalents 32 21
Closing cash and cash equivalents 133 32
Statement of cash flows for parent
73 Annual and Sustainability Report 2019

Note 1
FINANCIAL STATEMENTSNotes
74 Annual and Sustainability Report 2019
Notes Amounts are in SEK millions unless otherwise stated.
Material accounting policies
1.1 Compliance with standards and legal requirements The consolidated financial statements have been prepared in accord-ance with International Financial Reporting Standards (IFRS) issued by the International Accounting Standards Board (IASB) and interpre-tations published by the International Financial Reporting Interpre-tations Committee (IFRIC) approved by the European Commission for application in the EU. In addition, the Swedish Financial Reporting Board’s recommendation RFR 1 (Supplementary Accounting Rules for Groups) has been applied.
The parent applies the same accounting policies as the Group except in those cases specified below in the “Parent accounting policies” section. The differences between the accounting policies of the parent and the Group are due to limitations in the parent’s scope to apply IFRS imposed by the Swedish Annual Accounts Act and the Pension Obligations Vesting Act (Tryggandelagen), and in some cases to tax reasons.
1.2 Basis of preparation of the parent and consolidated financial statements The parent’s functional currency is the Swedish krona (SEK), which is also the presentation currency for the parent and the Group. This means that the financial statements are presented in SEK.
Assets and liabilities are recognised at cost, except for vari-ous investments and liabilities which are carried at fair value. The financial assets and liabilities which are carried at fair value are derivative instruments, contingent consideration and financial investments.
The preparation of financial statements in accordance with IFRS requires management to make judgements and estimates, and to make assumptions which affect the application of the accounting policies and the carrying amounts of assets, liabilities, income and expenses. These estimates and assumptions are based on historical experience and several other factors deemed reasonable under the circumstances. The results of these estimates and assumptions are then used to judge the carrying amounts of assets and liabilities where these are not clear from other sources. The actual outcome may differ from these estimates and judgements.
Estimates and assumptions are reviewed regularly. Changes in estimates are recognised in the period in which the change is made if the change affects only that period, or in both the period in which the change is made and future periods if the change affects both the current and future periods. Judgements made by man-agement in applying IFRS which have a significant effect on the financial statements, and estimates made which could result in material adjustments in subsequent year’s financial statements, are described in more detail in Note 31.
The following accounting policies for the Group have been applied consistently to all periods presented in the Group’s financial statements unless otherwise stated below. The Group’s accounting policies have been applied consistently in the reporting and consol-idation of the parent, subsidiaries and the inclusion of associates and joint ventures in the consolidated accounts.
The annual report and consolidated financial statements were approved for release by the Board of Directors on 26 March 2020. The consolidated income statement and balance sheet and the parent income statement and balance sheet will be put forward for adoption at the AGM on 28 April 2020.
1.3 Amended accounting policies and disclosure requirements 1.3.1 Amended and new accounting policies for the year Amended and new accounting policies have had no significant effect on the Group except for IFRS 16 Leases.
IFRS 16 LeasesReconciliation of obligations, operating leases
Operating leases at 31 December 2018 2,837
Finance lease liabilities 69
Short term and low value leases -295
Discounting and other adjustments -882
Lease liabilities at 1 January 2019 1,729
IFRS 16 LeasesThe Group applied IFRS 16 Leases as from 1 January 2019. IFRS 16 introduces a uniform lease accounting model for lessees. A lessee recognises a right-of-use asset that represents a right to use the underlying asset and a lease liability that represents an obligation make lease payments. The Group applies exemptions for short-term leases and leasing of low-value assets. The interest rate that has been used is set per country and asset class, and as regards the respective contract’s lease term.
As a result of IFRS 16, on 1 January 2019, the Group recognises additional lease liabilities of approximately SEK 1.7 billion (after adjustment for prepayment of leases recognised on 31 December 2018), as well as right-of-use assets of approximately SEK 1.7 billion.
The Group’s operating profit for 2019 increased compared to if previous accounting principles had been used, since some of the lease costs are recognised as interest expense. Cash flow from operating activities increased and cash flow from financing activities decreased, since amortisation of the lease payments is recognised as a disbursement under financing activities.
The Group has applied the modified retrospective approach. This means that the accumulated effect of IFRS 16 being introduced is recognised in the opening balance at 1 January 2019 without restating comparative figures. The right-of-use assets attributable to previous operational leases are recognised at the value of the liability on 1 January 2019, with adjustments for advance payments recognised in the balance sheet at 31 December 2018. Existing finance leases recognised in accordance with IAS 17 are recognised in accordance with IFRS 16 at the amount of their value immediately prior to the transition to the new standard.
The Group does not expect the introduction of IFRS 16 to affect its ability to meet the requirements contained in the covenants for the Group. The parent does not apply IFRS 16; it utilises the excep-tion in RFR 2 instead.
1.3.2 Future changes in accounting policiesNone of the IFRS or IFRIC interpretations which have not yet beco-me effective are estimated to have any significant impact on the Group.
1.4 Segment reporting Segment reporting is based on operating segments, which consist of the Group’s five divisions. This corresponds to the structure for the CEO’s monitoring and management of operations.
1.5 Classification etc. In the financial statements for both the parent and the Group, non-current assets and non-current liabilities consist essentially of amounts expected to be recovered or settled more than 12 months after the end of the reporting period. Current assets and liabilities con-sist essentially of amounts expected to be recovered or settled within 12 months of the end of the reporting period.
1.6 Basis of consolidation 1.6.1 Subsidiaries Subsidiaries are companies over which ÅF Pöyry AB has a controlling influence. A controlling influence means, directly or indirectly, the

75 Annual and Sustainability Report 2019
power to govern a company’s financial and operating policies with a view to deriving economic benefits.
Subsidiaries are accounted for using the acquisition method. This means that the acquisition of a subsidiary is treated as a transac-tion where the Group indirectly acquires the subsidiary’s assets and assumes its liabilities and contingent liabilities. The consolidated cost is determined by means of an acquisition analysis undertaken in connection with a business combination. The analysis determines the cost of participations or businesses, the fair value of acquired identifiable assets and assumed liabilities, contingent liabilities and equity instruments issued as consideration for the net assets acquired.
Goodwill is the difference between the cost of the shares in a subsidiary and the fair value of the assets acquired and liabilities and contingent liabilities assumed.
Subsidiaries’ financial statements are consolidated from the date of acquisition until the controlling influence is relinquished.
1.6.2 Associates and joint arrangements Associates Associates are companies over whose operational and financial management the Group exercises a significant but not controlling influence, generally through a holding of 20-50 percent of the votes. As from and including the date on which the controlling influence is obtained, participations in associates are recognised in accordance with the equity method in the consolidated financial statements.
Joint arrangements There are two types of joint arrangement: joint operation and joint venture. A joint operation arises when one party in a joint operation has direct rights to the assets and obligations for the liabilities in that joint arrangement. In such an arrangement, assets, liabilities, income and expenses are recognised in proportion to the operator’s interest in these. A joint venture is a joint arrangement whereby the parties that have joint control over the arrangement have rights to the net assets of the arrangement. Holdings in such an arrangement are recognised using the equity method.
The equity method The equity method means that the carrying amount of the shares in the associate/joint venture recognised in the consolidated financial statements consists of the Group’s share of the associate’s/joint ven-ture’s equity plus goodwill and any other remaining fair value adjust-ments. The Group’s share of the associate’s/joint venture’s net income after tax and non-controlling interests, adjusted for any depreciation/amortisation, impairment or reversal of fair value adjustments, is recognised in the consolidated income statement under profit/loss attributable to participation in associates. Any dividends received reduce the carrying amount of the investment.
Any difference at the time of acquisition between the cost of the investment and the investor’s interest in the net fair value of the associate’s/joint venture’s identifiable assets, liabilities and con-tingent liabilities is recognised in accordance with IFRS 3 Business Combinations.
If the Group’s interest in recognised losses exceeds the carrying amount of the shares in the consolidated balance sheet, the carry-ing amount of the shares is reduced to zero. Further losses are not recognised unless the Group has issued guarantees to cover losses arising. The equity method is applied until the significant influence is relinquished.
1.6.3 Transactions eliminated on consolidation Intra-Group receivables and liabilities, income or expenses, and unre-alised gains or losses arising on transactions between Group compa-nies, are eliminated in their entirety when preparing the consolidated financial statements.
Unrealised gains arising on transactions with associates and joint arrangements are eliminated in proportion to the Group’s interests in the company. Unrealised losses are eliminated in the same way as unrealised gains, but only to the extent that there is no indication of impairment.
1.7 Foreign currencies 1.7.1 Transactions in foreign currency Transactions in foreign currency are translated into the functional currency at the exchange rate in effect on the transaction date. Monetary assets and liabilities in foreign currency are translated into the functional currency at the exchange rate in effect at the end of the reporting period. Exchange differences arising on translation are recognised in profit or loss. Non-monetary assets and liabilities carried at cost are translated at the exchange rate in effect on the transac-tion date. Non-monetary assets and liabilities carried at fair value are translated into the functional currency at the exchange rate in effect when their fair value was determined, and changes in exchange rates are then recognised in the same way as other changes in the value of the asset or liability.
The functional currency is the currency of the primary eco-nomic environments in which the companies in the Group operate. The parent’s functional currency and presentation currency is the Swedish krona (SEK). The Group’s presentation currency is also the Swedish krona (SEK).
1.7.2 Financial statements of foreign operations The assets and liabilities of foreign operations, including goodwill and other fair value adjustments, are translated into SEK at the exchange rate in effect at the end of the reporting period. The income and expenses of foreign operations are translated into SEK at an average exchange rate which approximates the exchange rates on the various transaction dates.
Translation differences arising on the translation of net invest-ments in foreign operations are recognised in other comprehensive income. When a foreign operation is sold, the accumulated transla-tion differences attributable to the operation are realised net of any currency hedging in the consolidated income statement.
1.8 Revenue The Group’s business model is divided into two client offerings: Project Business and Professional Services. Project Business is the Group’s offering for major projects and end-to-end solutions. In such projects, the Group acts as a partner for the client, leading and running the entire project. Professional Services is our offering where the client leads and runs the project, while the Group provides suitable expertise at the right time. Invoicing in Project Business takes place as work proceeds in accordance with agreed terms and conditions, either periodically (monthly) or when contractual milestones are reached. Invoicing ordinarily takes place after the income has been recorded, resulting in revenue generated but not invoiced (contract assets). However, the Group sometimes receives advance payments or deposits from our clients before the income is recognised, which then results in work invoiced but not yet carried out (contract liabili-ties). In Professional Services, hours spent on a project are ordinar-ily invoiced at the end of each month. Performance obligations in Project Business are fulfilled over time as the service is provided. Revenue recognition is based on costs with accumulated costs set in relation to total estimated costs. In Professional Services, reve-nue is recognised by the amount that the unit is entitled to invoice, in accordance with IFRS 15 B16.
1.9 Operating expense and financial income and expense 1.9.1 Operating leases Before the introduction of IFRS 16 on 1 January 2019, costs for operat-ing leases were recognised in the income statement on a straight-line basis over the lease term. Benefits received in connection with signing a lease are recognised as part of the total lease cost in profit or loss. Contingent rents are expensed in the periods in which they arise.
1.9.2 Leases On 1 January 2019, IFRS 16 Leases was implemented. IFRS 16 intro-duces a uniform lease accounting model for lessees. A lessee recog-nises a right-of-use asset that represents a right to use the underlying asset and a lease liability that represents an obligation make lease payments. The Group applies exemptions for short-term leases and leasing of low-value assets. The interest rate that has been used is set per country and asset class, and as regards the respective contract’s lease term.

Note 1, cont.
FINANCIAL STATEMENTSNotes
76 Annual and Sustainability Report 2019
1.9.3 Financial income and expense Financial income and expense consists of interest income on bank balances and receivables etc., interest expense on loans, borrowing costs, dividend income and exchange differences on borrowings and receivables.
Interest income on receivables and interest expense on liabilities are calculated using the effective interest method. The effective rate is the interest rate that makes the present value of all future receipts and payments during the period of fixed interest equal to the carrying amount of the receivable or liability.
The interest component of lease payments is recognised in profit or loss by applying the effective interest method. Interest income includes accrued transaction costs and any discounts, premiums or other differences between the original value of the receivable and the amount received at maturity.
Borrowing costs are charged against profit/loss for the period to which they refer. Costs arising when raising a loan are divided over the maturity of the loan based on the recognised liability.
Dividend income is recognised when the right to receive payment has been determined.
1.10 Financial instruments Financial instruments recognised among assets in the balance sheet include cash and cash equivalents, accounts receivable, shares, finan-cial investments and other equity instruments and derivatives. Liabili-ties and equity include accounts payable, debt and equity instruments issued, borrowings, contingent considerations and derivatives.
A financial asset or financial liability is recognised in the bal-ance sheet when the company becomes a party to the terms and conditions of the instrument. Accounts receivable are recognised in the balance sheet when an invoice has been sent. A liability is recognised when the counterparty has completed its undertaking and a contractual obligation to pay exists, even if no invoice has yet been received. Accounts payable are recognised when the invoice has been received.
A financial asset is derecognised from the balance sheet when the rights in the contract are realised or mature or the company loses control of them. This also applies to parts of financial assets. A financial liability is derecognised from the balance sheet when the obligation in the contract is performed or otherwise extinguished. This also applies to parts of financial liabilities.
Acquisition and disposal of financial assets are recognised on the trade date, which is the date on which the company makes a binding commitment to buy or sell the asset.
1.10.1 Classification and valuation Financial instruments that are not derivatives are recognised initially at a cost equal to the fair value of the instrument plus transaction costs for all financial instruments except those in the financial assets at fair value through profit or loss category, which are recognised at fair value excluding transaction costs. A financial instrument is classi-fied on initial recognition based on the purpose for which the instru-ment was acquired. The classification determines how the financial instrument is measured after initial recognition, as described below.
Derivative instruments are initially recognised at fair value, meaning that transaction costs are charged to profit or loss for the period. After initial recognition, derivative instruments are recog-nised in the manner described below.
1.10.2 Financial assets not recognised at fair value Financial assets not recognised at fair value are non-derivative finan-cial assets with fixed or determinable payments that are not quoted in an active market. These assets are measured at amortised cost. Amortised cost is determined based on the effective interest rate calculated on the date of acquisition. Assets with short maturities are not discounted.
Accounts receivable are recognised at the amount which is expected to be received, i.e. after the deduction of bad debts, assessed individually. Impairment losses on accounts receivable are recognised in operating expenses.
Other receivables are classified as non-current receivables if the holding period is longer than one year and if they are shorter than other receivables.
Cash and cash equivalents consists of cash and funds imme-diately available in banks and equivalent institutions, as well as short-term liquid investments that mature less than three months after the time of acquisition and are subject to only an insignificant risk of fluctuation in value.
1.10.3 Financial assets and liabilities measured at fair value through profit or lossAssets and liabilities in this category are measured continuously at fair value with changes for the period recognised in profit or loss for the period. Contingent considerations belong to this category.
1.10.4 Financial liabilities not recognised at fair valueLoans and other financial liabilities, such as accounts payable, are included in this category. These liabilities are measured at amortised cost. Accounts payable have a short expected term and are valued without discounting to their nominal amount.
Non-current liabilities have an anticipated term exceeding one year, while current liabilities have a term of less than one year.
Staff convertibles may be converted into shares by the counter-party exercising their option to convert the receivable into shares and are recognised as a combined financial instrument divided into a liability component and an equity component. The fair value of the liability is calculated by discounting the future cash flows by the current market rate for a similar liability with no right to conversion. The value of an equity instrument is calculated as the difference between the issue proceeds when the convertible debt instrument was issued and the fair value of the financial liability at the time of issue. Any deferred tax attributable to the liability at the time of issue is deducted from the carrying amount of the equity instru-ment. Transaction costs in connection with the issue of a combined financial instrument are divided into the liability component and the equity component in proportion to the division of the issue proceeds. The interest expense is recognised in profit or loss and calculated using the effective interest method.
1.10.5 Financial assets and liabilities measured at fair value in other comprehensive income Financial investments measured at fair value in other comprehensive income are included in this category.
1.11 Derivatives and hedging Derivative instruments used for hedging future cash flows are rec-ognised in the balance sheet at fair value. The changes in value are recognised in other comprehensive income (cash flow hedging) or the balance sheet (fair value hedging) until the hedged flow affects profit or loss, at which point the accumulated changes in value of the hedging instrument are recycled into profit or loss simultaneously with the profit or loss effects of the hedged transaction. The flows hedged may be both contracted and forecast transactions. Gains and losses on hedges are recognised in the income statement concurrently with recognition of gains and losses for the items that are hedged. Even if hedge accounting is not applied, increases and decreases in the value of a derivative are recognised as income and expense, respectively, in operating profit or in net financial items, based on the intended use of the derivative instrument. In hedge accounting, the ineffective portion is recognised in the same way as changes in the value of derivatives not used for hedge accounting.
1.12 Property, plant and equipment 1.12.1 Owned assets Property plant and equipment are recognised as assets in the balance sheet if it is likely that future economic benefits will accrue to the company, and the cost of the asset can be calculated reliably. Property plant and equipment are recognised in the Group at cost less accu-mulated depreciation and any impairments. Cost is defined as the purchase price plus any additional expenses directly attributable to

77 Annual and Sustainability Report 2019
bringing the asset to the location and condition necessary for it to be capable of operating in the intended manner.
Property, plant and equipment comprising parts that have dif-ferent useful lives are treated as separate components of property, plant and equipment.
The carrying amount of property, plant and equipment is derec-ognised from the balance sheet on retirement or disposal or when no future economic benefits are expected to flow from the use or retirement/disposal of the asset. Gains or losses realised on the disposal or retirement of an asset consist of the difference between the sales price and the carrying amount of the asset, less direct selling expenses. Gains and losses are recognised as other operat-ing income/expenses.
Subsequent expenditure Subsequent expenditure is added to the cost only if it is probable that the future economic benefits associated with the asset will accrue to the company and the cost can be measured reliably.
1.12.2 Leased assets For leased assets, IFRS 16 Leases is applied as from 1 January 2019 instead of IAS 17 (see Note 24).
1.12.3 Depreciation Depreciation is linear over the estimated useful life of the asset. Esti-mated useful lives:
IT equipment ..................................................................................3 years Cars.............................................................................................................5 years Office equipment ....................................................................5 years Office furnishings ...................................................................10 years Buildings (owner-occupied properties) .....40-100 years
Owner-occupied properties consist of several components with differ-ent useful lives. The main division is land and buildings. Land is not sub-ject to depreciation as its useful life is deemed to be infinite. However, buildings consist of several components with different useful lives. The useful lives have been estimated to vary between 40 and 100 years for these components.
An asset’s residual value and useful life are assessed annually.
1.13 Intangible assets 1.13.1 Goodwill Goodwill is the difference between the cost of acquired businesses and the fair value of the assets acquired and liabilities and contingent liabilities assumed.
Goodwill is apportioned between cash-generating units and groups of cash-generating units and is tested annually for impair-ment. Thus, goodwill is carried at cost less accumulated impair-ment losses. Goodwill arising from the acquisition of associates is included in the carrying amount for participations in associates.
Where the cost of acquired businesses is less than the net fair value of the assets acquired and liabilities and contingent liabilities assumed, the difference is recognised immediately in profit or loss.
1.13.2 Other intangible assets Other intangible assets acquired by the Group are carried at cost less accumulated amortisation and impairment.
Costs incurred for internally generated goodwill and brands are recognised in the income statement when the cost is incurred.
1.13.3 Subsequent expenditure Subsequent expenditures for capitalised intangible assets are recognised as assets in the balance sheet only when they increase the future economic benefits of the specific asset to which they are attributed. All other expenditure is expensed as it is incurred.
1.13.4 Amortisation Amortisation is recognised in the income statement on a straight-line basis over the estimated useful lives of the intangible assets unless
such useful lives are unspecified. Amortisable intangible assets are amortised from the date on which they are available for use. Estimated useful lives:
Capitalised development expenditure ......1-3 years Outstanding orders ..............................................................1-5 years Client relationships ...............................................................10-20 years Trademarks ......................................................................................2-5 years ERP system...............................................................3-10 years
1.14 Impairment The carrying amounts of the Group’s assets — except for assets held for sale recognised in accordance with IFRS 5 and deferred tax assets — are tested at the end of each reporting period to assess whether there is any indication of impairment. If there is such an indication, the recoverable amount of the asset is calculated. Goodwill and intangible assets with indefinite useful lives are tested for impairment annu-ally, or as soon as there are indications that the asset in question has declined in value. For exempt assets described above, the measure-ment is tested in compliance with the respective standard.
1.14.1 Impairment tests for property, plant and equipment and intangible assets, as well as participations in subsidiaries and associates The recoverable amount is the higher of fair value less costs to sell and value in use. When estimating value in use, future cash flows are discounted by a factor that considers risk-free interest and the risk associated with the specific asset. For an asset that does not generate cash flows that are materially independent of other assets, value in use is calculated for the cash-generating unit to which the asset belongs. Impairment reflects the excess of the asset’s carrying amount over its recoverable amount. Impairment of assets attribut-able to a cash-generating unit is initially allocated to goodwill. This is followed by proportional impairment of other assets in the unit.
1.14.2 Impairment test for financial assets When accounts are prepared for reporting, the company assesses whether there is objective evidence that any financial asset or group of assets is impaired. Objective evidence consists both of observable circumstances that have arisen which have a negative effect on the ability to recover the cost, and of significant or long-lasting reductions in the fair value of an investment in a financial investment classified as a financial asset measured at fair value via comprehensive income.
The recoverable amount of assets in the financial assets not recognised at fair value category which are recognised at amor-tised cost is measured as the present value of future cash flow discounted at the effective interest rate of the date on which the asset was first recognised. Assets with short maturities are not discounted. Impairment is charged to profit or loss.
IFRS 9 replaced the ‘incurred loss model’ from IAS 39 with an ‘expected credit loss model’. The impairment model is applied to financial assets measured at amortised cost, contract assets and debt instruments measured at fair value via comprehensive income, but not to any investments in equity instruments.
1.14.3 Reversal of an impairment loss An impairment is reversed if there is an indication that there is no longer a need for the impairment and there has been a change in the assumptions on which the calculation of the recoverable amount was based. However, impairment of goodwill is never reversed. An impair-ment is reversed only to the extent to which the carrying amount of the asset after reversal does not exceed the carrying amount that would have been recognised, less depreciation where relevant, if no impair-ment had been made.
Impairments of loans and receivables recognised at amortised cost are reversed if a later increase in the recoverable amount is objectively attributable to an event that occurred after the impairment was made. Impairment losses on equity instruments designated as available-for-sale financial assets that have already been recognised in profit or loss may not subsequently be reversed

FINANCIAL STATEMENTSNotes
78 Annual and Sustainability Report 2019
through profit or loss. The impaired value is the value from which subsequent remeasurement takes place, which is recognised in other comprehensive income. Impairments of interest-bearing instruments classified as financial assets available for sale are reversed to profit or loss if the fair value increases and the increase may be objectively attributed to an event that occurred after the impairment was made.
1.15 Dividends Dividends are recognised as a liability once they have been approved at the Annual General Meeting.
1.16 Employee benefits 1.16.1 Defined-contribution pension plans Obligations concerning contributions to defined-contribution pension plans are recognised as expenses in the income statement when they are incurred.
1.16.2 Defined-benefit pension plans The Group’s obligations concerning defined-benefit pension plans are calculated separately for each plan by estimating the future payment which the employees earned through employment in both current and previous periods. This payment is discounted to present value. The discount rate is the interest rate at the end of the reporting period on a high-quality investment-grade corporate bond with the term equivalent to the Group’s pension obligations. When there is no active market for this type of corporate bond, the market rate for government mortgage bonds with an equivalent term is used instead. The calcu-lations are performed by a qualified actuary using the projected unit credit method.
Actuarial gains and losses are recognised in other comprehen-sive income for the period in which they arise. The Group’s net debt, which is also recognised in the balance sheet for each defined-ben-efit plan, consists of the present value of the obligation less the fair value of plan assets. If the value of plan assets exceeds the value of the obligation, a surplus arises, and this is recognised as an asset under other receivables. Past service costs are recognised immedi-ately in profit or loss.
When there is a difference in how the cost of a pension is deter-mined for a legal entity and the Group, a provision or claim for spe-cial employer’s contribution is recognised based on this difference. The provision or claim is not calculated at present value.
1.16.3 Share-based payment Under the share plan adopted by the AGM, employees are eligible to receive performance-related matching shares for shares which they have themselves purchased under the plan. For these share plans, pay-roll expenses for matching shares are recognised during the vesting period (three years) based on the fair value of the shares on the date on which the employee purchased shares under the plan. Provisions are made for estimated social security contributions during the vesting period. The buy-back of shares to meet obligations under outstanding share plans is recognised in equity.
1.16.4 Convertible programmeThe Group has issued convertible instruments to its employees. The convertible instruments are divided into an amount owed and a con-version option. The latter is recognised in equity. The programmes do not entail any personnel costs.
1.16.5 Termination benefits A provision is made for termination benefits only when the company is demonstrably committed to terminating employment before the normal date, or when the benefits are based on an offer made to encourage voluntary redundancy. If the company is obliged to lay off members of staff, a detailed plan is drawn up specifying as a minimum the location, function and approximate number of employees involved, the benefits for each job classification or function, and the time at which the plan will be implemented.
1.17 Provisions A provision is recognised in the balance sheet when the Group has a present legal or constructive obligation from a past event, and when it is probable that an outflow of economic resources will be required to meet this obligation, and a reliable estimate of the amount of the obligation can be made. If the effect of when in time payment is made is significant, provisions are calculated by discounting the expected future cash flow at an interest rate before tax that reflects current market assessments of the time value of money and, if applicable, the risks associated with the liability. A provision for restructuring is recognised when the Group has adopted a comprehensive and formal restructuring plan, and the restructuring has either been started or published. No provisions are made for future operating expenses.
1.18 Taxes Income taxes comprise current tax and deferred tax. Income taxes are recognised in the income statement except when the underlying trans-action is recognised in other comprehensive income, in which case the associated tax effect is recognised in other comprehensive income.
Current tax is the tax payable or recoverable in respect of the current year, based on the tax rates enacted or substantively enacted at the end of the reporting period, including adjustments of current tax in respect of prior periods.
Deferred tax is calculated using the balance sheet method, based on temporary differences between the carrying amount and tax values of assets and liabilities. The following temporary differ-ences are not taken into consideration: temporary differences that occurred when goodwill was first recognised and the first recogni-tion of assets and liabilities that are not business combinations and, at the time of the transaction, do not affect either the recognised or taxable profit. Nor are temporary differences considered that are attributable to participations in subsidiaries and associates in which the parent, the investor or the co-owner may control the time of reversal of the temporary differences, and it is probable that they will not be reversed in the foreseeable future. The measurement of deferred tax is based on how the carrying amounts of assets and liabilities are expected to be realised or settled. Deferred tax is calculated applying the tax rates and tax rules adopted or adopted in practice at the reporting date.
Deferred tax assets for tax-deductible temporary differences and loss carry-forwards are recognised only to the extent it is likely that it will be possible to utilise these items. The value of deferred tax assets is reduced when it is no longer deemed likely that they can be utilised.
Any additional income tax arising on the payment of dividends is recognised at the same time as the dividend is recognised as a liability.
1.19 Contingent liabilities A contingent liability is recognised whenever there is a possible obliga-tion arising from past events and the existence of which is confirmed only by one or more uncertain future events, or there is an obligation not recognised as a liability or provision because it is not probable that an outflow of resources will be required, or the amount cannot be calculated with adequate reliability.
1.20 Earnings per share Calculation of earnings per share is based on consolidated profit or loss for the year attributable to shareholders of the parent and on the weighted average number of outstanding shares during the year. In calculating earnings per share after dilution, the profit or loss and the average number of shares are adjusted to take account of the effects of potential diluting ordinary shares, which derive during the reporting periods from matching shares in the share plan and the staff convert-ible programme.
1.21 Parent accounting policies The parent has prepared its annual report in accordance with the Swedish Annual Accounts Act (1995:1554) and the Swedish Finan-cial Reporting Board’s recommendation RFR 2 Accounting for Legal
Note 1, cont.

Income and expense
Infrastructure
Industrial & Digital Solutions
Process Industries Energy
Management Consulting Group-wide Eliminations Group
Group 2019 2018 2019 2018 2019 2018 2019 2018 2019 2018 2019 2018 2019 2018 2019 2018
Sales to external clients 7,529 5,849 5,680 5,682 2,945 785 2,880 1,516 657 — 754 728 -652 -584 19,792 13,975
Sales between segments 142 106 124 100 103 26 121 43 11 — 530 350 -1,030 -626 — —
Net sales 7,670 5,955 5,805 5,782 3,047 811 3,001 1,559 668 — 1,284 1,078 -1,682 -1,209 19,792 13,975
Operating expense -6,940 -5,277 -5,310 -5,247 -2,716 -718 -2,772 -1,476 -575 — -1,138 -1,107 1,682 1,209 -17,769 -12,617
Amortisation and impairment of intangible assets -6 -3 -1 -1 -2 0 -1 -1 0 — -22 -8 — — -32 -13
Depreciation and impairment, property, plant and equipment -39 -38 -8 -8 -7 -2 -13 -10 -1 — -556 -44 — — -624 -102
EBITA 685 637 486 525 323 91 215 72 92 — -432 -82 — — 1,368 1,243
Acquisition-related items -5 — — — — — — — — — -87 -40 — — -91 -40
EBIT 680 637 486 525 323 91 215 72 92 — -520 -123 — — 1,276 1,203
Net financial items -237 -99 — — -237 -99
Pre-tax profit 1,039 1,103 — — 1,039 1,103
EBITA margin, % 8.9 10.7 8.4 9.1 10.6 11.2 7.2 4.6 13.7 — — — — — 6.9 8.9
Total growth, % 28.8 — 0.4 — 275.5 — 92.5 — — — — — — — 41.6 10.4
Note 2
Segment reporting
79 Annual and Sustainability Report 2019
Entities. RFR 2 requires that the parent’s annual report apply all IFRS standards and interpretations approved by the EU as far as is possible within the constraints of the Annual Accounts Act and the Pension Obligations Vesting Act (Tryggandelagen), and while considering the relationship between reporting and taxation. The recommendation specifies which exceptions from and additions to IFRS must be made. The differences between Group and Parent accounting policies are stated below.
The accounting policies outlined below have been applied con-sistently to all periods presented in the parent’s financial state-ments.
Differences between the Group’s and the parent’s accounting policies 1.21.1 Subsidiaries and associates Shares in subsidiaries and associates are recognised in the parent using the cost method. Acquisition costs are recognised as shares in subsidiaries instead of being expensed. Dividends received are recog-nised as income.
1.21.2 Property, plant and equipment Leased assetsThe parent recognises all leases based on RFR 2 as it did previously for operating leases.
1.21.3 Financial guarantees The parent’s financial guarantee contracts consist mainly of guar-antees in favour of subsidiaries and associates. Financial guarantees mean that the company has an obligation to compensate the holder of a debt instrument for losses the latter incurs as a result of a specified debtor failing to make payment when due under the contract terms.
The parent applies RFR 2 for the recognition of financial guarantee contracts. This represents a relaxation compared with the rules in IAS 39 in respect of financial guarantee contracts issued for the benefit of subsidiaries and associates. The parent recognises financial guaran-tee contracts as a provision in the balance sheet when the company has an obligation for which payment is probably necessary to settle the obligation.
1.21.4 Employee benefits Defined-benefit pension plans In calculating defined-benefit pension plans, the bases for calculation applied by the parent differ from those specified in IAS 19. The parent complies with the provisions of the Pension Obligations Vesting Act and the Swedish Financial Supervisory Authority’s regulations as this is a precondition for tax deductibility. The most significant differences compared with IAS 19 are the method for determining the discount rate, the calculation of defined-benefit obligations based on current salary levels without assumptions on future salary increases and the recognition of all actuarial gains and losses in profit or loss when they arise.
1.21.5 Taxes In the parent, untaxed reserves are recognised inclusive of deferred tax liability. In the consolidated accounts, however, untaxed reserves are split into deferred tax liability and equity.
1.21.6 Group contributions and shareholders’ contributions for legal entities Both Group contributions received and paid are recognised as appro-priations. Shareholders’ contributions are recognised directly in equity by the recipient and are capitalised as participations by the contribu-tor, insofar as impairment is not required.

Operating Segments The Group’s operating structure and internal reporting to the CEO are based on accounting by divisions. The aim is to classify the divisions based on their clients and their own expertise. Intra-group sales between segments are based on an internal market price, calculated on an arms-length basis, i.e. as between parties who are mutually independent, well-informed and with an interest in completing the transactions.
The Group-wide items concern traditional parent functions. The same accounting policies apply to operating segments as to the rest of the Group. There are no individual clients whose sales amount to 10 percent or more of the Group’s total sales.
The historical figures above are adjusted based on the organi-sational changes implemented on 1 June 2019, which affected all divisions to differing degrees. The change aims to create clarity and well-defined divisions and business areas that have full respon-sibility for profitability in a decentralised governance model. All divisions bear international responsibility.
Net sales Non-current assets
By geographical area 2019 2018 2019 2018
Sweden 12,679 11,848 1,813 329
Finland 2,112 277 65 3
Norway 1,899 1,459 412 248
Switzerland 1,742 969 302 209
Denmark 790 781 159 38
Germany 558 22 6 0
Other countries 2,802 447 144 19
Group-wide/eliminations -2,790 -1,828 13,659 6,891
Total 19,792 13,975 16,561 7,737
Income from external clients has been attributed to individual coun-tries based on the country from which the sale was made.
IncomeNet sales according to the business model
SEK million InfrastructureIndustrial &
Digital SolutionsProcess
Industries EnergyManagement
ConsultingGroup-wide/ eliminations Group
Project business 7,208 1,638 1,928 2,503 528 -248 13,557
Professional services 463 4,166 1,119 498 140 -152 6,234
Total 7,670 5,805 3,047 3,001 668 -400 19,792
ÅF Pöyry’s business model is divided into two client offerings: Project Business and Professional Services. Project Business is ÅF Pöyry’s offering for major projects and end-to-end solutions. In such projects, ÅF Pöyry acts as a partner for the client, leading and running the entire project. Professional Services is ÅF Pöyry’s offering where the client leads and runs the project, while ÅF Pöyry provides suitable expertise at the right time.
Invoicing in Project Business takes place as work proceeds in accordance with agreed terms and conditions, either periodically (monthly) or when contractual milestones are reached. Invoicing ordinarily takes place after the income has been recorded, resulting in contract assets. However, ÅF Pöyry sometimes receives advance payments or deposits from clients before the income is recognised, which then results in contract liabilities. In Professional Services, hours spent on a project are ordinarily invoiced at the end of each month. Performance obligations in Project Business are fulfilled over time as the service is provided. Revenue recognition is based on costs with accumulated costs set in relation to total estimated costs. In Professional Services, revenue is recognised by the amount that the unit is entitled to invoice, in accordance with IFRS 15 B16.
Outstanding orders (unfulfilled obligations)At the end of the reporting period, the Group had unfulfilled obliga-tions of approximately SEK 15 billion. Most of these obligations will be realised as revenue in the coming years. The outstanding orders exclude obligations in which the company is entitled to payment for time worked, i.e. primarily Professional services. Given the Group’s operations, follow-up is focused on major project obligations that are relevant as regards outstanding orders. Revenue generated but not invoicedNo significant reserves have been made in the balance sheet for revenue generated but not invoiced during the year. The acquisition of Pöyry had an effect of approximately SEK 442 million on the balance sheet. Work invoiced but not yet carried outThe items that were in the opening balance have essentially been entered as income during the year. The acquisition of Pöyry had an effect of approximately SEK 1 billion on the balance sheet.
Note 2, cont.
FINANCIAL STATEMENTSNotes
80 Annual and Sustainability Report 2019

Note 3
Acquisition of operations
Acquisitions 2019In 2019, ÅF Pöyry took possession of all shares in the companies shown in the table below. The acquired companies added approximately 4,782 employees to ÅF Pöyry’s roster. In February 2019, it was announced that the acquisition of Pöyry PLC was completed. The acquisition is material and is therefore recognised separately under the item Total net assets of acquired companies at date of acquisition, 2019. Other acquisitions are not material based on net sales and number of employees, and for that reason they are all recognised together under Total net assets of acquired companies at date of acquisition, 2019.
2019 Company Country Division Annual net sales FTEs
Jan–Mar Pöyry PLC Finland 5,944 4,700
Apr–Jun — — — — —
Jul–Sep AF-Incepal S.A. Spain Process Industries 35 40
CTT Systems AB SwedenIndustrial & Digital Solutions 12 10
Sonny Svenson Konsult AB Sweden Infrastructure 14 10
Oct–Dec Cervino Consulting AB SwedenIndustrial & Digital Solutions 40 22
Total 6,045 4,782
Effects of acquisitionsThe table below shows the effect of the 2019 acquisitions on consol-idated assets and liabilities. The acquisition analyses are preliminary since fair value has not been determined for all items.
Total net assets of acquired companies at date of acquisition, 2019Pöyry Other acquisitions
2019Identifiable assets
and liabilitiesFair value
adjustmentIdentifiable assets
and liabilitiesFair value
adjustmentFair value recognised
in the Group
Intangible assets 57 1,304 0 5 1,366
Property, plant and equipment 66 1 67
Right-of-use assets 938 — 938
Financial assets 303 0 303
Accounts receivable and other receivables 1,753 41 1,794
Cash and cash equivalents 1,044 22 1,066
Deferred tax — -293 — -1 -295
Accounts payable, loans and other lia-bilities -3,592 -21 -3,612
Net identifiable assets and liabilities 569 1,011 44 4 1,627
Non-controlling interest -2 – -2
Goodwill 4,829 83 4,912
Consideration including estimated contingent consideration/option 5,396 1,011 127 4 6,538
Transaction costs 69 1 70
Less:
Cash (acquired) 1,044 22 1,066
Estimated contingent consideration/option — 29 29
Estimated minority buyout 46 — 46
Net cash outflow 4,375 1,011 76 4 5,467
81 Annual and Sustainability Report 2019

Note 3, cont.
Note 4
Other operating income
Group 2019 2018
Capital gain on disposal of non-current assets — 0
Government grants 4 —
Other 23 —
27 0
Other operating income of SEK 271 million (230) in the parent largely relates to the re-invoicing of rental charges, mainly to subsidiaries.
Total net assets of acquired companies at date of acquisition, 2018
2018
Identifiable assets and
liabilitiesFair value
adjustment
Fair value recognised
in the Group
Intangible assets 1 36 37
Property, plant and equipment 12 12
Financial assets 0 0
Accounts receivable and other receivables 185 185
Cash and cash equivalents 81 81
Deferred tax -22 -8 -30
Accounts payable, loans and other liabilities -160 -160
Net identifiable assets and liabilities 98 28 126
Goodwill 477
Consideration including estimated contingent consideration/option 603
Transaction costs 4
Less:
Cash (acquired) -81
Estimated contingent consideration/option -191
Net cash outflow 335
GoodwillGoodwill primarily concerns human capital in the form of employee skills and synergy effects. Goodwill from acquisitions is not expected to be tax-deductible. For asset acquisitions, goodwill is tax-deductible in some countries. Non-controlling interest arising from an acquisition is recognised at fair value, which means that non-controlling interest has a measure of goodwill.
Contingent consideration and optionAgreed contingent considerations in the acquired companies relate to the performance of each company for up to three years. Total con-tingent consideration for the companies acquired during the year may not exceed SEK 32 million (203). For further information on contingent consideration, see Note 13.
Acquisition-related expenditureTransaction costs are recognised in Other external costs in profit or loss.
Acquired receivablesThe fair value of the acquired receivables is expected to be settled in full. The agreed gross values essentially correspond to the fair values of the receivables.
Revenue from acquired companiesDuring the year, acquired companies/operations contributed SEK 5,219 million (523) to consolidated revenue and SEK 541 million (38) to operating profit. During the year, the acquisition of Pöyry PLC con-tributed SEK 5,190 million to consolidated revenue and SEK 537 million to operating profit. If the acquisition of Pöyry PLC had been consoli-dated as from 1 January 2019, it would have contributed net sales of approximately SEK 6,242 million and operating profit of approximately SEK 615 million. If other acquired companies/operations had been consolidated as from 1 January 2019, they would have contributed net sales of approximately SEK 101 million (590) and operating profit of approximately SEK 21 million (45).
Fixed acquisition analyses in 2018In 2018, ÅF Pöyry took over all shares in Gottlieb Paludan Architects AS, Arcad Architects SG, Samtanke, Konsultbolag1 AB, Facilia AB, Momento AS, Effekt i Varberg AB, LBP AG, Profil-Bau Industrial Oy, P.A.P. A/S and IFEC Ingegneria SA. The acquired companies added approximately 485 employees to the company’s roster. None of the acquisitions is substantial, and for that reason they are all recog-nised together in the table below. All acquisition analyses have been completed.
FINANCIAL STATEMENTSNotes
82 Annual and Sustainability Report 2019

Note 5
Note 6
Fees and reimbursement of auditors’ expenses
Employees and personnel costs
Group Parent company
2019 2018 2019 2018
Auditing firm KPMG
Audit engagements 11 7 1 1
Tax advice 1 0 – 0
Other services 1 2 0 2
13 9 1 3
Other auditors
Audit engagements 3 1 — —
Tax advice 2 1 — —
Other services 1 1 — —
6 3 0 0
‘Audit engagements’ refers to the auditing of the annual report, the accounting records and the administration by the Board of Directors and the CEO, other duties which it is incumbent upon the company’s auditors to carry out, as well as advice and other assistance stemming from observations made during such audits or the execution of such other duties.
Average number of full-time employees (FTEs) by gender2019 2018
Parent company Women Men Total Women Men Total
Sweden 86 54 140 79 45 124
Subsidiaries
Sweden 2,001 5,968 7,970 1,809 5,587 7,395
Finland 425 1,062 1,486 33 131 164
Norway 226 668 894 237 570 807
Switzerland 191 683 874 136 464 600
Denmark 138 422 560 136 406 542
Brazil 106 304 410 11 39 51
Germany 133 273 405 1 7 8
Austria 33 171 205 — — —
Czech Republic 42 142 184 34 135 170
India 5 162 167 2 43 45
Thailand 39 121 160 — — —
Russia 62 83 145 5 13 19
UK 80 50 131 5 5 10
Philippines 24 62 86 — — —
China 23 63 86 1 11 12
Poland 22 57 79 — — —
Hungary 19 52 73 — — —
Canada 18 52 70 — — —
USA 14 50 64 — — —
Other 125 369 491 23 69 90
Group total 3,812 10,868 14,680 2,512 7,525 10,037
Gender distribution on the Board of Directors and in Group management
Women, %
2019 2018
Board of Directors1 27 30
Group management 40 22
1) Including employee representatives
Salaries, other remuneration and social security contributions2019 2018
Group
Salaries and
remunera-tion
Social security
contribu-tions
Salaries and
remunera-tion
Social security
contribu-tions
Board of Directors and Group management 55 26 46 22
of which annual varia-ble remuneration 15 5 10 3
of which pension costs1 — 12 — 10
Other employees 8,624 2,725 5,659 2,089
of which annual varia-ble remuneration 249 62 162 51
of which pension costs1 — 983 — 698
8,679 2,752 5,704 2,111
1) Including statutory charges.
2019 2018
Parent company
Salaries and
remunera-tion
Social security
contribu-tions
Salaries and remunera-
tion
Social security
contribu-tions
Board of Directors and CEO 19 9 18 9
of which annual variable remuneration 6 2 4 1
of which pension costs1 — 4 — 4
Other employees 114 64 101 50
of which annual varia-ble remuneration 15 5 10 3
of which pension costs1 — 30 — 18
133 72 119 60
1) Including statutory charges.
Annual variable remunerationWithin ÅF Pöyry’s divisions, there are different systems of variable remuneration for employees. Remuneration may be based on the division’s performance or be linked directly to individual performance.
Remuneration of the Board of DirectorsThe AGM held on 15 May 2019 approved remuneration, including remu-neration for committee work, totalling SEK 4,675,000 for the work of the Board of Directors in 2019. The Chairman received SEK 1,000,000 and other members of the Board of Directors not employed by the Group received SEK 400,000 each.
Fees for committee work of SEK 75,000 are to be paid to each member of the Audit Committee not employed in the Group, SEK 50,000 to each member of the Remuneration Committee not employed in the Group, SEK 175,000 to the Chairman of the Audit Committee, and SEK 50,000 to the Chairman of the Remuneration Committee.
83 Annual and Sustainability Report 2019

Note 6, cont.
The remuneration of the Board of Directors is determined annu-ally at the AGM and relates to the period until the next AGM. This means that the remuneration to the Board of Directors was at the rate determined by the AGM in 2018 for the first two quarters and at the rate determined by the AGM in 2019 for the remaining two quarters of the year.
Total remuneration of 60,000 SEK (60,000) was paid to the employee representatives.
There are no agreements on future pension commitments/sever-ance pay for either the Chairman of the Board or other directors.
Fees in SEK 2019
DirectorBoard of Directors Committee Total
Jonas Abrahamsson 375,000 — 375,000
Gunilla Berg 375,000 67,500 442,500
Henrik Ehrnrooth 200,000 25,000 225,000
Anders Narvinger 905,000 62,500 967,500
Maud Olofsson 175,000 22,500 197,500
Salla Pöyry 200,000 — 200,000
Joakim Rubin 375,000 47,500 422,500
Kristina Schauman 375,000 162,500 537,500
Anders Snell 375,000 67,500 442,500
Ulf Södergren 375,000 — 375,000
Total 3,730,000 455,000 4,187,000
Fees in SEK 2018
DirectorBoard of Directors Committee Total
Jonas Abrahamsson 175,000 — 175,000
Gunilla Berg 330,000 55,000 385,000
Staffan Jufors 155,000 — 155,000
Anders Narvinger 767,500 75,000 842,500
Björn O. Nilsson 155,000 25,000 180,000
Maud Olofsson 330,000 22,500 352,500
Joakim Rubin 330,000 45,000 375,000
Kristina Schauman 330,000 137,500 467,500
Anders Snell 330,000 52,500 382,500
Ulf Södergren 175,000 — 175,000
Total 3,077,500 412,500 3,490,000
Guidelines for remuneration of senior executives in accordance with the resolution of the 2019 AGMThe 2019 AGM resolved to adopt the following guidelines for remuner-ation of senior executives to be applicable until the 2020 AGM.
Remuneration CommitteeThe Board appoints a Remuneration Committee to prepare proposals relating to the CEO’s employment conditions, pension benefits and bonuses and to make decisions on corresponding conditions for the other senior executives. The Remuneration Committee shall also con-sider principles relating to terms of employment and other remunera-tion for all employees in the ÅF Pöyry Group.
Senior executivesSenior executives include the CEO, the senior management team and other executives reporting directly to the CEO.
Remuneration guidelinesThe remunerations are based on the principle that they shall be adjusted to conditions on the market facilitating that the Group can recruit and retain senior executives. ÅF employs the “grandfather prin-
ciple”, meaning that the immediate superior of the manager who has negotiated the terms shall approve all employment terms.
The remuneration of senior executives consists of the compo-nents basic salary, variable remuneration, pensions and long-term incentive programmes. Other remuneration may also be provided, usually in the form of car benefit.
The Board shall safeguard an appropriate balance between fixed and variable remuneration.
The Board may deviate from these principles if deemed neces-sary due to special circumstances.
Basic salary and variable remunerationThe individual annual variable remuneration can represent maximum 40-60% of the annual fixed remuneration depending on role and position. The size of the variable remuneration depends on the level of achievement of predetermined financial goals. The outcome of the individual variable remuneration is reported after the result for the cur-rent year is determined.
Long-term incentive programmesThe Board has proposed to implement a convertible debenture programme 2019, making it possible for key staff to take part of the growth in value of the company’s share. The set up and size (max 200 MSEK) is similar to the years 2015-2018 and is planned to be offered to some 320 key employees in the Company’s major countries.
In addition to the convertible debenture programme 2019, the Board intends to implement a long-term cash incentive programme for 2019. This long-term cash incentive programme shall be seen as a complement to the individual annual variable remuneration. It is directed to the company s executive management team and other senior executives and key employees. The Board considers long term incentive programmes important in order to attract, retain and motivate talents needed to build the success of the Company. The long-term incentive programmes shall be formed to strongly con-tribute to a long-term value creation for the shareholders.
The aim is that the long-term cash incentive programme relates to the financial goals the Board has decided, which also have been externally communicated. The programme for 2019 will therefore be based on adjusted EBITA margin and growth over three years, weighted 50/50. The outcome of the programme is calculated as an average of the three years EBITA margin as well as growth. The outcome range is linear between 6-10% for growth and 8-10% for EBITA margin.
The remuneration from the long-term cash incentive programme for the CEO is maximum 50% of annual fixed remuneration. For the senior executives in the management team the maximum outcome is 40% of annual fixed remuneration and for other senior executives and key employees the maximum outcome is 30% of annual fixed remuneration depending on role and position. The maximum cost for the long-term cash incentive programme is calculated to MSEK 40.
The payment of the long-term cash incentive programme is done after the programme period has ended (i.e. after 3-years). The pay-ment is done on the condition that the participant is still employed and not under notice at the time of the payment. The outcome of the long-term cash incentive programme 2019-2021 is thus calcu-lated in the beginning of year 2022.
PensionsSenior executives shall have defined contribution pension plans with premiums that reflect current market terms and conditions. All pension benefits shall be vested and thus not be dependent on future employment. The retirement age for both CEO and senior executives shall be 65 years. Remuneration resulting from the short term and long-term incentive programmes shall not constitute pensionable salary.
ÅF Pöyry offers other market based benefits to senior executives, adjusted for the market conditions in the country of employment. Examples of such benefits are company car and health insurance.
FINANCIAL STATEMENTSNotes
84 Annual and Sustainability Report 2019

Note 6, cont.
Termination of employment and severance payThe notice period for the CEO is 12 months when notice of termina-tion is given by the Company and 6 months if given by the CEO. In the event that the company gives notice the CEO shall receive a sever-ance payment corresponding to up to 12 month’s salary.
For other senior executives, the notice period is normally 12 months for the company and 6 months for the employee.
Proposal and decision processThe level of remuneration paid to the CEO is set by the Board of Directors following a proposal drafted by the Board’s Remuneration Committee. Remuneration paid to other senior executives is set by the Remuneration Committee.
Cost of remuneration of the CEO and other members of Group management
2019
Director CEO
Other mem-bers of Group management Total
Salary including daily allowance 9 27 36
Provisions for annual variable remuneration earned during the current year 3 8 10
Provisions for long-term variable remuneration 3 3 6
Pension costs1 4 8 12
Other social security contributions 5 8 13
Total 24 53 77
2018
Director CEO
Other mem-bers of Group management Total
Salary including daily allowance 8 21 29
Provisions for annual variable remuneration earned during the current year 4 7 10
Provisions for long-term variable remuneration 2 0 2
Pension costs1 4 7 10
Other social security contributions 4 6 11
Total 22 41 63
1) Including statutory charges.
President/CEOThe remuneration of the CEO is based on the ‘Guidelines for the remu-neration of senior executives’ as set out above.
The fixed basic salary of the CEO was SEK 9 million (8). There is also a company car benefit. Annual variable remuneration is based on the Group's results, as well as several pre-set targets, and may amount to a maximum of 60 percent of fixed basic salary. There is also a special incentive program for the CEO that is tied to the company’s growth target up to 2020. The amount of remuneration depends on the share price development between the first quarter of 2017 and the first quarter of 2021.
The CEO also participates in ÅF Pöyry’s long-term incentive programmes.
The CEO’s retirement benefit plan is defined-contribution, and an annual provision equivalent to 40 percent of the year’s basic salary is made for this.
Full salary continues to be payable during the period of notice. A duty to work during the period of notice may apply for no more than one year.
Note 7
Other operating expenses
2019 2018
Exchange losses 0 0
Other — 1
0 1
Other operating expenses of SEK 112 million (226) in the parent relate primarily to rental charges.
Group management, excluding the CEOThe Group management team consists of nine (eight) individuals excluding the President/CEO.
The remuneration of Group management has been based on the ‘Guidelines for the remuneration of senior executives’ as set out above.
ÅF Pöyry has no outstanding pension obligations to present and former directors or CEOs. Full salary continues to be payable during the period of notice.
Long-term variable remunerationStaff convertibleThe 2015 convertible programme ended in 2019.
In 2016, ÅF Pöyry AB issued convertible instruments to key staff members totalling SEK 142 million. The loan runs with an annual interest of Stibor 180 and a margin of 1.50 with effect from 17 August 2016. Conversion may be called during the period from 14 June 2019 to 13 March 2020. The conversion price is SEK 170.20. A commercial interest rate for the corresponding liability without con-version right has been estimated at Stibor 180 and a margin of 3.68.
In 2017, ÅF Pöyry AB issued convertible instruments to key staff members totalling SEK 180 million. The loan runs with an annual interest of Stibor 180 and a margin of 1.19 with effect from 17 August 2017. Conversion may be called during the period from 15 June 2020 to 15 March 2021. The conversion price is SEK 221.90. A commercial interest rate for the corresponding liability without con-version right has been estimated at Stibor 180 and a margin of 3.65.
In 2018, ÅF Pöyry AB issued convertible instruments to key staff members totalling SEK 189 million. The loan runs with an annual interest of Stibor 180 and a margin of 0.92 with effect from 17 August 2018. Conversion may be called during the period from 15 June 2021 to 15 March 2022. The conversion price is SEK 224.60. A commercial interest rate for the corresponding liability without con-version right has been estimated at Stibor 180 and a margin of 3.27.
In 2019, ÅF Pöyry AB issued convertible instruments to key staff members totalling SEK 171 million. The loan runs with an annual interest of Stibor 180 and a margin of 1.60 with effect from 17 August 2019. Conversion may be called during the period from 15 June 2022 to 15 March 2023. The conversion price is SEK 232.10. A commercial interest rate for the corresponding liability without con-version right has been estimated at Stibor 180 and a margin of 3.64.
The convertible programmes are not conditional on continued employment during the terms of the convertible programmes.
85 Annual and Sustainability Report 2019

Note 8
Note 11
Note 12
Note 9
Note 10
Acquisition-related items
Appropriations
Earnings per share and number of shares
Items affecting comparability
Net financial items
Group 2019 2018
Amortisation and impairment of intangible non-current assets -211 -41
Revaluation of contingent considerations 119 2
Divestment of operations 1 -1
-91 -40
To improve analysis between periods, acquisition-related items are reported separately here.
Parent company 2019 2018
Difference between recognised depreciation and depreciation according to plan -24 -9
Group contribution received 273 28
Reversal, tax allocation reserve 0 91
Transfers to tax allocation reserve -2 -3
248 107
Group 2019 2018
Transaction costs, Pöyry -44 -25
Integration costs, Pöyry -215 —
Restructuring costs, Energy Division -105 —
-364 -25
To improve analysis between periods, items affecting comparability are reported separately here.
Group 2019 2018
Interest income1 9 5
Other financial income 2 —
Exchange gains 168 21
Financial income 179 26
Interest expense1 -99 -57
Interest expense, discounting of contingent considerations -16 -16
Interest expense, IFRS 16 -60 —
Other financial expenses -73 -28
Exchange losses -169 -24
Financial expenses -416 -125
Net financial items -237 -99
Parent company 2019 2018
Dividends from Group companies 562 809
Impairment of shares in Group companies — -8
Profit from participations in Group companies 562 801
Interest income, Group companies 38 37
Interest income1 1 0
Exchange gains 69 16
Interest income and similar profit/loss items 109 53
Interest expense, Group companies -6 -1
Interest expense, discounting of contingent considerations/options -6 -4
Interest expense1 -155 -78
Exchange losses -64 -18
Interest expense and similar profit/loss items -231 -101
Net financial items 440 753
1) Includes interest on pension provisions.
Note 10, cont.
Basic earnings per share
Diluted earnings per share
SEK 2019 2018 2019 2018
Earnings per share 8.07 10.98 7.99 10.76
The calculation of the numerators and denominators used in the above calculations of earnings per share is specified below.
Basic earnings per shareThe calculation of earnings per share for 2019 has been based on the profit for the period attributable to the parent’s ordinary sharehold-ers, amounting to SEK 821 million (850) and on a weighted average number of outstanding shares in 2019 amounting to 101,712,840 (77,396,321).
Diluted earnings per shareIn calculating diluted earnings per share, the weighted number of outstanding ordinary shares was adjusted for the dilution effect of all outstanding potential ordinary shares. In calculating diluted earn-ings per share, outstanding ordinary shares have been adjusted for a potential dilution effect for shares in staff convertible programmes.
FINANCIAL STATEMENTSNotes
86 Annual and Sustainability Report 2019

Note 12, cont.
Profit attributable to the parent’s diluted ordinary sharesParent company 2019 2018
Profit attributable to the parent’s ordinary shares 821 850
Reversal of interest expense for staff convertibles 11 11
832 861
Weighted average number of diluted ordinary shares outstandingParent company 2019 2018
Weighted average number of basic ordinary shares during the year 101,712,840 77,396,321
Effect of outstanding PSPs 44,221 44,221
Effect of outstanding staff convertibles 2,286,833 2,580,855
Weighted average number of diluted ordinary shares during the year 104,043,894 80,021,397
Total number of shares2018
A shares B shares
Total number of
shares Of which
own shares
Total number of outstanding
shares
Opening balance 2018 3,217,752 75,044,113 78,261,865 939,285 77,322,580
Cancellation — -1,650,213 -1,650,213 -1,650,213 —
Conversion to shares (convertible programme) — 765,051 765,051 — 765,051
Share buy-backs — — — 824,875 -824,875
Matching shares for share plans — — — -113,947 113,947
Closing balance 2018 3,217,752 74,158,951 77,376,703 — 77,376,703
2019
A shares B shares
Total number of
shares Of which
own shares
Total number of outstanding
shares
Opening balance 2019 3,217,752 74,158,951 77,376,703 — 77,376,703
Rights issue 1,072,584 33,556,411 34,628,995 — 34,628,995
Cancellation — -738,345 -738,345 -738,345 —
Conversion to shares (convertible programme) — 906,775 906,775 — 906,775
Share buy-backs — — — 738,345 -738,345
Closing balance 2019 4,290,336 107,883,792 112,174,128 — 112,174,128
The total number of shares is divided into Class A shares (10 votes per share) and Class B shares (1 vote per share). As per the articles of association, the maximum permitted number of shares is two hundred eighty million (280,000,000).
87 Annual and Sustainability Report 2019

Responsibility for the Group’s financial transactions and risks is han-dled centrally by the parent’s Treasury Department, which implements the policy set by the Board of Directors. The finance policy is intended to reduce financial risks at a cost that is reasonable for consolidated equity. The aim is to ensure cost-effective financing while minimising the negative effects of market fluctuations on consolidated profit/loss. The Treasury Department identifies, evaluates and hedges financial risks in close collaboration with the Group’s operating units.
The Group is exposed to different kinds of financial risk through its operations, including exchange rate risk, interest rate risk, credit risk financing risk and liquidity risk.
Exchange rate riskExchange rate risk refers to changes in exchange rates which have a negative impact on the consolidated income statement, balance sheet and cash flow. Exchange rate risk can be split into transaction exposure and translation exposure. Transaction exposure is the net of operating and financial inflows and outflows in foreign currencies. Translation exposure consists of the net assets and profit/loss of foreign subsidiaries in foreign currency.
Translation exposureTranslation exposure consists of the net assets and profit/loss of foreign subsidiaries in foreign currency. In line with current policy, the Group does not hedge translation exposure. In connection with major acquisitions, the translation exposure may be hedged by raising loans in the same currency as corresponding net assets. The Group borrowed SEK 1,856 million denominated in EUR, in connection with its acquisition of Pöyry in 2019.
Transaction exposureTransaction exposure is the net of operating and financial inflows and outflows in foreign currencies. Transaction exposure is relatively limited within the Group in comparison with sales, as most sales and expenses are invoiced in local currencies. Under current policy, payment flows in foreign currencies are hedged using derivatives when the future payment flow is anticipated to exceed a value of EUR 100,000.
The Group’s largest operational transaction exposures involve the currency pairs EUR/SEK, USD/CHF and EUR/HUF. An unhedged currency fluctuation of 10 percent in these currencies would affect the Group’s operating profit/loss by approximately SEK 13 million, SEK 13 million and SEK 11 million respectively on an annual basis. An unhedged currency fluctuation of 10 percent in these currencies would affect the Group’s operating profit/loss by SEK 60 million on an annual basis.
The Group generates income and expenses in foreign currencies and is therefore exposed to exchange rate fluctuations against the Group’s presentation currency, SEK. An isolated increase in the exchange rate for SEK with a five percent profit denominated in a currency other than SEK would have an impact of approximately SEK 38 million on profit/loss for the period. The estimate is based on circumstances prevailing in 2019 and is expressed on an annual basis. Profit/loss in subsidiaries is translated to SEK based on the average rate for the period in which the profit/loss arises.
Interest rate riskInterest rate risk is the risk that changes in interest rates may have a negative impact on the Group’s net interest income/expense and cash flow.
The Group’s exposure to interest rate risk relates chiefly to out-standing external loans. Under the current policy, the Group raises loans both at fixed and variable interest. If necessary, the Group can use interest rate swaps to achieve the desired average duration. A change of one percentage point in market rates during the next 12 months would have an effect of SEK 21 million on the Group’s interest expenses. Loans and credit facilities consist of bank loans, commer-cial papers, bond loans and staff convertibles at both fixed and float-ing interest rates. Interest swaps are used to convert variable interest
rates to fixed interest rates. The Group’s cash and cash equivalents are kept in central cash pools or in bank accounts in local banks. There are no other significant interest-bearing assets otherwise.
Credit riskThe Group’s commercial and financial transactions give rise to credit risks in respect of the Group’s counterparties. Credit risk or counter-party risk is the risk of loss if the counterparty does not fulfil its obli-gations. The credit risk consists of outstanding accounts receivable and rendered but unbilled consulting assignments.
This risk is limited through the Group’s credit policy. All new clients are vetted for creditworthiness and project services are invoiced on a pay-as-you-go basis to minimise the cumulative credit risk. In addi-tion, advance payments are used on certain major projects in order to reduce the credit risk.
The Group’s ten largest clients, which account for a total of 20 per-cent of Group sales, are all large multinational companies or publicly owned institutions and enterprises. The remaining 80 percent of net sales is spread over many clients. Counterparties to derivative con-tracts and cash transactions are limited to financial institutions with a high credit rating.
Financing and liquidity risksThe financing risk faced by the Group is the risk of not being able to raise new loans or refinance existing ones on acceptable terms. The Group is also exposed to liquidity risk, which is defined as the risk that it will not be able to meet its immediate payment obligations. The Group’s policy is that the company shall have a net debt in relation to EBITDA of 2.5 over time. For the Group, prudent management of financing risk also means having adequate cash and cash equivalents and committed credit lines. There is a procedure in place to ensure the availability of appropriate lines of credit whenever necessary. In accordance with the current policy, the Group is to have cash and cash equivalents and unused credit facilities that together corre-spond to at least six percent of annual sales.
Closing day exchange rate 2019 2018
CHF 9.57 9.10
DKK 1.40 1.38
EUR 10.43 10.28
NOK 1.06 1.02
Note 13
Financial assets and liabilities
FINANCIAL STATEMENTSNotes
88 Annual and Sustainability Report 2019

2019
Carrying amount Fair value
Group
Fair value hedging
instrument
Mandatorily measured
at fair value through
profit or loss
Fair value through other
comprehensive income – debt
instruments
Fair value through other
comprehensive income – equi-ty instruments
Financial assets
measured at amortised
costOther
liabilities Total Level 1 Level 2 Level 3 Total
Financial assets measured at fair value
Forward exchange contracts for hedging 4 17 21 21 21
Total 4 17 — — — — 21 — 21 — 21
Financial assets not recognised at fair value
Financial investments 13 13
Accounts receivable 4,146 4,146
Revenue generated but not invoiced 1,602 1,602
Non-current receivables 23 23
Cash and cash equivalents 997 997
Total — — — — 6,781 — 6,781 — — — —
Financial liabilities measured at fair value
Interest rate swaps for hedging 2 2 2 2
Forward exchange contracts for hedging 5 26 32 32 32
Contingent considerations 358 358 358 358
Total 7 385 — — — — 392 — 34 358 392
Financial liabilities not recognised at fair value
Bank loans 894 894
Bond loan 3,200 3,200 3,207 3,207
Commercial paper 400 400
Staff convertibles 540 540
Lease liabilities 2,779 2,779
Work invoiced but not yet carried out 1,711 1,711
Accounts payable 869 869
Accrued expenses, subcontractors 187 187
Total — — — — — 10,580 10,580 3,207 — — 3,207
Note 13, cont.
89 Annual and Sustainability Report 2019
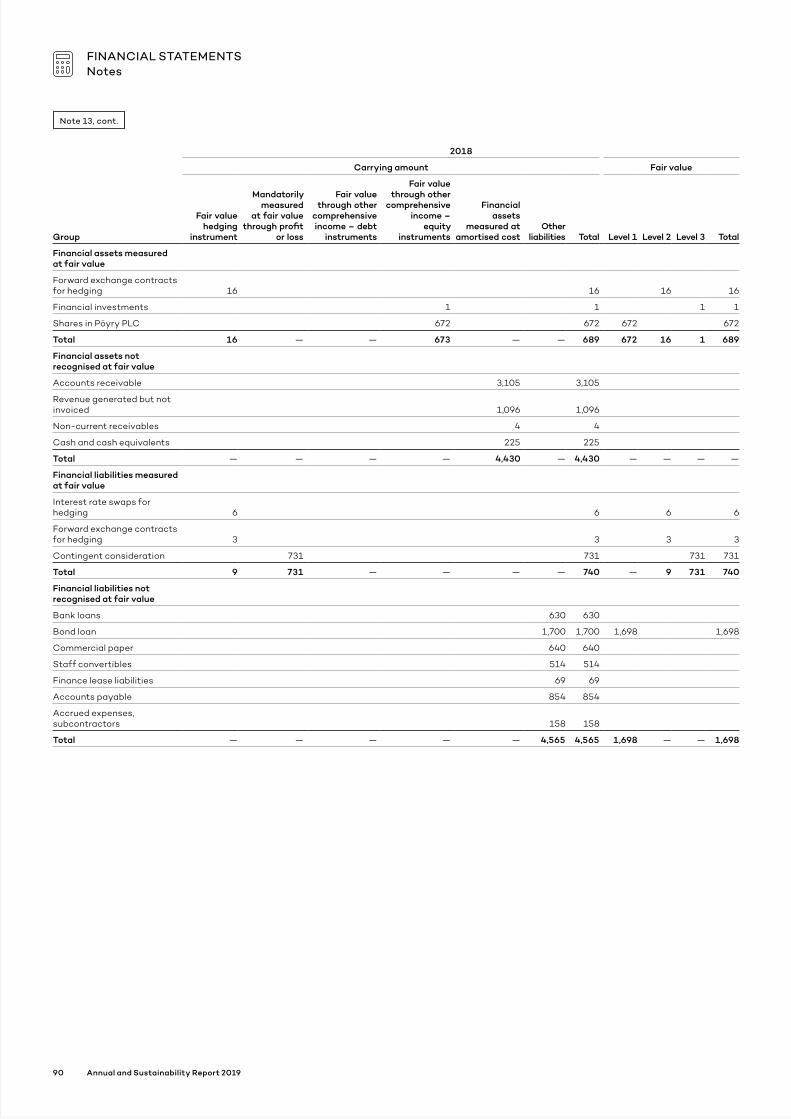
2018
Carrying amount Fair value
Group
Fair value hedging
instrument
Mandatorily measured
at fair value through profit
or loss
Fair value through other
comprehensive income – debt
instruments
Fair value through other
comprehensive income –
equity instruments
Financial assets
measured at amortised cost
Other liabilities Total Level 1 Level 2 Level 3 Total
Financial assets measured at fair value
Forward exchange contracts for hedging 16 16 16 16
Financial investments 1 1 1 1
Shares in Pöyry PLC 672 672 672 672
Total 16 — — 673 — — 689 672 16 1 689
Financial assets not recognised at fair value
Accounts receivable 3,105 3,105
Revenue generated but not invoiced 1,096 1,096
Non-current receivables 4 4
Cash and cash equivalents 225 225
Total — — — — 4,430 — 4,430 — — — —
Financial liabilities measured at fair value
Interest rate swaps for hedging 6 6 6 6
Forward exchange contracts for hedging 3 3 3 3
Contingent consideration 731 731 731 731
Total 9 731 — — — — 740 — 9 731 740
Financial liabilities not recognised at fair value
Bank loans 630 630
Bond loan 1,700 1,700 1,698 1,698
Commercial paper 640 640
Staff convertibles 514 514
Finance lease liabilities 69 69
Accounts payable 854 854
Accrued expenses, subcontractors 158 158
Total — — — — — 4,565 4,565 1,698 — — 1,698
Note 13, cont.
FINANCIAL STATEMENTSNotes
90 Annual and Sustainability Report 2019

Note 13, cont.
2019
Carrying amount Fair value
Parent company
Fair value hedging
instrument
Mandatorily measured
at fair value through
profit or loss
Fair value through other
comprehensive income – debt
instruments
Fair value through other
comprehen-sive income
– equity instruments
Financial assets
measured at amortised cost
Other liabilities Total Level 1 Level 2 Level 3 Total
Financial assets measured at fair value
Total — — — — — — — — — — —
Financial assets not recognised at fair value
Accounts receivable 244 244
Cash and cash equivalents 133 133
Total — — — — 377 — 377 — — — —
Financial liabilities measured at fair value
Interest rate swaps for hedging 2 2 2 2
Forward exchange contracts for hedging 16 16 16 16
Total 2 16 — — — — 18 — 18 — 18
Financial liabilities not recognised at fair value
Bank loans 892 892
Bond loan 3,200 3,200 3,207 3,207
Commercial paper 400 400
Staff convertibles 540 540
Accounts payable 169 169
Other current liabilities 130 130
Total — — — — — 5,331 5,331 3,207 — — 3,207
91 Annual and Sustainability Report 2019

2018
Carrying amount Fair value
Parent company
Fair value hedging
instrument
Mandatorily measured
at fair value through
profit or loss
Fair value through other
comprehensive income – debt
instruments
Fair value through other
comprehensive income – equity
instruments
Financial assets
measured at amortised cost
Other liabilities Total Level 1 Level 2 Level 3 Total
Financial assets measured at fair value
Forward exchange contracts for hedging 16 16 16 16
Shares in Pöyry PLC 672 672 672 672
Total 16 — — 672 — — 688 672 16 — 688
Financial assets not recognised at fair value
Accounts receivable 154 154
Cash and cash equivalents 32 32
Total — — — — 186 — 186 — — — —
Financial liabilities measured at fair value
Interest rate swaps for hedging 6 6 6 6
Forward exchange contracts for hedging 3 3 3 3
Total 9 — — — — — 9 — 9 — 9
Financial liabilities not recognised at fair value
Bank loans 564 564
Bond loan 1,700 1,700 1,698 1,698
Commercial paper 640 640
Staff convertibles 514 514
Accounts payable 162 162
Other current liabilities 85 85
Total — — — — — 3,665 3,665 1,698 — — 1,698
Note 13, cont.
Measurement of fair valueFair value corresponds with carrying amount, except for the bond loan. The following provides a summary of the main methods and assumptions used to determine the fair value of the Group’s financial instruments.
Derivative instrumentsForward contracts and interest rate swaps are measured at market value in accordance with level 2, i.e. fair value determined using a measurement method based on directly observable market inputs, either direct (such as price) or indirect (derived from price), and which are not included in level 1 (fair value determined based on quoted prices for the same instruments on active markets).
Non-current and current liabilities to credit institutionsSince interest on these liabilities is considered to essentially corre-spond to current market rates, the carrying amount is also considered to essentially correspond to fair value.
Commercial paperOutstanding commercial papers are classified as long-term loans since the certificate programme is secured by underlying credit facili-ties with a maturity exceeding 12 months.
Bond loanThe bonds are listed on Nasdaq Stockholm. The market value is based on the market price at the end of the reporting period.
Contingent considerationContingent considerations are valued at market value in accordance with level 3. The calculation of contingent consideration is depend-ent on parameters in the relevant agreements. These parameters are chiefly linked to expected EBIT over the next two to three years for the acquired companies.
An increase in expected EBIT means a higher liability for the contin-gent consideration. Normally, there is a ceiling on each contingent con-sideration which limits how large the liability can become (see Note 3).
Maximum payout for the contingent considerations totalled SEK 547 million (785) at the end of the reporting period.
OptionOptions are measured at market value in accordance with level 3. Measurement of fair value on put/call options is at fair value based on the present value of expected future payments. Acquisition of additional shares as found in some acquisition agreements depends on the parameters of the respective agreement. These parameters are chiefly linked to expected EBIT over the next few years for the acquired companies.
An increase in expected EBIT means a higher liability is related to the option. Normally, there is a ceiling on each option which limits how large the liability can become (see Note 3).
Due date structure, financial liabilities2019
Group <1 year1-2
years3–5
years>5
years
Bank loans, SEK 37 — — —
Bank loans, EUR — 850 8 —
Bond loan 700 — 2,500 —
Commercial paper — 400 — —
Staff convertible 37 180 360 —
Lease liabilities 617 663 656 843
Contingent considerations 138 225 7 —
Accounts payable 869 — — —
Accrued expenses, subcontractors 187 — — —
Interest 65 60 78 —
FINANCIAL STATEMENTSNotes
92 Annual and Sustainability Report 2019

Note 13, cont.
2018
Group <1 year 1-2 years 3–5 years >5 years
Bank loans, SEK 65 — 500 —
Bank loans, CHF 36 — — —
Bank loans, BRL 22 — — —
Other bank loans 7 — — —
Bond loan 500 700 500 —
Commercial paper — 640 — —
Staff convertible 26 142 369 —
Finance lease liabilities 32 20 18 —
Contingent considerations 284 278 200 —
Accounts payable 854 — — —
Accrued expenses, subcontractors 158 — — —
Interest 25 11 12 2
Accounts receivable
Age analysis of accounts receivable that are due but not impaired
Group Parent company
2019 2018 2019 2018
<30 days 444 319 — —
30–90 days 164 79 — —
91–180 days 155 51 — —
>180 days 283 40 — —
Total 1,046 489 — —
Group Parent company
Provision for doubtful receivables 2019 2018 2019 2018
Provision at start of year 70 52 — —
Provision for anticipated losses 97 47 — —
Established losses -14 -1 — —
Recovered losses -29 -30 — —
Acquired operations 47 1 — —
Exchange differences 4 0 — —
Provision at end of year 173 70 — —
Credit qualityClient credit risk is handled in each subsidiary in accordance with the centrally established credit policy. Outstanding accounts receivable are monitored and reported regularly within each company and within the Group. Provisions are made after individual assessment. The assessment of the amount which is expected to be received is based on careful analysis of the clients’ ability to pay and the markets they operate in. ÅF Pöyry’s ten largest clients, which account for a total of 20 percent of Group sales, are all large multinational companies or publicly owned institutions and enterprises.
Loans and credit facilitiesGroup 2019 2018
Non-current liabilities
Bank loans 857 500
Staff convertible 342 487
Bond loan 3,200 1,200
Commercial paper 400 640
Lease liabilities 2,162 38
6,961 2,865
Current liabilities
Bank loans 37 130
Staff convertible 197 26
Bond loan — 500
Lease liabilities 617 32
852 688
ÅF Pöyry has a Swedish programme for commercial papers that was established in 2017. During the year, the programme was expanded from SEK 1,000 million to SEK 2,000 million. The pro-gramme enables the issuance of commercial papers with maturities of up to 12 months. At 31 December 2019, ÅF Pöyry issued commercial papers in the amount of SEK 400 million (640).
ÅF Pöyry has a Swedish medium term note (MTN) programme that was established in May 2018. During the year, the loan limit for the programme was increased from SEK 3,000 million to 5,000 million, partially to repay the remaining part of the bridge facility of EUR 182 million taken in connection with the acquisition of Pöyry. ÅF Pöyry repaid another standalone bond loan of SEK 500 million that matured on 21 March 2019 and on 25 March 2019, Pöyry's hybrid bond of EUR 30 million was also repaid. On 31 December 2019, ÅF Pöyry issued three bonds within the programme for a total of SEK 2,500 million (500).
ÅF Pöyry also has a standalone issued bond of SEK 700 million due in May 2020.
ÅF Pöyry holds two syndicated revolving credit agreements, Revolving Facility Agreement 2014 and Revolving Credit Facility Agreement 2017, amounting to SEK 1,000 million each. The credit facilities are provided in equal parts by Svenska Handelsbanken and SEB. At 31 December 2019, ÅF Pöyry had utilised SEK 0 million (500). In connection with the acquisition of Pöyry, Revolving Credit Facility Agreement 2014 was refinanced to secure underlying available credit facilities in the company’s other financing. The facility runs over three years with possible extension.
ÅF Pöyry also has a EUR 81 million bank loan with equal parts drawn from Handelsbanken and SEB. The loan matures in 2021.
The agreements governing the Group’s bank loans contain certain financial obligations that must be fulfilled to retain the loans and avoid increased borrowing costs. The most important obligation is net debt/operating profit (EBITDA). During the year, all financial obliga-tions were met with a good margin.
Conditions and repayment periods2019
Group
Nom. amount
in original currency
Carrying amount Year due Fair value
Non-current liabilities
Bond loan, SEK 700 700 2020 703
Bond loan, SEK 1,000 1,000 2022 1,003
Bond loan, SEK 500 500 2023 495
Bond loan, SEK 1,000 1,000 2024 1,006
EUR, variable interest rate 850 850 2021 850
EUR, variable interest rate 8 8 2024 8
Commercial paper 400 400 2020 400
Rest of world 0
4,458 4,465
Current liabilities
Sweden, SEK, floating interest rate 37 37 2020 37
Rest of world 0 0
37 37
93 Annual and Sustainability Report 2019

2018
Group
Nom. amount in original
currencyCarrying amount Year due Fair value
Non-current liabilities
Bond loan, SEK 700 700 2020 704
Bond loan, SEK 500 500 2023 493
Sweden, SEK, floating interest rate 500 500 2021 500
Commercial paper 640 640 2020 640
Rest of world 0 0
2,340 2,337
Current liabilities
Bond loan, SEK 500 500 2019 501
Sweden, SEK, floating interest rate 53 53 2019 53
Sweden, SEK, floating interest rate 11 11 2019 11
Switzerland, CHF, floating interest rate 4 36 2019 36
Finland, EUR, floating interest rate 1 6 2019 6
Brazil, BRL, floating interest rate 9 22 2019 22
Rest of world 2 2
630 631
Note 13, cont.
Contingent considerations/options (level 3)Change in contingent considerations/options 2019 2018
Opening balance 731 554
Estimated liabilities, acquisitions 29 191
Payments -290 -39
Changes in value recognised in other operating income – other -119 -2
Adjustment of preliminary acquisition analysis -14 —
Discounting 16 16
Exchange differences 5 9
Closing balance 358 731
GroupThe Group’s intangible assets arise primarily from acquired busi-nesses. These acquired intangible assets consist largely of goodwill, as it is mainly human capital in the form of employee skills that con-stitutes the value of consulting companies. Other intangible assets identified in connection with acquisitions include client relationships. For information on amortisation, see the accounting policies in Note 1.
Goodwill has been allocated to cash-generating units. The cash- generating units comprise the Group’s segments.
Impairment tests on goodwill are carried out annually in the fourth quarter, or when there are indications that an impairment loss has
Intangible assets
Goodwill
Intangible assets related to acquired
businesses
Other intangible assets Total
Group 2019 2018 2019 2018 2019 2018 2019 2018
Cost 11,801 6,810 1,914 603 443 131 14,158 7,544
Accumulated depreciation — — -446 -238 -322 -105 -768 -343
Accumulated impairment -34 -34 — — -1 -1 -35 -35
Carrying amount 11,768 6,776 1,468 365 120 25 13,355 7,166
Opening carrying amount 6,776 6,157 365 365 25 21 7,166 6,542
Purchases — — — — 75 15 75 15
Divestments and disposals — — — — 0 0 0 0
Acquired operations 4,913 529 1,309 39 60 1 6,282 570
Changes in contingent consideration -14 — — — — — -14 —
Depreciation for the period — — -211 -41 -39 -13 -250 -54
Impairment for the period — — — — — — —
Exchange differences 92 90 5 2 -1 0 96 93
Closing carrying amount 11,768 6,776 1,468 365 120 25 13,355 7,166
Note 14
arisen due to the expected future cash flow being discounted with a weighted average cost of capital per cash-generating unit. The pres-ent value of cash flows, the value in use, is compared with the carrying amount including goodwill and other intangible assets.
Forecasts used in respect of future cash flows are based on the fore-cast approved by Group management for the next year supplemented by an individual assessment of a further four years. From that point on, the calculation is based on an annual growth rate of two percent.
The forecasts are based on previous experience, internal judgements and external sources of information. The most important variable is
FINANCIAL STATEMENTSNotes
94 Annual and Sustainability Report 2019

Note 14, cont.
Property, plant and equipment Equipment, tools,
fixtures and fittings Land and buildings Total
Group 2019 2018 2019 2018 2019 2018
Cost 1,164 729 295 273 1,459 1,002
Accumulated depreciation -791 -360 -80 -71 -871 -431
Carrying amount 373 369 215 203 587 571
Opening carrying amount 369 317 203 192 571 509
Purchases 140 151 7 0 147 151
Divestments and disposals -83 -17 — — -83 -17
Acquired operations 56 12 0 — 56 13
Depreciation for the period -111 -97 -5 -5 -116 -102
Exchange differences 1 3 10 16 12 18
Closing carrying amount 373 369 215 203 587 571
Note 15
operating margin, which is affected by hourly rate, capacity utilisation, payroll expenses and number of employees. No reasonable changes in the assumptions for these variables would lead to impairment.
The weighted average cost of capital is based on assumptions about average interest rates on 10-year government bonds, as well as company-specific risk factors and beta values. The forecast cash flows have been discounted to present value.
Discount rate before tax, %
Cash-generating unit 2019 2018
Infrastructure Division 9.5 9.2
Industrial & Digital Solutions Division 9.5 9.2
Process Industries Division 9.5 9.2
Energy Division 9.5 9.2
Management Consulting Division 9.5 —
Goodwill
Cash-generating unit 2019 20181
Infrastructure Division 3,608 —
Industrial & Digital Solutions Division 3,320 —
Process Industries Division 1,249 —
Energy Division 2,743 —
Management Consulting Division 846 —
Total 11,768 —
1) The comparative figures are not adjusted based on the organisational changes implemented on 1 June 2019. Comparative figures are presented in the next table according to the previous divisional structure.
Goodwill
Cash-generating unit 2019 2018
Infrastructure Division — 2,663
Industry Division — 2,368
Energy Division — 854
Digital Solutions Division — 890
Total — 6,776
Intangible assets
Parent company 2019 2018
Cost 131 76
Accumulated depreciation -70 -64
Carrying amount 61 12
Opening carrying amount 12 11
Purchases 55 9
Divestments and disposals — —
Depreciation for the period -6 -8
Closing carrying amount 61 12
Equipment, tools, fixtures and fittings
Parent company 2019 2018
Cost 348 302
Accumulated depreciation -193 -164
Carrying amount 155 137
Opening carrying amount 137 115
Purchases 46 47
Depreciation for the period -28 -25
Closing carrying amount 155 137
95 Annual and Sustainability Report 2019

Note 16 Note 17
Leases Participations in associates and joint arrangements
The effect of the transition to IFRS 16 on the Group’s leases is described in Note 1 Material accounting policies. The Group has chosen to apply the modified retrospective approach of transition to IFRS 16, which means that the comparative information has not been restated to reflect the new requirements.
Right-of-use assetsPrem-
ises Vehicle Other Total
Depreciation/amortisation during the year -472 -44 -4 -520
Closing balance 31 December 2019 2,497 113 9 2,619
The cost for newly acquired rights of use during the year, as well as additional amounts when reconsidering lease liabilities due to changed payments resulting from the change in the lease term are included in this amount.
Lease liabilities 2019
Non-current 2,162
Current 617
2,779
The maturity analysis for the lease liabilities is included in Note 13, Financial assets and liabilities.
Amount recognised in profit or loss 2019
Depreciation of right-of-use assets 520
Interest on lease liabilities 60
Income from onward leasing of right-of-use assets 1
Cost of short-term leases 8
Costs for low-value leases, not short-term low-value 26
Amount recognised in the statement of cash flows 2019
Total cash outflows attributable to leases 520
For a description of the new accounting policies for leases imple-mented 1 January 2019, see Note 1.
Group
2019 2018
Carrying amount at start of year 0 0
Dividend 0 0
Acquired associates and joint arrangements 22 —
Carrying amount at end of year 22 0
Country Category Projects
Amata Power (Bien Hoa) Ltd (30%) Vietnam Associates Energy
Project group Akutcenter Viborg (38.75%)
Denmark Associates Hospital
ARGE ÖV Emscher Germany Joint operation
Water and the environment
ARGE Pöyry/Spiekermann für GKW Flerzheim
Germany Joint operation
Water and the environment
ARGE Pumpwerk Handbach Germany Joint operation
Water and the environment
ARGE Berne Germany Joint operation
Water and the environment
ARGE Klem Germany Joint operation
Water and the environment
ARGE PöyTuM Germany Joint operation
Water and the environment
INGE BAB A8 Germany Joint operation
Railways
INGE Stadtbahn Europaviertel Germany Joint operation
Railways
INGE Pöyry Deutschland/Rapp Regioplan
Germany Joint operation
Railways
ARGE Spiekermann/Pöyry Ozonung Klärwerk Schönerlinde
Germany Joint operation
Water and the environment
ARGE PGM – Planungs-gemeinschaft Münster
Germany Joint operation
Water and the environment
ARGE Emscherkanal/DAGS Germany Joint operation
Water and the environment
ARGE HH KÖ-N Einlaufgruppe Germany Joint operation
Water and the environment
ARGE KW Buchenhofen c/o Hydro-Ingenieure
Germany Joint operation
Water and the environment
ARGE Neckarschleusen Germany Joint operation
Water and the environment
ARGE Pöyry-ICL IG5 Germany Joint operation
Water and the environment
ARGE Spiekermann/Pöyry A 46 Sonnborn
Germany Joint operation
Railways
Ingenieurgemeinschaft ASB 46/2 Germany Joint operation
Railways
Planungsgemeinschaft SFS Kassel-Würzburg
Germany Joint operation
Railways
Planungsgemeinschaft Nordmainische S-Bahn
Germany Joint operation
Railways
INGE BÜ S 21 PA 1.5, c/o Schüßler-Plan
Germany Joint operation
Railways
Ingenieurgemeinschaft VDE 8.2 Los 4
Germany Joint operation
Railways
INGE BÜ S 21 PA 1.5, c/o Schüßler-Plan
Germany Joint operation
Railways
INGE BÜ NBS PFA 2.3 c/o ZERNA Baumanagement GmbH
Germany Joint operation
Railways
INGE BÜ EÜ-L 1214 c/o ZERNA Baumanagement GmbH
Germany Joint operation
Railways
Groupment Pöry/Systra Algeria Joint operation
Railways
FINANCIAL STATEMENTSNotes
96 Annual and Sustainability Report 2019

Groupment Pöry/Systra Algeria Joint operation
Railways
Groupment Pöry/Setirail/Getinsa Algeria Joint operation
Railways
IC Implementation Consultant Vietnam Joint operation
Railways
Consorzio GM-TOS Switzerland Joint operation
Transport
IG Rothenbrunnen-Vial Switzerland Joint operation
Transport
Consorzio LU-NA Switzerland Joint operation
Transport
Consorzio Valascia Gallerie Switzerland Joint operation
Transport
Consorzio ARCHING GIORNICO Switzerland Joint operation
Transport
Consortium Toscano-ESM Switzerland Joint operation
Transport
IG Sempach Switzerland Joint operation
Transport
IG Oberland Switzerland Joint operation
Transport
IG Vizan Switzerland Joint operation
Transport
Consorzio TOLO Switzerland Joint operation
Transport
IG Reuss Switzerland Joint operation
Transport
Consorzio ETIP Switzerland Joint operation
Transport
IG N01 - Wil West Switzerland Joint operation
Transport
Consorzio ET-MA Switzerland Joint operation
Transport
Consorzio PreBe Toscano-FG Switzerland Joint operation
Transport
IG ETMA-SABA Switzerland Joint operation
Transport
Consortium ETENG Switzerland Joint operation
Transport
Consorzio ETASP - Sopraceneri Switzerland Joint operation
Transport
Consorzio Valascia Tracciato Switzerland Joint operation
Transport
Consortium Surveillance F1 Switzerland Joint operation
Transport
Consorzio NIV-ETARPA Switzerland Joint operation
Transport
IG OLS+ Switzerland Joint operation
Transport
Consorzio TARABUSINO Switzerland Joint operation
Transport
IG Station Sedrun Switzerland Joint operation
Transport
Consorzio BZU-Ticino23 Switzerland Joint operation
Transport
Consorzio TREI Switzerland Joint operation
Transport
IG Ibergereggstrasse (IG BHZ BHG / IUB)
Switzerland Joint operation
Transport
IG Toscano-Heierli Switzerland Joint operation
Transport
IG Scopi Switzerland Joint operation
Transport
Consortium AFT-SOL-PP Switzerland Joint operation
Transport
Country Category Projects Country Category Projects
Note 17, cont.
Työyhteenliittymä ÅF/MW Finland Joint operation
Nuclear power
IG BSA Bözberg Switzerland Joint operation
Transport
IG BSA Dixis Switzerland Joint operation
Transport
IG Bü Erzingen-Beringen Switzerland Joint operation
Transport
IG Doppelspur Switzerland Joint operation
Transport
IG GBTS Switzerland Joint operation
Transport
IG Gottrazione (Ceneri & Gotthard) Switzerland Joint operation
Transport
IG Groupment 4G Switzerland Joint operation
Transport
IG Kebo CEVA / Kebo SIG Switzerland Joint operation
Transport
IG Kerenzerberg Switzerland Joint operation
Transport
IG Planergmeinschaft Betr. Olten Switzerland Joint operation
Transport
IG POBC Switzerland Joint operation
Transport
IG Pöyry-Lombardi (Rheintunnel) Switzerland Joint operation
Transport
IG Pöyry-Tuffli Switzerland Joint operation
Transport
IG Pöyry-GVH Switzerland Joint operation
Transport
IG Pöyry-Lombardi BHU Bau ANU Los 1
Switzerland Joint operation
Transport
IG Schänzli Switzerland Joint operation
Transport
IG Tunnel Eyholz (M06106) Switzerland Joint operation
Transport
IG Tunnel Riedberg (M05054) Switzerland Joint operation
Transport
IG Tunnel Visp (M06105) Switzerland Joint operation
Transport
IG GETU (M05053, Einschnitt Turtmann)
Switzerland Joint operation
Transport
IG VBA ZH Nord Switzerland Joint operation
Transport
IG Ventilaziun Switzerland Joint operation
Transport
Sweco ÅF Healthcare AB Sweden Joint venture
Hospital
IG Vermessung GLC Switzerland Joint operation
Transport
IG Pöyry – Emch & Berger (WAKO) Switzerland Joint operation
Transport
IG PF Switzerland Joint operation
Transport
IG Wiki Switzerland Joint operation
Transport
IG PLC Kleinandelfingen Switzerland Joint operation
Transport
IG Chessiloch Switzerland Joint operation
Transport
IG SWT Switzerland Joint operation
Transport
Consorzio 2TGxFFS Switzerland Joint operation
Transport
IG PTG Switzerland Joint operation
Transport
97 Annual and Sustainability Report 2019

Note 17, cont. Note 19
Equity
GroupHolders of ordinary shares are entitled to dividends as approved annually by the Annual General Meeting. All shares have the same rights to the company’s residual net assets. The quota value of the shares is SEK 2.50 (2.50).
Dividends 2019 2018
Dividend per share, SEK 5.00 5.00
Number of shares outstanding 77,376,703 77,322,580
Dividend 387 387
ReservesTranslation
reserveHedge
reserveFair value
reserveTotal re-
serves
Opening balance, 2018 130 -6 — 124
Exchange differences for the year 87 — — 87
Cash flow hedges — -4 — -4
Interest rate swap — 6 — 6
Shareholdings in Pöyry PLC — — 15 15
Tax — 0 — 0
Closing balance, 2018 217 -5 15 227
Opening balance, 2019 217 -5 15 227
Exchange differences for the year 81 — — 81
Cash flow hedges — 12 — 12
Interest rate swap — 2 — 2
Shareholdings in Pöyry PLC — — 5 5
Tax — -4 — -4
Closing balance, 2019 298 5 20 322
Capital managementCapital is defined as total equity, which corresponds to equity in the consolidated balance sheet. ÅF Pöry’s objective is for the Group to maintain a net debt position over time.
Net debt is measured in relation to EBITDA (net debt/EBITDA) and the financial target is 2.5, excluding IFRS 16 Leases.
As at 31 December 2019, net debt/EBITDA excluding IFRS 16 Leases was 3.0 (2.5).
As at 31 December 2019, net debt/EBITDA including IFRS 16 Leases was 3.6 (2.5).
There are external requirements in the agreements governing the bank loans. Additional information on these is given in Note 13.
There were no changes in capital requirements during the year.
Proposed appropriation of profitsNon-restricted profits of SEK 8,669,936,817 are at the disposal of the AGM.
The Board of Directors and CEO propose that these profits be appropriated as follows:
To be carried forward 8,669,936,817
Total 8,669,936,817
Note 18
Prepaid expenses and accrued income
Group Parent company
2019 2018 2019 2018
Rent 106 73 72 64
Support and maintenance agreements 62 14 35 10
Insurance 5 1 0 0
Other 75 91 14 77
249 179 121 151
ARGE A26 Pöyry Metz Schimetta ÖBA Verwirklungsabschnitt 1
Austria Joint venture
Roads
ARGE Örtlich Bauaufsicht Bahnhofsumbau Rankweil Pöyry Austria GmbH - 3 G Gruppe Geotechnik Graz GmbH
Austria Joint venture
Railways
ARGE ÖBA GKI Austria Joint venture
Hydropower
ARGE Vermessung 380 kV-Salzburgleitung
Austria Joint venture
Power plants
arge:geo:kat2 Austria Joint venture
Geophysical survey
arge:geo:sbt3 Austria Joint venture
Geological documenta-tion
ARGE S7 Geodata Pöyry Tunnel Rudersdorf
Austria Joint venture
Geotechnical survey
ARGE Kraftwerk Tauernmoos Austria Joint venture
Power plants
Jerada Switzerland Joint operation
Thermal power
Cotlan Switzerland Joint operation
Hydropower
Vinh Switzerland Joint operation
Renewable energy
Piva Switzerland Joint operation
Hydropower
Axpo Switzerland Joint operation
Transmission
TOV Kharkiv Switzerland Joint operation
Heating
Verkis Switzerland Joint operation
Thermal power
RSM Turkey Switzerland Joint operation
Resource validation
Nam Kong 1 Switzerland Joint operation
Hydropower
Implementation DMDC Switzerland Joint operation
Hydropower
Talimarjan TPP Switzerland Joint operation
Thermal power
Efficient Power Grids Switzerland Joint operation
Power grid
Country Category Projects
FINANCIAL STATEMENTSNotes
98 Annual and Sustainability Report 2019

Note 20
Pension obligations
Of the Group’s total number of employees at the end of the year, around 12 percent have pensions that are recognised as defined benefit. Other employees within ÅF Pöyry have pensions that are recognised as defined contribution.
Defined benefit plans exist in Sweden, Switzerland, Finland, Germany, Austria, Norway, the Philippines, Indonesia and Italy. The plans in Finland, Italy, the Philippines, Indonesia and Norway are not material.
The defined benefit plans in Sweden and Switzerland are gov-erned by a broadly similar framework of rules. The plans are final salary retirement plans which give employees benefits in the form of a guaranteed level of pension payment during their lives. The plans are exposed, broadly speaking, to similar risks. The Swedish plan, however, covers only pensioners and paid-up policyholders, while the Swiss plan covers only active employees. The plan in Switzerland is secured by a fund. The Swedish plan is unfunded. The defined benefit plans in Germany are individual and partially funded. The company will meet the obligation to make payments for the unfunded plan when it runs out.
AlectaFor white-collar staff in Sweden, the ITP 2 occupational pension plan’s defined-benefit pension obligation for retirement and survivor pensions is secured through insurance with Alecta. According to a statement from the Swedish Financial Reporting Board this is a defined-benefit multiemployer plan. For the financial year, the company has not had access to the information required to recognise this plan as a defined-benefit plan. The ITP supplementary pension plan for salaried employees’ retirement benefits that is secured through insurance with Alecta is, therefore, recognised as a defined-contribution plan.
Contributions during the year for retirement benefit insurance with Alecta amounted to SEK 410 million (388). The fees for next year are expected to be in line with this year, adjusted for growth. Alecta’s surplus may be allocated to the insurance policy holder and/or the insured. At year-end Alecta’s surplus in the form of the collective funding ratio was 148 percent (142). The collective funding ratio is the market value of Alecta’s assets as a percentage of the insurance obli-gations calculated in accordance with Alecta’s actuarial calculation assumptions, which are not in conformity with IAS 19.
If funding is low, one possible action is to raise the agreed price for new entrants and for the extension of existing benefits. If funding is high, one possible action is to reduce premiums.
GroupDefined-benefit plans
2019 2018
Present value of funded obligations -2,902 -945
Fair value of plan assets 2,658 862
-244 -82
Present value of unfunded obligations -143 -58
Liability recognised in balance sheet -387 -141
Of which Sweden -62 -58
Of which Germany -107 —
Of which Switzerland -175 -82
Of which other countries -43 -1
Change in the defined-benefit net debt2019 2018
GroupPresent value of plan assets
Present value of obligations Total
Present value of plan assets
Present value of obligations Total
Opening balance 862 -1,003 -141 808 -905 -96
Current service costs 0 -55 -55 0 -16 -16
Past service costs 0 0 0 0 -15 -15
Change in special employers' contribution — 0 0 — 0 0
Interest income/expense 17 -21 -4 4 -4 -1
Return on plan assets (excluding interest) 71 0 71 -16 0 -16
Actuarial gains/losses 0 -163 -163 0 15 15
Exchange difference 54 -59 -5 31 -54 -23
Contributions by employer 70 0 70 29 0 29
Contributions by plan participants 48 -48 0 27 -27 0
Benefits paid -136 139 3 -84 87 3
Acquisitions 1,672 -1,835 -163 64 -84 -20
Closing balance 2,658 -3,045 -387 862 -1,003 -141
99 Annual and Sustainability Report 2019

Actuarial gains and losses2019 2018
Financial assumptions -210 -26
Demographic assumptions 22 -6
Experience-based adjustments 3 21
Total -184 -10
Allocation of plan assets2019 2018
Cash and cash equivalents 37 20
Equity instruments 719 229
Debt instruments 1,393 438
Property 389 154
Other 118 21
Total 2,658 862
All assets have a quoted market price.
Assumptions for defined-benefit obligationsSweden 2019 2018
Discount rate, % 1.2 2.1
Inflation, % 1.7 2.0
Switzerland 2019 2018
Discount rate, % 0.7 0.6
Inflation, % 1.0 0.5
Future increase in pensions, % 0.0 0.0
Future increase in salaries, % 1.0 0.5
Germany 2019 2018
Discount rate, % 0.7 —
Inflation, % 1.9 —
Future increase in pensions, % 1.7 —
The discount rate is equivalent to the market interest rate on mortgage bonds and corporate bonds, respectively, with the duration corresponding to the average remaining term of the obligation.
Sensitivity analysis of pension obligationsSweden Switzerland Germany
Change in assumptions
Increase/ decrease
Change in assumptions
Increase/ decrease
Change in assumptions
Increase/ decrease
Discount rate +/-0.50% +/-4 +/-0.50% +13/-15 +/- 0.50% +8/-6
Rate of salary increases — — +/-0.50% +/-2 — —
The sensitivity analysis is based on a change in one assumption while all other assumptions remain constant. It is unlikely that this will occur in practice, and changes in several of the assumptions may be correlated. Payments to plans are expected to totalSEK 180 million (32) over the coming year. The average remaining term for the Swedish plan is 13 years (13), 13 years for the German plan and 16 years (15) for the Swiss plan.
Defined-contribution plansGroup 2019 2018
Cost of defined-contribution plans (including Alecta) 1,009 677
Parent company 2019 2018
Cost of defined-contribution plans (including Alecta) 34 25
Defined-benefit plansParent company 2019 2018
Present value of unfunded obligations 18 19
Net amount recognised for defined-benefit plans 18 19
Of this, covered by credit insurance via FPG/PRI 18 19
Changes in obligations during the yearParent company 2019 2018
Net present value of pension obligations at start of year 19 18
Cost excluding interest expense charged to profit or loss 1 2
Interest expense 0 0
Payment of pensions -2 -2
Net present value of pension obligations at end of year 18 19
All obligations are for pension provisions under the Pension Obligations Vesting Act.
Note 20, cont.
FINANCIAL STATEMENTSNotes
100 Annual and Sustainability Report 2019

Note 21
Note 22
Other provisions
Taxes
Change in non-current provisions2019 2018
Carrying amount at start of period 15 18
Provisions during the period 85 7
Amount utilised during the period -45 -8
Releases during the period -35 -4
Transfer from non-current to current -4 0
Provisions from acquired operations 92 1
Adjustment regarding previously acquired operations 0 0
Translation differences -1 1
Carrying amount at end of period 107 15
Recognised in profit or lossGroup 2019 2018
Current tax
Tax expense for the period -210 -217
Adjustment of tax attributable to previous years -3 -2
Deferred tax
Deferred tax expense/income -6 -34
Total recognised consolidated tax -219 -253
Change in current provisionsRestructuring Other Total
2019 2018 2019 2018 2019 2018
Carrying amount at start of period 21 67 37 37 57 104
Provisions during the period 98 9 22 72 120 81
Amount utilised during the period -51 -56 -29 -73 -80 -128
Releases during the period — 0 0 0 — -1
Transfer from non-current to current — 0 4 0 4 0
Translation differences 0 0 0 0 0 0
Carrying amount at end of period 67 21 33 37 101 57
Parent companyOther provisions
2019 2018
Carrying amount at start of period 230 133
Provisions during the period — 113
Amount utilised during the period -76 -21
Releases during the period -86 0
Translation differences 11 4
Carrying amount at end of period 79 230
Of the recognised provisions, SEK 79 million (230) is for contingent considerations.
Parent company 2019 2018
Current tax
Tax expense for the period -1 1
Adjustment of tax attributable to previous years 0 0
Deferred tax
Deferred tax expense/income 3 -2
Total recognised parent tax 2 -1
101 Annual and Sustainability Report 2019

Note 22, cont.
Change in deferred tax in temporary differences and loss carry-forwards
GroupBalance at
1 January 2019
Recognised in profit or
loss
Recognised in other
comprehensive income
Recognised in equity
Acquisition/ divestment of business
Reclassification, translation
differences etc.Balance at 31
December 2019
Non-current assets -138 -56 -4 — -157 — -355
Current receivables and liabilities -73 — — — -3 -22 -98
Provisions and non-current liabilities 28 — 18 -3 12 — 55
Untaxed reserves -73 62 — — — — -11
Loss carry-forward 39 — — — 85 — 124
-217 6 14 -3 -63 -22 -285
Reconciliation of effective taxGroup 2019 (%) 2019 2018 (%) 2018
Pre-tax profit 1,039 1,103
Tax per parent’s applicable tax rate 21.4 222 22.0 243
Effect of other tax rates for foreign subsidiaries -1.4 -15 -0.6 -7
Non-deductible costs 4.5 47 1.1 12
Non-taxable income -5.8 -60 -0.7 -8
Tax for previous non-capitalised loss carry-forwards -2.1 -22 0.0 0
Effects of loss carry-forward without corresponding capitalisation of deferred tax 1.8 19 0.2 2
Effect of changed tax rates 0.0 0 -0.3 -4
Tax attributable to previous years -0.2 -3 0.2 2
Other 2.8 30 1.1 13
Recognised effective tax 21.0 219 22.9 253
Parent company 2019 (%) 2019 2018 (%) 2018
Pre-tax profit 547 791
Tax per parent’s applicable tax rate 21.4 117 22.0 174
Non-deductible costs 0.4 2 0.4 4
Non-taxable income -21.9 -120 -22.5 -178
Tax attributable to previous years 0.0 0 0.0 0
Other 0.4 2 -0.1 -1
Recognised effective tax 0.3 2 -0.2 -1
Recognised deferred tax assets and liabilitiesDeferred tax assets and liabilities are attributable to the following:
Deferred tax asset Deferred tax liability Net
2019 2018 2019 2018 2019 2018
Non-current assets 37 2 -393 -140 -355 -138
Current receivables and liabilities 29 2 -105 -75 -76 -73
Provisions and non-current liabilities 73 31 -17 -3 55 28
Untaxed reserves — -11 -73 -11 -73
Loss carry-forward 124 39 — 124 39
Tax assets/liabilities 263 74 -526 -291 -263 -217
Set-off -11 -57 -11 58 -22 0
Net tax assets/liabilities 252 17 -537 -233 -285 -217
Unrecognised deferred tax assetsDeductible temporary differences and loss carry-forwards for tax purposes for which deferred tax assets have not been recognised in profit or loss and balance sheets:
Group 2019 2018
Tax deficit 143 37
143 37
Deferred tax assets were not recognised for these tax deficits, since it has not yet been deemed likely that the Group will be able to uti-lise them against future taxable profits. The deficit is attributable to ÅF Pöyry’s subsidiaries in Germany, Poland, Brazil and Canada. The deficit is not due.
FINANCIAL STATEMENTSNotes
102 Annual and Sustainability Report 2019
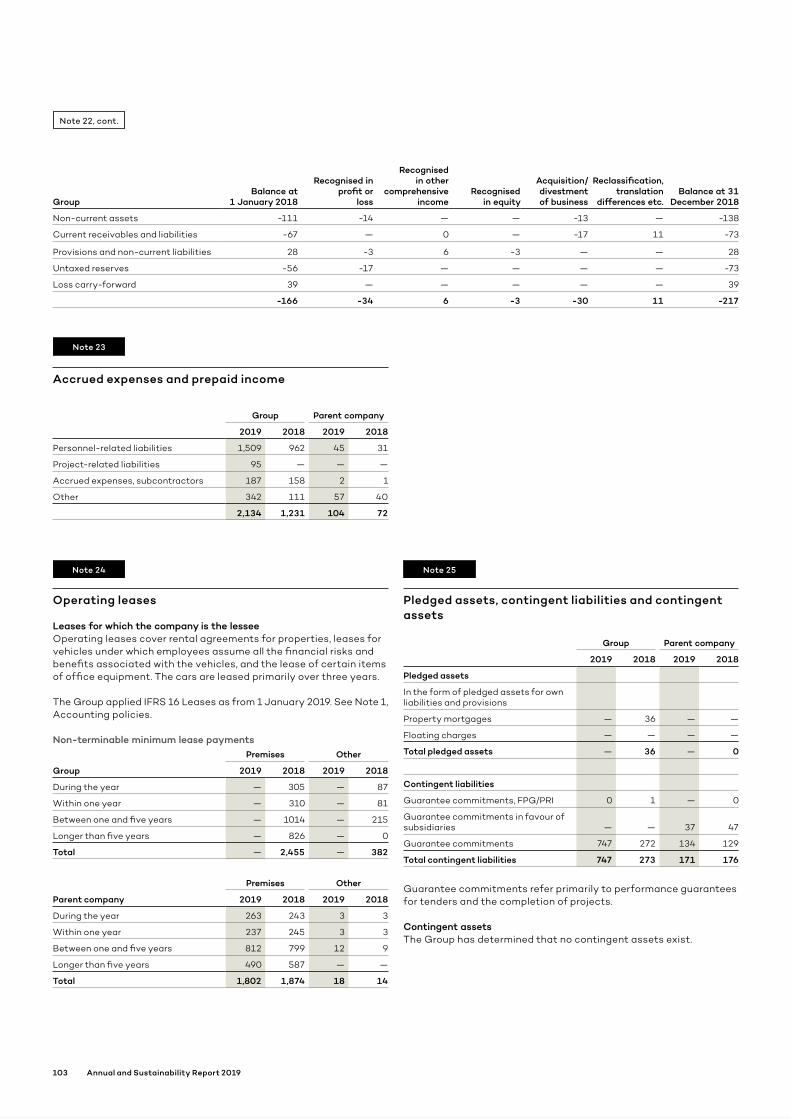
Note 22, cont.
Note 23
Note 24
Accrued expenses and prepaid income
Operating leases
Leases for which the company is the lesseeOperating leases cover rental agreements for properties, leases for vehicles under which employees assume all the financial risks and benefits associated with the vehicles, and the lease of certain items of office equipment. The cars are leased primarily over three years.
The Group applied IFRS 16 Leases as from 1 January 2019. See Note 1, Accounting policies.
Non-terminable minimum lease paymentsPremises Other
Group 2019 2018 2019 2018
During the year — 305 — 87
Within one year — 310 — 81
Between one and five years — 1014 — 215
Longer than five years — 826 — 0
Total — 2,455 — 382
Premises Other
Parent company 2019 2018 2019 2018
During the year 263 243 3 3
Within one year 237 245 3 3
Between one and five years 812 799 12 9
Longer than five years 490 587 — —
Total 1,802 1,874 18 14
Group Parent company
2019 2018 2019 2018
Personnel-related liabilities 1,509 962 45 31
Project-related liabilities 95 — — —
Accrued expenses, subcontractors 187 158 2 1
Other 342 111 57 40
2,134 1,231 104 72
Note 25
Pledged assets, contingent liabilities and contingent assets
Group Parent company
2019 2018 2019 2018
Pledged assets
In the form of pledged assets for own liabilities and provisions
Property mortgages — 36 — —
Floating charges — — — —
Total pledged assets — 36 — 0
Contingent liabilities
Guarantee commitments, FPG/PRI 0 1 — 0
Guarantee commitments in favour of subsidiaries — — 37 47
Guarantee commitments 747 272 134 129
Total contingent liabilities 747 273 171 176
Guarantee commitments refer primarily to performance guarantees for tenders and the completion of projects.
Contingent assetsThe Group has determined that no contingent assets exist.
GroupBalance at
1 January 2018
Recognised in profit or
loss
Recognised in other
comprehensive income
Recognised in equity
Acquisition/ divestment of business
Reclassification, translation
differences etc.Balance at 31
December 2018
Non-current assets -111 -14 — — -13 — -138
Current receivables and liabilities -67 — 0 — -17 11 -73
Provisions and non-current liabilities 28 -3 6 -3 — — 28
Untaxed reserves -56 -17 — — — — -73
Loss carry-forward 39 — — — — — 39
-166 -34 6 -3 -30 11 -217
103 Annual and Sustainability Report 2019

Note 27
Group companies
Comprehensive list of all Group subsidiaries2019
Corp. ID number Registered officeParticipating
interest, %1Carrying amount
in parent
ÅF Holding AB 556158-1249 Sweden 100 0
ÅF Digital Solutions AB 556866-4444 Sweden 100 —
Konsultbolag1 Dalarna AB 556936-3897 Sweden 100 —
ÅF Digital Experience AB 556890-5375 Sweden 100 —
AF Engineering & Design Inc 20061100908 USA 100 —
Alteco AB 556550-2209 Sweden 100 —
Ingenjörsprojekt i Sverige AB 556487-7164 Sweden 100 —
ÅF-Infrastructure AB 556185-2103 Sweden 100 —
ÅF Sandellsandberg arkitekter AB 556464-9308 Sweden 100 —
Koncept Arkitektur och Design ÅF AB 556496-2941 Sweden 100 —
Effekt i Varberg AB 556294-4438 Sweden 100 —
ÅF Reinertsen Sverige Deal AB 559034-2266 Sweden 100 —
ÅF-Industry AB 556224-8012 Sweden 100 —
Facilia AB 556766-3611 Sweden 100 —
ÅF Ukraine LLC 42703305 Ukraine 100 —
AF Engineering & Design Pty Ltd 2018/414610/07 South Africa 100 —
Gottlieb Paludan Architects A/S 18 35 59 49 Denmark 100 132
Note 26
Related party transactions
The parent has a related party relationship with its subsidiaries (see Note 27).
Summary of transactions with related partiesThis refers to the ÅForsk Foundation, which holds 33.6 percent of the votes in ÅF Pöyry AB, senior executives, associates and joint ventures. Transactions with these parties took place on commercial terms.
Group YearSale of services to
related partiesPurchase of services from related parties
Receivables from related parties at 31 Dec
Liabilities to related parties at 31 Dec
Joint venture 2019 1 — — —
Joint venture 2018 0 — — —
Senior executives 2019 — — — 43
Senior executives 2018 — — — 52
The ÅForsk Foundation 2019 1 — 0 —
The ÅForsk Foundation 2018 1 — 0 —
In 2019, in addition to the above, the Group received appropriations from the ÅForsk Foundation amounting to SEK 0 million (1). These grants were for projects administered by the Group.
For details of other remuneration to senior executives, please see Note 6.
Parent company YearSale of services to
related partiesPurchase of services from related parties
Receivables from related parties at 31 Dec
Liabilities to related parties at 31 Dec
Subsidiaries 2019 1,007 78 6,960 1,952
Subsidiaries 2018 843 55 5,738 615
Senior executives 2019 — — — 30
Senior executives 2018 — — — 37
The ÅForsk Foundation 2019 0 — 0 —
The ÅForsk Foundation 2018 1 — 0 —
FINANCIAL STATEMENTSNotes
104 Annual and Sustainability Report 2019

ÅF Infrastructure Danmark Aps 20 24 66 93 Denmark 100 90
ÅF Buildings Denmark P/S 34 07 48 01 Denmark 100 —
Komplementaranpartsselskabet Midtconsult 33 58 46 36 Denmark 100 —
LK Consultants Ltd. 0191285 Gibraltar 100 —
Light Bureau Limited 05333484 UK 100 16
Light Bureau AS 914939771 Norway 100 —
ÅF-Consult AB 556101-7384 Sweden 100 3
AF-Consult GmbH HRB 64461 Germany 100 0
ÅF-Teknik & Miljö AB 556534-7423 Sweden 100 0
Epsilon Holding AB 556421-6884 Sweden 100 3
Epsilon Polen Sp.z o.o. 9521980649 Poland 100 —
LeanNova Engineering AB 556880-7233 Sweden 100 0
AF Engineering (Shanghai) Co. Ltd. 9131000007482378XN China 100 —
AF Engineering (Chengdu) Co. Ltd. 91510100MA6C7ARL8F China 100 —
LeanNova Engineering UK Ltd 9039993 UK 100 0
ÅF Norge AS 911 567 989 Norway 100 668
ÅF Industry AS 997 671 651 Norway 100 —
ÅF Engineering AS 915 229 719 Norway 100 —
Tegn 3 AS 976 536 320 Norway 100 —
ÅF Advansia AS 883 889 762 Norway 100 —
Advansia AB 556742-2596 Sweden 100 —
ÅF Energy AS 984 615 051 Norway 88 —
ÅF Advansia Nordvest AS 986 580 719 Norway 100 —
ÅF Digital Solutions AS 974 415 852 Norway 100 —
ÅF A/S 21 007 994 Denmark 100 38
ÅF Infrastructure Planning A/S 13 59 08 85 Denmark 100 59
Traffic Team A/S 36 94 60 59 Denmark 51 0
P.A.P A/S 18064200 Denmark 100 75
ÅF-Consult Oy 1800189-6 Finland 100 291
ÅF-Consulting AS 10 449 422 Estonia 100 —
UAB AF-Consult 135 744 077 Lithuania 100 —
Enprima Engineering Oy 0477940-2 Finland 100 —
Profil-Bau Industrial Oy 2569789-5 Finland 100 53
ÅF-Automaatika OÜ 11 297 301 Estonia 100 8
AF Consult LLC 1 037 800 096 641 Russia 100 1
AF-Engineering s.r.o. 263 66 550 Czech Republic 100 11
AF-Consult Czech Republic s.r.o. 453 06 605 Czech Republic 100 75
AF Nuclear Projects CZ s.r.o. 016 06 239 Czech Republic 100 —
AF-CityPlan spol. s.r.o. 473 07 218 Czech Republic 100 21
AF Helvetia AG CHE 340.373.992 Switzerland 100 420
ET Holding AG CHE 112.276.851 Switzerland 100 —
AF Toscano AG CHE 105.960.103 Switzerland 25 —
Galli Group Holding AG CHE 114.656.176 Switzerland 100 —
AF Toscano AG CHE 105.960.103 Switzerland 45.16 —
AF Toscano AG CHE 105.960.103 Switzerland 29.84 —
AF-Consult Switzerland AG CHE-105.949.521 Switzerland 100 —
International Power Design Ltd. CHE-111.660.201 Switzerland 100 —
AF-Consult Italy S.r.l. MI-1808529 Italy 100 —
AF-Consult (Thailand) Ltd 3011879733 Thailand 100 —
AF-Consult India Pvt Ltd U74140DL2009FTC197507 India 100 —
AF Consult do Brazil Ltda 108.307.539/0001-08 Brazil 50 —
AF-Consult Ltd. 4080012527924 Northern Macedonia
100 —
2019
Corp. ID number Registered officeParticipating
interest, %1Carrying amount
in parent
Note 27, cont.
105 Annual and Sustainability Report 2019

Note 27, cont.
AF-Consult Energy doo Beograd 20 801 298 Serbia 100 —
AF-Iteco AG CHE-108.035.698 Switzerland 100 —
ITECO Nepal (Pvt.) Ltd 2616/043-44 Nepal 66.6 —
Power Design International Ltd 224 309 Uganda 100 —
Tree Holding SA CHE 165.482.900 Switzerland 100 —
IFEC Ingegneria SA CHE 436.940.173 Switzerland 100 —
AF Mercados Energy Markets International S.A. A-82316902 Spain 100 37
Mercados Energy Markets International Europé S.r.l. 6622220967 Italy 100 —
AF-MERCADOS EMI Enerji Mühendisligi, AR-GE, Kontrol ve Test Hizmetleri Ltd.Sti. 6 160 390 509 Turkey 100 —
AF-Aries Energia S.L. A-78660032 Spain 95 15
ÅF Infrastructure Polska Sp. z o.o. 0000751808 Poland 100 1
AF Consult do Brazil Ltda 108.307.539/0001-08 Brazil 50 28
AF-Incepal S.A. A2004 9870 Spain 100 12
AFPOYRY Engineering India Private Limited U74999DL2019FTC347883 India 99 0
Pöyry Oyj 1009321-2 Finland 100 6,463
Poyry Management Consulting (Australia) Pty Ltd ACN 008 503 517 Australia 100 —
Pöyry Austria GmbH FN95496k Austria 100 —
Pöyry (Beijing) Engineering and Consulting Company Limited 91110105772553297R China 100 —
Pöyry Finland Oy 0625905-6 Finland 100 —
Pöyry Shandong Engineering and Consulting Company Limited 004356 Jinan Shandong China 90 —
Salamanca Proyectos Llave en Mano S.L. C.I.F. B86087558 Spain 100 —
Pilowin S.A. 5356865 Uruguay 100 —
Pöyry Soluções em Projetos Ltda 12.051.324/0001-38 Brazil 100 —
EPP-Empresa de Pagamentos Planejados Ltda 14.576.556/0001-35 Brazil 33 —
Kiinteistö Oy Manuntori 0599822-8 Finland 34.2 —
Mifecor S.A. 6826148 Uruguay 100 —
East Engineering Ltd Oy 0781039-9 Finland 100 —
JP-Sijoitus Oy 0687625-7 Finland 100 —
Pöyry Latin America S.L.U. C.I.F. B85525699 Spain 100 —
Pöyry (Chile) Limitada 76.389.454-1 Chile 100 —
Pöyry (Peru) S.A.C. 20492556671 Peru 100 —
PT. Poyry Indonesia 01.869.762.3-058.000 Indonesia 100 —
Pöyry Management Consulting Oy 2302276-3 Finland 100 —
Pöyry Management Consulting (Italia) S.r.l. 03357900962 Italy 100 —
Pöyry Management Consulting Austria GmbH FN368887g Austria 100 —
Pöyry Management Consulting (France) S.A.S. 429,750,300 R.C.S. Paris France 100 —
Pöyry Management Consulting (Schweiz) AG CHE-108.336.384 Switzerland 100 —
Cordoba Management Consulting S.L. C.I.F. B86011814 Spain 100 —
Pöyry Consultoria em Gestao e Negocios Ltda 81.679.268/0001-01 Brazil 100 —
Pöyry Deutschland GmbH HRB 704261 Germany 100 —
Pöyry Management Consulting (Deutschland) GmbH HRB 50407 Germany 100 —
Pöyry Infra Traffic GmbH HRB 45419 Germany 100 —
Poyry Infra Sp. z o.o. 68184 Poland 100 —
PöyryCert GmbH & Co. KG HRA 43558 Germany 100 —
PÖYRY ERŐTERV Energetikai Tervező és Vállalkozó Zártkörűen Működő Részvénytársaság
Cg. 01-09-940929 Hungary 98.9 —
Pöyry Italy S.r.l. 03684000106 Italy 100 —
Poyry Energy Sdn Bhd 551240-M Malaysia 100 —
Poyry Management Consulting (NZ) Limited 358341 New Zealand 100 —
Pöyry Norway AS 934948262 Norway 100 —
Poyry Poland Sp. z o.o 150659 Poland 100 —
Poyry Rus LLC 1147847070007 Russia 100 —
2019
Corp. ID number Registered officeParticipating
interest, %1Carrying amount
in parent
FINANCIAL STATEMENTSNotes
106 Annual and Sustainability Report 2019

Note 27, cont.
Specification of changes in carrying amounts for the year
Parent company 2019 2018
Opening carrying amount 2,099 1,821
Acquisitions 6,506 287
Changed estimated contingent consideration 2 —
Internal share transfer 0 —
Impairment -86 -8
Shareholders’ contribution 1 —
Closing carrying amount 8,521 2,099
2019
Corp. ID number Registered officeParticipating
interest, %1Carrying amount
in parent
Poyry Management Consulting (Singapore) Pte. Ltd. 199200145K Singapore 100 —
Valencia Engineering S.L. C.I.F. B85756310 Spain 100 —
Pöyry Tecnologia Ltda. 50.648.468/0001-65 Brazil 100 —
EPP – Empresa de Pagamentos Planejados Ltda 14.576.556/0001-35 Brazil 34 —
Pöyry Consultoria e Projetos Ltda. 07.885.917/0001-60 Brazil 100 —
EPP-Empresa de Pagamentos Planejados Ltda 14.576.556/0001-35 Brazil 33 —
Pöyry Sweden AB 556850-0515 Sweden 100 —
Pöyry Schweiz AG CHE-108.100.605 Switzerland 100 —
Pöyry Energy Inc. A199718934 Philippines 100 —
Pöyry Contracting, Inc CS201417557 Philippines 100 —
Pöyry Infra Ltd. 0105534110367 Thailand 100 —
Pöyry (Thailand) Ltd. 0105549127651 Thailand 100 —
Pöyry Infra de Venezuela, S.A. (RIF) J-31047947-0 Venezuela 100 —
Poyry (B) Sdn Bhd RC/00006378 Brunei Darussalam
90 —
Pöyry Energy Ltd 0105539109073 Thailand 100 —
Poyry (México) S.A, de C.V. 357161 Mexico 100 —
Pöyry Energy Limited 1192469 UK 100 —
Poyry PNG Limited 1-116142 Papua New Guinea
100 —
Electrowatt Consultants Limited 1199099 UK 100 —
Poyry Energy Nigeria Limited RC 1479096 Nigeria 100 —
Pöyry Management Consulting (UK) Limited 2573801 UK 100 —
Pöyry Capital Limited 3639550 UK 100 —
Pöyry (USA) Inc. 049137, FEIN 39-1925989 USA 100 —
Pöyry (Montréal) Inc. 404505-0 Canada 100 —
Pöyry (Appleton) LLC FEIN 39-1909415 USA 100 —
Pöyry Management Consulting (USA) Inc. FEIN 98-0442806 USA 100 —
Pöyry Consulting and Engineering (India) Private Limited U93090MH2009195970 FTC
India 100 —
Pöyry South Africa (Proprietary) Limited 1997/011722/07 South Africa 100 —
1) Participating interest refers to both voting share and proportion of total number of shares.
107 Annual and Sustainability Report 2019

Reconciliation of liabilities arising from financing activitiesOpening balance Cash flows Changes that do not affect cash flow
Closing balance
Group Cash receiptsCash
disbursementsAcquisition of
subsidiaries ConversionTranslation differences Other
Long-term bank loans 500 855 -500 2 — 0 — 857
Bond loan 1,700 2,000 -500 — — — — 3,200
Short-term bank loans 130 — -93 — — 0 — 37
Commercial paper 640 — -240 — — — — 400
Staff convertible 514 171 — — -147 — 2 540
Lease liabilities 69 — -540 — — — 3,250 2,779
Other 6 8 -8 — — -6 — 1
Total liabilities arising from financing activities 3,559 3,035 -1,881 2 -147 -6 3,252 7,815
Note 28
Untaxed reserves
Parent company 2019 2018
Accumulated additional depreciation
Opening balance 1 January 54 45
Depreciation for the year, equipment 24 9
Closing balance 31 December 78 54
Transfers to tax allocation reserve
Opening balance 1 January 3 91
Reversal for the year — -91
Provisions for the year 2 3
Closing balance 31 December 4 3
Total untaxed reserves 82 57
Interest paid and dividends receivedGroup Parent company
2019 2018 2019 2018
Dividends received — — 562 809
Group contribution received — — 273 28
Interest received 9 5 39 37
Interest paid -99 -57 -93 -54
-90 -53 781 820
Adjustment for items not included in cash flowGroup Parent company
2019 2018 2019 2018
Depreciation/amortisation 868 138 34 34
Changed estimated contingent consideration -129 -2 1 4
Restructuring reserve 47 -46 — —
Anticipated dividend from subsidiaries — — -500 -150
Impairment of shares in subsidiaries — — — 8
Transaction costs 70 — — —
Other 24 -43 44 100
880 47 -421 -3
Note 29
Statement of cash flows
FINANCIAL STATEMENTSNotes
108 Annual and Sustainability Report 2019
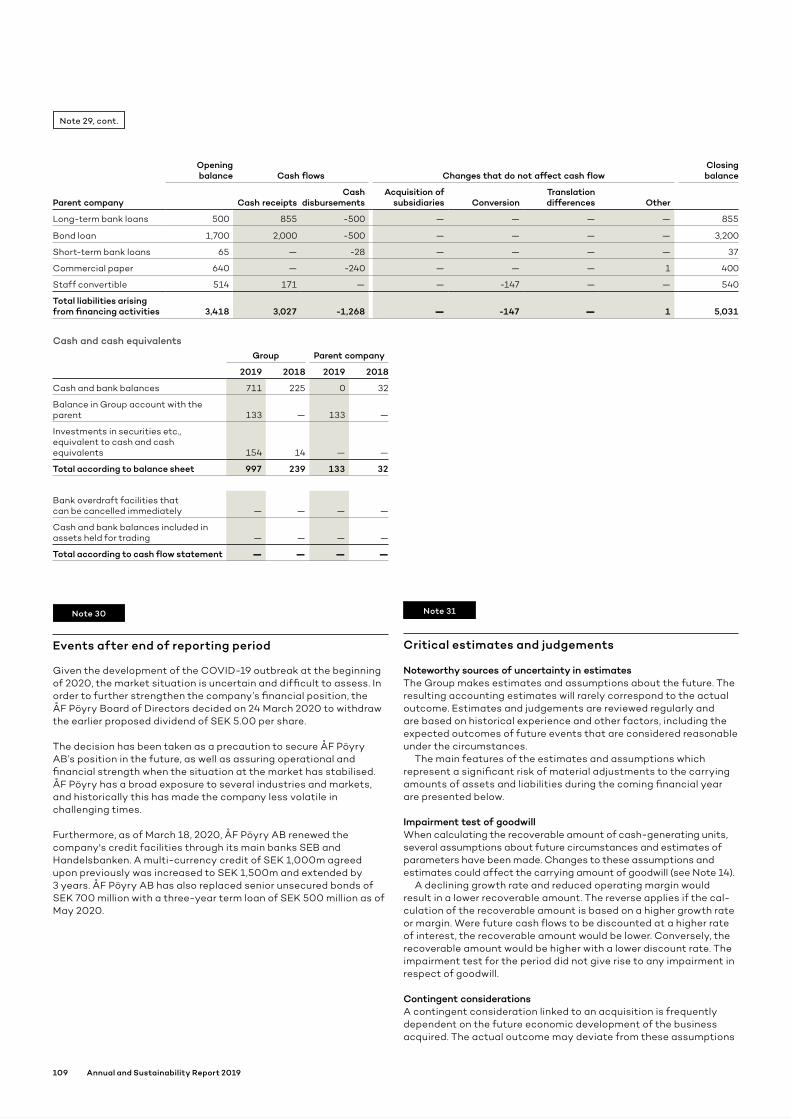
Note 29, cont.
Cash and cash equivalentsGroup Parent company
2019 2018 2019 2018
Cash and bank balances 711 225 0 32
Balance in Group account with the parent 133 — 133 —
Investments in securities etc., equivalent to cash and cash equivalents 154 14 — —
Total according to balance sheet 997 239 133 32
Bank overdraft facilities that can be cancelled immediately — — — —
Cash and bank balances included in assets held for trading — — — —
Total according to cash flow statement — — — —
Opening balance Cash flows Changes that do not affect cash flow
Closing balance
Parent company Cash receiptsCash
disbursementsAcquisition of
subsidiaries ConversionTranslation differences Other
Long-term bank loans 500 855 -500 — — — — 855
Bond loan 1,700 2,000 -500 — — — — 3,200
Short-term bank loans 65 — -28 — — — — 37
Commercial paper 640 — -240 — — — 1 400
Staff convertible 514 171 — — -147 — — 540
Total liabilities arising from financing activities 3,418 3,027 -1,268 — -147 — 1 5,031
Note 30
Events after end of reporting period
Given the development of the COVID-19 outbreak at the beginning of 2020, the market situation is uncertain and difficult to assess. In order to further strengthen the company’s financial position, the ÅF Pöyry Board of Directors decided on 24 March 2020 to withdraw the earlier proposed dividend of SEK 5.00 per share. The decision has been taken as a precaution to secure ÅF Pöyry AB’s position in the future, as well as assuring operational and financial strength when the situation at the market has stabilised. ÅF Pöyry has a broad exposure to several industries and markets, and historically this has made the company less volatile in challenging times. Furthermore, as of March 18, 2020, ÅF Pöyry AB renewed the company's credit facilities through its main banks SEB and Handelsbanken. A multi-currency credit of SEK 1,000m agreed upon previously was increased to SEK 1,500m and extended by 3 years. ÅF Pöyry AB has also replaced senior unsecured bonds of SEK 700 million with a three-year term loan of SEK 500 million as of May 2020.
Note 31
Critical estimates and judgements
Noteworthy sources of uncertainty in estimatesThe Group makes estimates and assumptions about the future. The resulting accounting estimates will rarely correspond to the actual outcome. Estimates and judgements are reviewed regularly and are based on historical experience and other factors, including the expected outcomes of future events that are considered reasonable under the circumstances.
The main features of the estimates and assumptions which represent a significant risk of material adjustments to the carrying amounts of assets and liabilities during the coming financial year are presented below.
Impairment test of goodwillWhen calculating the recoverable amount of cash-generating units, several assumptions about future circumstances and estimates of parameters have been made. Changes to these assumptions and estimates could affect the carrying amount of goodwill (see Note 14).
A declining growth rate and reduced operating margin would result in a lower recoverable amount. The reverse applies if the cal-culation of the recoverable amount is based on a higher growth rate or margin. Were future cash flows to be discounted at a higher rate of interest, the recoverable amount would be lower. Conversely, the recoverable amount would be higher with a lower discount rate. The impairment test for the period did not give rise to any impairment in respect of goodwill.
Contingent considerationsA contingent consideration linked to an acquisition is frequently dependent on the future economic development of the business acquired. The actual outcome may deviate from these assumptions
109 Annual and Sustainability Report 2019

Note 32
Information on parent
ÅF Pöyry AB is a Swedish public limited company domiciled in Stockholm. The parent’s shares are listed on the Nasdaq OMX stock exchange in Stockholm. The postal address to the company’s head office is ÅF Pöyry AB, SE-169 99 Stockholm, Sweden.
The consolidated financial statements for 2019 comprise the parent and its subsidiaries, which together form the Group. The Group also includes participations in associates.
and the effect of this will be to change the size of the previously recognised contingent consideration.
Pension assumptionsThe Group’s net obligations concerning defined-benefit plans are calculated separately for each plan by estimating the future pay-ment which the employees earned through employment in previous periods. This payment is discounted to present value. The calcula-tion of the size of the Group’s total retirement benefit obligations is based on several assumptions (see Note 19). Were a lower discount rate to be used, the obligations would increase and have a nega-tive effect on consolidated equity. The reverse applies if a higher discount rate is used.
Judgement on forecast and stage of completion of contractsThe Group applies the percentage of completion method, which means that income is recognised based on the stage of completion. The stage of completion is determined by comparing the accrued expenditure at the end of the reporting period with total expendi-ture. This means that the Group must perform multiple estimates of the percentage of total expenditures represented by accrued expenditures at the end of the reporting period. The forecasts for each assignment also represent an estimate of final income and expenditure.
DisputesThere is a risk that disputes may arise while doing business, such as in customer assignments and in conjunction with acquisitions. At year-end, the Group recognised provisions based on a best judgement. The most material disputes in 2019, both in progress and disputed, are summarised below.
Arbitration with Danir ABIn 2015, Danir AB initiated arbitration procedures regarding its claim for additional contingent consideration related to ÅF’s acquisition of Epsilon Holding AB in 2012. The main negotiation in the arbitration was held during the period from 4 to 25 February 2019. The outcome was announced on 25 May. The arbitration panel ruled in favour of ÅF Pöyry, and disallowed large parts of Danir’s claims. The ruling was in line with ÅF Pöyry’s expectations, and the provisions the Group had already made, creating a limited positive effect on profit.
Disputes arising from the construction of the Brazilian nuclear power plant Angra 3Legal proceedings are currently being held in Brazil concerning accusations of corruption relating to the awarding of contracts in connection with the procurement of the Brazilian nuclear power plant Angra 3. The previous Brazilian president Michel Temer is the focus of the proceedings, but accusations of corruption have also been lodged against several other people and companies, including some of ÅF Pöyry's foreign subsidiaries.
In June 2019 the Brazilian prosecutor brought a civil suit against certain subsidiaries of the ÅF Pöyry Group as well as other parties, which included claims for damages. The Brazilian prosecutor’s arguments include that ÅF Pöyry’s subsidiaries ÅF Consult OY and AF Consult Brazil were awarded the Angra 3 contract as part of an arrangement to facilitate the transfer of benefits to the former president from one of ÅF Pöyry’s clients. ÅF Pöyry has disputed the accusations and the prosecution. The trial is expected to take place some time in 2020.
The Angra 3 contract is furthermore being examined by the Court of Auditors in Brazil, and arbitration proceedings have been initiated by AF Consult Brazil.
Disputes in connection with Sino-Forest CorporationIn 2011 three competing class action lawsuits were filed in Ontario, Canada against certain subsidiaries of the ÅF Pöyry Group and other defendants relating to Sino-Forest Corporation. The Ontario court only allowed one of these suits to proceed (the Ontario law-suit), while the other two proceedings were suspended. Only one ÅF
Pöyry subsidiary was named as a defendant in the Ontario law-suit. An additional legal process was initiated at the same time in Quebec, Canada, and the same ÅF Pöyry subsidiary was named as a defendant there. (This and the Ontario lawsuit are jointly referred to as the "Canadian SFC lawsuits".) The plaintiffs in the Canadian SFC lawsuits accused the ÅF Pöyry subsidiary and other professional advisers of negligence in their respective assignments for SFC.
In 2012 the ÅF Pöyry subsidiary concerned reached agreement with the plaintiffs of the Canadian SFC lawsuits. However, later in 2012 the subsidiary named as a defendant in the Ontario lawsuit was sued as a defendant in additional class-action lawsuit already in progress against SFC and other defendants in New York in the US ("the US SFC lawsuit"). The claims resemble those made in the Canadian SFC lawsuits. No material developments have taken place in the US SFC lawsuit since the ÅF Pöyry was added as a defendant.
In 2012 SFC declared bankruptcy, and a special trust was estab-lished in connection with this (a litigation trust) that took over cer-tain legal claims that SFC, and/or some of its creditors, had against third parties (the SFC trust). In 2013 the SFC trust initiated legal proceedings in several jurisdictions against parties including certain ÅF Pöyry subsidiaries concerning services provided to SFC that SFC is alleged to have suffered harm from. However only one of these proceedings is currently in progress, a proceeding initiated in 2014 in Singapore against ÅF Pöyry's subsidiary in Singapore, where the SSC trust alleges breach of contract and negligence that caused harm to SSC. Even though ÅF Pöyry's legal representatives in the concerned jurisdictions consider the proceedings to be groundless, it's too early to assess the likely outcome of these proceedings.
Contraloria proceedings in PeruThe Office of the Comptroller General of the Republic of Peru (La Contraloria General De La Republica in Spanish, here referred to as “Contraloria”) has initiated several legal proceedings concerning the Metro Lima project in Peru against a consortium in which a ÅF Pöyry subsidiary participated. In 2013 Contraloria brought an action in court in Lima, Peru, with a claim of a total of USD 54 million, con-cerning alleged harm caused by the consortium, particularly con-cerning certain alleged failures to perform contracted undertakings. A decision in the first instance is expected to be announced in 2020 or the first half of 2021. Even though ÅF Pöyry's legal representative considers the proceedings to be groundless, it's too early to assess the likely outcome of these proceedings.
Dispute in Latvia The Latvian Prosecutor’s Office has brought charges in Latvian court against AF-Consult Switzerland and two former ÅF employ-ees. The action concerns suspected influence peddling in 2010 via AF-Consult Switzerland’s previous agent in Latvia in connection with a project to renovate a power plant in Riga. AF-Consult Swit-zerland has disputed the accusations and the prosecution. The main proceedings began in summer 2019 and are expected to continue in 2020. If there is a conviction, the maximum amount AF-Consult Switzerland can be ordered to pay is a fine of up to EUR 4.3 million.
Note 31, cont.
FINANCIAL STATEMENTSNotes
110 Annual and Sustainability Report 2019
Signatures
The undersigned declare that the consolidated accounts and annual report were prepared in accordance with IFRS, as approved by the EU, and with generally accepted accounting practices, and give a fair presentation of the position and performance of the Group and the company, and that the Group administration report and
the administration report give a fair review of the progress of the Group’s and the company’s operations, position and performance, as well as describing the material risks and uncertainty factors to which the companies that are members of the Group are exposed.
Stockholm, 26 March 2020
Anders NarvingerChairman of the Board
Jonas AbrahamssonDirector
Gunilla BergDirector
Henrik EhrnroothDirector
Salla PöyryDirector
Joakim RubinDirector
Kristina SchaumanDirector
Anders SnellDirector
Ulf SödergrenDirector
Tomas EkvallDirector,
employee representative
Stefan LöfqvistDirector,
employee representative
Jonas GustavssonPresident and CEO
Our Audit Report was presented on 26 March 2020
KPMG AB
Joakim ThilstedtAuthorised Public Accountant
111 Annual and Sustainability Report 2019

Auditors’ report
To the general meeting of the shareholders of ÅF Pöyry AB, corp. id 556120-6474
Report on the annual accounts and consolidated accounts
OpinionsWe have audited the annual accounts and consolidated accounts of ÅF Pöyry AB for the year 2019. The annual accounts and consol-idated accounts of the company are included on pages 54–111 in this document.
In our opinion, the annual accounts have been prepared in accord-ance with the Annual Accounts Act, and present fairly, in all material respects, the financial position of the parent company as of 31 December 2019 and its financial performance and cash flow for the year then ended in accordance with the Annual Accounts Act. The consolidated accounts have been prepared in accordance with the Annual Accounts Act and present fairly, in all material respects, the financial position of the group as of 31 December 2019 and their financial performance and cash flow for the year then ended in accordance with International Financial Reporting Standards (IFRS), as adopted by the EU, and the Annual Accounts Act..The statu-tory administration report is consistent with the other parts of the annual accounts and consolidated accounts.
We therefore recommend that the general meeting of sharehold-ers adopts the income statement and balance sheet for the parent company and the group.
Our opinions in this report on the the annual accounts and con-
solidated accounts are consistent with the content of the additional report that has been submitted to the parent company's audit com-mittee in accordance with the Audit Regulation (537/2014) Article 11.
Basis for Opinions We conducted our audit in accordance with International Stand-ards on Auditing (ISA) and generally accepted auditing standards in Sweden. Our responsibilities under those standards are further described in the Auditor’s Responsibilities section. We are independ-ent of the parent company and the group in accordance with profes-sional ethics for accountants in Sweden and have otherwise fulfilled our ethical responsibilities in accordance with these requirements.This includes that, based on the best of our knowledge and belief, no prohibited services referred to in the Audit Regulation (537/2014) Article 5.1 have been provided to the audited company or, where applicable, its parent company or its controlled companies within the EU.
We believe that the audit evidence we have obtained is sufficient and appropriate to provide a basis for our opinions.
Key Audit MattersKey audit matters of the audit are those matters that, in our pro-fessional judgment, were of most significance in our audit of the annual accounts and consolidated accounts of the current period. These matters were addressed in the context of our audit of, and in forming our opinion thereon, the annual accounts and consolidated accounts as a whole, but we do not provide a separate opinion on these matters.
Accounting for revenue and cost within fixed price projects See disclosure 2, 31 and accounting principles on page 75 in the annual account and consolidated accounts for detailed information and description of the matter.
Description of key audit matterPart of the Groups revenue are derived from projects where the Group has an obligation to perform the projects to a fixed price. Revenues and costs for fixed price contacts are recognized suc-cessively as the project progresses in accordance with the stage of completion, which is calculated on the basis of accumulated expenses in relation to estimated accumulated project expenses upon completion. Anticipated losses are immediately recognized as a cost.
The accounting for revenues and profit are based on an esti-mation of total costs and revenues within each project. Changes in estimations throughout the project can have a significant effect on the Groups result and financial position.During each project the Group performs a regular review of the project fore-casts to ensure that necessary changes are made. Change- and additional orders as well as claims are included in the forecast when the Group consider it probable that the amount will be received from the customer and when the amount can be reliably measured.
Response in the auditWe have received information and assessed the Groups process for project review including the routines for identifying loss pro-jects and/or projects with a higher risk as well as the process for assessing revenue and costs (including assessment of change- and additional orders).
We have for a random sample of projects assessed the most significant estimates. For these projects we have discussed and challenged managements estimations of total forecast, assessed if risks and possibilities in the projects has been rea-sonably reflected in the project valuations as well as assessed loss contracts and if provisions for losses reflects the risks in the projects.
We have also evaluated information from the Groups internal and external legal counsel regarding claims and assessed if and how these has been reflected in the forecasts.
112 Annual and Sustainability Report 2019
FINANCIAL STATEMENTSAuditors’ report

Vaulation of goodwill and parent company shares in subsidaries See disclosure 14, 26, 31 and accounting principles on pages 77-78 in the annual account and consolidated accounts for detailed infor-mation and description of the matter.
Description of key audit matterThe carrying value of intangible assets in the form of goodwill in the consolidated accounts at December 31, 2018 amounted to SEK 11,768 million, which is approximately 51% of total assets. Intangible assets with an indefinite useful life should annually, or when there are indication of impairment, be subject to impair-ment test. An impairment test comprise both complexity and are dependent on judgments.
The impairment test shall according to IFRS be performed in accordance with a certain method where management needs to make judgments of future, internal as well as external, conditions and plans. Examples of such judgments include forecasts of future cash flows and which discount rate to be used in order to reflect the risk in forecasted payments.
The carrying value of shares in subsidiaries in the parent company at December 31, 2018 amounted to SEK 8,521 million. In case of an impairment trigger, if for example the value of the shares is higher than group value, an impairment test, with the same technique and judgments, as above is performed.
Response in the auditWe have reviewed and assessed whether the impairment tests have been prepared in accordance with the method prescribed by IFRS.
Moreover, we have considered the reasonableness of the forecasted future cash flows as well as the discount rates used through evaluation of management’s written documentation and forecasts. We have also met with management and evaluated the accuracy of previous years’ cash flow forecasts in relation to actual outcome. An important part of our work has also been to examine the group’s own sensitivity analysis to evaluate how reasonable changes in the assumptions may impact the valua-tion.
Furthermore, we have considered the completeness of the disclosures made relating to the impairment tests in the annual accounts and assessed if they are in accordance with the assumptions used by management and that they, in all material aspects, are in accordance with the disclosures required by IFRS.
Valuation of contingent considerations from business combinations See disclosure 3, 13, 31 and accounting principles on page 76 in the annual account and consolidated accounts for detailed information and description of the matter.
Description of key audit matterIn certain business combinations the Group can agree with the seller to include a contingent consideration which normally imply that parts of the purchase price is contingent on the future finan-cial development of the acquired business.
The value is based on the terms in the agreement and include judgments about the discounted value of future revenue growth and profit margin. The calculation of the value is dependent of significant judgments. If actual outcome deviates from these assessments or if the assessments about the future financial development for an acquired business is changed this could result in a change in the value of the contingent considerations which is accounted for in the income statement as they occur.
Liabilities for contingent considerations are valued at fair value in the balance sheet and amounted to SEK 358 million as of December 31, 2019. Total maximal liability at the same date amounted to SEK 547 million.
Response in the auditWe have in our audit analyzed a sample of agreements from per-formed acquisitions and the terms that is the basis for the con-tingent considerations. We have also assessed management’s estimations regarding future financial performance and, through this, the size of contingent considerations.
Furthermore, we have considered the completeness of the disclosures in the annual accounts and assessed if they are in accordance with the assumptions used by management and that they, in all material aspects, are in accordance with the disclo-sures required by IFRS.
Acquistion of Pöyry PLC See disclosure 3 and accounting principles on page 75 in the annual account and consolidated accounts for detailed information and description of the matter.
Description of key audit matterIn February 2019 all the shares in Pöyry PLC were acquired for a total purchase price of SEK 6,407 million. Following a business combination, the acquired operations should be accounted for in the consolidated accounts which require acquired assets and liabilities to be identified and measured at its fair value at the acquisition date. The difference between the purchase price and the identified assets and liabilities is goodwill.
The purchase price allocation requires judgments to be made regarding which assets to account for in the consolidated accounts – in particular intangible assets may be difficult to assess – including the assigned fair values in the consolidated accounts. These judgments will affect the group’s future profits, partly depending on whether the identified assets are to be amortized or not in the consolidated accounts.
Response in the auditWe have analyzed the purchase price allocation in order to assess whether it has been prepared in accordance with com-monly prescribed methods and that all assets, in particular intangible assets, and liabilities have been identified. We have received and assessed the documentation management has prepared with assistance from external experts.
Furthermore, we have focused on whether the techniques used to measure the acquired assets and liabilities to fair value are in accordance with the prescribed framework and established valuation techniques. In the purchase price allocation intangible assets amounting to SEK 1,304 million have been identified in addition to what was recorded in Pöyry PLC. Goodwill amount to SEK 4,829 million.
We have also assessed the disclosures relating to the business combination included in the annual accounts and the consoli-dated accounts.
113 Annual and Sustainability Report 2019

Other Information than the annual accounts and consolidated accounts This document also contains other information than the annual accounts and consolidated accounts and is found on pages 1–53, 116–128, 130–134 and 136–144. The Board of Directors and the Managing Director are responsible for this other information.
Our opinion on the annual accounts and consolidated accounts does not cover this other information and we do not express any form of assurance conclusion regarding this other information.
In connection with our audit of the annual accounts and con-solidated accounts, our responsibility is to read the information identified above and consider whether the information is materially inconsistent with the annual accounts and consolidated accounts. In this procedure we also take into account our knowledge otherwise obtained in the audit and assess whether the information otherwise appears to be materially misstated.
If we, based on the work performed concerning this informa-tion, conclude that there is a material misstatement of this other information, we are required to report that fact. We have nothing to report in this regard.
Responsibilities of the Board of Directors and the Managing DirectorThe Board of Directors and the Managing Director are responsi-ble for the preparation of the annual accounts and consolidated accounts and that they give a fair presentation in accordance with the Annual Accounts Act and, concerning the consolidated accounts, in accordance with IFRS as adopted by the EU. The Board of Directors and the Managing Director are also responsible for such internal control as they determine is necessary to enable the prepa-ration of annual accounts and consolidated accounts that are free from material misstatement, whether due to fraud or error.
In preparing the annual accounts and consolidated accounts The Board of Directors and the Managing Director are responsible for the assessment of the company’s and the group's ability to continue as a going concern. They disclose, as applicable, matters related to going concern and using the going concern basis of accounting. The going concern basis of accounting is however not applied if the Board of Directors and the Managing Director intend to liquidate the company, to cease operations, or has no realistic alternative but to do so.
The Audit Committee shall, without prejudice to the Board of Director’s responsibilities and tasks in general, among other things oversee the company’s financial reporting process.
Auditor’s responsibilityOur objectives are to obtain reasonable assurance about whether the annual accounts and consolidated accounts as a whole are free from material misstatement, whether due to fraud or error, and to issue an auditor’s report that includes our opinions. Reasonable assurance is a high level of assurance, but is not a guarantee that an audit conducted in accordance with ISAs and generally accepted auditing standards in Sweden will always detect a material mis-statement when it exists. Misstatements can arise from fraud or error and are considered material if, individually or in the aggre-gate, they could reasonably be expected to influence the economic decisions of users taken on the basis of these annual accounts and consolidated accounts.
As part of an audit in accordance with ISAs, we exercise profes-sional judgment and maintain professional scepticism throughout the audit. We also:– Identify and assess the risks of material misstatement of the
annual accounts and consolidated accounts, whether due to fraud or error, design and perform audit procedures responsive to those risks, and obtain audit evidence that is sufficient and appropri-ate to provide a basis for our opinions. The risk of not detecting a material misstatement resulting from fraud is higher than for one resulting from error, as fraud may involve collusion, forgery, inten-tional omissions, misrepresentations, or the override of internal control.
– Obtain an understanding of the company’s internal control relevant to our audit in order to design audit procedures that
are appropriate in the circumstances, but not for the purpose of expressing an opinion on the effectiveness of the company’s internal control.
– Evaluate the appropriateness of accounting policies used and the reasonableness of accounting estimates and related disclosures made by the Board of Directors and the Managing Director.
– Conclude on the appropriateness of the Board of Directors’ and the Managing Director's, use of the going concern basis of accounting in preparing the annual accounts and consolidated accounts. We also draw a conclusion, based on the audit evidence obtained, as to whether any material uncertainty exists related to events or conditions that may cast significant doubt on the company’s and the group's ability to continue as a going concern. If we conclude that a material uncertainty exists, we are required to draw attention in our auditor’s report to the related disclosures in the annual accounts and consolidated accounts or, if such dis-closures are inadequate, to modify our opinion about the annual accounts and consolidated accounts. Our conclusions are based on the audit evidence obtained up to the date of our auditor’s report. However, future events or conditions may cause a com-pany and a group to cease to continue as a going concern.
– Evaluate the overall presentation, structure and content of the annual accounts and consolidated accounts, including the disclosures, and whether the annual accounts and consolidated accounts represent the underlying transactions and events in a manner that achieves fair presentation.
– Obtain sufficient and appropriate audit evidence regarding the financial information of the entities or business activities within the group to express an opinion on the consolidated accounts. We are responsible for the direction, supervision and performance of the group audit. We remain solely responsible for our opinions.
– We must inform the Board of Directors of, among other matters, the planned scope and timing of the audit. We must also inform of significant audit findings during our audit, including any signifi-cant deficiencies in internal control that we identified.
We must also provide the Board of Directors with a statement that we have complied with relevant ethical requirements regarding independence, and to communicate with them all relationships and other matters that may reasonably be thought to bear on our inde-pendence, and where applicable, related safeguards.
From the matters communicated with the Board of Directors, we determine those matters that were of most significance in the audit of the annual accounts and consolidated accounts, including the most important assessed risks for material misstatement, and are therefore the key audit matters. We describe these matters in the auditor’s report unless law or regulation precludes disclosure about the matter.
Report on other legal and regulatory requirements
OpinionsIn addition to our audit of the annual accounts and consolidated accounts, we have also audited the administration of the Board of Directors and the Managing Director of ÅF Pöyry AB for the year 2019 and the proposed appropriations of the company's profit or loss.
We recommend to the general meeting of shareholders that the profit be appropriated in accordance with the proposal in the stat-utory administration report and that the members of the Board of Directors and the Managing Director be discharged from liability for the financial year.
Basis for OpinionsWe conducted the audit in accordance with generally accepted auditing standards in Sweden. Our responsibilities under those standards are further described in the Auditor’s Responsibilities section. We are independent of the parent company and the group in accordance with professional ethics for accountants in Sweden and have otherwise fulfilled our ethical responsibilities in accord-ance with these requirements.
114 Annual and Sustainability Report 2019
FINANCIAL STATEMENTSAuditors’ report

We believe that the audit evidence we have obtained is sufficient and appropriate to provide a basis for our opinions.
Responsibilities of the Board of Directors and the Managing Director The Board of Directors is responsible for the proposal for appropri-ations of the company’s profit or loss. At the proposal of a dividend, this includes an assessment of whether the dividend is justifiable considering the requirements which the company's and the group's type of operations, size and risks place on the size of the parent company's and the group’s equity, consolidation requirements, liquidity and position in general.
The Board of Directors is responsible for the company’s organiza-tion and the administration of the company’s affairs. This includes among other things continuous assessment of the company’s and the group's financial situation and ensuring that the company's organization is designed so that the accounting, management of assets and the company’s financial affairs otherwise are controlled in a reassuring manner.
The Managing Director shall manage the ongoing administration according to the Board of Directors' guidelines and instructions and among other matters take measures that are necessary to fulfill the company's accounting in accordance with law and handle the management of assets in a reassuring manner.
Auditor’s responsibility Our objective concerning the audit of the administration, and thereby our opinion about discharge from liability, is to obtain audit evidence to assess with a reasonable degree of assurance whether any member of the Board of Directors or the Managing Director in any material respect:– has undertaken any action or been guilty of any omission which
can give rise to liability to the company, or– in any other way has acted in contravention of the Companies
Act, the Annual Accounts Act or the Articles of Association.
Our objective concerning the audit of the proposed appropriations of the company’s profit or loss, and thereby our opinion about this, is to assess with reasonable degree of assurance whether the pro-posal is in accordance with the Companies Act.
Reasonable assurance is a high level of assurance, but is not a guarantee that an audit conducted in accordance with generally accepted auditing standards in Sweden will always detect actions or omissions that can give rise to liability to the company, or that the proposed appropriations of the company’s profit or loss are not in accordance with the Companies Act.
As part of an audit in accordance with generally accepted auditing standards in Sweden, we exercise professional judgment and maintain professional scepticism throughout the audit. The examination of the administration and the proposed appropriations of the company’s profit or loss is based primarily on the audit of the accounts. Additional audit procedures performed are based on our professional judgment with starting point in risk and materiality. This means that we focus the examination on such actions, areas and relationships that are material for the operations and where deviations and violations would have particular importance for the company’s situation. We examine and test decisions undertaken, support for decisions, actions taken and other circumstances that are relevant to our opinion concerning discharge from liability. As a basis for our opinion on the Board of Directors’ proposed appro-priations of the company’s profit or loss we examined whether the proposal is in accordance with the Companies Act.
KPMG AB, Box 382, 101 27, Stockholm, was appointed auditor of ÅF Pöyry AB by the general meeting of the shareholders on the 15 May 2019. KPMG AB or auditors operating at KPMG AB have been the company's auditor since 2017.
Stockholm, 26 March 2020
KPMG AB
Joakim ThilstedtAuthorised Public Accountant
115 Annual and Sustainability Report 2019

Annual and Sustainability Report 2019116
Vlora Makolli, Strategist Peter Degerström, Process Engineer

Other information
117 Annual and Sustainability Report 2019

Responsibility and governance Within ÅF Pöyry there is a clearly stated responsibility for sustain-ability and governance is rooted at the highest managerial level. This gives us excellent opportunities to vigorously disseminate the business strategy’s basic component – sustainability – in the entire organisation.
Integrated sustainability efforts As CEO, Jonas Gustavsson has ultimate responsibility for ÅF Pöyry’s sustainability efforts. Head of Sustainability Marie Trogstam has the strategic responsibility. She has reported to Executive Vice Presi-dent and Group General Counsel Susan Gustafsson, a member of Group management, since 1 October 2019. The Head of Sustainability is supported by a team. Sustainability is an integral part of Group management’s work, and sustainability topics are continually under discussion. Sustainability topics are thereby prioritised early in the business process.
Sustainability is business critical for ÅF Pöyry, which is reflected in the sustainability strategy being integrated into the Making Future business strategy that was launched in 2017. This makes it easy for the organisation to use sustainability-critical aspects such as value creation, ethical engagement and commitment, and to be attractive employer to create value for ÅF Pöyry, its clients and society.
ÅF Pöyry’s Board of Directors incorporates sustainability topics into the overall decision process. Sustainability initiatives are also integrated into existing staff functions, ensuring their execution. Each division head is responsible for pushing the sustainability approach in their operations and in all their assignments through consultants. Each division also has a contact person for sustain-ability issues, who develops and carries out the company’s sustain-ability initiatives within the division in discussions with the Head of Sustainability.
Global Compact is the foundation ÅF Pöyry’s sustainability approach is based on the 10 principles of the Global Compact in human rights, labour, the environment and anti-corruption, which we follow, reporting our efforts and progress
Sustainability notes
annually to the UN. Since the launch of Agenda 2030 and the UN’s 17 Global Goals for Sustainable Development, ÅF Pöyry has sys-tematically worked to understand our impact on the goals based on our business and our offering. The goals are also used in business development. Initiatives and guidelines that ÅF Pöyry follows and is inspired by are:– The UN Global Compact– The UN’s 17 Global Goals for Sustainable Development – OECD guidelines for multinational companies– ILO’s Human Rights Guidelines– UN Guiding Principles on Business and Human Rights (UNGP)– Transparency International’s Corruption Perceptions Index– Equator Principles (EP)– International Finance Corporation (IFC) Performance Standards– Principles for Responsible Investment (PRI)
Governance, Risk and ComplianceIn autumn 2019 a project was initiated to further develop Governance, Risk and Compliance (”GRC”) efforts, and several initiatives are now under way to strengthen the Group's risk management and better manage the conditions that come with a stronger international pres-ence. Examples of these initiatives include the appointment of a new Chief Compliance and Ethics Officer and a Group-level risk man-ager, who reports to the Executive Vice President and Group General Counsel Susan Gustafsson who is part of Group Management; har-monisation of risk management processes; risk tools; incident, crisis, continuity and interruption plans; a review of the Sustainability Risk Assessment process (SRA process); and the rollout of a training on ÅF Pöyry’s Code of Conduct to all employees in the Group.
Code of ConductA new Code of Conduct for the Group was launched the day after the acquisition of Pöyry. The Code is based on the ten principles of the UN Global Compact. It is a compilation of the rules and guidelines that form the basis of our business and defines how we conduct business relationships with customers, business partners, employees and other stakeholders. The Code, which covers all employees in all countries and the Group’s Board of Directors, lays down the high ethical require-
About the sustainability report Sustainability is an integral part of ÅF Pöyry’s vision, mission and strategy. A crucial part of our sustainability efforts is to create sustainable solutions in client assignments. In addition to ÅF Pöyry’s 2019 sustainability report, sustainability information is therefore largely an integrated part of the annual report.
The following pages provide additional sustainability informa-tion, such as background information for the report, information about stakeholder dialogues, materiality assessment, sustain-ability data, and the GRI index. ÅF Pöyry publishes a sustainabil-ity report annually, the latest being published in March 2019. ÅF Pöyry’s sustainability report for 2019 is prepared in accordance with the Global Reporting Initiative (GRI) Standards, Core Level. The sustainability report covers the companies in the ÅF Pöyry Group, in accordance with the same principles applied to finan-cial reporting. The reporting principles in the GRI Standards were used to define the contents of the report.
Statistics on employees were compiled by the HR function from the HR system and refer to figures at 31 December 2019 for all companies in the Group unless otherwise stated.
The sustainability report, which also complies with ÅF Pöy-ry’s statutory sustainability report in accordance with Chapter
6 of the Annual Accounts Act, comprises pages 6-7 (non-finan-cial targets), 14-17, 43-45, 61 (sustainability risks) and 118-128. Also see the table of contents. Our sustainability report according to GRI Standards has been reviewed by an external party. See the auditor’s Limited Assurance Report on the sus-tainability report and statement on the Statutory Sustainabil-ity Report on page 129.
Changes compared to the previous year This year’s Sustainability report is the first since the acquisition of Pöyry. The materiality assessment previously performed remains the basis for determining the content of the Sustainability report, which means that the material sustainability topics are the same as in previous year's sustainability report. The reported sustain-ability information and data apply to the entire Group, and include data for Pöyry beginning at the acquisition date, 21 February 2019, unless otherwise indicated. Otherwise, no major changes have been made to the report’s frameworks or recalculations.
Contact point Inquiries about the sustainability report should be directed to: Marie Trogstam, Head of Sustainability, Tel.: +46 10 505 00 00.
OTHER INFORMATIONSustainability notes
118 Annual and Sustainability Report 2019

ments for conduct that we and our business partners are expected to comply with, and guides us in how our values and standpoints should permeate daily work. Through our principles, we increase ÅF Pöyry’s standards and strengthen the brand.
ÅF Pöyry expects all its business partners – including suppliers, subcontractors, joint venture partners and representatives – to adhere to principles that are consistent with ÅF Pöyry’s Code of Conduct. A Code of Conduct for business partners and suppliers will be rolled out in 2020.
Whistleblowing functionÅF Pöyry urges all of its employees to report unethical behaviour, suspected violations of laws, rules or regulations and violations of the Code of Conduct. They should first contact their closest manager, or else the Group's legal team. If this is not possible due to the nature of the case, they may use the confidential whistleblowing function. The whistleblowing function reports to the Audit Committee. In 2019 nine cases came in via the whistleblowing function; they were handled according to our procedures.
Risk assessment at the tender stage and in-depth analysisTo ensure compliance with the Global Compact’s ten principles, there is a systematic process called the Sustainability Risk Assessment (SRA) process. In the sales and bid process, a risk assessment, based on several criteria that reflect ÅF ’s’s Code of Conduct and thus the ten principles of the Global Compact, will always be done for poten-tial assignments, new clients and new markets. The employee who is responsible for the bid is responsible for ensuring that the risk assess-ment is carried out. The aim is to catch possible risks associated with the assignment at an early stage. After discussion with the Head of Sustainability, this risk assessment can lead to an in-depth analysis being carried out, which results in an SRA report with identified risks and recommendations for how they should be handled. If unacceptable risks are identified and ÅF Pöyry cannot influence them, we do not take the assignment. During the year, in-depth analyses within the scope of the SRA process were conducted on five assignments.
Security and vulnerability analyses are also performed as part of the risk assessment during the sales and tender process. More detailed security reports are prepared in certain cases before the implementation phase. During the year, more than 30 safety reports were prepared.
ÅF Pöyry’s compliance with the SRA process is continuously eval-uated through internal audits for the part of the business that was formerly ÅF. Any deviations are reported to the person responsible for the bid and the division’s quality control function for follow-up. A summary of the deviations is reported to Group management and
the Audit Committee. According to internal audits, risk assess-ments based on the Global Compact were made in 49 percent of the audited tenders in 2019 for the part of the business that was previously ÅF. The part of the business that was formerly Pöyry has carried out the internal audit programme that was planned for Pöyry at the acquisition. Compliance with the SRA process is planned to be incorporated into next year's internal audit programme for the entire Group.
As previously mentioned, in autumn 2019 a project was initi-ated to analyse and improve risk management at the Group, which included the SRA process. The purpose is to strengthen the Group's risk management and better manage the conditions that come with a stronger international presence.
Management system Operations at ÅF Pöyry are controlled and monitored by the manage-ment systems which include policies and processes that apply to the entire operations. The management systems are ISO 9001 (quality), ISO 14001 (environment) and OHSAS 18001 (occupational health and safety) certified. The transition to the new standard ISO 45001 (occu-pational health and safety) is planned for 2020, and some parts of the business have already made the transition. Approximately 85% of ÅF Pöyry's operations is covered by the ISO certifications, and the units that are covered are listed in the certificates for ÅF Pöyry AB and Pöyry PLC respectively. These certificates will be combined in 2020.
In 2019 the former ÅF and Pöyry conducted internal audit pro-grammes separately in accordance with the plans for 2019 for each company. Summaries of the results of the internal audits were reported to the Audit Committee and the management team. There will be a common audit programme for ÅF Pöyry in 2020.
Strengthened training Our sustainability efforts require that all employees know about the sustainability topics, as well as the risks and opportunities in our operations. Therefore, the part of the business that was formerly ÅF has a range of training courses, including web-based sustainability training for all employees in which anti-corruption is a material part. Sustainability topics are also included in the Welcome to ÅF Pöyry induction training as well as in the Leadership in Our Time manage-ment programme. The Welcome to ÅF Pöyry induction training also includes a workshop on impact and value creation. The former Pöyry incorporated sustainability topics including anti-corruption in a man-datory training on the Code of Conduct. During the year a project was initiated to develop a mandatory training on ÅF Pöyry's new Code of Conduct, which was launched in January 2020.
Stakeholders How we engage in dialogue Important topics
Clients Client meetings, project meetings, follow-up interviews after the end of the project, website, participation in client events
Satisfaction, perceived quality, prices, contracts, procure-ment, deliveries, sustainability where environmental impact including climate impact is of major importance, consul-tants' sustainability expertise, quantification of climate impact in the tender stage
Employees Performance reviews, intranet, workplace meetings, conferences, internal training, leadership programmes, newsletters
Well-being, salary, work environment and professional development, type of assignment, management of assign-ments in industries with a high climate impact
Partners Planning meetings, project meetings, website Prices, contracts, ethical issues
Owners Investment events, such as in connection with quarterly reports, capital market days, annual general meeting, interviews, website, newsletters
Growth, profitability, business ethics, risk and control, sus-tainability and macrotrends as drivers of profitability and new business opportunities, how strategic sustainability efforts develop
Suppliers Supplier meetings, follow-up meetings, requests for quotes and procurement, interviews and surveys
Contract negotiations, compliance with our Code of Con-duct
Media, students, authorities and organisations, universities and colleges
Website, mail, attendance at conferences, counselling on specific issues
Topics on how sustainability efforts are developing, the offering and business associated with industries that have a climate impact
119 Annual and Sustainability Report 2019

Anti-corruption trainingEmployees who received training1 in anti-corruption for ÅF Pöyry’s home markets
Managers ConsultantsAdministrative
staff
Number Percent Number Percent Number Percent
Sweden 845 88.4 5,218 80.6 190 74.2
Finland 103 83.7 1,166 83.2 122 83.0
Switzerland 57 51.8 366 51.8 52 56.5
Norway 33 28.4 199 26.0 6 18.8
Denmark 22 33.3 131 29.4 6 23.1
Rest of world 209 86.0 1,602 76.8 225 75.0
Total 1,269 78.6 8,682 73.1 601 70.5
Permanent employees.
1) One of the courses VTÅF Pöyry, sustainability training, LIOT or Pöyry CoC training.
Dialogue with stakeholders A close dialogue with our stakeholders is central to ÅF Pöyry’s sus-tainability work. The dialogue is ongoing in all projects, meetings and other contacts that we have with the most important stakeholders. Sustainability topics are often part of the discussion, not least in connection with customer assignments.
This integrated annual and sustainability report describes how ÅF Pöyry meets the demands and expectations of stakeholders. The table on the previous page lists our most important stakeholders, how we conduct an ongoing dialogue and what topics the various stakeholders regard as most important. These stakeholders are significant to ÅF Pöyry because they have a major impact on the company and/or are affected by the company’s operations.
Stakeholder dialogue sets the parameters In the autumn of 2017, ÅF Pöyry conducted a stakeholder dialogue within the framework of the materiality assessment as a complement to the ongoing dialogue. It has since formed the basis for further devel-opment of our sustainability work. The stakeholder dialogue consisted of surveys and interviews to get a picture of ÅF Pöyry’s sustainability work at the time and the priorities that should be set going forward. The survey was answered by 5,819 people, of whom 4,899 were employees. In addition to our own employees, the survey was answered by clients, suppliers, students, shareholders, analysts and associations. In con-nection with the survey, supplementary interviews were also conducted with members of the Board of Directors, and Group management attended a workshop. The sustainability topics raised by the stake-holders as most important were:- Sustainable solutions- Good business ethics- Partner responsibility- Client and project selection- Supplier responsibility- Own climate impact
- Positive working environment- Talent retention- Diversity, equal opportunity and inclusion
Focus on the material The outcome of the stakeholder dialogue – together with weighting by the management team – forms the basis for the sustainability topics that ÅF Pöyry defined as material according to the materiality assess-ment. The materiality assessment was validated in the autumn of 2018 based on changed requirements, expectations, technological advances and conditions for stakeholders and the outside world. The material-ity principle was applied by analysing the result from the stakeholder dialogue and the Group management workshop based on the external impact that ÅF Pöyry has on each sustainability topic. The result of the materiality assessment is presented in the illustration below. Delimita-tions for each sustainability topic are described in the report. The mate-rial sustainability topics covered by the sustainability report according to the GRI Standards are:- Sustainable solutions- Good business ethics- Partner responsibility- Client and project selection- Own climate impact- Positive working environment- Diversity, equal opportunity and inclusion
Value creation In ÅF Pöyry’s strategy, value creation is a designated strategic area. Our value creation and its contribution to society respond to global trends, utilise the opportunities presented by digitalisation and meet climate challenges. This is done through our deliveries of projects, services and cross-functional package solutions, concepts and selected products. Read more about this in the Business Model section on page 38.
Our clients, and the rest of the world, are making greater demands on us to act ethically and responsibly. This is evidenced, for exam-ple, by the increased demands that clients place on us at the tender stage and when procuring various services. ÅF Pöyry can go much further than pure responsibility issues by maximising sustainability values in assignments to create, develop and implement solutions that build a more sustainable society. This connects to the mate-rial sustainability topic sustainable solutions. ÅF Pöyry’s assign-ments generate values such as energy efficiency, renewable energy, resource efficiency, safe workplaces, improved health and safety, streamlined production processes, circular resource flows, increased accessibility, secure and inclusive societies and improved air and water quality. These values are reflected in Agenda 2030 and the UN’s 17 Global Goals for Sustainable Development, and ÅF Pöyry has systematically worked since the launch of Agenda 2030 to under-stand our impact on the goals based on our business and our offer-ing. The goals are also used as support in business development.
The UN recommends an integrated approach as critical to taking on the difficult challenges we are facing. This means understand-ing the global goals not as isolated goals and guidelines, but as an
Inform
– Talent retention– Supplier responsibility
Report
– Own climate impact – Diversity, equal opportunity and inclusion– Partner responsibility
Report and focus
– Sustainable solutions – Good business ethics– Positive working environment– Client and project selection
Medium High Critical
Impact on society (environmental, social and/or economic)
ÅF Pöyry's material sustainability topics according to the materiality assessment
OTHER INFORMATIONSustainability notes
120 Annual and Sustainability Report 2019Annual and Sustainability Report120

interwoven network of sustainable solutions. By contributing to one of the goals, we can create positive change in other areas at the same time, but it also means that a positive contribution to one of the goals may have a negative impact on another goal. Therefore a holistic perspective is needed not only in connection with cus-tomer assignments, but in business development and strategy and the formation of partnerships and cooperation with civil society and the public sector as well. ÅF Pöyry’s participation in Business Sweden's delegation to COP25 in Madrid is one part of increasing our contribution to sustainable development through cooperation and partnerships in order to scale up Nordic experience and use it to contribute to global change.
Sustainable solutions are also managed by defining and con-ceptualising the strategy's five growth drivers: Smart cities and infrastructure, Future mobility, Industrial digitalisation, Changing energy markets and Transition to bioeconomy. Read more about the five growth drivers in the Strong Drivers section on page 18. The strategy also points to the development of cross-functional solutions and products as a special focus – this is also a component of maximising our value creation. ÅF Pöyry acquires companies with expertise in design, and systematically employs design and inno-vation as key skills for sustainable development. The sustainability performance of our assignments is strongly linked to what the client defines and orders, and the opportunity to influence decisions early in the development process, already in the design phase, are crucial if ÅF Pöyry is to be able to maximise positive values and minimise negative impact. Sustainability topics have also been integrated into the project model, and we continue to focus on professional development activities to increase sustainability performance of our assignments. Read more about management of sustainable solutions on page 39.
One of ÅF Pöyry’s non-financial targets is to develop engineering and design solutions that contribute to the UN’s 17 Global Goals for Sustainable Development. ÅF Pöyry has analysed the 17 Global Goals and its 169 targets with respect to our offering and our business, and the analysis shows that we contribute to all 17 Global Goals. Of the 169 targets, we have identified 52 as relevant based on ÅF Pöyry’s ability to have a positive impact. Read more about how we contribute on pages 16-17. We annually evaluate several targets for which all employees who led assignments during the previous year are asked to evaluate their biggest assignment in terms of annual turnover. The result is then used to understand our contribution, as well as to further develop ÅF’s offering and management of sustainable solutions.
Economic value creationEconomic value generated (SEK million) 2019 2018 2017
Net sales 19,792 13,975 12,658
Distributed economic value (SEK million)
Operating costs, incl. depreciation/amortisation -6,971 -4,875 -4,432
Employee wages and benefits -10,018 -6,593 -5,992
Income tax and employer’s contributions -1,983 -1,656 -1,491
Dividend -560 -387 -350
Interest on loans -97 -56 -47
Interest on pensions -1.5 -1.4 -1.7
Value of societal investment1 -7.7 -9.9 -10.3
Economic value retained 154 397 334
1) Only central sponsorship and contributions due to technical collection limitations.
Operational excellence ÅF Pöyry’s strategy identifies the strategic area Operational Excel-lence as vital to development of the business. A strategic focus within Operational Excellence is to create ethical engagement and commitment, which reflects the material sustainability topic of good business ethics, client and project selection, partner responsibility, supplier responsibility and our own climate impact. Read more about
the Operational Excellence strategic area on page 40. Information about the Code of Conduct and our sustainability and whistleblowing policies is available on our website, afry.com
Client and project selectionBy declining projects and assignments that contribute undue impact on the environment, society or the individual, and to minimise nega-tive impact and maximise positive impact in the assignments that are carried out, ÅF Pöyry can have a great influence both internally at ÅF Pöyry and externally in society. Managing the material sustainability topic regarding the selection of clients and projects occurs within the framework of the SRA process (see page 119).
Good business ethicsThe material sustainability topic of good business ethics encom-passes our ethical positions in areas such as anti-corruption and human rights, as well as how we conduct ourselves in relation to our customers, business partners, employees and other stakeholders. This is managed through ÅF Pöyry's Code of Conduct. Read more about the Code of Conduct on page 118.
Anti-corruption ÅF Pöyry has offices in more than 40 countries and has projects in more than 100 countries. At ÅF Pöyry there is zero tolerance for corrup-tion and other forms of anti-competitive activities such as fraud. This is governed by our sustainability policy and Code of Conduct, as well as our anti-corruption framework. Assignments that entail risks related to corruption are identified within the context of the SRA process (see page 119). To assess corruption risk, we use tools including Transpar-ency International’s Corruption Perceptions Index in our risk assess-ment process. Before assignments with a particular risk of corruption, all consultants who are expected to participate in the assignment are trained in anti-corruption topics, current legislation and ÅF Pöyry’s anti-corruption framework. During the year no project participants underwent this training since no assignments were initiated where the need existed. New employees are trained in anti-corruption through mandatory training and all members of Group management have been trained in anti-corruption (see page 119).
No corruption incidents were reported via the whistleblowing function during the year. In 2018, ÅF Pöyry figured in a corruption investigation in Brazil regarding projects contracted in 2010-2012. Read more in the risk section on page 61 on managing risk of cor-ruption and in the dispute section on page 110.
Human rights ÅF Pöyry shall safeguard human rights, and we apply the UN Guiding Principles on Business and Human Rights as governed by our sustain-ability policy and Code of Conduct. The risk of human rights violations in the context of our own operations is relatively small. The issue is primarily relevant for certain types of assignments, and especially for hydropower and mining projects, which often imply the resettle-ment of people and affect access to land and water. For ÅF Pöyry it is important in such cases that international guidelines for resettlement are followed. To the extent that we can influence, we propose the Equator Principles and the IFC Performance Standards. When appli-cable, the results of an Environmental and Social Impact Assessment (ESIA) are used as a basis in project planning. Assignments that entail risks related to human rights are identified within the context of the SRA process (see page 119). Human rights training is ongoing, and all new employees undertake mandatory training (see page 119).
No reports of violations of human rights were made via the whis-tleblowing function in 2019. See the risk section on page 61 to read more about risks related to human rights.
Partner responsibilityÅF Pöyry works actively with partner responsibility, which has a posi-tive effect on the industries and contexts in which we operate. Partner responsibility has also been identified as a material sustainability topic. Partner responsibility is managed using ÅF Pöyry's business
121 Annual and Sustainability Report 2019

partner criteria based on the Global Compact’s ten principles. The Code of Conduct is applied for the part of the business that was formerly Pöyry. Managers are continuously trained to ensure that processes are followed on how our partners are to be managed. This helps us ensure that our partners respect and live up to our criteria. ÅF Pöyry does not hesitate to terminate a partnership if a breach of the criteria is detected.
ÅF Pöyry’s partnerships can be divided into partnerships in consor-tiums and sub-consultants. Before joining partnerships in consor-tiums, a screening is carried out according to the requirements of ÅF Pöyry’s business partner criteria for the former ÅF and the Code of Conduct for the former Pöyry. The Code of Conduct is included in partnership agreements that are used for sub-consultants and part-nerships in consortiums at the former Pöyry. Sub-consultants from the partner network are hired through partnership agreements that include ÅF Pöyry’s business partner criteria. By signing the agree-ment, the sub-consultants undertake to comply with the criteria. Today there are approximately 26,800 sub-consultants in ÅF Pöyry’s partner network, and approximately 1,400 are working on assign-ments. In 2019, the network accounted for approximately 10 percent of ÅF Pöyry’s sales. All of ÅF Pöyry's active sub-consultants in the partner network sign the partnership agreement.
Supplier responsibilityÅF Pöyry’s business partner criteria are also applied to procurements and purchases for the part of the business that was formerly ÅF. The guidelines for project purchases according to the manual Pöyry Proj-ect Management Guidelines apply for the former Pöyry. Evaluation and selection of suppliers is to be based on a weighted assessment of environmental and climate impact, quality and costs.
As a service provider of engineering and design solutions, most of our purchases are for office equipment, facility management services, IT equipment, licences and travel. We receive deliveries from some 30 preferred framework contract suppliers for things such as energy, travel, hotels, occupational health care and workwear. In 2019, purchases amounted to around SEK 2,400 million. ÅF Pöyry’s largest suppliers are in Sweden and include Microsoft, Tieto and Telia. ÅF Pöyry has framework agreements with the largest suppliers and these account for more than 70 percent of the total purchase sum.
Certain projects also entail the purchase of equipment, materials and services. To support these project purchases, ÅF Pöyry imple-mented a new purchasing system in Division Industrial & Digital Solutions during the year. The purchasing system will improve moni-toring, coordination and management of project purchases.
Climate and environment ÅF Pöyry has an ISO 14001 certified environmental management system that ensures systematic environmental efforts. Management of environmental work is covered by our sustainability policy. Our own climate impact has been identified as a material sustainability topic and concerns reducing our climate impact, which is mainly from carbon dioxide emissions due to business travel and energy use in offices. One of ÅF Pöyry’s non-financial targets is to halve carbon dioxide emissions per employee by 2030 with 2016 as the base year (1,347 kg CO₂/employee). ÅF Pöyry's carbon dioxide emissions are cal-culated annually and reported to the Carbon Disclosure Project (CDP), where we received score B in the climate change category.
Comparability with previous years for 2019 is limited due to the acquisition of Pöyry. The figures reported for previous years are the emissions for the part of the business that was formerly ÅF. Emis-sions for the former Pöyry have been incorporated into the entire 2019 financial year. As the methodology has been developed, the selection group for the number of employees has been adjusted to better represent the organisation.
In 2019, ÅF Pöyry’s calculated emissions amounted to 21,491 tonnes CO₂, compared to 13,556 tonnes in 2018 for ÅF. Emissions per employee amounted to 1,315 kg of CO₂, which is in parity with the previous year and about 2 percent lower than the base year 2016. The increase in total emissions during the year is explained by the fact that ÅF and Pöyry have merged and formed a signifi-
cantly larger group. Emissions per employee for business trips by air (Scope 3) increased slightly, which is explained by the Group’s more international character. The part of the business that was previously Pöyry also has a larger proportion of projects and assignments that require travel to and from the client’s facilities and construction sites. We will review ÅF Pöyry's work on its own climate impact in 2020, in order to better adapt our objectives and management based on the company's nature which is now more strongly inter-national, as well as to make our emission reduction activities more effective. Read more about our own climate impact on page 41.
Greenhouse gas emissionsScope (tonnes CO₂) 2019 2018 2017
Scope 1 (business trips, own car travel) 7,842 5,503 5,407Scope 2 (energy consumption, office) 3,835 1,987 2,151Scope 3 (business trips, other) 9,814 6,065 4,320Total 21,491 13,556 11,878
Greenhouse gas emissions per employeeGreenhouse gas emissions (Scope 1–Scope 3) per employee for ÅF Pöyry’s home markets (kg CO₂/employee)1.2 2019 2018 2017
Sweden 791 990 1,002Finland 1,982 3,145 3,322Switzerland 1,839 3,387 3,872Norway 1,831 1,465 1,220Denmark 1,391 1,309 667ÅF Pöyry total 1,315 1,324 1,285
ÅF Pöyry’s goal is to cut carbon dioxide emissions per employee in half by 2030 compared to the 2016 base year (1,347 kg CO₂/employee).1) Based on all types of employment.2) Figures for countries other than Sweden and Finland in 2017 and 2018 should be
read with caution due to uncertain data quality. Comparability between years is limited due to organisational changes and the development of the methodology.
Greenhouse gas emissions per employee and division for car and air travel, 2019Scope 1 (business trips, own car) and Scope 3 (business trips, other) per employee1
(kg CO₂/employee) Scope 1 Scope 3
Infrastructure 437 569Industrial & Digital Solutions 504 266Process Industries 353 794Energy 470 629Management Consulting 1,794 978Group common 611 1,790ÅF Pöyry total 480 600
1) Based on all types of employment.
Greenhouse gas emissions per employee
0
100
200
300
400
500
600
700
800
2017 2018 2019
Emissions (kg CO₂e/person)
Scope 1 (business trips, own car travel)Scope 2 (energy consumption, office)Scope 3 (business trips, other)
585
467
233
592
538
194
600
480
235
OTHER INFORMATIONSustainability notes
122 Annual and Sustainability Report 2019

Emission of carbon dioxide from business travel Emissions of carbon dioxide from business travel account for much of ÅF Pöyry’s total emissions as the Group is a large organisation with employees who have assignments all over the world. To reduce emis-sions from business trips, there is a travel policy and vehicle policy. The vehicle policy was updated in 2018 with the aim of transitioning to a fossil-free, safe, clean and quiet vehicle fleet by 2027. This means that the emissions limit will be reduced by 13 grams CO₂ on average per year starting from the base level of 120 grams CO₂ in 2019. One challenge for ÅF Pöyry is that the more the business expands, the more travel increases. We are working to expand the use of technical communication solutions wherever possible, instead of physically traveling to meetings. In addition, local initiatives are being imple-mented based on local conditions and needs. Some examples are bike share and electric car share schemes, as well as public transit cards that can be borrowed for business trips.
The calculations show that in 2019 emissions from business travel per employee decreased by 20 percent for the Swedish part of the business compared to the previous year. For the entire Group, emis-sions per employee from business travel decreased by almost 5 per-cent. Emissions per employee from business travel by car decreased by about 10 percent, while emissions from business travel by air went up by 1 percent.
Energy use in offices Energy use in ÅF Pöyry's offices also causes carbon dioxide emissions. Where ÅF Pöyry controls the choice of electricity supplier, centrally procured electricity contracts with entirely renewable energy sources (as defined in EU Directive 2009/28/EC) have been in use for the last five years for the offices in Sweden that were used by the former ÅF. The agreements now cover an estimated 50 percent of ÅF Pöyry’s total office space in Sweden. We monitor and measure energy use in six additional countries, that is, the data covers the seven countries where the majority of ÅF Pöyry’s employees are stationed. Actual energy use for office space in other countries is not measured at this time. Energy use for offices in these countries is instead calculated using standard amounts based on data for other countries outside Sweden and Finland.
For the Swedish part of the business, emissions per employee for energy use decreased by nearly 20 percent, while the corresponding figure for other countries was a 10 percent decrease. For the entire Group, emissions per employee from energy use increased by approxi-mately 20 percent, which is explained by the fact that we now have a significantly larger share of employees outside the Nordic region and that average emissions in these countries are higher.
Calculation methods for greenhouse gas emissionsThe calculations of ÅF Pöyry’s greenhouse gas emissions follow the guidelines of the GHG Protocol. ÅF Pöyry’s emissions under Scope 1 refer to direct emissions of greenhouse gases generated from our business travel with cars operated by employees: privately-owned cars, personnel cars, on-demand cars, service vehicles, rental cars and pool cars. Data is collected from the seven countries with the most employees: Sweden, Finland, Switzerland, Norway, Brazil, Germany and Denmark. The Swedish operation’s personnel, on-demand and service vehicles are based on calculated, detailed emission data per vehicle from ÅF Pöyry’s supplier of vehicle administrative services. For rental and pool cars, emissions data is supplied from travel providers, supplemented with data from ÅF Pöyry’s accounting system for rental and pool car outlays. For privately owned cars, the Swedish Environ-mental Protection Agency’s emission factors are used (0.112-0.172 kg CO₂/km depending on vehicle type). For the Finnish operations, data is used for kilometres travelled from the accounting system and from the car hire supplier together with the Environmental Protection Agency’s emission factor for general passenger cars in Finland (0.17 kg CO₂/km). Data from other operations that were measured are obtained as driven kilometres through questionnaires from the admin-istrative function in each country, where the Swedish Environmental Protection Agency’s standard values for calculating greenhouse gas emissions are used. The aggregated data are used as a basis for
estimating ÅF Pöyry’s total emissions, including those offices and countries from which data have not been collected.
ÅF Pöyry’s emissions under Scope 2 refer to indirect emissions of greenhouse gases generated from our energy consumption, including electricity purchased for our businesses and properties as well as heating and cooling Energy data is collected from the seven largest countries, based on the number of employees. The aggregated data are used as a basis for estimating the total emissions from ÅF Pöyry, including those offices and countries from which data have not been collected. The market-based method was used to calculate ener-gy-related emissions, which means that the calculations consider whether the purchased electricity was origin-labelled. For electricity use in Sweden and Finland, the emission factor for origin guarantees is used where such is purchased (0 g CO₂/kWh), otherwise residual mix is used (250.76 g CO₂/kWh for 2019). For other Nordic countries, Nordic electricity mix is used (50 g CO₂/kWh). For countries outside the Nordic region, European electricity mix is used (432 g CO₂/kWh). In cases where district heating is used in Sweden, emissions are cal-culated from the local production mix. For offices in Finland, Norway and Denmark using district heating, the same emission is assumed as from average Swedish district heating production. Offices outside the Nordic region are assumed to be heated with electricity.
ÅF Pöyry's estimated emissions under Scope 3 mean other indirect emissions of greenhouse gases and include our business travel by air. There is also some impact from consumables, but because they account for a marginal part of our overall impact and data collection requires considerable resources, we prioritise the most significant source of Scope 3 emissions: business travel by air. Emissions data relating to air transportation for Sweden and Fin-land are obtained from the travel agency, supplemented with data from ÅF Pöyry’s accounting system for airline ticket outlays. For offices outside Sweden and Finland, emissions from air travel are calculated based on kilometres travelled where data are available. Emissions per kilometre flown are assumed to be the same as the average for trips booked via the travel agency in each country. Air travel data is collected from the seven largest countries, based on the number of employees The aggregated data is used as a basis for estimating the total emissions from ÅF Pöyry, including those offices and countries from which data have not been collected. The structure of existing systems makes the quality of information from countries other than Sweden and Finland unreliable. Air travel emis-sion factors used are based on standard values from the Network for Transport and Environment (NTM). Air travel emissions are not adjusted for high altitude effects using the RFI factor.
Tax policyÅF’s Pöyry complies with the OECD guidelines for multinational com-panies and applicable laws and regulations for the countries in which we operate. ÅF Pöyry pays the tax that the Group is legally obliged to pay and in the right jurisdiction, and where there is a clearly imple-mented practice linked to the socio-economic intention of tax laws and regulations, this practice must be followed. Errors and discrepan-cies should be immediately communicated to the relevant authorities.
Attractive employer ÅF Pöyry's employees are our greatest asset. Attracting and developing talent is essential to developing in line with our vision and strategy. Therefore this is a definite priority area in ÅF Pöyry's strategy. Read more about how ÅF Pöyry works with this strategic area on pages 43-45.
Working environment, health and safetyTo be an attractive employer, ÅF Pöyry strives to provide a good, healthy and safe working environment for all employees, which includes the material sustainability topic of a positive working envi-ronment. This is also important for management, employees, partners and other stakeholders, as a good working environment for ÅF Pöyry’s employees ensures sustainable results and long-term relationships.
Assurance of a good working environment is managed on several levels within ÅF Pöyry. The Group has working environment policies.
123 Annual and Sustainability Report 2019

Responsibility for the working environment is delegated according to clear procedures and there are clear guidelines in various areas of the working environment, such as guidelines for rehabilitation, pro-active health initiatives and an anti-harassment policy. ÅF Pöyry’s management systems are OHSAS 18001 (occupational health and safety) certified, and the transition to the new standard ISO 45001 (occupational health and safety) is planned for 2020. Some parts of the business have already made the transition. Annual internal audits are carried out according to the Group’s procedures and processes in the area of occupational health and safety to prevent working environment risks in the best possible manner. External audits are also carried out to ensure compliance and highlight any deficiencies and uncertainties so we can continuously improve our efforts in this area.
ÅF Pöyry works with clients to ensure a pleasant and safe working environment for consultants working on site. ÅF Pöyry requires clients to comply with applicable health and safety regulations to protect the consultants working with them. There are employees who work in risky workplaces within the framework of client assign-ments. Therefore, all of them are trained in safety and occupational health requirements based on the requirements of the various work-places where ÅF Pöyry works.
Each country where ÅF Pöyry operates has local procedures for reporting work-related risks, accidents and illnesses that are mon-itored and reported according to national legal requirements. ÅF Pöyry has procedures for communicating about and evaluating the physical and mental work environment.
Statistics on sickness absence are analysed monthly at man-agement level, and if necessary, action plans are developed that are carefully followed up. Total sick leave in Sweden increased slightly in 2019 to 2.76 percent compared with 2.66 percent in 2018. ÅF Pöyry’s Swedish operation deployed an incident reporting system in May 2019. So far there is no coordinated monitoring of the number of reported work-related accidents and incidents since the acquisi-tion of Pöyry. They are currently monitored in each country where ÅF Pöyry operates, as well as in the division where the accident or incident occurred.
The outcome for 2019 reflects an increase in the number of reported incidents and accidents, which can be attributed to the new and improved system support for incident reporting as well as the sharpened focus on the working environment and incident reporting.
Health and safety2019 2018
Sickness absence, total, Sweden1 2.76% 2.66%
Reported occupational accidents, Sweden2 53 21
Reported occupational accidents with serious consequences, Sweden3 8 1
Reported occupational illnesses, Sweden 2 0
Reported travel accidents, Sweden 51 20
Reported incidents, Sweden 44 18
Number of fatal accidents 0 0
1) Statistics on sickness absence are analysed monthly at management level, and if necessary, action plans are developed that are carefully monitored.
2) ÅF Pöyry employees and subconsultants who work in risky workplaces within the framework of client assignments in Sweden. Also includes minor accidents.
3) Accidents reported to Swedish Work Environment Authority.4) We do not currently have information on which accidents led to sickness absence.
Diversity, equal opportunity and inclusionÅF Pöyry strives to increase diversity and gender balance to get the best people, secure long-term growth and profitability, and to create a good working environment and high-performance teams. Read more about the material sustainability topic diversity, equal opportunity and inclusion on page 43.
Harassment is totally unacceptable at ÅF Pöyry and there is zero tolerance for discrimination as there is for other human rights vio-lations. All employees should know this and anyone affected should know where they can turn for help and to initiate an investigation. ÅF Pöyry’s equal treatment policy, code of conduct, procedures and guidelines address harassment and bullying. It is essential for ÅF Pöyry’s equal treatment and diversity policy to be followed, and for harassment not to be tolerated in any form.
Inappropriate behaviour, harassment and discrimination within ÅF Pöyry are handled by the local units’ HR managers and managers in charge according to national law. The measures that are necessary according to law and ÅF Pöyry's policy are taken locally. These cases are not monitored at the Group level. In 2019 no cases relating to inap-propriate behaviour were reported via the whistleblowing function.
Discrimination issues are monitored at the Group level through ÅF Pöyry’s employee survey and measures are taken where necessary. A full-scale employee survey was not conducted in 2019. The next employee survey will be conducted in 2020. In the context of the 2018 employee survey, 207 employees stated that they had been subjected to bullying, discrimination or sexual harassment over the last 12-month period. Of the 7,834 respondents, 94 employees, or 1.2 percent, stated that they felt discriminated against. That was a striking decrease compared to the 2017 employee survey, when the figure was 2.8 percent of 7,023 respondents.
Responsibility for monitoring the results of the employee survey lies with each division’s HR manager, who is provided with the results for their division. The results indicate those parts of the business where special focus needs to be directed. However, the possibility of dealing with the issue of discrimination is limited to the information provided by employees in the survey.
Working conditions and professional developmentThe Equal Treatment Policy states that ÅF Pöyry will promote equal treatment at work by applying the terms of employment equally to all employees. ÅF Pöyry strives to be and be perceived as a good employer with attractive employment conditions to attract the best talent and retain committed employees.
A total of 10,631 employees (of which 8435 were in Sweden) were covered by collective agreements at year-end. This corresponds to 65 percent of all employees. In the entire business, employment conditions are competitive in the local market and comply with local regulations. At least one performance review involving individual development plans for employees is held annually. The percentage of employees who had performance reviews is not reported for 2019 due to the ongoing integration of the HR systems. Employees by capacity utilisation rate and gender
Women Men Total
Part-time employees 645 827 1,472
Full-time employees 3,242 9,502 12,744
Total 3,887 10,329 14,216
Permanent employees.Excluding employee records without data on gender (127 employees) due to local regulation.
Professional developmentHours of training/employee 2019 2018 2017
Hours of training 544,835 302,921 291,638
Average full-time equivalents (FTEs) 15,527 10,037 9,292
Total hours of training/employee 35.1 30.2 31.3
Permanent employees.
OTHER INFORMATIONSustainability notes
124 Annual and Sustainability Report 2019

Employee turnover2019
Number Percent
Sweden 1,295 15.3
Finland 167 9.0
Switzerland 92 9.1
Norway 119 13.2
Denmark 56 9.8
Other 290 8.4
Total 2,019 12.4
Permanent employees.
Gender and age distribution20191 2018
Distribution in % Women Men Age <30 30-50 >50 Women Men Age <30 30-50 >50
Board of Directors2 33.3 66.7 0.0 11.1 88.9 37.5 62.5 0.0 0.0 100.0
Group management 40.0 60.0 0.0 50.0 50.0 22.2 77.8 0.0 44.4 55.6
Managers 20.5 79.5 0.9 67.7 31.4 21.0 79.0 1.5 65.7 32.8
Consultants 25.0 75.0 18.5 58.6 22.9 24.7 75.3 20.7 56.8 22.5
Administrative staff 72.1 27.9 10.5 55.6 33.9 73.7 26.3 16.0 50.8 33.2
Total 27.3 72.7 16.0 59.4 24.6 26.2 73.8 18.1 57.6 24.2 Permanent employees.
1) Excluding employee records without data on gender (127 employees) or age (211 employees) due to local regulation.2) Excluding employee representatives. The proportion of women on the Board of Directors, including ordinary employee representatives,
is 27.3 percent for 2019 and 30.0 percent for 2018.
Number of employees by type of employment, gender and our largest market share
Permanent employment Other temporary All forms of employment
ÅF Pöyry’s largest markets Women Men Total Women Men Total Women Men Total
Sweden 2,068 5,616 7,684 180 571 751 2,248 6,187 8,435
Finland 494 1,177 1,671 49 169 218 543 1,346 1,889
Switzerland 216 692 908 24 69 93 240 761 1,001
Norway 264 649 913 2 12 14 266 661 927
Denmark 130 407 537 2 2 4 132 409 541
Other 715 1,788 2,503 172 739 911 887 2,527 3,414
Total 3,887 10,329 14,216 429 1,562 1,991 4,316 11,891 16,207 Excluding employee records without data on gender (141 employees) due to local regulation. The total number of employees is 16,348.
Age distribution
Age distribution in %
20191 2018 2017
Women Men Women Men Women Men
-29 6.1 11.8 6.6 13.0 5.6 12.2
30-39 9.0 22.6 9.0 22.6 9.2 23.7
40-49 6.2 16.7 6.3 17.1 6.1 18.6
50-59 4.0 13.8 3.4 13.7 3.3 14.7
60+ 1.3 8.5 0.9 7.4 0.9 5.5
Total 26.6 73.4 26.1 73.9 25.1 74.9 All forms of employment.
1) Excluding employee records without data on gender (141 employees) or age (238 employees) due to local regulation.
Percentage of women per division2019
Consultants ManagersAdministrative
staff Total
Infrastructure 30.8 19.5 81.0 31.1
Industrial & Digital Solutions 21.4 22.5 82.1 23.3
Process Industries 19.2 15.3 86.9 20.3
Energy 15.4 17.2 62.2 19.2
Management Consulting 29.3 17.6 88.9 30.7
ÅF Pöyry AB 47.6 44.6 63.0 58.7
Total 24.2 20.5 71.0 26.6
All forms of employment.Excluding employee records without data on gender (141 employees) due to local regulation.
New hires2019
Women Men
Number Percent Number Percent
Sweden 480 30.9 1,071 69.1
Finland 47 23.6 152 76.4
Switzerland 37 23.3 122 76.7
Norway 59 30.4 135 69.6
Denmark 23 30.7 52 69.3
Other 158 26.5 438 73.5
Total 804 29.0 1,970 71.0
Permanent employees.Excluding employee records without data on gender (50 employees) due to local regulation.
125 Annual and Sustainability Report 2019

Countries where ÅF Pöyry has offices, 2019
Strategic partnerships and community engagementÅF Pöyry is active in and is a member of several initiatives and strategic partnerships to empower, influence and drive sustainable development. ÅF Pöyry’s most important commitments in 2019 were as follows: – Gapminder: Towards the end of 2019, a collaboration was started
to identify knowledge gaps in a number of focus areas and to increase knowledge about the major challenges of our time.
– Limeblue: ÅF Pöyry employees with available capacity have the opportunity to contribute their specialist expertise to social entrepreneurs through partnership with Limeblue Impact.
– Royal Swedish Academy of Engineering Sciences (IVA): Collabo-rated with IVA on future energy solutions, Tekniksprånget, which involves preparing internships for young secondary school stu-dents, as well as Jobbsprånget, which involves mediating intern-ships for newcomers to Sweden who have engineering degrees.
– Green Cities: Member of business network Green Cities, which operates in three areas: interest and impact, meeting place for new opportunities, and advice and support.
Countries with offices
OTHER INFORMATIONSustainability notes
126 Annual and Sustainability Report 2019

GRI Index
GENERAL DISCLOSURES
GRI STANDARD DISCLOSURE DESCRIPTION PAGE REFERENCE COMMENTS
ORGANISATIONAL PROFILE
102-1 Name of the organisation 131
102-2 Important brands, products and services Cover, 1, 3, 15, 26-28, 30-31, 34, 37
102-3 Location of headquarters 131
102-4 Location of operations 3, 126
102-5 Ownership and legal form 51, 131
102-6 Markets served 3, 126
102-7 Scale of the organisation 2–3, 65–66
102-8 Information on employees and other workers 181, 124-125
102-9 Supply chain 15, 119, 121–122
102-10 Significant changes to the organisation and its supply chain
2–3, 34, 118
102-11 Precautionary principle or approach 61
102-12 External initiatives 118
102-13 Membership in associations 126
STRATEGY
102-14 Statement from senior decision-maker 4–5
ETHICS AND INTEGRITY
102-16 Values, principles, standards and norms of behaviour
13, 43, 45, 118-119, 121
GOVERNANCE
102-18 Governance structure 118, 131
STAKEHOLDER ENGAGEMENT
102-40 List of stakeholder groups 119–120
102-41 Number of employees covered by collective agreement
124
102-42 Identifying and selecting stakeholders 119–120
102-43 Approach to stakeholder engagement 119–120
102-44 Key topics and concerns raised 119–120
REPORTING PRACTICE
102-45 Entities included in the consolidated financial statements
104–107, 118
102-46 Defining report content and topic boundaries 120
102-47 List of material topics 120
102-48 Restatements of information 118
102-49 Changes in reporting 118
102-50 Reporting period 118
102-51 Date of most recent report 118
102-52 Reporting cycle 118
102-53 Contact point for questions regarding the report 118
102-54 Claims of reporting in accordance with the GRI Standards
118
102-55 GRI Index 127–128
102-56 External assurance 129
GRI 102: General
Disclosures 2016
This report is prepared in accordance with the Global Reporting Initiative (GRI) Standards, Core Level. The GRI index below lists the GRI Standards used, all with publication year and latest update 2016, and reported general and specific disclosures.
127 Annual and Sustainability Report 2019

MATERIAL SUSTAINABILITY TOPICS
GRI STANDARD DISCLOSURE DESCRIPTION PAGE REFERENCECOMMENTS AND OMISSIONS
SUSTAINABLE SOLUTIONS
GRI 103: Management approach 2016
103-1, 103-2, 103-3 Boundary, management and evaluation 7, 18–22, 38–39, 118–119, 120–121, 134
Company-specific disclosure Positive contribution to the UN’s global goals through our assignments
16-22, 120-121
GOOD BUSINESS ETHICS, PARTNER RESPONSIBILITY AND SELECTION OF CLIENTS AND PROJECTS
GRI 103: Management approach 2016
103-1, 103-2, 103-3 Boundary, management and evaluation 7, 40-41, 59, 61, 118-122, 134
GRI 205: Anti-corruption
205-1 Operations assessed for risks related to corruption 61, 119, 121 Not reported by region.
205-2 Communication and training about anti-corrup-tion policies and procedures
119–121
205-3 Confirmed incidents of corruption and actions taken
121
GRI 412: Human rights assessment 2016
412-1 Operations that have been subject to human rights reviews or impact assessments
119, 121 Not reported by region.
OWN CLIMATE IMPACT
GRI 103: Management approach 2016
103-1, 103-2, 103-3 Boundary, management and evaluation 7, 41, 61, 118–120, 122–123, 134
GRI 305: Emissions
305-1 Direct (Scope 1) GHG emissions 122–123
305-2 Energy indirect (Scope 2) GHG emissions 122–123
305-3 Other indirect (Scope 3) GHG emissions 122–123
305-4 GHG emissions intensity 123
POSITIVE WORKING ENVIRONMENT
GRI 103: Management approach 2016
103-1, 103-2, 103-3 Boundary, management and evaluation 7, 43–44, 60, 118–120, 123, 134
GRI 401: Employment 2016
401-1 New employee hires and employee turnover 44, 125 New employee hires and employee turnover are not reported by age and employee turnover is not reported by gender due to limitations on data collec-tion caused by integration work in progress.
GRI 403: Occupational Health and Safety 2016
403-2 Hazard identification, risk assessment and incident investigation
44, 123–124 Not reported by region and gender due to limitations on data collection caused by integration work in progress.
GRI 404: Training and Education 2016
404-1 Average hours of training per year per employee 124 Not reported by gender or job classification due to limitations on data collec-tion caused by integration work in progress.
404-3 Percentage of employees receiving regular per-formance and career development reviews
124 Not reported due to lim-itations on data collection caused by integration work in progress.
DIVERSITY, EQUALITY AND INCLUSION
GRI 103: Management approach 2016
103-1, 103-2, 103-3 Boundary, management and evaluation 7, 43–44, 118–120, 124, 134
GRI 405: Diversity and equal opportunity 2016
405-1 Diversity of governance bodies and employees 125
GRI 406: Non-dis-crimination 2016
406-1 Incidents of discrimination and corrective actions taken
124
OTHER DISCLOSURES
GRI 103: Management approach 2016
103-1, 103-2, 103-3 Boundary, management and evaluation 131–134
GRI 201: Economic performance 2016
201-1 Direct economic value generated and distributed 121
OTHER INFORMATIONSustainability notes
128 Annual and Sustainability Report 2019

Audit statementAuditor’s Limited Assurance Report on ÅF Pöyry AB’s Sustainability Report and statement regarding the Statutory Sustainability Report
To ÅF Pöyry AB, Corp. Id. 556120-6474
IntroductionWe have been engaged by the Board of Directors and the Managing Director of ÅF Pöyry AB to undertake a limited assurance engage-ment of ÅF Pöyry ABs Sustainability Report for the year 2019. ÅF Pöyry AB has defined the scope of the Sustainability Report that also is the Statutory Sustainability Report on page 118.
Responsibilities of the Board of Directors and the Managing DirectorThe Board of Directors and the Managing Director are responsible for the preparation of the Sustainability Report including the Statutory Sustainability Report in accordance with applicable criteria and the Annual Accounts Act respectively. The criteria are defined on page 118 in the Sustainability Report and are part of the Sustainability Reporting Standards published by GRI (The Global Reporting Initia-tive), that are applicable to the Sustainability Report, as well as the accounting and calculation principles that the Company has devel-oped. This responsibility also includes the internal control relevant to the preparation of a Sustainability Report that is free from material misstatements, whether due to fraud or error.
Auditor’s responsibilityOur responsibility is to express a conclusion on the Sustainability Report based on the limited assurance procedures we have performed and to express an opinion regarding the Statutory Sustainability Report. Our assignment is limited to the historical information that is presented and does not cover future-oriented information.
We conducted our limited assurance engagement in accordance with ISAE 3000 Assurance Engagements Other than Audits or Reviews of Historical Financial Information. A limited assurance engagement consists of making inquiries, primarily of persons responsible for the preparation of the Sustainability Report, and applying analytical and other limited assurance procedures. Our examination regarding the Statutory Sustainability Report has been
conducted in accordance with FAR’s accounting standard RevR12 Auditor's opinion on the statutory sustainability report. A limited assurance engagement and an examination according to RevR 12 is different and substantially less in scope than an audit conducted in accordance with International Standards on Auditing and generally accepted auditing standards in Sweden.
The firm applies ISQC 1 (International Standard on Quality Con-trol) and accordingly maintains a comprehensive system of quality control including documented policies and procedures regarding compliance with ethical requirements, professional standards and applicable legal and regulatory requirements. We are independent of ÅF Pöyry AB in accordance with professional ethics for accoun-tants in Sweden and have otherwise fulfilled our ethical responsibil-ities in accordance with these requirements.
The limited assurance procedures performed and the examina-tion according to RevR 12 do not enable us to obtain assurance that we would become aware of all significant matters that might be identified in an audit. The conclusion based on a limited assurance engagement and an examination according to RevR 12 does not provide the same level of assurance as a conclusion based on an audit.
Our procedures are based on the criteria defined by the Board of Directors and Managing Director as described above. We consider these criteria suitable for the preparation of the Sustainability Report.
We believe that the evidence obtained is sufficient and appropriate to provide a basis for our conclusions below.
ConclusionsBased on the limited assurance procedures performed, nothing has come to our attention that causes us to believe that the Sustain-ability Report is not prepared, in all material respects, in accordance with the criteria defined by the Board of Directors and Executive Management.
A Statutory Sustainability Report has been prepared.
Stockholm, 26 March 2020
KPMG AB
Joakim Thilstedt Karin Sivertsson
Authorised Public Accountant Specialist member of FAR
129 Annual and Sustainability Report 2019

130 Annual and Sustainability Report 2019
CORPORATE GOVERNANCE REPORTChairman’s report
Increased competitiveness in sustainable solutions The major transition to a more sustainable society is driving higher demand for engineering and design services. The acquisition of Pöyry has strengthened the company’s competitiveness and presented opportunities for continued value creation. This has characterised the work of the Board during the year and we are proud that we are now a joint company with a stronger position as a leading engineering and design company.
The Board of Directors and I are tasked with laying the groundwork for long-term sustainable growth and profitability. Providing higher returns for our shareholders depends on numerous factors, and the Board has an important role to play in our long-term strategy efforts. The trends we see in the market that affect our strategy are clear to see. It is important to offer our customers leading sustain-able solutions that feature innovation and digitalisation.
The Board is deeply committed to and follows developments in the sustainability field. We devote particular attention to the business ethics aspects of sustainability. As part of our corporate gover-nance we follow and monitor regulatory compliance, primarily the UN Global Compact, as regards ethics, anti-corruption and human rights, as well as our decision-making processes and risk manage-ment in these areas.
Our ability to attract the best employees is a key factor for the business, which makes it particularly important to nurture and develop the brand and the values it represents. Our new shared brand, AFRY, which was launched during the year, allows us to take a more pronounced position in sustainability and attract the best employees.
We completed two rights issues during the year to finance the Pöyry acquisition, and we are grateful for the strong support demon-strated by our shareholders. With a stronger capital base, we can then continue to deliver on our strategy with renewed energy.
At the beginning of 2020, the consequences of the global spread of the coronavirus have led to an uncertain market situation that is dif-ficult to assess. In order to further strengthen the company's financial position, the Board has decided to withdraw the dividend proposal of SEK 5.00 per share previously announced. The decision has been made as a precautionary measure, to ensure that the company remains well positioned in the future, as well as assuring operational and financial strength when the market situation has stabilised.
On behalf of the Board, I want to thank our CEO Jonas Gustavsson and the management team as well as all of the company's employees for their dedicated work and commitment. Finally, I want to especially thank you, the shareholders, for your strong support during the year. With a clearly defined strategy, we are continuing to focus on profit-able growth in order to generate value for our stakeholders.
Stockholm, March 2020
Anders NarvingerChairman of the Board

131 Annual and Sustainability Report 2019
This corporate governance report, prepared by the company’s Board of Directors, covers corporate governance during the 2019 financial year. The corporate governance report is submitted in accordance with the Swedish Annual Accounts Act and the Swedish Corporate Governance Code. The corporate governance report has been reviewed by KPMG, whose opinion follows immediately after the report.
Corporate governance within ÅF Pöyry ABÅF Pöyry AB is a Swedish public limited company domiciled in Stockholm. The company’s Class B shares are listed on Nasdaq Stockholm. Governance, management and control are divided between the shareholders, the Board of Directors, the CEO and senior management in accordance with applicable laws, rules and recommendations and with ÅF Pöyry AB’s Articles of Association and internal regulations. The General Meeting of Shareholders is the company’s highest decision-making body, where the shareholders exercise their voting rights. The Board of Directors and Chairman of the Board are elected by the General Meeting after proposals by the Nomination Committee. The Board of Directors appoints the CEO. The administration by the Board of Directors and President and CEO, as well as the financial statements are examined by the external auditor elected by the Annual General Meeting. To stream-line and intensify the work on some matters the Board of Directors has set up an Audit Committee and a Remuneration Committee. ÅF Pöyry AB’s internal audit is an important support function for the Audit Committee.
ÅF Pöyry AB applies the Swedish Corporate Governance Code (available at www.corporategovernanceboard.se) and did not devi-ate from it in 2019. ÅF Pöyry AB complies with Nasdaq Stockholm’s Rules for Issuers (available at nasdaq.com/solutions/rules-regula-tions-stockholm) and generally accepted stock exchange practice. The highest internal instrument of governance is the Articles of Association adopted by the shareholders’ meeting. The Board Of Directors has adopted rules of procedure and instructions for the work of the Board, its committees and the CEO. In addition, the company has adopted internal governing documents that clarify procedures and the allocation of responsibility and powers within important relevant areas, such as the Code of Conduct, gover-nance, risk management, quality, the working environment, infor-
mation security, data protection, sustainability, anti-corruption, whistle-blowing and regulatory compliance.
Ownership structureÅF Pöyry AB has issued two classes of shares: Class A shares and Class B shares. Each Class A share is entitled to 10 votes, and each Class B share to 1 vote.
Share distribution at 31 December 2019
Number of shareholders 14,791
Class A shares 4,290,336
Class B shares 107,883,792
Total number of shares 112,174,128
of which own Class B shares –
Votes 150,787,152
The largest shareholder at the end of 2019 according to Euroclear was the ÅForsk Foundation, with 33.6 percent of the votes. SEB Funds had 7.0 percent and Handelsbanken Funds had 5.8 percent of the votes.
ÅF Pöyry AB Annual General MeetingThe General Meeting of Shareholders that is held within six months of the close of the financial year and that adopts the income statement and balance sheet is called the Annual General Meeting. Shareholders registered in the share register on the record date and who have provided advance notice of their participation have the right to participate in the Meeting. Notice to attend is published on the company’s website and advertised in the Swedish Official Gazette (Post- och Inrikes Tidningar). The fact that notice to attend has been given is published in Dagens Industri. The 2019 AGM was held at ÅF Pöyry AB’s head office in Solna, Sweden, on 15 May 2019. In total, 191 shareholders participated, representing 60 percent of the share capital and 70 percent of the votes in the company. In addition to the election of the Board of Directors, the AGM resolved to introduce the 2019 Staff Convertible Programme and authorised the Board of Directors to acquire and transfer own shares and to
SHAREHOLDERSthrough general meeting
BOARD OF DIRECTORSAudit CommitteeProject Committee
Remuneration Committee
Division Infrastructure Division Industrial & Digital Solutions Division Process Industries Division Energy Division Management
Consulting
PRESIDENT/CEOGroup-wide functions
and processes
GROUP MANAGEMENT
Internal control
Nomination Committee
Auditors
Corporate governance report

132 Annual and Sustainability Report 2019
CORPORATE GOVERNANCE REPORTCorporate governance
resolve to issue new Class B shares. The minutes of the AGM and all documentation can be found on ÅF Pöyry AB’s website under the corporate governance section.
Nomination CommitteeIn accordance with the principles for the Nomination Committee passed at ÅF Pöyry AB’s 2018 AGM, the members of the Nomination Committee are appointed by at least three and at most five of the shareholders with the most votes, together with the Chairman of the Board. The names of the members were published more than six months before the AGM. The Nomination Committee for the 2020 AGM comprises: Magnus Olofsson (Chair), appointed by the ÅForsk Foundation; Johan Strandberg, appointed by SEB Funds; Monica Åsmyr, appointed by Swedbank Robur Funds; Lilian Fossum Biner, appointed by Handelsbanken Funds; Henrik Ehrnrooth, appointed by Corbis S.A.; and Anders Narvinger, Chairman of the Board.
Duties of the Nomination CommitteeThe duties of the Nomination Committee are to present propos-als ahead of the AGM on the number of directors, the composition and remuneration of the Board of Directors, as well as any sepa-rate remuneration for Committee work. Moreover, the Nomination Committee shall present a proposal for the chairs of the Board of Directors and AGM, as well as for the auditors and their remunera-tion. As part of its duties, the Nomination Committee is to fulfil in other respects the tasks incumbent on the Nomination Committee under the Swedish Corporate Governance Code.
Work of the Nomination CommitteeIn the period up to and including 26 March 2020, the Nomination Committee for the 2020 AGM held four minuted meetings and maintained contact between meetings. To assess the extent to which the current Board of Directors fulfils the requirements to be made of the Board based on the company’s situation and future focus, the Nomination Committee has discussed the size of the Board and its composition as regards experience of the industry, skills and diversity, for example. The company applies the Swedish Corporate Governance Code item 4.1 as its diversity policy for the Board of Directors. This means that the Board’s composition is to be appropriate with respect to the company’s business, stage of development and conditions in general, with diversity and breadth in terms of the skills, experience and background of the members elected by the AGM. Even gender distribution shall be pursued. The Board of Directors is made up of three women and six men. The Nomination Committee believes it is important for future nomina-tion committees to continue emphasising even gender distribution, with the objective of further increasing the percentage of women on the company board in the future.
As a basis for the committee’s work for the 2020 AGM, the Chair-man of the Board has informed the committee about the work of the Board of Directors during the year and of the work undertaken by the Audit Committee and the Remuneration Committee. An external adviser has evaluated the Board of Directors and its work in 2019 by interviewing individual directors. The Nomination Com-mittee has reviewed the results of this evaluation. The Nomination Committee has also evaluated the levels of fees for the Board of Directors. No remuneration has been paid for the work of the Nomination Committee. All shareholders are entitled to contact the Nomination Committee and propose board members. The com-mittee’s proposals, the report on the committee’s work prior to the 2020 AGM, and supplementary information on proposed members of the Board of Directors will be published in connection with the meeting notice and will be presented at the 2020 AGM.
Board of DirectorsThe Board of Directors of ÅF Pöyry AB is to consist of a minimum of six and a maximum of ten members with a maximum of five deputies to be appointed by the General Meeting. Nine board members were elected at the 2019 AGM. Apart from this the employees have two
ordinary representatives on the Board of Directors, with two depu-ties. The President and CEO does not sit on the Board of Directors. The following members were re-elected to the Board of Directors for 2019 as proposed by the Nomination Committee: Jonas Abraha-msson, Gunilla Berg, Henrik Ehrnrooth, Anders Narvinger, Joakim Rubin, Kristina Schauman, Anders Snell and Ulf Södergren. Salla Pöyry was elected as a new member of the Board. Maud Olofsson declined re-election. Anders Narvinger was re-elected by the AGM to serve as Chairman of the Board up until the close of the next AGM. For more information on the Board of Directors, please refer to pages 136-137 of the annual report. The Nomination Committee’s proposed fees to be paid to the Board of Directors were approved by the AGM.
Responsibilities and obligations of the Board of DirectorsThe Board of Directors of ÅF Pöyry AB is responsible for overall administration of the Group, and for organising it in accordance with the Swedish Companies Act. The work of the Board of Directors revolves mostly around strategic direction, business plans, budget-ing, annual accounts and acquisitions, and other decisions which must be dealt with by the Board of Directors under the resolutions procedures. On one occasion per year, the Board of Directors meets with the company’s auditors without the presence of management. On one occasion each year, the Board of Directors discusses issues related to succession planning for senior executives in the com-pany. As in previous years, a Remuneration Committee and Audit Committee have been appointed within the Board of Directors. The Board of Directors also decided to establish a special “Project Committee” tasked with reviewing and approving very large and important projects and assignments that the company is consid-ering, from a financial perspective. For the Board of Directors, these committees are preparatory bodies and do not limit the Board of Directors’ overall responsibility for the management of the com-pany or the decisions made by the Board.
Diversity policy for the Board of Directors Rule 4.1 of the Swedish Corporate Governance Code is applied as a diversity policy for the Board of Directors. The aim is for the Board of Directors to have an appropriate and versatile composition regarding experience and background, and that there should be even gender distribution on the Board. The Nomination Committee’s pro-posal means that the Board of Directors is made up of three women and six men, which means that it does not fully live up to the even gender distribution objective. The Nomination Committee believes it is important for future nomination committees to continue empha-sising even gender distribution, with the objective of further increas-ing the percentage of women on the company board in the future.
Independence of the Board of DirectorsThe composition of the Board of Directors of ÅF Pöyry AB meets the requirements of the Swedish Corporate Governance Code con-cerning independent members. Member of the Board of Directors Anders Snell is dependent in relation to ÅF Pöyry AB’s shareholders with the most voting rights but is independent of the company and Group management. None of the other Board members are depen-dent in relation to the company’s largest shareholders, the company or Group management.
Work of the Board of DirectorsÅF Pöyry AB’s Board of Directors annually adopts written rules of procedure that clarify the directors’ internal rules of procedure and responsibilities, resolutions procedure within the Board, the Board’s schedule of meetings, notice to attend, agenda and minutes of Board meetings and the work of the Board on accounting and audit matters. The Board of Directors holds an inaugural meeting in con-nection with the AGM. In addition, the Board of Directors is required to meet at least six times per calendar year. Each ordinary meeting of the Board of Directors follows an agenda as established in the rules of procedure for the Board of Directors, which includes a report

133 Annual and Sustainability Report 2019
by the President and CEO, financial reports and strategic matters. In 2019 the Board of Directors held thirteen meetings including
one inaugural meeting. Four of the meetings were held in connection with the publication of the company’s interim reports. The relatively large number of Board meetings were due to the acquisition of Pöyry.
The CEO presents reports at the meetings, and the company’s CFO and other members of Group management also participate to present reports on particular issues. The Group’s senior legal adviser acts as Secretary to the Board of Directors.
Remuneration CommitteeThe task of the Remuneration Committee is to prepare the guide-lines for the remuneration of senior executives which is then decided by the AGM, and to submit proposals to the Board of Directors for the salary and terms and conditions for the CEO. On behalf of the Board, the committee is also to deal with matters regarding salary and other terms of employment for senior executives who report directly to the President and CEO, and deal with general terms of employment and remuneration matters affecting all employees of the company.
The Remuneration Committee held three minuted meetings during the year. Since the inaugural meeting of 2019, the Committee has consisted of Anders Narvinger (Chair), Joakim Rubin and Henrik Ehrnrooth.
Audit CommitteeThe Audit Committee is a vital communication link between the Board of Directors and the company’s auditors. The Board’s Audit Committee is responsible for the auditor selection procedure, which is detailed in the Auditors Ordinance, and for submitting its auditor recommendation to the Nomination Committee at the general meeting of shareholders. The Audit Committee supports the Board of Directors in its work of quality assurance of financial reporting and following up the audit findings of the external auditors. The company’s internal audit staff support the committee in its work.
The Audit Committee held six minuted meetings during the year. Since the inaugural meeting of the Board of Directors in 2019, the Committee has consisted of Kristina Schauman (Chair), Gunilla Berg and Anders Snell. KPMG, the company’s audit firm, has been represented by chief accountant Joakim Thilstedt.
Project CommitteeThe Board of Directors also decided at its meeting on 4 September 2019 to establish a special “Project Committee” tasked with review-ing and approving very large and important projects and assign-ments that the company is considering, from a financial perspec-tive. This Committee has held one minuted meeting during the year since it was formed. The Committee consists of Anders Narvinger (Chair), Gunilla Berg and Henrik Ehrnrooth.
Evaluation of the Board of Directors and CEOAn external advisor conducted an evaluation of the Board of Directors’ work in 2019 by interviewing individual members of the Board and the CEO. The evaluation includes climate of cooperation, breadth of knowledge and board work performance. The intention of the evaluation is to gain an understanding of the effectiveness of the board work and the opinions of the Board members on this matter. The Board of Directors also regularly evaluates the work of the President and CEO by following business performance against targets set. Once a year a formal evaluation is made that is dis-cussed with the President and CEO.
Remuneration of the Board of DirectorsRemuneration of members of the Board of Directors for board and committee work is proposed by the Nomination Committee and approved by the AGM. The Nomination Committee’s proposals are based on comparisons with remuneration at other companies of similar size in the same industry. Information on remuneration to members of the Board of Directors can be found in Note 6. Members of the Board of Directors do not participate in the Group’s incentive programmes.
AuditorsThe task of the auditors is to examine on behalf of the shareholders the company’s bookkeeping and annual accounts and the adminis-tration by the Board of Directors and President and CEO. The annual accounts and consolidated accounts are audited. The auditors also review the nine-month interim report for the period up to September each year and attend some Audit Committee meetings. A review is also carried out of the Group’s corporate governance report and of compliance with the guidelines approved by the AGM relating to remuneration of senior executives. The 2019 AGM re-elected the
Board composition and attendance at Board and Committee meetings, 2019
DirectorsBoard
meetingsAudit
CommitteeRemuneration
CommitteeProject
CommitteeIndependent of major
shareholdersIndependent of the company
and its management
Anders Narvinger 14/14 3/3 1/1 Yes Yes
Jonas Abrahamsson 14/14 Yes Yes
Gunilla Berg 14/14 6/6 1/1 Yes Yes
Henrik Ehrnrooth 11/14 3/3 1/1 Yes Yes
Maud Olofsson1 5/14 Yes Yes
Salla Pöyry1 8/14 Yes Yes
Joakim Rubin 14/14 3/3 Yes Yes
Kristina Schauman 13/14 6/6 Yes Yes
Anders Snell 14/14 6/6 No Yes
Ulf Södergren 13/14 Yes Yes
Employee representatives
Tomas Ekvall 14/14 Yes No
Stefan Löfqvist2 13/14 Yes No
Guojing Chen (deputy)3 0/14 Yes No
Jessica Åkerdahl (deputy)3 1/14 Yes No
1) Maud Olofsson left the Board of Directors at the 2019 AGM, while Salla Pöyry joins the Board of Directors at the 2019 AGM.2) Stefan Löfqvist was elected employee representative on 24 April 2019, before which he was a deputy.3) Guojing Chen and Jessica Åkerdahl were elected as deputies on 24 April 2019.

134 Annual and Sustainability Report 2019
CORPORATE GOVERNANCE REPORTCorporate governance
auditing firm KPMG, represented by Joakim Thilstedt as the auditor in charge, to serve as the company’s auditor until the end of the 2020 AGM. The Audit Committee concluded that it will recommend that the Nomination Committee propose the appointment of KPMG as auditor to the 2020 AGM for the period extending up until the 2021 AGM. See Note 5 for more detailed information on audit fees.
President and CEO The CEO is responsible for ensuring that ongoing administration of the company is managed according to the Board of Directors' guidelines and directions. In consultation with the Chairman of the Board, the CEO produces the information and documentation needed as supporting information for the Board's work, to enable the Board to make well-informed decisions. The CEO supported by the executive management. The CEO and executive management, with the support of various staff functions, are responsible for the Group's fulfilment of its overall strategy and its financial and busi-ness controls, as well as the Group's financing, capital structure, risk management and acquisitions.
Group managementAt the end of 2019 Group management consisted of CEO Jonas Gustavsson, CFO Juuso Pajunen, and eight others. Group manage-ment normally meets once a month to discuss matters such as the Group’s financial performance, acquisitions, Group-wide develop-ment projects, succession planning and professional development, together with other strategic issues. In 2019, Group management held 12 full-day meetings, as well as a two-day meeting with addi-tional Group managers. Once a month the CEO and the CFO dis-cuss each of the divisions’ income statements, balance sheets, key ratios and major projects with the relevant president and controller. Three times a year a whole-day review is held with each division to examine more long-term issues, including HR, strategy and budget. For more information about the members of Group management, please see pages 138–139 of the annual report.
Remuneration of senior executives Every year the AGM adopts guidelines for the remuneration of senior executives. The guidelines adopted at the 2019 AGM and information on remuneration of senior executives paid in 2019 can be found in Note 6 for the Group.
The Remuneration Committee's evaluation led to the conclusion that the guidelines for remuneration of senior executives adopted by the 2019 AGM have been followed.
The Board of Directors proposed 2020 guidelines for remunera-tion of ÅF Pöyry AB’s CEO and senior executives are described in the Administration Report on pages 55-56.
Board of Directors’ description of internal control The Board of Directors’ responsibility for internal control is governed by the Swedish Companies Act and the Swedish Corporate Gover-nance Code that contain requirements for annual external provision of information on how internal control is organised as regards finan-cial reporting. Board members must keep themselves informed and evaluate the internal control system regularly. Internal control in ÅF Pöyry AB has been designed with the aim of efficient and appropri-ate business operations, reliable financial reporting and compliance with applicable laws and ordinances. The company divides its inter-nal controls over financial reporting into the following components: control environment, risk assessment, control activities, information and communication, and follow-up.
Control environmentThe control environment forms the basis of internal control as regards financial reporting. An important part of the control environment is that decision lines, powers and responsibility are clearly defined and communicated between different levels of the organisation and that governing documents in the form of policies, guidelines and manuals are available. A description of internal con-
trol in ÅF Pöyry AB can be found in the process-oriented manage-ment system used for business control and support. A description is given here of the organisational structure and the powers and responsibility that are associated with the various business roles. The process-orientation of the management system provides con-trol procedures and tools for the operation in question, thus creating a sound basis for meeting set requirements and expectations of a good control environment. The management system is available for all employees via ÅF Pöyry AB’s intranet.
Risk assessmentÅF Pöyry AB’s risk assessment regarding financial reporting aims to identify and evaluate the most significant risks in the Group’s com-panies, business areas, divisions, processes and operations, which in turn may impact financial reporting. The risk assessment results in a reference as to how the risks should be managed and controlled, and in control activities that support the basic requirements of the external financial reporting. Risks are assessed, reported and dealt with by ÅF Pöyry AB centrally, together with the divisions. Further, risks are assessed and dealt with in other contexts, such as risks linked to fixed price projects and acquisitions.
Control activitiesTo ensure that the business is run efficiently and that the sched-uled financial reports consistently provide a fair presentation of the situation, each process has several built-in control activities. These control activities involve all levels of the Group. Responsibil-ity for implementing control activities is distributed in the Group, where clear roles ensure efficiency and reliability. Specific control activities are in place, aimed at discovering or preventing risks of misstatements in the financial reporting in a timely manner. Performance analysis is carried out on a continuous basis for all of the Group's entities, including the foreign entities. Other control activities are carried out in the divisions’ central accounting func-tions and through ÅF Pöyry AB’s Group Accounting and Reporting Department. All accounting and reporting activities for the Group’s Swedish operations are centralised under an accounting unit based at the Group’s head office, using standardised control processes. Control activities include profit analyses and other controls in respect of revenue and receivables, payments, non-current assets, work in progress, wages and salaries, VAT/tax, book-keeping, con-solidation and reporting as well as the maintenance of databases.
Information and communicationInformation and communication of policies, process descriptions, procedures and tools applicable to financial reporting can be found in the management system that is available to all those concerned via the Group’s intranet. Updates are carried out in the event of any changes in internal or external requirements or expectations regarding financial reports. For communication with external parties there is a communication policy that sets out guidelines for how this communication should take place. The purpose of the policy is to ensure correct and complete compliance with all information obligations. The purpose of the internal communication guidelines is that all employees understand the company’s values and business. To achieve the objective of informed employees, there is active internal work, in which information is regularly communicated via the Group’s intranet and in other ways.
Follow-upCompliance and efficiency of internal controls are followed up on a continuous basis both by the Board of Directors and management to ensure the quality of the processes. The company’s financial situation and strategy in respect of its financial position are con-sidered at every Board meeting. In addition, the Board of Directors receives monthly reports on the financial position and development of the business. The Audit Committee fulfils an important function by ensuring control activities for material risk areas in the processes for the financial reporting. The Audit Committee, management and

135 Annual and Sustainability Report 2019
To the general meeting of the shareholders in ÅF Pöyry AB, corporate identity number 556120-6474 Engagement and responsibilityIt is the board of directors who is responsible for the corporate governance statement for the year 2019 on pages 131–134 and that it has been prepared in accordance with the Annual Accounts Act .
The scope of the audittOur examination has been conducted in accordance with FAR’s auditing standard RevU 16 Auditor’s review of the corporate governance report. This means that our examination of the corporate governance statement is different and substan-tially less in scope than an audit conducted in accordance with International Standards on Auditing and generally accepted
auditing standards in Sweden. We believe that the examination has provided us with sufficient basis for our opinions.
OpinionA corporate governance statement has been prepared. Dis-closures in accordance with chapter 6 section 6 the second paragraph points 2-6 the Annual Accounts Act and chapter 7 section 31 the second paragraph the same law are consistent with the annual accounts and the consolidated accounts and are in accordance with the Annual Accounts Act. Stockholm, 26 March 2020KPMG AB
Joakim ThilstedtAuthorised Public Accountant
Auditor’s report on the Corporate Governance Statement
the internal audit function regularly follow up reported deficiencies. ÅF Pöyry AB’s system for financial management and control paves the way for effective financial follow-ups throughout ÅF. Reports are generated monthly for each profit centre and reports on project finances are typically reliable and detailed. Identified errors and measures taken are reported in the line organisation to the immedi-ate superior. ÅF Pöyry AB conducts audits in the operations to mon-itor application of internal control and the management system to live up to the Group’s internal ambitions, external requirements and expectations. Priority areas for this audit are the Group’s brands, core values and ethics, processes and systems as well as the proj-ects that the Group has undertaken to carry out. Reporting is to the President and CEO and the Board of Directors’ Audit Committee.
SustainabilityÅF Pöyry AB focuses on long-term strategic work aimed at ensur-ing the company becomes a more sustainable company. The ten principles of the UN Global Compact, the OECD Guidelines for Multinational Enterprises and the Global Objectives for Sustain-able Development form a foundation for the work. The company’s non-financial goals govern the priorities that are set up for the area. This sustainability work is intended to contribute to the company’s growth and is, therefore, followed up by both the Board of Directors and by Group management. The statutory sustainability report, whose content is stated on page 118 in the annual report, has been approved for issue by the Board of Directors.

CORPORATE GOVERNANCE REPORTCorporate governance
Board of Directors
2
3
1
5
6
1 Anders NarvingerChairman of the Board and Chairman of the Remuneration CommitteeElected: 2011, Chairman of the Board 2014 Born: 1948Education: M.Sc. Engineering, Fac-ulty of Engineering, Lund Univer-sity, and graduate in economics, Uppsala UniversityCurrent position and other sig-nificant duties: Chairman of the Board of Alfa Laval AB. Professional experience: CEO of the Association of Swedish Engi-neering Industries (Teknikföreta-gen), former President and CEO of ABB Sverige. Shareholding: 30,000 Class B shares
2 Jonas AbrahamssonDirectorElected: 2018Born: 1967Education: MBA, Lund UniversityCurrent position and other signif-icant duties: President and Chief Executive Officer of Swedavia. Member of the Royal Swedish Academy of Engineering Sciences, director of Almega Service Asso-ciations.Professional experience: Works at E.ON, most recently as CEO of E.ON Sverige 2010-2016. Shareholding: –
3 Gunilla BergDirector and member of the Audit CommitteeElected: 2017Born: 1960Education: MBA, Stockholm School of Economics, StockholmCurrent position and other sig-nificant duties: Director of Atlas Copco AB.Professional experience: CFO, PostNord, Vice President and CFO of the SAS Group, Vice President and CFO of the KF Group.Shareholding: 1,000 Class B shares
4 Henrik EhrnroothDirectorElected: 2019Born: 1954Education: M.Sc. in Forest Eco-nomics, University of Helsinki and B.B.A., Hanken School of Econom-ics in Helsinki. Current position and other significant duties: Chairman of the Board of Otava Group and Climate Leadership Coalition, director of the Marcus Wallenberg Foundation. Professional experience: CEO of Pöyry, Chairman of the Board of YIT Corporation and Caverion Corporation.Shareholding: 6,568,026 B shares indirectly through Corbis S.A.
5 Salla PöyryDirectorElected: 2019Born: 1984Education: Engineering degree and economics doctorate from Hanken Swedish School of Busi-ness in Helsinki.Current position and other sig-nificant duties: CEO of Proc-urator-Holding Oy. Director of Aspo Plc, Procurator-Holding Oy, Jaakko Pöyry Holding Oy, Finnish Foundation for Technology Promotion and Combined Asset Management of Technological Foundations of Funds.Professional experience: Financial analyst at Vicus Capital Advisors.Shareholding: 1,253,200 B shares indirectly through Procura-tor-Holding Oy.
6 Joakim RubinDirector and member of the Remuneration CommitteeElected: 2012Born: 1960Education: Engineering degree, Institute of Technology, Linkoping UniversityCurrent position and other signif-icant duties: Partner EQT Public Value. Director of Cramo plc, Hoist Finance AB and Adapteo plc.Professional experience: Partner Zeres Capital, Senior Partner CapMan. Head of Corporate Finance and Debt, Handelsbanken Capital Markets.Shareholding: –
136 Annual and Sustainability Report 2019
4
OTHER INFORMATIONBoard of Directors
Shareholding on 31 December 2019, including related party holdings.

10
11
9
7
8
7 Kristina SchaumanDirector and Chair of the Audit CommitteeElected: 2012Born: 1965Education: MBA, Stockholm School of EconomicsCurrent position and other signif-icant duties: BillerudKorsnäs AB, Orexo AB, Coor Service Manage-ment Holding AB, Diaverum AB and Nordic Entertainment Group AB.Professional experience: CFO of OMX, Carnegie and Apoteket AB, CEO of Apoteket AB and finance manager at Investor AB. Shareholding: 3,333 B shares
8 Anders SnellDirector and member of the Audit CommitteeElected: 2009Born: 1950Education: M.Sc. Engineering, Royal Institute of Technology (KTH), StockholmCurrent position and other sig-nificant duties: Chairman of the Boardof Wibax AB and executive member of the ÅForsk Foundation.Professional experience: Senior Vice President BillerudKorsnäs, Senior Vice President AssiDomän, CEO Grycksbo, CEO Norrsundet Bruks AB, Chairman of the Board of the ÅForsk Foundation.Shareholding: 4,000 B shares
9 Ulf SödergrenDirectorElected: 2018Born: 1953Education: M.Sc. Engineering, Royal Institute of Technology and MBA, Stockholm University.Current position and other sig-nificant duties: Chairman of the Board of IV Produkt AB. Director of HMS Networks AB, IV Produkt AB and Lagercrantz Group AB. Professional experience: Various positions in the ASSA ABLOY Group 2000-2018, including Executive Vice President and Chief Technology Officer (CTO), Regional Manager Scandina-via and COO and Senior Vice President of Assa Abloy. Various senior management positions at Electrolux 1984-2000.Shareholding: 20,000 B shares
10 Tomas Ekvall Director, employee representativeElected: 2017Born: 1981Education: Engineer, IT & Automation Current position: Works in Indus-trial & Digital Solutions Division.Shareholding: 344 B shares
11 Stefan LöfqvistDirector, employee representativeElected: 2018 (deputy 2018, ordi-nary 2019)Born: 1980Education: Graduate engineer, mechanical engineering Current position: Works in Indus-trial & Digital Solutions Division.Shareholding: –
Guojing ChenDeputy employee representativeElected: 2019Born: 1990Education: M.Sc. EngineeringCurrent position: Works at Infra-structure DivisionShareholding: –
Jessica ÅkerdahlDeputy employee representativeElected: 2019Born: 1974Education: Engineering degreeCurrent position: Works in Indus-trial & Digital Solutions Division.Shareholding: –
AuditorsKPMG ABAuditor in chargeJoakim Thilstedt
137 Annual and Sustainability Report 2019

CORPORATE GOVERNANCE REPORTCorporate governance
138 Annual and Sustainability Report 2019
1 3
2 4
5
1 Jonas GustavssonPresident and CEOEmployed: 2017Born: 1967Education: M.Sc. Engineering, Luleå University of TechnologyProfessional experience: Business Area Manager Sandvik Machining Solutions 2013-2017 and Sandvik Materials Technology 2011-2013. Prior to that, several leading posi-tions at Sandvik and Vice Presi-dent of Operations at BRP-Rotax (Austria). Leading positions at Bombardier and ABB. Shareholding: 10,000 Class B shares2017 Staff Convertible Pro-gramme: nominal amount SEK 6,000,000. 2018 Staff Convertible Pro-gramme: nominal amount SEK 3,000,000. 2019 Staff Convertible Pro-gramme: nominal amount SEK 6,000,000.
2 Juuso PajunenCFOEmployed: 2019Born: 1981 Education: M.Sc. (Econ.) from Helsinki School of EconomicsProfessional experience: CFO Pöyry 2016-2019, various finance positions at Pöyry 2004-2016 Shareholding: 6,116 Class B shares2019 Staff Convertible Pro-gramme: nominal amount SEK 900,000.
3 Cathrine SandegrenEVP and Head of Communications and BrandEmployed: 2016Born: 1977Education: Graduate Diploma in Business Administration, Copen-hagen Business SchoolProfessional experience: Head of Corporate, IR and Internal Communication ÅF, Corporate Communication Manager, SASShareholding: 50 Class B shares 2018 Staff Convertible Pro-gramme: nominal amount SEK 300,000. 2019 Staff Convertible Pro-gramme: nominal amount SEK 3,000,000.
4 Susan GustafssonGroup General CounselEmployed: 2019Born: 1973 Education: Law degree (L.L.M) from Lund and Maastricht Univer-sity, INSEAD Leading Innovation ProgrammeProfessional experience: Group General Counsel (2015-2019), MTG Modern Times Group and Nordic Entertainment Group, Stockholm. EVP General Counsel Martell Mumm Perriet-Jouët (2008-2015), M&A and Corporate Counsel (2003-2008), Pernod Ricard, Paris. M&A and corporate lawyer (1999-2003), law firm Vinge and Landwell & Partners, Paris.Shareholding: 2019 Staff Convert-ible Programme: nominal amount SEK 3,000,000
5 Malin FrenningEVP and Head of Infrastructure DivisionEmployed: 2019Born: 1967Education: Mechanical engineer-ing programme at Luleå University of Technology Professional experience: County council director at Stockholm County Council. Executive posi-tions at Telia, including CEO of Telia Sverige and President Busi-ness Area Broadband for Nordics and Baltics.Shareholding: 1,250 B shares, 2019 Staff Convertible Programme: nominal amount SEK 3,000,000.
Group management
OTHER INFORMATIONGroup management
Shareholding on 31 December 2019, including related party holdings.
Emma Claesson, Head of Human Resources, has been a member of Group management since 2014, but she left the company in the spring of 2020.

139 Annual and Sustainability Report 2019
6
97
86 Robert Larsson
EVP and Head of Industrial & Digi-tal Solutions DivisionEmployed: 2018Born: 1967Education: M.Sc. EngineeringProfessional experience: Several leading executive positions at ABB, most recently Lead Division Manager, Robotics & Motion Scan-dinaviaShareholding: 4,000 Class B shares, 2019 Staff Convertible Programme: nominal amount SEK 2,000,000.
7 Nicholas OksanenEVP and Head of Process Indus-tries DivisionEmployed: 1993 (Pöyry) Born: 1967Education: M.Sc. Paper Tech-nology and Economics, Helsinki University of Technology, Finland 1993Professional experience: 2014-2019 EVP, President, Industry Business Group, Pöyry. 2009-2016 President, Business Unit Pulp and Paper, Pöyry. 2003-2009 various leading positions within Pulp and Paper, Pöyry. 1990-2002 various leading and specialist positions within Pulp & PaperShareholding: 4,000 Class B shares 2019 Staff Convertible Pro-gramme: nominal amount SEK 3,000,000.
8 Richard PinnockEVP and Head of Energy DivisionEmployed: 1997 (Pöyry)Born: 1962Education: B.Comm. (Hons), University of South Africa, South Africa, 1991, B.Sc. Mechanical Engineering, University of Witwa-tersrand, South Africa, 1983, LPSF Executive Programme, Harvard Business School, USA, 2002.Professional experience: Presi-dent, Energy Business Group and Executive Vice President at Pöyry since 2003. Before that, expe-rience from working at Eskom in South Africa and at UCI Interna-tional, GermanyShareholding: 2019 Staff Convert-ible Programme: nominal amount SEK 3,000,000.
9 Roland LorenzEVP and Head of Management Consulting DivisionEmployed: 1999 (Pöyry)Born: 1970Education: Computer Science and Electrical Engineering, University of Applied Science Dortmund and University Bochum, GermanyProfessional experience: VP and Head of Energy Management Consulting Nordics, Central and Southern Europe at Pöyry 2010-2019, MD and Head of Energy Management Consulting at Pöyry 2007-2010 and prior to that, various managerial positions in management consulting. Shareholding: 3,000 Class B shares, 2019 Staff Convertible Programme: nominal amount SEK 900,000.

SEK million, unless otherwise stated 2019 2018 2017 2016 2015
Net sales and profit
Net sales 19,792 13,975 12,658 11,070 9,851
EBITA excluding items affecting comparability 1,731 1,268 1,117 996 861
EBITA 1,368 1,243 1,027 992 817
Operating profit (EBIT) 1,276 1,203 1,033 965 839
Profit after financial items 1,039 1,103 957 923 799
Profit for the period 821 850 742 711 609
Capital structure
Non-current assets 16,872 8,432 7,070 6,462 5,224
Current assets 7,502 4,776 4,308 3,945 3,093
Equity including non-controlling interest 9,369 5,465 4,989 4,697 4,230
Non-current liabilities 8,240 3,718 2,323 2,880 1,527
Current liabilities 6,767 4,026 4,067 2,830 2,559
Balance sheet total 24,375 13,208 11,378 10,407 8,316
Equity (average) 7,740 5,279 4,813 4,473 4,115
Total capital (average) 21,833 12,063 10,835 9,166 8,016
Capital employed (average) 15,507 8,388 7,642 6,581 5,694
Net debt 4,424 3,455 2,631 2,298 1,486
Key ratios
EBITA margin excluding items affecting comparability 8.7 9.1 8.8 9.0 8.7
EBITA margin, % 6.9 8.9 8.1 9.0 8.3
Operating margin, % 6.4 8.6 8.1 8.7 8.5
Profit margin, % 5.2 7.9 7.6 8.3 8.1
Equity ratio, % 38.4 41.4 43.8 45.1 50.9
Net debt/EBITDA, times 3.0 2.5 2.3 2.1 1.6
Net debt/equity ratio, % 47.2 63.2 52.7 48.9 35.1
Current ratio, times 1.1 1.2 1.1 1.4 1.2
Return on equity, % 10.6 16.1 15.4 15.9 14.8
Return on total capital, % 5.5 9.9 9.4 10.5 10.5
Return on capital employed, % 8.3 14.4 13.6 14.7 14.8
Interest cover, times 12.3 19.8 20.0 22.6 20.0
The share
Basic earnings per share, SEK 8.07 10.98 9.58 9.32 7.81
Diluted earnings per share, SEK 7.99 10.76 9.39 9.14 7.63
Dividend yield, % 2.3 3.1 2.8 2.7 2.6
Equity per share, SEK 83.51 70.42 64.30 60.19 54.46
Diluted equity per share, SEK 90.03 68.06 62.01 58.50 52.85
Cash flow from operating activities per basic share, SEK 19.59 11.30 8.03 7.98 6.75
Cash flow from operating activities per diluted share, SEK 19.16 10.92 7.78 7.75 6.54
Market price on 31 December, SEK 218.60 160.40 180.90 167.00 143.75
Market capitalisation 24,521 12,411 13,988 12,978 11,153
Ordinary dividend per share, SEK 0.001 5.00 5.00 4.50 3.75
Other
Cash flow from operating activities 1,993 874 624 622 523
Cash flow from investing activities -5,290 -1,153 -525 -963 -807
Cash flow from financing activities 4,066 306 -209 411 370
Capacity utilisation, % 75.8 77.2 77.6 77.6 76.9
Average number of FTEs excluding associates 14,680 10,037 9,292 8,115 7,4531) Proposed dividend
Five-year financial summary, SEK
140 Annual and Sustainability Report 2019
OTHER INFORMATIONFive-year financial summary

EUR million, unless otherwise stated 2019 2018 2017 2016 2015
Closing day exchange rate 10.43 10.28 9.85 9.57 9.14
Average exchange rate 10.59 10.26 9.63 9.47 9.36
Net sales and profit
Net sales 1,869 1,363 1,314 1,169 1,053
EBITA excluding items affecting comparability 163 124 116 105 92
EBITA 129 121 107 105 87
Operating profit (EBIT) 121 117 107 102 90
Profit after financial items 98 108 99 97 85
Profit for the period 78 83 77 75 65
Capital structure
Non-current assets 1,617 821 718 675 572
Current assets 719 465 437 412 339
Equity including non-controlling interest 898 532 507 491 463
Non-current liabilities 790 362 236 301 167
Current liabilities 649 392 413 296 280
Balance sheet total 2,336 1,285 1155 1088 910
Equity (average) 731 515 500 472 440
Total capital (average) 2,062 1,176 1125 968 857
Capital employed (average) 1,464 818 793 695 609
Net debt 424 336 267 240 163
Key ratios
EBITA margin excluding items affecting comparability 8.7 9.1 8.8 9.0 8.7
EBITA margin 6.9 8.9 8.1 9.0 8.3
Operating margin, % 6.4 8.6 8.1 8.7 8.5
Profit margin, % 5.2 7.9 7.6 8.3 8.1
Equity ratio, % 38.4 41.4 43.8 45.1 50.9
Net debt/EBITDA, times 3.0 2.5 2.3 2.1 1.6
Net debt/equity ratio, % 47.2 63.2 52.7 48.9 35.1
Current ratio, times 1.1 1.2 1.1 1.4 1.2
Return on equity, % 10.6 16.1 15.4 15.9 14.8
Return on total capital, % 5.5 9.9 9.4 10.5 10.5
Return on capital employed, % 8.3 14.4 13.6 14.7 14.8
Interest cover, times 12.3 19.8 20 22.6 20.0
The share
Basic earnings per share, EUR 0.76 1.07 0.99 0.98 0.83
Diluted earnings per share 0.76 1.05 0.97 0.97 0.82
Dividend yield, % 2.3 3.1 2.8 2.7 2.6
Equity per share, EUR 8.00 6.85 6.53 6.29 5.96
Diluted equity per share, EUR 8.63 6.62 6.31 6.11 5.79
Cash flow from operating activities per basic share, EUR 1.85 1.10 0.83 0.84 0.72
Cash flow from operating activities per diluted share, EUR 1.81 1.06 0.81 0.82 0.70
Market price on 31 December, EUR 20.95 15.61 18.37 17.46 15.74
Market capitalisation 2,350 1,208 1,420 1,357 1,221
Ordinary dividend per share, EUR 0.001 0.51 0.51 0.47 0.41
Other
Cash flow from operating activities 188 85 65 66 56
Cash flow from investing activities -500 -112 -55 -102 -86
Cash flow from financing activities 384 30 -22 43 40
Capacity utilisation, % 75.8 77.2 77.6 77.6 76.9
Average number of FTEs excluding associates 14,680 10,037 9,292 8,115 7,4531) Proposed dividend
Five-year financial summary, EUR
141 Annual and Sustainability Report 2019

142 Annual and Sustainability Report 2019
OTHER INFORMATIONAlternative performance measures
InfrastructureIndustrial &
Digital SolutionsProcess
Industries EnergyManagement Consulting2
Group-wide and eliminations Group
2019 20181 2019 20181 2019 20181 2019 20181 2019 2018 2019 2018 2019 2018
%
Total growth 28.8 — 0.4 — 275.5 — 92.5 — — — — — 41.6 10.4
Acquired 22.2 — 1.2 — 262.1 — 93.1 — — — — — 39.0 4.1
Currency 1.0 — 0.2 — 0.5 — 2.8 — — — — — 1.7 6.3
Organic 5.5 — -1.0 — 13.0 — -3.4 — — — — — 0.9 1.1
Adjusted/underlying organic growth due to calendar effect 5.7 — -0.6 — 14.0 — -2.4 — — — — — 2.1 5.6
1) Comparative growth figures for 2018 are not available because 2017 has not been adjusted for the reorganisation that took place on 1 January 2019.2) There are no comparative figures for growth in 2019 and 2018 as the division was formed entirely by Pöyry.
InfrastructureIndustrial & Dig-
ital SolutionsProcess
Industries EnergyManagement
ConsultingGroup-wide and
eliminations Group
2019 2018 2019 2018 2019 2018 2019 2018 2019 2018 2019 2018 2019 2018
SEK million
EBIT 680 637 486 525 323 91 215 72 92 — -519 -123 1,276 1170
Acquisition-related items
Depreciation and impairment of property, plant and equipment 5 0 — — — — — 0 — — 206 41 211 41
Revaluation of contingent considerations/option — — — — — — — — — — -119 -2 -119 -2
Divestment of operations — — — — — — — — — — -1 1 -1 1
Profit/loss (EBITA) 685 637 486 525 323 91 215 72 92 — -432 -82 1,368 1,211
Items affecting comparability
Transaction costs — — — — — — — — — — 44 25 44 25
Integration costs — — — — — — — — — — 215 — 215 —
Transition costs — — — — — — — — — — 105 25 105 —
Adjusted EBITA 685 637 486 525 323 91 215 72 92 — -68 -57 1,731 1,236
InfrastructureIndustrial &
Digital SolutionsProcess
Industries EnergyManagement
ConsultingGroup-wide
and eliminations Group
2019 2018 2019 2018 2019 2018 2019 2018 2019 2018 2019 2018 2019 2018
%
EBIT margin 8.9 10.7 8.4 9.1 10.6 11.2 7.2 4.6 13.7 — -40.4 -11.4 6.4 8.6
Acquisition-related items
Depreciation and impair-ment of property, plant and equipment 0.0 — — — — — — — — — 16.2 0.3 16.2 0.3
Revaluation of contingent considerations/option — — — — — — — — — — -9.3 0.0 -9.3 0.0
Divestment of operations — — — — — — — — — — 0.0 0.0 0.0 0.0
Profit/loss (EBITA) 8.9 10.7 8.4 9.1 10.6 11.2 7.2 4.6 13.7 — -33.7 -11.1 6.9 8.9
Items affecting comparability — — — — — — — — — — 28.4 0.2 28.4 0.2
Adjusted EBITA 8.9 10.7 8.4 9.1 10.6 11.2 7.2 4.6 13.7 — -5.3 -10.9 8.7 9.1
Organic growth
EBITA/Adjusted EBITA
EBITA margin/ Adjusted EBITA margin
Alternative performance measures
This annual report contains financial ratios defined according to IFRS. It also includes measurements not defined according to IFRS, known as alter-native performance measures. Organic growth, EBITA, Adjusted EBITA, EBITA margin and Adjusted EBITA margin are alternative performance measures for which detailed calculations are set out above. The purpose
is to provide additional information for comparing performance between years while providing an indicator of the Group's performance and financial position. The alternative performance measures are used by management to monitor the business in the Group's financial targets. These alternative performance measures are important for understanding the underlying business.

143 Annual and Sustainability Report 2019
Acquired growth – Growth in net sales from an acquired operation, counted as an acquired turnover 12 months from the takeover date.
Acquisition-related items – Depreciation/amortisation and impair-ment of goodwill and acquisition-related intangible assets, revalu-ation of contingent considerations and gains/losses on disposal of companies and operations.
Average number of FTEs – Average number of FTEs during the year converted to the equivalent number of year-long, full-time posi-tions. The actual number of employees is higher, owing to part-time employment and the fact that some employees work for only part of the year.
Capacity utilisation – Time invoiced to clients in relation to total time all employees are present at work.
Cash flow per share – Cash flow from operating activities in relation to average number of outstanding shares.
Current ratio – Current assets in relation to current liabilities.
Dividend yield – Dividend per share in relation to share price at end of reporting period.
Earnings per share – Earnings attributable to the parent’s share-holders in relation to average number of outstanding shares. Own shares are not regarded as outstanding shares.
EBITA – Earnings before interest, taxes and amortisation. Operating profit/loss with restoration of acquisition-related items.
EBITA margin – EBITA in relation to net sales.
EBITDA – Earnings before interest, taxes, depreciation and amorti-sation. Operating profit/loss before interest, taxes, impairment and depreciation/amortisation.
Equity per share – Equity attributable to the parent’s shareholders relative to total number of outstanding shares.
Equity ratio – Equity including non-controlling interests in relation to balance sheet total.
Interest cover – Profit/loss after financial items with restoration of financial expenses in relation to financial expenses.
Items affecting comparability – Refers mainly to costs of restruc-turing and costs for major acquisitions. Other one-off items may also be reported as items affecting comparability in the cases where this gives a fairer picture of the underlying operating profit.
Net debt – Interest-bearing liabilities (excluding contingent con-siderations) and pension provisions less cash, cash equivalents and interest-bearing receivables.
Net debt/equity ratio – Net debt in relation to equity including non-controlling interests.
Number of employees – Total number of employees at end of reporting period.
Operating margin – Operating profit in relation to net sales.
Operating profit (EBIT) – Profit/loss before net financial items and tax (earnings before interest and tax).
Operating profit excl. items affecting comparability – Operating profit/loss adjusted for items affecting comparability.
Operating margin excl. items affecting comparability – Operating margin adjusted for items affecting comparability.
Organic growth – Total growth in relation to net sales less acquired growth and growth attributable to currency effects.
Profit margin – Profit/loss after financial items, in relation to net sales.
Return on capital employed – Profit/loss after financial items and restoration of financial expenses in relation to average balance sheet total, less non-interest-bearing liabilities and net deferred tax.
Return on equity – Profit/loss after tax in relation to average share-holders’ equity including non-controlling interests.
Return on total capital – Profit/loss after financial items and res-toration of financial expenses, in relation to average balance sheet total.
Rolling twelve-month sales and operating profit – Net sales and operating profit for the most recent twelve-month period.
Total shareholder return – Share price development including re-in-vested dividend.
Definitions

Annual and Sustainability Report 2019144
OTHER INFORMATIONCalendar
Calendar 2020
Q1 2020 28 April 2020
Annual General Meeting 28 April 2020
Q2 2020 14 July 2020
Q3 2020 23 October 2020
Q4 2020 5 February 2021
Production: Narva in collaboration with ÅF Pöyry.
Printing: Elanders Sverige AB, 2020.
Translation of English version: Fluid Translation AB
The Swedish text is the binding version and shall prevail in the event of any discrepancies. This is a translation of the Swedish original.
Head Office: ÅF Pöyry AB169 99 Stockholm Visitors’ address: Frösundaleden 2, SolnaTel: +46 10 505 00 [email protected]. ID no. 556120-6474


AFRY is an international engineering, design and advisorycompany. We support our clients to progress in sustainabilityand digitalisation. We are 17,000 devoted experts within the fields of infrastructure, industry and energy, operating across the world to create sustainable solu-tions for future generations.
NARVA