SUSTAINABILITY REPORT 2019 - Webflow
196
SUSTAINABILITY REPORT 2019
-
Upload
khangminh22 -
Category
Documents
-
view
2 -
download
0
Transcript of SUSTAINABILITY REPORT 2019 - Webflow

S U S TA I N A B I L I T Y R E P O R T 2 0 1 9

2 SUSTAINABILITY REPORT 2019
SUSTAINABILITY APPROACH 3ABOUT OUR REPORT 4MESSAGE FROM OUR CEO 6CCI AT A GLANCE 8Vision 8Corporate Values 8Key Financial and Operational Indicators 9Financial Highlights 9Brands 10Operating Geography 12Awards 14OPERATING CONTEXT and VALUE CREATION 18Our Operating Environment 18Value We Create 20Sustainability Highlights of 2019 22SUSTAINABILITY GOVERNANCE 26Sustainability Milestones 26Memberships and Cooperations 28Sustainability Reporting 34Corporate Governance 35Sustainability Organization 36Risk Management 37Ethics Management 42SUSTAINABILITY FOCUS 45Stakeholder Engagement 45Materiality Analysis 48Material Topics Along The Value Chain and SDG Mapping 50The Way Forward 50
1 2 3SUSTAINABILITY IN REVIEW 53MATERIAL SUSTAINABILITY TOPICS OF 2019 54CREATING VALUE FOR OUR CUSTOMERS & CONSUMERS 55CONSUMER WELL-BEING 55Product Safety and Quality 55Total Beverage Portfolio 57CUSTOMER VALUE 59Superior Execution 59Excellence in Supply Chain 63CREATING VALUE FOR OUR PEOPLE 66HUMAN RIGHTS 66Human Rights Along The Value Chain 66Health and Safety 71Diversity and Inclusion 75HUMAN CAPITAL 78Talent Management 78Employee Engagement 84CREATING VALUE FOR OUR COMMUNITY 86COMMUNITY DEVELOPMENT 86Economic Impact 86Community Investments 88Volunteerism 96ENVIRONMENTAL FOOTPRINT 98Energy Management and Climate Protection 101Sustainable Packaging 111Water Management 116
PERFORMANCE INDICATORS 117CCI REPORTING GUIDANCE 122Key Definitions 123Scope of Reporting 126Data Preperation 127MANAGEMENT SYSTEMS STANDARDS AND PRINCIPLES 130INDEPENDENT ASSURANCE 131Independent Assurance Statement 131EXTERNAL VERIFICATION 132Greenhouse Gas Verification Scope for Turkey 132GHG Emissions Verification Statement 133PERFORMANCE INDICATORS 134Human Rights 134Health and Safety 135Human Capital 137Economic Impact 150Community Development 151Environmental Footprint 152Sustainable Packaging 159Water Management 163SUPPLEMENTARY DISCLOSURES FOR BIST 167Environment 167Governance 183Human Rights 184Stakeholder Issues 185CONTENT INDICES 186GRI Content Index 186UNGC Content Index 193UN WEP Content Index 193CONTACTS 194
CONTENT INDEX
SUSTAINABILITY IN REVIEW
PERFORMANCE INDICATORS
SUSTAINABILITY APPROACH

3SUSTAINABILITY REPORT 2019
SUSTAINABILITY APPROACH
1

4 SUSTAINABILITY REPORT 2019
With CCI’s 12th sustainability report, we share our practices and performance results obtained during the period between January 1 and December 31, 2019 for seven of the ten operating countries: Turkey, Jordan, Azerbaijan, Kazakhstan, Pakistan, Kyrgyzstan and Tajikistan. Data and information under ‘CCI Operating Geography’, ‘Summary of Financials’ and ‘Key Financial and Operating Indicators’ topics represent all operating countries. In 2019, the coverage of the report reached 90,7% of CCI’s total production volume and 86.7% of CCI’s employees.
Standards UsedThis report has been prepared in accordance with the GRI Standards: Core option. It also serves as our Communication on Progress (COP) to the United Nations Global Compact (UNGC) as well as our progress report on how we incorporate the United Nations Women Empowerment Principles (WEPs). Materiality, inclusiveness and responsiveness principles of the AA1000 Assurance Standard guide the content development process of our report. Additionally, we measure and report our social, environmental and ethical performance using leading internationally excepted principles and frameworks adopted by Carbon Disclosure Project (CDP), the International Labor Organization (ILO), the United Nations Convention Against Corruption (UNCAC), and the Greenhouse Gas (GHG) Protocol developed by the World Resources Institute (WRI).
VerificationSame as in the last eight years, selected data in this report were independently audited for the ninth year. In 2019, the GHG emissions of CCI Turkey Operations’ manufacturing, sales and distribution operations were audited and verified by a third-party organization to meet the requirements of ISO 14064-1, according to the International Organization for Standardization’s ISO 14064-3 2006 Standard. CCI Turkey Operations successfully passed the audits.
As defined in the Independent Limited Assurance Report in the Performance Indicators section of this report, the selected information received limited assurance for our operations in Turkey and Tajikistan from KPMG.
As described in the CCI Reporting Guidance, included in the Performance Indicators section of this report, the selected information consists of total energy data, energy usage per product, total water withdrawal and consumption data, water usage per product and waste data (for Turkey only).
Within the context of this audit, data from CCI’s Turkey and Tajikistan plants for 2019 were assessed and received Limited Assurance according to ISAE 3000 Revised (International Standard Assurance Engagements) other than Audits or Reviews of Historical Financial Information.
StructureWe prepared three sections to address and respond to different expectations of our stakeholders. The first section, “Sustainability Approach” includes general information about CCI, our sustainability governance and approach. In the second section, “Sustainability in Review”, we summarize our programs and efforts to create value for our stakeholders by classifying them in three main groups: Customers & Consumers, People, and Community. Finally, the third section “Performance Indicators” provides supplementary technical and quantitative information about our operations for relevant stakeholders.
For our response to the Covid-19 pandemic, please visit Operating Context and Value Creation part of this report.
Feedback Receiving feedback from our stakeholders is vital to help us improve our practices, performance and reporting processes. We evaluate every feedback and use them to continuously for improvement purposes. We invite all our stakeholders to share their opinions, suggestions and/or complaints by sending e-mails to [email protected] or by calling the Corporate Affairs Department at +90 216 528 40 00 or through the ‘Contact Us’ tab on our website cci.com.tr
GRI 102-45; 102-46; 102-48; 102-49; 102-50; 102-53; 102-54
ABOUT OUR REPORT
5SUSTAINABILITY REPORT 2019

6 SUSTAINABILITY REPORT 2019
Dear Stakeholders,It is my pleasure to share with you CCI’s 12th Sustainability Report covering our performance in 2019, which has been another successful year marked with our achievements towards our targets. With accountability and integrity among our core values, CCI has been disclosing its social, environmental, and economic performance in line with international standards annually since 2009. I believe our holistic approach to sustainability that we reveal in these reports create value for us and our stakeholders by considering their expectations and sharing our goals, achievements, and projects.
As a multinational beverage company with operations in 10 countries and 26 plants, we employ approximately 8,500 employees, and we owe our success to our passionate and talented employees’ efforts and diligent work. This year, we expanded the scope of our report by including our Tajikistan operations and increasing the report’s coverage to 90.7% of CCI’s total production volume and 86.7% of employees.
CCI is one of the key bottlers in The Coca-Cola System in terms of the consumer base, and we serve a population of 400 million people in the geography of emerging markets with high growth potential and opportunities for our business. With our operations in Turkey, the Middle East, Central Asia, and Pakistan, we pledge to create value for all, by being a responsible corporate citizen for our communities, by being a great place to work for our employees, by being the preferred partner for our customers, and by offering an attractive portfolio of beverages for our consumers.
Although we have been exposed to macroeconomic fluctuations in 2019, with a continued focus on quality growth and successful portfolio strategy, we increased our market share in almost all our markets. Our consolidated net sales revenue increased by 15% to ¨ 12.25 billion and EBITDA by 19% to ¨ 2.3 billion. While growing our business, we were successful in using fewer resources and reduced energy intensity per TL revenue by 13.6% in 2019 compared to 2018.
Creating Value for Customers and ConsumersWe gave utmost importance to consumer well-being together with customer value. While offering our consumers a wide choice of products fit for every lifestyle and occasion, product safety and quality remain to be the priority of our commitment to well-being. Our products are externally audited by a third-party and we received FSSC 22000 Food Safety System Certification Standard at all plants in 2019.
In line with our vision, we aim to be the preferred partner of our customers. We offer them unique solutions that would create win-win solutions. Enhancing customer value requires effective communication; thus, we engaged with over 12,000 customers through CCINext Sales Channel, interviewed about 6,000 customers in Turkey, Kazakhstan, and Pakistan and performed over 200,000 outbound calls, consequently increasing the satisfaction levels of our customers by 10 points.
MESSAGE FROM OUR CEO

7SUSTAINABILITY REPORT 2019
Burak BaşarırCoca-Cola İçecek, CEO
Creating Value for Our PeopleI am proud of my team of passionate employees who respect and value each other and work in perfect harmony for our commitments to our social and ecological environment. 85% of CCI employees participated in the employee engagement survey, where the score of diversity & inclusion cluster increased by nine percentage points compared to 2016.
At CCI, we strive to create safe working conditions for all. Through training and safety programs, we continuously improve our health and safety performance, reducing the number of accidents by 12% in 2019. Our training and development platforms such as U30, Women in Leadership, and Accelerate Leadership Programs continued and helped CCI raise the future leaders of our company.
As the output of our unconditional respect within CCI, we launched our Human Rights Policy and CCI’m Human communications and training campaign across our company and provided 7,500 hours of human rights training to CCI employees. We expanded our efforts for human rights along our value chain, conducted supplier audits for compliance with Supplier Guiding Principles, and achieved a success rate of 89% for the SGP audits in all countries of operation.
Creating Value for Our CommunityAs CCI grows, both our direct and indirect economic impacts amplify consequently. Recent analyses show that the economic yield CCI creates with its input to the economy is 10-fold in Turkey and 1.6-fold in Kazakhstan. In Pakistan, CCI operations create an impact of 1.95% of total GDP. The indirect employment created by CCI operations inTurkey is 30,000 people.
During 2019, 1,080 volunteer employees in Turkey and Pakistan helped run ten community projects for the sake of the environment and the empowerment of youth and women, a total of 115 thousand beneficiaries, including 25 thousand women whom we supported the entrepreneurial potential. We also empower young people and women in our operations, where 48.3% of our employees are millennials, and the ratio of women holding management positions is %27.
World Economic Forum Global Risks Report 2019 shows that extreme weather events, mostly due to climate change, and failure of climate change mitigation and adaptation are the top two risks threatening the world economy. As CCI, we continuously work on reducing the natural resources we use for our operations with strict targets.
In 2019, through operational excellence projects and other efficiency and optimization efforts from logistics to using returnable glass bottles practices in the value chain, we avoided over 300,000 tons of CO2, which is equivalent to the amount absorbed by 25 million trees in a year. We saved about 130,000 m3 of water across seven countries of operation. The water replenishment rate for Turkey reached 159% through community projects, and we replenished about 5 billion liters of water in Turkey through our water replenishment programs. In Turkey, Jordan, Kazakhstan, Azerbaijan, Pakistan, and Kyrgyzstan, we saved USD 2.09 million as a result of the efficient consumption of energy and water.
Partnership for the Goals and Future Outlook As a strong supporter of UN Sustainable Development Goals, we believe in the power of partnerships and collaboration as addressed in Sustainable Development Goal 17. To enhance the value we create, we benefit from strategic partnerships with related business, social and environmental associations. As of 2019 end, CCI is an active member of reputable NGOs and business interest groups and continues supporting 20 Initiatives by undersigning their principles locally and internationally. In 2019, CCI became a member of ERTA; Integrated Reporting Turkey Network and joined “Business Initiative for Plastic” in Turkey.
We met most of our targets for 2019, and for the ones we could not, we will continue to work setting higher targets to run our business most efficiently and escalating the value we create for you, our valuable stakeholders. I would like to thank you for your feedback, contribution, and support in making CCI’s journey towards sustainability, exemplary.
GRI 102-14

8 SUSTAINABILITY REPORT 2019
Being the preferred partner of ourcustomers, offering our consumers a wide choice of products fit for every
lifestyle and occasion
Being a good corporate citizen
Great place to work
Customer & Consumer
Community People
CREATEVALUE
Our Vision
“Be the best FMCG company across our markets”
Customer centric organization Value-added customer solutions Competitive cost to serve
Corporate governanceEnvironmental footprintWorkplace rightsSocial license to operate
Capability and leadershipEngaged, diverse and inclusive
High performing One Team culture
Total beverage mindsetCommercial excellence
Our Values
PASSION ACCOUNTABILITY TEAMWORK INTEGRITYWe put our heart andmind into what we do.
GRI 102-6
We act with a high sense of responsibility and hold ourselves
accountable.
We collaborate for ourcollective success.
We are open, honestand ethical, and
we trust and respect each other.
CCI AT A GLANCE

Key Financial And Operational Indicators
Financial Highlights
2018
2018
2019
2019
1.8%
31.5%
31,1%
22.7%-1.5%
-0.6%
4,0%
9.4%
0.1%
19.9% 19.0%
15.3%
11.9%3.0%
18.1%12.4%
7.9%
18.6%
GROWTH
GROWTH
GROWTH
GROWTHGROWTH
GROWTH
GROWTH
GROWTH
GROWTH
GROWTH GROWTH
GROWTH
MARGINMARGIN
MARGINMARGIN
MARGIN
MARGIN
650
8901,088
4,6905,756
664
321
714
1,171
5,9356,493
1,315
1,315
1,269
1,269
1,919
1,919
6,424
2,793
14,155
15,960
10,623
10,623
12,245
12,245
662
1,170
1,426
654
966
710
1,217
1,316
1,316
1,521
1,521
2,283
2,283
7,369
2,559
TURKEY
Sales Volume Net Sales Revenue
EBIT EBITDA
TURKEY TURKEY TURKEY
Sales Volume (million UC)
Consolidated (million UC)
Consolidated (million TL)
EBIT (million TL) EBITDA (million TL)Net Sales Revenue (million TL)
INTERNATIONAL INTERNATIONAL INTERNATIONALINTERNATIONALCONSOLIDATED CONSOLIDATED CONSOLIDATEDCONSOLIDATED
NET INCOME TOTAL EQUITY TOTAL EQUITYTOTAL ASSEST
9SUSTAINABILITY REPORT 2019

10 SUSTAINABILITY REPORT 2019
GRI 102-2
Brands

11SUSTAINABILITY REPORT 2019

12 SUSTAINABILITY REPORT 2019
Countries ofOperation
Population(Millions) (1)
GDP per Capita PPP (thousands $) (2)
Per-capita Consumption of NARTD (L) (3)
CCI’s Market Share in Sparkling
Beverages (4)
CCI’s Ranking in Sparkling
Beverages (5)
Turkey 83.5 26.7 116.6 65.6 1
Jordan 10.1 8.9 75.9 19.7 2
Azerbaijan 10.0 17.4 69.2 86.2 1
Iraq 39.3 16.3 93.2 41.9 2
Syria 17.1 4.7 n/a n/a n/a
GRI 102-4 GRI 102-6 GRI 102-7
Operating
in 10 Countrieswith 26 plantsabout 8,500 employees780,000 sales points
Serving
400 million consumerswith more than 25 brands
Operating Geography

13SUSTAINABILITY REPORT 2019
Countries ofOperation
Population(Millions) (1)
GDP per Capita PPP (thousands $) (2)
Per-capita Consumption of NARTD (L) (3)
CCI’s Market Share in Sparkling
Beverages (4)
CCI’s Ranking in Sparkling
Beverages (5)
Turkmenistan 5.9 19.1 27.4 n/a n/a
Tajikistan 9.3 3.4 20.1 n/a n/a
Kazakhstan 18.6 27.2 126.6 51.3 1
Pakistan 216.6 4.4 29.0 48.1 2
Kyrgyzstan 6.4 3.8 65.3 70.3 1
Sources of Information for 2019 Data
(1) IHS Markit(2) IHS Markit(3) CCI and TCCC estimates(4) Nielsen / Canadean(5) Nielsen / Canadean
GRI 102-4 GRI 102-6 GRI 102-7

14 SUSTAINABILITY REPORT 2019
2010CCI İzmir Plant“Best Performing Plant for the Environment Award”
CCI Turkey Operations“Best Country Bottling Operation Grand Prize”
TCCC EAG President’s Environment Awards
2012CCI Ankara Plant“Taking Responsibility for a Sustainable Future Prize”KALDER EFQM
CCI Turkey Operations“Best Country Bottling Operation Grand Prize”
CCI Ankara Plant“Best Performing Plant for Quality”
CCI İzmir Plant“Best Performing Plant for the Environment”
TCCC EAG President’s Environment Awards
2013CCI“Ethics Award”Ethical Values Center Association
CCI“Best Country Bottling Operation”
“Best Performing Plant for Quality”
“Best Performing Plant for the Environment”
TCCC EAG President’s Environment Awards
2014CCI İzmir Plant“Water Management”Green Business Platform
CCIGrand Prize“Green Dot Industry Awards”ÇEVKO
CCI Ankara Plant“Best Performing Plant for Quality”
CCI İzmir Plant“Best Performing Plant for the Environment”
TCCC EAG President’s Environment Awards
CCI Bursa and Mahmudiye Plants“National Quality Excellence Awards”KALDER EFQM
AwardsAwards Received Over The Past 10 Years

15SUSTAINABILITY REPORT 2019
2015“3.2.1. Move! (CSR) Program”“Bronze Award”12th Annual Stevie International Business Awards
CCI Turkey Operations“Best Country Bottling Operation”
“Excellence Award” Individual Well-Being Category
CCI İzmir Plant“Best Performing Plant for the Environment”
CCI Bursa Plant“Excellence Award in the Developing Organizational Capability”
CCI Mahmudiye Plant “National Quality Excellence Grand Prize”KALDER EFQM
2016CCI “Climate Leadership Award”CDP Turkey
CCI “Plate of Appreciation” for its cooperative approach during the times of crisis and natural disasters”Pakistan Red Crescent
2017CCI Turkey Operations “Recycling Award” Turkish Ministry of Environment and Urbanization
CCIThe Grand Prize“Water Efficiency” 4th Sustainable Business Awards in Turkey
CCI Kyrgyzstan“Kyrgyzstan’s Best Taxpayer Award” Kyrgyz Republic
CCI Turkey Operations“International Safety Award” British Safety Council
CCI Mersin Plant “2nd Place in Efficiency Projects Competition” Among Midsize EnterprisesTurkish Ministry of Science, Industry and Technology
2018CCI10th Sustainability ReportSilver Award“LACP Inspire Awards”League of American Communications Professionals
CCI Turkey OperationsRecognition of Köyceğiz & Sapanca Plants for Energy EfficiencyRecognition of Elazığ Plant for Water EfficiencyTCCC
CCI Dudullu HQ“Energy Efficiency Initiatives “LEED Gold Certificate
CCI Kazakhstan“PARYZ Award”For CCI’s Contributions to a Sustainable DevelopmentKazakhstan President
CCI KyrgyzstanCertificate of Honorfor CCI’s Contributions to National EconomyKyrgyz Republic Ministry of Economy
16 SUSTAINABILITY REPORT 2019
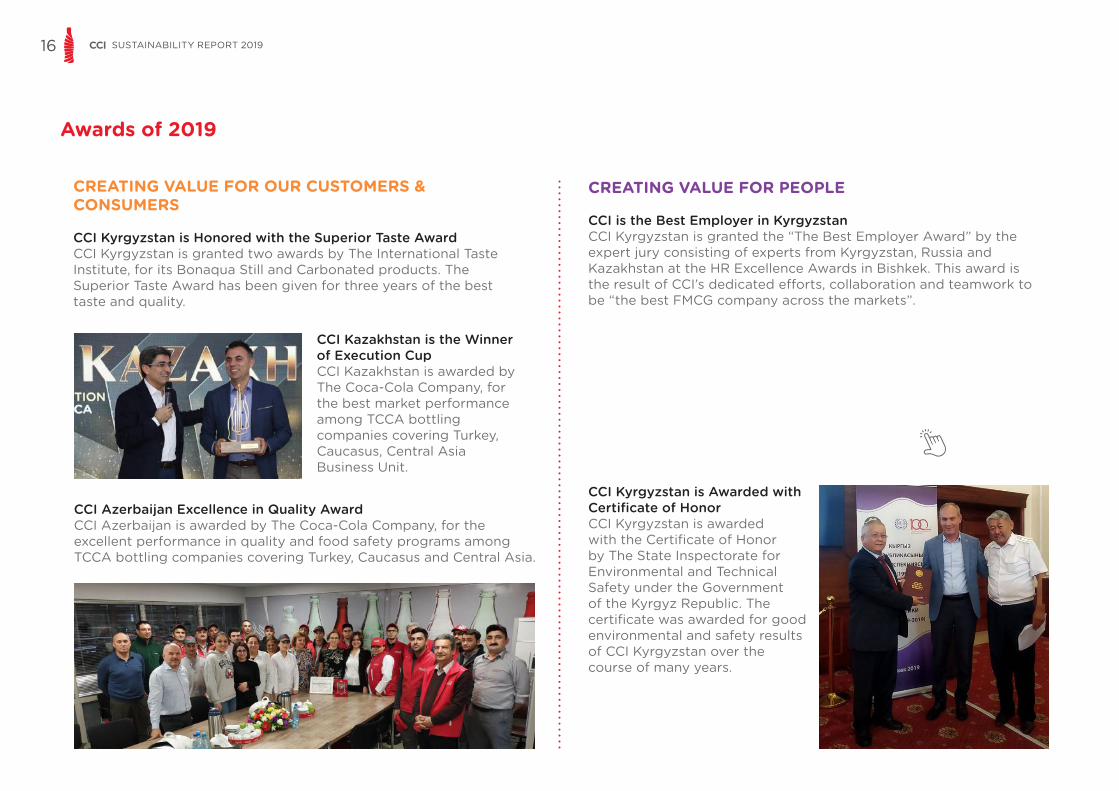
CREATING VALUE FOR OUR CUSTOMERS & CONSUMERS
CCI Kyrgyzstan is Honored with the Superior Taste AwardCCI Kyrgyzstan is granted two awards by The International Taste Institute, for its Bonaqua Still and Carbonated products. The Superior Taste Award has been given for three years of the best taste and quality.
CCI Azerbaijan Excellence in Quality AwardCCI Azerbaijan is awarded by The Coca-Cola Company, for the excellent performance in quality and food safety programs among TCCA bottling companies covering Turkey, Caucasus and Central Asia.
CCI Kazakhstan is the Winner of Execution CupCCI Kazakhstan is awarded by The Coca-Cola Company, for the best market performance among TCCA bottling companies covering Turkey, Caucasus, Central Asia Business Unit.
CREATING VALUE FOR PEOPLE
CCI is the Best Employer in KyrgyzstanCCI Kyrgyzstan is granted the “The Best Employer Award” by the expert jury consisting of experts from Kyrgyzstan, Russia and Kazakhstan at the HR Excellence Awards in Bishkek. This award is the result of CCI’s dedicated efforts, collaboration and teamwork to be “the best FMCG company across the markets”.
Awards of 2019
CCI Kyrgyzstan is Awarded with Certificate of HonorCCI Kyrgyzstan is awarded with the Certificate of Honor by The State Inspectorate for Environmental and Technical Safety under the Government of the Kyrgyz Republic. The certificate was awarded for good environmental and safety results of CCI Kyrgyzstan over the course of many years.

17SUSTAINABILITY REPORT 2019
CREATING VALUE FOR COMMUNITY
CCI Kazakhstan is the Winner of Environment and Safety AwardCCI Kazakhstan is granted with the “Environment and Safety Award” among 50 companies in 10 categories, at the AmCham Gala Awards’19 by the American Chamber of Commerce. The jury recognized the strong commitment of CCI Kazakhstan to the sustainability principles, particularly the measures to protect the environment and the water replenishment projects.
CCI Turkey’s Ankara Plant is Awarded with KAIZEN AwardCCI Turkey’s Ankara plant is awarded by KalDer, in KAIZEN Awards at the 22nd Quality Cycles Sharing Conference. Ankara and Çorlu plants participated with three projects and Ankara Plant’s ‘Decreasing Water Use-Ratio’ project became the winner among 13 projects of seven companies.
CCI Azerbaijan is Awarded for its Environmental Protection EffortsCCI Azerbaijan is awarded for its effective operations in environmental protection, such as land and water usage and, specific policy and actions during 2018 by the Ministry of Ecology and Natural Resources.

18 SUSTAINABILITY REPORT 2019
Our Response to the Covid-19 PandemicSince the very beginning of the Covid-19 outbreak, CCI has been closely following the global situation and actively monitoring all information, warnings and instructions given by national and international authorities on this issue. As CCI, our people; their health & wellbeing has always been and will remain to be our foremost priority. While adapting ourselves to this rapid change, we have focused on ensuring adherence to all the steps that need to be taken to help protect the health and safety of our employees, customers, consumers and community.
2020 goals stated in this report are determined as of end of 2019 and are subject to re-evaluation in the post coronavirus period.
For more information on our company’s actions during the pandemic, please visit CCI’s website.
OPERATING CONTEXT & VALUE CREATIONOur Operating Environment
Economic and Political Environment
CCI operates in a geography of political instabilities, macroeconomic challenges and security issues. As a consequence, economic growth in the Middle East markets have slowed down recently creating a challenging operating environment for CCI and causing increased price sensitivity amongst consumers.
The Turkish economy grew in the first two quarters of 2019 after experiencing a recession in the second half of 2018. (Source: World Bank in Turkey Website) Pakistan’s growth slowed to 3.3 percent in 2019 - a 2.2 percentage points decline compared to the previous year, due to the stabilization measures undertaken by the authorities. (Source: World Bank in Pakistan Website) Economies in Central Asia accelerated an already strong momentum. Tajikistan ranks among the top ten most improved economies globally over the 12-months until May 1, 2019. Azerbaijan, Kyrgyz Republic were among the top 20 most improved economies world-wide. (Source: Doing Business 2020 Study of World Bank)
In Turkmenistan, currency conversion problem persists. Consumers are at the heart of our business and we prioritize meeting consumer demands with great agility while not neglecting the social and environmental sustainability of our business. Looking ahead at 2020, we plan to maintain our quality growth algorithm through healthy topline growth and disciplined cost management. We will continue to focus on strong balance sheet and free cash flow generation while improving return on invested capital. We do realize that our operating environment will continue to be open to new risks and further volatilities, however we are taking precautions to be as efficient, as effective and as prudent as possible with increased immunity to weather challenges.
19SUSTAINABILITY REPORT 2019
Regulatory Environment
At CCI we live in a continuously changing environment where regulatory context has changed during the reporting period.
In Turkey, as a result of Zero Waste Project of Ministry of Environment and Urbanization, changes are made in the environmental legislation towards the end of 2018.
ZERO WASTE REGULATION: The new regulation is effective as of July 2019. It brings the responsibility of establishing “Zero Waste Management System” across the country within a specific timescale. With this regulation, public institutions and organizations, municipalities with population of more than 250,000 along with organized industrial zones, ports, business centers and commercial plazas are obliged to establish a zero-waste management system.
GEKAP: Recycling Contribution Share (GEKAP) is published on Official Gazette in 2019 and planned to be effective in 2020. GEKAP requires the legal entities to declare the recycling contribution fee for the primary and secondary packaging of the products they have imported or the products they supply to the market.
DEPOSIT RETURN SCHEME FOR ONE-WAY PACKAGING: Implementation of one-way beverage packaging deposit return scheme for transition to a more circular economy is planned to be effective by 2021. Material types in the scope are to be determined. At CCI, we aim to act proactively within the changing regulatory context. Coupled with consumers’ awareness on packaging waste pollution and our own aspiration to reduce our environmental impact, we strive to increase our recycling rates in transition to a circular economy.
RENEWABLE ENERGY: A new legislation in 2019 restricted the installation of wind turbines and solar panels to rooftops only, for facilities located in organized industrial zones.
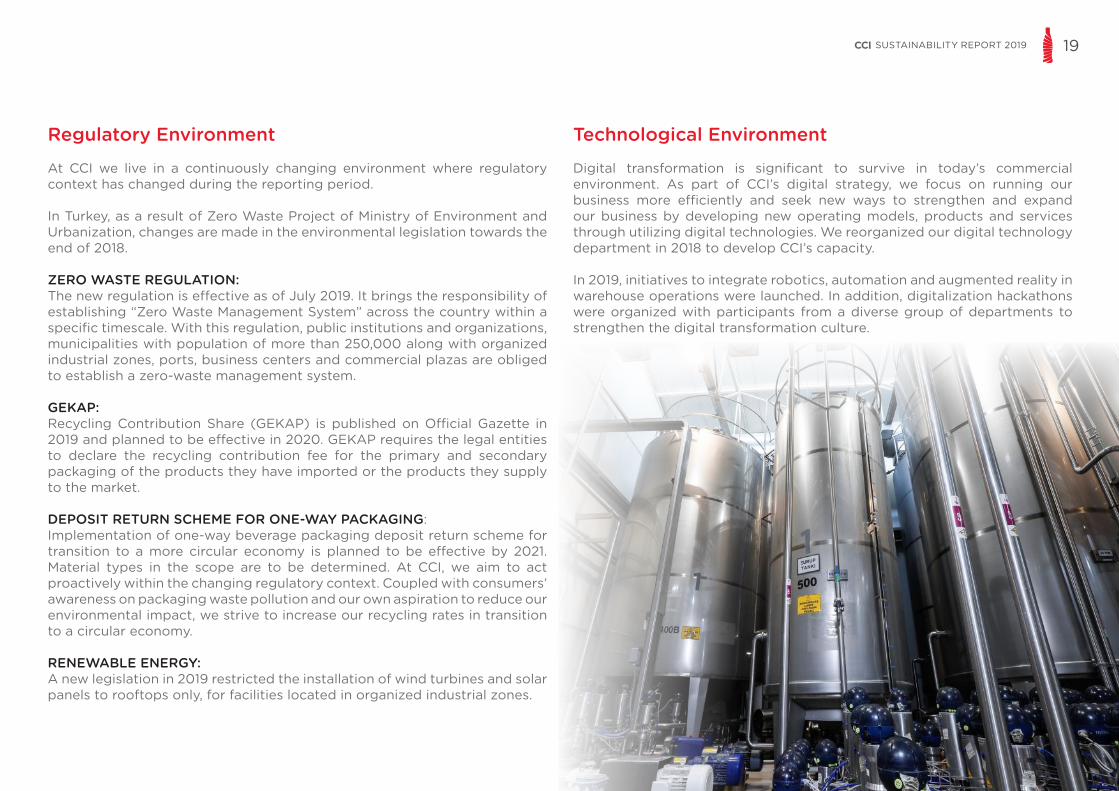
Technological Environment
Digital transformation is significant to survive in today’s commercial environment. As part of CCI’s digital strategy, we focus on running our business more efficiently and seek new ways to strengthen and expand our business by developing new operating models, products and services through utilizing digital technologies. We reorganized our digital technology department in 2018 to develop CCI’s capacity.
In 2019, initiatives to integrate robotics, automation and augmented reality in warehouse operations were launched. In addition, digitalization hackathons were organized with participants from a diverse group of departments to strengthen the digital transformation culture.

20 SUSTAINABILITY REPORT 2019
Value We Create
Total Equity 7,369 Million TL
Net Debt 2,559 Million TL
Incentives 72.8 Million TL
Manufactured Capital (1)
Number of Unit Cases Sold 1.3 Billion
Plants in 10 Countries 26
Social Capital
Number of Employees 8,646
Ratio of Millennials 48.3%
Number of Volunteers in
Turkey and Pakistan1,080
EBITDA 2,283 Million TL
Value Added for the Turkish Retailing Industry 4.1 Billion TL
Taxes Paid over the Net Income 281 Million TL
Value Created
Net Sales Revenue (1) 12,245 Mn TL+
15.3% GrowthEconomic Yield
(Turkey/Kazakhstan/Pakistan)
1:10 / 1:1.6 / 1.95% of total GDP
Value Created
Indirect Employment of CCI Operations
30,000 People
Women in Management Positions 27%
Donations (in Turkey) 40,000 TL
Financial Capital (1) Value Created
(1)Value Creation Process 2019
(1) Includes all CCI Countries (10 countries)
Investments
Employment
Superior Execution
Compliance
Transparency
Investments
Employment
Superior Execution
Compliance
Transparency
TrainingsTalent Development
Programs
Engagement Surveys
CCI Volunteers Program

21SUSTAINABILITY REPORT 2019
Intellectual Capital
Product Brands 25+Management Systems &
Certificates 7+Number of Internally Branded
Employee Engagement Platforms 14Number of Operational
Excellence Projects 29
Relationship Capital (1)
Sales Points 780,000Memberships 16
Community Projects 10
Natural Capital (2)
Energy Consumption 2,378 Million MJ
Water Withdrawal 10,130,884 m3
Value Created
Number of Low + No Calorie + Nutritionally Enhanced Products 8
Quality, Food Quality, H&S, Environment, Energy
Certifications at all Plants
Increase in Employee Engagement Score 9 points
OE Savings Across 7 Countries 2.09 Million USD
Value Created (1)
Potential Consumer Base 400 Million
Signed Initiatives & Partnerships 20Beneficiaries of Community Programs Total 114,500
(24,500 Women)
Value Created (2)
Energy & Carbon Emissions Saved 450,711 tCO2e
Trees Saved (3) 37.5 Million
Water Saved 128,593 m3
Water Recycled and Reused 589,625 m3
(1) Includes all CCI Countries (10 countries) (2) Includes CCI Countries in the reporting scope unless otherwise is stated (7 countries)(3) Calculation is made based the assumption that an average mature (15 years and older) tree absorbs 12 kg CO2 annually.
Value Creation Process 2019
Portfolio Mix
Policies
Guidelines
Management Systems
Trainings
Winning with the Customer
Active Participation in Management,
Conferences, Panels and Projects
Operational Excellence
Projects
Audits
Verifications

22 SUSTAINABILITY REPORT 2019
Sustainability Highlights of 2019
CONSUMER WELL-BEING
CUSTOMER VALUE
Audited by TCCC’s internal auditors for annual KORE
assessments
Passed the food safety and quality
audits
Ran Field Pie Stock Monitoring and Fairshare Distribution
ProgramsEngaged with
12,700 customers through CCINext Sales
Channel
Interviewed face-to-face with 5,700 customers in Turkey, Kazakhstan and Pakistan
Increased customer satisfaction score by 10 points
Performed 214,151 outbound calls to check the satisfaction levels
Reached 90.000 more customers through Customer
Interaction Center by responding to 86% of the
calls within the first 20 seconds.
Held the 4th CCI Innovation Day; “Alchemy of Innovation and Failure & Innovation” and
Participated in Anadolu Group’s Bi’ Fikir Festivali (An Idea Festival).
CCI participated in the festival with highest number of projects, won two awards and
was recognized as “The Most Successful Company”
Engaged Turkey, Jordan, Kazakhstan, Azerbaijan,
Pakistan, Kyrgyzstan for OE projects
Saved 2.09 million USD through 29 new
projects in all countries
Audited external by third-party for FSSC 22000
Standard
Received FSSC 22000 Food Safety
System Certification Standard at all plants
Invested in low or no-calorie and nutritionally enriched
productss
Launched Cappy Atom and Destek
drinks
Monitored Open to Curiosity Platform
Answered questions
of 616,072 users online
With CCI’s vision of being the best FMCG company across our markets and growing our business sustainably, we act responsibly as a corporate citizen while creating sustainable value for our diverse group of stakeholders along the value chain. “Create Value” is at the heart of our vision surrounded by our ‘Customers & Consumers’, ‘People’ and ‘Community’. We deliver the value we generate to our stakeholders under 6 major titles: Consumer Well-Being, Customer Value, Human Rights, Human Capital, Community Development and Environmental Footprint.

23SUSTAINABILITY REPORT 2019
HUMAN RIGHTS HUMAN CAPITAL
Launched Human Rights Policy and CCI’m Human
communications and training campaign across CCI
Provided 7,500 hours of
human rights trainings to CCI employees
Conducted two Talent Development Forums and reviewed our talent pools
Increased Talent Readiness Index (TRI)
from 46% to 53%
Ran Hand in Hand Safety Program 2.0 focusing on
behavioral safety
Improved our H&S performance
score by 5.4% in terms of the Safety
Maturity Index (SMI)
CCI Next Talent Program received about 2,000
applications
14 Next Talents joined CCI and started
their journeys in December 2019
Executed U30, Women in Leadership and Accelerate Leadership Programs
Diversity & Inclusion cluster of the employee
engagement survey resulted
with 9 points increase
compared to 2016
Executed Employee Engagement Survey (“Voice of CCI) with 85%
participationIncreased engagement score by 9 points
compared to 2016
Increased H&S trainings by 26% compared to 2018
Reduced the number of accidents by 12%
compared to 2018
Conducted supplier audits for compliance with Supplier Guiding
Principles (SGP)Realized
a success rate of 89% for the SGP audits in all countries of operation
Launched Accelerate 2.0 for LT and ELT of Group, Kazakhstan,
Pakistan and Turkey
Provided 78 leaders with intense experiential
learning and coaching
Provided 67,506 hours of H&S trainings for our employeesNo Lost time due to
accidents in 58% of our plants
24 SUSTAINABILITY REPORT 2019
COMMUNITY DEVELOPMENT
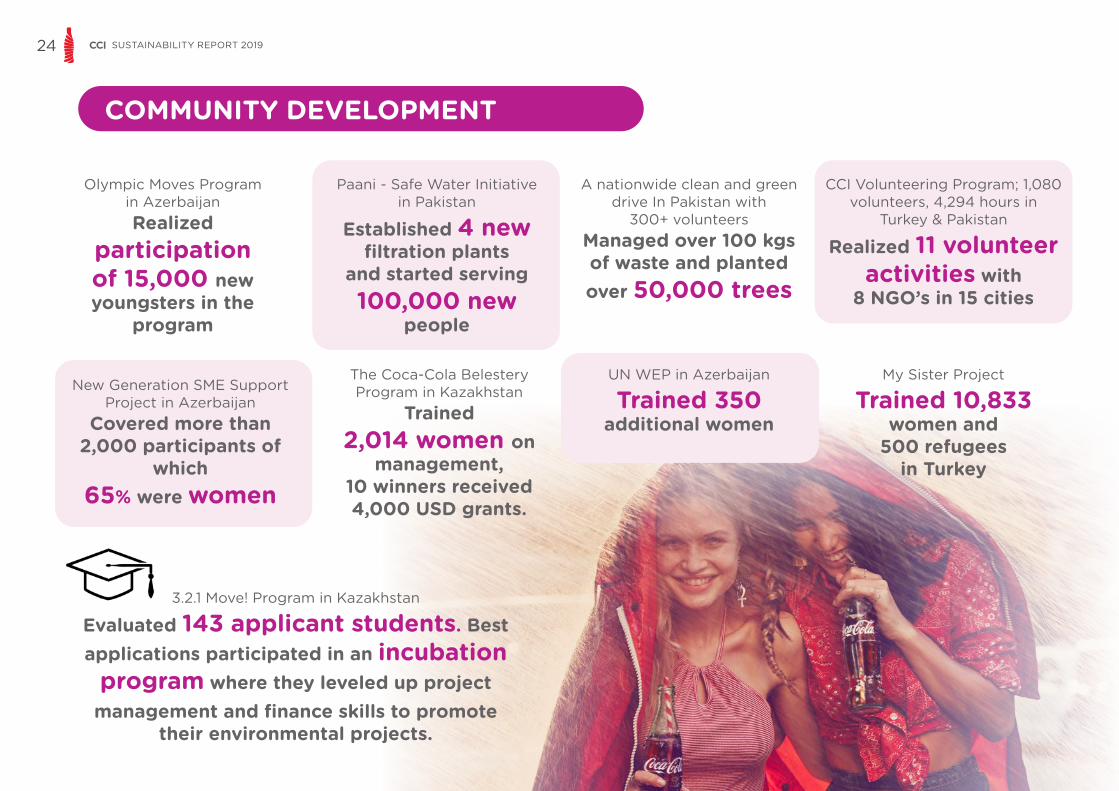
Olympic Moves Program in AzerbaijanRealized
participation of 15,000 new youngsters in the
program
UN WEP in Azerbaijan
Trained 350 additional women
3.2.1 Move! Program in Kazakhstan
Evaluated 143 applicant students. Best applications participated in an incubation
program where they leveled up project management and finance skills to promote
their environmental projects.
New Generation SME Support Project in Azerbaijan
Covered more than 2,000 participants of
which 65% were women
Paani - Safe Water Initiative in Pakistan
Established 4 new filtration plants
and started serving 100,000 new
people
A nationwide clean and green drive In Pakistan with
300+ volunteersManaged over 100 kgs of waste and planted over 50,000 trees
My Sister Project
Trained 10,833 women and
500 refugees in Turkey
CCI Volunteering Program; 1,080 volunteers, 4,294 hours in
Turkey & Pakistan
Realized 11 volunteer activities with
8 NGO’s in 15 cities
The Coca-Cola Belestery Program in Kazakhstan
Trained 2,014 women on
management, 10 winners received 4,000 USD grants.

25SUSTAINABILITY REPORT 2019
ENVIRONMENTAL FOOTPRINT
With 71 new operational excellence (OE) projects
Saved 142.3 million MJ of energy,
10.7 kilotons of CO2e emissions
Supplied the energy needs for illumination and post mix line in our İzmir Plant from 100% clean energy
resources
Provided 5,639 hours of environmental training for
our employees
Reached a ratio of 89.2% in cold drink equipment with Energy Management Device
(%48,2 in 7 countries)
Saved 525.6 GWh of energy and avoided 85.6 kilotons of CO2 emissions in 7 countries;
equivalent amount of CO2 that 7.1 million trees absorb
from the atmosphere
Achieved 360 kilotons of CO2 emissions reductions in Turkey as a result of our
efficiency and optimization efforts in the value chain
Avoided CO2 emissions equivalent to what 30 million
trees absorb from the atmosphere
The water replenishment rate for Turkey reached 159% through community projects
Replenished about 5 billion liters of water in Turkey
through our water replenishment programs
Reached ratio of 98.9% in newly purchased HFC-free cold drink equipment in Turkey
(37.9% in 7 countries)Reduced our CO2 emissions by 9,300 tons in 7 countries;
equivalent amount of CO2 that 775,000 trees absorb
from the atmosphere
Achieved Waste Recycling Rates up to 99%
98.1 % in Turkey97.0 % in Kyrgyzstan97.6 % in Pakistan99.0 % in Azerbaijan89.0 % in Jordan93.3 % in Kazakhstan77.6 % in Tajikistan
Recycled and reused 5.8% of our water (11% in Turkey)
Saved 128,593 m3 of water in the 7 countries
with OE projects

26 SUSTAINABILITY REPORT 2019
2002Published 1st Environmental
Policy
Listed among top two companies in Turkey’s CDP Carbon Performance Leaders
Completed the “Top 10 Energy-Saving Challenge Program” of
TCCC and the WWF (World Wildlife Fund) with İzmir and Mersin Plants in Turkey
Represented Turkey in Rio+20 Conference among
the best Green Economy Projects
2012
Achieved the 2nd highest score in the disclosure category of
CDP Turkey Climate Leadership Awards
Became 1st company from Turkey in the CDP Global Water Program
Increased Corporate Governance Rating from 8.8 to 9.25
2014
Ranked in the 1st place in Turkey’s Accountability Rating
Signed the United Nations Global Compact (UNGC)
Published 1st Sustainability Report
2009
2013CCI Operations became the
first multi-country operation in TCCS among all bottlers to complete the “Top 10 Energy-Saving Challenge Program”
Became the 1st company from Turkey and within TCCS in the UNGC 100 Index
Launched new “Code of Ethics”, “Workplace Rights Policy” and “Ethics Service”
Received the 1st ISO 14064-3 Certificate in Turkey for its GHG inventory
Listed among Carbon Disclosure and Performance Leaders in CDP Turkey 100 Climate Change Report
Received “Gender Equality Certification” from KAGİDER in Turkey
2011Externally assured for ISAE 3000
(for the 1st time)
Became Charter Member of the Climate Change Leaders Group
Listed as Turkey’s 1st food and beverage company in
CDP Global Disclosure Leaders
Signed to the “2°C Communiqué”
SUSTAINABILITY GOVERNANCESustainability Milestones

27SUSTAINABILITY REPORT 2019
2015Announced
“2025 Vision and Strategic Framework”
Joined the “BIST 50 Sustainability Index”
Joined the “Euronext Vigeo Emerging 70 Index”
Signed “UN Women’s Empowerment Principles”
Increased Corporate Governance Rating from 9.25 to 9.40
2017Joined “ECPI Emerging Markets
ESG Equity index”
Joined “Vigeo Eiris Best Emerging Markets Performers Ranking”
Joined “30% Club’s Turkey Chapter”, initiated by Sabancı University’s
Corporate Governance Forum and the Capital Markets Board of Turkey as
part of the Independent Women Directors Project
Achieved a Corporate Governance
Rating of 9.45
Externally assured Turkey Operations’ waste data
Updated “Workplace Rights Policy” as “Human Rights Policy”
Received LEED Gold Certificate with CCI Dudullu HQ
2018
2019Only company from Turkey and
within TCCS in the UNGC 100 Index (Since 2013)
Became a member of ERTA (Integrated Reporting Turkey Network)
Joined “Business Initiative for Plastic” in Turkey
Achieved a Corporate Governance Rating of 9.46
Joined the “BIST 100 Sustainability Index”
Joined “MSCI Global Sustainability Index”
Joined “FTSE4Good Emerging Index”
Listed among “Turkey’s CDP Climate Change
Leaders”
2016

28 SUSTAINABILITY REPORT 2019
Memberships And CooperationsOur Memberships and Signed Initiatives
MembershipsÇEVKO (Packaging Recovery Organization – Green Dot)
TÜSİAD (Turkish Industry and Business Association)
YASED (International Investors Association)
MEDER (Beverage Industry Association)
KALDER (Turkish Quality Association)
DEİK (Foreign Economic Relations Board)
SUDER (Bottled Water Manufacturers Association)
MEYED (Turkish Fruit Juice Industry Association)
TEİD (Turkish Ethics and Reputation Society)
TÜYİD (Turkish Investor Relations Society)
TOBB (Union of Chambers and Commodity Exchanges of Turkey)
TGDF (Federation of Food and Drink Industry Associations of Turkey)
UNGC Network Turkey (United Nations Global Compact Network Turkey)
ERTA (Integrated Reporting Turkey Network)
TKYD (Corporate Governance Association)
GRI Community (Global Reporting Initiative)
GRI 102-12; 102-13
Signed Initiatives
CDP Climate Change Program
CDP Water Program
Equality at Work Platform
United Nations Global Compact (UNGC)
Turkish Climate Change Platform
United Nations Women’s Empowerment Principles (UNWEP)
Brand Protection Group
30% Club Turkey Chapter (Growth Through Diversity)
Business Initiative for Plastic (TÜSİAD, UNGC, SKD)
Business Against Domestic Violence - Sabancı University Corporate Governance Forum
29SUSTAINABILITY REPORT 2019
External Recognition
Our sustainable business practices and communication of our sustainability vision through transparent means paid off, and CCI is distinguished by national and global sustainability indices.
CCI is the 1st and Still the Only Turkish Company in the UNGC 100 Index
CCI is Listed in the BIST Sustainability Index
CCI is Listed in the MSCI ESG Leaders Index
CCI is Listed in the FTSE4Good Emerging Index
Since its launch by the United Nations Global Compact (UNGC) in 2013, CCI is still the only company in Turkey that was included in the UNGC 100 Index. Companies listed in the index are selected from among the eligible UNGC members around the world. The eligible members are required to demonstrate their executive commitment to 10 UNGC principles, and continuously improve and disclose their sustainability performance and maintain consistent base-line profitability.
Based on the evaluation of our sustainability practice and performance in 2018-2019, CCI was included in Borsa Istanbul (BIST) Sustainability Index for the period between November 2019 and October 2020. In 2015, CCI became one of the first 29 companies to be included in the BIST Sustainability Index.
Upon evaluation of our environmental, social and corporate governance performance for 2017-2018 by Morgan Stanley Capital International, CCI was included in the 2019 MSCI ESG Leaders Index with score BBB. CCI joined the MSCI Global Sustainability Index in 2016.
In 2016, CCI joined FTSE4Good Emerging Index owing to its high performance in the environmental, social and corporate governance matters and sustained its position in the 2019 list as well. The FTSE4Good Emerging Index was launched in 2016 by FTSE Russell, a global leader in indices and data, globally used by investors.

30 SUSTAINABILITY REPORT 2019
External Recognition
CCI Joined the ECPI Emerging Markets ESG Equity Index
CCI is Included in Vigeo Eiris Best Emerging Markets Performers Ranking
CCI in CDP Turkey Climate Change and Water Programs
As of December 2017, CCI became a constituent of Emerging Markets ESG Equity index (ECPI). ECPI is a leading rating and index company dedicated to environmental, social and governance performance research.
In June 2019, CCI was once again included in Vigeo Eiris Best Emerging Markets Performers Ranking, selected as one of the 100 most advanced companies within the Equities Emerging Markets Universe consisting of 813 companies from 31 countries. Companies included in this index achieve the highest scores, as determined by a review based on 38 criteria, divided into six key areas of corporate environmental, social and governance matters, assessed by Vigeo Eiris.
CCI voluntarily participates in CDP Climate Change and Water Programs. CCI was honored with the Climate Leadership Award by CDP Turkey in performance and transparency categories three times. In 2019, CCI increased its score of Water Program from B- to B. CCI Climate Change Program score has not changed and stayed above all sectoral and regional averages.
GRI 102-12

31SUSTAINABILITY REPORT 2019
Partnerships for Sustainability
Work Groups Young SDG Innovators Program
Business Initiative for Plastic
ÇEVKO (Green Dot)
CCI is a member of Turkish Industry and Business Association (TÜSİAD) and CCI Corporate Affairs Director is a Board Member of UNGC Turkey. In line with ourcommitment to the Sustainable Development Goals, CCI is an active participant of the Climate Change, Diversity & Inclusion and Gender Equality and Women Empowerment Workgroups and “Business Initiative for Plastic” by TÜSİAD, UNGC and SKD.
The Young Sustainable Development Goals (SDG) Innovators Program is designed to engage a company’s brightest talents in not only advancing sustainability effortsbut driving innovation and delivering tangible solutions with potential market value for their company. Two talents from CCI participated the program in 2019.
CCI responded the call of Turkish Industry and Business Association, Business Council for Sustainable Development Turkey and United Nations Global Compact Turkey to fight plastic pollution through “Business Initiative for Plastic”. By signing the declaration of commitments CCI has become one of the 26 pioneer companies of the initiative proving dedication on efforts of reducing plastic consumption levels until 2021 and disclosing the results publicly.
CCI is a founding member of ÇEVKO and CCI Corporate Affairs Manager is a Board Member. By means of our strategic cooperation with ÇEVKO, we achieve a steadily increasing rate of post-consumer packaging waste collection as well as raising consumer awareness on recycling.

32 SUSTAINABILITY REPORT 2019
Partnerships for Sustainability
Habitat Association United Nations Development Program
International Labor Organization
MEDER (Beverage Industry Association)
Women empowerment is a priority topic in CCI’s sustainability strategy. Coca-Cola Turkey cooperated with Habitat Association for “My Sister” Project. The project aims to empower women, by equipping them with the necessary information and knowledge to take active role in the regional economic development, to improve their economic and social position and participate in economy.
CCI invests in community projects to tackle waste pollution and recycling. Since 2018, in cooperation with UNDP, a recycling program in the Mediterranean District of Turkey continues with the goal of enhancing the waste management capacity for recycling.
The project on Technical Assistance for Improving Social Dialogue in Working Life, run by the ILO Office in Turkey, prioritizes increasing the capacity of social partners, relevant public institutions and awareness-raising on social dialogue at all levels through a holistic approach. CCI contributed to the project along with other FMCG companies.
CCI Corporate Affairs Manager is selected as the President of the Board of MEDER, which was established in 1994 with the aim of supporting the growth of beverage sector, increasing the contributions of the sector on the Turkish economy and leading the sustainability efforts in the industry.

33SUSTAINABILITY REPORT 2019
Partnerships for Sustainability
Sabancı University Corporate Governance Forum (Business Against Domestic Violence)
The Business Against Domestic Violence Project is carried out by the Corporate Governance Forum of the Sabancı University in cooperation with TÜSİAD and with the main support of the United Nations Population Fund (UNFPA) and the Sabancı Foundation. It has the objective to establish support mechanisms in workplaces in case of employees being the subjects of violence in their close relationships. Three representatives of CCI attended BADV training. CCI’s objective is to share its management and organizational capabilities in order to spread best practices, tools and methods which lead to the decrease of domestic violence of the business world. In December, CCI Executive Committee and Turkey Leadership Team attended Gender Equality Awareness Training.
34 SUSTAINABILITY REPORT 2019
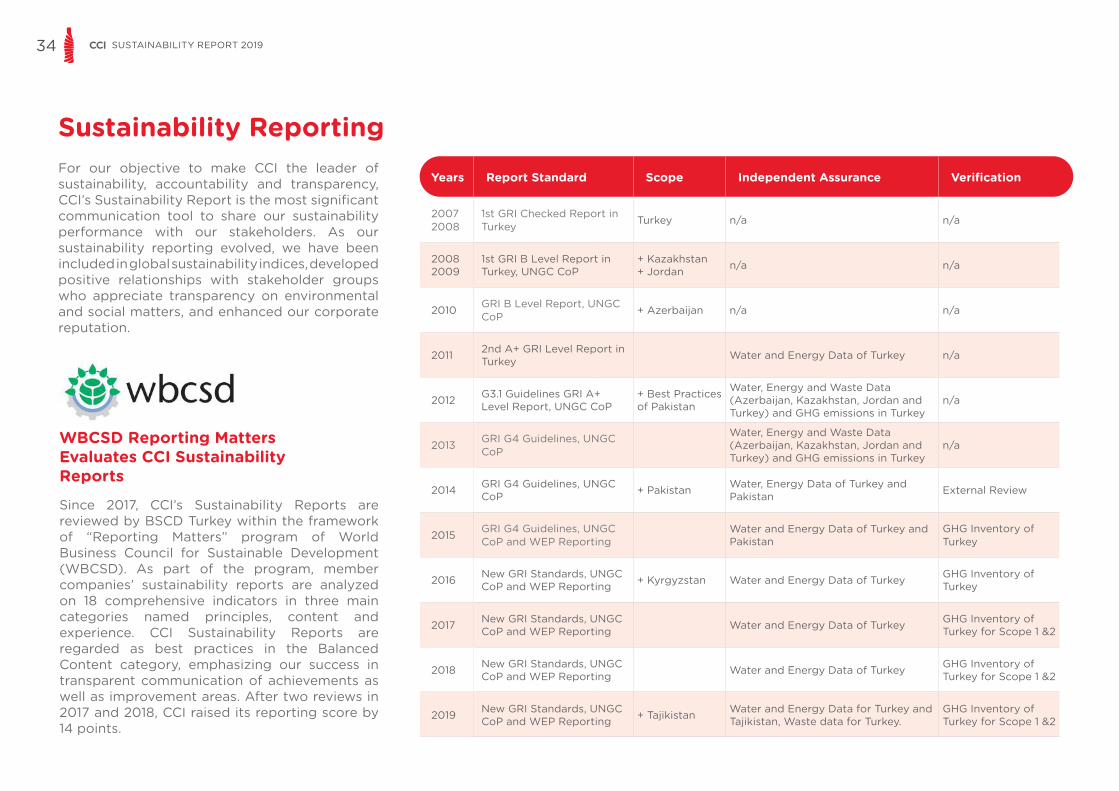
Sustainability ReportingYears Report Standard Scope Independent Assurance Verification
2007 2008
1st GRI Checked Report in Turkey Turkey n/a n/a
2008 2009
1st GRI B Level Report in Turkey, UNGC CoP
+ Kazakhstan + Jordan n/a n/a
2010 GRI B Level Report, UNGC CoP + Azerbaijan n/a n/a
2011 2nd A+ GRI Level Report in Turkey Water and Energy Data of Turkey n/a
2012 G3.1 Guidelines GRI A+ Level Report, UNGC CoP
+ Best Practices of Pakistan
Water, Energy and Waste Data (Azerbaijan, Kazakhstan, Jordan and Turkey) and GHG emissions in Turkey
n/a
2013 GRI G4 Guidelines, UNGC CoP
Water, Energy and Waste Data (Azerbaijan, Kazakhstan, Jordan and Turkey) and GHG emissions in Turkey
n/a
2014 GRI G4 Guidelines, UNGC CoP + Pakistan Water, Energy Data of Turkey and
Pakistan External Review
2015 GRI G4 Guidelines, UNGC CoP and WEP Reporting Water and Energy Data of Turkey and
PakistanGHG Inventory of Turkey
2016 New GRI Standards, UNGC CoP and WEP Reporting + Kyrgyzstan Water and Energy Data of Turkey GHG Inventory of
Turkey
2017 New GRI Standards, UNGC CoP and WEP Reporting Water and Energy Data of Turkey GHG Inventory of
Turkey for Scope 1 &2
2018 New GRI Standards, UNGC CoP and WEP Reporting Water and Energy Data of Turkey GHG Inventory of
Turkey for Scope 1 &2
2019 New GRI Standards, UNGC CoP and WEP Reporting + Tajikistan Water and Energy Data for Turkey and
Tajikistan, Waste data for Turkey. GHG Inventory of Turkey for Scope 1 &2
For our objective to make CCI the leader of sustainability, accountability and transparency, CCI’s Sustainability Report is the most significant communication tool to share our sustainability performance with our stakeholders. As our sustainability reporting evolved, we have been included in global sustainability indices, developed positive relationships with stakeholder groups who appreciate transparency on environmental and social matters, and enhanced our corporate reputation.
Since 2017, CCI’s Sustainability Reports are reviewed by BSCD Turkey within the framework of “Reporting Matters” program of World Business Council for Sustainable Development (WBCSD). As part of the program, member companies’ sustainability reports are analyzed on 18 comprehensive indicators in three main categories named principles, content and experience. CCI Sustainability Reports are regarded as best practices in the Balanced Content category, emphasizing our success in transparent communication of achievements as well as improvement areas. After two reviews in 2017 and 2018, CCI raised its reporting score by 14 points.
WBCSD Reporting Matters Evaluates CCI Sustainability Reports

35SUSTAINABILITY REPORT 2019
Corporate Governance Sustainability OrganizationCCI’s strong corporate governance structure plays a vital role in achieving our strategic goals. CCI conducts all its operations within the framework of established regulations in the operating countries and of the Corporate Governance Principles monitored by Turkey’s Capital Markets Board. We annually publish our Corporate Governance Principles Compliance Report in order to transparently inform our stakeholders on our performance. Corporate governance performance is managed by CCI Board of Directors, with the cooperation of Corporate Governance, Audit, and Risk Detection Committees which are involved under the Board. Corporate Governance Committee exercises the functions of Nomination and Remuneration Committees
CCI Board of Directors is actively engaged with the CCI’s sustainability strategy and its commitment to integrate sustainability into the business strategy. Corporate Governance Committee has the ultimate responsibility in determining and implementing the sustainability strategy. This responsibility is undertaken by the CCI Executive Committee, which is comprised of representative from senior management and steered by the CEO. Environmental and Social Sustainability Committee, Health and Safety Steering Committee, Diversity and Inclusion Advisory Board and, Ethics & Compliance Committee work separately to achieve the targets set for each of the strategic sustainability issues, together with the related working groups, and reporting to the Executive Committee.
Since 2015, CCI Corporate Affairs Director has also been serving as the Deputy Chairman of UNGC Turkey Network. CCI Corporate Affairs Department is responsible for the disclosure, reporting and communication of sustainability targets and performance results. CCI employees also play significant roles to integrate our sustainability strategy into our overall business processes.
GRI 102-18
Details on the Board Committees

36 SUSTAINABILITY REPORT 2019
Environmental &Social Sustainability
Committee
CSRWorkGroup
GroupH&S
Committees
EmissionsReduction
WorkGroup
Location BasedH&S
Committee
WaterStewardshipWork Group
CultureSustainablePackaging
Work GroupGender
GroupEthics
Committees
Production Steering
CommitteeGeneration
CountryEthics
Committees
SUSTAINABILITY GOVERNANCE MODEL
BOARD OF DIRECTORS
Corporate GovernanceCommittee
Health & Safety SteeringCommittee
ExecutiveCommittee
AuditCommittee
Diversity & InclusionAdvisory Board
Risk DetectionCommittee
Ethics & ComplianceCommittee

37SUSTAINABILITY REPORT 2019
BOARD OF DIRECTORS
Corporate Governance Committee
Country General Managers
Risk Mitigation
Action Plans
Risk Detection Committee
Audit Committee
Risk ManagementRisk Management Governance Structure
Risk Detection Committee reporting to the Board oversees the risk management at CCI. Enterprise Risk Management (ERM) Team, which directly reports to the CEO and the Risk Detection Committee, acts as the facilitator and conducts risk assessments. ERM team members are the CEO, the Strategy and Business Development Director, and the Regional Directors.
ERM conducts risk assessment on country and group levels using the input from the World Economic Forum, global surveys and The Coca Cola System. The risks are prioritized based on their general likelihood, and the probability of occurrence in the short-term and impact.
Country General Managers of CCI are responsible for risk management and mitigation. They identify the critical threats and opportunities based on the risk assessment results, integrate them into their Strategic Business Plans and prepare the mitigation action plans. High-priority risks are reported to the Board’s Risk Detection Committee along with mitigation action plans. Internal audits are performed to track the risk mitigation plans and the results are reported to the Audit Committee.
Actions of 2019
Our consolidated risks were categorized into seven groups parallel with the global risk ERM approach. Focus was on the financial reflections of economic and political risks in our geography and talent management in addition to detailed individual risks for operating countries and as common risk areas for all operations. Videoconferencing was utilized instead of travelling to each country of operation, as a tool for some internal audits to save time and be more environmentally friendly.
Risk Management Trainings
CCI employees are regularly trained on risk management and informed via the ERM website, that is accessible through the CCI internal portal. The website provides an ERM tool along with guidelines, leading articles, useful links and an awareness training presentation on ERM.

38 SUSTAINABILITY REPORT 2019
Top 5 Global Risks 1st 2nd 3rd 4th 5th
In Terms ofLikelihood
Extreme Weather Events
(1st in the last 3 years)
Failure of Climate Change
Mitigation and
Adaptation
Natural Disasters
Data Fraud or Theft
Cyber Attacks
In Terms ofImpact
Weapons of Mass Destruction
(1st in the last 3 years)
Failure of Climate Change
Mitigation and
Adaptation
Extreme Weather Events
Water Crises
Natural Disasters
Source. World Economic Forum, Global Risks Report 2019
Environmental Societal Technological Geopolitical
Global Risks Landscape 2019

39SUSTAINABILITY REPORT 2019
Top Risks for CCI’s in 2019
EconomicChange in consumer preferences has always been the risk against continuous growth that we mitigated through diversified product portfolio where operational challenges appear.
LegalRegulatory changes in Turkey and Pakistan regarding plastics, sugar and water consumption created financial and operational challenges.
TechnologicalCyber-attacks that we considered require innovative and agile approaches.
HumanRetention and management of talents is another risk where we aimed to recreate a training system to develop the skills needed in our human resources.
SocialKey stakeholders’ expectations and concerns around sustainability impacts grow more rapidly than in previous years. Responding them in their specific areas of concern is challenging.
EnvironmentalThe principal environmental risks we assessed are climate change (and energy management), post-consumer packaging and water scarcity.
Outlook for 2020
Adjusting operational business processes, increase operational efficiencies, accelerated portfolio diversification to align with changing consumer preferences.
Anticipating and planning for geopolitical and regulatory changes and collaborating with the industry and state authorities.
Addressing impact of digitization and technological development on strategy, business models and cybersecurity.
Overseeing the culture and talent in an era of innovation and transformation.
Engaging with the stakeholders on long-term governance, environmental and social issues
Continuing to invest in energy and water efficient equipment within mitigation actions.

40 SUSTAINABILITY REPORT 2019
CCI country management uses the pillars in the company’s strategic business plan to evaluate business risks.CCI’s principal risks and key mitigations are given below:
Risk Pillar Principal Risk Key Mitigations
Environmental
Climate Change• Programs for energy efficiency and GHG emission reduction at plants, logistics and cooling operations• Policy making and engagement with NGOs and legal authorities• Investigating in alternative clean energy sources
Energy • OE Projects, Behavioral Energy Programs• Improving energy efficiency (achieve energy usage ratio targets)
Packaging
• Implementation of sustainable packaging and waste solutions. • Maintaining packaging innovation, Lightweight, recycled PET, recycling activities• Post-consumer packaging recovery programs to reduce packaging materials and related GHG emissions• Coordination with local authorities for waste collection and recycling
Water Scarcity
• Sustainable sourcing• Conducting SVA studies.• Follow-up of Source Water Protection Plan• Continuing local replenishment and access to water program• Implementation of water efficiency projects at plants• Improving WUR (water usage ratio)
Wastewater• Wastewater treatment systems• Periodic analysis• ISO 14001 EMS and KORE Audits
Community & Stakeholder Relations
• Implementing locally relevant projects with local and international project partners• Driving stakeholder perception through transparency and reporting practices
Supply Chain
Food Safety & Quality • Implementing KORE audits and International Standards
Supplier Management • Follow-up of SGP audit findings
Legal & Compliance
Compliance Risks • Establishing an early warning mechanism for critical draft and recent regulations• Addressing regulatory changes and cooperate with government authorities, collaborate and lead the industry
Ethics-Bribery & Corruption
• Training employees on the Code of Ethics• Encouraging effective use of Ethic Hotline• Implementing ethics program
Work Life
Human & Workplace Rights
• SGP Audits• Follow-up SGP audit results• Ethics Hotline
Health & Safety
• Hand in Hand Safety Program• KORE Compliance Implementations• Distributor safety process implementations• Contractor safety process implementations• Driving Safety Program
Sustainable Talent Capability
• Continuing with talent development forum• Effective cooperation with respected universities to build employer branding
Cybersecurity
Cyber-attacks that may cause data leakage or service interruptions
• Security program• Cyber resilience• Cyber risk insurance (covers the cost of restoring the loss in terms of business income or reputation owing to
the damage of computers and computer networks.)
Business ContinuityCCI implements TCCC’s Incident Management and Crisis Resolution (IMCR) program, which is designed to create and maintain an efficient, integrated structure for preventing and managing incidents. Implementation of the IMCR program is a key management activity and is everyone’s responsibility at CCI. To ensure that we prevent or reduce the impact of incidents on our business, we have incident management teams in all countries of operation. Each team joins our annual training sessions, and collectively work on simulations of complex incidents. As part of the IMCR program, each country conducts the IMCR Validation Program every three years, which aims to create readiness for crisis situations, build awareness, identify gaps and develop action plans for improvements. In 2019, conducted the IMCR Validation Program in Azerbaijan, Kazakhstan, Kyrgyzstan and Pakistan. In 2020, we will continue to train and validate the crisis teams in Jordan and Iraq.
GRI 102-11; 102-15

41SUSTAINABILITY REPORT 2019
Data Security and PrivacyAccording to the Global Risk Report of the World Economic Forum; cyber risks are among the five top global risks. To address this challenge and mitigate risks, CCI owns a robust information security and privacy program with the following key elements to secure its information assets.
2019 Goals Performance Status 2020 Goals
Implement early and accurate threat detection systems by leveraging advanced deception technologies to ensure post- breach defense, contain cyber-attacks, mitigate the damages, take control of privileged accounts and apply privacy restrictions and policies to decrease data loss, thus increase cyber resilience.
Implemented trap servers, privileged account management and data loss prevention system over all CCI Information Security Monitoring Systems and additional initiatives (such as 2FA) were implemented over all CCI countries to increase security maturity. Employees were informed about modern information security threats and topics through security awareness trainings in the countries of operation.
Achieved
Implement Mobile Operation System solutions for company owned sales related devices
Continue creating awareness regarding algorithms to promote Digital Ethics and continue implementing appropriate technical security measures to ensure continuous privacy and security of personal data.
Challenge CCI’s infrastructure and application security by emulating attackers who use advanced tactics, techniques and procedures.
For OT, standardize secure-remote-access mechanism for vendor support and implement application whitelisting to effectively protect production systems in our plants.
Increase CCI resilience by monitoring and detection capabilities by improving service/system coverage, developing additional correlation rules based on products feature set.
Challenge CCI’s security maturity to sophisticated attacks by emulating attackers with advanced tactics, techniques and procedures.
Execute and mitigate urgent, critical risks and vulnerabilities to prevent loss of confidentiality, integrity, availability and safety
Establish, operationalize and adhere to data governance and privacy guidelines as per CCI countries regulations
Continuously assess security, compliance and ethics requirements and gaps for CCI data and analytics operations.
Continue implementing «secure-by-design» «privacy-by-design» approach in product development and lifecycle management for sustainable security culture
Continued implementations. Ongoing
Extend cybersecurity focus to OT/IoT to increase visibility with OT intrusion detection systems and effectively protect production systems in our plants
Continued implementations. Ongoing
42 SUSTAINABILITY REPORT 2019
Information Security GovernanceCCI runs company-wide information security governance structure that enables the effective management of potential risks and incorporates security and privacy controls into our information systems and services. Information Security Steering Committee, which consists of the Executive Committee and the security management team, acts as the governing body since 2009. CCI has implemented a comprehensive Information Security Management System (ISMS) based on the ISO 27001 ISMS standard to achieve its security objectives. CCI complies and was certified with ISO 27001 standards in 2016 and completed the surveillance audit in 2017, 2018 and 2019.
Ethics ManagementIntegrity and honesty are fundamental virtues for CCI. It is our whole-hearted obligation to protect our most valuable asset; the Coca-Cola brand and CCI. The CCI Code of Ethics guides our employees to live by our values and “do the right thing”. The scope applies to all CCI operating countries. CCI also developed the mechanisms for stakeholders to report any illegal or unethical practice within the company to the CCI Ethics and Compliance Officer.
CCI Code of Ethics
CCI Code of Ethics Handbook
Security AwarenessCCI has been running a mandatory cybersecurity awareness program for all employees since 2014, thereby promoting cybersecurity awareness across the company. The awareness program reports are submitted to top management to inform them of any risk. This awareness program includes online and offline trainings, awareness posters on displays at CCI workplaces, corporate social network groups as well as e-mail notifications on diverse topics such as phishing, travel security, URL security, e-mail security, physical security. Also, we are performing the cybersecurity contests with the prizes for most active employees.
Privacy and Data ProtectionCCI takes precautionary measures to secure the personal information of its employees and customers. Our IT environment, security measures, policies and cyber security awareness program support compliance with the privacy and data protection requirements. CCI fully complies with Turkish Personal Data Protection Law requirements and has been registered to the VERBIS system. In order to follow recent regulatory developments and sustain overall compliance, Data Protection and Digital Privacy Committee meets regularly and conducts on-spot audits to remain data protection awareness, reports result of on-spot audits to top management.
Regulatory ComplianceCCI designed and implemented many initiatives aimed at ensuring compliance with the requirements of:
• Turkish Personal Data Protection Law no. 6698 (KVKK)• Communiques published by Capital Markets Board of Turkey• Authorized Economic Operator program of Turkish Ministry of Customs and Trade

43SUSTAINABILITY REPORT 2019
Channels are available for our employees to express their concerns on ethical issues.
CCI Ethics Service Face to Face Notification
Is available 24/7 and run by a completely independent third party.
Can be accessed through Website (Turkish, English, Russian and Arabic) at www.cciethicsline.com or a dedicated phone number.
Online translation services in Arabic, English, Georgian, Russian and Turkish are available.
Employee’s name and e-mail address are kept anonymous and confidential.
Employees may direct their concerns to;
• Their managers
• Local Ethics and Compliance Managers
Employee’s name and information are kept
confidential.
GRI 102-16; GRI 102-17

44 SUSTAINABILITY REPORT 2019
Actions in 2019In 2019, we updated policies regarding third party relationships, gift and entertainment, conflict of interest. In 2020, we aim to ensure the enforcement of these policies and to provide unity of implementation for all countries.
We also established an integrity risk management program for CCI’s distributors to mitigate 3rd party risks, in cooperation with EBRD. 1st phase of the Program on ethics and compliance management is completed for beneficiary distributors. In 2020, we aim to complete the 2nd phase of the Program and enhance this initiative as a certificate program for the purpose of ensuring sustainable businesses.
During the reporting period, there were no legal actions against CCI for anti-competitive behavior, anti-trust or monopoly practices.
Training on EthicsWe continued to train all employees on Code of Ethics and anti-bribery rules in all CCI countries by using digital boards, internal social media platform to raise awareness; continued to review and update Code of Ethics and anti-bribery policy in line with TCCC practices. In 2019, we provided 1,840 human-hours of training to 1,776 employees. In 2020, we would like to sustain the awareness level through trainings and launch online trainings in the languages operating countries to ensure that all new employees start work with the integrated knowledge of Code of Ethics.
Awareness Raising on EthicsSince 2013, our employees are trained on the revised Code of Ethics, the Code of Ethics Handbook and procedural provisions. The Code of Ethics Handbook and Guidelines for Handling Code of Ethics Matters are shared with our employees. All newly recruited employees are obliged to sign an acknowledgement form confirming that they have read the Code of Ethics and agree to abide by its provisions. All employees are required to periodically make this acknowledgement. Representatives and consultants assigned by CCI and third parties doing work on behalf of CCI may also obtain a copy of the Code and learn their obligations. In 2018, CCI celebrated Global Ethics Day.
CCI Integrity Risk Management Program (IRM)IRM, launched in 2019 focuses on supporting SMEs in CCI’s supply chain on an individual basis in order to ensure that CCI distributors adopt internationally recognized practices in compliance and continue to improve their corporate governance skills. The Program is supporting the SME beneficiaries to become even more integrated in the supply chain, to adopt internationally recognized practices in compliance, to set up a compliance program, to conduct trainings and awareness programs on Code of Ethics and be compliant with CCI’s Code of Ethics. CCI intends to enlarge the Program in order to more distributors to benefit from this program.

45SUSTAINABILITY REPORT 2019
Building an effective and strong stakeholder dialogue is the core of keeping our business sustainable and engaging them in our sustainability strategy. Since 2013, we have been prioritizing our stakeholders and the means of communication through a comprehensive stakeholder mapping study pursuant to AccountAbility’s AA1000 SES Standard and the EFQM Business Excellence Model.
We engage with each stakeholder group on a regular basis not only to share our sustainability efforts but also to evaluate both our material issues and to consolidate their opinions and feedbacks. The various means of communication with different stakeholder groups and how we respond to their questions and concerns are provided on the following tables.
Stakeholder Day Series TCCC Reputation Survey
CCI and TCCC envisioned the Stakeholder Day series as a local engagement platform to further improve relations with key local stakeholders, and to raise awareness on economic and social influence, on CCI’s sustainability efforts, and manufacturing capabilities of CCI’s operating countries.
Stakeholder Day series was more systematically structured since 2017, when CCI and TCCC representatives came together with the local stakeholders and shared information about the operations and CSR efforts in the region, and CCI’s sustainability vision. İzmir Stakeholder Day is held in May 2019. Bursa, Isparta and Köyceğiz meetings are planned for 2020.
Within TCCS, we value feedback and opinions of our stakeholders and consequently plan and implement our actions with the insight we gain from them. For this purpose, we conduct a corporate reputation survey periodically with our internal and external stakeholders, including our consumers.
In 2019, via a third-party institution we conducted a reputation survey, in compliance with EFQM and AA1000 standards, with a sample group to represent Turkish urban population. The survey aimed at tracking consumers’ perceptions and attitude towards Coca-Cola Turkey on issues such as transparency, accountability, financial durability, corporate social responsibility, product and service quality, working conditions, campaigns - commercials, communication, innovation, environmental issues and company performance.
SUSTAINABILITY FOCUSStakeholder Engagement
GRI 102-42
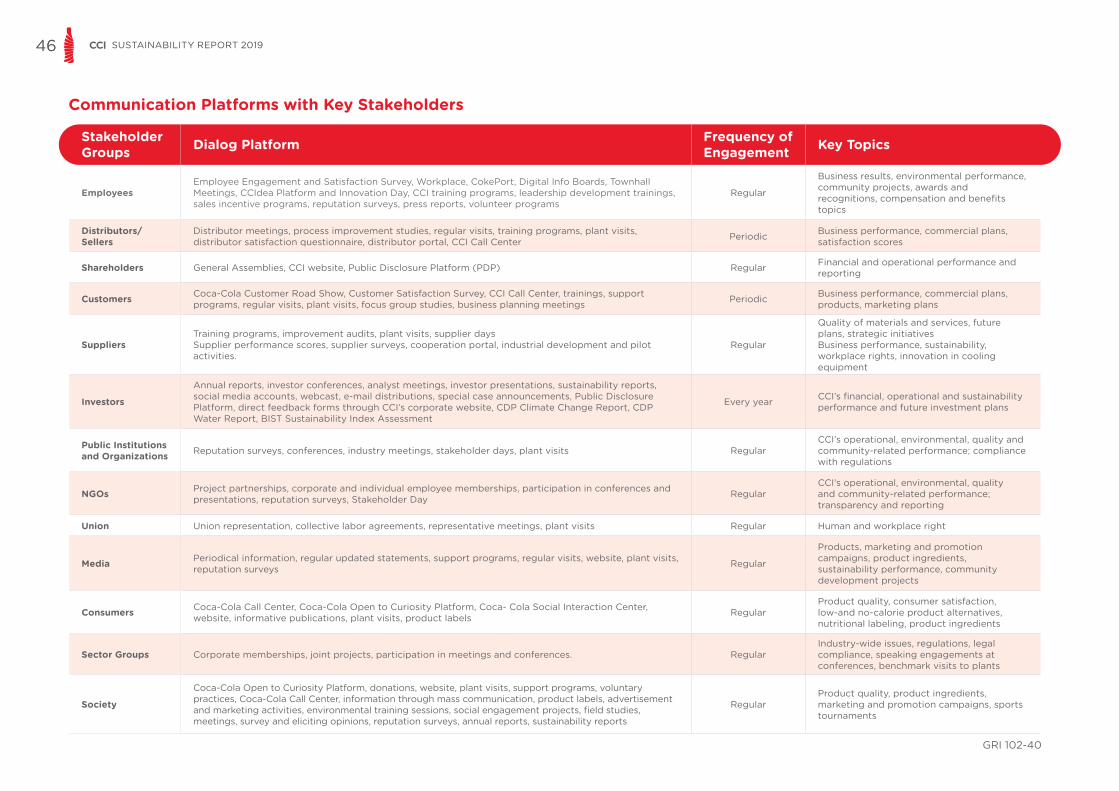
46 SUSTAINABILITY REPORT 2019
Stakeholder Groups Dialog Platform Frequency of
Engagement Key Topics
EmployeesEmployee Engagement and Satisfaction Survey, Workplace, CokePort, Digital Info Boards, Townhall Meetings, CCIdea Platform and Innovation Day, CCI training programs, leadership development trainings, sales incentive programs, reputation surveys, press reports, volunteer programs
Regular
Business results, environmental performance, community projects, awards and recognitions, compensation and benefits topics
Distributors/Sellers
Distributor meetings, process improvement studies, regular visits, training programs, plant visits, distributor satisfaction questionnaire, distributor portal, CCI Call Center Periodic Business performance, commercial plans,
satisfaction scores
Shareholders General Assemblies, CCI website, Public Disclosure Platform (PDP) Regular Financial and operational performance and reporting
Customers Coca-Cola Customer Road Show, Customer Satisfaction Survey, CCI Call Center, trainings, support programs, regular visits, plant visits, focus group studies, business planning meetings Periodic Business performance, commercial plans,
products, marketing plans
SuppliersTraining programs, improvement audits, plant visits, supplier daysSupplier performance scores, supplier surveys, cooperation portal, industrial development and pilot activities.
Regular
Quality of materials and services, future plans, strategic initiativesBusiness performance, sustainability, workplace rights, innovation in cooling equipment
Investors
Annual reports, investor conferences, analyst meetings, investor presentations, sustainability reports, social media accounts, webcast, e-mail distributions, special case announcements, Public Disclosure Platform, direct feedback forms through CCI’s corporate website, CDP Climate Change Report, CDP Water Report, BIST Sustainability Index Assessment
Every year CCI’s financial, operational and sustainability performance and future investment plans
Public Institutions and Organizations Reputation surveys, conferences, industry meetings, stakeholder days, plant visits Regular
CCI’s operational, environmental, quality and community-related performance; compliance with regulations
NGOs Project partnerships, corporate and individual employee memberships, participation in conferences and presentations, reputation surveys, Stakeholder Day Regular
CCI’s operational, environmental, quality and community-related performance; transparency and reporting
Union Union representation, collective labor agreements, representative meetings, plant visits Regular Human and workplace right
Media Periodical information, regular updated statements, support programs, regular visits, website, plant visits, reputation surveys Regular
Products, marketing and promotion campaigns, product ingredients, sustainability performance, community development projects
Consumers Coca-Cola Call Center, Coca-Cola Open to Curiosity Platform, Coca- Cola Social Interaction Center, website, informative publications, plant visits, product labels Regular
Product quality, consumer satisfaction, low-and no-calorie product alternatives, nutritional labeling, product ingredients
Sector Groups Corporate memberships, joint projects, participation in meetings and conferences. RegularIndustry-wide issues, regulations, legal compliance, speaking engagements at conferences, benchmark visits to plants
Society
Coca-Cola Open to Curiosity Platform, donations, website, plant visits, support programs, voluntary practices, Coca-Cola Call Center, information through mass communication, product labels, advertisement and marketing activities, environmental training sessions, social engagement projects, field studies, meetings, survey and eliciting opinions, reputation surveys, annual reports, sustainability reports
RegularProduct quality, product ingredients, marketing and promotion campaigns, sports tournaments
Communication Platforms with Key Stakeholders
GRI 102-40

47SUSTAINABILITY REPORT 2019
Highlights of Stakeholder Engagement Activities in 2019
Material Topics Supported Programs / Activities Primary Stakeholders
Involved Engagement Agenda
Product Safety and Quality“Sustainable Beet Sugar Production” Project
Leading FMCG & beverage companies and Suppliers
Acting with the industry to understand and implement effectively the best practices for the sustainable production of beet sugar in Turkey.
Superior Execution Women Distributors’ Empowerment Program Women distributors of CCI Developing leadership and institutional capacities of 17 female distributors of CCI and
enhancing our commercial relations.
Human Rights Along the Value Chain “CCI’m Human” Program Employees Training of CCI employees provided in 7,500 hours.
The International Human Rights Day celebration at CCI on December 10th
Talent Management Leadership Capability Development Programs Employees
Women Empowerment via “Women in Leadership” Program (22 women from CCI operations) Leadership Development via “Accelerate” Program (78 participants)Young Leaders Development via “U30” Program (47 participants under the age of 30 from CCI operations)
Talent Management Talent Acquisition Programs Universities
Meeting with university students through CCI at Campus Program designing series of events to present CCI and attract young talents.
CCI Next Talent Program
Water Stewardship Pakistan Water Workshop NGOs, private sector, media and Chairman Water Commission
Focus was on highlighting CCI’s crucial role in Pakistan’s economy and CCI’s commitment towards water efficiency via water conservation projects as well as water saving initiatives.
Energy Management and Climate Protection Conferences and Forums Sector Groups
Representation at ÇEVKO “Turkey’s Fight against Climate Change” ConferenceRepresentation at the 11th Global Warming Council hosted by Economic Journalists Association.
Sustainable Packaging Conferences and Forums Sector GroupsRepresentation at Zero Waste ForumRepresentation at the panel as part of 6th International Plastic Packaging Congress hosted by PAGEV (Turkish Plastic Industry Foundation)
Sustainable Packaging Kollekt App
Nature Conservation Centre and UNDP and TCCC, Consumers, Public, Kemer Municipality
Raising consumer awareness through an app and improving recycling rates in the region. Kemer district was chosen as the pilot region. Based on learning points from the pilot phase, the app is planning to be rolled out to Antalya and other cities in the medium term.
CCI’s Value Creation Communication Stakeholder Day in İzmir
Local stakeholders including municipality and relevant local NGOs
Information sharing on the operations in İzmir region, CSR efforts and the sustainability vision and feedback collection from local stakeholders on improvement areas.
CCI’s Value Creation Communication ESG Investor Roadshow Investors Briefing to Investors in Europe on CCI's ESG related achievements and performance via a
roadshow. Feedbacks were shared with relevant departments accordingly.
CCI’s Value Creation Communication Conferences and Forums Sector Groups
Representation at Turkey-Kazakhstan Business Forum to present CCI’s investments and economic and social contributions in Kazakhstan CCI's investments in Kazakhstan and the economic and social contributions these investments brought along.
GRI 102-43

48 SUSTAINABILITY REPORT 2019
Materiality AnalysisThe materiality analysis is a continuous process for us, and it is significant to review our progress and assess the results annually. We engage with each stakeholder group on a regular basis to prioritize our material issues considering their opinions and feedbacks.
The analysis of material topics for sustainability at CCI consists of four dimensions;
• Global and sectoral risks and opportunities
• CCI’s and TCCC’s strategic priorities
• CCI’s social, economic and environmental impacts our business and our value chain
• Stakeholder concerns and expectations
In our 2019 review and analyses, we grouped the material issues into two. The topics on the right column of the matrix are the primary issues detailed in this report. These topics are placed in the matrix according to their rate of significance for CCI and the rate of their influence on our external stakeholders we engaged in 2019.

CCI Materiality Matrix
Influ
ence
on
Stak
ehol
ders
’ Ass
essm
ents
and
Dec
isio
ns
LOW
HIGH
HIGH
Significance of Environmental, Social and Economic Impact
Energy Management andClimate Protection (*)
Product Safety and Quality (*)Sustainable Packaging (*)Water Management (*)
Health and Safety (*)Excellence in Supply Chain (*)Human Rights Along The Value Chain (*)Diversity and InclusionEconomic Impact (*)
Community Investments (*)Talent ManagementEmployee EngagementSuperior Execution (*)
Total Beverage Portfolio (**)Volunteerism (**)
Sustainable AgricultureBiodiversitySecurity Practices
PRIMARY ISSUES• Customers & Consumers• Our People• Community• Also Material for Value Chain (*)• Material for CCI only (**)
SECONDARY ISSUES• With low materiality for CCI and its stakeholders (Topics are not included in the report.)
PRIMARY ISSUESSECONDARY ISSUES
49SUSTAINABILITY REPORT 2019
GRI 102-44; 102-47

50 SUSTAINABILITY REPORT 2019
Material Topics Along The Value Chain and SDG MappingAt CCI, aligned with TCCC, we identified the areas where we can create value for our internal and external stakeholders. In order to have a broader perspective on the scope of the positive outcomes we want to reveal, we linked our material topics with the UN SDG’s (Sustainable Development Goals). We believe that the actions, projects and implementations that would take us to our corporate goals will also contribute to the 2030 Sustainable Development Goals (SDGs).
In 2019, two talents from CCI participated the Young SDG Innovators Program where the goal is to identify young talents and accelerate business innovation towards 2030 Sustainable Development Goals.
In 2019, we took part in a study with other Anadolu Group companies where SDG contributions of our Group is analyzed.
Please visit the following page to see CCI’s material topics along its value chain and
how they are mapped with Sustainable Development Goals.
The Way ForwardIn 2020, we plan to finalize CCI’s 2030 Sustainability Pledge and announce our long-term commitments.
In 2021, we aim to transform our sustainability report to an integrated report that will align our strategy, financial and extra-financial goals and in which we would like to disclose CCI’s short, medium and long-term value creation process more in detail.
Setting our climate related targets based on Science Based Targets Initiative is another sustainability agenda item we will focus on within the next few years. We aim to be a signatory of SBT as the first step within 2021.
For the report, please visit Anadolu Group’s website.

51SUSTAINABILITY REPORT 2019
LOGISTICSEnergy Management
and Climate ProtectionHealth and Safety
Superior Execution
SOURCING &PROCUREMENT
Excellence in Supply ChainSustainable Packaging
Superior ExecutionHealth and Safety
Energy Management and Climate Protection
CUSTOMERSSuperior Execution
Energy Management and Climate Protection
Total Beverage PortfolioHealth and Safety
CONSUMERS &COMMUNITY
Total Beverage PortfolioProduct Safety and
QualityEconomic Impact
Community InvestmentsVolunteerism
PRODUCTIONEnergy Management
and Climate ProtectionProduct Safety and
QualityWater ManagementHealth and Safety
MANAGEMENTHuman Rights Along The Value Chain
Health and Safety
Diversity and Inclusion
Talent Management
Employee Engagement

52 SUSTAINABILITY REPORT 201952 SUSTAINABILITY REPORT 2019

53SUSTAINABILITY REPORT 2019
SUSTAINABILITY IN REVIEW
2

54 SUSTAINABILITY REPORT 2019
MATERIAL SUSTAINABILITY TOPICS OF 2019Considering the significance of their impacts on our operations and also on the influence of our stakeholders’ assessments regarding CCI, we reviewed our material topics based on six major areas in line with our vision and strategy; Consumer Well-Being, Customer Value, Human Rights, Human Capital, Community Development and Environmental Footprint.
For Consumer Well-Being; we offer a wide beverage portfolio to our consumers that fit in their preferences and at high product quality and safety standards, which has a crucially important place in our business model.
For Customer Value; we are determined to reach higher customer satisfaction levels with our customer-centric approach and for operational excellence across our geographies with superior execution approach.
For Human Rights; we are committed to creating a great, safe, diverse and equal opportunity place to work and positive impacts for all the people along our operational value chain, through our pioneering policies and practices.
For Human Capital; we listen to the expectations of our employees via various branded engagement platforms, aim to create a satisfactory workplace and invest in their development through talent development programs.
For Community Development; we are pledged to be a good corporate citizen, proudly serving a great community with our projects focusing on youth, women empowerment, water and waste issues supported with employee volunteerism and creating positive economic impacts through our investments.
For Environmental Footprint; we aim to minimize our impacts on the environment by using fewer natural resources, operating efficiently and generating less waste, intensively focusing on ‘energy management and climate change’, ‘water’ and ‘sustainable packaging’ practices.
The following section of this report focuses on our actions, performance goals and commitments for our 2019 material topics.
GRI 102-15; 102-47
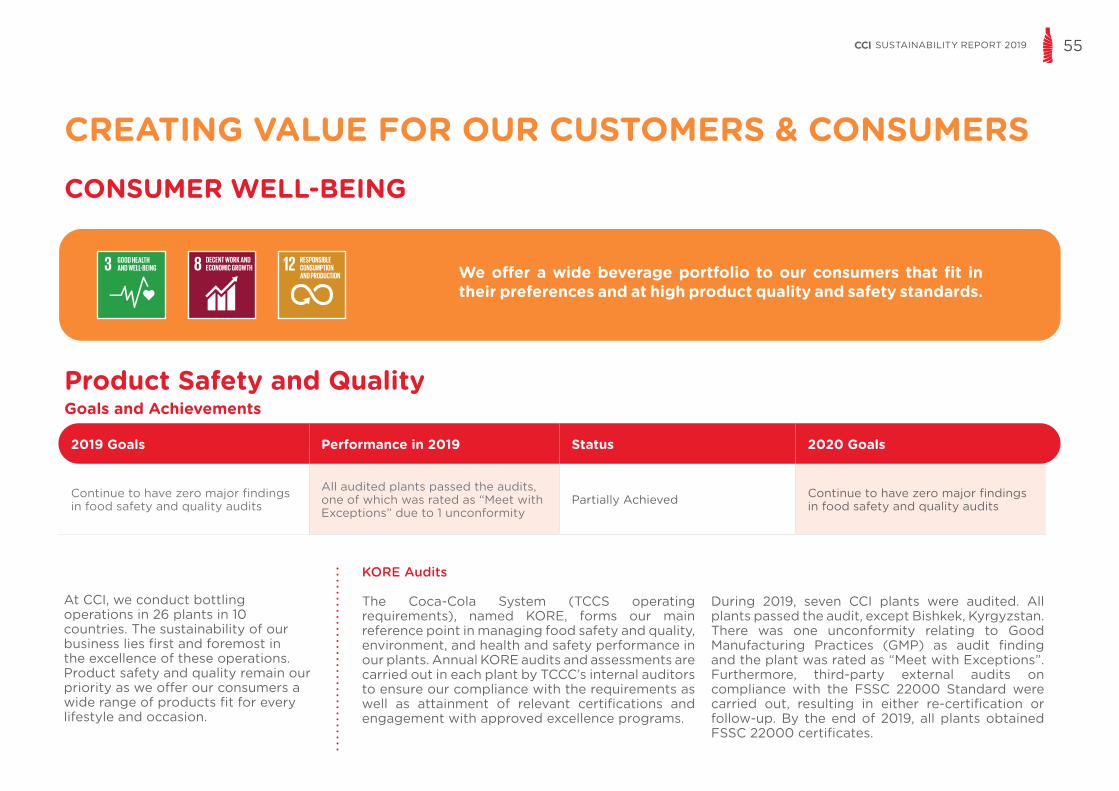
55SUSTAINABILITY REPORT 2019
CREATING VALUE FOR OUR CUSTOMERS & CONSUMERS
At CCI, we conduct bottling operations in 26 plants in 10 countries. The sustainability of our business lies first and foremost in the excellence of these operations. Product safety and quality remain our priority as we offer our consumers a wide range of products fit for every lifestyle and occasion.
KORE Audits
The Coca-Cola System (TCCS operating requirements), named KORE, forms our main reference point in managing food safety and quality, environment, and health and safety performance in our plants. Annual KORE audits and assessments are carried out in each plant by TCCC’s internal auditors to ensure our compliance with the requirements as well as attainment of relevant certifications and engagement with approved excellence programs.
During 2019, seven CCI plants were audited. All plants passed the audit, except Bishkek, Kyrgyzstan. There was one unconformity relating to Good Manufacturing Practices (GMP) as audit finding and the plant was rated as “Meet with Exceptions”. Furthermore, third-party external audits on compliance with the FSSC 22000 Standard were carried out, resulting in either re-certification or follow-up. By the end of 2019, all plants obtained FSSC 22000 certificates.
CONSUMER WELL-BEING
Product Safety and QualityGoals and Achievements
We offer a wide beverage portfolio to our consumers that fit in their preferences and at high product quality and safety standards.
2019 Goals Performance in 2019 Status 2020 Goals
Continue to have zero major findings in food safety and quality audits
All audited plants passed the audits, one of which was rated as “Meet with Exceptions” due to 1 unconformity
Partially Achieved Continue to have zero major findings in food safety and quality audits

56 SUSTAINABILITY REPORT 2019
External audits conducted in our plants verify our compliance with the necessary standards. Our up-to-date list of complied standards and completed verifications are as follows:
External Audits
Certifications
ISO 9001 Quality All Plants
For an explanation of compliance with regards to internal policies, external standards and principles, please see Management Systems Standards and Principles topic in Section 3 - Performance Indicators of the report.
ISO 14001 Environment All Plants
OHSAS 18001 Health & Safety All Plants
FSSC 22000 Food Quality All Plants
ISO 50001 Energy Management
Turkey: All plantsKazakhstan: Burundai Plant Kyrgyzstan: Bishkek PlantPakistan: Faisalabad, Gujranwala, Multan, Rahim Yar Khan and Lahore Plants
ISO 14064 Greenhouse Gases Standards Turkey: All plants, sales operations facilities and offices
LEED Gold Certificate Turkey: HQ Building
PAS 223 Food Packaging All plants that produce preforms

57SUSTAINABILITY REPORT 2019
Total Beverage PortfolioGoals and Achievements
In order to meet the ever-changing preferences of our consumers and to build a stronger business, we offer more than 25 consumer-centric brands to our consumers. The spectrum of choices across our beverage portfolio includes low or no calorie beverage options. Our team is dedicated to our portfolio growth and mix and focus on providing the best blend to present the highest satisfaction to our consumers. Our aim is to provide affordable, ready, innovative products for all lifestyles and occasions. We achieve our goals through our strategy
of lean production and transformation into the digital enterprise. The key driver of this new strategy is our agile operations, including the processes, tools and trainings which enable us to quickly respond to customer needs and market changes. CCI’s low or no calorie and nutritionally enhanced products are; Coca-Cola Light, Coca-Cola Şekersiz, Fanta-C, Cappy Atom, Cappy Destek, Sprite Light, Sprite Zero and Damla.
2019 Goals Performance in 2019 Status 2020 Goals
Continue to invest on increasing the ratio of low or no calorie and nutritionally enriched products in the portfolio
Launched Cappy Atom drink with honey and banana
Launched Cappy Destek enriched with the ingredients: peach, apple, carrot, orange, kiwi juices, ginger flavor, Vit B12, zinc, vitamin C
Achieved
Continue providing newly developed or diversified products to meet different preferences of consumers.

58 SUSTAINABILITY REPORT 2019
Product Labelling and Responsible Marketing
We transparently and clearly provide our consumers with the nutritional information of our products, allowing them to make choices that fit best to their lifestyles. Our labels provide basic nutritional information about the beverage, such as the amount of energy (kilocalories, calories, kilojoules), protein, carbohydrates, fats, total sugars and sodium.
Responsible advertising and marketing are other important means of how we engage with our consumers. In line with TCCC’s Global School Beverage Guidelines, we do not sell our sparkling beverages in elementary schools. Specifically, to honor the rights of parents and caregivers to make the appropriate choice for their children, we do not engage in advertising or marketing activities targeting those under the age of 12.
Open to Curiosity (Merak Ettim) The online Coca-Cola Open to Curiosity Platform in Turkey provides direct responses for our consumers to address their concerns regarding our products, corporate identity and marketing activities. We cater our consumers with clear, understandable and scientific information about our products, transparent information about our corporate identity and even resolve promotional conflicts. Hence, consumers tend to use our platform as a communication channel. 616,072 users made 715,862 visits and 820,427 pages were viewed in total during these visits in 2019.
CCI Turkey launched a campaign in 2019 to increase awareness on returnable packaging through its advertisements and TV commercials.
Advertising MessageBring your bottle and save 0.50 TL (Valid for 200 ml glass bottles of Coca-Cola, Fanta and Sprite)
Factory Visit Request Stakeholders who are also interested in seeing our production processes can easily attend our plant tours in person to learn about the production stages of Coca-Cola products.
TCCC Responsible Marketing Policy
Open to Curiosity Platform
Factory Visit Request

59SUSTAINABILITY REPORT 2019
Winning with the customer is the key motivation behind our customer-centric organization, our joint initiatives with customers, and our superior execution. In order to reach 400 million consumers, we work with more than 780,000 sales points, including supermarkets, restaurants, convenience stores, hotels and other retail outlets. We deliver products from 26 plants ensuring the highest quality products to our customers. We keep on investing in developing our people, technologies we use and cold drink equipment to ensure that our consumers access cold products.
Owl Awards 2019• Modern Trade • Traditional Trade• Discounter
Turkish Researchers Association (Türkiye Araştırmacılar Derneği) awarded CCI with three awards:
CUSTOMER VALUE
Superior ExecutionGoals and Achievements
We are determined to create unique solutions for our customers and winning together with them for operational excellence across our geographies with superior execution approach.
2019 Goals Performance in 2019 Status 2020 Goals
Conduct the studies in Kazakhstan, Pakistan and Iraq
Raised customer satisfaction score by 10 points; “Customer Centric League Matrix” showed that CCI moved up to champions league in FMCG and took the leadership role not only in NARTD but also FMSG and beverage sectors.
Interviewed 3,582 customers in Turkey and Kazakhstan for their 2019 performance.
AchievedConduct the customer satisfaction survey in all CCI countries except Kazakhstan in 2020.
Continue providing trainings to our distributors and pre-sellers
A total of 421 distributors from Turkey, Azerbaijan, Kyrgyzstan, Pakistan, Iraq and Turkmenistan participated in Distributor Pre-Seller Online Training in 2019 and 1,448 pre-sellers successfully completed and were certificated.
Achieved Continue providing trainings to our distributors and pre-sellers

60 SUSTAINABILITY REPORT 2019
Customer Satisfaction
Distributor Satisfaction
Understanding the dynamics behind customer satisfaction and taking necessary steps for a stronger and sustainable relationship is crucial for CCI. The Customer Satisfaction Surveys we conduct in all of our operating countries allow us to see our own performance and satisfaction levels from a customer perspective. These studies enable us to focus on the gap between our customers’ expectations and our current service levels. We have been conducting customer satisfaction surveys in Turkey since 2005 and in other countries of operation since 2012.
In 2019, total 3,582 customers in Turkey and Kazakhstan were interviewed face-to-face to take the actions necessary to improve our customer services. The customer satisfaction score increased significantly compared to 2018 as the result of our actions to increase in the timely product order delivery as well as relationship health tracking; a measure of customer relationship management.
Distributor Satisfaction Surveys are conducted via a third-party service provider annually to evaluate the satisfaction level of our distributors. As a measure of our company reputation, surveys inform us of our strengths and
weaknesses about our partnerships with our distributors and our ability to manage the distributor network. CCI Turkey’s 2019 survey score was 89%.
Distributor and Pre-Seller Trainings We provide CCI Distributors and Pre-Sellers both in-class and online trainings to support their sales capability developments and to equip them with in-depth knowledge through high interaction.
An online training system was launched in 2018 for our sales representatives to enable the newcomers to understand the TCCS and CCI business processes better, and to have a better understanding of their responsibilities. The online training includes modules such as “Basics of Coca-Cola System”, “A Day of a Pre-seller”, “Merchandising and RED”, “Trade Math” and “Dealing with Complaints”.
A total of 421 distributors from Turkey, Azerbaijan, Kyrgyzstan, Pakistan, Iraq and Turkmenistan participated in Distributor Pre-Seller Online Training in 2019 and 1,448 pre-sellers successfully completed and were certificated.
Customer Satisfaction Survey 2015 2016 2017 2018 2019
Customer Satisfaction Score (Turkey) 64 60 54 63 73
Customer Satisfaction Score (Kazakhstan) 60 - - - 67
Distributor Satisfaction Survey (Turkey) 2015 2016 2017 2018 2019
Distributor Satisfaction Score 84.5 84.3 86.0 91.0 89.0

61SUSTAINABILITY REPORT 2019
CCI Customer Interaction Center
CCI Customer Interaction Center’s mission is to understand and satisfy customers’ and distributors’ expectations across CCI geography and exceed their expectations with the best service methods.
• We create new customer opportunities through various and flexible workflows that we develop.
• We conduct issue-based customer satisfactions surveys and take proactive actions.
• We call back most of our incoming callers about their service requests to ensure their satisfaction with the solution provided.
• We analyze all our calls instantly and make issue-based reporting.
• We monitor our service and quality level daily and take actions when necessary.
In 2019, we received 315,000 service requests in Turkey for different issues regarding customers (both existing and new), distributors, fleet and finance. Moreover, our Customer Interaction Center performed 214,151 outbound calls to check the satisfaction with service levels, reaching 90.000 more customers compared to 2018. Also, in Pakistan, we received about 200,000 calls.
Joint Business Plan Meetings
In Turkey, to increase customer collaboration, Modern Channel Joint Business Plan (JBP) meetings are held every year with a joint agenda that constitutes top local and national accounts’ priorities and annual marketing plans. Every year, cross-functional teams from both the customer and CCI get together to ensure co-marketing and the alignment of operational plans of both parties. In 2019, we met with 250 participants representing 75 customers at JBP meetings where we shared our plans with our customers.
Route to Market (RTM)
We aim to offer a sustainable Route to Market (RTM) model for delivering superior customer service through perfect commercial execution. CCI Turkey’s indirect RTM model serves as the sustainable “Best in Class Customer Service”.
We implement FutureProof RTM which is a new and innovative RTM model in our Turkey operation to better serve our small traditional segment customers. We use omni channel capabilities and take orders through Customer Interaction Center. This enables us to re-evaluate the vehicles we need in the field and optimize the number of vehicle movements, the mileages and the time spent on a daily basis. This implementation gives us an opportunity to decrease CO2 emissions.
We track all potential customers every two to three years via our Every Outlet Survey (EOS). “One Number Score” is our monthly commercial KPI that helps us track 10 performance metrics which covers availability, visibility, cold drink equipment efficiency and effective customer call.
Customer Focus Groups
As a reflection of the emphasis we place on our customers; we occasionally organize Customer Focus Groups for the benefit of our Local Key Accounts (LKA). The main purpose is to create value for our LKA by helping them better internalize their own identity, capability and value.
Customer TrainingsIn Turkey, 14 customer development training sessions for 250 participants were organized.

62 SUSTAINABILITY REPORT 2019
The Right Execution Daily (RED) system helps us offer products to our customers and consumers in the most optimal ways. “Right Execution Daily” is a process that enables us to apply and monitor superior execution in line with commercial strategy at a sales point level. Ultimate goal of RED is to accelerate growth, with four pillars; “Picture of Success”, “Execution”, “Tracking” and “Coaching” across all CCI regions.
We switched to a higher level of monitoring in our RED project in Turkey by introducing image recognition technology in 2016. This new technology enables us to cover all of our traditional sales points. It allows our sales teams to follow their own customers’
merchandising standards and practices through photography. It has been a game changer for reaching execution excellence on field with solid business results and for being a volume growth driver. Following Turkey’s successful implementation, we started to use this technology in Iraq in 2017, Kazakhstan, Azerbaijan, and Kyrgyzstan in 2018. With Jordan and Pakistan, we reached seven countries in 2019. In addition, we have expanded this technology to On Premise Channel in Turkey and in Kazakhstan regions. We plan to roll-out in Tajikistan as well within 2020.
At Global Customer and Commercial Leadership Awards (GCCL) CCI won the 1st Place Award
Best All-Around the World & Commercial Market in Turkey&
RED became one of the finalists“How to Build a Sustainable Growth Momentum with RED”
Right Execution Daily (RED)

63SUSTAINABILITY REPORT 2019
Excellence in Supply ChainGoals and Achievements
2019 Goals Performance in 2019 Status 2020 Goals
Increase the number of OE (Operational Excellence) Projects and savings in all operations
Saved 2.09 million USD through 29 new projects in all countries and reached total savings of 73.21 million USD since 2008
AchievedIncrease the number of OE projects and savings in all operations

OE Performance (2019) OE Performance (2008 to 2019 Cumulative)
CERTIFICATIONS(7)
CERTIFICATIONS(788)
SAVINGS($2.09 MILLION)
SAVINGS($73.2 MILLION)
GREEN BELTS(10)
YELLOW BELTS(6)
OE PROJECTS(29) OE PROJECTS
(1,547)
* Other CCI countries; Jordan, Kazakhstan, Azerbaijan, Pakistan, Kyrgyzstan and Tajikistan. * Other CCI countries; Jordan, Kazakhstan, Azerbaijan, Pakistan, Kyrgyzstan and Tajikistan.
7
631 157$ 1.09 Million
$ 9.7 Mn.
$ 1 Million
$ 63.5 Million
16844
7
6
13703
3
CCI TURKEY CCI TURKEYOTHER CCI COUNTRIES* OTHER CCI COUNTRIES*
64 SUSTAINABILITY REPORT 2019

CCI Turkey Operations Innovation Day
EFQM Model’s fundamental goal, “harnessing creativity and innovation” along with CCI’s vision to become the best FMCG company were our inspirations in establishing CCI Turkey Operations Innovation Day.
This dynamic event provides an opportunity to all employees for sharing their ideas and fostering the innovation culture and to CCI to be able to recognize and reward innovation and stimulate new ideas that can lead to a positive impact on our communities and business operations, within CCI. The Innovation Day brings together CCIdea, OE projects and the Innovation Competition under a single roof.
Fourth CCI Innovation Day was held in 2019 with the concept of “Alchemy of Innovation and Failure & Innovation”. Seven finalist projects in OE category and 11 finalist projects in Innovation category were presented. The first three projects in each category were selected by televoting and were rewarded. We received 394 ideas in 2019 with a total of 3,499 ideas from our employees within the scope of CCIdea since 2014.
An Idea Festival of Anadolu Group
Bi’ Fikir Festivali (An Idea Festival) is open for participation by Group companies and rewarding the ones successful in innovation. CCI’s ‘Palletization Unit Occupational Safety System’ was selected as the second-best project in Explorer category and ‘First-Phone Charging Beverage’ project was ranked as third best in the Inventor category.
CCI participated in the festival with the highest number of projects and rewarded as ‘The Most Successful Company’ where various innovative and creative projects have gained great appreciation.

66 SUSTAINABILITY REPORT 2019
CCI Human Rights Policy
CREATING VALUE FOR OUR PEOPLE
Respect for human rights is one of CCI’s core values. We value our relationships with our employees and achieve success through the contributions that each and every individual makes. We are committed to having open and participatory workplace in which universal human rights are respected. We value every employee and encourage all to do their best.
In December 2018, CCI published its first Human Rights Policy, as a continuation of the existing CCI Workplace Rights Policy. This new policy is based on international standards of human rights as set forth in the United Nations Universal Declaration of Human Rights, the International Labor Organization Declaration of Basic Work Principles and Rights, and the United Nations Global Compact. Supported by these foundations,
we integrate human rights and workplace rights into all of our practices, corporate values, and sustainability strategy. The CCI Human Rights Policy is one of the fundamentals of our vision and it is communicated continuously and consistently throughout our entire procurement chain.
HUMAN RIGHTS
Human Rights Along The Value ChainGoals and Achievements
We are committed to creating a great, safe, diverse and equal opportunity place to work and positive impacts for all the people along our operational value chain, through our pioneering policies and practices.
2019 Goals Performance in 2019 Status 2020 Goals
Attain a success rate of 92% for the SGP Audits of CCI plants in all countries of operation The success rate was realized as 92%. Achieved Attain a success rate of 96% for the
SGP Audits of CCI plants
GRI 102-41

67SUSTAINABILITY REPORT 2019
The CCI Human Rights Policy addresses the following topics:
• Community and stakeholder engagement
• Diversity and inclusion
• Zero tolerance to arbitrary discrimination
• Freedom of association and collective bargaining
• Safe and healthy workplaces
• Workplace security
• Prohibition of forced labor and human trafficking
• Commitment not to employ child labor
• Fair work hours, wages, and benefits
• Protection of land rights and water resource use

68 SUSTAINABILITY REPORT 2019
CCI’M Human
Human Rights was a significant focus for CCI in 2019. Following the launch of the Human Rights Policy in December 2018, we created a communications campaign across all countries. The policy and the communication materials were translated into 10 local languages of the CCI geography. The campaign had online and offline execution. We organized classroom trainings available for all of our employees. During 2019, about 7,500 hours of trainings were provided to CCI employees in 10 countries of operation. In addition, all security personnel working in CCI operations are trained in human rights policies and procedures.
In 2019, we received 39 notifications through Ethics Hotline in relation with Human Rights Policy, all cases recorded to the system in order to conduct investigation by Human Rights Policy experts and to be decided by the Ethics and Compliance Committee. Among the total number of complaints, 15 complaints included discrimination claims. Human Rights Policy trainings are repeated regularly to prevent such non-compliance issues.
International Human Rights Day Celebrations at CCI
CCI Turkey organized a panel discussion at with the participation of external speakers, one of which is the Dean of Faculty of Law of a reputable university and CCI Group CHRO & CCI General Counsel, on December 10, 2019.
CCI Kyrgyzstan partnered with the International Debate Grand Tournament “Manas Cup XVI”, which is dedicated to “Human Rights Day” together with UNCHR.
CCI Pakistan organized a big town hall meeting with the employees in different locations to celebrate Human Rights Day. Leadership Team encouraged employees to internalize CCI Human Rights Policy and discussed what Human Rights Policy principles stand for.
Human Rights Trainings
Number of Participants Total Hours
Azerbaijan 248 260
Iraq 887 1,683
Jordan 346 200
Kyrgyzstan 76 76
Kazakhstan 630 1,007
Pakistan 1,850 1,850
Tajikistan 104 208
Turkey Operations 2,005 2,005
Turkey Group Office 114 176
Total 6,260 7,465
GRI 102-41

69SUSTAINABILITY REPORT 2019
Supplier Guiding Principles (SGP)
In order to determine the degree that our operations comply with the CCI’s Human Rights Policy and TCCC’s Supplier Guiding Principles (SGP), audits were conducted by an independent auditing firm in 2019. Four CCI
plants in Pakistan, Turkey and Iraq passed these audits successfully. Due to collaboration with Disney brand, CCI Kazakhstan Almaty Plant was audited by Disney ILS (International Labor Standards) Social Audit and passed.
Our local procurement policy supports the sustainable development of local economies and we support our suppliers to improve their sustainability performance with effective development practices. As part of our supplier agreements since 2002, the Supplier Guiding Principles (SGP) determine the social, environmental, ethical and economic minimal, which TCCS expect
from their suppliers. The latest human rights advancements from Ruggie, OECD and UNGC standards, as well as guidance provided by the Danish Institute for Human Rights study of TCCC policies and practices are reflected to SGP standards. At a minimum, our suppliers are required to meet these standards with respect to their operations.
We consistently cultivate effective communication and conduct audits & constructive practices in order to ensure that our suppliers adhere to our principles. Our suppliers receive a copy of our SGP at the beginning of the business relationship and are expected to transfer these principles to their stakeholders, in particular, to their workforce. We attach the SGP Policy to our supplier contracts when applicable, with the expectation that they will develop and implement appropriate internal business processes to guarantee their compliance with the SGP requirements. Supplier audits are conducted by TCCC and CCI’s trained personnel internally as well as by third parties. For our direct material and cold drink equipment suppliers, it is obligatory to undergo SGP audit and comply with SGP standards before signing contracts.
Third-party audits include confidential interviews both with employees and on-site contract workers. A supplier who fails to meet any aspect of the SGP requirements is expected to implement corrective actions. If a supplier fails to adhere to our principles, sanctions that include termination of the contract are applicable. The calibration of the SGP score was reverted to existing model in 2019 encompassing Raw Materials, Primary Packaging & Co-packers. With the revised logic, we were able to achieve 89% despite the expansion of supply base. We have revised our target for 2020 as 95%. As a result of the SGP audit, a remediation action plan that covers specific matters such as working hours (especially night shifts), rest day violation, overtime and health and safety, were sent to the relevant suppliers and supplementary audits were organized. In the last three years, TCCC audited all of CCI’s ingredient and packaging suppliers.
SGP Audit Targets for CCI Plants2018 2019 2020 Target
93% 92% 96%
SGP Audit Results of CCI Suppliers2015 2016 2017 2018 2019
91% 92% 93% 85% 89%
GRI 102-9; 102-10
Supplier Guiding Principles (SGP) SGP Audits for CCI Plants conducted by TCCC
SGP Audits for CCI Suppliers

70 SUSTAINABILITY REPORT 2019
TCCC Sustainable Agriculture Guiding Principles
Sourcing of CCI’s raw materials accounts for a large portion of our economic, social and environmental footprint. For CCI, sustainable sourcing is purchasing ingredients from farm locations and suppliers that meet TCCC-approved standards. Sustainable agriculture is critical for us to meet the expectations of our consumers, customers and other stakeholders and to enable the continued growth of our business.
The Coca-Cola Company is addressing the challenges of agriculture availability, quality and safety also addressing the improvement of the well-being of farming communities. TCCC set its target on sustainably sourcing key agricultural ingredients by 2020 and developed Sustainable Agriculture Guiding Principles (SAGP). TCCC’s approach to sustainable agriculture is founded on these principles that aims to assure responsible management in farming, protecting the environment, upholding human and workplace rights, and so contributing to build more sustainable communities. Compliance with SAGP is verified according to international third-party standards such as Bonsucro, Rainforest Alliance, Sustainable Agriculture Initiative Platform (SAI) and Fairtrade International or equivalent.
Workplace and Human Rights
• Freedom of association and collective bargaining• Prohibit child labor• Eliminate discrimination• Work hours and wages• Safe and healthy workplaces• Community and traditional rights
Environment
• Water management• Energy management and climate protection• Conservation of natural habitats and ecosystems• Soil management• Crop protection
Farm Management Systems
• Harvest and postharvest handling• Reproductive material identity, selection and handling• Management systems, record keeping and transparency• Business integrity
In 2016, conducted a feasibility study for sustainable sugar sourcing in Turkey.
In 2017, organized a workshop on the SAGP compliance program for sweetener suppliers in Turkey.
In 2019, engaged with the farmers, suger producers and international industrial platforms like SAI, to disseminate SAGP in Turkey and Pakistan. In cooperation with leading FMCG and beverage companies, we started “Sustainable Beet Sugar Production” Project to effectively understand and implement the best practices for the sustainable production of beet sugar in Turkey.
Sustainable Agriculture Guiding Principles (SAGP) Milestones of CCI Sustainable Sourcing Activities

71SUSTAINABILITY REPORT 2019
Health and SafetyGoals and Achievements
Highlights of 2019 Health & Safety Performance
Zero lost time in
58% of our plants
(15 of 26 plants)
12% Decrease in all accidents
(Jordan, Kazakhstan, Kyrgyzstan, Pakistan)
26% Increase in workplace
safety trainings(Turkey, Kazakhstan,
Kyrgyzstan)
Through our internal digital
social media application “Workplace”
by Facebook, we established a group
dedicated to H&S.
2019 Goals Performance in 2019 Status 2020 Goals
Assure no major findings from Coca-Cola Operating Requirements (KORE) and local legal audits
Have successfully passed the five unannounced KORE audits that took place in Bursa, İzmir, Baku, Bishkek, Burundai
Achieved Continue to have no fail status from all types of external audits
Reduce vehicle accidents across CCI by 30% Achieved the reduction in vehicle accidents by 10% across CCI
Partially Achieved
Continue to reduce the vehicle accidents by 10%.
Start telematics system in Jordan operationsInstalled telematics system in Jordan and started following up our safety leading KPIs through the system
OngoingContinue to do journey route risk assessments in all countries for fleet vehicles
Reduce the last year’s overall LTIR score by 20% Reduced LTIR score by 12% Partially
Achieved Reduce the LTIR score by 10%
Reduce the contractor incidents by 30% Improved the rate of contractor incidents by more than 30% Ongoing Reduce the contractor incidents
by 30%
72 SUSTAINABILITY REPORT 2019
Health and safety issues are managed through the Coca-Cola Operating Requirements (KORE). Furthermore, H&S issues are handled within the context of collective bargaining agreements signed with labor unions.
Location based cross-functional H&S committees meet on a monthly basis and report to the Country Health and Safety committees on a quarterly basis. Group H&S Manager coordinate H&S matters in collaboration with the Country Committees throughout all CCI countries and report to the Health & Safety Steering Committee, which meets every six months. The CEO is the highest rank executive with the ultimate responsibility and the HR Director is at the top in the chain of command for H&S.
All our operating plants have been certified with OHSAS 18001 Management System certification by 2019 and we are transitioning to the new ISO 45001 standard in accordance with our plan. So far, İzmir and Mersin plants obtained the new ISO 45001.
It is our primary responsibility to provide our employees a safe and healthy work environment to improve their work-life balance, and positively impact their motivation, productivity and business performance.
• Protect the most valuable and important resource of our company – our human capital – from any occupational health and safety risks or hazards.
• Ensure that H&S is an integral part of our business and is actively supported through management, leadership and commitment.
• Protect the Company from any legal challenges by complying with at least the local legal requirements and by applying industry best practices to set higher standards than these legal requirements.
• Protect all other resources and assets from any losses that may arise from work-related risks and hazards.
Health & Safety Management Main Health & Safety Objectives
GRI 102-41

73SUSTAINABILITY REPORT 2019
We established Hand in Hand Occupational Safety Program in 2016 in order to standardize occupational health and safety practices at CCI.
In 2019, we issued the new version of Hand in Hand 2.0 with more focus on behavioral safety and contractor management and improved its H&S performance in terms of the Safety Maturity Index (SMI) score by + 5.4%.
In 2020, the focus will be on the safety culture and awareness, thus CCI will work on the action plan to implement a Behavioral Safety Program.
Increasing the number of trained observers, the program will target to transform the hazardous behavior into safe actions. CCI will also invest on H&S digitalization and applications.
We conduct targeted and periodic H&S trainings to our employees and contractors providing services for CCI, to expand and strengthen our occupational health and safety culture throughout our operations.
We provided 67,506 hours of H&S trainings for our employees in 2019.
Main topics included first aid, confined space, working at height, emergency response, CCI’s Golden Rules, electrical safety, compressed gas safety, defensive driving and forklift safety
The program focuses on the people and unsafe behavior that are frequently observed in the routine and non-routine operations.
In a typical production environment, majority of the incidents happen as a result of risky employees’ behavior. The first step of culture transformation program is to identify the most common unsafe practices. The second step is to build corrective and preventive actions plan to transform the unsafe practices into safe behaviors.
The program uses both conventional methods like reward and recognition procedures, disciplinary actions, trainings and some other new tools like safety Olympics (H&S awareness competition), and dramas with safety themes.
Hand in Hand Safety Program Progress
Health & Safety Trainings at CCI
TCCC Health & Safety Culture Program
H&S Trainings Turkey* Jordan Kazakhstan Azerbaijan
2015 12,062 679 2,235 3,198
2016 16,159 992 4,525 4,392
2017 21,284 1,096 2,996 2,902
2018 25,407 1,698 1,772 3,202
2019 33,241 1,595 5,176 2,782
H&S Trainings Pakistan Kyrgyzstan Tajikistan OVERALL
2015 22,726 4,581 - 45,481
2016 18,557 6,603 - 51,228
2017 10,271 6,843 - 45,392
2018 15,610 5,540 - 53,229
2019 15,117 8,340 1,255 67,506
*Turkey (Operations and Group Office)

Health & Safety Performance in 2019
LTIR - Number of Lost Time Accidents (Per 100 Employee/Annum)
Lost Time Incidents (Workdays Lost)
Lost Time Incidents (Number)
LTISR - Number of Lost Days Caused by Accidents (Per 100 Employee/Annum)
20182018
2018 Employee2018 Employee
20192019
2019 Employee2019 Employee ContractorContractor
2
0
TURKEY KAZAKHSTAN PAKISTANAZERBAIJANJORDAN KYRGZSTAN TAJIKISTAN
0.17
173 173
51 51
4.850.16
18
2.88
0.16
38
44
2.130 00
0
0 0
00
0
0 00
0
0.96
60
00
00
0
11.50
0.72
29
10.470.21
5.300.15
9
1.400.06
50
1.60
0.90
133
39.80
0.45
13
0 0 0
0
2.90
0.35
10
3.50
TURKEY
TURKEY
TURKEYKAZAKHSTAN
KAZAKHSTAN
KAZAKHSTANPAKISTAN
PAKISTAN
PAKISTANAZERBAIJAN
AZERBAIJAN
AZERBAIJANJORDAN
JORDAN
JORDANKYRGZSTAN
KYRGZSTAN
KYRGZSTANTAJIKISTAN
TAJIKISTAN
TAJIKISTAN
1 1
0 03
6
5
3
5
0
0
0 3
0
4
2
0
20 0
0
20
1
74 SUSTAINABILITY REPORT 2019

AZERBAIJAN 123; 5%
PAKISTAN859; 37%
KYRGZYSTAN 53; 2%
Employees by Age Groups
TURKEYGROUP OFFICE
TURKEYOPERATIONS*
KAZAKHSTAN
PAKISTAN
AZERBAIJAN
JORDAN
KYRGZSTAN
TAJIKISTAN
*Turkey operations include factories and sales offices
141
413
60
181
122
1,959
492
92
33
154
39
113
176
440
1,615
UNDER 30 ABOVE 50BETWEEN 30-50
15
18
133
68
36
21
74
11
211
Employees With 11+ Years Seniority
TURKEY OPERATIONS*
948; 40%
TURKEY GROUP OFFICE 61; 3%
JORDAN 91; 4%KAZAKHSTAN210; 9%
75SUSTAINABILITY REPORT 2019
Diversity and InclusionGoals and Achievements
At CCI, we take firm steps towards building and strengthening an inclusive culture that nurtures diversity on an ongoing basis. Diversity and Inclusion (D&I) cluster of the employee engagement survey results of 2019 showed an increase of nine points, which is a testament of our programs and initiatives in the area of Diversity & Inclusion. We stand for our commitment to leverage equality and cultivate a sense of belongingness for all, irrespective of our employees’ persona and background.
In 2019, Diversity & Inclusion Steering Committee evolved into D&I Advisory Board chaired by Group Human Resource Director. It oversees three focus areas- gender, generational, cultural - under diversity, each having different programs. Inclusion is prioritized as a key culture
element for CCI to focus upon moving forward. Inclusive Leadership was consequently a focus topic in all developmental interventions at CCI throughout 2019. Cross Country and Function Coaching was initiated to enable inclusive climate.
CCI’s Pay Policy Principles are built on “equal pay for equal work”, rewarding our employees in accordance with their valuable contributions to our company regardless of gender bias.
2019 Goals Performance in 2019 Status 2020 Goals
Continue to run our D&I programs and initiatives under three pillars; Gender, Generational and Cultural
Executed:• U30 Strategy Bootcamp • Accelerate• Women in Leadership programs
Achieved
Continue to run our D&I programs and initiatives under three pillars; Gender, Generational and Cultural.

74.3%New Hires Male
87.3%Male
Employees by Gender
White Collar by Gender New Hires by Gender
Senior Management by Gender
79%Male Senior Managers
80%White Collar Male
25.7%New Hires
Female
12.7%Female
21%Female Senior
Managers
20%White-Collar
Female
76 SUSTAINABILITY REPORT 2019

Performance in 2019
77SUSTAINABILITY REPORT 2019
CCI Women’s Network setup is complete for all CCI countries.
CCI Women’s Network celebrated “International Women’s Day” in all CCI countries by working
on the field (through a Blitz activity) with sales team to create awareness on CCI’s commitment
to gender equality as One Team.
Annual gender-based hiring targets for every CCI country are established and tracked.
1st of its own kind, U30 Strategy Camp for 47 younger workforces was held serving the purpose
of creating generational sensitization and thought diversity. Average age of participants was 28 years, representing all countries and
functions with a 50:50 gender split.
Leadership at Field series continued. Senior leaders connected through informal events with employees belonging to different age groups,
seniorities, backgrounds, nationalities and cultures.
21 meetings, 5 countries, 9 cities, 600+ participants
Mentor program was launched for younger talents to fast track their leadership
growth.
“Conversation Clubs” were organized in countries to strengthen younger populations’ linguistic and
communication capabilities.
“Culture Workshop’’ was held in annual One Team meetings; leadership actions for “Inclusion” were
incorporated into performance goals.
Continued short-term assignments / rotation to create cross-cultural awareness, understanding
and appreciation.
CCI CEO attended Gender Equality roundtable organized by United Nations Global Compact.
CCI Turkey launched Women Capability Development Program for distributors to
empower and increase women workforce at their companies.
22 women from all CCI Countries’ management / leadership team attend the pioneering cohort
of “Women in Leadership” Program.
Conducted Gender Awareness Training for Executive Committee
Conducted an assessment with Internal Audit Department to conclude
no gender pay gap in Turkey

78 SUSTAINABILITY REPORT 2019
HUMAN CAPITAL
Talent ManagementGoals and Achievements
We see ourselves as one, diverse, engaged and inclusive team and consider it our Human Capital. We listen to the expectations of our employees, aim to create a satisfactory workplace and invest in their development through talent development programs.
2019 Goals Performance in 2019 Status 2020 Goals
Raise the Talent Readiness Index (TRI) from 46% to 55% until the first Talent Development Forum (TDF) in May and from 53% to 60% by the second TDF at year-end
Increased Talent Readiness Index (TRI) from 46% to 53% during mid-year TDF session and sustained the result at the year-end TDF session as 53%
Partially achieved
Raise the Talent Readiness Index (TRI) from 53% to 57% in 2020
Have a more integrated Talent Management process with Performance Management, Leadership Development and International Assignments.
Renew the process which enables to focus on different talent dimensions, and a single Future Leader understanding.
Focus on tailor made Individual Development Plants (IDP) for critical position holders and successors enabling them to realize their career aspirations in line with TDF plans.
Defined new talent dimensions in line with CCI Future Competencies.
Created one single tool which enables the transparency and objectivity of the assessments used across CCI.
Structured IDP’s of the critical position holders and revisited successors.
AchievedRe-design and enhance “Career Navigation Journey” at CCI.
Manage the process more integrated with other HR systems including Learning and Development, Compensation and Benefits, etc.
Start the pilot studies for transforming our performance management system into a more innovative, up to date process
Finalized pre-work like benchmark studies, consultancy inputs, engagement survey outputs, designed an online platform for the pilot study and created a project team to kick off the piloting
Designed Upward Feedback Survey and 360 Degree Survey to support continuous feedback initiative.
Achieved
Integrate Continuous Performance Model Platform at Group Office
Conduct Upward Feedback and 360 Degree Surveys across all CCI operations

79SUSTAINABILITY REPORT 2019
Talent Management (cont.)Goals and Achievements
2019 Goals Performance in 2019 Status 2020 Goals
Launch Accelerate 2.0 for all country LT team and ELT for Group, Kazakhstan, Pakistan & Turkey
78 leaders from all CCI countries attended Accelerate 2.0 in four groups Achieved
Organize Accelerate Homecoming for all attendees to capture learning into action.
Launch Women in Leadership 22 delegates attended the program and successfully completed the curriculum. Achieved Launch 2 more cohorts
Design and implement leadership development for younger workforce
U30 Strategy Camp executed for 49 young leaders from all CCI countries. Achieved
Design and implement U30+ Building Leaders of Tomorrow Program.
Building Internal Coaching Capabilities
“Leaders as Coaches” included as a key content in all capability and leadership development program.
Participants of accelerate 2.0 and Women in Leadership received coaching and applied their learning by coaching internally.
Spent 1000+ hours for coaching
Achieved and on-going
Launch Internal Coach PoolIntroduce a technology platform to automate the process.
Provide external coaching to employees.
Continue providing coaching skills training and refreshers to strengthen continuous coaching mindset.

80 SUSTAINABILITY REPORT 2019
CCI Talent Management Strategy
Plans for 2020In 2020, we will be focusing on promoting feedback culture in CCI, by utilizing newly introduced “Upward Feedback Survey” and “360 Degree Survey” redesigned in line with our IMPACT Model, piloting continuous feedback driven Performance Management System and re-designing and enhancing “Career Navigation Journey at CCI”.
Talent Segmentation Tool
In 2019, we continued to “objectively identify and diversify talents” and introduced “Talent Segmentation Tool” that enabled us to identify “talents” according to their different development needs and career aspirations as “Core Talent”, “Extending Talent”, and “Future Leader”. During the identification, standardized mechanisms and assessment processes have been used across CCI to maintain the process in a transparent, objective and equal way.
One People Technology Platform
We strengthened employee experience by integrating talent management processes into our new “One People Technology Platform” initiated in 2019. One People Platform provides end-to-end information and is a one-stop solution to a career at CCI and is supported with mobile and interactive applications. This platform helps CCI employees to follow up their performance objectives, Individual Development Plans (IDP’s) and talent profiles. Another e-talent source integrated into system has been the online Talent Profile, where our employees create their own personal career pages including their educational background, internal and external professional experiences, critical assignments/projects, key achievements, career aspirations, language skills and mobility preferences.
Talent Development Forum
One of the core parts of our Talent Management System at CCI, Talent Development Forum (TDF) also continued in 2019. We conducted two forums in May and October respectively and reviewed our talent pools, bench strengths and requirements to fill the critical positions with the right people accordingly. Talent Readiness Index (TRI), which is a customized index to show the usage of internal talent pool ratio, and to trace and track the overall succession readiness (indexing bench strength) across CCI continued in 2019. We achieved an index level of 53% - with seven points increase - and in 2020 we aim for 57% for critical positions and for all successors across CCI.
Individual Development Plans
In 2019, we continued to monitor Individual Development Plans (IDPs) of all our critical position holders and successors in line with their short and long-term career aspirations, future capability building needs and competency development requirements. In 2020, we aim to measure their development progress through 360 Degree Feedback Evaluation Survey that was revisited and restructured with the usage of IMPACT Leadership Behavior Model in 2019 and Upward Feedback Survey that was introduced also in 2019 to foster reverse feedback culture by providing direct feedback of the employees to their managers through a user-friendly and practical tool. Both surveys will be utilized in 2020 with the kickoff Performance Management System. The CCI Performance Management Process continues to facilitate both business objectives and people objectives that are aligned with CCI’s vision and secures that our organization delivers successful results by improving the skills, capabilities and competencies of the teams and the individuals.
We ensure to create high performing one team culture that enables each employee in the organization to get involved in talent management processes standardized across CCI. All employees are committed to CCI values with a willingness to undertake a variety of functional roles and/or responsibilities in different geographies we operate and demonstrate IMPACT leadership behaviors to sustain business results and future growth.

81SUSTAINABILITY REPORT 2019
Talent Acquisition
CCI Next Talent
In 2019, we designed the management trainee program called “CCI Next Talent” that aims talent intake at early career stages and to enhance CCI’s employer branding. Next Talent is designed for 4th-grade university students to gain part-time experience in Finance, Sales, Human Resources, Marketing or Supply Chain Departments.
Also, during their 18 months next talent process; they can gain project management experience with CCI mentors. We received about 2,000 applications on CCI’s job application page and candidates attended English Proficiency Test, General Ability Test, Video Interview, Real Time Gamification and prepared project presentations as assessment.
Next Talent is the program that uses real-time gamified assessment for the first-time selection. Therefore; it creates real impact and excitement for all stakeholders of this program. At the end of the selection process, 14 Next Talents joined CCI and started their journeys in December 2019. During their part-time period, they focused on different projects for CCI.
With Next Talent Program; on one side CCI finds an opportunity to inject young talents who have the potential to promote to the managerial roles in a short time, and on the other, university students find the opportunities the gain corporate experience as part-time and can enjoy their full-time job offers even before their graduations.
To upgrade our standardized talent acquisition process, we launched workshops across CCI. During these workshops, global trends were reviewed. The key focus was to leverage technology in all processes and automating end to end talent acquisition process across CCI.
In addition, various social media channels were used more effectively to extend our reach to young external talents. Campus recruitment and holding career fairs at key universities continued in 2019 as well.

82 SUSTAINABILITY REPORT 2019
Learning and Leadership Development The Learners Hub
This platform is designed for the modern learner, with a purpose of making learning more accessible, enabling on the go, curated and customized learning pathways to up-skill and re-skill CCI’s workforce. It has been setup and launched. CCI e-library pilot, in partnership with an online publishing company of audio and e-books was initiated. Within a short span of four months, 7,000+ books were downloaded and 80% of the beneficiary employees recommended its continuation.
Operating in frontier markets requires us to develop creative solutions to build our future talent and
leaders. In 2019, one such example is “Leadership Capability Development Project” for Iraq, which was developed based on the feedback obtained in the focus group with selected local talents. Not only this program received appreciation and recognition at the Board level, but also was identified as a best practice, to be replicated in 2 more CCI countries.
Building business English proficiency was a key priority in 2019. We took firm actions across all CCI countries to further strengthen linguistics and communication capabilities by running multiple workshops and virtual learning solutions.
2019 was a year focused on creating differentiated learning and capability development interventions to cater our diverse workforce in our geographies. While the goal is to strengthen leadership skills to enable business continuity and future growth, it is equally important to create platforms through which employees can take charge of their own skill development and remain ahead of the curve.

*Turkey operations include factories and sales offices.
Average Hours of Training per Employee
Total Training Hours by Type
*Other includes competencies, PAC and general trainings.
Commercial 19,134 21.0%
Human Rights 21,823 24.0%
Personal Development 13,314 14.7%
Supply Chain 14,077 15.5%
Leadership 7,775 8.6%
Functional 6,525 7.2%
Language 3,367 3.7%
Other* 86,015 5.3%
9.69.8
25.0
42.7
17.7 16.5
TURKEYGROUP OFFICE
TURKEYOPERATIONS*
KAZAKHSTAN PAKISTANAZERBAIJANJORDAN KYRGZSTAN TAJIKISTAN
Human Rights
Personal Development
Commercial
Leadership
Functional
Language
Other
27.4
8.8
Supply Chain
83SUSTAINABILITY REPORT 2019

84 SUSTAINABILITY REPORT 2019
Employee EngagementGoals and Achievements
Since people are one of the key pillars of our vision, employee engagement is a fundamental focus area to effectively manage our human capital and create value. We continuously run systems and programs that offer support to our employees, improve their skills, knowledge, competence, and raise their work and living standards. Our aim is to provide a pleasant workplace and a balanced work life for our employees.
At CCI, we are advancing decisively towards our goal of making CCI “A Great Place to Work”. Therefore, we conduct periodical engagement surveys and focus group studies in order to solicit employees’ ideas about and suggestions for their CCI experience. Through these surveys we are able to determine our key strengths and opportunities for improvement and to take measures as needed to support our company’s sustainable development. In 2019, CCI Employee Engagement Survey “Voice of CCI” was executed with 85% participation rate. The engagement score of CCI is increased nine points in comparison to 2016 survey.
2019 Goals Performance in 2019 Status 2020 Goals
Execute 2019 CCI Employee Engagement Survey within all CCI countries.
Executed CCI Employee Engagement Survey (“Voice of CCI) Achieved
Acquire and pilot a pulse check survey tool for the immediate needs in addition to the engagement surveys done in two years’ time.

New Hires by Age
Local Senior Managament Employment Rate by Location
Turnover by Age
TURKEYGROUP OFFICE
TURKEYGROUP OFFICE
TURKEYOPERATIONS*
TURKEYOPERATIONS*
KAZAKHSTAN KAZAKHSTAN
PAKISTAN PAKISTAN
AZERBAIJAN AZERBAIJAN
JORDAN JORDAN
KYRGZSTAN KYRGZSTAN
TAJIKISTAN TAJIKISTAN
*Turkey operations include factories and sales offices *Turkey operations include factories and sales offices
Tajikistan 0%
73% ; 44 75% ; 27
46% ; 42
47% ; 8
52% ; 13 63% ; 12
31% ; 26 56% ; 62
26% ; 19
32% ; 11 73% ; 198
38% ; 21
2% ; 2 9% ; 10
0%
6% ; 2 4% ; 10
4% ; 2
89% ; 174 54% ; 87
86% ; 43
32% ; 25
27% ; 16 17% ; 6
54% ; 50
53% ; 9
48% ; 12 37% ; 7
67% ; 57 35% ; 38
74% ; 53
62% ; 21 23% ; 62
58% ; 32
11% ; 22 43% ; 69
14% ; 7
56% ; 44
0% 3% ; 4
0%
12% ; 9
0% 8% ; 3
0%
0%
0% 0%
UNDER 30 UNDER 30ABOVE 50 ABOVE 50BETWEEN 30-50 BETWEEN 30-50
Turkey100%
Pakistan70%
Kyrgzystan33%
Jordan57%
Kazakhstan38%
Azerbaijan40%
85SUSTAINABILITY REPORT 2019

86 SUSTAINABILITY REPORT 2019
CREATING VALUE FOR OUR COMMUNITY
Operating in 10 countries with 780,000 sales points and serving 400,000 million consumers, CCI has a significant footprint across its communities. CCI creates a positive impact both directly and indirectly through investing a certain ratio of its annual pre-tax profit in local economies and communities. Our operations enable 4.1 billion TL of added value in retail business and generate income for 160,000 farmers. CCI operations create about 30,000 direct and indirect employment in its geographies.
Our products are produced, sourced (where possible), distributed and sold locally. A bottle of Coca-Cola creates added value for multiple
sectors during its journey from the production line to the consumer. Many industries, including agriculture, energy, production, transportation, distribution, retail, cooling, advertising, media and packaging have roles in the production of a single bottle of Coke.
Our business stimulates a significant volume of job creation throughout the value chain. We contribute to the economic welfare of each community by employing local people, paying tax to governments, paying suppliers for goods, services and capital equipment, and supporting community investment programs.
COMMUNITY DEVELOPMENT
Economic ImpactGoals and Achievements
We are pledged to be a good corporate citizen, proudly serving a great community with our projects focusing on youth, women empowerment, water and waste issues supported with employee volunteerism and creating positive economic impacts through our investments.
2019 Goals Performance in 2019 Status 2020 Goals
Continue working to build stronger communities through contributing to the economies of the countries we operate in.
Conducted an economic impact study for Kazakhstan in 2019. Pakistan Economic Impact Study is in progress.
Achieved
Keep monitoring and sustaining the economic yields we create with our investments and operations in the countries of operation.
Conduct economic impact studies for the other countries of operation across CCI.

Economic Impact Input Output
In Pakistan Overall operations 1 PKR (Rupee) (Tax)
1.95% share in GDP (National Economy)1.21 PKR (Government)
In Turkey 1 TL (Lira) 9.7 TL (National Economy)
In Kazakhstan 1 KZT (Tenge) (Operational) 1 Job (at TCCS)
1.6 KZT (National Economy)11.35 Jobs (Other industries)
Local Procurement (%) 2015 2016 2017 2018 2019
Turkey* 95 95 99 99 95
Jordan 55 95 95 94 95
Kazakhstan** n/a n/a n/a n/a 37
Azerbaijan** 47 47 49 35 53
Pakistan 95 97 97 90 81
Kyrgyzstan** n/a n/a n/a n/a 36
Tajikistan** n/a n/a n/a n/a 23
* Concentrate is not included.** There are no approved suppliers in these local markets for some product and service categories. ** There are also no local suppliers available for some of the product categories with high spend. Suppliers are selected and approved by TCCC.
87SUSTAINABILITY REPORT 2019
Local procurement is a significant means for us to contribute to the economies of the countries we operate. For CCI, local means “within the same country”. The proportion of our spending on raw materials from local suppliers is provided in the table below. Although our aim is to keep our local procurement rates as high as possible towards 100%, we are unable to reach these rates considering the market dynamics.
Our major constraint is that the industry footprint on materials we buy is quite limited in markets like Kazakhstan, Kyrgyzstan and Tajikistan. Nevertheless, as CCI our objective is to supply our needs first from the local markets provided that the materials are available and/or with the required quality features.
Economic Impacts of Local Procurement
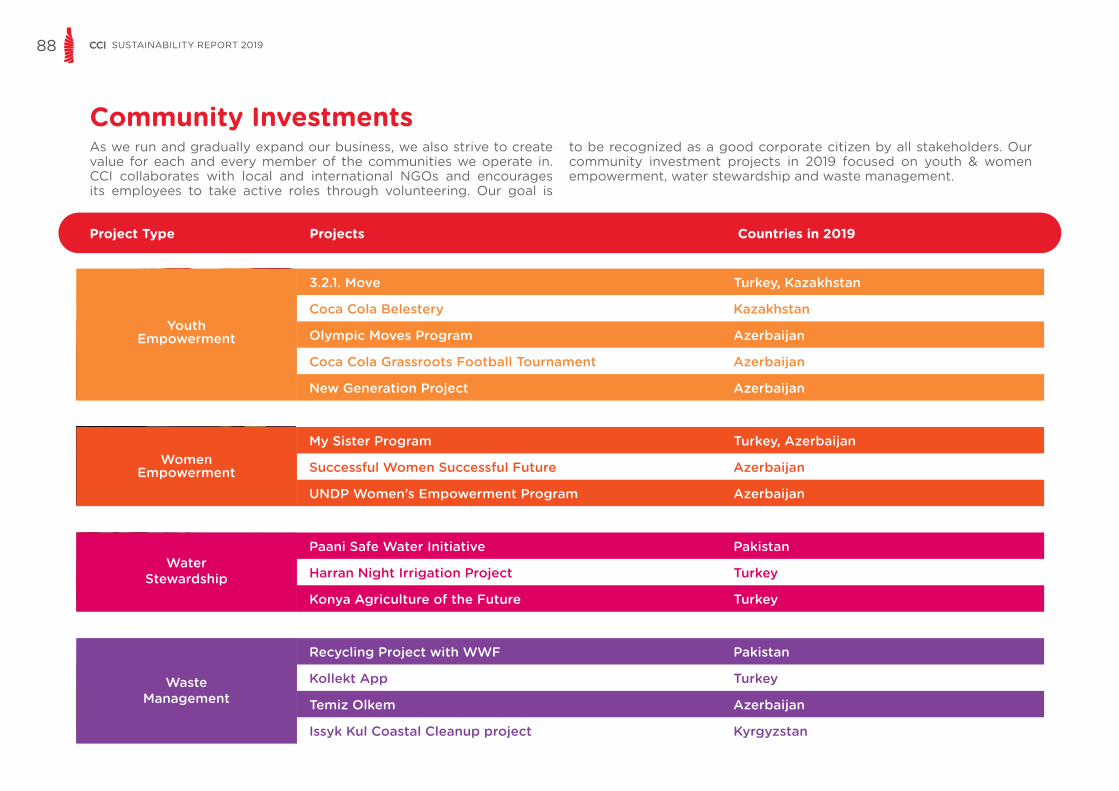
3.2.1. Move Turkey, Kazakhstan
Coca Cola Belestery Kazakhstan
Olympic Moves Program Azerbaijan
Coca Cola Grassroots Football Tournament Azerbaijan
New Generation Project Azerbaijan
My Sister Program Turkey, Azerbaijan
Successful Women Successful Future Azerbaijan
UNDP Women’s Empowerment Program Azerbaijan
Paani Safe Water Initiative Pakistan
Harran Night Irrigation Project Turkey
Konya Agriculture of the Future Turkey
Recycling Project with WWF Pakistan
Kollekt App Turkey
Temiz Olkem Azerbaijan
Issyk Kul Coastal Cleanup project Kyrgyzstan
Youth Empowerment
Women Empowerment
Water Stewardship
Waste Management
Project Type Projects Countries in 2019
88 SUSTAINABILITY REPORT 2019
Community InvestmentsAs we run and gradually expand our business, we also strive to create value for each and every member of the communities we operate in. CCI collaborates with local and international NGOs and encourages its employees to take active roles through volunteering. Our goal is
to be recognized as a good corporate citizen by all stakeholders. Our community investment projects in 2019 focused on youth & women empowerment, water stewardship and waste management.

2019 Goals Performance in 2019 Status 2020 Goals
Reach out to additional 75,000 youngsters in Azerbaijan within Olympic Moves Program to develop more active communities.
15,000 new youngsters participated in the program. Consequently, the total number of young people reached up to 115,000 in 4 cities.
PartiallyAchieved
Continue Grassroots Football Tournament Program in Azerbaijan and reach out to 150,000 youngsters.
Include 100 youngsters, aged between 18 and 29, in the social entrepreneurship program and train the best 10 participants.
Among the 143 applicants to 3.2.1 Move! Program in Kazakhstan, we trained 10 applicants, 7 of which were selected for final pitch. 2 winners were granted.
Achieved
Continue 3.2.1 Move! Program in Kazakhstan.Engage with 2,000 studentsReach at least 100 applicantsProvide workshops and training to 20 semifinalistsProvide grants to 3 best young people
Train 500 women on business development, effective communication and presentation skills within UN WEP in Azerbaijan.
350 additional women were trained in 2019, reaching a total of 1,650 since 2017.
Partially Achieved
Train an additional 20,000 women with My Sister Program in Turkey.
Initiate My Sister Program in Azerbaijan and train at least 1,000 women.
Continue Belestery Program in Kazakhstan and reach at least 2,050 women participants.
Establish additional 4 filtration plants in Pakistan and provide clean drinking water to additional 50,000 people.
Established 4 new filtration plants and started serving a total number of 1,000,000 people. Achieved
Install 4 new filtration plants to serve an additional 300,000 people; reaching a total of 32 plants to serve 1,250,000 beneficiaries.
Initiate an awareness raising program on recycling and waste management in Pakistan in cooperation with WWF.
Initiated a three-phase plan.Completed a PET waste study in collaboration with The Coca-Cola Export Corporation (TCCEC) during the first phase.
AchievedTake educational institutes on board to conduct awareness sessions for 1,500 individuals, in the second phase.
Conduct a nationwide clean and green drive In Pakistan.
300+ volunteers participatedManaged over 100 kgs of waste.Planted over 50,000 trees.
Achieved
Run the drive again with an improved plan Engage over 300 volunteers from CCI PakistanPlant over 1,000 trees Manage over 1,100 kgs of waste
89SUSTAINABILITY REPORT 2019

90 SUSTAINABILITY REPORT 2019
Youth Empowerment
3.2.1. Move!
CCI’s award-winning legacy program 3.2.1 Move! has revived enthusiasm for the development of thousands of young people since its inception in 2013 in Turkey. 3.2.1 Move! has initially aimed to transform public schools into habitats that effectively foster students’ physical and personal development through local projects. It was developed and executed by Physical Education (PE) teachers. Until 2018, the project supported 152 PE teachers from 131 public schools in 15 provinces in Turkey, especially by establishing and renovating sports facilities and providing sports equipment for students.
In the following years, 3.2.1 Move! Project evolved with a new framework where youngsters receive substantial help in implementing socially meaningful
projects through entrepreneurial activities. Through this project, youth initiatives, specifically focusing to solve specific social and environmental problems, receive mentorship and financial support. The program expanded to Kazakhstan and Iraq, in 2014 and 2015 respectively and reached about 170,000 young people through sports and group activities.
In 2019, 3.2.1 Move! in Kazakhstan aimed to support youth environmental initiatives and collected more than 143 applications from all over the country. The best 10 applications participated two days incubation program where they worked on project management, finance and leveled up SMM skills to promote their environmental projects. Seven projects were selected for the final pitching and two winners were granted.
Almost 60% of the population where CCI operates is below 30 years of age. Investing in our geographical regions’ young and growing population is critical to the sustainable development of our communities.
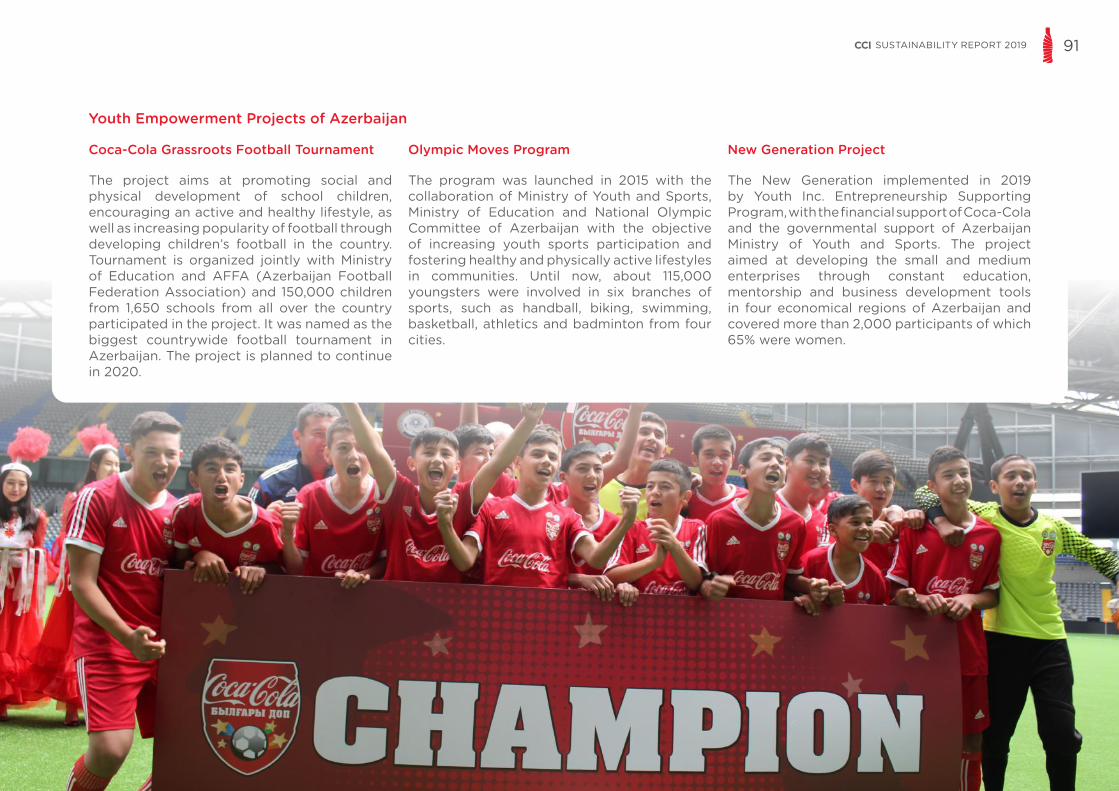
91SUSTAINABILITY REPORT 2019
Youth Empowerment Projects of Azerbaijan
Coca-Cola Grassroots Football Tournament
The project aims at promoting social and physical development of school children, encouraging an active and healthy lifestyle, as well as increasing popularity of football through developing children’s football in the country. Tournament is organized jointly with Ministry of Education and AFFA (Azerbaijan Football Federation Association) and 150,000 children from 1,650 schools from all over the country participated in the project. It was named as the biggest countrywide football tournament in Azerbaijan. The project is planned to continue in 2020.
Olympic Moves Program
The program was launched in 2015 with the collaboration of Ministry of Youth and Sports, Ministry of Education and National Olympic Committee of Azerbaijan with the objective of increasing youth sports participation and fostering healthy and physically active lifestyles in communities. Until now, about 115,000 youngsters were involved in six branches of sports, such as handball, biking, swimming, basketball, athletics and badminton from four cities.
New Generation Project
The New Generation implemented in 2019 by Youth Inc. Entrepreneurship Supporting Program, with the financial support of Coca-Cola and the governmental support of Azerbaijan Ministry of Youth and Sports. The project aimed at developing the small and medium enterprises through constant education, mentorship and business development tools in four economical regions of Azerbaijan and covered more than 2,000 participants of which 65% were women.
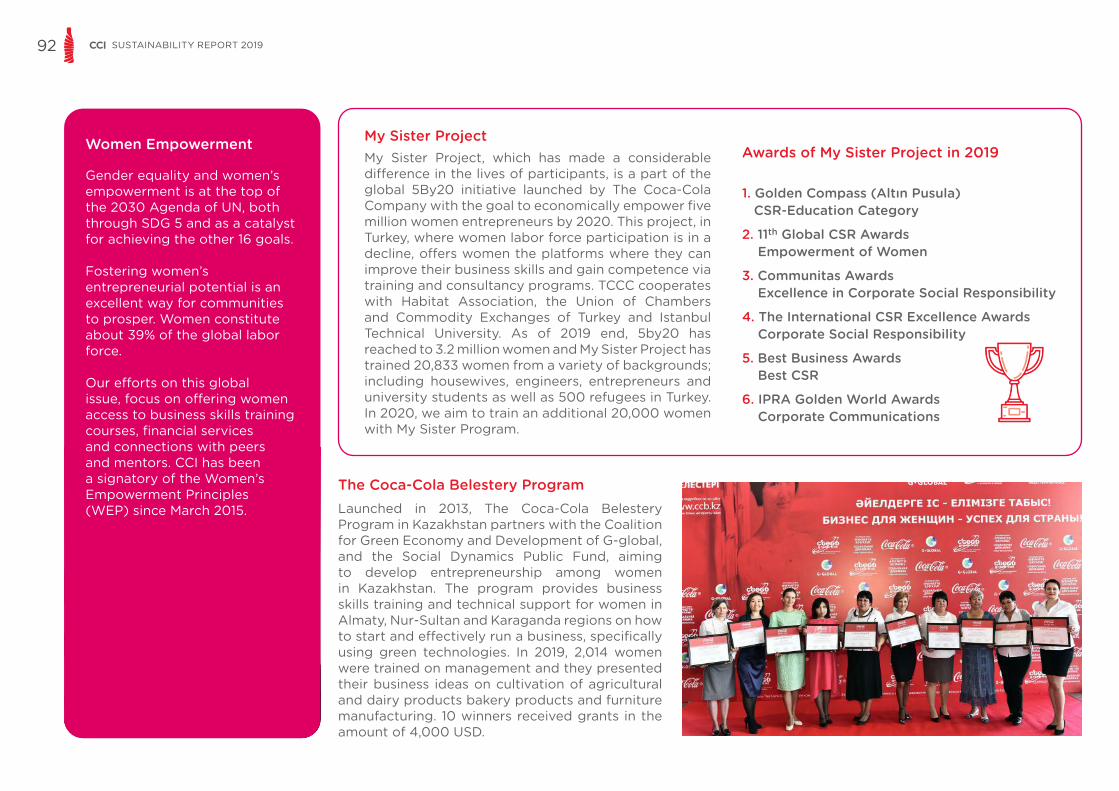
92 SUSTAINABILITY REPORT 2019
Women Empowerment My Sister ProjectAwards of My Sister Project in 2019
The Coca-Cola Belestery Program
My Sister Project, which has made a considerable difference in the lives of participants, is a part of the global 5By20 initiative launched by The Coca-Cola Company with the goal to economically empower five million women entrepreneurs by 2020. This project, in Turkey, where women labor force participation is in a decline, offers women the platforms where they can improve their business skills and gain competence via training and consultancy programs. TCCC cooperates with Habitat Association, the Union of Chambers and Commodity Exchanges of Turkey and Istanbul Technical University. As of 2019 end, 5by20 has reached to 3.2 million women and My Sister Project has trained 20,833 women from a variety of backgrounds; including housewives, engineers, entrepreneurs and university students as well as 500 refugees in Turkey. In 2020, we aim to train an additional 20,000 women with My Sister Program.
1. Golden Compass (Altın Pusula) CSR-Education Category
2. 11th Global CSR Awards Empowerment of Women
3. Communitas Awards Excellence in Corporate Social Responsibility
4. The International CSR Excellence Awards Corporate Social Responsibility
5. Best Business Awards Best CSR
6. IPRA Golden World Awards Corporate Communications
Launched in 2013, The Coca-Cola Belestery Program in Kazakhstan partners with the Coalition for Green Economy and Development of G-global, and the Social Dynamics Public Fund, aiming to develop entrepreneurship among women in Kazakhstan. The program provides business skills training and technical support for women in Almaty, Nur-Sultan and Karaganda regions on how to start and effectively run a business, specifically using green technologies. In 2019, 2,014 women were trained on management and they presented their business ideas on cultivation of agricultural and dairy products bakery products and furniture manufacturing. 10 winners received grants in the amount of 4,000 USD.
Gender equality and women’s empowerment is at the top of the 2030 Agenda of UN, both through SDG 5 and as a catalyst for achieving the other 16 goals.
Fostering women’s entrepreneurial potential is an excellent way for communities to prosper. Women constitute about 39% of the global labor force.
Our efforts on this global issue, focus on offering women access to business skills training courses, financial services and connections with peers and mentors. CCI has been a signatory of the Women’s Empowerment Principles (WEP) since March 2015.

93SUSTAINABILITY REPORT 2019
UNDP Women’s Empowerment Program Successful Woman Successful Future
Waste Management
CCI Azerbaijan has been partnering with the United Nations Development Program (UNDP) since 2014 on a project to sponsor the economic and social empowerment of young women. The project aims to create opportunities for women and youth to participate in economic and social life, offering trainings like business development, effective communication and presentation skills as well as awareness raising activities to help reduce gender stereotyping. The program also provides support to disabled women who are ambitious to start their own businesses. As part of the project, Women’s Resource Centers have been established in Neftchala and Salyan. Since 2017, a total of 1,650 women have been trained with 350 additional women trained in 2019.
Successful woman successful future program aims at women empowerment in Azerbaijan and increasing their active participation in a professional career. This program was mainly implemented in the touristic regions of Azerbaijan with the aim to enhance women’s involvement in country’s tourism industry. The program is conducted jointly with Coca-Cola and ASAN Volunteers Organization. 1,100 women will be trained within the project by the end of 2020.
Issyk-Kul Coastal Clean-Up Project in Kyrgyzstan
CCI Kyrgyzstan installed 28 recycle bins in most crowded beaches of Issyk-Kul for a world without waste. 2.5 tons of plastic waste was collected and sent for processing to Bishkek. Art installations in the form of fish, palm trees and Christmas trees were exhibited publicly to raise community awareness on plastic recycling.
Environmental Activities in Azerbaijan
Temiz Olkem (My Clean Country) is a project aimed at raising awareness about reducing waste, keeping the environment clean and sorting plastic waste. The project is implemented in partnership with the ADA University, Ministry of Environment and AzEkol. Several projects are implemented within the project such as tree planting, coastal cleanup, awareness raising in schools.
Kollekt App – Recycling Made Fun
Coca-Cola Turkey developed the smart phone application Kollekt in partnership with Nature Conservation Centre and UNDP. It aims to circulate the waste in nature back into the system through the help of communities. Kemer district was chosen as the pilot region. It is planned to further roll-out the application to Antalya and other cities.

94 SUSTAINABILITY REPORT 2019
Water Stewardship
The Life Plus Environment Program
Konya Agriculture of the Future Project Harran Night Irrigation Project
Two projects conducted under the Life Plus Environment Program are Agriculture of the Future and Harran Night Irrigation. The Program has so far reached over 40,000 people and saved 11.7 billion liters of water on 50 million m2 of agricultural land by the end of 2019.
In 2019, with the two ongoing projects, the program reached 37,850 people, including farmers, NGO representatives, academicians and the local community by the end of 2019 and helped save/conserve 4.9 billion liters of water.
The Project was realized in partnership with The Coca-Cola Life Plus Foundation, the Ministry of Food, Agriculture and Livestock, and the Nature Conservation Centre.
Agriculture of the Future Project has two objectives. The first is to improve the water-holding capacity of soil, ensuring efficient use of land and water. The second is to increase the capacity to use “ecosystem services” in agriculture through direct seeding and windbreaks, without reducing the prosperity of the communities. Approximately 200,000 saplings were planted as windbreakers in the Konya basin.
We reached 27,522 beneficiaries in Konya and helped conserve 1,888 million liters of water in 2019.
Harran Plain is one of the agricultural production centers in Turkey. During summer months, irrigation is done at high temperatures, which increases evaporation. In order to reduce the amount of water lost by evaporation, it is important to do irrigation in the early hours of the day, in the evening or at night, rather than during the daytime. Reducing water loss will also minimize environmental problems caused by over- irrigation, such as salination, fungal diseases and pollution.
The project aims at disseminating climate smart agricultural techniques, which reduce the costs of the farmers, improve their climate change adaptation capacity and reduce emissions from agricultural production, by providing equipment, trainings and publications to the project participants and short movies reaching a wider society.
We reached 10,328 beneficiaries in Harran and helped conserve 3,098 million liters of water in 2019.
By 2025, half of the world’s population will be living in water-stressed areas. Only 71% of the global population used a safely managed drinking-water service - that is, one located on premises, available when needed, and free from contamination in 2017. (Source: World Health Organization)
Access to clean drinking water is also a major problem in our countries of operation. Consequently, water problems directly affect the welfare of the communities where we operate and the sustainability of our business.
In this sense, The Life Plus Environment Program was initiated with the aim to foster a new approach to land and water management in line with adaptation to climate change and decreasing water resources.

Paani Project Progress
160,000
850,000900,000
1,000,000
750,000
8
21 24 24 28
20162015 2018 20192017
Filtration Plants Beneficiaries
95SUSTAINABILITY REPORT 2019
Paani Safe Water Initiative
In Pakistan, we have been running our Paani Clean Water project in collaboration with the Clean Water Trust, the World Wildlife Fund (WWF), and the Rotary International Pakistan. A report by Pakistan Council of Research in Water Resources (PCRWR) reveals that 44% of the total population in Pakistan has no access to safe drinking water. Another publication by Pakistan’s Waters at Risk states that 33% of fatalities are due to water related diseases - typhoid, cholera, dysentery and hepatitis.
Addressing the safe drinking water needs of our communities, especially in the underprivileged regions, CCI Pakistan set up its first filtration plant in Malir-Karachi in collaboration with Rotary International Pakistan. Following this, new plants were set up in Lahore and in Rahimyar Khan in collaboration with the Clean Water Trust. Each plant has the capacity to produce over 2,000 liters per hour and serve a population of over 20,000 people daily.
In 2015, CCI Pakistan launched and implemented the Paani – Safe Water Initiative in collaboration with WWF Pakistan. Up to date we provided clean water to approximately 1 million people across Pakistan. On top of 24 plants that were set up over the course of four years, additional four plants in Faisalabad, Gujranwala, Layyah and Tharparkar were launched in 2019 to provide clean water for 100,000 more people. Extensive community outreach and mobilization activities were conducted in the target areas informing communities about the importance of safe drinking water and its appropriate usage. For 2020, CCI Pakistan planned to invest in four new filtration plants to serve an additional 250,000 people; reaching a total of 32 plants to serve 1,250,000 beneficiaries.

2019 Goals Performance in 2019 Status 2020 Goals
Keep encouraging volunteering activities of CCI employees.
Conducted volunteering activities in Turkey, Pakistan and Iraq. Achieved Spread the spirit of volunteering
activities in all countries of operation.
96 SUSTAINABILITY REPORT 2019
For more information please visit Anadolu Foundation’s website.
Volunteerism
Encouraging and supporting employee volunteerism is one of the building blocks of CCI’s organizational culture. In 2013, CCI launched the CCI Volunteers Initiative and established employee volunteering clubs to encourage employee volunteering along its operations. These clubs guided employees to organize and jointly engage in social projects. Every year, CCI employees coordinate and actively participate in voluntary programs that serve their communities in a wide range of issues from environmental conservation activities (clean-ups, planting trees), to visiting orphans or children at hospitals; from distributing food to needy families to renovating school facilities, and such.
In 2017, CCI took a very important step and established the CCI Volunteering Program to systematically encourage and support volunteering activities for all its employees. Launched first in Turkey, the program is gradually expanding to other CCI countries. As part of the program, CCI collaborates with NGOs including The Anadolu Foundation as well as the Ministry of Education, universities and local governments. CCI employees can apply to join the Volunteering Program through the company’s intranet platform, indicating their preferred fields for activity.
Figures of Volunteerism in CCI Turkey Figures of Volunteerism in CCI Pakistan2019 Since 2017 2019
9 Cities(Antalya, İzmir, Manisa, Samsun,
İstanbul, Ankara, Bolu, Mersin, Muğla)2,450 Volunteers
7,300 Voluntary Hours
405,000 Beneficiaries
in 32 Activities
7 CitiesVolunteerism activities which started in CCI Pakistan in 2018, continued with community health initiatives in 2019. As a result of collaboration with Shaukat Khanum Memorial Cancer Hospital and Research Centre, over 300 beneficiaries’ children are treated at the Hospital.
Also, Nationwide Blood Donation Drive is conducted.
8 Projects 3 Projects
6 NGO’s 2 NGO’s
40,000 TL Donations 370 Volunteers
750 Volunteers2,200 Voluntary Hours 2,094 Voluntary Hours

97SUSTAINABILITY REPORT 2019
Greening Activities in Azerbaijan and Turkey
CCI Iraq Volunteers Campaign Orphan Day with CCI IraqWithin the community development programs conducted by CCI Azerbaijan together with Ministry of Environment and ADA University, more than 55,000 trees were planted by the end of 2019. CCI also participated in tree planting campaign dedicated to 650th anniversary of great Azerbaijani poet Nasimi. CCI planted 3,500 trees also in Turkey
In the spirit of CCI culture and sustainability, PAC team organized a CCI volunteer campaign which directed its full care to the refugee camps in both northern and southern Iraq, organizing visits to gathering places and making donations to displaced families.
This was organized with support of international human rights organizations, specifically the UN, and also support of government authorities and relevant authorities.
CCI team visited three orphanages at South Iraq region and another three at North Iraq, celebrating the Global Orphan Day. PAC Manager made a speech which spread spirit of fun and joy to the children. CCI Team shared these moments with orphans and presented CCI values and team spirit.

98 SUSTAINABILITY REPORT 2019
Our Environment Policy
All our plants in Turkey, Jordan, Kazakhstan, Azerbaijan, Pakistan, Kyrgyzstan, Tajikistan, Iraq and Turkmenistan hold the ISO 14001 standard certificates. In Turkey, all plants are certified according to ISO 50001 Energy Management System and all plants, sales operations and offices are certified according to ISO 14064-1 GHG Standards. The plants in Pakistan which are Lahore, Gujranwala, Faisalabad, Multan and Rahim Yar Khan are certified according to ISO 50001 Energy Management System.
We established a committee to maximize our potential to reduce our WUR (Water Usage Ratio) and EUR (Energy Usage Ratio) values in 2018. This committee conducted a current state assessment and gap analysis among the plants followed by an action plan. With this methodology, CCI reviews and evaluates its performance every three months.
We comply with local legal requirements, international standards and TCCC KORE requirements. Our perpetual goal is 100% compliance with legal environmental limits and TCCC’s standards. In 2019, we fully complied with environmental legislation and TCCC standards, and consequently did not receive any fines.
GRI 102-11
ENVIRONMENTAL FOOTPRINT
Governance
Management Systems
Compliance Trainings
With the concerns of growing population demand and scarce natural resources, management of our environmental impacts plays a vital role in the continuity of our business as a responsible company. We aim to use fewer natural resources, operate efficiently and generate less waste, intensively focusing on ‘energy management and climate change’, ‘water’ and ‘sustainable packaging’ practices.

Energy Intensity Performance 2017 2018 2019
Net Sales Revenue (Million TL) 8,392 10,623 12,245
Energy Consumption (Million MJ) 2,181 2,319 2,378
Energy Intensity* (MJ/TL) 0.26 0.22 0.19
*Energy Intensity (MJ/TL): Total Energy/Total Revenue
Energy Intensity Performance (MJ/TL)
0.26
0.190.22
20182017 2019
99SUSTAINABILITY REPORT 2019
Highlights of our Environmental Management Performance
Our primary goal is to grow by using less resources. Our performance shows that although we increased our sales revenue, we succeeded in reducing our energy intensity through the years. In 2019, with CCI operational excellence (OE) projects we saved 142,3 Million MJ of Energy, 10,737 tons of CO2e emissions, 99 tons of cardboard waste, 35 tons of PET waste and 128,593 m3 of water. We supplied the energy needs for illumination and post mix line in our İzmir Plant from 100% clean energy resources.
COUNTRY YEARSKey Performance Indicators
Energy Usage Ratio (MJ/L)
GHGEmissions Ratio
(g CO2e/L)
Water Usage Ratio (L/L)
Total Waste Recycling Ratio (%)
Turkey2019 *0.30 **24.18 *1.52 98.122020 Target 0.28 28.54 1.35 98.00
Jordan2019 0.31 34.51 1.61 89.002020 Target 0.23 50.00 1.41 94.00
Kazakhstan2019 0.67 44.45 1.51 93.352020 Target 0.64 45.00 1.55 92.00
Azerbaijan2019 ***0.36 62.58 1,58 99.012020 Target 0.35 55.00 1.70 98.00
Pakistan2019 0.36 31.35 2.03 97.562020 Target 0.37 32.41 1.78 98.60
Kyrgyzstan2019 ***0.42 24.18 1.62 96.972020 Target 0.45 27.00 1.57 98.50
Tajikistan2019 ***0.46 15.27 *2.28 77.642020 Target 0.46 15.27 1.95 95.00
*Figures have received limited assurance from the independent auditing firm KPMG.** Figure has been verified by BV. *** Azerbaijan, Kyrgyzstan and Tajikistan figures are Core EUR value.

Turkey 7,314,872
Pakistan 42,978,246
Azerbaijan 82,808
Kazakhstan 90,835,546
Kyrgyzstan 1,133,325
Turkey 578
Pakistan 3,207
Azerbaijan 50
Kazakhstan 6,651
Kyrgyzstan 251
Turkey 58,900
Pakistan 38,187
Azerbaijan 3,681
Kazakhstan 27,825
Emission Savings Through OE Projects; 142,344,797 MJ
Energy Savings Through OE Projects; 10,737 t CO2e
Water Savings Through OE Projects; 128,593 m3
TURKEY
TURKEY
TURKEY
KAZAKHSTAN KAZAKHSTANKAZAKHSTAN
PAKISTAN PAKISTAN
PAKISTAN
AZERBAIJAN
AZERBAIJAN
AZERBAIJAN
KYRGZSTAN
KYRGZSTAN
100 SUSTAINABILITY REPORT 2019

101SUSTAINABILITY REPORT 2019
Energy Management and Climate Protection
Country 2019 Goals Performance in 2019 Status 2020 Goals
Energy Management Achieve the following energy usage ratios Achieve energy usage ratios of;
Turkey0.30 MJ/L (total) 0.297 MJ/L (total) Achieved 0.295 MJ/L (total)
0.265MJ/L (core) 0.260 MJ/L (core) Achieved 0.258 MJ/L (core)
Jordan 0.265 MJ/L (core and total) 0.309 MJ/L (core and total) Underachieved 0.310 MJ/L (core and total)
Kazakhstan0.66 MJ/L (total) 0.67 MJ/L (total) Underachieved 0.66 MJ/L (total)
0.43 MJ/L (core) 0.44MJ/L (core) Underachieved 0.44 MJ/L (core)
Azerbaijan0.68 MJ/L (total) 0.72 MJ/L (total) Underachieved 0.71MJ/L (total)
0.35 MJ/L (core) 0.36 MJ/L (core) Underachieved 0.35 MJ/L (core)
Pakistan0.33 MJ/L (total) 0.36 MJ/L (total) Underachieved 0.35 MJ/L (total)
0.32 MJ/L (core) 0.33 MJ/L (core) Underachieved 0.33 MJ/L (core)
Kyrgyzstan0.66 MJ/L (total) 0.68MJ/L (total) Underachieved 0.65 MJ/L (total)
0.46 MJ/L (core) 0.42 MJ/L (core) Achieved 0.41 MJ/L (core)
Tajikistan N.A (added to the reporting scope in 2019)0.76 MJ/L (total) N.A (added to the reporting
scope in 2019) 0.46 MJ/L (core)0.46 MJ/L (core)
Climate Protection Achieve a carbon emissions ratio Achieve a carbon emissions ratio
Turkey in parallel with EUR28.5gr/ L (total)
In parallel with EUR24.1 gr/ L (core)
Jordan In parallel with EUR 34.5 gr/ L (core and total) In parallel with EUR
Kazakhstan In parallel with EUR65.4 gr/ L (total)
In parallel with EUR44.5 gr/ L (core)
Azerbaijan In parallel with EUR62,6gr/ L (total)
In parallel with EUR36.2 gr/ L (core)
Pakistan In parallel with EUR31.4 gr/ L (total)
In parallel with EUR28.9 gr/ L (core)
Kyrgyzstan In parallel with EUR24.2 gr/ L (total)
In parallel with EUR11.8 gr/ L (core)
Tajikistan N.A (added to the reporting scope in 2019)37.8 gr/L (total) N.A (added to the reporting
scope in 2019) In parallel with EUR31.3 gr/L (core)
Ensure that 98% of newly purchased cold drink equipment is HFC-free by the end of 2019. 98.87% Achieved 99%
Increase our EMD-equipped cold drink equipment to 90% of the total in Turkey. 89.2%
Partially Achieved (achieved for the cold drink equipment larger than 250 liters)
90%
Goals and Achievements

102 SUSTAINABILITY REPORT 2019
The focus areas of our energy efficiency and climate protection strategy are:
Climate change is among the biggest threats to the world’s ecosystems and humanity. With our responsible business practices, CCI joins the global business community in implementing the necessary changes to combat these risks. Energy efficiency and climate protection is our primary focus in reducing our environmental footprint. We are aware that climate change may have direct and indirect implications for our business, supply chain and communities.
1. Reducing energy usage and GHG emissions in our manufacturing operations, manufacturing and sales offices by implementing energy efficiency programs;
2. Reducing logistics-based direct emissions with effective fleet and fuel management and optimization practices;
3. Reducing indirect emissions by concentrating on our climate friendly refrigeration programs;
4. Increasing awareness on climate protection by collaborating with our distributors, dealers, suppliers and other stakeholders;
6. Calculating, verifying and reporting accurate carbon footprint of our operations;
7. Promoting climate change awareness by engaging with our stakeholders in relevant platforms;
8. Calculating the carbon footprint of our products in line with a life-cycle approach;
9. Researching clean and renewable energy and investing in, where possible;
10. Investigating opportunities and conducting a feasibility study to supply sustainable sources.

103SUSTAINABILITY REPORT 2019
2018
2018
20172016
2016
2006
2006
2019
2019
0.2
6 0
.26 0
,39
0.3
1 0
.31
-72%
-39% -46%
-16% -12%
0%
0%
0.4
4 0
.44
0.3
6 0
.36
0.3
3 0
.33
0,4
2 0
.42
0.4
6
0.4
6
0.3
3
0.2
6
0.2
7
0.4
5
0.3
5
0.3
6 0,4
6
0.3
9
0.3
9
0.2
6
0.2
6
1.12
1.12
0.7
2
0.7
2
0.6
7
0.6
7
0.4
0
0.4
0
0,4
8
0.4
8
0.2
7
0.2
5
0.4
4
0.3
8
0.3
8
0,4
4
TCCC
TCCC
TURKEY
TURKEY
JORDAN
JORDAN
2006 is the baseline year for the TCCC, Turkey, Jordan, Kazakhstan, Azerbaijan operations. 2016 is the baseyear of Pakistan and Kyrgzstan.
2006 is the baseline year for the TCCC, Turkey, Jordan, Kazakhstan, Azerbaijan operations. 2016 is the baseyear of Pakistan and Kyrgzstan.
KAZAKHSTAN
KAZAKHSTAN
AZERBAIJAN
AZERBAIJAN
PAKISTAN
PAKISTAN
CCI TOTALTAJIKISTAN
TAJIKISTAN
KYRGZSTAN
KYRGZSTAN
Core Energy Use Ratio (MJ/L)
Improvements in Core EURs between 2006 and 2019 (MJ/L)

104 SUSTAINABILITY REPORT 2019
Practices to Reduce Carbon Footprint
HFC-free Cold Drink Equipment
Cold Drink Equipment with LED Lights
Transport and Distribution Practices Cooling Practices
We transport millions of products from our suppliers to our plants and from our plants to our customers and distributors. Our business success is dependent on efficient logistics network that optimizes the number of vehicles in transit and the mileage covered and aims to reduce emissions. The optimization of distribution is crucial to our business performance, since transportation accounts for around 9.2% of the total GHG emissions of our value chain in Turkey. We choose vehicles that consume less fuel and emit less carbon. Through our “Route Optimization Project” since 2013 and the “Road Net” platform since 2016 enables us reducing 1,400 tons of GHG emissions and fuel saving of $650,000 annually.
The use of HFCs as refrigerants in cold drink equipment has negative impact on climate change. Together with its bottling partners, TCCC set the goal to have 100% of its new cold drink equipment HFC-free. In cases if a commercial HFC-free solution is not available, we collaborate with our suppliers to develop alternative HFC-free solutions. This effort is vitally important as HFC-free cold drink equipment have at least 1,000 times less effect on global warming when compared to their HFC counterparts. On the other side, refrigerants in cold drink equipment may slowly leak into the atmosphere during use or may leak completely if the equipment is not properly disposed at the end of its life cycle. CCI always ensures that cold drink equipment is properly degassed.
As of 2019 end, 74.6% of all cold drink equipment and 98.9% of newly purchased cold drink equipment in Turkey are HFC-free*.*HFC: Hydrofluorocarbon
At CCI Turkey operations, we have been purchasing cold drink equipment with LED lights since 2012. With the purchasing of all new cold drink equipment with LED lights, overall ratio of our cold drink equipment with LED lights increased from 8% in 2012 to 62% in 2019. With this strategy, we will keep increasing our ratio and minimizing our energy consumption.
Refrigeration greatly improves our consumers’ enjoyment of our products. Yet again, with regards to protecting the environment, we need to find the balance between our efforts to please our customers and our responsibility to decrease our environmental footprint. We continuously upgrade existing equipment to the energy efficient technology, and we continue to work with suppliers to innovate and develop climate-friendly cooling technologies. Within this reporting period, we collected and disposed about 34,000 old cooling equipment. We aim to prevent the emission of 1.75 million tons of CO2 with the EMD and HFC-Free Cold drink equipment procurement between 2010-2020 across CCI.

Cold Drink Equipment Ratios
CCI (7 countries) Turkey
37.9% 39%
75%
62%
48.2%
89.2%
Ratio of Cold Drink Equipment with EMD
Ratio of HFC-Free Cold Drink Equipment
Ratio of Cold Drink Equipment with LED Lights
105SUSTAINABILITY REPORT 2019
Cold Drink Equipment with Energy Management Device (EMD)
Effective since 2009, Energy Management Device (EMD) is another tool which enables us to tune our cold drink equipment’s environmental footprint. By using cold drink equipment with EMD, we can reduce energy consumption up to 42%. For this reason, we preferred to purchase new cold drink equipment (larger than 250-liter capacity) with EMD as part of the initiative.
With our climate-friendly actions in seven countries of operation, we avoided 1,686 kilotons of CO2 emissions since 2009 which is equivalent amount of CO2 emissions that 140 million trees* absorb from the atmosphere.
The total ratio of cold drink equipment with Energy Management Device (EMD) within our operations in seven countries increased by 8.2% to 48.2% in 2019.
* Calculation is made based the assumption that an average mature (15 years and older) tree absorbs 12 kg CO2 annually.

HFC-Free Saving (ton CO2) Trees due to HFC-Free*
Trees due to EMD Saving*Emissions Saving due to EMD (ton CO2)EMD Energy Saving (MWh)
Cumulative 2019
1,9
65,16
7
23,
582
53,
103
883
,833
10
,60
6
22
,739
1,6
86,6
26
10
4,6
82,3
03
14
0,13
5,50
0
24
2,4
07
775
,00
0
20
,20
0,5
83
3,4
86,14
4
525
,562
5,0
06
876
417
,167
73,
00
0
OTHER COUNTRIES
1,5
75,9
55
28,
40
6
131
,329
,569
231
,80
1
8,4
24
19,
316,
750
TURKEY ALL
TURKEYTURKEYTURKEY OTHER COUNTRIESOTHER COUNTRIESOTHER COUNTRIES
OTHER COUNTRIES
ALLALLALL
3,4
33,0
41*
50
2,82
3
33,
412
9,3
00
ALL
2,3
67,16
7
70
2,0
00
TURKEY
106 SUSTAINABILITY REPORT 2019
* Number of trees that would be needed to offset the emissions saved with EMD
*Equal to the annual energy consumption of 591.904 Turkish households

107SUSTAINABILITY REPORT 2019
Searching for new means and promoting effective change are fundamental to TCCC’s Behavioral Energy Efficiency Program (Energy Excellence). Our individual relationship with the systems, technology, procedures, and our perceptions of this relationship have direct impacts on productivity, collaborative efforts and success. This program is designed with staff awareness and culture at its core. Our goal is to extend the Energy Efficiency Top 10 by promoting a company roadmap that provides a holistic approach to “Energy Excellence”. It also helps to spread a sense of ownership and accountability for this issue. In 2017, the program was replicated in all 21 CCI plants in 10 countries.
“Turkey’s Fight against Climate Change” Conference organized by ÇEVKO was held in October 2019, with the participation of Deputy Minister of Environment and Urbanization of Turkey. CCI Group Corporate Affairs Manager shared CCI’s sustainability strategy and the pioneering practices with regards to climate change with the participants from the public, private sector and the academia.
In 2019, we had started to create the Hand in Hand Environmental Program in order to standardize environmental practices at CCI. Hand in Hand Environmental System focuses on preventing behavioral waste as well as sustainability projects.
TCCS launched a global initiative called “Reduce the CO2 emissions embedded in the drink in your hand by 25% by 2020” in 2013 and aimed at reducing GHG emissions across its entire value chain. In CCI, we align our climate change mitigation goal with this overall target in order to achieve comprehensive carbon footprint reductions across our value chain. In 2019, it is estimated that we reduced the CO2 embedded in the Coca-Cola “drink in your hand” by 24% below 2010 levels (Baseline: 2010).
Awareness Programs of TCCC and CCI on Energy and Climate
The Behavioral Energy Efficiency Program
CCI at Climate Change Conference
Hand in Hand Environment Program
Reduce the CO2 Emissions Embedded in the Drink in Your Hand by 25% by 2020

GHG Emissions (tCO2e)
Turkey 548,784 52.8%
Jordan 17,265 1.7%
Kazakhstan 78,726 7.6%
Azerbaijan 27,992 2.7%
Pakistan 357,854 34.5%
Kyrgyzstan 5,605 0.5%
Tajikistan 2,015 0.2%
TOTAL 1,038,241 100.0%
TURKEY
KAZAKHSTAN
JORDAN
PAKISTAN
AZERBAIJAN
KYRGZSTAN TAJIKISTAN
SCOPE 1+2+3
108 SUSTAINABILITY REPORT 2019
Emissions by Scope and Region

GHG Emissions (tCO2e)
Turkey 45,649 51.0%
Jordan 499 0.5%
Kazakhstan 20,820 23.0%
Azerbaijan 5,273 6.0%
Pakistan 13,726 15.0%
Kyrgyzstan 2,182 2.5%
Tajikistan 989 1.0%
TOTAL 89,138 100.0%
GHG Emissions (tCO2e)
Turkey 68,587 41.5%
Jordan 2,570 1.5%
Kazakhstan 30,737 18.5%
Azerbaijan 10,932 6.5%
Pakistan 52,311 31.5%
Kyrgyzstan 620 0.4%
Tajikistan 119 0.1%
TOTAL 165,876 100.0%
GHG Emissions (tCO2e)
Turkey 434,548 55.5%
Jordan 14,196 1.8%
Kazakhstan 27,169 3.5%
Azerbaijan 11,787 1.5%
Pakistan 291,817 37.2%
Kyrgyzstan 2,803 0.4%
Tajikistan 907 0.1%
TOTAL 783,227 100.0%
TURKEYTURKEY TURKEY
KAZAKHSTAN
KAZAKHSTAN
KAZAKHSTAN
JORDAN
JORDANJORDAN
PAKISTAN
PAKISTAN PAKISTAN
AZERBAIJAN
AZERBAIJAN
AZERBAIJAN
KYRGZSTAN KYRGZSTAN KYRGZSTANTAJIKISTAN TAJIKISTAN TAJIKISTAN
SCOPE 3SCOPE 1 SCOPE 2
109SUSTAINABILITY REPORT 2019

OTHERS
OTHERS
PRODUCTION
PRODUCTION
LOGISTICS
LOGISTICS
COLD DRINK EQUIPMENT
COLD DRINK EQUIPMENT
110 SUSTAINABILITY REPORT 2019
Emissions of Turkey Operations
In addition to reducing the absolute emissions, we optimized our operations to increase emission savings. We avoided 360 kilotons of CO2 emissions in Turkey in 2019 as a result of best practices executed all throughout the value chain, which is equal to the amount of CO2 that approximately 30 million trees* annually extract from the atmosphere.
Turkey Operations’ Emissions on the Value Chain (t CO2e) Total Share
Production 109,335 19.9%
Logistics 50,612 9.2%
Cold Drink Equipment 386,929 70.5%
Others* 1,907 0.4%
Total 548,783 100.0%
Turkey Operations’ Emissions Savings on the Value Chain (t CO2e) Total Share
Production (Energy efficiency projects, fugitive emission reductions of A/C equipment)
9,002 2.5%
Logistics (Route optimization, company cars upgrade to hybrid models)
2,113 0,.5%
Cold Drink Equipment (EMD improvements in cold drink equipment) 231,801 65.0%
Others (Returnable glass bottles, use of videoconferencing tool, reuse & share of wooden pallets)
117,128 32.0%
Total 360,044 100.0%
*Others include employee commuting and business travel.
* Calculation is made based the assumption that an average mature (15 years and older) tree absorbs 12 kg CO2 annually.

111SUSTAINABILITY REPORT 2019
Sustainable PackagingGoals and Achievements
2019 Goals Performance in 2019 Status 2020 Goals
Achieve a total waste ratio of:
Turkey: 4.25 g/LJordan: 1.36 g/LKazakhstan: 1.63 g/LAzerbaijan: 0.97 g/LPakistan: 10.01 g/LKyrgyzstan: 3.00 g/L
Performed the following ratios:
Turkey: 4.00 g/L Jordan: 1.44 g/LKazakhstan: 2.12 g/LAzerbaijan: 0.90 g/LPakistan: 8.03 g/LKyrgyzstan: 2.02 g/LTajikistan: 3.09 g/L
Compared to Annual Targets
Turkey: Overachieved by 6% Jordan: Underachieved by 6%Kazakhstan: Underachieved by 3%Azerbaijan: Overachieved by 8% Pakistan Overachieved by 20%Kyrgyzstan: Overachieved by 3%
Achieve a total waste ratio of:
Turkey: 4.10 g/LJordan: 1.4 g/LKazakhstan: 2.09 g/LAzerbaijan: 0.89 g/LPakistan: 8.89 g/LKyrgyzstan: 2.01 g/
Continue assessing opportunities to reduce packaging material.
Saved 145 tons of resin 232 tons of glass and 99 tons of carton with our lightweight practices and operational excellence projects
AchievedContinue implementing lightweight opportunities to reduce packaging material.
Use 6% of recycled plastic (r-PET) content
Used 6% of recycled plastic (r-PET) content. Achieved
Use 8% of recycled plastic contentUse r-PET in secondary packaging like labels and shrink
Packaging is an essential aspect of the quality of our products and ensures safe delivery of our products to our customers and consumers. With our sustainable packaging efforts to conserve resources and use less energy; we not only contribute to the circular economy, but also reduce our carbon footprint.
It is unacceptable that packaging ends up in our oceans and waterways or littering the communities in which we all live and work. Using less resources for packaging has always been one of CCI’s packaging strategy’s key elements and design lied beneath this goal. Consequently, we continuously work to develop lighter packaging by using less material and conduct lightweight projects on both glass and resin side. We also focus our efforts on reusing our glass bottles, collecting back the packaging we put on the market and increasing the recycled content in our packaging. We aligned our packaging strategy in 2019 with TCCC’s new environmental program: A World Without Waste.
Our Sustainable Packaging Strategy: Design, Collect, Partner!
Sustainable Packaging

112 SUSTAINABILITY REPORT 2019
For More Information about the Program please visit TCCC website
A World Without Waste
DESIGN COLLECT PARTNER
The Coca-Cola Company launched a bold and ambitious environmental program in 2018 with the vision for A World Without Waste. The three internal pillars of the plan are Design, Collect and Partner. Goals of the project revolve around:
• Continuing to focus on making the packaging 100% recyclable
• Collecting and recycling the equivalent of the 100% of the packaging it sells by 2030
• Increasing the recycled content in the packaging

Packaging Weight Reductions in Turkey (%)
2009 2019
5 lt Damla1.5 lt Packaging 2.5 lt Sprite1 lt Packaging450/500 ml Packaging
-26.05%
-15.38%
-9.52%-11.76%
-8.16%
113SUSTAINABILITY REPORT 2019
Lightweight PlantBottle
Recycled PET (r-PET)
Returnable Glass Bottle Use in Turkey and Pakistan
As defined in our strategy, we put several practices into action to reduce the amount of natural resources used in packaging without compromising the safety of our products. Our efforts began in 2008 when we reduced the length of the bottleneck for the lightweight PET bottle in Turkey. We have been implementing lightweight programs since 2010 in Kazakhstan, Azerbaijan and Kyrgyzstan operations.
In 2015, we conducted a benchmark study covering all CCI countries of operations to map the amount of resin used for all sizes of bottles and to share best practices of lightweight applications among the plants. With our lightweight practices; we save materials and also reduce GHG emissions released during production. With the help of lightweight and short neck practices; 145 tons of resin and 232 tons of glass is saved in seven countries of operation in 2019.
PlantBottle usage performance in 2019 was 99% in Azerbaijan and 98% in both Jordan and Pakistan.
As a consequence of the great emphasis we place on circular economy at CCI, we focus on the entire life cycle of packaging through a renewed perspective. We spend continuous efforts to increase the amount of recycled material in our packaging.
Besides the mandatory regulations on the use of r-PET up to 6% in beverage packaging, we have been long working on the use of recycled materials without compromising the product safety and consumer health.
In 2019, we used 14,105 tons of 20% content r-PET (compared with 800 tons in 2018) in 30% of our total volume; using chemical recycling method. The target for the r-PET usage in the content is 25% for 2020. Using r-PET in secondary packaging like labels and shrink is another target we work on with our strategic partners. In the upcoming years, we plan to continue our extensive efforts to further increase the r-PET content.
With returnable bottle practices, glass bottles can be used up to eight times. With this practice, less energy is used for the bottle production and less resources are consumed.
The amount of refillable glass packaging in Turkey and Pakistan in 2019 has reached 162,895 tons. Thus, we avoided 191,239 tons of CO2e via returnable glass bottle practices, equaling to the amount that is absorbed by 15.9 million trees.*
* Calculation is made based the assumption that an average mature (15 years and older) tree absorbs 12 kg CO2 annually.

Post-Consumer Packaging Recycling Performance of CCI Turkey
2018 201955% for PET, PE, PP, Steel
and Aluminum60% for Carton and Glass
20202016 201720152010
60%
54% 54%
TAR
GET
BA
SELI
NE
54%
37%
52%48%
114 SUSTAINABILITY REPORT 2019
Post-Consumer Packaging Waste Recycling
CCI Represented at Zero Waste Forum
CCI Group Corporate Affairs Manager was a speaker at the panel on ‘Waste and Resource Management for Industrial Sustainability’ at the 3-day Zero Waste Forum with the participation of Minister of Environment and Urbanization of Turkey. CCI shared its sustainability strategy and effective resource and waste management practices we adopted to reduce our environmental footprint and create value for all our stakeholders.

115SUSTAINABILITY REPORT 2019
201620152006 2019
77.6
4
98.12
8%
90.9
9
93.3
5
-1%
94.6
7
-1%
98.10
96.9
7
89.0
0
9%
81.6
0
31%
99.0
1
75.5
5
38%
97.5
6
70.5
4TURKEY JORDAN
Pakistan, Kyrgyzstan and Tajikistan data are included in the sustainability report in 2015, 2016 and 2019 respectively.
KAZAKHSTAN AZERBAIJAN PAKISTAN TAJIKISTANKYRGZSTAN
Zero Waste to Landfill
At all CCI plants, we work to minimize our environmental footprint by minimizing the amount of waste that is disposed of safely and in compliance with legislation. Our main strategy is based on preventing, reducing, reusing, recycling and recovering the waste. To do so, we employ the ISO 14001 environmental management system and carry out related operations in accordance with CCI’s environmental policy, legislations and TCCC’s KORE-EOSH requirements. At our production sites, we segregate our waste as reusable, recyclable, hazardous, landfill and non-recyclable wastes.
All waste that can be reused is reused, and that which can be recycled and recovered is delivered to licensed companies in all CCI operations. Waste that cannot be recycled or recovered is sorted according to specific, legally defined categories and delivered to licensed disposal facilities or municipalities to be used as landfill or to be incinerated. According to our waste management standards, all waste disposal sites are evaluated before use, and periodically thereafter, to verify and document site acceptability.
In line with our approach to produce more while consuming less, achieving zero waste production is our ultimate goal. Since 2006, we manage to improve our performance in all countries of operation. In line with compliance with Zero Waste Regulation, Hazar, Elazığ, Ankara and Çorlu plants in CCI Turkey currently operate as “Zero Waste” facilities and the roll-out for the remaining facilities is in progress.
Improvements in Total Waste Recycling Rates between 2006-2019

116 SUSTAINABILITY REPORT 2019
Water ManagementGoals and Achievements
Water is one of the most critical natural resources. It is as well the main ingredient of our products and indispensable element of our production. So, there is a direct link between sustainable use of water and the sustainability of our business. Therefore, minimizing our negative impacts on water and sustaining water efficient operations is of utmost priority and we fully support TCCC’s ultimate goal “replenish every drop of water we use.”
• Improving the overall water-use efficiency in our plants;
• Implementing Source Vulnerability Assessment (SVA) and Source Water Protection (SWP) studies to protect water catchment basins in the regions where our plants are located;
• Managing wastewater and storm water discharge in our plants (achieving 100% compliance in wastewater treatment);
• Replenishing the water, we use, back to the nature by implementing locally relevant programs;
• Mitigating risk for communities and for our business, by partnering with governments, NGOs and communities to assess, understand and generate effective, long-term water stress solutions, and implement source water protection plans;
• Researching and investing in new technologies to reduce water consumption;
• Investigating opportunities and conducting feasibility study to supply sustainable sources.
Our water management strategy is summarized below:
2019 Goals Performance in 2019 Status 2020 Goals
Achieve a Water Usage Ratio of:
Turkey: 1.52 L/LJordan: 1.51 L/LKazakhstan: 1.54 L/LAzerbaijan: 1.63L/LPakistan: 1.80 L/LKyrgyzstan: 1.63 L/L
Performed:
Turkey: 1.52 L/LJordan: 1.61 L/LKazakhstan: 1.51 L/LAzerbaijan: 1.58 L/LPakistan: 2.03 L/LKyrgyzstan: 1.62 L/LTajikistan: 2.28 L/L
Compared to Annual Targets
Turkey: AchievedJordan: Underachieved by 7%Kazakhstan: Improved by 2%Azerbaijan: Improved by 3%Pakistan: Underachieved by 13%Kyrgyzstan: Improved by 1%
Turkey: 1.50 L/LJordan: 1.60 L/LKazakhstan: 1.49 L/LAzerbaijan: 1.57 L/LPakistan: 1.97 L/LKyrgyzstan: 1.62 L/LTajikistan: 1.95 L/L
Conduct SVA study in our Hazar, Ashgabat plants. To conduct SVA studies in our Hilla, Karbala, Astana plants.
SVA study is conducted in our Hazar, Hilla and Karbala plants. Partially Achieved
Conduct studies in Astana, Çorlu, İzmir, Mersin, Ankara and Baku plants

Water Savings across CCI (m3)
2018 20192016 20172015
1,548,9051,420,312
985,785
654,000
177,000
117SUSTAINABILITY REPORT 2019
20162006 2019
2.28
1.52
1.74
1.51
-2%-53%
2.10
1.85
2.56
-14%-25%-13% -28%
-28%
1.88
1.62
1.61
3.4
4
1.58
2.10
2.0
3
2.0
0
TURKEY JORDAN
Pakistan, Kyrgyzstan and Tajikistan data are included in the sustainability report in 2015, 2016 and 2019 respectively.
KAZAKHSTANTCCC AZERBAIJAN PAKISTAN TAJIKISTANKYRGZSTAN
Water Management Performance
2019 Turkey All
Water Usage Ratio 1.52 L/L 1.71 L/L
Total Water Withdrawal 4,563,655 m3 10,130,884 m3
Savings of Efficiency Projects 58.900 m3 128,600 m3 (Worth USD 63,192)
Volume of Water Recycled and Reused 516,000 m3 589,600 m3
Share of Water Recycled and Reused 11% 5.8%
Water Replenishment (L) About 5 billion liters About 12 billion liters
Reductions in Water Usage Ratios (WURs) between 2006 - 2019 (L/L)

118 SUSTAINABILITY REPORT 2019
* For data source please visit State Hydraulic Works’ website.
At CCI, we monitor is the amount of water used for producing one liter of product. Our plants have created water map in order to follow water consumption on a daily basis. We continuously analyze, evaluate and
spread best practices among CCI plants to reduce our water usage ratio (WUR). Our 2020 goal for CCI Turkey Operations is to achieve a water usage ratio of 1.48 liter of water per liter of product.
All CCI plants completed the program in 2018, which was designed to reduce water usage in production facilities and to support continuous improvement of water usage ratio in our plants.
As a result of CCI water reduction activities started in CCI Operations in 2006, there has been a 30% improvement in TCCC’s water efficiency on a global basis by the end of 2019.
According to State Hydraulic Works data*, industry accounts for 14% of the total amount of annual usable water in Turkey and CCI Turkey Operations’ total water withdrawal accounts for only 0.058% of Turkey’s industrial water usage.
• Soft water regeneration optimization project in Isparta plant in Turkey;
• Wastewater treatment effluent to be used for road washing in Lahore plant in Pakistan;
• Replacing the water which enters the cooling tower of PET blow and preform injection parts with reverse osmosis water and consequently reducing the blowdown amount.
The water we use in our products and our production processes is drawn from local sources. As part of our water stewardship program, we conduct a local source vulnerability assessment (SVA) and develop Source Water Protection Plan (SWPP) to use water responsibly, mitigate water-related risks to our system and to the communities we serve.
SVAs allow us to assess vulnerabilities to community sources of water and help us determine potential impacts of our water usage and wastewater discharge. This assessment is
conducted in five-year rounds at all CCI plants. As of December 31, 2016, all CCI plants had completed their SVA studies in all countries of operation. The second round of SVA studies that began in 2016 will keep on until the assessments are complete for all CCI plants by 2020. In 2020, our goal is to conduct SVA studies in our Astana, Çorlu, İzmir, Mersin, Ankara and Baku plants.
During an SVA study, an analysis of water basins and sub-basins around our plants is conducted, and it includes the topographical, geological, hydro-geological and hydrological assessment
of the study areas as well as identification of any risks to the sustainability of water resources within these areas. SVA studies include processes such as field surveys, interviews with plant authorities or site representatives, interviews with local and national authorities as well as desktop studies. These assessments file an inventory of the social, environmental and political risks to the water sources supplying our facilities and surrounding communities. We evaluate the results of these studies with a SWPP and act on a plant-by-plant basis.
Plant Water Usage and Minimization
Top 10 Water Saving Program Some of the top water saving programs included;
Source Water Vulnerability Assessment (SVA)
119SUSTAINABILITY REPORT 2019
TCCS’s “water neutrality” goal is defined as:
1. Returning the water we use back to the communities we serve by treating all wastewater and returning it to the environment at a level of purity that supports aquatic life.
2. Replenishing the amount of water equivalent to our product volume through locally relevant water and sanitation projects.
TCCS globally replenished an estimated 100% of the equivalent amount of water used in their finished beverages as of 2015. The water replenishment rate for Turkey has reached 159% as of 2019
In 2019, TCCC’s global replenishment rate increased to 155%.
TCCC’s Replenishment Goal Replenishment Programs

120 SUSTAINABILITY REPORT 2019
The 2nd Water Workshop was organized and moderated by Pakistan Business Council’s Centre of Excellence in Responsible Business (CERB) in collaboration with Coca-Cola Pakistan to lead a dialogue on the UN’s Sustainable Development Goal # 6 (SDG 6) - Clean Water & Sanitation, with focus on water efficiency – internal and external – as an integral part of corporate water policy. Several NGOs, Multi Nationals and Media representatives were present at the Workshop. The
Guest of Honor was Lahore High Court appointed Chairman Water Commission.
At this workshop, CCI’s crucial role in Pakistan’s economy, how CCI derives its pillars directly from UN’s SDGs, and CCI’s commitment towards water efficiency in Pakistan were highlighted. CCI’s water conservation projects as well as water saving initiatives as a responsible corporation were shared with the invited guests.
At CCI, we have high standards around wastewater discharge. “Zero wastewater generation and reclamation” defines our wastewater management approach. We comply with local laws regulating wastewater treatment and discharge in all the operating countries. We also act in accordance with TCCC standards that determine the wastewater pollutant limits for our operations. In many cases, the allowed discharge limits set by TCCC are much lower than the limits established by the local authorities.
In addition to ISO 14001 Environment Management System Audits, all CCI operations are regularly audited in detail by third parties. We monitor our wastewater quality parameters by periodic analyses and reduce our environmental impact by treating wastewater prior to discharge. We also monitor the amount of wastewater discharged per liter of product. We also develop projects to reduce wastewater generated as a result of our activities.
Pakistan Water Workshop
Wastewater Management Water Discharge
Surface water (m3 ) 709,609
Organized Industrial Zone (m3) 1,811,210
Municipal sewage system(m3) 1,619,421
Total (m3) 4,140,241

121SUSTAINABILITY REPORT 2019
PERFORMANCE
INDICATORS3

122 SUSTAINABILITY REPORT 2019
For a full list of entities included in CCI’s financial statements,please see page 130 of the CCI 2019 Annual Report.
CCI REPORTING GUIDANCE
This document provides guidance on the indicators included in the 2019 CCI sustainability report, some of which have been externally assured for the current or a prior period.
Indicators that have been externally assured for this year’s report are marked within the report and the assurance statement is provided at Independent Assurance Statement title of this section.
Indicators covered in this sustainability report are reported in line with the;
• References to disclosures in accordance with the GRI Standards: Core option are listed under the GRI Content Index title in this section.
• United Nations Global Compact (UNGC) Communication on Progress (COP) of the UNGC and are listed at the UNGC Standards Content Index title of this section.
• United Nations Women Empowerment Program (UNWEP) and are listed at the UNWEP Standards Content Index title of this section.
The data within the scope of this guidance document is for the financial year ending on December 31, 2019 and concerns the relevant operations in Turkey, Jordan, Azerbaijan, Kazakhstan, Pakistan, Kyrgyzstan and Tajikistan. Referral to “The Company” covers these seven countries, unless otherwise stated.
Legal entities covered fully by this report include: • Coca-Cola İçecek A.Ş., Turkey • Coca-Cola Satış ve Dağıtım A.Ş., Turkey • Mahmudiye Kaynak Suyu Ltd. Şti., Turkey • J.V. Coca-Cola Almaty Bottlers LLP, Kazakhstan • Azerbaijan Coca-Cola Bottlers Limited LLC., Azerbaijan • The Coca-Cola Bottling Company of Jordan Ltd., Jordan • Coca-Cola Beverages Pakistan Ltd., Pakistan • Coca-Cola Bishkek Bottlers CJSC., Kyrgyzstan • Coca-Cola Beverages Tajikistan L.L.C., Tajikistan
General Reporting Principles In preparing this guidance document, consideration has been given to the following principles: • Information Preparation – to highlight the primary principles of relevance and reliability of information; and • Information Reporting – to highlight the primary principles of comparability, consistency (especially with regards to other data, including that of previous years), understandability and transparency in order to provide clarity to users.

123SUSTAINABILITY REPORT 2019
Key DefinitionsFor the purpose of this report, the following definitions apply:
TCCC: The abbreviation TCCC refers to “The Coca-Cola Company”. TCCS: The abbreviation TCCS refers to “The Coca-Cola System”.
PLANT: All on-site facilities, including production buildings, water treatment units, wastewater treatment units, warehouses, laboratories, administration buildings and technical service operations.
ENERGY: Electricity, natural gas, diesel, gasoline, fuel oil, liquefied petroleum gas (LPG) and steam. For the purpose of this report, energy does not include alternative forms of fuel, such as bio-waste, biomass, biodiesel, or renewable sources of energy such as wind or solar energy, which collectively represent an insignificant share of total energy consumption and carbon emissions.
ENERGY CONSUMPTION: The energy consumed during the reporting year (January 1 to December 31). Energy consumption data covers energy used in the operation of on-site industrial facilities and manufacturing processes, including electrical systems, heating, lighting, on-site transportation, air circulation and air conditioning (HVAC system). Manufacturing processes refer to the energy consumed in the core bottling (filling) operation. Total energy consumption also includes preform injection for those plants that use this energy-intensive process as well as energy used for CO2 production processes in our plants in Kazakhstan and Azerbaijan.
ENERGY USE RATIO (EUR, MJ): MJ of energy consumed per liter of product produced, calculated as the sum of all individual energy sources from the filling (core) production processes (in MJ) divided by production volume (in liters). To allow comparability between different CCI plants: • Energy consumption during preform injection, an energy-intensive process, is excluded from the core EUR. It is included in the total EUR calculations.• Energy consumption for CO2 production processes is also excluded from the core EUR calculation. It is included in the total EUR calculations. • Beginning in 2013, the electricity producing process, which is present in Kazakhstan, is included in EUR calculations.
GHG EMISSIONS (TON): Emissions during the reporting year (January 1 to December 31). The GHGs reported are those currently required by the United Nations Framework Convention on Climate Change and the Kyoto Protocol. These GHGs are currently: carbon dioxide (CO2), methane (CH4), nitrous oxide (N2O), hydrofluorocarbons (HFCs), perfluorocarbons (PFCs), Sulphur hexafluoride (SF6) and nitrogen trifluoride (NF3). Other GHGs, including those regulated by the Montreal Protocol, are excluded from GHG emissions and analyzed separately. “GHG emissions” refers to emissions from all production processes, such as bottling and preform injection, arising from The Company’s plants. In Turkey, CCI has been reporting its GHG emissions more extensively since 2012 in accordance with the ISO 14064-1 Standard for quantifying and reporting GHG emissions at the organization level. Consequently, GHG emissions reported for Turkey also include CCI’s GHG emissions from its non-plant buildings, e.g. offices, fleet transport and fugitive emissions. Where a plant generates energy on-site, the related energy consumption is defined as the energy of the fuel used for generation (e.g. for on- site, diesel-fired electricity generators, the energy consumption would be the diesel used rather than the electricity output of the generator).
WASTE (TON): Waste generated at a given site includes waste due to production, construction, food services or any other activity. Examples of the types of solid waste generated by The Company include paper, plastic, corrugated cardboard, metal, glass, sludge from water, waste oils, fleet waste (tires, batteries, coolants, oils, etc.) and damaged ingredients or products, plus all hazardous waste such as solvents, inks and lab waste. Liquid waste disposed of through the wastewater system is not included in the calculations as such waste is accounted for in wastewater discharge volume and wastewater sludge.
TOTAL WASTE RATIO (g/L): Grams of total waste generated per liter of product produced.

124 SUSTAINABILITY REPORT 2019
WASTE RECYCLING RATE (%): Tons of waste recovered, re-used or recycled divided by total waste generated (in tons), i.e. the Waste Recycling Rate represents the portion of waste that is not disposed to a landfill or incinerated. In the six countries covered by the 2018 CCI sustainability report, accredited waste contractors collected tons of waste for recycling and re-use.
WASTE DISPOSAL (TON): Waste disposal has followed the GRI Standards 306-1 classification. To determine the method of disposal, CCI has used the legal categories laid out in the disposal documentation provided by its accredited waste contractors. Based on the disposal documentation, the categories of waste generated by CCI during the reporting period were recycling, re-use, recovery, incineration and landfill. Some hazardous waste is sold for use as fuel in processes such as cement manufacturing. In accordance with the legal categories of accredited waste documentation, this waste is classified as recovery rather than incineration.
REUSED WASTE (TON): Waste used again for the same or different purposes without re-processing, e.g., wood.
RECYCLED WASTE (TON): Waste that is broken down into raw materials, changed and reprocessed for use and used for new products. Recyclable materials include many kinds of glass, paper, metal, plastic, textiles, and electronics. The composting or other reuse of biodegradable waste – such as food or garden waste – is also considered recycling. Materials to be recycled are brought to a collection center, or picked up from the curbside, then sorted, cleaned and reprocessed into new materials bound for manufacturing.
RECOVERED WASTE (TON): Non-recyclable waste materials and the extraction therefrom of heat, electricity or energy through a variety of processes, including combustion, gasification, pyrolysis and anaerobic digestion. For example, if waste is incinerated in an incineration plant to generate energy, then the waste is “recovered.” If there is no use of energy during the process, then the waste is incinerated. There are several ways to recover energy from waste. Anaerobic digestion is a process of decomposition that occurs naturally whereby organic matter is reduced to
a simpler chemical component in the absence of oxygen. “Recovery” also refers to incineration or directly controlled burning of municipal solid waste in order to reduce waste and create energy. Secondary recovered fuel is energy recovered from waste that cannot be reused or recycled through mechanical and biological treatment activities. Since most of the waste is recovered for energy in licensed facilities before storage, hazardous waste in Turkey is categorized as “recovery.
WASTE STORED ON SITE (TON): Waste stored initially before the final treatment. Wood waste is treated in different ways, and the final treatment method is confirmed with suppliers and categorized by operations. Methods for reuse, recycle and recovery of hazardous waste are confirmed with CCI’s service providers for waste management. For our Turkey operations, disposal and treatment methods are decided according to the waste disposal codes defined in the Turkish Hazardous Waste Control Regulation. The amount of waste from cold drink equipment and two-way bottles generated by the market is measured either by weighing it directly or by calculations using waste factors recorded after measuring the exact weight of each part of the equipment.
LANDFILLED WASTE (TON): Waste sent to landfills (of either a municipality or an accredited company) and disposed of by burial.
WATER: Includes water from all sources, including wells, spring water, municipality and collected rainwater.
WATER CONSUMPTION (LITER): All water used during the reporting year (January 1 to December 31). Water consumption data includes water used for production, water treatment, boiler makeup, cooling (contact and non-contact), cleaning and sanitation, backwashing filters, irrigation, washing trucks and other vehicles, kitchen or canteen, toilets and sinks, and fire control.

125SUSTAINABILITY REPORT 2019
WATER USE RATIO (L/L): Liters of water used per liter of product produced, calculated as total water use (in liters) divided by production volume (in liters).
WATER WITHDRAWAL (L): Total volume of water withdrawn from any source during the reporting year (January 1 to December 31), including ground water, municipality water and collected rainwater.
WASTE EFFLUENT (L): The total volume of water discharges during the reporting period by discharge and quality, including treatment method. This indicator is aligned with GRI’s Standards 306-1 disclosure.
ENVIRONMENTAL COMPLIANCE: The monetary value of significant fines (over $200,000) and the total number of non- monetary sanctions for non-compliance with national Environmental Laws and Regulations. This indicator is aligned with GRI’s Standards 307-1 disclosure.
EMPLOYEE NUMBERS: CCI employees working in The Company’s headquarters, plants and sales offices. Employee figures are categorized as permanent, temporary and contractor workers, and these data are recorded as year-end figures. Turkey operations include Turkey factories and Turkey sales offices. This indicator is aligned with GRI’s Standards 108-2 disclosure.
INJURIES AND LOST DAYS: Type of injury, rates of injury, lost days and total number of work-related fatalities, by region. This indicator is aligned with GRI Standards disclosure number 403-2. CCI’s main injury metric is the Lost Time Incident Rate (LTIR), which is number of lost time incidents/occupational illnesses multiplied by 200,000 and then divided by the total number of hours worked during the reporting period.
TRAINING (Hr.): Average hours of training carried out during the reporting period per employee, categorized in terms of OHS training, environmental training and total training. This indicator is aligned with GRI’s Standards 404-1 disclosure.

126 SUSTAINABILITY REPORT 2019
The following tables summarize the activities that are currently reported within the scope of this sustainability report for energy consumption, GHG emissions, water consumption and solid waste.
*Adjustment is made to the EUR (core) to allow comparability between plants by removing certain energy-intensive processes from the EUR, but not from total energy consumption. As explained in the RG, an adjustment is made to the EUR for energy consumption for preform injection processes, electricity generation processes (present only in our Kazakhstan plant) and CO2 production processes (present only in our plants in Kazakhstan and Azerbaijan). From 2013 onwards, energy use for electricity generation is included in the EUR data.
Total Energy Consumption Turkey Jordan Azerbaijan Kazakhstan Pakistan Kyrgyzstan Tajikistan
Industrial sites where bottling processes are conducted, together with secondary operations such as preform injection*, bottle blowing and lift truck operations
✓Except preform production
✓ ✓ ✓Except preform production
✓
Technical service operations (e.g. repairing of cold drink equipment, etc.)
✓ ✓ ✓ ✓ ✓ ✓ ✓
Administrative buildings located at industrial sites ✓ ✓ ✓ ✓ ✓ ✓ ✓
Own transportation of materials and products within industrial plant sites(e.g., forklift operations)
✓ ✓ ✓ ✓ ✓ ✓ ✓
Data adjustment for preform injection, CO2 production and electricity generation processes for energy consumption figures*
Preform production None
CO2 production and preform processes
✓ Preform production
CO2 production
CO2 production
Scope of Reporting

127SUSTAINABILITY REPORT 2019
Data PreperationEnergy Consumption
Energy consumption data are reported for electricity and primary fuel sources, including natural gas, diesel, LPG, heavy fuel oil and steam. Electricity and natural gas data are obtained from supplier meters and reconciled with internal meters (when available) and/or service provider invoices. Diesel, LPG, steam and fuel oil consumption data are obtained from supplier invoices. CCI Operations used the following published conversion factors:
• For electricity, the unit of supply is invoiced in kWh. To calculate energy use ratio, kWh is converted to megajoules (MJ) at a factor of 3.6.
• For natural gas, the unit of supply for most suppliers is invoiced in m3. To calculate the energy use ratio, cubic meters is converted to MJ with a conversion factor of 37.3, except for in Kazakhstan, where a factor of 34.4 is used based on the 2016 analysis conducted by an accredited local laboratory on the natural gas used on site.
• For fuels other than natural gas (diesel and heavy fuel oil), energy conversion factors (from liters or kilograms to MJ) are obtained from the calculation tool provided by TCCC Default Factors.
• For LPG (MJ/kg) a conversion factor (net calorific value) of 50.0 was used as part of the GHG verification process in accordance with the requirements of ISO 14064-1.
• For diesel (MJ/L) a conversion factor of 39.0 was used.
• For steam (MJ), a conversion factor of (GKAL): 4,186.8 was used (Kazakhstan operations only).
GHG Emissions
GHG emissions are calculated by CCI using published conversion factors. Conversion factors enable an estimate of the amount of GHGs released into the atmosphere per unit of energy consumed. Different types of energy sources have different conversion factors that reflect their carbon dioxide intensity. In future periods, conversion factors may be updated to reflect changes to, and/or improvements in, published data. During the current period, the following conversion factors were used:
For fuels such as natural gas, diesel and LPG, conversion factors are derived from calculation tools based on the May 2015 version of the GHG Protocol Standards found on the GHG Protocol website (www.ghgprotocol.org). The Global Warming Potentials (GWPs) used to calculate the emissions of different GHGs in terms of CO2-equivalents are taken from the Intergovernmental Panel on Climate Change’s Fifth Assessment Report.
In 2014, we began using the “GHG emissions from transport or mobile sources” tool, version 2.6 of May 2015, from the GHG Protocol of the World Resources Institute and World Business Council for Sustainable Development to calculate the emission values for employee commuting and business categories. GHG emissions of Turkey are taken from the report verified by the auditing firm in line with the ISO 14064-1 Standard. Since 2017, we have been using DEFRA emission factors for diesel, managed vans class 3.

128 SUSTAINABILITY REPORT 2019
Extrapolation Method Used for Energy Use Calculation and Total Energy Consumption
Since the period covered by invoices may not always fully align with The Company’s reporting period, adjustments are made where necessary in order to align the consumption data from the invoices with the reporting period as agreed with The Company’s verifiers.
TCCC Default Factors for CO2 Emissions
Natural gas (MJ): 0.050539 kg CO2 LPG (MJ): 0.056839 kg CO2 Diesel (MJ, light fuel oil): 0.070636 kg CO2 Heavy Fuel Oil (MJ): 0.073771 kg CO2 Electricity (kWh): For electricity, conversion factors for GHG emissions are obtained from the International Energy Agency (IEA) and shared by TCCC with the entire Coca- Cola system.
In this year’s report, we used IEA factors of the year 2017 (as there is a two-year time gap for IEA publish the factors for a certain year). Combined factors are used for all operations in the sustainability report. This information is available in the internal document entitled “SDW Fuel Conversion Factors”, which is updated every year by TCCC.
For our Kazakhstan operations, since electricity is generated by a co-generation plant at the site, local laboratory analysis results are used for the calculation of GHG emissions in these operations. The average value of external laboratory analysis results is used to determine the chemical composition of samples of the natural gas used in the plant.
Kg CO2 /kWh Electricity
2012 IEA Factors (Used for the 2014 Report)
2013 IEA Factors (Used for the 2015 Report)
2014 IEA Factors (Used for the 2016 Report)
2015 IEA Factors (Used for the 2017 Report)
2016 IEA Factors (Used for the 2018 Report)
2017 IEA Factors (Used for the 2019 Report)
Turkey 0.45915 0.42868 0.497 0.441 0.465 0.461
Jordan 0.63562 0.63939 0.656 0.588 0.497 0.498
Kazakhstan 0.46088 0.43243 0.515 0.416 0.505 0.612
Azerbaijan 0.49366 0.46879 0.477 0.487 0.479 0,488
Pakistan 0.41762 0.41617 0.425 0.410 0.397 0.416
Kyrgyzstan 0.050 0.092 0.074 0.051
Tajikistan 0.043

129SUSTAINABILITY REPORT 2019
Water Consumption
Water consumption data is obtained from internal meters where ground water is utilized. Moreover, separate data on water consumption is obtained from supplier meters and then reconciled with internal meters (when available) and/or service provider invoices where the water is supplied by the network.
Restatements The measuring and reporting of assured environmental data inevitably involve a degree of estimation. In exceptional circumstances, restatements of data reported in a prior year may be required. Restatements are considered where the data differs by more than 5% at The Company level.
SCOPE FOR WATER CONSUMPTION DATA Turkey Jordan Azerbaijan Kazakhstan Pakistan Kyrgyzstan Tajikistan
Industrial sites comprising bottle facilities ✓ ✓ ✓ ✓ ✓ ✓ ✓
Technical service operations at the site ✓ ✓ ✓ ✓ ✓ ✓ ✓
Administrative buildings located at industrial sites ✓ ✓ ✓ ✓ ✓ ✓ ✓
SCOPE FOR WASTE GENERATION DATA Turkey Jordan Azerbaijan Kazakhstan Pakistan Kyrgyzstan Tajikistan
Industrial sites comprising bottle facilities ✓ ✓ ✓ ✓ ✓ ✓ ✓
Technical service operations at the site ✓ ✓ ✓ ✓ ✓ ✓ ✓
Administrative buildings located at industrial sites ✓ ✓ ✓ ✓ ✓ ✓ ✓

130 SUSTAINABILITY REPORT 2019
MANAGEMENT SYSTEMS STANDARDS AND PRINCIPLES
Material Topic Internal Policies Related External Standards and Principles
Production
Environmental Footprint CCI Health, Safety & Environment (HSE) PolicyTCCC HSE PolicyKORE - EOSH* Requirements
ISO 14001
Water Management KORE - EOSH Requirements ISO 14001
Energy Management & Carbon Emissions KORE - EOSH Requirements ISO 14001, ISO 50001, ISO 14064-1, GHG Protocol
Sustainable Packaging & Waste Management KORE - EOSH Requirements ISO 14001, PAS223
Product Quality & Safety KORE - OE ISO 9001, EFQM Business Excellence Model, Lean Six Sigma
Product Quality & Safety KORE ISO 9001, ISO 22000, FSSC 22000, GFSI**
Health & Safety KORE - EOSH Requirements OHSAS 18001, ISO 45001
Other
Human Rights Along the Value Chain Supplier Guiding Principles UNGC, GRI
Total Beverage Portfolio TCCC Responsible Marketing Policy,TCCC Global School Beverage Guideline
Human Rights Along the Value Chain Human Rights Policy UN Guiding Principles on Business and Human Rights
Community Development TCCC’s Policy UNGC
Risk Management (Strategy) CCI Ethics Code, Human Rights Policy UNGC
Overall Code of Business Conduct, KORE UNGC, GRI
* EOSH: Environmental and Occupational Safety and Health ** GFSI: Global Food Safety Initiative

maintaining appropriate performance management and internal control systems from which the reported performance information is derived.
Management is responsible for preventing and detecting fraud and for identifying and ensuring that CCI complies with laws and regulations applicable to its activities.
Management is also responsible for ensuring that staff involved with the preparation and presentation of the description and the Selected Information are properly trained, information systems are properly updated and that any changes in reporting encompass all significant business units.
OOuurr rreessppoonnssiibbiilliittiieess
Our responsibility is to carry out a limited assurance engagement and to express a conclusion based on the work performed. We conducted our engagement in accordance with International Standard on Assurance Engagements (ISAE) 3000 (Revised), Assurance Engagements other than Audits or Reviews of Historical Financial Information, issued by the International Auditing and Assurance Standards Board. That Standard requires that we plan and perform the engagement to obtain limited assurance about whether the Selected Information is free from material misstatement.
We apply International Standard on Quality Control 1 and accordingly maintains a comprehensive system of quality control including documented policies and procedures regarding compliance with ethical requirements, professional standards and applicable legal and regulatory requirements.
We have complied with the independence and other ethical requirements of the Code of Ethics for Professional Accountants issued by the International Ethics Standards Board for Accountants, which is founded on fundamental principles of integrity, objectivity, professional competence and due care, confidentiality and professional behavior.
PPrroocceedduurreess ppeerrffoorrmmeedd
A limited assurance engagement on a Selected Information consists of making inquiries, primarily of persons responsible for the preparation of information presented in the Selected Information, and applying analytical and other evidence gathering procedures, as appropriate. These procedures included:
• Interviewing select key senior personnel of Coca-Cola İçecek A.Ş. responsible for providing the information in the Selected Information pertaining to the reporting period;
• Review of Selected Information on site covering Coca-Cola İçecek A.Ş. Corporate Office in Turkey and the plants at Izmir, Elazığ and Hazar in Turkey and the plant in Tajikistan as well as off-site review of the Selected Information pertaining to the Company’s other plants in Turkey, against evidence, on a sample basis;
• Comparing the information presented in the Selected Information to corresponding information in the relevant underlying sources to determine whether all the relevant information contained in such underlying sources has been included in the Selected Information.
• Using Coca-Cola İçecek A.Ş.’s Reporting Guidance document (given within the Company’s 2019 Sustainability Report) to evaluate and measure the Selected Information;
• Evaluated the design and implementation of key processes and controls over the Selected Information;
• Re-performing, on a sample basis, calculations used to prepare the Selected Information for the reporting period;
• Evaluating the disclosure and presentation of the Selected Information in the Company’s Sustainability Report for the 2019 calendar year period to determine whether it is in line with our overall knowledge of, and experience with, the sustainability performance of CCI.
The procedures performed in a limited assurance engagement vary in nature and timing from, and are less in extent than for, a reasonable assurance engagement, and consequently the level of assurance obtained in a limited assurance engagement is substantially lower than the assurance that would have been obtained had a reasonable assurance engagement been performed.
IInnhheerreenntt lliimmiittaattiioonnss
Due to the inherent limitations of any internal control structure it is possible that errors or irregularities in the information presented in the Selected Information may occur and not be detected. Our engagement is not designed to detect all weaknesses in the internal controls over the preparation and presentation of the Selected Information, as the engagement has not been performed continuously throughout the period and the procedures performed were undertaken on a test basis.
CCoonncclluussiioonn
Our conclusion has been formed on the basis of, and is subject to, the matters outlined in this report.
We believe that the evidence we have obtained is sufficient and appropriate to provide a basis for our conclusions.
Based on the procedures performed and the evidence obtained, as described above, nothing has come to our attention that causes us to believe that the Selected Information as defined in Key Definitions section of CCI Reporting Guidance in the CCI’s 2019 Sustainability Report for the year ended 31 December 2019 is not presented, in all material respects, in accordance with the CCI’s internally developed reporting criteria as explained in the Key Definitions section of the CCI Reporting Guidance given in the Report.
In accordance with the terms of our engagement, this independent limited assurance report on the Selected Information has been prepared for CCI in connect with reporting to CCI and for no other purpose or in any other context.
RReessttrriiccttiioonn ooff uussee ooff oouurr rreeppoorrtt
Our report should not be regarded as suitable to be used or relied on by any party wishing to acquire rights against us other than CCI, for any purpose or in any other context. Any party other than CCI who obtains access to our report or a copy thereof and chooses to rely on our report (or any part thereof) will do so at its own risk. To the fullest extent permitted by law, we accept
IInnddeeppeennddeenntt LLiimmiitteedd AAssssuurraannccee RReeppoorrtt
TToo tthhee BBooaarrdd ooff DDiirreeccttoorrss ooff CCooccaa CCoollaa İİççeecceekk AA..ŞŞ..
We were engaged by Coca Cola İçecek A.Ş. (hereinafter “Company” or “CCI”) to provide limited assurance on the “Selected Information” contained as defined in Key Definitions section of the CCI Reporting Guidance in the Sustainability Report (hereinafter "the Report") covering the Company’s Turkey and Tajikistan operations for the year ended 31 December 2019.
The scope of our assurance is limited to the Selected Information listed below:
• Total liters of water withdrawn and by source and total liters of water consumed
• Water use ratio (liters of water used per liter of product) • Total mega joules of energy used • Energy use ratio (mega joules of energy used per liter of product) • Core energy use ratio (mega joules of energy used in core processes per
liter of product) • GRI Standards (2016) Indicators: GRI 302-1 Energy consumption within
the organization, GRI 302-3 Energy intensity, 303-1 Water withdrawal by source.
• Total amount of solid waste generated and recycled (Turkey operations only) in tons
• Total solid waste recycling rate (Tons of waste recovered, reused or recycled divided by total waste generated) for Turkey operations only.
MMaannaaggeemmeenntt''ss rreessppoonnssiibbiilliittiieess
Management is responsible for the preparation and presentation of the Report for the Selected Information in accordance with the CCI’s internally developed criteria as described in the Key Definitions section of CCI Reporting Guidance in the Report, and the information and assertions contained within it; for determining the CCI’s objectives in respect of sustainable development performance and reporting, including the identification of stakeholders and material issues; and for establishing and
or assume no responsibility and deny any liability to any party other than CCI for our work, for this independent limited assurance report, or for the conclusions we have reached.
KPMG Bağımsız Denetim ve Serbest Muhasebeci Mali Müşavirlik Anonim Şirketi
A member firm of KPMG International Cooperative
Şirin Soysal,
Partner
İstanbul, 16 June 2020
131SUSTAINABILITY REPORT 2019
INDEPENDENT ASSURANCE
2019 Assurance Scope Independent Assurance Statement The Reporting Guidance (RG) document covers The Company’s data-gathering and reporting obligations for the indicators listed below. It is the responsibility of The Company management to ensure that appropriate procedures are in place to prepare data related to the below mentioned indicators in line with the RG in all material respects.
• The total energy consumption, energy usage ratio (EUR), total water withdrawal and water usage ratio (WUR) and data of CCI Turkey and Tajikistan 0perations as well as waste data of CCI Turkey operations, in year 2019, were audited according to the ISAE 3000 Standard (Revised).
• Scope 1 and 2 GHG emissions of Turkey operations were verified in line with the ISO 14064-3 Standard.
GRI 102-56

132 SUSTAINABILITY REPORT 2019
EXTERNAL VERIFICATION
GREENHOUSE GAS VERIFICATION SCOPE FOR TURKEY
GHG Emissions Included ✓
Industrial sites comprising bottling facilities together with secondary operations such as lift truck operations ✓
Technical service operations ✓
Preform manufacturing, bottle blowing processes ✓
Administrative buildings located at industrial sites ✓
Administrative buildings located away from industrial sites and headquarters ✓
Own transportation of materials and products within industrial plant sites (e.g. forklift operations) ✓
Own transportation of materials and products out of industrial plant sites ✓
Employees commuting with CCI-owned vehicles and sales fleet operations ✓
Energy used in the cooling of products (off site) ✓
Fugitive emissions from the cooling of products (off site) ✓
Fugitive emissions from the cooling system (on site) ✓
Fugitive emissions from fire extinguishers ✓
Fugitive emissions of CO2 filling process ✓
Fugitive emissions from off-site cold drink equipment ✓
Fugitive emissions from on-site cold drink equipment ✓

133SUSTAINABILITY REPORT 2019
GHG Emissions Verification Statement
C
Coca Cola İçecek A.Ş. Dudullu Organize Sanayi Bölgesi
5. Cad. No:36 34776 Ümraniye /İstanbul
To whom it may concern,
This letter is presented to COCA COLA İÇECEK A.Ş. to present opinion of the Bureau Veritas Certification Turkey on the Greenhouse Gases Verification for the period 1" January 2019 to 31" December 2019.
Bureau Veritas Turkey consent to release of this letter by you to the Carbon Disclosure project in order to satisfy the terms of CDP disclosure requirements. Bureau Veritas Turkey not accepts or assumes any responsibility or liability on our part to CDP or to any other party who may have access to this letter or assurance report.
COCA COLA İÇECEK A.Ş. commissioned Bureau Veritas to perform a verification of its 2019 GHG Inventory. The verification was performed on March 2020.
The GHG assertions verified were the following:
1. That the 2019 GHG Inventory for Customer has been developed in accordance with common industry practice, including ISO 14064-1:2006 Standard. 2. That the calculated Scope 1 and Scope 2 GHG emissions for the 2019 are
114,235.6 tons of CO2e (the emission sources included for each source has been given in verification report)
The verification task was to form an opinion at a reasonable level of assurance
about the above GHG assertions, regarding:
1. Conformance with the general requirements of ISO 14064-1. 2. Reasonableness of the calculated Scope 1 and Scope 2 emissions for the 01.01.2019-31.12.2019.
The verification performed by Bureau Veritas applied ISO 14064-3 International
Standard for GHG verifications. The following verification activities were
conducted:
1. Review of documentation, controls and methodologies, including other verification reports,
2. Assessment of risks and verification planning, 3. Assessment of documentation, controls and methodologies, including the
facility quality management systems,
4. Documentation of verification findings and outstanding issues in verification report,
C
5. Assessment and documentation of resolutions to outstanding issues in
verification report,
6. Issuance of verification statement and completion of verification.
GHG Assertion #1: The GHG inventory conforms to the general requirements of ISO 14064-1 Standard.
GHG Assertion #2: 114,235.6 tons CO2e of which 45,649.1 tons of CO2e are direct emissions (Scope 1) and 68,586.5 tons of CO2e are energy indirect emissions (Scope 2) are reasonable. (The emission sources included for each category has been given in verification report) View Declaration
The greenhouse gas emission data (Scope 1 and 2) for 2019 disclosed in the CDP Report as a result of verification audit held on the basis of international standards has been verified with reasonable assurance.
Verifier Opinion and Qualifications
Based on the process and procedures conducted, the GHG assertion is prepared in accordance with the requirements of ISO 14064-1.
Based on the process and procedures conducted, the GHG assertion is materially correct and is a fair representation of the GHG data and information.
Date: 04 APRIL 2020
Fikriye Seda Atabek Lead Verifier
Ayla BİLGİN Technical Manager

134 SUSTAINABILITY REPORT 2019
PERFORMANCE INDICATORS
Employees Covered By Collective Bargaining Agreements
2015 2016 2017 2018 2019
Rate (%)
Rate (%) Number Rate
(%) Number Rate (%) Number Rate
(%) Number Rate (%)
Turkey - Group Office 0 0 0 0 0 0 0 0 0 0
Turkey - Operations 52 6.20 761 90.38 770 91.02 768 93.77 772 94.18
Jordan 0 0 0 0 0 0 0 0 0 0
Kazakhstan 0 0 0 0 0 0 0 0 0 0
Azerbaijan 0 0 0 0 0 0 0 0 0 0
Pakistan 1,470 100 1,229 100 1,182 100 1,187 100 1,164 100
Kyrgyzstan 0 0 0 0 0 0 0 0
Tajikistan 0 0
Kyrgyzstan and Tajikistan data are included in the sustainability report in 2016 and 2019 respectively.Group Office includes employees responsible for all 10 companies. Turkey operations include Turkey factories and Turkey sales offices.
Human Rights

135SUSTAINABILITY REPORT 2019
Health and SafetyH&S Performance Indicators
Lost Time Incidents (Workdays lost) Lost Time Incidents (Number) Number of Fatalities
Employee Contractor Total Employee Contractor Total Employee Contractor Total
2015 Turkey 146 292 438 15 15 30 0 0 0Jordan 118 0 118 8 0 8 0 0 0Kazakhstan 0 0 0 0 0 0 0 0 0Azerbaijan 0 0 0 0 0 0 0 0 0Pakistan* 174 0 174 7 10 17 0 0 0OVERALL 438 292 730 30 25 55 0 0 02016 Turkey 141 109 250 19 11 30 0 0 0Jordan 296 0 296 18 0 18 0 0 0Kazakhstan 32 16 48 2 1 3 0 0 0Azerbaijan 0 0 0 0 0 0 0 0 0Pakistan 220 4 224 4 1 5 1 0 1Kyrgyzstan 0 0 0 0 0 0 0 0 0OVERALL 689 129 818 43 13 56 1 0 12017 Turkey 217 6 223 15 3 18 0 0 0Jordan 47 0 47 4 0 4 0 0 0Kazakhstan 10 0 10 1 0 1 0 0 0Azerbaijan 180 0 180 1 0 1 0 0 0Pakistan 8 33 41 1 3 4 0 0 0Kyrgyzstan 0 0 0 0 0 0 0 0 0OVERALL 462 39 501 22 6 28 0 0 02018 Turkey 173 51 224 3 5 8 0 0 0Jordan 60 0 60 5 0 5 0 0 0Kazakhstan 18 0 18 1 0 1 0 0 0Azerbaijan 0 0 0 0 0 0 0 0 0Pakistan 38 44 82 4 2 6 0 0 0Kyrgyzstan 29 0 29 2 0 2 0 0 0OVERALL 318 95 413 15 7 22 0 0 02019 Turkey 173 51 224 6 3 9 0 0 0Jordan 13 0 13 2 0 2 1 0 1Kazakhstan 9 0 9 1 0 1 0 0 0Azerbaijan 133 0 133 3 0 3 0 0 0Pakistan 50 0 50 2 0 2 0 0 0Kyrgyzstan 10 0 10 1 0 1 0 0 0Tajikistan 0 0 0 0 0 0 0 0 0OVERALL 388 51 439 15 3 18 1 0 1
VCR: Number of vehicle accidents per 100 vehicles* 2015 vehicle accident data for Pakistan was not prepared on a consistent basis between plants.
LTIR: Number of lost time accidents per 100 employee/annumLTISR: Number of lost days caused by accidents per 100 employee/annum

136 SUSTAINABILITY REPORT 2019
H&S Performance Indicators LTIR LTISR Total Vehicle
2015
Turkey 0.68 9.50 101 10.44Jordan 1.42 20.93 74 32.60Kazakhstan 0 0 2 0.73Azerbaijan 0 0 3 1.74Pakistan 0.37 3.77 13 2.51OVERALL 0.49 6.63 193 8.97
2016
Turkey 0.68 5.69 100 10.88Jordan 3.42 56.28 65 28.63Kazakhstan 0.43 6.91 0 0Azerbaijan 0 0 0 0Pakistan 0.13 5.98 13 2.16Kyrgyzstan 0 0 0 0OVERALL 0.57 8.35 178 8.59
2017
Turkey 0.38 4.70 95 10.70Jordan 0.73 8.63 39 17.18Kazakhstan 0.16 1.55 5 3.31Azerbaijan 0.34 60.96 0 0Pakistan 0.11 1.15 5 0.83Kyrgyzstan 0 0 8 9.20OVERALL 0.28 5.17 152 7.22
2018
Turkey 0.17 4.85 92 9.88Jordan 0.96 11.5 23 10.80Kazakhstan 0.16 2.88 0 0Azerbaijan 0 0 0 0Pakistan 0.16 2.13 11 1.83Kyrgyzstan 0.72 10.47 4 4.20OVERALL 0.22 4.12 130 6.18
2019
Turkey 0.21 5.3 94 11.13Jordan 0.45 2.9 15 7.79Kazakhstan 0.15 1.4 7 5.47Azerbaijan 0.9 39.8 0 0.00Pakistan 0.06 1.6 1 0.18Kyrgyzstan 0.35 3.5 4 3.80Tajikistan 0 0 2 4.12OVERALL 0.19 4.66 123 6.14
Main Types of Work-Related Injury 2018 2019
Laceration 13 5
Fracture 4 4
Slip, trip and fall 5 4
Poisoning 0 1
Burning 0 3
Electroshock 0 1

137SUSTAINABILITY REPORT 2019
Human Capital
Employees by Gender2015 2016 2017 2018 2019
Male Female Male Female Male Female Male Female Male Female
Turkey - Group Office 80 63 69 63 66 59 65 71 111 84
Turkey - Operations 1,908 311 1,923 318 1,879 321 1,835 316 1,848 327
Jordan 382 22 376 22 355 22 331 18 290 19
Kazakhstan 814 136 600 117 536 115 509 118 513 128
Azerbaijan 308 44 254 42 253 42 264 43 287 52
Pakistan 3,365 199 3,137 219 2,772 183 2,713 188 2,388 144
Kyrgyzstan 249 58 248 60 248 51 257 59
Tajikistan 81 29
TOTAL 6,857 775 6,608 839 6,109 802 5,965 805 5.775 842
Number of Employees 2015 2016 2017 2018 2019
Turkey - Group Office 143 132 125 136 195
Turkey - Operations 2,219 2,241 2,200 2,151 2,175
Jordan 404 398 377 349 309
Kazakhstan 950 717 651 627 641
Azerbaijan 352 296 295 307 339
Pakistan 3,564 3,356 2,955 2,901 2,532
Kyrgyzstan 355 307 308 299 316
Tajikistan 125 117 92 98 110
GRI 102-8

138 SUSTAINABILITY REPORT 2019
Employees by Gender (%)
2015 2016 2017 2018 2019
Male Female Male Female Male Female Male Female Male Female
Turkey – Group Office 55.9 44.1 52.3 47.7 55.9 47.2 48 52 57 43
Turkey – Operations 85.9 14.1 85.8 14.2 85.9 14.6 85 15 85 15
Jordan 94.5 5.4 94.5 5.5 94.5 5.8 95 5 94 6
Kazakhstan 85.7 14.3 83.7 16.3 85.7 17.7 81 19 80 20
Azerbaijan 87.5 12.5 85.8 14.2 87.5 14.2 86 14 85 15
Pakistan 94.4 5.6 93.5 6.5 94.4 6.2 94 6 94 6
Kyrgyzstan 81.1 18.9 80.5 19.5 83 17 81 19
Tajikistan 74 26
TOTAL 89.9 10.1 88.7 11.3 89.9 10.1 88.7 11.6 87.5 12.5
Number of Employees by Employee Category 2015 2016 2017 2018 2019
Senior Management
Turkey - Group Office 10 11 10 10 11
Turkey Operations 8 8 7 5 6
Jordan 6 5 5 3 7
Kazakhstan 8 8 6 8 8
Azerbaijan 6 3 5 5 5
Pakistan 10 10 9 9 10
Kyrgyzstan 6 5 5 6
Tajikistan 3
Other Employees
Turkey - Group Office 133 121 115 126 184
Turkey Operations 2,211 2,233 2,193 2,146 2,169
Jordan 398 393 372 346 302
Kazakhstan 942 709 645 619 633
Azerbaijan 346 293 290 302 334
Pakistan 3,554 3,346 2,946 2,892 2,522
Kyrgyzstan 301 303 294 310
Tajikistan 107
GRI 102-8
GRI 102-8
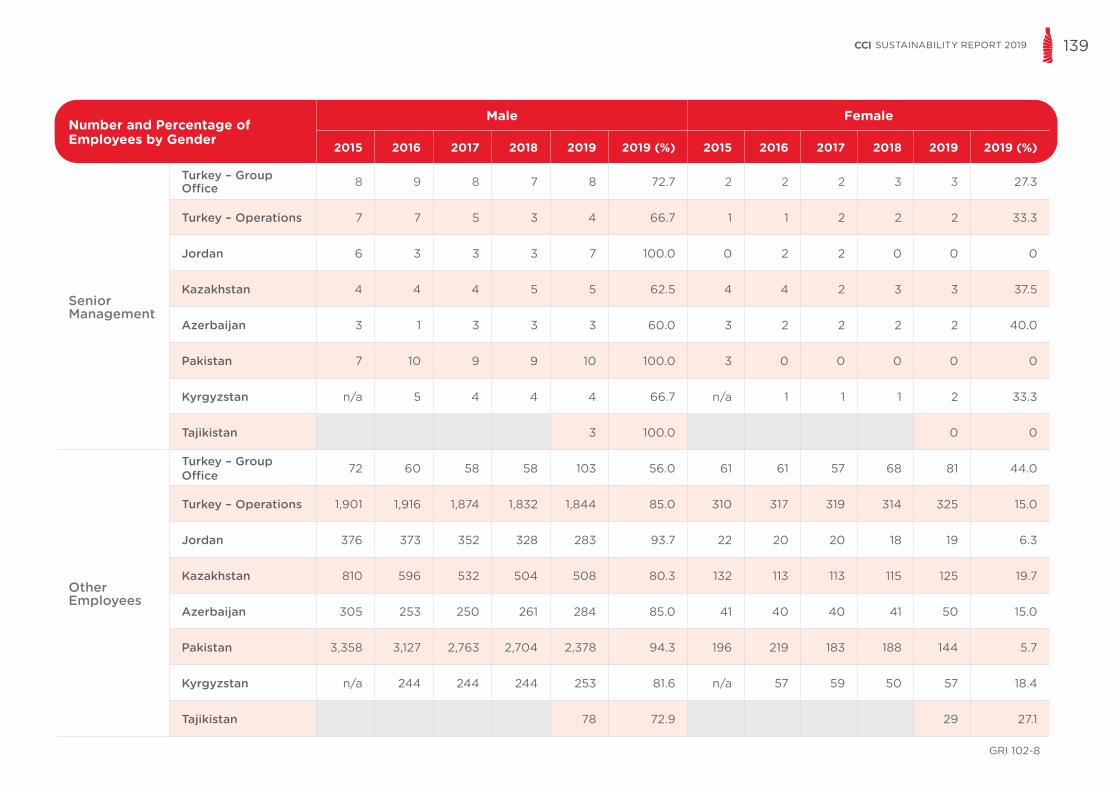
139SUSTAINABILITY REPORT 2019
GRI 102-8
Number and Percentage of Employees by Gender
Male Female
2015 2016 2017 2018 2019 2019 (%) 2015 2016 2017 2018 2019 2019 (%)
Senior Management
Turkey – Group Office 8 9 8 7 8 72.7 2 2 2 3 3 27.3
Turkey – Operations 7 7 5 3 4 66.7 1 1 2 2 2 33.3
Jordan 6 3 3 3 7 100.0 0 2 2 0 0 0
Kazakhstan 4 4 4 5 5 62.5 4 4 2 3 3 37.5
Azerbaijan 3 1 3 3 3 60.0 3 2 2 2 2 40.0
Pakistan 7 10 9 9 10 100.0 3 0 0 0 0 0
Kyrgyzstan n/a 5 4 4 4 66.7 n/a 1 1 1 2 33.3
Tajikistan 3 100.0 0 0
Other Employees
Turkey – Group Office 72 60 58 58 103 56.0 61 61 57 68 81 44.0
Turkey – Operations 1,901 1,916 1,874 1,832 1,844 85.0 310 317 319 314 325 15.0
Jordan 376 373 352 328 283 93.7 22 20 20 18 19 6.3
Kazakhstan 810 596 532 504 508 80.3 132 113 113 115 125 19.7
Azerbaijan 305 253 250 261 284 85.0 41 40 40 41 50 15.0
Pakistan 3,358 3,127 2,763 2,704 2,378 94.3 196 219 183 188 144 5.7
Kyrgyzstan n/a 244 244 244 253 81.6 n/a 57 59 50 57 18.4
Tajikistan 78 72.9 29 27.1

140 SUSTAINABILITY REPORT 2019
Employees by Gender, Employment Type (%)
Male Female
2015 2016 2017 2018 2019 2015 2016 2017 2018 2019
Blue Collar
Turkey – Group Office 0 0 0 0 0 0 0 0 0 0
Turkey – Operations 98.5 98.5 98.0 97.6 97.6 1.5 1.5 2.0 2.4 2.4
Jordan 100 100 100 100 100 0 0 0 0 0
Kazakhstan 99.2 99.1 99.0 100 100 0.8 0.9 1.0 0 0
Azerbaijan 97.1 97.0 97.0 96.6 96.0 2.9 3.0 3.0 3.4 4
Pakistan* 99.1 98.3 98.0 97.9 97.5 0.9 1.7 2.0 2.1 2.5
Kyrgyzstan n/a 94.7 93.0 98.9 99 n/a 5.3 7.0 1.1 1.0
Tajikistan n/a n/a n/a n/a 88.9 n/a n/a n/a n/a 11.1
White Collar
Turkey – Group Office 55.9 52.3 52.8 47.8 56.9 44.1 47.7 47.2 52.2 43.1
Turkey – Operations 78.3 78.2 77.5 77.8 77.3 21.7 21.8 22.5 22.2 22.7
Jordan 89.4 89.3 89.2 91.7 91.6 10.6 10.7 10.8 8.3 8.4
Kazakhstan 76.7 70.7 67.6 65.6 63.3 23.3 29.3 32.4 34.4 36.7
Azerbaijan 81.1 80.2 79.9 81.7 79.8 18.9 19.8 20.1 18.3 20.2
Pakistan* 90.8 90.4 90.8 90.5 91.4 9.2 9.6 9.2 9.5 8.6
Kyrgyzstan 64.2 64.7 75.7 73.6 35.8 35.3 24.3 26.4
Tajikistan 68.7 31.3
Outsourced EmployeesOutsource-Core Jobs (*) Outsource-Auxiliary Jobs (**)
2015 2016 2017 2018 2019 2015 2016 2017 2018 2019
Turkey – Group Office 0 0 0 0 0 0 0 0 0 0
Turkey – Operations 857 929 890 648 657 227 261 350 266 269
Jordan 0 0 0 0 0 48 50 50 42 44
Kazakhstan 0 0 0 0 0 108 122 122 126 124
Azerbaijan 0 0 0 0 0 44 37 38 34 36
Pakistan 409 271 294 295 224 885 579 528 619 534
Kyrgyzstan 0 0 2 2 49 64 65 56
Tajikistan 0 60
The blue-collar/white-collar distinction is based on permanent employees since Pakistan does not have this information for its temporary workers.
* Outsource-Core Jobs: Employees who are on the payroll of a third-party company and whose jobs are directly related to our own business (e.g., jobs in merchandising, sales, warehouse operations, production etc.)** Outsource-Auxiliary Jobs: Employees who are on the payroll of a third-party company and whose jobs are not directly related to our own business (e.g., jobs in security, gardening, health services etc.)

141SUSTAINABILITY REPORT 2019
Employees by Gender, Employment Type and Contract
Male Female Total
2015 2016 2017 2018 2019 2015 2016 2017 2018 2019 2015 2016 2017 2018 2019B
lue
Col
lar
Turkey – Group Office 0 0 0 0 0 0 0 0 0 0 0 0 0 0 0Turkey – Operations 830 829 829 799 800 13 13 17 20 20 843 842 846 819 820Jordan 197 192 173 131 82 0 0 0 0 0 197 192 173 131 82Kazakhstan 376 325 302 284 292 3 3 3 0 0 379 328 305 284 292Azerbaijan 136 96 98 86 97 4 3 3 3 4 140 99 101 89 101Pakistan 1,535 1,289 1,219 1,162 1,169 14 22 25 25 30 1,549 1,311 1,244 1,187 1,199Kyrgyzstan 161 160 92 95 9 12 1 1 170 172 93 96Tajikistan 24 3 27
Whi
te C
olla
r
Turkey – Group Office 80 69 66 65 111 63 63 59 71 84 143 132 125 136 195Turkey – Operations 1,078 1,094 1,050 1036 1,048 298 305 304 296 307 1,376 1,399 1,354 1,332 1,355Jordan 185 184 182 200 208 22 22 22 18 19 207 206 204 218 227Kazakhstan 438 275 234 225 221 133 114 112 118 128 571 389 346 343 349Azerbaijan 172 158 155 178 190 40 39 39 40 48 212 197 194 218 238Pakistan 1,830 1,848 1,553 1,551 1,219 185 197 158 163 114 2,015 2,045 1,711 1,714 1,333Kyrgyzstan 88 88 156 162 49 48 50 58 137 136 206 220Tajikistan 57 26 83
Perm
anen
t
Turkey – Group Office 80 69 66 65 110 63 63 59 70 83 143 132 125 135 193Turkey – Operations 1,908 1,921 1,879 1,828 1,838 309 316 314 314 323 2,217 2,237 2,193 2,142 2,161Jordan 377 376 355 268 265 22 22 22 18 19 399 398 377 286 284Kazakhstan 814 600 536 509 513 136 117 115 118 128 950 717 651 627 641Azerbaijan 307 253 253 264 287 44 42 42 43 52 351 295 295 307 339Pakistan 3,287 3,015 2,686 2,624 2,359 198 206 174 175 138 3,485 3,221 2,860 2,799 2,497Kyrgyzstan 249 248 248 257 58 60 51 59 307 308 299 316Tajikistan 76 29 105
Tem
pora
ry
Turkey – Group Office 0 0 0 0 1 0 0 0 1 1 0 0 0 1 2Turkey – Operations 0 2 0 7 10 2 2 7 2 4 2 4 7 9 14Jordan 5 0 0 63 25 0 0 0 0 0 5 0 0 63 25Kazakhstan 0 0 0 0 0 0 0 0 0 0 0 0 0 0 0Azerbaijan 1 1 0 0 0 0 0 0 0 0 1 1 0 0 0Pakistan* 78 122 86 89 29 1 13 9 13 6 79 135 95 102 35Kyrgyzstan 0 0 0 0 0 0 0 0 0 0 0 0Tajikistan 5 0 5
The blue-collar/white-collar distinction is based on permanent employees since Pakistan does not have this information for its temporary workers. GRI 102-8

142 SUSTAINABILITY REPORT 2019
Percentage of Employees by Age (%)
Under 30 Between 30-50 Above 50
2015 2016 2017 2018 2019 2015 2016 2017 2018 2019 2015 2016 2017 2018 2019
Seni
or M
anag
emen
t
Turkey – Group Office 0 0 0 0 0 60.0 54.5 60.0 70.0 45.5 40 45.5 40.0 30.0 54.6
Turkey – Operations 0 0 0 0 0 100.0 100.0 100.0 100.0 83.3 0 0 0 0 16.7
Jordan 0 0 0 0 0 100.0 100.0 100.0 100.0 85.7 0 0 0 0 14.3
Kazakhstan 0 0 0 0 0 75.0 87.5 83.3 87.5 87.5 25 12.5 16.7 12.5 12.5
Azerbaijan 0 0 0 0 0 100.0 100.0 80.0 80.0 80.0 0 0 20.0 20.0 20.0
Pakistan 0 0 0 0 0 90.0 90.0 100.0 100.0 90.0 10 10 0 0 10.0
Kyrgyzstan 16.7 20.0 0 0 83.3 80.0 100.0 100.0 0 0 0 0
Tajikistan 0 100.0 0
Oth
er E
mpl
oyee
s
Turkey – Group Office 11.9 13.2 16.5 7.9 17.9 81.8 80.2 74.8 76.9 73.9 6.3 6.6 8.7 15.1 8.2
Turkey – Operations 23.3 23.9 25.9 24.5 22.7 75.1 75.0 72.5 73.7 74.2 1.6 1.1 1.6 1.7 3.1
Jordan 38.2 42.5 41.1 28.3 37.4 56.0 53.2 54.6 65.9 57.9 5.8 4.3 4.3 5.8 4.6
Kazakhstan 36.3 30.3 29.5 26.5 24.3 56.5 61.5 60.6 61.2 64.1 7.2 8.2 9.9 12.3 11.5
Azerbaijan 36.1 34.8 32.1 25.5 27.5 53.2 55.6 57.2 63.3 61.9 10.7 9.6 10.7 11.2 10.5
Pakistan 33.3 27.0 31.3 23.5 17.5 62.7 69.3 65.7 72.4 77.3 4.0 3.7 3.0 4.1 5.2
Kyrgyzstan 62.1 59.7 50.0 56.8 30.2 33.3 43.5 37.4 7.6 6.9 6.5 5.8
Tajikistan 36.5 53.3 10.2
GRI 102-8

143SUSTAINABILITY REPORT 2019
Employee Breakdown by Seniority (%) (by years of service)
2015 2016 2017 2018 2019
0 –
5 Y
ears
Turkey – Group Office 54.0 47.0 36.0 29.0 47.0
Turkey – Operations 40.0 43.0 37.0 34.0 31.0
Jordan 55.0 57.0 56.0 49.0 56.0
Kazakhstan 63.0 56.0 51.0 48.0 52.0
Azerbaijan 56.0 47.0 47.0 41.0 40.0
Pakistan 54.0 42.0 41.0 31.0 22.0
Kyrgyzstan n/a 67.0 60.0 57.0 55.0
Tajikistan 84.0
6 –
10 Y
ears
Turkey – Group Office 31.0 25.0 26.0 29.0 22.0
Turkey – Operations 31.0 29.1 30.0 28.0 25.0
Jordan 16.0 15.0 13.0 15.0 14.0
Kazakhstan 23.0 25.0 22.0 17.0 15.0
Azerbaijan 28.0 35.0 23.0 26.0 24.0
Pakistan 33.0 40.0 39.0 43.0 44.0
Kyrgyzstan n/a 21.0 25.0 27.0 28.0
Tajikistan 16.0
11 –
15
Year
s
Turkey – Group Office 3.0 8.0 15.0 19.0 13.0
Turkey – Operations 11.0 11.0 16.0 21.0 26.0
Jordan 11.0 9.0 10.0 12.0 10.0
Kazakhstan 8.0 12.0 19.0 25.0 23.0
Azerbaijan 5.0 7.0 19.0 23.0 26.0
Pakistan 5.0 8.0 12.0 17.0 23.0
Kyrgyzstan n/a 5.0 7.0 7.0 9.0
Tajikistan 0.0
Employee Breakdown by Seniority (%) (by years of service)
2015 2016 2017 2018 2019
16 –
20
Yea
rs
Turkey – Group Office 6.0 7.0 9.0 5.0 4.0
Turkey – Operations 13.0 12.0 10.0 8.0 4.0
Jordan 12.0 14.0 13.0 15.0 7.0
Kazakhstan 5.0 5.0 4.0 6.0 5.0
Azerbaijan 10.0 10.0 4.0 3.0 2.0
Pakistan 8.0 8.0 7.0 7.0 7.0
Kyrgyzstan n/a 7.0 4.0 3.0 3.0
Tajikistan 0
20+
Year
s
Turkey – Group Office 6.0 14.0 14.0 18.0 14.0
Turkey – Operations 5.0 5.0 7.0 9.0 13.0
Jordan 5.0 5.0 7.0 9.0 12.0
Kazakhstan 1.0 2.0 4.0 4.0 4.0
Azerbaijan 1.0 1.0 6.0 7.0 8.0
Pakistan 0 2.0 2.0 2.0 4.0
Kyrgyzstan n/a 1.0 3.0 5.0 4.0
Tajikistan 0.0
GRI 102-8
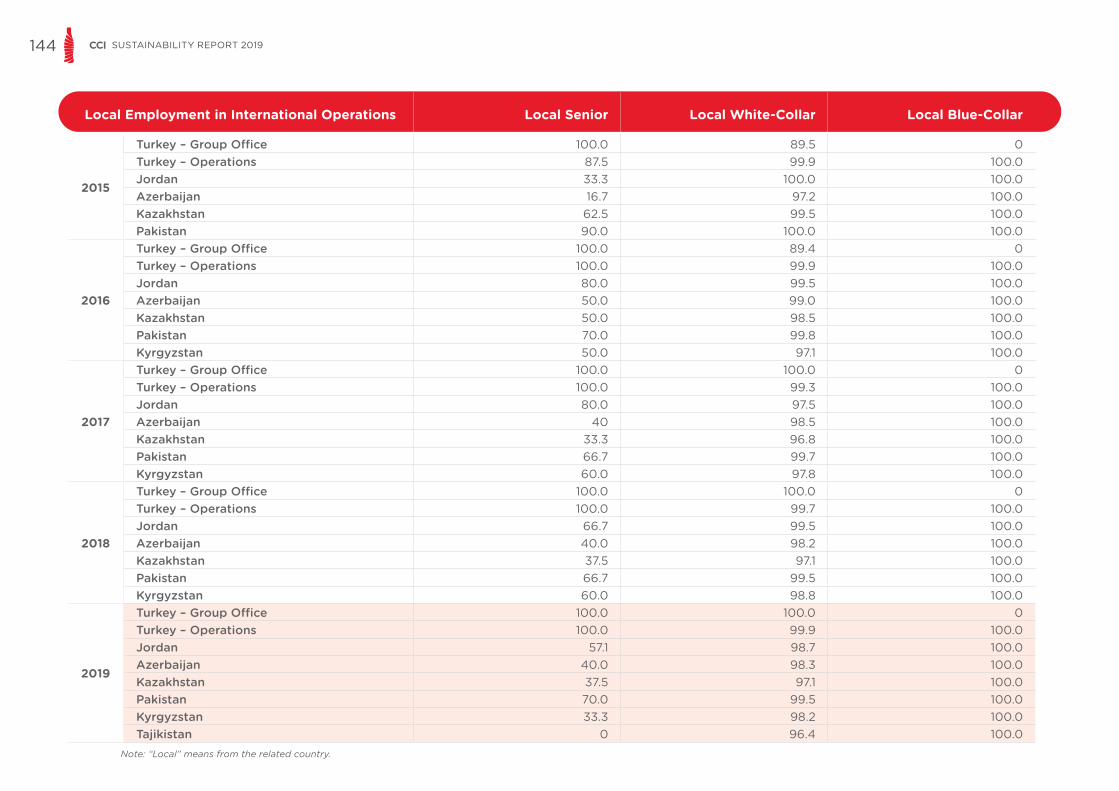
144 SUSTAINABILITY REPORT 2019
Note: “Local” means from the related country.
Local Employment in International Operations Local Senior Local White-Collar Local Blue-Collar
2015
Turkey – Group Office 100.0 89.5 0Turkey – Operations 87.5 99.9 100.0Jordan 33.3 100.0 100.0Azerbaijan 16.7 97.2 100.0Kazakhstan 62.5 99.5 100.0Pakistan 90.0 100.0 100.0
2016
Turkey – Group Office 100.0 89.4 0Turkey – Operations 100.0 99.9 100.0Jordan 80.0 99.5 100.0Azerbaijan 50.0 99.0 100.0Kazakhstan 50.0 98.5 100.0Pakistan 70.0 99.8 100.0Kyrgyzstan 50.0 97.1 100.0
2017
Turkey – Group Office 100.0 100.0 0Turkey – Operations 100.0 99.3 100.0Jordan 80.0 97.5 100.0Azerbaijan 40 98.5 100.0Kazakhstan 33.3 96.8 100.0Pakistan 66.7 99.7 100.0Kyrgyzstan 60.0 97.8 100.0
2018
Turkey – Group Office 100.0 100.0 0Turkey – Operations 100.0 99.7 100.0Jordan 66.7 99.5 100.0Azerbaijan 40.0 98.2 100.0Kazakhstan 37.5 97.1 100.0Pakistan 66.7 99.5 100.0Kyrgyzstan 60.0 98.8 100.0
2019
Turkey – Group Office 100.0 100.0 0Turkey – Operations 100.0 99.9 100.0Jordan 57.1 98.7 100.0Azerbaijan 40.0 98.3 100.0Kazakhstan 37.5 97.1 100.0Pakistan 70.0 99.5 100.0Kyrgyzstan 33.3 98.2 100.0Tajikistan 0 96.4 100.0
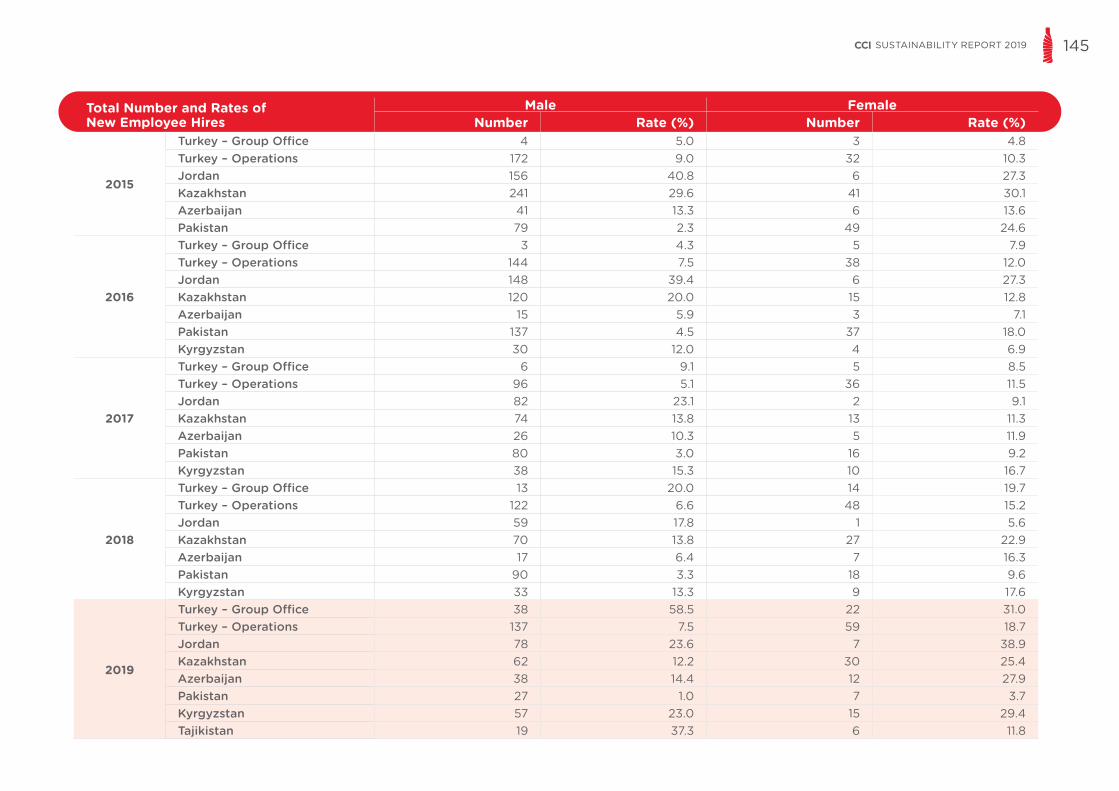
145SUSTAINABILITY REPORT 2019
Total Number and Rates of New Employee Hires
Male FemaleNumber Rate (%) Number Rate (%)
2015
Turkey – Group Office 4 5.0 3 4.8Turkey – Operations 172 9.0 32 10.3Jordan 156 40.8 6 27.3Kazakhstan 241 29.6 41 30.1Azerbaijan 41 13.3 6 13.6Pakistan 79 2.3 49 24.6
2016
Turkey – Group Office 3 4.3 5 7.9Turkey – Operations 144 7.5 38 12.0Jordan 148 39.4 6 27.3Kazakhstan 120 20.0 15 12.8Azerbaijan 15 5.9 3 7.1Pakistan 137 4.5 37 18.0Kyrgyzstan 30 12.0 4 6.9
2017
Turkey – Group Office 6 9.1 5 8.5Turkey – Operations 96 5.1 36 11.5Jordan 82 23.1 2 9.1Kazakhstan 74 13.8 13 11.3Azerbaijan 26 10.3 5 11.9Pakistan 80 3.0 16 9.2Kyrgyzstan 38 15.3 10 16.7
2018
Turkey – Group Office 13 20.0 14 19.7Turkey – Operations 122 6.6 48 15.2Jordan 59 17.8 1 5.6Kazakhstan 70 13.8 27 22.9Azerbaijan 17 6.4 7 16.3Pakistan 90 3.3 18 9.6Kyrgyzstan 33 13.3 9 17.6
2019
Turkey – Group Office 38 58.5 22 31.0Turkey – Operations 137 7.5 59 18.7Jordan 78 23.6 7 38.9Kazakhstan 62 12.2 30 25.4Azerbaijan 38 14.4 12 27.9Pakistan 27 1.0 7 3.7Kyrgyzstan 57 23.0 15 29.4Tajikistan 19 37.3 6 11.8

146 SUSTAINABILITY REPORT 2019
Total Number and Rates of Employee Turnover
Male Female Total Turnover (%)Number Rate (%) Number Rate (%)
2015
Turkey – Group Office 13 16.3 4 6.3 11.9Turkey – Operations 270 14.2 73 23.5 15.5Jordan 53 13.9 3 13.6 13.9Kazakhstan 145 17.8 24 17.6 17.8Azerbaijan 26 8.4 6 13.6 9.1Pakistan 163 4.8 42 21.1 5.8
2016
Turkey – Group Office 15 21.7 5 7.9 15.2Turkey – Operations 157 8.2 45 14.2 9.0Jordan 66 17.6 4 18.2 17.6Kazakhstan 334 55.7 34 29.1 51.3Azerbaijan 59 23.3 4 9.5 21.4Pakistan 417 13.8 37 18.0 14.1Kyrgyzstan 68 27.3 11 19.0 25.7
2017
Turkey – Group Office 16 24.2 7 11.9 18.4Turkey – Operations 133 7.1 36 11.5 7.7Jordan 48 13.5 3 13.6 13.5Kazakhstan 147 27.4 16 13.9 25.0Azerbaijan 26 10.3 5 11.9 10.5Pakistan 438 16.3 52 29.9 17.1Kyrgyzstan 41 16.5 8 13.3 15.9
2018
Turkey – Group Office 13 20.0 8 11.3 15.4Turkey – Operations 133 7.2 39 12.3 8.0Jordan 83 25.1 5 27.8 25.2Kazakhstan 105 20.6 18 15.3 19.6Azerbaijan 6 2.3 5 11.6 3.6Pakistan 147 5.4 24 12.8 5.9Kyrgyzstan 33 13.3 10 19.6 14.4
2019
Turkey – Group Office 13 11.7 23 27.4 18.5Turkey – Operations 133 7.2 27 8.3 7.4Jordan 105 36.2 5 26.3 35.6Kazakhstan 63 12.3 15 11.7 12.2Azerbaijan 14 4.9 3 5.8 5.0Pakistan 229 9.6 41 28.5 10.7Kyrgyzstan 48 18.7 7 11.9 17.4Tajikistan 11 13.6 8 27.6 17.3

147SUSTAINABILITY REPORT 2019
Benefits Provided to Full-time Employees Turkey Jordan Kazakhstan Azerbaijan Pakistan Kyrgyzstan Tajikistan
Private Health Insurance Yes Yes Yes Yes Yes Yes No
Private Life Insurance Yes Yes No No Yes No Yes
Individual Pension Funds Yes No No No No No No
Company Products Yes Yes Yes Yes Yes Yes Yes
Seniority Service Awards Yes Yes Yes Yes Yes Yes Yes
Average Hours of Training Per Employee (Hour)
2015 2016 2017 2018 2019
Turkey – Group Office 9.7 12.4 2.4 9.4 9.6
Turkey – Operations 4.3 4.0 5.4 6.6 9.8
Jordan 64.8 13.3 1.4 9.2 17.7
Kazakhstan 27.0 23.2 29.7 25.4 25.0
Azerbaijan 37.5 30.6 35.9 43.6 42.7
Pakistan 65.6 27.8 7.7 7.9 8.8
Kyrgyzstan 27.8 23.4 24.2 27.4
Tajikistan 16.5
TOTAL 40.6 19.3 10.5 11.5 13.9
Environmental Training Hours 2015 2016 2017 2018 2019
Turkey 2,590 2,818 5,043 2,819 2,004
Jordan 56 95 66 80 100
Kazakhstan 344 295 446 885 996
Azerbaijan 224 188 834 1,058 1,220
Pakistan 1,971 1,072 1,901 1,474 795
Kyrgyzstan 434 284 213 312
Tajikistan 212
TOTAL 5,185 4,902 8,574 6,529 5,639

148 SUSTAINABILITY REPORT 2019
Training by Employee Category Total number of hours of training (Employee*Hour)
Total Number of Employee
Average Hours of Training per Employee (Hour)
Turkey Operations Blue Collar 0 834 0.0White Collar 21,854 1,341 16.3
Corporate/Group OfficeBlue Collar 0 0 0.0White Collar 1,873 215 8.7
JordanBlue Collar 0 83 0.0White Collar 5,455 226 24.1
KazakhstanBlue Collar 4,198 292 14.4White Collar 11,860 349 34.0
AzerbaijanBlue Collar 3,652 101 36.2White Collar 10,808 238 45.4
PakistanBlue Collar 9,600 1,029 9.3White Collar 12,566 1,503 8.4
KyrgyzstanBlue Collar 5,058 96 52.7White Collar 3,591 220 16.3
TajikistanBlue Collar 306 27 11.3White Collar 1,593 83 19.2
Training by Employee / Contractor Total hours of training (Person*Hour)
Total Number of Employees
Average Hours of Training per Person (Hour)
Turkey Operations Employee 21,854 2,175 10,0Contractor 0 0 0.0
Corporate/Group OfficeEmployee 0 195 0.0Contractor 0 0 0.0
JordanEmployee 5,455 309 17.7Contractor 0 0 0.0
KazakhstanEmployee 16,057 641 25.0Contractor 10,632 1021 10.4
AzerbaijanEmployee 14,460 339 42.7Contractor 56 36 1.6
PakistanEmployee 22,166 2532 8.8Contractor 0 0 0,0
KyrgyzstanEmployee 8,649 316 27.4Contractor 1,002 826 1.2
TajikistanEmployee 306 110 2.8Contractor 0 0 0.0

149SUSTAINABILITY REPORT 2019
Employees Subject to Performance Reviews 2018 2019
Turkey Operations Male 56.1% 52.9%
Female 90,2% 83.5%
Corporate/Group OfficeMale 100.0% 100.0%
Female 100.0% 100.0%
JordanMale 74.9% 85.2%
Female 100.0% 68.4%
KazakhstanMale 92.% 96.7%
Female 85.6% 92.2%
AzerbaijanMale 97.3% 94.8%
Female 100.0% 84.6%
PakistanMale 53.2% 51.1%
Female 77.1% 75.7%
KyrgyzstanMale 100.0% 91.8%
Female 100.0% 86.4%
TajikistanMale 92.6%
Female 80.7%

150 SUSTAINABILITY REPORT 2019
Economic ImpactLocal Procurement (%) 2015 2016 2017 2018 2019
Turkey* 95 95 99 99 95
Jordan 55 95 95 94 95
Kazakhstan** n/a n/a n/a n/a 37
Azerbaijan** 47 47 49 35 53
Pakistan 95 97 97 90 81
Kyrgyzstan** n/a n/a n/a n/a 18
Tajikistan** n/a n/a n/a n/a 23
* Concentrate is not included.** There are no approved suppliers in these local markets for some product and service categories. ** There are also no local suppliers available for some of the product categories with high spend. Suppliers are selected and approved by TCCC.

151SUSTAINABILITY REPORT 2019
Community DevelopmentProject Type Projects Countries in 2019
Youth Empowerment
3.2.1. Move Turkey, Kazakhstan
Coca Cola Belestery Kazakhstan
Olympic Moves Program Azerbaijan
Coca Cola Grassroots Football Tournament Azerbaijan
New Generation Project Azerbaijan
Women Empowerment
My Sister Program Turkey, Azerbaijan
Successful Women Successful Future Azerbaijan
UNDP Women’s Empowerment Program Azerbaijan
Water Stewardship
Paani Safe Water Initiative Pakistan
Harran Night Irrigation Project Turkey
Konya Agriculture of the Future Turkey
Waste Management
Recycling Project with WWF Pakistan
Kollekt App Turkey
Temiz Olkem Azerbaijan
Issyk Kul Coastal Cleanup project Kyrgyzstan
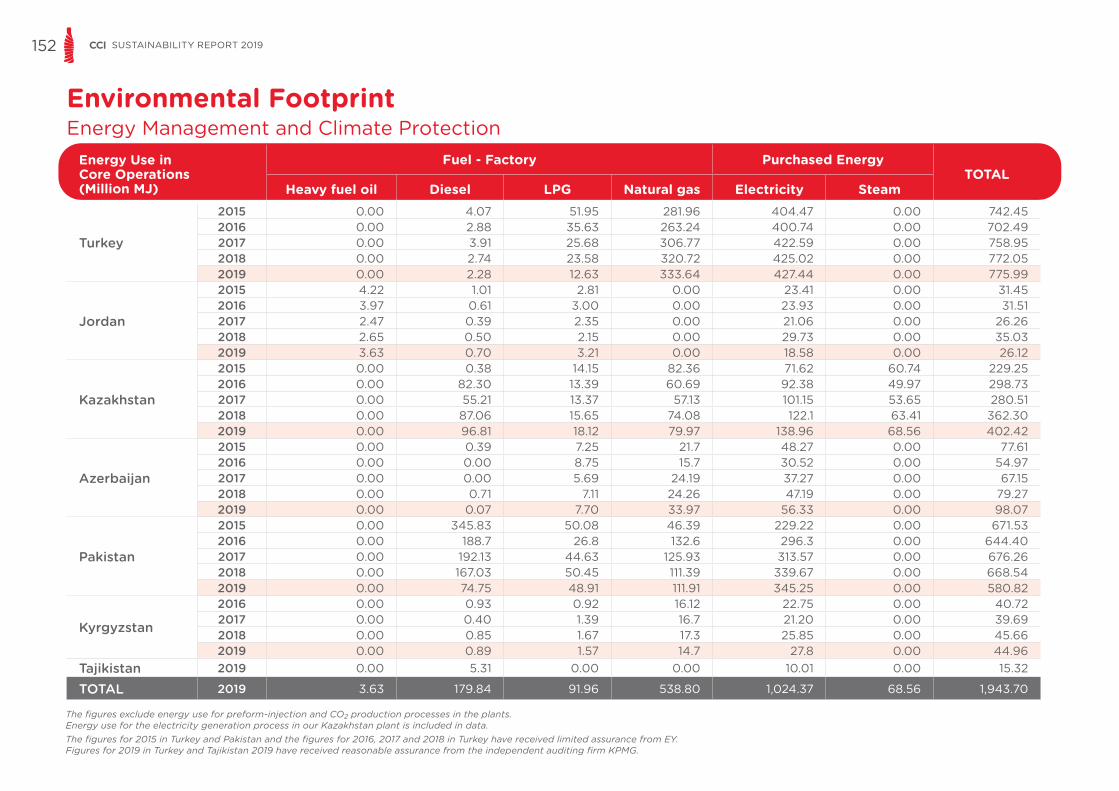
152 SUSTAINABILITY REPORT 2019
Environmental FootprintEnergy Management and Climate Protection
The figures exclude energy use for preform-injection and CO2 production processes in the plants. Energy use for the electricity generation process in our Kazakhstan plant is included in data. The figures for 2015 in Turkey and Pakistan and the figures for 2016, 2017 and 2018 in Turkey have received limited assurance from EY. Figures for 2019 in Turkey and Tajikistan 2019 have received reasonable assurance from the independent auditing firm KPMG.
Energy Use in Core Operations (Million MJ)
Fuel - Factory Purchased EnergyTOTAL
Heavy fuel oil Diesel LPG Natural gas Electricity Steam
Turkey
2015 0.00 4.07 51.95 281.96 404.47 0.00 742.452016 0.00 2.88 35.63 263.24 400.74 0.00 702.492017 0.00 3.91 25.68 306.77 422.59 0.00 758.952018 0.00 2.74 23.58 320.72 425.02 0.00 772.052019 0.00 2.28 12.63 333.64 427.44 0.00 775.99
Jordan
2015 4.22 1.01 2.81 0.00 23.41 0.00 31.452016 3.97 0.61 3.00 0.00 23.93 0.00 31.512017 2.47 0.39 2.35 0.00 21.06 0.00 26.262018 2.65 0.50 2.15 0.00 29.73 0.00 35.032019 3.63 0.70 3.21 0.00 18.58 0.00 26.12
Kazakhstan
2015 0.00 0.38 14.15 82.36 71.62 60.74 229.252016 0.00 82.30 13.39 60.69 92.38 49.97 298.732017 0.00 55.21 13.37 57.13 101.15 53.65 280.512018 0.00 87.06 15.65 74.08 122.1 63.41 362.302019 0.00 96.81 18.12 79.97 138.96 68.56 402.42
Azerbaijan
2015 0.00 0.39 7.25 21.7 48.27 0.00 77.612016 0.00 0.00 8.75 15.7 30.52 0.00 54.972017 0.00 0.00 5.69 24.19 37.27 0.00 67.152018 0.00 0.71 7.11 24.26 47.19 0.00 79.272019 0.00 0.07 7.70 33.97 56.33 0.00 98.07
Pakistan
2015 0.00 345.83 50.08 46.39 229.22 0.00 671.532016 0.00 188.7 26.8 132.6 296.3 0.00 644.402017 0.00 192.13 44.63 125.93 313.57 0.00 676.262018 0.00 167.03 50.45 111.39 339.67 0.00 668.542019 0.00 74.75 48.91 111.91 345.25 0.00 580.82
Kyrgyzstan
2016 0.00 0.93 0.92 16.12 22.75 0.00 40.722017 0.00 0.40 1.39 16.7 21.20 0.00 39.692018 0.00 0.85 1.67 17.3 25.85 0.00 45.662019 0.00 0.89 1.57 14.7 27.8 0.00 44.96
Tajikistan 2019 0.00 5.31 0.00 0.00 10.01 0.00 15.32
TOTAL 2019 3.63 179.84 91.96 538.80 1,024.37 68.56 1,943.70

153SUSTAINABILITY REPORT 2019
This table includes data on energy use for all processes in the plants.The figures for 2015 in Turkey and Pakistan and the figures for 2016, 2017 and 2018 in Turkey have received limited assurance from EY. Figures for 2019 in Turkey and Tajikistan 2019 have received reasonable assurance from the independent auditing firm KPMG.
Total Energy Use (Million MJ)
Fuel - Factory Purchased EnergyTOTAL
Heavy fuel oil Diesel LPG Natural gas Electricity Steam
Turkey
2015 0.00 4.07 51.95 281.96 404.47 0.00 742.452016 0.00 2.88 35.63 263.24 400.74 0.00 702.492017 0.00 3.91 25.68 321.21 504.73 0.00 855.532018 0.00 2.79 23.58 335.92 514.27 0.00 876.562019 0.00 2.33 12.64 353.87 523.62 0.00 892.45
Jordan
2015 4.22 1.01 2.81 0.00 23.41 0.00 31.452016 3.97 0.61 3.00 0.00 23.93 0.00 31.512017 2.47 0.39 2.35 0.00 21.06 0.00 26.262018 2.65 0.50 2.15 0.00 29.73 0.00 35.03 2019 3.63 0.70 3.21 0.00 18.58 0.00 26.12
Kazakhstan
2015 0.00 0.38 14.15 172.11 111.72 60.74 359.102016 0.00 96.83 13.39 134.45 119.23 49.97 413.872017 0.00 75.60 13.37 129.37 142.94 53.65 414.932018 0.00 87.06 15.65 161.15 156.36 63.41 483.632019 0,00 96.81 18.12 187.79 180.81 68.56 552.09
Azerbaijan
2015 0.00 0.39 7.25 75.58 71.61 0.00 154.832016 0.00 0.00 8.75 32.65 82.74 0.00 124.142017 0.00 0.00 5.69 60.19 54.27 0.00 120.152018 0.00 0.71 7.11 76.28 69.28 0.00 153.382019 0.00 0.07 7.70 104.50 83.12 0.00 195.39
Pakistan
2015 0.00 366.47 50.08 46.39 268.41 0.00 731.352016 0.00 195.6 46.49 132.59 338.56 0.00 713.242017 0.00 198.88 44.63 125.93 354.13 0.00 723.582018 0.00 173.45 50.45 111.39 375.39 0.00 710.682019 0.00 75.49 48.91 111.91 381.47 0.00 617.78
Kyrgyzstan
2016 0.00 1.15 1.01 38.60 23.80 0.00 64.562017 0.00 0.40 1.39 17.94 21.28 0.00 41.012018 0.00 0.85 1.67 39.64 27.16 0.00 69.322019 0.00 0.89 1.57 39.87 28.34 0.00 70.67
Tajikistan 2019 0.00 14.00 0.00 0.00 10.01 0.00 24.01
TOTAL 2019 3.63 189.27 91.96 802.67 1,225.94 68.56 2,378.51

154 SUSTAINABILITY REPORT 2019
Total Energy Use Ratio (MJ/L) 2015 2016 2017 2018 2019
Turkey *0.30 *0.29 *0.30 *0.30 **0.30
Jordan 0.33 0.30 0.25 0.27 0.31
Kazakhstan 0.65 0.76 0.65 0.68 0.67
Azerbaijan 0.74 0.70 0.68 0.68 0.72
Pakistan *0.52 0.43 0.41 0.38 0.36
Kyrgyzstan 0.76 0.69 0.69 0.68
Tajikistan **0.76
Core Energy Use Ratio (MJ/L) 2015 2016 2017 2018 2019
Turkey *0.27 *0.25 *0.27 *0.26 **0.26
Jordan 0.33 0.30 0.25 0.27 0.31
Kazakhstan 0.41 0.55 0.44 0.45 0.44
Azerbaijan 0.37 0.37 0.38 0.35 0.36
Pakistan *0.48 0.40 0.38 0.36 0.33
Kyrgyzstan 0.48 0.44 0.46 0.42
Tajikistan **0.46
Total Energy Use Ratio (MJ/L) is calculated by the total absolute energy consumption (in MJ) of the plant divided by total production (in liters).*These figures have received limited assurance from EY.** Figures for 2019 in Turkey and Tajikistan have received limited assurance from KPMG.
Core Energy Use Ratio (MJ/L), includes only the core process (includes filling, excludes preform-injection and CO2 production), so that the energy efficiency of the core process can be compared between plants. (For more information please see the Reporting Guidance section of the report.)*These figures have received limited assurance from EY.** Figures for 2019 in Turkey and Tajikistan have received limited assurance from KPMG.

155SUSTAINABILITY REPORT 2019
GHG Emissions (t CO2e) 2015 2016 2017 2018 2019
TurkeyScope 1 (1) 52,162 44,247 51,602 48,197 45,649Scope 2 (1) 60,397 69,697 63,346 67,964 68,587Scope 3 (2) 299,264 414,372 (4) 382,329 (4) 422,805 434,548Total 411,823 528,316 497,277 538,966 548,784JordanScope 1 535 331 218 353 499Scope 2 4,673 4,464 3,738 2,761 2,570Scope 3 (3) 28,062 22,550 17,943 (4) 13,903 14,196Total 33,270 27,345 21,898 17,017 17,265KazakhstanScope 1 13,942 18,009 14,053 17,495 20,820Scope 2 13,420 14,271 22,717 16,327 30,737Scope 3 (3) 36,902 41,694 43,800 26,831 27,169Total 64,264 73,974 80,570 60,653 78,726AzerbaijanScope 1 6,797 6,231 3,038 4,309 5,273Scope 2 6,789 5,985 6,694 9,218 10,932Scope 3 (3) 14,438 12,578 12,068 12,268 11,787Total 28,024 24,794 21,800 25,796 27,992PakistanScope 1 31,199 21,009 22,682 20,093 13,726Scope 2 30,653 39,270 48,562 46,578 52,311Scope 3 (3) 237,843 251,636 284,649 295,637 291,817Total 299,695 311,915 355,893 362,309 357,854KyrgyzstanScope 1 2,090 2,024 2,158 2,182Scope 2 3,271 2,866 560 620Scope 3 (3) 2,249 2,643 2,444 2,803Total 7,610 7,533 5,162 5,605TajikistanScope 1 989Scope 2 119Scope 3 (3) 907Total 2,015ALL COUNTRIESScope 1 104,635 91,917 93,617 92,606 89,138Scope 2 115,932 136,958 147,923 143,409 165,876Scope 3 (3) 616,509 745,079 (4) 743,432 (4) 773,888 783,227OVERALL TOTAL 837,076 973,954 (4) 984,971 (4) 1,009,902 1,038,241
(1) Scope 1 and Scope 2 emissions of Turkey from 2013 to 2019 are verified by a third-party according to the requirements of ISO 14064-1.
(2) Scope 3 emissions for Turkey operations include energy consumption of cold drink equipment by distributors and customers, employee commuting, business travels by air, downstream transport.
(3) Scope 3 emissions include emissions resulting from energy consumption of cold drink equipment by distributors.
Scope 1 and Scope 2 data in the table above include emissions from all processes, including filling, preform injection, CO2 production in our plants and Kazakhstan Plant’s electricity production. In all CCI countries except Turkey, emissions from fleet and fugitive emissions are excluded.
(4) Due to a change in methodology for calculating Scope 3 emissions, Turkey’s 2017 and 2018 Scope 3 figures and Jordan’s 2018 Scope 3 figures have been revised. Formerly, conversion factors of 0.168 and 0.169 kgCO2/kWh were used for Turkey. These are replaced by the IEA’s National Grid Conversion Factors kgCO2/kWh respectively. Similarly, 0.166 kgCO2/kWh was replaced with 0.497 kgCO2/kWh for Jordan in 2018.

156 SUSTAINABILITY REPORT 2019
Scopes GHG Emissions in Turkey (t CO2e) 2015 2016 2017 2018 2019
Scope 1 Stationary combustion emissions 16,218 14,896 17,045 17,965 18,648
Scope 1 Fleet emissions - mobile combustion 9,378 8,241 7,687 6,496 5,869
Scope 1 Fugitive emissions 26,566 20,634 26,869 23,737 21,133
Scope 1 Total 52,162 43,770 51,601 48,198 45,649
Scope 2 Emissions (electricity) 60,37 64,291 63,346 67,964 68,587
Scope 2 Total 60,37 64,291 63,346 67,964 68,587
Scope 3 Refrigeration in Value Chain 299,264 369,679 332,677 374,693 386,929
Scope 3 Employee commuting 1,621 1,130 177 159 164
Scope 3 Business travel 5,241 4,321 1,347 1,660 1,742
Scope 3 Downstream transportation 38,533 39,240 48,128 46,293 45,713
Scope 3 Total 344,659 414,370 382,329 422,805 434,548
Scope 1+2+3 TOTAL 457,191 522,431 497,276 538,967 548,784
Scopes GHG Emissions Savings in Turkey (t CO2e) 2015 2016 2017 2018 2019
Scope 1 Product distribution fleet improvement 2.075 0 0 65 -
Scope 1 Company cars upgrade to hybrid model - - - - 713
Scope 1 Fugitive (HFC-free) emission reductions of A/C 145 2,651 7,782 8,346 8,424
Scope 1 + 2 Energy efficiency and low-carbon projects in plants 1,402 80,289 661 1,006 578
Scope 3 Route optimization 1,050 1,050 1,400 1,400 1,400
Scope 3 Cold drink equipment EMD improvement 172,315 217,915 202,535 227,708 231,801
Scope 3 Utilization of videoconferencing tool - - 840 2,986 5,904
Scope 3 Returnable glass bottles - - - 115,356 110,731
Scope 3 Reuse & share of wooden pallets - - - 493 493
Scope 1+2+3 TOTAL 176,987 301,905 213,218 357,359 360,044
Due to a change in methodology for calculating Scope 3 emissions, Turkey’s 2017 and 2018 Scope 3 figures have been revised. Formerly, conversion factors of 0.168 and 0.169 kgCO2/kWh were used for Turkey in 2017 and 2018, respectively. These are replaced by the IEA’s National Grid Conversion Factors 0.441 and 0.465 kgCO2/kWh.
* Calculation is made based the assumption that an average mature (15 years and older) tree absorbs 12 kg CO2 annually.

157SUSTAINABILITY REPORT 2019
*Our cold drink equipment is used at our downstream supply chain.
For more accurate GHG inventory calculation for cold drink equipment, we revised the methodology and used the IAE conversion factors listed on page 117 for the national grid electricity emission factors. 2017 and 2018 data have been revised to reflect this change in methodology.
**Calculation is made based the assumption that an average mature (15 years and older) tree absorbs 12 kg CO2 annually.
Energy and GHG Emission Savings
2015 2016 2017 2018 2019Energy (Mn MJ)
Emissions (t CO2e)
Saving (USD)
Energy (Mn MJ)
Emissions (t CO2e)
Saving (USD)
Energy (Mn MJ)
Emissions (t CO2e)
Saving (USD)
Energy (Mn MJ)
Emissions (t CO2e)
Saving (USD)
Energy (Mn MJ)
Emissions (t CO2e)
Saving (USD)
Turkey 11.70 1,402 247,886 1,592 4,417 269,938 4.57 661 196,168 8.82 1,006 44,092 7.31 578 88,232
Jordan 2.50 200 40,869 2.87 373 95,100 1.04 169.72 71,499 0.56 42 13,500 0 0 0
Kazakhstan 0 0 0 0 0 0 19.60 2,265 199,514 7.78 537 53,233 90.84 6,651 170,354
Azerbaijan 0.20 28 2,655 0.39 54 4,403 0.18 24 2,576 0.05 6.16 681 0.08 50 52,443
Pakistan 12.80 1,168 387,455 16.3 1,699 19,163 1.41 99.14 85,459 24.88 2,259 720,240 42,98 3,207 566,932
Kyrgyzstan 9.1 431 83,831 3.38 87 30,586 1.13 251 794,628
Tajikistan 0 0 0
TOTAL 27.20 2,798 678,865 1,621 6,974 472,435 30.18 3,305.27 585,802 42.09 3,850 831,746 142.34 10,737 1,631,801
EMD Ratio (%) 2015 2016 2017 2018 2019
Turkey 87 88 90 90.0 89.2
Jordan 5 5 60 24.7 25.7
Kazakhstan 39 41 70 85.0 88.0
Azerbaijan 50 50 87 79.6 87.6
Pakistan 0.15 1.4 1.2
Kyrgyzstan 72.5 76 65.0 68
Tajikistan 100
EMD SavingsTurkey Seven Countries Including Turkey
Energy Saving GHG Emissions Number of Trees to Absorb Energy Saving GHG Emissions Number of Trees
to Absorb
2015 402 172,315 14.4 million 428 184,000 15.3 million
2016 438 217,915 18.1 million 475 231,000 19.2 million
2017* 459 202,535 16.8 million 468 206,007 17.1 million
2018 490 227,708 18.9 million 511 237,212 19.7 million
2019 503 231,801 19.3 million 526 242,407 20.2 million

158 SUSTAINABILITY REPORT 2019
Core GHG Emissions Ratio (gr/L) 2010 2015 2016 *2017 2018 2019
Turkey 28.95 27.68 29.09 40.43 28.71 24.18
Jordan 72.44 49.31 48.00 38.78 32.35 34.51
Kazakhstan 56.90 49.44 59.86 58.62 57,42 44.45
Azerbaijan 53.54 64.58 60.24 55.67 59.69 36.15
Pakistan 41.82 36.37 40.47 32.95 28.91
Kyrgyzstan 33.52 54.2 27.32 11.75
Tajikistan 15.27
* 2017 data is calculated based on emissions from plants, fleet and fugitive emissions.

159SUSTAINABILITY REPORT 2019
Sustainable Packaging
Packaging Materials Used (tons)
Steel Crown
PE Closure
PETPreform &
ResinGlass
Aseptic Carton
PackagingCarton
Aluminum Cans &
Cans End
Plastic Shrink & Stretch
Turkey
2015 1,259 3,986 46,274 39,414 5,131 9,742 12,533 6,6892016 1,385 3,966 4,758 45,844 4,825 8,924 12,008 7,0822017 1,552 3,970 44,585 54,433 4,668 19,276 13,926 6,9762018 1,674 4,174 50,215 60,536 4,624 13,008 14,086 8,3172019 1,636 4,215 57,555 57,755 4,458 11,313 13,709 7,849
Jordan
2015 45 129 1,234 1,272 0 220 1,719 2892016 28 151 1,362 200 0 417 1,874 3792017 29 126 1,984 242 0 309 1,733 3702018 6 96 1,404 311 0 234 1,696 5692019 14 88 968 870 0 200 1,498 329
Kazakhstan
2015 44 1,367 17,464 3,674 581 1,696 325 2052016 49 1,175 14,098 4,537 650 1,245 194 1,5362017 50 1,475 18,234 4,638 571 1,518 160 2,1692018 51 1,789 21,392 4,496 645 1,736 198 2,5352019 53 1,813 24,388 4,373 811 2,020 252 2,794
Azerbaijan
2015 0 528 6,776 0 0 384 0 7372016 0 375 4,276 0 0 275 0 4652017 0 474 5,518 0 0 295 0 5772018 0 607 14,662 0 52 544 0 7552019 0 691 17,557 0 0 441 0 921
Pakistan
2015 21 237 43,783 21,762 0 4,263 571 4,1612016 2,182 2,951 56,817 3,304 0 6,042 907 5,1782017 2,066 2,525 59,082 10,431 0 446 1,052 5,4732018 1,923 3,290 59,618 14,242 72 54 1,077 5,8482019 2,028 3,899 60,008 8,573 27 365 1,090 6,810
Kyrgyzstan
2016 0 250 2,932 0 0 192 0 2662017 0 254 3,068 0 0 244 0 2692018 0 245 3,143 0 0 230 0 2932019 0 228 3,167 0 0 223 0 315
Tajikistan 2019 0 208 128 0 0 200 0 108

160 SUSTAINABILITY REPORT 2019
Packaging Material Savings
Waste Management
Resin Savings (tons) 2018 2019 Glass Savings (tons) 2018 2019
Turkey 51 22.5 Turkey 2,148.00 0
Jordan 12 4.11 Jordan 0 0
Kazakhstan 0 0 Kazakhstan 9.30 0
Azerbaijan 549 78.3 Azerbaijan 0 0
Pakistan 276 3.7 Pakistan 384.26 232.16
Kyrgyzstan 223 35.62 Kyrgyzstan 0 0
Tajikistan 0 0.379 Tajikistan 0 0
TOTAL 1,111 144.6 TOTAL 2,541.56 232.16
Waste Ratio (g/L) 2006 2015 2016 2017 2018 2019
Turkey 3.74 5.09 4.99 4.77 4.31 4.00
Jordan 15.72 2.46 3.07 1.35 1.37 1.44
Kazakhstan 4.14 1.96 2.08 1.60 1.63 2.12
Azerbaijan 0.65 1.23 0.96 1.17 0.97 0.90
Pakistan 9.66 8.90 10.77 8.92 8.03
Kyrgyzstan 3.81 2.93 3.10 2.02
Tajikistan 3.09
Waste Recycling Ratio (%) 2006 2015 2016 2017 2018 2019
Turkey 90.99 95.57 94.79 96.00 98.70 98.12
Jordan 81.60 94.10 90.30 91.90 90.90 89.00
Kazakhstan 94.67 93.00 91.20 90.00 88.03 93.35
Azerbaijan 75.55 95.60 96.30 97.80 93.38 99.01
Pakistan 70.54 93.00 94.44 95.48 97.56
Kyrgyzstan 98.10 97.70 98.58 96.97
Tajikistan 77.64

161SUSTAINABILITY REPORT 2019
Weight of Waste by Type and Disposal Method (Tons) Turkey Jordan Kazakhstan Azerbaijan Pakistan Kyrgyzstan Tajikistan
2015
Hazardous
Reuse 0.0 0.0 0.0 0.0 0.0Recycle 18.7 0.0 17.1 0.0 0.0Landfill 4.3 0.0 0.0 13.5 24.1Incineration 18.6 0.0 0.4 0.0 324.0Recovery 2.0 0.0 0.0 0.0 0.0TOTAL 43.6 0.0 17.5 13.5 348.1
Non-Hazardous
Reuse 0.0 0.0 173.5 0.0 3,303.7Recycle 7,661.7 225.3 823.6 241.1 9,511.9Landfill 283.0 0.0 71.6 17.4 320.7Recovery 144.8 0.0 0.0 0.0 0.0TOTAL 8,089.5 225.3 1,068.7 258.5 13,136.3
2015 OVERALL TOTAL 8,133.1 225.3 1,086.2 272.0 13,484.4
2016
Hazardous
Reuse 78.3 0.0 0.0 0.0 0.0Recycle 243.7 0.0 9.4 19.6 0.0Landfill 7.7 0.0 0.0 0.0 0.4Incineration 33.5 0.0 0.52 0.0 148.5Recovery 0.4 0.0 0.0 0.0 0.0 2.8TOTAL 363.6 0.0 9.9 19.6 148.9 2.8
Non-Hazardous
Reuse 2,025.2 0.0 123.1 0.0 1.95 317.6Recycle 10,722.1 289.0 903.2 129.5 13,343 0.0Landfill 696.8 0.0 100.5 4.6 326.2 3.5Recovery 115.0 0.0 0.0 0.0 0.0 0.0TOTAL 13,559.1 289.0 1,126.8 134.1 13,671.2 321.1
2016 OVERALL TOTAL 13,922.7 289.0 1,136.7 153.7 13,820.1 323.9
2017
Hazardous
Reuse 0.8 0.0 0.0 0.0 0.0 0.0Recycle 28.1 0.0 6.9 0.0 0.0 0.0Landfill 13.7 1.9 0.0 18.0 0.0 0.0Incineration 273.3 0.0 0.45 0.0 280.4 0.0Recovery 116.8 0.0 0.0 0.0 0.0 2.3TOTAL 432.7 1.9 7.3 18.0 280.4 2.3
Non-Hazardous
Reuse 1361.8 0.0 160.5 7.0 668.6 258.8Recycle 10,859.7 157.7 742.4 166.8 17,327.2 0.0Landfill 677.7 12.0 105.5 0.0 779.2 3.7Recovery 107.0 0.0 0.0 10.0 0.0 0.0TOTAL 13,006.2 169.7 1,008.4 183.8 18,775.0 262.5
2017 OVERALL TOTAL 13,438.1 171.6 1,015.7 201.8 19,055.4 264.8

162 SUSTAINABILITY REPORT 2019
Weight of Waste by Type and Disposal Method (Tons) Turkey Jordan Kazakhstan Azerbaijan Pakistan Kyrgyzstan Tajikistan
2018
Hazardous
Reuse 0.0 0.0 0.0 0.0 0.0 0.0Recycle 285.9 0.0 11.1 0.0 0.0 0.0Landfill 50.2 0.0 0.0 14.5 0.0 0.0Incineration 116.9 0.0 0.4 0.0 171.0 0.7Recovery 0.5 0.0 0.0 0.0 0.0 14.4Other* 0.4 0.0 0.0 0.0 0.0 0.0TOTAL 453.94 0.0 11.44 14.50 171.00 15.1
Non-Hazardous
Reuse 0.0 0.0 215.0 19.0 0.0 290.7Recycle 12,256.0 119.8 803.7 185.5 15,917.0 0.0Landfill 272.0 12.0 139.7 0.0 582.0 3.7Incineration** 11.3 0.0 0.0 0.0 0.0 0.0Recovery 9.1 0.0 0.0 0.0 0.0 0.0Other*** 24.3 0.0 0.0 0.0 0.0 0.0TOTAL 12,579.2 131.8 1,158.4 204.5 16,499.0 294.4
2018 OVERALL TOTAL 13,033.1 131.8 1,169.8 219.0 16,670.0 309.5
2019
Hazardous
Reuse 5.6 0.0 0.0 0.0 0.0 9.5 0.0Recycle 119.0 0.0 20.1 3.8 0.0 0.0 0.0Landfill 2.9 0.0 0.0 7.5 0.0 0.0 0.0Incineration 27.1 0.0 0.6 0.0 45.5 1.3 0.0Recovery 0.2 0.0 0.0 0.0 0.0 0.0 0.0Other* 0.3 0.0 0.0 0.0 0.0 0.0 0.0TOTAL 155.1 0.0 20.7 11.3 45.5 10.8 0.0
Non-Hazardous
Reuse 0.0 0.0 992.7 0 300.6 0.0 0.0Recycle 11,461.0 97.8 613.1 230.2 13,315 194.1 75.5Landfill 213.7 12.0 115.8 2.3 294.7 5.1 21.7Incineration** 29.6 0.0 0.0 0.0 0.0 0.0 0.0Recovery 0.0 0.0 0.0 0.0 0.0 0.0 0.0Other*** 157.1 0.0 0.0 0.0 0.0 0.0 0.0
2019 TOTAL 11,861.5 109.8 1721.6 232.5 13,910.3 199.1 97.1OVERALL TOTAL 12,016.6 109.8 1742.3 243.8 13,955.8 209.9 97.1
* In 2018 Turkey operations, Köyceğiz sterilize its medical wastes.** Çorlu incinerates cigarette butts, toilet papers, dirty sugars etc.*** Elazığ and Hazar’s municipal wastes are used for methane production.

163SUSTAINABILITY REPORT 2019
* Turkey figures are assured by third party firm (2015-2018 by EY, 2019 by KPMG)** Pakistan 2015 figure was assured by a third party.*** Tajikistan 2019 figure was assured by KPMG.
Water Use Ratio (L/L) 2015 2016 2017 2018 2019
Turkey *1.44 *1.47 *1.56 *1.55 *1.52
Jordan 1.89 1.71 1.44 1.52 1.61
Kazakhstan 1.47 1.67 1.59 1.54 1.51
Azerbaijan 1.85 1.82 1.73 1.64 1.58
Pakistan **2.03 2.00 1.93 2.05 2.03
Kyrgyzstan 1.88 1.65 1.64 1.62
Tajikistan ***2.28
Water Withdrawal by Region (m3) 2015 2016 2017 2018 2019
Turkey *4,000,719 *4,130,826 *4,439,083 *4,599,993 *4,563,655
Jordan 180,232 177,137 153,807 146,145 122,390
Kazakhstan 816,221 911,071 1,005,964 1,099,998 1,240,248
Azerbaijan 388,103 251,715 304,544 371,174 430,230
Pakistan **2,829,952 3,161,737 3,418,428 3,836,782 3,534,028
Kyrgyzstan 160,373 148,610 163,582 168,678
Tajikistan ***71,656
TOTAL 8,215,227 8,792,859 9,470,436 10,217,674 10,130,884
Water Management

164 SUSTAINABILITY REPORT 2019
Water Recycled and Reused (m3) 2015 2016 2017 2018 2019
Turkey 80,000 341,973 345,551 490,695 516,016
Jordan 0 0 0 29,229 0
Kazakhstan 0 0 0 26,701 0
Azerbaijan 5,191 5,236 5,771 11,991 7,763
Pakistan 68,216 129,005 183,499 131,829 65,306
Kyrgyzstan 720 2,660 580 540
Tajikistan 0
TOTAL 153,407 476,934 537,481 691,025 589,625
Ratio of Water Recycled and Reused (%) 2015 2016 2017 2018 2019
Turkey 2.0 7.4 7.8 10.6 11.31
Jordan 0 0 0 20.0 0
Kazakhstan 0 0 0 2.4 0
Azerbaijan 1.3 2.08 1.9 3.2 1.80
Pakistan 2.4 4 5.4 3.4 1.85
Kyrgyzstan 0.5 1.8 0.4 0.32
Tajikistan 0
AVERAGE 1.9 5.4 5.8 6.7 5.80

165SUSTAINABILITY REPORT 2019
Wastewater Management
Water Discharge (L/L) 2015 2016 2017 2018 2019
Turkey 0.39 0.47 0.35 0.50 0.46
Jordan 0.89 0.71 0.44 0.47 0.61
Kazakhstan 0.36 0.56 0.55 0.55 0.52
Azerbaijan 0.97 0.96 0.84 0.78 0.70
Pakistan 1.01 0.82 0.87 1.00 1,13
Kyrgyzstan 0.95 0.71 0.70 0.67
Tajikistan 1.28
TCCC Wastewater Quality Parameters Maximum Allowable Limit Values
5-Day Biological Oxygen Demand < 50 mg/l
pH Level 6.5-8**
Total Suspended Solids < 50 mg/l
Total Dissolved Solids < 2,000 mg/l
Total Nitrogen < 5 mg/l
Total Phosphorus < 2 mg/l
Chlorine 0.1 mg/l
Temperature Variation (Receiving Water) ≤ 5°C
Maximum Allowable Limit ValuesDissolved Oxygen >1 mg/l
These values indicate the maximum allowable limit values unless applicable legal requirements are more stringent.These are 9 of the 20 water quality parameters established for TCCS.** Depends on receiving stream water conditions.

166 SUSTAINABILITY REPORT 2019
Water Discharge by Destination (m3) Destination 2015 2016 2017 2018 2019
Turkey
Surface water 421,941 530,676 677,174 590,849 533,547
Organized Industrial Zone 181,205 505,514 196,624 769,882 601,017
Municipal sewage system 489,190 191,590 121,795 120,791 256,580
Jordan
Surface water 0 0 0 0 0
Organized Industrial Zone 0
Municipal sewage system 84,771 73,125 46,685 44,818 46,457
Kazakhstan
Surface water 0 0 0 0 0
Organized Industrial Zone 0
Municipal sewage system 198,552 303,110 348,530 400,743 431,515
Azerbaijan
Surface water 0 0 0 0 0
Organized Industrial Zone 0
Municipal sewage system 204,397 132,284 118,654 177,691 191,326
Pakistan
Surface water 156,553 147,484 157,141 223,978 176.063
Organized Industrial Zone 519,763 168,036 629,581 483,826 1.210.193
Municipal sewage system 735,906 1,066,204 748,482 1,164,540 583.795
Kyrgyzstan
Surface water 0 0 0 0
Organized Industrial Zone 0 0 0 0
Municipal sewage system 80,893 64,284 69,863 69,498
Tajikistan
Surface water 0
Organized Industrial Zone 0
Municipal sewage system 40.251
TOTAL
Surface water 578,494 678,160 834,315 814,827 709.610
Organized Industrial Zone 700,968 673,550 826,205 1,253,708 1,811,210
Municipal sewage system 1,712,816 1,847,206 1,448,430 1,978,446 1.619.421

167SUSTAINABILITY REPORT 2019
SUPPLEMENTARY DISCLOSURES FOR BIST
EnvironmentEnvironmental Policy and Reporting
We prepared this section in line with TCCC standards and all the policies are relevant to CCI operations in order to provide additional qualitative and quantitative information required by the Sustainability Index on environment (including biodiversity and climate change), governance (including board
practice), bribery and corruption, human rights, and stakeholder issues (including health & safety, covering the parts of each topic which fall outside the scope of this sustainability report.
In addition to the above-mentioned topics, we also monitor and manage our atmospheric emissions in line with national regulations as well as with TCCC standards in all our operations. All CCI plants (except water treatment plants) are in the scope of “Emission Permission” according to Air Pollution Control Regulation. Sulphur oxides (SOx), nitrogen oxides (NOx), dust, and
carbon monoxide (CO) parameters are measured in every two years and an air emission reports prepared. The materiality assessment we conducted showed that air emissions from our factories, both quantitatively and qualitatively, are insignificant. Nevertheless, we also included atmospheric and wastewater data in this section.
CCI’s environmental policy, the results of key performance indicators and targets of our three main focus areas; • Energy Management and Climate Protection • Water Management • Sustainable Packaging

168 SUSTAINABILITY REPORT 2019
Environmental Management
Environmental Management System (EMS)CCI’s environmental management system has been established in compliance with KORE, which is the Environmental Management System of Coca-Cola Company and TSE ISO 14001, which covers the basic principles and practices of these systems.
This system is built on five basic principles:
1-Our commitment to be the leader in environmental protection For an effective environmental management program, and in terms of our commitment to environmental protection, the full participation of all employees of CCI’s operations is required. All employees should completely understand and practice the daily activities which should be complied with in terms of environment.
2-Compliance with environmental matters and going beyond compliance Our commitment to environmental protection extends beyond the legal requirements and regulations relating to the environment.
3-Minimizing the effect and determining the opportunities According to the results of various research conducted around the world, the negative effects on environment should be reduced by using new technologies and implementing recommendations of successful studies on the environment. Pollution prevention and control implementations should be practiced in a responsible manner, thereby minimizing our waste as well as costs related to waste management.
4-Auditing environmental activities For continuous development, every activity we performed, and every written document produced with respect to the environment should be audited pursuant to the quality system and environmental management system. If there are findings as a result of the audits conducted by auditors or government agencies or the auditors of TCCC, then the necessary corrective and preventive actions should be taken.
5-Social responsibility As being a part of the society, we use all kinds of information and combine our energies with public, private, and non-governmental organizations in a manner to create positive improvements and fulfill our social responsibilities to the environment.
Target Setting & Planning
At the beginning of each year, under the leadership of the Operations Manager and with the participation of the Environmental team, the objectives and targets of our plant environmental management system is defined for the new year according to the local legislation and company requirements as well as environmental policies in order to minimize the environmental impacts or to keep them under control. While determining the targets for the new year, the factors like the results of the previous years, company targets, legal requirements, measurability, traceability and applicability of the objectives are considered in accordance with our continuous development principle.
Major environmental performance indicators and targets determined by the plants are incorporated in CCI’s business plan.
Plant environmental performance indicators are shared with all employees and the Business Unit (BU). Performance indicators are constantly followed throughout the year and the compliance with the objectives is kept under control. Performance indicators are reported monthly to the BU, plant management and senior management.

169SUSTAINABILITY REPORT 2019
EMS Audits The environmental management system is assessed once a year. The nonconformities in matters regarding environment management system that are found both in internal and external assessments and in daily practice are processed according to the relevant procedures. The Environmental Coordinator is responsible for the assessment of the environment management system and for the follow-up of the corrective/preventive activities. The Environmental Management System is assessed every quarter during operation meetings and in annual management review meetings. The existing regions are also audited in terms of Environmental Management System during monthly environmental checks.
Those responsible for executing and coordinating CCI’s environmental management activities in our plants do so in line with the legislation, conduct and internal audit according to the provisions of the relevant legislation at least once a year and issue a report at the end of the internal audit. Non-conformities are followed, preventive and corrective actions are taken according to the relevant procedure.
CCI plants ensure that the obligations defined in the relevant legislation are fulfilled by monitoring the operations performed in regular intervals. The assessment of environmental management system performance at CCI locations is necessary to understand the effectiveness of the program. The final summary of the environmental performance is the monthly assessment of the factory environmental performance measurement report.
The basic performance indicators reported are as follows; • Water Usage Ratio (L / L) • Energy Usage Ratio (MJ / L) • Wastewater Generation Ratio (L / L) • Solid Waste Generation Ratio (g/L) • Solid Waste Recycling Ratio (%) • CO2 Emission Ratio (g/ L)
Additionally, every plant has to comply with local legal requirements and TCCC limits in air emissions and wastewater discharge.
All CCI plants are also audited regarding environment management system requirements and TCCC’s standards by TCCC audit department regularly (at least every 2 years).
ISO 14064-1 GHG verification and ISO 50001 Management System Certification Audits are conducted in CCI Turkey plants every year. Additionally, selected environmental KPIs are verified by third party auditing companies every year. Verification statements are available in this report.
EMS Review Management Review Meeting is held in line with CCI’s Environment Management System requirements at least once a year. Environmental key performance indicators are reviewed during Business Plan Meetings.
The Environmental board meetings and the annual management review meeting involves the following topics. a - Discussing the decisions made in the previous meeting, b - Discussing the environmental management system performance indicators, c - Revisions and improvements in environmental management system indicators, d - Internal and external audit findings and environmental accidents, feedbacks and complaints regarding environment management system, e - Corrective and preventive activities regarding the environmental management system, f - Improvement recommendation regarding environmental management system, g - Amendments in law and company requirements, h - Assessment of supplier and subcontractor activities and, if any, the nonconformities in environmental practices, i - Reviewing the environment policy and its fitness to the needs, j - Environmental Risk Assessment k - Technological, managerial, design, etc. changes which may affect the environment performance and objectives

170 SUSTAINABILITY REPORT 2019
EMS Procedures
The Environmental Coordinator is responsible for ensuring all associated operations are in compliance with all relevant laws and regulations regarding environment. He/she should find the method for applying these laws and regulations to work. He/she should follow all updated laws related to environment and evaluate compliance.
As well as laws and regulations, he/she should follow the Coca-Cola KORE system and ISO 14001 standards and adapt them to factory’s environmental management system and ensure its continuity.
The Environmental Coordinator also works in coordination with BU in environmental matters and completely fulfills the requests of The Coca-Cola Company within this respect.
There are several procedures that CCI follows and all these procedures are standard in all plants; • Environmental Management Procedure • Waste Management Procedure • Hazardous Materials Management Procedure • Wastewater Management Procedure • Storm Water Management Procedure • Fleet Management Procedure • Ozone Protection Procedure • Air Pollution Control Procedure • Water Management Procedure • Energy Management Procedure (ISO 50001) • ISO 14064-1 GHG Manual (CCI Turkey)
Environmental Operations Management Designs in Compliance with Environment While designing new packaging, products, processes, factories or offices, their full compliance with environmental laws should be checked. In new designs, systems which are recently invented, and which will further protect the environment should be used.
Forklifts using LPG should be used when possible in the factory while electric forklifts should be used indoors. Maintenance of forklifts is performed regularly. Waste from forklift maintenance is disposed of in a manner that is compliant with legislation.
Waste Management The type of waste generated at CCI locations, recyclable solid wastes, where and how to collect them, the amount of waste and whether to remove
them from the collection area are determined. The hazardous waste of the factory is determined by the Environmental Coordinator by considering the provisions of relevant regulations, and the storage and removal methods are appointed according to the same regulations. Recyclable waste, hazardous waste, and medical waste are stored separately in the factory. Wastes which may not be recycled are collected and disposed of separately from recyclable waste.
Rainwater Pollution Prevention Rainwater drainage channels are marked on a project plan showing all infrastructure drainage channels at CCI locations. The contamination of rainwater with substances hazardous to the environment through chemical diffusion or contamination of wastewater generated from the processes via channels in the factory is brought under control. Operators are trained on preventing the contamination of rainwater.
Wastewater Management All process and domestic wastewater at CCI locations are processed (local treatment facility, neutralization, central treatment facility, etc.) as required in order to discharge them to the receiving environment in compliance with discharging standards without harming the environment. The operation and analysis methods and the principles of local treatment facility are described in the relevant procedures/guidelines. The required intervention in case of nonconformities in the quality of the treated water from the wastewater facility is made by the Treatment Facility Operator under the supervision of the Quality Assurance Chief. The central treatment facilities are periodically visited, and discharge water analysis results are taken. In case of nonconformity, a Corrective/Preventive action is taken.
Environmental Risk Assessment and Generating Control Plans The environmental aspects which constitute a potential risk to the environmental pollution and ecological balance at CCI locations are determined. The environmental risk is scored on this list and the control measures for important environmental risks are determined. An action plan (Environmental Program) is prepared for medium and high risks, and it is updated in case of environmental accident, process amendment, new line installation, or legislation amendment is reviewed once every year.
Noise Control To determine the effects of the noise on environment and employees at CCI locations, necessary assessments are conducted regularly. If the noise level exceeds the standards in the assessment, then necessary improvements are performed. The purpose is to reduce noise at its source.

171SUSTAINABILITY REPORT 2019

172 SUSTAINABILITY REPORT 2019
Ecosystem Services Approach in the Project Natural ecosystems provide various benefits, which are called ecosystem services, for human welfare directly or indirectly. Agriculture is a dominant human activity and agricultural land covers nearly 40% of the terrestrial surface. The ecosystem services used by agricultural production can be provisioning (freshwater, genetic biodiversity etc.), supporting (soil structure and fertility), or regulating services (climate regulation, pollination, biological control etc.).
In the Agriculture of the Future Project, the aim is to integrate the ecosystem approach (a strategy for sustainable management of land, water and living resources) into agricultural activities. The ecosystem approach provides tools to minimize the conflicts between nature conservation and economic activities, and thus enhances sustainability of the socio-ecological systems. The project is the first of its kind in terms of having such a comprehensive approach to handling socio-economic activities and environmental values together.
The project includes conservation agriculture activities such as implementing direct seeding and wind breakers. These activities are important tools for protecting soil and water resources which are important components of ecosystems. In order to increase the integration level of the ecosystem approach into the project, the following activities are being carried out:
• Mapping of agricultural ecosystems • Determining the benefits of ecosystem services to agricultural practices • Developing, in collaboration with Yale University School of Forestry and Environmental Studies, a methodology for mapping these services • Mapping ecosystem services through advanced scientific approaches and incorporating local knowledge through a participatory approach • Analyzing the vulnerability of agricultural ecosystems • Modeling climate parameters related to agriculture • Determining to what extent ecosystems are vulnerable to climatic changes and human activities. • Developing recommendations for protection of the vulnerable ecosystem services
Below are ecosystem services maps produced for the Cihanbeyli District of Konya.

173SUSTAINABILITY REPORT 2019
Biodiversity Monitoring Activities in the Project The conservation agriculture activities in the project protect soil and water, both significant resources for biodiversity elements in the region. In order to monitor the interaction of the project activities with the biodiversity of the area, we developed a continuous monitoring program which includes:
• Determination of the species groups to be affected from agricultural activities • Determination of rare/endangered/endemic/sensitive species in Konya • Determination of the monitoring and inventory methodology • Continuous monitoring of selected species groups, especially those that are rare/ endangered/endemic/sensitive.
As a part of the biodiversity monitoring activities in the project, 43 bird species, 18 plant species, 15 butterfly species, and 10 small mammal species has been observed in the direct seeding areas, wind break zones and control areas. The project also develops environment-friendly solutions to the problems of agricultural production, such as rodent management. As a part of biological pest control scheme, owl and kestrel boxes are placed in farming areas as an alternative to chemical pesticides used to exterminate the rodents in the fields.

174 SUSTAINABILITY REPORT 2019
Discharge Parameter UnitTurkey Ankara Turkey Mersin Turkey-Bursa Turkey-Çorlu Turkey-Elazığ
Legal limit
2019 Legal limit
2019 Legal limit
2019 Legal limit
2019 Legal limit
2019Result Result Result Result Result
COD mg/dm3 160 33,87 <180 46 1000 952 160 26 4000 388
BOD mg/L <50 11 <50 22 - -
pH - 6-9 8,05 6< - <9 7,69 6-9 7,11 6-9 7,86 6.5-10.0 9,63
TDS mg/L <2000 1356 - -
TSS mg/dm3 <50 29 <70 17 250 43 - <50 40
Phosphorus mg/L <2 0,272 - 5,7 3,64 -
Nitrogen mg/L - - 43 5,58 -
Sulphate mg/L <250 199,48 - - - -
Iron mg/L - - <10 0,17 - -
Chloride mg/L 0.1 <0,05 - - - -
Oil products mg/L - 20 <10 - - -
Nitrates mg/L - - - - -
Discharge Parameter UnitTurkey - Isparta Turkey-İzmir Turkey - Köyceğiz Turkey - Sapanca Turkey - Hazar
Legal limit
2019 Legal limit
2019 Legal limit
2019 Legal limit
2019 Legal limit
2019Result Result Result Result Result
COD mg/dm3 2000 316 2500 806 400 11 - 133 <180 <30
BOD mg/L - - - - <50 <5
pH - 6-9 6,5-10 7,8 6-9 7,1 6-9 7,28 - 7,68
TDS mg/L - - - - 6< - <9 86
TSS mg/dm3 500 133 500 79 - <10 - <70 <10
Phosphorus mg/L 100 - 200 0,57 - 1,4 - <0,2
Nitrogen mg/L - - - - - <1
Sulphate mg/L - - - - - 5,04
Iron mg/L - - - - - <0,05
Chloride mg/L - - - - - <0,05
Oil products mg/L 100 38 250 <10 20 <10 - <20 <10
Nitrates mg/L - - - - - <1

175SUSTAINABILITY REPORT 2019
Discharge Parameter UnitPakistan Gujranwala Pakistan Karachi Pakistan Lahore Pakistan Multan Pakistan Rahim Yar Khan
Legal limit
2019 Legal limit
2019 Legal limit
2019 Legal limit
2019 Legal limit
2019Result Result Result Result Result
COD mg/dm3 150 <5 400 13 150 21,75 150 13 150 39
BOD mg/L 80 <3 80 5,5 80 6,75 80 4 80 10
pH - 6 to 9 8,09 6 to 9 7,68 6 to 9 8,045 6 to 9 7,66 6 to 9 8,06
TDS mg/L 3500 1264 3500 3236 3500 1320,5 3500 543 3500 1935
TSS mg/dm3 200 <5 200 22 200 10,375 200 24 200 7
Phosphorus mg/L - 0,38 Nil 1,34 - 1 - 0,95 - 0,16
Nitrogen mg/L - 0,3 Nil 2,89 - 1,6925 - 0,1 - <0.1
Sulphate mg/L 600 19,75 SC*** 520 600 101,455 600 42,8 600 306,22
Iron mg/L 8 <1 8 <.005 8 0,34 8 0,88 8 <1
Chloride mg/L 1000 NA SC*** 911 1000 76,9625 1000 60,74 1000 344,92
Oil products mg/L 10 <5 1 <1.00 10 5 10 <5.0 10 <5.0
Nitrates mg/L - NA Nil - NA - - NA NA
Discharge Parameter UnitTurkmenistan Ashgabat Tajikistan Dushanbe Azerbaijan Baku
Legal limit 2019 Legal limit 2019 Legal limit 2019Result Result Result
COD mg/dm3 <180 4,49 <600 537.2 <500 304
BOD mg/L <50 2,82 <300 346.97 <375 25
pH - 6< - <9 7,7 6-9 6.8 6,5-8,5 7,24
TDS mg/L 1637 - 904
TSS mg/dm3 <70 23,88 <70 539.17 <375 26.53
Phosphorus mg/L - 1,40 - 0.79
Nitrogen mg/L - 2,71 <5 4.7 1.76
Sulphate mg/L - 611,2 - 59.4
Iron mg/L - 0,25 - 0.006
Chloride mg/L - 1198,4 - -
Oil products mg/L <20 0.01 <20 0.50
Nitrates mg/L - 12,33 <5 6.17 1.76
SC*** Discharge concentration at or below sea concentration

176 SUSTAINABILITY REPORT 2019
Discharge Parameter UnitJordan Madaba South Iraq Hilla South Iraq Karbala North Iraq Erbil
Legal limit
2019 Legal limit
2019 Legal limit
2019 Legal limit
2019Result Result Result Result
COD mg/dm3 <1500 54,7 <100 843.5 <100 58 <100 10
BOD mg/L - <40 400 <50 12 <40 5
pH - 5.5-9.5 7,98 6-9.5 6.8 6-9 7.45 6-9 7.95
TDS mg/L <2000 1245 2000 815 <2000 967 2000 259
TSS mg/dm3 <700 16,8 60 103 <50 <10 60 <10
Phosphorus mg/L <30 6,9 3 1 <2 3 <2 0.6
Nitrogen mg/L <100 1,65 10 12.5 <5 4.34 5 1.5
Sulphate mg/L <10 <0.1 400 244 <400 306.47 400 25
Iron mg/L <30 0,32 2 0.726 <0.1 <0.05 2 <0.05
Chloride mg/L - 600 - No limit - 600 50
Oil products mg/L <100 <8 5 <10 <10 <10 5 <10
Nitrates mg/L - 50 - No limit - 50 1.79
Discharge Parameter UnitKyrgyzstan Bishkek Kazakhstan Burundai Kazakhstan Astana
Legal limit 2019 Legal limit 2019 Legal limit 2019Result Result Result
COD mg/dm3 <450 35,15 903,2 718,93 500 79,9
BOD mg/L <300 4,95 500 246,5 425 25
pH - 6.5-8.5 7,71 6-9 -
TDS mg/L <1000 <1000 - 1000 633
TSS mg/dm3 - 500 57,1 500 64
Phosphorus mg/L <5 0,36 - -
Nitrogen mg/L - 30 0,569 30 1,5
Sulphate mg/L <500 51,9 156,4 151,8 500 102
Iron mg/L <5 <0.1 3 0,136 5 0,52
Chloride mg/L <350 29,95 350 68,7 350 173
Oil products mg/L <3 <3 - 14 0,15
Nitrates mg/L - - -

177SUSTAINABILITY REPORT 2019
Plant Name On-site Industrial Zone Municipality
Turkey-Ankara ✓
Turkey-Bursa ✓
Turkey-Çorlu ✓
Turkey-Elazığ ✓
Turkey - Isparta ✓
Turkey-İzmir ✓
Turkey-Mersin ✓
Turkey - Köyceğiz ✓
Turkey - Sapanca ✓Turkey - Hazar ✓
Pakistan-Gujranwala ✓
Pakistan-Karachi ✓
Pakistan-Lahore ✓
Pakistan-Multan ✓
Pakistan-Rahim Yar Khan ✓
Kazakhstan-Burundai ✓ ✓Kazakhstan-Astana ✓ ✓South Iraq-Hilla ✓
South Iraq-Karbala ✓
Azerbaijan-Baku ✓ ✓Turkmenistan-Ashgabat ✓
Kyrgyzstan-Bishkek ✓Tajikistan-Dushanbe ✓
North Iraq-Erbil ✓
Jordan-Madaba ✓

178 SUSTAINABILITY REPORT 2019
Emissions to Air CCI manages all of its environmental impacts including emission to air. Our targets for atmospheric emissions are to improve our efficiency values and to remain 100% legally compliant. 2019 stack gas emission analysis results of CCI pants are given in the following tables.
Country Number/Name of the SourceParameter (kg/hour) 2019
CO2 % O2 %CO
mg/Nm3NOx
mg/Nm3NO2
mg/Nm3NO
mg/Nm3SO2
mg/Nm3Smoke
(RM-scale)PM
mg/Nm3
Turkey Çorlu
Boiler #1 Fuel Source Natural Gas 0,019 1,8713 1,1594 <0,0440
Boiler #2 Fuel Source Natural Gas <0,0196 2,0382 1,2686 <0,0438
Boiler #3 Fuel Source Natural Gas 0,013 0,077 0,0477 <0,0027
Piovan #1 Chimney <0,0006 0,0464 0,029 <0,0013
Piovan #2 Chimney <0,0006 0,0564 0,0354 <0,0013
Piovan #3 Chimney <0,0006 0,0615 0,0383 <0,0013
Piovan #4 Chimney 0,0017 0,0556 0,0344 <0,0013
Piovan #5Chimney <0,0006 0,0539 0,0333 <0,0013
Piovan #6 Chimney <0,0009 0,0436 0,0275 <0,0021
Piovan #7 Chimney <0,0005 0,0244 0,0153 <0,0012
Piovan #8 Chimney <0,0005 0,0236 0,0148 0,0012
Husky Machine chimney <0,0009 <0,0015 <0,0009 <0,0021
Turkey Bursa
Source #1 (Pet Line Filling Chimney) 0,0024
Source #2 (Line-5 Tunnel Pasteur Chimney) 0,0107
Source #3 (HOD old washing mach. chimney) 0,0575Source #4 (HOD new washing mach. chimney) 0,0073
Source #5 (Line-4 Coding chimney) 0,0014
Source #6 (Tetra-200 Line chimney) 0,0009
Source #7 (Boiler-Bosch) 0,0556 0 0,1354 0 0,0311
Source #8 (Boiler-Selnikel) 0,0399 0,0218 0,1566 0 0,0181

179SUSTAINABILITY REPORT 2019
Plant Number/Name of the SourceParameter (kg/hour) 2019
CO2 % O2 %CO
mg/Nm3NOx
mg/Nm3NO2
mg/Nm3NO
mg/Nm3SO2
mg/Nm3Smoke
(RM-scale)PM
mg/Nm3
Turkey Mersin
Boiler #1 Fuel Source Natural Gas 0,5404 0,6578 0,4255 0 0,0101
Boiler #2 Fuel Source Natural Gas 0,5169 0,5878 0,3799 0 0,0105
Boiler #3 Fuel Source Natural Gas 0,3818 0,8924 0,8924 0 0,0116
Turkey Ankara
Boiler #1 Fuel Source Natural Gas 5,83 0 82,85 50,85 1,13 3,73
Boiler #2 Fuel Source Natural Gas 5,81 0 83,55 51,35 3,39 3,9
Husky Machine #1 Chimney 14,82 0 77,84 46,86 5,57 4,91
Husky Machine #2 Chimney 7,29 0 104,29 64,5 2,49 4,24
Welding Room Chimney 20,95 0 0 0 5,71 2,39
Blower #1 Chimney 0 2,25
Blower #2 Chimney 0 2,22
Blower #3 Chimney 0 2,13
Blower #4 Chimney 0 2,06
Blower #5 Chimney 1,97
Turkey İzmir
Boiler #1 Fuel Source Natural Gas 0,3 0,3902 0,2411 0 0,0411
Boiler #2 Fuel Source Natural Gas 0,2 0,103 0,4866 0 0,0472
Turkey Elazığ
Boiler #1 Fuel Source Natural Gas 0,0445 0,0411 0,0021
Boiler #2 Fuel Source Natural Gas 0,5135 0,4781 0,0268
Turkey Isparta
Boiler #1 Fuel Source Natural Gas 0,974 0,01012 0,31853 0,01031
Boiler #2 Fuel Source Natural Gas 0,08748 0,02487 0,42368 0,02084

180 SUSTAINABILITY REPORT 2019
Plant Number/Name of the Source
Parameter (kg/hour) 2019
CO2 % O2 %CO
mg/Nm3NOx
mg/Nm3NO2
mg/Nm3NO
mg/Nm3SO2
mg/Nm3Smoke
(RM-scale)PM
mg/Nm3
Pakistan Rahim Yar Khan
Source #1 (Gen.) 3,1 16,8 133,8 554,1 36,9 517,2 102,9 1 143,8
Source #2 (Gen.) 2,7 17,3 133,8 427,4 34,8 392,6 77,2 1 137,5
Source #3 (Gen.) 1,9 18,4 101,2 297,9 20,5 277,4 54,3 1 151,7
Source #4 (Gen.) 3 16,9 177,5 433,5 32,8 400,7 77,2 1 157,4
Source #6 (Gen.) 2,8 17,2 100 497,1 34,8 462,3 91,5 1 161,7
Source #1 (Boiler) 6,1 10 43,8 49,1 6,2 42,9 42,9 1 68,4
Source #2 (Boiler) 1,2 18,1 131,2 49,4 16,4 33,5 0 1 NA
Pakistan Karachi
Generator 2250 KVA 475 476 83 393 ND 1 56
Generator 563 KVA 561 516 97 419 ND 1 79
DDFL boiler 1122 16 200 76 124 ND 1 11
Pakistan Faisalabad
Source #1 (Boiler) 12,11 23 81 20 61 38 33
Source #2 (Generator) 15,89 131 444 52 392 310 59
Pakistan Multan
Source #1 Boiler 6,72 12,3 109 98 31 69 0 0 24,1
Source #2 GenSet 1 4,29 16 192 465 38 427 15 1 43
Source #3 GenSet 2 3,16 16,9 247 382 47 335 0 1 38,7
Source #4 GenSet 3 3,86 16,1 241 539 76 463 0 1 59,42
Source #5 GenSet 4 2,2 17,2 185 545 67 478 0 1 61,83
Source #6 GenSet 5 3,72 16,7 165 532 105 427 0 1 56,41

181SUSTAINABILITY REPORT 2019
Plant Number/Name of the SourceParameter (kg/hour) 2019
CO2 % O2 %CO
mg/Nm3NOx
mg/Nm3NO2
mg/Nm3NO
mg/Nm3SO2
mg/Nm3Smoke
(RM-scale)PM
mg/Nm3
Pakistan Lahore
Boiler #1 Fuel Source Natural gas ` 7,99 3,66 78,33 21 57,33 233 23
Boiler#2 Fuel source Diesel 8,43 11 81,33 24 57,33 144,66 28
Generator # 1 18,43 143,33 327,66 12,33 315,33 46,66 61
Generator # 2 18,57 182,6 246,66 6 240,66 37 79
Generator # 4 18,04 146,33 504,33 15,33 489 40 69
Generator # 5 15,39 183 429 31,66 397,66 55 41
Generator # 6 18,13 188,6 407 8 399 36 51
Generator # 7 18,16 139 400 11,33 388,66 22,33 83
Generator # 8 17,08 209,66 486,66 34 451,66 44 39
Generator # 9 17,23 228 494 27 467 36 75
Generator # 10 18,33 141,33 469,66 16 453,66 28 89
Pakistan Gujranwala
Source #1 (Boiler) 14,5 3,1 125,6 126,6 1,9 124,7 0 0 24,5
Source #2 (Boiler) 14,9 2,7 118,9 113,7 1,2 112,5 0 0 17,4
Source #3 (Generator) 7,46 12,7 251,81 456,67 423,41 33,26 121,19 1 159
Source #4 (Generator) 8,2 11,3 235,5 327,7 7,2 320,5 95,5 1 112,5
Source #5 (Generator) 7,5 12,1 310,2 292,6 11,1 281,5 87,4 1 142,3
Source #6 (Generator) 6,8 13,6 280,8 252,9 2,5 250,4 144,7 1 95,3
Source #7 (Generator) 7,1 12,7 420,5 340,8 15,6 325,2 112,3 1 119,1
Source #8 (Generator) 8,2 11,2 255,6 245,5 2,6 248,1 89,6 1 93,5
Source #9 (Generator) 7,8 11,8 320,5 224,7 6,2 218,5 88,4 1 102,4

182 SUSTAINABILITY REPORT 2019
Plant Number/Name of the Source
Parameter (kg/hour) 2019
CO2 % O2 %CO
mg/Nm3NOx
mg/Nm3NO2
mg/Nm3NO
mg/Nm3SO2
mg/Nm3Smoke
(RM-scale)PM
mg/Nm3
KazakhstanAlmaty
Gas generator 1 14.844 14.295 0,2146
Gas generator 2 15.491 15.807 0,1980
Gas generator 3 15.984 14.796 0,1554
KazakhstanAstana
Chimney boiler room № 0012 not found not found 0,000215 not found
Chimney boiler room № 0013 not found not found 0,000149 not found
Copper chimney № 0014 not found not found 0,000002 not found
JordanMadaba
Generator 1 2,3 17,9 1644,2 2142,7 242,5 1909,6 0 not found not found
Generator 2 1,7 18,7 1760,8 3726,5 466,3 3277,5 0 not found not found
Gas boiler 2,9 15,8 641 149 72 50 0 not found not found
Heavy fuel boiler 12,7 3,9 17 188 0 148 4094 not found not found
AzerbaijanBaku
Source #6 (CO2 manufacturing) 1,47 0,07 0,002 0,0002
Source #7 (Boiler room) 0,73 0,03 0,001 0,0001
KyrgyzstanBishkek
Chimney boiler room not measured
not measured 0,813 not
measurednot
measured 0,227 not measured
not measured
ASCO - CO2 plant not measured
not measured 1,13 not
measurednot
measured 0,316 not measured
not measured
TurkmenistanAshgabat
Boiler room 0,12368 0,00079
Generator 19,23 7,69 3,84 2,98
Kitchen 0,022 0,004
TajikistanDushanbe
CO2 production
kg/h433,38Generator
Boiler

183SUSTAINABILITY REPORT 2019
For detailed information on board structure and practices please refer to CCI 2019 Annual Report pages 96-105.
GovernanceBoard Practice
Bribery and Corruption
Countering Bribery SystemEthics Line is managed by a completely independent third-party company where our employees may ask questions and share their concerns about corporate business principles, code of ethics, discrimination, superiors - subordinates, mobbing, conflict of interest and etc. Employees can access Ethic line by a dedicated e-mail address, an assigned telephone number or by the web site www.cciethicsline.com where the message may be sent anonymously via a free text area. This hotline gives service in Turkish, English, Russia, Arabic and Georgia. CCI has system and policy in place to ensure that the numeration of the independent company is appropriate, and the service received is legitimate.
All calls and e-mails received by ethics line are shared with Ethics and Compliance Manager and the Ethics and Compliance Manager records all the notifications on an Ethics Program where the notification is sent timely to the Ethics Committee.
Recording system for all ethics notifications is launched in 2016 where CCI keeps all the details on non-compliance and breaches of Code of Ethics (including the anti-bribery policy) and the issues consulted to Ethics and Compliance Managers. The system provides details of its performance and progresses in relation to bribery and other violations of Ethics Code and gives quantitative data on its whistle-blowing system in relation to bribery and all type of violations. Violations to Code of Ethics are audited by CCI Internal Audit department and reported to Audit Committee on regular basis.
Code of Ethics training is provided to most of the CCI employees through classroom trainings or as a part of orientation program and also of contract.
Companies’ policies on business conduct, anti-bribery/anti-corruption and copies of any notice, correspondence or memoranda to or from any governmental authority in connection with any possible violation of any statute, rule, regulation or other legal requirement by the Company or a description of any such possible violation where no such notice or correspondence exists are evaluated during due diligence process before establishing any joint ventures.
Code of Ethics is communicated to supplier and contractors as an appendix of contract. A newly based supplier evaluation process is alive on system and it is available both for pre and post evaluation. Suppliers are evaluated by engineering service, procurement, legal and finance and required to pass each evaluation successfully to give service to CCI. “Business Management Code of Ethics” and “Basic Principles for Suppliers” are also added to CCI contracts for Bribery, Child Labor, Abuse etc.
In 2019, we recorded 24 cases related to bribery, all in Pakistan. 15 cases have been finalized, 9 of which involve enforcement of action.
Political donations are prohibited by the company, consequently, no donations have been made in 2019 at CCI operations. Also, facilitation payments are strictly prohibited at CCI.

184 SUSTAINABILITY REPORT 2019
Human RightsHuman Rights Policy
SGP Audits for CCI Plants conducted by TCCCIf any CCI operation is deemed noncompliant with Supplier Guiding Principles, a corrective action plan is implemented immediately. Upon completion of the action plan, an independent auditing company audits it to evaluate of the corrective actions taken. In addition to our Human Rights Policy implementation efforts, independent audits for SGP compliance audits take place in all CCI countries periodically since 2014.
After passing audit, CCI operation is given a score that is linked to a color rating. A color rating determines follow-up requirements as below:
• Green (0 points)- No action required. Facility will be assessed in 1-3 years. • Yellow (1-7 points)- Correct minor findings to achieve Green status. Company will receive a new summary report with a zero score and Green rating after completing a desk review, after audit team receives letter within the time frame specified in assessment summary report along with any required evidence that corrective action has occurred. After desk review, company will be re-assessed in 1-3 years. • Orange (8-27)- Company fills out Facility Action Plan form and sends to audit team. Audit team will notify if the plan meets SGP requirements; if not, they will provide any necessary guidance. Company corrects findings as outlined on the approved Facility Action Plan. Follow-up assessment to occur within 6 months of the initial assessment. In certain instances, a Desk Review Assessment is acceptable in lieu of an in-person visit. Process continues until the facility becomes Green. • Red (28+ points)- Company fills out Facility Action Plan form and sends to the audit team. Audit team will notify if the plan meets SGP requirements; if not, they will provide any necessary guidance. Company corrects findings as outlined on the approved Facility Action Plan. Follow-up assessment to occur within 6 months of the initial assessment. Process continues until the facility becomes Green or is deauthorized.
Human Rights ReportingViolations and non-compliance related to Human Rights Policy (HRP) are governed by Code of Ethics Handbook. Ethics and Compliance Manager manages all HRP reports and notifications regarding possible violations of human rights in co-operation with the CCI Group Employee Relations department. The procedures below are implemented generally in order to lend additional integrity to the processes: Group HR Operations, Employee Relations and Human Rights department was established under CCI Group HR Department to lead the HRP implementations. Role of Ethic and HR Departments in the Human Rights Policy management process: • Investigating HRP related complaints and submitting report to Ethics and Compliance Manager; • Relations Specialist, depending on the location. • Maintains privacy and also enables others (managers) to do so. • Submits a written summary/report of the problems and corrective action, if any, to the Employee Relations.
The investigation should be completed in a timely fashion. A copy of the report should not be shared with any of the people related with the event in the report or accused. The report should only be shared on a “should be known” basis. It makes sure that management is aware of the Company policy against retaliation.
During this process, managers should do the following: • Take all complaints into account • Maintain integrity of the process • If Ethics Committee decides that corrective and preventive action is required, perform this action immediately • Consult Human Resources Manager if there are questions

185SUSTAINABILITY REPORT 2019
Stakeholder IssuesEmployee Issues
Corrective Action and Disciplinary Action All employees are held responsible for breaches of policy. Appropriate corrective actions are taken if a reported breach is proven, to ensure compliance to with Code of Ethics and CCI’s Human Rights Policy (HRP), as well as Code of Ethics. In some cases, disciplinary actions are taken for individuals who are found in breach of HRP, which are determined
incompliance with the disciplinary procedures.
All disciplinary actions are documented. Country Ethics Managers maintain records of all disciplinary actions and implementation of any corrective measures. Employee having questions have the liberty to ask their manager, HR or CCI Legal Department.
HUMAN RIGHTS BREACH MANAGEMENT
PROCESS
Create Notification
by EO
Submit to Ethics Committee
by EOReceive
Opinions of Ethics Committee by
EO & Go to HRP Responsible
Penalty
Ethics Committee
Decision
Submit Investigation
Report by Investigator
Assign Investigators by
EO
Claim/Consultancy to Ethics Officer
(EO)

186 SUSTAINABILITY REPORT 2019
CONTENT INDICES
Placeholder For GRI Service Mark
GRI Content Index For the Materiality Disclosures Service, GRI Services reviewed that the GRI content index is clearly presented and the references for Disclosures 102-40 to 102-49 align with appropriate sections in the body of the report.
GRI 101: FOUNDATION 2016GRI 102: GENERAL DISCLOSURES 2016 Location of Disclosure
Organizational Profile102-1 Name of the organization Page 194102-2 Activities, brands, products, and services Page 10102-3 Location of headquarters Page 194102-4 Location of operations Pages 12-13102-5 Ownership and legal form CCI Annual Report 2019 Page 129102-6 Markets served Pages 8, 12-13102-7 Scale of the organization Pages 12-13102-8 Information on employees and other workers Pages 137-143102-9 Supply chain Page 69102-10 Significant changes to the organization and its supply chain Page 69102-11 Precautionary principle or approach Pages 40, 98102-12 External initiatives Pages 28, 30102-13 Membership of associations Page 28 Strategy 102-14 Statement from senior decision-maker Page 6-7102-15 Key impacts, risks, and opportunities Page 40, 54 Ethics and Integrity 102-16 Values, principles, standards, and norms of behavior Page 43102-17 Mechanisms for advice and concerns about ethics Page 43
Governance102-18 Governance structure Page 35 Stakeholder Engagement102-40 List of stakeholder groups Page 46102-41 Collective bargaining agreements Pages 66, 68, 72102-42 Identifying and selecting stakeholders Page 45102-43 Approach to stakeholder engagement Page 47102-44 Key topics and concerns raised Page 49 Reporting Practice102-45 Entities included in the consolidated financial statements Page 4102-46 Defining report content and topic boundaries Page 4102-47 List of material topics Pages 49, 54102-48 Restatements of information Page 4102-49 Changes in reporting Page 4102-50 Reporting period 2019102-51 Date of most recent report 2018102-52 Reporting cycle Annual102-53 Contact point for questions regarding the report Pages 4, 194102-54 Claims of reporting in accordance with the GRI Standards Page 4102-55 GRI content index Page 186102-56 External assurance Page 131

187SUSTAINABILITY REPORT 2019
GRI 200-300-400 TOPIC SPECIFIC STANDARDS 2016 Location of Disclosure
GRI 200 ECONOMIC STANDARDS SERIES
Economic Performance
GRI 103 Management Approach 2016
103-1 Explanation of the material topic and its boundary Pages 49, 51
103-2 The management approach and its components Page 54
103-3 Evaluation of the management approach CCI Annual Report 2019 Page 106-111
GRI 201 Economic Performance 2016
201-1 Direct economic value generated and distributed Pages 20-21
201-2 Financial implications and risks & opportunities due to climate change Pages 38-40
201-4 Financial assistance received from government CCI Annual Report 2019 Page 163
Indirect Economic Impacts
GRI 103 Management Approach 2016
103-1 Explanation of the material topic and its boundary Pages 49, 51
103-2 The management approach and its components Page 54
103-3 Evaluation of the management approach Pages 86-87
GRI 203 Indirect Economic Impacts 2016203-1 Infrastructure investments and services supported Pages 88-89
203-2 Significant indirect economic impacts Pages 95-96
Procurement Practices
GRI 103 Management Approach 2016
103-1 Explanation of the material topic and its boundary Pages 49, 51
103-2 The management approach and its components Page 54
103-3 Evaluation of the management approach Pages 86-87
GRI 204 Procurement Practices 2016 204-1 Proportion of spending on local suppliers Page 87
Anti-Corruption
GRI 103 Management Approach 2016
103-1 Explanation of the material topic and its boundary Pages 49, 51
103-2 The management approach and its components Page 54
103-3 Evaluation of the management approach Pages 42-44
GRI 205 Anti-Corruption 2016 205-2 Communication & training about anti-corruption policies and procedures Pages 42-44
Anti-competitive Behavior
GRI 103 Management Approach 2016
103-1 Explanation of the material topic and its boundary Pages 49, 51
103-2 The management approach and its components Page 54
103-3 Evaluation of the management approach Page 44
GRI 206 Anti-competitive Behavior 2016 206-1 Legal actions for anti-competitive behavior, anti-trust, and monopoly practices Page 44

188 SUSTAINABILITY REPORT 2019
GRI 300 ENVIRONMENTAL STANDARDS SERIES Location of Disclosure
Materials
GRI 103 Management Approach 2016
103-1 Explanation of the material topic and its boundary Pages 49, 51
103-2 The management approach and its components Page 54, 111
103-3 Evaluation of the management approach Pages 98-100, 111
GRI 301 Materials 2016301-2 Recycled input materials used Page 113
301-3 Reclaimed products and their packaging materials Page 114
Energy
GRI 103 Management Approach 2016
103-1 Explanation of the material topic and its boundary Pages 49, 51
103-2 The management approach and its components Page 54, 101
103-3 Evaluation of the management approach Pages 98-100
GRI 302 Energy 2016
302-1 Energy consumption within the organization Page 103
302-2 Energy consumption outside of the organization Pages 105-106
302-3 Energy intensity Page 101
302-4 Reduction of energy consumption Page 103, 106
302-5 Reductions in energy requirements of products and services Page 103, 106
Water and Effluents
GRI 103 Management Approach 2016
103-1 Explanation of the material topic and its boundary Pages 49, 51
103-2 The management approach and its components Page 54, 116
103-3 Evaluation of the management approach Pages 98-100
GRI 303 Water and Effluents 2018
303-1 Interactions with water as a shared resource Pages 118-119
303-2 Management of water discharge related impacts Page 120
303-3 Water withdrawal Page 163

189SUSTAINABILITY REPORT 2019
GRI 300 ENVIRONMENTAL STANDARDS SERIES Location of Disclosure
Emissions
GRI 103 Management Approach 2016
103-1 Explanation of the material topic and its boundary Pages 49, 51
103-2 The management approach and its components Page 54
103-3 Evaluation of the management approach Pages 98-100
GRI 305 Emissions 2016
305-1 Direct (Scope 1) GHG emissions Pages 108-110
305-2 Energy indirect (Scope 2) GHG emissions Pages 108-110
305-3 Other indirect (Scope 3) GHG emissions Pages 108-110
305-4 GHG emissions intensity Page 101
305-5 Reduction of GHG emissions Page 106
Effluents and Waste
GRI 103 Management Approach 2016
103-1 Explanation of the material topic and its boundary Pages 49, 51
103-2 The management approach and its components Page 54, 115
103-3 Evaluation of the management approach Pages 98-100
GRI 306 Effluents and Waste 2016306-1 Water discharge by quality and destination Page 166
306-2 Waste by type and disposal method Pages 161-162
Environmental Compliance
GRI 103 Management Approach 2016
103-1 Explanation of the material topic and its boundary Pages 49, 51
103-2 The management approach and its components Page 54
103-3 Evaluation of the management approach Pages 98-100
GRI 307 Environmental Compliance 2016 307-1 Non-compliance with environmental laws and regulations Page 98
Supplier Environmental Assessment
GRI 103 Management Approach 2016
103-1 Explanation of the material topic and its boundary Pages 49, 51
103-2 The management approach and its components Page 54
103-3 Evaluation of the management approach Page 69
GRI 308 Supplier Environmental Assessment 2016 308-1 New suppliers that were screened using environmental criteria Page 69

190 SUSTAINABILITY REPORT 2019
GRI 400 SOCIAL STANDARDS SERIES Location of Disclosure
Employment
GRI 103 Management Approach 2016103-1 Explanation of the material topic and its boundary Pages 49, 51
103-2 The management approach and its components Page 54
103-3 Evaluation of the management approach Page 84
GRI 401 Employment 2016401-1 New employee hires and employee turnover Page 85
401-2 Benefits provided to full-time employees that are not provided to part-time employees Page 147
Labor/Management Relations
GRI 103 Management Approach 2016103-1 Explanation of the material topic and its boundary Pages 49, 51
103-2 The management approach and its components Page 54
103-3 Evaluation of the management approach Pages 78-79
GRI 402 Labor/Management Relations 2016 402-1 Minimum notice periods regarding operational changes CCI Annual Report 2019 Page 107
Occupational Health and Safety
GRI 103 Management Approach 2016103-1 Explanation of the material topic and its boundary Pages 49, 51
103-2 The management approach and its components Page 54
103-3 Evaluation of the management approach Pages 71-72
GRI 403 Occupational Health and Safety 2018
403-1 Occupational health and safety management system Page 73
403-2 Hazard identification, risk assessment, and incident investigation Page 71-74
403-3 Workers with high incidence or high risk of diseases related to their occupation Page 71-74
403-4 Health and safety topics covered in formal agreements with trade unions Page 71-74
403-5 Worker training on occupational health and safety Page 73
403-6 Promotion of worker health Page 71-74403-7 Prevention and mitigation of occupational health and safety impacts directly linked by business relationships Page 71-74
403-8 Workers covered by an occupational health and safety management system Page 71-74
403-9 Work-related injuries Page 74
403-10 Work-related ill health Page 74
Training and Education
GRI 103 Management Approach 2016103-1 Explanation of the material topic and its boundary Pages 49, 51
103-2 The management approach and its components Page 54
103-3 Evaluation of the management approach Pages 81-82
GRI 404 Training and Education 2016404-1 Average hours of training per year per employee Page 83
404-2 Programs for upgrading employee skills and transition assistance programs Pages 81-82
404-3 Percentage of employees receiving regular performance and career development reviews Page 149

191SUSTAINABILITY REPORT 2019
GRI 400 SOCIAL STANDARDS SERIES Location of Disclosure
Diversity and Equal Opportunity
GRI 103 Management Approach 2016103-1 Explanation of the material topic and its boundary Pages 49, 51
103-2 The management approach and its components Page 54
103-3 Evaluation of the management approach Pages 75-77
GRI 405 Diversity and Equal Opportunity 2016
405-1 Diversity of governance bodies and employees Page 76
405-2 Ratio of basic salary and remuneration of women to men Page 75
Non-Discrimination
GRI 103 Management Approach 2016103-1 Explanation of the material topic and its boundary Pages 49, 51
103-2 The management approach and its components Page 54
103-3 Evaluation of the management approach Pages 66-70
GRI 406 Non-Discrimination 2016 406-1 Incidents of discrimination and corrective actions taken Pages 66-70
Freedom of Association and Collective Bargaining
GRI 103 Management Approach 2016103-1 Explanation of the material topic and its boundary Pages 49, 51
103-2 The management approach and its components Page 54
103-3 Evaluation of the management approach Pages 66-70GRI 407 Freedom of Association and Collective Bargaining 2016
407-1 Operations and suppliers in which the right to freedom of association and collective bargaining may be at risk None
Child Labor
GRI 103 Management Approach 2016103-1 Explanation of the material topic and their boundaries Pages 49, 51
103-2 The management approach and its components Page 54
103-3 Evaluation of the management approach Pages 66-70
GRI 408 Child Labor 2016 408-1 Operations and suppliers at significant risk for incidents of child labor None
Forced or Compulsory Labor
GRI 103 Management Approach 2016103-1 Explanation of the material topic and its boundary Pages 49, 51
103-2 The management approach and its components Page 54
103-3 Evaluation of the management approach Pages 66-70GRI 409 Forced or Compulsory Labor 2016 409-1 Operations and suppliers at significant risk for incidents of forced or compulsory labor None
Security Practices
GRI 103 Management Approach 2016103-1 Explanation of the material topic and its boundary Pages 49, 51
103-2 The management approach and its components Page 54
103-3 Evaluation of the management approach Pages 66-70
GRI 410 Security Practices2016 410-1 Security personnel trained in human rights policies or procedures Pages 68

192 SUSTAINABILITY REPORT 2019
GRI 400 SOCIAL STANDARDS SERIES Location of Disclosure
Human Rights Assessment
GRI 103 Management Approach 2016103-1 Explanation of the material topic and its boundary Pages 49, 51
103-2 The management approach and its components Page 54
103-3 Evaluation of the management approach Pages 66-70
GRI 412 Human Rights Assessment 2016 412-2 Operations that have been subject to human rights reviews or impact assessments Pages 66-70
Local Communities
GRI 103 Management Approach 2016103-1 Explanation of the material topic and its boundary Pages 49, 51
103-2 The management approach and its components Page 54
103-3 Evaluation of the management approach Pages 88-89
GRI 413 Local Communities 2016 413-1 Operations with local community engagement, impact assessments, and development programs Pages 87-89
Customer Health and Safety
GRI 103 Management Approach 2016103-1 Explanation of the material topic and its boundary Pages 49, 51
103-2 The management approach and its components Page 54
103-3 Evaluation of the management approach Pages 55-56
GRI 416 Customer Health and Safety 2016
416-1 Assessment of the health and safety impacts of product and service categories Pages 55-56416-2 Incidents of non-compliance concerning the health and safety impacts of products and services Pages 55-56
Marketing and Labeling
GRI 103 Management Approach 2016103-1 Explanation of the material topic and its boundary Pages 49, 51
103-2 The management approach and its components Page 54
103-3 Evaluation of the management approach Page 58
GRI 417 Marketing and Labeling 2016 417-3 Incidents of non-compliance concerning marketing communications Page 58

193SUSTAINABILITY REPORT 2019
UN Global Compact Principles Location of Disclosure
Human RightsPrinciple 1: Businesses should support and respect the protection of internationally proclaimed human rights; and
Human RightsCommunity Development
Principle 2: make sure that they are not complicit in human rights abuses. Human RightsCommunity Development
Labor
Principle 3: Businesses should uphold the freedom of association and the effective recognition of the right to collective bargaining; Human Rights Along the Value Chain
Principle 4: the elimination of all forms of forced and compulsory labor; Human Rights
Principle 5: the effective abolition of child labor; and Human Rights
Principle 6: the elimination of discrimination in respect of employment and occupation Human Rights (Diversity and Inclusion)
Environment
Principle 7: Businesses should support a precautionary approach and environmental challenges; Environmental Footprint (Energy Efficiency and Climate Protection)
Principle 8: undertake initiatives to promote greater environmental responsibility; and Environmental Footprint
Principle 9: encourage the development and diffusion of environmentally friendly technologies. Environmental Footprint
Anti- Corruption Principle 10: Businesses should work against corruption in all its forms, including extortion and bribery. Risk Management and Ethics
UN Women’s Empowerment Principles Location of Disclosure
Principle 1: Establish high-level corporate leadership for gender equality. Community Development (Women Empowerment)
Principle 2: Treat all women and men fairly at work – respect and support human rights and nondiscrimination.Community Development (Women Empowerment)Human Rights (Diversity and Inclusion)
Principle 3: Ensure health, safety and well-being of all workers, regardless of gender. Human Rights (Health & Safety)
Principle 4: Promote women’s education, training and professional development. Community Development (Women Empowerment)
Principle 5: Implement enterprise development, supply chain and marketing practices that empower women.Community Development (Women Empowerment)Human Rights (Diversity and Inclusion)
Principle 6: Promote equality through community initiatives and advocacy. Community Development (Women Empowerment)
Principle 7: Measure and publicly report on progress to achieve gender equality. Community Development (Women Empowerment
UNGC Content Index
UN WEP Content Index

CCI COCA COLA İÇECEK A.Ş.
Mr. Servet Yıldırım Group Corporate Affairs Director
OSB Mah. Deniz Feneri Sokak No: 4 34776 Dudullu Ümraniye / İstanbul Tel: +90 216 528 40 00 Fax: +90 216 510 70 12
www.cci.com.tr
Reporting & Design Consultant
Design
194 SUSTAINABILITY REPORT 2019
LEGAL DISCLAIMER This sustainability report (the Report) was prepared by CCI within the principles of GRI (Global Reporting Initiative), the United Nations Global Compact, and United Nations Women Empowerment Program. This report has been prepared solely for informative purposes and does not aim to form the basis for any investment decision. No information in this report constitutes a proposal or part of a proposal relating to the sale of CCI shares, or an invitation to this kind of sales process, and the publishing of this report does not mean that a legal relationship of this kind has been established. All featured information and related documents are believed to be accurate at the time of this report’s preparation, and all information has been provided in good faith and relies on trustworthy sources. However, CCI does not make any kind of declaration, guarantee or promise in relation to this information.
GRI 102-1; 102-3; 102-53

195SUSTAINABILITY REPORT 2019

196 SUSTAINABILITY REPORT 2019