Annual and sustainability report 2020 - Cloetta
174
Cloetta Annual and Sustainability Report 2020 Annual and sustainability report 2020
-
Upload
khangminh22 -
Category
Documents
-
view
3 -
download
0
Transcript of Annual and sustainability report 2020 - Cloetta

Cloetta Annual and Sustainability Report 2020
Annual and sustainability report 2020

Cloetta Annual and Sustainability Report 2020
Contents
The audited annual report for Cloetta AB (publ) 556308-8144 consists of the administration report and the accompanying financial statements on pages 1– 4 and 69 –145.
The sustainability report consists of pages 2-3, 5, 8-13, 14–27, 53, 59 – 62, 76-80, 85, 90, 156 –162 and is limited assured by PwC. The definition of the statutory sustainability report can be found on page 75.
The annual report and sustainability report are published in Swedish and English. The Swedish version is the original.
2020 in brief 1
Words from the President 2
Goals and strategies 4
Long-term financial targets 4
Sustainability targets 2020 5
Impacts and responses to Covid-19 6
Strategic priorities 8
Sustainability 14
Our sustainability agenda 14
Cloetta’s value chain 16
For you 19
For people 20
For the planet 22
The confectionery market 28
Brand, category and product development 30
The consumer in the spotlight 31
Strategic product development 34
Brand and category leadership 36
Cloetta’s leading brands 40
Cloetta’s main markets 44
Operations 51
Source 51
Make 53
Deliver 58
Employees 59
Share and shareholders 63
Financial performance 69
Net sales and profit 69
Financial position 72
Comments on the cash flow statement 74
Future outlook, 75
Environmental impact and environmental management,
75
Statutory sustainability report 75
Risks and risk management 76
Letter from the Chairman 81
Corporate Governance Report 82
Remuneration of the Group Management Team 88
Internal control over financial reporting 90
Board of Directors 92
Group Management Team 94
Financial reports, contents 97
Consolidated financial statements 98
Parent Company financial statements 136
Proposed appropriation of earnings 145
Auditor’s report 146
Ten-year overview 150
Key ratios 152
Reconciliation of alternative performance measures
154
Materiality & impact 156
GRI index 160
Auditor’s Limited Assurance Report 163
Definitions and Glossary 164
Our history 166
Shareholder information 169
Cloetta Annual and Sustainability Report 2020
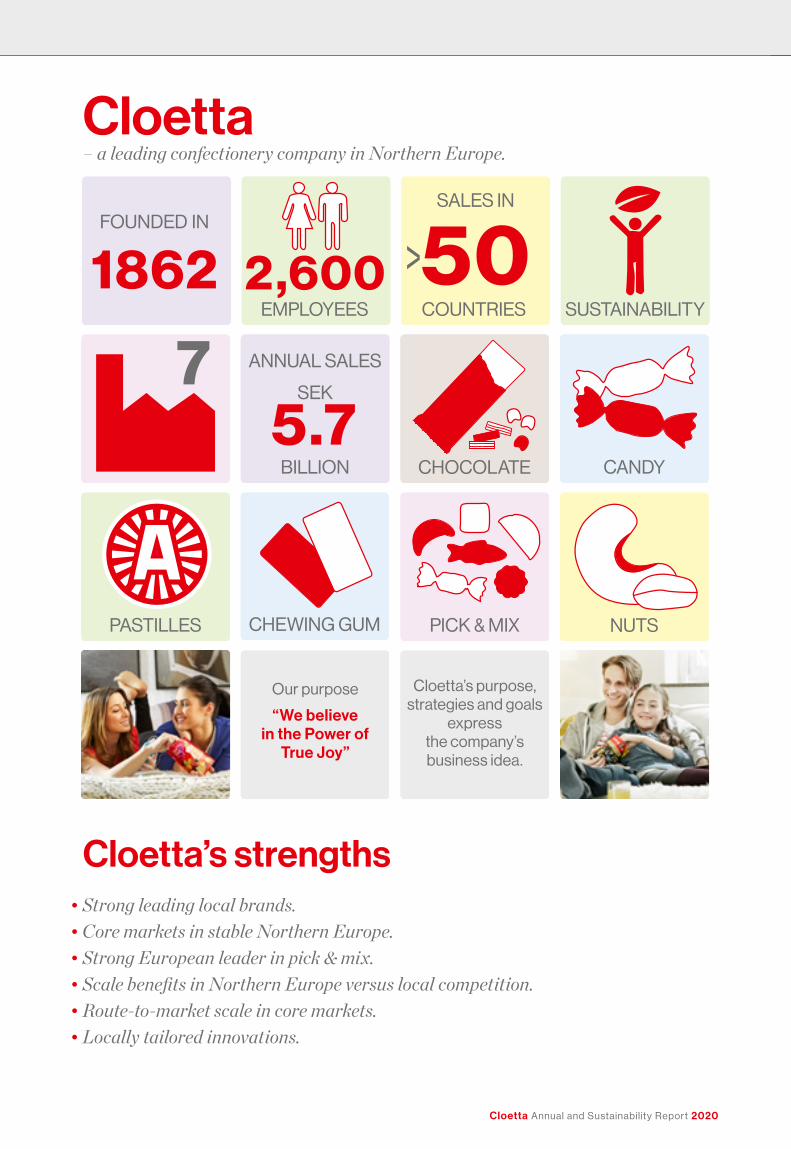
Cloetta’s strengths• Strong leading local brands.• Core markets in stable Northern Europe.• Strong European leader in pick & mix.• Scale benefits in Northern Europe versus local competition.• Route-to-market scale in core markets.• Locally tailored innovations.
CANDY
CHEWING GUM
CHOCOLATE
7
FOUNDED IN
1862SUSTAINABILITY
NUTSPASTILLES PICK & MIX
COUNTRIES
50SALES IN
Cloetta – a leading confectionery company in Northern Europe.
EMPLOYEES2,600
ANNUAL SALES
5.7BILLION
SEK
Our purpose
“We believe in the Power of
True Joy”
Cloetta’s purpose, strategies and goals
express the company’s business idea.
Cloetta Annual and Sustainability Report 2020
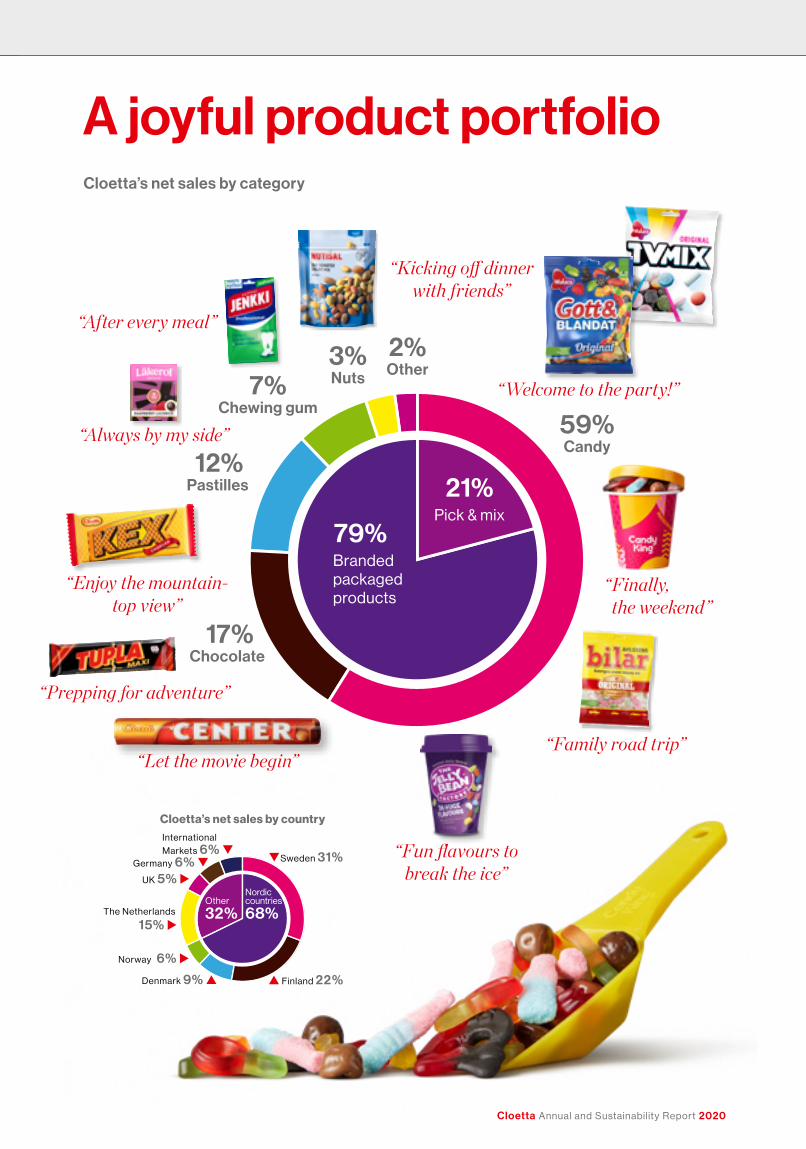
A joyful product portfolio
Norway 6% u
Denmark 9% p p Finland 22%
The Netherlands
15% u
qSweden 31%
International Markets 6% q
Nordiccountries 68%
Other 32%
UK 5% u
Cloetta’s net sales by country
Germany 6% q
59% Candy
17% Chocolate
12% Pastilles
7% Chewing gum
3% Nuts
2% Other
Pick & mix
21%
Branded packaged products
79%
“Kicking off dinner with friends”
“Welcome to the party!”
“Let the movie begin”“Family road trip”
“Fun flavours to break the ice”
“ Finally, the weekend”
“Prepping for adventure”
“Enjoy the mountain- top view”
“Always by my side”
“After every meal”
Cloetta’s net sales by category

1
Cloetta Annual and Sustainability Report 2020 << B a c k t o c o n t e n t s
2 0 2 0 i n B r i e f
Words from the president
Goals & strategies
Sustain ability Markets Operations & employees
Share & Shareholders
financial performance
risks & Corporate Governance
financial reports
Sustain ability impact
1
2020 in brief
SEKm
–150
–100
–50
0
50
100
150
200
250
300
Q4Q3Q2Q1
n 2019 n 2020
Free cash flow
Net salesSEKm
0
500
1,000
1,500
2,000
Q4Q3Q2Q1
n 2019 n 2020
Operating profit, adjusted SEKm
0
50
100
150
200
250
Q4Q3Q2Q1
n 2019 n 2020
Q1
Q2
Q3
Q4Examples of new product launches during the year
Key ratiosSEKm 2020 2019 2018 2017 2016
Net sales 5,695 6,493 6,218 5,784 5,107
Operating profit (EBIT), adjusted 515 743 677 604 695
Operating profit margin (EBIT margin), adjusted, %
9.0 11.4 10.9 10.4 13.6
Operating profit (EBIT) 462 727 660 527 635
Operating profit margin (EBIT margin), % 8.1 11.2 10.6 9.1 12.4
Profit before tax 403 648 562 443 469
Profit/loss for the period 281 498 483 –97 –191
Earnings per share, basic, SEK 0.98 1.74 1.69 – 0.34 – 0.67
Earnings per share, diluted, SEK 0.98 1.74 1.68 – 0.34 – 0.67
Net debt/EBITDA, x 2.7 2.2 2.3 2.4 2.4
Free cash flow 366 538 444 555 719
Cash flow from operating activities 656 724 628 712 889
For definitions, see page 164.
• Nomination Committee proposes Mikael Norman as new Chairman of the Board.
• Cloetta withdraws dividend proposal due to Covid-19 uncertainty.• New cross-functional Cash committee established.
• Cloetta introduces PlantPack, a plastic that is made partly from plants, suitable for confectionery packaging.
• Repositioning of CandyKing is rolled out.
• Cloetta decides to outsource the manufacturing of nuts to improve its competitiveness.
• Reorganisation in Sweden to increase the profitability of the market and drive operational improvements.
• The Board of Directors of Cloetta AB proposes new dividend for 2019.• Cloetta joins the Science Based Targets initiative.
• Cloetta in the Netherlands ranked by MT 500 magazine as the top employer of all FMCG companies in the Netherlands.
• Dividend of SEK 0.50 per share approved by the EGM and is paid out. • Läkerol Raspberry Licorice wins the award “Product of the Year”
within the confectionery category.
Words from the president
Goals & strategies
Sustain ability Markets Operations & employees
Share & Shareholders
financial performance
risks & Corporate Governance
financial reports
Sustain ability impact
2
Cloetta Annual and Sustainability Report 2020<< B a c k t o c o n t e n t s
W O r d S f r O M t h e P r e S i d e n t
Words from the president
Goals & strategies
Sustain ability Markets Operations & employees
Share & Shareholders
financial performance
risks & Corporate Governance
financial reports
Sustain ability impact
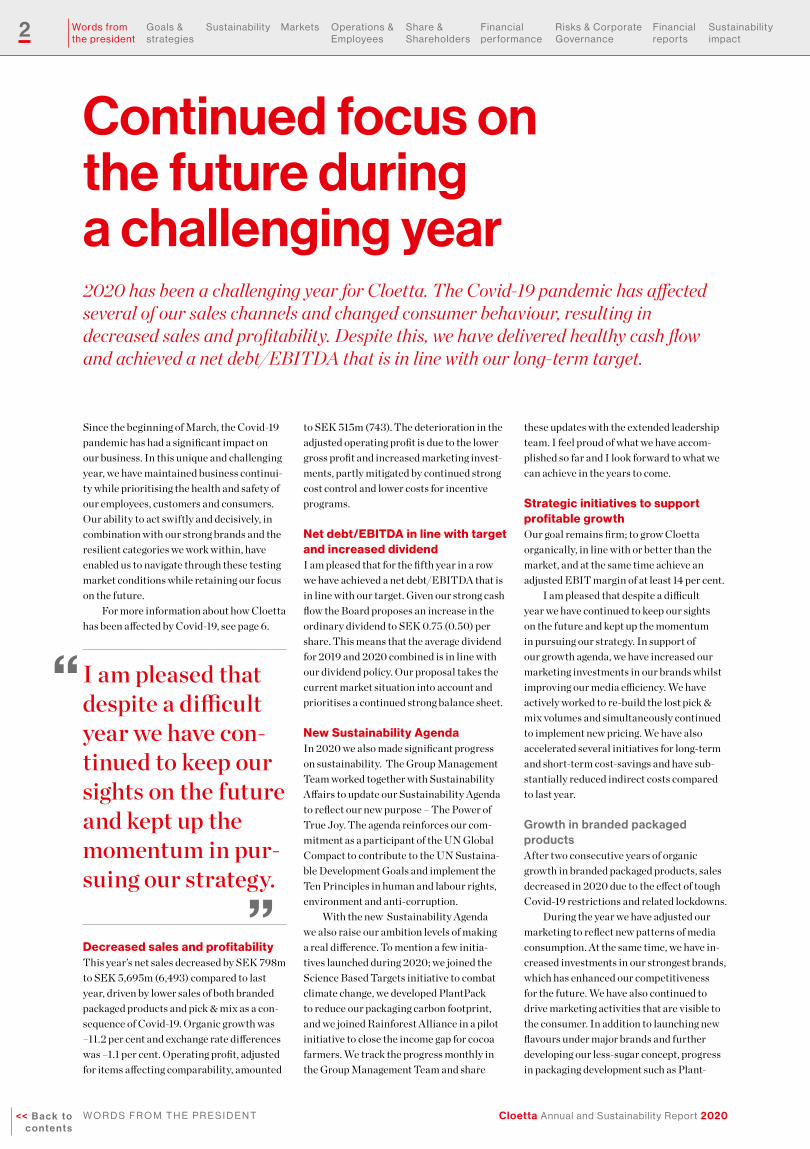
Continued focus on the future during a challenging year2020 has been a challenging year for Cloetta. The Covid-19 pandemic has affected several of our sales channels and changed consumer behaviour, resulting in decreased sales and profitability. Despite this, we have delivered healthy cash flow and achieved a net debt/EBITDA that is in line with our long-term target.
Since the beginning of March, the Covid-19 pandemic has had a significant impact on our business. In this unique and challenging year, we have maintained business continui-ty while prioritising the health and safety of our employees, customers and consumers. Our ability to act swiftly and decisively, in combination with our strong brands and the resilient categories we work within, have enabled us to navigate through these testing market conditions while retaining our focus on the future.
For more information about how Cloetta has been affected by Covid-19, see page 6.
Decreased sales and profitability This year’s net sales decreased by SEK 798m to SEK 5,695m (6,493) compared to last year, driven by lower sales of both branded packaged products and pick & mix as a con-sequence of Covid-19. Organic growth was –11.2 per cent and exchange rate differences was –1.1 per cent. Operating profit, adjusted for items affecting comparability, amounted
to SEK 515m (743). The deterioration in the adjusted operating profit is due to the lower gross profit and increased marketing invest-ments, partly mitigated by continued strong cost control and lower costs for incentive programs.
Net debt/EBITDA in line with target and increased dividendI am pleased that for the fifth year in a row we have achieved a net debt/EBITDA that is in line with our target. Given our strong cash flow the Board proposes an increase in the ordinary dividend to SEK 0.75 (0.50) per share. This means that the average dividend for 2019 and 2020 combined is in line with our dividend policy. Our proposal takes the current market situation into account and prioritises a continued strong balance sheet.
New Sustainability AgendaIn 2020 we also made significant progress on sustainability. The Group Management Team worked together with Sustainability Affairs to update our Sustainability Agenda to reflect our new purpose – The Power of True Joy. The agenda reinforces our com-mitment as a participant of the UN Global Compact to contribute to the UN Sustaina-ble Development Goals and implement the Ten Principles in human and labour rights, environment and anti-corruption.
With the new Sustainability Agenda we also raise our ambition levels of making a real difference. To mention a few initia-tives launched during 2020; we joined the Science Based Targets initiative to combat climate change, we developed PlantPack to reduce our packaging carbon footprint, and we joined Rainforest Alliance in a pilot initiative to close the income gap for cocoa farmers. We track the progress monthly in the Group Management Team and share
these updates with the extended leadership team. I feel proud of what we have accom-plished so far and I look forward to what we can achieve in the years to come.
Strategic initiatives to support profitable growthOur goal remains firm; to grow Cloetta organically, in line with or better than the market, and at the same time achieve an adjusted EBIT margin of at least 14 per cent.
I am pleased that despite a difficult year we have continued to keep our sights on the future and kept up the momentum in pursuing our strategy. In support of our growth agenda, we have increased our marketing investments in our brands whilst improving our media efficiency. We have actively worked to re-build the lost pick & mix volumes and simultaneously continued to implement new pricing. We have also accelerated several initiatives for long-term and short-term cost-savings and have sub-stantially reduced indirect costs compared to last year.
Growth in branded packaged productsAfter two consecutive years of organic growth in branded packaged products, sales decreased in 2020 due to the effect of tough Covid-19 restrictions and related lockdowns.
During the year we have adjusted our marketing to reflect new patterns of media consumption. At the same time, we have in-creased investments in our strongest brands, which has enhanced our competitiveness for the future. We have also continued to drive marketing activities that are visible to the consumer. In addition to launching new flavours under major brands and further developing our less-sugar concept, progress in packaging development such as Plant-
I am pleased that despite a difficult year we have con-tinued to keep our sights on the future and kept up the momentum in pur-suing our strategy.

3
Cloetta Annual and Sustainability Report 2020 << B a c k t o c o n t e n t s
W O r d S f r O M t h e P r e S i d e n t
Words from the president
Goals & strategies
Sustain ability Markets Operations & employees
Share & Shareholders
financial performance
risks & Corporate Governance
financial reports
Sustain ability impact
Pack have enabled us to innovate and meet important consumer demands. We have also continued to focus on premium products and value creation during the year.
We will continue to drive profitable growth in branded packaged products and thereby generate a more favourable product mix for the organisation as the category has an EBIT margin of more than 14 per cent.
Sustainable profitability in the pick & mix businessPick & mix is an important consumer market for us based on underlying consumer trends such as increasing individualism and less use of plastic packaging. The category is also of importance for our customers as it increases in-store traffic. Pick & mix is also of strategic importance for customer relations as it im-pacts our ability to sell other categories.
Since Covid-19 has had such a major impact on sales, our pick & mix business generated a negative EBIT of approximately SEK 135m in 2020. Rebuilding our volumes is critical for recovering the profitability in the business. To actively rebuild pick & mix volumes, we have successfully worked with our customers to ensure that the previously closed pick & mix fixtures remain open. The next step is to support our customers to fully reinstate consumer activation in the stores as the effects of the pandemic gradually ease. In 2021, we will accelerate the launch of the upgraded CandyKing offering, with increased emphasis on hygiene, to regain consumer confidence.
During the year we have also extended a number of pick & mix contracts to increase profitability and implemented many opera-tional improvements in our pick & mix busi-ness. These measures give me confidence that we will be able to handle the challenges we currently face in the category.
Lower costs and greater efficiencySeveral initiatives were carried out to reduce our costs and increase efficiency through-out the entire business during 2020. A reorganisation took place in Sweden aimed at increasing our profitability in the market and driving operational improvements. We also closed production in Helsingborg and outsourced nuts manufacturing to a third-party supplier. During 2020 we implemented the new system for demand forecasting and inventory optimisation in all markets and also closed our warehouse operations in Norrköping and merged them into the warehouse in Helsingborg. We are also continuously working to sharpen our product assortment by simplifying and reducing complexity.
Since 2019 our VIP+ cost program has enabled more than SEK 130m in reduced SG&A costs, half of which are one-off
savings due to Covid-19 and lower volumes. We will continue our VIP+ cost program activities to improve our underlying cost structure.
High ambitions and a bright outlook for the futureBy focusing on our core categories and main markets, as well as doubling sales in International Markets over time, we will grow at least at the same rate as the market. In addition to this, we may make selective acquisitions within our core categories in our main markets or in adjacent markets. In 2021 we will continue to pursue our strategy whilst adjusting our implementa-tion plans to a constantly changing market environment.
Product development is one of the key drivers for the strength of our brands. Through enhanced innovation efforts we enable market innovation and create the conditions for new product launches and re-launches. E-commerce is another key area to address. Since confectionery is known to be an impulse-purchase category, online shopping presents us with both challenges and new opportunities. We are therefore constantly developing new marketing tools so that we get noticed and end up in
consumers’ online shopping carts. During the coming year we will also intensify efforts to integrate sustainability into our business operations as well as make the company even more consumer focused and cost efficient.
In spite of the challenges, Covid-19 has also demonstrated the many strengths of Cloetta. We have strong local brands that consumers desire and a supply chain that has continued to operate effectively. We have one of the best sales and logistics organisations in our main markets. We have experienced, competent and engaged employees who are proud of both our company and our prod-ucts. And we are a profitable company that generates a stable cash flow that can be used for both dividend pay-outs and to further develop the company.
I therefore feel confident that we are well-equipped to get through this pandemic and come out stronger the other side, to the benefit of our customers, consumers, share-holders and employees.
Stockholm, March 2021
Henri de Sauvage-Nolting President and CEO

4
Cloetta Annual and Sustainability Report 2020<< B a c k t o c o n t e n t s
G O a l S a n d S t r at e G i e S
Words from the president
Goals & strategies
Sustain ability Markets Operations & employees
Share & Shareholders
financial performance
risks & Corporate Governance
financial reports
Sustain ability impact
Long-term financial targetsOrganic sales growth
Cloetta’s long-term target is to increase organic sales at least in line with market growth.
Dividend policy
Cloetta’s policy is to have a dividend payout ratio of 40 to 60 per cent of profit for the year.
Comment on the year’s outcomeThe Board of Directors proposes a dividend of SEK 0.75 (0.50) per share for 2020, which corresponds to 77 per cent (29) of the profit for the year. This brings the average dividend for 2019 and 2020 combined within the dividend policy.
EBIT margin
Cloetta’s long-term target is an adjusted eBit margin of at least 14 per cent.
Comment on the year’s outcomeThe decrease in the adjusted EBIT margin was driven by a lower gross profit and increased marketing investments, partly mitigated by continued strong cost control.
EBIT and margin, adjustedSEKm %
0
100
200
300
400
500
600
700
800
20202019201820172016
EBIT margin, adjusted, %nn EBIT, adjusted
0
2
4
6
8
10
12
14
16
Net salesSEKm
0
1,000
2,000
3,000
4,000
5,000
6,000
7,000
20202019201820172016
Net debt
Cloetta’s long-term target is a net debt/eBitda ratio of around 2.5x.
Comment on the year’s outcomeDespite the Covid-19 situation, Cloetta managed to keep its Net debt/EBITDA ratio around the target of 2.5x.
Net debt/EBITDASEKm
0
500
1,000
1,500
2,000
2,500
3,000
3,500
20202019201820172016
Net debt/EBITDA, xnn Net debt, SEKm
2.22.7
2.32.4 2.4
0
1
2
3
4
5
6
7
Comment on the year’s outcomeFollowing the impact of Covid-19, organic growth was –11.2 per cent. Sales of brand-ed packaged products decreased organi-cally by –2.7 per cent, as an increased de-mand from grocery stores was more than offset by a decline in other sales channels that have either closed or seen a reduction in the number of shoppers. Sales of pick & mix declined organically by –33.7 per cent, driven by temporary measures taken by grocery stores, a lower demand from consumers and lower in-store activation.
5
Cloetta Annual and Sustainability Report 2020 << B a c k t o c o n t e n t s
G O a l S a n d S t r at e G i e S
Words from the president
Goals & strategies
Sustain ability Markets Operations & employees
Share & Shareholders
financial performance
risks & Corporate Governance
financial reports
Sustain ability impact
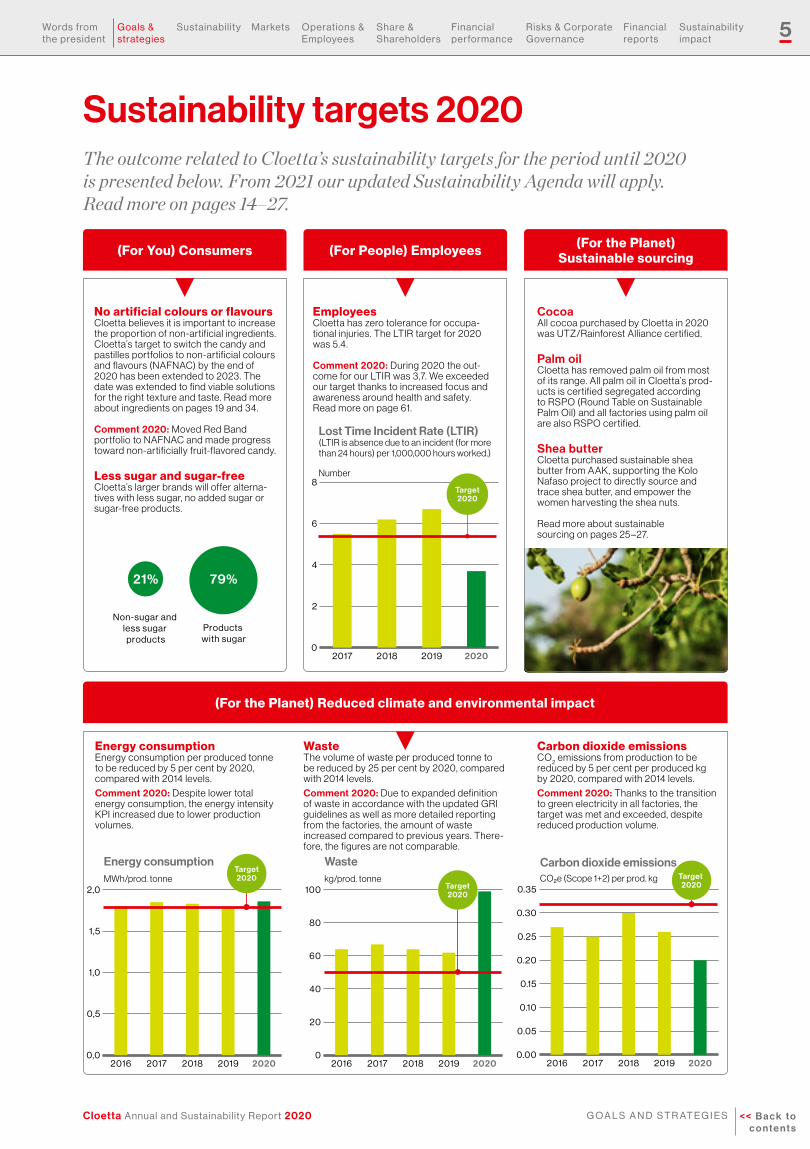
Sustainability targets 2020The outcome related to Cloetta’s sustainability targets for the period until 2020 is presented below. From 2021 our updated Sustainability Agenda will apply. Read more on pages 14–27.
No artificial colours or flavoursCloetta believes it is important to increase the proportion of non-artificial ingredients. Cloetta’s target to switch the candy and pastilles portfolios to non-artificial colours and flavours (NAFNAC) by the end of 2020 has been extended to 2023. The date was extended to find viable solutions for the right texture and taste. Read more about ingredients on pages 19 and 34.
Comment 2020: Moved Red Band portfolio to NAFNAC and made progress toward non-artificially fruit-flavored candy.
Less sugar and sugar-freeCloetta’s larger brands will offer alterna-tives with less sugar, no added sugar or sugar-free products.
EmployeesCloetta has zero tolerance for occupa-tional injuries. The LTIR target for 2020 was 5.4.
Comment 2020: During 2020 the out-come for our LTIR was 3,7. We exceeded our target thanks to increased focus and awareness around health and safety. Read more on page 61.
Carbon dioxide emissionsCO
2 emissions from production to be
reduced by 5 per cent per produced kg by 2020, compared with 2014 levels.
Comment 2020: Thanks to the transition to green electricity in all factories, the target was met and exceeded, despite reduced production volume.
(For the Planet) Reduced climate and environmental impact
(For People) Employees(For You) Consumers
Lost Time Incident Rate (LTIR) (LTIR is absence due to an incident (for morethan 24 hours) per 1,000,000 hours worked.)
Number
0
2
4
6
8
2020201920182017
Target2020
0,0
0,5
1,0
1,5
2,0
20202019201820172016
Energy consumptionMWh/prod. tonne
Target2020
0.00
0.05
0.10
0.15
0.20
0.25
0.30
0.35
20202019201820172016
Carbon dioxide emissions CO2e (Scope 1+2) per prod. kg Target
2020
0
20
40
60
80
100
20202019201820172016
Wastekg/prod. tonne
Target2020
Cocoa All cocoa purchased by Cloetta in 2020 was UTZ/Rainforest Alliance certified.
Palm oil Cloetta has removed palm oil from most of its range. All palm oil in Cloetta’s prod-ucts is certified segregated according to RSPO (Round Table on Sustainable Palm Oil) and all factories using palm oil are also RSPO certified.
Shea butter Cloetta purchased sustainable shea butter from AAK, supporting the Kolo Nafaso project to directly source and trace shea butter, and empower the women harvesting the shea nuts.
Read more about sustainable sourcing on pages 25 –27.
(For the Planet) Sustainable sourcing
Energy consumptionEnergy consumption per produced tonne to be reduced by 5 per cent by 2020, compared with 2014 levels.
Comment 2020: Despite lower total energy consumption, the energy intensity KPI increased due to lower production volumes.
WasteThe volume of waste per produced tonne to be reduced by 25 per cent by 2020, compared with 2014 levels.
Comment 2020: Due to expanded definition of waste in accordance with the updated GRI guidelines as well as more detailed reporting from the factories, the amount of waste increased compared to previous years. There-fore, the figures are not comparable.
Products with sugar
Non-sugar and less sugar
products
21% 79%

6
Cloetta Annual and Sustainability Report 2020<< B a c k t o c o n t e n t s
G O a l S a n d S t r at e G i e S
Words from the president
Goals & strategies
Sustain ability Markets Operations & employees
Share & Shareholders
financial performance
risks & Corporate Governance
financial reports
Sustain ability impact
Impacts and responses to Covid-19
Cloetta has taken different measures to mitigate the impacts of Covid-19, with the highest priority being the safety and well-being of our employees, customers and consumers. We have worked closely with business partners and local authorities to maintain business operations and to prepare for growth in the new reality.
As the pandemic is still active at the time of writing, we expect continued volatility and uncertainty as a result of Covid-19. However, we are convinced that our strategy, combined with our strong brands and market position, position us well to emerge stronger from the crisis.
Customers and consumersThe measures initiated by local authorities have had a major impact on our sales chan-nels and consumer behaviours. While we have seen an increased demand for branded
packaged goods from grocery stores and online sales, many of the sales channels have either been closed or had fewer shoppers for parts of the year. Additionally, we have seen lower sales of impulse purchases. Sales of pick & mix has been impacted negatively due to temporary measures taken by grocery stores and a lower demand from consumers.
To mitigate the impacts of Covid-19, Cloetta has adjusted its marketing costs in terms of media to reflect new patterns of consumption. During the year, we also launched the repositioning of CandyKing to generate sustainable profitability, while also working to re-gain consumer trust in the pick & mix category.
Employees and manufacturingTo ensure the health and safety of our employees and to secure delivery reliability, we took a number of precautions in relation
to Covid-19. We introduced a travel ban and meeting restrictions, restricted access to our factories, and increased inventories of the most crucial raw materials and products. Furthermore, we enhanced our already strict hygiene and safety procedures across the entire value chain.
There was increased absenteeism amongst our factory employees for a while, but we mitigated the negative impact this had on our manufacturing capacity by prior-itising the production of branded packaged goods. Due to the lower demand for pick & mix, a decision was also taken to furlough a limited number of employees in the pick & mix business for a period.
So far, we have avoided any material disruptions in our supply chain, and we have managed to maintain business continuity effectively.
Following the outbreak of Covid-19 and the extraordinary societal measures taken to reduce the spread of the virus, people, communities and companies have found themselves in unprecedented circumstances for the majority of 2020.
Covid-19 timeline
Monthly organic sales growth, %
Jan feB Mar aPr MaY JUn JUl aUG SeP OCt nOV deC
Total –3.9 2.7 –10.0 –25.4 –27.6 –10.1 –6.6 –10.7 –4.9 –11.9 –10.4 –14.7
Branded packaged products – 6.5 2.0 –2.9 –3.6 –16.6 1.5 – 0.9 – 0.4 4.1 –1.4 –3.4 – 6.8
Pick & mix 3.8 4.4 –27.9 –70.5 – 60.2 – 41.1 –27.2 –37.1 –29.6 –38.5 –30.1 –38.4
Planned production stoppages to reduce inventory levels
Jan feB Mar aPr MaY JUn JUl aUG SeP OCt nOV deC2020
Wave #2
Lower sales in channels outside grocery and e-commerce
Enhanced cleaning and safety routines
Travel bansMeeting restrictionsRestricted admission to factoriesSeparate factory shifts
Increased buffer stocks of raw materials and
finished products at risk
Wave #1
Lower consumer demand for pick & mix
Lower sales in channels outside grocery and e-commerce
Board withdraws dividend proposal
Increased absenteeism in factories. Prioritising production of branded products
Retailers opening closed pick & mix shelves
Retailers close pick & mix shelves
Board proposes new dividend
Lower consumer demand for pick & mix
Repositioning of CandyKing launched

7
Cloetta Annual and Sustainability Report 2020 << B a c k t o c o n t e n t s
G O a l S a n d S t r at e G i e S
Words from the president
Goals & strategies
Sustain ability Markets Operations & employees
Share & Shareholders
financial performance
risks & Corporate Governance
financial reports
Sustain ability impact

8
Cloetta Annual and Sustainability Report 2020<< B a c k t o c o n t e n t s
G O a l S a n d S t r at e G i e S
Words from the president
Goals & strategies
Sustain ability Markets Operations & employees
Share & Shareholders
financial performance
risks & Corporate Governance
financial reports
Sustain ability impact
Strategic priorities“We believe in the Power of True Joy”. Cloetta’s purpose is that our products play a positive part in adding that special touch to people’s daily lives. When they savour Cloetta’s products, people experience a moment of true joy. For us, the consumer always comes first in everything that we do. We are convinced that meeting consumer demands and expectations is how Cloetta will grow and our brands will flourish.
Cloetta aims to strengthen its position as the leading confectionery company in North-ern Europe within the candy, chocolate, pastilles, chewing gum, nuts and pick & mix categories.
Thanks to our strong local brands, Cloetta is well positioned to respond to the growing trend of consumers demanding local brands.
Individualisation is another strong glob-al trend. As the leading pick & mix player, this trend is in our favour as the category allows consumers to choose the mixture of candy that suits their individual preferences,
every time. With the shift to e-commerce, retailers are also increasingly looking for products that can give consumers an expe-rience in stores. This is something that the pick & mix category can offer.
Cloetta’s goal is to grow organically by 1–2 per cent, which is in line with or better than the market. This would mean an organ-ic growth of 1–2 per cent in our core markets of Sweden, Finland, the Netherlands, Denmark, Norway, Germany and the UK, as well as expanding and growing faster with selected brands in International Markets.
We will create the conditions for growth by building “One Cloetta” with a common agenda across the entire group.
Furthermore, a focus on cost-efficiency enables Cloetta to increase profitability and invest for the future. Investments are being made to strengthen and increase our manu-facturing capacity, and to enhance the value of the company’s most attractive brands. Our goal is to achieve an adjusted EBIT margin of at least 14 per cent.
Brands and customers
• Strengthen local brands and selectively expand brands internationally
• Focus on the core markets and double sales in International Markets
• Grow market shares and volumes in branded packaged products
• Grow the pick & mix value in core markets
• Offer consumers in all markets the choice of regular, less-sugar, or sugar-free products
• E-commerce channel focus
• Increase the support for leading brands
• Sustainability to come alive through brands
People and organisation
• Zero-tolerance for workplace accidents
• Create “One Cloetta” with one shared agenda and way of working
• Strengthen brand and category management
• Create a winning culture
• Develop, attract and retain skilled leaders and employees
• Educate employees through Cloetta academy
Cost and efficiency
• Drive cost-saving activities throughout the entire organisation within the Value Improvement Program Plus
• Further develop the “Perfect Factory”, a Lean program in manufacturing
• Increase emphasis on efficiency through complexity reductions
• Improve the effectiveness of marketing, and internal systems and processes
• Improve cash management through cash committee

9
Cloetta Annual and Sustainability Report 2020 << B a c k t o c o n t e n t s
G O a l S a n d S t r at e G i e S
Words from the president
Goals & strategies
Sustain ability Markets Operations & employees
Share & Shareholders
financial performance
risks & Corporate Governance
financial reports
Sustain ability impact
Since today’s Cloetta was created in 2012 through the merger of Cloetta and Leaf, the Group has developed in several phases. Im-mediately after the merger, our focus was on streamlining the network of factories, which involved approx. 40 per cent of the products changing factories. At the same time, the implementation of the Group-wide business system commenced, which has enabled fact-
based decision-making and allows orders to be traced from the customer through purchasing of raw materials, manufacturing, warehousing, delivery and invoicing. Imple-mentation was concluded in 2020 withGermany as the final market.
Two large structural changes took place in 2017. First, Cloetta’s Italian business was sold including several factories and a large
number of brands, and second came the acquisition of Candyking, which made pick & mix an important part of the ’s business.
Since 2018, Cloetta has focused on achieving organic growth with the customer front and center. This is how Cloetta will reach its financial goals.
Create opportunities for • Essential marketing investments
• Investments in manufacturing for growth
• Achieving financial goals
Adjusted EBIT margin
≥ 14.0%Long-term goal
Pick & mix business• Repositioning of CandyKing to a premium concept
• Rebuilding profitability through scale and price increases
Branded packaged products• Efficient, faster cross-market innovation
• More effective marketing
• Integration of Sustainability Agenda
Perfect Factory• Cost-efficiency through the Leading Performance program
• Continued insourcing of the sold Italian factories
Reduce indirect costs• Program based on zero-based budgeting
Other value-creating initiatives• New and shared best practices, including revenue
optimisation, net productivity, portfolio management and mix
Value Improvement Program Plus
Pick & mix business, profitability and growth
Organic growth for branded
packaged products
2
3 1
Adjusted EBIT margin
9.0% 2020
Strategic background
Focus for 2020–2021Cloetta will continue to create organic growth and generate a profitable pick & mix business by focusing on recovering the lost Covid-19 volumes, lower costs, greater efficiency and increased investments in marketing of the leading brands. Our long-term goal of at least 14 per cent adjusted EBIT margin will be achieved through three prioritised focus areas:
Sustainability
Lower costs and greater efficiency
Covid-19 recovery• The end of the pandemic will have a positive impact
on sales channels and consumer behaviors

10
Cloetta Annual and Sustainability Report 2020<< B a c k t o c o n t e n t s
G O a l S a n d S t r at e G i e S
Words from the president
Goals & strategies
Sustain ability Markets Operations & employees
Share & Shareholders
financial performance
risks & Corporate Governance
financial reports
Sustain ability impact
We have a clear strategy for growth for branded packaged products which focuses on both the core operations and the group’s strong brands. As branded packaged prod-ucts have an adjusted EBIT margin of over 14 per cent at a Group level, growth within the branded packaged products category is important for Cloetta to be able to reach its profitability target.
Following eight consecutive quarters of growth, the branded packaged products category declined in 2020 as a result of Covid-19. While we have seen an increased demand on branded packaged products from grocery stores and e-commerce, a large part of the sales channels where we sell branded packaged products have either closed or had a reduction in the number of shoppers during parts of the year. We have also seen a nega-tive product mix from a decline in impulse sales as well as lower sales of high-margin products such as chewing gum and pastilles.
Innovations and new productsWe have made fewer but larger investments in new products and flavours during the year. New products are needed for the confection-ery sector as consumers expect brands to offer new experiences and opportunities to try new flavours and textures. New ingredi-ents, flavours and packaging allow Cloetta’s brands to valorise by delivering higher value to the consumer and the retail trade.
At Cloetta, we constantly strive to capitalise on scale and use new product and flavour developments that can be launched in several markets under different brands. Ultimately, with fewer but larger new product developments, the lead times from concept to final product on the market can be reduced significantly. Besides new flavour developments in key brands and further extensions within the less-sugar offering, packaging developments like our PlantPack have enabled Cloetta to innovate and deliver on key consumer needs.
Media investments During the year we have increased the investments in our core brands, which has enhanced our competitiveness for the future. The “one-agency” approach fuelled by best-practice exchange led to media plan-ning and buying optimisation, acceleration of digital marketing transformation and overall ROMI (return on marketing invest-ment) maximisation. A robust ROI (return on investment) modelling was introduced in countries with the highest media spend to ensure further campaign media mix calibration. This has enabled our marketing organisation to build a new, more efficient way of working to allocate increased brand budgets.
Focus on organic growth for branded packaged products
Organic growth for branded
packaged products
1
Growth in branded packaged products, change from previous year%
–7
–6
–5
–4
–3
–2
–1
0
1
2
3
4
Q4Q3Q2Q1Q4Q3Q2Q1Q4Q3Q2Q1
2019 20202018
Global brands
Successful Godt & Blandet campaign across Scandinaviain the fall of 2020, denmark, norway and Sweden, ran a huge campaign for the Godt & Blandet assortment. the campaign is based on an everyday situation, when a dad is cooking for the family while secretly snacking on Godt & Blandet. he is of course found out by one of the children, much to everyone’s amusement. the campaign was rolled out through all relevant media channels; tV, online video and social media, combined with in-store displays and promotions.
iMPaCtfU l CaMPaiGnS

11
Cloetta Annual and Sustainability Report 2020 << B a c k t o c o n t e n t s
G O a l S a n d S t r at e G i e S
Words from the president
Goals & strategies
Sustain ability Markets Operations & employees
Share & Shareholders
financial performance
risks & Corporate Governance
financial reports
Sustain ability impact
Pick & mix is an important consumer market as it goes hand in hand with underlying consumer trends such as individualism and less use of plastic packaging. The category is also of importance for our customers as it increases in-store traffic. P&M is also of strategic importance for customer relations as it impacts our ability to sell other catego-ries. As the leading confectionery company in the Nordic countries, Cloetta has good opportunities to develop the category and thereby drive profitability and growth.
During the year, the pick & mix sales de-clined organically by –33.7 per cent, driven by temporary measures taken by grocery stores, a lower demand from consumers and lower in-store activation. We are now focusing on activities to regain the consumer confidence at the same time as we are con-ducting price increases across our markets to build sustainable profitability in the pick & mix category.
Pick & mix recovery plan – short-termDuring the last two years we have acceler-ated margin enhancement activities which would have brought the Swedish pick & mix business to a break-even point by the end of 2020. This would have been a first step towards building sustainable profitabili-ty. However, given the significant volume
loss due to Covid-19 the effect has been delayed by around one year. Furthermore, as Covid-19 has impacted sales significantly across all markets, and with the high share of fixed costs in the pick & mix business model, Cloetta’s total pick & mix business generated a negative EBIT of approximately SEK 135m in 2020, compared to a profit in 2019.
Rebuilding our volumes is critical for recovering the profitability in pick & mix. To actively rebuild the volumes, we have successfully worked with our customers to ensure that the previously closed pick & mix fixtures remain open. The next step is to support our customers to fully reinstate consumer activation as the suppressing effect of the pandemic gradually eases. In 2021, we will accelerate the launch of the up-graded CandyKing offering, with increased emphasis on hygiene, to regain consumer confidence.
Increase growth in other markets – medium-term Cloetta will continue to focus on creating profitable growth together with the retail trade. We offer a holistic concept including stands, bags and merchandising, both under Cloetta’s name and under the customer’s own name. Furthermore, we offer a hybrid service in which the customers themselves manage merchandising. In addition to our
own pick & mix concepts we offer bulk sales to other concept suppliers enabling avail-ability of Cloetta products and additional profitable sales.
Pick & mix business, profitability and
growth
2Focus on the pick & mix business
Hybrid
4% u
Own private labels u
17%
t Holistic concept 53%
Bulk 26% u
Business models
Denmark
16%
UK
11%
Norway
12%
Sweden
36%
Finland
20%
Other markets
5%
Share of Cloetta’s pick & mix sales
Sales in core markets
Four business models
Cloetta offers customers four different pick & mix business models:
Holistic concept• Includes branding, assortment, fixtures and
in-store merchandising
Own private labels• Similar to the holistic concept but products are
sold under the retailer’s own private brands
Hybrid• In the hybrid model, the customer handles
in-store merchandising themselves
Bulk• Bulk sales to other pick & mix concepts or sales
of individual products
1
2
3
4
5
Open channels
Consumer activation
Regain consumer demand
Address residual under- absorption of fixed costs through cost control and insourcingBuild sustainable profitability
Pick & mix recovery plan

12
Cloetta Annual and Sustainability Report 2020<< B a c k t o c o n t e n t s
G O a l S a n d S t r at e G i e S
Words from the president
Goals & strategies
Sustain ability Markets Operations & employees
Share & Shareholders
financial performance
risks & Corporate Governance
financial reports
Sustain ability impact
During the year, the repositioning of Candy-King was rolled out in selected stores aimed at building sustainable profitability, whilst adding additional activities to regain con-sumer confidence in the pick & mix category.
The new CandyKing is a premium concept and focuses on higher quality and a more attractive assortment with an increased em-phasis on hygiene and tidiness. With social media and in-store activation as a part of the
new concept, we also provide the customers with tangible solutions to increase the num-ber of shoppers.
Repositioning of CandyKingBuilding a brand to drive premium pricing and experience
the new concept symbolises the variety and joy through the design, expression and activities over the year. it is a new brand identity that is brilliantly bold, invitingly joyful and seriously dedicated. the CandyKing design can be customised and adjusted de-pending on the country, channel, consumer, occasion and packaging solution.
a brand that embraces individualism; my mix, my favourites, yet reaching a broad target group. We enhance different occasions, enabling the feeling of a sweeter moment. life is sweet with CandyKing.
360-degree activation with social media and in-store activations to interact and engage with the consumer and shop-per before, during and after the store visit.
higher quality, premium concept with a start & stop solution. attractive merchandising and signage.

13
Cloetta Annual and Sustainability Report 2020 << B a c k t o c o n t e n t s
G O a l S a n d S t r at e G i e S
Words from the president
Goals & strategies
Sustain ability Markets Operations & employees
Share & Shareholders
financial performance
risks & Corporate Governance
financial reports
Sustain ability impact
Cloetta needs to invest to continue to grow. This includes both increasing market invest-ments for branded packaged products and also adapting to changing customer demand.
Perfect Factory ProgramThe “Perfect Factory” program was launched in 2019 and will run over several years. It is a systematic approach with tools, training, knowledge exchange and other improvement activities that generates greater efficiency and reduced waste per unit produced, which translates into lower costs and increased capacity. Increased resource effectiveness contributes to Cloetta’s goal to reduce its negative impact on the environ-ment.
The program is built on standardised tools, real-time measurement, process control and skilled employees. Essential investments in manufacturing are being carried out gradually to increase capacity and efficiency and to reduce carbon dioxide emissions.
Value Improvement Program PlusDuring 2020, Cloetta continued to drive its group-wide holistic program aimed at im-proving profitability, referred to as the Value Improvement Program Plus (VIP+). Part of
the program focuses on optimising our cost structure. All indirect and marketing costs are being reviewed using industry-leading best practices and zero-based budgeting principles. Several activities are being driven in parallel within the scope of the program to improve profitability and provide flexibility for Cloetta to invest in its brands.
During the year, many initiatives were taken within the scope of the program. A reorganisation was initiated in Sweden to increase the profitability of the market and drive operational improvements. We also closed our nut manufacturing in Helsingborg and outsourced production to a third-party supplier. Furthermore, we continued to ex-ecute initiatives for sustainable cost savings and temporary cost avoidances, delivering substantially reduced indirect costs com-pared to the prior year.
Since 2019, the VIP+ cost program has enabled more than SEK 130m in reduced SG&A costs, half of which are one-off savings due to Covid-19 and lower volumes. Approximately SEK 30m of the cost savings has been reinvested into strengthening our brands and marketing capabilities. We will continue to drive our VIP+ cost program in 2021 to improve our underlying cost structure.
Lower costs and greater
efficiency
3 Focus on lower costs and greater efficiency
Sustainable VIP+ savings
One-off savings in 2020
Total savings
> SEK 130m
Significant savings from the VIP+ cost program
Since 2019 the VIP+ cost program has enabled more than SEK 130m in reduced S, G &A costs, half of which are one-off savings due to Covid-19 and lower volumes.

14
Cloetta Annual and Sustainability Report 2020<< B a c k t o c o n t e n t s
S U S ta i n a B i l i t Y
Words from the president
Goals & strategies
Sustain ability Markets Operations & employees
Share & Shareholders
financial performance
risks & Corporate Governance
financial reports
Sustain ability impact
Our Sustainability Agenda
Significant goals:
• Zero accidents.
• 100% Rainforest Alliance certified cocoa.
• 100% RSPO certified segregated palm oil.
• Living income paid to farmers in our supply chain.
Significance: Consumers are at the heart of our business. We provide consumers with high quality and safe prod-ucts, sustainable ingredients and healthy options.
Approach:We offer a wide variety of products, so that consumers can find options that cor-respond to their preferences, such as low sugar, sugar-free and vegan alternatives.
Significance: Taking care of the people involved in making our products – from farmers to factory staff, as well as the communities where we operate – is critical to our success.
Approach:We take care of our employees, we strengthen our partnerships with suppli-ers, engage with organisations to support farmers, and we take responsibility for our role in our communities and greater society.
Significance: Improving our total planet foot-print throughout the value chain is vital for future generations and essential for our company’s future.
Approach: We have defined three key areas in order to achieve this overarching goal:• Climate action by committing to the
Science Based Targets Initiative • Sustainable sourcing by promoting sus-
tainable practices in our supply chain • Better resource use by developing
sustainable packaging and reducing waste.
Significant goals:
• By 2023 our candy and pastilles will be 100% flavoured and coloured by non-artificial sources.
Significant goals:
• Develop science-based climate targets for 2025/2030.
• Engage key suppliers in sus-tainability sourcing program.
• 100% of our packaging is recyclable by 2025.
• 100% of packaging from renewable or recycled sources by 2030.
GoalGoalGoal
1
For you
2
For people
3
For the planet
Our Sustainability Agenda is built on three pillars that support our overall mission – delivering true joy for you, for people and for the planet. These three pillars represent important areas in our value chain where we have the ability and the responsibility to create a positive impact.
15
Cloetta Annual and Sustainability Report 2020 << B a c k t o c o n t e n t s
S U S ta i n a B i l i t Y
Words from the president
Goals & strategies
Sustain ability Markets Operations & employees
Share & Shareholders
financial performance
risks & Corporate Governance
financial reports
Sustain ability impact
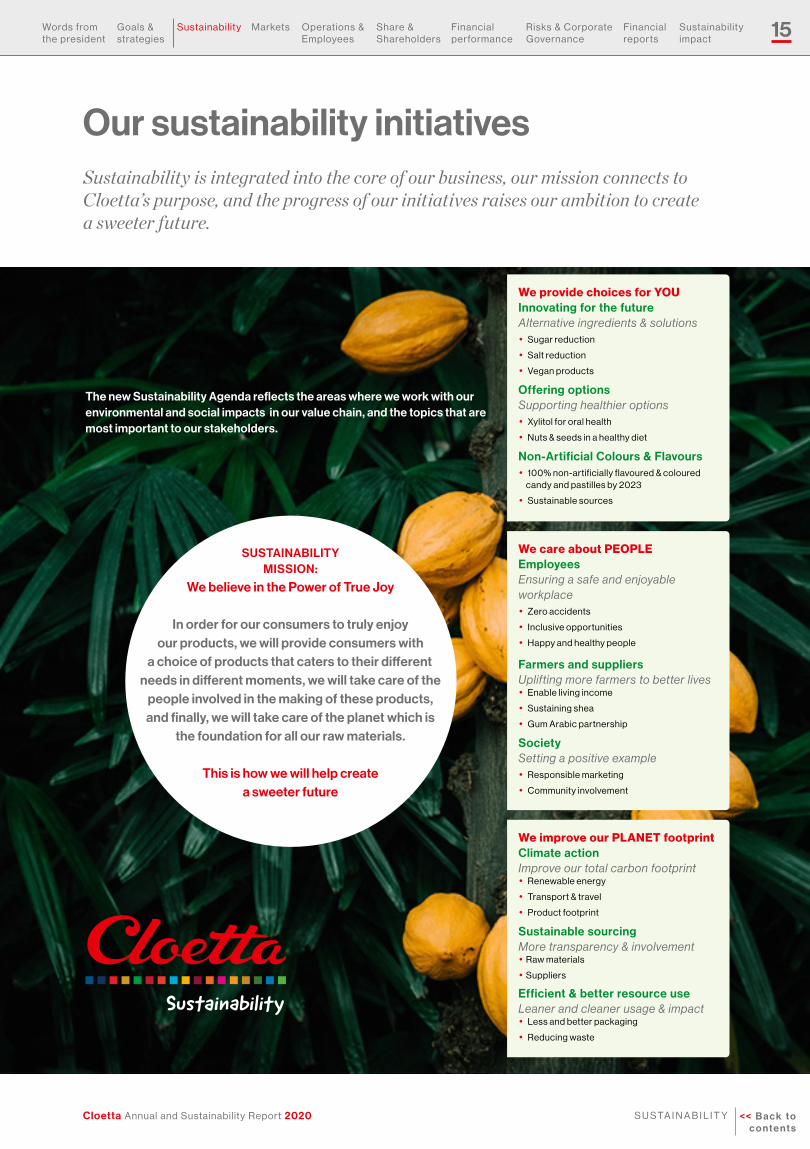
Our sustainability initiativesSustainability is integrated into the core of our business, our mission connects to Cloetta’s purpose, and the progress of our initiatives raises our ambition to create a sweeter future.
We improve our PLANET footprintClimate actionImprove our total carbon footprint• renewable energy
• transport & travel
• Product footprint
Sustainable sourcingMore transparency & involvement• raw materials
• Suppliers
Efficient & better resource useLeaner and cleaner usage & impact• less and better packaging
• reducing waste
The new Sustainability Agenda reflects the areas where we work with our environmental and social impacts in our value chain, and the topics that are most important to our stakeholders.
We provide choices for YOUInnovating for the futureAlternative ingredients & solutions• Sugar reduction
• Salt reduction
• Vegan products
Offering optionsSupporting healthier options• Xylitol for oral health
• nuts & seeds in a healthy diet
Non-Artificial Colours & Flavours• 100% non-artificially flavoured & coloured
candy and pastilles by 2023
• Sustainable sources
We care about PEOPLEEmployeesEnsuring a safe and enjoyable workplace• Zero accidents
• inclusive opportunities
• happy and healthy people
Farmers and suppliersUplifting more farmers to better lives• enable living income
• Sustaining shea
• Gum arabic partnership
Society Setting a positive example• responsible marketing
• Community involvement
SUSTAINABILITY MISSION:
We believe in the Power of True Joy
In order for our consumers to truly enjoy our products, we will provide consumers with
a choice of products that caters to their different needs in different moments, we will take care of the
people involved in the making of these products, and finally, we will take care of the planet which is
the foundation for all our raw materials.
This is how we will help create a sweeter future
16
Cloetta Annual and Sustainability Report 2020<< B a c k t o c o n t e n t s
S U S ta i n a B i l i t Y
Words from the president
Goals & strategies
Sustain ability Markets Operations & employees
Share & Shareholders
financial performance
risks & Corporate Governance
financial reports
Sustain ability impact
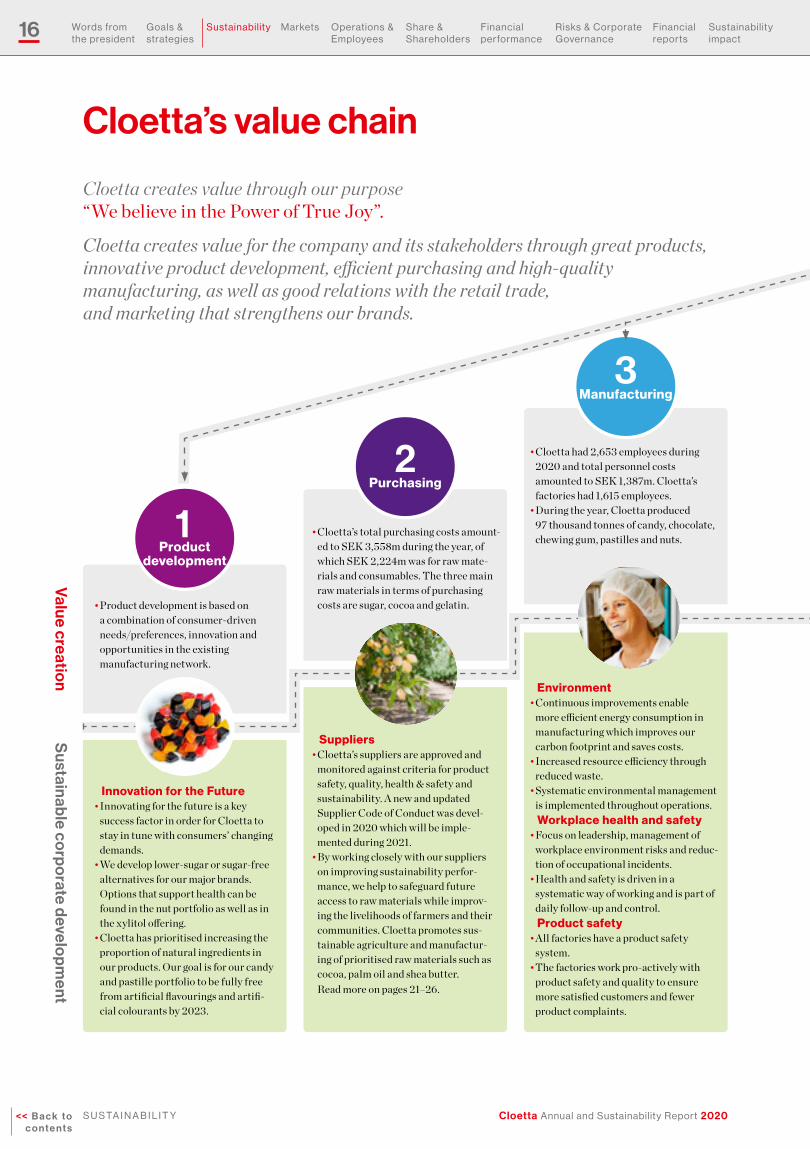
Cloetta’s value chain
Cloetta creates value through our purpose “We believe in the Power of True Joy”.
Cloetta creates value for the company and its stakeholders through great products, innovative product development, efficient purchasing and high-quality manufacturing, as well as good relations with the retail trade, and marketing that strengthens our brands.
Innovation for the Future• Innovating for the future is a key
success factor in order for Cloetta to stay in tune with consumers’ changing demands.
• We develop lower-sugar or sugar-free alternatives for our major brands. Options that support health can be found in the nut portfolio as well as in the xylitol offering.
• Cloetta has prioritised increasing the proportion of natural ingredients in our products. Our goal is for our candy and pastille portfolio to be fully free from artificial flavourings and artifi-cial colourants by 2023.
Suppliers• Cloetta’s suppliers are approved and
monitored against criteria for product safety, quality, health & safety and sustainability. A new and updated Supplier Code of Conduct was devel-oped in 2020 which will be imple-mented during 2021.
• By working closely with our suppliers on improving sustainability perfor-mance, we help to safeguard future access to raw materials while improv-ing the livelihoods of farmers and their communities. Cloetta promotes sus-tainable agriculture and manufactur-ing of prioritised raw materials such as cocoa, palm oil and shea butter. Read more on pages 21–26.
Value creation
Sustainable co
rpo
rate develop
ment
• Product development is based on a combination of consumer-driven needs/preferences, innovation and opportunities in the existing manufacturing network.
1Product
development
• Cloetta’s total purchasing costs amount-ed to SEK 3,558m during the year, of which SEK 2,224m was for raw mate-rials and consumables. The three main raw materials in terms of purchasing costs are sugar, cocoa and gelatin.
2Purchasing
• Cloetta had 2,653 employees during 2020 and total personnel costs amounted to SEK 1,387m. Cloetta’s factories had 1,615 employees.
• During the year, Cloetta produced 97 thousand tonnes of candy, chocolate, chewing gum, pastilles and nuts.
3Manufacturing
Environment • Continuous improvements enable
more efficient energy consumption in manufacturing which improves our carbon footprint and saves costs.
• Increased resource efficiency through reduced waste.
• Systematic environmental management is implemented throughout operations. Workplace health and safety
• Focus on leadership, management of workplace environment risks and reduc-tion of occupational incidents.
• Health and safety is driven in a systematic way of working and is part of daily follow-up and control. Product safety
• All factories have a product safety system.
• The factories work pro-actively with product safety and quality to ensure more satisfied customers and fewer product complaints.
17
Cloetta Annual and Sustainability Report 2020 << B a c k t o c o n t e n t s
S U S ta i n a B i l i t Y
Words from the president
Goals & strategies
Sustain ability Markets Operations & employees
Share & Shareholders
financial performance
risks & Corporate Governance
financial reports
Sustain ability impact
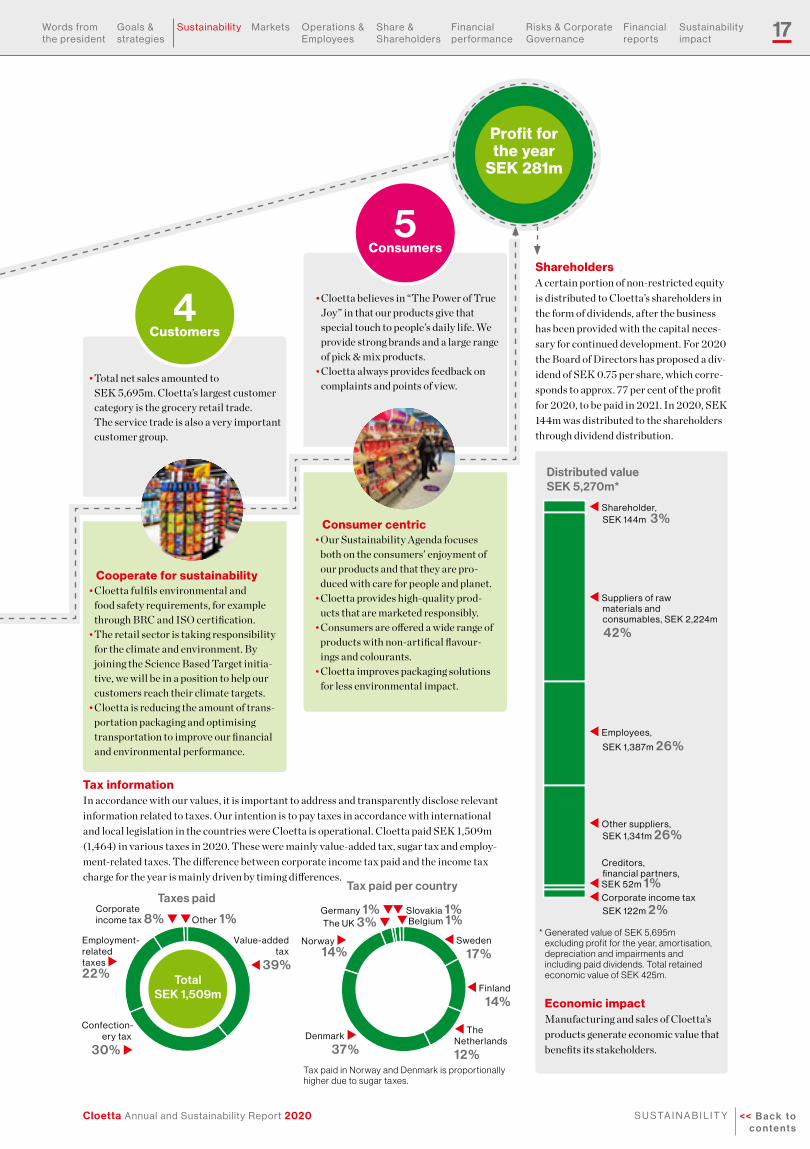
Profit for the year
SEK 281m
Cooperate for sustainability• Cloetta fulfils environmental and
food safety requirements, for example through BRC and ISO certification.
• The retail sector is taking responsibility for the climate and environment. By joining the Science Based Target initia-tive, we will be in a position to help our customers reach their climate targets.
• Cloetta is reducing the amount of trans-portation packaging and optimising transportation to improve our financial and environmental performance.
Consumer centric• Our Sustainability Agenda focuses
both on the consumers’ enjoyment of our products and that they are pro-duced with care for people and planet.
• Cloetta provides high-quality prod-ucts that are marketed responsibly.
• Consumers are offered a wide range of products with non-artifical flavour-ings and colourants.
• Cloetta improves packaging solutions for less environmental impact.
ShareholdersA certain portion of non-restricted equity is distributed to Cloetta’s shareholders in the form of dividends, after the business has been provided with the capital neces-sary for continued development. For 2020 the Board of Directors has proposed a div-idend of SEK 0.75 per share, which corre-sponds to approx. 77 per cent of the profit for 2020, to be paid in 2021. In 2020, SEK 144m was distributed to the shareholders through dividend distribution.
Economic impactManufacturing and sales of Cloetta’s products generate economic value that benefits its stakeholders.
* Generated value of SEK 5,695m excluding profit for the year, amortisation, depreciation and impairments and including paid dividends. Total retained economic value of SEK 425m.
Tax informationIn accordance with our values, it is important to address and transparently disclose relevant information related to taxes. Our intention is to pay taxes in accordance with international and local legislation in the countries were Cloetta is operational. Cloetta paid SEK 1,509m (1,464) in various taxes in 2020. These were mainly value-added tax, sugar tax and employ-ment-related taxes. The difference between corporate income tax paid and the income tax charge for the year is mainly driven by timing differences.
Taxes paidCorporate income tax 8% q
Employment-relatedtaxes u22%
Confection-ery tax
30% u
Value-added tax
t 39%
qOther 1%
Total SEK 1,509m
Tax paid per country
The UK 3% q
Norway u14%
Denmark u
37%
t Sweden
17%
Germany 1% q
t Finland
14%
t The Netherlands
12%
q Slovakia 1%qBelgium 1%
Tax paid in Norway and Denmark is proportionally higher due to sugar taxes.
• Total net sales amounted to SEK 5,695m. Cloetta’s largest customer category is the grocery retail trade. The service trade is also a very important customer group.
4Customers
• Cloetta believes in “The Power of True Joy” in that our products give that special touch to people’s daily life. We provide strong brands and a large range of pick & mix products.
• Cloetta always provides feedback on complaints and points of view.
5Consumers
Distributed value SEK 5,270m*
t Shareholder, SEK 144m 3%
Creditors, financial partners, t SEK 52m 1%
t Other suppliers, SEK 1,341m 26%
t Employees,
SEK 1,387m 26%
t Suppliers of raw materials and consumables, SEK 2,224m
42%
t Corporate income tax SEK 122m 2%

18
Cloetta Annual and Sustainability Report 2020<< B a c k t o c o n t e n t s
S U S ta i n a B i l i t Y
Words from the president
Goals & strategies
Sustain ability Markets Operations & employees
Share & Shareholders
financial performance
risks & Corporate Governance
financial reports
Sustain ability impact
There’s a present need for true joy for our planet, our society and our consumers. We’ve faced a year that has posed challenges, tragedies, and new norms, all while reinforcing the importance of the aims of our new Sustainability Agenda. The Sustainability Agenda reflects the issues that are the most impor-tant to our stakeholders and areas where we have the most ability to make an impact.
In 2020, we started several new initiatives, which is why all targets and KPIs aren’t clarified yet. These are developed with a strategic future focus, aligned with our business strategy and our commitment to the Global Sustainable Development Goals. Our initiatives are actively owned by Group Management and will be assessed annually based on the material-ity analysis. The following pages describe the three sustainability pillars and how we believe in the power of true joy for you, for people and for the planet.
The power of true joy …for our future
As a participant of the United Nations Global Compact since 2009, we support the Sustainable Development Goals (SDGs).
Cloetta’s Sustainability Agenda focuses on six of the 17 UN Global Sustainable Development Goals.
Each pillar of our new Sustainability Agenda contributes to at least one of the SDGs, both directly and indirectly. We’ve prioritised these six goals where our business has the greatest ability to impact and influence change.
As a fast-moving consumer goods business, we have an important role in promoting Responsible Consumption and Production (#12).
Gender Equality (#5) and Decent Work and Economic Growth (#8) are central to our For People pillar, working with our employees, supply chain and society. Climate Action (#13) and Life on Land (#15) are supported by our For the Planet initiatives. Partnerships for the Goals (#17) is the common theme enabling all of our efforts with the help of our partners and suppliers.
The Stockholm Resilience Centre’s “Wedding Cake”, illustrated below, visually portrays the goals as the environmental base, holding up the societal and economic goals, and with the common theme of partnerships through-out (the wedding couple). This representation resonates with how we as a business have an active role in the economic and social goals, but sustaina-bly managing our planet’s resources is fundamental for our business. Our so-cial and economic goals will be unattainable in the future if we do not do our part to combat climate change and take responsibility for our actions now.
Global Sustainable Development Goals
5. Gender Equality 8. Decent Work and Economic Growth 12. Responsible Consumption and Production 13. Climate Action 15. Life on Land 17. Partnerships for the Goals
Sustainability supports our business strategy
Cloetta’s Sustainability Agenda supports and is well embedded in the company’s business strategy.
• Brands and customers. through innovative, sustainable products and pack-aging we are responding to consumers’ increased awareness about social and environmental issues. We source sustainable raw materials to further strength-en our brands among customers and consumers. UtZ/rainforest alliance certified cocoa is one example. By committing to the Science Based targets initiative we join our customers in a common effort to take on the climate crisis.
• People and organisation. Cloetta enables growth by creating an attractive workplace and a high-performing organisation. We offer our employees attractive opportunities to grow as well as competitive remuneration. Cloetta’s inspiring corporate culture and clear corporate identity also enable growth. having a strong sustainability program helps to build pride in our workforce.
• Cost and efficiency. reducing our environmental impact often goes hand in hand with lower costs. as an example, when the factories reduce energy consumption and minimise waste this contributes to greater cost-efficiency. Streamlining and centralising management systems for health and safety and the environment will improve our performance even further.
for more information about Cloetta’s business strategy, see pages 8 –9.

19
Cloetta Annual and Sustainability Report 2020 << B a c k t o c o n t e n t s
S U S ta i n a B i l i t Y
Words from the president
Goals & strategies
Sustain ability Markets Operations & employees
Share & Shareholders
financial performance
risks & Corporate Governance
financial reports
Sustain ability impact
The first pillar of our Sustainability Agenda is grounded in the purpose of our business. When our consumers trust that we conduct our business responsibly, they can truly enjoy our products.
Responsible Consumption and Produc-tion is the core SDG for everything we do at Cloetta. We take responsibility for product quality and food safety, we source sustaina-ble ingredients and we provide options that consider consumers’ health. During 2020, we focused on three areas in the For You pillar: Innovating for the future, Offering op-tions, and Non-artificial flavours & colours.
For you
Choice for youtrue joy does not look the same for everyone, which is why we aim to pro-vide alternatives to our classic favour-ites. for example, the 30% less sugar alternative in Malaco’s Gott & Blandat has been well received in Sweden.
during 2020 we developed options without gelatin or milk-based ingredi-ents to cater to our vegan consumers, for example vegan Kexchoklad. We will continue to listen to consumer prefer-ences as we innovate new products.
Risks we consider • Brand-related risks resulting in
decreased sales• Political decisions such as sugar taxes• Risk of changing consumer dietary
preferences, with negative conse-quences for Cloetta
• Potential new risks from the substitu-tion of different ingredients
Innovating for the futureDeveloping alternatives with:• Less sugar, no added sugar,
or sugar-free• Reduced salt or no salt• Vegan choices: substituting
gelatin and milk-based ingredients
Offering optionsOur product offering responds to a diverse universe• Xylitol products support oral health• Nuts and seeds in a healthy diet• Varied portion & packaging sizes
NAFNAC (Non-artificial flavours and colours)Our goal is to have all candy and pastilles flavoured and coloured by non-artificial sources by 2023• Moving to more natural ingredients in
fruit flavoured candy• Nuts and chocolate in the pipeline
Consumers are always at the centre of what we do. Cloetta offers high-quality and safe products, serving the diverse universe with a variety of preferences.
Oral Health: Healthier smiles Cloetta has been a pioneer in com-mercialising the dental benefits of xylitol products since the 1970’s.B E N E FITS: reduces plaque & risk of tooth decay*.
E FFECTIVE PARTN E RS H I PS: Close co-operation with researchers, den-tists and dental hygienists.PART O F DAI LY N UTR ITI O N
R ECO M M E N DATI O N : Up to 90 per cent of finnish daycare centres provide xylitol pastilles after meals.G IVI N G BAC K TO TH E CO M M U N IT Y:
Cloetta finland hosts yearly activities to keep dental health and xylitol top-of-mind. SWE ET SU CC ESS : a functional alter-native that promotes fresh and healthy smiles.
* Chewing gum sweetened with 100% xylitol has been shown to reduce dental plaque. High content of dental plaque is a risk factor in the development of caries in children.
We’re nuts about nuts!Our nut profile is moving towards natural flavours, sustainable sources, reduced or no salt and recyclable packaging.
during 2020 we reduced salt in the entire nutisal portfolio. nuts and seeds make the perfect satisfying snack in a healthy diet, with Parrots and nutisal products offering a wide selection. nuts are a natural source of different vitamins and minerals and they also contain antioxidants.
1
For you
20
Cloetta Annual and Sustainability Report 2020<< B a c k t o c o n t e n t s
S U S ta i n a B i l i t Y
Words from the president
Goals & strategies
Sustain ability Markets Operations & employees
Share & Shareholders
financial performance
risks & Corporate Governance
financial reports
Sustain ability impact
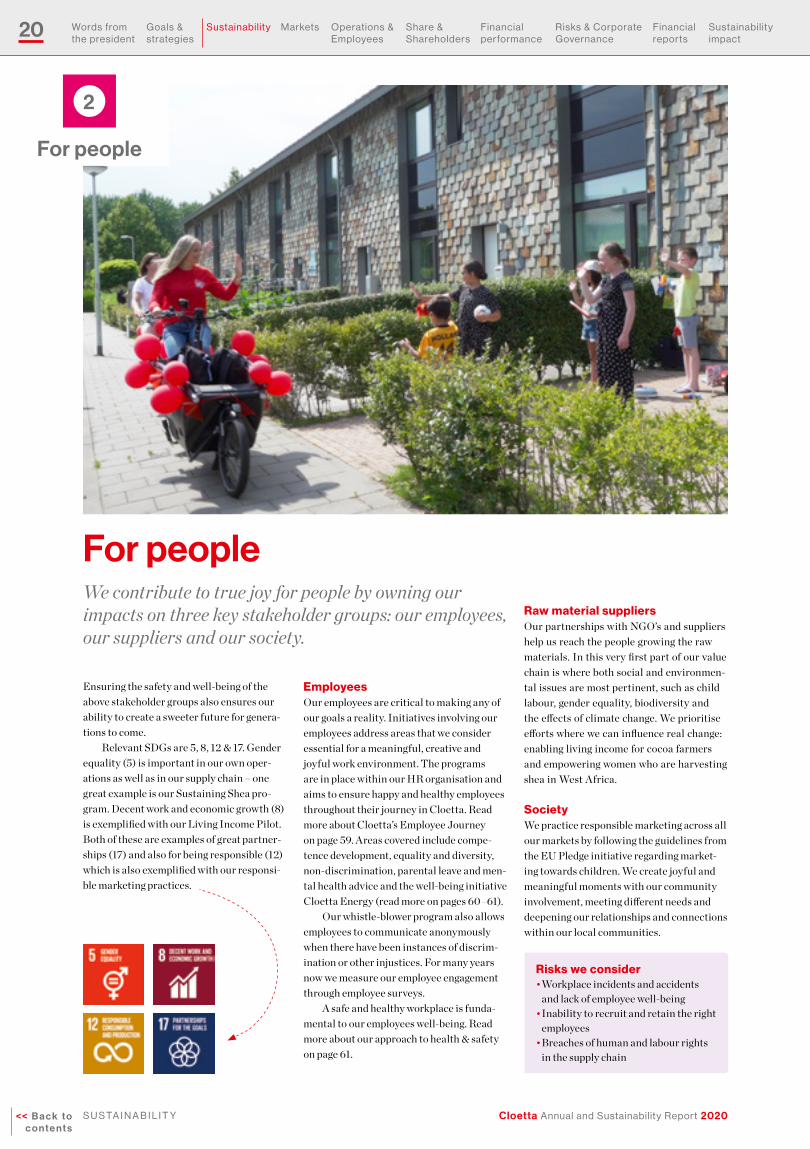
Ensuring the safety and well-being of the above stakeholder groups also ensures our ability to create a sweeter future for genera-tions to come.
Relevant SDGs are 5, 8, 12 & 17. Gender equality (5) is important in our own oper-ations as well as in our supply chain – one great example is our Sustaining Shea pro-gram. Decent work and economic growth (8) is exemplified with our Living Income Pilot. Both of these are examples of great partner-ships (17) and also for being responsible (12) which is also exemplified with our responsi-ble marketing practices.
For people
Risks we consider• Workplace incidents and accidents
and lack of employee well-being• Inability to recruit and retain the right
employees• Breaches of human and labour rights
in the supply chain
We contribute to true joy for people by owning our impacts on three key stakeholder groups: our employees, our suppliers and our society.
EmployeesOur employees are critical to making any of our goals a reality. Initiatives involving our employees address areas that we consider essential for a meaningful, creative and joyful work environment. The programs are in place within our HR organisation and aims to ensure happy and healthy employees throughout their journey in Cloetta. Read more about Cloetta’s Employee Journey on page 59. Areas covered include compe-tence development, equality and diversity, non-discrimination, parental leave and men-tal health advice and the well-being initiative Cloetta Energy (read more on pages 60–61).
Our whistle-blower program also allows employees to communicate anonymously when there have been instances of discrim-ination or other injustices. For many years now we measure our employee engagement through employee surveys.
A safe and healthy workplace is funda-mental to our employees well-being. Read more about our approach to health & safety on page 61.
Raw material suppliers Our partnerships with NGO’s and suppliers help us reach the people growing the raw materials. In this very first part of our value chain is where both social and environmen-tal issues are most pertinent, such as child labour, gender equality, biodiversity and the effects of climate change. We prioritise efforts where we can influence real change: enabling living income for cocoa farmers and empowering women who are harvesting shea in West Africa.
SocietyWe practice responsible marketing across all our markets by following the guidelines from the EU Pledge initiative regarding market-ing towards children. We create joyful and meaningful moments with our community involvement, meeting different needs and deepening our relationships and connections within our local communities.
2
For people
21
Cloetta Annual and Sustainability Report 2020 << B a c k t o c o n t e n t s
S U S ta i n a B i l i t Y
Words from the president
Goals & strategies
Sustain ability Markets Operations & employees
Share & Shareholders
financial performance
risks & Corporate Governance
financial reports
Sustain ability impact
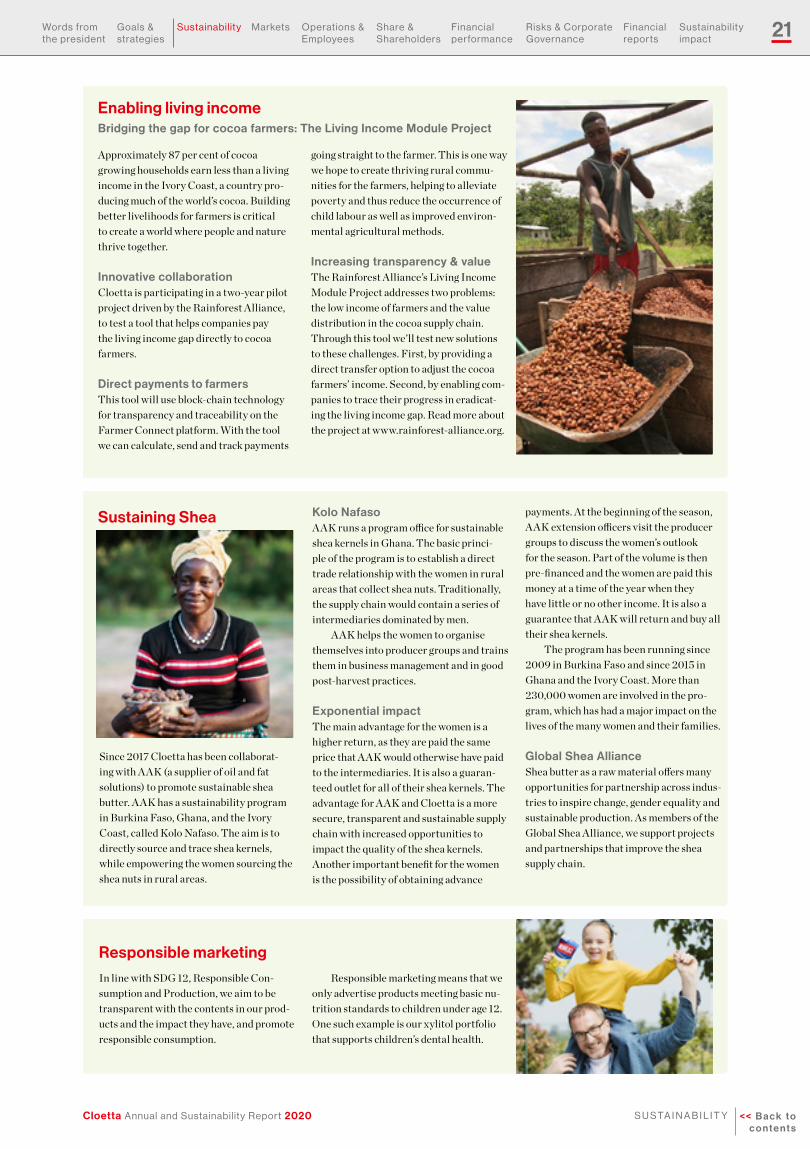
Enabling living incomeBridging the gap for cocoa farmers: The Living Income Module Project
Approximately 87 per cent of cocoa growing households earn less than a living income in the Ivory Coast, a country pro-ducing much of the world’s cocoa. Building better livelihoods for farmers is critical to create a world where people and nature thrive together.
Innovative collaborationCloetta is participating in a two-year pilot project driven by the Rainforest Alliance, to test a tool that helps companies pay the living income gap directly to cocoa farmers. Direct payments to farmersThis tool will use block-chain technology for transparency and traceability on the Farmer Connect platform. With the tool we can calculate, send and track payments
going straight to the farmer. This is one way we hope to create thriving rural commu-nities for the farmers, helping to alleviate poverty and thus reduce the occurrence of child labour as well as improved environ-mental agricultural methods.
Increasing transparency & valueThe Rainforest Alliance’s Living Income Module Project addresses two problems: the low income of farmers and the value distribution in the cocoa supply chain. Through this tool we’ll test new solutions to these challenges. First, by providing a direct transfer option to adjust the cocoa farmers’ income. Second, by enabling com-panies to trace their progress in eradicat-ing the living income gap. Read more about the project at www.rainforest-alliance.org.
Since 2017 Cloetta has been collaborat-ing with AAK (a supplier of oil and fat solutions) to promote sustainable shea butter. AAK has a sustainability program in Burkina Faso, Ghana, and the Ivory Coast, called Kolo Nafaso. The aim is to directly source and trace shea kernels, while empowering the women sourcing the shea nuts in rural areas.
Kolo NafasoAAK runs a program office for sustainable shea kernels in Ghana. The basic princi-ple of the program is to establish a direct trade relationship with the women in rural areas that collect shea nuts. Traditionally, the supply chain would contain a series of intermediaries dominated by men.
AAK helps the women to organise themselves into producer groups and trains them in business management and in good post-harvest practices.
Exponential impactThe main advantage for the women is a higher return, as they are paid the same price that AAK would otherwise have paid to the intermediaries. It is also a guaran-teed outlet for all of their shea kernels. The advantage for AAK and Cloetta is a more secure, transparent and sustainable supply chain with increased opportunities to impact the quality of the shea kernels.Another important benefit for the women is the possibility of obtaining advance
payments. At the beginning of the season, AAK extension officers visit the producer groups to discuss the women’s outlook for the season. Part of the volume is then pre-financed and the women are paid this money at a time of the year when they have little or no other income. It is also a guarantee that AAK will return and buy all their shea kernels.
The program has been running since 2009 in Burkina Faso and since 2015 in Ghana and the Ivory Coast. More than 230,000 women are involved in the pro-gram, which has had a major impact on the lives of the many women and their families.
Global Shea AllianceShea butter as a raw material offers many opportunities for partnership across indus-tries to inspire change, gender equality and sustainable production. As members of the Global Shea Alliance, we support projects and partnerships that improve the shea supply chain.
Sustaining Shea
Responsible marketing
In line with SDG 12, Responsible Con-sumption and Production, we aim to be transparent with the contents in our prod-ucts and the impact they have, and promote responsible consumption.
Responsible marketing means that we only advertise products meeting basic nu-trition standards to children under age 12. One such example is our xylitol portfolio that supports children’s dental health.

22
Cloetta Annual and Sustainability Report 2020<< B a c k t o c o n t e n t s
S U S ta i n a B i l i t Y
Words from the president
Goals & strategies
Sustain ability Markets Operations & employees
Share & Shareholders
financial performance
risks & Corporate Governance
financial reports
Sustain ability impact
For the planet
Our responsibility for the environment extends throughout our value chain – from the fields where our raw materials grow, to our own operations and all the way to our customers and consumers.
The global food system is under pressureThe global food system is facing considerable challenges as the basic conditions for the cultivation of food are affected by climate change, biodiversity loss, lower soil fertility and water stress. At the same time, today’s food production is responsible for making matters worse. Agriculture and forestry ac-counts for a major share of global greenhouse gas emissions, it accounts for two thirds of all fresh water used in the world and it is a major cause of soil degradation, deforestation and loss of biodiversity. Transforming the global food system is therefore a critical factor to solve the sustainability challenges ahead and Cloetta is committed to do our part and contribute to a more sustainable future.
We have defined three key areas in order to achieve this overarching objective; a) Climate action by committing to the
Science Based Targets Initiative, b) Sustainable sourcing by promoting
sustainable practices in our supply chain,
c) Better resource use by driving sustainable innovation in product and packaging development and using resources even more efficiently in our own operations.
Goals for 2021 a) Develop science-based climate
targets and a roadmap for achieving these targets by 2025/2030
b) Implement our new Supplier Code of Conduct and engage key suppliers in our sustainable sourcing program
c) 100 per cent of our packaging will be recyclable by 2025. 100 per cent of our packaging will come from renew-able sources or recycled materials by 2030
Goal
As a food company, our business is strongly dependent on natural resources and the state of the environment.
The new Sustainability Agenda – For the planetThe third pillar in our new Sustainability Agenda, For the planet, marks a re-commit-ment to consider environmental aspects in our business decisions and daily activities, as well as a raised ambition to improve our total planet footprint throughout our value chain.
As described on pages 14–15, the en-vironmentally related Sustainable Devel-opment Goals (SDGs) form the foundation upon which the social and economic related SDGs are dependent. Therefore, improv-ing our environmental performance will also help us to meet other objectives in our Sustainability Agenda. The three most relevant SDGs for this pillar are Responsible Consumption and Production (12), Climate Action (13) and Life on Land (15).
3
For the planet
Risks we consider• Climate impact on access to raw
materials• Disruptions in transportation and
production caused by extreme weather• Failing to act on climate crisis may in-
fluence relationships with customers and attractiveness to investors

23
Cloetta Annual and Sustainability Report 2020 << B a c k t o c o n t e n t s
S U S ta i n a B i l i t Y
Words from the president
Goals & strategies
Sustain ability Markets Operations & employees
Share & Shareholders
financial performance
risks & Corporate Governance
financial reports
Sustain ability impact
Climate action
The Science Based Targets initiative sup-ports companies to set ambitious emission reduction targets that are consistent with the Paris Agreement. The Paris Agreement’s central aim is to strengthen the global response to the threat of climate change by keeping a global temperature rise this centu-ry well below 2° Celsius above pre-industrial levels, and to pursue efforts to limit the tem-perature increase even further to 1.5° C.
To better understand our climate impact and to identify our total carbon footprint, in 2020 we started a thorough study of all the main sources of greenhouse gas emissions (scopes 1, 2 and 3) throughout our value chain. The study will be completed in the first quarter of 2021. The results will be used as a baseline against which we will set our Science Based Targets and create a roadmap on how to achieve them. We have chosen the highest commitment level for Cloetta, which is to be in line with the 1.5° C target by 2050.
Reducing our carbon impact from packaging is included in our initiatives related to Less and Better Packaging, which is described on page 27.
Reduced energy consumptionBased on the energy audits conducted at our factories in 2018, we have implemented several energy-saving projects that have
resulted in reduced energy consumption. Due to the Covid-19 pandemic, production in Cloetta’s factories decreased from approx-imately 106,000 tonnes in 2019 to just over 100,000 tonnes in 2020. This has resulted in an increased energy KPI since it is an intensity target using production output as denominator. Despite the fact that the total energy consumption decreased from 193 GWh to 186 GWh, the KPI increased from 1.79 MWh/ton to 1.86 MWh/ton, which meant lower energy efficiency for 2020.
Carbon emissions during 2020Our carbon emissions decreased substan-tially in 2020, largely due to the transition to green electricity in all factories. Total carbon emissions (scope 1 and 2) decreased with 28% from 27,407 to 19,699 tonnes CO2e . Scope 1 emissions from stationary combustion decreased by 12 percent from 13,792 to 12,143 tonnes of CO2e, while indirect emissions (scope 2) from the use of electricity and district heating decreased by 44,5 per cent from 13,614 to 7,556 tonnes of CO2e. The KPI for carbon emissions was also reduced from 0.26 to 0.20 kg CO2/kg produced. Cloetta thus met and exceeded its carbon dioxide target for 2020 (see also page 5). The target was reduced emissions by 5 per cent compared to 2014.
In October 2020, Cloetta joined the internationally renowned Science Based Targets initiative, together with more than 1,000 companies around the world taking climate action. By doing so, we also joined the even larger We Mean Business Coalition.
0,0
0,5
1,0
1,5
2,0
20202019201820172016
Energy consumptionMWh/prod. tonne
Target2020
Districtheating 43 p p Steam 10
t Electricity 70Gas 63 u
Sources of energy GWh
Total 186 GWh
Environmental key performance indicators
2020 2019 2018 2017 2016
Energy consumption (total, GWh)1 186 193 188 179 180
Energy consumption(MWh/produced tonne)1 1,86 1.79 1.83 1.85 1.80
CO₂e Scope 1 + 2 (kg/produced kg)1 0,20 0.26 0.30 0.25 0.27
Waste (kg/produced tonne)2, 3 99 62 64 67 64
Recycling (%)2, 4 84 88 88 82 81
Wastewater (m3/produced tonne)2, 3 2,5 2.0 1.7 1.7 1.5
1) The sold Italian businesses have been excluded since 2016. The factories in Dublin, Helsingborg and Roosendaal Borchwerf were added in 2017 but have been included in the key performance indicators from 2014. For this reason, the values for 2014, the base year, have been adjusted for total energy consumption, energy consumption per produced tonne, and CO₂e (Scope 1 + 2) per produced kg.
2) The sold Italian businesses have been excluded from 2016 onwards. The factories in Dublin, Helsing-borg and Roosendaal Borchwerf are included as of 2016.
3) Due to expanded definition of waste in accordance with GRI guidelines as well as more detailed reporting from the factories, the amount of waste increased compared to previous years, and figures are not comparable. The same is true for wastewater, where more waste streams are now included.
4) Despite the fact that the total amount of waste increased according to point 3, we were able to main-tain a high level of recycling rate.
0
20
40
60
80
100
20202019201820172016
Recycling%
0.00
0.05
0.10
0.15
0.20
0.25
0.30
0.35
20202019201820172016
Carbon dioxide emissions CO2e (Scope 1+2) per prod. kg Target
2020
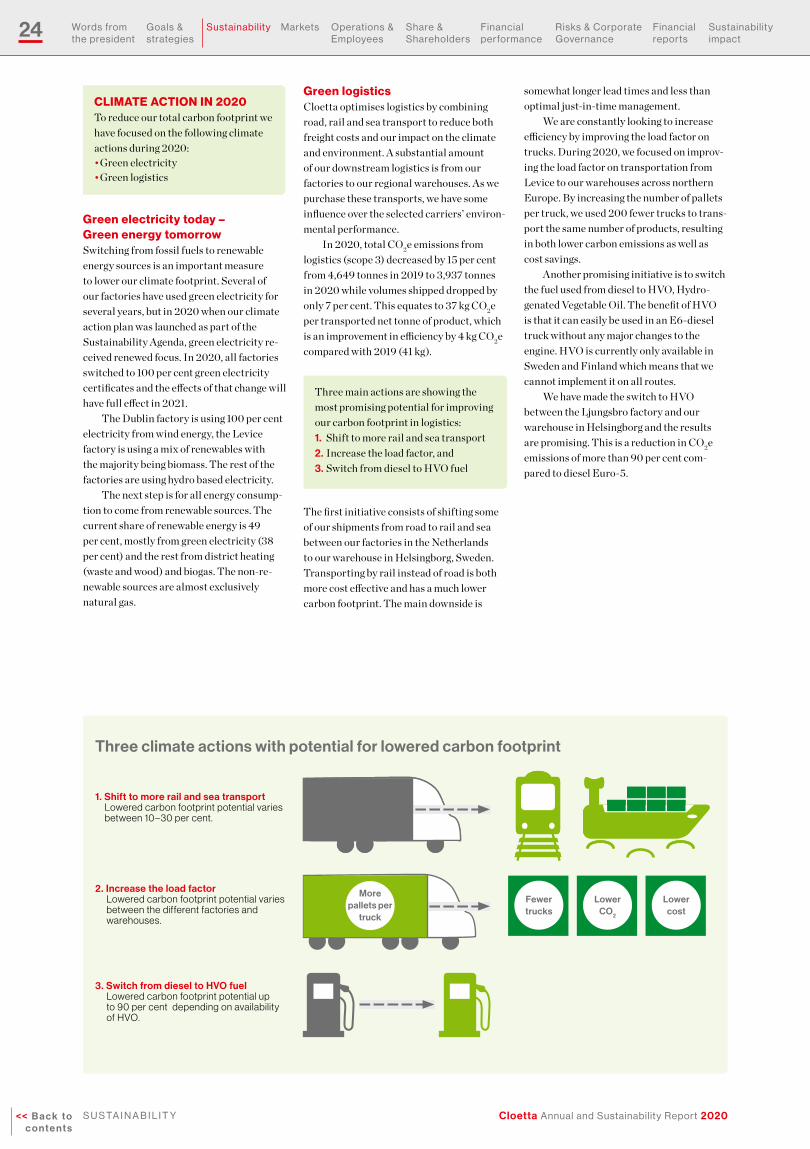
24
Cloetta Annual and Sustainability Report 2020<< B a c k t o c o n t e n t s
S U S ta i n a B i l i t Y
Words from the president
Goals & strategies
Sustain ability Markets Operations & employees
Share & Shareholders
financial performance
risks & Corporate Governance
financial reports
Sustain ability impact
.
CLIMATE ACTION IN 2020To reduce our total carbon footprint we have focused on the following climate actions during 2020:• Green electricity• Green logistics
Green electricity today – Green energy tomorrowSwitching from fossil fuels to renewable energy sources is an important measure to lower our climate footprint. Several of our factories have used green electricity for several years, but in 2020 when our climate action plan was launched as part of the Sustainability Agenda, green electricity re-ceived renewed focus. In 2020, all factories switched to 100 per cent green electricity certificates and the effects of that change will have full effect in 2021.
The Dublin factory is using 100 per cent electricity from wind energy, the Levice factory is using a mix of renewables with the majority being biomass. The rest of the factories are using hydro based electricity.
The next step is for all energy consump-tion to come from renewable sources. The current share of renewable energy is 49 per cent, mostly from green electricity (38 per cent) and the rest from district heating (waste and wood) and biogas. The non-re-newable sources are almost exclusively natural gas.
Green logisticsCloetta optimises logistics by combining road, rail and sea transport to reduce both freight costs and our impact on the climate and environment. A substantial amount of our downstream logistics is from our factories to our regional warehouses. As we purchase these transports, we have some influence over the selected carriers’ environ-mental performance.
In 2020, total CO2e emissions from logistics (scope 3) decreased by 15 per cent from 4,649 tonnes in 2019 to 3,937 tonnes in 2020 while volumes shipped dropped by only 7 per cent. This equates to 37 kg CO2e per transported net tonne of product, which is an improvement in efficiency by 4 kg CO2e compared with 2019 (41 kg).
Three main actions are showing the most promising potential for improving our carbon footprint in logistics:1. Shift to more rail and sea transport 2. Increase the load factor, and3. Switch from diesel to HVO fuel
The first initiative consists of shifting some of our shipments from road to rail and sea between our factories in the Netherlands to our warehouse in Helsingborg, Sweden. Transporting by rail instead of road is both more cost effective and has a much lower carbon footprint. The main downside is
somewhat longer lead times and less than optimal just-in-time management.
We are constantly looking to increase efficiency by improving the load factor on trucks. During 2020, we focused on improv-ing the load factor on transportation from Levice to our warehouses across northern Europe. By increasing the number of pallets per truck, we used 200 fewer trucks to trans-port the same number of products, resulting in both lower carbon emissions as well as cost savings.
Another promising initiative is to switch the fuel used from diesel to HVO, Hydro-genated Vegetable Oil. The benefit of HVO is that it can easily be used in an E6-diesel truck without any major changes to the engine. HVO is currently only available in Sweden and Finland which means that we cannot implement it on all routes.
We have made the switch to HVO between the Ljungsbro factory and our warehouse in Helsingborg and the results are promising. This is a reduction in CO2e emissions of more than 90 per cent com-pared to diesel Euro-5.
Three climate actions with potential for lowered carbon footprint
1. Shift to more rail and sea transport Lowered carbon footprint potential varies between 10 –30 per cent.
2. Increase the load factorLowered carbon footprint potential varies between the different factories and warehouses.
3. Switch from diesel to HVO fuel Lowered carbon footprint potential up to 90 per cent depending on availability of HVO.
Fewer trucks
Lower CO2
Lower cost
More pallets per
truck
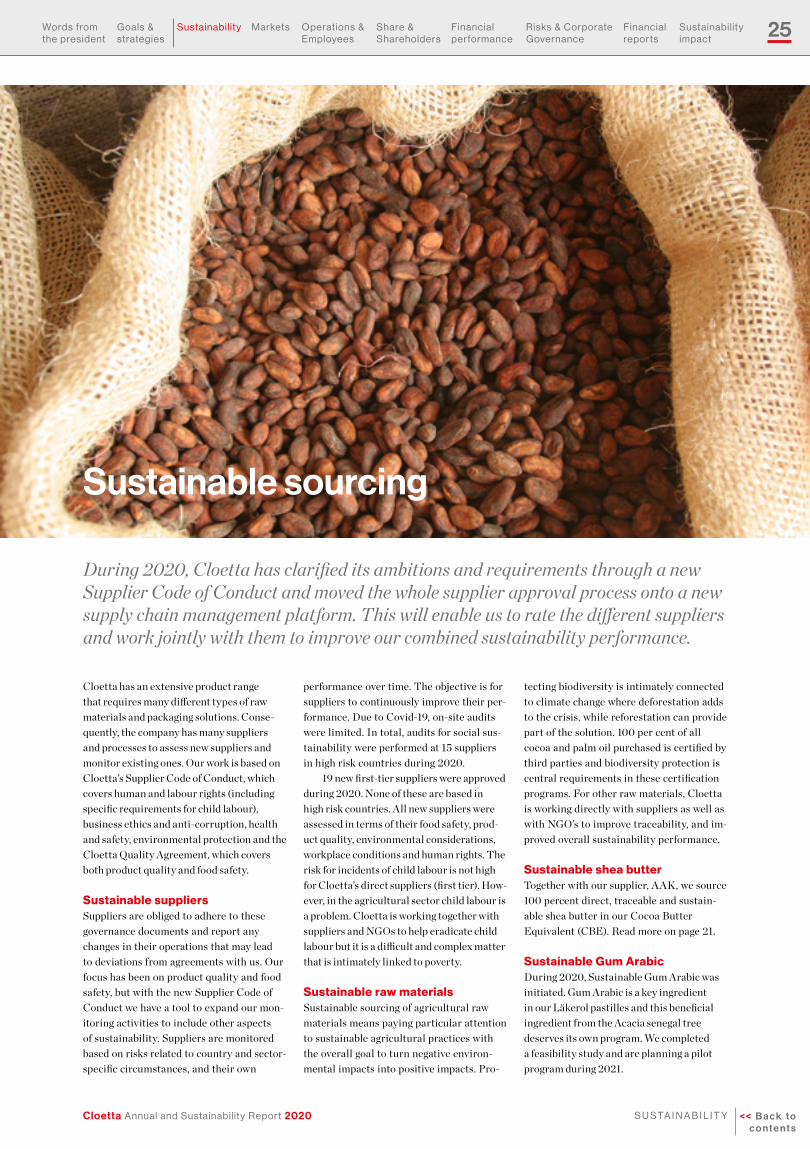
25
Cloetta Annual and Sustainability Report 2020 << B a c k t o c o n t e n t s
S U S ta i n a B i l i t Y
Words from the president
Goals & strategies
Sustain ability Markets Operations & employees
Share & Shareholders
financial performance
risks & Corporate Governance
financial reports
Sustain ability impact
Cloetta has an extensive product range that requires many different types of raw materials and packaging solutions. Conse-quently, the company has many suppliers and processes to assess new suppliers and monitor existing ones. Our work is based on Cloetta’s Supplier Code of Conduct, which covers human and labour rights (including specific requirements for child labour), business ethics and anti-corruption, health and safety, environmental protection and the Cloetta Quality Agreement, which covers both product quality and food safety.
Sustainable suppliersSuppliers are obliged to adhere to these governance documents and report any changes in their operations that may lead to deviations from agreements with us. Our focus has been on product quality and food safety, but with the new Supplier Code of Conduct we have a tool to expand our mon-itoring activities to include other aspects of sustainability. Suppliers are monitored based on risks related to country and sector- specific circumstances, and their own
performance over time. The objective is for suppliers to continuously improve their per-formance. Due to Covid-19, on-site audits were limited. In total, audits for social sus-tainability were performed at 15 suppliers in high risk countries during 2020.
19 new first-tier suppliers were approved during 2020. None of these are based in high risk countries. All new suppliers were assessed in terms of their food safety, prod-uct quality, environmental considerations, workplace conditions and human rights. The risk for incidents of child labour is not high for Cloetta’s direct suppliers (first tier). How-ever, in the agricultural sector child labour is a problem. Cloetta is working together with suppliers and NGOs to help eradicate child labour but it is a difficult and complex matter that is intimately linked to poverty.
Sustainable raw materialsSustainable sourcing of agricultural raw materials means paying particular attention to sustainable agricultural practices with the overall goal to turn negative environ-mental impacts into positive impacts. Pro-
tecting biodiversity is intimately connected to climate change where deforestation adds to the crisis, while reforestation can provide part of the solution. 100 per cent of all cocoa and palm oil purchased is certified by third parties and biodiversity protection is central requirements in these certification programs. For other raw materials, Cloetta is working directly with suppliers as well as with NGO’s to improve traceability, and im-proved overall sustainability performance.
Sustainable shea butterTogether with our supplier, AAK, we source 100 percent direct, traceable and sustain-able shea butter in our Cocoa Butter Equivalent (CBE). Read more on page 21.
Sustainable Gum ArabicDuring 2020, Sustainable Gum Arabic was initiated. Gum Arabic is a key ingredient in our Läkerol pastilles and this beneficial ingredient from the Acacia senegal tree deserves its own program. We completed a feasibility study and are planning a pilot program during 2021.
Sustainable sourcing
During 2020, Cloetta has clarified its ambitions and requirements through a new Supplier Code of Conduct and moved the whole supplier approval process onto a new supply chain management platform. This will enable us to rate the different suppliers and work jointly with them to improve our combined sustainability performance.
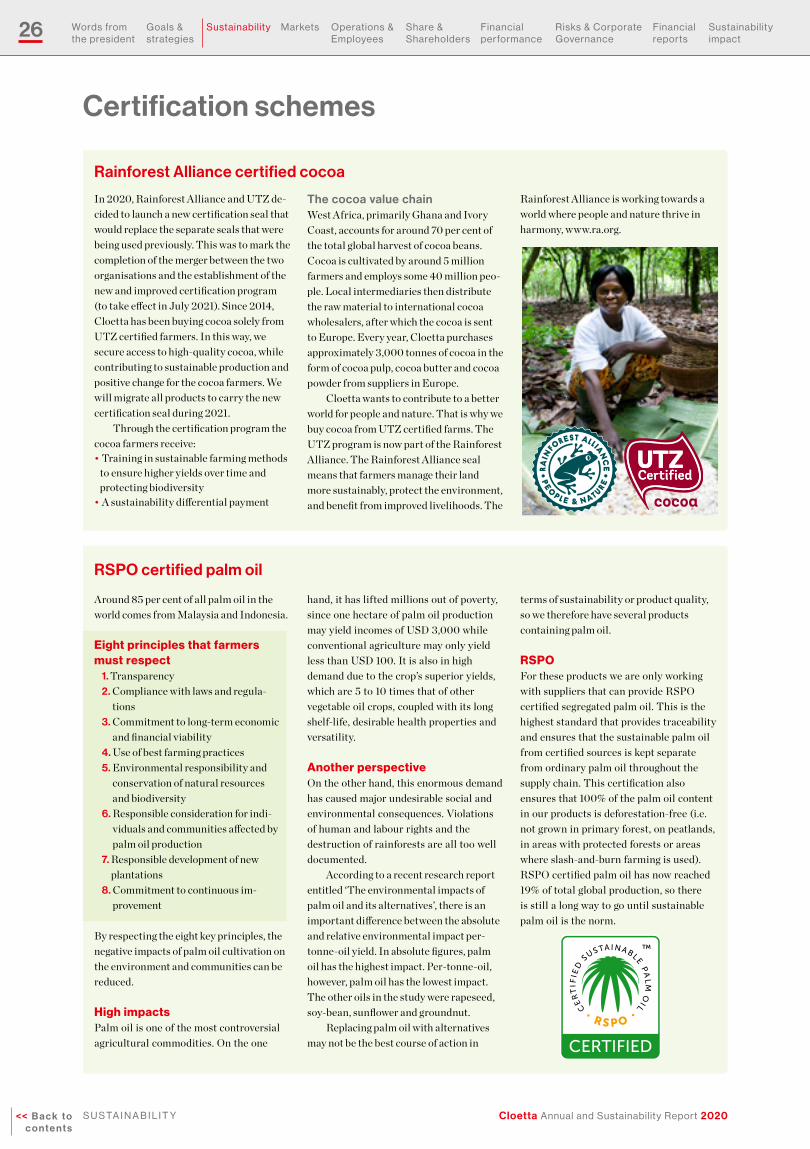
26
Cloetta Annual and Sustainability Report 2020<< B a c k t o c o n t e n t s
S U S ta i n a B i l i t Y
Words from the president
Goals & strategies
Sustain ability Markets Operations & employees
Share & Shareholders
financial performance
risks & Corporate Governance
financial reports
Sustain ability impact
Rainforest Alliance certified cocoa
In 2020, Rainforest Alliance and UTZ de-cided to launch a new certification seal that would replace the separate seals that were being used previously. This was to mark the completion of the merger between the two organisations and the establishment of the new and improved certification program (to take effect in July 2021). Since 2014, Cloetta has been buying cocoa solely from UTZ certified farmers. In this way, we secure access to high-quality cocoa, while contributing to sustainable production and positive change for the cocoa farmers. We will migrate all products to carry the new certification seal during 2021.
Through the certification program the cocoa farmers receive: • Training in sustainable farming methods
to ensure higher yields over time and protecting biodiversity
• A sustainability differential payment
The cocoa value chain West Africa, primarily Ghana and Ivory Coast, accounts for around 70 per cent of the total global harvest of cocoa beans. Cocoa is cultivated by around 5 million farmers and employs some 40 million peo-ple. Local intermediaries then distribute the raw material to international cocoa wholesalers, after which the cocoa is sent to Europe. Every year, Cloetta purchases approximately 3,000 tonnes of cocoa in the form of cocoa pulp, cocoa butter and cocoa powder from suppliers in Europe.
Cloetta wants to contribute to a better world for people and nature. That is why we buy cocoa from UTZ certified farms. The UTZ program is now part of the Rainforest Alliance. The Rainforest Alliance seal means that farmers manage their land more sustainably, protect the environment, and benefit from improved livelihoods. The
Rainforest Alliance is working towards a world where people and nature thrive in harmony, www.ra.org.
Certification schemes
RSPO certified palm oil
Around 85 per cent of all palm oil in the world comes from Malaysia and Indonesia.
Eight principles that farmers must respect
1. Transparency2. Compliance with laws and regula-
tions3. Commitment to long-term economic
and financial viability4. Use of best farming practices5. Environmental responsibility and
conservation of natural resources and biodiversity
6. Responsible consideration for indi-viduals and communities affected by palm oil production
7. Responsible development of new plantations
8. Commitment to continuous im-provement
By respecting the eight key principles, the negative impacts of palm oil cultivation on the environment and communities can be reduced.
High impactsPalm oil is one of the most controversial agricultural commodities. On the one
hand, it has lifted millions out of poverty, since one hectare of palm oil production may yield incomes of USD 3,000 while conventional agriculture may only yield less than USD 100. It is also in high demand due to the crop’s superior yields, which are 5 to 10 times that of other vegetable oil crops, coupled with its long shelf-life, desirable health properties and versatility.
Another perspectiveOn the other hand, this enormous demand has caused major undesirable social and environmental consequences. Violations of human and labour rights and the destruction of rainforests are all too well documented.
According to a recent research report entitled ‘The environmental impacts of palm oil and its alternatives’, there is an important difference between the absolute and relative environmental impact per-tonne-oil yield. In absolute figures, palm oil has the highest impact. Per-tonne-oil, however, palm oil has the lowest impact. The other oils in the study were rapeseed, soy-bean, sunflower and groundnut.
Replacing palm oil with alternatives may not be the best course of action in
terms of sustainability or product quality, so we therefore have several products containing palm oil.
RSPOFor these products we are only working with suppliers that can provide RSPO certified segregated palm oil. This is the highest standard that provides traceability and ensures that the sustainable palm oil from certified sources is kept separate from ordinary palm oil throughout the supply chain. This certification also ensures that 100% of the palm oil content in our products is deforestation-free (i.e. not grown in primary forest, on peatlands, in areas with protected forests or areas where slash-and-burn farming is used). RSPO certified palm oil has now reached 19% of total global production, so there is still a long way to go until sustainable palm oil is the norm.
27
Cloetta Annual and Sustainability Report 2020 << B a c k t o c o n t e n t s
S U S ta i n a B i l i t Y
Words from the president
Goals & strategies
Sustain ability Markets Operations & employees
Share & Shareholders
financial performance
risks & Corporate Governance
financial reports
Sustain ability impact
As a participant of the UN’s Global Compact, Cloetta applies the precautionary principle in its environmental work. The precaution-ary principle is particularly relevant to how we deal with the impact of our emissions into the air and water, as well as chemical usage. We also apply the principle of caution con-cerning allergies and food safety, supported by our quality and food safety programs.
A holistic approachCloetta uses resources efficiently by focusing on the energy consumption of our manu-facturing facilities, including recycling and waste.
We monitor the environmental impact of products and packaging throughout their entire lifecycle. This is done by understand-ing and dealing with the impact within each phase. In areas where Cloetta has a limited direct impact, we work through partner-ships, for example RSPO, UTZ/Rainforest Alliance and suppliers.
Improved systems and processesWithin operations, all functions and fac-tories work systematically with environ-mental matters, including action plans and follow-up in a number of different areas. Cloetta’s management system is based on ISO 14001 and our environmental goals and activities are defined within the management system. We have set goals for 2020 for all of Cloetta regarding energy, climate and waste. Processes and instruc-tions for data collection are in place and data is reported monthly and consolidated at Group level.
aakkoset (finnish for alphabet) is a finnish candy classic that has always played with words. So it was only natural to celebrate its 50 years, in several of the languages spoken in finland.
Besides using seven languages on the bags, there are 28 new letters embossed on the can-dies. the languages and alphabets mix happily together in our candy bags – just like in the world around us.
“We’re happy to use our brand to show we appreciate diversity and understanding,” says Maija Paakkanen, Marketing Manager at Cloetta Suomi Oy.
“in terms of media hits, consumer feedback and discussions online, this seems to be our most meaningful campaign so far,” explains Marja Piironen, Communications Manager at Cloetta Suomi Oy.
iMPaCtfU l CaMPaiGnS
Better resource useIn 2020, we adopted a completely new
approach to waste reporting where we follow the updated GRI guidelines and the GHG protocol. This has meant an expanded definition of what counts as waste. We also improved the reporting process with much more detailed reporting from the factories. This has meant that the KPI for total waste cannot be compared with previous years. Total waste is now 99 kg/tonne produced. Despite this increase in total waste, the recycling rate has been maintained at 84 per cent, which is only a small decrease com-pared with previous years.
Less and better packagingTo reduce the environmental impact of packaging and use resources more effective-ly, Cloetta has defined a program to develop more sustainable packaging solutions with improved environmental performance. Less and Better Packaging is an ongoing initiative, where the goal is that 100 per cent of our packaging is recyclable by 2025 and by 2030 we will use materials 100 per cent from renewable sources or recycled materials.
Our Vision for Less and Better Packaging
1. Circularity. By 2025 100 per cent of our packaging will be recyclable. This way we can contribute to a circular economy with the help of our consumers.
2. Plastic-free. Introducing plastic-free
material when possible and beneficial.
3. Packaging reduction. Reducing the total amount of packaging material.
4. Plant-based plastic. This is an area of packaging innovation where progress has been made during 2020 with the launch of PlantPack.
The PlantPack combines two aspects of the sustainable packaging program; circu-larity and plant-based plastics. While the packaging can be recycled as normal plastic, it contains up to 50 per cent plant-based plastics. This in turn will mean up to 25 per cent lower carbon footprint compared to the previous packaging. The new PlantPack will be rolled out for more products during 2021.
During 2020, we made developments toward our plastic-free and packaging reduc-tion visions. For our more complex packages we are also gradually removing metallised films from plastic packaging, which increas-es their recyclability. Approximately 85 per cent of Cloetta’s plastic packaging is now recyclable.
Aakkoset’s multilingual 50th birthday
for our planet! Do you know that up to 50% of this packaging is now plant-based plastic? This saves more than 25% CO2 compared to the previous packaging.
Sweet news
Check cloetta.com/plantpack For YOU we also have sweet news! You might be interested to know that this candy is free from gelatin, palm oil and has no artificial colours.

28
Cloetta Annual and Sustainability Report 2020<< B a c k t o c o n t e n t s
t h e C O n f e C t i O n e r Y M a r K e t
Words from the president
Goals & strategies
Sustain ability Markets Operations & employees
Share & Shareholders
financial performance
risks & Corporate Governance
financial reports
Sustain ability impact
The confectionery market
The graph refers to candy and chocolate inthe countries where Cloetta is active.
Source: Mintel and Global data
Netherlands
NorwayUKGermany
Sweden
Denmark
Finland
Confectionery consumption per capita, 2020
Kg per person
0
5
10
15
20
u Chewing gumu Candyu Chocolate
Source: Global data
Market development in Cloetta’s main markets
SEK billion
0
50
100
150
200
202020132007
u Chocolate u Chewing gumu Candy incl. pastilles Source: Global data
Market size, by region,Cloetta’s main markets, 2020
SEK billion
0
20,000
40,000
60,000
80,000
100,000
120,000
Sweden
Netherlands
Norway
Germany
Denmark
UK Finland
The confectionery market is traditionally divided into candy, chocolate, pastilles and chewing gum. Cloetta is active in all these categories, as well as in nuts.
Cloetta’s main markets are Sweden, Finland, the Netherlands, Denmark, Norway, Germany and the UK. The total market for confectionery in our main markets amounts to approximately SEK 273bn (269).
Mature marketThe confectionery market is relatively insensitive to economic fluctuations and shows stable growth that is driven primarily by population trends and price increases. Market recessions affect us mainly through general price pressure from the retail trade and increased competition from the trade’s own private labels. However, private labels account for a relatively small share of confec-tionery compared to other grocery products. Furthermore, the confectionary market may also be temporarily impacted by events such as a global pandemic.
Since growth takes place mostly through the development of existing strong confec-tionery brands, the continuous launch of new flavours and products is a key success factor.
In terms of value, candy including pastilles accounts for 30 per cent, chocolate
for around 62 per cent and chewing gum for around 8 per cent of the total market in Cloetta’s main markets.
Competitive marketThe global market for confectionery is dom-inated by international companies like Mars Wrigley, Mondelez, Nestlé, Ferrero, Perfetti, Haribo and Lindt & Sprüngli. However, in the local markets these meet tough opposi-tion from players with locally established brands such as Cloetta, Fazer, Orkla and Toms. No player has a strong position across all European markets.
Consolidation of the confectionery industry is taking place gradually. The in-dustry as such has a long history and the pace of technological product innovation is low.
The nut marketCloetta is also active in the nut market via the brands Nutisal and Parrots. The total nut market in the Nordic region is worth around SEK 5bn, and the private labels of the retail trade account for approximately one third of the total market.
In Cloetta’s main markets, the nut market is experiencing annual growth of 1–2 per cent in volume. However, in the past few years the growth has been around 4 per cent a year due to price increases and a shift to the premium product category, and more recently due to Covid-19 and the impact of the pandemic.
Consumption patternsConfectionery is one of the most impulse- driven categories in the retail trade. Up to 80 per cent of purchasing decisions are made at the point of sale, brand, availability and product placement are significant success factors.
The European confectionery market is characterised by strong consumer loyalty to local brands. The main considerations when buying are brand, flavour, quality and curiosity about new products.
Consumption patterns and taste pref-erences vary between the different markets. For example, compared to the rest of Europe, the Nordic region has a lower per capita
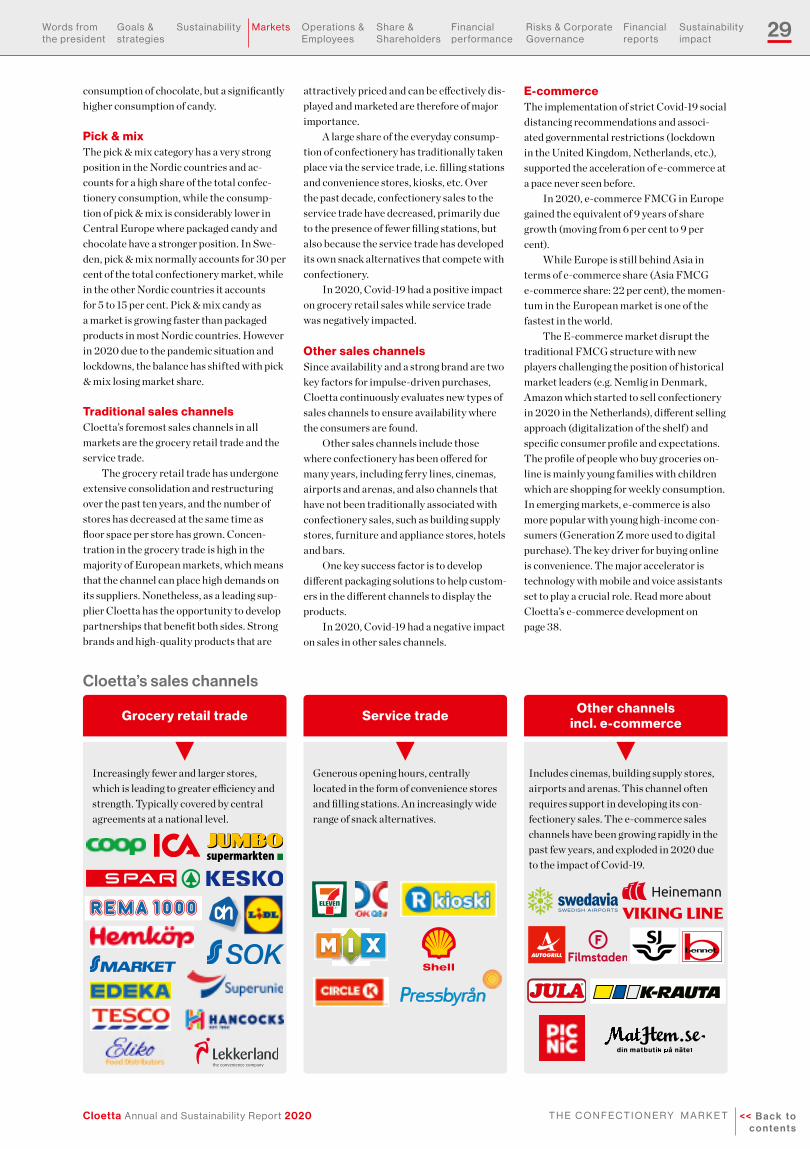
29
Cloetta Annual and Sustainability Report 2020 << B a c k t o c o n t e n t s
t h e C O n f e C t i O n e r Y M a r K e t
Words from the president
Goals & strategies
Sustain ability Markets Operations & employees
Share & Shareholders
financial performance
risks & Corporate Governance
financial reports
Sustain ability impact
consumption of chocolate, but a significantly higher consumption of candy.
Pick & mixThe pick & mix category has a very strong position in the Nordic countries and ac-counts for a high share of the total confec-tionery consumption, while the consump-tion of pick & mix is considerably lower in Central Europe where packaged candy and chocolate have a stronger position. In Swe-den, pick & mix normally accounts for 30 per cent of the total confectionery market, while in the other Nordic countries it accounts for 5 to 15 per cent. Pick & mix candy as a market is growing faster than packaged products in most Nordic countries. However in 2020 due to the pandemic situation and lockdowns, the balance has shifted with pick & mix losing market share.
Traditional sales channelsCloetta’s foremost sales channels in all markets are the grocery retail trade and the service trade.
The grocery retail trade has undergone extensive consolidation and restructuring over the past ten years, and the number of stores has decreased at the same time as floor space per store has grown. Concen-tration in the grocery trade is high in the majority of European markets, which means that the channel can place high demands on its suppliers. Nonetheless, as a leading sup-plier Cloetta has the opportunity to develop partnerships that benefit both sides. Strong brands and high-quality products that are
attractively priced and can be effectively dis-played and marketed are therefore of major importance.
A large share of the everyday consump-tion of confectionery has traditionally taken place via the service trade, i.e. filling stations and convenience stores, kiosks, etc. Over the past decade, confectionery sales to the service trade have decreased, primarily due to the presence of fewer filling stations, but also because the service trade has developed its own snack alternatives that compete with confectionery.
In 2020, Covid-19 had a positive impact on grocery retail sales while service trade was negatively impacted.
Other sales channelsSince availability and a strong brand are two key factors for impulse-driven purchases, Cloetta continuously evaluates new types of sales channels to ensure availability where the consumers are found.
Other sales channels include those where confectionery has been offered for many years, including ferry lines, cinemas, airports and arenas, and also channels that have not been traditionally associated with confectionery sales, such as building supply stores, furniture and appliance stores, hotels and bars.
One key success factor is to develop different packaging solutions to help custom-ers in the different channels to display the products.
In 2020, Covid-19 had a negative impact on sales in other sales channels.
E-commerceThe implementation of strict Covid-19 social distancing recommendations and associ-ated governmental restrictions (lockdown in the United Kingdom, Netherlands, etc.), supported the acceleration of e-commerce at a pace never seen before.
In 2020, e-commerce FMCG in Europe gained the equivalent of 9 years of share growth (moving from 6 per cent to 9 per cent).
While Europe is still behind Asia in terms of e-commerce share (Asia FMCG e-commerce share: 22 per cent), the momen-tum in the European market is one of the fastest in the world.
The E-commerce market disrupt the traditional FMCG structure with new players challenging the position of historical market leaders (e.g. Nemlig in Denmark, Amazon which started to sell confectionery in 2020 in the Netherlands), different selling approach (digitalization of the shelf) and specific consumer profile and expectations.The profile of people who buy groceries on-line is mainly young families with children which are shopping for weekly consumption. In emerging markets, e-commerce is also more popular with young high-income con-sumers (Generation Z more used to digital purchase). The key driver for buying online is convenience. The major accelerator is technology with mobile and voice assistants set to play a crucial role. Read more about Cloetta’s e-commerce development on page 38.
Cloetta’s sales channels
Increasingly fewer and larger stores, which is leading to greater efficiency and strength. Typically covered by central agreements at a national level.
Generous opening hours, centrally located in the form of convenience stores and filling stations. An increasingly wide range of snack alternatives.
Includes cinemas, building supply stores, airports and arenas. This channel often requires support in developing its con-fectionery sales. The e-commerce sales channels have been growing rapidly in the past few years, and exploded in 2020 due to the impact of Covid-19.
Pantone 485 (Red)
Pantone 116 (Yellow)
100m 100y
15m 100y
Pantone 301 (Blue)
Grocery retail trade Service trade Other channels incl. e-commerce

30
Cloetta Annual and Sustainability Report 2020<< B a c k t o c o n t e n t s
B r a n d , C at e G O r Y a n d P r O d U C t d e V e l O P M e n t
Words from the president
Goals & strategies
Sustain ability Markets Operations & employees
Share & Shareholders
financial performance
risks & Corporate Governance
financial reports
Sustain ability impact
Strategies for growth:
Brand, category and product development
The consumer in the spotlightListen, engage, understand and evolve. Consumers are the key to growth, which is why they are at the centre of all our strategies.
STRENGTHEN CONSUMER UNDERSTANDING
• Understand consumer behaviour and preferences
• Detect and follow trends
• Validate ideas and concepts
• Product testing
• Track market, brand and product performance
1Strategic product developmentINNOVATE TO ENABLE GROWTH
• Enter new markets and segments and implement new initiatives
• Enhance experiences through new flavours and textures
• Ensure sustainability and consumer choice
• Increase the value of products
• Develop new packaging technologies and sizes
2 3Brand and category leadershipACCELERATE GROWTH
• Continuous support for core brands through effective marketing campaigns
• Leverage category development strategies and future key growth drivers with retail customers
• Develop pick & mix concepts
• Develop consumer-centric and customer-centric activities through a strong and competent sales force
• Increase visibility in stores
• Launch sales and in-store campaigns

31
Cloetta Annual and Sustainability Report 2020 << B a c k t o c o n t e n t s
B r a n d , C at e G O r Y a n d P r O d U C t d e V e l O P M e n t
Words from the president
Goals & strategies
Sustain ability Markets Operations & employees
Share & Shareholders
financial performance
risks & Corporate Governance
financial reports
Sustain ability impact
Consumer and market insights are a key source of input for our strategies, devel-opment and continuous improvement. It is crucial to understand every part of the consumer journey in order to provide brands and products that are consistently liked, purchased and consumed. During 2020, Cloetta has strengthened its consumer understanding capabilities by restructuring the Insights function to ensure that teams from all categories and countries receive the required support and insights.
Understanding attitudes, perceptions and opinionsUnderstanding consumer attitudes, percep-tions and opinions of the brands and catego-ries is one part of our dedication to putting the consumer first. Cloetta’s consumer
focus takes a holistic approach; from early detection of trends to evaluating the market reception of the products.
The Insights team ensures that a strong research eco-system and infrastructure is in place, developing strong partnerships with world-leading research and insight agencies that provide well-established and innovative methods and approaches to understand consumer behaviour.
Product of the Year There has been an increased focus on getting direct feedback from the consumers on the products’ sensory aspects, like taste, texture, flavour, etc., leading to subsequent improve-ments in our products. One example of this is Läkerol Raspberry Licorice pastille, which won the ‘Product of the Year’ 2020 in the
confectionery category in Sweden. Engage-ment with followers on the Läkerol Facebook page, as well as research and insights into consumer preferences, guided product development to create the right flavours which were then fine-tuned through product testing to deliver a superior taste. This case demonstrates our commitment to not only listen to consumers’ wants and needs, but also to engage with them at every stage of the development of new products.
Strengthening consumer understanding
Detect and follow trendsCloetta continuously monitors market trends at macro and micro levels through market research, category and trend reports, social listening and various trackers. Keeping track of trends provides valuable information for us to feed into the development of new ideas and
concepts.
Understand consumer behaviour and preferencesexploring consumer behaviour, needs and pref-erences is fundamental for Cloetta. the insights provide essential understanding of how our brands resonate in consumers’ daily lives, and how Cloetta can further improve the relevance
and appeal of our offerings.
Cloetta’s approach to consumer centricity
Product testingit is crucial to ensure our products are vetted by con-
sumers before they are launched. By evaluating the physical products, consumers provide essential feedback to Cloetta’s innovation team who subsequently improve the product rec-ipes to fully meet consumers’ preferences. Cloetta manages and makes use of our own consumer panel to efficiently con-duct product tests, establishing a direct line with consumers, which supports the improvement of our current products as well as the development of new ones.
Track market, brand and product performance
We closely follow up on launch performance, and wider market developments and we track category and brand KPis. Consistent analysis of market data, such as sales figures and market shares, ensures a thorough understanding of the performance of our brands, and enables quick and effective actions when needed.
Validate ideas and conceptsan integral part of providing consumers with brands and products they want is translating trends, behavioural and attitudinal research into the right ideas and concepts. Cloetta continu-ously tests different hypotheses, concepts and prototypes to ensure our offerings resonate
well with consumers, and that there is a good fit with Cloetta’s brands.
2 3
45
1
The consumer in the spotlight

32
Cloetta Annual and Sustainability Report 2020<< B a c k t o c o n t e n t s
B r a n d , C at e G O r Y a n d P r O d U C t d e V e l O P M e n t
Words from the president
Goals & strategies
Sustain ability Markets Operations & employees
Share & Shareholders
financial performance
risks & Corporate Governance
financial reports
Sustain ability impact
ClOetta’SreSPOnSe
Our consumer promise
ClOetta’SreSPOnSe
Our consumer promise
Responsibility for the environment and human rightsOne of the key trends is the interest in the impact of food production on the environment and the social conditions of the producer. Suppliers have responded to consumer demand for information; above all in terms of the origins of raw materials, the farmers’ working conditions, quality and farming methods, by introducing different types of labelling and certification.
during 2020, Cloetta has initiated several programmes within these areas that aim to make a real impact in
the world. in partnership with the rainforest alliance, we have entered the living income
project that bridges the living income gap by making extra payments directly to cocoa farmers. Cloetta has committed to the Science Based targets initiative (SBti) which is a public commit-
ment to reduce direct and indirect carbon emis-sions. as an example of our commitment, all factories
now run on 100% Green electricity, and the next step is to move them to 100% Green energy.
Health and less sugarPeople are increasingly looking for natural raw materials with positive health benefits. Additives of various types and artificially produced sub-stances are being questioned in favour of natural ingredients. E-numbers are being replaced with the name of the additive in plain language. Natural sugar and natural sweeteners like xylitol and stevia are preferred to artificial sweeteners. Less sugar and fewer calories is another important aspect that con-sumers are demanding.
We are working to remove artificial flavourings and colourants from our assortment. they will be entirely replaced by natural fruit and plant extracts in our candy products.
Cloetta provides alternatives in the form of sugar-free products, products with less sugar and products that are naturally free from sugar, giving consumers the opportunity to choose. We also use the natural sweetener xylitol in brands such as Jenkki, Mynthon and läkerol dents. as an example of the company’s commitment to provide healthier choices, Cloetta finland works with health
professionals in the Project Jenkki campaign to inspire 100,000 school children to take care of their teeth, with xylitol playing an important part.
6 distinct consumer trendsGreater individualisationConsumers increasingly wish to satisfy their individual needs. This means that they want the option of both choosing products, and also having access to products and services that are individualised and can be adapted to different occasions.
Pick & mix is a good example of a concept that is individualised, and a category in which we are a leading market player. in 2020, the CandyKing brand was
relaunched to make it a more relevant and appealing offering, and give consumers exciting new options on the pick & mix shelf, through exclusive collaboration with suppliers. Cloetta also consistently works on different packaging sizes and formats to cater for different occasion needs,
such as the Jelly Bean factory providing a range of different formats, spanning from smaller “grab and go”– sachets, to larger
sharing & gift jars.
ClOetta’SreSPOnSe
Our consumer promise

33
Cloetta Annual and Sustainability Report 2020 << B a c k t o c o n t e n t s
B r a n d , C at e G O r Y a n d P r O d U C t d e V e l O P M e n t
Words from the president
Goals & strategies
Sustain ability Markets Operations & employees
Share & Shareholders
financial performance
risks & Corporate Governance
financial reports
Sustain ability impact
ClOetta’SreSPOnSe
Our consumer promise
ClOetta’SreSPOnSe
Our consumer promise
E-commerce and digital channels increasingly important for FMCGE-commerce is growing rapidly across all sectors, including the grocery retail trade. Fuelled by the Covid-19 pandemic, e-commerce has boomed in 2020, with grocery retailers and food companies building up their
own e-commerce capacity to sell their products online. New players are also capitalising on the fast growth of e-commerce. Alongside the growth of e-commerce, direct communication with consum-
ers via social media is emerging as one of the most important channels for feedback, capturing trends and sharing inspiration and preferences with others. Online sales in confectionery
are still lower than for other consumer product categories, but they are growing at dou-ble-digit pace – between 30 to 60 % market penetration in 2020 in the core markets.
e-commerce is one of our key focus areas. Cloetta’s e-commerce strategy is focused on growth through a dynamic channel that
matches our strong offline shares in online trade. Online grocery market maturity differs depending on the markets. this means
that Cloetta sets clear priorities for where and how to drive e-commerce projects including mobile image optimisation,
e-trade marketing activation and dedicated online product development.
Superior sensory experiences With the increased exposure to social media platforms where consumers share consumption experiences, and the need for affordable escapism, consumers are seeking heightened sensory experiences from their food. This is driving companies to regularly launch exciting new flavours and textures.
With our strong brands acting as a trustworthy ambassador for novel taste sensations, 2020
brought exciting taste experiences to consumers. for example, in addition to the yearly Juleskum
launch in Sweden, we added “Juleskum Christmas tree” to the range, a double-sided candy with a
soft vanilla foam and fruit jelly side. 2020 was also the year of the ‘ahlgrens elbilar’ launch, an electric
version of the candy favourite, providing a tantilizing mouth sensation.
Local, genuine and transparent brandsLocal brands with a strong history are favoured by consumers. This be-
came even more apparent during the pandemic, when consumers reverted far more to traditional and familiar brands. Authenticity and transparency are key
for brands to deliver in order to earn consumer trust.
in all core markets, we have some of the strongest local brands such as Venco in the netherlands, Kexchoklad in Sweden and aakkoset in finland. these iconic brands
consistently deliver joy and fun moments in consumers’ daily lives. We continue to invest in local brands and develop them in accordance with consumer trends whilst ensuring they meet
consumer expectations. to earn consumer trust and to truly deliver genuine brands, we work contin-uously to ensure all products meet high quality standards, and provide clear and transparent information
about the contents of the products on the packaging and our website.
ClOetta’SreSPOnSe
Our consumer promise
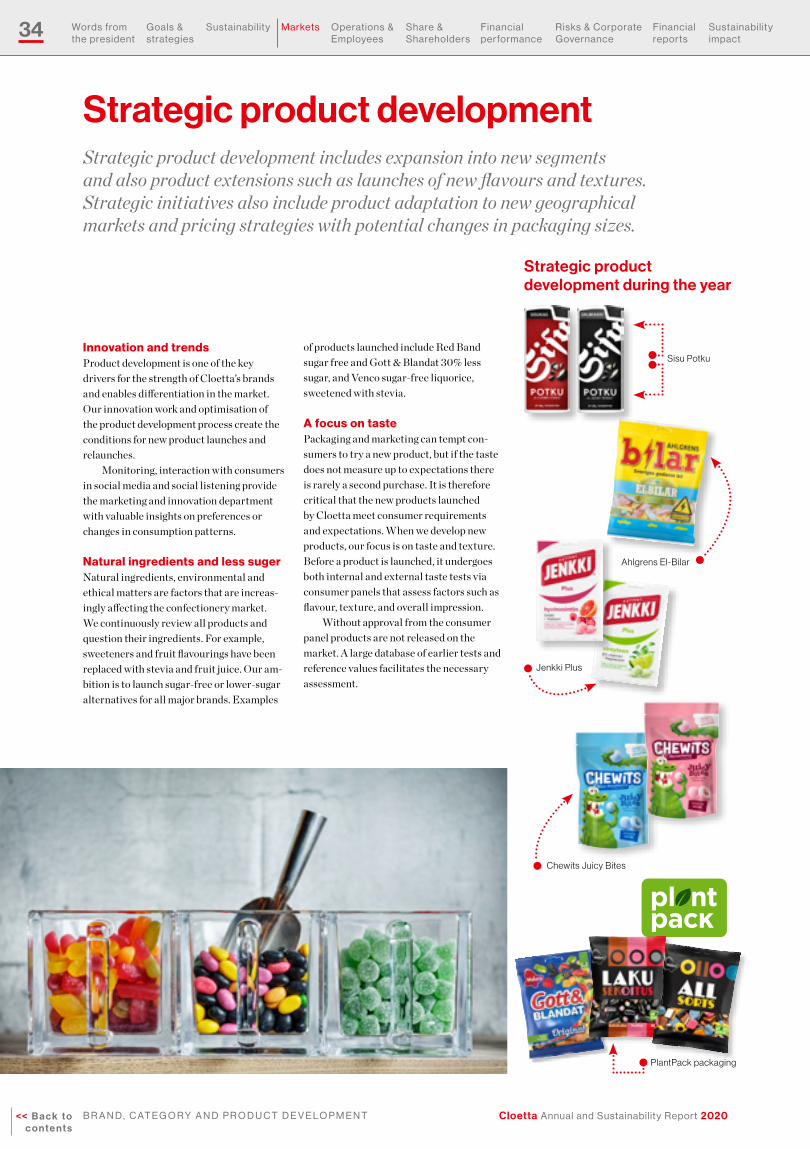
34
Cloetta Annual and Sustainability Report 2020<< B a c k t o c o n t e n t s
B r a n d , C at e G O r Y a n d P r O d U C t d e V e l O P M e n t
Words from the president
Goals & strategies
Sustain ability Markets Operations & employees
Share & Shareholders
financial performance
risks & Corporate Governance
financial reports
Sustain ability impact
Strategic product developmentStrategic product development includes expansion into new segments and also product extensions such as launches of new flavours and textures. Strategic initiatives also include product adaptation to new geographical markets and pricing strategies with potential changes in packaging sizes.
Innovation and trendsProduct development is one of the key drivers for the strength of Cloetta’s brands and enables differentiation in the market. Our innovation work and optimisation of the product development process create the conditions for new product launches and relaunches.
Monitoring, interaction with consumers in social media and social listening provide the marketing and innovation department with valuable insights on preferences or changes in consumption patterns.
Natural ingredients and less sugerNatural ingredients, environmental and ethical matters are factors that are increas-ingly affecting the confectionery market. We continuously review all products and question their ingredients. For example, sweeteners and fruit flavourings have been replaced with stevia and fruit juice. Our am-bition is to launch sugar-free or lower-sugar alternatives for all major brands. Examples
of products launched include Red Band sugar free and Gott & Blandat 30% less sugar, and Venco sugar-free liquorice, sweetened with stevia.
A focus on taste Packaging and marketing can tempt con-sumers to try a new product, but if the taste does not measure up to expectations there is rarely a second purchase. It is therefore critical that the new products launched by Cloetta meet consumer requirements and expectations. When we develop new products, our focus is on taste and texture. Before a product is launched, it undergoes both internal and external taste tests via consumer panels that assess factors such as flavour, texture, and overall impression.
Without approval from the consumer panel products are not released on the market. A large database of earlier tests and reference values facilitates the necessary assessment.
Strategic product development during the year
Ahlgrens El-Bilar
Sisu Potku
Jenkki Plus
PlantPack packaging
Chewits Juicy Bites

35
Cloetta Annual and Sustainability Report 2020 << B a c k t o c o n t e n t s
B r a n d , C at e G O r Y a n d P r O d U C t d e V e l O P M e n t
Words from the president
Goals & strategies
Sustain ability Markets Operations & employees
Share & Shareholders
financial performance
risks & Corporate Governance
financial reports
Sustain ability impact
• Needs
• Preferences
• Ideas
• Feelings
• Product development
• Packaging
• Packaging solution
MarketingConsumer & brand marketing
InnovationInnovation – product development
1Target group
2Technical solutions
The path to a new product – collaboration
between Marketing & Innovation
2Consumers
3Concept
3Product
solutions
1Trends
• Evaluation
• Market surveys
• Who?
• Why?
• When?
• What?
• Internal and external fact gathering
• Collaboration
• Technological development
• Role in existing product lines
• Exchanges between factories
Launches in new marketsA product that is successful in one market can be launched in another market under an existing local brand. For Cloetta, with our many brands in different markets, economies of scale in production can be used effectively by matching brands.
Examples include: • Sportlife Mints from the Netherlands sold
as Mynthon ZipMint in Finland. • Polly from Sweden sold as Pops in Norway.
Ahlgrens bilar Elbilar (electric cars)By January, the launch of ahlgrens bilar elbilar had already struck like lightning in the car world. the new model of Sweden’s best-selling car has a sparkly new body and an interior that is fully charged with electric and tantalizing flavours - offering an extraordinary driving experience. With the help of a successful pre-launch at Circle K, digital advertising and Pr, news about Sweden’s best-selling electric car spread widely – not least in car magazines and industry media. to further spread the word, we also offered private individuals the opportunity to test-drive the new model. this was mainly achieved through ahlgrens bilar’s part-nership with Melodifestivalen, with sample bags handed out to everybody who attended the event in the six cities. to maximise the visibility of the ahlgrens bilar brand, a broader media campaign took place during the spring.
Package designIn addition to tasting good and being afforda-ble for the consumer, a new product must be commercially attractive to the retail trade and be part of a category strategy reflecting local consumer expectations. Its weight, packaging and distribution are adapted to the various sales channels and markets. With the right packaging, many of the products that are strong in one market can also secure a good position in a new market.
Package sizes are often associated with pricing strategies for different customer categories and markets. Changing a package size is therefore a strategic decision for how a brand can be further developed in order to reach new customers and, thereby, also new consumers.
Travel retailFor many years, Cloetta has had substantial sales to ferry lines, charter tour operators and airports, referred to as Travel Retail.
Well-known brands and unique packag-es in terms of both appearance and size are two of the most important competitive tools in this market.
The Jelly Bean Factory enters Australia.
iMPaCtfU l CaMPaiGnS
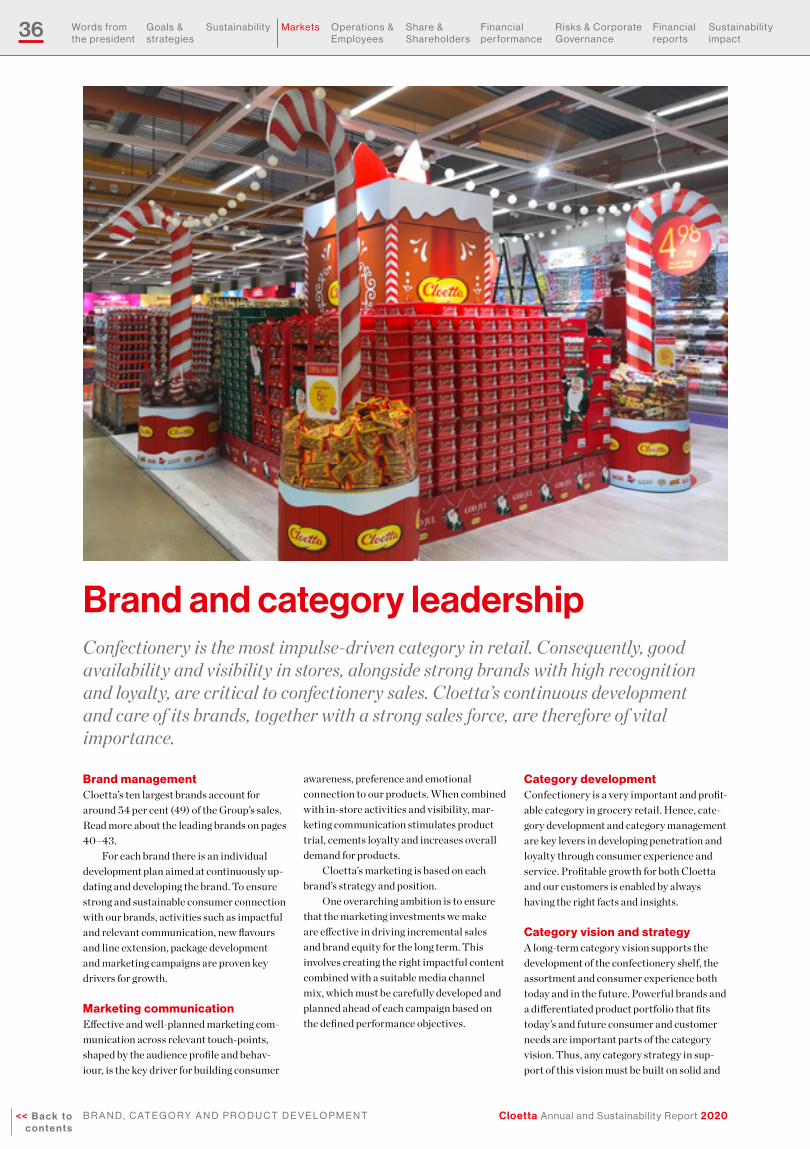
36
Cloetta Annual and Sustainability Report 2020<< B a c k t o c o n t e n t s
B r a n d , C at e G O r Y a n d P r O d U C t d e V e l O P M e n t
Words from the president
Goals & strategies
Sustain ability Markets Operations & employees
Share & Shareholders
financial performance
risks & Corporate Governance
financial reports
Sustain ability impact
Brand and category leadershipConfectionery is the most impulse-driven category in retail. Consequently, good availability and visibility in stores, alongside strong brands with high recognition and loyalty, are critical to confectionery sales. Cloetta’s continuous development and care of its brands, together with a strong sales force, are therefore of vital importance.
Brand managementCloetta’s ten largest brands account for around 54 per cent (49) of the Group’s sales. Read more about the leading brands on pages 40–43.
For each brand there is an individual development plan aimed at continuously up-dating and developing the brand. To ensure strong and sustainable consumer connection with our brands, activities such as impactful and relevant communication, new flavours and line extension, package development and marketing campaigns are proven key drivers for growth.
Marketing communicationEffective and well-planned marketing com-munication across relevant touch-points, shaped by the audience profile and behav-iour, is the key driver for building consumer
awareness, preference and emotional connection to our products. When combined with in-store activities and visibility, mar-keting communication stimulates product trial, cements loyalty and increases overall demand for products.
Cloetta’s marketing is based on each brand’s strategy and position.
One overarching ambition is to ensure that the marketing investments we make are effective in driving incremental sales and brand equity for the long term. This involves creating the right impactful content combined with a suitable media channel mix, which must be carefully developed and planned ahead of each campaign based on the defined performance objectives.
Category developmentConfectionery is a very important and profit-able category in grocery retail. Hence, cate-gory development and category management are key levers in developing penetration and loyalty through consumer experience and service. Profitable growth for both Cloetta and our customers is enabled by always having the right facts and insights.
Category vision and strategyA long-term category vision supports the development of the confectionery shelf, the assortment and consumer experience both today and in the future. Powerful brands and a differentiated product portfolio that fits today’s and future consumer and customer needs are important parts of the category vision. Thus, any category strategy in sup-port of this vision must be built on solid and
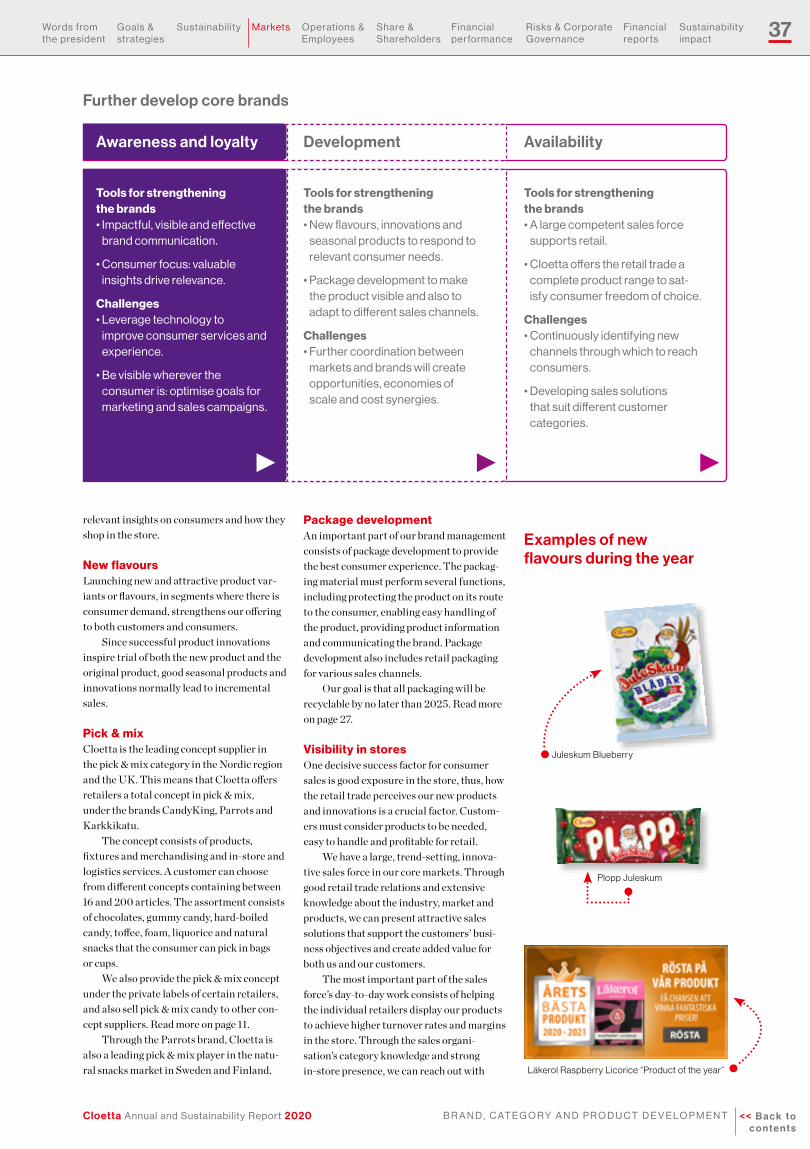
37
Cloetta Annual and Sustainability Report 2020 << B a c k t o c o n t e n t s
B r a n d , C at e G O r Y a n d P r O d U C t d e V e l O P M e n t
Words from the president
Goals & strategies
Sustain ability Markets Operations & employees
Share & Shareholders
financial performance
risks & Corporate Governance
financial reports
Sustain ability impact
Examples of new flavours during the year
Juleskum Blueberry
Plopp Juleskum
Läkerol Raspberry Licorice “Product of the year”
relevant insights on consumers and how they shop in the store.
New flavoursLaunching new and attractive product var-iants or flavours, in segments where there is consumer demand, strengthens our offering to both customers and consumers.
Since successful product innovations inspire trial of both the new product and the original product, good seasonal products and innovations normally lead to incremental sales.
Pick & mixCloetta is the leading concept supplier in the pick & mix category in the Nordic region and the UK. This means that Cloetta offers retailers a total concept in pick & mix, under the brands CandyKing, Parrots and Karkkikatu.
The concept consists of products, fixtures and merchandising and in-store and logistics services. A customer can choose from different concepts containing between 16 and 200 articles. The assortment consists of chocolates, gummy candy, hard-boiled candy, toffee, foam, liquorice and natural snacks that the consumer can pick in bags or cups.
We also provide the pick & mix concept under the private labels of certain retailers, and also sell pick & mix candy to other con-cept suppliers. Read more on page 11.
Through the Parrots brand, Cloetta is also a leading pick & mix player in the natu-ral snacks market in Sweden and Finland.
Package development An important part of our brand management consists of package development to provide the best consumer experience. The packag-ing material must perform several functions, including protecting the product on its route to the consumer, enabling easy handling of the product, providing product information and communicating the brand. Package development also includes retail packaging for various sales channels.
Our goal is that all packaging will be recyclable by no later than 2025. Read more on page 27.
Visibility in storesOne decisive success factor for consumer sales is good exposure in the store, thus, how the retail trade perceives our new products and innovations is a crucial factor. Custom-ers must consider products to be needed, easy to handle and profitable for retail.
We have a large, trend-setting, innova-tive sales force in our core markets. Through good retail trade relations and extensive knowledge about the industry, market and products, we can present attractive sales solutions that support the customers’ busi-ness objectives and create added value for both us and our customers.
The most important part of the sales force’s day-to-day work consists of helping the individual retailers display our products to achieve higher turnover rates and margins in the store. Through the sales organi-sation’s category knowledge and strong in-store presence, we can reach out with
Availability
Further develop core brands
Tools for strengthening the brands• impactful, visible and effective
brand communication.
• Consumer focus: valuable insights drive relevance.
Challenges• leverage technology to
improve consumer services and experience.
• Be visible wherever the consumer is: optimise goals for marketing and sales campaigns.
Tools for strengthening the brands• new flavours, innovations and
seasonal products to respond to relevant consumer needs.
• Package development to make the product visible and also to adapt to different sales channels.
Challenges• further coordination between
markets and brands will create opportunities, economies of scale and cost synergies.
Tools for strengthening the brands• a large competent sales force
supports retail.
• Cloetta offers the retail trade a complete product range to sat-isfy consumer freedom of choice.
Challenges• Continuously identifying new
channels through which to reach consumers.
• developing sales solutions that suit different customer categories.
Awareness and loyalty Development
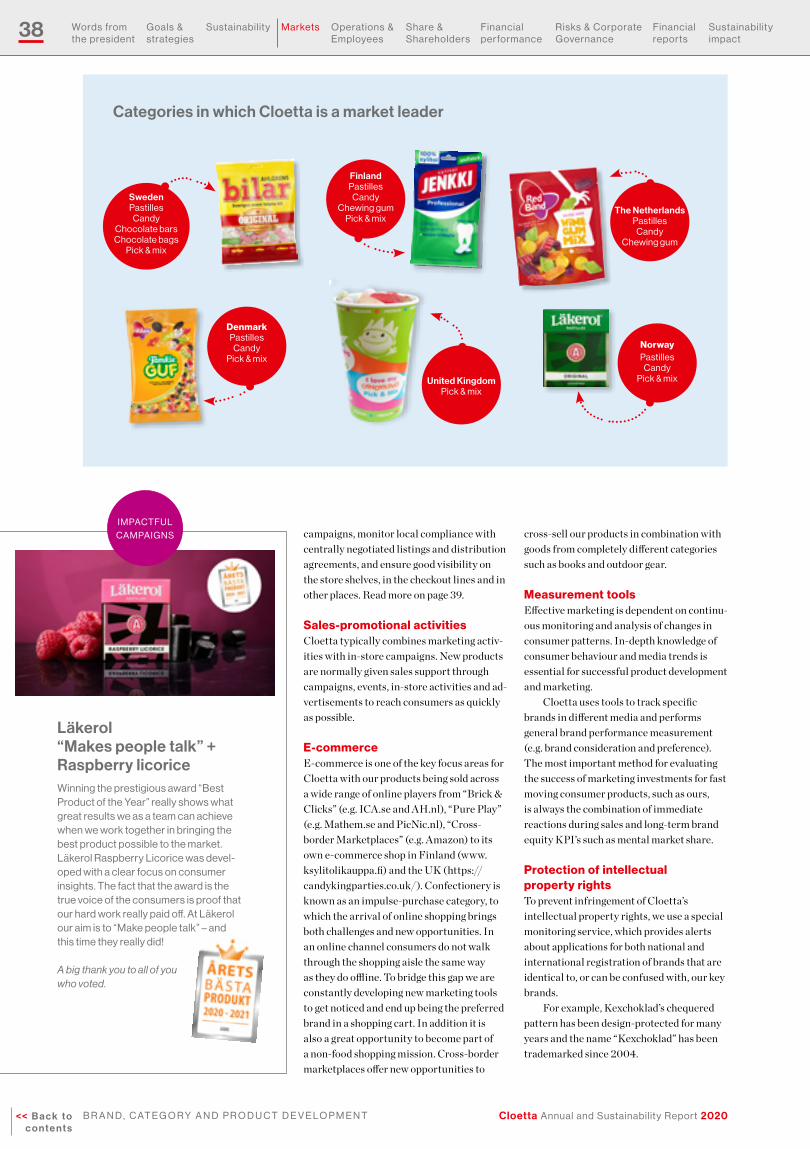
38
Cloetta Annual and Sustainability Report 2020<< B a c k t o c o n t e n t s
B r a n d , C at e G O r Y a n d P r O d U C t d e V e l O P M e n t
Words from the president
Goals & strategies
Sustain ability Markets Operations & employees
Share & Shareholders
financial performance
risks & Corporate Governance
financial reports
Sustain ability impact
NorwayPastilles
CandyPick & mix
Categories in which Cloetta is a market leader
The NetherlandsPastilles
Candy Chewing gum
FinlandPastilles
CandyChewing gum
Pick & mix
DenmarkPastilles
CandyPick & mix
United KingdomPick & mix
SwedenPastilles
CandyChocolate barsChocolate bags
Pick & mix
campaigns, monitor local compliance with centrally negotiated listings and distribution agreements, and ensure good visibility on the store shelves, in the checkout lines and in other places. Read more on page 39.
Sales-promotional activities Cloetta typically combines marketing activ-ities with in-store campaigns. New products are normally given sales support through campaigns, events, in-store activities and ad-vertisements to reach consumers as quickly as possible.
E-commerceE-commerce is one of the key focus areas for Cloetta with our products being sold across a wide range of online players from “Brick & Clicks” (e.g. ICA.se and AH.nl), “Pure Play” (e.g. Mathem.se and PicNic.nl), “Cross- border Marketplaces” (e.g. Amazon) to its own e-commerce shop in Finland (www.ksylitolikauppa.fi) and the UK (https://candykingparties.co.uk/). Confectionery is known as an impulse-purchase category, to which the arrival of online shopping brings both challenges and new opportunities. In an online channel consumers do not walk through the shopping aisle the same way as they do offline. To bridge this gap we are constantly developing new marketing tools to get noticed and end up being the preferred brand in a shopping cart. In addition it is also a great opportunity to become part of a non-food shopping mission. Cross-border marketplaces offer new opportunities to
cross-sell our products in combination with goods from completely different categories such as books and outdoor gear.
Measurement toolsEffective marketing is dependent on continu-ous monitoring and analysis of changes in consumer patterns. In-depth knowledge of consumer behaviour and media trends is essential for successful product development and marketing.
Cloetta uses tools to track specific brands in different media and performs general brand performance measurement (e.g. brand consideration and preference). The most important method for evaluating the success of marketing investments for fast moving consumer products, such as ours, is always the combination of immediate reactions during sales and long-term brand equity KPI’s such as mental market share.
Protection of intellectual property rights To prevent infringement of Cloetta’s intellectual property rights, we use a special monitoring service, which provides alerts about applications for both national and international registration of brands that are identical to, or can be confused with, our key brands.
For example, Kexchoklad’s chequered pattern has been design-protected for many years and the name “Kexchoklad” has been trademarked since 2004.
Läkerol “Makes people talk” + Raspberry licoriceWinning the prestigious award “Best Product of the Year” really shows what great results we as a team can achieve when we work together in bringing the best product possible to the market. läkerol raspberry licorice was devel-oped with a clear focus on consumer insights. the fact that the award is the true voice of the consumers is proof that our hard work really paid off. at läkerol our aim is to “Make people talk” – and this time they really did!
A big thank you to all of you who voted.
iMPaCtfU l CaMPaiGnS

39
Cloetta Annual and Sustainability Report 2020 << B a c k t o c o n t e n t s
B r a n d , C at e G O r Y a n d P r O d U C t d e V e l O P M e n t
Words from the president
Goals & strategies
Sustain ability Markets Operations & employees
Share & Shareholders
financial performance
risks & Corporate Governance
financial reports
Sustain ability impact
Success factors for the sales organisation
Good relations with customers at a central and local level
Through good relations with the retail trade and in-depth knowledge of the industry, market and products, we can present
attractive sales solutions that support each customer’s business objectives.
Good visibility for Cloetta’s products
High visibility in stores, particularly at the checkout stands, is vital for growth in sales. In order to increase the visibility of our products, the sales
force works actively to increase the number of display points in the stores.
Boost salesTo increase sales, our products need to be wherever consumers are. The task for our sales organisation is therefore to increase display space and sales in existing stores and also seek new non-traditional sales points for selected parts of the product range.
Ensure compliance with customer agreements
The sales force ensures compliance with central agreements and that the agreed range of products is
found in the stores.
Effective sales campaigns in cooperation with customers
Marketing campaigns are typically combined with sales promotional activities in stores. The sales force helps retailers
to display these in the best way.
The right products for the right customerSelling the right products to the right customer generates profitability for both us
and for the customer. Our sales force is extensive and effective, which provides good opportunities for a presence at many different sales points.

40
Cloetta Annual and Sustainability Report 2020<< B a c k t o c o n t e n t s
B r a n d , C at e G O r Y a n d P r O d U C t d e V e l O P M e n t
Words from the president
Goals & strategies
Sustain ability Markets Operations & employees
Share & Shareholders
financial performance
risks & Corporate Governance
financial reports
Sustain ability impact
Cloetta’s leading brandsCloetta is the name and symbol of the Nordic region’s oldest confectionery company, with a very strong local heritage. Cloetta’s brands fulfil the purpose: “We believe in the Power of True Joy”.
Chewits has a strong brand heritage, launched in the UK in 1965 as a chewy sweet for children. Known for its unique chewy texture, the range of delicious fruity chews are individually wrapped in stick packs, sold in multi-packs and sharing bags. 2019 saw the launch of a new colourful pack design with “Chewie the Chewitsaurus” the cheeky dino who likes to chew. newest to the range are Chewits Juicy Bites, liquid-filled bon-bons with a juicy strawberry flavour.
Sold in: the UK, ireland, norway, finland, the Baltics, russia and Belarus.
Ahlgrens bilar is a car-shaped foam candy that a large majority of the Swedes love and enjoy. the original flavour and elegant design have remained unchanged since 1953, when ahlgrens’ candy factory decided to try to manufacture marshmallows. the result was not as expected; instead it turned out to be small foam pieces of candy in the shape of a car. Sweden’s best selling car was born! new car models have been launched since then.
Sold in: Sweden, norway, denmark, Poland, thailand and the US.
Center has been around in Sweden since 1941 and is one of Cloetta’s many iconic brands. a tasty round chocolate with a luxurious filling. Center – it’s the inside that counts.
Sold in: Sweden, norway, denmark, estonia and finland.
CandyKing life is full of sweet and joyful occasions. With CandyKing you choose from hundreds of different candies and mix them just the way you want in a single bag or cup. CandyKing was founded in 1984 and the company was later bought by Cloetta in 2017. it is now the leading supplier of pick & mix in europe, with CandyKing as the leading pick & mix brand in the nordic region and the UK. So just Pick it, Mix it, love it!
Sold in: Sweden, denmark, norway, finland, the UK, ireland and the Baltics.
Bridge is a candy mix that was created in 1966 when some employees were playing the card game Bridge and ate a mixture of different tasting products that were made at the factory. One day someone came up with the idea of launching this mix of varied delicious flavours in a bag; including chocolate-coated hazelnuts, liquorice sticks and peppermint drops.
Sold in: Sweden, norway and denmark.
Aakkoset has been a beloved finnish candy bag classic since 1970. it has a bold, diamond-patterned design and clever, playful messaging. aakkoset translates to “alphabets” and the slogan “literally good” encapsulates aakkoset’s positioning as the ultimate indulgence for sweet cravings.
Sold in: finland and travel retail.
Familie Guf is a well-known and beloved brand in denmark and is the best-selling product within Cloetta denmark. familie Guf is a very inclusive brand and celebrates all different kinds of families with the slogan: ”Candy for all kinds of families.” even the mix of candy in the bag is diverse, consist-ing of both sweet and salty liquorice, wine gums, foam, caramel etc.
Sold in: denmark and Sweden.
Swedish Design Award
2020

41
Cloetta Annual and Sustainability Report 2020 << B a c k t o c o n t e n t s
B r a n d , C at e G O r Y a n d P r O d U C t d e V e l O P M e n t
Words from the president
Goals & strategies
Sustain ability Markets Operations & employees
Share & Shareholders
financial performance
risks & Corporate Governance
financial reports
Sustain ability impact
Jenkki is the market-leading chewing gum in finland where it was launched in 1951. Since 1975 the brand has been sweetened with the dental innova-tion xylitol, and has thus become a smart tooth-friendly habit for finns: a breath freshener and a nice little
treat after each meal. Jenkki – puts a smile on your face.
Sold in: finland and estonia.
Juleskum is the original that has become a natural part of the Swedish Christmas tradition. Cloetta started making marshmallow Santas as early as the 1930s. each year a limited edition is released, this year with a taste of blueberries. although Juleskum is only sold around Christmas, it is the third largest-selling candy bag in Sweden on an annual basis.
Sold in: Sweden, norway and denmark.
Kexchoklad was launched as early as 1938 and is Cloetta’s active Swedish classic. it is Sweden’s best-tasting between-meal snack. three layers of crispy, chocolate-covered filled wafers make Kexchoklad a snack for active people who need to quickly replenish their energy.
Sold in: Sweden, denmark and the Baltics.
Kingthe de Vries family started producing peppermint in 1902, and from 1922 under the brand name King. Over time, the brand has evolved from a simple throat lozenge into a modern breath freshener. today, after nearly 100 years, it still contains the same secret peppermint blend that makes King so loved by many dutch consumers.
Sold in: the netherlands, Belarus, Belgium, Canada, lithuania, Suriname, the UK and the US.
Lonka are soft, delicious sweets made with passion and carefully selected ingredients. lonka has been providing consumers with traditional favourites like Soft nougat and fudge Caramel ever since the first lonka factory opened in 1920 in the netherlands. the great taste and texture goes perfectly with a cup of coffee or tea and makes these moments more indulgent. Sit back, relax and enjoy! last year lonka celebrated its 100th anniversary. despite Covid-19 we were able to celebrate in lonka style. Our Pr campaign focusing on small moments of happiness received a lot of coverage in local and national media.
Sold in: Benelux, Sweden, denmark, Germany, the UK, Spain, Switzerland, france, South Korea, latvia, Singapore and South africa.
The Jelly Bean Factory offers 36 different flavours of gourmet jelly beans, made from 100 per cent natural flavours and fruit juices. free from gluten, gelatine and nuts. the Jelly Bean factory was established in 1998 in ireland. every day over 12 million gour-met jelly beans are manufactured in the factory in dublin, packaged in a wide range of playful formats. “the most juicy, mouth-watering jelly beans on the planet.”
Sold in: around 50 countries worldwide, mainly in the UK, Sweden, Germany, the netherlands, Switzerland, austria, the Baltics, russia, Canada, the US, Cyprus, Portugal, Spain, israel, China, Singapore, australia and new Zealand.
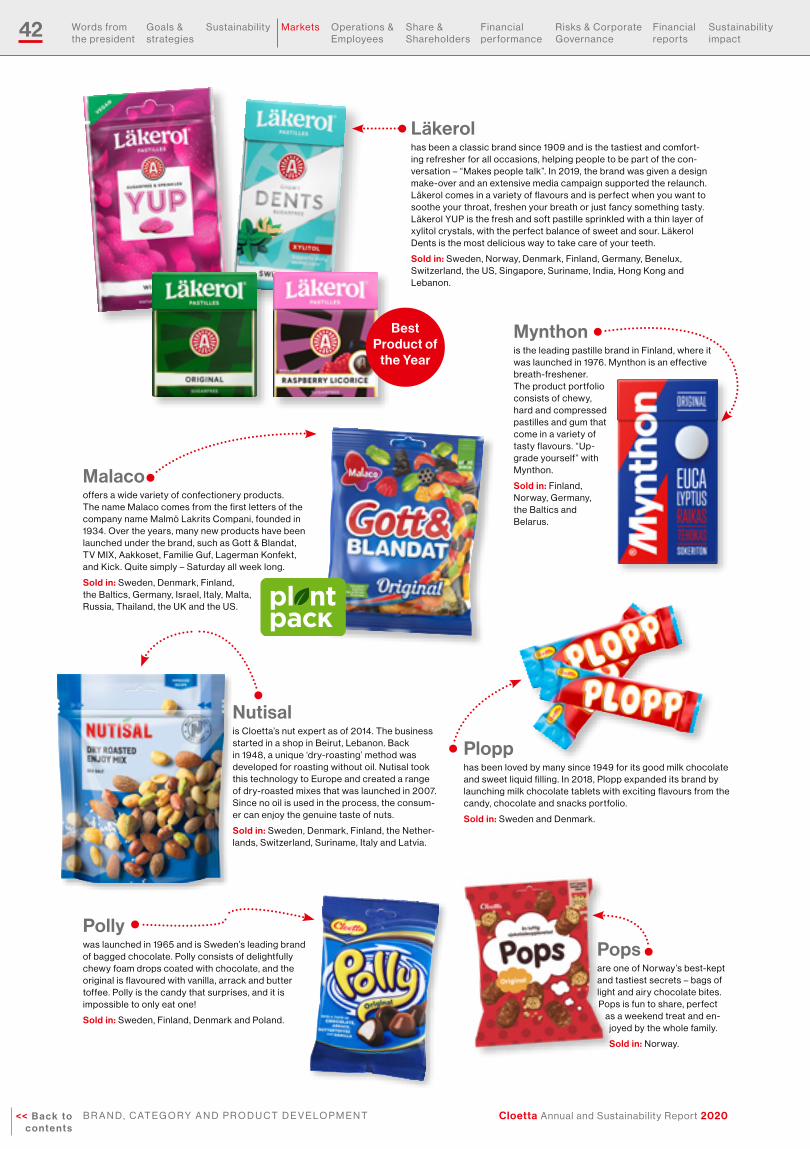
42
Cloetta Annual and Sustainability Report 2020<< B a c k t o c o n t e n t s
B r a n d , C at e G O r Y a n d P r O d U C t d e V e l O P M e n t
Words from the president
Goals & strategies
Sustain ability Markets Operations & employees
Share & Shareholders
financial performance
risks & Corporate Governance
financial reports
Sustain ability impact
Popsare one of norway’s best-kept and tastiest secrets – bags of light and airy chocolate bites. Pops is fun to share, perfect
as a weekend treat and en-joyed by the whole family.
Sold in: norway.
Nutisal is Cloetta’s nut expert as of 2014. the business started in a shop in Beirut, lebanon. Back in 1948, a unique ‘dry-roasting’ method was developed for roasting without oil. nutisal took this technology to europe and created a range of dry-roasted mixes that was launched in 2007. Since no oil is used in the process, the consum-er can enjoy the genuine taste of nuts.
Sold in: Sweden, denmark, finland, the nether-lands, Switzerland, Suriname, italy and latvia.
Plopp has been loved by many since 1949 for its good milk chocolate and sweet liquid filling. in 2018, Plopp expanded its brand by launching milk chocolate tablets with exciting flavours from the candy, chocolate and snacks portfolio.
Sold in: Sweden and denmark.
Pollywas launched in 1965 and is Sweden’s leading brand of bagged chocolate. Polly consists of delightfully chewy foam drops coated with chocolate, and the original is flavoured with vanilla, arrack and butter toffee. Polly is the candy that surprises, and it is impossible to only eat one!
Sold in: Sweden, finland, denmark and Poland.
Mynthon is the leading pastille brand in finland, where it was launched in 1976. Mynthon is an effective breath-freshener. the product portfolio consists of chewy, hard and compressed pastilles and gum that come in a variety of tasty flavours. “Up-grade yourself” with Mynthon.
Sold in: finland, norway, Germany, the Baltics and Belarus.
Malaco offers a wide variety of confectionery products. the name Malaco comes from the first letters of the company name Malmö lakrits Compani, founded in 1934. Over the years, many new products have been launched under the brand, such as Gott & Blandat, tV MiX, aakkoset, familie Guf, lagerman Konfekt, and Kick. Quite simply – Saturday all week long.
Sold in: Sweden, denmark, finland, the Baltics, Germany, israel, italy, Malta, russia, thailand, the UK and the US.
Läkerolhas been a classic brand since 1909 and is the tastiest and comfort-ing refresher for all occasions, helping people to be part of the con-versation – “Makes people talk”. in 2019, the brand was given a design make-over and an extensive media campaign supported the relaunch. läkerol comes in a variety of flavours and is perfect when you want to soothe your throat, freshen your breath or just fancy something tasty. läkerol YUP is the fresh and soft pastille sprinkled with a thin layer of xylitol crystals, with the perfect balance of sweet and sour. läkerol dents is the most delicious way to take care of your teeth.
Sold in: Sweden, norway, denmark, finland, Germany, Benelux, Switzerland, the US, Singapore, Suriname, india, hong Kong and lebanon.
Best Product of
the Year

43
Cloetta Annual and Sustainability Report 2020 << B a c k t o c o n t e n t s
B r a n d , C at e G O r Y a n d P r O d U C t d e V e l O P M e n t
Words from the president
Goals & strategies
Sustain ability Markets Operations & employees
Share & Shareholders
financial performance
risks & Corporate Governance
financial reports
Sustain ability impact
Sportlife was launched in the netherlands in 1981 as the first chewing gum in “blister” packaging. Since its start, Sportlife has been a leader in the dutch market and also has a strong position in Belgium. Sportlife’s brand positioning is “unex-pected freshness” and has an international brand profile. in 2015 Sportlife launched its best-selling flavours in tubs.
Sold in: the netherlands, Belgium and Suriname.
Sisuwas launched in finland in 1928 and it is a liquorice pastille flavored with a secret Sisu aroma. Sisu is named after the true nature of the finnish people. the word “Sisu” means guts, endurance or relentless courage. for the finns, Sisu is part of the finnish spirit that no other brand can replace. Sisu gets you through it. Sisu comes in several fla-vours and textures, packaged in boxes.
Sold in: finland.
Sportlunchis a crispy wafer generously coated with pure milk chocolate in easily breakable pieces. Sportlunch was launched in Sweden in 1937, under the name “Mellanmål” which was changed to Sportlunch in 1996.
Sold in: Sweden, norway, estonia and lithuania.
Tupla is an iconic chocolate bar hungering for adventure since 1960. finland’s number one choc-olate bar tupla means ‘double’ and contains two chocolate pieces with a unique taste and texture, giving you a boost and attitude for your adventures. the Original tupla has a cocoa nougat filling covered with milk chocolate, with a twist of saltiness and roasted almonds. tupla comes in different flavours and sizes, is available as a sport bar and since 2019 it also comes as a protein pudding under tupla+.
Sold in: finland, the Baltics and russia.Venco was launched way back in 1878 and is the leading liquorice brand in the netherlands. Venco has ‘a passion for liquorice’, which is delivered in a wide range of unique, iconic and top-selling items like honey liquorice and pyramids. When the dutch think of liquorice, they think of Venco. the best-loved Venco product is called ‘ ’Schoolkrijt’ ’. it is a liquorice that looks like blackboard chalk and has a sweet, crunchy mint outside and a soft high-quality aniseed filling. it’s not a surprise that Schoolkrijt is the number 1 selling Venco item.
Sold in: the netherlands, Belgium, Germany, Canada, israel, South-africa and Suriname.
Red Band dates as far back as 1928. Since its start, the red Band brand has built up a leading position in the dutch and German con-fectionery markets with a promise to deliver fun, quality and pleasure. the classic Wine Gum Mix, the original drop fruit duos and the Pret Mix are some of the well-known products that are sold under the red Band brand. today red Band also offers the consumer more alternatives with a wide variety of 30% less sugar products, sugar-free products and even vegitarian products.
Sold in: the netherlands, Belgium, Germany, austria, Canada, ireland, the UK, Switzerland, the Baltics, france, Suriname and taiwan.
Skipper’s Pipeswas established in 1920 and is a unique product due to its pipe shape and pink or yellow sprinkles on top, resembling embers. today there are two different versions; sweet or salty liquorice. the origi-nal liquorice pipe has been a great success and is iconic for thousands of danes, and is proba-bly one of the most photographed pieces of candy! the pipe is 80% hand-made and packed.
Sold in: denmark, Sweden, norway, finland, Greenland, the faroe islands and estonia.
TV Mixhas been an important part of finnish weekend candy since 1989. it is the most versatile mixed bag combining best-selling pick & mix candy with exciting novelties. Perfect for sharing with your friends and family.
Sold in: finland.

44
<< B a c k t o c o n t e n t s
C l O e t ta’ S M a i n M a r K e t S
Words from the president
Goals & strategies
Sustain ability Markets Operations & employees
Share & Shareholders
financial performance
risks & Corporate Governance
financial reports
Sustain ability impact
the UK
Germany
31%Sweden
22%Finland
15%
6%
9%
Denmark
6%Norway
5%
6%
InternationalMarkets
theNetherlands
Cloetta annual and Sustainability report 2020
Cloetta’s main marketsCloetta’s main markets are the countries in which we have our own sales and distribution organisation, and include Sweden, Finland, the Netherlands, Denmark, Norway, Germany and the UK.
•• Main markets – countries where Cloetta has its own sales and distribution organisation.
•• Countries where Cloetta’s products are sold primarily through sales and distribution organisation agreements.
•• Share of Cloetta’s sales.

45
<< B a c k t o c o n t e n t s
C l O e t ta’ S M a i n M a r K e t S
Words from the president
Goals & strategies
Sustain ability Markets Operations & employees
Share & Shareholders
financial performance
risks & Corporate Governance
financial reports
Sustain ability impact
the UK
Germany
31%Sweden
22%Finland
15%
6%
9%
Denmark
6%Norway
5%
6%
InternationalMarkets
theNetherlands
Cloetta annual and Sustainability report 2020
Sweden
Largest players, Sweden
Fazer 8% p
t Cloetta 22%Others 40%u
t Mondelez 30%
#2
Confectionery market excl. pick & mix
Source: Global data
Categories, Sweden
Chocolate 55%u
Chewing gum 11% ut Candy and pastilles 34%
Source: Global data
Confectionery market excl. pick & mix
Sweden is the largest single market in the Nordic region, with around one third of the total confectionery consumption. The total market declined in 2020.
SWEDEN
Share of Cloetta’s sales
31%
Population
10.2million
Market size
Consumer sales of approx.
SeK 14bn
Cloetta’s largest customers
Axfood, Coop, ICA,
Bergendahls and Privab
CaGr 2015–2020
Candy
Chocolate
Pastilles
Chewing gum
Nuts
Pick & mix
Cloetta’s presence
So
urce: Nielsen
top-selling brands
Cloetta’s sales and competitorsCloetta is the market leader in candy and pastilles, Mondelez (includ-ing the Marabou brand) leads the chocolate market and Wrigley’s leads in chewing gum in Sweden. Overall, Cloetta is the second largest player in the Swedish market for packaged confectionery, with a share of around 22 per cent (23). Mondelez has approximately 30 per cent (30) of the market. The retail chains’ private labels have a share of around 5 per cent (3) of the confectionery market and 46 per cent (43) within nuts.
Pick & mix, an important category that accounts for around 30 per cent of the total market, is not included in the market shares above, but through contracts with retailers Bergendahls and ÖoB, the acquisition of Candyking and sales of candy to other pick & mix players, Cloetta is the market leader in this category.
Sales channelsThe Swedish grocery retail trade is concentrated and increasingly centrally controlled, but with good opportunities for influence at the local store level. The task for Cloetta’s sales force is to ensure distri-bution as well as placement and space in the stores in accordance with the central agreements, and also to provide the trade with support in implementing campaigns and launches. The pick & mix concepts are handled by a dedicated sales and merchandising organisation.
The service trade is a vital sales channel. In recent years, alterna-tive sales channels such as building supply stores, cinemas and arenas have become increasingly important.
OrganisationIn Sweden, there are a total of around 230 employees in the sales and merchandising organisation and the office in Malmö.
0.1%

46
Cloetta Annual and Sustainability Report 2020<< B a c k t o c o n t e n t s
C l O e t ta’ S M a i n M a r K e t S
Words from the president
Goals & strategies
Sustain ability Markets Operations & employees
Share & Shareholders
financial performance
risks & Corporate Governance
financial reports
Sustain ability impact
Cloetta’s sales and competitors Cloetta is the second largest player in the Finnish market, with a share of around 24 per cent (25) of packaged confectionery. The market leader is Fazer, with approximately 40 per cent (40) of the confection-ery market. The private labels of retail chains have a share of around 8 per cent (8) of confectionery sales in the Finnish market. Cloetta is the market leader in pick & mix which represents about 10 per cent of the total market value.
Sales channelsThe Finnish grocery retail trade is dominated by two players, Kesko and S-Group. Lidl has a larger share of retail trade compared to the other Nordic countries with 10 per cent. Finland has the most central-ised purchasing of all the Nordic region markets which enables new products to achieve wide distribution and quickly become available to consumers.
OrganisationIn Finland, there are around 200 employees in the sales and mer-chandising organisation and at the office in Turku. Cloetta Finland employs around 130 people in field sales, visiting stores every day.
FINLAND
Finland
Share of Cloetta’s sales
22%
Population
5.5million
Cloetta’s largest customers
S-Group, Kesko and Tokmanni
CaGr 2015–2020
Finland is the third largest market in the Nordic region, with around one fifth of the region’s total confectionery consumption. The Finnish market grew in 2020.
Candy
Chocolate
Pastilles
Chewing gum
Nuts
Pick & mix
Cloetta’s presence
So
urce: SO
K
Market size
Consumer sales of approx.
SeK 13bn
top-selling brands
Largest players, Finland
t Fazer 40%
t Cloetta 24%Others 24%u
Mondelez
6%u
#2
Confectionery market excl. pick & mix
Source: Global data
Orkla 6%u
Categories, Finland
Chocolate 44%p
Chewing gum 11% qt Candy and pastilles 45%
Source: Global data
Confectionery market excl. pick & mix
3.3%

47
Cloetta Annual and Sustainability Report 2020 << B a c k t o c o n t e n t s
C l O e t ta’ S M a i n M a r K e t S
Words from the president
Goals & strategies
Sustain ability Markets Operations & employees
Share & Shareholders
financial performance
risks & Corporate Governance
financial reports
Sustain ability impact
Cloetta’s sales and competitorsCloetta is the largest player in the candy category in the Netherlands with a market share of 21 per cent (21), and the second largest player in the chewing gum market with a market share of 28 per cent (30). This has enabled the company to build strong relationships with the Dutch retail trade. Cloetta’s share in the overall chocolate and sugar confectionery market is 9 per cent (10). The private labels of retail chains have a share of around 9 per cent (9) of confectionery sales in the Dutch market.
Sales channelsThe grocery retail trade is concentrated around a few major players. Primarily centralised purchasing allows for wide and rapid distribu-tion of new products that are launched.
The hard discount retail chains have increased their share of the market during the year, with a high proportion of private labels. Other important channels for confectionery are pharmacy and out-of-home.
Online grocery shopping has a stronger position in the Nether-lands than in any other of Cloetta’s main markets, despite the fact that overall e-commerce is lagging in the Netherlands.
OrganisationCloetta has around 85 employees in the commercial organisation at the office in Oosterhout mainly focusing on the Dutch market. The Oosterhout office also supports the Cloetta International Markets division through back-office and support activities including demand, customer service, marketing, business controlling and finance & accounting.
NETHERLANDS
The Netherlands
Share of Cloetta’s sales
15%
Population
17.3million
Cloetta’s largest customers
Albert Heijn, Superunie,
Jumbo Supermarkten
and Maxxam
CaGr 2015–2020
Candy
Chocolate
Pastilles
Chewing gum
Nuts
Pick & mix
Cloetta’s presence
The Netherlands is the sixth largest confectionery market in Western Europe. The Dutch market grew slightly in 2020 mainly driven by chocolate.
top-selling brands
So
urce: IRI
Market size
Consumer sales of approx.
SeK 26bn
Largest players, the Netherlands
t Mars 11%
q Cloetta 9%Others 69%u
t Perfetti 11%
#3
Confectionery market
Source: Global data
Categories, the Netherlands
Chocolate 41%u
Chewing gum 15% u t Candy and pastilles 44%
Source: Global data
Confectionery market
4.1%

48
Cloetta Annual and Sustainability Report 2020<< B a c k t o c o n t e n t s
C l O e t ta’ S M a i n M a r K e t S
Words from the president
Goals & strategies
Sustain ability Markets Operations & employees
Share & Shareholders
financial performance
risks & Corporate Governance
financial reports
Sustain ability impact
Cloetta’s sales and competitors Cloetta is the second largest player in the Danish market for candy and pastilles, with a market share of around 18 per cent (19). Haribo is the market leader with around 29 per cent (25). The private labels of retail chains have a market share of around 7 per cent (9). Cloetta is the leading pick & mix player in Denmark and has strong positions in both candy and nuts.
Sales channelsThe grocery trade in Denmark is moving towards increasing cen-tralisation, albeit with a combination of centrally driven chains and a more decentralised approach than in the other Nordic countries. Extensive efforts are therefore required at an individual store level to achieve distribution and sales of in-store display racks. Growth in the discount channel has ceased and new channels such as non-food outlets and DIY stores are growing in importance.
OrganisationIn Denmark, there are around 100 employees at the offices in Brøndby and Randers and in the sales and merchandising organisation.
Largest players, Denmark
Toms 13% p
t Cloetta 18%Others 40%u
t Haribo 29%
#2
Candy and pastilles excl. pick & mix
Source: Global data
Categories, Denmark
Chocolate 47%u
Chewing gum 7% qt Candy and pastilles 46%
Source: Global data
Confectionery market excl. pick & mix
Denmark
DENMARK
Share of Cloetta’s sales
9%
Population
5.8million
Cloetta’s largest customers
Coop, Salling Group
and Reitan
CaGr 2015–2020
Denmark accounts for around a quarter of the Nordic region’s total confectionery consumption. The confectionery market grew during the year.
Candy
Chocolate
Pastilles
Chewing gum
Nuts
Pick & mix
Cloetta’s presence
So
urce: Nielsen
top-selling brands
Market size
Consumer sales of approx.
SeK 12bn 3.3%

49
Cloetta Annual and Sustainability Report 2020 << B a c k t o c o n t e n t s
C l O e t ta’ S M a i n M a r K e t S
Words from the president
Goals & strategies
Sustain ability Markets Operations & employees
Share & Shareholders
financial performance
risks & Corporate Governance
financial reports
Sustain ability impact
GERMANY
Cloetta’s salesCloetta is primarily active with the wine gum and liquorice brand Red Band. Besides that The Jelly Bean Factory and Lonka are also sold in Germany. Through its strong heritage in wine gum and liquorice products, Cloetta Germany has built a sustainable position with a candy portfolio covering different segments in the market. The specific Red Band texture is clearly seen as a differentiator by both the German customers and consumers. Red Band has thus become the leading non-domestic brand in the wine gum and liquorice sector.
OrganisationCloetta has its own sales organisation in Bocholt, Germany with 14 employees. The office takes care of marketing, customers and the brands, and also has direct contact with all major customer groups, which are supplied directly out of the German central warehouse. To ensure full country service coverage, Cloetta Germany works with sales agents in seven regions and more than 80 sales represent-atives.
Germany
So
urce:Glo
bal D
ata
Cloetta’s largest customers
Edeka, Lidl & Schwarz, Metro
and Rewe
Germany is the largest market in Western Europe and accounts for 6 per cent of Cloetta’s sales. The market is characterised by its large proportion of discounters and fierce competition.
Market size
Consumer sales of approx.
SeK 113bn
top-selling brands
Cloetta’s sales and competitors Cloetta is the third largest player in the Norwegian confectionery market, with a market share of 9 per cent (8). The market leaders are Mondelez with 35 per cent (37) and Nidar (owned by Orkla) with 22 per cent (22). Cloetta is the leading player in the candy category and Cloetta is also the leading pick & mix concept provider with approximately one third of the market. In 2021, the sugar tax will be abolished in Norway.
OrganisationIn Norway, Cloetta has around 30 employees at the office in Høvik just outside of Oslo and in the sales and merchandising organisation.
Largest players, Norway
Nidar (Orkla) 22% p
q Cloetta 9%Others 19%u
t Mondelez 35%
#3
Confectionery market excl. pick & mix
Source: Global data
Conaxess
7%u
Brynhild
8%u
Norway
NORWAY
Cloetta’s largest customers
Coop, NorgesGruppen and Rema 1000
So
urce: Nielsen
Market size
Consumer sales of approx.
SeK 14bn
top-selling brands
Norway is the smallest market in the Nordic region, with just under a fifth of the region’s total confectionery consumption and accounts for 6 per cent of Cloetta’s sales. The volumes in the Norwegian confectionery market increased in 2020.
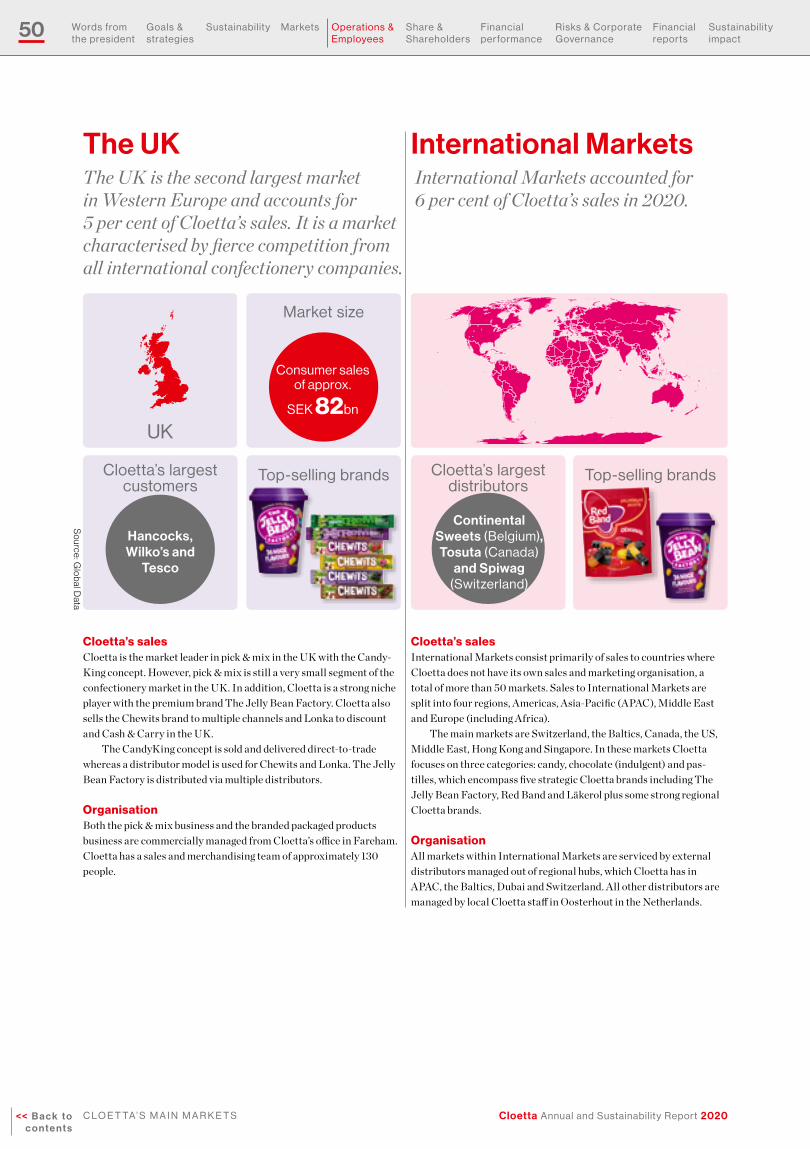
50
Cloetta Annual and Sustainability Report 2020<< B a c k t o c o n t e n t s
C l O e t ta’ S M a i n M a r K e t S
Words from the president
Goals & strategies
Sustain ability Markets Operations & employees
Share & Shareholders
financial performance
risks & Corporate Governance
financial reports
Sustain ability impact
Cloetta’s salesInternational Markets consist primarily of sales to countries where Cloetta does not have its own sales and marketing organisation, a total of more than 50 markets. Sales to International Markets are split into four regions, Americas, Asia-Pacific (APAC), Middle East and Europe (including Africa).
The main markets are Switzerland, the Baltics, Canada, the US, Middle East, Hong Kong and Singapore. In these markets Cloetta focuses on three categories: candy, chocolate (indulgent) and pas-tilles, which encompass five strategic Cloetta brands including The Jelly Bean Factory, Red Band and Läkerol plus some strong regional Cloetta brands.
OrganisationAll markets within International Markets are serviced by external distributors managed out of regional hubs, which Cloetta has in APAC, the Baltics, Dubai and Switzerland. All other distributors are managed by local Cloetta staff in Oosterhout in the Netherlands.
International MarketsInternational Markets accounted for 6 per cent of Cloetta’s sales in 2020.
Cloetta’s largest distributors
Continental Sweets (Belgium), Tosuta (Canada)
and Spiwag (Switzerland)
top-selling brands
Cloetta’s salesCloetta is the market leader in pick & mix in the UK with the Candy-King concept. However, pick & mix is still a very small segment of the confectionery market in the UK. In addition, Cloetta is a strong niche player with the premium brand The Jelly Bean Factory. Cloetta also sells the Chewits brand to multiple channels and Lonka to discount and Cash & Carry in the UK.
The CandyKing concept is sold and delivered direct-to-trade whereas a distributor model is used for Chewits and Lonka. The Jelly Bean Factory is distributed via multiple distributors.
OrganisationBoth the pick & mix business and the branded packaged products business are commercially managed from Cloetta’s office in Fareham. Cloetta has a sales and merchandising team of approximately 130 people.
The UK
UK
Cloetta’s largest customers
Hancocks, Wilko’s and
Tesco
The UK is the second largest market in Western Europe and accounts for 5 per cent of Cloetta’s sales. It is a market characterised by fierce competition from all international confectionery companies.
Market size
Consumer sales of approx.
SeK 82bn
top-selling brands
So
urce: Glo
bal D
ata
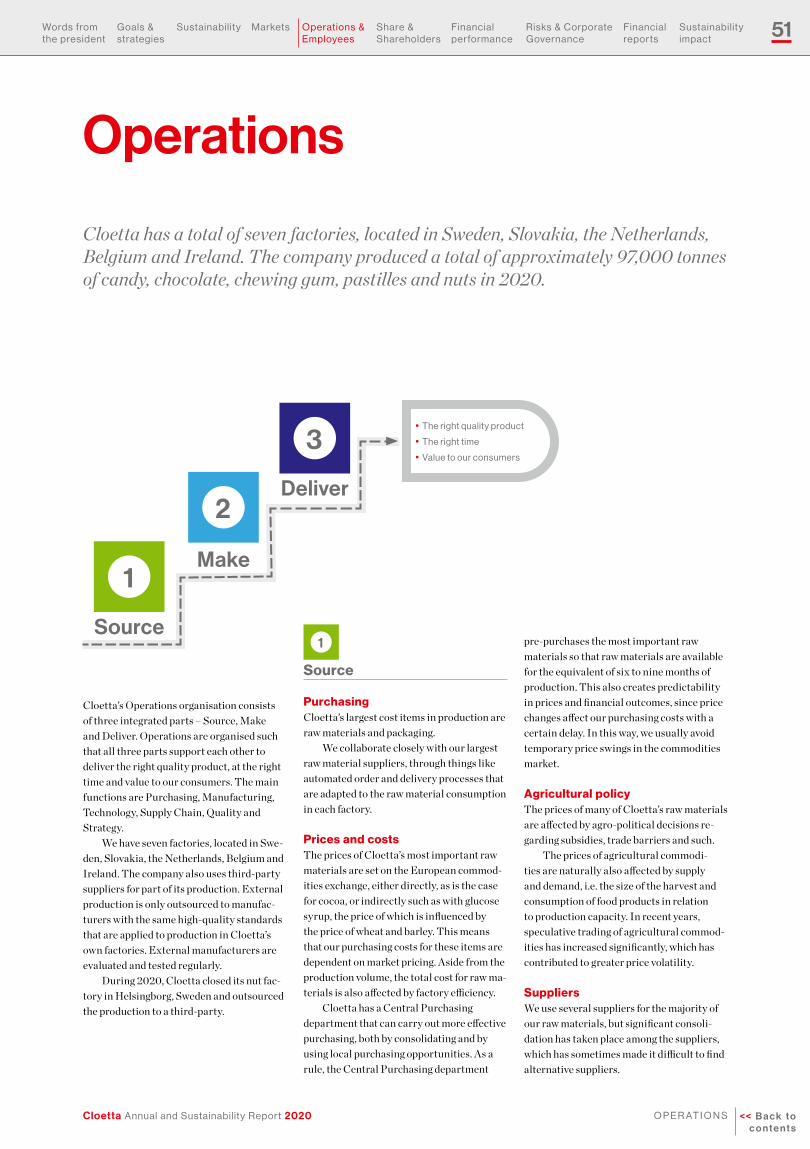
51
Cloetta Annual and Sustainability Report 2020 << B a c k t o c o n t e n t s
O P e r at i O n S
Words from the president
Goals & strategies
Sustain ability Markets Operations & employees
Share & Shareholders
financial performance
risks & Corporate Governance
financial reports
Sustain ability impact
Operations
Cloetta has a total of seven factories, located in Sweden, Slovakia, the Netherlands, Belgium and Ireland. The company produced a total of approximately 97,000 tonnes of candy, chocolate, chewing gum, pastilles and nuts in 2020.
Cloetta’s Operations organisation consists of three integrated parts – Source, Make and Deliver. Operations are organised such that all three parts support each other to deliver the right quality product, at the right time and value to our consumers. The main functions are Purchasing, Manufacturing, Technology, Supply Chain, Quality and Strategy.
We have seven factories, located in Swe-den, Slovakia, the Netherlands, Belgium and Ireland. The company also uses third-party suppliers for part of its production. External production is only outsourced to manufac-turers with the same high-quality standards that are applied to production in Cloetta’s own factories. External manufacturers are evaluated and tested regularly.
During 2020, Cloetta closed its nut fac-tory in Helsingborg, Sweden and outsourced the production to a third-party.
1
Source
Make
2Deliver
3• the right quality product
• the right time
• Value to our consumers
1
Source
PurchasingCloetta’s largest cost items in production are raw materials and packaging.
We collaborate closely with our largest raw material suppliers, through things like automated order and delivery processes that are adapted to the raw material consumption in each factory.
Prices and costsThe prices of Cloetta’s most important raw materials are set on the European commod-ities exchange, either directly, as is the case for cocoa, or indirectly such as with glucose syrup, the price of which is influenced by the price of wheat and barley. This means that our purchasing costs for these items are dependent on market pricing. Aside from the production volume, the total cost for raw ma-terials is also affected by factory efficiency.
Cloetta has a Central Purchasing department that can carry out more effective purchasing, both by consolidating and by using local purchasing opportunities. As a rule, the Central Purchasing department
pre-purchases the most important raw materials so that raw materials are available for the equivalent of six to nine months of production. This also creates predictability in prices and financial outcomes, since price changes affect our purchasing costs with a certain delay. In this way, we usually avoid temporary price swings in the commodities market.
Agricultural policyThe prices of many of Cloetta’s raw materials are affected by agro-political decisions re-garding subsidies, trade barriers and such.
The prices of agricultural commodi-ties are naturally also affected by supply and demand, i.e. the size of the harvest and consumption of food products in relation to production capacity. In recent years, speculative trading of agricultural commod-ities has increased significantly, which has contributed to greater price volatility.
SuppliersWe use several suppliers for the majority of our raw materials, but significant consoli-dation has taken place among the suppliers, which has sometimes made it difficult to find alternative suppliers.
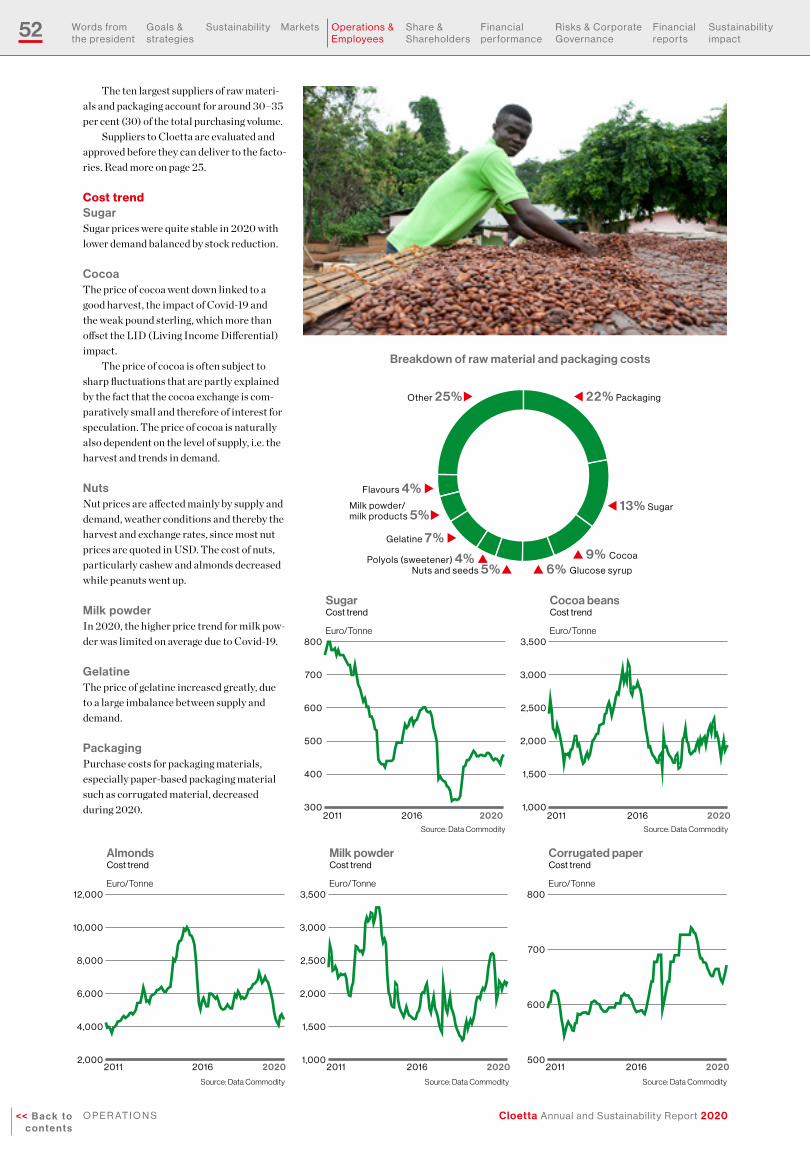
52
Cloetta Annual and Sustainability Report 2020<< B a c k t o c o n t e n t s
O P e r at i O n S
Words from the president
Goals & strategies
Sustain ability Markets Operations & employees
Share & Shareholders
financial performance
risks & Corporate Governance
financial reports
Sustain ability impact
The ten largest suppliers of raw materi-als and packaging account for around 30–35 per cent (30) of the total purchasing volume.
Suppliers to Cloetta are evaluated and approved before they can deliver to the facto-ries. Read more on page 25.
Cost trendSugar Sugar prices were quite stable in 2020 with lower demand balanced by stock reduction.
CocoaThe price of cocoa went down linked to a good harvest, the impact of Covid-19 and the weak pound sterling, which more than offset the LID (Living Income Differential) impact.
The price of cocoa is often subject to sharp fluctuations that are partly explained by the fact that the cocoa exchange is com-paratively small and therefore of interest for speculation. The price of cocoa is naturally also dependent on the level of supply, i.e. the harvest and trends in demand.
Nuts Nut prices are affected mainly by supply and demand, weather conditions and thereby the harvest and exchange rates, since most nut prices are quoted in USD. The cost of nuts, particularly cashew and almonds decreased while peanuts went up.
Milk powderIn 2020, the higher price trend for milk pow-der was limited on average due to Covid-19.
GelatineThe price of gelatine increased greatly, due to a large imbalance between supply and demand.
PackagingPurchase costs for packaging materials, especially paper-based packaging material such as corrugated material, decreased during 2020.
Source: Data Commodity
Cocoa beans Cost trend
Euro/Tonne
1,000
1,500
2,000
2,500
3,000
3,500
202020162011Source: Data Commodity
Sugar Cost trend
Euro/Tonne
300
400
500
600
700
800
202020162011
Source: Data Commodity
Milk powder Cost trend
Euro/Tonne
1,000
1,500
2,000
2,500
3,000
3,500
202020162011
Source: Data Commodity
Corrugated paperCost trend
Euro/Tonne
500
600
700
800
202020162011
Source: Data Commodity
Almonds Cost trend
Euro/Tonne
2,000
4,000
6,000
8,000
10,000
12,000
202020162011
Breakdown of raw material and packaging costs
Nuts and seeds 5%p
Milk powder/milk products 5%u
p 9% CocoaPolyols (sweetener) 4% p
t 22% PackagingOther 25%u
t 13% Sugar
Gelatine 7% u
p 6% Glucose syrup
Flavours 4% u
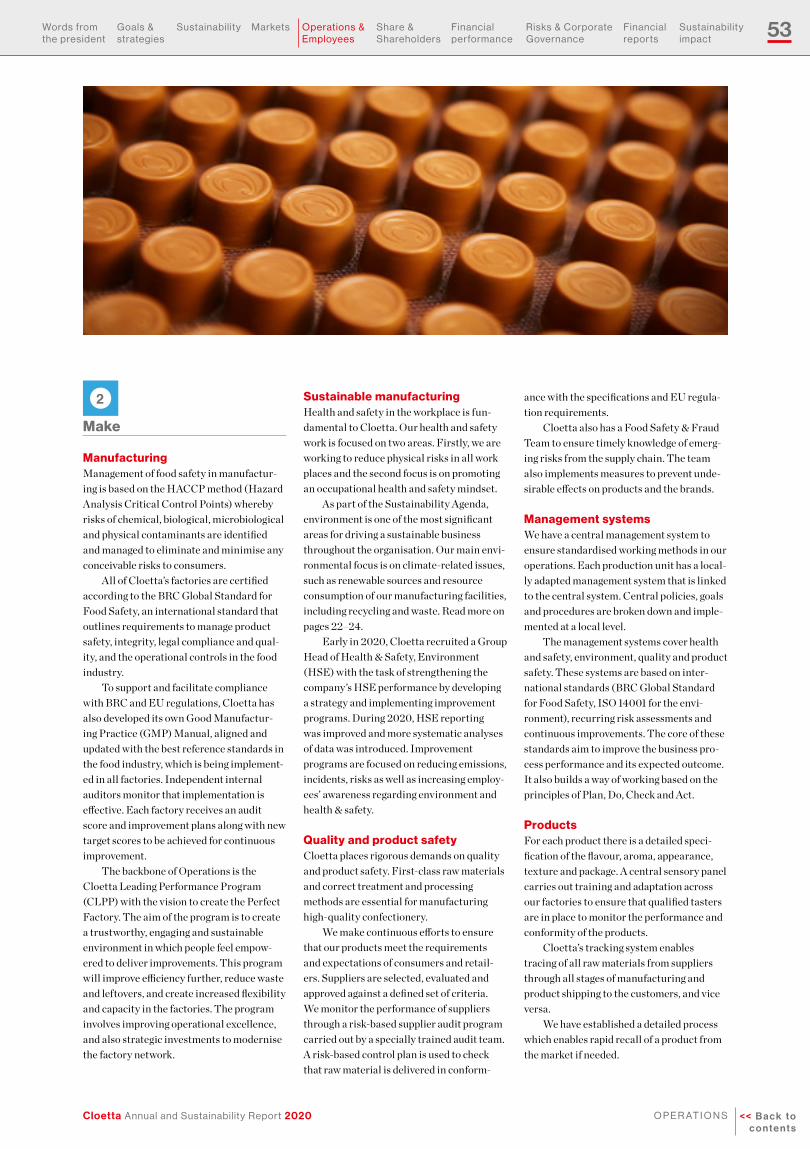
53
Cloetta Annual and Sustainability Report 2020 << B a c k t o c o n t e n t s
O P e r at i O n S
Words from the president
Goals & strategies
Sustain ability Markets Operations & employees
Share & Shareholders
financial performance
risks & Corporate Governance
financial reports
Sustain ability impact
2
Make
ManufacturingManagement of food safety in manufactur-ing is based on the HACCP method (Hazard Analysis Critical Control Points) whereby risks of chemical, biological, microbiological and physical contaminants are identified and managed to eliminate and minimise any conceivable risks to consumers.
All of Cloetta’s factories are certified according to the BRC Global Standard for Food Safety, an international standard that outlines requirements to manage product safety, integrity, legal compliance and qual-ity, and the operational controls in the food industry.
To support and facilitate compliance with BRC and EU regulations, Cloetta has also developed its own Good Manufactur-ing Practice (GMP) Manual, aligned and updated with the best reference standards in the food industry, which is being implement-ed in all factories. Independent internal auditors monitor that implementation is effective. Each factory receives an audit score and improvement plans along with new target scores to be achieved for continuous improvement.
The backbone of Operations is the Cloetta Leading Performance Program (CLPP) with the vision to create the Perfect Factory. The aim of the program is to create a trustworthy, engaging and sustainable environment in which people feel empow-ered to deliver improvements. This program will improve efficiency further, reduce waste and leftovers, and create increased flexibility and capacity in the factories. The program involves improving operational excellence, and also strategic investments to modernise the factory network.
Sustainable manufacturingHealth and safety in the workplace is fun-damental to Cloetta. Our health and safety work is focused on two areas. Firstly, we are working to reduce physical risks in all work places and the second focus is on promoting an occupational health and safety mindset.
As part of the Sustainability Agenda, environment is one of the most significant areas for driving a sustainable business throughout the organisation. Our main envi-ronmental focus is on climate-related issues, such as renewable sources and resource consumption of our manufacturing facilities, including recycling and waste. Read more on pages 22–24.
Early in 2020, Cloetta recruited a Group Head of Health & Safety, Environment (HSE) with the task of strengthening the company’s HSE performance by developing a strategy and implementing improvement programs. During 2020, HSE reporting was improved and more systematic analyses of data was introduced. Improvement programs are focused on reducing emissions, incidents, risks as well as increasing employ-ees’ awareness regarding environment and health & safety.
Quality and product safetyCloetta places rigorous demands on quality and product safety. First-class raw materials and correct treatment and processing methods are essential for manufacturing high-quality confectionery.
We make continuous efforts to ensure that our products meet the requirements and expectations of consumers and retail-ers. Suppliers are selected, evaluated and approved against a defined set of criteria. We monitor the performance of suppliers through a risk-based supplier audit program carried out by a specially trained audit team. A risk-based control plan is used to check that raw material is delivered in conform-
ance with the specifications and EU regula-tion requirements.
Cloetta also has a Food Safety & Fraud Team to ensure timely knowledge of emerg-ing risks from the supply chain. The team also implements measures to prevent unde-sirable effects on products and the brands.
Management systems We have a central management system to ensure standardised working methods in our operations. Each production unit has a local-ly adapted management system that is linked to the central system. Central policies, goals and procedures are broken down and imple-mented at a local level.
The management systems cover health and safety, environment, quality and product safety. These systems are based on inter-national standards (BRC Global Standard for Food Safety, ISO 14001 for the envi-ronment), recurring risk assessments and continuous improvements. The core of these standards aim to improve the business pro-cess performance and its expected outcome. It also builds a way of working based on the principles of Plan, Do, Check and Act.
ProductsFor each product there is a detailed speci-fication of the flavour, aroma, appearance, texture and package. A central sensory panel carries out training and adaptation across our factories to ensure that qualified tasters are in place to monitor the performance and conformity of the products.
Cloetta’s tracking system enables tracing of all raw materials from suppliers through all stages of manufacturing and product shipping to the customers, and vice versa.
We have established a detailed process which enables rapid recall of a product from the market if needed.
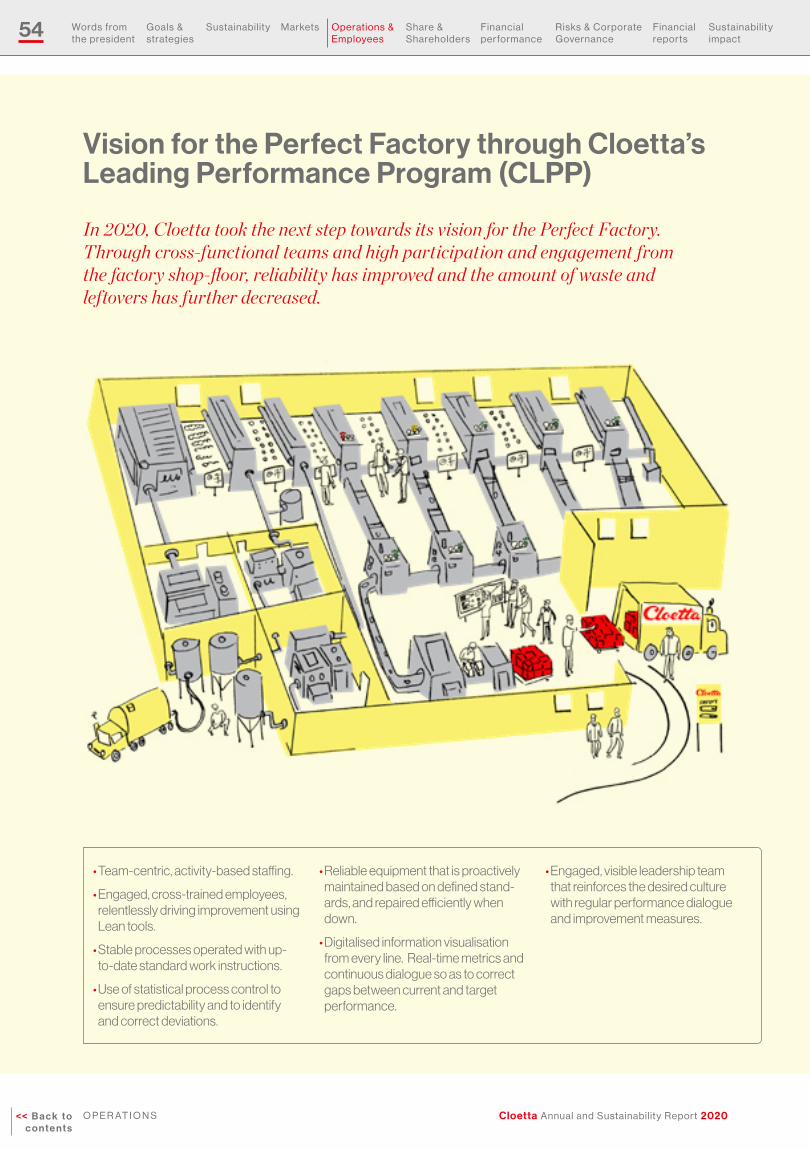
54
Cloetta Annual and Sustainability Report 2020<< B a c k t o c o n t e n t s
O P e r at i O n S
Words from the president
Goals & strategies
Sustain ability Markets Operations & employees
Share & Shareholders
financial performance
risks & Corporate Governance
financial reports
Sustain ability impact
Vision for the Perfect Factory through Cloetta’s Leading Performance Program (CLPP)
In 2020, Cloetta took the next step towards its vision for the Perfect Factory. Through cross-functional teams and high participation and engagement from the factory shop-floor, reliability has improved and the amount of waste and leftovers has further decreased.
• Team-centric, activity-based staffing.
• Engaged, cross-trained employees, relentlessly driving improvement using Lean tools.
• Stable processes operated with up-to-date standard work instructions.
• Use of statistical process control to ensure predictability and to identify and correct deviations.
• Reliable equipment that is proactively maintained based on defined stand-ards, and repaired efficiently when down.
• Digitalised information visualisation from every line. Real-time metrics and continuous dialogue so as to correct gaps between current and target performance.
• Engaged, visible leadership team that reinforces the desired culture with regular performance dialogue and improvement measures.

55
Cloetta Annual and Sustainability Report 2020 << B a c k t o c o n t e n t s
O P e r at i O n S
Words from the president
Goals & strategies
Sustain ability Markets Operations & employees
Share & Shareholders
financial performance
risks & Corporate Governance
financial reports
Sustain ability impact
Success factors for manufacturing
Employee health and safetyA healthy and safe workplace environment is a fundamental
right for each employee. Being and feeling safe at work is essential in order to develop and perform well in the
workplace.
FlexibilityA production line is often used for several different
products. Rapid changeovers and cleaning are vital for high machine capacity utilisation. Flexibility
also means that each employee knows how to work on more than one line.
Cost efficiencyCloetta’s sales are based on large volumes. Cost efficiency is necessary in order to stay competitive.
Delivery accuracyGood production planning is essential for effective production and low warehousing costs, and also for delivery accuracy to the customers.
High and consistent quality
The aim is to exceed consumer expectations through consistent high quality products in terms
of safety, flavour, appearance and texture.
Engaged employeesGood communication about processes and goals creates
engaged employees who understand the business and how their work contributes to the Cloetta’s overall results.

56
Cloetta Annual and Sustainability Report 2020<< B a c k t o c o n t e n t s
O P e r at i O n S
Words from the president
Goals & strategies
Sustain ability Markets Operations & employees
Share & Shareholders
financial performance
risks & Corporate Governance
financial reports
Sustain ability impact
Ljungsbro
Helsingborg
DublinSneek
Roosendaal
Turnhout
Levice
FactoriesProduction volumes 2020
Production by factory in 2020, tonnes
Turnhout, Belgium, 12,168 tonnes u
p Ljungsbro, Sweden, 24,401 tonnes
t Levice, Slovakia, 26,198 tonnes
Roosendaal (Spoorstraat), the Netherlands, 18,272 tonnes p
Roosendaal (Borchwerf), the Netherlands, 6,672 tonnes u
Sneek, the Netherlands, 5,584 tonnes qDublin, Ireland, 2,103 tonnes q
Helsingborg, Sweden, 1,379 tonnes q
Total96,777 tonnes

57
Cloetta Annual and Sustainability Report 2020 << B a c k t o c o n t e n t s
O P e r at i O n S
Words from the president
Goals & strategies
Sustain ability Markets Operations & employees
Share & Shareholders
financial performance
risks & Corporate Governance
financial reports
Sustain ability impact
Levice, SlovakiaProduction volume 2020: 26,198 tonnesnumber of plant employees: Approx. 755number of machine lines: 15 production lines,
24 packaging lineslargest brands: Malaco, Red Band, Läkerol, Chewits, Venco, Läkerol Dents, MynthonManufacturing methods: Starch moulding, extrusion, coating, hard and soft-boiled candy and toffee, chocolate enrobingCertifications: BRC Global Standard for Food Safety and IFS Food
Ljungsbro, SwedenProduction volume 2020: 24,401 tonnesnumber of plant employees: Approx. 340number of machine lines: 12 production lines with in-line packing, 3 separate packaging lines and 1 chocolate production centrelargest brands: Kexchoklad, Ahlgrens bilar, Center, Polly, Plopp, Sportlunch, Juleskum, TuplaManufacturing methods: Chocolate moulding, starch moulding, coating and wafer productionCertifications: BRC Global Standard for Food Safety and ISO 14001, RSPO, UTZ, Koscher
Roosendaal (Spoorstraat), the NetherlandsProduction volume 2020: 18,272 tonnesnumber of plant employees: Approx. 145number of machine lines: 5 production lines,
10 packaging lineslargest brands: Red Band, Malaco, Venco, LakrisalManufacturing methods: Starch moulding, coating and compression of pastillesCertifications: BRC Global Standard for Food Safety
Turnhout, BelgiumProduction volume 2020: 12,168 tonnesnumber of plant employees: Approx. 115number of machine lines: 2 production lines,
4 packaging lineslargest brands: Malaco, Red BandManufacturing methods: Starch mouldingCertifications: BRC Global Standard for Food Safety and ISO 14001
Roosendaal (Borchwerf), the NetherlandsProduction volume 2020: 6,672 tonnesnumber of plant employees: Approx. 65number of machine lines: 7 production lines,
14 packaging lineslargest brands: Lonka, Chewits, RolloManufacturing methods: Toffee and Nougat manufacturingCertifications: IFS, GMP and BRC global standard for Food Safety
Sneek, the NetherlandsProduction volume 2020: 5,584 tonnesnumber of plant employees: Approx. 95number of machine lines: 7 production lines,
14 packaging lineslargest brands: Sportlife, Jenkki, KingManufacturing methods: Chewing gum, coating, lozenges and hard-boiled candyCertifications: IFS, GMP and BRC Global Standard for Food Safety
Dublin, IrelandProduction volume 2020: 2,103 tonnesnumber of plant employees: Approx. 50number of machine lines: 1 production line,
10 packaging lineslargest brands: The Jelly Bean FactoryManufacturing methods: Starch mouldingCertifications: BRC Global Standard for Food Safety and ISO 14001
Helsingborg, Sweden*Production volume 2020: 1,379 tonnesnumber of plant employees: Approx. 50number of machine lines: 6 production lines,
4 packaging lineslargest brands: Nutisal, ParrotsManufacturing methods: Dry roasting, frying and coating of nutsCertifications: BRC Global Standard for Food Safety
* The Helsingborg factory was closed at the end of 2020 and manufacturing outsourced to a third party.

58
Cloetta Annual and Sustainability Report 2020<< B a c k t o c o n t e n t s
O P e r at i O n S
Words from the president
Goals & strategies
Sustain ability Markets Operations & employees
Share & Shareholders
financial performance
risks & Corporate Governance
financial reports
Sustain ability impact
0
2
4
6
8
10
2020201920182017
Complaints, feedback per millionconsumer units sold
Number
<7.0Goal 2020
3
Deliver
Planning and logisticsDelivery accuracy is one of the most critical parameters for the retail trade. Effective supply chain planning ensures the service target, while optimising the utilisation of factories and inventories from raw mate-rials to finished goods. This leads to less capital being tied up in the supply chain and lower operational costs in production and distribution.
Cloetta is running a project to renew our entire supply chain planning process from demand forecasting, service and inventory optimisation, delivery planning, scheduling and integration of third-party suppliers.
During 2020, the company implemented the new system for demand forecasting and inventory optimisation in all markets. The project will continue in 2021 with further roll-outs of supply planning and scheduling
MynthonMynthon’s new brand tagline “Upgrade yourself” primarily targets Generation Z. the messaging creates a link between fresh breath and self-confidence, and encourages people to be the best versions of themselves. in 2021, we will build on the concept further to support novelty launches in January and May.
iMPaCtfU l CaMPaiGnS
processes in the plants, as well as third-party integration. The system also provides data for financial planning and long-term sales and production planning to ensure that all functions in the Group are coordinated. We work continuously to optimise its our flows and working methods, both internally and externally, together with customers and suppliers.
We monitor the cost efficiency of our physical logistics operations continuously. We optimise our warehouse network to bal-ance the delivery-time expectations of our customers with optimal cost efficiency. Dur-ing 2020, the company closed operations in its warehouse in Norrköping, Sweden, and merged them into another warehouse in Helsingborg.
Consumer and customer feedbackFeedback from individual consumers is ex-tremely valuable in our pursuit of continuous improvement.
Each market has a Consumer Service department that receives, evaluates and responds to feedback and complaints. In the event of quality defects, Consumer Service always contacts the relevant factory. The fac-tory uses the information from complaints to systematically identify root causes and eliminate them, and also monitors trends so as to identify and initiate improvement initi-atives to prevent causes for complaints from occurring. In 2020 we improved the collec-tion of consumer complaints which allowed us to get more information and therefore to better prioritise our improvement initia-tives. While this generally increased the number of complaints compared to 2019, the situation was mixed with some significant improvements yet some factories missing their targets due to specific process-related issues. Dedicated resources and capex were made available and a significant reduction in complaints was visible at year end.
Starting from 2020 we have also included con-sumer information that was previously classified as feedback due to the lack of clear product references. The numbers related to 2019 were therefore re-calculated on the same basis.

59
Cloetta Annual and Sustainability Report 2020 << B a c k t o c o n t e n t s
e M P l O Y e e S
Words from the president
Goals & strategies
Sustain ability Markets Operations & employees
Share & Shareholders
financial performance
risks & Corporate Governance
financial reports
Sustain ability impact
Employees
Cloetta is driven by the conviction that value is created by our employees, and that the ability to attract, retain and develop the best and most competent people is crucial to our success.
Cloetta has four core values that guide how our people work and act, both within and outside the company. These core values are Focus, Passion, Teamplay and Pride.
is about doing the fundamentals with self-confidence, ambition
and a “will do” attitude.
is about “going the extra mile”, being positive and having fun.
is about mutual responsibility, doing your part and supporting
each other.
is about being proud of our company, our brands,
our products and our personal contribution.
focus Passion teamplay Pride
Cloetta Employee Journey is a strategic review of the HR focus areas, which also defines Cloetta as an employer. Employee Journey was developed to provide a simple way to visualise the four overarching HR ar-eas: Attract, Welcome, Develop and Engage.
Attract Cloetta endeavours to be an attractive employer in the markets where we are active and thereby attract and retain valuable employees.
Recruitment strategyCloetta’s recruitment strategy to attract the best candidates is continuously developed and improved. The strategy includes recruit-ment processes for different target groups, best practices per country and training for managers in how to recruit, including a tool-kit containing aptitude tests and self-as-sessment tests. For all positions, selection is based on a job description with a competence
specification against which candidates are compared, in combination with an analysis of the different tests and interviews.
Welcome“Cloetta Tasting” is an introduction program that was rolled out in all countries last year. The program includes welcome meetings, online courses, films and a welcome candy tub, which is also full of tasks for newcomers to complete during their induction period.
DevelopWe use the 70-20-10 method for learning, whereby 70 per cent happens when working, 20 per cent together with others and 10 per cent through formal training.
A key aspect of employee development is Cloetta’s annual performance manage-ment process, during which managers and employees evaluate and discuss objectives, behaviour and performance. This process is supported by the Workday system.
Several Cloetta-specific courses in dif-ferent areas are being developed into differ-ent academies. The core idea of an academy is to share best practice both internally and outside Cloetta. Within manufacturing, the core course is linked to continuous improve-ment under the banner of Perfect Factory. Within sales, the different countries collate knowledge to create the Perfect Store, for example how to create effective checkout counters, and other priorities for the sales organisation. Within marketing, seminars are organised that take a deeper look at mar-keting with people sharing experiences, for example regarding the future model of brand platforms. In 2020, due to Covid-19, the use of digitalisation tools has increased and they have been adopted faster and positively. These tools are constantly improved so that they can be used creatively and interactively.
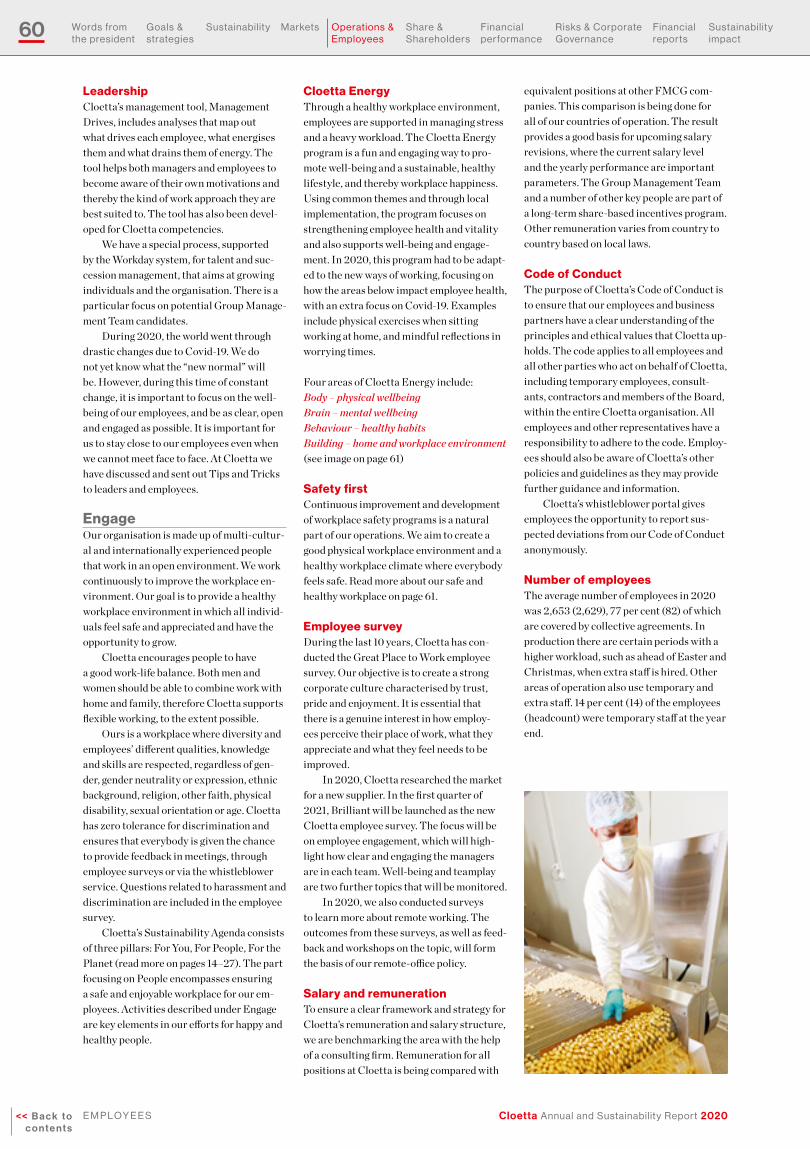
60
Cloetta Annual and Sustainability Report 2020<< B a c k t o c o n t e n t s
e M P l O Y e e S
Words from the president
Goals & strategies
Sustain ability Markets Operations & employees
Share & Shareholders
financial performance
risks & Corporate Governance
financial reports
Sustain ability impact
LeadershipCloetta’s management tool, Management Drives, includes analyses that map out what drives each employee, what energises them and what drains them of energy. The tool helps both managers and employees to become aware of their own motivations and thereby the kind of work approach they are best suited to. The tool has also been devel-oped for Cloetta competencies.
We have a special process, supported by the Workday system, for talent and suc-cession management, that aims at growing individuals and the organisation. There is a particular focus on potential Group Manage-ment Team candidates.
During 2020, the world went through drastic changes due to Covid-19. We do not yet know what the “new normal” will be. However, during this time of constant change, it is important to focus on the well-being of our employees, and be as clear, open and engaged as possible. It is important for us to stay close to our employees even when we cannot meet face to face. At Cloetta we have discussed and sent out Tips and Tricks to leaders and employees.
EngageOur organisation is made up of multi-cultur-al and internationally experienced people that work in an open environment. We work continuously to improve the workplace en-vironment. Our goal is to provide a healthy workplace environment in which all individ-uals feel safe and appreciated and have the opportunity to grow.
Cloetta encourages people to have a good work-life balance. Both men and women should be able to combine work with home and family, therefore Cloetta supports flexible working, to the extent possible.
Ours is a workplace where diversity and employees’ different qualities, knowledge and skills are respected, regardless of gen-der, gender neutrality or expression, ethnic background, religion, other faith, physical disability, sexual orientation or age. Cloetta has zero tolerance for discrimination and ensures that everybody is given the chance to provide feedback in meetings, through employee surveys or via the whistleblower service. Questions related to harassment and discrimination are included in the employee survey.
Cloetta’s Sustainability Agenda consists of three pillars: For You, For People, For the Planet (read more on pages 14–27). The part focusing on People encompasses ensuring a safe and enjoyable workplace for our em-ployees. Activities described under Engage are key elements in our efforts for happy and healthy people.
Cloetta EnergyThrough a healthy workplace environment, employees are supported in managing stress and a heavy workload. The Cloetta Energy program is a fun and engaging way to pro-mote well-being and a sustainable, healthy lifestyle, and thereby workplace happiness. Using common themes and through local implementation, the program focuses on strengthening employee health and vitality and also supports well-being and engage-ment. In 2020, this program had to be adapt-ed to the new ways of working, focusing on how the areas below impact employee health, with an extra focus on Covid-19. Examples include physical exercises when sitting working at home, and mindful reflections in worrying times.
Four areas of Cloetta Energy include: Body – physical wellbeingBrain – mental wellbeingBehaviour – healthy habits Building – home and workplace environment(see image on page 61)
Safety firstContinuous improvement and development of workplace safety programs is a natural part of our operations. We aim to create a good physical workplace environment and a healthy workplace climate where everybody feels safe. Read more about our safe and healthy workplace on page 61.
Employee surveyDuring the last 10 years, Cloetta has con-ducted the Great Place to Work employee survey. Our objective is to create a strong corporate culture characterised by trust, pride and enjoyment. It is essential that there is a genuine interest in how employ-ees perceive their place of work, what they appreciate and what they feel needs to be improved.
In 2020, Cloetta researched the market for a new supplier. In the first quarter of 2021, Brilliant will be launched as the new Cloetta employee survey. The focus will be on employee engagement, which will high-light how clear and engaging the managers are in each team. Well-being and teamplay are two further topics that will be monitored.
In 2020, we also conducted surveys to learn more about remote working. The outcomes from these surveys, as well as feed-back and workshops on the topic, will form the basis of our remote-office policy.
Salary and remunerationTo ensure a clear framework and strategy for Cloetta’s remuneration and salary structure, we are benchmarking the area with the help of a consulting firm. Remuneration for all positions at Cloetta is being compared with
equivalent positions at other FMCG com-panies. This comparison is being done for all of our countries of operation. The result provides a good basis for upcoming salary revisions, where the current salary level and the yearly performance are important parameters. The Group Management Team and a number of other key people are part of a long-term share-based incentives program. Other remuneration varies from country to country based on local laws.
Code of ConductThe purpose of Cloetta’s Code of Conduct is to ensure that our employees and business partners have a clear understanding of the principles and ethical values that Cloetta up-holds. The code applies to all employees and all other parties who act on behalf of Cloetta, including temporary employees, consult-ants, contractors and members of the Board, within the entire Cloetta organisation. All employees and other representatives have a responsibility to adhere to the code. Employ-ees should also be aware of Cloetta’s other policies and guidelines as they may provide further guidance and information.
Cloetta’s whistleblower portal gives employees the opportunity to report sus-pected deviations from our Code of Conduct anonymously.
Number of employeesThe average number of employees in 2020 was 2,653 (2,629), 77 per cent (82) of which are covered by collective agreements. In production there are certain periods with a higher workload, such as ahead of Easter and Christmas, when extra staff is hired. Other areas of operation also use temporary and extra staff. 14 per cent (14) of the employees (headcount) were temporary staff at the year end.

61
Cloetta Annual and Sustainability Report 2020 << B a c k t o c o n t e n t s
e M P l O Y e e S
Words from the president
Goals & strategies
Sustain ability Markets Operations & employees
Share & Shareholders
financial performance
risks & Corporate Governance
financial reports
Sustain ability impact
A healthy and safe workplaceEmployee health and safety is at the core of our sustainability fundamentals. We want to provide a safe workplace for all our employ-ees and people who perform work on behalf of Cloetta. In 2020, we established a Health & Safety strategy and roadmap that supports our journey from a reactive to a preventive state of mind. The main ingredient in this program is a strong safety culture, which will be defined and implemented so as to prevent injuries and risks while promoting well- being at all levels.
Towards a preventive state of mindWe have had a particular emphasis on health and safety during recent years, with the ultimate target of zero accidents. The most frequent types of accidents at Cloetta are related to human behaviour, machine-safety, and unforeseen risks at our production sites. For our office personnel the main health and safety risks are connected to travel. In improving safety and averting risks, a proactive, preventive approach is the most important tool. This includes increasing our employees’ safety awareness, observing risks systematically and auditing our safety practices. We also encourage reporting unsafe acts and conditions, and performing safety observation talks when both positive and negative situations are witnessed.
Within manufacturing, health and safety is mainly driven through the Cloetta Leading Performance Practices (CLPP) and the systematic approach to achieving a perfect factory. Read more on pages 53–54.The systematic approach is called Cloetta Operating System (COS), with health and safety forming one part of the foundation. The COS structure is aligned with the Health & Safety strategy and roadmap 2030 and supports the cultural journey towards a preventive state of mind.
Health and safety performanceWe are delighted that our efforts are paying off, as evidenced by our performance versus objectives and targets.
Lost time accidents (LTA) have reduced by 47 per cent compared to the 2019 year-end result. The number of LTAs in 2020 was 9, and in 2019 it was 17.
The lost time incident rate (LTIR) has reduced by 45 per cent compared to the 2019 year-end result. The rate for 2020 was 3.7, compared to 6.7 in 2019.
The total injury rate (TIR) consists of lost-time accidents, recordable accidents and first-aid injuries. The results for 2020 show an increase in the reported number of first-aid injuries, which impacts the KPI negatively by 22 per cent compared to the 2019 year-end result. This result indicates
improved awareness, training and reporting of accidents.
Total recordable injury rate (TRIR) consists of lost time accidents and record-able accidents. There was a decrease in the injury rate of 24 per cent compared to 2019.
Unsafe acts and conditions decreased by 8 per cent compared to 2019. One reason for the improved awareness and focus on safety is reflected in the 45 per cent increase in safety conversations taking place; 9,992 talks during 2020, compared to 6,870 talks in 2019.
Lost Time Incident Rate (LTIR) (LTIR is absence due to an incident (for morethan 24 hours) per 1,000,000 hours worked.)
Number
0
2
4
6
8
2020201920182017
Target2020
A safe and healthy workplaceOccupational health & safety is fundamental to Cloetta. We aspire to create a sus-tainable organisation that drives towards our targets through engaged, motivated and healthy employees. Our Health & Safety strategy involves improving the physi-cal, social and organisational workplace environment at all levels of the organisation.
Cloetta’s vitality program stimulates health and happiness in four ways: Body – we take care of our physical health to meet our challenges with energy.
Brain – we manage our mental health to deal with difficult situations and stress.
Behaviour – we make healthy choices and stimulate others so we can create a healthy work culture.
Building – we create a safe and healthy workspace to feel comfortable and perform well.

62
Cloetta Annual and Sustainability Report 2020<< B a c k t o c o n t e n t s
e M P l O Y e e S
Words from the president
Goals & strategies
Sustain ability Markets Operations & employees
Share & Shareholders
financial performance
risks & Corporate Governance
financial reports
Sustain ability impact
”Sweet spot for your career” is Cloetta’s employer branding slogan that has evolved further during the year. A common communication platform for employer branding has been created consisting of a common career portal, a common recruitment tool and integration with LinkedIn and other social media channels to reach the identified target groups.
there are many benefits to working at Cloetta:
• Impact – the chance to make a difference – our company offers the best of two worlds: both international and local, large-scale and small-scale, personal and professional, chal-lenging and decisive, free and responsible.
• Fun – not only does Cloetta have fun products, our people also have fun on the job. Cloetta offers products that create joy,
which is evident in our welcoming culture that is built on authenticity and camaraderie and where having fun together at work is encouraged. this is an important basis for creating an innovative, open and inclusive working climate.
• Strong brands – Cloetta was founded in 1862 and is famous for its well-known, strong local brands in categories including candy, chocolate, nuts, pastilles, chewing gum and pick & mix.
Facts about Cloetta’s employees
0
20
40
60
80
100
Board of Directors
Group Management TeamEmployees
over 5030–50under 30
Age distribution%
Gender distribution, all employees
56%44%
31 December 2020
48% 8%
Full-timeemployees
Part-timeemployees
38%6%
Full-timeemployees
Part-timeemployees
Gender distribution,Group Management Team
18%
82%
31 December 2020
Gender distribution,Board of Directors
33%67%
31 December 2020
Number of employees by category and region as per 31 December 2020
Number of employees
Number of permanent employees
Number of temporary employees
Women Men Women Men Women Men
Sweden 397 309 371 299 26 10
Slovakia 468 288 414 241 54 47
Netherlands 185 355 152 293 33 62
Finland 276 54 176 39 100 15
UK 172 56 168 55 4 1
Belgium 30 89 21 77 9 12
Denmark 67 48 67 47 – 1
Ireland 24 43 19 28 5 15
Norway 14 18 13 18 1 –
Germany 10 5 9 5 1 –
Italy 1 2 1 2 – –
Others 3 3 3 3 – –
Total Cloetta 1,647 1,270 1,414 1,107 233 163
See note 5 for average number of employees per country.
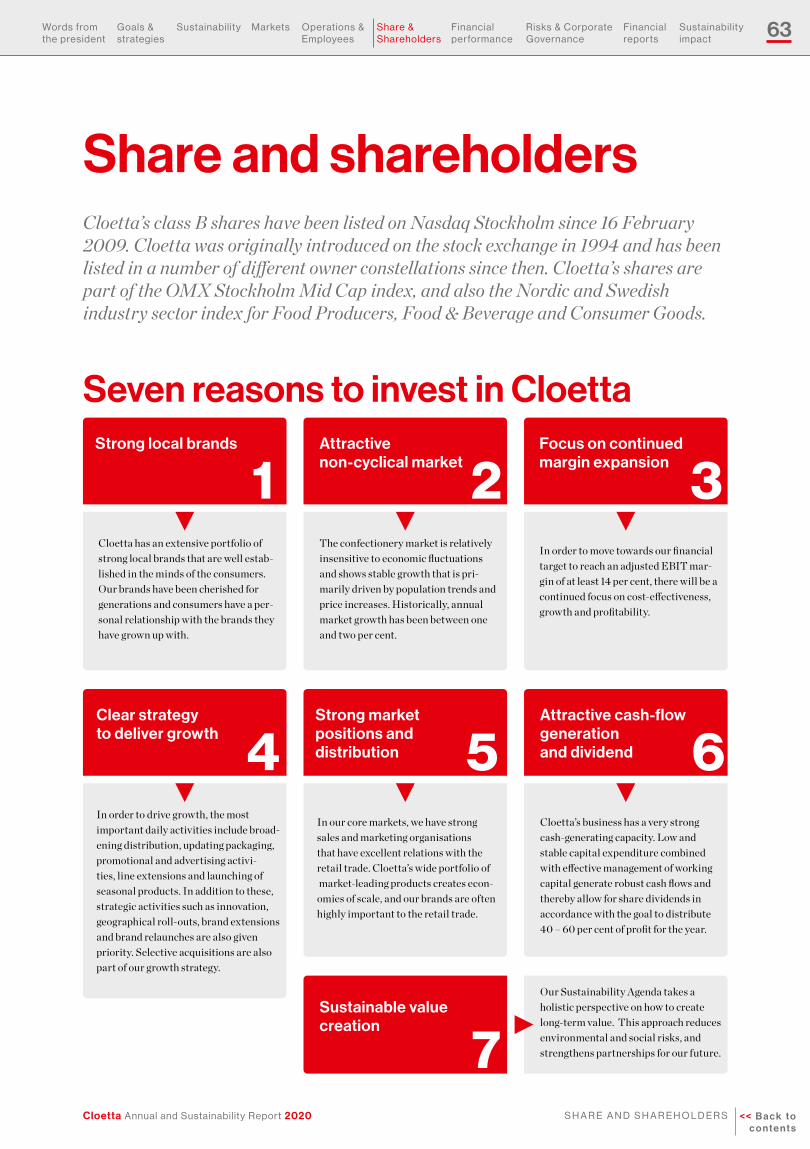
63
Cloetta Annual and Sustainability Report 2020 << B a c k t o c o n t e n t s
S h a r e a n d S h a r e h O l d e r S
Words from the president
Goals & strategies
Sustain ability Markets Operations & employees
Share & Shareholders
financial performance
risks & Corporate Governance
financial reports
Sustain ability impact
Sustainable value creation
Our Sustainability Agenda takes a holistic perspective on how to create long-term value. This approach reduces environmental and social risks, and strengthens partnerships for our future.7
Share and shareholdersCloetta’s class B shares have been listed on Nasdaq Stockholm since 16 February 2009. Cloetta was originally introduced on the stock exchange in 1994 and has been listed in a number of different owner constellations since then. Cloetta’s shares are part of the OMX Stockholm Mid Cap index, and also the Nordic and Swedish industry sector index for Food Producers, Food & Beverage and Consumer Goods.
Seven reasons to invest in CloettaStrong local brands Attractive
non-cyclical market
Cloetta has an extensive portfolio of strong local brands that are well estab-lished in the minds of the consumers. Our brands have been cherished for generations and consumers have a per-sonal relationship with the brands they have grown up with.
The confectionery market is relatively insensitive to economic fluctuations and shows stable growth that is pri-marily driven by population trends and price increases. Historically, annual market growth has been between one and two per cent.
Focus on continued margin expansion
Strong market positions and distribution
Attractive cash-flow generation and dividend
In order to move towards our financial target to reach an adjusted EBIT mar-gin of at least 14 per cent, there will be a continued focus on cost-effectiveness, growth and profitability.
In our core markets, we have strong sales and marketing organisations that have excellent relations with the retail trade. Cloetta’s wide portfolio of market-leading products creates econ-omies of scale, and our brands are often highly important to the retail trade.
Cloetta’s business has a very strong cash-generating capacity. Low and stable capital expenditure combined with effective management of working capital generate robust cash flows and thereby allow for share dividends in accordance with the goal to distribute 40 – 60 per cent of profit for the year.
1
Clear strategy to deliver growth
In order to drive growth, the most important daily activities include broad-ening distribution, updating packaging, promotional and advertising activi-ties, line extensions and launching of seasonal products. In addition to these, strategic activities such as innovation, geographical roll-outs, brand extensions and brand relaunches are also given priority. Selective acquisitions are also part of our growth strategy.
4
2 3
5 6
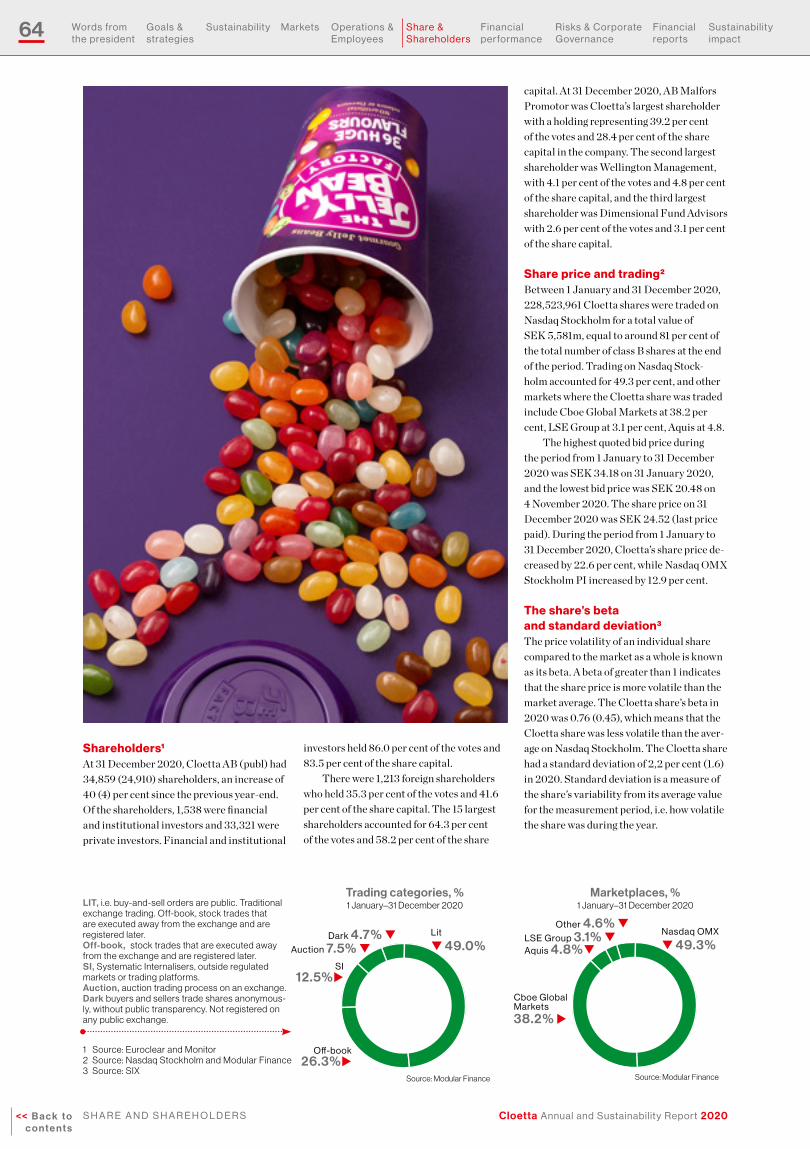
64
Cloetta Annual and Sustainability Report 2020<< B a c k t o c o n t e n t s
S h a r e a n d S h a r e h O l d e r S
Words from the president
Goals & strategies
Sustain ability Markets Operations & employees
Share & Shareholders
financial performance
risks & Corporate Governance
financial reports
Sustain ability impact
Marketplaces, %
Aquis 4.8%q
Cboe Global Markets38.2% u
Nasdaq OMX
q 49.3%
Source: Modular Finance
1 January–31 December 2020
LSE Group 3.1% qOther 4.6% q
Trading categories, %
O�-book 26.3%u
Lit
q 49.0%
1 January–31 December 2020
Auction 7.5% qDark 4.7% q
SI 12.5%u
Source: Modular Finance
Shareholders¹ At 31 December 2020, Cloetta AB (publ) had 34,859 (24,910) shareholders, an increase of 40 (4) per cent since the previous year-end. Of the shareholders, 1,538 were financial and institutional investors and 33,321 were private investors. Financial and institutional
investors held 86.0 per cent of the votes and 83.5 per cent of the share capital.
There were 1,213 foreign shareholders who held 35.3 per cent of the votes and 41.6 per cent of the share capital. The 15 largest shareholders accounted for 64.3 per cent of the votes and 58.2 per cent of the share
capital. At 31 December 2020, AB Malfors Promotor was Cloetta’s largest shareholder with a holding representing 39.2 per cent of the votes and 28.4 per cent of the share capital in the company. The second largest shareholder was Wellington Management, with 4.1 per cent of the votes and 4.8 per cent of the share capital, and the third largest shareholder was Dimensional Fund Advisors with 2.6 per cent of the votes and 3.1 per cent of the share capital.
Share price and trading² Between 1 January and 31 December 2020, 228,523,961 Cloetta shares were traded on Nasdaq Stockholm for a total value of SEK 5,581m, equal to around 81 per cent of the total number of class B shares at the end of the period. Trading on Nasdaq Stock-holm accounted for 49.3 per cent, and other markets where the Cloetta share was traded include Cboe Global Markets at 38.2 per cent, LSE Group at 3.1 per cent, Aquis at 4.8.
The highest quoted bid price during the period from 1 January to 31 December 2020 was SEK 34.18 on 31 January 2020, and the lowest bid price was SEK 20.48 on 4 November 2020. The share price on 31 December 2020 was SEK 24.52 (last price paid). During the period from 1 January to 31 December 2020, Cloetta’s share price de-creased by 22.6 per cent, while Nasdaq OMX Stockholm PI increased by 12.9 per cent.
The share’s beta and standard deviation³ The price volatility of an individual share compared to the market as a whole is known as its beta. A beta of greater than 1 indicates that the share price is more volatile than the market average. The Cloetta share’s beta in 2020 was 0.76 (0.45), which means that the Cloetta share was less volatile than the aver-age on Nasdaq Stockholm. The Cloetta share had a standard deviation of 2,2 per cent (1.6) in 2020. Standard deviation is a measure of the share’s variability from its average value for the measurement period, i.e. how volatile the share was during the year.
1 Source: Euroclear and Monitor 2 Source: Nasdaq Stockholm and Modular Finance 3 Source: SIX
LIT, i .e. buy-and-sell orders are public. Traditional exchange trading. Off-book, stock trades that are executed away from the exchange and are registered later.Off-book, stock trades that are executed away from the exchange and are registered later.SI, Systematic Internalisers, outside regulated markets or trading platforms. Auction, auction trading process on an exchange.Dark buyers and sellers trade shares anonymous-ly, without public transparency. Not registered on any public exchange.

65
Cloetta Annual and Sustainability Report 2020 << B a c k t o c o n t e n t s
S h a r e a n d S h a r e h O l d e r S
Words from the president
Goals & strategies
Sustain ability Markets Operations & employees
Share & Shareholders
financial performance
risks & Corporate Governance
financial reports
Sustain ability impact
Investor relations 2020
MA
R
FEB
JANDEC
NOV
OC
T
SE
PAUG
JUL JUNMAY
AP
R
JanUarY
SEB Nordic Seminar, Copenhagen Interim report Q4
MarCh
Annual report
aPril
Annual General Meeting Interim report Q1 Virtual Investor Roadshow
OCtOBer
Interim report Q3
JUlY
Interim report Q2
nOVeMBer
Erik Penser Banks bolagsdagExtraordinary General Meeting
Virtual Investor Roadshow
Cloetta meets regularly with investors and analysts. At least twice a year Cloetta arranges virtual or physical roadshows to Europe and the US. In addition, Cloetta regularly attends major investor club meetings, lunches and evening meetings organised by banks and the Swedish Shareholders Association (Aktiespararna).
JUne
Handelsbanken Nordic Mid/Small Cap Seminar
Share capital and capital structure Cloetta’s share capital at 31 December 2020 amounted to SEK 1,443,096,495. The total number of shares is 288,619,299, divided between 5,735,249 class A shares and 282,884,050 class B shares, equal to a quota value per share of SEK 5. According to the Articles of Association, the share capital shall amount to not less than SEK 400,000,000 and not more than SEK 1,600,000,000, divided between no less than 80,000,000 shares and no more than 320,000,000 shares.
Dividend policy Cloetta’s long-term goal is a dividend pay-out of 40–60 per cent of profit for the year. The ambition is for the cash flow to be used for dividends, but that it should also provide financial flexibility for complementary acquisitions. Neither the Swedish Compa-nies Act nor Cloetta’s Articles of Association contain any restrictions regarding the right to dividends for shareholders outside Swe-den. Aside from any limitations related to banking or clearing activities in the affected jurisdictions, payments to foreign sharehold-ers are carried out in the same manner as to shareholders in Sweden. A dividend of SEK 144m was transferred to the shareholders in 2020. For 2020 the Board proposes a divi-dend of SEK 0.75 (0.50) per share, which is equal to 77 per cent (29) of the profit for the year. The dividend is resolved on by the An-nual General Meeting (AGM) and disburse-ment is handled by Euroclear Sweden AB. The right to a dividend is granted to those
persons who are listed as shareholders in the share register maintained by Euroclear Sweden AB on the record date.
Articles of Association Cloetta’s Articles of Association contain a Central Securities Depository (CSD) provision and its shares are affiliated with Euroclear Sweden AB, which means that Euroclear Sweden AB administers the com-pany’s share register and registers the shares to owners. Each A share grants ten votes and each B share one vote in shareholder meetings. All shares grant equal entitlement to the company’s profits and an equal share in any surplus arising from liquidation. Should the company issue new shares of class A and class B through a cash or set-off issue, holders of class A and class B shares have the right to subscribe for new shares of the same class in proportion to the number of shares already held on the record date. If the issue includes shares of only class B, all holders of class A and class B shares have the right to subscribe for new class B shares in proportion to the number of shares already held on the record date. Corresponding rules of apportionment are applied in the event of a bonus issue or issue of convertibles and subscription warrants. The transference of a class A share to a person who is not previous-ly a holder of class A shares in the company is subject to a pre-emption procedure, except when the transfer is made through division of joint property, inheritance, testament or gift to the person who is the closest heir to the bequeather. After receiving a written request
from a holder of class A shares, the company shall convert the class A shares specified in the request to class B shares.
Individuals with an insider position Persons discharging managerial responsibil-ities for Cloetta and persons or legal entities closely associated with them are obliged to notify Cloetta and the Swedish Financial Supervisory Authority of every transaction conducted related to changes in their hold-ings of Cloetta shares once a total amount of EUR 5,000 has been reached within a calendar year, according to the regulation of the European Parliament and of the Council on Market Abuse. Listed companies are required to record a logbook of individuals who are employed or contracted by the com-pany and have access to insider information relating to the company. These can include insiders, and also other individuals who have obtained inside information. Cloetta records a logbook for each financial report or press release containing information that could affect the share price.
Silent periods Cloetta maintains a silent period of at least 30 days prior to the publication of its quar-terly financial reports. During this period, representatives of Cloetta do not meet with financial media, analysts or investors.

66
Cloetta Annual and Sustainability Report 2020<< B a c k t o c o n t e n t s
S h a r e a n d S h a r e h O l d e r S
Words from the president
Goals & strategies
Sustain ability Markets Operations & employees
Share & Shareholders
financial performance
risks & Corporate Governance
financial reports
Sustain ability impact
Shareholder countries, % share of capital
the US 22.4% u t Sweden
58.4%
Source: Euroclear and Monitor by Modular Finance AB
31 December 2020
Finland 3.9% uFrance 3.3% q
Norway 2.1% qOther countries 9.9%q
Shareholder countries, % of votes
the US 19.0%u
tSweden
64.7%
31 December 2020
Finland 3.3% uFrance 2.8% u
Norway 1.8% qOther countries 8.4%q
Source: Euroclear and Monitor by Modular Finance AB
Source: Euroclear
0
5,000
10,000
15,000
20,000
25,000
30,000
35,000
202020192018201720162015
Number of shareholders31 DecemberNumber
15 largest shareholders at 31 December 2020
% of votes
% of share
capitalTotal no. of
sharesNo. of A
sharesNo. of B
shares
Aktiebolaget Malfors Promotor 39.2 28.4 81,959,542 5,729,569 76,229,973
Wellington Management 4.1 4.8 13,878,706 – 13,878,706
Dimensional Fund Advisors 2.6 3.1 8,951,687 – 8,951,687
Franklin Templeton 2.5 3.0 8,647,658 – 8,647,658
La Financiére de l’Echiquier 2.4 2.9 8,308,301 – 8,308,301
PRI Pensionsgaranti 1.9 2.3 6,543,850 – 6,543,850
Nordea Fonder 1.7 2.1 5,927,989 – 5,927,989
Vanguard 1.6 1.9 5,395,424 – 5,395,424
Norges Bank 1.6 1.8 5,337,880 – 5,337,880
Ulla Håkanson 1.5 1.7 5,000,000 – 5,000,000
Avanza Pension 1.4 1.7 4,803,055 – 4,803,055
Ohio Police and Fire Pension Fund 1.1 1.3 3,792,200 – 3,792,200
Olof Svenfelt 0.9 1.1 3,175,030 30 3,175,000
Thompson, Siegel & Walmsley LLC 0.9 1.1 3,172,800 – 3,172,800
Didner & Gerge Fonder 0.9 1.0 3,008,180 – 3,008,180
Total, 15 largest shareholders 64.3 58.2 167,902,302 5,729,599 162,172,703
Other shareholders 35.7 41.8 120,716,997 5,650 120,711,347
Total 100 100 288,619,299 5,735,249 282,884,050
Source: Monitor by Modular Finance AB. Compiled and processed from various sources, including Euroclear, Morningstar and the Swedish Financial Supervisory Authority.
Nominee accounts/shareholders are not included in this compilation
Size categories at 31 December 2020
No. of share-
holdersTotal no.
of sharesNo. of
A-sharesNo. of
B-sharesCapital,
%Votes,
%
1 – 500 24,879 3,326,803 3,254 3,323,549 1.2 1.0
501 – 1,000 3,969 3,318,878 500 3,318,378 1.1 1.0
1,001 – 5,000 4,557 10,915,334 1,782 10,913,552 3.8 3.2
5,001 – 10,000 682 5,248,846 0 5,248,846 1.8 1.5
10,001 – 15,000 191 2,427,821 0 2,427,821 0.8 0.7
15,001 – 20,000 136 2,516,075 0 2,516,075 0.9 0.7
20,001 – 445 260,865,542 5,729,713 255,135,829 90.4 91.9
Total 34,859 288,619,299 5,735,249 282,884,050 100 100
Source: Euroclear
Shareholders by country at 31 December 2020
No. of share-
holders% of
votes
% of share
capitalTotal no. of
sharesNo. of A
sharesNo. of B
shares
Sweden 33,646 64.7 58.4 168,597,704 5,735,249 162,862,455the US 55 19.0 22.4 64,655,931 – 64,655,931Finland 222 3.3 3.9 11,178,091 – 11,178,091France 13 2.8 3.3 9,479,906 – 9,479,906Norway 90 1.8 2.1 6,084,574 – 6,084,574
Other countries 833 8.4 9.9 28,623,093 – 28,623,093
Total 34,859 100 100 288,619,299 5,735,249 282,884,050
Source: Monitor by Modular Finance AB
Shareholder categories at 31 December 2020
No. of share-
holders
% of share-
holders% of
votes
% of share
capital
Private investors 33,321 95.6 14.0 16.5
Of which, Swedish residents
33,116 95.0 13.9 16.4
Legal entities 1,538 4.4 86.0 83.5
Of which, Swedish residents
626 1.8 52.4 44.0
Total 34,859 100.0 100.0 100.0
Of which, Swedish residents
33,742 96.8 66.3 60.4
Source: EuroclearDevelopment of the share
Year EventIncrease in
share capitalTotal share
capitalIncrease in no.
of sharesTotal no. of
shares
1998 Opening share capital, par value of the share is SEK 100 – 100,000 – 1,0002008 Non-cash issue in connection with de-merger of Cloetta Fazer 99,900,000 100,000,000 999,000 1,000,0002008 Share split, quota value of the share changed from SEK 100 to SEK 4 – 100,000,000 23,119,196 24,119,1962008 Bonus issue, quota value of the share changed from SEK 4 to SEK 5 20,595,980 120,595,980 – 24,119,1962011–2012 Conversion of convertible debenture loan 2,836,395 123,432,375 567,279 24,686,4752012 Issue in kind 825,934,620 949,366,995 165,186,924 189,873,3992012 Rights issue 493,729,500 1,443,096,495 98,745,900 288,619,299
Source: Euroclear

67
Cloetta Annual and Sustainability Report 2020 << B a c k t o c o n t e n t s
S h a r e a n d S h a r e h O l d e r S
Words from the president
Goals & strategies
Sustain ability Markets Operations & employees
Share & Shareholders
financial performance
risks & Corporate Governance
financial reports
Sustain ability impact
IR contactNathalie RedmoInvestor RelationsPhone: +46 766 96 59 40Switchboard: +46 8 527 28 800E-mail: [email protected]
NASDAQSTOCKHOLM
The following analysts regularly monitor Cloetta’s development:
Handelsbanken: Nicklas Skogman, [email protected]
Nordea: Stefan Stjernholm, [email protected]
SEB: Andreas Lundberg, [email protected]
Marketplace Nasdaq StockholmDate of listing 16 February 2009Segment Mid capSector Food Producers, Food & Beverage
and Consumer GoodsTicker symbol CLA BISIN code SE0002626861Currency SEKStandard trading unit 1 shareNo. of shares in issue 288,619,299 A and B sharesHighest price paid in 2020 SEK 34.18 (31 January 2020)Lowest price paid in 2020 SEK 20.48 (4 November 2020) Last price paid 2020 SEK 24.52 Share price growth in 2020 –22.6 per centThe share’s beta against SIXGX 0.76 (0.45)The share’s standard deviation 2.2 (1.6)
Share dataAnalysts
0
10, 000
20,000
30,000
40,000
50,000
60,000
70,000
80,000
No. of shares traded, thousands per month
202020192018201720162015201420132012201120102009
0
5
10
15
20
25
30
35
40
OMX Stockholm_PICloetta B
Share price performanceClosing price, SEK No. of shares traded, thousands
Source: WebfinacialGroup
Incentive schemesThe table below represents the main characteristics of the share-based long-term incentive plans that have been approved by the AGM. For more information about the incentive plans, see pages 88–89, and Note 23 on pages 128–129.
LTI 2020 LTI 2019 LTI 2018 LTI 2017 LTI 2016
AGM approval date 2 April 2020 4 April 2019 16 April 2018 4 April 2017 12 April 2016
Maximum number of B shares to be allocated 1,206,374 1,648,046 1,201,602 1,221,698 1,524,100
as a percentage of total shares 0.4 0.6 0.4 0.4 0.5
as a percentage of voting rights 0.4 0.5 0.4 0.4 0.4
Number of employees offered the opportunity to participate 45 45 54 70 73
Number of participants at inception date 30 30 44 49 49
Estimated number of B shares to be allocated, subject to possible recalculation
1,021,771 523,046 138,441
as a percentage of total shares 0.4 0.2 0.0
as a percentage of voting rights 0.3 0.2 0.0
Number of participants at reporting date 28 25 32
Vesting date 28 April 2020 29 April 2019
Realised performance target, % 0.0 0.0
Actual number of matching shares granted on vesting date 95,264 109,369
Actual number of performance shares granted on vesting date – –
Total number of B shares granted on vesting date 95,264 109,369
as a percentage of total shares 0.0 0.0
as a percentage of voting rights 0.0 0.0
Number of participants at vesting date 30 30
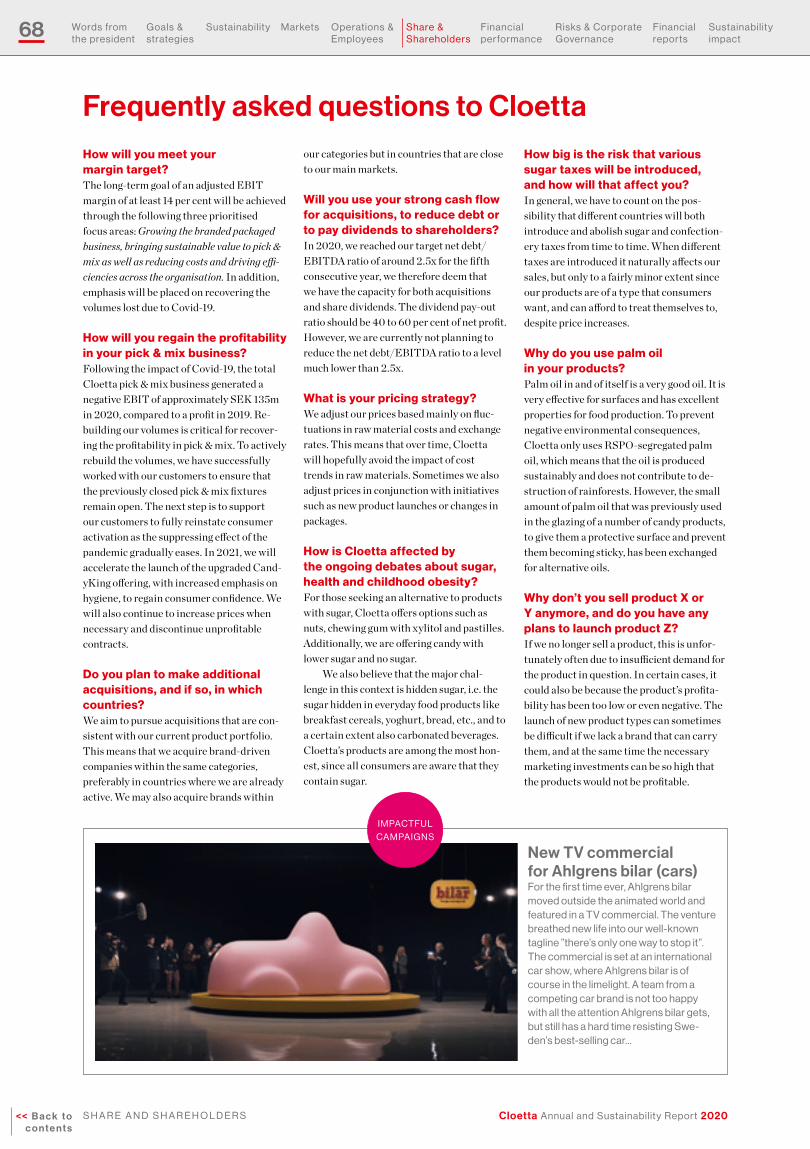
68
Cloetta Annual and Sustainability Report 2020<< B a c k t o c o n t e n t s
S h a r e a n d S h a r e h O l d e r S
Words from the president
Goals & strategies
Sustain ability Markets Operations & employees
Share & Shareholders
financial performance
risks & Corporate Governance
financial reports
Sustain ability impact
Frequently asked questions to CloettaHow will you meet your margin target?The long-term goal of an adjusted EBIT margin of at least 14 per cent will be achieved through the following three prioritised focus areas: Growing the branded packaged business, bringing sustainable value to pick & mix as well as reducing costs and driving effi-ciencies across the organisation. In addition, emphasis will be placed on recovering the volumes lost due to Covid-19.
How will you regain the profitability in your pick & mix business?Following the impact of Covid-19, the total Cloetta pick & mix business generated a negative EBIT of approximately SEK 135m in 2020, compared to a profit in 2019. Re-building our volumes is critical for recover-ing the profitability in pick & mix. To actively rebuild the volumes, we have successfully worked with our customers to ensure that the previously closed pick & mix fixtures remain open. The next step is to support our customers to fully reinstate consumer activation as the suppressing effect of the pandemic gradually eases. In 2021, we will accelerate the launch of the upgraded Cand-yKing offering, with increased emphasis on hygiene, to regain consumer confidence. We will also continue to increase prices when necessary and discontinue unprofitable contracts.
Do you plan to make additional acquisitions, and if so, in which countries?We aim to pursue acquisitions that are con-sistent with our current product portfolio. This means that we acquire brand-driven companies within the same categories, preferably in countries where we are already active. We may also acquire brands within
our categories but in countries that are close to our main markets.
Will you use your strong cash flow for acquisitions, to reduce debt or to pay dividends to shareholders?In 2020, we reached our target net debt/EBITDA ratio of around 2.5x for the fifth consecutive year, we therefore deem that we have the capacity for both acquisitions and share dividends. The dividend pay-out ratio should be 40 to 60 per cent of net profit. However, we are currently not planning to reduce the net debt/EBITDA ratio to a level much lower than 2.5x.
What is your pricing strategy?We adjust our prices based mainly on fluc-tuations in raw material costs and exchange rates. This means that over time, Cloetta will hopefully avoid the impact of cost trends in raw materials. Sometimes we also adjust prices in conjunction with initiatives such as new product launches or changes in packages.
How is Cloetta affected by the ongoing debates about sugar, health and childhood obesity?For those seeking an alternative to products with sugar, Cloetta offers options such as nuts, chewing gum with xylitol and pastilles. Additionally, we are offering candy with lower sugar and no sugar.
We also believe that the major chal-lenge in this context is hidden sugar, i.e. the sugar hidden in everyday food products like breakfast cereals, yoghurt, bread, etc., and to a certain extent also carbonated beverages. Cloetta’s products are among the most hon-est, since all consumers are aware that they contain sugar.
How big is the risk that various sugar taxes will be introduced, and how will that affect you?In general, we have to count on the pos-sibility that different countries will both introduce and abolish sugar and confection-ery taxes from time to time. When different taxes are introduced it naturally affects our sales, but only to a fairly minor extent since our products are of a type that consumers want, and can afford to treat themselves to, despite price increases.
Why do you use palm oil in your products?Palm oil in and of itself is a very good oil. It is very effective for surfaces and has excellent properties for food production. To prevent negative environmental consequences, Cloetta only uses RSPO-segregated palm oil, which means that the oil is produced sustainably and does not contribute to de-struction of rainforests. However, the small amount of palm oil that was previously used in the glazing of a number of candy products, to give them a protective surface and prevent them becoming sticky, has been exchanged for alternative oils.
Why don’t you sell product X or Y anymore, and do you have any plans to launch product Z?If we no longer sell a product, this is unfor-tunately often due to insufficient demand for the product in question. In certain cases, it could also be because the product’s profita-bility has been too low or even negative. The launch of new product types can sometimes be difficult if we lack a brand that can carry them, and at the same time the necessary marketing investments can be so high that the products would not be profitable.
New TV commercial for Ahlgrens bilar (cars)for the first time ever, ahlgrens bilar moved outside the animated world and featured in a tV commercial. the venture breathed new life into our well-known tagline ”there’s only one way to stop it”. the commercial is set at an international car show, where ahlgrens bilar is of course in the limelight. a team from a competing car brand is not too happy with all the attention ahlgrens bilar gets, but still has a hard time resisting Swe-den’s best-selling car…
iMPaCtfU l CaMPaiGnS

69
Cloetta Annual and Sustainability Report 2020 << B a c k t o c o n t e n t s
f i n a n C i a l P e r f O r M a n C e
Words from the president
Goals & strategies
Sustain ability Markets Operations & employees
Share & Shareholders
financial performance
risks & Corporate Governance
financial reports
Sustain ability impact
Financial performance
Condensed consolidated profit and loss account
SEKm 2020 2019
Net sales 5,695 6,493
Cost of goods sold –3,718 – 4,112
Gross profit 1,977 2,381
Selling expenses –951 –1,011
General and administrative expenses – 564 – 643
Operating profit 462 727
Net financial items –59 –79
Profit before tax 403 648
Income tax –122 –150
Profit for the year 281 498
Net salesNet sales for the year decreased by SEK 798m to SEK 5,695m (6,493) com-pared to last year. Organic growth was –11.2 per cent and exchange rate differences were –1.1 per cent. Sales of branded packaged products declined by –3.9 per cent. Pick & mix sales declined by –34.5 per cent.
Sales of branded packaged goods account for 79 per cent (73) of total sales, and pick & mix accounts for 21 per cent (27) of total sales. Divided by category, candy accounts for 59 per cent (59) of sales and chocolate accounts for 17 per cent (17). Pas-tilles account for 12 per cent (12), chewing gum for 7 per cent (6), nuts for 3 per cent (4) and other products for 2 per cent (2).
Sales in seven main marketsCloetta has seven main markets, of which Sweden is the largest with around 31 per cent (31) of Cloetta’s sales. The second largest market is Finland with 22 per cent (21). The Netherlands accounts for 15 per cent (14), Denmark for 9 per cent (10), Norway for 6 per cent (5), Germany for 6 per cent (6) and the UK for 5 per cent (7).
Sales of branded packaged products grew in Norway, Sweden and Finland, but declined in Denmark, the Netherlands Ger-many, the UK and International Markets. Sales of pick & mix were stable in Norway but declined in Sweden, Denmark, Finland and the UK.
International MarketsIn addition to the main markets, Cloetta’s products are sold through distributors in more than 50 International Markets. Sales in other markets decreased in 2020 and ac-counted for 6 per cent (6) of Cloetta’s sales.
Net sales and profit
Net sales – changeSEKm
Org
anic g
row
th
Exch
ang
e rate
chan
ge
s
–728
–70
6,493
4,000
4,500
5,000
5,500
6,000
6,500
20202019
5,695
Norway 6% u
Denmark 9% p p Finland 22%
The Netherlands
15% u
qSweden 31%
International Markets 6% q
Nordiccountries 68%
Other 32%
UK 5% u
Cloetta’s net sales by country
Germany 6% q
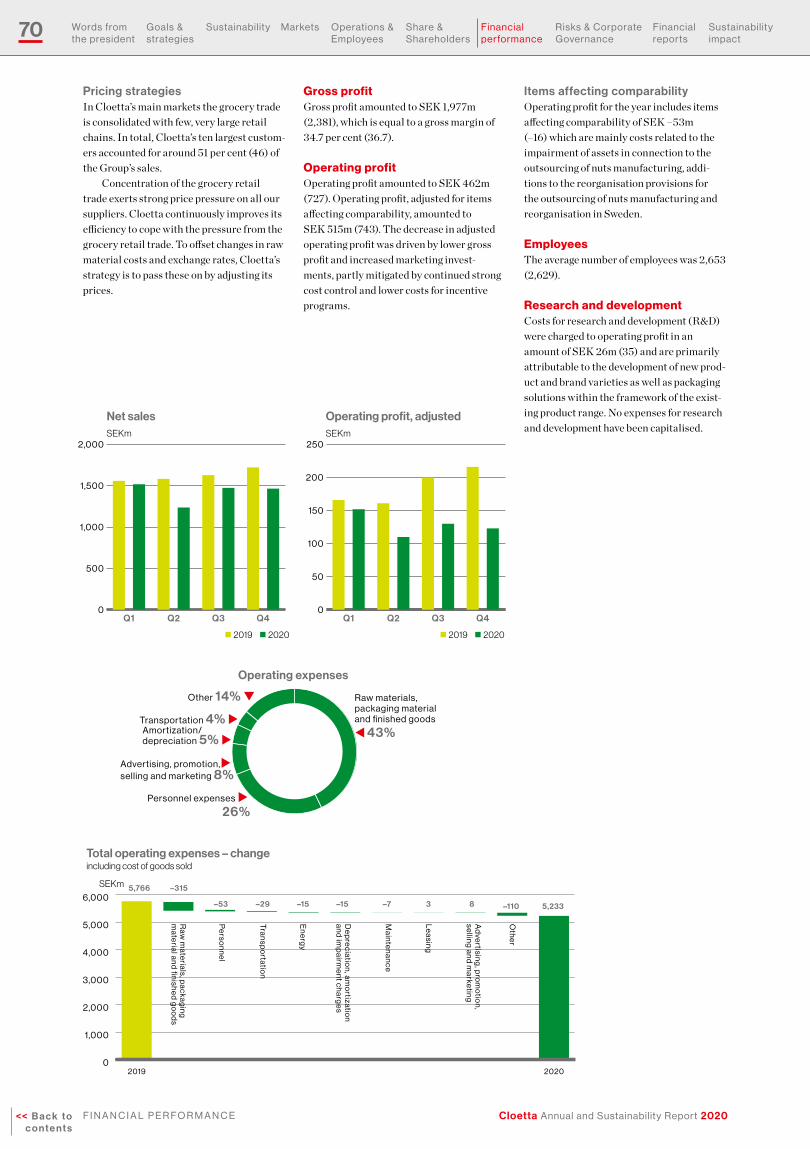
70
Cloetta Annual and Sustainability Report 2020<< B a c k t o c o n t e n t s
f i n a n C i a l P e r f O r M a n C e
Words from the president
Goals & strategies
Sustain ability Markets Operations & employees
Share & Shareholders
financial performance
risks & Corporate Governance
financial reports
Sustain ability impact
Pricing strategiesIn Cloetta’s main markets the grocery trade is consolidated with few, very large retail chains. In total, Cloetta’s ten largest custom-ers accounted for around 51 per cent (46) of the Group’s sales.
Concentration of the grocery retail trade exerts strong price pressure on all our suppliers. Cloetta continuously improves its efficiency to cope with the pressure from the grocery retail trade. To offset changes in raw material costs and exchange rates, Cloetta’s strategy is to pass these on by adjusting its prices.
Gross profitGross profit amounted to SEK 1,977m (2,381), which is equal to a gross margin of 34.7 per cent (36.7).
Operating profitOperating profit amounted to SEK 462m (727). Operating profit, adjusted for items affecting comparability, amounted to SEK 515m (743). The decrease in adjusted operating profit was driven by lower gross profit and increased marketing invest-ments, partly mitigated by continued strong cost control and lower costs for incentive programs.
Items affecting comparability Operating profit for the year includes items affecting comparability of SEK –53m (–16) which are mainly costs related to the impairment of assets in connection to the outsourcing of nuts manufacturing, addi-tions to the reorganisation provisions for the outsourcing of nuts manufacturing and reorganisation in Sweden.
EmployeesThe average number of employees was 2,653 (2,629).
Research and developmentCosts for research and development (R&D) were charged to operating profit in an amount of SEK 26m (35) and are primarily attributable to the development of new prod-uct and brand varieties as well as packaging solutions within the framework of the exist-ing product range. No expenses for research and development have been capitalised.
Operating expenses
Amortization/depreciation 5% u
Advertising, promotion,u selling and marketing 8%
Personnel expenses u
26%
Transportation 4% u
Raw materials,packaging materialand finished goods
t 43%
Other 14% q
–315
–53 –7–29 3 8
Total operating expenses – change including cost of goods sold
SEKm 5,766
5,233–15
0
1,000
2,000
3,000
4,000
5,000
6,000
20202019
–15 –110
Pe
rson
ne
l
Tran
spo
rtation
Oth
er
Ad
vertisin
g, p
rom
otio
n,
sellin
g an
d m
arketin
g
Mainte
nan
ce
En
erg
y
Raw
mate
rials, packag
ing
mate
rial and
finish
ed
go
od
s
Le
asing
De
pre
ciation
, amo
rtization
an
d im
pairm
ent ch
arge
s
Net salesSEKm
0
500
1,000
1,500
2,000
Q4Q3Q2Q1
n 2019 n 2020
Operating profit, adjusted SEKm
0
50
100
150
200
250
Q4Q3Q2Q1
n 2019 n 2020

71
Cloetta Annual and Sustainability Report 2020 << B a c k t o c o n t e n t s
f i n a n C i a l P e r f O r M a n C e
Words from the president
Goals & strategies
Sustain ability Markets Operations & employees
Share & Shareholders
financial performance
risks & Corporate Governance
financial reports
Sustain ability impact
Quarterly data
2020 Q4 Q3 Q2 Q1 2019 Q4 Q3 Q2 Q1
Net sales, SEKm 5,695 1,466 1,474 1,237 1,518 6,493 1,722 1,629 1,583 1,559
Operating profit, SEKm 462 121 87 105 149 727 209 195 159 164
Operating profit, adjusted, SEKm 515 123 130 110 152 743 216 200 161 166
Operating profit margin, % 8.1 8.3 5.9 8.5 9.8 11.2 12.1 12.0 10.0 10.5
Operating profit margin, adjusted, % 9.0 8.4 8.8 8.9 10.0 11.4 12.5 12.3 10.2 10.6
Seasonal variationsCloetta’s sales and operating profit are subject to some seasonal variations. Sales in the first and second quarters are affected by the Easter holiday, depending on the quarter in which it occurs. In the fourth quarter, sales are usually higher than in the first three quarters of the year, which is mainly attrib-
utable to the sale of products in Sweden in connection with the holiday season.
Net financial itemsNet financial items for the year amounted to SEK –59m (–79). Interest expenses related to external borrowings were SEK –32m (–29), exchange differences on cash and cash
equivalents were SEK –10m (–19) which mainly related to the development of the Swedish and Norwegian krona against the euro during the year. Other financial items amounted to SEK –17m (–31). Of the total net financial items SEK 57m (–33) is non-cash in nature.
Net financial items
SEKm 2020 2019
Exchange differences on cash and cash equivalents in foreign currencies –10 –19
Other financial income 2 2
Unrealised gains or losses on single currency interest rate swaps 1 –1
Interest expenses on third-party borrowings and realised losses on single currency interest rate swaps –32 –29
Interest expenses, third-party pensions –7 –11
Interest expenses, contingent earn-out liabilities – – 4
Other financial expenses –13 –17
Net financial items –59 –79
Profit for the yearProfit for the year was SEK 281m (498). Income tax for the period was SEK –122m (–150). The effective tax rate for the year was 30.3 per cent (23.1) and was negatively impacted by the revaluation of deferred tax balances in the Netherlands as a result of a reversal of the previously enacted corporate income tax rate decrease. Excluding this revaluation effect the effective tax ratewould have been slightly below last year’s effective tax rate for the year.
Furthermore, international tax rate differences, non-deductible expenses and an adjustment in prior year filing positions had a negative impact on the effective tax rate for
Key ratios
% 2020 2019
Gross margin 34.7 36.7
Operating profit margin 8.1 11.2
Operating profit margin, adjusted 9.0 11.4
Return on capital employed 6.3 10.0
Return on equity 6.7 11.9
For definitions, see page 164.
Distribution andwarehousing 8% q
Manufacturingcosts 33% u t Raw materials and
packaging 59%
Cost of goods sold
Administrative expenses 11% q
Sellingexpenses 18% u
t Cost of goods sold 71%
Total operating expenses
Sensitivity analysisThe effects on profit before tax of changes in the Swedish krona against the euro, interest rate and average raw material prices are shown below. These are estimated effects which could occur with an isolated change in each variable and should be interpreted with caution. The calculations are hypo-thetical and should neither be considered as an indicator of either of these factors being more or less likely to change, nor the size of the magnitude of the change. Real changes and their effects may be larger or smaller than presented below. In addition, it is likely that the real changes will affect other items, and that actions by Cloetta and others, as a result of the changes, may thereby affect other items.
Sensitivity analysis ChangeProfit
before tax
Currency riskIf the Swedish krona weakens/strengthens against the euro
-/+ 10% -/+ SEK 15m
Interest rate riskInterest rate
+/- 1% SEK -6m/SEK 2m
Commodity price riskAverage raw material prices
+/- 10% -/+ SEK 115m
Cloetta’s development is affected by multiple factors, which include those disclosed in the section Risks and risk management on pages 76–80.
the year. Profit for the year equates to basic and diluted earnings per share of SEK 0.98 (1.74).

72
Cloetta Annual and Sustainability Report 2020<< B a c k t o c o n t e n t s
f i n a n C i a l P e r f O r M a n C e
Words from the president
Goals & strategies
Sustain ability Markets Operations & employees
Share & Shareholders
financial performance
risks & Corporate Governance
financial reports
Sustain ability impact
Current assetsCurrent assets amounted to SEK 2,111m (2,401). This change is mainly due to a com-bination of an increase in inventories of SEK 64m, lower trade and other receivables of SEK 192m and lower cash and cash equiv-alents of SEK 183m.
Equity and liabilitiesEquity Consolidated equity at 31 December 2020 amounted to SEK 4,179m (4,197), which equates to SEK 14.5 (14.5) per share. On the balance sheet date, the share capital amounted to SEK 1,443m (1,443). The equity/assets ratio on the same date was 45.1 per cent (43.4).
LiabilitiesNon-current liabilities amounted to SEK 1,465m (2,249), which is a decrease of SEK 784m compared to the previous year. Long-term borrowings totalled SEK 111m (939) and consisted of SEK 112m (140) in non-current lease liabilities, SEK 0m (800) in gross non-current loans from credit institutions and SEK –1m (–1) in capitalised transaction costs. The deferred tax liability increased by SEK 34m to SEK 837m. Pen-sion provisions increased by SEK 13m to SEK 512m.
Total short-term borrowings amounted to SEK 2,368m (1,870) and consisted of gross loans from credit institutions of SEK 2,054m (1,306), commercial papers of SEK 250m (499), current lease liabilities of SEK 64m (64), capitalised transaction costs of SEK –1m (–0) and accrued interest on borrowings from credit institutions of SEK 1m (1). The current loans from credit institutions mature in the third quarter of 2021. The internal alignment for the re- financing of these loans is ongoing. It is Cloetta’s aim to have the refinancing formalised during the first half of 2021. The extension of a loan from credit institutions in the second quarter of 2020 and the improved market for commercial papers give sufficient confidence that Cloetta will be able to refinance the loans at competitive terms.
BorrowingsIn June 2020, Cloetta extended a loan from credit institutions in the amount of SEK 1,254m for a year.
The facilities agreement bears variable interest at a rate based on STIBOR, plus an applicable fixed margin for loans in SEK, and variable interest at a rate based on EURIBOR plus an applicable fixed margin for loans in EUR. The applicable margin at 31 December 2020 was 0.90 per cent (0.90) for the outstanding loans in SEK and 1.05 per cent (0.80) for the outstanding loans
goodwill and trademarks at 31 December 2020. Goodwill and trademarks are tested at least yearly for impairment.
Property, plant and equipment amounted to SEK 1,560m (1,559). The year’s investments amounted to SEK 349m (216). The year’s investments in property, plant and equipment referred primarily to contin-uous efficiency-enhancing and replacement investments in the existing production lines, as well as investments in pick & mix fixtures. Depreciation amounted to SEK –248m (–258). Exchange differences related to tangible assets recognised in foreign subsidiaries amounted to SEK –52m (23) during the year.
AssetsTotal assets at 31 December 2020 amounted to SEK 9,257m (9,660), which is a decrease of SEK 403m compared to the previous year.
Non-current assetsIntangible assets totalled SEK 5,563m (5,684). The change consists mainly of exchange differences related to intangible assets recognised in foreign subsidiaries of SEK –119m (83). Investments for the year amounted to SEK 23m (19) and amortisa-tion amounted to SEK –27m (–43).
Of total intangible assets, 98 per cent (97) or SEK 5,424m (5,540) pertained to
Consolidated balance sheet
SEKm 31 Dec 2020 31 Dec 2019
ASSETS
Non-current assets
Intangible assets 5,563 5,684
Property, plant and equipment 1,560 1,559
Deferred tax asset 20 9
Other financial assets 3 7
Total non-current assets 7,146 7,259
Current assets
Inventories 952 888
Trade and other receivables 736 928
Current income tax assets 27 6
Cash and cash equivalents 396 579
Total current assets 2,111 2,401
TOTAL ASSETS 9,257 9,660
EQUITY AND LIABILITIES
Equity 4,179 4,197
Non-current liabilities
Long-term borrowings 111 939
Deferred tax liability 837 803
Derivative financial instruments 0 3
Provisions for pensions and other long-term employee benefits
512 499
Provisions 5 5
Total non-current liabilities 1,465 2,249
Current liabilities
Short-term borrowings 2,368 1,870
Derivative financial instruments 54 68
Trade and other payables 1,144 1,227
Provisions 24 5
Current income tax liabilities 23 44
Total current liabilities 3,613 3,214
TOTAL EQUITY AND LIABILITIES 9,257 9,660
Financial position

73
Cloetta Annual and Sustainability Report 2020 << B a c k t o c o n t e n t s
f i n a n C i a l P e r f O r M a n C e
Words from the president
Goals & strategies
Sustain ability Markets Operations & employees
Share & Shareholders
financial performance
risks & Corporate Governance
financial reports
Sustain ability impact
in EUR. Interest on the commercial paper amounted to 0.82 per cent on average (0.38). Further, an additional 35 per cent (35) of the fixed applicable margin on the unutilised amounts of the credit revolving loans is paid as a commitment fee.
The combined effective interest rate for loans from credit institutions and the
commercial paper was 0.93 per cent (0.74) for the year.
Change in capital employed Capital employed during the year decreased from SEK 7,576m to SEK 7,224m, i.e. a decrease of SEK 352m.
Net debt Interest-bearing liabilities exceeded cash and cash equivalents and other inter-est-bearing assets by SEK 2,139m (2,302). The net debt/equity ratio on the balance sheet date was 51.2 per cent (54.8).
Net debt
SEKm 31 Dec 2020 31 Dec 2019
Gross non-current loans from credit institutions – 800
Gross current loans from credit institutions 2,054 1,306
Commercial papers 250 499
Lease liabilities 176 204
Derivative financial instruments (current and non-current) 54 71
Interest payable 1 1
Gross debt 2,535 2,881
Cash and cash equivalents –396 – 579
Net debt 2,139 2,302
Net debt/EBITDA
SEKm
0
500
1,000
1,500
2,000
2,500
3,000
3,500
20202019201820172016
Net debt/EBITDA, xnn Net debt, SEKm
0
1
2
3
4
5
6
7
2.22.7
2.32.4 2.4
Equity31 December
SEKm
0
1,000
2,000
3,000
4,000
5,000
20202019201820172016
Equity/assets ratioat 31 December
%
0
10
20
30
40
50
20202019201820172016

74
Cloetta Annual and Sustainability Report 2020<< B a c k t o c o n t e n t s
f i n a n C i a l P e r f O r M a n C e
Words from the president
Goals & strategies
Sustain ability Markets Operations & employees
Share & Shareholders
financial performance
risks & Corporate Governance
financial reports
Sustain ability impact
consideration arising from the acquisition of Candyking Holding AB and its subsidiaries.
Cash flow from financing activitiesCash flow from financing activities was SEK –476m (–362). The cash flow from financing activities was related to the dividend distribution of SEK –143m (–287), net proceeds and repayments of loans from credit institutions and commercial papers of SEK –245m (–1) and payments of lease liabilities of SEK –72m (–74). Other cash flows from financing activities amounted to SEK –16m (0).
Cash and cash equivalents The net cash flow was SEK –109m (32), which together with exchange differences of SEK –74m (–4) decreased cash and cash equivalents by SEK 183m to SEK 396m, compared to SEK 579m in the previous year. Cloetta had an unutilised credit facility of SEK 1,204m (1,254) and the possibility to issue additional commercial papers for an amount of SEK 750m (500). Cloetta’s working capital is exposed to seasonal variations, partly resulting from a build-up of inventories in preparation for increased sales ahead of the Christmas holiday. This means that the working capital requirement is normally highest during the summer and lowest at year-end.
Free cash flowThe free cash flow was SEK 366m (538). Cash flow from operating activities before changes in working capital was SEK 618m (908). The decrease compared to the prior year is mainly the result of a lower operating profit and increased corporate income tax payments due to less availability of tax losses carried forward. The cash flow from changes in working capital was SEK 38m (–184). The cash flow from investments in property, plant and equipment and intangible assets was SEK –290m (–186).
Cash flow from changes in working capitalCash flow from changes in working capital was SEK 38m (–184). The cash flow from changes in working capital was positively impacted by a decrease in receivables amounting to SEK 184m (–88) partly offset by the negative impact due to the increase in inventories of SEK –90m (–113) and the decrease in payables for an amount of SEK –56m (17).
Cash flow from other investing activities Cash flow from other investing activities was SEK 1m (–144). In the first quarter of 2019 an amount of SEK –146m was related to the settlement of the contingent earn-out
Consolidated cash flow statement
SEKm 2020 2019
Cash flow from operating activities before changes in working capital
618 908
Cash flow from changes in working capital 38 –184
Cash flow from operating activities 656 724
Investments in property, plant and equipment –267 –167
Investments in intangible assets –23 –19
Free cash flow 366 538
Other investing activities
Acquisition of subsidiaries – –146
Disposals of property, plant and equipment 1 2
Cash flow from other investing activities 1 –144
Cash flow from operating and investing activities 367 394
Cash flow from financing activities –476 –362
Cash flow for the year –109 32
Cash and cash equivalents at beginning of year 579 551
Cash flow for the year –109 32
Exchange difference –74 – 4
Cash and cash equivalents at end of year 396 579
Comments on the cash flow statement
Cash flow from investing activitiesSEKm
–400
–300
–200
–100
0
20202019201820172016
Cash flow from operating activitiesSEKm
0
200
400
600
800
1,000
20202019201820172016
Cash flow from financing activitiesSEKm
–800
–700
–600
–500
–400
–300
–200
–100
0
20202019201820172016
SEKm
–150
–100
–50
0
50
100
150
200
250
300
Q4Q3Q2Q1
n 2019 n 2020
Free cash flow
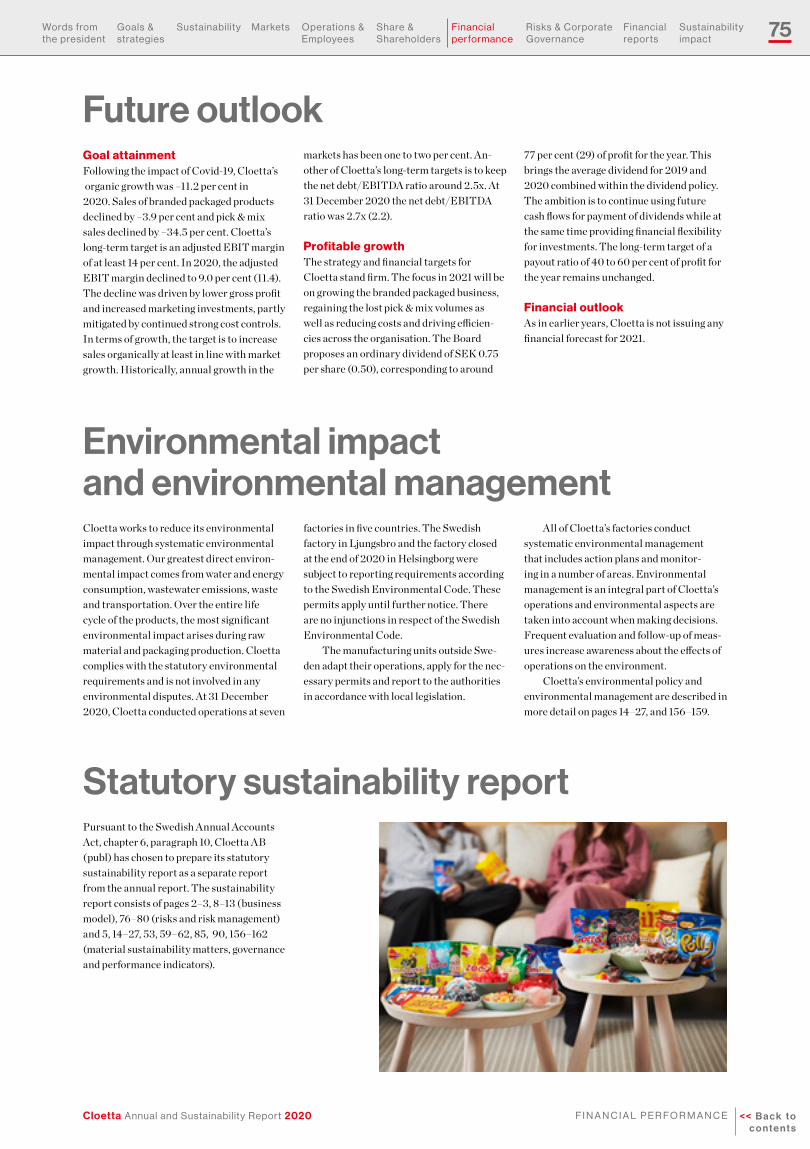
75
Cloetta Annual and Sustainability Report 2020 << B a c k t o c o n t e n t s
f i n a n C i a l P e r f O r M a n C e
Words from the president
Goals & strategies
Sustain ability Markets Operations & employees
Share & Shareholders
financial performance
risks & Corporate Governance
financial reports
Sustain ability impact
Future outlookGoal attainmentFollowing the impact of Covid-19, Cloetta’s organic growth was –11.2 per cent in 2020. Sales of branded packaged products declined by –3.9 per cent and pick & mix sales declined by –34.5 per cent. Cloetta’s long-term target is an adjusted EBIT margin of at least 14 per cent. In 2020, the adjusted EBIT margin declined to 9.0 per cent (11.4). The decline was driven by lower gross profit and increased marketing investments, partly mitigated by continued strong cost controls. In terms of growth, the target is to increase sales organically at least in line with market growth. Historically, annual growth in the
markets has been one to two per cent. An-other of Cloetta’s long-term targets is to keep the net debt/EBITDA ratio around 2.5x. At 31 December 2020 the net debt/EBITDA ratio was 2.7x (2.2).
Profitable growthThe strategy and financial targets for Cloetta stand firm. The focus in 2021 will be on growing the branded packaged business, regaining the lost pick & mix volumes as well as reducing costs and driving efficien-cies across the organisation. The Board proposes an ordinary dividend of SEK 0.75 per share (0.50), corresponding to around
77 per cent (29) of profit for the year. This brings the average dividend for 2019 and 2020 combined within the dividend policy. The ambition is to continue using future cash flows for payment of dividends while at the same time providing financial flexibility for investments. The long-term target of a payout ratio of 40 to 60 per cent of profit for the year remains unchanged.
Financial outlookAs in earlier years, Cloetta is not issuing any financial forecast for 2021.
Environmental impact and environmental managementCloetta works to reduce its environmental impact through systematic environmental management. Our greatest direct environ-mental impact comes from water and energy consumption, wastewater emissions, waste and transportation. Over the entire life cycle of the products, the most significant environmental impact arises during raw material and packaging production. Cloetta complies with the statutory environmental requirements and is not involved in any environmental disputes. At 31 December 2020, Cloetta conducted operations at seven
factories in five countries. The Swedish factory in Ljungsbro and the factory closed at the end of 2020 in Helsingborg were subject to reporting requirements according to the Swedish Environmental Code. These permits apply until further notice. There are no injunctions in respect of the Swedish Environmental Code.
The manufacturing units outside Swe-den adapt their operations, apply for the nec-essary permits and report to the authorities in accordance with local legislation.
All of Cloetta’s factories conduct systematic environmental management that includes action plans and monitor-ing in a number of areas. Environmental management is an integral part of Cloetta’s operations and environmental aspects are taken into account when making decisions. Frequent evaluation and follow-up of meas-ures increase awareness about the effects of operations on the environment.
Cloetta’s environmental policy and environmental management are described in more detail on pages 14–27, and 156–159.
Statutory sustainability reportPursuant to the Swedish Annual Accounts Act, chapter 6, paragraph 10, Cloetta AB (publ) has chosen to prepare its statutory sustainability report as a separate report from the annual report. The sustainability report consists of pages 2–3, 8–13 (business model), 76–80 (risks and risk management) and 5, 14–27, 53, 59–62, 85, 90, 156–162 (material sustainability matters, governance and performance indicators).

76
Cloetta Annual and Sustainability Report 2020<< B a c k t o c o n t e n t s
r i S K S a n d r i S K M a n a G e M e n t
Words from the president
Goals & strategies
Sustain ability Markets Operations & employees
Share & Shareholders
financial performance
risks & Corporate Governance
financial reports
Sustain ability impact
Risks and risk managementUncertainty about future events is a natural part of all business activities. Future events can have a positive impact on operations through opportunities to create increased value, or a negative impact through risks that may have an adverse effect on Cloetta’s business and results.
Risks can arise as a result of events or decisions that are beyond Cloetta’s control, but they can also be an effect of incorrect risk management within Cloetta or among its suppliers or customers.
Organisation for risk managementCloetta’s Board of Directors has a responsi-bility to the shareholders to oversee the com-pany’s risk management. Risk assessment associated with business development and long-term strategic planning is prepared by the Group Management Team and decisions are made by the Board of Directors.
The Group Management Team con-tinually reports to the Board of Directors on risk areas such as the Group’s financial status and compliance with Group’s finance policy. Operational risk management that takes place at all levels of the organisation is regulated by Cloetta’s Code of Conduct and a number of other central policies.
Identification of risksThe identification of risks and proactive measures to limit them, or prevent them from materialising and having a negative impact on operations, is of fundamental im-portance for operations and is a central part of every manager’s responsibility at Cloetta. Cloetta works continuously to assess and evaluate the risks to which the organisa-tion is, and can be, exposed. All events that could affect confidence in Cloetta or disrupt operations are essential to monitor and min-imise. This is the responsibility of the Group Management Team and is managed through dialogue with various stakeholders.
Risk managementEffective handling of risks is an integral part of Cloetta’s management and control. Rapid distribution of relevant information is ensured via the company’s management structures and processes. Where possible,
risks are eliminated, and undesired events are minimised through proactive measures. Alternatively, risks can be transferred, for example through insurance or agreements. However, certain risks are impossible to eliminate or transfer. These are often an ac-tive part of business operations. This year we are including more climate-related risks and we intend to disclose information according to the Task Force on Climate-related Finan-cial Disclosures (TCFD) recommendations within the next two years.
Risk overviewA number of risk areas have been identified through Cloetta’s risk management process. A selection of these, and a brief description of how each risk area is handled, is presented on the following pages. The Group’s financial risk management is also described in more detail in Note 26, on pages 129–131, and on page 6 more information regarding Covid-19 related risks can be found.
Pages 90–91 contain a description of the internal control processes and risk assess-ment aimed at preventing misstatements in the financial reporting.
Management of risks in the workplace environment is described on page 61.

77
Cloetta Annual and Sustainability Report 2020 << B a c k t o c o n t e n t s
r i S K S a n d r i S K M a n a G e M e n t
Words from the president
Goals & strategies
Sustain ability Markets Operations & employees
Share & Shareholders
financial performance
risks & Corporate Governance
financial reports
Sustain ability impact
Industry and market-related risks
Cloetta works continuously to assess and evaluate the risks to which the Group is, and can be, exposed. Critical external risks are managed both strategically through business and product development, and operationally through daily purchasing, sales and marketing activities.
Risks ManagementP r O Ba B i lit Y I M PACT
Market climate
Financial crises can have a negative impact on consumption patterns. This can affect operations if Cloetta’s customers experience lower profitability, which leads to price pressure.
Global pandemics can have a negative impact on various sales channels such as convenience stores and travel retail. This may affect Cloetta’s sales and profitability negatively.
Historically, the confectionery market has been relatively mildly affected by market downturns in consumption. This is particularly true for Cloetta’s products, which most people can afford to buy. To support the customers’ business and promote sound pricing development, Cloetta cooperates with its customers on in-store sales activities and other measures.
The majority of Cloetta’s sales come from grocery stores, which remain open during a global pandemic as they are considered essential for society.
Competition
The confectionery market is highly competitive and includes several major players. Furthermore, grocery retailers offer private labels that compete with certain Cloetta products. This competition may limit Cloetta’s ability to increase prices to compensate for higher raw material costs.
Cloetta may also need to increase its investments in market-ing and product development in order to retain or expand its market shares.
Cloetta is a significant pick & mix player, which by its nature is a market that often consists of multi-year contracts that must be continuously renewed. Competition from other players, including the grocery retail chains, may cause Cloetta to lose major contracts.
Cloetta competes in the market through active pricing, product innovation, product quality, brand recognition and loyalty, marketing and the ability to predict and satisfy customer preferences.
It is important that Cloetta’s products are perceived as provid-ing the consumers with greater added value than the cheaper alternatives.
Cloetta must therefore conduct effective marketing.
Cloetta endeavours to offer the best pick & mix concepts in terms of the customer and consumer experience. Further-more, an integrated production chain enables Cloetta to be cost-effective in pick & mix.
Retail trade development
The European grocery and service trade has undergone a process of consolidation leading to the establishment of large, sophisticated players with substantial purchasing power. These major players are not necessarily dependent on indi-vidual brands and can hold back price increases and demand higher investment in marketing initiatives. They can also take over shelf space that is currently used for Cloetta’s products for their own brands.
E-commerce is challenging the current retail structure and over time, will most likely change the retail landscape sub-stantially. The introduction of self-scanning services in stores might impact sales of Cloetta’s products since they are often placed next to regular store checkouts. Events such as a glob-al pandemic may accelerate the shift to e-commerce.
Major retailers are joining the Science-Based Target Initiative to join the fight against climate change. They need suppliers to act in order to reach their climate targets.
Cloetta’s strong brands and market position, together with a strong sales force and close cooperation with the retail trade, enable it to maintain good relations with the retail trade. Cloetta also works actively with new sales channels. Cloetta has a relatively wide and diversified customer base. In 2020 Cloetta’s ten largest customers accounted for around 51 (46) per cent of the Group’s total sales.
Cloetta is working actively with retailers regarding e-commerce, helping them to learn how to sell impulse confectionery products online.
By supporting retailers in learning how to sell products in self-scanning areas, Cloetta is able to maintain sales in the checkout area.
As Cloetta joined the Science-Based Target initiative in 2020, we join hands with our customers, thus strengthening our relationship and position ourselves as a responsible supplier.
Consumer trends health and Sustainability
Changes in consumer behaviour give rise to both opportuni-ties and risks. Health trends and the debate on health, weight and sugar may have a negative impact on confectionery consumption. The health trend has also spurred a growing interest in natural raw materials. Significant events, such as a global pandemic may also affect both short-term and long-term consumer behaviour.
In the wake of rapid globalisation, individual consumers are more aware of how their consumption patterns affect the environment and social/ethical conditions all over the world. Consumers want to know more about product origins, man-ufacturing methods and raw materials. Information indicating that Cloetta, or Cloetta’s suppliers, do not take adequate environmental or social responsibility could damage Cloetta’s brand.
Health trends have not affected confectionery sales to any great extent, since confectionery is often eaten as a small luxury in everyday life. Cloetta works continuously to satisfy consumer preferences. In addition, Cloetta offers both sugar- free products and products with less sugar, as well as prod-ucts that promote dental health. In the long term, Cloetta’s goal is for all products to be free from artificial colourants and additives (NAFNAC).
Cloetta developed a new Sustainability Agenda during 2020 to improve our overall sustainability performance. Consumers’ increased awareness are seen as an opportunity rather than a risk but improving conditions in our supply chain remains a priority. Therefore, a specific Supplier Code of Conduct was developed in 2020 that will be implemented during 2021. Cloetta sources certified raw materials where this is possible and continuously look to improve conditions through coopera-tion with suppliers and NGO’s.

78
Cloetta Annual and Sustainability Report 2020<< B a c k t o c o n t e n t s
r i S K S a n d r i S K M a n a G e M e n t
Words from the president
Goals & strategies
Sustain ability Markets Operations & employees
Share & Shareholders
financial performance
risks & Corporate Governance
financial reports
Sustain ability impact
Operational risksOperational risks can often be influenced, which is why they are normally regulated by policies, guidelines and instruc-tions. Operational risks are part of Cloetta’s day-to-day work and are managed by the operating units. Operational risks include those related to the brand, relocation of production, insurable risks and environmental, health and safety-related risks and IT-related risks.
Risks ManagementP r O Ba B i lit Y I M PACT
Business ethics and brand risks
Demand for Cloetta’s well-known brands is driven by consum-ers’ association of these brands with positive values. If Cloetta or any of the Group’s partners takes any measures that conflict with the values represented by the brands, the Cloetta brands could be damaged.
Cloetta takes a proactive approach by adhering to a Code of Conduct and a policy on anti-corruption and bribery.
A specific Supplier Code of Conduct was developed in 2020 that will be implemented during 2021. It covers human and labour rights, business ethics and anti-corruption, health and safety, and environmental protection.
Social con-ditions in the supply chain
Cloetta uses several raw materials that originate from regions or countries with an increased risk of human rights violations and corrupt behaviour.
Further, political instability in places where raw materials are produced can have a negative impact on availability and costs.
Cloetta’s Supplier Code of Conduct is part of all supplier agreements.
Cloetta assesses the raw materials and prioritises involve-ment with suppliers and organisations for certain materials based on climate, social and human-rights related risks.
100% of all cocoa purchased is UTZ/Rainforest Alliance certified.
100% of all palm oil used in Cloetta branded products is RSPO Certified Segregated palm oil which is the highest standard to ensure deforestation free and sustainably farmed palm oil. Certification of Cloetta’s factories according to this standard has been upheld since 2019.
Since 2017 Cloetta has purchased sustainable and traceable shea butter from women cooperatives in Africa.
In 2020, Cloetta joined a pilot initiative together with Rain-forest Alliance to close the income gap for cocoa farmers in Africa.
Risks ManagementP r O Ba B i lit Y I M PACT
Laws and taxes
Cloetta conducts operations through companies in a number of countries. New laws, taxes or rules in various markets may lead to limitations in operations or bring about new and higher demands. There is a risk that Cloetta’s interpretation of the applicable tax laws, tax treaties and regulations in the different markets is not entirely correct or that such rules will change, possibly with retroactive effect.
Cloetta continuously assesses legal issues in order to predict and prepare its operations for possible changes. The introduction of confectionery taxes and fat taxes often has a short-term impact on sales.
Provisions for legal disputes, tax disputes, etc., are based on an estimation of the costs, with the support of legal advice and based on the information available.
Raw material prices
Price development for raw materials is steered mainly by sup-ply and demand, and is beyond Cloetta’s control. The prices of sugar and many of the other raw materials purchased by Cloetta can also be affected by agro-political decisions in the EU regarding quotas, support, subsidies and trade barriers, and also by rising living standards and the activity of financial investors on the commodities exchanges.
Cloetta continuously monitors the development of raw mate-rial prices and all purchasing is carried out through a central purchasing function. To ensure access and price levels, Cloetta normally enters into supplier contracts that cover the need for raw materials for a period of 6 –9 months ahead. If the average raw material prices had been 10 per cent higher/lower at 31 December 2020, profit before tax for the year would have been around SEK 115m lower/higher.
Cloetta’s policy is to compensate for higher raw material costs by raising prices to its customers.
Industry and market-related risks, continued

79
Cloetta Annual and Sustainability Report 2020 << B a c k t o c o n t e n t s
r i S K S a n d r i S K M a n a G e M e n t
Words from the president
Goals & strategies
Sustain ability Markets Operations & employees
Share & Shareholders
financial performance
risks & Corporate Governance
financial reports
Sustain ability impact
Risks ManagementP r O Ba B i lit Y I M PACT
Environmental and climate related risks
There is a risk that climate change will impact Cloetta. This may involve transition risks such as changing rules and taxa-tion, as well as physical risks. Physical risks include changes that are both long-term and urgent in nature, for example extreme weather conditions and natural catastrophes that could impact Cloetta’s access to raw materials and disrupt business operations directly or indirectly.
Climate-related risks are becoming an ever growing concern among the investment community and new initiatives such as the Task Force on Climate-related Financial Disclosures are receiving more attention.
With the new Sustainability Agenda, Cloetta is raising the ambition level to improve its total environmental footprint. The climate crisis coincides with a biodiversity crisis and water crisis. Agriculture is at the very heart of both the risks but also of the potential solutions.
The future of agricultural production is of course of utmost importance to the future of any food company. Therefore, Cloetta joined the Science Based Targets Initiative to set targets and action plans to reduce our carbon footprint throughout our value chain, not only our own operations. We will cooperate with our customers and suppliers to find solutions that can tackle this enormous challenge.
Cloetta manages the environmental and climate impact of its business operations through systematic work within the scope of the company’s environmental management system.
Product safety risks
Handling of food products places high demands on traceabil-ity, hygiene and safety. In a worst-case scenario, inadequate control can lead to contamination or allergic reactions. These types of deficiencies in the handling of food products can lead to lower trust in Cloetta and the Group’s brands.
Cloetta works with first-class raw materials and in accordance with international quality standards. Analyses through chem-ical and physical tests are performed on both raw materials and finished products. Issues of importance for product safety are collated in special policies. Plans for information or prod-uct recalls in the event of deficiencies have been prepared.
Insurable risks
Assets such as factories and production equipment can be seriously damaged, for example in the event of a fire or power outage. Product recalls can incur substantial costs, resulting from both direct costs and damage to Cloetta’s reputation.
Cloetta has an insurance program for property and liability risks, and works systematically to limit the risk of incidents and to have robust contingency plans in place to limit the effects of any incidents.
Disruption and relocation of product manu-facturing
Disturbances and inefficiencies in the supply chain, as well as undesirable effects on and from the external environment, such as a fire, strikes, pandemics or extreme weather, could result in stoppages in production, operations and deliveries, and thus negatively affect the company’s business and repu-tation. To optimise efficiency, Cloetta continuously monitors capacity utilisation in manufacturing and evaluates the need to move manufacturing from one factory to another. This is however a complex process that can result in disruptions and delays in production, which can in turn also lead to delivery problems.
Cloetta has a good monitoring process in place to anticipate short term disruption both in sourcing and delivery. In our factories we have clear protective protocols in place to reduce the risk, provide a safe workplace and limit the impact. Cloetta also has an experienced and efficient organisation with well-established routines for handling relocation of produc-tion.
Access to the right expertise
To a large extent, Cloetta’s future is dependent on its capacity to recruit, retain and develop competent senior executives and other key staff.
Cloetta occasionally reorganises and streamlines its opera-tions, which in the short term may have a negative impact on its performance.
Cloetta endeavours to continue to be an attractive employer. Employee development and follow-up plans, together with market-based and competitive compensation, enable Cloetta to recruit and retain employees.
Cloetta has a strong and experienced organisation that is well equipped to handle organisational changes.
IT Security
Cloetta is highly dependent on having an efficient IT platform. Disruptions or faults in critical systems can have a direct impact on both production, financial systems, and business processes. Over the years efforts have been made to har-monise and standardise the IT landscape by minimising the number of supported IT applications and continuously invest in IT infrastructure. Examples of risk mitigation in infrastruc-ture is redundant network access, mirrored and physically separated environments for critical business applications. The IT Security is the defence to protect against potential loss or harm related to technical infrastructure, use of technology or reputation of our organisation.
Cloetta operates under a centrally controlled IT govern-ance and continuously mitigates against all dimensions of attacks by assessing its cyber risk profile, remediating where recommended and pro-actively managing and investing in its defences.
Operational risks, continued
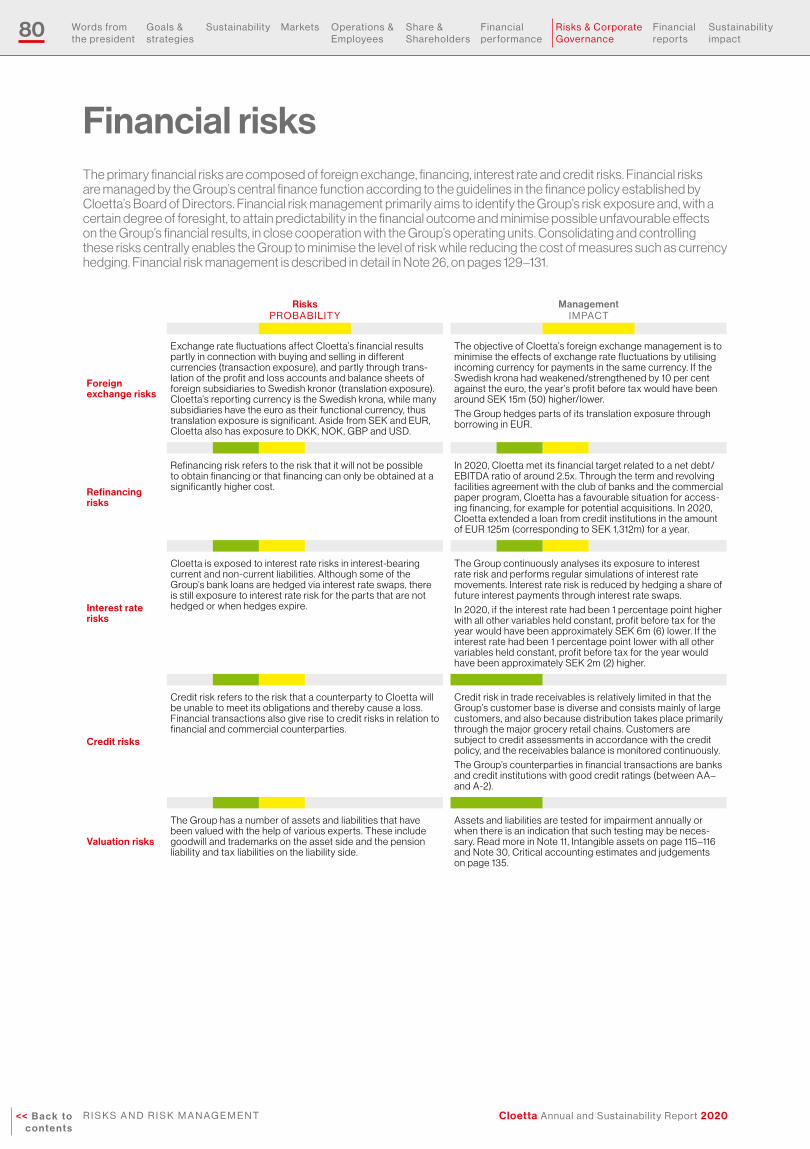
80
Cloetta Annual and Sustainability Report 2020<< B a c k t o c o n t e n t s
r i S K S a n d r i S K M a n a G e M e n t
Words from the president
Goals & strategies
Sustain ability Markets Operations & employees
Share & Shareholders
financial performance
risks & Corporate Governance
financial reports
Sustain ability impact
Financial risksThe primary financial risks are composed of foreign exchange, financing, interest rate and credit risks. Financial risks are managed by the Group’s central finance function according to the guidelines in the finance policy established by Cloetta’s Board of Directors. Financial risk management primarily aims to identify the Group’s risk exposure and, with a certain degree of foresight, to attain predictability in the financial outcome and minimise possible unfavourable effects on the Group’s financial results, in close cooperation with the Group’s operating units. Consolidating and controlling these risks centrally enables the Group to minimise the level of risk while reducing the cost of measures such as currency hedging. Financial risk management is described in detail in Note 26, on pages 129–131.
Risks ManagementP r O Ba B i lit Y i M PaCt
Foreign exchange risks
Exchange rate fluctuations affect Cloetta’s financial results partly in connection with buying and selling in different currencies (transaction exposure), and partly through trans-lation of the profit and loss accounts and balance sheets of foreign subsidiaries to Swedish kronor (translation exposure). Cloetta’s reporting currency is the Swedish krona, while many subsidiaries have the euro as their functional currency, thus translation exposure is significant. Aside from SEK and EUR, Cloetta also has exposure to DKK, NOK, GBP and USD.
The objective of Cloetta’s foreign exchange management is to minimise the effects of exchange rate fluctuations by utilising incoming currency for payments in the same currency. If the Swedish krona had weakened/strengthened by 10 per cent against the euro, the year’s profit before tax would have been around SEK 15m (50) higher/lower.
The Group hedges parts of its translation exposure through borrowing in EUR.
Refinancing risks
Refinancing risk refers to the risk that it will not be possible to obtain financing or that financing can only be obtained at a significantly higher cost.
In 2020, Cloetta met its financial target related to a net debt/EBITDA ratio of around 2.5x. Through the term and revolving facilities agreement with the club of banks and the commercial paper program, Cloetta has a favourable situation for access-ing financing, for example for potential acquisitions. In 2020, Cloetta extended a loan from credit institutions in the amount of EUR 125m (corresponding to SEK 1,312m) for a year.
Interest rate risks
Cloetta is exposed to interest rate risks in interest-bearing current and non-current liabilities. Although some of the Group’s bank loans are hedged via interest rate swaps, there is still exposure to interest rate risk for the parts that are not hedged or when hedges expire.
The Group continuously analyses its exposure to interest rate risk and performs regular simulations of interest rate movements. Interest rate risk is reduced by hedging a share of future interest payments through interest rate swaps.
In 2020, if the interest rate had been 1 percentage point higher with all other variables held constant, profit before tax for the year would have been approximately SEK 6m (6) lower. If the interest rate had been 1 percentage point lower with all other variables held constant, profit before tax for the year would have been approximately SEK 2m (2) higher.
Credit risks
Credit risk refers to the risk that a counterparty to Cloetta will be unable to meet its obligations and thereby cause a loss. Financial transactions also give rise to credit risks in relation to financial and commercial counterparties.
Credit risk in trade receivables is relatively limited in that the Group’s customer base is diverse and consists mainly of large customers, and also because distribution takes place primarily through the major grocery retail chains. Customers are subject to credit assessments in accordance with the credit policy, and the receivables balance is monitored continuously.
The Group’s counterparties in financial transactions are banks and credit institutions with good credit ratings (between AA– and A-2).
Valuation risks
The Group has a number of assets and liabilities that have been valued with the help of various experts. These include goodwill and trademarks on the asset side and the pension liability and tax liabilities on the liability side.
Assets and liabilities are tested for impairment annually or when there is an indication that such testing may be neces-sary. Read more in Note 11, Intangible assets on page 115 –116 and Note 30, Critical accounting estimates and judgements on page 135.

81
Cloetta Annual and Sustainability Report 2020 << B a c k t o c o n t e n t s
l e t t e r f r O M t h e C h a i r M a n
Words from the president
Goals & strategies
Sustain ability Markets Operations & employees
Share & Shareholders
financial performance
risks & Corporate Governance
financial reports
Sustain ability impact
Letter from the Chairman2020 has been characterised by Covid-19 and its many associated challenges. The pandemic had a major impact on Cloetta as it affected several of our sales channels and changed consumer behaviour. However, the company reacted to the situation swiftly and with decisive actions. These together with the positive progress made before the pandemic convince me that Cloetta remains strong.
Corporate governance creates systematic order The Board’s foremost responsibility to Cloetta’s shareholders is to ensure that the company is managed as effectively as possible, and also that Cloetta complies with the laws and regulations required by legislators, regulatory authorities and the stock exchange. Corporate governance is aimed at creating order and systems for both the Board and Group Management Team. By having a clear structure, with well-de-fined rules and processes, we can also ensure that management and employees focus on developing the business and strengthening the company.
The Corporate Governance Statement on pages 82–95 contains more information about Cloetta’s governance and management structure, the interplay between the com-pany’s formal governance bodies, internal steering documents and processes, and relevant control functions and reporting. All of these together ensure that we have robust, global corporate governance and a strong company culture.
The work of the Board During the year, Cloetta has taken many different actions to mitigate the impact of Covid-19. Our highest priority has been the health and safety of our employees, custom-ers and consumers. The Board has worked closely with the CEO and the Group Man-
agement Team to maintain operations, and followed up and developed the areas that are aimed at improving growth and profitability. We have also focused on how we can run the business in a more sustainable manner, and we launched a new Sustainability Agenda in 2020. Cloetta also joined the Science Based Targets Initiative during the year, through which a growing number of companies have set climate-related targets in line with the Paris Agreement.
With an operating margin of above 14 per cent in our branded packaged business, growth in this category is important for us to implement our strategy for profitable growth. Several Board meetings during the year were dedicated to the position of our brands in the minds of customers and consumers, which has resulted in increased investments. Our pick & mix business has had a challenging year due to Covid-19. Consequently, the Board has focused on measures to ensure that in both the short term and long term, this significant part of the company’s business will achieve an adequate level of profitability. E-commerce growth is another strategically important area for Cloetta, and the Board continuously monitors the work being done.
During the year, we have accelerated several of the cost efficiency initiatives under the VIP+ cost savings program. Further, to improve Cloetta’s competitiveness and offerings in the nut category, we also decided to close production in Helsingborg and outsource manufacturing to a third-party supplier.
The financing of our business operations remains healthy. Together with a strong cash flow, this enables us to propose that the ordinary dividend be increased to SEK 0.75 (0.50) per share for 2020. This means that the average dividend for 2019 and 2020 combined is in line with our dividend policy. Our proposal takes the current market situa-tion into account and prioritises a continued strong balance sheet.
More and new shareholders During 2020, Cloetta gained 10,000 new shareholders and by the end of the year we
had almost 35,000 owners of our company shares. Thus, the number of shareholders increased for the ninth consecutive year. It is encouraging that so many people want to invest in Cloetta’s shares. The Board intends to deliver on this entrusted confidence so that all shareholders may continue to have confidence in Cloetta.
Cloetta is well positioned for the future As the newly elected Chairman of the Board of Cloetta, I have dedicated this first year to gaining a deeper understanding of the company’s commercial drivers and local market conditions. This has involved a close and frequent dialogue with the CEO and his Group Management Team during the year, and also online meetings with many engaged and loyal employees in our different markets. These activities have given me a solid appre-ciation of our business and I am convinced of our ability to create value for our customers, consumers and shareholders for many years to come.
I would like to take this opportunity to thank my colleagues on the Board of Directors for their good cooperation, con-structive contributions and commitment in their work. I would also like to greatly thank the Group Management Team and our employees for their fantastic efforts during a challenging year.
Stockholm, March 2021
Mikael NormanChairman of the Board
I am convinced of our ability to create value for our customers, consumers and shareholders for many years to come.

82
Cloetta Annual and Sustainability Report 2020<< B a c k t o c o n t e n t s
C O r P O r at e G O V e r n a n C e r e P O r t
Words from the president
Goals & strategies
Sustain ability Markets Operations & employees
Share & Shareholders
financial performance
risks & Corporate Governance
financial reports
Sustain ability impactC O r P O r at e G O V e r n a n C e r e P O r t
Corporate Governance ReportThe purpose of corporate governance is to ensure that the company is managed as effectively as possible in the interests of its shareholders, and that Cloetta complies with all applicable rules. Corporate governance is also aimed at creating order and establishing systems for both the Board and the Group Management Team. Welldefined structures, clear rules and processes allow the Board to ensure that the Group Management Team and employees focus on developing the business and thereby creating shareholder value.
Cloetta AB (publ) is a Swedish public lim-ited company, with corporate identification number 556308-8144. The company’s class B shares are traded on the Nasdaq Stock-holm, Mid Cap. The company is domiciled in Ljungsbro, Linköping, and its head office is in Stockholm.
Framework for corporate governanceCloetta’s corporate governance is regulat-ed by external steering instruments that include the Swedish Companies Act, the Swedish Annual Accounts Act, Nasdaq Nordic Main Market Rulesbook for Issuers of Shares, and the Swedish Corporate Governance Code, as well as internal steering instruments such as the Articles of Association, instructions, policies and guide-lines. The Swedish Corporate Governance Code is available at www.bolagsstyrning.se, where a description of the Swedish model for corporate governance is also provided. Dur-ing the year, Cloetta complied with Nasdaq Nordic Main Market Rulesbook for Issuers of Shares and good stock market practice.
Application of the Swedish Corporate Governance CodeIn 2020, Cloetta complied with the Code, with no deviations.
Share and shareholders1
The class B shares of Cloetta AB (publ) have been listed on Nasdaq Stockholm since 16 February 2009 and have been traded on the Mid Cap list since 2 July 2012. Cloetta was originally introduced on the stock exchange
in 1994 and has been listed in a number of different owner constellations since then. At 31 December 2020, the number of shares was 288,619,299 of which 282,884,050 were class B shares and 5,735,249 were class A shares. Each class B share corresponds to one vote and each class A share corresponds to ten votes, although all shares carry equal entitlement to the company’s assets and profits. The number of shareholders at 31 December 2020 was 34,859 (compared to 24,910 at 31 December 2019). On 31 December 2020, AB Malfors Promotor was Cloetta’s largest shareholder, with a holding corresponding to 39.2 per cent of the votes and 28.4 per cent of the share capital in the company. For more information about Cloetta’s shares and shareholders, see section “Share and shareholders” on pages 63–68.
General meeting of shareholders
2
The general meeting of shareholders is Cloetta’s highest decision-making body. At the general meeting, all shareholders have the opportunity to influence the company by exercising the votes attached to their respec-tive shareholdings. The powers and duties of the general meeting are regulated by the Swedish Companies Act and the Articles of Association, amongst others. Cloetta’s financial year is 1 January to 31 December. The Annual General Meeting (AGM) must be held within a period of six months after the end of the financial year. The date and location of the AGM must be communicated on the company’s website no later than in
conjunction with the publication of the third quarter report. Notice of the AGM must be given no earlier than six weeks and no later than four weeks prior to the AGM through publication in “Post- och Inrikes Tidningar” (the Swedish Official Gazette) and on the company’s website. At the same time, confir-mation that notification has been given must be published in Dagens Industri.
Every shareholder has the right to request that a matter be taken up at the AGM and in such case must submit a written re-quest to the Board. In order to be addressed at the AGM, the request must be submitted to the Board no later than seven weeks prior to the AGM. In accordance with Chapter 7, paragraph 32, of the Swedish Companies Act, at a general meeting of shareholders all shareholders have the right to pose questions to the company about the matters that are addressed at the meeting and the financial situation of the company and the Group.
2020 Annual General Meeting The most recent AGM was held on 2 April 2020 in Stockholm. To prevent the spread-ing of Covid-19, the AGM was only attended by a few individuals and representatives. The total attended was 16 individuals represent-ing 51.5 per cent of the votes in the company.
The Chairman of the Board, the CEO and the Group’s CFO attended the AGM in person. All other Board members as well as the Lead Audit Partner of the Group’s independent auditor attended via conference call due to the prevailing pandemic.
The AGM approved the updated proposals of the Board and the nomination committee regarding: • Adoption of the balance sheet and the profit
and loss account

83
Cloetta Annual and Sustainability Report 2020 << B a c k t o c o n t e n t s
C O r P O r at e G O V e r n a n C e r e P O r t
Words from the president
Goals & strategies
Sustain ability Markets Operations & employees
Share & Shareholders
financial performance
risks & Corporate Governance
financial reports
Sustain ability impact
Information
Governance structureShareholders1
Board of Directors2
the members of the Board are appointed by the aGM. employee representatives and deputy representatives are appointed by the employee organisations. the members of the audit and remuneration committees are appointed by the Board.
4
Nomination committee13
General meeting of shareholders2 Auditor37
President and CEO
The Group Management Team
1 The nomination committee prepares proposals for decision that are presented to the AGM. The AGM decides on principles for appointment of the nomination committee.
2 The Board establishes the committees and appoints their members.
3 The auditor is responsible, on behalf of the shareholders, for auditing Cloetta’s annual report, accounts and the administration of the Board of Directors and the President and CEO. Reports to the Board of Directors and the shareholders.
external steering instrumentsImportant external steering instruments that provide the framework for corporate governance are:• The Swedish Companies Act• The Swedish Annual Accounts Act• Nasdaq Nordic Main Market Rulebook for Issuers
of Shares• The Swedish Code of Corporate Governance
internal steering instrumentsImportant binding internal control documents include:• The Articles of Association• The Board’s work plan• Instructions for the President and CEO, the audit
committee, the remuneration committee and financial reporting
• Policies
Goals, strategies, policies, steering instruments, core values, remuneration structure
Audit committee 5
Remuneration committee 5
Vote at the general meeting
Elects the Board of Directors
Resolve upon princi-ples for appointing the nomination committee
Proposes the Board, auditor and principles for appointing nomination committee ahead of AGM
Elects the auditor
Information
Reports, internal control8
6
6
• Appropriation of the earnings of the com-pany by carrying forward the earnings of SEK 1,764,226,166 that are at the disposal of the Annual General Meeting
• Discharge of liability of the board members and the President and CEO
• The number of Board members elected by the AGM to be seven, with no deputies
• Election of Mikael Norman as the new Chairman of the Board. Re-election of sitting Board members Camilla Svenfelt, Mikael Svenfelt, Lottie Knutson, Mikael Aru, Patrick Bergander and Alan McLean Raleigh. Former Chairman of the Board Lillian Fossum Biner, who had declined re-election, resigned in conjunction with the AGM. Aside from the members elected by the AGM, the employee organisations PTK and LIVS each appointed an employ-ee representative and a deputy representa-tive to the Board
• Setting the Board fees at SEK 685,000 for the Board Chairman and SEK 315,000 for each of the other Board members elected by the AGM. Fees for work on the Board committees shall be paid in the amount of
SEK 100,000 for each member of the audit committee, SEK 150,000 for the Chairman of the audit committee, SEK 100,000 for each member of the remuneration commit-tee and SEK 150,000 for the Chairman of the remuneration committee
• Fees for the auditor are to be paid according to approved account;
• Re-appointing the registered public accounting firm Öhrlings Pricewaterhouse-Coopers AB (“PwC”) as the auditor for the period until the next AGM. Sofia Götmar- Blomstedt will continue as the Lead Audit Partner
• The implementation of a share-based long-term incentive plan.
The complete minutes from the AGM can be viewed at www.cloetta.com.
Extraordinary General MeetingOn 3 November 2020, Cloetta held an Extraordinary General Meeting at which the Board of Directors’ proposal for a dividend payout of SEK 0.50 per share for the 2019 financial year was agreed. To prevent the spreading of Covid-19, the Extraordinary
General Meeting was conducted, in accord-ance with Section 22 of the Act (2020:198) on temporary exceptions to facilitate the execution of general meetings in companies and other associations, solely as a postal voting procedure, and there was thus no physical attendance of shareholders, repre-sentatives, or other persons.
2021 Annual General Meeting The 2021 AGM will be held on Tuesday 6 April 2021 as a postal voting procedure only in accordance with Section 22 of the Act (2020:198) on temporary exceptions to facilitate the execution of general meetings in companies and other associations. There will be no physical attendance of sharehold-ers, representatives or other persons. The Notice of the Annual General Meeting was published in March 2021 and contained the Board’s proposals. For more information, please refer to the section “Annual General Meeting” on page 169 and www.cloetta.com.
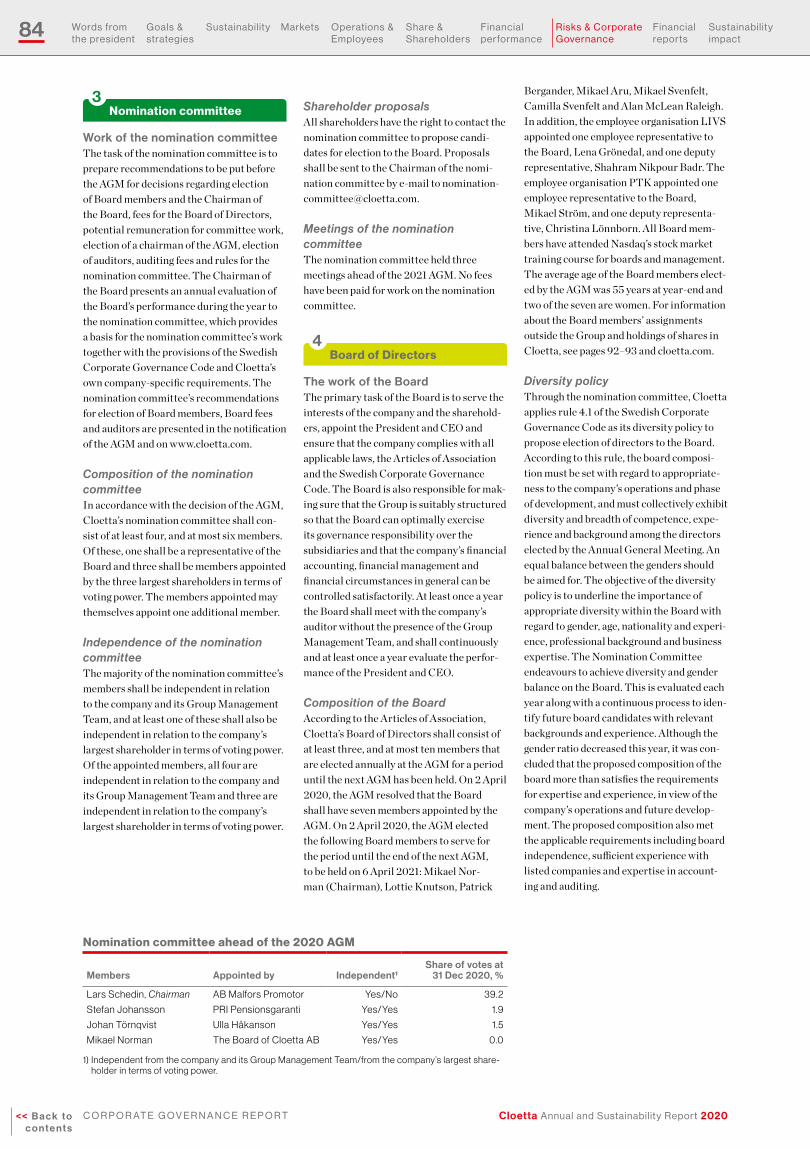
84
Cloetta Annual and Sustainability Report 2020<< B a c k t o c o n t e n t s
C O r P O r at e G O V e r n a n C e r e P O r t
Words from the president
Goals & strategies
Sustain ability Markets Operations & employees
Share & Shareholders
financial performance
risks & Corporate Governance
financial reports
Sustain ability impact
Nomination committee3
Work of the nomination committeeThe task of the nomination committee is to prepare recommendations to be put before the AGM for decisions regarding election of Board members and the Chairman of the Board, fees for the Board of Directors, potential remuneration for committee work, election of a chairman of the AGM, election of auditors, auditing fees and rules for the nomination committee. The Chairman of the Board presents an annual evaluation of the Board’s performance during the year to the nomination committee, which provides a basis for the nomination committee’s work together with the provisions of the Swedish Corporate Governance Code and Cloetta’s own company-specific requirements. The nomination committee’s recommendations for election of Board members, Board fees and auditors are presented in the notification of the AGM and on www.cloetta.com.
Composition of the nomination committeeIn accordance with the decision of the AGM, Cloetta’s nomination committee shall con-sist of at least four, and at most six members. Of these, one shall be a representative of the Board and three shall be members appointed by the three largest shareholders in terms of voting power. The members appointed may themselves appoint one additional member.
Independence of the nomination committeeThe majority of the nomination committee’s members shall be independent in relation to the company and its Group Management Team, and at least one of these shall also be independent in relation to the company’s largest shareholder in terms of voting power. Of the appointed members, all four are independent in relation to the company and its Group Management Team and three are independent in relation to the company’s largest shareholder in terms of voting power.
Shareholder proposalsAll shareholders have the right to contact the nomination committee to propose candi-dates for election to the Board. Proposals shall be sent to the Chairman of the nomi-nation committee by e-mail to [email protected].
Meetings of the nomination committeeThe nomination committee held three meetings ahead of the 2021 AGM. No fees have been paid for work on the nomination committee.
Board of Directors4
The work of the BoardThe primary task of the Board is to serve the interests of the company and the sharehold-ers, appoint the President and CEO and ensure that the company complies with all applicable laws, the Articles of Association and the Swedish Corporate Governance Code. The Board is also responsible for mak-ing sure that the Group is suitably structured so that the Board can optimally exercise its governance responsibility over the subsidiaries and that the company’s financial accounting, financial management and financial circumstances in general can be controlled satisfactorily. At least once a year the Board shall meet with the company’s auditor without the presence of the Group Management Team, and shall continuously and at least once a year evaluate the perfor-mance of the President and CEO.
Composition of the BoardAccording to the Articles of Association, Cloetta’s Board of Directors shall consist of at least three, and at most ten members that are elected annually at the AGM for a period until the next AGM has been held. On 2 April 2020, the AGM resolved that the Board shall have seven members appointed by the AGM. On 2 April 2020, the AGM elected the following Board members to serve for the period until the end of the next AGM, to be held on 6 April 2021: Mikael Nor-man (Chairman), Lottie Knutson, Patrick
Bergander, Mikael Aru, Mikael Svenfelt, Camilla Svenfelt and Alan McLean Raleigh. In addition, the employee organisation LIVS appointed one employee representative to the Board, Lena Grönedal, and one deputy representative, Shahram Nikpour Badr. The employee organisation PTK appointed one employee representative to the Board, Mikael Ström, and one deputy representa-tive, Christina Lönnborn. All Board mem-bers have attended Nasdaq’s stock market training course for boards and management. The average age of the Board members elect-ed by the AGM was 55 years at year-end and two of the seven are women. For information about the Board members’ assignments outside the Group and holdings of shares in Cloetta, see pages 92–93 and cloetta.com.
Diversity policy Through the nomination committee, Cloetta applies rule 4.1 of the Swedish Corporate Governance Code as its diversity policy to propose election of directors to the Board. According to this rule, the board composi-tion must be set with regard to appropriate-ness to the company’s operations and phase of development, and must collectively exhibit diversity and breadth of competence, expe-rience and background among the directors elected by the Annual General Meeting. An equal balance between the genders should be aimed for. The objective of the diversity policy is to underline the importance of appropriate diversity within the Board with regard to gender, age, nationality and experi-ence, professional background and business expertise. The Nomination Committee endeavours to achieve diversity and gender balance on the Board. This is evaluated each year along with a continuous process to iden-tify future board candidates with relevant backgrounds and experience. Although the gender ratio decreased this year, it was con-cluded that the proposed composition of the board more than satisfies the requirements for expertise and experience, in view of the company’s operations and future develop-ment. The proposed composition also met the applicable requirements including board independence, sufficient experience with listed companies and expertise in account-ing and auditing.
Nomination committee ahead of the 2020 AGM
Members Appointed by Independent1Share of votes at
31 Dec 2020, %
Lars Schedin, Chairman AB Malfors Promotor Yes/No 39.2
Stefan Johansson PRI Pensionsgaranti Yes/Yes 1.9
Johan Törnqvist Ulla Håkanson Yes/Yes 1.5
Mikael Norman The Board of Cloetta AB Yes/Yes 0.0
1) Independent from the company and its Group Management Team/from the company’s largest share-holder in terms of voting power.

85
Cloetta Annual and Sustainability Report 2020 << B a c k t o c o n t e n t s
C O r P O r at e G O V e r n a n C e r e P O r t
Words from the president
Goals & strategies
Sustain ability Markets Operations & employees
Share & Shareholders
financial performance
risks & Corporate Governance
financial reports
Sustain ability impact
MA
R
FEB
JANDEC
NOV
OC
T
SE
PAUG
JUL JUNMAY
AP
R
Board meetings in 2020
MarCh
Extra meeting: Cash flow and revisit AGM pending developments.Scheduled meeting; Annual Report, and report from Remuneration Committee.
aPril
Scheduled meeting; Statutory meeting, Resolution on signatory powers, Resolution of instructions and policies, Resolution regarding Remuneration Committee and Audit Commit-tee, Appointment of Board representative to the Nomination committee, Information regard-ing remuneration of the Board of Directors, Timetable for Board of Directors’ meetings and reporting dates.
Scheduled meeting; Cash forecast and sce-narios, A&P investments: balancing 2020 vs long-term brand health, Merchandising cost reduction 2020, Q1 Interim report incl. analytics.
MaY
Scheduled meeting; Financial update: NSV and EBIT scenarios 2020, A&P strategy and support plan top 25 brands, P&M review: strategic options and ignite plan, Supply capacity review.
JUlY
Scheduled meeting; Q2 Interim report incl. analytics, report from Audit Committee.
SePteMBer
Scheduled meeting; Road to 14%, EBIT update, Strategic house and 8
Essentials 2021 update, Marketing and innovation strategy, P&M update,
Dividend 2019.Extra Board meeting: Dividend 2019.
OCtOBer
Scheduled meeting; Cloetta Sustaina-bility Agenda, Germany overview,
Q3 Interim report incl. analytics.
deCeMBer
Scheduled meeting; Budget/business plans for the year ahead and bonus
targets/Yardstick 2021.
JanUarY
Scheduled meeting; Independent Audit Report PwC, Q4 Interim report incl. analytics, Perfect Factory review, AGM preparation.
Independence of the BoardIn accordance with the Swedish Corporate Governance Code, the majority of the Board members elected by the AGM shall be inde-pendent in relation to the company and its Group Management Team and at least two of these shall also be independent in relation to the company’s major shareholders. Of the Board’s seven members, all are independent in relation to the company and its Group Management Team and five are independent in relation to the company’s major share-holders.
The Board’s instructions and policiesOn a yearly basis, the Board reviews and adopts a work plan for its own activities and those of the Board’s audit and remunera-tion committees. The Board also adopts instructions for the President and CEO and instructions for financial reporting. Among other things, these regulate the segregation of duties between the Board of Directors, the Chairman of the Board, the President and CEO and the auditor, quorum, conflict of interest, the work of the committees, internal and external reporting, routines for notification of general meetings, Board meetings and minutes. In addition, the Board has issued and adopted a Code of Conduct and policies for Communications, Finance, HR, Inside information, Insurance, Internal Control, IT security, Mergers and Acquisitions, Fraud and Whistleblowing, Trade Sanctions, Anti-bribery and anti- corruption.
Instructions and policies
The Board reviews and adopts the following instructions and policies on a yearly basis:
• Work plan for the Board
• Instructions for the President and CEO
• Instructions for financial reporting
• Work plan and instructions for the Audit committee
• Work plan and instructions for the Remuner-ation committee
• Code of Conduct
• Communication policy
• Finance policy
• HR policy
• Insider policy
• Insurance policy
• Policy for internal control
• IT security policy
• Mergers and acquisitions policy
• Fraud and whistleblower policy (Anonymous reporting of violation of laws, the Code of Conduct or other rules at Cloetta)
• Anti-bribery and anti-corruption policy
• Trade sanction policy
ing the results to the nomination committee. The intention of the evaluation is to gather the Board members’ views on the Board’s performance, measures that can be taken to improve the efficiency of board work, and whether the Board has a well-balanced mix of competencies. The evaluation provides valuable input for the nomination committee ahead of the AGM. In 2020, one of the board members has conducted interviews on behalf of the Chairman with all Board members, including the employee representatives. The results of the evaluation have been reported to and discussed by both the Board and the nomination committee.
Board meetingsIn 2020, the Board held nine scheduled meetings, including one statutory meeting and two extra digital meetings. The Presi-dent and CEO and the CFO, who also acts as the Board Secretary, take part in the Board’s meetings. Other members of the Group Management Team participate as needed to report on special items of business.
Governance and organisation for sustainability workThe overall strategies for Cloetta’s sustain-ability work have been adopted by the Group Management Team and are controlled and monitored through business planning processes at several levels of the company. The ultimate responsibility for sustainabil-ity matters lies with Cloetta’s President and CEO.
nOVeMBer
Extraordinary General Meeting.
Evaluation of Board performanceThe performance of the Board is evaluated annually in order to continuously improve the Board’s working methods and efficiency. The Chairman of the Board is responsible for carrying out the evaluation and present-
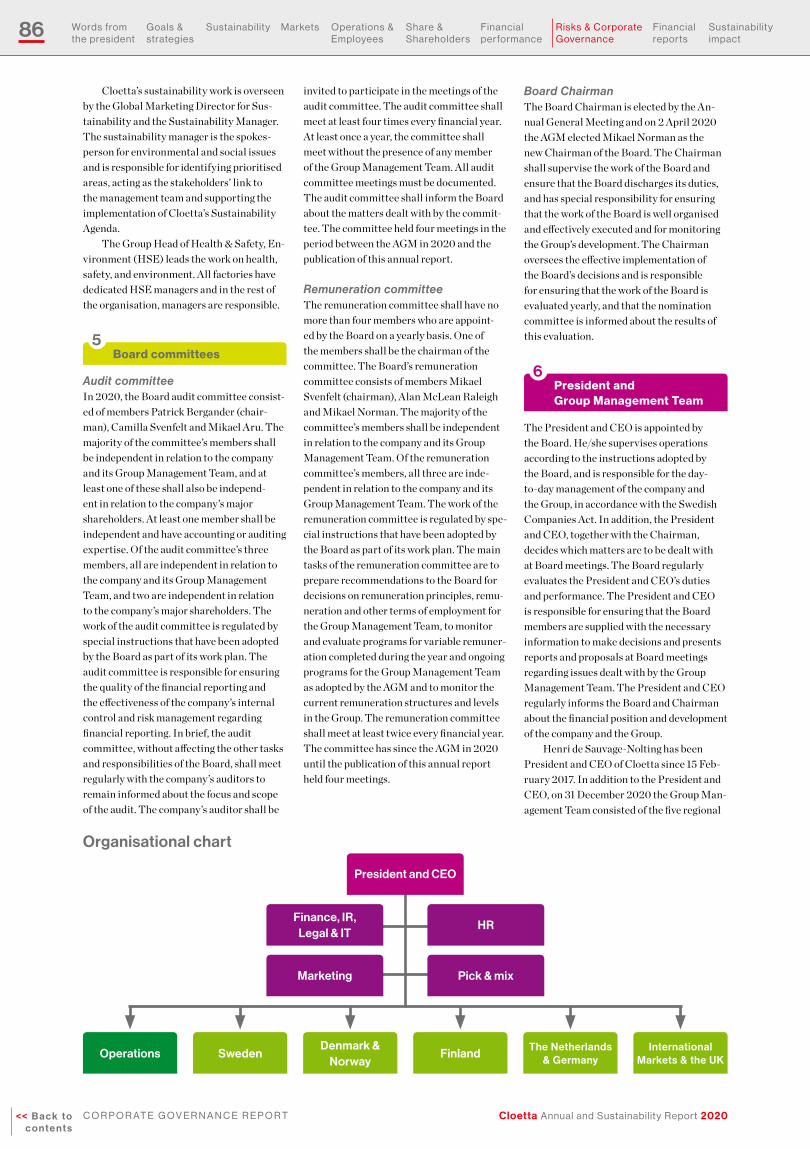
86
Cloetta Annual and Sustainability Report 2020<< B a c k t o c o n t e n t s
C O r P O r at e G O V e r n a n C e r e P O r t
Words from the president
Goals & strategies
Sustain ability Markets Operations & employees
Share & Shareholders
financial performance
risks & Corporate Governance
financial reports
Sustain ability impact
Organisational chart
Finance, IR, Legal & IT
Marketing
President and CEO
HR
Denmark &Norway
FinlandSwedenOperationsThe Netherlands
& GermanyInternational
Markets & the UK
Pick & mix
Cloetta’s sustainability work is overseen by the Global Marketing Director for Sus-tainability and the Sustainability Manager. The sustainability manager is the spokes-person for environmental and social issues and is responsible for identifying prioritised areas, acting as the stakeholders’ link to the management team and supporting the implementation of Cloetta’s Sustainability Agenda.
The Group Head of Health & Safety, En-vironment (HSE) leads the work on health, safety, and environment. All factories have dedicated HSE managers and in the rest of the organisation, managers are responsible.
Board committees5
Audit committeeIn 2020, the Board audit committee consist-ed of members Patrick Bergander (chair-man), Camilla Svenfelt and Mikael Aru. The majority of the committee’s members shall be independent in relation to the company and its Group Management Team, and at least one of these shall also be independ-ent in relation to the company’s major shareholders. At least one member shall be independent and have accounting or auditing expertise. Of the audit committee’s three members, all are independent in relation to the company and its Group Management Team, and two are independent in relation to the company’s major shareholders. The work of the audit committee is regulated by special instructions that have been adopted by the Board as part of its work plan. The audit committee is responsible for ensuring the quality of the financial reporting and the effectiveness of the company’s internal control and risk management regarding financial reporting. In brief, the audit committee, without affecting the other tasks and responsibilities of the Board, shall meet regularly with the company’s auditors to remain informed about the focus and scope of the audit. The company’s auditor shall be
invited to participate in the meetings of the audit committee. The audit committee shall meet at least four times every financial year. At least once a year, the committee shall meet without the presence of any member of the Group Management Team. All audit committee meetings must be documented. The audit committee shall inform the Board about the matters dealt with by the commit-tee. The committee held four meetings in the period between the AGM in 2020 and the publication of this annual report.
Remuneration committeeThe remuneration committee shall have no more than four members who are appoint-ed by the Board on a yearly basis. One of the members shall be the chairman of the committee. The Board’s remuneration committee consists of members Mikael Svenfelt (chairman), Alan McLean Raleigh and Mikael Norman. The majority of the committee’s members shall be independent in relation to the company and its Group Management Team. Of the remuneration committee’s members, all three are inde-pendent in relation to the company and its Group Management Team. The work of the remuneration committee is regulated by spe-cial instructions that have been adopted by the Board as part of its work plan. The main tasks of the remuneration committee are to prepare recommendations to the Board for decisions on remuneration principles, remu-neration and other terms of employment for the Group Management Team, to monitor and evaluate programs for variable remuner-ation completed during the year and ongoing programs for the Group Management Team as adopted by the AGM and to monitor the current remuneration structures and levels in the Group. The remuneration committee shall meet at least twice every financial year. The committee has since the AGM in 2020 until the publication of this annual report held four meetings.
Board ChairmanThe Board Chairman is elected by the An-nual General Meeting and on 2 April 2020 the AGM elected Mikael Norman as the new Chairman of the Board. The Chairman shall supervise the work of the Board and ensure that the Board discharges its duties, and has special responsibility for ensuring that the work of the Board is well organised and effectively executed and for monitoring the Group’s development. The Chairman oversees the effective implementation of the Board’s decisions and is responsible for ensuring that the work of the Board is evaluated yearly, and that the nomination committee is informed about the results of this evaluation.
President and Group Management Team
6
The President and CEO is appointed by the Board. He/she supervises operations according to the instructions adopted by the Board, and is responsible for the day-to-day management of the company and the Group, in accordance with the Swedish Companies Act. In addition, the President and CEO, together with the Chairman, decides which matters are to be dealt with at Board meetings. The Board regularly evaluates the President and CEO’s duties and performance. The President and CEO is responsible for ensuring that the Board members are supplied with the necessary information to make decisions and presents reports and proposals at Board meetings regarding issues dealt with by the Group Management Team. The President and CEO regularly informs the Board and Chairman about the financial position and development of the company and the Group.
Henri de Sauvage-Nolting has been President and CEO of Cloetta since 15 Feb-ruary 2017. In addition to the President and CEO, on 31 December 2020 the Group Man-agement Team consisted of the five regional

87
Cloetta Annual and Sustainability Report 2020 << B a c k t o c o n t e n t s
C O r P O r at e G O V e r n a n C e r e P O r t
Words from the president
Goals & strategies
Sustain ability Markets Operations & employees
Share & Shareholders
financial performance
risks & Corporate Governance
financial reports
Sustain ability impact
presidents, the President of Operations, the Chief Pick & Mix Officer, the CFO, the CMO and the Senior Vice President Human Re-sources. For information about the President and CEO and other members of the Group Management Team, see pages 94–95. The Group Management Team holds regular management meetings and held twelve meetings in 2020. The meetings are focused on the Group’s strategic and operational development and financial performance.
Auditor7
The auditor is elected by the AGM to ex-amine the company’s annual accounts and accounting records and the administration of the Board of Directors and the President and CEO. The auditor’s reporting to the shareholders takes place at the AGM through the presentation of the auditor’s report. At the AGM on 2 April 2020, the registered public accounting firm Öhrlings Pricewater-houseCoopers AB (“PwC”) was re-appoint-ed as the auditor for the company for the period until the next AGM. The authorised public accountant Sofia Götmar-Blomstedt was elected to continue as the Lead Audit Partner.
Financial reporting8
The Board of Directors is responsible for ensuring that the company’s organisation is structured in such a way that the company’s financial circumstances can be controlled satisfactorily and that external financial information, such as interim reports and annual reports to the market, are prepared in accordance with the legal requirements, applicable accounting standards and other requirements applicable to listed companies.
The tasks of the Board are to oversee the Group’s financial development, assure
the quality of the financial reporting and internal control and regularly monitor and evaluate operations. The task of the audit committee is to support the Board in assuring the quality of the company’s finan-cial reporting. The audit committee also oversees the financial reports and significant accounting matters, as well as matters relat-ed to internal control, compliance, material uncertainty in reported values, events after the balance sheet date, changes in estimates and judgements and other circumstances affecting the quality of the financial reports.
The President and CEO ensures that the financial accounting in the Group’s´ companies is carried out in compliance with legal requirements and that financial management is conducted in a satisfactory manner. Cloetta AB’s President and CEO is a member of the boards of all operating sub-sidiaries. Every month, the Group prepares a closing of the books that is submitted to the Board and the Group Management Team. For each financial year, a profit statement, balance sheet and investment budget are prepared and are adopted at the scheduled Board meeting in December. External financial information is regularly provided in the form of:• Interim reports;• The annual report;• Press releases about important news that
is deemed to have a potential impact on the share price;
• Presentations for financial analysts, investors and the media on the date of publication of the year-end and interim reports;
• Meetings with financial analysts and investors
Additional informationThe following information can be found at www.cloetta.com: Articles of Association, Code of Conduct, information from previous AGMs and corporate governance reports from previous years.
Press releases 2020
January • Invitation to an online conference in conjunc-
tion with Cloetta AB’s year-end report 2019
• Cloetta AB’s Q4 interim report October – December 2019
• Nomination committee proposes Mikael Norman as the new Chairman of Cloetta AB (publ)
February• Notification of Cloetta AB (publ) Annual
General Meeting
March• Cloetta’s 2019 Annual report published on
the website
• Update on the impact of Covid-19
• Updated information regarding Cloetta’s AGM on 2 April
• Cloetta retracts proposal for dividend pay-out and provides an update on the effects of Covid-19
April• Cloetta AB (publ) Annual General Meeting
2 April 2020
• New update on developments related to Covid-19
• Invitation to an online conference call in conjunction with Cloetta AB’s Q1 interim report 2020
• Cloetta AB’s Q1 interim report January – March 2020
July• Invitation to an online conference call in
conjunction with Cloetta AB’s Q2 interim report 2020
• Cloetta AB’s Q2 interim report April – June 2020
August• Cloetta outsources manufacturing of nuts to
improve competitiveness
• Nomination committee appointed ahead of the Cloetta AB (publ) 2021 AGM
September• The Board of Cloetta AB proposes dividend
pay-out for 2019
October• Invitation to Extraordinary General Meeting
of Cloetta AB (publ)
• Invitation to an online conference call in conjunction with Cloetta AB’s Q3 interim report 2020
• Cloetta AB’s Q3 interim report July – September 2020
November• Notification following the Extraordinary
General Meeting of Cloetta AB (publ) on 3 November 2020
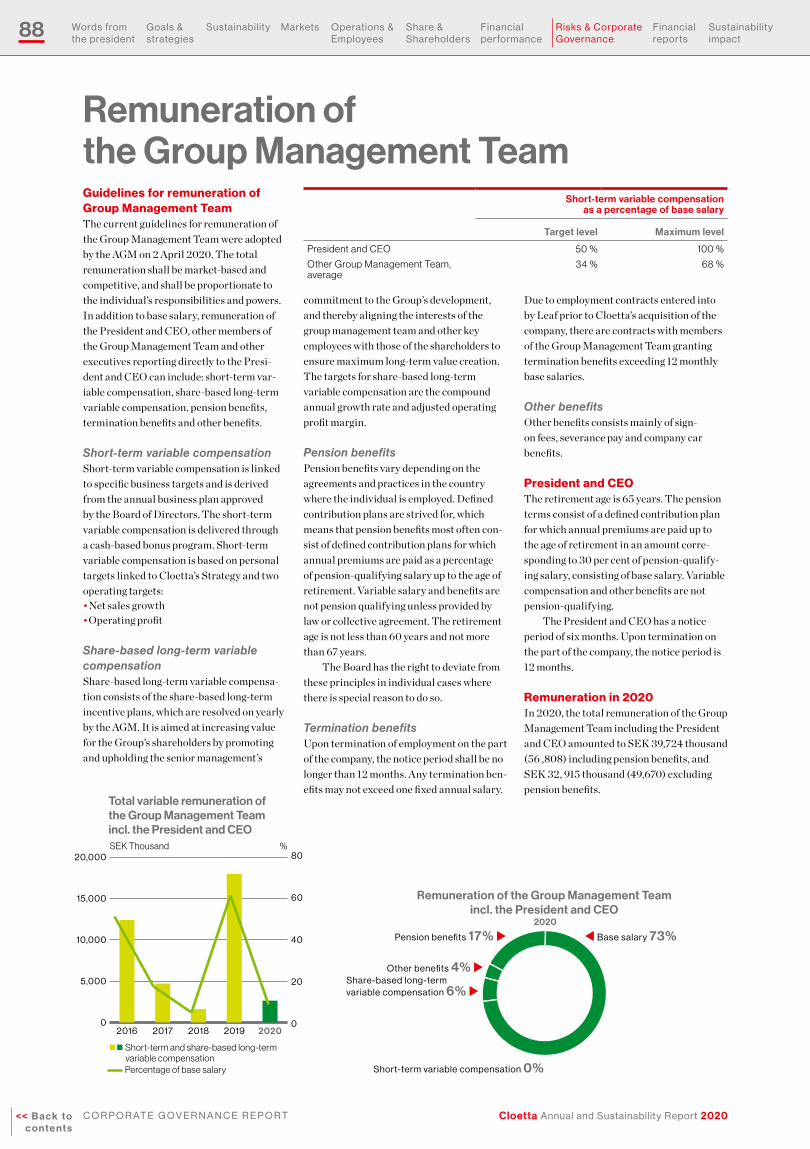
88
Cloetta Annual and Sustainability Report 2020<< B a c k t o c o n t e n t s
C O r P O r at e G O V e r n a n C e r e P O r t
Words from the president
Goals & strategies
Sustain ability Markets Operations & employees
Share & Shareholders
financial performance
risks & Corporate Governance
financial reports
Sustain ability impact
Total variable remuneration ofthe Group Management Teamincl. the President and CEOSEK Thousand
0
5,000
10,000
15,000
20,000
20202019201820172016
Percentage of base salary
nn Short-term and share-based long-term variable compensation
%
0
20
40
60
80
2020
Share-based long-termvariable compensation 6% u
t Base salary 73%
Short-term variable compensation 0%
Other benefits 4% u
Remuneration of the Group Management Teamincl. the President and CEO
Pension benefits 17% u
Remuneration of the Group Management TeamGuidelines for remuneration of Group Management TeamThe current guidelines for remuneration of the Group Management Team were adopted by the AGM on 2 April 2020. The total remuneration shall be market-based and competitive, and shall be proportionate to the individual’s responsibilities and powers. In addition to base salary, remuneration of the President and CEO, other members of the Group Management Team and other executives reporting directly to the Presi-dent and CEO can include: short-term var-iable compensation, share-based long-term variable compensation, pension benefits, termination benefits and other benefits.
Short-term variable compensationShort-term variable compensation is linked to specific business targets and is derived from the annual business plan approved by the Board of Directors. The short-term variable compensation is delivered through a cash-based bonus program. Short-term variable compensation is based on personal targets linked to Cloetta’s Strategy and two operating targets:• Net sales growth• Operating profit
Share-based long-term variable compensationShare-based long-term variable compensa-tion consists of the share-based long-term incentive plans, which are resolved on yearly by the AGM. It is aimed at increasing value for the Group’s shareholders by promoting and upholding the senior management’s
commitment to the Group’s development, and thereby aligning the interests of the group management team and other key employees with those of the shareholders to ensure maximum long-term value creation. The targets for share-based long-term variable compensation are the compound annual growth rate and adjusted operating profit margin.
Pension benefitsPension benefits vary depending on the agreements and practices in the country where the individual is employed. Defined contribution plans are strived for, which means that pension benefits most often con-sist of defined contribution plans for which annual premiums are paid as a percentage of pension-qualifying salary up to the age of retirement. Variable salary and benefits are not pension qualifying unless provided by law or collective agreement. The retirement age is not less than 60 years and not more than 67 years.
The Board has the right to deviate from these principles in individual cases where there is special reason to do so.
Termination benefitsUpon termination of employment on the part of the company, the notice period shall be no longer than 12 months. Any termination ben-efits may not exceed one fixed annual salary.
Due to employment contracts entered into by Leaf prior to Cloetta’s acquisition of the company, there are contracts with members of the Group Management Team granting termination benefits exceeding 12 monthly base salaries.
Other benefitsOther benefits consists mainly of sign-on fees, severance pay and company car benefits.
President and CEOThe retirement age is 65 years. The pension terms consist of a defined contribution plan for which annual premiums are paid up to the age of retirement in an amount corre-sponding to 30 per cent of pension-qualify-ing salary, consisting of base salary. Variable compensation and other benefits are not pension-qualifying.
The President and CEO has a notice period of six months. Upon termination on the part of the company, the notice period is 12 months.
Remuneration in 2020 In 2020, the total remuneration of the Group Management Team including the President and CEO amounted to SEK 39,724 thousand (56 ,808) including pension benefits, and SEK 32, 915 thousand (49,670) excluding pension benefits.
Short-term variable compensation as a percentage of base salary
Target level Maximum level
President and CEO 50 % 100 %
Other Group Management Team, average
34 % 68 %

89
Cloetta Annual and Sustainability Report 2020 << B a c k t o c o n t e n t s
C O r P O r at e G O V e r n a n C e r e P O r t
Words from the president
Goals & strategies
Sustain ability Markets Operations & employees
Share & Shareholders
financial performance
risks & Corporate Governance
financial reports
Sustain ability impact
Share-based long-term incentive plan for senior executivesOn 2 April 2020, the Annual General Meeting approved the Board’s proposal for a share-based long-term incentive plan. The plan aligns the interests of the shareholders with those of the Group Management Team and other key employees in order to ensure maximum long-term value creation.
A personal shareholding in Cloetta is required for all participants. See page 67 and Notes 23, 27 and 28 for more information about share-based payment.
The Board of Directors’ report on the remuneration committee’s evaluation of remuneration of the Group Management TeamThe Board of Directors has established a remuneration committee consisting of three members who prepare recommendations for decision by the Board regarding remuner-ation principles, remuneration levels and other terms of employment for the Group Management Team. The recommendations have included the proportional distribution
between base salary and variable compen-sation and the size of any salary increases. Furthermore, the remuneration committee has discussed pension terms and termina-tion benefits.
The remuneration committee is also entrusted with the task of monitoring and evaluating programmes for variable remu-neration of the Group Management Team, application of the guidelines for remuner-ation adopted by the AGM and the current remuneration structures and remuneration levels in the company. Pursuant to para-graph 9.1, points 2 and 3 of the Swedish Code of Corporate Governance, the Board hereby presents the following report on the results of the remuneration committee’s evaluation:
The variable compensation that is payable according to the guidelines is linked to both the individual’s responsibility for results and the Group’s profitability targets, which contributes to value growth for the company’s shareholders.
Market surveys are conducted regularly with respect to salary statistics, remuner-ation structures and levels for variable
remuneration. In the opinion of the remu-neration committee, Cloetta’s remuneration structures and remuneration levels have al-lowed Cloetta to recruit and retain the right personnel to the Group Management Team.
Remuneration of the President and CEO for the financial year 2020 has been determined by the Board. Remuneration of other members of the Group Management Team and of other senior executives has been determined by the President and CEO. Since the 2020 AGM, the remuneration committee has met on four occasions. The full principles for remuneration of the group management team in 2021 will be present-ed ahead of the AGM on 6 April 2021. The suggested principles for 2021 will deviate marginally from those applied in 2020.
For more information about remuneration of the President and CEO, see the compa-ny’s Remuneration Report published on the website.
Remuneration – the Group Management Team
Costs incurred in 2020SEK Thousand
Base salary
Short-term variable compensation incurred in
the year, expected to be paid out in the next year
Share-based long-term variable
compensationOther
benefits SubtotalPension
costs Total
Henri de Sauvage-Nolting, President and CEO
5,000 5 529 92 5,626 1,500 7,126
Other Group Management Team1 23,863 53 2,052 1,321 27,289 5,309 32,598
Total 28,863 58 2,581 1,413 32,915 6,809 39,724
of which, Parent Company 11,878 21 1,272 353 13,524 3,478 17,002
Amount paid in 2020
Henri de Sauvage-Nolting, President and CEO
5,000 3,649 257 92 8,998 1,500 10,498
Other Group Management Team1 23,863 10,678 381 1,321 36,243 5,309 41,552
Total 28,863 14,327 638 1,413 45,241 6,809 52,050
of which, Parent Company 11,878 7,156 257 353 19,644 3,478 23,122
Costs incurred in 2019SEK Thousand
Base salary
Short-term variable compensation incurred in
the year, expected to be paid out in the next year
Share-based long-term variable
compensationOther
benefits SubtotalPension
costs Total
Henri de Sauvage-Nolting, President and CEO
4,660 3,658 388 96 8,802 1,398 10,200
Other Group Management Team2 24,703 10,687 3,214 2,264 40,868 5,740 46,608
Total 29,363 14,345 3,602 2,360 49,670 7,138 56,808
of which, Parent Company 12,203 7,170 973 1,081 21,427 3,535 24,962
Amount paid in 2019
Henri de Sauvage-Nolting, President and CEO
4,660 263 - 96 5,019 1,398 6,417
Other Group Management Team2 24,703 1,843 765 2,264 29,575 5,740 35,315
Total 29,363 2,106 765 2,360 34,594 7,138 41,732
of which, Parent Company 12,203 477 189 1,080 13,949 3,535 17,484
1) Other Group Management Team comprised 10 persons for the period 1 January 2020 up to 31 December 2020.2) Other Group Management Team comprised 11 persons for the period 1 January 2019 up to 31 March 2019, 12 persons for the period 1 April 2019 to
30 April 2019 and 11 persons for the period 1 May 2019 to 31 August 2019. As from 1 September 2019 the other Group Management Team consisted of 10 persons.

90
Cloetta Annual and Sustainability Report 2020<< B a c k t o c o n t e n t s
C O r P O r at e G O V e r n a n C e r e P O r t
Words from the president
Goals & strategies
Sustain ability Markets Operations & employees
Share & Shareholders
financial performance
risks & Corporate Governance
financial reports
Sustain ability impact
Internal control over financial reportingCloetta’s internal control over financial re-porting is based on the framework published by the Committee of Sponsoring Organisa-tions of the Treadway Commission (COSO framework). The key objectives of Cloetta’s internal control environment for financial reporting are that it is appropriately struc-tured and effective, provides reliable reports and complies with any applicable laws and regulations.
The Board of Directors has defined policies regarding processes, roles and responsibilities that are vital for financial reporting and the internal control environ-ment of the company.
Roles and responsibilitiesThe Board of Directors is responsible for es-tablishing fundamental rules and guidelines for internal control. The audit committee as-sists the Board of Directors with its oversight of the performance of the company’s risk management function and internal control insofar as these affect the company’s quality and integrity of financial reporting. The Board of Directors and the audit committee interact directly with the external auditors.
Where the Board of Directors is responsible for establishing fundamental rules and guidelines, the President and CEO is responsible for the design effectiveness, implementation and supervision of moni-toring of the internal control environment within the Group. The CFO is responsible for the design and operating effectiveness of the internal control environment within the Group. At a local level, the design and op-erating effectiveness of the internal control environment is the responsibility of each of the area Presidents and local and regional finance teams.
Control environmentThe foundation for Cloetta’s internal control environment is the company’s corporate cul-ture and behaviour, amongst others, which are reflected in:• Performing our business with integrity and
ethical values. Cloetta’s Code of Conduct, fraud and whistleblower policy, anti-brib-ery and anti-corruption policy and trade
Rights and obligations, assets are the rights of the organisation and the liabilities are its obliga-tions as of a given date.
Presentation anddisclosure, items in the financial reports are properly described, sorted and classified.
Basis for risk assessment
Existence, reported assets and liabilities exist on the reporting date.
Completeness, all transac-tions during the reporting period are recorded and reported.
Valuation and allocation, all items in the financial re-porting are reported in com-pliance with ifrS valuation principles and are correctly calculated and summarised and appropriately recorded.
control policy form the platform for a set of guidelines and principles built on Cloetta’s core values that govern financial reporting;
• The management’s conduct and working methods based on a clearly defined working process described in documents such as:– Rules of procedure for the Board of
Directors– Instructions for the President and CEO– Instructions for financial reporting– Finance policy– Rules of procedure for and instructions to
the audit committee;• Rules for representations, commitments
and disbursements to third parties clearly defined in the Group’s authorisation framework;
• Processes for leading and developing employees in the organisation and the attention dedicated to these matters by Cloetta’s Board of Directors.
Financial reporting competenciesThe Group Management Team and local management teams ensure that the company has employees with the right competency in all key (financial) positions and that there are procedures in place to ensure that em-ployees in key (financial) positions have the requisite knowledge and skills.
Human Resources (HR)The guidelines and processes for manage-ment of human resources play a fundamental role in Cloetta’s system of internal control and help ensure the effectiveness of internal control. Key processes include compensa-tion and benefits, HR development, recruit-ment, allocation of resources, performance management and routines for feedback to the employees.
Risk assessmentCentral and local risk assessments are pre-pared and monitored periodically. In these assessments the likelihood that risks could occur and the potential impact they may have are assessed. Furthermore, the velocity at which a risk could occur is considered. Business risks as well as financial reporting and other risks are considered in the risk assessments.
Central and local financial reporting risks are assessed with respect to account balance assertions such as existence, com-pleteness, rights and obligations, valuation and allocation, presentation and disclosure assertions and financial impact. The internal control environment is designed to mitigate risks identified to a level considered accept-able by management.
Certain specific risks, for example risks related to taxes and legal matters and other financial risks, are reviewed pro-actively on a periodic basis. Risks and risk management are reported on separately in more detail in the annual report, on pages 76–80. Tax, legal and other financial risks are reflected based on management’s best estimate and judge-ment, and in accordance with the applicable accounting standards in the consolidated financial statements.
Fraud riskCloetta’s Group Management Team, local management teams and the central finance team are responsible for addressing the risk of fraud and for carrying out a continuous assessment of the risk for fraud with respect to the prevailing attitudes, incentives and opportunities to commit fraud. The Board of Directors has issued a fraud and whistle-blower policy aimed at preventing dishonest and/or fraudulent activity and to establish procedures for reporting fraudulent activ-ities to Cloetta’s management and/or audit committee.
In addition to the fraud and whistle-blower policy, Cloetta has adopted an anti-bribery and anti-corruption policy. The purpose of the policy is to prevent bribery and corruption by any employee or third party acting on behalf of Cloetta. The trade control policy summarises potentially ap-plicable sanctions and export control rules, and compliance procedures to be followed by all Cloetta employees. The purpose of this policy is to provide guidelines to ensure compliance with all local trade control laws and regulations including countries through which shipments or financial transactions flow.

91
Cloetta Annual and Sustainability Report 2020 << B a c k t o c o n t e n t s
C O r P O r at e G O V e r n a n C e r e P O r t
Words from the president
Goals & strategies
Sustain ability Markets Operations & employees
Share & Shareholders
financial performance
risks & Corporate Governance
financial reports
Sustain ability impact
Control activitiesControl activities are the policies and procedures that help ensure that manage-ment’s directives are carried out and that the necessary actions are taken to address risks that may hinder the achievement of the company’s objectives. Control activities oc-cur throughout the organisation, at all levels and in all functions. They include a range of activities as diverse as approvals, authorisa-tions, verifications, reconciliations, reviews of operating performance, security of assets and segregation of duties.
Control activities are embedded in Cloetta’s business processes and play a key role in ensuring effective internal control in the company. Local management is responsi-ble for having all required control activi-ties in place and maintained within their organisations. The CFO is responsible for ensuring that control activities are designed and operating effectively and are maintained centrally. The control environment is based on a balanced mix of preventive and detec-tive controls and of automated and manual controls. In addition to a standard set of automated controls embedded in Cloetta’s central ERP system, local management teams are encouraged to have as many au-tomated controls as possible, especially for routine transactions. Nevertheless, there are also manual control activities in place to ver-ify that the automated controls function as intended and for non-routine transactions.
Continuous reviews are performed by the Group Management Team and local management teams to safeguard proper and accurate financial reporting. These reviews are incorporated into the business process-es and are an important part of Cloetta’s monitoring controls. The local management teams are responsible for ensuring compli-ance with relevant laws and regulations in their respective areas of responsibility. All identified financial reporting risks are cov-ered by one or more control activities.
Monitoring and improvementCloetta continuously strengthens its internal control environment by evaluating the design and operating effectiveness of the environment. During the year, procedures are performed to verify the design and oper-ating effectiveness in specific areas. These procedures are performed on a central and a local level and are intended to address any weaknesses or inefficiencies in the internal control environment. Internal control defi-ciencies detected through the ongoing mon-itoring activities or separate evaluations are reported upstream and corrective actions are taken to ensure continuous improvement of the internal control environment. On a quarterly basis the follow up and status
Process for financial reporting
Monthly
Processing and consolidationany corrections are implemented in dialogue with the affected parties. reconciliation occurs.
Collection of information local units report monthly according to an established time-frame in compliance with the applicable laws, regulations and account-ing practices and the Group’s accounting manual.
Controls the Group’s reporting system contains embedded controls. in addition, the central finance team carries out analytical controls as well as controls of completeness and reasonability.
Reporting reporting of operational and financial information to the Board of directors and the Group Management team.
Quarterly
External reporting Cloetta publicly discloses its interim and year-end reports through press releases and publication on the company’s website.
Audit committeethe auditor attends every quarterly meeting. Possible actions are carried out in respect of the audit report.
of any weaknesses identified by internal procedures or external audits are reported and discussed with the persons involved and members of Cloetta’s Group Management Team.
Reporting routinesAn effective system for internal control re-quires sufficient, up-to-date and reliable in-formation both of a financial and non-finan-cial nature. As far as possible, management reporting is directly linked to the financial reporting and to the consolidation tool.
Local management teams report their financial results periodically and in accordance with the Group’s accounting and reporting policies. This reporting is the basis for Cloetta’s internal and external reporting and serves as a basis for legal and business reviews. The business reviews are carried out according to a structure in which sales, earnings, cash flow and other key ratios and trends of importance to the Group are compiled and form a basis for analysis and actions by the management and controllers at different levels. Other important and group-wide components of internal control and reporting routines include the annual business planning process and the monthly and quarterly forecasts.
To ensure the efficiency of internal control over financial reporting, reviews are carried out by the Board of Directors, the audit committee, the President and CEO, the Group Management Team, the central finance and treasury team and the Group’s various subsidiaries. Every month, financial reports are reviewed against budget
and established targets, and the results of self-assessments in the Group’s companies are reported. This review includes follow-up of observations that are reported by Cloetta’s auditor.
The company’s financial situation is dis-cussed at each Board of Directors meeting. The Board’s audit committee has important monitoring and control duties with regard to loans, investments, financial management, financial reporting and internal control. The audit committee and Board of Directors review and formally approve interim reports and the annual report prior to publication. In addition, the audit committee receives regu-lar reports from the independent auditor.
CommunicationInternal communicationEffective communication ensures the information flows in the organisation. Separate communication channels are used to communicate internally, based on what is most effective.
External communicationIt is also important to maintain communi-cation about relevant policies with external parties such as customers, suppliers, regula-tors and shareholders.
External communication is carried out in accordance with legal requirements and the Corporate Communications and IR policy.
Evaluation of the need for a separate internal audit function There is currently no internal audit function at Cloetta. The Board of Directors has reviewed this matter and determined that the existing structures for monitoring and evaluation provide a satisfactory basis for control. For certain special internal audit activities, external resources are used.

92
Cloetta Annual and Sustainability Report 2020<< B a c k t o c o n t e n t s
C O r P O r at e G O V e r n a n C e r e P O r t
Words from the president
Goals & strategies
Sustain ability Markets Operations & employees
Share & Shareholders
financial performance
risks & Corporate Governance
financial reports
Sustain ability impact
Board of Directors
Patrick BerganderPosition: Member of the BoardChairman of the Audit CommitteeElected: 2019Year of birth: 1971Nationality: SwedishEducation: B.Sc. Business and Economics, Stockholm University.Other assignments: CFO of Rosti Group.Previous assignments: CEO and former CFO RSA Scandinavia (Codan/Trygg-Hansa). Several positions at Electrolux, as CFO Asia Pacific and Head of Group Business Control. CFO, Business area Private at If Skadeförsäkring and Consultant and Auditor at Arthur Andersen. Independence:In relation to major shareholders: YesIn relation to the company and management: YesShareholding: Direct: 4,180 class B shares Related parties: –
Camilla SvenfeltPosition: Member of the Board Member of the Audit CommitteeElected: 2016Year of birth: 1981Nationality: SwedishEducation: Bachelor of Science in Social Work and courses in business administration, labour market economics and management, Stockholm University.Other assignments: Board member of AB Malfors Promotor and a deputy board member of the Hjalmar Svenfelt Foundation. Accounting supervisor at AB Malfors Promotor.Previous assignments: –Independence:In relation to major shareholders: NoIn relation to the company and management: YesShareholding: Class A shares, Direct: 60 Related parties: - Class B shares, Direct: 476,485 Related parties: 60,095
Mikael Norman Position: Chairman of the BoardMember of the Remuneration CommitteeElected: 2020Year of birth: 1958 Nationality: SwedishEducation: Bachelor of Laws, Stockholm University, Sweden.Other assignments: Chairman of the board of Bonava AB (ends in 2021). Previous assignments: CFO of Nobia AB, Group Financial Controller and several other roles at Electrolux AB, Tax lawyer at Pricewaterhouse-Coopers and Judge in the County Administrative Court and Administrative Court of Appeal in Stockholm. Independence:In relation to major shareholders: YesIn relation to the company and management: YesShareholding: Direct: 20,000 class B shares Related parties: –
Lottie KnutsonPosition: Member of the BoardElected: 2015Year of birth: 1964Nationality: SwedishEducation: Journalism at Stockholm University, Sweden, Diplôme de Culture Francaise, L’Université Paris IV, France.Other assignments: Member of the board of Stena Line and STS Alpresor. Writer and advisor in the areas of leadership, change and crisis management and tourism.Previous assignments: Director of Commu-nications at Fritidsresor Group for the Nordic countries, at SAS Group’s communications department, journalist at the Swedish newspaper Svenska Dagbladet and communications consult-ant at JKL and others.Independence:In relation to major shareholders: YesIn relation to the company and management: YesShareholding: Direct: 1,200 class B shares Related parties: –
Mikael Aru Position: Member of the BoardMember of the Audit CommitteeElected: 2017Year of birth: 1953 Nationality: SwedishEducation: B.Sc. Business Administration, Linköping University, Sweden. Other assignments: Chairman of the board at AB Axel Granlund. Board member of AB Stenströms Skjortfabrik, Bröderna Börjessons Bil AB, Dr Per Håkanssons Foundation and Gorthon Foundation. Previous assignments: CEO of Procordia Food Sverige, as well as executive positions at Kraft Foods, ORKLA and Nestlé. Independence:In relation to major shareholders: YesIn relation to the company and management: YesShareholding: Direct: 3,855 class B shares Related parties: –
Alan McLean RaleighPosition: Member of the BoardMember of the Remuneration CommitteeElected: 2018Year of birth: 1959Nationality: BritishEducation: B.Sc. (Hons) Production Engineering and Production Management, University of Strath-clyde, Scotland.Other assignments: Trustee on the Board of the Chartered Institute of Procurement and Supply (CIPS). Board Chairman of Robinson plc. Previous assignments: Executive Vice President, Personal Care Supply Chain, Unilever.Independence:In relation to major shareholders: YesIn relation to the company and management: YesShareholding: Direct: 7,887 Class B shares Related parties: –

93
Cloetta Annual and Sustainability Report 2020 << B a c k t o c o n t e n t s
C O r P O r at e G O V e r n a n C e r e P O r t
Words from the president
Goals & strategies
Sustain ability Markets Operations & employees
Share & Shareholders
financial performance
risks & Corporate Governance
financial reports
Sustain ability impact
Mikael SvenfeltPosition: Member of the BoardChairman of the Remuneration CommitteeElected: 2008Year of birth: 1966Nationality: SwedishEducation: Marketing and Business Economics, Tibbleskolan and Law studies, Folkuniversitetet.Other assignments: CEO and Board member of AB Malfors Promotor.Previous assignments: Senior positions in Nicator Group, Dell Financial Services, GE Capital Equipment Finance AB, and Rollox AB. Board Chairman of Fjärilshuset Haga Trädgård AB. Board member of Fjärilshuset Haga Trädgård Café AB.Independence:In relation to major shareholders: NoIn relation to the company and management: YesShareholding: Class A shares, Direct: 25 Related parties: 5,729,569 Class B shares, Direct: 42,535 Related parties: 76,229,973
Lena GrönedalPosition: Employee board member, LIVSElected: 2008Year of birth: 1962Nationality: SwedishPosition at Cloetta: Factory Operative, Cloetta Sverige ABShareholding: Direct: – Related parties: –
Mikael Ström Position: Employee board member, PTK Ledarna Elected: 2016Year of birth: 1961 Nationality: SwedishPosition at Cloetta: Head of Department, Cloetta Sverige ABShareholding: Direct: 32,243 class B shares. Related parties: –
Shahram Nikpour BadrPosition: Deputy employee board member, LIVSElected: 2013Year of birth: 1963Nationality: SwedishPosition at Cloetta: Factory Operative, Cloetta Sverige AB Shareholding: Direct: – Related parties: –
Christina Lönnborn Position: Deputy employee board member, PTK Unionen Elected: 2016 Year of birth: 1962 Nationality: SwedishPosition at Cloetta: Sales support Merchandis-ers, Cloetta Sverige AB Shareholding: Direct: - Related parties: –
Shareholding stated as at 31 December 2020
Composition of the Board
Fees2 Attendance4
Elected by the AGM1 Nationality Year elected Year of birthBoard
feesCommittee
fees Independence3Board
meetingsAudit
committeeRemuneration
committee
Chairman
Mikael Norman Swedish 2020 1958 685,000 100,000 Yes/Yes 11/11 4/4
Members
Camilla Svenfelt Swedish 2016 1981 315,000 100,000 Yes/No 11/11 4/4
Mikael Aru Swedish 2017 1953 315,000 100,000 Yes/Yes 11/11 4/4
Lottie Knutson Swedish 2015 1964 315,000 – Yes/Yes 11/11
Patrick Bergander Swedish 2019 1971 315,000 150,000 Yes/Yes 11/11 4/4
Alan McLean Raleigh British 2018 1959 315,000 100,000 Yes/Yes 11/11 4/4
Mikael Svenfelt Swedish 2008 1966 315,000 150,000 Yes/No 11/11 4/4
1) Education and other assignments are shown on pages 92–93.2) The fees refer to set amounts during the period from the AGM on 2 April 2020 until the AGM on 6 April 2021. Board fees shall be paid in amount of SEK
685,000 (unchanged) to the Board Chairman and SEK 315,000 (unchanged) to each other board member elected by the AGM. Fees for work on the Board committees will be paid in the amount of SEK 100,000 for each member of the audit committee (unchanged), SEK 150,000 for the Chairman of the audit committee (unchanged), SEK 100,000 for each member of the remuneration committee (unchanged) and SEK 150,000 for the Chairman of the remuneration committee (unchanged); For further details, see Note 6.
3) Independent in relation to the company and its Group Management Team/the largest shareholder. 4) Attendance refers to meetings during the period from the statutory meeting following the AGM on 2 April 2020 until the publication of this annual report on 15
March 2021.
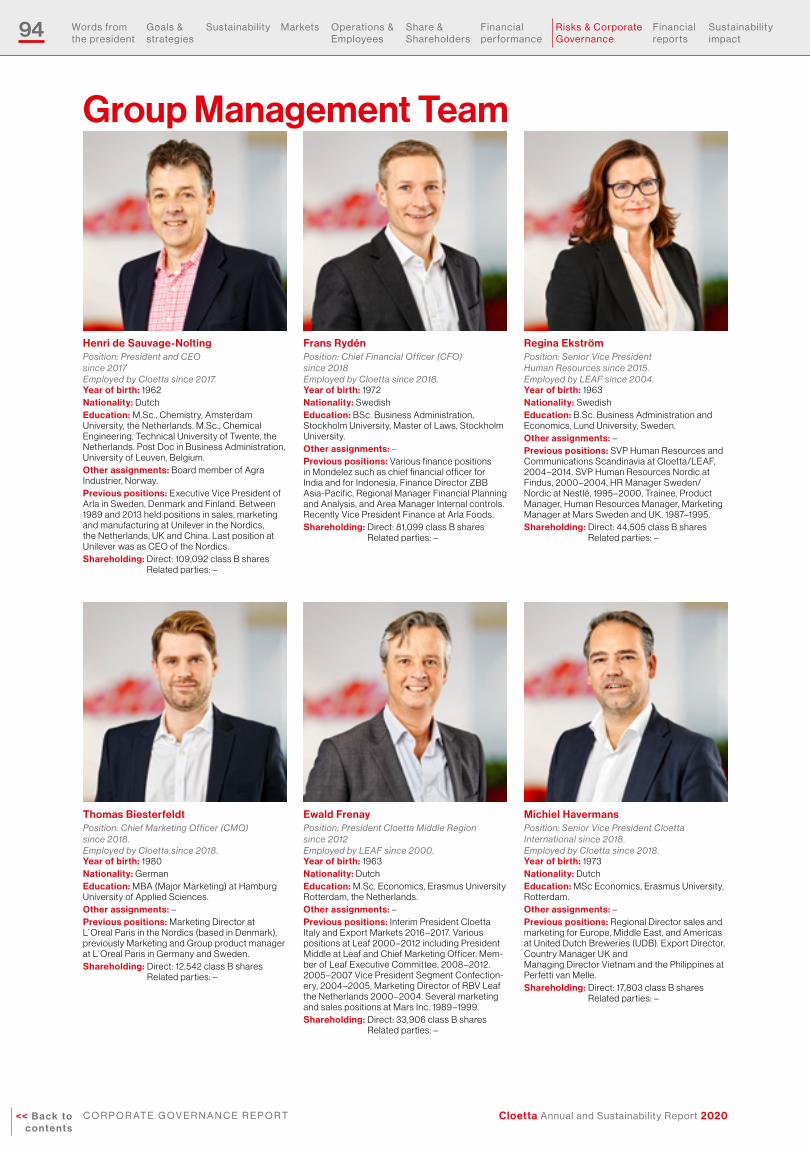
94
Cloetta Annual and Sustainability Report 2020<< B a c k t o c o n t e n t s
C O r P O r at e G O V e r n a n C e r e P O r t
Words from the president
Goals & strategies
Sustain ability Markets Operations & employees
Share & Shareholders
financial performance
risks & Corporate Governance
financial reports
Sustain ability impact
Group Management Team
Michiel HavermansPosition: Senior Vice President Cloetta International since 2018.Employed by Cloetta since 2018.Year of birth: 1973Nationality: DutchEducation: MSc Economics, Erasmus University, Rotterdam.Other assignments: –Previous positions: Regional Director sales and marketing for Europe, Middle East, and Americas at United Dutch Breweries (UDB). Export Director, Country Manager UK and Managing Director Vietnam and the Philippines at Perfetti van Melle.Shareholding: Direct: 17,803 class B shares
Related parties: –
Henri de Sauvage-Nolting Position: President and CEO since 2017 Employed by Cloetta since 2017.Year of birth: 1962 Nationality: DutchEducation: M.Sc., Chemistry, Amsterdam University, the Netherlands. M.Sc., Chemical Engineering, Technical University of Twente, the Netherlands. Post Doc in Business Administration, University of Leuven, Belgium. Other assignments: Board member of Agra Industrier, Norway. Previous positions: Executive Vice President of Arla in Sweden, Denmark and Finland. Between 1989 and 2013 held positions in sales, marketing and manufacturing at Unilever in the Nordics, the Netherlands, UK and China. Last position at Unilever was as CEO of the Nordics.Shareholding: Direct: 109,092 class B shares
Related parties: –
Frans RydénPosition: Chief Financial Officer (CFO) since 2018Employed by Cloetta since 2018.Year of birth: 1972Nationality: SwedishEducation: BSc. Business Administration, Stockholm University, Master of Laws, Stockholm University.Other assignments: –Previous positions: Various finance positions in Mondelez such as chief financial officer for India and for Indonesia, Finance Director ZBB Asia-Pacific, Regional Manager Financial Planning and Analysis, and Area Manager Internal controls. Recently Vice President Finance at Arla Foods.Shareholding: Direct: 81,099 class B shares
Related parties: –
Thomas BiesterfeldtPosition: Chief Marketing Officer (CMO) since 2018.Employed by Cloetta since 2018.Year of birth: 1980Nationality: GermanEducation: MBA (Major Marketing) at Hamburg University of Applied Sciences.Other assignments: –Previous positions: Marketing Director at L Oreal Paris in the Nordics (based in Denmark), previously Marketing and Group product manager at L Oreal Paris in Germany and Sweden.Shareholding: Direct: 12,542 class B shares
Related parties: –
Regina EkströmPosition: Senior Vice President Human Resources since 2015.Employed by LEAF since 2004.Year of birth: 1963Nationality: SwedishEducation: B.Sc. Business Administration and Economics, Lund University, Sweden.Other assignments: –Previous positions: SVP Human Resources and Communications Scandinavia at Cloetta/LEAF, 2004–2014. SVP Human Resources Nordic at Findus, 2000 –2004, HR Manager Sweden/Nordic at Nestlé, 1995 –2000, Trainee, Product Manager, Human Resources Manager, Marketing Manager at Mars Sweden and UK, 1987–1995.Shareholding: Direct: 44,505 class B shares
Related parties: –
Ewald FrenayPosition: President Cloetta Middle Region since 2012Employed by LEAF since 2000. Year of birth: 1963Nationality: DutchEducation: M.Sc. Economics, Erasmus University Rotterdam, the Netherlands.Other assignments: –Previous positions: Interim President Cloetta Italy and Export Markets 2016 –2017. Various positions at Leaf 2000 –2012 including President Middle at Leaf and Chief Marketing Officer. Mem-ber of Leaf Executive Committee, 2008 –2012. 2005 –2007 Vice President Segment Confection-ery, 2004–2005, Marketing Director of RBV Leaf the Netherlands 2000 –2004. Several marketing and sales positions at Mars Inc. 1989 –1999.Shareholding: Direct: 33,906 class B shares
Related parties: –
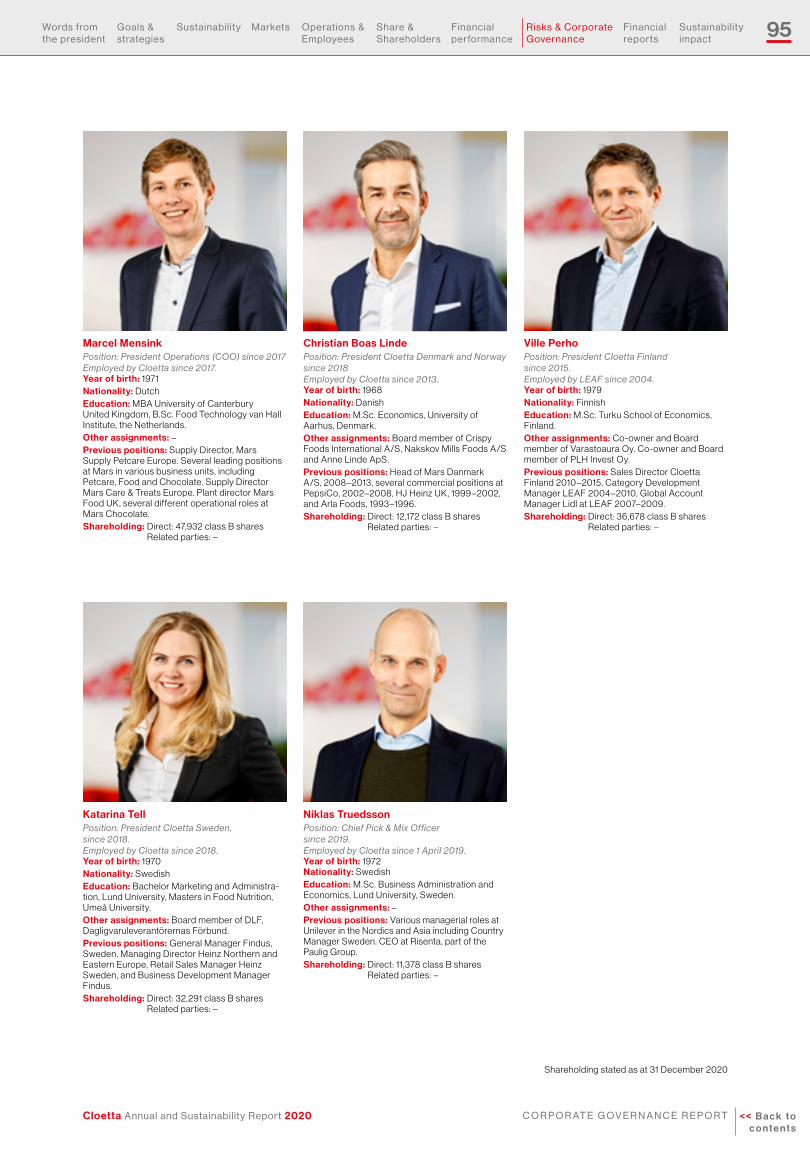
95
Cloetta Annual and Sustainability Report 2020 << B a c k t o c o n t e n t s
C O r P O r at e G O V e r n a n C e r e P O r t
Words from the president
Goals & strategies
Sustain ability Markets Operations & employees
Share & Shareholders
financial performance
risks & Corporate Governance
financial reports
Sustain ability impact
Ville PerhoPosition: President Cloetta Finland since 2015.Employed by LEAF since 2004.Year of birth: 1979Nationality: FinnishEducation: M.Sc. Turku School of Economics, Finland.Other assignments: Co-owner and Board member of Varastoaura Oy. Co-owner and Board member of PLH Invest Oy.Previous positions: Sales Director Cloetta Finland 2010 –2015, Category Development Manager LEAF 2004–2010, Global Account Manager Lidl at LEAF 2007–2009.Shareholding: Direct: 36,678 class B shares
Related parties: –
Niklas TruedssonPosition: Chief Pick & Mix Officer since 2019.Employed by Cloetta since 1 April 2019.Year of birth: 1972Nationality: SwedishEducation: M.Sc. Business Administration and Economics, Lund University, Sweden.Other assignments: –Previous positions: Various managerial roles at Unilever in the Nordics and Asia including Country Manager Sweden. CEO at Risenta, part of the Paulig Group.Shareholding: Direct: 11,378 class B shares
Related parties: –
Katarina Tell Position: President Cloetta Sweden, since 2018.Employed by Cloetta since 2018.Year of birth: 1970 Nationality: SwedishEducation: Bachelor Marketing and Administra-tion, Lund University, Masters in Food Nutrition, Umeå University.Other assignments: Board member of DLF, Dagligvaruleverantörernas Förbund.Previous positions: General Manager Findus, Sweden. Managing Director Heinz Northern and Eastern Europe, Retail Sales Manager Heinz Sweden, and Business Development Manager Findus.Shareholding: Direct: 32,291 class B shares
Related parties: –
Marcel MensinkPosition: President Operations (COO) since 2017Employed by Cloetta since 2017. Year of birth: 1971Nationality: DutchEducation: MBA University of Canterbury United Kingdom, B.Sc. Food Technology van Hall Institute, the Netherlands. Other assignments: –Previous positions: Supply Director, Mars Supply Petcare Europe. Several leading positions at Mars in various business units, including Petcare, Food and Chocolate. Supply Director Mars Care & Treats Europe. Plant director Mars Food UK, several different operational roles at Mars Chocolate. Shareholding: Direct: 47,932 class B shares
Related parties: –
Christian Boas Linde Position: President Cloetta Denmark and Norway since 2018 Employed by Cloetta since 2013. Year of birth: 1968Nationality: DanishEducation: M.Sc. Economics, University of Aarhus, Denmark.Other assignments: Board member of Crispy Foods International A/S, Nakskov Mills Foods A/S and Anne Linde ApS. Previous positions: Head of Mars Danmark A/S, 2008 –2013, several commercial positions at PepsiCo, 2002–2008, HJ Heinz UK, 1999 –2002, and Arla Foods, 1993 –1996.Shareholding: Direct: 12,172 class B shares
Related parties: –
Shareholding stated as at 31 December 2020
96
Cloetta Annual and Sustainability Report 2020<< B a c k t o c o n t e n t s
f i n a n C i a l r e P O r t S
Words from the president
Goals & strategies
Sustain ability Markets Operations & employees
Share & Shareholders
financial performance
risks & Corporate Governance
financial reports
Sustain ability impact
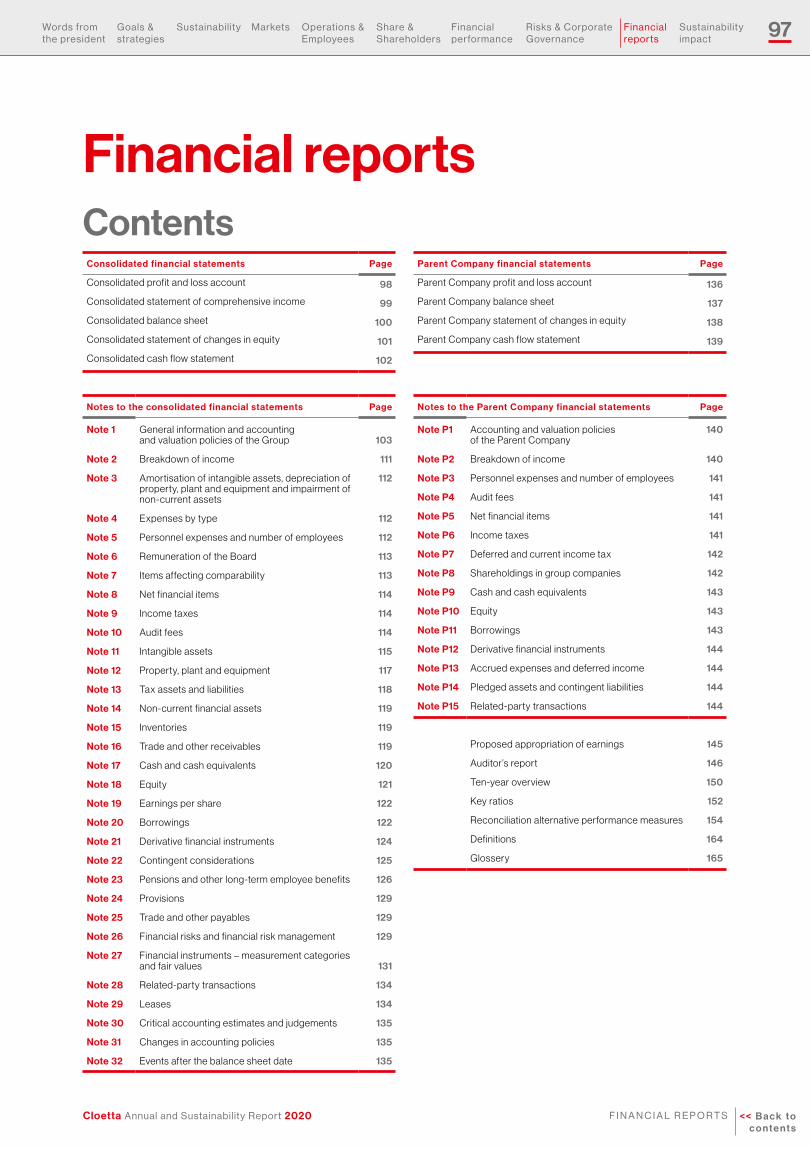
97
Cloetta Annual and Sustainability Report 2020 << B a c k t o c o n t e n t s
f i n a n C i a l r e P O r t S
Words from the president
Goals & strategies
Sustain ability Markets Operations & employees
Share & Shareholders
financial performance
risks & Corporate Governance
financial reports
Sustain ability impact
Financial reportsContents
Consolidated financial statements Page
Consolidated profit and loss account 98
Consolidated statement of comprehensive income 99
Consolidated balance sheet 100
Consolidated statement of changes in equity 101
Consolidated cash flow statement 102
Notes to the consolidated financial statements Page
Note 1 General information and accounting and valuation policies of the Group 103
Note 2 Breakdown of income 111
Note 3 Amortisation of intangible assets, depreciation of property, plant and equipment and impairment of non-current assets
112
Note 4 Expenses by type 112
Note 5 Personnel expenses and number of employees 112
Note 6 Remuneration of the Board 113
Note 7 Items affecting comparability 113
Note 8 Net financial items 114
Note 9 Income taxes 114
Note 10 Audit fees 114
Note 11 Intangible assets 115
Note 12 Property, plant and equipment 117
Note 13 Tax assets and liabilities 118
Note 14 Non-current financial assets 119
Note 15 Inventories 119
Note 16 Trade and other receivables 119
Note 17 Cash and cash equivalents 120
Note 18 Equity 121
Note 19 Earnings per share 122
Note 20 Borrowings 122
Note 21 Derivative financial instruments 124
Note 22 Contingent considerations 125
Note 23 Pensions and other long-term employee benefits 126
Note 24 Provisions 129
Note 25 Trade and other payables 129
Note 26 Financial risks and financial risk management 129
Note 27 Financial instruments – measurement categories and fair values 131
Note 28 Related-party transactions 134
Note 29 Leases 134
Note 30 Critical accounting estimates and judgements 135
Note 31 Changes in accounting policies 135
Note 32 Events after the balance sheet date 135
Notes to the Parent Company financial statements Page
Note P1 Accounting and valuation policies of the Parent Company
140
Note P2 Breakdown of income 140
Note P3 Personnel expenses and number of employees 141
Note P4 Audit fees 141
Note P5 Net financial items 141
Note P6 Income taxes 141
Note P7 Deferred and current income tax 142
Note P8 Shareholdings in group companies 142
Note P9 Cash and cash equivalents 143
Note P10 Equity 143
Note P11 Borrowings 143
Note P12 Derivative financial instruments 144
Note P13 Accrued expenses and deferred income 144
Note P14 Pledged assets and contingent liabilities 144
Note P15 Related-party transactions 144
Proposed appropriation of earnings 145
Auditor’s report 146
Ten-year overview 150
Key ratios 152
Reconciliation alternative performance measures 154
Definitions 164
Glossery 165
Parent Company financial statements Page
Parent Company profit and loss account 136
Parent Company balance sheet 137
Parent Company statement of changes in equity 138
Parent Company cash flow statement 139

98
Cloetta Annual and Sustainability Report 2020<< B a c k t o c o n t e n t s
f i n a n C i a l r e P O r t S
Words from the president
Goals & strategies
Sustain ability Markets Operations & employees
Share & Shareholders
financial performance
risks & Corporate Governance
financial reports
Sustain ability impact
Consolidated profit and loss account
SEKm Note 2020 2019
Net sales 2 5,695 6,493
Cost of goods sold 3, 4, 5, 7 –3,718 – 4,112
Gross profit 1,977 2,381
Selling expenses 3, 4, 5, 7 –951 –1,011
General and administrative expenses 3, 4, 5, 7, 10 – 564 – 643
Operating profit 462 727
Exchange differences on cash and cash equivalents in foreign currencies 8 –10 –19
Other financial income 8 3 2
Other financial expenses 8 – 52 – 62
Net financial items –59 –79
Profit before tax 403 648
Income tax 9 –122 –150
Profit for the year 281 498
Profit for the year attributable to:
Owners of the Parent Company 281 498
Earnings per share, SEK
Basic1 19 0.98 1.74
Diluted1 19 0.98 1.74
Number of shares at end of period 19 288,619,299 288,619,299
Average number of shares (basic)1 19 286,590,993 286,578,395
Average number of shares (diluted)1 19 286,805,203 286,724,049
1) Cloetta entered into forward contracts to repurchase own shares to fulfill its future obligation to deliver the shares to the participants of the long-term share-based incentive plan. The table in Note 21 presents the movements in the contracts after 1 January 2019. At the reporting date one contract is outstanding for 1,985,619 shares at a share price of SEK 24.90.
Consolidated financial statements

99
Cloetta Annual and Sustainability Report 2020 << B a c k t o c o n t e n t s
f i n a n C i a l r e P O r t S
Words from the president
Goals & strategies
Sustain ability Markets Operations & employees
Share & Shareholders
financial performance
risks & Corporate Governance
financial reports
Sustain ability impact
Consolidated statement of comprehensive income
SEKm 2020 2019
Profit for the year 281 498
Other comprehensive income
Remeasurements of defined benefit pension plans –10 – 80
Income tax on remeasurement of defined benefit pension plans 2 17
Items that will never be reclassified to profit or loss for the period –8 –63
Currency translation differences –193 103
Hedge of a net investment in a foreign operation 53 –24
Income tax on hedge of a net investment in a foreign operation –11 5
Items that are or may be reclassified to profit or loss for the period –151 84
Total other comprehensive income –159 21
Total comprehensive income, net of tax 122 519
Total comprehensive income for the period attributable to:
Owners of the Parent Company 122 519

100
Cloetta Annual and Sustainability Report 2020<< B a c k t o c o n t e n t s
f i n a n C i a l r e P O r t S
Words from the president
Goals & strategies
Sustain ability Markets Operations & employees
Share & Shareholders
financial performance
risks & Corporate Governance
financial reports
Sustain ability impact
Consolidated balance sheet
SEKm Note 31 Dec 2020 31 Dec 2019
ASSETS
Non-current assets
Intangible assets 11 5,563 5,684
Property, plant and equipment 12 1,560 1,559
Deferred tax asset 13 20 9
Other financial assets 14 3 7
Total non-current assets 7,146 7,259
Current assets
Inventories 15 952 888
Trade and other receivables 16 736 928
Current income tax assets 13 27 6
Cash and cash equivalents 17 396 579
Total current assets 2,111 2,401
Total assets 9,257 9,660
EQUITY AND LIABILITIES
Equity
Share capital 18 1,443 1,443
Other paid-in capital 18 4,124 4,124
Foreign currency translation reserve 18 540 733
Retained earnings including profit for the year 18 –1,928 –2,103
Equity attributable to owners of the Parent Company 4,179 4,197
Non-current liabilities
Long-term borrowings 20 111 939
Deferred tax liability 13 837 803
Derivative financial instruments 21 0 3
Provisions for pensions and other long-term employee benefits 23 512 499
Provisions 24 5 5
Total non-current liabilities 1,465 2,249
Current liabilities
Short-term borrowings 20 2,368 1,870
Derivative financial instruments 21 54 68
Trade and other payables 22, 25 1,144 1,227
Provisions 24 24 5
Current income tax liabilities 13 23 44
Total current liabilities 3,613 3,214
Total equity and liabilities 9,257 9,660
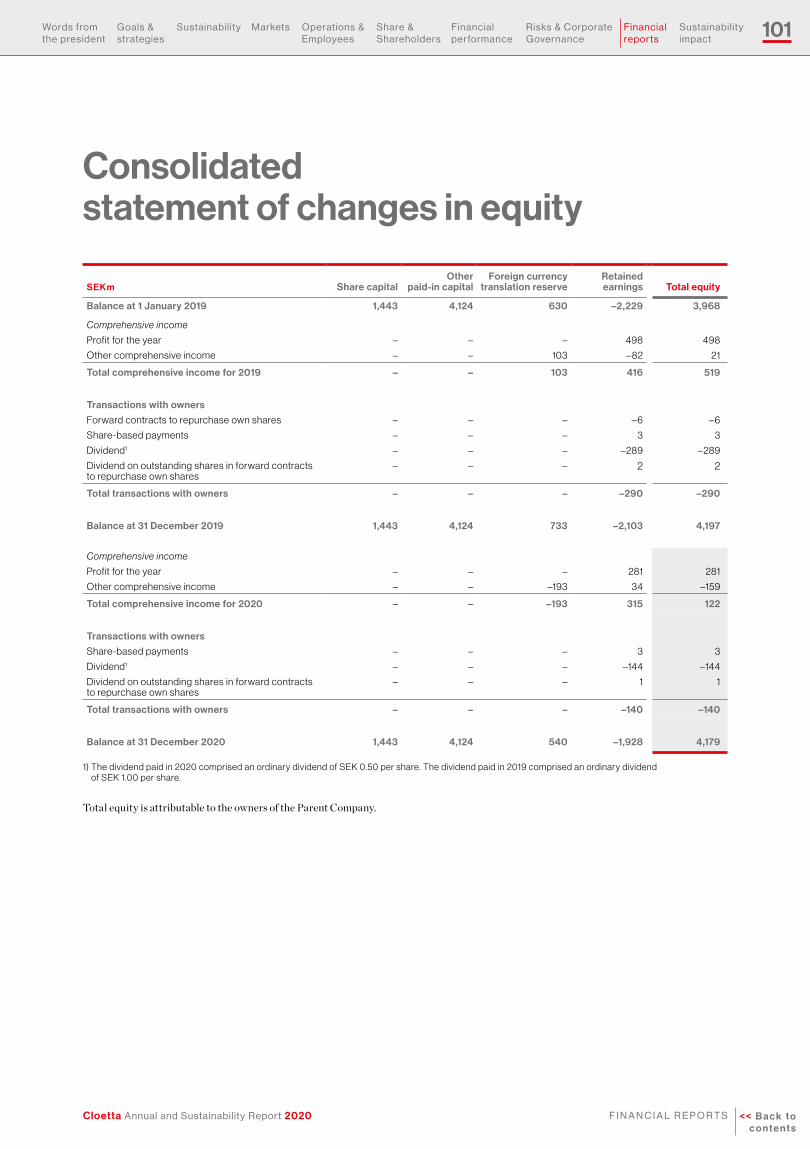
101
Cloetta Annual and Sustainability Report 2020 << B a c k t o c o n t e n t s
f i n a n C i a l r e P O r t S
Words from the president
Goals & strategies
Sustain ability Markets Operations & employees
Share & Shareholders
financial performance
risks & Corporate Governance
financial reports
Sustain ability impact
Consolidated statement of changes in equity
SEKm Share capitalOther
paid-in capitalForeign currency
translation reserveRetained earnings Total equity
Balance at 1 January 2019 1,443 4,124 630 –2,229 3,968
Comprehensive income
Profit for the year – – – 498 498
Other comprehensive income – – 103 – 82 21
Total comprehensive income for 2019 – – 103 416 519
Transactions with owners
Forward contracts to repurchase own shares – – – – 6 – 6
Share-based payments – – – 3 3
Dividend1 – – – –289 –289
Dividend on outstanding shares in forward contracts to repurchase own shares
– – – 2 2
Total transactions with owners – – – –290 –290
Balance at 31 December 2019 1,443 4,124 733 –2,103 4,197
Comprehensive income
Profit for the year – – – 281 281
Other comprehensive income – – –193 34 –159
Total comprehensive income for 2020 – – –193 315 122
Transactions with owners
Share-based payments – – – 3 3
Dividend1 – – – –144 –144
Dividend on outstanding shares in forward contracts to repurchase own shares
– – – 1 1
Total transactions with owners – – – –140 –140
Balance at 31 December 2020 1,443 4,124 540 –1,928 4,179
1) The dividend paid in 2020 comprised an ordinary dividend of SEK 0.50 per share. The dividend paid in 2019 comprised an ordinary dividend of SEK 1.00 per share.
Total equity is attributable to the owners of the Parent Company.

102
Cloetta Annual and Sustainability Report 2020<< B a c k t o c o n t e n t s
f i n a n C i a l r e P O r t S
Words from the president
Goals & strategies
Sustain ability Markets Operations & employees
Share & Shareholders
financial performance
risks & Corporate Governance
financial reports
Sustain ability impact
Consolidated cash flow statement
SEKm Note 2020 2019
Operating profit 462 727
Adjustments for non-cash items
Amortisation/depreciation of assets 3 275 301
Impairment of assets 3 13 2
Provisions for pensions –3 –10
Other provisions and contingent earn-out considerations 22 –23
Interest received 2 2
Interest paid –35 –34
Proceeds on derivative financial instruments – 4 – 4
Income tax paid –114 – 53
Cash flow from operating activities before changes in working capital 618 908
Cash flow from changes in working capital
Change in inventories –90 –113
Change in trade and other receivables 184 – 88
Change in trade and other payables – 56 17
Cash flow from operating activities 656 724
Investing activities
Acquisition of subsidiaries 22 – –146
Investments in property, plant and equipment 12 –267 –167
Investments in intangible assets 11 –23 –19
Disposals of property, plant and equipment 12 1 2
Cash flow from investing activities –289 –330
Cash flow from operating and investing activities 367 394
Financing activities
Proceeds from loans 20 310 –
Proceeds from commercial papers 20 798 1,557
Transaction costs paid 20 –1 –
Repayment of loans 20 –305 –
Repayment of commercial papers 20 –1,047 –1,558
Payment of lease liabilities 20 –72 –74
Dividends paid –143 –287
Other cash flow from financing activities –16 0
Cash flow from financing activities –476 –362
Cash flow for the year –109 32
Cash and cash equivalents at beginning of year 17 579 551
Cash flow for the year –109 32
Exchange difference –74 – 4
Cash and cash equivalents at end of year 17 396 579

103
Cloetta Annual and Sustainability Report 2020 << B a c k t o c o n t e n t s
f i n a n C i a l r e P O r t S
Words from the president
Goals & strategies
Sustain ability Markets Operations & employees
Share & Shareholders
financial performance
risks & Corporate Governance
financial reports
Sustain ability impact
Notes to the consolidated financial statements
Note 1 General information and accounting and valuation policies of the Group
General informationCloetta AB (publ), corporate identification number 556308-8144, is a Swedish-registered limited liability company domiciled in Linköping, Sweden. The company’s head office is in Stockholm with the address Solna Business Park, Englundavägen 7D, SE-171 06 Solna, Sweden.
Financial yearThe consolidated financial statements for the financial year from 1 January to 31 December 2020 include the accounts of the Parent Company and its subsidiaries (collectively the “Group” and individu-ally the “group companies”).
The annual report and consolidated financial statements were approved for publication by the Board of Directors on 11 March 2021. The profit and loss accounts and balance sheets of the Group and the Parent Company will be put before the Annual General Meeting on 6 April 2021 for adoption.
Covid-19At Cloetta, various measures have been taken to mitigate the short-term and long-term impact of the Covid-19 pandemic. Cloetta is monitoring the situation closely and when needed adapts its actions according to local government advice and regulations, whilst at the same time endeavouring to mitigate any disruptions to its business. Note 26 provides a description of the financial risks and risk manage-ment associated with the Covid-19 pandemic.
Disclosures regarding changes in group structureMergers• On 23 December 2019, E out instrument AB was merged into
Cloetta Sverige AB.
Incorporations• On 10 February 2019, Cloetta Middle East DMCC was incorpo-
rated.
Liquidations and dissolutions• On 8 February 2017, FTF Sweets USA Inc. was dissolved. The
three-year unwinding period ended on 8 February 2020.
• On 23 May 2017, Cloetta USA Inc. was dissolved. The three-year unwinding period ended on 23 May 2020.
• On 13 February 2020, Candyking Poland Sp. z o.o. was liquidated.
Note P8 provides an overview of the Cloetta Group and specifies all group companies and changes in the Group structure.
Compliance with legislation and accounting standardsThe consolidated financial statements are presented in accordance with the International Financial Reporting Standards (IFRS) estab-lished by the International Accounting Standards Board (IASB), and the interpretations issued by the IFRS Interpretations Committee (IFRIC), which have been endorsed by the European Commission for application in the EU, with supplementary requirements from the Annual Accounts Act. The applied standards and interpretations are those that were in force and have been endorsed by the EU as at 1 January 2020. Furthermore, the Swedish Financial Reporting Board’s recommendation RFR 1, Supplementary Accounting Rules for Groups, has been applied.
Guidelines on Alternative Performance MeasuresIn accordance with the ESMA (European Securities and Mar-kets Authority) guidelines on Alternative Performance Measures (APMs), additional information on the use of APMs, including ex-planations of use and reconciliation of the APMs to the most directly reconcilable measures in the financial statements, has been included in these financial statements. APMs presented in these financial statements should not be considered a substitute for measures of performance in accordance with IFRS and may not be comparable to similarly titled measures by other companies.
ActivitiesThe activities of the Group mainly comprise:• Sales, marketing and production of branded candy, chocolate,
pastilles, chewing gum and nuts; and
• Trading in candy, chocolate, pastilles, chewing gum and nuts.
The countries of the European Union, the UK and Norway form the most important markets.
Basis of presentationAssets and liabilities are recognised at historical cost, with the exception of certain financial assets and liabilities that are stated at fair value according to the accounting policies described below.
Unless otherwise stated, all amounts are rounded to the nearest million Swedish krona.
The preparation of financial statements in conformity with IFRS requires management to use certain critical accounting estimates and assumptions that affect the reported amounts of assets, liabili-ties, income and expenses. The estimates and assumptions are based on past experience and a number of other factors that are considered reasonable under the given circumstances. The results of these esti-mates and assumptions are used to make judgements about the car-rying value of assets and liabilities that cannot be readily determined from other sources. Actual results may differ from these estimates
Note 1
Note 2
Note 3
Note 4
Note 5
Note 6
Note 7
Note 8
Note 9
Note 10
Note 11
Note 12
Note 13
Note 14
Note 15
Note 16
Note 17
Note 18
Note 19
Note 20
Note 21
Note 22
Note 23
Note 24
Note 25
Note 26
Note 27
Note 28
Note 29
Note 30
Note 31
Note 32

104
Cloetta Annual and Sustainability Report 2020<< B a c k t o c o n t e n t s
f i n a n C i a l r e P O r t S
Words from the president
Goals & strategies
Sustain ability Markets Operations & employees
Share & Shareholders
financial performance
risks & Corporate Governance
financial reports
Sustain ability impact
Note 1
Note 2
Note 3
Note 4
Note 5
Note 6
Note 7
Note 8
Note 9
Note 10
Note 11
Note 12
Note 13
Note 14
Note 15
Note 16
Note 17
Note 18
Note 19
Note 20
Note 21
Note 22
Note 23
Note 24
Note 25
Note 26
Note 27
Note 28
Note 29
Note 30
Note 31
Note 32
and assumptions. The estimates and assumptions are reviewed on an ongoing basis. Changes in estimates are reported in the period of the change, if the change affects that period only. Changes in estimates are reported in the period of the change and in future periods, if the change affects both.
Note 30 provides a description of judgements made by manage-ment in the application of IFRS that have a significant impact on the financial statements, and estimates that can lead to material adjust-ments in the financial statements within the next year.
Unless otherwise stated below, the following accounting standards for the Group have been consistently applied in periods presented in the consolidated financial statements. The accounting standards for the Group have been consistently applied in reporting and consolidation of the Parent Company and the subsidiaries.
Segment reportingAn operating segment is an identified part of a group that engages in business activities from which it may earn revenues and incur expenses for which discrete financial information is available. An operating segment’s results are reviewed regularly by the entity’s chief operating decision maker to make decisions about resources to be allocated to the segment and assess its short and long-term financial performance. Operating segments are reported in a manner consistent with the internal reporting provided to the chief operat-ing decision maker. The President and CEO, who is responsible for allocating resources and assessing the performance of the operating segments, has been identified as the chief operating decision maker that makes strategic decisions.
Within the Cloetta Group five regions have been identified as the Group’s operating segments, following the setup of the responsibility areas in the Group Management Team. These five regions are: • Sweden,
• Denmark & Norway,
• Finland,
• the Netherlands & Germany, and
• International Markets & the UK.
The vast majority of sales takes place in the markets for confec-tionery and nuts, i.e. cold snacks between main meals, in Western Europe. It is the Group’s goal to realise production efficiency through homogeneous production processes in the different production facil-ities throughout the Group, regardless of their location. The Group has sales mainly in the confectionery and nuts segment, with compa-rable markets and customers. The Group has an integrated distribu-tion network and supply chain organisation. The identified operating segments are deemed to have similar economic characteristics.
As a result of these consistencies between the different regions, for financial statement reporting purposes, the operating segments are aggregated into one reportable segment. For information about the Group’s sales and earnings development and financial position, see the consolidated profit and loss accounts, balance sheet and cash flow statement.
ClassificationNon-current assets comprise amounts expected to be recovered or paid after more than twelve months from the balance sheet date, while current assets comprise amounts expected to be recovered or paid within twelve months of the balance sheet date. Non-current liabilities comprise amounts which the Group, at the end of the reporting period, has an unconditional right to choose to pay later than 12 months after the end of the reporting period. If the Group has no such right at the end of the reporting period, or if the liability is expected to be settled within the normal operating cycle, the liability is reported as current liability.
Basis of consolidationGroup structureThe company was originally founded in 1862. On 16 February 2012, Cloetta AB (publ) acquired Leaf Holland B.V. (currently known as Cloetta Holland B.V.) from Yllop Holding S.A. The acquisition has been accounted for as a reverse acquisition for consolidation purpos-es, where Cloetta Holland B.V. is the accounting acquirer and Cloetta AB (publ) is the legal acquirer.
All incorporated and acquired companies are wholly owned directly or indirectly by Cloetta AB (publ) and are consolidated from the date on which control is transferred.
SubsidiariesThe consolidated accounts include financial information for Cloetta AB (publ) and its subsidiaries. Subsidiaries are entities controlled directly or indirectly by Cloetta AB (publ). The Group controls an entity when it is exposed to, or has rights to, variable returns from its involvement with the entity and has the ability to affect those returns through its power over the entity. All subsidiaries are consolidated from the date on which control is transferred to Cloetta AB (publ).
The Group applies the acquisition method to account for busi-ness combinations. The consideration transferred for the acquisition of a subsidiary is the fair value of the assets transferred, the liabilities incurred to the former owners of the acquiree and the equity inter-ests issued by the Group. The consideration transferred includes the fair value of any asset or liability resulting from a contingent con-sideration arrangement. Identifiable assets acquired and liabilities assumed in a business combination are measured initially at their fair values at the acquisition date. Acquisition-related costs are expensed as incurred. If the business combination is realised in stages, the acquisition date fair value of the acquirer’s previously held equity interest in the acquiree is remeasured to fair value at the acquisition date through the profit and loss account.
Any contingent consideration to be transferred by the Group is recognised at fair value at the acquisition date. Any subsequent change to the fair value of the contingent consideration that is deemed to be a liability is recognised in accordance with IAS 32 in the case of the forward purchase of shares, or IFRS 9 either in the profit and loss account or as a change to other comprehensive income only if it is an asset which is classified as available for sale. Contingent consideration that is classified as equity is not remeasured, and its subsequent settlement is accounted for within equity.
Goodwill is initially measured as the excess of the aggregate of the consideration transferred and the fair value of non-controlling in-terests in the net identifiable assets acquired and liabilities assumed. If this consideration is lower than the fair value of the net assets of the subsidiary acquired, the difference is recognised in the profit and loss account.
Group companies are deconsolidated from the date that control ceases. When the Group ceases to have control, any retained interest in the entity is remeasured to its fair value at the date when control is lost, with the change in carrying amount recognised in the profit and loss account. The fair value is the initial carrying amount for the purposes of subsequently accounting for the retained interest as an associate, joint venture or financial asset. In addition, any amounts previously recognised in other comprehensive income in respect of that entity are accounted for as if the Group had directly disposed of the related assets or liabilities. This may mean that amounts previ-ously recognised in other comprehensive income are reclassified to the profit and loss account.
Note P8 provides an overview of all subsidiaries consolidated in the consolidated financial statements of Cloetta AB (publ).

105
Cloetta Annual and Sustainability Report 2020 << B a c k t o c o n t e n t s
f i n a n C i a l r e P O r t S
Words from the president
Goals & strategies
Sustain ability Markets Operations & employees
Share & Shareholders
financial performance
risks & Corporate Governance
financial reports
Sustain ability impact
Transactions eliminated on consolidationIntercompany transactions, balances, income and expenses on transactions between group companies are eliminated. Profits and losses resulting from inter-company transactions that are recognised in assets are also eliminated.
Foreign currency Functional and presentation currencyItems included in the financial information of each of our entities are measured using the functional currency of that entity, which is the currency of the primary economic environment in which the entity operates. The functional currency of foreign entities is generally local currency. The functional currency of the Parent Company is Swedish kronor (SEK), which is also the presentation currency of the Parent Company.
The consolidated financial statements are presented in SEK. The functional currency of the majority of the subsidiaries is the euro (EUR). The assets and liabilities are translated at the closing rate at the date of the financial statements. Income and expenses are translated at the average exchange rate for the year.
Transactions and balancesForeign currency transactions are translated into the functional currency using the exchange rates prevailing at the date of the trans-actions or the date of valuation where items are remeasured. Foreign exchange gains and losses resulting from the settlement of such transactions, and from the translation at the year-end exchange rates of monetary assets and liabilities denominated in foreign currencies, are recognised in the profit and loss account within operating profit.
Foreign exchange gains and losses that relate to cash and cash equivalents are presented in the profit and loss account within exchange differences on cash and cash equivalents in foreign currencies.
The Group applies hedge accounting for foreign exchange gains and losses that relate to borrowings. These foreign exchange gains and losses are presented in the statement of comprehensive income, see Note 1.XVIII for a description of the accounting policies on hedge accounting.
A monetary item held by a subsidiary, that is a receivable from or a payable to a foreign operation, for which settlement is neither planned nor likely to occur in the foreseeable future, is in substance a part of the entity’s net investment in that foreign operation. Foreign currency differences related to a foreign operation are initially recognised in other comprehensive income and reclassified from equity to the profit and loss account on disposal of the net investment. On disposal of the foreign operation, the cumulative amount of the exchange differences relating to the foreign operation, recognised in other comprehensive income, is reclassified from equity to the profit and loss account on the same line where the gain or loss of the disposal is accounted for.
Upon consolidation, exchange differences arising from the trans-lation of the borrowings and other currency instruments designated as hedges of such investments and the net investment in foreign operations are recognised in other comprehensive income.
All other foreign exchange gains and losses are presented in the profit and loss account within operating profit.
Financial statements of foreign operationsThe profit and loss accounts and balance sheets of all group com-panies that have a functional currency other than the presentation currency are translated into the presentation currency as follows: • Assets and liabilities for each balance sheet are translated at the
closing rate at the date of that balance sheet;
• Income and expenses for each profit and loss account are translated at average exchange rates unless this average is not a reasonable approximation of the cumulative effect of the rates prevailing on the transaction dates, in which case income and expenses are translat-ed at the rate on the dates of the transactions; and
• All resulting exchange differences are recognised in other compre-hensive income.
When a foreign operation is disposed of, unrealised exchange differences accumulated in currency translation adjustments after 1 January 2006 (first-time adoption of IFRS) are recognised in profit or loss as part of the gain or loss on the sale. Goodwill and fair value adjustments arising from the acquisition of a foreign entity are treat-ed as assets and liabilities in the functional currency of the attributa-ble foreign entity and translated at the closing rate.
Basis of accounting With the exception of the changes explained in Note 31, the Group has consistently applied the following accounting policies to all periods presented in these consolidated financial statements. Set out below is an index of the significant accounting policies, the details of which are available on the pages that follow:I Net salesII Cost of goods soldIII Other incomeIV Government supportV Selling expensesVI General and administrative expensesVII Employee remunerationVIII Research and development expensesIX Net financial itemsX Income taxXI Dividend distributionXII Items affecting comparabilityXIII Intangible assetsXIV Property, plant and equipmentXV Deferred taxXVI Financial assetsXVII Impairment of non-current non-financial assetsXVIII Derivative financial instruments and hedging activitiesXIX InventoriesXX Current income taxXXI Cash and cash equivalentsXXII Offsetting financial instrumentsXXIII EquityXXIV Other non-current liabilitiesXXV ProvisionsXXVI Employee benefitsXXVII BorrowingsXXVIII Borrowing costsXXIX Trade payablesXXX Leases
The balance sheet, profit and loss account and cash flow statement include references to the notes.
Recognition of revenue and expensesI Net salesNet sales are designated as income from the supply of goods, less discounts and similar, excluding sales taxes and after elimination of intra-group sales. Net sales are recognised as follows: • Sales of goods are recognised when a group company has delivered
products to the customer, the risks and rewards of the ownership of the products have been substantially transferred to the customer and the collectability of the related receivables is reasonably certain.
Note 1
Note 2
Note 3
Note 4
Note 5
Note 6
Note 7
Note 8
Note 9
Note 10
Note 11
Note 12
Note 13
Note 14
Note 15
Note 16
Note 17
Note 18
Note 19
Note 20
Note 21
Note 22
Note 23
Note 24
Note 25
Note 26
Note 27
Note 28
Note 29
Note 30
Note 31
Note 32

106
Cloetta Annual and Sustainability Report 2020<< B a c k t o c o n t e n t s
f i n a n C i a l r e P O r t S
Words from the president
Goals & strategies
Sustain ability Markets Operations & employees
Share & Shareholders
financial performance
risks & Corporate Governance
financial reports
Sustain ability impact
For pick & mix sales the following performance obligations have been identified in the contracts with customers:• Sales of goods;
• Utilisation of fixtures; and
• Merchandising services.
For the performance obligations utilisation of fixtures and merchan-dising services – which are satisfied over time – Cloetta selected an appropriate method for measuring its progress towards complete satisfaction of those performance obligations. For utilisation of fix-tures and merchandising services, a practical expedient is applicable, whereas Cloetta recognises revenue in the amount to which it has a right to invoice. Since delivery of goods and merchandising services normally takes place weekly, this output method best reflects that the measure of progress of the merchandising service as a performance obligation is satisfied at the same time as the goods are delivered.
Consumer incentive and trade promotion activities are recorded as a reduction in net sales based on amounts estimated as being due to customers at the end of a period, based principally on historical utilisation and redemption rates.
II Cost of goods soldCost of goods sold represents the direct and indirect expenses attrib-utable to sales revenue, including raw materials and consumables, cost of work contracted out and other external expenses, personnel expenses in respect of production employees, depreciation costs, impairment losses and losses on disposal relating to buildings and machinery and other operating expenses that are attributable to the production of products. Cost of goods sold is recognised in the profit and loss account, simultaneously with the income derived from the related sales transaction.
III Other incomeOther income consists of gains on disposal of assets. Gains on dispos-al of assets are determined by comparing the proceeds from disposal with the carrying amount and are recognised in other income in the profit and loss account upon disposal of the asset.
IV Government supportGovernment support received for measures supporting liquidi-ty, impacting the company’s cash flows and for measures for cost compensation impacting the company’s cash flows and/or results are recognised insofar as it is deemed that all conditions for the govern-ment support have been, or will be met. Government grants relating to costs are recognised at fair value in the cost of goods sold, selling expenses or general and administrative expenses in the profit and loss over the period when the related costs are incurred, depending on the nature of the costs they are intended to compensate.
V Selling expensesSelling expenses comprise the cost of brand support through direct and indirect advertising, promotional activities, the cost of support-ing sales and marketing efforts and amortisation and impairment losses of related intangible assets. The company promotes its prod-ucts through advertising and trade promotions. Selling expenses are recognised in the profit and loss account when incurred.
VI General and administrative expensesGeneral and administrative expenses include the costs of gener-al management, human resources, finance and administration, information technology, and other back office services as well as amortisation of software. General and administrative expenses are recognised in the profit and loss account when incurred.
VII Employee remunerationRegular paymentsSalaries, wages and social security costs are charged to the personnel expenses, which are included either in cost of goods sold, selling ex-penses or general and administrative expenses in the profit and loss account over the period when the related services are rendered, and in accordance with employment contracts and obligations.
Termination benefits A provision is recognised on the termination of employees as a result of either an entity’s decision to terminate employment before the normal retirement date or an employee’s decision to accept an offer of benefits in exchange for the termination of employment. When the criteria for recognition of a provision for termination benefits are met, the expenses are recognised either in cost of goods sold, selling expenses or general and administrative expenses in the profit and loss account.
Share-based long-term incentive plansThe cost of the share-based long-term incentive plans, which rep-resent the grant date fair value of the shares expected to be vested, multiplied by the shares vested and any social security expenses, is recognised in personnel expenses, which are included either in cost of goods sold, selling expenses or general and administrative expenses in the profit and loss account. The costs of the share-based long-term incentive plans are recognised pro rata over the vesting period of each plan.
VIII Research and development expensesExpenses for research are recognised in the cost of goods sold, selling expenses and general and administrative expenses in the profit and loss account as incurred, depending on the nature of the asset. Expenses incurred on development projects are recognised as intangible assets when it is probable that a project will generate eco-nomic benefits in the future, in view of its commercial and technolog-ical feasibility, and the costs can be reliably measured. Otherwise the expenses on development projects are recognised in the cost of goods sold, selling expenses or general and administrative expenses in the profit and loss account as incurred, depending on the nature of the asset.
IX Net financial itemsCash and cash equivalents denominated in foreign currencies are translated into the functional currency at the exchange rate at the reporting date. Any resulting exchange differences are recognised in net financial items. Gains and losses related to the effective portion of the net investment hedge are recognised in other comprehensive income.
Interest income and interest expenses on third-party borrowings are recognised in the profit and loss account when incurred using the effective interest method.
Unrealised interest on contingent considerations is recognised in other financial expenses at amortised costs. Interest income and expenses on cash and cash equivalents and banking costs are recog-nised in the profit and loss account when incurred, in other financial income and expenses at amortised cost.
Realised and unrealised gains and losses on single currency in-terest rate swaps are recognised in other financial income and other financial expenses at fair value.
X Income taxThe income tax expense for the period comprises current and de-ferred tax and is recognised in the profit and loss account. Corporate income tax is calculated on profit before tax in the profit and loss account, taking into account non-deductible expenses, non-taxable
Note 1
Note 2
Note 3
Note 4
Note 5
Note 6
Note 7
Note 8
Note 9
Note 10
Note 11
Note 12
Note 13
Note 14
Note 15
Note 16
Note 17
Note 18
Note 19
Note 20
Note 21
Note 22
Note 23
Note 24
Note 25
Note 26
Note 27
Note 28
Note 29
Note 30
Note 31
Note 32

107
Cloetta Annual and Sustainability Report 2020 << B a c k t o c o n t e n t s
f i n a n C i a l r e P O r t S
Words from the president
Goals & strategies
Sustain ability Markets Operations & employees
Share & Shareholders
financial performance
risks & Corporate Governance
financial reports
Sustain ability impact
profits and losses, temporary differences arising from applicable local tax laws and other factors that affect the tax rate, e.g. changes in valuation allowances, adjustments in tax positions and changes in tax law, such as changes in enacted or substantively enacted tax rates.
The current income tax charge is calculated on the basis of the tax laws enacted or substantively enacted at the balance sheet date in the countries where the company’s subsidiaries and associates operate and generate taxable profits.
XI Dividend distributionDividends paid to the company’s shareholders are recognised as a li-ability in the consolidated financial statements in the period in which the dividends are resolved on by the company’s shareholders. Divi-dend payments are recognised in equity as part of retained earnings.
XII Items affecting comparabilityItems affecting comparability are those significant items which are separately disclosed in the notes to the financial statements by virtue of their size or incidence, in order to enable a full understanding of the Group’s financial performance. Items affecting comparability are recognised in the profit and loss account. Their classification in the profit and loss account depends on the nature of the items affecting comparability.
Principles of valuation of assets and liabilitiesGeneralIf not specifically otherwise stated, assets and liabilities are initially recognised at the amounts at which they were acquired or incurred.
XIII Intangible assetsThe estimated economic useful lives of intangible assets are specified as follows:Trademarks IndefiniteGoodwill IndefiniteSoftware 3–5 yearsOther intangibles 5 years – indefinite
TrademarksAcquired trademarks are measured at historical cost. In view of the history of Cloetta’s trademark portfolio, combined with Cloetta’s commitment to continue supporting these trademarks with adver-tising and promotion resources and continuous product develop-ment, the useful lives of Cloetta’s trademarks are considered to be indefinite in nature. Trademarks with indefinite useful lives are not amortised, but are subject to impairment testing at least annually or whenever events or circumstances indicate a risk of impairment.
GoodwillGoodwill arises on the acquisition of subsidiaries and represents the excess of the consideration transferred over the Group’s interest in the net fair value of the net identifiable assets and liabilities assumed by the acquiree, and the fair value of any non-controlling interest in the acquiree.
For the purpose of impairment testing, goodwill acquired in a business combination is allocated to each of the cash generating units (CGUs), or groups of CGUs, that are expected to benefit from the synergies of the combination. Each CGU or group of CGUs to which the goodwill is allocated represents the lowest level within the Group at which goodwill is monitored for internal management purposes. A CGU is the lowest level to which an asset that generates cash flows independently from other assets can be allocated. A group of CGUs is not larger than an operating segment.
Goodwill impairment tests are undertaken annually or more frequently if events or changes in circumstances indicate a poten-
tial impairment. The carrying value of goodwill is compared to the recoverable amount, which is the higher of value in use and fair value less cost of disposal. Any impairment is recognised immediately as an expense and is not subsequently reversed.
SoftwareWhere computer software is not an integral part or a related item of computer hardware and not integral to the operation of an item of property, plant and equipment, the software is treated as a separate intangible asset.
Acquired software licenses are capitalised at historical cost and amortised on a straight-line basis over their estimated useful lives of 3 to 5 years.
Capitalised costs for internally generated software include exter-nal direct costs of materials and services consumed in developing or obtaining the software, and payroll and payroll-related costs for em-ployees who are directly associated with, and who devote substantial time to, the project. Capitalisation of these costs ceases no later than the point at which the project is substantially complete and ready for its intended use. These costs are amortised over their expected useful lives on a straight-line basis, with the useful lives reviewed annually. Other software-related costs that do not meet the above criteria for capitalisation are recognised either in cost of goods sold, selling expenses or the general and administrative expenses in the profit and loss account when incurred. Development expenses previ-ously recognised in the profit and loss account are not recognised as an asset in a subsequent period.
Software under construction is not amortised until the software is substantially complete and ready for its intended use. Software under construction is subject to impairment testing at least annually or whenever events or circumstances indicate a risk of impairment.
Amortisation of software is recognised in cost of goods sold and general and administrative expenses in the profit and loss account.
Other intangible assetsAn indefinite right of free electricity acquired is capitalised at acqui-sition cost. In view of the indefinite nature of the right, the right is not amortised, but is subject to impairment testing at least annually or whenever events or circumstances indicate a risk of impairment.
Other intangible assets, except the right of free electricity, contain acquired customer lists and capitalised registration fees, and are capitalised at historical cost and amortised based on their useful lives, with the useful lives reviewed annually. Other intangible assets are subject to impairment testing at least annually, or whenever events or circumstances indicate a risk of impairment.
For determining whether an impairment charge in respect of any intangible asset applies, see Note 11.
XIV Property, plant and equipmentItems of property, plant and equipment are valued at historical cost less accumulated depreciation and any accumulated impairment. Historical cost includes direct costs (materials, direct labour and work contracted out) and directly attributable overhead costs including interest expenses. Depreciation is accounted for using the straight-line method on the basis of the estimated economic useful life.
The estimated economic useful lives of property, plant and equipment are specified as follows:Land IndefiniteBuildings 20–50 yearsMachinery and equipment 3–55 yearsPP&E under construction n/aRight-of-use assets 1–33 years
Note 1
Note 2
Note 3
Note 4
Note 5
Note 6
Note 7
Note 8
Note 9
Note 10
Note 11
Note 12
Note 13
Note 14
Note 15
Note 16
Note 17
Note 18
Note 19
Note 20
Note 21
Note 22
Note 23
Note 24
Note 25
Note 26
Note 27
Note 28
Note 29
Note 30
Note 31
Note 32
108
Cloetta Annual and Sustainability Report 2020<< B a c k t o c o n t e n t s
f i n a n C i a l r e P O r t S
Words from the president
Goals & strategies
Sustain ability Markets Operations & employees
Share & Shareholders
financial performance
risks & Corporate Governance
financial reports
Sustain ability impact
The residual values and useful lives of the assets are reviewed, and adjusted if appropriate, at each balance sheet date.
An asset’s carrying amount is immediately written down to its recoverable amount if the asset’s carrying amount is greater than its estimated recoverable amount.
Gains and losses on disposals are determined by comparing the proceeds from the disposal with the carrying amount and are recognised in the profit and loss account. The classification in the profit and loss account depends on the nature of the gains or losses on the disposal.
Subsequent expenditure is included in the carrying amount of an asset or recognised as a separate asset, as appropriate, only when it is probable that future economic benefits associated with the item will flow to the Group and the cost of the item can be reliably measured. All other repairs and maintenance costs are charged to the profit and loss account when incurred. The classification in the profit and loss account depends on the nature of the property, plant and equipment.
Subsidies and grants related to investments in property, plant and equipment are deducted from the historical cost or the construc-tion cost of the related asset and are reflected in the profit and loss account as part of the depreciation charge.
Depreciation of property, plant and equipment is recognised in cost of goods sold, selling expenses and general and administrative expenses in the profit and loss account depending on the nature of the asset.
XV Deferred taxThe tax expense for the period comprises current and deferred tax. Tax is recognised in the profit and loss account, except to the extent that it relates to items recognised in other comprehensive income or directly in equity. In this case, the tax is also recognised in other comprehensive income or directly in equity, respectively.
Deferred income tax is recognised on temporary differences arising between the tax bases of assets and liabilities and their carrying amounts in the consolidated financial statements. However, deferred tax liabilities are not recognised if they arise from the initial recognition of goodwill. Deferred income tax is not accounted for if it arises from initial recognition of an asset or liability in a transaction other than a business combination that, at the time of the transaction, affects neither accounting nor taxable profit or loss. Deferred income tax is determined using tax rates (and laws) that have been enacted or substantively enacted at the balance sheet date and are expected to apply when the related deferred income tax asset is realised, or the deferred income tax liability is settled.
Deferred income tax assets are recognised for unused tax losses carried forward and deductible temporary differences, only to the extent that it is probable that future taxable profit will be available against which they can be used.
Deferred income tax assets are recognised on deductible tempo-rary differences arising from investments in subsidiaries, associates and joint arrangements only to the extent that it is probable the temporary difference will reverse in the future, and there is sufficient taxable profit available against which the temporary difference can be utilised.
Deferred income tax liabilities arise on taxable temporary dif-ferences arising from investments in subsidiaries, with the exception of deferred income tax liabilities where the timing of the reversal of the temporary difference is controlled by the Group, and it is probable that the temporary difference will not reverse in the foreseeable future.
For unrecognised deductible temporary differences and tax losses carried forward, it is not yet probable that these may be utilised against future taxable profits or set off against other tax liabilities within the same tax group or tax jurisdiction.
Deferred income tax assets and liabilities are offset when there is a legally enforceable right to offset current tax assets against current tax liabilities and when the deferred income tax assets and liabilities relate to income taxes levied by the same taxation authority on either the same taxable entity or different taxable entities where there is an intention to settle the balances on a net basis.
The positions taken in tax returns with respect to situations where the applicable tax rules are subject to interpretation are periodically evaluated. Provisions are established where appropriate on the basis of amounts expected to be paid to the respective tax authorities.
Deferred taxes are not discounted.
XVI Financial assetsRecognition and initial measurementTrade receivables and debt securities issued are initially recognised when they are originated. All other financial assets and financial liabilities are initially recognised when the Group becomes a party to the contractual provisions of the instrument. A financial asset (unless it is a trade receivable without a significant financing component) or financial liability is initially measured at fair value plus transaction costs that are directly attributable to its acquisition or issue, for items not measured at fair value through profit and loss (FVTPL). A trade receivable without a significant financing component is initially measured at the transaction price.
The Group derecognises a financial asset when the contractual rights to the cash flows from the asset are realised, expire, or the com-pany has relinquished the right to receive the contractual cash flows in a transaction in which substantially all the risks and rewards of ownership of the financial asset are transferred. Any interest in such transferred financial assets that is created or retained by the Group is recognised as a separate asset or liability.
On initial recognition, a financial asset is classified as measured at:• Amortised cost,
• Fair value through other comprehensive income (FVOCI) – debt investment,
• FVOCI – equity investment, or
• FVTPL.
Financial assets are not reclassified subsequent to their initial rec-ognition unless the Group changes its business model for managing financial assets, in which case all affected financial assets are reclas-sified on the first day of the first reporting period following the change in the business model.
A financial asset is measured at amortised cost if it meets both of the following conditions and is not designated as at FVTPL:• it is held within a business model whose objective is to hold assets to
collect contractual cash flows; and
• its contractual terms give rise on specified dates to cash flows that are solely payments of principal and interest on the principal amount outstanding.
The Group’s recognised financial assets, that are not derivatives, consist mainly of trade receivables and cash and cash equivalents, and to a minor extent of other receivables and accrued income. All these non-derivative financial assets meet the above criteria and are recognised at amortised cost.
The Group does not currently own any financial assets recog-nised at FVOCI – neither debt nor equity investments. All financial assets not classified as measured at amortised cost or FVOCI as described above are measured at FVTPL. This includes all derivative financial assets, see Note 21.
Note 1
Note 2
Note 3
Note 4
Note 5
Note 6
Note 7
Note 8
Note 9
Note 10
Note 11
Note 12
Note 13
Note 14
Note 15
Note 16
Note 17
Note 18
Note 19
Note 20
Note 21
Note 22
Note 23
Note 24
Note 25
Note 26
Note 27
Note 28
Note 29
Note 30
Note 31
Note 32
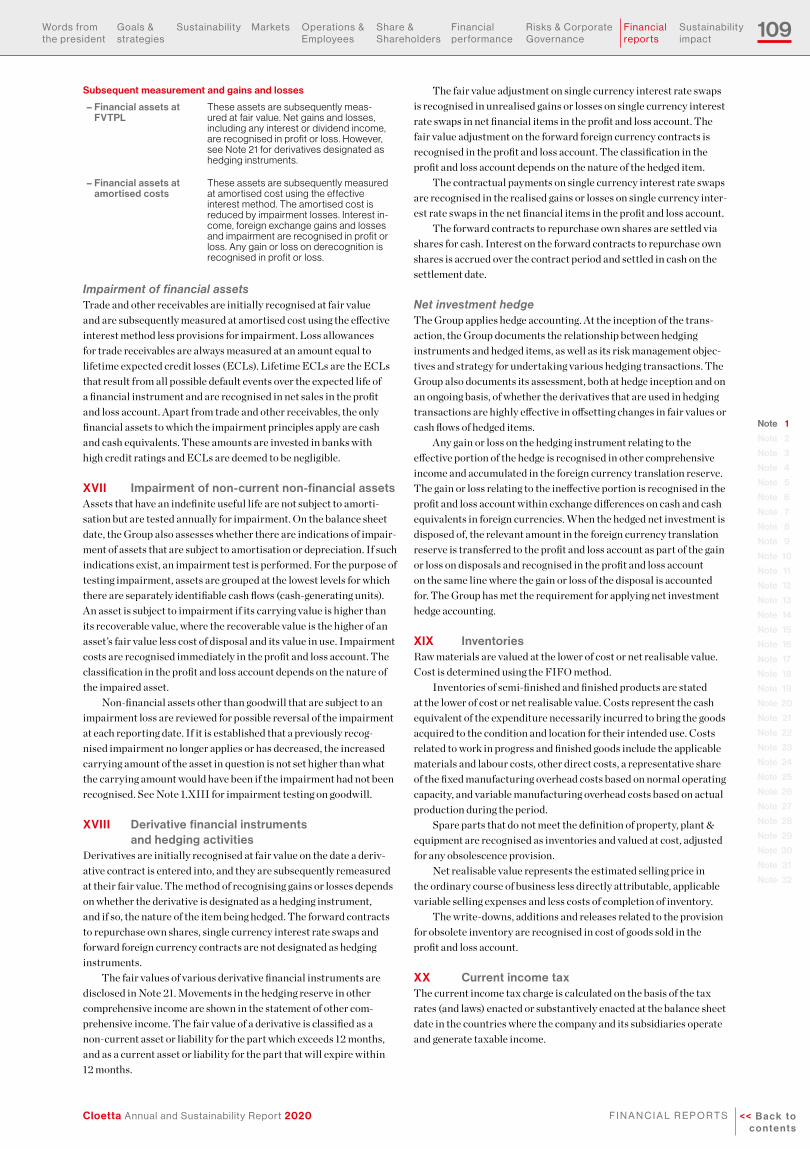
109
Cloetta Annual and Sustainability Report 2020 << B a c k t o c o n t e n t s
f i n a n C i a l r e P O r t S
Words from the president
Goals & strategies
Sustain ability Markets Operations & employees
Share & Shareholders
financial performance
risks & Corporate Governance
financial reports
Sustain ability impact
Subsequent measurement and gains and losses
– Financial assets at FVTPL
These assets are subsequently meas-ured at fair value. Net gains and losses, including any interest or dividend income, are recognised in profit or loss. However, see Note 21 for derivatives designated as hedging instruments.
– Financial assets at amortised costs
These assets are subsequently measured at amortised cost using the effective interest method. The amortised cost is reduced by impairment losses. Interest in-come, foreign exchange gains and losses and impairment are recognised in profit or loss. Any gain or loss on derecognition is recognised in profit or loss.
Impairment of financial assets Trade and other receivables are initially recognised at fair value and are subsequently measured at amortised cost using the effective interest method less provisions for impairment. Loss allowances for trade receivables are always measured at an amount equal to lifetime expected credit losses (ECLs). Lifetime ECLs are the ECLs that result from all possible default events over the expected life of a financial instrument and are recognised in net sales in the profit and loss account. Apart from trade and other receivables, the only financial assets to which the impairment principles apply are cash and cash equivalents. These amounts are invested in banks with high credit ratings and ECLs are deemed to be negligible.
XVII Impairment of non-current non-financial assetsAssets that have an indefinite useful life are not subject to amorti-sation but are tested annually for impairment. On the balance sheet date, the Group also assesses whether there are indications of impair-ment of assets that are subject to amortisation or depreciation. If such indications exist, an impairment test is performed. For the purpose of testing impairment, assets are grouped at the lowest levels for which there are separately identifiable cash flows (cash-generating units). An asset is subject to impairment if its carrying value is higher than its recoverable value, where the recoverable value is the higher of an asset’s fair value less cost of disposal and its value in use. Impairment costs are recognised immediately in the profit and loss account. The classification in the profit and loss account depends on the nature of the impaired asset.
Non-financial assets other than goodwill that are subject to an impairment loss are reviewed for possible reversal of the impairment at each reporting date. If it is established that a previously recog-nised impairment no longer applies or has decreased, the increased carrying amount of the asset in question is not set higher than what the carrying amount would have been if the impairment had not been recognised. See Note 1.XIII for impairment testing on goodwill.
XVIII Derivative financial instruments and hedging activities
Derivatives are initially recognised at fair value on the date a deriv-ative contract is entered into, and they are subsequently remeasured at their fair value. The method of recognising gains or losses depends on whether the derivative is designated as a hedging instrument, and if so, the nature of the item being hedged. The forward contracts to repurchase own shares, single currency interest rate swaps and forward foreign currency contracts are not designated as hedging instruments.
The fair values of various derivative financial instruments are disclosed in Note 21. Movements in the hedging reserve in other comprehensive income are shown in the statement of other com-prehensive income. The fair value of a derivative is classified as a non-current asset or liability for the part which exceeds 12 months, and as a current asset or liability for the part that will expire within 12 months.
The fair value adjustment on single currency interest rate swaps is recognised in unrealised gains or losses on single currency interest rate swaps in net financial items in the profit and loss account. The fair value adjustment on the forward foreign currency contracts is recognised in the profit and loss account. The classification in the profit and loss account depends on the nature of the hedged item.
The contractual payments on single currency interest rate swaps are recognised in the realised gains or losses on single currency inter-est rate swaps in the net financial items in the profit and loss account.
The forward contracts to repurchase own shares are settled via shares for cash. Interest on the forward contracts to repurchase own shares is accrued over the contract period and settled in cash on the settlement date.
Net investment hedgeThe Group applies hedge accounting. At the inception of the trans-action, the Group documents the relationship between hedging instruments and hedged items, as well as its risk management objec-tives and strategy for undertaking various hedging transactions. The Group also documents its assessment, both at hedge inception and on an ongoing basis, of whether the derivatives that are used in hedging transactions are highly effective in offsetting changes in fair values or cash flows of hedged items.
Any gain or loss on the hedging instrument relating to the effective portion of the hedge is recognised in other comprehensive income and accumulated in the foreign currency translation reserve. The gain or loss relating to the ineffective portion is recognised in the profit and loss account within exchange differences on cash and cash equivalents in foreign currencies. When the hedged net investment is disposed of, the relevant amount in the foreign currency translation reserve is transferred to the profit and loss account as part of the gain or loss on disposals and recognised in the profit and loss account on the same line where the gain or loss of the disposal is accounted for. The Group has met the requirement for applying net investment hedge accounting.
XIX InventoriesRaw materials are valued at the lower of cost or net realisable value.Cost is determined using the FIFO method.
Inventories of semi-finished and finished products are stated at the lower of cost or net realisable value. Costs represent the cash equivalent of the expenditure necessarily incurred to bring the goods acquired to the condition and location for their intended use. Costs related to work in progress and finished goods include the applicable materials and labour costs, other direct costs, a representative share of the fixed manufacturing overhead costs based on normal operating capacity, and variable manufacturing overhead costs based on actual production during the period.
Spare parts that do not meet the definition of property, plant & equipment are recognised as inventories and valued at cost, adjusted for any obsolescence provision.
Net realisable value represents the estimated selling price in the ordinary course of business less directly attributable, applicable variable selling expenses and less costs of completion of inventory.
The write-downs, additions and releases related to the provision for obsolete inventory are recognised in cost of goods sold in the profit and loss account.
XX Current income taxThe current income tax charge is calculated on the basis of the tax rates (and laws) enacted or substantively enacted at the balance sheet date in the countries where the company and its subsidiaries operate and generate taxable income.
Note 1
Note 2
Note 3
Note 4
Note 5
Note 6
Note 7
Note 8
Note 9
Note 10
Note 11
Note 12
Note 13
Note 14
Note 15
Note 16
Note 17
Note 18
Note 19
Note 20
Note 21
Note 22
Note 23
Note 24
Note 25
Note 26
Note 27
Note 28
Note 29
Note 30
Note 31
Note 32
110
Cloetta Annual and Sustainability Report 2020<< B a c k t o c o n t e n t s
f i n a n C i a l r e P O r t S
Words from the president
Goals & strategies
Sustain ability Markets Operations & employees
Share & Shareholders
financial performance
risks & Corporate Governance
financial reports
Sustain ability impact
XXI Cash and cash equivalentsCash and cash equivalents represent cash in hand and cash at banks.
Current account overdrafts at banks are included under borrow-ings under the heading current liabilities.
XXII Offsetting financial instruments The Group has a multicurrency zero-balancing cash pool with Danske Bank A/S. Until 13 November 2019 and 25 March 2020 respectively the Group also had a Multicurrency Functionality with Credit Facility for Global Cash Pool (Global Cash Pool agreement) with Nordea Bank AB (publ) and a Notional Group Account with Svenska Handelsbanken AB (publ). Insofar as the following criteria are met, the cash and cash equivalents of participating group compa-nies and the current account overdrafts at Nordea Bank AB (publ), Svenska Handelsbanken AB (publ) and Danske Bank A/S are offset and presented in the balance sheet as a net amount:• There is a legally enforceable right to offset the recognised
amounts; and• There is an intention to settle on a net basis or realise the asset and
settle the liability simultaneously.
XXIII EquityOrdinary shares are classified as share capital. Incremental costs directly attributable to the purchase, sale and/or issue of new shares are shown in equity as a deduction, net of tax, from the proceeds.
XXIV Other non-current liabilitiesContingent considerationsThe fair value of the contingent considerations is calculated using the income approach and is linked to the performance of the acquired companies. As part of accounting for business combinations, con-tingent considerations are initially recognised. Contingent consid-erations are discounted using the effective interest method. If the fair value of contingent considerations deviates from the carrying amount, the difference is recognised in general and administrative expenses in the profit and loss account.
If the contingent consideration will be settled within 12 months from the balance sheet date, the contingent consideration is present-ed as part of trade and other payables.
XXV ProvisionsProvisions are recognised for legally enforceable or constructive obligations existing on the balance sheet date, when it is probable that an outflow of resources will be required to settle the obligation and the amount can be reliably estimated.
Where there are a number of similar obligations, the likelihood that an outflow will be required for settlement is determined by con-sidering the class of obligations as a whole. A provision is recognised even if the likelihood of an outflow, with respect to any item included in the same class of obligations, is small.
The initial recognition, subsequent additions and releases to a provision are recognised in the profit and loss account. The classi-fication in the profit and loss account depends on the nature of the provision.
Provisions are measured at the present value of the expenditure expected to be required to settle the obligation using a pre-tax rate that reflects current market assessments of the time value of money and the risks specific to the obligation. The increase in the provision due to passage of time is recognised as other financial expenses, third parties in the profit and loss account.
If the expenditure to settle an obligation is expected to be recovered from a third party, the recovery is carried as an asset in the balance sheet if it is virtually certain to be received upon settlement of the obligation.
XXVI Employee benefitsPension obligationsThe liability recognised in the balance sheet in respect of defined benefit pension plans is the present value of the defined benefit obligation at the end of the reporting period less the fair value of plan assets. The defined benefit obligation is calculated annually by independent actuaries using the projected unit credit method. The present value of the defined benefit obligation is determined by discounting the estimated future cash outflows using interest rates of high-quality corporate bonds for all countries in the Eurozone. For the Swedish plans, the discount rate is based on mortgage bonds and for the Norwegian pension plans, the market yield of covered bonds is used. The rates of these bonds are used as equivalent to high-quality corporate bond rates in countries where there is no deep market in such bonds.
Remeasurements arising from defined benefit plans also include the return on plan assets excluding interest and the effect of the asset ceiling, if any, excluding interest. Remeasurements are recognised in other comprehensive income when incurred. All other expenses related to defined benefit plans are recognised in the profit and loss account when incurred, either in cost of goods sold, selling expenses or general and administrative expenses.
The interest on defined benefit obligations and plan assets is recognised in net financial items in the profit and loss account when incurred.
The defined benefit schemes in industry sector pension funds, which are held by pension funds that are not able to provide company- specific or reliable information, are accounted for as though they are defined contribution schemes. In the event of a deficit in these pen-sion funds, the company has no obligation to provide supplementary contributions, other than higher future contributions.
The contributions are recognised as personnel costs, which are included either in cost of goods sold, selling expenses or general and administrative expenses in the profit and loss account. Prepaid con-tributions are recognised as an asset to the extent that a cash refund or a reduction in the future payments is available to the Group.
Termination benefitsTermination benefits are payable when employment is terminated before the normal retirement date, or whenever an employee accepts voluntary redundancy in exchange for special compensation. A provision is recognised on the termination of employees as a result of either an entity’s decision to terminate employment before the normal retirement date or an employee’s decision to accept an offer of benefits in exchange for the termination of employment. The expens-es related to this provision are recognised in personnel expenses, which are included either in cost of goods sold, selling expenses or general and administrative expenses in the profit and loss account.
Share-based paymentsShare-based long-term incentive plansThe incentive plans qualify as equity-settled share-based payments. The expenses for the plans will amount to the grant date fair value per share right times the number of share rights vested, including any accelerated vesting. The expenses are recognised as personnel expenses, which are included either in cost of goods sold, selling expenses and general and administrative expenses in the profit and loss account.
The total expense depends on the number of share rights vested, but any changes in the price of the Cloetta share after the grant date do not impact the total expense. In some jurisdictions, social security expenses have to be paid. The total expense for social security con-tributions will be based on the vesting date fair value of the Cloetta share and is accrued on the balance sheet until vesting of the shares. Social security expenses recognised in the profit and loss account will therefore vary with changes in the share price.
Note 1
Note 2
Note 3
Note 4
Note 5
Note 6
Note 7
Note 8
Note 9
Note 10
Note 11
Note 12
Note 13
Note 14
Note 15
Note 16
Note 17
Note 18
Note 19
Note 20
Note 21
Note 22
Note 23
Note 24
Note 25
Note 26
Note 27
Note 28
Note 29
Note 30
Note 31
Note 32
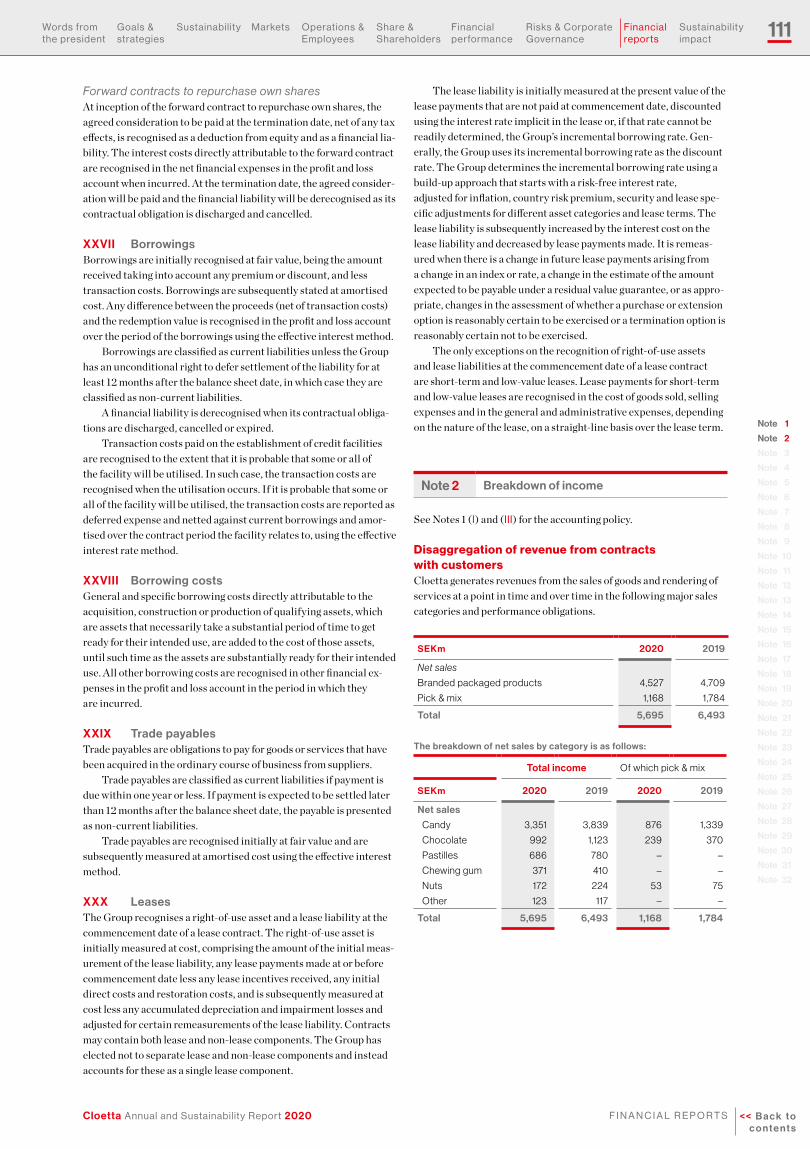
111
Cloetta Annual and Sustainability Report 2020 << B a c k t o c o n t e n t s
f i n a n C i a l r e P O r t S
Words from the president
Goals & strategies
Sustain ability Markets Operations & employees
Share & Shareholders
financial performance
risks & Corporate Governance
financial reports
Sustain ability impact
Forward contracts to repurchase own sharesAt inception of the forward contract to repurchase own shares, the agreed consideration to be paid at the termination date, net of any tax effects, is recognised as a deduction from equity and as a financial lia-bility. The interest costs directly attributable to the forward contract are recognised in the net financial expenses in the profit and loss account when incurred. At the termination date, the agreed consider-ation will be paid and the financial liability will be derecognised as its contractual obligation is discharged and cancelled.
XXVII BorrowingsBorrowings are initially recognised at fair value, being the amount received taking into account any premium or discount, and less transaction costs. Borrowings are subsequently stated at amortised cost. Any difference between the proceeds (net of transaction costs) and the redemption value is recognised in the profit and loss account over the period of the borrowings using the effective interest method.
Borrowings are classified as current liabilities unless the Group has an unconditional right to defer settlement of the liability for at least 12 months after the balance sheet date, in which case they are classified as non-current liabilities.
A financial liability is derecognised when its contractual obliga-tions are discharged, cancelled or expired.
Transaction costs paid on the establishment of credit facilities are recognised to the extent that it is probable that some or all of the facility will be utilised. In such case, the transaction costs are recognised when the utilisation occurs. If it is probable that some or all of the facility will be utilised, the transaction costs are reported as deferred expense and netted against current borrowings and amor-tised over the contract period the facility relates to, using the effective interest rate method.
XXVIII Borrowing costsGeneral and specific borrowing costs directly attributable to the acquisition, construction or production of qualifying assets, which are assets that necessarily take a substantial period of time to get ready for their intended use, are added to the cost of those assets, until such time as the assets are substantially ready for their intended use. All other borrowing costs are recognised in other financial ex-penses in the profit and loss account in the period in which they are incurred.
XXIX Trade payablesTrade payables are obligations to pay for goods or services that have been acquired in the ordinary course of business from suppliers.
Trade payables are classified as current liabilities if payment is due within one year or less. If payment is expected to be settled later than 12 months after the balance sheet date, the payable is presented as non-current liabilities.
Trade payables are recognised initially at fair value and are subsequently measured at amortised cost using the effective interest method.
XXX LeasesThe Group recognises a right-of-use asset and a lease liability at the commencement date of a lease contract. The right-of-use asset is initially measured at cost, comprising the amount of the initial meas-urement of the lease liability, any lease payments made at or before commencement date less any lease incentives received, any initial direct costs and restoration costs, and is subsequently measured at cost less any accumulated depreciation and impairment losses and adjusted for certain remeasurements of the lease liability. Contracts may contain both lease and non-lease components. The Group has elected not to separate lease and non-lease components and instead accounts for these as a single lease component.
The lease liability is initially measured at the present value of the lease payments that are not paid at commencement date, discounted using the interest rate implicit in the lease or, if that rate cannot be readily determined, the Group’s incremental borrowing rate. Gen-erally, the Group uses its incremental borrowing rate as the discount rate. The Group determines the incremental borrowing rate using a build-up approach that starts with a risk-free interest rate, adjusted for inflation, country risk premium, security and lease spe-cific adjustments for different asset categories and lease terms. The lease liability is subsequently increased by the interest cost on the lease liability and decreased by lease payments made. It is remeas-ured when there is a change in future lease payments arising from a change in an index or rate, a change in the estimate of the amount expected to be payable under a residual value guarantee, or as appro-priate, changes in the assessment of whether a purchase or extension option is reasonably certain to be exercised or a termination option is reasonably certain not to be exercised.
The only exceptions on the recognition of right-of-use assets and lease liabilities at the commencement date of a lease contract are short-term and low-value leases. Lease payments for short-term and low-value leases are recognised in the cost of goods sold, selling expenses and in the general and administrative expenses, depending on the nature of the lease, on a straight-line basis over the lease term.
Note 2 Breakdown of income
See Notes 1 (i) and (iii) for the accounting policy.
Disaggregation of revenue from contracts with customersCloetta generates revenues from the sales of goods and rendering of services at a point in time and over time in the following major sales categories and performance obligations.
SEKm 2020 2019
Net sales
Branded packaged products 4,527 4,709
Pick & mix 1,168 1,784
Total 5,695 6,493
The breakdown of net sales by category is as follows:
Total income Of which pick & mix
SEKm 2020 2019 2020 2019
Net sales
Candy 3,351 3,839 876 1,339
Chocolate 992 1,123 239 370
Pastilles 686 780 – –
Chewing gum 371 410 – –
Nuts 172 224 53 75
Other 123 117 – –
Total 5,695 6,493 1,168 1,784
Note 1
Note 2
Note 3
Note 4
Note 5
Note 6
Note 7
Note 8
Note 9
Note 10
Note 11
Note 12
Note 13
Note 14
Note 15
Note 16
Note 17
Note 18
Note 19
Note 20
Note 21
Note 22
Note 23
Note 24
Note 25
Note 26
Note 27
Note 28
Note 29
Note 30
Note 31
Note 32
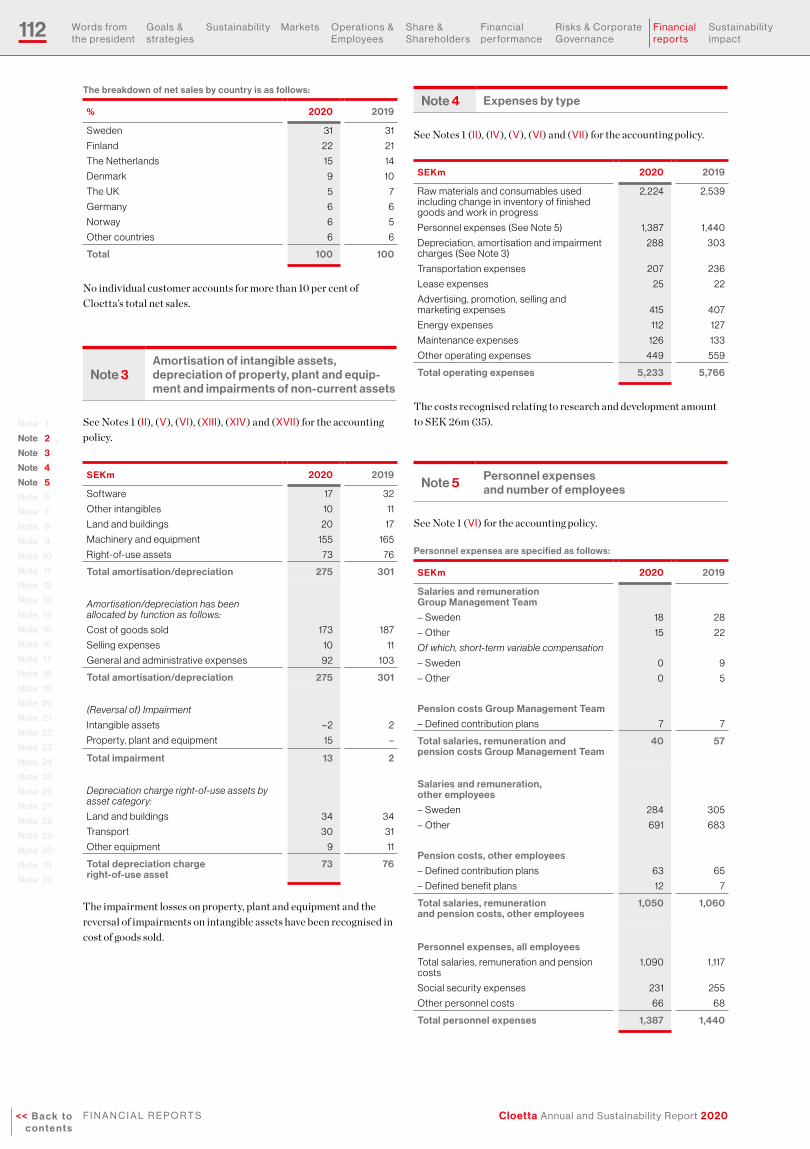
112
Cloetta Annual and Sustainability Report 2020<< B a c k t o c o n t e n t s
f i n a n C i a l r e P O r t S
Words from the president
Goals & strategies
Sustain ability Markets Operations & employees
Share & Shareholders
financial performance
risks & Corporate Governance
financial reports
Sustain ability impact
The breakdown of net sales by country is as follows:
% 2020 2019
Sweden 31 31
Finland 22 21
The Netherlands 15 14
Denmark 9 10
The UK 5 7
Germany 6 6
Norway 6 5
Other countries 6 6
Total 100 100
No individual customer accounts for more than 10 per cent of Cloetta’s total net sales.
Note 3Amortisation of intangible assets, depreciation of property, plant and equip-ment and impairments of non-current assets
See Notes 1 (ii), (V), (Vi), (Xiii), (XiV) and (XVii) for the accounting policy.
SEKm 2020 2019
Software 17 32
Other intangibles 10 11
Land and buildings 20 17
Machinery and equipment 155 165
Right-of-use assets 73 76
Total amortisation/depreciation 275 301
Amortisation/depreciation has been allocated by function as follows:
Cost of goods sold 173 187
Selling expenses 10 11
General and administrative expenses 92 103
Total amortisation/depreciation 275 301
(Reversal of) Impairment
Intangible assets –2 2
Property, plant and equipment 15 –
Total impairment 13 2
Depreciation charge right-of-use assets by asset category:
Land and buildings 34 34
Transport 30 31
Other equipment 9 11
Total depreciation charge right-of-use asset
73 76
The impairment losses on property, plant and equipment and the reversal of impairments on intangible assets have been recognised in cost of goods sold.
Note 4 Expenses by type
See Notes 1 (ii), (iV), (V), (Vi) and (Vii) for the accounting policy.
SEKm 2020 2019
Raw materials and consumables used including change in inventory of finished goods and work in progress
2,224 2,539
Personnel expenses (See Note 5) 1,387 1,440
Depreciation, amortisation and impairment charges (See Note 3)
288 303
Transportation expenses 207 236
Lease expenses 25 22
Advertising, promotion, selling and marketing expenses 415 407
Energy expenses 112 127
Maintenance expenses 126 133
Other operating expenses 449 559
Total operating expenses 5,233 5,766
The costs recognised relating to research and development amount to SEK 26m (35).
Note 5 Personnel expenses and number of employees
See Note 1 (Vi) for the accounting policy.
Personnel expenses are specified as follows:
SEKm 2020 2019
Salaries and remuneration Group Management Team
– Sweden 18 28
– Other 15 22
Of which, short-term variable compensation
– Sweden 0 9
– Other 0 5
Pension costs Group Management Team
– Defined contribution plans 7 7
Total salaries, remuneration and pension costs Group Management Team
40 57
Salaries and remuneration, other employees
– Sweden 284 305
– Other 691 683
Pension costs, other employees
– Defined contribution plans 63 65
– Defined benefit plans 12 7
Total salaries, remuneration and pension costs, other employees
1,050 1,060
Personnel expenses, all employees
Total salaries, remuneration and pension costs
1,090 1,117
Social security expenses 231 255
Other personnel costs 66 68
Total personnel expenses 1,387 1,440
Note 1
Note 2
Note 3
Note 4
Note 5
Note 6
Note 7
Note 8
Note 9
Note 10
Note 11
Note 12
Note 13
Note 14
Note 15
Note 16
Note 17
Note 18
Note 19
Note 20
Note 21
Note 22
Note 23
Note 24
Note 25
Note 26
Note 27
Note 28
Note 29
Note 30
Note 31
Note 32

113
Cloetta Annual and Sustainability Report 2020 << B a c k t o c o n t e n t s
f i n a n C i a l r e P O r t S
Words from the president
Goals & strategies
Sustain ability Markets Operations & employees
Share & Shareholders
financial performance
risks & Corporate Governance
financial reports
Sustain ability impact
The average number of employees is as follows:
# 2020 2019
– Group Management Team 11 12
– Other employees 2,642 2,617
Of whom, women
– Group Management Team 2 2
– Other employees 1,425 1,431
The average number of employees by country is as follows:
# 2020 2019
Sweden 700 715
Slovakia 749 757
The Netherlands 510 474
Finland 223 220
The UK 127 121
Belgium 114 111
Denmark 103 99
Ireland 73 74
Norway 34 40
Germany 10 10
Italy 4 4
Other 6 4
Total 2,653 2,629
Of whom, women:
Sweden 381 388
Slovakia 473 495
The Netherlands 165 158
Finland 183 181
The UK 89 83
Belgium 24 20
Denmark 57 51
Ireland 28 27
Norway 16 21
Germany 6 5
Italy 2 2
Other 3 2
Total 1,427 1,433
The specification of the gender distribution is as follows:
% 2020 2019
Percentage of women
Board of Directors 29 43
Group Management Team 18 17
Other employees 54 55
See pages 88–89 for further details on remuneration of the Group Management Team.
Note 6 Remuneration of the Board
Paid fees 2020 SEK 000s
Board fees
Commit-tee fees Total
Board Chairman
Mikael Norman1 457 67 524
Lilian Fossum Biner2 228 33 261
Board members
Mikael Aru 315 100 415
Patrick Bergander 315 150 465
Lottie Knutson 315 33 348
Alan McLean Raleigh 315 67 382
Camilla Svenfelt 315 100 415
Mikael Svenfelt 315 150 465
Total 2,575 700 3,275
Paid fees 2019 SEK 000s
Board fees
Commit-tee fees Total
Board Chairman
Lilian Fossum Biner 663 100 763
Board members
Mikael Aru 305 100 405
Patrick Bergander3 210 100 310
Lottie Knutson 305 100 405
Alan McLean Raleigh 305 – 305
Mikael Norman4 95 50 145
Camilla Svenfelt 305 100 405
Mikael Svenfelt 305 150 455
Total 2,493 700 3,193
1) Elected as per 2 April 2020.2) Resigned on 2 April 2020.3) Elected as per 4 April 2019.4) Resigned on 4 April 2019.
Note 7 Items affecting comparability
See Note 1 (Xi) for the accounting policy.
SEKm 2020 2019
Acquisitions, integration and restructurings – 53 –13
of which: impairment losses other non-current assets
–11 –
Other items affecting comparability – –3
Total –53 –16
Corresponding line in the consolidated profit and loss account:
Cost of goods sold –19 2
Selling expenses –12 – 6
General and administrative expenses –22 –12
Total –53 –16
See pages 154–155 for alternative performance measures.
Note 1
Note 2
Note 3
Note 4
Note 5
Note 6
Note 7
Note 8
Note 9
Note 10
Note 11
Note 12
Note 13
Note 14
Note 15
Note 16
Note 17
Note 18
Note 19
Note 20
Note 21
Note 22
Note 23
Note 24
Note 25
Note 26
Note 27
Note 28
Note 29
Note 30
Note 31
Note 32
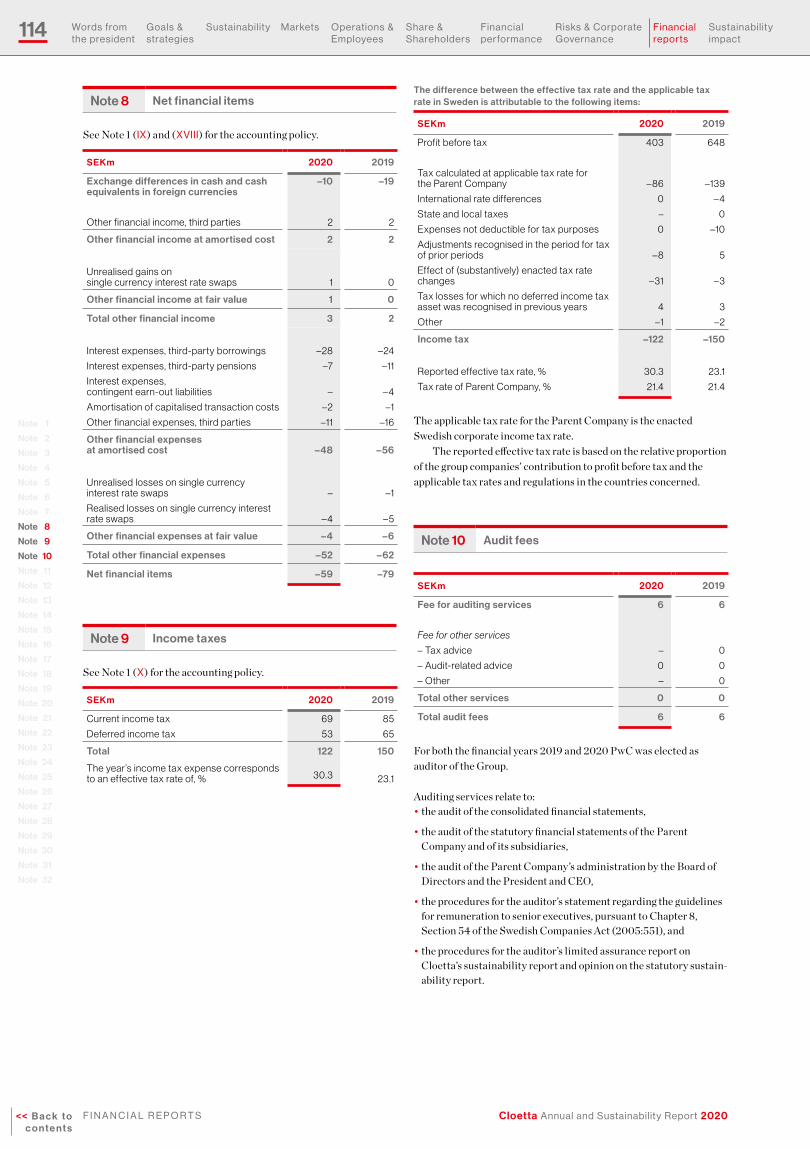
114
Cloetta Annual and Sustainability Report 2020<< B a c k t o c o n t e n t s
f i n a n C i a l r e P O r t S
Words from the president
Goals & strategies
Sustain ability Markets Operations & employees
Share & Shareholders
financial performance
risks & Corporate Governance
financial reports
Sustain ability impact
Note 8 Net financial items
See Note 1 (iX) and (XViii) for the accounting policy.
SEKm 2020 2019
Exchange differences in cash and cash equivalents in foreign currencies
–10 –19
Other financial income, third parties 2 2
Other financial income at amortised cost 2 2
Unrealised gains on single currency interest rate swaps 1 0
Other financial income at fair value 1 0
Total other financial income 3 2
Interest expenses, third-party borrowings –28 –24
Interest expenses, third-party pensions –7 –11
Interest expenses, contingent earn-out liabilities – – 4
Amortisation of capitalised transaction costs –2 –1
Other financial expenses, third parties –11 –16
Other financial expenses at amortised cost –48 –56
Unrealised losses on single currency interest rate swaps – –1
Realised losses on single currency interest rate swaps – 4 – 5
Other financial expenses at fair value –4 –6
Total other financial expenses –52 –62
Net financial items –59 –79
Note 9 Income taxes
See Note 1 (X) for the accounting policy.
SEKm 2020 2019
Current income tax 69 85
Deferred income tax 53 65
Total 122 150
The year’s income tax expense corresponds to an effective tax rate of, % 30.3 23.1
The difference between the effective tax rate and the applicable tax rate in Sweden is attributable to the following items:
SEKm 2020 2019
Profit before tax 403 648
Tax calculated at applicable tax rate for the Parent Company – 86 –139
International rate differences 0 – 4
State and local taxes – 0
Expenses not deductible for tax purposes 0 –10
Adjustments recognised in the period for tax of prior periods – 8 5
Effect of (substantively) enacted tax rate changes –31 –3
Tax losses for which no deferred income tax asset was recognised in previous years 4 3
Other –1 –2
Income tax –122 –150
Reported effective tax rate, % 30.3 23.1
Tax rate of Parent Company, % 21.4 21.4
The applicable tax rate for the Parent Company is the enacted Swedish corporate income tax rate.
The reported effective tax rate is based on the relative proportion of the group companies’ contribution to profit before tax and the applicable tax rates and regulations in the countries concerned.
Note 10 Audit fees
SEKm 2020 2019
Fee for auditing services 6 6
Fee for other services
– Tax advice – 0
– Audit-related advice 0 0
– Other – 0
Total other services 0 0
Total audit fees 6 6
For both the financial years 2019 and 2020 PwC was elected as auditor of the Group.
Auditing services relate to:• the audit of the consolidated financial statements,
• the audit of the statutory financial statements of the Parent Company and of its subsidiaries,
• the audit of the Parent Company’s administration by the Board of Directors and the President and CEO,
• the procedures for the auditor’s statement regarding the guidelines for remuneration to senior executives, pursuant to Chapter 8, Section 54 of the Swedish Companies Act (2005:551), and
• the procedures for the auditor’s limited assurance report on Cloetta’s sustainability report and opinion on the statutory sustain-ability report.
Note 1
Note 2
Note 3
Note 4
Note 5
Note 6
Note 7
Note 8
Note 9
Note 10
Note 11
Note 12
Note 13
Note 14
Note 15
Note 16
Note 17
Note 18
Note 19
Note 20
Note 21
Note 22
Note 23
Note 24
Note 25
Note 26
Note 27
Note 28
Note 29
Note 30
Note 31
Note 32
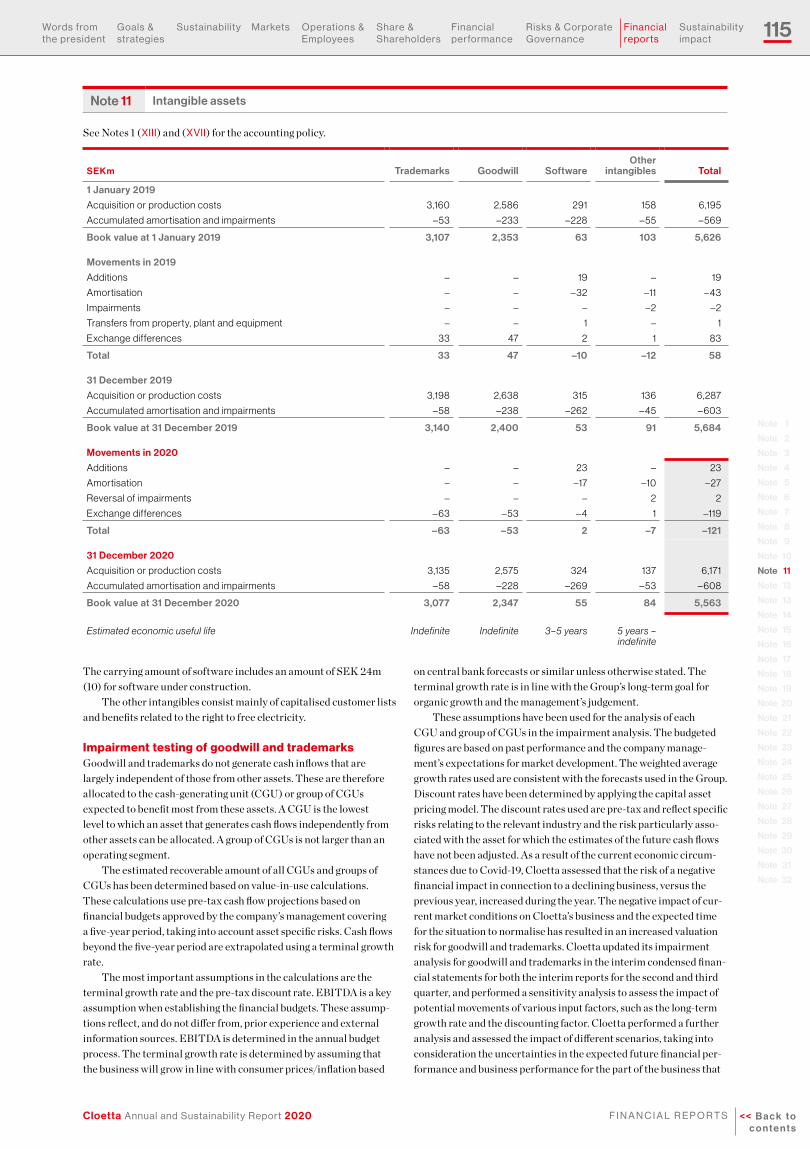
115
Cloetta Annual and Sustainability Report 2020 << B a c k t o c o n t e n t s
f i n a n C i a l r e P O r t S
Words from the president
Goals & strategies
Sustain ability Markets Operations & employees
Share & Shareholders
financial performance
risks & Corporate Governance
financial reports
Sustain ability impact
Note 1
Note 2
Note 3
Note 4
Note 5
Note 6
Note 7
Note 8
Note 9
Note 10
Note 11
Note 12
Note 13
Note 14
Note 15
Note 16
Note 17
Note 18
Note 19
Note 20
Note 21
Note 22
Note 23
Note 24
Note 25
Note 26
Note 27
Note 28
Note 29
Note 30
Note 31
Note 32
Note 11 Intangible assets
See Notes 1 (Xiii) and (XVii) for the accounting policy.
SEKm Trademarks Goodwill SoftwareOther
intangibles Total
1 January 2019
Acquisition or production costs 3,160 2,586 291 158 6,195
Accumulated amortisation and impairments – 53 –233 –228 – 55 – 569
Book value at 1 January 2019 3,107 2,353 63 103 5,626
Movements in 2019
Additions – – 19 – 19
Amortisation – – –32 –11 – 43
Impairments – – – –2 –2
Transfers from property, plant and equipment – – 1 – 1
Exchange differences 33 47 2 1 83
Total 33 47 –10 –12 58
31 December 2019
Acquisition or production costs 3,198 2,638 315 136 6,287
Accumulated amortisation and impairments – 58 –238 –262 – 45 – 603
Book value at 31 December 2019 3,140 2,400 53 91 5,684
Movements in 2020
Additions – – 23 – 23
Amortisation – – –17 –10 –27
Reversal of impairments – – – 2 2
Exchange differences – 63 – 53 – 4 1 –119
Total –63 –53 2 –7 –121
31 December 2020
Acquisition or production costs 3,135 2,575 324 137 6,171
Accumulated amortisation and impairments – 58 –228 –269 – 53 – 608
Book value at 31 December 2020 3,077 2,347 55 84 5,563
Estimated economic useful life Indefinite Indefinite 3–5 years 5 years – indefinite
The carrying amount of software includes an amount of SEK 24m (10) for software under construction.
The other intangibles consist mainly of capitalised customer lists and benefits related to the right to free electricity.
Impairment testing of goodwill and trademarksGoodwill and trademarks do not generate cash inflows that are largely independent of those from other assets. These are therefore allocated to the cash-generating unit (CGU) or group of CGUs expected to benefit most from these assets. A CGU is the lowest level to which an asset that generates cash flows independently from other assets can be allocated. A group of CGUs is not larger than an operating segment.
The estimated recoverable amount of all CGUs and groups of CGUs has been determined based on value-in-use calculations. These calculations use pre-tax cash flow projections based on financial budgets approved by the company’s management covering a five-year period, taking into account asset specific risks. Cash flows beyond the five-year period are extrapolated using a terminal growth rate.
The most important assumptions in the calculations are the terminal growth rate and the pre-tax discount rate. EBITDA is a key assumption when establishing the financial budgets. These assump-tions reflect, and do not differ from, prior experience and external information sources. EBITDA is determined in the annual budget process. The terminal growth rate is determined by assuming that the business will grow in line with consumer prices/inflation based
on central bank forecasts or similar unless otherwise stated. The terminal growth rate is in line with the Group’s long-term goal for organic growth and the management’s judgement.
These assumptions have been used for the analysis of each CGU and group of CGUs in the impairment analysis. The budgeted figures are based on past performance and the company manage-ment’s expectations for market development. The weighted average growth rates used are consistent with the forecasts used in the Group. Discount rates have been determined by applying the capital asset pricing model. The discount rates used are pre-tax and reflect specific risks relating to the relevant industry and the risk particularly asso-ciated with the asset for which the estimates of the future cash flows have not been adjusted. As a result of the current economic circum-stances due to Covid-19, Cloetta assessed that the risk of a negative financial impact in connection to a declining business, versus the previous year, increased during the year. The negative impact of cur-rent market conditions on Cloetta’s business and the expected time for the situation to normalise has resulted in an increased valuation risk for goodwill and trademarks. Cloetta updated its impairment analysis for goodwill and trademarks in the interim condensed finan-cial statements for both the interim reports for the second and third quarter, and performed a sensitivity analysis to assess the impact of potential movements of various input factors, such as the long-term growth rate and the discounting factor. Cloetta performed a further analysis and assessed the impact of different scenarios, taking into consideration the uncertainties in the expected future financial per-formance and business performance for the part of the business that

116
Cloetta Annual and Sustainability Report 2020<< B a c k t o c o n t e n t s
f i n a n C i a l r e P O r t S
Words from the president
Goals & strategies
Sustain ability Markets Operations & employees
Share & Shareholders
financial performance
risks & Corporate Governance
financial reports
Sustain ability impact
was impacted most. As the headroom per CGU remained positive in this analysis, no impairment was recognised. The assumptions used in performing the interim impairment analysis have been updated for the annual impairment test in December.
For impairment testing, the following assumptions have been used
Terminal growth rate
Pre-tax discount rate including
inflation1
% 2020 2019 2020 2019
Scandinavia n/a 2.5 n/a 7.2
Sweden 1.7 2.5 6.5 7.2
Denmark & Norway 1.7 2.5 7.3 7.2
Finland 1.7 2.5 8.0 8.8
Middle n/a 2.5 n/a 8.4
The Netherlands 1.7 2.5 7.3 8.4
The Netherlands & Germany 1.7 2.5 7.3 8.4
International Markets & the UK 1.7 2.5 8.5 8.4
Group 1.7 2.5 6.2 6.8
1 Pre-tax discount rates have been restated to include an inflation compo-nent, to align with the terminal growth rates that also include an inflation component.
In performing the impairment tests for goodwill and trademarks, a sensitivity analysis has been performed for each CGU and group of CGUs. The estimated recoverable amount of the Netherlands & Germany group of CGUs exceeds its carrying amount by approx-imately SEK 342m. If the terminal growth rate decreases by 1.9 percentage points to –0.2 per cent, the pre-tax discount rate will increase by 1.5 percentage points to 8.8 per cent, or if the expected EBITDA decreases by SEK 20m per year, the estimated recoverable amount of the Netherlands & Germany group of CGUs will be equal to its carrying amount. For the other groups of CGUs a reasonable change in assumptions will not lead to an impairment.
GoodwillGoodwill is allocated to a CGU or group of CGUs not larger than an operating segment. The allocation has been made to the groups of CGUs that correspond to the operating segments that are expected to benefit most, which are the commercial organisations of Sweden, Denmark & Norway, Finland, the Netherlands & Germany and International Markets & the UK. As a result of the division of the Scandinavia group of CGUs into Denmark & Norway and Sweden, and of the Middle group of CGUs into the Netherlands & Germany and International Markets & the UK, the goodwill of prior acquis-tions has been reallocated. The reallocation has taken place using a relative value approach.
The following summary specifies the allocation of goodwill to the different groups of cash-generating units
SEKm Scandinavia SwedenNorway & Denmark Finland Middle
International Markets & the UK
The Netherlands & Germany Total
1 January 2019 979 – – 1,047 327 – – 2,353
Exchange rate differences 6 – – 24 17 – – 47
31 December 2019 985 – – 1,071 344 – – 2,400
Reallocation goodwill –985 504 481 – –344 50 294 –
Exchange rate differences – – –3 –39 – –2 –9 – 53
31 December 2020 – 504 478 1,032 – 48 285 2,347
TrademarksFor trademarks, the related CGUs are the commercial organisations of the countries that own the respective trademarks. The products are mainly sold in the countries owning the trademarks. If products are sold by Group companies in other countries, the trademark owner charges royalty fees to the selling party.
The following summary specifies the allocation of trademarks to the different cash-generating units
SEKm Sweden Finland The Netherlands Other (corporate assets) Total
1 January 2019 1,545 530 969 63 3,107
Exchange rate differences – 11 21 1 33
31 December 2019 1,545 541 990 64 3,140
Exchange rate differences – –21 –39 –3 – 63
31 December 2020 1.545 520 951 61 3,077
The key assumptions underlying the cash flow projections for the period covered by recent forecasts are included in the table below
Key assumption used in value in use calculation
Basis for determining value assigned to key assumption
EBITDA External market studies on growth of market, historical growth rates, current market developments and outlook for a five year period.
Impairment of goodwill and trademarks An impairment analysis has been performed in which the carrying amount of a CGU or group of CGUs is compared with the total recov-
erable amount. No impairments on goodwill or trademarks have been recorded in the financial years 2019 and 2020.
Corporate assetsGroup-wide assets and liabilities, including the right of free electrici-ty and software under construction, that cannot be directly allocated on a reasonable and consistent basis to the CGUs or groups of CGUs are classified as corporate assets. A group impairment analysis has been performed in which the carrying amount of the total group of CGUs, including the portion of the carrying amount representing the Group’s corporate assets, is compared with the total recoverable amount.
Note 1
Note 2
Note 3
Note 4
Note 5
Note 6
Note 7
Note 8
Note 9
Note 10
Note 11
Note 12
Note 13
Note 14
Note 15
Note 16
Note 17
Note 18
Note 19
Note 20
Note 21
Note 22
Note 23
Note 24
Note 25
Note 26
Note 27
Note 28
Note 29
Note 30
Note 31
Note 32
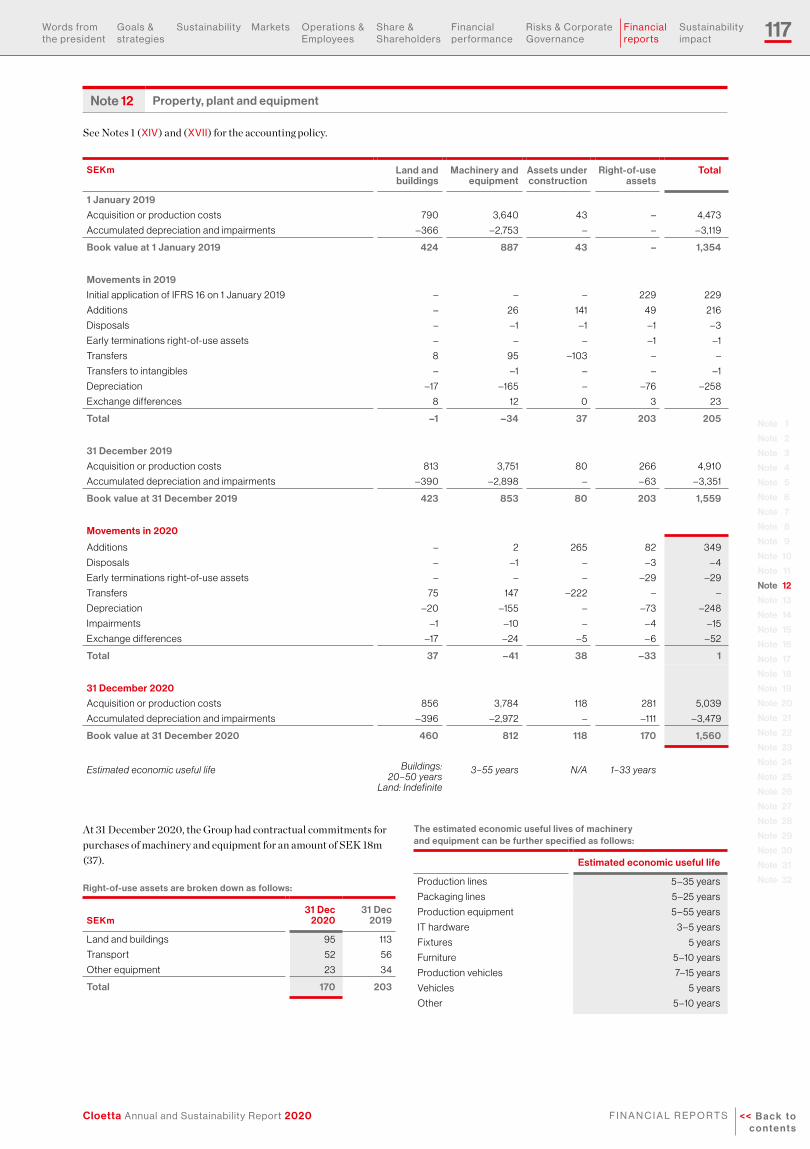
117
Cloetta Annual and Sustainability Report 2020 << B a c k t o c o n t e n t s
f i n a n C i a l r e P O r t S
Words from the president
Goals & strategies
Sustain ability Markets Operations & employees
Share & Shareholders
financial performance
risks & Corporate Governance
financial reports
Sustain ability impact
Note 1
Note 2
Note 3
Note 4
Note 5
Note 6
Note 7
Note 8
Note 9
Note 10
Note 11
Note 12
Note 13
Note 14
Note 15
Note 16
Note 17
Note 18
Note 19
Note 20
Note 21
Note 22
Note 23
Note 24
Note 25
Note 26
Note 27
Note 28
Note 29
Note 30
Note 31
Note 32
Note 12 Property, plant and equipment
See Notes 1 (XiV) and (XVii) for the accounting policy.
SEKm Land and buildings
Machinery and equipment
Assets under construction
Right-of-use assets
Total
1 January 2019
Acquisition or production costs 790 3,640 43 – 4,473
Accumulated depreciation and impairments –366 –2,753 – – –3,119
Book value at 1 January 2019 424 887 43 – 1,354
Movements in 2019
Initial application of IFRS 16 on 1 January 2019 – – – 229 229
Additions – 26 141 49 216
Disposals – –1 –1 –1 –3
Early terminations right-of-use assets – – – –1 –1
Transfers 8 95 –103 – –
Transfers to intangibles – –1 – – –1
Depreciation –17 –165 – –76 –258
Exchange differences 8 12 0 3 23
Total –1 –34 37 203 205
31 December 2019
Acquisition or production costs 813 3,751 80 266 4,910
Accumulated depreciation and impairments –390 –2,898 – – 63 –3,351
Book value at 31 December 2019 423 853 80 203 1,559
Movements in 2020
Additions – 2 265 82 349
Disposals – –1 – –3 – 4
Early terminations right-of-use assets – – – –29 –29
Transfers 75 147 –222 – –
Depreciation –20 –155 – –73 –248
Impairments –1 –10 – – 4 –15
Exchange differences –17 –24 – 5 – 6 – 52
Total 37 –41 38 –33 1
31 December 2020
Acquisition or production costs 856 3,784 118 281 5,039
Accumulated depreciation and impairments –396 –2,972 – –111 –3,479
Book value at 31 December 2020 460 812 118 170 1,560
Estimated economic useful life Buildings: 20–50 years
Land: Indefinite
3–55 years N/A 1–33 years
At 31 December 2020, the Group had contractual commitments for purchases of machinery and equipment for an amount of SEK 18m (37).
Right-of-use assets are broken down as follows:
SEKm31 Dec
202031 Dec
2019
Land and buildings 95 113
Transport 52 56
Other equipment 23 34
Total 170 203
The estimated economic useful lives of machinery and equipment can be further specified as follows:
Estimated economic useful life
Production lines 5 –35 years
Packaging lines 5 –25 years
Production equipment 5 – 55 years
IT hardware 3 – 5 years
Fixtures 5 years
Furniture 5 –10 years
Production vehicles 7–15 years
Vehicles 5 years
Other 5 –10 years
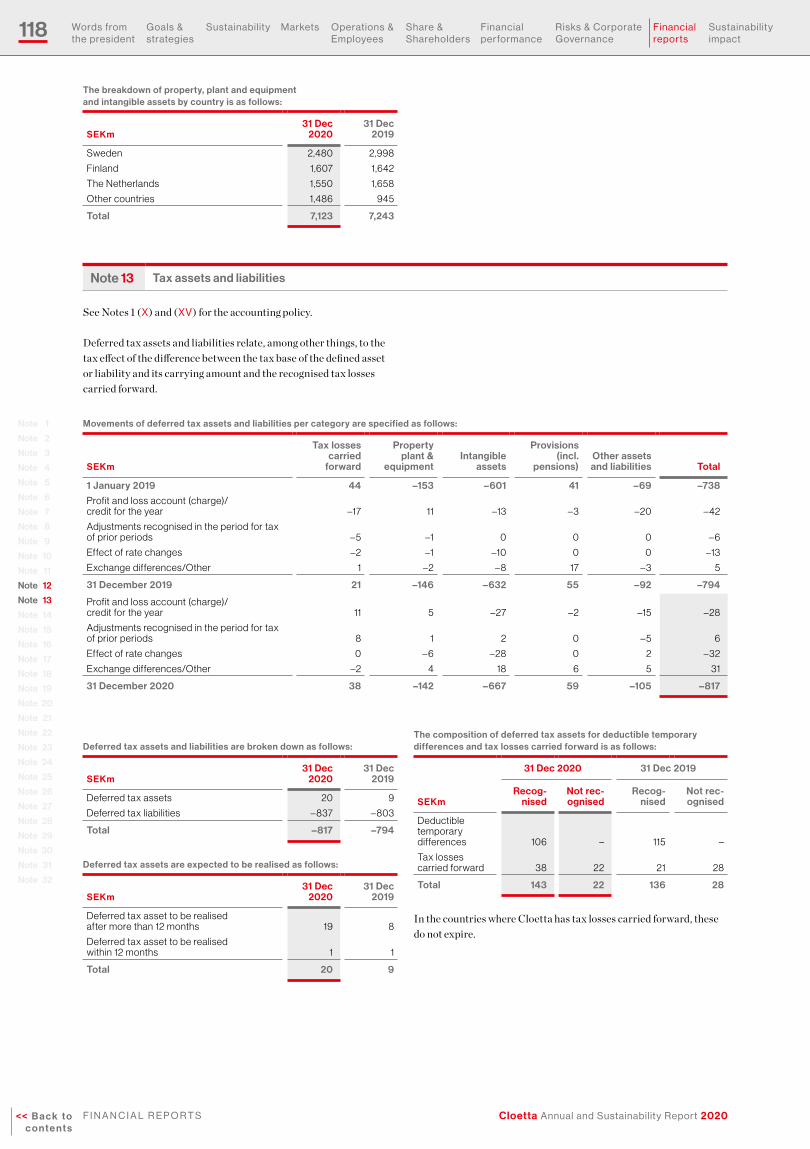
118
Cloetta Annual and Sustainability Report 2020<< B a c k t o c o n t e n t s
f i n a n C i a l r e P O r t S
Words from the president
Goals & strategies
Sustain ability Markets Operations & employees
Share & Shareholders
financial performance
risks & Corporate Governance
financial reports
Sustain ability impact
The breakdown of property, plant and equipment and intangible assets by country is as follows:
SEKm31 Dec
202031 Dec
2019
Sweden 2,480 2,998
Finland 1,607 1,642
The Netherlands 1,550 1,658
Other countries 1,486 945
Total 7,123 7,243
Note 13 Tax assets and liabilities
See Notes 1 (X) and (XV) for the accounting policy.
Deferred tax assets and liabilities relate, among other things, to the tax effect of the difference between the tax base of the defined asset or liability and its carrying amount and the recognised tax losses carried forward.
Movements of deferred tax assets and liabilities per category are specified as follows:
SEKm
Tax losses carried
forward
Property plant &
equipmentIntangible
assets
Provisions (incl.
pensions)Other assets
and liabilities Total
1 January 2019 44 –153 –601 41 –69 –738
Profit and loss account (charge)/ credit for the year –17 11 –13 –3 –20 – 42
Adjustments recognised in the period for tax of prior periods – 5 –1 0 0 0 – 6
Effect of rate changes –2 –1 –10 0 0 –13
Exchange differences/Other 1 –2 – 8 17 –3 5
31 December 2019 21 –146 –632 55 –92 –794
Profit and loss account (charge)/ credit for the year 11 5 –27 –2 –15 –28
Adjustments recognised in the period for tax of prior periods 8 1 2 0 – 5 6
Effect of rate changes 0 – 6 –28 0 2 –32
Exchange differences/Other –2 4 18 6 5 31
31 December 2020 38 –142 –667 59 –105 –817
Deferred tax assets and liabilities are broken down as follows:
SEKm31 Dec
202031 Dec
2019
Deferred tax assets 20 9
Deferred tax liabilities – 837 – 803
Total –817 –794
Deferred tax assets are expected to be realised as follows:
SEKm31 Dec
202031 Dec
2019
Deferred tax asset to be realised after more than 12 months 19 8
Deferred tax asset to be realised within 12 months 1 1
Total 20 9
The composition of deferred tax assets for deductible temporary differences and tax losses carried forward is as follows:
31 Dec 2020 31 Dec 2019
SEKmRecog-
nisedNot rec-ognised
Recog-nised
Not rec-ognised
Deductible temporary differences 106 – 115 –
Tax losses carried forward 38 22 21 28
Total 143 22 136 28
In the countries where Cloetta has tax losses carried forward, these do not expire.
Note 1
Note 2
Note 3
Note 4
Note 5
Note 6
Note 7
Note 8
Note 9
Note 10
Note 11
Note 12
Note 13
Note 14
Note 15
Note 16
Note 17
Note 18
Note 19
Note 20
Note 21
Note 22
Note 23
Note 24
Note 25
Note 26
Note 27
Note 28
Note 29
Note 30
Note 31
Note 32

119
Cloetta Annual and Sustainability Report 2020 << B a c k t o c o n t e n t s
f i n a n C i a l r e P O r t S
Words from the president
Goals & strategies
Sustain ability Markets Operations & employees
Share & Shareholders
financial performance
risks & Corporate Governance
financial reports
Sustain ability impact
Note 1
Note 2
Note 3
Note 4
Note 5
Note 6
Note 7
Note 8
Note 9
Note 10
Note 11
Note 12
Note 13
Note 14
Note 15
Note 16
Note 17
Note 18
Note 19
Note 20
Note 21
Note 22
Note 23
Note 24
Note 25
Note 26
Note 27
Note 28
Note 29
Note 30
Note 31
Note 32
Deferred tax liabilitiesThe deferred tax liability is recognised to account for the taxable temporary differences between the tax bases of intangible assets, property, plant and equipment, work in progress, inventories, receiv-ables and provisions and their carrying amounts.
SEKm31 Dec
202031 Dec
2019
Deferred tax liability to be recovered after more than 12 months 837 793
Deferred tax liability to be recovered within 12 months 0 10
Total 837 803
Current income tax
SEKm31 Dec
202031 Dec
2019
Current income tax assets 27 6
Current income tax liabilities –23 – 44
Total 4 –38
See also Note 30 for further details regarding accounting estimates and judgments in respect of the ongoing tax audits.
Note 14 Non-current financial assets
See Notes 1 (XVi) and (XVii) for the accounting policy.
SEKm31 Dec
202031 Dec
2019
Deposits 2 2
Funded pension schemes in a net asset position 1 –
Other financial assets 0 5
Total 3 7
The fair values of non-current financial assets approximate their carrying amounts.
None of the different classes of non-current financial assets contain impaired assets. The maximum exposure to credit risk at the reporting date is the fair value of each class of receivable mentioned above. The Group does not hold any collateral as security.
See Note 23 for further details on the funded pension schemes in a net asset position.
Note 15 Inventories
See Note 1 (XiX) for the accounting policy.
Inventories for own use and resale
SEKm31 Dec
202031 Dec
2019
Raw materials and consumables 286 282
Work in progress 60 69
Finished goods and goods for resale 606 537
Total 952 888
Movements in the provision for obsolete inventory are as follows:
SEKm 2020 2019
At 1 January 19 20
Provision for impairment of inventories 10 –1
Inventories written off during the year as obsolete -11 –
Unused amounts reversed 0 –1
Exchange differences 0 1
At 31 December 18 19
Note 16 Trade and other receivables
See Notes 1 (XVi) for the accounting policy.
SEKm31 Dec
202031 Dec
2019
Trade debtors 650 826
Loss allowances for trade receivables – 4 –3
Trade receivables – net 646 823
Other receivables 58 47
Prepaid expenses and accrued income 32 58
Total 736 928
Movements in the loss allowance for trade receivables are as follows:
SEKm 2020 2019
At 1 January 3 1
Provision for impairment of trade receivables 2 3
Trade receivables written off during the year as uncollectible –1 0
Unused amounts reversed 0 –
Exchange differences 0 –1
At 31 December 4 3
Cloetta Denmark ApS entered into a receivable purchase agreement with Skandinaviska Enskilda Banken for one Danish customer. As a result per year-end, Cloetta Denmark ApS received an amount of DKK 17m (0), equivalent to SEK 24m (0) in advance before the due date. Cloetta Denmark ApS pays a discount fee for the early receipt based on 3M CIBOR with a zero-floor clause and a fixed margin.
The individual trade receivables for which provisions were made relate to uncollectible receivables that are not covered by credit insurance.
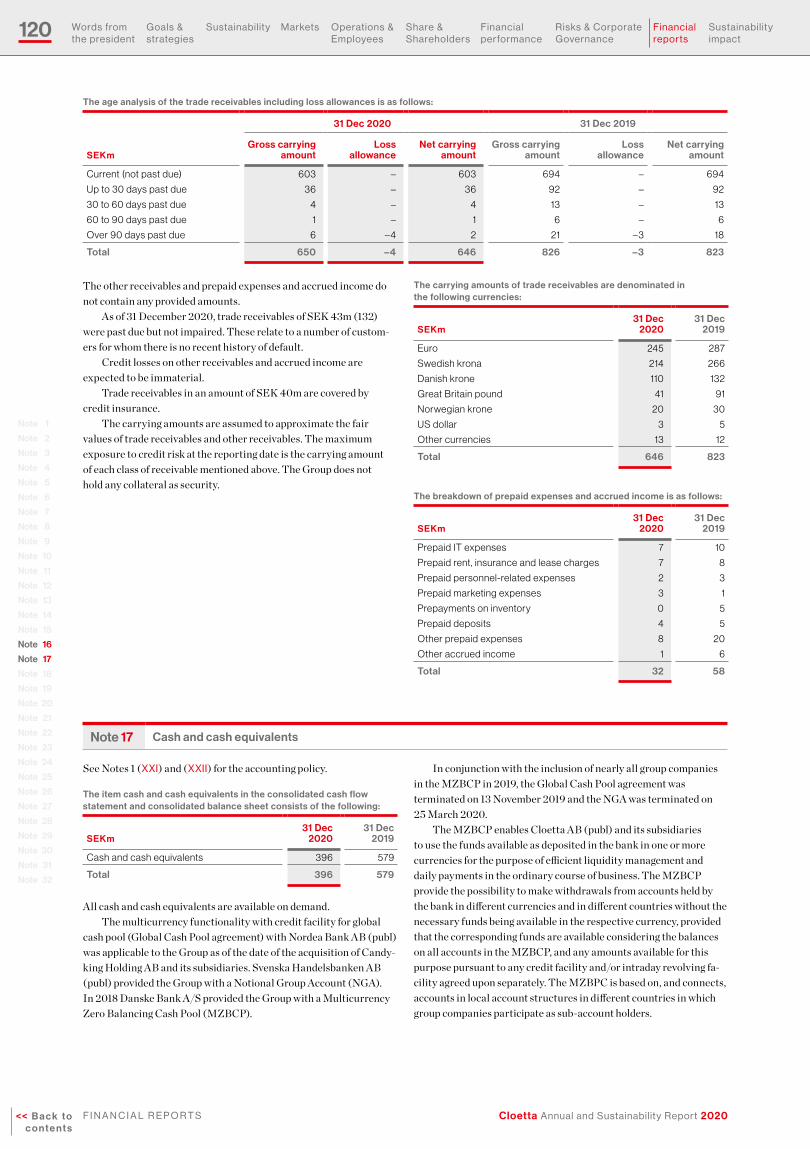
120
Cloetta Annual and Sustainability Report 2020<< B a c k t o c o n t e n t s
f i n a n C i a l r e P O r t S
Words from the president
Goals & strategies
Sustain ability Markets Operations & employees
Share & Shareholders
financial performance
risks & Corporate Governance
financial reports
Sustain ability impact
The age analysis of the trade receivables including loss allowances is as follows:
31 Dec 2020 31 Dec 2019
SEKmGross carrying
amountLoss
allowanceNet carrying
amountGross carrying
amountLoss
allowanceNet carrying
amount
Current (not past due) 603 – 603 694 – 694
Up to 30 days past due 36 – 36 92 – 92
30 to 60 days past due 4 – 4 13 – 13
60 to 90 days past due 1 – 1 6 – 6
Over 90 days past due 6 – 4 2 21 –3 18
Total 650 –4 646 826 –3 823
The other receivables and prepaid expenses and accrued income do not contain any provided amounts.
As of 31 December 2020, trade receivables of SEK 43m (132) were past due but not impaired. These relate to a number of custom-ers for whom there is no recent history of default.
Credit losses on other receivables and accrued income are expected to be immaterial.
Trade receivables in an amount of SEK 40m are covered by credit insurance.
The carrying amounts are assumed to approximate the fair values of trade receivables and other receivables. The maximum exposure to credit risk at the reporting date is the carrying amount of each class of receivable mentioned above. The Group does not hold any collateral as security.
The carrying amounts of trade receivables are denominated in the following currencies:
SEKm31 Dec
202031 Dec
2019
Euro 245 287
Swedish krona 214 266
Danish krone 110 132
Great Britain pound 41 91
Norwegian krone 20 30
US dollar 3 5
Other currencies 13 12
Total 646 823
The breakdown of prepaid expenses and accrued income is as follows:
SEKm31 Dec
202031 Dec
2019
Prepaid IT expenses 7 10
Prepaid rent, insurance and lease charges 7 8
Prepaid personnel-related expenses 2 3
Prepaid marketing expenses 3 1
Prepayments on inventory 0 5
Prepaid deposits 4 5
Other prepaid expenses 8 20
Other accrued income 1 6
Total 32 58
Note 17 Cash and cash equivalents
See Notes 1 (XXi) and (XXii) for the accounting policy.
The item cash and cash equivalents in the consolidated cash flow statement and consolidated balance sheet consists of the following:
SEKm31 Dec
202031 Dec
2019
Cash and cash equivalents 396 579
Total 396 579
All cash and cash equivalents are available on demand.The multicurrency functionality with credit facility for global
cash pool (Global Cash Pool agreement) with Nordea Bank AB (publ) was applicable to the Group as of the date of the acquisition of Candy-king Holding AB and its subsidiaries. Svenska Handelsbanken AB (publ) provided the Group with a Notional Group Account (NGA). In 2018 Danske Bank A/S provided the Group with a Multicurrency Zero Balancing Cash Pool (MZBCP).
In conjunction with the inclusion of nearly all group companies in the MZBCP in 2019, the Global Cash Pool agreement was terminated on 13 November 2019 and the NGA was terminated on 25 March 2020.
The MZBCP enables Cloetta AB (publ) and its subsidiaries to use the funds available as deposited in the bank in one or more currencies for the purpose of efficient liquidity management and daily payments in the ordinary course of business. The MZBCP provide the possibility to make withdrawals from accounts held by the bank in different currencies and in different countries without the necessary funds being available in the respective currency, provided that the corresponding funds are available considering the balances on all accounts in the MZBCP, and any amounts available for this purpose pursuant to any credit facility and/or intraday revolving fa-cility agreed upon separately. The MZBPC is based on, and connects, accounts in local account structures in different countries in which group companies participate as sub-account holders.
Note 1
Note 2
Note 3
Note 4
Note 5
Note 6
Note 7
Note 8
Note 9
Note 10
Note 11
Note 12
Note 13
Note 14
Note 15
Note 16
Note 17
Note 18
Note 19
Note 20
Note 21
Note 22
Note 23
Note 24
Note 25
Note 26
Note 27
Note 28
Note 29
Note 30
Note 31
Note 32
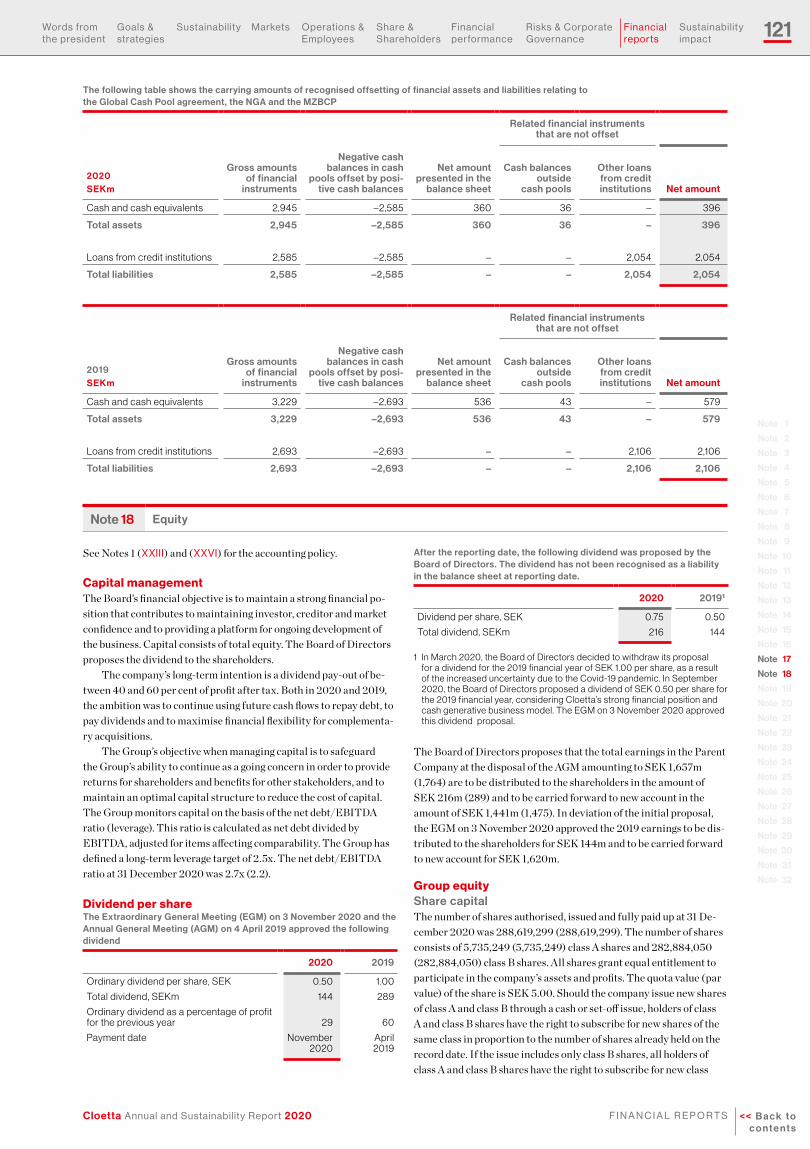
121
Cloetta Annual and Sustainability Report 2020 << B a c k t o c o n t e n t s
f i n a n C i a l r e P O r t S
Words from the president
Goals & strategies
Sustain ability Markets Operations & employees
Share & Shareholders
financial performance
risks & Corporate Governance
financial reports
Sustain ability impact
Note 1
Note 2
Note 3
Note 4
Note 5
Note 6
Note 7
Note 8
Note 9
Note 10
Note 11
Note 12
Note 13
Note 14
Note 15
Note 16
Note 17
Note 18
Note 19
Note 20
Note 21
Note 22
Note 23
Note 24
Note 25
Note 26
Note 27
Note 28
Note 29
Note 30
Note 31
Note 32
The following table shows the carrying amounts of recognised offsetting of financial assets and liabilities relating to the Global Cash Pool agreement, the NGA and the MZBCP
Related financial instruments that are not offset
2020 SEKm
Gross amounts of financial
instruments
Negative cash balances in cash
pools offset by posi-tive cash balances
Net amount presented in the
balance sheet
Cash balances outside
cash pools
Other loans from credit institutions Net amount
Cash and cash equivalents 2,945 –2,585 360 36 – 396
Total assets 2,945 –2,585 360 36 – 396
Loans from credit institutions 2,585 –2,585 – – 2,054 2,054
Total liabilities 2,585 –2,585 – – 2,054 2,054
Related financial instruments that are not offset
2019 SEKm
Gross amounts of financial
instruments
Negative cash balances in cash
pools offset by posi-tive cash balances
Net amount presented in the
balance sheet
Cash balances outside
cash pools
Other loans from credit institutions Net amount
Cash and cash equivalents 3,229 –2,693 536 43 – 579
Total assets 3,229 –2,693 536 43 – 579
Loans from credit institutions 2,693 –2,693 – – 2,106 2,106
Total liabilities 2,693 –2,693 – – 2,106 2,106
Note 18 Equity
See Notes 1 (XXiii) and (XXVi) for the accounting policy.
Capital managementThe Board’s financial objective is to maintain a strong financial po-sition that contributes to maintaining investor, creditor and market confidence and to providing a platform for ongoing development of the business. Capital consists of total equity. The Board of Directors proposes the dividend to the shareholders.
The company’s long-term intention is a dividend pay-out of be-tween 40 and 60 per cent of profit after tax. Both in 2020 and 2019, the ambition was to continue using future cash flows to repay debt, to pay dividends and to maximise financial flexibility for complementa-ry acquisitions.
The Group’s objective when managing capital is to safeguard the Group’s ability to continue as a going concern in order to provide returns for shareholders and benefits for other stakeholders, and to maintain an optimal capital structure to reduce the cost of capital. The Group monitors capital on the basis of the net debt/EBITDA ratio (leverage). This ratio is calculated as net debt divided by EBITDA, adjusted for items affecting comparability. The Group has defined a long-term leverage target of 2.5x. The net debt/EBITDA ratio at 31 December 2020 was 2.7x (2.2).
Dividend per shareThe Extraordinary General Meeting (EGM) on 3 November 2020 and the Annual General Meeting (AGM) on 4 April 2019 approved the following dividend
2020 2019
Ordinary dividend per share, SEK 0.50 1.00
Total dividend, SEKm 144 289
Ordinary dividend as a percentage of profit for the previous year 29 60
Payment date November 2020
April 2019
After the reporting date, the following dividend was proposed by the Board of Directors. The dividend has not been recognised as a liability in the balance sheet at reporting date.
2020 20191
Dividend per share, SEK 0.75 0.50
Total dividend, SEKm 216 144
1 In March 2020, the Board of Directors decided to withdraw its proposal for a dividend for the 2019 financial year of SEK 1.00 per share, as a result of the increased uncertainty due to the Covid-19 pandemic. In September 2020, the Board of Directors proposed a dividend of SEK 0.50 per share for the 2019 financial year, considering Cloetta’s strong financial position and cash generative business model. The EGM on 3 November 2020 approved this dividend proposal.
The Board of Directors proposes that the total earnings in the Parent Company at the disposal of the AGM amounting to SEK 1,657m (1,764) are to be distributed to the shareholders in the amount of SEK 216m (289) and to be carried forward to new account in the amount of SEK 1,441m (1,475). In deviation of the initial proposal, the EGM on 3 November 2020 approved the 2019 earnings to be dis-tributed to the shareholders for SEK 144m and to be carried forward to new account for SEK 1,620m.
Group equityShare capitalThe number of shares authorised, issued and fully paid up at 31 De-cember 2020 was 288,619,299 (288,619,299). The number of shares consists of 5,735,249 (5,735,249) class A shares and 282,884,050 (282,884,050) class B shares. All shares grant equal entitlement to participate in the company’s assets and profits. The quota value (par value) of the share is SEK 5.00. Should the company issue new shares of class A and class B through a cash or set-off issue, holders of class A and class B shares have the right to subscribe for new shares of the same class in proportion to the number of shares already held on the record date. If the issue includes only class B shares, all holders of class A and class B shares have the right to subscribe for new class
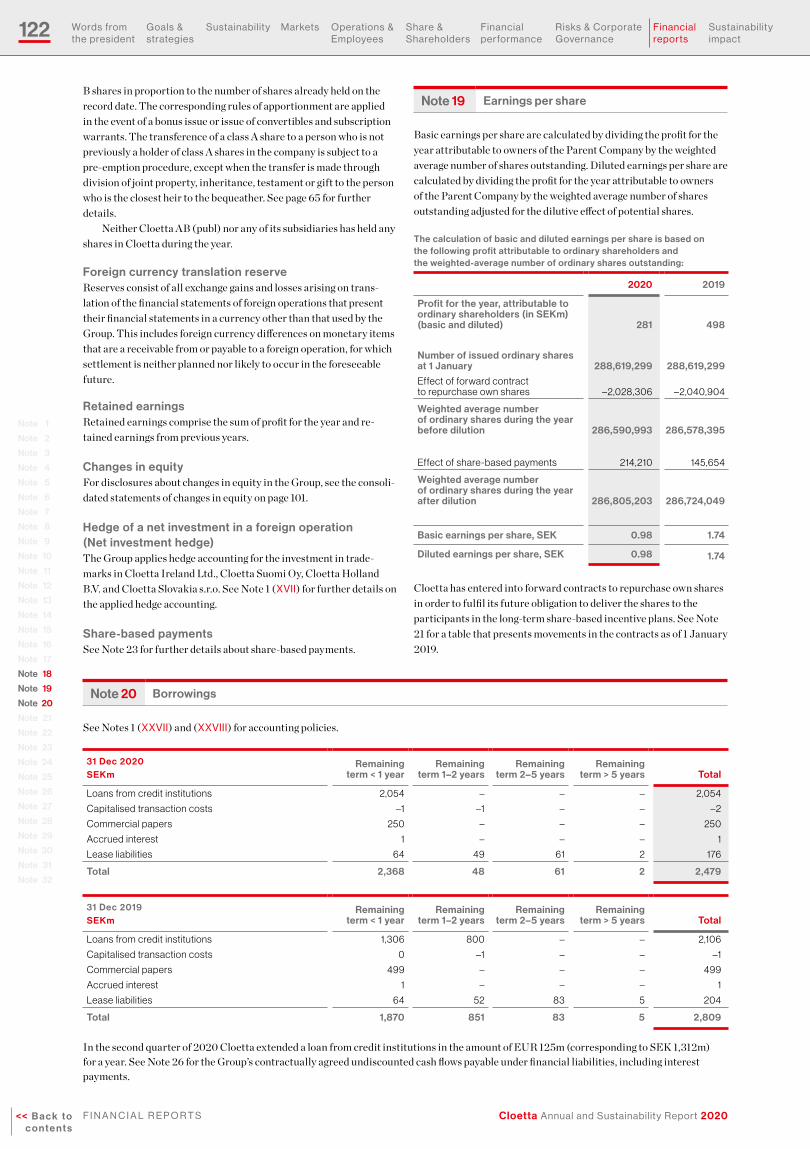
122
Cloetta Annual and Sustainability Report 2020<< B a c k t o c o n t e n t s
f i n a n C i a l r e P O r t S
Words from the president
Goals & strategies
Sustain ability Markets Operations & employees
Share & Shareholders
financial performance
risks & Corporate Governance
financial reports
Sustain ability impact
B shares in proportion to the number of shares already held on the record date. The corresponding rules of apportionment are applied in the event of a bonus issue or issue of convertibles and subscription warrants. The transference of a class A share to a person who is not previously a holder of class A shares in the company is subject to a pre-emption procedure, except when the transfer is made through division of joint property, inheritance, testament or gift to the person who is the closest heir to the bequeather. See page 65 for further details.
Neither Cloetta AB (publ) nor any of its subsidiaries has held any shares in Cloetta during the year.
Foreign currency translation reserveReserves consist of all exchange gains and losses arising on trans-lation of the financial statements of foreign operations that present their financial statements in a currency other than that used by the Group. This includes foreign currency differences on monetary items that are a receivable from or payable to a foreign operation, for which settlement is neither planned nor likely to occur in the foreseeable future.
Retained earningsRetained earnings comprise the sum of profit for the year and re-tained earnings from previous years.
Changes in equityFor disclosures about changes in equity in the Group, see the consoli-dated statements of changes in equity on page 101.
Hedge of a net investment in a foreign operation (Net investment hedge)The Group applies hedge accounting for the investment in trade-marks in Cloetta Ireland Ltd., Cloetta Suomi Oy, Cloetta Holland B.V. and Cloetta Slovakia s.r.o. See Note 1 (XVii) for further details on the applied hedge accounting.
Share-based paymentsSee Note 23 for further details about share-based payments.
Note 19 Earnings per share
Basic earnings per share are calculated by dividing the profit for the year attributable to owners of the Parent Company by the weighted average number of shares outstanding. Diluted earnings per share are calculated by dividing the profit for the year attributable to owners of the Parent Company by the weighted average number of shares outstanding adjusted for the dilutive effect of potential shares.
The calculation of basic and diluted earnings per share is based on the following profit attributable to ordinary shareholders and the weighted-average number of ordinary shares outstanding:
2020 2019
Profit for the year, attributable to ordinary shareholders (in SEKm) (basic and diluted) 281 498
Number of issued ordinary shares at 1 January 288,619,299 288,619,299
Effect of forward contract to repurchase own shares –2,028,306 –2,040,904
Weighted average number of ordinary shares during the year before dilution 286,590,993 286,578,395
Effect of share-based payments 214,210 145,654
Weighted average number of ordinary shares during the year after dilution 286,805,203 286,724,049
Basic earnings per share, SEK 0.98 1.74
Diluted earnings per share, SEK 0.98 1.74
Cloetta has entered into forward contracts to repurchase own shares in order to fulfil its future obligation to deliver the shares to the participants in the long-term share-based incentive plans. See Note 21 for a table that presents movements in the contracts as of 1 January 2019.
Note 20 Borrowings
See Notes 1 (XXVii) and (XXViii) for accounting policies.
31 Dec 2020 SEKm
Remaining term < 1 year
Remaining term 1–2 years
Remaining term 2–5 years
Remaining term > 5 years Total
Loans from credit institutions 2,054 – – – 2,054
Capitalised transaction costs –1 –1 – – –2
Commercial papers 250 – – – 250
Accrued interest 1 – – – 1
Lease liabilities 64 49 61 2 176
Total 2,368 48 61 2 2,479
31 Dec 2019 SEKm
Remaining term < 1 year
Remaining term 1–2 years
Remaining term 2–5 years
Remaining term > 5 years Total
Loans from credit institutions 1,306 800 – – 2,106
Capitalised transaction costs 0 –1 – – –1
Commercial papers 499 – – – 499
Accrued interest 1 – – – 1
Lease liabilities 64 52 83 5 204
Total 1,870 851 83 5 2,809
In the second quarter of 2020 Cloetta extended a loan from credit institutions in the amount of EUR 125m (corresponding to SEK 1,312m) for a year. See Note 26 for the Group’s contractually agreed undiscounted cash flows payable under financial liabilities, including interest payments.
Note 1
Note 2
Note 3
Note 4
Note 5
Note 6
Note 7
Note 8
Note 9
Note 10
Note 11
Note 12
Note 13
Note 14
Note 15
Note 16
Note 17
Note 18
Note 19
Note 20
Note 21
Note 22
Note 23
Note 24
Note 25
Note 26
Note 27
Note 28
Note 29
Note 30
Note 31
Note 32
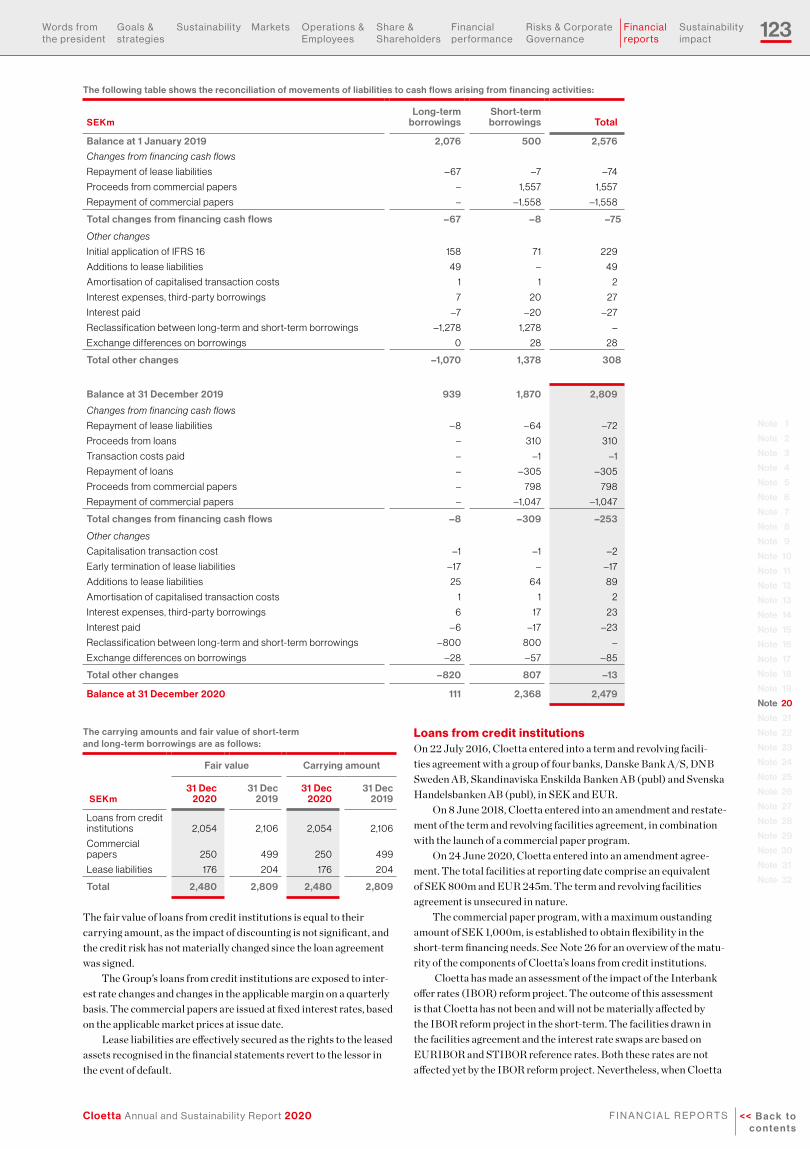
123
Cloetta Annual and Sustainability Report 2020 << B a c k t o c o n t e n t s
f i n a n C i a l r e P O r t S
Words from the president
Goals & strategies
Sustain ability Markets Operations & employees
Share & Shareholders
financial performance
risks & Corporate Governance
financial reports
Sustain ability impact
Note 1
Note 2
Note 3
Note 4
Note 5
Note 6
Note 7
Note 8
Note 9
Note 10
Note 11
Note 12
Note 13
Note 14
Note 15
Note 16
Note 17
Note 18
Note 19
Note 20
Note 21
Note 22
Note 23
Note 24
Note 25
Note 26
Note 27
Note 28
Note 29
Note 30
Note 31
Note 32
The following table shows the reconciliation of movements of liabilities to cash flows arising from financing activities:
SEKmLong-term
borrowingsShort-term borrowings Total
Balance at 1 January 2019 2,076 500 2,576
Changes from financing cash flows
Repayment of lease liabilities – 67 –7 –74
Proceeds from commercial papers – 1,557 1,557
Repayment of commercial papers – –1,558 –1,558
Total changes from financing cash flows –67 –8 –75
Other changes
Initial application of IFRS 16 158 71 229
Additions to lease liabilities 49 – 49
Amortisation of capitalised transaction costs 1 1 2
Interest expenses, third-party borrowings 7 20 27
Interest paid –7 –20 –27
Reclassification between long-term and short-term borrowings –1,278 1,278 –
Exchange differences on borrowings 0 28 28
Total other changes –1,070 1,378 308
Balance at 31 December 2019 939 1,870 2,809
Changes from financing cash flows
Repayment of lease liabilities – 8 – 64 –72
Proceeds from loans – 310 310
Transaction costs paid – –1 –1
Repayment of loans – –305 –305
Proceeds from commercial papers – 798 798
Repayment of commercial papers – –1,047 –1,047
Total changes from financing cash flows –8 –309 –253
Other changes
Capitalisation transaction cost –1 –1 –2
Early termination of lease liabilities –17 – –17
Additions to lease liabilities 25 64 89
Amortisation of capitalised transaction costs 1 1 2
Interest expenses, third-party borrowings 6 17 23
Interest paid – 6 –17 –23
Reclassification between long-term and short-term borrowings – 800 800 –
Exchange differences on borrowings –28 – 57 – 85
Total other changes –820 807 –13
Balance at 31 December 2020 111 2,368 2,479
The carrying amounts and fair value of short-term and long-term borrowings are as follows:
Fair value Carrying amount
SEKm31 Dec
202031 Dec
201931 Dec
202031 Dec
2019
Loans from credit institutions 2,054 2,106 2,054 2,106
Commercial papers 250 499 250 499
Lease liabilities 176 204 176 204
Total 2,480 2,809 2,480 2,809
The fair value of loans from credit institutions is equal to their carrying amount, as the impact of discounting is not significant, and the credit risk has not materially changed since the loan agreement was signed.
The Group’s loans from credit institutions are exposed to inter-est rate changes and changes in the applicable margin on a quarterly basis. The commercial papers are issued at fixed interest rates, based on the applicable market prices at issue date.
Lease liabilities are effectively secured as the rights to the leased assets recognised in the financial statements revert to the lessor in the event of default.
Loans from credit institutions On 22 July 2016, Cloetta entered into a term and revolving facili-ties agreement with a group of four banks, Danske Bank A/S, DNB Sweden AB, Skandinaviska Enskilda Banken AB (publ) and Svenska Handelsbanken AB (publ), in SEK and EUR.
On 8 June 2018, Cloetta entered into an amendment and restate-ment of the term and revolving facilities agreement, in combination with the launch of a commercial paper program.
On 24 June 2020, Cloetta entered into an amendment agree-ment. The total facilities at reporting date comprise an equivalent of SEK 800m and EUR 245m. The term and revolving facilities agreement is unsecured in nature.
The commercial paper program, with a maximum oustanding amount of SEK 1,000m, is established to obtain flexibility in the short-term financing needs. See Note 26 for an overview of the matu-rity of the components of Cloetta’s loans from credit institutions.
Cloetta has made an assessment of the impact of the Interbank offer rates (IBOR) reform project. The outcome of this assessment is that Cloetta has not been and will not be materially affected by the IBOR reform project in the short-term. The facilities drawn in the facilities agreement and the interest rate swaps are based on EURIBOR and STIBOR reference rates. Both these rates are not affected yet by the IBOR reform project. Nevertheless, when Cloetta

124
Cloetta Annual and Sustainability Report 2020<< B a c k t o c o n t e n t s
f i n a n C i a l r e P O r t S
Words from the president
Goals & strategies
Sustain ability Markets Operations & employees
Share & Shareholders
financial performance
risks & Corporate Governance
financial reports
Sustain ability impact
The Group credit facility at reporting date relates to:
Outstanding amount Interest percentage Applicable margin
SEKm 31 Dec 2020 31 Dec 2019 31 Dec 2020 31 Dec 2019 31 Dec 2020 31 Dec 2019
Multicurrency term loan of nominal EUR 125m (125) 1,254 1,306
Variable EURIBOR + fixed applica-ble margin, with
zero-floor
Variable EURIBOR + fixed
applicable margin, with zero-floor 1.05% 0.80%
Single currency term loan of nomi-nal SEK 800m (800) 800 800
Variable STIBOR + fixed applica-ble margin, with
zero-floor
Variable STIBOR + fixed
applicable margin, with zero-floor 0.90% 0.90%
Commercial papers of nominal SEK 1,000m (1,000) 250 499
Fixed margin per issued paper
Fixed margin per issued paper 0.66% 0.43%
Multicurrency credit revolving loan of EUR 110m (110) – –
Variable IBOR + fixed applicable
margin, with zero-floor
Variable IBOR + fixed
applicable margin, with zero-floor 1.00% 1.00%
Credit revolving loan of EUR 10m (10) – –
Variable EURIBOR + fixed applicable
margin, with a floor of 0.20%
Variable EURIBOR + fixed applicable
margin, with a floor of 0.20% 0.70% 0.70%
Total Group credit facility 2,304 2,605
Capitalised transaction costs –2 –1
Lease liabilities 176 204
Accrued interest 1 1
Total borrowings 2,479 2,809
Note 21 Derivative financial instruments
See Note 1 (XViii) for the accounting policy.
31 Dec 2020 31 Dec 2019
SEKm Assets Liabilities Assets Liabilities
Non-current
Single currency interest rate swaps – 0 – 3
Total non-current – 0 – 3
Current
Forward contract to repurchase own shares – 49 – 65
Single currency interest rate swaps – 5 – 3
Total current – 54 – 68
Total – 54 – 71
Forward contracts to repurchase own sharesFollowing the introduction of share-based long-term incentive plans, Cloetta entered into forward contracts in order to repurchase own shares to fulfil its future obligation to deliver the shares to the participants in its share-based long-term incentive plans. The forward contract to repurchase own shares is measured at cost.
At 31 December 2020, the Group had an unutilised credit facility of SEK 1,204m (1,254) and the possibility to issue additional commer-cial papers for an amount of SEK 750m (500). 35 per cent (35) of the fixed applicable margin on the unutilised amounts of the credit revolving loans is paid as a commitment fee.
All borrowings are denominated in euros, with the exception of the single currency term loan of SEK 800m (800), the commercial papers of SEK 250m (499) and part of the lease liabilities for an amount corresponding to SEK 83m (108).
The effective interest rate for the loans from credit institutions and the senior secured notes was 0.93 per cent (0.74).
refinances its loans in 2021, it will incorporate provisions setting out the fallback position for the event that the STIBOR and EURIBOR cease to be published. Upon prolongation of or entering into new
contracts containing references to IBOR reference rates, Cloetta will add provisions setting out fallback provisions as described above.
Note 1
Note 2
Note 3
Note 4
Note 5
Note 6
Note 7
Note 8
Note 9
Note 10
Note 11
Note 12
Note 13
Note 14
Note 15
Note 16
Note 17
Note 18
Note 19
Note 20
Note 21
Note 22
Note 23
Note 24
Note 25
Note 26
Note 27
Note 28
Note 29
Note 30
Note 31
Note 32

125
Cloetta Annual and Sustainability Report 2020 << B a c k t o c o n t e n t s
f i n a n C i a l r e P O r t S
Words from the president
Goals & strategies
Sustain ability Markets Operations & employees
Share & Shareholders
financial performance
risks & Corporate Governance
financial reports
Sustain ability impact
Note 1
Note 2
Note 3
Note 4
Note 5
Note 6
Note 7
Note 8
Note 9
Note 10
Note 11
Note 12
Note 13
Note 14
Note 15
Note 16
Note 17
Note 18
Note 19
Note 20
Note 21
Note 22
Note 23
Note 24
Note 25
Note 26
Note 27
Note 28
Note 29
Note 30
Note 31
Note 32
The following table shows the movements in contracts since 1 January 2019
Date Contract 1 Contract 2 Contract 3
Balance at 1 Jan 2019 1,991,906 – –
Shares granted to participants LTI'16 (settlement of forward contract to repurchase own shares) 26 April 2019 –109,369 – –
Roll-forward to new forward contract to repurchase own shares 11 June 2019 –1,882,537 1,882,537 –
New forward contract to repurchase own shares 11 June 2019 – 198,346 –
Balance at 31 Dec 2019 – 2,080,883 –
Shares granted to participants LTI'17 (settlement of forward contract to repurchase own shares) 28 April 2020 – –95,264 –
Roll-forward to new forward contract to repurchase own shares 10 June 2020 – –1,985,619 1,985,619
Balance at 31 Dec 2020 – – 1,985,619
Price, SEK 29.3886 31.2385 24.9000
See Note 23 for more details about the share-based long-term incentive plan.
Single currency interest rate swapsThe Group has entered into several single currency interest rate swap contracts to partially cover the interest rate risk on the loans denominated in both SEK and EUR.
The following table shows the combined notional principal amounts of the outstanding single currency interest rate swaps
Notional principal amounts
Fixed interest currency rates Duration
31 Dec 2020 31 Dec 2019 31 Dec 2020 31 Dec 2019 31 Dec 2020 31 Dec 2019
STIBOR Interest rate swaps SEKm 800 800 0.4630% 0.4630% Q1 2021 – Q4 2021 Q1 2020 – Q4 2021
EURIBOR Interest rate swaps EURm – 50 – 0.1560% – Q1 2020 – Q2 2020
EURIBOR Interest rate swaps EURm 35 35 0.3375% 0.3375% Q1 2021 – Q3 2022 Q3 2020 – Q3 2022
All single currency interest rate swaps include zero-floors on the floating leg.
Note 22 Contingent considerations
See Note 1 (XXV) for the accounting policy.
On 28 April 2017 a contingent earn-out consideration arising from the acquisition of Candyking Holding AB and its subsidiaries was issued to the former bondholders of Candyking Holding AB in ex-change for corporate bonds in Candyking Holding AB. The contin-gent earn-out consideration was initially recognised in an amount of SEK 128m. The final earn-out consideration amounted to SEK 146m and was settled in 2019. See Note 25.
Movements in contingent considerations are specified as follows:
SEKm 2020 2019
At 1 January – 142
Remeasurements recognised in profit and loss
– Unrealised interest on contingent considerations recognised in other financial expenses – 4
Settlements
– Settlements via balance sheet – –146
At 31 December – –

126
Cloetta Annual and Sustainability Report 2020<< B a c k t o c o n t e n t s
f i n a n C i a l r e P O r t S
Words from the president
Goals & strategies
Sustain ability Markets Operations & employees
Share & Shareholders
financial performance
risks & Corporate Governance
financial reports
Sustain ability impact
Note 23 Pensions and other long-term employee benefits
See Notes 1 (Vii) and (XXVi) for the accounting policy.
Group companies use various post-employment schemes, including both defined benefit and defined contribution pension plans.
A defined contribution plan is a pension plan under which the Group pays fixed contributions to a separate entity. The Group has no legal or constructive obligations to pay further contributions, even if the fund does not hold sufficient assets to pay all employees the benefits relating to employee service in the current and prior periods. Defined benefit plans define an amount of pension benefit that an employee will receive upon retirement, usually dependent on one or more factors such as age, years of service and compensation.
The defined benefit schemes in industry sector pension funds, which are held by pension funds that are not able to provide compa-ny-specific or reliable information, are accounted for as though they were defined contribution schemes. In the event of a deficit in these pension funds, the company has no obligation to provide supplemen-tary contributions, other than higher future contributions.
For defined contribution plans, the Group pays contributions to publicly or privately administered pension insurance plans on a mandatory, contractual or voluntary basis. The Group has no further payment obligations once the contributions have been paid.
The Group has a number of defined benefit pension plans in Sweden, the Netherlands, Belgium, Finland, Germany and Norway that relate to pension and other long-term benefit schemes.
For the defined benefit pension plan in the Netherlands, the Group accounts as though this were a defined contribution scheme since sufficient information is not available to enable the Group to account for the plan as a defined benefit plan. Cloetta complies with UFR 10 for reporting plans with multiple employers. Sufficient infor-mation is not available, since asset administration of the fund is not designed to allocate the total assets of the fund to the participating companies. In the event of a deficit in this pension fund, the Group has no obligation to provide further contributions other than higher future contributions.
Monthly premiums are average premiums expressed as a per-centage of the pension calculations basis and should, as a minimum, cover the cost of the fund. The minimum pension premium is deter-mined in accordance with the actuarial and business note of the fund. In the event of liquidation of the fund, an amount that is sufficient to cover defined benefits will be secured. In the event of a deficit in the fund at the moment of liquidation, the defined benefits will be proportionally reduced taking into consideration Article 134 of the Dutch Pension Act. Contributions to the plan for the next annual year are expected to amount to SEK 33m (37). These are split into employer contributions of SEK 22m (25) and employee contributions of SEK 11m (12). At year-end 2020, the coverage of the pension fund was 97.8 per cent (106.6).
At 31 December 2020, the main defined benefit plans in the Group were:Sweden – ITP2 plan: The ITP2 plan covers employees born before 1979. Benefits provided in the old defined benefit plan include a final pay-based retirement pension. This plan is an unfunded defined benefit plan.
The ITP plan benefit formula provides pension benefits as a per-centage of salary. Benefits are reduced proportionally if the expected years of service within the plan, are less than 30 years, irrespective of employer. ITP plan benefits vested with former employers are indexed according to the consumer price index.
Finland – Leaf/Merijal plan:This plan is an insured voluntary final salary pension plan. It was established on 31 December 2005 when the liabilities and assets of Merijal Pension Foundation and Leaf Pension Foundation were transferred to Pohjola Life Insurance Company.
NorwayThe Norwegian subsidiary has one plan, which is insured in a life insurance company. This funded plan, together with the national pension scheme, provides an old-age pension of a maximum of 66 per cent of final salary. The plan includes a widow(er)’s pension equal to 60 per cent of the old-age pension and children’s pension equal to 50 per cent of the old-age pension. Members who become disabled will receive a disability pension linked to the old-age pension they would have received with their present salary.
The total pensions and other long-term employee benefits are determined as follows:
SEKm31 Dec
202031 Dec
2019
Funded pension schemes in a net asset position 1 –
Obligation for pension benefits – 512 – 499
Total –511 –499
The amounts recognised in the balance sheet are determined as follows:
SEKm31 Dec
202031 Dec
2019
Funded pension schemes in a net asset position 1 –
Asset in the balance sheet 1 –
Present value of funded obligations 78 87
Fair value of plan assets – 62 – 69
Deficit of funded plans 16 18
Present value of unfunded obligations 495 481
Liability in the balance sheet 511 499
Note 1
Note 2
Note 3
Note 4
Note 5
Note 6
Note 7
Note 8
Note 9
Note 10
Note 11
Note 12
Note 13
Note 14
Note 15
Note 16
Note 17
Note 18
Note 19
Note 20
Note 21
Note 22
Note 23
Note 24
Note 25
Note 26
Note 27
Note 28
Note 29
Note 30
Note 31
Note 32

127
Cloetta Annual and Sustainability Report 2020 << B a c k t o c o n t e n t s
f i n a n C i a l r e P O r t S
Words from the president
Goals & strategies
Sustain ability Markets Operations & employees
Share & Shareholders
financial performance
risks & Corporate Governance
financial reports
Sustain ability impact
Note 1
Note 2
Note 3
Note 4
Note 5
Note 6
Note 7
Note 8
Note 9
Note 10
Note 11
Note 12
Note 13
Note 14
Note 15
Note 16
Note 17
Note 18
Note 19
Note 20
Note 21
Note 22
Note 23
Note 24
Note 25
Note 26
Note 27
Note 28
Note 29
Note 30
Note 31
Note 32
Movements in the combined net defined benefit obligations and other long-term employee benefits over the year are as follows:
SEKmPresent value
of obligationFair value of
plan assets Total
1 January 2019 484 –67 417
Current Service cost 7 – 7
Interest expense/(income) 12 –1 11
Total amount recognised in profit or loss 19 –1 18
Remeasurements:
– Return on plan assets, excluding amounts included in interest expense/(income) – –2 –2
– Losses from change in financial assumptions 79 – 79
– Experience (gains)/losses 3 – 3
Total remeasurements recognised in other comprehensive income 82 –2 80
Exchange differences 1 –1 0
Contributions:
– Employers – –16 –16
– Plan participants 0 0 –
Payments from plans:
– Benefit payments –18 18 –
31 December 2019 568 –69 499
Current Service cost 12 – 12
Interest expense/(income) 7 0 7
Total amount recognised in profit or loss 19 0 19
Remeasurements:
– Return on plan assets, excluding amounts included in interest expense/(income) – 4 4
– Losses from change in financial assumptions 15 – 15
– Experience (gains)/losses –9 – –9
Total remeasurements recognised in other comprehensive income 6 4 10
Exchange differences –3 1 –2
Contributions:
– Employers – –15 –15
– Plan participants 0 0 –
Payments from plans:
– Benefit payments –17 17 –
31 December 2020 573 –62 511
The Group expects to pay SEK 14m (16) in contributions to its defined benefit plans in 2021.
The defined benefit obligation and plan assets are composed by country as follows:
Present value of obligation
Fair value of plan assets
Defined benefit obligation
SEKm31 Dec
202031 Dec
201931 Dec
202031 Dec
201931 Dec
202031 Dec
2019
Sweden 489 477 –13 –14 476 463
Norway 10 16 –11 –15 –1 1
Finland 31 34 –25 –28 6 6
Other countries 43 41 –13 –12 30 29
Total 573 568 –62 –69 511 499

128
Cloetta Annual and Sustainability Report 2020<< B a c k t o c o n t e n t s
f i n a n C i a l r e P O r t S
Words from the president
Goals & strategies
Sustain ability Markets Operations & employees
Share & Shareholders
financial performance
risks & Corporate Governance
financial reports
Sustain ability impact
The significant actuarial assumptions are as follows:
Weighted average percentage31 Dec
202031 Dec
2019
Discount rate 1.06 1.45
Expected rate of future salary increases 1.50 1.75
Expected rate of future increase for benefits in payment
2.02 2.15
Expected long-term inflation rate 1.42 1.64
Assumptions regarding future mortality are based on actuarial advice in accordance with published statistics and experience in each territory.
These assumptions translate into an average life expectancy in years for a pensioner retiring at the age of 67 for men in Norway, at the age of 62 for women in Norway and at the age of 65 in other countries:
2020 2019
Years Sweden Others Sweden Others
Retiring at the end of the reporting period:
– Male 22 21 22 21
– Female 24 25 25 24
Retiring 20 years after the end of the reporting period
– Male 43 36 43 36
– Female 45 41 45 41
At 31 December 2020 the weighted average duration of the defined benefit obligation was 18.92 years (19.06 years).
The sensitivity of the combined net defined benefit obligations and other long-term employee benefits to changes in the weighted principal assumptions is as follows:
Impact on defined benefit obligation
2020 2019
%Change in
assumptionsIncrease in
assumptionsDecrease in
assumptionsIncrease in
assumptionsDecrease in
assumptions
Discount rate 1%-point –19 22 –18 24
Salary growth rate 1%-point 5 – 5 6 – 5
Pension growth rate 1%-point 17 –15 1 –1
%
Increase by 1 year in
assumption
Decrease by 1 year in
assumption
Increase by 1 year in
assumption
Decrease by 1 year in
assumption
Life expectancy 4.28 – 4.98 4.37 – 4.98
The sensitivity analyses above are based on a change in one assump-tion while holding all other assumptions constant. In practice, this is unlikely to occur, and changes in some of the assumptions may be correlated. When calculating the sensitivity of the defined benefit obligation to significant actuarial assumptions, the same method has been applied as when calculating the pension liability recognised in the statement of financial position.
Plan assets for both 2019 and 2020 are 100 per cent comprised of insurance contracts.
The expected maturity analysis for undiscounted combined net defined benefit obligations and other long-term employee benefits is as follows:
SEKm31 Dec
202031 Dec
2019
Less than 3 years – 0
Between 3 –7 years – –
Between 7–15 years 89 107
Over 15 years 484 461
Total 573 568
Total pension costs for defined benefit plans amounting to SEK 19m (18) are included in costs of goods sold, selling expenses, general and administrative expenses and financial income and expenses, in the profit and loss account.
Share-based paymentsShare-based long-term incentive planThe AGM approved the Board’s proposals for a share-based long-term incentive plan to align the interests of the shareholders on the one hand, and the Group Management Team and other key employ-ees on the other hand in order to ensure maximum long-term value creation.
To participate in the plan, a personal shareholding in Cloetta is required. Following a three-year vesting period, the participants will be allocated class B shares in Cloetta free of charge, provided that certain conditions are fulfilled.
To be eligible for so-called matching share rights entitling the participant to class B shares in Cloetta, continued employment with Cloetta is required and the personal shareholding in Cloetta must be continuously maintained. For each invested share one matching share will be granted if the above requirements are fulfilled, for the long-term incentive plans until 2018. For the long-term incentive plans as from 2019, the matching shares are replaced by series A performance shares, that are conditional on Cloetta’s average EBIT over the vesting period.
In addition, allocation of class B shares on the basis of perfor-mance share rights (series B) requires the attainment of two perfor-mance targets, one of which is related to Cloetta’s EBIT and the other to Cloetta’s net sales value in the respective vesting periods. The share-based long-term incentive plans of 2016 and 2017 were vested in 2019 and 2020, respectively.
Note 1
Note 2
Note 3
Note 4
Note 5
Note 6
Note 7
Note 8
Note 9
Note 10
Note 11
Note 12
Note 13
Note 14
Note 15
Note 16
Note 17
Note 18
Note 19
Note 20
Note 21
Note 22
Note 23
Note 24
Note 25
Note 26
Note 27
Note 28
Note 29
Note 30
Note 31
Note 32

129
Cloetta Annual and Sustainability Report 2020 << B a c k t o c o n t e n t s
f i n a n C i a l r e P O r t S
Words from the president
Goals & strategies
Sustain ability Markets Operations & employees
Share & Shareholders
financial performance
risks & Corporate Governance
financial reports
Sustain ability impact
Note 1
Note 2
Note 3
Note 4
Note 5
Note 6
Note 7
Note 8
Note 9
Note 10
Note 11
Note 12
Note 13
Note 14
Note 15
Note 16
Note 17
Note 18
Note 19
Note 20
Note 21
Note 22
Note 23
Note 24
Note 25
Note 26
Note 27
Note 28
Note 29
Note 30
Note 31
Note 32
With respect to the share-based long-term incentive plan of 2018, the target levels set by the Board for the two performance targets were not met. The performance targets were related to growth in Cloetta’s compounded sales value during the period 2018 to 2020 and EBITA level during 2020. As a result, Cloetta will transfer, free of charge, no more than 138,441 shares to participants holding matching share rights and no shares to participants holding performance share rights.
Total costs related to the non-vested share-based long-term incentive plans are expected to amount to SEK 51m (47) during the total vesting period. The total costs for the share-based long-term incentive plans recognised in 2020 are SEK 3m (4).
See page 67 for further details on the main characteristics of the share-based long-term incentive plans.
The forward contracts to repurchase own shares amount to SEK 49m (65). See Note 21 for further details on the forward con-tracts to repurchase own shares.
Movements in the number of shares for the share-based long-term incentive plans are as follows:
Number of shares in thousands 2020 2019
At 1 January 1,415 1,404
Granted for new plans 1,046 1,010
Vested plans –95 –109
Released – 683 – 890
At 31 December 1,683 1,415
Note 24 Provisions
See Note 1 (XXV) for the accounting policy.
Movements in provisions, excluding pension benefits and other long-term employee benefits, are specified as follows:
SEKmRe-
organisation Other Total
1 January 2019 26 6 32
Additions 4 – 4
Utilisations –21 – –21
Unused amounts reversed – 4 –1 – 5
Exchange differences 0 0 0
31 December 2019 5 5 10
Analysis of total provisions
Non-current 5
Current 5
Total 10
SEKmRe-
organisation Other Total
1 January 2020 5 5 10
Additions 31 3 34
Utilisations –11 – –11
Unused amounts reversed –1 –1 –2
Exchange differences –1 –1 –2
31 December 2020 23 6 29
Analysis of total provisions
Non-current 5
Current 24
Total 29
See Note 23 for details about pension benefits and other long-term employee benefits.
Note 25 Trade and other payables
See Note 1 (XXiX) for the accounting policy.
Trade and other payables are specified as follows:
SEKm31 Dec
202031 Dec
2019
Trade payables 474 492
Other taxes and social security expenses 162 175
Pension liabilities 6 8
Other liabilities 38 33
Accruals and deferred income 464 519
Total 1,144 1,227
The carrying amounts of trade and other payables are considered to be the same as their fair values, due to their short-term nature.
Accruals and deferred income are specified as follows:
SEKm31 Dec
202031 Dec
2019
Accrued personnel-related expenses 153 200
Accrued customer bonuses and discounts 173 178
Other accrued expenses and deferred income 138 141
Total 464 519
Note 26 Financial risks and financial risk management
Through its activities, the Group is exposed it to a variety of financial risks, such as financial market risk (including currency risk, interest rate risk, cash flow interest rate risk and price risk), credit risk and liquidity risk. The Group’s overall risk management program focuses on the unpredictability of financial markets and seeks to minimise potential adverse effects on the Group’s financial performance.
Financial risks are managed by the Group treasury department under policies approved by the Board of Directors. The Group treasury department identifies, evaluates and, if applicable, hedges financial risks in close cooperation with the Group’s operating units. The Board of Directors provides written principles for overall risk management, as well as written policies covering specific areas, such as foreign exchange risk, interest rate risk, credit risk, use of deriva-tive financial instruments and non-derivative financial instruments and investment of excess liquidity. The primary market and financial risks are described in detail below.
Financial market risk Currency riskThe Group is primarily active in the European Union, Norway and the UK.
The Group’s currency risk mainly relates to positions and future transactions in euros (EUR), Danish kroner (DKK), Norwegian kroner (NOK), US dollars (USD) and British pounds (GBP).
The Group has major investments in foreign operations whose net assets are exposed to foreign currency translation risk.
Based on a risk analysis, the Group’s Boards of Directors has decided to hedge the euro-related currency risk by drawing part of the credit facility in euros. This hedge covers part of the currency risk in euros. Hedge accounting (hedges of net investments in foreign operations) is applied. This has resulted in a reduction in the volatili-ty of net financial items caused by revaluation of monetary assets and liabilities as of the date of initial application of hedge accounting.

130
Cloetta Annual and Sustainability Report 2020<< B a c k t o c o n t e n t s
f i n a n C i a l r e P O r t S
Words from the president
Goals & strategies
Sustain ability Markets Operations & employees
Share & Shareholders
financial performance
risks & Corporate Governance
financial reports
Sustain ability impact
The Group’s investment in trademarks in Cloetta Ireland Ltd, Cloetta Suomi Oy, Cloetta Holland B.V. and Cloetta Slovakia s.r.o. is hedged by a net euro-denominated loan (carrying amount: EUR 158m (160)) which mitigates the foreign currency translation risk on these trademarks. The fair value of the loan was EUR 158m (160). The loan is designated as a net investment hedge. The effectiveness of the hedge is tested and documented on a quarterly basis. The hedge effectiveness at 31 December 2020 was 104 per cent (104). No ineffectiveness has been recognised from the net investment hedge. The effect of the net investment hedge in a foreign operation is recognised in other comprehensive income. At 31 December 2020, the cumulative effect of the net investment hedge in a foreign opera-tion amounted to SEK –139m (–181), net of tax, and was reported as part of the retained earnings within equity.
The Group’s defined objective is to cover between 50 and 80 per cent of the expected net exposure on purchases and sales in USD and GBP if the exposure exceeds the equivalent of EUR 10m. To manage the foreign exchange risk arising from future commercial transac-tions and recognised assets and liabilities, the Group uses forward contracts. Foreign exchange risk arises when future commercial transactions or recognised assets or liabilities are denominated in a currency that is not the entity’s functional currency. At reporting date, the Group had no forward foreign currency contracts to hedge the currency risk of the USD and GBP. The Group is in compliance with the defined objectives for currency risks.
During 2020, exchange rates have been volatile and as a result impacted Cloetta’s financial performance significantly.
In the 2020 financial year, if the Swedish krona had weakened/strengthened by 10 per cent against the euro with all other varia-bles held constant, profit before tax for the year would have been approximately SEK 14m (46) lower/higher, as a result of the foreign exchange gains/losses on translation of all euro-denominated trading in Europe and foreign exchange losses/gains on translation of euro-denominated borrowings. During 2020 the Norwegian krona weakened from 1.0591 to 0.9584 (–9.5%). As a result, a total exchange difference on cash and cash equivalents in an amount of SEK –10m was recognised.
The currency risk attached to the transactions in the other cur-rencies is not significant as the amounts involved are not significant to the total Group.
Interest rate riskThe Group is exposed to interest rate risk on the interest-bearing non-current and current liabilities.
The Group is exposed to the consequences of variable interest rates on the multicurrency term loan of EUR 125m and the single- currency term loan of SEK 800m. In relation to fixed interest liabil-
ities, it is exposed to market values, which is not a significant risk for the Group. The Group’s objective when managing the interest rate risk is to have a fixed percentage between 50 and 80 per cent with an average maturity of 2 to 3.5 years on borrowings that are long-term in nature. At reporting date, the Group covered 1.75 years of its exposure to interest rate fluctuations. Pending the refinancing of the multicurrency term loan and single currency term loan in 2021, the Group decided to deviate from the abovementioned objective.
If the interest rate had been 1 percentage point higher with all other variables held constant, profit before tax for the year would have been approximately SEK 6m (6) lower. If the interest rate had been 1 percentage point lower with all other variables held constant, profit before tax for the year would have been approximately SEK 2m (2) higher. The analysis considers the effects of single cur-rency interest rate swaps and the impact of negative interest rates.
Credit risk The Group does not have any significant concentrations of credit risk.
The Group’s customers are subject to a credit policy. Sales are subject to payment conditions which vary per customer.
A loss allowance for expected credit losses on trade receivables is established taking into account all possible default events that could lead to the Group not being able to collect all amounts due according to the original terms of the receivables. Significant financial difficul-ties of the debtor, probability that the debtor will enter bankruptcy or financial reorganisation, and default or delinquency in payments (more than 30 days overdue) are considered indicators that the trade receivable should be impaired. The amount of the allowance is the difference between the asset’s carrying amount and the present value of estimated future cash flows, discounted by the original effective interest rate. The carrying amount of the asset is reduced through the use of an allowance account, and the amount of the loss is recognised in the profit and loss account within net sales.
When a trade receivable is uncollectible, it is written off against the allowance account for trade receivables.
Credit terms for customers are determined individually in the different markets. Concentrations of credit risk with respect to trade receivables are limited, due to the size and diversity of the Group’s customer base. Diversity exists amongst other things in the size of customers, country of origin, size of outstanding receivables and types of customers. A large part of the trade debtors for International Markets, Ireland, the UK, Germany and the Netherlands and smaller trade debtors in Finland are insured via credit risk insurances. In addition, receivable balances are monitored on an ongoing basis with the result that the Group’s exposure to bad debts is not significant. The Group’s historical experience of collecting receivables is that credit risk is considered to be low across all markets.
The Group uses several banks (range of most used banks varies between AA- and A (long-term) and A-1+ and A-2 (short-term)) and has a revolving facility available
Cash balances Credit revolving loan Other loans
SEKm Rating (S&P)31 Dec
202031 Dec
201931 Dec
202031 Dec
201931 Dec
202031 Dec
2019
Danske Bank A/S Long-term A 360 519 – – – 618 – 526
DNB Sweden AB Long-term AA- – – – – – 618 – 526
KBC Short-term A-1 3 1 – – – –
Nordea Short-term A-1+ 2 3 – – – –
Skandinaviska Enskilda Banken AB (publ)
Long-term A+ 0 0 – – – 618 – 526
Svenska Handelsbanken AB (publ) Long-term AA- – 41 – – –200 – 526
Tatra Banka Short-term A-2 7 8 – – – –
Ulster Bank Ltd. Short-term A-1 15 5 – – – –
Other banks 8 1 – – – –
Total 396 579 – – –2,054 –2,106
Note 1
Note 2
Note 3
Note 4
Note 5
Note 6
Note 7
Note 8
Note 9
Note 10
Note 11
Note 12
Note 13
Note 14
Note 15
Note 16
Note 17
Note 18
Note 19
Note 20
Note 21
Note 22
Note 23
Note 24
Note 25
Note 26
Note 27
Note 28
Note 29
Note 30
Note 31
Note 32

131
Cloetta Annual and Sustainability Report 2020 << B a c k t o c o n t e n t s
f i n a n C i a l r e P O r t S
Words from the president
Goals & strategies
Sustain ability Markets Operations & employees
Share & Shareholders
financial performance
risks & Corporate Governance
financial reports
Sustain ability impact
Note 1
Note 2
Note 3
Note 4
Note 5
Note 6
Note 7
Note 8
Note 9
Note 10
Note 11
Note 12
Note 13
Note 14
Note 15
Note 16
Note 17
Note 18
Note 19
Note 20
Note 21
Note 22
Note 23
Note 24
Note 25
Note 26
Note 27
Note 28
Note 29
Note 30
Note 31
Note 32
Liquidity riskCash flow forecasting is performed in the operating entities of the Group, reviewed by the Cloetta cash committee and is aggregated by the Group treasury department. The Group treasury department monitors the sources and the amounts of the company’s cash flows, dividend, obligation, loans, actual cash position and rolling forecasts of the Group’s liquidity requirements to ensure it has sufficient cash to meet operational needs, while maintaining sufficient headroom on its undrawn committed borrowing facilities (Note 20) at all times so that the Group does not breach borrowing limits or covenants on any of its borrowing facilities, and the impact such restrictions had or are expected to have on its ability to meet its cash obligations. Such forecasting takes into consideration the Group’s debt financing plans, covenant compliance, compliance with internal balance sheet ratio targets and, if applicable, external regulatory or legal requirements - for example, currency restrictions.
The Multi-currency Zero Balancing Cash Pool (MZBCP) includes both the Parent Company and several operating entities. Surplus cash held by operating entities included in the MZBCP is available to the Group’s treasury department and is used for the Group’s internal and external financing activities. Surplus cash held by operating entities not included in the MZBCP is transferred to the Group’s treasury department and is also used for the Group’s internal and external financing activities.
The Covid-19 pandemic lockdown had a negative impact on the Group’s liquidity position as revenue-generating activities were im-pacted, mainly in the second quarter of the year. The Group has taken actions to mitigate the impact, including the deferral and reduction of the dividend payment for the 2019 financial year.
The table below analyses the Group’s financial liabilities into relevant maturity groupings based on the remaining period at the balance sheet date to the contractual maturity date.
SEKm 31 Dec 2020
Term < 1 year
Term 1–2 years
Term 2–3 years
Term 3–4 years
Term 4–5 years
Term >5 years Total
Loans from credit institutions 2,180 – – – – – 2,180
Commercial papers 253 – – – – – 253
Lease liabilities 64 49 33 20 8 2 176
Derivative financial liabilities 53 0 – – – – 53
Trade and other payables, excluding other taxes and social security payables 982 – – – – – 982
Total 3,532 49 33 20 8 2 3,644
SEKm 31 Dec 2019
Term < 1 year
Term 1–2 years
Term 2–3 years
Term 3–4 years
Term 4–5 years
Term >5 years Total
Loans from credit institutions 1,320 806 – – – – 2,126
Commercial papers 500 – – – – – 500
Lease liabilities 64 52 44 25 14 5 204
Derivative financial liabilities 70 5 1 – – – 76
Trade and other payables, excluding other taxes and social security payables 1,052 – – – – – 1,052
Total 3,006 863 45 25 14 5 3,958
Capital risk managementIn addition to the capital management disclosure in Note 18, the Group’s priority in monitoring capital is to maintain compliance with the covenants in the applicable credit facilities agreements. Cloetta actively monitors these covenants and other ratios on a quarterly ba-sis. The term and revolving facilities agreement, which is unsecured in nature, includes one covenant, relating to the net debt/EBITDA ratio. Throughout 2019 and 2020, the Group was in compliance with the covenant requirements.
BrexitChanging regulatory schemes and tariffs imposed by Brexit will add additional complexity, costs and delays in the distribution of Cloetta’s products in the UK. In the short term, there is a risk that Brexit may disrupt import and export processes due to a lack of administrative processing capacity by the customs agencies of the UK and the Euro-pean Union.
Note 27 Financial instruments – measurement categories and fair values
Share-based long-term incentive planThe AGMs approved the Board’s proposal relating to a share-based long-term incentive plan.
Under the share-based long-term incentive plans, the entity receives services from employees as consideration for equity instru-ments (shares) of the Group. The fair value of the employee services received in exchange for the grant of the shares is recognised as an expense.
The total amount to be expensed is determined by reference to the fair value of the shares granted:• including any market performance conditions (for example, an
entity’s share price); and• including the impact of any service and non-market performance
vesting conditions (for example, profitability, sales growth targets and remaining as an employee of the entity over a specified time period).
See Note 23 for more information.

132
Cloetta Annual and Sustainability Report 2020<< B a c k t o c o n t e n t s
f i n a n C i a l r e P O r t S
Words from the president
Goals & strategies
Sustain ability Markets Operations & employees
Share & Shareholders
financial performance
risks & Corporate Governance
financial reports
Sustain ability impact
The following table presents the carrying amounts and fair values of the Group’s financial assets and financial liabilities, including their levels in the fair value hierarchy:
Carrying amount Fair value
SEKm 31 Dec 2020
Mandatorily at FVTPL
Financial assets at
amortised cost
Other financial
liabilities at amortised
cost Total Level 1 Level 2 Level 3 Total
Financial assets
Trade and other receivables, excluding other taxes and social security receivables and prepaid expenses and accrued income – 663 – 663
Cash and cash equivalents – 396 – 396
Total assets – 1,059 – 1,059 – – – –
Financial liabilities
Loans from credit institutions – – 2,054 2,054
Commercial papers – – 250 250
Forward contract to repurchase own shares – – 49 49 – 2 – 2
Single currency interest rate swaps 5 – – 5 – 5 – 5
Lease liabilities – – 176 176
Trade and other payables, excluding other taxes and social security payables and excluding contingent consideration – – 982 982
Total liabilities 5 – 3,511 3,516 – 7 – 7
Carrying amount Fair value
SEKm 31 Dec 2019
Mandatorily at FVTPL
Financial assets at
amortised cost
Other financial
liabilities at amortised
cost Total Level 1 Level 2 Level 3 Total
Financial assets
Trade and other receivables, excluding other taxes and social security receivables and prepaid expenses and accrued income – 832 – 832
Cash and cash equivalents – 579 – 579
Total assets – 1,411 – 1,411 – – – –
Financial liabilities
Loans from credit institutions – – 2,106 2,106
Commercial papers – – 499 499
Forward contract to repurchase own shares – – 65 65 – 0 – 0
Single currency interest rate swaps 6 – – 6 – 6 – 6
Lease liabilities – – 204 204
Trade and other payables, excluding other taxes and social security payables and excluding contingent consideration – – 1,052 1,052
Total liabilities 6 – 3,926 3,932 – 6 – 6
Fair value measurementThe only items recognised at fair value are the single currency inter-est rate swaps categorised within level 2 of the fair value hierarchy in all periods presented.
The fair values of the financial assets and liabilities measured at amortised cost are approximately equal to their carrying amounts,
with the exception of the forward contract to repurchase own shares which has a fair value of SEK 2m (liability) while the carrying amount is SEK 49m (liability).
Note 1
Note 2
Note 3
Note 4
Note 5
Note 6
Note 7
Note 8
Note 9
Note 10
Note 11
Note 12
Note 13
Note 14
Note 15
Note 16
Note 17
Note 18
Note 19
Note 20
Note 21
Note 22
Note 23
Note 24
Note 25
Note 26
Note 27
Note 28
Note 29
Note 30
Note 31
Note 32
133
Cloetta Annual and Sustainability Report 2020 << B a c k t o c o n t e n t s
f i n a n C i a l r e P O r t S
Words from the president
Goals & strategies
Sustain ability Markets Operations & employees
Share & Shareholders
financial performance
risks & Corporate Governance
financial reports
Sustain ability impact
Note 1
Note 2
Note 3
Note 4
Note 5
Note 6
Note 7
Note 8
Note 9
Note 10
Note 11
Note 12
Note 13
Note 14
Note 15
Note 16
Note 17
Note 18
Note 19
Note 20
Note 21
Note 22
Note 23
Note 24
Note 25
Note 26
Note 27
Note 28
Note 29
Note 30
Note 31
Note 32
The assets and liabilities measured at fair value at 31 December 2020 and 31 December 2019 respectively are reflected in ‘derivative finan-cial instruments’. There are no financial instruments categorised within level 3 of the fair value hierarchy.
On 28 April 2017, the contingent earn-out consideration arising from the acquisition of Candyking Holding AB and its subsidiaries was recognised in an amount of SEK 128m. The final earn-out consideration amounted to SEK 146m and was settled in 2019. No transfers between fair value hierarchy levels have occurred during the financial year or the prior financial year.
The fair value of financial instruments that are not traded in an active market (for example, over-the-counter derivatives) is determined using valuation techniques. These valuation techniques maximise the use of observable market data where it is available and rely as little as possible on entity specific estimates. If all significant inputs required to determine the fair value of an instrument are observable, the instrument is included within level 2. The valuation of these instruments is based on quoted market prices (price-compo-
nent), but the underlying contract amounts (quantity-component) are based on the specific requirements of the Group. These instruments are therefore included within level 2. The fair value measurement of the contingent consideration requires use of significant unobservable inputs and was thereby initially categorised within level 3.The valuation techniques and inputs used to value financial instru-ments are:• Quoted market prices or dealer quotes for similar instruments;
• The fair value of single currency interest rate swaps is calculated as the present value of the estimated future cash flows based on observable yield curves;
• The fair value of forward foreign currency contracts is calculated using the difference between the exchange rate on the balance sheet date with the contractually agreed upon exchange rate;
• Other techniques, such as discounted cash flow analysis, are used to determine fair value for the remaining financial instruments.
The valuation techniques used in measuring Level 2 and Level 3 fair values, as well as the significant unobservable inputs used, are specified as follows:
Type Valuation techniqueSignificant unobservable inputs
Inter-relationship between significant unobservable inputs and fair value measurement
Derivative financial instruments
– Single currency interest rate swaps
The valuation of the single currency interest rate swaps is calculated as the present value of the estimated future cash flows based on observable yield curves.
Not applicable Not applicable
– Forward contracts to repurchase own shares
The valuation of the forward contract to repurchase own shares is calculated as the agreed upon price for repurchasing own shares multiplied by the number of shares to be repurchased on the maturity date of the contract.
Not applicable Not applicable
See Note 22 for the effect of the measurements regarding contingent consideration liabilities in the profit and loss account or other comprehensive income and for movements in contingent consideration liabilities.
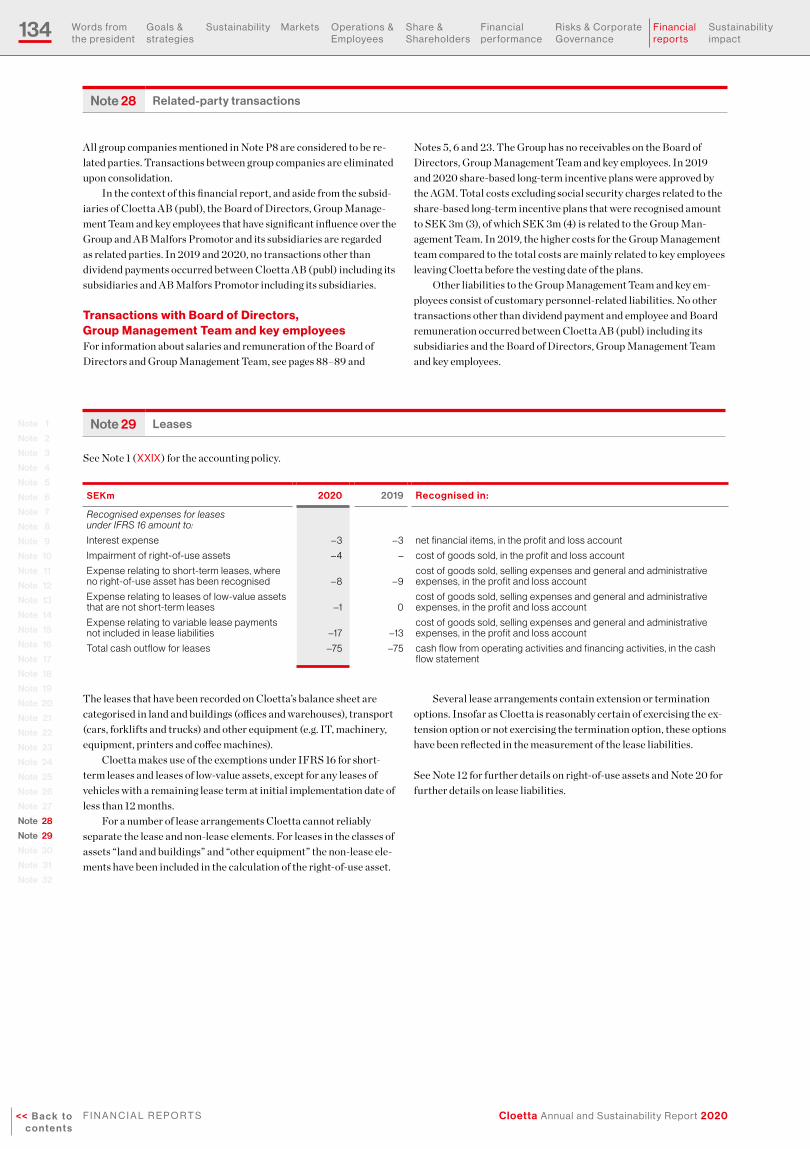
134
Cloetta Annual and Sustainability Report 2020<< B a c k t o c o n t e n t s
f i n a n C i a l r e P O r t S
Words from the president
Goals & strategies
Sustain ability Markets Operations & employees
Share & Shareholders
financial performance
risks & Corporate Governance
financial reports
Sustain ability impact
All group companies mentioned in Note P8 are considered to be re-lated parties. Transactions between group companies are eliminated upon consolidation.
In the context of this financial report, and aside from the subsid-iaries of Cloetta AB (publ), the Board of Directors, Group Manage-ment Team and key employees that have significant influence over the Group and AB Malfors Promotor and its subsidiaries are regarded as related parties. In 2019 and 2020, no transactions other than dividend payments occurred between Cloetta AB (publ) including its subsidiaries and AB Malfors Promotor including its subsidiaries.
Transactions with Board of Directors, Group Management Team and key employees For information about salaries and remuneration of the Board of Directors and Group Management Team, see pages 88–89 and
Notes 5, 6 and 23. The Group has no receivables on the Board of Directors, Group Management Team and key employees. In 2019 and 2020 share-based long-term incentive plans were approved by the AGM. Total costs excluding social security charges related to the share-based long-term incentive plans that were recognised amount to SEK 3m (3), of which SEK 3m (4) is related to the Group Man-agement Team. In 2019, the higher costs for the Group Management team compared to the total costs are mainly related to key employees leaving Cloetta before the vesting date of the plans.
Other liabilities to the Group Management Team and key em-ployees consist of customary personnel-related liabilities. No other transactions other than dividend payment and employee and Board remuneration occurred between Cloetta AB (publ) including its subsidiaries and the Board of Directors, Group Management Team and key employees.
Note 29 Leases
See Note 1 (XXiX) for the accounting policy.
SEKm 2020 2019 Recognised in:
Recognised expenses for leases under IFRS 16 amount to:
Interest expense –3 –3 net financial items, in the profit and loss account
Impairment of right-of-use assets – 4 – cost of goods sold, in the profit and loss account
Expense relating to short-term leases, where no right-of-use asset has been recognised – 8 –9
cost of goods sold, selling expenses and general and administrative expenses, in the profit and loss account
Expense relating to leases of low-value assets that are not short-term leases –1 0
cost of goods sold, selling expenses and general and administrative expenses, in the profit and loss account
Expense relating to variable lease payments not included in lease liabilities –17 –13
cost of goods sold, selling expenses and general and administrative expenses, in the profit and loss account
Total cash outflow for leases –75 –75 cash flow from operating activities and financing activities, in the cash flow statement
The leases that have been recorded on Cloetta’s balance sheet are categorised in land and buildings (offices and warehouses), transport (cars, forklifts and trucks) and other equipment (e.g. IT, machinery, equipment, printers and coffee machines).
Cloetta makes use of the exemptions under IFRS 16 for short-term leases and leases of low-value assets, except for any leases of vehicles with a remaining lease term at initial implementation date of less than 12 months.
For a number of lease arrangements Cloetta cannot reliably separate the lease and non-lease elements. For leases in the classes of assets “land and buildings” and “other equipment” the non-lease ele-ments have been included in the calculation of the right-of-use asset.
Several lease arrangements contain extension or termination options. Insofar as Cloetta is reasonably certain of exercising the ex-tension option or not exercising the termination option, these options have been reflected in the measurement of the lease liabilities.
See Note 12 for further details on right-of-use assets and Note 20 for further details on lease liabilities.
Note 28 Related-party transactions
Note 1
Note 2
Note 3
Note 4
Note 5
Note 6
Note 7
Note 8
Note 9
Note 10
Note 11
Note 12
Note 13
Note 14
Note 15
Note 16
Note 17
Note 18
Note 19
Note 20
Note 21
Note 22
Note 23
Note 24
Note 25
Note 26
Note 27
Note 28
Note 29
Note 30
Note 31
Note 32

135
Cloetta Annual and Sustainability Report 2020 << B a c k t o c o n t e n t s
f i n a n C i a l r e P O r t S
Words from the president
Goals & strategies
Sustain ability Markets Operations & employees
Share & Shareholders
financial performance
risks & Corporate Governance
financial reports
Sustain ability impact
Note 1
Note 2
Note 3
Note 4
Note 5
Note 6
Note 7
Note 8
Note 9
Note 10
Note 11
Note 12
Note 13
Note 14
Note 15
Note 16
Note 17
Note 18
Note 19
Note 20
Note 21
Note 22
Note 23
Note 24
Note 25
Note 26
Note 27
Note 28
Note 29
Note 30
Note 31
Note 32
Note 30 Critical accounting estimates and judgements
In preparing the financial statements, the Group Management Team makes estimates and judgments that affect the reported amounts of assets and liabilities, net sales and expenses, and disclosures of contingent liabilities at the date of the financial statements. The estimates and assumptions that are associated with a significant risk of causing a material adjustment to the carrying amounts of assets and liabilities in the next financial year, as well as critical judgments in applying the Group’s accounting policies are discussed below. The accounting estimates and judgments are believed to be reasonable under the circumstances.
The Group Management Team and audit committee have discussed the development, selection and disclosures regarding the Group’s critical accounting principles and estimates. The estimates and judgments made in the application of the Group’s accounting policies are described below.
Impairment testing of intangible assetsFor the purpose of impairment testing, assets are allocated to CGUs or groups of CGUs when it is not possible to assess impairment on an individual asset level. The recoverable amount of an asset is com-pared to the carrying amount to determine if an asset is impaired. An asset’s recoverable amount is the higher of its value in use and its fair value less cost of disposal. The value in use is the present value of the future cash flows to be generated by an asset from its continuing use in the business.
Using the company management’s best estimates in determina-tion of the terminal growth rates, pre-tax discount rates and future cash flows, the estimated recoverable amounts of the group of CGUs for goodwill impairment testing in Sweden, Denmark & Norway, Finland, the Netherlands & Germany and International Markets & the UK and the CGUs for trademarks impairment testing in Sweden, Finland and the Netherlands exceed the carrying amounts. The estimated recoverable amount of the Netherlands & Germany group of CGUs exceeds its carrying amount by approximately SEK 342m. If the terminal growth rate decrease by 1.9 percentage points to –0.2 per cent, the pre-tax discount rate will increase by 1.5 percent-age points to 8.8 per cent, or if the expected EBITDA decreases by SEK 20m per year, the estimated recoverable amount of the Nether-lands & Germany group of CGUs will be equal to its carrying amount. For the other groups of CGUs a reasonable change in as-sumptions will not lead to an impairment.
The carrying amount of the intangible assets at the end of the reporting period was SEK 5,563m (5,684).
Accounting for income taxesAs part of the process of preparing the financial statements, the Group is required to estimate income taxes in each of the jurisdic-tions in which the Group operates. There are many transactions and calculations for which the ultimate tax determination is uncertain during the ordinary course of business. The Group recognises liabil-ities for anticipated tax audit issues based on estimates of whether additional taxes will be due. Where the final tax outcome of these matters differs from the amounts that were initially recorded, such differences impact the current and deferred income tax assets and liabilities in the period in which such determination is made.
Temporary differences between tax and financial reporting give rise to deferred tax assets and liabilities, which are included in
the balance sheet. The Group must also assess the likelihood that deferred tax assets will be recovered from future taxable income. A deferred tax asset is not recognised if, and to the extent that it is probable that, all or some portion of the deferred tax asset will not be realised.
Accounting for pensions and other post-employment benefitsPension benefits represent obligations that will be settled in the future and require assumptions to project the benefit obligations and fair values of plan assets. Post-employment benefit accounting is intended to reflect the recognition of future benefit costs over the employee’s expected service period, based on the terms of the plans and the investment and funding decisions made by the Group. For calculation of the present value of the pension obligation and the net cost, actuarial assumptions are made about demographic variables (such as mortality) and financial variables (such as future increases in salaries). Changes in these key assumptions can have a significant impact on the projected benefit obligations, funding requirements and periodic costs incurred. It should be noted that when discount rates decline or rates of future salary increase, the pension benefit obligations will increase. For details about the key assumptions and policies, see Note 23. The carrying amount at the end of the reporting period was SEK 511m (499).
LeasesThe Group applies judgment to determine the lease term for some lease contracts, in which it is a lessee, that include renewal options. The assessment of whether the Group is reasonably certain of exer-cising such options impacts the lease term, which significantly affects the amounts of lease liabilities and right-of-use assets recognised.
Note 31 Changes in accounting policies
New and amended standards and interpretations adopted by the GroupNo new standards have been issued that are effective for annual periods beginning on or after 1 January 2020.
A number of amendments to standards and interpretations are effective for annual periods beginning on or after 1 January 2020. None of these have a material impact on the consolidated financial statements of the Group.
New standards and amendments to standards not yet adoptedA number of amendments to standards and interpretations are effective for annual periods beginning after 1 January 2020, which have not been applied in preparing these consolidated financial statements. None of these are expected to have a material impact on the consolidated financial statements of the Group.
There are no other IFRSs or IFRIC interpretations that are not yet effective that are expected to have a material impact on the Group.
Note 32 Events after the balance sheet date
After the end of the reporting period, no significant events have taken place that could affect the company’s operations.

136
Cloetta Annual and Sustainability Report 2020<< B a c k t o c o n t e n t s
f i n a n C i a l r e P O r t S
Words from the president
Goals & strategies
Sustain ability Markets Operations & employees
Share & Shareholders
financial performance
risks & Corporate Governance
financial reports
Sustain ability impact
Parent Company profit and loss account
SEKm Note 2020 2019
Net sales P2 79 83
Gross profit 79 83
General and administrative expenses P3, P4 – 81 –105
Operating loss –2 –22
Exchange differences on borrowings and cash P5 –2 7
Other financial income P5 79 75
Other financial expenses P5 –27 –23
Net financial items 50 59
Profit before tax 48 37
Income tax P6 –11 – 5
Profit for the year 37 32
Profit for the year corresponds to comprehensive income for the year.
Primary activitiesCloetta AB’s primary activities include head office functions such as group-wide management and administration.
Parent Company financial statements
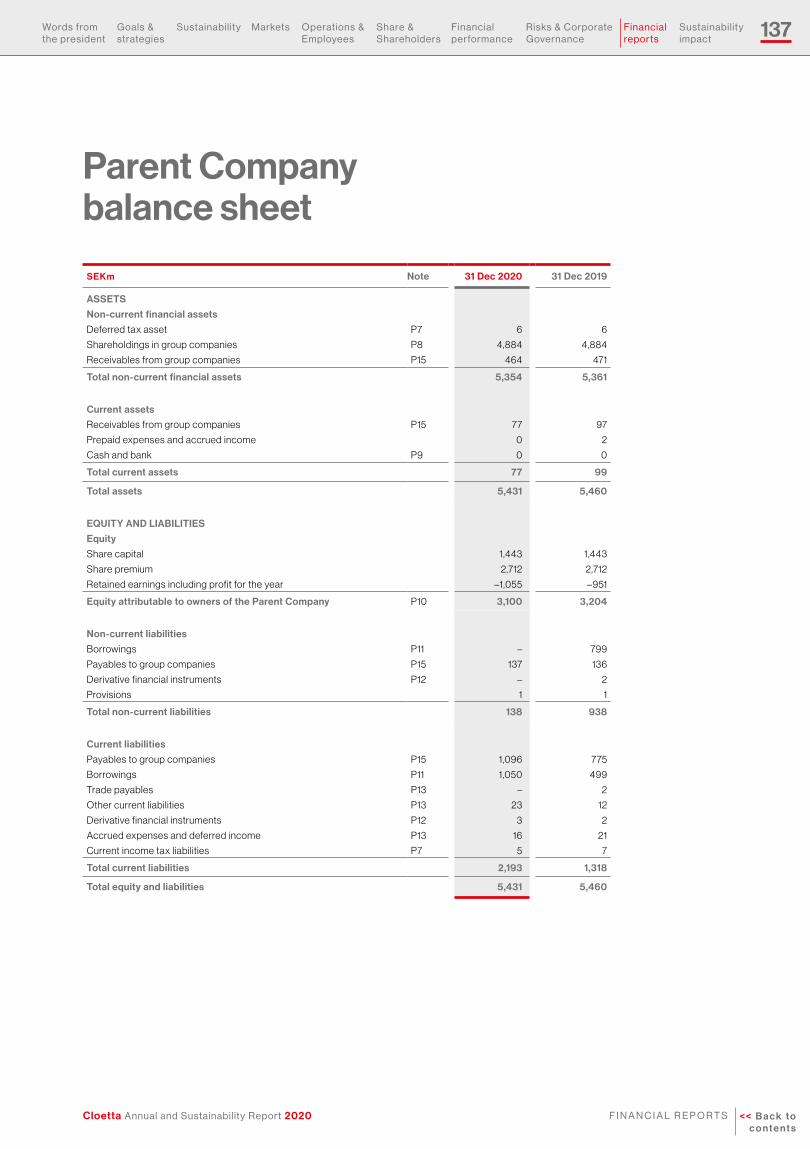
137
Cloetta Annual and Sustainability Report 2020 << B a c k t o c o n t e n t s
f i n a n C i a l r e P O r t S
Words from the president
Goals & strategies
Sustain ability Markets Operations & employees
Share & Shareholders
financial performance
risks & Corporate Governance
financial reports
Sustain ability impact
Parent Company balance sheet
SEKm Note 31 Dec 2020 31 Dec 2019
ASSETS
Non-current financial assets
Deferred tax asset P7 6 6
Shareholdings in group companies P8 4,884 4,884
Receivables from group companies P15 464 471
Total non-current financial assets 5,354 5,361
Current assets
Receivables from group companies P15 77 97
Prepaid expenses and accrued income 0 2
Cash and bank P9 0 0
Total current assets 77 99
Total assets 5,431 5,460
EQUITY AND LIABILITIES
Equity
Share capital 1,443 1,443
Share premium 2,712 2,712
Retained earnings including profit for the year –1,055 –951
Equity attributable to owners of the Parent Company P10 3,100 3,204
Non-current liabilities
Borrowings P11 – 799
Payables to group companies P15 137 136
Derivative financial instruments P12 – 2
Provisions 1 1
Total non-current liabilities 138 938
Current liabilities
Payables to group companies P15 1,096 775
Borrowings P11 1,050 499
Trade payables P13 – 2
Other current liabilities P13 23 12
Derivative financial instruments P12 3 2
Accrued expenses and deferred income P13 16 21
Current income tax liabilities P7 5 7
Total current liabilities 2,193 1,318
Total equity and liabilities 5,431 5,460
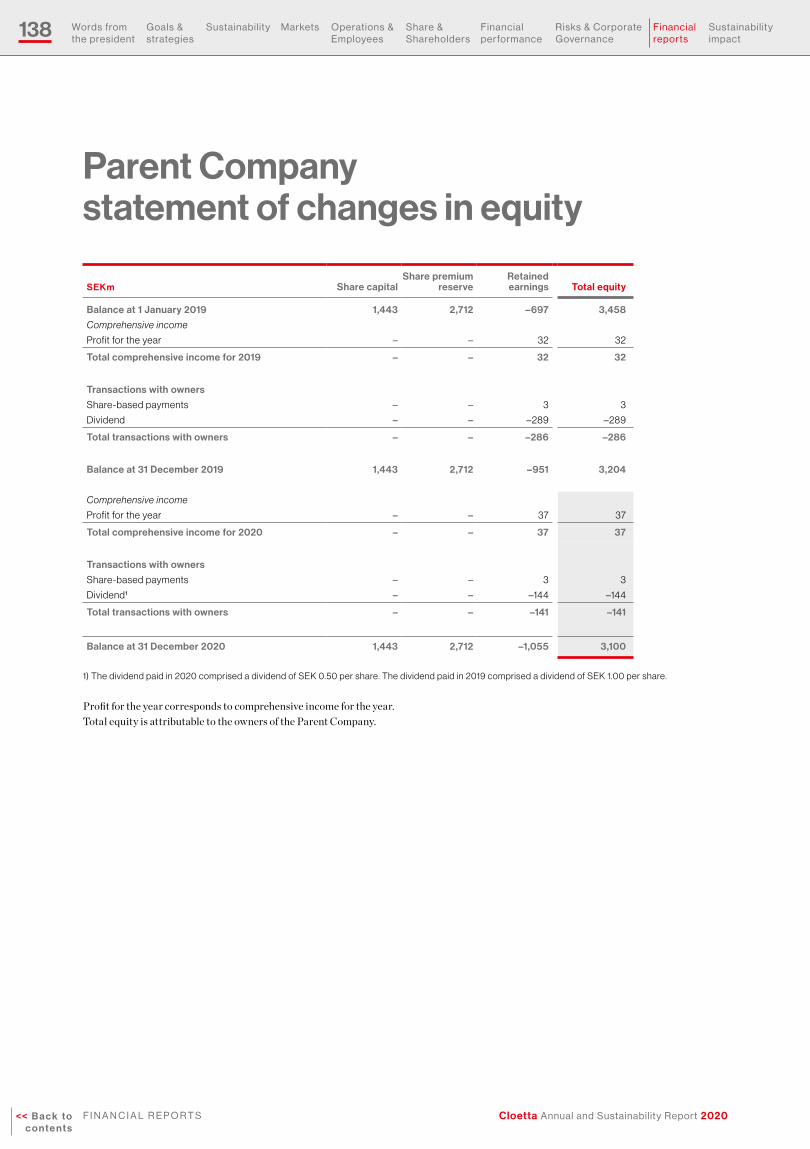
138
Cloetta Annual and Sustainability Report 2020<< B a c k t o c o n t e n t s
f i n a n C i a l r e P O r t S
Words from the president
Goals & strategies
Sustain ability Markets Operations & employees
Share & Shareholders
financial performance
risks & Corporate Governance
financial reports
Sustain ability impact
Parent Company statement of changes in equity
SEKm Share capitalShare premium
reserveRetained earnings Total equity
Balance at 1 January 2019 1,443 2,712 –697 3,458
Comprehensive income
Profit for the year – – 32 32
Total comprehensive income for 2019 – – 32 32
Transactions with owners
Share-based payments – – 3 3
Dividend – – –289 –289
Total transactions with owners – – –286 –286
Balance at 31 December 2019 1,443 2,712 –951 3,204
Comprehensive income
Profit for the year – – 37 37
Total comprehensive income for 2020 – – 37 37
Transactions with owners
Share-based payments – – 3 3
Dividend1 – – –144 –144
Total transactions with owners – – –141 –141
Balance at 31 December 2020 1,443 2,712 –1,055 3,100
1) The dividend paid in 2020 comprised a dividend of SEK 0.50 per share. The dividend paid in 2019 comprised a dividend of SEK 1.00 per share.
Profit for the year corresponds to comprehensive income for the year.Total equity is attributable to the owners of the Parent Company.

139
Cloetta Annual and Sustainability Report 2020 << B a c k t o c o n t e n t s
f i n a n C i a l r e P O r t S
Words from the president
Goals & strategies
Sustain ability Markets Operations & employees
Share & Shareholders
financial performance
risks & Corporate Governance
financial reports
Sustain ability impact
Parent Company cash flow statement
SEKm Note 2020 2019
Operating loss –2 –22
Interest paid –19 –15
Income tax paid –2 –1
Cash flow from operating activities before changes in working capital –23 –38
Cash flow from changes in working capital
Change in operating receivables 92 –7
Change in operating liabilities 326 342
Cash flow from operating activities 395 297
Cash flow from operating and investing activities 395 297
Financing activities
Repayment of interest-bearing borrowings –1,247 –1,558
Proceeds from borrowings (net of transaction cost) 998 1,557
Dividends to shareholders –144 –289
Cash flow from financing activities –393 –290
Cash flow for the year 2 7
Cash and cash equivalents at beginning of year P9 0 0
Cash flow for the year 2 7
Exchange difference –2 –7
Cash and cash equivalents at end of year P9 0 0

140
Cloetta Annual and Sustainability Report 2020<< B a c k t o c o n t e n t s
f i n a n C i a l r e P O r t S
Words from the president
Goals & strategies
Sustain ability Markets Operations & employees
Share & Shareholders
financial performance
risks & Corporate Governance
financial reports
Sustain ability impact
Notes to the Parent Company financial statements
Note P1 Accounting and valuation policies of the Parent Company
The annual financial statements of the Parent Company are present-ed in accordance with the Swedish Annual Accounts Act (1995:1554) and the Swedish Financial Reporting Board’s recommendation RFR 2, Accounting for Legal Entities. The statements issued by the Board with respect to listed companies are also applied. RFR 2 states that in the report for the legal entity, the Parent Company shall apply all EU-endorsed IFRSs and statements as far as possible, within the framework of the Annual Accounts Act and with respect to the connection between accounting and taxation. This recommendation defines the exceptions and additional disclosures compared to IFRS. These financial statements include the financial statements of the Parent Company covering the period from 1 January to 31 December 2020.
Changed accounting standardsNeither revised IFRSs, nor revised RFR 2 (January 2018) effective from 1 January 2020 have entailed any practical change in the accounting standards for the Parent Company.
Differences between the accounting policies of the Group and the Parent Company The differences between the accounting principles applied by the Group and the Parent Company are described below.
Classification and presentation The profit and loss account and balance sheet of the Parent Company are presented in accordance with the Swedish Annual Accounts Act. The differences compared to IAS 1, Presentation of Financial State-ments, relate mainly to financial income and expenses, equity and the presentation of provisions as a separate item in the balance sheet.
Borrowing costs Borrowing costs are expensed when incurred and recognised in the other financial expenses in the profit and loss account.
Group contributions Group contributions received are recognised in other financial income in the profit and loss account. Group contributions paid to group companies are reported by the Parent Company as an invest-ment in shareholdings in group companies in the balance sheet.
Shareholdings in group companiesShareholdings in group companies are accounted for at acquisition costs. The transaction costs are included in the carrying amount of shareholdings in group companies.
Dividends Anticipated dividends from group companies are recognised in cases where the Parent Company has full control over the size of the dividend and has decided on the size of the dividend before the Parent Company publishes its financial reports.
Dividends received from group companies are recognised in the profit and loss account.
Employee benefitsRemeasurements arising from defined benefit plans also include the return on plan assets excluding interest and the effect of the asset ceiling, if any, excluding interest. Remeasurements are recognised in the profit and loss account when incurred. Salary increases are not taken into account in the calculation of the defined benefit obligation, and the applied discount rate is established by the Swedish Financial Supervisory Authority. All other expenses related to defined benefit plans are recognised in the general and administrative expenses in the profit and loss account when incurred.
Financial guaranteesFor reporting of financial guarantee contracts on behalf of group companies, the Parent Company applies a voluntary exemption that is permitted by the Swedish Financial Reporting Board. The voluntary exemption relates to financial guarantees issued on behalf of group companies. The Parent Company recognises financial guar-antee contracts as provisions in the balance sheet when it is probable that an outflow of resources will be required to settle the obligation. The costs are recognised in the general and administrative expenses in the profit and loss account.
Note P2 Breakdown of income
The net sales of SEK 79m (83) relate to intra-group services and intra-group royalty income.
The breakdown of net sales by market is as follows:
SEKm 2020 2019
Sweden 31 36
The Netherlands 17 13
Finland 8 5
Other 23 29
Total 79 83
Note P1
Note P2
Note P3
Note P4
Note P5
Note P6
Note P7
Note P8
Note P9
Note P10
Note P11
Note P12
Note P13
Note P14
Note P15
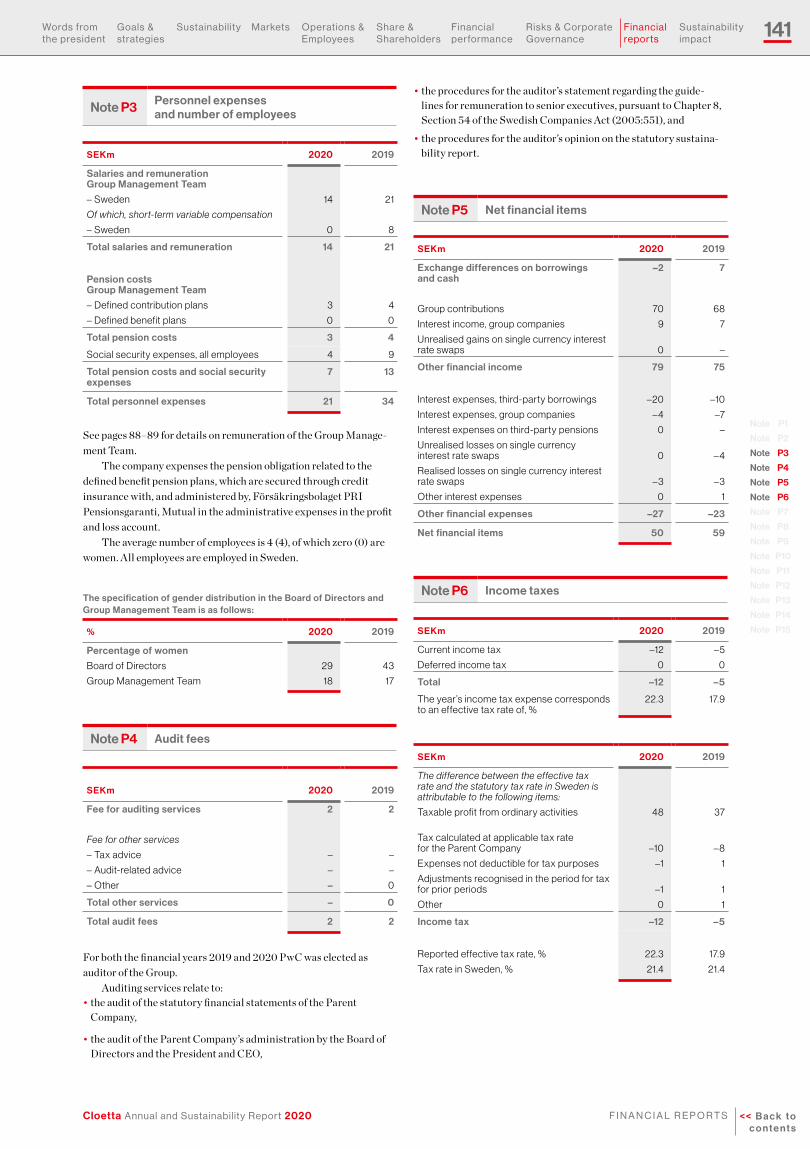
141
Cloetta Annual and Sustainability Report 2020 << B a c k t o c o n t e n t s
f i n a n C i a l r e P O r t S
Words from the president
Goals & strategies
Sustain ability Markets Operations & employees
Share & Shareholders
financial performance
risks & Corporate Governance
financial reports
Sustain ability impact
Note P1
Note P2
Note P3
Note P4
Note P5
Note P6
Note P7
Note P8
Note P9
Note P10
Note P11
Note P12
Note P13
Note P14
Note P15
Note P3 Personnel expenses and number of employees
SEKm 2020 2019
Salaries and remuneration Group Management Team
– Sweden 14 21
Of which, short-term variable compensation
– Sweden 0 8
Total salaries and remuneration 14 21
Pension costs Group Management Team
– Defined contribution plans 3 4
– Defined benefit plans 0 0
Total pension costs 3 4
Social security expenses, all employees 4 9
Total pension costs and social security expenses
7 13
Total personnel expenses 21 34
See pages 88–89 for details on remuneration of the Group Manage-ment Team.
The company expenses the pension obligation related to the defined benefit pension plans, which are secured through credit insurance with, and administered by, Försäkringsbolaget PRI Pensionsgaranti, Mutual in the administrative expenses in the profit and loss account.
The average number of employees is 4 (4), of which zero (0) are women. All employees are employed in Sweden.
The specification of gender distribution in the Board of Directors and Group Management Team is as follows:
% 2020 2019
Percentage of women
Board of Directors 29 43
Group Management Team 18 17
Note P4 Audit fees
SEKm
2020
2019
Fee for auditing services 2 2
Fee for other services
– Tax advice – –
– Audit-related advice – –
– Other – 0
Total other services – 0
Total audit fees 2 2
For both the financial years 2019 and 2020 PwC was elected as auditor of the Group.
Auditing services relate to:• the audit of the statutory financial statements of the Parent
Company,
• the audit of the Parent Company’s administration by the Board of Directors and the President and CEO,
• the procedures for the auditor’s statement regarding the guide- lines for remuneration to senior executives, pursuant to Chapter 8, Section 54 of the Swedish Companies Act (2005:551), and
• the procedures for the auditor’s opinion on the statutory sustaina-bility report.
Note P5 Net financial items
SEKm 2020 2019
Exchange differences on borrowings and cash
–2 7
Group contributions 70 68
Interest income, group companies 9 7
Unrealised gains on single currency interest rate swaps 0 –
Other financial income 79 75
Interest expenses, third-party borrowings –20 –10
Interest expenses, group companies – 4 –7
Interest expenses on third-party pensions 0 –
Unrealised losses on single currency interest rate swaps 0 – 4
Realised losses on single currency interest rate swaps –3 –3
Other interest expenses 0 1
Other financial expenses –27 –23
Net financial items 50 59
Note P6 Income taxes
SEKm 2020 2019
Current income tax –12 – 5
Deferred income tax 0 0
Total –12 –5
The year’s income tax expense corresponds to an effective tax rate of, %
22.3 17.9
SEKm 2020 2019
The difference between the effective tax rate and the statutory tax rate in Sweden is attributable to the following items:
Taxable profit from ordinary activities 48 37
Tax calculated at applicable tax rate for the Parent Company –10 – 8
Expenses not deductible for tax purposes –1 1
Adjustments recognised in the period for tax for prior periods –1 1
Other 0 1
Income tax –12 –5
Reported effective tax rate, % 22.3 17.9
Tax rate in Sweden, % 21.4 21.4

142
Cloetta Annual and Sustainability Report 2020<< B a c k t o c o n t e n t s
f i n a n C i a l r e P O r t S
Words from the president
Goals & strategies
Sustain ability Markets Operations & employees
Share & Shareholders
financial performance
risks & Corporate Governance
financial reports
Sustain ability impact
Note P8 Shareholdings in group companies
Cloetta Sverige AB
Candyking Sverige AB
Pickalot AB
Cloetta Nutisal AB
Cloetta Finance
Holland BV
Cloetta België NV
Cloetta Deutschland
GmbH
Cloetta Suomi Oy
Cloetta Slovakia sro
Cloetta Ireland
Holding Ltd
Cloetta Holland BV
Cloetta Ireland Ltd
Candymix Ireland
Ltd*
Cloetta Holland BV
italian branch
Cloetta Danmark
ApS
Cloetta Norge AS
Cloetta UK Ltd
Cloetta UK Dormant
Ltd*
Cloetta AB (publ)
Cloetta Holland BV
Singapore branch
% of capital Carrying amount in SEKm
Corp. ID no. Domicile 2020 2019 2020 2019
Cloetta Holland B.V. 34221053 Amsterdam, the Netherlands 100 100 4,087 4,087
Cloetta België N.V. 0404183756 Turnhout, Belgium 100 100 – –
Cloetta Suomi Oy 1933121-3 Turku, Finland 100 100 – –
Cloetta Danmark ApS 28106866 Brøndby, Denmark 100 100 – –
Cloetta Norge AS 987943033 Høvik, Norway 100 100 – –
Cloetta Deutschland GmbH HRB 9561 Bocholt, Germany 100 100 – –
Cloetta USA Inc. 2 EIN 46-2706408 Wilmington, United States – – – –
Cloetta Finance Holland B.V. 20078943 Amsterdam, the Netherlands 100 100 – –
Cloetta Slovakia s.r.o. 35 962 488 Bratislava, Slovakia 100 100 – –
Cloetta Nutisal AB 556706-9264 Helsingborg, Sweden 100 100 – –
Cloetta Ireland Holding Ltd. 544426 Dublin, Ireland 100 100 – –
Cloetta Ireland Ltd. 285910 Dublin, Ireland 100 100 – –
Candymix Ireland Ltd.7 494493 Dublin, Ireland 100 100 – –
Cloetta Middle East DMCC3 DMCC156985 Dubai, United Arab Emirates 100 100 – –
Cloetta Sverige AB5 556674-9155 Malmö, Sweden 100 100 795 795
E out instrument AB5 559094-9748 Linköping, Sweden – – – –
Candyking Sverige AB 556319-6780 Stockholm, Sweden 100 100 – –
Pickalot AB 556730-1857 Stockholm, Sweden 100 100 – –
Cloetta UK Ltd.4 01726257 Hampshire, United Kingdom 100 100 – –
Cloetta UK Dormant Ltd.4,7 06775890 Heysham, United Kingdom – 100 – –
FTF Sweets USA Inc.1 211476123 Newark, United States – – – –
Candyking Poland Sp. z o.o.6 0000347591 Warsaw, Poland – 100 – –
Cloetta Development AB 556377-3182 Linköping, Sweden 100 100 2 2
Total 4,884 4,884
1) On 8 February 2017, FTF Sweets USA Inc. was dissolved. The three-year unwinding period ended on 8 February 2020.2) On 23 May 2017, Cloetta USA Inc. was dissolved. The three-year unwinding period ended on 23 May 2020. 3) On 10 February 2019, Cloetta Middle East DMCC was incorporated. 4) On 1 May 2019, Cloetta UK Ltd was renamed to Cloetta UK Dormant Ltd and Candyking UK Ltd was renamed to Cloetta UK Ltd.5) On 23 December 2019, E out instrument AB was merged into Cloetta Sverige AB.6) On 13 February 2020, Cloetta Poland Sp. z o.o. was liquidated.7) Cloetta UK Dormant Ltd. and Candymix Ireland Ltd. are in the process of being struck off at reporting date.
See Note 1 for disclosures on changes in Group structure.
Cloetta Middle East
dMCC
Cloetta Development
AB
* Cloetta UK Dormant Ltd. and Candymix Ireland Ltd. are in the process of being struck off at reporting date.
Note P7 Deferred and current income tax
Deferred tax assets and liabilities relate to the tax effect of the difference between the tax base of the defined asset or liability and its carrying amount as recognised in the financial statements. Deferred tax for the period was SEK 6m (6) and is considered to be realised
after more than 12 months. The recognised deferred taxes comprise deductible temporary differences of SEK 6m (6) and unutilised tax losses carried forward of SEK 0m (0). There are no unrecognised deferred taxes.
Note P1
Note P2
Note P3
Note P4
Note P5
Note P6
Note P7
Note P8
Note P9
Note P10
Note P11
Note P12
Note P13
Note P14
Note P15
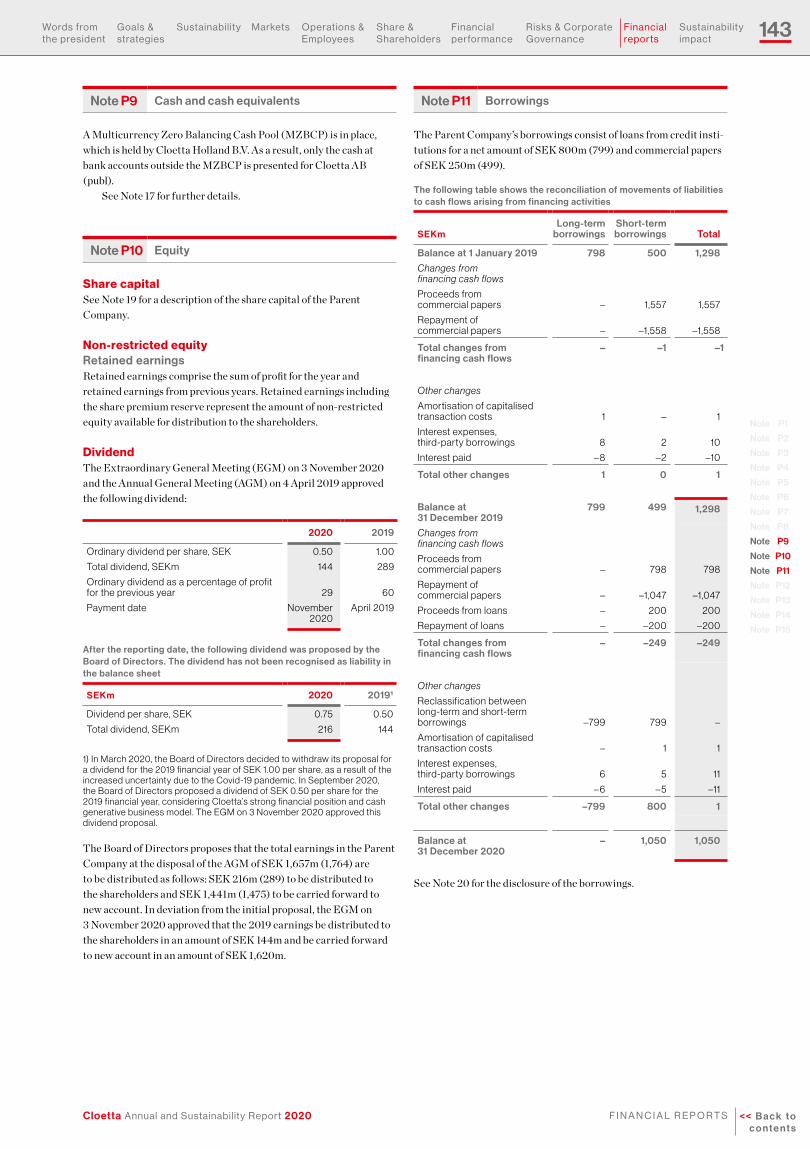
143
Cloetta Annual and Sustainability Report 2020 << B a c k t o c o n t e n t s
f i n a n C i a l r e P O r t S
Words from the president
Goals & strategies
Sustain ability Markets Operations & employees
Share & Shareholders
financial performance
risks & Corporate Governance
financial reports
Sustain ability impact
Note P1
Note P2
Note P3
Note P4
Note P5
Note P6
Note P7
Note P8
Note P9
Note P10
Note P11
Note P12
Note P13
Note P14
Note P15
Note P9 Cash and cash equivalents
A Multicurrency Zero Balancing Cash Pool (MZBCP) is in place, which is held by Cloetta Holland B.V. As a result, only the cash at bank accounts outside the MZBCP is presented for Cloetta AB (publ).
See Note 17 for further details.
Note P10 Equity
Share capitalSee Note 19 for a description of the share capital of the Parent Company.
Non-restricted equityRetained earningsRetained earnings comprise the sum of profit for the year and retained earnings from previous years. Retained earnings including the share premium reserve represent the amount of non-restricted equity available for distribution to the shareholders.
DividendThe Extraordinary General Meeting (EGM) on 3 November 2020 and the Annual General Meeting (AGM) on 4 April 2019 approved the following dividend:
2020 2019
Ordinary dividend per share, SEK 0.50 1.00
Total dividend, SEKm 144 289
Ordinary dividend as a percentage of profit for the previous year 29 60
Payment date November 2020
April 2019
After the reporting date, the following dividend was proposed by the Board of Directors. The dividend has not been recognised as liability in the balance sheet
SEKm 2020 20191
Dividend per share, SEK 0.75 0.50
Total dividend, SEKm 216 144
1) In March 2020, the Board of Directors decided to withdraw its proposal for a dividend for the 2019 financial year of SEK 1.00 per share, as a result of the increased uncertainty due to the Covid-19 pandemic. In September 2020, the Board of Directors proposed a dividend of SEK 0.50 per share for the 2019 financial year, considering Cloetta’s strong financial position and cash generative business model. The EGM on 3 November 2020 approved this dividend proposal.
The Board of Directors proposes that the total earnings in the Parent Company at the disposal of the AGM of SEK 1,657m (1,764) are to be distributed as follows: SEK 216m (289) to be distributed to the shareholders and SEK 1,441m (1,475) to be carried forward to new account. In deviation from the initial proposal, the EGM on 3 November 2020 approved that the 2019 earnings be distributed to the shareholders in an amount of SEK 144m and be carried forward to new account in an amount of SEK 1,620m.
Note P11 Borrowings
The Parent Company’s borrowings consist of loans from credit insti-tutions for a net amount of SEK 800m (799) and commercial papers of SEK 250m (499).
The following table shows the reconciliation of movements of liabilities to cash flows arising from financing activities
SEKmLong-term
borrowingsShort-term borrowings Total
Balance at 1 January 2019 798 500 1,298
Changes from financing cash flows
Proceeds from commercial papers – 1,557 1,557
Repayment of commercial papers – –1,558 –1,558
Total changes from financing cash flows
– –1 –1
Other changes
Amortisation of capitalised transaction costs 1 – 1
Interest expenses, third-party borrowings 8 2 10
Interest paid – 8 –2 –10
Total other changes 1 0 1
Balance at 31 December 2019
799 499 1,298
Changes from financing cash flows
Proceeds from commercial papers – 798 798
Repayment of commercial papers – –1,047 –1,047
Proceeds from loans – 200 200
Repayment of loans – –200 –200
Total changes from financing cash flows
– –249 –249
Other changes
Reclassification between long-term and short-term borrowings –799 799 –
Amortisation of capitalised transaction costs – 1 1
Interest expenses, third-party borrowings 6 5 11
Interest paid – 6 – 5 –11
Total other changes –799 800 1
Balance at 31 December 2020
– 1,050 1,050
See Note 20 for the disclosure of the borrowings.

144
Cloetta Annual and Sustainability Report 2020<< B a c k t o c o n t e n t s
f i n a n C i a l r e P O r t S
Words from the president
Goals & strategies
Sustain ability Markets Operations & employees
Share & Shareholders
financial performance
risks & Corporate Governance
financial reports
Sustain ability impact
Note P12 Derivative financial instruments
The derivative financial instruments comprise single currency inter-est rate swap liabilities amounting to SEK 3m (4) of which SEK 0m (2) is non-current in nature.
Note P13 Accrued expenses and deferred income
Accrued expenses and deferred income amount to SEK 16m (21), of which SEK 3m (13) is related to accrued personnel-related expenses and SEK 13m (8) to other accrued expenses and deferred income.
Note P14 Pledged assets and contingent liabilities
SEKm31 Dec
202031 Dec
2019
Contingent liabilities
Guarantees on behalf of group companies 801 834
Guarantee for loans from credit institutions for group companies 1,254 1,306
Total 2,055 2,140
The company issued a parent company guarantee pursuant to Article 403, Book 2 of the Dutch Civil Code in respect of Cloetta Holland B.V. and Cloetta Finance Holland B.V. This means that Cloetta AB declares and accepts, under reservation of legal repeal of the decla-ration, joint and several liability for the debts resulting from legal acts of Cloetta Holland B.V. and Cloetta Finance Holland B.V. As the probability of a settlement is remote, an estimate of the financial effect is not practical to calculate. The term and revolving facilities agreement is unsecured in nature.
Note P15 Related-party transactions
The Parent Company’s holdings of shares and participations in subsidiaries are specified in Note P8.
Receivables from and liabilities to subsidiaries are broken down as follows:
SEKm31 Dec
202031 Dec
2019
Non-current interest-bearing receivables 464 471
Current interest-free receivables 77 97
Non-current interest-bearing payables –137 –136
Current interest-bearing payables –1,096 –758
Current interest-free payables 0 –17
Total –692 –343
For the Parent Company, SEK 79m (83), equal to 100 per cent (100) of the year’s net sales, and SEK 50m (57), equal to 62 per cent (54) of the year’s purchases, relate to group companies in the Cloetta Group. The prices of goods and services sold to and purchased from related parties are set on market-based terms.
At 31 December 2020, the Parent Company’s receivables from group companies amounted to SEK 521m (568) and liabilities to subsidiaries amounted to SEK 1,233m (911). Transactions with re-lated parties are priced on market-based terms. Total costs excluding social security charges related to the share-based long-term incentive plan amounted to SEK 1m (1), of which SEK 1m (1) is related to the Group Management Team.
The Parent Company has no past experience of credit losses on receivables from group companies and future credit losses are expected to be immaterial.
Note P1
Note P2
Note P3
Note P4
Note P5
Note P6
Note P7
Note P8
Note P9
Note P10
Note P11
Note P12
Note P13
Note P14
Note P15

145
Cloetta Annual and Sustainability Report 2020 << B a c k t o c o n t e n t s
f i n a n C i a l r e P O r t S
Words from the president
Goals & strategies
Sustain ability Markets Operations & employees
Share & Shareholders
financial performance
risks & Corporate Governance
financial reports
Sustain ability impact
Proposed appropriation of earnings
Earnings in the Parent Company at the diposal of the Annual General Meeting 2020
Share premium reserve SEK 2,711,620,366
Retained earnings SEK –1,091,817,857
Profit for the year SEK 36,972,469
Total SEK 1,656,774,978
The Board of Directors proposes that dividends be paid in a total amount of SEK 216,464,474 equal to SEK 0.75 per share. The Board of Directors proposes that the earnings be disposed of as follows:
The earnings are to be disposed as follows: 2020
To be distributed to the shareholders SEK 216,464,474
To be carried forward to new account SEK 1,440,310,504
Total SEK 1,656,774,978
The number of shares at 31 December 2020 was 288,619,299.
The Board of Directors and the President and CEO give their assurance that the consolidated financial statements and annual report have been prepared in accordance with Regulation (EC) No. 1606/2002 of the European Parliament and of the Council of 19 July 2002, on the Application of International Accounting Standards and Generally Accepted Accounting Standards, and give a true and fair view of the financial position and results of operations of the Group and the Parent Company. The administration report for the Group and the Parent Company gives a true and fair view of the business activities, financial position and results of operations of the Group and
the Parent Company, and describes the significant risks and uncertainties to which the Parent Company and the Group companies are exposed. The statutory Sustainability Report, comprising those areas in the Cloetta AB (publ) annual report with content
specified on the inside of the front cover, has been approved for publication by the Board of Directors.
Stockholm, 11 March 2021
Mikael NormanChairman
Lottie KnutsonMember of the Board
Patrick BerganderMember of the Board
Alan McLean RaleighMember of the Board
Mikael SvenfeltMember of the Board
Camilla SvenfeltMember of the Board
Mikael AruMember of the Board
Lena GrönedalEmployee Board member
Mikael StrömEmployee Board member
Henri de Sauvage-NoltingPresident and CEO
Our audit report was issued on 11 March 2021.
Öhrlings PricewaterhouseCoopers AB
Sofia Götmar-BlomstedtAuthorised Public Accountant
Partner in charge
Erik BerghAuthorised Public Accountant
The profit and loss accounts and balance sheets of the Group and the Parent Company are subject to approval by the AGM on 6 April 2021. The information in this report is subject to the disclosure requirements of Cloetta AB (publ) under the provisions in the Swedish Securities
Market Act. The information was submitted to the media for publication on 15 March 2021, at 08:00 CET.

146
Cloetta Annual and Sustainability Report 2020<< B a c k t o c o n t e n t s
f i n a n C i a l r e P O r t S
Words from the president
Goals & strategies
Sustain ability Markets Operations & employees
Share & Shareholders
financial performance
risks & Corporate Governance
financial reports
Sustain ability impact
Auditor’s reportUnofficial translation
to the general meeting of the shareholders of Cloetta aB (publ), corporate identity number 556308-8144
Report on the annual accounts and consolidated accountsOpinionsWe have audited the annual accounts and consolidated accounts of Cloetta AB (publ) for the year 2020 except for the corporate govern-ance statement and sustainability report on pages 2–3, 76–79, 85 and 90. The annual accounts and consolidated accounts of the company are included on pages 1–4 and 69–145 in this document.
In our opinion, the annual accounts have been prepared in accordance with the Annual Accounts Act and present fairly, in all material respects, the financial position of parent company and the group as of 31 December 2020 and its financial performance and cash flow for the year then ended in accordance with the Annual Accounts Act. The consolidated accounts have been prepared in accordance with the Annual Accounts Act and present fairly, in all material respects, the financial position of the group as of 31 December 2020 and their financial performance and cash flow for the year then ended in accordance with International Financial Reporting Standards (IFRS), as adopted by the EU, and the Annual Accounts Act. Our opinions do not cover the corporate governance statement on pages 82–95 and the sustainability report on pages 2–3, 76–79, 85 and 90. The statutory administration report is consistent with the other parts of the annual accounts and consolidated accounts.
We therefore recommend that the general meeting of sharehold-ers adopts the income statement and balance sheet for the parent company and the group.
Our opinions in this report on the annual accounts and consol-idated accounts are consistent with the content of the additional re-port that has been submitted to the parent company’s audit commit-tee in accordance with the Audit Regulation (537/2014) Article 11.
Basis for OpinionsWe conducted our audit in accordance with International Standards on Auditing (ISA) and generally accepted auditing standards in Swe-den. Our responsibilities under those standards are further described in the Auditor’s Responsibilities section. We are independent of the parent company and the group in accordance with professional ethics for accountants in Sweden and have otherwise fulfilled our ethical responsibilities in accordance with these requirements. This includes that, based on the best of our knowledge and belief, no prohibited ser-vices referred to in the Audit Regulation (537/2014) Article 5.1 have
been provided to the audited company or, where applicable, its parent company or its controlled companies within the EU.
We believe that the audit evidence we have obtained is sufficient and appropriate to provide a basis for our opinions.
Our audit approachOverviewAudit scopeWe designed our audit by determining materiality and assessing the risks of material misstatement in the consolidated financial statements. In particular, we considered where management made subjective judgements; for example, in respect of significant account-ing estimates that involved making assumptions and considering future events that are inherently uncertain. As in all of our audits, we also addressed the risk of management override of internal controls, including among other matters consideration of whether there was evidence of bias that represented a risk of material misstatement due to fraud.
We tailored the scope of our audit in order to perform sufficient work to enable us to provide an opinion on the consolidated financial statements as a whole, taking into account the structure of the Group, the accounting processes and controls, and the industry in which the group operates.
MaterialityThe scope of our audit was influenced by our application of material-ity. An audit is designed to obtain reasonable assurance whether the financial statements are free from material misstatement. Misstate-ments may arise due to fraud or error. They are considered material if individually or in aggregate, they could reasonably be expected to influence the economic decisions of users taken on the basis of the consolidated financial statements.
Based on our professional judgement, we determined certain quantitative thresholds for materiality, including the overall group materiality for the consolidated financial statements as a whole as set out in the table below. These, together with qualitative consider-ations, helped us to determine the scope of our audit and the nature, timing and extent of our audit procedures and to evaluate the effect of misstatements, both individually and in aggregate on the financial statements as a whole.

147
Cloetta Annual and Sustainability Report 2020 << B a c k t o c o n t e n t s
f i n a n C i a l r e P O r t S
Words from the president
Goals & strategies
Sustain ability Markets Operations & employees
Share & Shareholders
financial performance
risks & Corporate Governance
financial reports
Sustain ability impact
Other Information than the annual accounts and consolidated accountsThis document also contains other information than the annual accounts and consolidated accounts and is found on pages 149–169. Other information also consists of the renumeration report 2020 which we obtained before the date of this auditor’s report. The Board of Directors and the Managing Director are responsible for this other information.
Our opinion on the annual accounts and consolidated accounts does not cover this other information and we do not express any form of assurance conclusion regarding this other information.
In connection with our audit of the annual accounts and consolidated accounts, our responsibility is to read the information identified above and consider whether the information is materially inconsistent with the annual accounts and consolidated accounts. In this procedure we also take into account our knowledge otherwise obtained in the audit and assess whether the information otherwise appears to be materially misstated.
If we, based on the work performed concerning this information, conclude that there is a material misstatement of this other informa-tion, we are required to report that fact. We have nothing to report in this regard.
Responsibilities of the Board of Directors and the Managing DirectorThe Board of Directors and the Managing Director are responsible for the preparation of the annual accounts and consolidated accounts and that they give a fair presentation in accordance with the Annual Accounts Act and, concerning the consolidated accounts, in accord-ance with IFRS as adopted by the EU. The Board of Directors and the Managing Director are also responsible for such internal control as they determine is necessary to enable the preparation of annual accounts and consolidated accounts that are free from material mis-statement, whether due to fraud or error.
In preparing the annual accounts and consolidated accounts, the Board of Directors and the Managing Director are responsible for the assessment of the company’s and the group’s ability to continue as a going concern. They disclose, as applicable, matters related to going concern and using the going concern basis of accounting. The going concern basis of accounting is however not applied if the Board of
Directors and the Managing Director intend to liquidate the compa-ny, to cease operations, or has no realistic alternative but to do so.
The Audit Committee shall, without prejudice to the Board of Director’s responsibilities and tasks in general, among other things oversee the company’s financial reporting process.
Auditor’s responsibilityOur objectives are to obtain reasonable assurance about whether the annual accounts and consolidated accounts as a whole are free from material misstatement, whether due to fraud or error, and to issue an auditor’s report that includes our opinions. Reasonable assurance is a high level of assurance, but is not a guarantee that an audit conducted in accordance with ISAs and generally accepted auditing standards in Sweden will always detect a material misstatement when it exists. Misstatements can arise from fraud or error and are considered material if, individually or in the aggregate, they could reasonably be expected to influence the economic decisions of users taken on the basis of these annual accounts and consolidated accounts.
A further description of our responsibility for the audit of the an-nual accounts and consolidated accounts is available on Revisorsins-pektionen’s website: www.revisorsinspektionen.se/revisornsansvar. This description is part of the auditor’s report.
Report on other legal and regulatory requirementsOpinionsIn addition to our audit of the annual accounts and consolidated accounts, we have also audited the administration of the Board of Di-rector’s and the Managing Director of Cloetta AB (publ) for the year 2020 and the proposed appropriations of the company’s profit or loss.
We recommend to the general meeting of shareholders that the profit be appropriated in accordance with the proposal in the statutory administration report and that the members of the Board of Director’s and the Managing Director be discharged from liability for the financial year.
Basis for OpinionsWe conducted the audit in accordance with generally accepted audit-ing standards in Sweden. Our responsibilities under those standards are further described in the Auditor’s Responsibilities section. We are independent of the parent company and the group in accordance
Key Audit Matter
Impairment test for intangible assetsGoodwill and other intangible assets with an indefinite useful life repre-sent a significant part of the Balance Sheet of Cloetta and amount to SEK 5,424m (5,540) as of 31 December 2020. The group annually per-forms an impairment assessment of the assets based on a calculation of the discounted cash flow for the cash generating unit in which goodwill and other intangible assets are reported, as required by IFRS. Impair-ment tests, are by their nature, is based on a high level of judgments and assumptions regarding future cash flows. Information is provided in Notes 11 and 30 as to how the group’s management has undertaken its assessments, and, also provides information on important assumptions. Key variables in the test are growth rate and discount factor (cost of cap-ital). It is also presented that no impairment requirement has been iden-tified based on the assumptions undertaken. As described in note 11 the current market conditions, which are affected by the current pandemic, have had a negative effect on Cloetta’s business and thereby increased the risk for impairment of intangibles assets. Cloetta has concluded that there is no impairment of intangible assets to be recorded per 31 Decem-ber 2020 for any of its cash generating units. It has also been concluded that the cash generating unit Netherlands & Germany is most sensitive to a negative development in key assumptions.
How our audit addressed the Key Audit Matter
In our audit, we have evaluated the calculation model applied by man-agement and tested the mathematical accuracy. This implies that we have reconciled and critically tested essential variables against budget and long-term plan for the group and in some cases towards external data. Furthermore, we have performed a retrospective review of the prior period estimate by comparing it to actual current period results.
We have tested the sensitivity in the group’s analysis for key variables in order to assess the risk for impairment. We have also assessed the disclosures included in the financial statements.
Key audit mattersKey audit matters of the audit are those matters that, in our professional judgment, were of most significance in our audit of the annual accounts and consolidated accounts of the current period.
These matters were addressed in the context of our audit of, and in forming our opinion thereon, the annual accounts and consolidated accounts as a whole, but we do not provide a separate opinion on these matters.

148
Cloetta Annual and Sustainability Report 2020<< B a c k t o c o n t e n t s
f i n a n C i a l r e P O r t S
Words from the president
Goals & strategies
Sustain ability Markets Operations & employees
Share & Shareholders
financial performance
risks & Corporate Governance
financial reports
Sustain ability impact
with professional ethics for accountants in Sweden and have other-wise fulfilled our ethical responsibilities in accordance with these requirements.
We believe that the audit evidence we have obtained is sufficient and appropriate to provide a basis for our opinions.
Responsibilities of the Board of Directors and the Managing DirectorThe Board of Directors is responsible for the proposal for appropri-ations of the company’s profit or loss. At the proposal of a dividend, this includes an assessment of whether the dividend is justifiable considering the requirements which the company’s and the group’s type of operations, size and risks place on the size of the parent com-pany’s and the group’ equity, consolidation requirements, liquidity and position in general.
The Board of Directors is responsible for the company’s organi-sation and the administration of the company’s affairs. This includes among other things continuous assessment of the company’s and the group’s financial situation and ensuring that the company’s organisa-tion is designed so that the accounting, management of assets and the company’s financial affairs otherwise are controlled in a reassuring manner. The Managing Director shall manage the ongoing adminis-tration according to the Board of Directors’ guidelines and instruc-tions and among other matters take measures that are necessary to fulfill the company’s accounting in accordance with law and handle the management of assets in a reassuring manner.
Auditor’s responsibilityOur objective concerning the audit of the administration, and thereby our opinion about discharge from liability, is to obtain audit evidence to assess with a reasonable degree of assurance whether any member of the Board of Directors or the Managing Director in any material respect:• has undertaken any action or been guilty of any omission which can
give rise to liability to the company, or
• in any other way has acted in contravention of the Companies Act, the Annual Accounts Act or the Articles of Association.
Our objective concerning the audit of the proposed appropria-tions of the company’s profit or loss, and thereby our opinion about this, is to assess with reasonable degree of assurance whether the proposal is in accordance with the Companies Act.
Reasonable assurance is a high level of assurance, but is not a guarantee that an audit conducted in accordance with generally accepted auditing standards in Sweden will always detect actions or omissions that can give rise to liability to the company, or that the proposed appropriations of the company’s profit or loss are not in accordance with the Companies Act.
A further description of our responsibility for the audit of the administration is available on Revisorsinspektionen’s website: www.revisorsinspektionen.se/revisornsansvar. This description is part of the auditor’s report.
The auditor’s examination of the corporate governance statementThe Board of Directors is responsible for that the corporate govern-ance statement on pages 82–95 has been prepared in accordance with the Annual Accounts Act.
Our examination of the corporate governance statement is conducted in accordance with FAR’s auditing standard RevU 16 The auditor’s examination of the corporate governance statement. This means that our examination of the corporate governance statement is different and substantially less in scope than an audit conducted in accordance with International Standards on Auditing and generally accepted auditing standards in Sweden. We believe that the examina-tion has provided us with sufficient basis for our opinions.
A corporate governance statement has been prepared. Disclo-sures in accordance with chapter 6 section 6 the second paragraph points 2–6 of the Annual Accounts Act and chapter 7 section 31 the second paragraph the same law are consistent with the other parts of the annual accounts and consolidated accounts and are in accordance with the Annual Accounts Act.
Öhrlings PricewaterhouseCoopers AB, Anna Lindhs plats 4, Malmö, was appointed auditor of Cloetta AB (publ) by the general meeting of the shareholders on the 2 April 2020 and has been the company’s auditor since the 4 April 2019.
Stockholm 11 March 2021
Öhrlings PricewaterhouseCoopers AB
Sofia Götmar-BlomstedtAuthorised Public Accountant
Partner in charge
Erik BerghAuthorised Public Accountant
149
Cloetta Annual and Sustainability Report 2020 << B a c k t o c o n t e n t s
f i n a n C i a l r e P O r t S
Words from the president
Goals & strategies
Sustain ability Markets Operations & employees
Share & Shareholders
financial performance
risks & Corporate Governance
financial reports
Sustain ability impact

150
Cloetta Annual and Sustainability Report 2020<< B a c k t o c o n t e n t s
f i n a n C i a l r e P O r t S
Words from the president
Goals & strategies
Sustain ability Markets Operations & employees
Share & Shareholders
financial performance
risks & Corporate Governance
financial reports
Sustain ability impact
Ten-year overview
SEKm 2020 2019 2018 2017 2016 2015 2014 2013 2012 2011
Profit and loss account in summary
Net sales 5,695 6,493 6,218 5,784 5,107 5,674 5,313 4,893 4,859 4,658
Cost of goods sold –3,718 – 4,112 –3,934 –3,678 –3,084 –3,463 –3,325 –3,081 –3,157 –2,911
Gross profit 1,977 2,381 2,284 2,106 2,023 2,211 1,988 1,812 1,702 1,747
Other operating income – – 4 6 – 0 5 12 13 1
Selling expenses –951 –1,011 –1,025 –972 – 806 –949 – 892 – 850 – 888 –915
General and administrative expenses – 564 – 643 – 603 – 613 – 582 – 591 – 524 – 556 –702 – 473
Operating profit 462 727 660 527 635 671 577 418 125 360
Exchange differences cash and cash equivalents in foreign currencies
–10 –19 –16 –17 – 8 –1 –11 –12 20 –12
Other financial income 3 2 5 7 17 6 4 24 5 11
Other financial expenses – 52 – 62 – 87 –74 –175 –183 –232 –220 –290 – 599
Net financial items –59 –79 –98 –84 –166 –178 –239 –208 –265 –600
Profit/loss before tax 403 648 562 443 469 493 338 210 –140 –240
Income tax expense –122 –150 –79 –206 –122 –107 –96 54 67 172
Profit/loss for the period for continuing operations
281 498 483 237 347 386 242 264 –73 –68
Result after tax from discontinued operations
– – – –334 – 538 – – – – –
Net profit/loss for the period 281 498 483 –97 –191 386 242 264 –73 –68
Profit for the period attributable to:
Owners of the Parent Company
Continuing operations 281 498 483 237 347 386 242 264 –73 – 68
Discontinued operation – – – –334 – 538 – – – – –
Total 281 498 483 –97 –191 386 242 264 –73 –68

151
Cloetta Annual and Sustainability Report 2020 << B a c k t o c o n t e n t s
f i n a n C i a l r e P O r t S
Words from the president
Goals & strategies
Sustain ability Markets Operations & employees
Share & Shareholders
financial performance
risks & Corporate Governance
financial reports
Sustain ability impact
SEKm31 Dec
202031 Dec
201931 Dec
201831 Dec
201731 Dec
201631 Dec
201531 Dec
201431 Dec
201331 Dec
201231 Dec
2011
Balance sheet in summary
Intangible assets 5,563 5,684 5,626 5,490 5,354 5,948 5,882 5,252 5,099 4,811
Property, plant and equipment 1,560 1,559 1,354 1,338 1,700 1,698 1,667 1,660 1,611 1,318
Deferred tax asset 20 9 16 20 54 64 84 73 473 447
Other financial assets 3 7 11 11 13 27 105 91 88 261
Total non-current assets 7,146 7,259 7,007 6,859 7,121 7,737 7,738 7,076 7,271 6,837
Inventories 952 888 765 745 780 786 853 798 773 640
Trade and other receivables 736 928 838 881 988 975 1,121 933 951 1,051
Current income tax assets 27 6 6 8 36 3 3 0 4 2
Derivative financial instruments – – 1 0 4 1 2 – – –
Cash and cash equivalents 396 579 551 759 298 246 229 167 306 97
Total current assets 2,111 2,401 2,161 2,393 2,106 2,011 2,208 1,898 2,034 1,790
Assets held for sale – – – – 9 11 16 15 35 15
TOTAL ASSETS 9,257 9,660 9,168 9,252 9,236 9,759 9,962 8,989 9,340 8,642
Equity 4,179 4,197 3,968 3,818 4,199 4,344 4,048 3,747 3,326 –385
Long-term borrowings 111 939 2,076 1,715 2,666 2,612 2,993 3,096 2,516 6,077
Deferred tax liability 837 803 754 703 586 621 483 397 824 728
Derivative financial instruments 0 3 3 2 12 44 56 21 3 0
Other non-current liabilities – – – 138 – 43 147 2 – –
Provisions for pensions and other long-term employee benefits
512 499 419 374 396 378 505 360 452 250
Provisions 5 5 9 5 22 10 16 7 11 24
Total non-current liabilities 1,465 2,249 3,261 2,937 3,682 3,708 4,200 3,883 3,806 7,079
Short-term borrowings 2,368 1,870 500 999 2 344 423 212 747 747
Derivative financial instruments 54 68 61 71 54 35 16 2 21 0
Trade and other payables 1,144 1,227 1,342 1,394 1,196 1,216 1,152 967 1,264 1,038
Provisions 24 5 23 3 64 57 65 79 79 60
Current income tax liabilities 23 44 13 30 39 55 58 99 97 103
Total current liabilities 3,613 3,214 1,939 2,497 1,355 1,707 1,714 1,359 2,208 1,948
Total equity and liabilities 9,257 9,660 9,168 9,252 9,236 9,759 9,962 8,989 9,340 8,642

152
Cloetta Annual and Sustainability Report 2020<< B a c k t o c o n t e n t s
f i n a n C i a l r e P O r t S
Words from the president
Goals & strategies
Sustain ability Markets Operations & employees
Share & Shareholders
financial performance
risks & Corporate Governance
financial reports
Sustain ability impact
Key ratios
SEKm 2020 2019 2018 2017 2016 2015 2014 2013 2012 20111
Profit
Net sales 5,695 6,493 6,218 5,784 5,107 5,674 5,313 4,893 4,859 4,658
Net sales, change % –12.3 4.4 7.5 13.3 n/a 6.8 8.6 0.7 4.3 n/a
Organic net sales, change, % –11.2 2.3 –2.8 –1.2 n/a 1.5 1.0 –1.0 – 4.1 n/a
Gross margin, % 34.7 36.7 36.7 36.4 39.6 39.0 37.4 37.0 35.0 37.5
Depreciation –265 –290 –218 –218 –206 –227 –198 –175 –167 –115
Amortisation –10 –11 –12 –11 – 5 – 4 –3 –2 –1 – 8
Impairment loss other non-current assets
–13 –2 – –9 –2 – – – – –
Operating profit (EBIT), adjusted 515 743 677 604 695 690 632 585 432 565
Operating profit margin (EBIT margin), adjusted %
9.0 11.4 10.9 10.4 13.6 12.2 11.9 12.0 8.9 12.1
Operating profit/loss (EBIT) 462 727 660 527 635 671 577 418 125 360
Operating profit/loss margin (EBIT margin), %
8.1 11.2 10.6 9.1 12.4 11.8 10.9 8.5 2.6 7.8
EBITDA, adjusted 792 1,046 907 833 906 921 833 762 600 688
EBITDA 750 1,030 890 765 848 902 778 595 293 483
Profit margin, % 7.1 10.0 9.0 7.7 9.2 8.7 6.4 4.3 –2.9 – 5.1
Financial position
Working capital 540 589 402 232 572 628 819 763 458 586
Capital expenditure 372 235 184 157 170 161 186 211 269 224
Net debt 2,139 2,302 2,091 2,035 2,443 2,818 3,308 3,230 3,056 2,827
Capital employed 7,224 7,576 7,027 6,979 7,329 7,756 8,041 7,438 7,066 6,682
Return on capital employed, %2 6.3 10.0 9.5 8.2 11.1 8.6 7.5 6.1 1.9 5.7
Equity/assets ratio, % 45.1 43.4 43.3 41.3 45.5 44.5 40.6 41.7 35.6 – 4.5
Net debt/equity ratio, % 51.2 54.8 52.7 53.3 58.2 64.9 81.7 86.2 91.9 –734.3
Return on equity, % 6.7 11.9 12.2 6.2 – 4.5 8.9 6.0 7.0 –2.2 n/a
Equity per share, SEK 14.5 14.5 13.7 13.2 14.5 15.1 14.0 13.0 11.5 n/a
Net debt/EBITDA, x 2.7 2.2 2.3 2.4 2.4 3.0 4.0 4.2 4.9 n/a
Cash flow
Cash flow from operating activities 656 724 628 712 889 927 500 131 330 492
Cash flow from investing activities –289 –330 –184 –22 –322 –367 –369 –202 –1,506 –335
Cash flow after investments 367 394 444 690 567 560 131 –71 –1,176 157
Free cash flow 366 538 444 555 719 766 318 – 80 61 268
Free cash flow yield, % 5.2 5.9 6.3 6.5 8.7 9.5 4.9 –1.4 1.6 7.0
Cash flow from operating activities per share, SEK
2.3 2.5 2.2 2.5 3.1 3.2 1.7 0.5 1.1 n/a
1) The key figures per share for the year 2011 are not representative for the current group due to to a completely different equity structure before the merger between Cloetta and Leaf.
2) Return on capital employed for 2016 was calculated pro-forma for continuing operations.3) Average number of employees is presented for continuing operations in 2017. Employee numbers in 2019 have been updated following the implementation
of a new company-wide HR system. Comparative figures have not been restated. 4) Cloetta entered into forward contracts to repurchase own shares to fulfill its future obligation to deliver the shares to the participants of its long-term share-
based incentive plan. The table in Note 23 presents the movements in the contracts since 1 January 2019.5) In March 2020, the Board of Directors decided to withdraw its proposal for a dividend for the 2019 financial year of SEK 1.00 per share, as a result of the
increased uncertainty due to the Covid-19 pandemic. In September 2020, the Board of Directors proposed a dividend of SEK 0.50 per share for the 2019 financial year, considering Cloetta’s strong financial position and cash generative business model. The EGM on 3 November 2020 approved this dividend proposal.

153
Cloetta Annual and Sustainability Report 2020 << B a c k t o c o n t e n t s
f i n a n C i a l r e P O r t S
Words from the president
Goals & strategies
Sustain ability Markets Operations & employees
Share & Shareholders
financial performance
risks & Corporate Governance
financial reports
Sustain ability impact
1) The key figures per share for the year 2011 are not representative for the current group due to to a completely different equity structure before the merger between Cloetta and Leaf.
2) Return on capital employed for 2016 was calculated pro-forma for continuing operations.3) Average number of employees is presented for continuing operations in 2017. Employee numbers in 2019 have been updated following the implementation
of a new company-wide HR system. Comparative figures have not been restated. 4) Cloetta entered into forward contracts to repurchase own shares to fulfil its future obligation to deliver the shares to the participants of its long-term share-
based incentive plan. The table in Note 23 presents the movements in the contracts since 1 January 2019.5) In March 2020, the Board of Directors decided to withdraw its proposal for a dividend for the 2019 financial year of SEK 1.00 per share, as a result of the
increased uncertainty due to the Covid-19 pandemic. In September 2020, the Board of Directors proposed a dividend of SEK 0.50 per share for the 2019 financial year, considering Cloetta’s strong financial position and cash generative business model. The EGM on 3 November 2020 approved this dividend proposal.
2020 2019 2018 2017 2016 2015 2014 2013 2012 20111
Employees
Average number of employees3 2,653 2,629 2,458 2,467 2,115 2,583 2,533 2,472 2,579 2,192
Share data1
Earnings per share, SEK
Basic4 0.98 1.74 1.69 – 0.34 – 0.67 1.35 0.84 0.92 – 0.26 n/a
Diluted4 0.98 1.74 1.68 – 0.34 – 0.67 1.35 0.84 0.92 – 0.26 n/a
Earnings per share from continuing operations, SEK
Basic4 0.98 1.74 1.69 0.83 1.21 1.35 0.84 0.92 – 0.26 n/a
Diluted4 0.98 1.74 1.68 0.83 1.21 1.35 0.84 0.92 – 0.26 n/a
Earnings per share from discontinued operation, SEK
Basic4 – – – –1.17 –1.88 – – – – –
Diluted4 – – – –1.17 –1.88 – – – – –
Ordinary dividend per share, proposed, SEK⁵
0.75 0.505 1.00 0.75 0.75 0.50 – – – –
Special dividend per share, SEK – – – 0.75 – – – – – –
Number of shares at end of period 298,619,299 288,619,299 288,619,299 288,619,299 288,619,299 288,619,299 288,619,299 288,619,299 288,619,299 262,137,526
Average number of shares (basic)4 286,590,993 286,578,395 286,492,413 286,320,464 286,193,024 286,290,840 286,987,990 288,010,947 276,132,021 262,137,526
Average number of shares (diluted)4 286,805,203 286,724,049 286,650,070 286,492,178 286,447,465 286,561,607 287,092,780 288,026,408 276,132,021 262,137,526
Share-price at year-end, SEK 24.52 31.70 24.30 29.70 28.70 28.00 22.60 19.40 13.45 14.50
Exchange Rates
EUR, average 10.4880 10.5815 10.2543 9.6362 9.4700 9.3445 9.1051 8.6513 8.6958 9.0228
EUR, end of period 10.0343 10.4468 10.2274 9.8210 9.5804 9.1679 9.3829 8.8630 8.5750 8.9100
NOK, average 0.9757 1.0748 1.0672 1.0324 1.0200 1.0432 1.0882 1.1071 1.1643 1.1577
NOK, end of period 0.9584 1.0591 1.0294 0.9997 1.0548 0.9563 1.0439 1.0592 1.1667 1.1467
GBP, average 11.7868 12.0732 11.5917 10.9909 11.5480 12.8736 11.3118 10.1987 10.7429 10.4057
GBP, end of period 11.1613 12.2788 11.3992 11.0684 11.1673 12.4835 12.0340 10.6501 10.5215 10.6668
DKK, average 1.4070 1.4173 1.3760 1.2956 1.2721 1.2529 1.2215 1.1601 1.1682 1.2112
DKK, end of period 1.3485 1.3982 1.3698 1.3192 1.2888 1.2287 1.2604 1.1882 1.1495 1.1987

154
Cloetta Annual and Sustainability Report 2020<< B a c k t o c o n t e n t s
f i n a n C i a l r e P O r t S
Words from the president
Goals & strategies
Sustain ability Markets Operations & employees
Share & Shareholders
financial performance
risks & Corporate Governance
financial reports
Sustain ability impact
Reconciliation of alternative performance measures
SEKm 2020 2019 2018 2017 2016 2015 2014 2013 2012 2011
Items affecting comparability
Acquisitions, integration and restructurings – 53 –13 –38 – 62 – 43 – 47 – 85 –167 n/a n/a
of which: impairment loss other non-current assets –11 – – –9 –2 – – – n/a n/a
Remeasurements of contingent considerations – – 21 5 –17 33 27 – n/a n/a
Remeasurements of assets held for sale – – – – – – 5 – – n/a n/a
Other items affecting comparability – –3 0 –20 – – 3 – n/a n/a
Items affecting comparability* –53 –16 –17 –77 –60 –19 –55 –167 –307 –205
* Corresponding line in the condensed consolidated
profit and loss account:
Net Sales – – 0 – – – 4 – – n/a n/a
Cost of goods sold –19 2 3 – 39 –15 –22 – 51 –121 n/a n/a
Other operating income – – 4 4 – – 3 12 n/a n/a
Selling expenses –12 – 6 –1 – 6 – –12 –7 – 4 n/a n/a
General and administrative expenses –22 –12 –23 – 36 – 45 19 – – 54 n/a n/a
Total –53 –16 –17 –77 –60 –19 –55 –167 –307 –205
Operating profit, adjusted1
Operating profit 462 727 660 527 635 671 577 418 125 360
Minus: Items affecting comparability – 53 –16 –17 –77 – 60 –19 – 55 –167 –307 –205
Operating profit, adjusted 515 743 677 604 695 690 632 585 432 565
Net sales 5,695 6,493 6,218 5,784 5,107 5,674 5,313 4,893 4,859 4,658
Operating profit margin, adjusted, % 9.0 11.4 10.9 10.4 13.6 12.2 11.9 12.0 8.9 12.1
EBITDA, adjusted1
Operating profit 462 727 660 527 635 671 577 418 125 360
Minus: Depreciation –265 –290 –218 –218 –206 –227 –198 –175 –167 –115
Minus: Amortisation –10 –11 –12 –11 – 5 – 4 –3 –2 –1 – 8
Minus: Impairment loss other non-current assets –13 –2 – –9 –2 – – – – –
EBITDA 750 1,030 890 765 848 902 778 595 293 483
Minus: Items affecting comparability (excl. impairment loss goodwill and trademarks and other non-current assets) – 42 –16 –17 – 68 – 58 –19 – 55 –167 –307 –205
EBITDA, adjusted 792 1,046 907 833 906 921 833 762 600 688
Capital employed1,2
Total assets 9,257 9,660 9,168 9,252 9,236 9,759 9,962 8,989 9,340 8,642
Minus: Deferred tax liability 837 803 754 703 586 621 483 397 824 728
Minus: Other non-current liabilities – – – 138 – 43 147 2 – –
Minus: Non-current provisions 5 5 9 5 22 10 16 7 11 24
Minus: Current provisions 24 5 23 3 64 57 65 79 79 60
Minus: Trade and other payables 1,144 1,227 1,342 1,394 1,196 1,216 1,152 967 1,264 1,038
Minus: Current income tax liabilities 23 44 13 30 39 55 58 99 97 103
Plus: Interest-bearing other current liabilities – – – – – –1 – – 1 –7
Capital employed 7,224 7,576 7,027 6,979 7,329 7,756 8,041 7,438 7,066 6,682
Capital employed comparative period previous year 7,576 7,027 6,979 5,966 7,756 8,041 7,438 7,066 6,682 6,575
Average capital employed 7,400 7,302 7,003 6,473 7,543 7,899 7,740 7,252 6,874 6,629
1) The key figure has been affected by IFRS 16 ‘Leases’ as of 1 January 2019. Comparative figures are not restated.2) Return on capital employed for 2017 has been calculated pro-forma for continuing operations.
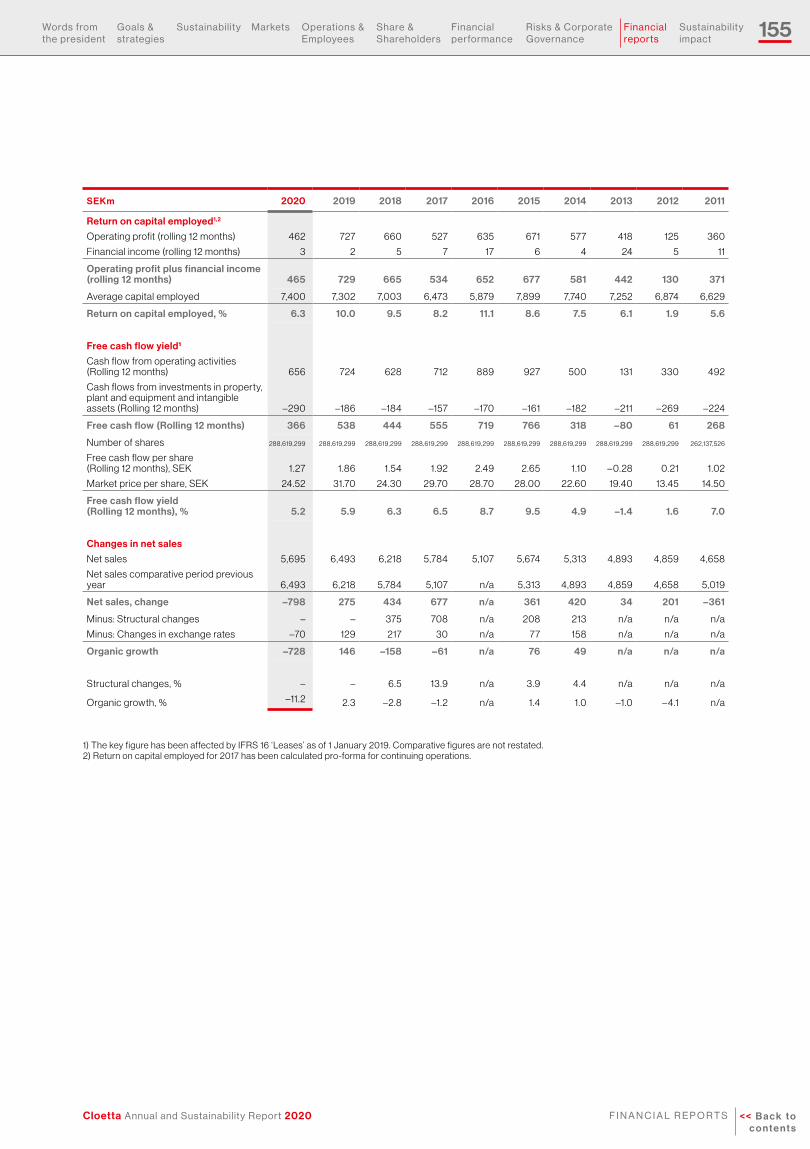
155
Cloetta Annual and Sustainability Report 2020 << B a c k t o c o n t e n t s
f i n a n C i a l r e P O r t S
Words from the president
Goals & strategies
Sustain ability Markets Operations & employees
Share & Shareholders
financial performance
risks & Corporate Governance
financial reports
Sustain ability impact
SEKm 2020 2019 2018 2017 2016 2015 2014 2013 2012 2011
Return on capital employed1,2
Operating profit (rolling 12 months) 462 727 660 527 635 671 577 418 125 360
Financial income (rolling 12 months) 3 2 5 7 17 6 4 24 5 11
Operating profit plus financial income (rolling 12 months) 465 729 665 534 652 677 581 442 130 371
Average capital employed 7,400 7,302 7,003 6,473 5,879 7,899 7,740 7,252 6,874 6,629
Return on capital employed, % 6.3 10.0 9.5 8.2 11.1 8.6 7.5 6.1 1.9 5.6
Free cash flow yield1
Cash flow from operating activities (Rolling 12 months) 656 724 628 712 889 927 500 131 330 492
Cash flows from investments in property, plant and equipment and intangible assets (Rolling 12 months) –290 –186 –184 –157 –170 –161 –182 –211 –269 –224
Free cash flow (Rolling 12 months) 366 538 444 555 719 766 318 –80 61 268
Number of shares 288,619,299 288,619,299 288,619,299 288,619,299 288,619,299 288,619,299 288,619,299 288,619,299 288,619,299 262,137,526
Free cash flow per share (Rolling 12 months), SEK 1.27 1.86 1.54 1.92 2.49 2.65 1.10 – 0.28 0.21 1.02
Market price per share, SEK 24.52 31.70 24.30 29.70 28.70 28.00 22.60 19.40 13.45 14.50
Free cash flow yield (Rolling 12 months), % 5.2 5.9 6.3 6.5 8.7 9.5 4.9 –1.4 1.6 7.0
Changes in net sales
Net sales 5,695 6,493 6,218 5,784 5,107 5,674 5,313 4,893 4,859 4,658
Net sales comparative period previous year 6,493 6,218 5,784 5,107 n/a 5,313 4,893 4,859 4,658 5,019
Net sales, change –798 275 434 677 n/a 361 420 34 201 –361
Minus: Structural changes – – 375 708 n/a 208 213 n/a n/a n/a
Minus: Changes in exchange rates –70 129 217 30 n/a 77 158 n/a n/a n/a
Organic growth –728 146 –158 –61 n/a 76 49 n/a n/a n/a
Structural changes, % – – 6.5 13.9 n/a 3.9 4.4 n/a n/a n/a
Organic growth, % –11.2 2.3 –2.8 –1.2 n/a 1.4 1.0 –1.0 – 4.1 n/a
1) The key figure has been affected by IFRS 16 ‘Leases’ as of 1 January 2019. Comparative figures are not restated.2) Return on capital employed for 2017 has been calculated pro-forma for continuing operations.
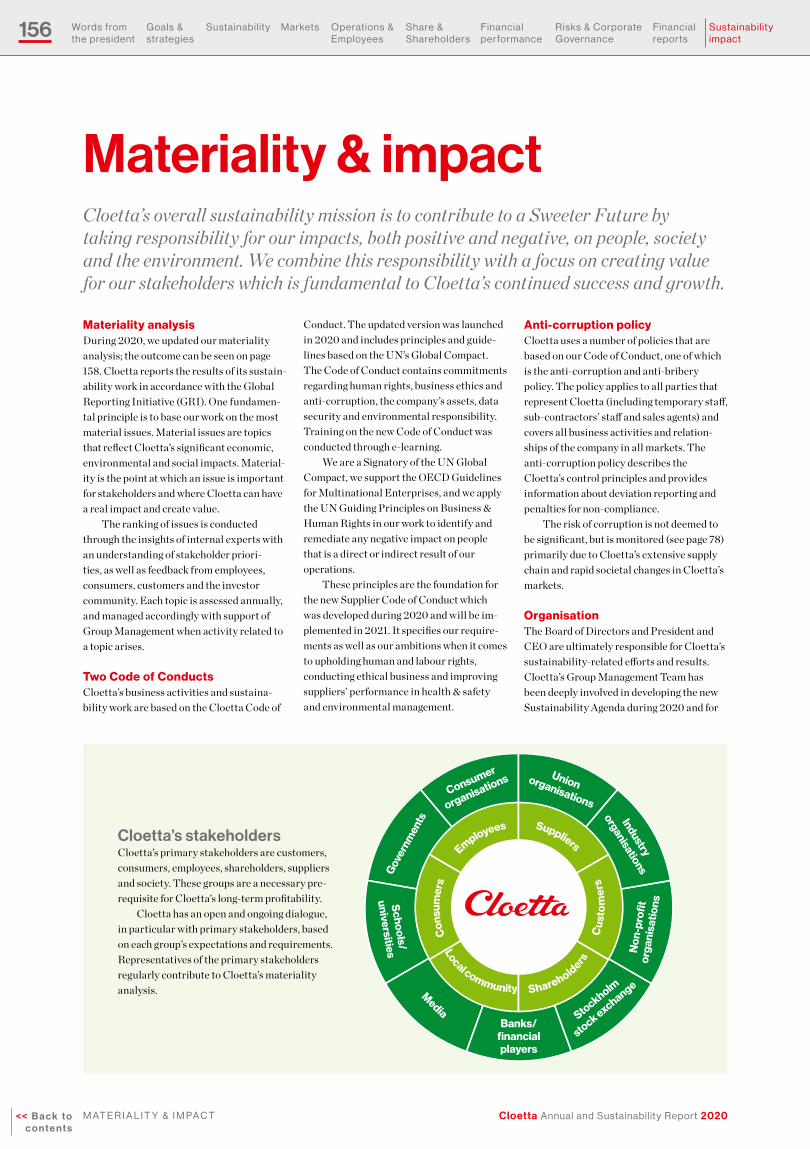
156
Cloetta Annual and Sustainability Report 2020<< B a c k t o c o n t e n t s
M at e r i a l i t Y & i M P a C t
Words from the president
Goals & strategies
Sustain ability Markets Operations & employees
Share & Shareholders
financial performance
risks & Corporate Governance
financial reports
Sustain ability impact
Employees
ShareholdersC
usto
mer
s
Suppliers
Con
sum
ers
Local community
Banks/financialplayers
Stockholm
stock exchangeMedia
Non
-pro
fitor
gani
satio
nsSchools/
universities
Govern
ments
Consumer
organisations Unionorganisations
Industry
organisations
Materiality analysisDuring 2020, we updated our materiality analysis; the outcome can be seen on page 158. Cloetta reports the results of its sustain-ability work in accordance with the Global Reporting Initiative (GRI). One fundamen-tal principle is to base our work on the most material issues. Material issues are topics that reflect Cloetta’s significant economic, environmental and social impacts. Material-ity is the point at which an issue is important for stakeholders and where Cloetta can have a real impact and create value.
The ranking of issues is conducted through the insights of internal experts with an understanding of stakeholder priori-ties, as well as feedback from employees, consumers, customers and the investor community. Each topic is assessed annually, and managed accordingly with support of Group Management when activity related to a topic arises.
Two Code of ConductsCloetta’s business activities and sustaina-bility work are based on the Cloetta Code of
Conduct. The updated version was launched in 2020 and includes principles and guide-lines based on the UN’s Global Compact. The Code of Conduct contains commitments regarding human rights, business ethics and anti-corruption, the company’s assets, data security and environmental responsibility. Training on the new Code of Conduct was conducted through e-learning.
We are a Signatory of the UN Global Compact, we support the OECD Guidelines for Multinational Enterprises, and we apply the UN Guiding Principles on Business & Human Rights in our work to identify and remediate any negative impact on people that is a direct or indirect result of our operations.
These principles are the foundation for the new Supplier Code of Conduct which was developed during 2020 and will be im-plemented in 2021. It specifies our require-ments as well as our ambitions when it comes to upholding human and labour rights, conducting ethical business and improving suppliers’ performance in health & safety and environmental management.
Anti-corruption policyCloetta uses a number of policies that are based on our Code of Conduct, one of which is the anti-corruption and anti-bribery policy. The policy applies to all parties that represent Cloetta (including temporary staff, sub-contractors’ staff and sales agents) and covers all business activities and relation-ships of the company in all markets. The anti-corruption policy describes the Cloetta’s control principles and provides information about deviation reporting and penalties for non-compliance.
The risk of corruption is not deemed to be significant, but is monitored (see page 78)primarily due to Cloetta’s extensive supply chain and rapid societal changes in Cloetta’s markets.
Organisation The Board of Directors and President and CEO are ultimately responsible for Cloetta’s sustainability-related efforts and results. Cloetta’s Group Management Team has been deeply involved in developing the new Sustainability Agenda during 2020 and for
Materiality & impact
Cloetta’s stakeholdersCloetta’s primary stakeholders are customers, consumers, employees, shareholders, suppliers and society. These groups are a necessary pre-requisite for Cloetta’s long-term profitability.
Cloetta has an open and ongoing dialogue, in particular with primary stakeholders, based on each group’s expectations and requirements. Representatives of the primary stakeholders regularly contribute to Cloetta’s materiality analysis.
Cloetta’s overall sustainability mission is to contribute to a Sweeter Future by taking responsibility for our impacts, both positive and negative, on people, society and the environment. We combine this responsibility with a focus on creating value for our stakeholders which is fundamental to Cloetta’s continued success and growth.
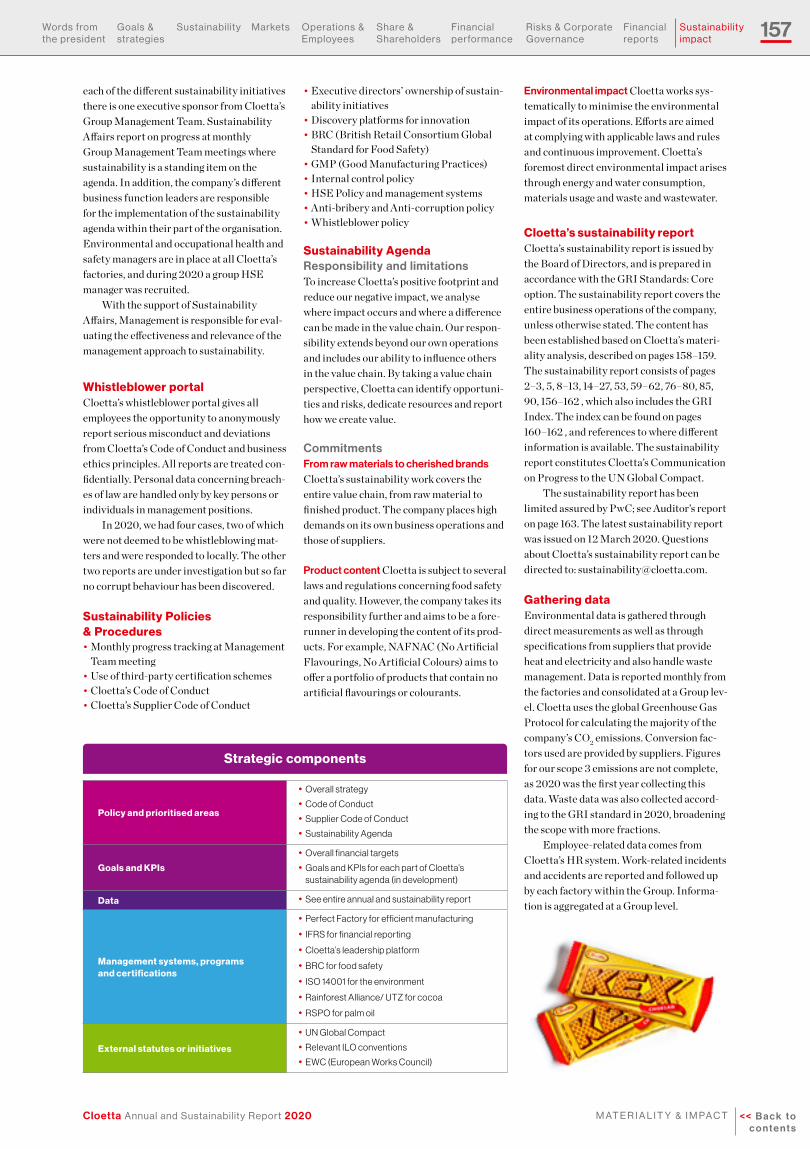
157
Cloetta Annual and Sustainability Report 2020 << B a c k t o c o n t e n t s
M at e r i a l i t Y & i M P a C t
Words from the president
Goals & strategies
Sustain ability Markets Operations & employees
Share & Shareholders
financial performance
risks & Corporate Governance
financial reports
Sustain ability impact
each of the different sustainability initiatives there is one executive sponsor from Cloetta’s Group Management Team. Sustainability Affairs report on progress at monthly Group Management Team meetings where sustainability is a standing item on the agenda. In addition, the company’s different business function leaders are responsible for the implementation of the sustainability agenda within their part of the organisation. Environmental and occupational health and safety managers are in place at all Cloetta’s factories, and during 2020 a group HSE manager was recruited.
With the support of Sustainability Affairs, Management is responsible for eval-uating the effectiveness and relevance of the management approach to sustainability.
Whistleblower portalCloetta’s whistleblower portal gives all employees the opportunity to anonymously report serious misconduct and deviations from Cloetta’s Code of Conduct and business ethics principles. All reports are treated con-fidentially. Personal data concerning breach-es of law are handled only by key persons or individuals in management positions.
In 2020, we had four cases, two of which were not deemed to be whistleblowing mat-ters and were responded to locally. The other two reports are under investigation but so far no corrupt behaviour has been discovered.
Sustainability Policies & Procedures• Monthly progress tracking at Management
Team meeting• Use of third-party certification schemes• Cloetta’s Code of Conduct • Cloetta’s Supplier Code of Conduct
Policy and prioritised areas
• Overall strategy
• Code of Conduct
• Supplier Code of Conduct
• Sustainability Agenda
Goals and KPIs
• Overall financial targets
• Goals and KPIs for each part of Cloetta’s sustainability agenda (in development)
Data • See entire annual and sustainability report
Management systems, programs and certifications
• Perfect Factory for efficient manufacturing
• IFRS for financial reporting
• Cloetta’s leadership platform
• BRC for food safety
• ISO 14001 for the environment
• Rainforest Alliance/ UTZ for cocoa
• RSPO for palm oil
External statutes or initiatives
• UN Global Compact
• Relevant ILO conventions
• EWC (European Works Council)
Strategic components
• Executive directors’ ownership of sustain-ability initiatives
• Discovery platforms for innovation• BRC (British Retail Consortium Global
Standard for Food Safety) • GMP (Good Manufacturing Practices)• Internal control policy• HSE Policy and management systems• Anti-bribery and Anti-corruption policy• Whistleblower policy
Sustainability Agenda Responsibility and limitationsTo increase Cloetta’s positive footprint and reduce our negative impact, we analyse where impact occurs and where a difference can be made in the value chain. Our respon-sibility extends beyond our own operations and includes our ability to influence others in the value chain. By taking a value chain perspective, Cloetta can identify opportuni-ties and risks, dedicate resources and report how we create value. Commitments From raw materials to cherished brands Cloetta’s sustainability work covers the entire value chain, from raw material to finished product. The company places high demands on its own business operations and those of suppliers.
Product content Cloetta is subject to several laws and regulations concerning food safety and quality. However, the company takes its responsibility further and aims to be a fore-runner in developing the content of its prod-ucts. For example, NAFNAC (No Artificial Flavourings, No Artificial Colours) aims to offer a portfolio of products that contain no artificial flavourings or colourants.
Environmental impact Cloetta works sys-tematically to minimise the environmental impact of its operations. Efforts are aimed at complying with applicable laws and rules and continuous improvement. Cloetta’s foremost direct environmental impact arises through energy and water consumption, materials usage and waste and wastewater.
Cloetta’s sustainability report Cloetta’s sustainability report is issued by the Board of Directors, and is prepared in accordance with the GRI Standards: Core option. The sustainability report covers the entire business operations of the company, unless otherwise stated. The content has been established based on Cloetta’s materi-ality analysis, described on pages 158–159. The sustainability report consists of pages 2–3, 5, 8–13, 14–27, 53, 59–62, 76–80, 85, 90, 156–162 , which also includes the GRI Index. The index can be found on pages 160–162 , and references to where different information is available. The sustainability report constitutes Cloetta’s Communication on Progress to the UN Global Compact.
The sustainability report has been limited assured by PwC; see Auditor’s report on page 163. The latest sustainability report was issued on 12 March 2020. Questions about Cloetta’s sustainability report can be directed to: [email protected].
Gathering data Environmental data is gathered through direct measurements as well as through specifications from suppliers that provide heat and electricity and also handle waste management. Data is reported monthly from the factories and consolidated at a Group lev-el. Cloetta uses the global Greenhouse Gas Protocol for calculating the majority of the company’s CO2 emissions. Conversion fac-tors used are provided by suppliers. Figures for our scope 3 emissions are not complete, as 2020 was the first year collecting this data. Waste data was also collected accord-ing to the GRI standard in 2020, broadening the scope with more fractions.
Employee-related data comes from Cloetta’s HR system. Work-related incidents and accidents are reported and followed up by each factory within the Group. Informa-tion is aggregated at a Group level.
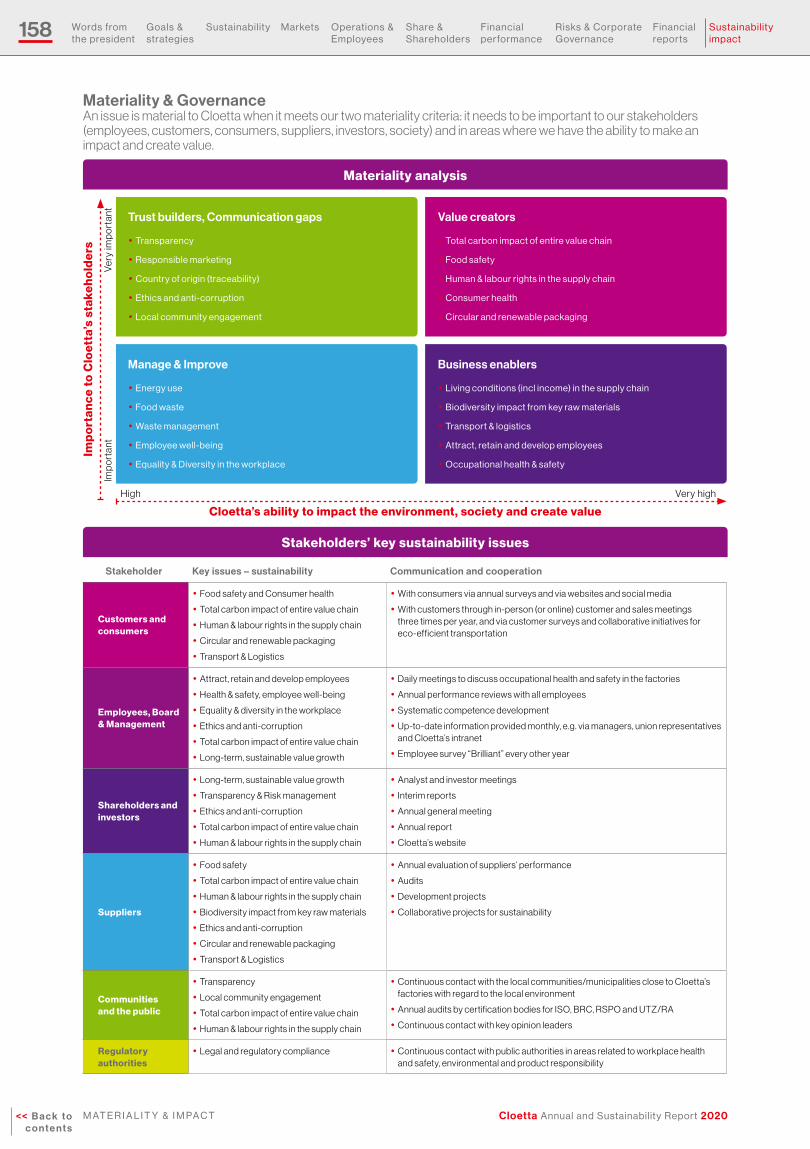
158
Cloetta Annual and Sustainability Report 2020<< B a c k t o c o n t e n t s
M at e r i a l i t Y & i M P a C t
Words from the president
Goals & strategies
Sustain ability Markets Operations & employees
Share & Shareholders
financial performance
risks & Corporate Governance
financial reports
Sustain ability impact
Materiality & GovernanceAn issue is material to Cloetta when it meets our two materiality criteria: it needs to be important to our stakeholders (employees, customers, consumers, suppliers, investors, society) and in areas where we have the ability to make an impact and create value.
Stakeholders’ key sustainability issues
Cloetta’s ability to impact the environment, society and create value
High Very high
Imp
ort
ant
Imp
ort
ance
to
Clo
etta
’s s
take
ho
lder
s
Stakeholder Key issues – sustainability Communication and cooperation
Customers and consumers
• Food safety and Consumer health
• Total carbon impact of entire value chain
• Human & labour rights in the supply chain
• Circular and renewable packaging
• Transport & Logistics
• With consumers via annual surveys and via websites and social media
• With customers through in-person (or online) customer and sales meetings three times per year, and via customer surveys and collaborative initiatives for eco-efficient transportation
Employees, Board & Management
• Attract, retain and develop employees
• Health & safety, employee well-being
• Equality & diversity in the workplace
• Ethics and anti-corruption
• Total carbon impact of entire value chain
• Long-term, sustainable value growth
• Daily meetings to discuss occupational health and safety in the factories
• Annual performance reviews with all employees
• Systematic competence development
• Up-to-date information provided monthly, e.g. via managers, union representatives and Cloetta’s intranet
• Employee survey “Brilliant” every other year
Shareholders and investors
• Long-term, sustainable value growth
• Transparency & Risk management
• Ethics and anti-corruption
• Total carbon impact of entire value chain
• Human & labour rights in the supply chain
• Analyst and investor meetings
• Interim reports
• Annual general meeting
• Annual report
• Cloetta’s website
Suppliers
• Food safety
• Total carbon impact of entire value chain
• Human & labour rights in the supply chain
• Biodiversity impact from key raw materials
• Ethics and anti-corruption
• Circular and renewable packaging
• Transport & Logistics
• Annual evaluation of suppliers’ performance
• Audits
• Development projects
• Collaborative projects for sustainability
Communitiesand the public
• Transparency
• Local community engagement
• Total carbon impact of entire value chain
• Human & labour rights in the supply chain
• Continuous contact with the local communities/municipalities close to Cloetta’s factories with regard to the local environment
• Annual audits by certification bodies for ISO, BRC, RSPO and UTZ/RA
• Continuous contact with key opinion leaders
Regulatory authorities
• Legal and regulatory compliance • Continuous contact with public authorities in areas related to workplace health and safety, environmental and product responsibility
Materiality analysis
Value creators
• total carbon impact of entire value chain
• food safety
• human & labour rights in the supply chain
• Consumer health
• Circular and renewable packaging
Trust builders, Communication gaps
• transparency
• responsible marketing
• Country of origin (traceability)
• ethics and anti-corruption
• local community engagement
Business enablers
• living conditions (incl income) in the supply chain
• Biodiversity impact from key raw materials
• transport & logistics
• attract, retain and develop employees
• Occupational health & safety
Manage & Improve
• energy use
• food waste
• Waste management
• employee well-being
• equality & diversity in the workplace
Ver
y im
po
rtan
t
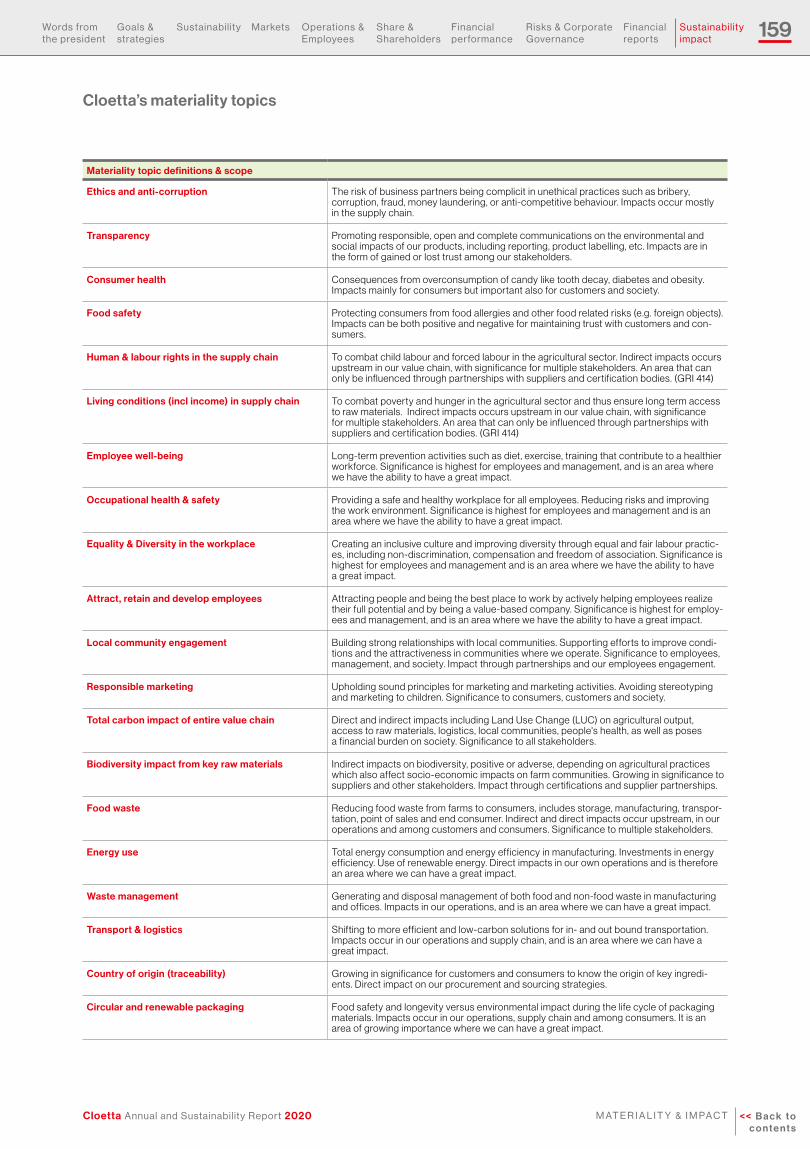
159
Cloetta Annual and Sustainability Report 2020 << B a c k t o c o n t e n t s
M at e r i a l i t Y & i M P a C t
Words from the president
Goals & strategies
Sustain ability Markets Operations & employees
Share & Shareholders
financial performance
risks & Corporate Governance
financial reports
Sustain ability impact
Materiality topic definitions & scope
Ethics and anti-corruption The risk of business partners being complicit in unethical practices such as bribery, corruption, fraud, money laundering, or anti-competitive behaviour. Impacts occur mostly in the supply chain.
Transparency Promoting responsible, open and complete communications on the environmental and social impacts of our products, including reporting, product labelling, etc. Impacts are in the form of gained or lost trust among our stakeholders.
Consumer health Consequences from overconsumption of candy like tooth decay, diabetes and obesity. Impacts mainly for consumers but important also for customers and society.
Food safety Protecting consumers from food allergies and other food related risks (e.g. foreign objects). Impacts can be both positive and negative for maintaining trust with customers and con-sumers.
Human & labour rights in the supply chain To combat child labour and forced labour in the agricultural sector. Indirect impacts occurs upstream in our value chain, with significance for multiple stakeholders. An area that can only be influenced through partnerships with suppliers and certification bodies. (GRI 414)
Living conditions (incl income) in supply chain To combat poverty and hunger in the agricultural sector and thus ensure long term access to raw materials. Indirect impacts occurs upstream in our value chain, with significance for multiple stakeholders. An area that can only be influenced through partnerships with suppliers and certification bodies. (GRI 414)
Employee well-being Long-term prevention activities such as diet, exercise, training that contribute to a healthier workforce. Significance is highest for employees and management, and is an area where we have the ability to have a great impact.
Occupational health & safety Providing a safe and healthy workplace for all employees. Reducing risks and improving the work environment. Significance is highest for employees and management and is an area where we have the ability to have a great impact.
Equality & Diversity in the workplace Creating an inclusive culture and improving diversity through equal and fair labour practic-es, including non-discrimination, compensation and freedom of association. Significance is highest for employees and management and is an area where we have the ability to have a great impact.
Attract, retain and develop employees Attracting people and being the best place to work by actively helping employees realize their full potential and by being a value-based company. Significance is highest for employ-ees and management, and is an area where we have the ability to have a great impact.
Local community engagement Building strong relationships with local communities. Supporting efforts to improve condi-tions and the attractiveness in communities where we operate. Significance to employees, management, and society. Impact through partnerships and our employees engagement.
Responsible marketing Upholding sound principles for marketing and marketing activities. Avoiding stereotyping and marketing to children. Significance to consumers, customers and society.
Total carbon impact of entire value chain Direct and indirect impacts including Land Use Change (LUC) on agricultural output, access to raw materials, logistics, local communities, people's health, as well as poses a financial burden on society. Significance to all stakeholders.
Biodiversity impact from key raw materials Indirect impacts on biodiversity, positive or adverse, depending on agricultural practices which also affect socio-economic impacts on farm communities. Growing in significance to suppliers and other stakeholders. Impact through certifications and supplier partnerships.
Food waste Reducing food waste from farms to consumers, includes storage, manufacturing, transpor-tation, point of sales and end consumer. Indirect and direct impacts occur upstream, in our operations and among customers and consumers. Significance to multiple stakeholders.
Energy use Total energy consumption and energy efficiency in manufacturing. Investments in energy efficiency. Use of renewable energy. Direct impacts in our own operations and is therefore an area where we can have a great impact.
Waste management Generating and disposal management of both food and non-food waste in manufacturing and offices. Impacts in our operations, and is an area where we can have a great impact.
Transport & logistics Shifting to more efficient and low-carbon solutions for in- and out bound transportation. Impacts occur in our operations and supply chain, and is an area where we can have a great impact.
Country of origin (traceability) Growing in significance for customers and consumers to know the origin of key ingredi-ents. Direct impact on our procurement and sourcing strategies.
Circular and renewable packaging Food safety and longevity versus environmental impact during the life cycle of packaging materials. Impacts occur in our operations, supply chain and among consumers. It is an area of growing importance where we can have a great impact.
Cloetta’s materiality topics

160
Cloetta Annual and Sustainability Report 2020<< B a c k t o c o n t e n t s
M at e r i a l i t Y & i M P a C t
Words from the president
Goals & strategies
Sustain ability Markets Operations & employees
Share & Shareholders
financial performance
risks & Corporate Governance
financial reports
Sustain ability impact
Disclosure Scope, comment, and/or omissions Page(s)
102-1 Name of the organisation Front and back cover
102-2 Activities, brands, products and services inside front cover, 8 –11, 30 – 43
102-3 Location of headquarters 82, 102
102-4 Location of operations 44– 50, 56 – 57, 62
102-5 Ownership and legal form 82
102-6 Markets served 35, 44-50
102-7 Scale of the organisation Inside front cover, 16 –17, 44, 51, 56, 62, 72, 99 –100
102-8 Information on employees and other workers 60, 62, 157
102-9 Supply chain 25, 51– 53, 58
102-10 Significant changes to the organisation and its supply chain
Helsingborg factory was closed during 2020. 51
102-11 Precautionary principle or approach 27
102-12 External initiatives 18, 21, 23
102-13 Membership of associations 168
Strategy
102-14 Statement from senior decision-maker CEO statement 2–3
Ethics and Integrity
102-16 Values, principles, standards and norms of behaviour
59 – 61
Governance
102-18 Governance structure 82– 87, 156 –158
Stakeholder Engagement
102-40 List of stakeholder groups 156, 158
102-41 Collective bargaining agreements 60
102-42 Identifying and selecting stakeholders 156, 158
102-43 Approach to stakeholder engagement 156
102-44 Key topics and concerns raised 156, 158-159
Reporting practice
102-45 Entities included in the consolidated financial statements
141
102-46 Defining report content and topic boundaries 14–18, 156 –159
102-47 List of material topics 158 –159
102-48 Restatements of information 23
102-49 Changes in reporting Included scope 3, included more GRI indicators to align with 2020 disclosures.
157
102-50 Reporting period January 1 2020-December 31 2020
102-51 Date of most recent report 12 March 2020 157
102-52 Reporting cycle Calendar year
102-53 Contact point for questions regarding the report 157
102-54 Claims of reporting in accordance with the GRI Standards
157
102-55 GRI content index 160 –162
102-56 External assurance 163
GRI Content Index
GR
I 102: G
eneral Disclo
sures 2016

161
Cloetta Annual and Sustainability Report 2020 << B a c k t o c o n t e n t s
Words from the president
Goals & strategies
Sustain ability Markets Operations & employees
Share & Shareholders
financial performance
risks & Corporate Governance
financial reports
Sustain ability impact
Performance indicators
Disclosure Scope, comment and/or omissions Page(s)
Economic Performance
GRI 103: Management Approach 2016
103-1 Explanation of the material topic and its boundary 4, 9, 156 –159
103-2 The management approach and its components 82– 87
103-3 Evaluation of the management approach 8 –13, 156 –157
GRI 201: Economic Performance 2016
201-1 Direct economic value generated and distributed
17
Anti-corruption
GRI 103: Management Approach 2016
103-1 Explanation of the material topic and its boundary 156 –159
103-2 The management approach and its components 60, 85, 90, 156 –158
103-3 Evaluation of the management approach Adjustments included more awareness and training around anti-corruption.
90, 156
GRI 205: Anti-corruption 2016
205-3 Confirmed incidents of corruption and actions taken
No incidents of corruption. 157
Energy
GRI 103: Management Approach 2016
103-1 Explanation of the material topic and its boundary 22–24, 159
103-2 The management approach and its components 22–24, 156 –158
103-3 Evaluation of the management approach 156 –157
GRI 302: Energy 2016
302-1 Energy consumption within the organisation 23 –24, 157
302-3 Energy intensity 23
302-4 Reduction of energy consumption Specific savings on separate energy efficiency initiatives cannot be disclosed due to lack of such information.
5, 23, 25
Biodiversity
GRI 103: Management Approach 2016
103-1 Explanation of the material topic and its boundary 22,25 –26, 159
103-2 The management approach and its components 20, 22, 25 –26, 156 –158
103-3 Evaluation of the management approach 156 –157
GRI 304: Biodiversity 2016
304-2 Significant impacts of activities, products, and services on biodiversity
Scope: Description of areas restored or protected, but omitting the specifics of size, species, etc.
22, 25 –26, 79, 158
Emissions
GRI 103: Management Approach 2016
103-1 Explanation of the material topic and its boundary 23 –24, 159
103-2 The management approach and its components 20, 22–24, 156 –158
103-3 Evaluation of the management approach 156
GRI 305: Emissions 2016
305-1 Direct (Scope 1) GHG emissions Due to improved measurement processes, data for 2019 has been corrected to enable comparisons with 2020. Only CO₂ gases included in calculation, emission factors provided by suppliers.
5, 23 –25, 157
305-2 Energy indirect (Scope 2) GHG emissions See comment for 305-1. 5, 23, 157
305-3 Other indirect (Scope 3) GHG emissions Data on Scope 3 emissions only includes logistics for 2020, provided by freight suppliers. Lack of information for other Scope 3 emissions.
23 –24, 157
305-5 Reduction of GHG emissions 23 –24
Waste
GRI 103: Management Approach 2016
103-1 Explanation of the material topic and its boundary 27, 53, 159
103-2 The management approach and its components 27, 53, 156 –158
103-3 Evaluation of the management approach 156 –157
GRI 306: Waste 2020
306-1 Waste generation and significant waste-related impacts
27
306-2 Management of significant waste-related impacts 27, 157
306-3 Waste generated 5, 23 –24, 27
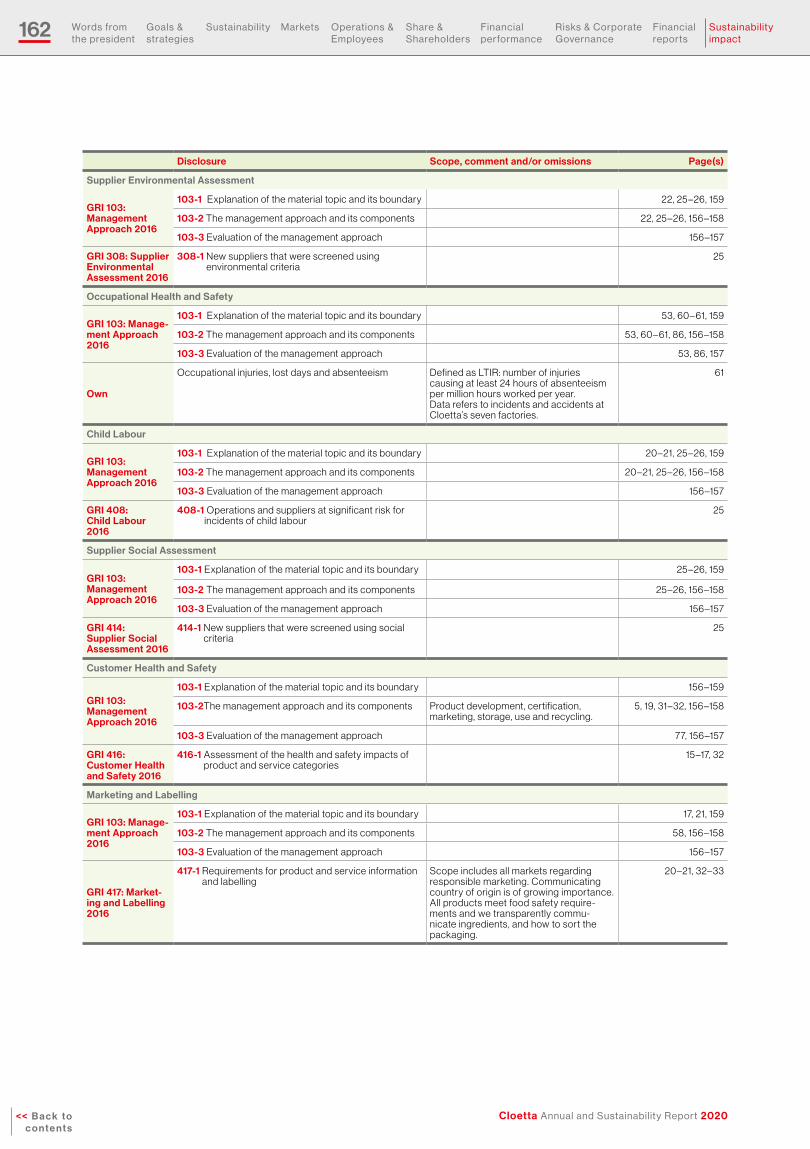
162
Cloetta Annual and Sustainability Report 2020<< B a c k t o c o n t e n t s
Words from the president
Goals & strategies
Sustain ability Markets Operations & employees
Share & Shareholders
financial performance
risks & Corporate Governance
financial reports
Sustain ability impact
Disclosure Scope, comment and/or omissions Page(s)
Supplier Environmental Assessment
GRI 103: Management Approach 2016
103-1 Explanation of the material topic and its boundary 22, 25 –26, 159
103-2 The management approach and its components 22, 25 –26, 156 –158
103-3 Evaluation of the management approach 156 –157
GRI 308: Supplier Environmental Assessment 2016
308-1 New suppliers that were screened using environmental criteria
25
Occupational Health and Safety
GRI 103: Manage-ment Approach 2016
103-1 Explanation of the material topic and its boundary 53, 60 – 61, 159
103-2 The management approach and its components 53, 60 – 61, 86, 156 –158
103-3 Evaluation of the management approach 53, 86, 157
Own
Occupational injuries, lost days and absenteeism Defined as LTIR: number of injuries causing at least 24 hours of absenteeism per million hours worked per year. Data refers to incidents and accidents at Cloetta’s seven factories.
61
Child Labour
GRI 103: Management Approach 2016
103-1 Explanation of the material topic and its boundary 20 –21, 25 –26, 159
103-2 The management approach and its components 20 –21, 25 –26, 156 –158
103-3 Evaluation of the management approach 156 –157
GRI 408: Child Labour 2016
408-1 Operations and suppliers at significant risk for incidents of child labour
25
Supplier Social Assessment
GRI 103: Management Approach 2016
103-1 Explanation of the material topic and its boundary 25 –26, 159
103-2 The management approach and its components 25 –26, 156 –158
103-3 Evaluation of the management approach 156 –157
GRI 414: Supplier Social Assessment 2016
414-1 New suppliers that were screened using social criteria
25
Customer Health and Safety
GRI 103: Management Approach 2016
103-1 Explanation of the material topic and its boundary 156 –159
103-2 The management approach and its components Product development, certification, marketing, storage, use and recycling.
5, 19, 31–32, 156 –158
103-3 Evaluation of the management approach 77, 156 –157
GRI 416: Customer Health and Safety 2016
416-1 Assessment of the health and safety impacts of product and service categories
15 –17, 32
Marketing and Labelling
GRI 103: Manage-ment Approach 2016
103-1 Explanation of the material topic and its boundary 17, 21, 159
103-2 The management approach and its components 58, 156 –158
103-3 Evaluation of the management approach 156 –157
GRI 417: Market-ing and Labelling 2016
417-1 Requirements for product and service information and labelling
Scope includes all markets regarding responsible marketing. Communicating country of origin is of growing importance. All products meet food safety require-ments and we transparently commu-nicate ingredients, and how to sort the packaging.
20 –21, 32–33
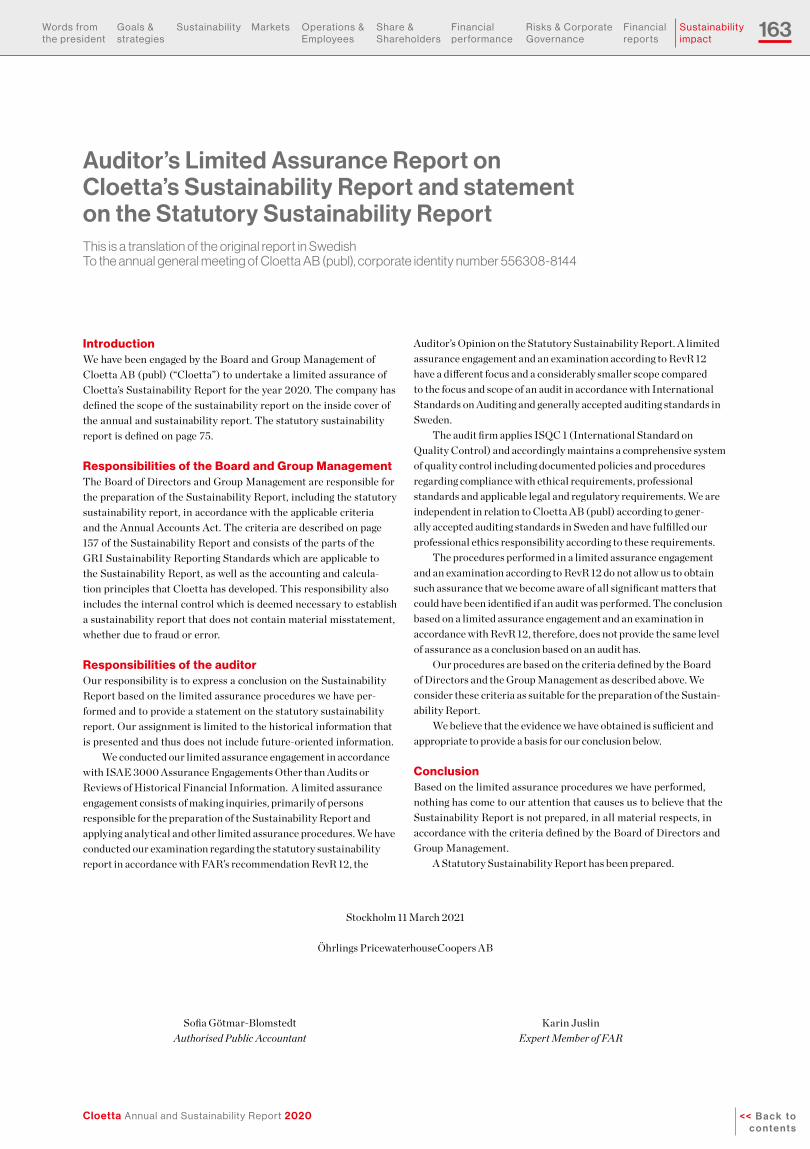
163
Cloetta Annual and Sustainability Report 2020 << B a c k t o c o n t e n t s
Words from the president
Goals & strategies
Sustain ability Markets Operations & employees
Share & Shareholders
financial performance
risks & Corporate Governance
financial reports
Sustain ability impact
IntroductionWe have been engaged by the Board and Group Management of Cloetta AB (publ) (“Cloetta”) to undertake a limited assurance of Cloetta’s Sustainability Report for the year 2020. The company has defined the scope of the sustainability report on the inside cover of the annual and sustainability report. The statutory sustainability report is defined on page 75.
Responsibilities of the Board and Group Management The Board of Directors and Group Management are responsible for the preparation of the Sustainability Report, including the statutory sustainability report, in accordance with the applicable criteria and the Annual Accounts Act. The criteria are described on page 157 of the Sustainability Report and consists of the parts of the GRI Sustainability Reporting Standards which are applicable to the Sustainability Report, as well as the accounting and calcula-tion principles that Cloetta has developed. This responsibility also includes the internal control which is deemed necessary to establish a sustainability report that does not contain material misstatement, whether due to fraud or error.
Responsibilities of the auditorOur responsibility is to express a conclusion on the Sustainability Report based on the limited assurance procedures we have per-formed and to provide a statement on the statutory sustainability report. Our assignment is limited to the historical information that is presented and thus does not include future-oriented information.
We conducted our limited assurance engagement in accordance with ISAE 3000 Assurance Engagements Other than Audits or Reviews of Historical Financial Information. A limited assurance engagement consists of making inquiries, primarily of persons responsible for the preparation of the Sustainability Report and applying analytical and other limited assurance procedures. We have conducted our examination regarding the statutory sustainability report in accordance with FAR’s recommendation RevR 12, the
Auditor’s Opinion on the Statutory Sustainability Report. A limited assurance engagement and an examination according to RevR 12 have a different focus and a considerably smaller scope compared to the focus and scope of an audit in accordance with International Standards on Auditing and generally accepted auditing standards in Sweden.
The audit firm applies ISQC 1 (International Standard on Quality Control) and accordingly maintains a comprehensive system of quality control including documented policies and procedures regarding compliance with ethical requirements, professional standards and applicable legal and regulatory requirements. We are independent in relation to Cloetta AB (publ) according to gener-ally accepted auditing standards in Sweden and have fulfilled our professional ethics responsibility according to these requirements.
The procedures performed in a limited assurance engagement and an examination according to RevR 12 do not allow us to obtain such assurance that we become aware of all significant matters that could have been identified if an audit was performed. The conclusion based on a limited assurance engagement and an examination in accordance with RevR 12, therefore, does not provide the same level of assurance as a conclusion based on an audit has.
Our procedures are based on the criteria defined by the Board of Directors and the Group Management as described above. We consider these criteria as suitable for the preparation of the Sustain-ability Report.
We believe that the evidence we have obtained is sufficient and appropriate to provide a basis for our conclusion below.
ConclusionBased on the limited assurance procedures we have performed, nothing has come to our attention that causes us to believe that the Sustainability Report is not prepared, in all material respects, in accordance with the criteria defined by the Board of Directors and Group Management.
A Statutory Sustainability Report has been prepared.
Auditor’s Limited Assurance Report on Cloetta’s Sustainability Report and statement on the Statutory Sustainability ReportThis is a translation of the original report in SwedishTo the annual general meeting of Cloetta AB (publ), corporate identity number 556308-8144
Stockholm 11 March 2021
Öhrlings PricewaterhouseCoopers AB
Sofia Götmar-BlomstedtAuthorised Public Accountant
Karin JuslinExpert Member of FAR

164
Cloetta Annual and Sustainability Report 2020<< B a c k t o c o n t e n t s
Words from the president
Goals & strategies
Sustain ability Markets Operations & employees
Share & Shareholders
financial performance
risks & Corporate Governance
financial reports
Sustain ability impact
General All amounts in the tables are presented in SEK millions unless otherwise stated. All amounts in brackets () represent comparative figures for the same period of the prior year, unless otherwise stated.
Margins Definition/calculation Purpose
Gross margin Net sales less cost of goods sold as a percentage of net sales.
Gross margin measures production profitability.
Operating profit margin (EBIT margin)
Operating profit expressed as a percentage of net sales. Operating profit margin is used for measuring the operational profitability.
Operating profit margin, adjusted
Operating profit, adjusted for items affecting comparability, as a percentage of net sales.
Operating profit margin, adjusted excludes the impact of items affecting comparability, enabling a comparison of operational profitability.
Profit margin Profit/loss before tax expressed as a percentage of net sales.
This metric enables the profitability to be compared across locations where corporate taxes differ.
Return Definition/calculation Purpose
Free cash flow Sum of the cash flow from operating activities and cash flow from investments in property, plant and equipment and intangible assets.
The free cash flow is the cash flow available to all investors consisting of shareholders and lenders.
Free cash flow yield Free cash flow over the last 12 months divided by the num-ber of shares at the end of the period and subsequently di-vided by the market price per share at the end of the period.
This metric is an indicator of the return on investment of investors in the company.
Return on capital employed
Operating profit plus financial income as a percentage of average capital employed. The average capital employed is calculated by taking the capital employed per period end and the capital employed by period end of the comparative period in the previous year divided by two.
Return on capital employed is used to analyse profitabil-ity, based on the amount of capital used. The leverage of the company is the reason that this metric is used next to return on equity, because it includes equity, but takes into account borrowings and other liabilities as well.
Return on equity Profit from continuing operations for the period as a percentage of total equity.
Return on equity is used to measure profit generation, given the resources attributable to the owners of the Parent Company.
Capital structure Definition/calculation Purpose
Capital employed Total assets less interest-free liabilities (including deferred tax).
Capital employed measures the amount of capital used and serves as input for the return on capital employed.
Equity/assets ratio Equity at the end of the period as a percentage of total assets. The equity/assets ratio represents the amount of assets on which shareholders have a residual claim.
This ratio is an indicator of the company’s leverage used to finance the company.
Gross debt Gross current and non-current borrowings, credit overdraft facilities, lease liabilities, derivative financial instruments and interest payable.
Gross debt represents the total debt obligation of the company irrespective of its maturity.
Net debt Gross debt less cash and cash equivalents. The net debt is used as an indication of the ability to pay off all debts if these became due simultaneously on the day of calculation, using only available cash and cash equivalents.
Net debt/EBITDA Net debt at the end of the period divided by the adjusted EBITDA for the last 12 months, taking into consideration the annualisation of EBITDA for acquired or divested companies.
The net debt/EBITDA ratio approximates the company’s ability to decrease its debt. It represents the number of years it would take to pay back debt if net debt and EBITDA were held constant, ignoring the impact from cash flows from interest, tax and capital expenditure.
Net debt/equity ratio Net debt at the end of the period divided by equity at the end of the period.
The net debt/equity ratio measures the extent to which the company is funded by debt. Because cash and overdraft facilities can be used to pay off debt at short notice, the leverage takes into account net debt instead of gross debt.
Working capital Total inventories and trade and other receivables adjusted for trade and other payables.
Working capital is used to measure the company's ability, besides cash and cash equivalents, to meet current operational obligations.
Data per share Definition/calculation Purpose
Cash flow from operating activities per share
Cash flow from operating activities in the period divided by the average number of shares.
The cash flow from operating activities per share measures the amount of cash the company generates per share from the revenues it brings irrespective of the capital investments and cash flows related to the financ-ing structure of the company.
Earnings per share Profit for the period divided by the average number of shares adjusted for the effect of forward contracts to repur-chase own shares.
The earnings per share measures the amount of net profit that is available for payment to shareholders per share.
Equity per share Equity at the end of the period divided by number of shares at the end of the period.
Equity per share measures the net-asset value backing up each share of the company's equity and determines if a company is increasing shareholder value over time.
Definitions
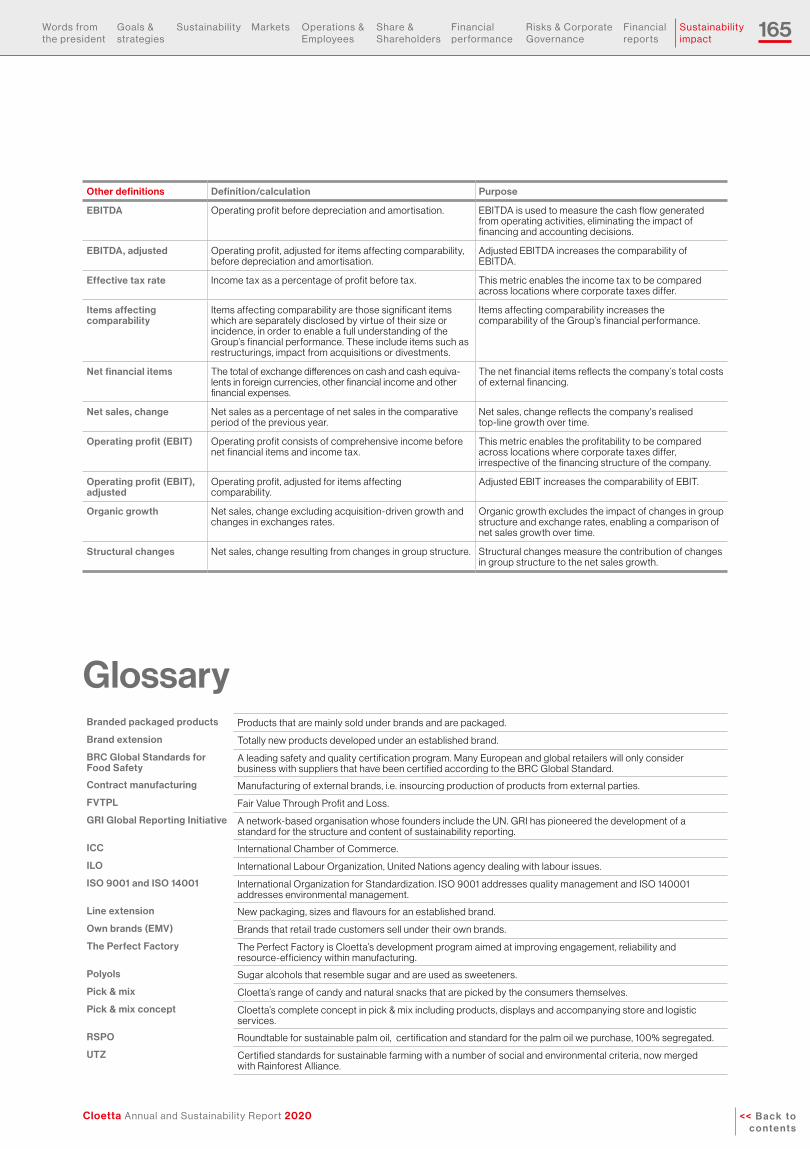
165
Cloetta Annual and Sustainability Report 2020 << B a c k t o c o n t e n t s
Words from the president
Goals & strategies
Sustain ability Markets Operations & employees
Share & Shareholders
financial performance
risks & Corporate Governance
financial reports
Sustain ability impact
Other definitions Definition/calculation Purpose
EBITDA Operating profit before depreciation and amortisation. EBITDA is used to measure the cash flow generated from operating activities, eliminating the impact of financing and accounting decisions.
EBITDA, adjusted Operating profit, adjusted for items affecting comparability, before depreciation and amortisation.
Adjusted EBITDA increases the comparability of EBITDA.
Effective tax rate Income tax as a percentage of profit before tax. This metric enables the income tax to be compared across locations where corporate taxes differ.
Items affecting comparability
Items affecting comparability are those significant items which are separately disclosed by virtue of their size or incidence, in order to enable a full understanding of the Group’s financial performance. These include items such as restructurings, impact from acquisitions or divestments.
Items affecting comparability increases the comparability of the Group’s financial performance.
Net financial items The total of exchange differences on cash and cash equiva-lents in foreign currencies, other financial income and other financial expenses.
The net financial items reflects the company’s total costs of external financing.
Net sales, change Net sales as a percentage of net sales in the comparative period of the previous year.
Net sales, change reflects the company's realised top-line growth over time.
Operating profit (EBIT) Operating profit consists of comprehensive income before net financial items and income tax.
This metric enables the profitability to be compared across locations where corporate taxes differ, irrespective of the financing structure of the company.
Operating profit (EBIT), adjusted
Operating profit, adjusted for items affecting compa rability.
Adjusted EBIT increases the comparability of EBIT.
Organic growth Net sales, change excluding acquisition-driven growth and changes in exchanges rates.
Organic growth excludes the impact of changes in group structure and exchange rates, enabling a comparison of net sales growth over time.
Structural changes Net sales, change resulting from changes in group structure. Structural changes measure the contribution of changes in group structure to the net sales growth.
Branded packaged products Products that are mainly sold under brands and are packaged.
Brand extension Totally new products developed under an established brand.
BRC Global Standards for Food Safety
A leading safety and quality certification program. Many European and global retailers will only consider business with suppliers that have been certified according to the BRC Global Standard.
Contract manufacturing Manufacturing of external brands, i.e. insourcing production of products from external parties.
FVTPL Fair Value Through Profit and Loss.
GRI Global Reporting Initiative A network-based organisation whose founders include the UN. GRI has pioneered the development of a standard for the structure and content of sustainability reporting.
ICC International Chamber of Commerce.
ILO International Labour Organization, United Nations agency dealing with labour issues.
ISO 9001 and ISO 14001 International Organization for Standardization. ISO 9001 addresses quality management and ISO 140001 addresses environmental management.
Line extension New packaging, sizes and flavours for an established brand.
Own brands (EMV) Brands that retail trade customers sell under their own brands.
The Perfect Factory The Perfect Factory is Cloetta’s development program aimed at improving engagement, reliability and resource-efficiency within manufacturing.
Polyols Sugar alcohols that resemble sugar and are used as sweeteners.
Pick & mix Cloetta’s range of candy and natural snacks that are picked by the consumers themselves.
Pick & mix concept Cloetta’s complete concept in pick & mix including products, displays and accompanying store and logistic services.
RSPO Roundtable for sustainable palm oil, certification and standard for the palm oil we purchase, 100% segregated.
UTZ Certified standards for sustainable farming with a number of social and environmental criteria, now merged with Rainforest Alliance.
Glossary

166
Cloetta Annual and Sustainability Report 2020<< B a c k t o c o n t e n t s
O U r h i S t O r Y
Words from the president
Goals & strategies
Sustain ability Markets Operations & employees
Share & Shareholders
financial performance
risks & Corporate Governance
financial reports
Sustain ability impact
Cloetta’s oldest brands date from the
1800sVenco is launched in 1878
when Gerrit van Voornveld started manufacturing
liquorice and peppermint pastilles in a steam factory
in Amsterdam. Liquorice, peppermint and jujubes have
long been known for their cough suppressing effects.
1900–1913, exploiting industrialisation
Electrification and railway construction accelerate the
pace of industrialisation, a critical enabler for business-es like the Swedish compa-nies Ahlgrens and Cloetta,
which are active in industrial production of confectionery. Läkerol is launched in 1909
and Guldnougat in 1913. Läkerol is also launched in Denmark in 1910 and
Norway in 1912.
The roaring
twenties The confectionery
industry grows after the war. The slogan
“Choose right – choose Cloetta” is created in 1921.
In the Netherlands, Lonka opens its first factory 1920 and the pastille brand
King is launched in 1922. In 1928 Sisu is launched in
Finland, Red Band in the Netherlands and
Tarragona in Sweden.
1950–60s, an interest in the USA and carsThe chewing gum Jenkki (Yankee) is launched in Finland in 1951.
Ahlgrens bilar – the world’s best-selling car, is launched in 1953 with Italian Bugatti as its inspiration.
The double countline Tupla is launched in Finland in 1960.
In Sweden, Polly is launched in 1965 and Bridge-blandning in 1966.
Chewits are launched in the United Kingdom in 1965.
The first marshmallow Santas are also sold in the 1960s.
The 1930–40s, launch of strong brandsMalaco (Malmö Lakrits Compani) is founded in 1934 during the period between the two world wars. Sportlunch (then called Mellanmål) is launched in 1937.
Kexchoklad is introduced in 1938 and Center in 1941.
Plopp is launched after WWII in 1949.
1900–1910
1920
1800s
1930–1940
1950–1960
Cloetta’s history filled with legendary brands
The Cloetta brothers In 1862 the three Swiss Cloetta brothers, Bernard, Christoffer and Nutin Cloetta, founded the company “Brødrene Cloëtta” for manufacturing chocolate and confectionery in Copenhagen, Denmark. The brothers later moved their manufacturing to Sweden and the company was owned by the Cloetta family until 1917, when the Svenfelt family took over the majority shareholding in Cloetta via the newly formed Svenska Chokladfabriks AB. The Svenfelt family has major ownership interests in Cloetta to this day.
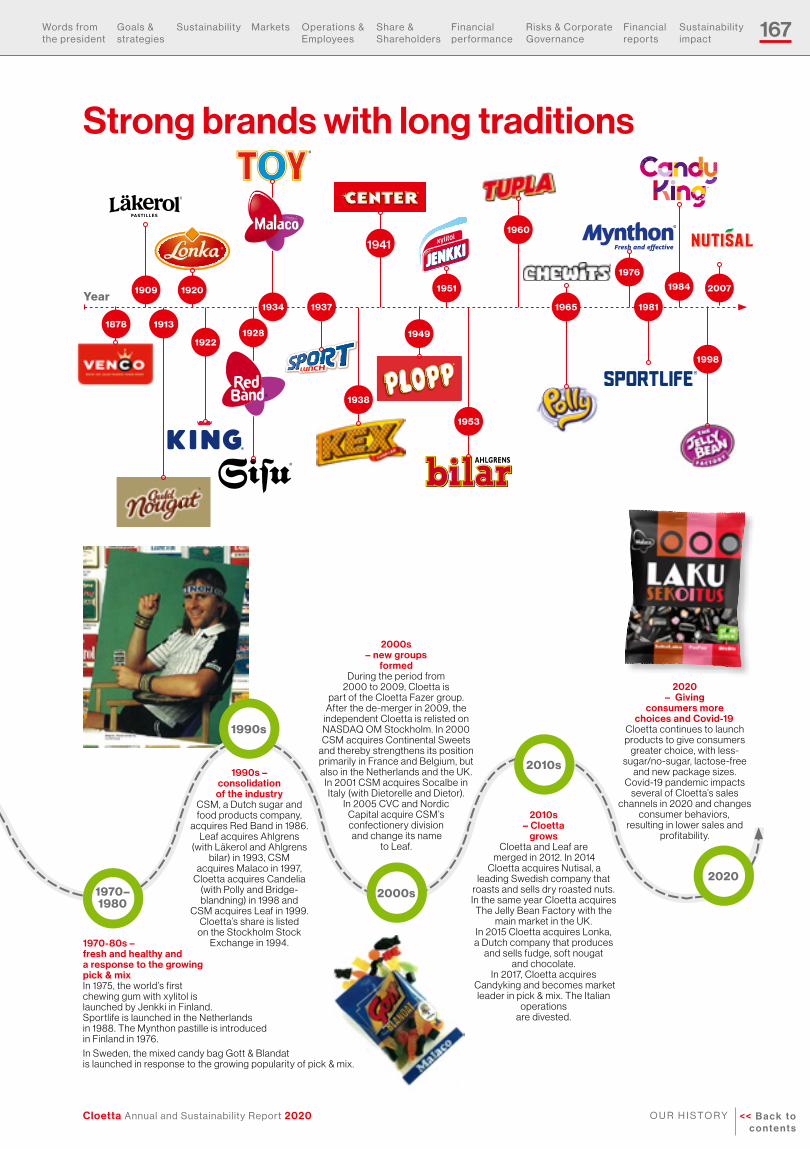
167
Cloetta Annual and Sustainability Report 2020 << B a c k t o c o n t e n t s
O U r h i S t O r Y
Words from the president
Goals & strategies
Sustain ability Markets Operations & employees
Share & Shareholders
financial performance
risks & Corporate Governance
financial reports
Sustain ability impact
1990s – consolidation
of the industry CSM, a Dutch sugar and food products company,
acquires Red Band in 1986. Leaf acquires Ahlgrens
(with Läkerol and Ahlgrens bilar) in 1993, CSM
acquires Malaco in 1997, Cloetta acquires Candelia
(with Polly and Bridge-blandning) in 1998 and
CSM acquires Leaf in 1999. Cloetta’s share is listed
on the Stockholm Stock Exchange in 1994.
2000s – new groups
formedDuring the period from
2000 to 2009, Cloetta is part of the Cloetta Fazer group.
After the de-merger in 2009, the independent Cloetta is relisted on NASDAQ OM Stockholm. In 2000 CSM acquires Continental Sweets
and thereby strengthens its position primarily in France and Belgium, but also in the Netherlands and the UK.
In 2001 CSM acquires Socalbe in Italy (with Dietorelle and Dietor).
In 2005 CVC and Nordic Capital acquire CSM’s confectionery division
and change its name to Leaf.
2010s – Cloetta
growsCloetta and Leaf are
merged in 2012. In 2014 Cloetta acquires Nutisal, a
leading Swedish company that roasts and sells dry roasted nuts.
In the same year Cloetta acquires The Jelly Bean Factory with the
main market in the UK.In 2015 Cloetta acquires Lonka, a Dutch company that produces
and sells fudge, soft nougat and chocolate.
In 2017, Cloetta acquires Candyking and becomes market
leader in pick & mix. The Italian operations
are divested.
2020 – Giving
consumers more choices and Covid-19
Cloetta continues to launch products to give consumers
greater choice, with less- sugar/no-sugar, lactose-free
and new package sizes.Covid-19 pandemic impacts
several of Cloetta’s sales channels in 2020 and changes
consumer behaviors, resulting in lower sales and
profitability.
2020
2010s
2000s
1990s
1970–1980
Strong brands with long traditions
®®®®®
Year
1878 19131913
1909 1920
19221928
1934 1937
1938
1941
1949
1951
1953
1960
1965
1976
1998
1981
20071984
1970-80s – fresh and healthy and a response to the growingpick & mix In 1975, the world’s first chewing gum with xylitol is launched by Jenkki in Finland. Sportlife is launched in the Netherlands in 1988. The Mynthon pastille is introduced in Finland in 1976.
In Sweden, the mixed candy bag Gott & Blandat is launched in response to the growing popularity of pick & mix.
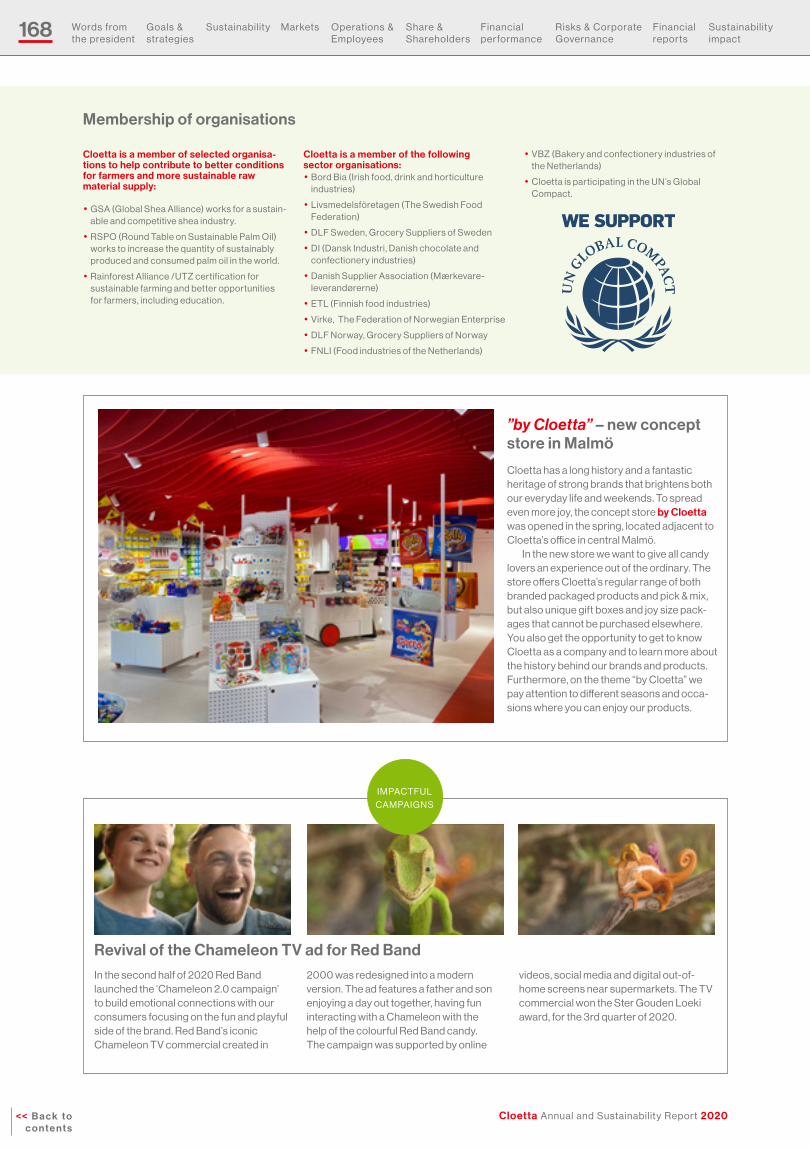
168
Cloetta Annual and Sustainability Report 2020<< B a c k t o c o n t e n t s
Words from the president
Goals & strategies
Sustain ability Markets Operations & employees
Share & Shareholders
financial performance
risks & Corporate Governance
financial reports
Sustain ability impact
Cloetta is a member of selected organisa-tions to help contribute to better conditions for farmers and more sustainable raw material supply:
• GSa (Global Shea alliance) works for a sustain-able and competitive shea industry.
• rSPO (round table on Sustainable Palm Oil) works to increase the quantity of sustainably produced and consumed palm oil in the world.
• rainforest alliance /UtZ certification for sustainable farming and better opportunities for farmers, including education.
Cloetta is a member of the following sector organisations: • Bord Bia (irish food, drink and horticulture
industries)
• livsmedelsföretagen (the Swedish food federation)
• dlf Sweden, Grocery Suppliers of Sweden
• di (dansk industri, danish chocolate and confectionery industries)
• danish Supplier association (Mærkevare-leverandørerne)
• etl (finnish food industries)
• Virke, the federation of norwegian enterprise
• dlf norway, Grocery Suppliers of norway
• fnli (food industries of the netherlands)
• VBZ (Bakery and confectionery industries of the netherlands)
• Cloetta is participating in the Un’s Global Compact.
Membership of organisations
”by Cloetta” – new concept store in Malmö
Cloetta has a long history and a fantastic heritage of strong brands that brightens both our everyday life and weekends. to spread even more joy, the concept store by Cloetta was opened in the spring, located adjacent to Cloetta’s office in central Malmö.
in the new store we want to give all candy lovers an experience out of the ordinary. the store offers Cloetta’s regular range of both branded packaged products and pick & mix, but also unique gift boxes and joy size pack-ages that cannot be purchased elsewhere. You also get the opportunity to get to know Cloetta as a company and to learn more about the history behind our brands and products. furthermore, on the theme “by Cloetta” we pay attention to different seasons and occa-sions where you can enjoy our products.
in the second half of 2020 red Band launched the ‘Chameleon 2.0 campaign’ to build emotional connections with our consumers focusing on the fun and playful side of the brand. red Band’s iconic Chameleon tV commercial created in
2000 was redesigned into a modern version. the ad features a father and son enjoying a day out together, having fun interacting with a Chameleon with the help of the colourful red Band candy. the campaign was supported by online
videos, social media and digital out-of-home screens near supermarkets. the tV commercial won the Ster Gouden loeki award, for the 3rd quarter of 2020.
iMPaCtfU l CaMPaiGnS
Revival of the Chameleon TV ad for Red Band
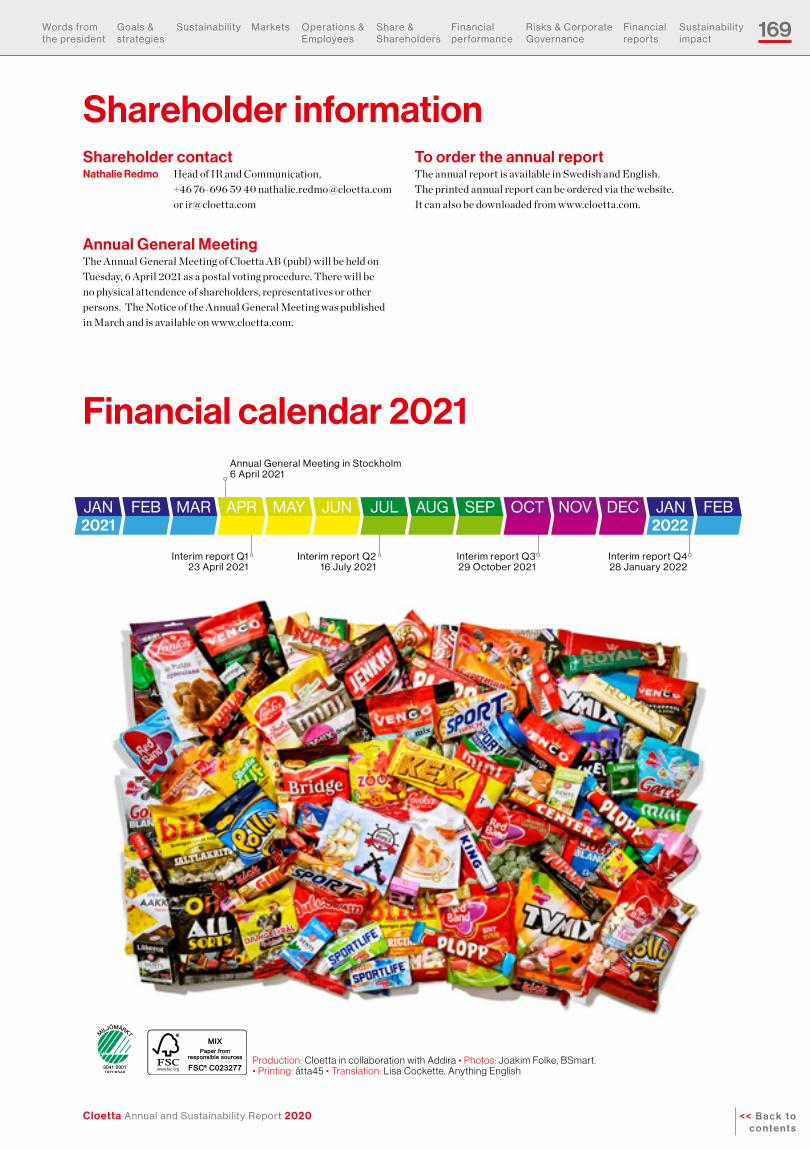
169
Cloetta Annual and Sustainability Report 2020 << B a c k t o c o n t e n t s
Words from the president
Goals & strategies
Sustain ability Markets Operations & employees
Share & Shareholders
financial performance
risks & Corporate Governance
financial reports
Sustain ability impact
Production: Cloetta in collaboration with Addira • Photos: Joakim Folke, BSmart. • Printing: åtta45 • Translation: Lisa Cockette, Anything English
Shareholder informationShareholder contactNathalie Redmo Head of IR and Communication,
+46 76-696 59 40 [email protected] or [email protected]
Annual General MeetingThe Annual General Meeting of Cloetta AB (publ) will be held on Tuesday, 6 April 2021 as a postal voting procedure. There will be no physical attendence of shareholders, representatives or other persons. The Notice of the Annual General Meeting was published in March and is available on www.cloetta.com.
To order the annual reportThe annual report is available in Swedish and English. The printed annual report can be ordered via the website. It can also be downloaded from www.cloetta.com.
Financial calendar 2021
interim report Q1 23 april 2021
annual General Meeting in Stockholm 6 april 2021
interim report Q2 16 July 2021
interim report Q3 29 October 2021
Jan feB Mar aPr MaY JUn JUl aUG SeP OCt nOV deC Jan feB2021
interim report Q4 28 January 2022
2022
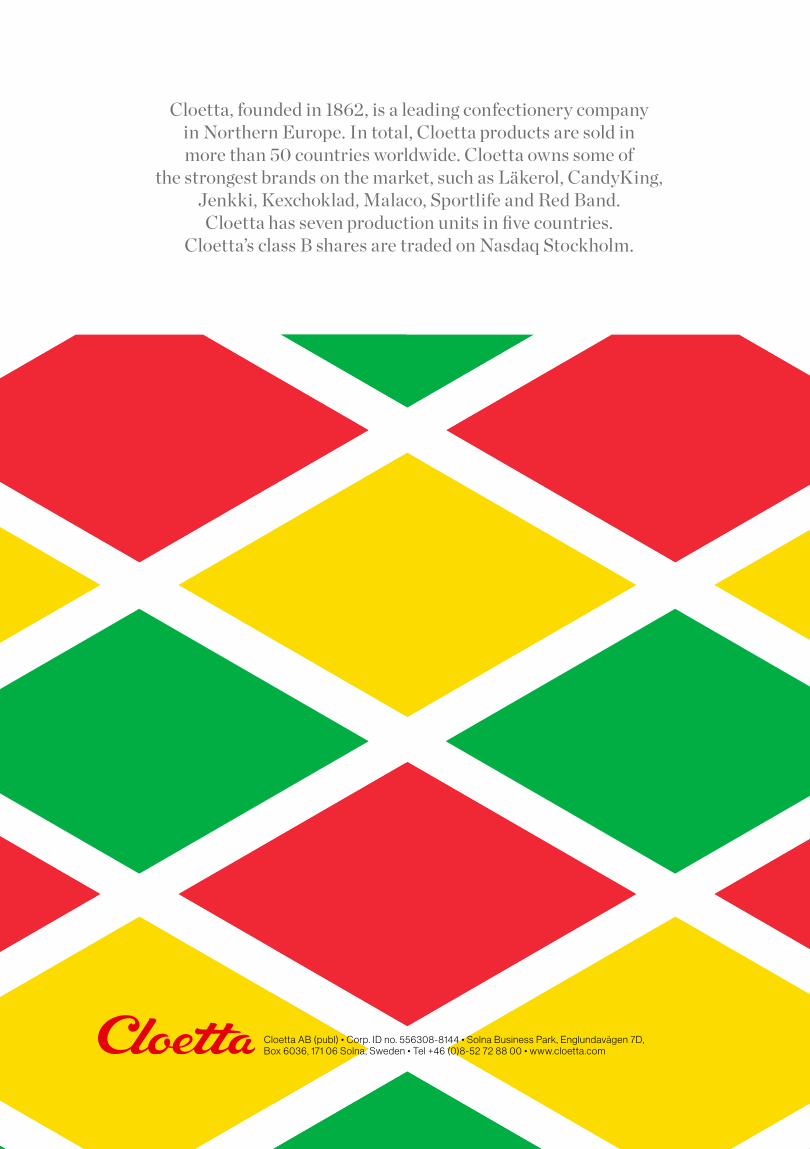
Cloetta AB (publ) • Corp. ID no. 556308-8144 • Solna Business Park, Englundavägen 7D, Box 6036, 171 06 Solna, Sweden • Tel +46 (0)8-52 72 88 00 • www.cloetta.com
Cloetta, founded in 1862, is a leading confectionery company in Northern Europe. In total, Cloetta products are sold in more than 50 countries worldwide. Cloetta owns some of
the strongest brands on the market, such as Läkerol, CandyKing, Jenkki, Kexchoklad, Malaco, Sportlife and Red Band.
Cloetta has seven production units in five countries. Cloetta’s class B shares are traded on Nasdaq Stockholm.