Annual 30 m dataset for glacial lakes in High Mountain Asia ...
26
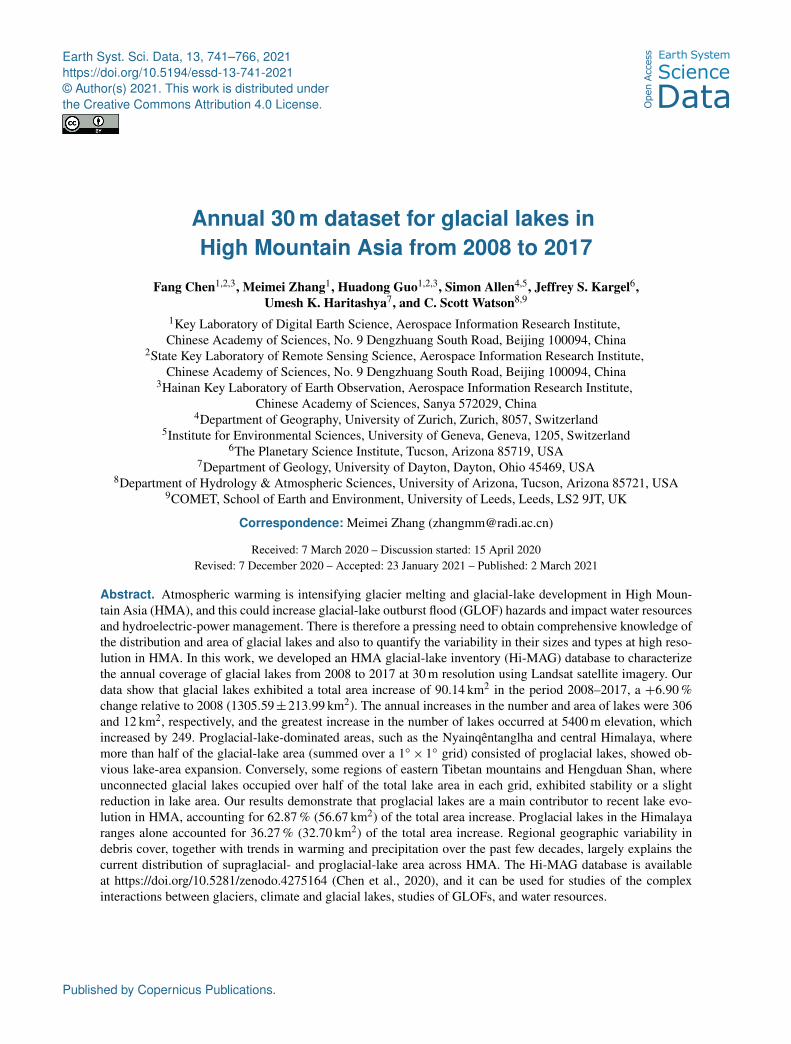
Earth Syst. Sci. Data, 13, 741–766, 2021 https://doi.org/10.5194/essd-13-741-2021 © Author(s) 2021. This work is distributed under the Creative Commons Attribution 4.0 License. Annual 30 m dataset for glacial lakes in High Mountain Asia from 2008 to 2017 Fang Chen 1,2,3 , Meimei Zhang 1 , Huadong Guo 1,2,3 , Simon Allen 4,5 , Jeffrey S. Kargel 6 , Umesh K. Haritashya 7 , and C. Scott Watson 8,9 1 Key Laboratory of Digital Earth Science, Aerospace Information Research Institute, Chinese Academy of Sciences, No. 9 Dengzhuang South Road, Beijing 100094, China 2 State Key Laboratory of Remote Sensing Science, Aerospace Information Research Institute, Chinese Academy of Sciences, No. 9 Dengzhuang South Road, Beijing 100094, China 3 Hainan Key Laboratory of Earth Observation, Aerospace Information Research Institute, Chinese Academy of Sciences, Sanya 572029, China 4 Department of Geography, University of Zurich, Zurich, 8057, Switzerland 5 Institute for Environmental Sciences, University of Geneva, Geneva, 1205, Switzerland 6 The Planetary Science Institute, Tucson, Arizona 85719, USA 7 Department of Geology, University of Dayton, Dayton, Ohio 45469, USA 8 Department of Hydrology & Atmospheric Sciences, University of Arizona, Tucson, Arizona 85721, USA 9 COMET, School of Earth and Environment, University of Leeds, Leeds, LS2 9JT, UK Correspondence: Meimei Zhang ([email protected]) Received: 7 March 2020 – Discussion started: 15 April 2020 Revised: 7 December 2020 – Accepted: 23 January 2021 – Published: 2 March 2021 Abstract. Atmospheric warming is intensifying glacier melting and glacial-lake development in High Moun- tain Asia (HMA), and this could increase glacial-lake outburst flood (GLOF) hazards and impact water resources and hydroelectric-power management. There is therefore a pressing need to obtain comprehensive knowledge of the distribution and area of glacial lakes and also to quantify the variability in their sizes and types at high reso- lution in HMA. In this work, we developed an HMA glacial-lake inventory (Hi-MAG) database to characterize the annual coverage of glacial lakes from 2008 to 2017 at 30m resolution using Landsat satellite imagery. Our data show that glacial lakes exhibited a total area increase of 90.14 km 2 in the period 2008–2017, a +6.90 % change relative to 2008 (1305.59 ± 213.99 km 2 ). The annual increases in the number and area of lakes were 306 and 12 km 2 , respectively, and the greatest increase in the number of lakes occurred at 5400m elevation, which increased by 249. Proglacial-lake-dominated areas, such as the Nyainqêntanglha and central Himalaya, where more than half of the glacial-lake area (summed over a 1 ◦ × 1 ◦ grid) consisted of proglacial lakes, showed ob- vious lake-area expansion. Conversely, some regions of eastern Tibetan mountains and Hengduan Shan, where unconnected glacial lakes occupied over half of the total lake area in each grid, exhibited stability or a slight reduction in lake area. Our results demonstrate that proglacial lakes are a main contributor to recent lake evo- lution in HMA, accounting for 62.87 % (56.67 km 2 ) of the total area increase. Proglacial lakes in the Himalaya ranges alone accounted for 36.27 % (32.70 km 2 ) of the total area increase. Regional geographic variability in debris cover, together with trends in warming and precipitation over the past few decades, largely explains the current distribution of supraglacial- and proglacial-lake area across HMA. The Hi-MAG database is available at https://doi.org/10.5281/zenodo.4275164 (Chen et al., 2020), and it can be used for studies of the complex interactions between glaciers, climate and glacial lakes, studies of GLOFs, and water resources. Published by Copernicus Publications.
-
Upload
khangminh22 -
Category
Documents
-
view
0 -
download
0
Transcript of Annual 30 m dataset for glacial lakes in High Mountain Asia ...
Earth Syst. Sci. Data, 13, 741–766, 2021https://doi.org/10.5194/essd-13-741-2021© Author(s) 2021. This work is distributed underthe Creative Commons Attribution 4.0 License.
Annual 30 m dataset for glacial lakes inHigh Mountain Asia from 2008 to 2017
Fang Chen1,2,3, Meimei Zhang1, Huadong Guo1,2,3, Simon Allen4,5, Jeffrey S. Kargel6,Umesh K. Haritashya7, and C. Scott Watson8,9
1Key Laboratory of Digital Earth Science, Aerospace Information Research Institute,Chinese Academy of Sciences, No. 9 Dengzhuang South Road, Beijing 100094, China
2State Key Laboratory of Remote Sensing Science, Aerospace Information Research Institute,Chinese Academy of Sciences, No. 9 Dengzhuang South Road, Beijing 100094, China
3Hainan Key Laboratory of Earth Observation, Aerospace Information Research Institute,Chinese Academy of Sciences, Sanya 572029, China
4Department of Geography, University of Zurich, Zurich, 8057, Switzerland5Institute for Environmental Sciences, University of Geneva, Geneva, 1205, Switzerland
6The Planetary Science Institute, Tucson, Arizona 85719, USA7Department of Geology, University of Dayton, Dayton, Ohio 45469, USA
8Department of Hydrology & Atmospheric Sciences, University of Arizona, Tucson, Arizona 85721, USA9COMET, School of Earth and Environment, University of Leeds, Leeds, LS2 9JT, UK
Correspondence: Meimei Zhang ([email protected])
Received: 7 March 2020 – Discussion started: 15 April 2020Revised: 7 December 2020 – Accepted: 23 January 2021 – Published: 2 March 2021
Abstract. Atmospheric warming is intensifying glacier melting and glacial-lake development in High Moun-tain Asia (HMA), and this could increase glacial-lake outburst flood (GLOF) hazards and impact water resourcesand hydroelectric-power management. There is therefore a pressing need to obtain comprehensive knowledge ofthe distribution and area of glacial lakes and also to quantify the variability in their sizes and types at high reso-lution in HMA. In this work, we developed an HMA glacial-lake inventory (Hi-MAG) database to characterizethe annual coverage of glacial lakes from 2008 to 2017 at 30 m resolution using Landsat satellite imagery. Ourdata show that glacial lakes exhibited a total area increase of 90.14 km2 in the period 2008–2017, a +6.90 %change relative to 2008 (1305.59±213.99 km2). The annual increases in the number and area of lakes were 306and 12 km2, respectively, and the greatest increase in the number of lakes occurred at 5400 m elevation, whichincreased by 249. Proglacial-lake-dominated areas, such as the Nyainqêntanglha and central Himalaya, wheremore than half of the glacial-lake area (summed over a 1◦× 1◦ grid) consisted of proglacial lakes, showed ob-vious lake-area expansion. Conversely, some regions of eastern Tibetan mountains and Hengduan Shan, whereunconnected glacial lakes occupied over half of the total lake area in each grid, exhibited stability or a slightreduction in lake area. Our results demonstrate that proglacial lakes are a main contributor to recent lake evo-lution in HMA, accounting for 62.87 % (56.67 km2) of the total area increase. Proglacial lakes in the Himalayaranges alone accounted for 36.27 % (32.70 km2) of the total area increase. Regional geographic variability indebris cover, together with trends in warming and precipitation over the past few decades, largely explains thecurrent distribution of supraglacial- and proglacial-lake area across HMA. The Hi-MAG database is availableat https://doi.org/10.5281/zenodo.4275164 (Chen et al., 2020), and it can be used for studies of the complexinteractions between glaciers, climate and glacial lakes, studies of GLOFs, and water resources.
Published by Copernicus Publications.

742 F. Chen et al.: Annual 30 m dataset for glacial lakes in High Mountain Asia
1 Introduction
High Mountain Asia (HMA), consisting of the whole Ti-betan Plateau and adjacent mountain ranges such as the Hi-malayas, Karakoram, and Pamirs, contains the largest areaof mountainous glaciers in the world. Atmospheric warminghas resulted in widespread glacier retreat and downwastingin many mountain ranges of HMA (Bolch et al., 2012; Brunet al., 2017), which favors the formation and developmentof a large number of glacial lakes. However, glacial lakeshave been incompletely documented over small time inter-vals. Glacial-lake development varies according to climatic,cryospheric, and lake-specific conditions, including whetherthe basin geometry is connected to glaciers and the length oflake and glacier contact (Zhao et al., 2018).
There have been many previously published studies de-voted to mapping glacial lakes using remote-sensing dataover different regions of HMA. Some works have focusedon investigating the development of relatively large glaciallakes. Rounce et al. (2017) identified 131 glacial lakes inNepal in 2015 that had an area greater than 0.1 km2. Liet al. (2020) compiled an inventory of glacial lakes (≥0.01 km2) with a spatial resolution of 30 m in the Karako-ram mountains. Aggarwal et al. (2017) shared a new datasetof glacial and high-altitude lakes having an area > 0.01 km2
for Sikkim, eastern Himalaya, in the period 1972–2015.Ukita et al. (2011) constructed a glacial-lake inventory ofBhutan in the Himalayas for the period 2006–2010 basedon the high-resolution Panchromatic Remote-sensing Instru-ment for Stereo Mapping (PRISM) and Advanced Visibleand Near Infrared Radiometer type 2 (AVNIR-2) data fromthe Advanced Land Observing Satellite (ALOS). Consider-ing that small lakes represent less of a glacial-lake outburstflood (GLOF) risk, they set 0.01 km2 as the minimum lakesize. Ashraf et al. (2012) used Landsat-7 Enhanced The-matic Mapper Plus (ETM+) images for the 2000–2001 pe-riod to delineate glacial lakes greater than 0.02 km2 in theHindukush–Karakoram–Himalaya region of Pakistan.
Because small glacial lakes are highly variable in theirshape, location, and occurrence and are clearly sensitive tothe warming climate and glacier wastage, a growing num-ber of scholars have been paying attention to their abun-dance. Salerno et al. (2012) provided a complete mappingof glacial lakes (including lake size less than 0.001 km2)and debris-covered glaciers with a 10 m spatial resolution inthe Mount Everest region in 2008. Wang et al. (2013) uti-lized Landsat Thematic Mapper (TM) and ETM+ imagesfor the years 1990, 2000, and 2010 to map glacial lakeswith areas greater than 0.002 km2 in the Tien Shan moun-tains. Luo et al. (2020) examined glacial-lake changes (lakearea > 0.0036 km2) for the entire western Nyainqêntanglharange for five periods between 1976 and 2018 using multi-temporal Landsat images. The International Centre for Inte-grated Mountain Development provided comprehensive in-formation about the glacial lakes (greater than or equal to
0.003 km2) of five major river basins of the Hindu Kush Hi-malaya using Landsat images from 2005 (Sudan et al., 2018).Nie et al. (2017) mapped the distribution of glacial lakesacross the entire Himalaya in 2015 using 348 Landsat im-ages at 30 m resolution. They set the minimum mapping unitto 0.0081 km2. Zhang et al. (2015) presented a database ofglacial lakes larger than 0.003 km2 in the Third Pole for theyears 1990, 2000, and 2010.
All of these studies significantly help to fill the data gaprelating to information about glacial lakes in the HMA re-gion. At the global scale, Pekel et al. (2016) used millions ofLandsat satellite images to record global surface water overthe past 32 years at 30 m resolution, and many large and visi-ble glacial lakes were also included. More recently, Shugaret al. (2020) mapped glacial lakes with areas > 0.05 km2
around the world using 254 795 satellite images from 1990to 2018. X. Wang et al. (2020) developed an inventory ofglacial lakes with areas greater than 0.0054 km2 across HMAat two time points (1990 and 2018) using manual mappingwith 30 m Landsat images. They were the first to introducea glacial-lake inventory at such a large scale, and the datashared will serve as a baseline for further studies related towater resource assessment and glacier hazards.
In summary, a homogeneous, annually resolved inventoryand analysis of the spatial and temporal extent of differenttypes of glacial lakes over the entire HMA region are stilllacking. In this study, we developed an HMA glacial-lake in-ventory (Hi-MAG) database to characterize the annual cov-erage of glacial lakes from 2008 to 2017 at 30 m resolu-tion. A total of 40 481 Landsat scenes were processed us-ing the Google Earth Engine (GEE) cloud-computing plat-form to delineate glacial lakes (located within 10 km of thenearest glacier terminus) larger than 9 (e.g., 3× 3) pixels(0.0081 km2) (Nie et al., 2017).
Lakes were manually classified into four categories ac-cording to their position relative to the parent glacier or theirformation mechanisms (Fig. A1). Category (i) constitutesproglacial lakes, which are usually connected to the glaciertongue and dammed by glacier ice or unconsolidated or ice-cemented moraines (a mixture of ice, snow, rock, debris,clay, etc.). Proglacial lakes are located next to the glacierterminus and receive meltwater directly from their motherglaciers. Category (ii) constitutes supraglacial lakes, whichare ponds that form in depressions on low-sloping parts ofthe surface of a melting glacier and are dammed by ice or theend moraine or stagnating glacier snout. Category (iii) con-stitutes unconnected glacial lakes, which are not currentlydirectly connected to their parent glaciers, but they may tosome extent be fed by at least one of the glaciers located inthe basin. They may (but not necessarily) have recently de-tached from ice contact due to glacial recession. Althoughnot directly connected with the parent glaciers, these glaciallakes are also an outcome of glacier melting in response toatmospheric warming. They can supply fresh water to ma-jor river systems of the HMA region, and their changes have
Earth Syst. Sci. Data, 13, 741–766, 2021 https://doi.org/10.5194/essd-13-741-2021
F. Chen et al.: Annual 30 m dataset for glacial lakes in High Mountain Asia 743
significant scientific and socioeconomic implications (Nie etal., 2017; Song et al., 2016). Finally, category (iv) constitutesice-marginal lakes, which are generally distributed on oneside of the glacier tongue, meaning that the lake is dammedby the glacier ice on this side, while on the other side, it isbounded by a lateral moraine. With the increase in atmo-spheric warming and accelerated melting of glaciers, someglacier tributaries gradually detach from a main trunk glacier.These detachment locations, where glacier melting has beenparticularly intense, are in some cases also likely to form ice-marginal lakes. We note that such ice-marginal lakes are verycommon in some parts of the world (e.g., Alaska) but are notcommon in HMA (Armstrong and Anderson, 2020; Cappset al., 2011). Additionally, purely glacier-dammed lakes areformed by the advance of glaciers and dammed by almostpure glacier ice. Although the dam composition and structureare slightly different between proglacial lakes and glacier-dammed lakes because they are all located in the front of theglacier tongue and driven by the mother glacier, in the pro-cess of appending attributed information to each glacial lake,glacier-dammed lakes were merged into the proglacial-lakecategory.
Every lake was cross-checked manually for its boundaryand attribution. We defined an uncertainty of 1 pixel for thedetected glacial-lake boundaries and calculated the error inthe lake area for the whole HMA region. We also assessedthe inventory for climatic and geomorphological influenceson lake distribution across HMA.
2 Study area and data
2.1 Study area
The HMA region refers to a broad high-altitude regionin South and Central Asia that covers the whole TibetanPlateau and adjacent mountain ranges, including the easternHindu Kush, western Himalaya, eastern Himalaya, centralHimalaya, Karakoram, western Pamir, Pamir-Alay, northernand western Tien Shan, Dzhungarsky Alatau, western Kun-lun Shan, Nyainqêntanglha, Gangdise Mountains, HengduanShan, Tibetan interior mountains, Tanggula Shan, easternTibetan mountains, Qilian Shan, eastern Kunlun Shan, Al-tun Shan, eastern Tien Shan, central Tien Shan, and east-ern Pamir (Figs. 1 and 6a). It extends from 26 to 45◦ N andfrom 67 to 105◦ E, and the altitude of the plateau is about4500 m on average (Baumann et al., 2009). It is made up ofalternating mountains, valleys, and rivers, and the terrain isfragmented, showing a decreasing terrain from northwest tosoutheast. The HMA region has a series of east–west moun-tain ranges that occupy most of the area. Among these, Tang-gula Shan lies in the central part of HMA, with an altitude ofover 6000 m. The heights of the 15 highest mountains in theHimalayas are greater than 8000 m, while the peaks of themountains in the northern plateau are greater than 6500 m.The north–south mountain ranges are mainly distributed in
the southeast of the plateau and near the Hengduan Moun-tains area. These two groups of mountains constitute thegeomorphic framework and control the basic pattern of theplateau landform. Continuous and discontinuous permafrosthas developed on the higher land and north-facing slopes.
The HMA region is the source of several of Asia’s ma-jor rivers, including the Yellow, Yangtze, Indus, Ganges,Brahmaputra, Irrawaddy, Salween, and Mekong. They play acrucial role in downstream hydrology and water availabilityin Asia (Immerzeel and Bierkens, 2010). Most glaciers in theTibetan Plateau are retreating, except for the western Kunlun(Neckel et al., 2014; Kääb et al., 2015) and the Karakoram,where a slight mass gain is occurring (Bolch et al., 2012;Gardner et al., 2013). Moreover, glaciers in different moun-tain ranges show contrasting patterns. Local factors (e.g., ex-posure, topography, and debris coverage) may partly accountfor these differences, but the spatial and temporal hetero-geneity of both the climate and degree of climate changemay be the main reason. Glacial lakes are formed and de-velop temporally with the retreat or thinning of glaciers andare directly or indirectly fed by glacier meltwater. They arelocated within 10 km of the nearest glacier terminus (Wanget al., 2013; Zhang et al., 2015).
The HMA climate is under the combined and competinginfluences of the East Asian and South Asian monsoons andof the westerlies (Schiemann et al., 2009). This unique geo-graphical position produces an azonal plateau climate char-acterized by strong solar radiation, low air temperatures,large daily temperature variations, and small differences be-tween annual mean temperatures (Yao et al., 2012). The an-nual mean temperature is 1.6 ◦C, with the lowest temperatureof −1 to −7 ◦C occurring in January and the highest temper-ature of 7 to 15 ◦C occurring in July. The cumulative annualprecipitation is about 413.6 mm.
2.2 Dataset
A total of 40 481 satellite images, including Landsat 5 TMimagery during 2008–2011, Landsat 7 ETM+ imagery in2012, and Landsat 8 Operational Land Imager (OLI) dur-ing the period 2013–2017, were available in GEE and wereused to produce the annual glacial-lake maps over the entireHMA (Fig. 2). Here, when Landsat 5 or 8 data were avail-able, Landsat 7 ETM+ imagery with Scan Line Corrector(SLC)-off gaps was generally excluded due to the artifactsinduced by the slatted appearance of the original images, butthese were exclusively used for the glacial-lake mapping in2012 since no other Landsat data were acquired that year.For the years before 2008, all the available Landsat 5 TMdata in each year (e.g., 2004, 2005, 2006, and 2007) do notfully cover the HMA region.
The SLC-off condition of Landsat ETM+ introduces arti-facts because the slatted appearance of the original images isoccasionally carried into the glacial-lake map in 2012. Tech-niques to fill the SLC-off gaps exist, but these create artificial
https://doi.org/10.5194/essd-13-741-2021 Earth Syst. Sci. Data, 13, 741–766, 2021

744 F. Chen et al.: Annual 30 m dataset for glacial lakes in High Mountain Asia
Figure 1. Location of the HMA region. Glacier outlines from the Randolph Glacier Inventory (RGI v5.0), the Second Chinese GlacierInventory (CGI2), and the Glacier Area Mapping for Discharge from the Asian Mountains (GAMDAM) glacier inventory are drawn in blue.Publisher’s remark: Please note that the above figure contains disputed territories.
values that will result in false detections of water (Chen et al.,2011). Considering the strong spatial and temporal variabil-ity in glacial lakes such as supraglacial lakes, techniques thatmerge data from one or more SLC-off fill scenes for gener-ation of a gap-free image require careful use, even when us-ing the thousands of Landsat ETM+ images. It is noted thatwater mapping using time series images at large scales usu-ally avoids the use of such techniques (Mueller et al., 2016).Therefore, Landsat 7 ETM+ data with an intensive slattedappearance are not suitable for the classification of numer-ous glacial lakes. In this study, because the only useable datasource for 2012 was Landsat 7 ETM+, to ensure continuityof annual data from 2008 to 2017, we applied our best ef-forts to manual extraction of the glacial lakes from the 2012ETM+ images with the highest possible accuracy.
3 Methods
3.1 Satellite imagery selection strategy
One effective solution to reduce the influence of seasonallake fluctuations on the mapping is to map glacial lakes and
measure their long-term changes during stable seasons, whenthe lake extents are minimally affected by meteorologicalconditions and glacier runoff. Here, based on analyses of themapping times of glacial lakes in different regions, the se-lected time series of Landsat data were generally from Julyto November. During this period of each year, the Landsatimagery featured lower perennial snow coverage. Followingglacier runoff and precipitation, the area of a glacial lake islarge, and changes in this area will be small (Nie et al., 2017;Chen et al., 2017; Zhang et al., 2015). These lakes may alsoreach their maximum extent around the end of the glacierablation season (June to August) (Gardelle et al., 2013; Liuet al., 2014), except in the central and eastern Himalaya,where peak ablation extends into post-monsoon Septemberand October. In monsoon-affected areas such as Nepal andBhutan, monsoon cloud cover from July to mid-Septembermeans that clear-sky images can mostly only be obtainedfrom late September to November. The southeastern Tibet re-gion is problematic not only because the observation seasonis short but also as a result of abundant cloud cover, which isformed by the warm and humid airflow raised by the topog-
Earth Syst. Sci. Data, 13, 741–766, 2021 https://doi.org/10.5194/essd-13-741-2021

F. Chen et al.: Annual 30 m dataset for glacial lakes in High Mountain Asia 745
Figure 2. (a) The distribution of total observation numbers from all GEE Landsat scenes, along with these numbers broken down by (b) yearand (c) month.
raphy (Zhang et al., 2020; Umesh et al., 2018; Qiao et al.,2016).
As the most highly variable glacial lakes in the study area,supraglacial lakes change preferentially in the year, showingan increase in area during the pre-monsoon and rising to theirpeak area in the early monsoon (June to July) (Miles et al.,2017a, b). Although the selected image seasons are slightlydifferent due to the meteorological conditions in different re-gions, they all comply with the same criterion that the lakeswere in clear-sky images having little snow coverage. Thisensured the initial reliability of the mapping of glacial lakesthrough the GEE cloud-computing platform. If no valid ob-servations could be obtained, then the optimal mapping timeneeded to be broadened during the whole year.
To further increase data availability and also as the basisfor data selection in the periods beyond the optimum map-ping time, we set two criteria for the selection of imagerywith valid observations over the potential glacial-lake area byusing the cloud-score functions in GEE, including (i) cloud
cover being less than 20 % in the 10 km buffer around eachglacier outline of a Landsat scene or (ii) less than 20 % cloudcover for the entire scene. The cloud-score functions in GEEmay have significant difficulty in detecting clouds in moun-tain headwaters with high snow and ice cover, where largeamounts of snow and ice are likely to be identified as clouds.However, in this study, it was considered better to use muchstricter criteria to filter out a larger number of images withlots of clouds or objects that look like clouds (snow or ice) tofinally select only images with good observations.
3.2 Extraction of glacial-lake outlines
For the development of the Hi-MAG database, we applied asystematic glacial-lake detection method that comprised twosteps: initial glacial-lake extraction and subsequent manualrefinement of these lake-mapping results. The main proce-dures for glacial-lake mapping using Landsat data, as shownin Fig. 3, are as follows. (i) The Landsat top-of-atmosphere
https://doi.org/10.5194/essd-13-741-2021 Earth Syst. Sci. Data, 13, 741–766, 2021

746 F. Chen et al.: Annual 30 m dataset for glacial lakes in High Mountain Asia
data were clipped according to the extent of the glacierbuffers and assembled into a time series dataset. (ii) Poor-quality observations were identified. These included areasaffected by clouds, cloud shadow, topographic shadow, andSLC-off gaps. Here, we used the Fmask routine (Zhu andWoodcock, 2012) to detect the clouds and cloud shadows inthe imagery. Fmask has the advantage of being able to pro-cess a large number of images in a computationally efficientway. Topographic shadows are located in the areas where thesunlight is blocked. Generally, on the dark side of high moun-tains, the surface gradients are great, and the terrain reliefsare small. Therefore, topographic shadows were masked us-ing the slopes (larger than 10◦) and shaded relief values (lessthan 0.25) calculated from Shuttle Radar Topography Mis-sion (SRTM) data (Li and Sheng, 2012; Quincey et al., 2007).This removes a considerable number of mountain shadowsthat have a similar spectral reflectance as water bodies. How-ever, the SRTM digital elevation model (DEM) was gener-ated in 2000, which is different from the acquisition time ofthe Landsat images used for the glacial-lake mapping in thisstudy. The derived slopes and shaded relief cannot thereforefully represent the conditions on the date a given Landsatscene was acquired. As a consequence, some lakes that havegrown at steep glacier tongues may be masked, and somemountain shadows that interfere with the mapping results ofglacial lakes from GEE still remain, leading to the fact thatglacial lakes in steep areas are omitted, and residual shadowsare misclassified as glacial lakes. As for the SLC-off gapsin the ETM+ images, lakes outside the gaps will be accu-rately classified, but if they are covered by gaps, then theywill be misclassified. Errors caused by striped gaps in Land-sat ETM+ data were manually corrected using additionalhigh-quality scenes across the whole year with the assistanceof images from adjacent years. (iii) The modified normalizeddifference water index (MNDWI) was calculated (Xu, 2006).(iv) The potential glacial-lake areas were extracted by ap-plying an adaptive MNDWI threshold (Li and Sheng, 2012).The minimum number of water pixels used to define a glaciallake in an image is inconsistent in different studies. For ex-ample, Zhang et al. (2015) set the smallest detectable glaciallakes in the Third Pole as being larger than 0.0027 km2 (3connected pixels) using the Landsat TM and ETM+ data.Nie et al. (2017) selected 0.0081 km2 (9 connected pixels)as the minimum mapping unit to map glacial lakes in the Hi-malayas. Other studies have set the minimum threshold areasas 0.001 km2 (Salerno et al., 2012), 0.002 km2 (Wang et al.,2013), 0.0036 km2 (Luo et al., 2020), 0.0054 km2 (X. Wanget al., 2020), or 0.01 km2 (Li et al., 2020). A smaller mini-mum mapping unit will detect more glacial lakes. However,the uncertainty this brings will also be larger than using alarger threshold at the same resolution (Salerno et al., 2012).Our results demonstrate that a lake area covering fewer than9 water pixels will have an area error of greater than 50 %(see Sect. 4). Given the uncertainty in the areas of glaciallakes and the spatial resolution of Landsat data, in this study,
glacial lakes larger than 9 pixels (≥ 0.0081 km2) were con-sidered to be the minimum mapping unit. (v) Manual in-spection and refinement of individual glacial lakes were con-ducted, and the related attributions were added for each lake.
Based on the automated processing, nearly 60 % of glaciallakes in each year can be correctly classified. Of the otherlakes that were not properly classified, 30 % were missed,and 10 % were misclassified. For such a large-scale area thatis characterized by various and complex climatic, geologi-cal, and terrain conditions, this classification method is sim-ple but effective. The results are also reasonable since theyprovide very low commission errors. To ensure the qualityof the inventory, strict quality control was conducted to vi-sually inspect and correct the mapping errors after the au-tomated processing using GEE. False lake features, mainlyidentified as mountain shadows and river segments, weremanually removed by overlapping mapped lake shorelines inthe source Landsat imagery and higher-resolution imageryin Google Earth. Some glacial lakes may be covered byice and clouds for years, grow at steep glacier tongues, orshow heterogeneous reflectance with the surrounding back-grounds. For these missing glacial lakes, their boundarieswere edited further using ArcGIS. Furthermore, a cross-check and modification were conducted for each glacial lakebased on the lake-mapping results in conjunction with multi-temporal Landsat imagery. Here, all the Landsat imagerythat was used for the inspection was downloaded manuallyfrom the United States Geological Survey (USGS) Earth Ex-plorer website (https://earthexplorer.usgs.gov/, last access:30 September 2020). The outputs for each lake polygon in-clude information about the lake type, elevation, Euclidiandistance to the nearest glacier terminus, area, and perime-ter. Note that if there was more than one suitable satel-lite image in a year, the image with the lowest cloud coverwas selected for the calculation of the area and perimeterof a given lake. Each mountain range was characterized in-dividually by utilizing the mountain boundary shapefile inHMA (http://geo.uzh.ch/~tbolch/data/regions_hma_v03.zip,last access: 4 December 2020).
3.3 Yearly lake-area-change calculations
Based on the final generated lake inventory data, we used theslope of a linear regression of the lake area (over the gridcells of 1◦× 1◦) versus mapping year to qualify the yearlychanges in lake area during the study period. The changeanalysis used the Theil–Sen estimator, which chooses themedian slope of all the derived fitted lines and can effec-tively represent long-term area changes due to its robustnessfor trend detection and its insensitivity to outliers. It is alsouseful for the elimination of effects arising from differencesin sensor performance for the mapping of glacial lakes (Sen,1968; Song et al., 2018).
Although all the lakes were manually checked and edited,due to the limitation of available images and other factors,
Earth Syst. Sci. Data, 13, 741–766, 2021 https://doi.org/10.5194/essd-13-741-2021

F. Chen et al.: Annual 30 m dataset for glacial lakes in High Mountain Asia 747
Figure 3. Diagram of the glacial-lake mapping workflow.
the conditions for glacial-lake mapping were not perfectlyconsistent for each year. For example, the image dates werenot consistent across the whole HMA region because of at-mospheric disturbances, and there were also influences fromvarying lake characteristics, image quality (Bhardwaj et al.,2015; Thompson et al., 2012), ice, and shadows that obscuredthe lakes, which all contributed to detection errors in thelake extent and their annual variation. Generally, these er-rors were objective and acceptable as a result of the natureof the limited remote-sensing data. For this study, becausewe used time series data covering a period of 10 years forthe estimation of annual changes in lake area and also be-cause the errors only account for a small proportion of the to-tal glacial-lake area for each year, the errors in the observedlake area caused by these different effects do not appear toaffect the trends in the statistical results. In addition to theTheil–Sen estimator, a Mann–Kendall trend test was used todetect and further confirm the statistical confidence of thelinear regression results, and all the estimated trends werefound to fall within the 90 % confidence intervals. The upperand lower change estimates satisfying the 90 % confidenceinterval for the slope were also derived over the whole HMAregion (Fig. A2).
4 Cross-validation and uncertainty estimates
Accuracy assessment of the mapping results is difficult due tothe lack of field measurements of glacial lakes in continental-scale areas such as HMA. To obtain quality-controlled data,the glacial-lake vectors over the entire HMA for the yearsfrom 2008 to 2017 were rechecked and re-edited individuallythrough dynamic cross-validation by 10 trained experts. Thiswas a time-consuming process but was essential for maxi-mizing the quality of the data.
A key factor influencing the estimation of the uncertaintyin the glacial-lake area measurements is the spatial resolu-tion of the satellite data. In this study, the uncertainty in theglacial-lake area was estimated as an error of ±1 pixel on ei-ther side of the delineated lake boundary. The percentage er-ror in the area determinations, Aer, is then proportional to thesensor resolution and is given by (Krumwiede et al., 2014)
Aer = 100 · (n1/2·m)/Agl, (1)
where n is the number of pixels on the boundary of a glaciallake, as approximated by the ratio of the perimeter length andthe spatial resolution; m is the area of a pixel in the Landsatimage (m2); Agl is the lake area (m2); and the factor 100converts the value to a percentage.
Assuming an uncertainty of 1 pixel for the detectedglacial-lake boundaries, we calculated the systematic errorsfor the whole HMA region, and the results are shown inFig. 4. For the years between 2008 and 2017, the area un-certainty in each glacial lake generally ranged from 0.30 %to 50 %, with the mean value falling around 17 % and thestandard deviation around 11 % (Fig. 4a). The maximum andmean values of area uncertainty for the glacial lakes in 2010were the lowest, while for 2016, the corresponding statisticswere the highest. This can be attributed to a number of differ-ent factors. The maximum in the area uncertainty in glaciallakes is related to the shape and size of a certain lake, as canbe seen from Eq. (1). However, its mean value is equal tothe sum of the area uncertainties in each glacial lake dividedby the total number, which depends on the total number ofglacial lakes in a given year as well as the shape and areaof each lake. Furthermore, a close relationship can be foundbetween the area uncertainties and sizes of the glacial lakes(Fig. 4b). Most of the large glacial lakes (area ≥ 0.04 km2)have a mean area uncertainty of about 7 %. These system-atic errors were more significant for the small-sized glaciallakes. We measured glacial lakes down to 0.0081 km2 (9 pix-els in Landsat imagery), where systematic errors calculatedby Eq. (1) were ∼ 50 %.
5 Results
5.1 Distribution of various types and sizes of glaciallakes
The area coverage of glacial lakes increased by 90.14 km2
in the period 2008–2017, a 6.90 % increase relative to 2008(1305.59±213.99 km2) (Fig. 5a). A Theil–Sen regression fitto all the data showed a mean expansion rate of 12 km2 a−1
for the 10-year record, as shown in Fig. 5a. Meanwhile, theestimated changes in glacial-lake number from 2008 (12 593lakes) to 2017 (15 348 lakes) showed an average increase of306 lakes a−1. The steeper percentage increase in the number
https://doi.org/10.5194/essd-13-741-2021 Earth Syst. Sci. Data, 13, 741–766, 2021

748 F. Chen et al.: Annual 30 m dataset for glacial lakes in High Mountain Asia
Figure 4. (a) Statistics relating to the uncertainty (%) in the measured areas of glacial lakes for the years from 2008 to 2017. (b) Relationshipbetween the area uncertainties and the areas of all the glacial lakes in HMA in 2017.
Figure 5. Numbers and total areas of glacial lakes for different years. (a) Total number and area of glacial lakes for HMA in the period2008–2017. The annual increment is the slope of the trend of annual lake area and number. Altitudinal distribution (100 m bin sizes) of lakenumbers for (b) all glacial lakes, (c) proglacial lakes, and (d) unconnected glacial lakes.
Earth Syst. Sci. Data, 13, 741–766, 2021 https://doi.org/10.5194/essd-13-741-2021

F. Chen et al.: Annual 30 m dataset for glacial lakes in High Mountain Asia 749
of lakes (22.33 %) compared to the slower expansion of theirarea (8.79 %) based on their linear-fit trends shows that manysmall glacial lakes formed over this period. The number oflakes increased most rapidly in areas beyond 4400 m abovesea level (a.s.l.), especially beyond 5300 m (Fig. 5b). Theincrease in proglacial lakes was concentrated above 4900 m(Fig. 5c). Unconnected glacial lakes grew very slightly in to-tal area below 4400 m (Fig. 5d) but increased notably moreat higher elevations. Glaciers are retreating and thinning atever-higher elevations (Nie et al., 2017), causing the for-mation of new supraglacial lakes at high elevations, the ex-pansion of existing ice-contact lakes, and the detachment ofglaciers from some lakes.
Annual changes in glacial lakes were further analyzed spa-tially using a 1◦× 1◦ grid over 22 mountain regions (Fig. 6a)using Theil–Sen regression analysis. An analysis of themountain-wide lake area loss or gain from 2008 to 2017 wasconducted (Table A1). Negative or undiscernible changes inglacial-lake area were observed in the eastern Tien Shan,eastern Hindu Kush, Hengduan Shan, and eastern Tibetanmountains (Fig. 6b), thus reducing the otherwise overall in-creasing glacial-lake area in HMA. The eastern Hindu Kushlost 2.8 km2 of lake area (Table A1), with a negative areachange (−0.43 km2 a−1) near 35◦ N, 73◦ E. Glacial lakes inthe Nyainqêntanglha and the Gangdise Mountains exhibitedarea loss and gain in different regions. In contrast, the centraland eastern Himalaya and central Tien Shan showed rapidincreases in lake area. Between 2008 and 2017, the cen-tral Himalaya’s glacial-lake area increased by 27.09 km2 (Ta-ble A1), exhibiting both a high density of 47 glacial lakes per100 km2 in 2017 (Fig. A3) and rapid growth,+0.94 km2 a−1,in lake area due to retreat and thinning of debris-coveredglaciers (Song et al., 2016). Moderate area gains occurredalong most of the western Kunlun and Tanggula Shan, e.g.,+0.38 km2 a−1 in Tanggula Shan. The areas of glacial lakesin Pamir-Alay, eastern Pamir, and eastern Kunlun Shan werespatially and temporally invariant across the whole observa-tion record.
We found that glacial lakes exhibited different expansiontrends for different lake types, and supraglacial and ice-marginal lakes have relatively few coverage areas compar-ing with proglacial and unconnected lakes (Fig. 6b, c). Inthe Nyainqêntanglha and central Himalaya, around half ofthe glacial-lake area consisted of proglacial lakes, wheremost growth occurred. In the negative-lake-growth (shrink-age) regions of the eastern Tibetan mountains and Heng-duan Shan, unconnected glacial lakes were dominantly oc-cupied. As the interaction with a glacier gradually weak-ens, part of the water source supplied by that glacier is re-duced, and when combined with the effects from atmosphericwarming and a decrease in precipitation, this means that re-gions mainly consisting of unconnected glacial lakes showa trend of decreasing area. Proglacial lakes contributed ap-proximately 62.87 % (56.67 km2) to the total area increaseover HMA (Tables A1 and A2). Proglacial lakes in the cen-
tral Himalaya, eastern Himalaya, and western Himalaya ac-counted for 36.27 % (32.70 km2) of the total area increase.In general, proglacial lakes are the main contributor to recentlake evolution in HMA.
We also noted that the large area growth of lakes occurredin areas with a relatively large proportion of small glaciallakes, and this was mainly due to the rapid growth of ex-isting lakes and the formation of new lakes (Fig. 6d). For ex-ample, in some areas of the central and eastern Himalaya andNyainqêntanglha that have large annual increases in lake area(greater than 0.23 km2 a−1), glacial lakes with a size of lessthan 0.16 km2 occupied more than 30 % of the total area (Ta-ble A3). In particular, in Nyainqêntanglha, the area of smallglacial lakes (≤ 0.16 km2) accounted for 69.47 % of the totalarea.
5.2 Influencing factors of current distribution of glaciallakes
To explore factors that have potentially influenced theglacial-lake distribution across HMA, we focus on proglacialand supraglacial lakes, for which the changes are closelyrelated to glaciers, and expansion is most rapid. Proglaciallakes frequently develop from the enlargement and coales-cence of one or more supraglacial lakes (Thakuri et al., 2016;Umesh et al., 2018). Proglacial- and supraglacial-lake devel-opment from 2008 to 2017 is significantly correlated withinitial lake area in 2008 (R = 0.82; Table A4); larger ice-contact proglacial lakes imply a larger water body in contactwith the calving front of the glacier and more rapid retreat(Truffer and Motyka, 2016; King et al., 2019).
For the years before 2008, the year-round Landsat 5 TMdata in many years do not fully cover the HMA region. Inthis study, we constructed the inventory over a 10-year timeperiod. This is shorter than typical glacier response times,which start from a minimum of 10 years for short, steepglaciers to over 150 years for long, debris-covered glaciers(Scherler et al., 2011). Hence, lake expansion is not expectedto be coupled with short-term climate trends, particularly fordebris-covered glaciers (Umesh et al., 2018). In the inclusionof mass balance forcing of glacial-lake changes, the samequestions about response times also occur. Hence, rather thanfocus on the short-term evolution of lake expansion, we in-vestigated whether the climate and other factors have influ-enced the overall distribution of lake area, as observed in2017.
To investigate the factors influencing the predominance ofproglacial and supraglacial lakes, geomorphic, topographic,and climate parameters were correlated with lake area overa 1◦× 1◦ grid, and these were aggregated (taking the meanor sum) for HMA regions. A statistically significant posi-tive correlation exists between lake area and debris-coveredglacial area (after Scherler et al., 2018) across HMA (R =0.36; Table A4), confirming the predominance of proglacialand supraglacial lakes forming on debris-covered glacier
https://doi.org/10.5194/essd-13-741-2021 Earth Syst. Sci. Data, 13, 741–766, 2021

750 F. Chen et al.: Annual 30 m dataset for glacial lakes in High Mountain Asia
Figure 6. Glacial-lake area changes and area distribution. (a) Geographic coverage of mountain ranges in HMA. (b) Annual rate of changein lake area (2008–2017) on a 1◦× 1◦ grid. The sizes of the circles represent the total glacial-lake area in 2017. (c) Proportional areas of fourtypes of glacial lakes in 2017. (d) Areas of different sizes of glacial lakes in 2017. The terrain basemap is sourced from Esri (© Esri 2013).
tongues (Nie et al., 2017). Correlations and significance lev-els strengthen if the Karakoram is excluded (Table A5). TheKarakoram is known as an anomaly of positive glacier massbalances and glacier advances (Gardelle et al., 2012) and alsohas an anomalously small area of proglacial lakes. Glacierlength (RGI-Consortium, 2017) and debris cover are stronglycorrelated (R = 0.85; Table A4), reflecting abundant debrison most large, low-gradient valley glacier tongues in HMA;in turn, there is a statistically significant direct correlationbetween glacier length and lake area (R = 0.32; Table A4)as these tongues provide the ideal conditions for the coales-cence of supraglacial ponds and formation of large proglaciallakes (Nie et al., 2017; Richardson and Reynolds, 2000).Glaciers are generally longest and most heavily debris-covered in the Hindu Kush Himalaya region (Fig. 7a and b).
Some regions have comparable numbers of large debris-covered glaciers but substantial differences in total lake areaand area growth rates (for example, the central Himalayacompared to central Tian Shan or western Pamir; Table A5).
Regional differences in multi-decadal climate trends couldplay a role in this observation, with Nyainqêntanglha andthe central and eastern Himalayan regions all being charac-terized by rapid warming and decreased precipitation since1979 (Fig. 7c and d), favoring negative glacial mass bal-ances (Brun et al., 2017). This plausibly explains why thelake area is typically larger in these regions relative to ad-jacent regions further to the west and north (e.g., the west-ern Himalaya) despite often similar glacier characteristics (interms of debris cover and glacier length) (Fig. 7e and f). Fur-thermore, there is very little debris-covered area but rapidwarming in the eastern Himalaya, where proglacial lakes areabundant (Fig. 7f). These results emphasize that the distribu-tion of supraglacial and proglacial lakes across HMA is pri-marily associated with the presence of large debris-coveredglaciers, but regional variability in warming and precipita-tion trends over the past few decades has likely also hadsome influence (Shugar and Clague, 2011; Zhao et al., 2019;Umesh et al., 2018; Scherler et al., 2018). These results are
Earth Syst. Sci. Data, 13, 741–766, 2021 https://doi.org/10.5194/essd-13-741-2021

F. Chen et al.: Annual 30 m dataset for glacial lakes in High Mountain Asia 751
consistent with previous findings at regional scales, whichhave demonstrated a rapid expansion of proglacial lakes ondebris-covered glaciers, with expansion in the upstream di-rection demonstrated to occur primarily through a process ofsubsidence at the lake-contact debris-covered glacier tongue(Harrison et al., 2018; Song et al., 2016, 2017a).
6 Discussion
6.1 Comparison with other lake datasets
We compared our dataset with that of X. Wang et al. (2020)for the closest period (2017 from the Hi-MAG database and2018 from X. Wang et al., 2020) over the spatial extent of ourHMA region. The differences in the total number and area oflakes between these two datasets are 6206 and 223.97 km2,respectively. We also found that 2077 glacial lakes with atotal area of 178.77 km2 in our Hi-MAG dataset were notdetected by X. Wang et al. (2020). The main reasons forthe missed glacial lakes in Hi-MAG are the interference ofsome bad observations (cloud or snow), glacial lakes thathave dried up or burst out, and glacial lakes that were locatedin the middle of the river.
To test the spatial correlation of the distributions of theglacial lakes in the two datasets, we compared the numbersof glacial lakes and their areas aggregated on a 0.1◦× 0.1◦
grid for the HMA regions. The results for the total glacial-lake area, areas of glacial lakes larger than 0.04 km2, and thenumber of glacial lakes larger than 0.04 km2 are shown inFig. A4. A clear and strong correlation can be observed forall the statistics between the Hi-MAG dataset and the glacial-lake data of X. Wang et al. (2020). Most of the points aredistributed around the 1 : 1 line, which shows that there isgreat consistency between the two sets of data.
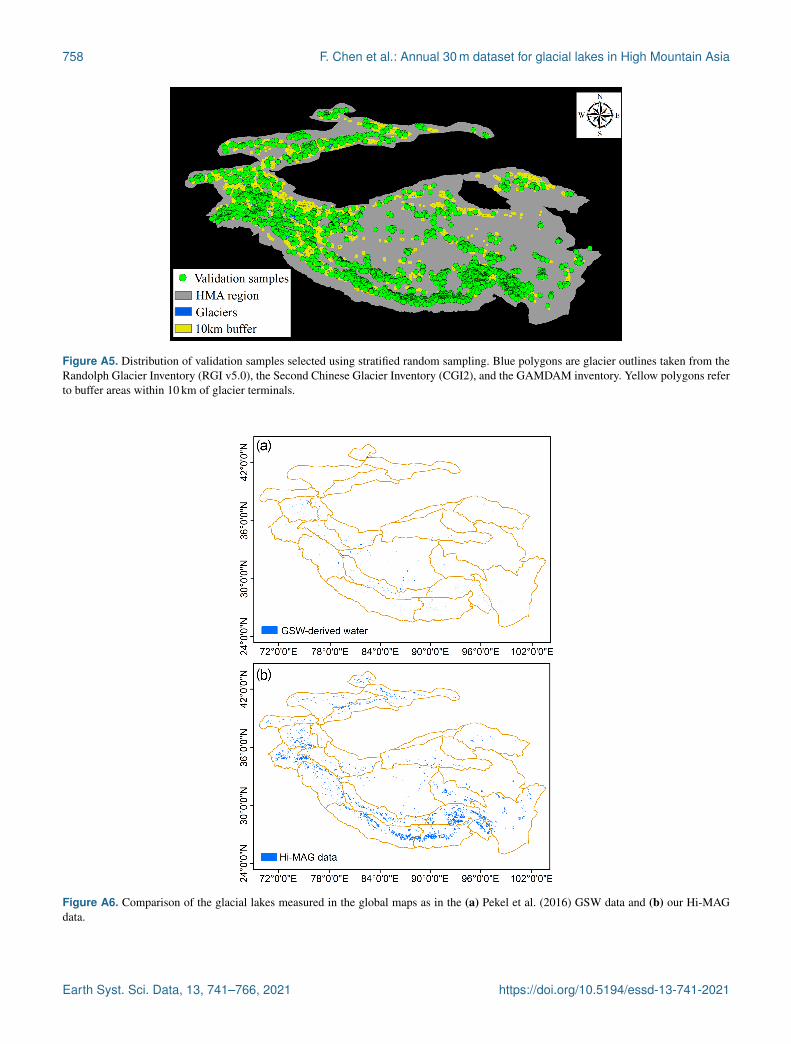
To quantitatively and systematically evaluate the accu-racy of our data, we implemented stratified random sampling(Song et al., 2017b; Stehman, 2012), in which the glaciallakes were divided into four strata. The sample sizes werethe spatial resolution (30 m) of the data, and the strata weredesigned such that C0W0 indicates that both the results arenon-glacial lakes, C0W1 indicates a non-glacial lake in thepresent data and a glacial lake in X. Wang et al.’s (2020)data, C1W0 indicates a glacial lake in the present data anda non-glacial lake in X. Wang et al.’s (2020) data, and C1W1indicates that both results are glacial lakes.
A total of 4000 points were randomly selected, as shownin Fig. A5. The number of samples for C1W1 and C1W0were 1300 and 700, respectively, and these numbers havealmost the same ratio as that between the total areas forthe two strata (1450.50 vs. 732.77 km2). Because of the ap-proximate total area with C1W0, we also randomly selected700 samples from stratum C0W1. The remaining 1300 sam-ples were from C0W0. Every validation sample was visuallyexamined using Landsat imagery and higher-resolution im-agery in Google Earth. Sample pixels were interpreted by a
glacial-lake-mapping expert, and ambiguous samples werecross-validated by a second observer. If a sample was diffi-cult to interpret, it was marked as ambiguous and excludedfrom the accuracy assessment. The sample number estimateswere produced for each of the four strata (Table A6), andthese strata totals were then summed to obtain the total accu-racy.
For the 1300 samples that were considered by bothdatasets to be non-glacial lakes, after the pixel-by-pixel ver-ification, 1215 were found to indeed be non-glacial lakes,while 37 were missed glacial lakes. In contrast, 1260 out ofthe 1300 samples belonged to the class of glacial lakes, and25 were misclassified as glacial lakes by both inventories. Atotal of 307 error pixels were found in the results of X. Wanget al. (2020), constituting about half of the total validationnumber. For the glacial lakes identified only by our inventory,678 out of 700 were correctly classified. Our results yieldedhigh overall classification accuracy (88 %), user’s accuracy(97 %), and producer’s accuracy (82 %) for glacial-lake clas-sification using Landsat data.
The Hi-MAG dataset was also compared with otherLandsat-based lake inventories (Nie et al., 2017; Pekel et al.,2016; Zhang et al., 2015). The number of lakes in Hi-MAGwas found to be 7268 higher, and the area was 644.26 km2
greater than the estimation for the Tibetan Plateau (Zhanget al., 2015). The largest discrepancies were found in theGangdise, Himalaya, and Nyainqêntanglha mountains in2010. Across the Himalaya region, we found 476.09 km2 ofglacial lakes, 4.57 % more than previous estimates in 2015(Nie et al., 2017). In addition, we qualitatively compared thelake extents between the publicly available high-resolutionGlobal Surface Water (GSW) dataset (Pekel et al., 2016) andour Hi-MAG database summed by mountain range in 2015.For the sake of a reliable comparative analysis, lake polygonsin the Hi-MAG dataset were converted into a grid format,and glacial lakes in the GSW were further extracted usingthe range of glacier buffer (10 km). Hi-MAG detected moreglacial lakes in the Himalaya region, eastern Hindu Kush,and Tien Shan and fewer in eastern Pamir and western Kun-lun Shan. Figure A6 illustrates the differences between ourHi-MAG glacial-lake results and the GSW-derived lake areafor the whole HMA region.
The glacial-lake area observed in our lake dataset in theeastern Pamir and western Kunlun Mountains does not con-form to the mapped surface water in the GSW for thesesub-regions. While there are numerous glacial lakes from anopen-water perspective, actually part of them are river seg-ments. Additionally, the Himalaya, eastern Hindu Kush, andsome other Tien Shan areas host thousands of glacial lakesthat are not readily observable in the GSW dataset. Large dis-crepancies in mountainous glacial-lake estimates preclude asignificant consistency between the GSW and our Hi-MAGlake data over the HMA region. The region with the high-est consistency between GSW and Hi-MAG product is in-terior Tibet. There is little agreement for Tien Shan, where
https://doi.org/10.5194/essd-13-741-2021 Earth Syst. Sci. Data, 13, 741–766, 2021

752 F. Chen et al.: Annual 30 m dataset for glacial lakes in High Mountain Asia
Figure 7. Geomorphic and climatic influences on lake distribution. (a) Debris-covered area and (b) glacier length aggregated on a 1◦× 1◦
grid. Linear trends in (c) temperature and (d) precipitation calculated for 1979–2017 from ERA-Interim, including aggregated means overHMA regions. Relationship between total debris-covered area, near-surface temperature warming, and proglacial- and supraglacial-lake areaof 2017 in (e) 1◦× 1◦ grid tiles and (f) HMA regions. Some regions discussed in the text are labeled. The lake coverage is high in areas ofboth rapid warming and high debris cover (e, dashed ellipse). Dot sizes are proportional to lake number. See Table A4 for details on datasources.
Earth Syst. Sci. Data, 13, 741–766, 2021 https://doi.org/10.5194/essd-13-741-2021

F. Chen et al.: Annual 30 m dataset for glacial lakes in High Mountain Asia 753
the weather is rainy and snowy in the region above 3000 m,and large quantities of ancient glacial deposits have accumu-lated. Here, glacial lakes are characterized by small sizes, anddue to the influence of their source glaciers and lake beds aswell as the water depth and sediment inflow, glacial lakes ap-pear to have heterogeneous reflectance in the images. Errorscould exist in datasets produced by automated classification,but, as noted, we also conducted detailed manual editing, sowe were not relying exclusively on automatic classification.The Karakoram region seems to have fewer glacial lakes inour estimate, owing to the overestimation of surface water ondebris-covered glaciers in the GSW dataset.
The low agreement between our Hi-MAG glacial-lake dataand the GSW data is mainly due to their lack of systematicglacial-lake inventory and mapping capabilities. The lake dy-namics and differing climate contexts within HMA may alsolead to inconsistencies between the sub-regions. Hi-MAGmight have made better use of the optimum satellite imag-ing season to map glacial lakes, potentially resulting in morecomplete mapping by avoiding conditions such as periods oflake ice that may confound mapping.
6.2 Known issues and planned improvements
There are several important issues and limitations to thedatasets produced and the methods used within this study thatare important to highlight to potential users. (i) Bodies of wa-ter smaller than 9 connected pixels (e.g., 1×9 or 3×3 pixels,corresponding to 30× 270 m or 90× 90 m, respectively) andthose obscured by frozen water surface or loose moraines orhidden by terrain shadows were not included. Broken float-ing ice or isolated moraines that stood in open water for sometime were mapped. Supraglacial lakes such as melt pondsdeveloped on the surface of glaciers present particular chal-lenges because of their small size and highly dynamic prop-erties. Most supraglacial lakes are transient or seasonal or atleast fluctuate seasonally as they commonly drain and mayrefill. In fact, this short-duration seasonal water is in generalmore likely to be underestimated because of temporal discon-tinuities in the archive and gaps caused by persistent cloudcover. (ii) The spatial and temporal information reported inthe Landsat dataset used in this study complements that ac-quired in the past. Nevertheless, the biggest limitations toglacial-lake mapping from these data are undoubtedly the ge-ographic and temporal discontinuities of the Landsat archiveitself. Historical data over the entire HMA before 2008 canbe recovered partly from the Landsat 4 TM or MultispectralScanner (MSS), Landsat 5 TM, and Landsat 7 ETM+ andpartly from SPOT, other satellite systems, etc., although dataaccess is not always at the full, free, and open level of Land-sat. In this regard, the Advanced Spaceborne Thermal Emis-sion and Reflection Radiometer (ASTER) is freely accessi-ble and has a higher resolution than Landsat, but its temporalcoverage is very limited in most of HMA. Other Landsat-like moderate-resolution multi-spectral sources could also be
used to improve and extend the temporal sampling. For ex-ample, the European Space Agency’s Sentinel 2a satellitelaunched in 2015 and provides optical imagery at 10 m res-olution (N. Wang et al., 2020; Yu et al., 2020), which willbenefit future research combing all available satellite obser-vations with GEE cloud-computing power and would makelong-term monitoring of changes to HMA’s glacial lakes andinland waters possible.
7 Data availability
The Hi-MAG database is distributed under the Cre-ative Commons Attribution 4.0 License. The data canbe downloaded from the data repository Zenodo athttps://doi.org/10.5281/zenodo.4275164 (Chen et al., 2020).
8 Conclusions
In conclusion, the Hi-MAG dataset and others have usedEarth observation satellite data, especially Landsat imagery,to provide a more consistent delineation of large-scaleglacial-lake changes. Some glacial-lake mapping methodshave enabled local-scale area estimation or spatial represen-tation of lake extent and change. Such methods result in rela-tively good performance for lake areas that remain clear andshow homogeneous reflectance in the image but do not allowfor continental-scale mapping of glacial lakes that have spec-tral interference from other objects such as glaciers, snow,clouds, turbidity, and the sedimentation characteristics of theglacial lake itself or the atmospheric interference and ter-rain effects. Automated methods for the extraction of glaciallakes over large-scale areas have been further developed inthis work. However, visual interpretation and manual editingare still effective ways to ensure high accuracy of lake inven-tories and append attributed information for further analysis.Based on an error of ±1 pixel on the lake boundary, the areauncertainty in each glacial lake ranges from 0.30 % to 50 %for the years between 2008 and 2017, and there is a meanarea uncertainty of 17 % in the entire HMA region.
Mapping of glacial lakes across the Tibetan Plateau andadjoining ranges reveals a complex pattern of lake occur-rence and growth or shrinkage. During the past 10 years,2755 glacial lakes with a total area of 90.14 km2 were in-creased in the HMA region. Proglacial lakes contributed62.87 % of that increase. We found that most areas in HMAhave experienced rapid expansions; the central and east-ern Himalaya and central Tien Shan showed the most lakearea increases (up to +0.94 km2 a−1). Negative area changeswere observed in the eastern Tien Shan, eastern Hindu Kush,Hengduan Shan, and eastern Tibetan mountains. The num-ber of lakes grew very rapidly above 4400 m a.s.l., andproglacial-lake growth is proceeding at high elevations ofabove 4900 m, but glacier retreat and lake disconnectionsare also starting to occur at higher elevations, causing the
https://doi.org/10.5194/essd-13-741-2021 Earth Syst. Sci. Data, 13, 741–766, 2021

754 F. Chen et al.: Annual 30 m dataset for glacial lakes in High Mountain Asia
number and area of both classes to increase. At low eleva-tions, few glaciers remain where proglacial lakes can form,and already-detached lakes lack growth mechanisms. Over-all, continued growth of glacial lakes can be expected, par-ticularly where large debris-covered tongues remain.
The freely downloadable, detailed Hi-MAG dataset canalso be used in future studies to provide a sound and consis-tent basis on which to quantify critical relationships and pro-cesses in HMA, including glacier–climate–lake interactions,glacio-hydrologic models, GLOFs and potential downstreamrisks, and water resources.
Earth Syst. Sci. Data, 13, 741–766, 2021 https://doi.org/10.5194/essd-13-741-2021
F. Chen et al.: Annual 30 m dataset for glacial lakes in High Mountain Asia 755
Appendix A
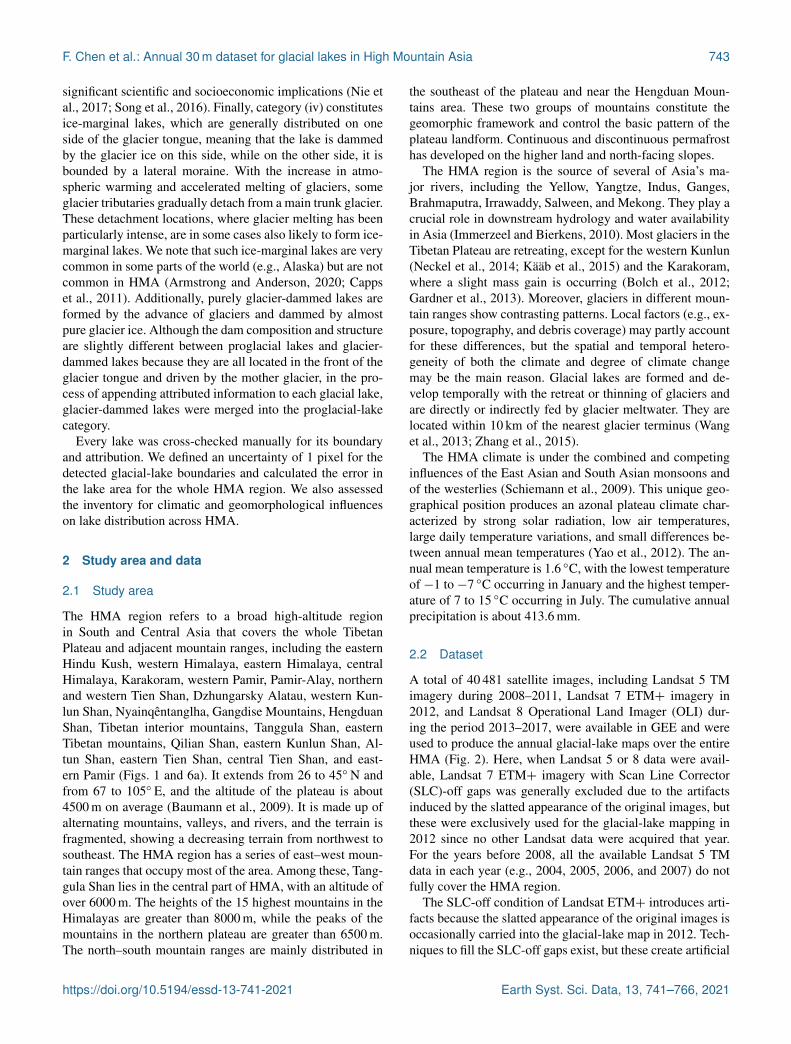
Figure A1. Examples of the various types of glacial lakes found in the HMA region: (a) proglacial lakes, which are connected to theparent glacier and usually impounded by a debris dam (usually a moraine or ice-cored moraine); (b) supraglacial lakes (denoted by the redrectangle), which develop on the glacier surface; (c) unconnected glacial lakes; and (d) ice-marginal lakes that are distributed on the edge of aglacier. Background images were acquired from © Google Earth and were obtained in 2009, 2011, 2012, and 2014, respectively. Glacial-lakeoutlines for each type are shown in blue.
Figure A2. Annual changes in lake area between 2008 and 2017 on a 1◦× 1◦ grid. The (a) upper and (b) lower slopes represent the 90 %confidence interval.
https://doi.org/10.5194/essd-13-741-2021 Earth Syst. Sci. Data, 13, 741–766, 2021

756 F. Chen et al.: Annual 30 m dataset for glacial lakes in High Mountain Asia
Figure A3. Density (number per 100 km2) distribution of glacial lakes in 2017.
Earth Syst. Sci. Data, 13, 741–766, 2021 https://doi.org/10.5194/essd-13-741-2021

F. Chen et al.: Annual 30 m dataset for glacial lakes in High Mountain Asia 757
Figure A4. Comparison of the results of (a) total glacial-lake area, (b) areas of glacial lakes larger than 0.04 km2, and (c) number of glaciallakes larger than 0.04 km2 summed over a 0.1◦× 0.1◦ grid between the Hi-MAG database and the inventory of X. Wang et al. (2020).
https://doi.org/10.5194/essd-13-741-2021 Earth Syst. Sci. Data, 13, 741–766, 2021
758 F. Chen et al.: Annual 30 m dataset for glacial lakes in High Mountain Asia
Figure A5. Distribution of validation samples selected using stratified random sampling. Blue polygons are glacier outlines taken from theRandolph Glacier Inventory (RGI v5.0), the Second Chinese Glacier Inventory (CGI2), and the GAMDAM inventory. Yellow polygons referto buffer areas within 10 km of glacier terminals.
Figure A6. Comparison of the glacial lakes measured in the global maps as in the (a) Pekel et al. (2016) GSW data and (b) our Hi-MAGdata.
Earth Syst. Sci. Data, 13, 741–766, 2021 https://doi.org/10.5194/essd-13-741-2021

F. Chen et al.: Annual 30 m dataset for glacial lakes in High Mountain Asia 759
Tabl
eA
1.M
ount
ain-
wid
egl
acia
l-la
kenu
mbe
rand
area
pery
eara
ndto
tall
oss
orga
infr
om20
08to
2017
.The
unit
ofar
eais
squa
reki
lom
eter
s.
Mou
ntai
nra
nge
2008
2009
2010
2011
2012
2013
2014
2015
2016
2017
Tota
lgai
nor
loss
(200
8–20
17)
No.
Are
aN
o.A
rea
No.
Are
aN
o.A
rea
No.
Are
aN
o.A
rea
No.
Are
aN
o.A
rea
No.
Are
aN
o.A
rea
No.
Are
a
Eas
tern
Hin
duK
ush
1227
73.6
385
661
.40
1113
68.9
110
3667
.94
1015
59.8
012
0667
.90
1179
71.3
011
7266
.36
1260
65.7
713
9970
.83
172
−2.
80W
este
rnH
imal
aya
894
77.6
585
670
.23
756
71.2
574
771
.38
746
68.9
577
976
.00
874
82.7
682
378
.33
999
79.5
110
0587
.96
111
10.3
1E
aste
rnH
imal
aya
1634
164.
1216
6716
3.10
1675
166.
4918
3617
2.87
1859
171.
6719
1017
6.54
1943
174.
9321
5919
0.96
1954
179.
0919
4317
9.80
309
15.6
8C
entr
alH
imal
aya
1312
182.
5416
9717
9.04
1577
188.
3518
4719
5.77
1782
195.
5617
2819
6.72
1850
198.
5220
4920
6.80
2096
206.
4121
8220
9.63
870
27.0
9K
arak
oram
167
18.8
921
416
.78
206
17.9
115
914
.90
152
13.5
518
214
.76
163
15.4
118
217
.02
250
18.2
621
918
.60
52−
0.29
Wes
tern
Pam
ir48
175
.53
486
77.6
452
683
.27
548
80.8
649
579
.17
537
79.3
255
081
.20
557
83.9
657
081
.76
624
75.8
214
30.
29E
aste
rnPa
mir
385.
0645
5.69
485.
8143
4.99
565.
7550
5.43
505.
2649
5.65
585.
6656
5.81
180.
75Pa
mir-
Ala
y12
410
.82
799.
7610
010
.93
132
11.7
912
911
.60
127
11.7
412
811
.66
137
11.7
913
011
.54
131
12.1
07
1.28
Nor
ther
n/w
este
rnTi
enSh
an47
436
.16
358
37.2
049
936
.87
541
41.7
152
236
.04
518
36.9
855
146
.06
530
38.2
851
237
.38
626
40.9
115
24.
75C
entr
alTi
enSh
an30
729
.19
241
29.4
330
532
.65
334
35.4
434
035
.41
335
32.3
633
336
.07
337
35.5
144
135
.97
471
36.6
916
47.
50E
aste
rnTi
enSh
an24
715
.83
230
17.2
424
115
.99
245
15.6
425
115
.75
259
16.1
525
016
.07
297
17.3
124
117
.99
245
18.3
1−
22.
48W
este
rnK
unlu
nSh
an11
240
.27
134
38.3
012
136
.92
119
41.4
111
139
.84
136
37.0
910
837
.62
120
41.6
212
640
.54
132
44.7
120
4.44
Eas
tern
Kun
lun
Shan
180
11.9
219
312
.83
265
20.6
223
716
.46
232
15.7
424
615
.90
244
16.7
229
018
.49
255
17.9
524
816
.90
684.
98G
angd
ise
Mou
ntai
ns85
299
.15
908
96.4
684
810
4.24
886
96.8
896
110
2.48
895
95.7
595
496
.28
991
94.6
410
5396
.37
1116
99.8
326
40.
68H
engd
uan
Shan
909
62.2
510
7764
.70
967
65.3
886
761
.29
927
62.7
510
6466
.53
948
63.8
210
2365
.45
942
62.9
396
163
.35
521.
10Ti
beta
nin
teri
orm
ount
ains
335
52.9
630
844
.76
349
47.5
933
446
.42
318
46.9
433
447
.73
313
46.1
733
548
.12
318
44.7
431
547
.97
−20
−4.
99E
aste
rnTi
beta
nm
ount
ains
5712
.74
8613
.74
8614
.39
107
15.3
884
13.6
510
014
.35
9314
.93
7613
.58
8514
.53
6613
.60
90.
86Ta
nggu
laSh
an46
839
.45
318
40.9
934
444
.28
327
43.2
434
742
.17
363
43.4
037
644
.97
461
45.5
337
245
.94
363
44.9
7−
105
5.52
Qili
anSh
an82
7.96
788.
6791
9.68
779.
2376
9.19
859.
3690
10.3
886
9.90
809.
9967
8.97
−15
1.01
Dzh
unga
rsky
Ala
tau
290
13.8
221
811
.57
233
11.7
527
212
.60
259
12.4
826
912
.68
267
12.9
020
511
.80
240
12.4
426
412
.80
−26
−1.
02N
yain
qênt
angl
ha24
0127
5.33
2647
255.
2326
1427
2.95
2539
273.
2825
9426
6.60
2856
275.
4626
4627
7.70
2977
280.
3526
6029
2.24
2911
285.
6851
010
.35
https://doi.org/10.5194/essd-13-741-2021 Earth Syst. Sci. Data, 13, 741–766, 2021

760 F. Chen et al.: Annual 30 m dataset for glacial lakes in High Mountain Asia
TableA
2.Mountain-w
ideannualglacial-lake
areafrom
2008to
2017forproglaciallakes
andunconnected
lakes.Supraglacialandice-m
arginallakeshave
relativelyfew
coverageareas
andare
notlistedin
thetable.T
heunitofarea
issquare
kilometers.A
bbreviationsare
usedto
representthenam
esofm
ountainranges
tosave
space(eastern
Hindu
Kush
(EH
K),w
esternH
imalaya
(WH
),easternH
imalaya
(EH
),centralH
imalaya
(CH
),Karakoram
(K),w
esternPam
ir(W
P),easternPam
ir(E
P),Pamir-A
lay(PA
),northern/western
TienShan
(N/W
T),
centralTienShan
(CT
),easternTien
Shan(E
T),w
esternK
unlunShan
(WK
),easternK
unlunShan
(EK
),Gangdise
Mountains
(G),H
engduanShan
(H),Tibetan
interiorm
ountains(T
IM),eastern
Tibetanm
ountains(E
TM
),TanggulaShan
(T),Q
ilianShan
(Q),D
zhungarskyA
latau(D
A),N
yainqêntanglha(N
)).
EH
KW
HE
HC
HK
WP
EP
PAN
/WT
CT
ET
WK
EK
GH
TIM
ET
MT
QD
AN
Total
Proglacial lakes
200846.71
34.5891.45
133.0610.99
34.074.56
4.1317.77
14.529.12
5.151.58
24.0111.40
3.590.76
9.733.74
11.19133.29
605.402009
37.9830.03
92.97130.09
10.6034.27
5.302.79
16.3914.07
8.115.69
1.7219.97
12.582.97
1.5410.12
4.719.04
122.95573.90
201041.68
29.7395.11
137.4910.55
35.725.02
3.5718.09
16.709.18
5.735.66
22.2713.55
4.721.68
11.525.25
9.24136.04
618.482011
42.7732.88
100.58143.53
9.7034.82
4.624.04
20.2715.64
8.664.73
3.6920.76
12.143.80
1.7410.63
4.7110.18
136.69626.59
201237.32
31.3099.54
143.029.00
34.875.12
3.9118.58
16.768.83
4.693.66
21.7812.83
3.731.74
10.604.66
10.02133.29
615.252013
41.6730.58
100.97141.25
9.2234.57
4.714.08
18.2816.72
9.204.95
3.5120.56
13.553.99
1.6710.60
4.7410.07
136.58621.47
201443.88
36.1298.12
145.229.96
35.064.71
4.1520.33
17.378.88
5.044.40
21.8812.91
4.381.75
10.685.01
10.21136.95
637.002015
40.4933.88
108.45151.17
10.6837.63
5.034.02
18.9816.26
9.535.08
5.0122.66
13.534.44
1.6211.30
4.679.43
138.12652.00
201640.52
34.20103.31
150.5910.92
36.135.02
3.8318.12
17.638.31
4.674.03
23.2913.03
4.081.74
10.754.73
9.99147.83
652.732017
43.5335.52
103.75152.52
11.3337.60
5.164.03
20.0718.56
8.525.36
4.2123.31
13.594.41
1.6910.49
4.7110.15
143.58662.07
Unconnected lakes
200826.82
41.8670.98
43.826.33
41.240.47
6.7018.38
14.566.69
35.1010.35
74.8350.60
49.0811.98
29.504.23
2.57140.42
686.532009
23.3539.37
69.4145.41
4.8143.00
0.396.98
20.7915.36
9.0732.56
11.0776.41
52.1041.80
12.2130.87
3.972.49
131.63673.04
201027.08
40.6970.78
46.965.64
47.240.80
7.3718.78
15.876.79
31.2014.81
81.9751.83
42.8712.71
32.764.44
2.49136.12
699.222011
25.0037.62
71.6547.79
4.4445.79
0.317.75
21.4219.76
6.9636.65
12.7876.13
49.1642.63
13.6432.59
4.522.34
136.05694.98
201222.41
36.8071.23
47.753.74
44.130.50
7.6917.44
18.486.82
35.1512.04
80.7149.92
43.2211.92
31.534.54
2.37132.53
680.922013
26.1044.59
74.8150.85
4.0944.52
0.597.67
18.6815.55
6.8332.09
12.3475.20
52.9843.75
12.6932.77
4.622.51
138.07701.31
201427.27
45.6975.92
48.654.31
45.850.43
7.5225.69
18.547.08
32.5512.29
74.4050.92
41.7413.19
34.265.38
2.60140.03
714.332015
25.7643.60
81.1150.30
5.7646.08
0.477.76
19.2919.15
7.6636.54
13.4471.98
51.9243.66
11.9634.20
5.232.30
141.40719.59
201625.14
44.3474.76
50.306.06
45.390.49
7.7019.24
17.779.57
35.8113.91
73.0949.91
40.6612.79
35.155.26
2.35143.38
713.112017
27.1951.42
74.9651.59
6.5437.95
0.468.06
20.8117.52
9.6639.34
12.6876.53
49.7643.57
11.9134.45
4.272.56
141.22722.44
Earth Syst. Sci. Data, 13, 741–766, 2021 https://doi.org/10.5194/essd-13-741-2021

F. Chen et al.: Annual 30 m dataset for glacial lakes in High Mountain Asia 761
Table A3. Areas of different sizes of glacial lakes in 2017 for some regions with large area growth rates. The unit of area is square kilometers.
Lake grid ID 69 116 274 71 48 74 72 14 13 39 15(Mountain ranges) (N) (CH) (WH) (N) (H) (N) (N) (EH) (EH) (CH) (EH)
≤ 0.01 km2 0.18 0.28 0.20 0.16 0.22 0.16 0.17 0.23 0.16 0.32 0.330.01–0.02 km2 0.85 1.51 1.29 0.71 1.43 1.08 1.37 1.45 1.45 1.49 2.460.02–0.04 km2 1.69 2.16 2.22 1.79 3.24 2.09 2.29 2.24 2.06 2.72 4.140.04–0.08 km2 1.78 3.19 2.98 2.20 5.30 3.38 4.45 2.77 2.69 3.66 7.160.08–0.16 km2 1.91 5.38 3.87 2.86 4.81 4.03 5.06 3.75 4.33 5.00 13.160.16–0.32 km2 1.81 4.53 2.23 2.76 4.62 5.55 5.81 2.91 3.90 5.66 11.620.32–0.64 km2 1.01 5.37 1.77 1.79 3.88 1.75 3.81 5.72 3.99 7.13 12.370.64–1.28 km2 0.00 2.94 0.00 1.38 2.82 2.96 4.43 0.96 7.10 8.97 7.74≥ 1.28 km2 0.00 7.22 4.19 0.00 11.46 3.17 2.59 6.07 1.40 6.06 12.00Total area (km2) 9.22 32.58 18.76 13.66 37.76 24.17 29.99 26.10 27.09 41.00 70.96Total area (≤ 0.16 km2) 6.41 12.52 10.57 7.72 14.99 10.74 13.35 10.45 10.69 13.18 27.24% of total area (≤ 0.16 km2) 69.47 38.43 56.32 56.56 39.70 44.45 44.52 40.03 39.47 32.15 38.39Annual area increase (km2 a−1) 0.23 0.28 0.28 0.29 0.32 0.41 0.42 0.49 0.70 0.74 0.94
https://doi.org/10.5194/essd-13-741-2021 Earth Syst. Sci. Data, 13, 741–766, 2021

762 F. Chen et al.: Annual 30 m dataset for glacial lakes in High Mountain Asia
TableA
4.Summ
aryofcorrelation
coefficients(R
)forkeylake
topographic,geomorphic,and
climatologicalparam
eters,calculatedw
ithin1◦×
1◦
gridcells
acrossH
MA
.Correlation
coefficientsare
boldw
herep
<0.05;*
indicatesp
<0.01.
Lake
areaL
akearea
Lake
changeG
lacier(gl.)D
ebris-coveredTotalgl.
Mean
gl.M
eangl.
Temperature
change bPrecipitation
change(2008)
(2017)(2008–2017)
area agl.area
lengthslope
elevation1979–2017
1979–2017
Lake
area(2008)
1.00L
akearea
(2017)0.99*
1.00L
akechange
(2008–2017)0.82*
0.87*1.00
Glacier(gl.)area
0.23*0.24*
0.22*1.00
Debris-covered
gl.area0.35*
0.36*0.34*
0.85*1.00
Totalgl.length0.32*
0.32*0.28*
0.90*0.85*
1.00M
eangl.slope
0.070.07
0.050.02
0.180.06
1.00M
eangl.elevation
0.120.14
0.170.11
0.000.05
−0.28*
1.00Tem
peraturechange
1979–2017−
0.09
−0.07
0.10−
0.17
−0.25
∗−
0.27
∗0.00
0.071.00
Precipitationchange
−0.03
−0.01
0.09−
0.13
−0.16
−0.15
−0.18
∗0.15
0.161.00
aG
lacierdataare
derivedfrom
theR
andolphG
lacierInventory(R
GIC
onsortium,2017),exceptfordebris
cover(afterScherleretal.,2018).Clim
atedata
areforE
RA
-Interim.
bE
RA
-Interimnear-surface
temperature
andprecipitation
fieldsforthe
period1979–2017
were
obtainedfrom
theK
oninklijkN
ederlandsM
eteorologischInstituut(K
NM
I)climate
explorer(https://climexp.knm
i.nl,lastaccess:30Septem
ber2020).
Earth Syst. Sci. Data, 13, 741–766, 2021 https://doi.org/10.5194/essd-13-741-2021

F. Chen et al.: Annual 30 m dataset for glacial lakes in High Mountain Asia 763
Table A5. Regional summary of key topographic, geomorphic, and climatological parameters compared to proglacial- and supraglacial-lakearea in 2017. Correlation coefficients are bold where p < 0.05; * indicates p < 0.01.
Region Total area Lake Glacier (gl.) Debris-covered Total gl. Mean gl. Mean gl. Temperature change Precipitation(km2) area area (km2) gl. area (km2) length slope (◦) elevation 1979–2017 change
(km2) (km) (m) (◦C/century) 1979–2017
Central Himalaya 254 886 155.7 8678 1567 10 669 26 5542 2.77 −0.25Central Tien Shan 105 456 19.0 7270 842 7415 27 4181 1.35 0.05Dzhungarsky Alatau 37 542 10.3 521 18 978 24 3615 1.85 0.74Eastern Himalaya 164 785 104.7 2838 357 3614 24 5484 3.26 −0.84Eastern Hindu Kush 95 404 43.6 2938 609 5062 25 4856 0.08 −0.86Eastern Kunlun Shan 256 729 4.2 2995 45 3384 24 5389 3.60 0.06Eastern Pamir 39 605 5.2 2118 291 2364 27 5064 3.42 −0.50Eastern Tibetan mountains 333 123 1.8 312 12 483 24 5345 3.55 0.73Eastern Tien Shan 140 900 8.7 2332 193 3977 28 3974 2.65 0.17Gangdise Mountains 154 884 23.2 1271 80 2570 24 5892 2.42 0.33Hengduan Shan 372 649 13.6 1281 212 2048 23 5278 2.24 −0.13Karakoram 83 644 11.7 21 474 2013 16 460 31 5399 2.37 −0.35Northern/western Tien Shan 187 275 20.1 2262 223 4138 23 3943 3.22 −0.36Nyainqêntanglha 172 746 144.6 7047 1011 8710 25 5282 2.37 −1.00Pamir-Alay 71 845 4.0 1847 319 3441 25 4109 3.88 −0.27Qilian Shan 201 699 4.7 1598 30 2588 26 4847 4.07 0.51Tanggula Shan 145 064 10.6 1841 84 1893 21 5521 3.34 0.46Tibetan interior mountains 526 111 4.4 3815 59 4179 23 5927 2.64 0.31Western Himalaya 189 494 36.3 7986 1149 11 974 24 5180 1.93 −1.24Western Kunlun Shan 123 388 5.3 8457 159 8108 26 5642 3.22 −0.55Western Pamir 109 239 37.9 8417 1118 11 640 27 4844 1.61 0.08
Lake area: correlation coefficient (R) 0.21 0.50 0.36 0.01 0.23 −0.17 −0.49Excl. Karakoram 0.49 0.72* 0.52 0.10 0.25 −0.18 −0.50
Table A6. Statistical results of stratified random sampling.
Stratum Total pixel Total area No. of No. of non-glacial- No. of glacial- No. of ambiguousnumber (km2) samples lake samples lake samples samples
C0W0 2 022 448 650 1 820 203.78 1300 1215 37 48C0W1 925 449 832.90 700 307 362 31C1W0 814 196 732.77 700 21 678 1C1W1 1 611 668 1450.50 1300 25 1260 15
https://doi.org/10.5194/essd-13-741-2021 Earth Syst. Sci. Data, 13, 741–766, 2021

764 F. Chen et al.: Annual 30 m dataset for glacial lakes in High Mountain Asia
Author contributions. FC designed the study, performed analy-sis, and wrote the manuscript. MZ developed the methodology, con-ducted the lake evolution analysis, and wrote the manuscript. HGprovided the funding support and supervision. SA performed theclimate and debris-cover analysis. JSK, UKH, and CSW discussedand drew conclusions. All authors contributed to the final form ofthe paper.
Competing interests. The authors declare that they have no con-flict of interest.
Acknowledgements. We thank Tobias Bolch and Dan H. Shugarfor their contributions to this project in its stages of developmentand Li Wang, Shiguang Xu, Zhengyang Lin, Hang Zhao, Yuan-huizi He, Tianchan Shan, Ning Wang, Zhenzhen Yin, and Jinx-iao Wang for the cross-validations of the data that were so integralto this project.
Financial support. This work was supported by the Strategic Pri-ority Research Program of the Chinese Academy of Sciences (grantno. XDA19030101), the International Partnership Program of theChinese Academy of Sciences (grant nos. 131211KYSB20170046and 131C11KYSB20160061), and the National Natural ScienceFoundation of China (grant no. 41871345). Simon Allen was sup-ported by the EVOGLAC project under the Swiss National ScienceFoundation (grant no. IZLCZ2_169979/1).
Review statement. This paper was edited by Birgit Heim and re-viewed by two anonymous referees.
References
Aggarwal, S., Rai, S. C., Thakur, P. K., and Emmer, A.: In-ventory and recently increasing GLOF susceptibility of glaciallakes in Sikkim, Eastern Himalaya, Geomorphology, 295, 39–54,https://doi.org/10.1016/j.geomorph.2017.06.014, 2017.
Armstrong, W. H. and Anderson, R. S.: Ice-marginallake hydrology and the seasonal dynamical evolutionof Kennicott Glacier, Alaska, J. Glaciol., 66, 1–15,https://doi.org/10.1017/jog.2020.41, 2020.
Ashraf, A., Naz, R., and Roohi, R.: Glacial lake out-burst flood hazards in Hindukush, Karakoram and Hi-malayan Ranges of Pakistan: implications and riskanalysis, Geomatics, Nat. Hazard. Risk, 3, 113–132,https://doi.org/10.1080/19475705.2011.615344, 2012.
Baumann, F., Jinsheng, H. E., Karsten, S., Peter, K., and Thomas,S.: Pedogenesis, permafrost, and soil moisture as control-ling factors for soil nitrogen and carbon contents acrossthe Tibetan Plateau, Glob. Change Biol., 15, 3001–3017,https://doi.org/10.1111/j.1365-2486.2009.01953.x, 2009.
Bhardwaj, A., Singh, M. K., Joshi, P. K., Snehmani Singh, S.,Sam, L., Gupta, R. D., and Kumar, R.: A lake detection al-gorithm (LDA) using Landsat 8 data: A comparative approach
in glacial environment, Int. J. Appl. Earth Obs., 38, 150–163,https://doi.org/10.1016/j.jag.2015.01.004, 2015.
Bolch, T., Kulkarni, A., Kääb, A., Huggel, C., Paul, F., Cogley,J. G., Frey, H., Kargel, J. S., Fujita, K., and Scheel, M.: Thestate and fate of Himalayan glaciers, Science, 336, 310–314,https://doi.org/10.1126/science.1215828, 2012.
Brun, F., Berthier, E., Wagnon, P., Kääb, A., and Treichler, D.:A spatially resolved estimate of High Mountain Asia glaciermass balances from 2000 to 2016, Nat. Geosci., 10, 668–673,https://doi.org/10.1038/NGEO2999, 2017.
Capps, D. M., Wiles, G. C., Clague, J. J., and Luckman, B. H.: Tree-ring dating of the nineteenth-century advance of Brady Glacierand the evolution of two ice-marginal lakes, Alaska, Holocene,21, 641–649, https://doi.org/10.1177/0959683610391315, 2011.
Chen, F., Zhang, M., Tian, B., and Li, Z.: Extraction of glaciallake outlines in Tibet Plateau using Landsat 8 imagery andGoogle Earth Engine, IEEE J. Sel. Top. Appl., 10, 4002–4009,https://doi.org/10.1109/JSTARS.2017.2705718, 2017.
Chen, F., Zhang, M., Guo, H., Allen, S., Kargel, J., Haritashya,U., and Watson, S.: Annual 30-meter Dataset for Glacial Lakesin High Mountain Asia from 2008 to 2017 (Hi-MAG), Zenodo,https://doi.org/10.5281/zenodo.4275164, 2020.
Chen, J., Zhu, X., Vogelmann, J. E., Gao, F., and Jin, S.: A sim-ple and effective method for filling gaps in Landsat ETM+SLC-off images, Remote Sens. Environ., 115, 1053–1064,https://doi.org/10.1016/j.rse.2010.12.010, 2011.
Gardelle, J., Berthier, E., and Arnaud, Y.: Slight mass gainof Karakoram glaciers in the early twenty-first century, Nat.Geosci., 5, 322–325, https://doi.org/10.1038/ngeo1450, 2012.
Gardelle, J., Berthier, E., Arnaud, Y., and Kääb, A.: Region-wide glacier mass balances over the Pamir-Karakoram-Himalaya during 1999–2011, The Cryosphere, 7, 1263–1286,https://doi.org/10.5194/tc-7-1263-2013, 2013.
Gardner, A. S., Moholdt, G., Cogley, J. G., Wouters, B., Arendt,A. A., Wahr, J., Berthier, E., Hock, R., Pfeffer, W. T.,and Kaser, G.: A reconciled estimate of glacier contribu-tions to sea level rise: 2003 to 2009, Science, 340, 852,https://doi.org/10.1126/science.1234532, 2013.
Harrison, S., Kargel, J. S., Huggel, C., Reynolds, J., Shugar, D. H.,Betts, R. A., Emmer, A., Glasser, N., Haritashya, U. K., Klimeš,J., Reinhardt, L., Schaub, Y., Wiltshire, A., Regmi, D., andVilímek, V.: Climate change and the global pattern of moraine-dammed glacial lake outburst floods, The Cryosphere, 12, 1195–1209, https://doi.org/10.5194/tc-12-1195-2018, 2018.
Immerzeel, W. W. and Bierkens, M. F. P.: Seasonal prediction ofmonsoon rainfall in three Asian river basins: the importance ofsnow cover on the Tibetan Plateau, Int. J. Climatol., 30, 1835–1842, https://doi.org/10.1002/joc.2033, 2010.
Kääb, A., Treichler, D., Nuth, C., and Berthier, E.: Brief Communi-cation: Contending estimates of 2003–2008 glacier mass balanceover the Pamir–Karakoram–Himalaya, The Cryosphere, 9, 557–564, https://doi.org/10.5194/tc-9-557-2015, 2015.
King, O., Bhattacharya, A., Bhambri, R., and Bolch, T.: Glaciallakes exacerbate Himalayan glacier mass loss, Sci. Rep., 9,18145, https://doi.org/10.1038/s41598-019-53733-x, 2019.
Krumwiede, B. S., Kamp, U., Leonard, G. J., Kargel, J. S., Dasht-seren, A., and Walther, M.: Recent glacier changes in the Mongo-lian Altai Mountains: Case studies from Munkh Khairkhan andTavan Bogd, edited by: Kargel, J. S., Leonard, G. J., Bishop, M.
Earth Syst. Sci. Data, 13, 741–766, 2021 https://doi.org/10.5194/essd-13-741-2021
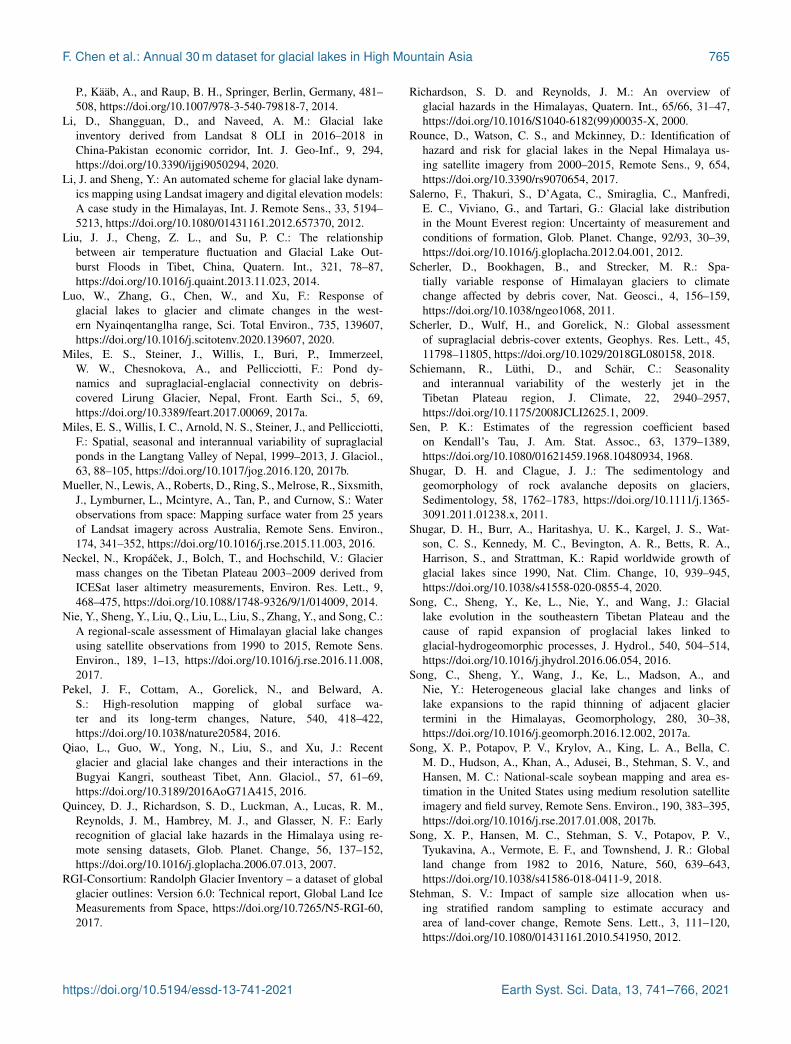
F. Chen et al.: Annual 30 m dataset for glacial lakes in High Mountain Asia 765
P., Kääb, A., and Raup, B. H., Springer, Berlin, Germany, 481–508, https://doi.org/10.1007/978-3-540-79818-7, 2014.
Li, D., Shangguan, D., and Naveed, A. M.: Glacial lakeinventory derived from Landsat 8 OLI in 2016–2018 inChina-Pakistan economic corridor, Int. J. Geo-Inf., 9, 294,https://doi.org/10.3390/ijgi9050294, 2020.
Li, J. and Sheng, Y.: An automated scheme for glacial lake dynam-ics mapping using Landsat imagery and digital elevation models:A case study in the Himalayas, Int. J. Remote Sens., 33, 5194–5213, https://doi.org/10.1080/01431161.2012.657370, 2012.
Liu, J. J., Cheng, Z. L., and Su, P. C.: The relationshipbetween air temperature fluctuation and Glacial Lake Out-burst Floods in Tibet, China, Quatern. Int., 321, 78–87,https://doi.org/10.1016/j.quaint.2013.11.023, 2014.
Luo, W., Zhang, G., Chen, W., and Xu, F.: Response ofglacial lakes to glacier and climate changes in the west-ern Nyainqentanglha range, Sci. Total Environ., 735, 139607,https://doi.org/10.1016/j.scitotenv.2020.139607, 2020.
Miles, E. S., Steiner, J., Willis, I., Buri, P., Immerzeel,W. W., Chesnokova, A., and Pellicciotti, F.: Pond dy-namics and supraglacial-englacial connectivity on debris-covered Lirung Glacier, Nepal, Front. Earth Sci., 5, 69,https://doi.org/10.3389/feart.2017.00069, 2017a.
Miles, E. S., Willis, I. C., Arnold, N. S., Steiner, J., and Pellicciotti,F.: Spatial, seasonal and interannual variability of supraglacialponds in the Langtang Valley of Nepal, 1999–2013, J. Glaciol.,63, 88–105, https://doi.org/10.1017/jog.2016.120, 2017b.
Mueller, N., Lewis, A., Roberts, D., Ring, S., Melrose, R., Sixsmith,J., Lymburner, L., Mcintyre, A., Tan, P., and Curnow, S.: Waterobservations from space: Mapping surface water from 25 yearsof Landsat imagery across Australia, Remote Sens. Environ.,174, 341–352, https://doi.org/10.1016/j.rse.2015.11.003, 2016.
Neckel, N., Kropácek, J., Bolch, T., and Hochschild, V.: Glaciermass changes on the Tibetan Plateau 2003–2009 derived fromICESat laser altimetry measurements, Environ. Res. Lett., 9,468–475, https://doi.org/10.1088/1748-9326/9/1/014009, 2014.
Nie, Y., Sheng, Y., Liu, Q., Liu, L., Liu, S., Zhang, Y., and Song, C.:A regional-scale assessment of Himalayan glacial lake changesusing satellite observations from 1990 to 2015, Remote Sens.Environ., 189, 1–13, https://doi.org/10.1016/j.rse.2016.11.008,2017.
Pekel, J. F., Cottam, A., Gorelick, N., and Belward, A.S.: High-resolution mapping of global surface wa-ter and its long-term changes, Nature, 540, 418–422,https://doi.org/10.1038/nature20584, 2016.
Qiao, L., Guo, W., Yong, N., Liu, S., and Xu, J.: Recentglacier and glacial lake changes and their interactions in theBugyai Kangri, southeast Tibet, Ann. Glaciol., 57, 61–69,https://doi.org/10.3189/2016AoG71A415, 2016.
Quincey, D. J., Richardson, S. D., Luckman, A., Lucas, R. M.,Reynolds, J. M., Hambrey, M. J., and Glasser, N. F.: Earlyrecognition of glacial lake hazards in the Himalaya using re-mote sensing datasets, Glob. Planet. Change, 56, 137–152,https://doi.org/10.1016/j.gloplacha.2006.07.013, 2007.
RGI-Consortium: Randolph Glacier Inventory – a dataset of globalglacier outlines: Version 6.0: Technical report, Global Land IceMeasurements from Space, https://doi.org/10.7265/N5-RGI-60,2017.
Richardson, S. D. and Reynolds, J. M.: An overview ofglacial hazards in the Himalayas, Quatern. Int., 65/66, 31–47,https://doi.org/10.1016/S1040-6182(99)00035-X, 2000.
Rounce, D., Watson, C. S., and Mckinney, D.: Identification ofhazard and risk for glacial lakes in the Nepal Himalaya us-ing satellite imagery from 2000–2015, Remote Sens., 9, 654,https://doi.org/10.3390/rs9070654, 2017.
Salerno, F., Thakuri, S., D’Agata, C., Smiraglia, C., Manfredi,E. C., Viviano, G., and Tartari, G.: Glacial lake distributionin the Mount Everest region: Uncertainty of measurement andconditions of formation, Glob. Planet. Change, 92/93, 30–39,https://doi.org/10.1016/j.gloplacha.2012.04.001, 2012.
Scherler, D., Bookhagen, B., and Strecker, M. R.: Spa-tially variable response of Himalayan glaciers to climatechange affected by debris cover, Nat. Geosci., 4, 156–159,https://doi.org/10.1038/ngeo1068, 2011.
Scherler, D., Wulf, H., and Gorelick, N.: Global assessmentof supraglacial debris-cover extents, Geophys. Res. Lett., 45,11798–11805, https://doi.org/10.1029/2018GL080158, 2018.
Schiemann, R., Lüthi, D., and Schär, C.: Seasonalityand interannual variability of the westerly jet in theTibetan Plateau region, J. Climate, 22, 2940–2957,https://doi.org/10.1175/2008JCLI2625.1, 2009.
Sen, P. K.: Estimates of the regression coefficient basedon Kendall’s Tau, J. Am. Stat. Assoc., 63, 1379–1389,https://doi.org/10.1080/01621459.1968.10480934, 1968.
Shugar, D. H. and Clague, J. J.: The sedimentology andgeomorphology of rock avalanche deposits on glaciers,Sedimentology, 58, 1762–1783, https://doi.org/10.1111/j.1365-3091.2011.01238.x, 2011.
Shugar, D. H., Burr, A., Haritashya, U. K., Kargel, J. S., Wat-son, C. S., Kennedy, M. C., Bevington, A. R., Betts, R. A.,Harrison, S., and Strattman, K.: Rapid worldwide growth ofglacial lakes since 1990, Nat. Clim. Change, 10, 939–945,https://doi.org/10.1038/s41558-020-0855-4, 2020.
Song, C., Sheng, Y., Ke, L., Nie, Y., and Wang, J.: Glaciallake evolution in the southeastern Tibetan Plateau and thecause of rapid expansion of proglacial lakes linked toglacial-hydrogeomorphic processes, J. Hydrol., 540, 504–514,https://doi.org/10.1016/j.jhydrol.2016.06.054, 2016.
Song, C., Sheng, Y., Wang, J., Ke, L., Madson, A., andNie, Y.: Heterogeneous glacial lake changes and links oflake expansions to the rapid thinning of adjacent glaciertermini in the Himalayas, Geomorphology, 280, 30–38,https://doi.org/10.1016/j.geomorph.2016.12.002, 2017a.
Song, X. P., Potapov, P. V., Krylov, A., King, L. A., Bella, C.M. D., Hudson, A., Khan, A., Adusei, B., Stehman, S. V., andHansen, M. C.: National-scale soybean mapping and area es-timation in the United States using medium resolution satelliteimagery and field survey, Remote Sens. Environ., 190, 383–395,https://doi.org/10.1016/j.rse.2017.01.008, 2017b.
Song, X. P., Hansen, M. C., Stehman, S. V., Potapov, P. V.,Tyukavina, A., Vermote, E. F., and Townshend, J. R.: Globalland change from 1982 to 2016, Nature, 560, 639–643,https://doi.org/10.1038/s41586-018-0411-9, 2018.
Stehman, S. V.: Impact of sample size allocation when us-ing stratified random sampling to estimate accuracy andarea of land-cover change, Remote Sens. Lett., 3, 111–120,https://doi.org/10.1080/01431161.2010.541950, 2012.
https://doi.org/10.5194/essd-13-741-2021 Earth Syst. Sci. Data, 13, 741–766, 2021

766 F. Chen et al.: Annual 30 m dataset for glacial lakes in High Mountain Asia
Sudan, B. M., Pradeep, K. M., Wu, L., Gao, X., Finu, S., Rajen-dra, B. S., Narendra, R. K., Samjwal, R. B., Sharad, J., Sonika,S., and Prasant, B.: The status of glacial lakes in the HinduKush Himalaya-ICIMOD Research Report 2018/1, InternationalCentre for Integrated Mountain Development (ICIMOD), Kath-mandu, Nepal, 82 pp., 2018.
Thakuri, S., Salerno, F., Bolch, T., Guyennon, N., and Tartari,G.: Factors controlling the accelerated expansion of Imja Lake,Mount Everest region, Nepal, Ann. Glaciol., 57, 245–257,https://doi.org/10.3189/2016AoG71A063, 2016.
Thompson, S. S., Benn, D. I., Dennis, K., and Luckman,A.: A rapidly growing moraine-dammed glacial lake onNgozumpa Glacier, Nepal, Geomorphology, 145, 1–11,https://doi.org/10.1016/j.geomorph.2011.08.015, 2012.
Truffer, M. and Motyka, R. J.: Where glaciers meet water: Subaque-ous melt and its relevance to glaciers in various settings, Rev.Geophys., 54, 220–239, https://doi.org/10.1002/2015RG000494,2016.
Ukita, J., Narama, C., Tadono, T., Yamanokuchi, T., Tomiyama,N., Kawamoto, S., Abe, C., Uda, T., Yabuki, H., and Fu-jita, K.: Glacial lake inventory of Bhutan using ALOS data:methods and preliminary results, Ann. Glaciol., 52, 65–71,https://doi.org/10.3189/172756411797252293, 2011.
Umesh, H., Jeffrey, K., Dan, S., Gregory, L., Katherine, S., Watson,C., David, S., Stephan, H., Kyle, M., and Dhananjay, R.: Evolu-tion and controls of large glacial lakes in the Nepal Himalaya,Remote Sens., 10, 798, https://doi.org/10.3390/rs10050798,2018.
Wang, N., Chen, F., Yu, B., and Qin, Y.: Segmentationof large-scale remotely sensed images on a Spark plat-form: A strategy for handling massive image tiles with theMapReduce model, ISPRS J. Photogramm., 162, 137–147,https://doi.org/10.1016/j.isprsjprs.2020.02.012, 2020.
Wang, X., Ding, Y., Liu, S., Jiang, L., Wu, K., Jiang, Z., and Guo,W.: Changes of glacial lakes and implications in Tian Shan,central Asia, based on remote sensing data from 1990 to 2010,Environ. Res. Lett., 8, 575–591, https://doi.org/10.1088/1748-9326/8/4/044052, 2013.
Wang, X., Guo, X., Yang, C., Liu, Q., Wei, J., Zhang, Y.,Liu, S., Zhang, Y., Jiang, Z., and Tang, Z.: Glacial lake in-ventory of high-mountain Asia in 1990 and 2018 derivedfrom Landsat images, Earth Syst. Sci. Data, 12, 2169–2182,https://doi.org/10.5194/essd-12-2169-2020, 2020.
Xu, H.: Modification of normalised difference water in-dex (NDWI) to enhance open water features in remotelysensed imagery, Int. J. Remote Sens., 27, 3025–3033,https://doi.org/10.1080/01431160600589179, 2006.
Yao, T., Thompson, L., Yang, W., Yu, W., Yang, G., Guo,X., Yang, X., Duan, K., Zhao, H., and Xu, B.: Differ-ent glacier status with atmospheric circulations in TibetanPlateau and surroundings, Nat. Clim. Change, 2, 663–667,https://doi.org/10.1038/nclimate1580, 2012.
Yu, B., Chen, F., and Xu, C.: Landslide detection based oncontour-based deep learning framework in case of nationalscale of Nepal in 2015, Comput. Geosci., 135, 104388,https://doi.org/10.1016/j.cageo.2019.104388, 2020.
Zhang, G., Yao, T., Xie, H., Wang, W., and Yang, W.: An inventoryof glacial lakes in the Third Pole region and their changes inresponse to global warming, Glob. Planet. Change, 131, 148–157, https://doi.org/10.1016/j.gloplacha.2015.05.013, 2015.
Zhang, M., Chen, F., Tian, B., Liang, D., and Yang, A.: High-frequency glacial lake mapping using time series of sentinel-1A/1B SAR imagery: An assessment for the southeastern Ti-betan Plateau, Int. J. Environ. Res. Publ. Health, 17, 1072,https://doi.org/10.3390/ijerph17031072, 2020.
Zhao, B., Wang, Y., Luo, Y., Liang, R., Li, J., and Xie, L.:Large landslides at the northeastern margin of the Bayan HarBlock, Tibetan Plateau, China, Roy. Soc. Open Sci., 6, 180844,https://doi.org/10.1098/rsos.180844, 2019.
Zhao, H., Chen, F., and Zhang, M.: A systematic extractionapproach for mapping glacial lakes in High Mountain re-gions of Asia, IEEE J. Sel. Top. Appl., 11, 2788–2799,https://doi.org/10.1109/JSTARS.2018.2846551, 2018.
Zhu, Z. and Woodcock, C. E.: Object-based cloud and cloud shadowdetection in Landsat imagery, Remote Sens. Environ., 118, 83–94, https://doi.org/10.1016/j.rse.2011.10.028, 2012.
Earth Syst. Sci. Data, 13, 741–766, 2021 https://doi.org/10.5194/essd-13-741-2021