Annexure 3 Main and Supporting budget tables
64
Annexure 3 Main and Supporting budget tables – Prior Year outcomes 2013/2014 – 2015/2016 Medium Term Revenue and Expenditure Framework (MTREF)
-
Upload
khangminh22 -
Category
Documents
-
view
0 -
download
0
Transcript of Annexure 3 Main and Supporting budget tables
Annexure 3
Main and Supporting budget
tables – Prior Year outcomes
2013/2014 – 2015/2016
Medium Term
Revenue and Expenditure
Framework (MTREF)
Description 2013/14 2014/15 2015/16
R thousandsAudited
Outcome
Audited
Outcome
Audited
Outcome
Original
Budget
Adjusted
Budget
Full Year
Forecast
Pre-audit
outcome
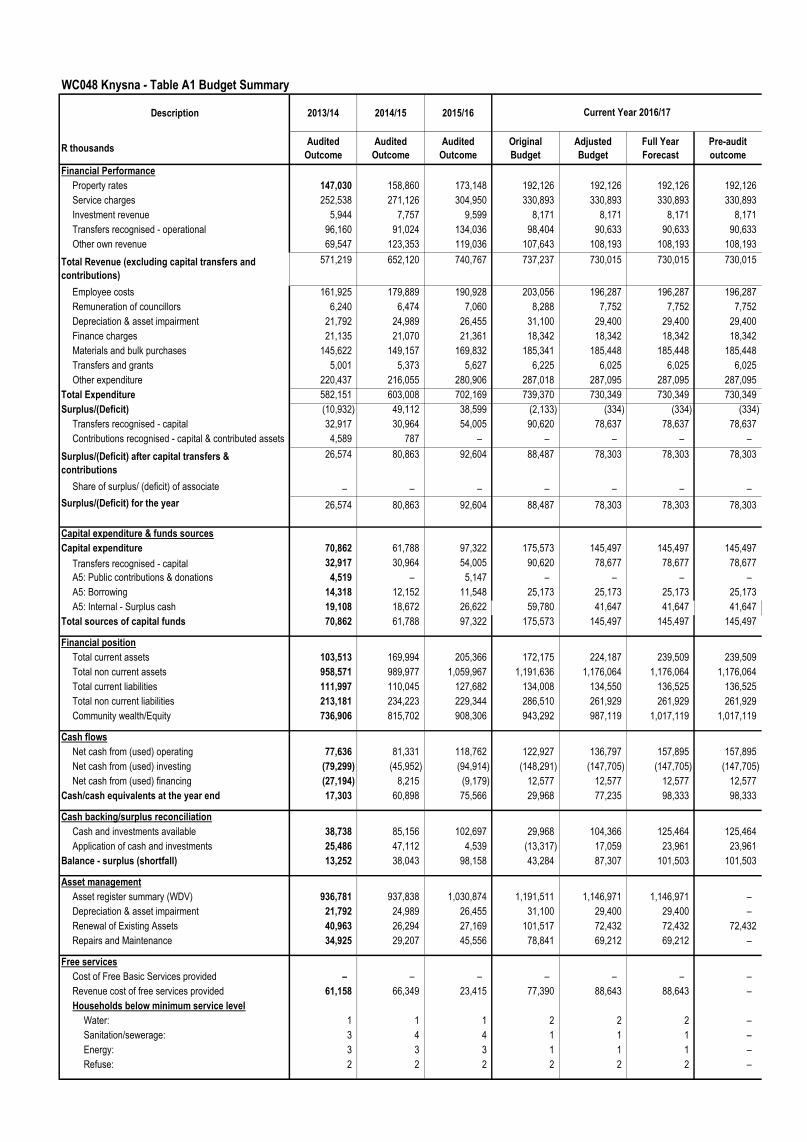
Financial Performance
Property rates 147,030 158,860 173,148 192,126 192,126 192,126 192,126
Service charges 252,538 271,126 304,950 330,893 330,893 330,893 330,893
Investment revenue 5,944 7,757 9,599 8,171 8,171 8,171 8,171
Transfers recognised - operational 96,160 91,024 134,036 98,404 90,633 90,633 90,633
Other own revenue 69,547 123,353 119,036 107,643 108,193 108,193 108,193
Total Revenue (excluding capital transfers and
contributions)
571,219 652,120 740,767 737,237 730,015 730,015 730,015
Employee costs 161,925 179,889 190,928 203,056 196,287 196,287 196,287
Remuneration of councillors 6,240 6,474 7,060 8,288 7,752 7,752 7,752
Depreciation & asset impairment 21,792 24,989 26,455 31,100 29,400 29,400 29,400
Finance charges 21,135 21,070 21,361 18,342 18,342 18,342 18,342
Materials and bulk purchases 145,622 149,157 169,832 185,341 185,448 185,448 185,448
Transfers and grants 5,001 5,373 5,627 6,225 6,025 6,025 6,025
Other expenditure 220,437 216,055 280,906 287,018 287,095 287,095 287,095
Total Expenditure 582,151 603,008 702,169 739,370 730,349 730,349 730,349
Surplus/(Deficit) (10,932) 49,112 38,599 (2,133) (334) (334) (334)
Transfers recognised - capital 32,917 30,964 54,005 90,620 78,637 78,637 78,637
Contributions recognised - capital & contributed assets 4,589 787 – – – – –
Surplus/(Deficit) after capital transfers &
contributions
26,574 80,863 92,604 88,487 78,303 78,303 78,303
Share of surplus/ (deficit) of associate – – – – – – –
Surplus/(Deficit) for the year 26,574 80,863 92,604 88,487 78,303 78,303 78,303
Capital expenditure & funds sources
Capital expenditure 70,862 61,788 97,322 175,573 145,497 145,497 145,497
Transfers recognised - capital 32,917 30,964 54,005 90,620 78,677 78,677 78,677
A5: Public contributions & donations 4,519 – 5,147 – – – –
A5: Borrowing 14,318 12,152 11,548 25,173 25,173 25,173 25,173
A5: Internal - Surplus cash 19,108 18,672 26,622 59,780 41,647 41,647 41,647
Total sources of capital funds 70,862 61,788 97,322 175,573 145,497 145,497 145,497
Financial position
Total current assets 103,513 169,994 205,366 172,175 224,187 239,509 239,509
Total non current assets 958,571 989,977 1,059,967 1,191,636 1,176,064 1,176,064 1,176,064
Total current liabilities 111,997 110,045 127,682 134,008 134,550 136,525 136,525
Total non current liabilities 213,181 234,223 229,344 286,510 261,929 261,929 261,929
Community wealth/Equity 736,906 815,702 908,306 943,292 987,119 1,017,119 1,017,119
Cash flows
Net cash from (used) operating 77,636 81,331 118,762 122,927 136,797 157,895 157,895
Net cash from (used) investing (79,299) (45,952) (94,914) (148,291) (147,705) (147,705) (147,705)
Net cash from (used) financing (27,194) 8,215 (9,179) 12,577 12,577 12,577 12,577
Cash/cash equivalents at the year end 17,303 60,898 75,566 29,968 77,235 98,333 98,333
Cash backing/surplus reconciliation
Cash and investments available 38,738 85,156 102,697 29,968 104,366 125,464 125,464
Application of cash and investments 25,486 47,112 4,539 (13,317) 17,059 23,961 23,961
Balance - surplus (shortfall) 13,252 38,043 98,158 43,284 87,307 101,503 101,503
Asset management
Asset register summary (WDV) 936,781 937,838 1,030,874 1,191,511 1,146,971 1,146,971 –
Depreciation & asset impairment 21,792 24,989 26,455 31,100 29,400 29,400 –
Renewal of Existing Assets 40,963 26,294 27,169 101,517 72,432 72,432 72,432
Repairs and Maintenance 34,925 29,207 45,556 78,841 69,212 69,212 –
Free services
Cost of Free Basic Services provided – – – – – – –
Revenue cost of free services provided 61,158 66,349 23,415 77,390 88,643 88,643 –
Households below minimum service level
Water: 1 1 1 2 2 2 –
Sanitation/sewerage: 3 4 4 1 1 1 –
Energy: 3 3 3 1 1 1 –
Refuse: 2 2 2 2 2 2 –
Current Year 2016/17
WC048 Knysna - Table A1 Budget Summary
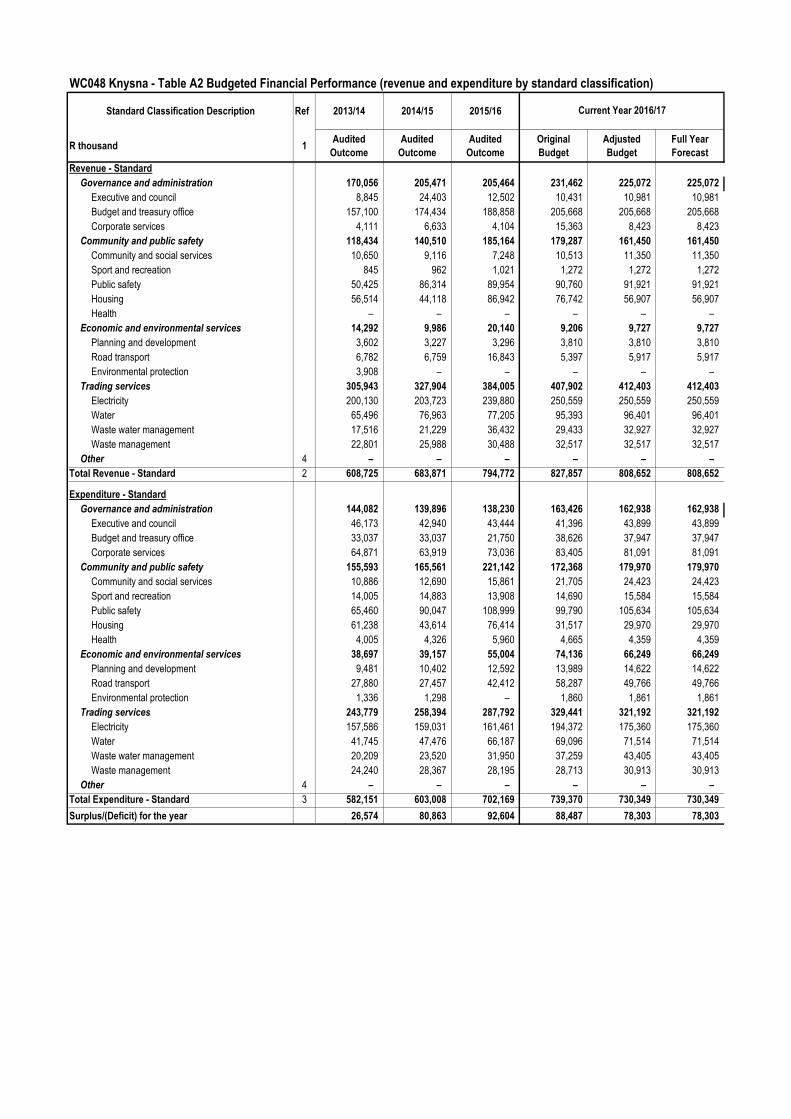
WC048 Knysna - Table A2 Budgeted Financial Performance (revenue and expenditure by standard classification)
Standard Classification Description Ref 2013/14 2014/15 2015/16
R thousand 1Audited
Outcome
Audited
Outcome
Audited
Outcome
Original
Budget
Adjusted
Budget
Full Year
Forecast
Revenue - Standard
Governance and administration 170,056 205,471 205,464 231,462 225,072 225,072
Executive and council 8,845 24,403 12,502 10,431 10,981 10,981
Budget and treasury office 157,100 174,434 188,858 205,668 205,668 205,668
Corporate services 4,111 6,633 4,104 15,363 8,423 8,423
Community and public safety 118,434 140,510 185,164 179,287 161,450 161,450
Community and social services 10,650 9,116 7,248 10,513 11,350 11,350
Sport and recreation 845 962 1,021 1,272 1,272 1,272
Public safety 50,425 86,314 89,954 90,760 91,921 91,921
Housing 56,514 44,118 86,942 76,742 56,907 56,907
Health – – – – – –
Economic and environmental services 14,292 9,986 20,140 9,206 9,727 9,727
Planning and development 3,602 3,227 3,296 3,810 3,810 3,810
Road transport 6,782 6,759 16,843 5,397 5,917 5,917
Environmental protection 3,908 – – – – –
Trading services 305,943 327,904 384,005 407,902 412,403 412,403
Electricity 200,130 203,723 239,880 250,559 250,559 250,559
Water 65,496 76,963 77,205 95,393 96,401 96,401
Waste water management 17,516 21,229 36,432 29,433 32,927 32,927
Waste management 22,801 25,988 30,488 32,517 32,517 32,517
Other 4 – – – – – –
Total Revenue - Standard 2 608,725 683,871 794,772 827,857 808,652 808,652
Expenditure - Standard
Governance and administration 144,082 139,896 138,230 163,426 162,938 162,938
Executive and council 46,173 42,940 43,444 41,396 43,899 43,899
Budget and treasury office 33,037 33,037 21,750 38,626 37,947 37,947
Corporate services 64,871 63,919 73,036 83,405 81,091 81,091
Community and public safety 155,593 165,561 221,142 172,368 179,970 179,970
Community and social services 10,886 12,690 15,861 21,705 24,423 24,423
Sport and recreation 14,005 14,883 13,908 14,690 15,584 15,584
Public safety 65,460 90,047 108,999 99,790 105,634 105,634
Housing 61,238 43,614 76,414 31,517 29,970 29,970
Health 4,005 4,326 5,960 4,665 4,359 4,359
Economic and environmental services 38,697 39,157 55,004 74,136 66,249 66,249
Planning and development 9,481 10,402 12,592 13,989 14,622 14,622
Road transport 27,880 27,457 42,412 58,287 49,766 49,766
Environmental protection 1,336 1,298 – 1,860 1,861 1,861
Trading services 243,779 258,394 287,792 329,441 321,192 321,192
Electricity 157,586 159,031 161,461 194,372 175,360 175,360
Water 41,745 47,476 66,187 69,096 71,514 71,514
Waste water management 20,209 23,520 31,950 37,259 43,405 43,405
Waste management 24,240 28,367 28,195 28,713 30,913 30,913
Other 4 – – – – – –
Total Expenditure - Standard 3 582,151 603,008 702,169 739,370 730,349 730,349
Surplus/(Deficit) for the year 26,574 80,863 92,604 88,487 78,303 78,303
Current Year 2016/17
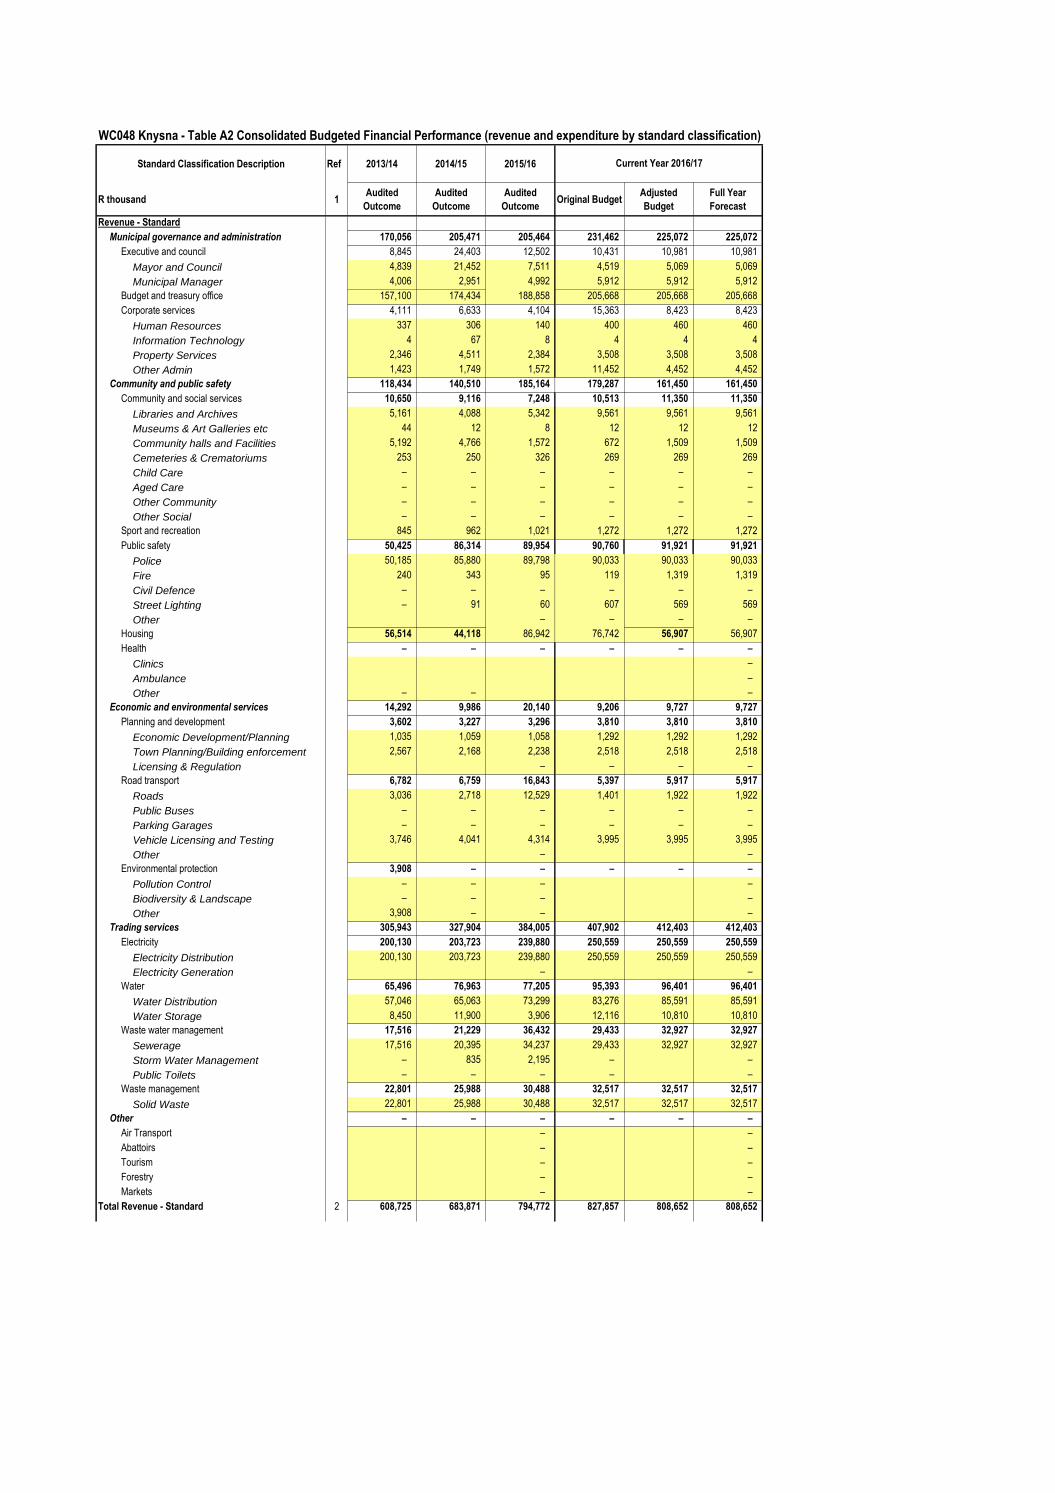
WC048 Knysna - Table A2 Consolidated Budgeted Financial Performance (revenue and expenditure by standard classification)
Standard Classification Description Ref 2013/14 2014/15 2015/16
R thousand 1Audited
Outcome
Audited
Outcome
Audited
OutcomeOriginal Budget
Adjusted
Budget
Full Year
Forecast
Revenue - Standard
Municipal governance and administration 170,056 205,471 205,464 231,462 225,072 225,072
Executive and council 8,845 24,403 12,502 10,431 10,981 10,981
Mayor and Council 4,839 21,452 7,511 4,519 5,069 5,069
Municipal Manager 4,006 2,951 4,992 5,912 5,912 5,912
Budget and treasury office 157,100 174,434 188,858 205,668 205,668 205,668
Corporate services 4,111 6,633 4,104 15,363 8,423 8,423
Human Resources 337 306 140 400 460 460
Information Technology 4 67 8 4 4 4
Property Services 2,346 4,511 2,384 3,508 3,508 3,508
Other Admin 1,423 1,749 1,572 11,452 4,452 4,452
Community and public safety 118,434 140,510 185,164 179,287 161,450 161,450
Community and social services 10,650 9,116 7,248 10,513 11,350 11,350
Libraries and Archives 5,161 4,088 5,342 9,561 9,561 9,561
Museums & Art Galleries etc 44 12 8 12 12 12
Community halls and Facilities 5,192 4,766 1,572 672 1,509 1,509
Cemeteries & Crematoriums 253 250 326 269 269 269
Child Care – – – – – –
Aged Care – – – – – –
Other Community – – – – – –
Other Social – – – – – –
Sport and recreation 845 962 1,021 1,272 1,272 1,272
Public safety 50,425 86,314 89,954 90,760 91,921 91,921
Police 50,185 85,880 89,798 90,033 90,033 90,033
Fire 240 343 95 119 1,319 1,319
Civil Defence – – – – – –
Street Lighting – 91 60 607 569 569
Other – – – –
Housing 56,514 44,118 86,942 76,742 56,907 56,907
Health – – – – – –
Clinics –
Ambulance –
Other – – –
Economic and environmental services 14,292 9,986 20,140 9,206 9,727 9,727
Planning and development 3,602 3,227 3,296 3,810 3,810 3,810
Economic Development/Planning 1,035 1,059 1,058 1,292 1,292 1,292
Town Planning/Building enforcement 2,567 2,168 2,238 2,518 2,518 2,518
Licensing & Regulation – – – –
Road transport 6,782 6,759 16,843 5,397 5,917 5,917
Roads 3,036 2,718 12,529 1,401 1,922 1,922
Public Buses – – – – – –
Parking Garages – – – – – –
Vehicle Licensing and Testing 3,746 4,041 4,314 3,995 3,995 3,995
Other – –
Environmental protection 3,908 – – – – –
Pollution Control – – – –
Biodiversity & Landscape – – – –
Other 3,908 – – –
Trading services 305,943 327,904 384,005 407,902 412,403 412,403
Electricity 200,130 203,723 239,880 250,559 250,559 250,559
Electricity Distribution 200,130 203,723 239,880 250,559 250,559 250,559
Electricity Generation – –
Water 65,496 76,963 77,205 95,393 96,401 96,401
Water Distribution 57,046 65,063 73,299 83,276 85,591 85,591
Water Storage 8,450 11,900 3,906 12,116 10,810 10,810
Waste water management 17,516 21,229 36,432 29,433 32,927 32,927
Sewerage 17,516 20,395 34,237 29,433 32,927 32,927
Storm Water Management – 835 2,195 – –
Public Toilets – – – – –
Waste management 22,801 25,988 30,488 32,517 32,517 32,517
Solid Waste 22,801 25,988 30,488 32,517 32,517 32,517
Other – – – – – –
Air Transport – –
Abattoirs – –
Tourism – –
Forestry – –
Markets – –
Total Revenue - Standard 2 608,725 683,871 794,772 827,857 808,652 808,652
Current Year 2016/17
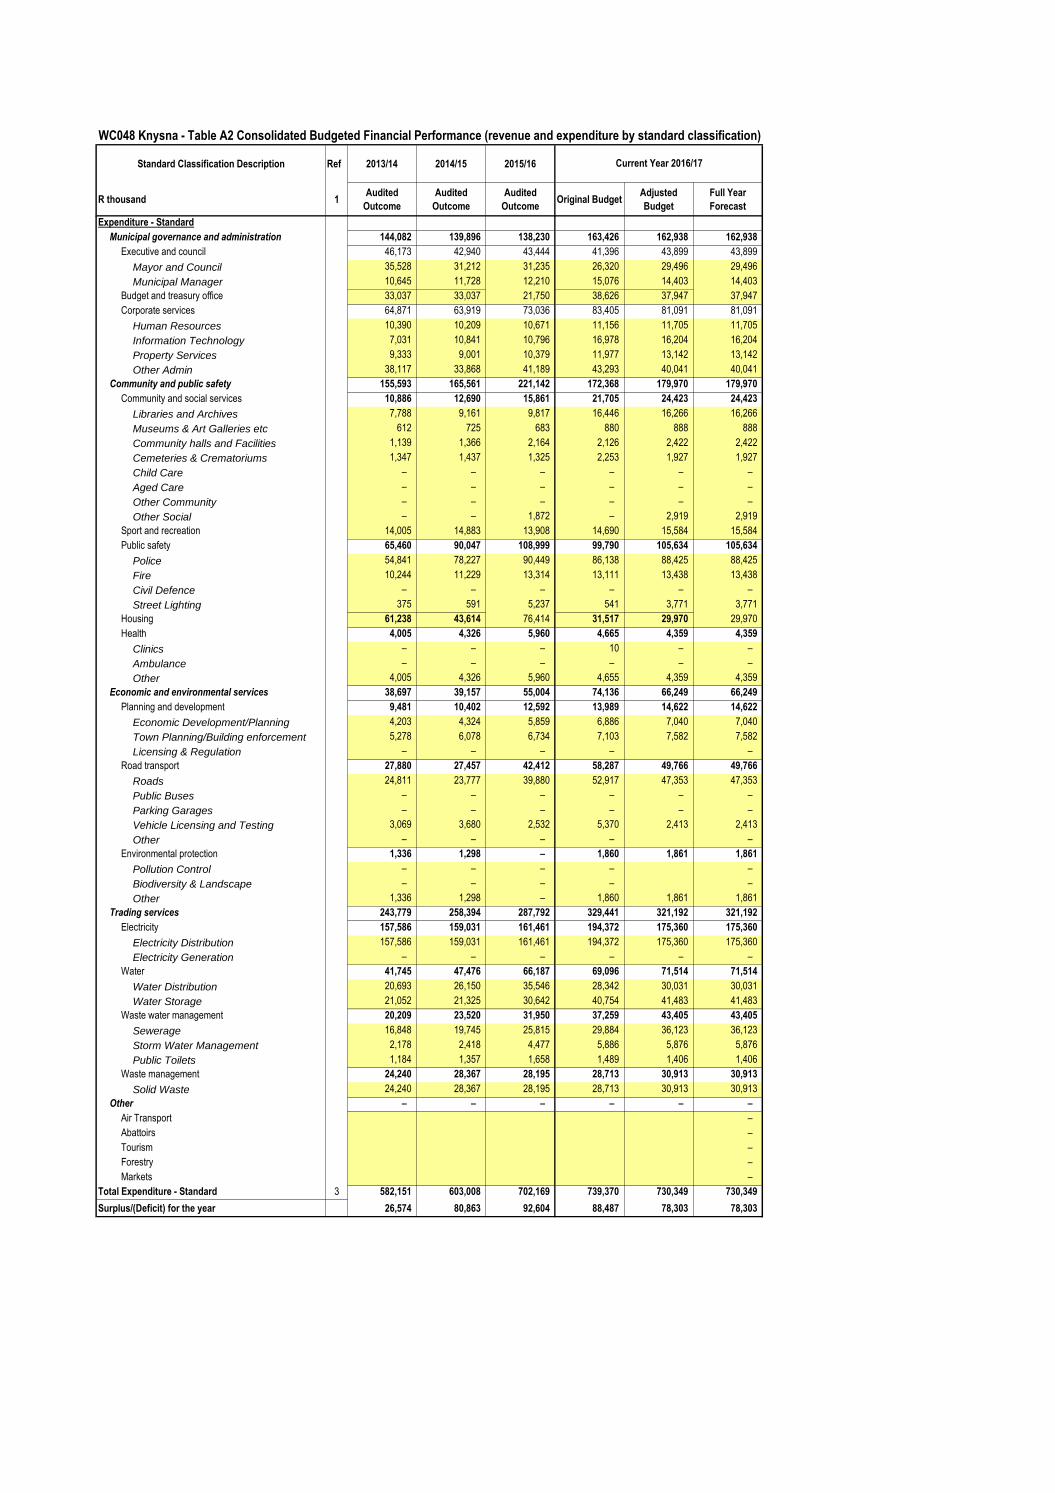
WC048 Knysna - Table A2 Consolidated Budgeted Financial Performance (revenue and expenditure by standard classification)
Standard Classification Description Ref 2013/14 2014/15 2015/16
R thousand 1Audited
Outcome
Audited
Outcome
Audited
OutcomeOriginal Budget
Adjusted
Budget
Full Year
Forecast
Current Year 2016/17
Expenditure - Standard
Municipal governance and administration 144,082 139,896 138,230 163,426 162,938 162,938
Executive and council 46,173 42,940 43,444 41,396 43,899 43,899
Mayor and Council 35,528 31,212 31,235 26,320 29,496 29,496
Municipal Manager 10,645 11,728 12,210 15,076 14,403 14,403
Budget and treasury office 33,037 33,037 21,750 38,626 37,947 37,947
Corporate services 64,871 63,919 73,036 83,405 81,091 81,091
Human Resources 10,390 10,209 10,671 11,156 11,705 11,705
Information Technology 7,031 10,841 10,796 16,978 16,204 16,204
Property Services 9,333 9,001 10,379 11,977 13,142 13,142
Other Admin 38,117 33,868 41,189 43,293 40,041 40,041
Community and public safety 155,593 165,561 221,142 172,368 179,970 179,970
Community and social services 10,886 12,690 15,861 21,705 24,423 24,423
Libraries and Archives 7,788 9,161 9,817 16,446 16,266 16,266
Museums & Art Galleries etc 612 725 683 880 888 888
Community halls and Facilities 1,139 1,366 2,164 2,126 2,422 2,422
Cemeteries & Crematoriums 1,347 1,437 1,325 2,253 1,927 1,927
Child Care – – – – – –
Aged Care – – – – – –
Other Community – – – – – –
Other Social – – 1,872 – 2,919 2,919
Sport and recreation 14,005 14,883 13,908 14,690 15,584 15,584
Public safety 65,460 90,047 108,999 99,790 105,634 105,634
Police 54,841 78,227 90,449 86,138 88,425 88,425
Fire 10,244 11,229 13,314 13,111 13,438 13,438
Civil Defence – – – – – –
Street Lighting 375 591 5,237 541 3,771 3,771
Housing 61,238 43,614 76,414 31,517 29,970 29,970
Health 4,005 4,326 5,960 4,665 4,359 4,359
Clinics – – – 10 – –
Ambulance – – – – – –
Other 4,005 4,326 5,960 4,655 4,359 4,359
Economic and environmental services 38,697 39,157 55,004 74,136 66,249 66,249
Planning and development 9,481 10,402 12,592 13,989 14,622 14,622
Economic Development/Planning 4,203 4,324 5,859 6,886 7,040 7,040
Town Planning/Building enforcement 5,278 6,078 6,734 7,103 7,582 7,582
Licensing & Regulation – – – – –
Road transport 27,880 27,457 42,412 58,287 49,766 49,766
Roads 24,811 23,777 39,880 52,917 47,353 47,353
Public Buses – – – – – –
Parking Garages – – – – – –
Vehicle Licensing and Testing 3,069 3,680 2,532 5,370 2,413 2,413
Other – – – – –
Environmental protection 1,336 1,298 – 1,860 1,861 1,861
Pollution Control – – – – –
Biodiversity & Landscape – – – – –
Other 1,336 1,298 – 1,860 1,861 1,861
Trading services 243,779 258,394 287,792 329,441 321,192 321,192
Electricity 157,586 159,031 161,461 194,372 175,360 175,360
Electricity Distribution 157,586 159,031 161,461 194,372 175,360 175,360
Electricity Generation – – – – – –
Water 41,745 47,476 66,187 69,096 71,514 71,514
Water Distribution 20,693 26,150 35,546 28,342 30,031 30,031
Water Storage 21,052 21,325 30,642 40,754 41,483 41,483
Waste water management 20,209 23,520 31,950 37,259 43,405 43,405
Sewerage 16,848 19,745 25,815 29,884 36,123 36,123
Storm Water Management 2,178 2,418 4,477 5,886 5,876 5,876
Public Toilets 1,184 1,357 1,658 1,489 1,406 1,406
Waste management 24,240 28,367 28,195 28,713 30,913 30,913
Solid Waste 24,240 28,367 28,195 28,713 30,913 30,913
Other – – – – – –
Air Transport –
Abattoirs –
Tourism –
Forestry –
Markets –
Total Expenditure - Standard 3 582,151 603,008 702,169 739,370 730,349 730,349
Surplus/(Deficit) for the year 26,574 80,863 92,604 88,487 78,303 78,303
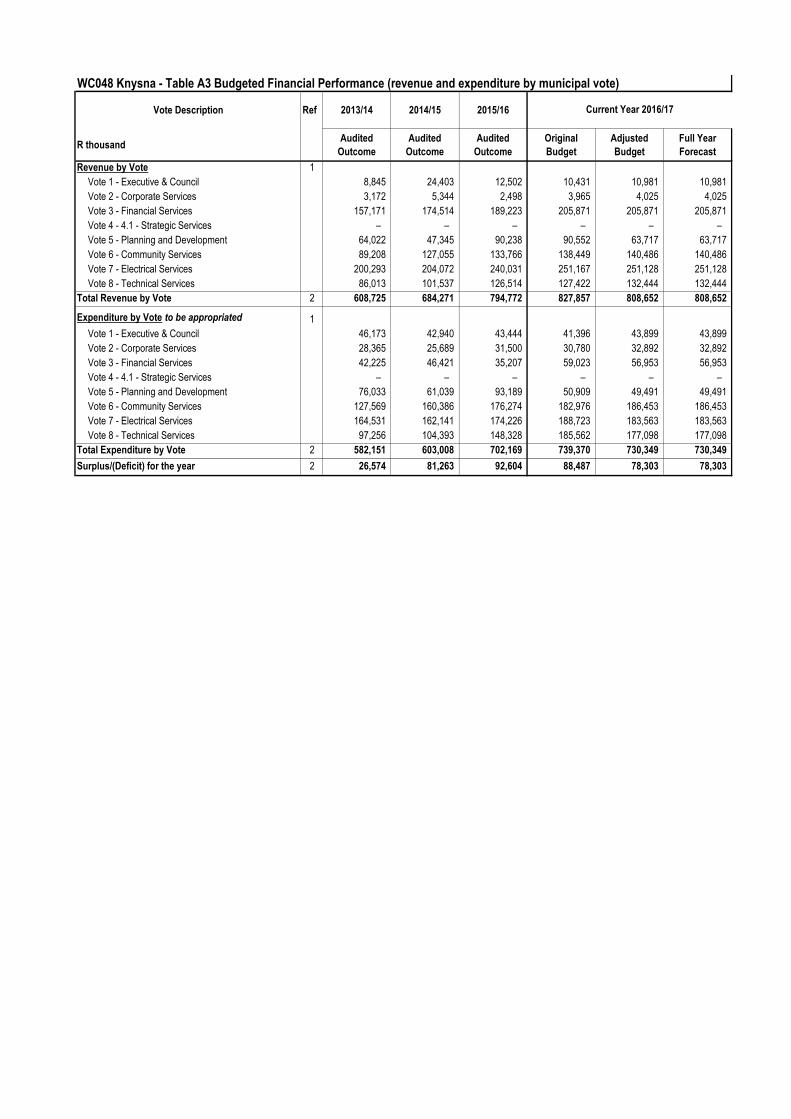
WC048 Knysna - Table A3 Budgeted Financial Performance (revenue and expenditure by municipal vote)
Vote Description Ref 2013/14 2014/15 2015/16
R thousandAudited
Outcome
Audited
Outcome
Audited
Outcome
Original
Budget
Adjusted
Budget
Full Year
Forecast
Revenue by Vote 1
Vote 1 - Executive & Council 8,845 24,403 12,502 10,431 10,981 10,981
Vote 2 - Corporate Services 3,172 5,344 2,498 3,965 4,025 4,025
Vote 3 - Financial Services 157,171 174,514 189,223 205,871 205,871 205,871
Vote 4 - 4.1 - Strategic Services – – – – – –
Vote 5 - Planning and Development 64,022 47,345 90,238 90,552 63,717 63,717
Vote 6 - Community Services 89,208 127,055 133,766 138,449 140,486 140,486
Vote 7 - Electrical Services 200,293 204,072 240,031 251,167 251,128 251,128
Vote 8 - Technical Services 86,013 101,537 126,514 127,422 132,444 132,444
Total Revenue by Vote 2 608,725 684,271 794,772 827,857 808,652 808,652
Expenditure by Vote to be appropriated 1
Vote 1 - Executive & Council 46,173 42,940 43,444 41,396 43,899 43,899
Vote 2 - Corporate Services 28,365 25,689 31,500 30,780 32,892 32,892
Vote 3 - Financial Services 42,225 46,421 35,207 59,023 56,953 56,953
Vote 4 - 4.1 - Strategic Services – – – – – –
Vote 5 - Planning and Development 76,033 61,039 93,189 50,909 49,491 49,491
Vote 6 - Community Services 127,569 160,386 176,274 182,976 186,453 186,453
Vote 7 - Electrical Services 164,531 162,141 174,226 188,723 183,563 183,563
Vote 8 - Technical Services 97,256 104,393 148,328 185,562 177,098 177,098
Total Expenditure by Vote 2 582,151 603,008 702,169 739,370 730,349 730,349
Surplus/(Deficit) for the year 2 26,574 81,263 92,604 88,487 78,303 78,303
Current Year 2016/17
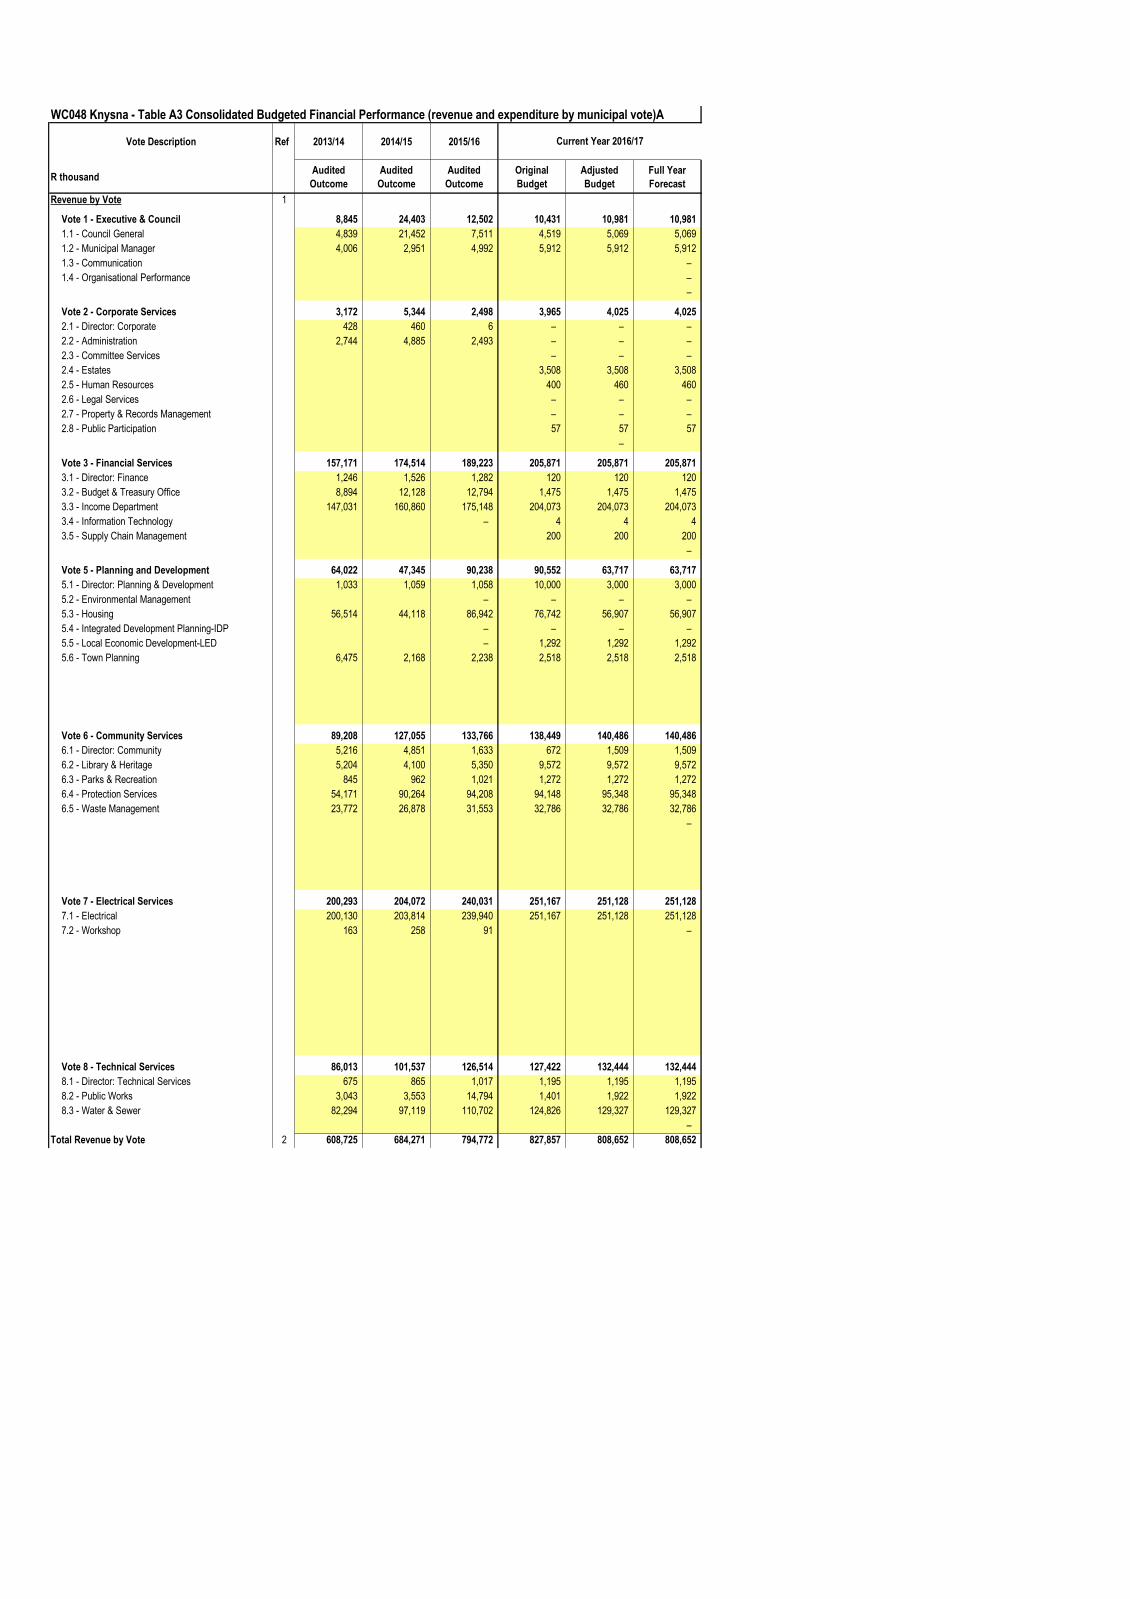
WC048 Knysna - Table A3 Consolidated Budgeted Financial Performance (revenue and expenditure by municipal vote)A
Vote Description Ref 2013/14 2014/15 2015/16
R thousandAudited
Outcome
Audited
Outcome
Audited
Outcome
Original
Budget
Adjusted
Budget
Full Year
Forecast
Revenue by Vote 1
Vote 1 - Executive & Council 8,845 24,403 12,502 10,431 10,981 10,981
1.1 - Council General 4,839 21,452 7,511 4,519 5,069 5,069
1.2 - Municipal Manager 4,006 2,951 4,992 5,912 5,912 5,912
1.3 - Communication –
1.4 - Organisational Performance –
–
Vote 2 - Corporate Services 3,172 5,344 2,498 3,965 4,025 4,025
2.1 - Director: Corporate 428 460 6 – – –
2.2 - Administration 2,744 4,885 2,493 – – –
2.3 - Committee Services – – –
2.4 - Estates 3,508 3,508 3,508
2.5 - Human Resources 400 460 460
2.6 - Legal Services – – –
2.7 - Property & Records Management – – –
2.8 - Public Participation 57 57 57
–
Vote 3 - Financial Services 157,171 174,514 189,223 205,871 205,871 205,871
3.1 - Director: Finance 1,246 1,526 1,282 120 120 120
3.2 - Budget & Treasury Office 8,894 12,128 12,794 1,475 1,475 1,475
3.3 - Income Department 147,031 160,860 175,148 204,073 204,073 204,073
3.4 - Information Technology – 4 4 4
3.5 - Supply Chain Management 200 200 200
–
Vote 5 - Planning and Development 64,022 47,345 90,238 90,552 63,717 63,717
5.1 - Director: Planning & Development 1,033 1,059 1,058 10,000 3,000 3,000
5.2 - Environmental Management – – – –
5.3 - Housing 56,514 44,118 86,942 76,742 56,907 56,907
5.4 - Integrated Development Planning-IDP – – – –
5.5 - Local Economic Development-LED – 1,292 1,292 1,292
5.6 - Town Planning 6,475 2,168 2,238 2,518 2,518 2,518
Vote 6 - Community Services 89,208 127,055 133,766 138,449 140,486 140,486
6.1 - Director: Community 5,216 4,851 1,633 672 1,509 1,509
6.2 - Library & Heritage 5,204 4,100 5,350 9,572 9,572 9,572
6.3 - Parks & Recreation 845 962 1,021 1,272 1,272 1,272
6.4 - Protection Services 54,171 90,264 94,208 94,148 95,348 95,348
6.5 - Waste Management 23,772 26,878 31,553 32,786 32,786 32,786
–
Vote 7 - Electrical Services 200,293 204,072 240,031 251,167 251,128 251,128
7.1 - Electrical 200,130 203,814 239,940 251,167 251,128 251,128
7.2 - Workshop 163 258 91 –
Vote 8 - Technical Services 86,013 101,537 126,514 127,422 132,444 132,444
8.1 - Director: Technical Services 675 865 1,017 1,195 1,195 1,195
8.2 - Public Works 3,043 3,553 14,794 1,401 1,922 1,922
8.3 - Water & Sewer 82,294 97,119 110,702 124,826 129,327 129,327
–
Total Revenue by Vote 2 608,725 684,271 794,772 827,857 808,652 808,652
Current Year 2016/17
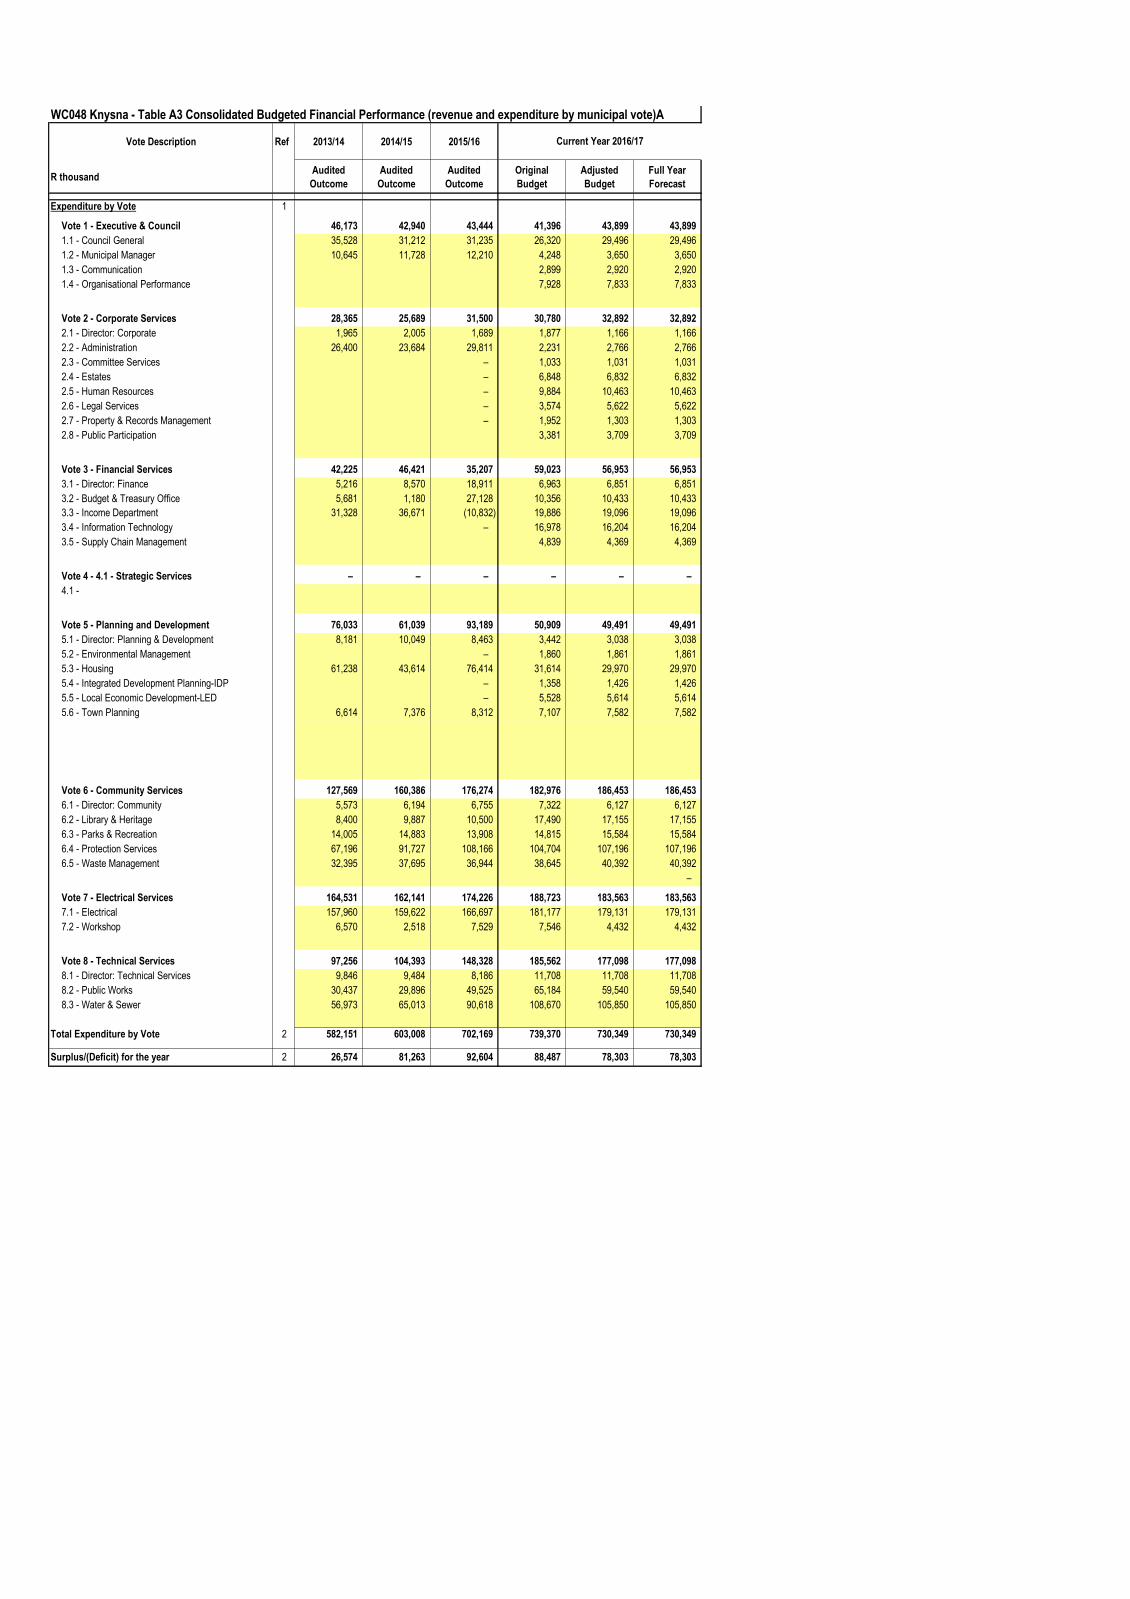
WC048 Knysna - Table A3 Consolidated Budgeted Financial Performance (revenue and expenditure by municipal vote)A
Vote Description Ref 2013/14 2014/15 2015/16
R thousandAudited
Outcome
Audited
Outcome
Audited
Outcome
Original
Budget
Adjusted
Budget
Full Year
Forecast
Current Year 2016/17
Expenditure by Vote 1
Vote 1 - Executive & Council 46,173 42,940 43,444 41,396 43,899 43,899
1.1 - Council General 35,528 31,212 31,235 26,320 29,496 29,496
1.2 - Municipal Manager 10,645 11,728 12,210 4,248 3,650 3,650
1.3 - Communication 2,899 2,920 2,920
1.4 - Organisational Performance 7,928 7,833 7,833
Vote 2 - Corporate Services 28,365 25,689 31,500 30,780 32,892 32,892
2.1 - Director: Corporate 1,965 2,005 1,689 1,877 1,166 1,166
2.2 - Administration 26,400 23,684 29,811 2,231 2,766 2,766
2.3 - Committee Services – 1,033 1,031 1,031
2.4 - Estates – 6,848 6,832 6,832
2.5 - Human Resources – 9,884 10,463 10,463
2.6 - Legal Services – 3,574 5,622 5,622
2.7 - Property & Records Management – 1,952 1,303 1,303
2.8 - Public Participation 3,381 3,709 3,709
Vote 3 - Financial Services 42,225 46,421 35,207 59,023 56,953 56,953
3.1 - Director: Finance 5,216 8,570 18,911 6,963 6,851 6,851
3.2 - Budget & Treasury Office 5,681 1,180 27,128 10,356 10,433 10,433
3.3 - Income Department 31,328 36,671 (10,832) 19,886 19,096 19,096
3.4 - Information Technology – 16,978 16,204 16,204
3.5 - Supply Chain Management 4,839 4,369 4,369
Vote 4 - 4.1 - Strategic Services – – – – – –
4.1 -
Vote 5 - Planning and Development 76,033 61,039 93,189 50,909 49,491 49,491
5.1 - Director: Planning & Development 8,181 10,049 8,463 3,442 3,038 3,038
5.2 - Environmental Management – 1,860 1,861 1,861
5.3 - Housing 61,238 43,614 76,414 31,614 29,970 29,970
5.4 - Integrated Development Planning-IDP – 1,358 1,426 1,426
5.5 - Local Economic Development-LED – 5,528 5,614 5,614
5.6 - Town Planning 6,614 7,376 8,312 7,107 7,582 7,582
Vote 6 - Community Services 127,569 160,386 176,274 182,976 186,453 186,453
6.1 - Director: Community 5,573 6,194 6,755 7,322 6,127 6,127
6.2 - Library & Heritage 8,400 9,887 10,500 17,490 17,155 17,155
6.3 - Parks & Recreation 14,005 14,883 13,908 14,815 15,584 15,584
6.4 - Protection Services 67,196 91,727 108,166 104,704 107,196 107,196
6.5 - Waste Management 32,395 37,695 36,944 38,645 40,392 40,392
–
Vote 7 - Electrical Services 164,531 162,141 174,226 188,723 183,563 183,563
7.1 - Electrical 157,960 159,622 166,697 181,177 179,131 179,131
7.2 - Workshop 6,570 2,518 7,529 7,546 4,432 4,432
Vote 8 - Technical Services 97,256 104,393 148,328 185,562 177,098 177,098
8.1 - Director: Technical Services 9,846 9,484 8,186 11,708 11,708 11,708
8.2 - Public Works 30,437 29,896 49,525 65,184 59,540 59,540
8.3 - Water & Sewer 56,973 65,013 90,618 108,670 105,850 105,850
Total Expenditure by Vote 2 582,151 603,008 702,169 739,370 730,349 730,349
Surplus/(Deficit) for the year 2 26,574 81,263 92,604 88,487 78,303 78,303
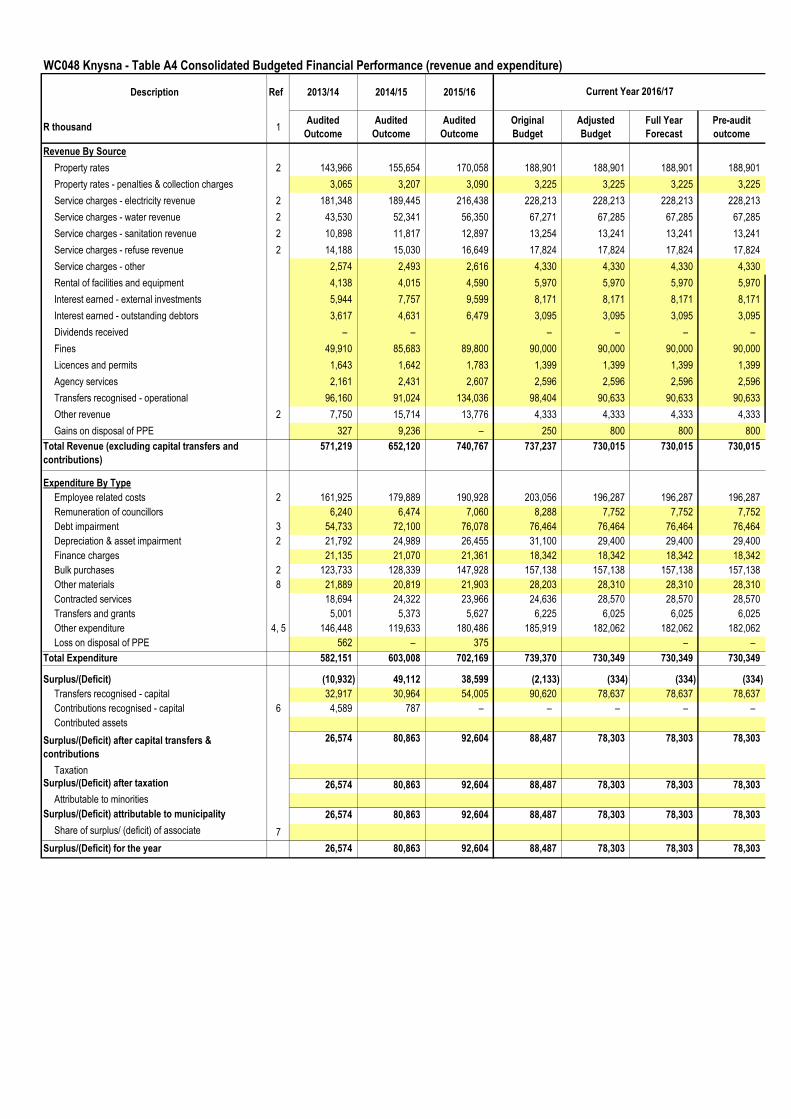
WC048 Knysna - Table A4 Consolidated Budgeted Financial Performance (revenue and expenditure)
Description Ref 2013/14 2014/15 2015/16
R thousand 1Audited
Outcome
Audited
Outcome
Audited
Outcome
Original
Budget
Adjusted
Budget
Full Year
Forecast
Pre-audit
outcome
Revenue By Source
Property rates 2 143,966 155,654 170,058 188,901 188,901 188,901 188,901
Property rates - penalties & collection charges 3,065 3,207 3,090 3,225 3,225 3,225 3,225
Service charges - electricity revenue 2 181,348 189,445 216,438 228,213 228,213 228,213 228,213
Service charges - water revenue 2 43,530 52,341 56,350 67,271 67,285 67,285 67,285
Service charges - sanitation revenue 2 10,898 11,817 12,897 13,254 13,241 13,241 13,241
Service charges - refuse revenue 2 14,188 15,030 16,649 17,824 17,824 17,824 17,824
Service charges - other 2,574 2,493 2,616 4,330 4,330 4,330 4,330
Rental of facilities and equipment 4,138 4,015 4,590 5,970 5,970 5,970 5,970
Interest earned - external investments 5,944 7,757 9,599 8,171 8,171 8,171 8,171
Interest earned - outstanding debtors 3,617 4,631 6,479 3,095 3,095 3,095 3,095
Dividends received – – – – – –
Fines 49,910 85,683 89,800 90,000 90,000 90,000 90,000
Licences and permits 1,643 1,642 1,783 1,399 1,399 1,399 1,399
Agency services 2,161 2,431 2,607 2,596 2,596 2,596 2,596
Transfers recognised - operational 96,160 91,024 134,036 98,404 90,633 90,633 90,633
Other revenue 2 7,750 15,714 13,776 4,333 4,333 4,333 4,333
Gains on disposal of PPE 327 9,236 – 250 800 800 800
Total Revenue (excluding capital transfers and
contributions)
571,219 652,120 740,767 737,237 730,015 730,015 730,015
Expenditure By Type
Employee related costs 2 161,925 179,889 190,928 203,056 196,287 196,287 196,287
Remuneration of councillors 6,240 6,474 7,060 8,288 7,752 7,752 7,752
Debt impairment 3 54,733 72,100 76,078 76,464 76,464 76,464 76,464
Depreciation & asset impairment 2 21,792 24,989 26,455 31,100 29,400 29,400 29,400
Finance charges 21,135 21,070 21,361 18,342 18,342 18,342 18,342
Bulk purchases 2 123,733 128,339 147,928 157,138 157,138 157,138 157,138
Other materials 8 21,889 20,819 21,903 28,203 28,310 28,310 28,310
Contracted services 18,694 24,322 23,966 24,636 28,570 28,570 28,570
Transfers and grants 5,001 5,373 5,627 6,225 6,025 6,025 6,025
Other expenditure 4, 5 146,448 119,633 180,486 185,919 182,062 182,062 182,062
Loss on disposal of PPE 562 – 375 – –
Total Expenditure 582,151 603,008 702,169 739,370 730,349 730,349 730,349
Surplus/(Deficit) (10,932) 49,112 38,599 (2,133) (334) (334) (334)
Transfers recognised - capital 32,917 30,964 54,005 90,620 78,637 78,637 78,637
Contributions recognised - capital 6 4,589 787 – – – – –
Contributed assets
Surplus/(Deficit) after capital transfers &
contributions
26,574 80,863 92,604 88,487 78,303 78,303 78,303
Taxation
Surplus/(Deficit) after taxation 26,574 80,863 92,604 88,487 78,303 78,303 78,303
Attributable to minorities
Surplus/(Deficit) attributable to municipality 26,574 80,863 92,604 88,487 78,303 78,303 78,303
Share of surplus/ (deficit) of associate 7
Surplus/(Deficit) for the year 26,574 80,863 92,604 88,487 78,303 78,303 78,303
Current Year 2016/17
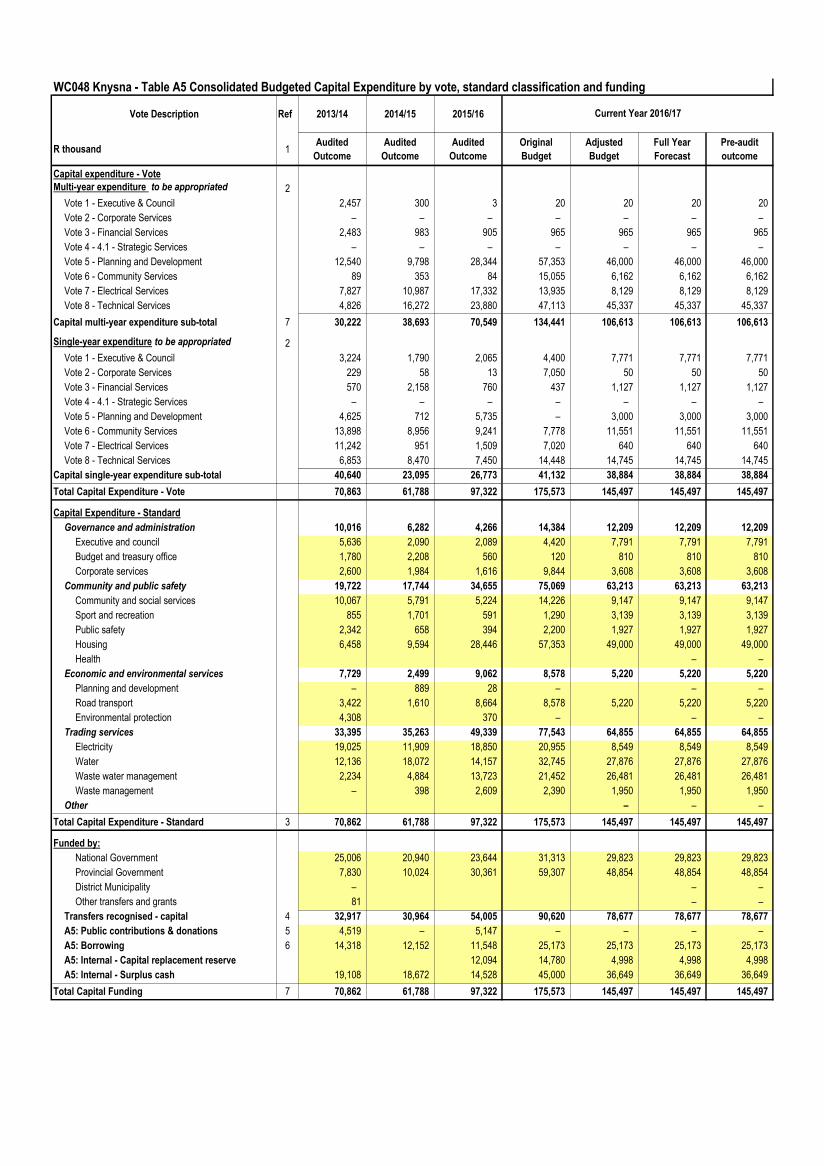
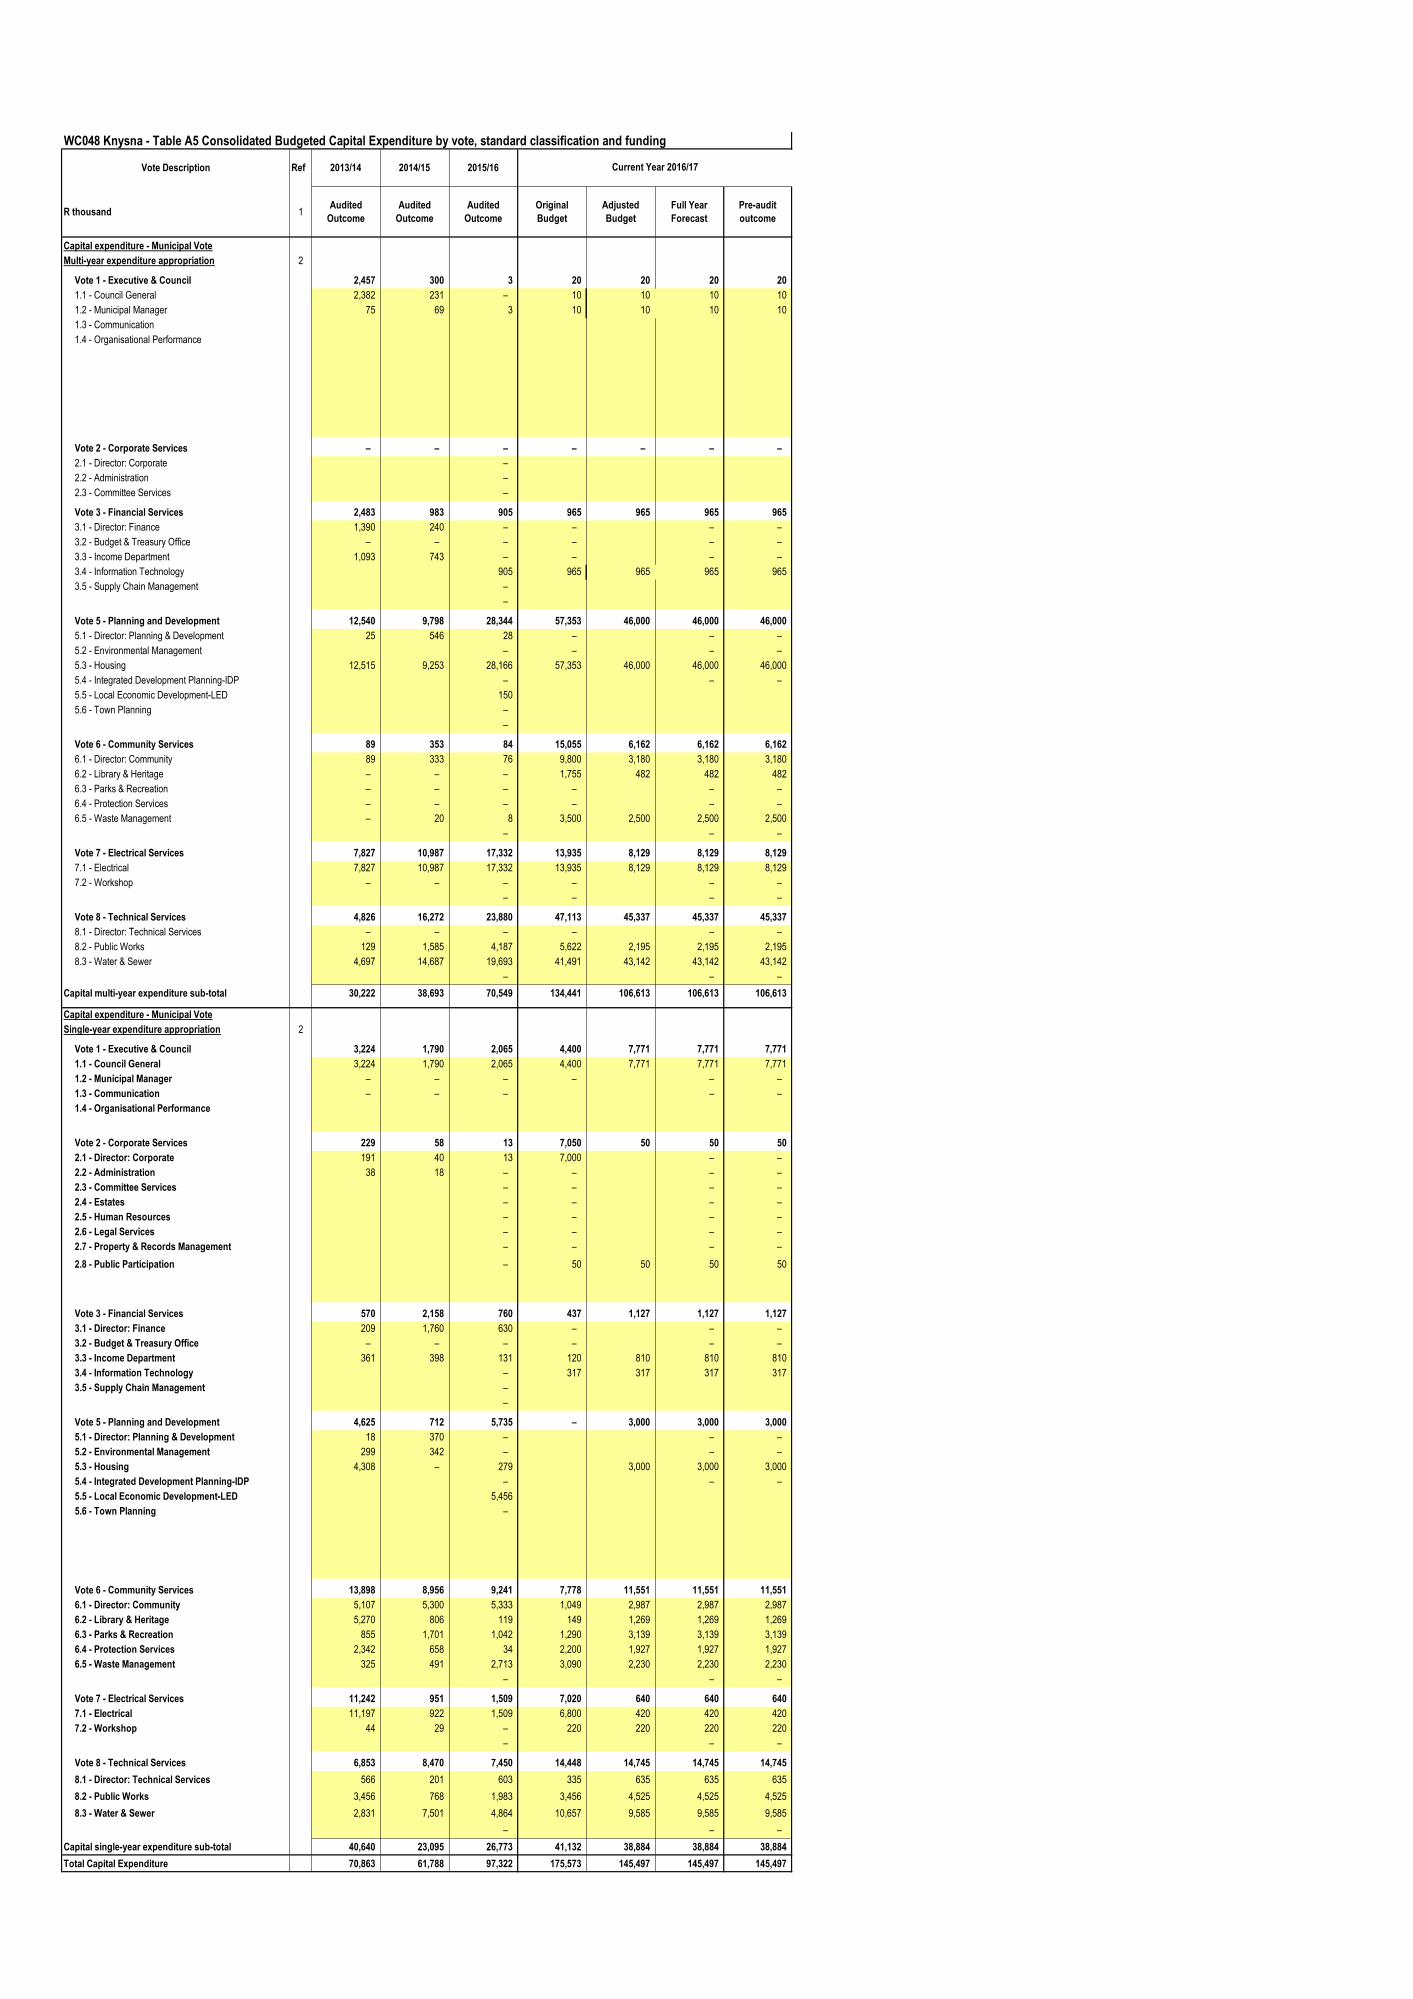
WC048 Knysna - Table A5 Consolidated Budgeted Capital Expenditure by vote, standard classification and funding
Vote Description Ref 2013/14 2014/15 2015/16
R thousand 1Audited
Outcome
Audited
Outcome
Audited
Outcome
Original
Budget
Adjusted
Budget
Full Year
Forecast
Pre-audit
outcome
Capital expenditure - Vote
Multi-year expenditure to be appropriated 2
Vote 1 - Executive & Council 2,457 300 3 20 20 20 20
Vote 2 - Corporate Services – – – – – – –
Vote 3 - Financial Services 2,483 983 905 965 965 965 965
Vote 4 - 4.1 - Strategic Services – – – – – – –
Vote 5 - Planning and Development 12,540 9,798 28,344 57,353 46,000 46,000 46,000
Vote 6 - Community Services 89 353 84 15,055 6,162 6,162 6,162
Vote 7 - Electrical Services 7,827 10,987 17,332 13,935 8,129 8,129 8,129
Vote 8 - Technical Services 4,826 16,272 23,880 47,113 45,337 45,337 45,337
Capital multi-year expenditure sub-total 7 30,222 38,693 70,549 134,441 106,613 106,613 106,613
Single-year expenditure to be appropriated 2
Vote 1 - Executive & Council 3,224 1,790 2,065 4,400 7,771 7,771 7,771
Vote 2 - Corporate Services 229 58 13 7,050 50 50 50
Vote 3 - Financial Services 570 2,158 760 437 1,127 1,127 1,127
Vote 4 - 4.1 - Strategic Services – – – – – – –
Vote 5 - Planning and Development 4,625 712 5,735 – 3,000 3,000 3,000
Vote 6 - Community Services 13,898 8,956 9,241 7,778 11,551 11,551 11,551
Vote 7 - Electrical Services 11,242 951 1,509 7,020 640 640 640
Vote 8 - Technical Services 6,853 8,470 7,450 14,448 14,745 14,745 14,745
Capital single-year expenditure sub-total 40,640 23,095 26,773 41,132 38,884 38,884 38,884
Total Capital Expenditure - Vote 70,863 61,788 97,322 175,573 145,497 145,497 145,497
Capital Expenditure - Standard
Governance and administration 10,016 6,282 4,266 14,384 12,209 12,209 12,209
Executive and council 5,636 2,090 2,089 4,420 7,791 7,791 7,791
Budget and treasury office 1,780 2,208 560 120 810 810 810
Corporate services 2,600 1,984 1,616 9,844 3,608 3,608 3,608
Community and public safety 19,722 17,744 34,655 75,069 63,213 63,213 63,213
Community and social services 10,067 5,791 5,224 14,226 9,147 9,147 9,147
Sport and recreation 855 1,701 591 1,290 3,139 3,139 3,139
Public safety 2,342 658 394 2,200 1,927 1,927 1,927
Housing 6,458 9,594 28,446 57,353 49,000 49,000 49,000
Health – –
Economic and environmental services 7,729 2,499 9,062 8,578 5,220 5,220 5,220
Planning and development – 889 28 – – –
Road transport 3,422 1,610 8,664 8,578 5,220 5,220 5,220
Environmental protection 4,308 370 – – –
Trading services 33,395 35,263 49,339 77,543 64,855 64,855 64,855
Electricity 19,025 11,909 18,850 20,955 8,549 8,549 8,549
Water 12,136 18,072 14,157 32,745 27,876 27,876 27,876
Waste water management 2,234 4,884 13,723 21,452 26,481 26,481 26,481
Waste management – 398 2,609 2,390 1,950 1,950 1,950
Other – – –
Total Capital Expenditure - Standard 3 70,862 61,788 97,322 175,573 145,497 145,497 145,497
Funded by:
National Government 25,006 20,940 23,644 31,313 29,823 29,823 29,823
Provincial Government 7,830 10,024 30,361 59,307 48,854 48,854 48,854
District Municipality – – –
Other transfers and grants 81 – –
Transfers recognised - capital 4 32,917 30,964 54,005 90,620 78,677 78,677 78,677
A5: Public contributions & donations 5 4,519 – 5,147 – – – –
A5: Borrowing 6 14,318 12,152 11,548 25,173 25,173 25,173 25,173
A5: Internal - Capital replacement reserve 12,094 14,780 4,998 4,998 4,998
A5: Internal - Surplus cash 19,108 18,672 14,528 45,000 36,649 36,649 36,649
Total Capital Funding 7 70,862 61,788 97,322 175,573 145,497 145,497 145,497
Current Year 2016/17
WC048 Knysna - Table A5 Consolidated Budgeted Capital Expenditure by vote, standard classification and funding
Vote Description Ref 2013/14 2014/15 2015/16
R thousand 1Audited
Outcome
Audited
Outcome
Audited
Outcome
Original
Budget
Adjusted
Budget
Full Year
Forecast
Pre-audit
outcome
Capital expenditure - Municipal Vote
Multi-year expenditure appropriation 2
Vote 1 - Executive & Council 2,457 300 3 20 20 20 20
1.1 - Council General 2,382 231 – 10 10 10 10
1.2 - Municipal Manager 75 69 3 10 10 10 10
1.3 - Communication
1.4 - Organisational Performance
Vote 2 - Corporate Services – – – – – – –
2.1 - Director: Corporate –
2.2 - Administration –
2.3 - Committee Services –
Vote 3 - Financial Services 2,483 983 905 965 965 965 965
3.1 - Director: Finance 1,390 240 – – – –
3.2 - Budget & Treasury Office – – – – – –
3.3 - Income Department 1,093 743 – – – –
3.4 - Information Technology 905 965 965 965 965
3.5 - Supply Chain Management –
–
Vote 5 - Planning and Development 12,540 9,798 28,344 57,353 46,000 46,000 46,000
5.1 - Director: Planning & Development 25 546 28 – – –
5.2 - Environmental Management – – – –
5.3 - Housing 12,515 9,253 28,166 57,353 46,000 46,000 46,000
5.4 - Integrated Development Planning-IDP – – –
5.5 - Local Economic Development-LED 150
5.6 - Town Planning –
–
Vote 6 - Community Services 89 353 84 15,055 6,162 6,162 6,162
6.1 - Director: Community 89 333 76 9,800 3,180 3,180 3,180
6.2 - Library & Heritage – – – 1,755 482 482 482
6.3 - Parks & Recreation – – – – – –
6.4 - Protection Services – – – – – –
6.5 - Waste Management – 20 8 3,500 2,500 2,500 2,500
– – –
Vote 7 - Electrical Services 7,827 10,987 17,332 13,935 8,129 8,129 8,129
7.1 - Electrical 7,827 10,987 17,332 13,935 8,129 8,129 8,129
7.2 - Workshop – – – – – –
– – – –
Vote 8 - Technical Services 4,826 16,272 23,880 47,113 45,337 45,337 45,337
8.1 - Director: Technical Services – – – – – –
8.2 - Public Works 129 1,585 4,187 5,622 2,195 2,195 2,195
8.3 - Water & Sewer 4,697 14,687 19,693 41,491 43,142 43,142 43,142
– – –
Capital multi-year expenditure sub-total 30,222 38,693 70,549 134,441 106,613 106,613 106,613
Capital expenditure - Municipal Vote
Single-year expenditure appropriation 2
Vote 1 - Executive & Council 3,224 1,790 2,065 4,400 7,771 7,771 7,771
1.1 - Council General 3,224 1,790 2,065 4,400 7,771 7,771 7,771
1.2 - Municipal Manager – – – – – –
1.3 - Communication – – – – –
1.4 - Organisational Performance
Vote 2 - Corporate Services 229 58 13 7,050 50 50 50
2.1 - Director: Corporate 191 40 13 7,000 – –
2.2 - Administration 38 18 – – – –
2.3 - Committee Services – – – –
2.4 - Estates – – – –
2.5 - Human Resources – – – –
2.6 - Legal Services – – – –
2.7 - Property & Records Management – – – –
2.8 - Public Participation – 50 50 50 50
Vote 3 - Financial Services 570 2,158 760 437 1,127 1,127 1,127
3.1 - Director: Finance 209 1,760 630 – – –
3.2 - Budget & Treasury Office – – – – – –
3.3 - Income Department 361 398 131 120 810 810 810
3.4 - Information Technology – 317 317 317 317
3.5 - Supply Chain Management –
–
Vote 5 - Planning and Development 4,625 712 5,735 – 3,000 3,000 3,000
5.1 - Director: Planning & Development 18 370 – – –
5.2 - Environmental Management 299 342 – – –
5.3 - Housing 4,308 – 279 3,000 3,000 3,000
5.4 - Integrated Development Planning-IDP – – –
5.5 - Local Economic Development-LED 5,456
5.6 - Town Planning –
Vote 6 - Community Services 13,898 8,956 9,241 7,778 11,551 11,551 11,551
6.1 - Director: Community 5,107 5,300 5,333 1,049 2,987 2,987 2,987
6.2 - Library & Heritage 5,270 806 119 149 1,269 1,269 1,269
6.3 - Parks & Recreation 855 1,701 1,042 1,290 3,139 3,139 3,139
6.4 - Protection Services 2,342 658 34 2,200 1,927 1,927 1,927
6.5 - Waste Management 325 491 2,713 3,090 2,230 2,230 2,230
– – –
Vote 7 - Electrical Services 11,242 951 1,509 7,020 640 640 640
7.1 - Electrical 11,197 922 1,509 6,800 420 420 420
7.2 - Workshop 44 29 – 220 220 220 220
– – –
Vote 8 - Technical Services 6,853 8,470 7,450 14,448 14,745 14,745 14,745
8.1 - Director: Technical Services 566 201 603 335 635 635 635
8.2 - Public Works 3,456 768 1,983 3,456 4,525 4,525 4,525
8.3 - Water & Sewer 2,831 7,501 4,864 10,657 9,585 9,585 9,585
– – –
Capital single-year expenditure sub-total 40,640 23,095 26,773 41,132 38,884 38,884 38,884
Total Capital Expenditure 70,863 61,788 97,322 175,573 145,497 145,497 145,497
Current Year 2016/17
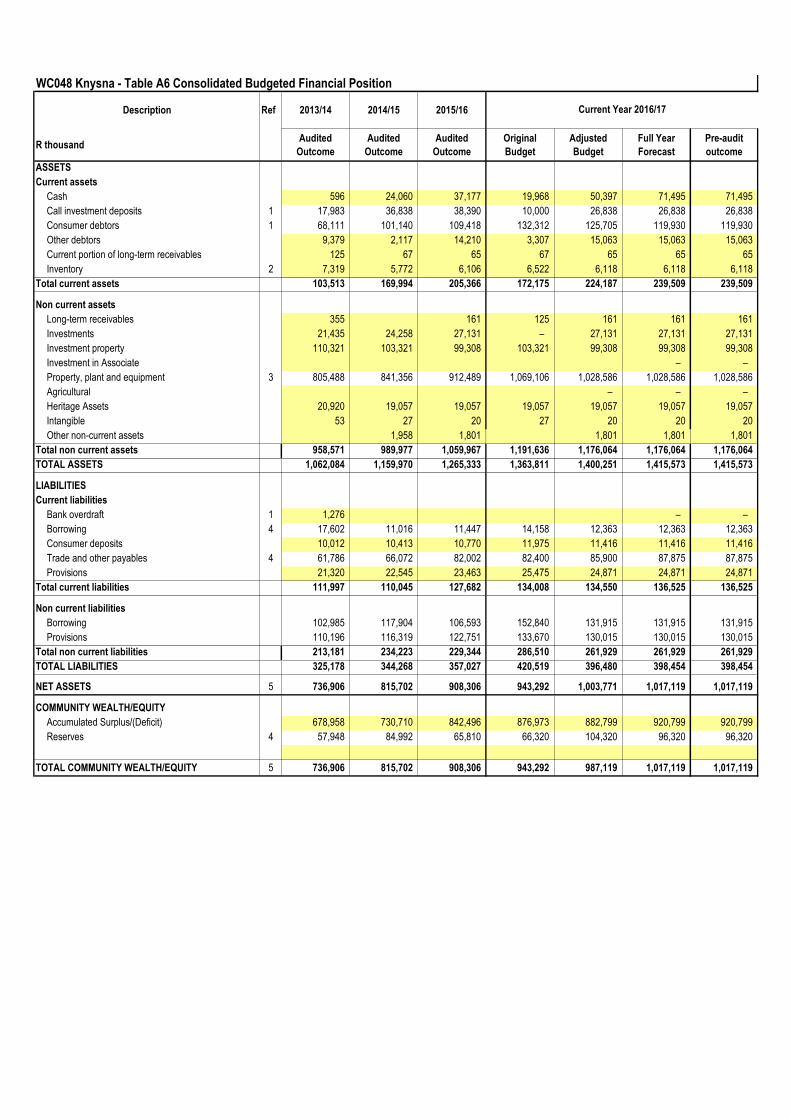
WC048 Knysna - Table A6 Consolidated Budgeted Financial Position
Description Ref 2013/14 2014/15 2015/16
R thousandAudited
Outcome
Audited
Outcome
Audited
Outcome
Original
Budget
Adjusted
Budget
Full Year
Forecast
Pre-audit
outcome
ASSETS
Current assets
Cash 596 24,060 37,177 19,968 50,397 71,495 71,495
Call investment deposits 1 17,983 36,838 38,390 10,000 26,838 26,838 26,838
Consumer debtors 1 68,111 101,140 109,418 132,312 125,705 119,930 119,930
Other debtors 9,379 2,117 14,210 3,307 15,063 15,063 15,063
Current portion of long-term receivables 125 67 65 67 65 65 65
Inventory 2 7,319 5,772 6,106 6,522 6,118 6,118 6,118
Total current assets 103,513 169,994 205,366 172,175 224,187 239,509 239,509
Non current assets
Long-term receivables 355 161 125 161 161 161
Investments 21,435 24,258 27,131 – 27,131 27,131 27,131
Investment property 110,321 103,321 99,308 103,321 99,308 99,308 99,308
Investment in Associate – –
Property, plant and equipment 3 805,488 841,356 912,489 1,069,106 1,028,586 1,028,586 1,028,586
Agricultural – – –
Heritage Assets 20,920 19,057 19,057 19,057 19,057 19,057 19,057
Intangible 53 27 20 27 20 20 20
Other non-current assets 1,958 1,801 1,801 1,801 1,801
Total non current assets 958,571 989,977 1,059,967 1,191,636 1,176,064 1,176,064 1,176,064
TOTAL ASSETS 1,062,084 1,159,970 1,265,333 1,363,811 1,400,251 1,415,573 1,415,573
LIABILITIES
Current liabilities
Bank overdraft 1 1,276 – –
Borrowing 4 17,602 11,016 11,447 14,158 12,363 12,363 12,363
Consumer deposits 10,012 10,413 10,770 11,975 11,416 11,416 11,416
Trade and other payables 4 61,786 66,072 82,002 82,400 85,900 87,875 87,875
Provisions 21,320 22,545 23,463 25,475 24,871 24,871 24,871
Total current liabilities 111,997 110,045 127,682 134,008 134,550 136,525 136,525
Non current liabilities
Borrowing 102,985 117,904 106,593 152,840 131,915 131,915 131,915
Provisions 110,196 116,319 122,751 133,670 130,015 130,015 130,015
Total non current liabilities 213,181 234,223 229,344 286,510 261,929 261,929 261,929
TOTAL LIABILITIES 325,178 344,268 357,027 420,519 396,480 398,454 398,454
NET ASSETS 5 736,906 815,702 908,306 943,292 1,003,771 1,017,119 1,017,119
COMMUNITY WEALTH/EQUITY
Accumulated Surplus/(Deficit) 678,958 730,710 842,496 876,973 882,799 920,799 920,799
Reserves 4 57,948 84,992 65,810 66,320 104,320 96,320 96,320
TOTAL COMMUNITY WEALTH/EQUITY 5 736,906 815,702 908,306 943,292 987,119 1,017,119 1,017,119
Current Year 2016/17
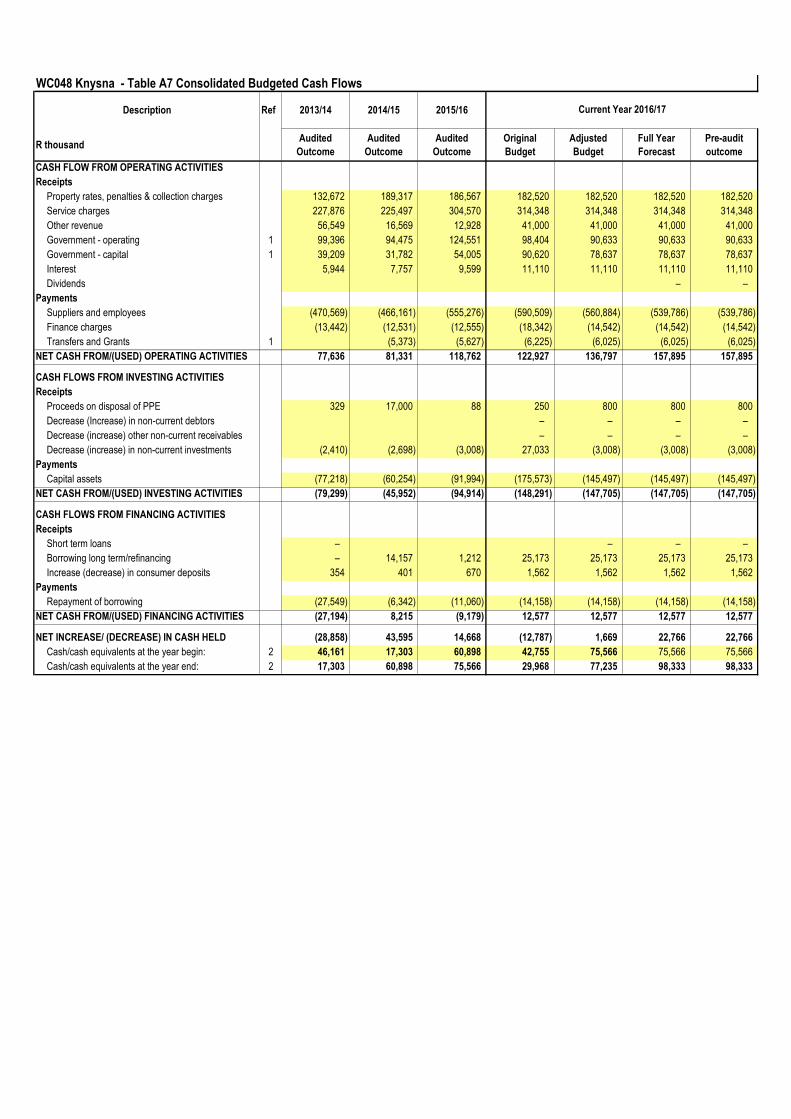
WC048 Knysna - Table A7 Consolidated Budgeted Cash Flows
Description Ref 2013/14 2014/15 2015/16
R thousandAudited
Outcome
Audited
Outcome
Audited
Outcome
Original
Budget
Adjusted
Budget
Full Year
Forecast
Pre-audit
outcome
CASH FLOW FROM OPERATING ACTIVITIES
Receipts
Property rates, penalties & collection charges 132,672 189,317 186,567 182,520 182,520 182,520 182,520
Service charges 227,876 225,497 304,570 314,348 314,348 314,348 314,348
Other revenue 56,549 16,569 12,928 41,000 41,000 41,000 41,000
Government - operating 1 99,396 94,475 124,551 98,404 90,633 90,633 90,633
Government - capital 1 39,209 31,782 54,005 90,620 78,637 78,637 78,637
Interest 5,944 7,757 9,599 11,110 11,110 11,110 11,110
Dividends – –
Payments
Suppliers and employees (470,569) (466,161) (555,276) (590,509) (560,884) (539,786) (539,786)
Finance charges (13,442) (12,531) (12,555) (18,342) (14,542) (14,542) (14,542)
Transfers and Grants 1 (5,373) (5,627) (6,225) (6,025) (6,025) (6,025)
NET CASH FROM/(USED) OPERATING ACTIVITIES 77,636 81,331 118,762 122,927 136,797 157,895 157,895
CASH FLOWS FROM INVESTING ACTIVITIES
Receipts
Proceeds on disposal of PPE 329 17,000 88 250 800 800 800
Decrease (Increase) in non-current debtors – – – –
Decrease (increase) other non-current receivables – – – –
Decrease (increase) in non-current investments (2,410) (2,698) (3,008) 27,033 (3,008) (3,008) (3,008)
Payments
Capital assets (77,218) (60,254) (91,994) (175,573) (145,497) (145,497) (145,497)
NET CASH FROM/(USED) INVESTING ACTIVITIES (79,299) (45,952) (94,914) (148,291) (147,705) (147,705) (147,705)
CASH FLOWS FROM FINANCING ACTIVITIES
Receipts
Short term loans – – – –
Borrowing long term/refinancing – 14,157 1,212 25,173 25,173 25,173 25,173
Increase (decrease) in consumer deposits 354 401 670 1,562 1,562 1,562 1,562
Payments
Repayment of borrowing (27,549) (6,342) (11,060) (14,158) (14,158) (14,158) (14,158)
NET CASH FROM/(USED) FINANCING ACTIVITIES (27,194) 8,215 (9,179) 12,577 12,577 12,577 12,577
NET INCREASE/ (DECREASE) IN CASH HELD (28,858) 43,595 14,668 (12,787) 1,669 22,766 22,766
Cash/cash equivalents at the year begin: 2 46,161 17,303 60,898 42,755 75,566 75,566 75,566
Cash/cash equivalents at the year end: 2 17,303 60,898 75,566 29,968 77,235 98,333 98,333
Current Year 2016/17
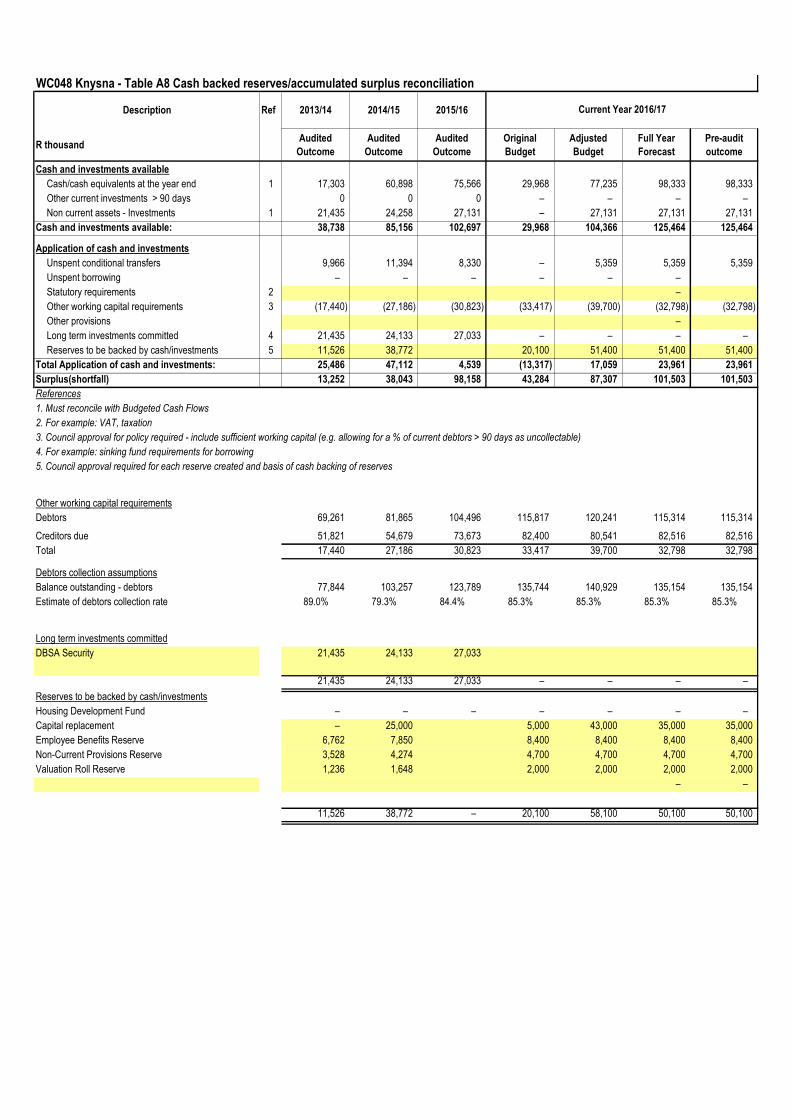
WC048 Knysna - Table A8 Cash backed reserves/accumulated surplus reconciliation
Description Ref 2013/14 2014/15 2015/16
R thousandAudited
Outcome
Audited
Outcome
Audited
Outcome
Original
Budget
Adjusted
Budget
Full Year
Forecast
Pre-audit
outcome
Cash and investments available
Cash/cash equivalents at the year end 1 17,303 60,898 75,566 29,968 77,235 98,333 98,333
Other current investments > 90 days 0 0 0 – – – –
Non current assets - Investments 1 21,435 24,258 27,131 – 27,131 27,131 27,131
Cash and investments available: 38,738 85,156 102,697 29,968 104,366 125,464 125,464
Application of cash and investments
Unspent conditional transfers 9,966 11,394 8,330 – 5,359 5,359 5,359
Unspent borrowing – – – – – –
Statutory requirements 2 –
Other working capital requirements 3 (17,440) (27,186) (30,823) (33,417) (39,700) (32,798) (32,798)
Other provisions –
Long term investments committed 4 21,435 24,133 27,033 – – – –
Reserves to be backed by cash/investments 5 11,526 38,772 20,100 51,400 51,400 51,400
Total Application of cash and investments: 25,486 47,112 4,539 (13,317) 17,059 23,961 23,961
Surplus(shortfall) 13,252 38,043 98,158 43,284 87,307 101,503 101,503
References
1. Must reconcile with Budgeted Cash Flows
2. For example: VAT, taxation
3. Council approval for policy required - include sufficient working capital (e.g. allowing for a % of current debtors > 90 days as uncollectable)
4. For example: sinking fund requirements for borrowing
5. Council approval required for each reserve created and basis of cash backing of reserves
Other working capital requirements
Debtors 69,261 81,865 104,496 115,817 120,241 115,314 115,314
Creditors due 51,821 54,679 73,673 82,400 80,541 82,516 82,516
Total 17,440 27,186 30,823 33,417 39,700 32,798 32,798
Debtors collection assumptions
Balance outstanding - debtors 77,844 103,257 123,789 135,744 140,929 135,154 135,154
Estimate of debtors collection rate 89.0% 79.3% 84.4% 85.3% 85.3% 85.3% 85.3%
Long term investments committed
DBSA Security 21,435 24,133 27,033
21,435 24,133 27,033 – – – –
Reserves to be backed by cash/investments
Housing Development Fund – – – – – – –
Capital replacement – 25,000 5,000 43,000 35,000 35,000
Employee Benefits Reserve 6,762 7,850 8,400 8,400 8,400 8,400
Non-Current Provisions Reserve 3,528 4,274 4,700 4,700 4,700 4,700
Valuation Roll Reserve 1,236 1,648 2,000 2,000 2,000 2,000
– –
11,526 38,772 – 20,100 58,100 50,100 50,100
Current Year 2016/17
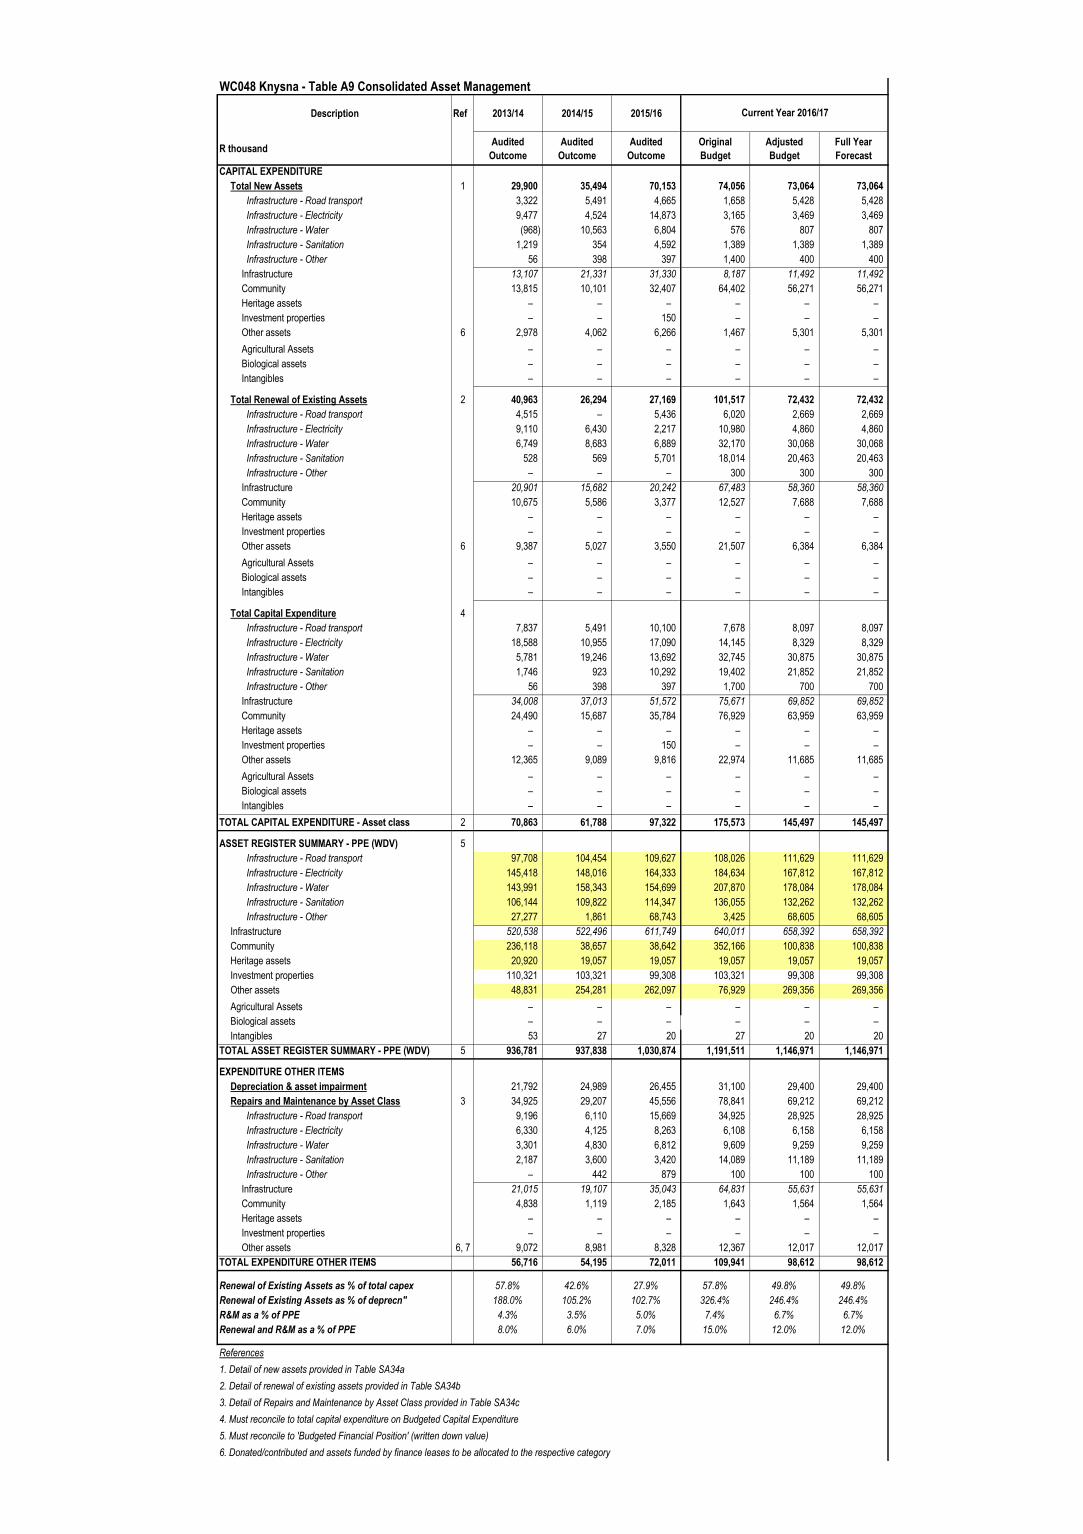
WC048 Knysna - Table A9 Consolidated Asset Management
Description Ref 2013/14 2014/15 2015/16
R thousandAudited
Outcome
Audited
Outcome
Audited
Outcome
Original
Budget
Adjusted
Budget
Full Year
Forecast
CAPITAL EXPENDITURE
Total New Assets 1 29,900 35,494 70,153 74,056 73,064 73,064
Infrastructure - Road transport 3,322 5,491 4,665 1,658 5,428 5,428
Infrastructure - Electricity 9,477 4,524 14,873 3,165 3,469 3,469
Infrastructure - Water (968) 10,563 6,804 576 807 807
Infrastructure - Sanitation 1,219 354 4,592 1,389 1,389 1,389
Infrastructure - Other 56 398 397 1,400 400 400
Infrastructure 13,107 21,331 31,330 8,187 11,492 11,492
Community 13,815 10,101 32,407 64,402 56,271 56,271
Heritage assets – – – – – –
Investment properties – – 150 – – –
Other assets 6 2,978 4,062 6,266 1,467 5,301 5,301
Agricultural Assets – – – – – –
Biological assets – – – – – –
Intangibles – – – – – –
Total Renewal of Existing Assets 2 40,963 26,294 27,169 101,517 72,432 72,432
Infrastructure - Road transport 4,515 – 5,436 6,020 2,669 2,669
Infrastructure - Electricity 9,110 6,430 2,217 10,980 4,860 4,860
Infrastructure - Water 6,749 8,683 6,889 32,170 30,068 30,068
Infrastructure - Sanitation 528 569 5,701 18,014 20,463 20,463
Infrastructure - Other – – – 300 300 300
Infrastructure 20,901 15,682 20,242 67,483 58,360 58,360
Community 10,675 5,586 3,377 12,527 7,688 7,688
Heritage assets – – – – – –
Investment properties – – – – – –
Other assets 6 9,387 5,027 3,550 21,507 6,384 6,384
Agricultural Assets – – – – – –
Biological assets – – – – – –
Intangibles – – – – – –
Total Capital Expenditure 4
Infrastructure - Road transport 7,837 5,491 10,100 7,678 8,097 8,097
Infrastructure - Electricity 18,588 10,955 17,090 14,145 8,329 8,329
Infrastructure - Water 5,781 19,246 13,692 32,745 30,875 30,875
Infrastructure - Sanitation 1,746 923 10,292 19,402 21,852 21,852
Infrastructure - Other 56 398 397 1,700 700 700
Infrastructure 34,008 37,013 51,572 75,671 69,852 69,852
Community 24,490 15,687 35,784 76,929 63,959 63,959
Heritage assets – – – – – –
Investment properties – – 150 – – –
Other assets 12,365 9,089 9,816 22,974 11,685 11,685
Agricultural Assets – – – – – –
Biological assets – – – – – –
Intangibles – – – – – –
TOTAL CAPITAL EXPENDITURE - Asset class 2 70,863 61,788 97,322 175,573 145,497 145,497
ASSET REGISTER SUMMARY - PPE (WDV) 5
Infrastructure - Road transport 97,708 104,454 109,627 108,026 111,629 111,629
Infrastructure - Electricity 145,418 148,016 164,333 184,634 167,812 167,812
Infrastructure - Water 143,991 158,343 154,699 207,870 178,084 178,084
Infrastructure - Sanitation 106,144 109,822 114,347 136,055 132,262 132,262
Infrastructure - Other 27,277 1,861 68,743 3,425 68,605 68,605
Infrastructure 520,538 522,496 611,749 640,011 658,392 658,392
Community 236,118 38,657 38,642 352,166 100,838 100,838
Heritage assets 20,920 19,057 19,057 19,057 19,057 19,057
Investment properties 110,321 103,321 99,308 103,321 99,308 99,308
Other assets 48,831 254,281 262,097 76,929 269,356 269,356
Agricultural Assets – – – – – –
Biological assets – – – – – –
Intangibles 53 27 20 27 20 20
TOTAL ASSET REGISTER SUMMARY - PPE (WDV) 5 936,781 937,838 1,030,874 1,191,511 1,146,971 1,146,971
EXPENDITURE OTHER ITEMS
Depreciation & asset impairment 21,792 24,989 26,455 31,100 29,400 29,400
Repairs and Maintenance by Asset Class 3 34,925 29,207 45,556 78,841 69,212 69,212
Infrastructure - Road transport 9,196 6,110 15,669 34,925 28,925 28,925
Infrastructure - Electricity 6,330 4,125 8,263 6,108 6,158 6,158
Infrastructure - Water 3,301 4,830 6,812 9,609 9,259 9,259
Infrastructure - Sanitation 2,187 3,600 3,420 14,089 11,189 11,189
Infrastructure - Other – 442 879 100 100 100
Infrastructure 21,015 19,107 35,043 64,831 55,631 55,631
Community 4,838 1,119 2,185 1,643 1,564 1,564
Heritage assets – – – – – –
Investment properties – – – – – –
Other assets 6, 7 9,072 8,981 8,328 12,367 12,017 12,017
TOTAL EXPENDITURE OTHER ITEMS 56,716 54,195 72,011 109,941 98,612 98,612
Renewal of Existing Assets as % of total capex 57.8% 42.6% 27.9% 57.8% 49.8% 49.8%
Renewal of Existing Assets as % of deprecn" 188.0% 105.2% 102.7% 326.4% 246.4% 246.4%
R&M as a % of PPE 4.3% 3.5% 5.0% 7.4% 6.7% 6.7%
Renewal and R&M as a % of PPE 8.0% 6.0% 7.0% 15.0% 12.0% 12.0%
References
1. Detail of new assets provided in Table SA34a
2. Detail of renewal of existing assets provided in Table SA34b
3. Detail of Repairs and Maintenance by Asset Class provided in Table SA34c
4. Must reconcile to total capital expenditure on Budgeted Capital Expenditure
5. Must reconcile to 'Budgeted Financial Position' (written down value)
6. Donated/contributed and assets funded by finance leases to be allocated to the respective category
Current Year 2016/17
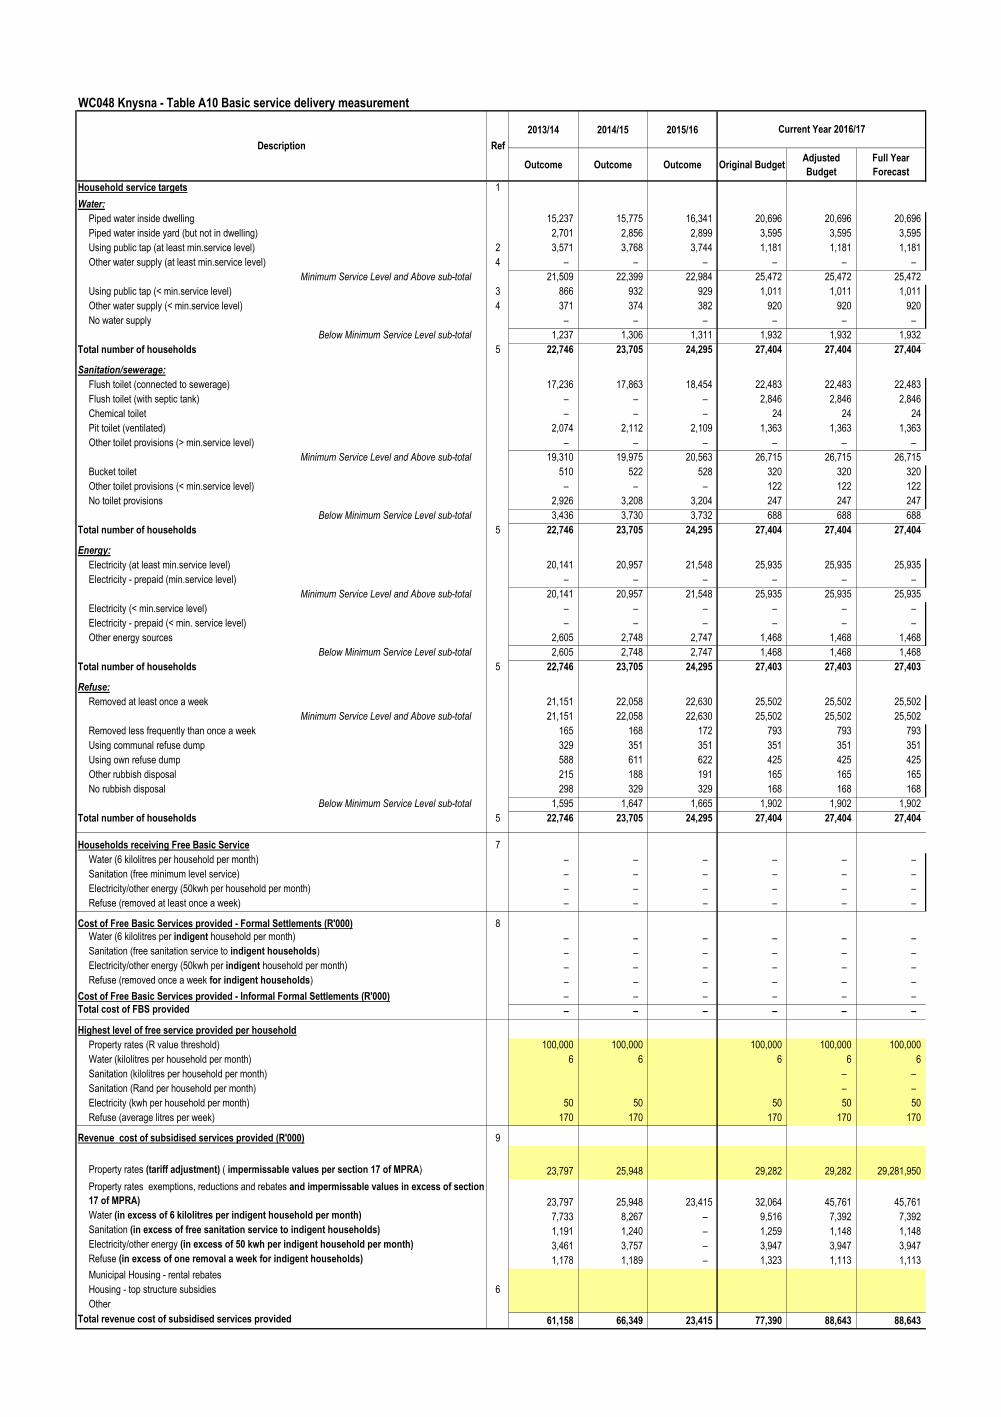
WC048 Knysna - Table A10 Basic service delivery measurement
2013/14 2014/15 2015/16
Outcome Outcome Outcome Original BudgetAdjusted
Budget
Full Year
Forecast
Household service targets 1
Water:
Piped water inside dwelling 15,237 15,775 16,341 20,696 20,696 20,696
Piped water inside yard (but not in dwelling) 2,701 2,856 2,899 3,595 3,595 3,595
Using public tap (at least min.service level) 2 3,571 3,768 3,744 1,181 1,181 1,181
Other water supply (at least min.service level) 4 – – – – – –
Minimum Service Level and Above sub-total 21,509 22,399 22,984 25,472 25,472 25,472
Using public tap (< min.service level) 3 866 932 929 1,011 1,011 1,011
Other water supply (< min.service level) 4 371 374 382 920 920 920
No water supply – – – – – –
Below Minimum Service Level sub-total 1,237 1,306 1,311 1,932 1,932 1,932
Total number of households 5 22,746 23,705 24,295 27,404 27,404 27,404
Sanitation/sewerage:
Flush toilet (connected to sewerage) 17,236 17,863 18,454 22,483 22,483 22,483
Flush toilet (with septic tank) – – – 2,846 2,846 2,846
Chemical toilet – – – 24 24 24
Pit toilet (ventilated) 2,074 2,112 2,109 1,363 1,363 1,363
Other toilet provisions (> min.service level) – – – – – –
Minimum Service Level and Above sub-total 19,310 19,975 20,563 26,715 26,715 26,715
Bucket toilet 510 522 528 320 320 320
Other toilet provisions (< min.service level) – – – 122 122 122
No toilet provisions 2,926 3,208 3,204 247 247 247
Below Minimum Service Level sub-total 3,436 3,730 3,732 688 688 688
Total number of households 5 22,746 23,705 24,295 27,404 27,404 27,404
Energy:
Electricity (at least min.service level) 20,141 20,957 21,548 25,935 25,935 25,935
Electricity - prepaid (min.service level) – – – – – –
Minimum Service Level and Above sub-total 20,141 20,957 21,548 25,935 25,935 25,935
Electricity (< min.service level) – – – – – –
Electricity - prepaid (< min. service level) – – – – – –
Other energy sources 2,605 2,748 2,747 1,468 1,468 1,468
Below Minimum Service Level sub-total 2,605 2,748 2,747 1,468 1,468 1,468
Total number of households 5 22,746 23,705 24,295 27,403 27,403 27,403
Refuse:
Removed at least once a week 21,151 22,058 22,630 25,502 25,502 25,502
Minimum Service Level and Above sub-total 21,151 22,058 22,630 25,502 25,502 25,502
Removed less frequently than once a week 165 168 172 793 793 793
Using communal refuse dump 329 351 351 351 351 351
Using own refuse dump 588 611 622 425 425 425
Other rubbish disposal 215 188 191 165 165 165
No rubbish disposal 298 329 329 168 168 168
Below Minimum Service Level sub-total 1,595 1,647 1,665 1,902 1,902 1,902
Total number of households 5 22,746 23,705 24,295 27,404 27,404 27,404
Households receiving Free Basic Service 7
Water (6 kilolitres per household per month) – – – – – –
Sanitation (free minimum level service) – – – – – –
Electricity/other energy (50kwh per household per month) – – – – – –
Refuse (removed at least once a week) – – – – – –
Cost of Free Basic Services provided - Formal Settlements (R'000) 8
Water (6 kilolitres per indigent household per month) – – – – – –
Sanitation (free sanitation service to indigent households) – – – – – –
Electricity/other energy (50kwh per indigent household per month) – – – – – –
Refuse (removed once a week for indigent households) – – – – – –
Cost of Free Basic Services provided - Informal Formal Settlements (R'000) – – – – – –
Total cost of FBS provided – – – – – –
Highest level of free service provided per household
Property rates (R value threshold) 100,000 100,000 100,000 100,000 100,000
Water (kilolitres per household per month) 6 6 6 6 6
Sanitation (kilolitres per household per month) – –
Sanitation (Rand per household per month) – –
Electricity (kwh per household per month) 50 50 50 50 50
Refuse (average litres per week) 170 170 170 170 170
Revenue cost of subsidised services provided (R'000) 9
Property rates (tariff adjustment) ( impermissable values per section 17 of MPRA) 23,797 25,948 29,282 29,282 29,281,950
Property rates exemptions, reductions and rebates and impermissable values in excess of section
17 of MPRA) 23,797 25,948 23,415 32,064 45,761 45,761
Water (in excess of 6 kilolitres per indigent household per month) 7,733 8,267 – 9,516 7,392 7,392
Sanitation (in excess of free sanitation service to indigent households) 1,191 1,240 – 1,259 1,148 1,148
Electricity/other energy (in excess of 50 kwh per indigent household per month) 3,461 3,757 – 3,947 3,947 3,947
Refuse (in excess of one removal a week for indigent households) 1,178 1,189 – 1,323 1,113 1,113
Municipal Housing - rental rebates
Housing - top structure subsidies 6
Other
Total revenue cost of subsidised services provided 61,158 66,349 23,415 77,390 88,643 88,643
Current Year 2016/17
Description Ref
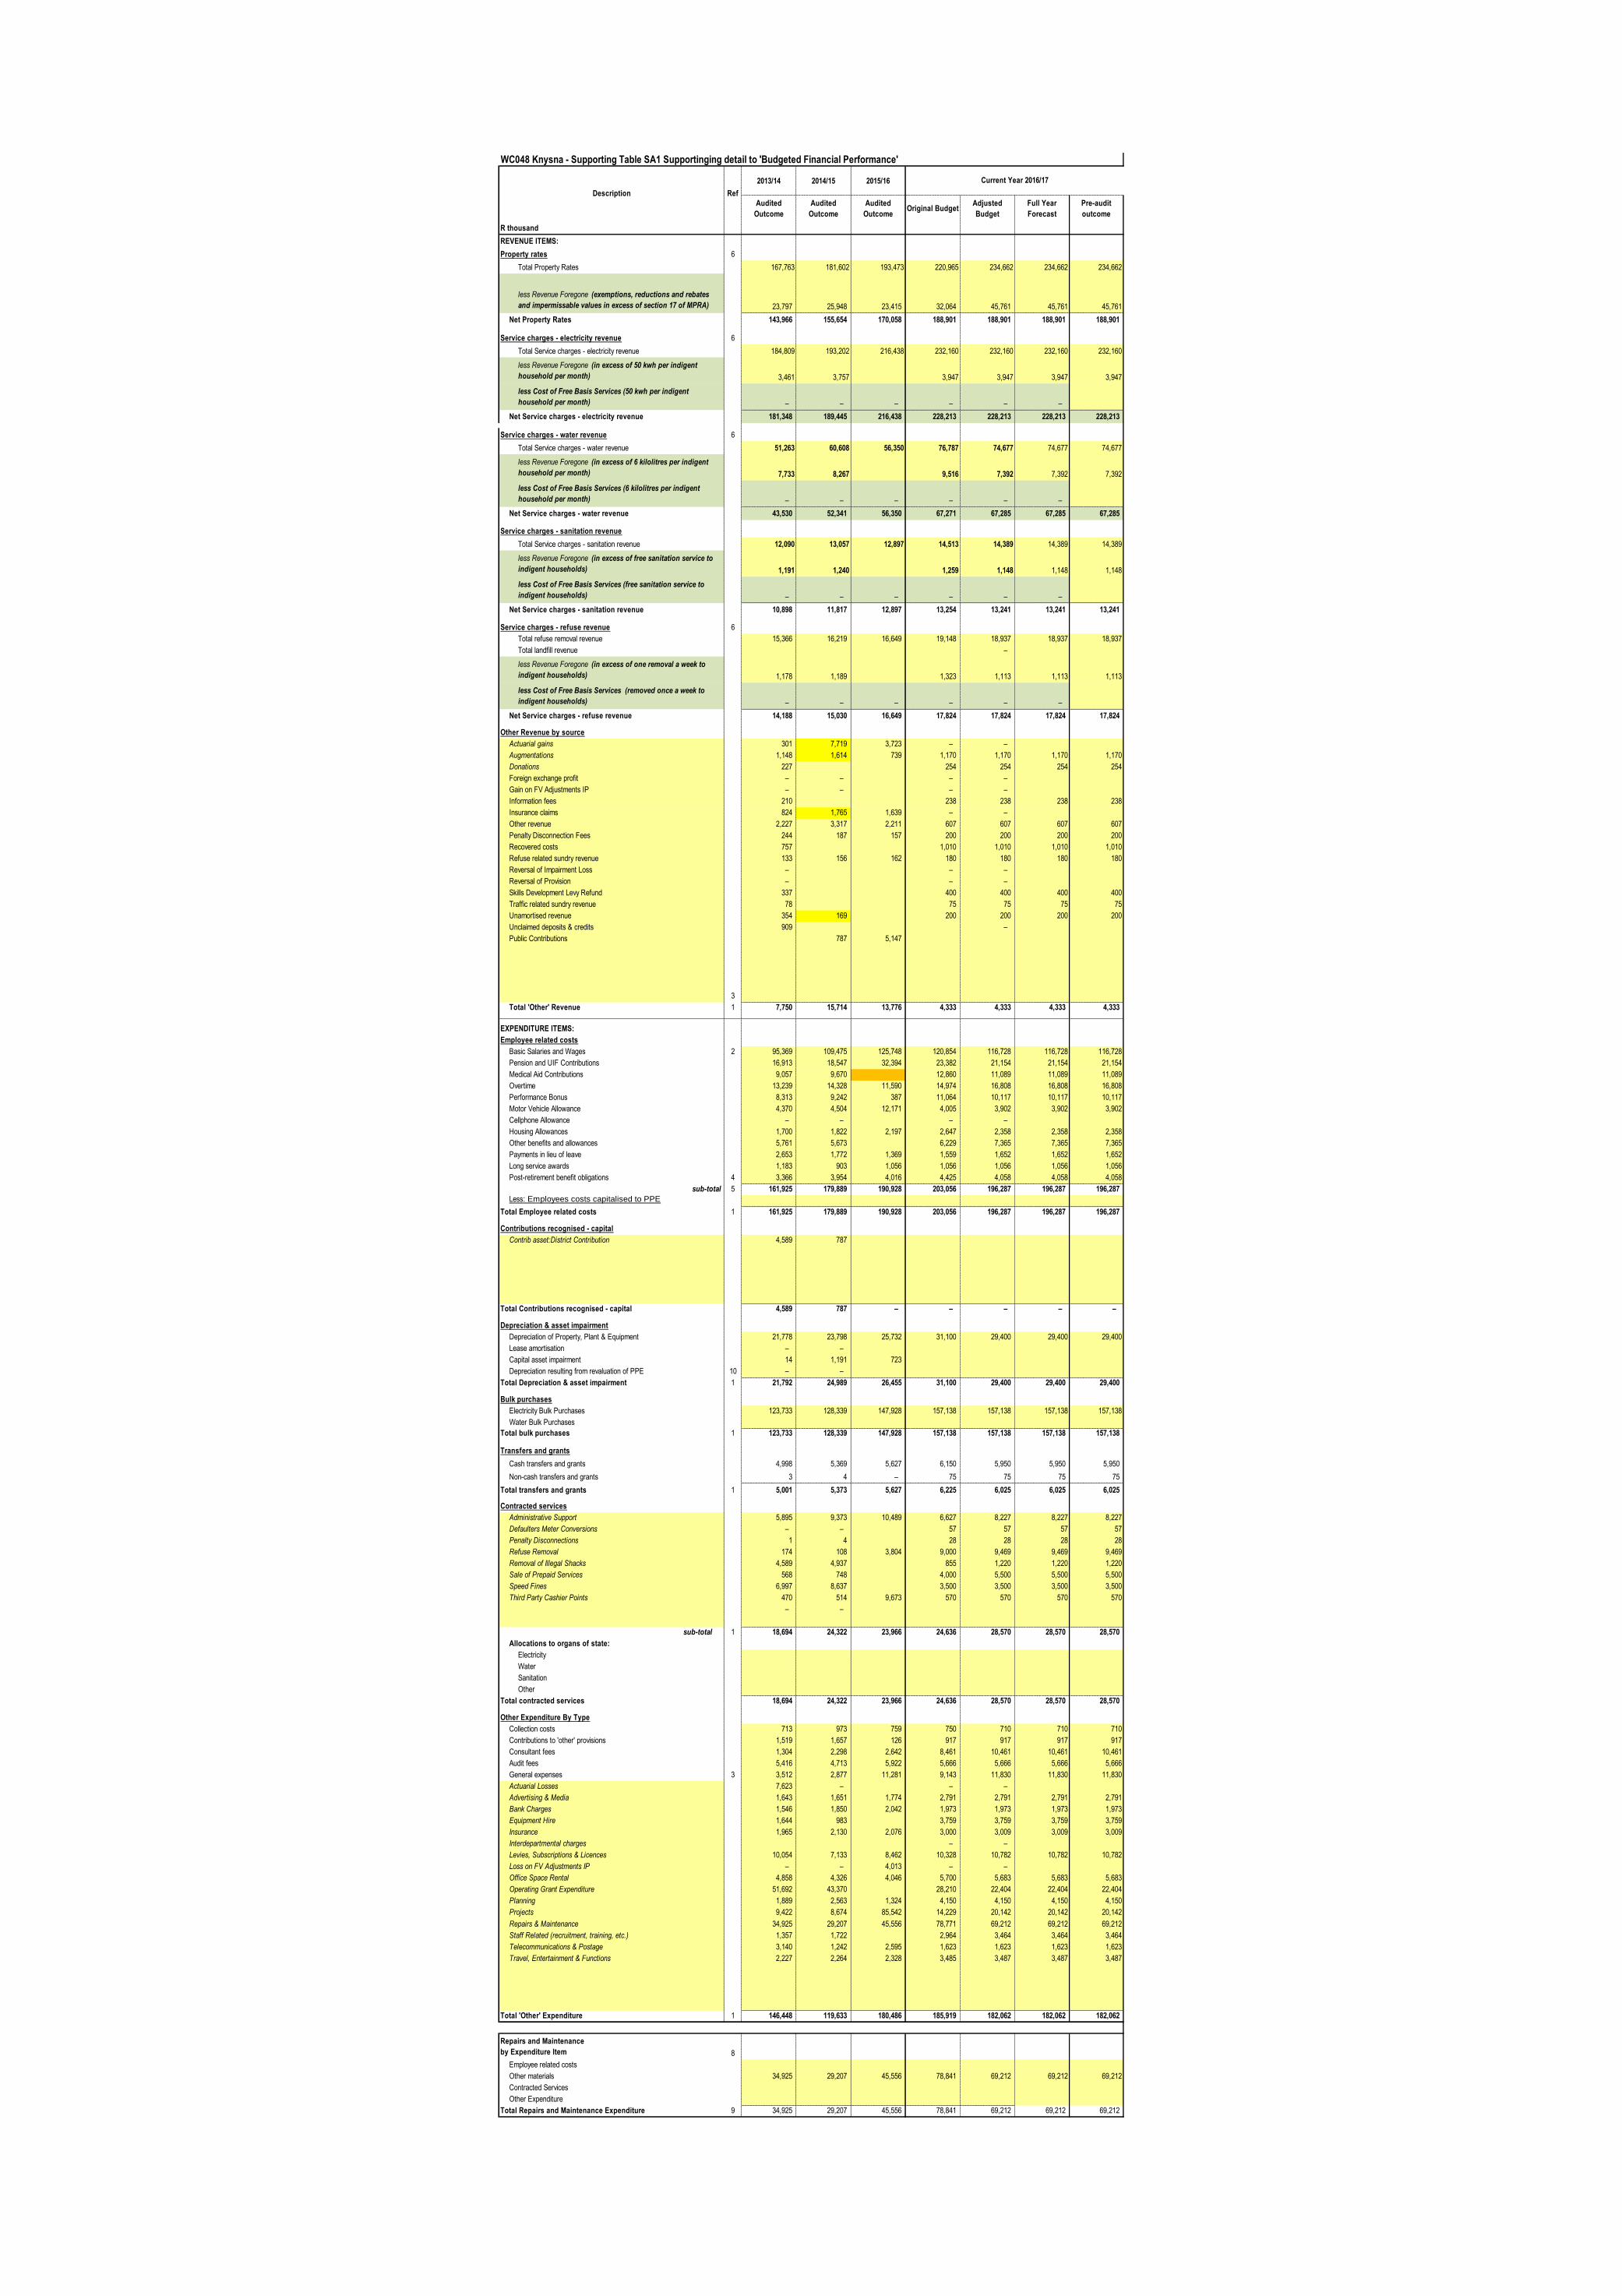
WC048 Knysna - Supporting Table SA1 Supportinging detail to 'Budgeted Financial Performance'
2013/14 2014/15 2015/16
Audited
Outcome
Audited
Outcome
Audited
OutcomeOriginal Budget
Adjusted
Budget
Full Year
Forecast
Pre-audit
outcome
R thousand
REVENUE ITEMS:
Property rates 6
Total Property Rates 167,763 181,602 193,473 220,965 234,662 234,662 234,662
less Revenue Foregone (exemptions, reductions and rebates
and impermissable values in excess of section 17 of MPRA) 23,797 25,948 23,415 32,064 45,761 45,761 45,761
Net Property Rates 143,966 155,654 170,058 188,901 188,901 188,901 188,901
Service charges - electricity revenue 6
Total Service charges - electricity revenue 184,809 193,202 216,438 232,160 232,160 232,160 232,160
less Revenue Foregone (in excess of 50 kwh per indigent
household per month) 3,461 3,757 3,947 3,947 3,947 3,947
less Cost of Free Basis Services (50 kwh per indigent
household per month) – – – – – –
Net Service charges - electricity revenue 181,348 189,445 216,438 228,213 228,213 228,213 228,213
Service charges - water revenue 6
Total Service charges - water revenue 51,263 60,608 56,350 76,787 74,677 74,677 74,677
less Revenue Foregone (in excess of 6 kilolitres per indigent
household per month) 7,733 8,267 9,516 7,392 7,392 7,392
less Cost of Free Basis Services (6 kilolitres per indigent
household per month) – – – – – –
Net Service charges - water revenue 43,530 52,341 56,350 67,271 67,285 67,285 67,285
Service charges - sanitation revenue
Total Service charges - sanitation revenue 12,090 13,057 12,897 14,513 14,389 14,389 14,389
less Revenue Foregone (in excess of free sanitation service to
indigent households) 1,191 1,240 1,259 1,148 1,148 1,148
less Cost of Free Basis Services (free sanitation service to
indigent households) – – – – – –
Net Service charges - sanitation revenue 10,898 11,817 12,897 13,254 13,241 13,241 13,241
Service charges - refuse revenue 6
Total refuse removal revenue 15,366 16,219 16,649 19,148 18,937 18,937 18,937
Total landfill revenue –
less Revenue Foregone (in excess of one removal a week to
indigent households) 1,178 1,189 1,323 1,113 1,113 1,113
less Cost of Free Basis Services (removed once a week to
indigent households) – – – – – –
Net Service charges - refuse revenue 14,188 15,030 16,649 17,824 17,824 17,824 17,824
Other Revenue by source
Actuarial gains 301 7,719 3,723 – –
Augmentations 1,148 1,614 739 1,170 1,170 1,170 1,170
Donations 227 254 254 254 254
Foreign exchange profit – – – –
Gain on FV Adjustments IP – – – –
Information fees 210 238 238 238 238
Insurance claims 824 1,765 1,639 – –
Other revenue 2,227 3,317 2,211 607 607 607 607
Penalty Disconnection Fees 244 187 157 200 200 200 200
Recovered costs 757 1,010 1,010 1,010 1,010
Refuse related sundry revenue 133 156 162 180 180 180 180
Reversal of Impairment Loss – – –
Reversal of Provision – – –
Skills Development Levy Refund 337 400 400 400 400
Traffic related sundry revenue 78 75 75 75 75
Unamortised revenue 354 169 200 200 200 200
Unclaimed deposits & credits 909 –
Public Contributions 787 5,147
3
Total 'Other' Revenue 1 7,750 15,714 13,776 4,333 4,333 4,333 4,333
EXPENDITURE ITEMS:
Employee related costs
Basic Salaries and Wages 2 95,369 109,475 125,748 120,854 116,728 116,728 116,728
Pension and UIF Contributions 16,913 18,547 32,394 23,382 21,154 21,154 21,154
Medical Aid Contributions 9,057 9,670 12,860 11,089 11,089 11,089
Overtime 13,239 14,328 11,590 14,974 16,808 16,808 16,808
Performance Bonus 8,313 9,242 387 11,064 10,117 10,117 10,117
Motor Vehicle Allowance 4,370 4,504 12,171 4,005 3,902 3,902 3,902
Cellphone Allowance – – – –
Housing Allowances 1,700 1,822 2,197 2,647 2,358 2,358 2,358
Other benefits and allowances 5,761 5,673 6,229 7,365 7,365 7,365
Payments in lieu of leave 2,653 1,772 1,369 1,559 1,652 1,652 1,652
Long service awards 1,183 903 1,056 1,056 1,056 1,056 1,056
Post-retirement benefit obligations 4 3,366 3,954 4,016 4,425 4,058 4,058 4,058
sub-total 5 161,925 179,889 190,928 203,056 196,287 196,287 196,287
Less: Employees costs capitalised to PPE
Total Employee related costs 1 161,925 179,889 190,928 203,056 196,287 196,287 196,287
Contributions recognised - capital
Contrib asset:District Contribution 4,589 787
Total Contributions recognised - capital 4,589 787 – – – – –
Depreciation & asset impairment
Depreciation of Property, Plant & Equipment 21,778 23,798 25,732 31,100 29,400 29,400 29,400
Lease amortisation – –
Capital asset impairment 14 1,191 723
Depreciation resulting from revaluation of PPE 10 – –
Total Depreciation & asset impairment 1 21,792 24,989 26,455 31,100 29,400 29,400 29,400
Bulk purchases
Electricity Bulk Purchases 123,733 128,339 147,928 157,138 157,138 157,138 157,138
Water Bulk Purchases
Total bulk purchases 1 123,733 128,339 147,928 157,138 157,138 157,138 157,138
Transfers and grants
Cash transfers and grants 4,998 5,369 5,627 6,150 5,950 5,950 5,950
Non-cash transfers and grants 3 4 – 75 75 75 75
Total transfers and grants 1 5,001 5,373 5,627 6,225 6,025 6,025 6,025
Contracted services
Administrative Support 5,895 9,373 10,489 6,627 8,227 8,227 8,227
Defaulters Meter Conversions – – 57 57 57 57
Penalty Disconnections 1 4 28 28 28 28
Refuse Removal 174 108 3,804 9,000 9,469 9,469 9,469
Removal of Illegal Shacks 4,589 4,937 855 1,220 1,220 1,220
Sale of Prepaid Services 568 748 4,000 5,500 5,500 5,500
Speed Fines 6,997 8,637 3,500 3,500 3,500 3,500
Third Party Cashier Points 470 514 9,673 570 570 570 570
– –
sub-total 1 18,694 24,322 23,966 24,636 28,570 28,570 28,570
Allocations to organs of state:
Electricity
Water
Sanitation
Other
Total contracted services 18,694 24,322 23,966 24,636 28,570 28,570 28,570
Other Expenditure By Type
Collection costs 713 973 759 750 710 710 710
Contributions to 'other' provisions 1,519 1,657 126 917 917 917 917
Consultant fees 1,304 2,298 2,642 8,461 10,461 10,461 10,461
Audit fees 5,416 4,713 5,922 5,666 5,666 5,666 5,666
General expenses 3 3,512 2,877 11,281 9,143 11,830 11,830 11,830
Actuarial Losses 7,623 – – –
Advertising & Media 1,643 1,651 1,774 2,791 2,791 2,791 2,791
Bank Charges 1,546 1,850 2,042 1,973 1,973 1,973 1,973
Equipment Hire 1,644 983 3,759 3,759 3,759 3,759
Insurance 1,965 2,130 2,076 3,000 3,009 3,009 3,009
Interdepartmental charges – –
Levies, Subscriptions & Licences 10,054 7,133 8,462 10,328 10,782 10,782 10,782
Loss on FV Adjustments IP – – 4,013 – –
Office Space Rental 4,858 4,326 4,046 5,700 5,683 5,683 5,683
Operating Grant Expenditure 51,692 43,370 28,210 22,404 22,404 22,404
Planning 1,889 2,563 1,324 4,150 4,150 4,150 4,150
Projects 9,422 8,674 85,542 14,229 20,142 20,142 20,142
Repairs & Maintenance 34,925 29,207 45,556 78,771 69,212 69,212 69,212
Staff Related (recruitment, training, etc.) 1,357 1,722 2,964 3,464 3,464 3,464
Telecommunications & Postage 3,140 1,242 2,595 1,623 1,623 1,623 1,623
Travel, Entertainment & Functions 2,227 2,264 2,328 3,485 3,487 3,487 3,487
Total 'Other' Expenditure 1 146,448 119,633 180,486 185,919 182,062 182,062 182,062
Repairs and Maintenance
by Expenditure Item 8
Employee related costs
Other materials 34,925 29,207 45,556 78,841 69,212 69,212 69,212
Contracted Services
Other Expenditure
Total Repairs and Maintenance Expenditure 9 34,925 29,207 45,556 78,841 69,212 69,212 69,212
Current Year 2016/17
Description Ref
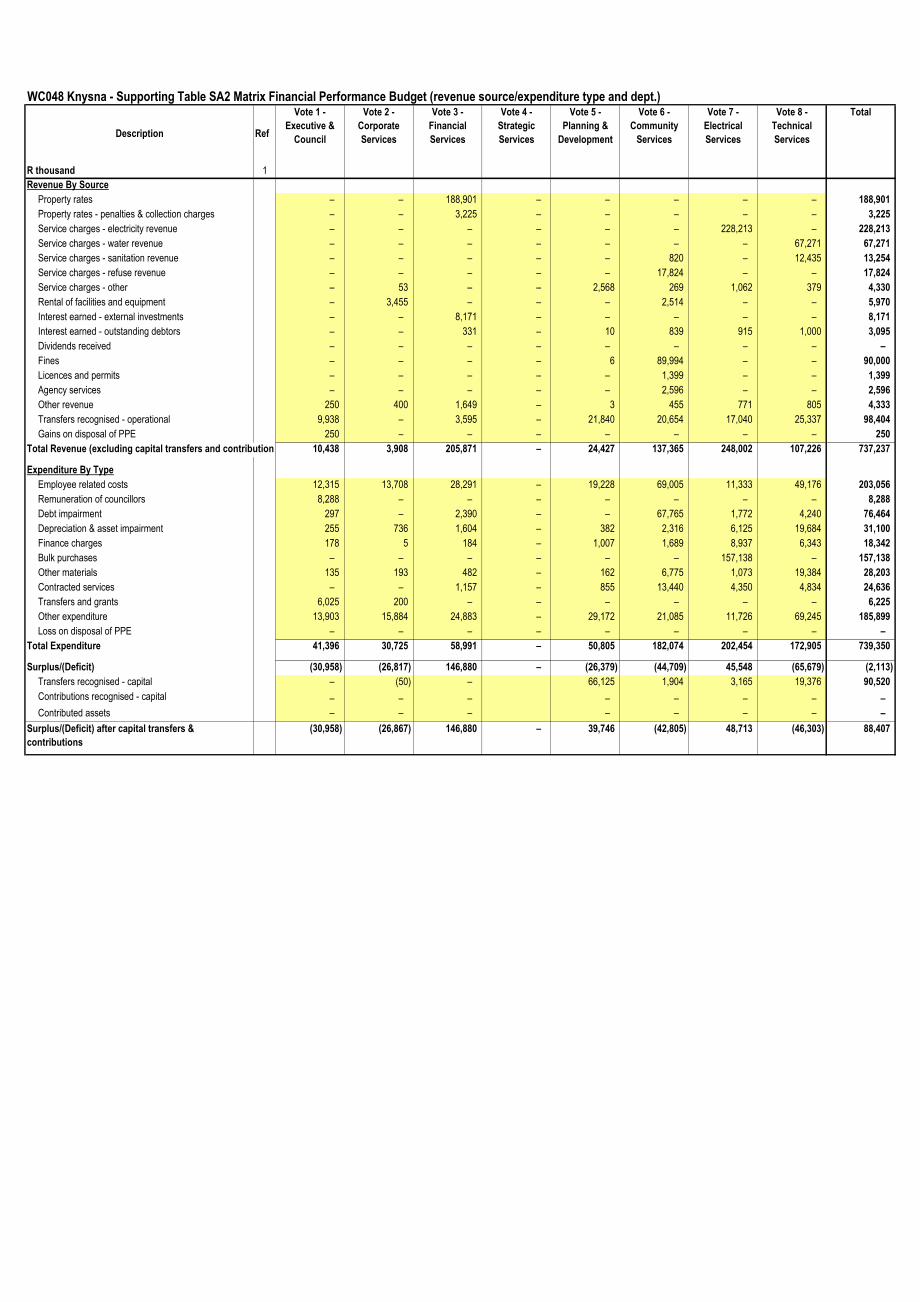
WC048 Knysna - Supporting Table SA2 Matrix Financial Performance Budget (revenue source/expenditure type and dept.)
Description Ref
R thousand 1
Revenue By Source
Property rates – – 188,901 – – – – – 188,901
Property rates - penalties & collection charges – – 3,225 – – – – – 3,225
Service charges - electricity revenue – – – – – – 228,213 – 228,213
Service charges - water revenue – – – – – – – 67,271 67,271
Service charges - sanitation revenue – – – – – 820 – 12,435 13,254
Service charges - refuse revenue – – – – – 17,824 – – 17,824
Service charges - other – 53 – – 2,568 269 1,062 379 4,330
Rental of facilities and equipment – 3,455 – – – 2,514 – – 5,970
Interest earned - external investments – – 8,171 – – – – – 8,171
Interest earned - outstanding debtors – – 331 – 10 839 915 1,000 3,095
Dividends received – – – – – – – – –
Fines – – – – 6 89,994 – – 90,000
Licences and permits – – – – – 1,399 – – 1,399
Agency services – – – – – 2,596 – – 2,596
Other revenue 250 400 1,649 – 3 455 771 805 4,333
Transfers recognised - operational 9,938 – 3,595 – 21,840 20,654 17,040 25,337 98,404
Gains on disposal of PPE 250 – – – – – – – 250
Total Revenue (excluding capital transfers and contributions) 10,438 3,908 205,871 – 24,427 137,365 248,002 107,226 737,237
Expenditure By Type
Employee related costs 12,315 13,708 28,291 – 19,228 69,005 11,333 49,176 203,056
Remuneration of councillors 8,288 – – – – – – – 8,288
Debt impairment 297 – 2,390 – – 67,765 1,772 4,240 76,464
Depreciation & asset impairment 255 736 1,604 – 382 2,316 6,125 19,684 31,100
Finance charges 178 5 184 – 1,007 1,689 8,937 6,343 18,342
Bulk purchases – – – – – – 157,138 – 157,138
Other materials 135 193 482 – 162 6,775 1,073 19,384 28,203
Contracted services – – 1,157 – 855 13,440 4,350 4,834 24,636
Transfers and grants 6,025 200 – – – – – – 6,225
Other expenditure 13,903 15,884 24,883 – 29,172 21,085 11,726 69,245 185,899
Loss on disposal of PPE – – – – – – – – –
Total Expenditure 41,396 30,725 58,991 – 50,805 182,074 202,454 172,905 739,350
Surplus/(Deficit) (30,958) (26,817) 146,880 – (26,379) (44,709) 45,548 (65,679) (2,113)
Transfers recognised - capital – (50) – 66,125 1,904 3,165 19,376 90,520
Contributions recognised - capital – – – – – – – –
Contributed assets – – – – – – – –
Surplus/(Deficit) after capital transfers &
contributions
(30,958) (26,867) 146,880 – 39,746 (42,805) 48,713 (46,303) 88,407
Vote 5 -
Planning &
Development
Vote 6 -
Community
Services
Vote 1 -
Executive &
Council
Vote 2 -
Corporate
Services
Vote 3 -
Financial
Services
Vote 4 -
Strategic
Services
TotalVote 7 -
Electrical
Services
Vote 8 -
Technical
Services
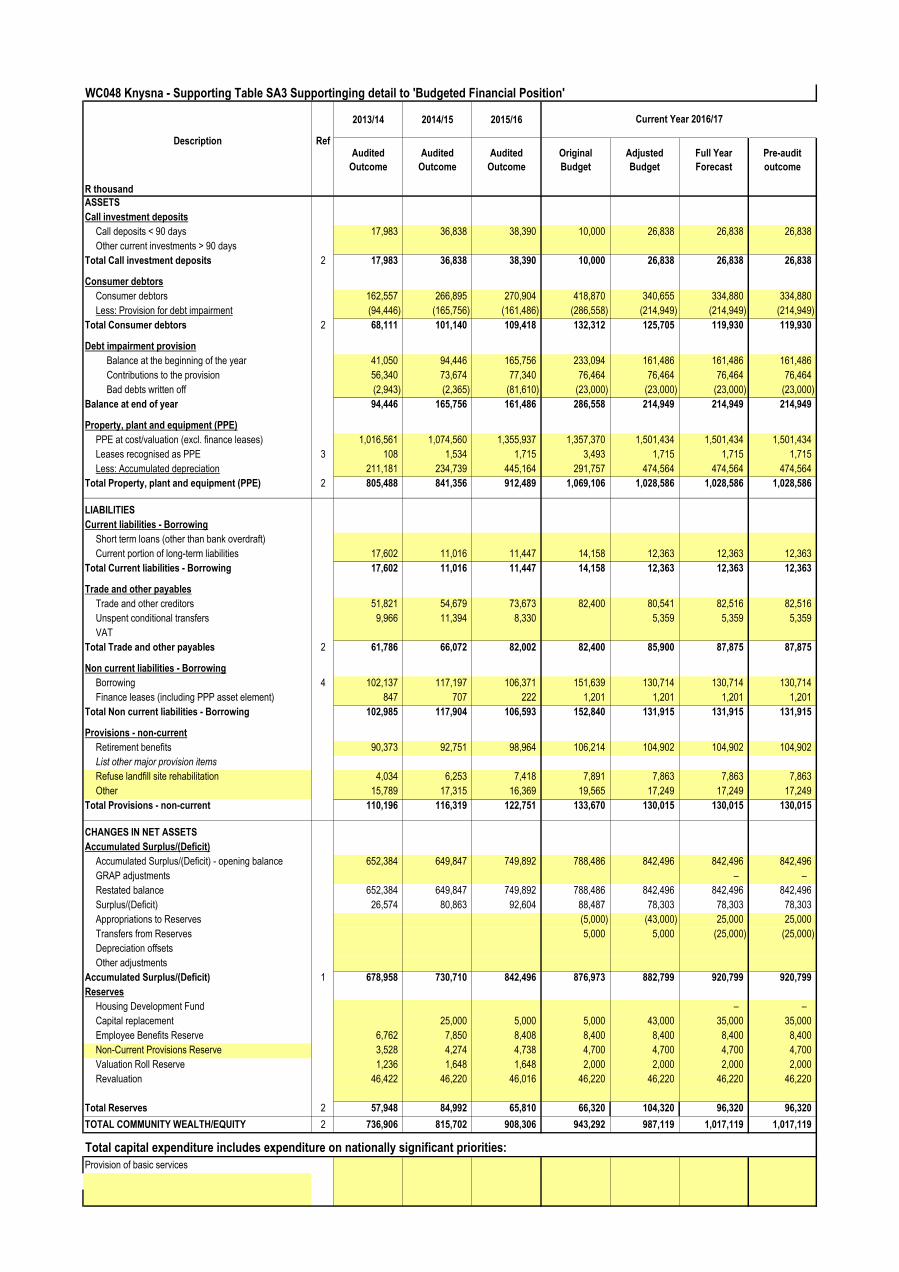
WC048 Knysna - Supporting Table SA3 Supportinging detail to 'Budgeted Financial Position'
2013/14 2014/15 2015/16
Audited
Outcome
Audited
Outcome
Audited
Outcome
Original
Budget
Adjusted
Budget
Full Year
Forecast
Pre-audit
outcome
R thousand
ASSETS
Call investment deposits
Call deposits < 90 days 17,983 36,838 38,390 10,000 26,838 26,838 26,838
Other current investments > 90 days
Total Call investment deposits 2 17,983 36,838 38,390 10,000 26,838 26,838 26,838
Consumer debtors
Consumer debtors 162,557 266,895 270,904 418,870 340,655 334,880 334,880
Less: Provision for debt impairment (94,446) (165,756) (161,486) (286,558) (214,949) (214,949) (214,949)
Total Consumer debtors 2 68,111 101,140 109,418 132,312 125,705 119,930 119,930
Debt impairment provision
Balance at the beginning of the year 41,050 94,446 165,756 233,094 161,486 161,486 161,486
Contributions to the provision 56,340 73,674 77,340 76,464 76,464 76,464 76,464
Bad debts written off (2,943) (2,365) (81,610) (23,000) (23,000) (23,000) (23,000)
Balance at end of year 94,446 165,756 161,486 286,558 214,949 214,949 214,949
Property, plant and equipment (PPE)
PPE at cost/valuation (excl. finance leases) 1,016,561 1,074,560 1,355,937 1,357,370 1,501,434 1,501,434 1,501,434
Leases recognised as PPE 3 108 1,534 1,715 3,493 1,715 1,715 1,715
Less: Accumulated depreciation 211,181 234,739 445,164 291,757 474,564 474,564 474,564
Total Property, plant and equipment (PPE) 2 805,488 841,356 912,489 1,069,106 1,028,586 1,028,586 1,028,586
LIABILITIES
Current liabilities - Borrowing
Short term loans (other than bank overdraft)
Current portion of long-term liabilities 17,602 11,016 11,447 14,158 12,363 12,363 12,363
Total Current liabilities - Borrowing 17,602 11,016 11,447 14,158 12,363 12,363 12,363
Trade and other payables
Trade and other creditors 51,821 54,679 73,673 82,400 80,541 82,516 82,516
Unspent conditional transfers 9,966 11,394 8,330 5,359 5,359 5,359
VAT
Total Trade and other payables 2 61,786 66,072 82,002 82,400 85,900 87,875 87,875
Non current liabilities - Borrowing
Borrowing 4 102,137 117,197 106,371 151,639 130,714 130,714 130,714
Finance leases (including PPP asset element) 847 707 222 1,201 1,201 1,201 1,201
Total Non current liabilities - Borrowing 102,985 117,904 106,593 152,840 131,915 131,915 131,915
Provisions - non-current
Retirement benefits 90,373 92,751 98,964 106,214 104,902 104,902 104,902
List other major provision items
Refuse landfill site rehabilitation 4,034 6,253 7,418 7,891 7,863 7,863 7,863
Other 15,789 17,315 16,369 19,565 17,249 17,249 17,249
Total Provisions - non-current 110,196 116,319 122,751 133,670 130,015 130,015 130,015
CHANGES IN NET ASSETS
Accumulated Surplus/(Deficit)
Accumulated Surplus/(Deficit) - opening balance 652,384 649,847 749,892 788,486 842,496 842,496 842,496
GRAP adjustments – –
Restated balance 652,384 649,847 749,892 788,486 842,496 842,496 842,496
Surplus/(Deficit) 26,574 80,863 92,604 88,487 78,303 78,303 78,303
Appropriations to Reserves (5,000) (43,000) 25,000 25,000
Transfers from Reserves 5,000 5,000 (25,000) (25,000)
Depreciation offsets
Other adjustments
Accumulated Surplus/(Deficit) 1 678,958 730,710 842,496 876,973 882,799 920,799 920,799
Reserves
Housing Development Fund – –
Capital replacement 25,000 5,000 5,000 43,000 35,000 35,000
Employee Benefits Reserve 6,762 7,850 8,408 8,400 8,400 8,400 8,400
Non-Current Provisions Reserve 3,528 4,274 4,738 4,700 4,700 4,700 4,700
Valuation Roll Reserve 1,236 1,648 1,648 2,000 2,000 2,000 2,000
Revaluation 46,422 46,220 46,016 46,220 46,220 46,220 46,220
Total Reserves 2 57,948 84,992 65,810 66,320 104,320 96,320 96,320
TOTAL COMMUNITY WEALTH/EQUITY 2 736,906 815,702 908,306 943,292 987,119 1,017,119 1,017,119
Total capital expenditure includes expenditure on nationally significant priorities:
Provision of basic services
Description Ref
Current Year 2016/17

WC048 Knysna - Supporting Table SA4 Reconciliation of IDP strategic objectives and budget (revenue)
Strategic Objective GoalGoal
Code2013/14 2014/15 2015/16
R thousand
Audited
Outcome
Audited
Outcome
Audited
Outcome
Original
Budget
Adjusted
Budget
Full Year
Forecast
SFA1 - Basic Service Delivery SO1: To promote access for all
citizens to equitable, appropriate
and sustainable infrastructure and
services within a safe
environment
431,166 475,149 586,086 592,585 573,380 573,380
SFA1 - Basic Service Delivery SO2: To ensure ecological
integrity through sustainable
practices of municipal governance
3,908 – – – – –
SFA1 - Basic Service Delivery SO5: To ensure a municipality
that is committed to an innovative
approach, prudent investment of
public funds, good governance,
financial viability and optimal
institutional transformation that
accommodates diversity in service
delivery
163 258 91 – – –
SFA2 - Local Economic
Development
SO3: To create an enabling
environment for economic growth
that attracts investors,
encourages innovation and
facilitate pro-poor interventions
3,601 3,227 3,294 13,810 13,810 13,810
SFA3 - Municipal Financial
Viability & Transformation
SO5: To ensure a municipality
that is committed to an innovative
approach, prudent investment of
public funds, good governance,
financial viability and optimal
institutional transformation that
accommodates diversity in service
delivery
157,167 174,448 189,215 205,868 205,868 205,868
SFA4 - Municipal Transformation
& Organisational Development
SO5: To ensure a municipality
that is committed to an innovative
approach, prudent investment of
public funds, good governance,
financial viability and optimal
institutional transformation that
accommodates diversity in service
delivery
3,469 5,988 3,406 4,706 4,706 4,706
SFA4 - Municipal Transformation
& Organisational Development
SO6: To develop progressive
strategies to optimise the use of
available human resources
337 306 245 400 400 400
SFA5 - Good Governance &
Public Participation
SO5: To ensure a municipality
that is committed to an innovative
approach, prudent investment of
public funds, good governance,
financial viability and optimal
institutional transformation that
accommodates diversity in service
delivery
4,074 3,018 4,926 5,969 5,969 5,969
SFA5 - Good Governance &
Public Participation
SO7: To establish a common
vision and create coherence in
government’s work by seeking
close partnerships with citizenry
4,839 21,476 7,509 4,519 4,519 4,519
Allocations to other priorities 2
Total Revenue (excluding capital transfers and contributions) 1 608,725 683,871 794,772 827,857 808,652 808,652
Current Year 2016/17
Ref
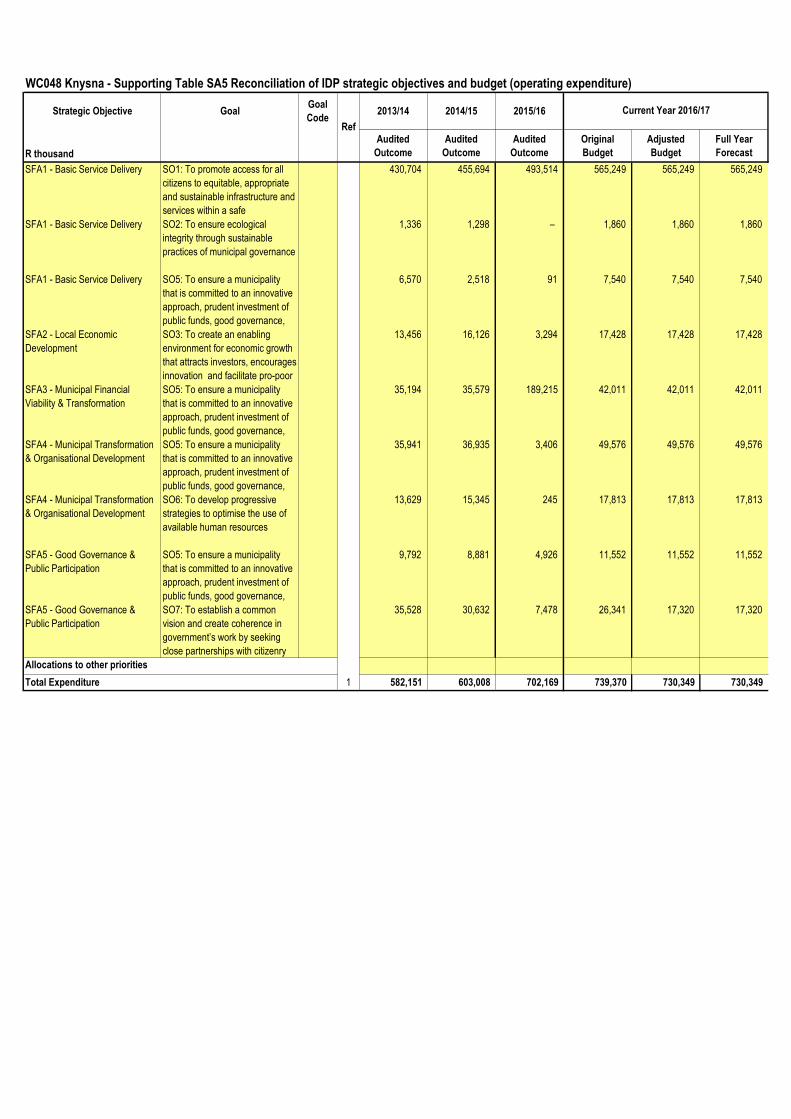
WC048 Knysna - Supporting Table SA5 Reconciliation of IDP strategic objectives and budget (operating expenditure)
Strategic Objective GoalGoal
Code2013/14 2014/15 2015/16
R thousand
Audited
Outcome
Audited
Outcome
Audited
Outcome
Original
Budget
Adjusted
Budget
Full Year
Forecast
SFA1 - Basic Service Delivery SO1: To promote access for all
citizens to equitable, appropriate
and sustainable infrastructure and
services within a safe
environment
430,704 455,694 493,514 565,249 565,249 565,249
SFA1 - Basic Service Delivery SO2: To ensure ecological
integrity through sustainable
practices of municipal governance
1,336 1,298 – 1,860 1,860 1,860
SFA1 - Basic Service Delivery SO5: To ensure a municipality
that is committed to an innovative
approach, prudent investment of
public funds, good governance,
financial viability and optimal
6,570 2,518 91 7,540 7,540 7,540
SFA2 - Local Economic
Development
SO3: To create an enabling
environment for economic growth
that attracts investors, encourages
innovation and facilitate pro-poor
interventions
13,456 16,126 3,294 17,428 17,428 17,428
SFA3 - Municipal Financial
Viability & Transformation
SO5: To ensure a municipality
that is committed to an innovative
approach, prudent investment of
public funds, good governance,
financial viability and optimal
35,194 35,579 189,215 42,011 42,011 42,011
SFA4 - Municipal Transformation
& Organisational Development
SO5: To ensure a municipality
that is committed to an innovative
approach, prudent investment of
public funds, good governance,
financial viability and optimal
35,941 36,935 3,406 49,576 49,576 49,576
SFA4 - Municipal Transformation
& Organisational Development
SO6: To develop progressive
strategies to optimise the use of
available human resources
13,629 15,345 245 17,813 17,813 17,813
SFA5 - Good Governance &
Public Participation
SO5: To ensure a municipality
that is committed to an innovative
approach, prudent investment of
public funds, good governance,
financial viability and optimal
9,792 8,881 4,926 11,552 11,552 11,552
SFA5 - Good Governance &
Public Participation
SO7: To establish a common
vision and create coherence in
government’s work by seeking
close partnerships with citizenry
35,528 30,632 7,478 26,341 17,320 17,320
Allocations to other priorities
Total Expenditure 1 582,151 603,008 702,169 739,370 730,349 730,349
Current Year 2016/17
Ref

WC048 Knysna - Supporting Table SA6 Reconciliation of IDP strategic objectives and budget (capital expenditure)
Strategic Objective GoalGoal
Code2013/14 2014/15 2015/16
R thousand
Audited
Outcome
Audited
Outcome
Audited
Outcome
Original
Budget
Adjusted
Budget
Full Year
Forecast
SFA1 - Basic Service Delivery SO1: To promote access for all
citizens to equitable, appropriate
and sustainable infrastructure and
services within a safe
environment
A 62,479 52,412 96,236 149,550 140,897 140,897
SFA1 - Basic Service Delivery SO2: To ensure ecological
integrity through sustainable
practices of municipal governance
B – 487 – 4,600 4,600 4,600
SFA1 - Basic Service Delivery SO5: To ensure a municipality
that is committed to an innovative
approach, prudent investment of
public funds, good governance,
financial viability and optimal
C – – – – –
SFA2 - Local Economic
Development
SO3: To create an enabling
environment for economic growth
that attracts investors, encourages
innovation and facilitate pro-poor
interventions
D – 518 – – –
SFA3 - Municipal Financial
Viability & Transformation
SO5: To ensure a municipality
that is committed to an innovative
approach, prudent investment of
public funds, good governance,
financial viability and optimal
E – – 131 – –
SFA4 - Municipal Transformation
& Organisational Development
SO5: To ensure a municipality
that is committed to an innovative
approach, prudent investment of
public funds, good governance,
financial viability and optimal
F – – – – –
SFA4 - Municipal Transformation
& Organisational Development
SO6: To develop progressive
strategies to optimise the use of
available human resources
G 79 – – – –
SFA5 - Good Governance &
Public Participation
SO5: To ensure a municipality
that is committed to an innovative
approach, prudent investment of
public funds, good governance,
financial viability and optimal
H 1,706 430 – – –
SFA5 - Good Governance &
Public Participation
SO7: To establish a common
vision and create coherence in
government’s work by seeking
close partnerships with citizenry
I (6,355) 123 955 – –
Allocations to other priorities 3 –
Total Capital Expenditure 1 70,863 61,788 97,321 175,573 145,497 145,497
Current Year 2016/17
Ref
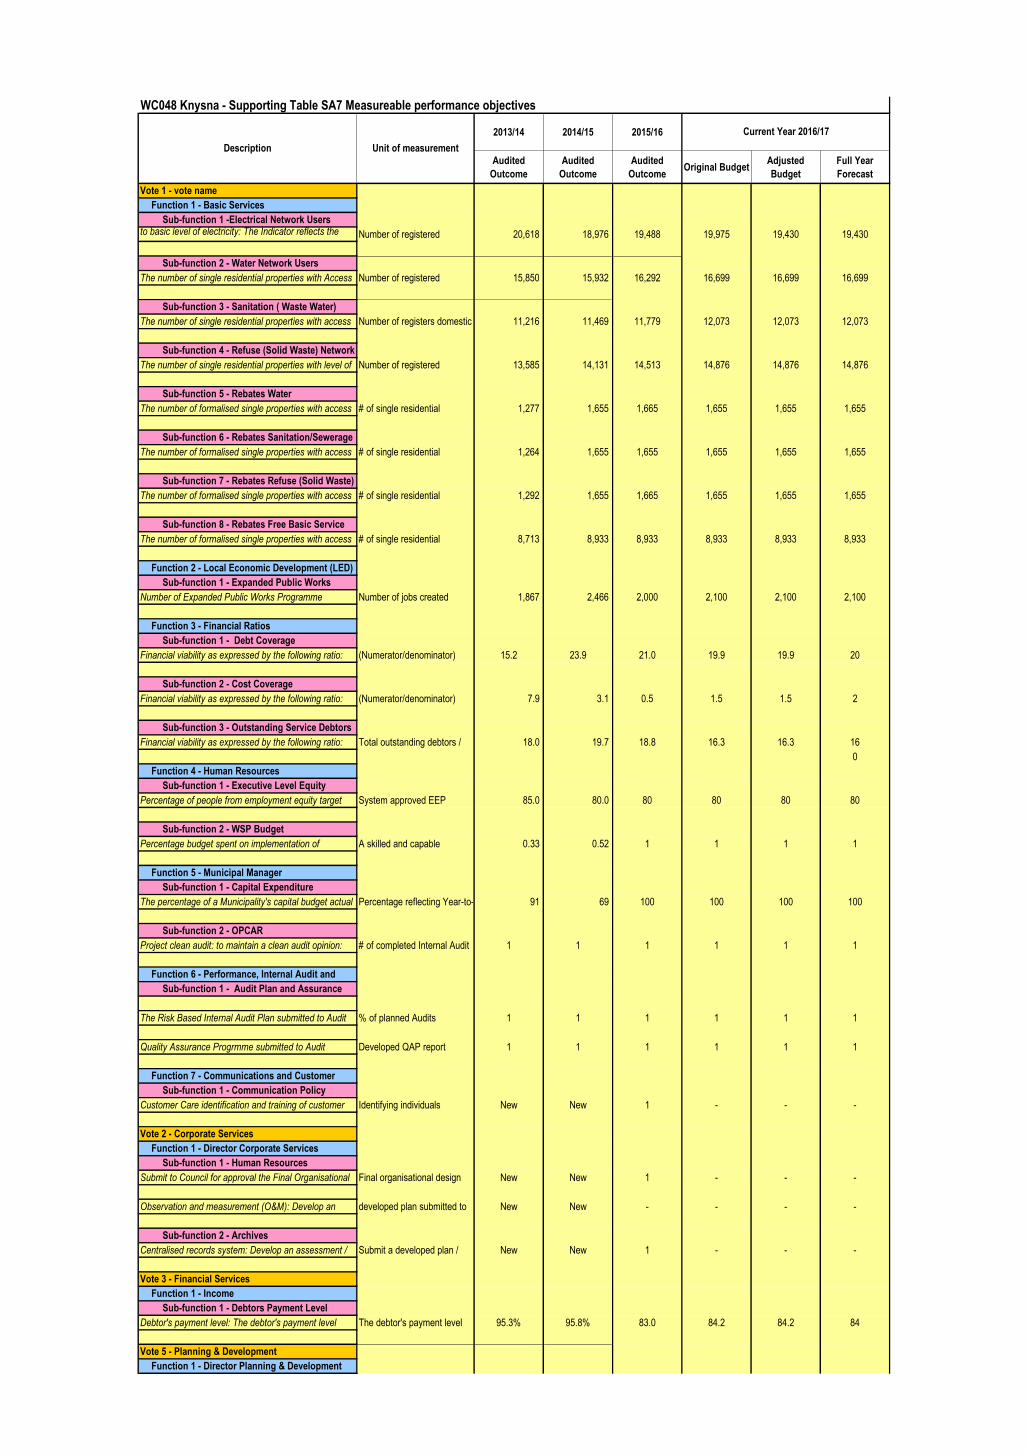
WC048 Knysna - Supporting Table SA7 Measureable performance objectives
2013/14 2014/15 2015/16
Audited
Outcome
Audited
Outcome
Audited
OutcomeOriginal Budget
Adjusted
Budget
Full Year
Forecast
Vote 1 - vote name
Function 1 - Basic Services
Sub-function 1 -Electrical Network UsersThe number of single residential properties with access
to basic level of electricity: The Indicator reflects the Number of registered
consumers on the Promun
20,618 18,976 19,488 19,975 19,430 19,430
Sub-function 2 - Water Network Users
The number of single residential properties with Access
to basic level of water: The Indicator reflects the
Number of registered
consumers on the Promun
15,850 15,932 16,292 16,699 16,699 16,699
Sub-function 3 - Sanitation ( Waste Water)
Network UsersThe number of single residential properties with access
to basic level of sanitation: The indicator reflects the
Number of registers domestic
consumers on the Promun
11,216 11,469 11,779 12,073 12,073 12,073
Sub-function 4 - Refuse (Solid Waste) Network
UsersThe number of single residential properties with level of
solid waste removal: The indicator reflects the number
Number of registered
domestic consumers on the
13,585 14,131 14,513 14,876 14,876 14,876
Sub-function 5 - Rebates Water
The number of formalised single properties with access
to free basic service: WATER: The indicator reflects
# of single residential
properties receiving free
1,277 1,655 1,665 1,655 1,655 1,655
Sub-function 6 - Rebates Sanitation/Sewerage
(Waste Water)The number of formalised single properties with access
to free basic service: SANITATION / SEWERAGE: The
# of single residential
properties receiving free
1,264 1,655 1,655 1,655 1,655 1,655
Sub-function 7 - Rebates Refuse (Solid Waste)
The number of formalised single properties with access
to free basic service: SOLID WASTE / REFUSE: The
# of single residential
properties receiving free
1,292 1,655 1,665 1,655 1,655 1,655
Sub-function 8 - Rebates Free Basic Service
ElectricityThe number of formalised single properties with access
to free basic service: ELECTRICY: This indicator
# of single residential
properties receiving free
8,713 8,933 8,933 8,933 8,933 8,933
Function 2 - Local Economic Development (LED)
Sub-function 1 - Expanded Public Works
Programme (EPWP)Number of Expanded Public Works Programme
(EPWP) job opportunities created by the organisation:
Number of jobs created 1,867 2,466 2,000 2,100 2,100 2,100
Function 3 - Financial Ratios
Sub-function 1 - Debt Coverage
Financial viability as expressed by the following ratio:
Debt Coverage: The ratio measures the ability to cover
(Numerator/denominator)
Total Revenue-Less: grants
15.2 23.9 21.0 19.9 19.9 20
Sub-function 2 - Cost Coverage
Financial viability as expressed by the following ratio:
Cost Coverage: To calculate the ability to cover fixed
(Numerator/denominator)
Cash and cash equivalent &
7.9 3.1 0.5 1.5 1.5 2
Sub-function 3 - Outstanding Service Debtors
to RevenueFinancial viability as expressed by the following ratio:
Outstanding Services Debtors Revenue: To calculate
Total outstanding debtors /
Total service revenue
18.0 19.7 18.8 16.3 16.3 16
0
Function 4 - Human Resources
Sub-function 1 - Executive Level Equity
Percentage of people from employment equity target
groups employed in the three highest levels of
System approved EEP
versus actual employment
85.0 80.0 80 80 80 80
Sub-function 2 - WSP Budget
Percentage budget spent on implementation of
workplace skill plan (WSP): Public Service employers
A skilled and capable
workforce to support
0.33 0.52 1 1 1 1
Function 5 - Municipal Manager
Sub-function 1 - Capital Expenditure
The percentage of a Municipality's capital budget actual
spent on budgeted capital projects: Percentage
Percentage reflecting Year-to-
date spend / total budget_
91 69 100 100 100 100
Sub-function 2 - OPCAR
Project clean audit: to maintain a clean audit opinion:
The indicator measures good governance and
# of completed Internal Audit
reports to the AC for
1 1 1 1 1 1
Function 6 - Performance, Internal Audit and
Risk ManagementSub-function 1 - Audit Plan and Assurance
The Risk Based Internal Audit Plan submitted to Audit
Committee: The Risk Based Audit Plan (RBAP) is
% of planned Audits
completed and submitted to
1 1 1 1 1 1
Quality Assurance Progrmme submitted to Audit
Committee: Internal Audit Quality and Improvement
Developed QAP report
submitted to Audit Committee
1 1 1 1 1 1
Function 7 - Communications and Customer
RelationsSub-function 1 - Communication Policy
Customer Care identification and training of customer
care officials: Identifying individuals responsible for
Identifying individuals
responsible for customer
New
Performance
New
Performance
1 - - -
Vote 2 - Corporate Services
Function 1 - Director Corporate Services
Sub-function 1 - Human Resources
Submit to Council for approval the Final Organisational
Design.
Final organisational design
submitted to Council
New
Performance
New
Performance
1 - - -
Observation and measurement (O&M): Develop an
assessment / plan to be submitted to Council for a way
developed plan submitted to
Council
New
Performance
New
Performance
- - - -
Sub-function 2 - Archives
Centralised records system: Develop an assessment /
plan to be submitted to Council for a way forward
Submit a developed plan /
assessment to Council
New
Performance
New
Performance
1 - - -
Vote 3 - Financial Services
Function 1 - Income
Sub-function 1 - Debtors Payment Level
Debtor's payment level: The debtor's payment level
directly relates to the municipalities' capacity to collect
The debtor's payment level
directly relates to the
95.3% 95.8% 83.0 84.2 84.2 84
Vote 5 - Planning & Development
Function 1 - Director Planning & Development
Unit of measurementDescription
Current Year 2016/17
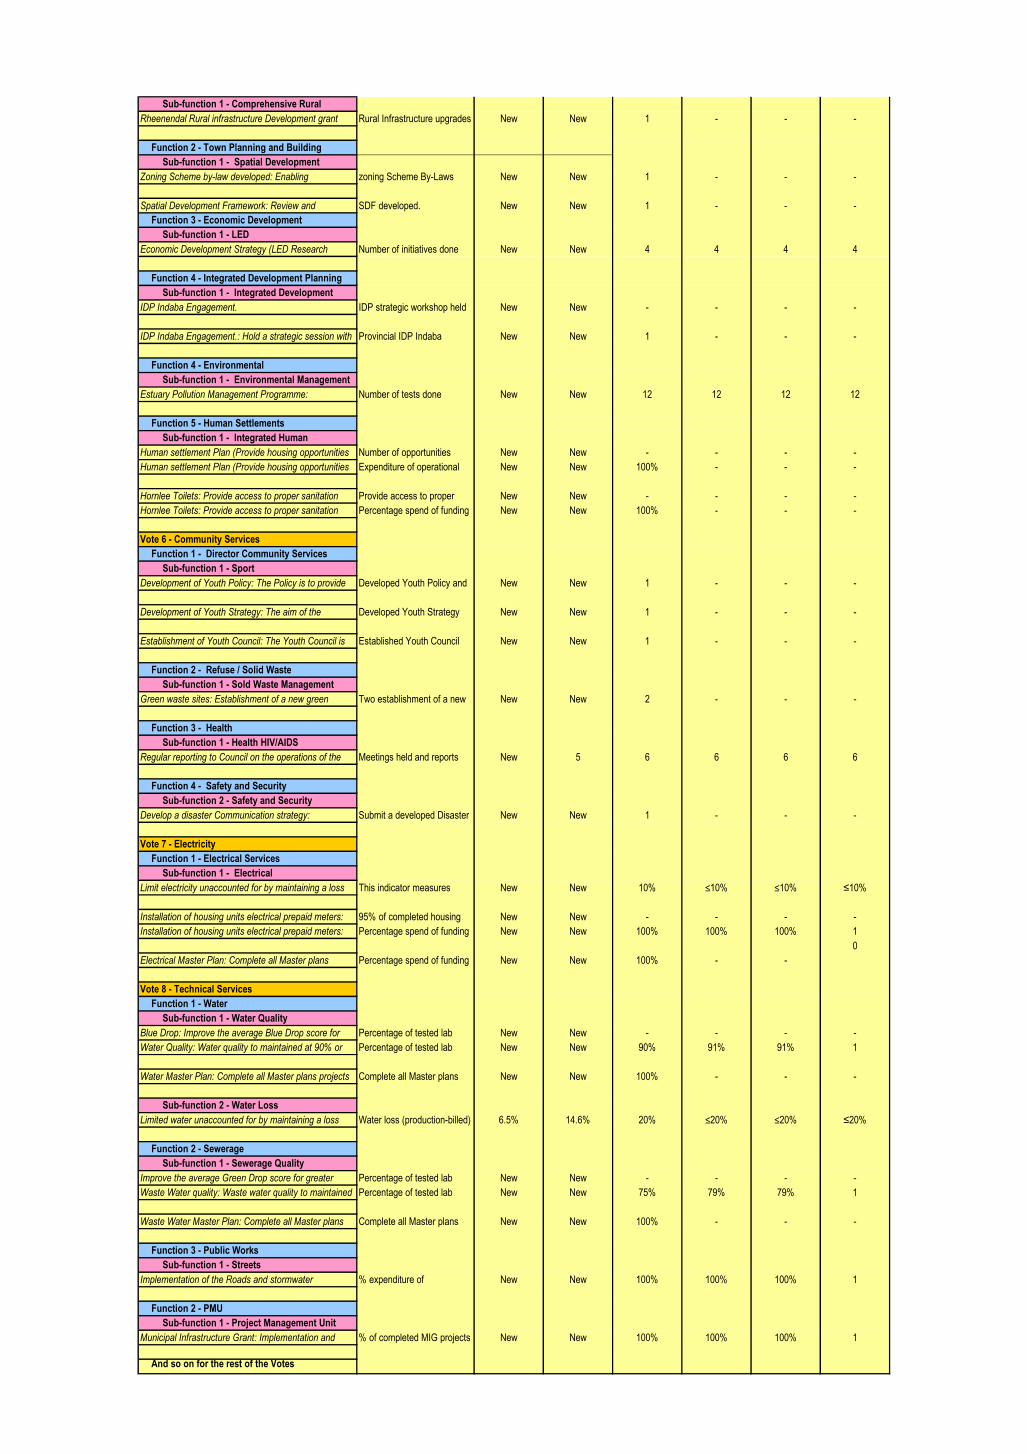
Sub-function 1 - Comprehensive Rural
Development Programme (CRDP)Rheenendal Rural infrastructure Development grant
Project: Rural Infrastructure upgrades (RID) grant
Rural Infrastructure upgrades
(RID) grant Projects in
New
Performance
New
Performance
1 - - -
Function 2 - Town Planning and Building
ControlSub-function 1 - Spatial Development
FrameworkZoning Scheme by-law developed: Enabling
institutional readiness for Spatial Planning and Land
zoning Scheme By-Laws
developed.
New
Performance
New
Performance
1 - - -
Spatial Development Framework: Review and
submission of the Spatial Development Framework
SDF developed. New
Performance
New
Performance
1 - - -
Function 3 - Economic Development
Sub-function 1 - LED
Economic Development Strategy (LED Research
initiatives).: Provide LED development and support
Number of initiatives done New
Performance
New
Performance
4 4 4 4
Function 4 - Integrated Development Planning
Sub-function 1 - Integrated Development
PlanningIDP Indaba Engagement. IDP strategic workshop held
with extended management
New
Performance
New
Performance
- - - -
IDP Indaba Engagement.: Hold a strategic session with
Western Cape Government sector departments -
Provincial IDP Indaba New
Performance
New
Performance
1 - - -
Function 4 - Environmental
Sub-function 1 - Environmental Management
Estuary Pollution Management Programme:
Recreational Water Quality monitoring
Number of tests done New
Performance
New
Performance
12 12 12 12
Function 5 - Human Settlements
Sub-function 1 - Integrated Human
SettlementsHuman settlement Plan (Provide housing opportunities
through servicing sites and building top structures).:
Number of opportunities
provided
New
Performance
New
Performance
- - - -
Human settlement Plan (Provide housing opportunities
through servicing sites and building top structures).:
Expenditure of operational
and capital funding provided.
New
Performance
New
Performance
100% - - -
Hornlee Toilets: Provide access to proper sanitation
through constructing toilets attached to houses in
Provide access to proper
sanitation through
New
Performance
New
Performance
- - - -
Hornlee Toilets: Provide access to proper sanitation
through constructing toilets attached to houses in
Percentage spend of funding
provided.
New
Performance
New
Performance
100% - - -
Vote 6 - Community Services
Function 1 - Director Community Services
Sub-function 1 - Sport
Development of Youth Policy: The Policy is to provide
the framework against which the municipality as well as
Developed Youth Policy and
submitted to Council for
New
Performance
New
Performance
1 - - -
Development of Youth Strategy: The aim of the
strategy is to address challenges and support the
Developed Youth Strategy
and submitted to Council for
New
Performance
New
Performance
1 - - -
Establishment of Youth Council: The Youth Council is
representative of different areas and the needs of the
Established Youth Council New
Performance
New
Performance
1 - - -
Function 2 - Refuse / Solid Waste
Sub-function 1 - Sold Waste Management
Green waste sites: Establishment of a new green
waste site in Knoetzie(Quarter three)and the closure
Two establishment of a new
green waste site in
New
Performance
New
Performance
2 - - -
Function 3 - Health
Sub-function 1 - Health HIV/AIDS
Regular reporting to Council on the operations of the
Greater Knysna Welfare Forum: Quarterly reports to
Meetings held and reports
submitted to Council
New
Performance
5 6 6 6 6
Function 4 - Safety and Security
Sub-function 2 - Safety and Security
Develop a disaster Communication strategy:
Development of an Integrated and comprehensive
Submit a developed Disaster
Communication strategy for
New
Performance
New
Performance
1 - - -
Vote 7 - Electricity
Function 1 - Electrical Services
Sub-function 1 - Electrical
Limit electricity unaccounted for by maintaining a loss
or less than 10%: This indicator measures
This indicator measures
unaccounted for electricity
New
Performance
New
Performance
10% ≤10% ≤10% ≤10%
Installation of housing units electrical prepaid meters:
Utilize approved integrated national electrification
95% of completed housing
units electrified
New
Performance
New
Performance
- - - -
Installation of housing units electrical prepaid meters:
Utilize approved integrated national electrification
Percentage spend of funding
provided.
New
Performance
New
Performance
100% 100% 100% 1
0
Electrical Master Plan: Complete all Master plans
projects programmed for the financial year within
Percentage spend of funding
provided.
New
Performance
New
Performance
100% - -
Vote 8 - Technical Services
Function 1 - Water
Sub-function 1 - Water Quality
Blue Drop: Improve the average Blue Drop score for
greater Knysna by improve institutional capacity as well
Percentage of tested lab
results
New
Performance
New
Performance
- - - -
Water Quality: Water quality to maintained at 90% or
above in support of the Blue Drop program
Percentage of tested lab
results
New
Performance
New
Performance
90% 91% 91% 1
Water Master Plan: Complete all Master plans projects
programmed for the financial year within available
Complete all Master plans
projects programmed for the
New
Performance
New
Performance
100% - - -
Sub-function 2 - Water Loss
Limited water unaccounted for by maintaining a loss
percentage of equal to or less 20%: The indicator
Water loss (production-billed)
/ production <20%
6.5% 14.6% 20% ≤20% ≤20% ≤20%
Function 2 - Sewerage
Sub-function 1 - Sewerage Quality
Improve the average Green Drop score for greater
Knysna by improve institutional capacity as well as
Percentage of tested lab
results
New
Performance
New
Performance
- - - -
Waste Water quality: Waste water quality to maintained
at 75% or above in support of the Green Drop program
Percentage of tested lab
results
New
Performance
New
Performance
75% 79% 79% 1
Waste Water Master Plan: Complete all Master plans
projects programmed for the financial year within
Complete all Master plans
projects programmed for the
New
Performance
New
Performance
100% - - -
Function 3 - Public Works
Sub-function 1 - Streets
Implementation of the Roads and stormwater
maintenance plan: Develop and action a Roads and
% expenditure of
maintenance budget
New
Performance
New
Performance
100% 100% 100% 1
Function 2 - PMU
Sub-function 1 - Project Management Unit
Municipal Infrastructure Grant: Implementation and
monitoring of MIG projects to be completed by June
% of completed MIG projects
by June 2016
New
Performance
New
Performance
100% 100% 100% 1
And so on for the rest of the Votes
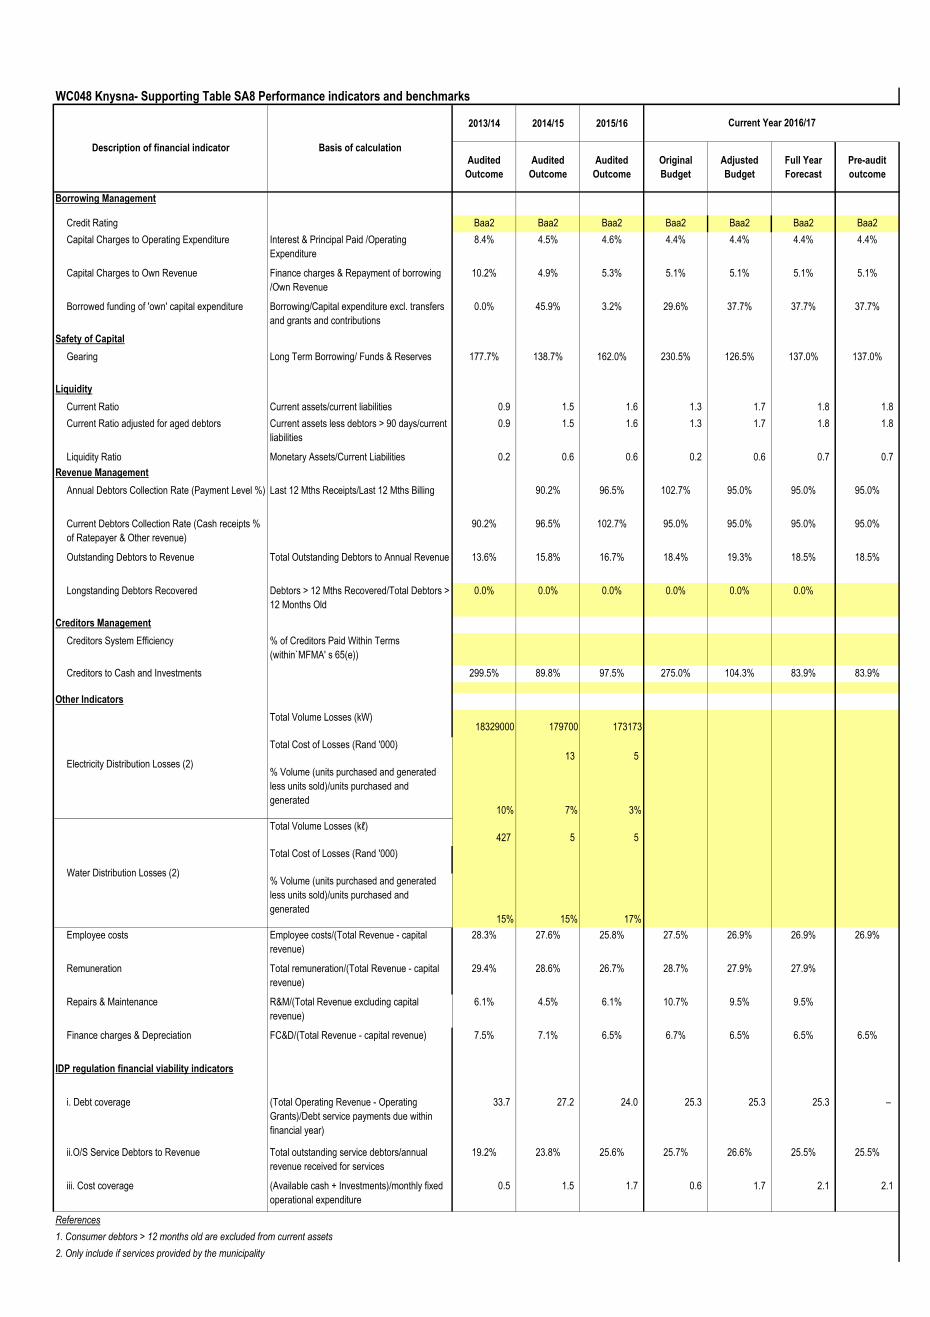
WC048 Knysna- Supporting Table SA8 Performance indicators and benchmarks
2013/14 2014/15 2015/16
Audited
Outcome
Audited
Outcome
Audited
Outcome
Original
Budget
Adjusted
Budget
Full Year
Forecast
Pre-audit
outcome
Borrowing Management
Credit Rating Baa2 Baa2 Baa2 Baa2 Baa2 Baa2 Baa2
Capital Charges to Operating Expenditure Interest & Principal Paid /Operating
Expenditure
8.4% 4.5% 4.6% 4.4% 4.4% 4.4% 4.4%
Capital Charges to Own Revenue Finance charges & Repayment of borrowing
/Own Revenue
10.2% 4.9% 5.3% 5.1% 5.1% 5.1% 5.1%
Borrowed funding of 'own' capital expenditure Borrowing/Capital expenditure excl. transfers
and grants and contributions
0.0% 45.9% 3.2% 29.6% 37.7% 37.7% 37.7%
Safety of Capital
Gearing Long Term Borrowing/ Funds & Reserves 177.7% 138.7% 162.0% 230.5% 126.5% 137.0% 137.0%
Liquidity
Current Ratio Current assets/current liabilities 0.9 1.5 1.6 1.3 1.7 1.8 1.8
Current Ratio adjusted for aged debtors Current assets less debtors > 90 days/current
liabilities
0.9 1.5 1.6 1.3 1.7 1.8 1.8
Liquidity Ratio Monetary Assets/Current Liabilities 0.2 0.6 0.6 0.2 0.6 0.7 0.7
Revenue Management
Annual Debtors Collection Rate (Payment Level %) Last 12 Mths Receipts/Last 12 Mths Billing 90.2% 96.5% 102.7% 95.0% 95.0% 95.0%
Current Debtors Collection Rate (Cash receipts %
of Ratepayer & Other revenue)
90.2% 96.5% 102.7% 95.0% 95.0% 95.0% 95.0%
Outstanding Debtors to Revenue Total Outstanding Debtors to Annual Revenue 13.6% 15.8% 16.7% 18.4% 19.3% 18.5% 18.5%
Longstanding Debtors Recovered Debtors > 12 Mths Recovered/Total Debtors >
12 Months Old
0.0% 0.0% 0.0% 0.0% 0.0% 0.0%
Creditors Management
Creditors System Efficiency % of Creditors Paid Within Terms
(within`MFMA' s 65(e))
Creditors to Cash and Investments 299.5% 89.8% 97.5% 275.0% 104.3% 83.9% 83.9%
Other Indicators
Total Volume Losses (kW)18329000 179700 173173
Total Cost of Losses (Rand '000)13 5
% Volume (units purchased and generated
less units sold)/units purchased and
generated10% 7% 3%
Total Volume Losses (kℓ)427 5 5
Total Cost of Losses (Rand '000)
% Volume (units purchased and generated
less units sold)/units purchased and
generated15% 15% 17%
Employee costs Employee costs/(Total Revenue - capital
revenue)
28.3% 27.6% 25.8% 27.5% 26.9% 26.9% 26.9%
Remuneration Total remuneration/(Total Revenue - capital
revenue)
29.4% 28.6% 26.7% 28.7% 27.9% 27.9%
Repairs & Maintenance R&M/(Total Revenue excluding capital
revenue)
6.1% 4.5% 6.1% 10.7% 9.5% 9.5%
Finance charges & Depreciation FC&D/(Total Revenue - capital revenue) 7.5% 7.1% 6.5% 6.7% 6.5% 6.5% 6.5%
IDP regulation financial viability indicators
i. Debt coverage (Total Operating Revenue - Operating
Grants)/Debt service payments due within
financial year)
33.7 27.2 24.0 25.3 25.3 25.3 –
ii.O/S Service Debtors to Revenue Total outstanding service debtors/annual
revenue received for services
19.2% 23.8% 25.6% 25.7% 26.6% 25.5% 25.5%
iii. Cost coverage (Available cash + Investments)/monthly fixed
operational expenditure
0.5 1.5 1.7 0.6 1.7 2.1 2.1
References
1. Consumer debtors > 12 months old are excluded from current assets
2. Only include if services provided by the municipality
Water Distribution Losses (2)
Description of financial indicator Basis of calculation
Current Year 2016/17
Electricity Distribution Losses (2)
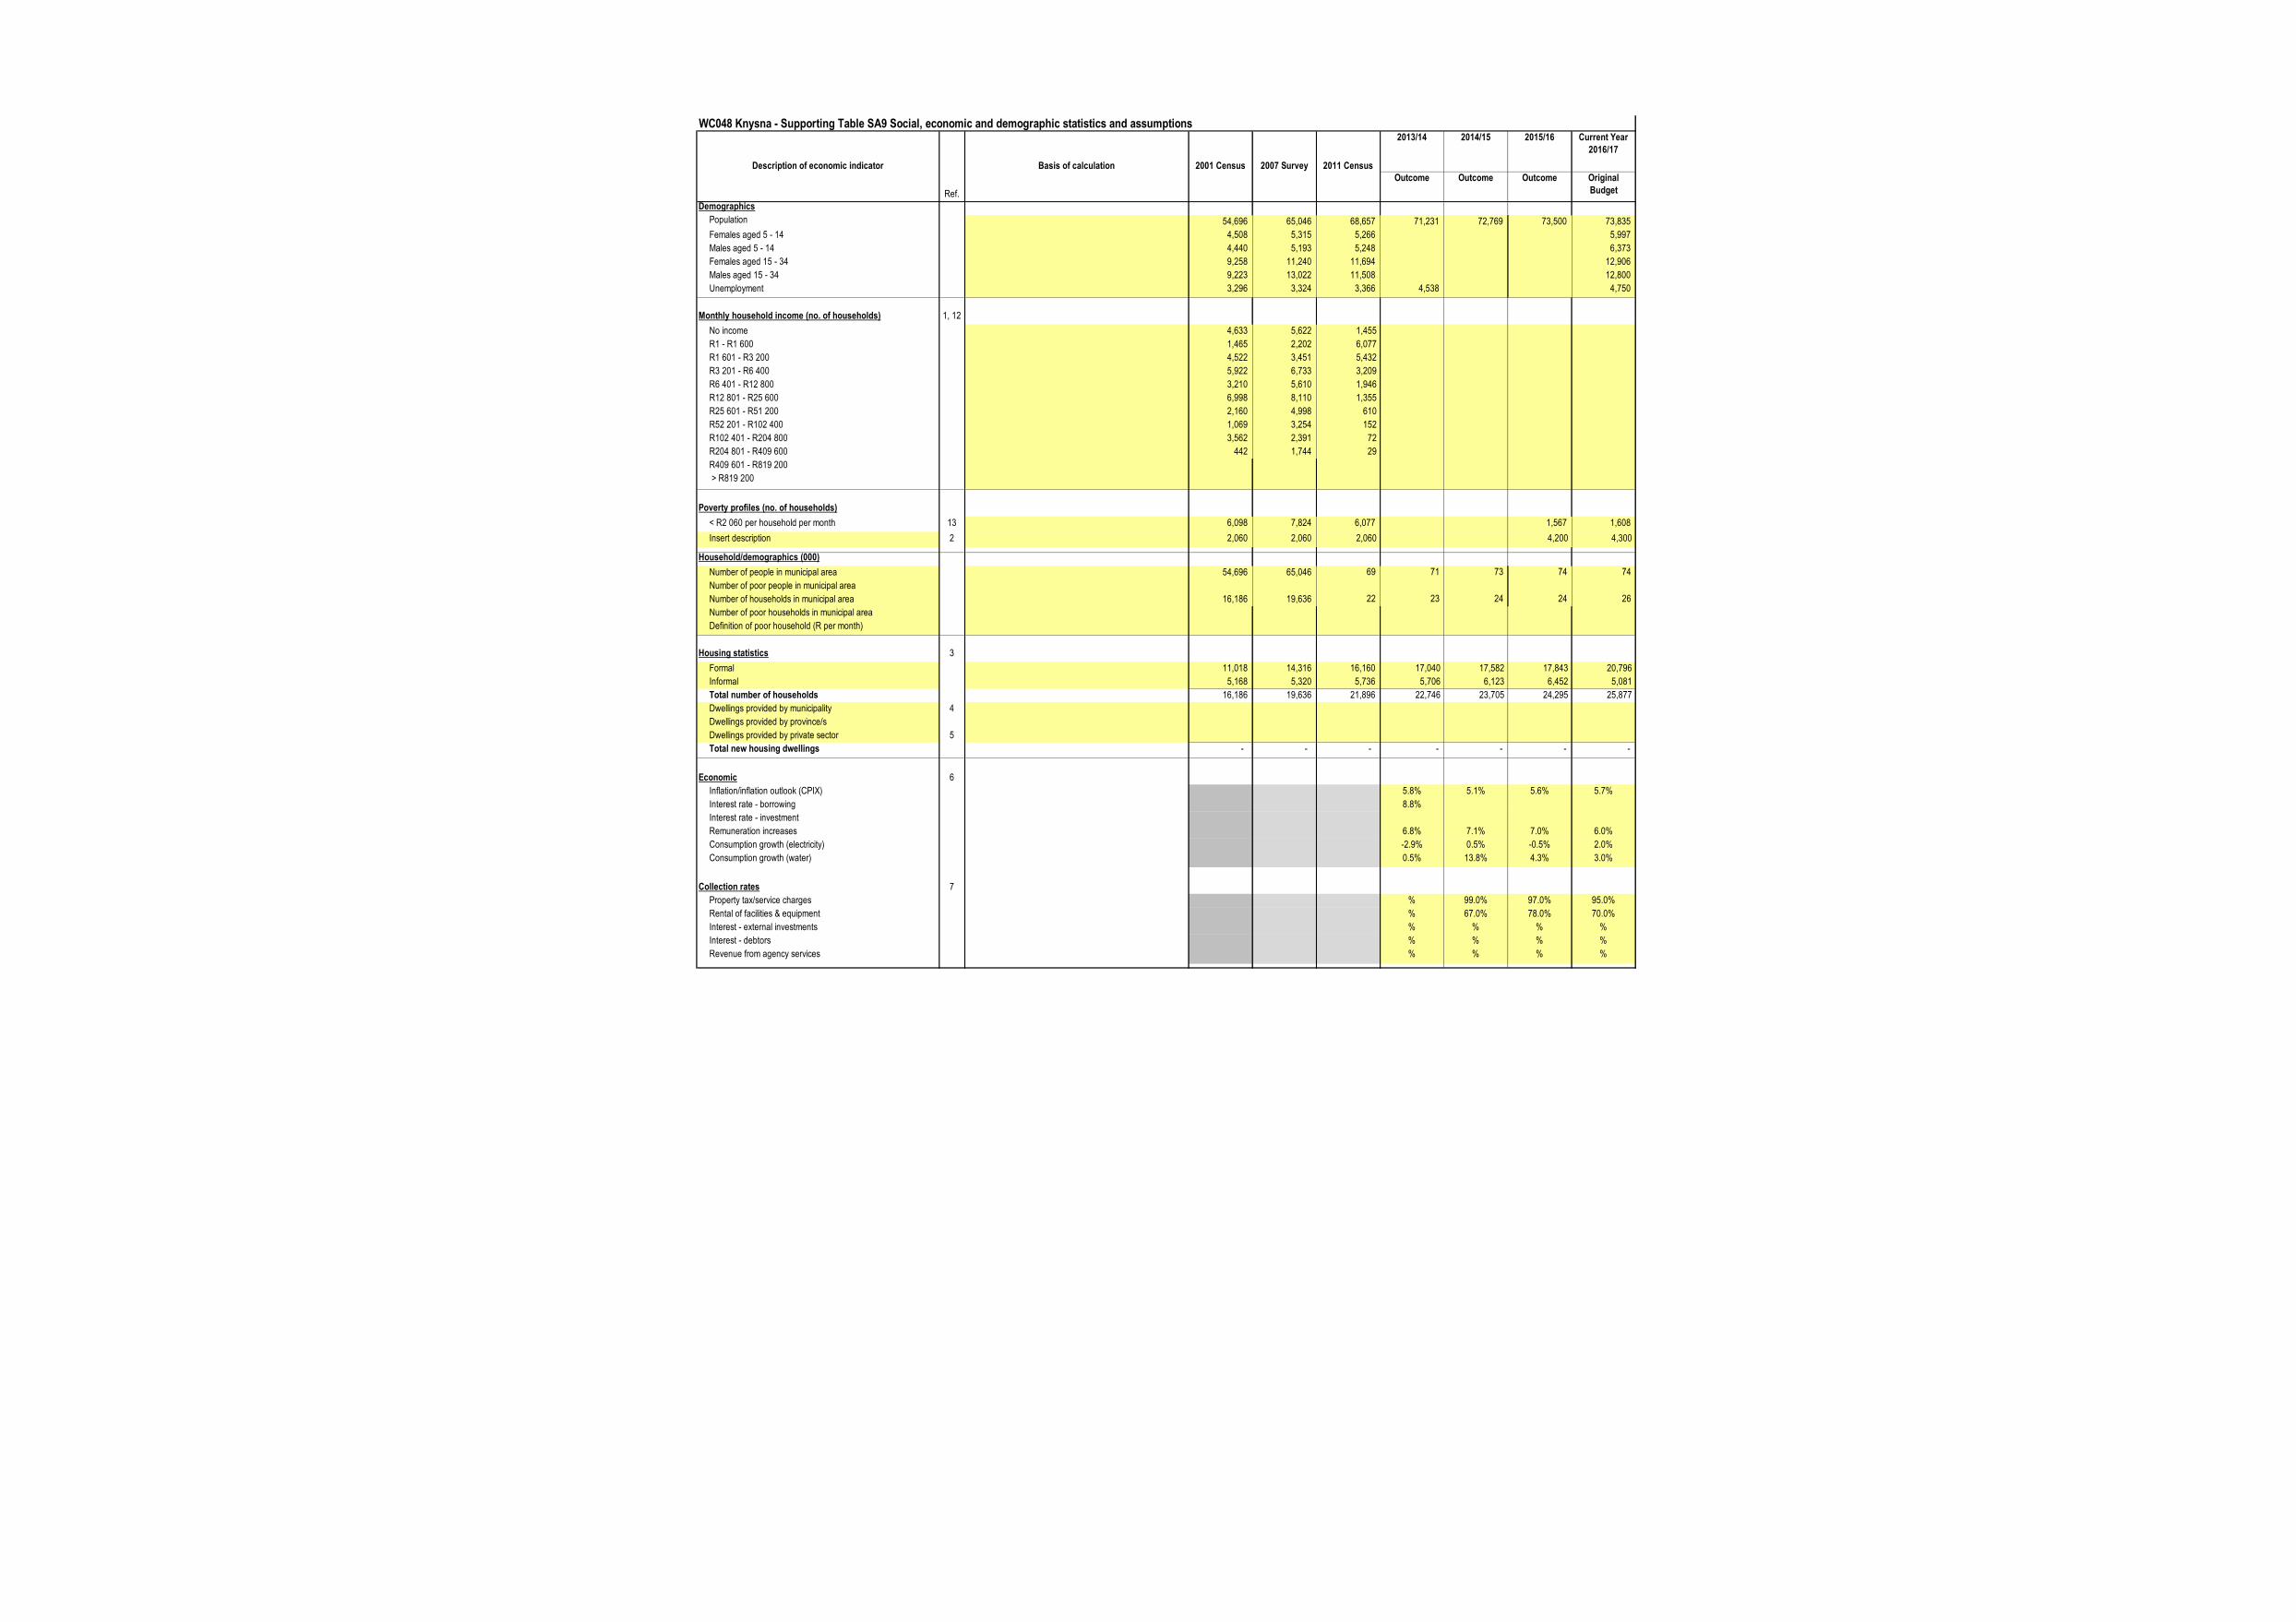
WC048 Knysna - Supporting Table SA9 Social, economic and demographic statistics and assumptions2013/14 2014/15 2015/16 Current Year
2016/17
Outcome Outcome Outcome Original
Budget
Demographics
Population 54,696 65,046 68,657 71,231 72,769 73,500 73,835
Females aged 5 - 14 4,508 5,315 5,266 5,997
Males aged 5 - 14 4,440 5,193 5,248 6,373
Females aged 15 - 34 9,258 11,240 11,694 12,906
Males aged 15 - 34 9,223 13,022 11,508 12,800
Unemployment 3,296 3,324 3,366 4,538 4,750
Monthly household income (no. of households) 1, 12
No income 4,633 5,622 1,455
R1 - R1 600 1,465 2,202 6,077
R1 601 - R3 200 4,522 3,451 5,432
R3 201 - R6 400 5,922 6,733 3,209
R6 401 - R12 800 3,210 5,610 1,946
R12 801 - R25 600 6,998 8,110 1,355
R25 601 - R51 200 2,160 4,998 610
R52 201 - R102 400 1,069 3,254 152
R102 401 - R204 800 3,562 2,391 72
R204 801 - R409 600 442 1,744 29
R409 601 - R819 200
> R819 200
Poverty profiles (no. of households)
< R2 060 per household per month 13 6,098 7,824 6,077 1,567 1,608
Insert description 2 2,060 2,060 2,060 4,200 4,300
Household/demographics (000)
Number of people in municipal area 54,696 65,046 69 71 73 74 74
Number of poor people in municipal area
Number of households in municipal area 16,186 19,636 22 23 24 24 26
Number of poor households in municipal area
Definition of poor household (R per month)
Housing statistics 3
Formal 11,018 14,316 16,160 17,040 17,582 17,843 20,796
Informal 5,168 5,320 5,736 5,706 6,123 6,452 5,081
Total number of households 16,186 19,636 21,896 22,746 23,705 24,295 25,877
Dwellings provided by municipality 4
Dwellings provided by province/s
Dwellings provided by private sector 5
Total new housing dwellings - - - - - - -
Economic 6
Inflation/inflation outlook (CPIX) 5.8% 5.1% 5.6% 5.7%
Interest rate - borrowing 8.8%
Interest rate - investment
Remuneration increases 6.8% 7.1% 7.0% 6.0%
Consumption growth (electricity) -2.9% 0.5% -0.5% 2.0%
Consumption growth (water) 0.5% 13.8% 4.3% 3.0%
Collection rates 7
Property tax/service charges % 99.0% 97.0% 95.0%
Rental of facilities & equipment % 67.0% 78.0% 70.0%
Interest - external investments % % % %
Interest - debtors % % % %
Revenue from agency services % % % %
Description of economic indicator
Ref.
Basis of calculation 2001 Census 2007 Survey 2011 Census
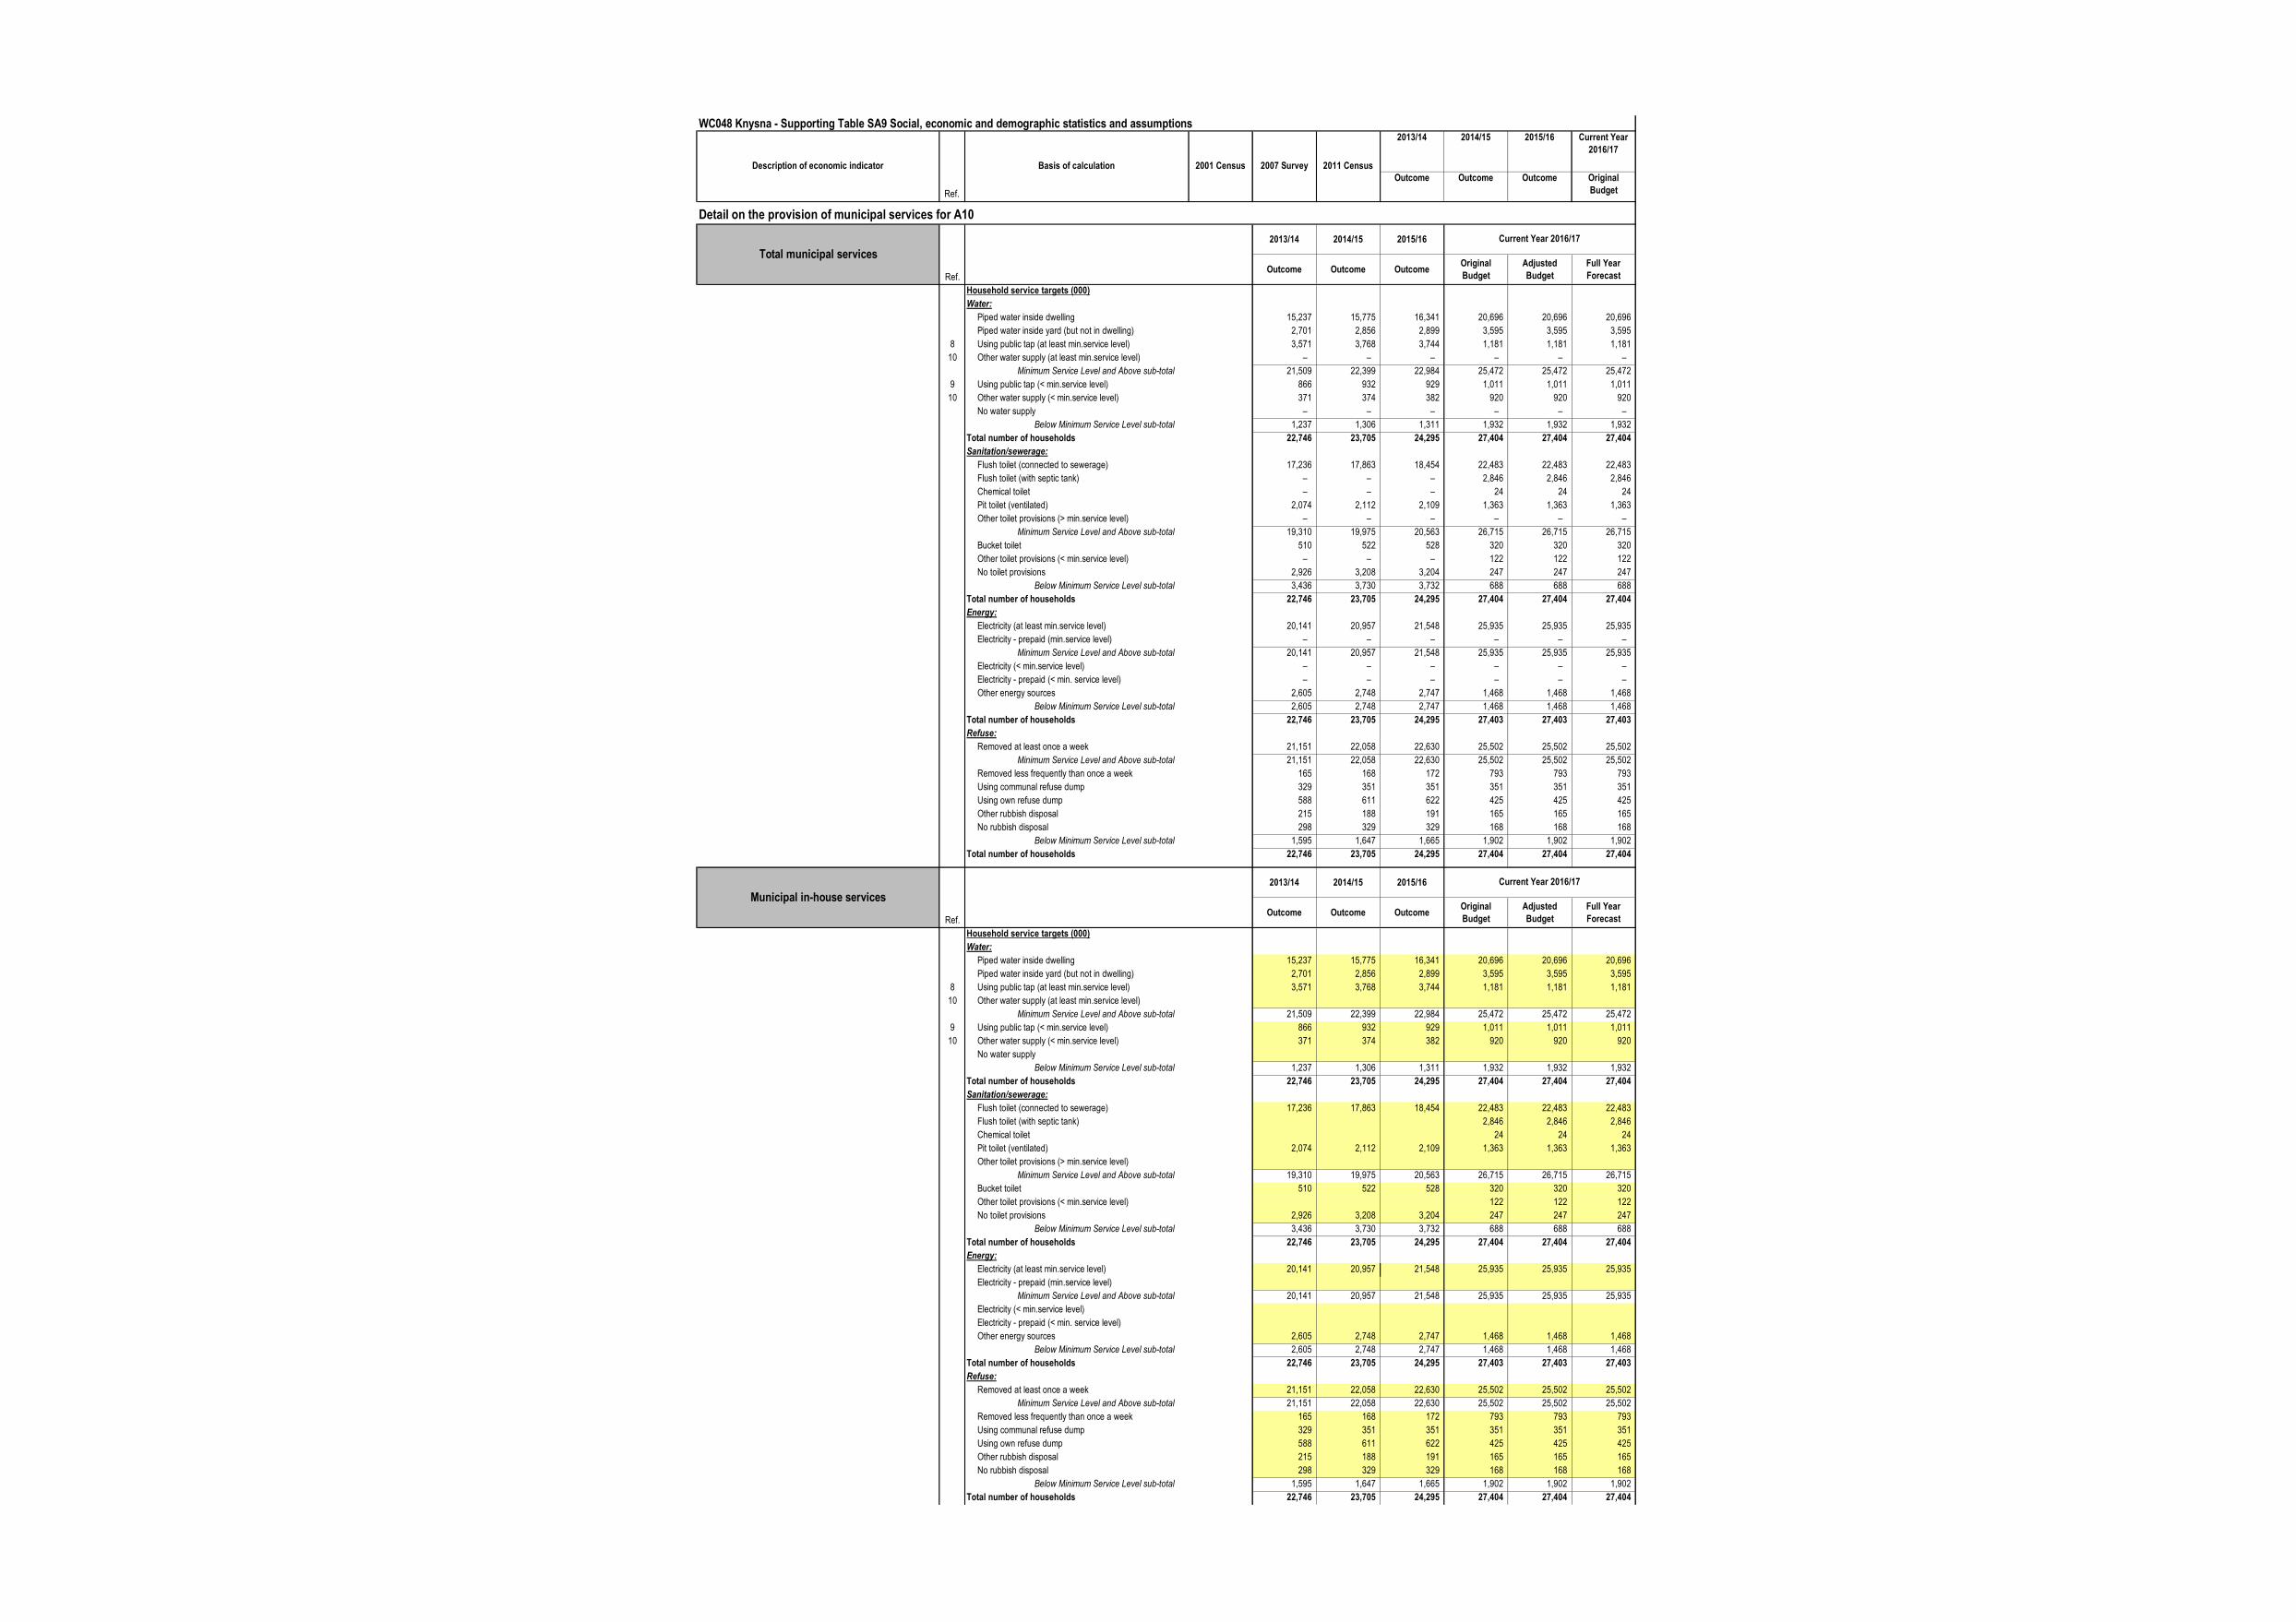
WC048 Knysna - Supporting Table SA9 Social, economic and demographic statistics and assumptions2013/14 2014/15 2015/16 Current Year
2016/17
Outcome Outcome Outcome Original
Budget
Description of economic indicator
Ref.
Basis of calculation 2001 Census 2007 Survey 2011 Census
Detail on the provision of municipal services for A10
2013/14 2014/15 2015/16
Ref.Outcome Outcome Outcome
Original
Budget
Adjusted
Budget
Full Year
Forecast
Household service targets (000)
Water:
Piped water inside dwelling 15,237 15,775 16,341 20,696 20,696 20,696
Piped water inside yard (but not in dwelling) 2,701 2,856 2,899 3,595 3,595 3,595
8 Using public tap (at least min.service level) 3,571 3,768 3,744 1,181 1,181 1,181
10 Other water supply (at least min.service level) – – – – – –
Minimum Service Level and Above sub-total 21,509 22,399 22,984 25,472 25,472 25,472
9 Using public tap (< min.service level) 866 932 929 1,011 1,011 1,011
10 Other water supply (< min.service level) 371 374 382 920 920 920
No water supply – – – – – –
Below Minimum Service Level sub-total 1,237 1,306 1,311 1,932 1,932 1,932
Total number of households 22,746 23,705 24,295 27,404 27,404 27,404
Sanitation/sewerage:
Flush toilet (connected to sewerage) 17,236 17,863 18,454 22,483 22,483 22,483
Flush toilet (with septic tank) – – – 2,846 2,846 2,846
Chemical toilet – – – 24 24 24
Pit toilet (ventilated) 2,074 2,112 2,109 1,363 1,363 1,363
Other toilet provisions (> min.service level) – – – – – –
Minimum Service Level and Above sub-total 19,310 19,975 20,563 26,715 26,715 26,715
Bucket toilet 510 522 528 320 320 320
Other toilet provisions (< min.service level) – – – 122 122 122
No toilet provisions 2,926 3,208 3,204 247 247 247
Below Minimum Service Level sub-total 3,436 3,730 3,732 688 688 688
Total number of households 22,746 23,705 24,295 27,404 27,404 27,404
Energy:
Electricity (at least min.service level) 20,141 20,957 21,548 25,935 25,935 25,935
Electricity - prepaid (min.service level) – – – – – –
Minimum Service Level and Above sub-total 20,141 20,957 21,548 25,935 25,935 25,935
Electricity (< min.service level) – – – – – –
Electricity - prepaid (< min. service level) – – – – – –
Other energy sources 2,605 2,748 2,747 1,468 1,468 1,468
Below Minimum Service Level sub-total 2,605 2,748 2,747 1,468 1,468 1,468
Total number of households 22,746 23,705 24,295 27,403 27,403 27,403
Refuse:
Removed at least once a week 21,151 22,058 22,630 25,502 25,502 25,502
Minimum Service Level and Above sub-total 21,151 22,058 22,630 25,502 25,502 25,502
Removed less frequently than once a week 165 168 172 793 793 793
Using communal refuse dump 329 351 351 351 351 351
Using own refuse dump 588 611 622 425 425 425
Other rubbish disposal 215 188 191 165 165 165
No rubbish disposal 298 329 329 168 168 168
Below Minimum Service Level sub-total 1,595 1,647 1,665 1,902 1,902 1,902
Total number of households 22,746 23,705 24,295 27,404 27,404 27,404
2013/14 2014/15 2015/16
Ref.Outcome Outcome Outcome
Original
Budget
Adjusted
Budget
Full Year
Forecast
Household service targets (000)
Water:
Piped water inside dwelling 15,237 15,775 16,341 20,696 20,696 20,696
Piped water inside yard (but not in dwelling) 2,701 2,856 2,899 3,595 3,595 3,595
8 Using public tap (at least min.service level) 3,571 3,768 3,744 1,181 1,181 1,181
10 Other water supply (at least min.service level)
Minimum Service Level and Above sub-total 21,509 22,399 22,984 25,472 25,472 25,472
9 Using public tap (< min.service level) 866 932 929 1,011 1,011 1,011
10 Other water supply (< min.service level) 371 374 382 920 920 920
No water supply
Below Minimum Service Level sub-total 1,237 1,306 1,311 1,932 1,932 1,932
Total number of households 22,746 23,705 24,295 27,404 27,404 27,404
Sanitation/sewerage:
Flush toilet (connected to sewerage) 17,236 17,863 18,454 22,483 22,483 22,483
Flush toilet (with septic tank) 2,846 2,846 2,846
Chemical toilet 24 24 24
Pit toilet (ventilated) 2,074 2,112 2,109 1,363 1,363 1,363
Other toilet provisions (> min.service level)
Minimum Service Level and Above sub-total 19,310 19,975 20,563 26,715 26,715 26,715
Bucket toilet 510 522 528 320 320 320
Other toilet provisions (< min.service level) 122 122 122
No toilet provisions 2,926 3,208 3,204 247 247 247
Below Minimum Service Level sub-total 3,436 3,730 3,732 688 688 688
Total number of households 22,746 23,705 24,295 27,404 27,404 27,404
Energy:
Electricity (at least min.service level) 20,141 20,957 21,548 25,935 25,935 25,935
Electricity - prepaid (min.service level)
Minimum Service Level and Above sub-total 20,141 20,957 21,548 25,935 25,935 25,935
Electricity (< min.service level)
Electricity - prepaid (< min. service level)
Other energy sources 2,605 2,748 2,747 1,468 1,468 1,468
Below Minimum Service Level sub-total 2,605 2,748 2,747 1,468 1,468 1,468
Total number of households 22,746 23,705 24,295 27,403 27,403 27,403
Refuse:
Removed at least once a week 21,151 22,058 22,630 25,502 25,502 25,502
Minimum Service Level and Above sub-total 21,151 22,058 22,630 25,502 25,502 25,502
Removed less frequently than once a week 165 168 172 793 793 793
Using communal refuse dump 329 351 351 351 351 351
Using own refuse dump 588 611 622 425 425 425
Other rubbish disposal 215 188 191 165 165 165
No rubbish disposal 298 329 329 168 168 168
Below Minimum Service Level sub-total 1,595 1,647 1,665 1,902 1,902 1,902
Total number of households 22,746 23,705 24,295 27,404 27,404 27,404
Total municipal services
Current Year 2016/17
Municipal in-house services
Current Year 2016/17
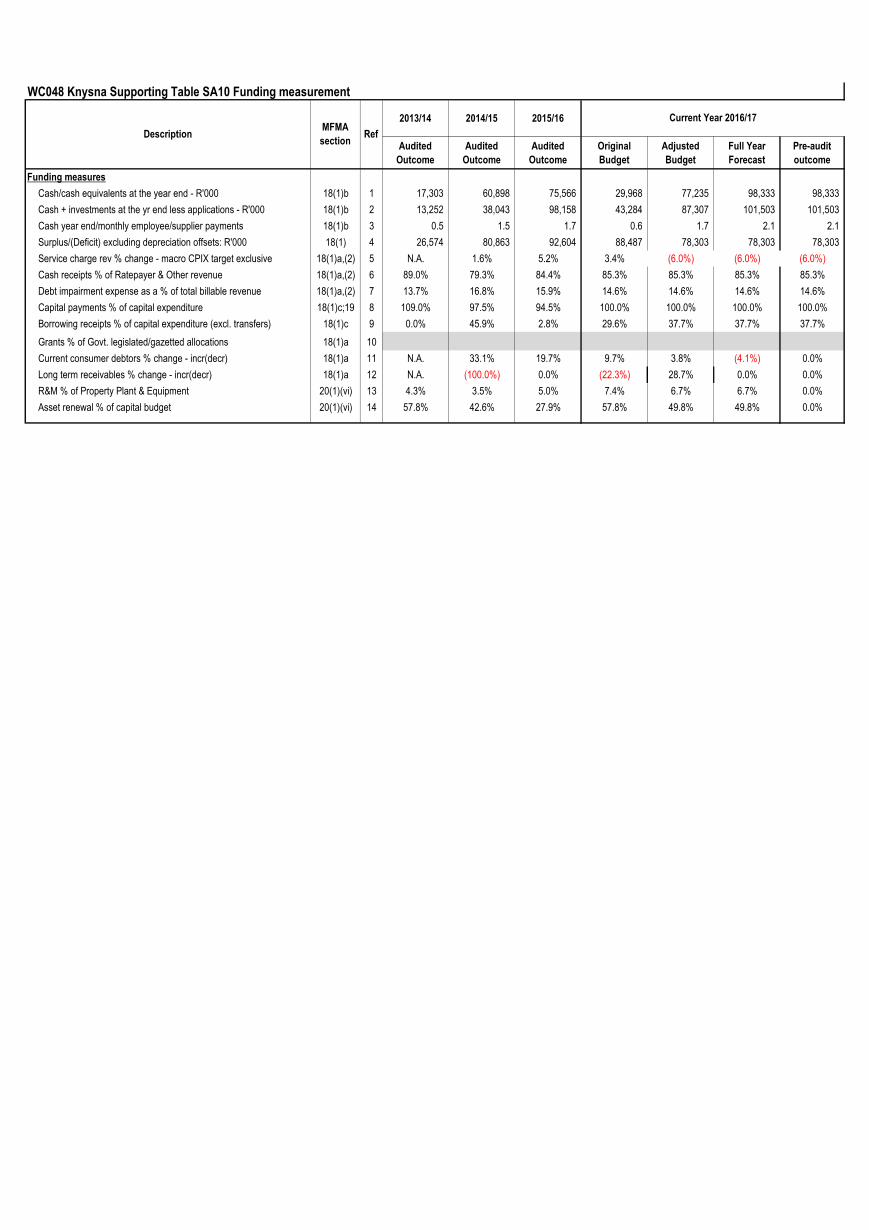
WC048 Knysna Supporting Table SA10 Funding measurement
2013/14 2014/15 2015/16
Audited
Outcome
Audited
Outcome
Audited
Outcome
Original
Budget
Adjusted
Budget
Full Year
Forecast
Pre-audit
outcome
Funding measures
Cash/cash equivalents at the year end - R'000 18(1)b 1 17,303 60,898 75,566 29,968 77,235 98,333 98,333
Cash + investments at the yr end less applications - R'000 18(1)b 2 13,252 38,043 98,158 43,284 87,307 101,503 101,503
Cash year end/monthly employee/supplier payments 18(1)b 3 0.5 1.5 1.7 0.6 1.7 2.1 2.1
Surplus/(Deficit) excluding depreciation offsets: R'000 18(1) 4 26,574 80,863 92,604 88,487 78,303 78,303 78,303
Service charge rev % change - macro CPIX target exclusive 18(1)a,(2) 5 N.A. 1.6% 5.2% 3.4% (6.0%) (6.0%) (6.0%)
Cash receipts % of Ratepayer & Other revenue 18(1)a,(2) 6 89.0% 79.3% 84.4% 85.3% 85.3% 85.3% 85.3%
Debt impairment expense as a % of total billable revenue 18(1)a,(2) 7 13.7% 16.8% 15.9% 14.6% 14.6% 14.6% 14.6%
Capital payments % of capital expenditure 18(1)c;19 8 109.0% 97.5% 94.5% 100.0% 100.0% 100.0% 100.0%
Borrowing receipts % of capital expenditure (excl. transfers) 18(1)c 9 0.0% 45.9% 2.8% 29.6% 37.7% 37.7% 37.7%
Grants % of Govt. legislated/gazetted allocations 18(1)a 10
Current consumer debtors % change - incr(decr) 18(1)a 11 N.A. 33.1% 19.7% 9.7% 3.8% (4.1%) 0.0%
Long term receivables % change - incr(decr) 18(1)a 12 N.A. (100.0%) 0.0% (22.3%) 28.7% 0.0% 0.0%
R&M % of Property Plant & Equipment 20(1)(vi) 13 4.3% 3.5% 5.0% 7.4% 6.7% 6.7% 0.0%
Asset renewal % of capital budget 20(1)(vi) 14 57.8% 42.6% 27.9% 57.8% 49.8% 49.8% 0.0%
DescriptionMFMA
sectionRef
Current Year 2016/17
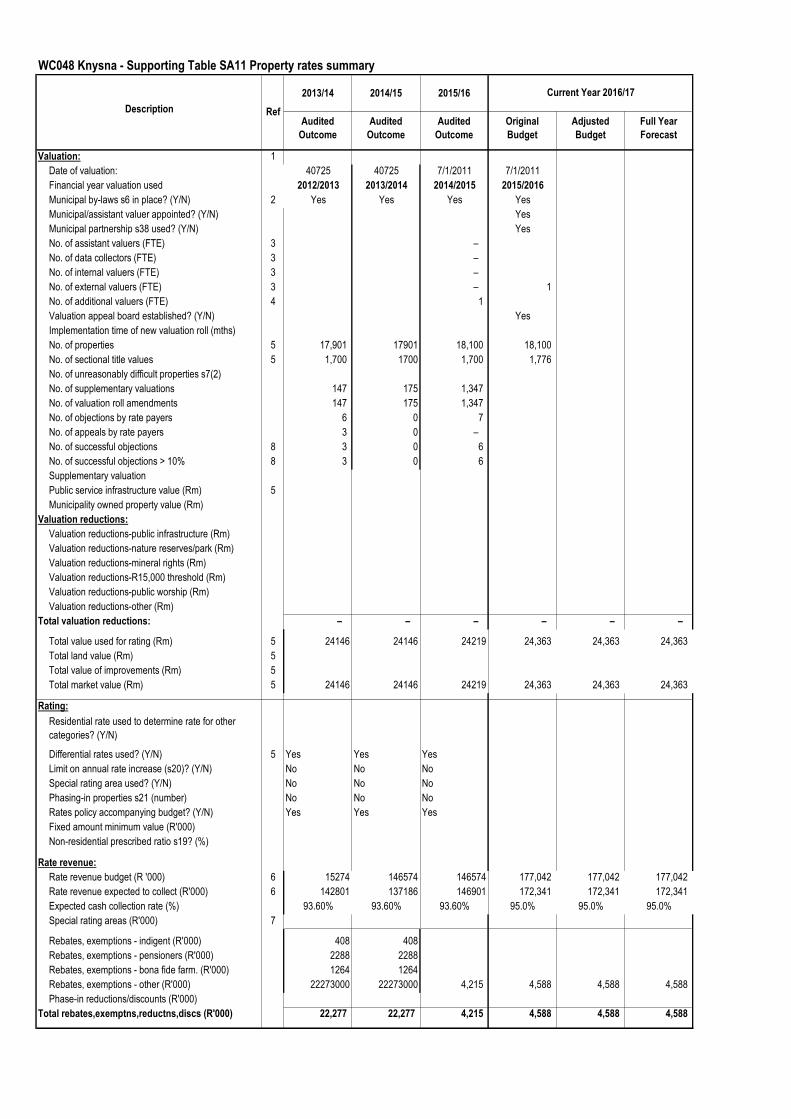
WC048 Knysna - Supporting Table SA11 Property rates summary
2013/14 2014/15 2015/16
Audited
Outcome
Audited
Outcome
Audited
Outcome
Original
Budget
Adjusted
Budget
Full Year
Forecast
Valuation: 1
Date of valuation: 40725 40725 7/1/2011 7/1/2011
Financial year valuation used 2012/2013 2013/2014 2014/2015 2015/2016
Municipal by-laws s6 in place? (Y/N) 2 Yes Yes Yes Yes
Municipal/assistant valuer appointed? (Y/N) Yes
Municipal partnership s38 used? (Y/N) Yes
No. of assistant valuers (FTE) 3 –
No. of data collectors (FTE) 3 –
No. of internal valuers (FTE) 3 –
No. of external valuers (FTE) 3 – 1
No. of additional valuers (FTE) 4 1
Valuation appeal board established? (Y/N) Yes
Implementation time of new valuation roll (mths)
No. of properties 5 17,901 17901 18,100 18,100
No. of sectional title values 5 1,700 1700 1,700 1,776
No. of unreasonably difficult properties s7(2)
No. of supplementary valuations 147 175 1,347
No. of valuation roll amendments 147 175 1,347
No. of objections by rate payers 6 0 7
No. of appeals by rate payers 3 0 –
No. of successful objections 8 3 0 6
No. of successful objections > 10% 8 3 0 6
Supplementary valuation
Public service infrastructure value (Rm) 5
Municipality owned property value (Rm)
Valuation reductions:
Valuation reductions-public infrastructure (Rm)
Valuation reductions-nature reserves/park (Rm)
Valuation reductions-mineral rights (Rm)
Valuation reductions-R15,000 threshold (Rm)
Valuation reductions-public worship (Rm)
Valuation reductions-other (Rm)
Total valuation reductions: – – – – – –
Total value used for rating (Rm) 5 24146 24146 24219 24,363 24,363 24,363
Total land value (Rm) 5
Total value of improvements (Rm) 5
Total market value (Rm) 5 24146 24146 24219 24,363 24,363 24,363
Rating:
Residential rate used to determine rate for other
categories? (Y/N)
Differential rates used? (Y/N) 5 Yes Yes Yes
Limit on annual rate increase (s20)? (Y/N) No No No
Special rating area used? (Y/N) No No No
Phasing-in properties s21 (number) No No No
Rates policy accompanying budget? (Y/N) Yes Yes Yes
Fixed amount minimum value (R'000)
Non-residential prescribed ratio s19? (%)
Rate revenue:
Rate revenue budget (R '000) 6 15274 146574 146574 177,042 177,042 177,042
Rate revenue expected to collect (R'000) 6 142801 137186 146901 172,341 172,341 172,341
Expected cash collection rate (%) 93.60% 93.60% 93.60% 95.0% 95.0% 95.0%
Special rating areas (R'000) 7
Rebates, exemptions - indigent (R'000) 408 408
Rebates, exemptions - pensioners (R'000) 2288 2288
Rebates, exemptions - bona fide farm. (R'000) 1264 1264
Rebates, exemptions - other (R'000) 22273000 22273000 4,215 4,588 4,588 4,588
Phase-in reductions/discounts (R'000)
Total rebates,exemptns,reductns,discs (R'000) 22,277 22,277 4,215 4,588 4,588 4,588
Current Year 2016/17
RefDescription
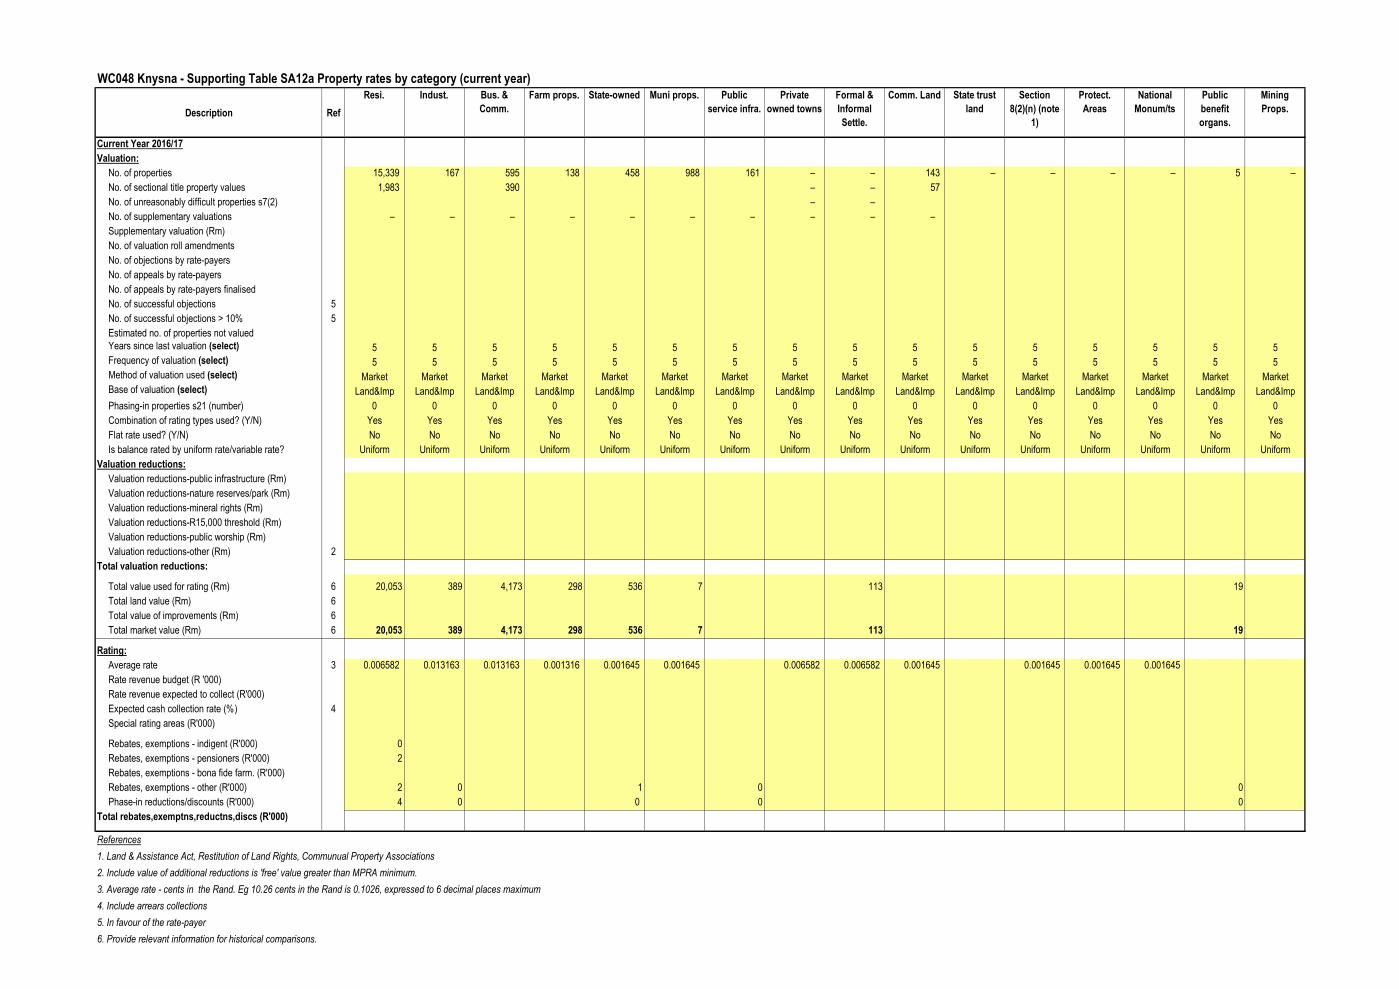
WC048 Knysna - Supporting Table SA12a Property rates by category (current year)
Description Ref
Resi. Indust. Bus. &
Comm.
Farm props. State-owned Muni props. Public
service infra.
Private
owned towns
Formal &
Informal
Settle.
Comm. Land State trust
land
Section
8(2)(n) (note
1)
Protect.
Areas
National
Monum/ts
Public
benefit
organs.
Mining
Props.
Current Year 2016/17
Valuation:
No. of properties 15,339 167 595 138 458 988 161 – – 143 – – – – 5 –
No. of sectional title property values 1,983 390 – – 57
No. of unreasonably difficult properties s7(2) – –
No. of supplementary valuations – – – – – – – – – –
Supplementary valuation (Rm)
No. of valuation roll amendments
No. of objections by rate-payers
No. of appeals by rate-payers
No. of appeals by rate-payers finalised
No. of successful objections 5
No. of successful objections > 10% 5
Estimated no. of properties not valued
Years since last valuation (select) 5 5 5 5 5 5 5 5 5 5 5 5 5 5 5 5
Frequency of valuation (select) 5 5 5 5 5 5 5 5 5 5 5 5 5 5 5 5
Method of valuation used (select) Market Market Market Market Market Market Market Market Market Market Market Market Market Market Market Market
Base of valuation (select) Land&Imp Land&Imp Land&Imp Land&Imp Land&Imp Land&Imp Land&Imp Land&Imp Land&Imp Land&Imp Land&Imp Land&Imp Land&Imp Land&Imp Land&Imp Land&Imp
Phasing-in properties s21 (number) 0 0 0 0 0 0 0 0 0 0 0 0 0 0 0 0
Combination of rating types used? (Y/N) Yes Yes Yes Yes Yes Yes Yes Yes Yes Yes Yes Yes Yes Yes Yes Yes
Flat rate used? (Y/N) No No No No No No No No No No No No No No No No
Is balance rated by uniform rate/variable rate? Uniform Uniform Uniform Uniform Uniform Uniform Uniform Uniform Uniform Uniform Uniform Uniform Uniform Uniform Uniform Uniform
Valuation reductions:
Valuation reductions-public infrastructure (Rm)
Valuation reductions-nature reserves/park (Rm)
Valuation reductions-mineral rights (Rm)
Valuation reductions-R15,000 threshold (Rm)
Valuation reductions-public worship (Rm)
Valuation reductions-other (Rm) 2
Total valuation reductions:
Total value used for rating (Rm) 6 20,053 389 4,173 298 536 7 113 19
Total land value (Rm) 6
Total value of improvements (Rm) 6
Total market value (Rm) 6 20,053 389 4,173 298 536 7 113 19
Rating:
Average rate 3 0.006582 0.013163 0.013163 0.001316 0.001645 0.001645 0.006582 0.006582 0.001645 0.001645 0.001645 0.001645
Rate revenue budget (R '000)
Rate revenue expected to collect (R'000)
Expected cash collection rate (%) 4
Special rating areas (R'000)
Rebates, exemptions - indigent (R'000) 0
Rebates, exemptions - pensioners (R'000) 2
Rebates, exemptions - bona fide farm. (R'000)
Rebates, exemptions - other (R'000) 2 0 1 0 0
Phase-in reductions/discounts (R'000) 4 0 0 0 0
Total rebates,exemptns,reductns,discs (R'000)
References
1. Land & Assistance Act, Restitution of Land Rights, Communual Property Associations
2. Include value of additional reductions is 'free' value greater than MPRA minimum.
3. Average rate - cents in the Rand. Eg 10.26 cents in the Rand is 0.1026, expressed to 6 decimal places maximum
4. Include arrears collections
5. In favour of the rate-payer
6. Provide relevant information for historical comparisons.
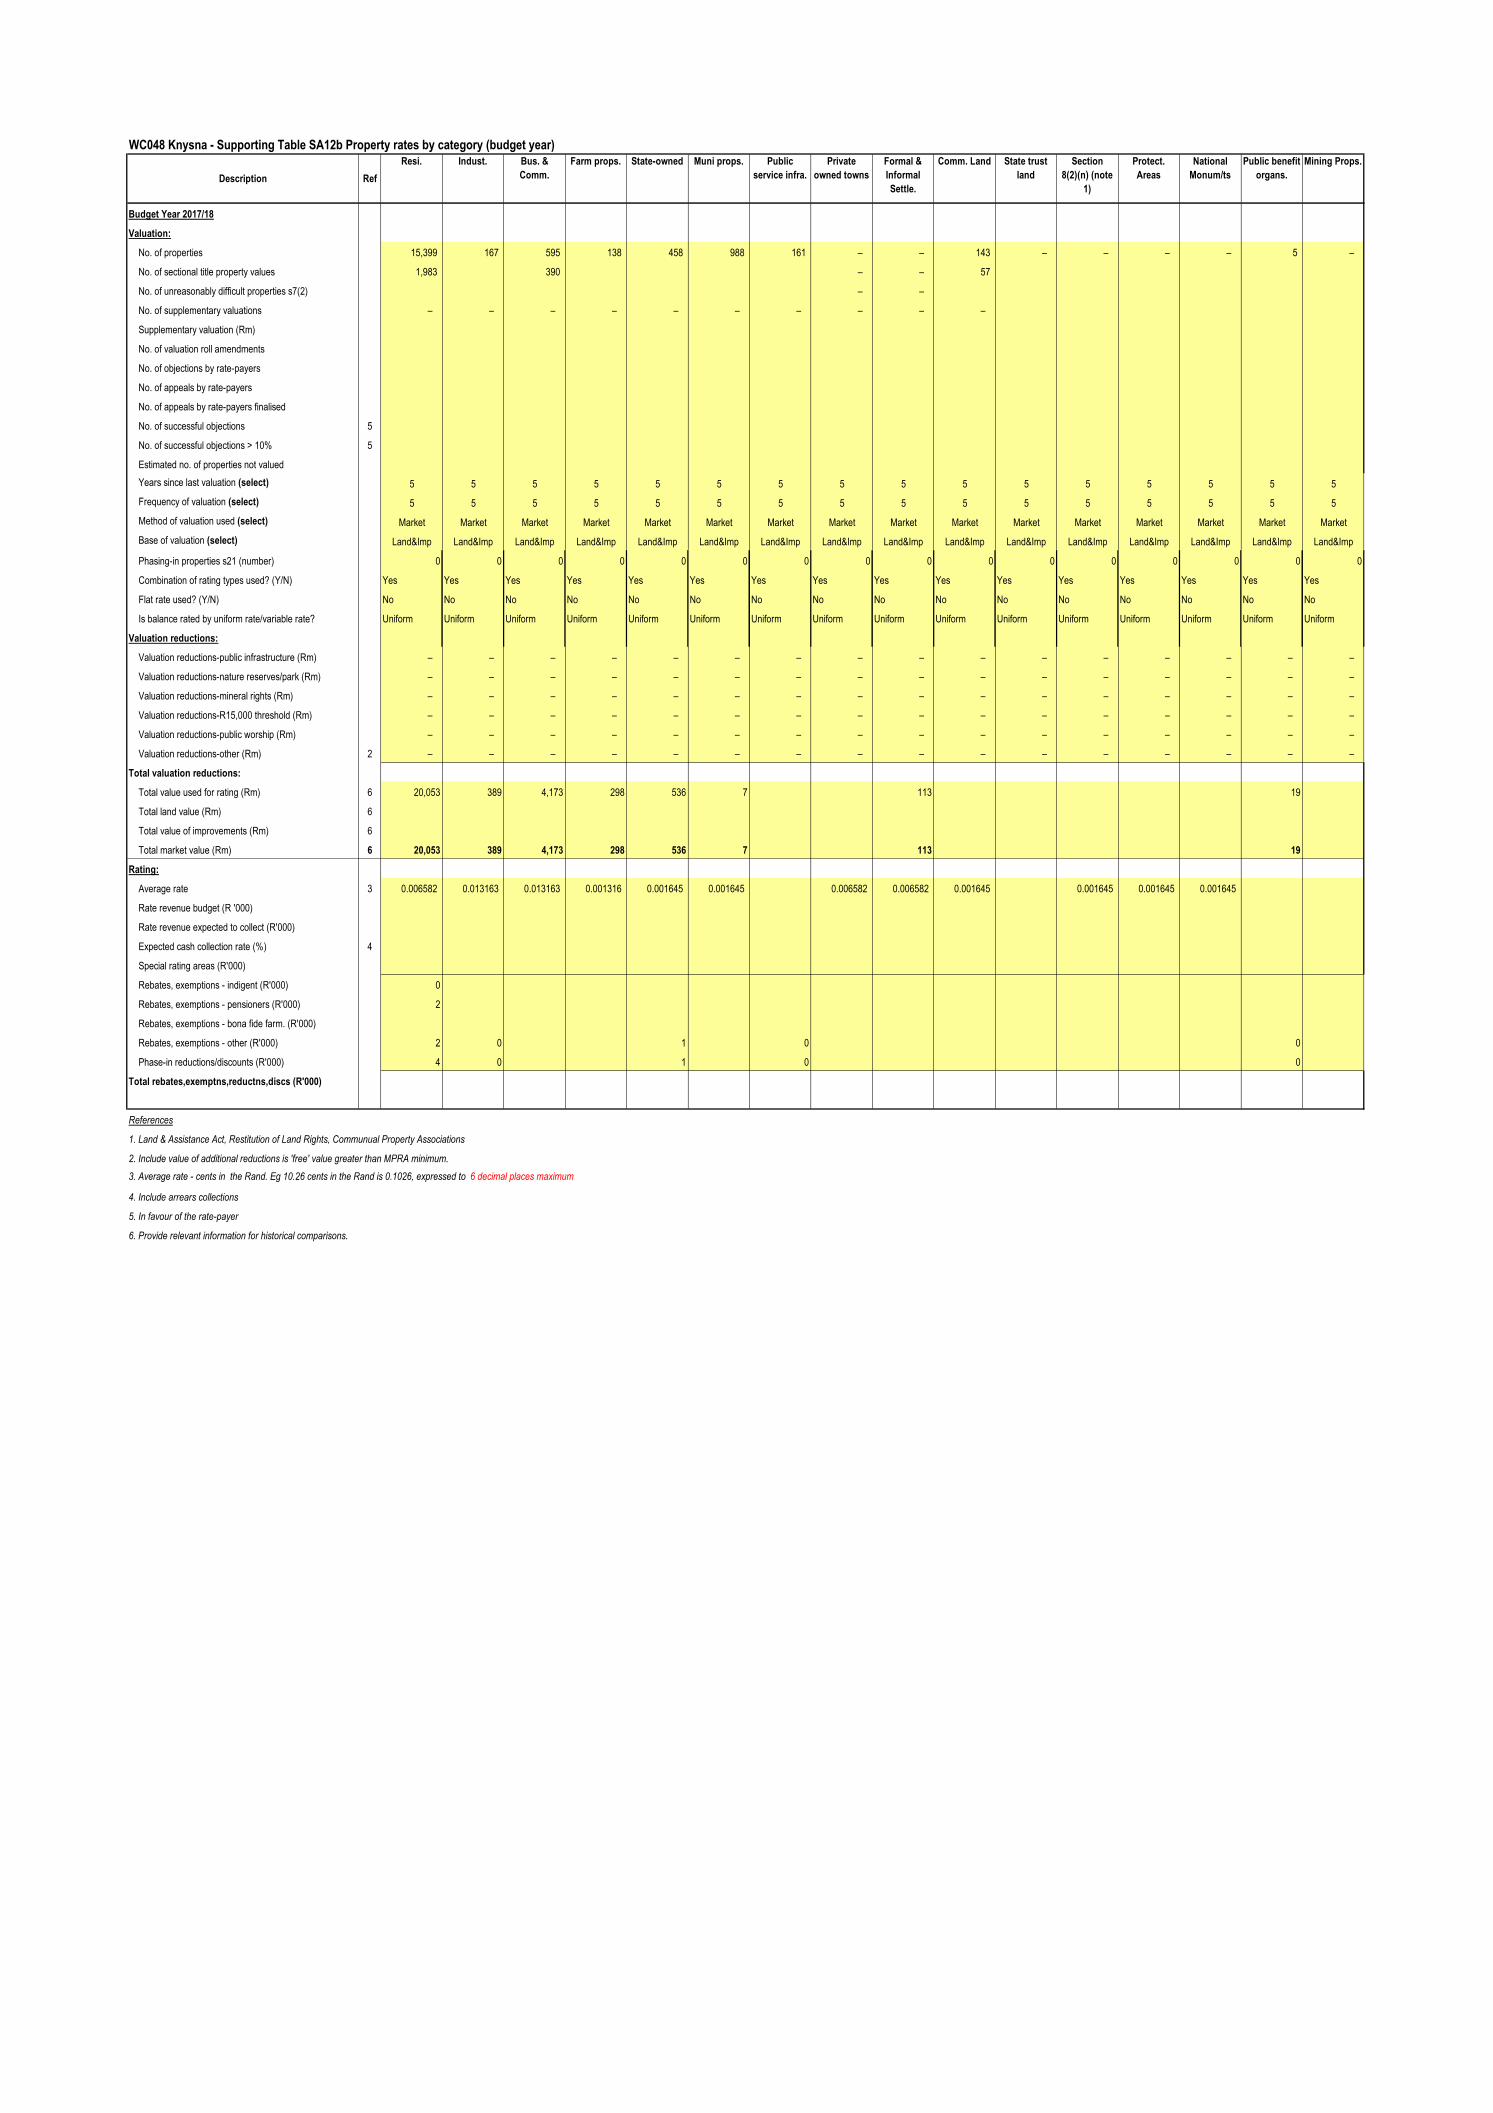
WC048 Knysna - Supporting Table SA12b Property rates by category (budget year)
Description Ref
Resi. Indust. Bus. &
Comm.
Farm props. State-owned Muni props. Public
service infra.
Private
owned towns
Formal &
Informal
Settle.
Comm. Land State trust
land
Section
8(2)(n) (note
1)
Protect.
Areas
National
Monum/ts
Public benefit
organs.
Mining Props.
Budget Year 2017/18
Valuation:
No. of properties 15,399 167 595 138 458 988 161 – – 143 – – – – 5 –
No. of sectional title property values 1,983 390 – – 57
No. of unreasonably difficult properties s7(2) – –
No. of supplementary valuations – – – – – – – – – –
Supplementary valuation (Rm)
No. of valuation roll amendments
No. of objections by rate-payers
No. of appeals by rate-payers
No. of appeals by rate-payers finalised
No. of successful objections 5
No. of successful objections > 10% 5
Estimated no. of properties not valued
Years since last valuation (select) 5 5 5 5 5 5 5 5 5 5 5 5 5 5 5 5
Frequency of valuation (select) 5 5 5 5 5 5 5 5 5 5 5 5 5 5 5 5
Method of valuation used (select) Market Market Market Market Market Market Market Market Market Market Market Market Market Market Market Market
Base of valuation (select) Land&Imp Land&Imp Land&Imp Land&Imp Land&Imp Land&Imp Land&Imp Land&Imp Land&Imp Land&Imp Land&Imp Land&Imp Land&Imp Land&Imp Land&Imp Land&Imp
Phasing-in properties s21 (number) 0 0 0 0 0 0 0 0 0 0 0 0 0 0 0 0
Combination of rating types used? (Y/N) Yes Yes Yes Yes Yes Yes Yes Yes Yes Yes Yes Yes Yes Yes Yes Yes
Flat rate used? (Y/N) No No No No No No No No No No No No No No No No
Is balance rated by uniform rate/variable rate? Uniform Uniform Uniform Uniform Uniform Uniform Uniform Uniform Uniform Uniform Uniform Uniform Uniform Uniform Uniform Uniform
Valuation reductions:
Valuation reductions-public infrastructure (Rm) – – – – – – – – – – – – – – – –
Valuation reductions-nature reserves/park (Rm) – – – – – – – – – – – – – – – –
Valuation reductions-mineral rights (Rm) – – – – – – – – – – – – – – – –
Valuation reductions-R15,000 threshold (Rm) – – – – – – – – – – – – – – – –
Valuation reductions-public worship (Rm) – – – – – – – – – – – – – – – –
Valuation reductions-other (Rm) 2 – – – – – – – – – – – – – – – –
Total valuation reductions:
Total value used for rating (Rm) 6 20,053 389 4,173 298 536 7 113 19
Total land value (Rm) 6
Total value of improvements (Rm) 6
Total market value (Rm) 6 20,053 389 4,173 298 536 7 113 19
Rating:
Average rate 3 0.006582 0.013163 0.013163 0.001316 0.001645 0.001645 0.006582 0.006582 0.001645 0.001645 0.001645 0.001645
Rate revenue budget (R '000)
Rate revenue expected to collect (R'000)
Expected cash collection rate (%) 4
Special rating areas (R'000)
Rebates, exemptions - indigent (R'000) 0
Rebates, exemptions - pensioners (R'000) 2
Rebates, exemptions - bona fide farm. (R'000)
Rebates, exemptions - other (R'000) 2 0 1 0 0
Phase-in reductions/discounts (R'000) 4 0 1 0 0
Total rebates,exemptns,reductns,discs (R'000)
References
1. Land & Assistance Act, Restitution of Land Rights, Communual Property Associations
2. Include value of additional reductions is 'free' value greater than MPRA minimum.
3. Average rate - cents in the Rand. Eg 10.26 cents in the Rand is 0.1026, expressed to 6 decimal places maximum
4. Include arrears collections
5. In favour of the rate-payer
6. Provide relevant information for historical comparisons.
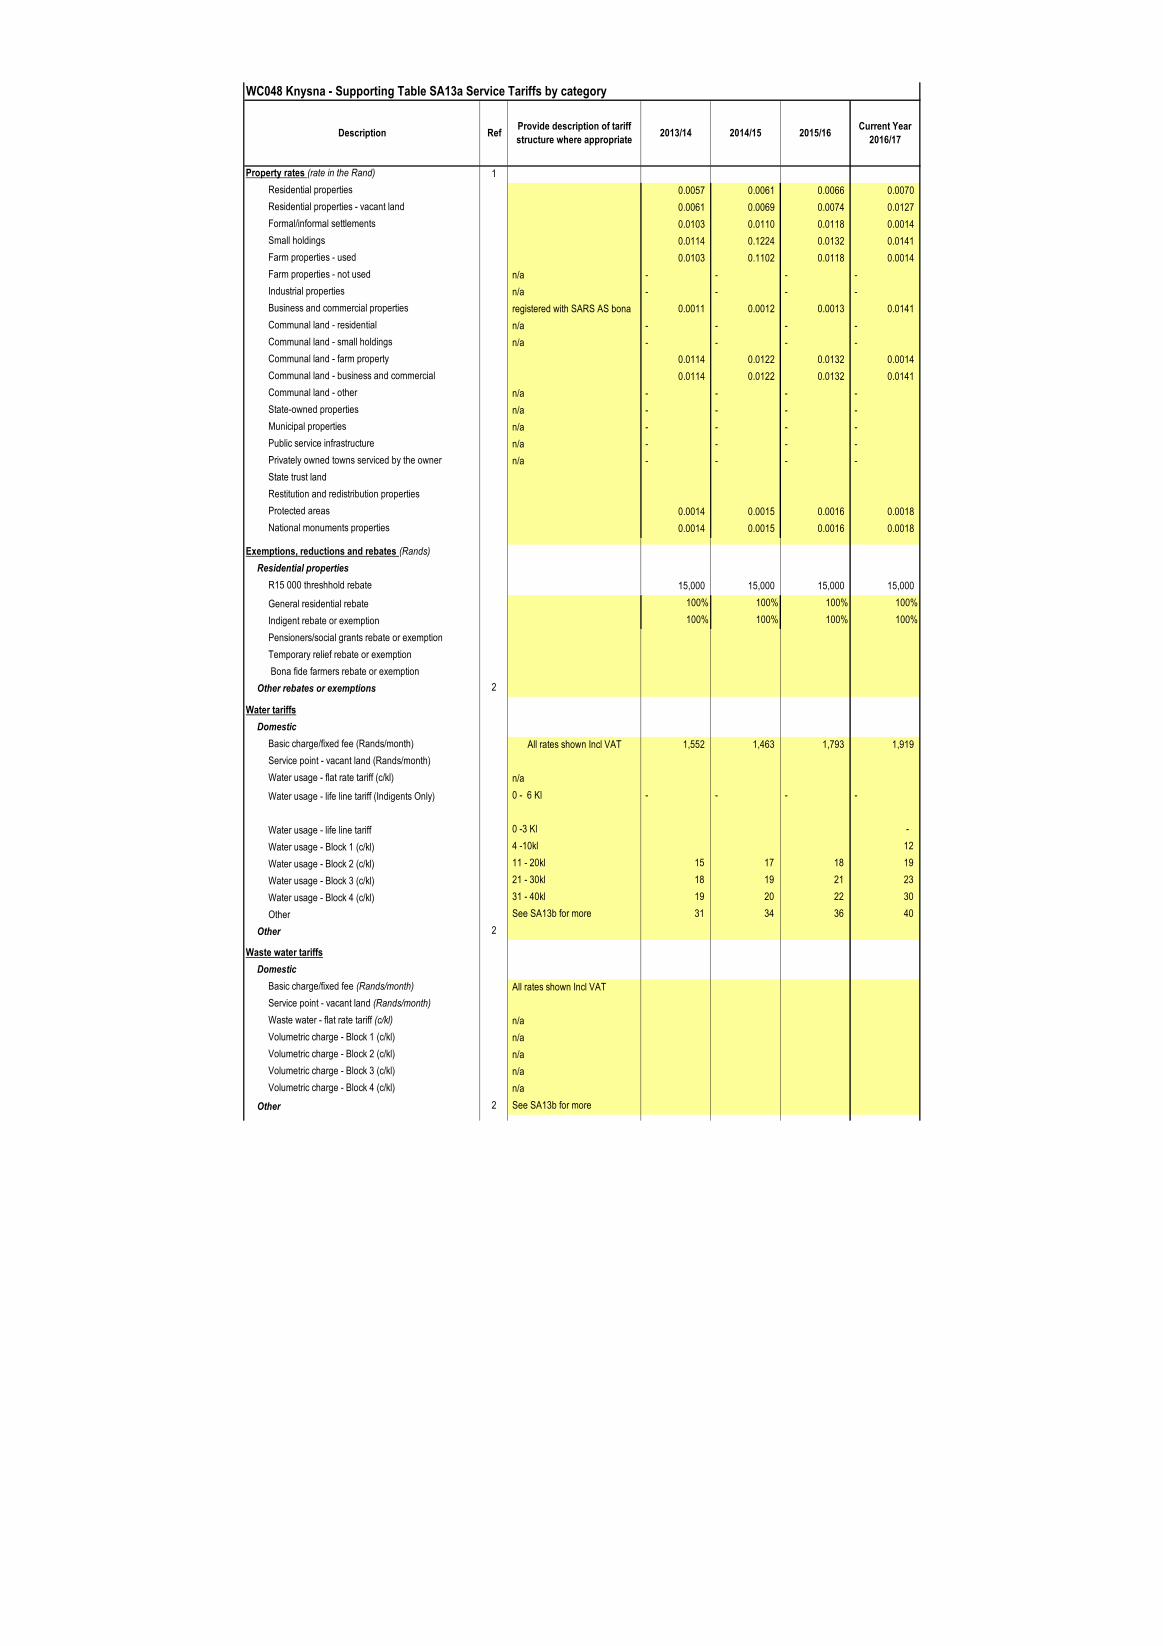
WC048 Knysna - Supporting Table SA13a Service Tariffs by category
Property rates (rate in the Rand) 1
Residential properties 0.0057 0.0061 0.0066 0.0070
Residential properties - vacant land 0.0061 0.0069 0.0074 0.0127
Formal/informal settlements 0.0103 0.0110 0.0118 0.0014
Small holdings 0.0114 0.1224 0.0132 0.0141
Farm properties - used 0.0103 0.1102 0.0118 0.0014
Farm properties - not used n/a - - - -
Industrial properties n/a - - - -
Business and commercial properties registered with SARS AS bona
fide
0.0011 0.0012 0.0013 0.0141
Communal land - residential n/a - - - -
Communal land - small holdings n/a - - - -
Communal land - farm property 0.0114 0.0122 0.0132 0.0014
Communal land - business and commercial 0.0114 0.0122 0.0132 0.0141
Communal land - other n/a - - - -
State-owned properties n/a - - - -
Municipal properties n/a - - - -
Public service infrastructure n/a - - - -
Privately owned towns serviced by the owner n/a - - - -
State trust land
Restitution and redistribution properties
Protected areas 0.0014 0.0015 0.0016 0.0018
National monuments properties 0.0014 0.0015 0.0016 0.0018
Exemptions, reductions and rebates (Rands)
Residential properties
R15 000 threshhold rebate 15,000 15,000 15,000 15,000
General residential rebate 100% 100% 100% 100%
Indigent rebate or exemption 100% 100% 100% 100%
Pensioners/social grants rebate or exemption
Temporary relief rebate or exemption
Bona fide farmers rebate or exemption
Other rebates or exemptions 2
Water tariffs
Domestic
Basic charge/fixed fee (Rands/month) All rates shown Incl VAT 1,552 1,463 1,793 1,919
Service point - vacant land (Rands/month)
Water usage - flat rate tariff (c/kl) n/a
Water usage - life line tariff (Indigents Only) 0 - 6 Kl - - - -
Water usage - life line tariff 0 -3 Kl -
Water usage - Block 1 (c/kl) 4 -10kl 12
Water usage - Block 2 (c/kl) 11 - 20kl 15 17 18 19
Water usage - Block 3 (c/kl) 21 - 30kl 18 19 21 23
Water usage - Block 4 (c/kl) 31 - 40kl 19 20 22 30
Other See SA13b for more 31 34 36 40
Other 2
Waste water tariffs
Domestic
Basic charge/fixed fee (Rands/month) All rates shown Incl VAT
Service point - vacant land (Rands/month)
Waste water - flat rate tariff (c/kl) n/a
Volumetric charge - Block 1 (c/kl) n/a
Volumetric charge - Block 2 (c/kl) n/a
Volumetric charge - Block 3 (c/kl) n/a
Volumetric charge - Block 4 (c/kl) n/a
Other 2 See SA13b for more
Current Year
2016/17Description Ref
Provide description of tariff
structure where appropriate2013/14 2014/15 2015/16
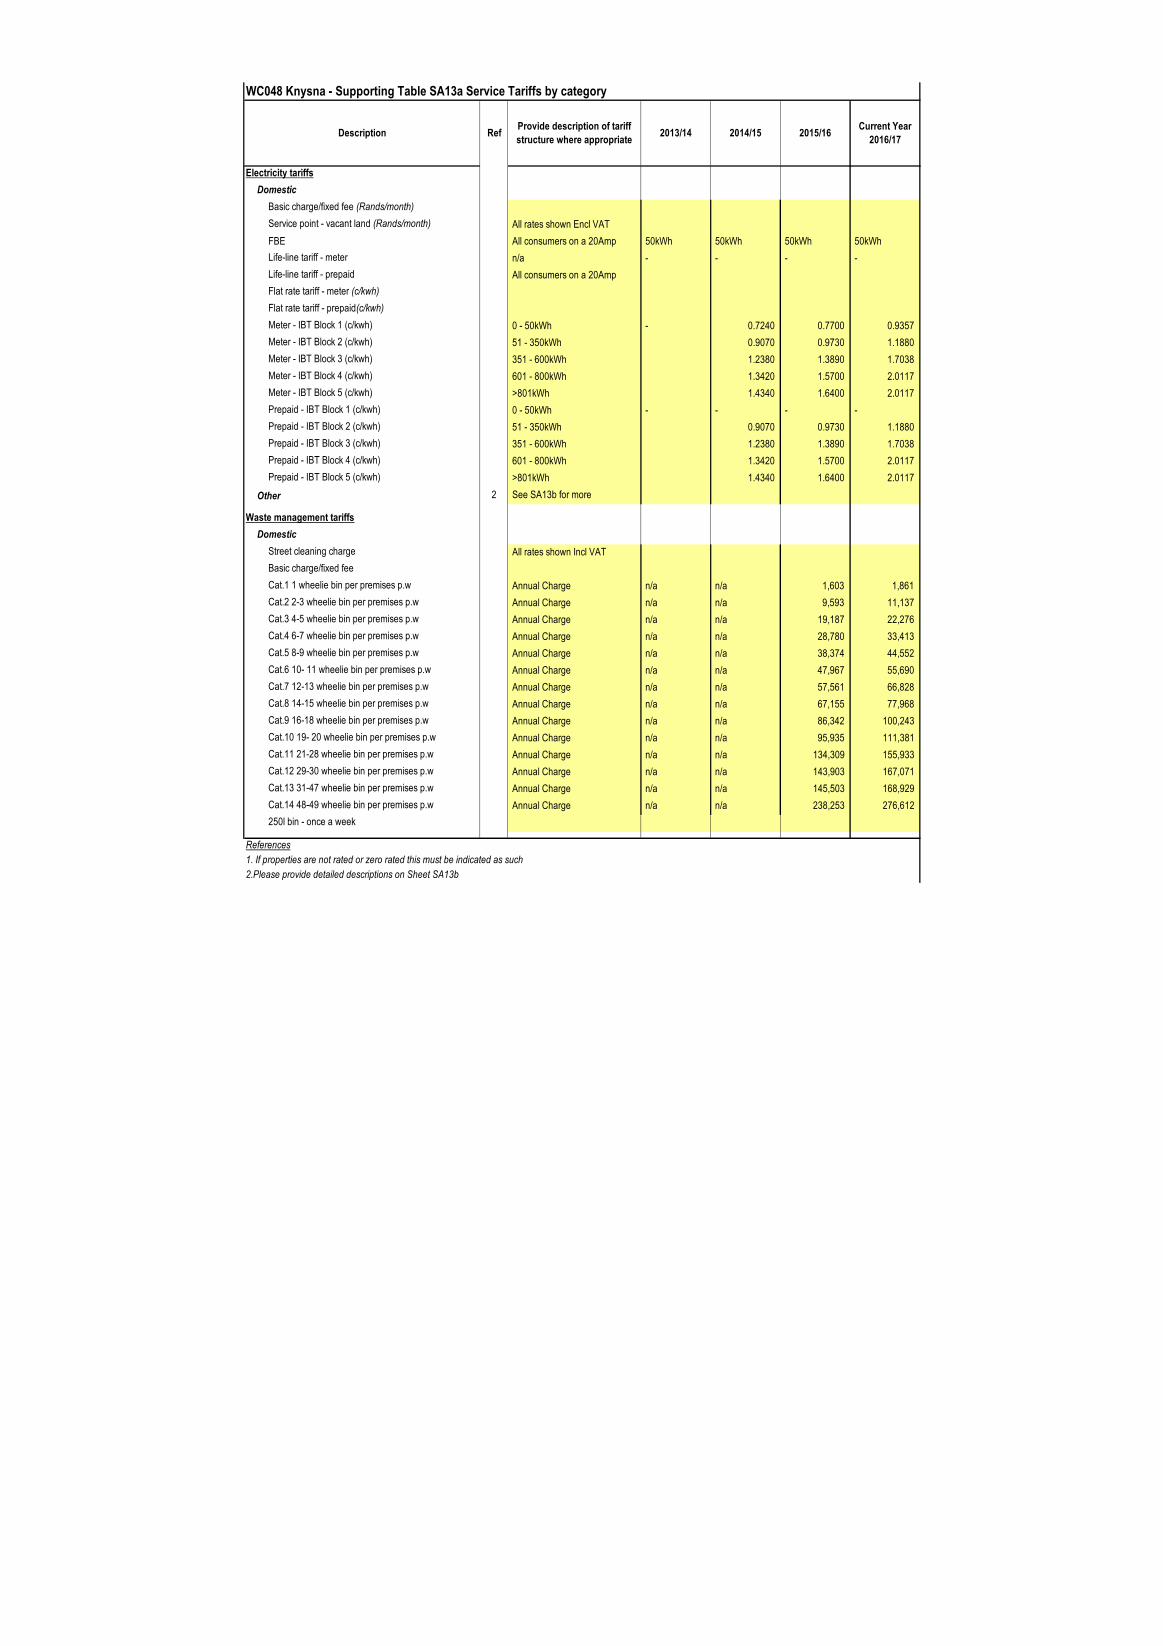
WC048 Knysna - Supporting Table SA13a Service Tariffs by category
Current Year
2016/17Description Ref
Provide description of tariff
structure where appropriate2013/14 2014/15 2015/16
Electricity tariffs
Domestic
Basic charge/fixed fee (Rands/month)
Service point - vacant land (Rands/month) All rates shown Encl VAT
FBE All consumers on a 20Amp 50kWh 50kWh 50kWh 50kWh
Life-line tariff - meter n/a - - - -
Life-line tariff - prepaid All consumers on a 20Amp
Flat rate tariff - meter (c/kwh)
Flat rate tariff - prepaid(c/kwh)
Meter - IBT Block 1 (c/kwh) 0 - 50kWh - 0.7240 0.7700 0.9357
Meter - IBT Block 2 (c/kwh) 51 - 350kWh 0.9070 0.9730 1.1880
Meter - IBT Block 3 (c/kwh) 351 - 600kWh 1.2380 1.3890 1.7038
Meter - IBT Block 4 (c/kwh) 601 - 800kWh 1.3420 1.5700 2.0117
Meter - IBT Block 5 (c/kwh) >801kWh 1.4340 1.6400 2.0117
Prepaid - IBT Block 1 (c/kwh) 0 - 50kWh - - - -
Prepaid - IBT Block 2 (c/kwh) 51 - 350kWh 0.9070 0.9730 1.1880
Prepaid - IBT Block 3 (c/kwh) 351 - 600kWh 1.2380 1.3890 1.7038
Prepaid - IBT Block 4 (c/kwh) 601 - 800kWh 1.3420 1.5700 2.0117
Prepaid - IBT Block 5 (c/kwh) >801kWh 1.4340 1.6400 2.0117
Other 2 See SA13b for more
Waste management tariffs
Domestic
Street cleaning charge All rates shown Incl VAT
Basic charge/fixed fee
Cat.1 1 wheelie bin per premises p.w Annual Charge n/a n/a 1,603 1,861
Cat.2 2-3 wheelie bin per premises p.w Annual Charge n/a n/a 9,593 11,137
Cat.3 4-5 wheelie bin per premises p.w Annual Charge n/a n/a 19,187 22,276
Cat.4 6-7 wheelie bin per premises p.w Annual Charge n/a n/a 28,780 33,413
Cat.5 8-9 wheelie bin per premises p.w Annual Charge n/a n/a 38,374 44,552
Cat.6 10- 11 wheelie bin per premises p.w Annual Charge n/a n/a 47,967 55,690
Cat.7 12-13 wheelie bin per premises p.w Annual Charge n/a n/a 57,561 66,828
Cat.8 14-15 wheelie bin per premises p.w Annual Charge n/a n/a 67,155 77,968
Cat.9 16-18 wheelie bin per premises p.w Annual Charge n/a n/a 86,342 100,243
Cat.10 19- 20 wheelie bin per premises p.w Annual Charge n/a n/a 95,935 111,381
Cat.11 21-28 wheelie bin per premises p.w Annual Charge n/a n/a 134,309 155,933
Cat.12 29-30 wheelie bin per premises p.w Annual Charge n/a n/a 143,903 167,071
Cat.13 31-47 wheelie bin per premises p.w Annual Charge n/a n/a 145,503 168,929
Cat.14 48-49 wheelie bin per premises p.w Annual Charge n/a n/a 238,253 276,612
250l bin - once a week
References
1. If properties are not rated or zero rated this must be indicated as such
2.Please provide detailed descriptions on Sheet SA13b
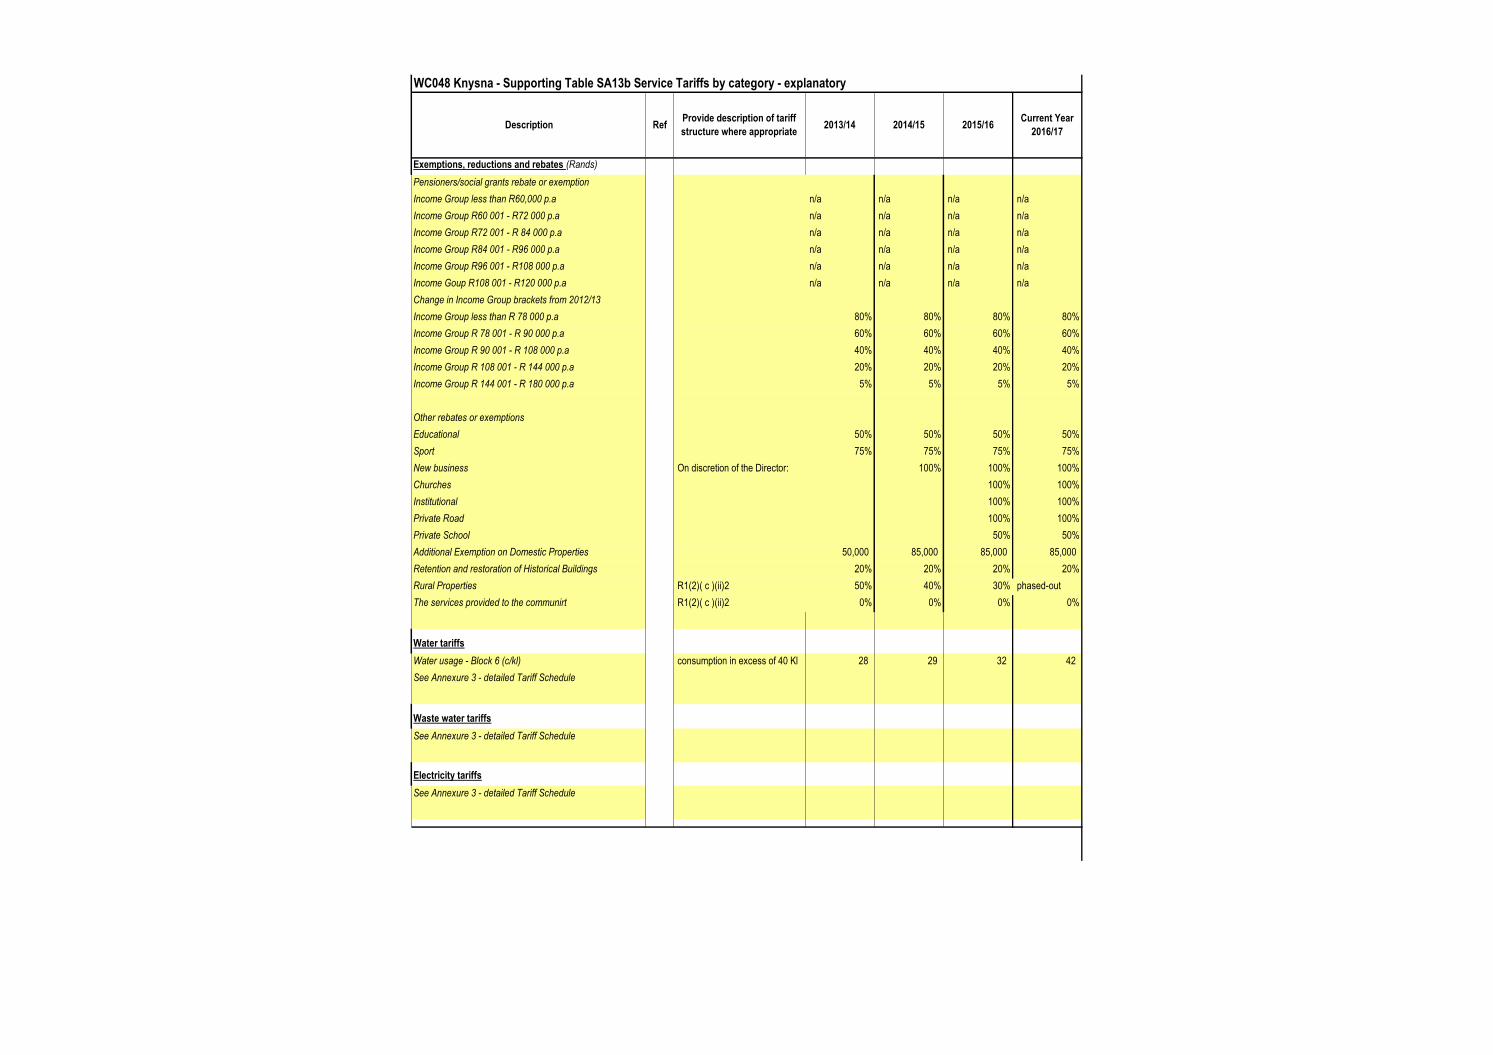
WC048 Knysna - Supporting Table SA13b Service Tariffs by category - explanatory
Exemptions, reductions and rebates (Rands)
Pensioners/social grants rebate or exemption
Income Group less than R60,000 p.a n/a n/a n/a n/a
Income Group R60 001 - R72 000 p.a n/a n/a n/a n/a
Income Group R72 001 - R 84 000 p.a n/a n/a n/a n/a
Income Group R84 001 - R96 000 p.a n/a n/a n/a n/a
Income Group R96 001 - R108 000 p.a n/a n/a n/a n/a
Income Goup R108 001 - R120 000 p.a n/a n/a n/a n/a
Change in Income Group brackets from 2012/13
Income Group less than R 78 000 p.a 80% 80% 80% 80%
Income Group R 78 001 - R 90 000 p.a 60% 60% 60% 60%
Income Group R 90 001 - R 108 000 p.a 40% 40% 40% 40%
Income Group R 108 001 - R 144 000 p.a 20% 20% 20% 20%
Income Group R 144 001 - R 180 000 p.a 5% 5% 5% 5%
Other rebates or exemptions
Educational 50% 50% 50% 50%
Sport 75% 75% 75% 75%
New business On discretion of the Director:
Finance
100% 100% 100%
Churches 100% 100%
Institutional 100% 100%
Private Road 100% 100%
Private School 50% 50%
Additional Exemption on Domestic Properties 50,000 85,000 85,000 85,000
Retention and restoration of Historical Buildings 20% 20% 20% 20%
Rural Properties R1(2)( c )(ii)2 50% 40% 30% phased-out
The services provided to the communirt R1(2)( c )(ii)2 0% 0% 0% 0%
Water tariffs
Water usage - Block 6 (c/kl) consumption in excess of 40 Kl 28 29 32 42
See Annexure 3 - detailed Tariff Schedule
Waste water tariffs
See Annexure 3 - detailed Tariff Schedule
Electricity tariffs
See Annexure 3 - detailed Tariff Schedule
Current Year
2016/172015/16Description Ref
Provide description of tariff
structure where appropriate2013/14 2014/15
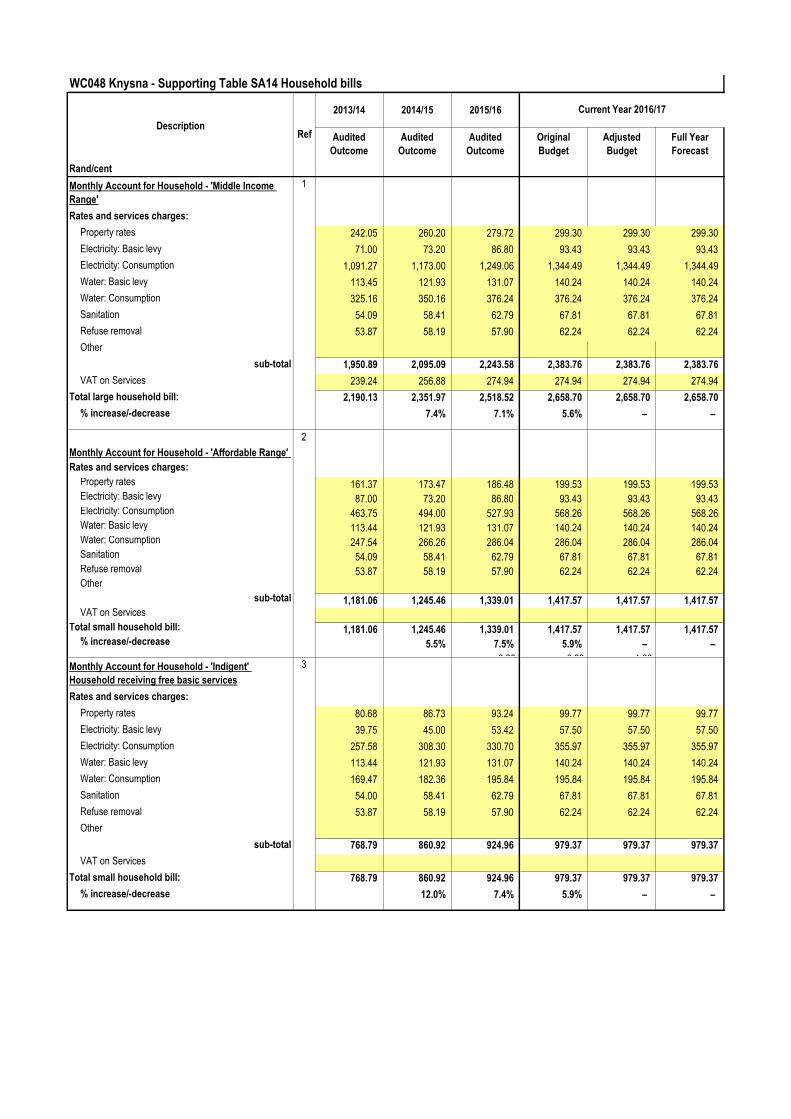
WC048 Knysna - Supporting Table SA14 Household bills
2013/14 2014/15 2015/16
Audited
Outcome
Audited
Outcome
Audited
Outcome
Original
Budget
Adjusted
Budget
Full Year
Forecast
Rand/cent
Monthly Account for Household - 'Middle Income
Range'
1
Rates and services charges:
Property rates 242.05 260.20 279.72 299.30 299.30 299.30
Electricity: Basic levy 71.00 73.20 86.80 93.43 93.43 93.43
Electricity: Consumption 1,091.27 1,173.00 1,249.06 1,344.49 1,344.49 1,344.49
Water: Basic levy 113.45 121.93 131.07 140.24 140.24 140.24
Water: Consumption 325.16 350.16 376.24 376.24 376.24 376.24
Sanitation 54.09 58.41 62.79 67.81 67.81 67.81
Refuse removal 53.87 58.19 57.90 62.24 62.24 62.24
Other
sub-total 1,950.89 2,095.09 2,243.58 2,383.76 2,383.76 2,383.76
VAT on Services 239.24 256.88 274.94 274.94 274.94 274.94
Total large household bill: 2,190.13 2,351.97 2,518.52 2,658.70 2,658.70 2,658.70
% increase/-decrease 7.4% 7.1% 5.6% – –
Monthly Account for Household - 'Affordable Range'
2
Rates and services charges:
Property rates 161.37 173.47 186.48 199.53 199.53 199.53 Electricity: Basic levy 87.00 73.20 86.80 93.43 93.43 93.43 Electricity: Consumption 463.75 494.00 527.93 568.26 568.26 568.26 Water: Basic levy 113.44 121.93 131.07 140.24 140.24 140.24 Water: Consumption 247.54 266.26 286.04 286.04 286.04 286.04 Sanitation 54.09 58.41 62.79 67.81 67.81 67.81 Refuse removal 53.87 58.19 57.90 62.24 62.24 62.24 Other
sub-total 1,181.06 1,245.46 1,339.01 1,417.57 1,417.57 1,417.57 VAT on Services
Total small household bill: 1,181.06 1,245.46 1,339.01 1,417.57 1,417.57 1,417.57 % increase/-decrease 5.5% 7.5% 5.9% – –
0.38 -0.22 -1.00 - Monthly Account for Household - 'Indigent'
Household receiving free basic services
3
Rates and services charges:
Property rates 80.68 86.73 93.24 99.77 99.77 99.77
Electricity: Basic levy 39.75 45.00 53.42 57.50 57.50 57.50
Electricity: Consumption 257.58 308.30 330.70 355.97 355.97 355.97
Water: Basic levy 113.44 121.93 131.07 140.24 140.24 140.24
Water: Consumption 169.47 182.36 195.84 195.84 195.84 195.84
Sanitation 54.00 58.41 62.79 67.81 67.81 67.81
Refuse removal 53.87 58.19 57.90 62.24 62.24 62.24
Other
sub-total 768.79 860.92 924.96 979.37 979.37 979.37
VAT on Services
Total small household bill: 768.79 860.92 924.96 979.37 979.37 979.37
% increase/-decrease 12.0% 7.4% 5.9% – –
Ref
Current Year 2016/17
Description
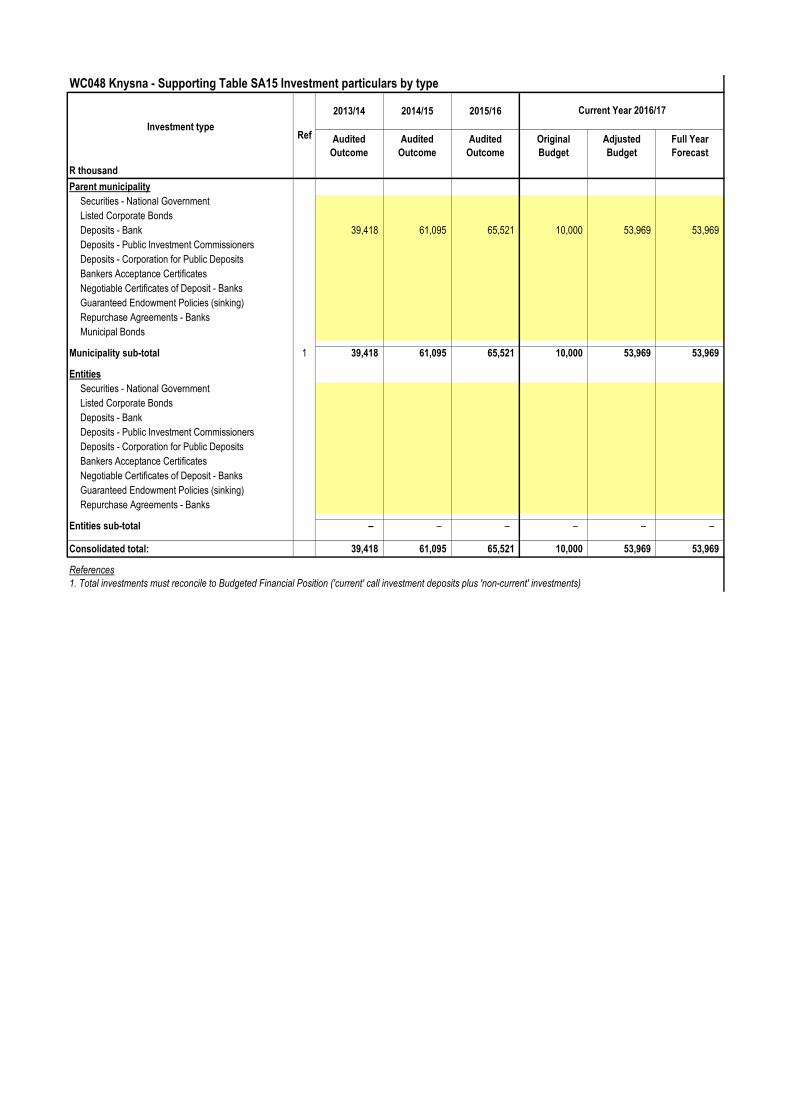
WC048 Knysna - Supporting Table SA15 Investment particulars by type
2013/14 2014/15 2015/16
Audited
Outcome
Audited
Outcome
Audited
Outcome
Original
Budget
Adjusted
Budget
Full Year
Forecast
R thousand
Parent municipality
Securities - National Government
Listed Corporate Bonds
Deposits - Bank 39,418 61,095 65,521 10,000 53,969 53,969
Deposits - Public Investment Commissioners
Deposits - Corporation for Public Deposits
Bankers Acceptance Certificates
Negotiable Certificates of Deposit - Banks
Guaranteed Endowment Policies (sinking)
Repurchase Agreements - Banks
Municipal Bonds
Municipality sub-total 1 39,418 61,095 65,521 10,000 53,969 53,969
Entities
Securities - National Government
Listed Corporate Bonds
Deposits - Bank
Deposits - Public Investment Commissioners
Deposits - Corporation for Public Deposits
Bankers Acceptance Certificates
Negotiable Certificates of Deposit - Banks
Guaranteed Endowment Policies (sinking)
Repurchase Agreements - Banks
Entities sub-total – – – – – –
Consolidated total: 39,418 61,095 65,521 10,000 53,969 53,969
References
1. Total investments must reconcile to Budgeted Financial Position ('current' call investment deposits plus 'non-current' investments)
Current Year 2016/17
RefInvestment type
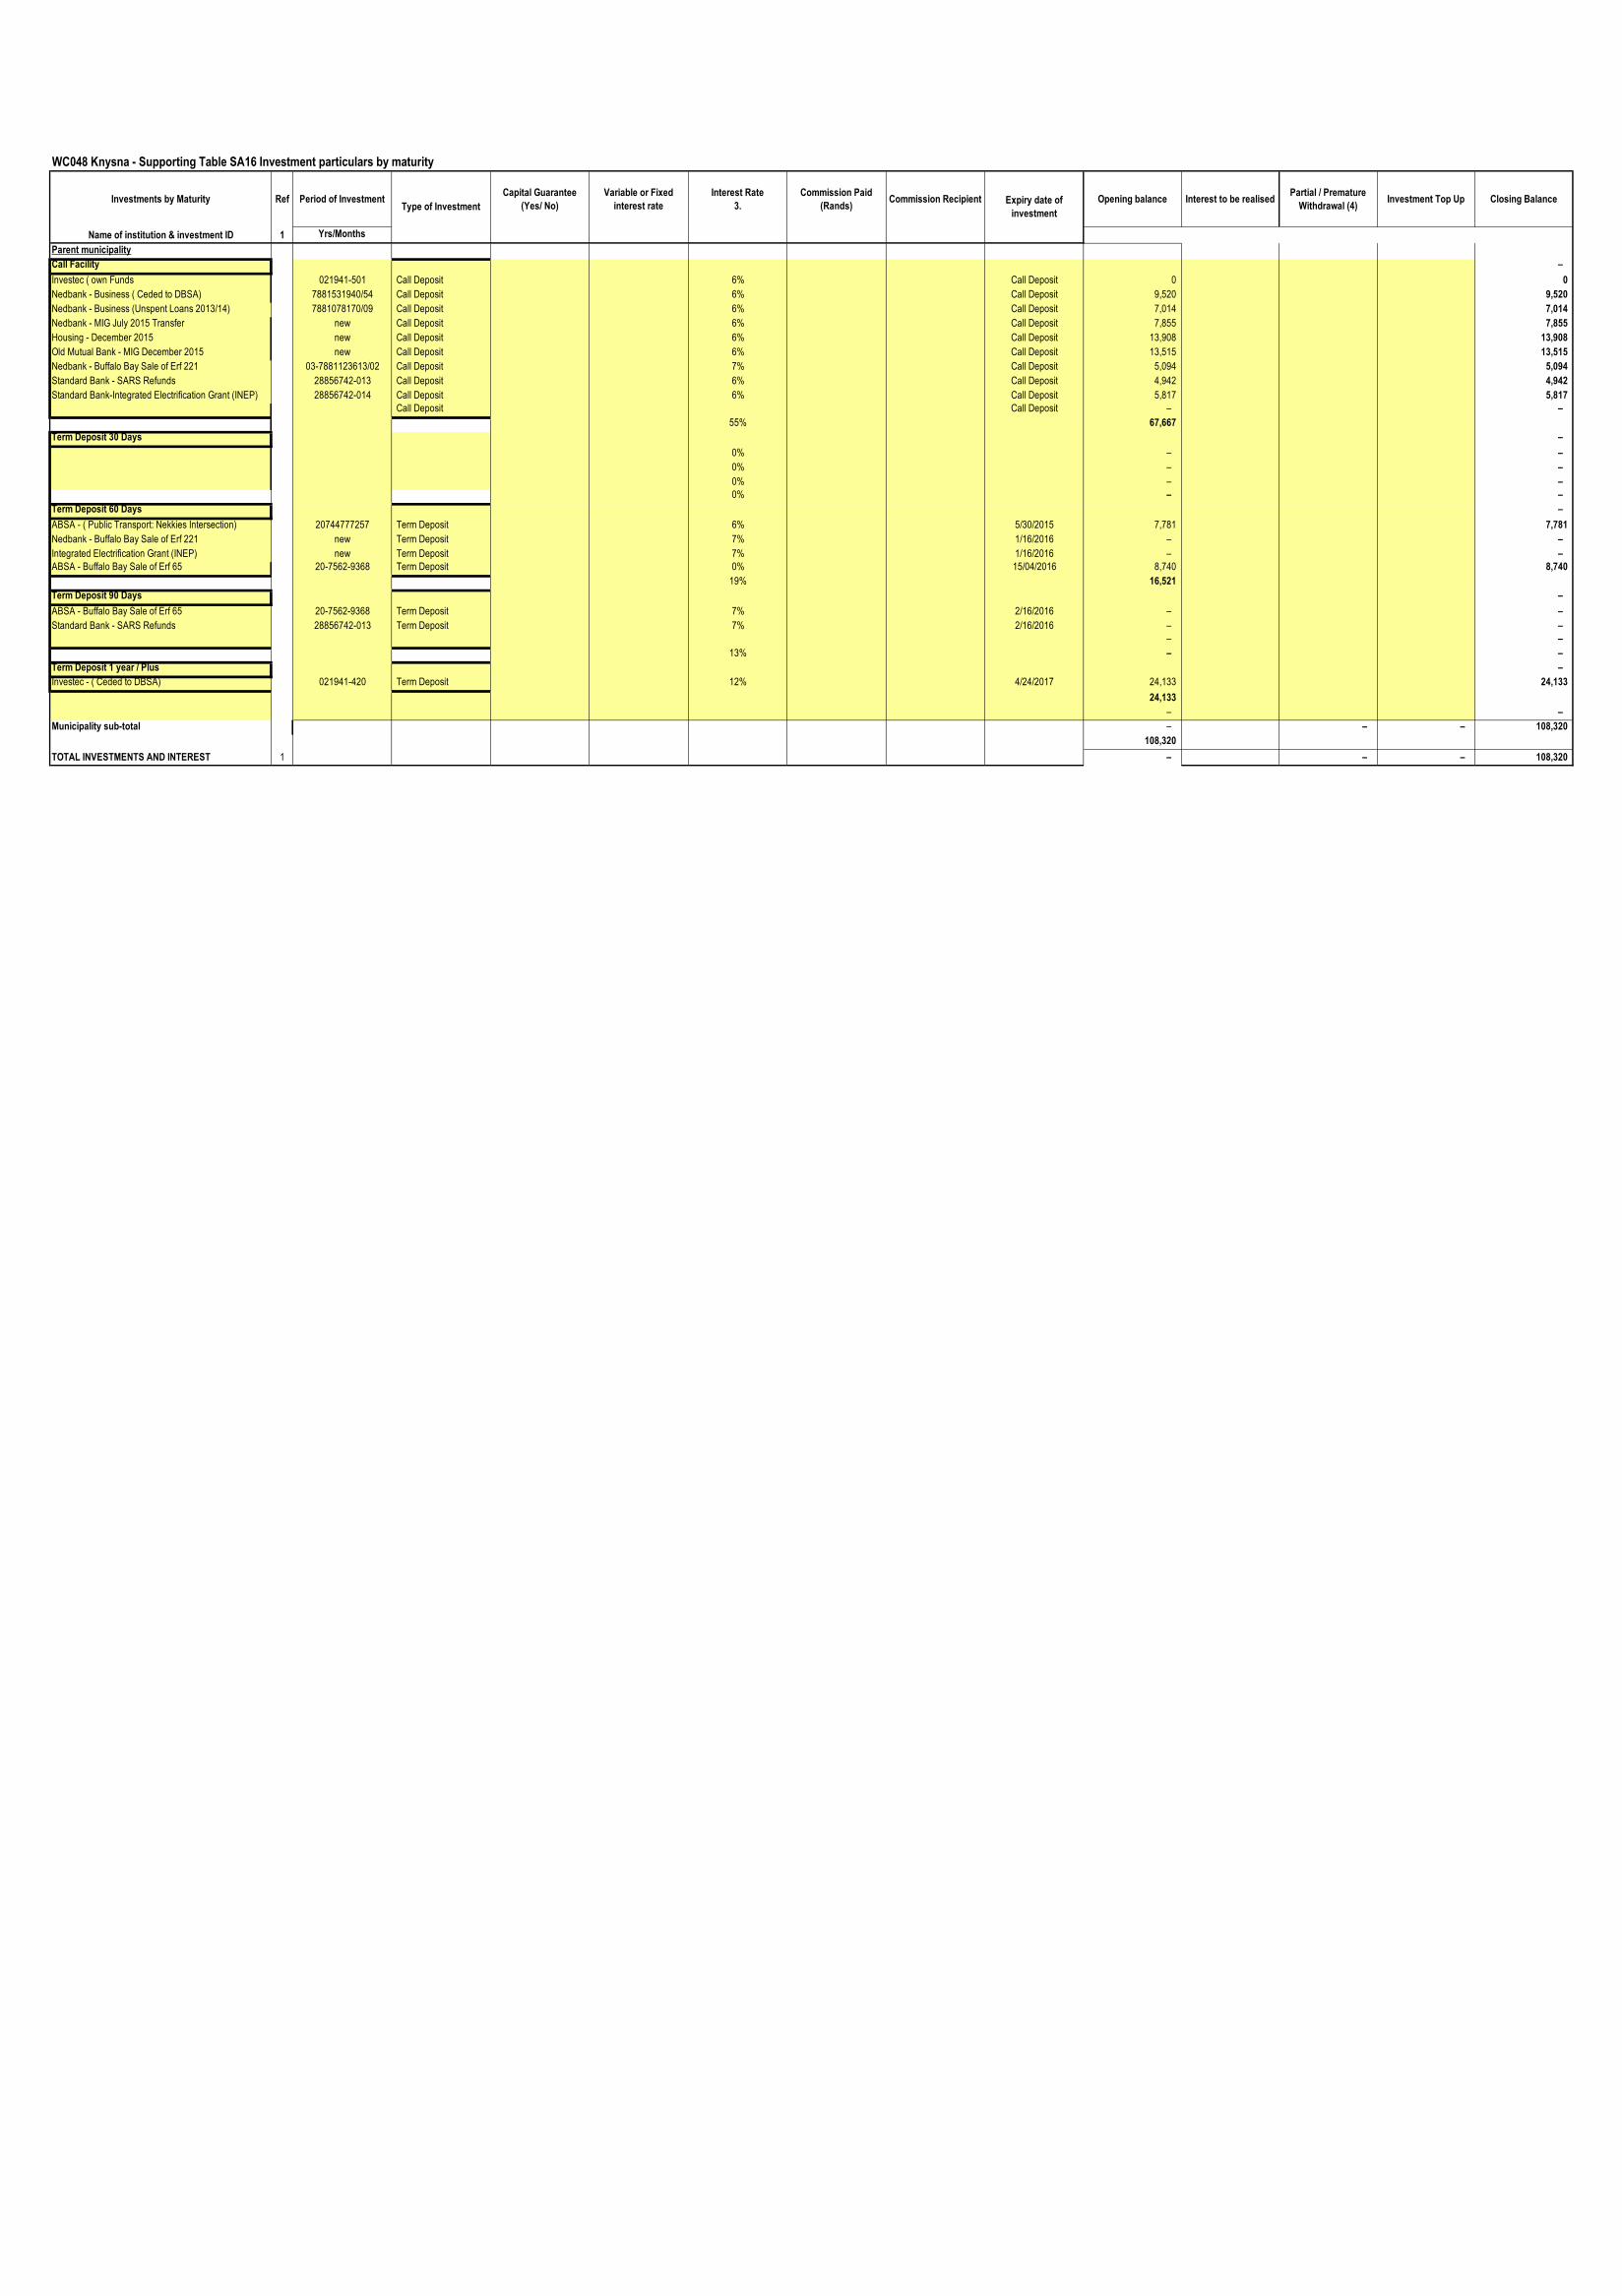
WC048 Knysna - Supporting Table SA16 Investment particulars by maturity
Investments by Maturity Ref Period of InvestmentCapital Guarantee
(Yes/ No)
Variable or Fixed
interest rate
Interest Rate
3.
Commission Paid
(Rands)Commission Recipient Opening balance Interest to be realised
Partial / Premature
Withdrawal (4)Investment Top Up Closing Balance
Name of institution & investment ID 1 Yrs/Months
Parent municipality
Call Facility –
Investec ( own Funds 021941-501 Call Deposit 6% Call Deposit 0 0
Nedbank - Business ( Ceded to DBSA) 7881531940/54 Call Deposit 6% Call Deposit 9,520 9,520
Nedbank - Business (Unspent Loans 2013/14) 7881078170/09 Call Deposit 6% Call Deposit 7,014 7,014
Nedbank - MIG July 2015 Transfer new Call Deposit 6% Call Deposit 7,855 7,855
Housing - December 2015 new Call Deposit 6% Call Deposit 13,908 13,908
Old Mutual Bank - MIG December 2015 new Call Deposit 6% Call Deposit 13,515 13,515
Nedbank - Buffalo Bay Sale of Erf 221 03-7881123613/02 Call Deposit 7% Call Deposit 5,094 5,094
Standard Bank - SARS Refunds 28856742-013 Call Deposit 6% Call Deposit 4,942 4,942
Standard Bank-Integrated Electrification Grant (INEP) 28856742-014 Call Deposit 6% Call Deposit 5,817 5,817
Call Deposit Call Deposit – –
55% 67,667
Term Deposit 30 Days –
0% – –
0% – –
0% – –
0% – –
Term Deposit 60 Days –
ABSA - ( Public Transport: Nekkies Intersection) 20744777257 Term Deposit 6% 5/30/2015 7,781 7,781
Nedbank - Buffalo Bay Sale of Erf 221 new Term Deposit 7% 1/16/2016 – –
Integrated Electrification Grant (INEP) new Term Deposit 7% 1/16/2016 – –
ABSA - Buffalo Bay Sale of Erf 65 20-7562-9368 Term Deposit 0% 15/04/2016 8,740 8,740
19% 16,521
Term Deposit 90 Days –
ABSA - Buffalo Bay Sale of Erf 65 20-7562-9368 Term Deposit 7% 2/16/2016 – –
Standard Bank - SARS Refunds 28856742-013 Term Deposit 7% 2/16/2016 – –
– –
13% – –
Term Deposit 1 year / Plus –
Investec - ( Ceded to DBSA) 021941-420 Term Deposit 12% 4/24/2017 24,133 24,133
24,133
– –
Municipality sub-total – – – 108,320
108,320
TOTAL INVESTMENTS AND INTEREST 1 – – – 108,320
Type of InvestmentExpiry date of
investment
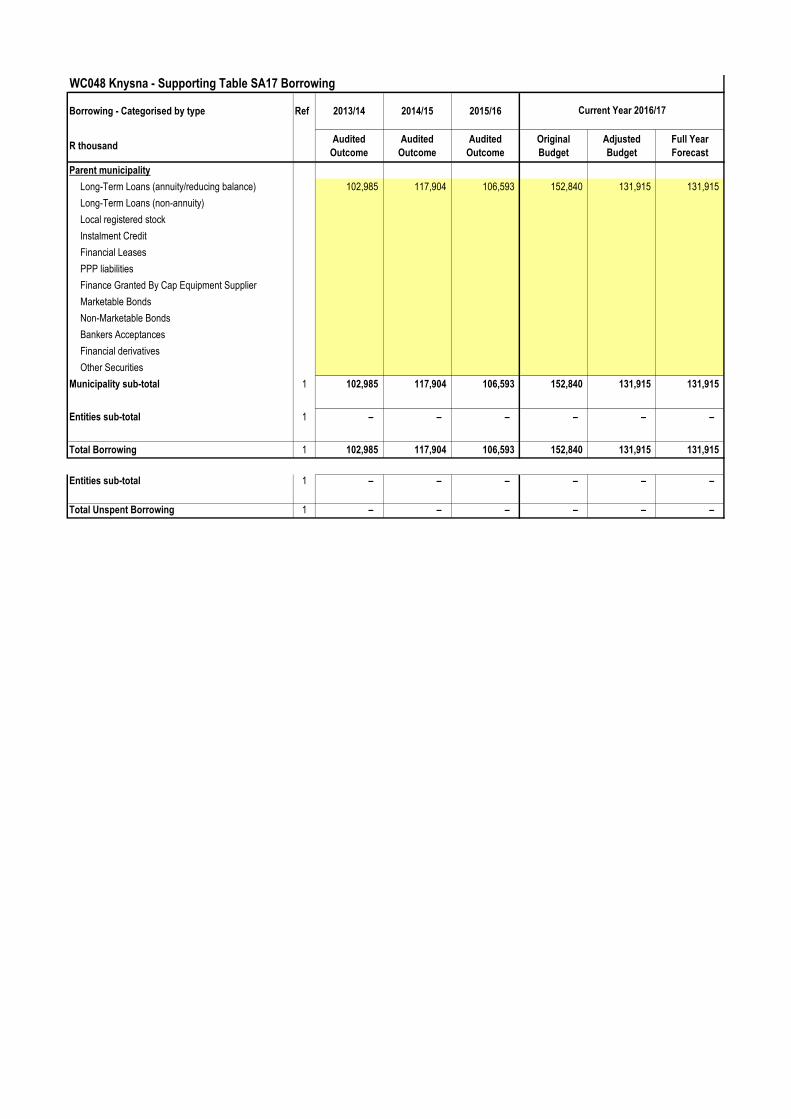
WC048 Knysna - Supporting Table SA17 Borrowing
Borrowing - Categorised by type Ref 2013/14 2014/15 2015/16
R thousandAudited
Outcome
Audited
Outcome
Audited
Outcome
Original
Budget
Adjusted
Budget
Full Year
Forecast
Parent municipality
Long-Term Loans (annuity/reducing balance) 102,985 117,904 106,593 152,840 131,915 131,915
Long-Term Loans (non-annuity)
Local registered stock
Instalment Credit
Financial Leases
PPP liabilities
Finance Granted By Cap Equipment Supplier
Marketable Bonds
Non-Marketable Bonds
Bankers Acceptances
Financial derivatives
Other Securities
Municipality sub-total 1 102,985 117,904 106,593 152,840 131,915 131,915
Entities sub-total 1 – – – – – –
Total Borrowing 1 102,985 117,904 106,593 152,840 131,915 131,915
Entities sub-total 1 – – – – – –
Total Unspent Borrowing 1 – – – – – –
Current Year 2016/17
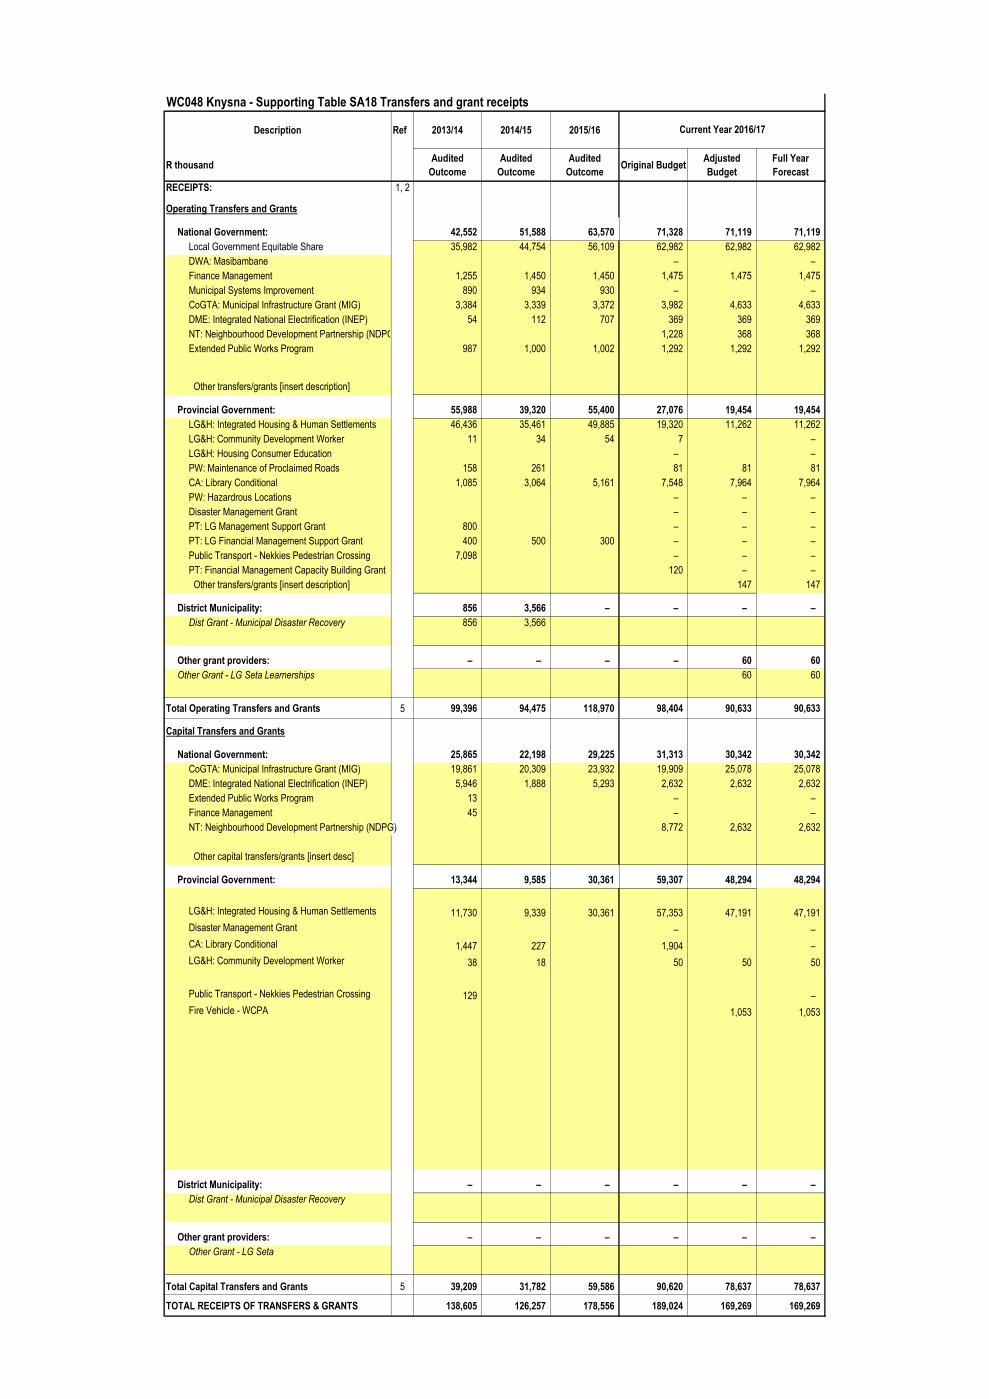
WC048 Knysna - Supporting Table SA18 Transfers and grant receipts
Description Ref 2013/14 2014/15 2015/16
R thousandAudited
Outcome
Audited
Outcome
Audited
OutcomeOriginal Budget
Adjusted
Budget
Full Year
Forecast
RECEIPTS: 1, 2
Operating Transfers and Grants
National Government: 42,552 51,588 63,570 71,328 71,119 71,119
Local Government Equitable Share 35,982 44,754 56,109 62,982 62,982 62,982
DWA: Masibambane – –
Finance Management 1,255 1,450 1,450 1,475 1,475 1,475
Municipal Systems Improvement 890 934 930 – –
CoGTA: Municipal Infrastructure Grant (MIG) 3,384 3,339 3,372 3,982 4,633 4,633
DME: Integrated National Electrification (INEP) 54 112 707 369 369 369
NT: Neighbourhood Development Partnership (NDPG) 1,228 368 368
Extended Public Works Program 987 1,000 1,002 1,292 1,292 1,292
Other transfers/grants [insert description]
Provincial Government: 55,988 39,320 55,400 27,076 19,454 19,454
LG&H: Integrated Housing & Human Settlements 46,436 35,461 49,885 19,320 11,262 11,262
LG&H: Community Development Worker 11 34 54 7 –
LG&H: Housing Consumer Education – –
PW: Maintenance of Proclaimed Roads 158 261 81 81 81
CA: Library Conditional 1,085 3,064 5,161 7,548 7,964 7,964
PW: Hazardrous Locations – – –
Disaster Management Grant – – –
PT: LG Management Support Grant 800 – – –
PT: LG Financial Management Support Grant 400 500 300 – – –
Public Transport - Nekkies Pedestrian Crossing 7,098 – – –
PT: Financial Management Capacity Building Grant 120 – –
Other transfers/grants [insert description] 147 147
District Municipality: 856 3,566 – – – –
Dist Grant - Municipal Disaster Recovery 856 3,566
Other grant providers: – – – – 60 60
Other Grant - LG Seta Learnerships 60 60
Total Operating Transfers and Grants 5 99,396 94,475 118,970 98,404 90,633 90,633
Capital Transfers and Grants
National Government: 25,865 22,198 29,225 31,313 30,342 30,342
CoGTA: Municipal Infrastructure Grant (MIG) 19,861 20,309 23,932 19,909 25,078 25,078
DME: Integrated National Electrification (INEP) 5,946 1,888 5,293 2,632 2,632 2,632
Extended Public Works Program 13 – –
Finance Management 45 – –
NT: Neighbourhood Development Partnership (NDPG) 8,772 2,632 2,632
Other capital transfers/grants [insert desc]
Provincial Government: 13,344 9,585 30,361 59,307 48,294 48,294
LG&H: Integrated Housing & Human Settlements 11,730 9,339 30,361 57,353 47,191 47,191
Disaster Management Grant – –
CA: Library Conditional 1,447 227 1,904 –
LG&H: Community Development Worker 38 18 50 50 50
Public Transport - Nekkies Pedestrian Crossing 129 –
Fire Vehicle - WCPA 1,053 1,053
District Municipality: – – – – – –
Dist Grant - Municipal Disaster Recovery
Other grant providers: – – – – – –
Other Grant - LG Seta
Total Capital Transfers and Grants 5 39,209 31,782 59,586 90,620 78,637 78,637
TOTAL RECEIPTS OF TRANSFERS & GRANTS 138,605 126,257 178,556 189,024 169,269 169,269
Current Year 2016/17
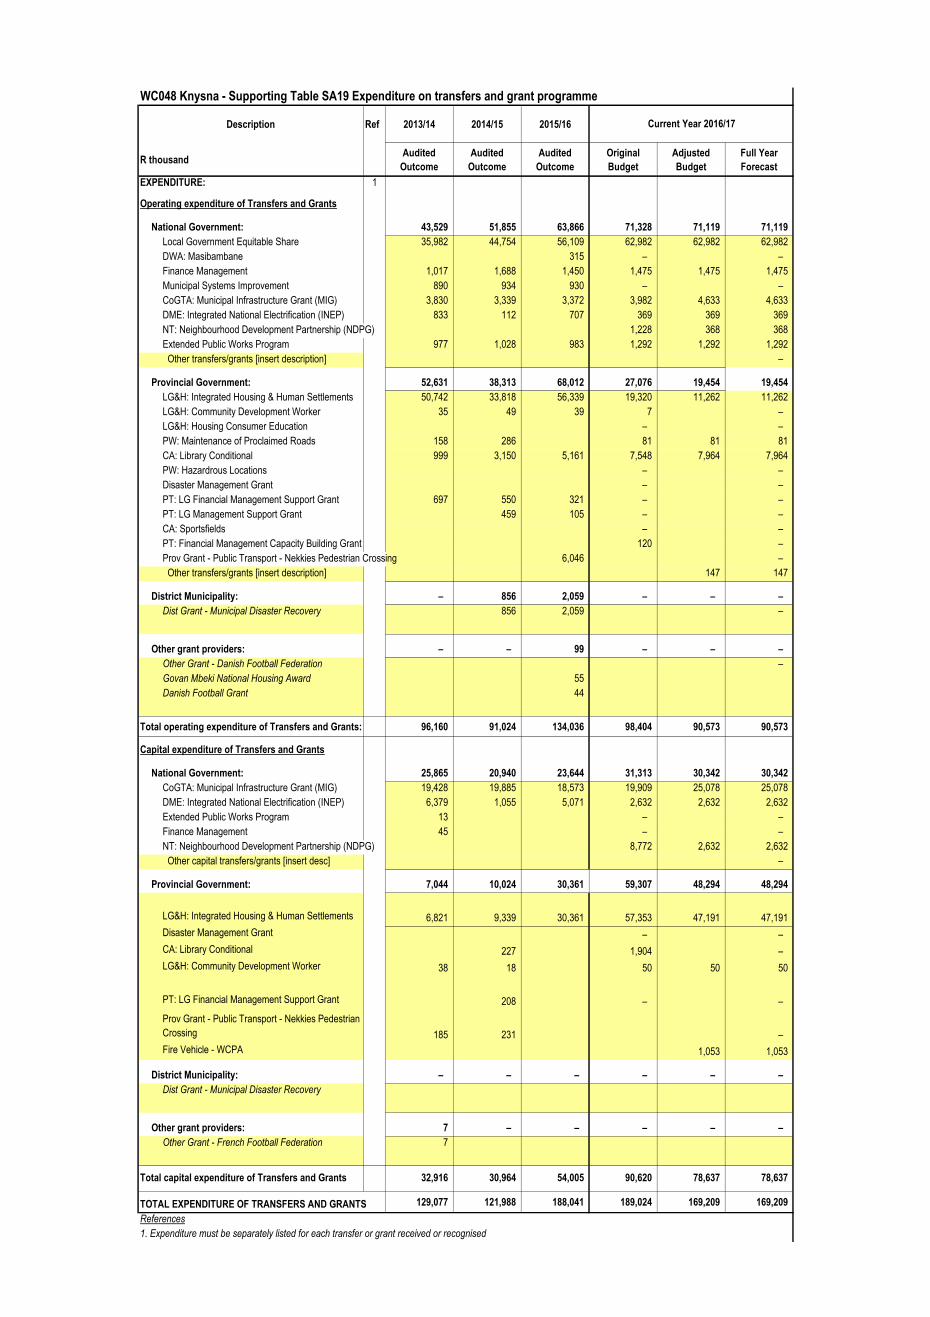
WC048 Knysna - Supporting Table SA19 Expenditure on transfers and grant programme
Description Ref 2013/14 2014/15 2015/16
R thousandAudited
Outcome
Audited
Outcome
Audited
Outcome
Original
Budget
Adjusted
Budget
Full Year
Forecast
EXPENDITURE: 1
Operating expenditure of Transfers and Grants
National Government: 43,529 51,855 63,866 71,328 71,119 71,119
Local Government Equitable Share 35,982 44,754 56,109 62,982 62,982 62,982
DWA: Masibambane 315 – –
Finance Management 1,017 1,688 1,450 1,475 1,475 1,475
Municipal Systems Improvement 890 934 930 – –
CoGTA: Municipal Infrastructure Grant (MIG) 3,830 3,339 3,372 3,982 4,633 4,633
DME: Integrated National Electrification (INEP) 833 112 707 369 369 369
NT: Neighbourhood Development Partnership (NDPG) 1,228 368 368
Extended Public Works Program 977 1,028 983 1,292 1,292 1,292
Other transfers/grants [insert description] –
Provincial Government: 52,631 38,313 68,012 27,076 19,454 19,454
LG&H: Integrated Housing & Human Settlements 50,742 33,818 56,339 19,320 11,262 11,262
LG&H: Community Development Worker 35 49 39 7 –
LG&H: Housing Consumer Education – –
PW: Maintenance of Proclaimed Roads 158 286 81 81 81
CA: Library Conditional 999 3,150 5,161 7,548 7,964 7,964
PW: Hazardrous Locations – –
Disaster Management Grant – –
PT: LG Financial Management Support Grant 697 550 321 – –
PT: LG Management Support Grant 459 105 – –
CA: Sportsfields – –
PT: Financial Management Capacity Building Grant 120 –
Prov Grant - Public Transport - Nekkies Pedestrian Crossing 6,046 –
Other transfers/grants [insert description] 147 147
District Municipality: – 856 2,059 – – –
Dist Grant - Municipal Disaster Recovery 856 2,059 –
Other grant providers: – – 99 – – –
Other Grant - Danish Football Federation –
Govan Mbeki National Housing Award 55
Danish Football Grant 44
Total operating expenditure of Transfers and Grants: 96,160 91,024 134,036 98,404 90,573 90,573
Capital expenditure of Transfers and Grants
National Government: 25,865 20,940 23,644 31,313 30,342 30,342
CoGTA: Municipal Infrastructure Grant (MIG) 19,428 19,885 18,573 19,909 25,078 25,078
DME: Integrated National Electrification (INEP) 6,379 1,055 5,071 2,632 2,632 2,632
Extended Public Works Program 13 – –
Finance Management 45 – –
NT: Neighbourhood Development Partnership (NDPG) 8,772 2,632 2,632
Other capital transfers/grants [insert desc] –
Provincial Government: 7,044 10,024 30,361 59,307 48,294 48,294
LG&H: Integrated Housing & Human Settlements 6,821 9,339 30,361 57,353 47,191 47,191
Disaster Management Grant – –
CA: Library Conditional 227 1,904 –
LG&H: Community Development Worker 38 18 50 50 50
PT: LG Financial Management Support Grant 208 – –
Prov Grant - Public Transport - Nekkies Pedestrian
Crossing 185 231 –
Fire Vehicle - WCPA 1,053 1,053
District Municipality: – – – – – –
Dist Grant - Municipal Disaster Recovery
Other grant providers: 7 – – – – –
Other Grant - French Football Federation 7
Total capital expenditure of Transfers and Grants 32,916 30,964 54,005 90,620 78,637 78,637
TOTAL EXPENDITURE OF TRANSFERS AND GRANTS 129,077 121,988 188,041 189,024 169,209 169,209
References
1. Expenditure must be separately listed for each transfer or grant received or recognised
Current Year 2016/17
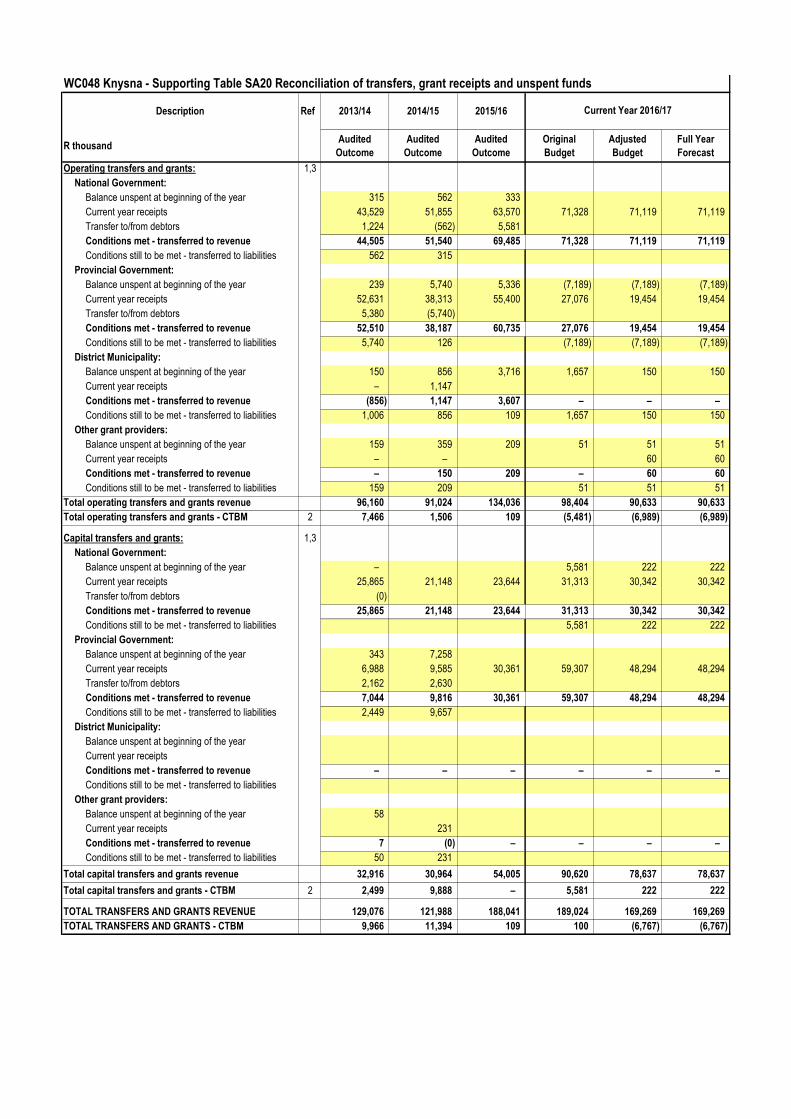
WC048 Knysna - Supporting Table SA20 Reconciliation of transfers, grant receipts and unspent funds
Description Ref 2013/14 2014/15 2015/16
R thousandAudited
Outcome
Audited
Outcome
Audited
Outcome
Original
Budget
Adjusted
Budget
Full Year
Forecast
Operating transfers and grants: 1,3
National Government:
Balance unspent at beginning of the year 315 562 333
Current year receipts 43,529 51,855 63,570 71,328 71,119 71,119
Transfer to/from debtors 1,224 (562) 5,581
Conditions met - transferred to revenue 44,505 51,540 69,485 71,328 71,119 71,119
Conditions still to be met - transferred to liabilities 562 315
Provincial Government:
Balance unspent at beginning of the year 239 5,740 5,336 (7,189) (7,189) (7,189)
Current year receipts 52,631 38,313 55,400 27,076 19,454 19,454
Transfer to/from debtors 5,380 (5,740)
Conditions met - transferred to revenue 52,510 38,187 60,735 27,076 19,454 19,454
Conditions still to be met - transferred to liabilities 5,740 126 (7,189) (7,189) (7,189)
District Municipality:
Balance unspent at beginning of the year 150 856 3,716 1,657 150 150
Current year receipts – 1,147
Conditions met - transferred to revenue (856) 1,147 3,607 – – –
Conditions still to be met - transferred to liabilities 1,006 856 109 1,657 150 150
Other grant providers:
Balance unspent at beginning of the year 159 359 209 51 51 51
Current year receipts – – 60 60
Conditions met - transferred to revenue – 150 209 – 60 60
Conditions still to be met - transferred to liabilities 159 209 51 51 51
Total operating transfers and grants revenue 96,160 91,024 134,036 98,404 90,633 90,633
Total operating transfers and grants - CTBM 2 7,466 1,506 109 (5,481) (6,989) (6,989)
Capital transfers and grants: 1,3
National Government:
Balance unspent at beginning of the year – 5,581 222 222
Current year receipts 25,865 21,148 23,644 31,313 30,342 30,342
Transfer to/from debtors (0)
Conditions met - transferred to revenue 25,865 21,148 23,644 31,313 30,342 30,342
Conditions still to be met - transferred to liabilities 5,581 222 222
Provincial Government:
Balance unspent at beginning of the year 343 7,258
Current year receipts 6,988 9,585 30,361 59,307 48,294 48,294
Transfer to/from debtors 2,162 2,630
Conditions met - transferred to revenue 7,044 9,816 30,361 59,307 48,294 48,294
Conditions still to be met - transferred to liabilities 2,449 9,657
District Municipality:
Balance unspent at beginning of the year
Current year receipts
Conditions met - transferred to revenue – – – – – –
Conditions still to be met - transferred to liabilities
Other grant providers:
Balance unspent at beginning of the year 58
Current year receipts 231
Conditions met - transferred to revenue 7 (0) – – – –
Conditions still to be met - transferred to liabilities 50 231
Total capital transfers and grants revenue 32,916 30,964 54,005 90,620 78,637 78,637
Total capital transfers and grants - CTBM 2 2,499 9,888 – 5,581 222 222
TOTAL TRANSFERS AND GRANTS REVENUE 129,076 121,988 188,041 189,024 169,269 169,269
TOTAL TRANSFERS AND GRANTS - CTBM 9,966 11,394 109 100 (6,767) (6,767)
Current Year 2016/17
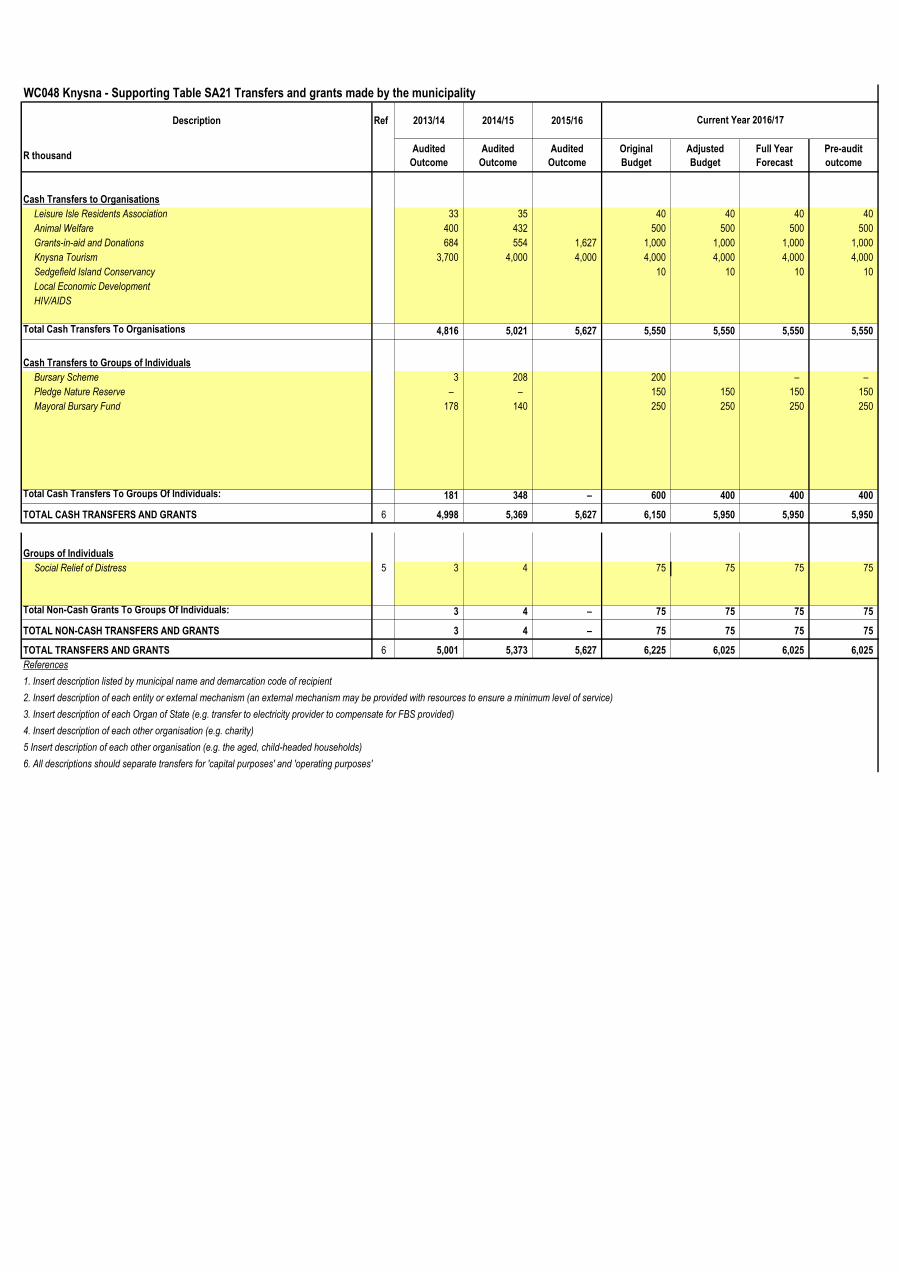
WC048 Knysna - Supporting Table SA21 Transfers and grants made by the municipality
Description Ref 2013/14 2014/15 2015/16
R thousandAudited
Outcome
Audited
Outcome
Audited
Outcome
Original
Budget
Adjusted
Budget
Full Year
Forecast
Pre-audit
outcome
Cash Transfers to Organisations
Leisure Isle Residents Association 33 35 40 40 40 40
Animal Welfare 400 432 500 500 500 500
Grants-in-aid and Donations 684 554 1,627 1,000 1,000 1,000 1,000
Knysna Tourism 3,700 4,000 4,000 4,000 4,000 4,000 4,000
Sedgefield Island Conservancy 10 10 10 10
Local Economic Development
HIV/AIDS
Total Cash Transfers To Organisations 4,816 5,021 5,627 5,550 5,550 5,550 5,550
Cash Transfers to Groups of Individuals
Bursary Scheme 3 208 200 – –
Pledge Nature Reserve – – 150 150 150 150
Mayoral Bursary Fund 178 140 250 250 250 250
Total Cash Transfers To Groups Of Individuals: 181 348 – 600 400 400 400
TOTAL CASH TRANSFERS AND GRANTS 6 4,998 5,369 5,627 6,150 5,950 5,950 5,950
Groups of Individuals
Social Relief of Distress 5 3 4 75 75 75 75
Total Non-Cash Grants To Groups Of Individuals: 3 4 – 75 75 75 75
TOTAL NON-CASH TRANSFERS AND GRANTS 3 4 – 75 75 75 75
TOTAL TRANSFERS AND GRANTS 6 5,001 5,373 5,627 6,225 6,025 6,025 6,025
References
1. Insert description listed by municipal name and demarcation code of recipient
2. Insert description of each entity or external mechanism (an external mechanism may be provided with resources to ensure a minimum level of service)
3. Insert description of each Organ of State (e.g. transfer to electricity provider to compensate for FBS provided)
4. Insert description of each other organisation (e.g. charity)
5 Insert description of each other organisation (e.g. the aged, child-headed households)
6. All descriptions should separate transfers for 'capital purposes' and 'operating purposes'
Current Year 2016/17
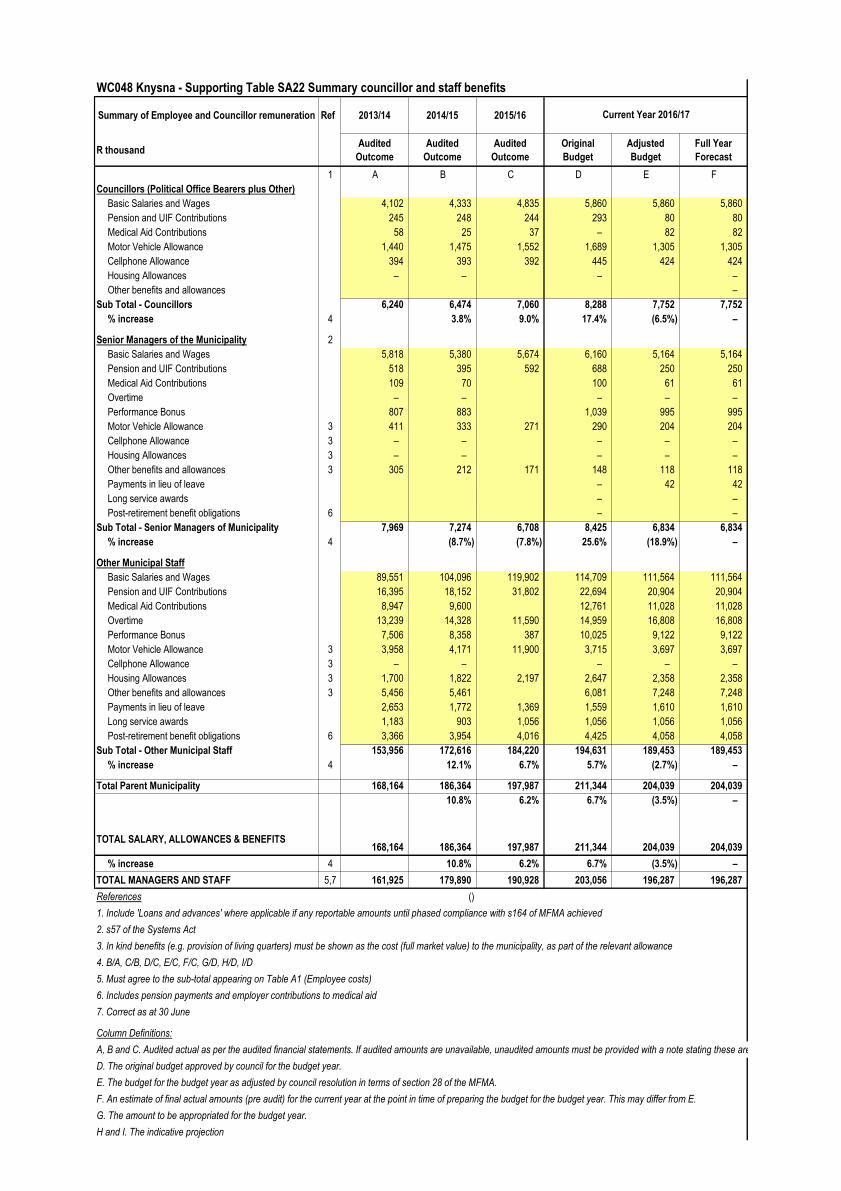
WC048 Knysna - Supporting Table SA22 Summary councillor and staff benefits
Summary of Employee and Councillor remuneration Ref 2013/14 2014/15 2015/16
R thousandAudited
Outcome
Audited
Outcome
Audited
Outcome
Original
Budget
Adjusted
Budget
Full Year
Forecast
1 A B C D E F
Councillors (Political Office Bearers plus Other)
Basic Salaries and Wages 4,102 4,333 4,835 5,860 5,860 5,860
Pension and UIF Contributions 245 248 244 293 80 80
Medical Aid Contributions 58 25 37 – 82 82
Motor Vehicle Allowance 1,440 1,475 1,552 1,689 1,305 1,305
Cellphone Allowance 394 393 392 445 424 424
Housing Allowances – – – –
Other benefits and allowances –
Sub Total - Councillors 6,240 6,474 7,060 8,288 7,752 7,752
% increase 4 3.8% 9.0% 17.4% (6.5%) –
Senior Managers of the Municipality 2
Basic Salaries and Wages 5,818 5,380 5,674 6,160 5,164 5,164
Pension and UIF Contributions 518 395 592 688 250 250
Medical Aid Contributions 109 70 100 61 61
Overtime – – – – –
Performance Bonus 807 883 1,039 995 995
Motor Vehicle Allowance 3 411 333 271 290 204 204
Cellphone Allowance 3 – – – – –
Housing Allowances 3 – – – – –
Other benefits and allowances 3 305 212 171 148 118 118
Payments in lieu of leave – 42 42
Long service awards – –
Post-retirement benefit obligations 6 – –
Sub Total - Senior Managers of Municipality 7,969 7,274 6,708 8,425 6,834 6,834
% increase 4 (8.7%) (7.8%) 25.6% (18.9%) –
Other Municipal Staff
Basic Salaries and Wages 89,551 104,096 119,902 114,709 111,564 111,564
Pension and UIF Contributions 16,395 18,152 31,802 22,694 20,904 20,904
Medical Aid Contributions 8,947 9,600 12,761 11,028 11,028
Overtime 13,239 14,328 11,590 14,959 16,808 16,808
Performance Bonus 7,506 8,358 387 10,025 9,122 9,122
Motor Vehicle Allowance 3 3,958 4,171 11,900 3,715 3,697 3,697
Cellphone Allowance 3 – – – – –
Housing Allowances 3 1,700 1,822 2,197 2,647 2,358 2,358
Other benefits and allowances 3 5,456 5,461 6,081 7,248 7,248
Payments in lieu of leave 2,653 1,772 1,369 1,559 1,610 1,610
Long service awards 1,183 903 1,056 1,056 1,056 1,056
Post-retirement benefit obligations 6 3,366 3,954 4,016 4,425 4,058 4,058
Sub Total - Other Municipal Staff 153,956 172,616 184,220 194,631 189,453 189,453
% increase 4 12.1% 6.7% 5.7% (2.7%) –
Total Parent Municipality 168,164 186,364 197,987 211,344 204,039 204,039
10.8% 6.2% 6.7% (3.5%) –
TOTAL SALARY, ALLOWANCES & BENEFITS168,164 186,364 197,987 211,344 204,039 204,039
% increase 4 10.8% 6.2% 6.7% (3.5%) –
TOTAL MANAGERS AND STAFF 5,7 161,925 179,890 190,928 203,056 196,287 196,287
References ()
1. Include 'Loans and advances' where applicable if any reportable amounts until phased compliance with s164 of MFMA achieved
2. s57 of the Systems Act
3. In kind benefits (e.g. provision of living quarters) must be shown as the cost (full market value) to the municipality, as part of the relevant allowance
4. B/A, C/B, D/C, E/C, F/C, G/D, H/D, I/D
5. Must agree to the sub-total appearing on Table A1 (Employee costs)
6. Includes pension payments and employer contributions to medical aid
7. Correct as at 30 June
Column Definitions:
A, B and C. Audited actual as per the audited financial statements. If audited amounts are unavailable, unaudited amounts must be provided with a note stating these are unaudited
D. The original budget approved by council for the budget year.
E. The budget for the budget year as adjusted by council resolution in terms of section 28 of the MFMA.
F. An estimate of final actual amounts (pre audit) for the current year at the point in time of preparing the budget for the budget year. This may differ from E.
G. The amount to be appropriated for the budget year.
H and I. The indicative projection
Current Year 2016/17
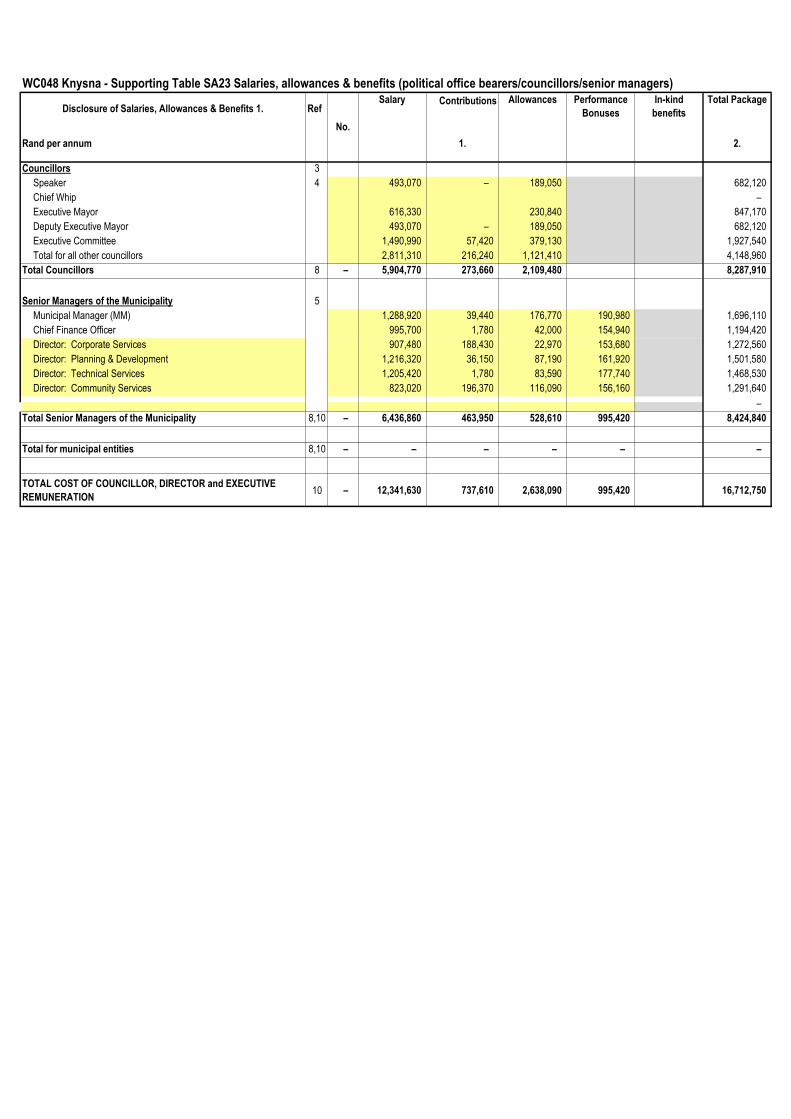
WC048 Knysna - Supporting Table SA23 Salaries, allowances & benefits (political office bearers/councillors/senior managers)
Disclosure of Salaries, Allowances & Benefits 1. RefContributions In-kind
benefits
Total Package
Rand per annum 1. 2.
Councillors 3
Speaker 4 493,070 – 189,050 682,120
Chief Whip –
Executive Mayor 616,330 230,840 847,170
Deputy Executive Mayor 493,070 – 189,050 682,120
Executive Committee 1,490,990 57,420 379,130 1,927,540
Total for all other councillors 2,811,310 216,240 1,121,410 4,148,960
Total Councillors 8 – 5,904,770 273,660 2,109,480 8,287,910
Senior Managers of the Municipality 5
Municipal Manager (MM) 1,288,920 39,440 176,770 190,980 1,696,110
Chief Finance Officer 995,700 1,780 42,000 154,940 1,194,420
Director: Corporate Services 907,480 188,430 22,970 153,680 1,272,560
Director: Planning & Development 1,216,320 36,150 87,190 161,920 1,501,580
Director: Technical Services 1,205,420 1,780 83,590 177,740 1,468,530
Director: Community Services 823,020 196,370 116,090 156,160 1,291,640
–
Total Senior Managers of the Municipality 8,10 – 6,436,860 463,950 528,610 995,420 8,424,840
Total for municipal entities 8,10 – – – – – –
TOTAL COST OF COUNCILLOR, DIRECTOR and EXECUTIVE
REMUNERATION10 – 12,341,630 737,610 2,638,090 995,420 16,712,750
No.
AllowancesSalary Performance
Bonuses
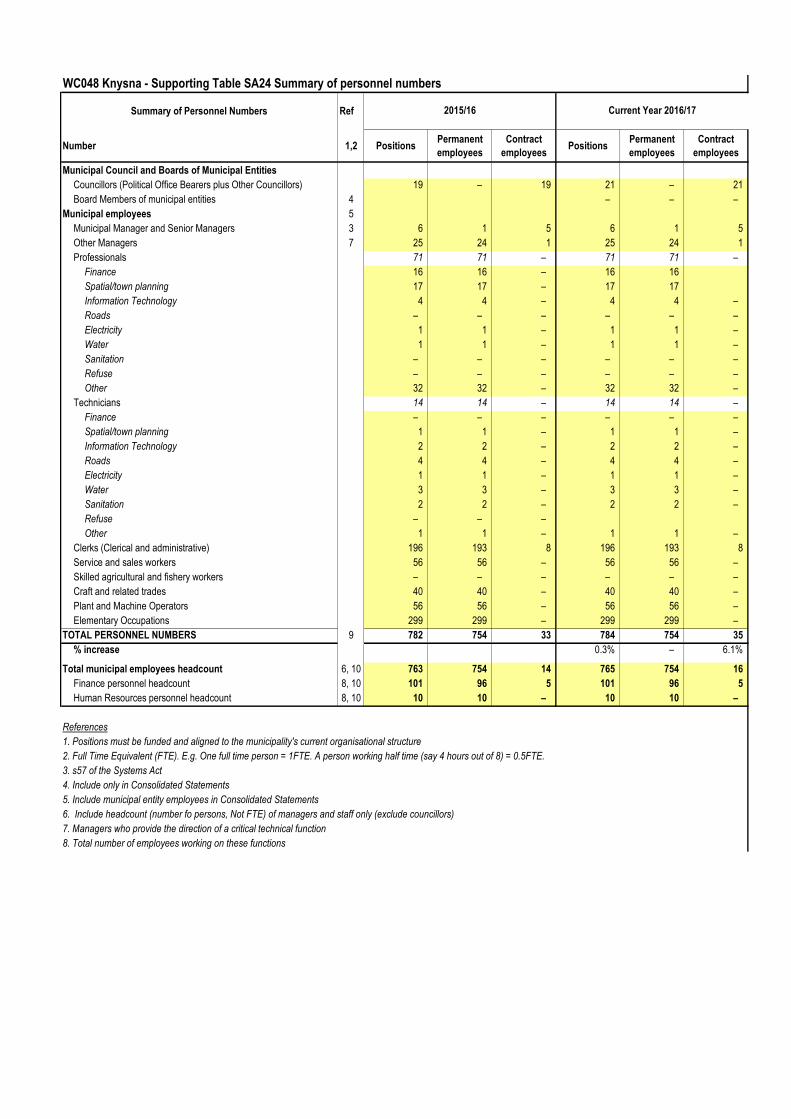
WC048 Knysna - Supporting Table SA24 Summary of personnel numbers
Summary of Personnel Numbers Ref
Number 1,2 PositionsPermanent
employees
Contract
employeesPositions
Permanent
employees
Contract
employees
Municipal Council and Boards of Municipal Entities
Councillors (Political Office Bearers plus Other Councillors) 19 – 19 21 – 21
Board Members of municipal entities 4 – – –
Municipal employees 5
Municipal Manager and Senior Managers 3 6 1 5 6 1 5
Other Managers 7 25 24 1 25 24 1
Professionals 71 71 – 71 71 –
Finance 16 16 – 16 16
Spatial/town planning 17 17 – 17 17
Information Technology 4 4 – 4 4 –
Roads – – – – – –
Electricity 1 1 – 1 1 –
Water 1 1 – 1 1 –
Sanitation – – – – – –
Refuse – – – – – –
Other 32 32 – 32 32 –
Technicians 14 14 – 14 14 –
Finance – – – – – –
Spatial/town planning 1 1 – 1 1 –
Information Technology 2 2 – 2 2 –
Roads 4 4 – 4 4 –
Electricity 1 1 – 1 1 –
Water 3 3 – 3 3 –
Sanitation 2 2 – 2 2 –
Refuse – – –
Other 1 1 – 1 1 –
Clerks (Clerical and administrative) 196 193 8 196 193 8
Service and sales workers 56 56 – 56 56 –
Skilled agricultural and fishery workers – – – – – –
Craft and related trades 40 40 – 40 40 –
Plant and Machine Operators 56 56 – 56 56 –
Elementary Occupations 299 299 – 299 299 –
TOTAL PERSONNEL NUMBERS 9 782 754 33 784 754 35
% increase 0.3% – 6.1%
Total municipal employees headcount 6, 10 763 754 14 765 754 16
Finance personnel headcount 8, 10 101 96 5 101 96 5
Human Resources personnel headcount 8, 10 10 10 – 10 10 –
References
1. Positions must be funded and aligned to the municipality's current organisational structure
2. Full Time Equivalent (FTE). E.g. One full time person = 1FTE. A person working half time (say 4 hours out of 8) = 0.5FTE.
3. s57 of the Systems Act
4. Include only in Consolidated Statements
5. Include municipal entity employees in Consolidated Statements
6. Include headcount (number fo persons, Not FTE) of managers and staff only (exclude councillors)
7. Managers who provide the direction of a critical technical function
8. Total number of employees working on these functions
Current Year 2016/172015/16
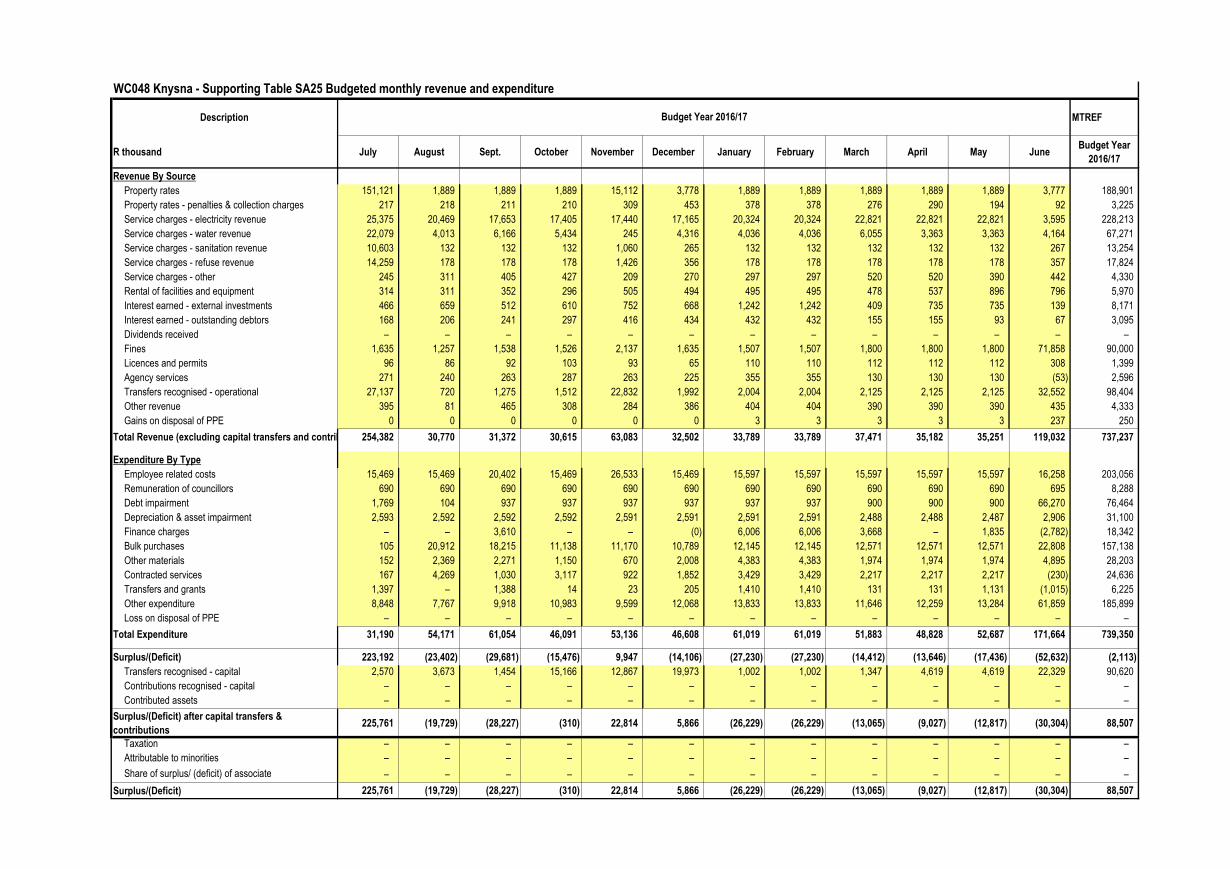
WC048 Knysna - Supporting Table SA25 Budgeted monthly revenue and expenditure
Description MTREF
R thousand July August Sept. October November December January February March April May JuneBudget Year
2016/17
Revenue By Source
Property rates 151,121 1,889 1,889 1,889 15,112 3,778 1,889 1,889 1,889 1,889 1,889 3,777 188,901
Property rates - penalties & collection charges 217 218 211 210 309 453 378 378 276 290 194 92 3,225
Service charges - electricity revenue 25,375 20,469 17,653 17,405 17,440 17,165 20,324 20,324 22,821 22,821 22,821 3,595 228,213
Service charges - water revenue 22,079 4,013 6,166 5,434 245 4,316 4,036 4,036 6,055 3,363 3,363 4,164 67,271
Service charges - sanitation revenue 10,603 132 132 132 1,060 265 132 132 132 132 132 267 13,254
Service charges - refuse revenue 14,259 178 178 178 1,426 356 178 178 178 178 178 357 17,824
Service charges - other 245 311 405 427 209 270 297 297 520 520 390 442 4,330
Rental of facilities and equipment 314 311 352 296 505 494 495 495 478 537 896 796 5,970
Interest earned - external investments 466 659 512 610 752 668 1,242 1,242 409 735 735 139 8,171
Interest earned - outstanding debtors 168 206 241 297 416 434 432 432 155 155 93 67 3,095
Dividends received – – – – – – – – – – – – –
Fines 1,635 1,257 1,538 1,526 2,137 1,635 1,507 1,507 1,800 1,800 1,800 71,858 90,000
Licences and permits 96 86 92 103 93 65 110 110 112 112 112 308 1,399
Agency services 271 240 263 287 263 225 355 355 130 130 130 (53) 2,596
Transfers recognised - operational 27,137 720 1,275 1,512 22,832 1,992 2,004 2,004 2,125 2,125 2,125 32,552 98,404
Other revenue 395 81 465 308 284 386 404 404 390 390 390 435 4,333
Gains on disposal of PPE 0 0 0 0 0 0 3 3 3 3 3 237 250
Total Revenue (excluding capital transfers and contributions)254,382 30,770 31,372 30,615 63,083 32,502 33,789 33,789 37,471 35,182 35,251 119,032 737,237
Expenditure By Type
Employee related costs 15,469 15,469 20,402 15,469 26,533 15,469 15,597 15,597 15,597 15,597 15,597 16,258 203,056
Remuneration of councillors 690 690 690 690 690 690 690 690 690 690 690 695 8,288
Debt impairment 1,769 104 937 937 937 937 937 937 900 900 900 66,270 76,464
Depreciation & asset impairment 2,593 2,592 2,592 2,592 2,591 2,591 2,591 2,591 2,488 2,488 2,487 2,906 31,100
Finance charges – – 3,610 – – (0) 6,006 6,006 3,668 – 1,835 (2,782) 18,342
Bulk purchases 105 20,912 18,215 11,138 11,170 10,789 12,145 12,145 12,571 12,571 12,571 22,808 157,138
Other materials 152 2,369 2,271 1,150 670 2,008 4,383 4,383 1,974 1,974 1,974 4,895 28,203
Contracted services 167 4,269 1,030 3,117 922 1,852 3,429 3,429 2,217 2,217 2,217 (230) 24,636
Transfers and grants 1,397 – 1,388 14 23 205 1,410 1,410 131 131 1,131 (1,015) 6,225
Other expenditure 8,848 7,767 9,918 10,983 9,599 12,068 13,833 13,833 11,646 12,259 13,284 61,859 185,899
Loss on disposal of PPE – – – – – – – – – – – – –
Total Expenditure 31,190 54,171 61,054 46,091 53,136 46,608 61,019 61,019 51,883 48,828 52,687 171,664 739,350
Surplus/(Deficit) 223,192 (23,402) (29,681) (15,476) 9,947 (14,106) (27,230) (27,230) (14,412) (13,646) (17,436) (52,632) (2,113)
Transfers recognised - capital 2,570 3,673 1,454 15,166 12,867 19,973 1,002 1,002 1,347 4,619 4,619 22,329 90,620
Contributions recognised - capital – – – – – – – – – – – – –
Contributed assets – – – – – – – – – – – – –
Surplus/(Deficit) after capital transfers &
contributions225,761 (19,729) (28,227) (310) 22,814 5,866 (26,229) (26,229) (13,065) (9,027) (12,817) (30,304) 88,507
Taxation – – – – – – – – – – – – –
Attributable to minorities – – – – – – – – – – – – –
Share of surplus/ (deficit) of associate – – – – – – – – – – – – –
Surplus/(Deficit) 225,761 (19,729) (28,227) (310) 22,814 5,866 (26,229) (26,229) (13,065) (9,027) (12,817) (30,304) 88,507
Budget Year 2016/17
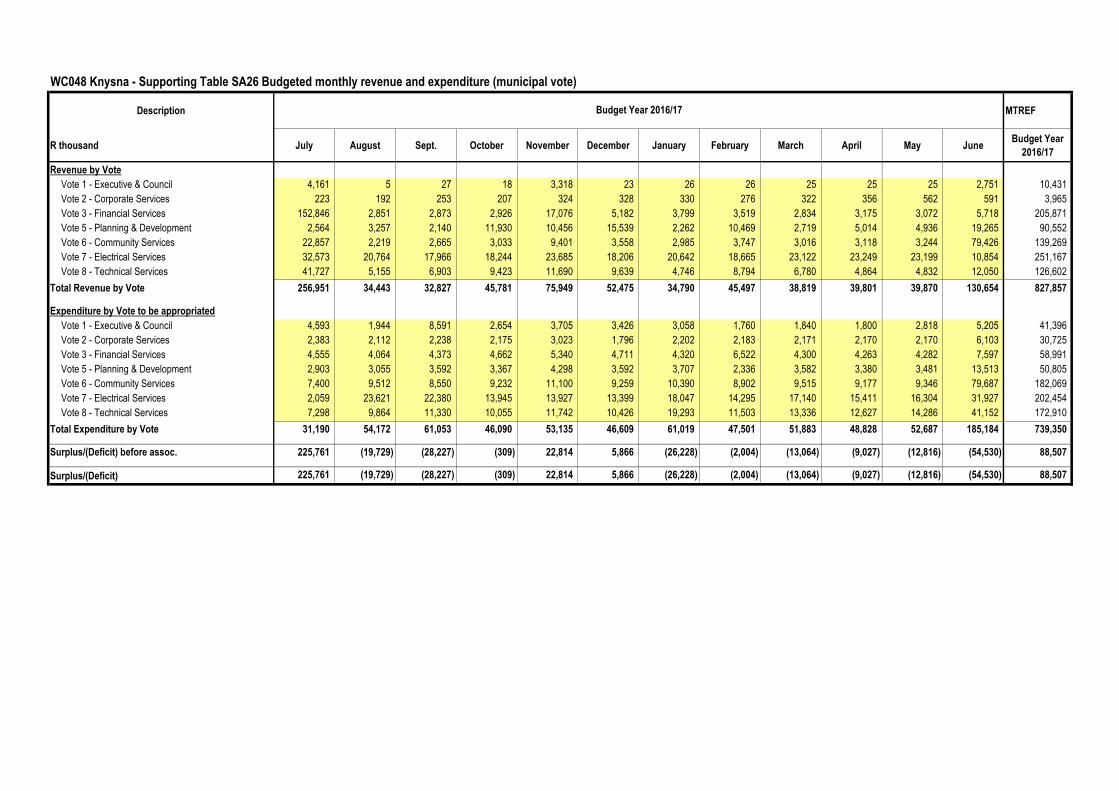
WC048 Knysna - Supporting Table SA26 Budgeted monthly revenue and expenditure (municipal vote)
Description MTREF
R thousand July August Sept. October November December January February March April May JuneBudget Year
2016/17
Revenue by Vote
Vote 1 - Executive & Council 4,161 5 27 18 3,318 23 26 26 25 25 25 2,751 10,431
Vote 2 - Corporate Services 223 192 253 207 324 328 330 276 322 356 562 591 3,965
Vote 3 - Financial Services 152,846 2,851 2,873 2,926 17,076 5,182 3,799 3,519 2,834 3,175 3,072 5,718 205,871
Vote 5 - Planning & Development 2,564 3,257 2,140 11,930 10,456 15,539 2,262 10,469 2,719 5,014 4,936 19,265 90,552
Vote 6 - Community Services 22,857 2,219 2,665 3,033 9,401 3,558 2,985 3,747 3,016 3,118 3,244 79,426 139,269
Vote 7 - Electrical Services 32,573 20,764 17,966 18,244 23,685 18,206 20,642 18,665 23,122 23,249 23,199 10,854 251,167
Vote 8 - Technical Services 41,727 5,155 6,903 9,423 11,690 9,639 4,746 8,794 6,780 4,864 4,832 12,050 126,602
Total Revenue by Vote 256,951 34,443 32,827 45,781 75,949 52,475 34,790 45,497 38,819 39,801 39,870 130,654 827,857
Expenditure by Vote to be appropriated
Vote 1 - Executive & Council 4,593 1,944 8,591 2,654 3,705 3,426 3,058 1,760 1,840 1,800 2,818 5,205 41,396
Vote 2 - Corporate Services 2,383 2,112 2,238 2,175 3,023 1,796 2,202 2,183 2,171 2,170 2,170 6,103 30,725
Vote 3 - Financial Services 4,555 4,064 4,373 4,662 5,340 4,711 4,320 6,522 4,300 4,263 4,282 7,597 58,991
Vote 5 - Planning & Development 2,903 3,055 3,592 3,367 4,298 3,592 3,707 2,336 3,582 3,380 3,481 13,513 50,805
Vote 6 - Community Services 7,400 9,512 8,550 9,232 11,100 9,259 10,390 8,902 9,515 9,177 9,346 79,687 182,069
Vote 7 - Electrical Services 2,059 23,621 22,380 13,945 13,927 13,399 18,047 14,295 17,140 15,411 16,304 31,927 202,454
Vote 8 - Technical Services 7,298 9,864 11,330 10,055 11,742 10,426 19,293 11,503 13,336 12,627 14,286 41,152 172,910
Total Expenditure by Vote 31,190 54,172 61,053 46,090 53,135 46,609 61,019 47,501 51,883 48,828 52,687 185,184 739,350
Surplus/(Deficit) before assoc. 225,761 (19,729) (28,227) (309) 22,814 5,866 (26,228) (2,004) (13,064) (9,027) (12,816) (54,530) 88,507
Surplus/(Deficit) 225,761 (19,729) (28,227) (309) 22,814 5,866 (26,228) (2,004) (13,064) (9,027) (12,816) (54,530) 88,507
Budget Year 2016/17
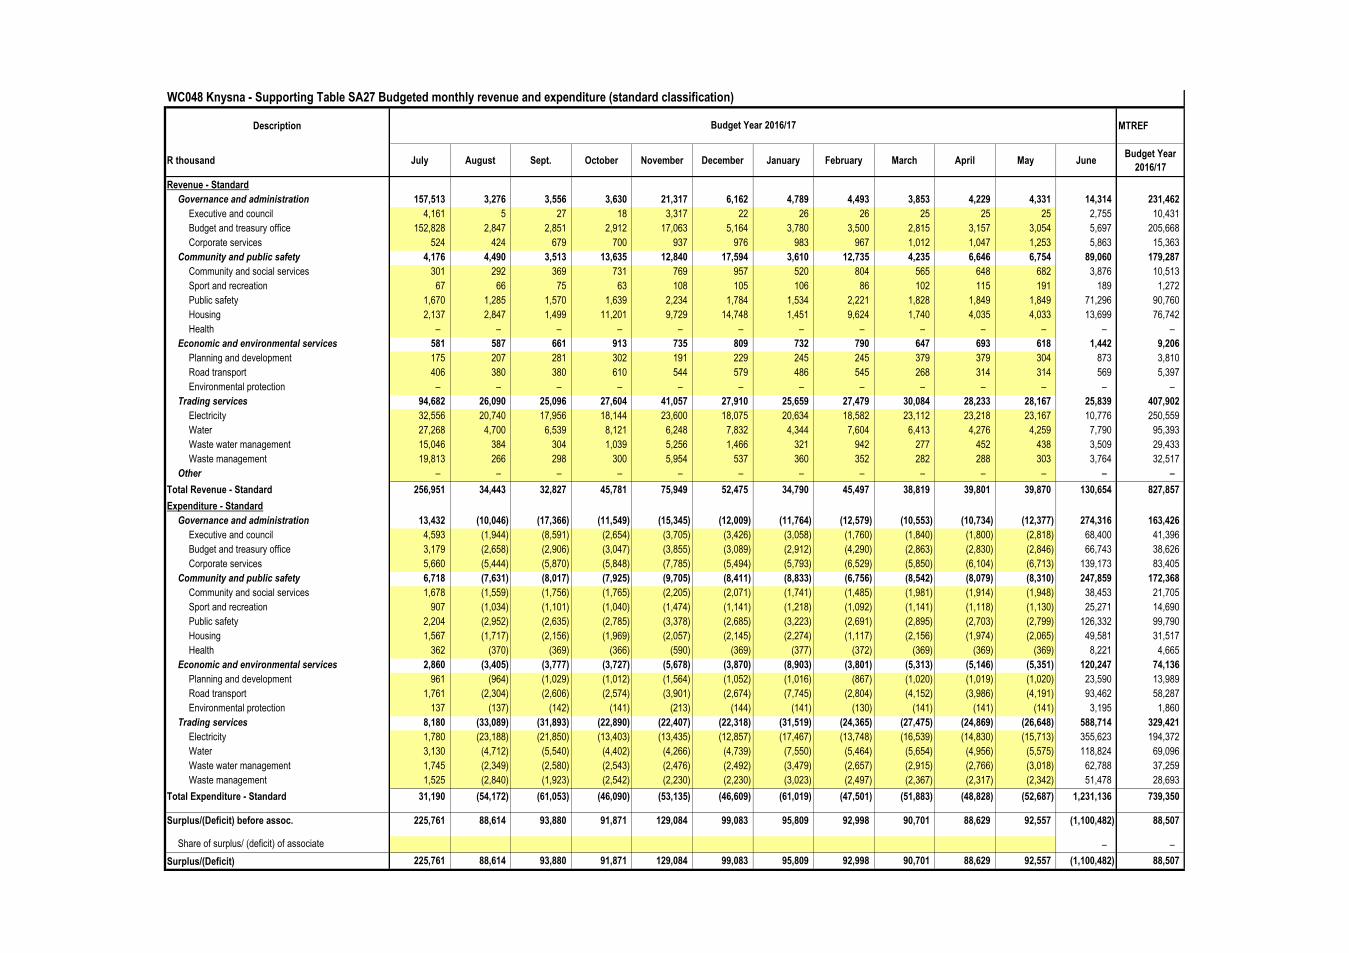
WC048 Knysna - Supporting Table SA27 Budgeted monthly revenue and expenditure (standard classification)
Description MTREF
R thousand July August Sept. October November December January February March April May JuneBudget Year
2016/17
Revenue - Standard
Governance and administration 157,513 3,276 3,556 3,630 21,317 6,162 4,789 4,493 3,853 4,229 4,331 14,314 231,462
Executive and council 4,161 5 27 18 3,317 22 26 26 25 25 25 2,755 10,431
Budget and treasury office 152,828 2,847 2,851 2,912 17,063 5,164 3,780 3,500 2,815 3,157 3,054 5,697 205,668
Corporate services 524 424 679 700 937 976 983 967 1,012 1,047 1,253 5,863 15,363
Community and public safety 4,176 4,490 3,513 13,635 12,840 17,594 3,610 12,735 4,235 6,646 6,754 89,060 179,287
Community and social services 301 292 369 731 769 957 520 804 565 648 682 3,876 10,513
Sport and recreation 67 66 75 63 108 105 106 86 102 115 191 189 1,272
Public safety 1,670 1,285 1,570 1,639 2,234 1,784 1,534 2,221 1,828 1,849 1,849 71,296 90,760
Housing 2,137 2,847 1,499 11,201 9,729 14,748 1,451 9,624 1,740 4,035 4,033 13,699 76,742
Health – – – – – – – – – – – – –
Economic and environmental services 581 587 661 913 735 809 732 790 647 693 618 1,442 9,206
Planning and development 175 207 281 302 191 229 245 245 379 379 304 873 3,810
Road transport 406 380 380 610 544 579 486 545 268 314 314 569 5,397
Environmental protection – – – – – – – – – – – – –
Trading services 94,682 26,090 25,096 27,604 41,057 27,910 25,659 27,479 30,084 28,233 28,167 25,839 407,902
Electricity 32,556 20,740 17,956 18,144 23,600 18,075 20,634 18,582 23,112 23,218 23,167 10,776 250,559
Water 27,268 4,700 6,539 8,121 6,248 7,832 4,344 7,604 6,413 4,276 4,259 7,790 95,393
Waste water management 15,046 384 304 1,039 5,256 1,466 321 942 277 452 438 3,509 29,433
Waste management 19,813 266 298 300 5,954 537 360 352 282 288 303 3,764 32,517
Other – – – – – – – – – – – – –
Total Revenue - Standard 256,951 34,443 32,827 45,781 75,949 52,475 34,790 45,497 38,819 39,801 39,870 130,654 827,857
Expenditure - Standard
Governance and administration 13,432 (10,046) (17,366) (11,549) (15,345) (12,009) (11,764) (12,579) (10,553) (10,734) (12,377) 274,316 163,426
Executive and council 4,593 (1,944) (8,591) (2,654) (3,705) (3,426) (3,058) (1,760) (1,840) (1,800) (2,818) 68,400 41,396
Budget and treasury office 3,179 (2,658) (2,906) (3,047) (3,855) (3,089) (2,912) (4,290) (2,863) (2,830) (2,846) 66,743 38,626
Corporate services 5,660 (5,444) (5,870) (5,848) (7,785) (5,494) (5,793) (6,529) (5,850) (6,104) (6,713) 139,173 83,405
Community and public safety 6,718 (7,631) (8,017) (7,925) (9,705) (8,411) (8,833) (6,756) (8,542) (8,079) (8,310) 247,859 172,368
Community and social services 1,678 (1,559) (1,756) (1,765) (2,205) (2,071) (1,741) (1,485) (1,981) (1,914) (1,948) 38,453 21,705
Sport and recreation 907 (1,034) (1,101) (1,040) (1,474) (1,141) (1,218) (1,092) (1,141) (1,118) (1,130) 25,271 14,690
Public safety 2,204 (2,952) (2,635) (2,785) (3,378) (2,685) (3,223) (2,691) (2,895) (2,703) (2,799) 126,332 99,790
Housing 1,567 (1,717) (2,156) (1,969) (2,057) (2,145) (2,274) (1,117) (2,156) (1,974) (2,065) 49,581 31,517
Health 362 (370) (369) (366) (590) (369) (377) (372) (369) (369) (369) 8,221 4,665
Economic and environmental services 2,860 (3,405) (3,777) (3,727) (5,678) (3,870) (8,903) (3,801) (5,313) (5,146) (5,351) 120,247 74,136
Planning and development 961 (964) (1,029) (1,012) (1,564) (1,052) (1,016) (867) (1,020) (1,019) (1,020) 23,590 13,989
Road transport 1,761 (2,304) (2,606) (2,574) (3,901) (2,674) (7,745) (2,804) (4,152) (3,986) (4,191) 93,462 58,287
Environmental protection 137 (137) (142) (141) (213) (144) (141) (130) (141) (141) (141) 3,195 1,860
Trading services 8,180 (33,089) (31,893) (22,890) (22,407) (22,318) (31,519) (24,365) (27,475) (24,869) (26,648) 588,714 329,421
Electricity 1,780 (23,188) (21,850) (13,403) (13,435) (12,857) (17,467) (13,748) (16,539) (14,830) (15,713) 355,623 194,372
Water 3,130 (4,712) (5,540) (4,402) (4,266) (4,739) (7,550) (5,464) (5,654) (4,956) (5,575) 118,824 69,096
Waste water management 1,745 (2,349) (2,580) (2,543) (2,476) (2,492) (3,479) (2,657) (2,915) (2,766) (3,018) 62,788 37,259
Waste management 1,525 (2,840) (1,923) (2,542) (2,230) (2,230) (3,023) (2,497) (2,367) (2,317) (2,342) 51,478 28,693
Total Expenditure - Standard 31,190 (54,172) (61,053) (46,090) (53,135) (46,609) (61,019) (47,501) (51,883) (48,828) (52,687) 1,231,136 739,350
Surplus/(Deficit) before assoc. 225,761 88,614 93,880 91,871 129,084 99,083 95,809 92,998 90,701 88,629 92,557 (1,100,482) 88,507
Share of surplus/ (deficit) of associate – –
Surplus/(Deficit) 225,761 88,614 93,880 91,871 129,084 99,083 95,809 92,998 90,701 88,629 92,557 (1,100,482) 88,507
Budget Year 2016/17
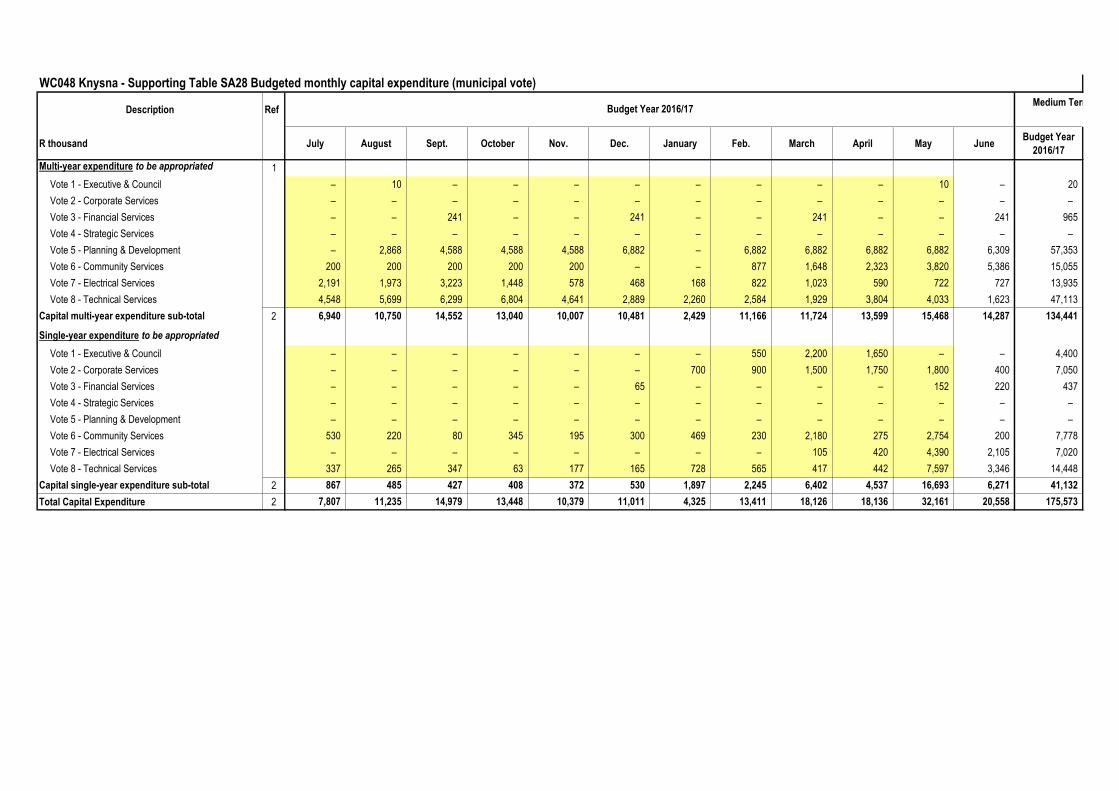
WC048 Knysna - Supporting Table SA28 Budgeted monthly capital expenditure (municipal vote)
Description Ref
R thousand July August Sept. October Nov. Dec. January Feb. March April May JuneBudget Year
2016/17
Multi-year expenditure to be appropriated 1
Vote 1 - Executive & Council – 10 – – – – – – – – 10 – 20
Vote 2 - Corporate Services – – – – – – – – – – – – –
Vote 3 - Financial Services – – 241 – – 241 – – 241 – – 241 965
Vote 4 - Strategic Services – – – – – – – – – – – – –
Vote 5 - Planning & Development – 2,868 4,588 4,588 4,588 6,882 – 6,882 6,882 6,882 6,882 6,309 57,353
Vote 6 - Community Services 200 200 200 200 200 – – 877 1,648 2,323 3,820 5,386 15,055
Vote 7 - Electrical Services 2,191 1,973 3,223 1,448 578 468 168 822 1,023 590 722 727 13,935
Vote 8 - Technical Services 4,548 5,699 6,299 6,804 4,641 2,889 2,260 2,584 1,929 3,804 4,033 1,623 47,113
Capital multi-year expenditure sub-total 2 6,940 10,750 14,552 13,040 10,007 10,481 2,429 11,166 11,724 13,599 15,468 14,287 134,441
Single-year expenditure to be appropriated
Vote 1 - Executive & Council – – – – – – – 550 2,200 1,650 – – 4,400
Vote 2 - Corporate Services – – – – – – 700 900 1,500 1,750 1,800 400 7,050
Vote 3 - Financial Services – – – – – 65 – – – – 152 220 437
Vote 4 - Strategic Services – – – – – – – – – – – – –
Vote 5 - Planning & Development – – – – – – – – – – – – –
Vote 6 - Community Services 530 220 80 345 195 300 469 230 2,180 275 2,754 200 7,778
Vote 7 - Electrical Services – – – – – – – – 105 420 4,390 2,105 7,020
Vote 8 - Technical Services 337 265 347 63 177 165 728 565 417 442 7,597 3,346 14,448
Capital single-year expenditure sub-total 2 867 485 427 408 372 530 1,897 2,245 6,402 4,537 16,693 6,271 41,132
Total Capital Expenditure 2 7,807 11,235 14,979 13,448 10,379 11,011 4,325 13,411 18,126 18,136 32,161 20,558 175,573
Budget Year 2016/17Medium Term Revenue and Expenditure
Framework
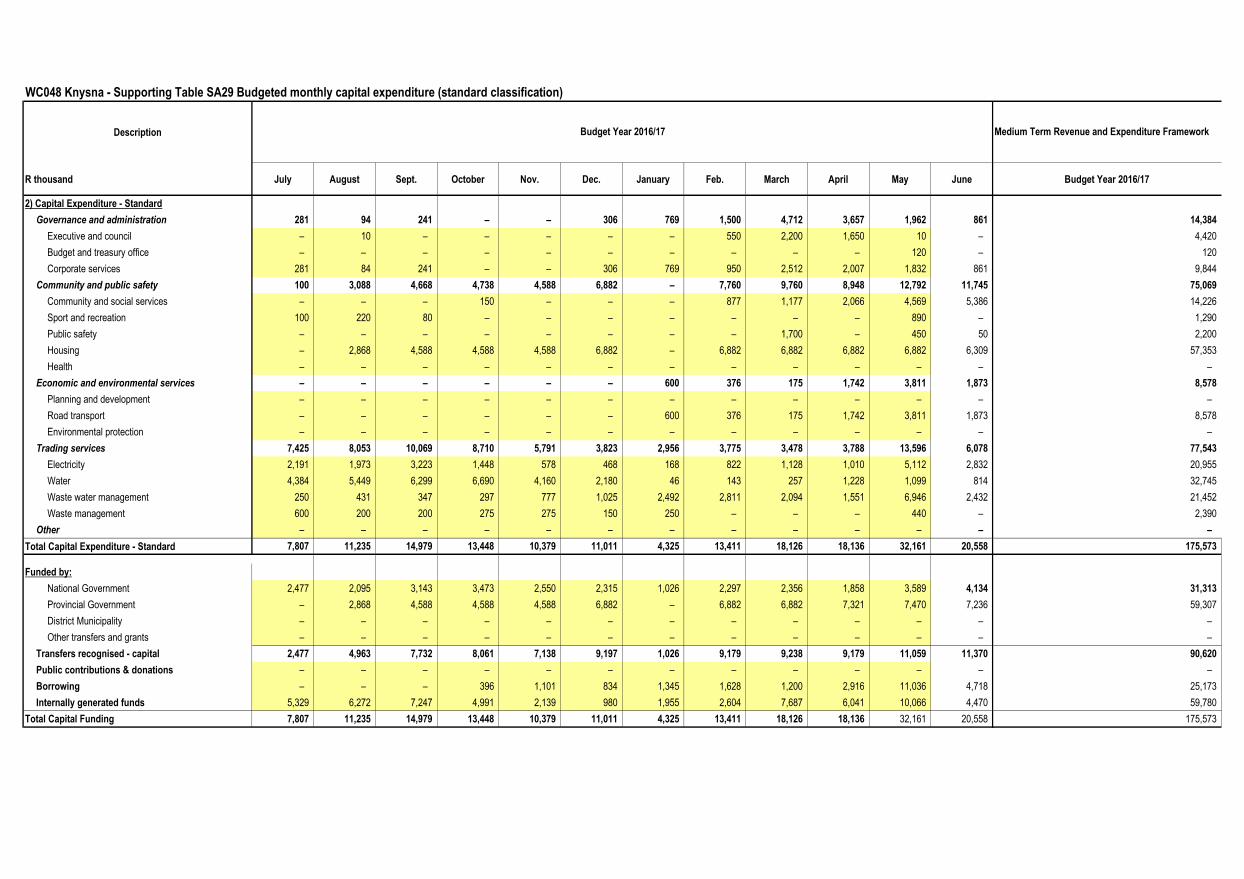
WC048 Knysna - Supporting Table SA29 Budgeted monthly capital expenditure (standard classification)
Description
R thousand July August Sept. October Nov. Dec. January Feb. March April May June Budget Year 2016/17
2) Capital Expenditure - Standard
Governance and administration 281 94 241 – – 306 769 1,500 4,712 3,657 1,962 861 14,384
Executive and council – 10 – – – – – 550 2,200 1,650 10 – 4,420
Budget and treasury office – – – – – – – – – – 120 – 120
Corporate services 281 84 241 – – 306 769 950 2,512 2,007 1,832 861 9,844
Community and public safety 100 3,088 4,668 4,738 4,588 6,882 – 7,760 9,760 8,948 12,792 11,745 75,069
Community and social services – – – 150 – – – 877 1,177 2,066 4,569 5,386 14,226
Sport and recreation 100 220 80 – – – – – – – 890 – 1,290
Public safety – – – – – – – – 1,700 – 450 50 2,200
Housing – 2,868 4,588 4,588 4,588 6,882 – 6,882 6,882 6,882 6,882 6,309 57,353
Health – – – – – – – – – – – – –
Economic and environmental services – – – – – – 600 376 175 1,742 3,811 1,873 8,578
Planning and development – – – – – – – – – – – – –
Road transport – – – – – – 600 376 175 1,742 3,811 1,873 8,578
Environmental protection – – – – – – – – – – – – –
Trading services 7,425 8,053 10,069 8,710 5,791 3,823 2,956 3,775 3,478 3,788 13,596 6,078 77,543
Electricity 2,191 1,973 3,223 1,448 578 468 168 822 1,128 1,010 5,112 2,832 20,955
Water 4,384 5,449 6,299 6,690 4,160 2,180 46 143 257 1,228 1,099 814 32,745
Waste water management 250 431 347 297 777 1,025 2,492 2,811 2,094 1,551 6,946 2,432 21,452
Waste management 600 200 200 275 275 150 250 – – – 440 – 2,390
Other – – – – – – – – – – – – –
Total Capital Expenditure - Standard 7,807 11,235 14,979 13,448 10,379 11,011 4,325 13,411 18,126 18,136 32,161 20,558 175,573
Funded by:
National Government 2,477 2,095 3,143 3,473 2,550 2,315 1,026 2,297 2,356 1,858 3,589 4,134 31,313
Provincial Government – 2,868 4,588 4,588 4,588 6,882 – 6,882 6,882 7,321 7,470 7,236 59,307
District Municipality – – – – – – – – – – – – –
Other transfers and grants – – – – – – – – – – – – –
Transfers recognised - capital 2,477 4,963 7,732 8,061 7,138 9,197 1,026 9,179 9,238 9,179 11,059 11,370 90,620
Public contributions & donations – – – – – – – – – – – – –
Borrowing – – – 396 1,101 834 1,345 1,628 1,200 2,916 11,036 4,718 25,173
Internally generated funds 5,329 6,272 7,247 4,991 2,139 980 1,955 2,604 7,687 6,041 10,066 4,470 59,780
Total Capital Funding 7,807 11,235 14,979 13,448 10,379 11,011 4,325 13,411 18,126 18,136 32,161 20,558 175,573
Budget Year 2016/17 Medium Term Revenue and Expenditure Framework
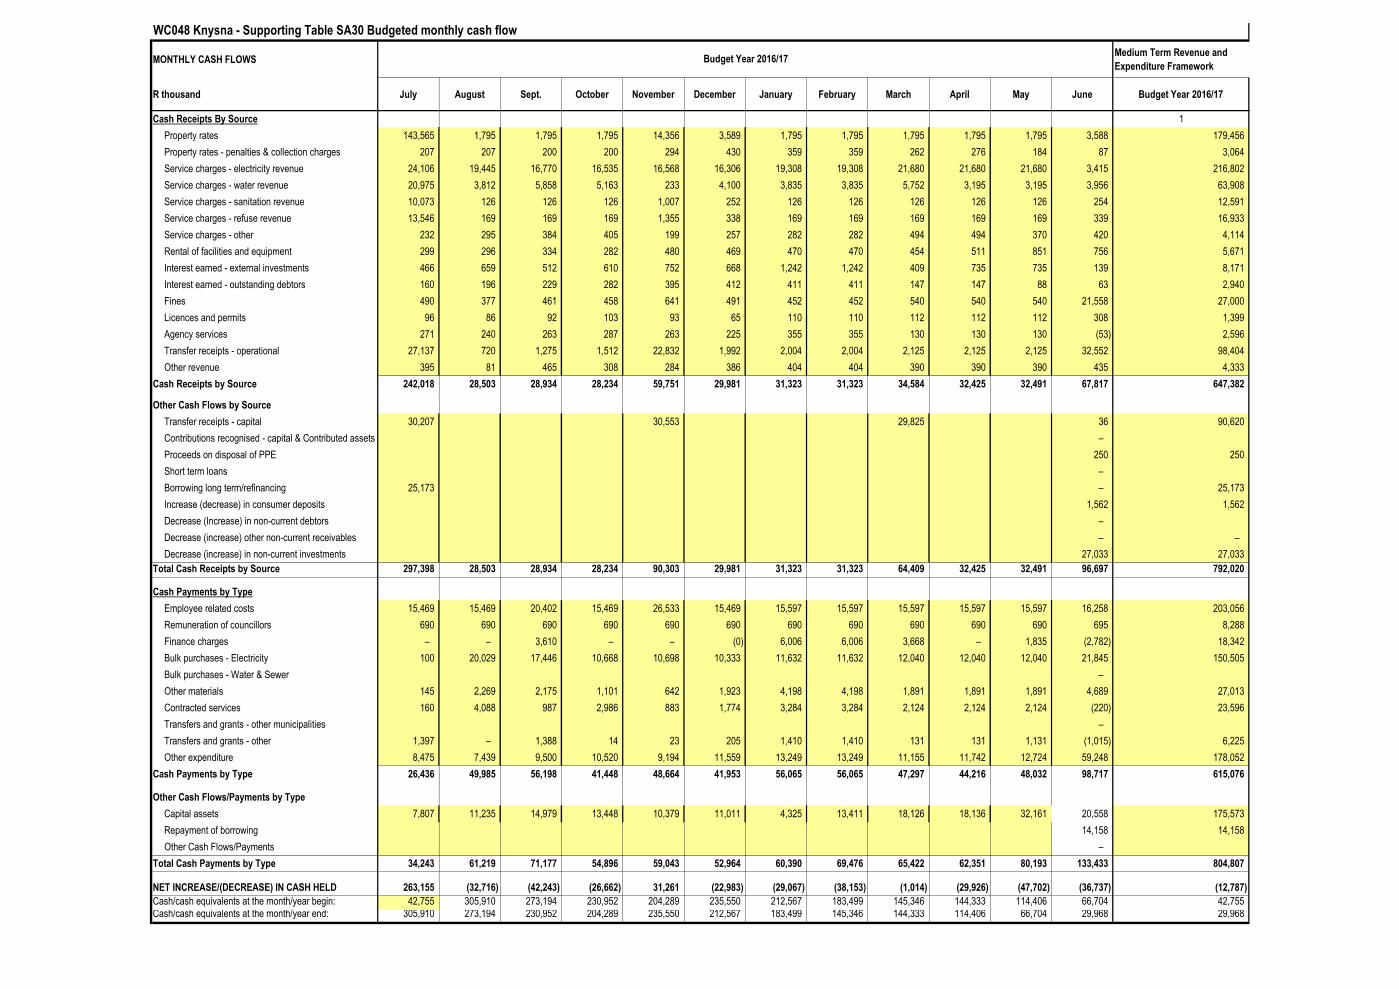
WC048 Knysna - Supporting Table SA30 Budgeted monthly cash flow
MONTHLY CASH FLOWSMedium Term Revenue and
Expenditure Framework
R thousand July August Sept. October November December January February March April May June Budget Year 2016/17
Cash Receipts By Source 1
Property rates 143,565 1,795 1,795 1,795 14,356 3,589 1,795 1,795 1,795 1,795 1,795 3,588 179,456
Property rates - penalties & collection charges 207 207 200 200 294 430 359 359 262 276 184 87 3,064
Service charges - electricity revenue 24,106 19,445 16,770 16,535 16,568 16,306 19,308 19,308 21,680 21,680 21,680 3,415 216,802
Service charges - water revenue 20,975 3,812 5,858 5,163 233 4,100 3,835 3,835 5,752 3,195 3,195 3,956 63,908
Service charges - sanitation revenue 10,073 126 126 126 1,007 252 126 126 126 126 126 254 12,591
Service charges - refuse revenue 13,546 169 169 169 1,355 338 169 169 169 169 169 339 16,933
Service charges - other 232 295 384 405 199 257 282 282 494 494 370 420 4,114
Rental of facilities and equipment 299 296 334 282 480 469 470 470 454 511 851 756 5,671
Interest earned - external investments 466 659 512 610 752 668 1,242 1,242 409 735 735 139 8,171
Interest earned - outstanding debtors 160 196 229 282 395 412 411 411 147 147 88 63 2,940
Fines 490 377 461 458 641 491 452 452 540 540 540 21,558 27,000
Licences and permits 96 86 92 103 93 65 110 110 112 112 112 308 1,399
Agency services 271 240 263 287 263 225 355 355 130 130 130 (53) 2,596
Transfer receipts - operational 27,137 720 1,275 1,512 22,832 1,992 2,004 2,004 2,125 2,125 2,125 32,552 98,404
Other revenue 395 81 465 308 284 386 404 404 390 390 390 435 4,333
Cash Receipts by Source 242,018 28,503 28,934 28,234 59,751 29,981 31,323 31,323 34,584 32,425 32,491 67,817 647,382
Other Cash Flows by Source
Transfer receipts - capital 30,207 30,553 29,825 36 90,620
Contributions recognised - capital & Contributed assets –
Proceeds on disposal of PPE 250 250
Short term loans –
Borrowing long term/refinancing 25,173 – 25,173
Increase (decrease) in consumer deposits 1,562 1,562
Decrease (Increase) in non-current debtors –
Decrease (increase) other non-current receivables – –
Decrease (increase) in non-current investments 27,033 27,033
Total Cash Receipts by Source 297,398 28,503 28,934 28,234 90,303 29,981 31,323 31,323 64,409 32,425 32,491 96,697 792,020
Cash Payments by Type
Employee related costs 15,469 15,469 20,402 15,469 26,533 15,469 15,597 15,597 15,597 15,597 15,597 16,258 203,056
Remuneration of councillors 690 690 690 690 690 690 690 690 690 690 690 695 8,288
Finance charges – – 3,610 – – (0) 6,006 6,006 3,668 – 1,835 (2,782) 18,342
Bulk purchases - Electricity 100 20,029 17,446 10,668 10,698 10,333 11,632 11,632 12,040 12,040 12,040 21,845 150,505
Bulk purchases - Water & Sewer –
Other materials 145 2,269 2,175 1,101 642 1,923 4,198 4,198 1,891 1,891 1,891 4,689 27,013
Contracted services 160 4,088 987 2,986 883 1,774 3,284 3,284 2,124 2,124 2,124 (220) 23,596
Transfers and grants - other municipalities –
Transfers and grants - other 1,397 – 1,388 14 23 205 1,410 1,410 131 131 1,131 (1,015) 6,225
Other expenditure 8,475 7,439 9,500 10,520 9,194 11,559 13,249 13,249 11,155 11,742 12,724 59,248 178,052
Cash Payments by Type 26,436 49,985 56,198 41,448 48,664 41,953 56,065 56,065 47,297 44,216 48,032 98,717 615,076
Other Cash Flows/Payments by Type
Capital assets 7,807 11,235 14,979 13,448 10,379 11,011 4,325 13,411 18,126 18,136 32,161 20,558 175,573
Repayment of borrowing 14,158 14,158
Other Cash Flows/Payments –
Total Cash Payments by Type 34,243 61,219 71,177 54,896 59,043 52,964 60,390 69,476 65,422 62,351 80,193 133,433 804,807
NET INCREASE/(DECREASE) IN CASH HELD 263,155 (32,716) (42,243) (26,662) 31,261 (22,983) (29,067) (38,153) (1,014) (29,926) (47,702) (36,737) (12,787)
Cash/cash equivalents at the month/year begin: 42,755 305,910 273,194 230,952 204,289 235,550 212,567 183,499 145,346 144,333 114,406 66,704 42,755 Cash/cash equivalents at the month/year end: 305,910 273,194 230,952 204,289 235,550 212,567 183,499 145,346 144,333 114,406 66,704 29,968 29,968
Budget Year 2016/17
WC048 Knysna - NOT REQUIRED - municipality does not have entities
Description 2013/14 2014/15 2015/16
R millionAudited
Outcome
Audited
Outcome
Audited
Outcome
Original
Budget
Adjusted
Budget
Full Year
Forecast
Financial Performance
Property rates
Service charges
Investment revenue
Transfers recognised - operational
Other own revenue
Contributions recognised - capital & contributed assets
Total Revenue (excluding capital transfers and contributions) – – – – – –
Employee costs
Remuneration of Board Members
Depreciation & asset impairment
Finance charges
Materials and bulk purchases
Transfers and grants
Other expenditure
Total Expenditure – – – – – –
Surplus/(Deficit) – – – – – –
Capital expenditure & funds sources
Capital expenditure
Transfers recognised - operational
A5: Public contributions & donations
A5: Borrowing
A5: Internal - Surplus cash
Total sources – – – – – –
Financial position
Total current assets
Total non current assets
Total current liabilities
Total non current liabilities
Equity
Cash flows
Net cash from (used) operating
Net cash from (used) investing
Net cash from (used) financing
Cash/cash equivalents at the year end
Current Year 2016/17
Ref
WC048 Knysna - Supporting Table SA32 List of external mechanisms NO SUCH INSTANCES
External mechanismPeriod of
agreement 1.
Monetary value
of agreement 2.
Name of organisation Number R thousand
References
1. Total agreement period from commencement until end
2. Annual value
Service provided
Expiry date of service
delivery agreement or
contract
Yrs/
Mths
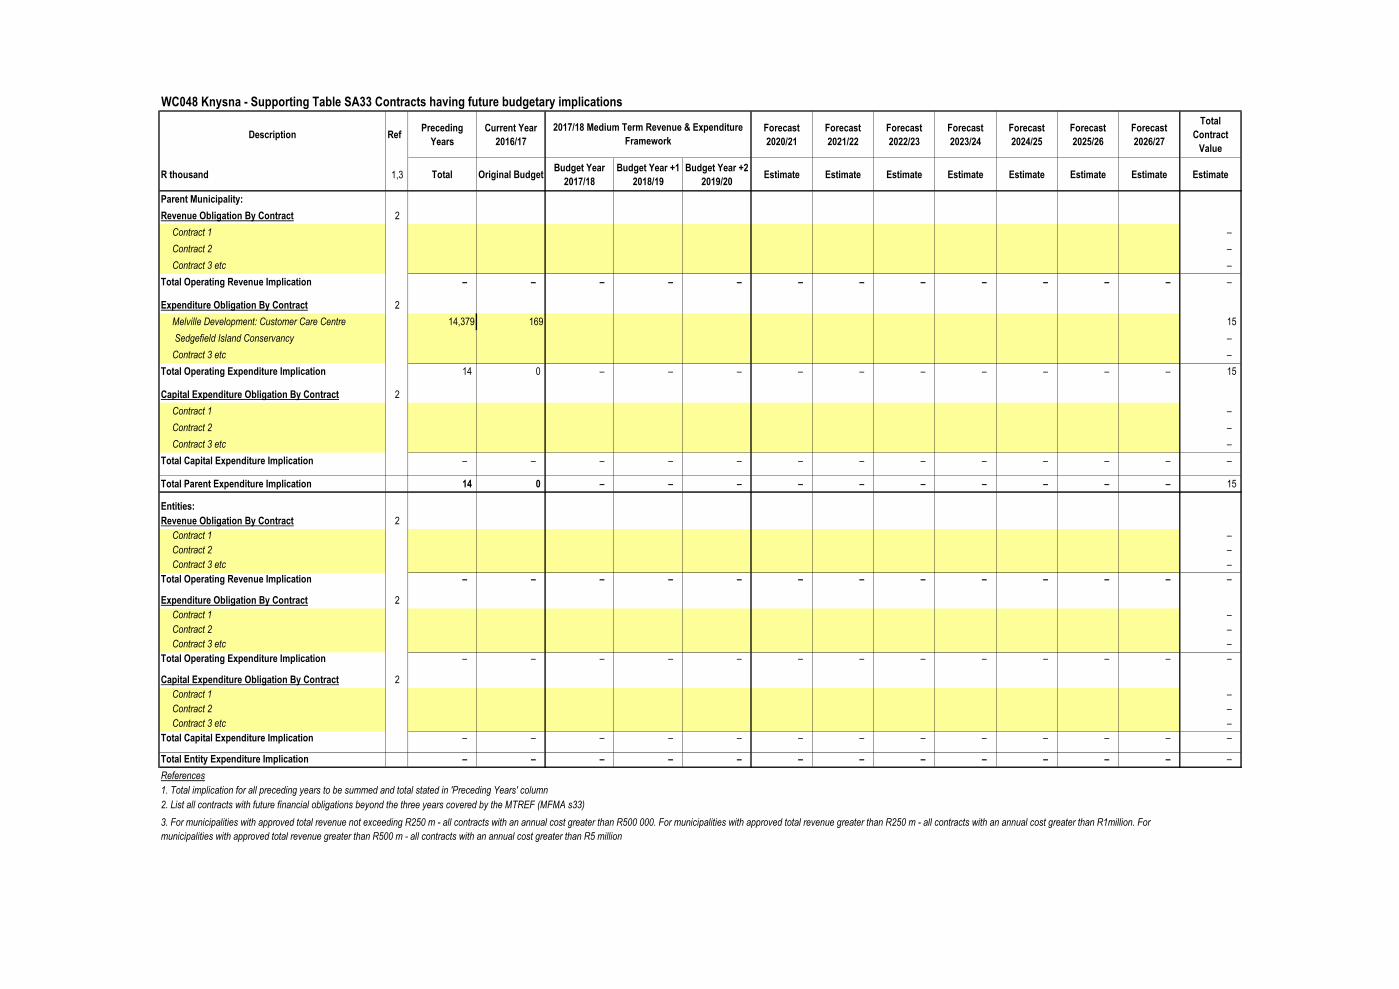
WC048 Knysna - Supporting Table SA33 Contracts having future budgetary implications
Description RefPreceding
Years
Current Year
2016/17
Forecast
2020/21
Forecast
2021/22
Forecast
2022/23
Forecast
2023/24
Forecast
2024/25
Forecast
2025/26
Forecast
2026/27
Total
Contract
Value
R thousand 1,3 Total Original BudgetBudget Year
2017/18
Budget Year +1
2018/19
Budget Year +2
2019/20Estimate Estimate Estimate Estimate Estimate Estimate Estimate Estimate
Parent Municipality:
Revenue Obligation By Contract 2
Contract 1 –
Contract 2 –
Contract 3 etc –
Total Operating Revenue Implication – – – – – – – – – – – – –
Expenditure Obligation By Contract 2
Melville Development: Customer Care Centre 14,379 169 15
Sedgefield Island Conservancy –
Contract 3 etc –
Total Operating Expenditure Implication 14 0 – – – – – – – – – – 15
Capital Expenditure Obligation By Contract 2
Contract 1 –
Contract 2 –
Contract 3 etc –
Total Capital Expenditure Implication – – – – – – – – – – – – –
Total Parent Expenditure Implication 14 0 – – – – – – – – – – 15
Entities:
Revenue Obligation By Contract 2
Contract 1 –
Contract 2 –
Contract 3 etc –
Total Operating Revenue Implication – – – – – – – – – – – – –
Expenditure Obligation By Contract 2
Contract 1 –
Contract 2 –
Contract 3 etc –
Total Operating Expenditure Implication – – – – – – – – – – – – –
Capital Expenditure Obligation By Contract 2
Contract 1 –
Contract 2 –
Contract 3 etc –
Total Capital Expenditure Implication – – – – – – – – – – – – –
Total Entity Expenditure Implication – – – – – – – – – – – – –
References
1. Total implication for all preceding years to be summed and total stated in 'Preceding Years' column
2. List all contracts with future financial obligations beyond the three years covered by the MTREF (MFMA s33)
2017/18 Medium Term Revenue & Expenditure
Framework
3. For municipalities with approved total revenue not exceeding R250 m - all contracts with an annual cost greater than R500 000. For municipalities with approved total revenue greater than R250 m - all contracts with an annual cost greater than R1million. For
municipalities with approved total revenue greater than R500 m - all contracts with an annual cost greater than R5 million
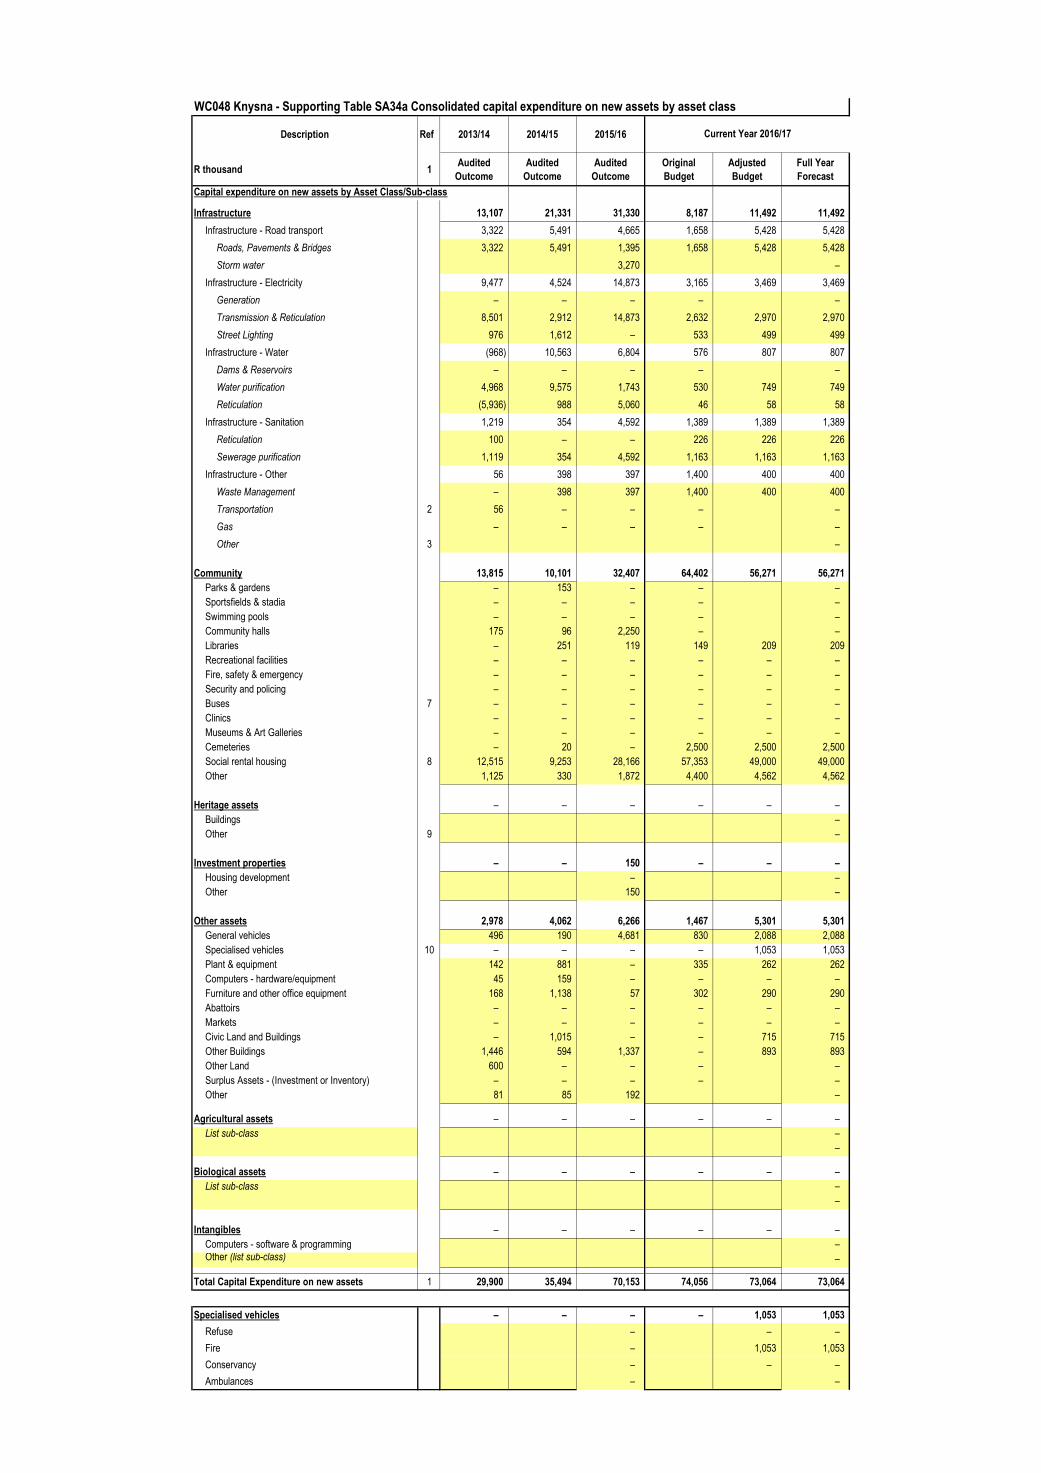
WC048 Knysna - Supporting Table SA34a Consolidated capital expenditure on new assets by asset class
Description Ref 2013/14 2014/15 2015/16
R thousand 1Audited
Outcome
Audited
Outcome
Audited
Outcome
Original
Budget
Adjusted
Budget
Full Year
Forecast
Capital expenditure on new assets by Asset Class/Sub-class
Infrastructure 13,107 21,331 31,330 8,187 11,492 11,492
Infrastructure - Road transport 3,322 5,491 4,665 1,658 5,428 5,428
Roads, Pavements & Bridges 3,322 5,491 1,395 1,658 5,428 5,428
Storm water 3,270 –
Infrastructure - Electricity 9,477 4,524 14,873 3,165 3,469 3,469
Generation – – – – –
Transmission & Reticulation 8,501 2,912 14,873 2,632 2,970 2,970
Street Lighting 976 1,612 – 533 499 499
Infrastructure - Water (968) 10,563 6,804 576 807 807
Dams & Reservoirs – – – – –
Water purification 4,968 9,575 1,743 530 749 749
Reticulation (5,936) 988 5,060 46 58 58
Infrastructure - Sanitation 1,219 354 4,592 1,389 1,389 1,389
Reticulation 100 – – 226 226 226
Sewerage purification 1,119 354 4,592 1,163 1,163 1,163
Infrastructure - Other 56 398 397 1,400 400 400
Waste Management – 398 397 1,400 400 400
Transportation 2 56 – – – –
Gas – – – – –
Other 3 –
Community 13,815 10,101 32,407 64,402 56,271 56,271
Parks & gardens – 153 – – –
Sportsfields & stadia – – – – –
Swimming pools – – – – –
Community halls 175 96 2,250 – –
Libraries – 251 119 149 209 209
Recreational facilities – – – – – –
Fire, safety & emergency – – – – – –
Security and policing – – – – – –
Buses 7 – – – – – –
Clinics – – – – – –
Museums & Art Galleries – – – – – –
Cemeteries – 20 – 2,500 2,500 2,500
Social rental housing 8 12,515 9,253 28,166 57,353 49,000 49,000
Other 1,125 330 1,872 4,400 4,562 4,562
Heritage assets – – – – – –
Buildings –
Other 9 –
Investment properties – – 150 – – –
Housing development – –
Other 150 –
Other assets 2,978 4,062 6,266 1,467 5,301 5,301
General vehicles 496 190 4,681 830 2,088 2,088
Specialised vehicles 10 – – – – 1,053 1,053
Plant & equipment 142 881 – 335 262 262
Computers - hardware/equipment 45 159 – – – –
Furniture and other office equipment 168 1,138 57 302 290 290
Abattoirs – – – – – –
Markets – – – – – –
Civic Land and Buildings – 1,015 – – 715 715
Other Buildings 1,446 594 1,337 – 893 893
Other Land 600 – – – –
Surplus Assets - (Investment or Inventory) – – – – –
Other 81 85 192 –
Agricultural assets – – – – – –
List sub-class –
–
Biological assets – – – – – –
List sub-class –
–
Intangibles – – – – – –
Computers - software & programming –
Other (list sub-class) –
Total Capital Expenditure on new assets 1 29,900 35,494 70,153 74,056 73,064 73,064
Specialised vehicles – – – – 1,053 1,053
Refuse – – –
Fire – 1,053 1,053
Conservancy – – –
Ambulances – –
Current Year 2016/17
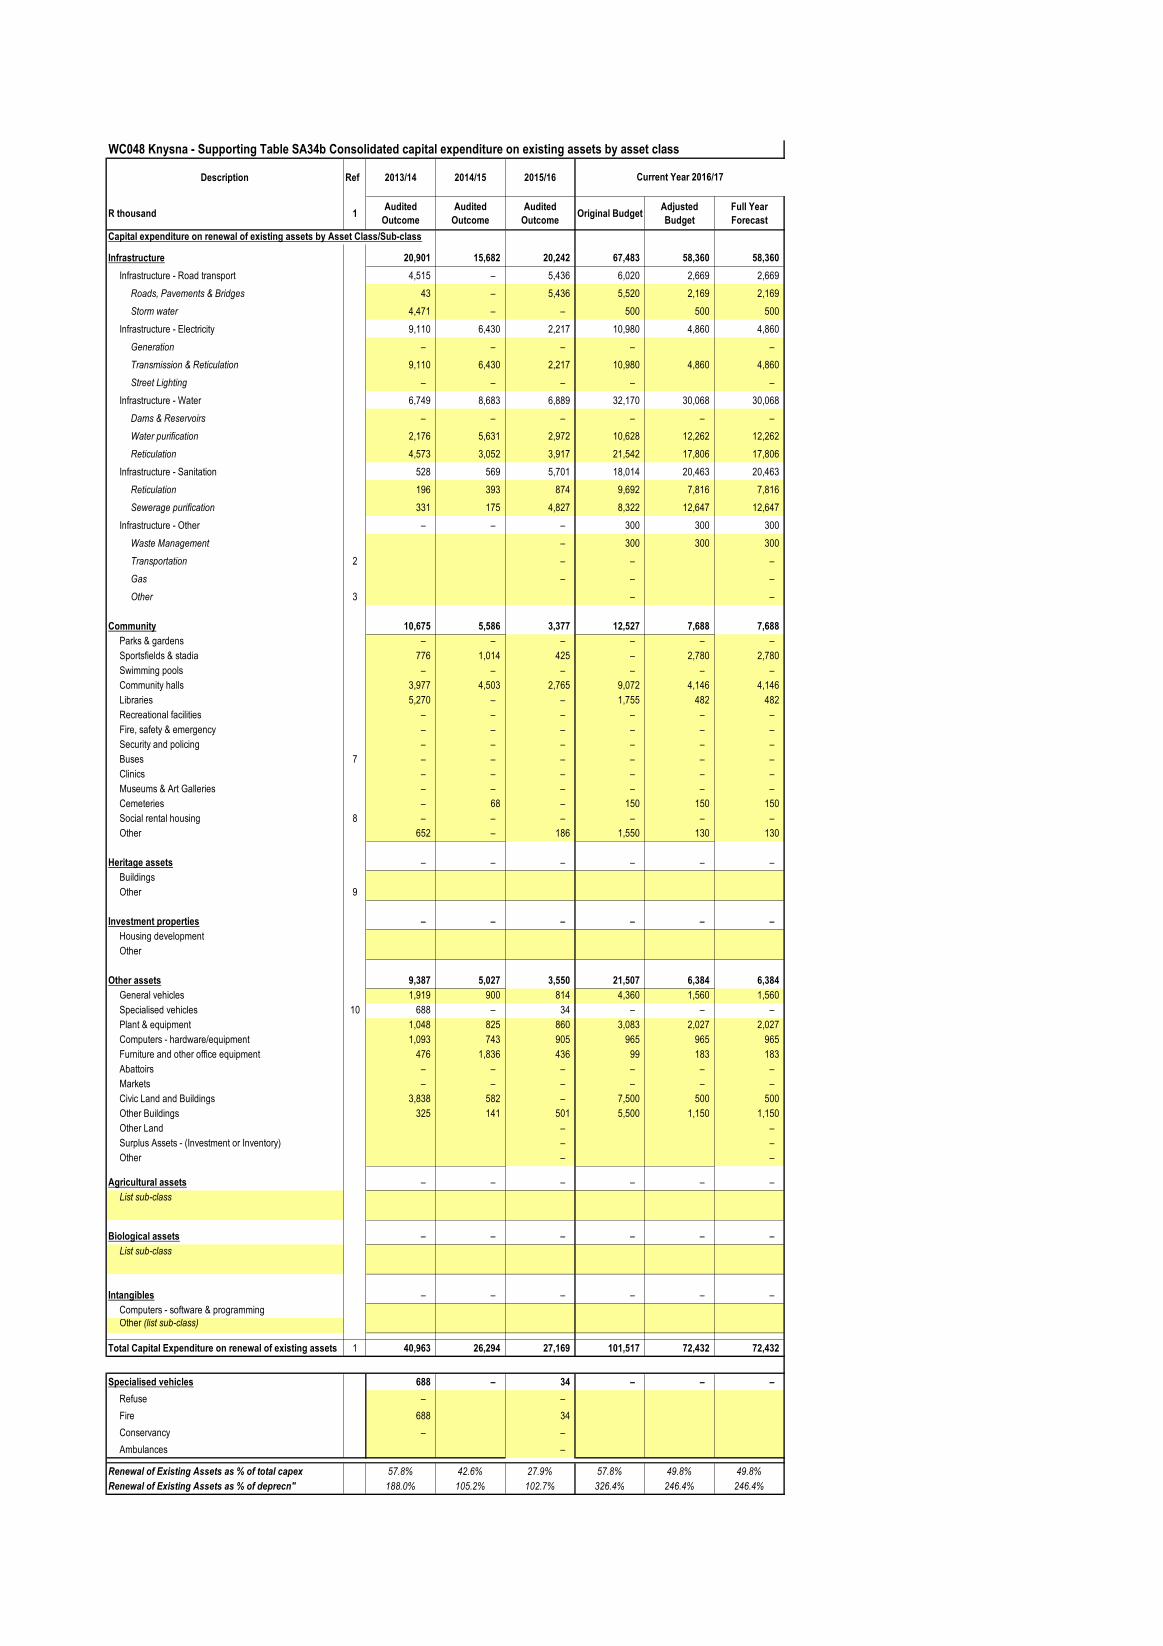
WC048 Knysna - Supporting Table SA34b Consolidated capital expenditure on existing assets by asset class
Description Ref 2013/14 2014/15 2015/16
R thousand 1Audited
Outcome
Audited
Outcome
Audited
OutcomeOriginal Budget
Adjusted
Budget
Full Year
Forecast
Capital expenditure on renewal of existing assets by Asset Class/Sub-class
Infrastructure 20,901 15,682 20,242 67,483 58,360 58,360
Infrastructure - Road transport 4,515 – 5,436 6,020 2,669 2,669
Roads, Pavements & Bridges 43 – 5,436 5,520 2,169 2,169
Storm water 4,471 – – 500 500 500
Infrastructure - Electricity 9,110 6,430 2,217 10,980 4,860 4,860
Generation – – – – –
Transmission & Reticulation 9,110 6,430 2,217 10,980 4,860 4,860
Street Lighting – – – – –
Infrastructure - Water 6,749 8,683 6,889 32,170 30,068 30,068
Dams & Reservoirs – – – – – –
Water purification 2,176 5,631 2,972 10,628 12,262 12,262
Reticulation 4,573 3,052 3,917 21,542 17,806 17,806
Infrastructure - Sanitation 528 569 5,701 18,014 20,463 20,463
Reticulation 196 393 874 9,692 7,816 7,816
Sewerage purification 331 175 4,827 8,322 12,647 12,647
Infrastructure - Other – – – 300 300 300
Waste Management – 300 300 300
Transportation 2 – – –
Gas – – –
Other 3 – –
Community 10,675 5,586 3,377 12,527 7,688 7,688
Parks & gardens – – – – – –
Sportsfields & stadia 776 1,014 425 – 2,780 2,780
Swimming pools – – – – – –
Community halls 3,977 4,503 2,765 9,072 4,146 4,146
Libraries 5,270 – – 1,755 482 482
Recreational facilities – – – – – –
Fire, safety & emergency – – – – – –
Security and policing – – – – – –
Buses 7 – – – – – –
Clinics – – – – – –
Museums & Art Galleries – – – – – –
Cemeteries – 68 – 150 150 150
Social rental housing 8 – – – – – –
Other 652 – 186 1,550 130 130
Heritage assets – – – – – –
Buildings
Other 9
Investment properties – – – – – –
Housing development
Other
Other assets 9,387 5,027 3,550 21,507 6,384 6,384
General vehicles 1,919 900 814 4,360 1,560 1,560
Specialised vehicles 10 688 – 34 – – –
Plant & equipment 1,048 825 860 3,083 2,027 2,027
Computers - hardware/equipment 1,093 743 905 965 965 965
Furniture and other office equipment 476 1,836 436 99 183 183
Abattoirs – – – – – –
Markets – – – – – –
Civic Land and Buildings 3,838 582 – 7,500 500 500
Other Buildings 325 141 501 5,500 1,150 1,150
Other Land – –
Surplus Assets - (Investment or Inventory) – –
Other – –
Agricultural assets – – – – – –
List sub-class
Biological assets – – – – – –
List sub-class
Intangibles – – – – – –
Computers - software & programming
Other (list sub-class)
Total Capital Expenditure on renewal of existing assets 1 40,963 26,294 27,169 101,517 72,432 72,432
Specialised vehicles 688 – 34 – – –
Refuse – –
Fire 688 34
Conservancy – –
Ambulances –
Renewal of Existing Assets as % of total capex 57.8% 42.6% 27.9% 57.8% 49.8% 49.8%
Renewal of Existing Assets as % of deprecn" 188.0% 105.2% 102.7% 326.4% 246.4% 246.4%
Current Year 2016/17
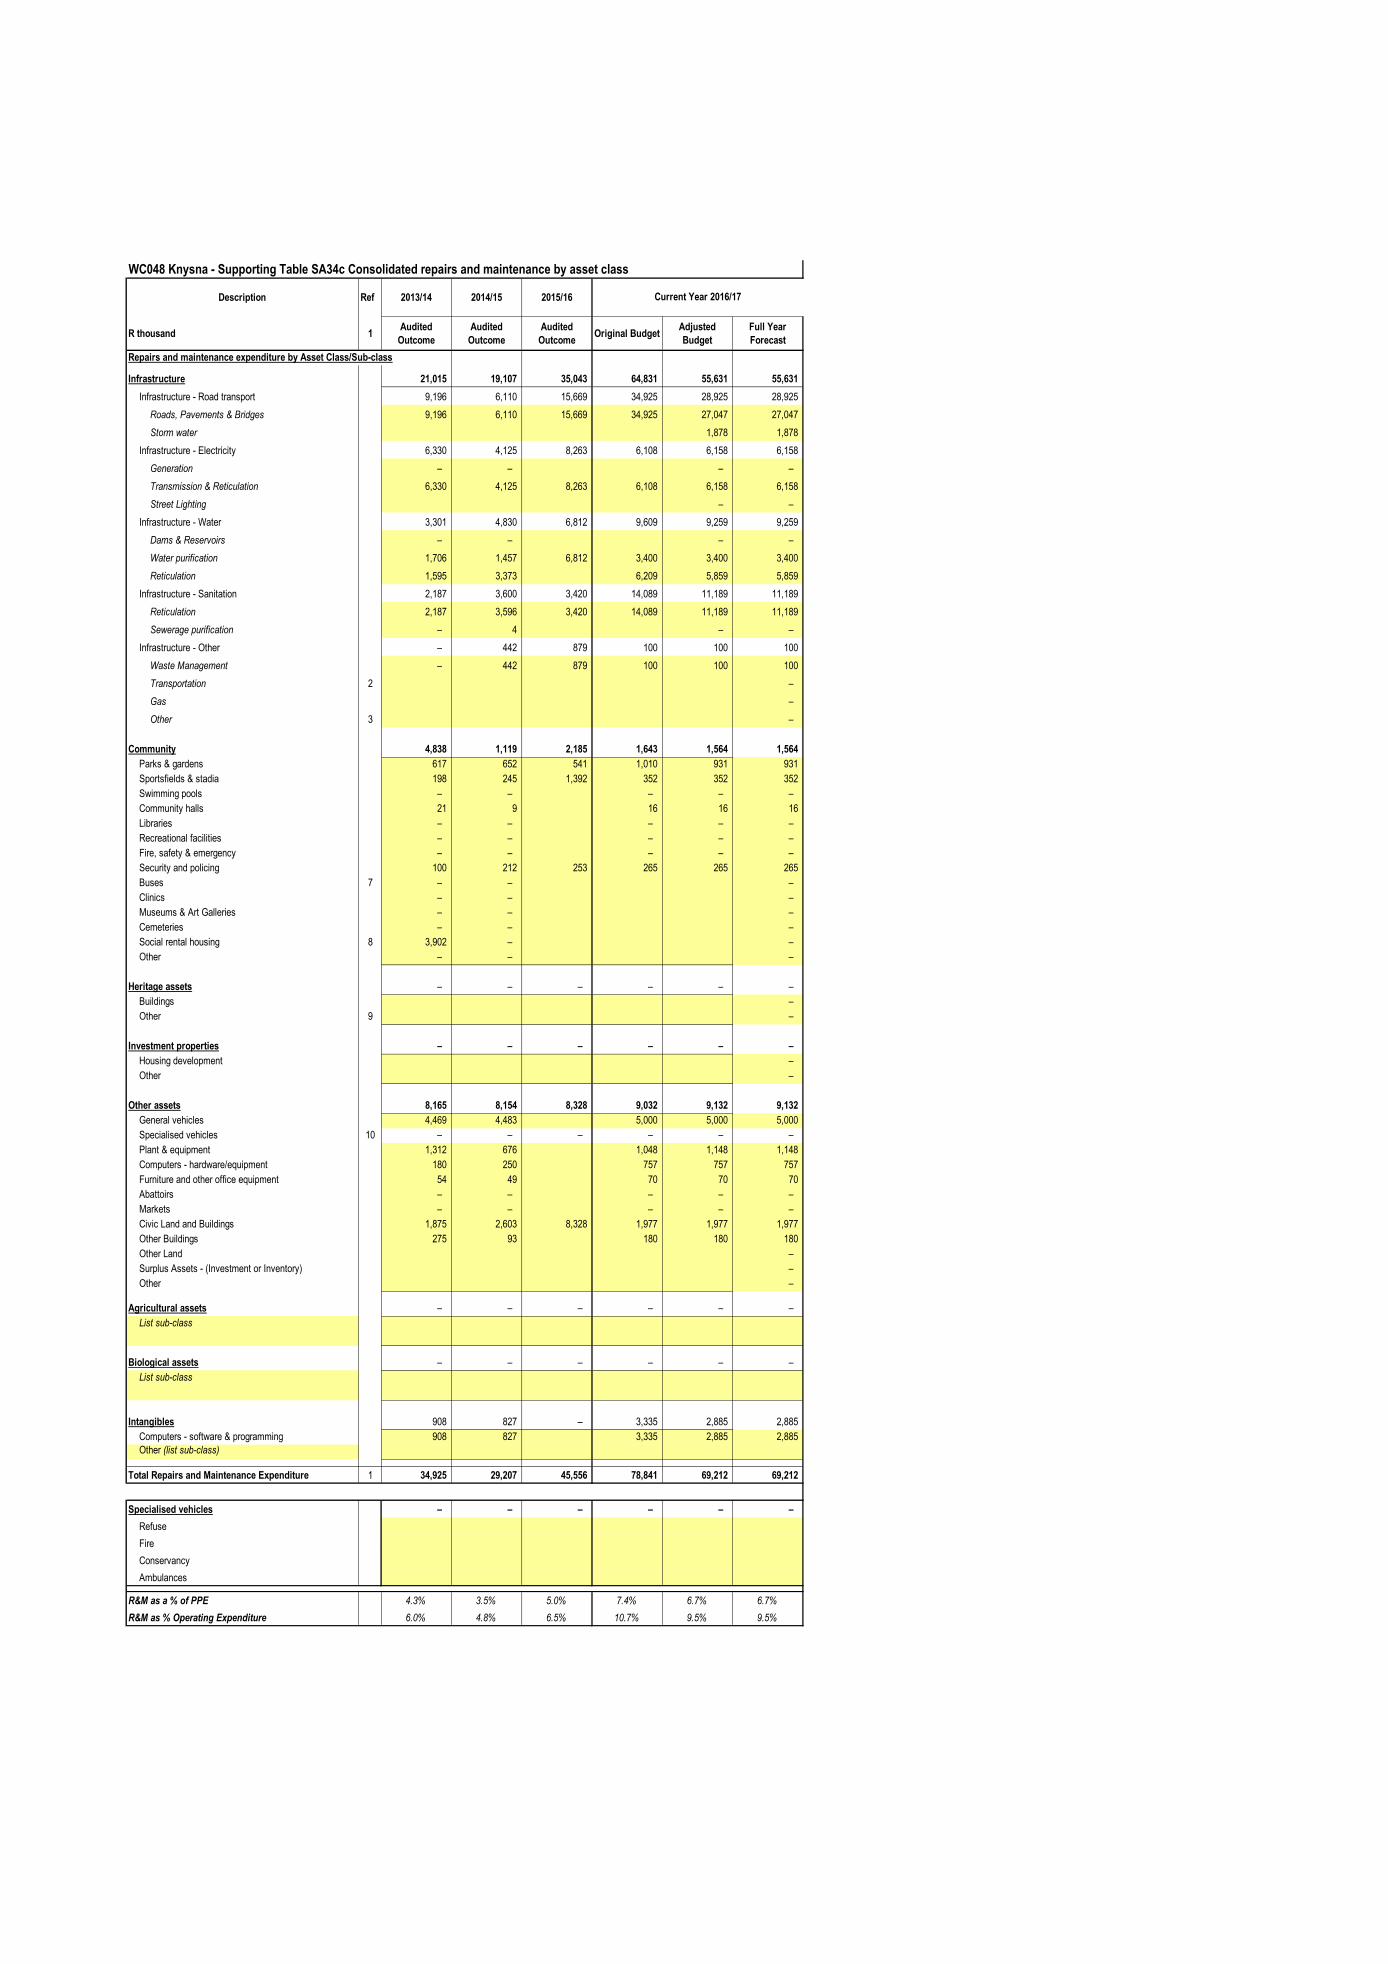
WC048 Knysna - Supporting Table SA34c Consolidated repairs and maintenance by asset class
Description Ref 2013/14 2014/15 2015/16
R thousand 1Audited
Outcome
Audited
Outcome
Audited
OutcomeOriginal Budget
Adjusted
Budget
Full Year
Forecast
Repairs and maintenance expenditure by Asset Class/Sub-class
Infrastructure 21,015 19,107 35,043 64,831 55,631 55,631
Infrastructure - Road transport 9,196 6,110 15,669 34,925 28,925 28,925
Roads, Pavements & Bridges 9,196 6,110 15,669 34,925 27,047 27,047
Storm water 1,878 1,878
Infrastructure - Electricity 6,330 4,125 8,263 6,108 6,158 6,158
Generation – – – –
Transmission & Reticulation 6,330 4,125 8,263 6,108 6,158 6,158
Street Lighting – –
Infrastructure - Water 3,301 4,830 6,812 9,609 9,259 9,259
Dams & Reservoirs – – – –
Water purification 1,706 1,457 6,812 3,400 3,400 3,400
Reticulation 1,595 3,373 6,209 5,859 5,859
Infrastructure - Sanitation 2,187 3,600 3,420 14,089 11,189 11,189
Reticulation 2,187 3,596 3,420 14,089 11,189 11,189
Sewerage purification – 4 – –
Infrastructure - Other – 442 879 100 100 100
Waste Management – 442 879 100 100 100
Transportation 2 –
Gas –
Other 3 –
Community 4,838 1,119 2,185 1,643 1,564 1,564
Parks & gardens 617 652 541 1,010 931 931
Sportsfields & stadia 198 245 1,392 352 352 352
Swimming pools – – – – –
Community halls 21 9 16 16 16
Libraries – – – – –
Recreational facilities – – – – –
Fire, safety & emergency – – – – –
Security and policing 100 212 253 265 265 265
Buses 7 – – –
Clinics – – –
Museums & Art Galleries – – –
Cemeteries – – –
Social rental housing 8 3,902 – –
Other – – –
Heritage assets – – – – – –
Buildings –
Other 9 –
Investment properties – – – – – –
Housing development –
Other –
Other assets 8,165 8,154 8,328 9,032 9,132 9,132
General vehicles 4,469 4,483 5,000 5,000 5,000
Specialised vehicles 10 – – – – – –
Plant & equipment 1,312 676 1,048 1,148 1,148
Computers - hardware/equipment 180 250 757 757 757
Furniture and other office equipment 54 49 70 70 70
Abattoirs – – – – –
Markets – – – – –
Civic Land and Buildings 1,875 2,603 8,328 1,977 1,977 1,977
Other Buildings 275 93 180 180 180
Other Land –
Surplus Assets - (Investment or Inventory) –
Other –
Agricultural assets – – – – – –
List sub-class
Biological assets – – – – – –
List sub-class
Intangibles 908 827 – 3,335 2,885 2,885
Computers - software & programming 908 827 3,335 2,885 2,885
Other (list sub-class)
Total Repairs and Maintenance Expenditure 1 34,925 29,207 45,556 78,841 69,212 69,212
Specialised vehicles – – – – – –
Refuse
Fire
Conservancy
Ambulances
R&M as a % of PPE 4.3% 3.5% 5.0% 7.4% 6.7% 6.7%
R&M as % Operating Expenditure 6.0% 4.8% 6.5% 10.7% 9.5% 9.5%
Current Year 2016/17
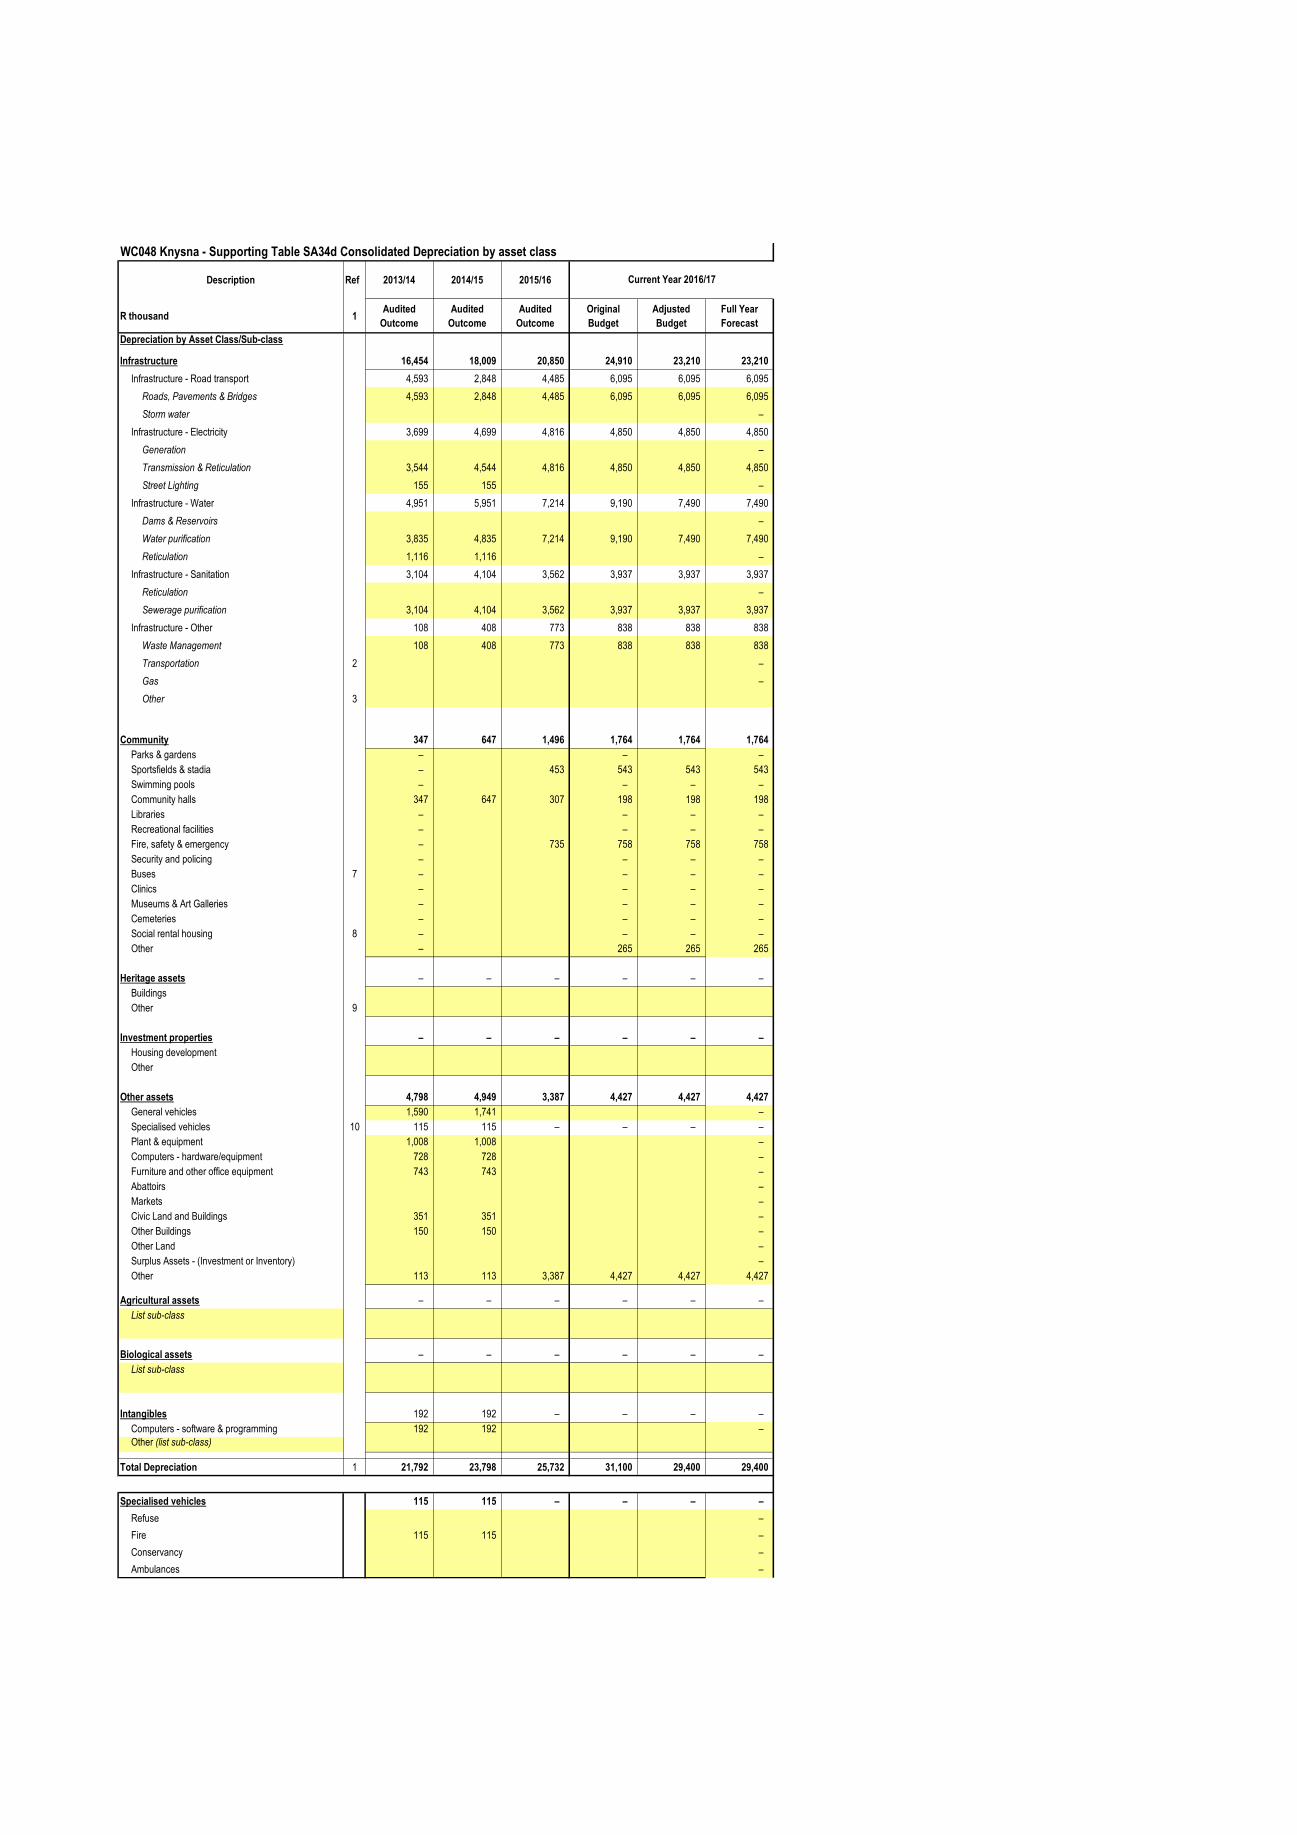
WC048 Knysna - Supporting Table SA34d Consolidated Depreciation by asset class
Description Ref 2013/14 2014/15 2015/16
R thousand 1Audited
Outcome
Audited
Outcome
Audited
Outcome
Original
Budget
Adjusted
Budget
Full Year
Forecast
Depreciation by Asset Class/Sub-class
Infrastructure 16,454 18,009 20,850 24,910 23,210 23,210
Infrastructure - Road transport 4,593 2,848 4,485 6,095 6,095 6,095
Roads, Pavements & Bridges 4,593 2,848 4,485 6,095 6,095 6,095
Storm water –
Infrastructure - Electricity 3,699 4,699 4,816 4,850 4,850 4,850
Generation –
Transmission & Reticulation 3,544 4,544 4,816 4,850 4,850 4,850
Street Lighting 155 155 –
Infrastructure - Water 4,951 5,951 7,214 9,190 7,490 7,490
Dams & Reservoirs –
Water purification 3,835 4,835 7,214 9,190 7,490 7,490
Reticulation 1,116 1,116 –
Infrastructure - Sanitation 3,104 4,104 3,562 3,937 3,937 3,937
Reticulation –
Sewerage purification 3,104 4,104 3,562 3,937 3,937 3,937
Infrastructure - Other 108 408 773 838 838 838
Waste Management 108 408 773 838 838 838
Transportation 2 –
Gas –
Other 3
Community 347 647 1,496 1,764 1,764 1,764
Parks & gardens – – –
Sportsfields & stadia – 453 543 543 543
Swimming pools – – – –
Community halls 347 647 307 198 198 198
Libraries – – – –
Recreational facilities – – – –
Fire, safety & emergency – 735 758 758 758
Security and policing – – – –
Buses 7 – – – –
Clinics – – – –
Museums & Art Galleries – – – –
Cemeteries – – – –
Social rental housing 8 – – – –
Other – 265 265 265
Heritage assets – – – – – –
Buildings
Other 9
Investment properties – – – – – –
Housing development
Other
Other assets 4,798 4,949 3,387 4,427 4,427 4,427
General vehicles 1,590 1,741 –
Specialised vehicles 10 115 115 – – – –
Plant & equipment 1,008 1,008 –
Computers - hardware/equipment 728 728 –
Furniture and other office equipment 743 743 –
Abattoirs –
Markets –
Civic Land and Buildings 351 351 –
Other Buildings 150 150 –
Other Land –
Surplus Assets - (Investment or Inventory) –
Other 113 113 3,387 4,427 4,427 4,427
Agricultural assets – – – – – –
List sub-class
Biological assets – – – – – –
List sub-class
Intangibles 192 192 – – – –
Computers - software & programming 192 192 –
Other (list sub-class)
Total Depreciation 1 21,792 23,798 25,732 31,100 29,400 29,400
Specialised vehicles 115 115 – – – –
Refuse –
Fire 115 115 –
Conservancy –
Ambulances –
Current Year 2016/17
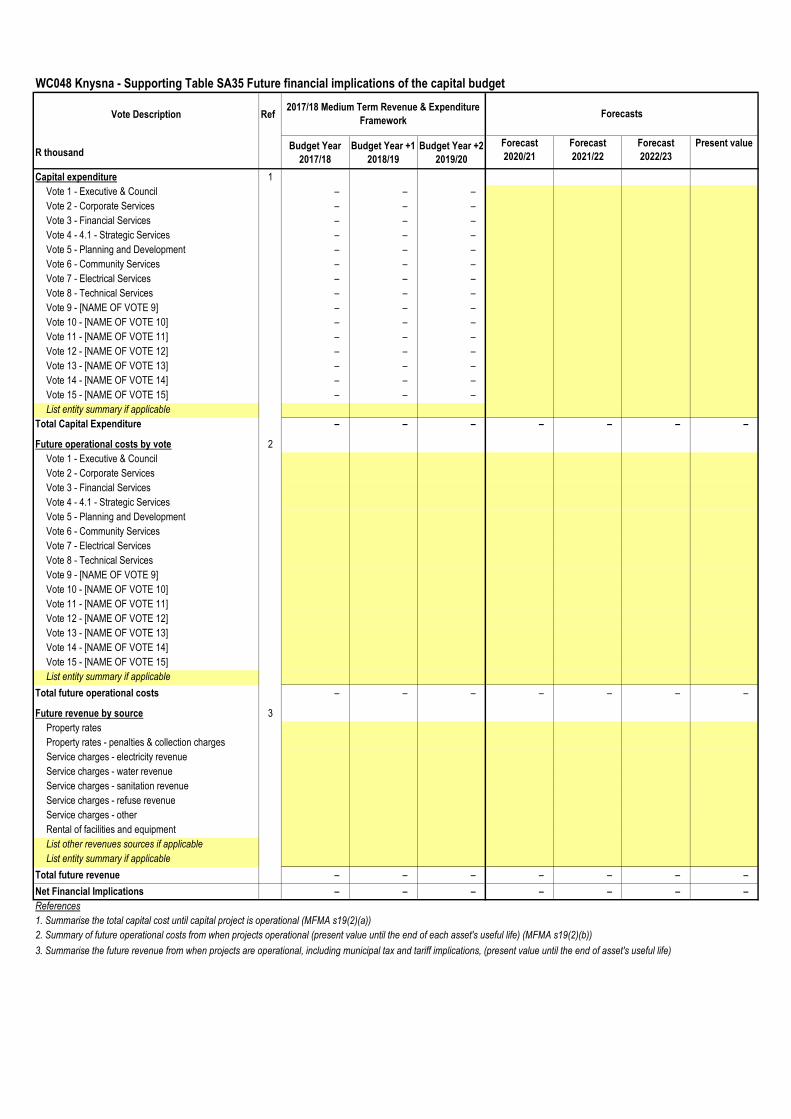
WC048 Knysna - Supporting Table SA35 Future financial implications of the capital budget
Vote Description Ref
R thousandBudget Year
2017/18
Budget Year +1
2018/19
Budget Year +2
2019/20
Forecast
2020/21
Forecast
2021/22
Forecast
2022/23
Present value
Capital expenditure 1
Vote 1 - Executive & Council – – –
Vote 2 - Corporate Services – – –
Vote 3 - Financial Services – – –
Vote 4 - 4.1 - Strategic Services – – –
Vote 5 - Planning and Development – – –
Vote 6 - Community Services – – –
Vote 7 - Electrical Services – – –
Vote 8 - Technical Services – – –
Vote 9 - [NAME OF VOTE 9] – – –
Vote 10 - [NAME OF VOTE 10] – – –
Vote 11 - [NAME OF VOTE 11] – – –
Vote 12 - [NAME OF VOTE 12] – – –
Vote 13 - [NAME OF VOTE 13] – – –
Vote 14 - [NAME OF VOTE 14] – – –
Vote 15 - [NAME OF VOTE 15] – – –
List entity summary if applicable
Total Capital Expenditure – – – – – – –
Future operational costs by vote 2
Vote 1 - Executive & Council
Vote 2 - Corporate Services
Vote 3 - Financial Services
Vote 4 - 4.1 - Strategic Services
Vote 5 - Planning and Development
Vote 6 - Community Services
Vote 7 - Electrical Services
Vote 8 - Technical Services
Vote 9 - [NAME OF VOTE 9]
Vote 10 - [NAME OF VOTE 10]
Vote 11 - [NAME OF VOTE 11]
Vote 12 - [NAME OF VOTE 12]
Vote 13 - [NAME OF VOTE 13]
Vote 14 - [NAME OF VOTE 14]
Vote 15 - [NAME OF VOTE 15]
List entity summary if applicable
Total future operational costs – – – – – – –
Future revenue by source 3
Property rates
Property rates - penalties & collection charges
Service charges - electricity revenue
Service charges - water revenue
Service charges - sanitation revenue
Service charges - refuse revenue
Service charges - other
Rental of facilities and equipment
List other revenues sources if applicable
List entity summary if applicable
Total future revenue – – – – – – –
Net Financial Implications – – – – – – –
References
1. Summarise the total capital cost until capital project is operational (MFMA s19(2)(a))
2. Summary of future operational costs from when projects operational (present value until the end of each asset's useful life) (MFMA s19(2)(b))
3. Summarise the future revenue from when projects are operational, including municipal tax and tariff implications, (present value until the end of asset's useful life)
Forecasts2017/18 Medium Term Revenue & Expenditure
Framework
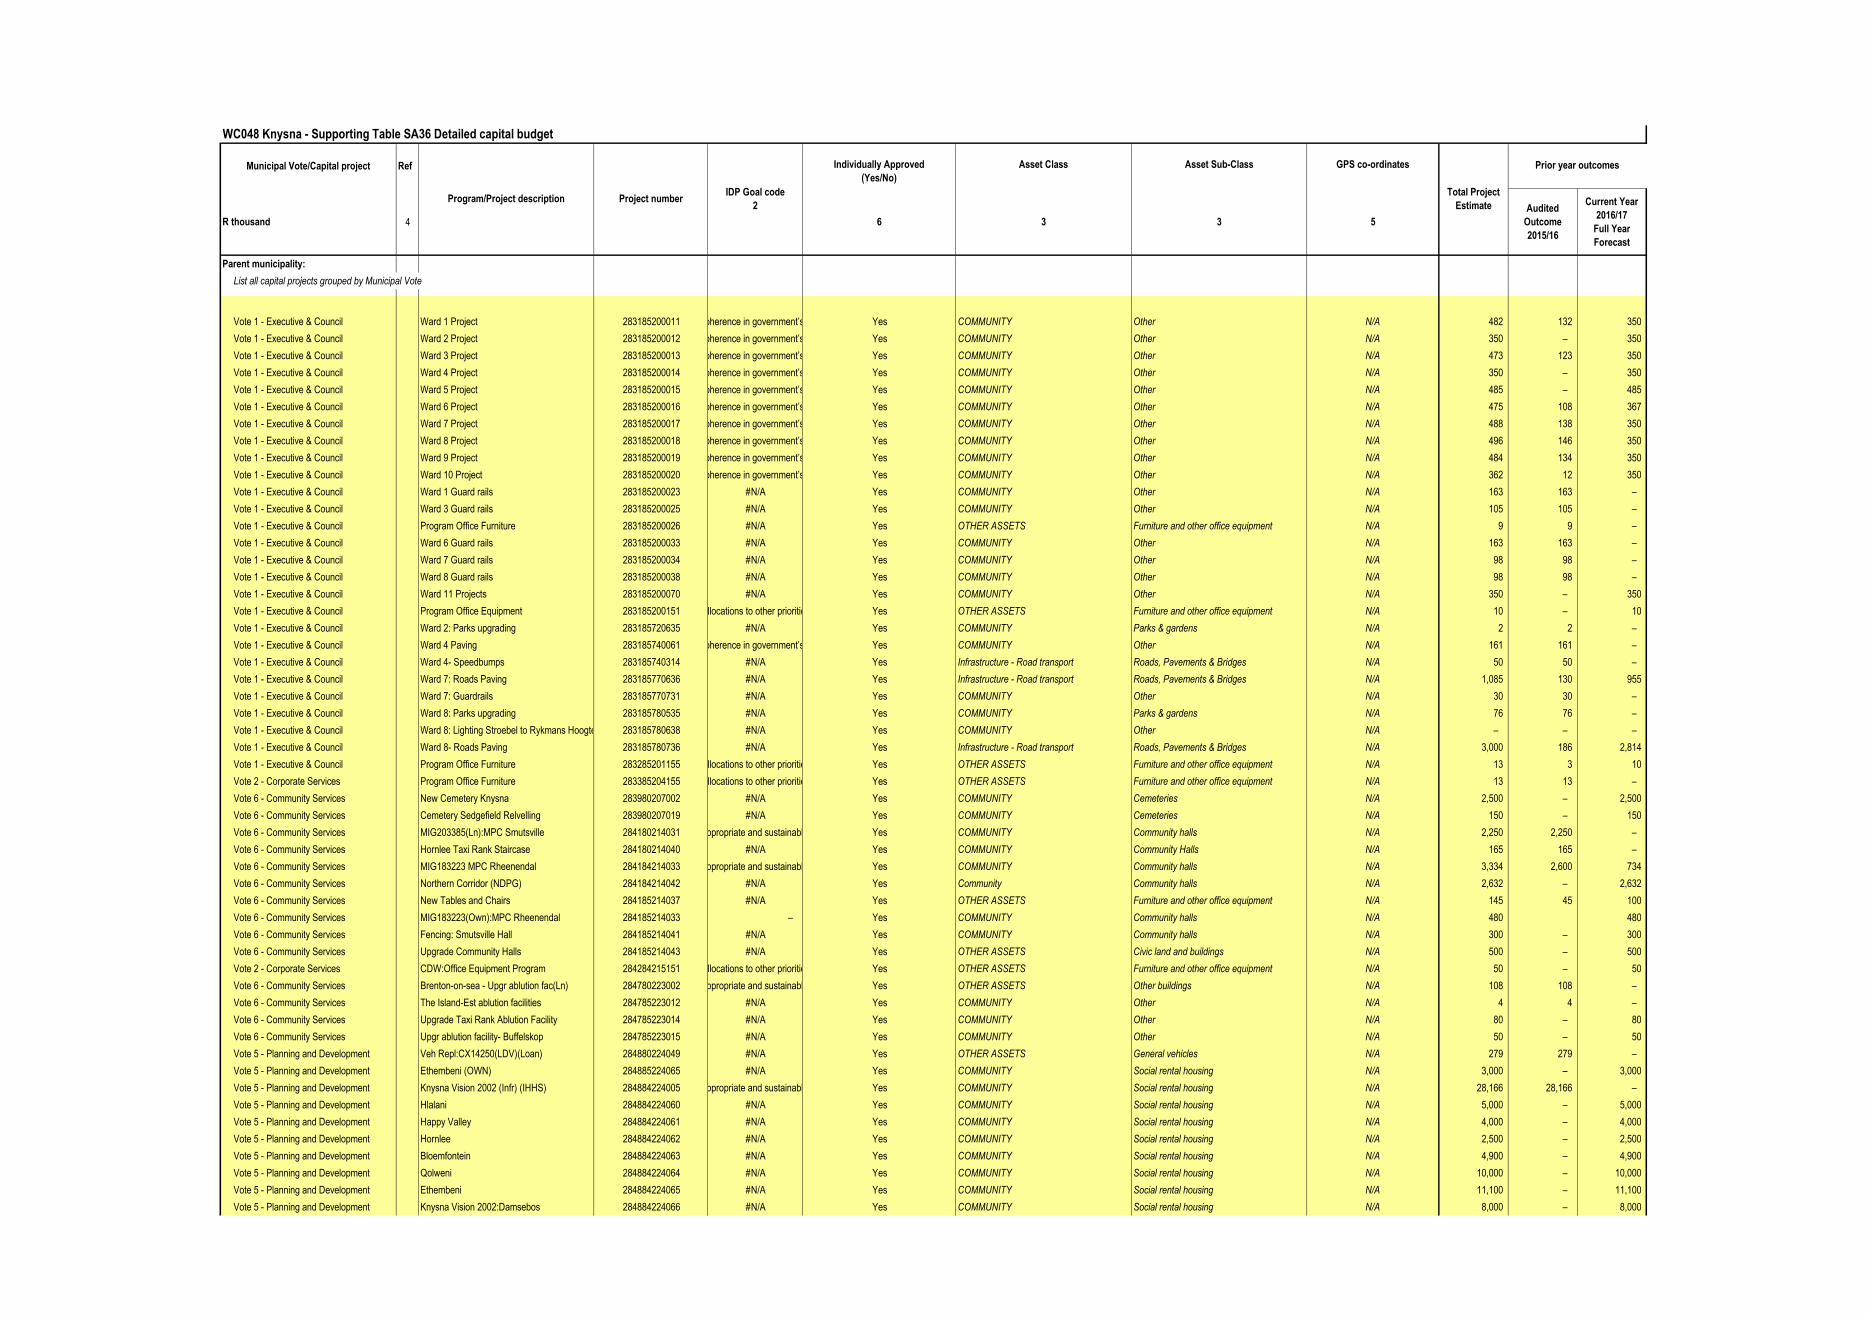
WC048 Knysna - Supporting Table SA36 Detailed capital budget
Municipal Vote/Capital project Ref Individually Approved
(Yes/No)
Asset Class Asset Sub-Class GPS co-ordinates
R thousand 4 6 3 3 5
Audited
Outcome
2015/16
Current Year
2016/17
Full Year
Forecast
Parent municipality:
List all capital projects grouped by Municipal Vote
Vote 1 - Executive & Council Ward 1 Project 283185200011SO7: To establish a common vision and create coherence in government’s work by seeking close partnerships with citizenryYes COMMUNITY Other N/A 482 132 350
Vote 1 - Executive & Council Ward 2 Project 283185200012SO7: To establish a common vision and create coherence in government’s work by seeking close partnerships with citizenryYes COMMUNITY Other N/A 350 – 350
Vote 1 - Executive & Council Ward 3 Project 283185200013SO7: To establish a common vision and create coherence in government’s work by seeking close partnerships with citizenryYes COMMUNITY Other N/A 473 123 350
Vote 1 - Executive & Council Ward 4 Project 283185200014SO7: To establish a common vision and create coherence in government’s work by seeking close partnerships with citizenryYes COMMUNITY Other N/A 350 – 350
Vote 1 - Executive & Council Ward 5 Project 283185200015SO7: To establish a common vision and create coherence in government’s work by seeking close partnerships with citizenryYes COMMUNITY Other N/A 485 – 485
Vote 1 - Executive & Council Ward 6 Project 283185200016SO7: To establish a common vision and create coherence in government’s work by seeking close partnerships with citizenryYes COMMUNITY Other N/A 475 108 367
Vote 1 - Executive & Council Ward 7 Project 283185200017SO7: To establish a common vision and create coherence in government’s work by seeking close partnerships with citizenryYes COMMUNITY Other N/A 488 138 350
Vote 1 - Executive & Council Ward 8 Project 283185200018SO7: To establish a common vision and create coherence in government’s work by seeking close partnerships with citizenryYes COMMUNITY Other N/A 496 146 350
Vote 1 - Executive & Council Ward 9 Project 283185200019SO7: To establish a common vision and create coherence in government’s work by seeking close partnerships with citizenryYes COMMUNITY Other N/A 484 134 350
Vote 1 - Executive & Council Ward 10 Project 283185200020SO7: To establish a common vision and create coherence in government’s work by seeking close partnerships with citizenryYes COMMUNITY Other N/A 362 12 350
Vote 1 - Executive & Council Ward 1 Guard rails 283185200023 #N/A Yes COMMUNITY Other N/A 163 163 –
Vote 1 - Executive & Council Ward 3 Guard rails 283185200025 #N/A Yes COMMUNITY Other N/A 105 105 –
Vote 1 - Executive & Council Program Office Furniture 283185200026 #N/A Yes OTHER ASSETS Furniture and other office equipment N/A 9 9 –
Vote 1 - Executive & Council Ward 6 Guard rails 283185200033 #N/A Yes COMMUNITY Other N/A 163 163 –
Vote 1 - Executive & Council Ward 7 Guard rails 283185200034 #N/A Yes COMMUNITY Other N/A 98 98 –
Vote 1 - Executive & Council Ward 8 Guard rails 283185200038 #N/A Yes COMMUNITY Other N/A 98 98 –
Vote 1 - Executive & Council Ward 11 Projects 283185200070 #N/A Yes COMMUNITY Other N/A 350 – 350
Vote 1 - Executive & Council Program Office Equipment 283185200151 Allocations to other priorities Yes OTHER ASSETS Furniture and other office equipment N/A 10 – 10
Vote 1 - Executive & Council Ward 2: Parks upgrading 283185720635 #N/A Yes COMMUNITY Parks & gardens N/A 2 2 –
Vote 1 - Executive & Council Ward 4 Paving 283185740061SO7: To establish a common vision and create coherence in government’s work by seeking close partnerships with citizenryYes COMMUNITY Other N/A 161 161 –
Vote 1 - Executive & Council Ward 4- Speedbumps 283185740314 #N/A Yes Infrastructure - Road transport Roads, Pavements & Bridges N/A 50 50 –
Vote 1 - Executive & Council Ward 7: Roads Paving 283185770636 #N/A Yes Infrastructure - Road transport Roads, Pavements & Bridges N/A 1,085 130 955
Vote 1 - Executive & Council Ward 7: Guardrails 283185770731 #N/A Yes COMMUNITY Other N/A 30 30 –
Vote 1 - Executive & Council Ward 8: Parks upgrading 283185780535 #N/A Yes COMMUNITY Parks & gardens N/A 76 76 –
Vote 1 - Executive & Council Ward 8: Lighting Stroebel to Rykmans Hoogte 283185780638 #N/A Yes COMMUNITY Other N/A – – –
Vote 1 - Executive & Council Ward 8- Roads Paving 283185780736 #N/A Yes Infrastructure - Road transport Roads, Pavements & Bridges N/A 3,000 186 2,814
Vote 1 - Executive & Council Program Office Furniture 283285201155 Allocations to other priorities Yes OTHER ASSETS Furniture and other office equipment N/A 13 3 10
Vote 2 - Corporate Services Program Office Furniture 283385204155 Allocations to other priorities Yes OTHER ASSETS Furniture and other office equipment N/A 13 13 –
Vote 6 - Community Services New Cemetery Knysna 283980207002 #N/A Yes COMMUNITY Cemeteries N/A 2,500 – 2,500
Vote 6 - Community Services Cemetery Sedgefield Relvelling 283980207019 #N/A Yes COMMUNITY Cemeteries N/A 150 – 150
Vote 6 - Community Services MIG203385(Ln):MPC Smutsville 284180214031SO1: To promote access for all citizens to equitable, appropriate and sustainable infrastructure and services within a safe environmentYes COMMUNITY Community halls N/A 2,250 2,250 –
Vote 6 - Community Services Hornlee Taxi Rank Staircase 284180214040 #N/A Yes COMMUNITY Community Halls N/A 165 165 –
Vote 6 - Community Services MIG183223 MPC Rheenendal 284184214033SO1: To promote access for all citizens to equitable, appropriate and sustainable infrastructure and services within a safe environmentYes COMMUNITY Community halls N/A 3,334 2,600 734
Vote 6 - Community Services Northern Corridor (NDPG) 284184214042 #N/A Yes Community Community halls N/A 2,632 – 2,632
Vote 6 - Community Services New Tables and Chairs 284185214037 #N/A Yes OTHER ASSETS Furniture and other office equipment N/A 145 45 100
Vote 6 - Community Services MIG183223(Own):MPC Rheenendal 284185214033 – Yes COMMUNITY Community halls N/A 480 480
Vote 6 - Community Services Fencing: Smutsville Hall 284185214041 #N/A Yes COMMUNITY Community halls N/A 300 – 300
Vote 6 - Community Services Upgrade Community Halls 284185214043 #N/A Yes OTHER ASSETS Civic land and buildings N/A 500 – 500
Vote 2 - Corporate Services CDW:Office Equipment Program 284284215151 Allocations to other priorities Yes OTHER ASSETS Furniture and other office equipment N/A 50 – 50
Vote 6 - Community Services Brenton-on-sea - Upgr ablution fac(Ln) 284780223002SO1: To promote access for all citizens to equitable, appropriate and sustainable infrastructure and services within a safe environmentYes OTHER ASSETS Other buildings N/A 108 108 –
Vote 6 - Community Services The Island-Est ablution facilities 284785223012 #N/A Yes COMMUNITY Other N/A 4 4 –
Vote 6 - Community Services Upgrade Taxi Rank Ablution Facility 284785223014 #N/A Yes COMMUNITY Other N/A 80 – 80
Vote 6 - Community Services Upgr ablution facility- Buffelskop 284785223015 #N/A Yes COMMUNITY Other N/A 50 – 50
Vote 5 - Planning and Development Veh Repl:CX14250(LDV)(Loan) 284880224049 #N/A Yes OTHER ASSETS General vehicles N/A 279 279 –
Vote 5 - Planning and Development Ethembeni (OWN) 284885224065 #N/A Yes COMMUNITY Social rental housing N/A 3,000 – 3,000
Vote 5 - Planning and Development Knysna Vision 2002 (Infr) (IHHS) 284884224005SO1: To promote access for all citizens to equitable, appropriate and sustainable infrastructure and services within a safe environmentYes COMMUNITY Social rental housing N/A 28,166 28,166 –
Vote 5 - Planning and Development Hlalani 284884224060 #N/A Yes COMMUNITY Social rental housing N/A 5,000 – 5,000
Vote 5 - Planning and Development Happy Valley 284884224061 #N/A Yes COMMUNITY Social rental housing N/A 4,000 – 4,000
Vote 5 - Planning and Development Hornlee 284884224062 #N/A Yes COMMUNITY Social rental housing N/A 2,500 – 2,500
Vote 5 - Planning and Development Bloemfontein 284884224063 #N/A Yes COMMUNITY Social rental housing N/A 4,900 – 4,900
Vote 5 - Planning and Development Qolweni 284884224064 #N/A Yes COMMUNITY Social rental housing N/A 10,000 – 10,000
Vote 5 - Planning and Development Ethembeni 284884224065 #N/A Yes COMMUNITY Social rental housing N/A 11,100 – 11,100
Vote 5 - Planning and Development Knysna Vision 2002:Damsebos 284884224066 #N/A Yes COMMUNITY Social rental housing N/A 8,000 – 8,000
Program/Project description Project numberIDP Goal code
2
Prior year outcomes
Total Project
Estimate
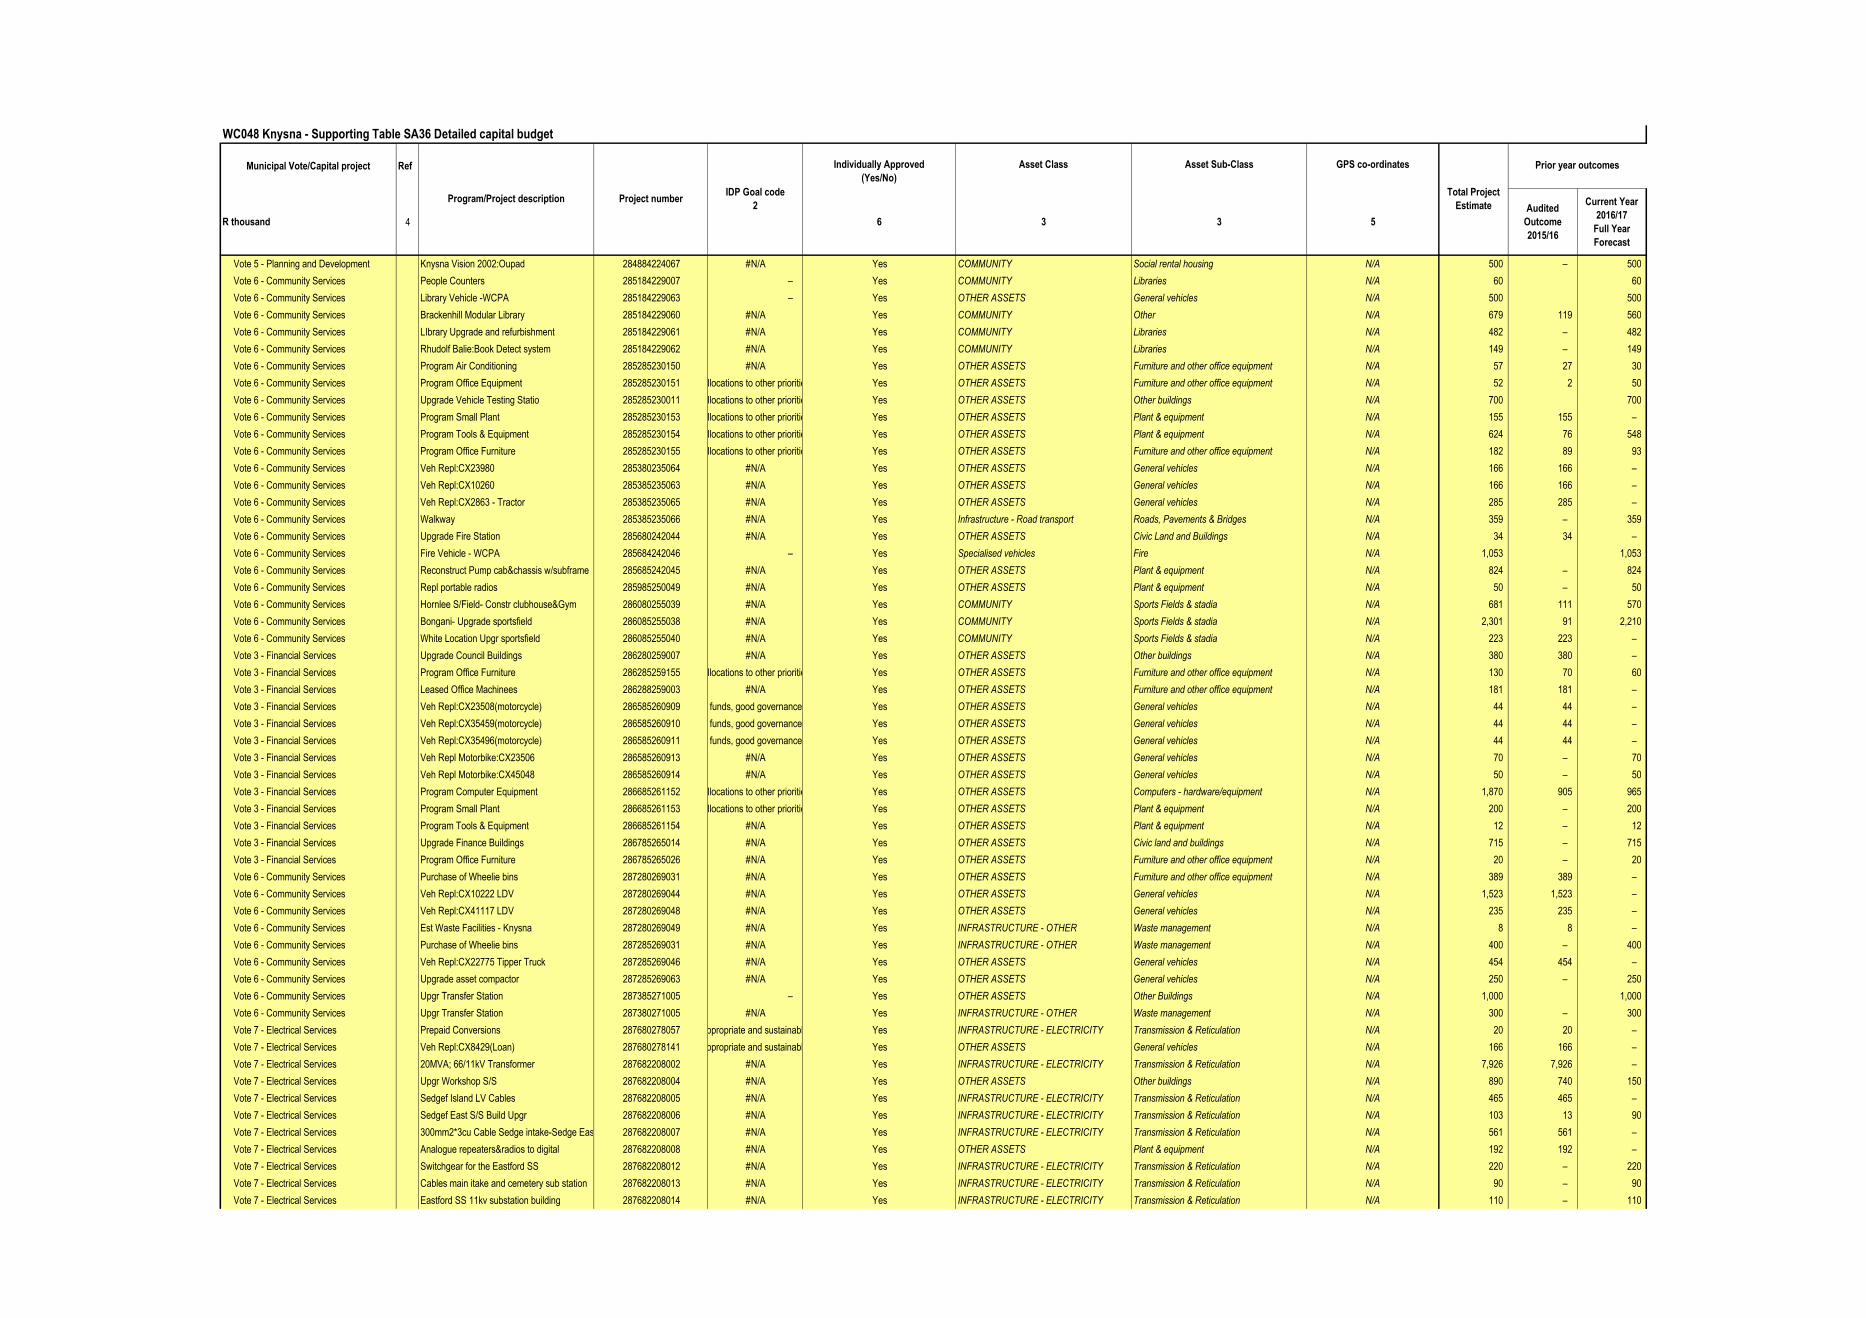
WC048 Knysna - Supporting Table SA36 Detailed capital budget
Municipal Vote/Capital project Ref Individually Approved
(Yes/No)
Asset Class Asset Sub-Class GPS co-ordinates
R thousand 4 6 3 3 5
Audited
Outcome
2015/16
Current Year
2016/17
Full Year
Forecast
Program/Project description Project numberIDP Goal code
2
Prior year outcomes
Total Project
Estimate
Vote 5 - Planning and Development Knysna Vision 2002:Oupad 284884224067 #N/A Yes COMMUNITY Social rental housing N/A 500 – 500
Vote 6 - Community Services People Counters 285184229007 – Yes COMMUNITY Libraries N/A 60 60
Vote 6 - Community Services Library Vehicle -WCPA 285184229063 – Yes OTHER ASSETS General vehicles N/A 500 500
Vote 6 - Community Services Brackenhill Modular Library 285184229060 #N/A Yes COMMUNITY Other N/A 679 119 560
Vote 6 - Community Services LIbrary Upgrade and refurbishment 285184229061 #N/A Yes COMMUNITY Libraries N/A 482 – 482
Vote 6 - Community Services Rhudolf Balie:Book Detect system 285184229062 #N/A Yes COMMUNITY Libraries N/A 149 – 149
Vote 6 - Community Services Program Air Conditioning 285285230150 #N/A Yes OTHER ASSETS Furniture and other office equipment N/A 57 27 30
Vote 6 - Community Services Program Office Equipment 285285230151 Allocations to other priorities Yes OTHER ASSETS Furniture and other office equipment N/A 52 2 50
Vote 6 - Community Services Upgrade Vehicle Testing Statio 285285230011 Allocations to other priorities Yes OTHER ASSETS Other buildings N/A 700 700
Vote 6 - Community Services Program Small Plant 285285230153 Allocations to other priorities Yes OTHER ASSETS Plant & equipment N/A 155 155 –
Vote 6 - Community Services Program Tools & Equipment 285285230154 Allocations to other priorities Yes OTHER ASSETS Plant & equipment N/A 624 76 548
Vote 6 - Community Services Program Office Furniture 285285230155 Allocations to other priorities Yes OTHER ASSETS Furniture and other office equipment N/A 182 89 93
Vote 6 - Community Services Veh Repl:CX23980 285380235064 #N/A Yes OTHER ASSETS General vehicles N/A 166 166 –
Vote 6 - Community Services Veh Repl:CX10260 285385235063 #N/A Yes OTHER ASSETS General vehicles N/A 166 166 –
Vote 6 - Community Services Veh Repl:CX2863 - Tractor 285385235065 #N/A Yes OTHER ASSETS General vehicles N/A 285 285 –
Vote 6 - Community Services Walkway 285385235066 #N/A Yes Infrastructure - Road transport Roads, Pavements & Bridges N/A 359 – 359
Vote 6 - Community Services Upgrade Fire Station 285680242044 #N/A Yes OTHER ASSETS Civic Land and Buildings N/A 34 34 –
Vote 6 - Community Services Fire Vehicle - WCPA 285684242046 – Yes Specialised vehicles Fire N/A 1,053 1,053
Vote 6 - Community Services Reconstruct Pump cab&chassis w/subframe 285685242045 #N/A Yes OTHER ASSETS Plant & equipment N/A 824 – 824
Vote 6 - Community Services Repl portable radios 285985250049 #N/A Yes OTHER ASSETS Plant & equipment N/A 50 – 50
Vote 6 - Community Services Hornlee S/Field- Constr clubhouse&Gym 286080255039 #N/A Yes COMMUNITY Sports Fields & stadia N/A 681 111 570
Vote 6 - Community Services Bongani- Upgrade sportsfield 286085255038 #N/A Yes COMMUNITY Sports Fields & stadia N/A 2,301 91 2,210
Vote 6 - Community Services White Location Upgr sportsfield 286085255040 #N/A Yes COMMUNITY Sports Fields & stadia N/A 223 223 –
Vote 3 - Financial Services Upgrade Council Buildings 286280259007 #N/A Yes OTHER ASSETS Other buildings N/A 380 380 –
Vote 3 - Financial Services Program Office Furniture 286285259155 Allocations to other priorities Yes OTHER ASSETS Furniture and other office equipment N/A 130 70 60
Vote 3 - Financial Services Leased Office Machinees 286288259003 #N/A Yes OTHER ASSETS Furniture and other office equipment N/A 181 181 –
Vote 3 - Financial Services Veh Repl:CX23508(motorcycle) 286585260909SO5: To ensure a municipality that is committed to an innovative approach, prudent investment of public funds, good governance, financial viability and optimal institutional transformation that accommodates diversity in service deliveryYes OTHER ASSETS General vehicles N/A 44 44 –
Vote 3 - Financial Services Veh Repl:CX35459(motorcycle) 286585260910SO5: To ensure a municipality that is committed to an innovative approach, prudent investment of public funds, good governance, financial viability and optimal institutional transformation that accommodates diversity in service deliveryYes OTHER ASSETS General vehicles N/A 44 44 –
Vote 3 - Financial Services Veh Repl:CX35496(motorcycle) 286585260911SO5: To ensure a municipality that is committed to an innovative approach, prudent investment of public funds, good governance, financial viability and optimal institutional transformation that accommodates diversity in service deliveryYes OTHER ASSETS General vehicles N/A 44 44 –
Vote 3 - Financial Services Veh Repl Motorbike:CX23506 286585260913 #N/A Yes OTHER ASSETS General vehicles N/A 70 – 70
Vote 3 - Financial Services Veh Repl Motorbike:CX45048 286585260914 #N/A Yes OTHER ASSETS General vehicles N/A 50 – 50
Vote 3 - Financial Services Program Computer Equipment 286685261152 Allocations to other priorities Yes OTHER ASSETS Computers - hardware/equipment N/A 1,870 905 965
Vote 3 - Financial Services Program Small Plant 286685261153 Allocations to other priorities Yes OTHER ASSETS Plant & equipment N/A 200 – 200
Vote 3 - Financial Services Program Tools & Equipment 286685261154 #N/A Yes OTHER ASSETS Plant & equipment N/A 12 – 12
Vote 3 - Financial Services Upgrade Finance Buildings 286785265014 #N/A Yes OTHER ASSETS Civic land and buildings N/A 715 – 715
Vote 3 - Financial Services Program Office Furniture 286785265026 #N/A Yes OTHER ASSETS Furniture and other office equipment N/A 20 – 20
Vote 6 - Community Services Purchase of Wheelie bins 287280269031 #N/A Yes OTHER ASSETS Furniture and other office equipment N/A 389 389 –
Vote 6 - Community Services Veh Repl:CX10222 LDV 287280269044 #N/A Yes OTHER ASSETS General vehicles N/A 1,523 1,523 –
Vote 6 - Community Services Veh Repl:CX41117 LDV 287280269048 #N/A Yes OTHER ASSETS General vehicles N/A 235 235 –
Vote 6 - Community Services Est Waste Facilities - Knysna 287280269049 #N/A Yes INFRASTRUCTURE - OTHER Waste management N/A 8 8 –
Vote 6 - Community Services Purchase of Wheelie bins 287285269031 #N/A Yes INFRASTRUCTURE - OTHER Waste management N/A 400 – 400
Vote 6 - Community Services Veh Repl:CX22775 Tipper Truck 287285269046 #N/A Yes OTHER ASSETS General vehicles N/A 454 454 –
Vote 6 - Community Services Upgrade asset compactor 287285269063 #N/A Yes OTHER ASSETS General vehicles N/A 250 – 250
Vote 6 - Community Services Upgr Transfer Station 287385271005 – Yes OTHER ASSETS Other Buildings N/A 1,000 1,000
Vote 6 - Community Services Upgr Transfer Station 287380271005 #N/A Yes INFRASTRUCTURE - OTHER Waste management N/A 300 – 300
Vote 7 - Electrical Services Prepaid Conversions 287680278057SO1: To promote access for all citizens to equitable, appropriate and sustainable infrastructure and services within a safe environmentYes INFRASTRUCTURE - ELECTRICITY Transmission & Reticulation N/A 20 20 –
Vote 7 - Electrical Services Veh Repl:CX8429(Loan) 287680278141SO1: To promote access for all citizens to equitable, appropriate and sustainable infrastructure and services within a safe environmentYes OTHER ASSETS General vehicles N/A 166 166 –
Vote 7 - Electrical Services 20MVA; 66/11kV Transformer 287682208002 #N/A Yes INFRASTRUCTURE - ELECTRICITY Transmission & Reticulation N/A 7,926 7,926 –
Vote 7 - Electrical Services Upgr Workshop S/S 287682208004 #N/A Yes OTHER ASSETS Other buildings N/A 890 740 150
Vote 7 - Electrical Services Sedgef Island LV Cables 287682208005 #N/A Yes INFRASTRUCTURE - ELECTRICITY Transmission & Reticulation N/A 465 465 –
Vote 7 - Electrical Services Sedgef East S/S Build Upgr 287682208006 #N/A Yes INFRASTRUCTURE - ELECTRICITY Transmission & Reticulation N/A 103 13 90
Vote 7 - Electrical Services 300mm2*3cu Cable Sedge intake-Sedge East 287682208007 #N/A Yes INFRASTRUCTURE - ELECTRICITY Transmission & Reticulation N/A 561 561 –
Vote 7 - Electrical Services Analogue repeaters&radios to digital 287682208008 #N/A Yes OTHER ASSETS Plant & equipment N/A 192 192 –
Vote 7 - Electrical Services Switchgear for the Eastford SS 287682208012 #N/A Yes INFRASTRUCTURE - ELECTRICITY Transmission & Reticulation N/A 220 – 220
Vote 7 - Electrical Services Cables main itake and cemetery sub station 287682208013 #N/A Yes INFRASTRUCTURE - ELECTRICITY Transmission & Reticulation N/A 90 – 90
Vote 7 - Electrical Services Eastford SS 11kv substation building 287682208014 #N/A Yes INFRASTRUCTURE - ELECTRICITY Transmission & Reticulation N/A 110 – 110
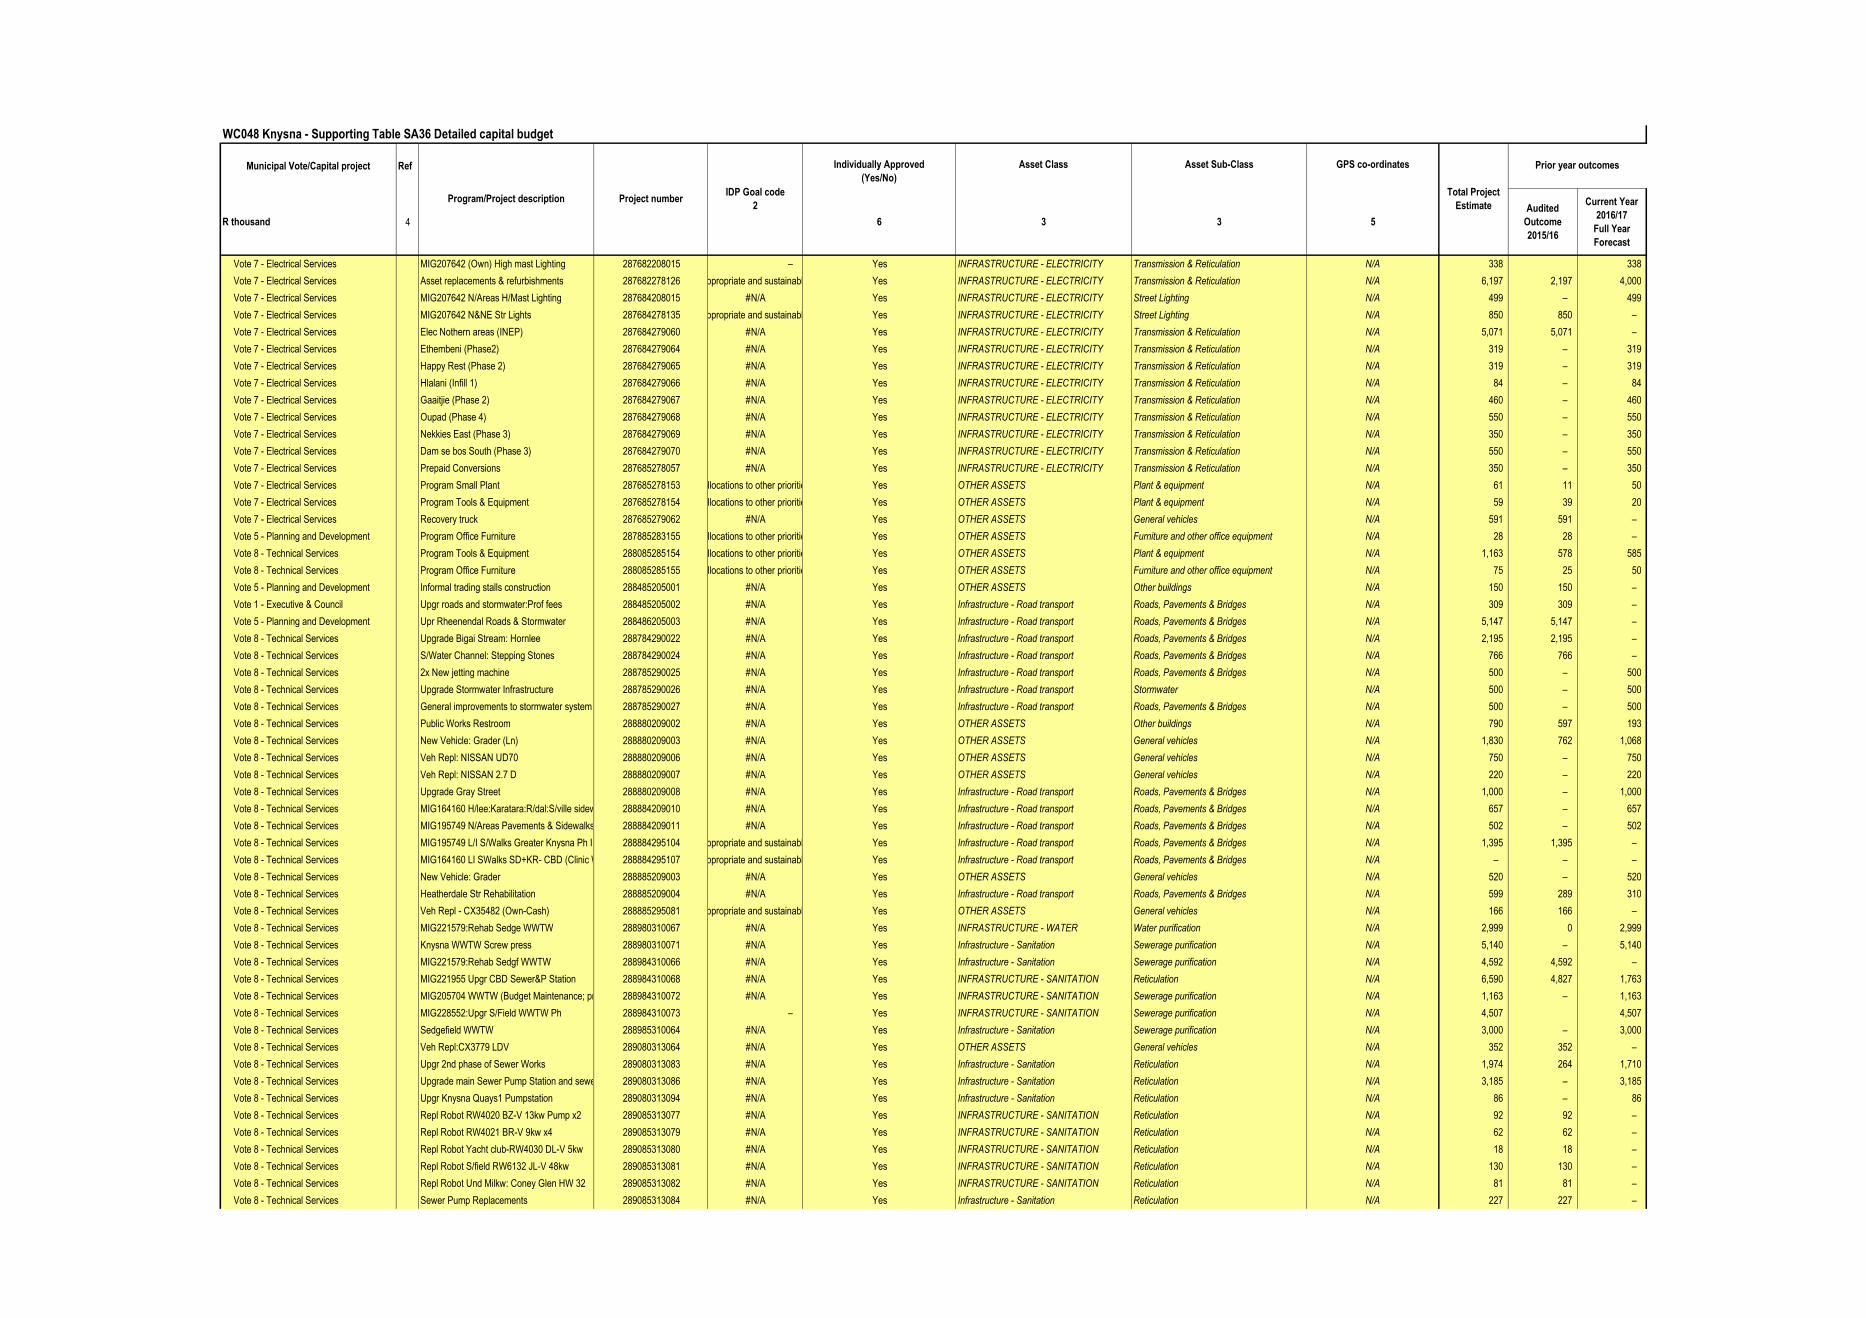
WC048 Knysna - Supporting Table SA36 Detailed capital budget
Municipal Vote/Capital project Ref Individually Approved
(Yes/No)
Asset Class Asset Sub-Class GPS co-ordinates
R thousand 4 6 3 3 5
Audited
Outcome
2015/16
Current Year
2016/17
Full Year
Forecast
Program/Project description Project numberIDP Goal code
2
Prior year outcomes
Total Project
Estimate
Vote 7 - Electrical Services MIG207642 (Own) High mast Lighting 287682208015 – Yes INFRASTRUCTURE - ELECTRICITY Transmission & Reticulation N/A 338 338
Vote 7 - Electrical Services Asset replacements & refurbishments 287682278126SO1: To promote access for all citizens to equitable, appropriate and sustainable infrastructure and services within a safe environmentYes INFRASTRUCTURE - ELECTRICITY Transmission & Reticulation N/A 6,197 2,197 4,000
Vote 7 - Electrical Services MIG207642 N/Areas H/Mast Lighting 287684208015 #N/A Yes INFRASTRUCTURE - ELECTRICITY Street Lighting N/A 499 – 499
Vote 7 - Electrical Services MIG207642 N&NE Str Lights 287684278135SO1: To promote access for all citizens to equitable, appropriate and sustainable infrastructure and services within a safe environmentYes INFRASTRUCTURE - ELECTRICITY Street Lighting N/A 850 850 –
Vote 7 - Electrical Services Elec Nothern areas (INEP) 287684279060 #N/A Yes INFRASTRUCTURE - ELECTRICITY Transmission & Reticulation N/A 5,071 5,071 –
Vote 7 - Electrical Services Ethembeni (Phase2) 287684279064 #N/A Yes INFRASTRUCTURE - ELECTRICITY Transmission & Reticulation N/A 319 – 319
Vote 7 - Electrical Services Happy Rest (Phase 2) 287684279065 #N/A Yes INFRASTRUCTURE - ELECTRICITY Transmission & Reticulation N/A 319 – 319
Vote 7 - Electrical Services Hlalani (Infill 1) 287684279066 #N/A Yes INFRASTRUCTURE - ELECTRICITY Transmission & Reticulation N/A 84 – 84
Vote 7 - Electrical Services Gaaitjie (Phase 2) 287684279067 #N/A Yes INFRASTRUCTURE - ELECTRICITY Transmission & Reticulation N/A 460 – 460
Vote 7 - Electrical Services Oupad (Phase 4) 287684279068 #N/A Yes INFRASTRUCTURE - ELECTRICITY Transmission & Reticulation N/A 550 – 550
Vote 7 - Electrical Services Nekkies East (Phase 3) 287684279069 #N/A Yes INFRASTRUCTURE - ELECTRICITY Transmission & Reticulation N/A 350 – 350
Vote 7 - Electrical Services Dam se bos South (Phase 3) 287684279070 #N/A Yes INFRASTRUCTURE - ELECTRICITY Transmission & Reticulation N/A 550 – 550
Vote 7 - Electrical Services Prepaid Conversions 287685278057 #N/A Yes INFRASTRUCTURE - ELECTRICITY Transmission & Reticulation N/A 350 – 350
Vote 7 - Electrical Services Program Small Plant 287685278153 Allocations to other priorities Yes OTHER ASSETS Plant & equipment N/A 61 11 50
Vote 7 - Electrical Services Program Tools & Equipment 287685278154 Allocations to other priorities Yes OTHER ASSETS Plant & equipment N/A 59 39 20
Vote 7 - Electrical Services Recovery truck 287685279062 #N/A Yes OTHER ASSETS General vehicles N/A 591 591 –
Vote 5 - Planning and Development Program Office Furniture 287885283155 Allocations to other priorities Yes OTHER ASSETS Furniture and other office equipment N/A 28 28 –
Vote 8 - Technical Services Program Tools & Equipment 288085285154 Allocations to other priorities Yes OTHER ASSETS Plant & equipment N/A 1,163 578 585
Vote 8 - Technical Services Program Office Furniture 288085285155 Allocations to other priorities Yes OTHER ASSETS Furniture and other office equipment N/A 75 25 50
Vote 5 - Planning and Development Informal trading stalls construction 288485205001 #N/A Yes OTHER ASSETS Other buildings N/A 150 150 –
Vote 1 - Executive & Council Upgr roads and stormwater:Prof fees 288485205002 #N/A Yes Infrastructure - Road transport Roads, Pavements & Bridges N/A 309 309 –
Vote 5 - Planning and Development Upr Rheenendal Roads & Stormwater 288486205003 #N/A Yes Infrastructure - Road transport Roads, Pavements & Bridges N/A 5,147 5,147 –
Vote 8 - Technical Services Upgrade Bigai Stream: Hornlee 288784290022 #N/A Yes Infrastructure - Road transport Roads, Pavements & Bridges N/A 2,195 2,195 –
Vote 8 - Technical Services S/Water Channel: Stepping Stones 288784290024 #N/A Yes Infrastructure - Road transport Roads, Pavements & Bridges N/A 766 766 –
Vote 8 - Technical Services 2x New jetting machine 288785290025 #N/A Yes Infrastructure - Road transport Roads, Pavements & Bridges N/A 500 – 500
Vote 8 - Technical Services Upgrade Stormwater Infrastructure 288785290026 #N/A Yes Infrastructure - Road transport Stormwater N/A 500 – 500
Vote 8 - Technical Services General improvements to stormwater system 288785290027 #N/A Yes Infrastructure - Road transport Roads, Pavements & Bridges N/A 500 – 500
Vote 8 - Technical Services Public Works Restroom 288880209002 #N/A Yes OTHER ASSETS Other buildings N/A 790 597 193
Vote 8 - Technical Services New Vehicle: Grader (Ln) 288880209003 #N/A Yes OTHER ASSETS General vehicles N/A 1,830 762 1,068
Vote 8 - Technical Services Veh Repl: NISSAN UD70 288880209006 #N/A Yes OTHER ASSETS General vehicles N/A 750 – 750
Vote 8 - Technical Services Veh Repl: NISSAN 2.7 D 288880209007 #N/A Yes OTHER ASSETS General vehicles N/A 220 – 220
Vote 8 - Technical Services Upgrade Gray Street 288880209008 #N/A Yes Infrastructure - Road transport Roads, Pavements & Bridges N/A 1,000 – 1,000
Vote 8 - Technical Services MIG164160 H/lee:Karatara:R/dal:S/ville sidewalks 288884209010 #N/A Yes Infrastructure - Road transport Roads, Pavements & Bridges N/A 657 – 657
Vote 8 - Technical Services MIG195749 N/Areas Pavements & Sidewalks 288884209011 #N/A Yes Infrastructure - Road transport Roads, Pavements & Bridges N/A 502 – 502
Vote 8 - Technical Services MIG195749 L/I S/Walks Greater Knysna Ph III 288884295104SO1: To promote access for all citizens to equitable, appropriate and sustainable infrastructure and services within a safe environmentYes Infrastructure - Road transport Roads, Pavements & Bridges N/A 1,395 1,395 –
Vote 8 - Technical Services MIG164160 LI SWalks SD+KR- CBD (Clinic Walkway)-Sedgf288884295107SO1: To promote access for all citizens to equitable, appropriate and sustainable infrastructure and services within a safe environmentYes Infrastructure - Road transport Roads, Pavements & Bridges N/A – – –
Vote 8 - Technical Services New Vehicle: Grader 288885209003 #N/A Yes OTHER ASSETS General vehicles N/A 520 – 520
Vote 8 - Technical Services Heatherdale Str Rehabilitation 288885209004 #N/A Yes Infrastructure - Road transport Roads, Pavements & Bridges N/A 599 289 310
Vote 8 - Technical Services Veh Repl - CX35482 (Own-Cash) 288885295081SO1: To promote access for all citizens to equitable, appropriate and sustainable infrastructure and services within a safe environmentYes OTHER ASSETS General vehicles N/A 166 166 –
Vote 8 - Technical Services MIG221579:Rehab Sedge WWTW 288980310067 #N/A Yes INFRASTRUCTURE - WATER Water purification N/A 2,999 0 2,999
Vote 8 - Technical Services Knysna WWTW Screw press 288980310071 #N/A Yes Infrastructure - Sanitation Sewerage purification N/A 5,140 – 5,140
Vote 8 - Technical Services MIG221579:Rehab Sedgf WWTW 288984310066 #N/A Yes Infrastructure - Sanitation Sewerage purification N/A 4,592 4,592 –
Vote 8 - Technical Services MIG221955 Upgr CBD Sewer&P Station 288984310068 #N/A Yes INFRASTRUCTURE - SANITATION Reticulation N/A 6,590 4,827 1,763
Vote 8 - Technical Services MIG205704 WWTW (Budget Maintenance; project 178845)288984310072 #N/A Yes INFRASTRUCTURE - SANITATION Sewerage purification N/A 1,163 – 1,163
Vote 8 - Technical Services MIG228552:Upgr S/Field WWTW Ph 288984310073 – Yes INFRASTRUCTURE - SANITATION Sewerage purification N/A 4,507 4,507
Vote 8 - Technical Services Sedgefield WWTW 288985310064 #N/A Yes Infrastructure - Sanitation Sewerage purification N/A 3,000 – 3,000
Vote 8 - Technical Services Veh Repl:CX3779 LDV 289080313064 #N/A Yes OTHER ASSETS General vehicles N/A 352 352 –
Vote 8 - Technical Services Upgr 2nd phase of Sewer Works 289080313083 #N/A Yes Infrastructure - Sanitation Reticulation N/A 1,974 264 1,710
Vote 8 - Technical Services Upgrade main Sewer Pump Station and sewers in the289080313086 #N/A Yes Infrastructure - Sanitation Reticulation N/A 3,185 – 3,185
Vote 8 - Technical Services Upgr Knysna Quays1 Pumpstation 289080313094 #N/A Yes Infrastructure - Sanitation Reticulation N/A 86 – 86
Vote 8 - Technical Services Repl Robot RW4020 BZ-V 13kw Pump x2 289085313077 #N/A Yes INFRASTRUCTURE - SANITATION Reticulation N/A 92 92 –
Vote 8 - Technical Services Repl Robot RW4021 BR-V 9kw x4 289085313079 #N/A Yes INFRASTRUCTURE - SANITATION Reticulation N/A 62 62 –
Vote 8 - Technical Services Repl Robot Yacht club-RW4030 DL-V 5kw 289085313080 #N/A Yes INFRASTRUCTURE - SANITATION Reticulation N/A 18 18 –
Vote 8 - Technical Services Repl Robot S/field RW6132 JL-V 48kw 289085313081 #N/A Yes INFRASTRUCTURE - SANITATION Reticulation N/A 130 130 –
Vote 8 - Technical Services Repl Robot Und Milkw: Coney Glen HW 32 289085313082 #N/A Yes INFRASTRUCTURE - SANITATION Reticulation N/A 81 81 –
Vote 8 - Technical Services Sewer Pump Replacements 289085313084 #N/A Yes Infrastructure - Sanitation Reticulation N/A 227 227 –
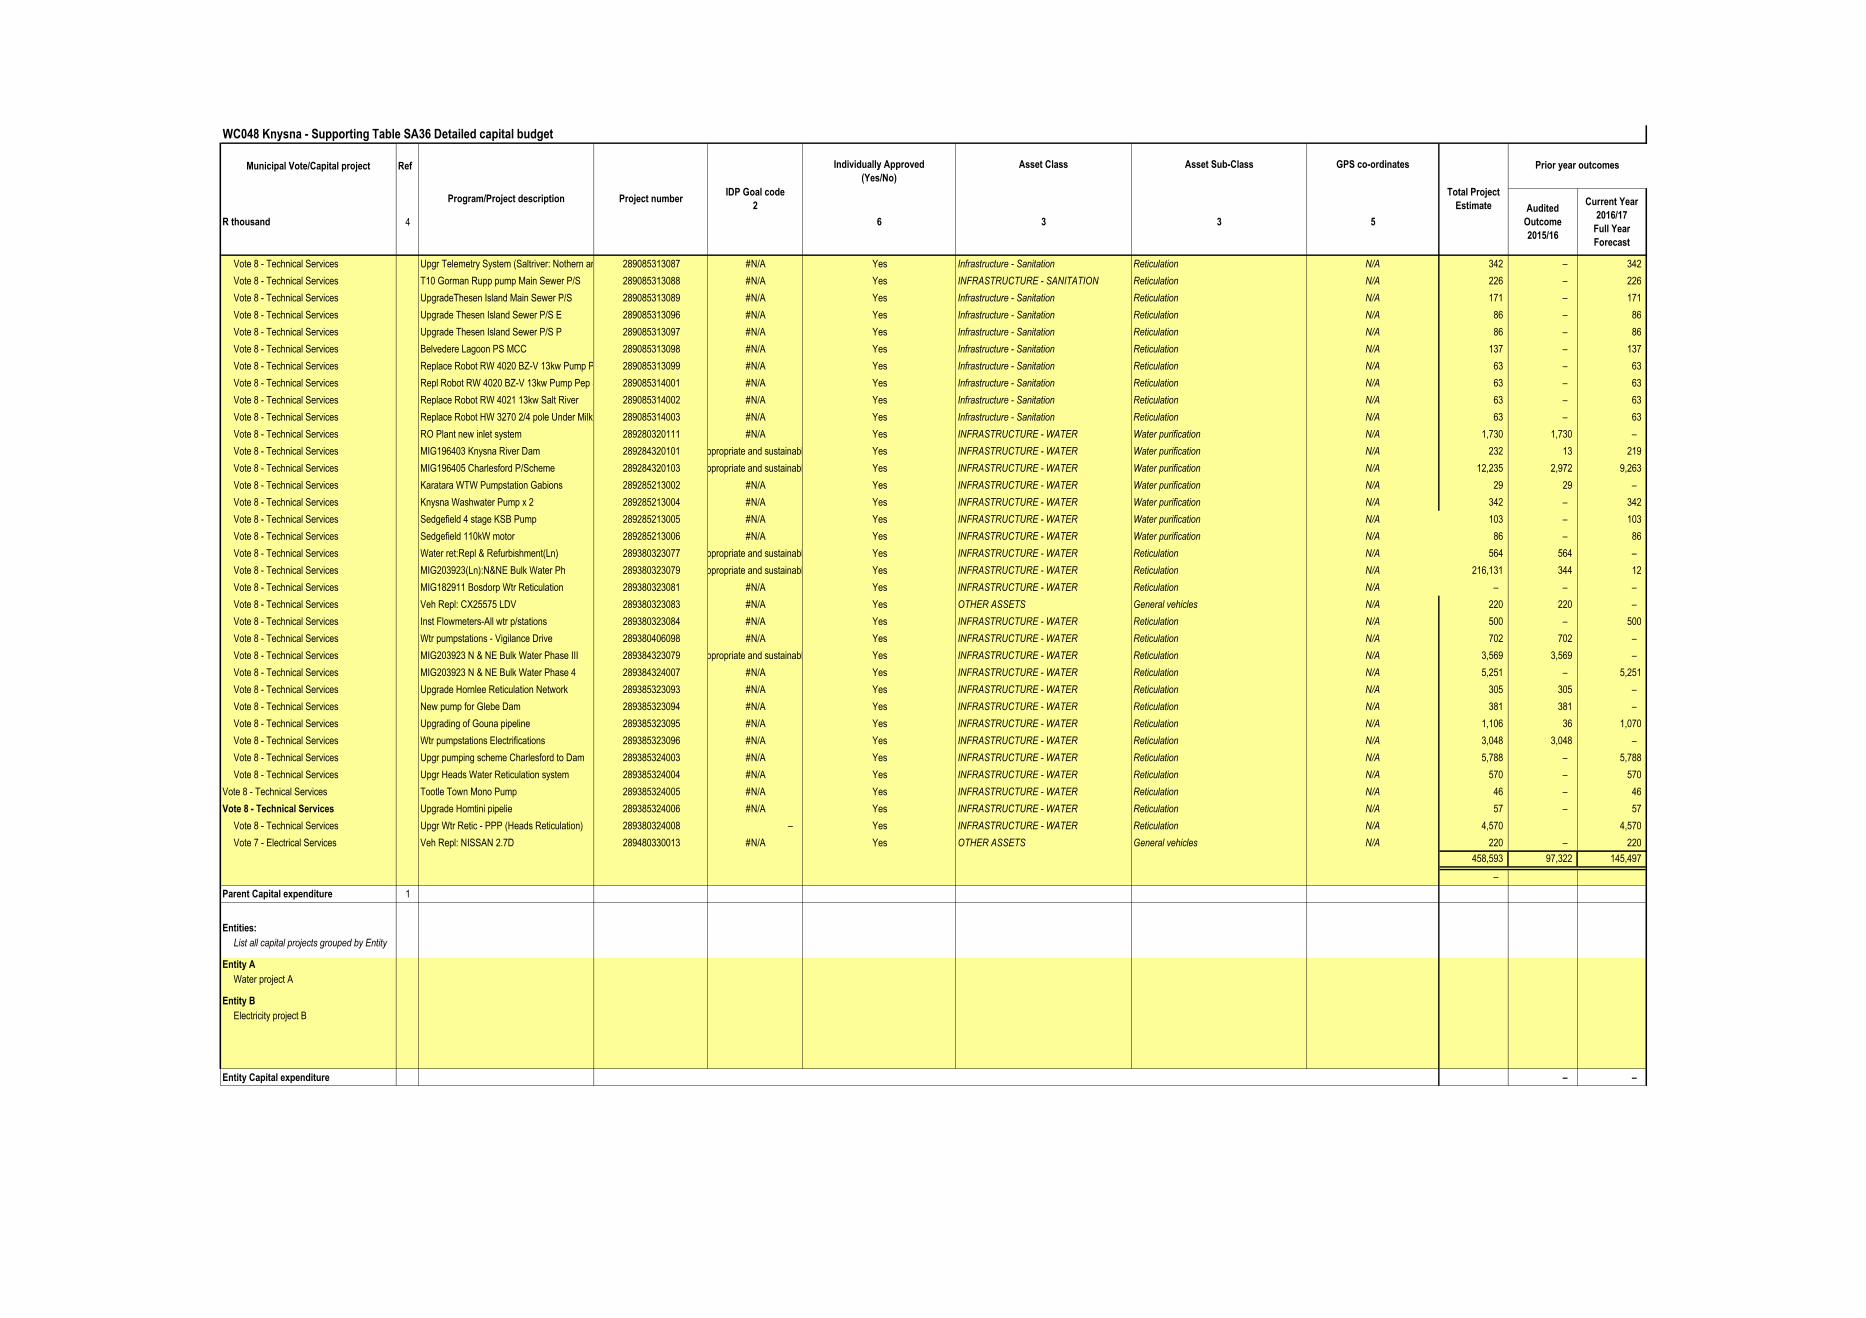
WC048 Knysna - Supporting Table SA36 Detailed capital budget
Municipal Vote/Capital project Ref Individually Approved
(Yes/No)
Asset Class Asset Sub-Class GPS co-ordinates
R thousand 4 6 3 3 5
Audited
Outcome
2015/16
Current Year
2016/17
Full Year
Forecast
Program/Project description Project numberIDP Goal code
2
Prior year outcomes
Total Project
Estimate
Vote 8 - Technical Services Upgr Telemetry System (Saltriver: Nothern area PS7:289085313087 #N/A Yes Infrastructure - Sanitation Reticulation N/A 342 – 342
Vote 8 - Technical Services T10 Gorman Rupp pump Main Sewer P/S 289085313088 #N/A Yes INFRASTRUCTURE - SANITATION Reticulation N/A 226 – 226
Vote 8 - Technical Services UpgradeThesen Island Main Sewer P/S 289085313089 #N/A Yes Infrastructure - Sanitation Reticulation N/A 171 – 171
Vote 8 - Technical Services Upgrade Thesen Island Sewer P/S E 289085313096 #N/A Yes Infrastructure - Sanitation Reticulation N/A 86 – 86
Vote 8 - Technical Services Upgrade Thesen Island Sewer P/S P 289085313097 #N/A Yes Infrastructure - Sanitation Reticulation N/A 86 – 86
Vote 8 - Technical Services Belvedere Lagoon PS MCC 289085313098 #N/A Yes Infrastructure - Sanitation Reticulation N/A 137 – 137
Vote 8 - Technical Services Replace Robot RW 4020 BZ-V 13kw Pump Pep Stores Jood se Kamp289085313099 #N/A Yes Infrastructure - Sanitation Reticulation N/A 63 – 63
Vote 8 - Technical Services Repl Robot RW 4020 BZ-V 13kw Pump Pep Stores Jood se Kamp289085314001 #N/A Yes Infrastructure - Sanitation Reticulation N/A 63 – 63
Vote 8 - Technical Services Replace Robot RW 4021 13kw Salt River 289085314002 #N/A Yes Infrastructure - Sanitation Reticulation N/A 63 – 63
Vote 8 - Technical Services Replace Robot HW 3270 2/4 pole Under Milkwood: Coney Glen289085314003 #N/A Yes Infrastructure - Sanitation Reticulation N/A 63 – 63
Vote 8 - Technical Services RO Plant new inlet system 289280320111 #N/A Yes INFRASTRUCTURE - WATER Water purification N/A 1,730 1,730 –
Vote 8 - Technical Services MIG196403 Knysna River Dam 289284320101SO1: To promote access for all citizens to equitable, appropriate and sustainable infrastructure and services within a safe environmentYes INFRASTRUCTURE - WATER Water purification N/A 232 13 219
Vote 8 - Technical Services MIG196405 Charlesford P/Scheme 289284320103SO1: To promote access for all citizens to equitable, appropriate and sustainable infrastructure and services within a safe environmentYes INFRASTRUCTURE - WATER Water purification N/A 12,235 2,972 9,263
Vote 8 - Technical Services Karatara WTW Pumpstation Gabions 289285213002 #N/A Yes INFRASTRUCTURE - WATER Water purification N/A 29 29 –
Vote 8 - Technical Services Knysna Washwater Pump x 2 289285213004 #N/A Yes INFRASTRUCTURE - WATER Water purification N/A 342 – 342
Vote 8 - Technical Services Sedgefield 4 stage KSB Pump 289285213005 #N/A Yes INFRASTRUCTURE - WATER Water purification N/A 103 – 103
Vote 8 - Technical Services Sedgefield 110kW motor 289285213006 #N/A Yes INFRASTRUCTURE - WATER Water purification N/A 86 – 86
Vote 8 - Technical Services Water ret:Repl & Refurbishment(Ln) 289380323077SO1: To promote access for all citizens to equitable, appropriate and sustainable infrastructure and services within a safe environmentYes INFRASTRUCTURE - WATER Reticulation N/A 564 564 –
Vote 8 - Technical Services MIG203923(Ln):N&NE Bulk Water Ph 289380323079SO1: To promote access for all citizens to equitable, appropriate and sustainable infrastructure and services within a safe environmentYes INFRASTRUCTURE - WATER Reticulation N/A 216,131 344 12
Vote 8 - Technical Services MIG182911 Bosdorp Wtr Reticulation 289380323081 #N/A Yes INFRASTRUCTURE - WATER Reticulation N/A – – –
Vote 8 - Technical Services Veh Repl: CX25575 LDV 289380323083 #N/A Yes OTHER ASSETS General vehicles N/A 220 220 –
Vote 8 - Technical Services Inst Flowmeters-All wtr p/stations 289380323084 #N/A Yes INFRASTRUCTURE - WATER Reticulation N/A 500 – 500
Vote 8 - Technical Services Wtr pumpstations - Vigilance Drive 289380406098 #N/A Yes INFRASTRUCTURE - WATER Reticulation N/A 702 702 –
Vote 8 - Technical Services MIG203923 N & NE Bulk Water Phase III 289384323079SO1: To promote access for all citizens to equitable, appropriate and sustainable infrastructure and services within a safe environmentYes INFRASTRUCTURE - WATER Reticulation N/A 3,569 3,569 –
Vote 8 - Technical Services MIG203923 N & NE Bulk Water Phase 4 289384324007 #N/A Yes INFRASTRUCTURE - WATER Reticulation N/A 5,251 – 5,251
Vote 8 - Technical Services Upgrade Hornlee Reticulation Network 289385323093 #N/A Yes INFRASTRUCTURE - WATER Reticulation N/A 305 305 –
Vote 8 - Technical Services New pump for Glebe Dam 289385323094 #N/A Yes INFRASTRUCTURE - WATER Reticulation N/A 381 381 –
Vote 8 - Technical Services Upgrading of Gouna pipeline 289385323095 #N/A Yes INFRASTRUCTURE - WATER Reticulation N/A 1,106 36 1,070
Vote 8 - Technical Services Wtr pumpstations Electrifications 289385323096 #N/A Yes INFRASTRUCTURE - WATER Reticulation N/A 3,048 3,048 –
Vote 8 - Technical Services Upgr pumping scheme Charlesford to Dam 289385324003 #N/A Yes INFRASTRUCTURE - WATER Reticulation N/A 5,788 – 5,788
Vote 8 - Technical Services Upgr Heads Water Reticulation system 289385324004 #N/A Yes INFRASTRUCTURE - WATER Reticulation N/A 570 – 570
Vote 8 - Technical Services Tootle Town Mono Pump 289385324005 #N/A Yes INFRASTRUCTURE - WATER Reticulation N/A 46 – 46
Vote 8 - Technical Services Upgrade Homtini pipelie 289385324006 #N/A Yes INFRASTRUCTURE - WATER Reticulation N/A 57 – 57
Vote 8 - Technical Services Upgr Wtr Retic - PPP (Heads Reticulation) 289380324008 – Yes INFRASTRUCTURE - WATER Reticulation N/A 4,570 4,570
Vote 7 - Electrical Services Veh Repl: NISSAN 2.7D 289480330013 #N/A Yes OTHER ASSETS General vehicles N/A 220 – 220
458,593 97,322 145,497
–
Parent Capital expenditure 1
Entities:
List all capital projects grouped by Entity
Entity A
Water project A
Entity B
Electricity project B
Entity Capital expenditure – –
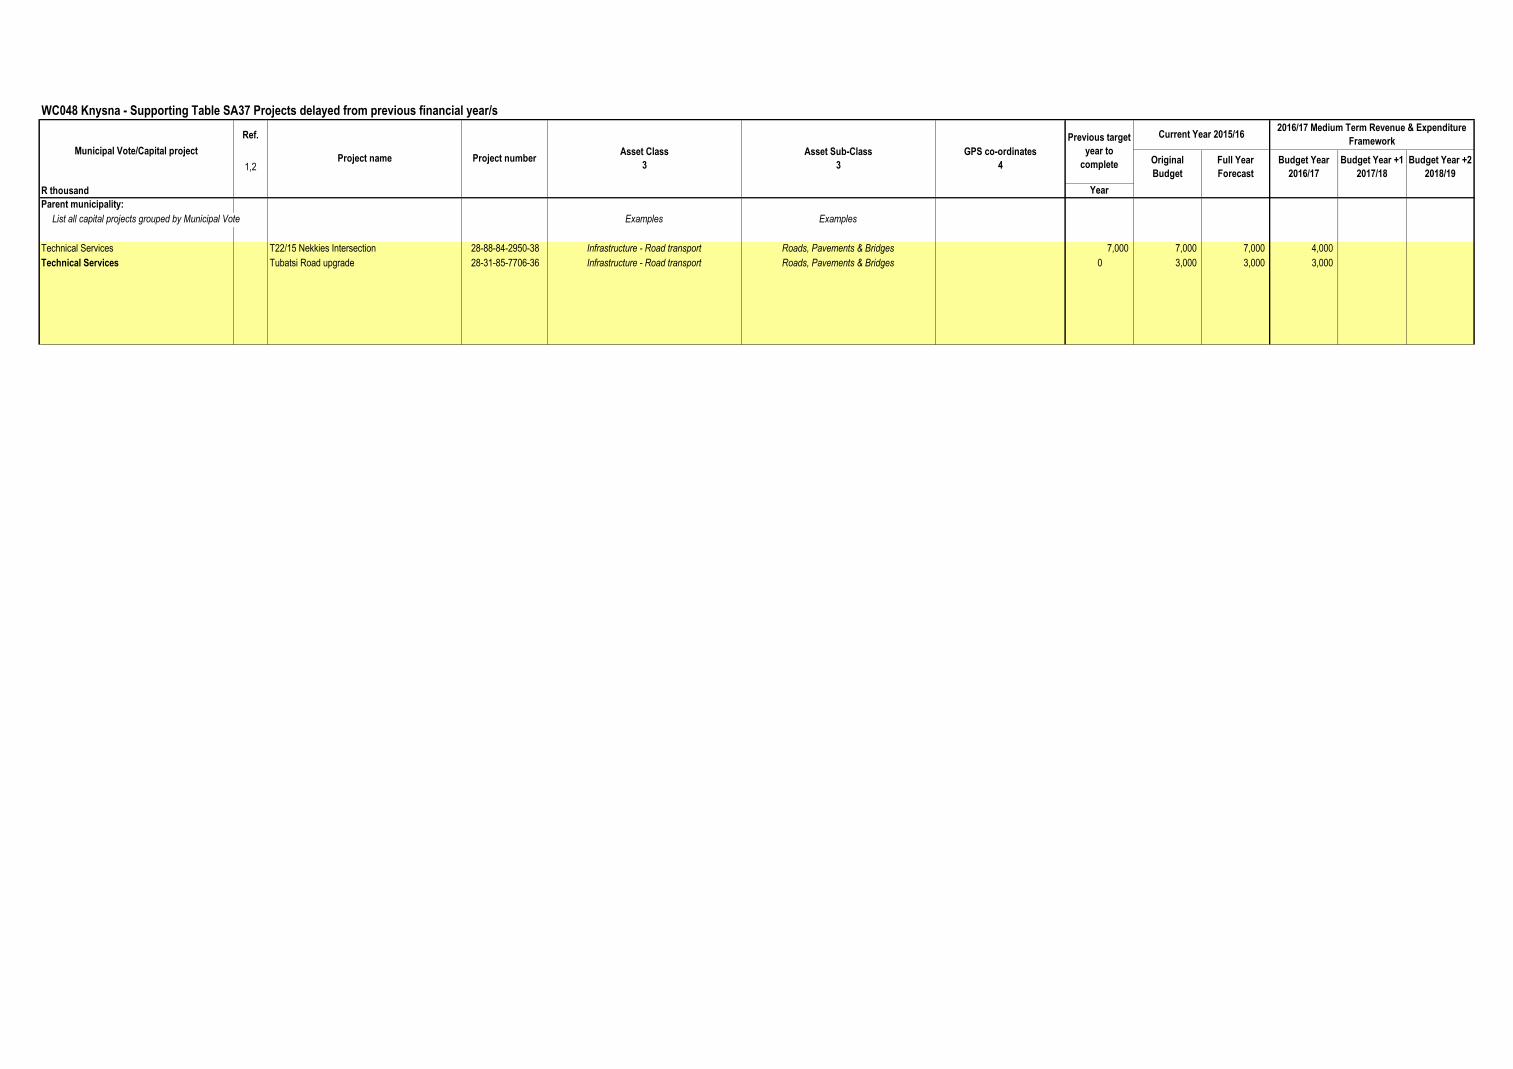
WC048 Knysna - Supporting Table SA37 Projects delayed from previous financial year/s
Ref.
1,2Original
Budget
Full Year
Forecast
Budget Year
2016/17
Budget Year +1
2017/18
Budget Year +2
2018/19
R thousand Year
Parent municipality:
List all capital projects grouped by Municipal Vote Examples Examples
Technical Services T22/15 Nekkies Intersection 28-88-84-2950-38 Infrastructure - Road transport Roads, Pavements & Bridges 7,000 7,000 7,000 4,000
Technical Services Tubatsi Road upgrade 28-31-85-7706-36 Infrastructure - Road transport Roads, Pavements & Bridges 0 3,000 3,000 3,000
Municipal Vote/Capital project
Previous target
year to
complete
Current Year 2015/162016/17 Medium Term Revenue & Expenditure
Framework
Project name Project numberAsset Sub-Class
3
Asset Class
3
GPS co-ordinates
4