
Cone Penetration Testing in Geotechnical Practice - Taylor ...
Upload
independentCategory
view
2download
0
ORIGINAL PAPER
ANN prediction of some geotechnical properties of soilfrom their index parameters
Parichehr Tizpa & Reza Jamshidi Chenari &Mehran Karimpour Fard & Sandro Lemos Machado
Received: 30 September 2013 /Accepted: 22 January 2014# Saudi Society for Geosciences 2014
Abstract This paper presents artificial neural network pre-diction models which relate compaction characteristics, per-meability, and soil shear strength to soil index properties. Inthis study, a database including a total number of 580 data setswas compiled. The database contains the results of grain sizedistribution, Atterberg limits, compaction, permeability mea-sured at different levels of compaction degree (90–100%) andconsolidated–drained triaxial compression tests. Comparisonbetween the results of the developed models and experimentaldata indicates that predictions are within a confidence intervalof 95 %. To evaluate the effect of each factor on thesegeotechnical parameters, sensitivity analysis was performedand discussed. According to the performed sensitivity analy-sis, Atterbeg limits and the soil fine content (silt+clay) are themost important variables in predicting the maximum drydensity and optimum moisture content. Another aspect thatis coherent from the sensitivity analysis is the considerableimportance of the compaction degree in the prediction of thepermeability coefficient. However, it can be seen that effectivefriction angle of shearing is highly dependent on the bulkdensity of soil.
Keywords Artificial neural network . Compactioncharacteristics . Permeability . Soil shear strength . Sensitivityanalysis
Introduction
Permeability and shear strength are two vital parameters need-ed for almost all geotechnical designs. These two parametersare governed by the degree of compaction. During the com-paction process, the shear strength of soil increases and per-meability decreases due to the reduction in the void ratio.Moreover, the shear strength of soils decreases with increasingwater content. In some cases, shear strength and hydraulicconductivity requirements should be addressed simultaneous-ly, which means they should be achieved at the peak point ofcompaction curve of soil. Thus, both the maximum dry den-sity (MDD) and optimum moisture content (OMC) are essen-tial data for earthwork projects. Since laboratory tests fordetermining permeability, maximum dry density, optimummoisture content, and shear strength are time-consuming, itis desirable to develop models to predict compacted soilcharacteristics based on the classification properties soils.Many attempts have been made to relate these key parametersto the physical properties of soils. The physical propertiesused generally include grain size distribution, specific gravity,and plasticity characteristics (liquid limit, plastic limit, shrink-age limit, and plasticity index).
Rowan and Graham (1948), Davidson and Gardiner(1949), Turnball (1948), Jumikis (1946), Ring et al. (1962),Ramiah et al. (1970), Nagaraj (1994), etc., are among theresearchers who tried to relate the compaction characteristicsof soils to their index properties.
The permeability of soils depends greatly on soil structure,void ratio, soil density, water content, degree of saturation, andthe type of permeant which the soil is exposed to. Variousrelationships between the permeability and grain size distri-bution of the soil have been reported, such as those of Hazen(1911), Zunker (1930), Carman (1937), Burmister (1954),Michaels and Lin (1954), Olsen (1962), and Mitchell et al.(1965). Wang and Huang (1984), using a data bank including
P. Tizpa :R. Jamshidi Chenari :M. Karimpour Fard (*)Department of Civil Engineering, Faculty of Engineering,University of Guilan, P.O. Box 1841, Rasht, Irane-mail: [email protected]
R. Jamshidi Chenarie-mail: [email protected]
S. Lemos MachadoDepartment ofMaterials Science and Technology, Federal Universityof Bahia, 02 Aristides Novis St., Salvador 40210-630, BA, Brazile-mail: [email protected]
Arab J GeosciDOI 10.1007/s12517-014-1304-3
57 synthetic soils, developed several regression equations tocorrelate the compaction characteristics and permeability withthe soil’s index properties. Koltermann and Gorelick (1995),Boadu (2000), Chapuis (2004), Sinha and Wang (2008), and,more recently, Cote et al. (2011) developed different numeri-cal and analytical models to estimate the hydraulic conductiv-ity of soils based on their index parameters.
In recent years, some efforts have been made to develop acorrelation between the effective friction angle and the basicproperties of soil. Kayadelen et al. (2009) used artificial neuralnetwork (ANN), genetic programming (GP), and adaptiveneuro-fuzzy methods to predict the φ′ value of soils.Mousavi et al. (2011) used GP and orthogonal least squaresalgorithm to present a correlation between the internal frictionangle and the physical properties of soils such as the fine andcoarse content, density, and liquid limit. Sezer (2013)employed nonlinear multiple regression, neuro-fuzzy, andANN methods to predict this soil parameter.
Materials and methods
Database
A database including a total number of 580 data sets wascompiled, in which 155 data sets were used for modeling the
permeability, 320 data sets for modelingMDD and OMC, and105 cases for modeling effective friction angle of shearing.Different types of soils were used in these tests; therefore, theresults of this research could be valid for all types of soils.
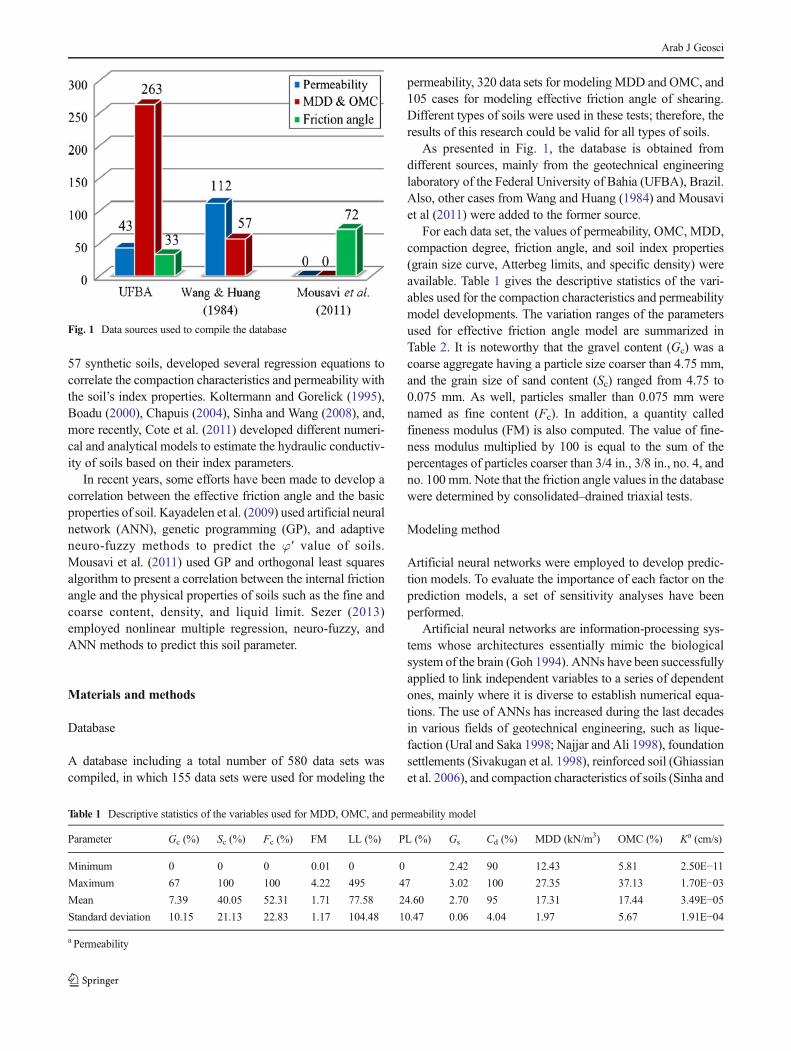
As presented in Fig. 1, the database is obtained fromdifferent sources, mainly from the geotechnical engineeringlaboratory of the Federal University of Bahia (UFBA), Brazil.Also, other cases from Wang and Huang (1984) and Mousaviet al (2011) were added to the former source.
For each data set, the values of permeability, OMC, MDD,compaction degree, friction angle, and soil index properties(grain size curve, Atterbeg limits, and specific density) wereavailable. Table 1 gives the descriptive statistics of the vari-ables used for the compaction characteristics and permeabilitymodel developments. The variation ranges of the parametersused for effective friction angle model are summarized inTable 2. It is noteworthy that the gravel content (Gc) was acoarse aggregate having a particle size coarser than 4.75 mm,and the grain size of sand content (Sc) ranged from 4.75 to0.075 mm. As well, particles smaller than 0.075 mm werenamed as fine content (Fc). In addition, a quantity calledfineness modulus (FM) is also computed. The value of fine-ness modulus multiplied by 100 is equal to the sum of thepercentages of particles coarser than 3/4 in., 3/8 in., no. 4, andno. 100 mm. Note that the friction angle values in the databasewere determined by consolidated–drained triaxial tests.
Modeling method
Artificial neural networks were employed to develop predic-tion models. To evaluate the importance of each factor on theprediction models, a set of sensitivity analyses have beenperformed.
Artificial neural networks are information-processing sys-tems whose architectures essentially mimic the biologicalsystem of the brain (Goh 1994). ANNs have been successfullyapplied to link independent variables to a series of dependentones, mainly where it is diverse to establish numerical equa-tions. The use of ANNs has increased during the last decadesin various fields of geotechnical engineering, such as lique-faction (Ural and Saka 1998; Najjar and Ali 1998), foundationsettlements (Sivakugan et al. 1998), reinforced soil (Ghiassianet al. 2006), and compaction characteristics of soils (Sinha and
Fig. 1 Data sources used to compile the database
Table 1 Descriptive statistics of the variables used for MDD, OMC, and permeability model
Parameter Gc (%) Sc (%) Fc (%) FM LL (%) PL (%) Gs Cd (%) MDD (kN/m3) OMC (%) Ka (cm/s)
Minimum 0 0 0 0.01 0 0 2.42 90 12.43 5.81 2.50E−11Maximum 67 100 100 4.22 495 47 3.02 100 27.35 37.13 1.70E−03Mean 7.39 40.05 52.31 1.71 77.58 24.60 2.70 95 17.31 17.44 3.49E−05Standard deviation 10.15 21.13 22.83 1.17 104.48 10.47 0.06 4.04 1.97 5.67 1.91E−04
a Permeability
Arab J Geosci

Wang 2008; Gunaydın 2009). In this study, a multilayerperceptron network has been utilized to present the predictionmodels.
A multilayer perceptron (MLP) is a feed-forward artificialneural network model that maps sets of input data onto a set ofappropriate outputs. MLP utilizes a supervised learning tech-nique called back-propagation for training the network. In theapplication of MLP, data are categorized as input layer, outputlayer, and one or more hidden layers. The input patterns arefed to the network for feed-forward computations to calculateoutput patterns. The output patterns are compared with corre-sponding output patterns and the summation of the square ofthe errors is calculated. The errors are then back-propagatedthrough the network using the gradient-descent rule to modifythe weights and minimize the summed squared errors.Figure 2 illustrates the typical ANN structure and the relationbetween the input and output parameters.
In this study, a MLP network consisting of three hid-den layers with nine, ten, and one neurons for the first,second, and third hidden layers, respectively, has beenused. The number of neurons in the hidden layer was deter-mined by training several networks with different numbers ofhidden neurons and comparing the predicted results with thedesired output.
Since the manner in which the database is used in thetraining and testing sets has a significant effect on the results,the database was divided into several combinations of trainingand testing sets until a robust representation of the wholepopulation was achieved. To select an optimal combinationof training and testing sets, a statistical analysis consideringthe maximum, minimum, mean, and standard deviation wasperformed on the input and output parameters. The aim of theanalysis was to ensure that the statistical properties of the datain each of the subsets were as close to each other as possibleand therefore represented the same statistical population(Rezania et al. 2008).
Sensitivity analysis concerns the mathematical model rep-resentation of a physical system and attempts to evaluate the
Table 2 Descriptive statistics of the variables used for effective frictionangle model
Parameter Cc
(%)Fc
(%)γ(kN/m3)
LL(%)
Shearing rate(mm/min)
φ (deg)
Minimum 1 15 14.11 1 0.024 19
Maximum 85 99 21.54 105 0.350 35.27
Mean 38.37 63.16 17.64 45.34 0.240 27.49
Standarddeviation
21.54 21.08 1.52 18.75 0.142 3.26
Fig. 2 Typical structure of ANN
Fig. 3 Comparison between the predicted values of MDD and the actualdata
Arab J Geosci

sensitivity of the output patterns to variations of inputpatterns. The main issues in designing methods for regres-sion sensitivity analysis are the choice of perturbationscheme and the way to assess and measure any influence.An appropriate method for perturbation is to delete obser-vations individually or in groups. This approach is knownas case deletion and aims to assess the influence of an obser-vation on the final results.
In this research, the type of sensitivity analysis was ANN-based. At the first step, a MLP network was trained in the caseof each parameter with all data. In the trained network, eachneuron in a specific layer is connected to other neurons viaweighted connections in which scalar weights show thestrength of the connections. In the second step, one of theinputs is removed from the ANN model by setting its scalarweight to zero and then an output is achieved. In this way, allthe weighted connections between this variable and othervariables will be dropped from the model; therefore, the effectof the removed input on the prediction of outputs could bepictured.Fig. 4 Comparison between the predicted values of OMC and the actual
data
Fig. 5 Comparison of the ANN results on MDD model by excluding each parameter
Arab J Geosci

Evaluation method
Different statistical approaches were used to evaluate the perfor-mance of the prediction model. These parameters were coeffi-cient of determination (COD), root mean squared error (RMSE),and coefficient of residual mass (CRM). The following equa-tions are the mathematical expressions of these parameters.
COD ¼ 1 −
Xn
i¼1Mi−Pið Þ
Xn
i¼1M 1−M
ð1Þ
RMSE ¼ffiffiffiffiffiffiffiffiffiffiffiffiffiffiffiffiffiffiffiffiffiffiffiffiffiffiffiffiffiffiffiXn
i¼1Pi−Mið Þ2n
s
� 100 ð2Þ
Fig. 6 Comparison of the ANN results on OMC model by excluding each parameter
Table 3 Summary of the ANN’s performance
Outputs Statistics Total Ex. w1a (Gc) Ex. w2 (Sc) Ex. w3 (Fc) Ex. w4 (Gs) Ex. w5 (LL) Ex. w6 (PL)
MDD COD 0.92 0.57 0.57 0.67 0.64 0.74 0.42
RMSE 54.42 128.23 184.29 390.94 162.58 387.32 235.57
CRM 1.50E−04 3.30E−02 8.40E−02 2.1E−01 −1.40E−02 2.10E−01 −8.70E−02OMC COD 0.92 0.84 0.83 0.83 0.85 0.61 0.65
RMSE 199.11 236.89 245.06 246.76 223.39 373.11 355.93
CRM 4.92E−05 1.40E−04 6.80E−05 1.30E−03 −8.70E−05 4.50E−04 5.90E−04
Ex. excludinga Scalar weights
Arab J Geosci
CRM ¼ 1 −
Xn
i¼1Pið Þ
Xn
i¼1Mið Þ
ð3Þ
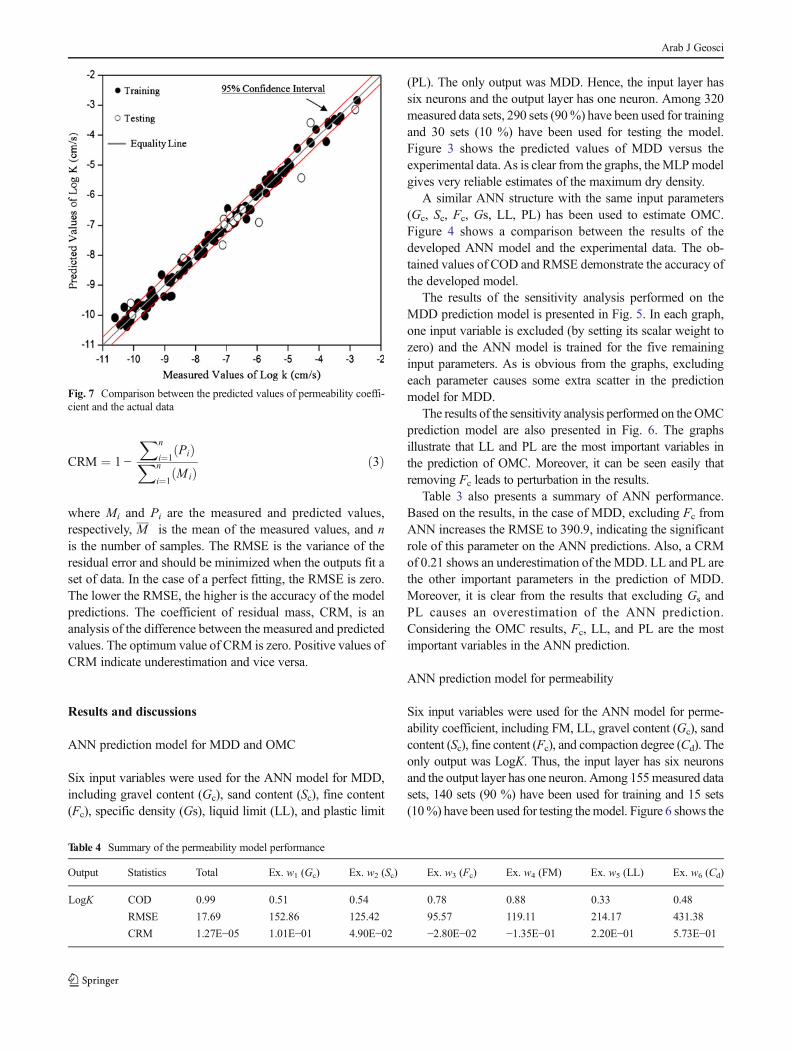
where Mi and Pi are the measured and predicted values,respectively, M is the mean of the measured values, and nis the number of samples. The RMSE is the variance of theresidual error and should be minimized when the outputs fit aset of data. In the case of a perfect fitting, the RMSE is zero.The lower the RMSE, the higher is the accuracy of the modelpredictions. The coefficient of residual mass, CRM, is ananalysis of the difference between the measured and predictedvalues. The optimum value of CRM is zero. Positive values ofCRM indicate underestimation and vice versa.
Results and discussions
ANN prediction model for MDD and OMC
Six input variables were used for the ANN model for MDD,including gravel content (Gc), sand content (Sc), fine content(Fc), specific density (Gs), liquid limit (LL), and plastic limit
(PL). The only output was MDD. Hence, the input layer hassix neurons and the output layer has one neuron. Among 320measured data sets, 290 sets (90%) have been used for trainingand 30 sets (10 %) have been used for testing the model.Figure 3 shows the predicted values of MDD versus theexperimental data. As is clear from the graphs, theMLPmodelgives very reliable estimates of the maximum dry density.
A similar ANN structure with the same input parameters(Gc, Sc, Fc, Gs, LL, PL) has been used to estimate OMC.Figure 4 shows a comparison between the results of thedeveloped ANN model and the experimental data. The ob-tained values of COD and RMSE demonstrate the accuracy ofthe developed model.
The results of the sensitivity analysis performed on theMDD prediction model is presented in Fig. 5. In each graph,one input variable is excluded (by setting its scalar weight tozero) and the ANN model is trained for the five remaininginput parameters. As is obvious from the graphs, excludingeach parameter causes some extra scatter in the predictionmodel for MDD.
The results of the sensitivity analysis performed on theOMCprediction model are also presented in Fig. 6. The graphsillustrate that LL and PL are the most important variables inthe prediction of OMC. Moreover, it can be seen easily thatremoving Fc leads to perturbation in the results.
Table 3 also presents a summary of ANN performance.Based on the results, in the case of MDD, excluding Fc fromANN increases the RMSE to 390.9, indicating the significantrole of this parameter on the ANN predictions. Also, a CRMof 0.21 shows an underestimation of the MDD. LL and PL arethe other important parameters in the prediction of MDD.Moreover, it is clear from the results that excluding Gs andPL causes an overestimation of the ANN prediction.Considering the OMC results, Fc, LL, and PL are the mostimportant variables in the ANN prediction.
ANN prediction model for permeability
Six input variables were used for the ANN model for perme-ability coefficient, including FM, LL, gravel content (Gc), sandcontent (Sc), fine content (Fc), and compaction degree (Cd). Theonly output was LogK. Thus, the input layer has six neuronsand the output layer has one neuron. Among 155measured datasets, 140 sets (90 %) have been used for training and 15 sets(10%) have been used for testing themodel. Figure 6 shows the
Fig. 7 Comparison between the predicted values of permeability coeffi-cient and the actual data
Table 4 Summary of the permeability model performance
Output Statistics Total Ex. w1 (Gc) Ex. w2 (Sc) Ex. w3 (Fc) Ex. w4 (FM) Ex. w5 (LL) Ex. w6 (Cd)
LogK COD 0.99 0.51 0.54 0.78 0.88 0.33 0.48
RMSE 17.69 152.86 125.42 95.57 119.11 214.17 431.38
CRM 1.27E−05 1.01E−01 4.90E−02 −2.80E−02 −1.35E−01 2.20E−01 5.73E−01
Arab J Geosci

predicted values of LogK versus the experimental data. Figure 7shows an almost perfect prediction of hydraulic conductivitybased on the employed index parameters; however, in thetesting cases, the predictions exhibit a higher scatter.
Table 4 and Fig. 8 illustrate the results of the sensitivityanalysis performed on the permeability prediction model. Inaccordance with Table 4, removing Cd increases the RMSE to431.4, which indicates that the compaction degree is of greatimportance in predicting the permeability of soils. In this case,the obtained value for CRM shows an overestimation ofpermeability. As is clear from the results, Gc, Sc, and LL arethe other important variables in the ANN prediction model.Another aspect that is obvious from the results is that exclud-ing Fc and FM causes an underestimation of the ANN model.
As mentioned above, the degree of compaction has thehighest effect on the prediction of permeability coefficient. Itis well known that the volume of voids decreases due to anincrease in the degree of compaction, which causes the per-meability of a soil to decrease. Boynton and Daniel (1985)
conducted hydraulic conductivity tests on compacted clays.They plotted the variation of permeability at different densities(Fig. 9). As could be seen, for the same soil, permeabilitycould be changed almost in one order of magnitude. Ahangar-Asr et al. (2011) have presented the same results for the effectsof compaction degree on the permeability of soils. The resultsof their parametric analysis show a decreasing trend for per-meability by increasing the degree of compaction. In addition,Mesri and Olson (1971), by comparing the permeability ofdifferent type of clays, stated that the size and arrangement ofparticles have a significant effect on the permeability coeffi-cient. According to their studies, decreasing the void ratio,which is a result of increasing the compaction degree, willcause the permeability of soils to decline.
ANN prediction model for effective friction angle
Five input variables were used for the ANN model for effec-tive friction angle of shearing, including coarse content (Cc),
Fig. 8 Comparison of the ANN results on permeability model by excluding each parameter
Arab J Geosci
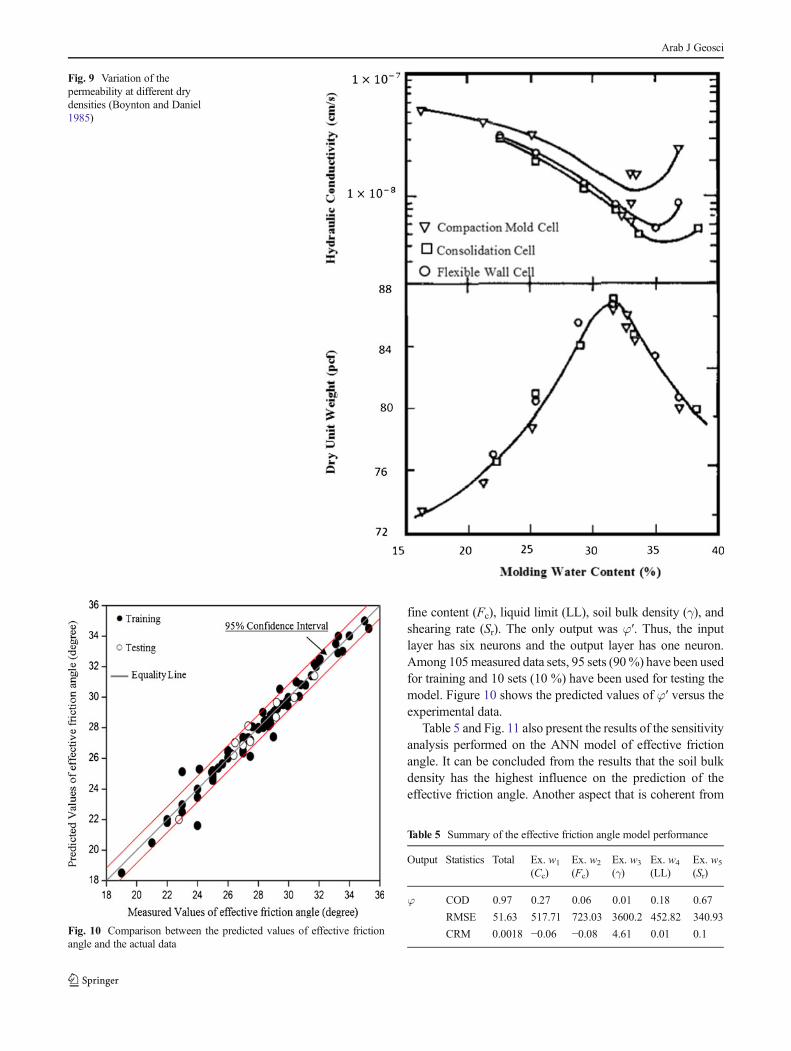
fine content (Fc), liquid limit (LL), soil bulk density (γ), andshearing rate (Sr). The only output was φ′. Thus, the inputlayer has six neurons and the output layer has one neuron.Among 105measured data sets, 95 sets (90%) have been usedfor training and 10 sets (10 %) have been used for testing themodel. Figure 10 shows the predicted values of φ′ versus theexperimental data.
Table 5 and Fig. 11 also present the results of the sensitivityanalysis performed on the ANN model of effective frictionangle. It can be concluded from the results that the soil bulkdensity has the highest influence on the prediction of theeffective friction angle. Another aspect that is coherent from
Fig. 9 Variation of thepermeability at different drydensities (Boynton and Daniel1985)
Fig. 10 Comparison between the predicted values of effective frictionangle and the actual data
Table 5 Summary of the effective friction angle model performance
Output Statistics Total Ex. w1
(Cc)Ex. w2
(Fc)Ex. w3
(γ)Ex. w4
(LL)Ex. w5
(Sr)
φ COD 0.97 0.27 0.06 0.01 0.18 0.67
RMSE 51.63 517.71 723.03 3600.2 452.82 340.93
CRM 0.0018 −0.06 −0.08 4.61 0.01 0.1
Arab J Geosci
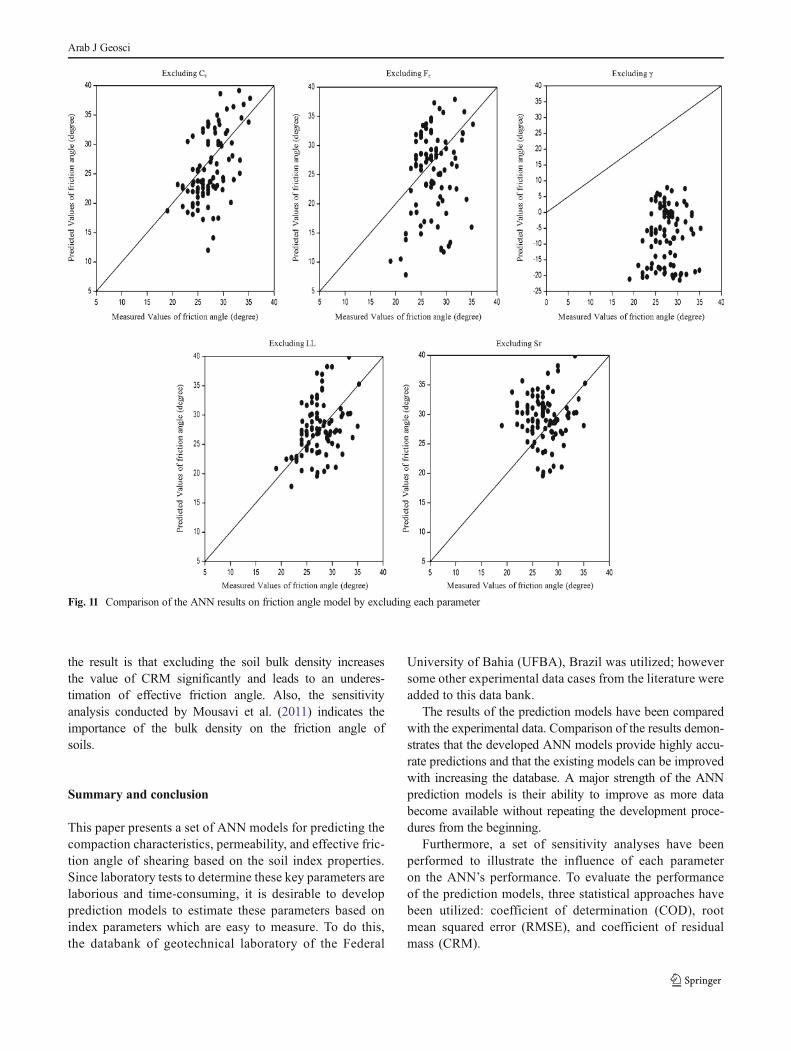
the result is that excluding the soil bulk density increasesthe value of CRM significantly and leads to an underes-timation of effective friction angle. Also, the sensitivityanalysis conducted by Mousavi et al. (2011) indicates theimportance of the bulk density on the friction angle ofsoils.
Summary and conclusion
This paper presents a set of ANN models for predicting thecompaction characteristics, permeability, and effective fric-tion angle of shearing based on the soil index properties.Since laboratory tests to determine these key parameters arelaborious and time-consuming, it is desirable to developprediction models to estimate these parameters based onindex parameters which are easy to measure. To do this,the databank of geotechnical laboratory of the Federal
University of Bahia (UFBA), Brazil was utilized; howeversome other experimental data cases from the literature wereadded to this data bank.
The results of the prediction models have been comparedwith the experimental data. Comparison of the results demon-strates that the developed ANN models provide highly accu-rate predictions and that the existing models can be improvedwith increasing the database. A major strength of the ANNprediction models is their ability to improve as more databecome available without repeating the development proce-dures from the beginning.
Furthermore, a set of sensitivity analyses have beenperformed to illustrate the influence of each parameteron the ANN’s performance. To evaluate the performanceof the prediction models, three statistical approaches havebeen utilized: coefficient of determination (COD), rootmean squared error (RMSE), and coefficient of residualmass (CRM).
Fig. 11 Comparison of the ANN results on friction angle model by excluding each parameter
Arab J Geosci

References
Ahangar-Asr A, Faramarzi A, Mottaghifard N, Javadi AA (2011)Modeling of permeability and compaction characteristics of soilsusing evolutionary polynomial regression. Comput Geosci 37(11):1860–1869
Boadu FK (2000) Hydraulic conductivity of soils from grain-size distri-bution. J Geotech Geoenviron Eng 126(8):739–746
Boynton SS, Daniel ED (1985) Hydraulic conductivity of compactedclay. J Geotech Eng 111(4):465–478
Burmister DM (1954) Principles of permeability testing of soils, sympo-sium on permeability of soils. ASTM Spec Tech Publ 163:3–26
Carman PC (1937) Fluid flow through granular beds. Trans Inst ChemEng 15:150
Chapuis RP (2004) Predicting the saturated hydraulic conductivity ofsand and gravel using effective diameter and void ratio. CanGeotech J 41(5):787–795
Cote J, Fillion MH, Konrad JM (2011) Estimating hydraulic andthermal conductivity of crushed granite using porosity andequivalent particle size. J Geotech Geoenviron Eng ASCE137(9):834–842
Davidson DT, Gardiner WF (1949) Calculation of standard proctordensity andnoptimum moisture content from mechanical analysis,shrinkage factors, and plasticity index. Proceedings of the HRB29,pp 447–481
Ghiassian H, Jamshidi R, Poorebrahim G (2006) Neural network analysisof silty sand reinforced by carpet wastes. Kuwait J Sci Eng 33(1):119–139
Goh ATC (1994) Nonlinear modeling in geotechnical engineering usingneural networks. Aust Civ Eng Trans CE36(4):293–297
Gunaydın O (2009) Estimation of soil compaction parameters by usingstatistical analyses and artificial neural networks. J Environ Geol 57:203–215
Hazen A (1911) Discussion of ‘Dams on sand foundations’ by A. C.Koenig. Trans ASCE 73:199–203
Jumikis AR (1946) Geology and soils of the Newark metropolitan area.Journal of the Soil Mechanics and Foundations Division, ASCE93(SM2), pp 71–95
Kayadelen C, Gu¨naydın O, Fener M, Demir A, O¨ zvan A (2009) Amodeling of the angle of shearing resistance of soils using softcomputing systems. Expert Syst Appl 36:11814–11826
Koltermann CE, Gorelick SM (1995) Fractional packing model forhydraulic conductivity derived from sediment mixtures. WaterResour Res 31:3283–3297
Mesri G, Olson RE (1971) Mechanism controlling the permeability ofclays. Clay Clay Miner 19:151–158
Michaels AS, Lin CS (1954) The permeability of kaolinite. Ind EngngChem 46:1239–1246
Mitchell JK, Hopper DR, Campanella RC (1965) Permeability ofcompacted clay. J Soil Mech Found Div ASCE 91(No. SM4):41–66
Mousavi SM, Alavi AH, Mollahasani A, Gandomi AH, Arab Esmaeili M(2011) Formulation of soil angle of shearing resistance using ahybrid GP and OLS method. Eng Comput. doi:10.1007/s00366-011-0242-x
Nagaraj TS (1994) Analysis and prediction of compaction characteristicsof soils. Unpublished
Najjar YM, Ali HE (1998) CPT-based liquefaction potential assessment:a neuronet approach. ASCE Geotech Spec Publ 1:542–553
Olsen HW (1962) Hydraulic flow through saturated clays. Clay ClayMiner 9:131–161
Ramiah BK, Viswanath V, Krishnamurthy HV (1970) Interrelationship ofcompaction and index properties. Proceedings of the SecondSouth East Asian Conference on Soil Engineering, Singapore,pp 577–587
Rezania M, Javadi AA, Giustolisi O (2008) An evolutionary-based datamining technique for assessment of civil engineering systems. J EngComput 25(6):500–517
Ring GW, Sallgerb JR, Collins WH (1962) Correlation of compactionand classification test data. HRB Bull 325:55–75
Rowan HW, Graham WW (1948) Proper compaction eliminates curingperiod in construction fills. Civ Eng 18:450–451
Sezer A (2013) Simple models for the estimation of shearing resistanceangle of uniform sands. Neural Comput & Applic 22(1):111–123
Sinha SK, Wang MC (2008) Artificial neural network prediction modelsfor soil compaction and permeability. Geotech Geol Eng J 26(1):47–64
Sivakugan N, Eckersley JD, Li H (1998) Settlement predictions usingneural networks. Aust Civ Eng Trans CE40:49–52
Turnbull JM (1948) Computation of the optimummoisture content in themoisture density relationship of soils. Proceedings of the SecondInternational Conference on Soil Mechanics and FoundationEngineering, Rotterdam, Holland, pp 256–262
Ural DN, Saka H (1998) Liquefaction assessment by neural networks.Electronic Journal of Geotechnical Engineering. http://www.ejge.com/Ppr9803/Ppr9803.htm
Wang MC, Huang CC (1984) Soil compaction and permeability predic-tion models. J Environ Eng ASCE 110(6):1063–1083
Zunker F (1930) Das verhalten des bodens zum wasser. Handbuch derbodenlehre 6:66–220
Arab J Geosci
Copyright © 2022 FDOKUMEN