Anionic Surfactant Aggregation with (Hydroxypropyl)cellulose in the Presence of Added Salt
11
PROOF 1 2 3 4 5 6 7 8 9 10 11 12 13 14 15 16 17 18 19 20 21 22 23 24 25 26 27 28 29 30 31 32 33 34 35 36 37 38 39 40 41 42 43 44 45 46 47 48 49 50 51 J. Braz. Chem. Soc., Vol. 00, No. 00, 1-xx, 2006. Printed in Brazil - ©2006 Sociedade Brasileira de Química 0103 - 5053 $6.00+0.00 Article *e-mail: [email protected]; [email protected] # Present addresses: Fundação Estadual de Proteção Ambiental Henrique Luis Roessler, Rua Carlos Chagas, 55, 90030-020 Porto Alegre-RS, Brazil and Universidade Estadual do Rio Grande do Sul, Unidade Bento Gonçalves, Av. Benjamin Constant, 229, 95700-000 Bento Gonçalves-RS, Brazil. Anionic Surfactant Aggregation with (Hydroxypropyl)cellulose in the Presence of Added Salt Ricardo M. de Martins, Carolina A. da Silva, Cristiane M. Becker, Dimitrios Samios, Marcelo Christoff * ,# and Clara I. D. Bica * Instituto de Química, Universidade Federal do Rio Grande do Sul, Av. Bento Gonçalves, 9500, CP 15003, 91501-970 Porto Alegre-RS, Brazil Estudou-se a agregação de surfactantes aniônicos em soluções aquosas diluídas de (hidroxipropil)celulose (HPC) sob moderada força iônica (NaCl 0,1 mol L -1 ). Empregaram-se os surfactantes colato de sódio (CS), deoxicolato de sódio (DC) e dodecil sulfato de sódio (SDS). Observou-se decréscimo da concentração de agregação crítica (C 1 ) para SDS e DC em comparação à concentração micelar crítica (CMC), enquanto ocorreu aumento para CS, a 298 K. A viscosidade relativa apresentou um máximo para o sistema SDS/HPC, mas permaneceu constante para CS/HPC ou DC/HPC. Houve aumento da temperatura de turbidez para todos os sistemas. Utilizando-se espalhamento de luz dinâmico, verificou-se que, a baixas concentrações de surfactante, o modo rápido da HPC relaciona-se a agregados surfactantes/HPC e cadeias poliméricas curtas; a altas concentrações, a micelas livres. O modo lento relaciona-se a complexos surfactante/HPC ou a “clusters” de HPC. Nos sistemas sais biliares/HPC, o mecanismo de agregação pode ocorrer em duas etapas. The aggregation of different anionic surfactants in dilute aqueous solutions of (hydroxypropyl)cellulose (HPC) under moderate ionic strength (NaCl 0.1 mol L -1 ) was studied. The surfactants were sodium cholate (CS), sodium deoxycholate (DC) and sodium dodecylsulphate (SDS). By fluorescence probing, the critical aggregate concentration (C 1 ) decreased for SDS and DC in comparison to the critical micelle concentration (CMC) whereas it increased for CS at 298 K. The relative viscosity reached a maximum for SDS/HPC but remained constant for CS/HPC and DC/HPC. By light scattering, cloud points were verified to increase. By dynamic light scattering, it was concluded that, at low surfactant contents, the fast mode of HPC is related to surfactant/HPC aggregates and shorter HPC chains; at high contents, to free micelles. The slow mode is linked to interchain polymer-surfactant complexes and HPC clusters. For the bile salts/ HPC systems, the mechanism of aggregation may occur in two steps. Keywords: bile salt, cholate, anionic surfactant, (hydroxypropyl)cellulose, light scattering Introduction Polymer-surfactant systems are subject of great interest because their physical properties are relevant to scientific and technological development. Cellulose ether derivatives such as (hydroxypropyl)cellulose (HPC) are water-soluble uncharged polymers that interact with anionic surfactants in solution changing the rheological properties of the system. 1 Interactions between nonionic polymers and ionic surfactants are a consequence of weak intermolecular forces which allow for a wide variety and range of behaviors in these systems. The directed action of a number of weak interactions leads to the cooperative nature of the aggregation behavior usually characterized by a starting surfactant concentration termed the critical aggregation concentration (C 1 ). The stabilization of the interfaces between the hydrophobic core of the aggregates and water is the major driving force for polymer-surfactant interaction. 2,3 Different research groups have focused on the relations between structure, charge and hydrophobicity of surfactants and polymers. With the aim to investigate systematically the hydrophobicity influence, many studies have introduced
Transcript of Anionic Surfactant Aggregation with (Hydroxypropyl)cellulose in the Presence of Added Salt

PROOF
123456789101112131415161718192021222324252627282930313233343536373839404142434445464748495051
J. Braz. Chem. Soc., Vol. 00, No. 00, 1-xx, 2006.Printed in Brazil - ©2006 Sociedade Brasileira de Química
0103 - 5053 $6.00+0.00
Article
*e-mail: [email protected]; [email protected]#Present addresses: Fundação Estadual de Proteção Ambiental Henrique LuisRoessler, Rua Carlos Chagas, 55, 90030-020 Porto Alegre-RS, Brazil andUniversidade Estadual do Rio Grande do Sul, Unidade Bento Gonçalves,Av. Benjamin Constant, 229, 95700-000 Bento Gonçalves-RS, Brazil.
Anionic Surfactant Aggregation with (Hydroxypropyl)cellulose in the Presence of Added Salt
Ricardo M. de Martins, Carolina A. da Silva, Cristiane M. Becker, Dimitrios Samios,Marcelo Christoff *,# and Clara I. D. Bica*
Instituto de Química, Universidade Federal do Rio Grande do Sul, Av. Bento Gonçalves, 9500, CP 15003,91501-970 Porto Alegre-RS, Brazil
Estudou-se a agregação de surfactantes aniônicos em soluções aquosas diluídas de(hidroxipropil)celulose (HPC) sob moderada força iônica (NaCl 0,1 mol L-1). Empregaram-seos surfactantes colato de sódio (CS), deoxicolato de sódio (DC) e dodecil sulfato de sódio(SDS). Observou-se decréscimo da concentração de agregação crítica (C
1) para SDS e DC em
comparação à concentração micelar crítica (CMC), enquanto ocorreu aumento para CS, a 298K. A viscosidade relativa apresentou um máximo para o sistema SDS/HPC, mas permaneceuconstante para CS/HPC ou DC/HPC. Houve aumento da temperatura de turbidez para todos ossistemas. Utilizando-se espalhamento de luz dinâmico, verificou-se que, a baixas concentraçõesde surfactante, o modo rápido da HPC relaciona-se a agregados surfactantes/HPC e cadeiaspoliméricas curtas; a altas concentrações, a micelas livres. O modo lento relaciona-se a complexossurfactante/HPC ou a “clusters” de HPC. Nos sistemas sais biliares/HPC, o mecanismo deagregação pode ocorrer em duas etapas.
The aggregation of different anionic surfactants in dilute aqueous solutions of(hydroxypropyl)cellulose (HPC) under moderate ionic strength (NaCl 0.1 mol L-1) was studied.The surfactants were sodium cholate (CS), sodium deoxycholate (DC) and sodiumdodecylsulphate (SDS). By fluorescence probing, the critical aggregate concentration (C
1)
decreased for SDS and DC in comparison to the critical micelle concentration (CMC) whereasit increased for CS at 298 K. The relative viscosity reached a maximum for SDS/HPC butremained constant for CS/HPC and DC/HPC. By light scattering, cloud points were verified toincrease. By dynamic light scattering, it was concluded that, at low surfactant contents, the fastmode of HPC is related to surfactant/HPC aggregates and shorter HPC chains; at high contents,to free micelles. The slow mode is linked to interchain polymer-surfactant complexes and HPCclusters. For the bile salts/ HPC systems, the mechanism of aggregation may occur in twosteps.
Keywords: bile salt, cholate, anionic surfactant, (hydroxypropyl)cellulose, light scattering
Introduction
Polymer-surfactant systems are subject of greatinterest because their physical properties are relevant toscientific and technological development. Cellulose etherderivatives such as (hydroxypropyl)cellulose (HPC) arewater-soluble uncharged polymers that interact withanionic surfactants in solution changing the rheologicalproperties of the system.1 Interactions between nonionic
polymers and ionic surfactants are a consequence of weakintermolecular forces which allow for a wide variety andrange of behaviors in these systems. The directed actionof a number of weak interactions leads to the cooperativenature of the aggregation behavior usually characterizedby a starting surfactant concentration termed the criticalaggregation concentration (C
1). The stabilization of the
interfaces between the hydrophobic core of theaggregates and water is the major driving force forpolymer-surfactant interaction.2,3
Different research groups have focused on the relationsbetween structure, charge and hydrophobicity of surfactantsand polymers. With the aim to investigate systematicallythe hydrophobicity influence, many studies have introduced

123456789101112131415161718192021222324252627282930313233343536373839404142434445464748495051
525354555657585960616263646566676869707172737475767778798081828384858687888990919293949596979899100101102
PROOF
2 Martins et al. J. Braz. Chem. Soc.
hydrophobic modifications into polymers, as for examplepoly(sodium acrylate),4 (hydroxyethyl)cellulose,5-7
(hydroxypropyl)cellulose,8 ethyl(hydroxyethyl)cellulose,9, 10
and poly(oxyethylene).11 It was verified that hydro-phobically modified polymers have improved propertiesin comparison to their unmodified analogues. Thesemodified polymers show interesting rheological behaviordepending the viscosity strongly on the shear rate andsurfactant concentration.12 In general both block and graftcopolymers as well as more complex architectures werestudied.11 Nevertheless only a few types of surfactants havebeen investigated, most of them formed by long alkyl chainswith a polar head group.13-16
We have previously studied different anionicsurfactants with respect to the aggregation with the lowmolar mass, non charged flexible polymer poly(ethylene oxide),17 including some natural anionicsurfactant bile salts, namely, sodium cholate (CS) andsodium deoxycholate (DC), that are carboxylicpolyhydroxy derivatives from cholesterol18 and the well-known sodium dodecylsulfate (SDS) that is a long chainalkylsulfate. The molecular shape of the bile saltsexhibits a planar polarity due to spatial distribution oflateral groups in their steroid backbone. The bile saltstructures result in smaller and more rigid aggregatesthan the micelles formed by conventional alkyl-surfactants providing highly non-polar micro-environments with chiral properties.19 Indeed thebalance of hydrophobic and electrostatic forces in thepolymer-surfactant interaction in moderate ionicstrength was shown to be sensitive to different surfactantstructures being the hydrophobic component morerelevant to bile salt aggregation.17 The present articleuses the same set of surfactants (CS, DC and SDS)
(Figure 1) in order to study their aggregation behaviorin the presence of the semi-rigid non-ionic polymerHPC by applying techniques such as fluorescenceprobing, capillary viscometry, static and dynamic lightscattering, including turbidimetry. Due to the presenceof salt in all body fluids20 and to potential applicationsin pharmaceutical formulations, the interaction of HPCwith each of these anionic surfactants was investigatedin aqueous NaCl 0.1 mol L-1.
The interaction between bile salts and cellulosederivatives at molecular level has received littleattention. Up to our knowledge it has been studied onlywith (hydroxypropylmethyl)cellulose.21,22 It wasverified that the aggregation process was cooperativeand that the aggregates were small, highly hydrophobicand with low surface charge density.21 The addition ofa very small amount of DC to an aqueous HPMCsolution already changed the dynamics of the reductionof surface tension.22
Experimental
The surfactants CS (99%, Sigma), DC (99%, Sigma),SDS (99.5%, Fischer) were used as received. (Hydroxy-propyl)cellulose (HPC, Aldrich) has average molarsubstitution degree for hydroxypropyl oxide group peranhydroglucose unit MS = 4.5 (NMR). A stock aqueoussolution of HPC was dialyzed one week (Membraceltubing, cut-off 12,000-16,000 g mol-1; Polylabo) andfiltered subsequently through 8 and 0.45 μm membranefilters (Millipore). After dialysis HPC presents M
w =
110,000 g mol-1, radius of gyration Rg = 39.5 nm; secondvirial coefficient A
2 = 1.02 10-3 mol cm3 g-2 (data obtained
through static light scattering by using Zimm plotextrapolation procedures); refractive index increment dn/dc = 0.1736 mL g -1 obtained by differential refrac-tometry; hydrodynamic radius R
H =13.2 nm obtained by
dynamic light scattering (DLS) at infinite dilution andzero angle (aqueous NaCl 0.1 mol L-1 solution, T = 298K) and M
w/M
n = 2.5 (GPC). Pyrene (Py, Aldrich) was
recrystallized twice from ethanol solution. All solutionswere prepared with Milli-Q grade water (Millipore). Theprobe solution was prepared by evaporating the suitablevolume of the ethanol stock solution, followed bydissolution of the remaining solid in the surfactant/HPCsolution. All surfactant/HPC solutions were stirred for12 h at room temperature before the measurements. Toremove dust for the light scattering experiments thesolutions were filtered through 0.45 μm filter (Millipore)and centrifuged at 4000 rpm for 90 minutes. All thepresented data are averaged from three experimental sets.Figure 1. Idealized structure of HPC and the anionic surfactant struc-
tures.

123456789101112131415161718192021222324252627282930313233343536373839404142434445464748495051
525354555657585960616263646566676869707172737475767778798081828384858687888990919293949596979899100101102
PROOF
3Anionic Surfactant Aggregation with (Hydroxypropyl)celluloseVol. 00, No. 00, 2006
Fluorescence
The steady-state fluorescence measurements employeda Hitachi F-4500 Spectrophotometer with cell holderthermostated by a circulating ethylene glycol bath. Thefluorescence spectra for Py were recorded in the correctedspectrum mode with excitation wavelength set at 336 and2.5 mm slit. The ratio I
1/I
3 was taken from first (372 nm)
and third (384 nm) vibronic peaks in the Py emissionspectrum that has been shown to be a sensitive functionof local polarity in organized systems.23 The Pyconcentration was kept low (≤ 5 × 10⁻⁶ mol L-1) to excludethe possibility of excimer formation that may occur whenthe concentration is higher than 10 -4 mol L-1.
Light scattering
Static and dynamic light scattering as well asturbidimetry have been undertaken on a BrookhavenInstruments spectrometer with a He-Ne laser at 632.8 nm.A 264-channel BI-9000 AT correlator covering 7 decadesin delay time was used. The samples were thermostatedin a refractive-index-matching liquid (decaline). A BI-DNDCW Brookhaven differential refractometer was usedto measure the refractive index increment of HPC in NaCl0.1 mol L-1 aqueous solution. All experiments took placeat 298 K. The cloud point of the solutions was measuredby the intensity of the scattered light, I
S, using the
apparatus described above. The procedure involvedheating at a constant rate of ca. 1.2 K min-1. Thetemperature step was 1 K in the temperature range whereI
S changed. Before the measurement, each sample was
pre-heated above the cloud point and cooled to roomtemperature.
In dynamic light scattering (DLS) the intensity timeautocorrelation function G
2(τ) of the scattered light
intensity was measured:
G2(τ) = <I(0)I(τ)> (1)
and normalized by dividing it by the average intensitysquared <I>2 (baseline). When the scattered electric fieldis a gaussian process, the Siegert relation is valid:24
g2(τ) = 1+β [g
1(τ)]2 (2)
where g2(τ) is the normalized intensity time
autocorrelation function, g1(τ) is the field correlation
function and β is the spatial coherence factor whichdepends on the optical set-up. In order to characterize thehydrodynamic behavior of the aggregates, electric field
time correlation functions were analyzed by two-exponential fits24 (Microcal Origin 5.0) according to:
g1(τ) = A
1exp(-Γ
1τ)+A
2exp(-Γ
2τ) (3)
where A1 and A
2 are the amplitudes of the fast and the
slow modes, respectively and Γ1 and Γ
2 are the relaxation
rates of each mode. The translational diffusion coefficientD is obtained as:
Γ = Dq2 (4)
where q is the scattering vector whose modulus is givenby q = 4πnsin(θ/2)/ λ
o with n the refractive index of the
medium, θ the scattering angle and λ o the wavelength ofradiation in vacuum. It was also performed an inverseLaplace transformation to obtain the relaxation timedistribution using the Repes Routine25 incorporated in theGendist26 commercial software package. The apparenthydrodynamic radius, R
H,app’ was obtained from the
apparent diffusion coefficient at the fixed polymerconcentration of [HPC] = 0.5% m/m and scattering angleθ = 90° according to the Stokes-Einstein equation:24
(5)
where kB is the Boltzmann constant, T the absolute
temperature and η the solvent viscosity. All experimentstook place at 298 K.
Viscosity
The viscometric measurements were carried out in anordinary Cannon-Fenske capillary viscometer (water flowtime ~ 100 s) thermostated at 298 K by a water bath. Therelative viscosity, η
rel was obtained by the expression
where η and η0 are the viscosity of the sample
and surfactant (free of polymer) in aqueous NaCl 0.1 molL-1 solutions, respectively. The overlapping concentration,c*, for HPC was obtained from determination of theintrinsic viscosity, [η] as 1/[η] ≅ 0.93% (not shown) inagreement with 1/(A
2 M
w) ≅ 0.89%.
Results and Discussion
The ratio I1/I
3 from Py fluorescence decreases for
different systems as the total surfactant concentrationincreases reflecting the incorporation of Py in ahydrophobic site due to aggregate formation (Figures 2and 3). The critical surfactant concentration (C
1) was

123456789101112131415161718192021222324252627282930313233343536373839404142434445464748495051
525354555657585960616263646566676869707172737475767778798081828384858687888990919293949596979899100101102
PROOF
4 Martins et al. J. Braz. Chem. Soc.
determined either by the inflection point of the curve (C1
A)or by the intercept from linear extrapolation on bottomand steep data (C
1B) (Table 1). The difference between
both C1 values is proportional to non-cooperative character
of the aggregation process. The critical surfactantconcentration without polymer or critical micellizationconcentration (CMC) was obtained for each surfactant at298 K in good agreement with literature values.16, 27 In thepresence of 0.5% HPC the C
1 decreases with respect to
CMC observed for the SDS/HPC2,28 and DC/HPC systemswhereas an opposite trend is observed for CS/HPC. Anearlier study22 on the system DC/HPMC/NaCl 0.01 molL-1 indicated no changes with respect to CMC of DC butin our work the higher ionic strength may have contributedto decrease the solubility of the system leading to
aggregation at lower concentration. The CMC reductionindicates polymer-surfactant association however theincrement of CMC does not exclude it.22,29 The latter casereflects a destabilization of the micelle. The cooperativedegree of the aggregation leads to the sharpness of thesteeper segment in the curves (Figures 2 and 3) whichapproximates both C
1 values (Table 1). Therefore the
cooperative degree of the aggregation in 0.5% HPC seemsto increase for SDS (Figure 2) and DC30,31 but decreasesfor CS (Figure 3). The same surfactants have shown asimilar behavior with the non-ionic polymer poly(ethyleneoxide).17 The micropolarity (μP) being the average ratioI
1/I
3 value at the concentration range higher than C
1
(bottom plateau range) indicates that 0.5% HPC does notchange the hydrophobic pocket occupied by thefluorescent probe in the aggregate for any system.30 Inthe case of bile salts/0.5% HPC systems, the low μP valuesindicate a possible absence of the palisade layer assuggested long ago for CS and DC free micelles in waterin the presence of NaCl.32
The relative viscosity, ηrel
of 0.5% HPC as a functionof total surfactant concentration is presented in Figure 4.At 298 K the main change of η
rel is observed to SDS/HPC
system as the viscosity increases up to 2.56 at 4 × 10⁻³
mol L-1 SDS concentration and decreases to 1.46 about20 × 10-3 mol L-1. The curve for SDS/HPC system has thesame shape that was reported without salt33 changing themaximum position to lower SDS concentration due toincrease of the ionic strength.34 In addition, the maximumviscosity at 4 × 10⁻³mol L-1 is also close to the valueobserved for SDS/ethyl(hydroxyethyl)cellulose systemsindependently of the polymer concentration.1,14,35
Table 1. Aggregation parameters from fluorescence measurements at 298 K
Systemsa in μPb Cc (103 mol L-1)NaCl 0.1 mol L-1
Ad Bd
SDS 1.12 1.0 2.0SDS, HPC 0.5% 1.12 0.63 1.0SDS, HPC 1.2% 1.15 1.1 2.2DC 0.68 2.3 3.1DC, HPC 0.5% 0.67 0.78 1.1DC, HPC 1.2% 0.75 1.4 3.2CS 0.78 6.5 9.3CS, HPC 0.5% 0.75 7.0 12.0CS, HPC 1.2% 0.84 8.0 13.3
aHPC 110,000 g mol-1; bMicropolarity, μP, is the bottom average value ofthe ratio I
1/I
3 (Py) in Figures 2 and 3, error ± 0.02; cC is the critical mi-
celle (CMC) or aggregation (C1) concentration, in mol L-1, error ± 10%;
dobtained as (A) by the inflection point of aggregation curves calculatedfrom the minimum of its first derivative, or (B) by the intercept fromlinear extrapolation on bottom and steep data.
Figure 2. Dependence of the ratio I1/I
3 on SDS concentration in NaCl 0.1
mol L-1 aqueous solution, in absence (open triangles) or with 0.5% (fulltriangles) and 1.2% (diamonds) HPC at 298 K.
Figure 3. Dependence of the ratio I1/I
3 on CS concentration in NaCl 0.1
mol L-1 aqueous solution, in absence (open squares) or with HPC 0.5%m/m (squares) and 1.2% m/m (triangles) at 298 K.

123456789101112131415161718192021222324252627282930313233343536373839404142434445464748495051
525354555657585960616263646566676869707172737475767778798081828384858687888990919293949596979899100101102
PROOF
5Anionic Surfactant Aggregation with (Hydroxypropyl)celluloseVol. 00, No. 00, 2006
The occurrence of the maximum viscosity above C1 can
be attributed to the formation of interchain polymer-surfactant complexes.1,3,36 The subsequent decrease in theviscosity with increasing SDS concentration indicates thatthe aggregate formation leads to a more compact polymerstructure due to intrachain polymer-surfactantcomplexes.1,3 At higher SDS concentration the viscosityfalls below the initial level indicating the increase of thedegree of flexibility/mobility as a result of HPC becomingmore hydrophilic.3 In accordance to this interpretation isthe fact that the value of the micropolarity for SDS/HPCsystem is higher than that found for CS/HPC and DC/HPC systems.30,31On the other hand the relative viscosityfor bile salts/0.5% HPC solutions is nearly constant. Inthis case, the technique was not sensitive enough to detectthe interaction bile salts/HPC since no significant changeswere observed in viscosity profile for these systems. Thisevidence can be related to the intensity of the interactionsurfactant/HPC. It is known that free micelles of bile saltsare smaller than the corresponding SDS systems even inthe presence of PEO.17,27 The different behavior of thesesystems can be correlated with a larger number ofaggregates with smaller charge density and size in thecase of the bile salts when compared to SDS.
The results obtained for turbidimetry are in agreementwith this explanation. Typical experiments for the cloudpoint determination are shown in Figure 5a being the ratioI
S/I
M the scattered light intensity normalized by the highest
intensity of each sample. The cloud point value is takenas the intercept from linear extrapolation between bottomand steep data. In Figure 5b in turn is shown the cloudpoint dependence on the total surfactant concentration forall surfactant/0.5% HPC systems. In the low surfactant
concentration range, the cloud point for 0.5% HPC / NaCl0.1 mol L-1 (311K) is almost unchanged for all surfactant/HPC solutions (Figure 5b). However at surfactantconcentrations above each C
1 there is a clear upper shift
of the cloud point. The steep segment for SDS/HPC occursabout 4 × 10⁻³ mol L-1 surfactant concentration and it ismore pronounced than in the bile salts/HPC systems. Theeffectiveness of SDS to increase the cloud point of HPChas been attributed to electrostatic repulsion between theirmicelles bound to the polymer.33,37 In the present case,the amount of added NaCl leads to a moderate ionicstrength which seems not being able of completelyscreening this electrostatic repulsion. On the other hand
Figure 4. Relative viscosity, η/η0 of 0.5% m/m HPC / NaCl 0.1 mol L-1 as
a function of surfactant concentration, [Surfactant]: SDS (triangles), DC(circles) and CS (squares) where η
0 stands for the viscosity of the free
surfactant solutions (empty symbols) at 298K.
Figure 5. a) Temperature dependence of scattered light intensity (IS /I
M) -
normalized by the highest intensity of each sample - 0.5% m/m of HPC(up triangles); with [SDS] = 5 × 10⁻³ mol L-1 (down triangles), [DC] =5 × 10⁻³ mol L-1 (circles) or [CS] = 17 × 10-3 mol L-1 (squares). All solu-tions with NaC l 0.1 mol L-1. b) Cloud point as a function of the surfactantconcentration for 0.5% m/m of HPC; NaCl 0.1 mol L-1 with SDS (tri-angles), DC (circles) or CS (squares). The lines are guides to the eyes.

123456789101112131415161718192021222324252627282930313233343536373839404142434445464748495051
525354555657585960616263646566676869707172737475767778798081828384858687888990919293949596979899100101102
PROOF
6 Martins et al. J. Braz. Chem. Soc.
the behavior of the bile salts/HPC aggregate solutions isalmost the same within the experimental error, startingthe steep segment about 10-2 mol L-1 surfactant concen-tration and reaching an upper limit to cloud point at 320± 3 K about 2 × 10⁻² mol L-1 surfactant concentration.Another study employing some cationic surfactants asdodecyl tetramethyl ammonium halides with HPC hasshown a cloud point increase also followed by a plateaudependent on type of the halide and the overall effect wasattributed to small size – that is the case for bile salts –and spherical shape of their micelles.33
It is worth commenting on the fact that the heatingrate of ca. 1.2 K min-1 is sufficiently slow for equilibriumto be achieved and allowed to obtain reproducible results.For the cloud point determination of aqueous celluloseether solutions, other studies38,39 have used even higherrates. Moreover the procedures reported in the literatureusually involve visual inspection. Our study detectsclouding by the scattered light intensity with the advantagethat this procedure does not depend on the human eye.Good reproducibility was achieved also by preheating thesamples above their cloud points. When cooling back toroom temperature, all material was dissolved, as indicatedby the low scattered intensity sensitively monitored.
Figure 6 shows ratios of time averaged scatteredintensities being the intensity scattered by surfactant/HPCsystems over that of free HPC solution at 298K. Thebehavior is similar to the viscometric one seen in Figure4: there is a maximum at [SDS] = 4 × 10 -3 mol L-1 followedby a decrease of the intensity ratio while in the presenceof the bile salts this ratio is nearly constant over the wholesurfactant concentration range. When SDS is thesurfactant, the concentration of added salt is again notenough to completely screen the electrostatic repulsion.This observed scattering behavior is consistent with thatreported for high molecular weight poly(vinylpyrro-lidone), PVP, under moderate ionic strength40 where thedecrease of the scattered intensity was attributed to theeffect of electrostatic repulsion which leads to enhan-cement of the second virial coefficient.
In dynamic light scattering two modes wereobserved in the time correlation functions: (i) a fastmode, related to single polymer chain, intrachainpolymer/surfactant aggregates or free micelles and (ii)a slow mode assigned to polymer clusters and interchainpolymer/surfactant complexes. It is well recognized thatcellulose derivatives in aqueous solutions may showthe presence of clusters that originate from theaggregation of their hydrophobic groups.41,42
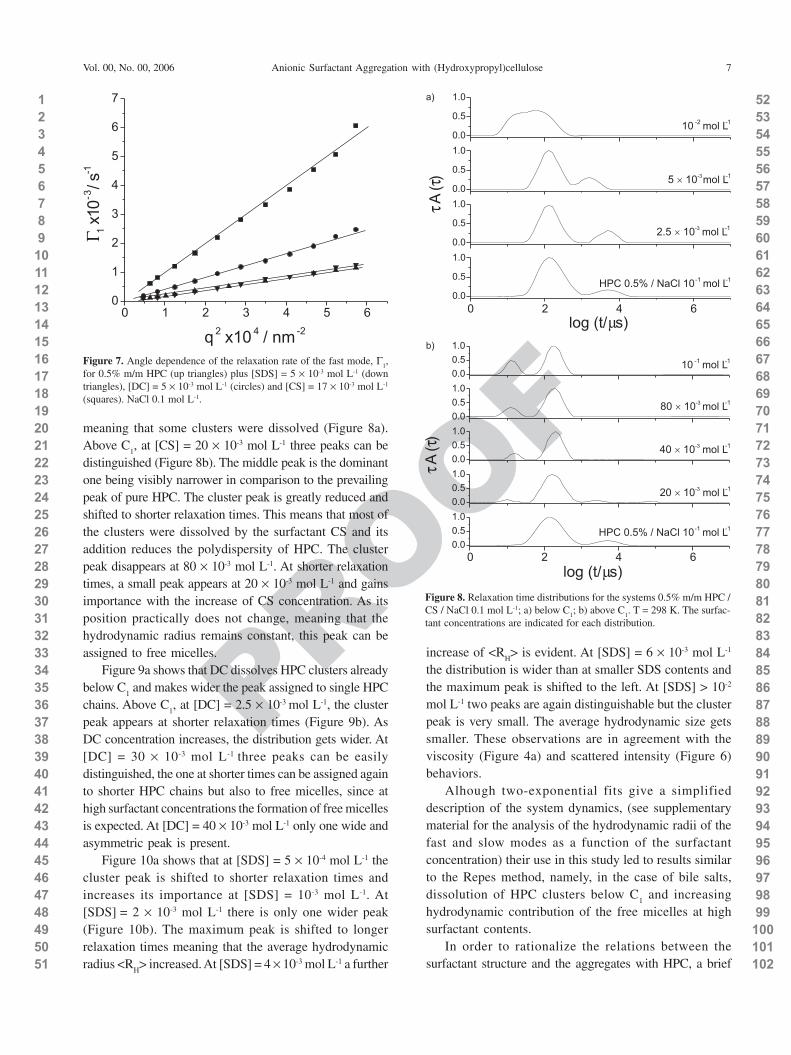
Figure 7 shows the angle dependence for relaxationrate of the fast mode, Γ
1, for different 0.5% HPC / NaCl
0.1 mol L-1 solutions with and without surfactants,calculated from a two-exponential fit to the fieldcorrelation functions. For the free HPC solution the fastmode predominates over the slow mode: at 0.5% m/mHPC shows ca. 27% clusters (not shown). Both modesare diffusive as can be seen by the plots of the relaxationrate Γ
1 (fast) and Γ
2 (slow, not shown) versus the square
of the scattering vector (q2) passing through the originwithin the experimental error. In Figure 7 the slope of thecurves is proportional to the apparent diffusion coefficientwhich means that a common feature for bile salt aggregatesis the increment of diffusiveness for the fast polymer modewhile SDS does not change it. Considering the fast mode,the CS addition shows the highest diffusion coefficientamong the systems presented being followed by DC. Thebehavior is analogous in the case of the slow mode withthe exception that SDS/HPC system is faster than HPCwithout surfactant. These facts may reflect its highestunimer solubility among the three surfactants and,therefore, pointing out the main contribution fromloosening the water superstructure (entropic component).It is also worth noting that the surfactant concentrationsin Figure 7 were chosen in the aggregate range thatrepresents similar aggregate concentration value for allsurfactant/HPC systems.
Figure 8 shows relaxation time distributions for thesystem CS/HPC 0.5%. In the absence of surfactant, HPCshows two distinct broad peaks, the one at longer relaxationtimes corresponds to HPC clusters whereas the other onecan be assigned to single polymer chains. The latter is thedominant peak. When CS is added, changes in thedistribution occur already below C
1. At [CS] =
5 × 10⁻³ mol L-1 the cluster peak is shifted to shorter times
Figure 6. Ratio of scattered intensities of 0.5% m/m HPC/surfactant so-lutions to the intensity of the free polymer solution HPC (Ihpc + surfac-tant/Ihpc) as a function of the surfactant concentration (mol L-1). Sym-bols as in Figure 4. T = 298 K. Scattering angle 90o; NaCl 0.1 mol L-1.
123456789101112131415161718192021222324252627282930313233343536373839404142434445464748495051
525354555657585960616263646566676869707172737475767778798081828384858687888990919293949596979899100101102
PROOF
7Anionic Surfactant Aggregation with (Hydroxypropyl)celluloseVol. 00, No. 00, 2006
meaning that some clusters were dissolved (Figure 8a).Above C
1, at [CS] = 20 × 10-3 mol L-1 three peaks can be
distinguished (Figure 8b). The middle peak is the dominantone being visibly narrower in comparison to the prevailingpeak of pure HPC. The cluster peak is greatly reduced andshifted to shorter relaxation times. This means that most ofthe clusters were dissolved by the surfactant CS and itsaddition reduces the polydispersity of HPC. The clusterpeak disappears at 80 × 10-3 mol L-1. At shorter relaxationtimes, a small peak appears at 20 × 10-3 mol L-1 and gainsimportance with the increase of CS concentration. As itsposition practically does not change, meaning that thehydrodynamic radius remains constant, this peak can beassigned to free micelles.
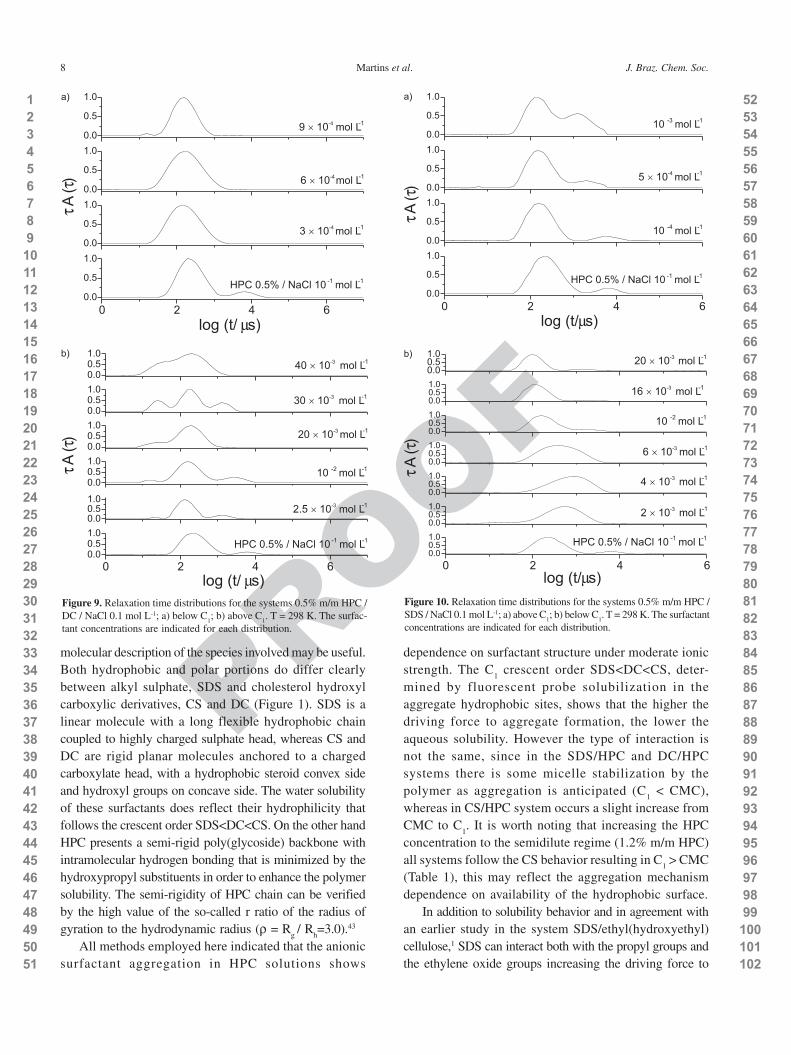
Figure 9a shows that DC dissolves HPC clusters alreadybelow C
1 and makes wider the peak assigned to single HPC
chains. Above C1, at [DC] = 2.5 × 10⁻³ mol L-1, the cluster
peak appears at shorter relaxation times (Figure 9b). AsDC concentration increases, the distribution gets wider. At[DC] = 30 × 10-3 mol L-1 three peaks can be easilydistinguished, the one at shorter times can be assigned againto shorter HPC chains but also to free micelles, since athigh surfactant concentrations the formation of free micellesis expected. At [DC] = 40 × 10-3 mol L-1 only one wide andasymmetric peak is present.
Figure 10a shows that at [SDS] = 5 × 10⁻⁴ mol L-1 thecluster peak is shifted to shorter relaxation times andincreases its importance at [SDS] = 10-3 mol L-1. At[SDS] = 2 × 10⁻³ mol L-1 there is only one wider peak(Figure 10b). The maximum peak is shifted to longerrelaxation times meaning that the average hydrodynamicradius <R
H> increased. At [SDS] = 4 × 10⁻³ mol L-1 a further
increase of <RH> is evident. At [SDS] = 6 × 10⁻³ mol L-1
the distribution is wider than at smaller SDS contents andthe maximum peak is shifted to the left. At [SDS] > 10-2
mol L-1 two peaks are again distinguishable but the clusterpeak is very small. The average hydrodynamic size getssmaller. These observations are in agreement with theviscosity (Figure 4a) and scattered intensity (Figure 6)behaviors.
Alhough two-exponential fits give a simplifieddescription of the system dynamics, (see supplementarymaterial for the analysis of the hydrodynamic radii of thefast and slow modes as a function of the surfactantconcentration) their use in this study led to results similarto the Repes method, namely, in the case of bile salts,dissolution of HPC clusters below C
1 and increasing
hydrodynamic contribution of the free micelles at highsurfactant contents.
In order to rationalize the relations between thesurfactant structure and the aggregates with HPC, a brief
Figure 7. Angle dependence of the relaxation rate of the fast mode, Γ1,
for 0.5% m/m HPC (up triangles) plus [SDS] = 5 × 10⁻³ mol L-1 (downtriangles), [DC] = 5 × 10⁻³ mol L-1 (circles) and [CS] = 17 × 10-3 mol L-1
(squares). NaCl 0.1 mol L-1.
Figure 8. Relaxation time distributions for the systems 0.5% m/m HPC /CS / NaCl 0.1 mol L-1; a) below C
1; b) above C
1. T = 298 K. The surfac-
tant concentrations are indicated for each distribution.
123456789101112131415161718192021222324252627282930313233343536373839404142434445464748495051
525354555657585960616263646566676869707172737475767778798081828384858687888990919293949596979899100101102
PROOF
8 Martins et al. J. Braz. Chem. Soc.
molecular description of the species involved may be useful.Both hydrophobic and polar portions do differ clearlybetween alkyl sulphate, SDS and cholesterol hydroxylcarboxylic derivatives, CS and DC (Figure 1). SDS is alinear molecule with a long flexible hydrophobic chaincoupled to highly charged sulphate head, whereas CS andDC are rigid planar molecules anchored to a chargedcarboxylate head, with a hydrophobic steroid convex sideand hydroxyl groups on concave side. The water solubilityof these surfactants does reflect their hydrophilicity thatfollows the crescent order SDS<DC<CS. On the other handHPC presents a semi-rigid poly(glycoside) backbone withintramolecular hydrogen bonding that is minimized by thehydroxypropyl substituents in order to enhance the polymersolubility. The semi-rigidity of HPC chain can be verifiedby the high value of the so-called r ratio of the radius ofgyration to the hydrodynamic radius (ρ = R
g / R
h=3.0).43
All methods employed here indicated that the anionicsurfactant aggregation in HPC solutions shows
dependence on surfactant structure under moderate ionicstrength. The C
1 crescent order SDS<DC<CS, deter-
mined by fluorescent probe solubilization in theaggregate hydrophobic sites, shows that the higher thedriving force to aggregate formation, the lower theaqueous solubility. However the type of interaction isnot the same, since in the SDS/HPC and DC/HPCsystems there is some micelle stabilization by thepolymer as aggregation is anticipated (C
1 < CMC),
whereas in CS/HPC system occurs a slight increase fromCMC to C
1. It is worth noting that increasing the HPC
concentration to the semidilute regime (1.2% m/m HPC)all systems follow the CS behavior resulting in C
1 > CMC
(Table 1), this may reflect the aggregation mechanismdependence on availability of the hydrophobic surface.
In addition to solubility behavior and in agreement withan earlier study in the system SDS/ethyl(hydroxyethyl)cellulose,1 SDS can interact both with the propyl groups andthe ethylene oxide groups increasing the driving force to
Figure 9. Relaxation time distributions for the systems 0.5% m/m HPC /DC / NaCl 0.1 mol L-1; a) below C
1; b) above C
1. T = 298 K. The surfac-
tant concentrations are indicated for each distribution.
Figure 10. Relaxation time distributions for the systems 0.5% m/m HPC /SDS / NaCl 0.1 mol L-1; a) above C
1; b) below C
1. T = 298 K. The surfactant
concentrations are indicated for each distribution.
123456789101112131415161718192021222324252627282930313233343536373839404142434445464748495051
525354555657585960616263646566676869707172737475767778798081828384858687888990919293949596979899100101102
PROOF
9Anionic Surfactant Aggregation with (Hydroxypropyl)celluloseVol. 00, No. 00, 2006
aggregation as HPC decreases the critical concentration forfree SDS. In the bile salts/HPC systems the interaction occursmainly through the propyl groups, although a previous studyindicates a weak interaction of these surfactants withpoly(ethylene oxide) (PEO).17 The observed effects seem toindicate that the partial polymer solubilization in the micellepalisade layer of SDS attributed for PEO1 does not occur inthe interaction of the bile salts/HPC aggregates as alsoobserved to bile salts/PEO.17 Indeed, as mentioned before,the palisade layer seems even to be absent in the case of bilesalt aggregates. Also in agreement with the unchangedmicropolarity between the free bile salts and aggregates,30,31
an alternative interaction could be the polymer adsorptionon the hydrophobic exposed surfaces of the free bile saltsthat is about 60-80% of total hydrophobic surface.16
As can be seen by the dynamic light scattering results,the behavior of the bile salts/HPC systems seems tosupport the process of polymer adsorption since there isdissolution of polymer clusters already at surfactantconcentrations lower than the critical aggregationconcentration C
1. This effect may also be interpreted as
follows: at first bile salt unimers attach to the HPC chainand in a second step bile salt micelle-like aggregatesfurther bind to it. Also at low surfactant contents (< C
1)
DC seems to be more effective in dissolving polymerclusters than CS (see Figures 8a and 9a) indicating that,in the presence of HPC, the hydrophobic surface is lessexposed in the case of CS.
Finally, concerning the viscosity results, it is worthcommenting that the lack of change in the viscosity profileof the curves (Figure 4) for bile salts/HPC systems doesnot exclude the interaction between these compounds. Infact, this behavior only ratifies that such interaction isweak. However, it indeed exists, as verified mainly bylight scattering results. Also a similar behavior was foundin another recent study.44
Conclusions
The surfactant alkylsulphate, SDS and the bile salts,CS and DC have shown different aggregate behavior inthe presence of HPC at moderate ionic strength. Thebinding of the bile salts to HPC starts already below thecritical aggregation concentration. Regarding themechanism of aggregation, it may occur in two steps: (i)attachment of bile salt unimers to the HPC chain leadingto the formation of aggregation nuclei; (ii) further bindingof surfactant micelle-like aggregates on it. In addition therigidity of both HPC and bile salts seem to play a role inorder to expose the hydrophobic molecular segmentsresponsible for the interaction.
Acknowledgments
We are grateful to Capes, CNPq, Fapergs, Propesq-UFRGS for financial support and fellowships.
Supplementary Information
Additional results obtained from two-exponential fitsare available free of charge at http://jbcs.sbq.org.br as PDFfile .
References
1. Wang, G.; Olofsson, G.; J. Phys. Chem. 1995, 99, 5588.
2. Winnik, F. M.; Regismond, S. T. A.; Colloids Surf. A 1996,
118, 1.
3. Singh, S. K.; Nilsson, S.; J. Colloid Interface Sci. 1999, 213,
152.
4. Illopoulos, I.; Wang, T. K.; Audebert, R.; Langmuir 1991, 7,
617.
5. Dualeh, A. J.; Steiner, C.; Macromolecules 1990, 23, 251.
6. Antunes, F. E.; Marques, E. F.; Gomes, R.; Thuresson, K.;
Lindman, B.; Miguel, M. G.; Langmuir 2004, 20, 4647.
7. Maestro, A.; González, C.; Gutiérrez, J. M.; J. Colloid Interface
Sci. 2005, 288, 597.
8. Winnik, F. M.; Langmuir 1990, 6, 522.
9. Thuresson, K.; Karlström, G.; Lindman, B.; J. Phys. Chem.
1995, 99, 3823.
10. Joabsson, F.; Rosen, O.; Thuresson, K.; Piculell, L.; Lindman,
B.; J. Phys. Chem. B 1998, 102, 2954.
11. Thuresson, K.; Karlson, L.; Lindman, B.; Colloids Surf. A 2002,
201, 9.
12. Lindman, B.; Thalberg, K. In Interactions of Surfactants with
Polymers and Proteins; Goddard, E.D.; Ananthapadmanabhan,
K.P., eds; CRC Press: New York,1993, p. 235.
13. Anthony, O.; Zana, R.; Langmuir 1994, 10, 4048.
14. Evertsson, H.; Nilsson, S.; Carbohydr. Polym. 1998, 35, 135.
15. Aoudia, M.; Zana, R.; J. Colloid Interface Sci. 1998, 206, 158.
16. Garidel, P.; Hildebrand, A.; Neubert, R.; Blume, A.; Langmuir
2000, 16, 5267.
17. Christoff, M.; da Silveira, N. P.; Samios, D.; Langmuir 2001,
17, 2885.
18. Small, D. M. In The Bile Salts; Nair, P. P.; Kritchevsky, D.,
eds.; Plenum Press: New York, 1971, pp. 249-256.
19. Yim, C.T.; Langmuir 1997, 13, 4383.
20. Evertsson, H.; Holmberg, C.; Colloid Polym. Sci. 1997, 275,
830.
21. Löfroth, J-E.; Johansson, L.; Norman, A.C.; Wettström, K.;
Prog. Colloid Polym. Sci. 1991, 84, 73.
22. Avranas, A.; Tasopoulos, V.; J. Colloid Interface Sci. 2000,
221, 223.

123456789101112131415161718192021222324252627282930313233343536373839404142434445464748495051
525354555657585960616263646566676869707172737475767778798081828384858687888990919293949596979899100101102
PROOF
10 Martins et al. J. Braz. Chem. Soc.
23. Kalyanasundaram, K.; Thomas, J. K.; J. Am. Chem. Soc. 1977,
99, 2039.
24. Chu, B. In Laser Light Scattering: Applications of Photon
Correlation Spectroscopy; Academic Press: London, 1991, pp.
84-134.
25. Jakes, J.; Collect. Czech. Chem. Commun. 1995, 60, 1781.
26. Schillen, K.; Brown, W.; Johnsen, R. M.; Macromolecules 1994,
27, 4825.
27. Paula, S.; Sus, W.; Tuchtenhagen, J.; Blume, A.; J. Phys. Chem.
1995, 99, 11742.
28. Persson, B.; Nilsson, S.; Sundelöf, L.-O.; Carbohydr. Polym.
1996, 29, 119.
29. Brackman, J. C.; Engberts, F. N.; Chem. Soc. Rev. 1993, 22,
85.
30. Martins, R. M.; Silva, C. A.; Becker, C.; Samios, D.; Bica, C. I.
D.; Christoff, M.; Polímeros 2002, 12, 109.
31. Martins, R. M.; MSc. Dissertation, Universidade Federal do
Rio Grande do Sul, Brazil, 2002.
32. Zana, R.; Guveli, D.; J. Phys. Chem. 1985, 89, 1687.
33. Drummond, C. J; Albers, S.; Furlong, D. N.; Colloids Surf. A.
1992, 62, 75.
34. Evertsson, H.; Nilsson, S.; Holmberg, C.; Sundelöf, L.-O.;
Langmuir 1996, 12, 5781.
35. Holmberg, C.; Nilsson, S.; Singh, S. K.; Sundelöf, L.-O.; J.
Phys. Chem. 1992, 96, 871.
36. Mya, K. Y.; Sirivat, A.; Jamieson, A. M; Macromolecules 2001,
34, 5275.
37. Suto, S.; Iwasawa, I.; J. Polym. Sci. A. 1993, 31, 1599.
38. Carlsson, A.; Karlström, G.; Lindman, B.; Stenberg, O.; Colloid
Polym. Sci. 1988, 266, 1031.
39. Karlström, G.; Carlsson, A.; Lindman, B.; J. Phys. Chem. 1990,
94, 5005.
40. Norwood, D. W.; Minatti, E.; Reed, W. F.; Macromolecules
1998, 31, 2966.
41. Schulz, L.; Seger, B.; Burchard, W.; Macromol. Chem. Phys.
2000, 201, 2008.
42. Wittgren, B.; Porsch, B.; Carbohydr. Polym. 2002, 49, 457.
43. Burchard, W.; Richtering, W.; Prog. Colloid Polym. Sci. 1989,
80, 151.
44. Martins, R. M.; Silva, C. A.; Becker, C. M.; Samios, D.;
Christoff, M.; Bica, C. I. D.; Colloid Polym. Sci., in press
Received: March 2, 2006
Published on the web: ?????????

123456789101112131415161718192021222324252627282930313233343536373839404142434445464748495051
525354555657585960616263646566676869707172737475767778798081828384858687888990919293949596979899100101102
PROOF
11Anionic Surfactant Aggregation with (Hydroxypropyl)celluloseVol. 00, No. 00, 2006
XXXX Anionic Surfactant Aggregation with (Hydroxypropyl)cellulose in the Presence of Added SaltRicardo M. de Martins, Carolina A. da Silva, Cristiane M.Becker, Dimitrios Samios, Marcelo Christoff andClara I. D. Bica