Angola: Issues and Options in the Energy Sector
306
Report No.7408-ANG Angola: Issues and Options in the Energy Sector May1989 Report 61 the Joint UNDPAVorld Bank Energy S6ctor Assessment Program ~'This documen4 has a restricted distribution. Its contents may not be disclosed without authorization from the (,-qvernmient, theUNDP orthdWorld,3ank., 9 'I~~ Public Disclosure Authorized Public Disclosure Authorized Public Disclosure Authorized Public Disclosure Authorized Public Disclosure Authorized Public Disclosure Authorized Public Disclosure Authorized Public Disclosure Authorized
-
Upload
khangminh22 -
Category
Documents
-
view
2 -
download
0
Transcript of Angola: Issues and Options in the Energy Sector

Report No. 7408-ANG
Angola: Issues and Options
in the Energy Sector
May 1989
Report 61 the Joint UNDPAVorld Bank Energy S6ctor Assessment Program~'This documen4 has a restricted distribution. Its contents may not be disclosedwithout authorization from the (,-qvernmient, the UNDP or thd World,3ank.,
9 'I~~
Pub
lic D
iscl
osur
e A
utho
rized
Pub
lic D
iscl
osur
e A
utho
rized
Pub
lic D
iscl
osur
e A
utho
rized
Pub
lic D
iscl
osur
e A
utho
rized
Pub
lic D
iscl
osur
e A
utho
rized
Pub
lic D
iscl
osur
e A
utho
rized
Pub
lic D
iscl
osur
e A
utho
rized
Pub
lic D
iscl
osur
e A
utho
rized

JOINT UNDP/WORLD BANK ENERGY SECTOR ASSESSMENT PROGRAM
Reports Already Issued
Country Date Number
Indonesia November 1981 3543-INDMauritius December 1981 3510-MASKenya May 1982 3800-KESri Lanka May 1982 8792-CEZimbabwe June 1982 3765-ZIMHaiti June 1982 3672-HAPapua New Guinea June 1982 3882-PNGBurundi June 1982 3778-BURwanda June 1982 3779-RWMalawi August 1982 3903-MALBangladesh October 1982 3873-BDZambia January 1983 4110-ZATurkey March 1983 3877-TUBolivia April 1983 4213-BOFiji June 1983 4462-FIJSolomon Islands June 1983 4404-SOLSenegal July 1983 4182-SESudan July 1983 4511-SUUganda July 1983 4453-UGNigeria August 1983 4440-UNINepal August 1983 4474-NEPThe Gambia November 1983 4743-GMPeru January 1984 4677-PECosta Rica January 1984 4655-CRLesotho January 1984 4676-LSOSeychelles January 1984 4693-SEYMorocco March 1984 4157-MORPortugal April 1984 4824-PONiger May 1984 4642-NIREthiopia July 1984 4741-ETCape Verde August 1984 5073-CVGuinea Bissau August 1984 5083-CUBBotswana September 1984 4998-BTSt. Vincent andthe Grenadines September 1984 5103-STV
St. Lucia September 1984 5111-SLUParaguay October 1984 5145-PATanzania November 1984 4969-TAYemen Arab Republic December 1984 4892-YARLiberia December 1984 5279-LBRIslamic Republic ofMauritania April 1985 5224-MAU
Jamaica April 1985 5466-JMC6te d'Ivoire April 1985 5250-IVCBenin June 1985 5222-BEN
Continued on inside back cover

ANGOLA
ISSUES AND OPTIONS IN THE ENERGY SECTOR
MAY 1989
This is one of a series of reports of the Joint UNDP/World Bank EnergySector Assessment Program. Finance for this work has been provided, inpart, by the Government of Sweden, the UNDP and the World Bank, and thework has been carried out by the World Bank. This report has arestricted distribution. Its contents may not be disclosed withoutauthorization from the Government of Angola, the UNDP or the World Bank.

This Report was based in part on the findings of a mission which visitedAngola in April/May 1987. The mission was led by Michel Del Buono(Senior Economist) and comprised of Messrs. W. Teplitz-Sembitsky(Consultant, Energy Economist and Deputy Mission Leader), J. Baptista(Power Engineer/Economist), S. Dalin (Power Engineer), M. Grimaud(Natural Gas Specialist), J. Lopes (Power Engineer/Household EnergySpecialist), W. Matthews (Petroleum Specialist - Refining andDistribution), M. Paues (Researcher), R. Sergio (Utility/FinancialAnalyst), R. Soto (Petroleum Specialist - Expioration and Contracts), H.Warfvinge (Forestry Economist). Mr. R. Bates (Deputy Division Chief)joined the mission in its final stage and participated in the round-upmeetings. Mr. Pedro V. Pinheiro reviewed the sections dealing withpetroleum and product marketing procurement. The main authors of thisReport are Messrs. Michel Del Buono and Witold Teplitz-Sembitsky. Apreliminary version of this report was discussed with the AngolanGovernment in late September 1988 and in early February 1989 and wasissued simultaneously in Portuguese and English.

ABSTRACT
Angola has sizeable hydrocarbon reserves, a large hydropotential and ample woodfuel resources. Its ability to export annually12-14 million tons of crude oil has sustained the economy over the pastdozen years of civil war. However, the war has significantly affectedthe energy sector. While the State oil company, SONANGOL, and the oilrefinery in Luanda run well, the power sector has steadily deterioratedover the last decade, and the utilities have run into ever increasingcash deficits. Artificially low prices for both electricity and oilproducts are encouraging wasteful consumption, and not permiczingrecovery of costs, particularly for electric power. Some investment innatural gas is justifiable, to increase the supplies of LPG. With regardto traditional fuels, the Government's "hands off" policy should becontinued in the current situation until a more active policy becomespossible with the return of security in the supply areas.
The proposals made in this report are designed to increase theefficiency of the energy sector, through a number of moderate investmentsin infrastructure, but also through changes in pricing policy, andoverall improvements in sector management. The mission recommends thatthe focus for the electric power subsector should be on maintaining andupgrading the existing electric power infrastructure and improving thereliability of supply. The expensive Capanda project should bepostponed. A power consulting firm has reevaluated the Capanda projectand the Bank has agreed to review the resulting report. To keep theoil sector prospering and avert a precipitous drop in petroleum reservesand production, it is recommended that the Government continuestrengthening SONANCOL and maintaining the competitiveness of contractualterms for foreign oil companies. SONANGOL should resume fullresponsibility for petroleum product trading to reduce the foreignexchange costs involved. Angola's LPG imports could be replaced byrefractionating LPG obtained through the LPG recovery scheme inCabinda. Domestic distribution of oil products should be assigned to anautonomous or semi-autonomous division of SONANGOL, which could,possibly, include private, foreign or domestic capital. In householdenergy, a return to peace would require the development of new strategiesto ensure a less wasteful utilization and more competitive trading of thecountry's woodfuel resources, the demand for which is bound to increaseif and when more reasonable prices are are set for petroleum derivatives.

ABBREVIATIONS AND ACRONYMS
AGIP Italian State Oil Company (Part of ENI Group)BEP Belgian Engineering PromotionBNA Banco Nacional de Angola (the Central Bank)BRASPETRO International Affiliate of Petrobras,
(State Oil Company of Brazil)CABGOC Cabinda Gulf Oil Company
(Joint Venture between SONANGOL and Gulf-Chevron)CELB Companhia Eletrica do Lobito e BenguelaCEPSA Oil refining companyCHEVRON U.S. oil companyCIDA Canadian International Development AgencyCOMERINT A consulting firm belonging to the ENI Croup
(Italy's State Hydrocarbons Holding Company)CONOCO U.S. oil company (Continental Oil Company)DNACO National Directorate for the Conservation of NatureDNERFE Department of New and Renewable Sources of EnergyEEC European Economic CommissionEDEL Empresa de Eletricidade de LuandaELF French oil companyENDIAMA Empresa Nacional de Diamantes de AngolaENE Empresa Nacional de EletricidadeERR Economic Rate of ReturnESMAF Joint UNDP/World Bank Energy Sector Management Assistance ProgramESPA Empresa de Servicios Petroliferos de AngolaE.T.C. Dutch Foundation for Economic ResearchFPA Fina ?etroleos de AngolaFURNAS Furnas Centrais Eletricas, a Brazilian utilityGAMEK Gabinete de Aproveitamento do Medio Kwanza
(Office for the Harnessing of the Middle Kwanza)GDI Gross Domestic InvestmentCDP Gross Domestic ProductHEAC Hidro Eletrica do Alto CatumbelaHFO Heavy Fuel OilIBRD International Bank for Reconstruction and DevelopmentINP Instituto Nacional de PetroleoJPEA Junta Provincial de Eletrificacao de Angola
(utility of Southern Angola)LFO Light Fuel OilLPG Liquefied Petroleum Gas fLRMC Long Run Marginal CostsLSFO Low Sulfur Fuel Oil

ABBREVIATIONS AND ACRONYMS(continued)
MEP Ministerio dti Energia e Petroleo (Ministry of Energy and Petroleum)MPLA PT Movimento Popular de Libertacao de Angola
- Partido do Trabalho (the ruling party)OGE Orcamento Geral do Estado (General Budget)PSA Production Sharing AgreementSADCC Southern African Development Coordination ConferenceSEF Saneamento Economico e Financeiro
(Program for Economic and Financial Restructuring)SOFRELEC French engineering firmSONANCOL Sociedade Nacional de Combustiveis de Angola (State oil company)SONEFE Sociedade Nacional de Estudo e Financiamento de
Empreendimentos Ultramarinos (northern Angola utility)TAU Technical and Adm.nistrative Unit (Energy) of the SADCCTEXACO Texas Oil CorporationTOTAL French oil companyTPE Technopromexport (Soviet engineering company)UINDP United Nations Development ProgramUNIDO United Nations Industrial Development Organization

CURRENCY EQUIVALENTS
US$1 = 29.62 Kz (Kwanza) 1/1 Kz = 3.38 US cents
ENERGY TERMS AND MEASUREMENTS
BCF billion cubic feetCIF cost + insurance + freightDWT deadweight tonsFOB free on boardft/y feet a yearGWh Gigawatt hoursHV high voltagekcal kilocalorieskcal/kg kilocalories per kilogrammekgoe kilogram of oil equivalentkm kilometerkm' square kilometerskWh kilowatt hourskV kilovoltsLY low voltageMN cubic metersMAI mean annual incrementMCF thousand cubic feetmcwb moisture content, wet basisMMBTU millions of British Thermal UnitsMMCF millions of cubic feetMMCFD millions of cubic feet per dayMV medium voltageMW megawattsTCF trillion cubic feett/d tons a dayt/y tons a yeartoe tons of oil equivalent
1/ Official exchange rate prevailing in Angola since 1975.

TABLE OF CONTENTS
Page
SUMMARY, CONCLUSIONS, AND RECOMMENDATIONS ........................... i
I. ENERGY IN THE ECONOMY ....................................... . 1General Economic Framework. . .. .... *. ..... ....... .... .. ..e ooo 1
Petroleum and Public Financ-... .......................... 3International Trade and Bal.,ce of Payments.............. 3Policy Reforms.... ..... . o...* ... e... . o.. .. .. ooo 4
Energy Sector Overview..oo... .... ...... . oo. o ....... *. 4Petroleum Products.ooo .o.oo..*...*o.o....oo.o...o....... 6Crude Oil ...........................ooo.o..ooooo .o ..oo.o 7Natural Gas.................,............................ 10Electricityo .........................................0 10Woodfuelso oo.,...* o.o ., o.*,,o...o...oo..oos.. 11
Energy Demand Projections.... .ooooo.ooooo.o .o.o. ....... 12Institutional Framework....................... 13
SADCC - Energy Technical and Administrative Unit (TAU).. 14Manpower, Technical Assistance, and Trainingo............... 15
Training for the Petroleum Subsector.........................** 15Training for the Power Subsector......................... 16
Angolan Development Strategy in the Energy Sector ........... 17Petroleum Developmenit Strategy and Peace..o.. .o.o...... 18SONANGOL o..o.esooooo.oo.ooooooo.oooo..................... 18Refining and Product Supply .. o.......................... 18Power. wo. eooro *,eoo.. ...***,,,ooo,.,*oooo,o.oo.oo.oo..oo 19Household Energy .............. 20
II.-A. CRUDE OIL: UPSTREAM ACTIVITIES ......... o ................. 21Summary and Recommendations.......e......o... .........o.o.o ...oo 21Oil Exploration and Production History ...................... 23
Oil Production and Investmento ..........................00 24Institutional and Fiscal Framework.......................... 26
Oil Taxation ooo..**,o.o..o.oe.ooeooo.o................... 28Marginal Oil Fed .................... 30
Prospects for Oil Field Development......................... 31
II.-B. GAS SUPPLY AND UTILIZATION...... .... oooo*..o..o. .......... 36Summary and Recommendations. .. e. .... o. * .o. ........ 36Gas Reserves and Utilization................................. 37
Market Potential of Non-Associated Gas................... 39

TABLE OF CONTENTS (Continued)
III. CRUDE OIL: REFINING AND PRODUCT SUPPLY ........ 42Summary and Conclusions... ..... *........ 42
Advantage of a Correct Pricing Policy.. .................. 42R3fining 0................. 43Distribution ......... of ..... 0 .... *...* 44Procurement ........... ****.... . .......... 44
Production, Supply and Consumption Considerations ........... 44Product Trading/Import-Export ........... .... .;.. 45International Comparisons ........ ... .. . ....... . ..... 51Projected Petroleum Product Consumption9. ................. 52
Pricing of Petroleum Products ............................... 53Refinery Gate (RG) Pricing of Products ................ . 54Pricing of Products to Final Consumers ................... 55Economics of Refining vs. Direct Product Supply .......... 57
IV. ELECTRICITY SUPPLY ............ ......................... ....... 60Summary and Recommendations.......o. ...... ....... ... .. ..... . 60Electricity Supply.. .... ........... .* 61
Overall Generating Conditions. .......... o.. o.o.o.o.. .... 61Northern Sys temi a ........... ................. 63Central System ........................................ 63
Southern System tems................ ............ 64Transmission and Distribution ............ ..** ........ 65
Ele ctricity Demands...... .... .. .... ... .... . ..... 66Past Situation... .. ............ 0.... 66Luanda.E Northern tem ............... ,0*00&....... 67E entral and Southern Systems .............. ........ 68Load Curve .Demand Pojecion..... .. ... .... . .... .. 69
Dem and P rojectionsand Uti ..ity..ina.ce..... ....o....... 69SONEFEi Northern System Power Utliie.......... ..... 70ENE: Central and South ern Systems .....O..#......** ..... 70Alternative Demand Projections ............... .............. 71
Electricity Tariffs and Utility Financesi c.* .... ... 73A ccounting onof.ua .if .edManp o.oo* ... .. 74Fin ancial Si tuation of the Power Utilities ............... 75External Debt of the Power Subsector ................o .......... 76Billing and Collection..... ................... .. 77
Manpower, Staffing, and Technical Assistance ... ..........to............ 77Misallocation of Qualified Manpower*............. ..............*****..... .... 78Technical Assistance ......... .. ... ...... 79
Main Issues and Recommendationso ..o.o..................... 79
Org anizati on ....... Pla..ng........ ...,.......... 79Management ... ......... ................,....... 82Financial Situation and Tarif r....i f... f s.O* .. 83Billing and Revenue Collcto l.....c0t.. i on06 .. 8 5Qualified Manoea......p`o..w...e r0.00. .. 86Training ........ ........... ,0 .. 86Technical Assistance.. 87Investment and Expansion Planig n.. n in...g ..... 0 87Investment Priorities ... .**o... oo.......o.o... ,eee 89
TABLE OF CONTENTS (Continued)
IV. ELECTRICITY SUPPLY (Continued)
The Capanda Hydroelectric Project ........................... 92Summary and Recommendations .. ..... **.. - 92Background to the Capanda Project........................ 93Capanda and the Least Cost Expansion Plan.a n.0..,...... 94Long Run Marginal COSILs......................... 95Technical and Financial Information........................... 96Capanda and the Need for Interconnections..... 99Final Remarks ................................. 100
V. FORESTRY, WOODFUELS AND HOUSEHOLD ENERGY....................... 101Summary, Conclusions, and Recommendations................... 101Consumption and Production of Woodfuels, ................... 103
Consumption of Woodfuels.. .. .... ... ........ .... . 103Wood Production ...... * ... .. ,. 106Production Estimate by DNRFE.......... 107Production Versus Consumption.s.um............... 109
Institutional Issues:Administration of the Forestry Sector ........... 110
Marketing and Pricing ........ .. ... .* ........... . 111Organizations of Woodfuels Suppliers..............p 113Issues and Recommendations ............ ...... 114Actions That Can Be Undertaken
Under the Present "No Peace" Situation..u.,..o.... 115The Coast: "No Pea e" ......... l...S1Inland Areas: "No Peace"............ 0.0 ...... . ....... 117
Alternative Priorities in a "Peace" Situation............... 118Proposed Actions .... ................ ................. 118Pilot Project in Huila-Namibe ................... 119
Proposed Supportive Action at the National Levelv.... 121Strengthening of Institutions.......... G . ..... . 122

ANNEXES
Annex 1 Macroeconomic Indicators. ... * ........................ ... 123Annex 2 Institutional Organizations within the Energy Sector ..... 129Annex 3 Angola Energy Balance............................... ..... 137Annex 4 Figures on Petroleum and Case ......................... 144Annex 5 The Petroleum Law.. ..... ..... ..... *..* a.. .. . .. .. . ....... 150
Annex 6 Taxation of the Petroleum Sector ........... ............... 152Annex 7 Financial Analybis of the Ammonia/Urea Plant ............. 158Annex 8 Figures on the Petroleum Product Subsector........... ..... 162Annex 9 Structure of Petroleum Product Prices*.................... 172Annex 10 Economics of Luanda Refinery
Using Actual Historical Values .................... 176Annex 11 Human Resources in the Downstream Petroleum Sector ....... 180Annex 12 Petroleum Product Trading . ............... ...... s. 182Annex 13 Figures on the Power Subsector ......... s.**** ....... 185Annex 14 Electricity Demand Projections - Main Assumptions, BEP,
THEMAG, and Mission Studies ................ 195Annex 15 Angola - Electricity Tariff System...9-9 ......... sees 223Annex 16 Summary of the Capanda Hydro Project ..................... 234Annex 17 Angola: Forestry and Household Energy--Outline of
Four Priority Projects. ................ ...... 0. 253Annex 18 Draft Terms of Reference for Preparation of a Power
Subsector Rehabilitation Project, updating of LCEPfor the Northern System and Costs and Benefits ofHalting Work on the Capanda Project.................... 265
TABLES
1 Angola. Action Plan for the Development of the Energy Sectorxviii1.1 ComparaLtive Economic Indicators, 1985ooe-....... -. .0.00.6.. L.1.2 Angola: Key Economic ndicatorsn...o 31.3 Summary of Angola Energy Balance, 19 86 51.4 Summary of Trends in Commercial Energy Consumption.... 61.5 Domestic Petroleum Product Sales by Sector, 1985.. 8 5.*... ... 71.6 Trends in the Performance of the Petroleum Sector. to......sees 81.7 Indicators for Petroleum Sector Claims on Resources......... 91.8 Commercial Energy Demand Projections..............es........ 122.1 Oil Production and Investments in the Petroleum Sector*.....*. 242.2 Angola: Changes in Oil Tax Revenues and Oil Output, 1985-86.. 302.3 Projections for Future Exploration and Development, 1987-90... 322.4 Oil Production and Reserves, 1986-90. 8 6.- 9....so............. 342.5 Economics of Ammonia/Urea Plant............................... 403.1 Imports of Petroleum Products, 1980-86..0.-.........so... see. 453.2 Jet Fuel Supply 1980-86, Imports vs. Local Refinery-Sourced... 463.3 Petroleum Product Exports (Cargo) 1980-86.................. 473.4 Net Plant Yied. i..... elds. ... a....#...... 483.5 Crude Oil Feed - Luanda Refinery, 1985-86 ................. ....... 483.6 Luanda Refinery Production/Yield Balance, 1980 and 1985-86 .... 493.7 Luanda Refinery Operating Costs and Total Gross Margin, 1986.. 503.8 Inland Petroleum Product Consumption (Sales), 1980-86.........* 513.9 Per Capita Petroleum Consumption--International Comparison,
1984-853..0. P e Pt oleuPo o..nmi...on....................... 523.10 Projected Petroleum Product Consumption ..** ...................... 53

TABLES (continued)
3.11 Official Refinery Gate Prices vs. International Prices*........ 553.12 Illustrative Petroleum Product Pricing (at Kz 44/US$).......... 573.13 Illustrative Petroleum Product Pricing (at Kz 104/U3$)........ 583.14 Summary of Luanda Refinery Economics.......................... 594.1 Installed Available Generating Capacity, 1987................" 624.2 Electricity Generation and Consumption Projections............ 714.3 Energy and Demand Projections, 1986-2000 ........ 0.. 0....... 724.4 Angola: Electric Power Utilities, Sales and Cash Flow, 1986 ... 764.5 Angola: Electric Power Subsector,
Theoretical and Actual Staff Profiles, 1987..-.. ........... 784.6 Electric Power Subsector: Suggested Priority Investment
Program, 1987(88) - 1992. ... . .......... .. * 914.7 Capanda Hydro Project - GAMEK - Investment Program.......0 ..... 974.8 Capanda: Financing Package.. . . .. .. ....... ...... . .* ...... . 985.1 Woodfuels - Priorities for Action ...............G.......,....... 1025.2 Consumption of Household Fuels, 1987......... ... 1045.3 Aggregate Use of Firewood and Charcoal, 1987...* o .... o..,... 1055.4 Hypothetical Annual Wood Fuel Demand ............. 1065.5 Main Forest Formations ......................... 1075.6 Selected Vegetation Groups and
Their Fuelwood Production Potential...**e................. 1085.7 Provincial Fuelwood Production Potential..................... 1095.8 Prices Paid for Firewood and Charcoal
in Seven Provinces, 1987................ .......... ........ 1125.9 Comparative Cooking Costs of Four Household Fuels.o .......... 1135.10 Priority Listing of Activities.....o..................o...... 115
MAP"Angola" IBRD 20067

SUMMARY, CONCLUSIONS, AND RECOMMENDATIONS
1. Angola is a large, potentially rich country with energyresources far in excess of its own needs. Development of some of theseresources has already made a major contribution, if not to thedevelopment, at least to the maintenance of a society facing internalinstability and external aggression. Angola's ability to export annually12-14 million tons of crude oil, worth between US$1.5 and US$2 billion,has certainly helped the population to weather the last ten years withfewer hardships than otherwise. In short, petroleum production,intelligently managed, has financed the past unavoidable and considerabledefense effort and the basic consumption needs of the urban population.
2. The objective of this report is to clarify, for the benefit ofAngolan policymakers, some of the main issues which should be resolved inorder to meet the energy needs of the country most economically and,subsequently, to develop energy as a leading sector in economic growthand development. Needless to say, many of the recommendations made canonly bear fruit if and when a reasonable degree of peace returns toAngola. Therefore, a number of these, such as the recommendation to setpower tariffs on the basis of Long Run Marginal Costs (LRMC), are meantto be implemented gradually. Others, such as the recommendation to setpower tariffs to cover the financial costs of the utilities, can beimplemented immediately. Implementing them would have an immediatefavorable impact on the energy sector, on sector enterprises, and on theefficiency of resource allocation. 1/
3. Many of the problems addressed in this report are known to theAngolan staff working in the sector and to sector managers andtechnicians. The analysis and most of the recommendations presentedherein have been discussed extensively with energy sector policymakers,managers, and staff. The recommendations rest mostly on economic,financial sr technical principles and analysis. No attempt has been madeto deal with the political dimensions of the issues, a matter with whichthe Angolan authorities have to deal, and which could be much morecomplicated than the application of analytical principles that the EnergyAssessment has performed.
4. While the report presents some urgent problems facing Angolanpolicymakers, it is by no means a complete treatment of all issues in theenergy sector. Rather, it provides an overview of the role of the energysector in the Angolan economy and its main problems. It also describesthe main features of the Angolan economy as the framework in which theenergy sector functions, but does not attempt to provide an exhaustive
1/ As of January 1, 1989, the MEP has proposed to increase electricitytariffs to an average of Kz 3/kWh, in line with the analysis of thisreport. This should be sufficient to cover, for the time being, thecash deficit of the utilities.

- ii -
treatment of general economic issues 2/. Coverage of the petroleum andgas subsector is limited to issues such as pricing, taxation, andsupervision of oil companies which the Angolan authorities suggested andwhich are some of the most pressing ones. The report does not give adetailed descriptive picture of the oil subsector. This is, in any case,well known both in Angola and abroad and is reported on systematically bythe petroleum press. Analysis of the electric power subsector does,however, intend to cover all important issues. Through extensiveanalysis, the aim of this report i_. to outline a development strategy forthe energy sector, indicating the broad directions which management ofthe sector ought to take. This is summarized below and developedsomewhat more fully in paragraphs 1.41 to 1.51. The summary of sectorstrategy is followed by discussion of the three main issues that must beaddressed immediately. The report's main recommendations are presentedin the form of an action plan for development of the energy sector. Thisplan is outlined in matrix form in Table 1 at the conclusion of thesummary.
Recommended Development Strategy for the Energy Sector
Oil Exploration and Production
5. In the short run, Angola has little choice but to develop andexploit its oil resources as fast as it can. Continuing and evenincreasing investments in exploration by international oil companiesshould be encouraged to prevent too rapid a drop in oil production in themid-1990s, especially in view of the recent acceleration of oil output.In fact, if current (mid-1988) production levels are to be maintainedindefinitely, Angola needs to reassess whether the current level ofexploration expenditures is sufficient to avert a precipitous drop inreserves and, eventually, in production. To maintain incentives forexploration, the Government should not allow the competitiveness ofcontractual terms for the oil companies to fall significantly behindthose of other countries. The Government also needs to continuestrengthening the State-owned oil company, SONANGOL (Sociedade Nacionalde Combustiveis de Angola), its effective instrument for promotion andcontrol of oil activities. The best way to strengthen SONANGOL is toincrease its managerial and financial autonomy as much as possible, whileimproving its capacity to analyze the economic and technical issues thatarise in its activities. To strengthen SONANGOL's management andsupervisory role, an incentive system should be developed that willenable SONANGOL to attract and retain specialized staff. To improve itscapacity to analyze economic and technical issues, an improved managementinformation system is needed.
2/ This is done in the UNDP/World Bank Report entitled, "Angola: AnIntroductory Economic Review".

- iii -
Refining and Petroleum Product Supply
6. In refining and petroleum product supply, the present situationis broadly satisfactory. The FPA (Fina Petr6leos de Angola) refinery inLuanda runs economically. As a result of its recent de-bottlenecking andlife-prolongation, it should be able to supply most of Angola's needs forquite some time, especially if peace returns soon. Angola can continueto satisfy its excess demand via imports but should act to reducewasteful or low-priority consumption through a substantial increase inprices and the elimination of redundant subsidies.3/ To reduce theforeign exchange costs of petroleum product import/export arrangements,SONANGOL should resume full responsibility for procurement of imports andcargo exports and seek cheaper supply sources. For the short-to-mediumterm, large investments in refinery capacity can probably be postponedbecause of the great uncertainties in forecasting demand. At a time whenboth the State and SONANGOL need to devote resources to petroleumexploration and production, purchasing most or all of the stock or assetsof the refinery cannot be a high priority. However, if a share ofrefinery ownership can be obtained without great, net outlays of Angolanpublic resources in the framework of a reshuffling of assets and claimsbetween SONANGOL, FINA and the Government, then such a transaction couldtake place.
7. Refinery and distribution operations need to be studied toimprove upon the cost-plus system that is common to both. In refining,incentives toward greater eTficiency could be built in and applied. Oneway to achieve this goal would be to have FPA share in any savings earnedthrough improved productivity and be penalized for inefficiencies, e.g.,by paying some share of them. To improve efficiency in distributionoperations, rather than creating incentives and penalties, it might beeasier to spin off distribution to a relatively autonomous affiliate ofSONANGOL. Additional work would be needed to define the precise form ofth_ incentive system. This is proposed as a subsequent ESMAP activity.
Natural Gas
8. In general, prospects for development of non-associated fieldsare not promising. Rather than exploiting these fields, it is better toleave the gas in the ground until economic uses can be found for it. Noinvestments should be made in assessment or delineation of gas fieldsunless major economic uses for the gas have been identified. Of theassocieted gas currently produced, about 50% is being used productively.New lift and reinjection schemes and the expansion of existing ones arelikely to increase the utilization rate to 70% by 1990. As regards thefurther use of associated gas, highest pricrity should be given to an LPGfractionation scheme in Cabinda which would replace LPG imports, and an
3/ In the absence of a reliable exchange rate, the report finds itdifficult to make precise price recommendations. However, internalprices of petroleum derivatives are widely held to be negligible andin need of serious adjustment, if only to dispel the false idea thatpetroleum products are costless.

- iv -
export-oriented LPG/condensates recovery program in Block 3. If thefirst project goes ahead, an LPG bottle rehabilitation plant would berequired as well. SONANGOL's ability to study and supervise gas-relatedprojects should also be strengthened by forming around the few peoplecurrently dealing with gas in SONANGOL, a small unit responsible for gasmatters. While large petrochemical projects (such as ammonia urea) seemto have rather dim prospects, if foreign investors are prepared to takeall risks, Angola could well accept such projects, provided a reasonableprice were paid for the gas.
Electric Power
9. Angola's electric power subsector still operates reasonablywell but has suffered from more than a decade of neglect, and the war hasfurther contributed to this problem. Demand has stagnated, especially inindustry, and households have become the main consumers of power. Giventhe great uncertainties in forecasting demand, a risk-averse stance withrespect to investments would seem the preferable strategy. Morespecifically, this report suggests the following strategic guidelines:
(a) maintain a reasonable quality of service, without sizeable newinvestments;
(b) launch a rehabilitation program for existing dams, powerplants, and transmission grids;
(c) strengthen key central management functions, such as system andfinancial planning and equipment standardization, but maintaina decentralized operations structure; and
(d) set the base for future growth by strengthening management,accounting, and finance and ensuring that the utilities havethe managerial autonomy which they require for efficientoperation.
Additions to capacity should be very low on the list ofpriorities until after the mid-1990s. The current centerpiece ofinvestment in electric power, the Capanda project, should be postponedand re-examined in the mid-1990s when, hopefully, a better assessment offuture demand would be possible.
Household Energy
10. For household use, the cities presently receive bothtraditional and commercial energy. A major problem is the dramaticunder-valuation of commercial fuels such as Liquefied Petroleum Gas (LPG)and kerosene. With a more balanced pricing policy in the future and withthe removal of inefficiencies and risks in the supply of firewood andcharcoal, consumption patterns even in the cities might not sooverwhelningly favor commercial fuels. For the present, the Government

v
needs to make sure that supplies to the cities are maximized. Theessentially correct policy of keeping "hands off" trade in traditionalfur'ls should continue in the short run. However, with the return ofpeace, the situation should be reviewed with the aim of: (a)establishing policies to promote a more efficient and competitive tradein fuelwood and charcoal; and (b) economizing on domestic use of some ofthe commercial fuels, thus creating exportable surplus. This longer-termstrategy is viable because the country's forestry/biomass resources aresufficient and sufficiently, broadly distributed to satisfy the needs ofthe population under normal situations. No large, urgent interventionsin forestry are really necessary or nossible at present. However, someuseful actions are suggested in paragraphs 5.34 to 5.44.
Main Issues in the Energy Sector
11. There are a number of issues and problems in the Angolan energysector. Many are analyzed and discussed in the body of this report. Themost important ones, however, are highlighted in the paragraphs below.For ease of discussion, they are organized under three headings:
(a) investment programming in the electric power subsector;
(b) price policies and financial problems of sector enterprises;and
(c) management, qualified manpower, training, and technicalassistance.
12. These issues are interrelated. They are probably of aboutequal importance in that they must all be resolved to allow improvedefficiency and viable development of the sector. While there are someproblems in the petroleum and gas subsector, none seem really grave orurgent, except for pricing of petroleum products, which is discussed inparagraphs 16 to 20.
Investment Programming in the Electric Power Subsector
13. Investment programming in the electric power subsector reflectsan economy-wide weakness in project analysis and selection. It alsoreflects a weak institutional capability in the utilities and in thesupervising ministries. As a result, real needs or problems are notidentified and projects to satisfy or resolve them are not carried out.An extreme case of the above is the centering of the investment programof the electric power subsector on the Capanda dam. This project, whichmay end up costing more than US$2 billion, is being considered despitethe fact that it does not resolve the subsector's problems. Generatingcapacity would be added that, even allowing for a high degree ofuncertainty over demand, would not be needed for many years. Moreover,this additional capacity could not be used because transmission and

- vi -
distribution facilities are limited as well as run-down, and could nothandle increased supply. Furthermore, an enormous share of generatingcapacity (about 50%) would be concentrated in one distant region of thecountry at a time when insecurity makes transmission iines vulnerable.This investment at Capanda would create very little additional revenuefor the utilities and thus could exacerbate rather than alleviate thefinancial problems of the sector. Given the commercial nature of thefinancing plan for this investment, carrying it out would greatly inflatethe sectorts external debt and even threaten availability of free foreignexchange if future oil output were offered as a guarantee. Recent loansobtained in an effort to fill a large gap in the financing plan (inexcess of US$500 million) are at wholly inappropriate terms (7.5%, 2%insurance fee, two years grace, and 90 months amortization period).
14. In reality, the needs of the electric power subsector are quitedifferent from those that a project such as Capanda would resolve. Thesubsector needs to catch up on major maintenance, which was neglected formore than a decade. It needs this for generating plants, transmissionlines, and distribution grids. Given the u:certainties, firm forecastsare not possible, so that che subsector needs flexibility to respond todemand wherever in the country it might arise. To achieve flexibility,improvements and small additions to capacity are needed everywhere, inthe Northern, Central, and Southern Systems.
1J. A project to resolve these problems is essentially themission's main investment proposal for the electric power subsector(paras. 4.90-4.95). Briefly put, the objective of the project recom-mended in this report is to rehabilitate power subsector facilities sothat they are able to operate at or near their installed capacity, withsome small additions in some places, such as Matala and Lomaum. Sincepresent available capacity is only about 59% of installed capacity (i.e.,27i MW out of 470 MW) this rehabilitation project is a substantial one.It is also a much better risk-averse response to the problems of thepower subsector, and the uncertainties it faces, than a lumpy investmentsuch as Capanda. In brief, therefore, this report recommends investmentsin the power subsector of about US$200 million (including technicalassistance) over the next five years, as opposed to present programsexceeding US$1 billion.
Pricing
16. Energy pricing is an area where immediate and radical policychanges are both imperative and feasible. Severe price distortions arean economy-wide phenomenon and must be addressed in an overall policywhich seeks to revive the allocative role of markets. Under theprevailing regime, prices perform a passive, accounting function or serveas an inefficient redistributional mechanism. These prices do notprovide signals to assist producers and consumers in their decisionsabout the rational use of scarce energy resources.

a-- vii -
17. The relative price of energy in Angola has fallen precipitouslyin the last several years as a result of basically fixed nominal pricesfor petroleum products and fixed nominal electricity tariffs. Otherprices have increased at rapid rates. As a result, energy prices,including tariffs, have become negligible in real terms, resulting inwasteful consumption on the demand side, and large financial deficits forenergy supplying firms, in addition to sizeable subsidies paid orrevenues forgone by the State budget. Since energy prices have becomenegligible, subsidies have become redundant, i.e., whether LPG is sold atKz 15 per kg or Kz 25 (at a definite cqt to the budget) is essentiallyimmaterial at the present purchasing pL Ir of the Kwanza. Justificationfor these consumption subsidies is therefore non-existent. Similarly,crude oil for domestic refining costs the State budget approximately US$3per barrel in subsidies, but results in no appreciable reduction in thecost of oil products to consumers. The pricing, taxation andsubsidization system for oil products is described more fully inparagraphs 3.27 to 3.36.
18. Briefly put, this report suggests that oil products be sold atprices which reflect their opportunity costs at a suitable exchangerate. Products should also be taxed at roughly similar rates (becausethey are close substitutes). Automotive fuel prices should include alevy for road maintenance. In paragraphs 3.35 to 3.36 some calculationsare made to determine illustrative prices for oil products. With morerealistic exchange rates, and minding the revenue needs of the budget,this report calculates that prices of oil products would need to beincreased three- to four-fold. As a result of these higher prices,excess low-priority consumption might be reduced somewhat, yielding agreater exportable surplus. Meanwhile, the Government would reap enoughrevenues to substantially reduce the current budget deficit. This wouldhave a positive deflationary impact, even if public (defense) use ofproducts were to be tax-exempt.
19. In the case of electric power, the immediate goal should be torestore the financial viability of the utilities. In the longer run, theaim of policy should be to base tariffs on Long Run Marginal Costs. Inthe meantime, electricity tariffs have become meaningless (the annualcost of electricity supply to a high income urban home is equivalent to afew cans of beer) ard the financial position of the electric powerutilities, untenable. In the immediate, this report suggests thatelectricity tariffs be increased three- to four-fold to urgently directsome resources to the utilities. This would relieve the budget fromhaving to supply Kz 1 - 1.5 billion in subsidies each year. In themedium term, an appropriate goal could be that tariffs should cover allfinancial costs as well as a share (say 20%-25%) of a reasonableinvestment program, or more simply, obtain a modest return on assets (say4% or 5%) in addition to covering all costs.
20. Price measures are meant to help improve efficiency, and not tosubstitute for it. Thus, they need to be accompanied by other supportiveactions. For example, in oil refining and distribution, the cost-plus

- viii -
system governing these activities gives no incentive to cut costs, assavings are automatically transferred to the budget, and losses are auto-matically covered by the budget. A formula tying reductions in costs ofrefining with compensation to FPA needs to be defined and implemented.This formula could be defined in a subsequent ESMAP-assisted task.Similarly, the distribution activities now carried out by SONANGOL couldbe carried out more efficiently in a separate enterprise, or a veryautonomous affiliate of SONANCOL, and without the cost-plus arrangementcurrently in force. The easiest system could be a tax regime thatapportions the benefits of greater efficiency between the budget and theenterprise. For the power utilities also, increased tariffs will nothelp unless they are accompanied by measures to strengthen billing,collections, and technical and financial management generally, includingsystem planning and project selection under uncertainty.
Management, Manpower, Training, Technical Assistance
21. The shortage of skilled and trained manpower which Angolainherited, and which was exacerbated by the exodus of Portuguesesettlers, still remains one of the most pressing problems to beresolved. Many of the shortcomings in the selection, preparation, andexecution of basic policies to a large extent are attributable to thelack of qualified and experienced personnel. These constraints alsoapply to the energy sector though it appears that the energy subsectors,notably the oil enclave, are somewhat better off than the rest of theeconomy.
22. Not suprisingly, the petroleum subsector has been leastaffected by the country's shortage of managerial capabilities andtechnical skills. So far SONANGOL's high- and medium-level managementpositions have been staffed with comparatively experienced and competentpersonnel. In addition, SONANCOL has had access to, and has extensivelyused, the expertise of foreign oil companies and consulting firms, andthere is little doubt that it should continue to do so in the future,while trying to reduce the cost by tapping potential sources ofconcessional technical assistance. However, other existing sources ofknow-how, such as on-the-job training programs provided by foreign oilcompanies, are biased towards technical and engineering skills. SONANGOLitself more urgently needs additional expertise in the areas ofmanagement, supervision, financial analysis and economics.
23. A unique feature of Angola's Petroleum Law is that all oilcompanies are required to assign US$0.15/bbl produced, to a training fundwhich is controlled by the Ministries of Finance, Education and theMinistry of Energy and Petroleum (the MEP, Ministerio de Energia ePetr6leos). At current production rates, these payments amount toUS$16.8 million per year (Kz 500 million). However, control over thesefunds is unclear. A more transparent mechanism should be established tomake sure that the resotrces, which are paid in hard currencies, arechannelled into areas with highest educational priorities.

- ix -
24. In 1986, the power sector, excluding the Office for theHarnessing of the Middle Kwanza (GAMEK, Cabinete de Aproveitamento doMedio Kwanza) employed about 4,000 persons. About 100 of these wereexpatriates. While the know-how provided by the expatriate employeesproved remarkably cheap (US$1,000 per man-month), it contributed littleto improving the management and planning capabilities of the powerutilities. With only 51 higher-level technicians and professionals (30Angolans plus 21 expatriates), the power sector is extremely short ofexperienced and qualified manpower. Moreover, a disproportionate shareof the higher-level staff is concentrated in the head office of thenational electricity company (ENE, Empresa Nacional de Electricidade) inLuanda so that many of the operating utilities are left without anyprofessional back-up. Given the formidable task of rehabilitating thebasic infrastructure of the utilities and improving the sector's overallmanagement capabilities, an additional and sizeable inflow of financialand human resources will be required. The technical assistance needed toimprove the efficiency and financial viability of the power utilitieswould amount to 105 man-years (equivalent to US$10 million) over a three-year period. Much larger sums would need to be raised in order tofinance the implementation of a minimum rehabilitation program centeredon strengthening the operational capabilities of the power sector.
25. Compared to the immediate needs of the electricity subsector,external support to the country's forestry administration in the area ofwoodfuel resource management is not as pressing. Thus, priority for theassignment of qualified manpower, whether national or expatriate, shouldgo towards strengthening operating companies in the various subsectors(power utilities, SONANGOL), the policy-making units of the MEP, and,eventually, the staff of the central power planning in a yet to becreated decentralized national power company. Priority should be givento training efforts and technical assistance which:
(a) meet the manpower requirements of the power subsector; and
(b) keep the managerial capabilities of SONANGOL at their currenthigh level (with small improvements where necessary, forexample in examining issues of gas utilization).
Other Conclusions and Recommendations
26. The following sections of the Executive Summary moresystematically enumerate the conclusions and recommendations of thisstudy.

x
Oil and Gas
27. Angola depends on oil income economically and politically.General Government policies on oil development have been enlightened, andthus deservedly successful. A workable modus operandi was establishedbetween SONANGOL and the MEP (which has the overall policy andsupervisory mandate over oil) in supervising oil activities in Angola.Even though its enabling legislation empowers it to explore for, produce,transport, refine and distribute oil, SONANGOL has two major practicaltasks. The first is to encourage foreign investment in oil explorationand production and to negotiate advantageous contractual terms withinterested oil companies. The second is to supervise and control foreignoil companies and to raise the funds required to meet its share ofinvestment programs. Therefore, the performance of SONANGOL should bejudged on its success in mobilizing and steering external resources intooil operations and in supervising and controlling foreign oil companies.For these reasons, for the time being SONANCOL should minimize itsinvolvement in upstream operations and other extraneous activities unlessthese strengthen its supervisory role. Similarly, the domesticdistribution and marketing operations of SONANGOL could be spun off intoa relatively autonomous division or subsidiary, if not privatized.Although it is inescapable that SONANCOL remain under the politicalcontrol of the State, it should be granted greater managerial andfinancial autonomv. SONANGOL's ability to raise the funds required tomeet its financial obligations is crucial. Therefore, the Governmentshould not routinely use oil as collateral except for oil operations.SONANGOL's ability to adequately control and supervise the activities offoreign oil companies can be improved by establishing a more efficientmanagement information system. This could be done with ESMAPassistance. Training of qualified staff, in conjunction with thedevelopment of an incentive structure for skilled personnel, is animportant task. However, a more efficient utilization of existingtraining opportunities and institutions should suffice, rather than thecreation of new or specially designed programs. A suitable incentivesystem could play an important role in attracting and retainingmanagerial and highly specialized staff. Technical assistance wouldstill be needed both to carry out complex tasks and to help train newerstaff.
28. So far, the taxation system for the oil sector has workedwell. Tax legislation has allowed the Government to capture windfallprofits, while oil companies have been protected against a profit squeezein periods of declining oil prices. It would therefore be counter-productive to make fundamental changes in the fiscal terms that apply tooil companies.
29. Part of the existing legislative framework was established inthe 1950s and does not match the contractual approach and taxation systemembodied in the more recent joint venture and production-sharing

- xi -
agreements (PSAs). There are also differences in the contractual termsfor joint venture and PSA operations. Although the Government is readyto deal with these problems pragmatically, it might be preferable to makesmall textual adjustments to the text of the legislation and contracts.
30. Significant quantities of associated gas (currently about 50%of total production) are used for gas lift and reinjection schemes. Newlift and reinjection schemes are underway, and existing ones are beingexpanded. A target utilization rate of 70% is the goal for late 1990, upfrom the present 50% or so. This is a reasonable objective. No economiclarge-scale projects are presently known. Thus, prospects for thedevelopment of non-associated gas fields are dim. The only large-scaleproject capable of using sizeable quantities of natural gas is theproposed export-oriented ammonia/urea plant which would require about50.6 MMCFD of gas. However, in view of the depressed internationalfertilizer market and given that gas supply costs are relatively high,Angola would not have a substantial comparative advantage even in a well-managed plant.
31. SONANGOL's ability to study and supervise even a limited numberof gas-related projects should be strengthened by building a small unitresponsible for gas matters, using as a nucleus the few people currentlydealing with gas in SONANGOL. This unit should be in a position tomonitor ongoing gas-related activities more thoroughly and to cocrdinateplans for future projects with related activities in other subsectors.
32. Highest priority should be given to two projects presentlyunder consideration by SONANGOL: the LPC recovery scheme in Cabinda, andthe export-oriented LPC/Condensates recovery program in Block 3. Otherprojects which deserve further investigation in the short term are:the planned LPG bottle rehabilitation plant, the proposed dual-fuelthermal power plant in the Soyo area, and the onshore plant for recoveryof LPG at Malongo costing US$3-4 million (provided that demand will beadequate at the higher LPG prices which the report proposes).
33. Pricing of petroleum products at the refinery gate and to finalconsumers, and pricing of crude oil for domestic refining, are areaswhere substantial reforms could be implemented most easily. Manycountries use oil prices as a fiscal mechanism to raise public revenuesand to impress on the consumer the fact that oil is a scarce, costly andexhaustible resource. Both these aspects of oil pricing could fit wellwith the present economic situation of Angola. Yet, specific pricingrecommendations are difficult to make in the macroeconomic policyenvironment of Angola. However, given the extreme overvaluation of theKwanza, the standard economic prescription of using opportunity costs asthe basis for pricing would only fully make sense after the value of theKwanza has been adjusted downwards to some sort of equilibrium level (orto a level nearer to equilibrium than is currently the case). But sincefinal petroleum product prices in Angola are below border prices even atthe highly overvalued, present, official exchange rate, and the crude oil

- xii -
for local refining is subsidized, these shortcomings would need to becorrected first. A series of step adjustments in prices would probablybe easiest to apply. The steps could be as follows, using hypotheticalexchange rates:
Step One: Eliminate all subsidies to crude and products includingLPG, and immediately bring all prices to border levelsat the official rate of exchange.
Step Two: Adjust all petroleum product prices to an exchange rateof, say, Kz 100/US$.
Step Three: By this time, the Program for Economic and rinancialReconstruction (SEF, Saneamento Econ6mico e Financeiro)should be in progress and a more adequate exchange ratemight be available to guide the MEP in the pricing ofpetroleum products. Should the exchange rate remainfixed in spite of notable domestic price increases, theMEP could use an index of inflation to keep realproduct prices stable.
34. The refining of indigenous crude in Luanda in a hydroskimmer isan economically viable product-supply strategy for Angola as compared toimports of products. The FPA refinery is a reasonably run and well-maintained facility. The Government seems intent on purchasing thisrefinery or a genuine controlling interest in it. This would seem a low-priority use of limited Angolan funds unless it is done in such a way asto minimize the drain on public resources. Furthermore, lack ofincentive to reduce costs and possibly high use of expatriate labor arethe most apparent contributors to high operating costs. The FPA refineryoperates on a "cost-plus" refinery gate pricing arrangement which givesno particular incentive for cost minimization and optimization ofoperations. Therefore, efforts should be made to design and implement apricing scheme which encourages the refinery to operate in a moreefficient way--for example, through a tax scheme that would shareproductivity gains between the Government and FINA. This could be donein the context of an ESMAP activity.
Electric Power
35. Angola's power subsector, which still operates reasonably well,has suffered from more than a decade of neglect. By 1987 the firmcapacity had deteriorated to 275 MW, which is less than 60% of totalinstalled capacity. Transmission and distribution lines have hardly

- xiii -
received any niaintenance since 1975. Though the present state of theutilities' accounts makes it almost impossible to assess their financialperformance, there was little doubt that in 1987 the global cash deficitof the sector would approach the level of US$50 million (or about Kz 1.5billion).
36. In order to safeguard a reasonable quality of service and togradually restore the utilities' financial viability, strong measures arerequired immediately. Priority should be given to: improving thefinancial performance of the utilities; strengthening the utilities'operational and managerial capabilities, including accounting, billing,and collection systems; reorganizing the subsector to provide moreinternal managerial autonomy; and, most importantly, reorienting theinvestment program to favor rehabilitation of the existing physicalinfrastructure rather than expansion of capacity.
37. A significant and sustained improvement in operations,maintenance and management requires the influx of know-how and finance.Operational support for the Central and Southern Systems as well asadvisory assistance to a proposed task force would require about 35 man-years of long-term consultants plus some short-term consultants at atotal estimated cost of US$10 million.
38. The financial losses of the power sector are no longersustainable. Therefore, cost recovery is a matter of utmost concern. Toensure cost recovery, there should be immediate increases in tariffs upto 400Z. The utilities' billing and revenue collection procedures shouldalso be improved. In the short term, tariffs need to be simplified andrestructured to enable the utilities to meet simple financial targets.In the medium term the adjustments should be designed so as to bring thelevel and structure of the tariffs in lire with Long Run Marginal Costs.
39. In the past, ENE--the national power company--was neither giventhe actual means nor the authority to assume the management of thesubsector in a reasonably efficient way. Therefore, measures should beinstituted to decentralize all operations and maintenance and part of theproposed rehabilitation activities to the Regional Directions, as this iscloser to actual practice than the theoretical centralization implicit inthe formal structure of ENE. At the central level, a small planning unitshould be established and be responsible for strategic matters (demandstudies, capacity planning, tariff studies, etc.). Such a unit iscurrently being established in the MEP.

- xiv -
Investment Priorities in Electric Power
40. In the short term, investment priorities must center on repair,rehabilitation, and resumed maintenance of existing facilities.Rehabilitation should proceed simultaneously on all three systems as bothsecurity and economics relegate interconnection of the systems to afairly distant future. The medium-term goal should be to fully restoresupply capabilities in line with installed capacities. The investmentprograms for the electric power subsector as a whole, excluding Capanda,totalled about US$100 million for 1987 and 1988, 75% of it in foreignexchange. A program of this size is beyond the financial and technicalcapabilities of the utilities. A scaling down of future investments isthus inevitable. A tentative priority investment program described inChapter IV should be based on the following considerations: assignhighest priority to rehabilitation of existing facilities; strive forimproved reliability of supply to main cities, which are also the mainindustrial areas; improve supply to Luanda by addressing the mainproblems in generation, transmission, transformation, and distribution;postpone most small projects in isolated systems, mainly for lack ofmanagerial/technical staff, even if equipment has been purchased;postpone new rural/village electrification until hydro supply conditionshave been improved and tariffs readjusted; limit new connections incities until tariffs are adjusted and (especially in Luanda) untilbilling and collection procedures are substantially improved; and plan asubstantial amount of technical assistance to support ENE task forces inbig rehabilitation projects such as Lomaum and the Southern System.
41. A minimal priority investment progran. in line with the abovepriorities and considerations was prepared by the mission incollaboration with the staff and managers of the utilities and the staffof MEP. Given the above priorities and constraints, the mission sees nouseful role for additions to capacity of the scale being considered atCapanda. The priority investment program should be carried out over thenext five years and would cost about US$200 million (Kz 6-7 billion).This seems to accord better with the financial and managerial/technicalpossibilities of the subsector. However, it would still be a heavyfinancial and management burden on the utilities.
42. A general recommendation, in addition to the considerationslisted above, is to subject every substantial project (say, exceedingUS$2 million) to e:onomic and financial feasibility analysis.
Capanda
43. The Government's apparent decision to advance the constructionof a dam and power plant at Capanda presents several major issues.Although the analysis done is preliminary and conclusions should be takenas tentative, several robust conclusions emerge. First, Capanda

- xv -
represents a significant departure from the lowest cost expansion path,even if it has not been updated recently. Second, the huge capacity(4 x 130 MW) planned for Capanda will probably not be needed until wellinto the next century. Third, it is a project which, by itself, will notimprove the reliability of service in the Northern System and will notmitigate the problems of the other two systems at all. Fourth, actualand expected low demand growth rates a.d the availability of substantialthermal reserve would allow the postponement of this irreversible majorinvestment decision during this period of uncertainty and stringentfinancial conditions, at a very low risk, until the economic environmentbecomes more stable and a better perception of the potential medium- andlong-term demand is possible. Fifth, making,the investment in Capandawill add substantially to the public external debt burden (commercialfinancing). It may also undermine Angola's ability to finance the vitalpetroleum development program (on which its future export earningsdepend) because part of Angola's future petroleum output has beenearmarked as a repayment guarantee on some of the Brazilian financing forCapanda. Sixth, only about half of the financing required for theproject is firmly in place. That is, out of a total cost optimisticallyestimated at about US$1.5 billion* about US$528 million has been securedon commercial terms from Banco do Brazil (and these funds willessentially run out by early 1989) for civil works, and about US$275million have been firmly committed by the Soviet Union forelectromechanical equipment only. Thus, only about US$800 million hasbeen committed. For this reason, it might be preferable to stop workdeliberately rather than wait until funds run out. An alternative andbetter justified project would be the rehabilitation of all existingsystems and small-capacity additions. In any case, it is likely that theCovernment of Angola will be unable to raise funds to complete theproject. Meanwhile, a consulting firm has been retained to reevaluatethe Capanda Project, and the Government has requested World Bank commentson the resulting report.
44. In the final analysis, therefore, this report recommends thatthe existing least cost expansion plan be updated, based on the bestavailable demand projection, so as to confirm the stage at which Capandapower should be developed. Alternative expansion sequences in theNorthern System (with different timings for Capanda and complementaryworks in Cambambe) should be evaluated in full detail and in the contextof the entire power subsector, with all economic and financialimplications reassessed in a realistic framework of demand projectionsand updated costs. To assist in these tasks, this report includes Termsof Reference (see Annex 18) for the carrying out of a Power Subsector
* This total cost figure is approximate but excludes the cost of atransmission line to Luanda and of transformers and substations. Italso excludes physical and price contingencies. With all theseelements, and assuming good cost control measures--which are not nowin evidence--the overall cost might well exceed US$2.0 billion.

- xvi -
Investment Review which would further identify and start preparing therehabilitation of the three power systems, review or carry out theeconomic financial analysis of major projects and study the feasibilityand costs of stopping the work on Capanda dam, protecting the worksalready executed and finding uses for materials and equipment alreadyprocured.
Forestry, Woodfuels and Household Energy
45. While available statistics are few and unreliable, two recentstudies and mission estimates have produced a picture of the situation ofsupply and demand for forestry and woodfuels in Angola which can besummarized as follows.
46. Most Angolans use firewood or charcoal for cooking andheating. In the cities, however, a significant minority use LPG. Theaggregate consumption of firewood is in the order of 2.5 million tons/yand of charcoal about 0.5 million t/y, requiring a total removal of 6million tons or about 10 million m3 of wood. Angola possesses some 50million hectares of dense forests and a further 55 million hectares ofwoodland and savanna. Together these forests are capable of producingmuch more wood on a sustained basis than is at present consumed in thecountry.
47. Out of Angola's nine million inhabitants, almost half live inareas with more or less pronounced fuelwood shortages, either on the drycoast or in inland cities. In the shortage areas, the group hardest hitis the periurban population. They have limited access to alternativefuels (more easily available in urban centers) and, unlike most ruralpeople, they cannot gather their own fuelwood for free. They are,furthermore, penalized by high market prices for woodfuels: the cost perthousand useful kilocalories is only Kz 10 for LPG but 10 to 20 times asmuch for firewood and charcoal.
48. The institutional framework for energy forestry in Angola isweak. Exploitation of fuelwood is regulated by the National Directoratefor the Conservation of Nature (DNACO), which issues cutting licenses.The DNACO, however, has no resources to ensure that the actual cuttingconforms to the licenses issued.
49. The creation of new forests is not the best (cheapest) way tosolve the fuelwood problem. This is primarily because the dry coastalstrip of Angola, where most of the people experiencing fuelwood shortagelive, is poorly suited for tree-growing.
50. This report proposes several sets of priority activities at theregional and national levels. Four are regional in character while twoare national. The first regional set of activities covers the provinces

- xvii -
of Huila and Namibe, a region where the security situation is fairlygood. It includes both city-oriented activities like the improvement ofstoves and rural-based ones like improved supply systems for firewood andcharcoal. The other three regional sets of activities all cover urbanareas: one for Luanda; one for Benguela/Lobito; and one for Huambotownship. For Luanda and Benguela/Lobito, it is proposed that emphasisbe put on increased use of LPG as a domestic fuel. In Huambo township,improved stoves should be given first priority.
51. Two national activities should be carried out in support of theregional ones. One covers the development and introduction of improvedstoves and the other concerns initial development work and trials inagroforestry. The activities listed, regional and national, have beengrouped into four projects. They are the following:
(a) a pilot project in Huila-Namibe, to integrate the variouscomponents of energy forestry, including the development ofagroforestry;
(b) improved cooking stoves, mainly for the urban and periurbanpopulations in Luanda, Benguela, Lobito, and Huambo;
(c) an improved supply system for woodfuels, mainly for the citiesof Luanda, Benguela, Lobito, and Huambo; and
(d) continuing, partial replacement of firewood and charcoal by LPGas a domestic fuel for the urban and periurban population onthe coast, at least until more peaceful conditions improvesupplies and lower the prices of woodfuels, and economicadjustment measures increase the prices of petroleum products(LPG, kerosene).
52. Table 1 presents in matrix form an overview of the variousactions proposed in this report to enhance the development of Angola'senergy sector. Each action is assigned a priority and a time frame forcompletion. The time frame is divided into short term (actions to beimplemented immediately), medium term (actions to be implemented over twoto three years), and long term (actions to be considered over a periodlonger than three years). Estimated costs are given for specificprojects, where these are already known or have been calculated for thepurposes of this report.

- xviii -
Table 1: ANGOLA : ACTION PLAN FOR THE DEVELOPMENT OF THE ENERGY SECTOR
Objective Action Cost Priority Time Frame a/
A, Electricity
(1) Operational Increase technical assistance FIRST ST - MTstrengthening and training in preparationof utilitles. for rehabilitation program.
(2) Reorientation of Plan and execute a Power USS200 million FIRST ST - LTInvestment policy to- Sector Rehabilitation (of which USSIOwards repair and main- investment program. million to tech-tenance of the sector's nical assistance)existing facilities. between 1988-92.
(3) Financial recovery Raise tariffs 300-400% - FIRST ST-MTof the power sector. immediately. Design and
implement gradually a moreeconomically efficient tariffpolicy. Improved billing andrevenue collection system.
(4) Administrative and Except for system planning, - SECOND STInstitutional reform decentralize operations andof the power sector. maintenance.
B. Crude Oil
(1) Maintenance of Provide SONANGOL with a - FIRST MT - LTlevel of Investment greater managerial andrequired to prevent financial autonomy.the crude oil produc-tion rate fromdeclining,
(2) Strengthening of Establish an Improved - SECOND MTthe supervisory role management informationof SONANGOL. system; provide an incen-
tive system to attract andretain specialized staff.
(3) Improvement In Standardize the fiscal - THIRD MT - LTthe competitiveness treatment of oil companies;of contractual terms revise outmoded legislation.for oil companies.
a/ ST = short-term; MT = medium-term; LT 5 long-term.

- xix -
Objective Action Cost Priority Time Frame a/
C. Natural Gas
(1) Reduced dependence LPG fractionating offshore USS2-3 million FIRST STon LPG imports. Cabinda to supply 30,000
t/y to the domestic market.
(2) Increase In export LPG/condensates recovery in to be determined SECOND MT - LTrevenues. Block 3.
(3) Improvements In LPG bottle rehabilitation US$5 million SECOND MTthe supply Infrastruc- plant in Luanda.ture for domestic LPG.
(4) Improved power Dual fuel 15 MW thermal USS20-25 million SECOND/ MTgeneration In Isolated power plant In the Soyo area TN lIFDaceas. and rehabilitation of 10 MW
gas-fired turbine in Cabinda.
(5) Increase In LPG Onshore plant for LPG USS3-4 million THIRD ST - MTsupply to domestic recovery at Malongo.market.
D. Petroleum Products
(1) Removal of a) Eliminate all direct - FIRST STdistortions in subsidies and adjustpetroleum product refinery gate prices toand crude oil prices. higher levels.
b) Increase the price level - FIRSTIn accordance withadjustments in exchangerate.
(2) Increase In the Modify existing cost plus - MTefficiency of arrangement.refinery operations.
(3) Reductlon In the SONANGOL to resume full res- - SECOND ST - MTforeign exchange ponsibility for procurementcosts of petroleum of imports and cargo exportsproduct Import/- (Low Sulfur Fuel Oil) and seekexport arrangements. cheaper supply sources.
a/ ST a short-term; MT a medium-term; LT = long-term.

- xx -
Objective Action Cost Priority Time Frame a/
Petroleum Products (Continued)
(4) Reduction in the SONANGOL to delegate the - SECOND ST - MTcost of domestic wholesale business to anpetroleum product autonomous affiliate.distribution. Transport and retail
business to be privatizedgradually
E. Woodfuels : Scenario : No Peace
Coastal Areas
(1) Improved fuel Increase the supply of USS5 or 6 million FIRST M4Tsubstitution. Liquefied Petroleum Gas.
(2) Increase In Produce and disseminate USS100,000 SECOND NT - LTend-use efficiency for improved stoves.fuelwood and charcoal.
(3) Improvements in Develop selected measures USS75,000 THNIRD MT - LTthe woodfuel supply designed to improve theinfrastructure. organizational set-up, the
operational efficiency andthe feed stock extractionof charcoal production.
Inland
(4) Reduction of Introduce Improved stoves. USS600,000 FIRST ST - MTspecific woodfuelconsumption In urbanconcentrations.
(5) Improvements in Develop selected measures Included In cost SECOND LTthe woodfuel supply designed to increase the use above.system. of resources with marginal
ecological Importance, toupgrade harvestingtechniques and to maintainthA sustainability of supply.
a/ ST n short-term; MT medium-term; LT a long-term.

- xXi -
Objective Action Cost Prlority Time Frame a/
Woodfuels : Scenarlo Peace
Coastal Areas:
(6) Improvements In Develop selected measures - FIRST MT - LTthe woodfuel supply designed to Improve thesystem. organizational set-up,
operational efficiency andfeedstock extraction ofcharcoal production.
(7) Increase in the Increase the supply of LPG. - SECOND MTscope for fuel
substitution.
(8) Survey of Described in Chapter V. USS200,000 SECOND ST-MTwoodfuel supplysystems to Luanda.
(9) Improvements in Produce and disseminate - THIRD ST - MTend-use efficiency. Improved stoves.
Inland:(10) Improvements In Develop selected measures - SErOND ST - MTthe woodfuel supply designed to increase the usesystem. of resources with marginal
ecological importance, toupgrade harvestingtechniques and to maintainthe sustainability of supply.
;11) Improvements In Introduce Improved stoves. - FIRST LTend-use efficiency.
a/ ST = short-term; MT = medium-term; LT = long-term.

I. ENERGY IN THE ECONOMY
General Economic Framework
1.1 The People's Republic of Angola is located on the west coast ofAfrica, with Namibia to the south, Zambia to the east, and Zaire and theCongo to the north. The country also includes the enclave of Cabinda,which is separated from the rest of Angola by a corridor of Zairianterritory and the mouth of the Zaire River. Angola covers an area of1.27 million km2 . Its land borders measure 5,070 km and it has anAtlantic coastline exceeding 1,600 km. The climate is tropical in thenorth, subtropical in the south, and temperate on the high plateau. Inmid-1986, Angola's population was estimated at about 9 million(1970 census: 5.6 million), and the current rate of population growth isin the vicinity of 2.8%. While the overall population density iscomparatively low, there has been significant migration to urban areas inrecent years. At present, urban and periurban dwellers probably accountfor about 30% of the total population.
1.2 After independence in November 1975, Angola was left with asignificant shortage of trained professionals and skilled workers of alltypes needed to undertake the formidable task of rebuilding the economywhich had been damaged by the war and was collapsing after a mass exodusof the Portuguese settlers. However, the country also inherited: a well-developed transport infrastructure; a relatively diversified manufactur-ing sector (above all in consumer and intermediate goods); richagricultural areas; a healthy mining sector; and (e) a sizeable enclavepetroleum sector. After independence, the continuing civil war hasseriously hampered economic development and remains the most seriousobstacle to economic recovery. Economic policy since independence hasbeen based on central planning and administrative controls. Thiseconomic system has had various adverse effects, including the emergenceof a parallel market, severe price distortions, wasteful investmentprograms, undesirable effects on the distribution of real income, and ageneral lack of financial and fiscal discipline.l/
1.3 Angola can be classified as a lower middle-income petroleumexporter. With an estimated GDP per capita of US$485 (1986) 2/ it ranksslightly above the average of the SADCC (Southern African DevelopmentCoordination Conference) countries. However, compared to other Africancountries with average hydrocarbon endowments (Tunisia, Gabon, and thePeople's Republic of Congo), Angola's GDP per capita is low
1/ For a comprehensive analysis of the Angolan economy, see theUNDP/World Bank report entitled, "Angola: An Introductory EconomicReview", July 1988.
2/ All of these figures are subject to large errors, but they arequoted in this report as they are the only ones available.

- 2 -
(Table 1.1). Moreover, despite large and increasing oil revenues, thecountry's GDP fell in real terms between 1980 and 1985. Angola issimilar to other African countries with medium-scale hydrocarbonendowments in the sense that oil provides the lion's share of Governmentrevenue (53% in 1985) and accounts for a significant portion of GDP (30%in 1985). As a consequence, the dramatic drop in international oilprices in late 1985 had a disastrous impact on the Angolan economy.
Table 1.1: COMPARATIVE ECONOMIC INDICATORS, 1985
Share of
GDP Share of Oil Incomeper capita Petroelum in Government
Country (1985-86 US$) in GDP Revenues
.^ngola 485 30% 53.1%
Congo 1,110 40% 66.6%Gabon 3,350 45% 66.0%Nigeria 800 23%
Source: Angolan authorities; World DevelopmentReport 1986; Mission estimates.
1A4 As indicated in Table 1.2, the post-independence development ofthe Angolan economy can be subdivided into three distinct periods.Between 1977 and 1981, real GDP grew at an average annual rate of 4.3%.This upswing, however, was short-lived and came to a sudden halt in1981-82 when internal strife intensified and oil revenues dropped becauseof sagging international petroleum prices. As a result, between 1981 and1983 real GDP fell at an average annual rate of 5.1%. A series ofausterity measures were enacted while oil production continued to grow.These two events cushioned the fall in GDP in the period between 1983 and1985, but the collapse of petroleum prices in late 1985 precipitated thesharp recession of 1986. The figures presented in Table 1.2 alsounderscore the dominant role played by the petroleum sector. Imports andGovernment expenditures both strongly depend on the country's petroleumexports. In 1985 these accounted for almost 96% of total merchandiseexports.

- 3 -
Table 1.2: ANGOLA: KEY ECONOMIC INDICATORS a/
(Percent Annual Change)
Indicator 1986 1978-81 1981-83 1983-85 1986
Absolute Amount
(in US$ million)
Real GDP 4,409 +4.3 b/ -5.1 -1,7 -8.7
Government expenditure 3,110 +30.7 -9.9 +14.7 -14,1
Energy exports 1,150 +25.5 +5.7 +10.9 -39.7
Merchandise imports 1,062 +19.6 -19.1 +18.2 -23.3
a/ Least square estimates for average annual rate of change (%)
in the value of above variables.
b/ 1977-81.
Source: Mission estimates (Annex 1),
Petroleum and Public Finance
1.5 The most direct linkage between the petroleum sector's value-added (which accounts for about 30% of GDP) and the rest of the economy(the non-oil sectors) is the impact which oil revenues have on theGovernment budget and Government spending. Between 1980 and 1986petroleum contributed on average about 63% of total tax income (or almost52% of total Government revenues). In fact, in every year except 1986the rise or fall in total Government revenues was almost completelyattributable to a corresponding change in the level of tax receipts fromthe petroleum sector. The momentum of public spending proved hard tocurb when oil revenues slowed down or declined. As a consequence, largebudget deficits were incurred between 1979 and 1986 (totallingKz 140 billion). This gives the impression that Government expenditureout of oil revenues was adjusted, but with significant lags.
1.6 The medium-term impact of oil revenues on GDP growth has beenminimal because most of the revenue either financed current consumption(public, mainly defense, and private) or went into low-productivitypublic investment projects, some of which remain incomplete. Moreover,oil income allowed the country to maintain a highly overvalued exchangerate which undermined the competitiveness of domestic tradeables bymaking imports artificially cheap, put an upward pressure on the pricesof non-tradeables, and thus tended to distort the structure of GDP.
International Trade and Balance of Payments
1.7 The most striking feature of Angola's foreign trade is thesteady increase in both the size and relative importance of the petroleum

- 4 -
sector. The share of crude oil in total exports has increasedconsistently, climbing from about 30% in 1973 to 74% in 1980, and to morethan 90% in 1986. Except for 1986, when oil income fell sharply, and1981-82, when a slight temporary decrease was registered, oil exportearnings have grown every year since 1978. In contrast, income fromother export commodities such as coffee and diamonds--which used toaccount for a sizeable share of export revenues--has droppedcontinuously, and is today almost negligible. Since 1978 the country hasalways incurred a deficit on current account since the trade surplus(goods, especially crude oil, and non-factor services) and net unrequitedtransfers never offset the substantial--and steadily increasing--deficiton factor services. However, since 1978 Angola has invariably achieved asurplus on its capital a count. However, more than 80% of the inflowswere accounted for by ftreign loans, and the small amount of foreigndirect investment went mostly into oil activities. During the liquiditycrisis of 1985-86, Angola's short-term foreign indebtedness increasedsignificantly mostly because of increasing payment arrears which arerecorded as short-term capital inflows.
Policy Reforms 3/
1.8 In view of the country's steadily worsening economic situation,Government authorities are seeking to develop and implement a series ofpolicy reforms, such as granting more managerial and financial autonomyto State firms, relaxing price controls, limiting access to credit,making capital more costly, and devaluing the Kwanza. The proposedProgram for Economic and Financial Reconstruction (SEF, Plano deSaneamento Econ6mico e Financeiro) contains different ideas andproposals, but the specific objectives, design, and timing of the reformare still under discussion. The measures proposed so far are expected tohelp eliminate the most harmful features of Angola's economic system,i.e., the lack of fiscal and monetary discipline, the distortions createdby price controls, the excess supply of money, and the overvaluation ofthe Kwanza. Should oil prices recuperate even partially, the balance ofpayments constraint would be eased and rising oil revenues and manageablebudget deficits should lead to a sustained recovery, especially in thecontext of a better incentive framework and a winding down of the war.
Energy Sector Overview
1.9 By African standards, Angola is richly endowed with energyresources. The country has sizeable oil and gas reserves, a large hydropotential, and ample woodfuel resources. Currently, the proven oilreserves amount to 1,418 million bbl (sufficient to maintain the 1986production level for the next 12 years), while natural gas reserves are
3/ These policies are described and analyzed in greater detail in"Angola: An Introductory Economic Review".

- 5 -
estimated at 5 TCF. With its substantial oil and gas reserves, Angolaranks second only to Nigeria as an oil producer among Sub-Saharancountries.
1.10 In 1986, the primary energy equivalent of Angola's totalcommercial energy production amounted to 17.7 million toe, or 1.96 toeper capita. Only a few African countries, e.g., Libya, Algeria, andSouth Africa, recorded significantly higher figures on a per capitabasis. If woodfuels are included (about 2 million toe of primaryenergy), per capita production was almost 2.2 toe. However, since morethan 70% of the primary commercial energy production leaves the countryin the form of crude oil and LPG (liquefied petroleum gas) exports, while95% of the natural gas jointly supplied with crude oil is flared orreinjected, the final per capita consumption of commercial energy provesto be moderate. In 1986 it was 103 kgoe. This compares to 602 kgoe forCabon (1985 figures), 151 kgoe for the Congo (1985), 142 kgoe for Sa6Tome and Principe, and 24 kgoe for Mozambique (1984). If woodfuels areincluded, which accounted for 56% of the net domestic energy supply,final energy consumption for 1986 worked out to 297 kgoe. Accuratefigures on the sectoral breakdown of final energy consumption are notavailable. However, in rough terms about 50% of petroleum products,which account for 95% of final commercial energy or 42% of total finalenergy consumption, are used in transport and for military purposes,whereas the lion's share of woodfuels goes to households. A summary ofAngola's 1986 Energy Balance is given in Table 1.3.
Table 1.3: SUMMARY OF ANGOLA ENERGY BALANCE 1986(In *OOOs toe)
Woodfuels Natural Crude Hydro Electricity Petroleum TotalGas Oil Products
Total Production 2,074 3,418 14,102 173 - - 19,765
Total AvailableSupply 2,074 3,241 1,498 173 - - 7,080
Net supplyavailable a/ 1,180 - - - 49 1,443 2,672
Final consumption b/ 1,180 - - - 49 879 2,108
a/ Adjusted for conversion losses and non-energy uses.b/ Adjusted for secondary exports and bunker sales.
Source: Annex 3.

- 6 -
1.11 Table 1.4 summarizes the trends in commercial energyconsumption. The figures indicate the extent to which final consumptionof petroleum products and electricity have been decoupled from theoverall performance of the economy, particularly in the 1980s. Whilereal GDP declined, the consumption of petroleum products showed a sharpupward trend. Even in the aftermath of the oil price drop of 1985-86,domestic sales of petroleum derivatives continued to increase. On theother hand, the changes in electricity consumption appear to be more inline with GDP growth. Between 1977 and 1982, consumption rose in directproportion to CDP, and then declined as the economic situation worsened.However, this is not evidence of causality. The drop in electricityconsumption may well have been due to supply constraints. Since theshare of low voltage consumers (households) in total consumptionircreased significantly in the 1980s to more than 50% (a trend reinforcedbh extremely low tariffs), it appears that electricity ccnsumption wasmore or less determined by power generation (net of transmission anddistribution losses). Similar arguments apply to petroleum products.Between 1980 and 1986, consumption grew most for LPG, kerosene, and jetfuels which are demand inelastic with respect to income and prices(household and military use). Thus, lack of correlation betweencommercial energy consumption and overall economic growth can beexplained by the fact that official tariffs for power and prices ofpetroleum products had become insignificant and no longer served asrationing devices. Indeed, at negligible prices, consumption may proveperfectly elastic until it meets another constraint such as appliarces orsupply capacity.
Table 1.4: SUMMARY OF TRENDS IN COMMERCIAL ENERGY CONSUMPTION a/
Energy Type 1977-82 1982-85 1980-86 1986 Absolute
Electricity +6.6 -5.5 -0.5 49 ('000s toe)Petroleum products -- +9.0 +6.6 915 ('000s toe)Total commercial energy -- -- +6.2 965 (OOOs toe)
Total per capitaconsumption -- -- +3,3 110 (kgoe)
GDP +4,3 -1,9 -3.9 485 (USS)
a/ Least square estimates of average annual rates of change.
Source: Angolan authorities and mission estimates (Annex 3).
Petroleum Products
1.12 As can be seen from Table 1.5, Angola's structure of petroleumproduct demand is heavily biased towards middle distillates, whichaccount for more than 75% of total domestic sales. Within middledistillates, gasoil plays a less important role than it does in other

- 7 -
countries at the same level of economic development as Angola, indicatingthat demand is artificially low in road transport, industry andagriculture. On the other hand, kerosenes account for more than onequarter of the total domestic petroleum product sales. Agricultureaccounts for only 2% of domestic sales of refined products, which ishardly surprising given the low level of commercial agriculturalproduction and the fact that many rural areas are cut off from thecountry's transport and distribution infrastructure. Industrial demanddepends on a small number of energy-intensive operations (refinery,extraction, cement) which account for about three-quarters of thecountry's boiler fuel consumption. The public sector accounts for morethan 50% of the aviation fuels consumed in Angola. Household consumptionof petroleum products--primarily gasoline, kerosene, and LPG--is stronglybiased towards the urban centers. Thus, the regional and sectoraldistribution of Angola's petroleum product consumption are highlydistorted, i.e., they mirror the constraints imposed by both the civilwar and the depressed state of the economy.
Table 1.5: DOMESTIC PETROLEUM PRODUCT SALESBY SECTOR, 1985 (in %)
Share InLPG/Kerosene Gas/Oil Jet Fue!s Gasoline Fuel Oil Total Sales
Industry 3.8 26,2 10.3 1.7 52.2 20.6Agriculture 0.7 3e1 - 0.5 6.8 2.2Transport 0.2 27.1 47.1 0.8 39.3 28.8Construction 0.2 4.8 - 0.6 0.1 2.1Resale 77.2 20,4 - 42.2 - 19,6Government 1.7 4.0 0.1 2.5 0.4 2.2Defense & Security 3.1 10.1 42.0 49.8 0,3 21.1Others 13.1 4.3 0.5 1.9 0.9 3.4
Share InTotal Sales 8.2 42.6 26.7 10.7 11.8 100.0
Source: Annex 8.
Crude Oil
1.13 In contrast to the rest of the economy, Angola's petroleumsector recovered rapidly after independence. Crude oil productionclimbed from 94,000 bbl/d in 1975 to 164,000 in 1979. Owing to thedisruption of exploration and development efforts during the second halfof the 1970s, a temporary decline in crude oil production was inevitable;but the trend was quickly reversed in 1981-82, and by 1983 output had re-bounded to its 1974 level. In fact, large investments undertaken inrecent years have resulted in a continuous increase in oil production

- 8 -
since 1982 (while the reserve-to-production rate was kept above 12years), and this upward trend in output is likely to continue until theend of the 1990s. Except for 1986, output growth even offset the fall ininternational petroleum prices to the extent that between 1982 and 1985nominal export revenues continued to increase (Table 1.6).
Table 1.6: TRENDS IN THE PERFORMANCE OF THE PETROLEUM SECTOR a/(Percent Annual Changes)
1975-79 1979-81 1981-85 1986
Crude Oil Production +16.6 -11.7 +18.0 +21.0
1978-80 1980-82 1982-85 1986
Export Revenues fromn Crude Oil +59.0 -5.8 +15.3 -39.3
1978-80 1980-82 1982-85 1986
Export Revenues as % of GDP +38.7 -6.3 +4.8 -33.4Deflated Export Revenue +32.0 -6.4 +10.7 -41.2from Crude Oil
a/ Least square estimates of average annual rates of change.
Source: Annexes 1 and 4.
1.14 Table 1.7 provides some rough indicators as to the relativemagnitude of the resources which were required to keep the petroleumsector prospering. Between 1982 and 1986 the petroleum sector claimed anaverage of about 85% of Angola's Gross Domestic Investment ((DI). Duringthe same period foreign direct investments in the petroleum sectoraccounted for more than 70% of the medium- and long-term capital inflow,while a rising share of the petroleum revenues was spent to finance thefactor services required by the petroleum sector. However, these figuresdo not mean that in the absence of the oil boom considerable resourceswould have been available for non-oil ventures. On the contrary, giventhe extremely low level of national savings and the limited scope forproductive investments in the non-oil economy, sectors other thanpetroleum would neither have been able to attract nor to absorb thisexternal capital.

- 9 -
Table 1.7: INDICATORS FOR PETROLEUM SECTOR CLAIMS ON RESOURCES
(In percentages)
1982 1983 1984 1985 1986
Share of GDI in
GDP 15.4 11.0 10.1 12.4 11.3
Investments In the
petroleum sector as
a share of GDI 83.2 88,2 76.8 87.2 86.6
Direct investments in
the petroleum sector
as a share of medium-
to long-term capital
Inflow 69.3 84.4 61.5 63.7 87.5
Factor income a/
transferred abroad as
a share of oil export
revenues 11.3 11.1 11.3 12.1 16.8
a/ Attributable to the petroleum sector.
Source: Annexes 1 and 4 and mission estimates,
1.15 However, the overall performance of Angola's economy remainedhighly sensitive to changes in oil revenues. With rising oil revenuesthe petroleum sector increased its share in GDP, resulting in an oil-ledgrowth of the economy. On the other hand, in periods of falling oilrevenues (1980-82), the petroleum sector's contribution to the country'svalue-added tended to decline and, thus, to adversely affect GDPgrowth. Moreover, since 1982 when the growth of oil revenues reflectedonly increases in output, the foreign exchange costs associated with anincrement in revenues tended to rise. As a consequence, an increasingshare of the oil revenue had to be transferred abroad (16.8% in 1986) topay for the factor services required for the development of new fieldsand for the additional costs of higher output (Table 1.7).
1.16 While this drawback is likely to lose importance with risingprices, another difficulty may arise in the near future. So far, theState-owned oil company, SONANGOL (Sociedade Nacional de Combustiveis deAngola) has had no problems raising the funds required to meet thefinancial obligations of its investment agreements with foreign oilcompanies. However, SONANGOL's total debt service outlays have steadilyincreased and in 1986 amounted to US$56.1 million, which is equal toroughly half of the company's average annual investment expenditures forexploration and development during the period 1980-86. Given the

- 10 -
country's critical balance of payments situation it may well become moredifficult to finance the exploration and development needed between nowand 1990 to ensure that production continues to rise in the early1990s. Thus, attention should focus on the question of how SONANGOL'sfinancial position can be improved and to what extent the legal andfiscal framework needs to be modified to encourage new investments.
Natural Gas
1.17 Angola has only begun to exploit its natural gas reserves. Todate, efforts have centered on the gas which is produced in associationwith oil at a rate of about 1.34 MCF/bbl. Some 50% of the associated gasis put to productive use, primarily for lift and reinjection, with theremainder being flared. There is little evidence that the picture willchange considerably in the near future. Some associated gas is recoveredfor LPG production off the coast of Cabinda. The scheme has beenoperating since 1983. In 1986 output was 177,000 tons of LPG, of which168,000 tons were exported to Brazil. Revenues amounted to US$21.3million and contributed 1.8% of the country's earnings from energyexports (crude oil, 95%; petroleum products, 3.2%).
Electricity
1.18 Basically, Angola's power subsector consists of three systems.The largest one, in the north, currently accounts for about 80% of thecountry's electric power production. In 1986 the country's totalinstalled capacity was estimated at 463 MW (62% hydro) of which 275 MWwere firm. At that time, peak demand was about 150 MW. While totalgeneration reached 754 GWh, consumption accounted for only 78% (590 GWh)of the energy generated. On a per capita basis, this works out at66.3 kWh per annum, a consumption figure which is relatively low (inMozambique, for instance, the 1984 per capita consumption of electricitywas about 44 kWh, while Gabon--a country with a high degree ofurbanization--recorded 756 kWh).
1.19 Since independence, the most pronounced decline in electricitydemand has taken place in the industrial sector. In 1986, industrialconsumption of electricity was only 200 GWh, (i.e., 17,000 toe, comparedto more than 50,000 toe in 1974), while about 170,000 toe were used inthe form of boiler fuels. The residential sector's electricity con-sumption has increased steadily since the mid-1970s. In fact, it hasproved to be a stable component of the country's electricity demand. Inthe mid-1970s, electricity became essentially a free good, i.e., itsdemand was not limited in any way by the consumers' willingness or(income-dependent) ability to pay, but mostly by the utilities' abilityto generate and distribute power. Thus, it would be difficult toestimate the effect on demand of the significant increases in tariffsrequired to restore financial viability to the utilities and to adjustthe relative price of electricity to the costs of alternative sources of
- 11 -
energy. At the current level of tariffs, for instance, the totalrevenues from electricity sales are just sufficient to finance theforeign debt service (denominated at the official rate of exchange) ofthe utilities.
Woodfuels
1.20 Woodfuels play a significant role in the country's energybalance. While fuelwood is the dominant source of energy in rural areas,most of which are cut off from the supply of commercial fuels andelectricity, charcoal is consumed by urban households, which have littleor no access to LPG and kerosene or are not connected to the grid. In1986, total woodfuel consumption was probably 6-8 million tons offuelwood, equivalent to 2 million toe of primary energy (including thefuelwood equivalent of charcoaL) and accounted for 56% of Angola's finalenergy demand. While there is little doubt that the country's overallbiomass resources are sufficient to meet aggregate woodfuel demand on asustained basis, the rapid growth of cities and the supply constraintsimposed b) the civil war have led to regional and local imbalances andshortfalls, particularly in urban coastal areas. However, theseimbalances do not affect each and every household. In a broad sense,there are two categories of urban households: the privileged households,which have access to the official supply of cheap commercial fuels andelectricity (if measured in terms of the purchasing power of parallelmarket income, then LPG, kerosene, and electricity could be consideredfree goods), and underprivileged households, which have no choice but tobuy on the parallel market where charcoal is the dominant fuel.
1.21 Currently, Government can do very little to improve the energysituation of rural households, and even less to increase the flow ofwoodfuels supplied to urban areas. In the present situation, Governmentintervention is likely to exacerbate the danger of disruptions insupply. The Government should therefore continue a "hands-off" policywhich would avoid additional frictions until improving security wouldpermit the establishment of more active policies related to supply andmarketing. Some small, focused projects or measures could bring somerelief, especially in coastal urban areas.
1.22 Among the activities proposed for the urban areas, priority isgiven to fuel substitution and to stove improvement, both falling withinthe purview of DNRFE (Department of New and Renewable Sources ofEnergy). The two rural-oriented groups of activities--the pilot projectfor Huila and Namibe and the development of agroforestry--would on theother hand require some support from DMACO (National Directorate for theConservation of Nature). This would require some strengthening of thefield representation of DNACO in the Southern Region.

- 12 -
Energy Demand Projections
1.23 Given the past and current distortions in energy consumptionand production, it is difficult to forecast future energy demand in termsof historic trends, nor is it certain that demand will respond to changesin GDP or prices in a predictable way. Much depends on how long thecivil strife continues and to what extent a return to peace will resultin a gradual resumption of growth in the agricultural and manufacturingsectors. The hypothesis of peace in the early 1990s is the cornerstoneof the most-favorable-base-case scenario. This scenario consists of anaverage annual rate of GDP growth of 2.5% for the period between 1990 and1995, followed by a sustained upswing which would keep the growth rateabove 5% during the second half of the 1990s.
1.24 On the energy demand side, it is assumed that until 1990 thegrowth of petroleum product consumption will slow down to about 2.5% perannum, while electricity sales are likely to recover, rising at anaverage annual rate of slightly more than 2%. During the first half ofthe 1990s, the return to peace will dampen petroleum product demand dueto the significant decrease in military consumption. However, with thesubsequent recovery of the agricultural and industrial sectors, thepattern of demand will not cnly shift to productive uses (transport,industry) but also rise at a rate (3%) exceeding that of the late 1980s.But even if the demand for petroleum derivatives continues to grow at 5%during the second half of the 1990s, demand would still not exceed thecapacity of the Luanda refinery. Electricity consumption, on the otherhand, is assumed to increase at an average annual rate of 6.5% (1990-95),followed by an even more pronounced growth of 11% in the late 1990s.
1.25 Table 1.8 provides a summary of the base case demandprojections. As can be seen, the implicit elasticity of commercialenergy demand, with respect to GDP, decreases from a high figure of 1.64in the late-1980s to about 1.5 in the ei,rly-1990s (which is still high,reflecting a need to catch up). But .urther increases in consumptionwould eventually lead to an elasticity just above unity.
Table 1.8: COMMERCIAL ENERGY DEMAND PROJECTIONS
Average Annual Rate of Increase Level of Demand(%) (in 'OOOs toe)
1987-90 1990-95 1995-2000 1990 1995 2000
Petroleum products 2.5 3.5 5 1,000 1,190 1,500Electricity 2.5 6.5 11 67 92 155
Total Demand 2.5 3.7 5.3 1,067 1,282 1,655
GDP Elasticity 1.67 1.48 1.06 - - -
Source: Mission estimates.

- 13 -
Institutional Framework
1.26 The Ministry of Energy and Petroleum (MEP, Ministerio daEnergia e Petr6leo) has overall responsibility for establishing andimplementing national policies in the energy sector. In the petroleumfield, the MEP supervises the operations of SONANGOL, which in turnsupervises the operations of the international oil companies and therefinery. The MEP also supervises the operations of the three powerutilities--ENE (Empresa Nacional de Electricidade), SONEFE (SociedadeNacional de Estudo e Financiamento de Empreendimentos Ultramarinos), andEDEL (Empresa de Electricidade de Luanda). Through the DNRFE (NationalDepartment of New and Renewable Sources of Energy) the MEP keeps abreastof developments in biomass and new and renewable sources of energy.
1.27 MEP is the result of a 1984 merger of the then separateministries of Energy and Petroleum. Until 1987, the MEP had "central"departments which reported directly to the Minister (such as the Planningand Technical Departments) and "executive" departments (such as theNational Department of [Oil] Transformation which supervised therefinery) which reported directly to one of the Vice-Ministers (forEnergy or Petroleum). This organization perpetuated the split betweenEnergy and Petroleum and is being abandoned, following the MEF's"Consultative Council" in November 1986. The new MEP will have only fourNational Departments, or "Gabinetes", one each for Planning, Technical,Legal, and Human Resources, and the Vice-Ministers will no longer havesubsectoral responsibilities. Vice-Ministers will perform assignments atthe request of the Minister (Annex 2 gives organization charts). Thisreorganization of the MEP entails a significant reduction in staff (from360 to 200) and seems to be part of a Government-wide restructuringeffort designed to cut administrative expenditures and to diminish sectorministry supervision over State enterprises. 3upervision by sectorMinistries of the routine management of State enterprises is to cease,and only the central Ministries (Planning and Finance/Central Bank) willhave supervisory functions over the finances and management of Stateenterprises. This, of course, is to lead to greater autonomy in themanagement of State enterprises, which is one of the main components ofthe SEF.
1.28 In addition to the MEP, the Ministries of Finance and Planningand the Central Bank play a role in the control/supervision of Stateenterprises. The Ministry of Planning has the last word on sector in-vestments, in the sense that only the Ministry of Planning can includesuch investments in the (annual or pluriannual) Plan. In fact, actualinvestments take place in a much more haphazard fashion and noinstitution seems to really control the process. The Ministry of Financetaxes and subsidizes energy sector enterprises widely. With the help ofSONANGOL and the MEP, the Ministry of Finance oversees the financialoperations of the international oil companies and assesses and collectsthe various taxes on oil operations (so-called "Special Regimes"). TheMinistry of Finance also subsidizes the operations of the powerutilities. Finally the Banco Nacional de Angola (BNA), the only real

- 14 -
bank in Angola, has the final word on the allocation of foreignexchange. This is a difficult task, and it is not suprising that foreignexchange operations are slow, complex, and disrupt external procurementprograms of the enterprises, whether for current operations or forinvestment.
SADCC - Energy Technical and Administrative Unit (TAU)
1.29 The Energy Technical and Administrative Unit (TAU) is an entityset up by the Angolan Government, or more specifically by the MEP9 todischarge the responsibility for energy sector coordination which SADCC(the Southern Africa Development Coordinating Conference) assigned toAng^la. The TAU reports to the Minister of Energy and Petroleum ofAngola, as does any other department of the MEP, but its roles do notconcern Angola specifically. According to SADCC documents, the mainpurpose of the Energy TAU is to develop a regional energy development,conservation and security plan.
1.30 In practice, the TAU has gone about its work by establishing aportfolio of regional energy projects which can be classified under threeheadings:
(a) national pilot projects, the results of which are expected tobe applicable to other countries;
(b) projects which benefit more than one country (i.e., "regional"projects); and
(c) projects which support other regional projects.
Although the range and diversity of projects promoted by TAU is striking,the electricity subsector is dominant. taking up to 50% of TAU's time.
1.31 The Government of Angola provides most of the TAU's funds,personnel and physical facilities. About a dozen Angolan professionalswork for TAU. In addition to sizeable contributions in kind (offices,office equipment, vehicle maintenance), the Angolan Government alsoprovided Kz 32 million in 1986 and Kz 33 million in 1987 (i.e., a littleover US$1 million per annum). In addition, the TAU has attractedconsiderable donor support, especially from Europe (Belgium, Norway, EEC)and also from Canada. Norway provided US$300,000-400,000 per year in1986 and 1987 while the Canadian International Development Agency (CIDA)provided about US$100,000 in each of those years. Funding for expandedactivities was under consideration in late 1987, especially by CIDA,while Norway was preparing a study to redefine its support policy towardTAU. The TAU and the Angolan MEP also requested ESMAP support to conductan evaluation of the TAU's mandate and achievements. This evaluation iscurrently in preparation with its report due to be released in mid-1989.

- 15 -
Manpower, Technical Assistance, and Training
1.32 The shortage of qualified manpower has been a ubiquitousproblem in Angola since independence. Most shortcomings in the executionof basic policies can be ascribed to the shortage of competent staff.Similarly, poor performance by State enterprises can partly be blamed ona lack of qualified personnel to properly plan, evaluate, execute, andoperate public investments. In addition, qualified Angolan staff commandvery high wages in the service of international oil companies. While thecivil service can hardly compete with oil majors, the problem ofproviding qualified staff with suitable incentives is a pressing one andhas yet to be satisfactorily resolved.
1.33 Responses to this problem of staff shortage have varied amongdifferent organizations, as follows:
(a) the Central Government is making use of bilaterally-suppliedexpatriate experts (from the U.S.S.R., Cuba, Eastern Europe)and gets significant help from the U.N. system in addition tohaving first claim on the supply of qualified Angolans;
(b) the petroleum subsector has access to the qualified manpower ofthe international oil companies, uses high level consultants,and invests heavily in training for its own needs anlgenerally;
(c) the power subsector has essentially concentrated on day-to-dayoperations (with lower service standards) while using someexpatriate assistance (from Cuba, the U.S.S.R., and Portugal).Activities that require much highly qualified manpower(planning, ta-iffs, demand studies) are simply deferred;
(d) in forestry, the level of upstream activities is at a virtualstandstill with almost no foresters deployed while someforestry technicians are being trained in Cuba (mainly forlogging and sawmilling, areas that have attracted externalcapital and technical assistance from Cuba and Italy); and
(e) in addition, a number of individual technical and professionalpersonnel are hired and paid directly by the Government (the"Cooperantes") but with recent budget strictures this form oftechnical assistance, which is often used in administrativeposts rather than in advising policymakers, is declining.
Training for the Petroleum Subsector
1.34 In the petroleum subsector, the effect of qualified manpowershortages has been mitigated by recourse to the expertise of theinternational petroleum companies and the acquisition of staff services

- 16 -
from abroad. SONANCOL has effectively and advantageously used externalconsultants to supplement its capabilities in all aspects of its opera-tions. There is little doubt that it should continue to do so. It mightbe possible, however, to reduce the cost of this option by turning toconcessional sources of technical assistance, such as the United NationsDevelopment Programme (UNDP), the European Economic Commission (EEC), theWorld Bank Group, or bilateral aid (Canada, Norway) for at least part ofits needs.
1.35 The petroleum subsector contributes (by law) to the financingof nation-wide training programs. All petroleum companies are requiredto pay (US$0.15 per produced barrel) into a training fund which iscontrolled by the Ministries of Finance, Education, and the MEP. Atcurrent rates of production, (i.e., 400,000 bbl/d) this fund accounts forabout US$21 million in hard currency.
1.36 Control over this fund appears to be diffused and no mechanismexists to ensure that the highest priorities in training are identifiedand then funded. In addition, the contribution is paid to the Statebudget in hard currency, but is not available in hard currency topotential users, who must follow normal, lengthy procedures to obtainneeded foreign exchange. At times, pressing needs for foreign exchangemay result in a total diversion of foreign exchange to these other needs,at the expense of training.
1.37 Other training programs for the petroleum industry include:on-the-job training wit, the petroleum companies; company-owned trainingcenters (at Malongo for CABINDA GULF; at Soyo for TEXACO); and the SumbePetroleum Training Institute, which is supported by UNDP and Norway andmanaged by COMERINT, a consulting firm belonging to the ENI Group,Italy's State hydrocarbons holding company (this Institute also servesthe needs of other SADCC countries). According to SONANGOL, trainingopportunities in the above programs favor engineers, technicians, andskilled laborers rather than managers, economists, or accountants andother financial staff. This presents a problem because SONANGOL itselfneeds mostly the latter type of qualified staff, including engineers, asit does not yet operate any oil field or other facilities. Expatriatestaff resources are also used in the management and operation ofsupport/logistical facilities such as the Kwanza Offshore PetroleumOperations Support Base in Soyo, at the mouth of the Zaire River.
Training for the Power Subsector
1.38 In 1986, the electric power utilities, excluding the Office forthe Harnessing of the Middle Kwanza (GAMEK, Gabinete de Aproveitamento doMedio Kwanza) employed about 4000 4/ persons, of which about 100 wereexpatriates. The expatriate staff cost roughly Kz 3,200/man/month
4/ Of the Angolans, 30 are higher-level technical or professionalstaff, 200 are technicians, and 3,600 are skilled, semi-skilled, andunskilled workers. Of the 100 expatriates, 21 are higher-leveltechnical/professional staff, 30 are higher-level technicians, and50 are skilled workers.

- 17 -
(US$1,100/man/month). This relatively low figure reflects the fact thatmost of these expatriates originate from Cuba or Eastern Europe (wherequalified manpower is plentiful) and that many are relatively low-leveltechnicians or workers.
1.39 According to available information, higher-level manpower isextremely scarce and badly deployed. A disproportionate share of higher-level staff is concentrated in ENE's head office in Luanda while, forexample, tne Southern Grid does not have even one Angolan engineer orprofessional manager. The situation is similar in other utilities, withdistribution companies--such as EDEL and CELB (Companhia Electrica doLobito e Benguela)--usually worse off. In addition, expatriate stafftend to work in a vacuum because of the shortage of Angolan counterparts.No skills/knowledge can therefore be transferred.
1.40 A major investment in a training school for the electricitysubsector is about to be made with financing through a FF 60 million(about US$11 million) loan from the Caisse Centrale de CooperationEconomique. This financing covers school construction and equipment,curriculum preparation, and an initial infusion of teaching staff totrain future teachers, but not housing for the teachers. This could be aproblem because the school will be located near Mabubas, far from anyreasonable supply of housing.5/ In addition, most of the financing willgo for state-of-the-art buildings and equipment. The new traininginstitute's main objective is to upgrade the skills of the workers ofpower utilities. This priority fits well with this report'srecommendations. However, it might have been possible to set up a morecost effective system for the same purpose.
1.41 A sizeable influx of financial and staff resources would berequired to maintain the existing assets of the power subsector. Thetechnical assistance needed for minimal improvements in power subsectorefficiency would entail roughly 35 man-years of technical assistance.This level of technical assistance would have to be maintained for atleast three years during which time trained Angolan staff could be hiredand receive on-the-job-training from expatriate staff. A three-yearpower subsector rehabilitation project would thus require US$10 millionfor technical assistance in addition to the need to finance pressingimports of materials, supplies, and spares. Major rehabilitationinvestments would require much larger sums.
Angolan Development Strategy in the Energy Sector
1.42 The role of energy in the Angolan economy has been highlightedin earlier sections: energy exports provide Angola with resources tokeep the economy and polity functioning. In fact, the abundance andrapid development of Angola's oil reserves can be said to have financedthe political survival of Angola over the past decade.
5/ The location of the school is being reevaluated. It may, in fact,be built in Luanda. This would mitigate the housing problem.

- 18 -
Petroleum Development Strategy and Peace
1.43 Angola's choices in future development of its oil resourcesdepend, at least in part, on the evolution of internal stability. If thecivil war persists, then, realistically, Angola has no choice but tocontinue developing and exploiting its resources as fast as it can. Thishas been the policy over the last decade. If civil peace returns soon,paradoxically Angola could have more leeway in the speed of developmentof its oil resources. In the event of immediate peace, Angola's priorityshould be~ to carry out a structural economic reform to set the stage fora resumption of growth in agriculture and industry rather than tocontinue rapid expansion of oil exports. Energy would, in thatsituation, play its normal role of supporting growth rather than leadingit.
1.44 While expenditures on petroleum exploration and developmentshould be maintained--lead times are lengthy in the petroleum industry--the next burst of activity in petroleum should take place when Angolawill be able to "sow" petroleum revenues most readily. That is, aftersubstarntial reforms permit (public and private) investment to becomeproductive once more, and when qualified manpower supplies have increasedthrough lower military needs, then there could be a higher output ofAngolan training institutions and a better framework for the effectiveuse of external technical assistance. in essence, the Government's firstpriority with the return of peace should be to give petroleumsecond priority.
SONANGOL
1.45 In the immediate, the Government should continue perfectingSONANGOL--the effective instrument it has slowly created to promote andcontrol petroleum development--under general State guidance. SONANGOLneeds continued slow growth in its capabilities in both oil and gas andincreased financial and managerial autonomy. Economy-wide measures underconsideration to increase the autonomy of State enterprises should beextended to SONANGOL as soon as possibie, keeping in mind that SONANGOLis in a position to benefit from these measures immediately, as itsmanagement, staffing, structure, and mandate are functional andundisputed, while many other enterprises are not in such a position yet.
Refining and Product Supply
1.46 The present situation in refining and petroleum product supplyis broadly satisfactory. At current relative world prices for crude oiland products, the FPA (Fina Petroleos de Luanda) refinery at Luandaappears to be economic. In addition, with recent de-bottlenecking andlife prolongation, the refinery can supply most of Angola's needs forquite some time, especially if peace returns soon. Thus, Angola should

- 19 -
continue satisfying its excess demand through imports while attempting toreduce wasteful or low priority consumption through a substantialincrease in prices and the elimination of subsidies on kerosene, gasoil,and LPG. This would give prices a role in controlling demand and wouldrestore a price structure more in line with economic costs (i.e., worldmarket prices, CIF or FOB. Angola, depending on whether Angola is animoorter or exporter of the given product). In view of the above, largenew investments in expansion of refinery capacity should be postponed asthey have low priority. Similarly, the expenditure of large sums to buya majority or the totality of the stock (or assets) of the refinerycannot have much of a priority when both the State and SONANGOL are in aperiod of financial stringency (although if the transfer could beaccomplished without the disbursement of large sums, as through areordering of assets and liabilities between SONANCOL, FPA and theGovernment, then this would not cause any problem). An equivalent amountinvested in petroleum exploration or field development would have a muchhigher economic return. Independently of who owns the refinery, anincentive framework designed to lower costs at the refinery seems to beAngola's best option to reduce the economic costs of supply of petroleumproducts in conjunction with the elimirnation of the subsidy on crude oilfor domestic refining. A similar framework should be extended tSONANGOL's domestic distribution operations.
Power
1.47 With few exceptions, Angola's power infrastructure has sufferedfrom more than a decade of active neglect. Fortunately, the demand forpower stagnated during this period, with households the major activeconsumers of power. This allowed the utilities to maintain a reasonablelevel of service. Since power has become essentially free after themonetary inflation of the mid-1970s, consumption has been supply-constrained. While the quick return of peaceful conditions might makethe agenda for the power subsector somewhat easier to implement, it willremain essentially unchanged over the better part of the next decade.Assuming that power is to be sold at a price covering economic costs ofsupply, household demand will probably not grow very fast, and increaseddemand will only come about through the reactivation of industry, whichwill take time.
1.48 The tasks facing Angolan authorities in power would thereforebe: (i) maintenance of a reasonable level of service without sizeablenew investments; (ii) launching of a rehabilitation program for existingdams, power plants, and transmission Lines; (iii) reorganization of thesector in a more decentralized structure better able to improveefficiency; and (iv) setting the bases for future growth by improvingmanagement, accounting, and finances through a sizeable infusion oftechnical assistance, simultaneous with a major training effort and anincrease in tariffs. Addition of new capacity should be very low on thelist of priorities at least until the mid-1990s. Mission demand

- 20 -
projections show that new capacity (above and beyond existingrehabilitable capacity) would probably not be needed until the latterpart of the 1990s even under sanguine assumptions about the pace of theeconomic recovery (Annex 14).
Household Energy
1.49 The Government can do very little to improve the energysituation of rural households, especially at times of civil strife. Thecities are presently receiving both commercial (LPG, kerosene,electricity) and traditional (fuelwood, charcoal) energy products. Majorhardships would be caused by interruption of either source of energy.The Government should therefore continue its "hands off" policy to ensurethat supplies of traditional fuels continue to reach the cities. This isnot the time to crack down on wood/charcoal truckers or merchants, nor isit the time to try to enforce cutting regulations. Efforts at managingforests, charging user fees, ensuring a competitive supply system, andestablishing reserves will be needed, but this should await the return ofmore normal conditions, especially in the countryside. In the meantime,some improvements in the distribution of kerosene (especially in suburbanand rure.l areas) and LPG (mostly in urban areas) should be carried out.
1.50 Angola's forest resources are sufficient, and sufficientlybroadly distributed, to satisfy the needs of the population in normalsituations. After the return of peace, the supply of woodfuels to allpotential users should be relatively easy to assure. The Governmentshould, at that time, establish basic policies that promote competitivewoodfuels markets. This would ensure the lowest possible prices tousers, while legislation, management, and supervision of forests willensure that the ccsts of reforestation (i.e., value of the treesthemselves) are taken into account by the market.
1.51 Kerosene and LPG are excessively undervalued in relation towoodfuels. With more reasonable relative prices for commercial andtraditional sources of energy, (i.e., with the removal of security risksand premia in the supply of woodfuels and the removal of subsidies to LPGand kerosene) it is not certain whether consumption patterns, even in thecities, would favor modern commercial fuels as much as they do now. Thissituation should be kept under review, and excessive consumption ofmodern fuels (which can be exported) should perhaps not be promoted asaggressively as has been done over the past several years. The proposedLPG fractionation project (offshore Cabinda) would add about 30,000 t/yof LPG to domestic supplies. This will eliminate high-priced LPG imports(about 10,000 tons costing US$2.5 million) yet permit a 60% increase indomestic consumption over a short period. By the time this increasedsupply reaches the market, prices should have been increasedsubstantially, or the amount of Government subsidy would also have toincrease.

- 21 -
II.A. CRUDE OIL: UPSTREAM ACTIVITIES
Summary and Recommendations
2.1 Angola depends on oil income economically and politically. Allmatters relating to oil are therefore of extreme concein. GeneralGovernment policies on oil development have been enlightened, and thusdeservedly successful. The State gave its oil enterprise, SONANGOL, themost important responsibilities in oil development by making it soleconcessionaire for all hydrocarbons. A successful modus operandi wasworked out between SONANCOL and the MEP in supervising oil activities inAngola. As the business arm of the Government in oil, SONANGOL will playa significant role in the development of Angola as a whole.Recommendations for SONANGOL are as follows:
(a) Although the legislation establishing SONANGOL empowered it toundertake virtually all activities related to oil (exploration,production, transport, refining, distribution), in addition togeneral supervisory responbilities, it really has two majortasks. The first is to encourage foreign investment in oilexploration and production under general Government guidanceand in accordance with the existing legislation, and tonegotiate advan,ageous contracts with internal oil companies.The second is to contract, supervise, and control foreign oilcompanies in exploring and developing the country' s oilreserves and to raise the funds required to meet its share ofinvestment programs. Therefore, the performance of SONANGOLshould be judged on its success in mobilizing and steeringexternal resources into oil operations and in supervising andcontrolling foreign oil companies rather than in terms of itsperformance as an operator or a project manager. For the samereason, SONANCOL should minimize its involvement in upstreamoperations and other extraneous activities unless thesestrengthen its supervisory role as the 'trustee" of Angola'spetroleum reserves. Similarly, the domestic distribution andmarketing operations of SONANGOL could be spun-off into arelatively autonomous division or subsidiary, if notprivatized;
(b) SONANGOL should be granted greater managerial and financialautonomy, particularly in the area of joint venture agreements,to improve its ability to carry out its responsibilities.Although it is inescapable that SONANGOL should remain dnderthe political control of the State, it should not be undulyconstrained by the short-run difficulties of the Ministries ofFinance and Planning. SONANGOL should be allowed to retain areasonable part of its after-tax cash flow;
(c) SONANGOL's ability to raise the funds required to meet itsfinancial obligations will be highly sensitive to the overall

- 22 -
financial health of the country. Therefore, the Governmentshould not routinely use oil as collateral for external loans,as this could undermine the present creditworthiness and futureprofitability of SONANGOL;
(d) SONANCOL's ability to adequately control and supervise theactivities of foreign oil companies can be improved through theestablishment of a more efficient management informationsystem. Emphasis should be given to procedures which systemizeand "digest" the flood of information SONANGOL receives.Uniform accounting procedures should be established for all oiloperations;
(e) Training of qualified staff, in conjunction with the develop-ment of an incentive structure for skilled personnel, is animportant task. For technical staff, a more efficientutilization of existing training opportunities and institutionsshould suffice, rather than the creation of new or speciallydesigned programs. For managerial and highly specializedtechnical staff, a suitable incentive system could play animportant role in attracting and retaining such personnel.Technical assistance, however, would still be needed both tocarry out complex tasks and to help train newer stafF.
2.2 Even though the contractual terms for oil exploration anddevelopment are not particularly soft, many international oil companieshave been attracted to Angola. The geology is highly prospective, theinvestment-cost-to-production ratio is low, and the operating costs aremoderate. In addition, the Government and SONANGOL have shown apractical, business-minded attitude. While the State owns the hydro-carbon reserves, SONANGOL, as sole concessionnaire, has been doing mostof the work required to attract companies and investments. The modelcontract has been conceived as a framework with room for negotiation.Thus, major changes in the legal framework are not needed.
2.3 So far, the taxation system has worked well. Government taxincome from joint ventures was based more on net profits than onroyalties. The progressivity of the tax legislation allowed theGovernment to capture windfall profits, while oil companies wereprotected against a profit squeeze in periods of declining oil prices.So, output rose steadily from 1981 to 1986 in spite of stagnating ordeclining international oil prices. It would be counterproductive tomake fundamental changes in the fiscal terms which apply to oilcompanies. Minor modifications, however, may be useful.
2.4 Part of the existing legislative framework (especially civiland commercial laws) was established in the 1950s and, therefore, doesnot match the contractual approach and the taxation system embodied inthe more recent joint venture and production-sharing agreements (PSAs).Moreover, differences in the contractual terms for joint venture and PSAoperations (eog., tax base) have led to an unequal fiscal treatment of

- 23 -
production revenues. Although the Government is ready to deal with theseproblems pragmatically, it might be preferable to make small adjustmentsto the legialation and the contracts.
2.5 Some companies have requested softening of the contractual andfiscal terms for commercially unattractive discoveries. Urgent revenueneeds and high rates of time preference probably argue in favor ofcareful, controlled development of those marginal fields. Nonetheless,the Government should be aware of the trade-off between the short termbenefits (revenues) and the possibly higher (though uncertain) futurerevenues which it would forego by developing these fields now. In anycase, the issue of permitting development of these marginal fields is noturgent and Angola should carefully weigh the pros and cons of modifying--strictly for this purpose--a fiscal framework that has been and isworking well.
2.6 Balancing the maximizing of Government revenues with attractingforeign oil companies is a difficult task. The best strategy to maintaincompetitiveness (which Angola follows) is to give foreign oil companies astable and well-defined contractual framework, leaving sufficientincentives to attract risk capital. Contractua, arrangements should bereliable and flexible, rather than generally hard or liberal. Angola'sframework for petroleum activities meets most of these criteria well.
Oil Exploration and Production History
2.7 Intermittent oil exploration in Angola began in 1910 andconcentrated on the lower Congo and Kwanza basins, but the firstdiscovery was not made until 1955 by a subsidiary of PETROFINA.Production from the Benfica field started in 1956, while PETRANGOL--thename under which PETROFINA was reorganized in 1957--continued its onshoreexploration activities. A major breakthrough came in 1966, when GULF OIL(which had entered Cabinda in 1957 through its subsidiary, CABGOC)discovered the first offshore field (Malongo), the reserves of whichproved substantially larger than the delineated onshore deposits. Duringthe 1960s, several other international oil companies initiatedexploration activities, but CABGOC's Cabinda finds remained Angola's mostimportant source of oil. Total production rose to 49,000 bbl/d in 1969,and further increased to 163,000 bbl/d in 1973. Ninety percent of theoutput was exported; the remainder was used as a feedstock for the Luandarefinery which came on-stream in the late 1950s.
2.8 After independence, CABGOC--by far the largest producer--ceasedits operations, and crude oil production collapsed. This was reversedwhen CABGOC returned to Angola in 1976. However, uncertainties aboutfuture Government policy towards oil tended to reduce the company'spropensity to invest in the development of existing fields and theexploration of new prospects. As a consequence, oil output ceasedgrowing in the late 1970s. The Government quickly responded to the newsituation and implemented a series of measures to improve the

- 24 -
institutional and incentive framework of the petroleum sector. Themeasures included:
(a) the establishment of SONANGOL (1976) as the business arm of theGovernment to coordinate and control petroleum activities;
(b) the enactment of the Petroleum Law (1978) which made SONANGOLthe sole concessionaire for oil exploration and production inthe country (see Annex 5);
(c) the renegotiation of CABCOC's and PETRANGOL's concessions(1978), giving SONANGOL a 51% share in the existing productiveoperations;
(d) the division of the continental shelf into 13 blocks (1978) tobe offered to interested oil companies under terms of PSAs; and
(e) the creation of the MEP (Ministry of Petroleum) (1979).
The reorganization of the petroleum sector, the new legal and fiscalframework, the comparatively low operating costs prevailing in Angola, aswell as favorable prospects for new discoveries attracted numerousinternational oil companies, which has led to substantial investments andto continuously increasing production since 1982. This activity hastaken place despite the recent decline in international oil prices. In1988, production reached 441,800 bbl/d, 157% above the 1974 level.
oil Production and Investment
2.9 As of June 1987, 7 of the 13 blocks (of about 4,000 km2 each)making up the country's offshore area (except Cabinda) had been awardedto oil companies. Table 2.1 summarizes production and investmentactivities in the different areas between 1980 and 1986.
Table 2.1: OIL PRODUCTION AND INVESTMENTS IN THE PETROLEUM SECTOR
Total Production Total Production Total Investments1980-86 1986 1980-86
(Million tons) (%) ('OOOs bbl/d) (%) (Million USS) (%)
Cabinda 45.0 69.8 190 67.4 816.4 30,0Congo Onshore A 0.4 0.6 1 0.4 52.9 2.0Congo Onshore B 11.3 17.5 32 11.3 189.1 6.9
Block 1 - - - - 216.1 7.9
Block 2 2.7 4.2 6 2.1 493.0 18.1Block 3 3.7 5.7 50 17.7 878.4 32.2Block 4 - - - - 78.0 2.9
Kwanza 1.4 2.2 3 1.1
TOTAL 64.5 100 282 100 2,723.9 100
Source: Annex 4.

- 25 -
2.10 More than 60% of total investments (US$2.7 billion) undertakenbetween 1980 and 1986 went into Cabinda and Block 3. The largest sharewas accounted for by Block 3 which started production in 1985 and, by1986, already contributed 17.7% of the country's total petroleum output.While investments in Block 3 concentrated on exploration (until 1983) anddevelopment (since 1985), investmeLits at Cabinda focused on increasingproduction from proven reserves, rather than on discovering newdeposits. In terms of investment outlays, Block 2 ranks third.
2.11 In spite of significant expenditures to explore and develop newfields, the performance of Block 2 has been disappointing until recently.Production fell from a peak of 13,000 bbl/d in 1982 to 6,000 bbl/d in1986. Many of the new discoveries are considered marginal so that somecompanies called for a softening of fiscal and contractual terms toencourage further development. These claims, however, appear to beexaggerated. Government has already written off a considerable share ofits (potential) revenues by allowing the companies to take more "CostOil" than stipulated in the contracts. In addition, more recent findsare reported to be more promising and may reverse the downward trend ofthe past. In fact, 1988 output increased to about 35,000 bbl/d.
2.12 Other problem areas are the onshore Congo and Kwanza basins.Of the nearly US$440 million spent on these areas between 1980 and 1986,almost US$150 million was used for the development of the onshore Barea. Since 1982, however, the onshore B output has been stagnating (inthe vicinity of 30,000 bbl/d) while total onshore production (includingonshore Congo A and Kwanza) declined from 56,000 bbl/d in 1977 to36,000 b/d in 1986. The investments made in Blocks 1 and 4 wereexclusively for exploration, with results still in the future. Thcughalmost US$200 million was spent for exploration in Block 1, only marginaldiscoveries were made. The companies involved have already asked forfiscal incentives to develop fields which, at present prices, areunprofitable. Exploration rights in Block 4 were awarded in 1984, but nosignificant discoveries have been made yet.
2.13 In 1987, some 16 foreign companies were engaged in Angola'spetroleum industry and others were queuing to get in. Thus, the role tobe played by SONANGOL as the sole oil concessionaire is becoming moreimportant. SONANGOL's first joint venture was formed with CABGOC in1978, giving SONANGOL a 51% share in the Cabinda offshore. CABGOCremained the operator, and the Association successfully embarked on afive-year investment program (1980-85) to develop production from provendeposits. CHEVRON, which took over GULF OIL in 1984, continued to investin Cabinda, but dropped GULF's plans to reduce its share in some deeperareas.6/ In 1978, SONANGOL also obtained a 51% participation in theCongo/Kwanza onshore areas formerly held by PETRANCOL. When FPAsucceeded PETRANGOL and became operator, it retained a 49% share in the
6/ However, for other reasons, CHEVRON-GULF reduced its overall sharein the Cabinda Joint-Venture to 39.2% by farming out a 9.8%participating interest to AGIP.

- 26 -
onshore A areas and a 32% share in the onshore B area, while TEXACO keptthe remaining 16.4%. As for new blocks, SONANGOL contracted severalforeign companies into PSAs under the 1978 Petroleum Law. In Block 2 itacquired a 25% working interest in an association in which TEXACO is theoperator, thus providing SONANGOL with a 25% share of production inaddition to the share it gets as concessionaire. Since 1984 it has alsokept a 20% interest (on a carried basis) in an association led byBRASPETRO (PETROBRAS) in Block 4. Also in Block 4, SONANGOL owns 51% ofthe mixed company Empresa de Servicios Petroliferos de Angola (ESPA)which has operational responsibilities. SONANCOL does not hold anyshares (interest) in Block 1 (AGIP is operator), Block 3 (ELF isoperator), and Block 5 (which was awarded to a group of companies formedby CONOCO in 1986). It must, nonetheless, as concessionaire, supervisethe activities of the operators.
Institutional and Fiscal Framework
2.14 As the agency responsible for the overall coordination anddevelopment of the energy sector and the implementation of nationalenergy policies, the MEP also has responsibility over the policies andperformance of the petroleum subsector. In particular, the DirectorGeneral of SONANGOL reports directly to the Minister of Energy andPetroleum. The MEP receives (through SONANGOL) detailed information anditemized financial statements on all oil-related activities to controland coordinate ongoing operations. In performing these functions, it canresort to external assistance, be it from SONANGOL or foreignconsultants.
2.15 The division of tasks between the MEP and SONANGOL is asfollows:
The MEP is the only organ competent to decide on:
(a) the authorization to open blocks for bidding, the commencementof production (including the field-specific production levels),and the flaring of gas;
(b) the approval of development programs; and
(c) the determination of reference prices for tax purposes.
The MEP's oversight responsibilities are not meant to intrudeinto the day-to-day management of SONANGOL. So far, the division oflabor between the MEP and SONANGOL has worked well. But there could becomplications since the MEP's ability to supervise petroleum operationsdepends, to a large extent, on SONANGOL's ability to provide thenecessary information in a timely fashion.

- 27 -
2.16 SONANGOL's responsibilities include:
(a) the collection and compilation of technical and geological dataprior to distinct exploration activities;
(b) advisory assistance to the Government;
(c) the opening of blocks for bidding and the evaluation ofproposed work programs;
(d) the negotiation of (production-sharing) contracts;
(e) commencs and suggestions on exploration activities carried outby foreign companies (i.e., participation in ExplorationAdvisory Committees); and
(f) the approval and auditing of all activities which follow acommercial discovery.
The latter function is executed through SONANCOL's participation in so-called Operating Committees (staffed with two representatives of thecontractor and two SONANGOL members, with SONANGOL appointing the votingchairman) which monitor, control, and regulate the technical andfinancial performance of the contractors. In addition to ex antesupervision and approval faculties, the production-sharing contract alsoempowers SONANCOL to undertake ex post auditing and evaluation of pastactivities, facilitated by reporting obligations on the part of the oilcompanies.
2.17 However, in contrast to SONANGOL's powerful position within thepetroleum subsector, its financial latitude is strongly circumscribed.About 50% of its amortizations and 95% of its profits accrue to theTreasury, so that investment decisions are subject to the Budgetreallocating funds to SONANGOL. 7/ Though in practice only the balanceis transferred to and fro, this makes SONANGOL subject to the prioritiesof the Ministries of Finance and Planning and leaves little financialautonomy. SONANGOL's dependence on the fiscal/budget authorities has ledit to rely on foreign oil companies to assist it in raising the fundsrequired to meet its financial commitments. Skillful balancing of thesetwo options has allowed SONANCOL to acquire the resources to financelarge-scale investment programs (which, between 1980 and 1986 accountedfor more than US$1 billion). By these means, SONANGOL succeeded infinancing almost 25% of the total expenditures for exploration anddevelopment of the country's petroleum reserves over the seven-yearperiod (Annex 4, Table 2). However, a higher degree of financialautonomy would help SONANCOL fulfill its obligations in the future
7/ Changes to increase the autonomy of State enterprises are beingconsidered under the SEF program of structural adjustment. If thesechanges were approved and enforced, SONANGOL would no longer have totransfer any of its depreciation allowance but would only be subjectto a corporation profit tax.

- 28 -
development of the petroleum subsector, now that the State Budget istight and the finances of the oil companies are less buoyant because oflow world prices.
2.18 In the past the main advantages of Angola's petroleum sectorwere:
(a) the promising geological potential;
(b) the low ratio between investments (for exploration anddevelopment) and output;
(c) the low level of operating costs; and, complementarily,
(d) the practical, business-minded attitude of SONANGOL andthe Government.
Thanks to these advantages, Angola succeeded in attracting foreigncompanies and resources necessary to maintain continuous growth ofpetroleum production in the face of falling world oil prices. Forinstance, while operating costs in Angola varied between US$1.5/bbl andUS$4.9/bbl in 1985, and averaged US$1.73/bbl, operating costs in theCongo varied from US$4/bbl to US$10/bbl. Moreover, in Angola, investmentper unit of output was only one-third of that of the Congo. Thesefigures illustrate the fact that Angola's oil reserves are economicallyattractive (measured in terms of the net-back value of the extracted oil)and, therefore, have encouraged foreign investors even though thecontractual terms are among the toughest in the world, the minimumexploration requirements are high, SONANCOL's power to intervene (e.g.,through the Operating Committees) is unusually broad, and the Angolantake in any commercial production is very high.
Oil Taxation
2.19 Annex 6 provides a detailed description of the tax and tax-likesystems which are applied to foreign companies and SONANGOL. Their mainfeatures can be summarized as follows:
(a) under joint venture arrangements (Cabinda) the Government'sshare in oil revenues is captured in the form of a royalty(which is essentially a sales tax), a tax on "excess profits"(= the income in excess of operating costs and some allowancesfor investment expenditures), and a tax on net income (= valueof output less operating cost less royalty and taxes on "excessprofits");
(b) in the case of PSAs, the value of total output is dividedbetween "Cost Oil" and "Profit Oil" whereby "Cost Oil" whichcovers normal operating costs as well as past expenditures forexploration and development may not exceed a certain percentageof total production (50%) for a predetermined number of years.The "Profit Oil" is split between SONANGOL and the foreigncompany in accordance with a progressive sliding scale scheme

- 29 -
(in favor of SONANGOL) related to the cumulative output of thefield. While the "Profit Oil" is subject to income taxation, aprice-cap provision (which is essentially a 100% tax on excessprofits) would apply If oil prices were to exceed the US$20/bbllevel;
(c) the lion's share of Angola's revenues from oil (more than 80%)has been and is still being provided by joint ventures, due tothe low output attributable to PSAs (although this is beginningto change with the explosive growth of output in Block E PSA).
(d) the specific tax-contract schemes which apply to joint-venturesand PSAs provide a progressive system of revenue-sharing andare designed to capture windfall profits. While in joint-ventures (from which most of Angola's take is collected in theform of taxes) the effect of volume-induced changes on taxes isless pronounced than that of price changes, the share of"Profit Oil" (which accrues to Angola from PSAs) is dependenton: (i) the speed with which the capital expenditures offoreign companies are recovered; and (ii) cumulative output.Both mechanisms protect the interests of foreign oil companies,particularly under unfavorable market conditions, and provideAngola with returns which adjust to the relative market-dependent profitability of its oil resources; and
(e) PSAs are designed to give SONANGOL a significant part ofAngola's take. In joint ventures, the lion's share of Angola'stake accrues directly to the Government. This accountingdifference and the fact that the time profile of the netrevenues from PSAs is not in line with the current financialneeds of the Government, have become a minor source of discordbetween the Treasury and SONANGOL. Furthermore, the taxationof foreign oil companies operating under PSAs has turned intoan issue that affects the distribution of Angola's take betweenthe Treasury and SONANGOL.
2.20 As international oil prices weakened after 1981-82, the taxregime for joint-ventures reduced Angola's petroleum revenues. The samemechanism which captures windfall profits for the Government also reducesthe take when oil prices fall and output remains constant. Angola'sresponse to the decline in international oil prices was to raise itsoutput significantly. However, in periods of falling oil prices, outputmust grow at a rate exceeding the rate of price erosion in order torecoup lost income. This explains why Angola's oil revenues,particularly those from joint-ventures, have fallen off sharply eventhough it has succeeded in boosting its outp"t, above all in 1985 and1986. Some illustrative figures are given in Table 2.2.

- 30 -
Table 2.2: ANGOLA: CHANGES IN OIL TAX REVENUES
AND OIL OUTPUT 1985-86
(Percentage)
1985 1986
Crude Oil Production +13,7 +21.0Price of Crude Oil -5.5 -51.6
Tax Revenues from Oil -1.4 -49.3
Source: The MEP.
2.21 The workings cf the fiscal regime (taxes, royalties, price cap,other levies) transfer to Angola a large share of windfall oil revenuesand prevent "excess profits" from accruing to the oil companies. Theyalso protect the oil companies against a profit squeeze in periods ofdeclining prices by shifting some of the burden of adjustment on toGovernment revenues. To the extent that the tax system for joint-ventures transforms a decrease in prices into a reduction of Angola'sshare in oil revenues (since tax income rises faster than the company'sprofit), it does not erode the incentives for foreign oil companies tocontinue operating and investing. Thus, the adverse impact of oil pricedeclines on the activities of the oil companies was softened by the taxlegislation. This made continued investment and a steady increase inoutput financially rewarding to the companies, which in turn provided theGovernment with income partly offsetting the losses caused by the fall inoil prices.
Marginal Oil Fields
2.22 Several suggestions have been made recently to soften thecontractual and fiscal terms of production-sharing operations formarginal fields. Many of these suggestions come from Block 1 where morethan US$180 million has been invested in exploration since 1982 withoutfinding any commercially attractive deposits. PSAs provide that any findwhich is not developed within three years of discovery must be handedover to SONANGOL (when no discoveries are made, the company that took theexploration risk must absorb the costs, without any recourse). Usuallycompanies are reluctant to develop marginal fields (i.e., less lucrativethan average or even unprofitable, at prevailing prices). However,SONANGOL should be wary of setting a precedent in shading contractualterms. Basically, the tax-contract system of PSAs does not distort thedecision of whether or not to develop a marginal field. Oil companiesmay recover their outlays for exploration and development, and there isno tax or, output (which would affect marginal revenues from decliningflows or marginal fields). If some fields are not developed (whileothers are), it is for the reason that they appear less profitable thanthe average. In principle, unprcfitable oil should be left in the grourduntil it becomes profitable to lift. Funds saved should be invested in

- 31 -
the development of more profitable fields, either proven ones or newdiscoveries (assuming that the probability of new discoveries justifiesthe delay in investment).
2.23 However, strict economic reasoning may not be appropriate in asecond-best world as the Government urgently requires additional oilincome. A case could be made for fiscal incentives to encourage thecompanies to develop less attractive finds: a comparatively lower takefrom marginal fields may be preferable to no additional revenues atall. And since under prevailing economic constraints any incomeavailable today is considerably more valuable than income accruing in thefuture (i.e., the rate of time-preference is very high), the earlyexploitation of marginal reserves could be justified. Nonetheless, theGovernment should be aware of the trade-off between the benefits ofshort-term revenues and the possibly higher, though uncertain, futurerevenues forgone by developing these fields now rather than later.Further, the setting of a precedent may undermine future negotiations.
2.24 Also under discussion are: (i) the possibility of extending theperiod between the commercial discovery and field development; and (ii)the unequal fiscal treatment of joint ventures and PSAs. The latterproblem is created because in offshore Cabinda the tax base is calculatedby consolidating total revenues and total expenditures for exploration,8/development, and operation, whereas in PSAs, investments in explorationand development can only be recovered from oil from the same field. As aconsequence, under PSAs the pay-back period for development expendituresmay prove much longer than for joint ventures, However, in both cases(i.e., the determination of the length of the exploration period and thefiscal treatment of development expenditures) the Governmentpragmatically intends to adapt contractual terms to field-specificconditions. Thus, the issues in question no longer pose any seriousobstacle to future oil development.
Prospects for Oil Field Development
2.25 As can be seen from Table 2.3, the oil activities which the MEPexpects to be undertaken between 1987 and 1990 center on the developmentof proven fields. The average level of planned annual investment isalmost twice as much as in the past seven years. Highest priority isgiven to Cabinda which accounts for about 40% of total plannedexploration and development expenditures. More than 70% of theinvestments projected for Cabinda will be used to develop (i.e., bringinto production) new fields. One of the largest projects is thedevelopment of the Numbi field in which US$230 million will beinvested. The recoverable reserves of Takula, Angola's biggest oil field(about one-third of total current production) were expected to increaseto 240 million barrels in 1988 when a US$200 million water injection
8/ This means that exploration expenditures can be used to offsetcurrent revenues of other (already developed) fields.

- 32 -
program was to be completed. The second largest investment is inBlock 3, where most of the projected expenditures of about US$770 millionwill be used to accelerate the development of proven reserves.Expenditures for development are also dominant in Block 2. And, in theonshore areas of the Congo and Kwariza basins, the main objective is tomaintain the present production of about 33,000 bbl/d. No developmentexpenditures are planned for Blocks 1, 4, 5, 6, and 8.
Table 2.3: PROJECTIONS FOR FUTURE EXPLORATION AND DEVELOPMENT(1987-90)
Number of Number of Total Investments inExploration Development Exploration & Development
Wells Wells US$ million S
Cabinda 9 134 800 39.0Cabinda B/C 17 14Congo Onshore 3 6 80 3.9Block I 1 - - _
Block 2 4 24 >180 8.8Block 3 6 31 770 37,6Block 4 3 - -Block 5 5 - 135 6.6
Block 6 a/ 4 - 35 1,7Block 8 a/ 4 - 35 1.7
Cabinda Onshore a/ 5 _ 15 0.7
Total 61 209 2,050 100.0
Subtotal b/ 48 209 1,965 -
a/ Estimates. Exact figures are conditional on future negotiations.b/ Not including Cabinda Onshore and Blocks 6 and 8.
Source: The MEP; SONANGOL; and Mission estimates.
2.26 Forty-eight exploratory wells 9/ were firmly scheduled for theperiod 1987-90, which means 12/y, compared to 15/y in the period 1981-86. Based on previous contractual commitments, the annual number ofprojected wells will decrease from 20 in 1987 to six in 1990, indicatingthat new agreements will be required to keep exploration activities atthe rhythm of the early 1980s. The majority of the scheduled exploratorywells (26) will be in Cabinda, reversing recent trends. Exploration inBlock 1 will stop and the companies concerned will try to obtain bettercontractual terms to make development of marginal discoveries feasible.Since the prospects for BRASPETRO's Block 4 are not bright, it is likelythat exploration there will also stop. On the other hand, a minimum offive exploration wells are scheduled for 1988-89 for Block 5, where
9/ Not including Cabinda Onshore and Blocks 6 and 8.

- 33 -
drilling started in April 1987. Negotiations between SONANCOL andTOTAL/PETROFINA are under way to define an exploration and productionprogram for Block 8 (with TOTAL as the operator), and plans called forthe re-opening of Block 6 during 1988. Offers for Block 7 were requestedfor the second half of 1988, and negotiations are expected to take placein 1989. Further exploration in Cabinda (over what is now planned) maywell result now that another international oil company, AGIP, has beenadmitted to the joint venture. Offers for Cabinda Onshore are still beingevaluated. Negotiations may start in 1988, but are expected to bedifficult. Thus if Blocks 6 and 8 as well as Cabinda Onshore areincluded, the total number of exploratory wells drilled in the period1987-90 may turn out to be 67. On an annual basis, this would equal the1981-86 average.
2.27 Estimates of future production vary considerably depending onthe source of information. The figures published by the MEP (Table 2.4)are based on forecasts prepared by SONANGOL and can be considered aconservative estimate of what is achievable in the light of past andplanned development activities. The projections understate the potentialfor a more rapid exploitation of producing fields, 10/ but alsooverestimate future success in developing proven fields. On the otherhand, average annual investments projected for the period 1987-90 arerather high (relative to the country's finances) and might not be carriedout in toto. As a result of these countervailing biases, the forecastcould end up being rather accurate over a number of years.
2.28 Angola's exploration strategy has been well thought out andsuccessful. However, Angola has usually stuck rather closely to its oildevelopment plans. Now, for the first time, production in Block 3 isexceeding previous, firm plans by a substantive margin with output inlate 1987 at 110,000 bbl/d, well above the 70,000 bbl/day that wasplanned in early 1987. This is leading to a rapid reduction in thereserves-to-production ratio (from about 13 years in 1987, to as littleas 8 years by 1990). While there is no magic reserves-to-productionratio, many countries feel that a suitable level is between 10 and 15years. If output in Block 3 is not expected to return to its earliertime profile, then a reassessment of the planned level of explorationactivities may be needed to arrest the decline in the reserves-to-production ratio. Any worsening of exploration performance (i.e., fewer,
10/ In late 1987, production in Block 3 was raised to 110,000 bbl/d,effectively reducing the reserves-to-production ratio to about sevenyears. This product'on is almost double the previous projections(Table 2.4). The reasons for this massive departure from theproductive path set forth in early 1987 are not quite obvious. Itmay be that the Government's short-term revenue needs are in favorof a more rapid exploration, which in the case of Block 3 also"benefits" foreign oil companies since higher production ratesshorten the pay-back period of exploration and development costs ofPSAs.

- 34 -
or smaller finds) or any slowing down of the pace of exploration couldquickly lead to a dangerous situation as the cushion of reserves couldbecome dangerously thin. Also, independently of whether the Angolanauthorities consider their level of revenues adequate, internationalmarkets might not. This could cause an increase in the cost of raisingcapital (for any purpose) for Angolan needs.
2.29 As regards the composition of crude oil output, the MEP'sscenario predicts that the share of Cabinda crude in total productionwill decrease from about 70% in the mid-1980s to 55% in 1990, while theshare of Block 3 would rise from 18% in 1986 to about 30% in 1990. Thisshift in output is also reflected in the projected allocation ofinvestment funds, the structure of which will change in favor ofBlock 3. Thus, the strategy in petroleum is to keep the production levelin Cabinda as high as possible (base production) and to spur outputgrowth by expanding activities in Block 3. In other words, Governmentpolicy is oriented to the short term objective of maximizing output andrevenues, while long term considerations are, at present, givenrelatively less importance. This is the expected behavior of a countryin the political situation of Angola.
Table 2.4: OIL PRODUCTION AND RESERVES, 1986-90
(in 'OOOs bbl/d)
Production by 1986 Projected 1990Area Actual % 1987 1988 1989 1990 in %
Cabinda 190 67.4 220 256 246 246 54.9Block 3 50 17.7 85 113 128 136 30,4Block 2 6 2.1 10 29 39 38 8.5Onshore 36 12.8 36 36 32 28 6,3
Total: 282 100 351 434 445 448 100
Reserves-to-ProductionRatio (in years): 13.7 12.6 9.6 8.8 7.8
Source: SONANGOL and the MEP (estimate was done in late 1987).
2.30 According to the MEP, a higher level of investment than in thepast will not necessarily prevent output growth from slowing down at theend of the 1990s. Thus any shortfall in planned investments will have asevere impact on future oil output and revenues. Since a considerableshare of the investment is to be carried out in Cabinda, a joint venture,the investment program will place a heavy financial burden on SONANGOL.Unlike the "pure" production-sharing onerations which, for instance, arecarried out in Block 3, the Cabinda Joint venture requires a 51%financial participation by SONAI4COL. Thus, since most of Angola's oil isproduced in Cabinda, increasing output reqtires the assumption of highup-front costs by SONANGOL, whose financial position is weakening, andcould precipitate a serious decline in the ccuntry's creditworthiness and

- 35 -
credit rating. This also explains why the less costly Block 3 (where nofitarcial commitments by SONANGOL are required) is gaining increasingimportance within Angola's crude oil development strategy. But as longas Cabinda remains the country's major source of oil, SONANCOL will haveto meet the sizeable financial obligations required (unless it sells partof its shares). As a consequence, SONANGOL's ability to raise therequired funds at low cost will be highly sensitive to both its ownfinancial performance and to the country's ability to keep its creditorsreasonably content. In ouch a delicate situation, the Government shouldnot embark on the risky course of offering future oil as a security tocreditors (other than SONANGOL's). The Government should also avoidmajor delays in servicing its external debt since any deterioration inthe country's debt discipline will reduce the market value of the loanswhich have been raised in the past and, therefore, tend to raise thecosts of future borrowing.
2.31 SONANGOL has recently expressed interest in gathering practicalexperience as an operator. So far, SONANGOL's operational responsibili-ties have been limited to Block 4 where it owns 51% of the mixed-economycompany ESPA (the Empresa de Servicios Petroliferos de Angola). Plans toincrease its share to 100% and, thus, to become fully responsible foroperations have been dropped because of the disappointing explorationresults. Nonetheless, SONANGOL may still intend to expand its upstreamactivities and is currently exploring the option of assuming FINA's roleas the operator in onshore Cabinda. Taking over ongoing operations is aless risky strategy than exploring and developing new fields. However,while additional experience as an operator may help SONANGOL to improveits capacity to supervise foreign oil companies, resource constraints andthe scarcity of qualified personnel might complicate SONANGOL's role ascontroller of oil activities. While this report does not strongly favoreither option (operating or not operating), on baLance SONANCOL shouldprobably not become more heavily involved in field operations, but directexperience can't hurt, provided its costs are kept low and the operatingresults are acceptable.

- 36 -
II.B. GAS SUPPLY AND UTILIZATION
Summary and Recommendations
2.32 Significant quantities of associated gas (currently about 50%of total production) are used for gas lift and reinjection schemes.Government policy calls for a rapid increase in the gas utilizationrate. New lift and reinjection schemes (where compatible with oilproduction and reservoir characteristics) and expansion of existing ones(replacement of Livuite gas with associated gas sources) are under way.A target utilization rate of 70% is the goal for late 1990, up from thepresent 50% or so; this is a reasonable objective. However, purereinjection of associated gas (to save it for future use) may have costswhich exceed the economic value of the gas in the ground.
2.33 No investments in gas field assessment or delineation should beundertaken unless major economic uses have been identified. Inparticular, only large-scale projects which could steadily consume aconsiderable amount of gas would justify the delineation and developmentof known, existing non-associated gas fields. No economic large-scaleprojects are presently known, and thus prospects for the development ofnon-associated gas fields are dim.
2.34 The only large-scale project capable of using sizeable quanti-ties of natural gas is the proposed export-oriented ammonia/urea plantwhich would require about 50.6 MMCFD of gas. However, in view of thedepressed international fertilizer market and given that gas supply costsare relatively high, Angola would not have a substantial comparativeadvantage even in a well-managed plant. Furthermore, there are no otherdomestic consumers who could absorb natural gas in large quantities orwould have an incentive to switch to gas. Thus, the country's non-associated gas should be left in the ground until economic uses for itcan be found.
2.35 As crude production in Block 3 rises, the potential for a newlarge-scale LPG recovery scheme could increase. If world prices for LPCdo not deteriorate, such a scheme could expand exports and provide thecountry with additional foreign exchange.
2.36 SONANGOL's ability to study and supervise even a limited numberof gas-related projects sho d be strengthened in the small unitresponsible for gas matters set up around the few people currentlydealing with gas in SONANGOL. This unit should be in a position tomonitor ongoing gas-related activities more thoroughly and to coordinateplans for future projects with related activities in other subsectors.It should not become a bureaucratic unit which wastes manpower in thepursuit of elusive gas projects for their own sake.
2.37 Highest priority should be given to two projects presentlyunder consideration by SONANGOL:

- 37 -
(a) the LPG recovery scheme in Cabinda, i.e., on the moored LPGtanker, Berge Sisar, (estimated investment costs: US$2-3million). This project would increase the domestic supply ofLPG by about 60% and replace costly LPG imports of 8,000-10,000tons/year.
(b) the export-oriented LPG/condensates recovery program inBlock 3. This project, if economic, could produce significantforeign exchange revenues.
Other projects which deserve further investigation in the shortterm are:
(c) the planned LPG bottle rehabilitation plant, with investmentcosts estimated at US$5 million (essential, if the firstproject is to go ahead);
(d) the proposed dual-fuel thermal power plant in the Soyo area,and rehabilitation of the gas-fired turbine for Cabinda; and
(e) the onshore plant for recovery of LPG at Malongo costing US$3-4million (provided that demand will be adequate at the higherLPG prices which this report proposes).
Gas Reserves and Utilization
2.38 Angola's natural gas resources probably exceed 5 TCF. Non-associated gas accounts for about 3 TCF of the probable reserves, andassociated gas for about 2.5 TCF, of which 1.8 TCF were proven in early1987. At present the average associated gas-to-oil ratio isapproximately 1.34 MCF/1,000 bbl of oil. Thus, a crude oil output of282,000 bbl/d in 1986 yielded 379 MMCFD of associated gas (Annex 4,Table 7). By 1990, associated gas production is expected to reach515-536 MMCFD, although the official forecast is about 488 MMCFD. Non-associated gas reserves are not yet being exploited except for a smalloffshore field in Cabinda. The main resources are located offshore ofZaire province in Blocks 2 and 3, but because of the limited number ofexploratory wells, information about reserves is limited (Annex 4).
2.39 In 1986 about 51% of the associated gas output was actually putto use, primarily in gas lift and reinjection schemes which account formore than 85% of the country's gas utilization (Annex 4, Table 8). Onlya minor fraction of the associated gas which is not flared is directlyrecovered as a fuel, either for use in oil operations or for LPG, and thepicture for productive uses (other than uplift and reinjection) is notlikely to change in the near future. By 1990 the gas utilization rate isexpected to rise to 70%, with most of the gas still being used in liftand reinjection schemes.

- 38 -
2.40 The declared policy of the Government is to increase theutilization of associated gas; hence flaring is prohibited, whilerecovered gas may be used free of charge. The Government has neverconducted a comprehensive assessment of whether reinjection iseconomically justified. From an economic point of view, reinjection toconserve associated gas for future use makes sense only if the costs perCF saved do not exceed the user costs (i.e., depletion value) of non-associated gas. Although there is a lack of precise data .n this area,it is likely that this condition is not met in Angola. While thecountry's non-associated gas reserves are comparatively small in absoluteterms, the ratio of probable reserves to projected production, i.e., thetima horizon for resource depletion, is quite high. As a consequence,the user costs of the non-associated gas tend to be negligible (probablyin the vicinity of US$0.2/MMBTU), and thus the scope for profitablereinjection is limited.
2.41 A more promising option for associated gas utilization is theproduction of LPG. At present, the only facility in which associated gasis being recovered for LPG production is located offshore of Cabinda onthe tanker, Berge Sisar. The output, consisting of a 66:34 mixture ofpropane and butane, rose from less than 500,000 bbl in 1983 to about 2million bbl in 1984 and is now stable. Output is expected to rise to2.6 million bbl/y over the next few years. In 1986, almost the totaloutput (170,000 t) was sold to Brazil at about US$125/t (FOB Angola) orUS$2.89/MMBTU.
2.42 In 1986, sales of LPG in the national market reached32,000 t. However, the cost of imported LPG (about 12,000 t) is muchhigher than the FOB value of export LPGQ The import parity costs ofLPG--(c.i.f. coastal terminals) are US$250/t, while the FOB value ofexport LPG is US$125/ton. The costs of adjusting the composition of"'export LPG" to meet the national specifications and shipping it tocoastal terminals are estimated at US$90/t. Thus, the opportunity costof LPG could be considered either US$250/t, or US$215/t (i.e., US$125/tFOB plus US$90/t fractionation and delivery costs). 11/
2.43 The LPG fractionation project would add about 30,000 t/y(80-85 t/d) to domestic supplies. This would suffice to eliminate high-cost imports (about 10,000 t/y costing about USt2.5 million) and add20,000 t/y to meet domestic consumption. At present prices, there is
11/ Gas is both imported and exported. Angola is a net exporter of LPG,but export LPG (66% propane, 34% butane) is not the same as the LPGconsumed domstically (produced in the Luanda refinery and imported).Thus if both LPGR can be considered one good, then the opportunitycost is the FOB value of export LPG; while if they are considered tobe different goods, the opportunity cost would be the CIF cost ofimported LPG, and shipping it to Luanda could be used as a guide todomestic price setting or as the opportunity cost of LPG.

- 39 -
little doubt that this quantity of LPG could be absorbed (provided alsothat bottles and stoves are available). However, a more reasonable pricefor LPG (paras. 3.35 and 3.36) in the range of Kz 45 90/kg (with a12.5-kg bottle costing Kz 563 to Kz 1,125 12/) could well dampen thegrowth of demand. It might therefore be prudent to increase the supplyto the domestic market more gradually than is implicit in the 85 t/dfractionation project. 13/ Similarly, preparation of additional projectsto expand the availability of LPG for domestic consumption should best bepostponed until the effect of the higher price on demand can beevaluated.
Market Potential of Non-Associated Gas
2.44 As regards the exploitation of the country's non-associated gasreserves, the short- to medium-term outlook is not particularlypromising. Unless a large market can be identified, the extraction andgathering of non-associated gas will almost certainly prove to beuneconomic. So far, the only large-scale project which could use asizeable amount of natural gas as a feedstock is an ammonia/urea plantproposed for the Soyo area. The project has been under study since theearly 1980s.
2.45 indivisibilities and economies of scale require a minimumcapacity of 1,000 t/d of ammonia. World-class plants typically have aninstalled capacity of 1,500 t/d of ammonia and 500 t/d of urea, and costabout US$330 million (at 1987 prices). Capacity utilization in theseplants typically hovers in the 80-90% range. The maximum output wouldtherefore be about 164,000 t/y of urea and 396,000 t/y of ammonia. Giventhe limited domestic demand for nitrogen fertilizers (about 10,000 t/y in1987), the plant would have to sell most of its output abroad wherefierce competition and a general glut of fertilizers are keeping priceslow. A sustained market recovery with prices above US$200/t is notlikely to occur before the mid-1990s. Moreover, since the plant willrequire a gas supply of about 51 MMCFD (16.65 BCF/y) which cannot be metfrom associated gas alone, non-associated gas would have to be developedand used. Therefore, feedstock costs will most likely exceedUS$1.5/MMBTU.
12 Even at the higher price for LPG, the price of one 12.5 kg. bottlecould be equal to the parallel market price of only 3-4 kg. ofcharcoal, i.e., LPG would still be considerably less costly thanwoodfuels.
13/ In some uses, fractionation may not be needed. The export LPG couldsimply be mixed with the refinery-produced LPG and used. This isusually acceptable in household use. However, tests should beconducted to see if this is correct for any use being contemplated.
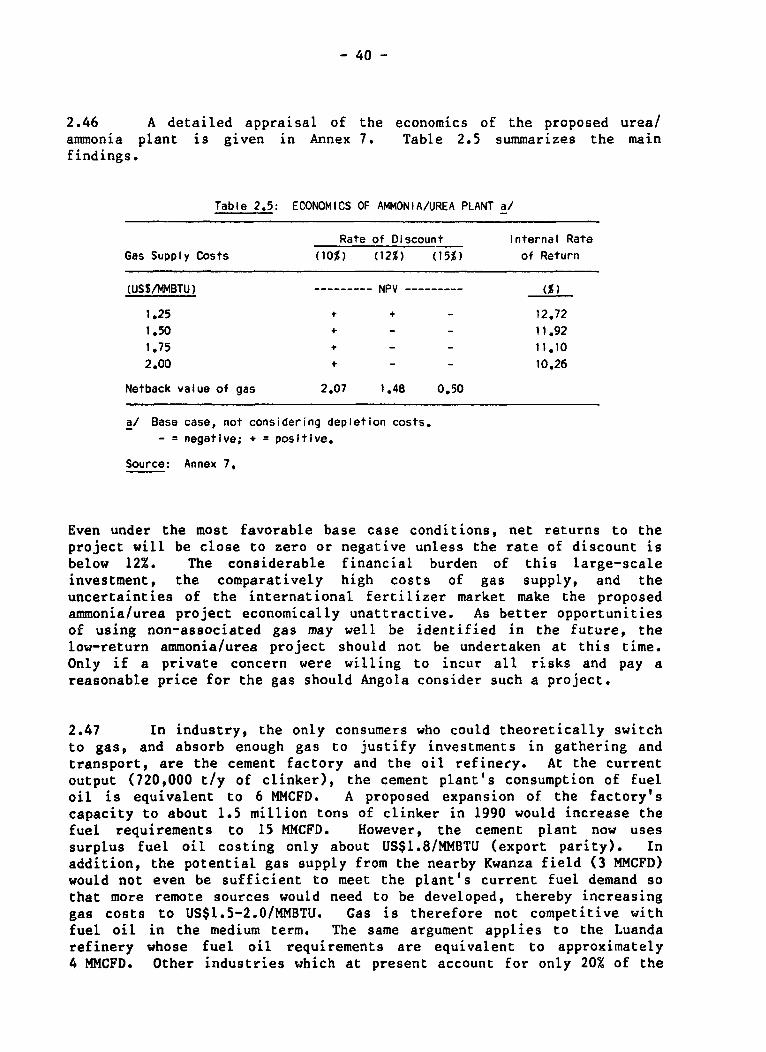
- 40 -
2.46 A detailed appraisal of the economics of the proposed urea/ammonia plant is given in Annex 7. Table 2.5 summarizes the mainfindings.
Table 2.5: ECONOMICS OF AMMONIA/UREA PLANT a/
Rate of Discount Internal RateGas Supply Costs (10%) (12%) (15%) of Return
(US$/MMBTU) --------- NPV --------- ()
1.25 + + - 12.72
1.50 + - - 11.92
1.75 - - 11.10
2.00 + - - 10.26
Netback value of gas 2.07 1.48 0.50
a/ Base case, not considering depletion costs.- = negative; + = positive.
Source: Annex 7.
Even under the most favorable base case conditions, net returns to theproject will be close to zero or negative unless the rate of discount isbelow 12%. The considerable financial burden of this large-scaleinvestment, the comparatively high costs of gas supply, and theuncertainties of the international fertilizer market make the proposedammonia/urea project economically unattractive. As better opportunitiesof using non-associated gas may well be identified in the future, thelow-return ammonia/urea project should not be undertaken at this time.Only if a private concern were willing to incur all risks and pay areasonable price for the gas should Angola consider such a project.
2.47 In industry, the only consumers who could theoretically switchto gas, and absorb enough gas to justify investments in gathering andtransport, are the cement factory and the oil refinery. At the currentoutput (720,000 t/y of clinker), the cement plant's consumption of fueloil is equivalent to 6 MMCFD. A proposed expansion of the factory'scapacity to about 1.5 million tons of clinker in 1990 would increase thefuel requirements to 15 MMCFD. However, the cement plant now usessurplus fuel oil costing only about US$1.8/MMBTU (export parity). Inaddition, the potential gas supply from the nearby Kwanza field (3 MMCFD)would not even be sufficient to meet the plant's current fuel demand sothat more remote sources would need to be developed, thereby increasinggas costs to US$1.5-2.0/MMBTU. Gas is therefore not competitive withfuel oil in the medium term. The same argument applies to the Luandarefinery whose fuel oil requirements are equivalent to approximately4 MMCFD. Other industries which at present account for only 20% of the

- 41 -
country's boiler fuel consumption might demand 2-5 MMCFD of gas. Thus,the low potential demand for gas and the availability of cheapalternative fuels make the near-term development of non-associated gasreserves for domestic use uneconomic.
2.48 As for power, most of the electricity is supplied from low-costhydro plants (with a substantial hydro potential still to be developed).The use of gas would only be needed for peak-load generation in thermalpower plants. However, given the alternative of petroleum products andthe fact that an optimistic peak-load scenario might require at most anaverage of 3-4 MMCFD of gas, then power demand cannot justify anyinvestment in gas gathering and transport. Gas for power generationmight prove economically viable only in isolated areas with low primaryenergy requirements and cheap gas available nearby. The most promisingoptions of this type are the 15 MW dual-fuel power plant proposed forSoyo and the rehabilitation of a 10 MW gas turbine in Malongo-Cabinda.
2.49 If the international price of LPG does not fall below thecurrent level, there may also be a significant potential for new export-oriented LPG recovery schemes similar to the one in offshore Cabinda.The most promising area is Block 3 where oil production is expected toincrease considerably, in association with large volumes of gas rich inLPG. These schemes will only be justified by exports, but they couldalso provide a low-cost source for small (gradually increasing) volumesof LPG (adjusted to meet national specifications) used domestically. Inthis respect, the planned offshore Cabinda production of 85 t/d for thedomestic market is a logical step. With estimated investment costs ofUS$2-3 million, the project will probably replace imported LPG economi-cally. However, small-scale LPG recovery plants will not be economicallyviable, unless there are isolated markets which can be supplied from
nearby gas resources. The onshore Cabinda project, for instance, whichis supposed to produce 8 t/d of LPG from gas recovered at the Malongo oilterminal (investment costs: US$3-4 million) is a case in point, and itseconomics are probably marginal. Other proposals, such as the 3-4 t/donshore Kwanza LPG recovery plant, will probably not be justified either.

- 42 -
III, CRUDE OIL: REFINING AND PRODUCT SUPPLY
Summary and Conclusions
3.1 Pricing of petroleum products at the refinery gate and to finalconsumers, and pricing of crude oil for domestic refining, are areaswhere substantial reforms could be implemented most easily. Yet,specific pricing recommendations are difficult to make in themacroeconomic policy environment of Angola. The normal pricerecommendation would be to base domestic prices of petroleum products onopportunity costs such as the CIF cost of bringing products to Angola, orthe FOB cost for net exports, or full cost recovery for those productsproduced in Angola (i.e., remove subsidies to crude oil and specificproducts). However, given the extreme overvaluation of the Kwanza, thestandard economic prescription of using opportunity costs as the basisfor pricing would only fully make sense after the value of the Kwanza hadbeen adjusted downwards to some sort of equilibrium level (or to a levelnearer to equilibrium than is currently the case). But since finalpetroleum product prices in Angola are below border prices even at thehighly overvalued present official exchange rate, and the crude oil forlocal refining is subsidized, these shortcomings would need to becorrected first. In fact, an overvalued exchange rate doesn't mean thatpetroleum products should continue to be consumed wastefully by beingpriced excessively cheap. A series of step adjustments in prices wouldprobably be easiest to apply. The steps could be as follows, usinghypothetical exchange rates:
Step One: eliminate all subsidies to crude and products,including LPG, and immediately bring all prices toborder levels at the official rate of exchange.
Step Two: adjust all petroleum product prices to an exchangerate of, say, Kz 100/US$.
Step Three: by this time, the SEF should be in progress and amore adequate exchange rate might be available toguide the MEP in the pricing of petroleum products.Should the exchange rate remain fixed in spite ofnotable domestic price increases, the MEP could usean index of inflation to keep real product pricesstable.
Advantage of a Correct Pricing Policy
3.2 Basically, pricing policies should be based on the economiccost of supplying or using a particular energy resource. Adherence tothis principle ensures efficiency in resource allocation and providesconsumers with correct signals for their economic decisions (i.e., it

- 43 -
tells consumers the cost of an additional unit of each resource andthereby enables them to make the best choice). However, given the largedistortions and the difficulties of running the economy along optimallines, second-best policies are more expedient for Angola in the short tomedium term. 14/ While these policies would involve a gradual departurefrom the severe price distort,.ons described below, the medium- to long-term goal should be to adjust prices and tariffs so as to reflect thetrue economic cost aL the margin.
3.3 Currently, the structure of petroleum product prices looks asfollows:
(a) the present official refinery gate prices are now, on average,slightly below border prices at the official exchange rate andmid-1987 values. Gasoil and fuel oil are priced considerablybelow international parity while LPG, gasoline andkerosene/jet fuel are reasonably in line with border pricelevels;
(b) LPC, kerosene and light fuel oil (LFO) are sold at priceswhich are less than full cost recovery, while gasoline, jetfuel, gasoil, and heavy fuel oil (HFO) are sold above cost--all in Kz valued at the official exchange rate; and
(c) the FPA refinery pays less than the economic opportunity costfor indigenous crude oil feedstock. The Government providesan effective subsidy to FPA by not collecting royalties oncrude for local refining.
Refining
3.4 The refining of indigenous crude in Luanda in a hydroskimmer isan economically viable product-supply strategy for Angola as compared toimports of products. The FPA refinery is a reasonably well run and wellmaintained facility. Purchasing this refinery (or a controlling interestin it) would seem a wasteful use of limited Angolan financialresources. Furthermore, lack of incentive to reduce costs and possiblyhigh use of expatriate labor are the most apparent contributors to higioperating costs. The FPA refinery operates on a "cost-plus" refinerygate pricing arrangement. On the aggregate, all verified operatingcosts, depreciation and allowable profit are recovered, but there is noparticular incentive for cost minimization and optimization ofoperations. Therefore, efforts should be made to design and implement apricing scheme which encourages the refinery to operate in a moreefficient way. This could be done in the context of an ESMAP activity.
14/ For example, the second-best pricing strategies aiming at thefinancial strengthening of utilities that the mission proposes forthe power sector.

- 44 -
Distribution
3.5 SONANGOL distribution and marketing departments have excessivestaff, facilities, and overheads in relation to volume distributed. Theoperations are based on a "cost-plus" arrangement. All verified costsand a guaranteed profit margin are supposed to be covered either throughthe final selling price or through a subsidy from either a profitableproduct or the Government budget. In practice, however, petroleumproduct distribution is a loss-making business since large consumers(e.g., the army, cement plants) fail to pay their bills.
3.6 In order to improve the situation a study should be undertaken,dealing with revisions in the cost-plus pricing scheme, the enforcementof a higher financial discipline on customers and, most importantly,investigation of the options for a gradual rationalization(privatization) of SONANGOL's distribution and marketing activities.
Procurement
.7 SONANGOL Limited, London, with its own staff and its jointventure arrangement with the West German trader, STINNES, currentlymanages Angola's product import and export arrangements. However,SONANGOL itself has the knowledge and capacity to organize tenders orsupply contracts either as a buyer or a seller. SONANGOL might considerselling excess fuel oil (as it has done in the past) through aninternational tender for a one-year contract, or through sales to end-users in the United States via a brokerage firm which could do all thework for about US$0.03/bbl. Jet fuel, kerosene, and gasoil could beprocured from a nearby reliable refiner such as CEPSA or CHEVRON, both ofwhom have processing agreements in Abidjan, Gabon, and Moanda-Zaire(south of Cabinda). In this manner, Angola may be able to lower the costof its product imports, especially when purchases are made fromaffiliates of companies already present in Angola.
Production, Supply and Consumption Considerations
3.8 Angola currently consumes some 0.9 million t/y of petroleumproducts compared with total production of crude and gas liquids inexcess of 14 million t/y. In spite of its large oil production andexports, Angola's revenue requirements are so critical that any reductionin domestic consumption of petroleum products would be advantageous. Thelack of incentives to cost effectiveness under existing "cost-plus"product pricing regimes for both refining and product distribution appearto be major contributors to inflated product supply costs above"efficient" levels.

- 45 -
Product Trading/Import-Export
3.9 Imports. Although the principal products supply source forinland consumption is the Luanda refinery, shortfalls in certain productsare met through direct product imports. Table 3.1 provides a summary ofimports for the 1980-86 period. As indicated, jet fuel (A-1) has becomethe predominant import, mostly because of military use. Table 3.2illustrates the growth in jet fuel imports versus refinery supply andtotal supply/requirements over the 1980-86 period. Imported supply in1986 represented 40% of the total, up from zero in 1980.
3.10 Over the past three years, Angola has also experienced a smallshortfall in gasoil supply, which has been met by imports. This wasexpected to turn into a slight surplus in 1987 as the yield from theexpanded refinery at higher throughputs more than matches growth indemand. In addition, there has been a consistent shortfall in high-butane LPG from the refinery, which has been met through imports. On theother hand, since 1983 significant amounts of high propane LPG have beenrecovered from Cabinda associated gas. This, however, has never beenused to supply the domestic market because of the difference inspecifications. Since the Cabinda export type of LPG is 70% propane vs.about 30% (maximum) propane for the refinery/imported material, it is notadapted to the storage and end-use equipment in Angola. A project isproposed (para. 2.37) to recove- part of the Cabinda LPG fox householduse and, if required for technical reasons, to fractionate a portion ofthe Cabinda production on board the floating storage tanker, Berge Sisar,to produce a high butane/low propane LPG for the national market. Thiswould make it possible to eliminate present imports.
Table 3.1: IMPORTS OF PETROLEUM PRODUCTS 1980-86
(Tons)
1980 1985 1986
LPG 6,942 11,710 10,913
Jet fuel 0 102,633 114,184
Gasoil 0 36,693 16,435Total products 6,492 151,036 141,532
Percentage Share of Petroleum Imports
LPG 100.0% 7.8% 7.7%
Jet fuel 0.0% 68.0% 80.7%
Gasoil 0.0% 24.3% 11.6%
Total products 100.0% 100.0% 100.0%
Estimated value (USS million)-- 41,85 24.94
LPG: Liquefied Petroleum Gas (LPG).
Source: SONANGOL and MEP.

- 46 -
Table 3.2: JET FUEL SUPPLY 1980-86IMPORTS VS. LOCAL REFINERY-SOURCED
(Tons)
1980 1981 1982 1983 1984 1985 1986
Ex-refinery 118,559 126,960 99,493 143,527 161,527 172,809 171,064
Ex-imports 0 7,764 39,796 24,925 62,895 102,633 114,184
Total supply 118,559 134,724 139,289 168,452 224,841 275,442 285,248
Percentage Share of Total Supply
Ex-refinery 100.0% 94.2% 71.4% 85.2% 72.0% 62.7% 60.0%
Ex-imports 0.0% 5.8% 28.6% 14.8% 28.0% 37.3% 40.0%
Total supply 100.0% 100.0% 100.05% 100.0% 100.0% 100.0% 100.0%
Source: SONANGOL.
3.11 Since 1986, SONANGOL has procured jet fuel and gasoil imports
through its U.K. subsidiary, SONANCOL Limited. This joint venture
partnership with the West German trading company, STINNES, has
established a steady import pattern of 5,000-ton parcels roughly every
month from Tenerife, Canary Islands (Annex 12 gives details).
3.12 The mission believes that Angola can organize its procurement
without the help of an intermediary and that there are more logical
sources of supply (such as Abidjan, Moanda/Zaire or Cabon) which would
cause much lower freight rates (Annex 12 provides some indicative
figures). It seems feasible for SONANGOL to procure middle distillates
at substantially less than the current cost of Mediterranean plus
US$39/t, most probably in the range of Mediterranean plus US$19-22/t. In
fact, Angola should consider the option of opening tenders for 10,000-ton
parcels CIF Luanda rather than going to the trouble of chartering its own
vessel.
3.13 Cargo Exports. The principal export is fuel oil, which is
produced in the refinery in excess of requirements. Sporadic naphtha
exports also represent a habitual surplus over Angola's requirements.
The remaining small, rather sporadic volumes of other clean products are
principally exported to favored countries such as Sao Tome and Principe,
Guinea-Bissau or Mozambique under special government-to-government
arrangements. A summary of cargo exports of finished products is shown
in Table 3.3.

- 47 -
Table 3.3: PETROLEUM PRODUCT EXPORTS (CARGO) 1980-86
(Tons)
1980 1985 1986
LPG at Cabinda 0 173,836 166,782
Ex-refinery:
GasolIne 2,606 3,192 2,902Naphtha 0 5,069 8,642Kerosene 2,375 0 0Jet fuel 0 2,952 0Gasoil 23,839 7,322 5,642Fuel oil 481,613 585,922 528,766Total ex-refinery 510,433 604,457 545,952
Total al; products 510,433 778,293 712,734
Source: SONANGOL.
3.14 Excess fuel oil is sold by the refinery at official refinery
gate prices to SONANCOL which then sells it to the SONANCOL-STINNES
(U.K.) joint venture. With the U.S. Northeast coast being the major
market outlet, SONANCOL currently receives New York harbor cargo prices
less US$22/t. It should therefore consider returning to its 1981-82
practice of opening tenders in the international fuel oil market, for
which the mission believes SONANGOL has the expertise.
3.15 Refining. Angola's requirements for domestic proCucts are met
primarily through refining of domestic crude oil. The principal facility
is a simple, 1.7 million ton/y hydroskimmer in Luanda owned and operated
by FPA. In addition, there is a small 100,000 t/y topping plant owned
and operated by CABCOC at its Cabinda/Malongo base. 15/ The Luanda
refinery dates back to 1958 when a 100,000 t/y topping unit was built.
At thdt time, it was fed with crude from the newly discovered onshore
Kwanza field.
3.16 The present plant has a nominal capacity of 1.7 million t/y but
actual yearly capacity considering planned maintenance shutdowns and
unforeseen outages is rated at 1.6 million tons. The plant was
recently expanded from 1.5 million t/y nominal capacity through the
15/ This takes a slipstream of crude from the large Cabinda crude
production stream, extracts gasoil and jet fuel for local
operations, and returns the remainder to the crude stream.

- 48 -
de-bottlenecking of one of the topping plants (Annex 8 gives technicaldetails). Along with minor modification to the tower internals andpumps, the total cost of the expansion was only US$2 million.
3.17 Crude oil feedstock. The present feedstock consists of Kwanzaand Soyo crudes, both from FPA-operated fields. Table 3.4 summarizes theestimate of net plant yields from Luanda refinery for the two crudes.
Table 3.4: NET PLANT YIELDS a/(% By Weight on Crude)
Kwanza Soyo
LPG 0.8 1.4
Gasoline/Naphtha 11.8 10.3Kerosene 8.0 11.0Gasoll 22.5 24.8Fuel oil 53.2 48.3Total 95.8 95.8
a/ After refinery fuel and losses, estimated atabout 4.2% by weight of crude throughput.
Source: FPA and SONANGOL.
The Kwanza crude is of slightly lower quality than Soyo, havinga higher fuel oil and lower clean products yield. Kwanza is also ofslightly higher sulfur content than Soyo, but both crudes would beclassified as low sulfur crudes by international standards. 16/ Thefeedstock mix for 1985-86 shown in Table 3.5.
Table 3.5: CRUDE OIL FEED - LUANDA REFINERY, 1985-86
…---- 1985 ------ 1986-
Tons % Tons %
Kwanza 201,323 13.9 155,363 10.7Soyo 1,249,993 86.1 1,296,820 89.3Total 1,451,316 100.0 1,452,183 100.0
Source: FPA and SONANGOL.
16/ The refinery takes the entire production of the declining Kwanzafield. The Soyo (Congo basin) crude is also produced from a fairlymature field. At best its production is stable in the face of anincreasing refinery throughput.

- 49 -
3.18 Production/Yields. Table 3.6 summarizes the production/yieldbalance for the refinery from 1980 through 1986. As would be expectedwith a simple skimming refinery running a fairly steady crude slate overthe period, there is not much variation in yield of major productstreams. The total kerosene/jet fuel yield has increased as this is theproduct in greatest demand. There has been a slight reduction in fueloil yield, probably because of the Lightening of the average crude slateas heavier Kwanza decreased as proportion of total feed. There may alsohave been some improvement in fractionation over the period, since theshare of after-refinery fuel and losses has decreased significantly, froman average of about 6% in the 1980-83 period to a reasonably low 4.2% in1985-86.
Table 3.6: LUANDA REFINERY PRODdCTION/YIELD BALANCE, 1980 AND 1985-86(Tons)
-1980 - 1985 -1986-
Crude run (1,237,507) 100% (1,451,316) 100% (1,452,183) 100%
Product Yield:LPG 11,746 0.9% 18,269 1.3% 18,690 1.3%Gasoline 89,563 7.2% 103,450 7.1% 104,675 7.2%Naphtha 0 0.0% 9,914 0.7% 21,471 1.5%Subtotal 89,563 7.2% 113,364 7.8% 126,146 8.7%
Kerosene 33,007 2,7% 45,598 3.1% 35,637 2.5%Jet fuel 118,559 9.6% 172,809 11.9% 171,064 11.0%
Sub total 151,556 12.2% 218,407 15.0% 206,701 14,2%
Gasoil 294,728 23.8% 353,699 24.4% 347,288 23.9%Fuel oil 609,418 49.2% 679,419 46.8% 685,767 47.2%Asphalt 7,358 0.6% 7,924 0.5% 7,253 0.5%Subtotal 616,776 49.8% 687,343 47.4% 693,020 47.7%
Total (excl. loss) 1,164,379 94.1% 1,391,082 95.8% 1,391,845 95.8%Fuel & loss 73,128 5,9% 60,234 4.2% 60,338 4.2%Total 1,237,507 100.0% 1,451,316 100.0% 1,452,183 100.0%
Source: FPA and SONANGOL.
3.19 Operating Costs/Efficiency. The refinery gives the impressionof a well managed, well maintained, neat, and tidy facility. Maintenance,housekeeping, and safety practices have been satisfactory. The fractiona-tion performance and fuel and loss figures look favorable. However, thetotal operating cost figure of US$2.28/bbl appears high for this type ofrefinery (Table 3.7). The range of total operating costs for severalother hydroskimmers over the past few years (inflated to 1986 levels) is

- 50 -
US$1.20-1.50/bbl, excluding depreciation. This compares with US$1.88/bblfor Luanda, excluding depreciation, The main discrepancy appears to bein labor costs. The figure of almost US$1.00/bbl compares with US$0.40-0.60/bbl in other similar operations. Luanda's high cost reflects boththe high level of staffing, 450 in all, and the excessive complement ofexpatriates. Given the rather low salaries for nationals, the excessivedependence on expatriates is probably the main reason for the higher thannormal payroll.
Table 3.7: LUANDA REFINERY OPERATING COSTS ANDTOTAL GROSS MARGIN - 1986
US$/bbl US$/million
Salaries, wages, benefits 0.98 10.4Materials, chemicals 0.72 7.7Depreciation 0.40 4.2Financial charges 0.11 1.2Training 0.07 0.7lotal operating cost 2.28 24.2
Allowable profit 0.33 3.5Gross Refinery Margin 2,61 27.7
Source: FPA.
The expatriates alone probably account for US$4-S million of the totalUS$10.4 million/y labor cost. A significant reduction in the number ofexpatriates would bring the total operating costs for the Luanda refinerymore in line with other similar refineries. Given appropriate humanresource training and development planning there is no reason why thisrefinery could not be run with half of its present expatriate force. Thebiggest problem in encouraging such cost saving may be the lack ofappropriate incentives under the existing "cost-plus" refinery gatepricing arrangements.
3.20 Distribution and Marketing. SONANGOL, which has a monopoly onthe distribution and marketing of petroleum products in Angola, can relyon an e:vAnsive network of storage terminals, most of which wereinherited from the former private distributors. The largestconcentration of storage is in Luanda, followed by other large coastalinstallations in Namibe, Lobito, and Porto Amboim (Annex 8, Table 3).The large Luanda, Namibe, and Lobito terminals are tied in to the threemajor railway lines so as co serve the smaller depots up-country, all ofwhich are on these rail lines. Due to deterioration of the rail systems,the inland terminals are largely dry. Most products that reach theinterior come by road tanker direct to customer tanks or to the rareservice stations. SONANCOL operates its own fleet of some 300 roadtankers wi - an average capacity of 18,700 liters each.

- 51 -
3.21 Under current conditions, the coastal region is well served,with little evidence of suppressed demand. In the interior, the normalmanifestations of shortages such as service station queues and elevatedblack-market prices are rare for products such as gasoline and gasoilsince there is very little transport or commercial activity gaing on. Onproducts like kerosene for lighting, however, there is supprossed demandand high prices but this also is the case in the outskirts of Luanda.Table 3.8 summarizes total inland sales for 1980, 1985 and 1986.
Table 3,8: INLAND PETROLEUM PRODUCT CONSUMPTION (SALES) 1980-86(Tons)
1980 1985 1986 a/ 1980-86
(S) per annum
LPG (Butane) 18,688 28,695 30,200 8.3Gasoline - t'btor 79,567 95,004 103,680 4,5
= Aviation 1_391 987 430 -17.8Total gasoline 80,958 95,991 104,110 4.3
Kerosene 29,835 43,908 46,310 7.6Jet fuel 114,350 235,567 260,550 14.7Total kerosene/jet fuel 144,185 279,475 306,860 13.4
Gasoi l 268,806 376,865 344,770 4.2Fuel oil 121,268 104,622 119,200 -0.3Asphalt 3,171 5,593 4,200 4.8Total all products 637,096 891,241 909,340 6.1
a/ 1986 estimate based on 9-month actuals.
Source: SONANGOL.
International Comparisons
3.22 A comparison of Angola's petroleum consumption per capita in1984 with that for seven "lower middle-income" countries shows Angolanconsumption is low compared with the range of values and the average forthe group. The stagnation in the economy is probably offset by militaryconsumption but the overwhelming use of hydrogeneration for power wouldkeep Angola's consumption of petroleum products lower than other similarcountries, ceteris paribus.

- 52 -
Table 3.9: PER CAPITA PETROLEUM CONSUMPTION
INTERNATIONAL COMPARISON, 1984
Lower/Middle-Income GNP Population Consumption
USS/Cap (millions) -- Kg/Cap --
Mauritania 450 1.7 100
Zambia 470 6.4 110
Bolivia 540 6.2 195
C6te d'lvoire 610 9.9 95
Zimbabwe 760 8.1 90
Peru 1,000 18.2 370
Costa Rlca 1,190 2.5 380
Total average 7 countries 764 7.6 216
Angola 485 8.9 79
Source: World Bank and Angolan authorities.
Projected Petroleum Product Consumption
3.23 SONANCOL's sales department has developed a forecast of product
consumption for AngoLa to 1992. This projection is summarized for each
product in Table 3.10. No details on the rationale for the assumed
growth rates for each category were available to the mission. It appears
that the growth in consumption of products such as gasoline, kerosene,
and gasoil has moderated slightly from the actual 1980-86 rate. The most
striking reduction has been for jet fuel for which per annum growth is
shown as falling from 14.7% in 1980-86 to an assumed 2.2% per annum
growth in 1986-92. This low growth is based on a 24% reduction in jet
fuel use assumed for the military in 1987, followed by a 3% per annum
growth thereafter, such that 1992 military consumption is still some 12%
lower than 1986 levels. Non-military jet fuel use is assumed to grow at
a fast 5.6% per annum over the period.
3.24 The basic assumption underlying the SONANGOL forecast, namely
that the growth of aggregate petroleum product consumption will slow down
until the early 1990s, seems to be reasonable. The mission estimates
that during the remaining years of the 1980s, the rate of increase will
fall below 3%, but rise above 3% in the 1990s in the event of a return to
peace.

- 53 -
Table 3.10: PROJECTED PETROLEUM PRODUCT CONSUMPTION
(Tons)
Actual Assumed
Actual a/ per annum Forecast per annum
1986 1980-86 1992 1986-92
LPG (Butane) 30,200 8.3% 39,213 4.0%
Gasoline (99,5% motor) 104,110 4.3% 131,618 4.0%
Kerosene 46,310 7.6% 65,692 6.0%
Jet fuel 260,550 14.7% 297,051 2,2%
Total Kerosene/jet fuel 306,860 13.4% 362,743 2.8%
Gasoll 344,770 4.2% 431,346 3.8%
Fuel oil 119,200 -0.3% 143,912 3.2%
Asphalt 4,20 4,8% 4,730 2.0%
Total all products 909,340 6.1% 1,112,562 3.4%
a/ Estimated from 9-month actuals.
Source: SONANGOL sales department.
Pricing of Petroleum Products
3.25 The final price of petroleum products to consumers in Angola is
affected by price controls at three different downstream levels:
(a) crude oil into the FPA refinery;
(b) products ex-refinery (refinery gate); and
(c) products for final sale by the distributor, SONANGOL.
At present, all of the crude oil feed for the FPA refinery
comes from the FPA-operated joint-venture areas. The refinery pays the
joint venture crude owners a price that yields to the crude owners an
equivalent revenue from a refinery sale as from an export. Since the
royalty paid on crude sold to the refinery is deducted from the income
tax on production, the crude owners can accept a lower crude price for
refining than for export. It also means that the refinery is paying less
than the economic (opportunity) value for the crude.
3.26 An illustration of how the system works is provided in
Annex 9. In the case considered, the refinery crude prices work out at
US$15.25 for Soyo and US$14.40 for Kwanza based on a starting reference
marker price of US$20 for "Bonny Light". The forgone Government tax
revenues amount to US$2.75 in the case of Soyo and US$2.58 for Kwanza.
This loss of Government revenue (US$25-30 million) is a subsidy to
domestic consumption of oil.

- 54 -
Refinery-Gate (RC) Pricing of Products
3.27 The refinery-gate prices of finished products for sale from FPAto SONANGOL are fixed in the official price structure established January1985 (see Table 3.11). They are based on complete refinery cost recoveryincluding a return on net investment. The relative prices of productswere set in approximate accord to international/import parityrelationships. At the time this official structure was established,crude prices were much higher than at present and the relative volumeassumptions and refinery operating costs have changed from the originalbasis. Rather than have a continuous, regular refinery gate priceadjustment based on changes in crude costs and other factors, theMinistry of Finance's Ceneral Budget (OGE, Or9amento Geral do Estado)acts as a balancing fund while official prices remain stable for longperiods of time.
3.28 A prel minary balance on the refinery cost recovery isperformed quarterly and any over-recovery (the case at present) isreturned to the OGE. Under-recovery based on the official structurewould be received as a subsidy from the OCE. About two months into thenew year a final balance is made based on verified operating costs forthe previous year and any outstanding imbalance is settled. The pricingsystem is, therefore, a completely "cost-plus" arrangement. There is noparticular incentive on the part of FPA to save operating costs as thesaving would simply revert to the OGE.
3.29 At recent lower crude :ces and higher production/sales volumethere has been considerable 3t-recovery. During 1986, some Kz 2billioa w'ere returned to Lhe OGE out of total refinery gross sales ofKz 7.5 billion for the year.
3.30 A comparison of present official refinery-gate prices withinternational prices is provided in Table 3.11. The current structurefor all major products is compared with a hypothetical freight andrelated charges figure of US$20/t added to FOB Mediterranean spot as abasis for border prices for the liquid products. For LPG, a hypotheticalfreight charge of US$80/t was used, although current LPG imports costmore than this estimated figure. In 1985, the official refinery gateprice for all products was below average border prices. Following thedecline in crude and product prices in 1986 the official structure moved,on average, above border prices on all products except gasoil. Butrecent crude and product price increases have undoubtedly pushedinternational prices to a point where, on an average, the Angolastructure is below border prices.

- 55 -
Table 3.11: OFFICIAL REFINERY GATE PRICES VS. INTERNATIONAL PRICES
(Exchange Rate of Kz 29.62 = US$1)
FOB Mediterranean plus US$20/t a/
-- Official Structure -- 1985 1986 1st Half1987
US$/t US$ USS US$
LPG 7.8950 Kz/kg 266.54 304.58 204.75 223.57
Gasoline 4.9989 Kz/liter 228.06 275.50 161.25 186.50
Kerosene/Jet fuel 5.0240 Kz/liter 209.40 281.75 172.58 179.33
Gasoil 3.5488 Kz/liter 140,95 255,00 151,92 171.50
Fuel oil (Heavy) 2.6600 Kz/kg 89.80 167.25 87.42 121.00
Official price as % International
LPG 88% 1301 119%
Gasoline 83% 141% 122%
Kerosene/Jet fuel 74% 121% 117%
Gasoil 55% 93% 82%
Fuel oil (Heavy) 54% 103% 74%
a/ Except LPG for which USS80/t added to FOB Mediterranean.
Source: SONANGOL and World Bank.
Pricing of Products to Final Consumers
3.31 There is a fixed structure of final prices at which SONANGOL
sells the products. This structure was established in 1985 and is still
in effect except for a few relatively minor adjustments. The revised
pricing scheme as per original documents received from SONANGOL is shown
in Annex 9. Allowable SONANGOL profit is 10% of the refinery gate price
plus SONANGOL costs and import differential. The latter element is
intended to account for the differential between the landed cost of the
imported product and the refinery gate cost for domestic-sourced
material. The reseller margins have all been increased slightly. The
difference between all these allowable costs and the final selling price
is made up by a payment to, or subsidy from, the OGE. If these
paymeiits/subsidies for each product are multiplied by the 1987 budget-
projected volumes of sales for each product, the total gross payment
owing to the General Budget for 1987 would appear to be Kz 877 million.
SONANGOL is also permitted to deduct its costs of transporting Soyo crude
to the refinery. These transport costs were budgeted for 1987 at Kz 111
million. The estimated total net flow to the OGE on this payment/subsidy
differential for 1987 would therefore have been Kz 766 million. If we
add total budget-projected revenue from product taxes at Kz 1,735 million
we arrive at a total Government revenue of Kz 2,501 million on SONANGOL
product sales estimated for 1987.

- 56 -
3.32 Looking at the COSt recovery on individual products, based onofficial RG prices and the current SONANGOL cost/profit structure,kerosene, LPG, and LFO (light fuel oil) are the only products whichreceive a net subsidy from the General Budget, The kerosene net subsidyat Kz 1.2034/liter and LFO at Kz 1.2568/liter are fairly minor, but LPGat Kz 7.1843/kg below cost is a significant distortion.
3.33 Apart from official prices and markets, there is also aparallel market in petroleum products, mainly kerosene and LPG. Even onthe outskirts of Luanda, where supplies should be relatively plentiful,kerosene trades at high prices in small quantities. In the interior ofAngola, where supplies are extremely short, the parallel market price canreach several hundred Kz/liter for kerosene and similar levels for LPG.There does not seem to be a significant parallel market for products suchas gasoline and gasoil, which are normally traded in bulk or throughretail service station outlets.
3.34 The fiscal treatment of products is highly discriminatory tothe effect that tax considerations rather than relative prices orscarcities determine the allocation of petroleum products. To remedythis problem, products should be taxed roughly equally, at the same rateas gasoline (i.e., 133% of the refinery gate price, adjusted to the levelof import/export parity). Arbitrary budget contributions (surtax) couldbe added to round out the retail price. Also, automotive fuels could beassessed an additional fee to cover road maintenance.
3.35 In order to illustrate the impact of adjustments towards a morereasonable valuation of the Kz, the following pricing analysis will beconducted using an illustrative exchange rate of Kz 104 per US$1 ratherthan the official rate of 29.62 Kz/US$. The refinery gate price based onworld market prices will be recalculated and it is assumed that SONANGOLcosts, margins, etc., will rise by about one-third. Since the averagelevel of refinery gate prices was close to world prices in mid-1987, andthe structure of refinety-gate prices was closer to economic costs thanretail prices were, the refinery-gate prices will be used as the startingpoint of the exercise, except for the prices of HFO (heavy fuel oil) andgasoil, whici were significantly lower than world prices.
3.36 The adoption of a price structure similar to the above would bea useful step towards a more rational price policy. Such a structure ofrelative product prices approximates economic costs, thus givingconsumers appropriate signals as to the relative scarcity or opportunitycost of products. In addition, if these prices were in effect, theGovernment would have received approximately Kz 15 billion of the rz 2.5billion estimated for that year. A more appropriate price level wouldhave to be set in relation to the purchasing power of the Kwanza. Toillustrate this, a price build-up at the hypothetical exchange rate of Kz104/US$l is shown in Table 3.12. At these prices, Government revenuesfor 1987 would have exceeded Kz 50 billion (20-25 times the actualestima:ed level of Kz 2.5 billion). To the extent that this increase in

- 57 -
revenues would have helped to reduce the relative magnitude of the budgetdeficit, it would also have exerted deflationary pressure on the overallprice level even though absolute petroleum product prices would haverisen only three to four times in the same period.
Table 3.12: ILLUSTRATIVE PETROLEUM PRODUCT PRICING-- 1987(Kzlliter or kg; Kz 104/USS Hypothetical Exchange Rate)
Gasoline Kerosena Jet A Gasoil LPG HFO
------------- (Kz/liter) ------------ --- (Kz/kg) ---
Refinery gate 17.56 17.61 17.61 14.92 27.68 11.68Tax 23.36 23.42 23.42 19.84 36.82 15.54SONANGOL cost 4.22 2.67 1.62 2.58 16.72 0.23SONANGOL profit 1,09 1.01 0.89 0.79 2.88 0.42Reseller margin 0.51 1.04 - 0.24 1.62 _Subtotal 46.74 45.75 43.54 38.37 85.72 27.88
Surtax (budget contribution) 3.26 0.25 6.46 7.63 4.28 2.12
Hypothetical selling prices 50.00 46.00 50.CO 46.00 90.00 30.00Government revenue 26.62 23.67 29.88 27.47 41.10 17.66
Source: Mission calculations.
Economics of Refining vs. Direct Product Supply
3.37 Fundamental Economics of Refining at Luanda. Based on Angola'slocation in relation to major crude markets and major exportrefining/product supply sources, and on the marketability of its crudecompared to standard world "marker" gradess, there are certain fundamentaladvantages/disadvantages to refining Angolan crude in the country inorder to supply local markets. These advantages/disadvantages are basedon the following factors:
(a) the opportunity cost to a crude-producing nation of using itsown crude as feedstock to an indigenous refinery, which is therevenue it will lose by not exporting the crude;
(b) the export opportunity value of crude, which is based on itsvalue in major crude markets in relation to mejor world"marker" grades; and
(c) the refinery-gate opportunity value of domestically refinedproducts, which equals: (i) the cost of landing products frommajor world export refining sources, or (ii) revenue earned

- 58 -
from export of the products, netted back to the refinery gate(as is the case with heavy fuel, which is currently produced inexcess of domestic demand).
3.38 Soyo/Kwanza, the major refined grade in Angola, is not a majorexport grade since almost all of it is used in local refining. Poormarketability for Soyo compared to the better-know.a Cabinda would make itsell at a lower price than Cabinda in spite of Soyo's slightly betterquality. It is estimated that a combined discount on Soyo for freightand marketability, excluding quality, would be about US$0.50/bbl(US$3.65/t).
3.39 The major export refining sources used as basing pointstandards for pricing the supply of products for the West African coastare the Mediterranean and Northwestern Europe (Rotterdam). If Angolawere to import all its product needs, it is reasonable to expecc that an"efficient" freight supply mechanism would cost about US$20/t orUS$2.67/bbl. In addition, in order to equate this supply cost to thecost of supplying the products at a refinery gate location, the cost of areceiving and storage terminal operation would have to be included in thecalculation. The cost of such an operation on a reasonably large scalewould be no less than about US$0.50/bbl. In the particular case of theLuanda refinery, Soyo crude must be transported to the refinery from thesame terminal from which it would be exported. An estimated "efficient"cost of such a shuttle movement is US$3/t or US$0.4/bbl.
3.40 The fundamental economic advantage of a refinery in Luandarunning local crude to supply local product markets versus a Europeanrefinery running the same quality of crude to a similar yield patternalso supplying Angola's product markets is as follows:
Locational Advantage to Luanda Refineryvs. European
US$/bbl
Crude feedstock cost (Soyo) 0.50
Product transport 2.67
Product terminalling cost 0.50
Local transport of crude to refinery (0.40)
Total Advantage to Luanda 3.27
3.41 As indicated above, this only considers the fundamental crudeand product freight differentials based on the location of Luanda inrelation to crude markets and product supplies, as well as a "market-

- 59 -
ability" evaluation of the refined crude. Operating cost differentialsamong refineries, considering "efficient" refiners in both cases, arerarely more than US$l/bbl and would not outweigh the fundamentalgeographical advantage that the Luanda refinery enjoys. What matters,however, are the relative prices that the different petroleum productsand crude oil capture in the world market, the output mix, and thepercentage share of fuel oil that has to be exported. Based on typicalplant yields and an 80% share of fuel oil exports, the refinery operatingprofit has been calculated for import/export parity levels that prevailedbetween 1985 and mid-1987. The results are summarized in Table 3.14. Amore detailed analysis is provided in Annex 10. The figures show that onaverage, the refinery would have enjoyed a comfortable profit margin onits "efficient" operating costs during that period if the calculationshad been based on border prices.
Table 3,14: SUMMARY OF LUANDA REFINERY ECONOMICS
LSFO a/ Soyo crude Operating Profit
to export discount 1985 1986 1st half 1987
(P ---------------…US$/t ----- …---------
Base 80 3.65 8.21 9.69 4.41Sensitivity I 100 3.65 7.10 8.31 2.11Sensitivity 11 80 0 4.56 6.04 0.76
a/ Low sulfur fuel oil,
Source: Annex 3.3.
3.42 Based on these findings, it can be concluded that the simplehydroskimming refinery in Luanda is an economically justifiable means ofsupplying local product requizements. Operating profits would provepositive even if:
(a) the total LSFO output had to be exported, thus reducing thenet-back value of LSFO by the amount of forgone proceeds fromdomestic sales at higher import border prices (Sensitivity I);or
(b) the Soyo crude discount in comparison with Cabinda crude werezero (Sensitivity II).

- 60 -
IV. ELECTRICrTY SUPPLY
Summary and Recommendations
4.1 Angola's power subsector, which still opLrates reasonably well,has suffered from more than a decade of neglect, caused in part bycontinued civil war, sabotage, losses of qualified personnel and anextreme scarcity of other resources. By 1987 the firm capacity haddeteriorated to 275 MW, which is less than 60% of the total installedcapacity. Transmission and distribution lines have hardly received anymaintenance since 1975. Though the present state of the utilities'accounts makes it almost impossible to assess their financialperformance, there was little doubt that in 1987 the global cash deficitof the sector would approach the level of US$50 million (or about Kz 1.5billion).
4.2 In order to safeguai a reasonable quality of service and togradually restore the utilities' financial viability, immediate, strongmeasures are required. Priority should be given to:
(a) strengthening the utilities' operational and managerialautonomy and capabilities, including accounting, billing, andthe revenue collection system;
(b) raising tariffs to generate a cash flow sufficient to coverfinancial costs;
(c) reorienting the investment program to favor rehabilitation ofthe existing physical infrastructure; and
(d) decentralizing responsibility for operations and maintenance,as is largely the case at present.
4.3 A significant and sustained improvement in operations,maintenance and management requires an influx of know-how and finance.Operational support for the Central and Southern Systems as well asadvisory assistance to a proposed task force (which will be in charge ofall rehabilitation works) would require 75 man-years of long-termconsultants plus 25 man-years of short-term consultants at a totalestimated cost of US$10 million.
4.4 A minimal priority investment program should be carried outover the next four years to repair and maintain the existing facilitiesand create some reserve margins to cover rising demand. This would costabout US$200 million. Efforts should be undertaken to obtain financialassistance from bilateral or multilateral aid agencies. Such "soft"financing would help reduce the financial burden of the proposedrehabilitation measures.
4.5 The mission strongly recommends that the existing least-costcapacity expansion plan be updated, based on the best available demandprojection. This would also require a reassessment of the future point

- 61 -
at which the Capanda power project should be reintroduced in theexpansion plan.
4.6 The financial losses of the power sector are no longersustainable. Therefore, cost recovery is a matter of utmost concern. Toensure cost recovery, there should be immediate increases in tariffs upto 400%. The utilities' billing and revenue collection procedures shouldalso be improved. However, no attempts should be made to set the tariffsat uniform levels throughout the country. In the short term, tariffsneed to be simplified and restructured to enable the utilities to meetsimple financial targets (e.g., covering 20%-30% of investment programsor obtaining a return of 3%-4% on assets in use). The adjustments shouldbe designed so as to bring the level and structure of the tariffs in linewith Long Run Marginal Costs in the medium term (up to 1992).
4.7 In the past, ENE (the national power company) was given neitherthe authority nor the means of assuming its (legal) duties of managingthe entire subsector in a reasonably efficient way. Also, importantmergers of utilities did not take place. Therefore, all operations andmaintenance and part of the proposed rehabilitation activities should bedecentralized to the Regional Directions as this is closer to actualpractice than the theoretical centralization implicit in the formalstructure of ENE. At the central level, a small planning unit should beestablished to be responsible for strategic matters (demand studies,capacity planning, tariff studies, etc. and such a unit is beingestablished at present.)
Eleccricity Supply
4.8 Electricity supply in Angola is the responsibility of twocompanies: ENE and SONEFE (Sociedade Nacional de Estudo e Financiamentode Empreendimentos Ultramarinos). ENE is a State enterprise, created in1980 and incended, eventually, to become the sole nacional power utilityin charge of generation, transmission, and medium voltage distributionall over the country. The company is currently operating the "Central"and "Southern" Systems and several isolated systems. SONEFE is in chargeof generation and transmission in the "Northern" System, the largestsystem in the country, and supplies about 300 clients directly at highvoltage (60 kV) and medium voltage. Distribution in the area of Luandais the responsibility of EDEL (Empresa de Electricidade de Luanda). Lowvoltage distribution in the rest of the country is sometimes theresponsibility of ENE but is often handled by local municipal bodies(Comissariados) who may also own small captive diesel sets.
Overall Generating Conditions
4.9 Total installed capacity in ENE and SONEFE plants isapproximately 463 MW. Of the total capacity, 287 MW is in hydro units,102 MW in gas turbines, and 74 MW in diesel sets. In 1987 available

- 62 -
capacity reached 275 MW (59% of total) but there were severe constraintson thermal units due to difficulties in fuel supply. The two gasturbines in Luanda (56.8 MW) burn Jet B fuel while the gas turbine inCabinda (12.3 MW) runs on natural gas. The two remaining gas turbines,in Biopio (22.8 MW) and Huambo (10 MW), run on diesel oil. Annualelectricity generation in Angola peaked at 1,029 CWh in 1974, with858 GWh (83.4%) from hydro origin. After a sharp decline in the yearsfollowing independence, generation resumed growth but experienced asecond decline over the period 1983-85 and is still below the values of1974. In 1986, total generation was 754 GWh with 691 (91.7%) from hydroplants. (See Annex 13 for additionial information on electricity assets.)
4.10 Electricity supply in Angola consists of three separate gridsand numerous isolated systems. The three main systems are associatedwith the basins of three important rivers: the Kwanza for the NorthernSystem; the Catumbela for the Central System; aid the Cunene for theSouthern System. These systems supply the main load centers in Angola:Luanda (in the Northern System); Benguela, Lobito, and Huambo (in theCentral System); and Lubango and Namibe (in the Southern System). Themain isolated systems are those of Cabinda, Uige, and Bie. Anotherimportant system in the province of Luanda Norte belongs to the miningcompany ENDIAMA (Empresa Nacional de Diamantes de Angola) and was mainlyused for diamond mining activities.
4.11 Hydro has always been the main supply source. Its share hasremained within 80-85% of total supply, increasing to 91% in 1986 inspite of the total and partial unavailability of the Lomaum and Biopioplants. No new hydro plant has been built since 1974. From 1980onwards, SONEFE and ENE tried to overcome the difficulties caused bysabotage and disruption of the hydro supply by installing new gasturbines in Luanda and Huambo and diesel units in Lobito and other majorcenters. Because of inadequate maintenance, lack of technical assistanceand spare parts, and erratic fuel deliveriesp the new facilities have notresolved supply problems. Therefore, current available capacity in theCentral System is limited to 47 MW out of the 111 MW installed.Table 4.1 summarizes the installed and available capacities in thevarious systems and compares them with peak demand.
Table 4.1: INSTALLED AVAILABLE GENERATING CAPACITY, 1987
(MW)
Hydro Thermal Total Peak
System Insti. Avail. Instl. Avail. Instl. Avail. Demand a/
Northern 197.6 135.0 56.8 56.8 254.6 191.8 90-100
Central 49.4 7.2 61,8 39.5 111.2 46.7 30
Southern 27.2 13.6 25.3 15.1 52.5 28.7 9-10
Isolated 12,9 2.4 31.7 5.0 44.6 7.4 na.a
a/ Estimated at generation; reflects varying amounts of suppressed demand. Suppressed
demand in Luanda (Northern System) is estimated at about 15% of current consumption,
Source: SONEFE and ENE, Annex 13.

- 63 -
Northern System
4.12 The Northern System is operated by SONEFE using the hydropotential of the rivers Kwanza and Donde and two gas turbines inLuanda. The system generated 606 GWh in 1986, or 80% of all theelectricity produced in Angola. Peak load at generation oscillatesbetween 90 and 100 MW. The main plant is Cambambe with an installedcapacity of 180 MW (four units of 45 Me), the largest in Angola. Theplant is run-of-river with daily regulating capabilities, a minimum flowaround 130 m3 /s (in October), giving a firm power in the critical day of90 MW. It was generally assumed that the next demand increase in theNorthern System would be met by raising the height of the dam at Cambambeby 20 meters, which would increase total installed power to 260 MW. Thesite was also meant to receive a second power plant, with four units of110 MW each. 17/ All the units in Cambambe (four units installed in 1963and two in 1973) require urgent inspection and overhaul (Unit No.1received a general overhaul and was recommissioned in mid-1986 but workon unit No. 2 is delayed due to shortages of foreign exchange). Thesituation calls for urgent attention from SONEFE and the MEP as thesupply of the current peak (around 100 MW) requires three units inCambambe or the starting of one gas turbine with high operating costs.The other hydro plant in the system is Mabubas, 54 km northeast ofLuanda, built in 1953 with an installed capacity of 17.8 MW. The plantwas derated to half its capacity in 1974 and completely shut down in 1986for a rehabilitation costing about US$7 million, Due to delays intransportation and payments, it will not resume operation before late1988.
Central System
4e13 Two companies operated the Central System beforeindependence: the Hydro Electric Company of the Upper Catumbela (HEAC,Hidro Electrica do Alto Catumbela), in charge of generation andtransmission, and thL Electric Company of Lobito and Benguela (CELB,Companhia Electrica do Lobito e Benguela), in charge of distribution inthe province of Benguela. In 1982 HEAC was incorporated into ENE as itsCentral Direction. However, although the merging of CELB was firmlyplanned, the company is still a separate entity in both the MEP's Planand in its Reports. The system is based on two hydro plants located onthe western course of the Catumbela river: Lomaum (35 MW) and Bi6pio(14.4 MW). A gas turbine of 22.8 MW was installed in Bi6pio in 1974 anda second gas turbine in Huambo in 1981, both interconnected with the restof the system. The system supplies energy to the provinces of Benguela
17/ The decision to initiate Capanda is currently seen as anticipatingan investment included for a later stage in SONEFE expansion plansand postponing for many years (or indefinitely) the investments inCambambe (see para. 4.100).

- 64 -
and Huambo, the two main districts of Angola (after Luanda) in populationand industrial development. The transmission system runs more or lessparallel to the Benguela railway.
4.14 In 1974, the Central System supplied 171 GWh, or nearly 17% ofgeneration in Angola. Peak demand (at generation) was about 29 MW, witha load factor of 67Z. In 1983, the substation at Alto Catumbela and theLomaum plant were sabotaged, resulting in the flooding of the station andthe destruction of the control and protection system. A project has beennegotiated for financing part of the rehabilitation of Lomaum and theinstallation of two additional units of 15 MW each, to increase installedcapacity to 65 MW. Excluding the cost of the new sets, the totalrehabilitation cost is estimated at US$55 million.
4.15 The gas turbine at Huambo was installed in 1981 and intendedfor stand-by duty. The turbine has a nameplate rating of 13.0 MW, butderating due to altitude (Huar-ho is at 1,800 meters) limi-s availableoutput to 10 MW. The turbine was bought with a minimum of spares and noservice contract and was run continuously but with numerous stops andstarts due to fuel shortages or disruptions on the line from Bi6pio toBenguela. Keeping the unit running without the necessary overhaul causeda serious breakdown in 1985. While negotiations for the repair of thisunit (and a similar one in Cabinda) go on, Huambo is supplied from Bi6pio(264 km, 150 kV line), and has 4 x 0.8 MW rehabilitated diesels and2 x 1 MW new diesels. The situation is serious and frequently requiresload shedding at peak time. In spite of this, the situation at Huambo ismuch better than in Cabinda where the breakdown of the gas turbine haspractically stopped public electricity supply. The required backup inHuambo is more easily insured by traditional diesel sets than by the gasturbine (which could be moved to a coastal area such as Cabinda toreplace diesel sets or to Soyo, where SONANGOL has a project with 15 MWof gas-fired turbines). ENE and SONANGOL should jointly evaluate theinterest and feasibility of this transfer, taking into account that gasturbines are naturally advantageous for Soyo and questionable in Huarrbo.
Southern System
4.16 The main facility in the Southern System is the hydro plant atMatala, on the Cunene river, with a total capacity of 27.2 MW in twounits. A third unit has been stored for several years in Belgium and itsinstallation is now foreseen for the end of 1987. The Gove dam, upstreamfrom Matala, was completed in 1974 for irrigation but mainly to regulatethe flow at Matala. Without Gove, the natural low flow at Matala wouldnot permit significant generation during 4-5 months of the year. Firmpower in the critical day is now 10.9 MW, but present operatingconditions are bad, with Unit No.1 out of order since 1984 and Unit No.2derated to 60% of its nameplate rating. The plant suffered several fireswhich damaged the generators, the control room, and the power cables. Acomplete rehabilitation program has been designed and was supposed tostart in late 1987, to replace the control room and power cables. Next

- 65 -
is the installation of the third unit and the rehabilitation of Units No.1 and 2.
4.17 Both the Matala and Gove dams present serious safetyproblems. The 29 gates of Matala cannot be operated due to fractures inthe dam's structure. The same occurs with the 3 gates at Cove due tosabotage of the control equipment in 1986. Furthermore, Gove dam, whichis of earth-fill Lype, is showing considerable percolation. Unlessaction is taken to open at least one gate, natural (or disaster) floodconditions could occur and endanger not only Gove but the downstreamMatala dam and power plant and, thus, supply to the whole SouthernSystem, let alone loss of life and property.18/ Delays in the processare partly due to the fact that Cove belongs to the Ministry ofConstruction. An urgent intervention by both parties is necessary toprevent a dramatic accident. The mission suggests that Gove be placedunder the responsibility and management of ENE since a power plant of40 MW is foreseen there later.
4.18 Concerning Matala, ENE consulted several organizations whichagree that Matala dam presents serious safety problems resulting fromstructural anomalies, inoperability of its hydraulic security devices,and complete lack of periodic observations for many years. It is,therefore, risky to start extensive rehabilitation of electricalequipment and installation of a third generator without a rigorousidentification (and correction) of the causes of the problems of the dam.
4.19 A diesel plant was built in Namibe in 1980, with an installedcapacity of 11.5 MW in two units. Some equipment needed to complete theplant (namely one fuel storage tank) is still missing but the plant hasalready operated for short periods. Coordinated operation of thisfacility with Matals is a priority because it is the only supplyalternative to the Southern System while Matala is unavailable. ENE mayneed assistance with the parallel operation of Namibe and Matala as thelink between them is very long and weak (330 km with half the distance at60 kV).
Transmission and Distribution
4.20 Transmission and distribution is made at 220, 150, 100, 60, 30,20, 15, 10, and 6 kV. The proliferation of voltage levels shows that notenough attention was paid to the advantages of standardization. Thesituation is typical of different companies, each with its own area ofinfluence. The variety of voltage levels increases the difficulties andcosts of maintenance and makes it difficult to keep an adequate stock ofspares. The number of standard voltage levels 10, 20, and 100 kV shouldbe eliminated from new investments. The need to keep 15 kV (instead of20 kV) is lnfortunate as this type of equipment is becoming uncommon andexpensive. However, since the entire Luanda network is at 15 kV, EDELhas no choice. Total length and characteristics of transmission lines,in 1987, are given in Annex 13, Table 6.
18/ Work to repair the dam started shortly after the mission's visit.

- 66 -
4.21 The 220 kV voltage level exists only in the Northern System andis used to carry energy from Cambambe to Luanda (175 km) and to make theinjections to Kwanza Norte (73 km, and Kwanza Sul (125 km). The 100 kVvoltage level is used only in the Northern System. No furtherdevelopment of 100 kV lines beyond the two existing ones should takeplace because it is not a standard voltage and because 60 kV and 150 kVare much more extensively used in Angola. Transmission in the Centraland Southern Systems is made at 150 kV, with long lines at 60 kV in theSouthern System. The lines have had no preventive maintenance since 1975and are seldom inspected. The cable and most of the towers on the 60 kVNamibe-Tombwa line (95 km long) are very badly corroded due to a mixtureof salt air and desert winds. ENE acknowledges the urgent need toreplace cable and wires as well as to rehabilitate the towers, but lackof staff, inefficient organization, and scarcity of foreign exchange aredelaying any decision.
Electricity Demand
Past Situation
4.22 Until 1974, electricity generation and consumption statisticsin Angola were regularly established and published, giving a rathercomplete and reliable picture of its situation and evolution. Because ofdeterioration of metering equipment in power plants and substations,frequent outages (by sabotage or poor maintenance) of generating andtransmission facilities, poor record-keeping, and lack of communicationbetween regional centers and ENE headquarters in Luanda, the quality andreliabiiity of electricity statistics have declined. Forced to fill outforms in the absence of hard information, the utilities often supplyunreliable, inconsistent figures to satisfy reporting requirements.
4.23 Growing difficulties of supply due to outages or sabotage ledthe Government, through ENE, to install a large number of small andmedium-sized captive diesel units (up to 1.5 MW of rated power) at thefacilities of local authorities (Comissariados) and major consumers.Little is known about these sets, yet they may represent a non-negligibleshare of total generation in Angola, not only in isolated centers butalso in areas supplied by one of the three main systems. In 1986, about200 new diesel units were acquired by ENE and installed all over thecountry with rated power estimated between 30 and 40 MW (total cost ofpounds sterling 30 million). Production from these units partiallyreplaced unavailable supply from the grid but is not accounted for in ENEor MEP statistics.
4.24 Gross electricity generation in Angola totaled 754 GWh in1986. Final consumption must be estimated, as figures for electricitydistribution in the MEP's reports are established from utility estimatesof emission to distribution grids. Assuming an overall figure of 22% fortransmission and distribution losses, total consumption may be estimatedat about 590 GWh in 1986. The share of total generation among thedifferent systems in 1986 waq as follows: 80.4% in the Northern System,

- 67 -
10.0% in the Central System, 7.5% in the Southern System, and 2.1% inisolated centers. The absolute values and the pattern of generation andconsumption in 1986 are not typical of earlier periods, either before orafter independence, as they were constrained by temporary irregularitiesof supply and demand whose duration is not known. The present overallsituation and past trends since 1967 are shown in more detail inAnnex 13, Table 2.
4.25 Between 1967 and 1973, generation and consumption increased atan average rate of about 16.3%. The bulk of growth was concentrated inthe six major load centers: Luanda, in the Northern System; Huambo,Lobito, and Benguela, in the Central System; and Lubango and Namibe inthe Southern System. Only one additional load center grew in relativeimportance during that period--the isolated system of Cabinda. Afterindependence, in 1975, consumption declined sharply to only about halfthe level of 1974. Starting in 1977, a slow recovery process lasteduntil 1982. Annual growth rates during that period averaged 6.0% andconsumption in 1982 was roughly equal to that of 1971. Between 1983 and1985 a new period of decline occurred, due to intensification of sabotageactivities. A whole plant (Lomaum, 35 MW) and a substation (AltoCatumbela) were severely damaged and put out of order, constraining thesupply in the Central System. In the Northern System, supply to the wholeprovince of Kwanza Sul, estimated at about 20 GWh, was interrupted due tothe sabotage of the 20 kV Cambambe-Cabela line. Supply had not yet beenrestored in May 1987. The overall negative trend of the period 1983-85was reversed in 1986 mainly because of faster growth in the Luanda area.
4.26 In 1974, over 50% of the load was already concentrated in theprovinces of Luanda and Bengo, which encompass the Luanda metropolitanarea. The absolute consumption of Luanda is currently slightly higherthan in 1974, and its share of the total consumption of Angola hasincreased to nearly 76%. The most interesting years for comparison are1974 (the last year before independenc-), 1982 (the last year before thesecond declining period), and 1986. In 1974, 83% of total consumptionwas concentrated in the five provinces with the six main load centers.In 1986 the share of the same provinces had increased to nearly 96%.Between 1974 and 1986 Luanda's share increased while that of the otherfour main provinces decreased. Decreases in Benguela and Huambo were notonly due to a reduction in economic activity but also to supplyconstraints, as the Central System facilities which serve both provinceshave been particularly hard hit by acts of sabotage. Generation andconsumption over the last five years are summarized in Annex 13, Tables 3and 7, showing the contribution of each system to global supply and theshare of each province in total consumption.
Luanda
4.27 The consumption of the Northern System is concentrated inLuanda, which represents more than 90% of the total system load. Themain part of the Luanda load is EDEL's distribution network in the urbanarea, the rest being industrial consumers (around 300) directly supplied

- 68 -
at 60 kV, 30 kV, and 15 kV by SONEFE, and some local authorities(Comissariados). Consumption has been stagnant over the period 1982-86,at a level between 480 and 500 GWh. Accepting EDEL estimates of 12%technical and 9% non-technical losses in its distribution network, totalsales in the Northern System, in 1986, may have reached about 440 GWh fora total generation of 605 GWh (total losses of 27%). Figures should betaken with caution as the large variations between consecutive years maybe due to incorrect measurements (different time periods, for instance)or long and frequent interruption of supply (at any voltage level). Along-run average annual growth rate of 5% is plausible (see Annex 13,Table 8 for further details).
Central and Southern Systems
4.28 The disruption of supply in the Central System is the maincause of decline in overall Angolan generation and consumption since1982. The share of the Central System in total generation whichrepresented 20% in 1982 declined to 10% in 1986, and consumption in 1986(79 GWh) was roughly equivalent to half the value of 1982 (145 GWh). TheCentral System has the highest level of suppressed demand, and more than50% of the present generation is of thermal origin (from the gas turbinein Biopio with a specific consumption of at least 0.360 kg/kWh or0.425 liter/kWh). Average operating costs, just for fuel, amount toKz 3.5/kWh. Rehabilitation of the Lomaum hydro plant, foreseen for early1989, is thus a priority cost-cutting task for ENE.
4.29 The Southern System currently represents 5.5% to 7.5% ofoverall generation. No significant disruption of supply has occurred andconsumption has slowly but regularly increased. Some potential represseddemand is caused by shortage of materials for network extensions andconnections. However, the system depends on practically a single source,the Matala hydro plant. This plant currently has safety problems, partlylocal (in the dam) and partly related to safety problems in the upstreamCove dam. Furthermore, ENE plans to install a third unit at Matala whichwill require an interruption of supply. Lubango and Namibe may thusexperience serious supply problems, and ENE has not yet taken any steps(e.g., completing the Namibe thermal plant) to minimize theinterruptions.
4.30 The sbare of isolated centers, which in 1974 accounted for atotal consumption of 115 CWh, (12.5% of the overall consumption of thecountry) fell noticeably, to 30 CWh (or 2%), after the breakdown of theCabinda gas turbine. Aging of units, lack of maintenance and spares,difficulties of fuel supply, the complete cessation of mining activitiesin Luanda province (representing between 50-60 GWh), and a markeddecrease in commercial and industrial activities were the main cause ofthe substantial reduction of that share. However, part of the alreadyexisting demand is likely to be supplied by captive diesel sets, notaccounted for in global statistics.

- 69 -
Load Curve
4.31 Information on the daily and seasonal pattern of demand is onlyavailable for the Luanda area. Present coincident peak demand is about90 MW, of which 70 MW corresponds to the EDEL network. For the wholeNorthern System, annual peak demand measured in Cambambe oscillatedbetween 80 and 100 MW over the period 1978-86.
4.32 For the main ioad center of Luanda, yearly load factors vary inrange between 0.63 and 0.70. Working day load factors are about 0.80.The daily load curve normally features two peaks: a morning peak,lasting from 10.00 to 13.00 and a higher evening peak, between 19.00 and21.00. Might load remains at about 65% of peak load, indicating a fairlyhigh permanent base load. Night load is mainly due to air conditioningand refrigerators together with public lighting. ENE statistics do notstate the peak demand associated with the Central or Southern systems.Present peak demand in Huambo is around 9 MW, for a total of 13,000customers, but load shedding at evening peak may be quite extensive andan unknown portion of this peak may be covered by captive diesel sets. A9 MW value can be considered conservative, and could increase 20% to 30%in normal supply conditions from the grid. Peak demand in the SouthernSystem is about 9.5 MW, measured at the Matala power plant, with a peakdemand of 5 MW in Lubango, the main load center.
Demand Projections
4.33 In the present context there is no firm basis for making demandprojections in Angola with any reasonable degree of confidence. Thedifficult economic and security conditions of the country, even ifconsidered transient, impede any demand forecasts. Application ofstandard forecasting methodologies (either the use of statistical data todefine approximate laws of probable evolution for already electrifiedregions, or comparison with areas with similar geographical, demographic,and economic conditions for regions to be electrified) is hindered by anexceptionally high degree of uncertainty about future economic activity,which strongly depends on the return of peace to the country. Pastrecords of power system performance are inadequate and unreliable and donot correspond to historical trends in a stable economic framework,
4.34 The utilities have no idea of the potential number of clientsand potential consumption. It is thus understandable that ENE and SONEFEhave given up making any medium- or long-term forecasts. Figures sent toMEP and included in the Plan Report of the Ministry cover only 1987 and1988, and are considered perfunctory by the utilities. Forecasts are notbased on a breakdown of total consumption by customer class or loadcenter but only by province, and bear a rough relationship to the valuesof the two previous years.

- 70 -
SONEFE: Northern System
4.35 SONEFE estimates an annual growth rate of 2% for the NorthernSystem 19/ under the joint effect of two opposite trends: an increase inresidential consumption, mainly due to the connection of new customers,and a stagnation (or even decline) of industrial consumption. Globalprojected generation is distributed among the existing power plants,assuming a certain availability of units and pre-established minimumgeneration from thermal origin. "Distribution" is calculated usinggeneration forecasts, assuming a fixed value of 10.6% for transmissionlosses and internal consumption (Cambambe village and installations).This percentage is a traditional value which SONEFE has no means toverify or correct. The share among the four provinces supplied by SONEFEis calculated on the basis of recent figures (1985 and 1986), taking intoconsideration the actual unavailability and expected repair times ofmajor transmission lines. According to SONEFE, the consumption of thegreater Luanda area in 1987 and 1988 is supposed to represent 94.1% and93.2%, respectively, of the total consumption of the Northern System.
ENE: Central and Souchern Systems
4.36 Generation and consumption projections in ENE are even moreprimitive than in SONEFE. The staff assigned to prepare projections iscxtremely reduced and ill-prepared. It faces two additional difficultiesin comparison with SONEFE: the need to deal with several systems ofvariable extension and characteristics distributed all over the territoryand the lack of information, at ENE headquarters in Luanda, on reliablehistorical consumption figures and realistic constraints on insta!ledcapacity. )3NE is currently assuming that all the systems are supply-constrained (which is essentially correct) so that primary forecastingconcerns generation according to expected available supply facilities.Forecasts for 1987 and 1988 are optimistic concerning the speed ofrehabilitation. Projections of "distribution" were established assuminga certain percentage of losses, arbitrarily set at 4% for the CentralSystem and 9% for the Southern System. "Distribution" should beunderstood as deliveries to the distribution network at the high voltagebusbars of HV/MV substations, although 4% of losses is too low for lossesin a long transmission system like the Central System. ENE and SONEFEprojections are summarized in Table 4.2.
19/ In October 1988, SONEFE surmised that a repressed demand of 15 '1Wmight exist in Luanda, and 10 MW in the rest of the NorthurnSystem. It also thought that peak demand could increase by 6% in1988 and that average annual growth in the period 1988-1998 could be6%. The mission's estimates tor the same period vary between 6.7%(base case) and 9.3% (high case).

- 71 -
Table 4.2: ELECTRICITY GENERATION AND CONSUMPTION PROJECTIONS(GWh)
Projections1986 (Actual) .987 1988
System Generation Consumption Generation Consumption Generation Consumption
Northern 605.9 506.1 615.9 551.0 628.3 561.6(Lianda Metroshiare) (491.9) (518.4) (523.3)
Cenitral 75.2 72.6 71.6 68,7 83.8 80.5
Southern 56.3 43.3 57.4 51.7 58.0 52.2
Isolated 16.0 14.2 25.5 24.4 27.0 25.8
Total 753.4 636.2 770.3 695.8 797.1 720.1
SONEFE 605,9 506.1 615.9 551.0 628.3 561.6
ENE 147,5 130.1 154.4 144.8 168.8 158.5
Total 753.4 636.2 770.3 695.8 797.1 720.1
Average Growth Rate, 1986-88 (U p.a.):
System Generation Consumption
SONEFE 1.83 5.34ENE 7.00 10.40
Total 2.86 6.39
Source: ENE, SONEFE, MEP, and mission estimates.
4037 ENE and SONEFE face a number of serious and difficalt planning
issues for the development of the three main systems as well as their
possible interconnection. Serious thought about expansion plans and
investment options requires some knowledge of future (long-term)
electricity demand. The only possible approach 's to construct some
alternative scenarios for the evolution of demand, which cannot be
considered forecasts, but could be used to test policies for supplying
load centers and to test alternative timings and options for major
development of new power plants and transmission facilities and
acceptable delays and cost implementations for major investment
decisions.
Alternative Demand Projections
4.38 SONEFE and ENE do not prepare medium- or long-term demand
projections. They only compile short-term (2 years) perfunctory figures
to satisfy MEP reporting requirements. However, over the years many

- 72 -
studies have been done about various aspects of Angola's powersubsectors. This report will limit itself to a review of the two mostrecent ones 20/ and will also present its own set of demand projectionsbased on past studies and on specific hypothesis about the pace ofeconomic rehabilitation in Angola. The various projections aresummarized in Table 4.3 and compared with present installed and availablecapacity. The main assumptions are listed after the table while detailsand specifics are described in Annex 14.
Table 4.3: ENERGY AND DEMAND PROJECTIONS, 1986-2000Comparison f Generation Requirements
(Base Cases)
Energy (GWh) Peak Demand (MW) Capacity (MW)BEP THEMAG Mission BEP THEMAG Mission installed Available
Northern System
1987 554 693 618 102.3 123.7 112.0 254.6 191.81990 732 943 656 141.1 167.6 118.81995 1,278 1,514 859 244.0 274.3 155.72000 1,876 2,225 1,461 355.0 403.0 264.7
Central System
1987 217 175 98 43.2 37.1 18.8 111.2 46.71990 263 244 115 52.8 52.8 21.81995 528 375 196 103.3 81.3 35.72000 743 551 329 144.0 119.5 60.1
Southern System
1987 57 81 55 1.8 17.4 10.8 44.6 28.71990 67 102 58 14.0 22.2 11.71995 132 157 85 26.8 34.1 16.92000 193 231 124 38.6 50.1 24.9
UNDP: The United Nations Development Program.
Source: BEP, THEMAG, mission estimates, and Annex 14.
20 Belgian Engineering Promotion: "Etude d'un Plan Directeur du ReseauElectrique National d'Angola", Bruxelles (financed by the AfricanDevelopment Bank); and Themag Engenharia: "Interligacao dos SistemasNorte/Centro/Sul em Angola, Possibilidades de Interligacao com aNamibia", Estudo Preliminar, Sao Paulo, Outubro 1986 (done withinthe SDACC framework).

- 73 -
4.39 Table 4.3 shows that this report's projections, based onrelatively sanguine hypotheses, are much lower than the base cases ofother studies, which must be considered excessively optimistic. If1BRD/UNDP projection figures are even only broadly indicative of futureneeds, present investment plans will overshoot actual demandsubstantially, especially if a tariff reform were to take place. Theseprojections further show that demand can be met substantially until theend of the 1990s by rehabilitating presently installed capacity, exceptin the Northern System where some new capacity will be needed after 1995.
Electricity Tariffs and Utility Finances
4.40 Electricity tariffs have not changed since the 1960s except innewly electrified areas where rates have remained constant since servicestarted. As a result, wide variations in tariffs can be observed inareas served by the same interconnected system. Variations of the orderof 3 to 1 are not uncommon. However, absolute tariff levels are so lowthat consumers perceive electricity to be essentially free. Consumptionhas therefore increased, with limits set only by supply and applianceconstraints.
4.41 A complex and widely varying declining block structure prevailsfor low voltage tariffs (often with a minimum monthly bill), with higherrates for residential consumers and lower rates for industrialconsumers. In the EDEL distribution area (i.e., greater Luanda) LVtariffs discriminate among residential, commercial, industrial, andpublic lighting uses. Residential and commercial tariffs have a verycomplex declining block structure, with block sizes related to housesizes or floor area and minimum monthly bills related to meter caliber.The LV industrial tariff, covering only 2% of sales, is a three-periodtime-of-day tariff with energy rates declining with load factor and metercaliber. Public lighting is charged at a flat rate, which is about one-half of the average price of other LV sales.
4.42 HV tariffs usually include block rates whose size is a functionof (non-coincident) peak demand, leading to average prices declining withload factor. Large consumers benefit from contracts negotiated long ago,at times of excess supply capacity. High voltage (HV) tariffs take asbilling variables non-coincident peak demand and active and reactiveenergy. Energy rates decline with the load factor, that is, utilizationof peak demand. Demand rates increase with the load factor. In Luanda,the marginal price for active energy declines from Kz 1.1/kWh (loadfactor of 12.5%) to Kz 0.85/kWh (load factor of 25%) and Kz 0.505/kWh(load factor of 100%). Reactive energy is charged through a monthly billmultiplier: it is free up to 60% of active energy (cos 0 = 0.8) and ischarged at a price rising to 63% of the normal rate when it reaches 92%of active energy (cos 0 = 0.4).

- 74 -
4.43 This tariff structure cannot be adjusted to the pattern ofmargindl costs in the Northern System. These are determined by thegeneration and transmission capacity needed to meet peak demand (atpresent, only 3 to 4 hours in the evening, and, in the future, also asecond industrial peak period during the morning) and by local gridcapacity requirements determined by maximum demand. Tariff reform wouldtherefore require significant changes.
4.44 In the Luanda area, tariffs were set in 1962. Residentialtariffs consist of three declining blocks varying with house size (12classes) and meter size (9 classes). The rates vary from Kz 2.50/kWh(first block) to Kz 0.70/kWh (for the third block). The average price ofelectricity sold is about Kz 0.83/kWh. Industrial and HV tariffs areeven lower, as low as Kz 0.55/kWh.
4.45 A rough estimate of the cost of producing electricity in Angolashows that energy costs alone in the ENE systems amount to aboutKz 5-6/Kz ($US0.17-0.19/kWh). SONEFE's energy costs (almost 100% hydro)are about Kz 1.0/kWh. 21/ This superficial comparison of tariffs withcosts points to one cause of the poor financial performance and conditionof the power utilities. Other reasons are that costs are not knownaccurately, that the utilities are overstaffed, and that billing andcollection are extremely inefficient.
Accounting
4.46 The present state of financial reporting makes it almostimpossible to assess the financial condition of the utilities. ENE hasnever produced statements of accounts since its establishment in 1980. Alist of ENE's inherited fixed assets and inventories, financial claims,and liabilities was prepared for the approval of its initial net worth,but so far no accounting records have even been made.
4.47 EDEL's legal status as a public enterprise was unclear at thetime of the mission.22/ The utility presented a report dated August 1984showing a balance sheet as of December 31, 1982 based on asset valuessubmitted for Government approval, and is preparing the statement ofaccounts fur 1983. These documents were never approved by theGovernment.
4.48 SONEFE has closed accounts for 1981 and 1982. Assets arevalued at historical book value. Capital and liabilites do not reflectthe de facto legal status of the utility, i.e., a State enterprise under
21/ Distribution costs alone add another Kz 0.5/kWh. This would givetotal average costs (excluding capacity) of Kz 1.3 to Kz 2.5/kWh inthe Luanda System.
22/ EDEL's status has been legalized since.

- 75 -
the guise of a private corporation. Poor enforcement of accountingprinciples and the mixing of traditional and new accounting practices,partially influenced by new national standards (set in "Plano Nacional deContas") produce statements of accounts that require extensive revisionto come closer to international standards.
4.49 No accounting records for CELB are known. Although thetransformation of CELB into ENE's Central Region is firmly planned, CELBis still considered a separate unit in plan execution and forecastingreports.
4.50 In conclusion, those power utilities that have accounts at allhave extremely weak accounting procedures. While both the utilities andthe Government are aware of this, the remedies being proposed areprobably not the most effective. The utiUities are planning to prepareaccounts for the last several years (ENE since its conception in 1980,EDEL since 1982) and the Government is proposing a new, uniformaccounting plan for State enterprises. The relative merits of theseproposals are questioned and a more modest suggestion, better matched tothe abilities of the utilities, will be made in the following paragraphs.
Financial Situation of the Power Utilities
4.51 The power utilities together incurred a global cash deficit ofabout Kz 1.4 billion (US$46.7 million) in 1985. Total sales revenue thatyear was about Kz 650 million (US$21.7 million) or 46.5% of the cashdeficit. In 1986, thanks to lower investment expenditures, the totalcash deficit fell to Kz 1.1 billion or 176% of consolidated salesrevenues. This is a significant share of the overall budget deficitwhich was estimated at Kz 13 billion in 1986. Given the sfiort-term plansof the utilities, cash deficits are expected to increase in 1987 and 1988(to about Kz 1.4 billion and Kz 1.5 billion, respectively). These cashshortfalls include about 20% of capital expenditure (however difficultthat is to estimate).
4.52 Total fixed assets of the power utilities in (about) 1982 wereestimated at about Kz 4.5 billion (US$150 million). A net return of 3%to 4% on these assets would require the utilities to produce aconsolidated profit of Kz 150-180 million (in addition to coveringcosts). This is far from the present situation. However, since the cashdeficit figures quoted above included some investment expenditures,covering those cash deficits (as presently estimated) would be areasonable short-term goal for the power utilities. This would requiremultiplying the present tariffs by an average of 3 to 4 (excluding anyexchange rate consideration--more than 50% of operating expenditures ofthe utilities are in foreign exchange).
4.53 Table 4.4 summarizes the cash flow situation of the powersubsector as a whole. It is interesting to note that although ENE sellsonly one-third as much energy as EDEL (or one-fourth as much as SONEFE),

- 76 -
its total costs, on a cash flow basis, are 250% higher. 23/ This is duemainly to the much larger proportion of thermal generation by ENE (eventhough diesel oil is sold at the low price of Kz 7/liter).
Table 4.4: ANGOLA: ELECTRIC POWER UTILITIES, SALES AND CASH FLOW, 1986(Million Kz)
ENE CELB SONEFE EDEL TOTAL
SALES (GWh) 123.0 n.a. 506.1 365.9 995.0(intrasectoral) (417.2) (417.2)Net Consolidated Sales 123.0 88.9 365.9 577.8
CASH INFLOWS (million Kz) 259.7 118.4 346.2 329.2 1,053.5(Intrasectoral) (35.0) (207.8) (242.8)Net Consolidated Cash Inflows 224.7 118.4 138.4 329.2 810.7
CASH CJUTFLOWS (million Kz) 1,022,1 196.7 523.5 449.1 2,191.4(Intrasectoral) ____ (35.0) (207.9) (242.9)
Net Consolidated Casn Outflows 1,022.1 161.7 523.5 241.2 1,948.5
CASH DEFICIT (million Kz) 762.4 78.3 177.3 119.9 1,137.9
FINANCING OF CASH DEFICIT
Net Budget Inflows 366.6 43.3 -38.0 123.8 495.7
Other Transf'rs a/ 395.8 35.0 215.3 -3.8 642.2and Variations in Cash Balances
a/ Including payment arrears.
Source: ENE, EDEL, SONEFE, the MEP, and Mission estimates.
External Debt of the Power Subsector
4.54 In 1987, the electric power subsector, excluding GAMEK, had adebt of about US$101 million, of which about US$60 million was disbursedand outstanding. The average maturity was about 8.5 years including agrace period of 2.5 years, and the average interest rate was about8.5%. These conditions are typical of export financing schemes in theadvanced market economies where most of these loans originate. In 1987,the amount needed to service this debt was about $US17 million. It isexpected to rise to about US$20 million in the years 1988 to 1989, thento decline to US$15-20 million in the early 1990s. Annex 13, Table 9gives a more detailed breakdown of available information. GAMEK's
23/ Correcting for capital expenditures (roughly estimated), ENE's costswould still be nearly twice those of EDEL.

- 77 -
currently disbursed debt was about US$250 million as of mid-1987 out ofcommitments of about US$600 million from various external creditors. Itis expected to increase at about US$200 million/y in the next threeyears. Debt service is currently US$20-25 million/y, or a little morethan the debt service of the rest of the power subsector. However, ifthe Capanda project were to go ahead, GAMEK's debt service would reachUS$150 million by 1990. Some part of this amount may be repaid inpetroleum.
Billing and Collection
4.55 Billing and collection difficulties are significant in Luanda.Electricity consumption for the last four years has not been recovered.EDEL considers one of the four years (still unbilled) to berecoverable. Consumption for 1986 was expected to be billed all at once,although six-monthly bills were used in 1985. It is obvious that suchlengthy billing periods are only possible when electricity tariffs arenegligible. This is the case in Luanda at present. 24/ The problem ofbilling is about to be resolved through computerization and because EDELmanagement is giving priority to this problem.
4.56 In Luanda, LV collections are effected door-to-door. EDELemployees report serious difficulties in collecting payments. HV and MVconsumers pay their bills through bank account transfers ordered by theutilities. The problems are therefore essentially limited to LVresidential customers.
4.57 Outside Luanda, LV customers pay their bills at banks or utilityoffices and recoveries are a high percentage of billings. Severepenalties and disconnections are actively imposed to enforce punctualpayments. HV and MV consumers also pay through bank transfers.
Manpower, Staffing, and Technical Assistance
4.58 In mid-1987 the power utilities (EDEL, ENE, SONEFE, CELB)employed 3,830 persons, of whom 30 were senior-level staff (engineering,managerial, and technical grades), 200 were skilled workers, less than1,000 were semi-skilled workers, and the remaining 2,600 were unskilledworkers. The clerical staff constituted 23% of the total labor force.
4.59 To make up for the shortage of qualified personnel, theutilities recruited 104 expatriates (21 senior-level staff, 30 skilledworkers, and 53 semi-skilled). Except for some skilled workers and allthe semi-skilled workers (most of whom ate Angolan residents even if theyare classified as technical assistants), the utilities recruited the
24/ For example, one year's average consumption of electricity in Luandais equivalent to the parallel market price of two eggs (i.e., aboutKz 1,000).

- 78 -
technicians either under bilateral agreements (U.S.S.R., 9; Cuba, 11) orunder individual contracts (Portugal, 18). Recently, however, theGovernment passed a law withdrawing some contractual advantages forexpatriates (who are also long-term residents). These expatriates aretherefore unlikely to stay on and will probably seek work elsewhere, orin other sectors, where perquisites are better.
Misallocation of Qualified Manpower
4.60 To tackle this difficult situation, the power sector shoulddesign a manpower policy targeting the operational manpower requirements.This policy should combine: (i) effective allocation of Angolan skills;(ii) technical assistance; and (iii) training. The present allocation ofskilled manpower resources reflects recent hiring (of mainly students)which causes low productivity and the lopsided organization of the powerutilities (76%o of senior-level staff perform non-operational duties andonly 50% of the skilled workers are directly involved in operations).Furthermore, skilled personnel are relatively more scarce in the Centraland Southern systems (in comparison with the Northern region), and in allparts of the country, the distribution function is least favored withrespect to qualified manpower.
Typical utility staffing profiles would be roughly as shown inTable 4.5, Column B. The actual staffing profiles of the utilities inAngola are shown in column A.
Table 4.5: ANGOLA: ELECTRIC POWER SUBSECTORTheoretical and Actual Staff Profiles (1987)
(Percentage)
A BActual Staff Distribution Theoretical Staff Distribution
Generationand Transmission 31 35
Distribution 26 50Functional Services 43 15
Totals 100 100
Source: Angolan authorities and mission estimates.
In addition to this inappropriate deployment, the utilities areexcessively overstaffed with unskilled workers and low-skill clericalworkers. Although salaries have been frozen since 1977, the utiLities'labor costs contribute to financial losses. Labor costs amount to 35% ofbilled sales in EDEL, 60% in CELB, 29% in SONEFE, and 118% in ENE. Sincerevenue collection (except for SONEFE and CELB) is low, labor costs are

- 79 -
an even higher proportion of sales revenues and generally requiresubsidization through the Budget.
Technical Assistance
4.61 At present, the recruitment of expatriates for technicalassistence does not follow any consistent policy. State-to-Statearrangements (U.S.S.R. and Cuba) or individual contracts are entered intoon an ad hoc basis. These expatriates generally work in isolation andqualified Angolan counterparts are extremAly scarce. Furthermore thepoor management of these skills, the lack of a structure into which theycould be integrated, and the absence of performance monitoring threatenthe cost--effectiveness of this assistance. Consi.iering the level ofstaff shortages and the weak institutions of the power subsector, tech-nical assistance deserves careful attention. In the Angolan context,individual contracts, particularly those shorter than two years, areseldom effective.
Main Issues and Recommendations
4.62 As is evident in the preceding description, the main issues inthe electric power subsector are:
(a) organization;
(b) management;
(c) financial situation, tariffs, billing, and collections;
(d) qualified manpower, training and technical assistance; and
(e) investment planning and priorities.
Organization
4.63 A major issue in the organization of the subsector is thedetermination of an appropriate role and structure for ENE. Formallyestablished in 1980, ENE has not yet been able to assume the role ofnational electricity utility it was intended to play. The variousutilities that should have been integrated into the ENE structure stillretain autonomous management and operating procedures. A strong sense ofautonomy is felt at the regional level. The only important link with thecenter is the dependence of the regional departments on headquarters forpurchases of imported materials/supplies. Meanwhile, the current Angolanunrest exacerbates transportation and communication difficulties. Also,the fact that 80% of total generation and consumption are outside ENEcomplicates the establishment of a national power company. Since SONEFEand EDEL were kept out of ENE, what emerged from its creation was anentity responsible for most of the country but without control over the

- 80 -
main generating system and the main load center, and with itsheadquarters and most of its qualified staff in Luanda, far from any ofits operating installations.
4.64 ENE has also been acting as a service company, importingsupplies and electric materials and selling electrical appliances. 25/The fact that ENE often supports local authorities (Commissariados) wouldsuggest that it be in charge of LV distribution in the Central andSouthern areas which are supplied by its interconnected systems. Therationale behind such an organization is the vertical integration offunctions (generation, transmission, distribution) within each regionalinterconnected system supported by the physical infrastructure of thenetwork.
4.65 The importance of the tasks to be carried out together with thedeeply troubled external environment and the day-to-day pressures on thereduced number of managers and skilled personnel of ENE does not permitheadquarters to effectively supervise the Regional Directorates. Itwould seem more appropriate to decentralize all operations andmaintenance as well as most of the rehabilitation activities to theRegional Directorates. At the central level, a small central unit shouldbe created, close to the Director General. The unit would have planningand standardization functions and should give priority to demand studies(which ENE lar`ks), expansion alternatives, and tariff studies. The unitwould also be responsible for standardizing accounting and budgetingprocedures, standardizing technical characteristics of equipment andmaintenance and safety procedures, auditing, evaluating consultants'reports or project proposals, negotiating external credits, and settingguidelines for system expansion.
4.66 In fact, given ENE's lack of success, the question ariseswhether the initial idea of centralizing everything is appropriate.After thorough review, it would seem that, under present conditions,centralization is not the preferred option. ENE has become a rather top-heavy organization with almost all qualified staff assigned atheadquarters while most of the activities (generation, distribution) arein the Central and Southern Directions. Furthermore, communicationsbetween the "frontlines", as it were, and headquarters are deficient, sothat headquarters can contribute but little to solving problems at theoperations level. For all these reasons, of which the Angolanauthorities are well aware, the optimal amount of centralization in theelectric power subsector is less, probably much less, than was initiallyattempted by the creation of ENE. While not wanting to go intounnecessary detail, this Report suggests much greater decentralization,with most functions centered on the physical systems themselves.
25/ The importing and selling of materials and electrical appliancescould be better handled by a separate company. It is recommendedthat the Government of Angola set up such a company, thereby freeingENE from activities marginal to its main role.
- 81 -
4.67 Whether the Southern and Central systems should be separatecompanies or very autonomous divisions of a reorganized ENE should bedecided by the Government after careful analysis. Some centralizedfunctions would need to be carried out for the whole power system,whether in a modified ENE or an "Electricity Commission" (CNE) betweenthe operating utilities and the MEP. The main tasks in question are:
(a) system planning and the standardization of equipment, safetyprocedures, procurement, and auditing;
(b) evaluation of consultant studies;
(c) coordination/execution/evaluation of demand studies;
(d) setting up accounting and budgeting procedures for allutilities; and
(e) preparation/updating of a least-cost system expansion programfor the grids.
4.68 Part of the staff needed for these functions could come fromENE's present nucleus of staff, and part could come from the MEP'sTechnical Department. Other qualified staff should be assigned inpriority to the operating utilities or divisions.
4.69 As for the Northern System, the merger of SONEFE and ENE shouldbe postponed at least until: (a) final decisions have been taken on theorganization of the subsector; (b) accounting and budgeting procedureshave been defined and put into practice; and (c) the assets andliabilities of both companies have been ascertained and evaluatedproperly. SONEFE would either become a very autonomous division of areorganized ENE or a separate entity, but subject to the centralizedfunctions enumerated earlier.
4.70 This report suggests that distribution in the Central andSouthern systems be integrated with the generation and transmissionactivities of the new utilities or autonomous divisions of ENE. In theNorthern System, the size of the distribution task would argue in favorof retaining EDEL as a separate entity.
4.71 In management terms, the subsector would thus be made up of thefollowing managerial units:
(a) a central ENE or national electricity commission (CNE, ComissaoNacional de Electricidade) in charge of tasks that can or musteffectively be carried out in a centralized fashion);
(b) a Northern Division or Utility, i.e., SONEFE, in charge ofgeneration in the northern grid;
(c) a Northern Distribution Division or Company, i.e., EDEL;

- 82 -
(d) a Central Division or Utility in charge of generation,transmission, and distribution in the central grid;
(e) a Southern Division or Utility, in charge of generation,transmission, and distribution in the southern grid; and
(f) a number of isolated systems which could either be directlymanaged by ENE (e.g., the Cabinda or Soyo groups) or by one ofthe regional utilities, whichever option is the mostconvenient.
Management
4.72 The utilities provide the MEP with plans and annual reportsthat could be valuable tools for the coordination of sector/subsectorpolicy and investment. However, these plans and reports have majorweaknesses which seriously hamper their usefulness both to utilitymanagement and to MEP coordination. The main managerial problems concernthe MEP, the utilities, and the relations of both with the rest of theeconomy. They are briefly described in the following paragraphs.(Further information on institutional arrangements and problems is givenin Annex 2):
(a) inadequate accounting, budgeting, and financing systems inthe utilities, which give a poor, incorrect, and frequentlydistorted picture of their situation and performance.Within the utilities, the departments which prepare the Plan(Budget) sometimes do not fully comprehend the officialforms. Their contributions are not consistent with eachother. No department seems able to consolidate theinformation received from the various sources.
(b) poor intersectoral coordination. Coordination should takeplace at the Ministry level and be communicated to theutilities. There is no reliable information on newindustrial loads. Major investments may be decided andcarried out without regard to energy availability. On theother hand, utilities may be building network extensiotns forprojects that have no priority within their ownministries. Coordination is poor between the utilities andthe Ministry, and between the utilities and other Governmentagencies (such as the National Bank, whose control--or lackof control--over the foreign exchange budget exerts a majorinfluence over the performance of the utilities);
(c) lack of a decision-making process based on or supported bysound technical, economic, and financial appraisal of theprojects. Investment plans are shopping lists of worksshifted around from year to year as foreign exchange becomesscarcer;

- 83 -
(d) lack of planning capabilities to prioritize investmentswithin budget constraints and allocate resources accordingto preestablished criteria. Neither the utilities nor theMinistry are able to judge the relative merits of differentinvestments either in terms of their economic return ortheir impact on preventing future disruptions or meetingdemand requirements. Investments are often decided not oneconomic grounds but based on offers of credit or politicalpressures;
(e) total lack of information on major ongoing investments inthe power subsector. This ignorance extends even toentities responsible for preparing expansion plans orformulating energy policies and strategy, including thePlanning Office of the Ministry. For example, withoutreliable economic and financial data available on theCapanda project, it is impossible for ENE, SONEFE, or theMinistry (assuming they had the necessary manpower resourcesand technical skills) to evaluate the financial and economiccosts of supply and to design a consistent tariff policy;and
(f) the utilities incur chronic financial losses which arecovered by the national budget. These losses are mostly dueto poor billing and collection procedures and inadequatetariffs. So far, however, these losses do not seem to havespurred much activity to correct the basic causes offinancial losses.
Financial Situation and Tariffs
4.73 The financial situation of the utilities is precarious. Asdescribed in paragraphs 4.51 to 4.53, the utilities sustain financiallosses which are covered by Budget subsidies or other transfers, or bypayment arrears. If the Budget had no pressing revenue needs and ifpublic resources were plentiful, this situation could possibly besustainable. However, this is not the case. High, persistent budgetdeficits are causing many problems in the economy. Furthermore, withmany more critical expenditures (e.g., health, nutrition) drasticallycurtailed, a subsidy to electricity consumption (by the better-offsectors of the population, by definition) can hardly be justified indistributional terms.
4.74 This report therefore proposes that the electric powersubsector cover its costs (and a part of its investment needs--this couldalso be seen as a return on public capital invested in electric power)with its own revenues. 26/ Covering the present subsector deficits atpresent price and exchange rate levels would require a multiplication of
26/ Given the weakness of accounting procedures in the utilities, thefigures presented here are only rough orders of magnitude.

- 84 -
tariffs by 3 or 4. At the same time, tariffs should be greatlysimplified, and inefficient features, such as the "declining block"structure should be removed. However, this report also suggests ageneral increase in petroleum product prices. Obviously, such priceincreases (diesel could be increased to Kz 25 or Kz 40/liter) would haveto be taken into account in setting tariffs. 27/ In addition, sincealmost 50% of the operating costs of the utilities are in foreignexchange, any change in the exchange rate would affect these costs andshould also be reflected in a revised tariff.
4.75 Since Luanda is the largest load center, it should be dealtwith first. In broad terms, EDEL's proposal for tariff reform should beaccepted. It should be modified immediately t result in an averageresidential LV tariff of about Kz 3/kWh (up from the presentKz 0.80/kWh). Given the low absolute level of tariffs, this increase canprobably be effected in a single step. A roughly similar increase shouldbe enacted in other areas of the Northern System and also for MV and HVconsumers.
4.76 In other areas, similar basic policies should be pursued. Noattempt, however, should be made to set uniform tariffs in all systems,as this would constrain the design and implementation of a more efficienttariff policy in the future. The following steps are suggested as asequence to tariff reform:
(a) simplify LV tariffs (eliminating declining blocks) and raisingthe average price level to cover the utilities' financialdeficit;
(b) study and introduce changes to bring the tariff system closerto a second-best efficient system (e.g., avoid discriminationby end-use: choose appropriate billing parameters and variablessuch as supply voltage, contracted peak demand for HVconsumers, energy demand during system peak hours, etc.);
(c) set prices to meet specified financial targets (e.g., settingtariffs to cover all costs of operation plus about 20% ofinvestment spending or, more simply, to attain a modest returnof 3% to 4% on subsectoral assets in use); and
(d) adjust the tariff to the level and structure of Long RunMarginal Costs. (This is a medium-term goal towards whichtariff reform should aim; it should be possible to reach it by1992, when the present priority investment rehabilitationprogram will be completed).
27/ The full cost of generation would be about Kz 7.5/kWh with dieselcosting Kz 25/liter, and Kz 12/kWh with diesel costing Kz4O/liter.

- 85 -
4.77 Setting tariffs on the basis of the utilities' financialrequirements is not as simple as it appears. A comprehensive assessmentof the utilities' revenue needs would require considerable efforts andtime because of the scarcity of accounting/financial skills and theunsatisfactory present state of accounting, budgeting, billing, andcollection procedures. Setting tariffs to cover part of investmentopending could require that a realistic investment program be prepared.However, if the goal were to achieve a certain return on assets, a betterdefinition/evaluation of assets and overall balance sheets would berequired. The initial step to improve accounting information should bethe adoption, for present and future operations, of a much simpleraccounting system than the existing National Accounting Plan (PianoNacional de Contas). Also, the idea of re-creating accounts for pastyears should be abandoned for the time being.
Billing and Revenue Collection
4.78 The main problems in billing and collection are in Luanda. Inother systems and load centers, billing and collection are generallysatisfactory. For one thing, outside Luanda the problem is on a muchsmaller scale. Local managers have usually succeeded in resolving themajor difficulties. 28/ Although billing and collection are generallyadequate, tariffs are extremely low. Some regional managers have decidedto extend the higher-priced blocks in an effort to increase the averageprice per kWh.
4.79 Billing and collection difficulties in Luanda are due toseveral factors such as the lack of effective penalties for non-paymentof bills (EDEL staff are apparently unable to disconnect delinquentcustomers), the large number of illegal connections (possibly 10,000-15,000 in addition to about 75,000 legal connections), and the lack of asystem for the easy payment of electricity bills. In addition to thesereasons, EDEL has been unable to bill ics customers expeditiously for avariety of reasons (lack of staff, lack of computers, breakdowns).Delays in billing have not helped customers maintain their paymentdiscipline.
4.80 Broad recommendations to EDEL to improve billing and collectionshould be:
(a) correct the internal (computer) problems which prevent timelyissuance of bill+. Given the low tariffs, annual or semi-annual bills may be adequate. However, tariffs will eventuallyrise and then gradually more frequent billing will probably beneeded. The MEP should immediately grant any assistance
28/ In Huambo after independence, power company workers resumed serviceand worked several months without salary. Salary payment wasresumed only once successful billing and collection permitted it.

- 86 -
required by EDEL to recreate a credible billing/collectionsystem;
(b) obtain permission from Government authorities to disconnectdelinquent customers as a routine measure in order to enforcepayment of electricity bills; and
(c) improve the qbility to satisfy consumer requests for servicepremptly (afte: the increase in tariffs and improvements inbilling and collection). A campaign to legalize or rectifyillegal connections should then be conducted. Heavy sanctionsshould thereafter be imposed on illegal connections orre-connections.
4.81 Naturally, efforts to improve billing and collection would bemore rewarding if tariffs were more appropriate. Therefore, the effortsmentioned in the preceding paragraphs should proceed simultaneously withan increase in tariffs and reform of the tariff structure. Tariff reformand tariff increases, and improved billing and collection are essentialingredients in a strategy of improving the financial condition andprospects of the electric power subsector. Once these changes have beenmade, the utilities will be better able to supply power efficiently andreliably.
Qualified Manpower
4.82 In Angola, qualified manpower is extremely scarce. A largenumber of qualified people left Angola at independence or during thetroubled times that followed. Since then, high defense needs forqualified manpower have reduced the supply to all civilian users, whetherpublic or private. The power subsector has suffered from the shortage.Within the subsector, distribution companies have been relatively worseoff. Technical, financial/economic, and managerial skills are allextremely scarce. This situation may well explain many of thedifficulties the power utilities currently face.
4.83 The organization of the power subsector (i.e., the attempt tocreate a national power company) and the rather ineffective deployment ofwhat little qualified manpower there is (too many of the few qualifiedpersons available are assigned to Luanda headquarters) compound theutilities' difficulties. Until recently, a problem of lack of incentives(inability to get access to official shops for their qualified people)prevented ENE and EDEL from recruiting qualified people. This obstaclehas since been partially overcome but the problem of motivating higherlevel staff is a persistent one.
Training
4.84 Training programs are costly and time-consuming but necessary.Therefore the most urgent training needs should be identified and acted

- 87 -
upon. Most probably, the priority is for on-the-job or "near-the-job"training in operation and maintenance of power pla.its and distributionlines. Administrative and accounting skills are probably almost asimportant. Global needs should be arrived at by asking the RegionalDirections to estimate their minimum requirements (and, possibly, choosethe candidates for training). In this way, training will be concentratedon the highest pciorities, and the new electricity training school willbe able to make an immediate useful contribution, which would becomplemented by training-oriented technical assistance. In addition, thecost effectiveness of training programs/institutions needs to be examinedcritically as there are currently several cases of extremely high costsper trainee.
Technical Assistance
4.85 The primary objective of technical assistance should be theinstitutional strengthening of the utilities, especially in operationsand maintenance. Because of the length and complexity of this task, anintegrated and lasting assistance will be needed. This can probably bestbe supplied by other utilities. In all likelihood, the best vehicle forassistance would be a contract with another utility to provide managementand supervision of expatriates, especially for the Central and Southernsystems. Even this approach will only work if Angolan qualified manpoweris deployed so that the expatriates have trainable counterparts workingwith them. Operational support to the Central and Southern systems wouldrequire approximately 20 persons for a period of three years.
4.86 Technical assistance will also be necessary to execute theinvestment program of the electric power subsector. In order to focus ontechnical assistance and ensure that it is used effectively, a task forcein charge of aAl rehabilitation should be formed with staff contributedby SONEFE, ENE, and MEP. If the Capanda dam were delayed or postponed,some of the staff of CAMEK could also be added to this task force. Thistask force would be supported by a substantial infusion of externaltechnical assistance: five persons (2 power engineers, 2 powereconomists, and 1 financial analyst) would be required over a period ofthree years. At least an equal number of qualified Angolans should workwith them. This strengthened task force would prepare and supervise theexecution of the various priority rehabilitation tasks. This task forcewould also help coordinate capital assistance to the projects under itsresponsibility. The technical assistance considered in the two previousparagraphs would consist of about 75 man-years of long-term consultantsand about 25 man-years of short-term consultants and studies. Approximatecosts would be US$10 million for the three-year period.
Investment and Expansion Planning
4.87 At the time of the mission's visit, no systematic expansionplanning was taking place in Angola. An approximate least-cost expansionplan for the Northern System was prepared before independence and still

- 88 -
survives within SONEFE, but it has not been recently updated. This maybe due to lack of resources and personnel at a time when the utilitiesare hard-pressed to cover routine operations which are complicated by thewar situation. Investment programming has also suffered, withinvestments generally conditioned by the availability of finance.Sometimes, when financing is available, it is limited to the foreignexchange share, with no provision for installation or civil engineering.
4.88 The main issues for the electric power subsector can be listedas follows:
(a) There is an absence of a coordinated policy and systematicdecision-making process for investments, and this isexacerbated by the war situation. Investment decisions aretaken on a short-term basis without the help of economic orfinancial scrutiny and under pressures of all sorts (political,from supplier countries, etc.).
(b) Financing considerations generally prevail over any integratedapproach or strategy. Consistent sequences of activities, whenthey are identified, are almost always ignored as financing isnegotiated on a case-by-case basis. If a package of equipmentand civil works is financed (often with pressure-selling on thepart of the suppliers), it is then called a "project" even ifthe financial provision for it does not extend to completionand commissioning.
(c) Contracts are awarded haphazardly, without making sure that theprevious and subsequent stages of work have been identified,planned, and financed. As a result of this, millions ofdollars of equipment has been purchased but cannot beinstalled, and is deteriorating. While these assets are notcontributing anything, the debt, often incurred on commercialterms, is being serviced.
(d) The utilities have no control over commitments and drawing offoreign exchange. The BNA has this responsibility, andcoordination between the BNA and the utilities has proven to bedifficult.
(e) The utilities have a tendency to add new capacity rather thanrelying on preventive and corrective maintenance in order tokeep capacity available and operational. This is partly theresult of the foreign exchange shortage, which prevents thetimely purchase of spare parts and materials while exter alsupDliers and credits are often more easily available forpurchase of large quantitites of new equipment.
(f) As a result of lower levels and reliability of service, highnumbers of small diesel sets and gas turbines have beenpurchased and are spread all over the country. They represent

- 89 -
a large foreign exchange debt and occupy an inordinate share ofthe utilities' qualified manpower, which should be concentratedon the main installations. Servicing these scattered, smallsystems also requires a costly logistical system (fuel,transportation, storage), and places a heavy burden on thelimited resources of the utilities.
4.89 In light of these difficulties, the next few paragraphs willsuggest some priorities for investment and expansion planning. Better,more effective planning and investment decisions have as goals thesatisfaction of Angola's projected electric power needs at lowest costand the strengthening of the utilities to make them better able to meetthese future needs. Minimizing investment expenditures will often berequired as a means to reduce costs, and higher tariffs will be needed toprovide a safe financial basis for the strengthening of the utilities.
Investment Priorities
4.90 In the short term, investment priorities must, of necessity,center on repair, rehabilitation, and resumed maintenance of existingfacilities. Rehabilitation should proceed simultaneously on all threesystems as both security and economics relegate an interconnection to afairly distant future. The medium-term goal should be to fully restoresupply capabilities in line with installed capacities, and to createadiquate reserve margins for potential demand growth. Uncertainty in theevolution of demand and the high cost of supply options coupled withresource constraints (finance and qualified staff) militate in favor ofan investmnent program that addresses the most pressing needs whilemeeting the most stringent economic criteria.
4.91 Existing investment programs for the electric power subsectoras a whole, excluding Capanda, total about US$100 million for 1987 and1988p 75% of it in foreign exchange. A program of this size is probablybeyond the financial and technical capabilities of the utilities. Ascaling down of investments is thus inevitable; this must be done,keeping in mind the key priorities. The utilities' detailed investmentprograms are reviewed and evaluated in Annex 16.
4.92 A tentative priority investment program is described inTable 4.6 below, based on the following considerations:
(a) assign highest priority to rehabilitation of existingfacilities;
(b) strive for improved reliability of supply to main cities whichare also the main industrial areas;
(c) improve supply to Luanda by addressing the main problems ingeneration, transmission, transformation, and distribution;

- 90 -
(d) postpone most small projects in isolated systems, mainly for'ack of managerial/technical staff, even if equipment has beenpurchased (only those that can actually be built should beconsidered);
(e) postpone new rural/village electrification until hydro supplyconditions have been improved and tariffs readjusted;
(f) limit new connections in cities until tariffs are adjusted and(especially in Luanda) until billing and collection proceduresare substantially improved; and
(g) plan a substantial amount of technical assistance to supportENE task forces in big rehabilitation projects such as Lomaum,the Southern System, and the Luanda distribution grid.
4.93 A general recommendation, in addition to the aboveconsiderations, is to subject every substantial project (say, exceedingKz 50 million) to economic and financial feasibility analysis.29/ Thiswould alert the utilities' management to the need to redesign, scale downor reschedule the project. Accurate cost data would also facilitate thesearch for financing for the complete projects, rather than having manyprojects only partly financed as at present. A project evaluation unitshould be set up in the central staff of ENE (or CNE) for this purpose.This unit should also advise the Government on the cost of "politicalpriorities" so that the quality of "political" projects could beimproved. Finally, the unit would make sure that its programs for thepower subsector are consistent with programs in other sectors (industry,mining, agriculture, etc.).
4.94 A minimal priority investment program in line with the abovepriorities and considerations was prepared by the m.ssion. Given theabove priorities and constraints, the mission sees no useful role foradditions to capacity of the scale being considered at Capanda. Thepriority investment program should be carried out over the next fiveyears and would cost about US$200 million (Kz 6 billion). This seems toaccord better with the financial and managerial/technical possibilitiesof the subsector. However, it would still be a heavy financial andmanagement burden on the utilities. The financial burden could bereduced somewhat if efforts were made to obtain financial assistance f-omthe numerous bilateral or multilateral aid agencies. All these agenciesrequire economic and financial analyses (and are willing to fund them)but lend at considerably softer terms than export financing agencies.The suggested five-year priority investment program is presented inTable 4.6.
29/ This would make the project attractive to concessional donors andresult in lower financial costs.

- 91 -
Table 4.6: ELECTRIC POWER SUBSECTOR INDICATIVE
SUGGESTED PRIORITY INVESTMENT PROGRAM 1987/88-1992
Project --- Million --- Timing
USS Kz
Generation
Cambambe - Repair units 2, 3, 4 5 150 ongoing
MaLubas - Rehabilitation 7 210 1989-ongoing
Lomaum - General rehabilitation 60 1,8C0 1989-92-ongoing
B16pio - Rehabilitation of 2 units & dam 15 450 1989-91
Southern System:
Matala - Repair dams & generators 25 750 1988(89)-92
Gove - Repair dam 5 150 1989-92
Namibe - Complete thermal plant 1 30 1989
Huambo - Repair/replace gas turbine 2 60 1989-ongoing
Cabinda - Repair gas turbine 1 30 1989-ongoing
Ulge - Erect diesel unit 1 30 1989
Transmission
Bi6pio Substation - Rehabilitation 2 60 1989-90
Viana Substation - Expand/complete 4 120 1987-89
Quinfangondo - Complete substation 3 90
Luanda Substation - Replace transformers 2 60 1988-90
Renovation of
various lines 10 300 1989-94
Distribution
Luanda - General rehabilitation 30 900 1989-94
Small urban networks 5 150 1988-92
Renovation of other systems (Lobito, Benguelu, etc.) 15 450 ;989-94
Other 22 660 1989-94
TOTALS 215 6,450 19fl9-94
Average per year 43 1,290
Source: ENE, EDEL, SONEFE, a,d Mission estimates.
4.95 The investment program outlined in Table 4.6 may seem modest.This is inevitably so when compared to the huge expenditures programmedfor Capanda, where annual investments are expected to exceed the five-year total for all utilities. However, this priority investment programis by no means small: it provides for che rehabilitation of all
- 92 -
installed capacity and some additions, notably at Lomaum and Matala. Itwould be sufficient to meet demand reliably until the mid- to late-1990s. The investment program is by no means easy to carry out. Themission estimates that as much as US$10 million in external technicalassistance may be needed to carry it out. But this is a small amountcompared to the about US$50 million of technical assistance expected tobe provided to the Capanda project by FURNAS alone). This small,priority investment program will certainly do morc to improve service andreliability and create a useful reserve margin in all systems than themassive investment at Capanda, which is described in the next section.The smaller program is a better risk-averse response to uncertainty thana big investment in generation in one part of the country because it willequip the utilities to be able to provide power aiywhere it may beneeded. In any case, before Capanda can help improving supplies to anygrid, substantial additional investments will be needed in lines,substations, transformers, distribution grids, user installations, etc.Since the Capanda project can be seen as an issue in investment andsystem planning, it is discussed more at length in the next section, andin detail in Annex 16.
The Capanda Hydroelectric Project
Summary and Recommendations
4.96 The Government's apparent decision (which can still bereversed) to advance the construction of a dam and power plant at Capandapresents several major issues. Although the analysis done is extremelyrough and conclusions should be taken as tentative, several robustconclusions emerge and are stated as follows:
(a) Capanda represents a significant departure from the lowest costexpansion path, even if it is not well-known and has not beenupdated recently;
(b) the huge capacity (4 x 130 MW) planned for Capanda willprobably not be needed until well into the next century. Untilthe year 2000, maximum requirements to fully meet the projectedenergy and capacity needs of the Northern System, in the worstcase ("High" scenario), with hydrogeneration alone, would onlybe 170 MW of additional capacity and 520 GWh of additionalenergy. A "High" dam in Cambambe in the early 1990s,2 x 100 MW in the second Cambambe power plant in the mid-1990s,and a "Low" dam in Capanida in the year 2000 would be enough tomeet those requirements with a high reserve margin at the timeof system peak and no need for thermal support. The requiredinvestments would be significantly lower and much farther intothe future than the Capanda option now being considered;
(c) it is a project which, by itself, will not improvesubstantially the reliability of service in the Northern System

- 93 -
and will not mitigate the problems of the other two systems atall;
(d) actual and expected low demand growth rates and theavailability of substantial thermal reserve (capacity andenergy) would allow the postponement of this irreversible majorinvestment decision during this period of uncertainty andstringent financial conditions, at a very low risk, until theeconomic environment becomes more stable and a betterperception of the potential medium- and long-term demand marketis possible;30/
(e) alternative expansion sequences in the Northern System, withdifferent timings of Capanda and complementary works inCambambe, should be evaluated in full detail and in the contextof the entire power subsector, with all economic and financialimplications reassessed in a realistic framework of demandprojections and updated costs. Such studies, if immediatelyinitiated, could be carried out within five to six months. Thedelay would not create any additional risk of energy shortagesin the early 1990s and could bring the benefit of redirectingmore efficiently the large investments already made in supportinfrastructures; and
(f) making the investment in Capanda will add substantially to thepublic external debt burden (commercial financing). It mayalso undermine Angola's ability to finance the vital petroleumdevelopment program on which its future export earnings depend,because part of Angola's future petroleum output has beenearmarked as a repayment guarantee on some of the Brazilianfinancing for Capanda.
While, at times, a state may need to take all manner of risks to financea vital investment, the case of Capanda definitively does not fall inthis category. On the contrary, going ahead with Capanda will preventAngola from undertaking activities which are truly of vital importance.In the final analysis, therefore, this Report recommends that theexisting least cost expansion plan be updated, based on the bestavailable demand projection, so as to confirm the stage and the speed atwhich Capanda power should be developed.
Background to the Capanda Project
4.97 In 1982, Angola and the U.S.S.R. signed an agreement to developa major hydroelectric dam and plant at Capanda on the middle course ofthe Kwanza River. A new organization, CAMEK, attached directly to the
30/ Satisfying repressed demand in Luanda would require expensive,large, and time-consuming investments in the medium and low tensiongrids.

- 94 -
MEP, was created to execute this task. Soon thereafter, a "mastercontract" was signed between the MEP and a Soviet/Brazilian engineeringfirm, N. ODEBRECHT. By these decisions, the hydro plant at Capanda(4 x 130 MW) was given priority over the further development of Cambambewhich was then part of SONEFE's expansion plan.
4.98 TECHNOPROMEXPORT (TPE) is the team leader for the project andsupervisor for the construction. Other Soviet firms or institutes areresponsible for geological prospecting, dam design, and equipmentsupply. The Brazilian engineering/construction firm, N. ODEBRECHT, orits subcontractors, are in charge of the civil works. Availableinformation on contractual details is scarce, and seem far fromcomprehensive. A mechanism has been created to regulate subsequentactivities by requiring additional contracts each time an importantactivity or set of activities is identified and programmed. So far ten"Partial Supplements" have been signed since 1985 (one with the Sovietparty for geological prospecting and dam design; nine with the Brazilianparty).
4.99 GAMEK's staff is made up of senior people seconded (often part-time) from other enterprises (such as SONEFE and SONANGOL) as well as 55middle and higher level staff seconded by contract from the Brazilianutility, FURNAS CENTRAIS ELECTRICAS. GAMEK'S complete staff currentlytotals about 165 persons (55 Brazilians and 110 Angolans). Salaries aresimilar to those of other utilities in Angola, but fringe benefits (suchas access to official stores) are much better. GAMEK is thus success-fully competing with other utilities for scarce qualified manpower.
Capanda and the Least Cost Expansion Plan
4,100 Developing the plant at Capanda represents a serious departurefrom a least-cost expansion plan. The steps in this plan were asfollows:
(a) increase the height of the Cambambe dam, thus increasingcapacity from 180 MW to 260 MW (which might be needed in themid- to late-1990s);
(b) build a low retention dam at Capanda giving Cambambe monthlyregulating capability, and build a second power plant atCambambe (2 x 110 MW), pushing total capacity at Cambambe to400 MW (which would only be needed around the year 2000);
(c) increase the dam height at Capanda and build a second stage ofthe second power plant at Cambambe (2 x 100 MW) (would beneeded beyond reasonable present planning horizon); and

- 95 -
(d) build a power plant at Capanda (4 x 110 MW assumed in oldstudies, 4 x 130 MW in more recent ones; only required beyondthe present planning horizon).
4.101 The investment costs of the above sequence were compared withthose for advancing Capanda (as estimated by BEP) and gave the followingresults: Cambambe, US$1,030/kW; Capanda, US$1,800/kW. The comparison,however, should not be pushed too far as firm capacities are not ac-counted for and Capanda would look even less economic if the two damswere really considered alternatives rather than complements. Contrarily,however, these figures embody costs of turbine plus generators estimatedby BEP at US$500/kW for Cambambe and only US$345/kW for Capanda, withoutany plausible explanation of the difference.
Long Run Marginal Costs
40102 The Long Run Marginal Costs (LRMC) of producing electricityfrom Capanda are a multiple (8 or 10 times) of present average energycosts in the Northern System served by Cambambe. Rough estimates of theinvestment and operating costs of Capanda and a set of assumptions on theshare of demand (as estimated by the UNDP/IBRD mission) supplied byCapanda provide a rough indication of the LRMC of electricity fromCapanda.31/ A fair estimate of LRMC is roughly US$0.334/kWh (orKz 10.037ikWh) with the base UNDP/IBRD scenario of demand, assuming thatgeneration at Cambambe is limited at 780 CWh/y (which is about its firmgeneration capacity) 32/, and a discount rate of 12%. A sensitivityanalysis (three demand scenarios, three discount rates--10%, 12%, and15%--and three levels of generation by Cambambe) was performed. Thisanalysis shows that LRMC could go from a minimum of US$0.127/kWh(Kz 3.80/kWh) (Cambambe generates only 200 CWh, 10% discount rate, highdemand scenario) to a maximum of US$0.547/kWh (Kz 16.41/kWh) or even abit more if Cambambe generated 1,000 GWh (which it can generate in anaverage year) rather than its firm energy of 780 GWh. See Annex 16,paras. 15-16 for a detailed comparison/discription of these variouscases. It is clear that even under favorable assumptions, covering thecosts of Capanda would require a large increase in tariffs (excluding anyexchange rate shadow pricing). If demand were to grow more slowly thanprojected, Capanda power could not be sold and costs could riseenormously. At best, Capanda will be a project of marginal economicinterest. At worst, it will be a heavy financial burden making nocontribution in the medium term to the development of Angola.
31/ Based on updated information supplied by GAMEK/MEP during theOctober 1988 mission.
32/ 786 GWh is actually the joint firm generation of Cambambe andMabutas, assuming 700 GWh for Cambambe and 80 GWh for Mabutas.

- 96 -
Technical and Financial Information
4.103 No preinvestment studies, either technical or economic, weredone to aid in the decision to develop Capanda. Some old studies existedbut it was decided to proceed with const-..ction pari passu with theneeded technical studies. No economic or financial studies or demandprojections were made specifically for the justification of the Capandadam. 33/ Given this fact, all statistics connected with Capanda must beconsidered as rough approximations. Total investment cost was notprecisely known but was stated to be about US$1 billion in 1986 prices.This was revised upwards in 1987 (in 1987 prices). Total cost was thenestimated at $1250 million for direct costs, that is, about $1600 millionincluding financial costs (and interest during construction). In fact,only in 1987 were technical studies advanced enough to allow theestimation of a cost (the 1985 figures were later described as"guesses"). However, even the 1987 figures probably understate costs asthey do not allow for any contingencies. A rough description of costs isshown in Table 4.7.
4.104 The financing package described in Table 4.8 is close tocommercial terms (interest at 7X-8%, 2 years' grace, 7-8 year repaymentperiod).
33/ The BEP and THEMAG studies had other specific goals, i.e., expansionplan and interconnection grids.

- 97 -
Table 4.7: CAPANDA HYDRO PROJECT - GAMEK INVESTMENT PROGRAM
(in USS million)
Firm/Component Actual 1988 1989 1990 1991 1992-4 TOTAL
1985-87 Est. Act.
N. ODEBRECHT
TOTAL 327.9 109.1 117.1 119.6 120.3 77.2 871.3
of which: Labor 73.7 40.1 48.0 58.0 59.6 37.3 317.4
Materials 89.1 20.5 23.9 26.8 26.8 14.1 201.2Food 12.8 8.2 11.4 11.5 10.7 9.2 63.8
TPE
TOTAL 4.2 8.4 14.3 23.1 79.8 145.4 275.0
of which: Equipment 0 0 0.2 4.8 65.6 99.2 169.8
FURNAS
TOTAL 23.4 10.2 7.0 7.0 6.5 11.0 65.0
(Tech. Assistance)
GAMEK 9.5 4.0 4.0 3.5 3.5 10.1 34.5TOTAL DIRECT COSTS 365.0 131.6 142.4 153.1 210.1 243.6 1,245.8
Interest + Commission 17.1 56.1 34.4 42.9 41.7 164.5 1/ 357.1
+ Exchange Losses
GRAND TOTAL 382.1 187.7 176.7 196.0 251.7 408.4 1,603.0
1/ Financial charges run up to 2003.
GAMEK: Gabinete de Aproveltamento do Medio Kwanza (Office for the Harnessing of the Middle Kwanza).
Note: Totals may not add up because of rounding.
Source: Angolan authorities and GAMEK.

- 98 -
Table 4.8: CAPANDA: FINANCING PLAN
(in USS million)
COUNTRY/INSTITUTION COMMITTED SOUGHT TOTAL TERMS
CACEX/ Banco do Brazil 4/ 408 120 21 528 7%-8%
2 years grace.
7-8 years repayment
period.
Cash Payments 162 162
408 282 690
U.S.S.R. (for equipment) 275 -- 275 3%
10-year life.
Includes 3 years
grace period.
Other countries 2! 8 97 105 S8 million for
(cash payments until funded) 3 years at
commercial rates.
SUBTOTAL 765 475 1,240
SUBTOTAL(Excl. Cash & Budget)3/ 691 120 811
TOTAL COST OF PROJECT
(Incl. Financial Charges) 1,600
FINANCING GAP 780
i/ These amounts are carried as cash payments until such time as they are
financed,
2/ This amount was committed by Brazil in 1989.
3/ The Angolan Government (or its Budget) is the financier of last resort, i.e.,
it would have to make up any shortfall. This shows that the shortfall, whichAngola may have to make up, is really S789 million.
4/ The Government of Angola has given a general guarantee in oil to Banco do
Brazil for these loans.
5/ This Is theoretically in local currency, but local expenditures have an
extremely high foreign exchange interest in Angola.
Source: The MEP, GAMEKO
4.105 The total amount being sought, $1240 million, falls short ofeven direct costs ($1245 million) let alone adding the financial costs.In October 1988, only $691 million was firmly committed (excluding GOAand OGE) which means that there was a financing gap of $909 million(inlcuding financial costs) or $554 million (excluding financialcosts). Since then, an additional $120 million has been secured fromBanco do Brazil. The financing gaps are therefore US$789 million andUS$434 million (respectively including and excluding financiel

- 99 -
charges). In addition, $17 million of debt service was paid between 1985and 1987, while in 1988 debt service was expected to reach $56 million.Except for Soviet financing, by October 1988 funds had practically runout. Were it not for an additional $120 million supplied by Brazil, workwould have had to stop. All this raises serious questions about thefeasibility of building Capanda as planned and reinforces the need toseriously reexamine this investment within the context of an overallsystem expansion plan, i.e., most probably to abandon the idea ofbuilding Capanda in one stage and to weave it into the overalldevelopment of generation along the Kwanza River.
Capanda and the Need for Interconnections
4.106 The use of Capanda to supply the three interconnected systemsalso deserves some comment. Under the present conditions of unrest, theconstruction of new transmission lines to link the three systems isimpossible. The existing Cambambe-Cabela line, the first stage of afuture North-Center link, has been out of service since 1984 and securityconditions have not allowed a restoration of service, and the Governmenthas therefore installed diesel sets in Porto Amboim. Similarly, Line 1between Cambambe and Luanda cannot be properly maintained and is in aprecarious situation. Major Central and Southern transmission linescannot receive maintenance for lack of security. In the meantime,regional power supplies will be rehabilitated and expanded to meetpotential demand (Lomaum, Bi6pio, Huambo, Matala, Namibe). The threesystems will necessarily remain self-sufficient and will have to providefor their own (separate) reserve margins.
4.107 Prolonged conditions of insecurity will keep demand growth lowand will prevent construction of interconnections. Thus a larger marketfor Capanda power will not be able to develop. A short-term cease-firefollowed by a quick economic recovery, approaching the demand growthrates projected by BEP, might allow and possibly call for aninterconnection but a least-cost expansion plan would apparently postponeCapanda itself until after the year 2000, giving earlier preference tonew supply sources in the Central and Southern Systems.
4.108 In an interconnected environment, Capanda would have difficultymeeting reliability criteria (too much generation in a single pole,hundreds of kilometers away from the main consumption centers), operatingproblems (the interconnected systems would be of the "weak longitudinal"type which is known to present difficult voltage control and dynamicoscillation problems), requiring the opening of the interconnecting linksor putting serious restrictions on power transfers 34/, and on-linedispatching. No experience exists in Angola of real-time dispatching of
34/ Low load situations require special compensating devices (varstatic compensators) in different points of the system and mayalso produce severe cavitation in the turbines of Capanda.

- 100 -
distant interconnected plants; this requires reliable communications andcontrol systems together with highly-trained personnel.
Final Remarks
4.109 Although information is patchy, the decision to advance Capandarests on highly optimistic expectations regarding economic developmentand electricity consumption, insufficient appreciation of sound economicconsiderations, an underestimation of the financial burden, andunderestimation of the difficulties of operating and maintaining such ahuge installation. The Government's wish to take advantage of its hydroresources is understandable. However, this cannot be done without largeinvestments in transmission and distribution in addition to thegeneration investments. Two theoretical alternatives might eventuallylead to a justification:
(a) attracting foreign investments in power-intensive industriesthat do not require significant investments in distributionnetworks; (the negative experience of Zaire with its Inga powerplant would be an interesting comparison here); and
(b) providing generalized access to electricity to Luanda'spopulation and providing incentives for industrialrehabilitation.
While the first alternative remains theoretically open butrequires a relatively long period of stability before materializing, thesecond would require enormous investments in distribution networks (fromhigh to low voltage) that the utilities and the Government simply cannotafford. The issue of appropriate tariffs will not even be mentioned herebut higher tariffs would have a significant impact on both alternatives.
4.110 The whole issue of Capanda remains basically that a market of asize that could justify the investment does not exist nor can be expectedto materialize within a reasonable period. By the end of 1988, almostUS$500 million had been spent and heavy infrastructures built in Luandaand on-site. There are large quantities of equipment and the project isat the crucial stage just before the river is to be deviated. On theother hand, financing for the completion of the project is, most likely,unavailable. Finally, there now exists an institution, GAMEK, whose goodcapabilities should be utilized. For all these reasons, it would seemjustified to stop building and carry out a study of the feasibility ofstopping the project, of looking for the best alternatives to develop theNorthern System and, finally, of the best way of introducing Capanda intothis system (when to resume construction, optimizing the power of theunits and their coming on-line, etc.) within a global expansion planwhich would develop the hydro resources to best advantage. Brief Termsof Reference for such a study (which would also include preparation of arehabilitation program for the existing power systems) are presented inAnnex B.

- 101 -
V. FORESTRY, WOODFUELS AND HOUSEHOLD ENERGY
Summary, Conclusions, and Recommendations
5.1 While available statistics are few and unreliable, two recentstudies and mission estimates have produced a picture of the supply anddemand for forestry and woodfuels in Angola which can be summarized asfollows:
(a) most Angolans use firewood or charcoal for cooking and heating(in the cities, however, a significant minority use LPG);
(b) the aggregate consumption of firewood is in the order of 2.5million tons/y and of charcoal about 0.5 million t/y, requiIinga total removal of 6 million tons or about 10 million m ofwood;
(c) Angola possesses some 50 million hectares of dense forests anda further 55 million hectares of woodland and savanna. Togetherthese forests are capable of producing much more wood on asustained basis than is presently consumed in the country;
(d) out of Angola's nine million inhabitants, almost half live inareas with more or less pronounced fuelwood shortages, eitheron the dry coast or in inland cities;
(e) in the shortage areas, the periurban population constitutes thegroup hardest hit. They have limited access to alternativefuels (more easily available in urban centers) and, unlike mostrural people, they cannot gather their own fuelwood for free.They are, furthermore, penalized by high market prices forwoodfuels: the cost per thousand useful kilocalories is onlyKz 10 for LPG but 10 to 20 times as much for firewood andcharcoal;
(f) the institutional framework for energy forestry in Angola isweak. Exploitation of fuelwood is regulated by the NationalDirectorate for the Conservation of Nature (DNACO), whichissues cutting licenses. The DNACO, however, has no resourcesto ensure that the actual cutting conforms to the licensesissued; and
(g) the creation of new forests is not the best (cheapest) way tosolve the fuelwood problem. This is primarily because the drycoastal strip of Angola, where most of the people experiencingfuelwood shortage live, is poorly suited for tree-growing.

- 102 -
5.2 At present relative prices and depending on the securitysituation, the priorities for action in forestry/household energy ate asshown in Table 5.1.
Table 5.1: WOODFUELS - PRIORITIES FOR ACTION
Increased ImprovedFuel Efficiency Supply Wood
Area Action Substitution of Stoves System Production
Peace II IlIl I IVCoast
No Peace I II III IV
Peace IV III 11 IInland
No Peace IV I II III
Source: Mission.
5.3 If the reduction in civil strife is accompanied by structuralchanges in the economy such as a major devaluation carried through tocommercial energy prices, then relative prices will probably changedrastically. The prices of petroleum products would rise markedly whilethe reduction of the risk premia and increased competition (because ofeasier market entry) and lower rents to truck owners and otherentrepreneurs would most probably lead to (comparatively) lower pricesfor traditional fuels. In that case, consumption of LPG might not growas fast as in the past (although this might not be noticed for some timebecause of the existence of repressed demand), and traditional fuelsmight once again become competitive with LPG (or kerosene). Measures toimprove the supply of woodfuels to the cities might then become thehighest priority, as indicated in Table 5.1.
5.4 This report proposes several sets of priority activities at theregional and national levels. Four are regional in character while twoare national. The first regional set of activities covers the provincesof Huila and Namibe, a region where the security situation is fairlygood. It includes both city-oriented activities such as the improvementof stoves, and rural-based activities such as improved supply systems forfirewood and charcoal. The other three regional sets of activities allcover urban areas: one for Luanda; one for Benguela/Lobito; and one forHuambo township. For Luanda and Benguela/Lobito, it is proposed thatemphasis be put on increased use of LPG as a domestic fuel. In Huambotownship, improved stoves should be given first priority.
5.5 Two national activities should be carried out in support of theregional ones. One covers the development and introduction of improved
- 103 -
stoves and the other concerns initial development work and trials inagroforestry. The activities listed have been grouped into fourprojects. They are the following:
(a) a pilot project in Huila-Namibe, to integrate the variouscomponents of energy forestry, including the development ofagroforestry;
(b) improved cooking stoves, mainly for the urban and periurbanpopulations in Luanda, Benguela, Lobito, and Huambo;
(c) an improved supply system for woodfuels, mainly for the citiesof Luanda, Benguela, Lobito, and Huambo;
(d) replacement of firewood and charcoal by LPG as a domestic fuelfor the urban and periurban population on the coast, at leastuntil more peaceful conditions improve supplies and lower theprices of woodfuels, and until economic adjustment measuresincrease the prices of petroleum products (LPC, kerosene);
Consumption and Production of Woodfuels
Consumption of Woodfuels
5.6 The consumption of woodfuels in a country is never easy tomeasure or estimate accurately. It takes place among hundreds ofthousands of households, generally in an uncoordinated fashion, largelyoutside the monetized economy. Until quite recently, knowledge regardingthe consumption of woodfuels in Angola was extremely poor. In theabsence of any consumption survey, estimates were little more thanguesses. Further, available figures on wood removals reflected onlyofficially recorded harvests of wood for fuel, corresponding to a minorshare of the total.
5.7 Material presented at the First National Seminar on Woodfueland Charcoal, held in Luanda, June 8-10, 1987, improved the situationconsiderably. As a part of the preparation for the seminar, theDepartment of New and Renewable Sources of Energy (DNRFE) within theMinistry of Energy and Petroleum (the MEP) made a survey of householdfuels in seven provinces. The survey covered 4,466 persons, 1,557 ofwhom resided in urban areas, 2,063 in periurban areas, and 846 in ruralareas. In addition, discussions were held with producers and traders offuelwood and charcoal and traders of LPG and kerosene in the same sevenprovinces. As one result of the survey, average consumption figures perperson and month were obtained for four main fuels (firewood, charcoal,LPG, and kerosene) in each of the three population strata (urban,periurban, and rural). The findings are presented in Table 5.2.

- 104 -
Table 5.2: CONSUMPTION OF HOUSEHOLD FUELS, 1987 a/
(In kg/capita/month)
Firewood Charcoal LPG Kerosene
Urban 23 10 2.5 1.5
Perlurban 30 13 2.2 2.2
Rural 39 13 0 2.0
Average 32 12 2.4 1.9
a/ Figures are based on data from seven provinces.
Source: DNRFE.
5.8 According to this data, the urban population consumes either23 kg of firewood or 10 kg of charcoal or 2.5 kg of LPG or 1.5 kg ofkerosene per person per month. This is probably largely correct forfirewood, charcoal, and LPG if the families use either of these threefuels as a source of 3nergy for cooking. However, the figure seemsunrealistic for kerosene, which is used mainly for lighting. Moreover,
since the data were recorded between late 1986 and early 1987, the energyneeds for heating which peak between May and August may not beincluded. Therefore, average annual household energy consumption islikely to be higher than Table 5.2 suggests.
5.9 In the absence of any population survey since 1970, all figureson the present population of Angola are rough estimates. While theymight be fairly correct as regards the national totals, they are probablyquite unreliable as to the distribution of the population betweendifferent provinces or, indeed, between urban and rural areas. Mostrecent reports estimate that between one-quarter and one-third of thepopulation lives in urban areas, while observations during the surveypointed to a quite different picture, with half the population living inurban and periurban areas. For the sake of the present report, it isassumed that the population is distributed as follows:
Absolute Share(millions) (%)
Urban population: 2.5 28Periurban population: 1.5 17Rural population: 5.0 55Total 9.0 120
5.10 Based on the results of the DNRFE survey, with the specificfuel consumption figures adjusted upwards to acount for heating andtaking into consideration the estimated distribution of the overallpopulation, the tentative picture of aggregate fuelwood and charcoalconsumption may look as shown in Table 5.3.

- 105 -
Table 5.3: AGGREGATE USE OF FIREWOOD AND CHARCOAL IN 1987
Amount Wood Needed
1,000 t/y 1,000 t/yr
Domestic Consumption
as Surveyed by DNRFE
- Firewood 1,920 1,920
- Charcoal 440 3,080
Domestic Heating
- Firewood 360 360
- Charcoal 84 590
Industry 180 180
Total 6,130
Source: DNRFEe
The figures suggest that aggregate woodfuel consumption amountsto a fuelwood equivflent of ten million solid m3 /y, which corresponds to670 kg (about 1.1 m ) of wood per person per year.
5.11 A consistency check makes the above estimate appear reasonable.Based on a set of general assumptions, 35/ the country's overall woodfuelrcquirements are likely to amount to about 7.5 million tons, as detailed
35/ First, it is assumed that the daily minimum per capita requirementsof cooking are equivalent to 160 kcal delivered to the pot. Second,the gross calorifics are assumed to be: 5,000 kcal/kg at 5Z mcwbfor charcoal, and 3,000 kcal/kg at 25% mcwb for wood. Third, stoveefficiencies are 15% for charcoal and 10% for wood stoves. Fourth,it is assumed that 50% more energy is delivered to the pot thanstrictly necessary (rice boiling rather than simmering, forexample). Fifth, an allowance of 50% on top of the total above ismade for preparation of beverages and for water heating for otherpurposes. Sixth, an allowance is made for non-cooking use offirewood, for example as a source of light or as a focal point forsocial gathering, corresponding to 25% of the energy used forcooking and water heating. Seventh, household use of firewood orcharcoal fcr space heating is assumed. It is assumed that fourmillion persons need such heating for four months per year, three-fourths using firewood and one-fourth using charcoal. Each personis supposed to nced 1 kg of wood or 0.7 kg of charcoal per day.Eighth, an allowance is made for non-household uses of firewood inrestaurants, small-scale industry, lime factories, schools,hospitals, and so on, amounting to 10% of the energy value of allhousehold use of firewood and charcoal in urban areas and 5% inrural areas.

- 106 -
in Table 5.4. 36/ These figures are roughly in line with findings of theDNRFE survey. While the survey recorded a total annual consumption of2.46 million tons of firewood plus 0.52 million tons of charcoal (with aroundwood equivalent of 3.64 million tons), Table 5.4 suggests thatwoodfuel consumption amounts to 2.63 million tons of firewood and 0.69million tons of charcoal (with a roundwood equivalent of 4.83 milliontons).
Table 5.4: HYPOTHETICAL ANNUAL WOOD FUEL DEMAND
Annual WoodPopulation Fuel Needed Equivalents(millions) (million tons) (million tons)
Cooking
- Firewood 4.3 1.55 1.55- Charcoal 3.1 0,61 4.27
Light and Social 7.4 a/ 0.54 0,54
Heating- Firewood 3.0 0.36 0.36- Charcoal 1.0 0.084 0.59
Sum for Households 7.4 - 6.38
Industrial Use(Firewood) - 0.18 0.18
Total - 7.49
a/ Firewood with energy value corresponding to a quarter of the total fuelused for cooking (1 kg of fIrewood per day by 365 days by 4.3 millionpersons plus 0.36 kg of charcoal by 365 days by 3.1 million persons).
Source: Mission estimates and calculations.
Wood Production
5.12 No national forest inventory has ever been carried out inAngola. Depending on how the term "forest" is interpreted, the countrymay possess between 50 and 75 million hectares of forests, or 40% to 60%of its land surface. Recently, however, two new estimates of forest areaand wood yields in Angola have been made. One was carried out by the
36/ Not all of this amount is burned in the form of wood. At least someof the agricultural residues, such as corn stalks and cobs, end upin the domestic fire. In overall terms, however, the amount is notlikely to be large, as wood and charcoal are uniformly claimed to bethe dominant household fuels.

- 107 -
consulting company E.T.C. as part of a survey of fuelwood resources inall Southern African Development Coordination Conference (SADCC)countries, while the other was part of the preparatory work for the FirstNational Seminar on Firewood and Charcoal, held in June 1987 in Luanda.
5.13 Remote Sensing Estimate. The E.T.C. study is based onsatellite images of all SADCC countries taken between 1984 and 1986.Ground truthing was undertaken in most of the 26 vegetation classesdistinguished. However, none of these checks were made in Angola. Theresults of the study for Angola are summarized in Table 5.5.
Table 5.5: MAIN FOREST FORMATIONS
Standing Mean Annual Total
Woody Increment Annual
Area Biomass (tons per Increment
Vegetation (million per hectare hectare (million
Class hectares) (tons) per year) tons)
1. Transitional
Rain Rorest/
Miombo Woodlands 16.0 200 6 96
2. Dense High
and Medium-High
Miombo Woodlands 33,2 71 2.2 73
3. Seasonal Miombo
Woodlands and
Wooded Sav nnas 30.7 20 0.5 15
4. Dry Deciduous
Savannas 23.0 17 0.5 12
5. Other Open Forest
& Bush Formations 15.8 13 0.4 7.2
TOTAL 118,7 - - 203
AVERAGE - 57 1.7
Source: E.T.C., but standing mass of Vegetation Class I has been reduced from
440 m /ha to the more plausible 200 m3/ha by the mission, and M.A.I.
reduced from 17 T/Ha to 6 T/Ha (or from 3.8% to 3% of standing mass).
Production Estimate by DNRFE
5.14 During the first half of 1987, DNRFE also made an estimate ofproduction potential for fuelwood throughout the country. DNRFE basedits work on an ecological classification scheme elaborated by GRANDVAUX

- 108 -
BARBOSA in 1970, where the natural vegetation of the country is brokendown into 32 groups. DNRFE obtained updated figures for 21 vegetationgroups relevant for the production of fuelwood in the country. Table 5.6provides an overview of the main results. 37/
Table 5.6: SELECTED VEGETATION GROUPS AND THEIR FUELWOOD PRODUCTION POTENTIAL
Natural TotalVegetation Fuelwood WoodType Number Area Production "Human ProductionAccording Vegetation (million Potential Influence Potentialto Barbosa Group hectares) (m /ha/year) Factor" (million m3 ) Tons a/
2-4 1. Humid Forests 2.6 2.0 0.58 3.0 1.9
7-10 2. Mixed MoistForests 13.4 0.46 0.70 4.3 2.8
11-14 3. Mixed DryForests 10.1 0.31 0.75 2.3 1.5
16-19 4. MiomboFormations 44.0 0.45 0.70 13,9 9.0
20-22 5. Bushland 10.2 0.19 0.78 1.5 0.9
23-24 6. WoodedGrasslands 14.0 0.20 0.81 2.3 1.5
25-26 7. Mixed Savanna/Open Grasslands 16.5 0.10 0.86 1.4 0.9
27 8. Steppe 3,5 0.05 0.75 0.1 -
Total 114.3 - - 28.8 18.4
Average 0.34 0.75
a/ Conversion factor 0.65.
Source: DNRFE.
37/ DNRFE proceeded as follows: (a) determined the area of eachvegetation group in each province; (b) deternined the share ofeach vegetation group in each province where the natural produc-tion potential has been destroyed through human influence; and(c) estimated the fuelwood production capacity of the remainderof the various vegetation groups in the various provinces.

- 109 -
Production Versus Consumption
5.15 Both E.T.C. and DNRFE compiled production/consumption balancesfor woodfuels in Angola. As some of the data--particularly on theproduction potential of the Angolan forests--are widely diverging, itappears that the conclusions of the two studies are quite different.Table 5.7 compares the different findings by region.
Table 5.7: PROVINCIAL FUELWOOD PRODUCTiON POTENTIAL
Estimated FuelwoodFuelwood production Production
Estimated 1980 Potential pe capTta/yearPopulation ('OOOs tons) (tons)
Province ('OOs) ETC DNRFE ETC DNRFE
Luanda & Bengo 1,200 650 380 0.49 0.32Benguela 590 1,400 450 2.9 0.76Wi6 780 14,600 1,000 19 1.3Cabinda 100 560 390 6.0 3.9Cuene 130 8,800 590 68 4.5Huambo ',100 5,500 530 5.0 0.48Huila 740 8,100 1,290 11 1.7Kuando-Kubango 140 21,000 1,890 150 14Kwanza Norte 390 1,200 670 3.2 1.7Kwanza Sul 590 5,300 830 9.2 1.4Lunda Norte 150 54,700 2,190 364 15Lunda Sul 220 7,600 1,510 35 6.9Malanje 690 23,200 1,440 34 2.1Moxico 230 20,000 2,880 87 12Namibe 60 1,200 180 21 3.0Uige 490 27,300 1,680 56 3.4Zaire 50 1,600 480 32 9.6
Total 7,650 202,700 18,380Averdge 36 2.4
Source: E.T.C., DNRFE, and Mission computations.
5.16 According to DNRFE, three provinces (Luanda/Bengo, Benguela, andHuambo) show production capacities below one ton of fuelwood per capita,while five (Bie, Huila, Kwanza Norte, Kwanza Sul, and Malanje) havepotentials between 1 and 3 tons per capita. The first group ofprovinces, where around 3 million people live, is clearly unable tosupply its own population with firewood from within its own borders. Theother group of provinces, where a further 3 million people live, arebarely able to do so. In fact, the estimated deficit from Luanda/Bengo,

- 110 -
amounting to some 200,000 tons, probably further aggravates the situationin nearby areas, particularly in Kwanza Norte. On the other hand, theDNRFE figures suggest that only about one-third of the population ofAngola lives in provinces with ample supplies of fuelwood. Thoseprovinces have a combined surplus of production over consumption of some9 million tons.
5.17 Compared to the DNRFE estimates, the remote sensing data of theE.T.C. study indicate a significantly higher potential for woodfuelproduction, both at the macro and micro level. On average, the E.T.C.figures exceed the DNRFE estimates by a factor of 10. This may grosslyunderestimate the scarcity of woodfuels, but it does not contradict theview that the urban concentrations in the coastal area, compared withother regions, are poorly endowed with woodfuel resoures.
5.18 The wide gap between the two estimates may in part be attributableto the fact that they measure different things. The E.T.C. study draws apicture of Angola's overall potential for woodfuel production, regardlessof whether the resource base grows close to where people live or whetherthe wood is obtained in small sizes, useful for rural people with simpletools, or as large tree trunks, practically useless as a raw material fordomestic fuel. Thus, while it is probably correct to conclude that theaggregate sustained yield in Angola is in excess of 100 million tons peryear, the annual yield accessible to and directly useful to thepopulation of the country is certainly much lower, maybe in the vicinityof 20 million tons or somewhat higher.
5.19 Neither study, however, succeeds in convincingly describing thesituation of the people concerned; nor do they provide a statisticallyaccurate overall picture of the country's biomass reserves. What isundisputed is that from a global point of view Angola is not runningshort of biomass stocks. Both studies also indicete where the problemareas in domestic woodfuel supplies lie. The situation is crucial fortwo kinds of population concentrations: all urban concentrations on theseaboard, particularly Luanda and Benguela/Lobito, and the major urbanconcentrations inland, particularly Huambo. It is obvious that anyattempt to solve the woodfuel problem in any of these areas will have toinvolve areas far beyond the urban concentrations, often even reachingbeyond the home province.
Institutional Issues: Administration of the Forestry Sector
5.20 The institutions dealing with forestry and woodfuels in Angola arevery weak, particularly at the field level. The DNACO (NationalDirectorate for the Conservation of Nature) within the Ministry ofAgriculture has only one professional Angolan forester. In addition,there are a number of expatriates, mostly Cubans, working mainly inindustrial forest operations in Cabinda. One expatriate forester is,however, working in DNACO. In the provinces where woodfuels are thedominant forest products, DNACO is typically represented by a mid-level

- 111 -
forest technician who has received his training, mainly in silviculture,in Cuba. As a direct consequence of its lack of funds, DNACO has verylittle influence over forest operations in Angola. It issues cuttinglicenses for both forest industries and charcoal makers but is unable toverify whether actual cutting is carried out according to the licenses.It is, of course, even less able to carry out field operations, such asreforestation.
5.21 The other institution is the DNRFE of the MEP. This Department,created in 1981, has a small but growing staff of qualified people,although none with training in forestry. DNRFE is not represented at theprovincial level.
5.22 DNRFE pursues various objectives such as research and transfer oftechnology in new, renewable, and non-conventional forms of energy.Although it does not have any staff trained in forestry, DNRFE hasconducted, so far, the only credible study of the use of woodfuels inhouseholds. The reorganization of the MEP calls for the transformationof DNRFE into a separate "institute" whose goals would be principallyresearch and experimentation. The splitting-off of DNRFE from the MEPwould leave it without any capability either in research or policy-makingin woodfuels/biomass and household energy. It has taken years for DNRFEto put together a nucleus of qualified staff, which is exceedingly scarcein AngoLa. The MEP must have some capability and, if qualified staff arenot readily available, then the removal of DNRFE from the MEP should bedelayed until at least some qualified persons can be attached to MEPproper. A unit or division for woodfuels/biomass for household ene-rgyshould be located within the reorganized Technical Department (CabineteTecnico).
Marketing and Pricing
5.23 In Angola, marketing and pricing mechanisms operate in a distortedeconomic environment. Official rules for production and marketing offirewood and charcoal, which exist mostly on paper, are seldom applied inpractice. Prices paid by consumers often exceed the officially setlevels by a factor of 10 to 50. 38/ Thus, while official retail pricesfor firewood and charcoal are Kz 1.2/kg and Kz 7.5/kg, respectively,effective retail prices are between Kz 5/kg and Kz 300/kg for firewoodand between Kz 13/kg and Kz 600/kg for charcoal according to the recentsurvey undertaken by DNRFE (Table 5.8).
38/ No one knows why official prices for woodfuel are set at all. Theyare not readily available; they are obviously not meant to beenforced; and except in Namibe, which is in a special situation,they are meaningless.

- 112 -
Table 5.8: PRICES PAID FOR FIREWOOD AND CHARCOAL IN SEVEN PROVINCES, 1987
(Kz/kg)
Firewood Charcoal
Province Urban Periburban Rural Urban Periburban Rural
Luanda 105 235 265 'fo 280
Bengo - 60 - 130 85 165
Cabinda 40 40 - 200 320 -
Huambo 40 60 55 65 310 55
Huila 50 15 - 30 75 40
Namibe 20 15 - 35 35 35
Uige - 80 - 165 160 75
Country 30 40 120 145 220 80
(Official price) (1.2) (1.2) (1.2) (7.5) (7.5) (7.5)
Source: DNRFE.
5.24 The picture on woodfuel prices provided by DNRFE constitutes a vastimprovement over the previous state of affairs, when there was virtuallyno reliable data on prices at the consumer level. The mission has alsoconducted a small survey of charcoal and firewood prices in eacE of threemarkets in or near Luanda. Retail charcoal prices were about Kz 500/kgin all three markets, i.e., somewhat higher than found by DNRFE.Firewood was sold at Kz 150/kg in the market on the outskirts of Luandaand at Kz 50/kg at the village of Cacuaco near Luanda. This resultcontradicts the findings of the DNRFE study (which may have been inerror) where the price of firewood in the rural areas of Luanda provincewas found to be much higher than in the periurban areas.
5.25 The system suppling charcoal and firewood to Luanda is not wellknown. In theory, in order to engage in the woodfuel business, personsor organizations have to apply to DNACO for a cutting license. Inreality, these licenses often function as a clearance to transportfirewood and charcoal through the checkpoints on the outskirts of Luandaand other cities and towns. This is indicated by the fact that thevolume of woodfuel cuttings covered by official licenses amounts to nomore than 150,000 mn , while total cuttings are in the general order of10 million cubic meters.
5.26 Not all the difference between the total cuttings and thoselicensed are illegal, however, since fuelwood cutting and charcoalproduction for home consumption are permitted without license. There isevidence that a significant proportion of the charcoal traded in Luandapasses the checkpoints under the guise of "home consumption". Small-scale traders shuttle between central Luanda and Viana (the woodfuels

- 113 -
terminal, outside the Luanda checkpoints) bringing only two sacks ofcharcoal per person per trip. They pass the checkpoints claiming thatthe charcoal they are carrying is for their own home consumption.
5.27 Based on data gathered by DNFRE, the costs of various fuels as asource of cooking heat can be approximated as shown in Table 5.9.
Table 5.9: COMPARATIVE COOKING COSTS OF FOUR HOUSEHOLD FUELS a/
Estimated Effective CostPrice Heat Value End-Use of Useful Heat
Fuel Kz/kg kcal/kg Efficiency Kz/1000 kcal
Firewood 45 3,500 10% 130Charcoal 180 5,000 15% 240LPG 60 11,000 55% 10Kerosene 135 9,000 40% 38
a/ Fuel prices are calculated as means.
Source: DNRFE and mission calculations.
5.28 On average the price structure of cooking fuels is strongly biasedin favour of those households which have access to LPG or kerosene, i.e.,mainly relatively well-ofZ families living in urban centers. Thus,policy measures designed to raise the relative price of LPG and kerosenewill mainly affect those households which, under the present conditions,are well-off. Charcoal, on the other hand, turns out to be the mostexpensive urban household fuel. Clearly, the terms of trade betweencommercial fuels (LPG, kerosene) and woodfuels are hardly in line withtheir relative scarcities. Rather, they reflect the fact that the fuelsare currently supplied to two different markets (official and parallel)where the purchasing power of the Kwanza varies considerably.
Organizations of Woodfuel Suppliers
5.29 In most cases, owners of means of transport occupy a keyposition as regards exploitation of wood, its conversion to firewood andcharcoal, and transportation to urban areas. Truck owners engagelaborers for cutting wood and producing charcoal. In certain areas ofthe country, however, for example in the province of Namibe, locallaborers formed cooperatives which apply for cutting licenses, produ'cefirewood and charcoal and transport it to the consumption centers. Asthe cooperative is formed among local inhabitants licensed to use aspecific area, its members are more likely to have an interest in the

- 1.4 -
sustained production of wood. They might, thus, respect certainrestrictions such as minimum diameters for cutting, prohibition tocultivate exploited areas, obligations to carry out reforestation, etc.A limited iumber of cooperatives, each working within a set geographicalarea, is also fairly easy to supervise. To improve the supply ofwoodfuels, cooperatives might be an option where security conditions makethem feasible and where the problems (as in Namibe) are not excessivelyserious. Elsewhere, private truck owners using hired labor would have tocontinue supplying the bulk of woodfuel needs. While it is not possibleto do so at present, these private entrepreneurs would eventually have tobe supervised more stringently to ensure that minimal rules are followedto permit forest regeneration and, thus, sustained wood production.
Issues and Recommendations
5.30 In comparison with most other countries in Sub-Saharan Africa,the wood resources of Angola are large, particularly in relation to itspopulation. Thus, for a significant percentage of the inhabitants ofAngola, there is no serious fuelwood problem. Most of the forests ofAngola are exploited for fuelwood far below their rates of growth.However, all urban concentrations on the seaboard and the major inlandcities constitute pockets of wood shortage.
5.31 Although reliable statistics are not available, it is estimatedthat 3 million people live in the comparatively dry coastal areas withscarce supplies of woodfuels. While some scattered fishing and farmingcommunities can obtain the woodfuel they need from the local bushland,most concentrations of people have to obtain woodfuels from considerabledistances. Inland, mainly in the township of Huambo and other provincialcapitals, about one million persons are experiencing a shortage offuelwood. Thus, a total of some four million people in Angola, i.e.,almost half the population, live in areas with a more or less pronouncedshortage of woodfuels. Unless serious action is taken, the problem willprobably continue to grow as people migrate toward the coast and towardtowns and cities.
5.32 The characteristics of supply and demand for woodfuels arequite different on the seaboard than inland. First, the natural con-ditions for tree growth are less favorable in the dry coastal areas thanin the moister inland areas. This means that there is less woodavailable per unit area, both at present and as a result of possiblereforestation activities. Second, the access to alternative sources ofhousehold energy, mainly LPG and kerosene, is much easier on the seaboardthan inland.
5.33 In the short run, security problems severely restrict themovement of fuelwood from wood-rich to wood-poor areas of the country.When the security situation improves, the institutional weaknesses of the

- 115 -
forestry sector are likely to become the main bottlenecks to rapidimprovement. Consequently, the discussion of possible activities aimingat an improvement will have to be made in two parts: actions that can becarried out under the present security situation and those that requiremarked improvements in the security situation. They are labelled "Peace"and "No Peace". The priorities for action are summarized in Table 5.10.
Table 5.10: PRIORITY LISTING OF ACTIVITIES
Increased ImprovedFuel Efficiency Supply Wood
Substitution of Stoves System Froduction
No Peace Coast I 11 III IV
Inland IV I 11 III
Peace Coast It l1 I IV
Inland IV III 11 I
Note: Although not shown as a distinct activity, institutionalstrengthening and technical assistance would become muchmore urgent and important with the return of peace.
Actions That Can Be Undertaken
Under the Present "No Peace" Situation
5.34 As the problem is different on the coast versus inland, the twoareas will be treated separately. Only activitie3 explicitly directed atthe problem areas, i.e., the urban concentrations on the coastal stripand the major urban concentrations inland, will be discussed. This doesnot imply that all is well for the estimated four to five million peopleliving in the countryside but only that major woodfuel problems lieelsewhere. Also, information on the overall rural energy situation isunavailable. A major survey would be needed to obtain such information.
The Coast: "No Peace"
5.35 A number of alternative actions to improve the situation can beenvisaged. They would comprise the following:
- Increased use of fuels other than firewood and charcoal(substitution).
- More efficient use of firewood and charcoal.

- 116 -
- Improvements in the present supply system.
- Establishment of forest plantations.
(a) Increased Use of Fuels Other than Firewood and Charcoal. Inthe coastal cities and towns, the use of LPG as a cooking fuelis already fairly widespread. For the population, this fuelrepresei.!.s a very attractive option. Its average cost,according to DNRFE, is only about Kz 60/kg, (although theofficial selling price to the public is Kz 15/kg), i.e., muchless per useful energy unit than both firewood and charcoal,which sell at average prices of Kz 45/kg and Kz 180/kgrespectively. LPG could become an even more importanthousehold fuel in the coastal areas, 39/ even if it were toincrease considerably in price. The main problems are likelyto be supply shortages of gas bottles and stoves, and,possibly, cash-flow difficulties for the initial purchase ofbottles among poor families.
The low cost of kerosene parallels that of LPG. It is,however, much less widespread as a cooking fuel and has a lessdeveloped distribution network. On the other hand, it posesfewer technical problems in distribution. Perhaps the mostimportant role of kerosene would be as a source of light inrural dwellings. The economics of kerosene versus LPC in urbanhousehold energy have not been studied,
(b) More Efficient Use of Firewood and Charcoal. At present,firewood is almost universally burned in three-stone hearthswhose thermal efficiency is quite low, probably about 10%.Charcoal is generally burned in simple square metallic stoveswith efficiencies around 15%. There is obvious scope forimprovements in stove design for both firewood and charcoal.There are also local varieties of improved stoves which couldbe used as demonstrations or starting points for more efficientdesigns.
(c) Improvements in the Present Supply System. The present supplysystem is not well known as it is organized informally, withthe owners of means of transport having a key position asholders of cutting licenses. In Namibe, where the securitysituation is much better than average, the charcoal producershave formed cooperatives which, in turn, have obtained cuttinglicenses and also organized the transport of the charcoal tothe consumption centers. Where possible, woodfuel cooperativesare recommended. A limited number of charcoal cooperativesconstitute a more easily managed group than a much larger
39/ About 30,000 tons of LPG are currently being consumed, mostly inLuanda and other coastal cities.
- 117 -
number of truck owners, charcoal producing farmers, andunorganized laborers. The cooperatives could get various kindsof support (tools, etc.) as compensation for the obligation tofollow certain conservation rules in their operations. Thoserules would primarily consist of forestry and cuttingmanagement principles to be followed in forest operations toensure sustained wood production.
(d) Establishment of Forest Plantations. The establishment offorest plantations is an awkward proposition for the coastalareas of Angola. If they were to be established close to theconsumers, in the arid coastal areas, their establishment wouldbe technically difficult and expensive. Further, tree growthwould be slow, resulting in long rotations and low yield, againcausing higher costs. If the plantations were to beestablished in the moister inland areas, long transportdistances might outweigh the more advantageous growthconditions. Further, the general security situation would makethe establishment and management of forest plantationsdifficult and costly, and the same applies to transport of theoutput of the plantations. Finally, in those areas whereforest plantations could be expected to yield well, there areoften natural forests available, which can be exploited. Byexploiting the natural forests, the initial investment and thedelay of five to ten years before harvesting can be avoided.
Inland Areas: "No Peace"
5.36 Inland, where about one million persons live in wood-shortareas, replacing wood and charcoal by other fuels, mainly LPG, is muchless attractive. Instead, the following options (in order of priority)would seem more appropriate:
- More efficient use of firewood and charcoal.
- Improvement in the present supply system.
- Improved use of existing forest plantations or establishment ofnew ones.
- Improved supplies of modern fuels (kerosene, LPG).
(a) More Efficient Use of Firewood and Charcoal. In the inlandcities (Huambo and other provincial capitals) three-stonehearths for wood and simple metal stoves for charcoal are ingeneral use. As in the coastal areas, there is scope forimprovement.

- 118 -
(b) Improvement in the Present Supply System. The averagetransport distance for woodfuels from existing forests--naturalor planted--to the consumers is much shorter inland than on thecoast. Although it seems that the present supply systemsfunction better inland than on the coast, there is scope forimprovement, particularly in order to safeguard the long-runproductivity of the wood sources. This would require theestablishment of rules guiding the exploitation of the forestareas and a system for supervision and control of thelicensees.
(c) Improved Management of Existing Forest Plantations orEstablishment of New Ones. At present, existing forestplantations, for example in the province of Huambo, are notused in any systematic manner for the supply of woodfuels tourban centers. Furthermore, present practices (cutting,burning of stumps, cultivation of cleared areas) prevent theregeneration of the harvested areas. A program for controllingcutting methods in nearby plantations should be developed. Oflower priority is whether any additional plantations arerequired. Inland, the growth conditions for forest plantationsare generally good. Security and the difficulties ofmobilizing sufficient funds for such plantations are likely tobe serious problems.
Alternative Priorities in a "Peace" Situation
5.37 In a situation of peace, the order of priority of the variousactions would change somewhat, so that field activities, particularlyforestry management and plantations, would ascend in priority when thecountryside becomes secureo Such increased field activities would, inturn, require a strengthening of the institutions concerned.Institutional strengthening is not the highest priority (although gaps inthe institutional structure need to be filled even under the currentsecurity situation) but with the return of peace, institutionalstrengthening would become a high priority.
Proposed Actions
5.38 Various solutions for the problem areas on the coast and aroundthe urban centers inland were discussed in the previous section. In thissection, four groups of activities for the major problem areas will beproposed. The first is a pilot project to be executed in Huila-Namibe.The second and third ones are activities for Luanda and Benguela/Lobito,respectively, while the fourth one concerns the township of Huambo. Inaddition, three national-level activities are proposed to support thesefour regional projects: improved stoves, agroforestry, and institutionalstrengthening.

- 119 -
Pilot Project in Huila-Namibe
5.39 In the provinces of Huila and Namibe, the military situation ismuch better than elsewhere in Angola, with most of the two provincessafe. Also, the economy in these provinces seems to be functioningbetter than elsewhere. Additionally, the provinces do not have largepopulation concentrations in areas far from the forests. It is true thatthe coastal towns of Namibe and Tombwa have virtually no wood resourcesin their neighborhood, but the fact that the towns are fairly small makesthe problem more easily managed than in the cases of Luanda andBenguela/Lobito. Taken together, these facts point to the possibility ofdeveloping a pilot project in energy forestry in these two provinces.
Coast
(Mainly Namibe Township and its Neighborhood)
- Priority I: Fuel subsitution.
- Priority II: Increased efficiency of stoves.
- Priority III: Improved supply system.
Inland
(Mainly Lubango Town and its Surroundings)
- Priority I: Increased efficiency of stoves.
- Priority II: Improved supply system.
- Priority III: Wood production/forestry management.
5.40 Luanda. The city of Luanda and its surroundings constitute thesingle largest consumption center for household fuels. The use of LPG,kerosene, and electricity in households is more widespread than elsewherebut woodfuels, mainly charcoal, are still used by almost half thepopulation. Wood and charcoal are bought in the parallel market, atabout Kz 140/kg for firewood and Kz 320/kg for charcoal. In comparison,the average price for LPG in Luanda is about Kz 100/kg. In terms ofuseful heat delivered to the pot, the cost of wood and charcoal is about15 times higher than LPG (Kz 400, 400, and 27 per 1,000 kcal,respectively). A logical first priority is thus to spread the use of LPGamong the urban and periurban population of Luanda. At the same time,however, improved stoves for firewood and charcoal should be madeavailable to the large share of the urban and periurban population thatwill continue to use wood or charcoal for many years.

- 120 -
5.41 The supply system for woodfuels is not well known, or at leastnot well documented. Many of the present operations are carried out byindividuals operating informally outside the legal framework. Therefore,mapping of the supply system is not likely to be an easy task. Improvedknowledge of that system seems, however, to be a necessary condition forany action aimed at its improvement. A survey of the present supplysystem for firewood and charcoal to Luanda is, thus, the first step inthe design of an improved system for supply of firewood and charcoal toLuanda.
5.42 Benguela/Lobito. The coastal cities of Benguela and Lobito, inthe province of Benguela, exhibit much of the same characteristics asLuanda. Generally speaking, the solutions in the medium term would alsobe similar, i.e., a gradual change to LPG for household cooking fuel,improved stoves for fuelwood and charcoal, and preparations for animproved system for the supply of firewood and charcoal to the urban andperiurban areas. The geographical/ecological position of Benguela/Lobitois, however, somewhat more favorable than that for Luanda, as areasfavorable for tree growth (i.e., the escarpment) are closer to thepopulation centers. Further, there are plantations, mainly ofeucalyptus, on tha escarpment close to the border with the province ofHuambo. Those plantations were established as the raw material sourcefor the Alto Catumbela pulp and paper mill. As the mill has been closLdfor some time, the forests might be available for an alternative use.The fact that the forests are located fairly close to the railway linebetween Huambo and Benguela should facilitate their use for energy inBenguela and Lobito.
5.43 Huambo Township. With about half a million inhabitants usingfirewood and charcoal, Huambo is the largest inland fuelwood shortagearea. For that area, the order of priorities is the following:
(a) increased efficiency of stoves;
(b) improved supply system;
(c) wood production (or better forestry/plantation management); and
(d) fuel substitution.
A project for the development and dissemination of improved wood andcharcoal stoves for Huambo would have much in common with thecorresponding projects in Luanda and Benguela/Lobito. The same isbasically true for the improvement of the supply system, even if thenatural conditions for tree growth are much more favorable in Huambo. Infact, the province of Huambo already has extensive plantations ofeucalyptus, mainly along the Benguela railway line, established toprovide firewood to the steam engines. Most of the locomotives now runon diesel oil instead of wood, which means that the forests should beavailable for other uses. Some of the forests may have been damaged ordestroyed due to excessive cutting or clearing for agriculture, but mostare likely to have remained productive. In the short term, the lack of
- 121 -
security in the forest areas may be the more serious limitation to theirincreased use as woodfuel sources.
5.44 In seeking to improve the supply of woodfuels for Huambotownship, an inventory should be made of the existing raw materialsources, whether natural or man-made. Second, a management system shouldbe developed for the forests. Further, it might be advantageous toestablish cooperatives among the producers of firewood and charcoal. Itis also necessary to consider whether longer-term needs can be met fromexisting forests or would require additional plantations.
Proposed Supportive Action at the National Level
5.45 There are three activities of value for all the provincialprojects which would be carried out most advantageously at the nationallevel or at least with strong support from an institution at the nationallevel. First, improved cooking stoves for firewood and charcoal need tobe designed and introduced. Second, suitable forms of tree cultivationin conjunction with agriculture (agroforestry) should be developed.Third, there is a need to strengthen the forestry institutions in Angolato help define and enforce policies, to support the provincial projects,and to prepare for more activities when the security situation improves.
5.46 Improved Cooking Stoves. In its preparations for the Seminaron Firewood and Charcoal in Luanda in June 1987, DNRFE made a survey ofbiomass cooking stoves in the seven provinces surveyed. This is theappropriate, albeit modest, beginning of a national program for thedesign, production, and dissemination of improved cooking stoves inAngola--which are a priority in Luanda, Benguela/Lobito and Huambo. Itseems practical that much of the development work should be carried outat the national level or at least with strong technical support from thatlevel. It is, further, advantageous that field trials for improvedstoves should initially be concentrated in Luanda, where a large numberof people use inefficient stoves for woodfuels bought at quite highprices. Benguela/Lobito would get second priority in the program andHuambo, third.
5.47 Agroforestry. Planting of trees which (among other things)yield fuelwood can take various forms. At one end of the spectrum thereis the dedicated energy plantation, where densely planted trees form aforest which is managed for the main purpose of producing fuelwood. Atthe other end of the spectrum, there are trees planted for otherpurposes, such as to provide shade, shelter against wind, or to producefruit, fodder or other non-wood products. While international assistancein energy forestry during the 1970s focused on "village woodlots" andother forms of collective creation of fuelwood forests, attention hasshifted towards other forms of tree cultivation during the presentdecade. There are several reasons for this shift. First are thetechnical and economic problems associated with village woodlot schemes

- 122 -
and other forms of collective or centrally organized fuelwoodplantations, such as peri-urban plantations. Another is the realizationthat the planting of trees for the production of fuelwood alone does notrank high in the list of priority for most rural inhabitants.
5.48 In Angola at present, both the village woodlot and the peri-urban fuelwood plantation are concepts likely to face severe implementa-tion problems. They would face the same technical and economic problemsencountered elsewhere but with much less favorable technical and economicconditions. Further, the extreme scarcity of trained people for projectplanning and management, together with the poor security situation, wouldmake fuelwood plantations a risky venture. Instead, the agroforestryapproach would stimulate other forms of tree cultivation, where farmersplant trees for a variety of purposes, with fuelwood as a by-product.Such plantations can take the form of windbreaks, a small grove toprovide shade or shelter, fruit orchards, single trees in agriculturalfields, contour plantations (or soil conservation and erosion control),possibly for fodder, and so on. In many of those cases, the treessupplement rather than compete with agriculture and animal husbandry,thereby eliminating one difficulty and reducing the opportunity cost ofland, so that economic criteria are more easily satisfied.
5.49 The forms of tree planting referred to above are oftencollectively called "agroforestry". Such tree planting, for food,fodder, shelter, etc., would obviously be only a minor source of woodfuelfor the major urban areas, but could become an important woodfuel sourcefor rural people. An important advantage of such tree planting in Angolais that it does not need centralized project management but can beintegrated into other agricultural activities. Thus, the weakness of theforestry administration in Angola is less of an obstacle for agroforestrythan for the traditional forms of forestry.
5.50 In the present security situation in Angola, activities in thefield of agroforestry might have to be limited to training combined withfield trials. Among the activities proposed above, all but one areurban-oriented. The exception, the pilot project for Huila/Namibe, wouldthus provide a focal point for agroforestry centered on the agriculturalschool of Tchivinguiro, 35 km from Lubango.
Strengthening of Institutions
5.51 In Angola, the institutions in the forestry sector, i.e., theDNACO and the DNRFE, are weak. The selection of activities proposed inthis chapter has been made against this background. Nevertheless, theseactivities would be very much easier to carry out if the institutionsconcerned were strengthened. The minimal needs are for some capabilityin the MEP (currently provided by DNRFE), a strengthening of DNACO in theprovinces where projects are proposed, some technical assistance at thecentral level for DNACO, and some funds for very limited studies, such asa forest inventory around Huambo, and a study of woodfuels marketingsystems in Luanda, Benguela/Lobito and Lubango.

- 123 -
Annex 1Page 1 of 6
KACROECOOKIIC INDICATORS
Table 1; INDICATORS FOR GDP AND GNP
1977 1978 1979 1980 1981 1982 1983 1984 1985 1986
GDP at factor cost n.a n.a n.a n.a n.a 3,922 4,307 4,811 4,174
(in million USS)
- of which petroleum n.a n.a n.a n.a n.a n.a 1,098 !,383 1,487 1,131
GDP at market prices
(In million current US$) 2,445 2,750 3,323 3,617 3,933 3,647 4,212 4,719 4,831 4,409
Deflator (1980=100) a/ 78.2 85,2 91.3 100 92.6 84.8 77.8 71.5 65.6 60.3
GDP at 1980 prices a/(In million USS) 3,127 3,228 3,640 3,617 3,642 3,091 3,278 3,37S 3 70 2,658
GNP at current prices b/
(In million USS) n.a n.a n,a n,a n,a 3,529 3,725 4,153 4.'99 3,863
GNP at 1980 prices a/ n.a n.a n.a n.a n.a 2,991 2,899 2,969 2.755 2,329
Exchange rate: US$1= 30 Kz.
a/ Estimate for 1983-86.
b/ Estimates based on balance of payments statistics.
Source: Ministry of Planning, the National Bank of Angola (BNA), and mission estimates.

- 124 -
Annex 1Page 2 of 6
Table 2: GOVERNT BUDGET(In million Kz)
1978 1979 1980 1981 1982 1983 1984 1985 1986
Total revenues 38,866 37,155 60,143 73,708 50,656 55,589 74,556 78,528 71,205
Pet Iu(e ) n.a. n.a. 56.4 61,3 41.5 48.0 56,7 53,1 29.7
Tax Revenues n.a. n.a. 51,556 63,340 41,573 47,136 62,193 66,646 51,945
- of which petroleum n.a. n.a. 33,917 45,185 21,046 26,672 42,267 41,667 21,132
Non-tax revenues n.a. n.a, 8,587 10,368 9,083 8,453 11,643 11,882 19,263
Total Expenditures 41,331 57,540 76,920 91,640 72,133 74,427 86,360 97,987 84,207
- of which Defense 10,270 15,100 16,821 18,505 18,257 23,295 31,943 34,306 32,630
Deficit 2,465 20.385 16,777 17,932 21,477 18,838 11,804 19,459 13,002
Other areas 5,253 5,712 13,100 13,100 2,000 2,379 2,857 4,063 4,831
Deficit 2,465 20,385 27,000 17,900 21,500 11-990 7,746 11,960 15,000
Source: Ministry of Finance.

- 125 -
Annex IPage 3 of 6
Table 3: BALANCE OF PAYrENTS(In million Kz)
1978 1979 1980 1983 1982 1983 1984 1985 1986
Exports a/ 29,940 35,460 48,699 38,126 44,705 47,493 58,800 59,280 38,350- of which petroleum 16,507 26,745 41,730 40,350 b/ 37,029 45,768 52,455 56,868 34,485
imports 26,640 38,840 44,503 45,417 (33,684) (29,708) (37,950) (41,527) (31,868)
Balance 3,300 (1,380) 4,196 (7,291) 11,021 17,785 20,8509 17,753 6,482
Invisibles (net) (3,720) (4,350) (5,734) (12,683) (19,007) (19,792) (23,613) (26,494) (22,009)of which:- Factor services (not) n.a n.o n.a n.a (13,050) (14,520) (16,950) (18,960) (16,410)
Unrequted transfers 90 300 508 1,505 794 986 1,047 1,657 2,108
Current account (330) (5,430) (1,030) (18,469) (7,192) (1,021) (1,716) (7,084) (13,419)
Medium- + long-term capital 1,950 1,950 7,016 7,110 3,026 1,628 6,103 5,335 1,567
Basic balance 1,620 (3,480) 5,986 (11,359) (4,166) 607 4,387 (1,749) (11,852)
Short-term capital,
errors and omissions 1,080 3,930 (8,096) 5,566 3,901 (466) (2,557) 2,709 11,103
Overall balance 2,700 450 2,110 (5,793) (265) 141 1,830 960 (749)
a/ Between 1978 and 1981 taxes on oil exports paid by foreign oil companies are included in service income.
b/ Figures were obtained from MEP Independent of total export figures (BNA).
Source: National Bank of Angola (BNA).

- 126 -
Annex 1Page 4 of 6
Table 4: DISBURSED PUBLIC EXTERNAL DEST(In million Kz)
1978 1979 1980 1981 1982 1983 1984 1985 1986
Short-term n.a n.a n.o nfa 8,138 7,551 4,888 7,525 18,434
Mkdium- Long-term 11,340 11,430 18,420 59,490 62,259 63,193 68,482 73,482 73,695
TOTAL n.o n.a n.o n.o 70,397 70,744 73,370 81,007 92,129
Total as % of GNP n.a n.u n.o n.a 73.1 63.3 58.8 64,3 79.5
Total as % of exportsof goods and services n.a. n.o n.o n.a 144.7 142.1 118.7 128.3 223.9
Source: The National Bank of Angola (BNA) and own calculations.

- 127 -
Annex 1Page 5 of 6
Table 5: GOVERNMENT PROJECTIONS FOR KEY ECONOMIC FIGURES(in million US$)
Actual Projected -----------1986 1987 1988 1989 1990
Revenues from oil exports 1,150 1,653 1,841 2,018 2,137
Average price of oil 12 16 16 17 18(In USS/bbl)
Trade balance 216 602 682 756 777
Current account (448) (238) (181) (142) (135)
External debt 3,024 3,163 3,289 3,335 3,393of which:- Short-term 568 219 257 309 359- Long-term 2,456 2,944 3,032 3,046 3,034
Potential for gross 1,123 659 1,320 1,562 1,692domestic investment
Source: The National Bank of Angola (BNA).

Table 6: COWPARATIVE ECONOMIC INDICATORS
External Pub- Debt Government Broad Current Snare Share of
GNP per GDP lic Debt as Service Expenditure Money as Account Deficit of '^'roleum Oil Income In
Country Capita Growth a/ S of GNP Ratio as S of G9P % of GDP as S of GDP Sector in GDP Goverment Revenues
(1985 USS) (1980-85) (1985) (1985) (1985) (1985) (1985) (1985) (1985)
Zambia 390 0.1 150.8 10.2 30.3 33.4 4.2 -- --
Zimbabwe 680 2.5 31.3 32.2 39.1 45.2 2.1 -- --
Tanzania 290 0.8 48.5 16.7 24.7 -- -- -- --
Malawi 160 2.0 75.7 -- 29.5 24.3 -- -- --
Lesotho 470 0.5 30.1 6.2 22.7 48.8 3.5 -- --
Botswana 840 12.1 47.3 5.4 48,2 29.5 16.9 -- --
Mozambique 160 -9.6 -- -_ __ 94.8 b/ __ __ _-
Angola 485 -2.3 59.2 22.0 71.8 142.6 4.9 30.0 53.1 OD
Tunisia 1,190 4.1 56.1 24.9 40.4 48.6 7.4 -- --
Congo 1,110 7.8 86.5 19.6 -- 16.2 -- 40.0 66.6
Gabon 3,350 4.5 a/ n.a. -- -- -- -- 45.0 66.0
Nigeria 800 -3.4 17.8 30.8 -- 34.7 1.6 23.0 --
a/ Least square estimates.
b/ 1984 estimate.
c/ 1980-84
Source: World Development Report, 1987 and mission estimates.
o0 Ft

- 129 -
Annex 2Page 1 of 8
INSTITUTIONAL ORGANIZATIONS WITHIN THE ENERGY SECTOR
The Ministry of Energy and Petroleum (MEP) is the principalGovernment body responsible for the development and implementation ofnational policy within the energy sector. In practice, it deals with themajor aspects of the oil, gas, and electricity power industries.
The main responsibilities of the MEP include:
(a) preparing the National Plan for the energy sector;
(b) supervising SONANGOL and the power utilities;
(c) promoting and coordinating training activities within thesector; and
(d) implementing international technical cooperation.
The present Ministry has its origin in the 1984 merging of theMinistry of Energy and the Ministry of Petroleum--both separate entitiescreated in 1976. In 1987 the MEP was re-organized into four units orGabinetes with functional responsibilities over the electricity andpetroleum subsectors. The four Gabinetes are: Planning, Technology,Legal, and Human Resources.
In addition to the Gabinetes, the departments of New andRenewable Energy Sources and of Budget are kept under the MEP's directsupervision, at a lower administrative level.
Within the MEP, the National Department for Transformation isresponsible for coordination with and monitoring of the refineryindustry, and the Department of External Trade monitors external andinternal trade in crude oil and petroleum products. These twodepartments have continued in existence in spite of the reorganization.Their functions will eventually be redistributed to the Gabinetes.
The MEP itself is not involved in the day-to-day management ofthe sector but establishes guidelines to be used by executing agencies inthe implementation of policies.
An organization chart for the MEP is given on page 2.

MINISTRY OF ENERGY AND PETROLEUM (MEP)
Inspector
General |
IMinisteriDeputy Minister Deputy Minister Physical Protectionfor Energy for Petroleum | and State Secrets |
Ottices Pianning Technical and Legal aEnergy Development I
Economic |.|Elecricity | t r tion StudiesStudies A tnalAviv l
|Finance & Petroleum Contracts Labor 0Accounting Resources
Departments investment[ Studies a ProfessionalProject Mgmt Energy Devel. rraining
Commercialization I Inspection|8 Pricing g
Inspection
New and External Budget ProvincialRenewable Trade Managementl I DelegationSources
Source: MEP.
0
OD

- 131 -Annex 2Page 3 of 8
PETROLEUM PRODUCTS
The MEP has specific managerial responsibilities within thepetroleum subsector:
(a) authorizing the opening of blocks for bids;
(b) approving development programs;
(c) authorizing the commencement of production;
(d) regulating field production levels;
(e) sanctioning the flaring of natural gas in special cases;
(f) setting crude oil prices for tax purposes; and
(g) reviewing SONANGOL's investment programs and foreign companies'accounts.
Sociedade Nacional de Combustiveis de Angola (SONANGOL) is theState-owned company established in 1976 as the business arm of theCovernment with the main responsibility of implementing policy for chepetroleum sector. Its structure is based on that of ANGOL, the onlyPortuguese company in Angola with interests in petroleum, which wasnationalized after independence.
SONANGOL is managed by a Director General who reports to theMEP, and three deputy directors responsible for hydrocarbons, distri-bution, and adiainistration and finance. The Deputy Director forHydrocarbons supervises four departments: Exploration, Production andReserves, Administration and Finance 1/, and a fourth department whichhandles air transport services for the oil companies.
The Director General directly supervises a unit responsible fornegotiations.
The main function of SONANGOL is to oversee the petroleumoperations of all foreign companies. It makes recommendations to theGovernment in respect to areas that should be open for exploration,conducts the bidding process, and handles negotiations. SONANGOL reviewsthe foreign companies' proposals, and, once operations begin, discusseswork programs and budgets and supervises activities.
1/ The Deputy Director for Administration and Finance deals withcorporate functions.

- 132 -
Annex 2Page 4 of 8
In addition to exploration and production activities, SONANGOLis responsible for domestic product distribution and marketing. SONANCOLowns and operates a network of storage installations throughout thecountry and maintains a small marine tanker fleet and a sizeable fleet ofroad tankers.
SONANGOL enters into partnerships with qualified foreigncompanies in order to obtain the requisite financial and technicalresources for exploration, development, and production. Thesepartnerships take one of two forms:
(a) Joint Ventures in which both SONANGOL and its partners share ininvestments and receive petroleum produced according to theirpercentage interests. Foreign companies pay taxes and royal-ties on their equity shares of production. SONANGOL pays taxesto the Government and operates under the same foreign exchangeregulations that govern oil companies.
(b) Production Sharing Agreements in which the companies serve ascontractors to SONANGOL, finance the full cost of investment inboth exploration and development, and are compensated with ashare of the oil produced. Companies' investments costs arerecouped from "cost oil", set at a fixed proportion ofproduction (normally 50%) and are then taxed on their "profitoil".
Hydrocarbon deposits declared non-commercial are the propertyof the State and revert to SONANGOL.
SONANGOL has a joint venture arrangement with STINNES, a WestGerman oil trading firm, in which all matters pertaining to the export/-sale and import/procurement of petroleum products for Angola are handled.
As a working partner, SONANGOL finances its share of investmentprograms in both offshore and onshore activities with CHEVRON in Cabinda,FINA in onshore Angola, and TEXACO in Block No.2. It has supervisoryrights over these ventures, but limited day-to-day operational capacity.
In one instance SONANGOL indirectly acts as operator. Emprcsados Servicios Petroliferos de Angola (ESPA) is a mixed-economy enterpriseset up to operate Block No.4. It is owned by: SONANGOL (51%), BRASPETRO(24.5%), and PETROFINA (24.5%). Each company contributes to themanagement and staffing of the operating company.
Fina Petroleos de Angola (FPA) is primarily a privately-ownedcompany within the petroleum industry. Shares are owned: 55.6% byPETROFINA, 11.1% by the public, and 33.3% by the Government. Governmentshares are described as "non-participating", and do not entitle it to anyshare of the profits.

- 133 -
Annex 2Page 5 of 8
FPA owns interests upstream in two blocks. It acts as operatorof the Kwanza and Soyo fields on behalf of its joint venture partners--SONANGOL in Kwanza, SONANGOL and TEXACO in Soyo. FPA owns and operatesthe refinery in Luanda, the principal product supplier to SONANGOL forthe domestic market, and also provides SONANCOL with its export volume.
The refinery is a comparatively high-cost operation byinternational standards. It operates on a "cost plus" refinery gatepricing arrangement. All verified operating costs, depreciation, andallowable profit are recovered and there is no particular incentive forcost minimization and optimization of operations.
ELECTRIC POWER
MEP is responsible for the main operating organizations in theelectric power subsector. These are:
(a) Empresa Nacional de Electricidade (ENE). ENE was created in1980 with the aim of becoming the sole national power utilityin charge of generation, transmission, and medium-voltagedistribution across the country. After independence, ENEreceived the assets of the Junta Provincial de Electrificacaode Angola (JPEA), represented by the Southern System. The mainfacility in the Southern System is the Matala hydro plant onthe Cunene River. The system also includes the upstream Govedam, and an unfinished diesel plant in Namibe. In addition toseveral isolated systems, ENE also currently operates theCentral System. This system is based on two hydro plantslocated on the western part of the Catumbela River at Lomaumand Biopio, and two diesel-fired turbines at Biopio and Huambo;
(b) Sociedade Nacional de Estudo e Financiamento de EmpreendimentosUltramarinos (SONEFE). SONEFE is the utility in charge ofgeneration and transmission in the Northern System, the largestin the country. The system directly supplies about 300industrial consumers at high and medium voltage and operatesusing the potential of the Kwanza and Donde Rivers and twoJet B-fueled gas turbines in Luanda. The plant in Mabubas,also part of the system, has been shut down for rehabilitationand will remain shut down until late 1988. SONEFE has nocentralized department for operations. It is organized intofive departments: Planning and Finance, Studies and Projects,Stocks and Purchases, Human Resources, and AdministrativeServices;
(c) Empresa de Electricidade de Luanda (EDEL). EDEL is the utilityin charge of medium- and low-voltage distribution in the urbanarea of Luanda. Autonomous since 1980, and with its legal

- 134 -
Annex 2Page 6 of 8
status not fully clarified, it remains separate from ENE due tothe significance and volume of its services;
(d) Companhia de Electricidade do Lobito e Benguela (CELB). CELBis the utility in charge of distribution to Lobito andBenguela. Nationalized in 1982, it remains a distinct, sepa-rate management unit, as its assets have not yet beenintegrated into ENE; and
(e) Cabinete de Aproveitamento do Medio Kwanza (GAMEK). GAMEK wascreated in 1982 with the two immediate goals of coordinatingand supervising the work to be done at Capanda and defining adevelopment plan for the Middle Kwanza. Over the long term,GAMEK will be in charge of all works related to the exploita-tion of the hydro resources of the Middle Kwanza basin and anynew major hydrogeneration investments in the Northern System.
NATURAL GAS
A limited task force attached to the Oil Production/ReservesManagement in SONANGOL deals specifically with the supply aspects of thegas industry. It monitors appraisal and feasibility studies requested byoil companies operating in Angola or presented by foreign companies andconsultants.
FORESTRY/WOODFUELS
The Ministry of Agriculture has a Vice Minister in charge offorestry but no separate forestry department. Within the Ministry, theNational Directorate for the Conservation of Nature IDNACO) is the bodyresponsible for regulating the exploitation of firewood. It hasprovincial representation and issues licences to parties wishing toengage in woodfuel production.
The Department of New and Renewable Sources of Energy (DNRFE)within the MEP was created in 1981 and is mainly a research body with noprovincial representation at the fit.d level. Its main objectives areresearch and transfer of technology in new, renewable, and non-conventional forms of energy.

- 135 -
Annex 2Page 7 of 8
EMPRESA NACIONAL DE ELECTRICIDADE (ENE)
Organization Chart. Present Central Structure
|General Director
|Deputy Director ||Deputy Director |Regional . .|Planning 8 !Administration | Technic al lDirection Statistics!
- North
*nac Studies, Projects - South I Standardization!& Construction
_ ~~~~~~~~~~I _ - ......pStocks and | . . , ! LegalInventories jOperation 8 Planning 8
Maintenance Project Analysis
|Human Resources Lomaum a/ | Project Evaluation
Project I & Control l
PublicRelations5 New Technologies
a/ Temporary, related to rehabilitation of the Lomaum hydro plant.
Source: ENE.

- 136 -
Annex 2Page 8 of 8
PROPOSED ORGANIZATION OF THE POWER SUBSECTOR
Organization Chart
Electricity
Coordinating
& PlanningCommission
Central Units Technical Support Economics
& Supervision Planning
Department
Operating ! _SONEFE ntral Southern
Dlvisions Power Power
System
50oated Systems

Table 1: ANGOLA ENERGY BALANCE: 1986
(In 'OOOs toe)
Primary Energy Petroleum Products
Natural Hydro Crude Char- Electri- LPG Gasoline/ Kero- Aviation Diesel Fuel Line
Fuelwood Gas Elect Oil coal city Naphtha sene Fuel Oil Oil Total Totals
Gross Supply
Production 2,074 a/ 3,418 173 14,102 0 19,765
lports 12 116 16 144 144
Primary Exports (177) (12,637) 3 (12,814)
Stock Changes b/ 33 (10) (12) (11) 4 (7) (34) (48) (15)
Total avail. supply 2,074 3,241 173 !,498 0 0 2 (12) (ll) 120 9 (34) 96 7,080
Conversion
Petroleum refining (1,445) 20 130 36 174 344 658 1,362 (83)
Non-energy use (3,24)) c/ (53) d/ 0 (3,294)
Charcoal production (364) 364 0 0 I..
Electric power generation e/ (173) 188 (15) (15) 0 w
Conversion losses b/ (892) a/ (125) 0 (1,017)
Trhns. & distr. losses (14) 0 (14)
Net supply available 816 0 0 0 364 49 22 118 47 294 338 624 1,443 2,672
Secondary exports (13) (6) (508) (527) (527)
Bunker sales (29) (6) (2) (37) (37)
Net domestic consumption 816 0 0 0 364 49 22 105 47 265 326 114 879 2,108
Consumption by sector
(not available)
Industry O
TransportHouseholds/PublicAgriculture
0
Other
a/ Refer to Annex 8, Table 2, for assumptions.
b/ Includes statistical discrepancies, stock draw (or build).
c/ Either flared or reinjected. 188 MMCFD (1,695,000 toe).
d/ Includes 7,253 Tons of asphalt and 45,452 tons of crude for field use.
es An unknown amount of natural gas Is used for generating electricity.
Source: MEP and mission estimates

- 138 -Annex 3Page 2 of 7
COMMODITY BALANCE - FUELWOOD
FIREWOOD
Consumption 000s toe'000 tons/y
Urban 72 24
Periurban 190 65
Rural 1,600 544
Subtotal 1,862 633
Heating a/ 360 122
Industry b/ 180 61
Total 2,402 816
Conversion Factor: 0.34 toe/ton firewood.
a/ Approximately 3.0 million use I kg/d for 4 months.3 x 1 x 4 x 30 = 360,000 tons.
Conversion: 360 x 0.34 toe/ton = 122,000 toe.
b/ Industrial use of firewood is equivalent to: 10%firewood in urban and periurban households and 5%firewood in rural households.
POPULATION: Urban 2.5 million
Periburban 1.5 million
Rural 5.0 million
Total 9.0 million

- 139 -
Annex 3Page 3 of 7
COMMODITY BALANCE - FUELWOOD
CHARCOAL
Consumption '000s toe'000 tons/y
Urban 115 79
Periburban 103 71
Rural 226 156
Subtotal 444 306
Heating a/ 84 58
Total 528 364
Conversion Factor: 0.69 toe/ton charcoal.
a/ Approximately 1.0 million use 0.7 kg/d for 4 months1 x 0.7 x 4 x 30 = 84,000 tons.
Conversion: 84 x 0.69 toe/ton = 58,000 toe.
For conversion of charcoal into toe of firewood, it isassumed that 7 kg of firewood is equivalent to 1.0 kgcharcoal.
CHARCOAL FIREWOOD '000s toe'000s tons '000s tons
Urban 115 805 273
Periurban 103 721 245
Rural 226 1,582 538
Heating 84 558 200
Total 528 3,696 1,256
Conversion factor: 0.34 toe/ton firewood. Therefore 1,256toe are needed to produce 364 toe charcoal. Hence, totalfuelwood production:
'000s toe
Firewood 816
Charcoal 1,256
2,072

- 140 -Annex 3Page 4 of 7
COMMODITY BALANCE - NATURAL GAS
Production (1986): 379 MMCFD.
1 ft 3 = 0.0283168 m3
Calorific content of natural gas: 8.9 x 10³ kcal/m3
379 x 106 ft3 x 365 days = 138,335 x 106 ft3/y
138,335 x 106 x 0.0283168 = 3,912.20 x 106 m3
Calorific content:
8v9 x 103 x 3,912.20 x 106 kcal = 34,863.12 x 109 kcal
10.6 x 10⁶ kcal = 1 toe
1 x 34,863.12 x 109 kcal…---------------------- = 3,417.9 x 10 toe
10.2 x 1o6 kcal
Equal to 3,418,000 toe
Consumption (1986): 191 MMCFD.
Therefore, amount of natural gas flared:
(379-191) MMCFD = 188 MMCFD
188 MMCFD x 106 x 365 x 0.0283168 x 8.9 x 103 x 1---- …-------------------------------------------- = toe
10.2 x 10⁶
Equal to 1,695,000 toe

- 141 -
Annex 3Page 5 of 7
COMMODITY BALANCE - ELECTRICITY
HYDRO
Systems GWh
North 595
CentraL 40
South 56
Total Generation 691
1 MWh = 859,845 kcal
Calorific content: 691 x 103 x 859845 x 3 x 1
10.2 x 10⁶
Equal to 58,250.28 toe, or 58,000 toe
THERMAL
Systems GWhNorth 21
Central 41
South 0
Total Generation 62
1 MWh = 859,845 kcal
Calorific content: 62 x 103 x 859,845 x 303 x 1
10.2 x 10⁶
Equal to 5,226.51 toe, or 5,000 toe

- 142 -Annex 3Page 6 of 7
CONVERSION INTO PRIMARY ENERGY
Hydro
Conversion factor: 0.25 toe/MWh.
691 x 103 x 0.25 = 172.75 x 10³ toe = 173,000 toe
Thermal
Conversion factor: 1 MWh = 0.248 toe at 34% efficiency inthermal (oil) generation.
62 x 103 x 0.2248 = 15.3 x 10³ toe = 15,000 toe
Total Electric Power Generatior, (Hydro + Thermal)
(173,000 + 15,000) toe = 188,000 toe
Conversion Losses
Conversion loss (hydro) + conversion loss (thermal):
L (173,000 - 58,000) + (15,000 - 5,000) 1 toe = 125,000 toe
Transmission and Distribution Losses
Total generation: 753 CWh.22% transmission and distribution losses.
753 x 0.22 = 165.66 GWh
165.66 x 103 MWh x 859,845 x 103 kcal x 1
10.2 x 10⁶ kcal
Equal to 13,964.89 toe, or 14,000 toe.

- 143 -Annex 3Page 7 of 7
COMMODITY BALANCE - PETROLEUM
'000s tons Conv. '000s toeFactor
PRODUCTIONCrude 14,102 1.00 14,102
IMPORTSAverage Fuel 114,184 1.02 116,467Casoil 16,435 0.99 16,270LPG 10,913 1.06 11,567
PRIMARY EXPORTSCrude (12,637) 1.00 (12,637)LPG (166,782) 1.06 (176,788)
REFININGAverage fuel 171,064 1.02 174,485Crude (1,452) 1.00 (1,452) a/Fuel oil 685,767 0.96 658,336Gasoil 347,288 0.99 343,815Gasoline/Naphtha 126,146 1.03 129,930Kerosene 35,637 1.01 35,993LPG 18,690 1.06 19,810
NON-ENERGY USEAsphalt 7,253 0.99 7,180Crude 45,452 1.00 45,452
SECONDARY EXPORTSCasoil 5,642 0.99 5,585Gasoline/Naphtha 11,544 1.03 11,890Fuel oil 528,766 0.96 507,615
BUNKER SALESAverage fuel 28,920 1.02 29,498Fuel oil 2,600 0.96 2,496Gasoil 5,850 0.99 5,791
STOCK CHANGES +/(-)Average fuel 4,222 1.02 4,306Crude 33,277 1.00 33,277Fuel oil (35,201) 0.96 33,792LPG (9,621) 1.06 (10,198)Gasoil (7,461) 0.99 (7,386)Gasoline/Naphtha (10,492) 1.03 (10,806)Kerosene 10,673 1.01 10,779
a/ Figure quoted is net of asphalt, i.e., (1452 - 7) = 1,445thousand toe.

Table 1: SELECTED FIGURES ON THE PETROLEUM SECTOR a/
Annual
1973 1974 1975 1976 1977 1978 1979 1980 1981 1982 1983 1984 1985 1986 Growth
Rate
1978-86
Crude oil production 163 172 94 102 128 156 164 136 128 130 179 205 233 282 7.9%
(in 'OOOs bbl/d)
Export revenues Ofrom crude oil (in Z
million current USS) 233 n.a n.a n.a n.a 550 902 1,391 1,357 1,234 1,526 1,749 1,896 1,150 10.1%
4-4
Deflator b/ 34.7 68.9 81.4 100.0 103.4 98.7 95.1 93.2 90.5 87.6 r .s
Dettated revenues
from crude oil (in
million USS) n.a n.a n.a n.a n.a 798 1,108 1,391 1,403 1,218 1,451 1,583 1,661 976 c/ 3.9%
Export revenues
frcm crude oil
as % of GDP n.a n.a n.a n.a n.a 20.0 27.1 38.5 34.5 33.8 36,2 37.1 39.2 26.1 3.6% c/
Factor income trans-
ferred abroad d/ as S of revenue
from exports n.a n.a n,a n.a n.a n.a n.a n.a n.a 11.3 11.1 11.3 12.1 16.8 9.2% e/
a/ Using least square estimates.
b/ Import unit values, International Financial Statistics.
c/ Estimates. M PDd/ Attributable to the petroleum sector. X
e/ Growth rate 1982-1986. 0
Source: MEP and mission estimates.

- 145 -
Annex 4Page 2 of 6
Table 2: TOTAL INVESTMENTS IN PETROLEUM SECTOR(In million US$)
Year Exploration Develop Other Total SONANCOL %
1980 49.1 49.5 103.0 201.6 76.4 37.91981 89.0 64.6 172.7 326.3 108.9 33.41982 200.7 311.6 (46.5) 465.8 132.7 28.51983 218.8 187.7 3.2 A09.7 91.2 22.31984 92.3 237.9 34.6 364.8 86.5 23.71985 186.7 292.4 43.4 522.5 100.2 19.21986 104.2 329.0 - 433.2 62.7 14.5
Total 940.8 1,472.7 310.4 2,723.9 658.6 24.2
Source: SONANGOL.
Table 3: TOTAL INVESTMENTS BY AREA - 1980-86(In million US$)
Exploration Development Other TotaL
Cabinda Offshore 49.0 653.4 114.0 816.4 30.0
Onshore Angola 35.6 134.8 71.6 242.0 8.9of which : A 11.8 34.2 6.9 52.9
B 23.8 100.6 64.7 189.1
Block 1 186.2 - 29.9 216.1 7.9
Block 2 195.9 270.4 26.7 493.0 18.1
Block 3 402.0 413.9 62.5 878.4 32.2
Block 4 72.1 - 5.9 78.0 2.9
Total 940.8 1,472.5 310.6 2,723.9 100.0
Source: SONANCOL

- 146 -Annex 4Page 3 of 6
Table 4: CRUDE OIL PRODUCTION BY BASIN(In '000s bbl/d)
1980 1981 1982 1983 1984 1985 1986
Cabinda 90 86 80 130 159 165 190
Kwanza 3 4 5 5 4 4 3
Congo 42 40 45 43 41 63 89
Block 2 2 5 13 12 9 7 6Block 3 - - - - - 24 50
Onshore A 2 1 1 1 1 1 1Onshore B 38 34 31 30 31 31 32
Total 134 130 130 179 205 232 282
Source: SONANGOL.
Table 5: CRUDE OIL OPERATING COSTS a/
1982 1983 1984 1985 1986
Total (in US$ million)
Block 2 8.4 7.8 6.5 4.6 2.1Block 3 - - - 13.036.4Onshore A 11.1 10.8 8.1 8.9 9.8Onshore B 20.8 24.6 18.0 17.3 14.4Cabinda 209.0 229.6 124.6 113.6 117.1
Per barrel (US$)
Block 2 1.8 1.8 1.9 1.8 0.9Block 3 - - - 1.5 2M0Onshore A 5.3 4.8 4.1 4.9 6.5Onshore B 1.8 2.2 1.6 1.5 1.2Cabinda 7.1 4.8 2.2 1.9 1.7
a/ Not including expenses for exploration and development.
Source: SONANGOL.

- 147 -
Annex 4Page 4 of 6
Table 6: SUMMARY OF MAIN OIL DISCOVERIES IN ANGOLA
Name Discovery Bbl/d average Cumulative million bblfirst 6 months to 01-JUL-86
Offshore Cabinda
Takula 1982 107,350 91.3Malongo West 1967 16,900 220.6Malongo North 1966 14,500 203.0Kungulo 1975 13,150 37.2Limba 1969 12,400 79.3Vuko 1983 10,500 2.0Malongo South 1966 8,200 67.5Kambala 1971 7,800 13.9Others 2,090 6.4TOTAL 192,890 721.1
Onshore
N'Zombo 1973 13,000 81.1Quinguila 1972 7,500 28.6Quinfuquena 1975 5,100 21.7Quenguela 1968 2,500 36.0Ganda 1975 2,500 4.3Lumueno 1977 2,300 2.2Pambo 1982 850 1.6Luango 1977 800 1.6Other 1,334 48.0TOTAL 35,884 224.8
Bbl/d average Cumulative million1986 bbl to 31-DEC-86
Block 2
Essungo 1975 5,930 17.7Cuntla 1978 170 2.2Total 6,100 19.9
Block 3
Palanca 1981 39,900 23.2Pacaca 1982 9,700 3.5Total 49,600 26.7
Source: SONANGOL and "Oil and Gas Journal".

- 148 -
Annex 4Page 5 of 6
Table 7: NATURAL GAS RESERVES AND PRODUCTIONAssociated Gas Production (MMCFD)
1984 1985 1986 1988 1990Area (Forecast) (Estimate) a/
Cabinda 280 277 305 305 335-355
Congo 12 12 13 8.5 6-7
Kwanza 5 6 5.5 3 3
Block 2 15 15 11.5 41 41
Block 3 - 23 44 100 130
TOTAL 312 333 379 458 515-536
a/ Mission estimate.
Source: SONANGOL.
Probable and possible reserves of non-associated gas or gas associated withcondensates in Blocks 2 and 3.
Block 2 a/ Etele 600 BCFSulele 210 BCFGaroupa 280 BCFLua 320 BCFPolvo 530 BCF
Block 3 b/ Punja 4,040-650 BCF
a/ Plus Maleva North and Prata Southb/ Plus Buffalo North (minimum, 2,340-2,590 BCF)
Source: SONANGOL.

- 149 -
Annex 4Page 6 of 6
Table 8: ASSOCIATED GAS UTILIZATIONAssociated Gas Utilized
(MMCFD)
1984 1985 1986 1988 1990Area (Forecast) (Estimate) a/
Cabinda 135 145 180 b/ 215 245-265
Congo 3.5 4.5 4 7 c/ 6-7
Kwanza 1 1 1 1 1
Block 2 0.5 0.5 0.5 31 31
Block 3 - 3 4.5 a/ 8a/ 70 d/
TOTAL 140 154 191 262 353-374
% Utilization 45 46 51 57 69-70
a/ Mission estimate.b/ Breakdown: 21 for own fuel, 11.7%; 67 for reinjection, 37.2%;, 92 for gas
lift, 51.1%; and others.c/ Soyo Power Plant Project having started-up before that year.d/ Based on assumption that the reinjection scheme for Impala South East will
have started up before 1990.
Source: SONANGOL.

- 150 -
Annex 5Page 1 of 2
THE PETROLEUM LAW
On September 6, 1978 a law consisting of 30 Articles governingall petroleum activities in Angola was enacted. Petroleum Law 13/78 setsgeneral principles rather than regulatory details and establishes that:
- Ownership of hydrocarbons, underground, is vested in the State.
- SONANGOL is the only company to whom exploration and productionrights can be granted (existing concessions at the time ofenactment of the Law were declared invalid).
- The Council of Ministers has approval over future concessionareas.
- Exploration and production rights are granted for fixed termson a case-by-case basis.
- Mining activities are to be carried out in accordance withmodern petroleum industry practices.
- SONANGOL may enter into arrangements with financially and tech-nically capable oil companies to carry out exploration andproduction activities.
- Petroleum agreements can take the form of joint ventures (asso-ciations between F"MANGUL and a foreign company with each part-ner having rights and obligations in proportion to their par-ticipating interests in the venture), production sharing agree-ments (service contracts between SONANGOL and foreign compa-nies), and commercial companies. In all cases there should bea joint management body in charge of operations, and SONANGOLwill have a minimum of 51% participation except where the waterdepth in the contract area exceeds 150 meters.
- Where no commercial discovery is made, companies will have noright to recover investments. In other cases, they will havethe right to recover expenses and realize profits in accordancewith their contractual terms. Beyond the wellhead, title totheir share of the oil produced will pass on to the companies.
- In exceptional cases, the Council of Ministers can authorizecontractual terms different to those outlined above.
- Disputes will be solved by arbitration, in Angola, in accord-ance with procedures agreed upon between SONANGOL and theforeign company.

- 151 -
Annex 5Page 2 of 2
The Law is concise, yet general in nature, making it a flexibleinstrument in contract negotiations. A model production sharing agree-ment exists detailing the rights and obligations of each party, leavingonly the main parameters, such as work program and financial terms, openfor niegotiations.

- 152 -
Annex 6Page 1 of 6
TAXATION OP THE PETROLEUM SECTOR
(a) Investment Sharing Operations (Joint Ventures)
The fiscal regime which applies to joint ventures betweenSONANGOL and foreign oil companies and thus mainly effects the conces-sions for Cabinda, was originally established by Decree No. 5/84 of March28, 1984 and comprises:
(a) a 20% tax on production ("royalty");
(b) a 65.7% tax on income; and
(c) a 70% tax on "excess profits" (transaction tax).
Taxes on production and petroleum transactions are deductiblefrom the tax base for income taxation. In the case of the transactiontax, provisions are made for production and investment incentives whichare deductible from net revenues (profits = gross reverues minus costs)as far as they are subject to taxation. Thus, in a simplified manner,Government's total tax income, denoted as "T", accruing from jointventures, can be broken down into the following components:
Production tax = tp px
Transaction tax = tt (px cx - ix - zx)
Income tax = r [(1 - t p) px - cx -, px -cx - ix - zx)]
where:
p = price of crude oil (US$/bbl);
x = crude oil output (bbl);
c = unit production costs (US$/bbl);
i = production incentive (US$/bbl);
z = investment incentive (US$/bbl);
P = production tax rate (%);
tt = transaction tax rate (%); and
r - income tax rate (%).
It is to be noted that Angola's total take is the sum of thetaxes that accrue to the Government and SONANCOL's profits (net oftaxes).

- 153 -
Annex 6Page 2 of 6
Assuming that the production incentive (which, in practice, isadjusted to production costs) and the investment incentive (which is afraction of total historic investment costs) are linear in "x", then thechange in total tax revenues that is due to a marginal increase in pricesand/or quantities can be calculated by applying the following formula:
dT = x [(l - r) (tp + tt) + r] dp +
p [t + r (l-t) - rc + t (1-r) (P c iZ )] d xp p p t p
with p - (c 1 z) = 0 for (p-c-i-z) < 0p
Thus, the marginal change in tax income that results from achange in gross oil revenues can be split up into:
(a) a price effect (dp >< 0, dx = 0), which is equal to a constantfraction of the price-dependent change in gross revenues (xdp);and
(b) a quantity effect (dx >< 0, dp = 0), which is equal to aconstant fraction of the quantity-dependent change in grossrevenues (pdx).
In particular, unless production costs are zero and "i" and "z"happen to be sufficiently small (relative to the price of oil) to benegligible, the price effect will be more pronounced than the quantityeffect. In fact, at the prevailing tax rates one obtains:
dT = 0.966 . x for dx = 0dp
Supposing that "i" = US$8/bbl; that "z" = US$1.50/bbl; and thatic" = US$5.50/bbl (which is roughly in line with the current cost andincentive structure of the Cabinda concessions) and taking into account aper barrel price of US$17 (which is the Government projection for 1988),then the quantity effect works out at follows:
dT = 0.542. p for dp = 0d-x
Thus, if prices are declining, output must grow at a rateexceeding the rate of price erosion in order to keep the tax income at agiven level. However, the higher the level of oil prices (relative tothe level of costs), the more pronounced will be the quantity effect.For instance, at "p" = US$40/bbl, the quantity effect works out at0.786 .p.

- 154 -
Annex 6Page 3 of 6
While marginal tax income is linear for output and prices, theaverage tax income tends to increase with oil revenues (progressive taxsystem).
Let AT = T/px denote the average tax earnings, then
d (AT) = [ [ (l-r) tt (c+i+z) + rc I p 2 1 dp
Obviously, the average tax income is increasing at a decreasingrate, and the higher the level of production or the price level, thelower will be the increase in average tax income that is due to a price-dependent rise in (gross) oil revenues.
For instance, in the case of the parameter configurationpresented above, one obtains:
d (AT) / dp = 0.025
with AT = 0.581
Thus, a doubling of the petroleum price, i.e., an increase fromUJS17/bbl to US$34/bbl, will raise the Government's income share fromgross revenues by 42.5%. In other words: Government's take willincrease from a 58.1% share to an 82.8% share of total revenues.
It can therefore be concluded that, in the case of iointventures the main objective of the taxation system is to capture windfallprofits accruing from rising oil prices. On the other hand, if pricesare decreasing or constant, the tax regime tends to protect the oilcompanies, i.e., lower prices result in a lower (dp < 0) or stagnantGovernment share (dp = 0) of income from oil revenues.
(b) Production Sharing Operations
Basically, .-he production-sharing type of agreement that hasbecome fashionable in many countries during the last 10 years works asfollows:
(a) SONANGOL subcontracts--on behalf of the Government--the opera-tional services of a foreign oil company;
(b) exploration is financed and carried out by the foreign companyat its own risk, i.e., exploration costs will be reimbursedonly if there is a commercial discovery. (A commercial well isdefined as being capable of producing a minimum number of bbl/dfor a given water depth, i.e., 1,000 bbl/d for a depth of lessthan 50 meters, 1,500 bbl/d for a depth between 50 and 100metersp etc.);

- 155 -
Annex 6Page 4 of 6
(c) in case of a commercial discovery, the foreign company financesand undertakes the development of the reserves as approved bythe Government;
(d) the subcontractor recovers his costs by taking a percentageshare of total production ("cost oil"), while the remainder("profit oil") is split between the foreign oil company andSONANGOL on a sliding scale basis linked to cumulative output;and
(e) the foreign company's remuneration is taxed at special rates.
The key issues to be negotiated are the work program (tasks andfinance) and the production splits. In the past, the foreign companies'exploration commitments included a minimum number of wells (e.g., six) tobe drilled within a predetermined period of time (e.g., three years).Any extension of the exploration period was subject to additionaldrilling obligations. Fields with commercial discoveries had to bedeveloped within another three years. Thus, SONANGOL's interest in sub-contracting foreign companies is to achieve a maximum number ofdrillholes and discoveries within the shortest period of time, withouttaking any of the risk involved in the operations.
As soon as production starts the contractor is allowed torecoup his expenses from total output. Cost oil may account for up to50% of annual production and includes:
(a) operating costs recovered on a recurrent basis;
(b) administration expenses;
(c) development costs recoverable over a period of four years witha 33.3% "uplift"; and
(d) exploration costs recovered from the unused balance of costoil.
Excess recoverable costs are rolled over to the next year.
What is left over after costs have been recovered (includingthe unused share of cost oil) constitutes the annual profit oil. Clear-ly, once all major expenses have been reimbursed, the share of profit oiltends to exceed the 5C% level. This situation generally applies to, say,the first five to six years of oil production.
In Angola profit oil splits between SONANGOL and a foreigncompany are based on a field-specific scale of cumulative productionrates. This scheme avoids the shortcomings involved in the more commonapproach of fixing production thresholds on a daily or monthly basis,thus providing a disincentive to increase the production rate when a

- 156 -
Annex 6Page 5 of 6
lower share in profits is entailed. A representative example of Angola'ssliding scale scheme is given in the following table.
Table 1: SLIDING SCALE FOR PROFIT OIL SHARING
Cumulative Production Profit Oil (X)(Million bbl) SONANGOL Contractor
0-25 40 60
25-50 70 30
50-100 80 20
>100 90 10
A unique feature of Angola's production sharing agreements isthe "price cap" provision which acts as a 100% tax on "excess" profits,defined by the extent to which the price of oil exceeds a particular pre-established upper limit. Initially, the price limit was set at US$13/bbl(in 1978 prices) and adjustments were to be made in accordance withchanges in the U.N. index for manufactured goods. Since, in themeantime, real oil prices have declined below the 1978 level, the limithas been increased to US$26/bbl. However, under the current conditionsthis ceiling does not affect the oil company's profits.
If the profit sharing agreements (PSAs) were implemented inaccordance with the terms set forth in the late 1970s, no tax would applyto foreign oil companies. However, in order to take advantage of U.S.tax credit laws TEXACO requested a change in the PSAs. Under the revisedcontractual setting, the foreign oil companies of Block 2 and 3 pay a 50%income tax to Angola on a nominal share that exceeds the initially agreedshare in profit oil by 100%. The "grossing up" involved in this schemeis financed by SONANGOL out of its own share in profit oil.
Basically, this accounting system does not change the agreedsplit in profit oil, i.e., Angola's take from the profit oil isinvariably equal to SONANGOL's share. However, it affects theGovernment's tax income from PSAs.
If P is the profit oil, "s" the foreign company's share inprofit oil with 1>5>0, and "r" the income tax rate, then Government taxrevenues from the grossing-up scheme are determined by:
T = (1-r - 1) s P + r [ s) P) - (l-r) - 1) s PI
= r P

- 157 -Annex 6Page 6 of 6
It there were no income tax on the foreign companies' profit oil and,thus, no grossing-up financed by SONANGOL, the tax income would amount to
T = r (l-s) P
Thus, under the current tax-contract system, Government captures 50% ofthe total profit oil, while in the absence of the grossing-up scheme,Government would only receive 50% of SONANGOL's share in profit oil. Inthe meantime, however, the liberalization of U.S. tax laws has erased thedouble taxation problem so that foreign oil companies have become lessinterested in the option of transferring tax payments to Angola.Moreower, SONANGOL fears that it may no longer be in the position tofinance the grossing-up of the foreign oil companies' share in profit oilas soon as cost oil accounts for a significantly lower share in totalproduction than during the initial years of operation. Therefore,SONANCOL has suggested exempting foreign oil companies operating underPSAs from the Angolan income tax. Not surprisingly, Government is notvery happy with the proposal. In particular, the Ministry of Financefeels that the income tax on profit oil should even be increased to 65%,a rate that would be in line with the general tax laws applying to theindustrial sector (as well as to joint ventures with foreign oilcompanies).
In fact, the basic problem is that the very logic of PSAs doesnot fit well with the Government's current very pressing revenue needs.While PSAs provide an incentive framework with a progressive system ofsharing that works best if the investment expenditure of foreign oilcompanies are reimbursed as fast as possible, Government would preferthat the PSAs work as if the initial risk in exploring and devel-,4ng theoil reserves were shared as in joint ventures. Moreover, PSAs require a"strong" treasury in the host country. In the case of Angola, however,the treasury is in a comparatively weak position, struggLing with fiscallegislation that is not adjusted to a modern tax-contract system like thePSAs, and relying exclusively on the supervisory function that SONANGOLhas to assume towards foreign oil companies. This dependency onSONAdGOL, coupled with the fact that Angola's take of the oil revenuesfrom PSAs is not yet readily available and, in addition, has to be sharedbetween the Government and SONANGOL, creates a potential for conflict.

- 158-
4nnex 7Page 1 of 4
FINANCIAL ANALYSIS OF THE AMMONIA/URA PLANT
Assumptions
A. Limited absorptive capacity of the national market. In recent yearsnot more than 10,000 t/y of nitrogen fertilizers have been consumedin Angola.
B. Prices. Angolan border prices for ammonia are assumed to develop asfollows:
Year 1995 Year 2000
Ammonia FOB Angola 200 215
Urea FOB Angola 200 210
Source: Mission estimates.
C. The economic value of gas consists of two components, the productioncost and the depletion value for gas in the field. The productioncost is the cost of extracting the gas and shipping it to the plantgate. In the present context, the depletion value is defined as thediscounted cost of using an alternative source of energy et somefuture date when the currently available reserves will bedepleted. The depletion value is calculated by assuming that thegas production costs of the "backstopping" fields amount toUS$2.50/MMBTU. The considered range for current production cost hasbeen allowed to vary between US$1.25 and US$2.00/MMBTU.
The domestic market could possibly absorb not more than theequivalent of the production of a 100-200 t/d ammonia plant, even takinga confirmed recovery of agriculture into account. However, economies ofscale only justify setting up a plant with the minimum capacity of1,000 t/d of ammonia. The analysis is therefore based on a layout with anominal capacity of 1,500 t/d of ammonia and 500 t/d of urea.
The project will require an investment of a minimum of US$330million (at 1987 prices) for the basic equipment and all surroundingfacilities, excluding working capital requirements.
At best the plant could operate at a 90% capacity utilizationlevel (329 full operating days per year) which, by internationalstandards, is only reached in a few very well operated plants. A maximumcapacity utilization of 80% would be more likely. Producing 500 t/d ofurea is equal to a yearly capacity of 182,500 tons of urea. Four hundred

- 159 -
Annex 7Page 2 of 4
and forty thousand tons of excess ammonia is obtained at this productionlevel.
The Economic Rate of Return (ERR) for the project has beencalculated in two ways, i.e., excluding or including the depletion valueof gas. As it turns out, the depletion value has only a minor effect otlthe project's viability. Therefore, the sensitivity analysis can roughlybe based on figures which exclude the depletion value of gas.
Assuming a low gas production cost of USS1.25/MMBTU, then theeconomic rate of return on investment works out as follows:
12.72% ERR in the Base Case (no depletion costs)8.49% ERR in Case C (lower annual capacity utilization and
lower product prices), which is the least favorablealternative to the Base Case.
Taking into account the scarcity of capital in Angola, thetarget discount rate should be set at 15% or higher.
The effect of lower capacity utilization on the ERR is greaterthan the effect of lower world market prices. Taken together the impacton the ERR is considerable.
The sensitivity analysis on product prices and/or utilizationof capacity shows verv low or negative economic values for gas at thewellhead (gas netback value). In particular, at discount rates of 10%and more the netback values faLl below the production cost of gas.
Taking into consideration the low economic returns of theproject, the probability of low capacity utilization, and theuncertainties involved in the future of product prices, the projectcannot be considezed economically viable.
The following cases have been analyzed:
Base Case Maximum capacity utilization at 90% (equivalent to 329full operating days/year), with or without depletioncosts.
Case A As Base Case with maximum capacity utilization at 80%(equivalent to 292 full operating days/year).
Case B As Base Case with product prices decreased by US$15/t.
Case C: Combination of Cases A and B.

Table 1: AMMONIA/UREA PROJECT
Financial Analysis
Ist Year: 1988 Lifetime: 20 years
Start up: 1992 Project capacity: 182,500 tons of urea, 440,000 tons of ammonia
Year Invest- Oper. UREA AMMONIA UREA AMMONIA Total Fxd.Cost Var.Cost Net income Gas Cons
ment rate Output Output Price Price Sales 22 5 a/
MM US$ (%) '000s t 'OOOs t US$/t USS/t MM US$ MM USs$ MM US$ mm UJS BCF
1988 33 0% 0.0 0.0 0.00 0.00 0.00 -33.00 0.00
1989 95 0% 0.0 0.0 0.00 0.00 0.00 -95.00 0.00
1990 123 0% 0.0 0.0 0.00 0.00 0.00 -123.00 0.00
1991 139 0% 0.0 0.0 0.00 0.00 0.00 -139.00 0.00
1992 19 65% 118.6 286.0 188 188 76.07 22.00 3.25 31.82 12.03
1993 0 85% 155.1 374.0 192 192 101,59 22.00 4.25 75.34 15.73
1994 0 90% 164.3 396.0 196 196 109.81 22.00 4.50 83.31 16.65 0
1995 0 90% 164.3 396.0 200 200 112.05 22.00 4.50 85.55 16.65 1
1996 0 90% 164.3 396.0 202 203 113.57 22.00 4.50 87.07 16.65
1997 0 90% 164.3 396.0 204 206 115.08 22.00 '.50 88.58 16.65
1998 0 90% 164.3 396.0 206 209 116.60 22.00 4.50 90.10 16.65
1999 0 90% 164.3 396.0 208 212 118.12 22.00 4.50 91.62 16.65
2000 0 90% 164.3 396.0 210 215 119.63 22.00 4.50 93.13 16.65
2001 0 90% 164.3 396.0 211 217 120.59 22.00 4.50 94.09 16.65
2002 0 90% 164.3 396.0 212 219 121.55 22.00 4.50 95.05 16.65
2003 0 90% 164.3 396.0 213 221 122.50 22.00 4.50 96.00 16.65
2004 0 90% 164.3 396.0 214 223 123.46 22.00 4.50 96.96 16.65
2005 0 90% 164.3 396.0 215 225 124.41 22.00 4.50 97.91 16.65
2006 0 90% 164.3 396.0 215 225 124.41 22.00 4.50 97.91 16.65
2007 0 90% 164.3 396.0 215 225 124.41 22.00 4.50 97.91 16.65
2008 0 90% 164.3 396.0 215 225 124.41 22.00 4.50 97.91 16.65 ,.
2009 0 90% 164.3 396.0 215 225 124.41 22.00 4.50 97.91 16.65 0
2010 0 90% 164.3 396.0 215 225 124.41 22.00 4.50 97.91 16.65 M X
2011 -39 90% 164.3 396.0 215 225 124.41 22.00 4.50 136.91 16.65 4
0
a/ Not including the economic costs of gas.

- 161 -
Annex 7Page 4 of 4
Table 2: ECONOMIC RATE OF RETURN
At gas Base Base Case A b/ Case B b/ Case C b/prod. cost Case I a/ Case II b/ Luwer Lower Lower capacity(US$/MMBTU) capacity prices and prices
1.25 11.52% 12.72% 10.09% 11.09% 8.49%1.50 10.86% 11.92% 9.21% 10.24% 7.55%1.75 10.22% 11.10% 8.30% 9.37% 6.58%2.00 9.61% 10.26% 7.35% 8.46% 5.55%
a/ Including gross depletion costs.b/ Excluding gross depletion costs.
Source: Mission calculations.
Gas netback value (in MM USS)
…------------------- Discount Races ------------------
5% 10Z 12% 15% 20%
Base Case 3.30 2.07 1.48 0.50 -1.32Case A 2.58 1.27 0.68 -0.30 -2.12Case B 2.88 1.52 0.97 0.00 -1.83Case C 2.13 0.83 0.23 -0.74 -2.56
Source: Mission calculations.

- 162 -
Annex 8Page 1 of 10
PIcURzs o0 THE PMTROLUMQ PRODUCT SUBSECTOR
Tabie 1: ANGOLA PETROLEUM SUPPLY - DISPOSITION BALANCE - 1980-86(In 'OOOs tons)
1980 1981 1982 1983 1984 1985 1986
PROOUCTION Crude 6,710.0 6,470.0 6,520.8 8,949.6 10,228.1 11,599.6 14,101.5LPG 0.0 0.0 0.0 97.8 167.7 165.8 177.0
IMPORTS LPG 6.9 6.0 9.2 6.0 6.8 11.7 10.9Jet fuel 0.0 7.8 39.8 24.9 62.9 102.6 114.2Gasoil 0.0 0.0 0.0 0.0 23.7 36.7 16.4
Total Products 6.9 13.8 49.0 30.9 93.4 151.0 141.5
REFINING Crude -1,237,5 -1,240.7 -1,014.3 -i,300,6 -1,380.5 -1,451.3 -1,452.2
LPG 11,7 12.8 13.0 17.3 17.7 18.3 18.7Gasoline 89.6 85.2 84.4 92,3 103.6 103.5 104.7Naphtha 0.0 0.0 0.0 4.6 4.0 9.9 21,5Kerosene 33.0 34.8 31.6 32.1 39.7 45.6 35.6
Jet fuel 118.6 127.0 99.5 143.5 161.9 172.8 171.1Gasol I 294.7 308.6 243.4 316.9 344.6 353.7 347,3
Fuel oil 609.4 604.8 479.2 606.3 636.8 679.4 685.8Asphalt 7.4 7.1 8.0 4.2 5.0 7,9 7.3
Total Products 1,164.4 1,180.3 959.1 1,217.2 1,313.3 1,391.1 1,391.8fuol & loss 73.1 60.4 55.3 83,4 67.2 60.2 60,3(in S) 5.9% 4.9% 5.4% 6.4% 4.9% 4.2% 4.2%
TOTAL SUPPLY Crude 5,472.5 5,229.3 5,506.5 7,649.0 8,847.5 10,'48.3 12,649.3
LPG 18,7 18,8 22,1 121,1 192.2 195.8 206.6Gasoline 89.6 85.2 84.4 92.3 103,6 103.5 104,7Naphtha 0.0 0.0 0.0 4.6 4.0 9.' 21.5
Kerosene 33.0 34.8 31.6 32.1 39.7 45.6 35.6jet fuel 118.6 134.7 139.3 8a.5 224.8 275.4 285,2
Gasoil 294,7 308,6 243.4 316.9 368.3 390.4 363.7Fuel oil 609.4 604.8 479.2 606.3 636.8 679.4 685.8
Asphalt 7.4 7.1 8.0 4.2 5.0 7.9 7.3
Total Products 1,171.3 1,194.0 1,008.0 1,345.9 1,574.4 1,708,0 1,710,4
FIELD USE Crude 25.6 26.4 36,9 43.1 57.8 51.1 45,5
CARGO EXPORTS Crude 5,576.0 5,224.9 5,378.8 7,514.2 8,789.7 10,057.3 12,637.1
LPG 0.0 0.0 0.0 97.8 167.7 173.8 166.8Gasoline 2.6 5.4 7.2 16.8 8.2 3,2 2.9
Naphtha 0.0 0.0 0.0 4.0 0.0 5.1 8.6Kerosene 2.4 2.1 1.9 0.0 0.0 0.0 0.0Jet Fuel 0.0 0.0 1.0 1.8 3.5 3,0 0.0Gasoll 23,8 7.8 4.5 5.6 9.7 7.3 5.6Fuel oil 481.6 495.6 346.2 496.7 511.3 585.9 528.8
Total Products 510.4 510.9 360,8 622.6 700.5 778.3 712.7

- 163 -
Annex 8Page 2 of 10
Tabie 1: ANGOLA PETROLEUM SUPPLY - DISPOSITION BALANCE ̂ 1980-86(In 'OOOs tons)
(Continued)
1980 1981 1982 1983 1984 1985 1986
BUNKER EXPORTS Jet Fuel 0.0 29,1 32.5 22.3 .1.7 19.8 28.9
Gasoil 0.0 37.8 35.0 38.5 11.5 11.6 5.9
Fuel oil 0.0 2.8 4.0 21.3 4.1 3.4 2.6
Total Products 0.0 69,6 71.5 82.1 37.3 34.8 37.4
INLAND SALES LPG 18.7 18.8 22.1 23.3 26.5 28.7 30.2
Gasoline 81.0 82.9 88.9 89.5 95.1 96.0 104.1
Kerosene 29.8 32.4 36.9 39.2 40.6 43.9 46.3
Jet fuel 114,4 105.7 106.0 144.4 184.5 235.6 260.6
Gasoil 268.8 300.4 323.5 334.6 340.8 376.9 344.8
Fuel oil 121.3 120.5 109.6 83.8 88.2 104.6 119.2
Asphalt 3.2 4.5 2.6 0.4 1.7 5.6 4.2
Total Products 637.1 665.2 689.7 715.2 777.5 891.2 909.3
TOTAL DISPOSITION Crude 5,601.7 5,251.3 5,415.7 7,557.3 8,847.6 '0,108.5 12,682.6
LPG 18.7 18.8 22.1 121.1 194.1 202.5 197.0
Gasoline 83.6 88.3 96.1 106.2 103.3 99.2 107.0
Naphtha 0.0 0.0 0,0 4.0 0.0 5.1 8.6
Kerosene 32.2 34.5 38.8 39.2 40.6 43.9 46.3
Jet fuel 114.4 134.7 139.5 168.5 209.7 258.3 289.5
Gasoil 292,6 308.3 328.1 340.2 350.5 384.2 356.3
Fuel oil 602.9 Gt6.1 455.8 580.5 599.6 690.5 650.6
Asphalt 3.2 4.5 2.6 0.4 1.7 5.6 4.2
Total Products 1,147.5 1,205.2 1,083.0 1,360.0 1,499.6 1,689.4 1,659.5
STOCK DRAW Crude 129.2 22.0 -90.8 -91.7 0.0 -39.8 33.2
(BUILD) or Other Residuai
LPG 0.0 0.0 0.0 0.0 1.9 6.7 -9.6
Imbalance Gasoline -6.0 3.1 11.7 13.9 -0.2 -4.3 2.3
Naphtha 0.0 0.0 0.0 -0.6 -4.0 -4.8 -12.8
Kerosene -0.8 -0.3 7.2 7.2 0.9 -1.7 10.7
Jet fuel -4.2 0.0 0.2 0.0 -15.1 -17.1 4.2
Gasoil -2.1 -0.3 84.7 23.3 -17.8 -6,2 -7.4
Fuel oil -6.5 11.3 -23.4 -25.8 -37,2 11.1 -35.2
Asphalt -4.2 -2.6 -5.3 -3.8 -3.3 -2.3 -3.1
Total Products -23.8 11.1 75.0 14.1 -74.8 -18.6 -50.9
Source: SONANGOL and mission calculations.

- 164 -
Annex 8Page 3 of 10
SUMMARY OF PHYSICAL FACILITIES LUANDA REFINERYFINA PETROLEOS DE ANGOLA
Nominal Capacity 1.7 Million tons/yearActual Capacity 1.6 Million tons/year
(a) Process Units Capacity (bbl/cd) 1/
3 Topping plants 32,000Vacuum distillation unit 1,900Reformer 1,900Merox 1,300Naphtha Hydroheater 3,800Kerosene Hydrodesurgurizer 2,800Gas Recovery Unit 500
(b) Off-sites
(i) Electric Power: 12.5 MW gas turbine generator 2/0.8 MW diesel drive generator (back-up)
3.(ii) Tankage 3/ Crude oil - 70,460 m
Slops - 2,900 m3;LPG - 1,184 m';Naphtha - 7,918 m3Gasoline - 15,000 m3;Jet Fuel - 33,048 m 3;
Kerosene - 1,700 m'3.Gasoil - 41,915 mi
Fuel Oil - 95,616 m3;Asphalt - 2,543 m3
Total: 272,284 m3
1/ Barrels per calendar day.
2/ The recently installed turbine naphtha-fired generator is normallynot used since it is more economic for the refinery to draw hydropower from the grid to serve its total load of about 3 MW.Occasionally the turbine is run )n request of the Government inorder to supply the grid.
3/ The tankage capacity is now back, to normal levels after the majorsabotage of 1981 when 45,000 m3 of capacity were lost.

- 165 -
Annex 8Page 4 of 10
(iii) Receiving Facilities: 4/ Oil Port - 44 feet draft; Maximumvessel size - 75,000 DWT.
(iv) Product Pipelines
No. Services
1 LPG
1 Fuel oil
1 Clean products
4/ The oil port adjacent to the refinery is owned and operated byFPA. It has a 44 foot draft and can accomodate vessels of up to75,000 DWT. All the Soyo crude is received through this facilityand finished products are shipped to SONANCOL marine terminals andto export destinations from here. A significant number of thevessels bunkering in Luanda are handled by FPA at its facilities inthe oil port.

- 166 -
Annex 8Page 5 of 10
Table 2: FPA LUANDA REFINERY PRODUCTION BALANCE - 1980-86
('000 tons)
1980 1981 1982 1983 1984 1985 1986
Refinery Input
Crude oil 1,237.5 1,240.7 1,014.3 1,300.6 1,380.5 1,451.3 1,452.2
Refinery Output
LPG 11.7 12.8 13.0 17.3 17.7 18.3 18.7
Gasoline 89.6 85.2 84.4 92.3 103.6 103.5 104.7
Naphtha 0.0 0.0 0.0 4.6 4.0 9.9 21.5
Kerosene 33.0 34.8 31.6 32.1 39.7 45.6 35.6
Jet fuel 118.6 127.0 99.5 143.5 161.9 172.8 171.1
Gasoil 294^7 308.6 243.4 316.9 344.6 353.7 347.3
Fuel oil 609.4 604.8 479.2 606.3 636.8 679.4 685.8
Asphalt 7.4 7.1 8.0 4.2 5.0 7.9 7.3
Rerun slops 5,4 4,5 4.1 6.2 5.0 4.4 4.4
Total ex-loss 1,169.8 1,184.7 963.2 1,223.4 1,318.3 1,395.5 1,396.3
fuel & loss 73,1 60.4 55.3 83.4 67.2 60.2 60.3
TOTAL 1,242.9 1,245.2 1,018.4 1,306.8 1,385.5 1,455.8 1,456.6
Note: Annual growth rate of total output: 4% (least square estimate).
Source: FPA.

- 167 -
Annex 8Page 6 ol 10
Table 3: ANGOLA - PRODUCT STORAGE TERMINALS(All owned by SONANGOL)
Location/Name Capacity Original Owner/-m3 % of Constructor
Total
Coastal
Luanda IBV-1 26,000 SACORLuanda IBV-5 51,000 MOBILLuanda IMUL 5,990 SHELLLuanda TEMAR 22,300 SHELL
Subtotal 105,290 54%
Namibe 30,000 TEXACOLobito 18,900 FINAPorto Amboim 10,750 SONANGOL (USSR-built)Tombua 1,200 FINACabinda 900 SONANGOLSoyo 435 FINA
Total Coastal 167,475 85%
Up-Country
Huambo II 10,120 SONANGOL (Romanian)Huambo I 1,360 FINAMalange III 6,600 SONANGOL (USSR-tuilt)Malange II 324 FfNAMalarnge I 330 SACORJamba 3,000 FINAMatala 2,500 FINATchamutete 1,200 FINAKuito 800 SONANGOLLubango 450 FINALubango 206 SACORLwena 370 SACORLwena 200 MOBILKaala 250 MOBILLucala 250 MOBILCubal 125 FINACubal 95 MOBILMenongue 160 TEXACODondo 100 MOBILGanda 100 FINA
Total Up-Country 28,540 15%
TOTAL ANGOLA 196,015 100%
Source: SONANGOLO

- 168 -
Annex 8Page 7 of 10
Table 4: ANGOLA - INlAND PETROLEUM PRODUCT CONSUMPTION (SA'ES) - 1980-86(Tons)
Annual1900 1981 1982 1983 1984 1985 1986 growth
rate 80-86
a/ b/
LPG (Butane) 18,688 18,822 22,138 23,288 26,459 28,695 30,200 9.2%
Gasoline - Motor 79,567 81,794 87,814 88,722 94,252 95,004 103,680 4.3%Aviation 1,391 1,107 1,128 744 866 987 430 -13.4%
Total Gasoline 80,958 82,901 88,942 89,466 95,118 95,991 104,110 4.1%
Kerosene 29,835 32,412 36,910 39,229 40,625 43,908 46,310 7.5%
Jet fuel 114,350 105,650 105,965 i44,375 184,522 235,567 260,550 18.0%
Totai Kerosene/Jet fuel 144,185 138,062 142,875 183,604 225,147 279,475 306,860 15.9%
Gasoil 268,806 300,438 323,542 334,588 340,799 376,865 344,770 4.6%
Fuel oil 121,288 120,549 109,601 83,814 88,225 104,622 119,200 -2.0%
Asphalt 3L171 4,455 2,648 426 1,708 5,593 4,2C) 3.1%
TOTAL All Products 637,096 665,227 689,746 715,186 777,456 891,241 909,340 6.5%
a/ 1986 estimate based on 9-months' actuals.bl Least square estimates.
Source: SONANGOL.

- 169 -
Annex 8Page 8 of 10
Table 5: ANGOLA - PETROLEUM PRODUCT CONSUMPTION (SALES)Sectoral Breakdown, 1985
LPG Gasoline Kerosene Jet fuel Gasoil Fuel oil Total %
Industry 2,217 1,608 550 24,257 98,556 54,645 181,833 20.6XAgriculture 86 484 408 0 11,578 7,115 19,670 2.2%Transport 92 755 81 111,026 102,134 41,119 255,206 28.8%Construction 84 600 38 0 17,937 140 18,800 2.1%Resale 16,387 40,112 39,687 4 77,061 0 173,251 19.6%Government 642 2,417 563 198 14,911 423 19,154 2.2%Armed Forces 1,990 47,271 268 98,903 37,963 284 186,678 21.1%Other 7,197 1,757 2,314 1,179 16,726 895 30,068 3.4%
Total 28,695 95,004 43,908 235,567 376,865 104,622 884,661 100.0%
Source: SONANGOL.

- 170 -
Annex 8Paae 9 of 10
Table 6: SONANGOL - SALES THRO#JGH RESELLERS BY PROVINCE(In cubic meters)
Ist 9 months of
1984 1985 1986Gasolino Gasoil Kerosene Gasoline Gasoll Kerosene Gasoline Gasoll Kerosene
Coastal ProvincesLuanda 36,405 37,258 20,017 40,836 51,041 23,550 37,025 44,925 19,827
Other Coastal
Cabinda 814 931 110 396 719 152 649 607 265Zaire 508 542 1,047 291 632 1,011 372 604 952
Bongo 69 244 227 34 198 287 7 95 1,359Kwanza South 884 3,264 1,576 730 2,8(03 1,171 703 2,449 811Benguela 6,286 13,866 9,527 6,983 16,685 12,523 4,466 10,848 8,501Namibe 493 2,287 11.9 681 2,992 2,117 536 212 1,769
Subtotal Other 9,054 21,134 14,483 9,11' 24,029 17,261 6,733 16,715 13,657
Total Coastal 45,459 58,392 34,500 49,951 75,070 40,811 43,758 61,640 33,484
Up-Country ProvincesUlge 299 1,052 2,495 124 649 1,520 50 1,775 1,030Kwanza North 1,279 5,598 3,042 906 4,537 2,632 490 2,695 1,479Malange 697 1,539 563 194 366 265 25 132 38
Huambo 318 168 624 5)7 544 497 435 844 257
Ble 43 62 104 141 185 153 21 90 18Huila 3,288 7,071 3,037 3,457 7,994 3,491 2,354 5,222 3,011
Cuneno 20 24 0 9 0 25 0 53 15Lunda North 0 0 0 0 0 0 0 0 0Lunda South 0 0 0 0 0 0 0 0 0Moxico 0 0 0 0 0 0 0 0 0
Kuando Kubango _ 0 0 0 0 0 0 0 0
Total Up-Country 5,944 15,514 9,865 5,338 14,275 8,583 3,375 10,811 5,848
TOTAL Angola 51,403 73,906 44,365 55,289 89,345 49,394 47,133 72,451 39,332
AS PERCENTAGES OF TOTAL ANGOLA
1984 1985 1986Gasoline Gasoil Kerosene Gasollne Gasoll Kerosene Gasoline Gasoil Kerosene
Luanda 70.8 50.4 45.1 73.9 57.1 47.7 78.6 62.0 50.4Other Coastal 17.6 28.6 32.6 16.5 26.9 34,9 14.3 23.1 34.7Up-Country 11.6 21.0 22.2 9.7 16.0 17.4 7.2 14.9 14.9
Source: SONANGOL.

- 171 -
Annex 8Page 10 of 10
Table 7: PROJECTED ANGOLA PETROLEUM PRODUCTS CONSUMPTiON(In tons)
Actual Est.ann. -------------------Forecast------------- Assumed1986 growti 1987 1988 1990 1992 per annuma/ 1980-86 1987-92
LPG (Butane) 30,200 9.2% 31,408 32,664 35,330 38,213 4.0%
Gasoline - Motor 103,680 4.3% 107,827 112,140 121,291 131,188 4.0%
Aviation 430 -13.4% 430 43u 430 430 0.0%
Total Gasoline 104,110 4.1% 108,257 112,570 121,721 131,618 4.0%
Kerosene 46,310 7.5% 49,089 52,034 58,465 65,692 6,0%
Jet fuel 260,550 18.0% 266,193 272,005 284j158 2 170,051 2.2%
Total Kerosene/Jet fuei306,860 15.9% 315,282 324,039 342,623 362,743 2.8%
Gasoil 344,770 4.6% 357,874 371,481 400,284 431,346 3.8%
Fuel oil 119,200 -2.0% 122,984 126,896 135,120 143,912 3.2%
Asphalt 4,200 3.1% 4,284 4,370 4,546 4,730 2.0%
Total All Products 909,340 6.5% 940,089 972,020 1,039,624 1,112,562 3.4%
a/ Estimated from 9-months' actuals.
Source: SONANGOL Sales Department.

- 172 -
Annex 9Page 1 of 4
STRUCTURE OF PETROLEUM PRODUCT PRICES
The final price of petroleum products to consumers in Angola isaffected by price controls at three different transactional levels withinthe downstream sector:
(a) Crude Oil to the Luanda Refinery
(b) Products to the distributor (SONANGOL)
(c) Products to the final consumer
Pricing of Crude Oil to The Luanda Refinery
The prices paid by the refinery for crude oil are establishedby a "Protocol" agreed upon between the Government and the refineryowner, Fina Petroleos de Angola (FPA). This document guarantees that thecrude owners will receive as much revenue from a refinery sale as from anexport sale of the same crude grade. The crude owners do not pay royaltyon crude sold to the refinery. The royalty is deducted from theproduction income tax paid by crude owners. As the Government waives theroyalty income on crude sales to the refinery, the refinery is payingless than economic opportunity cost for the crude.
At present the crude oil feed for the refinery comes from tqefollowing FPA-operated areas:
- Onshore Kwanza - FINA/SONANGOL joint venture
- Onshore Congo (Soyo Crude) two areas:
(a) FINA/SONANGOL joint ventures
(b) FINA/TEXACO/SONANGOL joint venture.
In principle, the refinery crude price formula as defined bythe "Protocol" is as follows 1/:
PREF = PEXP x (l-r) + t x r = PEXP - (PEXP-t)r
Where, PREF = price per barrel of crude to the refinery
1/ At a fixed transport cost factor of US$1.50 the formula simplifiesto:
PREF = PEXP x 0.8333 + 0.25

- 173 -
Annex 9Page 2 of 4
PEXP = export price per barrel of crude
t = transport cost factor allowable under royaltycalculations, presently US$1.5/bbl for Congo andKwanza crudes.
r = royalty factor (0.1667).
Thus, the refinery price is equal to:
the export equivalent price of Congo/Kwanza crude
less the royalties, adjusted fo: tha cost of transporting thecrude to the refinery.
Currently the export equivalent price of Congo crude is set at$US2.00/bbl off .ne market price of "Bonny Light", while Kwanza crude ispriced for export at 94.32% of Congo crude. For instance, assuming thatthe market price of "Bonny Light" amounts to US$20.00/bbl, then theexport equivalent prices work out at $USl8.00/bbl (Congo) andUS$16.98/bbl (Kwanza), respectively. Thus, with r = 0.167 andt = US$1.50/bbl the refinery prices are US$15.25/bbl for Congo crude andUS$14.40/bbl for Kwanza crude, involving foregone tax revenues ofUS$2.75/bbl in the case of Congo crude and US$2.58/bbl for Kwanza crude.
Pricing of Products to the Distributor
The refinery gate prices of finished products for sale from FPAto SONANGOL are fixed by Government Decree No. 18/86 of November 1985.
The prices were based on complete refinery cost recoveryincluding a 10% return on investment. As opposed to the price of crudeto the refinery, these prices are not adjusted to changing crude oilprices or operating costs. The return on investment is fixed to 10% ofrefinery assets. Refinery deficits are covered by subsidies from theState budget, and surpluses are repaid to the State budget. Every year abalance is made based on verified operating costs for the previous yearand any outstanding imbalance is settled.
The pricing system is a pure "cost-plus" arrangement, providingno incentives to the refinery to minimize operating costs, as any savingswould revert to the Ministry of Finance. In recent years lower crudeprices and higher production and sales volumes have increased thepayments from the refinery to the Ministry of Finance. During 1986approximately 2 billion Kz was returned to the Ministry of Finance out ofa total refinery gross of 7.5 billion Kz for the year.
The prices of products are set mainly to attain social goalsrather than to perform allocative functions. However, since prices onthe world market have declined since 1985 official refinery gate pricesare roughly on par with their import parity values, as shown in

- 174 -
Annex 9Page 3 of 4
Table 1. In the table, the current price structure for the .najorproducts is compared with a CIF cost arrived at on the basis of ahypothetical freight and relate4 charges figure of US$20.00/t added toFOB Mediterranean spot. For LPG a hypothetical freight charge of US$80/twas used in addition to the FOB price.
Table 1: OFFICIAL REFINERY GATE PRICES VS INTERNATIONAL PRICES
-- Official Structure -- FOB Mediterranean plus US$20/t a/
US$/t 1985 1986 Ist H 1987
LFG 7.90 Kz/kg 266.54 304,58 204.75 223.67Gasoline 5.00 Kz/litre 228.06 275.50 161.25 186.50Kerosene/Jet fuel 5.02 Kz/litre 209.40 281.75 172.58 179.33Gasoil 3.55 Kz/litre 140.95 255.00 151.92 171.50Fuel oil (Heavy) 2.66 Kz/kg 89.80 167.25 87.42 121.00
Official Price as percent of International
LPG 88% 130% 119%Gasoline 83% 141% 122%Kerosene/Jet fuel 74% 121% 117%Gasoil 55% 931 82%Fuel oil (Heavy) 54% 103% 74%
a/ Except LPG for which US$80/t is added to FOB Mediterranean.
Source: Mission estimates.
Pricing of Products to Final Consumer
The Decree which stipulates the price structure of products tothe distributor also sets the structure of prices to the final con-sumer. Some minor adjustments have been made since the Decree came intoeffect in 1985.
SONANGOL is the only distributor of petroleum products andoperates the distribution on a "cost-plus" basis. The price structureallows SONANGOL a 10% profit margin plus a distribution cost allowanceand import differential. The latter element is intended to cover thedifference between the landed cost of the imported product and therefinery gate cost for domestic products. The difference between theseallowable costs and the final selling price is made up of a tax to orsubsidy from the Ministry of Finance. An illustration of the pricebuildup for the major products is shown in Table 2.

- 175 -
Annex 9Page 4 of 4
Table 2: OFFICIAL PRICE STRUCTURE INCLUDING REVISIONS
Gasoline Kerosene Jet B Jet A Gasoil LPG LFO HFO
--------- Kz/litre ---------------- ---------Kz/k--
Refinery Gate 5.00 5.02 3.75 5,02 3.55 7.90 3.93 2.66
Tax 6.64 0.50 0.11 0.32 1.43 1.96 0,07 0.07
SONANGOL Costs 2.83 1.79 1.01 1.09 1.72 11.22 1,58 0.15
SONANGOL Profit 0.73 0.68 0.48 0.60 0.53 1.92 0.55 0.28
Reseller Margin 0.34 0.70 0.00 0.00 0.16 1.08 0.00 0.00
Import Differentia; 0.00 0.00 0.00 (0.07) 0.00 0.07 0.00 0.00
Margin 9.46 (1.70) 0.94 0.53 (0.38) (9.14) (1.33) 0.04
Final Price 25,00 7.00 6.29 7.50 7.00 15.00 4.80 3.20
Net Margin 16.10 (1.20) 1.06 0.78 1.05 (7.25) (1.26) 0.11
Source: MEP.
Looking at cost recovery on individual products, based on officialprices and the current SONANGOL cost/profit structure, kerosene, LPG, andlight fuel oil are the only products which receive a payment from theState budget.
The total payment owing to the Ministry of Finance on themargins on petroleum product distribution was projected at Kz 877 millionin 1987. SONANGOL is permitted to deduct its costs for transporting Soyocrude to the refinery. These were budgeted at Kz 111 million for 1987.Therefore the net payment to the Ministry of Finance in 1987 would havebeen Kz 766 million. Adding Kz 1,735 million of total projected revenueaccruing from product taxes, total government revenue from SONANGOL salescan be estimated at Kz 2,501 million for 1987.

- 176 -
Annex 10Page 1 of 4
ECONOMICS OF THE LUANDA REFINERY USING ACTUAL HISTORICAL VALUES
In order to evaluate the economics of the Luanda refinery asimplified model was developed. The revenues and costs per ton of cruderun are calculated using typical plant yields for crude multiplied byproduct values based on FOB Mediterranean plus USS20/t plus a charge forterminalling, in these cases assumed to be US$40/t for liquid products,and US$20/t for LPG. The model is designed to allow a selected propor-tion of the total fuel oil yield to be sold to export at low sulfur fueloil (LSFO) prices with a deduction for freight. Cabinda crude with adiscount is used as the price basis for the Soyo FOB export price. Threecases were run using actual crude and product values for three differentperiods: 1985, 1986, and the first six months of 1987. The model andresults for each period are illustrated in Tables 1, 2, and 3.
As indicated with these opportunity values assumed for crudecosts and product values, the gross refining margin is sufficient in allcases to cover "efficient" cash operating costs of US$10.95/t (US$1.50per barrel) and earn a substantial operating profit.
The model was set up so that the values of a few basic para-meters could be varied in order to check the sensitivity of the economiesto these variations.
For example, as more LSFO is sold to export the operatingprofit declines since a lower netback value is obtained on this than onlocal sales at border prices. Also, the smaller the discount assumed forSoyo crude off Cabinda "marker" the lower the operating profit.
A s';mmary of the base case operating profits and assumptionsand aforementioned sensitivity results is provided in the followingtables.

- 177 -
Annex 10Page 2 of 4
Table 1: ECONOMICS OF THE LUANDA REFINERY - RUNNING SOYO CRUDE1985 OPPORTUNITY VALUES
Assumptions
LSFO to export 80.0 Total productionTerminalling Liq. Products USS 4.00 per tonTerminalling LPG USS 20.00 per tonLSFO Freight etc. USNE USS 22.00 per tonCabinda Crude FOB USS 188.76 per tonSoyo Discount USS 3.65 per tonSoyo FOB USS 185.11 per tonLocal Crude Transport USS 3.00 per ton
Crude & Product Cost/Revenue perTon Values per ton ton Crude run FOB MED NYH
(USS) (USS) (US$)
Crude ('0OOs) 188.11 (188.11) +20 LSFOProduction
LPG 0.014 324.58 4.54 304.58Gasoline 0.103 279.50 28.79 275,50Kerosene/jet fuel 0.110 285.75 31.43 281.75Gasoil 0.248 259.00 64.23 255.00Fuel oil inland 0.097 171.25 16.54 167.25LSFO exwert 0.386 159.75 61.73 167.25 181.75
Total products 0.958 207.27
Gross Refinery Margin 19.16"Efficient" Cash Operating Costs (10.95)Operating - Profit 8.21
Source: Mission calculations.

- 178 -
Annex 10Page 3 of 4
Table 2: ECONOMICS OF THE LUANDA REFINERY - RUNNING SOYO CRUDE1986 OPPORTUNITY VALUES
Assumptions
LSFO to export 80.0% Total productionTerminalling Liq. Products US$ 4.00 per tonTerminalling LPG USS 20.00 oer tonLSFO Freight etc. USNE USS 22.00 Der tonCabinda Crude FOB US$ 96.92 per tonSoyo Discount US$ 3.65 per tonSoyo FOB US$ 93.27 per tonLocal Crude Transport USS 3.00 per ton
Crude & Product Cost/Revenue perTon Values per ton Ton crude run FOB MED NYH
(US$) (US$) (US$)
Crude ('OOs) 96.27 (96.27) +20 LSFO
ProductionLPG 0.014 224.75 3.15 204.75Gasoline 0.103 165.25 17.02 161.25Kerosene/jet fuel 0.110 176.58 19.42 172.58Gasoil 0.248 155.92 38.67 151.92Fuel oil inland 0.097 91.42 8.83 87.42LSFO export 0.386 77.17 29.82 99.17
Totai products 0.958 116.91
Gross Refinery Margin 20.64"'Efficient" Cash Operating Costs (10.95)Operating - Profit 9.69
Source: Mission calculations.

- 179 -
Annex 10Page 4 of 4
Table 3: ECONOMICS OF THE LUANDA REFINERY - RUNNING SOYO CRUDEIst Half 1987 OPPORTUNITY VALUES
Assumptions
LSFO to export 80.0% Tota oroducTion
Terminalling Liq. Products US$ 4.00 Der ton
Terminalling LPG US$ 20.00 De- ton
LSFO Freight etc. USNE USS 22.00 per ton
Cabinda Crude FOB US$ 123.18 per ton
Soyo Discount USS 3.65 per ton
Soyo FOB JSS 119.53 per ton
Local Crude Transport US$ 3.00 per ton
Crude & Product Cost/Revenue perTon Values Per ton ton Crude run FOB MED NYH
(US$) (USS) (USS)
Crude ('°°°s) 122.53 (122.53) +20 LSFO
ProductionLPG 0.014 243.67 3.41 223.67Gasoline 0.103 190.50 19.62 186.50Kerosene/jet fuel 0.110 183.33 20.17 179,33
Gasoil 0.248 175.50 43.52 171.50Fuel oil inland 0.097 125.00 12.07 121.00LSFO export 0.386 101.18 39.10 167.25 123.18
Total products 0.958 137.89
Gross Refinery Margin 15.36"Efficient" Cash Operating Costs (10.95)Operating - Profit 4.41
Source: Mission calculations.

- 180 -
Annex 11Page 1 of 2
HUMAN hESOURCES IN THE DOWNSTREAM PETROLEuM SECTOR
Refinery
1. There are presently about 450 refinery employees, about 70 ofwhom are expatriates. 3ix of the expatriates are in top management while65 are skilled laborers (first-class operators, senior mechanics,mechanical foremen, etc.). The total numoer of expatriates is down fromabout 100 three years ago and is continuing to decline through attri-tion. FPA is engaged in extensive training of Angolans. They haverelied heavily on the Instituto Nacional de Petroleo (INP) at Sumbe(para. 4) for training operators and at present have about 20 traineesthere. They are sufficiently encouraged by the good results obtainedfrom the training of operators at Sumbe that they are now starting tosend trainees in more specialized areas such as instrument mechanics andgeneral mechanics. They have also regularly sent people abroad for two-month training courses at PETROFINA refineries, but this program has beenconstrained by Government authorities of late due to foreign exchangelimitations. They also have some refinery on-site training run by anItalian firm, IDEAS.
SONANGOL: Distribution and Marketing
2. There are some 3,000 employees in SONANGOL'S distribution andmarketing division. This does not include service station staff whooperate as independent dealers on a reseller margin. About half ofSONANGOL's employees are attached to the storage installations while therest are drivers, mechanics, accountants, sales agents, etc. There areseveral hundred employees at the 20-odd empty inland terminals. Even ifthe distribution system were running properly it is apparent that withthe present work force there would be overstaffing in relation to volumedistributed. Excessive staif, buildings, and facilities are the resultof SONANGOL's taking over the old private companies. This led toduplication, overstaffing, and higher overheads than necessary. SONANGOLrecognizes that it must rationalize inherited staff and facilities. Withthe strategic/military situation as it is, however, it is difficult topropose a major rationalization study and program at this time. SONAN4COLhas made some progress in this regard and will continue to do so--perhapsin smaller steps and in more gradual fashion than would be ideal in a"normal" environment.
3. In summary, SONANGOL has trained a total of about 100 operatorsat INP, Sumbe, in the past five years. This may seem large in relationto the total staff complement but turnover at SONANGOL is extremely high.SONANGOL must train many just to have an available pool as many are lostto other enterprises. One of the causes of the high turnover or drop-outrate is the low trainee pay. Trainees receive about Kz 8,000/monthduring training and no food benefits except for use of the refinerycafeteria while within the plant. Even a trained operator receives nomore than about Kz 12,000 to Kz 15,000/month, some of it in food.

- 181 -
Annex 11Page 2 of 2
4. Petroleum Training Center (PTC) - Sumbe. The informationavailable on the PTC 1/ at Sumbe suggests that the preparation/-feasibility stage for this center was insufficient, start-up difficultieswere greater than expected (16-month delay from early 1984 to late 1985)and training objectives are not being attained. UNDP/UNIDO (the UnitedNations Development Programme/United Nations International DevelopmentOrganization), contrary to its practice, did not assign a project managerso that decision-making and problem-solving were a slow and cumbersomeprocess. The PTC did not have the support of its main designatedbeneficiaries (the oil companies) in part because training programs werenot designed in consultation with or to satisfy the oil companies.Naturally enough, the oil companies preferred to use their own trainingfacilities. More recently, however, they are showing more activeinterest and support, to the extent of sending their own instructors tothe center together with training equipment. The Government (Ministry ofEducation and the MEP) and the international partners (UNDP, UNIDO,NORAD, and Italy) should perhaps reconsider the scale of this projectand, possibly, restart it under the firm control of the oil industry butwith assistance from any of the present partners willing to continuehelping Angola train people for its most important industry. Theinterests of the oil companies in Angola probably do not extend to otherSADCC (Southern African Development Coordination Conference) countries.If so, training of nationals of other SADCC countries should still bepossible, but could probably not be the main task of the PTC.
5. The greatest shortfall in meeting objectives has been in thetraining of instructors. Reportedly, only ten instructors were trainedand only five remain at the PTC. 2/ Obviously, this is the highestpriority for future action if the PTC is ever going to become even partlyself-sustaining.
6. No financial information at all was available to the mission.Therefore, it is impossible to comment on the cost-effectiveness of thePTC. However, operating the PTC is clearly very expensive. Beforemaking a decision either to continue using or stop using the center,objectives and achievements need to be compared to costs. The PTCrepresents a considerable claim on the scarce resources of Angola whichcontributed US$2-3 million/y to the operation of the center. This amountis in addition to the many millions supplied by other donors.
1/ A member of the Energy Assessment Mission visited Sumbe but thisreport benefitted from consulting a UNDP report entitled: UNDP:Evaluation Mission on RAF/83/22 - Assistance to the PetroleumTraining Center, UNDP/UNIDO, Luanda, Final Report, 25 April, 1987.
2/ Ten other instructors from other SADCC countries were also trainedand returned home. Between late 1985 and early 1987, 311 traineesattended courses or seminars.

- 182 -
Anndx 12Page 1 of 3
PETROLEUM PRODUCT TRADING
Middle Distillate Imports
1. SONANGOL procures its imports of jet fuel and gasoil throughits U.K. subsidiary, SONANGOL LIMITED. SONANCOL LIMITED is a jointventure with the large West German trading company, STINNES, whichassists in arrangements related to external product trading--both importsand exports. Before the SONANGOL-STINNES inint venture arrangement waspromulgated about a year ago, SONANGOL LIi ED tried to handle middledistillates imports on an as-needed, ad hoc cargo-by-cargo basis. Thesporadic nature of the demand, long distance from major supply sources,and foreign exchange/letter of credit problems all combined to make theattempt at importing in 10,000 DWT vessels somewhat complicated. Withthe joint venture arrangement a steady import pattern of 5,000-tonparcels roughly every month from Tenerife, Canary Islands has beenestablished. The joint venture partnership has a 5,000 DWT tanker ontime-charter which can be out-chartered to earn revenues when notrequired for the Angola import chartering. For instance, at presentAngola via SONANGOL pays the joint venture Platt's Mediterranean plusUS$39.00/t CIF Luanda for A-1 jet fuel. This covers FOB cost ofacquiring the product, marine insurance, marine loss, letter of creditarrangements, necessary financing and management of the entireacquisition, and chartering operations. One half of the profits on thisand other partnership activities flow back to SONANGOL LIMITED throughits joint venture share. Currently, these profits on product trading arefinancing the entire SONANCOL LIMITED London office, whose principalactivity is crude oil trading.
2. The mission has undertaken an analysis of the middledistillates procurement arrangement. Small tanker freight quotations forservice from the major supply sources of Tenerife, the Canaries, andAugusta, Italy, are illustrated in Table 1. These figures result in acalculated freight cost of US$26.91/t for Tenerife-Luanda and US$39.64/tfor Augusta-Luanda. If a trading commission (for chartering, financing,and general "implementation" function of the joint venture) is includedin the total, CIF-FOB differential works out at US$33.62/t for Tenerife-Luanda and US$46.81/t foe AL3usta-Luanda as shown in Table 1.
3. Since the existing arrangement incorporates a totaldifferential of US$39.00/t above Platt's Mediterranean spot price, Angolapays an "excess margin" of about US$5/t on a Tenerife sourcing. Procur-ing in Augusta would clearly be too costly.
These calculations call for two comments:
(a) assuming that the 5,000-ton shipment is correct, then even ahigh cost (i.e., distant) source of supply such as Tenerifeapparently costs less than present arrangements (by aboutUS$5/t);

- 183 -
Annex 12Page 2 of 3
Table 1: DERIVED CIF-FOB DIFFERENTIAL FOR MIDDLE DISTILLATES REPLENISHMENT-LUANDA
Tenerife- Augusta-Luanda Luanda Bases
USS/t US$/t
FOB Cost 159.51 159.51 Average Med PIW Ist 6 months, 1987
Ocean Freight 26.91 39.64186.42 199.15
Marine loss, Insurance, 1.12 1.20 0.6% FOB pius freightCommission 5.59 5.97 3.0% FOB plus freight
CIF Luanda 193.13 206.32
CIF-FOB differential 33.62 46.81
Source: SONANGOL and Annex 9, Table 1.
(b) it seems evident that a 10,000 DWT vessel is much more appro-priate given that total imports exceed 100,000 t/y and Tenerifeis an unnecessarily distant source of supply.
US$/t
Acquisition cost FOB Luanda 108.00Ocean freight Luanda-New York 11.25
119.25
Marine loss 0.3Z 0.36Marine insurance 0.2Z 0.24Trading commission 3% 3.58Landed cost New York 123.19
4. Assuming that SONANCOL-STINNES could actually sell the fuel oilat New York Harbor spot cargo prices and get a 3% trading commission formanaging all "implementation" functions, it would make an "excess margin"of about US$7/t under the current arrangement. At present export levelsthis amounts to some US$3.5 million/y. It appears that some profitswhich could go to SONANGOL (and the Government) thus accrue to SONANGOLLIMITED. Even if half the profits flow back to SONANGOL LIMITED it mightbe worth discussing with STINNES whether a better deal could be struck.Alternatively, 3ONANGOL would probably do better by returning to its1981-82 practices of opening tenders in the international fuel oilmarkets. In the past, offers received were about New York Harbor lessUS$2.40/bbl or US$16.80/t. Adding other incidentals, this would give
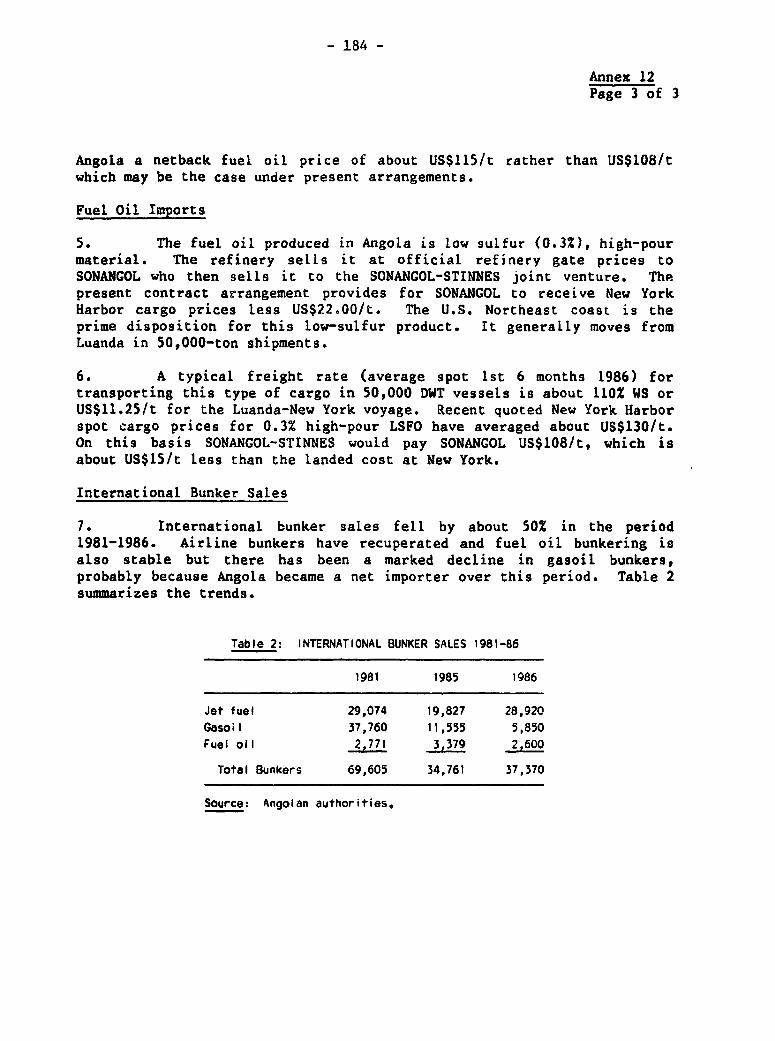
- 184 -
Annex 12Page 3 of 3
Angola a netback fuel oil price of about US$115/t rather than US$108/twhich may be the case under present arrangements.
Fuel Oil Imports
5. The fuel oil produced in Angola is low sulfur (0.3%), high-pourmaterial. The refinery seLls it at official refinery gate prices toSONANGOL who then sells it to the SONANGOL-STINNES joint venture. Thepresent contract arrangement provides for SONANGOL to receive New YorkHarbor cargo prices less US$22.00/t. The U.S. Northeast coast is theprime disposition for this low-sulfur product. It generally moves fromLuanda in 50,000-ton shipments.
6. A typical freight rate (average spot 1st 6 months 1986) fortransporting this type of cargo in 50,000 DWT vessels is about 110% WS orUS$11.25/t for the Luanda-New York voyage. Recent quoted New York Harborspot cargo prices for 0.3% high-pour LSFO have averaged about US$130/t.On this basis SONANGOL-STINNES would pay SONANGOL US$108/t, which isabout US$15/t less than the landed cost at New York.
International Bunker Sales
7. International bunker sales fell by about 50% in the period1981-1986. Airline bunkers have recuperated and fuel oil bunkering isalso stable but there has been a marked decline in gasoil bunkers,probably because Angola became a net importer over this period. Table 2summarizes the trends.
Table 2: INTERNATIONAL BUNKER SALES 1981-86
1981 1985 1986
Jet fuel 29,074 19,827 28,920Gasoil 37,760 11,555 5,850Fuel oil 2,771 3,379 2,600
Total Bunkers 69,605 34,761 37,370
Source: Angolan authorities.

- 185 -
Annex 13Page 1 of 10
FIGURES ON TM POWER SUBSECTOR
Table 1: INSTALLED AND AVAILABLE GENERATING CAPACITY (1987)
System Name of Type Number of units Capacity (MW) Date of Date of
and Plant a/ and unit power Installed/Availabie Commissioning Unavailability
Province (MW) Month/year Month/year
North
Kuanza N. Cambambe H 2 w 45 & 2 x 45 180.0 135.0 1963,1973
Bengo Mabubas H 2 x 3 & 2 x 5.9 17.8 - 1953,1959 2/1986
Luanda Luanda, GTI GT I x 25.6 25.6 25.6 1980it Luanda, GT2 GT I x 31.2 31.2 31.2 8/1985
Subtotal 254.6 191.8
Central
Benguela Lomaum H 2 x 10 & 1 x 15 35.0 - '964-1972 3/1983
Blopio H 4 x 3.6 14.4 7.2 1957
Biopio GT I x 22.8 22.8 22.8 2/1974
of Biopio D 2 x 1.5 3.0 1.5 1982
it Lobito D 4 x 5 b/ 20.0 10.0 1986
Huambo Huambo GT 1 x 10 c/ 10.0 - 1981 2/1985
to Huambo D 5 x 0.8 & 2 x 0.85 6.0 5.2 1953-1986
Subtotal 111.2 46.7
South
Huila Matala H 2 x 13.6 27.2 13.6 1959It Lubango D 3 x 0.4 & 12 x 0.2 3.6 3.6 n.a.
it Namibe D 2 x 5.75 11.5 11,5 1980
it Tombwe 0 1 x 1.6 1.6 - 1970
it Jamba D 3 x 1.9 5.7 - 1968
if Saco D 2 x 1.45 2.9 - n.a
Subtotal 52.5 28.7
Isolated Systems
Cabinda Malongo GT I x 12.3 12.3 - 1980 1985
to it D 3 x 1.5 4.5 - 8/1971
it it D 4 x 0.3 1.2 1.2 n.a
Ulge Luquixe H 3 x 0.36 1.1 1.1 1957,1968,1971
it Uiae D 3 x 06 1.8 1.8 n.ato It D 1 x 1.5 1.5 1.5 1982
a/ H = Hydroelectric; D a Diesel; GT = Gas Turbine.b/ Railway carriage mounted.c/ ISO rating 13.5 MWo Derating of 22% due to altitude.
Source: SADCC, SCNEFE, and ENE.
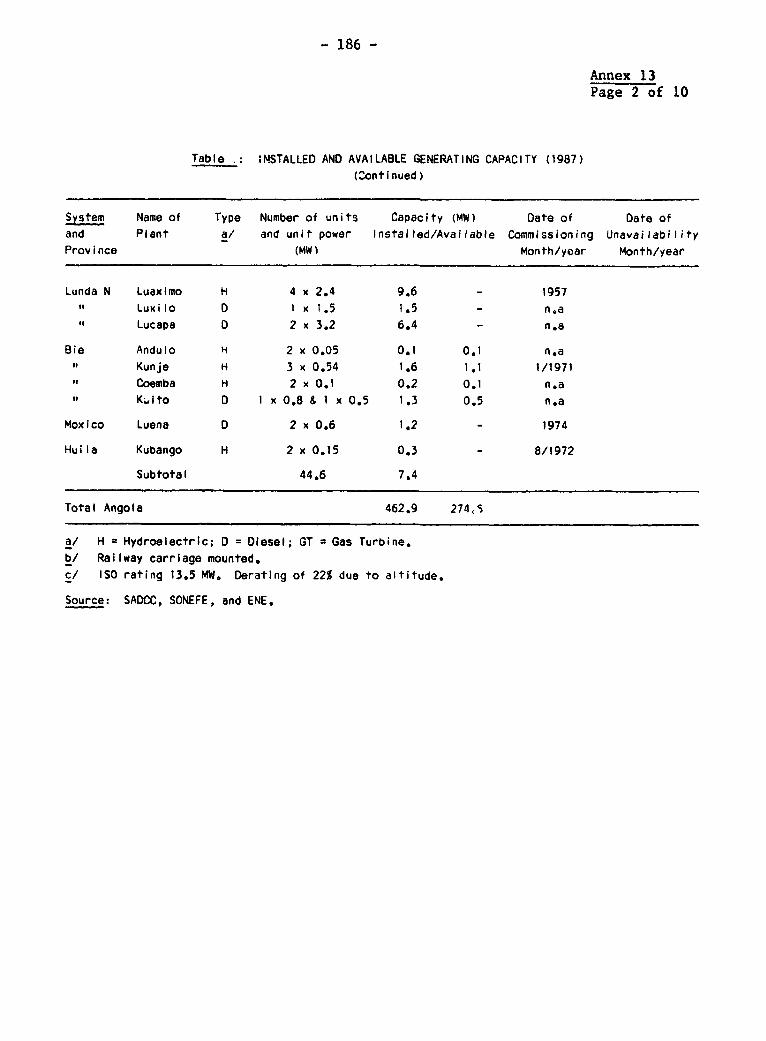
- 186 -
Annex 13Page 2 of 10
Table : ;NSTALLED AND AVAILABLE GENERATING CAPACITY (1987)(Continued)
System Name of Type Number of units Capacity (MW) Date of Date ofand Plant a/ and unit power Installed/Available Commissioning UnavailabilityProvince (MW) Month/year Month/year
Lunda N Luaximo H 4 x 2.4 9.6 - 1957of Luxilo D I x 1.5 1.5 - n.aof Lucapa D 2 x 3.2 6.4 - n.a
Bie Andulo H 2 x 0.05 0.1 0.1 n.aKunje H 3 x 0.54 1.6 1.1 1/1971
ft Coemba H 2 x 0.1 0.2 0.1 n.aof Kuito D I x 0.8 & 1 x 0.5 1.3 0.5 n.a
Moxico Luena D 2 x 0.6 1.2 - 1974
Huila Kubango H 2 x 0.15 0.3 - 8/1972
Subtotal 44.6 7.4
Total Angola 462.9 274.S
a/ H c Hydroelectric; D = Diesel; GT = Gas Turbine.b/ Railway carriage mounted.c/ ISO rating 13.5 MW. Derating of 22% due to altitude.
Source: SADCC, SONEFE, and ENE.

Table 2: TOTAL GENERATION BY TYPE OF PLANT
(GWh)
1970 1971 1972 1973 1974 1975 1976 1977 1978 1979 1980 1981 1982 1983 1984 1985 1986
Hydro
Cabinda 255.7 303.2 370.7 502.6 552.2 421.4 338.6 394.7 419.4 465.0 489.9 506.7 545.0 674.4 565.6 544.2 590.4
Mabubas 46.7 72.5 67.4 27.7 15.2 6.3 0.3 1.3 2.9 1.3 2.4 1.6 1.9 4.1 3.6 4.7 1.3
Lomaum 81.9 97.9 109.9 120.8 125.8 92.4 63.4 72.4 90.4 85.3 112.4 99.4 112.5 2.4 0.0 0.0 0.0
Olopio 37.2 34.9 34.1 43.1 37.6 42.7 14.4 24.0 16.0 39.0 22.6 32.1 38.3 34.5 16.4 12.0 35.1
Matala 91.5 61.8 67.5 77.8 62.1 69.3 9.6 10.8 8.7 10.5 10.5 10.7 8.6 10.9 8.0 9.6 8.1
Other hydro 91.5 61.R 67.5 77.8 62.1 69.3 9.6 10.8 8.7 10.5 10.5 10.7 8.6 10.9 8.0 9.6 8.1
Total Hydro 543.7 605,0 680.3 814.1 858.1 705.1 460.7 529.4 568.1 636.4 675.3 688.1 748.4 674.3 634.7 621.0 691.1
Gas turbines
Luanda - - - - - - - - - - 0.1 0.0 0.3 0.1 0.5 6.2 14.2
Bioplo - - - - 8.0 0.0 0.0 0.0 0.1 0.0 1.8 8.8 0.7 60.0 61.9 49.7 15.5
Huambo - - - - - - - - - - 1.8 1.7 0.1 11.0 7.1 2.9 0.0
Cabinda - - - - - - - - - - 6.0 9.9 18.8 14.2 13.6 18.1 5.7
Total Gas t:rbines 0.0 0.0 0.0 0.0 8.0 0.0 0.0 0.0 0.1 0.0 9.7 20.4 19.9 85.3 88.1 76.3 35.4
Diesel Generation
100.0 137.0 158.5 170.2 162.7 133.2 71.4 28.8 15.0 13.0 5.3 8.0 10.3 4.2 8.6 7.5 27.0
Total Angola 643.7 742.0 838.8 984.3 1023.8 838.3 532.1 558.2 588.2 649.4 690.3 716.5 778.6 763.8 726.4 704.8 753.5
Average growth rate
S p.a. 15.3 13.0 17.3 4.5 -18.5 -36.5 4.9 4.5 11.4 6.3 3,8 8.7 -1.9 -4.9 -3.0 6.9
Percentage of Total
Hydro 84.46 81.54 81.10 82.71 88.41 84.11 86.58 94.84 97,41 98.00 97.83 96.04 96.12 88.28 87.98 88.11 91.72 0 D
Gas turbines 0.00 0.00 0.00 0.00 0.78 0.00 0.00 0.00 0.02 0.00 1.41 2.85 2.56 11.17 11.44 10.83 4.70
Diesel 15.54 18.46 18.90 17.29 15.81 15.89 13.42 5.16 2.57 2.00 0.77 1.12 1.32 0.56 1.18 1.06 3.58 0 w
I-r
Source: SADCC, SONEFE. and ENE. 0
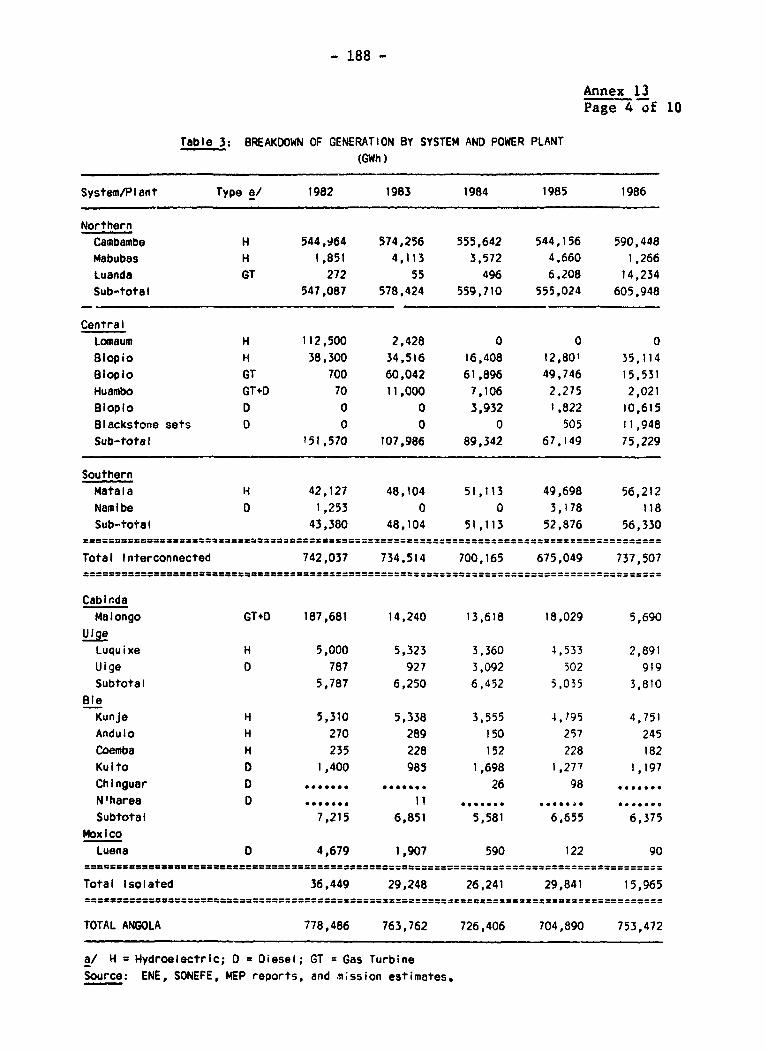
- 188 -
Annex 13Page 4 of 10
Table 3: BREAKDOWN OF GENERATION BY SYSTEM AND POWER PLANT(GWh)
System/Plant Type a/ 1982 1983 1984 1985 1986
NorthernCambambe H 544,964 574,256 555,642 544,156 590,448Mabubas H 1,851 4,113 3,572 4,660 1,266Luanda GT 272 55 496 6,208 14,234Sub-total 547,087 578,424 559,710 555,024 605,948
CentralLomaum H 112,500 2,428 0 0 0Blopio H 38,300 34,516 16,408 12,801 35,114Bloplo GT 700 60,042 61,896 49,746 15,531Huambo GT+D 70 11,000 7,106 2,275 2,021slopio D 0 0 3,932 1,822 10,615Blackstone sets D 0 0 0 505 11,948Sub-total 151,570 107,986 89,342 67,149 75,229
SouthernMatala H 42,127 48,104 51,113 49,698 56,212Namlbe 0 1,253 0 0 3,178 118Sub-total 43,380 48,104 51,113 52,876 56,330
Total Interconnected 742,037 734,514 700,165 675,049 737,507
CabindaMalongo GT.D 187,681 14,240 13,618 18,029 5,690
U;QeLuquixe H 5,000 5,323 3,360 1,533 2,891Uige 0 787 927 3,092 502 919Subtotal 5,787 6,250 6,452 5,035 3,810
BieKunje H 5,310 5,338 3,555 4,795 4,751Andulo H 270 289 150 257 245Coemba H 235 228 152 228 182Kulto D 1,400 985 1,698 1,277 1,197Chinguar D ....... ..*.... 26 98 ......
N'harea D ....... 11 . , ...... .......
Subtotal 7,215 6,851 5,581 6,655 6,375Moxico
Luena 0 4,679 1,907 590 122 90
Total Isolated 36,449 29,248 26,241 29,841 15,965
TOTAL ANGOLA 778,486 763,762 726,406 704,890 753,472
a/ H4 = Hydroelectric; D = Diesel; GT = Gas TurbineSource: ENE, SONEFE, MEP reports, and Csssion estimates.

- 189 -
Annex 13Page 5 of 10
Table 4: TOTAL ELECTRICITY GENERATION, DISTRIBUTION AND LOSSES(1967-1986)
Generation Distribution a/ LossesBase Growth rate Base Growth rate % of
Year GWh 100 a p.a. GWh 100 % p.a. GWh Generation
1967 390.8 38.0 - 372.8 40.6 - 18.0 4.6
196d 456.8 44.4 16.9 433.2 47.1 16.2 23.6 5.21969 541.5 52.6 18.5 519.0 56.5 19.8 22.5 4.21970 643.8 62.6 18.9 618.9 67.3 19.2 24.9 3.91971 741.9 72.1 15.3 702.0 76.4 13.4 39.9 5.41972 838.8 81.5 13.0 787.2 85.6 12.1 51.6 6.21973 984.3 95.7 17.3 914,5 99.5 16.2 69.8 7.11974 1,028.8 100.0 4.5 919.2 100.0 0.5 109.6 10.71975 838.8 81.5 -18.5 768.6 83.6 -16.4 69.7 8.31976 532.1 51.7 -36.5 487.9 53.1 -36.5 44.2 8.31977 558.8 54.3 4.9 511.9 55.7 4.9 46.3 8.31978 583.2 56.7 4.5 540.6 58.8 5.6 42.6 7.31979 649.4 63.1 11.4 596.8 64.9 10.4 53.5 8.31980 690.3 67.1 6.3 626.1 68.1 4.9 63.8 9.21981 716.5 69.6 3,8 644.0 70.1 2.9 72.5 10,11982 778.6 75.7 8.7 712.6 77.5 10.7 66.0 8.51983 763.8 74.2 -1.9 686.6 74.7 -3.6 77.2 10.11984 726.4 70.6 -4.9 634.3 69.0 -7.6 92.1 12.71985 7804.8 68.5 -3.0 605.0 65.8 -4.6 99.8 14.21986 753.5 73.2 6.9 636.2 69.2 5.2 117.3 15.6
Average Annual growth rates (%) calculated using least square estimates:
Generation Distribution
1967 - 1973 16.6 16.2
1977 - 1982 6.9 6.6
1977 - 1986 3.1 2.1
a/ tIDistribution", figures apparently include losses in MV (60 kV and lower) distributionnetworks.
Source: Industrial Statistics (INE: 1967-1973); ENE, SONEFE, MEP reports, and missionestimates.

- 190 -
Annex 13Page 6 of 10
Table 5: TOTAL LENGTH OF TRANSMISSION LINES - 1987
North Central South IsolatedVoltage system system system systems Total
kV (km) (km) (km) (km) (km)
220 548 - - - 548
150 - 281 288 - 569
100 159 - - - 159
60 223 a/ 62 b/ 496 228 c/ 1,009
a/ Includes 109 km of new line Mabubas-Quibaxe (Dembos electri-fication).
b/ Currently operated at 30 kV.c/ ENDIAMA system, province of Lunda N.
Source: SADCC, SONEFE, and ENE.

- 191 -
Annex 13Page 7 of 10
Table 6: MAIN TRANSMISSION LINES - CHARACTERISTICS
System No. of Commiss.Line Circu Its kV km Conductors Year Comments
North
Cambambe-Luanda I 220 175.0 ACSR Crow 1963
Cambambe-Viana 1 220 158.0 " 1984 a/Viana-Luanda 1 220 17.0 o 1984 Currqntly at 60 kVCambamto-N'Dalatando 1 220 73.0 o 1970Camtdmbe-Gabela 1 220 125.0 "t 1974 Out of order since 1984N'rialatando-Cacuso I 100 97.0 ACSR 30/7 1974Cacuso-Malange I 100 62.0 "1 1974
Mabubas-Luanda 2 60 57.0 Cu 50mm 2 1953Mabubas-Quibaxe 1 60 109.0 n.a. 1987 b/
Center
Biopio-Quileva 1 150 17.5 ACSR Panther n.a,Biopio-Lomaum 1 150 96.5 t 1964Lomaum-A. Catumbela 1 50 48.5 of 1964A. Catumbela-Huambo 1 150 118.5 " 1964
Huambo-Chinguar 1 60 n.a. n.a. n.a. Operated at 30 kV
South
Matala-Lubango I 150 168.0 ACSR Panther 1959Matla-Jamba 1 150 120.0 " 1973
Lubango-Namibe 2 60 162.0 (i) Cu 70mm2 1960(ii) ASCSR Partridge 1974
Namibe-Toinbwa 1 60 94.5 ACSR Civetta 1974 Highly corrodedNamibe-Saco I 60 9.0 f' 1973
Jamba-Tchamutete 1 60 68.0 ACSR 26/7 1973 Out of order
a/ Inactive due to works in Viana substation.b/ Dembos electrification. To be commissioned in July 1987.
Source: "Estudo da Interligacao das Redes de Angolat", EDP; Lisbon 1984.

- 192 -
Annex 13Page 8 of 10
Table 7: BREAKDOWN OF DISTRIBUTION BY SYSTEM AND PROVINCE(MWh)
System/Prevince 1982 1983 1984 1985 1986
Northern
Luanda & Bengo 440,750 475,893 453,115 459,763 491,920Kuanza N+Malange 35,190 23,159 22,596 16,256 13,260Kuanza S 19,980 17,946 10,322 308 925
Subtotal 495,920 516,998 486,033 476,336 506,105
Central
Benguela 113,400 73,252 68,123 52,252 61,018Huambo 33,254 30,278 17,719 10,895 11,563
Subtotal 146,654 103,530 85,842 63,147 72,581
Southern
Huila 20,392 22,697 21,957 21,292 21,501Namibe 15,787 14,328 18,038 16,960 21,789
Subtotal 36,179 37,025 39,995 38,252 43,290
TOTAL INTERCONNECTED 678,753 657,553 611,870 577,735 621,976
Isolated
Cabinda 17,401 14,225 11,516 16,943 4,744Uige 5,281 6,249 5,386 4,064 3,458Bie 6,808 6,639 5,007 6,116 5,920Moxico 4,397 1,907 590 121 90
Total Isolated 33,387 29,021 22,499 27,244 14,212
TOTAL ANGOLA 712,640 686,574 634,369 604,979 636,188
Source: ENE, SONEFE, MEB reports, and mission estimates.

- 193 -
Annex 13Page 9 of 10
Table 8: REGIONAL BREAKDOWN OF ELECTRICITY DISTRIBUTION a/ IN SELECTED YEARS(In GWh and Percentage)
Percentage ofElectricity Distribution (GWh) total (3)
Province 1967 1970 1972 1974 1982 1986 1974 1986
Luanda & Bengo b/ 172.8 285.6 409.0 478.8 440.8 491,. 52.1 77.3
Benguela c/ 93.5 124.4 137.8 147.2 113,4 61.0 16.0 9.6
Huila l Namibe d/ 20.6 69.3 78.2 95.5 36.2 43.3 10.4 6.8
Huambo e/ 16.6 30.3 32.1 40.1 33.3 11.6 4.4 1.8
Sub total 303.5 509,6 657.1 761.6 623.7 607.8 82.9 95.5
Others 69.3 109.3 130.1 157.6 88.9 28.4 17.1 4.5
Total 372.8 618.9 787.2 919.2 712.6 636.2 100.0 100.0
a Distribution includes customer consumption and MV and LV distribution losses.b/ Includes the city and greater Luanda.c/ Includes the urban areas of Benguela and Lobito.d/ Includes the urban areas of Lubango and Namibe.e/ Includes the urban area of Huambo.
Source: Industrial Statistics (INE), ENE, and mission estimates.

Table 9: FOREIGN BORRO4INGS AND FOREIGN DEBT SERVICE OF THE POWER SUBSECTOR - EXCLUDING GAMEK
(In 'OOOs units)
Currency Loan amounts Av. int. Av. grace Av. repmnt Debt incurred Debt Service: repayment and interest ('OOOs)
Borrowers (a) contracted (b) rate % period-year period-year 1-DEC-86 1987 1988 1989 1990
ENE USS 21,951 9.2 1.8 5.7 10,733 929 1,805 4,907 4,810
574 1,463 1,488 1,027
1,503 3,268 6,395 5,837
FRF 109,361 8.9 3.8 4.9 46,285 7,382 26,610 26,610 26,125
3,444 8,64 6,145 3,660
10,826 35,250 32,755 29,785
GBP 10,323 9.2 0.0 6.9 5,907 1,493 1,493 1,493 1,429
872 653 433 214
2,365 2,146 1,926 1,643
BEF 351,098 8.4 2.0 7.4 325,333 35,939 54,835 54,835 54,835
14,956 31,146 19,935 13,63
50,895 85,981 74,770 68,468
US3 equivalents (a);
63,279 9.0 1.9 6.0 34,935 7,999 14,149 16,277 14,673
SONEFE USS 29,237 7.4 3.6 6.6 20,603 4,242 4,125 3,298 1,941
1,696 11M93 774 577
5,938 5,218 4,072 2,518
CHF 14,581 6.9 2.0 3.0 7,401 4,860 2,541 - -
426 91
5,286 2,632 - -
US$ equivalents (a):
38,277 7.3 3.2 5.7 25,192 9,215 6,850 4,072 2,518
TOTALS US$ equivalents (a); >
101,556 8.4 2.4 5.9 60,127 17,214 20,999 20,349 17,191 a rmrm#-x
(a) Exchange rates: French FR = US$0.157; Sterling Pound = US$1.49; Belgian FR = US$O.025; Swiss FR = US$0.62. ° X
(b) In 1981 23.4 million US$ equivalent; 1983, 1.3 million; 1984, 44.9 million; 1985, 12.0 million; 1986, 0.7 million; 1987, 19.2 01-h
million; total, 101.5 million.
Source: ENE and mi-sion estimates.

- 195 - Annex 14Page 1 of 28
ELECTRICITY DEMAND PROJECTIONS - MAIN ASSUMPTIONSBEP, THEMAG, AND MISSION STUDIES
1. Since the early 1970s international consultants have tried atleast four different approaches to electricity demand projections. Thefirst was prepared by SOFRELEC in 1971, for the Junta Provincial deElectri.ficao de Angola (JPEA). l/ In 1984 a technical study waspresented by Electricidade de Portugal (EDP). Recently, two studiesaiming to define a minimum cost expansion plan and interconnectionfacilities were undertaken. Both studies covered the planning period1986-2005. The first was financed by the Banque Africaine de Develop-pement (BAD) and prepared by Belgian Engineering Promotion (BEP) 2/, thesecond was prepared within the framework of the Southern African Develop-ment Coordination Conference (SADCC) by the Brazilian consulting firmTHEMAG 3/.
2. The demand forecasts of these two studtes are not immediatelycomparable. BEP presented its forecasts by province, using the annualreports and plans' outLine of the Ministry of Energy and Petroleum's(Ministerio de Energia e Petroleos, MEP). THEMAG defined 20 major "load-centers" (corresponding to 20 main regions) to concentrate load for thepurpose of studies and simulations. Connection- criLeria of new munici-palities were also different. Angolan technicians contributed verylittle to the BEP study, while that of THEMAG was based on existingSONEFE and ENE approximations. Both studies assumed that either noprice-elasticity measure existed or that it would have no effect in spiteof the urgent need for tariff increases all over the country. BEP used asectoral approach, analyzing the development of the t,iree mainsectors: industry, services, and residential, but used outdatedindustrial statistics (1967-72) complemented by recent Governmentalintentions. Some assumptions were also made on the rate of replacemenLof other energy sources by electricity. BEP distributed aggregate demandforecasts by province and municipality. THEMAG used a global approach,preparing demand scenarios on the basis of present demand in the mainsubstation and applying growth rates in agreement with "optimistic" and"pessimistic" market expectations. Each main substation, or "loadcenter" was characterized by two components: one corresponding to the
1/ "Etude de l'Interconnexion des Principaux Systemes de Productiond'Energie", SOFRELEC, 1971.
2/ "Etude d'un Plan Directeur de Developpement du Reseau ElectriqueNational d'Angola"; Brussels, August 1986.
3/ "Interligacao dos Sistemas Norte/Centro/Sul em Angola. Possibilida-des de Interligacao com a Namibia"; Preliminary Report; S. Paulo,October 1986.

- 196 - Annex 14Page 2 of 28
"natural" consumption growth of existing consumers and the otherresulting from the extension of electrification to new areas.
3. To overcome the uncertainties on the rehabilitation and develop-ment of the productive system and urban infrastructure, the studiesassumed that the general rehabilitation of the socio-economic frameworkcould start by the end of 1986. "Natural" consumption would experiencemoderate growth untiL 1989 when suppLy conditions should be back tonormal. Then five years of accelerated development would follow, re-establishing full use of productive capabilities. The second half of theplanning period (1995-2005) would be characterized by stable conditionsof economic development and lower growth rates for electricity consump-tion. In addition to a "Base" scenario, THEMAG used "Low" and "High"scenario projections which concerned only the "Natural" component of con-sumption and resulted from "Base" projections -8% and +8% respectively.THEMAG used the same annual growth rates within each system for the threescenarios. Resulting demand differences among scenarios for that studyare an outcome of distinct "starting" values.
4. In order to compare both forecasts, BEP projections were rear-ranged into regions to match load centers used by THEMAG. Additionally,all values were converted into consumption (energy) and demand at the HVbusbars of HV/MV substations.
5. Energy and demand forecasts for the three systems made by BEP,THEMAG, and IBRD/UNDP are detailed in Tables 1 through 21,

- 197 Annex 14Page 3 of 28
Tabie 1: NORTHERN SYSTEM - CASE I (BEP STUDY)Energy and demand forecasts, 1986-2000
Energy Peak demand Transmission Generation Load factor
Consum Annu at Annu losses requirements at
at HV Grow wv Grow Energy Demand Energy Demand Generation
Year GWh % MW I % GWh MW Hours %
1986 474.8 84.5 6,0 8.0 505,1 91.8 5,499 62.8
1987 520.9 9.7 94.1 11.3 6.0 8,0 554,. :02.3 5,420 61.9
1988 571.6 9.7 104.7 11.3 6.0 8.0 608. 1'3.8 5,342 61.0
1989 627.1 9.7 116.6 11,3 6.0 8.0 6b7.i '26.7 5,264 60.'1990 688.1 9.7 129.8 11.3 6.0 8.0 732.0 141.1 5,188 59.2
1991 769.3 11.8 144.8 11.6 6.0 8.0 818.4 157.4 5,198 59.3
1992 860.0 11.8 161,6 11.6 6.0 8.0 914.9 175.7 5,209 59.51993 961.5 11.8 180.3 li.6 6.0 8.0 1,022.8 196.0 5,219 59.6
1994 1,047.9 11.8 201.2 11.6 6.0 8.0 1,143.5 218.7 5,229 59.71995 1,201.7 11.8 224.5 11.6 6.0 8.0 1,278.4 244.0 5,239 59.81996 1,297.5 8.0 242.0 7.8 6.0 8.0 1,380.3 263.0 5,248 59.91597 1,400.9 8.0 260,8 7.8 6,0 8.0 1,490.3 283.5 5,257 60.01998 1,512.5 8.0 281.1 7.8 6.0 8.0 1,609.1 305.6 5,266 60.11999 1,633.1 8,0 303.0 7.8 6.0 8.0 1,737.3 329.4 5,275 60.22000 1,763.2 8.0 326.6 7.8 6.0 8.0 1,875.7 355.0 5,284 60.3
Note: Annu: Annual; Consum: Consumption; Grow: Growth; HV: High voltage.
Source: BEP.

- 198 - Annex 14Page 4 of 28
Table 2: NORTHERN SYSTEM - CASE 2 (THEMAG "LOW" SCENARIO)
Energy and demand forecasts, 1986-2000
Energy Peak demand Transmission Generation Load factor
Consum Annu at Annu losses requirements at
at HV Grow HV Grow Energy Demand Energy Demand Generation
Year GWh % MW % % % GWh MW Hours %
1986 537.0 94.4 6.0 8.0 571.3 102,6 5,568 63.6
1987 599.5 11.6 104.7 10.9 6.0 8.0 637.8 113.8 5,604 64.0
1988 669.7 11.7 116.6 11.4 6.0 8.0 712.4 126.7 5,621 64.2
1989 748.1 11.7 130.2 1:.7 6.0 8.0 795.9 141,5 5,624 64,2
1990 815.5 9.0 141.9 9.0 6.0 8.0 867.6 154.2 5,625 64.2
1991 898.7 1U.2 157.1 10.7 6.0 8.0 956.1 170.8 5,599 63.9
1992 1,011.1 12.5 179.3 14.1 6.0 8.0 1,075.6 194.9 5,519 63.0
1993 1,102.1 9.0 195.4 9.0 6.0 8.0 1,172.4 212.4 5,520 63.0
1994 1,201.2 9.0 213.0 9.0 6.0 8.0 1,277.9 231.5 5,519 63.0
1995 1,309.3 9.0 232.2 9.0 6.0 8.0 1,392.9 252.4 5,519 63.0
1996 1,414.0 8.0 250.7 8.0 6.0 8.0 1,504.3 272.5 5,520 63.0
1997 1,527.2 8.0 270.8 8.0 6.0 8.0 1,624.7 294.3 5,520 63.0
1998 1,649.4 8.0 292.5 8.0 6.0 8.0 1,754.7 317.9 5,519 63.0
1999 1,781.3 8.0 315.8 8.0 6.0 8.0 1,895.0 343.3 5,521 63.0
2000 1,923.8 8.0 341.1 8.0 6.0 8.0 2,046.6 370.8 5,520 63.0
Note: Annu: Annual; Consum: Consumption; Grow: Growth; HV: High voltage.
Source: THEMAG.

- 199 - Annex 14Page 5 of 28
Table 3: NORTHERN SYSTEM - CASE 3 (THEMAG "BASE" SCENARIO)
Energy and demand forecasts, 1986-2000
Energy Peak demand Transmission Generation Load factor
Consum Annu at Annu losses requirements atat HV Grow HV Grow Energy Demand Energy Demand Generation
Year GWh % MW % I % GWh MW Hours %
1986 583.7 102.6 6.0 8.0 621.0 111.5 5,568 63.6
1987 651.6 11,6 113.8 10.9 6.0 8.0 693.2 123.7 5,604 64.0
1988 727.9 11.7 126.7 11.3 6.0 8.0 774.4 137.7 5,623 64.2
1989 813.2 11.7 141.5 11.7 6.0 8.0 865.1 153.8 5,625 64.2
1990 886.3 9.0 154.2 9.0 6.0 8.0 942.9 167.6 5,625 64.2
1991 976.8 10.2 170.8 10.8 6.0 8.0 1,039.1 185.7 5,597 63.9
1992 1,099.0 12.5 194.9 14.1 6.0 8.0 11,69.1 21'.8 5,519 63.0
1993 1,197.9 9.0 212.4 9.6 6.0 8.0 1,274.4 230.9 5,520 63.0
1994 1,305.7 9.0 231.5 9.0 6.0 8.0 1,389.0 251.6 5,520 63.0
1995 1,423.2 9.0 252.4 9.0 6.0 8.0 1,514.0 274.3 5,519 63.0
1996 1,537.0 8.0 272.5 8.0 6.0 8.0 1,635.1 296.2 5,520 63.0
1997 1,660.0 8.0 294.4 8.0 6.0 8.0 1,766.0 320.0 5,519 63.0
1998 1,792.8 8.0 317,9 8.0 6.0 8.0 1,907.2 345.5 5,520 63.0
1999 1,936.2 8.0 343.3 8.0 6.0 8.0 2,059.8 373.2 5.520 63.0
2000 2,091.2 8.0 370.8 8.0 6.0 8.0 2,224.7 403.0 5.520 63.0
Note: Annu: Annual; Consum: Consumption; Grow: Growth; HV: High voltage.
Source: THEMAG.

- 200 - ~~~~~Annex 14- 200 - Page 6 of 28
Table 4: NORTHERN SYSTEM - CASE 4 (THEMAG "HIGH" SCENARIO)Energy and demand forecasts, 1986-2000
Energy Peak demand Transmission Generation Load factorConsum Annu at Annu losses requirements at
at HV Grow HV Grow Energy Demand Energy Demand Generation
Year GWhI MW % % GWh MW Hours %
1986 630.4 110,8 6.0 8,0 670.6 120.4 5,568 63.61987 703.7 11.6 122.9 10,9 6.0 8.0 748.6 133.6 5,604 64.01988 786.1 11.7 136.8 11.3 6.0 8.0 836.3 148.7 5,624 64.21989 878.3 11.7 152.8 11.7 6.0 8.0 934.4 166.1 5,626 64.21990 957.3 9.0 166.5 9.0 6.0 8.0 1,018.4 181.0 5,627 64.21991 1,054.9 10.2 184.5 10.8 6.0 8.0 1,122.2 200.5 5,596 63.91992 1,186.9 12.5 210.5 14.1 6.0 8.0 1,262.7 228.8 5,519 63.01993 1,293.7 9.0 229.4 ".0 6.0 8.0 1,376,3 249.3 5,520 63.01994 1,410.2 9.0 250.0 9.0 6.0 8.0 1,500.2 271.7 5,521 63.01995 1,537.1 9.0 272.6 9.0 6.0 8.0 1,635,2 296.3 5,519 63.01996 1,660.0 8.0 294.3 8.0 6.0 8.0 1,766.0 319.9 5,520 63.01997 1,792.8 8.0 318.0 8.1 6.0 8.0 1,907.2 345.7 5,518 63.01998 1,936.2 8.0 343.3 8.0 6.0 8.0 2,059.8 373.2 5,520 63.01999 2,091.1 8.0 370,8 8.0 6.0 8.0 2,224.6 403.0 5,519 63.02000 2,258.4 8.0 400.5 8.0 6.0 8.0 2,402.6 435.3 5,519 63.0
Note: Annu: Annual; Consum: Consumption; Grow: Growth; HV: High voltage.
Source: THEMAG.

- 201 - Annex 14Page 7 of 28
Table 5: NORTHERN SYSTEM - CASE 5 (MISSION "BASE" SCENARIO)
Energy and demand forecasts, 1986-2000
Energy Peak demand Transmission Generation Load factor
Consum Annu at Annu losses requirements at
at HV Grow HV Grow Energy Demand Energy Demand Generation
Year GWh MW % GWh MW Hours %
1986 569.5 101.C 6.0 8.0 605.9 109.8 5,519 63.0
1987 580.9 2.0 103.0 2.0 6.0 8.0 618.0 '12.0 5,519 63.0
1988 592.5 2.0 105.1 2.0 6.0 8.0 630.3 114.2 5,519 63.0
i989 604.4 2.0 107.2 2.0 6.0 8.0 642.9 116.5 5,519 63.0
1990 616.4 2.0 109.3 2.0 6.0 8.0 655.8 118.8 5,519 63.0
1991 628.8 2.0 111.5 2.0 6.0 8.0 668.9 121.2 5,519 63.0
1992 647.6 3.0 114.9 3.0 6.0 8.0 689.0 124.8 5,519 63.0
1993 680.0 5.0 120.6 5.0 6.0 8.0 723.4 131.1 5,519 63.0
1994 734,4 8.0 130.2 8.0 6.0 8.0 781.3 141.6 5,519 63.0
1995 807.9 10.0 143,3 10.0 6.0 8.0 859.4 155.7 5,519 63.0
1996 904.8 12.0 160.5 12.0 6.0 8.0 962.6 174.4 5,519 63.0
1997 1,013.4 12.0 '79.7 12.0 6.0 8.0 1,078.1 195.3 5,519 63.0
1998 1,135.0 12.0 201.3 12.0 6.0 8.0 1,207.4 218.8 5,519 63.0
1999 1,259.8 11.0 223.4 11.0 6.0 8.0 1,340.3 242.9 5,519 63.0
2000 1,373.2 9.0 243.5 9.0 6.0 8.0 1,460.9 264.7 5,519 63.0
Note: Annu: Annual; Consum: Consumption; Grow: Growth; HV: High voltage.
Source: Mission estimates.

- 202 - Annex 14Page 8 of 28
Table 6: NORTHERN SYSTEM - CASE 6 (MISSION "INTERMEDIATE, SCENARIO)
Energy and demand forecasts, 1986-2000
Energy Peek demand Transmission Generation Load tactor
Consum Annu at Annu losses requirements at
at HV Grow HV Grow Energy Demand Energy Demand Generation
Year GWh MW % % % GWh MW Hours %
1986 569.5 101,0 6.0 8.0 605.9 109.8 5,519 63.0
1987 580.9 2.0 103.0 2.0 6.0 8.0 618.0 112.0 5,519 63.0
1988 592.5 2.0 105.1 2.0 6.0 8.0 630. 114.2 5,519 63.0
1989 610.3 3.0 108.2 3.0 6.0 8.0 649.2 117.6 5,519 63.0
1990 -540.8 5.0 113.6 5.0 6.0 8.0 681.7 123X5 5,519 63.0
1991 672.8 5.0 119.3 5.0 6.0 8.0 715.8 129.7 5,519 63.0
1992 719.9 7.0 127.7 7.0 6.0 8.0 765.9 138.8 5,519 63.0
1993 777.5 8.0 137.9 8.0 6.0 8.0 827.2 149.9 5,519 63.0
1994 855.3 10.0 151.7 10.0 6.0 8.0 909.9 164,9 5,519 63.0
1995 957.9 12.4 169.9 12.0 6.0 8.0 1,019.1 184.7 5,519 63.0
1996 1,072.9 12.0 iMO.3 12.0 6.0 8.0 1,141.3 206.8 5,519 63.0
1997 1,201.6 12.0 2'3.1 12.0 6.0 8.0 1,278.3 231.6 5,5!9 63.0
1998 1,333.8 11.0 236.5 11.0 6.0 8.0 1,418.9 257.1 5,519 63.0
1999 1,453.8 9.0 257.8 9.0 6.0 8.0 1,546.6 280.3 5,519 63.0
2000 1,570.1 8.0 278.5 8.0 6.0 8.0 1,670.4 302.7 5,519 63.0
Note: Annu: Annual; Consum: Consumption; Grow: Growth; HV: High voltage.
Source: Mission estimates.

- 203 - Annex 14Page 9 of 28
Table 7: NORTHERN SYSTEM - CASE 7 (MISSION ,HIGH SCENARIO)
Energy and demand forecasts, 1986-2000
Energy PeaK demand Transmission Generation Load factor
Consum Annu at Annu losses requirements at
at HV Grow HV Grow Energy Demand Energy Demand Generation
Year GWh I MW % % % GWh MW Hours %
1986 569.5 101.0 6.0 8.0 605,9 109.8 5,519 63.0
1987 590.9 2.0 103.0 2.0 6.0 8.0 618.0 112.0 5,520 63.0
1988 592.5 2.0 105.1 2.0 6.0 8.0 630.3 114.2 5,520 63.0
1989 610.3 3.0 108.2 3.0 6.0 8.0 649.2 117.6 5,520 63.0
1990 659.1 8.0 116.9 8.0 6.0 8.0 701.2 127.0 5,520 63.0
1991 725.0 10.0 128.6 10.0 6.0 8.0 771.3 139.7 5,520 63.0
1992 812,0 12.0 114.0 12,0 6.0 8.0 863.8 156.5 5,520 63.0
1993 909.5 12.0 161.3 12.0 6.0 8.0 967.5 175.3 5,520 63.0
1994 1,019.6 12.0 180.6 12.0 6.0 8.0 1,083.6 196,3 5,520 63.0
1995 1,130.6 11.0 200.5 1.0 6.0 8.0 1,202.8 217.9 5,520 63.0
1996 1,232.4 9.0 218.5 9.0 6.0 8.0 1,211.1 237.5 5,520 63,0
1997 1,331.0 8.0 236,0 8.0 6.0 8.0 1,415.9 256,5 5,520 63,0
1998 1,437.5 8.0 254.9 8.0 6.0 8.0 1,529.2 277.0 5,520 63.0
1999 1,552.5 8.0 275.3 8.0 6.0 8.0 1,651.6 299,2 5,220 63.0
2000 1,676.7 8.0 297,3 8.0 6.0 8.0 1,783.7 323.1 5,520 63.0
Note: Annu: Annual; Consum: Consumption; Grow: Growth; HV: High voltage.
Source: Mission estimates.

- 204 - Annex 14Page 10 of 28
Table 8: CENTRAL SYSTEM - CASE 1 (BEP STUDY)Energy and demand forecasts, 1986-2000
Energy Peak demand Transmission Generation Load factorConsum Annu at Annu losses requirements atat HV Grow HV Grow Energy Demand Energy Demand Generation
Year GWh % MW % % % GWh MW Hours %
1986 191.0 37.2 6.0 8.0 203.2 40.4 5,025 57.41987 203.7 6.7 39.8 6.9 6.0 8.0 216.7 43.2 5,014 57.21988 217.3 6.7 42.5 6.9 6.0 8.0 231.2 46.2 5,003 57.11989 231.8 6.7 45.5 6.9 6.0 8.0 246.6 49,4 4,991 57.01990 247.3 6,7 48.6 6.9 6.0 8.0 263.1 52.8 4,980 56.91991 284.2 14.9 55e6 14.3 6.0 8.0 302.4 60.4 5,006 57.11992 326.7 14,9 63.5 14.3 6,0 8.0 347.6 69.1 5,032 57.41993 375.5 14.9 72.7 14.3 6.0 8.0 399.5 79.0 5,058 57.71994 431.6 14.9 83,1 14.3 6.0 8.0 459.0 90.3 5,085 58.01995 496.1 14.9 95.0 14.3 6.0 890 527.8 103.3 5,111 58.31996 531.3 7.1 101.5 6.9 6.0 8.0 565.2 110.4 5,121 58.51997 568.9 7,1 108,5 6.9 6.0 8,0 605.2 118.0 5,131 58.61998 609.3 7.1 116.0 6.9 6,0 8.0 648,1 126,1 5,141 58.71999 652.4 7.1 124.0 6.9 6.0 8.0 694.1 134.8 5,151 58.82000 698.7 7.1 132.5 6.9 6.0 8.0 743.3 144.0 5,161 58.9
Note: Annu: Annual; Consum: Consumption; Grow: Growth; HV: High voltage.
Source: Mission estimates.

- 205 - Annex 14Page 11 of 28
Table 9: CENTRAL SYSTEM - CASE 2 (THEMAG "LOW" SCENARIO)
Energy and demand forecasts, 1986-2000
Energy Peak demand Transmission Generation Load factor
Consum Annu at Annu losses requirements at
at HV Grow HV Grow Energy Demand Energy Demand Generation
Year GWh % MW % % % GWh MW Hours %
1986 143.0 29.6 6.0 8.0 152.1 32.2 4,728 54.0
1987 151.5 5.9 31.4 6.1 6.0 8.0 161.2 34.1 4,722 53.9
1968 160.6 6.0 33.3 6.1 6.0 8.0 170.9 36.2 4,720 53.9
1989 182.3 13,5 38.3 15.0 6.0 8.0 193.9 41.6 4,659 53.2
1990 210.7 15.6 44.7 16.7 6.0 8.0 224.1 48.6 4,612 52.7
1991 229.6 9.0 48.8 9.0 6.0 8.0 244.3 53.0 4,610 52.6
1992 250.3 9.0 53.1 9,0 6.0 8.0 266.3 57.7 4,612 52.6
1993 272.9 9.0 57.9 9.0 6.0 8.0 290.3 62.9 4,613 52.7
1994 297.4 9.0 63.1 9.0 6.0 8.0 316.4 68.6 4,613 52.7
1995 324.2 9.0 68.8 9.0 6.0 8.0 344.9 74.7 4,615 52.7
1996 350.2 8.0 74.2 8.0 6.0 8.0 372.6 80.7 4,617 52,7
1997 378.1 8.0 80.2 8.0 6.0 8.0 402.2 87.2 4,614 52.7
1998 408.4 8.0 86.7 8.1 6.0 8.0 434.5 94.2 4,610 52.6
1999 441.0 8.0 93.6 8.0 6.0 8.0 469.1 101.7 4,611 52.6
2000 476.4 8.0 101.1 8.0 6,0 8.0 506.8 109.9 4,612 52.6
Note: _nnu: Annual; Consum: Consumption; Grow: Growth; HV: High voltage.
Source: Mission estimates.

- 206 - Annex 14Page 12 of 28
Table 10: CENTRAL SYSTEM - CASE 3 (THEMAG "BASE" SCENARIO)
Energy and demand forecasts, 1986-2000
Energy Peak demand Transmission Generation Load factorConsum Annu at Annu losses requirements atat HV Grow HV Grow Energy Demand Energy Demand Generation
Year GWh % MW % % % GWh MW Hours %
1986 155.4 32.2 6.0 8.0 165.3 35.0 4,723 53.91987 164.7 6.0 34.1 5.9 6.0 8.0 175.2 37.1 4,727 54.019E8 174.6 6.0 36.2 6.2 6.0 8.0 185.7 39.3 4,721 53.9
1989 198.2 13.5 41.6 14.9 6.0 8.0 210.9 45.2 4,663 53.21990 228.9 15.5 48.6 16.8 6.0 8.0 243.5 52.8 4,610 52.61991 249.6 9.0 53.0 9.1 6.0 8.0 265.5 57.6 4,609 52.61992 272.1 9.0 57.7 8.9 6.0 8.0 239,5 62.8 4,613 52.71993 296.6 9.0 62.9 9.0 6.0 8.0 315.5 68.4 4,615 52.71994 323.3 9.0 68.6 9.1 6.0 8.0 343.9 74.6 4,613 52.71995 352.3 9.0 74.8 9.0 6.0 8.0 374.8 31.3 4,612 52.61996 380.6 8.0 80.7 8.0 6.0 8.0 404.9 87.8 4,614 52.71997 411.0 8.0 87.2 8.0 6.0 8.0 437.2 94.8 4,613 52,71998 443.9 8.0 94,2 8.0 6.0 8.0 472.2 102.4 4,612 52.61999 479.4 8.0 101.7 8.0 6.0 8.0 510.0 110.5 4,614 52.72000 517,8 8.0 109.9 8.1 6.0 8.0 550.9 119,5 4,611 52.6
Note: Annu: Annui3; Consum: Consumption; Grow: Growth; FV: High voltage.
Source: Mission estimates.

- 207 - Annex 14Page 13 of 28
Table 11: CENTRAL SYSTEM - CASE 4 (THEMAG "HIGH" SCENARIO)
Energy and demand forecasts, 1986-2000
Energy Peak demand Transmission Generation Load factor
Consum Annu at Annu losses requirements at
at HV Grow HV Grow Energy Demand Energy Demand G*neration
Year GWh % MW % % % GWh MW Hours L
1986 167.8 34.8 6.0 8.0 178.5 37.8 4,719 53.9
1987 177.9 6.0 36.8 5.7 6.0 8.0 189.3 40.0 4,731 54.0
1988 188.6 6.0 39.1 6.3 6.0 8.0 200.6 42.5 4,721 53.9
1989 214.1 13.5 44.9 14.8 6.0 8.0 227.8 48.8 4,667 53.3
1990 247.3 15.5 52.5 16.9 6.0 8.0 263.1 57.1 4,610 52.6
1991 269.6 9.0 57.2 9.0 6.0 8.0 286.8 62.2 4,613 52.7
1992 293.9 9.0 62.3 8.9 6.0 8.0 312.7 67.7 4,617 52.7
1993 320.3 9.0 67.9 9.0 6.0 8.0 34Q,7 73.8 4,617 52.7
1994 349,2 9.0 74.1 9.0 6.0 8.0 371.5 80.5 4,612 52.7
1995 380.6 9.0 80.8 9.0 6.0 8.0 404.9 87.8 4,610 52.6
1996 411,0 8.0 87.2 7.9 6.0 8.0 437.2 94.8 4,613 52.7
1997 443,9 8.0 94,2 8.0 6.0 8.0 472.2 102,4 4,612 52.6
1998 479.4 8.0 101.7 8.0 6.0 8.0 510.0 110.5 4,614 52.7
1999 517.8 8.0 1098 8.0 6.0 8.0 550.9 119.3 4,616 52.7
2000 559.2 8.0 118.7 8.1 6.0 8.0 594.9 129,0 4,611 52.6
Note: Annu: Annual; Consum: Consumption; Grow: Growth; HV: High voltage.
Source: Mission estimates.

- 208 - Annex 14Page 14 of 28
Table 12: CENTRAL SYSTEM - CASE 5 (MISSION "BASE" SCENARIO)Energy and demand forecasts, 1986-2000
Energy Peak demand Transmission Generation Load factor
Consum Annu at Annu losses requirements at
at HV Grow HV Grow Energy Demand Energy Demand Generation
Year GWh MW % % % GWh MW Hours %
1986 90.0 17.0 6.0 8.0 95.7 18.5 5,181 59.1
1987 91.8 2.0 17.3 2.0 6.0 8.0 97.7 18.8 5,181 59.1
1988 94.6 3.0 17.9 3.0 Z.1 8.0 100.6 19,4 5,181 59,1
1989 99.3 5.0 18,6 4,0 6.0 8.0 105.6 20.z 5,231 59.7
1990 108.2 9.0 20.1 8.0 6.0 8.0 115,1 21.8 5,280 60.3
1991 118.0 9.0 21.7 8.0 6.0 8.0 125,5 23.5 5,329 60.8
1992 129.8 10.0 23.4 8.0 6.0 8.0 138,0 25.4 5,427 52.0
1993 142.7 10.0 25.7 10.0 6.0 8.0 151.8 28.0 5,427 62.0
1994 159.9 12.0 28.6 11.0 6.0 8.0 70.1 31.1 5,476 62.5
1995 183.8 15.0 32.9 15,0 6.0 8.0 '95,6 35.7 5,476 62.5
1996 211.4 15.0 37.8 15.0 6.0 8.0 224.9 41,1 5,476 62.5
1997 236.8 12.0 42.3 12.0 6.0 8.0 251.9 46,0 5,476 62.5
1998 262.8 11.0 47.0 11.0 6.0 8.0 279.6 51.1 5,476 62.5
1999 286.5 9.0 51.2 9.0 6.0 8.0 304.8 55 .7 5,476 62.5
2000 309.4 8.0 55.3 8.0 6.0 8.0 329.1 60.1 5,476 62.5
Note: Annu: Annual; Consum: Consumption; Grow: Growth; HV: High voltage.
Source: Mission estimates.

- 209 - Annex 14Page 15 of 28
Table 13: CENTRAL SYSTEM - CASE 6 (MISSION "INTERMEDIATE" SCENARIO)
Energy and demand forecasts, 1986-2000
Energy Peak demand Transmission Generation Load factor
Consum Annu at Annu losses requirements at
at HV Grow HV Grow Energy Demand Energy Demand Generation
Year GWh £ MW % S % GWh MW Hours %
1986 90.0 !7.0 6.0 8.0 95.7 !8.5 5,181 59.1
1987 91.8 2.0 17.3 2.0 6.0 8.0 97.7 18.8 5,181 59,1
1988 94.6 3.0 17.9 3.0 6.0 8.0 100,6 19,. 5.'81 59.1
1989 101.2 7.0 18.9 6.0 6.0 8.0 107.6 20.6 5,230 59.7
1990 112.3 11.0 20,8 10.0 6.0 8.0 119.5 22.6 5,278 60.3
[991 125.8 12.0 22.9 10.0 6.0 8.0 133.8 24,3 5,374 61,3
1992 142.1 13.0 25.9 13.0 6.0 8.0 151.2 28.1 5,374 61.3
1993 163.4 15.0 29.3 13.0 6.0 8.0 173.9 31.8 5,469 62.4
1994 188.0 15.0 33.6 15.0 6.0 8.0 200.0 36.6 5,469 62.4
1995 216.2 15.0 38,7 15.0 6.0 8.0 230.0 42.0 5,469 62.4
1996 242.1 12.0 43.3 12.0 6.0 8.0 257.6 47.1 5,469 52.4
1997 271.2 12.0 48.5 12.0 6.0 8.0 288.5 52.7 5,469 62.4
1998 303,7 12.0 54.3 12.0 6.0 8.0 323.1 59.1 5,469 62.4
1999 337.1 11.0 60.3 t1.0 6.0 8.0 358.6 65.6 5,469 62.4
2000 367.4 9.0 65.8 9.0 6.0 8.0 390.9 71.5 5,469 62.4
Note: Annu: Annuai; Consum: Consumption; Grow: Growth; HV: High voltage.
Source: Mission estimates.

- 210 - Annex 14Page 16 of 28
Table 14: CENTRAL SYSTEM - CASE 7 (MISSION t1HIGH'. SCENARIO)
Energy and demand forecasts, 1986-2000
Energy Peak demand Transmission Generation Load factorConsum Annu at Annu losses requirements atat HV Grow HV Grow Energy Demand Energy Demand Generation
Year GWh % MW % % % GWri MW Hours %
1986 90.0 17.0 6.0 8.0 95.7 18.5 5,181 59.11987 91.8 2.0 17.3 2.0 6.0 8.0 97.7 18.8 5,181 59.11988 94.6 3.0 17.9 3.0 6.0 8.0 100.6 19.4 5,181 59.11989 105.9 12.0 19.8 11.0 6.0 8.0 112.7 21.5 5,228 59.71990 125.0 18.0 22.8 15.0 6.0 8.0 132.9 24.8 5,365 61.21991 152.5 22.0 27.4 20.0 6.0 8.0 162.2 29.7 5,454 62.31992 179.9 18.0 32.3 18.0 6.0 8.0 191.4 35.1 5,454 62.31993 206,9 15,0 37.1 15.0 6.0 8.0 220.1 40.4 5,454 6?.31994 237.9 15.0 42.7 15.0 6.0 8.0 253.1 46.4 5,454 62.31995 266.5 12.0 47.8 12.0 6.0 8.0 283.5 52.0 5,454 62.31996 298.4 12.0 53.6 12.0 6.0 8.0 317.5 58.2 5,454 62.31997 331,3 11.0 59.4 11.0 6.0 8.0 352,4 64.6 5,454 62.31998 361.1 9.0 64.8 9.0 6.0 8.0 384.1 70.4 5,454 62.31999 390,0 8.0 70.0 8.0 6.0 8.0 414.9 76.1 5,454 62.32000 421.2 8.0 75.6 8.0 6.0 L.O 448.0 82.2 3,454 62.3
Note: Annu: Annual; Consum: Consumption; Grow: Growth; HV: High voltage.
Source: Mis5ion estimates.

211 Annex 14Page 17 of 28
Tabte 15: SOUTHERN SYSTEM - CASE 1 (BEP STUDY)
Energy and domand forecasts, 1986-2000
Energy Peak demand Transmission Generation Load factor
Consum Annu at Annu losses requirements at
at HV Grow HV Grow Energy Demand Energy Demand Generation
Year GWh % MW % % GWh MW Hours %
1986 50,2 10.3 6.0 8.0 53.4 11.2 4,770 54.5
1987 53,1 5.8 10.9 5.8 6.0 8.0 56.5 11.8 4,769 54.4
1968 56.1 5.8 11.5 5.8 6.0 8.0 59.7 12.5 4,767 54.4
1989 59.4 5.8 12.2 5.8 6.0 8.0 63.2 13.3 4,766 54.4
1990 62.8 5.8 12.9 5.8 6.0 8.0 66.8 14.0 4,765 54.4
1991 72.0 14.6 14.7 ;3.9 6.0 8.0 76.6 16.0 4,796 54.7
1992 82.5 14.6 16.7 13.9 6.0 8.0 87.8 18.2 4,827 55.1
1993 94.5 14.6 19.0 13.9 6.0 8.0 100.6 20.7 4,858 55.5
1994 103.4 14.6 21.7 13.9 6.0 8.0 115.3 23.6 4,890 55.8
1995 124.2 14.6 24.7 13,9 6.0 8.0 132.1 26.8 4,921 56.2
1996 133,9 7.8 26.6 7.5 6.0 8.0 142.5 28.9 4,936 56.3
1997 144.4 7.8 28.6 7,5 6.0 8.0 153.6 31.0 4,950 56.5
1998 155,7 7.8 30.7 7.5 6.0 8.0 165.7 33.4 4,964 56.7
1999 167.9 7.8 33.0 7.5 6.0 8.0 178.7 35.9 4,978 56.8
2000 181.1 7,8 35.5 7.5 6.0 8.0 192.7 38.6 4,993 57.0
Note: Annu: Annual; Consum: Consumption; Grow: Growth; HV: High voltage.
Source: Mission estimates.

- 212 - Annex 14Page 18 of 28
Table 16: SOUTHERN SYSTEM - CASE 2 (THEMAG "LOW" SCENARIO)
Energy and demand forecasts, 1986-2000
Energy Peak demand Transmission Generation Load tactor
Consum Annu at Annu losses requirements at
at HV Grow HV Grow Energy Demand Energy Demand Generation
Year GWh % MW % % % GWh MW Hours £
1986 65.9 13,9 6.0 8.0 70.1 15,1 4,640 53.0
1987 69.8 5.9 14.7 5.8 6.0 8.0 74.3 16.0 4,647 53.1
1988 74.0 6.0 15.6 6.1 6.0 8.0 78.7 17.0 4,643 53.0
1989 78.5 6.1 16.6 6.4 6.0 8.0 83.5 18.0 4,628 52.8
1990 88.5 12.7 18.e 13.0 6.0 8.0 94.1 20.4 4,617 52.7
1991 96.4 8.9 20.5 9.0 6.0 8.0 102.6 22.2 4,614 52.7
1092 105.1 9.0 22.3 9.0 6.0 8.0 111.8 24.2 4,615 52.7
1993 114.5 8.9 24.3 9.0 6.0 8.0 121.8 26.4 4,612 52.6
1994 124.8 9.0 26.5 9.1 6.0 8.0 132.8 28.8 4,607 52.6
1995 136.1 9.1 28.9 9.0 6.0 8.0 144.8 31.4 4,609 52.6
1996 147.0 8.0 31.2 8.0 6.0 8.0 156.4 33.9 4,611 52.6
1997 158.8 8.0 33.7 8.0 6.0 8.0 168.9 36.6 4,612 52.6
1998 171.5 8.0 36.4 8.0 6.0 8.0 182.4 39.6 4,611 52.6
1999 185.2 8.0 39.3 8.0 6.0 8.0 197.0 42.7 4612 52.72000 200.0 8.0 42.5 8.0 6.0 8.0 212.8 46.1 4,611 52.6
Note: Annu: Annual; Consum: Consumption; Grow: Growth; HV: High voltage.
Source: Mission estimates.

- 213 - Annex 14Page 19 of 28
Table 17: SOUTHERN SYSTEM - CASE 3 (THEMAG "BASE" SCENARIO)Energy and demand forecasts, 1986-2000
Energy Peak demand Transmission Generation Load factorConsum Annu at Annu losses requirements atat HV Grow HV Grow Energy Demand Energy Demand Generation
Year GWh % MW % % % GWh MW Hours %
1986 71.6 15,1 6.0 8,0 76.2 16.4 4,641 53,01987 75,9 6.0 16,0 6.0 6.0 8.0 80.7 17.l 4,643 53.01988 80,4 5.9 17,0 6.3 6.0 88,0 85.5 18.5 4,629 52.81989 85.3 6.1 18,0 5.9 6.0 8.0 90.7 19.6 4,638 52.91990 96.2 12.8 20,4 13.3 6.0 8.0 102,3 22.2 4,615 52.71991 104.8 8.9 22.2 9.0 6.0 8.0 111.5 24.2 4,614 52,71992 114.2 9.0 24,2 9.0 6.0 8.0 121.5 26.3 4,613 52.71993 124,5 9.0 26.4 9,0 6.0 8.0 132.4 28.7 4,616 52.71994 135.7 9.0 29.8 9.0 6,0 8.0 144.4 31.3 4,615 52,71995 147.9 9.0 31,4 9.0 6.0 8.0 157,3 34.1 4,613 52,71996 159.8 8.0 33,9 8.0 6.0 8.0 170.0 36.8 4,614 52,71997 172.6 8.0 36,6 8.0 6.0 8.0 183.6 39,8 4,616 52.71998 186.4 8.0 39.5 8,0 6.0 8.0 198.3 43.0 4,616 52.71999 201.3 8.0 42,7 8.0 6.0 8.0 214.1 46,4 4,614 52.72000 217.4 8,0 46.1 8.0 6.0 8.0 231.3 50.1 4,615 52.7
Note: Annu: Annual; Consum: Consumption; Grow: Growth; HV: High voltage.
Source: Mission estimates.

- 214 - Annex 14Page 20 of 28
Table 18: SOUTHERN SYSTEM - CASE 4 (THEMAG "HIGH" SCENARIO)
Energv and demand forecasts, 1986-2000
Energy Peak demand Transmission Generat on Load factor
Consum Annu at Annu losses requirements at
at HV Grow HV Grow Energy Demand Energy Demand Generation
Year GWh l MW % % % GWh MW Hours %
1986 77.3 16.3 6.0 8,0 82.2 17.7 4,614 53.0
1987 82.0 6.1 17.3 6.1 6.0 8.0 87.2 18.8 4,639 53.0
1988 86.8 5.9 18.4 6,4 6,0 8.0 92.3 20.0 4,617 52.7
1989 92.1 6.1 19.4 5.4 6.0 8.0 98.0 21.1 4,646 53.0
1990 103.9 12.8 22.0 13.4 6.0 8.0 110.5 23.9 4,622 52.8
1991 113.2 9.0 24.0 9.0 6.0 8.0 120.4 26.1 4,620 52.7
1992 123.3 8.9 26.1 9.0 6.0 8.0 131,2 28.4 4,617 52.7
1993 134.5 9.1 28.5 9.0 6.0 8.0 143.1 31.0 4,621 52.7
1994 146.6 9.0 31.1 9.1 6.0 8.0 156.0 33.8 4,615 52.7
1995 159.7 8.9 33.9 9.0 6.0 8.0 169.9 36.8 4,611 52.6
1996 172.6 8.1 36.6 8.0 6.0 8.0 183.6 39.8 4,616 52.7
1997 186.4 8.0 39.5 8.0 6.0 9.0 198.3 43.0 4,616 52.7
1998 201.3 8.0 42.7 8.0 6.0 8.0 214.1 46.4 4,614 52.7
1999 217.4 8,0 46.1 8.0 6.0 8.0 231.3 50.1 4,615 52.7
2000 234,8 8.0 49.8 8.0 6.0 8.0 249.8 54.1 4,615 52.7
Note: Annu: Annual; Consum: Consumption; Grow: Growth; HV: High voltage.
Source: Mission estimates.

Annex 14- 215 - Page 21 of 28
Table 19: SOUTHERN SYSTEM - CASE 5 (MISSION "BASE, SCENARIO)
Energy and demand forecasts, 1986-2000
_ Energy Peak demand Transmission Generation Load factor
Consumn Annu at Annu losses requirements at
at HV Grow HV Grow Energy Demand Energy Demand Generation
Year GWh I MW % % % GWh MW Hours 9
1986 50.0 9.5 8.0 10.0 54.3 10.6 5,149 58.8
1987 50.5 1.0 9.7 2.0 8.0 10.0 54.9 10.8 5,098 58.2
1988 51.0 1.0 10.0 3.0 8.0 10.0 55.4 11.1 4,999 57.'1989 52.0 2.0 10.2 2.0 8.0 10.0 56.5 11.3 4,999 57.
1990 53.6 3.0 10.5 3.0 8.0 1O.O 58.2 11.7 4,999 57.1
1991 56.3 5.0 11.0 5.0 8.0 10.0 61.2 12.2 4,999 57.1
1992 59.1 5.0 11.6 5.0 8.0 10.0 64.2 12.8 4,999 57.1
1993 63.8 8.0 12.5 8.0 8,0 10.0 69.4 13.9 4,999 57,1
1994 71.5 12.0 14.0 12.0 8.0 10.0 77.7 15.5 4,999 57.1
1995 77,9 9.0 15.2 9.0 8.0 10,0 84.7 16.9 4,999 57.1
1996 84.1 8.0 16.5 8.0 8.0 10.0 91.4 18.3 4,999 57.1
1997 90.9 8.0 17.8 8.0 8.0 '0.0 98,8 19.8 4,999 57.1
1998 98.1 8.0 19.2 8.0 8.0 10.0 106.7 21.3 4,999 57.1
1999 106.0 8.0 20.7 8.0 8.0 10.0 115.2 23.0 4,999 57.1
2000 114.5 8.0 22.1, 8.0 8.0 10.0 124.4 24.9 4,999 57.1
Note: Annu: Annual; Consum: Consumption; Grow: Growth; HV: High voltage.
Source: Mission estimates.

- 216 - Annex 14Page 22 of 28
Tatle 20: SOUTHERN SYSTEM - CASE 6 (MISSION "INTERMEDIATE" SCENARIO)
Energy and demand forecasts, 1986-2000
Energy Peak demand Transmission Generation Load factor
Consum Annu at Annu losses requirements at
at HV Grow HV Grow Energy Demand Energy Demand Generation
Year GWh % MW z % % GWh MW Hours %
1986 50,0 9.5 8.0 10.0 54,3 10.6 5,149 58,8
1987 50.5 1.0 9.7 2.0 8.0 10.0 54.9 10.8 5,098 58.2
1988 51.0 1.0 10.0 3.0 8.0 10.0 55.4 '1.1 4,999 57.11989 52.5 3.0 10.3 3.0 8.0 10.0 57.1 11,4 4,999 57.1
1990 55.2 5.0 10.8 5.0 8.0 10.0 60.0 12.0 4,999 57.1
1991 59.6 8.0 11.7 8.0 8.0 10.0 64.8 13.0 4,999 57.11992 65.5 10.0 12.8 10.0 8.0 10.0 71.2 14.2 4,999 57.1
1993 73.4 12.0 14.4 12.0 8.0 10.0 79.8 16.0 4,999 57.1
1994 84.4 15.0 16.5 15.0 8.0 10.0 91.7 13.4 4,999 57.1
1995 93.7 11.0 18.3 11.0 8.0 10.0 101.8 20,4 4,999 57.1
1996 101.2 8.0 19.8 8.0 8.0 10.0 110.0 22.0 4,999 57,1
1997 109.3 8.0 21.4 8.0 8.0 10.0 118.8 23.8 4,999 57.1
1998 118.0 8.0 23.1 8.0 8.0 10,0 128.3 35.7 4,999 57.1
1999 127.5 8.0 24.9 8.0 8.0 10.0 138.5 27.7 4,999 57.1
2000 137.7 8.0 26.9 8.0 8.0 10.0 149.6 29.9 4,999 57.1
Note: Annu: Annual; Consum: Consumption; Grow: Growth; HV: High voltage.
Source: Mission estimates.
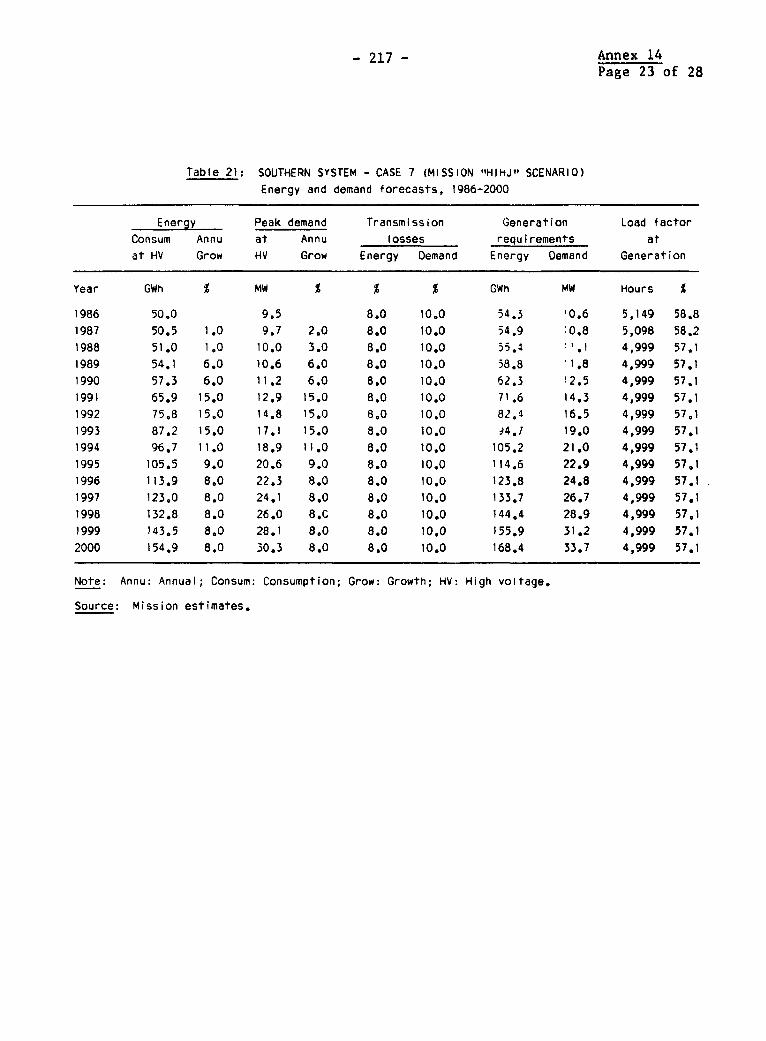
- 217 - Annex 14Page 23 of 28
Table 21: SOUTHERN SYSTEM - CASE 7 (MISSION .tHIhJ1. SCENARIO)
Energy and demand forecasts, 1986-2000
Energy Peak demand Transmission Generation Load factor
Consum Annu at Annu losses requirements at
at HV Grow HV Grow Energy Demand Energy Demand Generation
Year GWh % MW % % % GWh MW Hours %
1986 50.0 9.5 8.0 10.0 54.3 '0.6 5,149 58.8
1987 50.5 1.0 9.7 2.0 8.0 10.0 54.9 :0.8 5,098 58.2
1988 51,0 1.0 10.0 3.0 8.0 10.0 55.4 1.1 4,999 57.1
1989 54.1 6.0 10.6 6.0 8.0 10.0 58.8 1.8 4,999 57.1
1990 57.3 6.0 11.2 6.0 8.0 10.0 62.3 12.5 4,999 57.1
1991 65.9 15.0 12.9 15.0 8.0 10.0 71.6 14.3 4,999 57.1
1992 75,8 15.0 14.8 15,0 8,0 10.0 82.1 16.5 4,999 57.1
1993 87.2 15.0 17.1 15.0 8.0 10.0 94.7 19.0 4,999 57.1
1994 96.7 11.0 18.9 11.0 8.0 10.0 105.2 21.0 4,999 57.1
1995 105.5 9.0 20.6 9.0 8.0 10.0 114.6 22.9 4,999 57.1
1996 113.9 8.0 22.3 8.0 8.0 10.0 123.8 24.8 4,999 57.1
1997 123.0 8.0 24.1 8.0 8.0 10.0 133,7 26.7 4,999 57.1
1998 132.8 8.0 26.0 8.C 8.0 10.0 144.4 28.9 4,999 57.1
1999 143.5 8.0 28.1 8.0 8.0 10.0 155.9 31.2 4,999 57.1
2000 154.9 8.0 30.3 8.0 8.0 10.0 168.4 33.7 4,999 57.1
Note: Annu: Annual; Consum: Consumption; Grow: Growth; HV: High voltage.
Source: Mission estimates.

- 218 - Annex 14Page 24 of 28
BEP and THEMAG Studies
6. Projections for the period 1986-2005 made by both consultantgroups are based on the following assumptions:
(a) BEP assigns an important consumption to the Viana substation(increasing from 9% to 16% of Luanda consumption over the 1986-2005 period) while for THEMAG such consumption is negligible;
(b) demand at the Mabubas substation is neglible for BEP and about10% of that of Luanda in the THEMAG projection;
(c) THEMAC allows for an increase in the demand connected toMalanga between 1986 and 1990, due to a requirement of 15 MW atthe Capanda site during building. BEP does not consider such arequirement;
(d) BEP assumes Uige is supplied by the Southern System from 1986while THEMAG considers its connection in 1995, with a nigherdemand;
(e) BEP assumes a doubling of consumption by Lobito and Benguelabetween 1990 and 1995. THEMAG limits the increase to 55% forthe same period; and
(f) THEMAG assumes a significant consumption at Jamba (Matala)corresponding to a resumption of iron-mining activities inCassinga from 1986.
7. Up to the year 2000, the mission has outlined three scenariosfor the evolution of demand on the three main Systems: "Base", "High",and "Intermediate". As no substantial changes are expected in the short-term, all scenarios use MEP projections for 1987 and 1988 (with minorcorrections). After that date, the "Base" scenario assumes a decrease ofacts of sabotage but the continuation of economic difficulties, witheconomic recovery beginning in 1993. The "High" scenario assumes acessation of sabotage in 2-3 years with improved economic conditionsfacilitating a quicker recovery with high growth rates of electricityconsumption. The "Intermediate" scenario assumes a restoration of peacebefore 1990 with a slower rate of economic recovery than in the "High"scenario.
8. Different rates of growth as well as load factors were assumedfor the three systems to take into account different loadcharacteristics, the relative predominance of industrial loads andhigher-income residential loads, existing trends and, absolute values in

- 219 -Annex 14Page 25 of 28
1974 (just before independence), present constraints on supply facilitiesand realistic schedules for their rehabilitation and, when available,potential demand of previously high industrial load whose resumption islinked to the general economic recovery by Angolan authorities. With noreliable information existing on realistic operational investmentprograms, the scenarios do not anticipate new, sizeable, discreteindustrial loads.
9. Mission projections were based on overall general assumptionsand on assumptions for each of the three main systems:
General Assumptions
Ci) No significant load increase, under all scenarios, until1989. The general disarray of the economy, particularlyforeign currency constraints, prevents industrial recoveryon the demand side as well as rehabilitation or extensionof the distribution networks. Repressed residentialdemand will not be met until that date.
(ii) Load (Energy and Demand) is calculated and projected at HVbusbars of main substations and includes losses in MVdistribution networks.
(iii) Losses in transmission systems (220, 150 and 150 kV and60 kV in the Southern System) are arbitrarily set at 6%for energy and 8% for peak demand (% of generation) forall the systems.
(iv) Influence of possible HV interconnections among systems isnot considered.
(v) Supply constraints are assumed to be only those existingin 1987. The timing of rehabilitation projects to reducethese constraints has been tentatively scheduled. Noadditional major supply constraint is envisaged.
Northern System
(i) Load factor at generation assumed to be around 0.63 (5,500hours).
(ii) Energy and Demand, at HV level, have the same annualgrowth rates.

- 220 - Anaex 14
Page 26 of 28
(iii) "Low" scenario assumes a low capacity of ZDEL to developthe Luanda distribution network and no further HVtransmission net extensions until 1992. Load grows at 2%until 1991 with substantial growth rates of 8% takingplace only after 1994.
(iv) "High" scenario is associated with high growth rates,starting with 8% in 1990, increasing to 12% between 1992-94 and stabilizing at 8% from 1997 onwards. It assumesdevelopment and rehabilitation of the Luanda network,recovery of industrial loads, and the possibility of agradual supply of repressed demand.
Central System
Si) Energy growth rates in initial years are higher than thoseof demand due to a normalization of supply from thesystem. Annual load factor increases from 0.59 (in 1986)to nearly 0.625 in a variable number of years depending onthe scenario.
(ii) Energy consumption and generation value for 1986 and 1987are higher than those presented by MEP. A large share ofcaptive diesel sets (about 15 CWh) is considered.
(iii) "Low" scenario implies a slow recovery of consumption andlonger supply constraints. Pre-independence levels of1974 are obtained only by 1994.
(iv) "High" scenario assumes supply constraints are overcome by1990 and consumption resumes quickly with growth rates ofbetween 18-22% for the 1990-92 period.
(v) The "Intermediate" scenario assumes recovery beginning in1990, developing at a slower pace than in the "High"scenario, and lasting longer.
Southern System
(i) Load factor remains constant around 0.57 (5,000 hours).
(ii) Energy and Demand growth rates are similar.
(iii) Different assumptions on the resumption of iron-miningactivities at Cassinga account for notable distinctions

- 221 - Annex 14Page 27 of 28
among the three scenarios. In the "Base" scenario,recovery starts in 1991 with increases of 1.2 MW peryear. Recovery also begins in 1991 for the "High"scenario and increases by about 2 MW per year. The"Intermediate" scenario accounts for a similar developmentbut at a slower pace. Iron mining in Cassinga may notresume, in which case all scenar.os are over-estimated.The mines have been depleted of higher quality ores. A"resumption" would essentially mean a fresh mining ventureutilizing new installations yielding a different output.
10. A comparison of Energy and Peak Demand generation requirementsfor typical years for the seven scenarios presented is shown in Table 22.

Table 22: ENERGY DEMAND FORECASTS (1986-2000)
Comparison of Generation Requirements in 7 Scenarios
Energy (GWh) Peak Demand (MW)
THEMAG Mission THEMAG Mission
Year BEP Low Base High Base Interm High BEP Low Base High Base Interm High
NORTHERN SYSTEM
1986 505 571 621 671 606 606 606 91.8 102.6 111.5 120.4 109.8 109.8 109.8
1987 554 638 693 749 618 618 618 102.3 113.8 123.7 133.6 112,0 112.0 112.0
1990 732 868 943 1,018 656 682 701 141.1 154.2 167.6 181.0 118.8 123.5 127.0
1995 1,278 1,393 1,514 1,635 859 1,019 1,203 244.0 252.4 274.3 296.3 155.7 184.7 217.9
2000 1,876 2,047 2,225 2,403 1,461 1,670 1,784 365.0 370.8 403.0 436.3 264.7 302.7 323.1
CENTRAL SYSTEM ra
1986 203 152 165 179 96 96 96 40.4 32.2 35.0 37.8 18.5 18.5 18.5
1987 217 161 175 189 98 98 98 43.2 34.1 31.1 40.0 18.8 18.8 18.8
1990 263 224 244 263 115 120 135 52.8 48.6 52.8 57.1 21.8 22.6 24.8
1995 528 345 375 405 196 230 284 103.3 74.7 81.3 87.8 35.7 42.0 52.0
2000 743 507 551 595 329 391 448 144.0 109.9 119.5 129.0 60.1 71.5 82.2
SOUTHERN SYSTEM
1986 53 70 76 82 54 54 54 11.2 15.1 16.4 17.7 10.6 10.6 10.6
1987 57 74 81 87 55 b5 55 11.8 16.0 17.4 18.8 10.8 10.8 10.8
1990 67 94 102 III 58 60 62 14.0 20.4 22.2 23.9 11.7 12.0 12.5
1995 132 145 157 170 85 192 115 26.8 31.4 34.1 36.8 16.9 20.4 22.9
2000 193 213 231 250 124 150 168 38.6 46.1 50.1 54.1 24.9 29.9 33.7
Source: BEP, THEMAG, and mission estimates.
m m
oQH
x0

- 223 - Annex 15Page 1 of 11
ANGOLA - ELECTRICITY TARIFF SYSTEM
1. Since the 1960s, electricity tariffs in Angola have changedonly in newly electrified urban areas. In these areas of the countryrates have not aLtered since the initiation of service. As a result,variation in tariffs of the order of 3:1 can often be observed in areasserved by the same interconnected system. High levels of demand fromexisting consumers in traditional urban centers are derived from what areperceived as low price levels.
Low-voltage Tariffs
2. A complex and widely varying declining block structure prevailsfor low-voltage tariffs with higher rates for residential consumers thanfor industrial ones. In greater Luanda, low-voltage tariffs, set in1962, discriminate between residential, commercial, industrial, andpublic lighting uses, as follows:
(a) residential and commercial tariffs have a declining blockstructure with block sizes (12 classes) related to house sizesor floor area and minimum monthly bills related to metercaliber (9 classes). The average price of electricity sold isKz 0.87/kWh;
(b) low-voltage industrial tariffs cover 2% of sales and are three-period, time-of-day tariffs with energy rates declining withload factor and meter caliber. The average price of eLectri-city soLd is Kz 0.55/kWh; and
(c) a flat rate of about one-half the average of other low-voltagesales is charged for public lighting.
High-voltage Tariffs
3. High-voltage tariffs include block rates sized as a function ofnon-coincident peak demand, leading to a decline in average prices withload factor. The billing variables used are non-coincident peak demandand active and reactive energy. The tariffs function as follows:
(a) demand rates increase with load factor;
(b) in Luanda, the marginal price for active energy declines fromKz 1.1/kWh (load factor of 12.5%) to Kz 0.85/kWh (load factorof 25%), and Kz 0.505/kWh (load factor of 100%); and
(c) reactive energy is charged through a monthly bill multiplier-free up to 60% of active energy (cos 0 = 0.8) and charged at aprice rising to 63% of the normal rate upon reaching 92% ofactive energy.

- 224 - Annex 15Page 2 of 11
4. Marginal costs in the Northern System are determined bygeneration and transmission capacity requirements to meet peak demand,and by local grid capacity requirements determined by maximum demand.The present tariff structure cannot be adjusted to the pattern ofmarginal costs and a step-by-step process is suggested to attain astructure of tariffs more closely related to the Long-Run Marginal Cost(LRMC).
5. To illustrate the complexity of the tariff system, datacollected from the Empresa Nacional de Electricidade (ENE), the SociedadeNacional de Estudo e Financiamento de Empreendimentos Ultramarinos(SONEFE), and the Empresa de Electricidade de Luanda (EDEL) on tariffs inforce in May 1987 is summarized in Tables 1 (LV Residential tariffs), 2(LV Industrial tariffs), 3 (LV tariffs in EDEL distribution area), and 4(HV tariffs in the Northern System). Although incomplete, the data covermore than 70% of sales and are adequate to identify the major issues.

Table 1: RESIDENTIAL TARIFFS - 1987
(1) (2) (3) (4) (5)
Province Cabinda Uige Malanga Kwanza Norte Luanda
Municipality Cabinda Cangola Malanga Bula Atumba Luanda, Viana
Interconnected system - Northern Northern
Number of consumers 5,993 a/ .... .... .... 55,551 b/
Enforced since Before 1965 1973 ... X 1962
Tariff structure Declining block Decl;ning block Declining block Declining block Declining block,
with minimum with minimum with minimum block size
monthly bill monthly bill monthly bill related to house
size (12 classes);
monthly fixed rate
related to meter
size (up to 9 classes)
Block sizes kWh/
Energy rates KzlkWh
1 100/6.00 30/5.00 30/5.00 15/6.00 8 to 54/2.50
2 100/3.00 70/4.00 70/4.00 15/5.00 14 to 82/1.50
3 /2.00 150/3.50 150/3.50 70/4.00 /0.70
4 /3.00 /3.00 150/3.50
5 /3.00
6
Minimum monthly demand kWh 15 10 15 3 to 10
Notes Applicable to Applicable to Applicable to Monthly fixed rate
non-industrial non-industrial non-industrial 0.12 to 5 Kz/kVA
consumers consumers consumers Average price
Kz 0.83/kWh
58% of EDEL energy
sales
Dq X
a/ Totdl nuiber of LV consumers (1986). w
b/ 1983. 0 tn
Source: ENE, SONEFE, EDEL.

Table 2: RESIDENTIAL TARIFFS - 1987
(6) (7) (8) (9) (10)
Province Kwanza Sul Benguela Benguela Huambo Bie
Municipality Libolo Bolambo Cubalga Caala
Interconnected system .... Central -
Number of consumers *0.* .... ,.. 680 a/ 3,300 a/
Enforced since 1973 1973 1974 . .*. Before 1971
Tariff structure Declining block Declining block Declining block Declining block Declining block
with minimum with minimum with minimum
monthly bill monthly bill monthly bill
Block sizes kWh/
Energy rates Kz/kWh
1 20/4.50 30/6.00 30/4.00 25/4.00 20/5.00
2 30/3.00 70/4.00 /3.50 25/3.50 20/4.80
3 /2.00 150/3.00 50/3.20 20/4.60
4 /1.50 /2.20 20/4.40
5 20/4.20
6 /4.00
Minimum monthly demand kWh 20 10 5
Notes Applicable to Applicable to Applicable to Applicable to Applicable to
non-industrial non-industrial non-industriai non-industrial non-industrial
consumers. Non- consumers consumers consumers; off-peak off-peak (18 hours)
profit institu- (18 hours) available available Kz 1.50 to
tions and other at 1.50 to Kw 1.20/kWh 1.20/kWh
at Kz 1/kWh Advertising uses
charged at Kz 1.00/kWh
a! Total number of LV consumers (1986). ° X
Source: ENE, SONEFE, EDEL. en
o HH'

Table 3: RESIDENTIAL TARIFFS - 1987
(11) (12) (13) (14) (15)
Province Moxico Namibe Huila Cunene Lunda Sul
Municipality Lwena Namibe ..... N'Giva
Interconnected system - Southern Southern
Number of consumers .... 3,074 a/ .... .... ....
Enforced since 1974 .... 1975 1972 1975
Tariff structure Declining block Declining block Declining block Declining block Declining block
with minimum with minimum with minimum with minimum wiith minimum
monthly bill monthly bill monthly bill monthyly bill monthly bill
Block sizes kWh/
Energy rates Kz/kWh
1 30/5.00 30/3.50 30/3.50 30/5.00 30/5.00
2 70/4.00 50/2.75 70/2.50 70/4.00 30/4.50
3 150/3.50 /1.25 /1.50 150/3.50 /4.00
4 /3.00 /3.00
56
Minimum monthly demand kWh 15 10 15 15 10
Notes Applicable to Business rate Applicable to Applicable to Applicable to
non-industrial Kz 2.00/kWh; non-industrial non-industrial non-industrial
consumers consumers consumers consumers consumers
Agriculture Kz 0.83/kWh;
Kz 2.00-0.80/kWh; Administrations
Advertising and non-profit
Kz 1.00/kWh organizations
entitled to 20%
rebate D
a/ Total number of LV consumers (1986). Z
Source: ENE, SONEFE, EDEL.

Table 4: LOW-VOLTAGE INDUSTRIAL TARIFFS - 1987
(1) (2) (3) (4) (5)
Province Cabinda Uige Malange Kwanza Norte Kwanza Norte
Municipality Cabinda Cangola Malange Bula Atumba N'Dalatando
Interconnected system - Northern Northern
Number of consumers ,.... O."
Enforced since Before 1965 1973 .... .O.
Tariff structure Declining block Declining block Declining block Declining block Time of day energywith minimum with minimum with minimum rates, with decliningmonthly bill monthly bill monthly bill blocks related to load
factor; monthly fixedrated to meter size
Block sizes kWh/
Energy rates Kz/kWh 001 100/3.00 250/3.00 250/3.00 250/3.002 400/1.50 /2.50 /2.50 /2.503 /1.00
4
5
6
Minimum r nthly demand kWh - 100 100 100
Notes Energy rates: peak 3hours: Kz 3.00; off-
peak, 8 hours: Kz 0.80;
other hours: K2.00-0.85
Source: ENE, SONEFE, EDEL.
0 'Ph.
o t;

Table 5: LOW-VOLTAGE INDUSTRIAL TARIFFS - 1987
(6) (7) (8) (9) (10)
Province Luanda Kwanza Sul Benguela Benguela Benguela
Municipality Luanda, Viana Libolo Balombo Cubal
Interconnected systcm Northern .... Central
Number of consumers 333 a/ .... ... .... ....
Enforced since 1962 1973 1960 1973 1974
Tariff structure Time of day energy Declining block Declining blocks Declining block Declining block
rates, with declin- with minimum determined by peak with minimum
ing blocks related monthly bill demand (6 classes) monthly bill
to load factor and load factor
monthly fixed rate (4 classes)
related to meter
size
Block sizes kWh/
Energy rates Kz/kWh1 - 20/4.50 *../l.40 to 0.43 250/3.00 1,000/2.50
2 30/3.00 /1.50 /1.60
3 /2.00
4
5
6
Minimum monthly demand kWh 20 100
Notes Energy rates: peak, Rates applied by
3 hours: Kz 3.00; CELB
off-peak, 9 hours:
Kz 0.70; other:
Kz 1.80-0.75;
average price
Kz 1.10-1.20. °Qa
2% of EDEL energy _I X
sales 0
a/ 1983. F
Source: ENE, SONEFE, EDEL.

Table 6: LOW-VOLTAGE INDUSTRIAL TARIFFS - 1987
(11) (12) (13) (14) (15)
Province Huambo Huambo Moxico Namibe Huila
Municipality Caala Caala Lwena Namibe
Interconnected system Central Central Sout;iern Southern
Number of consumers ... *. .... .... ....
Enforced since .... .... 1974 .... 1975
Tariff structure Declining block Declining block Declining block Declining block Declining block,with minumum with minimum with minimum with ,ninimum
monthly bill monthly bill monthly bill monthly bibill °
Block sizes kWh/
Energy rates Kz/kWh
1 100/2.50 500/2.00 250/3.00 200/2.00 250/1.202 /2.00 500/1.80 /2.50 300/1.50 /1.003 500/1.50 /1.00
4 /1.30
5
6
Minimum monthly demand kWh 50 100 100 100
Notes Small industry Other industry HV at Kz 0.80/kWh
supplies from supplies from
7.00 to 18.00 hr 7.00 to 18.00 hr
e3 :Source: ENE, SONEFE, EDEL. PQ
m mn
co j
-I-

Table 7: LOW-VOLTAGE INDUSTRIAL TARIFFS - 1987
(16) (17)
Province Cunene Lunda Sul
Municipality N'Giva Saurimo
Interconnected system -
Number of consumers * e
Enforced since 1972 1975
Tariff structure Declining block Declining block
with minimum with minimum w
monthly bill monthly bill
Block sizes kWh/
Energy rates Kz/kWh
1 250/3.00 300/4.00
2 /2.50 300/3.00
3 /2.80
4 /3.00
5
6
Minimum monthly demand kWh 100 100
Notes
Source: ENE, SONEFE, EDEL.
OQ 0
o XI-hF

Table 8: LOW-VOLTAGE TARIFFS IN EDEL DISTRIBUTION AREA - 1987 (ENFORCED SINCE 1962)
(1) (2 ) &.' (3) (4)
Tariff designation General domestic Lighting and other Industrial power Public lighting
uses
Consumer type Residential Offices, shops Industry -
Share in EDEL eaergy sales b/ 58.0% 15.0% 2.0% 2.2%
Nunber of consumers b/ 55,551 6.642 333 737
Tariff structure c/ Declining block, block Decliniiig block, bloch Time of day enery rates: Flat rate Kz 0.50
size related to house size related to floor peak: 3 hr, Kz 2.00/kWh; per kWh
size (12 classes); area (6 classes); off-peak: 9 hr. Kz 0.70
monthly fixed rate monthly fixes rate per kWh; other hours
related to meter size related to meter size Kz 1.80-0.75/kWh
(up to 9 classes) (up to 9 classes) declining with load
factor and meter size
Block size range kWh/
Energy rates Kz/kWh:
1 8 to 54/2.50 30 to 150/2.50 -
2 14 to 82/1.50 220 to 350/1.50
3 /0.70 /0.70
Minimum monthly demand kWh 3 to 10 Related to meter sixe ....
Average price b/ in Kz/kWh 0.83 1.06 1.01 0.50
a/ Shop window lighting and advertising uses may be charged by a declining block tariff: 3 consumers, average price Kz 0.88/kWh.
Water heating and cooking and air conditioning uses with dedicated meter may be charged by a tariff close to industrial power
tariff: 7 consumers, average price Kz 0.88/kWh.
b/ 1983. o
c/ Monthly fixed rate Xz 0.12 to 5.00/kVA of meter caliber. D X
Source: ENE, SONEFE, EDEL.0

Table 9: HIGH-VOLTAGE TARIFFS IN THE NORTHERN SYSTEM
(1) (2) (3) (4) (5) (6) (7)
Utility SONEFE SONEF SONEFE SONEFE SONEFE SONEFE, EDEL SONEFE
Consumer/s EDEL Fina Petroleos SECiL Siderurgia Siderurgia Other in Luanda, Other, Kwanza Swl
Nacional Nacional Benco, and Malenga, Uige
Steel Furnace Other uses Kwanza Norte
Enforced since .... .... .... .... .... 1965 ....
Billing variables 12 month, 15 12 month, 15- 12 month, 15- Active energy: 12 month, coin- 12 month, 15- Declining block
minute peak m;nute demand: minute peak W, kWh. cident peak minute peak rates related to
demand kW; active P, kW; active demand: P, kW; demand: P1, kW demand: P, kW; 12 month, 15-
P, kW; active energy: W, kW; active energy: peak and off- active energy: minute peak demand
energy; W, kW; reactive energy. W, kWh. peak energy W, kWh; utilisation (6 classes) and
reactive energy. 7 demdnd: Wl, W2 of P: H, hr; reac- load factor (4 clas-
? kWh. tive energy ses); react;ve ener-
- Cos 0 gy Cos 0
Rates (in Kz) P: 55.8 P: 62.0 P: 56.4 Pl: 0, MAY/OCT H c 30: P < 50 kW and
W: 0.369 W: 0.410 W: 0.373 W: 0.163 P1: 62 NOV/APR P: 39 H < 30 hr:
W1= W2:0.410 W: 0 1.40/kWh
MAY/OCT H < 90: ....
WI: 0.07 P. ) P > 2,000 kW and
NOV/APR W: 1 H > 90 hours: 0.43/kWh
WI: 0.41 H < 180:
NOV/APR P: 45
W: 0.6
H > 180:
P. 45
W: 0.39
Reactive energy Cos 0 - 0.8.1.000 Cos 0 = 0.8:1,000
multipliers for .... ....
monthly bills Cos 0 = 0.4:1,573 Cos 0 = 0.4:1,573
Notes 25% rebate on Interruptible Demand rate increas- .
energy input 4 hours November ing and energy rate x
to exported to April decreasing with load 1- I-
cement. factor Average price
for EDEL Kz 1.2 to
to 1.4, 25 to 28% of
EDEL sales.
Source: ENE, SONEFE, EDEL.
- 234 - Annex 16
Page 1 of 19
SUMMARY OF THE CAPANDA [YDRO PROJECT
1. In 1982 the Government reached an agreement with aU.S.S.R./Brazilian consortium for the development of a hydroelectricplant at Capanda on the Kwanza River about 400 km southwest of Luanda.In December of that year, a contract was signed and CAMEK, the Office forthe Harnessing of the Middle Kwanza, was created to coordinate andsupervise the work. CAMEK was placed under the direct supervision of theMinister of Energy and Petroleum (MEP) and is in charge of coordinatingand supervising the project.
2. The main contractors for the Project are the Soviet firmTECHNOPROMEXPORT (TPE) and the Brazilian firm, N. ODEBRECHT. TPE, theteam-leader, supervises Lonstruction. It also supervises related Sovietfirms and institutes responsible for geological prospecting, dam design,and equipment supply. N. ODEBRECHT is in charge of the civil works andsupport infrastructure.
3. Future activities to be carried out under the Project areregulated by "Partial Supplement of Services" agreements consisting ofadditional contracts. From 1985 to mid-1987, ten "supplements" have beensigned--one with the Soviet group and nine with the BraziLian group.
4. The Brazilian utility, FURNAS CENTRAIS ELECTRICAS (FURNAS), holdsa contract signed in November 1984, estimated at US$65 million for theprovision (on secondment) of higher-level staff to GAMEK to deal withadministrative, managerial, and technical issues. In mid-1987, FURNAShad 55 persons seconded to GAMEK, and, by end-1986, about half of thecontract value was to have been completed.
5. Large infrastructures were required. With the exception of thosein Luanda, those at the work sites are required to counter serioussecurity problems. Access to the site required 75 km of paved roads fromCacuso, with a 100-meter strip cleared on either side for securityreasons. Two 30 kV lines from Cacuso were also required for energysupply during construction. In addition to normal facilities, heavyinvestments were required for transport (airports), health andcommunications. GAMEK estimated that 2,500 people were working on thesite in July 1988 and that 4,200 would by the end of 1989. The shortageof housing in Luanda, and the large numbers of foreign technicians,workers and family members required the construction, in the capitalcity, of a complete residential and administrative center.
6. Work on the project, on site, started in February 1987 andexcavations (deviation tunnel) started in April 1988 with deviation ofthe river scheduled for July 1989. The dam itself would be built afterthis date and the first group would come on stream in January 1993. Itshould be noted that measurements show that the high flow always exceeds1500 m3 /s, which requires particular care in building the deviation

- 235 - Annex 16
Page 2 of 19
tunnel (and its not being lined could prove risky). Scheduling wouldalso need to be very careful to avoid forced interruption of work duringthe high flow period. When Cambambe was built, and in spite of the manyprecautions taken, the work site was flooded three times.
7, Until recently, feasibility studies undertaken within theframework of the old SONEFE expansion plan offered the only availabledata on the characteristics of the Project and its position in thedevelopment of the Northern System. The plan outlined the building ofthe Capanda hydroelectric plant in three stages interwoven withdevelopments in Cambambe (150 km downstream).
(a) a "low" dam only for regulatory purposes, creaying areservoir with a total volume of 900 million m , andraising the minimum guaranteed flow at Cambambe from 130 to250 m3/s;
(b) a "high" dam (height raised roughly 30 meters) creating areservoir with a total volume of 3,400 million m3 andguaranteeirng a minimum flow in Cambambe of around 350 m/s;and
(c) a power plant with an installed capacity of 440 MW(4 x 110 MW).
8. The Government's ostensible decision to develop the middle courseof the Kwanza River took priority over the further development ofCambambe. Under the present Project, the three stages are combined. Adam and power plant are to be built at the same time as the dam is beingraised to its final height. Finally, and without the help ofoptimization studies, the capacity to be installed was raised to 520 MW(4 x 130 MW). According to information received from GAMEK in October1988, the dam will be of 3gravity type, 110 m highs with a storagecapacity of 3700 million m (live storage of 2200 m ), a regularizedannual flow of 500 m3/s and an average energy output of 2400 GWh.
Project Costs and Investment Program
9. When the decision to proceed with the project was taken, thereexisted no reasonably firm, recent estimate of the costs of theinvestment. A figure of about US$1000 million was often quoted fordirect costs based on rough updates of old studies without even a designfor the dam (which was under discussion at the timel.
10. Only in 1987 did the studies carried out by TPE permitted adecision as to the type of dam and a first estimate of costs. The totaldirect costs at 1987 prices are estimated at US$1250 million or about$1600 million including financial charges (interest duringconstruction). This total also most probably understates costs as it

- 236 - Annex 16
Page 3 of 19
allows neither for physical contingencies nor for the high sums neededfor certain costs (food, transport, infrastructures) imposed by thedifficult conditions under which the project is being executed.
11. The investment program is described in Table 1. Of the US$1246million of direct costs, at end-1988 about US$500 million had been spent,or about 40% of the total. By the end of 1989, more than 50% of thefunds would have been spent. Total financial charges (including interestduring construction) amount to about $360 million and average about US$40million p.a. in the period 1988-1992, a sum which exceeds all otherinvestments in the power subsector over the same period. Includingfinancial charges, total expenditures at end-1988 would have reachedUS$570 million, US$750 million by end-1989.
12. The project is being financed essentially from externalcommercial loans as described below:
(a) US$408 million from Banco do Brasil (CACEX) in twotranches, the first tranche of US$308 million granted inDecember 1984 with a disbursement period of 6.5 years(interest rate of 8%, 7.5 years repayment period startingin June 1991) and a second tranche of $100 million grantedin July 1988 to be disbursed before December 1990 (interestrate of 7.15%, a flat, up-front insurance fee of 2%, 7.5years' repayment period starting in June 1991). Bothtranches are guaranteed by petroleum exports under theterms of a contract between SONANGOL and PETROBRAS.Indications in early 1989 were that Banco do Brasil wasgranting an additional US$120 million and that anadditional US$162 million was to be negotiated. Thus,expected financing from Brazil would reach US$690 million.
(b) The U.S.S.R. approved a loan of US$275 million to coverengineering design, manufacturing and installation ofSoviet-supplied electromechanical equipment. The loancarries an interest rate of 3% and a repayment period ofnine years, including three years of grace.
(c) Other (unidentified) countries were expected to provideUS$105 million through supplies' credits. Until mid-1989,only US$8 million had been obtained, from Finland, on hardcommerc;al terms (3 years).
(d) The Government of Angola/State Budget was to provide US$170million, theoretically in domestic currency--however, asfinancier of last resort, the Angolan State would have tomake up any shortfall.
13. So, theoretically, a financing plan exists for the estimatedUS$1240 million of direct costs (even though there are unfunded financial

- 237 - Annex 16Page 4 of 19
charges during construction of US$360 million). However, as at the endof 1988 only US$691 million was firmly committed, which means that thereis a financial gap of US$912 million (or US$555 million, excludinginterest during construction). Excluding Soviet financing, cumulativeexpenditures at the end of 1988 exceeded firm commitments, therebyraising serious questions as to the feasibility of continuing the work onthe current schedule.
Alternate Expansion Programs
14. Energy production costs at Capanda cannot be assessed preciselybecause of insufficient and unreliable information. However, based onoptimistic forecasts for demand expansion, (requiring 915 GWh in 1992 and1280 GWh in 1995, in the Northern Grid), the BEP study recommendsdeveloping hydro resources according to either of the two followingstrategies:
Strategy 1: Priority to Northern Region; development ofCambambe and Capanda.
Strategy 2: Priority to the Central and Southern Regions;development of Lomaum (Units Nos. 4 and 5),Cacombo, Jamba-la-Mina, and Cove.
15. Simultaneous development of both strategies was not recommendedas the systems were assumed to be interconnected by 1992. Strategy No. 1would require two units in Capanda in 1995, followed by small additionalcapacity in the Central System by the year 2000. Strategy No. 2 wouldrequire a simultaneous development of Lomaum and Cove in the CentralSystem and Jamba-la-Mina in the Southern System. The "high" dam inCambambe would be required in 1995 and only the two first units ofCapanda by the year 2005. Strategy No. 2 leads to a net present value ofinvestment and operating costs below that of Strategy No. 1. Therelative position of the two strategies is not necessarily robust ifdemand were significantly lower, especially in the Central Grid (BEPprojects a demand of 528 GWh while the mission's "high" scenario is only284 GWh).
16. The comparison of SONEFE's expansion plan with alternativeoptions done by BEP suggests that the following sequence may be the mosteconomic:
(a) "High" dam in Cambambe. A total capacity increase from 180to 260 MW (due to head increase). The plant is providedwith weekly regulating capability while its minimum flowremains 130 m3/s and its firm energy rises from 700 GWh to1000 GWh.

- 238 - Annex 16
Page 5 of 19
(b) "Low" dam in Capanda, and first stage of second power plantat Cambambe (2 x 110 MW). Cambambe is provided withmonth y regulating capability and its minimum flow rises to250 m Is.
(c) "High" dam in Capanda and second-stage of second powerplant at Camb*mbe (2 x 110 MW); minimum flow at Cambamberises to 350 m Is.
(d) power plant at Capanda (4 x 110 MW in old studies or4 x 130 MW in more recent ones).
The above sequencing could be modified to ensure that generation couldalways, simultaneously satisfy the requirements for firm power (firmenergy at the critical day) and for useful power for covering the peak.
17. BEP estimated the investment costs for the above sequence atUS$1,030/kW for Cambambe as compared with US$1,800 for Capanda (in 1986prices). Firm energy capabilities are not accounted for and discountingheightens the relative costs of Capanda if projects are consideredalternative rather than complementary. Thus the comparison should not becarried too far. Moreover, unit turbine plus generator costs were ratedby BEP, with no explanation, at US$500/kW for Cambambe and at onlyUS$345/kW for Capanda.
Estimated Costs of Energy Production at Capanda
18. The cost of energy produced in a power plant within a system canonly be estimated correctly by analyzing the whole system and optimizingits operation. In spite of this, order of magnitude estimates of LRMC atCapanda can be obtained. To do this, the investment program (of Table 1)was used, with the addition of a 10% margin on the activities of TPE andODEBRECHT to account for physical contingencies. A useful life of 50years was hypothesized (30 years for the equipment and 75 years for thedam might be more appropriate), together with operation and maintenancecosts of 2% of baseline investment costs. The first unit is assumed tocome on stream January 1, 1993 and the other three at six-month intervals(the last one, on July 1, 1994). Firm energy production of 2400 GWh wasassumed (prorated as to entry on stream of units). Discount ratesensitivity analysis was done using 10%, 12% and 15% together with thethree demand scenarios developed by the mission. It was assumed that thedemand to be satisfied would be that of the Northern Grid alone (whichreduces the market for Capanda power over some years). Finally, threelevels of generation were assumed at Cambambe, namely 200 GWh/year, 500GWh/year and 780 GWh/vear. The last figure is the sum of the firm energyproduced by Cambambe and Mabubas. In the average year, this easilyexceeds 1000 GWh which means that if this energy were given priority, itwould postpone even further the possibility of placing Capanda's entireoutput.
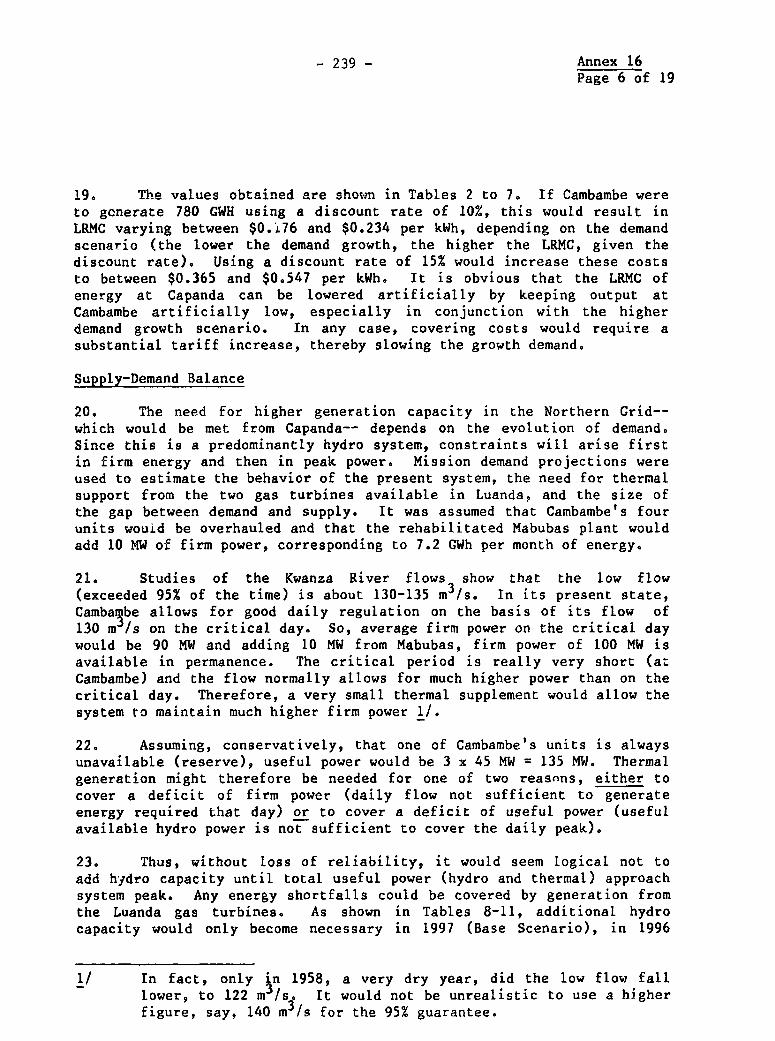
- 239 - Annex 16Page 6 of 19
19. The values obtained are shown in Tables 2 to 7, If Cambambe wereto generate 780 GWH using a discount rate of 10%, this would result inLRMC varying between $0.i76 and $0.234 per kWh, depending on the demandscenario (the lower the demand growth, the higher the LRMC, given thediscount rate). Using a discount rate of 15% would increase these coststo between $0.365 and $0.547 per kWh. It is obvious that the LRMC ofenergy at Capanda can be lowered artificially by keeping output atCambambe artificially low, especially in conjunction with the higherdemand growth scenario. In any case, covering costs would require asubstantial tariff increase, thereby slowing the growth demand.
Supply-Demand Balance
20. The need for higher generation capacity in the Northern Grid--which would be met from Capanda-- depends on the evolution of demand.Since this is a predominantly hydro system, constraints will arise firstin firm energy and then in peak power. Mission demand projections wereused to estimate the behavior of the present system, the need for thermalsupport from the two gas turbines available in Luanda, and the size ofthe gap between demand and supply. It was assumed that Cambambe's fourunits wouid be overhauled and that the rehabilitated Mabubas plant wouldadd 10 MW of firm power, corresponding to 7.2 CWh per month of energy.
21. Studies of the Kwanza River flows show that the low flow(exceeded 95% of the time) is about 130-135 m3/s. In its present state,Cambambe allows for good daily regulation on the basis of its flow of130 m /s on the critical day. So, average firm power on the critical daywould be 90 MW and adding 10 MW from Mabubas, firm power of 100 MW isavailable in permanence. The critical period is really very short (atCambambe) and the flow normally allows for much higher power than on thecritical day. Therefore, a very small thermal supplement would allow thesystem to maintain much higher firm power 1/.
22. Assuming, conservatively, that one of Cambambe's units is alwaysunavailable (reserve), useful power would be 3 x 45 MW = 135 MW. Thermalgeneration might therefore be needed for one of two reasons, either tocover a deficit of firm power (daily flow not sufficient to generateenergy required that day) or to cover a deficit of useful power (usefulavailable hydro power is not sufficient to cover the daily peak).
23. Thus, without loss of reliability, it would seem logical not toadd hydro capacity until total useful power (hydro and thermal) approachsystem peak. Any energy shortfalls could be covered by generation fromthe Luanda gas turbines. As shown in Tables 8-11, additional hydrocapacity would only become necessary in 1997 (Base Scenario), in 1996
1/ In fact, only in 1958, a very dry year, did the low flow falllower, to 122 m 1s. It would not be unrealistic to use a higherfigure, say, 140 m3/s for the 95% guarantee.

- 240 - Annex 16
Page 7 of 19
(Intermediate Scenario) or in 1994 (High Scenario). Thermal supportwould be needed briefly during the four years before the commissioning ofnew hydro capacity. This support would vary between 80 and 120 GWh peryear (depending on demand) and would cost (1987 prices, no discounting)between $6.1 million and $9.1 million.
24. Under the same assumptions, the maximum requirements for powerand energy to satisfy demand to the year 2000 would be 170 MW and 520 GWh(under the high demand growth scenario). Heightening the Cambambe daminthe early 1990's and a low dam at Capanda around 2000 would amply coverthe demand with a high margin of reserve and without thermal support.The investments required would be substantially lower than the cost ofCapanda and would allow greater flexibility for matching investments tothe actual growth of demand (i.e., reducing the uncertainty and thepossibility of making costly mistakes). On the contrary, the Capandaproject makes investments long before the emergence of actual demand,with adjustments limited to the timing of commissioning of the generatingunits. Consequently, all this causes higher costs which will need to bereflected in higher electricity tariffs.
Interconnection
25. Under present security conditions, the construction of newtransmission lines between systems is impossible. The existing linebetween Cambambe and Gabela (125 km, 220 KV) is the first stage of afuture link between the Northern and Central Systems. It has been out ofservice since 1984 and security conditions have allowed neither itsrestoration nor the maintenance of important Central and Southern lines(creating supply difficulties for Porto Amboim). In the meantimeregional power supply (Lomaum, Biopio, Huambo, Matala, Namibe) will berehabilitated and expanded to meet potential demand. The three systemswould remain self-sufficient and would have to provide for their ownreserve margin. If a protracted war were to continue it would suppressdemand growth and prevent construction of interconnections. Thus, alarger electrical market for Capanda would not develop. A short-termcease-fire followed by quick economic recovery would allow and possiblyrequire electrical interconnections, but the least-cost expansion planwould postpone these until near the year 2000, giving preference topreviously proposed supply sources in the Central and Southern systems,whose requirements are modest in absolute terms. If an interconnectedsystem with Capanda were to be considered in the short run, problems ofreliability, operations, and on-line dispatching could arise.
Conclusions
26. At the present stage of development of the power systems ofAngola, the construction of the dam and power plant at Capanda would be,at best, a project of marginal economic interest and, at worst, a veryheavy financial burden without contribution to revolving the problems ofthe subsector and the country. Several major issues arise:

- 241 - Annex 16Page 8 of 19
(a) the Project represents an important departure from the least-cost expansion path;
(b) the huge capacity (4 x 130 MW) will probably not be neededuntil the late 1990s (10 to 12 years after project completion)and no additional capacity will be required in the NorthernSystem until then;
(c) building the Capanda dam will neither improve the reliabilityof supply in the Northern System, nor mitigate the problems ofthe other two systems; and
(d) investment in Capanda will substantially add to the publicexternal debt burden and could undermine the financing of thevital petroleum development program, on which future exportearnings depend.
22. The Government's goal of taking advantage of Angola's hydroassets cannot be reached without large additional investments intransmission and distribution (together with investments in generntionwhich are the only ones being consdiered under the Capanda Project).Only two alternatives seem open for the utilization of Capanda powerearlier than presently foreseeable demand would justify. These are:
(a) attract foreign investment in power-intensive industries thatdo not require significant developments in the distributionnetwork; and
(b) provide generalized access to electricity to a larger propor-tion of Luanda's population and provide incentives toindustrial rehabilitation.
The first alternative is practically open but a relatively longperiod of stability is needed for it to materialize. The secondalternative would require enormous investments in distribution networks(from HV to LV) that neither the utilities nor the Government canafford. Therefore, the whole issue of Capanda remains closely tied tothe absence of a market that could justify the investment and thedifficulty of predicting how and where such a market could develop.

- 242 - &Rex 16Page 9 of 19
Table 1: CAPANOA HYDROELECTRIC PROJECT: INVESTMENT PROGRAM(S million)
Retf escription 1985-87 88 85 90 91 92 93 94 95-2003 Total
N. OOEB1ECHT
I Labor 73,740 40,854 47,960 57,963 59,630 37,253 0 0 0 317,4002 Materlals 89,064 20,530 23,934 26,841 26,754 14,123 0 0 0 201,2463 Food 12,760 8.236 11,386 11,500 10,748 9,169 0 0 0 63,7994 Equipment 35,698 8,898 8,900 0 0 0 0 0 0 53,4965 Freight 41,516 13,212 5,916 5,973 5,973 4,790 0 0 0 77,3806 Subcontracts 28,109 3,679 7,511 5,150 5,155 2,137 0 0 0 51,7417 Travel 26,642 8,284 6,223 6,715 6,715 5,244 0 0 0 59,7228 Othor 20,395 6,630 5,313 5,453 5,287 4,515 0 0 0 46,4839 Subtotal 327,924 109,112 117,143 119,595 120,262 77,231 0 0 0 871,26710 Cumulative 327,924 437,036 554,179 673,774 794,036 871,267 0 0 0 871,267
TPE
11 Eng. Design 4,156 7,464 7,460 3,240 3,180 3,160 4,090 3,450 0 36,20012 Equipment 0 0 130 4,760 65,640 72,000 27,110 140 0 7,17713 Installatlon 0 0 5,210 13,2AO 9,220 14,210 11,200 4,720 0 57,84014 Supervislon 0 920 1,500 1,780 1,780 1,780 1,780 1,640 U 11,18015 Subtotal 4,156 8,384 14,300 23,060 79,820 91,150 44,180 9,950 0 275,00016 Cumulativo 4,156 12,540 26,840 49,900 129,720 220,810 265,050 275,000 0 275,000
FU.iAS
17 Services 18,981 8,984 6,616 6,616 6,150 5,238 5,238 0 0 57,28318 Other Exp. 4,424 1,181 348 348 324 276 276 0 0 7,17719 Subtotal 23,405 10,165 6,964 6,964 6,474 5,514 5,514 0 0 65,00020 Cumulative 23,405 33,570 47,498 47,498 53,972 59,486 65,000 0 0 65,000
GAWEK
21 Insurance 6,047 3,966 3,993 3,505 3,505 3,505 3,505 3,020 0 31,04622 Other Exp. 3,500 0 0 0 0 0 0 0 0 3,50023 Subtotal 9,547 3,966 3,993 3,505 3,505 3,505 3,502 3,020 0 34,54624 Cumulative 9,547 13,513 17,506 21,011 24,516 28,021 31,526 34,546 0 34,546
25 Dlrect Costs 365,032 131,627 142,400 153,124 210,061 177,400 53,199 12,970 0 1,245,81326 Cumulative 365,032 496,659 639,059 792,183 1,002,244 1,179,644 1,232,843 1,245,813 0 1,245,813
27 Interest 17,045 37,284 34,248 42,822 41,610 38,086 34,512 29,8'8 62,406 337,86128 Commission 75 42 109 83 57 44 38 29 0 47729 Exch. Variation 0 18,733 0 0 0 0 0 0 0 18,733
30 Fin. Charges 17,120 56,059 34,357 42,905 41,667 38,130 34,550 29,877 62,406 357,07131 Cumulative 17,120 73,179 107,536 150,441 192,108 230,238 264,788 294,665 357,071 357,071
32 Grand Total 382,152 187,686 176,757 196,029 251,728 215,530 87,749 42,847 62,406 1,602,88433 Cumulative 382,152 569,838 746,595 942,624 1,194,352 1,409,882 1,497,631 1,540,478 1,602,884 1,602,884
Source: GAMEK.

Annex 16- 24 3 - Page 10 of 19
Table 2: CAPANDA: TOTAL COSTS (1987 PRICES) AND YEARLY OUTPUT
(Output of Cambambe: 200 GWh)
Annual Generation (GWh)
Year Expenditures (million US$) Scenarios
Nr Year Invest O&M Total Base Intermediate High
-8 1985 64 0 64 - - -
-7 1986 116 0 116 - - -
-6 1987 185 0 185 - - -
-5 1988 159 0 159 - - -
-4 1989 155 0 155 - - -
-3 i990 163 0 163 - - -
-2 1991 227 0 227 - - -
-1 1992 191 0 191 - - -
0 1993 58 26 84 523 (a)614 (a)684
1 1994 14 26 40 581 710 884
2 1995 0 26 26 659 819 1,103
3 1996 0 26 26 763 941 1,111
4 1997 0 26 26 876 1,078 1,216
5 1998 0 26 26 1,008 1,219 1,329
6 1999 0 26 26 1,140 1,346 1,451
7 2000 0 26 26 1,263 1,470 1,584
8 2001 0 26 26 1,384 1,594 1,706
9 2002 0 26 26 1,504 1,715 1,828
10 2003 0 26 26 1,606 1,830 1,949
11 2004 0 26 26 1,714 1,952 2,078
12 2005 0 26 26 1,829 2,081 2,215
13 2006 0 26 26 1,931 2,195 2,336
14 2007 0 26 26 2,037 2,315 2,400
15 2008 0 26 26 2,149 2,400 2,400
16 2009 0 25 26 2,266 1,400 2,400
17 2010 0 26 26 2,390 2,400 2,400
18 2011 0 26 26 2,400 2,400 2,400
19 2012 0 25 26 2,400 2,400 2,400
20 2013 0 26 26 2,400 2,400 2,400
21 2014 0 26 25 2,400 2,400 2,400
49 2042 0 26 26 2,400 2,400 2,400
50 2043 0 26 26 2,400 2,400 2,400
(a) Output of Cambambe should exceed 200 GWh in that year.
Notes: (1) Ecotomic life of project : 50 years,
(2) Entry on stream, 1993 (1 unit/six months).
(3) 1987 prices,(4) Maximum yearly output of Capanda: 240 GWh.(5) Total Investment $1331 million
(information provided GAMEK, 1988)o(6) Yearly O&M : 2% of total investment.
Source: Mission estimates.

- 244 - Annex 16Page 11 of 19
Table 3: CAPANDA: TOTAL cosrs (1987 PRICES) AND YEARLY OUTPUT(Output of Cambambe: 500 GWh)
Annual Generation (GWh)Year Expenditures (Million US$) ScenariosNr Year Invest 0&M Total Base Intermediate High
-8 1985 64 0 64 - - --7 1986 116 0 116 - - -
-6 1987 185 0 185 - - --5 1988 159 0 159 - - --4 1989 155 0 155 - - --3 1990 163 0 163 - - --2 1991 227 0 227 - - --1 1992 191 0 191 - - -
0 1993 58 26 84 223 327 4681 1994 14 26 40 281 410 5842 1995 0 26 26 359 519 7033 1996 0 26 26 463 641 8114 1997 0 26 26 576 778 9165 1998 0 26 26 708 919 1,0296 1999 0 26 26 840 1,046 1,1517 2000 0 26 26 963 1,170 1,2848 2001 0 26 26 1,084 1,294 1,4069 2002 0 26 26 1,204 1,415 1,52810 2003 0 26 26 1,306 1,530 1,64911 2004 0 26 26 1,414 1,652 1,77812 2005 0 26 26 1,529 1,781 1,91513 2006 0 26 26 1,631 1,895 2,03614 2007 0 26 26 1,737 2,015 2,16215 2008 0 26 26 1,849 2,140 2,29516 2009 0 26 26 1,966 2,272 2,40017 2010 0 26 26 2,090 2,400 2,40018 2011 0 26 26 2,219 2,400 2,40019 2012 0 26 26 2,355 2,400 2,40020 2013 0 26 26 2,400 2,400 2,40021 2014 0 26 26 2,400 2,400 2,40022 2015 0 26 26 2,400 2,400 2,400
49 2042 0 26 26 2,400 2,400 2,40050 2043 0 26 26 2,400 2,400 2,400
Notes: (1) Economic life of project 50 years,(2) Entry on stream, 1993 (1 unit/six months).(3) 1987 prices.(4) Maximum yearly output of Cspanda: 2400 GWh.(5) Total Investment $1331 million
(Information provided GAMEK, 1988).(6) Yearly 0&M : 2% of total investment,
Source: Mission estimates.

- 245 - Annex 16Page 12 of 19
Table 4: CAPANDA: TOTAL COSTS (1987 PRICES) AND YEARLY OUTPUT(Output of Cambambe: 780 GWh)
Annual Generation (GWh)Year Expenditures (Million US$) ScenariosNr Year Invest O&M Total Base Intermediate High
-8 1985 64 0 64 --7 1986 1!6 0 116 - - -
-6 '987 185 0 185 - - -
-5 1988 159 0 159 - - --4 1989 155 0 155 - - --3 1990 163 0 163 - - --2 1991 227 0 227 - - --1 1992 191 0 191 - - -0 1993 58 26 84 0 47 1881 1994 14 26 40 1 130 3042 1995 0 26 26 79 239 4233 1996 0 26 26 183 361 5314 1997 0 26 26 296 498 6365 1998 0 26 26 428 639 7496 1999 0 26 26 560 766 8717 2000 0 26 26 683 890 1,0048 2001 0 26 26 804 1,014 1,1269 2002 0 26 26 924 1,135 1,24810 2003 0 26 26 1,026 1,250 1,36911 2004 0 26 26 1,134 1,372 1,49812 2005 0 26 26 1,249 1,501 1,63513 2006 0 26 26 1,351 1,615 1,75614 2007 0 26 26 1,457 1,735 1,88215 2008 0 26 26 1,569 1,860 2,01516 2009 0 26 26 1,686 1,992 2,15517 2010 0 26 26 1,810 2,131 2,30218 2011 0 26 26 1,939 2,276 2,40019 2012 0 26 26 2,075 2,400 2,40020 2013 0 26 26 2,218 2,400 2,40021 2014 0 26 26 2,368 2,400 2,40022 2015 0 26 26 2,400 2,400 2,400
49 2042 0 26 26 2,400 2,400 2,40050 2043 0 26 26 2,400 2,400 2,400
Notes: (1) Economic life of project : 50 years,(2) Entry on stream, 1993 (1 unit/six months).(3) 1987 prices.(4) Maximum yearly output of Capanda: 2400 GWh.(5) Total investment $1331 million
(Information provided GAMEK, 1988).(6) Yearly O&M : 2% of total investment.
Source: Mission estimates.

- 246 - Annex 16Page 13 of 19
Table 5: CAPANDA: LONG RUN MARGINAL COSTS (LRMC)(Yearly output of Cambambe: 200 GWh)
Discount Rate Annuities (50 years)i=10% i=12% i=15% i=10% i=12% i=15%
Discounted expenditures (USS Million)Investment 1,946.4 2,102.3 2,361.1 196.3 253.2 354.5Operation and maintenance 283.6 241.8 199.1 28,6 29.1 29.9Total 2,230.0 2,344.2 2,560.2 224,9 282.3 384,4
Discounted energy (GWh)Base scenario 14,869.9 11,772.7 8,784.4 1,499.8 1,417.6 1,318.9Intermediate scenario 16,514.0 13,231,9 10,023.4 1,665.6 1,593.9 1,504.9High scenario 17,598.6 14,224.6 10,902.8 1,775,0 1,712,9 1,636,9
Long Range MargiiGa! Costs (US$/kWh)Base scenario 0,150 0,199 0.291Intermediate scenario 0.135 0.177 0.255High scenar;o 0,127 0.165 0.235
Long Range Marginal Costs (Kz/kWh)Base scenario 4.50 5.97 8.74Intermediate scenario 4.05 5,31 7.66High scenario 3.80 4.94 7.04
Notes: (1) Project economic lifetime: 50 years.(2) First year of operation: 1993.(3) Base year for discounting/compounding: 1993,(4) Discouat rates: 10%, 12%, and 15%.(5) 1987 pt tes.(6) Insta .J capacity at Capanda: 4 x 130 MW = 520 MW
(First Unit 1.1.1993; other units installed every six months),(7) Calculated on the basis of Table 2.
Source: Mission estimates.

- 247 - Annex 16Page 14 of 19
Table 6: CAPANDA: LONG RUN MARGINAL COSTS (LRMC)(Yearly output of Cambambe: 500 GWh)
Discount Rate Annuities (50 years)1=10% i=12% 1=15% i=10% i=12% i-15%
Discounted expenditures (US$ Million)Investment 1,946.4 2,102.3 2,361.1 196.3 253.2 354,5Operation and maintenance 283.6 241.8 199.1 28.6 29.1 29.9Total 2,230.0 2,344.2 2,560.2 224.9 282.3 384.4
Discounted energy (GWh)Base scenario 12,123.6 9,308.1 6,652.5 1,222.8 1,120.9 998.8Intermediate scenario 13,927.0 10,888.2 7,973.5 1,404.7 1,311,1 1,197.1High scenario 15,164.0 12,013.8 8,965.4 1,529,4 1,446.7 1,346.6
Long Range Marginal Costs (US$/kWh)Base scenario 0.184 0,252 0.385Intermediate scenario 0.169 0.215 0.321High scenario 0,147 0.195 0.286
Long Range Marginal Costs (Kz/kWh)Base scenario 5.52 7.56 11,55Intermediate scenario 4.05 6.46 9.63High scenario 3.80 5.85 8,57
Notes: (1) Project economic lifetime: 50 years.(2) First year of operation: 1993.(3) Base year for discounting/compounding: 1993.(4) Discount rates: 10%, 12%, and 15%.(5) 1987 prices.(6) Installed capacity at Capanda: 4 x 130 MW = 520 MW
(First Unit 1.1.1993; other units installed every six months).(7) Calculated on the basis of Table 3.
Source: Mission estimates.

- 243 Annex 16Page 15 of 19
Table 7: CAPANDA: LONG RUN MARGINAL COSTS (LRMC)(Yearly output of Cambambe: 780 GWh)
Discount Rate Annuities (50 years)i=10% i=12% i=15% i=10% 1=12% i=15%
Discounted expenditures (US$ Million)Investment 1,946.4 2,102.3 2,361,1 196.3 253.2 354.5Operation and maintenance 283.6 241.8 199.1 28.6 29.1 29.9Total 2,230.0 2,344.2 2,560.2 224.9 282.3 384,4
Discounted energy (GWh)Base scenario 9,527.1 7,009.2 4,681.1 960.9 844.0 702,8Intermediate scenario 11,380.9 8,608.5 5,991.3 1,147,9 1,036.6 899.5High scenario 12,681.6 9,780.8 7,012.8 1,279.1 1,177.8 1,052,9
Long Range Marginal Costs (US$/kWh)Base scenario 0.234 10.03 16.41Intermediate scenario 0,196 8.17 12,82High scenario 0.176 7.19 10.95
Long Range Marginal Costs (Kz/kWh)Base scenario 4 5.97 8.74Intermediate scenario 4.05 5.31 7.66High scenario 3.80 4.94 7.04
Notes: (1) Project economic lifetime: 50 years.(2) First year of operation: 1993,(3) Base year for discounting/compounding: 1993.(4) Discount rates: 10%, 12%, and 15%.(5) 1987 prices,(6) Installed capacity at Capanda: 4 x 130 MW = 520 MW
(First Unit 1,1,1993; other units installed every six months).(7) Calculated on the basis of Table 4.
Source: Mission estimates,

Annex 16Page 16 of 19
Table 8: NORTHERN SYSTEM: ENERGY AND POWER BALANCE, 1988-2000
BASE SCENARIO
1988 1989 1990 1991 1992 1993 1994 1995 1996 1997 1998 1999 2000
System Needs
(1) Generation (GWh) 630.3 642.9 655.8 668.9 689.0 723.4 781.3 859.4 962.6 1078.1 1207.4 1340.3 1460.9
(2) Peak Power Equivalent Needs (MW) 114.2 116,5 118.8 121.2 124.8 131.1 141.6 155.7 174.4 195.3 218.8 242.9 264.7(3) Critical Day Generation (313 days) (MWh) 2014 2054 2095 2137 2201 2311 2496 2746 3075 3444 3858 4282 4667(4) Firm Power Required (7500 hours) (MW) 84.0 85.7 87.4 89.2 91.9 96.5 104.2 114.6 128.3 143.7 161.0 178.7 194.8(5) Average Daily Flow at Cambambe (m3/s) 121 124 126 129 133 139 151 166 185 208 233 258 281
Total Capacity (Hydro and Thermal)
(6) Installed (MW) 236.8 254.6 254.6 254.6 254.6 254.6 254 6 254.6 254.6 254.6 254.6 254.6 254.6 254.6(7) Useful (MW) 191.8 209.6 209.6 209.6 209.6 209.6 209.6 209.6 209.6 209.6 209.6 209,6 209.6(8) Firm (MW) 135.4 145.4 145,4 145,4 145.4 145.4 145.4 145.4 145.4 145.4 145.4 145.4 145.4
Hydro Capacity
9) Installed (MW) 180.0 197.8 197.8 197.8 197.8 197.8 197.8 197.8 197.8 197,8 197.8 197.8 197.8(10) Useful (MW) 135.0 152.8 152.8 152.8 152.8 152.8 152.8 152.8 152.8 152,8 152.8 152.8 152.8 ~0(11) Firm (MW) 90.0 100.0 100.0 100.0 100.0 100.0 100.0 100.0 100.0 100.0 100.0 100.0 100.0
Energy Balance
(12) Deficit of Firm Hydro Power (MW) - - - - - - 4.2 14.6 28.3 43.7 61.0 78.7 94.8(13) Thermal Base Energy Required (GWh) - - - - - - 0.2 2.6 9.3 17.1 25.7 35.2 43.6
(14) Deficit of Useful Hydro Power (MW) -20.8 -36.3 -34.0 -31.6 -28.0 -21.7 -11.2 2.9 21.6 42.5 66.0 90.1 111.9(15) % of Deficit (Pdef/Peak) (M) - - - - - - - 1.9 12.4 21.8 30.2 37.1 42.3
(16) % Peak Energy (M) - - - - - - _ (0) 0.9 3.4 6.9 10.6 14.9(17) Thermal Energy Required (Peak) (GWh) - - - - - - - (0) 8.7 36.7 83.3 142.1 217.7
(18) Total Thermal Energy Required (GWh) - - - - - - 0.2 2.6 18.0 53.8 109.0 177.3 261.3
(Base + Peak)
Balance of Peak Power
(19) Total Deficit of Useful Capacity (MW) -77.6 -93.1 -90.8 -88.4 -84.8 -78.5 -68.0 -53.9 -35.2 -14.3 9.2 33.3 55.1
Scurce: 1973 SONEFE Study; Mission estimates.

Annex 16Page 17 of 19
Table 9: NORTHERN SYSTEM: ENERGY AND POWER BALANCE, 1988-2000INTERMEDIATE SCENARIO
1988 1989 1990 1991 1992 1993 1994 1995 1996 1997 1998 1999 2000
Systom reeds(1) Generation (GWh) 630.3 649.2 681.7 715.8 765.9 827.2 909.9 1019.1 1141.3 1278.3 1418.9 1546.6 1670.4
(2) Peak Power Equivalent Needs (MW) 114.2 117.6 123.5 129.7 138.8 149.9 164.9 184.7 206.8 231.6 257.1 280.3 302.7
(3) Critical Day Generation (313 days) (MWh) 2014 2074 2178 2287 2447 2643 2907 3256 3646 4084 4533 4941 5337
(4) Firm Power Required (7500 hours) (MW) 84.0 86.6 90.9 95.4 102.1 110.3 121.3 135.9 152.2 170.4 189.2 206.2 222.7
(5) Average Daily Flow at Cambambe (m3/s) 121 125 131 138 148 159 175 196 220 246 273 298 322
Total Capacity (Hydro and Thermal)
(6) Installed (WV) 236.8 254.6 254.6 254.6 254.6 254.6 254.6 254.6 254.6 254.6 254.6 254.6 254.6 254.6
(7) Useful (MW) 191.8 209.6 209.6 209.6 209.6 209.6 209.6 209.6 209.6 209.6 209.6 209.6 209.6
(8) Firm (MW) 135.4 145.4 145.4 145.4 145.4 145.4 145.4 145.4 145.4 145.4 145.4 145.4 145.4
Hydro Capacity
9) Installed (MW) 180.0 197.8 -7.8 197.8 197.8 197.8 197.8 197.8 197.8 197.8 197.8 197.8 197.8 0(10) Useful (MH) 135.0 152.8 .;'.8 152.8 152.8 152.8 152.8 152.8 152.8 152.8 152.8 152.8 152.8 1(11) Firm (MW) 90.0 100.0 100.0 100.0 100.0 100.0 100.0 100.0 100.0 100.0 100.0 100.0 100.0
Energy Balance
(12) Deficit o, Firm Hydro Power (MW) - - - - 2.1 !'.3 21.3 35.9 52.2 70.4 89.2 106.2 i22.7(13) Thermal Base Energy Required (Gwh) - - - - (0) 1.4 5.8 13.2 21.6 30.9 40.7 49.5 58.1
(14) Deficit of Useful Hydro Power (K") -20.8 -35.2 -29.3 -23.1 -14.0 -2.9 12.1 31.9 54.0 78.8 104.3 127.5 149.9(15) % of Deficit (Pdef/Peak) (M) - - - - - - 7.3 17.3 26.1 34.0 40.6 45.5 49.5(16) % Peak Energy (M) - - - - - - 0.3 1.9 4.9 9.2 12.9 18.0 21.5(17) Thermal Energy Required (Peak) (GWh) _- - 2.7 19.4 55.9 117.6 183.0 278.4 359.1
(18) Total Thermal Energy Required (GWh) - - - (0) 1.4 8.5 32.6 77.5 148.5 223.7 327.9 417.2(Base e Peak)
Balance of Peak Power(19, Total Deficit of Useful Capacity (MW) -77.6 -92.0 -86.1 -79.9 -70.8 -59.7 -44.7 -24.9 -2.8 22.0 47.5 70.7 93.1
Source: 1973 SONEFE Study; Mission estimates.
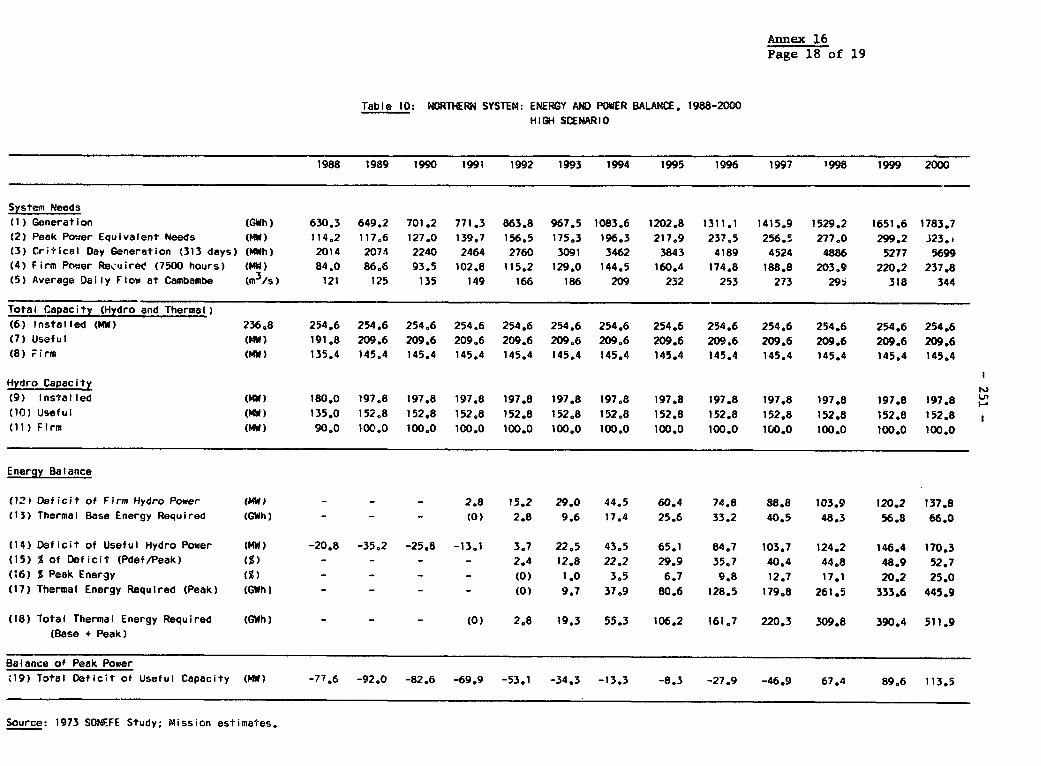
Annex 16Page 18 of 19
Table 10: NORTHERN SYSTEN: ENERGY AND POWER BALANCE, 1988-2000HIGH SCENARIO
1988 1989 1990 1991 1992 1993 1994 1995 1996 1997 1998 1999 2000
Systemi Needs
(1) Generation (GWh) 630.3 649,2 701.2 771.3 863.8 967.5 1083.6 1202.8 1311.1 1415.9 1529.2 1651.6 1783.7(2) Peak Power Equivalent Needs (MW) 114.2 117.6 127.0 139.7 156.5 175.3 196.3 217.9 237.5 256.5 277,0 299.2 323.v(3) Critical Day Generation (313 days) (MWh) 2014 2071 2240 2464 2760 3091 3462 3843 4189 4524 4886 5277 5699(4) Firm Power Rec'uired (7500 hours) (MW) 84.0 86.6 93.5 102.8 115.2 129.0 144.5 160.4 174.8 188.8 203.9 220.2 237.8(5) Average Daily Flow at Cambambe (m3/s) 121 125 135 149 166 186 209 232 253 273 295 318 344
Total Capacity (Hydro and Thermal)
(6) Installed (MW) 236.8 254.6 254.6 254.6 254.6 254.6 254.6 254.6 254.6 254.6 254.6 254.6 254.6 254.6(7) Useful (MW) 191.8 209.6 209.6 209.6 209.6 209.6 209.6 209.6 209.6 209.6 209.6 209.6 209.6(8) Firm (MW) 135.4 145.4 145.4 145.4 145.4 145.4 145.4 145.4 145.4 145.4 145.4 145.4 145.4
Hydro Capacity
(9) Installed (MW) 180.0 197.8 197,8 197.8 197.8 197.8 197.8 197.8 197.8 197.8 197.8 197.8 197.8 F(10) Useful (MW) 135.0 152.8 152.8 152.8 152.8 152.8 152.8 152.8 152.8 152.8 152.8 152.8 152.8(11) Firm (MW) 90.0 100.0 100.0 100.0 100.0 100.0 100.0 100.0 100.0 100.0 100.0 100.0 100.0
Energy Balance
(12\ Deficit of Firm Hydro Power (MW) - - - 2.8 15.2 29.0 44.5 60.4 74.8 88.8 103.9 120.2 137.8(13) Thermal Base Energy Required (GWh) - - - (0) 2.8 9.6 17.4 25.6 33.2 40.5 48.3 56.8 66.0
(14) Deficit of Useful Hydro Power (MW) -20.8 -35.2 -25.8 -13.1 3.7 22.5 43.5 65.1 84.7 103.7 124.2 146.4 170.3(15) % of Deficit (Pdef/Peak) (5) - - - - 2.4 12.8 22.2 29.9 35.7 40.4 44.8 48.9 52.7(06) % Peak Energy (S) - - - - (0) 1.0 3.5 6.7 9.8 12.7 17.1 20.2 25.0(17) Thermal Energy Required (Peak) (GWh) - - - - (0) 9.7 37.9 80.6 128.5 179.8 261.5 333.6 445.9
(18) Total Thermal Energy Required (GWh) - - - (0) 2.8 19.3 55.3 106.2 161.7 220.3 309.8 390.4 511.9(Base + Peak)
Balance of Peak Power
(19) Total Deficit of Useful Capacity (MW) -77.6 -92.0 -82.6 -69.9 -53.1 -34.3 -13.3 -8.3 -27.9 -46.9 67.4 89.6 113.5
Source: 1973 SONEFE Study; Mission estimates.

Annex 16
- 252 - Page 19 of 19
Table 11: NORTHERN SYSTEM : ENERGY AND POWER BALANCE, 1988-2000
Notes to Tables 8, 9, 10
(1) : Demand proj3ctions.
(2) :Demand projections.
(3) =(1) * 1000/313 output on critical day (working day In October).
(4) = (3)/24 or (4) = (1) * 1000/7500 average power on critical day (working day in October).
(5) : Average daily flow of Cambambe to guarantee critical day output.
(6) * 4 * 45 MW (Cambambe) + 1 * 25.6 MW (GTI Luanda) = 1 * 31.2 MW (GT2 Luanda) from 1989)17.8 MW (mabubas) available starting 1989.
(7) = (6) - 45 MW: Reserve = 1 unit of Cambambe.
(8) = 90 MW (Cambambe) + 45.4 MW (80% of GTI+GT2 Luanda) + 10 MW (Mabubas, from 1989)
(9) = 4 * 45 MW (Cambambe) + 17.8 MW (Mabubas, from 1989).
(10) = (9) - 45 MW: Reserve = 1 unit of Cambambe.
(11) 90 MW = power corresponding to minimum yearly flow of 130 m3/s in Cambambe.10 MW = assumed firm power for Mabubas from 1989.
(12) = (4) - (11)
(13) taken from 1973 Sonefe study according to (12).
(14) (2) - (10).
(15) = (14) * 100/ (2).
(16) taken from the Energy/Power load curve in the 1973 SONEFE Study.
(17) (16) * (1)/100
(18) = (13) + (17)
(19) = (2) - (7)
Source: 1973 Sonefe study; mission estimates.

- 253 -
Annex 17Page 2 of 13
DRAFT TERMS OF REFERENCE:PREPARATION OF A PILOT PROJECT IN HUILA-NAMIBE
Background
The provinces of Huila and Namibe are in a more favorableposition to be able to undertake forest operations than most otherprovinces in Angola. The military situation is much better, with most ofthe two provinces safe. The economy in the two provinces seems to befunctioning better than in most of the country. Also, the two provincesdo not have large population concentrations in areas far from theforests. It is true that the coastal towns of Namibe and Tombwa havevirtually no wood resources close by, but the fact that the towns arefairly small makes the problem more easily managed than in the cases ofLudnda and Benguela/Lobito. The supply of woodfuels is also betterorganized than elsewhere. Considering the above facts, a pilot projectin the provinces of Huila and Namiba would seem to be feasible.
The pilot project would contain the following items:
(a) increased efficiency of stoves (coast and inland);
(b) improved woodfuel supply system (coast and inland);
(c) fuel substitution (coast); and
(d) wood production, mainly consisting of development work inagroforestry, supplemented by training based at the agri-cultural school at Tchivinguiro.
The Project would be operated jointly by the MEP (Ministry ofEnergy and Petroleum) through the DNRFE (Department of New and RenewableSources of Energy) and the Ministry of Agriculture, through the DNACO(National Directorate for the Conservation of Nature).
The project is closely interrelated with and could obtainsignificant support from other proposed projects, particularly those onImproved Cooking Stoves (ICS) and Improved Woodfuel Supply Systems(WSS). This is true for both project preparation and implementation.The preparation of the pilot project for Huila-Namibe should follow thatfor the ICS and WSS projects. In that way, project leaders can benefitfrom the experience gained in preparing these specialized projects.
Project Components
A team of specialists should prepare an integrated pilotproject in the field of biomass energy for the provinces of Huila andNamibe. The team should base its work on & reading of the availabLeliterature (especially that on the regional project prepared under UNDP

- 254 -
Annex 17Page 3 of 13
financing) and on the work done to prepare the ICS and WSS projects. Theteam should formulate a coherent pilot project that could be replicatedin other areas wherever the security situation is favorable. Inpreparing the pilot project, the team should consider at least thefollowing technical components:
(a) inventory of accessible forest resources, particularly forestplantations;
(b) mapping of the present system for supply of woodfuels to themain urban centers (Lubango, Namibe, and Tombwa);
(c) analysis of the workings of existing charcoal production -o-operatives and investigation of the possibilities of organizingother producers now operating outside the cooperative;
(d) development and implementation of a revised supply system forLubango, Namibe, and Tombwa;
(e) development, introduction and dissemination of improved cookingstoves;
(f) establishment of tree nurseries for the creation of windbreaksand other forms of tree planting outside forests;
(g) introduction of an elementary course in agroforestry at theagricultural school at Tchivinguiro, near Lubango; and
(h) strengthening of DNACO's provincial representation for Huilaand Namibe using, if possible, highLy qualified manpoweravailable at the Lubango branch of the Agostinho NetoUniversity.
The fuel substitution component listed under "Background" aboveis not included in the specific Terms of Reference for the projectpreparation team as the issue of increasing the use of LPG in coastalcities falls somewhat outside the professional competence of a forestryteam.
The Project Team
Areas of specialization of team members should include thefollowing;
(a) forest operations for fuel production;(b) Charcoal production;(c) agroforestry;(d) stove improvement;(e) training; and(f) project economics.

- 255 -
Annex 17Page 4 of 13
Two or three persons would need to work about five man-months, includingthree man-months in Angola. Estimated costs for the pilot project areapproximately US$100,000 for the study and about US$500,000 forconducting the proposed operations on a pilot scale.

- 256 -
Annex 17Page 5 of 13
2. Improved Cooking Stoves
Development and distribution of improved cooking stoves hasbeen suggested for several areas in Chapter V. The best strategy is todevelop a national project for improved cooking stoves. Initialactivities could well be concentrated in Luanda, where the largest singleconcentration of people using traditional stoves is found. The highprices for woodfuels in Luanda provide an incentive for economizing onthe use of fuelwood and charcoal.
The Project would be carried out by the DNRFE within the MEP.The DNRFE has already initiated activities in this field as part of itspreparations for the first national seminar on firewood and charcoal,which took place in Luanda in Jun 19d7.
Terms of Reference for preparation of a project to improve theefficiency of cooking stoves are attached.

-- 257 -
Annex 17Page 6 of 13
DRAFT TERMS OF REFERENCE:PREPARATION OF A PROJECT FOR IMPROVED COOKING STOVES
During early 1987, partially in preparation for the firstnational seminar on firewood and charcoal, the DNRFE (Department of Newand Renewable Sources of Energy) of the MEP (Ministry of Energy andPetroleum) studied the stoves used in the seven provinces where it hadundertaken a survey of the consumption of woodfuels. Although some localvariations and innovations were found, the picture that emerged from thestudy was rather uniform: firewood was burned in ordinary three-stonestoves placed in unsheltered positions, and charcoal was burned in simplesquare metal stoves. There were also cases where charcoal was burned inthree-stone stoves.
Three arguments are generally given to support the introductionof improved cooking stoves. They are: (a) use of improved stoves canhelp reduce the national consumption of fuelwood, thus reducing thepressure on available forest resources and safeguarding the environment(however, it is well-known that the effect of a stove program on nationalwood consumption is marginal); (b) use of improved stoves reduces ahousehold's need for wood and thus also reduces both the cash cost ofprocuring woodfuels and the cost in time needed for woodfueL collection;(c) use of improved stoves couLd contribute to an improvement of theenvironment in the kitchen.
While rhe forest administration of a country often stresses thefirst argument, the ultimate success or failure of a stove improvementprogram depends on the degree of acceptance of the stoves on the part ofthe population. This means that the stove improvement program must bedesigned so that it primarily meets the needs and aspirations of thepopulation concerned.
A large number of stove projeccs are being implemented invarious countries in Africa. Being a latecomer in this field, Angola canlearn from successes and failures elsewhere. For this purpose, it isproposed that one or several study tours be organized for the concernedstaff at DNRFE to observe other stove projects. One stove projectacknowledged to be successful is the national program in Burkina Faso forthe development and introduction of improved stoves for firewood andcharcoal.
As regards the availability of woodfuels, the capital ofBurkina Faso, Ouagadougou, shares many of the characteristics ofLuanda. There are also clear differences. Thus, while ch6rcoal is theprincipal woodfuel used in Luanda, in Ouagadougou firewood is theprincipal fuel. Further, the urban and peri-urban population inOuagadougou is thoroughly organized, which makes the task of introducing

- 258 -
Annex 17Page 7 of 13
improved stoves easier. Also, the stove models used in Ouagadougou areadapted to the particular social and dietary conditions prevailing inthat city and are made to fit a number of standard cooking pot sizes.However, in spite of the differences between the two cities in thisregard, information useful to Angola could certainly be obtained from theprogram in Burkina Faso.
DNRFE's 1987 survey of biomass cooking stoves in sevenprovinces of Angola can be viewed as an appropriate, if modest, beginningof a national program for the design, production and dissemination ofimproved cooking stoves in Angola. Such activities have been proposed asa matter of priority in both Luanda, Benguela/Lobito, and Huambo. Itseems appropriate that much of the development work should be carried outat the national level or at least with strong technical support at thatlevel. It is, further, believed that field activities in such a programfor improved stoves should initially be concentrated in Luanda, where alarge number of people use inefficient stoves to burn woodfuels that arebought at quite high prices. Benguela/Lobito would get second priorityin the program and Huambo third. Stove development should also beincluded in the pilot project in Huila-Namibe, principally in the city ofLubango.
Project Components
The preparation of an enlarged project for improved cookingstoves should probably start with a study visit to an ongoing successfulstove project elsewhere in Africa. As mentioned above, Ouagadougou seemsto be a suitable location. However, other locations should also beconsidered. The study tour should be organized for both the Angolanspotentially concerned by the project, mainly in DNRFE, and the expatriatespecialists expected to take part in project preparation.
The second step in project preparation would be a search forsuitable stove models and competent stove producers (existing orpotential) in Angola. As a third step, the project preparation teamwould design an expanded project for development and introduction ofimproved cooking stoves in Angola, to be centered initially in Luanda.
The Project Team
The expatriate member or members of the project preparationteam would mainly investigate the general field of stove projects,particularly in Africa. Knowledge of wood and charcoal combustion and ofthe technical design of stoves for these fuels is also needed. One ortwo expatriates would probably be needed. The expatriates would need tospend about three man-months in project preparation, includingarrangements for and participation in the study tour mentioned above.

- 259 -
Arnex 17Page 8 of 13
Costs
Expatri.ate experts (3 man-months) $ 35,000
Expenses 10,000
Study tour (3 Angolans, 2 expatriates) 25,000
Materials and other 15,000
85,000
Importation of 1,000 stove kits 15,000
$100,000

- 260 -
Annex 17Page 9 of 13
3. Improved Woodfuel Supply System
In Chapter 5, the need for an improved system for the supply ofwoodfuels to the major cities both on the coast and in the inland areasof Angola was discussed. A project should be undertaken to analyse thepresent woodfuel supply system for Luanda, Benguela-Lobito, and Huamboand to develop ways to improve the system.
The Project would be organized by the DNACO within the Ministryof Agriculture. Terms of Reference for preparations for the project areattached.

- 261 -
Annex 17Page 10 of 13
DRAFT TERMS OF REFERENCE:PREPARATION OF A PROJECT FOR IMPROVED WOODFUEL SUPPLY SYSTEMS
Background
Improved woodfuel supply systems are needed in Angola,particularly for Luanda, Benguela-Lobito, and Huambo. An improvement ofthe presently fairly well-functioning system for Lubango and NamLbe wouldalso be included in the pilot project proposed for Huila-Namibe.Initially, however, efforts should probably be concentrated on Luanda.
The present system for supply of woodfuels to Luanda is tiotwelh known, or at least not well documented. There are uncertainties asto the geographical origin of the firewood and charcoal being used inLuanda, the organization of production, and the distribution network.Many of the present operations are carried out by individuals operatingoutside the formal, legal framework. Better knowledge of the presentsystenm is a necessary condition for any action aimed at improving thesystem.
While no inventory of Angola's forests exists, the generalextent of the forest resources in Bengo and Kwanza Norte is known.Efforts should be devoted to finding an area of natural forest able tosupply a significant part of the fuel needed in Luanda. The area shouldthen be allocated to firewood and charcoal producers, who would beobliged to follow certain management principles, primarily to ensure asuccessful natural regrowth of che forest cover following cutting of thewood. The main threats to such regrowth are probably grass and bushfires. Therefore, the need for fire protection must be considered.
Particular attention should be devoted to finding suitableorganizational forms for the production and marketing of firewood andcharcoal. At present, owners of the means of transport occupy a keyposition in exploitation of the wood, its conversion to firewood andcharcoal, and transportation of these fuels to the urban areas. Licensesto cut wood are often issued to truck owners, who have to show them inorder to pass road check points with a load of firewood or charcoal. Thetruck owners then engage laborers to cut the wood and produce thecharcoal. DNACO (National Directorate for the Conservation of Nature) isresponsible for issuing the licenses. Given DNACO's acute shortage ofqualified field staff, it is difficult to ascertain whether a given loadof woodfuels has been produced in accordance with a given license.
In certain areas of the country, for example in the province ofNamibe, local laborers have formed cooperatives, which apply for cuttinglicenses, produce the firewood and charcoal, and transport the fuels tothe centers of consumption. Such a cooperative forms a very differentmanagement unit than that of a truck owner using hired laborers. As thecooperative is formed on a geographical basis, its members are likely to

- 262 -
Annex 17Page 11 of 13
value the sustained production of wood, as this will secure themcontinuous employment in the area they can cover. They could thus beexpected to respect certain restrictions regarding exploitation, such asminimum diameters for cutting, prohibitions against cultivating exploitedareas, obligations to carry out reforestation, etc. The truck ownerhiring local laborers would seem to have much less to gain from followingsuch rules. A limited number of cooperatives, each working within a setgeographical area, are also fairly easy to supervise. If this reasoningis valid, it would be advisable to study whether woodfuel supply coopera-tives could also be successfully established around Luanda.
In designing the woodfuel supply system for Luanda, similarsystems operating in other countries in Africa can serve as usefulexamples. One such case is the system for supply of charcoal toMogadishu in Somalia. The wood used is an Acacia species. It growsquite slowly (less than half a cubic meter per hectare per year) butpresently covers a large area, about a million hectares. The wood istransported to Mogadishu from an average distance of about 300 km, mainlyover a rather poor asphalt road. The charcoal is produced by"icooperatives" (in reality teams of workers employed by an entrepreneur),which have licenses covering 25 square kilometers. This area lasts threeto seven years for the team. As the forest stands are not cut tooheavily cut at thy time of exploitation, they are able to recover inabout 20 years, when they can be exploited again.
The Mogadishu system is well integrated into the country'slegal and fiscal framework. Fees are paid for Licenses and further feesare paid by the truck owners, based on the weight of the charcoalentering Mogadishu. Although some charcoal does enter Mogadishu outsidethis organized system, the amounts are generally believed to be small.
While there are a feq key similarities between the supplysystem of Mogadishu and Luanda, such as the shortage of woodfuels closeto the city, the arid conditions, the long distances from forested areas,and the existence of large natural forest stands, there are also obviousdifferences. For example, in Angola the institutional framework for asupply system of the Mogadishu type is lacking. Further, the presentsecurity situation both in the areas potentially suitable forexploitation and along the roads leading to Luanda makes organization ofa functioning, unified supply system unfeasible. Nevertheless, it isquite possible that a study of the Mogadishu system (or another systemshowing key similarities to Luanda) could provide inspiration for thedesign of an improved system for Luanda.
Project Components
Project preparation would proceed as follows:
Phase I: Study of present system, probably including:- mapping of the present supply routes- survey of present raw material areas

- 263 -
Annex 17Page 12 of 13
- study of the generation process in cut-cover areas- mapping of the present organizational set-up.
Phase II: Study of a functioning woodfuel supply system foranother major city in Africa.
Phase III: Development of an improved system for Luanda.
Most of the work in the first phase of project preparationwould probably have to be done by the Angolan organizations concerned,primarily by DNACO. During Phases II and III, however, expatriatesacquainted with well-functioning systems for supply of woodfuels to majorcities elsewhere in Africa might provide valuable additional knowledge.Specification of the expatriate knowledge required would probably have toawait the completion of Phase I outlined above. About four man-months ofexpatriate inputs could, however, be put forward as the minimum forproject preparation as outlined above. The cost of the above expatriatemanpower, together with travel, subsistence and support would be aboutUS$75,000.

- 264 -
Annex 17Page 13 of 13
4. Domestic Fuel Substitution
This Project would aim at the gradual susbtitution of LPG forfirewood and charcoal for use as a domestic cooking fuel. It would bedirected mainly at the major urban concentrations on the coast, namelyLuanda, Benguela, and Lobito. Needed for the project is mainly increasedproduction and distribution of LPG and gas containers. In order to makeit possible for poor families to use LPG, which is a much cheaper fuelthan either firewood or charcoal, a simple short-term credit scheme mayprove to be essential.
This Project would be carried out by the appropriate unitswithin the MEP and SONANGOL as it falls outside the competence oforganizations primarily engaged in biomass energy.

- 265 - Annex 18Page 1 of 6
JOINT UNDP/WORLD BANK ESMAP PROGRAM
ANGOLA: POWER SUBSECTOR INVESTMENT REVIEW
AND UPDATING OF THE LEAST COST EXPANSION PLAN FOR THE NORTHERN SYSTEM
1. The Energy Assessment recently concluded for Angola by the JointUNDP/World Bank Energy Sector Management Assistance Program (ESMAP)identifies investment planning in the electric power subsector as a majorunresolved issue in the development of the energy sector as a wl. uie.
Angola needs assistance in designing an investment strategy includingrehabilitation, resumption of deferred maintenance, and new facilities inthe context of a country with three separate grids facing greatuncertainties in the pace of power demand growth in both space and time.
Electricity Supply
2. Electricity supply in Angola is the responsibility of twocompanies: ENE and SONEFE (Sociedade Nacional de Estudo e Financiamentode Empreendimentos Ultramarinos). ENE is a State enterprise, created in1980 and intended to become the sole national power utility in charge ofgeneration, transmission, and medium voltage distribution all over thecountry. The company is currently operating the "Central" and "Southern"Systems and several isolated systems. SONEFE is in charge of generationand transmission in the "Northern" System, the largest system in thecountry, and supplies about 300 clients directly at high voltage (60 kV)and medium voltage. Distribution in the area of Luanda is theresponsibility of EDEL (Empresa de Electricidade de Luanda). Low voltagedistribution in the rest of the country is sometimes the responsibilityof ENE but is often handled by loca' municipal bodies (Comissariados) whomay also own small captive diese'l sets.
Overall Generating Conditions
3. Total installed capacity in ENE and SONEFE plants isapproximately 463 MW. Of the total capacity, 287 MW is in hydro units,102 MW in gas turbines, and 74 MW in diesel sets. In 1987 availablecapacity reached 275 MW (59% of total) but there were severe constraintson thermal units due to difficulties in fuel supply. rhe two gasturbines in Luanda (56.8 MW) burn Jet B fuel while the gas turbine inCabinda (12.3 MW) runs on natural gas. The two remaining gas turbines,in Biopio (22.8 MW) and Huambo (10 MW), run on diesel oil. Annual

- 266 - Annex 18
Page 2 of 6
electricity generation in Angola peaked at 1,029 GWh in 1974, with858 CWh (83.4%) from hydro origin. After a sharp decline in the yearsfollowing independence, generation resumed growth but experienced asecond decline over the period 1983-85 and is still below the values of1974. In 1986, total generation was 754 GWh with 691 (91.7%) from hydroplants.
4. Electricity supply in Angola consists of three separate grids andnumerous isolated systems. The three main systems are associated withthe basins of three important rivers: the Kwanza for the NorthernSystem; the Catumbela for the Central System; and the Cunene for theSouthern System. These systems supply the main load centers in Angola:Luanda (in the Northern System); Benguela, Lobito, and Huambo (in theCentral System); and Lubango and Namibe (in the Southern System). Themain isolated systems are those of Cabinda, Uige, and Bie. Anotherimportant system in the province of Lunda Norte belongs to the miningcompany ENDIAMA (Empresa Nacional de Diamantes de Angola) and was mainlyused for diamond mining activities.
5. Hydro has always been the main supply source. Its share hasremained within 80-85% of total supply, increasing to 91% in 1986 inspite of the total unavailability of Lomaum and a partial unavailabilityof the Biopio plants. No new hydro plant has been built since 1974.From 1980 onwards, SONEFE and ENE tried to overcome the difficultiescaused by sabotage and disruption of the hydro supply by installing newgas turbines in Luanda and Huambo and diesel units in Lobito and othermajor centers. Because of inadequate maintenance and lack of technicalassistance and spare parts, the new facilities have not resolved supplyproblems. Therefore, current available capacity in the Central System islimited to 47 MW out of the 111 MW installed. The table below summarizesthe installed and available capacities in the various systems andcompares them with peak demand.
ANGOLA: INSTALLED AND AVAILABLE GENERATING CAPACITrY, 1987(MW)
Hydro Thermal Total PeakSystem Instl. Avail. InstI. Avail. Insti. Avail. Demand a/
Northern 197.6 135.0 56.8 56.8 254.6 191.8 90-100Central 49.4 7.2 61.8 39.5 111.2 46.7 30Southern 27.2 13.6 25.3 15.1 52.5 28.7 9-10Isolated 12.9 2.4 31.7 5.0 44.6 7.4 n.a.
a/ Estimated at generation; reflects varying amounts of suppressed demand.
Source: SONEFE and ENE.

- 267 - Annex 18Page 3 of 6
Background
6. Tentative conclusions of the Energy Assessment are to emphasizemaintenance and rehabilitation and to give lower priority to additional(new) generation capacity. Furthermore, a rehabilitation program for theentire subsector was identified. It would take 5 or 6 years to completeand require about US$200 million at 1987 prices. The Assessment furthermade a critical analysis of some of the new investments being consideredby Angola, notably the dam and power plant at Capanda.
The Review
7. The present review would be built on existing subsectoralknowledge. Its objectives would be to:
(i) Identify better and in greater detail the power sectorrehabilitation program; analyze its needs for qualifiedmanpower, management and materials; to identify the mainconstraints to the execution of this program and to findways to resolve them; to conduct a critical review of itsfeasibility;
(ii) Critically review the investment program of the subsectorand the various utilities (ENE, EDEL, SONEFE, CELB, GAMEK);verify the justification of the investment program and itscompatibility with utility and government finances and itsadequation to the needs of the grids. Conduct thisanalysis in the context of realistic assumptions about thegrowth of the economy and of power demand. Review existingfeasibility and prefeasibility studies for hydropowerplants in the Northern, Central and Southern Systems andsuggest a priority list of which ones should be updatedfirst, especially their technical and economiccharacteristics.
(iii) Review the technical and economic feasibility of majorinvestments or, if needed, perform such analysis;
(iv) Update the Least Cost Expansion Plan of the NorthernSystem. Analyse the earlier expansion plans developed bySONEFE and more recent consultant studies and compare theirhypotheses and conclusions. Analyze their relevance to thepresent and foreseeable situation of Angola. Analyze theexpansion of the Northern System both with and without aninterconnection to the other two systems.
(v) Study what alternative uses could be found for equipmentand materials already procured for projects which, forvarious reasons, cannot or should not be pursued.

- 268 - Annex 18Page 4 of 6
Evaluate the condition of this equipment and makerecommendations regarding its utilization, including thepossibility of trade among the variousutilities/enterprises.
(vi) Prepare an investment program with an estimate of financialcosts (including the costs of safeguarding existing workswhich are not now needed until they will be) and a timephasing which takes into account Angolan staff constraintsand a feasible level of external technical assistance.This investment program should be presented in such detailas to permit a rapid appraisal by international financialinstitutions and/or other bilatetal or multilateraldonoes/financiers; and
(vii) Identify the most urgeL. technical assistance needs tostrengthen management and acccnting of the utilities.Evaluate ongoing activities under multilateral or bilateralauspices and propose a global technical assistance program,of three to five years' duration, closely tied to theavailability of Angolan counterparts.
8. This investment review would considet the demand growth scenariosprepared for the Energy Assessment Report (corrected by any newinformation) as a basis from which to determine the need forrehabilitation and new investment and the updating of the Least CostExpansion Plan (LCEP) for the Northern System. A sensitivity analvsis ofdemand growth in Luanda should be carried out by taking into account agradual meeting of repressed demand (through improvements in thedistribution grid), the effect of substantially higher tariffs and thepace of industrial sector rehabilitation (major consumers or potentialconsumers should be treated individually, separate from small orresidential consumers).
9. The following considerations should be kept in mind as guidelinesto the carrying out of the investment review:
(i) Assign highest priority to rehabilitation of existingfacilities;
(ii) Strive for improved reliability of supply to the maincities which are also the main industrial areas;
(iii) Improve supply to Luanda by addressing the main problems ingeneration, transmission, transformation and distributionin the Northern Grid;

- 269 - Annex 18Page 5 of 6
(iv) Postpone most small projects in isolated systems mainly forlack of managerial/technical staff, even if equipment ormaterials have been purchased;
(v) Postpone rural/village electrification and urban householdconnections until hydro supply conditions have beenimproved, tariffs readjusted and billing and collectionprocedures have been strengthened; and
(vi) Estimate the need for external technical assistance tosupport power subsector staff ( iE and other utilities) incharge of the major rehabilitation projects (Lumaum, theSouthern System, transmission and distribution grids).
Capanda
10. With respect to the Capanda dam and power plant, this study willinclude a detailed analysis of the feasibility of continuing the projector of interrupting it, for an eventual resumption of work at a futuretime to be determined. The main objective of this part of the Study isto provide an exhaustive analysis of the costs and benefits ofinterrupting the project in comparison with other alternatives availableto Angola. More specificelly, the study will:
(i) Identify the best moment for (and the implications of)stopping work on the Capanda project, taking into account:(i) technical aspects (size and stage of the civil worksalready carried out and to be carried out); ii) economicaspects (possibility of selling the energy produced,feasibility of expanding the Northern Grid andrepercussions on the costs of energy in the NorthernSystem); iii) financial aspects (status of the financingplan and probability of obtaining the additional fundsneeded to complete the project); and iv) organizationalaspects (structure of GAMEK and its institutional andmanagement capability).
(ii) Identify alternatives to be developed in the event thatwork is interrupted on the Capanda Project, tying them inwith the rehabilitation of the three systems, which isproposed and is being prepared through another part of thisstudy). Identify specific investments to be made, untilsuch time as the Capanda project can be resumed, to meetrising demand reliably. Identify the human and materialresources needed and possible constraints to carrying outseveral projects simultaneously.
(iii) Analyze the consequences of stopping work on the Capandaproject under two assumptions: i) a North-Center

- 270 - Annex 18Page 6 of 6
interconnection assumed around the year 2000; ii) such aninterconnection to be constructed as soon as possible (say,early 1990s). The joint analysis of stopping work atCapanda and interconnecting the system should be rarriedout while fully keeping in mind the actual conditions inAngola pertaining to security, qualified manpower,financing, managerial capabilities and the status of power(rehabilitation/expansion) projects already decided upon inthe Central and Southern Systems.
(iv) Analyze the financial and technical feasibility ofsafeguarding--over the next several years--theinfrastructure and civil works already executed(excavation, tunnel).
(v) Evaluate the feasibility and costs of using such equipmentand materials (already acquired) for other justifiableprojects including other power projects (identified in thisreview) or projects in other sectors (roads, ports,construction, agriculture, other infrastructure, etc.).Identify ways of preserving this equipment (or of using it)to minimize the deterioration and the costs ofpreservation.
(vi) Review legal and contractual questions which would need tobe addressed should Angola decide to stop work on theproject.
(vii) Identify the needs of CAMEK as an institution responsiblefor planning the development of the Kwanza River.
11. This Review would be carried out under the supervision of theJoint UNDP/World Bank ESMAP Program which would assume overallresponsibility for the Review but parts of the work could be contractedout to a utility or to an engineering firm.
12. The overall Review would require approximately 25 manmonths ofconsultant time (including 10 man-months for the updating of the LCEP)and would cost between US$555,000 and US$600,000.

GA'T�'�"vn('
-��014ZAIRE ANGOLA
0 National Copital
Atlantic 0 Pro�;nce Capitals
e N-:-�c MA 0 Selected TowrIs
Ocean ZAMBIA 1--' -- Main Road,
Railroads
ZIMBABWENAMIBIA Ri�e,s
BOTSWANA Airports
12' PEO�,LFS REP. OF THE-CCINGO 16'
B.1 Ports
�9Pr-i- B-d-ies
Ime-atio.al Bowd-ies
C,�Bl � A Z R ECo2?0 AMLES
01 ?O
0 1(� 760 360 4& 560 KIIOMETERS
Mba... Co.go,+,
2cr, 24'
ZAIREDT-b-.
G E
Ulge
91
+�L.cap-C.At. Z A I R E'7
LUANDA'L� A
C-3.
7Atlantic imo
P.ft A.bi.
OceanN,
gunz
12' 0 2'
Benqu to
ZAMBIALuba.g
amiT + C-ing. 0
c u A. N D
16'
cl u B A N G
'117jivazT. W,�dh-k
N A I B2W ol
14

Continued from inside front cover
Reports Already Issued
Togo June 1985 5221-TOVanuatu June 1985 5577-VP.Tonga June 1985 5498-TONWestern Samoa June 1985 5497-WSOBurma June 1985 5416-BAThailand September 1985 5793-THSao Tome and Principe October 1985 5803-STPEcuador December 1985 5865-ECSomalia December 1985 5796-SOBurkina January 1986 5730-BURZaire May 1986 5837-ZRSyria May 1986 5822-SYRGhana November 1986 6234-CHGuinea November 1986 6137-GUIMadagascar January 1987 5700-MACMozambique January 1987 6128-MOZSwaziland February 1987 6262-SWHonduras August 1987 6476-HOSierra Leone October 1987 6597-SLComoros January 1988 7104-COMCongo January 1988 6420-COBGabon July 1988 6915-GA
Energy Assessment Status Reports
Papua New Guinea July, 1983Mauritius October, 1983Sri Lanka January, 1984Malawi January, 1984Burundi February, 1984Bangladesh April, 1984Kenya May, 1984Rwanda May, 1984Zimbabwe August, 1984Uganda August, 1984Indonesia September, 1984Senegal October, 1984Sudan November, 1984Nepal January, 1985Zambia August, 1985Peru August, 1985Haiti August, 1985Paraguay September, 1985Morocco January, 1986Niger February, 1986