
Defense Contracting in Iraq: Issues and Options for Congress
Upload
khangminh22Category
view
7download
0
Report No. 6128-MOZ
Mozambique: Issues and Optionsin the Energy Sector
January 1987
~. . ..
.. 2.
: .~~~~~~~~~~~~~~~~~~~~~~~~~~~~~~~~~~~~~~~~~~~~~~~~~..~~~~~~~~~~~~~~~~~~~~~~~
.: . . . ., i t
. .. . . . . . .~~~~~~~~~~~~~~~~~~~~~~14
Pub
lic D
iscl
osur
e A
utho
rized
Pub
lic D
iscl
osur
e A
utho
rized
Pub
lic D
iscl
osur
e A
utho
rized
Pub
lic D
iscl
osur
e A
utho
rized
Pub
lic D
iscl
osur
e A
utho
rized
Pub
lic D
iscl
osur
e A
utho
rized
Pub
lic D
iscl
osur
e A
utho
rized
Pub
lic D
iscl
osur
e A
utho
rized

JOIMT UNW/WOULD RAW ENICRY SSCTOR ASS3SSNENT PROGRHMREPORTS AJREADY ISSUED
Country Date Number
Indonesia November 1981 3543-INDMauritius December 1981 3510-MASKenya May 1982 3800-KESri Lanka May 1982 3792-CEZimbabwe June 1982 3765-ZIMHaiti June 1982 3672-HAPapua New Guinea June 1982 3882-PNGBurundi June 1982 3778-BURwanda June 1982 3779-RWMalawi August 1982 3903-MALBangladesh October 1982 3873-BDZambia January 1983 4110-ZATurkey March I983 3877-TUBolivia April 1983 4213-BOFiji June 1983 4462-FIJSolomon Islands June 1983 4404-SOLSenegal July 1983 4182-SESudan July 1983 4511-SUUganda July 1983 4453-UGNigeria August 1983 4440-UNINepal August 1983 4474-NEPGambia November 1983 4743-GMPeru January 1984 4677-PECosta Rica January 1984 4655-CRLesotho January 1984 4676-ISOSeychelles January 1984 4693-SEYMorocco March 1984 4157-MORPortugal April 1984 4824-PoNiger May 1984 4642-NIREthiopia July 1984 4741-ETCape Verde August 1984 5073-CVGuinea Bissau August 1984 5083-GUBBotswana September 1984 4998-BTSt. Vincent andthe Grenadines September 1984 5103-STV
St. Lucia September 1984 5111-SLUParaguay October 1984 5145-PATanzania November 1984 4969-TAYemen Arab Republic December 1984 4892-YARLiberia December 1984 5279-LBRIslamic Republic ofMauritania April 1985 5224-MAU
Jaiiaica April 1985 5466-JMIvory Coast April 1985 5250-IVCBenin June 1985 5222-BENTogo June 1985 5221-TOVanuatu June 1985 5577-VATonga June 1985 5498-TONWestern Samoa June 1985 5497-WSOBurma June 1985 5416-BAThailand September 1985 5793-THSao Tome & Principe October 1985 5803-STPEcuador December 1985 5865-ECSomalia December 1985 5796-SOBurkina January 1986 5730-BURZaire May 1986 5837-ZRSyria May 1986 5822-SYRGhana November 1986 6234-GHGuinea November 1986 6137-GUIMadagascar January 1987 5700-MAG
FM O"ICIAL USE OILYREPORT 10. 6128-MUo
MlOZAMBIQUE
ISSUES AiD OPTIONS IN THE ENECY SCTOR
JANUARY 197
This report is based on the findings of an energy assssmnt missionwhich visited Mozambique in April/lNy 1985. The mission consisted ofMessrs. J. Besant-Jones, Mi-uion Leader; M. Del muono, Deputy MissionLeader; A. Alberti, Manpower and Training; H. Chaves* Power Engineer;D.C. Krishnamurthy, Refinery Engineer; J. Rochet, Geologist;I. Rodriguea, Researcher; and A. Bellasoug (Consultant) Gas Expert;Sroukhorst (Consultant) Coal Mining Expert; and Mrs. S. Carbonnier,(Consultant) Forestry Expert. Messrs. Sesant-Jones and Del Buono werethe principal authors of this report, which benefited also fromcontributions by Ms. D. Williamon (Economist), Messrs. C. Warren (CoalEconomist), K. Rornby (Consultant), E. Roumeni (Consultant) endR. Williams (Consultant). The draft report was discussed several timeswith the Mozambican authorities, most notably in July and November, 1986.
Mosambique is relatively well endowed with energy resourc e andits long run economic prospects are good once peaceful conditions arerestored to the country. However, the poor conditions of energy supplysystems could constrain economic recovery. Gover t s policy ofrehabilitation of ezisting sector assets and institutions should be therecommended priority. Planning for meting future energy demand,manpower develeimsnt and improving operational capability are alsopriorities. Past policy and the incrasing over-valuation of the m_icalhave kept the prices of comercial energy well below the economic cost ofmeeting demand. This policy has been dvitrimetal to the viability ofsector enterprises and has resulted in inadequate incentives for energyconservation, The present relationship betwee prices of energy productsare inequitab'e, with traditional fuels used by poorer households beingmuch more costly than the commercial fuels used - when available - by therelatively better off households. This report recommends that prices forimported fuels should be raised and maintaine at least at the importparity levels, if possible within an economic reform encompassing wages,prices and exchange rates. Priority invescaets that are recommetIed inthis Report amount to about US$175 million in 1985 price terms for thenext five years. This total excludes the large export-oriented projects(Cahora Bassa IIt aluminium, coal) currently being studied because, basedon information available to the mission,, their feasibility has not beenadequately established, especially in terms of locating firm attractivemarkets, economic returns, and the high financial risks for loambique.rhis total also excludes iLnvestments in domestic gas utilisation sincetnese have yet to be firmly defined and evaluated.
ARDRIYATU SAND ACUUS
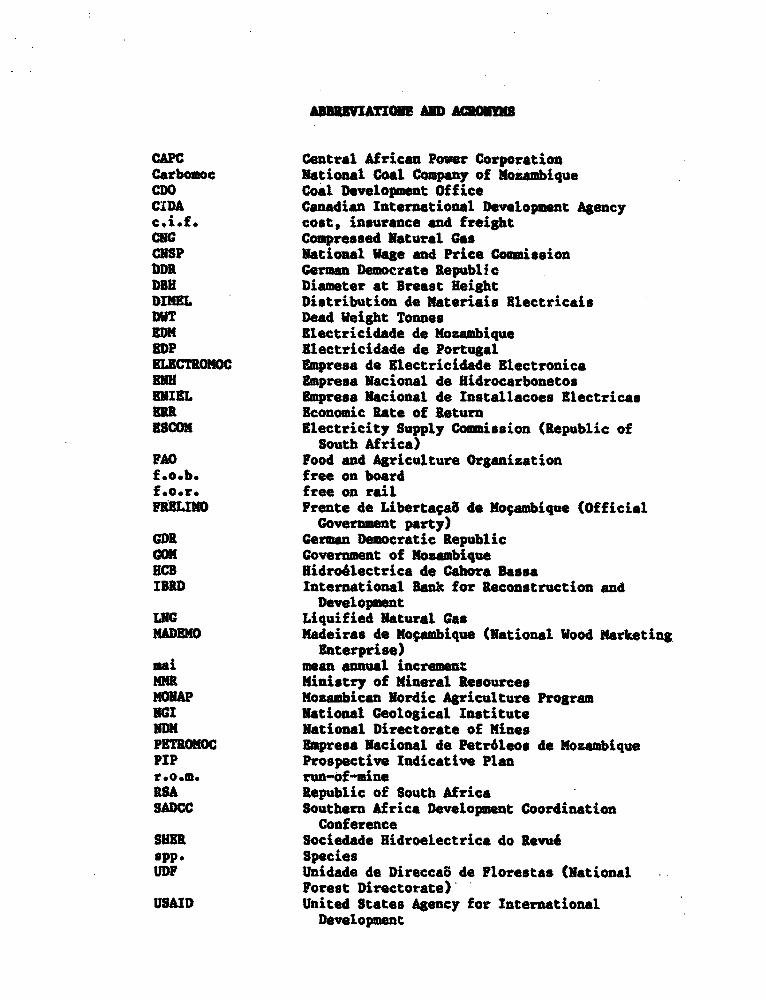
CAPC Central African Power CorporationCarboamoc National Coal Companry of MozambiqueCDO Coal Development OfficeCIDA Canadian International Development Agencyc.i.f. cost, insurance and freightCNG Compressed Natural GasCUSP National Wage and Price CommissionDDR German Democrate RepublicDBH Diameter at Breast HeightDIMEL Distribution de Materiais ElectricaisDWT Dead eipght TonnesEDM Electricidade de MozambiqueEDP Electricidade de Portugal8LECTROMOC Empresa de Electricidade Electronicamm Empresa Nacional de RidrocarbouetosEVIEL Empresa Nacional de Installacoes BlectricasERR Economic Rate of ReturnBROOM Electricity Supply Commission (Republic of
South Africa)PAO Food and Agriculture Organizationf.o.b. free on boardf.o.r. free on railFuELIaG Prente de Liberta,a8 de Mogambique (Official
Government party)CDR German Democratic RepublicGMI Government of MozambiqueBCB Hidroelectrica de Cahora BassaIBID International Bank for Reconstruction and
DevelopmentLNG Liquified Natural GasMADEMO Madeiras de Mogambique (National Wood Marketing
Enterprise)mai mean annual incrementRUE Ministry of Mineral ResourcesMONAP Mozambican Nordic Agriculture ProgramNCI National Geological InstituteNDM National Directorate of MinesPETROKOC EMpresa acional de Petr6leos de KozambiquePIP Prospective Indicative Planr.o.m. run-of-mineBBA Republic of South Africa
SADCC Southern Africa Development CoordinationConference
SHER Sociedade Hidroelectrica do Rev%Aspp. speciesUDP Unidade de Direccab de Florestas (National
Forest Directorate)USAID United States Agency for International
Development

WIN W
bbl barrelB/D barrel per dayBCP billion cubic feetBTU British Thermal UnitDC direct currentcJ GigajouleGCh Gigawatt hourha hectarekcal kilocaloriekm kilometerkWh kilowatthoorkV kilovoltkA kilovoltamperemtpy million tonmes per yearHJ emgajouleUT meticl (pl. meticais)
million cubic feet per day.NP ahmillion cubic feetHa Megawatthour
thousand cubic feet'V cubic meterIWA NegavoltempereMW megawattX RandTCP trillion cubic feetTOG tonnes of oil equivalentt tonnet/d tonnes per dayt/y tonnes per yearU8 United States dollar
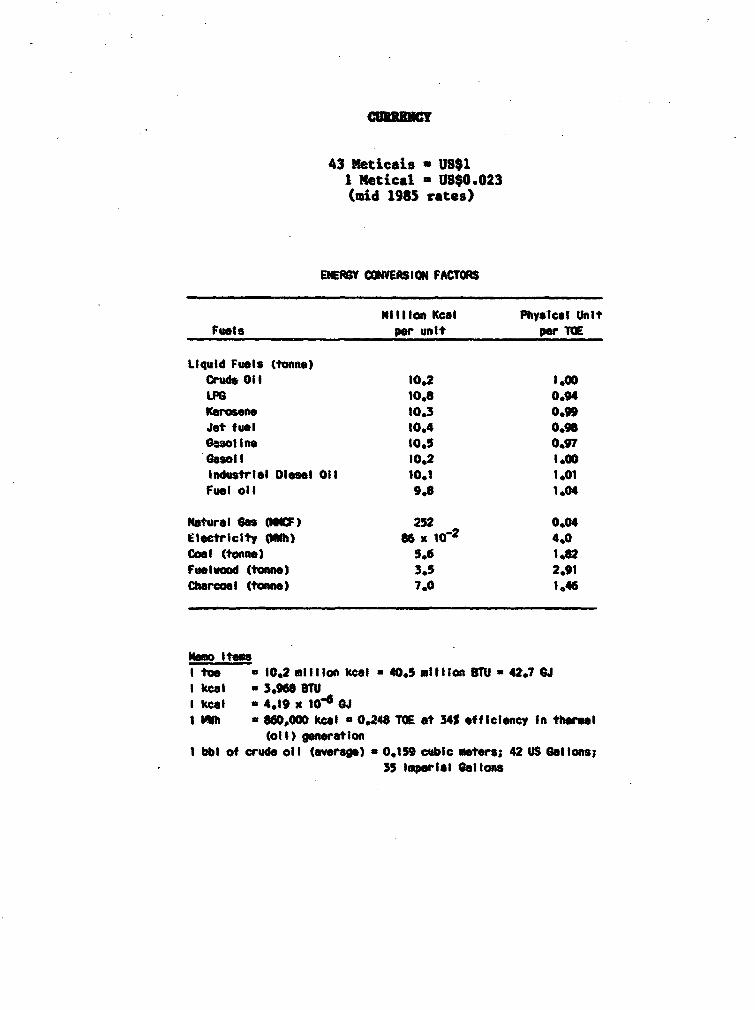
43 Meticais a US$1I J4etical - US$0.023(mid 1985 rates)
ENEMY CONVERS ION FACTOR
4I llon tKcal Physical UnitFuets per unit per TOE
Liquid Fuels (tonne)Crude 011 10.2 .00OLPG 10.8 0.94Kerosene 10.3 0.99Jet fuel 10.4 0.96sao lne 10.5 0.97
S.i1 10.2 1.00Industrial Diesel Ol 10.1 1.01Fuel oIl 9.8 1.04
Natural GOs O ) 252 0.04Electricity 0Ih) 86 x o12 4.0cool Itoene) 5.6 1.82Fueluood (tone) 3.5 2.91Charcoal (tono.) 7.0 1,46
mo Ito"I toe a 10,2 mi lIon kcal u 40.5 ml I I Ion OBM 427 U JI keal 3.968 STUI keal I 4.19 x 10⁴ @1 Ywh a 60,000 kcal a 0.248 TOE at 34S of filency In thermal
(ol) genration1 bbl of crude oll (averge) a 0.159 cubic atets; 42 US Gallons;
35 Im_eial Gotllns

TAM, OF c .ToTV
?sge
EXECUTIVE sUMARY......................................... i
It SCTOR R..................... ...... 1Macro-economic Trendse.................* ........o...*o 1Energy 2sources............. .. , 2Overview of Energy in the Economy..................... 2Energy Supply and Consumptio 4n......................... 4Woodfuels and Household Energy.0 ...................... SPetroleum and Cas..................................... 5Electric Power ........................ e.o .*eeee 7
7The Inotutional Framework for the Energy Sector....... 8Policies and Investments in the Last Ten Years ........ 9Energy Planning Issues...................................... 10Operational Efficiency and Institutional
Strengtheninge .................................................11Future Large Energy Projects .................... 11Large Energy-Intensive Industrial Projects............ 12Energy .............................. ................. 14Energy Conservation, Fuel Substitution and
Rural Enela............. 18Energy Development Strategies and Policies............ 18Rec ded Prioritie s 20.....................**.. 20Recommended Technical Assistance Priorities
for the Energy Sector ....................... ..... 21
II. WOODFUELS AND HOUSEHOLD ENERGY .......... .*e .... 23Voodfuel Supply and Demand............................ 23Woodfuel Situation in Urban Areaa..................... 23Voodfuel Situation in Rural Ares..................... 25Voodfuel Resources .................................... 25Puelwood Nantstsons......., .......................... 27Priorities for Increasing Puelwood Supply .............*- 30Institutional Issues for Woo6fuels and
Household Eergy.................................... 3234
Urban Household Energy Consumption.........e ....* .. 34Comparative Costs of Household Energy................. 36Household Energy Supply Options ....................... 38Priorities for Household Eergy....................... 39Priorities for Development ............................ 41
Summary of the Mission's Recommendations for theVoodfuels and Household Energy.. 42

III. PETROLEUM AND CAS*......................................... 44Crude Oil and Petroleum ProductSfe,..................... 44Petroleum Products Supply end Demandt... ............., 44The Matola Refinery.................... ............... 46Product Pricing....................................... 48Product Supply, Storage and Distribution .............. 49Petroleum Supply, Procurement and Planning............ 51PERIROMOC's Manpower................................... 52Corporate Accounting................ .... .......... 52Indicative Investment Program.....,.................. 52
Petroleum ard Gas Exploration and Development ........... 53Geological Framework.................................. 53Past Exploration Activity............................. 53Petroleum Promotion Strategy.......................... 54Current and Proposed Exploration Work................. 54Manpower and Organizational Needs..................... 55
Gas Demand and Utilization ......... 5.........* ..... 57Use of Pande Field Gas ................................ 57Ammonia Project .............................. 58Domestic Use of Natural Gas........................... 61Use of Busi Field Gas................................. 62Export Market Potential for Natural Gas.............. 63Priority Investment Program. ...... .... ..... ....*...... 63
Summary of the Mission's Recommendations forthe Petroleum Supply Sector ........................*. 64
Swumary of the Mission's Recommendations forPetroleum and Gas Exploration and Development ........ 65
IV. ELECTRIC ..................... *....................... 67Organization of the Power Sector...................... 67Physical Facilities ........ *. 68
71Historic Demand and Supply....................... 72Present Supply/Demand Situation....................... 73-RED's Taif ...........................75EDM's Financial Position and Practices................ 78Power Resources.............. . 80Cabora Bassa Developments ..... .... . ................... 81Prospective Demand for Power .......................... 84Power Exports................................. 85Power Supply to Southern Mozambique.................. 86Power Supply to Central-Northern Mozambiquee........... 88Priority Investments.................................. 88
Sumary of the Mission's Recommendationsfor the Power Sector.................................. 89
Ve O ............................. 91Introductionooeoo*oooooooo*to*ooeotoooe* * ........... 91
Cosl Resources........................................ 91Supply and Demand..................................... 92ColPrcst.......................... 94
Sector Organi:ation.....................,.. 96Mbnpower ..... 4 ~~~~~~~97
Domestic Market Prospects......e..................e... 98Rehabilitation of Existing Moatize Mines ............. 99Planned Coal Developments.....0. *. ......*.** *. .. , 99Coal Transport Facilities.eee................e........ 101Viability of Investments for Coal Exports 102
Past and Projected Investment in the Coal Sectors.....,* 105Summary of Mission's Recommendations for theCoal Setr105
VI, INSTITUTIONAL I ES .............. . 107Sector Organization and Institutions............s..... 107Sector Coordination 108National Energy Council ....... 109Department of E ner g y 110Management .................... 111Manpower Development....... 112Technical Assistance ...... 112Mul-wti-sectoral Developments*********oeo*o 113
Summary of the Mission's Recommendationson I n s t i t u t i o n s 114
TABLES
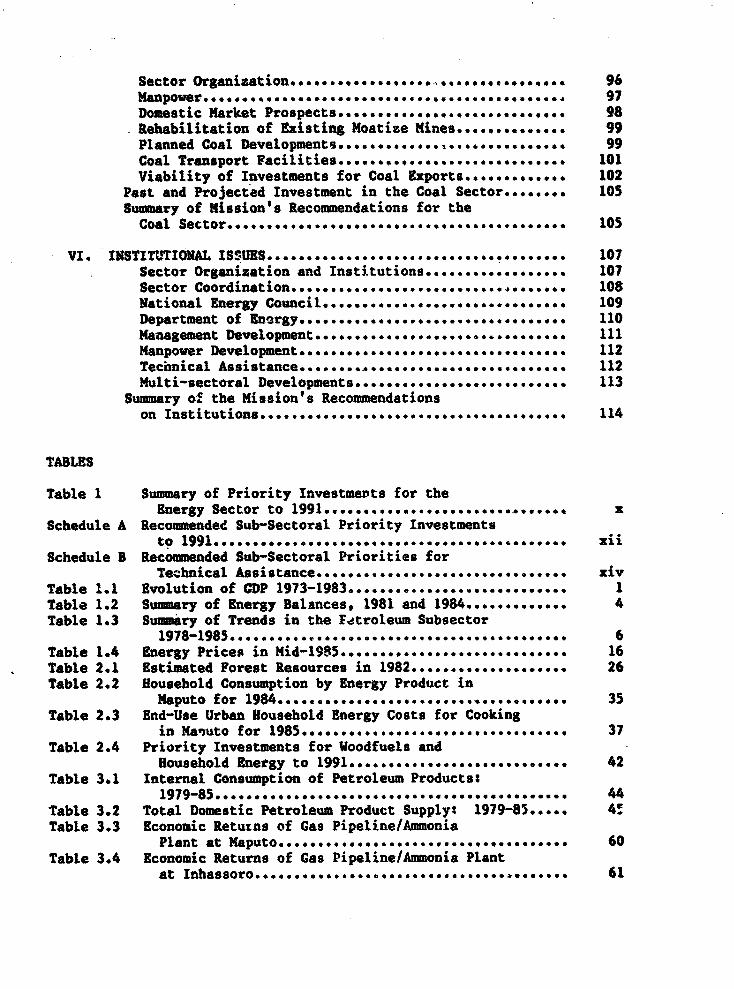
Table 1 Summary of Priority Investments for theEnergy Sector to 1991 x
Schedule A Recommended Sub-Sectoral Priority Investmentsto 19919.......................... xii
Schedule B Recommended Sub-Sectoral Priorities forTechnical Assistance......94444 4@*494444444@444 Xiv
Table 1.1 Evolution of CDP 1973-1983.... 1Table 1.2 Summary of Energy Balances, 1981 and 1984. 8 4.......... 4Table 1.3 Sammory of Trends in the Fetroleum Subsector
1978-1985 .................... 6Table 1.4 Energy Prices in Mid-1985....... ..................... 16Table 2.1 Estimated Forest Resources in 19 8 2 26Table 2.2 Household Consumption by Energy Product in
Maputo for 1984 35Table 2.3 End-Use Urban Household Energy Costs for Cooking
in Ma-uto for 1985 ..... 37Table 2.4 Priority Investments for Woodfuels and
Household Energy to 1991.... 42Table 3.1 Internal Consumption of Petroleum Products:
1979-85 .... w ~~~~~~~44Table 3.2 Total Domestic Petroleum Product Supply: 1979-85 ..... 4Table 3.3 Economic Retutas of Gas Pipeline/Ammonia
Plant at Maputo............ 4 60Table 3.4 Economic Returns of Gas Pipeline/Ammonia Plant
at Inbassoro ..... .... e a 61
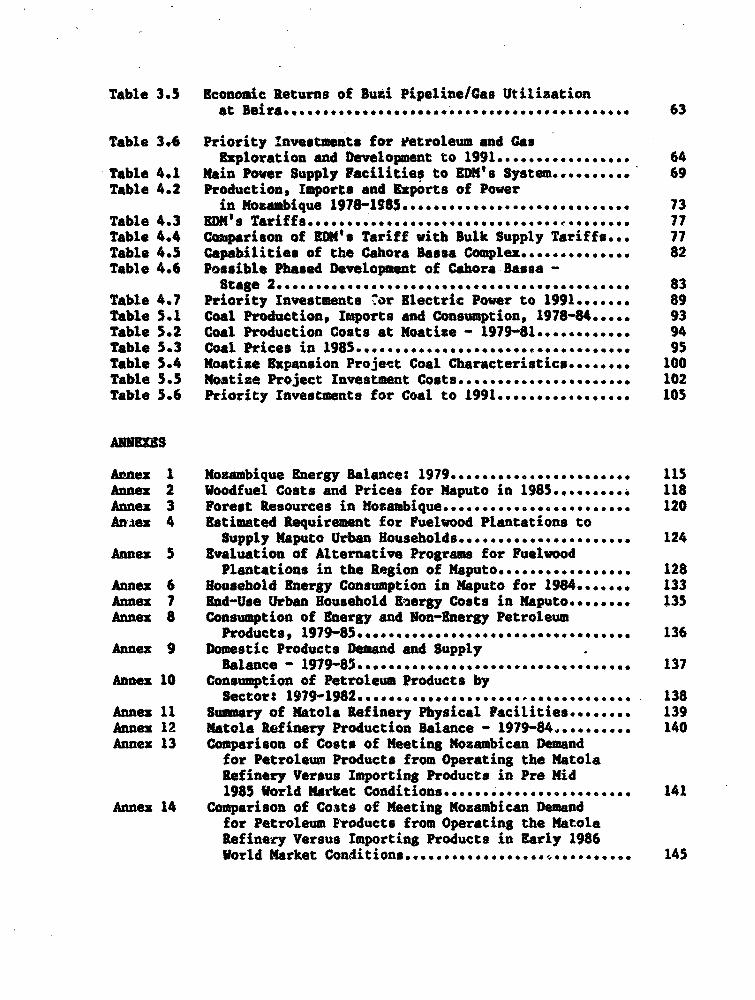
Table 3.5 Economic Returns of Buxi Pipeline/Gas Utilisationat Ber ....* ...63
Table 3.6 Priority 'vtavesents for Petroleum and CasExploration and Development to 199 1 64
Table 4.1 Main Power Supply Facilities to EDN's System....... 69Table 4.2 Production, Imports and Exports of Power
in Mozambique 1978-1985........ 73Table 4.3 ESM's Tariffs....... 77Table 4.4 Comparison of EDM's Tariff with Bulk Supply Tariffs... 77Table 4.5 Capabilities of the Cahora Bassa Complex.......... 82Table 4.6 Possible Phased Development of Cahora Bassa -
Stage 2............ 83Table 4.7 Priority Investments ^or Electric Power to 1991....... 89Table 5.1 Coal Production, Imports and Consumption, 1978-84..... 93Table 5.2 Coal Production Costs at Moatize - 1979-819........... 94Table 5.3 Coal Prices in 1985................ <. .......... 95Table 5.4 Moatize Expansion Projeet Coal Characteristics******* 100Table 5.5 Moatise Project Investment Costs....... t s............. 102Table 5.6 Priority Investments for Coal to 1991................. 105
ANNEXES
Annex I Mozambique Energy Balance: 19797 99.................... 115Annex 2 Woodfuel Costs and Prices for Maputo in 1985.,.......o 118Annex 3 Forest Resources in Mozambique.... 120Aniex 4 Estimated Requirement for Puelwood Plantations to
Supply Maputo Urban Households... 124Annex 5 Evaluation of Alternative Programs for Fuelwood
Plantations in the Region of Maputo................. 128Aunex 6 Household Energy Consumption in Maputo for 1984 4...... 133Annex 7 End-Use Urban Household Energy Costs in Maputoo....... 135Annex 8 Consumption of Energy and Non-Energy Petroleum
Producta, l7 98 136Annex 9 Domestic Products Demand and Supply
Balance - 1991 9-........... 137Annex 10 Consumption of Petroleum Products by
Sector: 9918 138Annex 11 Sumary of Matola Refinery Physical Pacilities........ 139Annex 12 Matola Refinery Production Balance - 1979-84 .... 140Annex 13 Comparison of Costs of Meeting Mozambican Demand
for Petroleum Products from Operating the MatolaRefinery Versus Importing Products in Pre Mid1985 Vorld Market Conditionstit..............ons... 141
Annex 14 Comparison of Costs of Meeting Mozambican Demandfor Petroleum Products from Operating the MatolaRefinery Versus Importing Products in Early 1986World Market Conditions ... 145
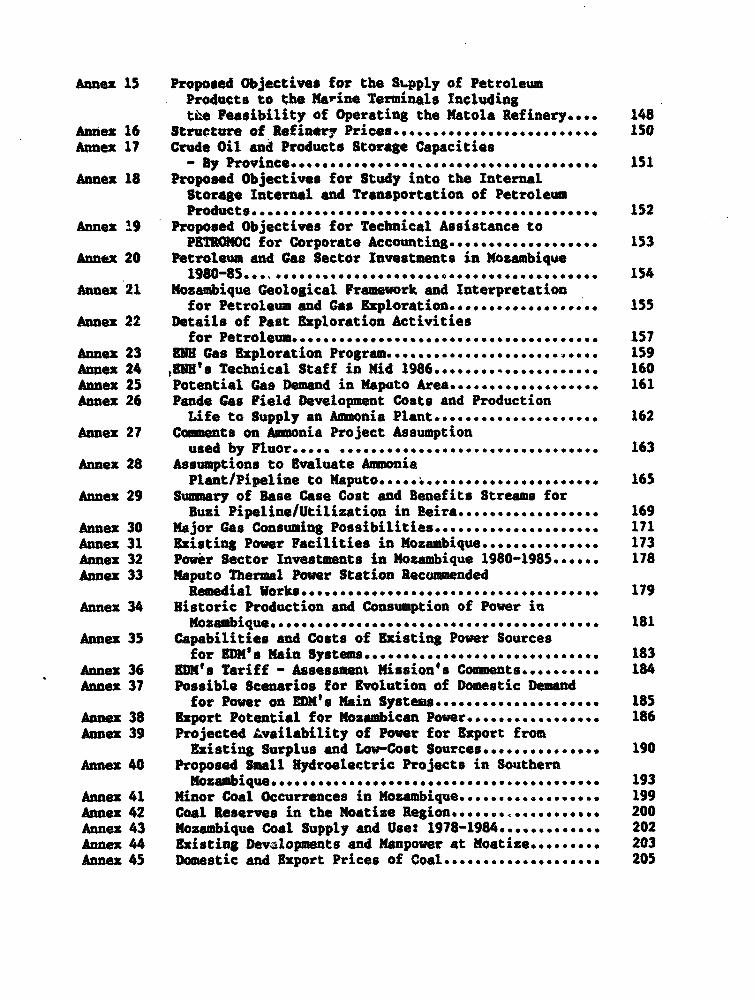
Annex 15 Proposed Objectives for the Supply of PetroleumProducts to the Marine Terminals Includingtke Feasibility of Operating the Natola Refinery.... 148
Annex 16 Structure of Refinery Prices.......................... 1SOAnnex 17 Crude Oil and Products Storage Capacities
- BY Pr1no........................... SAnnex 18 Proposed Objectives for Study into the Internal
Storage Internal and Transportation of PetroleumProdueto ..... P ........... ~152
Annex 19 Proposed Objectives for Technical Assistance toPETROMOC for Corporate Accounting...............o... 153
Annex 20 Petroleum and Gas Sector Investments in Mozambique
Annex 21 Mozambique Geological Framework and Interpretationfor Petroleum and Gas Exploration ...... o.......... 155
Annex 22 Details of Past Exploration Activitiesfor Petroleum...... .. eo.oo...ooe.ooo.@ . .. o....... 157
Annex 23 E HGas Exploration Programs.......................... 159Annex 24 SUE's Technical Staff in Mid 1986 ........... 4*....... 160Annex 25 Potential Gas Demand in Mapoto Area ...................0 161Annex 26 Pande Gas Field Development Costs and Production
Life to Supply an Ammonia Plant..................... 162Annex 27 Comments on Awmonia Project Assumption
used by Fluor e.go. g......ee.e.......... ........... 163Annex 28 Assumptions to Evaluate Ammonia
Plant/Pipeline to Naputo.e.**.**.. *..***o.. .. .....*- 165Annex 29 Summary of Base Case Cost and Benefits Streams for
Buzi Pipeline/Utilization in Beira.................. 169Annex 30 Major Gas Consuming Possibilities...............g..... 171Annex 31 Existing Power Facilities in Mozambique............... 173Annex 32 Power Sector Investments in Mozambique 1980-1985...... 178Annex 33 Maputo Thermal Power Station Recumnended
Remedial Vorks.................gge......eeg... 179Annex 34 Historic Production and Consumption of Power in
Mozaimbique. g.gs.......e.g....... g e.g...... .....geg...... 181Annex 35 Capabilities and Costs of Existing Power Sources
for EDM's Main Systems .............................. 183Annex 36 EDK's Tariff - Assessment Mission's Coments*****e*.......... 184Annex 37 Possible Scenarios for Evolution of Domestic Demand
for Power on EDN's Main Systess......e.............. 185Annex 38 Export Potential for Mozambican Power................. 186Annex 39 Projected Availability of Power for Export from
Existing Surplus and Low-Cost Sources............... 190Annex 40 Proposed Small Hydroelectric Projects in Southern
Mozambique........g................................ ,193Annex 41 Minor Coal Occurrences in Mozambique.................. 199Annex 42 Coal Reserves in the Moatize Region .................. 200Annex 43 Mozambique Coal Supply and Use: 1978-1984 ........ .* 202Annex 44 Existing Dev4lopments and Manpower at Moatiiez.e*e**,& 203Annex 45 Domestic and Export Prices of Coal 205
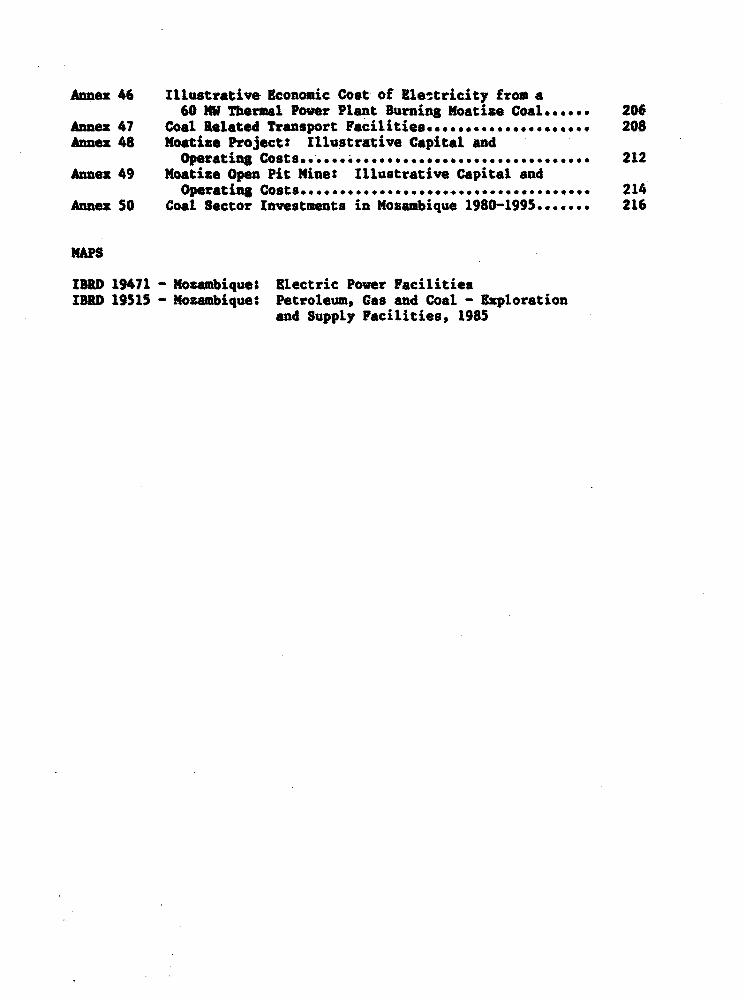
Anne" 46 Illustrative Economic Cost of Ele^tricity from a60 NW Thermal Power Plant Burning Moatize Coal...... 206
Annex 47 Coal Related Transport Facilities..................... 208Annex 48 Noaitixe Projects Illustrative Capital and
Operating Costs* *,** 212Annex 49 Noatise Open Pit Mine: Illustrative Capital and
Operating Costs 214Annex 50 Coal Sector Investments in Mozambique 1980-19959... 216
MAPS
IBiD 19471 - Mozambique$ Electric Power FacilitiesIBRD 19515 - Mozambique: Petroleum, Gas and Coal - Exploration
and Supply Facilities, 1985

EXECUTm SUNU&RY
Present Situation in the Energy Sector
Adverse Factors for the Energy Sector
1. Recent trends in the energy sector of Mozambique reflect theprevailing conditions throughout the economy, particularly disruption toeconomic activity by armed bands, acute scarcity of foreign exchange andtrained manpower, and shortcomings in management and operationalcapability and in financial performance. The continuous decline ineconomic activity since 1981, as indicated in estimates of GDP, has beencause and effect of a fall in Mozambican consumption of commercial energyforms (petroleum products, electricity and coal) of about 40X between1981 and 1984. Government attributes the main cause of this decline tothe activities of armed bands.
Disruption to Energy Supply
2. Acts of sabotage and attacks on the local populace by armedbands have severely disrupted energy production and supply, especiallyfor electricity transmission since 1981 and for coal transportaticr since1983. Consequently, the two major facilities for the production ofenergy in Mozambique, the Cahora Bassa hydroelectric power station andthe coal mines at Noatize. are virtually out of operation at present.The direct annual cost to Mozambique of this disruption is aboutUS$20 million in terms of foregone earnings from exported energy andadditional costs of imported energy. The activities of armed bands aredisrupting supplies of woodfuels to urban areas with grave socio-economicconsequences for the urban population. These activities are alsopreventing the exploration and development of natural gas resources andthe implementation of major new developments to exploit Mozambique'sconsiderable energy resources.
Woodfuels and Household Energy
3. Shortages of energy supplies to urban households are the mostserious problem in the energy sector. These shortages have a greatersignificance to the national socio-economic fabric than even the con-sequences for economic activity arising from interruptions of commercialenergyXsupplies to the productive sectors of the economy. The problemhas been manifested by the rising cost of woodfuels as degradation of thenatural forests and savanna-land around towns becomes more acute.Evidence of this problem is the ten-fold increase in woodfuel prices inMaputo since the early 1980's, compared to a three-fole increase ingeneral prices. Loss of supplies has also been due to the activities ofarmed bands. This burden is causing major social and economic hardshipfor lower and even middle-income urban households. Restoration ofpeaceful conditions to the country would bring some relief to this
- ii -
situation, but a significant impact on household energy suppi.es throughthe development of indigenous energy resources (woodfuels, electricity,coal and natural gas) would take many years and require large amounts offinancial resources and skilled manpower. For the short-term, Governmentconsiders the only technically available option to be importation ofkerosene and LPG, but there was a shortage of these products during 1985and 1986 due to scarcity of foreign exchange.
Shortage of Foreign Bzchange
4. Shortages of foreign exchange have periodically interrupted thesupply of petroleum products since 1983. PETRONC has not been able topurchase petroleum products on the best terms with the small andunpredictable amounts of foreign exchange that are put at its disposal,thus leading to an increase in procurement costs. Government has createda Petroleum Funds, operated by PETROMOC at the Bank of Mozambique, tochannel foreign exchange for increasing procurement efficiency andstabilising the supply of petroleum products at least to key consmers.Consumption of petroleum products in 1984 and 1985 was abuout 251 belowthe level in the period 1970-1982 due to constraints on supply, as notedabove, and a fall in demand due to the decline in economic activity.
5. Lack of foreign exchange has contributed to a decline inoperational efficiency by causing shortages of spare parts, materials andequipment required for system operation, maintenance andrehabilitation. These constraints are particularly evident in thedistribution systems for electricity and petroleum products. Thedistribution systems of Electricidade de Mocambique (1DM) have been keptin operation largely through substantial donor support for importedgoods. The handling and distribution facilities owned by PETRONOC andprivate sector oil companies need to be rehabilitated urgently. Thetransport fleets of EDM and PETRONOC are inadequate to sustain efficientoperations. In the main urban areas, there are frequent power outagesand inefficient distribution of petroleum products, while many areas ofthe country do not receive any petroleum supplies or electricity fromlocal diesel generators. One of the results is loss of agroindustrialproduction and interruption of other produtive activities.
6. Lack of foreign exchange threatens to delay rehabilitation workon major coal and petroleum production facilities. Once securityconditions allow normal operations at the Noatize coal mines, foreignexchange will be required for rehabilitation of the mines (US$14 million)and the railway link from the mines to the main railway system(US$10 million) to allow a resumption of production at historic maximumlevels (S50,000 tpy). Likewise, foreign exchange would be required forthe recommissioning of PETROMOC's Matola refinery, if justified.However, the mission's review supports Government's present policy ofimporting petroleum products for meeting domestic demand instead ofoperating the Natola Refinery. A comprehensive study into the supply anddistribution of petroleum products is required before any commitments aremade on the refinery.

- iii
Shortage of Trained Manpower
7. The shortage of trained manpower that resulted from the exodusof Portuguese managers and technicians in the mid 1970s has been a majorimpediment to achieving the Government's objective for its manpowerpolicy of improving the operational performunce of the sector insti-tutions and to support -sustained economic development. Government wasfaced at Independence with a national illiteracy rate of about 98X, andit has hsd to allocate a substantial proportion of its scarce resourcesto education. Past and probable future levels of output of trainedpersonnel in Mozembique are low relative to the needs of the economy andthe sector. There is also a shortage of teachers and educationalmaterials. In addition, emigration of skilled manpower has been andstill is occurring. Consequently, there is a reliance on expatriateworkers for the operation of energy sector facilities, who are generallyprovided under bilateral agreements. Government has attempted to stemthe outflow of skilled personnel by issuing a new labor law in December,1985 that allows enterprises to offer wages and incentives to motivateand retain such personnel.
Institutional Weaknesses
8. The sector organizations responsible for production and distri-bution of energy share common institutional and management problems.Nany of the problems stem from the newness of these organisations and theshortages of skilled manpower. Broadly, these problems fall into thefollowing categories: (a) inadequate financial data; (b) absence ofoperating, financial and accounting systems; (c) lack of manag_emntinformation systems; (d) minimal planning and budgeting; (e) absence ofinternal auditing; (f) little or no technical and management training;(g) inadequate computer facilities; and (h) little coordination withrelated enterprises. Presently, the management of these organizations is'supported by some assistance from expatriates.
Energy Pricing
9. The Government has a general policy of maintaining pricestability and enterprise viability. Electricity prices were not changedbetween the mid 1960's and January 1986. Petroleum product prices havenot been changed since 1979. The economic costs of meeting energy demandare not generally considered in setting energy prices, so that changes inimport parity prices or the long run marginal costs of meeting demand arenot reflected in corresponding changes in the retail prices for energyproducts. Consequently, consumers of these products aave becomeincreasingly subsidized. Thus, there is little incentive for improvingthe efficiency of energy consumption and for economically justifiedsubstitution between fuels to reduce costs.
10. The policy of keeping the metical grossly overvalued hasfacilitated the maintenance of official prices of petroleum products,electricity and coal at artificially low levels. On the other hand,
- iv -
prices for woodfuels which are market determined, are substantiallyincreased by supply constraints and by general inflation due to excessivemonetary expansion. At present, these official prices are only afraction of the prices of fuelwood and charcoal, whose prices aremarket-determined. For example, charcoal is about 500 times moreexpensive than steam coal and 85 times more expensive than fuel oil on agross energy basis, while fuelwood is nearly 13 times more expensive thanilluminating kerosene. The comparison of the costs of fuels to consumerswhich takes account of the conversion efficiencies of energy appliancesshows even greater differences. For household cooking, charcoal is about53 times more expensive than kerosene and 15 times more expensive thanelectricity on a useful energy basis. Likewise, fuelwood is 24 and 14times more expensive than kerosene and electricity respectively. Theseexceedingly large price differentials are not justifiable in terms ofeconomic efficiency or social equity.
11. Prices for some of the most important energy products aresubstantially below their imported cost even at the overvalued officialexchange rate. In mid-1985, when world crude oil prices were aroundUS~30/bbl, the retail prices of kerosene and fuel oil were only about 402and 30X respectively of the imported costs. Even at the much lower worldprices for petroleum products during the first half of 1986, kerosene andfuel oil prices in Mozambique remained below their imported costs, beingabout 50S of these prices. The retail prices for steam coal were onlyabout one sixth of the equivalent world market prices.
Enterprise Financial Viability
12. Government's policy an energy pricing has prejudiced theviability of the energy supplying agencies, with detrimental consequencesfor operating efficiency. EDM was making increasing losses from 1981onwards, and it may at best only break even in 1986 on a cash accrualbasis after the major tariff increase in January 1986. PETRONOC andCARBONOC are also extremely short of financial resources, but theirfinancial position cannot be analysed until they start to producefinancial accounts. The failure of prices to cover the actual costs ofthe enterprises has been accommodated through subsidies from the centralbudget and credit from the banking system. The Government decreed in1984 that all enterprises should produce full sets of accounts from PY86,which will require technical assistance to fulfill by the energyagencies.
Policy Issues
13. The present assessment of the energy sector in Mozambique hasidentified aiany policy issues concerning investments, pricing, manpowerand institutional development. Covernment's investment strategy is basedon two principles which it considers to be complementary, namely tomaintain viable productive assets in operation through rehabilitation and
maintenance programs, and to promote sustained economic developmentthrough exploitaticn of natural resources. The basic issue concerns thepriority between these two principles given the country's financial andeconomic difficulties in the short to medium term.
Investment Policy
14. Government has expended in the last few years substantialamounts of scarce financial and trai}ed manpower resources on thepreparation and promotion of a number of very large export-orientedenergy and energy-intensive projects. This work forms part ofGovernment's strategy for placing Mozambique in a position from which itcould exploit regional and international market opportunities should theyoccur. The present activities of armed bands in the country limitGovernment's scope for starting in the near future any of the majordevelopments. The combined investment in these projects (inhydroelectricity, coal, natural gas, asmonia and aluminum) would be morethan US $2 billion in constant price terms of the early 1980's, andrepresent massive comitments relative to the size and ebsorptivecapacity of the Mozambican economy.
15. The mission's reviews in this report conclude that the strategyof large-scale development of known energy resources specifically forexport by Mozambique has not been shown to be viable for the foreseeablefuture, with the possible exception of the ammonia project, mainly due toconstraints or lacK of competitiveness in export markets. A major changein the circumstances of the project environment would be required tomodify this general conclusion, including improved project preparationand a substantial and sustained increase in world commodity prices. Themission supports government's criteria for acceptability before enteringinto commitments for large investments in export-oriented projectsnamelys (a) viability at world market prices with secure marketprospects; and (b) satisfactory economic benefits to Mozambique from theexploitation of its resources. The mission also recommends thatGovernment's policy of taking steps to reduce the risks to the Mozambicaneconomy be strengthened through the use of foreign capital, marketing,management and technical expertise and long-term commitments to theproject by foreign partners.
Rehabilitation Policy
16. The mission agrees with Government that the main objective inthe short and medium term for the energy sector should be the improvementof operational efficiency and the strengthening of sectoralinstitutions. Improvements to operational efficiency cover a wide rangeof activities. Individually, many are relatively small, but togetherthey comprise a major program. The main activities cover manpowertraining, davelopment of improved management, financial and operationalprocedures, rehabilitation of facilities, improvements in the efficiencyof energy utilization and supply, and fuel substitution. This objectiveis a vital component of any strategy for economic recovery in Mozambique
- vi -
and for enabling the country to benef it from its locational advantage forproviding transit services to inland countries. The effort ofrehabilitating energy and transport facilities would fully absorbMosambican institutional capacity and available financial and manpowerresources for many years to come. In fact, substantial inputs fromabroad will also be required, making technical assistance a vitalcomponent of this strategy. Any allocation of resources for large newdevelopmnets should not be at the expense of sector operatingperformance.
Knergy Pricing Policy
17. The essential objectives of energy pricing in Mozambique shouldbe the efficient use of economic resources, the financial viability ofsector enterprises and the satisfaction of demand for energy at leastcost to the economy. The main issues are the need to: (a) eliminategross distortion in prices between energy products; (b) take account ofeconomic factors in pricing policy, especially to cover import parityprices and to provide incentives for efficient utiliuation of energy; and(c) make the institutional procedures for price-setting more responsiveto changes in economic and financial circumstances, and thus establish abetter balance between the objectives of price stability and theobjectives listed above.
18. Implementation of a new policy for energy pricing in Mozambiqueis complicated by the major distortions in the foreign exchange rate ofthe domestic currency and prices and wages throughout the economyrelative to economic costs. Thus, energy pricing policy is bound up witheconomy-wide pricing issues. Without subbtantial investigation, it isnot possible to estimate reliably the import parity prices at a realisticexchange rate. Preparation of least-cost development programs would alsobe required to set the economic basis for energy pricing throughderivation of the long run marginal costs of meeting demand. While theseparameters are being researched and until new policies are implemented,there is a strong economic case for raising imuediately the prices ofimported energy at least to import parity levels based on the presentofficial exchange rate. This adjustment would substantially improve thefinancial position of the energy supplying enterprises and would givemore appropriate indications of economic costs to energy consumers. Ingeneral, the mission recommends that Government should implement apricing policy of at least full financial cost recovery from energyconsumers, thus maintaining import parity levels for initernationallytraded energy products.
Manpower Policy
19. The challeage to energy sector enterprises posed by theshortages of trained manpower is to develop low-cost and efficienttraining systems that will meet their requirements and reduce the needfor expensive expatriate support. The enterprises must be able 1* stemthe emigration of skilled manpower. Recent labor legislation allows
- vii -
enterprises to offer wages and incentives to motivate and retain staffwith key skills. However, there is still a need to give employersgreater scope for recruiting and laying-off labor to improve operationalperformance. These issues are economy-wide, but they require attentionurgently to support the training efforts to bring about sustainedimprovements in the manpower situation.
Institutional Policy
20. The need to redress the institutional weaknesses noted above(pars. 8) requires a stronger adhereuce to policies already laid down.For example, sector enterprises are required to submit financial reportsat specified frequencies and standards in their decrees of establishment,yet they have not fulfilled this requirement. The capabilities of theMinistry of Industry and Energy and the Ministry of Mineral Resourcesneed to be strengthened to monitor and coordinate the activities in theirsectors and to liaise with other ministries.
21. The role of the prospective National Energy Council will beimportant for development of the energy sector through itsresponsibilities for recommending policies, setting priorities andensuring the adequacy of investment planning for the sector. The missionfully supports the proposal to set up the Council. The mission alsoconsiders that the role of the Department of Energy should be critical inthe formulation of energy policies through its responsibility forcoordination and monitoring in the energy sector and support to theNational Energy Council. One important area that requires thepolicy-based perspective and coordinating role of the National EnergyCouncil is the planning of large, multi-sectoral projects and programs,taking into account explicitly the linkages between the energy sector andthe agricultural, industrial, and transport sectors.
Strategy and Priorities
Develoo_ nt Stretegy
22. The evaluation of issues and options in this Report indicatesthat the order of priorities for energy development in Mozambique in theshort to medium term should be determined through the following strategy:
First: to satisfy Mozambique's own energy needs by using primarilydomestic sources, if economic, and by rehabilitating and improvingexisting sector assets.
Second: to develop Mosambique's potential to benefit from transit tradeTn energy products for inland countries and trade in electricity, and tocooperate with neighbouring countries in development of solutions toco on energy issues.
- viii -
Third: to invest in energy or energy intensive industries for export;Wl yif a number of important conditions are met, especially economic,financial and market criteria.
23. The mission's recommended strategy for development gives alower priority to large scale export-oriented projects than torehabilitation of existing facilities to meet the domestic demand forenergy. While security constraints exist, even investments that satisfyall the proposed criteria will not be feasible. While the conditions ofinsecurity and scarcity of financial and human resource persist, themission recommends that Government focus resources on rehabilitation andinstitutional strengthening. The mission's reconmendations on prioritiesare given at the end of this Summary. Furthermore, before entering intoany major commitments, Government should strengthen its coordination forthe planning of large-scale developments in energy, industry andtransportation.
Regional Cooperation
24. Development of Mozambique's potential for transit trade inenergy products (petroleum products and coal) conforms to the generalstrategy for regional cooperation under the auspices of SADCC. Otherimportant areas are trade in electricity, natural gas utilization,cooperation in developing regional solutions to common issues such asfuelwood plantations, improving efficiencies of cooking stoves andcharcoal manufacture, and development of coal as a household fuel. Themission supports these efforts. On the other hand, concerningGovernment's policy towards energy trade with the Republic of SouthAfrica (RSA), the right balance is required between taking advantage ofthe availability of low-cost energy (coal, electricity) from RSA andmaintaining the capability to supply key energy consumers in the Maputoregion in the event of prolonged disruption to transportation andtransmission links between the coast and inland areas.
Recommended Sector Priorities
25. Sumuaries of the mission's recommendations concerning policiesand strategies and for technical assistance are given for each of themain energy subsectors at the end of the chapters in this Report. Takentogether, general themes emerge from these recommendations and constitutethe following recommended priorities for the Government in the energysector.
(a) remedy shortages of energy products and secure stable supplyconditions;
(b) improve the reliability of energy supply facilities throughrehabilitation;
(c) carry out institutional strengthening and manpower developmentof the energy suppliers (EDM, PITROMOC, and CARBONOC) end also

- is -
ENH* the Ministry of Industry and Energy and the Ministry ofNatural Resources;
(d) remove distortions to energy pricing, at least by increases inofficial prices to import parity levels at the prevailing offi-cial exchange rate; account should be taken of the rela-tionship between eaergy prices and other prices in the economy,and to the structure of economic costs of meeting energydemand;
(e) strengthen the capacity for planning in energy sector agenciesto meet domestic demand for energy and to evaluate large energyprojects;
(f) address the urban household energy crisis to arrest the des-truction of natural forests around cities (especially Maputo,Beira and Nampula) and to ameliorate socio-economic hardshipthrough a combination of measures to manage demand and increasesupply of energy; and
(g) continue promotional efforts to stimulate the interest offoreign oil companies in petroleum exploration.
Generally, these priorities reflect Governrii's own priorities, and themission considers that Government could proceed with the implementationof most of these recommendations. Some of the measures required toimprove the reliability of energy supply may not be feasible whilst theactivities of the armed bands persist.
Recommended Technical Assistance Priorities
26. The following priorities for technical assistance emerge fromthis assessment of the energy sector:
(a) to strengthen the management, financial and operatingperform-n'ce of the main sector agencies;
(b) to develop manpower resources at all levels of skills;
(c) to improve the planning capability of the main supply agenciesand assist in the preparation of sub-sector developmentprograms;
(d) to improve sector-wide planning and coordination throughdevelopment of the capability of the Department of Energy;
(e) to assist with specific important studies covering thestructure of energy prices, household energy demand, mappingand forest inventories, petroleum procurement, natural gasutilization, electricity tariffs, rehabilitation requirementsfor existing operating facilities (petrolem, electricity andcoal), energy conservation, fuel substitution and the use ofenergy in rural communities.
Recommended Priority Investments
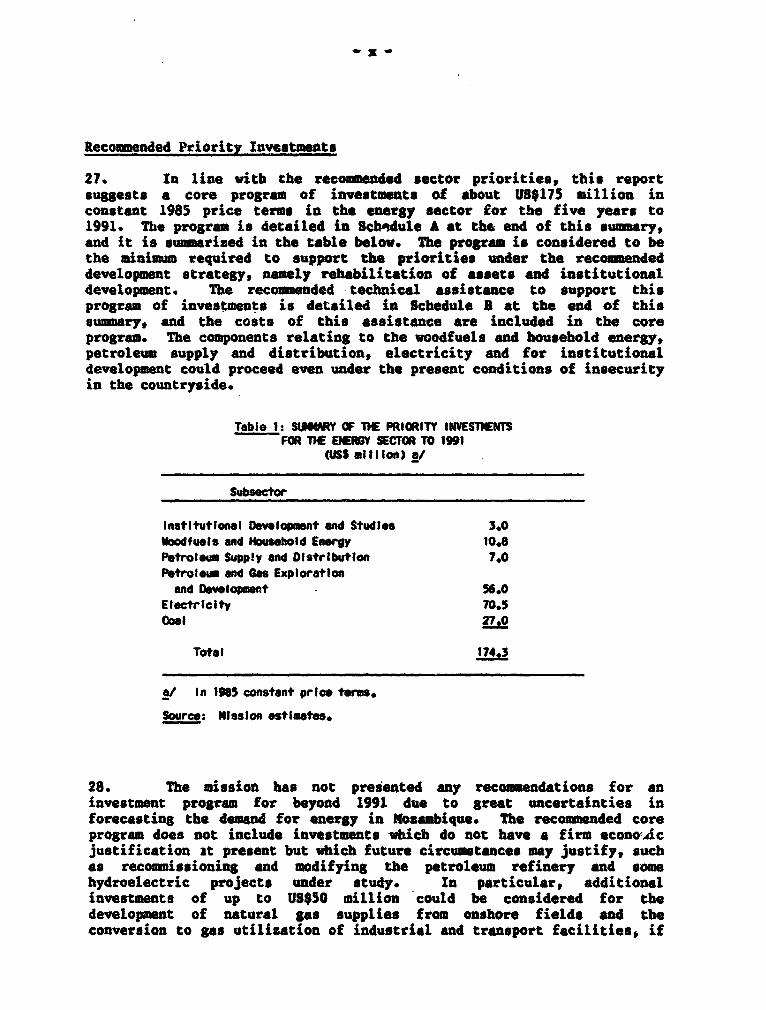
27. In line witb the recommended sector priorities, this reportsuggests a core program of investments of about US$175 million inconstant 1985 price terms in the energy sector for the five years to1991. The program is detailed in Scb,dule A at tba end of this summary,and it is summarized in the table below. The program is considered to bethe minimum required to aupport the priorities under the recommendeddevelopment strategy, namely rehabilitation of assets and institutionaldevelopment. The recommended technical assistance to support thisprogram of investments is detailed in Schedule 3 at the end of thissummary, and the costs of this assistance are included in the coreprogram. The components relating to the woodfuelu and household energy,petroleum supply and distribution, electricity and for institutionaldevelopment could proceed even under the present conditions of insecurityin the countryside.
Table 1: SUIUIRY OF THE PRIORITY INWESTMENTSFOR THE ENEMY SECTOR TO 1991
(1110 million) a
Subsector
lnstitutional DOvelopment ond Studies 3.0Woodfuels and Household Energy 10.8Petroleum Supply and Distribution 7.0Petroleum and Gas Exploration
and Oevelopment 56.0Electricity 70.5Coal 27.0
Total 174.3
a/ In 1985 constant price terms.
Source: NIsslon estImates.
28. The mission has not presented any recommendations for aninvestment program for beyond 1991 due to great uncertainties inforecasting the demand for energy in Mozambique. The recommended coreprogram does not include investments which do not have a firm econo,dcjustification it present but which future circumstances may justify, suchas recommisuioning and modifying the petroleum refinery and somehydroelectric projects under study. In particular, additionalinvestments of up to US$50 million could be considered for thedevelopment of natural gas supplies from onshore fields and theconversion to gas utilization of industrial and transport facilities* if
- xi -
shown to be economically justified. Large energy-intensive projects,such as the proposed _aoia plant, are not included since they would beclassified as induttial sector development. Large energy resourcedevelopments, such as for coal, are not included due to the presentunfavorable international market prospects and the lack of economicjustification based on inforation available to the mission, and to thegreat uncertainty concerning the availability of funds and the securitysituation. In addition to surmounting the difficulties enumerated above,interested foreign investors would have to satisfy themselves of thefinancial and technical feasibility of these projects under the stringentcriteria of the private sector.

xii -
Schedule A: RECCOMENDED ENER6Y SUE-SECTORAL PRIORITY INNESTIMENTS TO 1991(USS million) 8/
Voodfuels and Househrld EneMr2Preparation of woodfu*ls program 0.5Progra of Natural Forest Managementfor fuelwood supply 2.0
Program of fuelwood plantations 5.0Managemont Assistance for plantatlons 2.5Household Energy Survey 0.2Plirt Coat projects and cooking stovetrials O.1
Cooking Stove Program 0.Total for Sub-Sector 10.8
Petroleum SUDPIY and DistributionRehabilitation of Storage and Distribution FaciIlties 4.0Technical assistance for institutlonal strengthening 3.0
Petroleum and Gas Exploration and DevelopmentPromotion and preparation 1.5Driling/f lolJ development 3.0
Gas ExplorationPande Field 10.0Temane Flold and others 14.0
Gas Fleld DevelopmentPands Field 13.0
ans f&oectsPipelIne Pande-Inhassoro 10.009 Pilolt ProJect 1.0
Assistance and Training to ENHManagement and Administration 1.0Technical staff for gas proJects 2.5
Total for Sub-Sector 63.0
ElectricityCompletion of ongoing projects 10.0Uprating of teputo area substations 2.5RehabilIltation of Power Stations 1S.0Extension of Southern 110 kV network 5.0Rehabilitation of distribution systems 10.0Connections to new power consumers 4.0Support facilities for EOM 5.0Coinunicatton system for EON 1.0Technical assistance for Institutional strengthening 8.0New and rehabilitated Isolated diesel power plants 3.0Nini-"ydro stations -fi0
Total for Sub-Sector 70.
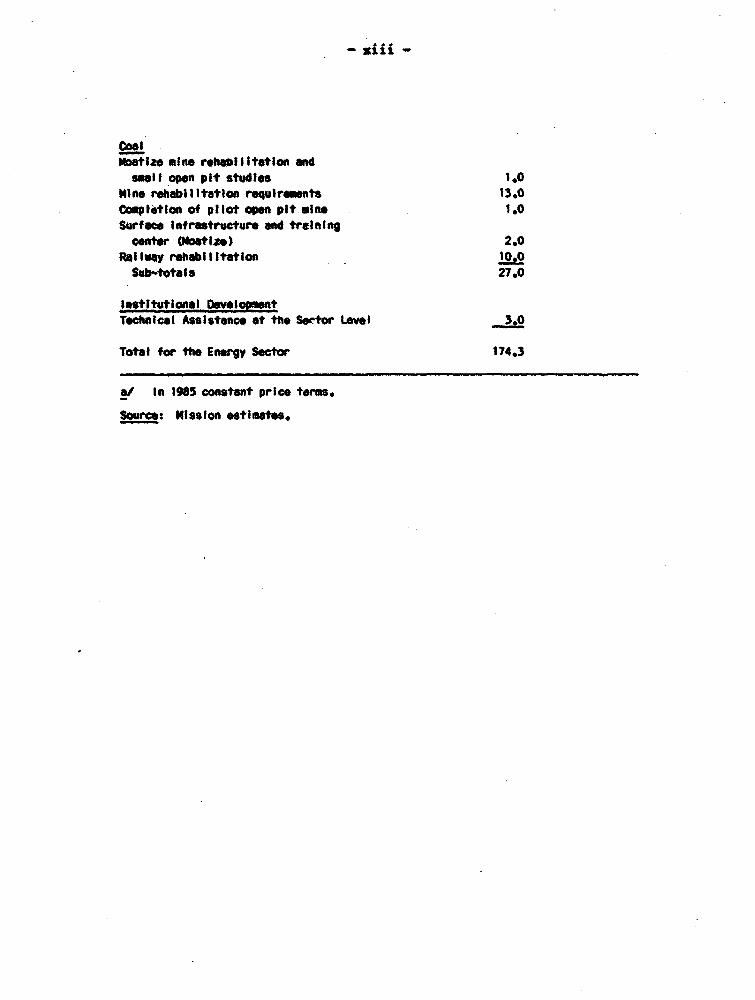
- Aii -
coalNcotize mine rehai itetatlo ands"ll open pit studies 1.0
Nine rehSabIltation requirsemnts 13.0Compltilon of pilot open pit sine 1.0Surface Infrastructure and trainingcenter (Ioatlze) 2.0
Railway rehbilIltation f0.Sub-totals 27.0
Institutional DeveloPoentTchnical Assistance at the Sertor Level 3.0
Total for the Energy Sector 174.3
a/ In 1985 constant price terms.
Source: mission estimates.
z-iv -
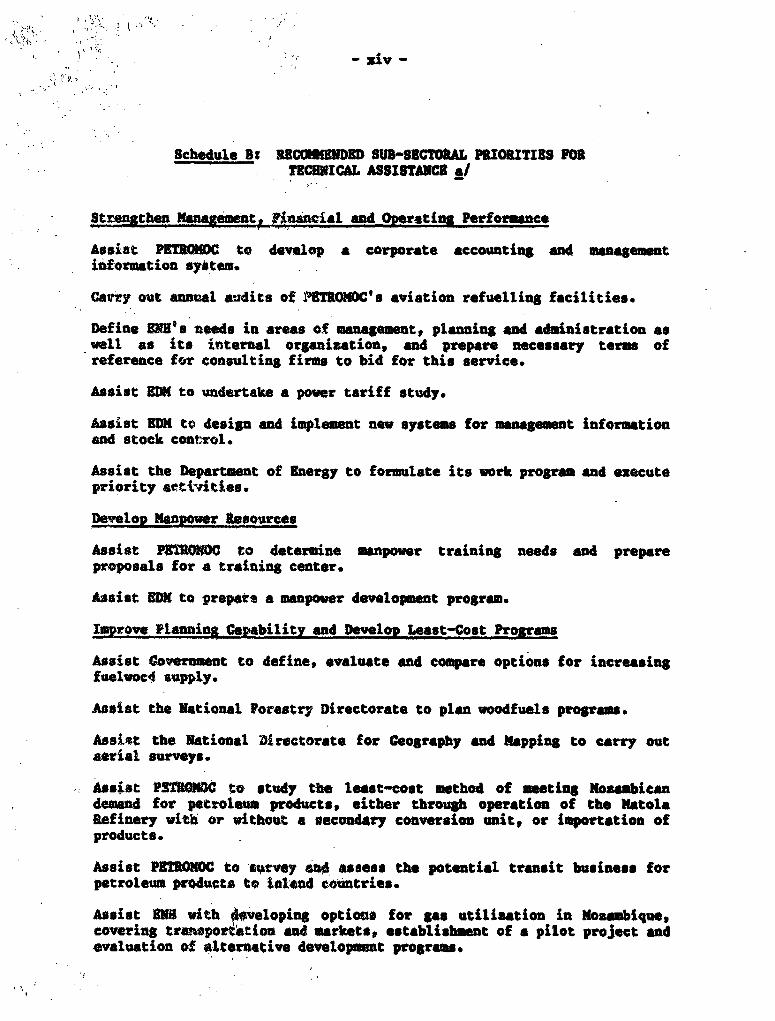
Schedule Bs RBCHMQSNDED SUB-SECTOftL PRIORITIES FORTECHNICAL ASSISTANCE */
Stgrengtben Management Financial and Overatins Performance
Assist PETROMC to develop a corporate accounting and managementinfcrumtion syitem.
Carry out annual audits of IMETRONOC's aviation refuelling facilities.
Define INK's needs in areas of managemnt, planning and administration aswell as its internal organisation, and prepare necessary terms ofreference for consulting firms to bid for this service.
Assist EDM to undertake a power tariff study.
Assist RDO to design and implement new systems for management iniormationand stock control.
Assist the Department of Energy to formulate its work program and executepriority act;b'ities.
Develop Mlaenpwr ftesoureas
Assist PSTRO WO to determine manpower training needs and prepareproposals for a training center.
Assist EDM to prepate a manpower development program.
Improve Flanni Capability and Develop Least-Cost Program
Assist Covernment to define, evaluate and compare options for increasingfuelvoc4 supply.
Assist the National Forestry Directorate to plan woodfuels programs.
Assist the National Dirctorate for Geography and Mapping to carry outserial surveys.
Assist PSTnOMWo to study th least-cost method of eeting Kos abicandemand for petroleum products, either through operation of the KatolaRefinery with or without a secondary conversion unit, or importation ofproducts.
Assist PETROMOC to stgrvey mo assess the potential transit business forpetroleum products to blotnd countries.
Assist BIP with 4veloping options for gSa utilization in Kozambique,covering tranwpo erion and markets, establishment of a pilot project andevaluation of alternative development programs.
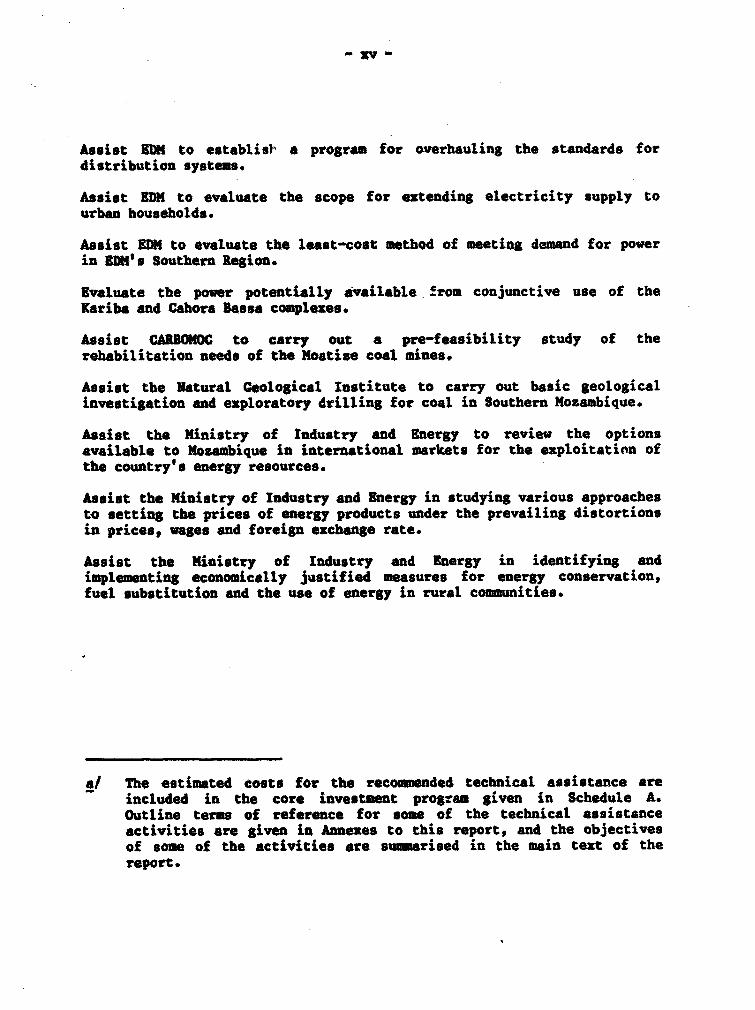
- xv
Assist 5DM to establish a program for overhauling the standards fordistribution systems.
Assist EDM to evaluate the scope for extending electricity supply tourban households.
Assist EDM to evaluate the least-cost method of meeting demand for powerin 1DM's Southern Region.
Evaluate the power potentially available from conjunctive use of theKariba and Cabora Bassa complexes.
Assist CARBONOC to carry out a pre-feasibility study of therehabilitation needs of the Moatise coal mines.
Assist the Natural Geological Institute to carry out basic geologicalinvestigation and exploratory drilling for coal in Southern Noxambique.
Assist the Ministry of Industry and Energy to review the optionsavailable to Mosambique in international markets for the exploitation ofthe country's energy resources.
Assist the Ministry of Industry and Energy in studying various approachesto setting the prices of energy products under the prevailing distortionsin prices, wages and foreign exchange rate.
Assist the Ministry of Industry and Energy in identifying andimplementing economically justified measures for energy conservation,fuel substitution and the use of energy in rural communities.
a/ The estimated costs for the recommended technical assistance areincluded in the core investment program given in Schedule A.Outline terms of reference for some of the technical assistanceactivities are given in Annexes to this report, and the objectivesof some of the activities are sumuarised in the main text of thereport.
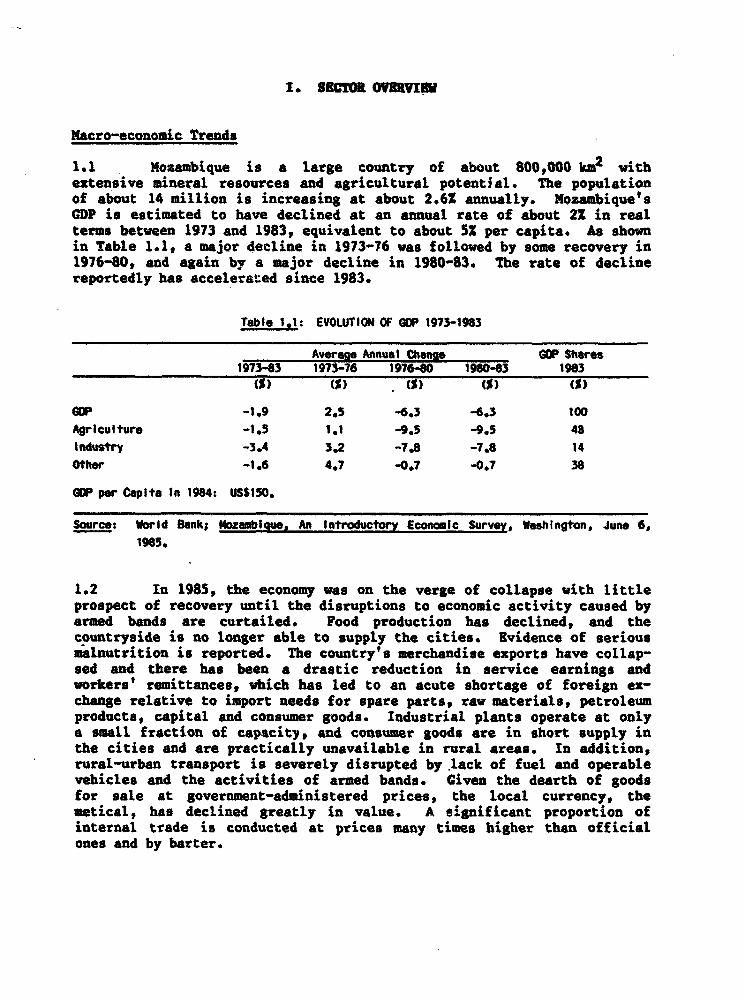
I. 8SCTOR OVRVIYD
Macro-economic Trends
1.1 Mozambique is a large country of about 800,000 km2 withextensive mineral resources and agricultural potential. The populationof about 14 million is increasing at about 2.62 annually. Mozambique'sCDP is estimated to have declined at an annuAl rate of about 2X in realterms between 1973 and 1983, equivalent to about 52 per capita. As shownin Table 1.1, a major decline in 1973-76 was followed by some recovery in1976-80, and again by a major decline in 1980-83. The rate of declinereportedly has accelerated since 1983.
Table 1.1: EVOLUTION OF GOP 1973-1983
Averan4 Annua I Chang. GOP Shares1973-83 1973-76 1976-80 1980-83 1963'O) CS) (5) (5i) (5)
GOP -1.9 2.5 -6.3 -6.3 100Agriculture -1.5 1.1 -9.5 -9.5 43Industry -3.4 3.2 -7.8 -7.8 14Other -1.6 4.7 -0.7 -0.7 38
GOP per Capita In 1984: US$150.
Source: World Bank; Mozambigue, An Introductory Economic Survey, Washington, June 6,1985.
1.2 In 1985, the economy was on the verge of collapse with littleprospect of recovery until the disruptions to economic activity caused byarmed bands are curtailed. Food production has declined, and thecountryside is no longer able to supply the cities. Evidence of seriousmalnutrition is reported. The country's merchandise exports have collap-sed and there has been a drastic reduction in service earnings andworkers' remittances, which has led to an acute shortage of foreign ex-change relative to import needs for spare parts, raw materials, petroleumproducts, capital and consumer goods. Industrial plants operate at onlya small fraction of capacity, and consumer goods are in short supply inthe cities and are practically unavailable in rural areas. In addition,rural-urban transport is severely disrupted by lack of fuel and operablevehicles and the activities of armed bands. Given the dearth of goodsfor sale at government-administered prices, the local currency, themetical, has declined greatly in value. A eignificant proportion ofinternal trade is conducted at prices many times higher than officialones and by barter.
-2-
1.3 Pac%ors beyond Government's control have been instrumentat inthe decline of the economy. The main factors are the vacuum in skilledand semi-skilled manpower left by the mass exodus of Portuguese residentsin the mid 1970, various natural calamities, spreading of disruption byarmed bands since the early 19809 and the fall in revenues from transittrade and worker's remittances from the Republic of South Africa (RSA).However, the economic decline has also resulted from shortcomings inAovernment's economic and financial policies and institutionalweaknesses, especially the severe shortage of trained manpower.
Energy Resources
1.4 Mozambique has substantial energy resources which, have beenidentified fro exploration work undertaken largely since Independence toassist Government in the identification of investment opportunities.Hydroelectric potential is estimated at about 11,000 MW, of which onlyabout 2,200 NW have been developed. Coal deposits abound although provenreserves are only about 5 million tonnes and probable reserves areestimated at 82 million tonnes, but estimates of possible reserves exceed3 billion tonnes. On-shore gas has been discovered, and estimates ofdiscovered reserves vary between 0.4 TCF and 1.4 TCP. Many other areasare considered to be prospective for gas. Petroleum has not bendiscovered but several international oil companies have been exploring,mainly in off-shore areas. Existing forests are still substantial(19 million ha) even though they have been depleted during the last twodecades. The country's locational advantage for offering transitservices to inland countries also provides substantial potential fordevelopment. Good examples of the potential for transit tradt in thesector are the exports of coal and importation of petroleum products.
Overview of Energy in the Economy
1.5 Developments in the energy sector have been both cause and con-sequence of the depressed macro-economic situation. The sector agenciessuffer from institutional weaknesses and shortages of trained anpowerthat are endemic throughout the economy. Shortages of petroleum productshave contributed to a decline in production in many sectors, while thedepressed state of the economy has reduced the demand for energy. Thecollapse of exports and consequent dearth of foreign exchange areresponsible for the shortage of petroleum products, but there is excesssupply capacity of electricity at the national level when all supplyfacilities are in operation. The use of commercial sources of energy byhouseholds has been receding because of supply constraints, andincreasing reliance is being placed on traditional fuels. The lack offoreign exchange has reduced the supply of kerosene, and supplies during1985 and 1986 have been negligible. The activities of armed bands in thecountryside have constrained supplies of fuelwood, charcoal and evenelectricity, or made supply less ru'iable and more costly. Consequently,there are inadequate supplies of woodfuels to meet the urban demand.
-3-
1.6 In an average year of the early 1980s, the gross energy avail-able to Mozambique from all energy forms was About 3 million tofnes ofoil equivalent (T08) or roughly 250 kgoe per capita (of which about 80Xwas from woodfuels). This compares with about 560 kgoe for Malawi,470 kgo. for Tonmania, 760 kgoe for Zimbabwe, 350 kgoe for Uganda, and270 kgoe for Ethiopia. Mozambique's per capita energy consumption wasthus at the lower end of the average for Eastern Africa, although agreater share of total supply came from comercial sources. I1 Of the20S provided from commercial sources, 7O1 to 752 was from petroleum, 1Sto 202 was from primary electricity, and 51 to 101 was from coal.
1.7 In the early 1980s, the distribution of commercial energyconsumption on an oil equivalent basis in Nozambique was approximately271 in industry, 271 in transportation, 311 in households and publicinstitutions, and 151 in agriculture and other sectors. Consumption ofcommercial and traditional forms of energy together in households andpublic institutions averaged about 901 of national consumption. Inoverall terms, Nozambique required about 1.4 toe of energy per thousandUS$ of CDP, while for commercial energy only the intensity of consumptionwas about 280 kgoe per thousand US$ of GDP. Compared to some neighboringcountries, 2/ Mozambique requires more commercial energy (most of whichis importeds) relative to economic output, which possibly reflects acombination of differences in structure of demand and lower efficiency inenergy utilization.
1.8 Energy used to play a much larger role in the country's foreigntrade than it. does presently. Power exports from the Cahora Bassahydroelectric complex were reduced in 1981 and halted in 1984 due tosabotage to transmission lines at a cost to Mozambique in foregoneforeign exchange earnings of about US$8.4 million annually. Nationalcoal production is a fraction of its level in the late 19709 due to theseverance of transport links from the coal mines, and the country islosing about US$4 million annually in revenues from coal exports. 3/
1/ Commercial ene gy sources here mean electricity, petroleum, gas, andcoal, even though sizeable quantities of "traditional' fuels (mainlyfirewood and charcoal) are traded in markets for cash. Zimbabweconsumes a higher share of commercial energy, essentially because ofthe importance of mining and heavy industries.
2/ Comparable numbers for Tanzania are:- all energy sourcest 1.6 TOE per US$1,000 of GDP- commercial energy : 126 kgoe per n n "and for Ethiopia:- all energy sources: 1.8 TOE per US$1,000 of GDP- commercial energy s 116 kgoe per n n
3/ In 1985 total merchandise exports by Mozambique were aboutUS$70 million.
-.4-
Imports of crude oil have been replaced by imports of refined produActs,and the total volume and value of imported petroleum has declinedsubstantially from 1981 onwards. With the closure of the petroleumrefinery in Maputo, excess refined products ceased to be exported during1984. 4/
Energy Supply and Consumption
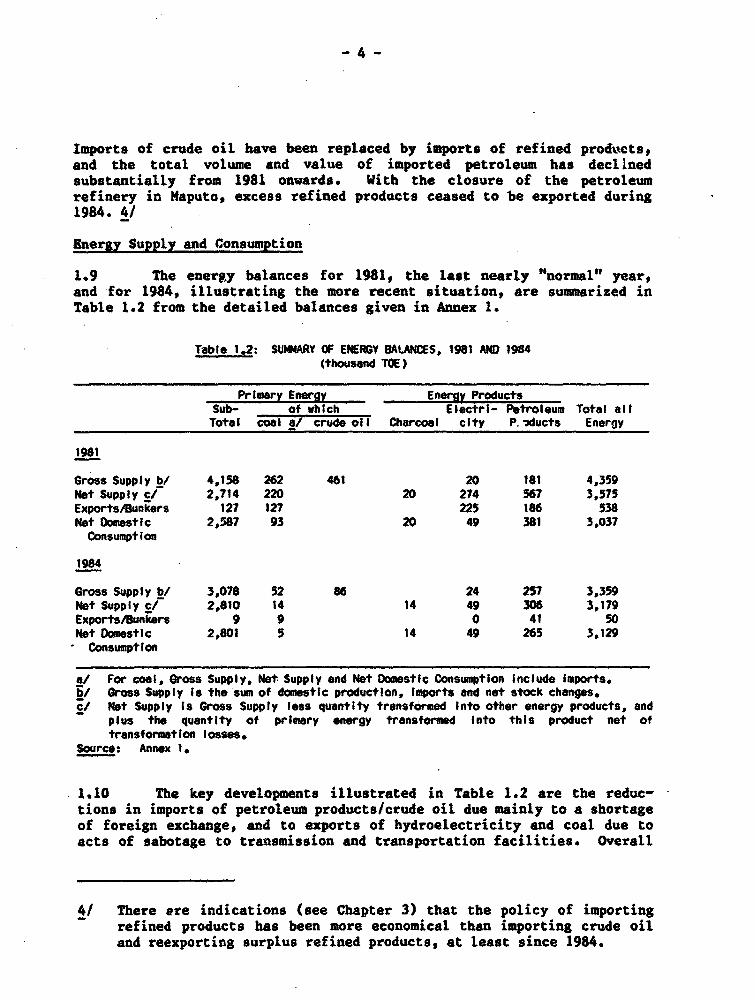
1.9 The energy balances for 1981, the last nearly "normal" year,and for 1984, illustrating the more recent situation, are summarized inTable 1.2 from the detailed balances given in Annex 1.
Table 1.2: SUOWARY OF ENEtGY BALANCES, 1981 AND 1984(thousand TOE)
Primary Energy Energy ProductsSub- of whIch ElectrI- Petroleum Total allTotal coal a/ crude oil Coarcoal city P.'ducts Energy
190?'
Gross Supply b/ 4,158 262 461 20 181 4,359Net Supply cl 2,714 220 20 274 567 3,575Exports/Bunkers 127 127 225 186 538Net Domestic 2,587 93 20 49 381 3,037Consumption
1984
Gross Supply b/ 3,078 52 86 24 257 3,359Net Supply c/ 2,810 14 14 49 306 3,179ExportsABunkers 9 9 0 41 50Net Domestic 2,801 5 14 49 265 3,129
Consumptlon
a/ For coal, Gross Supply, Net Supply end Net Domestic Consumption Include Imports.b/ Gross Supply Is the sum of domestic production, Imports and net stock changes.cl Net Supply Is Gross Supply less quantity transformed Into other energy products, and
plus the quantity of primary energy transformed into this product net oftransformation losses.
Source: Annex 1.
1.10 The key developments illustrated in Table 1.2 are the reduc-tions in imports of petroleum products/crude oil due mainly to a shortageof foreign exchange, and to exports of hydroelectricity and coal due toacts of sabotage to transmission and transportation facilities. Overall
4/ There are indications (see Chapter 3) that the policy of importingrefined products has been more economical than importing crude oiland reexporting surplus refined products, at least since 1984.

-5-
net 4omestic consumption of energy increased marginally assuming that percapita fuelwood consumption remained roughly constant as the populationincreased. As a result, it is estimated that traditional fuels accountedfor about 80Z of net domestic energy consumption in 1981 and 90% in 1984,a significant increase attributable mainly to the decline in consumptionof commercial fuels.
Woodfuels and Household Energy
1.11 Woodfuels are the main source of energy for households (thecategory with the largest consumption of energy), and nearly allwoodfuels- originate from natural forests and savanna-land around townsand villages. These resources are badly degraded and cannot sustainpresent levels of urban consumption in the long term. Deforestationaround the main urban areas will continue due to demand for woodfuels.The prices of woodfuels in urban markets are extremely high relative toofficial prices for other commodities and wages, causing major economicand social hardship. Further deterioration in the urban energy situationduring the next few years is unavoidable, and the major issue facingGovernment is the need to implement measures to reverse this trend assoon as possible.
1.12 On the national scale, consumption of fuelwood and smalldiameter poles in 1980 was estimated to be roughly equivalent to thenatural growth of the total standing volume of wood in the country. How-ever, the balance between supply and demand varied greatly over thecountry, with most of the population living in areas of woodfuelsscarcity. Government embarked on a program of fuelwood plantations inthe late 19709, investing about US$31.5 million. The results from theprogram have been poor due to unforeseen natural factors, inadequateplanning, preparation and management, and disruption by armed bands.
Petroleum and Gas
1.13 In an average year in the early 19809, petroleum supplied about751 of the commercial energy used in Mozambique. Consumption of petro-leum energy products fell by about 21Z over the period 1978 to 1985, from384,373 tons in 1979 to 303,820 tons in 1985. The structure of supplyhowever, changed markedly. Up to 1980, Mozambique refined sizeablequantities of imported crude oil (600,000-700,000 tpy), exported morethan 200,000 tpy of products (mostly gasoline and heavy fuels), andimported gas oil because of a mismatch between refinery yield compositionand the pattern of demand for products. 5/ In the most recent years, incontrast, crude oil imports were drastically cut (to 250,000 tons in1983, 86,000 t in 1984), while product imports rose substantially, from
5/ The historical pattern of demand, skewed towards gasoil and awayfrom gasoline, has also been partly the result of a policy ofkeeping gasoil prices much lower than gasoline prices.
-6-
an average of about 100,000 tpy in the period 1978-1980, about200,000 tpy in the period 1982-84 and about 300,000 tons in 1983.Notwithstanding this increase, there have been acute shortages ofkerosene, LPG and gasoline in 1985 and 1986.
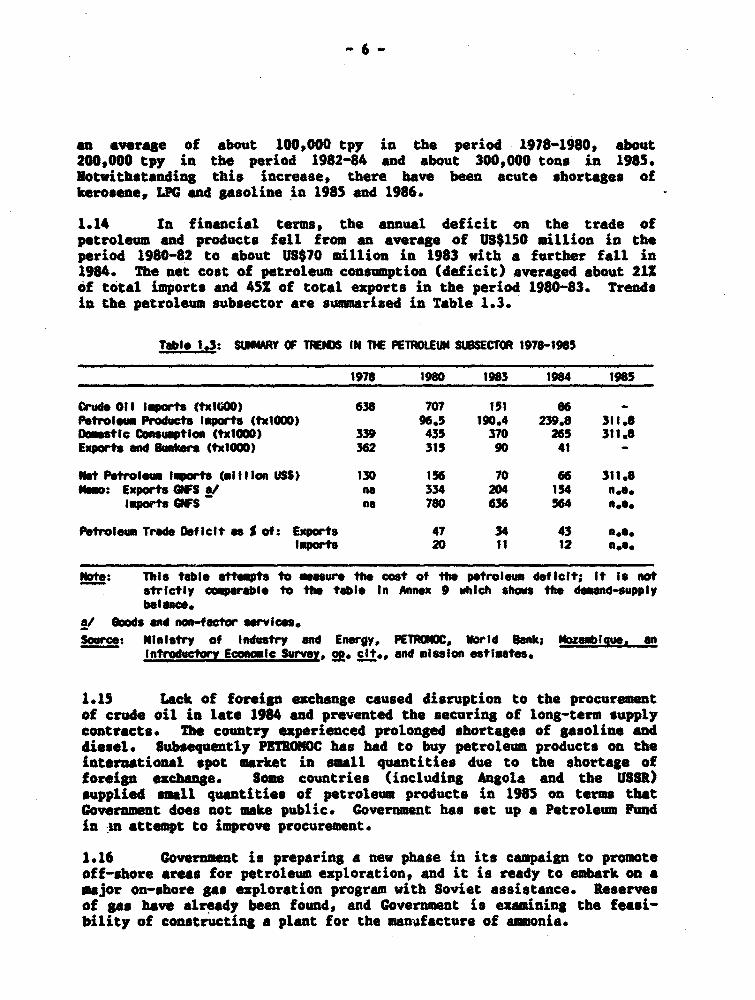
1.14 In financial terms, the annual deficit on the trade ofpetroleum and products fell from an average of US$150 million in theperiod 1980-82 to about US$70 million in 1983 with a further fall in1984. The net cost of petroleum consumption (deficit) averaged about 212of total imports and 45Z of total exports in the period 1980-83. Trendsin the petroleum subsector are summarized in Table 1.3.
Table 1.3: SUIIRY OF T1EN16 IN T1E PETRMOUM SUBSECTOR 1978-1965
1978 1980 1963 1964 1985
Coudroil Imports (txlCOO) 638 707 151 86 -Petroleum Products lpowts (txlOOO) 96.5 190.4 239.8 311.8Yomestic Consumption (txwIOo) 339 435 370 265 311.8Exports and Sunkews (txlOOO) 362 315 90 41 -
Not Petroleum Imports (millon USS) 130 156 70 66 311.8'_g: Exports GFS a/ na 334 204 154 n.a.
Imporfts NFS na 760 636 56 n.ea.
Petroleum Trade Deficit es £ of: Exports 47 34 43 na..Imports 20 11 12 n.o.
Note: This table ettempts to asesure the cost of the petroleum def let; It ts notstrictly cmoparable to the table In Annex 9 which shows the domend-supplybelance.
G/ oods and non-fector services.Source: Ministry of Industry and Energy, FETPROOC, World Sank; Nozambigue. an
Introductory Economic Sur"ey, g. i-t.. and mission estimates.
1.15 Lack of foreign e"change caused disruption to the procurementof crude oil in late 1984 and prevented the securing of long-term supplycontracts. The country experienced prolonged shortages of gasoline anddiesel. Subsequently P3TRONOC has had to buy petroleum products on theinternational spot market in small quantities due to the shortage offoreign exchange. Some countries (including Angola and the USSR)supplied small quantities of petroleum products in 198S on terms thatGovernment does not mke public. Government has set up a Petroleum Fudin nm attempt to improve procurement.
1.16 Covernmeut is preparing a new phase in its campaign to promoteoff-shore areas for petroleum exploration, and it is ready to embark on amajor on-shore gas exploration program with Soviet assistance. Reservesof gas have already been found, and Government is examining the feasi-bility of constructing a plant for the manafacture of ammonia.

Eloctric Power
1.17 Rlectri,idade de Mo9ambique (EDM) was created in 1977 and givenexclusive responsibility for the public supply of electricity includinggeneration, transmission and distribution. 3DM operates a considerablearray of facilities including about 250 HU of available generatingcapacity, 3,000 km of high and medium tension transmission lines, andthree grid systems. In addition, EDM has at its disposal up to 200 MI ofpower from Cahora Bassa as Mozambique's entitlement. Production fromDU's own facilities has oscillated around 300 GWh annually in the lastfive years, while anual consumption (served in part by imports) hasvaried between 600 and 650 CUh. The 2,075 MW Cahora Bassa hydroelectriccomplex and D.C. transmission link to Pretoria in the Republic of SouthAfrica (RSA) are owned and operated by Hidroelectrica de Cahora Bassa(ICB), an international public corporation owned by Portuguese interests(821) and the Government of Mozambique (18X). The status of the contractbetween MCB and the Electricity Supply Commission (ESCOM) of RSA greatlyaffects the price that 8DM pays for the power it receives from ES8OM. 6/
coal
1.18 There are three major, known coal deposits, all around Tete inthe western-central part of the country located at substantial distancesfrom the coast and the main domestic markets. Coal has been producedsince the 1940 from the Moatise underground mines near Tete. Productionof coal has virtually ceased with the cutting of the railway link betweenNoatise and Beira, impeding most domestic and export sales. Productionpeaked in 1981 at about 330,000 t (screened), of which 220,000 t/y wereexported and 110,000 tons sold domestically. In addition, Mosambiquenormally imports 120,000 tons of coal from RSA at very low prices tosupply the Maputo area. Domestic consumption averaged about 215,000 tpyin the period 1979-1982 7/ but has declined subsequently because ofdisruption by sabotage to coal transportation facilities from Moatize andthe general decline in economic activity.
1.19 The Government is investigating a major expansion in coalproduction capacity to an annual level of 6 million tonnes of saleablecoal in two trenches of 3 million tonnes. Implementation of these plonsdepends on the restoration of peaceful conditions in the country and
6/ lhen the supply contract is in force, EDM effectively "reimports"Cahora Bassa power via ESCOM's grid to supply Maputo; when the con-tract is not in force, as when the DC link is interrupted due tosabotage, 3DM imports power from ESCOM. The link has been out ofservice since 1984.
7/ The main coal users in Mozambique are the railwayst cementfactories, sugar mills and the Maputo Power Plant (which uses coalimported from RSA).
progress in arranging the huge amounts of finance for capital investrzentsin new mines, rehabilitation and upgrading of railway and portfacilities. 8/
The Institutional Framework for the Energy Sector 9/
1.20 The economy of Mozambique is managed through central plan-ning. Economic decision-making, including the allocation of resources,is highly centralized. The planning and administrative structure isstrictly hierarchical and is dominated by vertical linkages. The focusof planning has so far been the implementation of development projectsconsidered strategic to the country's development, establishing outputtargets, and allocating the corresponding requirements for inputs.Government intends to modify the system of economic management in thenear future to include the use of fiscal, monetary and pricing policiesin resource allocation. The official exchange rate massively overvaluesthe domestic currency, and the State has nearly total control of foreigntrade.
1.21 Central agencies are assigned exclusive responsibility for thedefinition of principles, objectives, norms, methods and procedures forthe allocation of resources, and for their implementation through controlof planning, budgeting, credit and prices. Within the framework of theCentral State Plan, these tasks are coordinated by the National PlanningCommission (which has formal responsibility for ensuring theintersectoral consistency of investments and the compatibility of pro-duction plans for enterprises with resource availability), the Ministryof Finance, the Bank of Mozambique, and the National Wage and PriceCommission. Sectoral ministries are responsible for the coordination andsubmission to these agencies of proposals made by the enterprises undertheir supervision regarding production targets, requirements for rawmaterials and spare parts and output prices, and for transmitting tothese enterprises the decisions of the central agencies on these matters.
8/ The estimated capital cost, excluding price escalation, of the fulldevelopment to 6 million tpy is about US$1 billion. Financing forthe first tranche of the mine development program has been securedfrom the USSR; France, Italy and Portugal are reportedly interestedin the second 3 million tpy tranche.
9/ The reviews of the institutional framework and of development andpolicy issues in this chapter are based on: World Bank; Mozsambique- An Introductory Economic Survey, June 6, 1985.

9
Policies and Investments in the Last Ten Years
1.22 Since the late 1970s, highest priority in the allocation ofresources has been given to implementing projects envisaged- in theProspective Indicative Plan. 10/ The Prospective Indicative Planenvisaged projects for the production of agricultural commodities,textiles, iron and steel, machinery, aluminium, gas, basic chemicals,coal, electr5.city and construction materials; dams, br^iges and roads;and oil exploration. Government's policy was to create the infra--structure expected to stimulate investment in productive capacity.Implementation of new investments during the years following Independence(on state farms and, since the late 1970s, on major development projects)has claimed the bulk of the available financial and quelified manpowerresources. The major electrification works are now almost complete, butthe envisaged associated agricultural and industrial developments havenot taken place. Investments in the energy sector (including fuelwood)since the late 1970s (based on data given in the Central State Plan)amounted to about US$335 million, or 20% of total investment expendi-tures.
1.23 Government's policy was established before armed bands startedto cause major disruption to the economy. However, shortcomings in theexecution of this policy have also been recognized as a contributoryfactor to non-fulfillment of the objectives. ll/ Some investments havebeen undertaken without a realistic assessment of the physical andfinancial resources available in the short to medium-term, or an adequateevaluation of the benefits and costs. These factors, aggravated by thedisruption caused by armed bands, have contributed to the critica! under-performance of these investments.
1.24 Existing installations and equipment have either deterioratedor been utilized below capacity because of poor management and lack ofraw materials, spare parts, maintenance and qualified manpower, andbecause of the focus on new investments. In addition, efficiency inresource use has been discouraged by pricing and credit policies.
1.25 Present prices, the most important of which are fixed orregulated by the Council of Ministers and the National Wage and PriceCommission (CNSP), reflect neither costs- of supply nor scarc;ty inrelation to demand. The price structure is highly distorted, between aswell as within sectors. Covernment has so far allowed the metical tobecome grossly overvalued, which has facilitated maintaining official
10/ Rep6blica Popular de Mocambique, "Linhas Fundamentais do PlanoProspectivo Indicativo para 1981-1990" (Maputo: Imprensa Nacionaln.d.).
11/ These shortcomings were openly discussed at the Fourth PartyCongress in 1°°
10 -
prices of petroleum products, electricity and coal at artificially lowlevels. While inflation has been substantial (about 30X/year between1983 and 1985), nominal wages and salaries have not changed for severalyears. However, wage bills have risen as a result of overemployment ofunskilled labor. The fall in real wages has discouraged the labor forceand promoted the emigration of semi-skilled and skilled workers. TheGo .trnment has attempted to stem the outflow of skilled personnel byissu-n- a new labor law (December 1985) that allows enterprises to offerwages and incentives to motivate and retain skilled personnel.
1.26 The failure of prices to cover the actual costs of the enter-prises has been accommodated through subsidies from the central budgetand credit from the banking system. Although subsidies are reportedlygranted only to enterprises of social, rather than economic, interest,other loss-making enterprises have obtained credit even when their repay-ment prospects were poor. Interest rates have not changed since 1980 andthey do not have an allocative role because credit is allocated withinthe framework of the Central State Plan.
1.27 The negative impact of these development orientations on theeconomy has been substantial. The impact of the financial, physical andparticularly, manpower constraints on one sector of the economy cannot beresolved in the context of that sector alone. Managing the transition toan economic system wbich includes fiscal, monetary and price policies inthe allocation of resources is a major task facing Government. Since theFourth Party Congress in 1983, the Government has undertaken somemeasures to address these problems, although the depth of the crisis andthe activities of armed bands will hinder recovery. It would go beyondthe scope of this Report to make recommendations on such generalissues. However, the Report does assess the impact of these issues onthe performance of the energy sector.
Energy Planning Issues
1.28 Government maintains that its economic strategy is guided bytwo complementary principles: to maintain the viability of productiveassets through rehabilitation and maintenance programs, and to promotesustained economic development through exploitation of indigenousresources. Likewise, energy planning issues can be classified into thosethat focus on the short to medium term, and those whose nature isessentially long term. This distinction separates issues of operationalefficiency, institutional development and pricing from those ofexploiting the major resource potential. A fundamental dilemma in theenergy sector is the relative importance attached to these two componentsgiven the shortage of trained manpower and financial resources.Government needs to develop a program within its selected strategy thatis consistent with the availability of resources. Under the circum-stances, the overriding issue is the need to prioritize the claims oncurrent and future resources. In the mission's view, issues related tothe first group should be given priority. The state of insecurity limitsgovernment's scope for immediate action, especially in implementing major
- 11 -
projects. Implemetcation of most of the recoumendations for action givenin this report could be undertaken irrespective of the securitysituation.
Operational EfficiencX and Institutional Strengthening
1.29 The main institutions in the energy sector are relatively new,being founded after Independence. They have encountered obstacles todeveloping and maturing due to the shortage of skills and resources. Themission agrees with Governoent that improving operational efficiency andstrengthening sectoral institutions should be the main objectives for theenergy sector in the short and medium terms. The subsectoral reviewsgiven in Chapters 2 to S of this report identify major shortages inmanagement, technical and financial skills, and the recommendations fortechnical assistance give priority to these areas. The institutionalissues are reviewed at the sectoral level in Chapter 6. This objectiveis a -. tal component of the strategy for economic recovery based onimproving the use of existing productive capacity. The measures toachieve this objective would also support the objective of harnessingMozambique's potential to handle transit trade for inland countries inenergy products. The effort will fully absorb the country's institu-tional capacity and skilled manpower resources for many years to come.In fact, mLbstantial assistance from abroad will be required to fulfillthis objective properly. Thus, any major diversion of these resourceswithin the nezt few years into large investments in energy is likel, toinflict a substantial cost to the economy through lowering the standardsof energy supply. 121
Future Large Energy ProJects
1.30 Government has expended in the last few years substantialsmounts of scarce financial and manpower resources on the preparation andpromotion of a number of large energy projects. This work forms part ofGoverauient's strategy for placing Mozambique in a position to exploitregional and international market opportunities once the securitysituation improves and markets can be assured at viable prices. Some ofthese projects involve massive investments relative to the size of theeconomy. The combined investment on the large energy-intensive projectsbeing considered for implementation amount to about US$2,150 million in
12/ Such effects can be diverse, ranging from loss of industrialproduction due to power outages and disruption to transportation dueto shortages of petroleum fuels, to poor labor productivity in ruralareas because of time taken to collect scarce woodfuels.
- 12 -
constant, early 1980s prices. 13/ These projects would be additional tomany smaller investments required to replace, modernize and extendexisting energy facilities which cumulatively will also be expensive andhave to bei financed externally. This amount compares to aboutUS$1,540 million for total public investment, and to about US$335 millionfor investment in the energy sector for the period 1980-1985, 141 and toa national external debt of about US$2,900 million at end 1985.
1.31 Even the realization of only one of the proposed largeinvestments in the next ten years would raise the proportion of totalinvestment in energy well above 20% of total tational intvestdent(estimated actual proportion in the period 1980-1985). Government's viewis that viable projects should be undertaken provided that the requiredfinancial and human resources are available. Nevertheless, in view ofthe massive scale of the investments under consideration, the missionconsiders that Covernment should set priorities among potentialdevelopments according to economic benefits, and determine the optimallevel of investment in energy in relation to overall investment needs andresource availability.
1.32 Based on information available to the mission, the strategy oflarge-scale development of known energy resources specifically for exportby Mozambique has not been shown to be economicIly Justifiable atpresent. This conclusion results mainly from constraints or lack ofcompetitiveness in export markets and from inadequate projectpreparation. A major change in circumstances would be required toreverse this general conclusion, such as a substantial and sustainedincrease in commodity prices. The justification for continuing to expandon resource exploration and project identification under the presentlyunfavorable economic, financial and security circumstances needs to bereviewed because this policy diverts scarce resources from short- andmedium-term priorities. The case of petroleum exploration, financedlargely from foreign resources, is an exception.
Large Energy-Intensive Industrial Projects
1.33 The Government is also investigating export-oriented, energy-intensive industrial projects to exploit the country's energy re-sources. Two of these projects are worthy of mention. One project is to
131 The major energy developments currently being promoted or preparedby Government are Cahora Bassa Stage 2 (US$512 million), MoatizeCoal (US$979 million for Phases 1 and 2-6 million tpy and includingassociated infrastructure" Pande Gas Field (US$20 million), anammouia plant (US$280 million including associated infrastructureand community development), and an aluminum plant (US$360 millionexcludirg associated infrastructure), totalling US$2,151 million.
14/ Central State Plan, converted to US$ at the rate of ZT43 per US$.
- 13 -
produce ammonia from natural gas at Pande, and the other is to establishan aluminium smelter based on low-cost hydroelectricity from CahoraBassa.'
1.34 The a_monia project, reviewed in Chapter 3, yields an economicrate of return on the total investment of about 12X under favorable con-ditions. However, there are substantial market and technical risks whichcould jeopardize the economic returns to the project. The missionsupports Government's poliey of taking steps to reduce these risks, suchas the conclusion of long-term contracts or "letters of intent" for thesale of ammonia before committing substantial resources to the project,and by locking-in purchasers as investors in the project. This could befeasible since the specific characteristics of the regional market inSouthern Africa seem favorable for local ammonia producers. On the otherhand, conditions in the open international market for large energy-intensive industrial projects are much less favorable.
1.35 The aluminium project that is being studied would be based onan electric smelter with a capacity of about 80,000 tpy, and it wouldimpose a load of abqut 180 MW on the power system. One of the locationsunder consideration is Caia which already has adequate power transmissionand substation capacity for this project. However, this location wouldimpose substantial (rail) transport costs, and would require majorinvestment in rehabilitation of the railway track. The other location isat Beira which would require power transmission ficilities costing aboutUS$50 million, but would save rail transport costs. Government anti-cipates that the required power could be obtained from existing capacityat Cahora Bassa through negotiations with HCB and ESCOM, even thoughagreement wotuld be required for a relatively small reduction in thecontracted sunply to ESCOM. Another issue is the need to ensure a veryhigh degree of reliability of power supply since an electric smeltercannot tolerate power outages of longer than 3 to 4 hours; this wouldrequire the provision of double transmission circuits and othersafeguards involving major expenditure on the long link from Caia toBeira.
1.36 Feasibility studies for the aluminium project give an estimatedrate of return of lOX on the investment in new plant, excluding the majorinvestment in associated ixfrastructure, assuming that the realizet priceof aluminium ingots on the international market will be US$1,750/tonne in1982 terms. In comparisont actual prices since 1983 have been belowUS$1,500/tonne, and the rate of return falls to about zero at thatprice, Prices are not expected to rise above their real 1982 level for
- 14 -
the rest of this century. 16/ Taking account of investmnts required inrailway or power tra s_isslon facilities, difficulties in ensuring thereliability of supplies of inputs, and of international price prospects,the project does not appear to be economically justified at present.
Energy Pricing
1.37 Government's policy on energy pricing is in accordance with itsgeneral policy of maintaining price stabllity and enterprise viability.The economic costs of meeting demand are not generally considered in thesetting of energy prices. Following this general policy, Government aimsto develop fuel supply options that are affordable to the majority of thepopulation. Because of the link between the exchange rate and domesticprice levels, the policy of keeping the metical grossly overvalued hashelped to keep the official prices of petroleum products, electricity andcoal at artificially low levels. At present, these official prices areonly a fraction of the prices of fuelwood and charcoal which are nottraded internationally and whose prices are market-determined.Ultimately, recommendations on energy prices will have to be formulatedin the context of the exchange rate, taxes, prices and wages. Never-theless, measures are required quickly to reduce the gross distortions inthe present structure of energy prices, I1/ while a study should beundertaken to determine a rational energy pricing structure for thelonger run. 18/
1.38 The objectives of energy pricing in Mozambique should be theefficient use of economic resources, the financial viability of sectorenterprises, and the satisfaction of demand for energy at least cost tothe economy. Current energy pricinl policies do not provide correctsignals to consumers for efficient resource allocation, nor do they giveincentives for energy conservation# improvements in energy efficiency, oreconomic fuel substitution. Close substitutes are sold at widelydiffering prices, thus distorting consumer choice. For example, kerosenefor lighting is sold at half the price of kerosene for cooking. Gasoilis sold at less than half the price of gasoline.
1.39 For various reasons, implementation of the present pricingpolicy fails to take account of economic factors. First, enterprises donot have the financial and economic expertise to support this pricing
16/ For example, the mid-1985 edition of the World ank's CommodityPrice forecasts quote the following prices for aluminium ingots inEuropean markets in 1983 constant US$ terms (US$/t): 1984 actual -1396; 1985 actual - 1184; 1986 (forecast) - 1262; 1990 - 1403; 1995- 1560.
17/ Para. 1.42.
18/ Para. 1.43.
- 1S -
proposal. Second, they do not keep reliable financial accounts. Third,enterprises are not subject to financial discipline because their lossesare usually financed by credit from the banking system.
1.40 The Council of Ministers and the National Wage and PriceCommission, which have the final say on the most important pricesincluding those of energy, do not respond promptly to proposals for priceincreases. The consequences generally support Government's objective ofprice stability, although large increases in prices have to be concededeventually, which often results in greater economic disruptionthansmaller and more frequent increases. 19/ Until price increases areapproved, enterprises continue to make large and increasing losses, whichconflicts with Government's objective of enterprise viability. It isclear that pricing decisions, when warranted, should be taken morequickly. A better balance is required between the objective of pricestability and other pricing objectives.
1.41 Retail prices for energy products in mid-1985 are given inTable 1.4 to illustrate the price distortions that exist between fuels.Traditional energy sources (fuelwood and charcoal) are much moreexpensive than other fuels which are mostly imported (and are subsidisedby overvaluation of the metical). For example, charcoal is about 500times more expensive than steam coal and 85 times more expensive thanfuel oil on a gross energy basis, while fuelwood is nearly 13 times moreexpensive than illuminating kerosene on a gross energy basis. Thecomparison of the costs of fuels to consumers which takes account ofconversion efficiencies of energy appliances shows even greaterdifferences and is given in Chapter 2 for household cooking. Charcoal isabout 53 times more expensive than kerosene and 15 times more expensivethan electricity on a useful energy basis (i.e., taking account ofconversion efficiencies) for household cooking. Likewise, fuelwood isabout 24 and 14 times more expensive than kerosene for cooking and elec-tricity respectively. These exceedingly large price differentials arenot justifiable in terms of economic efficiency (they undervalue importedfuels) or social equity (they are highly regressive).
19/ For example, electricity rates were hardly changed between 1960s and1986, but the increase in early 1986 averaged about 120X. Petroleumproduct prices have remained unchanged since late 1979 (except forJP1 which was reviewed in 1980).
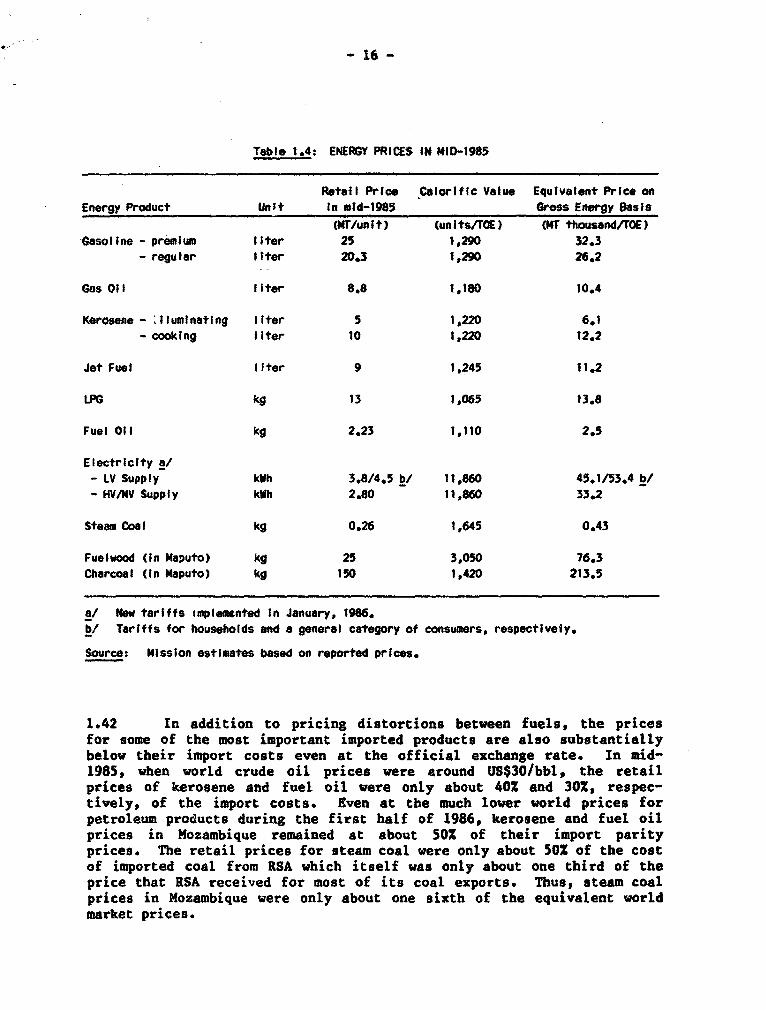
16 -
Table 1.4: ENERGY PRICES IN MID-1985
Retail Price Calorific Value Equivalent Price on
Energy Product Unit In mid-1985 Gross Energy Basis
ffT/unit) (units/TOE) (MT thousand/TOE)-Gasoline - premiun liter 25 1,290 32.3
- regutar Itter 20.3 1,290 26.2
Gas Oil liter 8.8 1,180 10.4
Kerosene - Iluminating liter 5 1,220 6.1- cooking liter 10 1,220 12.2
Jet Fuel liter 9 1,245 11.2
LPG kg 13 1,065 13.8
Fuel Oil kg 2.23 1,110 2.5
Electricity a/- LV Supply kWh 3.8/4.5 b/ 11,860 45.1/53.4 b/
- HV/MV Supply kWh 2.80 11,860 33.2
Steam Coal kg 0.26 1,645 0.43
Fueiwood (in Maputo) kg 25 3,050 76.3
Charcoal (In Maputo) kg 150 1,420 213.5
a/ New tariffs ampleminted In January, 1986.b/ Tariffs for households and a general category of consumers, respectively.
Source: Mission estimates based on reported prices.
1.42 In addition to pricing distortions between fuels, the pricesfor some of the most important imported products are also substantiallybelow their import costs even at the official exchange rate. In mid-1985, when world crude oil prices were around US$30/bbl, the retailprices of kerosene and fuel oil were only about 40% and 30X, respec-tively, of the import costs. Even at the much lower world prices forpetroleum products during the first half of 1986, kerosene and fuel oilprices in Mozambique remained at about 50% of their import parityprices. The retail prices for steam coal were only about 50% of the costof imported coal from RSA which itself was only about one third of theprice that RSA received for most of its coal exports. Thus, steam coalprices in Mozambique were only about one sixth of the equivalent worldmarket prices.
- 17 -
1.43 Clear guidelines for economic pricing in Mozambique are noteasy to obtain at present. The macroeconomic situation is not fullyunderstood, so it is difficult to establishy a realistic foreign exchangerate for the metical. At some point, market prices will have tocorrespond with the economic costs of energy, and will be based on arealistic foreign exchange rate. Recognizing the complexity of thisissue, the mission recommends that Government implement at least apricing policy of full financial cost recovery from energy consumers.For imported energy products, the prices of kerosene, fuel oil and steamcoal should be raised and maintained at their import parity levels at theofficial exchange rate. At the present official exchange rate, theseincreases would be small relative to the appropriate overall adjustmentrequired, but they would reduce financial subsidies to consumers. 20/The absence of least-cost development programs prevents the use of LongRun Marginal Cost (LRMC) as a guide to pricing non-traded energy products(power, woodfuels). The mission recommends that these deficiencies beremedied as a matter of priority. While the required macro-economicparameters and LRMC are being researched, energy pricing will have to bebased on the following important though incomplete principles:
(a) retail prices for imported fuels should be based on fullfinancial cost recovery, covering at least the import parityprices of these fuels (especially after any devaluation whichmay take place);
(b) the market prices of traditional fuels 21/ and relative energycontents of energy products should be used to arrive at reason-able relationships between the prices of commercial and tradi-tional fuels;
(c) the relationship between prices of indigenous and importedfuels in economies similar to Mozambique that do not have majoreconomic distortions should be used as a guide to the structureof energy prices in Mozambique;
20/ The possible effect on demand for woodfuels following a substantialincrease in the prices of imported fuels would need to be consideredbecause of the critically short supply situation of woodfuels.However, this effect probably would be minimal because of theenormous differential that exists between the prices of woodfuelsand imported fuels on a useable energy basis (para. 1.41).
21/ Some adjustment to these prices would have to be made for purposesof comparison, especially a reduction in the price used forwoodfuels to compensate for increases in prices caused by presentproduction and distribution inefficiencies and supply constraintscaused by armed bands (para. 2.7).
-~ 18 -
(d) the prices of co_mercial and traditional sources of energy(especially in household uses, where they are close sub-stitutes) should not show the existing exaggerated differencesin prices (especially on a useful energy basis) on the groundsof technical and equity considerations; and
(e) prices should be set at levels that cover the financial needsof energy sector enterprises with due consideration fornecessary improvements in operating efficiency and funding ofinvestments.
The mission recommends that Government commission a study into the dif-ferent approaches to setting prices of energy products with theobjectives of determining a rational structure for energy prices and ofdesigning appropriate economic and financial incentives for consumers andenergy enterprises.
Energy Conservation, Fuel Substitution and Rural Energ
I.44 There are major gaps in knowledge about the economy and theenergy sector of Mozambique, and there are major uncertainties abouteconomic prospects and the related future course of demand for energy duepartly to the situation of insecurity in the country. For these reasons,the Assessment has not been able to review all the energy activities,particularly the use of energy in the industrial and transportationsectors (efficiency, fuel substitution) and the use of energy in ruralcommunities and the smaller isolated urban communities. Nor has themission attempted to prepare energy demand forecasts except for projec-tions used only to illustrate certain planning issues. These areimportant areas for energy policy, and the mission believes thatGovernment and specifically, the Department of Energy, should take thelqad in reviewing the issues and options for improvements in theseareas. The mission recommends that these activities be considered one ofthe priorities for technical assistance.
Energy Development Strategies and Policies
1.45 The evaluation of issues and options in this Report indicatesthat the order of priorities for investments in energy in Mosambique inthe short to medium term should be determined through the followingstrategy:
First: to satisfy Mozambique's own energy needs by usingprimarily domestic sources, if economic, and by rehabilitating andimproving existing sector assets. The primary objective would be toensure that energy constraints do not impede an eventual economicrecovery.
-19-
Second: to develop Mozambique's potential to benefit fromtransit trade in energy products with inland countries and trade inelectricity, and to cooperate with neighbouring countries in developingsolutions to common energy issuer.
Third: to invest in energy or energy-intensive industries forexport only if a number of important conditions are met, especiallyeconomic, financial and market criteria.
1.46 The mission supports the Government's criteria for selectinginvestments in export-oriented projects, namely that: (a) the venture beeconomic at world prices and there be secure market prospects for theoutput (e.g. gas, fertilizers, coal, aluminium, hydroelectricity)$ an(b) the economy obtain a satisfactory benefit from the exploitation ofthe national resources. The mission also reconoends that Government'spolicy of taking steps to reduce the risks to the Mozambican economy bestrengthened through the use of foreign capital, marketing, managementand technical expertise, and long-term commitments to the project byforeign partners. The mission recommends that Government undertake areview of the most promising options available for developing energyresources in line with the above-mentioned criteria. 22/
1.47 The mission's recommended strategy for development gives alower priority to large scale export-oriented projects than to therehabilitation of existing facilities. While security constraints exist,even investments that satisfy all the criteria will not be feasible.While the conditions of insecurity and scarcity of financial and humanresources persist, the mission recommends that Government focus resourceson rehabilitation and institutional strengthening.
1.48 Government should strengthen its coordination in planninglarge-scale developments in energy, industry and* transportation.Government also attaches high priority to the rehabilitation andupgrading of the country's transport infrastructure (ports, railways,roads) for economic development in Mozambique and for transit trade withinland countries. The economic justification is often sought inconjunction with investments for large-scale exports of energy pro-ducts. The Government's policy has been similar to that for newinvestments, namely that rehabilitation of infrastructural facilities isundertaken to stimulate development of productive capacity. Export oftransport services (i.e. serving the needs of landlocked countries)should be considered explicitly in evaluating proposals for rehabi-litation of transport facilities in conjunction with prospectivedevelopments in energy, heavy industry and agriculture.
1.49 Enclave export projects (especially energy export projects) notonly have the attraction of prospective foreign exchange earnings, but
22/ Para. 1.50.
- 20 -J.
such investments al80 may apFear to be less sensitive to conditions ofinsecurity than investments in other sectors. Furthermore, theseinvestments offer prospective financial resources for the State.Government's policy is to devote resources to preparatiou of suchprojects so as to be in a position to take opportunities for viabledevelopment if economic conditions become favorable. With the presentshortages of human and financial resources, there are risks that such apolicy will divert resources required for higher priorities, which themission considers to be rehabilitation of facilities and strengthening ofenergy sector institutions.
1.50 Mozambique's internal market is too small to absorb a largeproportion of the output from massive projects, and the returns expectedfrom the four major export-oriented projects reviewed in this Report arerelatively low under present international market prospects. It ispossible that the best options for developing the natural resources havenot been identified. Therefore, the mission recommends that Governmentcarry out a review of the options available to Mozambique ininternational markets for exploiting the country's energy resources. Theobjectives of the review should be tot (a) identify the most promisingmarkets and energy-based products in the long-term for the country;(b) examine various levels of transformation and industrialization of thecountry's energy resources; (c) examine prospective developments inrelevant technologies and international markets; (d) assess the likelyintensity of competition; (e) recommend the best forms of contractualarrangements for Mozambique with foreign partners; and (f) recommend astrategy for -developing the energy resources in terms of markets,products and required economic return to the energy resources to justifyexploitation. In the mission's view, the objectives of the contractualarrangements should be to minimize the burden of the investments on thecountry's economy, including the potential burden arising from marketing,financial and technical risks, and to generate substantial economicbenefits for Mozambique. The review should cover hydroelectricity, coaland natural gas. Petroleum need not be included since the marketingissues are relatively straightforward.
Recommended Priorities
1.51 Summaries of the mission's recommendations concerning policiesand strategies and for technical assstance are given for each of the mainenergy subsectors at the end of the following chaptes in this Report.Taken together, general themes emerge from these recommendations andconstitute the following recommended priorities for the Government in theenergy sector.
(a) remedy shortages of energy products and secure stable supplyconditions;
(b) improve the reliability of supply of energy products throughrehabilitation of operating facilities;
- 21 -
(c) carry out institutional strengthening and manpower developmentof the energy suppliers (SDM, PET.OMOC, and CARBOMOC) and alsoMMN the Ministry of Industry and Energy and the Ministry ofNatural Resources;
(d) remove distortions to energy pricing, at least by increases inofficial prices to import parity levels at the prevailing offi-cial exchange rate; account should also be taken of the rela-tionship between energy prices a4nd other prices irn the economy,and to the structure of economic costs of meeting energydemand;
(e) strengthen the capacity for planning in energy sector agenciesto meet domestic demand for energy and to evaluate large energyprojects;
(f) address the urban household ene.gy crisis to arrest the des-truction of natural forests around cities (especially Maputo,Beira and Nampula) and to ameliorate socio-economic hardshipthrough a combination of measures to manage demand and increasesupply of energy; and
(g) continue promotional efforts to stimulate the interest offoreign oil companies in petroleum exploration.
Generally, these priorities reflect Government's own priorities, and themission considers that Government could proceed with the implementationof most of these recommendations. Some of the measures required toimprove the reliability of energy supply may not be feasible whilst theactivities of armed bands persist.
Recommended Technical Assistance Priorities for the Energy Sector
1.52 The following priorities for technical assistance emerge fromthis assessment of the energy sector:
(a) to strengthen the management, financial and operatingperformance of the main sector agencies;
(b) to develop manpower resources at all levels of skills;
(c) to improve the planning capability of the main supply agenciesand assist in the preparation of sub-sector developmentprograms;
(d) to improve sector-wide planning and coordination throughdevelopment of the capability of the Department of Energy;
(e) to assist with identifying and implementing economicallyjustified measures for energy conservation, fuel substitutionand the use of energy in rural communities.

- 22 -
(f) to assist with specific studies covering the structure ofenergy prices, household energy demand, mapping and forest in-ventories, petroleum procurement, electricity tariffs, andrehabilitation requirements for existing operating-facilities(petroleum, electricity and coal).
- 23 -
II. WOODFUBLS AMD HMOUSEOLD INDICT
Woodfuel Iupply and Demand
2.1 Households ire the largest consumers of energy, accounting forabout 902 of national energy consumption, and the energy they consume issupplied overwhelmingly by woodfuels. Both urban and rural householdsare facing serious energy shortages. Since 1981, urban households havebeen suffering from the virtual disappearance of supplies of kerosene andLPG and the decreasing reliability of electricity supply, while they havebeen bearing the brunt of large increases in the prices of firewood andcharcoal. More than half the rural households are in areas of fuelwoodscarcity and people must devote increasing amounts of time and effort tothe collection of firewood. One of the Government's measures to amelio-rate the situation has been to free the trade in firewood and charcoalfrom official controls, which has resulted in increase of supplies tourban areas. There were also attempts in the late 19709 to startprograms of peri-urban fuelwood plantations which have failed, so far, tomake a significant contribution to fuelwood supplies.
2.2 The condition of insecurity characterizing Mozambique at pre-sent is one of the causes of the difficulties. Disruptions to thewoodfusls transport by armed bands is frequent, as is the disruption towood cutting and gathering and charcoal production. Insecurity has dis-rupted large-scale charcoal trade, thereby causing inefficiency andhigher costs in supplying urban areas.
2.3 Up to 1985 there was an absence of credible systematic datawhich prevented quantification of the supply and demand for woodfuels andthe effects of the security situation. The first survey was carried outin July 1985. Often the systems of data collection themselves have beendeficient. Furthermore, collected data were neither stored nor processedproperly. These shortcomings stem in part from the acute shortage oftrained manpower and in part, from weak management. This situation hasto be corrected to obtain even a minimal quantification of the urbanwoodfuel situation for planning purposes.
Woodfuel Situation in Urban Areas
2.4 Areas around major cities have been deforested, especiallyaround Maputo, Beira and Nampula, and even around smaller urbancenters. The situation around Maputo, & city of about 820,000 people in1984, is aggravated by the low forestry potential in the region of thesavanna-land which has virtually disappeared within a radius of50-60 km. Thus, most fuelwood supplies for Maputo originate at 50 km ormore from the city. Annual woodfuel consumption in Mapuro is equivalentto the clear felling of a forested area of 300 to 350 km . Beira, whichis located near a major forest, receives its fuelwood from a distance of25-30 km. It is reported that the situation around Nampula is similat tothat around Maputo. The trade in woodfuels is conducted entirely by the
- 24 -
private sector. The situation will deteriorate unavoidably during thenest ten years, and will do so thereafter unless measures are taken inthe next year or two to counteract this trend.
2.5 Urban market prices of woodfuels are not systematicallyrecorded, but knowledgeable traders and consumers estimate that thoseprices rose ten-fold in the period 1981-84. The main factors accountingfor this rapid price escalation are the decline in the value of themetical, depletion of woodfuel resources around the urban areas, andrestrictions on woodfuel suppliers due to armed bands in the countrysidewho threaten wood-cutters, charcoal producers, drivers and their trucks.
2.6 At the time of the mission (April/Hay 1985), the market priceof fueLwood in Maputo was roughly NT25/kg for air-dried wood (about 25Z-30X moisture content). Charcoal, when available, costs about HT150/kg.An analysis of the transactions in the marketing chains for fuelwood andcharcoal is given in Annex 2. Many families (typically about 7 members)reported spending about MT200 per day for fuelwood and/or charcoal. 23/Given that the minimum wage is HT62.5 per day, and monthly salaries forskilled and professional workers are generally in the range of MT2,000 toNT1O,000, it is not surprising that woodfuels have become the heaviestitem in the budget of poor and even middle-income urban families. Therewere reports that some families were unable to afford the cost of bothfood and fuel for cooking. The cost of fuelwood has altered culinarypractices away from dishes requiring lengthy cooking.
2.7 While there are no obvious barriers to entry to the charcoaland fuelwood trades, charcoal trading is carried out on a small scale andis inefficient. The typical charcoal merchant (most often a woman)handles only one or, at best, a few sacks per day. Rural insecurity issuch that large-scale charcoal production (which requires several days)has all but ceased, and production is too dispersed to allow collectionof a full truck load from one or a few locations. Calculations by themission (Annex 2) indicate that there is scope for a reduction of up to401 in the retail price of charcoal in Maputo with the introduction ofeconomies of scale to charcoal production and transportation. Thisestimate indicates the order of magnitude of the costs to the urbanpopulation of the disruption caused by armed bands, and represent riskand scarcity premia to producers and transporters. In contrast, thefuelwood trade appears to be conducted efficiently, although shortages ofvehicles and motor fuel may be restricting the total quantities offuelwood supplied to cities.
23/ At roughly 1.5 kg/capita/day of air-dried fuelwood, consumption isabout 10 kg/day for a family of seven. At MT25/kg, the daily expen-diture on fuelwood for a family was MT250. Of course, at theseprices, families greatly economize on the use of fuelwoods and thepoorest households probably make do with less as they cannot affordto spend MT200/day on fuelwood.
- 25 -
Uoodfuel Situation in Rural Areas
2.8 Although there is no generalixed information available on ruralpatterns of woodfuel consumption, several partial surveys 241 indicatethe existence of the following features:
(a) more than 90Z of families use exclusively fuelwood for cooking,and less than 101 use charcoal (mostly those families thatproduce charcoal as a major activity);
(b) most households use small quantities of kerosene for lighting,but none use it for cooking (some use kerosene for ignitingcharcoal, which is sometimes used in small quantities for iron-ing clothes);
(c) consumption of fuelvood rarely exceeds 70 kg/week; 501 offamilies use less than 50 kg/week and conseq.uently they couldbe experiencing social hardship; in areas of pronouncedshortage, about two-thirds of families use only 30 kg/week andconsequently are obliged to restrict fuelwood-consumingactivities to only those that are vital for survival;
(d) responsibility for timely supply of fuelwood rests largely withwomen, who spend 8-14 hours weekly on fuelwood gathering. In atypical village situation in fuelwood deficit areas, it hasbeen estimated that villagers (mostly women) roam for six toeight kilometers in search of firewood;
(e) kerosene has been available only in the larger communities, andpurchasers have had to spend a considerable amount of time(4-5 hours/week) to obtain supplies. Under the present circum-stances, restrictions on availability effectively rule outkerosene as an option for rural household energy.
Woodfuel Resources
2.9 The last inventory of forestry resourceb in Mozambique was anational forest reconnaissance survey carried out in 1979-80 with FAOassistance, and was based on satellite imagery and aerial photographstaken in 1972. According to this survey, forests in Mozambique coveredabout 56.5 million hectares in 1972, equivalent to about 71X of the coun-try's area. Houaver, most of the forested area is made up of sparselywooded, open savanna with low wood production potential. Relativelydense forest of high and medium productive potential has been reducedprobably to less that 5 million hectares, following intense deforestation
24/ S. Mondlane University -- Department of Geography and Anthro-pology: Seminar on "Trabalho da ffulher Rural" (the work of therural woman) -- 1980.
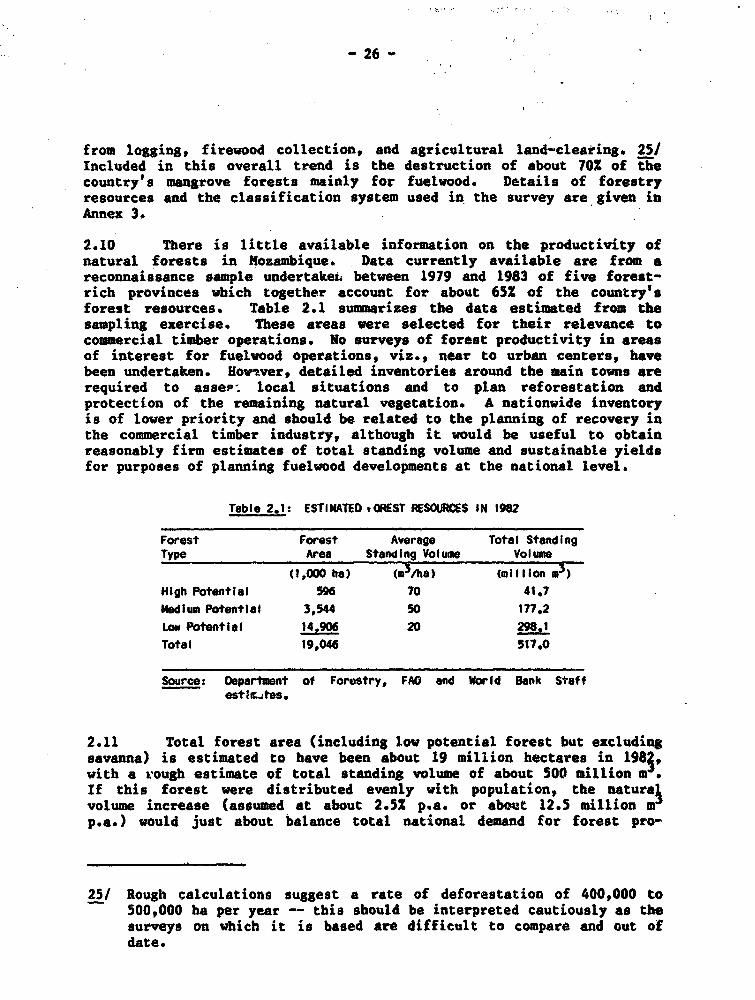
- 26 -
from logging, firewood collection, and agricultural land-clearing. 25/Included in this overall trend is the destruction of about 70% of thecountry's mangrove forests mainly for fuelvood. Details of forestryresources and the classification system used in the survey are given inAnnex 3.
2.10 There is little available information on the productivity ofnatural forests in Mozambique. Data currently available are from areconnaissance sample undertakeL between 1979 and 1983 of five forest-rich provinces which together account for about 65Z of the country'sforest resources. Table 2.1 summarizes the data estimated from thesampling exercise. These areas were selected for their relevance tocommercial timber operations. No surveys of forest productivity in areasof interest for fuelvood operations, viz., near to urban centers, havebeen undertaken. Howtver, detailed inventories around the main towns arerequired to asse,; local situations and to plan reforestation andprotection of the remaining natural vegetation. A nationwide inventoryis of lover priority and should be related to the planning of recovery inthe commercial timber industry, although it would be useful to obtainreasonably firm estimates of total standing volume and sustainable yieldsfor purposes of planning fuelvood developments at the national level.
Table 2.1: ESTIMATED .OREST RESOURCES IN 1982
Forest Forest Average Total StandingType Area Standlng Volume Volume
(1,000 ha) (m3/ha) (miliIon 03))
High Potential 596 70 41.7
Medium PotentIal 3,544 50 177.2
Low Potential I4,906 20 298.1
Total 19,046 517.0
Source: Department of Forestry, FAO and World Bank Staffesticites.
2.11 Total forest area (including low potential forest but excludingsavanna) is estimated to have been about 19 million hectares in 198 ,with a rough estimate of total standing volume of about 50 million m.If this forest were distributed evenly with population, the naturaivolume increase (assumed at about 2.5X p.a. or about 12.5 million mp.a.) would just about balance total national demand for forest pro-
25/ Rough calculations suggest a rate of deforestation of 400,000 to500,000 ha per year -- this should be interpreted cautiously as thesurveys on which it is based are difficult to compare and out ofdate.
-27-
ducts. However, there are major imbalances at the regional level betweendemand and sustainable yield. %be remaining dense forests are concen-trated in the provinces of Sofala, Manica, Niassa and Cabo Delgado, whichhave low population density and thus have a surplus of fuelwood overdemand. There is a shortage of fuelwood in the provinces of GCaa,Inhambane and Nampula, and it is critically scarce in the provinces ofNaputo, Tete and Zambesia. The Government, with FAO assistance, has beenintroducing manA ement in the remaining forest for sustsined productionof fuelwood and timber, and protection of the environment andecosystems. However, specific areas for fuelvood production have not yetbeen selected, and a detailed survey would be needed to help manage theremaining forest areas.
2.12 The reconnaissance survey also shaowed that the wood productionpotential of the remaining vegetation around the major urban areas isvery low. Some degraded forests could eventually be managed for sus-tained production of fuelwood, but the productivity would be low. Theeconomic value of land for agricultural production around the urban areasis high, and only fuelwood plantations based on fast-growing species arelikely to be economically cometitive. Thus, such plantations have acentral role in strategies for meeting the demand for energy in urbanhouseholds togetber with the management of natural forests.
Puelvood Plantations
2.13 several plantations were started near Maputo in the 1960s,notably at Salamnga, where 830 ba were planted with various species, ofwhich Eucalyptus saligna and grandis were planted on 620 ha. In resp%nseto the developing fuelwood shortages and deforestation, the directives ofFreliRo's Third party Congress in 1977 placed high emphasis on fo-restrydevelopment. Three projects were identified for the production offuelwood for Maputo, Beira and Nampula, for which assistance was providedby FAO and the Nosambican Nordic Agriculture Program (MONAP). Up to1984, the espenditure on establishing these three projects totalledUS$31.5 million. 26/ However, as described below, only about 3,000 ha ofplantations have been establiehed and the projects are virtually at astandstill. With this result, there have been poor benefits from thesubstantial resources spent on fuelwood plantations, notwithstanding thevaluable experience that has been gained for future plantation develop-ments. The overall poor performance has resulted from a combination ofexteroal factors, poor management control of labor and poor coordinationof project components. In addition, project preparation was weakened by
26/ Sources UND? 8valuation Mission Report -- Project MOZ82/009Annex 4 (November, 1984). The expenditure to date includessubstantial investments in physical and social infrastructuralfacilities. Rapfrience with the projects for Beira and Nampula itshort and these orojects, which are such smaller and less ambitious,probably have a better probability of success.
-28-
lack of knowledge about key technical parameters such as soils, climateand tree species behavior.
2.14- The reafforestation project near Maputo was started in 1977,and the main objective was to supply 60-70X of the fuelwood and charcoalneeds of the urban population of Maputo. The mission estimates that thisobJective would require the harvesting and renewal of plantations at anannual rate of about 8,000 ha. 27/ This objective was highly ambitiousin terms of demands on land antd financial resources and particularly,managerial capability. However, the project also had a number ofadditional objectives for generating employment, establishing communalvillages and production cooperatives, creating training centers anddeveloping social facilities in the project area.
2.15 The performance of the project, however, has fallen far shortof the targets in technical, economic and social terms, and it has beendiscontinued, due partly to the difficulties being experienced and partlythrough lack of decisions on land to be used for expansion of the plan-tations. The project has been the subject of critical reviews by FAOconsultants and in KONAP progress reports. Only 1,370 ha of eucalyptuswere planted compared to the objective of about 24,000 ha for the firstsix years. The average survival rate among the four plantation units wasvery low, varying between 32X and 50, due to the low quality of seed-lings, abnormally low rainfall and poor timing of the planting seasons.The trees exhibited irregular growth rates which indicates the need forfertilizer trials. There were also substantial losses from fires due topoor measures for protection.
2.16 Labor productivity on the plantations around Maputo was ex-tremely low, with absenteeism reaching 50X due to lack of incentives (thepurchasing power of wages in the parallel market became negligible duringthe initial period of the project). Furthermore, many of the workerswere migrant laborers who were waiting for jobs in the South Africanmines. Thus, the labor force was not settled and focused on the projectarea, and the families that were expected to constitute the nucleus ofcommunal villages did not identify themselves with project objectives,nor did they participate in decision-making concerning the project.
2.17 The reafforestation project around Beira was started in 1981with similar objectives to the project near Maputo. By 1984, abouti,OOO ha had been planted; it is planned to harvest the plantation andrenew at a rate of 2,000 ha/year to meet about two-thirds of the demandfor fuelvood and charcoal in Beira. The project appeared to be per-forming reasonably veil against its targets up to 1983, but sufferedlater because of insecurity in the countryside.
27/ The basis for the mission's estimate is given in Annex 4, in whichit is estimated that a rate of harvesting of 12,000 ha/year would berequired to meet the total woodfuel demand of Maputo.
- 29 -
2.18 The reafforestation project around Nampula was started in 1981with the objectives of producing fuelwood, charcoal and timber forNampula city and to diminish the cutting of natural forests for fuelwood,making more timber available for export. In the first five years of theproject, 550 ha of plantation had been established, mainly with Eucalyp-tus spp. In 1983 and 1984, serious fires and armed bands destroyed partof the plantation, and recent security problems have virtually paralyzedthe project.
2.19 An objective of all the plantations was to alleviate theshortages of woodfuels immediately by using timber felled during landclearing operations for the projects to supply urban areas, particularlyas charcoal. Actual production has been much less than planned and hasnot. made a significant contribution to meeting the urban demand forwoodfuels. The shortfall in production was because the sites selectedfor the plantations had low standing volumes of natural forest, and laborwas used for other activities (construction of housing and infra-structure) rather than charcoal production.
2.20 In snite of the poor performance of fuelwood plantations, theyhave provided valuable inf^rmation (on tree species, cultural practicesand labor productivity) for fhe design of future plantations. However,the following fundamental policy issues still require resolution for thesuccessful implementation of large-scale plantation programs:
(a) the need to develop a strategy for meeting urban householdenergy demand that defines the roles of all availablefuels 28/;
(b) the requirement for the formation of a land-use strategy whichcombines management of natural forests and fuelwood plantationsfor supplying woodfuels to urban areas, and which promotesintegrated rural development to meet rural woodfuel needs andcontribute to meeting urban demand. Attention should also begiven to the trade-off between land clearance for agricultureand the protection of forests for fuelwood and timber;
(c) the need for substantial investment of resources to sustainplantation programs of the magnitude required to make a sig-nificant contribution to urban demand for woodfuels;
(d) the heavy demands on management capability, the need to moti-vate plantation workers and their families to identify withproject objectives, ar-d the means to integrate foreignspecialists successfully into the project organization;
28/ Para. 2.44.
- 30 -
(e) the lack of local skilled manpower for plantation managementand operations, and the possibility of contracting foreigncompanies to undertake these activities until sufficient localcapability has been developed;
(f) the roles of parastatal organizations and local cooperatives inthe implementation and management of the project and the mar-keting of production (and competitiveness with the privatesector); and
(g) the degrees of mechanization to be used in preparation andmaintenance of work for plantations.
Priorities for Increasing Fuelwood Supply
2.21 Experience with fuelwood plantations and the degradation ofnatural forests indicate that there is a need for review of major optionsfor supplying fuetwood. The principal options are Government fuelwoodplantations, community plantations, commercial (private sector)plantations and programs of incentives for smallholders to grow trees.The financial end economic costs of production vary substantially betweenthese options. The last mentioned option could be competitive, and themission recommends that Government examine it seriously. Governmentshould also review the possibility of providing incentives tosmallholders to organize their own transport for fuelwood. Plantationsrequire the greatest investments. Apart from experience withplantations, there is a lack of solid technical and economic data onthese options. The mission recommends that Government should commissionstudies to define, evaluate and compare options for increasing fuelwoodsupply.
2.22 The economically justifiable role of fuelwood ptsantationscompared to other options for fuelwood supply to Naputo and other urbanareas needs to be demonstrated. Due to the long lead times from start ofinvestment to production, it is safe to conclude that new plantationscould not make a significant contribution before the year 2000. Giventhe magnitude of the requirement for urban household energy in the long-term, a major expansion of the program for fuelwood plantations might bejustified. In practice, a program on a substantial scale would beconstrained by limitations on resource availability and implementationcapability. A realistic estimate of tbe maximum implementation capacitywould be between 2,000 and 4,000 ha/year. Even a program of this scalewould require substantial planning to define the most economic plantationunit on which to model a plantation program. An evaluation of alter-native plantation development programs is given in Annex 5, according towhich the least-cost option would be a program of 3,000 ha/year with a
- 31 -
rotation of 8 years. Such a program 29/, starting in 1990, would meetonly 262 of the projected total demand for woodfuels in Maputo (Annex 4)by the year 2010. On this basis, the option of fuelwood plantations canbe considered only for the long-term to provide a limited proportion offuelwood needs, and other supply and demand options are required as well.
2.23 Prospects for implementing fuelwood plantation projects aredependent on the security situation, and there can be no significantprogress until peace is restored to the countryside. Nevertheless, theissues that bave emerged during the past few years from the existingfuelvood programs, as noted above, will require substantial time forresolution, and they can be tackled independently of progress inrestoring peace. The mission recomends priority be given to thefoLlowing activities for which implementation would not be prevented bysecurity problems: *(a) determine the amount of information available andstill required for a survey of land use potential (soils classification,topography, etc.); (b) identify suitable areas for reafforestation inperi-urban areas; (c) examine the feasibility of transporting to urbanareas the woodfuels from forest areas that will be cleared (probably froma radius of up to 150 km from Maputo city); and (d) prepare a plan forthe management of natural forests to supply woodfuels. In planning theseactivities, Mozambique should draw on the experience and cooperate withits neighboring countries, notably Malawi and Swaziland, who also facesimilar issues. Proposals for such cooperation have been made under theauspices of SADCC.
2.24 The available forest inventory data are inadequate for theplanning of forest management programs. Three areas in Maputo Province,totalling about 1 million ha., have been identified through the nationalforest reconnaissance survey as priority zones for forestry management.Part of this area, covering 560,000 ha, has been surveyed recently, butthe, remaining 440,000 ha require aerial surveying. Associated groundinventory work is required in these areas. There is also a lack ofreliable maps of infrastructural facilities. For Maputo province, a mapof the infrastructure to a scale of I to 40,000 was prepared in 1982 forthe part around and to the south of Maputo. However, the areas to thenorth of Maputo were last surveyed in 1958. Thus, aerial surveys of theprovince to map both infrastructure and forestry resources are requiredand could be undertaken jointly to reduce survey costs.
2.25 The National Directorate for Ceography and Mapping (DINAGECA)is reported to have the necessary specialists and photographic equipmentfor aerial surveys, but it needs about US$130,000 in foreign currency toadapt a small aeroplane and to acquire additional laboratory equipmentfor aerial survey work. This investment would equip DINAGECA to carry
29/ This plantation program ;ould require annual expenditures risingfrom about US$1 million in 1985 prices initially, to about US$4million after 20 years.
- 32 -
out survey work nationally as well as in Maputo. Alternatively, therequired aerial survey work in Maputo Province could be contracted to aforeign company at an estimated cost of US$45,000. The mission recom-mends that technical assistance be provided to DINAGWAC and the NationalForestry Directorate to define in detail a program of survey work forMaputo and to determine the requirements for similar programs for Beiraand Nampula.
Institutional Issues for Woodfuels and Household Energy
2.26 The importance of the forestry sector was recognized at theThird Party Congress in 1977 and the Third Agrarian Council in 1978. TheGovernment's principal objective for forestry development is the pro-duction of timber for the industrial and construction sectors and forexport, and large industrial timber plantations were started in thecentral part of the country. In addition, fuelwood plantations were alsostarted under MONAP near Maputo, Beira and Nampula. The missionrecommends that energy forestry continues to be given high priority inview of the key role of woodfuels in household energy supplies.
2.27 The present institutional system for the woodfuels sector isbased on the structure established by the Third Party Congress andAgrarian Council, and it consists of the following organizations:
(a) the National Forestry Directorate (Unidade de Direcgao deFlorestas - UDF) in the Ministry of Agriculture which hasresponsibilities for legislation, policy-making, primary pro-duction, and supervision;
(b) the National Wood Marketing Enterprise (Mademo - Madeiras deMocambique) to market wood products at the national level andall exports. This organization is being decentralized to theprovincial level;
(c) Forest industry production enterprises which report to UDF andwhich carry out all forestry act .vities in their areas in-cluding technical assistance/extension to communal villages.These enterprises also supply timber to wood processing enter-prises; 30/
(d) communal villages which are responsible for forestry activitiesin their localities.
In practice, the demarcation of responsibilities and lines of communi-cations are unclear, and in many cases are not feasible due to poor
30/ The two largest enterprises are IFWMA (Industrias Florestais deManica) in Ma.ica province and SAMOFOR (Sociedade FlorestalArgelino-Mozambicana) in ZambEzia province.
- 33 -
communications and lack of manpower and physical resources. The organi-zational structure needs to be simplified in accordance with prevailingconditions.
2.28 At the present early stage of development there are advantagesto a centralized system of technical management to economize on qualifiedmanpower, but forestry activities/problems are highly localized andideally require a degree of autonomy for local organizations. Effectivedecentralization of activities, though clearly desirable, requires moremanpower and physical resources than are likely to be-available for many.years. An important organizational issue therefore, is the extent andthe pace of decentralization. The strategy for the transition should beto initially decentralize a few activities for which there are sufficientresources. Such activities should include: (a) gathering information;(b) technical support to local timber industries; (c) applied researchand development (species trials, observations); and (d) monitoring theimplementation of legislation and regulations.
2.29 At present, virtually all woodfuels are cut, gathered,processed, transported and marketed by private individuals. Except forlegislation and regulations, few of the Congress or Council decisionsaffect the present system of forest exploitation. There does not yetexist any fuelwood or charcoal production cooperatives in comunalvillages, nor are there any formal organizations among the small farmersengaged in fuelwood collection or as charcoal producers. The missionrecommends that a survey of the production and marketing of woodfuels beundertaken as part of the recommended household demand survey. 31/Meanwhile, some simple measures for inct'asing the efficiency of thefuelvood marketing chain should be identified and implemented, such asmaking available saws to fuelwood tranporters to increase the amount ofwood that can be transported in a vehicle load. 32/
2.30 - The major institutional weakness in household energy is thelack of a central institutional focus for studying and resolving inter-fuel issues relating to both energy demand and supply. The responsi-bility for sector-level policy-making and planning lies with the Ministryof Industry and Energy. The recently-created Department of Energy inthis Ministry should play a key role in fulfilling this responsibility,and recommendations on this aspect, among others, are given in Chapter6. Coordination between the Department of Energy and the NationalForestry Directorate should be established as the critical institutionallink between household energy and woodfuels.
31/ Para. 2.47.
32/ A survey of stacking densities for truckloads of fuelwood beingbrought into Maputo in mid-1985 showed that the solid volume of woodwhich is in straight lengths and is well stacked is about twice thesolid volume of highly twisted logs in the same stacked volume.

-34-
2.31 At present, there is no institution with respontibility forother new and renewable sources of energy. Therefore, very little isknown about the potential contribution of these sources. A project toinstall windmills in Gaza province is reportedly being carried out withDutch assistance, and E. Mondlane University is interested inexpermential work with dendro-thermal power. Although the mission didnot systematically study these sources of energy, it would be useful togather the basic data (wind, sun, biomass) if this is not already beingdone and security conditions permit it.
Manpower
2.32 There is an extreme shortage of skilled manpower at all levelsfor the forestry sector. Manpower training has been started on a smllscale relative to needs in the last few years with UNDP and PAO assii-tance and under MONAP. However, the output of graduates in forestryrelated subjects from the E. Mondlane University is totally inadequate,and the policy of giving priority to the forestry sector has yet to betranslated into concrete actions by the Ministries of Labor andEducation. The Ministry of Agriculture has been heavily dependent onexpatriates (9 through PA0, 3 through MONAP in 1985) for expertise inforestry planning, management and teaching, but a major issue is the lackof sufficient counterpart staff to benefit from the opportunities for on-the-job training with these experts. The lack of skilled manpower willbe a major impediment to successful implementation of programs for fuel-wood plantations, and manpower development should be given high priorityalong the lines of the existing approach.
Urban Household Energy Consumption
2.33 The main feature of the urban household energy market iswidespread shortages of all fuels, and high prices for energy products(woodfuels) which are set in the uncontrolled market. The principalhousehold fuels used in the main cities of Maputo, Beira and lampula isfuelwood, but the use of charcoal and electricity is also significant.Up to 1984, consumption of kerosene was also significant, and mallquantities of LPC have been used. During the past few years, energyconsumption has been constrained by shortages of woodfuels and keroseneand by interruptions to the supply of electricity. Many urban householdshave acquired appliances, especially cooking stoves, for a number ofenergy products to increase the overall security of supply of energy.The main cause of these shortages has been the activity of armed bandswhich have reduced access to sources of fuelwood and have sabotaged powertransmission lines. The availability of kerosene and LWG has beenseverely constrained by shortages of foreign exchange. Expansion andconnection of the electricity distribution networks to more homes hasbeen limited by shortages of materials and equipment. Consequently, theproportion of urban household energy consumption taken up by woodfuelshas probably increased during the last few years.
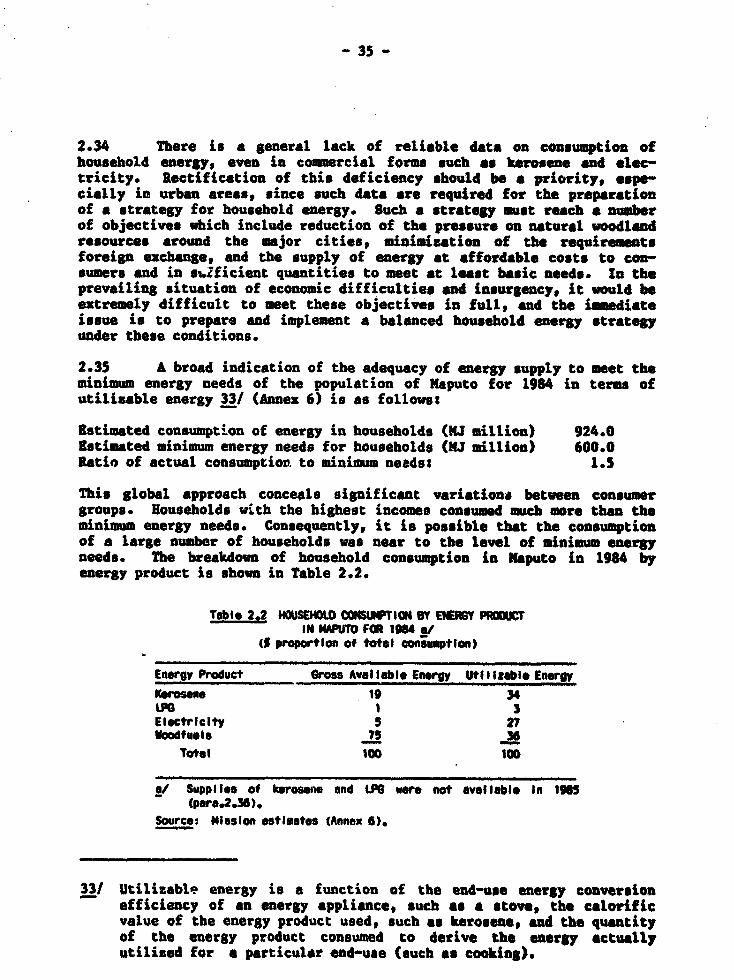
- 35 -
2.34 There is a general lack of reliable data on consumption ofhousehold energy, even in commercial forms such as kerosene and elec-tricity. Rectification of this deficiency should be a priority, espe-cially in urban areas, since such data are required for the preparationof a strategy for household energy. Such a stratey must rech a numberof objectives which include reduction of the pressure on natural woodlandresources around the major cities, minimiaztion of the requirementsforeign exchange, and the supply of energy at affordable costs to con-sumers and in s.Zficient quantities to meet at least bsic needs. In theprevailing situation of economic difficulties sad insurgency, it would beextrepmly difficult to meet these objectives in full, and the imediateissue is to prepare and implement a balanced household energy strategyunder these conditions.
2.35 A broad indication of the adequacy of energy supply to meet theminimum energy needs of the population of Maputo for 1984 in terms ofutilizable energy 33/ (Annex 6) is as follow:t
Estimated consumption of energy in households (MJ million) 924.0Estimated minimum energy needs for households (NJ million) 600.0Ratio of actual consumption to minimum neads: 1.5
This global approach conceals significant variation, between consumergroups. Households wvth the highest incomes consumed much more than theminimum energy needs. Consequently, it is possible that the consumptionof a large number of households was near to the level of minimum energyneeds. The breakdown of household consumption in Maputo in 1984 byenergy product is shown in Table 2.2.
Table 2.2 HOUSEHOLD CONSUIPTION BY EM PRIMUCTIN MAPUTO FOR 198 at
(S proportion of total consumption)
Energy Product Gross Aval lable Energy UtIizable EnergyKerosene 19 34LPG 1 3Electricity 5 27Noodfuels 75 36
Total 100 100
a/ Supplies of kerosene and LPG were not avallable In 1985(pars.2.6).
Source: MIssion estimates (Annex 6).
331 Utilizable energy is a function of the end-use energy conversionefficiency of an energy appliance, such as a stove, the calorificvalue of the energy product used, such as kerosene, and the quantityof the energy product consumed to derive the energy actuallyutilized for a particular end-use (such as cooking).
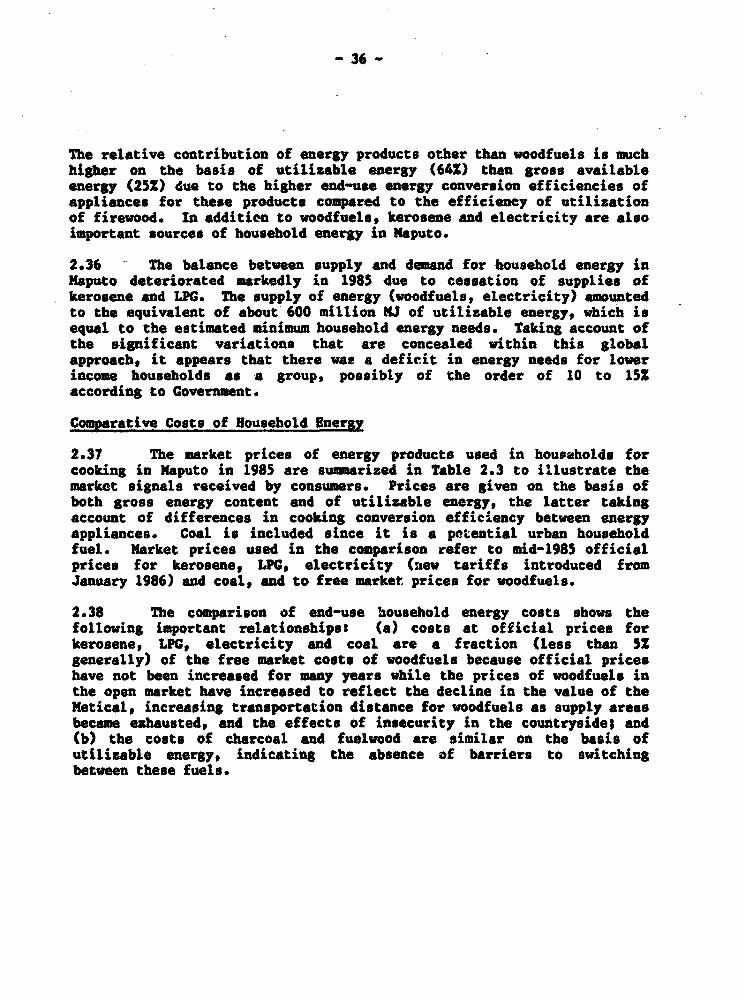
-36-
The relative contribution of energy products other than woodfuels is muchhigher on the basis of utilizable energy (646) than gross availableenergy (25Z) due to the higher end-use energy conversion efficiencies ofappliances for these products compared to the efficiency of utilizationof firewood. In addition to woodfuels, kerosene and electricity are alsoimportant sources of household energy in Naputo.
2.36 The balance between supply and demand for household energy inMaputo deteriorated markedly in 1985 due to cessation of supplies ofkerosene and LPG. The supply of energy (woodfuels, electricity) amountedto the equivalent of about 600 million NJ of utilizable energy, which isequal to the estimated minimum household energy needs. Taking account ofthe significant variations that are concealed within this globalapproach, it appears that there was a deficit in energy needs for lowerincome households as a group, possibly of the order of 10 to 151according to Government.
5omparative Costs of Household Energy
2.37 The market prices of energy products used in households forcooking in Maputo in 1985 are sum_arized in Table 2.3 to illustrate themarket signals received by consumers. Prices are given on the basis ofboth gross energy content and of utilizable energy, the latter takingaccount of differences in cooking conversion efficiency between energyappliances. Coal is included since it is a potential urban householdfuel. Market prices used in the comparison refer to mid-1985 officialprices for kerosene, LPG, electricity (new tariffs introduced fromJanuary 1986) and coal, and to free market prices for woodfuels.
2.38 The comparison of end-use household energy costs shows thefollowing important relationships: (a) costs at official prices forkerosene, LPG, electricity and coal are a fraction (less than 52generally) of the free market costs of woodfuels because official priceshave not been increased for many years while the prices of woodfuels inthe open market have increased to reflect the decline in the value of theMetical, increasing transportation distance for woodfuels as supply areasbecame exhausted, and the effects of insecurity in the countryside; and(b) the costs of charcoal and fuelwood are similar on the basis ofutilizable energy, indicating the absence of barriers to switchingbetween these fuels.
- 37 -
Table 2.3: END-USE UREAN HOUEH4OUD ENEtGY COSTS FOR COOKINGIN KAPUTO FOR 1985
Energy Product Gross Energy Utilizable Energy
fMT thousand/OE) Ofr thousand/TOE)
Kerosene- Illuminating 6.1 20- cooking 12.2 40
LPG 15.8 ?1Electrtcity 45 69Stem Cost 0.4 2Fuelwood 76 953Charcoal 214 1,068
a/ Allowing for end-use energy conversion efficiencies.b/ New tariffs lmplesented In Januarw, 1966.Source: Misslon estimates (Annex 7).
2.39 Cenerally, official prices for imported energy products usableby households were also far below estimated financial costs (borderprices) in mid 1985 at the official exchange rate, except forelectricity. 34/ The existence of massive distortions to prices andcosts, due maTmly to the overvaluation of the Metical and shortages ofgoods, complicates the estimation of the economic costs of householdenergy. The differences between official prices for imported energybased on the recommended policy of full financial cost recovery, 35/ andthe prices of voodfuels would be much less with the cost of importedenergy expressed in local currency terms based on the use of a realisticforeign exchange rate and with corresponding adjustments to officialprices. The difference would be reduced further through the decline inwoodfuel prices that would follow the resumption of peaceful conditionsand increased availability of trucks and motor fuel.
2.40 The relationship between open market prices for woodfuels andofficial prices for other energy products raises a number of importantissues. Firstly, the relationship is contrary to the economic priorityof encouraging the use of indigenous resources (taking due account ofenvironmental constraints) in place of imported goods. Secondly, therelationship is highly regressive in socio-economic terms, sincegenerally the poorest sectors of the population are able to use onlyfuelwood, while the highest income groups can take advantage of thelowest-cost fuels that are available. Thirdly, the relationshipindicates the major distortions to the energy market that result from a
34/ Details of border prices are given in Chapter 3 for petroleumproducts, Chapter 4 for electricity and Chapter 5 for coal.
35/ Para. 1.43.
- 38 -
severely overvalued currency. 36/ The mission recommends that a study becarried out to determine a rational structure for energy prices(Chapter 1) as one of the principal components of energy strategy, theother main component being the means to inrease energy supplies. 371
Household Energy SuPply Options
2.41 The low costs of supplying electricity and steam coal indicatethat the strategy for meeting urban household energy demand at least costshould aim to maximise the use of these sources. However, there oretechnical and social limitations to the extent to which this strategy canbe implemented. In the case of electricity, the limitation is the numberof houses that meet the minimum standards required for installation ofelectrical wiring and fittings. The Ministry of Industry and Energyestimate that there still are many houses in Maputo that could be, butare not connected to the public electricity system. The mission recom-mends that the connection of these houses be given priority, and thattechnical assistance be provided to 8DM to improve its capability toprovide consumer services (Chapter 4).
2.42 The main limitations of coal as a household fuel are acceptanceby householders of the pollution (smoke, volatile products from com-bustion and dirt) and the danger of poisoning by carbon monoxide in theabsence of adequate ventilation. In the suburbs of Maputo, this dangeris avoided by the practice of cooking with coal in the yards to houses,and it is envisaged that the use of coal as a household fuel will bedirected to suburban areas. Acceptance is also Limited by thedisadvantages of using coal as a fuel for cooking, especially incomparison with charcoal, since it is more difficult to kindle, requireslarger minimum quantities to stay alight, and burns much more fiercelythus requiring more robust and expensive stoves and cooking utensils.
2.43 Attempts have been made in many African countries to introducecoal for domestic fuel, mostly without success even when there was a sub-stantial price incentive. The introduction of coal requires research anddevelopment, particularly for a suitable stove. Such work has been pro-ceeding for some years in Africa, drawing in part on experience in Chinaand India, but a solution to overcoming the difficulties of introducingcoal on a large scale as a household fuel in Africa has yet to be demon-strated successfully. The optimal course for Mozambique is to keepabreast of developenet rather than try to expend scarce resources induplicating work already done. Government is carrying out appraisalwork, with Swedish support, to assess local receptivity to coal and stovedesigns from other countries. The Department of Energy is responsiblefor these tasks. The mission recommends that a program for the
36/ See footnote 20.
37/ Pars. 2.44.
- 39 -
development and dissemination of coal as an urban household fuel,following successful completion of appraisal work, be considered fortechnical assistanc-.
Priorities for Household Energy
2.44 The dominant issue for urban household energy policy, espe-.cially for Maputo and to a lesser extent, Beira and Nampula, is the needto met basic energy needs at least cost and at acceptable *anvironmeutalconsequences such as the avoidance of undue deforestation. The obviousstrategies are to increase the supply of,energy and to improve efficiencyof energy use. However, while attacks by armed bands persist, the scopefor improvements in the supply of woodfuels is severely limited. Theexpansion of electricity supply to urban households can make only alimited contribution to closing the gap between demand and supply. Theforeign exchange burden of a large increase in the use of kerosene andLPG as a major long-term contribution to increasing energy supply, has tobe given due consideration. However, in the short-term such a course isthe only technically feasible option, and its implementation isconstrained only by shortage of foreign exchange. 38/ Therefore,covernment's main options for alleviating the long-term situation thatare not dependent on the restoration of security are basic planning andpreparation for future programs to increase household energy supply, asalready discussed in this chapter for fuelwood 391, electricity 40/ andcoal 41/, and for demand management.
2.45 Demand management covers conservation and improvement in theefficiency of the use of energy. The greatest potential for improvingutilization efficiency lies in increasing the efficiency of convertingwood into charcoal and in a campaign to raise the efficiency of householdstoves. There is little data available on these activities inKosambique. The potential for improving stove efficiencies appliesparticularly for fuelwood and charcoal, and also for kerosene stoves andlamps, but it also requires better availability of properly designed andmnufactured stoves for all energy products including electricity, todisplace the existing inefficient stoves of substandard design andconstruction. The considerable research and development work recentlycarried out on stove design for fuelwood, charcoal and kerosene in Africaand elsewhere has yet to produce a consensus on the optimal design.
38/ Government estimates that the annual cost of restoring adequatekerosene and LPG supplies to households would cost about US$2.5million in mid 1986 prices.
39/ Para. 2.23.
40/ Para. 2.41.
411 Para. 2.43.
- 40 -
Nevertheless, a number of designs are now available that are proven andwould be major improvements on the current stove designs used inMozambique. The mission recommends that Government instigate a programof trials from these proven designs rather than wait for the emergence ofeven better designs, and that a major program for the manufacture anddissemination of improved stoves be given priority. govever, such aprogram requires rehabilitation of local manufactaring capacity and thesupply of adequate quantities of inputs, which will take time toorganise. Consideration should also be given to importing stovesinitially for an immediate impact on fuel efficiency, especially inMaputo. These programs should be coordinated by the Department of Energyin the Ministry of Industry and Energy,
2.46 one available instrument of demand matnagement is pricingpolicy. The mission considers that the official prices for kerosene,LPG, electricity and coal should be raised on the grounds of equity,foreign exchange conservation and financial solvency of energy suppliersrather than reduction in demand. At present levels of household energyconsumption any attempts to reduce energy demand would result in severehardship for much of the population. Nevertheless, one of basicrequirements for energy policy is to signal to consumers through pricingthe economic costs of meeting their demand. Removing price distortionsand improving supplies of both fuels and energy appliances are importantrequirements for implementation of a household energy strategy. Theobjective of such a strategy should be to secure adequate energy suppliesat an affordable cost to meet urban household energy demand. The mainimpediments to implementation of the strategy is the lack of resources toenable consumers to choose between options for meeting their demand, andthe need to set energy pricing in the present macrfi-economic context oflarge distortinns to the exchange rate, prices and wages (Chapter I).
2.47 A major impediment to tbe planning of a least-cost program formeeting the demand for urban household energy in Mozambique is the lackof information on the characteristics of demand and the options forsupply. The dearth of data on supply and consumptiou has been shown inthis Chapter, and the consequent difficul&ies for planning are illus-trated by the number of assumptions made by the mission for its indi-cative assessments that have had to be based on knowledge of comparativesituations elsewhere. The mission recommends that a comprehensive surveybe carried out to rectify these deficiencies. The survey should coverhousehold energy demond, the consumption of energy products in the house-hold sector, and the inventory of fuelwood/forest resources discussedearlier in this Chapter. This work is required to determine the optimalrole for fuelwood plantations, to identify locations and estimate costsof supply, taking into account constraints on the rate of plantationimposed by technical, financial and management resources and skilled andsemi-skilled labor. This study should also identify the potential forincreasing the efficiency of charcoal production from existing fuelwoodplantations and natural forests.
-41-
2.48 The recommended main objective of the proposed survey of urbanhousehold veeregy is to determine the characteristics of demand ratherthan to assemble historic data on consumption which is likely to beunrepresentative of future consumption patterns. An understanding ofthese characteristics is essential for the design of policies for demandmanageient. The following characteristics should be surveyed: (a) thefuel of choice for social, cooking and other purposes; (b) the accept-ability of other fuels; () .the appliances owned and in use; (d) willing-Uess to pay in cash a*4 kind for various fuels and energy appliances;(s) patterns of enerp use by time of day and season of the year and interms of fuel manageent; (f) the proportion of total household expen-diture taken up by energy, including the equivalent cash value forgathered or bartered wood; and (g) the quantities of energy required tomeet demand under existing utilization practices. Thus, this surveywould be focussed intensively on a representative sample of households.Considerable effort would be required for the design of the survey andthe training of interviewers and evaluators. The mission recommends thattechnical assistanee be provided for the preparation, execution andevalua,ion of the survey.
2.49 The lack of reliable data on the quantities of energy consumedin the major urban areas has already been noted by the mission in thisChapter for the case of woodfuels. A lack of firm data on kerosene andelectricity coneumption is also noted in subsequent Chapters on theseproducts, in which the mission recommends assistance for improving thequality of statistics. Collection and compilation of data is the respon-sibility of the agencies concerned with energy supply, and the missionrecommends that the Department of Energy undertake as one of its coreactivities the task of drawing together these statistics and assessingthe overall patterns of energy supply to the urban household sector.
Priorities for Development
2.50 Based on tkie foregoing review of the woodfuels and householdenergy subsectore, the priorities for investment up to 1991 are accordingto the schedule showa in Table 2.4. Implementation of these investmentsdepends largely on the restoration of peaceful conditions to thetouattyside, but prepatation of projects should proceed as recommended.
II.
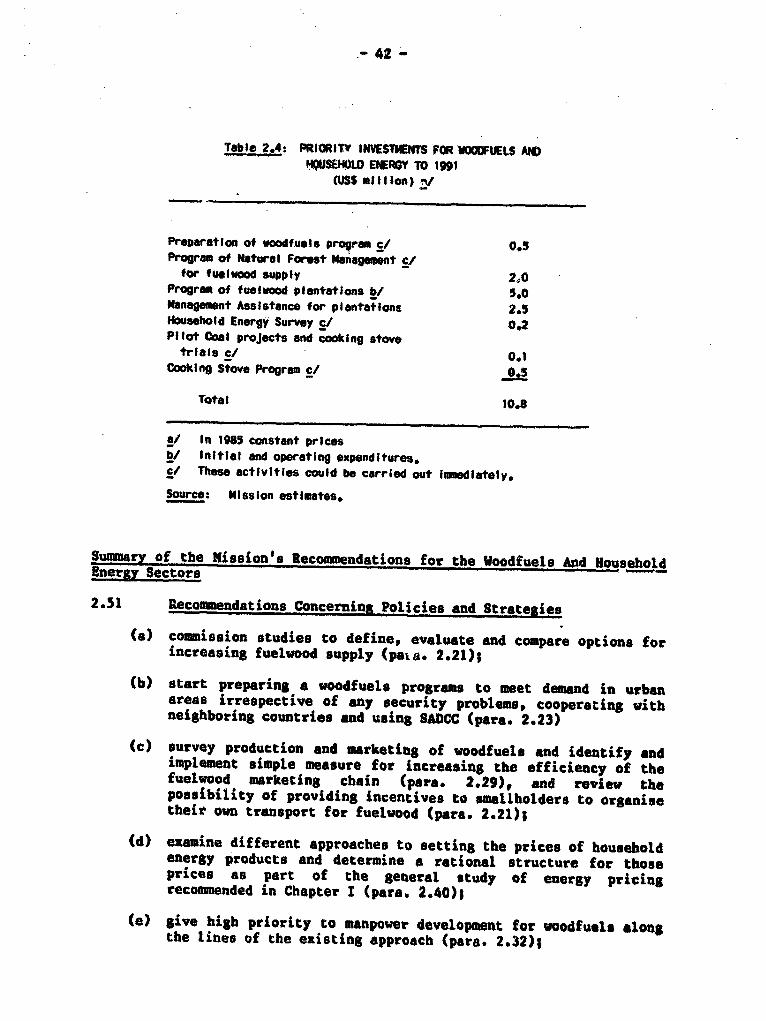
- 42 -
Table 2.4: PRICRITY INVEStIENTS FOR CWOUELS ANDWUS,H0LD ENERGY TO 1991(USS mII on) n/
Preporation of voodfugls provam c/ 0,5
Program of Natural Forest MNnagmment c/for fusiwood supply 2,O
Program of fuOlwo*d plantations bf 5.0Management Assistance for plontat lons 2.5Household Energy Survey c/ 0,2
Pilot Cool projects and cooking stovetrials cJ 0.1
Cooking Stove Program c/ 0.3
Total 10.8
a/ In 1985 constant pricesb/ Initiol and operating expenditures.S/ These activities could be carried out Immedlately.
Source: Mission estimates.
Summary of the Mission's Recommendations for the Woodfuels And HouseholdEnerg Sectors
2.51 Recommendations Concerning Policies and Strategies
(a) cOmmission studies to define, evaluate and compare options forincreasing fuelwood supply (pata. 2.21);
(b) start preparing a woodfuels programs to meet demand in urbanareas irrespective of any security problems, cooperating withneighboring countries and using SADCC (para. 2.23)
(c) survey production and marketing of woodfuels and identify andimplement simple measure for increasing the efficiency of thefuelwood marketing chain (para. 2.29), and review thepossibility of providing incentives to smallholders to organisetheir own transport for fuelvood (para. 2.21)
(d) examine different approaches to setting the prices of householdenergy products and determine a rational structure for thoseprices as part of the general study of energy pricingrecommended in Chapter I (para. 2.40);
(e) give high priority to manpower development for woodfuelc alongthe lines of the existing approach (para. 2.32);
- 43 -
(f) the Department of Energy and the National Directorate shouldcoordinate activities in the household energy and woodfuelssectors (par.. 2.30);
(g) give priority to connecting more houses to the electricitysystem, and improve EDM's capability to provide consumerservices (para. 2.41);
(h) undertake pilot projects to test local receptivity to the useof coal in urban households, and test stove designs from othercountries (pars. 2.43);
(i) instigate a program of trials for proven designs of kerosene,electricity, fuelwood aad charcoal stoves in preparation for acampaign to improve cooking stove efficiencies and charcoalproduction (para. 2.45);
5j) the Department of Energy should take responsibility forimproving the collection and analysis of statistics onhousehold energy demand and supply (pars. 2.47).
2.52 Recom_iendations for Studies and Technical Assistance
(a) to Covernment to define, evaluate and compare options forincreasing fuelvood supply (para. 2.21);
(b) to the national Forestry Directorate for planning woodfuelsprograms (para. 2.24);
Sc) to the National Directorate for Ceography and Mapping foraerial surveys and to the National Forestry Directorate forforest inventories (pars. 2.25);
(d) to the Department of Energy to carry out a survey of householdenergy demand (para. 2.47), for pilot projects on the use ofcoal in households (pars. 2.43), improvement of stoveefficiencies (para. 2.45), and statistical work (pars. 2.47).
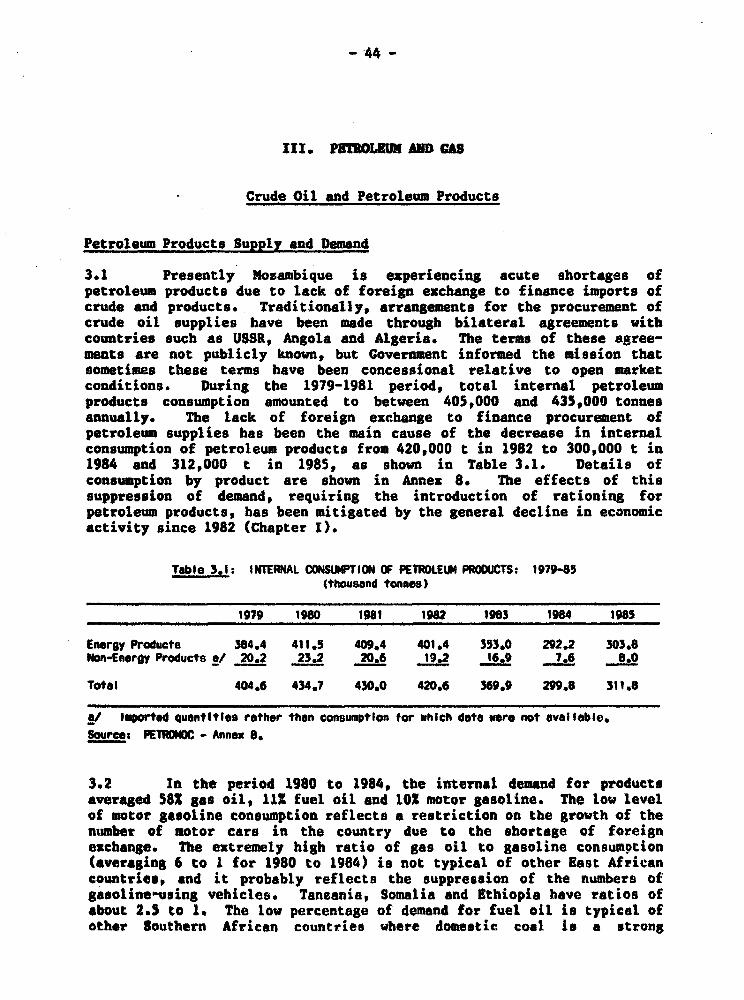
- 44 -
III. PEThOLIUN AND GAS
- Crude Oil and Petroleum Products
Petroleum Products Supply and Demand
3.1 Presently Mozambique is experiencing acute shortages ofpetroleum products due to lack of foreign exchange to finance imports ofcrude and products. Traditionally, arrangements for the procurement ofcrude oil supplies have been made through bilateral agreements withcountries such as USSR, Angola and Algeria. The terms of these agree-ments are not publicly known, but Government informed the mission thatsometimes these terms have been concessional relative to open marketconditions. During the 1979-1981 period, total internal petroleumproducts consumption amounted to between 405,000 and 435,000 tonnesannually. The lack of foreign exchange to finance procurement ofpetroleum supplies has been the main cause of the decrease in internalconsumption of petroleum products from 420,000 t in 1982 to 300,000 t in1984 and 312,000 t in 1985, as shown in Table 3.1. Details ofconsumption by product are shown in Annex 8. The effects of thissuppression of demand, requiring the introduction of rationing forpetroleum products, has been mitigated by the general decline in economicactivity since 1982 (Chapter I).
Table 3,1: INTERNAL CONSUMPTION OF PETROEUM PRODUCTS: 197985(thousand tonnes)
1979 1980 1981 1982 1983 1984 1985
Energy Products 3184.4 411.5 409.4 401.4 353.0 292.2 303.8Non-Energy Products a/ 20.2 23.2 20.6 19.2 16.9 7.6 8.0
Totel 404.6 434.7 430.0 420.6 369.9 299.8 311.8
I/ Imported quantitles rather than consumption for which date were not available.Sours: PIETIOWC - Annex 0.
3.2 In the period 1980 to 1984, the internal demand f or productsaveraged 58X gas oil, 11X fuel oil and 10£ motor gasoline. The low levelof motor gasoline consumption reflects a restriction on the growth of thenumber of motor cars in the country due to the shortage of foreignexchange. The extremely high ratio of gas oil to gasoline consumption(averaging 6 to I for 1980 to 1984) is not typical of other East Africancountries, and it probably reflects the suppression of the numbers ofgasoline-using vehicles. Tanzania, Somalia and Ethiopia have ratios ofabout 2.5 to 1. The low percentage of demand for fuel oil is typical ofother Southern African countries where domestic coal Is a strong
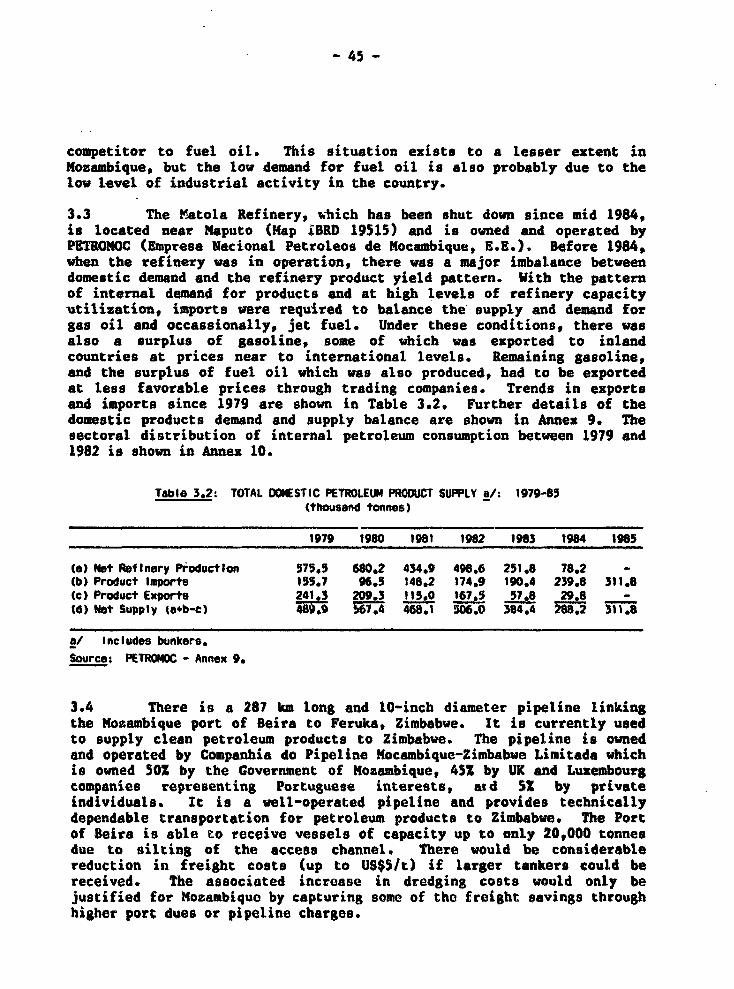
- 45 -
competitor to fuel oil. This situation exists to a lesser extent inMozambique, but the low demand for fuel oil is also probably due to thelow level of industrial activity in the country.
3.3 The Yatola Refinery, which has been shut down since mid 1984,is located near Maputo (Map !BRD 19515) and is owned and operated byPETIOMOC (Empresa lacional Petroleos de Mocambique, E.E.). Before 1984,when the refinery was in operation, there was a major imbalance betweendomestic demand and the refinery product yield pattern. With the patternof internal demand for products and at high levels of refinery capacityutilisation, imports were required to balance the supply and demand forgas oil and occassionally, jet fuel. Under these conditions, there wasalso a surplus of gasoline, some of which was exported to inlandcountries at prices near to international levels. Remaining gasoline,and the surplus of fuel oil which was also produced, had to be exportedat less favorable prices through trading companies. Trends in exportsand imports since 1979 are shown in Table 3.2, Further details of thedomestic products demand and supply balance are shown in Annex 9. Thesectoral distribution of internal petroleum consumption between 1979 and1982 is shown in Annex 10.
Table 3.2: TOTAL OCMESTIC PETROLEUM PRODUCT SUPPLY a/: 1979-85(thousand tonnes)
1979 1980 1981 19812 N193 1984 1985
(a) Net Refinery ProductIon 575.5 680.2 434.9 498.6 251.8 78.2 -(b) Product Imports 155.7 96.5 148.2 174.9 190.4 239.8 311.8(c) Product Exports 241.3 209.3 115.0 167.5 57.8 29.8 -
(i) Not Supply (a4b-c) 489.9 567.4 468.1 506.0 384.4 288.2 11.8
a/ Includes bunkers.
Source: PETROMOC - Annex 9.
3.4 There is a 287 km long and 10-inch diameter pipeline linkingthe Mozambique port of Beira to Feruka, Zimbabwe. It is currently usedto supply clean petroleum products to Zimbabwe. The pipeline is ownedand operated by Companhia do Pipeline Mocambique-Zimbabwe Limitada whichis owned 50 by the Government of Mozsambique, 452 by UK and Luxembourgcompanies representing Portuguese interests, a d S2 by privateindividuals. It is a well-operated pipeline and provides technicallydependable transportation for petroleum products to Zimbabwe. The Portof Beira is able to receive vessels of capacity up to only 20,000 tonnesdue to silting of the access channel. There would be considerablereduction in freight costs (up to US$5/t) if larger tankers could bereceived. The associated increase in dredging costs would only bejustified for Mozambique by capturing some of the freight savings throughhigher port dues or pipeline charges.
- 46 -
The Natola Refinery
3.5 The refinery is a 25 year old hydroakimiing refinery with acrude-oil processing capacity of 17,000 B/D. A sumary of the refinery'sphysical facilities is listed in Annex 11. A refinery production balancefor 1979-1984 is shown in Annex 12. During 1983 and until the refineryshutdown, PETROOC was unable to obtain crude oil on a regularlyscheduled basis due to lack of foreign exchange, and the refinery has hadto operate at raduced throughputs with frequent *hutdown*. Governmentnow faces a decision about the future of the refinery. The realisticoptions are to reopen it sometime in the future after some expenditure onrestarting, rehabilitation and possible modification, or to close it downpermanently. One of the most important arguments in favor of re-openingit is Government's desire to retain flexibility in the acquisition ofcrude oil and products, especially by being able to take advantage ofavailability of crude oil on concessional terms. The arguments in favorof closure rest on the inefficiency of the refinery due to its age andoutdated technology, high shipping costs for crude oil due torestrictions on access to Maputo harbor, and the imbalance between bherefinery yield pattern and the pattern of domestic demand.
3.6 The recent construction of export-oriented large refineries inthe Arab Gulf and Red Sea areas has severely prejudiced the viability ofsmall, old hydroskimuing refineries, such as the one at Matola, situatedon the fringes of the Indian Ocean. Under the netback pricingarrangements introdured in late 185 for Arabiein crude oil, based on theweighted average of .he prevailing product prices in North-West Europeand freight costs from the Arab Gulf, producers in the Gulf have theincentive to drop the prices of products sold in the Indian Ocean regionby the equivalent of about US$l5/t lower than prices in North-WestEurope. This incentive in price reflects the difference in transportcosts from the Gulf Area to the North-Vest Europe and to the Indian Oceanregion.
3.7 The mission has made a number of comparisons of the cost ofproducts produced from the Matola Refinery with the cost of importedproducts. Two basic scenarios have been analysed with the existingrefinery configuration, namely under the old system of fixed peices forcrude oil and under the netback basis for costing Arabian crude oilintroduced in late 1985. Between mid 1984 and mid 1985, when crude oilprices vere fixed at around US$30/bbl, the additional annual cost ofproducing products from the Matola Refinery compared with importation ofproducts at world spot prices ranged between US$12 million and US$26million at about 40Z and 85X effective refinery capacity utilization(Annex 13). Under these market arrangements, it was apparent thatoperation of the refinery wao not economic, thus justifying theindefinite closure in mid 1984.
3.8 In late 1985, Arabian oil producers changed the basis forpricing their crude oil to the netback value of products in North-VestEurope. In early 1986 the netback price of Arabian crude oil dropped to
- 47 -
the region of US$12 and US$15/bbl. The relationship between the:nternational market prices of crude oil and petroleum products, as wellas among petroleum- products, became much less rigid. The mission hasanalysed these movements between January and April 1986 in Annex 14,based on certain assumptions concerning demand, prices, operating costsand refinery capacity utilixation. Under all the scenarios analysed bythe mission, on average refining crude oil in the Matola Refinery wouldhave been more costly than importing petroleum products during thisperiod to meet the projected domestic demand. The review also indicatesthat the type of crude oil influences the costs of meeting demand if therefinery is used as a supply source.
3.9 PETROMOC is considering the installation of thermal creackingvia breaking plants in the Katola Refinery to increase the proportion ofgasoil in the final product yield pattern, and thereby to improve thematch with the pattern of product demand. PETROMOC received anindicative estimate of the cost of such a unit in 1982 amounting to aboutUS$8 million. The mission considers that this is not a reliable basisfor evaluating this option, and that the cost could be as much as twicethis estimate. An evaluation is required of the difference in the costsof meeting domestic demand between a refinery yield pattern modified by avis-breaker and importation of products.
3.10 The results of the mission's review of the economics ofoperating or closing the refinery are not sufficiently conclusive to forma basis for long-term commitments. Whether a vis breaker would providesufficient cost savings to justify the investment in this plant and inre-starting the refinery is an issue which requires further study. Nuchfirmer estimates of capital and operating costs need to be obtained, andthe analysis needs to be broadened to cover sensitivity to refinerycapacity utilization, a wider range of types of crude oils, and differentlevels and patterns of domestic demand. There are also other factorswhich need to be considered in evaluating the economic justification ofrenewed refinery operation, notably ENH's proposals to ship CNC to Maputofrom the Pande field to displace imported motor fuels. 42/ However, thefuture of the world oil marketing arrangements appear to be the dominantfactor, especially the evolving relationship between prices of crude oiland products as competition from the new Culf refintries develops,between tifferent product prices, the relationship between prices ofgasoline and gas oil, and any possibility that the Arab oil producersmight revert to the pre-netback basis for crude oil pricing sometime inthe future.
3.11 In view of the conclusions of its analysis of refineryoperations, the mission recomends that PETROMOC obtain consultantassistance to evaluate the available options to minimize the cost ofproducing refined products to meet domestic demand. In particular,
42/ Para. 3.56.
-48-
evaluation is required of (a) the impact of processing different,feasible crude oils on products demand/supply balances, and (b) theimpact of installing low-cost secondary conversion units, mainly a visbreaking/thermal cracking unit, on domestic refining economics. Thebasis for costing supplies of crude oil in the evaluation of the proposedinvestments in the refinery should be term contracts, if possible for 2to 3 years, rather than spot prices that would be available toMozambique. The evaluation should also include a full technical auditand examine other areas for potential cost reductions in operating costsand operational improvements given the age and state of the refinery andits technology. Pinally, a comparison of the least-cost refining optionis required with the cost of meeting demand entirely by importedproducts. The mission's proposed terms of reference for this exerciseare given in Annex 15.
3.12 While the Matola refinery is shutdown, PETROMOC have to retainthe maintenance workforce, the process operators, other key skilled tech-nicians and selected staff since fully trained and skilled techniciansand tradesmen are scarce in Mozambique. The refinery shut-down providesa good opportunity to undertake some needed training in the areas ofinspection and maintenance. This activity is vieved essentially as themeans for Mozambique to retain the procurement flexibility/independencethat may be needed in the future as pricing and supply conditionschange. The annual cost to retain key personnel and maintain therefinery is estimated to be between US$1 and 2 million. PETBOMOC havebeen hiring out their underemployed skilled workers to other industrialplants since the refinery was shutdown. The future of this labor forceshould be determined only after long-term decisions have been taken aboutthe future of the refinery.
Product Pricing
3.13 Ex-refinery product prices have not changed since 1979, exceptfor jet fuel prices in 1980. Their structure and a comparison with mid-1986 import parity prices, when world crude oil prices were aroundUS$30/bbl, is shown in Annex 16. The price structure is based on the end1979 world price for crude oil. Adjustments are made through mechanismswhich allocate the joint cost of production from the refinery and ineffect, cross-subsidise other fuels from gasolines. Kerosene and fueloil are heavily subsidised. Gas oil was subsidised before the fall inworld oil prices in late 1985. The policy for price setting is thatGovernment takes the full differential between revenues and costs, andtargets subsidies to specific consumer categories.
3.14 The principal economic issue relating to the price structure ofpetroleum products is whether all prices are at least as high as thecorresponding import parity prices, so that all the cost of meetingdemand is met fully by the consumer. Provided this criteria is met,internal cross-subsidies are a matter mainly for Government fiscalpolicy. Gasoline ex-refinery prices were about three times their importcost in mid 1986 at the official exchange rate, but the ex-refinery

- 49 -
prices of illuminating kerosene and fuel oil were only about 501 of theimport costs. At the higher parity prices prevailing in mid 1985,kerosene and fuel oil prices were about 401 and 30Z respectively of theimport parity prices. The price of gas oil was higher than the parityprice in mid 1986 but lower than the mid 1985 parity price.
3.15 The product pricing structure needs to be rationalised.PETROMOC submitted proposals for new prices in early 1986. In line withits overall recommendation on energy pricing poli'y, the mission recom-mends that product prices be raised at least to their respective importparity levels at the official exchange rate plus internal handling andtransportation costs. 43/ In view of the tendency for world oil pricesto undergo substantial and continual changes, the mission recomends thatGovernment introduce an adjustment mechanism to the structure of fuelprices that can be reviewed periodically. This measure would eliminatethe need for a new decree to change prices, thus improving flexibility torespond to changes in the world market. Differentials between productprices should not be so large as to distort optimal consumption patternsor lead to product contamination. The need for an economically rationalpricing structure for energy under conditions of a greatly overvaluedexchange rate is dealt with in Chapter I. Higher prices would alsoenable PETRONOC to generate sufficient income to cover operating andfinancial costs, and to provide an operating margin.
Products SupplZ, Storage and Distribution
3.16 The marketing of products in Mozambique is shared betweenPETROMOC (691), BP (231), Mobil (6Z) and Mocacor (a local company thathandles the bottling and distribution of LPG) (2Z). There are a total of242 retail outlets throughout the country owned by PETROMOC (581), BP(291) and Mobil (131). The method of transporting products throughoutMozambique could not be evaluated by the mission because of a lack ofdata. A listing of storage capacities by province is shown inAnnex 17. From a preliminary review, it appears that there is scope forrationalising these facilities. There is excess capacity relative todomestic requirements in some places, notably Maputo, and a shortage inBeira for transit trade. 44/ However, any new investment should takeaccount of long-term prospects for international transit business. 45/
431 Para. 1.43.
44/ British Petroleum is currently installing six new storage tanks inBeira for transit products.
45/ Para. 3.18.
- 50 -
3.17 The facilities for product unloading, 46/ distribution andtankage, aviation refueling and at service sta-tions are in poorcondition. The main cause of this deterioration is lack of foreigncurrency for importing replacement parts and materials. Ihile P*TRDIOCand the petroleum industry have been resourceful in maintaining thefacilities in operation through cannibalization and improvisation, thescope for continuing in this fashion is extremely limited. Furthermore,standards of safety for handling products have been seriously affected.In particular, there is cause for concern about the conditions ofPETROWOC's aviation refuelling facilities and its consequences foraviation safety through contamination of aviation fuel. The missionrecommend that PETRONOC should give priority to rebabilitating itsdistribution and storage facilities (suggested terms of reference aregiven in Annex 13), and to establishing a mechanism that assures theavailability of foreign exchange for the maintenance of thesefacilities. In particular, PETROMOC should get an independent expert tocarry out anually a complete audit of aviation refuelling facilities andoperating procedures.
3.18 Nosambique is uniquely located for the transit of petroleumproducts destined for Zimbabwe, Malawi, Botswana, Swaxiland and theTransval. In the past this was an important money earner forMozambique. The storage facilities at Matola and Maputo (includingrefinery tankage), Beira and Macala could be operated as import storageand transit facilities to earn foreign exchange, and they would offer anattractive additional import route for inland countries. Once secureconditions for cross-country transportation have been restored, there isthe potential for transshipment of more than a million tons of productsannually to neighboring countries, yielding foreign exchange earnings ofbetween US$5 million and US$10 million. The mission recommends thatPITRONOC be given technical assistance to survey and assess the potentialtransit business and the infrastructure in Mosambique as well asneighboring countries which might compete for the business. The assess-umat should cover inter alia port limitations, tankage limitations, andthe capacities for onward transit by rail, road, and pipeline facili-ties. A determination of the potential profitability of this activityshould be reached to establish if and how the transit activity should bepursued. On this basis PETROMOC should prepare a long-term investmentprogram for handling and distribution facilities. The program should bestarted only when Government, PETROMOC and any Mozambican transportcompanies involved are able to esercise their capability to provide areliable service.
6I/ Government is keen to invest in ship to shore unloading facilitiesfor LPG in Maputo as part of its strategy tar alleviating shortagesof household energy.
- S1-
Petroleum Supply, Procurement and Planning
3.19 PETRONOC is responsible for planning the country's petroleumrequirements and for purchasing the major portion of tbesa needs. Theynegotiate the terms of the purchases and sometime negotiate and contractfor the ocean freight. In carrying out this role PETRONOC has tocoordinate with and seek the approval of the Mitnistry of Energy andIndustry, the Ministry of Finance and Economic Planning and the BanK ofNoxembique. About 602 of Noxambique's petroleum needs are presentlyprovided under a term contract which is finsnced by a loan onconcessional terms from Eastern European countries, and the balance isacquired by ad hoc purchases that resemble spot market operations.Foreign exchange is made available for these supplemental purchases insmall amounts and at times of acute shortages of products in Kosambique,so that PETRONOC is not able to purchase on optimal terms.
3.20 Government has set up a Petroleum Fund, which is operated byPITROMOC at the Bank of Mosambique. The purpose of the fund is to enableprocurement efficiency to be increased and to stablize the supply ofpetroleum products, at least to key consumers. The fund receives foreignexchange payments for services, transportation and handling, and bunker-ing provided by Mosambique to other countries and for internationalsupport to Mozambique for petroleum supplies. Theose receipts partly off-set the foreign exchange cost of petroleum imports. The balance of therequirement is being partly covered at present by a loan from EasternEuropean Countries. However, as that financing in tied, Mosambique isnot able to buy from the lowest cost sources. The mission estimates thatpresently about US$50 million annually is requietd to fully satisfycurrent domestic demand. If funds were to be made available on areliable and predictable basis, Mozambique could achieve large savings inpetroleum import costs. In the prevailing circumstances there are fewoptions open to PETRONOC to optimize their purchasing procedures.However, the mission zecommends that PETRONOC seek technical assistanceto improve its information about internationol oil markets, in terms ofcomprehensibility and timeliness.
- 52 -
PETROMOC's Manpower
3.21 Out of a total labor force of about 1000, PETROMOC employs astaff of 360 at the refinery, 47/ of which 22 are engineers, techniciansand supervisors. To make tus for the shortage of skilled workers, in mid1985 there were 16 expatriates employed mainly for maintenance, processand administration purposes. PETROMOC estimates that 57 local staff arerequired to carry out the duties of engineers, technicians andsupervisors when the refinery is in operation, so that they requireanother 35 staff for these grades.
3.22 PETROMOC has limited training facilities and personnel of itsown. It is making a great effort to improve the general level ofeducation of its workers, several of whom are studying at night atprimary and secondary levels of education. Instruction is provided bythe technicians employed by PETROMOC. This approach is practical in thecircumstances, although the quality of instruction suffers through lackof support from training specialists. The mission recommends thattechnical assistance be provided to PETROMOC to determine training needs,prepare a manpower training program, curricula and teaching aids, and totrain instructors. This assistance should also include elaboration of aproject for a training center prepared to feasibility ievel.
Corporate Accounting
3.23 PETROMOC has not produced comprehensive financial accounts forthe last seven years. Computer expertise in the company is virtuallynon-existent. PETROMOC has requested assistance to improve corporateaccounting and to install a management information system. The missionrecommends that this request for assistance be met. The proposed objec-tives of this assistance are summarized in Annex 19.
Indicative Investment Program
3.24 The only capital investment that can be firmly recommended bythe mission in the next few years is for improvements in product storageand distribution (estimated US$4 million). This is less than thatinvested in the pe:iod 1980-1985 due to the exclusion of unforeseeablemaintenance and repair requirements. The total expenditure for thesepurposes from 1980 to 1985 was WT1,370 million (US$31.9 million) asdetailed in Annex 20. However, additional investment in this subsectormay be justified. Refinery repair and replacement work has not beenincluded, and it is subject to the conclusions of the recommended studyinto the future of the refinery. After these expenditures, some low-costsecondary conversion facilities (US$15 million to US$20 million) may be
47/ The manpower of the other companies active in the distribution ofpetroleum products in Mozambique was reported in mid-1985 to be asfollows: BP-460; CALTEX-381 MOBIL-106; MOCACOR-270.
-53-
justified. Likewise, recommendations for investment in petroleumhandling and distribution facilities for rationalisation and for inter-national transit business depeud on the conclusions of the recommendedstudy into these facilities.
Petroleum and Gas Exploration and Development
Geological Framework
3.25 Mozsmbique has large sedimentary basins, both on-shore and off-shore. Geochemical studies, based mostly on on-shore wells, indicatethat organic content is dominated by gas-prone material, while the geo-logical and seismic surveys indicate that the presence of oil-pronesource rocks increase eastward into the off-shore area. Detailed infor-mation on the geological framework and interpretations is given inAnnex 21.
Past Exploration Activity
3.26 Prior to 1974, three gas accumulations were discovered of whichonly the Pande field was considered commercial. Estimates of the provenreserves in these fields vary from 0.4 to 1.3 TCP in Pande, prior to a 15month "blow-out" whose effect on reserves has not been fully assessedyet, 63 BCP in Temane and 15 BCF in Busi (Map IBRD 19515). From 1948 to1914, 46,000 km of seismic profiles were shot (including 28,000 km off-shore) and 59 exploration wells were dtilled. Exploration and develop-ment work stopped in 1974. Details of past exploration activity aresummarized in Annex 22.
3.27 Government interest in petroleum and gas exploration revived in1981 with three off-shore seismic surveys. Promotional efforts, includ-ing a new petroleum law and development of a model concession contract,resulted in the signing of three exploration contracts (two off-shore,one on-shore). Concession blocks and location of previously drilledwells are shown on Map IBRD 19515. Substantial expenditure has beencomitted to petroleum and gas exploration since 1980. According toGovernment's officially published statistics (Annex 21), expenditure inpetroleum and gas exploration from 1980 to 1985 amounted to MT2,053million (US$47.7 million), of which 88X was in foreign currency. ENH'scoatribution was US$25 million. Outstanding work at end 1985, mainly onpetroleum exploration, from this program is scheduled to involveadditional expenditure of MT1,931.5 million (US$44.9 million).
3.28 ESH (Empresa Nacional de Hidrocarbonetos), a parastatalreporting to the Ministry of Mineral Resources, was established in 1981and is responsible for all exploration, development and production ofhydrocarbons. ENH signed a technical assistance program in 1982 with thegovernments of East Germany and USSR. The program, costing US$40 millionto US$50 million, provides approximately S experts for the geologicaldepartment of ENH and technical assistance and equipment for seismic anddeilling operations. The purpose of this program is to renew and
- 54 -
reinterpret the available data on the geology of Mozambique in generaland the onshore gas province in particular. This wotk will be followedby additional seismic work, renovation of the existing gas wells, and thedrilling of approximately ten additional weIls. Exploratory work willalso be carried out in the Pande and Temane areas, and may include thedrilling of exploration wells within the existing limits of the Pande andTemane fields. The protocol to the program specifically escludes anywork downstream from the wellhead. The interpretation work has beencompleted, mobilixation of the equipment in the Pande area is inprogress, but fieldwork has not started because of security problem.Feasibility studies funded by other sources of assistance have beencomuissioned for an ammonia plant, domestic gas utilization and a gaspipeline.
Petroleum Promotion Strategy
3.29 Seismic technology today provides much better Lnformation than10 years ago when the last seismic surveys were carried out by foreigncompanies. Most wells drilled in the past were poorly located, eitherstructurally or from an oil production point of view because of limita-tions in the seismic technology and geological knowledge then avail-able. In 1981 at:t 1982, 26,000 line km of seismic surveys vere shot off-shore by Western Geophysics and CECO on a speculative basis at an esti-mated cost of US$14 million. Only a few companies purchased these datafor a total revenue of about US$2 million. These data ,have been inter-preted by companies that carried out the surveys and by some consul-tants. An overall geological and geophysical interpretation, usingmodern techniques, is nearing completion by a consultant to ENH. Themission recommends that this interpretive work be reviewed and a sampleof these dota be put into a form suitable for new promotional efforts.However, even with new seismic results, the exploration status ofMozambique can still only be considered as largely immature, and it willrequire more wells to confirm basic information.
3.30 In the mission's view, no changes are needed in the petroleumlaw and model concession contract. The fact that three concessioncontracts were signed recently will also help promotional efforts. The.mission recommends that Government strategy should be to continue itsefforts to induce companies to drill additional off-shore wells inexchange for being given priority in the subsequent award of blocks forfurther exploration work, thus reducing each company's risk exposure.
Current and Proposed Exploration Work
3.31 On-shore exploration by private oil companiea is unlikelybecause of the gas-prone nature of the are&. Consequently, SM. basdeveloped its own exploration program with help provided under the Sovietprotocol, the first stage of which concentrates in areas where gas hasbeen discovered. Details of the two-stage ERH exploration progrom areshown in Annex 23.
.~~~~~~~~~~I .-55-
J j.32 'lMH has aleady, spent about US$l5 million (as part of the USSRagreement? On tho'acquisition of two seismic units, two drilling rigs and;otbor equipl"Ut pt"3 technical assistance. Delivery of a third and
w\ a ,trig at Xa atr date is under consideration. All the equipment*eetiwd thas, been stored and is inactive because of conditions ofi,tsecurity. Hl'*s strategy is first to confirm gas reserves at Pandeibat 6wce te 'assured for an ammonia plant, second to explore forn4ditionalraterves at Pande, and tnird to look for gas .t Temane. Themissaon recammends that no additional equipment be acquired untilseciitity is re-established and economically viable gas markets areconfirmed for the potential reserves.
3.33 The flM program also includes other on-shore areas for seismicwork and exploration wells, as follows:
* NE of Beira - 310 km of seismic to locate a deep explorationwell;Between Save and Punsu e Rivers - 800 km of seismic, mapstructure, determine site for future well;
* Vilanculos-Uhachengue - 655 km of seismic (4 profiles);Southern Area - 410 km of seismic (2 profiles).
The areas between the Save and Pungue Rivers is prospective for gas only,and the other three areas are considered to be prospective for both oiland gas. The mission recommends that this additional exploration work befocussed on exploration for oil and that auy further exploration for gasbe concentrated in the south of Nozambirque since it is nearest to theMaputo potential market for natural gas.
3.34 All HEU efforts in exploration and development should becoordinated to minimize financial risks to Government while developingpetroleum and gas resources to the extent economically justified. Themission recommends that the following order of priority be given to theseefforts by Covernment and EoH:
(a) actively pursue promotion of petroleum exploration with inter-national oil companies;
(b) limit direct government involvement in exploration;
(c) review gas utilization possibilities;
(d) develop a field-by-field gas exploration and development planwhich is linked to a program for developing domestic and exportmarkets for gas.
Nenpower *nd Organizational Needs
3.35 In mid-1986 131 employed 162 staff of whom eight wereuniversity graduates and about 20 were graduates of technical schools.FUM was also assisted by 7 expatriate specialists. The composition of
-56 -
the present MWH technical staff is shown in Annex 24. ENH isunderstaffed for the promotion of petroleum exploration and the economicevaluation of gas utilizacion possibilities. In 1986 about 20 youngmembers of the staff were being trained as drilling technicians in theSoviet Union. MWH has received other offers to train engineers andtechnicians abroad, but it has difficulty in finding suitable candidatesdue to the shortage of graduates from technical and university courses.In 1985 five engineers were trained abroad.
3.36 ENH has estimated its total requirements for professional andtechnical staff -! be 36 within the next three years on the basis of thefollowing activites: (a) seismic survey work; (b) continue the opera-tion of two sets of drilling equipment and start drilling onshore wells;(c) development of the Pande gas field for the ammonia project; and(d) continuation of promotion work for petroleum exploration. ENHmanagement plans to add fc-ur technical staff and three economists eachyear for explGration, development and production activities, and anti-cipates that its training needs for technical staff will be coveredthrough various technical assistance programs already in place.
3.37 EHH urgently needs technical assistance in management, planningand administration (accounting, procurement, computer systems, stock con-trol, distribution management and personnel management). The missionrecommends that assistance be provided to de :ine precisely the needs andto prepare the necessary terms of reference to allow bidding for thisassistance which should also study and make recommendations on MUH's man-power requirements and organizational structure.
3.38 ENH hired Braspetro (a subsidiary of the Brazilian company,Petrobras) to reviev its organizational structure and managementdevelopment requirements. On the basis of an extensive list ofresponsibilities, Braspetro recommended in its report of March 1985 anambitious program which would require a technical staff of about 160within five to 10 years. KWH is making its own assessment of its needsand the feasibility of implementing BRASPETRO's recommendations. Themission considers that qualified manpower in such strength is not likelyto be available. However, the mission also considers that EKH shoulddecide whether it would like BRASP8TRO to assist in restructuring ENH andif so, invite BRASPETRO to prepare a more modest set of proposals and amore gradual implementation program that accord with the priorities fororganizational development set by RUH and recommended by the miesion.
3.39 Under the present uncertainties regarding petroleum and gasactivity in the country, it is difficult to design a training program.On the other hand, the supply of qualified manpower emerging from theuniversity and technical schools is restricted. _n ENH has difficulty insecuring from the Ministry of Labor a reliable allocation of thesepeople. There are no courses for specialization in gas, oil andpetrochemical subjects in Wozambique. ENH's best strategy for obtainingskilled workers is to use graduates from the Industrial School of Natola,and to provide them with on-the-job training. For engineers and othertechnical specialists, EWH should rely on training abroad.
- 57 -
3.40 The statutes of EMi define it as an autonomous parastatalcompany. However, most of KNl's activities are funded on a project byproject basis under the Ministry of Mineral Resources (MMR)'s 5 yearprogram approved by the National Planning Commis ion. OMH keepssignature bonuses from exploration contracts and income of a similarnature for its own use, and it bills MMB for its expenditure. ENH hasnot produced financial accounts, but would like to develop the capabilityas part of its reorganisation program. 481 The mission supports thisobjective.
3.41 Under IHM's present responsibilities, a conflict of interestmight arise from EiH's oversight of and participation in the ownership ofgas utilization projects, such as the ammonia plant and pipelines servinggas consumers. ENH has the potential to become a holding company withdiverse operation, from petroleum extraction to operation of an samoniaplant and gas transportation. For EKl to perform these functionseffectively, it should have an arm's length relationship with MMR whichin turn, should strengthen its own capability for setting policy, liaisonwith organisations outside its own area of responsibility, and regulatingorganisations for which it is responsible. ENK participation in gas-using projects and pipelines would be needed to fulfill government policyan state participation in development projects.
Cas Demand and Utilization
Use of Pande Field Gas
3.42 Most of 9M's gas exploration and development program isconcentrated in the Pande and Temane fields, with some attention paid toa small field at Buzi. The production potential from the known gasfiel4s is about 70 MNCFD from Pande and 3.5 MMCFD from Buzi. Feasibleproduction rates from the Temasne field are not yet known, but since itsreservoirs appear to have similar characteristics to those in the Pandefield, similar production rates are a possibility.
3.43 The potential gas consuming facilities currently underconsideration by ENH are an export-oriented ammonia plant at Inhassoro,some consumption in industry, power generation and transportation(CNC). After confirming an economic use for gas, the mission considersthat it is essential that Government minimises its financial risk forMozambique in major gas-based developments. No unilateral investmentsshould be made (i.e., gas field development) until satisfactory off-takecontracts are in place with the potential buyers that guaranteequantities and prices of future gas purchases. It is also preferable tolock in the buyers to the project as investors to increase their
48/ Para. 3.37.
- 58 -
commitment to the project. These recommendations are based on thepremise that Government will not enter into any major commitments untilit can guarantee secure conditions for development.
3.44 Naputo is the major energy consuming center in Mozambique, butit is located some 750 km from the Poad. field. NORCONSULT carried out areview of the potential domestic demand for gas in the Maputo area,without taking into account the economics of utilization. The estimatedpotential is summarized in Annex 25 together with the mission's commentson these estimates. In the mission's view, the economically justifiabledemand is considerably lower than the estimted potential demand, and theprojected base load demand is insufficient to justify a pipeline fortransporting the gas to Maputo. The justification for such an investmentwould therefore depend mainly on the economics of the ammonia plant andalternative mesns for transporting gas to Kaputo, for example, by coastalbarge as LNG.
Ammonia ProJect
3.45 Since a large share of ammonia production would be exported bysea, the plant would have to be located near the coast. Two locationswere reviewed in the pre-feasibility studies for the project:
(a) Maputo, to have the possibility of supplying other gasconsumers and to avoid the need to provide communitydevelopment and possibly other offaite facilities for theplant. However, this option requires a 750 km pipelineestimated to cost US$128 million.
(b) Inhassoro (located only 54 km from the Pande field), for whichthe community development facilities for the plant would costless tban the pipeline investaent to I puto.
The estimated cost, timing and expected production levels of the Pandefield development to supply gas to an amonia plant are of the order ofUS$20 million (Annex 26). NE is considering the development of anammonia plant only at Inhassoro.
3.46 Fluor prepared a feasibility study to determine the size andlocation of the proposed ammonia plant. They recommended a world scaleammonia plant tli0O t/d) located at Inhassoro. The major assumptionsused by Fluor have been reviewed and commented on by the mission inAnnex 28. The main issues concern the economic value of the gas used forthe manufacture of amonia, future world market prospects for ammoniaexports and the projected export prices, the optimal scale and timing ofdevelopment and the capital costs of development.
3.47 The economic value of the gas reserves dedicated to an ammoniaplant is not likely to be a major issue. In principal, this value is thegreater of the cost of extraction and the value of the foregone bestalternative use for the gas. In Nosambique, alternative economically-
-59-
justified uses have not been identified and, if they are in the future,there may well be additional reserves of gas available in the Pande andTemane fields to supply these uses. Thus, the mission considers that thecost of extracting the gas, estimated by the mission to be aboutUS$0.5/MCF, ie a reasonable basis for estimating the economic value ofthe gas for an ammonia plant in Moxambique.
3.48 The world fertilizer industry has been suffering a severerecession during the last few years. This situation will probablycontinue for another two years or so, but even with a relatively modestincreose of 3Xlyear in world demand for nitrogenous fertilizers, a globalbalance between demand and supply is in prospect around 1990. The rateof building of ammonia capacity has declined significantly in recentyears in a situation of exce"s supply, so that the commissioning from1990 onwards of substantial new capaeity for production of ammonia willhave to be planned to meet the increase in demand and to replace worn-outplants built during the 19609. However, a new plant in Mozambique wouldhave to face stiff competition from new plants being constructed andplanned in the Arabian Gulf which will be supplied from the hugeresources of low cost gas in that region. The World Bank presentlyestimates that ammonia prices in the Indian Ocean areas by the mid-1990'swill reach around US$200/t in 1985 price terms compared to late 1985prices of around US$150/t. This estimate assumes that the prospect ofhigher prices over the present levels will stimulate the construction ofnew ammonia production capacity in the region.
3.49 The uncertainty over future energy prices, particularly ofcrude oil and petroleum products, has a major influence on the assessmentof the future competitiveness of new gas-based ammonia plants indeveloping countries such as Kozambique. The optimal locations of theseplants depend on the trade-off between gas prices in the main markets ofthe developed economies, particularly USA and Western Europe, and higherconstruction costs and product transport costs to these markets fromdeveloping economies. Gas prices in USA and Europe are linked to oilprices, so that low oil prices in the future (around US$1S/bbl of crudeoil) would favor production of amonia in developed economies with gasresources. High oil prices, (around US$30/bbl) would favor constructionof new plants near cheap gas sources and inhibit such development in themajor developed economies. At the World Bank's present long-termforecast for crude oil prices of around US$20/bbl in 1985 price terms,the present trend of building export-based plants where gas is cheap islikely to continue. However, this prediction is subject to theuncertainties about future trends i:: oil prices.
3.50 The market uncertainties outlined above give emphasis to theneed for Mozambique to minimise its exposure to financial risk from alarge investment in an ammonia plant. One method of reducing risk is tostagger the total investment by building two production units withindividual capacities of about half the proposed single plant capacity.The cost penalty associated with smaller units is a higher capital costper unit of capacity and the need to undertake initially the total

- 60 -
investment in infrastructural and off-site facilities. Nevertheless# thesavings in terms of delaye' investment whilst markets and operationalcapacity are being built up could outweigh the cost penalty, especiallyif market conditions turn out to be less favorable than anticipated. Themission recommends that ENH examine this option before making any majorcomitments.
3.51 The mission considers that Fluor's estimates of capital costfor the ammonia plant and the pipeline to Maputo are low, possibly byabout 202, and therefore, they should be reviewed. For an ammonia plantlocated in Maputo, the mission's estimate of the capital cost is aboutUS$240 million in 1985 prices. For the pipeline from Pande to Maputo,the estimated cost is US$128 million (Annex 27). These estimates ofcapital cost cover base costs and physical contingencies only and do notinclude any financial costs such as interest during construction,provision for inflation and any investment premiums/fees. Thesecategories of costs must be take. into account in financial analysis andwhen arranging for project financing. Thus, the total project financingrequirement is usually substantially greater t6an the estimate of basecapital costs used in an economic evaluation.
3.52 The mission has carried out indicative economic evaluation ofthe ammonia plant in Maputo supplied through a pipeline from Pande,taking account of the potential economic benefits from making gasavailable to other users. According to the mission's assumptions whichare given in Annex 28, the propective economic returns to a pipeline andan ammonia plant in Maputo are marginal in comparison to an opportunitycost of capital of 12X. The estimated economic return are summarised inTable 3.3.
Table 3.3: ECONOMIC RETURNS OF GAS "!PELINE/AMUONIA PLANT AT MAPUTO
Net PresentERR a/ Value Q 12%
(S) (USS million)
a. Base Case: Industry, Power, TranspoWtConsumers, Pipeline, Ammonai Plantat 90% capacity utilization 12.2 3_3
be Same as (a) but 10% lower Investment for 13.5 25.7pipeline and ummonia plant
c. Same as (a) but at 60$ capacity utilization 10.8 -21.5
a/ ERR u Economic Rate of Return.
Source: Mission estimates - Annex 28.
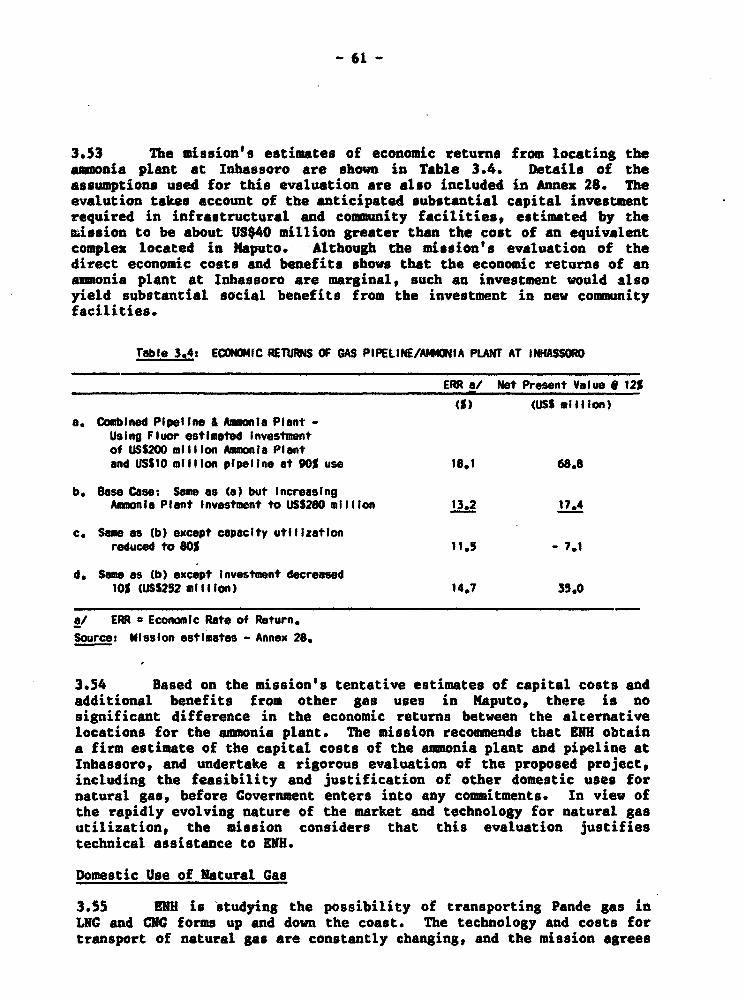
- 61 -
3.53 The mission's estimates of economic returns from locating theammonia plant at Inhassoro are shown in Table 3.4. Details of theassumptions used for this evaluation are also included in Annex 28. Theevalution takes account of the anticipated substantial capital investmentrequired in infrastructural and community facilities, estimated by themission to be about US$40 million greater than the cost of an equivalentcomplex located in Maputo. Although the mission's evaluation of thedirect economic costs and benefits shows that the economic returns of anammonia plant at Inhassoro are marginal, such an investment would alsoyield substantial social benefits from the investment in new communityfacilities.
Table 3.4: ECONOMIC RETURNS OF GAS PIPELINE/A14MMNiA PLANT AT INHASSORO
ERR a/ Not Present Value w 12S
(%) (USS millton)a. Combined Pipeline & A lmonia Plant -
Using Fluor estimated Investmentof USS200 million Ammonia Plantand USSIO million pipeline at 900 use 18.1 68.8
b. Base Case: Swme as (a) but increasingAmmonia Plant Investment to USS280 million 13.2 17.4
c, Same as (b) except capacity utilizationreduced to 80% 11.5 - 7.1
d, Same as (b) except Investment decreased10% (USS2S2 milion) 14.7 35.0
a/ ERR a EconOmic Rate of Return.Source: Mission estimates - Annex 28.
3.54 Based on the mission's tentative estimates of capital costs andadditional benefits from other gas uses in Naputo, there is nosignificant difference in the economic returns between the alternativelocations for the ammonia plant. The mission recommends that MHM obtaina firm estimate of the capital costs of the ammonia plant and pipeline atInhassoro, and undertake a rigorous evaluation of the proposed project,including the feasibility and justification of other domestic uses fornatural gas, before Government enters into any commitments. In view ofthe rapidly evolving nature of the market and technology for natural gasutilization, the mission considers that this evaluation justifiestechnical assistance to BUR.
Domestic Use of Natural Gas
3.55 ENH is studying the possibility of transporting Pande gas inLNG and CNG forms up and down the coast. The technology and costs fortransport of natural gas are constantly changing, and the mission agrees
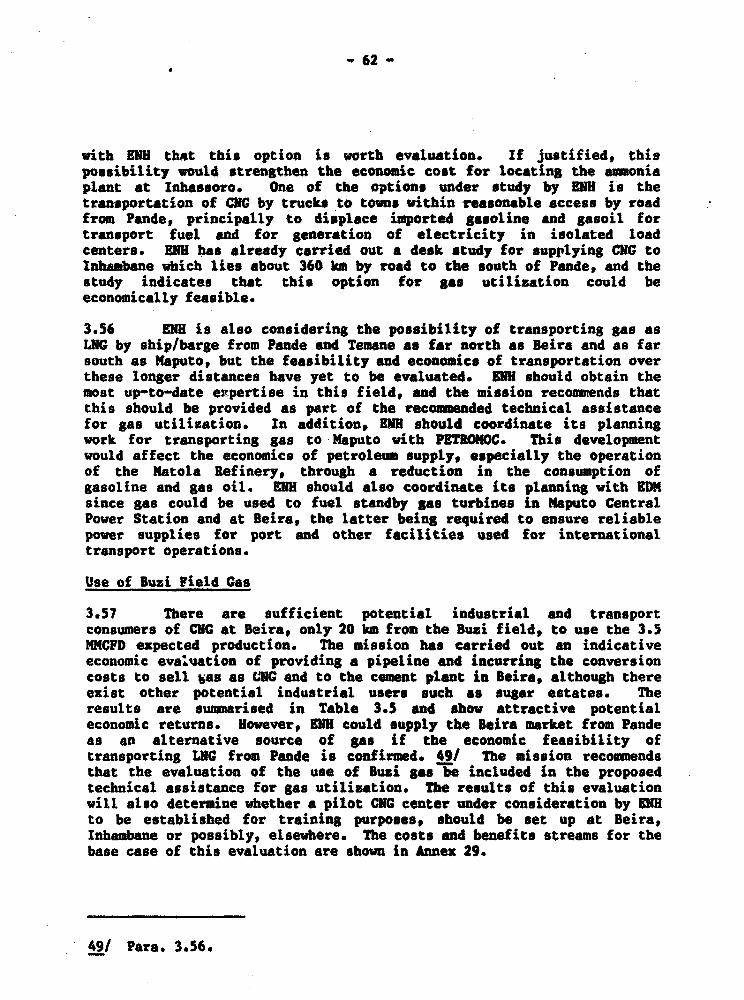
" 62 -
with HNH th*t this option is worth evaluation. If justified, thispossibility would strengthen the economic cost for locating the ammuoniaplant at Inhassoro. One of the options under study by ENH is thetransportation of COG by trucks to towns within reasonable access by roadfrom Pande, principally to displace imported gasoline and gasoil fortransport fuel and for generation of electricity in isolated loadcenters. EDH has already carried out a desk study for supplying CNG toInhambane which lies about 360 km by road to the south of Pande, and thestudy indicates that this option for gas utilization could beeconomically feasible.
3.56 VNA is also considering the possibility of transporting gas asLNG by ship/barge from Pande and Temne as far north as Beira and as farsouth as Maputo, but the feasibility and economics of transportation overthese longer distances have yet to be evaluated. EUH should obtain themost up-to-date expertise in this field, and the mission recommends thatthis should be provided as part of the recommended technical assistancefor gas utilization. In addition, OHM should coordinate its planningwork for transporting gas to Maputo with PETROKOC. This developmentwould affect the economics of petroleum supply, especially the operationof the Natola Refinery, through a reduction in the consumption ofgasoline and gas oil. ENH should also coordinate its planning with EDMsince gas could be used to fuel standby gas turbines in Maputo CentralPower Station and at Beira, the latter being required to ensure reliablepower supplies for port and other facilities used for internationaltransport operations.
Use of Buzi Field Gas
3.57 There are sufficient potential industrial and transportconsumers of CNC at Beirap only 20 km from the Buxi field, to use the 3.5MMCFD expected production. The mission has carried out an indicativeeconomic evaluation of providing a pipeline and incurring the conversioncosts to sell Uss as CXC and to the cement plant in Beira, although thereexist other potential industrial users such as sugar estates. Theresults are suwnarised in Table 3.5 and show attractive potentialeconomic returns. However, ENH could supply the Beira market from Pandeas an alternative source of gas if the economic feasibility oftransporting LNG from Pande is confirmed. 49/ The mission recommendsthat the evaluation of the use of Buzi gas be included in the proposedtechnical assistance for gas utilization. The results of this evaluationwill also determine whether a pilot CNC center under consideration by ENHto be established for training purposest should be set up at Beira,Inhambane or possibly, elsewhere. The costs and benefits streams for thebase case of this evaluation are shown in Annex 29.
49/ Para. 3.56.
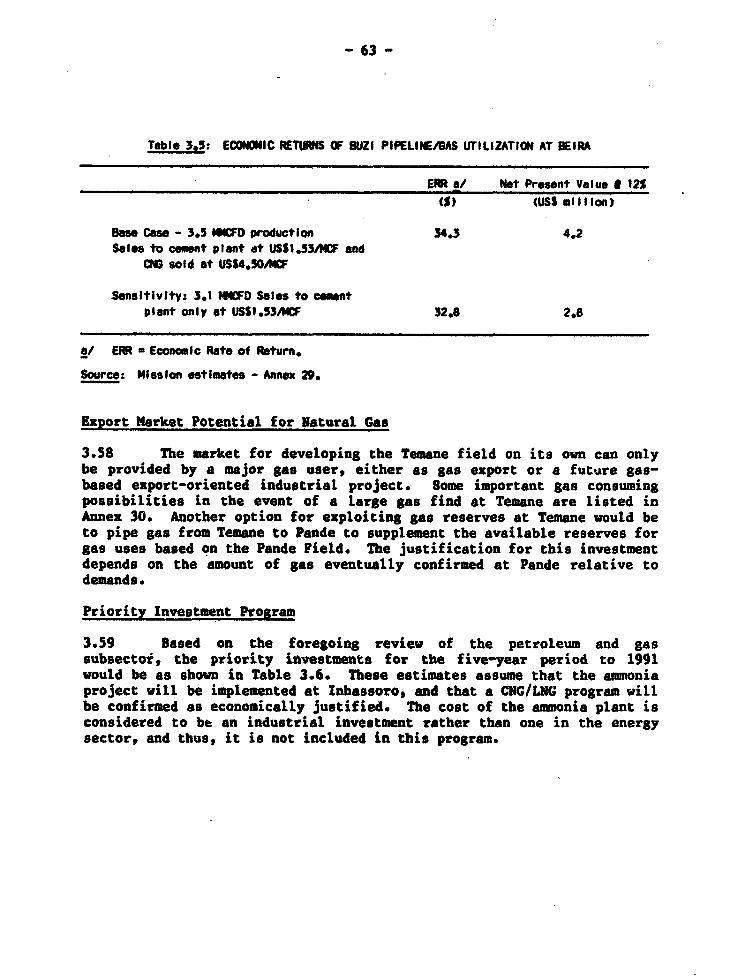
- 63 -
Table 3.5: ECONIC RETWURS OF BUZI PIPELINEA3S UTILIZATION AT BEIRA
ERR a/ Net Present Value 8 125(S) (USS million)
Base Case - 3.5 ID production 34.3 4.2Sales to cemt plant dt USSI.S53AF and
0N9 sold at USS4,5JACF
Sensitivity: 3.1 #'CFD Sales to cmentplant only ot USS1.53MCF 32.8 2.8
a/ ERR * Economic Rate of Return.
Source: MIsslon estimates - Annex 29.
Export Market Potential for Natural Gas
3.58 The market for developing the Temane field on its own can onlybe provided by a major gas user, either as gas export or a future gas-based export-oriented industrial project. Some important gas consumingpossibilities in the event of a large gas find at Temane are listed inAnnex 30. Another option for exploiting gas reserves at Temane would beto pipe gas from Temane to Pande to supplement the available reserves forgas uses based on the Pande Field. The justification for this investmentdepends on the amount of gas eventually confirmed at Pande relative todemands.
Priority Investment Program
3.59 Based on the foregoing review of the petroleum and gassubsectoi, the priority itvestments for the five-year period to 1991would be as shown in Table 3.6. These estimates assume that the ammoniaproject will be implemented at Inhassoro, and that a CNG/LNC program willbe confirmed as economically justified. The cost of the ammonia plant isconsidered to be an industrial investment rather than one in the energysector, and thus, it is not included in this program.
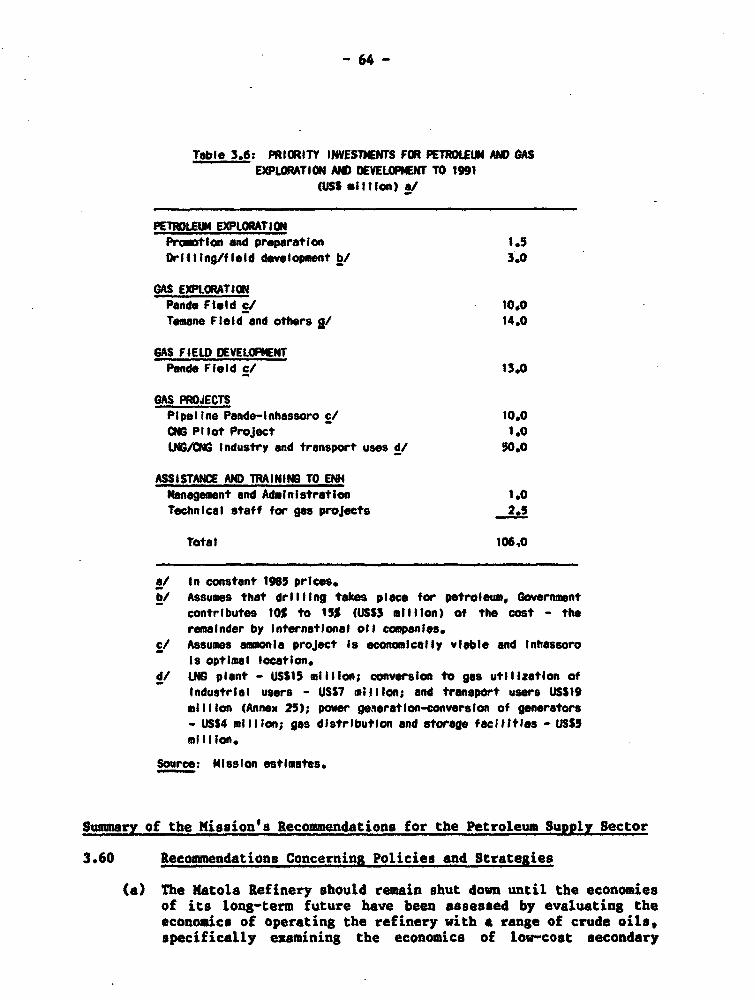
- 64 -
Table 3.6: PRIORITY INWESTNENTS FOR PETROLEUM AND GAS
EXPLORATION AM) OEVELOPMENT TO 1991
(USS million) o/
PETROLEUM EXPLORATIONPromotion and prpeoratlon 1.5
Drilling/field development b/ 3.0
GAS EXPLORATIONPande Field c/ 10.0
Tmmane Field and others gl 14.0
GAS FIELD DEVELOPMENTPande Field cl 13.0
GAS PROJECTS
Pipeline Pande-lnhassoro c/ 10.0
ONB Pilot ProJect 1.0LNG8NG Industry and transport uses d1 50.0
ASSISTANCE AND TRAINING TO ENIManagement and Administration 1.0Technical staff for gas proJects 2.5
Tota I 106,0
a/ In constant 1985 prices.
bf Assumes that drilling takes place for petroleum, Governmentcontributes 10% to 15% (USS3 mIllion) of the cost - theremainder by International oil copsnlos.
c/ Assumes amonia project Is economically viable and Inhossoro
Is optimal location.df LNG plant - USS15 million; conversion to gas utIlization of
Industrial users - USS7 miltlon; and transport users USS19million (Annex 25); power gewieration-conversion of generators
- USS4 million; gas distrIbutlon and storage facilItIes -USSSmllilon.
Source: Mission estImates.
Sumnary of the Missions Recommendations for the Petroleum Supply Sector
3.60 Recommendations Concerning Policies and Strategies
(a) The Natola Refinery should remain shut down until the economiesof its long-term future have been assessed by evaluating theeconomics of operating the refinery with a range of crude oils,specifically examining the economics of low-cost secondary
- 65 -
conversion facilities (thermal cracker/viobreaker) andpotential operating cost reductions (para. 3.11).
(b) Until the future of the Natola Refinery has been determined,PETROMOC should retain key personnel (maintenance department,process operators, and certain laboratory and staff) andcontinue to maintain the refinery facilities (para. 3.12).
(c) PETROMOC should give priority to rehabilitation of itsdistribution, tankage and aviation refuelling facilities (para.3.17) and prepare a long term investment program (para. 3.18).
(d) Ex-refinery petroleum product prices should be raised to atleast import parity levels and also to levels that insuresufficient income to cover costs of imported products, PETROMOCoperating costs, and the required profit margin (para. 3.15).
Ce) The structure of petroleum product prices should berationalized (para. 3.15).
3.61 Recommendations for Technical Assistance to PETROMOC(a) Study the least-cost method of meeting Mosambican demand for
petroleum products, either through operation of the MatolaRefinery with or without a secondary conversion unit, orimportation of products (para. 3.12).
(b) Survey and assess the potential transit business for productsto inland countries (para. 3.18).
Cc) Improve PETROMOC's market intelligence capability (para. 3.20).
(d) Carry out annual audits of PETROMOC's aviation refuellingfacilities (para. 3.17).
(e) Determine manpower training needs and proposals for a trainingcenter (par.. 3.22).
(f) Develop a corporate accounting and management informationsystem for PETRONOC (para. 3.23).
Summary of the Mission's Recommendations for Petroleu-A and GasExploration and Development
3.62 Recommendations Concerning Policies and Strategies
(a) Review petroleum exploration data as the basis for mounting newpromotion efforts to sttract more interest by private sectorinvestors (para. 3.29).
(b) Continue efforts to induce companies to drill more off-shorewells (para. 3.30).
- 66 -
(c) Focus *dditional on-shore exploration activities on oil and onthe southern areas of Mozombique for gas (para.3.33).
(d) Follow the set of recommended guidelines for exploration addevlopment given in para. 3.34.
(e) No additional gas exploration equipent be acquired untilsecurity is re-established and development of gas productionfacilities is economically justified (para. 3.32).
(f) UEH to be allowed to develop its financial autonomy(para. 3.41).
(g) The Ministry of Mineral Resources to strengthen its capabilityfor setting policy, liaison and regulation (para. 3.41).
Ch) Covernment to minimise the financial risise for Mozambique inmajor gas-based developments (para. 3.43).
Si) The ammonia plant capital cost to be re-estimated withattention to defining the community development facilitiesrequired for a reaote location (Inhassoro), and to determine ifany offsite facilities could be eliminated from the investmentif the ammonia plant is located at Maputo. Also, refineestimates of pipeline capital costs (Pande to Maputo)Cpara. 3.51).
(j) LEN to coordinate its planning work for CEC/LNG with PITROWOCand DM (para. 3.56).
3.63 Recommendations for Technical Assistance to MM
(a) Define MMN's needs in areas of management, planning andadministration as well as its internal organization, andprepare necessary terms of reference for consulting firms tobid for this service (para. 3.37).
(b) Assist MME with developing options for gas utilization inMozambiquep covering transportation and markets, establishmentof a pilot project and evaluation of alternative develop _tprograms (paras. 3.54, 3.56 and 3.57).
- 67 -
IV. 8EL CTUC PO=
Organization of the Power Sector
4. The Ministry of Industry and Energy (HIS) has overall respon-sibility for the electric power subsector. Slectricidade de Mozambique(EOM) which reports to the MIR, was created in 1977 and given theexclusive responsibility in the country for the public supply of elec-tricity including generation, transmission and distribution of power.During the next few years, NDM took over the operations of numerousregional and municipal undertakings that supplied both electricity andwater. Subsequ;ently, EDM relinquished most of the water supplyoperations. lmpresa Macional de Installa9oes Electricas (lIUL) isresponsible for the construction of major public works, and it reports tothe Ministry of Construction and Waters. ELECTROMOC is responsible forthe constructiou of other works, and it reports to the Ministry ofIndustry and Energy. Electrical work in houses is carried out by privatesector organisations that are approved by 3DM.
4.2 Over the years, EDM has experienced difficulties in integratingits operations due to shortages of skilled manpower, to the wide dis-persion of local centers and facilities, and to a lack of standardizationamong inherited generating plant, distribution voltages and accountingsystem and tariffs. The principal organizational components of EDM servethe regions in the south (Maputo), center (Beira) and the north(Nampula), and these regions are subdivided into 42 districts.
4.3 3DM faces the task of completing the integration of itsinherited operational units and establishing a helance between central-ization and regionalization in its organisation. These tasks requiremuch greater staff and material resources than are presently available toEDM. In fact, 3DM would have great difficulty in providing a reasonablelevel of service without the substantial technical and financial Assis-tance being given under aid programs from Norway, Sweden and Holland.EDM has had to maintain its level of activity in recent yearo in responseto a steady demand for power even in a period of general economic dif-ficulties, sabotage to its facilities, and lack of maintenance due torestrictions on ground access to power facilities caused by the activ-ities of armed bands.
4.4 There are major issues for EDM's regional operations. Inaddition to its headquarters in Maputo, EDM has offices for its southern,central, and northern regions located in Kaputo, Beira and Nampularespectively. EDM plans to decentralise to these offices certainfunctions including operations, maintenance and construction work.However, due to restrictions on ground access and to lack of oualifiedstaff, EDM is not able to enforce full control and accountability onoutlying organizations, or to provide sufficient skilled staff.
-68-
4.5 EDM has yet to fully consolidate the operations of SociedadeHidroelectrica do Revu4 (SHER), the local organisation that se.ves theBeira region. SOER is also treated by RDM as a, third party. foraccounting transactions. EDN's limited mewtogement veroirces are fullystretched in dealing with day-to-day matters, and they-are not able togive the required attention to managing, planningnand ivpleteenting a neworganizational structurs. Nevertheless ;MW. intends to complete theintegration of the constituent organisatioas,.
Physical Facilities
4.6 The Cshora Bassa hydroelectric complas on the Zambezi river hasan installed capacity of 2,075 KW (5 turbo'-renerator units of capacity415 NW located on the south bank) and is the largest at present inAfrica. With this capacity, the available firm energy at the station isabout 14,000 CWh/year. The complex is linked by a DC transmission syscemoperated at 533 kV to the Republic of South Africa (RSA). It is one ofthe major DC links in the world. These facilities are vnsie4 and operatedby Hidro6lectrica de Cahora Bassa (HCB), a company largely owned andcontrolled by Portuguese interests (82x) with a minority share (182) heldby Mozambican interests. The installed generating capacity of thecomplex can be expanded by the addition of a new power station on thenorth bank of the river, for which construction of the underwaterconcrete part of the cofferdam in front of the future north bank intakeshas already been built. This additional power station will increase theavailable firm energy from the complex to 18,500 Gwh/year.
4.7 The overall capacity of the DC link of about 1,920 MS is pre-sently determined by the capacity of the two terminal converter stations,whereas the joint capacity of the two DC lines is estimated at3,2C, MW. Hence, the capacity of the link could be increased atrelatively low cost with extensions to the converter stations. Therehave been problems in maintaining the availability of DC link. Duringthe first few years of operation, it was subject to a large number ofline faults. Since 1980 the lines have been sabotaged, putting the linkout of service for long periods, notably in 1984 and onwards. Majorreplacement work is required to restore the lines to service.
4.8 Under parallel arrangements to the Cahora Bassa supply con-tract, Mozambique imports power from RSA to. 6upply the Maputo area.Other areas of Mozambique are supplied by direct off-take from CahoraBassa and from local hydroelectric and thermal plants. There are anumber of small private producers of electricity in the country, thelargest ones linked to sugar-cane milling operations. The total in-stalled generating capacity under EDM's control is approximately 350 MS,excluding Cahora Bassa, but the available capacity is not more than 250KW. Nozambique is also entitled to take up to 200 MW from CaheraBassa. The transmission link between EDM's system in southern Nozambiqueand ESCOM (RSA)'s system can be used to transmit up to 120 MN of CahoraBasta power to the Maputo area or to supply power from ESCOM's systemwhen the link between Cahora Bassa and RSA is out of operation. 8DM's

- 69 -
system also contains about 3,000 km of high and medium voltage trans-mission lines and about 1,300 substations. EDM's main power supplyfacilities in Mozambique are summarized in Table 4.1 and are shown on MapIBRD 19471. A description of the generation, transmission anddistribution facilities in Mozambique is given in Annex 31.
Table 4.1: MAIN POWER SUPPLY FACILITIES TO EOM'S SYSTEM
AvaltableRegion Location Type Capacity
(MW)South RSA/Maputo Transmission Line
for imported power 120 a/South Maputo Thermal Generation
(coal and gas) 94Central Chicombo Hydro Generation 38Central Mavuzi Hydro Generation 52 b/Central Navuzi-Belra Two Transmission lines
at 110 kV 100Center-north Cahora Basso c/ Hydro Generation 200Center-north Cahora Bassa-Tete Transmission line
-Nacala at 220 kY/110 kV 400 to Cala200 to Nampula50 to Nacala
Center-south Cahora Bassa-Tete Transmission line-Chimolo at 110 kV 100
North Nacala/Nampuls Thermal Generation (diesel) 20
a/ Off-take capacity at Maputo restricted to 80 MW presently bytransformer capacity at substations.
b/ Presently, only 21 MW are available due to technical constraints.cl Mozabtique's entitlement to the output from Cahora Basse.
4.9 With the completion of the Linha Centro-Norte (Center-NorthLine), scheduled for 1986, KDM has approached the end of its strategictransmission development program, costing about US$120 million, toconnect load centers in Central-Northern regions with Cahora Bassa. Thecentral-north and central systems are scheduled to be connected by1988/1989 through the commissioning of a new substation at Chimoio whichwill link the 220 kV Linha Centro-Sul (Cahora Bassa/Tete to Chimoio) withthe 511 system. The program for the Linha Centro-Norte was started in1980 to meet forecast new power demands from substantial agricultural andagroindustrial developments which have not been realized, and for whichthere is presently no firm program, due to disruption to economicactivity by armed bands since the early 1980s.
4.10 Minor transmission works are presently being constructed tointerconnect load centers in the Limpopo and Incomati river basins withMaputo by means of a 110 kV transmission network. Transmission spurs at110 kV are planned to run from the main central-northern transmissionsystem to serve siseable load centers such as Marromeu, Luabo and Guruein the center-north, and Pemba, Cuamba, Angoche and Montepuez in the
- 70 -
north. Ertensions to distribution networks along the northern trans-mission line are also planned. A schedule of projects undertaken in theperiod 1980-85 is shown in Annex 32. The total cost of these projectswas about MT 10 thousand million (US$250 million)i of which 831 wasincurred in foreign currencies.
4.11 The main issues facing EDM are the backlog of maintenance workon power facilities and EM's difficulties in carrying out operationsefficiently. Itports to RSA from Cahora Bassa through repairs to thesabotaged transmission lines are the responsibility of HCB. Only urgentmaintenance work on the EDM system has been carried out with assistancefrom Norway, Italy and Holland for supply of imported materials. EDM ispresently installing remote system control facilities in Maputo withSwedish assistance, required to discriminate between distribution feedersand thus favor key power users for the economy. The mission considersthat the provision of such facilities in Beira as well should be givenpriority, especially if unplanned disruptions to power supplies arelikely to continue.
4.12 1DM 'as insufficient maintenance and transport equipment whichhinders the efficiency of system operations. A survey of EDM's transportrequirements in the Maputo area has been undertaken with Norwegianassistance. The mission supports the strategy of giving priority torehabilitation of ED's system, including maintenance work on some of theunits in the Maputo power station for which an inspection report wasprepared in 1985 under USAID assistance (Annex 33). Other highpriorities are to survey and reinforce the transmission lines from RSA toMaputo and from the central hydroelectric staSions to Beira, upgradetransmission equipment and substation transformer capacity in Maputo, andperform maintenance work on distribution systems. Maintenance andtransport equipment are also required, together with training of EDNstaff to improve operating performance. EDM has alr6ady started to dealwith this problem with technical assistance from various sources, and themission recomends that a long-term program for overhauling the standardsfor distribution system be prepared to rationalise repairs, replacementand system development. Technical assistance should be provided to 1DMfor the following aspects of distribution engineering: design criteria,construction standards, technical specifications, stores administration,and consumer services including metering.
4.X3 Shortages of equipment and material have severely restrictedthe rate at which houses are connected to the public electricity system,and EDM has a substantial backlog of requests for connections. Theseshortages result in substantial cost to the national economy sinceelectricity is a low-cost source of energy for the residential sector(Chapter 2). The mission recommends that EDM, with technical assistance,evaluate the scope for extending electricity supply to urban house-holds. BDM organizes its own imports, which have been limited byshortage of foreign currency.
- 71
4.14 Private sector contractors obtain supplies principally on theparallel market which is financed partly by remittances from migrantworkers from R8A. As a result, rhere is a lack of standardization ofmaterials and parts. Nevertheleso, the materials available areinsufficient to meet demand, and this causes substantial idleness amongprivate tradesmen. Elimination of shortages of materials and equipmentshould be a priority for implementing the recommended policy of extendingthe use of electricity in households. The present system of allocatingimported goods through Interelectrica is intended to direct supplies toMEZEL, Ilectromoc and DINEL, but it has not worked efficiently. The
mission recouends that a coordinating mechanism be established toimprove the supply of materials, to order in bulk, and to standardise thespecifications of materials and parts. One arrangement could be for SEWto manage a program of household electrification through allowing privatecontractors to bid for materials that EDM has obtained.
, Power
4.15 In mid-1985, MD was employing 3,809 staff of which 1,036 weresemi-skilled workers (mainly electricians and mechanics), 610 were inclerical grades, and 2,110 were unskilled, in addition to 90 skilledworkers and 30 senior level staff in engineering, professional,managerial and technical grades. About 1,370 other workers were employedon construction projects. ISDl estimates that it will need 159 additionalskilled staff during the next three years to maintain operationss 43professional and managerial staff, 55 technicians, 26 accountonts and 35skilled workers. This quantity of trained staff is not available inMosambique. EDM's own training program cannot achieve this output andfurthermore, ODN will lose some staff because of- the low level ofwages. Thus, expatriate assistance will be required for some time.lowever, the mission recommends that Govermment allow MDM to offer betterincentives to keep skilled staff and thus minimize the considerableexpense of employing expatriates.
4.16 EDl's shortage of skilled manpower has been partly relieved bya substantial nuber of expatriate staff. In mid-1985, there were 80expatriates (23 engineers and 57 technicians) mainly from Portugal, butwith some from Norway, Sweden and Italy. The total complement of seniorstaff is low for the scale of SD!"'s operations. Furtherdore, the numberof expatriate technicians has been declining without being offset by anincrease in comparably qualified and experienced local technicians due tolack of suitable counterparts. The only viable long-term solution to theshortage of skilled manpower is to mount a major training effort whichwill require substantial external support.
4.17 IED has developed a good basis for carrying out training forwhich it is receiving substantial support from Italy, Norway andSweden. The Italian assistance is a two-year program with a budget ofUS$662,000 to train workers in installation and maintenance oftrasmission and distribution lines and transformers, and to providestaff for maintenance workshops, laboratories and telecontrols for
- 72 -
substations. The Norwegian aseistance has provided equipment costingabout US$1 million for EDN's training center and has financed courses andteaching materials that have been subcontracted to Electricidade dePortugal (EDP) for US$200,000. Sweden has provided assistance valued atabout US$1 million for training, providing engineers for the operation ofthe new central-northern transmission system, supporting EDM's engineersin the southern system, and studying the feasibility of a system controlcenter for the Raputo area. For the short to medium term, EDM willcontinue to require external assistance for running its trainingcenter.
4.18 EDM's training center, Centro de Formacao Profissional, islocated in Maputo and is equipped to provide basic training. Mm1 hasalso made a considerable effort to improve the general educationalstandard of its workers. From 1981 to 1984, the training center offeredseveral courses for the general and technical education of young schoolleavers to prepare them for careers in the power industry. About 120electricians had been trained by 1985.
4.19 The training center is presently understaffed for carrying outa program to reduce ED8's shortage of qualified manpower. The futurerole of the center should be determined in the context of an overallmanpower development program for 3DM. A study into EDO's personnelmanagement practices was started in 1985 with EDP assistance and is beingfinanced under Norwegian aid. The mission recommends that a manpowerdevelopment program be prepared to define the future role of the trainingcenter, and to present estimates of costs. Although cost estimates arenot available, it is clear that major funding will be required to provideexpatriate staff for operations, to support the present level of manpowertraining and to expand the training facilities and activities to meet themanpower needs of the power system. However, the full benefits from amajor training effort would only be realised with the introduction of asound policy for retaining skilled staff through satisfactory employmentconditions. In this contest, the mission supports Government's recentlegislation to allow enterprises to implement the necessary policies.
Historic Demand and Supply
4.20 The supply of power in Mosambique, excluding exports fromCahora Bassa, increased from 586 GWh in 19878 to 645 GWh in 1983 and thendeclined to 545 GWh in 1985. There have been two major changes in thepattern of supply. First, there has been the advent of imported powerfrom Cahora Bassa. Second, the activities of armed bands have cut powersupplies and suppressed growth in consumption of power, particularly inthe industrial sector, and have even resulted in a reduction inconsumption, mainly in the Beira area. Over the period 1978-1983, theaverage annual rate of growth in consumption on EDH's southern system wasabout 4Z, whereas the consumption in the SHER system in 1985 was onlyabout half the level before 1982. Consumption in the southern systemalso declined from 1983 to 1985 due to supply interruptions. Consumptionof power in the northern region increased by about 502 between 1979 and
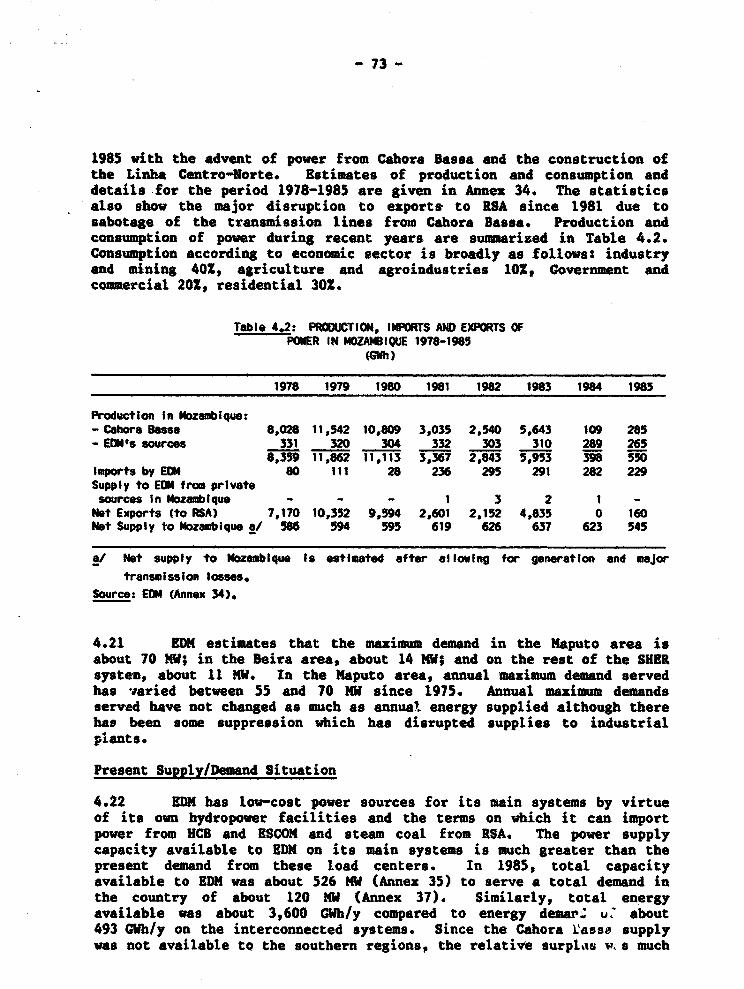
- 73 -
1985 with the advent of power from Cahora Bassa and the construction ofthe Linha Centro-Norte. Estimates of production and consumption anddetails for the period 1978-1985 are given in Annex 34. The statisticsalso show the major disruption to exports to RSA since 1981 due tosabotage of the transmission lines from Cahora Bassa. Production andconsumption of power during recent years are summarized in Table 4.2.Consumption according to economic sector is broadly as follows: industryand mining 40Z, agriculture and agroindustries 10, Government andcommercial 20Z, residential 30X.
Table 4.2: PROOUCTION, IMPORTS AND EXPORTS OFPOWER IN MOZAMBIQUE 1976-1985
(GWh)
1978 1979 1980 1981 1982 1983 1984 1985
Production in Mozambique:- Cahora Bassa 8,028 11,542 10,809 3,035 2,540 5,643 109 285- EOM's sources 331 320 304 332 303 310 289 265
8,359 11,862 11,113 3,367 2,843 S,953 398 550Imports by EON 80 111 28 236 295 291 282 229Supply to EOM from privatesources In Nozambique - - - 1 3 2 1 -
Net Exports (to RSA) 7,170 10,352 9,594 2,601 2,152 4,835 0 160Not Supply to Mozambique a/ 586 594 595 619 626 637 623 545
a/ Net supply to Mozeambique Is estimated after allowing for generation and major
transmission losses.
Source: EOM (Annex 34),.
4.21 EDM estimates that the maximum demand in the Maputo area isabout 70 MK; in the Beira area, about 14 MW; and on the rest of the SHERsystem, about 11 MW. In the Maputo area, annual maximum demand servedhas varied between 55 and 70 MS since 1975. Annual maximum demandsserved have not changed as much as annual energy supplied although therehas been some suppression which has disrupted supplies to industrialplants.
Present Supply/Demand Situation
4.22 EDM has low-cost power sources for its main systems by virtueof its own hydropower facilities and the terms on which it can importpower from HCB and ESCOM and steam coal from RSA. The power supplycapacity available to EDM on its main systems is much greater than thepresent demand from these load centers. In 1985, total capacityavailable to EDM was about 526 MW (Annex 35) to serve a total demand inthe country of about 120 MW (Annex 37). Similarly, total energyavailable was about 3,600 GWh/y compared to energy demar2 u. about493 GCh/y on the interconnected systems. Since the Cahora *'asse supplywas not available to the southern regions, the relative surpl-s wv s much
- 74 -
greater ir the Central-Northern regions than in the Southern region.Details of the supply capabilities and marginal economic costs for powerfrom existing generating facilities are given in Annex 35. Much of thesurplus generating capacity could be taken up if EDM concludes agreementsto export substantial quantities of power to Zimbabwe and Malawi. Themain uncertainty in this reassuring scenario is the vulnerability of thetransmission links to a continuation of acts of sabotage. Thus, theMaputo power station is important for security of supply to the Maputoarea.
4.23 The supply of power from Cahora Bassa to RSA and Mozambique iscovered by three interlinked contracts between HCS, ESCOM and EDM thatwere signed during 1984 and which replaced the original supply con-tracts. Under these contracts, HCB can supply EDM with up to 200 MV attwo locations, namely at Komatipoort on the border with RSA to supplyEDN's southern system (Maputo) through the ESCOM system, and directlyfrom Cahora Bassa to EDM's central-north system. In the second half of1985 EDM contracted to be supplied with a maximum demand of 86 MW (69 MWat Komatipoort, 17 MV directly from Cohora Bassa).
4.24 When power supplies from Cahora Bassa are firm and near to thecontractual maximum demand (1,450 MW), the average cost to ESCOM isequivalent to about Rle per kWh. This cost is comparable with thevariable costs of generation from ESCOM's large coal-fired generatingfacilities which benefit from very low coal costs. At the exchange rateprevailing at the time of signature of the contracts, this tariff wasequivalent to about US 0.8 cents/kWh which is low by world standards.With the subsequent eepreciation in the value of the Randl, the ratedeclined to about US 0.4 cents/kWh by mid 1986. This decline is notreflected in payments since there has been no trade in Cabora Bassa powerwith ESCOM in 1985 and 1986. However, there is provision for review ofthe tariff resulting from fluctuation in the value of the rand. Thus, itis possible that the tariff will be renegotiated to reflect the originalrate in U8$ terms once supply in resumed from Cabora Bassa.
4.25 Mosambique suffers a significant loss in foreign currency whenthe supply from Cahora ?iassa to RSA is not firm (e.g., when the trans-mission lines between Cahora Bassa and Apollo (RSA) are not in opera-tion). The major loss for Mozambique is that 1DM mw-t pay ESCOM in hardcurrency for the power supplied to Maputo and at a higher tariff thenwhen the supply from Cahora Bassa is firm. For the supply to the Maputoarea, in 1985 at ESCOM's tariff for that year EDM would pay annuallyabout R 12 million. If the supply from Cahora Bassa had been firm, thepayments would have been R 0.8 million in hard currency plus R 3.0 mil-lion equivalent in meticais. In addition, Mozambique has a share in thereliability premium payable by ESCOM to HCB when the Cahora Bassa supplyis firm, which is worth about R 10 million to Mozambique at the maximumguaranteed supply. Thus, Nozambique lost in 1985 the equivalent of aboutR 22 million (US$10.5 million) in hard curreacy from the trade in powerbecause the transmission facilities from Cahora Bassa to RSA were notoperational.

- 75 -
4.26 ESCOM's tariff level for bulk supplies, which EMR pays whenESCON is not receiving a firm supoly from Cahora Bassa, is low by worldstandards even though it is substantially greater than the total ratethat EDM pays to NCR and 8SCOM when the Cahora Bassa supply is firm(about R 1.25/kWh). The energy charge in the bulk tariff was R cents1.625 (USCO.8) per kWh in 1985, and the maximum demand charge was R 8.38(US$4.2) per kVA of maximum demand per month. With this tariffstructure, the average cost of power increases as the load factordecreases, which has implications for EDM. Under uninterrupted supplyconditions from the ESCOM system to Maputo, EM.'s load factor on the bulksupply is about 65X and the average cost is about R cents 4/kWh.However, when the transmission line to Maputo is out -1 operation, themonthly load factor typically declines to about 351, and the average costof supply increases to about R cents 6/kWh. Of concern to Mozambique iswhether the substantial and sustained rise in ESCOM's tariffs, which havedoubled between 1981 and 4986 in rand terms, is likely to continue.
4.27 The present security problems, the poor condition of the coal-fired generating units at Maputo power station and the limited sub-trans-mission capacity in the Maputo area dictate EDN's current operatingstrategy for meeting demand in Maputo. EDM has to keep some of the coalunits on spinning reserve, meet demands in excess of its supply from RSAby operating the coal units and gas turbines, and minimize the risks ofbreakdowns on the units at Maputo power station in their present con-dition. The least-cost merit order of supply to meet the demand inMaputo when the supply from Cahors Bassa to RSA is not firm is to useESCON's bulk supply at the highest possible load factor, and to use thecoal units to minimise the influence of ESCON's demand charge on theaverage cost of supply. This situation does not apply of course, whenEON benefits from its entitlement to power from Cahora Bassa.
4.28 Coal for Naputo power station is imported from RSA since it hasbeen much cheaper than coal supplied from Moaambique's mines in Noatize.In addition, supplies from Moatise to Beira and thence to Maputo havebeen curtailed since 1983 by sabotage and deterioration of the railwaytrack. In mid 1985 3DM was paying R 17 per tonne of coal at minemouth inISA, payable in hard currency. However, EDM pays in meticais the railtransport cost equivalent to R 15 per tonne and the costs of dmurrage andstorage at an average rate of R 5 per tonne. The fuel cost of powerproduced from the coal units is equivalent to about USC1.5 per kWh.Mozambique benefitted from a substantial drop in the cost of power andcoal imported from RISA due to the depreciation of the Rand in 1984 and1985. Conversely, Noxambique's power costs are also vulnerable to thepossibility of an appreciation of the Rand relative to the metical aswell as to increases in mine-mouth prices.
3DM's Tariffs
4.29 The tariffs that EDM inherited from the munitipal electricitysupply entities had not been changed since the mid-1960s and wereantiquated and complex. In 1981, EDM submitted a proposal for a tariff
- 76 -
increase which was not approved by the Government. However, theredeveloped large and growing cost distortions, and financial deficitscontinued to increase under the present tariffs. In additica , substan-tial changes took place to EDM's- supply arrangements following majorinvestments in transmission facilities. EDM thus submitted another pro-posal in late 1984 for a major restructuring and increase in tariffswhich was approved in late 1985 and took effect from January 1986.According to EDM, the new tariffs increase average revenue by about 1202to about MT 3.7/kWh in comparison with the previous tariff. Thus, theaverage tariff is equivalent to USll/kWh, which is not low by thestandards of other countries with similar power resources, but this levelis computed at the greatly overvalued exchange rate.
4.30 There are three broad issues at stake for tariff setting,namely: (a) the extent to which the tariff structure gives the correctsignals to power consumers about the costs of their patterns of demand;(b) the need to establish tariff levels which enable EDM to satisfy itsfinan,ial objectives; and (c) the need for a mechanism that allowstariffs to be adjusted for major but unpredictable changes in supplycosts, particularly to imported fuel and power costs, such as would beprovided by a special clause in the tariff. The issue of relating energyprices to economic costs in an economy with gross distortions due to agreatly overvalued exchange rate, as in Mozambique, is discussed inChapter I. The discussion in the following paragraphs should thereforebe understood to be in relative price terms, as the absolute levels ofthese prices or tariffs depend in part on the choice of an exchange rate.
4C31 ED4's tariff structure is a reasonable reflection of theeconomic cost of meeting demand by incorporating a maximum demand chargeas well as an energy charge, defining the main tariff categoriesaccording to the voltage level at which a consumer is supplied, andincluding a charge for reactive energy. However, the tariffs differ fromthe costs of meeting demand on EDM's systems in a number of respectswhich are detailed in Annex 36. The mission recommends that thesedifferences be reduced or eliminated once EDM has improved its tillingsand collections systems. 50/ The main features of the tariffs aresummarized in Table 4.3.
S0/ Para. 4.40.
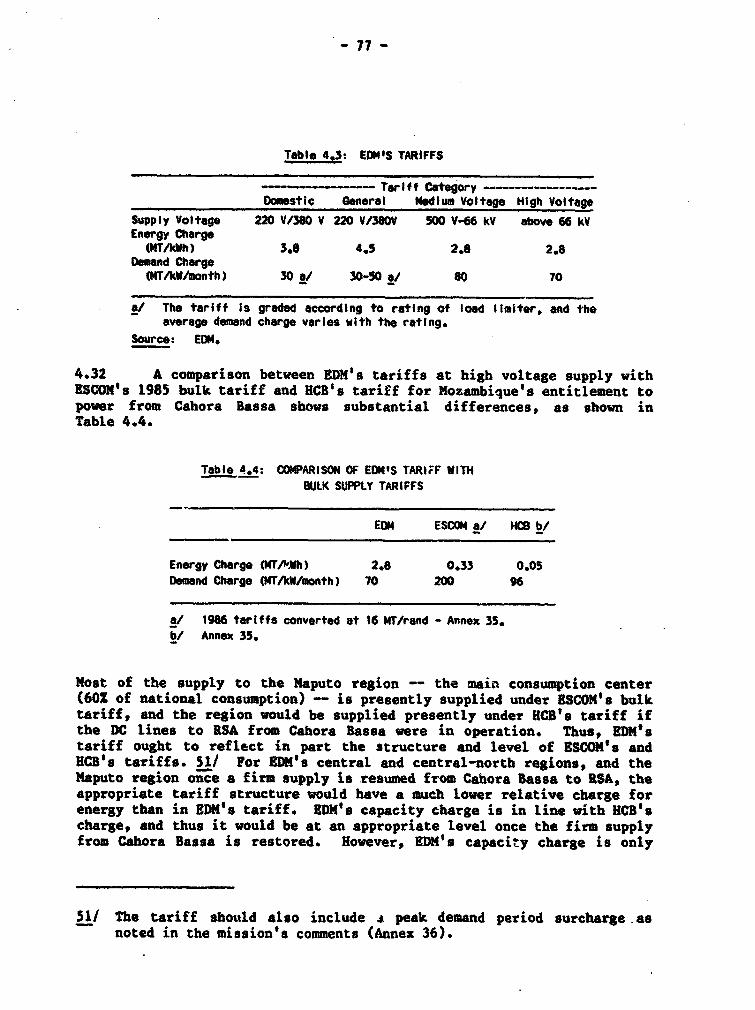
- 77 -
Table 4.3: EDMNS TARIFFS
Twritf CategoryDomestic General Medium Voltage High Voltage
Supply Voltage 220 V/380 V 220 V/380V 500 V-66 kV above 66 kVEnergy Charge
fMT/kWh) 3.8 4.5 2.8 2.8Demand Charge
fAT/kW/month) 30 a/ 30-50 a/ 80 70
a/ The tariff Is graded according to rating of load limiter, and theaverage demand charge varies with the rating.
Source: EDY.
4.32 A comparison between EDM's tariffs at high voltage supply withESCOW's 1985 bulk tariff and HCB's tariff for Mozambique's entitlement topower from Cahora Bassa shows substantial differences, as shown inTable 4.4.
Table 4.4: COMPARISON OF EDMOS TARIFF WITH
BULK SUPPLY TARIFFS
EON ESCOM a/ HCB b/
Energy Charge fMTA.Wh) 2.8 0.33 0.05Demand Charge (MT/kM/month) 70 200 96
a/ 1986 tariffs converted at 16 MT/rand - Annex 35.
b/ Annex 35.
Most of the supply to the Maputo region -- the main consumption center(60X of national consumption) - is presently supplied under ESCOM'. bulktariff, and the region would be supplied presently under HCB's tariff ifthe DC lines to RSA from Cahora Bassa were in operation. Thus, EDM'stariff ought to reflect in part the structure and level of ESCO's andRCB's tariffs. 51/ For EDM's central and central-north regions, and theMaputo region once a firm supply is resumed from Cabora Bassa to RSA, theappropriate tariff structure would have a much lower relative charge forenergy than in ED3's tariff. EDM's capacity charge is in line with HCB'scharge, and thus it would be at an appropriate level once the firm supplyfrom Cahora Bassa is restored. However, EDN's capacity charge is only
51/ The tariff should also include A peak demand period surcharge asnoted in the mission's comments (Annex 36).
- 78 -
about 30X of the charge in RSCOM's bulk tariff, and therefore the lengthof delay in restoring the CB supply is an issue for tariff setting.
4.33 8DM generates most of its cash requirements from an energycharge of between 2.8 and 4.5 MT/kWh on systems supplied withhydroelectricity or by ESCOM in which energy costs to the utility arezero or extremely low. This enables DM to provide subsidies toconsumers on isolated systems whos energy costs are in the range of 5 to8 MT/kWh. The mission considers Government and 3DM should consider atransition to higher energy charges on isolated systems.
4.34 The mission recommends that EDM commission a study of itstariffs that examines both the costs of meeting demand and 3DN'sfinancial requirements. The study's recommendations should take accountof the scope for reducing operating costs and for improving EDM'soperational capability, notably its systems for accounting, managementinformation, meter reading and maintenance, billing and collections. Thestudy should estimate the cost of implementing a new tariff system,particularly for new meters and operator training, and specificallyassess the level of connection charges that are appropriate to a policyof extending the use of electricity in households. The tariff studyshould be undertaken in conjunction with the system operations studyrecommended by the mission since the latter would be required to provideestimates of costs of meeting demand.
EDM's Financial Position and Practices
4.35 EDm's financial position has been deteriorating since 1980 andis presently in a serious state. A major cause of the deterioration isGovernment's policy of not increasing power tariffs before 1986. Othermajor problems are the large amount of unpaid bills and the six-monthbacklog of billings. In 1985, cash receipts covered only about 70% ofcash expenses and about 502 of total operating costs (includingamortizaLion). The depreciation of the rand in 1984 and 1985 has reducedthe cost in meticais of power from ESCOK and of power station coal fromRSA, but these decreases have been off-set subsequently by priceincreases. 52/ RDM has had to draw extensively on its credit with Bancode Mozambique, and at end 1984 EDM's account was in deficit by aboutMT260 million (US$6 million), equivalent to about 3 months' revenues fromannual billings of about MT1,OOQ million (US$23.3 million) at 1984tariffs. 3DM estimates its annual losses excluding amortization to havebeen MT 1.25 million (US$0.3 million) in 1984 and MT 1.45 million(US$0.34 million) in 1985. With the tariff increase implemented inJanuary 1986, under normal operating conditions, EDM anticipate that itwill make a small loss in 1986 of about MT 0.1 million. With the
52/ These prices when expressed in Mozambican currency terms, arealready artificially low because of the overvaluation of theMetical.
- 79 -
inclusion of depreciationt 1DM was operating at an annual loss in 1985 ofabout MT2,500 million (US$57 million).
4.36 Payments for imported power and fuel, which in 1985 amounted toabout MT900 million (US$22 million), are the largest item of cashexpenditure in EDM's optrations and account for about 60X of total cashexpenditure. Thus, EDN's cashflow position is highly sensitive tochanges in the prizes of imported power and coal (from RSA) and petroleumfuels and to any exrchange rate movements. A mechanism is required forrevising tariffs in response to changes in production costs. EDMreceives annual grants from Norway and Holland (about US$1.7 millionequivalent) for the import of materials and equipment for operations.The grants account for most of EDM's foreign purchases for these itemsand are a vital support.
4.37 EDM's cash-flow problems are aggravated by difficulties withcollections. EDM has computerized the production of monthly statementsof consumer accounts, yet outstanding debts owed to EDM have beenincreasing steadily from MT530 million at end 1980 to MT850 million(US$20 million) at end 1984 which is equivalent to about 10 months ofbillings in 1984. About 60X of the total debts are owed by Governmentand public organizations, and Government is giving support to 5DM forcollection of revenues. These data understate the true rate of increasesince EDM has a policy of writing off debts after three years forhousehold consumers. KDM estimates that collections in some areas ofMozambique are running at less than 50% of billings, while billingsthemselves show a six-month backlog.
4.38 In turn, eDM's debts to its creditors have increased fromMT269 million at end 1980 to MT1,460 million (US$34 million) at end1984. Most of the amount owed to creditors at end 1984 was to Governmentand public organizations. A major creditor was PETROMOC (for petroleumfuels). SHER is also a creditor since it is still treated as a thirdparty in EDM's accounts because of the delay in consolidating theaccounts of EDM and SHER.
4.39 EDM has not been able to implement a sound system for col-lecting and recording its financial data due to lack of qualified staffand the diversity of the accounting systems that it inherited. Conse-quently, EDM has produced only provisional sets of accounts which havenot been prepared to international standards. EDM has not been able toproduce consolidated balance sheets because the Ministry of Finance hasnot yet approved the valuation of assets taken over by EDM. The missionrecommends that EDM be granted a legal status and a capital s;:ructurewhich enables EDM to implement and operate major new investments.
4.40 In late 1985, 5DM took delivery of an IBM 36 computer, financedby Norway, to replace its aging computer. EDM is presently tackling thebacklog of work on preparing reliable, consolidated accounts from 1980onwards. The advent of the new computer provides both the need and theopportunity to institute a major overhaul of EDM's eccounting systems and
s 80 -
a program of staff training. The opportunity should also be taken tointroduce a modern management information system to improve the operatingefficiency of the company. There is also a need to set up a modernsystem for controlling stocks because the existing system is unsatis-factory. The mission recommends that ROM obtain technical assistance forthese purposes as a matter of priority.
Power Resources
4.41 Mozambique is extremely well endowed with indigenous resourcesfor power generation, particularly with hydroelectric potential, but alsowith coal and natural gas. However, there are presently substantialconstraints to the development of these resources or, a large-scale,notably the smallness and dispersion of the domestic market for power,the limited potential of neighboring power export markets, and theremoteness of the resources from the main load centers.
4.42 Coal-fired steam generation of power is unlikely to be com-petitive with hydroelectric resources. A new power station located bythe Moatize coal deposits could supply power to the existing transmissionnetwork at an estimated average cost of about USC6.5/kWh, 531 compared toa cost of about USC1.5/kWh for power from the proposed Cahora Bassa Stage2 project. 54/
4.43 Gas turbines located in natura.. gas fields at Pande andprospectively, Temane for power generation would yield a negative net-back value for gas in this use after allowing for the major investmentsrequired, and by valuing the power produced on the basis of the least-cost alternative, namely hydroelectricity. Transmission of gas by pipe-line to Maputo for power generation (as one of a number of uses for thegas) does not appear economically justified (Chapter 3). However, ENH isconsidering the use of Temane gas, transptorted by sea, for fuelling back-up generators in Beira.
4.44 The country's power resource that offers the best economic casefor development is its hydroelectric potential, both in sites with largepotential such as Cahora Bassa, and in numerous sites with relativelysmall potential. The hydropower potential of Mozambique has been sur-veyed during the last three decades and there is now substantial infor-mation available in terms of sites, river flow data, and possible projectconfigurations. Many potential projects have been prepared to pre-feasi-bility level, and some are at feasibility level. Much of the main surveywork has been carried out by tnree agencies, during the 1960's and 1970'sby Hidrotkcnica Portuguesa and the Direc9ao dos Servicos Hidraulicos, andduring the 1980's by Norconsult under the Norwegian aid program. More
53/ Annex 46.
34/ Para. 4.46.
81 -
than a hundred sites that have hydroelectric potential have beenidentified throughout the country, some of them near to existing orpotential load centers. The total annual hydroelectric generating capa-city in the country has been broadly estimated at 12,500 NW with anindicative estimate of total annual generation of 60,000 GWh. Due to theprospective surplus of available capacity, the extensive survey workalready undertaken and poor prospects for development of major new exportmarkets or large industrial plants in Mozambique, the mission recommendsa marked slowdown in hydroelectric surveys.
4.45 The hydroelectric potential can be categorized for planningpurposes according to four zones whicti are defined by the principalrivers that cross the country eastwards to the coast:
(a) the zone that lies to the south of the River Save, which has arelatively low potential of about 230 MW but which also liesnear the main area of economic activity in the country, namelythe Maputo region and the agricultural region in the Limpopovalley;
(b) the zone that lies between the basins of the Save and Zambezirivers, including the Pungoe, Revue (on which the two existingSHER hydroelectric plants lie) and Buzi rivers, where thepotential is about 1,150 MW;
(c) the Zambezi river basin which has a potential of about 10,000MW/45,000 CWh per year of which two-thirds are on the Zambeziitself. 6,500 MW of this potential lies at four dam sites 551within a stretch of river of only 230 km; and
(d) the zone that is north of the Zambesi basin with a potential ofabout 1,100 MW. Some of the most promising sites are in theLugio and Lugenda river basins. The river flows at many sitesare highly seasonal, so that complementary thermal capacitywould have to be investigated in light of the requirement forfirm power.
Cahora Bassa Developments
4.46 MDM has been promoting the development of the Cahora BassaStage 2 project since 1982, assisted by its consultants SWECO ,AndSWEDPOWER, principally for export since the prospective demand inMozambique is too small to justify the project at least for the next tenyears. Preliminary design work has been undertaken for a new undergroundpower station located on the north bank of the Zambezi river at CahoraBassa, even though a market has not been established for the output. The
55/ Cahora Bassa - 3,600 MW; Nepanda Unca - 1,800 M"; Boroma - 450 KW;Lupata - 650 KW.

- 82 -
proposed turbo-generating installations would be six units each of 200 NWoutput, totalling 1,200 MV. The capabilities of the complex aresummarized in Table 4.5.
Table 4.5: CAPABILITIES OF THE CHOR BASSA OWPLEX
POWer FirmCepabilIty Energy
(3W) (GWh/year)
Stage Installation: 2,075 14,000Stag 2 Installation: 1.200 _5.800 a/
TotalI:- 3,275 18,500/19,500 b/
a/ Incremsntal energy to Stage I capability.b/ 16,400 GS/year if the two installations are operated
Independently;19,500 SOOhyear approximately If the operations of thoInstallations are coordinated, thus effectively allowingpower from the fIfth unit In the Stage I Installation tobe considered as firm.
Source: ECK and SECO: ACahorw Bassa Stae 2: Pre-lnvest-ment Report" (1982).
SVEC0 estimated the cost of the proposed stage 2 project at US$512 mil-lion in 1982 prices, excluding interest during construction endassociated transamission costs. Thus, the project would be able to supplya large amount of power at a very low cost of about USOl.51/kVh of fir.energy at full utilization. 56/ According to 5W1C0, the constructionperiod for the Stage 2 project would be about seven years from award ofcontract to commissioning of the last unit to be installed. Additionaltime would be required beforehand to secure markets for tho output,arrange financing and prepare engineering designs.
4.47 The Stage 2 project started to be investigated on the basis offull rather than phased development for which ISA would be the onlylikely market. However, according to ESCOM, their criteria for syteamreliability appear to preclude the possibility of taking additional powerfrom Cahora Rassa at least until after the mid-1990's. Zimbabwe's least-cost power development program is to be updated by early 1987 and itcould include a major new source of energy between 1993 and 1995. The
56/ The average economic cost would be US cents 1.5/kWh of firm energyif computed from an economic life for the project of 30 years and anopportunity cost of capital of 12X (thus a capital recovery factorof 0.124), capital cost of US$512 million in constant price termsand incurred during the 7 years prior to comnissioning, firm energyof 5,800 Glh/ye&r, and 100l utilization.
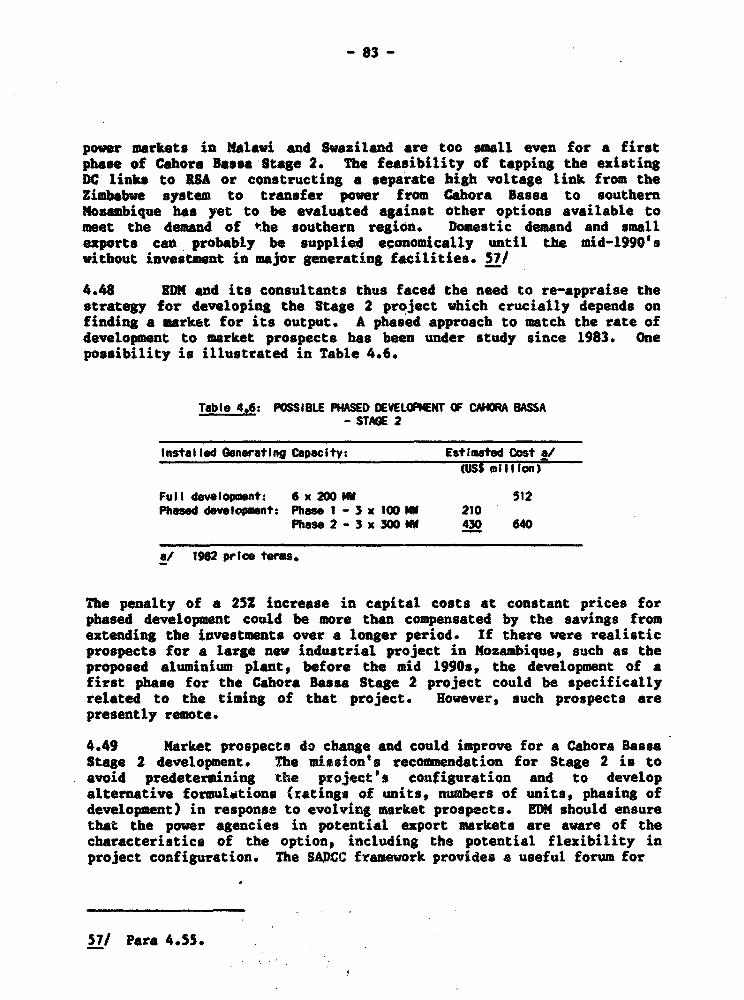
- 83 -
power markets in Malawi and Swaziland are too small even for a firstphase of Cdhora Bassa Stage 2. The feasibility of tapping the existingDC links to RSA or constructing a separate bigh voltage link from theZimbabwe system to transfer power from Cahora Bassa to southernMosambique has yet to be evaluated against other options available tomeet the demand of the southern region. Domestic demand and smallexports can probably be supplied economically until the mid-1990'swithout investment in major generating facilities. 57/
4.48 EDM and its consultants thus faced the need to re-appraise thestrategy for developing the Stage 2 project which crucially depends onfinding a market for its output. A phased approach to match the rate ofdevelopment to market prospects has been under study since 1983. Onepossibility is illustrated in Table 4.6.
Table 4.6: POSSIBLE PHASED DEVELOPENT OF CAHORA BASSA- STAGE 2
Installed GeneratIng Copecity: Estimted Cost a/
SUSS lliion)
Fu II development: 6 x 200 MN 512Phased developmnt: Phase 1 - 3 x 100 M1 210
Phase 2 - 3 x 300 M 430 640
a/ 19f2 price terms,
The penalty of a 25Z increase in capital costs at constant prices forphased development could be more than compensated by the savings fromextending the investments over a longer period. If there were realisticprospects for a large new industrial project in Nozambique, such as theproposed aluminium plants before the mid 19909, the development of afirst phase for the Cahora Bassa Stage 2 project could be specificallyrelated to the timing of that project. However, such prospects arepresently remote.
4.49 Market prospects do change and could improve for a Cahora BassaStage 2 development. The mission's recommendation for Stage 2 is toavoid predetermining the project's configuration and to developalternative formulations (ratings of units, numbers of units, phasing ofdevelopment) in response to evolving market prospects. EDM should ensurethat the power agencies in potential export markets are aware of thecharacteristics of the option, including the potential flexibility inproject configuration. The SADC5 framework provides a useful forum for
57/ Para 4.55.
84 -
this cooperative effort. Meanwhile, the mission supports EDM's effortsto promote exports from existing facilities.
4.50 EDM with it* consultants SWIECO, have also studied the potentialfor increasing power from the conjunctive use of the Kariba and CahoraBassa complexes on the Zambesi river. To obtain this increase, LakeKariba would be used as a regulator to keep up the reservoir level inLake Cahora Bassa, since more power can be generated from a given volumeof water at Cahora Bassa than at Kariba. The potential increase in totalfirm energy from the two complexes with conjunctive use of stored wateris estimated at 600 GWh per year. 1DM considers the Zimbabwe main systemas one of the potential markets for this output, and this option isscheduled for consideration in the updating work on Zimbabwe's powerdevelopment program. As with the Cahora Bassa Stage 2 project, themission recommends that this option be evaluated in the context of adevelopment program for the (multi-country) subregion.
Prospective Demand for Power
4.51 There is no basis at present for undertaking demand forecastingin Mozambique with any substantial degree of confidence. The main fac-tors that militate against application of standard forecasting techniquesfor power demand are the exceptionally high degree of uncertainty aboutfuture economic activity, the absence of historic trends based on stableeconomic conditions, and the inadequacy of the past records of powersystem performance. Forecasting also requires an explicit assumptionabout the timing of any long-term recovery in the economy, which dependson the return of peace to the countryside. The ability of Mozambique toattract investment resources is also uncertain and this introducesanother unknown in forecasting demand for power.
4.52 EDM faces a number of planning issues for operation anddevelopment of its systems which require some view of future demand forpower. In this situation, it is helpful to construct scenarios for theevolution of demand which are not forecasts but are used to test policiesfor supplying load centers, tariffs, export promotion and investments,especially in transmission and sub-transmission facilities and small tomedium hydroelectric plants. The principal objective will be to meetdemand for power in Mozambique at least cost.
4.53 EDM and its consultants have outlined two possible scenariosfor the evolution of domestic demand for power on EDM's main systems to1990, which the mission has extended to 1995 (Annex 37). Scenario A ispredicated on a continuation of the present economic difficulties butcessation of acts of sabotage. Expansion will come mainly fromextensions to sub-transmission and distribution systems. Scenario Breflects a recovery in economic growth based on the directives of theFourth Party Congress in 1983 which emphasize rehabilitation andincreasing utilization of existing productive capacity, with some newcapital development only as required to eliminate bottlenecks.
- 85 -
Power Exports
4,54 Besides favoring a development strategy based on extort-oriented energy-intensive industrial projects, such as aluminium,iron/steel and ammnonia plants, Government is also seeking to developenergy exports from the country's large and low-cost energy resources.Government is keen to conclude agreements for exports supplied fromMozambique's present entitlement to power from Cahora Bassa and the SHERhydroelectric plants since these facilities are substantially under-utilized. The mission's assessment of the prospects for exporting poweris given in Annex 38. Up to the mid-1990's, there are reasonableprospects for exporting to Malawi, Eastern Zimbabwe and possibly, toSwaziland.
4.55 The mission has projected the supply/demand balance on EDMN'ssystem to 1995 (Annex 39) to assess the future availability of surplus,exportable, low-cost power from existing facilities. On the basis of anindicative analysis, it appears that EDM would be able to supplypresently anticipated exports to Zimbabwe, Malawi and Swaziland fromsurplus or low cost power capacity to the early 1990a without relying onESCON supply to make up for the exported power in meeting domesticdemand. However, the mission recommends that EDM explore with Zimbabweand HCB the possibility of routing additional power from existing faci-lities at Cahora Bassa resulting from conjunctive use of the Kariba andCahora Bassa complexes 58/ as part of a broader strategy for developingmajor trade in electricity in the long-term, particularly withZimbabwe. The proposed Zambezi hydrological project under the auspicesof SADCC would be a useful forum for bringing cooperation amongst theZambezi riverine states.
4.56 The operational links that exist or could exist between EDM'sthree systems should be explicitly taken into account in theidentification of feasible options for supplying new large loads, and toassess the economic cost of supplying a particular large power load orexport commitment as a basis for tariff-setting and evaluation ofproposed investments. For example, the economic cost of exporting power(from presently underutilized, low-cost hydroelectric capacity) is deter-mined by the need to use higher cost power sources (existing thermalunits, new hydroelectric facilities) to meet increases in system demandonce excess capacity is committed. The economic cost of supplying newloads from the main systems is required as the comparator for evaluatingthe development of small hydropower options as alternatives to extendingthe main transmission system.
58/ Pars 4.49.
86 -
Power Supply to Southern Mosambique
4.57 The least-cost mens of meeting demand for power in ErM'sSouthern Region needs to be evaluated to resolve a number of issues. Themain issues are tos (a) establish clear operational rules and proceduresfor the utilization of different power sources for meeting demand atleast economic cost to Mozambique, and to estimate the financial cost toEDM of meeting this demand; (b) establish the scope for expansion ofpower service to urban households; 59/ tc) determine the future role andjustifiable rehabilitation needs of the units in Maputo Pover Station;(d) assess the required upgrading of equipment on the RSAJMaputo trans-mission system and the Maputo sub-transmission system; (e) evaluate DN'sproposed hydropower projects in relation to security of supply 60/ andimported power, taking into account prospective increases in the costs ofESCOM's power and the prospective availability of power from CahoraBassa; and (f) quantify the economic cost to Mozambique of exporting toSwaziland.
4.58 Security of supply is also an important issue which turns onwhether DDM should continue to rely on a single-circuit transmission linefor most of the supply to Maputo, or whether to construct a secondcircuit to the line or a new line along a different route that runs nearto sites with hydropower potential. BDM also needs to consider thestrategic issue of being able to maintain power supply to key economicconsumers ir the Southern Region in the event of a prolonged loss ofsupply transmitted from external sources. The mission recommends thisstudy be given priority by EDM. Preparation of the study should draw oncompleted and ongoing studies by Norconsult into hydropower schemes inthe Region, on the review of the rehabilitation needs of Maputo PowerStation financed by USAID (Annex 33), and on the study financed by CIDAinto options for interconnecting Mozambique's Southern System with thepower system in Swaziland.
4.59 The prospects for resumption of firm power supply from CahoraBassa to RSA is a fundamental issue for power planning in the SouthernRegion. With resumption of supplies, EDN would have available a sub-stantial surplus of power relative to present demand at a much lower costthan any other source of power, either existing or prospective, in theRegion. In the absence of a firm supply from Cohora Bassa to RSA, thekey economic issue for power supply in the Southern Region is the extentto which local hydroelectric potential could justifiably displaceimported power from ESCOM or imported primary fuels for power generation(coal from RSA, diesel and jetfuel) in meeting the demand for power inthe Southern Region. Although a reduction in dependence on RSA for powersupplies (whether from BSCON or of coal for generating power) i- a
591 Chapter 2.
60/ Para. 4.58.
- 87 -
Government objective, cooperation with R9A is still a key component ofKouambique's strategy for maximizing the benefits from-its entitlement topower at very low cost-from Cahora Bassa since this strategy requires theuse of E5003's transmission facilities for the transmission of powerindirectly from Cahora Basis to Maputo.
4.6 CMN has identified a number of hydropower projects in theSouthern legion as options for meting increases in demand, exporting toSwailand or as part of a national strategy to reduce Mozambique'sdependence for power on external sources (Annex 40). The project that ismost advanced in its preparation, which is being funded under SADCC as aregional energy project, and for which tender documents have beenprepared by Norconsult, is a hydroelectric scheme at Corumana on theSabie River. The proposed project would have an installed capacity of14.5 MM and firm energy capability of 31 CGh per year. A dam has alreadybeen built for irrigation and river control purposes.
4.61 The evaluation of the Corumana project should be undertaken inthe context of the issues raised in paragraphs 4.57 and 4.58. Theproject has been evaluated by EDN's consultants as a regular source ofpower against alternative supply sources that do not involve the use ofCO's facilities. This evaluation concluded that the project will notbe economically justifiable when power from Cahora Bassa becomesavailable to the Southern Region but that the cost of power from Corumanawould be similar to the cost under ESCOM's bulk supply tariff in 1986.
4.62 The mission's indicative evaluation of the Corumana project instrictly economic terms, at mid-1985 exchange rates (Annex 40), based ondata reported by DMN's consultants, concludes that there would be noeconomic justification for the project when low cost power from CahoraBass becomes available to the Southern Region again. The mission'sevaluation also concludes that even in the case of a prolonged absence ofthe Cahora Bassa supply, the economic justification for the projectdepends on the availability and cost of power from the ESCON link. Underthe scenarios considered by the mission, it is concluded that, at mid-1985 exchange rates, the Corumana project would be a higher cost sourceof power than the E8003 bulk supply. The mission's evaluation of therole of Corumana for serving system peak loads shows that the installedcapacity at Corumans has to be sufficient to displace a substantialamount of energy that would otherwise be generated from gas turbines.The misaion considers that the generating capacity for Corumana needs tobe re-assessed, and in view of SWM's assessment of the project 61/, themission recommends that the role of the Corumana project be evaluatedunder the recoumended study for the Southern Region. 62/
61/ Para. 4.63.
62/ Pars. 4.57.

4.63 8DM considers that the Corumana project is justified as part ofa national strategy to reduce Nozambique's dependence on external sourcesand to ensure power supplies to key power users in the Southern Region inthe event of a prolonged disruption of the power suppl7 from RSA(together with the rehabilitation of Maputo Power Station and measuresfor demand management). EDM assesses the advantages of the Corumana insuch a situation to be a reliable power source which is not dependent onimported fuel and thus availability of foreign exchange. cDM alsoconsiders that a factor that favors the Corumana project is that fundsfor the capital costs are being made available under SADCC auspices as aregional energy project, partly because Corumana could also serve as aback-up source of power for Swaziland. These funds would only beavailable for a SADCC regional project.
4.64 EDM's consultants have studied a small project at PequenosLibombos (4 MV) on the Umbeluzi River which was planned primarily as aback-up power supply to the water supply installation which servesMaputo. Norconsult have concluded that this project is not the least-cost method of providing security. The project which offers the bestopportunity for economic development is at Massinger and is currentlybeing evaluated. This evaluation should be incorporated in thepreparation of a least-cost development program.
Power Supply to Central-Northern Mozambique
4.65 EDM's consultants, Norconsultt have reported on numerous siteswith hydro-potential in the central-northern regions of Mozambique thatwould be useful in planning industrial and agricultural developments.The main issue is the balance between development of isolated hydropowerstations and extensions to the main transmission system to new loadcenters. An associated issue is the extent to which the cost ofsupplying power is a significant factor in locating new industrial andagroindustrial plants. With the main transmission system virtually inplace, and many of the isolated hydroelectric sites lacking significantfirm power capability, the preferred strategy generally appears to beextension of the main system. Furthermore, the economic viability andtiming of substantial industrial and agricultural projects in the regionare highly uncertain. The mission therefore recommends that futuresurvey work for hydroelectric potential be conducted only for new loadswith reasonably firm prospects of implementation.
Priority Investments
4.66 Based on the foregoing review of the electricity subsector,EDM's priorities for investment up to 1991 would be according to theschedule shown in Table 4.7, in which the mission envisages an investmentprogram that costs about US$70 million in constant 1985 prices. Thisschedule does not include any major new investments in generatingcapacity, but gives priority to rehabilitation of existing facilities,improvements to operating efficiency and extension of supply to urbanhouseholds. The average annual level (US$14 million/year) is
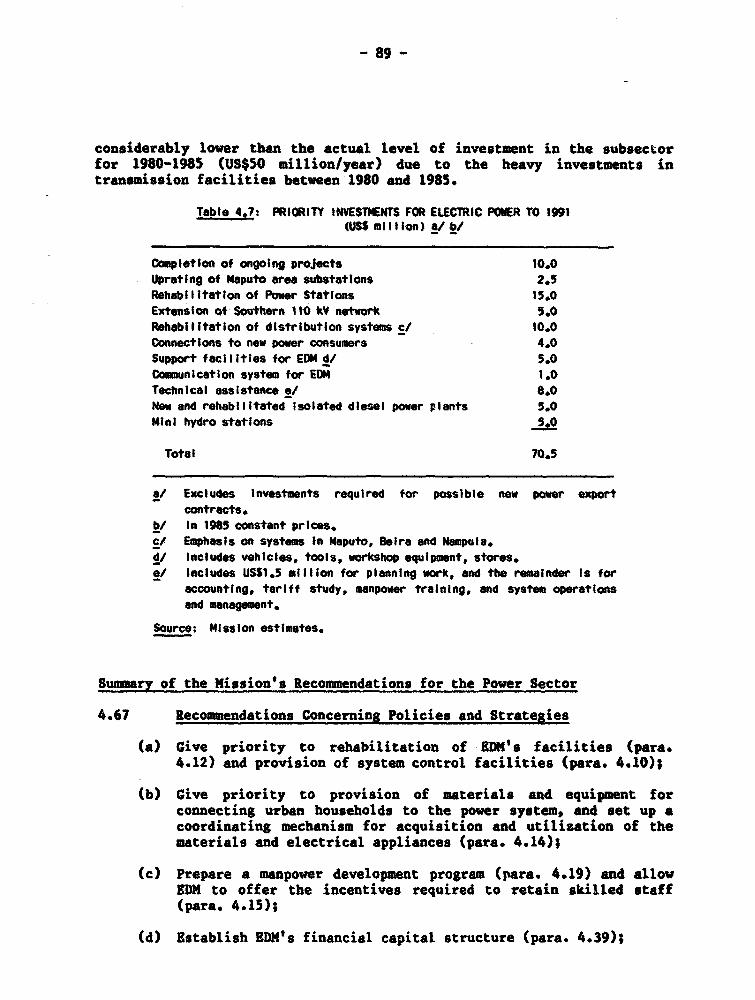
- 89 -
considerably lower than the actual level of investment in the subsectorfor 1980-1985 (US$50 million/year) due to the heavy investments intransmission facilities between 1980 and 1985.
Table 4.:? PRIORITY INVESTMENTS FOR ELECTRIC POWER TO 1991(USS million) a/b/
Completion of ongoing proJects 10.0
Uprating of Mtaputo are substatlons 2.5
Rehabilitation of Power Stations 15.0Extension of Southern 110 kV network 5.0Rehebilitation of distribution systems c/ 10.0Connections to new power consumers 4.0Support facilities for EOM d/ S.0
Communication system for EDM 1.0Technical assistance e/ 8.0New and rehabilitated isolated diesel power plants 5.0Mini hydro stations 5.0
Total 70.5
a/ Excludes Investments required for possible new power exportcontracts.
b/ in 1985 constant prices,cl Emphasis on systems in tMaputo, Beira and Nampula.d/ Includes vehicles, tools, workshop equipment, stores.0/ Includes iSSl.5 million for planning work, and the remainder Is for
accounting, tariff study, manpower training, and system operationsand management.
Source: Mission estimates.
Summary of the Mission's Recommendations for the Power Sector
4.67 Recommendations Concerning Policies and Strategies
(a) Give priority to rehabilitation of EDN's facilities (para.4.12) and provision of system control facilities (para. 4.10);
(b) Give priority to provision of materials and equipment forconnecting urban households to the power system, and set up acoordinating mechanism for acquisition and utilization of thematerials and electrical appliances (para. 4.14);
(c) Prepare a manpower development program (para. 4.19) and allowEDM to offer the incentives required to retain skilled staff(para. 4.15);
(d) Establish EDM's financial capital structure (para. 4.39);

-90-
(e) Survey hydropower potential primarily for specific new loads(para. 4.65);
(f) Keep open the formulation of the Cahora Bassa Stage 2 proJectwith alternative configurations and phasings until a firmmarket for the output is identified; SWl should ensure thatother power agencies are aware of flexibility in the formu-lation (para. 4.49);
(g) Determine the priority developments for supplying power to theSouthern Region (para. 4.57).
4,68 Recommendations for Studies and Technical Assistance to EDE
(a) Establish a program for overhauling the standards fordistribution systems (para. 4.12);
(b) Evaluate the scope for extending electricity supply to urbanhouseholds (para. 4.13);
(c) Evaluate the least-cost method of meeting demand for power in5DM's Southern Region (para. 4.57);
(d) Evaluate the use of power potentially available from conjunc-tive use of the Kariba and Cahora 8ass complexes (paras. 4.49and 4.55);
(e) Prepare a manpower development and training program (para.4.19);
(f) Undertake a tariff study (gara. 4.34);
(g) Design and implement new systems for management information andstock control (para. 4.40).
(h) Expatriate assistance for EDm' operations (para. 4.16).
- 91 -
V. CO*L 63/
Introduction
5.1 The main features of the coal subsector are the presentcessation of production due to deterioration and acts of sabotage torailway links between the mines and the main markets, and the highinvestment required in infrastructure for major expansion of productioncapacity. These handicaps presently preclude coal from playitg animportant role as a domestic source of energy and prejudice the prospectsof being a major earner of foreign exchange. Domestic prices are muchlower than the costs of production or import parity prices.Domestically, Mozambican coal faces competition from low-cost, importedSouth African coal, while current and prospective world market prices forcoal do not appear to be adequate to yield an attractive economic returnto investments for expanding Mosambican coal exports.
Coal Resources
5.2 There are three major known coal deposits, all located in thecentral-western part of the country at substantial distances from themain domestic markets and from the coast. The existing underground coalmines near Tete are located in one of these deposits, Moatize, andcurrent measures of the country's coal reserves cover this field alone.A number of minor coal occurrences are known to exist at several loca-tions in the country, but no systematic exploration has been carriedout. Annex 41 describes the better knovn of these occurrences, and mapno. IBRD 19515 shows their location and those of the three major depositswhich are described below.
(a) Moatize-Mi'ov The best known area, in Tete province,started being mined about 1920. There are six principal coalseams in the Noatize area which cover about 250 squarekilometers, and reserves are currently estimated at 87.1million tonnes proven, 736.5 million tonnes probable, and1144.6 million tonnes possible (Annex 42). Detailedexploration activity has been going on since 1979, first withassistance from the German Democratic Republic, andsubsequently from the Soviet Union. Plans have been preparedfor large scale exploitation of these reserves.
(b) Senanaoe (Estima): This coal basin is located 100 km west ofMoatize, south, st of the Cahora Bassa dam and it covers anarea of 550 km. Even though exploration drilling was carriedout during 1970-1975, little is known about the quality and
63/ It should be noted that the analysis and conclusions of this Chapterare not fully accepted by the Government.
- 92 -
quantity of coal in the basin, but it is judged that the areais underlain by coal seams. In 1985 the National Directorateof Mines invited bids for the development of 35,000 ha of thisbasin, and subsequently has been discussing an explorationcontract with British Petroleum. A successful private sectorbidder for the development of this basin would be responsiblefor making all necessary investments in infrastructure, and theGovernment would provide guarantees against nationalisation andfor the operator's right to repatriate earnings.
(c) Mucanha-Vusi: Nueanha-Vuzi is an area of 96 km2, 300 km to thewest of Noatize on the north shore of the Cahora Bassa lake,where coal occurs over 150 km. Seventy holes have been drilledand six coal seams found, of which the four intermediate onesare of potential economic interest. The coal potential of thisarea is considerable, and indicative estimates of reserves arearound 3 billiou tonnes. Development of these reserves wouldrequire construction of a 250 km railway to link the area tothe Moatize/Beira railway, and Government is giving this arealower priority than the other areas due to the high cost ofadditional infrastructure.
5.3 Potential coal bearing strata extend all the way alongMozambique's border with South Africa, and there is reportedly a coalmine close to the border in South Africa. Coal found in this area wouldbe relatively close to the main domestic market, Maputo, and to transportfacilities. The mission recommends that Government carry out furthergeological work in the southern border region prior to entering into com-mitments for large-scale investments in Moatize. The Government shouldalso develop a medium term (five to ten years) strategy for coal explo-ration. Assistance from bilateral agencies could be sought for carryingout this program.
Supply and Demand
5.4 Coal plays a relatively minor role in the Nozambican energybalance. Coal production, imports and consumption during the period 1978to 1984 are given in Annex 43 and summarized in Table 5.1.
5.5 Mozambique has one domestic supplier of coal, the Moatizeunderground coat mines near Tete which have been active since the1940s. A description of the mine developments at Moatize is given inAnnex 44. Companhia Carbonifera de Mocambique (called Carbomoc afternationalization) started work on an industrial scale in the 1950s, and atthe end of the decade it was producing over 250,000 tpy. Productionpeaked in 1975 at 575,000 tons run-of-mine (r.o.m.) and then declined to553,000 tons r.o.m. in 1976 and 288,000 tons in 1977 (due to uandergroundgas and coaldust explosions). Production declines since 1981 are theresult of deficiencies of supplies and disruption of the rail link toBeira due to acts of sabotage. During 1978-84, 55% of productionconsisted of coking coal. Exports accounted for 56% of total production,
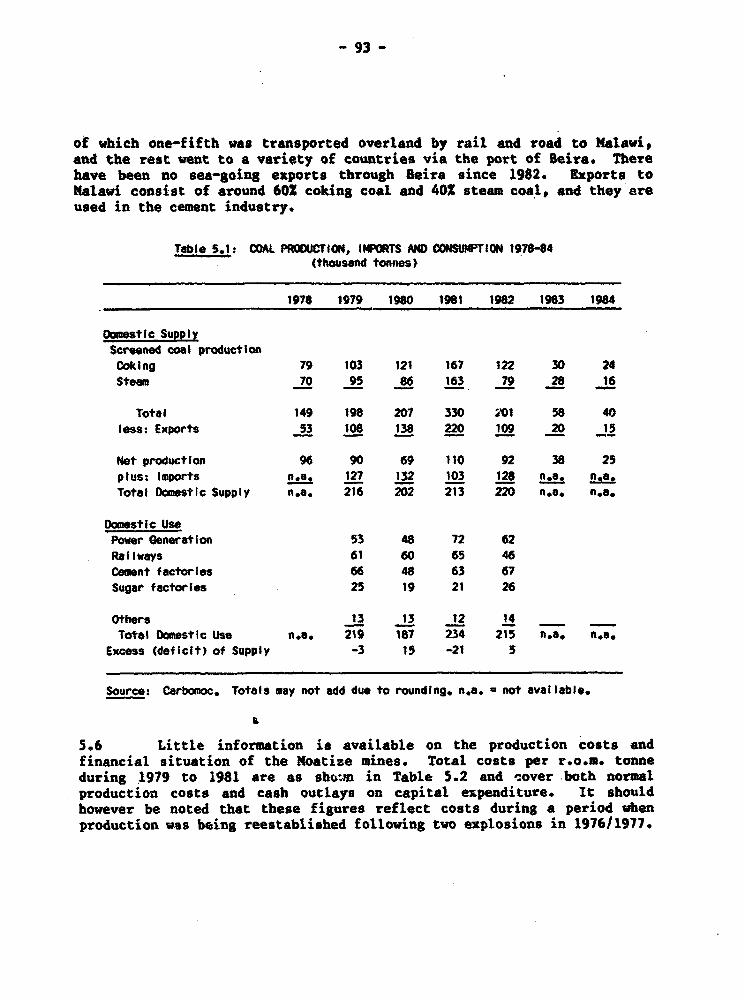
- 93 -
of which one-fifth was transported overland by rail and road to Malawi,and the rest went to a variety of countries via the port of Beira. Therehave been no sea-going exports through Beira since 1982. Exports toMalawi consist of around 60X coking coal and 40X steam coal, and they areused in the cement industry.
Table 5.1: COAL PRODUCTION, IMPORTS AND CONSUMPTION 1978-84(thousand tonnies)
1978 1979 1980 1981 1982 1983 1964
Domestic SupplyScreened coal productionCokIng 79 103 121 167 122 30 24Steam 70 95 86 163 79 28 16
Total 149 198 201 330 AO1 58 40less: Exports 53 108 138 220 109 20 15
Net production 96 90 69 110 92 38 25plus: Imports n.a. 127 132 103 128 n,a. n.a.Total Domestic Supply n.a. 216 202 213 220 n.e. n.e.
Domestic UsePower Generation 53 48 72 62RaIlways 61 60 65 46Cement factories 66 48 63 67Sugar factories 25 19 21 26
Others 13 13 12 14Total Domestic Use n.e. 219 187 234 215 n.a. n.e.
Excess (deficit) of Supply -3 1S -21 5
Source: Carbomoc. Totals may not add due to rounding. n.a. a not available.
5.6 Little information is available on the production costs andfinancial situation of the Noatize mines. Total costs per r.o.m. tonneduring 1979 to 1981 are as sho-n in Table 5.2 and cover both normalproduction costs and cash outlays on capital expenditure. It shouldhowever be noted that these figures reflect costs during a period whenproduction was being reestablished following two explosions in 1976/1977.
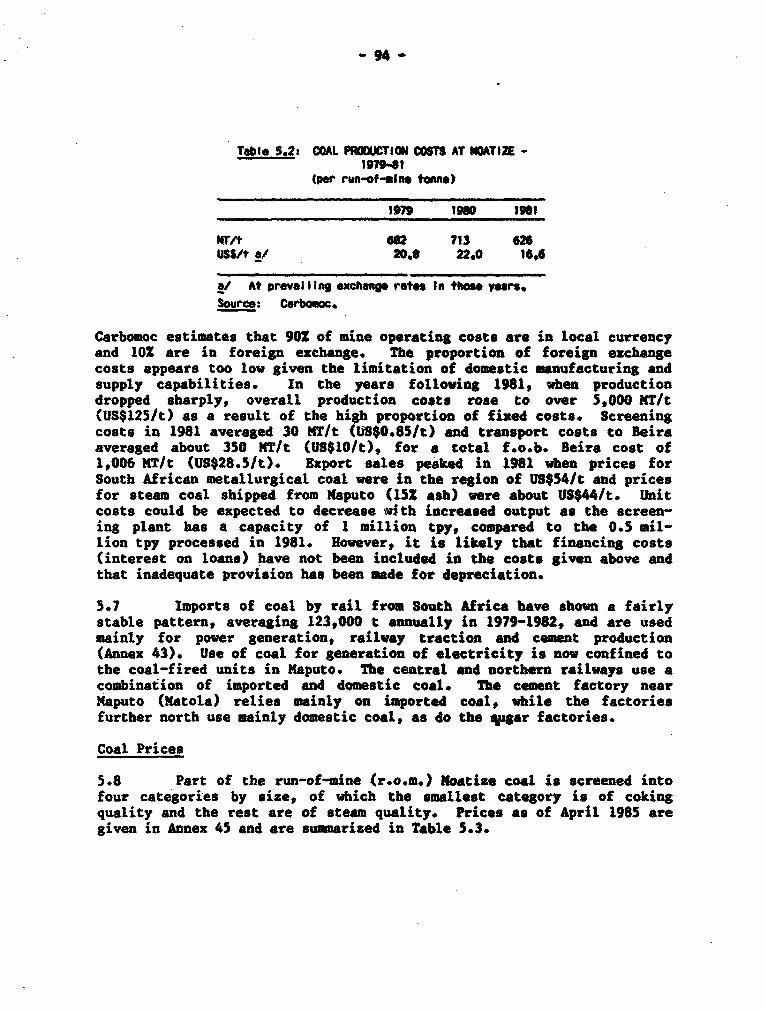
- 94 -
Table 5.2: COAL PRIOCUTICN COSTS AT MOATIZE -197941t
(per run-of-eIne tonne)
1979 9iO iWt
68.2 713 626jJsI/t a/ 20.8 22.0 16,6
a/ At preva IIng exchange rates In those years,SOurce: Carboc.
Carbomoc estimates that 901 of mine operating costs are in local currencyand 101 are in foreign ezchange. The proportion of foreign exchangecosts appears too low given the limitation of domestic manufacturing andsupply capabilities. In the years following 1981, when productiondropped sharply, overall production costs rose to over 5,000 MT/t(US$125/t) as a result of the high proportion of fixed costs. Screeningcosts in 1981 averaged 30 MT/t (US$0.85/t) and transport costs to Beiraaveraged about 350 MTIt (US$10/t), for a total f.o.b. Beira cost ofI,006 MT/t (US$28.5/t). Export sales peaked in 1981 when prices forSouth African metallurgical coal were in the region of US$54/t and pricesfor steam coal shipped from Naputo (152 ash) were about US$44/t. Unitcosts could be expected to decrease with increased output as the screen-ing plant has a capacity of 1 million tpy, compared to the 0.5 mil-lion tpy processed in 1981. However, it is likely that financing costs(interest on loans) have not been included in the costs given above andthat inadequate provision has been made for depreciation.
5.7 Imports of coal by rail from South Africa have shown a fairlystable pattern, averaging 123,000 t annually in 1979-1982, and are usedmainly for power generation, railway traction and cement production(Annex 43). Use of coal for generation of electricity is now confined tothe coal-fired units in Maputo. The central and northern railways use acombination of imported and domestic coal. The cement factory near14aputo (Matola) relies mainly on imported coal, while the factoriesfurther north use mainly domestic coal, as do the war factories.
Coal Prices
5.8 Part of the run-of-mine (r.o.m.) Noatize coal is screened intofour categories by size, of which the smallest category is of cokingquality and the rest are of steam quality. Prices as of April 1985 aregiven in Annex 45 and are sumarized in Table 5.3.
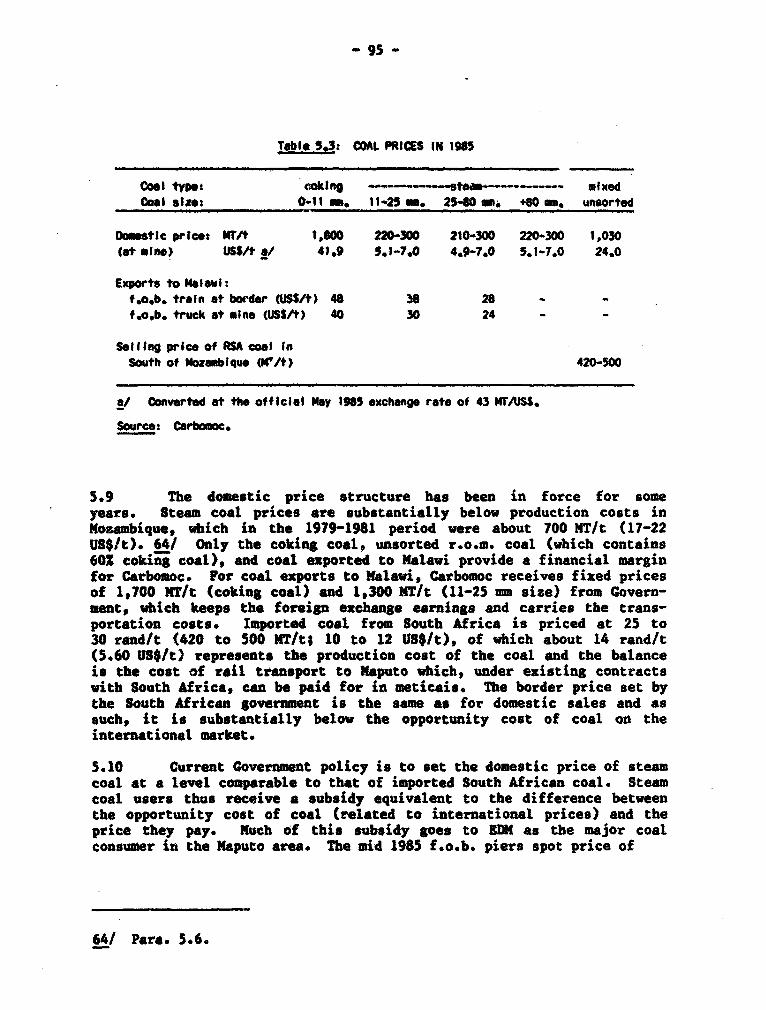
- 95 -
Tabl* 532 OAlt PRICES IN 1985
cool type: Collkng --- s ------- mixedCoal size: 0-tl m. 11-25 w. 25-0 -. .80 mu, unsorted
Domstic pric:t Wl/t t1800 220-300 210-300 220-300 1,030(at *In*) USS/t a/ 41.9 5.1-7.0 4.97.0 5.1-7.0 24,0
Exports to Melalw:f.o.b. tretn at borde (USS/t) 48 36 28 - -f.o.b. truck at mine (USS/t) 40 30 24 -
Sellng price of RSA coal InSouth of Mozambiqua (Wlt) 420-500
a/ Converted at the official May 1985 exchange rate of 43 I/USS.
Source: Carbc.
5.9 The domestic price structure has been in force for someyears. Steam coal prices are substantially below production costs inNozambique, which in the 1979-1981 period were about 700 MT/t (17-22US$/t). 64/ Only the coking coal, unsorted r.o.m. coal (which contains6OZ coking coal), and coal exported to Malawi provide a financial marginfor Carbomoc. For coal exports to Malawi, Carbomoc receives fixed pricesof 1,700 MTtt (coking coal) and 1,300 NT/t (11-25 mm size) from Govern-ment, which keeps the foreign exchange earnings and carries the trans-portation costs. Imported coal from South Africa is priced at 25 to30 rand/t (420 to 500 MTIt; 10 to 12 US$/t), of which about 14 rand/t(5.60 US$/t) represents the production cost of the coal and the balanceis the cost of rail transport to Maputo which, under existing contractswith South Africa, can be paid for in meticais. The border price set bythe South African government is the same as for domestic sales and assuch, it is substantially below the opportunity cost of coal on theinternational market.
5.10 Current Covernment policy is to set the domestic price of steamcoal at a level comparable to that of imported South African coal. Steamcoal users thus receive a subsidy equivalent to the difference betweenthe opportunity cost of coal (related to international prices) and theprice they pay. Much of this subsidy goes to EDM as the major coalconsumer in the Maputo area. The mid 1985 f.o.b. piers spot price of
64/ Para. 5.6.

- 96 -
South African steam coal shipped via Maputo is about US$33/t, 65/implying a subsidy element of about US$21/t of imported steam coal(assuming a selling price of about MT 500/ton or $12). 66/ Foregonerevenue for the Government on coal imports alonet based on the 1982 salesvolume, totals about US$2.6 million per year.
5.11 Government's pricing policy deprives Carbomoc of funds neededto restore the productive capacity of the Moatize coal mines and toexpand capacity. The mission recommends that a coal pricing policy basedon opportunity cost considerations be adopted for all domestic coal salesto final consumers. The pithead opportunity cost of export grade coal isthe imputed export value f.o.b. Beira, less transport costs from Moatizeto Beira, since coal consumed domestically could alternatively, beexported. For non-exportable (high ash) coal, the opportunity cost wouldbe based on the cost of alternative fuels. Carbomoc should receive aminehead price which reflects this opportunity cost, less transport costsbetween the minehead and Beira. The issue of relating energy prices toe:onomic costs in an economy with gross distortions due to a greatlyovervalued exchange rate, as in Mozambique, is discussed in Chapter I.
Sector Organization
5.12 The coal sector consists of five organizations, all of whichreport to the Ministry of Mineral Resources (MMR) which was set up in1984. The main sector entities are described briefly below:
(a) National Directorate of Mines (NDM) is the policy-making bodythat covers all mining activities in the country 671 with theexception of the Moatize coal development. The Directorate'smain functions are to define the legal framework for theexploitation of mineral resources, to coordinate and planexploitation of existing mines and to negotiate contracts withmining companies. Among its staff are three Mozambicans withuniversity education and eight foreign technical assistancestaff. The Directorate has completed a new mining law thatwill allow foreign participation in the exploration andproduction of minerals, including coal. All the existingmining companies in the country report directly to the MMR.
65/ Coal specification: 10,600 Btu/lb, 18X ash, 1 sulfutr.
66/ Equivalent to a subsidy of approximately USC}.O/kWh of electricitygenerated from the coal-fired steam generators in Maputo PowerStation.
67t Besides coal, a wide range of mineral ores and stones are mined inMozambique.
- ,~ .4
(b) Carbomoc is the Notional coal mining company that operates theiti3;igq cqal tines in. Tete province., Carbomoc also maintainsadministrativ,-c-ontacts with the Coal Development Office.
(c) Cool Uevelopment Office (CDO) was set up in 1984 to coordinatethe future development -4,,-the Moatize coalfield. Its mainfunctions are to interest foreign governments and/or companiesin tb*. Moatize developteAt .t program, and to coordinate alltechnical idpects of developing the mines and associatedinfrastructure until production start-up. In mid 1985, thetecbnital staff of this office consitted of six Mosambicanspetc-ilists and six Uviet engineers. To date, attractingforeipS interest has absorbed most of the time of this office,leaving little tius for attention to technical aspects on thepart of Motambican staff.
(d) National Geological Institute (NGI) was created in 1984, and itis responsible for carrying out basic geological surveys. Inmid 1983, the Institute had nine Nozambican geologists, between20 and 30 foreign specialists, 120 drillers and 250 fieldhelpers. In addition, about 70 staff are studying abroad incourses ranging from secondary school to university levelgeology courses. The Government's current policy forexploration and production is to attract foreign risk capital,and the Institute is now preparing a dossier on the mineralpotential of the country whie is to be published.
(e) Directorate of Finance: this office eaerts financial controlover departments which fall. u*nder the jurisdiction of the MMB.
5.13 The existing division of rtesponsibilities between sectorentities and the- lines of reportin smay be a result of the scarcity ofqualified perohnnpl, but the situation could be improved. The NCI andthe NDN are able to, handle their assigned tasks . with the externalassistance presently ov4ilable. The CDO is understafted to carry out itsresponsibilities, and roquires technical assistancsa especially if theplanned major new coal developments are brought to fruition. One of theCDO's most important responsibilities is for the coordination of cross-sectoral linkages especlally between coal production andtransportation. MMR's infLuence on the coal sector is effected throughits control of he NDN and WI., Clear divisions of responsibilities areestablished for survey"ag ard preliminary exploration (NBI), policydevelopment and attr*4ing foreign participatioa (NMf), and minedevelopment (Carbomoc and any newly created companies)-.
5.14 Carbomoc faces a shortage of skilled staff at the Moatizemines, and it relies on a sizeable contingent of technical andprofessional staff from the German DeMocratic Republic (GDR) for itsexisting operations. Details of the manpower aituation at Moatize are
- 98 -
given in Annex 44. Currently, about 70 Mozambicans are receiving longterm training in coal-related subjects in Portugal and the CDR. Thefirst group will return in 1987, and it is envisaged that they willgradually replace the CDR engineers and technicians. The long-termoptions being considered by Government to redress the lack of profes-sional and skilled technical staff are construction of a secondary schoolat Matundo, the creation in Tete of an institute to train assistantgeologists and mining technicians, and the reopening of the MiningSection at the Eduardo Nondlane University in lbputo. The missionrecommends that these options be reviewed in light -of the mission'sconclusions about the lack of prospective viability of the majorexpansion plans for Moatize. 681
Domestic Market Prospects
5.15 When the situation in the country returns to normal, demand inthe central and northern parts of the country could amount to 160,000 tto 180,000 t annually. Moatise cannot supply coal to Maputo more cheaplythan South Africa. 69/ Therefore, the mission supports the presentpolicy of taking advantage of low cost South African coal. However,Mosambique does not have long-term contracts for the supply of low-costcoal from RSA. Some contingency planning is required to assure energysupplies to important coal users in Maputo, such as for establishing astrategic stockpile of coal at Maputo, Power Station and even theconstruction of coal-handling facilities at Maputo harbor.
5.16 A possible option for the use of Moatise coal would be to againgenerate power at a mine-mouth plant. A rough estimate of the cost ofelectricity from a 60 MW power plant, requiring only 160,000 tpy of coal(with steam coal at US$18.5/t), 70/ is about 6.5 US¢/kWh (Annex 46).Obviously, electricity from this source is not competitive with that fromthe Cahora Bassa hydroelectric plant. 71/
5.17 Little coal is used as a household fuel in Mozambique. In theimmediate vicinity of Moatize, it is reported that a number of coalstoves are in use, but these have not spread to the main towns.Production of smokeless fuel briquettes from low grade washery fractions,
68/ Pare. 5.31.
69/ The price of coal from RSA in Maputo is between 420 and 500 MT/t (10to 12 US$/t) - para. 5.9, whereas the production cost alone of coalfrom Moatize is about US$17/t - para. 5.6, to which should be addedthe cost of railway transport to Beira, coastal shipping costs andthe investment in coal receiving facilities in Maputo harbor.
70/ Para. 5.27.
7I/ Chapter IV.
_ 99 -
if a washery were to be built, could increase tbe demand for coal as ahousehold fuel, but briquetting tests are not being carried out withMozambican coal. Neighboring countries (Zambia, Zimbabwe and Botswana)are carrying out such tests, and it would be worthwhile for the CoalDevelopment Office to follow their progress and assess their applicationto Moatize coal. If the technical and social issues concerning the useof coal in households can be resolved, there could be a strong economiccase for its use in urban areas. 72/
Rehabilitation of Existing Moatize Mines
5.18 - The costs of rehabilitating the existing mines at Moatize areestimated at about US$10 million spread over four years, excludingcustoms duties (151) and internal transport of imported equipment (151 ofequipment costs). Operating costs for the rehabilitated mines could beassumed to be similar to those of the 1979 to 1981 period, at around 700NT1r.o.m. tonne (US$l7/t) including screening, although there would beadditional financing charges related to the new investments. The totalcost of coal at the pithead would be about US$19/t, 73/ which is belowthe pithead price currently received for exports to Nalawi, 74/indicating that continued operation of the five existing mines at thesrpotential capacity of 0.8 Mtpy may be economically feasible until theirreserves are exhausted in about 15 years. The mission recommends thatGovernment carry out a pre-feasibility study of the viability ofrehabilitating each of the existing mines. The study should includeidentification of firm markets for the coal to be produced and anexamination of coal transport issues.
Planned Coal Developments
5.19 One of Government's priorities is the development of coalexports to earn foreign exchange. To this end, investigation of thebetter known coal deposits has been contracted out to foreign entities.The Moatize area was first studied by engineers from CDR and later bySoviet engineers. The Nucanha-Vuzi area has been studied by Braziliancontractors (CPRM - Companhia de Pesquisa de Recursos Minerais), and theMinjova area has been studied by the Swedish mining company, LKAB.
5.20 Of the coalfields studied, plans for Moatize are the furthestadvanced. The ultimate goal envisaged is to produce 6 Ntpy in two phasesof 3 Ntpy each. Seventy-four million tonnes of probable and possible
72/ Chapter II.
73/ Consisting of a capital cost of 1.8 US$/t (US$10 million averagedover 0.8 Ntpy for 15 years at 12Z opportunity cost of capital forrehabilitation of the mine) and an operating cost of 17 US$/t.
74/ Table 5.3.
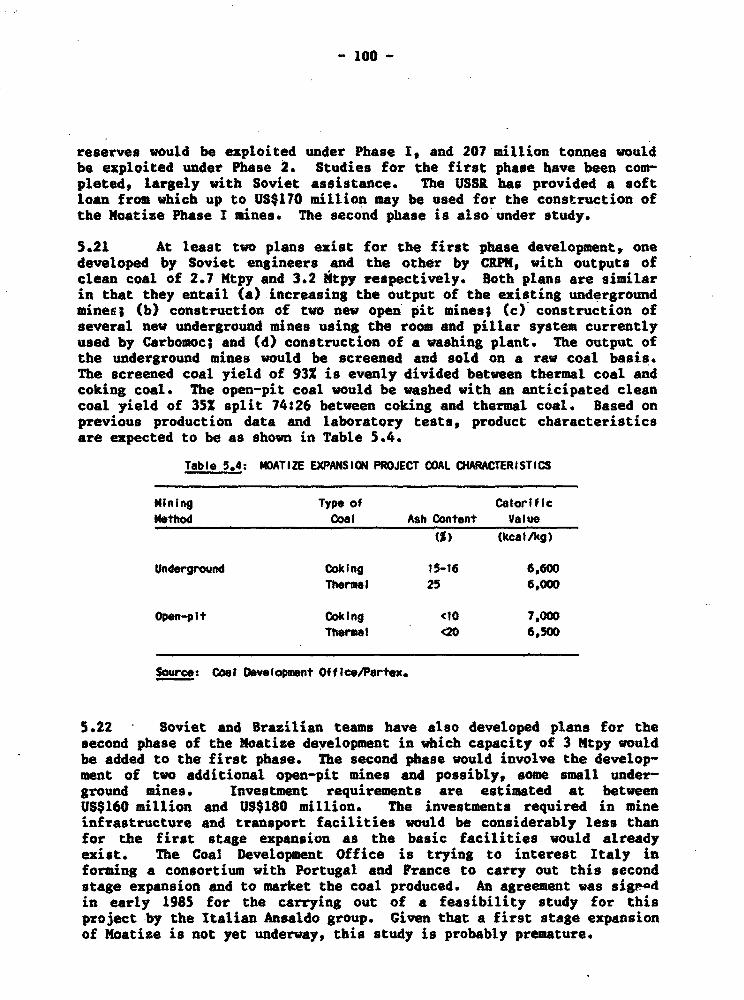
- 100 -
reserves would be exploited under Phase I, and 207 million tonnes wouldbe exploited under Phase 2. Studies for the first phase have been com-pleted, largely with Soviet assistance. The USSR has provided a softloan from which up to US$170 million may be used for the construction ofthe Moatize Phase I mines. The second phase is also under study.
5.21 At least two plans exist for the first phase development, onedeveloped by Soviet engineers and the other by CRPM, with outputs ofclean coal of 2.7 Mtpy and 3.2 Mtpy respectively. Both plans are similarin that they entail (a) increasing the output of the existing undergroundmines; (b) construction of two new open pit mines; (c) construction ofseveral new underground mines using the room and pillar system currentlyused by Carbomoc; and (d) construction of a washing plant. The output ofthe underground mines would be screened and sold on a raw coal basis.The screened coal yield of 93% is evenly divided between thermal coal andcoking coal. The open-pit coal would be washed with an anticipated cleancoal yield of 35Z split 74:26 between coking and thermal coal. Based onprevious production data and laboratory tests, product characteristicsare expected to be as shown in Table 5.4.
Table 5.4: MOATIZE EXPANSION PROJECT COAL CHARACTERISTICS
Mining Type of CalorificMethod Coal Ash Content Value
(%) (kcalkg)
Underground Coking 15-16 6,6C0Thermal 25 6,000
Open-pit Coking <10 7,000Thermal c20 6,500
Source: Coal Development Office/Pertex.
5.22 Soviet and Brazilian teams have also developed plans for thesecond phase of the Noatise development in which capacity of 3 Mtpy wouldbe added to the first phase. The second phase would involve the develop-ment of two additional open-pit mines and possibly, some small under-ground mines. Investment requirements are estimated at betweenUS$160 million and US$180 million. The investments required in mineinfrastructure and transport facilities would be considerably less thanfor the first stage expansion as the basic facilities would alreadyexist. The Coal Development Office is trying to interest Italy informing a consortium with Portugal and France to carry out this secondstage expansion and to market the coal produced. An agreement was sigrvdin early 1985 for the carrying out of a feasibility study for thisproject by the Italian Ansaldo group. Given that a first stage expansionof Moatize is not yet underway, this study is probably premature.
-101-
Coal Transport Facilities
5.23 Transportation of coal from Moatize is largely dependent on the560 km rail link to the port of Beira via Dona Ana, Inhamitanga and Dondo(map no. IBRD 19515). The line is currently in a poor state of repairdue to sabotage and years of deferred maintenance. Annex 47 describesthe rehabilitation and capacity expansiot works required for three levelsof coal transport capacity, namely 1 Ntpy, 3 Mtpy and 10 Mtpy, asestimated during the planning of the expansion of production atMoatize. The first part of this work consists of repairs to 110 km oftrack between Dondo and Inhamitanga, of which the first 30 km havealready been completed by Mozambique under an assistance program withItaly amounting to US$40 million which includes the construction of afactory for making railway sleepers. Expansion to 3 Mtpy capacityrequires repairs to and upgrading of the track between Dona Ana andMoatize and between Beira and Dondo, and the purchase of rolling stock.
5.24 Rehabilitation of the Beira coal terminal with Dutch assistancewas scheduled to be completed by the end of 1985. The terminal will beable to handle vessels of up to 25,000 DWT, and its handling capacitywill be increased from 0.5 Mtpy to 1.2 Mtpy. Eventually, 1.5 Mtpy mightbe achievable under good management. To handle coal traffic of more than1.5 Mtpy, a new coal terminal would have to be built (in stages) at thenorthern end of the port. Present plans envisage a fully developedcapacity of 10 Mtpy, with the possibility of expansion ultimately to20 Mtpy. The first stage expansion to 3 Mtpy (70,000 DiT vessels) wouldinvolve land reclamation and protection works, construction of terminalbuildings, jetties, bridges, stockyards, access roads and rail connec-tions, and dredging of the channel by an additional depth of 4 m.Subsequent increases in capacity would require only additional dredgingand ship loading equipment. The first stage of the expansion isestimated to cost US$116 million, with annual operating costs ofUS$16.1 million, equivalent to US$5.4/ton at full utilization of capacity(Annex 48). Port and railway charges would amount to roughly $20/ton.
5.25 An alternative route for transporting Moatize coal to the coastwould be via the 615 km northern railway line from Malawi to Nacala (MapNo. IBRD 19515). Nacala has the advantage of a natural deep water harborwhich would require minimal additional investment in harbor works andallow large colliers to transport Moatize coal at lower unit costs thanis possible from Beira. The port now handles some 0.5 Mtpy of goods, aLittle more than half the throughput before Independence. However, a newrailway connection from Moatize to Malawi, or a line of several hundredkilometers around Malawi, would be required. On the basis of two studiesof this option, Government concluded that for traffic levels of less than10 Ntpy, Beira was the cheapest route. The possibility of barging coaldown the Zambezi River has not been studied in detail since it wouldrequire major investments in navigation works.
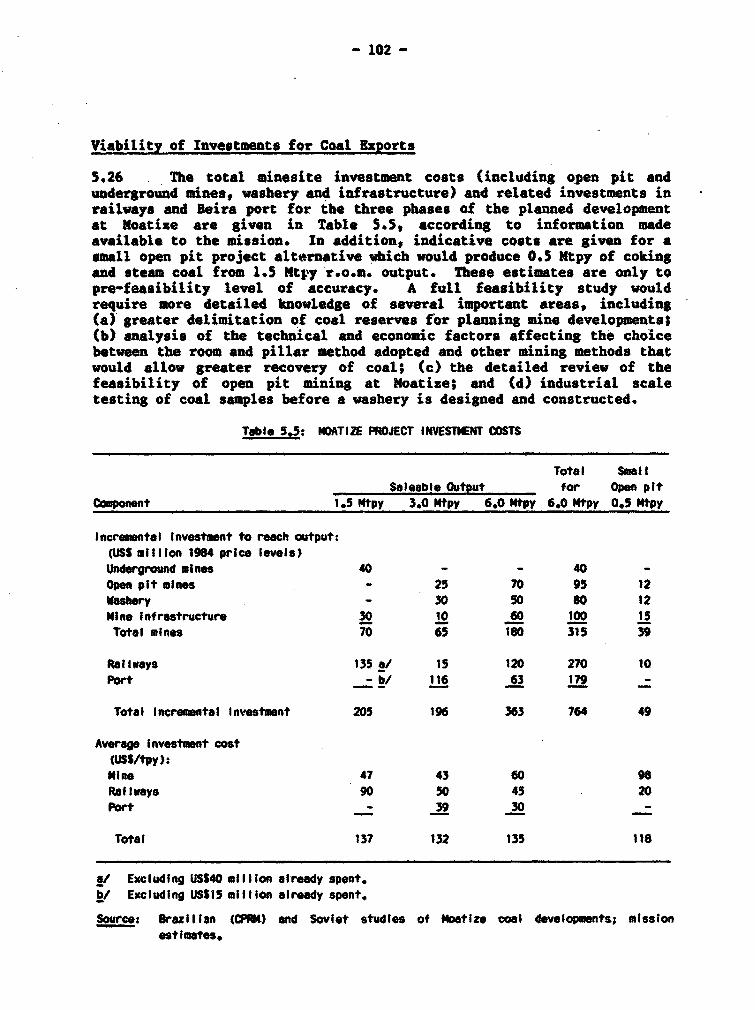
- 102 -
Viability of Investments for Coal Exports
5.26 The total minesite investment costs (including open pit andunderground mines, washery and infrastructure) and related investments inrailways and Beira port for the three phases of the planned developmentat Moatize are given in Table 5.5, according to information madeavailable to the mission. In addition, indicative costs are given for asmall open pit project alternative which would produce 0.5 Mtpy of cokingand steam coal from 1.5 Mtpy r.o.m. output. These estimates are only topre-feasibility level of accuracy. A full feasibility study wouldrequire more detailed knowledge of several important areas, including(a) greater delimitation of coal reserves for planning mine developments;(b) analysis of the technical and economic factors affecting the choicebetween the room and pillar method adopted and other mining methods thatwould allow greater recovery of coal; (c) the detailed review of thefeasibility of open pit mining at Moatize; and (d) industrial scaletesting of coal samples before a washery is designed and constructed.
Table 5.5: MOATIZE PROJECT INVESTMENT COSTS
Total Small
Saleable Output for Open pitComnent 1.S Mtpy 3.0 Mtpy 60 Npy 6.0 Ntpy 0.5 Mtpy
Increnental Investment to reach output:(USS millton 1984 price levels)Underground mines 40 - - 40 -Open pit ines - 25 70 95 12
Vashery - 30 50 80 12
Nine Infrastructure 30 10 60 100 15
Total mines 70 65 180 315 39
Railways 135 a/ 15 120 270 10Port _ bf 116 63 179 _
Total Incremental Investment 205 196 363 764 49
Average investment cost(USS/tpy):
Mitne 47 43 60 98
Rat vays 90 50 45 20
Port - 39 30 -
Total 137 132 135 118
a/ Excluding USS40 million aI-ready spent.
b/ Excluding USS15 million already spent.
Source: Brazilian (CPa) and Soviet studies of Noatize col developments; missionestimates.
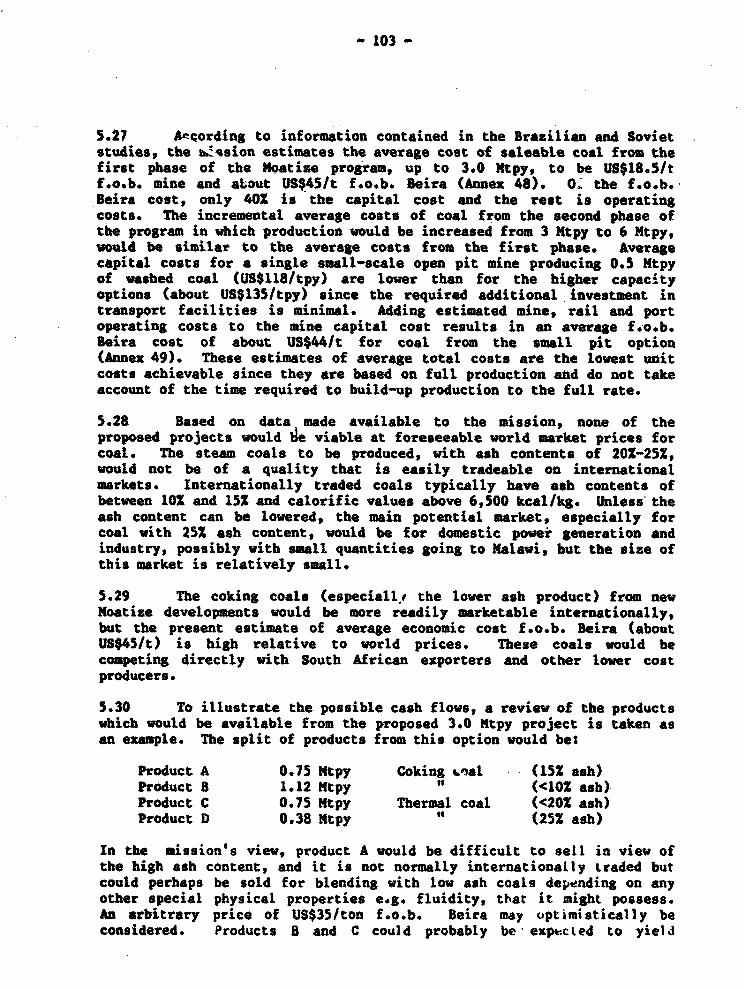
_ 103 -
5.27 Aincording to information contained in the Brazilian and Sovietstudies, the v2q%sion estimates the average cost of saleable coal from thefirst phase of the Moatiae program, up to 3.0 Mtpy, to be US$18.5/tf.o.b. mine and aLout US$45/t f.o.b. Beira (Annex 48). 04. the f.o.b.Beira cost, only 401 is the capital cost and the rest is operatingcosts. The incremental average costs of coal from the second phase ofthe program in which production would be increased from 3 Ntpy to 6 Mtpy,would be similar to the average costs from the first phase. Averagecapital costs for a single small-scale open pit mine producing 0.5 Ntpyof washed coal (US$118/tpy) are lower than for the higher capacityoptions (about US$135/tpy) since the required additional investment intransport facilities is minimal. Adding estimated mine, rail and portoperating costs to the mine capital cost results in an average f.-o.b.Beira cost of about US$44/t for coal from the small pit option(Annex 49). These estimates of average total costs are the lowest unitcosts achievable since they are based on full production atd do not takeaccount of the time required to build-up production to the full rate.
5.28 Based on data made available to the mission, none of theproposed projects would tle viable at foreseeable world market prices forcoal. The steam coals to be produced, with ash contents of 20X-25Z,would not be of a quality that is easily tradeable on internationalmarkets. Internationally traded coals typically have ash contents ofbetween 10 and 15 and calorific values above 6,500 kcal/kg. Unless theash content can be lowered, the main potential market, especially forcoal with 25X ash content, would be for domestic powei generation andindustry, possibly with small quantities going to Nalawi, but the size ofthis market is relatively small.
5.29 The coking coals (especiall,t the lower ash product) from newMoatize developments would be more readily marketable internationally,but the present estimate of average economic cost f.o.b. Beira (aboutUS$45/t) is high relative to world prices. These coals would becompeting directly with South African exporters and other lower costproducers.
5.30 To illustrate the possible cash flows, a review of the productswhich would be available from the proposed 3.0 ltpy project is taken asan example. The split of products from this option would be:
Product A 0.75 Mtpy Coking #nal (151 ash)Product 8 1.12 Mtpy " (10oz ash)Product C 0.75 Ntpy Thermal coal (<202 ash)Product D 0.38 Mtpy is (252 ash)
In the mission's view, product A would be difficult to sell in view ofthe high ash content, and it is not normally internationally traded butcould perhaps be sold for blending with low ash coals depending on anyother special physical properties e.g. fluidity, that it might possess.An arbitrary price of US$35lton f.o.b. Beira may optimistically beconsidered. Products B and C could probably be' exptcLed to yielJ
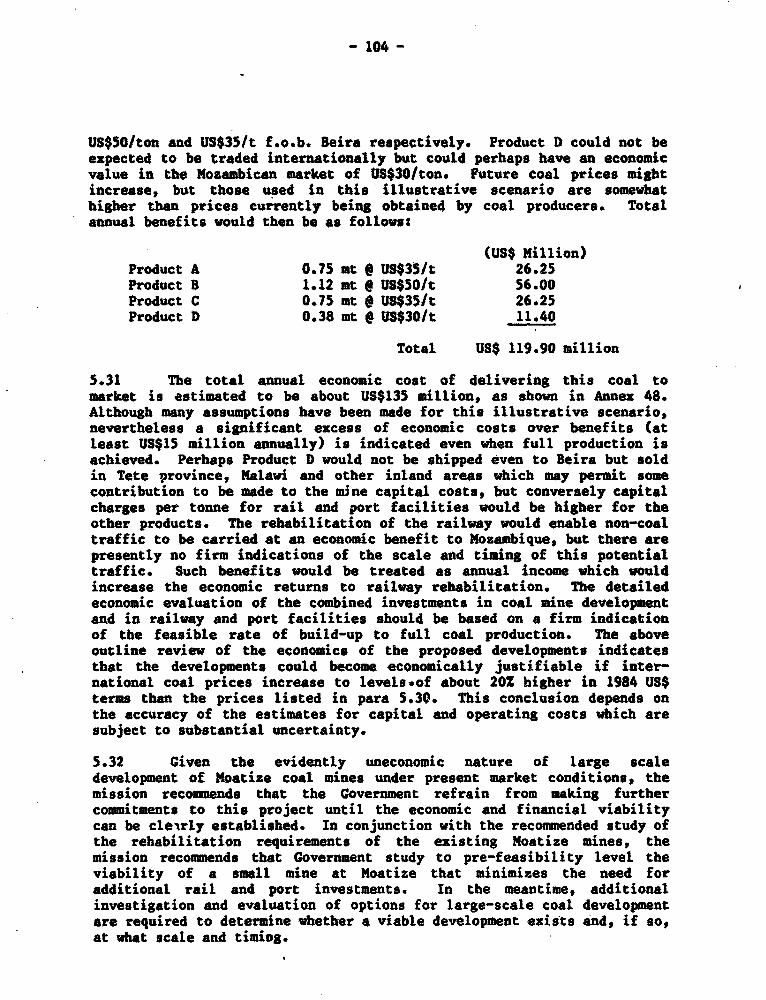
- 104 -
U$$50/ton and US$35/t f.o.b. Beire respectively. Product D could not beexpected to be traded internationally but could perhaps have an economicvalue in the Mozambican market of US$30/ton. Future coal prices mightincrease, but those used in this illustrative scenario are somewhathigher than prices currently being obtained by coal producers. Totalannual benefits would then be as follows:
(US$ Million)Product A 0.75 mt @ US$35/t 26.25Product B 1.12 mt @ US$50/t 56.00Product C 0.75 mt * US$35/t 26.25Product D 0.38 mt Q US$30/t 11.40
Total US$ 119.90 million
5.31 The total annual economic cost of delivering this coal tomarket is estimated to be about US$135 million, as shown in Annex 48.Although many assumptions have been made for this illustrative scenario,nevertheless a significant excess of economic costs over benefits (atleast US$15 million annually) is indicated even when full production isachieved. Perhaps Product D would not be shipped even to Beira but soldin Tete province, Malawi and other inland areas which may permit somecontribution to be made to the mine capital costs, but conversely capitalcharges per tonne for rail and port facilities would be higher for theother products. The rehabilitation of the railway would enable non-coaltraffic to be carried at an economic benefit to Mozambique, but there arepresently no firm indications of the scale and timing of this potentialtraffic. Such benefits would be treated as annual income which wouldincrease the economic returns to railway rehabilitation. The detailedeconomic evaluation of the combined investments in coal mine developmentand in railway and port facilities should be based on a firm indicationof the feasible rate of build-up to full coal production. The aboveoutline review of the economics of the proposed developments indicatesthat the developments could become economically justifiable if inter-national coal prices increase to levels.of about 20Z higher in 1984 US$terms than the prices listed in para 5.30. This conclusion depends onthe accuracy of the estimates for capital and operating costs which aresubject to substantial uncertainty.
5.32 Given the evidently uneconomic nature of large scaledevelopment of Moatize coal mines under present market conditions, themission recommends that the Government refrain from making furthercommitments to this project until the economic and financial viabilitycan be clearly established. In conjunction with the recommended study ofthe rehabilitation requirements of the existing Moatize mines, themission recommends that Government study to pre-feasibility level theviability of a small mine at Moatize that minimizes the need foradditional rail and port investments. In the meantime, additionalinvestigation and evaluation of options for large-scale coal developmentare required to determine whether a viable development eisits and, if so,at what scale and timing.
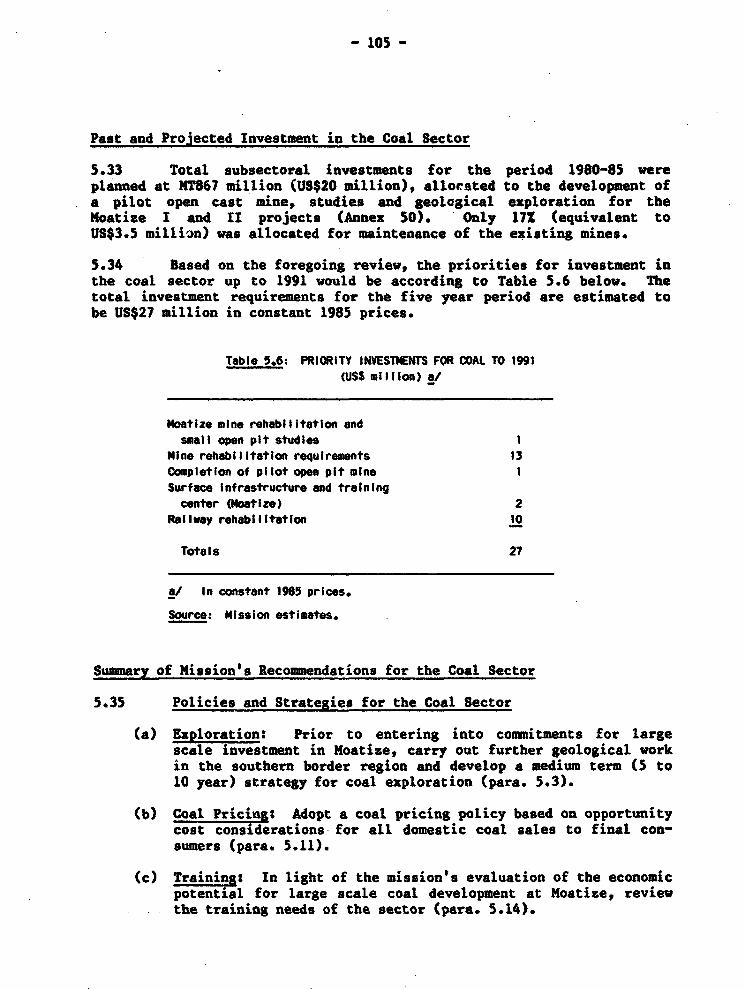
- 105 -
Past and Projected Investment in the Coal Sector
5.33 Total subsectoral investments for the period 1980-85 wereplanned at MT867 million (US$20 million), allocsted to the development ofa pilot open cast mine, studies and geological exploration for theMoatime I and II projects (Annex 50). Only 17Z (equivalent toUS$3.5 million) was allocated for maintenance of the existing mines.
5.34 Based on the foregoing review, the priorities for investment inthe coal sector up to 1991 would be according to Table 3.6 below. Thetotal investment requirements for the five year period are estimated tobe US$27 million in constant 1985 prices.
Table 5.6: PRIORITY INVESTIENTS FOR COAL TO 1991(USS milIlon) a/
Moatize mine rehabilitation andsmall open pit studies 1
Mine rehabilitation requirements 13Completion of pilot open pit mine 1Surface Infrastructure and trainingcenter (Moat ize) 2
Railway rehabilitation 10
Totals 2?
a/ In constant 1985 prices.
Source: Mission estimates.
Summary of Mission's Recommendations for the Coal Sector
5.35 Policies and Strategies for the Coal Sector
(a) Exploration: Prior to entering into commitments for largescale investment in Moatize, carry out further geological workin the southern border region and develop a medium term (5 to10 year) strategy for coal exploration (para. 5.3).
(b) Coal Pricing: Adopt a coal pricing policy based on opportunitycost considerations for all domestic coal sales to final con-sumers (para. 5.11).
(c) Training: In light of the mission's evaluation of the economicpotential for large scale coal development at Noatize, review
- the training needs of the sector (para. 5.14).

- 106-
(d) Moatize Rehabilitations Carry out a pre-feasibility study oftbe viability of rehabilitating the existing Carbomoc mines atMoatize (para. S.18).
(e) Moatize Expansion: Refrain from devoting further resources toMoatize expansion projects until the economic and financialviability is established. In conjunction with the recommendedrehabilitation study, carry out a pre-feasibility study of asmall mine development which would minimize transport invest-ment requirements (para. 5.32).
5.36 Studies and Tecbnical Assistance
(a) Noatize Rehabilitation and Small Scale Exoansion: Carry out apre-feasibility study of the rehabilitation needs of theNoatize mines, based on a realistic assessment of the domesticand Malavian markets for Moatize coal (including the potentialfor use as household fuel and processing into briquettes), butexcluding overseas export markets. The study should concen-trate on measures that could be adopted to minimize coal pro-duction costs, and it should examine the associated trainingand technical assistance requirements. In addition, carry outa pre-feasibility study of a least cost small scale expansionof Moatize output with emphasis on coal transport needs (paras.5.18 and 5.32).
(b) Exploration: Carry out basic geological investigation andexploratory drilling in the area near the border with SouthAfrica, and to develop a five to ten year coal explorationprogram (para. 5.3).
- 107 -
VI. INSTITUTIONAL ISSUES
Sector Organization and Institutions
6.1 The Ministry of Industry and Energy (MIE) has overall respon-sibility for implementing energy policies in Mosambique, and it isresponsible for the two main operating organizations in the electricityand petroleum supply sub-sectors, namely 5DM and PBTROMOC. The Ministryof Miin*ral Resources (HNR) is also prominent in the energy sector through-ts responsibilities for petroleum, gas and coal exploration, developmentand production. The principal operating organizations reporting to MMRare ENH (for petroleum and gas) and CARBOMOC (coal producdion). TheMinistry of Agriculture is involved in the energy sector on woodfuelmatters through the Directorate of Forestry. The Ministry ofConstruction and Waters is responsible for national constructionorganizations that are involved in capital works such as dams. The StateSecretariat for Light Industry and Supplies has responsibility for themanufacture of stoves. Descriptions of the principal operatingorganizations in the energy sector are given in Chapters 2, 3, 4 and 5.
6.2 In addition to the two ministries, HIE and MMR, that are res-ponsible for the supply of energy, and the Ministry of Agriculture, anumber of Government organizations influence the performance of theenergy sector through their responsibility for implementing nationaleconomic policies. Many policy decisions that affect the energy sectorare made by the Bank of Mozambique through its control over foreignexchange and domestic credit, and by the Ministry of Finance through itsresponsibilities for budgetary allocations, taxation and pricingpolicies. The Ministry of Planning has formal responsibility for con-sidering energy within the context of inter-sectoral priorities andresource requirements. The Ministry of Labor and the National Wages andPrices Commission also have an important bearing on the energy sector. Adescription of the national policy, planning and regulatory framework forthe energy sector is given in Chapter 1.
6.3 The present organization of the energy sector in Mozambique isfragmented and difficult to coordinate. At the national level, thedecision-making process seldom considers the impact of policies on sectorperformance and development. One example is the lack of response onsubmissions for increases in prices, as illustrated in the cases ofpetroleum products and electricity to the detriment of the operatingefficiency of PETROMOC and DDM. Another example is the national policyof holding down wages which results in a loss of scarce trained manpowerto other countries, and the control on labor allocation and mobility ofemployment.
6.4 At the sector level, MIE lacks the staff required to exerciseany significant regulatory control over energy subsectors other thanelectricity and petroleum supply, and in these cases the function isperformed indirectly througp z4 and PETROMOC. The Ministry's operations
- 108 -
are reduced to a minimum because its budgetary allocation can financelittle more than wages and salaries. A similar situation exists inINR. The departmental secretariats in these ministries are desperatelyunderstaffed, and they are heavily dependent on expatriate advisorsprovided under technical assistance programs for their technical staffregources. Recruitment of qualified Mozambican staff is extremelydifficult due to the scarcity of such people and the low level of civilservice wages.
6.5 The organizations in the energy sector were created after thegeneral collapse of institutions that occurred in the mid 1970s followingthe Portuguese exodus, and they have suffered from the economicdifficulties that followed Independence. The two striking indicators ofthese difficulties are the shortages of skilled manpower and thedeterioration of the physical facilities, both of which are common themesto the review of the main energy subsectors in Chapters 2 to 5. Veryscarce management resources are fully occupied in handling routinematters, often on the basis of crisis-management, and they have littleoppottunity to tackle fundamental issues. Consequently, the organi-zations have encountered major obstacles to developing and maturing sincetheir inception. These arte economy-wide problems which cannot beresolved in the context of the energy sector alone. Any lasting solutionto break the vicious circle of manpower and budgetary constraints, weakadministration and poor economic performance will require mutually rein-forcing improvements in all areas. Sustained improvement in economicperformance also requires the resumption of peaceful conditions in thecountryside. Inevitably, the achievement of a lasting solution is likelyto be a long-term process. It would go beyond the scope of this Reportto make recommendations on such general issues as wage levels and theallocation of manpower and budgetary expenditures between sectors.However, two observations are relevant. First, the enetgy sector has acritical role to play in the revival of the economy. Second, manpowerand budgetary constraints will remain a fact of life in the energy sectorfor the foreseeable future, and any proposals for institutionkl reformmust take this fact into account.
Sector Coordination
6.6 A major hindrance to coordination of the sector is the lack ofreliable data on the sector's outputs, inputs and financial performance.This lack is also an obstacle to diagnosing problems and planningimprovements to the efficient use of resources and the development of thesector's production capacity. This issue is common to all the energysub-sectors, ranging from the absence of reliable da;a on the flow ofwoodfuels to urban areas to lack of detailed information on consumptionof energy products. Under the intense pressure of keeping facilities inoperation with inadequate resources, data collection can appear to be ofsecondary importance. Nevertheless, the mission recommends that Govern-ment require organizations to maintain reliable records and to submitreports of adequate quality and frequency. A firm lead from Governmenton this matter is required to provide the incentive, especially for the
- 109 -
presentation of financial statements. Such requirements are generallyincluded in the enacting legislation on the establishment of these organ-izations. The mission also recommends that NDM, PETROMOC and OSM beprovided with technical assistance to establish the necessary capability,as described in Chapters 3 and 4. This recommended policy should beenacted without delay since fundamental changes to administrative atti-tudes can take a long time to implement.
6.7 There is also a need to improve coordination between the energyand other sectors. The report has already raised this issue with respectto some large investments (Chapter I). Other examples are the construc-tion of dams for irrigation purposes in Southern Mosambique without anypower components, the preparation and promotion of large energy-intensiveindustrial projects without due regard to the full impact on the costs ofmeeting their demand for energy, the design of rural fuelwood schemesindependently of agricultural activities, and the elaboration of invest-ments in the petroleum refinery without taking account of the possibilityof supplying natural gas from Pande to Maputo. Small but highly bene-ficial measures have been neglected, such as giving priority to theproduction of matches to reduce wastage of woodfuels, to the availabilityof cooking stoves, especially electrical, to improve energy efficiency,and to improvements in trucking capacity for transportation of fuelwood.One difficulty facing MIS in implementing such small measures is that theother Ministries concerned also lack the resources for such measures.
National Energy Council
6.8 Government has recopnized the need for high-level coordinationof energy policies and programs, and presently it is reviewing a draftproposal for setting up a National Energy Council. The proposed mainresponsibilities of the Energy Council, which would report to theNational Council of Ministers, are to (a) formulate and approve nationalenergy policy; (b) recomend policies to ensure that energy matters aregiven proper and timely consideration in the formulation of policies andprojects in other sectors; (c) recommend policies for the optimaldevelopment and utilization of national energy resources; and (4) setinvestment priorities in the energy sector within the framework ofdevelopment for the whole economy. The Council would be composed of theMinisters and heads of the organizations in the energy sector itself andof sectors that have strong links with the energy sector (industry, agri-culture, transportation). Thus, the Council would be a suitable forumfor laying down policies for the energy sector. The Minister forIndustry and Energy would be the Chairman of the Council, which wouldhelp the MIB to discharge its overall responsibility for the energysector. Howevert MIe would need sufficient staff and material resourcesto hold a position of leadership. Its Department of Energy would thusfulfill an important role.
- 110 -
Department of Energy
6.9 A Department of Energy was set up in MIl in 1985 to providetechnical support and act as a secretariot to the gatiopal EnArGyCouncil. The general scope of the Departments activities is defined bythe responsibilities of the Energy Council. However, due to the presentbudgetary and staffing constraints, the Departmnt will initially con-centrate on the following priority areass (a) energy conservation andsubstitution; (b) energy in rural development and fuelwood plantations;(c) prootion of new technologies for new and renewable sources ofenergy; and (d) formulation of standards for evaluation of energyprojects that cover development of new energy production fitilities,energy utilization in development projects, and energy pricing. TheDepartment will review proposals for investments that originate' from theoperating agencies in the energy sector, and advise the Energy Council ontheir suitability. The Department will review proposals for priceincreases in the context of overall energy sector considerations such asconsistency with sector policies and impact on energy cousumers, thenagree to modifications with the energy supplying organization, andfinally submit the proposal to the Energy Council.
6.10 The Department of Energy is the logical organization to havethe responsibility for coordination and monitoring in the energysector. In addition to the priority areas already identified, in prin-ciple the Department should also take on the following important respon-sibilities: (a) standardizing, collecting and analising of energy sectordata; (b) ensuring that the viewpoints of energy users are given dueweight by monitoring the standard of service given by energy suppliers;(c) coordinating multi-sectoral inputs to the planning of investments inthe energy sector; (d) integrating sub-sectoral development schemes intoa coherent program for the energy sector; (a) ensuring that, relevant andtimely enfirgy considerations are taken into account in planning invest-ments in other sectors; (f) preparing sutmissions on behalf of the energysector for national planning purposes; and (g) monitering externaltechnical and financing assistance to the energy sector.
6.11 An important function of the Department should be to initiateand manage research in the energy sector which has an economic or socialbias. Other organizations are keen to pursue technical research butseldom delve into non-technical aspects. for example, there is a con-spicuous lack of studies on energy consumption patterns with particularreference to seasonality in fuel demand, per capita consumption trends,demand elasticities, energy costs in industry and transportation, and thedeterminants of inter-fuel substitution. All these aspects provideessential inputs to policy planning tad analysis based on local con-ditions.
6.12 At present, the Department has very few staff, most of whomhave relatively little experience. The Department does not bave suf-ficient resources to take on all these responsibilities, but there is astrong case for the provision of technical assistance to" the Department
- lIl -
to assist with'some of these responsibilities and to develop the Depart-ment's capability. Bowever, even if substantial technical assistancewere to be providedi, priorities have to be estobliohed for the Depart-ment's functions. The Department should concentratb initially on coor-dination gnd monitoring, and on the energy problem of households. Apriority for the Department shoul be a* survey of household energy con-sumptiom. Technical assistance should be provided to help formulate theDepartumst's work program and priorities, and to estimate the requirementfor t*phniial assistance and traimig.
Management ftvalopment
6.13 The energy sector organisations responsible for production ofenergy share common institutional and menagement problems. Broadly,'these problems fall into the following categories: (a) inadequatefinancial data; (b) absence of operating, financial and accountingsystems; (c) lack of management information systems; (d) minimal planningand budgeting; (e) absence of internal auditing; (f) little or notechnical and management training; (g) inadequate computer facilities;and (h) little coordination with related enterprises.
6.14 Presently, the maaagement of these organisation is supported bysome assistance from expatriates. A major issue facing theseorganisations is how to find and develop skilled and semi-skilled workersWho -could reduce the need for and expense of expatriate workers.Resolution of this issue is also essential for establishing the basis forlong tore institutional development. Therefore, the design andimplementation of technical assistance programs should include strongttaining programs, preferably in the form of on-the-job training whichwould require the sector organisations to comit some of their staff ascounterparts for the programs.
6.15 Many of the institutional and management problems areattributable to lack of staffing and resources at the middle and lowermanagement levels of the sector organisations. With the minimal staffresources available, only the most essential functions are undertaken.Lack of financial resources for recruitment, training and employment ofappropriate personnel would inhibit expansion of staff at these levels,notwithstanding a grave shortage of suitable candidates. The organi-zations have targeted their limited training resources at vital technicalareas, unavoidably neglecting management and administrative training.Nevertheless, the mission considers that it is essential for trainingefforts to be broadened, with the support of technical assistance, toinclude management development.
6.16 The strategy for technical assistance to sector organizationsfor management development should be based on three components:(a) short-term assistance required to sustain daily operations andsupport long term development; (b) a long-term program to developmanagerial skills and systems in each organization; and (c) integratedprograms covering more thn- one organization aimed at common problem
- 112 -
areas. The mission recommends that technical assistance be provided todevelop options for implementing management development programs and toassist the sector organizations in selecting an option and preparingdetailed programs.
Manpower Development
6.17 One of the major constraints to the development of the energysector in Mozambique is the scarcity of qualified manpower at most levelsof expertise. Past and probable future levels of output of trainedpersonnel in Mozambique are low in comparison to the needs of theeconomy. There is also a lack of teachers, equipment and textbooks. Inaddition, emigration of skilled manpower has been and still is occur-ring. Consequently, there is a heavy reliance on expatriate workers forthe operation of energy sector facilities. institutions in the energysector have recognised the necessity of developing their own trainingsystems. In the past few years, they have had to concentrate on raisingthe general level of education of recruits prior to training them inspecific skills. For the foreseeable future, the challenge to theseinstitutions is to develop low-cost and efficient training systems thatmeet their requirements.
6.18 Some initiatives have already been taken in the energysector. EDM has a small training center but it is too small for EDM'sneeds throughout the country. PETROMOC has a small informal trainingsystem that needs to be improved substantially, even if the refineryremains closed. CARBOMOC has begun to develop a national training centerat Moatise in anticipation of a major expansion in coal production capa-city. Thus, training is being provided but it is insufficient for thesector's needs. A huge effort has been and is being made to improve thegeneral level of literacy of the labor-force. The mission has recom-mended that technical assistance be given to sector institutions formanpower development. However, it should be noted that it is difficultto design training programs in the absence of firm and realisticsector/subsector development programs.
Technical Assistance
6.19 The institutions in the energy sector have difficulty inabsorbing technical assistance due to the scarcity of suitable counter-part staff to work with expatriates. These institutions also haveproblems in managing the logistics and work programs of expatriates withtheir scarce management resources. Implementation of a major program oftechnical assistance will require careful consideration of the form thatthis assistance should take. In some cases, such as the filling of keyskilled positions, the most appropriate form of technical assistance isspecifically recruited expatriates. In other cases, the appropriatetechnical assistance is to specifically develop a particular institu-tional capability rather than undertake operational duties, as formanagement, accounting and planning. However, where the demand forsupport greatly exceeds absorptive and managerial capacity, the most
- 113 -
appropriate form would be to appoint an expatriate organization toprovide a package of assistance and to take care of the logisticalrequirements of its staff. The mission recommends that this approach beconsidered for many of the technical assistance requirements, includingto MMH, EDM and for fuelwood plantations.
6.20 In common with general experience in Mozambique sinceIndependence, some of the technical assistance in the energy sector hasnot yielded benefits that are commensurate with the costs or expec-tations. The total cost of all technical assistance to the energy sectorsince Independence amounts to many millions of US dollars. The majorsuccess has been in maintaining facilities in operation and in con-structing new facilities. Technical assistance efforts relatingparticularly to institutional development have generally not had theexpected success. Lack of suitable counterpart staff has been a majorfactor in reducing the contribution made by assistance in training andmanpower development. Lack of information on priorities and difficultiesin supervising field staff may also have contributed to the modesty ofthe success obtained from technical assistanc, but poor design oftechnical assistance programs and inadequate supervision of expatriateadvisors may also have contributed to the lack of progress. The missionhas noted in Chapters 2 to 5 a number of actual or proposed planning andengineering studies whose priority is not the highest. Their costs tothe funding agencies and demands on Mozambican management resources areconsiderable. Mozambican and donor agency managers should ensure infuture that the studies undertaken are consistent with the priorities ofthe energy sector. The mission's recommendations that the Department ofEnergy coordinate technical assistance and that firms be used wheneveradvantageous, should assist in improving the relevance of technicalassistance and minimizing its demands on Mozambican managers.
Multi-sectoral Developments
6.21 The existing institutional approach to planning large multi-sectoral projects is to set up a development office for a specificproject and to staff it with representatives from the principal sectoralministries involved, as is the case presently for the coal and aluminiumprojects. However, this approach does not allow the planning of infra-structural development to be coordinated with a number of projects.Associated investments in transportation facilities are a major burdenfor many potential large energy and heavy industrial projects inMozambique, particularly investments in the railway system leading toBeira. It will probably not be possible for a project to be justifiedeconomically if it must carry the costs of rehabilitating a largeproportion of the railway system. Similar considerations apply to alesser extent for major new power transmission facilities, and they wouldalso apply in the case of a major gas pipeline. Resolution of theseissues requires an integrated,multi-sectoral approach to the planning andevaluation of large investments in transportation or transmissionfacilities with new developments in agriculture, agroirz-stry, industry
- 114 -
and mining. This approach would also improve the planning basis forselecting the locations of new demands on infrastructural facilities.
6.22 In Mozambique, the Zambezi valley region is an outstandingexample of an area that requires an integrated approach to planning largeprojects such as Cahora Bassa Stage 2, Noatize coal mines and the aluwminium project, as well as irrigated agriculture and associated agro-industries. Gas could be piped to the region if large reserves were tobe discovered to the south of the region. The railway and river systmeprovide the transportation backbone to the region, but huge investmentsare required to rehabilitate and upgrade the railways and ports and toturn the Zambezi into a navigable waterway. Realization of even a smallproportion of the region's economic potential can only be a long-termproposition due to the present poor economic prospects, to the magnitudeof the investments involved, to the present lack of knowledge aboutresource potential and markets, and to the shortage of managerial andprofessional personnel.
6.23 The institutional arrangements for planning and developing theZambesi region should be reviewed because of the need for a global pers-pective and for effective use of qualified manpower and technical assis-tance. This review (which should receive technical assistance) wouldcomplement the recommended strategic review of international marketopportunities, and together they would provide the basis for planning thelong-term development of the Zambezi region.
gummary of the Mission's Recommendations on Institutions
(a) The National Energy Council should be established as aneffective policy-making body (para. 6.8).
(b) The Department of Energy should be given technical assistanceto formulate its work program and execute priority activities(para. 6.12).
(c) The major sector enterprises (PETROMOC, CARBONOC, EDM, EU)should be required to submit operational and financial reportsto permit basic coordination within the sector (para. 6.7).
(d) The major sector enterprises should be given technicalassistance to develop a strategy and prepare details ofmanagement development programs (para. 6.16).
(e) The form of technical assistance should be given due attentionand designed to the specific circumstances (para. 6.19).
(f) The planning of large investments should encompass anintegrated, multi-sectoral approach (para. 6.21), especiallyregarding developments in the Zambezi Valley region(para. 6.24).
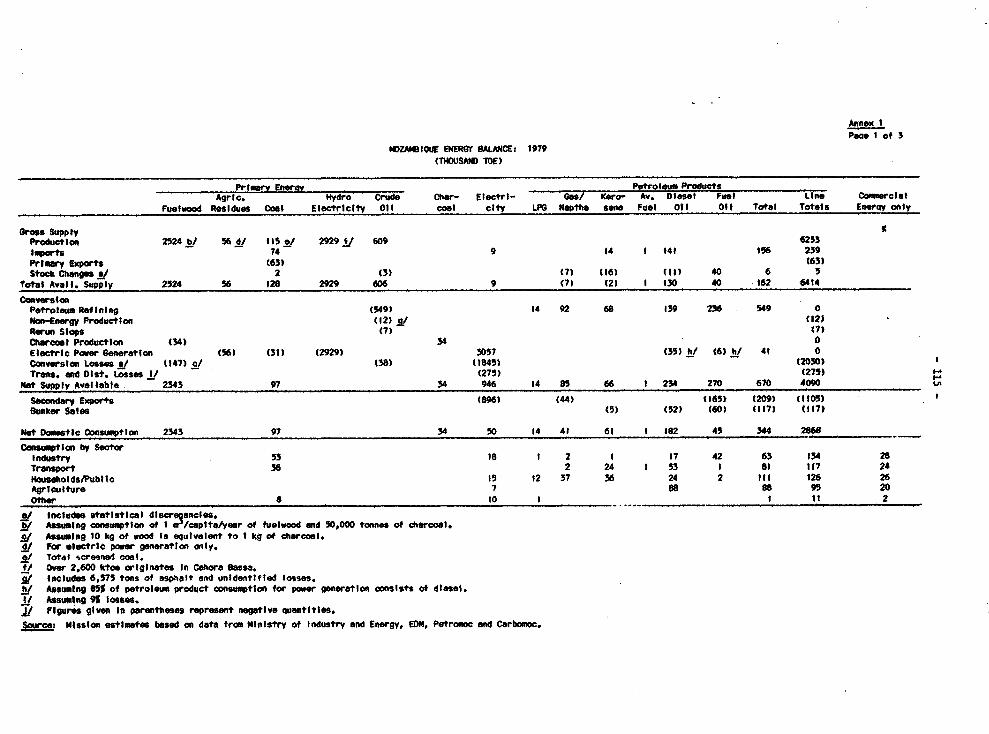
Annex IPeqe I of 3
IDZA4(10UE ENEREY 8ALACE: 1979(tHOUSAND MOE)
Pgr mary EneraY Petroe Prdut-Ic AEyd Cero Crude Char- Electrl- Gas/ Kero- Av. Dl Fuel LIne Coasercile
Fuelwood Residues Coal Electricity Ol coal city LPG Naptms sane Fuel Otl Off Total T¢tals Entray only
Gross Supply Production 2524 b/ 56 di IIS 2929 mg1/ 69 6253Imports 74 9 14 1 M41 156 239
Prlnry Exports (63) (63)Stock Changetsi 2 (3) (7) (16) (II) 40 6 5
total Avail. Supply 2524 56 128 2929 606 9 (71) (21 1 f30 40 162 6414
ConversionPetrolem Refining (549) 14 92 68 139 236 549 0Noln-Energy Productlon (12) j/ (12)
Rorun Slos (7)Charcoal Productlon (34) 34 0 DElectritc Power Generation (56) (31) (2929) 3057 (35) hJ (6) h/ 41 0Conversion Losses t 147) cJ (38) (1845) (2030)Trans. and Dist. Losses I/ (275) (275)
Not Supply Available 2343 97 34 946 14 85 66 1 234 270 670 4090
Secondar Exports (896) (44) (165) (209) ( 11s)SWuker Sales (5) (52) (60) (117) (117)
NOt DOnstitcConsuptlon 2343 97 34 50 14 41 61 1 182 45 34 2868
Consumption by SectorIndustry 53 18 1 2 1 17 42 63 134 28Transport 36 2 24 1 53 1 8I I t7 24
ousedolds/Pubilc 15 12 37 36 24 2 fi1 126 26AgrWculture 7 88 88 9g 20
Other 8 10 I 1 11 2
2/ Includes statIstical discregancles.# A"unming consumptIon of 1 '/ceapttet/yeer of fuolvood and 50,000 tonnes of charcoal.f Assumlng 10 kg of wood Is equlvalent to t kg of charcoal.
J For electric power generation only.eJ Total screened coal.1/ Ower 2,600 ktoe originates In Cahora oassa.2/ Includes 6,575 tons of asphalt and unidentifIed losses.,Df Assming 85% of petroleum product consumtlon for power gneration conststs of dlisel.(/ Assuming 9% losses., Figures given In parenthetses represent negative quantities.
Seorce: Nlssion estImates based on data from Ministry of Industry and Energy, EO, Petromoc and Carloc.
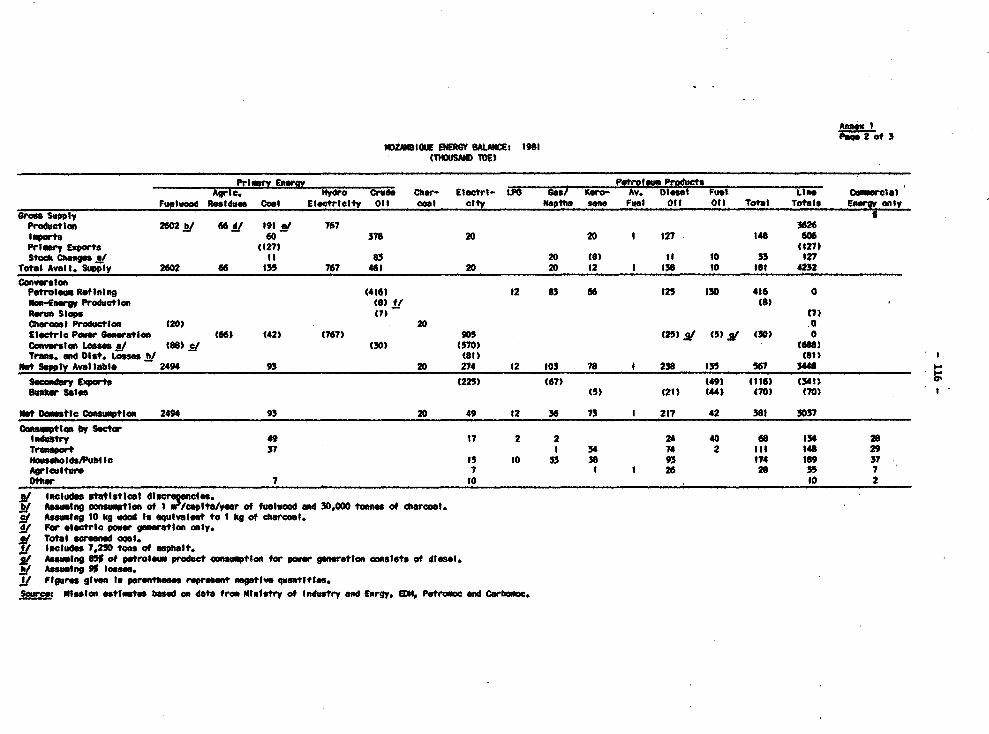
Pae2 of 3ItZAMIOUE DOW CESAL : 1981
(THOlUSAND TOEI
Prima Enm Po ProAgric. Wydro Crude Chw- Electri- LPG Gs/ -Keo- A,. De- Dcsc tucl Le Corcial
Fuelwood ResIdue Coel ElectrIIty Oil coal city Iapi sego Fuel Off Off Total Totals Eem' onlyGross Supply IProduction 2602 i 66 d/ 191 i 767 3626low" 60 378 20 20 1 127 M4e 606PrImary Exports (127) £127)Stock Changesf 1 83 20 (6) 11 10 3 127
Total Avail. Supply 2602 46 135 767 461 20 20 12 1 138 10 161 4252
ConversIonPetroleu Ref ining (416) 12 63 66 125 130 416 0on-Ernerg Production (6e lf (8)Reun Stope (7) (1)Charot lProduction (20) 20 0ElectrIc Paiar Senaratlon (661 (42) (767) 905 (25) ' (5) f (30) 0ConversIon Losses/ i (88) ,f (30) (570) (6M8)Tres. ud Dist. Lossey (61) (81)
Mtt Supty Avellable 2494 93 20 274 12 103 78 t 236 135 567 5448
Secodry leprt (225) (67) (49) (116) (341)lanker Sales 5) (21) (44) (70) (70)
Not Dnestle 0ono_tlto 2494 93 20 49 12 36 73 1 217 42 381 3037
Conseptlon by SectorIdtr 49 17 2 2 24 40 69 134 28Transport 37 1 34 74 2 itt 148 29llouseholdaPubl Is 1 3 39 174 169 37Agrlaltwu I I 1 26 28 35 7Other 7 10 10 2
if Include statiscal dlncroomles.f Assmng cnswptlon of I 0?cap1t6/Yftr of fulvod and 30,000 tons dartcoa.f ssWIg 10 kg Wod Is equivalent to I kg of cnarcoal.
For *lectrtc ptar genrtion only.d Total scre d coal.
f Includs 7.250 tons of aphialt.AssmIng % of petroleum product onseion for pgor g rtion consists of dIeel.Assu_ng 9% losses.
.V Flgres given In perenthae represert negtIve quantIttos.Source MIssIon esttimtoe basd on d" ta frm Mnistry of Industry and Eorgy, EOM, Petromo and C Nrhmoc.

oii -f 3
ItZAlIIQIE DOUB 8UANCE: 1984(THOUSMA TOE)
PrIm nerof Petoleu ProductsArgc. Hydro Crudt Ct,- Electrl- G35 Ibro Av. Del rul Line Crcwtel
FuelvOod Residues Caol ElectreIIty Oil costl cIty UV6 Wath Son Fuel Oil Ofl Total Totals Ene only
Gross SuplIyProductoln 2869 25if 23d/ 46 2963
Imports 41 h/ 88 24 2 19 59 152 6 23 391
Primar E,ports (9)Stoc Changmsa/ (12) (2) 4 £12) 14 13 19 5
Totl Aval. Supply 2869 25 43 46 86 24 2 23 47 "66 19 257 3350
ConversionPetroleu RefIning (78) 1 12 11 17 37 78 0
WNobEnegy Production (2) (2)
Reru Slos (1) e Chacol Production (14) t4
Electric Poer eratleon (25) (38) (46) 136 (23) St (6) if (29) 0
Conerslon Loss"e _59) t (100) (164
Trans. ard 01st. LOses I (13) (131
Wmt Suoly Aallable 2796 5 14 49 5 35 ss to60 So s 5170
Secay Es (2) (27) (29) (29)
Sua5ka Sales (4) (3) (5) (12) (12)
Ibt 0Ole onstlcn 2796 5 14 49 3 54 155I to 265 3129
Conmpn by Sector
Trnporttlauseold subilicAglwaltureother
leluds statistical dlscregancle.Aesuang osuptWlo of I Vecsptesr of fuelvood and 20,000 tamo s of ecosl.
i For olectrIc poer genratln nly.if Total screeed owl.i lnclwld 1.172 tone of sphalt.lt AssMIng 9% losses.
Assumlng 9% of perolem podt onupion for poe generatlon consIsts of dIesel.
Mslso e stimate./ Flgme Ive In paetss rerse negaive auantItles.
Seggrco ZMission estimates baed on datt fIn Ministry of Indsty an Ene, M, P c and Crbomoc.

Annex 2
-118- Page-of2
WOODFUEL COSTS AND PRICeS PFOR MAPUTO IN 1985
Prices, Margins and Cost& for Fuelvood and Charcoal
1. In mid 1985 the retail price of fuelvood with a moisture con-tent of 20X-30% in Naputo was about MT 25/kg The wholesale price wasroughly MT15/kg when purchased by the truckload of about 4 tonnes. Theretail margin is thus roughly 67Z (retail value of a truckload isMT100,000 while wholesale cost is about NT60,000) but must cover split-ting and selling costs (market fees, watchmn, salesmen) so that the netmargin is about 401. The monthly remuneration of an average merchant(selling 5 to 6 truckloads per month) would therefore be aboutMT15,00O. This high margin partly reflects the risks involved in thetrade, due to the possibility of attacks by armed bands, and probably italso includes some economic rent that reflects the shortage of vehiclesand motor fuels. In absolute terms this remuneration is about ten timesthe monthly salary of a high level civil servant.
2. The retail price of charcoal in s'puto in mid-1985 was roughlyMTl50/kg, but even at such a high price, demand clearly exceeded supply.The advantages of charcoal over firewood in urban areas appeared to beundervalued by the market because useful energy in the form of charcoalwas almost about the same cost as energy from fuelvood (assuming finalconversion efficiencies of 8Z for fuelvood and 201 for charcoal). Theexplanation might have been that the price of fuelwood had reached thehighest level that the market could bear (approximately NT0.10/kcal ofuseful energy), at which level producers found it more profitable tosupply fuelwood rather than charcoal from most of the woodfuel supplyareas.
3. A tentative break-down of costs for the charcoal trade inMaputo suggest that the retail margin is about 1001. However, since thetrade in charcoal is carried on a very small scale, this seemingly highmargin could well result from high risks and fixed costs for small-scaleactivities in production and transportation. Pull truckloads of charcoalhad not been seen in Maputo for some time, and the typical trader handlesonly one or a few sacks 11 each day. The total ernings of a charcoaltrader are thus not very high, and the trade is often conducted as asecondary activity (e.g. by workers absent from their Jobs or during theweekends, and by women who have to travel to their gardens or farms).
I/ The official literature refers to 40 kg bags of chareoal. Thisprobably refers to the sacks used on government projects whoseoutput is negligible and is generally not sold on the open market.The largest sacks seen by the mission (and weighed) were approx.0.16 m (6 cubic feet) and contained about 55 lbs (23 kg) of char-coal. A 40 kg bag would be too big and heavy to be carried bypeople over long distances.
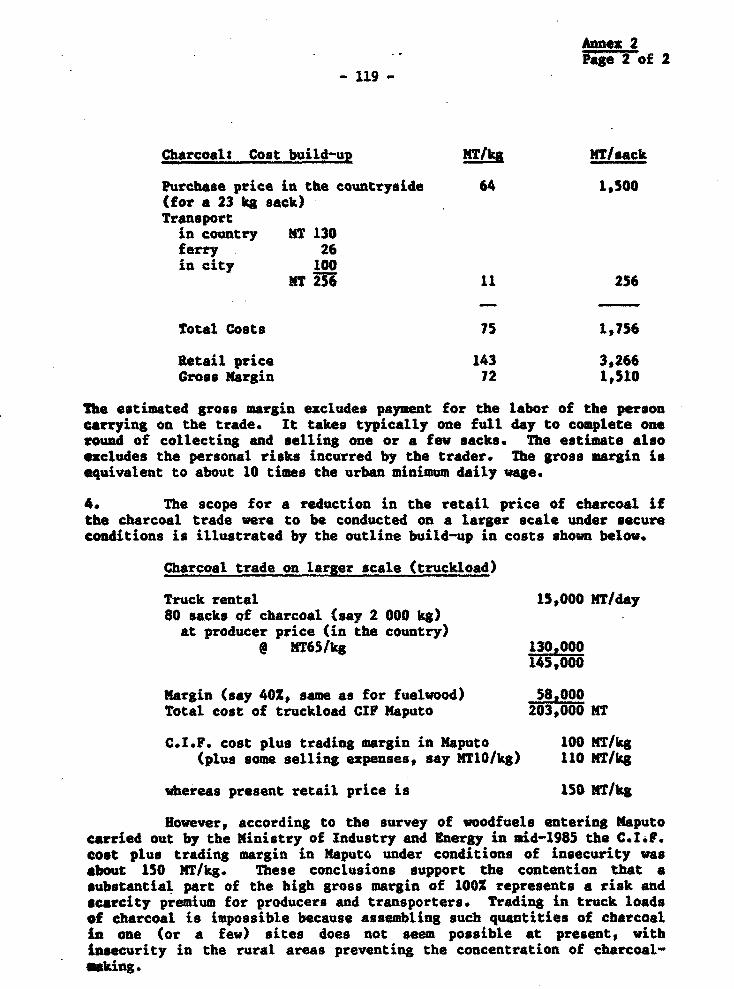
Anne* 2Page2 of 2
- 119-
Charcoalt Cost build-up MT/kg MT/sack
Purchase price in the countryside 64 1,500(for a 23 kg sack)Transportin country NT 130ferry 26in city 100
MT 256 11 256
Total Costs 75 1,756
Retail price 143 3,266Gross Margin 72 1,510
The estimated gross margin excludes payment for the labor of the personcrrying on the trade. It takes typically one full day to complete onewound of collecting and selling one or a few sacks. The estimate alsoexcludes the personal risks incurred by the trader. The gross margin isequivalent to about 10 times the urban minimum daily wage.
4. The scope for a reduction in the retail price of charcoal ifthe charcoal trade were to be conducted on a larger scale under secureconditions is illustrated by the outline build-up in costs shown below.
Charcoal trade on larger scale (truckload)
Truck rental 15,000 MT/day80 sacks of charcoal (say 2 000 kg)at producer price (in the country)
- MT65/kg 130,000145,000
Margin (say 402, same as for fuelwood) 58,000Total cost of truckload CIP Maputo 203,000 MT
C.I.F. cost plus trading margin in Maputo 100 NT/kg(plus some selling expenses, say NTIO/kg) 110 MT/kg
whereas present retail price is 150 MT/kg
However, according to the survey of woodfuels entering Maputocarried out by the Ministry of Industry and Energy in mid-1985 the C.I.f.cost plus trading margin in Mbputo under conditions of insecurity wasabout 150 MT/kg. These conclusions support the contention that asubstantial part of the high gross margin of 100X represents a risk andscarcity premium for producers and transporters. Trading in truck loadsof eharcoal is impossible because assembling such quantities of charcoalin one (or a few) sites does not seem possible at present, withinsecurity in the rural areas preventing the concentration of charcoal-makin$.
Annex 3Page l of 4
-120 -
FOREST RESOURCES IN MOZAMBIQUE 11
1. The forest resources ot Mozambique consist of natural broad-leaved forests and plantations of mainly eucalyptus species. Naturalforests range from closed moist forest to open, savanna formations, andmake up more than 99 percent of the existing resources, with mangrovesmaking up the rest.
Forests types
2. The following classification of forest types was used in themost extensive forest inventory undertaken in Nozambique. High potentialforests include moist and dry forests with the superior stratum formed bytrees with an average height of over 20 meters. These forests arelocated in Sofala and other northern provinces, and they are the bestsources of commercially valuable timber. They require protection fromencroachment and fire through a sound management plan because of theirimportant role in protecting several watersheds. Medium productiveforests have the superior stratum formed by trees with a maximum heightof 12 meters, the intermediary stratum with trees of 5 to 7 meters, anddense grass and bushy low vegetation close to ground level. This type offorest was formed as a result of overexploitation of high productiveforests and by being exposed constantly to fires which has interruptedthe process of regeneration. It is found on land with poor sandysoils. This type is located mostly in the central and northernregions. Low productive forests are characterized by relatively lowtrees in the superior stratum of about 10-meter height with canopyclosure of less than 50X. The medium stratum is formed by trees of 6meter height, and the herbaceous ground cover is relatively high. Thesecondary growth forests or degraded forest, called locally "matagalalto," are included in this category. It has the appearance of forestbut its composition is quite different, mostly of thorny and "erophyticspecies suited to dry conditions. The tree coverage occupies about 301of the area.
Savanna with and without trees
3. A range of complex vegetation was grouped under this category,but its main characteristic is the dominance of the grass and herbaceousstratum, sometimes with sparse tree cover. It is also called "zona docajuW (cashew sone) due to the presence of Anacardium occidentalis. Theperiurban formations surrounding Maputo and Beira belong to thiscategory. This is the dominant type of vegetation over large areas ofthe country.
1/ This Annex also draws heavily from the work of Mr. A. Kir and othersof the FAO/UNDP team in the Directorate of Forests, Ministry ofAgriculture, Maputo.
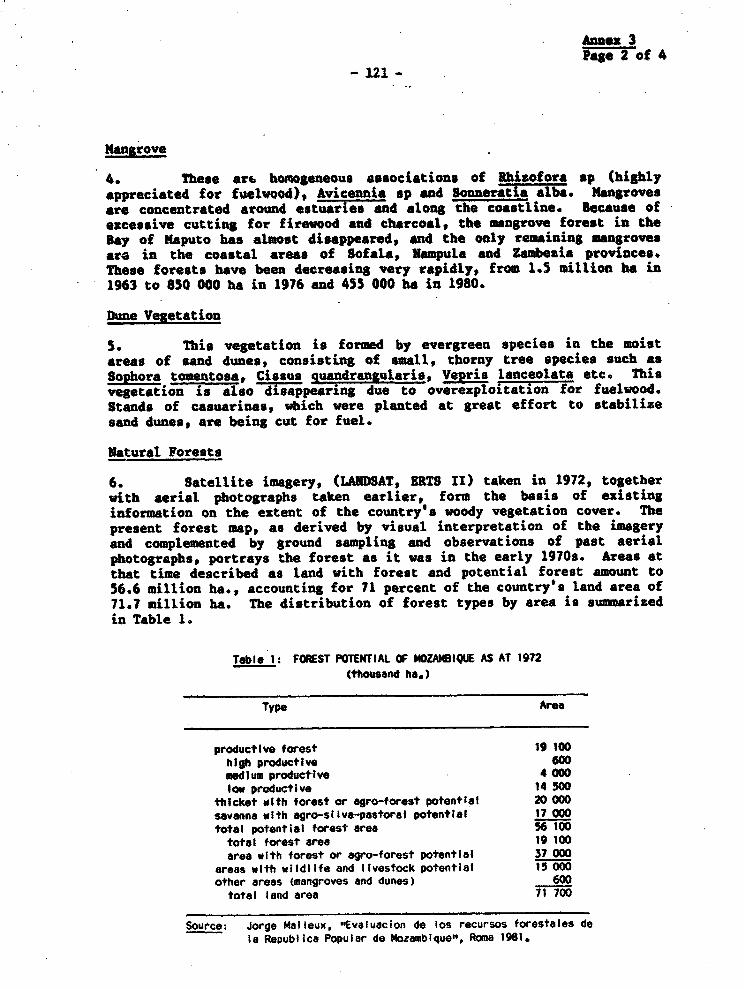
kAnn" 3Pagse2 of 4
- 121 -
Mangrove
4. These ar6 hboogeneous associations of Rhisofora ap (highlyappreciated for fuelwood), Avicennia ap and Sonneratia alba. Mangrovesare concentrated around estures aend along the coastline. Because ofexcessive cutting for firewood and charcoal, the mangrove forest in theBay of Maputo has almost disappeared, and the only remaining mangrovesare in the coastal areas of Sofala, Nampula and Zambezia provinces.These forests have been decreasing very rapidly, from 1.5 million ha in1963 to 850 000 ha in 1976 and 455 000 ha in 1980.
Dune Vegetation
5. This vegetation is formed by evergreen species in the moistareas of sand dunes, consisting of small, thorny tree species such asSophora tomentosa, Cissus quandrangularis, Vepris lanceolata etc. Thisvegetation is also disappearing due to overexpLoitation for fuelwood.Stands of casuarinss, which were planted at great effort to stabilizesand dunes, are being cut for fuel.
Natural Forests
6. Satellite imagery, (LANDSAT, ERTS II) taken in 1972, togetherwith aerial photographs taken earlier, form the basis of existinginformation on the extent of the country's woody vegetation cover. Thepresent forest map, as derived by visual interpretation of the imageryand complemented by ground sampling and observations of past aerialphotographs, portrays the forest as it was in the early 1970s. Areas atthat time described as land with forest and potential forest amount to56.6 million ha., accounting for 71 percent of the country's land area of71.7 million ha. The distribution of forest types by area is summarizedin Table 1.
Table 1: FOREST POTENTIAL OF NOZABI6QUE AS AT 1972(thousand ha.)
Type Area
productive forest 19 100htgh productive 600medium productive 4 000low productive 14 500
thicket with forest or agro-forest potential 20 000savanna wIth agro-silva-pastoral potentIal 17 000total potential forest area 56 100total forest area 19 100area with forest or agro-forest potential 37 000
areas with wildlife and livestock potential 15 000other areas (mangroves and dunes) 600
total land area 71 700
Soutce: Jorge Malloux, "Evaluacion de los recursos forestales de
la Republica Popular de Mozambique", Roma 1981.
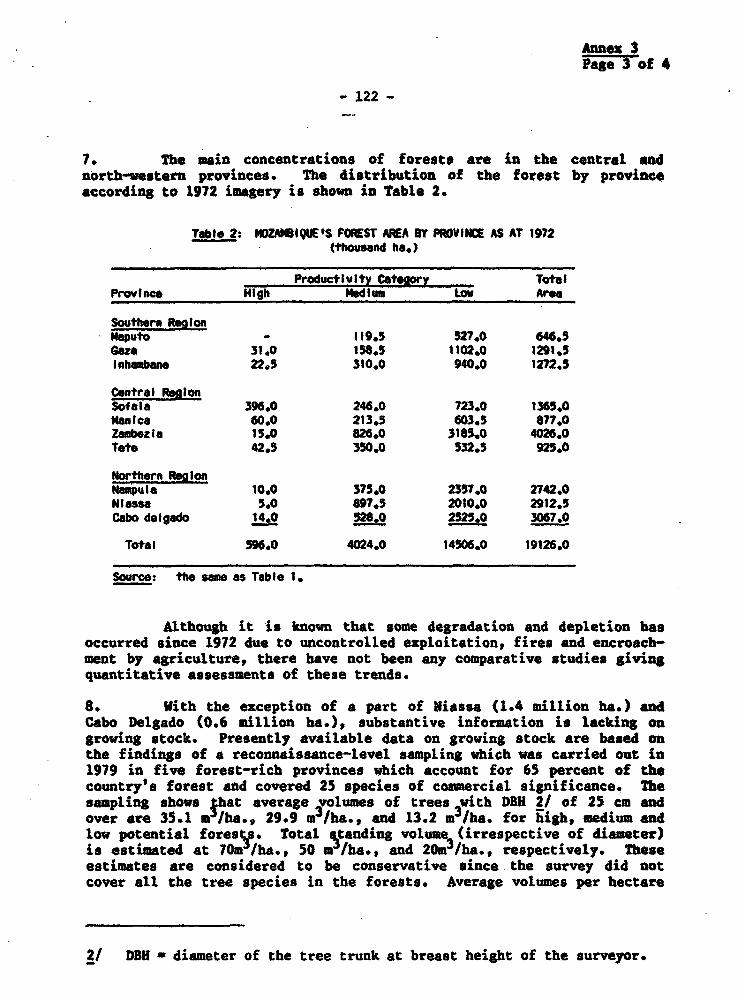
Anne" 3Page 3 of 4
- 122 -
7. The main concentrations of forests are in the central andnorth-western provinces. The distribution of the forest by provinceaccording to 1972 imagery is shown in Table 2.
Table 2: MOZA'SIUE'S FGIEST AEA BY PROVINIM AS AT 1972(tousand he.)
ProductIvitY CateyorY TotalProvince High medium LoW Area
Southern ReglonMaputo - 119.5 527.0 646.5GuaZ 31.0 158.5 1102,0 1291,5Inhambane 22,5 310.0 940.0 1272.5
Central RegionSofala 396.0 246.0 723.0 1365.0Mo"nIa 60.0 213.5 603.5 87.0Zmmbetza 15.0 826.0 3185.0 4026.0Yete, 42*5 350.0 332.5 925.0
Nohern th Iontanpula 10.0 375.0 2357.0 2742.0Miass" 5.0 897.5 2010.0 2912.5Cabo delgado 14.0 _ L525. 3067.0
Total 596.0 4024.0 14506.0 19126.0
Source: the sae as Table 1.
Although it 'is known that some degradation and depletion hasoccurred since 1972 due to uncontrolled exploitation, fires and encroach-ment by agriculture, there have not been any comparative studies givingquantitative assessments of these trends.
8. With the exception of a part of Viassa (1.4 million ha.) andCabo Delgado (0.6 million ha.), substantive information is lacking ongrowing stock. Presently available data on growing stock are based onthe findings of a reconnaissance-level sampling which was carried out in1979 in five forest-rich provinces which account for 65 percent of thecountry's forest and covered 25 species of conmercial significance. Thesampling shows that average volumes of trees with DBH 2/ of 25 cm andover are 35.1 m'/ha. 29.9 m'/ha., and 13.2 m3/ha. for high, medium andlow potential forests. Total otanding volume (irrespective of diameter)is estimated at 70m /ha., 50 in /ha., and 20m3Jha., respectively. Theseestimates are considered to be conservative since the survey did notcover all the tree species in the forests. Average volumes per hectare
2/ DBE = diameter of the tree trunk at breast height of the surveyor.
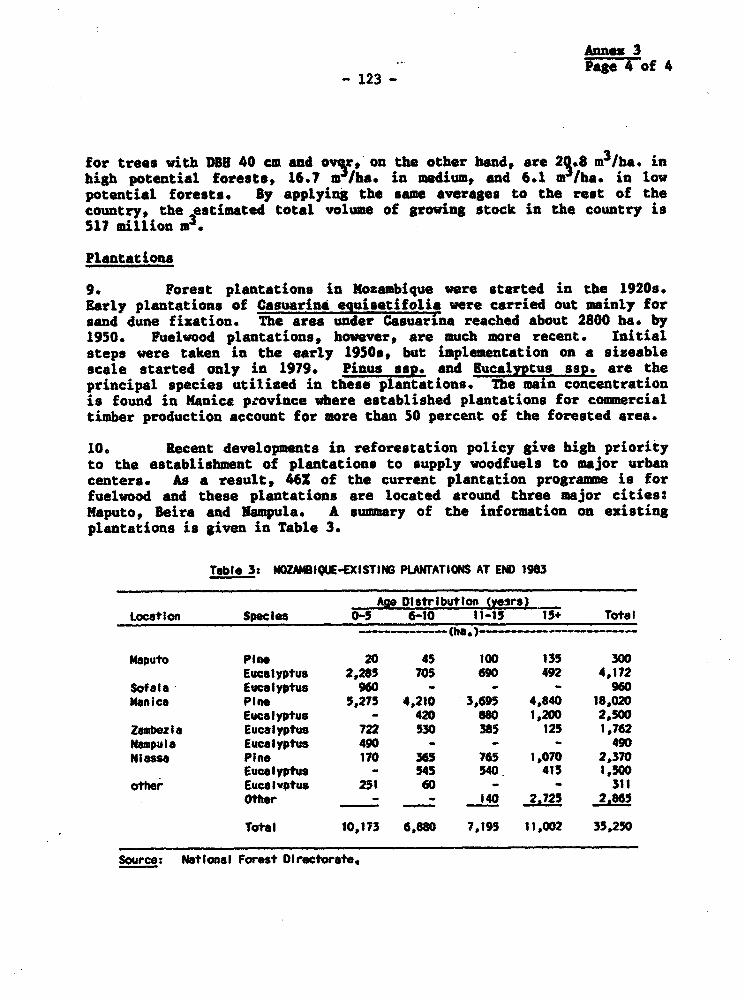
Annses 3
- 123 -Page of 4
for trees with DBI 40 cm and ov r, on the other hand, are 2S.8 m3/ha. inhigh potential forests, 16.7 I/ha. in medium, and 6.1 m /ha. in lowpotential forests. By applying the same averages to the rest of thecountry, the estimated total volume of growing stock in the country is517 million m3.
Plantations
9. Forest plantations in Mozambique were started in the 19209.Early plantations of Casuarina equisetifolia were carried out mainly forsand dune fixation. The area under Casuarina reached about 2800 ha. by1950. Puelwood plantations, however, are much more recent. Initialsteps were taken in the early 1950s, but implementation on a sizeablescale started only in 1979. Pinus ssp. and Eucalyptus 80p. are theprincipal species utilised in these plantations. The main concentrationis found in Manica pwovince where established plantations for commercialtimber production account for more than 50 percent of the forested area.
10. Recent developments in reforestation policy give high priorityto the establishment of plantations to supply woodfuels to major urbancenters. As a result, 46S of the current plantation programme is forfuelwood and these plantations are located around three major cities:Maputo, Beira and Nampula. A summary of the information on existingplantations is given in Table 3.
Table 3: MOZAbIQUE-EXISTING PLANTATIONS AT EN) 1983
Age Distribution (yesrs)Location Species 0-5 6-10 11-15 15+ Total
-- (ha.)-
Maputo Pine 20 45 100 135 300Eucalyptus 2,285 705 690 492 4,172
Sofela Eucalyptus 960 - - - 960Menica Pine 5,275 4,210 3,695 4,840 18,020
Eucalyptus - 420 880 1,200 2.500Zambezia Eucalyptus 722 530 385 125 1,762kempula Eucalyptus 490 - - - 490Kiassa Pine 170 365 ?65 1,070 2,370
Eucalyptus - 545 540. 415 1,500other Eucalyptus 251 60 - - 311
Other - - 140 2.725 2.665
Total 10,173 6,880 7,195 11,002 35,250
Source: National Forest Directorate.
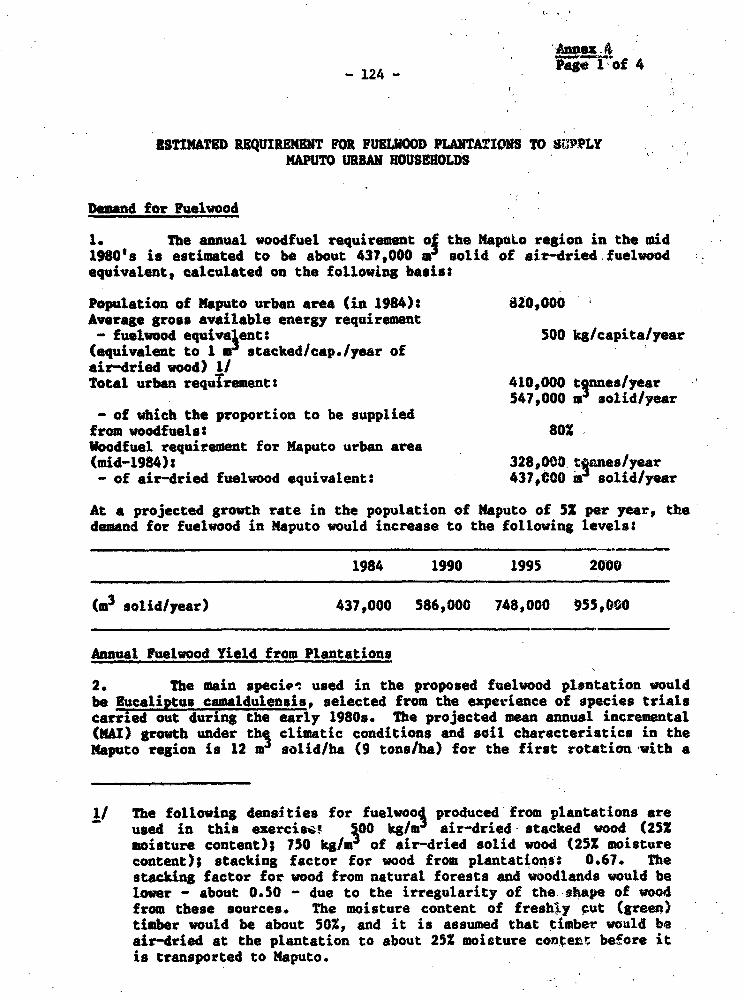
Page l'of 4-124-
£STINATMT REQUIREMENT FOR FUIMLOOD PLANTATIONS TO .SCPPLYMAPUTO URBAN HOUSEHOLDS
Demand for Fuelvood
1. The annual woodfuel requirement of the NapuLo region in the mid1980's is estimated to be about 437,000 a' solid of air-dried.fuelvoodequivalent, calculated on the following basis3
Population of Naputo urban area (in 1984): 820,000Average gross available energy requirement
- fuelvood equiva ent: 500 kg/capita/year(equivalent to 1 m' stacked/cap./year ofair-dried wood) 1/Total urban requirement: 410,000 tQnnes/year
547,000 mi solid/year- of which the proportion to be suppliedfrom woodfuels 8OX-Uoodfuel requirement for Maputo urban area(mid-1984): 328,O0cD t nnes/year- of air-dried fuelwood equivalent: 437,COO a solid/year
At a projected growth rate in the population of Maputo of 5S per year, thedemand for fuelwood in Maputo would increase to the following levels:
1984 1990 1995 2400-
(W3 solid/year) 437,000 586,000 748,000 955,000
Annual Puelwood Yield from Plantations
2. The main specie^ used in the proposed fuelwood plentation wouldbe Eucaliptus camaldulensis, selected from the experience of species trialscarried out during the early 1980s. The projected mean annual incremental(MAI) growth under the climatic conditions and sail characteristics in theNaputo region is 12 mP solid/ha (9 tons/ha) for the first rotation with a
1I The following densities for fuelwooi produced from plantations areused in this ezercise-! 100 kg/mJ air-dried- stacked wood (25Zmoisture content); 750 kg/mr of air-dried solid wood (25X moisturecontent); stacking factor for wood from plantations: 0.67. Thestacking factor for wood from natural forests and woodlands would belower - about 0.50 - due to the irregularity of the.,shape of woodfrom these sources. The moisture content of freshly put (green)timber would be about 50%, and it is assumed that timber would beair-dried at the plantation to about 25% moisture contet be-fore itis transported to Maputo.
- Annex 4aPage 2 of 4
._ 25
10 year rotation period. It is envisaged that three rotations would beharvested, and that the MAI would decrease by 101 with each rotation. Theyield of fuelwood would be about 851 of the MAu, about 100 ml solid/ha fora 10 yeat rotation, after allowing for unusable biomass. The possibilityof reducing the rotation period to 8 years is also considered in view ofthe critical shortage of woodfuel supplies to Maputo.
Requirement for Fuelwood Plantations
3. The framework for assessing the requirement for fuelwoodplantation to supply the Maputo urban area has to encompass supplies fromnatural woodlands in the region, potential for woodfuel production from.logging and land clearance for agricultural production. The fuelwoodrequirements of the rural population that dwell in the surrounding areas ofKaputo also have to be considered. Data are not available to make a firmassessment of the global situation, but a preliminary assessment can bemade from a review of forestry resources made in 1980 under an FAO project.2/ in that review, it is estimated thet the annual sustainable yield offuelwood from natural wooilands that lie within a radius of 60 km fromMaputo was about 200,000 m solid of harvested wood. This capability willhave diminished with deforestation, and is likely to continue todiminish. An assessment of trends in standing biomass and sustainableyields is one of the main objectives of the proposed forest inventory work(Chapter 2).
4. The fuetwood needs of the rural population that exists within a60 km radius of Maputo, estimated to be about 350,000 people in 1980 andgrowing m3t an annual rate of between 2% and 2.51, is presently about350,000 m solid/year. Some of these needs are met from local savannah-type land, but the sustainablt yield of local natural forests would meetonly about half the needs of the local rural population. Thus, forplanning purposes it would be sensible to consider that most of the sus-tainable yield from pstural forest wiLthin 60 km of Maputo are required tomeet the demands for fuelwood of the rural population. In the presentdepressed state of the sawmilling industry, the amount of logging wastescould make only * marginal contribution to urban fuelwood supplies. Thefuture scale of land clearence programs is conjectural at present. A firstorder approximation of the requirement for fuelwood plantations is thus,the proJected demand for woodfuels in the Maputo urban area. This estimatedoes n9t a1l1G for woodfuel supplies, especially charcoal, beingtranspofted froM production areas beyond a 60 km radius from Maputo.
Ma4nitude of Requirement for Plantations
5. The demand for woodfuel in Maputo projected in paragraph 1 woutdrequire the harvesting of the following plantation areas:
2/ "Avaliajao dos lecursos Ploreotais de Mocambique" by Jorge Malleux,Maputo, June 1980 (PAO Project MOM/76/007).
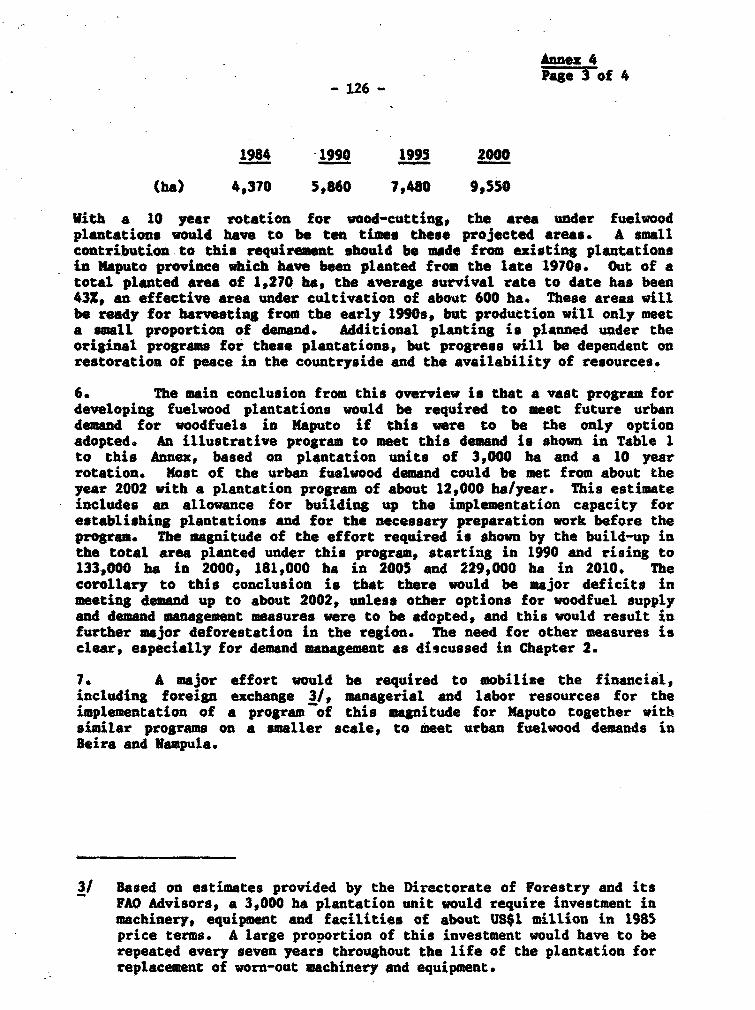
Annex 4Page 3 of 4
- 126 -
1984 -1990 1995 2000
(ha) 4,370 5,860 7,480 9,550
With a 10 year rotation for wood-cutting, the area under fuelwoodplantations would have to be ten times these projected areas. A smallcontribution to this requirement should be made from existing plantationsin Maputo province which have been planted from the late 1970s. Out of atotal planted area of 1,270 ha, the average survival rate to date has been43X, an effective area under cultivation of about 600 ha. These areas willbe ready for harvesting from the early 1990s, but production will only meeta sall proportion of demand. Additional planting is planned under theoriginal programs for these plantations, but progress will be dependent onrestoration of peace in the countryside and the availability of resources.
6. The main conclusion from this overview is that a vast program fordeveloping fuelvood plantations would be required to meet future urbandemand for woodfuels in Maputo if this were to be the only optionadopted. An illustrative program to meet this demand is shown in Table 1to this Annex, based on plantation units of 3,000 ha and a 10 yearrotation. Most of the urban fuelvood demand could be met from about theyear 2002 with a plantation program of about 12,000 ha/year. This estimateincludes an allowance for building up the implementation capacity forestablishing plantations and for the necessary preparation work before theprogram. The magnitude of the effort required is shown by the build-up inthe total area planted under this program, starting in 1990 and rising to133,000 ha in 2000, 181,000 ha in 2005 and 229,000 ha in 2010. Thecorollary to this conclusion is that there would be major deficits inmeeting demand up to about 2002, unless other options for woodfuel supplyand demand management measures were to be adopted, and this would result infurther major deforestation in the region. The need for other measures isclear, especially for demand management as discussed in Chapter 2.
7. A major effort would be required to mobilize the financial,including foreign exchange 31/, managerial and labor resources for theimplementation of a program of this magnitude for Maputo together withsimilar programs on a smaller scale, to meet urban fuelvood demands inBeira and Nampula.
3/ Based on estimates provided by the Directorate of Forestry and itsFAO Advisors, a 3,000 ha plantation unit would require investment inmachinery, equipment and facilities of about US$1 million in 1985price terms. A large proportion of this investment would have to berepeated every seven years throughout the life of the plantation forreplacement of worn-out machinery and equipment.
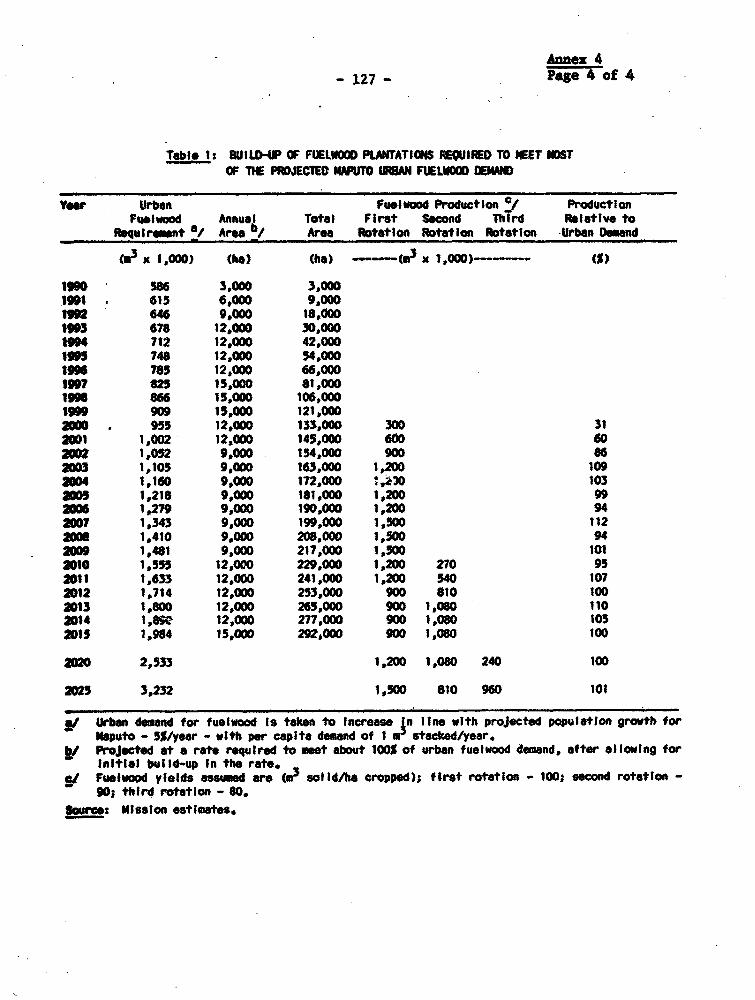
Annex 4-127_ Page 4 o£ 4
Table 1: BUILD-I OF FUELIOOD PLANTATIONS iEQUIRED TO WEET MOSTOF TM PROJECTE WMUTO iAN FUELWOOO MEIUJO
Yvw Urban Fuelwood Production f/ ProductionFPolwood Annual Totlo First Second Third Rlative to
ReuI rewnt a/ Area b/ Area RotatIon Rotation Rotation Urban Deand
(m x 1,000) (ha) (hb) ( x ,ooo -(7
1990 546 3,000 3,000191 . 615 6,000 9,000192 646 9,000 18,600103 678 12,000 30,000104 712 12,000 42,000lo5 748 12,000 54,0001096 785 12,000 66,00019t 825 15,00o 81,000190 866 13,000 106,0001999 909 15,000 121,0002000 955 12,000 133,000 300 312001 1,002 12,000 145,000 600 6020m2 1,052 9,000 154,000 900 862003 1,105 9,000 163,000 1,200 1092004 1,160 9,000 172,000 *,230 1033005 1,218 9,000 181,000 1,200 99206 1,279 9,000 190,000 1,200 942007 1,343 9,000 199,000 1,300 112am8 1,410 9,000 208,000 1,500 942009 1,481 9,000 217,000 1,50O 101MO10 1,555 12,000 229,000 1,200 270 952011 1,633 12,000 241,000 1,200 540 1072012 1,714 12,000 253,000 900 810 1002013 1,800 12,000 265,000 900 1,080 1102014 1,8w 12,000 277,000 900 1,080 1052015 1,984 15,000 292,000 900 1,080 100
2020 2,533 1,200 1,060 240 100
2025 3,232 1,500 810 960 101
/ Urban demand for fuelwood Is taken to Increase in line with projected population growth forMaputo - 5S/year - with per capita demand of 1'e stacked/year.
b/ ProJected at a rate required to meet about 100% of urban fuelvood demand, after 0llowing forIniti*l but Id-up In the rate.
0 Fuelwood yields assumed are (m so IdAhe cropped); first rotation - 100; second rotation -90; third rotation - 60,
s5urce: Mission estimates.
Annex 5Page of 5
-128-
EVALUATION OF ALTERNATIVE PROGRAMS FOR FUELVOOD PLANTATIONSIN THE REGION OF MAPUTO 1/
1. A number of programs for supplying fuelwood to Naputo areevaluated in this Chapter. The scale of these programs is substantially.less than the estimated order of magnitude required to meet the totaldemand (Annex 4). The evaluated fuelwood programs consist of annualplanting rates of between 2,000 and 4,000 ha over 20 years, with a totalarea under cultivation of 40,000 ha for three alternatives and 60,000 hafor six alternatives. If the program period started in 1990, plantingwould take place between 1990 and 2010, and fuelwood would be producedbetween 2000 and 2040. An average annual planting rate of 3,000 ha isabout 25% of the average rate for the program required to meet most ofthie urban fuelwood demand in Maputo from 2002 onwards (Annex 4).
2. The direct costs of the plantation programs were derived on thefollowing basis:
- costs of machines, equipment and materials are based onworld prices, CIF Maputo;
- local skilled manpower is costed at the salaries paid;
- local unskilled manpower is costed at the value of themonthly basket of goods required for living according toequivalent world commodity prices; 2/
- foreign technical assistance is costed on the basis of amanagement contract with a firm, to whom payments are madein foreign currency;
- land used for fuelwood plantations is valued at anopportunity cost in terms of foregone production ofsubsistence food crops;
1/ This evaluation is based on planning work done by members of theDirectorate for Forestry in the Ministry of Agriculture and the FAOadvisors attached to the Directorate.
2/ The cost of unskilled labor valued according to this method is about10 of the wages paid to these laborers, at an exchange'rate ofNT43IUS$, accordling to a comparison of costs between this exerciseand a similar ext.icise carried out at market prices by the Direc-torate for Forestry (Ref: "Reflorestamento para Produgao de Lenha eCarvao para a Cidade de Maputo - Ideia de Projecto", March 1985).

Annex 5Page 2 of 5
-129 -
These cost estimates do not include the indirect costs of setting upfuelwood plantations, especially government support infrastructure.These costs may be substantial.
3. The following nine alternative planting progrums have beenevaluated to test the sensitivity of the economics of production to thescale of operation and the length of rotation period.
Planting Program Rotation Total AreaProgram Nb. Program Period Planted
(ba/yea) (years) (years) (ha)
1 2,000 20 10 40,0002 2,000 20 8 40,0003 2,000 14 (first) a 40,000
42,000 6 (subsequent) 104 3,000 20 10 60,0005 3,000 20 8 60,0006 3,000 20 (fIrst) 8 60,000
.3,000 10 (subsequent) 107 2,000 10 (first) 10 60,000
+4,000 10 (subsequent), 108 2,000 10 (fIrst) 8 60,000
+4,000 10 (subsequent) 89 2,000 10 (fIrst) a 60,000
+4,000 10 (subsequent) 10
The projected yields of fuelvood are based on a value for the mean annualincrement (NAI) of 9 tonnes/ha/year, and assumes that 15Z of the totalbiomass would be unusable for woodfuel. Each plant is carried throughthree rotations and it is assumed that the MAI decreases by 10X with eachrotation.
4. Unit costs for establishing and maintaining a fuelwood planta-tion in the Maputo Region are given in Table 1 to this Annex. Theseestimated were prepared by the Directorate of Porestry and the PADadvisors attached to the Directorate. The costs are translated intoannual costs for each alternative plantation program that is evaluated,together with the corresponding annual quantities of fuelwood that areproduced. The average cost of production is computed from the followingformula:
(Discounted Present Value of Annual Costs over the Program Life)divided by the (Discounted Present Value of the Annual Quantities ofPuelwood Produced).
The advantages of this formula are that it takes account of the timevalue of investment resources and the irregularity of the patterns ofAnnual costs and production. The annual streams for costs and productionfor Program 5 (paragraph 3) are shown in Table 2 to this Annex. The
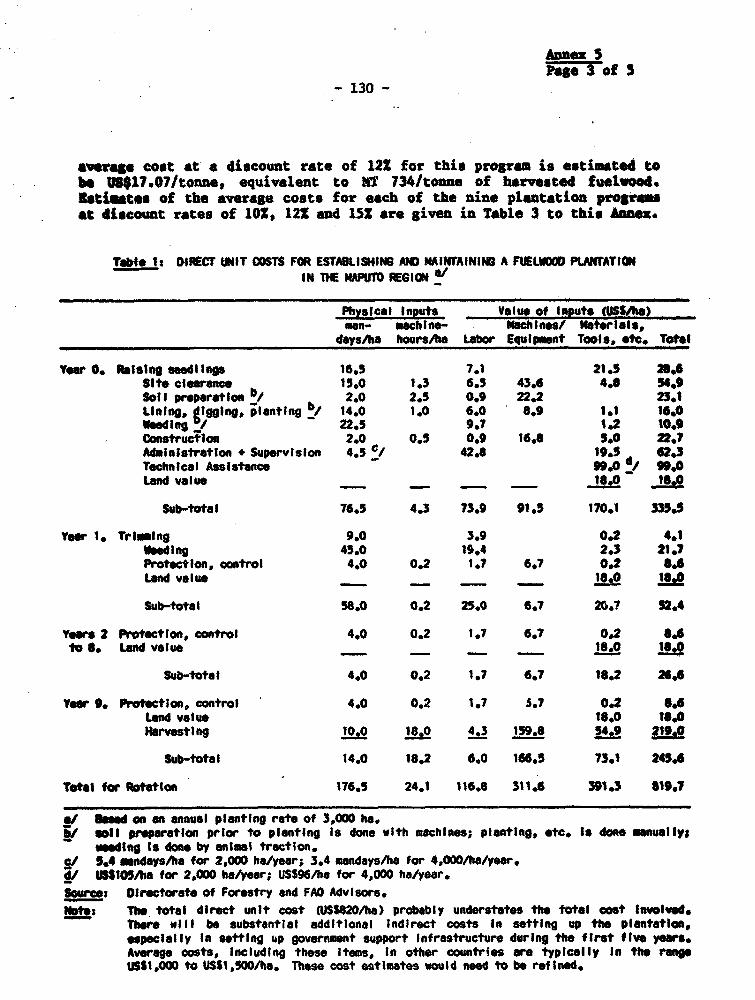
Annex 5
-130-~~~~ 8ag 3 of S-130-
averag cost at a discount rate of 122 for this program is estimated tobe US$17*07/tonne, equivalent to MT 734/tonne of harvested fueltood.Ist5ustes of the average costs for each of the nine plantation progra_at discount rates of 102, 122 and 15X are given in Table 3 to this Annei.
Taft 1: DIOCT UNIT COSTS FOR ESTASLISHING AND MAIWNAINING A FUELUOOD PLAWATIONIN THE NAPUO REGION a
Physical Inputs Value of Inputs (UllS/ha)mn- machine- Nchines/ Neterlals,
days/h hours/ha Labor Equipw t Tools, etc. Total
Vowr 0. feisng seedlrngs 16.S 7.1 21.5 28.6Site clerance 15.0 1.3 6.5 43.6 4.S 54.9Soil preparatIon b, 2.0 2.5 0.9 22.2 23.1Linin g,ging, planting b 14.0 1.0 6.0 8.9 1.1 10.0Weeding :/ 22.5 9.? 1.2 10.9Constructlon 2.0 0.5 0.9 16.8 5.0 22.?Administratlon + Supervision 4.5 O/ 42.8 19.5 62.3Technical Assistance 99.0 el 99.0Land value 18.0 1.0
Sub-total 76.5 4.3 73.9 91.5 170.1 535.5
Yea 1. Triming 9.0 3.9 0.2 4.1Welng 45.0 19.4 2.3 21.7
Protection, control 4.0 0.2 1.? 6.7 0.2 8.6Land value - 60 8.
Sub-total 58.0 0.2 25.0 6.7 20.1 52.4
Ywers 2 Protection, control 4.0 0.2 1.7 6.7 0.2 Sk6to S. Land value _ _ _18.0 1 60
Sub-total 4.0 0.2 1.7 6.7 18.2 26.6
Voer 9. Protection, control 4.0 0.2 1.7 S.7 0.2 6.6Land value 18.0 18.0Harvesting 10.0 18.0 4.3 159.8 54.9 219M0
Sub-total 14.0 18.2 6.0 166.5 73.1 245.6
Total for Rstatton 176.5 24.1 116.8 311.6 391.3 819.?
sf Boed an an annual planting rate of 3,000 ha,>I solI pparatIon prior to planting is done with machines; planting, etc. Is done anusaly;
weIng Is done by animal traction.C, 5.4 andays/ha for 2,000 he/yeoar; 3.4 mandays/ha for 4,000/ho/year.a/ U5105/ha for 2,000 ha/year; US596/ha for 4,000 ha/year.Sourco: ODrectorate of Forestry and FAO Advisors.Notes Th total direct unit cost (USS420/ha) probably understates the total cost InVolved.
there will be substantial additional Indirect costs In setting up the plantation,especwilly In "stting up government suWport Infrastructure during the first fIve yer.Average costs, Including these Items, In other countries are typically In te rangeustt.,oo to USSl1,SOfha. These cost estimates would need to be refined.
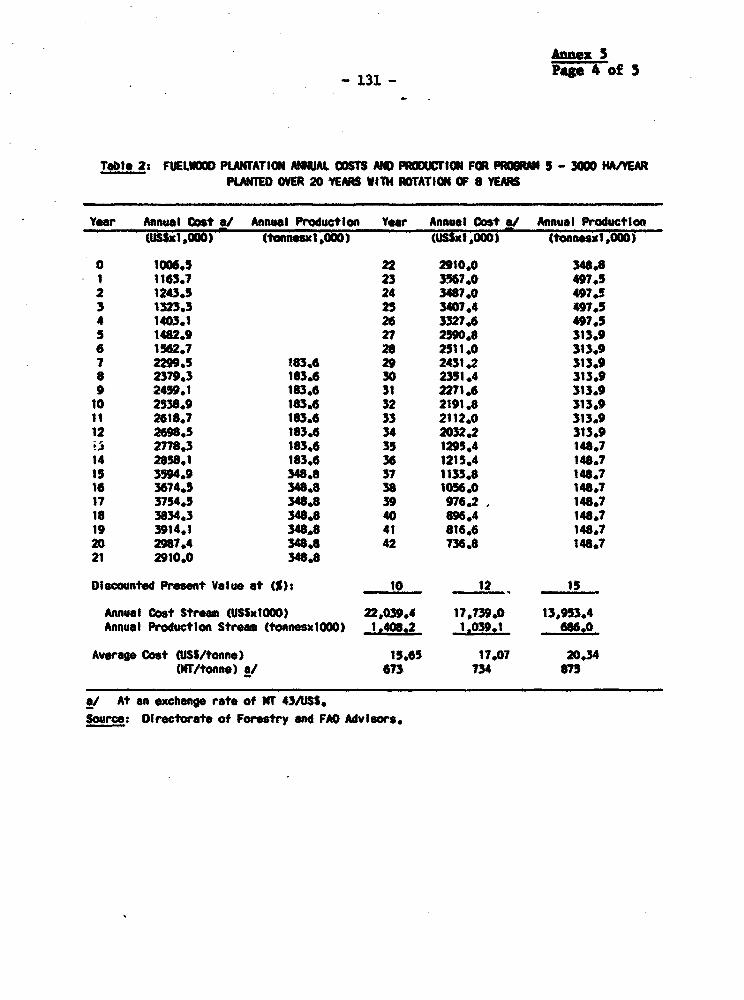
Annem 5
-131 - age 4 of 5
Table 2: FUELVOOD PLANTATION A*NL COS AM) FRODUCT'IN FOR PR1R 5 - 3000 MA/YEARPLANED OVER 20 YEAMS VIT14 RtOTATION OF 8 YEAR
Year Annual Cost A/ nnual Production Year Annual Cost _I Annual Production(US1 ,1000) (tanneaxl ,000) (USSXi .000) (tonnl l.000)
o 1006.5 22 2910.0 348.81 1103.7 23 3567.0 497.52 1243.5 24 3487.0 497433 1323.3 25 3407.4 491.54 1403.1 26 3327.6 497.55 1482.9 27 2S90.8 313.96 56S2.7 28 2511.0 313*97 2299*5 183,6 29 243142 313.98 2379*3 183*6 30 23514 313.99 2459,1 183.6 31 2271.6 313*9
10 2538.9 183.6 32 2191.8 313.911 2618.7 183*6 33 2112.0 313.912 2696.5 183.6 34 2032.2 313*9
3i 2778*3 183.6 35 1295.4 148.714 2858.1 183.6 36 1215,4 148*715 3594.9 348.8 37 113518 148*716 3674.5 348.8 38 1056.0 148.717 3754.5 348.8 39 976.2 . 148*718 3834*3 348.8 40 896.4 148.719 3914.1 348o8 41 816.6 148*720 2987.4 348.8 42 736.8 148*721 2910.0 348.8
Discounted Prosent Value at (S): 10 12 15
Annual Cost Stream (USSxIOOO) 22,039.4 17,739.0 13,953.4Annual Production Strem (tonnesxlOOO) -1,408,2 1,039.1 68610
Average Cost (USS/tonne) 15.65 17.07 20.34(N1/tonne) a/ 673 734 875
a@ At an exchange rate of NT 43AiSS,Source: Directorate of Forestry and FAO AdvIsors.
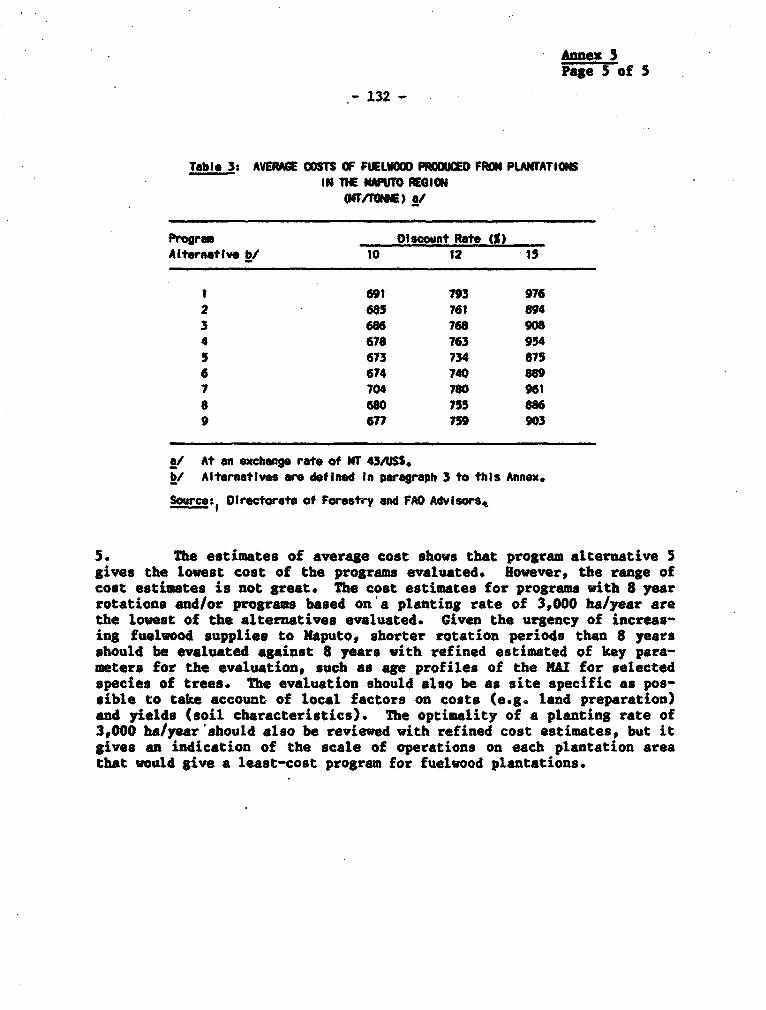
Annex 5Page S of S
-132-
Table 3: AVERAGE COSTS OF FUELVOOD PRODUCED FR0 PLANTATIONS1N THE NAPUTO REGION
(MT#TONNE) !S
Progan Discount Rate ts)Altornative bl 10 12 1S
l 691 793 9762 685 761 8943 686 768 9084 678 763 9543 673 734 8756 674 740 6897 704 780 961a 680 755 8a69 677 759 903
a/ At an exchange rate of UT 43AUSS.b/ Alternatives are defined In Wargraph 3 to this Annex.
Source: Directorate of Forestry and fAO Advisors.
5. The estimates of average cost shows that program alternative Sgives the lowest cost of the programs evaluated. However, the range ofcost estimates is not great. The cost estimates for programs with 8 yearrotations and/or programs based on a planting rate of 3,000 ha/year arethe lowest of the alternatives evaluated. Given the urgency of increas-ing fuelwood supplies to Naputo, shorter rotation periods than 8 yearsshould be evaluated against 8 years with refined estimated of key para-meters for the evaluation, such as age profiles of the MUI for selectedspecies of trees. The evaluation should also be as site specific as pos-sible to take account of local factors on costs (e.g. land preparation)and yields (soil characteristics). The optimality of a planting rate of3,000 ha/year should also be reviewed with refined cost estimates, but itgives an indication of the scale of operations on each plantation areathat would give a least-cost program for fuelwood plantations.

- 133 -Annex 6
HOUSEHOU ENEKtY CON6UYPTION IN MAPUTO FCR 1964
Estimtes of Actual Con!usptlon of Enerqy In NbsUto In 1964
End-Use Utilzable9uantity Unit Energy gross Energy Conversion Energy
Energy Product Unit Consumed Value Consuned Effceloncy Consumed(millIons of (NJ/unit) (millons (%) (S) ( illtons (C)
units) of lJ) Of NJ)
Kerosene Ilter 30 V/ 35 1,050 (18.8) 30 315 (34.1)LPG kg 342 b/ 13 40 (0.7) 60 25 (2.?)Electricity kWh 83.5 cl 3.6 300 (5.4) 65 d/ 248 (26.8)Woodfuels kg 300 e/ 14 4200 (75.1) 8 336 (36.4)
Total 5590 (100) 924 (100)
a/ Estimated from consumption tn Maputo accounting for 5S% of national consumption (52618tonnes - Chapter 3), of which about 80M Is assumed to have been for household use, Specificgravity of kerosene Is 1.335.
b/ Total national consumption In 1984 (Chapter 3) Is assumed to have been by households InMaputo.
c/ Estimated from household oonsumption eccounting for 25X of total consumption In Maputo whichIs estimated to have been 334 Glb in 1984 (Chapter 4).
d/ Conversion efficiency of 65% appiles to cooking only which Is assumed to account for about50% of average electricity consumption (which was about 6 klh/day/connected household In1984).
a/ Consumption is estimated from the observed supply of woodfuels entering Mapult during a twoweek sample survey In mid 1985 organized by the Department of Enargy. Charocal Is expressedIn terms of equlvalent woodfuel. Estimated annual rates of supply are: fuelwood - 220,000tonnes; charcoal - 7,000 tonnes.
Estimated Minimum Energy Needs for Naputo Households In 1984
Annual Minimum Need for Utilizable Energy (NJ/capita) 730 a
Population of Maputo In 1984 820,000
Annual Household Minimum Need for Utilizable Energy 600In Mea'uto tMJxl 6)
a/ Cooking: 1.5 NJ/aepita/dayLighting and other: O.S NJ/capita/day
Total 2.0 NJ/capita/day a 730 NJ/capita/year
The cooking needs corresponds to an average requirement of 500 kg/capita/year for fuelwood If
used In an open fire with en energy conversion efficeloncy of 8$ taking a,calorific value of 14NJ/kg for air-dried fuelvood (25% moisture content). The needs for lighting and electrical
appliances (except cooking and excluding space heating) correspond to an average household
requirement for electricity of I kWh/day, taking a calorific valw of 3.6 NJ/kWh and assuming 7
persons/household. The combined energy needs of 2.0 NJ/cap/day corresponds to a kerosenerequirement of 1.4 liters/household/day, taking a calorific value of 35 NJ/liter and an energy
conversion efficiency of 30%.Source: Mission estimates.
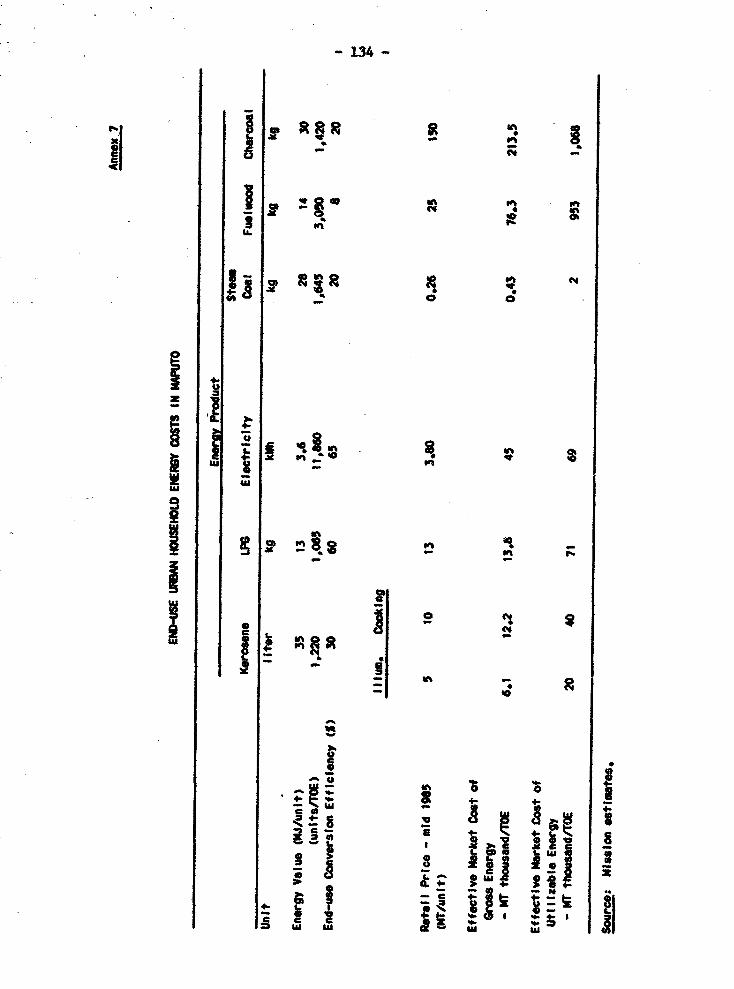
- 134
| g t 2 5|^Pt St
I Q _i aes b I
XI e 3 s ; i X S ! # i i
8~~~~~~~c
in ot~~~~~Uon~~~~~C.U
I U'~~~C
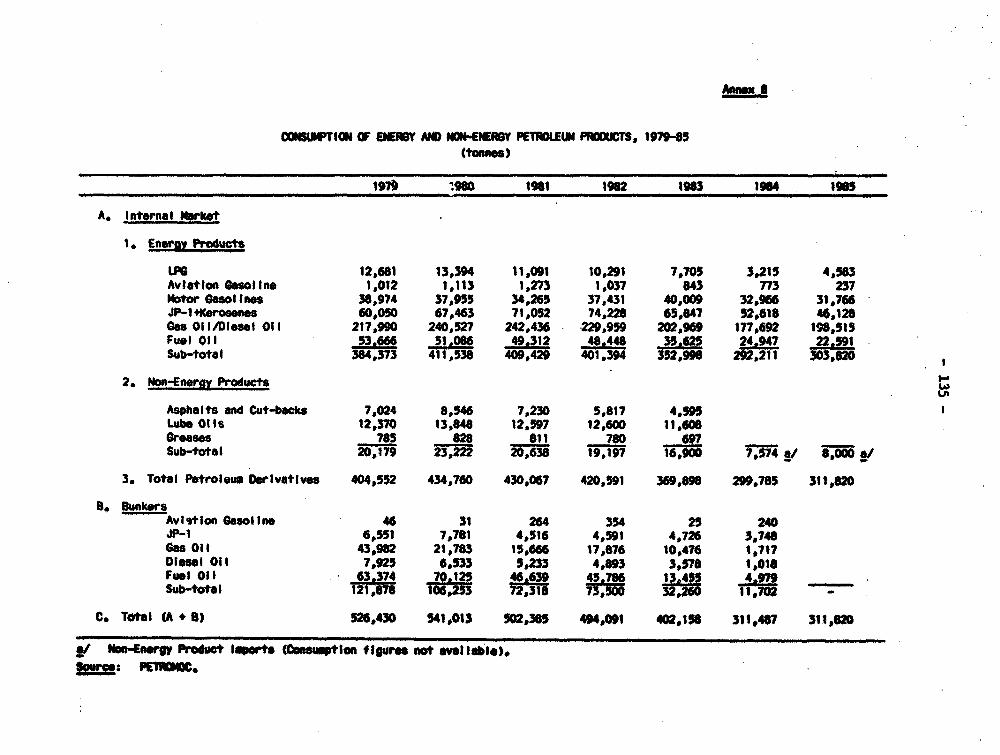
hN |
OONSUWTION OF ENERSY AND NON-ENERGY PETRULEM FPRaOUCTS, 1979-S(tosses)
.. 197§90 1981 1982 1983 I loss
A. Internal Market
1. Enrwgs Products
LPG 12,681 13,394 11,091 10,291 7,705 3,215 4,583
Avlation Gesoltne 1,012 1,113 1,273 1,037 843 773 237
Mot GasolInes 38,974 37,955 34,265 37,431 40,009 32,966 31,766
JP-141(eros.nes 60,050 67,463 71,052 74,228 65,647 52,618 46,128
Gas Oil/Diesel 011 217,990 240,527 242,436 229,959 202,969 177,692 198,513
Fuel Of1 S3' 666 51 06 49 312 48 44U 35 625 24.947 22 591
Sub-total 384,373 411,538 409,429 401,394 352,996 292,211 303,820
2. Non-Energ Products U'
Asphalts and Cut-backs 7,024 8,546 7,230 5,817 4,5ffLube OIlS 12,370 13,648 12,597 12,600 11,608Greases 785 828 811 780 697
Sub-total 20,179 23,2 20,638 19,197 16,900 7,574 a 8000 a/
3. Total Petroleu Derivatives 404,552 434,760 430,067 420,591 369,898 299,785 311,820
B. BunkersAvlotlon 6asollne 46 31 264 354 25 240
JP-1 6,551 7,781 4,516 4,591 4,726 3,748
Gas oil 43,92 21,73 15,646 17,876 10,476 1,717
Diesel Of I 7,925 6,533 5,233 4,893 3,578 1,018Fuel OfI 63 374 70.125 46.639 45 786 13.455 4.9?9
Sub-total 121,078 106,253 72,31 7332260 11,702 -
C. Totl (A + 8) 526,430 541,013 502,395 494,091 402,156 311,467 311,620
/ Noo-4nerog Prodct lports (Csoptlos filgure st wvaltable).
: M~0PEn
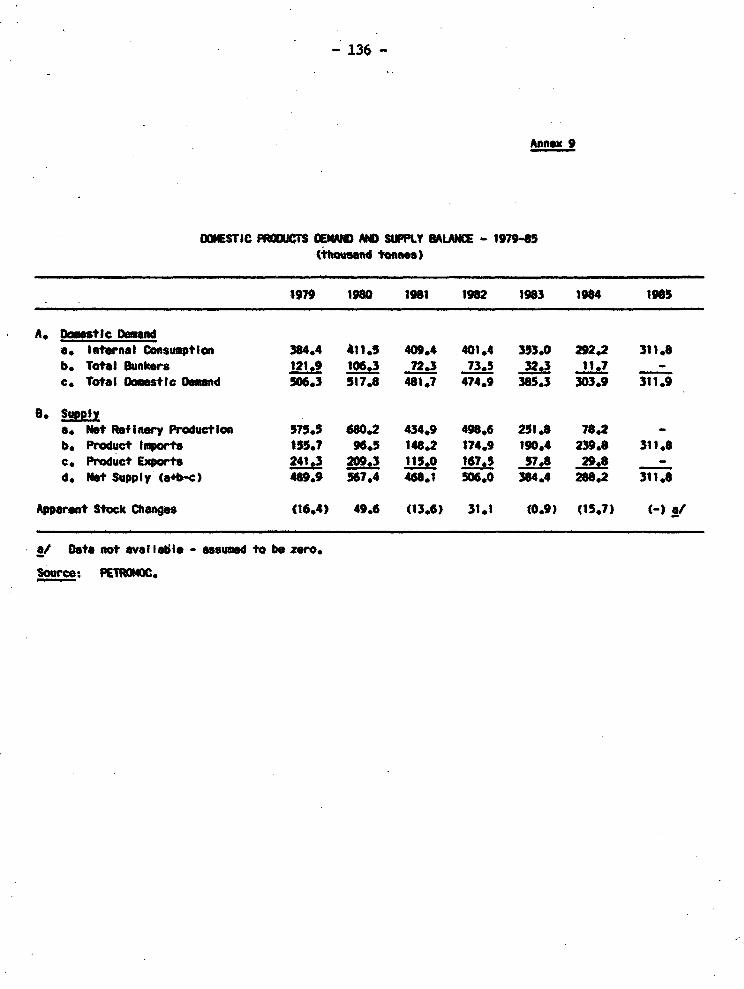
-136-
Annex 9
oESTIC PROUCS DEMO AND SUPPLf 8ALANI - 197945(tiwwa tonaes)
1979 1980 1981 1982 1983 1984 t6sB
A. Doiestlc Danda. Internal Consumption 384.4 All.S 409.4 401.4 353.0 292.2 311.8b. Total Bunkers 121.9 106.3 72.3 73.5 32.3 11.7 -
c. rotal omestic Demand 506.3 517.6 481.7 474.9 386.3 303.9 311.9
8. SuPplya. Not RefInery Productlon 575.5 660.2 434.9 496.6 231.8 78.2 -b. Product Imports ISS.7 96.5 148.2 174,9 19O.4 239.8 311.8c. Product Exports 241.3 209.3 115.0 167.5 57.8 29.8 -d. Not Supply (o*b-c) 489.9 567.4 468.1 5060. 384.4 288.2 311.8
Apparent Stock Changes (16.4) 49.6 (13.6) 31.1 (0.9) (15.7) -) 3/
a/ Deta not oval Iasie - assumed to be zero.
Sauce ff~NC.
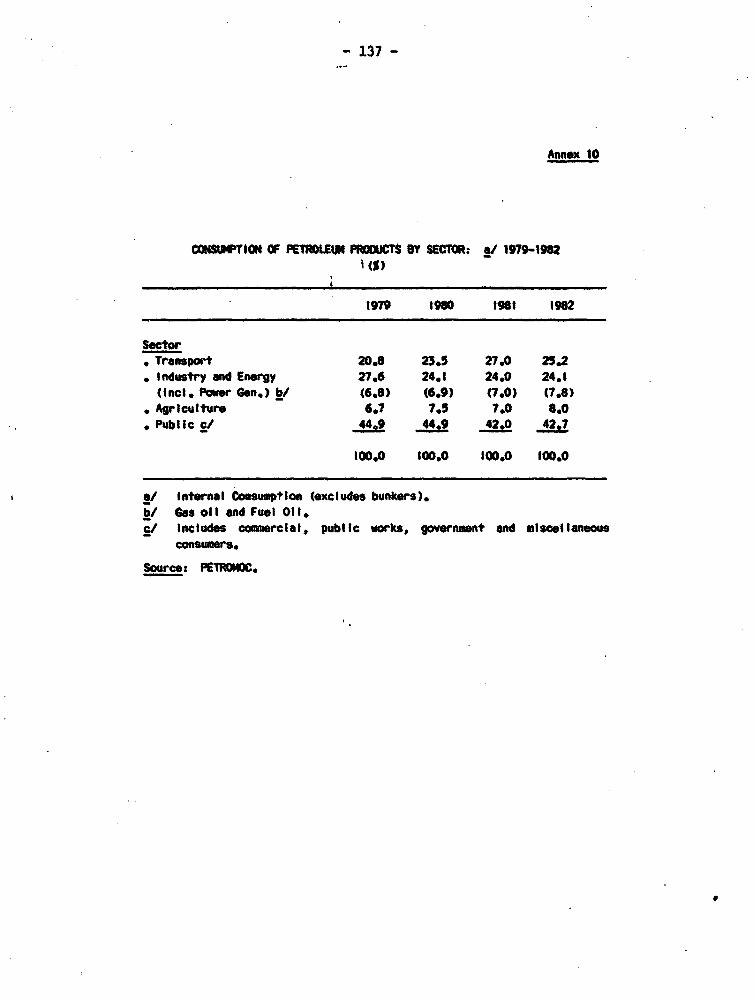
- 137 -
Annex 10
OONSPTWr1ON OF PElROLE1U P1IROUCTS EY SECTOR: a/ 1979-19U
1979 I980 M t 1982
Soctor* Transport 20.8 2354 27.0 25.2. Industry and Energy 27.6 24.1 24.0 24.1(inci Power Gen.) b/ (6.8) (6.9) (7.0) (7*8)
, Agrlculture 6.? 7.5 7.0 8.0P Public c/ 44e9 _.9 42.0 42.7
0oo.o 100.0 100.0 100.0
1 Internal Consumption (excludes bunkers).b/ Gas oil and Fuel 011.ci Includes comercial, public works, gowernment and miscellaneous
consumers.
Source: PETRCNOC.

138-..... - Annexl 11
SUuAY O7 MATOL wM Y PMICAL F0=TIES
A. Process Units Capacity, /SD
Atmospheric Distillation Unit #1 12,000Atmospberic Distillation Unit #2 5,900Vacuum Distillation Unit 2,500Beformer 2,500Unifiner 2,500Merox 1 ,00Gas Recovery Unit .700Asphalt Unit 900
B. Offsites
(i) Steam: 2 x 6 tph, 16 atm., 200C superheat and 1 z 13 tph,16 atm., 280"C superheat boilers with associated feedwatersoftening system.
(ii) Cooling Water: 2 x 386 m3/hr and 1 x 350 m3/hr induceddraft cooling towers (40'C inlet to 28C outlettemperatures).
(iii) Compressed Air (100 psig systems):
No. Drive Duty Capacity, CPM
i Diesel Plant air 3001 Motor Plant air 1061 Diesel Plant air (spare) 2001 Motor Instrument air 250
(iv) Electric Powert 4 z 687.5 kVA, 2 x 750 kVA tad I x 40 kVAdiesel drive generators*
(v) Tankage: crude oil - 320 000 m3; gasolines - ,450 *3 kerosene/jef fuel - 9,250 at; S oil - 38,200 i fuel oil-45,50k asphalt - 6,900 mP; LPG 2:700 a3; others -4,000 .
(vi) Crude and Product Pipelines (2 km length):
No. Size, inches Services
1 24 Crude oil1 10 Fuel oil1 12 Fuel oil1 16 Fuel oil1 6 marine diesel1 10 Clean products1 12 Clean products
ource: PETOM.
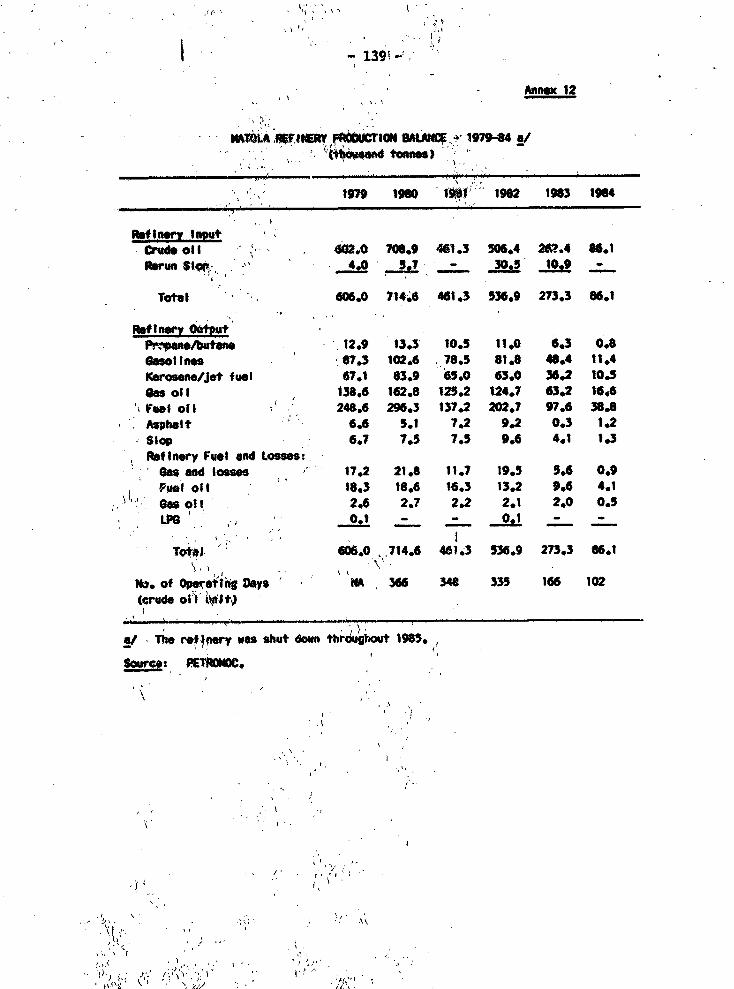
I - 13-
- 13?An 1u-2
- ~ ~ I,UIn- hoWt 1
1979 1960 0 f91 1982 1963 196
$bt n Input Crude oll 4. 2.0 706.9 461.3 S06.4 262.4 86.1Rerun Siop .. b v-. 30.5 10.9 -
Tota - 606.0 o 14i 461.3 536.9 273.3 86.1
Refiner 0Z,1pt'Preane/butae t12.9 13.3 10.5 11*0 6.3 0.8GasolInes 87.3 102A6 78.5 816*8 484 11.4Kerosene/Jet fuel 67*1 83.9 65.0 63.0 36*2 10.5Gan oil 138.6 162.8 125.2 124.7 63*2 16*6Feet of0 248.6 296.3 137.2 202.7 97*6 38.8Aiphlt 6.6 5.1 7,2 9.2 0.3 1.2Slop 6*7 7.s 7.5 9.6 4.1 1.3Refinery Fuel and Losses:o
Oan and losses 17.2 21.8 11.7 19.5 5.6 0.9poou oil 18.3 18.6 16.3 13*2 9.6 4.1Ga. '; Soil0} 1 2.6 2.7 2.2 2.1 2.0 0.5LPG 0.1 - - 0.1 f -
To*il ,606.0 _714.6 4611 J 536.9 273*3 86*1
t1. of qlwaBi4g Days NA 366 348 335 166 102(crude oll l\$tE)
8 The retfaery was shut down trogout 1965.,
'Su,e: FECC.
N -
. . ~ I
.

Anne 13
-140- Page-of4
COPAD 0SN OF COSTS 0f MEETING ESTIIATN)D NOZANRICAM DEMANDFOR PZTROLEUI PRODUCTS THROUGH OPIEATIYG THE MATOLA
&WINERY VERSUS IMPORTING PRODUCTS INPEE MID-1985 WORLD MARKET COW1ITIONS
Source: mission estimates and assuvptions
Cases Au*lysed and Assumptions
1. Two lNosambique demand cases are reviewed:
Case A: Actual 1984 demand of 304,100 tonnes of products produced bythe Matola Refinery.
Case B: Annual product demand of 600,000 tonnes.
2. July, 1984 official OPEC crude and spot product prices andfreight rates were used with Case A.
July, 1985 official OPEC crude and spot product prices andfreight rates were used with Case B.
3. Surplus and imported clean products were assumed to be tradet.at their CIF Maputo value. Fuel oil is exported to Singapore.
4. Saharan blend crude was used because it contains the bestsuited product yield pattern (of the crudes for which data areavailable in meeting the heavily skewed clean products demandin Mozambique.
S. Refinery operating cost assumed to be 10 higher than actual1983 costs (used 19US$/t).

hAnnex 3
-V141- Page 2 of 4
CEIWO, REFINERY YIELDS AN) BALANCES OF THE Wo CASES(thousend toones)
Ca"e A Cae SProduct Sahara Product Product
Crue Product Refinery Surplus/ Product Ref!ino Surplus/Yield Dwand Production (Deficit) 0em_d Productlon (lefit)
(%)
LPG 2.9 3.2 3.2 - 13.8 13.8 -6seol Ino 23.0 33.0 76.7 43.7 42.0 126.5 84.5Ker-jet fuel 16.9. 56.4 56.4 - 93.0 93.0 -ans ofI 27.1 180.4 90.4 (90.0) 324.0 149.0 (175.0)Fuel o11 23.5 29.9 85.8 55.9 1 18.2 131.4 13.2Asphalt 0.6 1.2 1,2 - 9.0 3.3 (5.7)Fuel & Uns 6.0 - 0.0 - - 33.0
100oo 304.1 333.7 9.6 600.0 5S0.0 (83.0)
July, 1984 Prices, USS/t
Loading Port Freight & CIF MaputoCrude/Products Price Insurance Price
Sahwan Blend Crude 239.73 18.23 257.9687R Gsdline 259 25 284Kerosene/jet fuel 269 25 294Gas oll 230 25 255Fuel oil 175 24.5 199.5
July. 1985 Prices. USS/t
Saharn Blend Crude 231.87 16.45 248.3287R asoI[no 266 23 289Kerosene/Jet fuel. 247 23 270Gas fit 208 23 231Fuel oIl 125 23 148
Note: Case A Is based on 1984 production demand at July 1984 prices.Case B Is based on roughly twice the Case A product demand at July1985 prices.
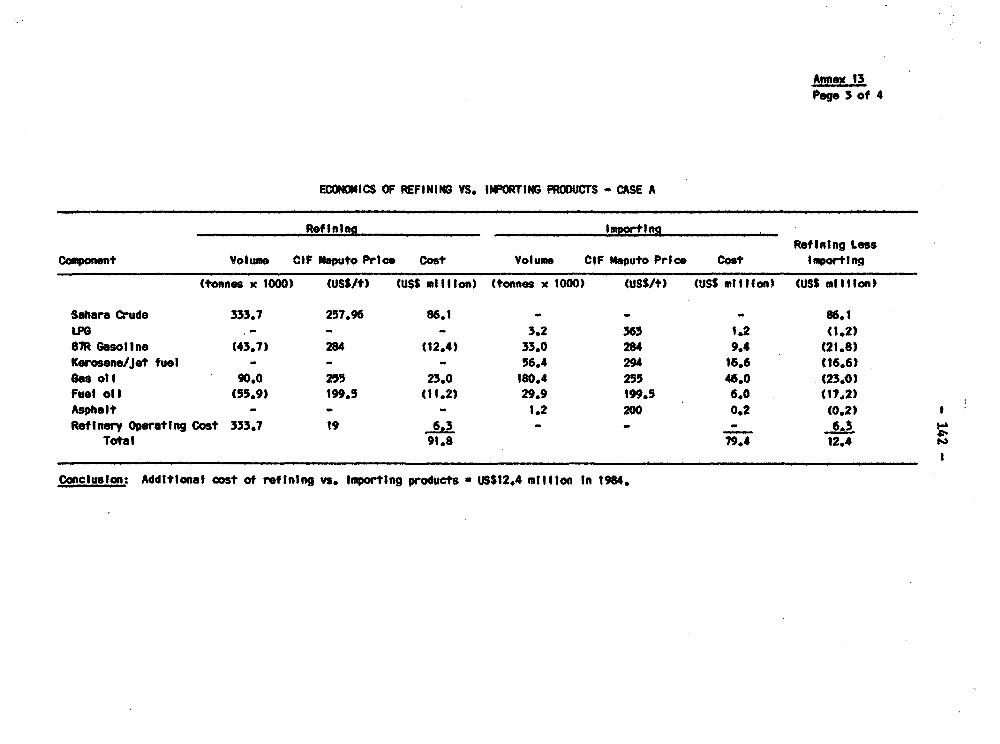
Annex 13Pap 3 of 4
ECONOIMICS OF REFINING VS. IMPORTING PRODUCTS - CASE A
Ref trina ImportingRefining Less
Component Volume CIF Maputo Prtce Cost Volume CIF Maputo Price Cost Importing
(tonnes x 1000) (USS/t) (USS mtilton) (tonnes x 1000) (USS/+) (USS million) (USS mtillon)
Sahara Crude 333.7 257.96 86.1 - - - 86.1LPG - - 3.2 363 1.2 (1.2)87R Gasoline (43.7) 284 (12.4) 33.0 284 9.4 (21.8)Kerosene/Jet fuel - - - 56.4 294 16.6 (16.6)Gas oil 90.0 255 23.0 180.4 255 46.0 (23.0)fuel ofl (55.9) 199.5 (11.2) 29.9 199.5 6.0 (17,2)Asphalt - - - 1.2 200 0.2 (0.2) tRefinery Operating Cost 333.7 19 63 - - - 6.3
Total 91.8 79.4 12.4
Conclusion: Additional cost of refining vs. Importing products a USS12.4 mtillon In 1984.
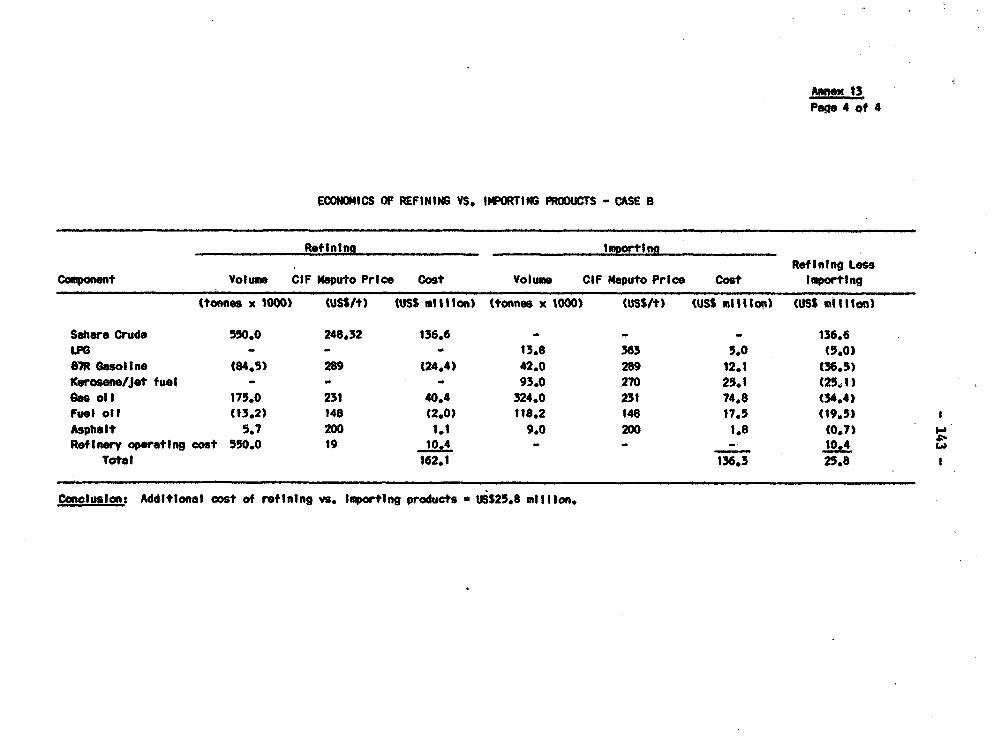
Ann% 13Paq. 4 of 4
ECNOMICS OF REFINING VS. ItORTING PRODUCTS - CASE B
Ref tn_ lnnamportinRofining Less
Cponent Volume CIF Maputo Price Cost Volume CIF Maputo Price Cost lnportIng
(tonnes x 1000) WUSSWt) WUSS million) (tonnes x 1000) WUSS/t) USSt miliIon) wUSS miliIon)
Sahara Crude 550.0 248.32 136.6 - - - 136.6
LPG - - 13.8 363 5.0 (5.0)
87R Gasoline (84.5) 289 (24.4) 42.0 289 12.1 (36.5)Kerosene/Jet fuel - - - 93.0 270 25.1 (25,1)
an ofl 175.0 231 40.4 324.0 231 74,8 (34.4)
Fuel ofl (13.2) 146 (2.0) 116.2 148 17.5 (19.5)
Asphalt 5.7 200 1.1 9.0 200 1.8 (0.7) i
Refinery operating cost 550.0 19 I0O4 - - - tD.4
Total 162.1 136.3 25.81
Conclusion: Additlonal cost of ref 1ning vs im"portIng products * USS25.8 million.
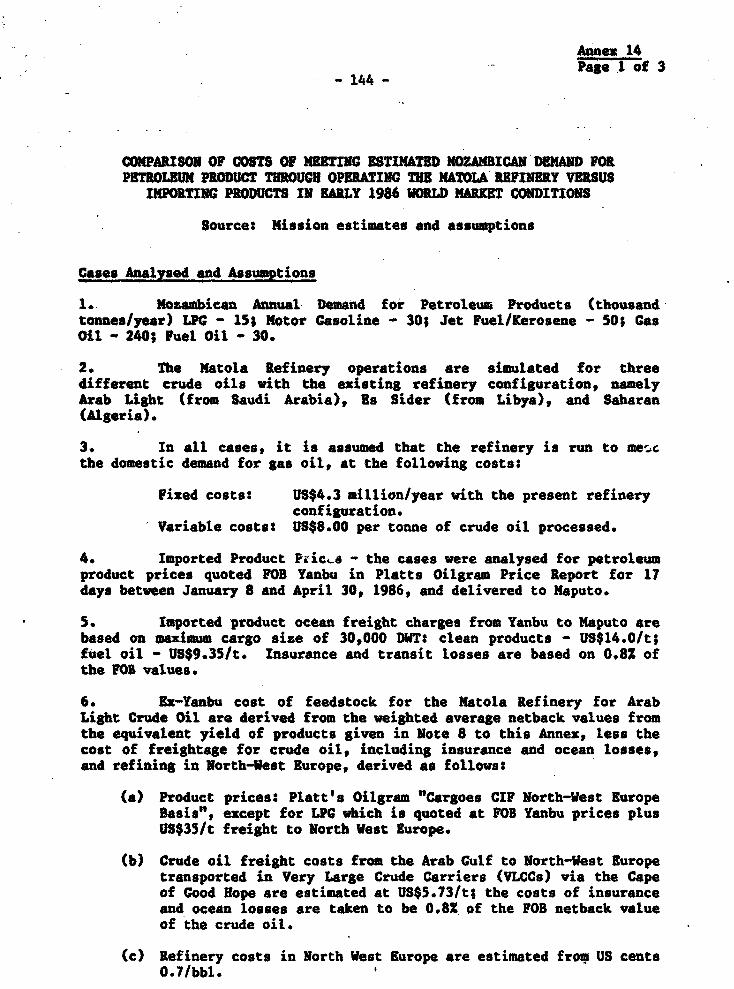
Annex 14Page 1 of 3
- 144 -
COMPARISON OF CWSTS OF NEETrNG ESTIMATED MCZAMUBICAN DEMAND FORPETROLEUM PRODUCT THROUGH OPERh!ING THE NATOLA REFINERY VERSUS
IMPOBTING PRODUCTS IN EARLY 1986 WO1LD MARKET CONDITIONS
Sources Mission estimates and assumptions
Cases AnalZsed and Assumptions
1. Mosambican Annual Demand for Petroleum Products (thousandtonnes/year) LPG - 15; Motor Gasoline - 30; Jet Fuel/Kerosene - 50; GasOil - 240; Fuel Oil - 30.
2. The Matola Refinery operations are simulated for threedifferent crude oils with the existing refinery configuration, namelyArab Light (from Saudi Arabia), Es Sider (from Libya), and Sabaran(Algeria).
3. In all cases, it is assumed that the refinery is run to mee~cthe domestic demand for gas oil, at the following costs:
Fixed costs: US$4.3 million/year with the present refineryconfiguration.
V Variable costs: US$8.00 per tonne of crude oil processed.
4. Imported Product Pzic~.~ - the cases were analysed for petroleumproduct prices quoted FOB Yanbu in Platts Oilgram Price Report for 17days between January 8 and April 30, 1986, and delivered to Maputo.
5. Imported product ocean freight charges from Yanbu to Maputo arebased on maximum cargo size of 30,000 DWT: clean products - US$14.0/t;fuel oil - US$9.35/t. Insurance and transit losses are based on 0.8X ofthe FOB values.
6. Ex-Yanbu cost of feedstock for the Matola Refinery for ArabLight Crude Oil are derived from the weighted average netback values fromthe equivalent yield of products given in Note 8 to this Annexs, less thecost of freightage for crude oil, including insurance and ocean losses,and refining in North-Vest Europe, derived as follows:
(a) Product prices: Platt's Oilgram "Cargoes CIF North-West EuropeBasis", except for LPG which is quoted at FOB Yanbu prices plusUS$35/t freight to North West Europe.
(b) Crude oil freight costs from the Arab Gulf to North-West Europetransported in Very Large Crude Carriers (VLCCs) via the Capeof Good Hope are estimated at US$5.73/t; the costs of insuranceand ocean losses are taken to be 0.82 of the FOB netback valueof the crude oil.
(c) Refinery costs in North West Europe are estimated from US cents0.7/bbl. f
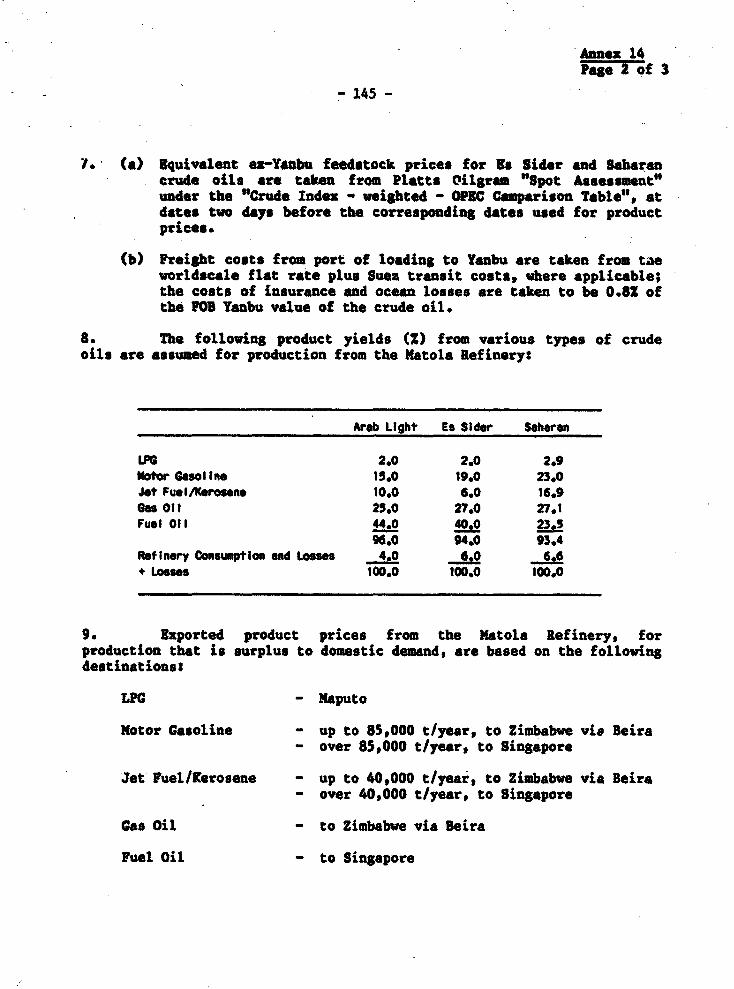
Annex 14Pogo 2 of 3
- 145 -
7* (a) Equivalent ex-Ye*bu feedstock prices for Es Sider and Saharancrude oils are taken from Platte Oilgram "Spot Assessment"under the "Crude Index - weighted - OPEC Camparison Table", atdates two days before the corresponding dates used for productprices.
(b) Freight costs from port of loading to Yanbu are taken from taeworldacale flat rate plus Suez transit costs, where applicable;the-costs of insurance and ocean losses are taken to be 0.82 ofthe FO0 Yanbu value of the crude oil.
8. The following product yields (2) from various types of crudeoils are assumed for production from the Matola Refinery:
Arab Light Es Sidr Shwsan
LPG 2.0 2.0 2.9Notoar GasolIno 15.0 19.0 23.0Jet Fuel/Ktrose 10.0 6.0 16.9Gas ofl 25.0 27.0 27.1Fuel 011 44.0 40.0 23.3
96.0 94*0 93*4Ref inery Consumptlon and Loss" e s 6.0 6.6+ Loss"s 100.0 100.0 100.0
9. Exported product prices from the Matola Refinery, forproduction that is surplus to domestic demand, are based on the followingdestinations:
LPC - Maputo
Motor Gasoline - up to 85,000 t/year, to Zimbabwe vie Beira- over 85,000 t/year, to Singapore
Jet Fuel/Kerosene - up to 40,000 tlye r, to Zimbabwe via beira- over 40,000 t/year, to Singapore
Gas Oil - to Zimbabwe via Beira
Fuel Oil - to Singapore
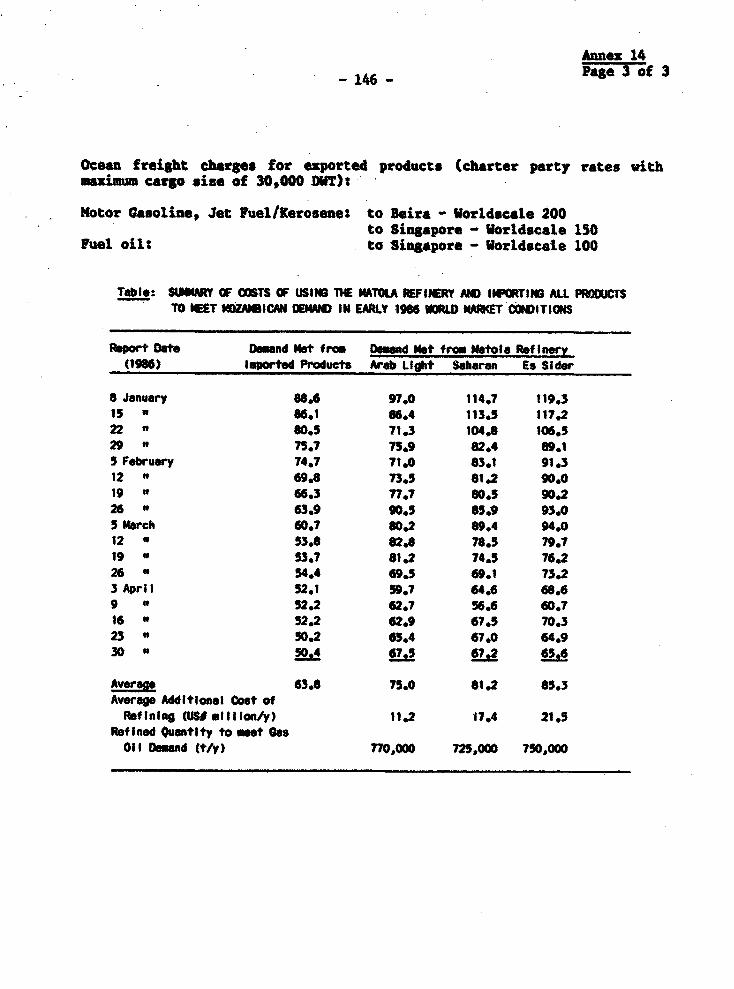
Anne- 14
-146- Page of3
Ocea freight charses for exported products (chrter party rates with=uin= cargo size of 30,000 DUT)s
Motor Gasoline, Jet Fuel/Kerosene: to Beira - Vorldecale 2ooto Singapore - Vorldscale 150
Fuel oil: to Singapore - Worldstale 100
Table: SUMMARY OF COSTS OF USING THE NATOLA REFIIERY AIm I WORTIN ALL PRODUSTO MEET 4ZAbICAN DEMAND IN EARLY 1966 WOPID MAIKET COSITIONS
ARport Data ODand Hotf frm mand Hot from eteols R.f Inar(1986) Imported Products Arab Light Saharan Es Sider
8 January 88.6 97.0 114.7 119.315 i8 86.1 6.4 113.S 117.2
22 ' 80.S 71.3 104.8 106.529 ' 75.7 75.9 82.4 89.15 February 74,7 71.0 83.1 91.312 " 69.6 73.5 81.2 90.019 n 66.3 77.7 80.S 90.226 " 63.9 90.5 85.9 93.05 March 60.7 80*2 89.4 94.012 * 53.8 82.8 78.5 79.719 n 53.7 81.2 74.5 76.226 5 54.4 69.5 69.1 73.23 Apri l 52.1 59.7 64.6 68.69 a 52.2 62.7 56.6 60.716 " 52.2 62.9 67.5 70.323 * 50.2 65.4 67.0 64.930 n 50.4 67.5 66.2 65.6
Avere 63*.8 75.0 81.2 85.3Average Additional Cost of
R&fining (USfa IIIIon/y) 11.2 17.4 21.5Refined quantity to meet GasOil Demand (t/y) 770,000 725,000 750,000
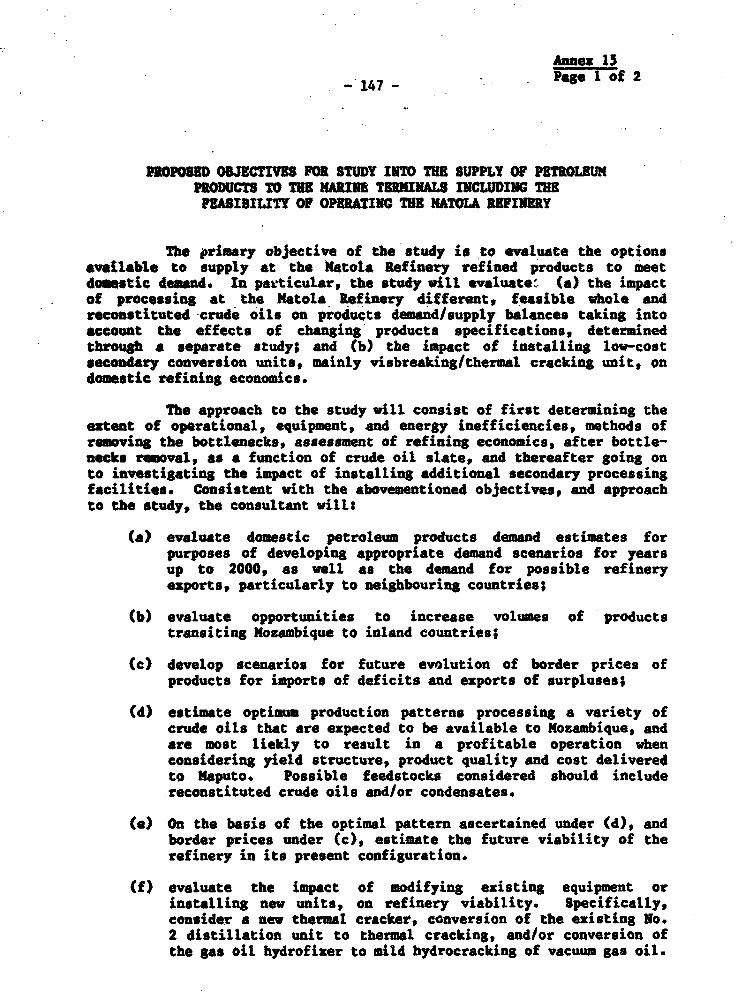
Ann"e 1S
-'147- Pagelof2
PROPOSED OBJECTIVES FOR STUDY INTO THE SUPPLY OF PETROLEUPRODUCTS TO TO NARIL TEMINALS INCLDIN THEFEA8IBILITY OF OPERATING THE MATOLA REFINERY
The iprimary objective of the study is to evaluate the optionsavailable to supply at the Matola Refinery refined products to meetdomstic demand. In particular, the study will evaluate (a) the impactof processing at the Matola Refinery different, feasible whole andreconstituted crude oils on products demand/supply balances taking intoaccount the effects of changing products specifications, determinedthrough a separate study; and (b) the impact of installing low-costsecondary conversion units, mainly visbreaking/thermal cracking unit, ondomestic refining economics.
The approach to the study will consist of first determining theextent of operational, equipment, and energy inefficiencies, methods ofremoving the bottlenecks, assessment of refining economics, after bottle-necks removal, as a function of crude oil slate, and thereafter going onto investigating the impact of installing additional secondary processingfacilities. Consistent with the abovementioned objectives, and approachto the study, the consultant will:
(a) evaluate domestic petroleum products demand estimates forpurposes of developing appropriate demand scenarios for yearsup to 2000, as well as the demand for possible refineryexports, particularly to neighbouring countries;
(b) evaluate opportunities to increase volumes of productstransiting Mozambique to inland countries;
(c) develop scenarios for future evolution of border prices ofproducts for imports of deficits and exports of surpluses;
(d) estimate optimum production patterns processing a variety ofcrude oils that are expected to be available to Moxambique, andare most liekly to result in a profitable operation whenconsidering yield structure, product quality and cost deliveredto Maputo. Possible feedstocks considered should includereconstituted crude oils and/or condensates.
(e) On the basis of the optimal pattern ascertained under (d), andborder prices under (c), estimate the future viability of therefinery in its present configuration.
(f) evaluate the impact of modifying existing equipment orinstalling new units, on refinery viability. Specifically,consider a new thermal cracker, conversion of the existing No.2 distillation unit to thermal cracking, and/or conversion ofthe gas oil hydrofixer to mild hydrocracking of vacuum gas oil.
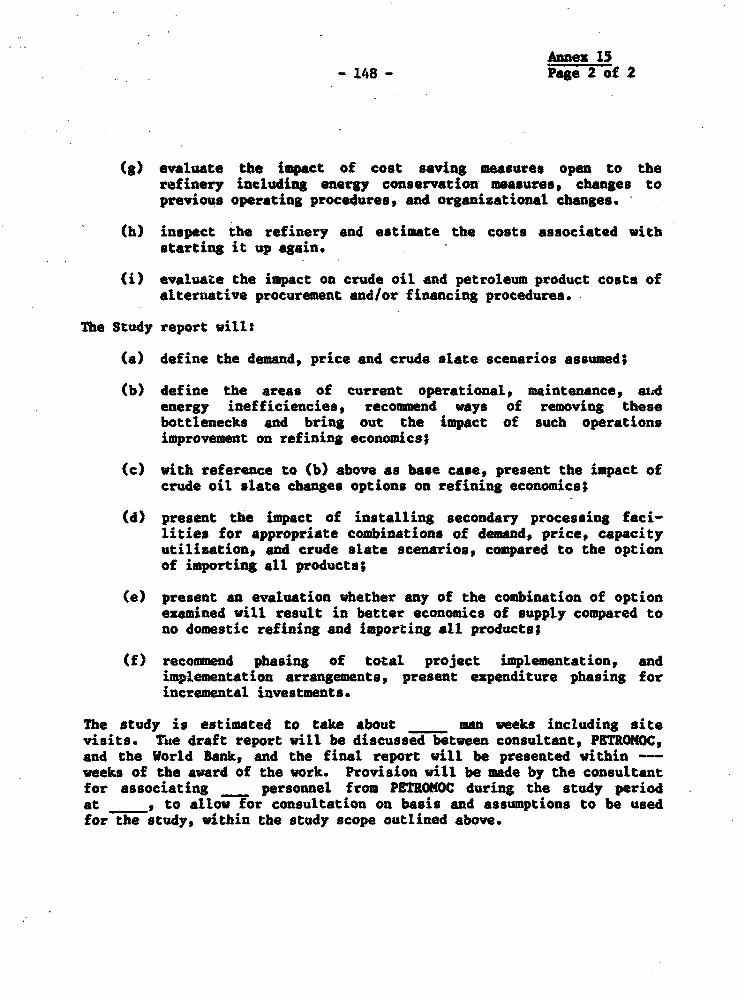
Annex 15-148- Page 2 o£ 2
(g) evaluate the impact of cost saving measures open to therefinery including energy conservation measures, changes toprevious operating procedures, and organizational changes.
(h) inspect the refinery and estimate the costs associated withstarting it up again.
(i) evaluate the impact on crude oil and petroleum product costs ofalternative procurement and/or finAncing procedures.-
The Study report will:
(a) define the demand, price and crude slate scenarios assumed;
(b) define the areas of current operational, maintenance, atdenergy inefficienciess recommend ways of removing thesebottlenecks and bring out the impact of such operationsimprovement on refining economics;
(c) with reference to (b) above as base case, present the impact ofcrude oil slate changes options on refining economics;
(d) present the impact of installing secondary processing faci-lities for appropriate combinations of demand, price, capacityutilization, and crude slate scenarios, compared to the optionof importing all products;
(e) present an evaluation whether any of the combination of optionexamined will result in better economics of supply compared tono domestic refining and importing all products;
(f) recommend phasing of total project implementation, andimplementation arrangements, present expenditure phasing forincremental investments.
The study is estimated to take about - man weeks including sitevisits. T6e draft report will be discussed between consultant, PETROMOC,and the World Bank, and the final report will be presented within --weeks of the award of the work. Provision will be made by the consultantfor associating _ personnel from PETROMOC during the study periodat , to allow for consultation on basis and assumptions to be usedfor the study, within the study scope outlined above.
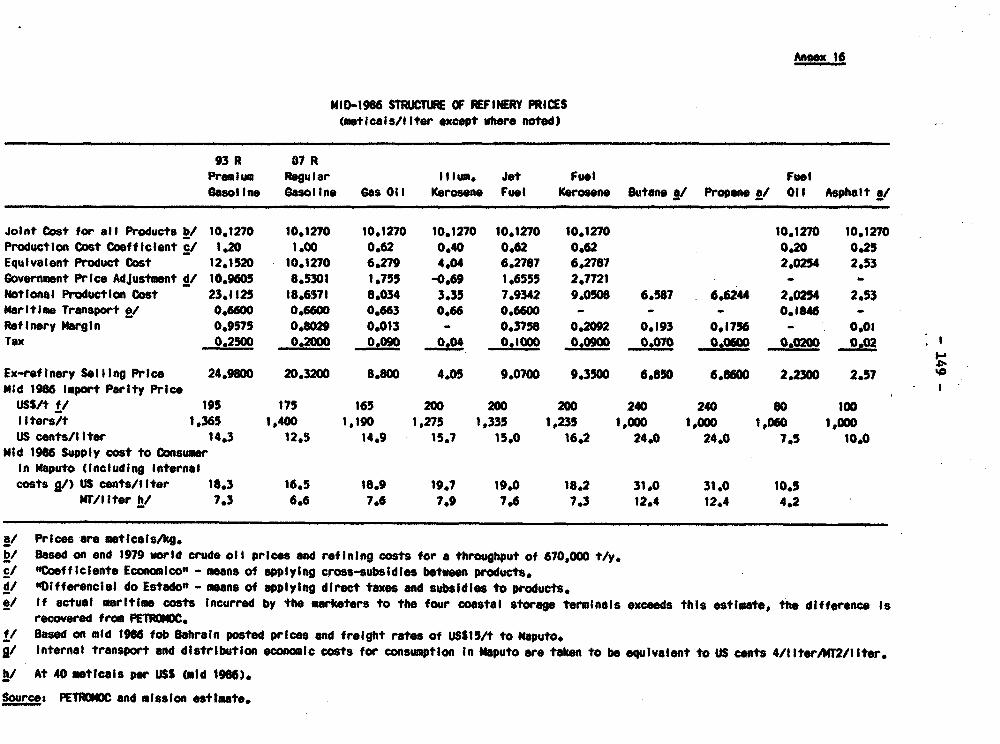
Annex 16
MID-1986 STRUCTUC£ OF RFINERY PRICES(metIcal s/ lter except where noted)
93 R 87 RPremium Regular Ilium. Jet Fuel Fuot
Gasoline Gasoline Gas Oil Kerosene Fuel Kerosene Eutne a/ Propene a/ oil Asphalt a/
Joint Cost for all Products b/ 1O.t270 10.1270 10.1270 10.1270 10.1270 10.1270 10.1270 10.1270
Production Cost Coefficient cl 1.20 1.00 0.62 0.40 0.62 0.62 0.20 0.25
Equivalent Product Cost 12.1520 10.1270 6.279 4.04 6.2787 6.2787 2.0254 2.53
Government Price Adjustment d/ 10.9605 8.5301 1,755 -0,69 1.6555 2.7721 - -
Notional Production Cost 23.1125 18.6571 8.034 3.35 7.9342 9.0506 6.587 6.6244 2.0254 2.53Maritime Transport ,/ 0.6600 0.6600 0.663 0.66 0.6600 - - - 0.1846 -
Refinery Margin 0.9575 0.8029 0.013 - 0.3738 0.2092 0.193 0.1756 - 0.01
Tax 0.25000 00 0 . 0 4 0000 0 .070 0 . oo 0.02 .*O
Ex-refinery Selling Price 24.9800 20.3200 8.800 4.05 9.0700 9.3500 6.850 6.8600 2.2300 2.57
Mid 1986 Import Parity PriceUSS/t f/ 195 175 165 200 200 200 240 240 so 100llters/t 1,365 1,400 1,190 1,275 1,335 1,235 1,000 1,000 1,060 1,000
US cents/liter 14.3 12.5 14.9 15.7 15.0 16.2 24.0 24.0 7.5 10.0
Mtd 1986 Supply cost to Consumerin Maputo (Including Internalcosts g/) US cents/liter 18.3 16.5 18.9 19.7 19.0 18.2 31.0 31.0 10.5
MT/lIter hi 7.3 6.6 7.6 7.9 7.6 7.3 12.4 12.4 4.2
a/ Prices are ueticais/kg.Bi Eased on end 1979 world crude oll prices and refining costs for a throughput of 670,000 t/y.
cf "Coofficiento Economico" - means of applying cross-subsidles between products.d/ "Differenciol do Estado" - means of applying direct taxes and subsidies to products.el If actual maritime costs incurred by the marketers to the four coastal storage terminals exceeds this estleate, the difference Is
recovered from PETRWIOC.fB Pased on mid 1986 fob Bahrain posted prices and freight rates of USS15/t to Meputo.9/ Internal transport and distribution economlc costs for consumption In Maputo are taken to be equivalent to US cents 4/11ter/KT2/11ter.
h/ At 40 meticais per USS (mld 1986).
Source: PETROMOC and mission estimate.
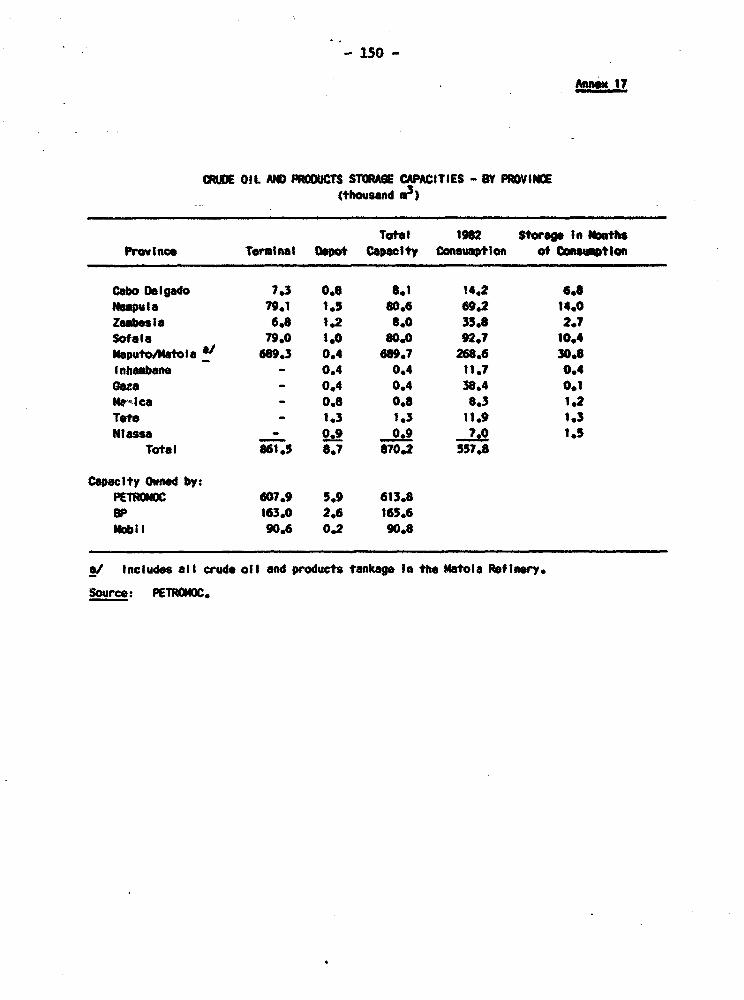
- 150 -
Annex 17
MRUOE OIL AND PRODUCTS STORUGE CAPACITIES - BY PROVINCE(thousand *3)
Total 1982 Storge In MonthsPiroInc Terminal Depot Capality Consupt ion of Consumptlon
Cabo Delgado 7.3 0.8 8.1 14.2 6.0Mempula 79.1 1.5 80.6 69.2 14.0Zambesla 6.8 1.2 8.0 35.8 2.?Sofala 79.0 1.0 60.0 92.7 10.4Naputo*btola a/ 689.3 0.4 689.7 268.6 30.6Inhambane - 0.4 0.4 11.7 0.4G8za - 0.4 0.4 38.4 0.1Nkreac - 0.8 0.8 8.3 1.2
Tote - 1.3 1.3 11.9 1.3Nlass - 0.29 0.9 _7. 1.5
Total 661.5 8.7 670.2 557.8
Capacity owned by:PETFXROMC 607.9 5.9 613.8BP 163.0 2.6 165.6Iobi1 90.6 0.2 90.8
e/ Includes ael crude ofl and products tankage In the Matola Refinery.
Source: PETROMOC.
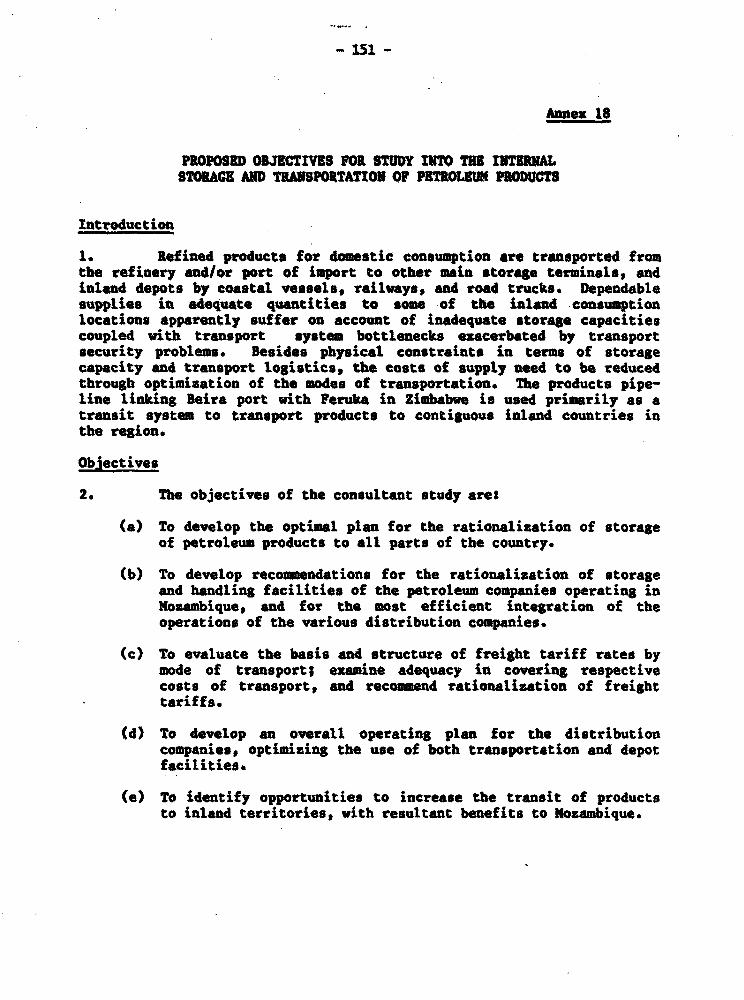
- 151 -
Annex 18
PROPOSED OBJECTIVES FOR STUDY INTHE INMRALSTORACE AND TRANSPOBtTATION OF PRMOLEUN PRODUCTS
Introduction
1. Refined products for domestic consumption are transported fromthe refinery and/or port of import to other main storage terminals, andinaend depots by coastal vessels, railways, and road trucks. Dependablesupplies in adequate -quantities to some of the inland consumptionlocations apparently suffer on account of inadequate storage capacitiescoupled with transport system bottlenecks exacerbated by transportsecurity problems. Besides physical constraints in terms of storagecapacity and transport logistics, the costs of supply need to be reducedthrough optimization of the modes of transportation. The products pipe-line linking Beira port with Peruka in Zimbabwe is used primarily as atransit system to transport products to contiguous inland countries inthe region.
Objectives
2. The objectives of the consultant study are:
(a) To develop the optimal plan for the rationalization of storageof petroleum products to all parts of the country.
(b) To develop recomendations for the rationalization of storageand handling facilities of the petroleum companies operating inMozambiquep and for the most efficient integration of theoperations of the various distribution companies.
(c) To evaluate the basis and structure of freight tariff rates bymode of transport; examine adequacy in covering respectivecosts of transport, and recommend rationalization of freighttariffs.
(4) To develop an overall operating plan for the distributioncompanies, optimizing the use of both transportation and depotfacilities.
(e) To identify opportunities to increase the transit of productsto inland territories, with resultant benefits to Mozambique.
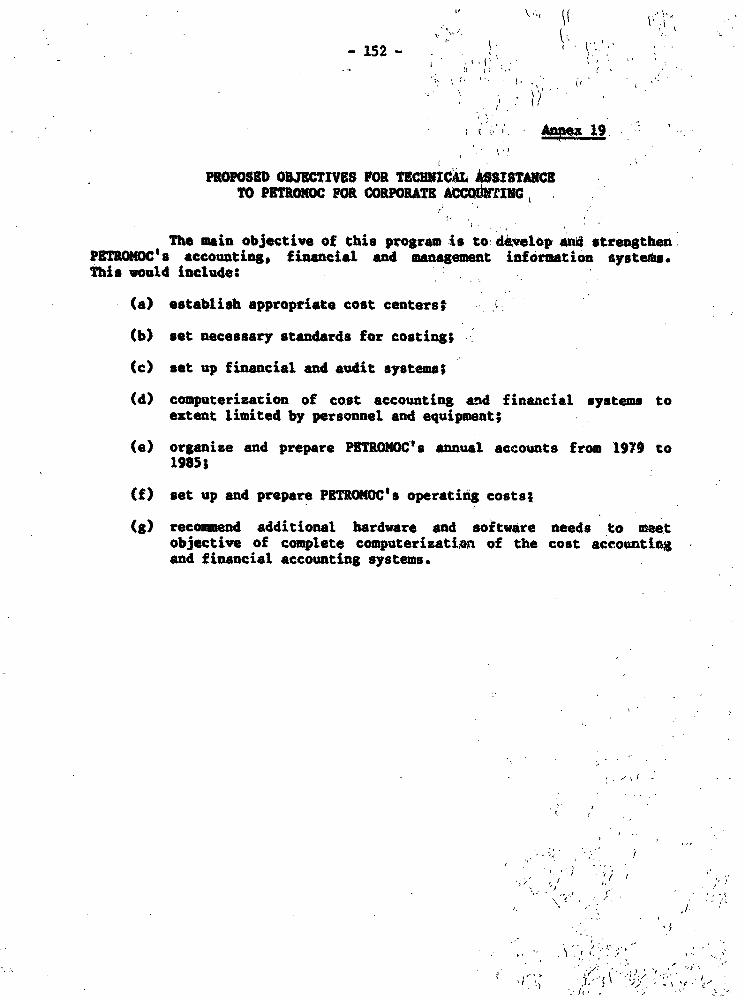
-152-
PROPOSED) OBJECTIVES FOR TECETCM, ASSI.STAUC.TO PETIMOC FOR CORPORATE ACCQOIiVING
The main objective of this prograp -is to 4~velop, &An strengthen.PETROMOC' a accounting, financial, and management infoirmatio'n systemas*This would include:
(a) establish appropriate cost centerst
(b) set necessary standards for costing;
(c) set up financial and audit systmes;
Cd) computerization of cost accounting and f inancial systems toextent limited by personnel and equipment;
(e) organize and prepare PETROMOC's annuAl accounts from 1979 to1985;
(f) set up and prepare PETROMOC' s operating costsl
(g) recommend additional hardware and so*tware needs to meetobjective of complete computerizatio of the cost accountingand financial accounting systems.
(d)~~~~~~~~~~~~~~~~~~' coIueiain fes con,ig8dfnca ytmst
ext,ent li",ited by personnel and equipent;~~~~~~~~~~~~~~~~~~~~~
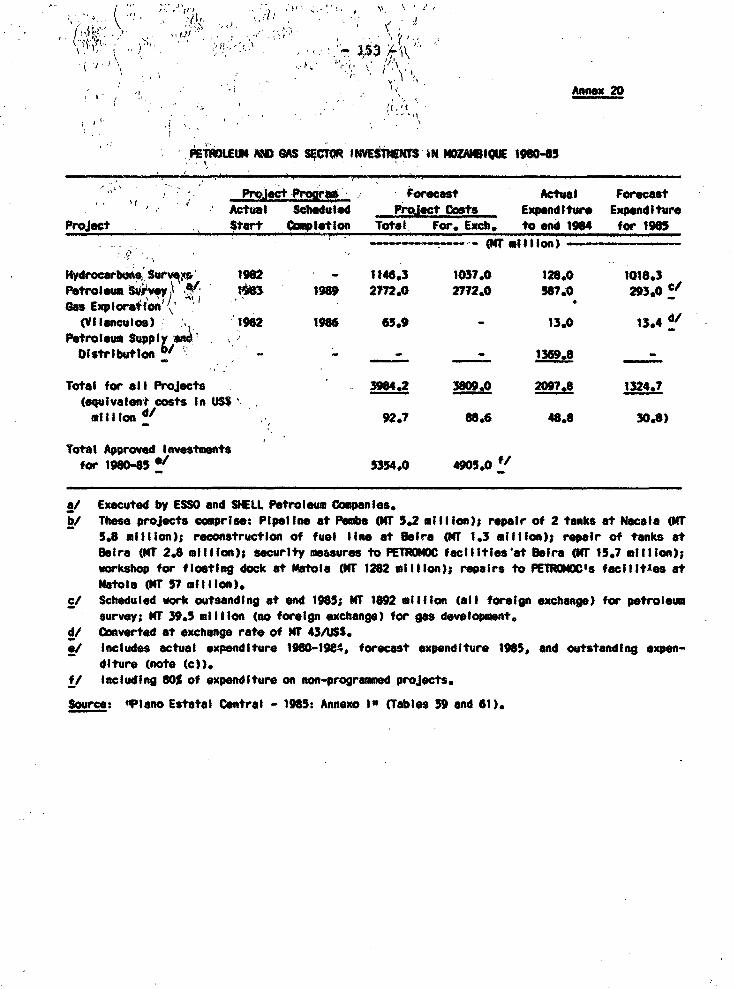
j 8 s ~~~~~~~~~~~~~~~.' , '. '*Annex 20
: FEVEtM AND GAS SqCTOR IN9ES115 IN NWAMIUE 198045
'"' ;ect Progre Foreat Acftua ForecastActual Scheduled oct Costs Expend I it ExpendIture
Project Start Cailetlon Total For. Excb. to end 1964 for 1965- - - ---- (r4r mttilon)
Hydrocarbons.MSue' 1982 - 1146,3 1037.0 126.0 1018.3Poltroeuw jY t' 1 t969 22.0 2772.0 567.0 293.0 c"Gas Explorat1oa0t
(VYI anculos) 1962 1966 65.9 - 13.0 13.4 d/Ptroleum Suppil . -
Olstrlbutlon bf-__1369.8_
Total for all Projects 3984.2 3809^ 2097.8 6A.(equlvalent costs In USS',oiIon d/ 92.7 86.6 48.8 30.8)
Total Approved Investmentsfor 1980-85S 5354.0 4905.0
q/ Executed by ESSO and SHELL Petroleum Companies.b/ These projects comprise: Pipellnte at Pemba (MT 5.2 mI IIon); repair of 2 tanks at Nacala (MT
5.8 million); reconstruction of fuel lin at Beira Off 1.3 millIon); repaIr of tanks atDeira (nT 2.8 million); security measures to PETRONOC feclIItles'at Beira Oft 15.7 wIlIon);workshop for floating dock at MAtols Off 1282 mIlIIon); repaIrs to PETRONOC's fcIlItIes atMatola (4T 57 millon).
cf Scheduled work outsanding at end 1965; MT 1892 mIllIon (all foreign exchange) for petroleumsurvey; MT 39.5 million (no foreIgn exchange) for gas development.
d/ Converted at exchange rate of MT 43/USS.e/ Includes actual expenditure 1980-1984, forecast expenditure 1985, end outstanding expen-
diture (note Cc)).f/ Including 80% of expenditure on non-programmed projects.
Source: "Piano Estotal Central - 1965: Annexo In (Tables 59 and 61).
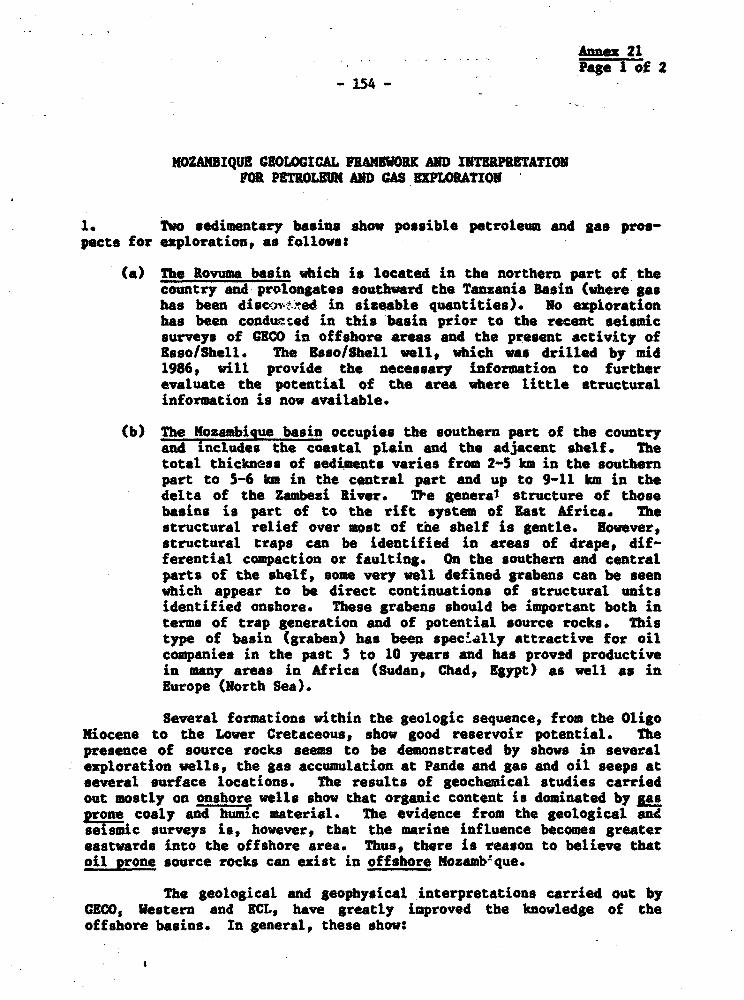
Annex 21Page 1 of 2
- 154 -
MOZAIBIQU GRLOGICAL FRAMBRK AND INTRPRATIONFOR PETROLE AND GAS EXPOATION
1. Two sedimentary basins show possible petroleum and gas pros-pects for explorationp as follows:
(a) The Rovuma basin which is located in the northern part of thecountry and prolongates southward the Tanzania Basin (where gashas been discov:'ed in sizeable quantities). No explorationhas been conduwte4 in this basin prior to the recent seismicsurveys of G0OG in offshore areas and the present activity ofEsso/Shell. The Esso/Shell well, which was drilled by mid1986, will provide the necessary information to furtherevaluate the potential of the area where little structuralinformation is now available.
(b) The Mozambigue basin occupies the southern part of the countryand icludes the coastal plain and the adjacent shelf. Thetotal thickness of sediments varies from 2-5 km in the southernpart to 5-6 km in the central part and up to 9-11 km in thedelta of the Zambesi River. TIe general structure of thosebasins is part of to the rift system of East Africa. Thestructural relief over most of tne shelf is gentle. Nowever,structural traps can be identified in areas of drape, dif-ferential compaction or faulting. On the southern and centralparts of the shelf, some very well defined grabens can be seenwhich appear to be direct continuations of structural unitsidentified onshore. These grabens should be important both interms of trap generation and of potential source rocks. Thistype of basin (graben) has been speclally attractive for oilcompanies in the past 5 to 10 years and has proved productivein many areas in Africa (Sudan, Chad, Egypt) as well as inEurope (North Sea).
Several formations within the geologic sequence, from the OligoMiocene to the Lower Cretaceous, show good reservoir potential. Thepresence of source rocks seems to be demonstrated by shows in severalexploration wells, the gas accumulation at Pande and gas and oil seeps atseveral surface locations. The results of geochemical studies carriedout mostly on onshore wells show that organic content is dominated by Sasprone coaly and humic material. The evidence from the geological andseismic surveys is, however, that the marine influence becomes greatereastvards into the offshore area. Thus, there is reason to believe thatoil prone source rocks can exist in offshore Mozamb que.
The geological and geophysical interpretations carried out byGREO, Western and ECL, have greatly improved the knowledge of theoffshore basins. In general, these show:
Annex 21
-155- Pa-e2 f 2
(a) geothermal history could be more favorable than is generallyinferred, especially in those areas where grabens havedmloped in the Southern or in the Eastern parts of thebasing;
(b) seismic evidence for extensive rifting and of truncatedreflectors below the pre-Cretaceous unccnformity testify to thepresence of tcetonic activity preceding the break-up ofCodwnnaland. lence, preconceived ideas about the nature andthe depth of the basement and about the absence of matureource rocks should be revised;
(c) apart from the potential of grabens, future exploration willbave to be largely directed towards stratigraphic or combina-tion traps.
156 Aae2Page t of 2
DETAILS OP PAST EXPLORATION ACTIVITIES FOR PETROLEUM
Prior to 1980
1. During the period from 1948 to 1974, several companies exploredin Noxambique (Gulf, Amoco, Sunray, Aquitaine, Hunt). In all, 46,000 kmof seismic profiles were sbot, including 23,000 km offshore, and 59exploration wells bUve -ben trilled, 12 of which are offshore. The mostnortherly extension of exploration was around the latitude of Quelimane,and no exploration activities have been reported for the Northern coastalsection and the Rovums basin. No commercial discovery has been madeoffshore though a few wells had gas and oil shows. Onshore, three gasaccumulations were discovered of which one was commercial (Pande) and twowere considered to be non-commercial (Buzi and Temane). All contractshad expired by 1974.
After 1980
2. Based on the contracts signed during 1983 and 1984 between EWEand international oil companies, petroleum exploration activity iscurrently taking place in several areas of Mosambique:
(a) 8sso/Shell have completed an onshore regional seismic survey of2004 km at Rovuma. The first well was spudded in April, 1986.
(b) BP has completed an offshore seismic survey of 2,357 km atNaputo. The survey was an infill program based on aspeculative seismic survey by Western Geophysical, and had theobjective of defining possible locations for wells.
(c) Based on the interpretation of GECO's speculative seismic data,during 1985 Amoco has shot an infill seismic program of 877 kmon blocks offshore of the Zambezi, to define the extension ofatt-active prospects.
(d) During late 1984, the Japanese state oil company JNOC,completed a 360 km shallow water survey in Basaruto Bay.
(e) A northerly extension of JNOC's program of 946 km between Beiraand Ingoimano, was subsequently performed by MMH.
(f) In October 1985, Vestern Geophysical completed an infillseismic survey of 760 km in blocks M7, NS and M10 for EWE.
3. In addition to these activities, other companies have alsoundertaken or are planning exploration programs which are designed tohelp companies assess the prospects for hydrocarbons in Mozambique:
Annex 22-157- Page 2 of 2
(a) Two regional speculative seismic surveys were carried outduring 1981-1982# including the acquisition of gravity andmagnetic data.
(b) Western Geophysical shot 12,275 km in water depths of 20 to 500meters, between Beira and Maputo.
(c) GBC0 shot 13,018 km in uaters depths of 20 to 500 meters,betveen Beira and the Tanzanian border.
(d) Duke University is carrying out a seismic survey of LakeNyassa.
(e) Robertson Research International Ltd. is performing asystematic geochemical evaluation of potential source rocks inEastern Africa, including Somalia, Ethiopia, Kenya, Tanzaniaand Mozambique. Mozambique contributed sub-surface samples tothe study.
-158-
Anne 23
O GAS I RATIONI P11OM
The two-stage HM exploration progra, estimated to Coot U840 million toUS$50 million and financed by GM ad USS, is defined as follows$
First Stage (2 yars)
O 600 km detailed seismic survey on the Pande field.O 1,000 km semi-detailed seimic survey on the Tmene field.O 5 delineation wells in Pande field.o Vorkover and testing 4 existing Panda field wells.o Sevral wells in Temane area depending on seismic survey
results.o lorkover discovery well in lusi field and drill one well.
Second Stgae (3 y"et)
o 1,500 km of seismic survey including 1,200 km of reconaissancelines.
o 30/40 wells including reconnaissance and delineation ofdiscoveries.
Source: MIH.
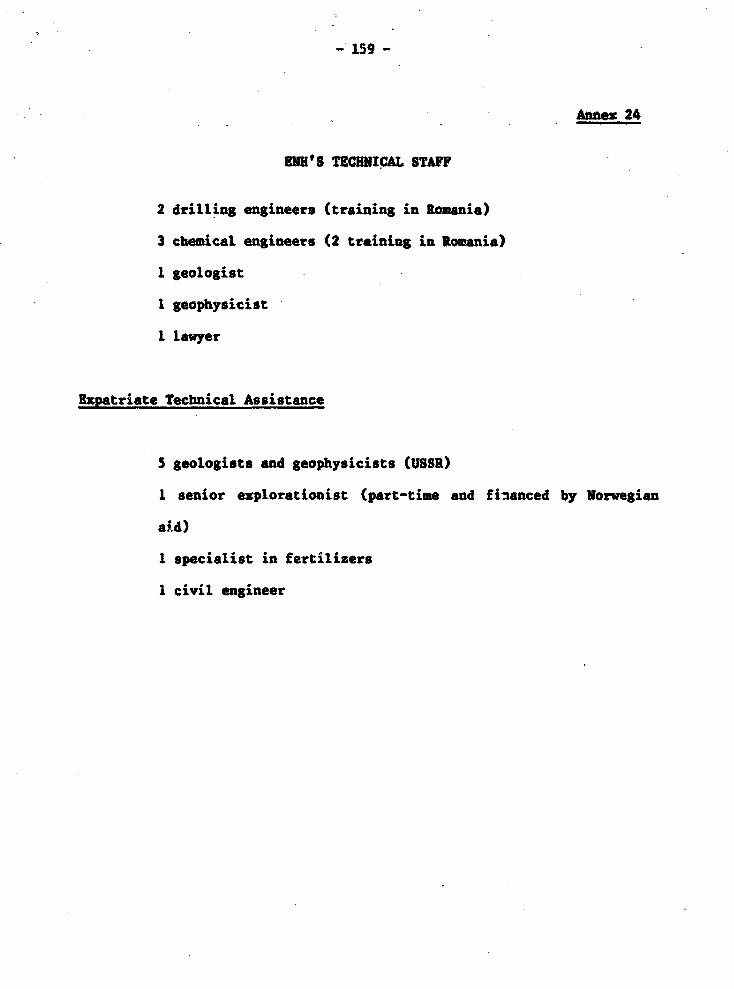
- 159 -
Annex 24
HUH'S TECHNICAL STAFF
2 drilling engineers (training in Romania)
3 chemical engineers (2 training in Ronania)
1 geologist
1 geophysicist
1 lawyer
Expatriate Technical Assistance
5 geologists and geophysicists (USSR)
1 senior explorationist (part-time and financed by Norwegian
aid)
1 specialist in fertilizers
1 civil engineer
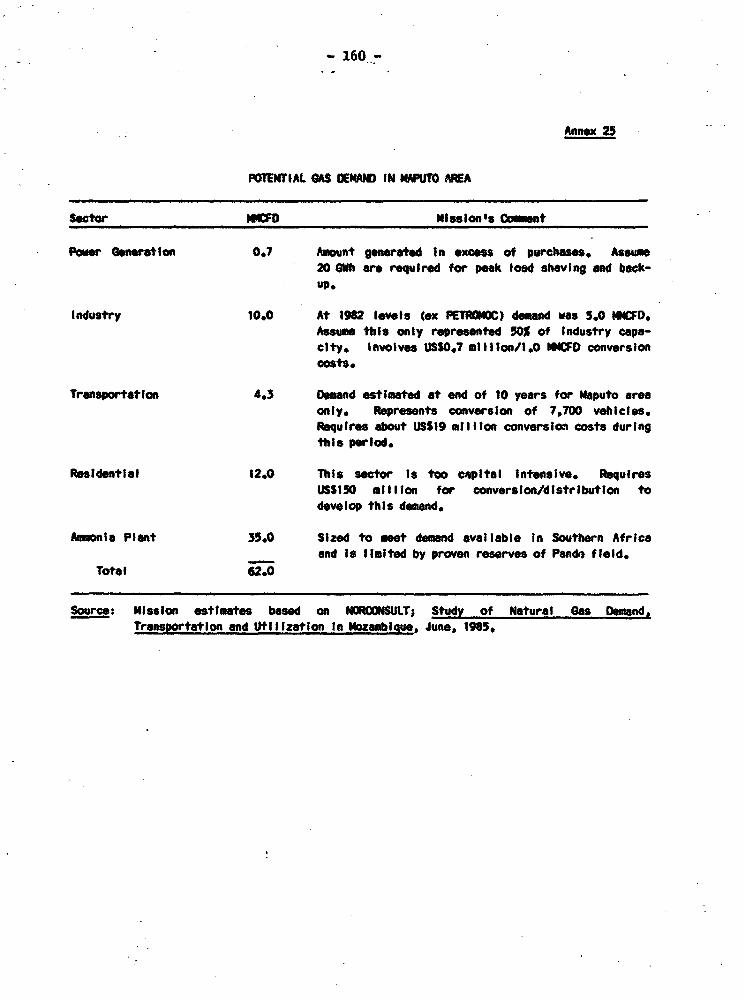
- 160 -
Annex 25
POTENTIAL GAS CEi410 IN MPUTO ARA
Sector MtCO Mi41ssions Comnt
Powr 6bnerestion 0.7 Amount generated In excess of purchases, Assume20 GOh are required for peak load shoving and back-up.
industry 10.0 At 1982 levels (ox PETRMOC) demand was 5.0 4CfD.Assume this only represented 50% of Industry capa-city. Involves USS0.7 mlilion/1.0 4MCFD conversioncosts.
Transportation 4.3 Demand estimated at end of 10 years for Maputo areaonly. Represents conversion of 7,700 vehicles.Requires about US$19 millon conversion costs duringthis perlod.
Residential 12.0 This sector Is too capital Intensive. RequiresUSS150 million for converslon/distributlon todevelop this demand.
Ammonal Plant 35.0 Slzed to meet demand available In Southern Africaand Is limited by proven reserves of Panda fleld.
Total 62.0
Source: Mission estimates based on NORCONSULT; Study of Natural Gas Demand,Transtortation and Utilization In MWozambIue, June, 1965.
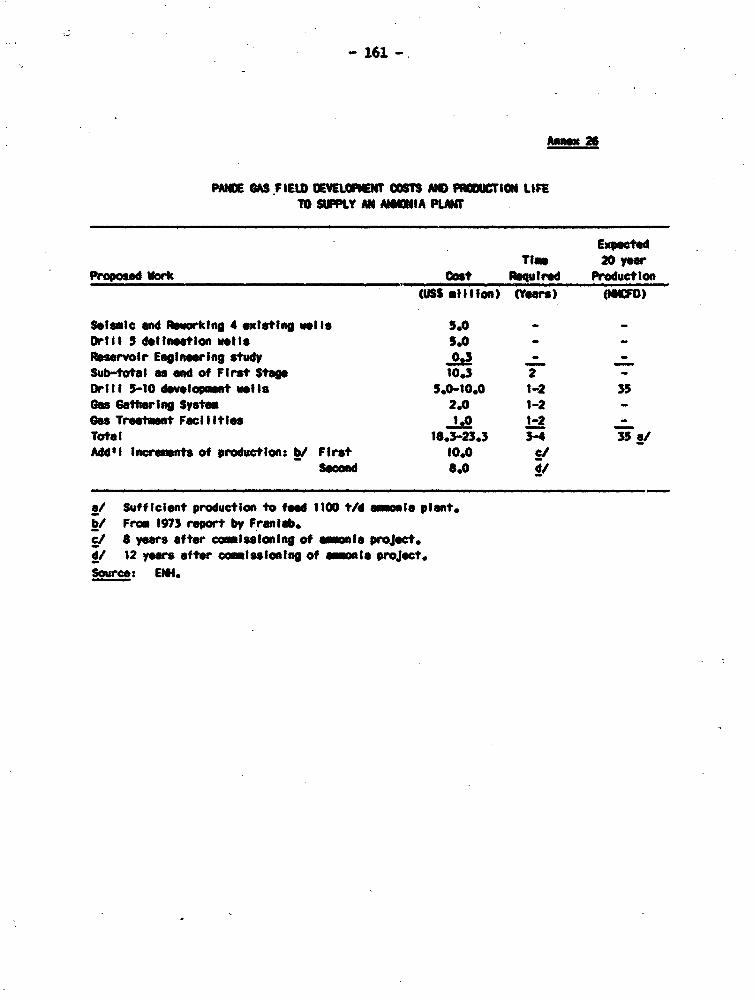
- 161 -.
PMM 03SFIEW IFELS OMIE S AND P1iicriei LtFETO SIPPLY Ul AUNIA PLAN
ExpCtdTliw 20 yea
Proposed ork aost qutired Production(USS ofIIon) (Yers) (MM")
Seismic an Reworking 4 existing wells 3.0 - -
Orill del Ieatlon NteIs 5.0 - -
Rosorvoir Engineing study --
Sub-totaesnd of First Stop 10.3 2 -Drill 5-10 deelopmet wells 5.0-10.0 1-2 35as Gathering System 2.0 1-2 -Gas Treatment FacIlties 1.0 1-2 -
Total 18.3-23,3 3- a/Add'i lnermnts of production: y/ First 10.0 ct
Secnd S.0d
e/ Sufficlent production to feed 1100 t/d onia plant./ From 1973 report by Frnlab.
Cl 8 yeas after comissioning of aman projct.4/ 12 yars after commissioning of onia project.Source: ElM.

Annes 27Page 1 of 2
- 162 -
CONKNM ON AMMONIA PROJECT ASSUMTONS USED BY PLUABO
I. Pluor prepared a feasibility study to determine the size andlocation of the proposed ammonia plant. They recomsended a world scalemmonia plant (1100 t/d) located at Inhassoro. The mission's comments onthe major assumptions used by Fluor are as follows:
(a) Ammonia Demand Forecast: South Africa, plua smaller amounts toZimbabwe and Swaziland, are the logical markets. The othermain potential market is the Indian -Ocean region, which couldbe in surplus or deficit for nitrogenous fertilizers during the19909, depending on a number of factors that are difficult topredict.
(b) Ammonia Prices The study used an export price of US$200/t FOBand expected freight of US$201t to South Africa (RichardsSay). This laid down price generally agrees with missionestimates. A.D. Little updated the evaluation in end 1985, andtheir forecast for world ammonia prices in 1985 US$ terms areUS$185/t fob Arabian Gulf in 1990, U9$195/t in 1995 andUS$225/t in 2000.
(c) Oeating Costs: The study used US$13.0 and US$15.5 mil-lion rear operating costs for a Maputo located plant and anInLassoro plant, respectively. These costs check very closelywith other similar projects throughout the world.
(d) Selling Costs: Selling costs normally amount to about 2X ofthe selling price according to mission data but this depends oncertain selling conditions (who arranges shipping, use ofbrokers and agents, etc.). Since most of the production couldbe going to South Africa, arrangements could be made for FOB-type sales with essentially no selling costs (as was assumed inthis study).
(e) Ammonia Plant Investment: The Pluor study used a totalinvestment of US$200 million for the Inhassoro location whichincluded US$13 million for a gas gathering pipeline. Nothingwas included for community development. Based on other studiesby Fluor and SNUM PROGETTI, community development would costUS$30 million to US$50 million depending on the size of theplant workforce. Consequently, the investment of US$200million must be considered as being too low. This estimate mayhave been influenced by some very low bids for constructingammoaia plants made during 1984 and 1985, mainly by Japanesecompanies, which reflected intense competition for constructionwork during a period of low activity. Based on the WorldBank's recent experience of the total costs of building andestablishing an ammonia complex, which includes additionalexpenses to contractors bids to cover unforeseen and
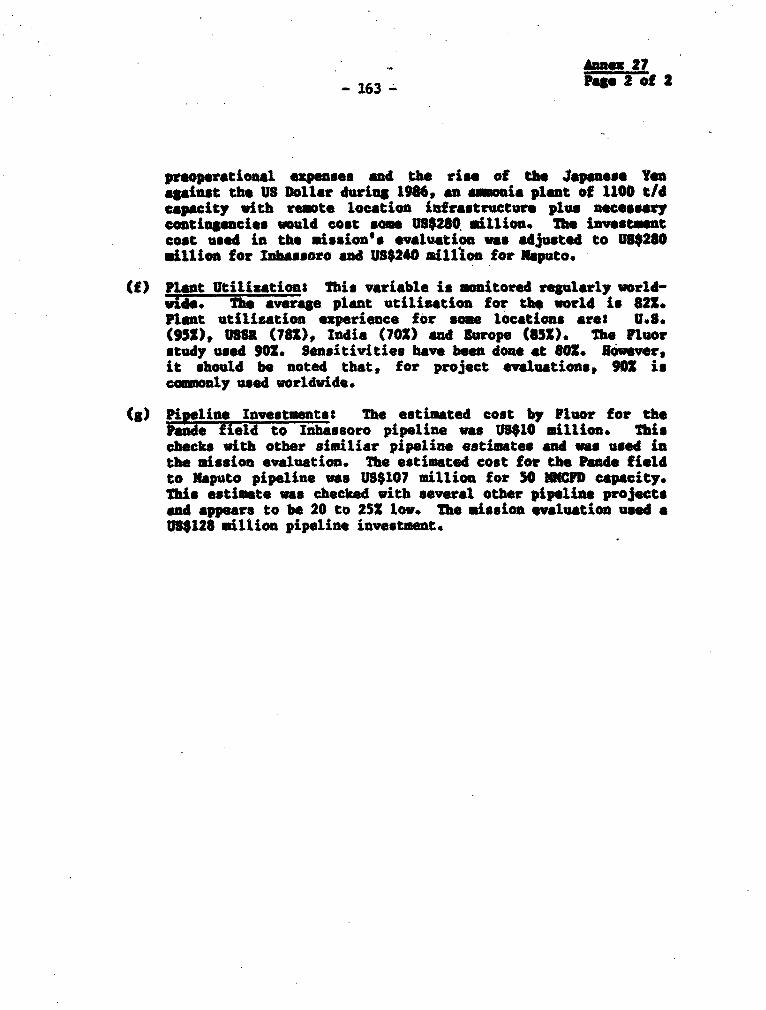
hAnex 2
-163- F" 2 of 2
prepetatiomal expenses and the rie of the Japanes Venapinst the US Dollar during 1986, an monia plant of 1100 tIdcapacity with rmote location infrastructure plus necessarycontingencies would cost some US$280 million. The invest_mtcost used in the mission's evaluation was adjusted to U$280million for Inhssoro and US$240 millon for ifsputo.
(f) Plant Utilisation: This variable is monitored regularly world-wide. The average plant utilisation for the world is 821.Plant utilisation experience for some locations areS U.S.(952), USSR (781), India (701) nd Europe (851). Th Fluorstudy used 901. sensitivities have been done at 80X. However,it should be noted that, for project evaluations, 90 iscomionly used worldwide.
(g) Pipeline Investmentst The estimated cost by Fluor for thePande field to Inhassoro pipeline was US$10 million. Thischecks with other similiar pipeline estimates and was used inthe mission evaluation. The estimated cost for the Pende fieldto Naputo pipeline was US$107 million for 50 lUCID capacity.This estimate was checked with several other pipeline projectsand appears to be 20 to 252 low. The mission evaluation used aUS$128 million pipeline investment.
Annex 28-164- 4aelof4
ASSUMPTIONS TO EVALUATt AMMONIA PLANT/PIPELINS TO MAPUTO
Gas Consumers in Naputo The gas consumption in 10 years would amount to13 MNCFD based on the development of the following sectorss3
- Power Generation: Some 60-100 GWh per year bas been generatedat Naputo over last several years. However, over the longterm, it is envisioned that only about 20 GWh per year will begenerated at Haputo for peak load shaving and back-up needs.Gas price to power generation assumed to be US$4.50/MCF.
- Energy Consuming Industries: The NORCONSULT Report, "Study ofNatural Gas Demand, Transportation and Utilization inMozambique", June 1985" provided actual consumption for 1982made up of 20X gas oil and 802 fuel oil (excluding PETROMOCRefinery which is assumed to be shut down). This can beconverted to natural. gas use for US$3.5 million investment.Gas price assumed to the US$4.50/MCF for gas oil conversion andUS$3.00MCP for fuel oil conversion {assume fuel oil price isno longer subsidized). NORCONSULT considered the 1982 con-sumption level to represent only 332 of industry capacityutilization. The mission believes this would overstate thecapacity of industry. This evaluation assumes the 1982 levelto be at 502 of industry capacity and could be increased by102/year for 5 years.
- Transportation: The total Mozambique motor vehicle populationis about 30,000 (excluding two wheeled transportation) of whichapproximately 50 are located in Maputo. Of this number, onlyabout 402 can be considered as potentially convertible to CNGdue to age and vehicle end use limitations. If 501 of thosecan be converted to CNG over a 10 year period plus an estimated600 new vehicles per year, some 7,700 vehicles would be con-verted at the end of 10 years. The total investment for con-versions and stations over the 10 year period is assumed to beUS$18.5 million. The 7,700 vehicles would consume 4.2 MNCFD ofCNG. Gas price to transportation users is assumed to beUS$4. 50/MCF.
- Residential: Gas to this sector requires considerable con-version and distribution investments (US$150 million, accordingto the NORCONSULT Report, for potential conversion of 11 to13 MMCFD). Therefore, no residential conversion was assumed inthis evaluation.
Anaox 28Page 2 of 4
- 165 -
Capital and Ooerating Costs and Product Prices- are discussed in Annex 3.21
Pipeline
Pande to taputo: The capital investment of US$107 mill'ion fromthe Fluor study was increased by 20Z to US$128 million. Opera-ting coat of the pipline of US$1.9 million/year was used fromFluor study.
- Pande to Inhassoro: The capital investment of US$10 millionfrom the Plour study was used. Operating costs were estimatedat US$0.02lMCF. 901 plant utilizaion was used in the basecase economic evaluations. Sensitivities at 80Z utilizationwere developed.
Ammonia Plant
Investment assumed to be US$240 million at Maputo. This isbased on adjusting the Fluor cost estimate of the proposed plant atInbassoro from US$200 million to US$280 million, then deducting anestimated US$40 million for community development costs not needed atMaputo. Operating costs were taken from the Fluor study at US$13 millionand US$15.5 million/year for the Maputo and Inhassoro plants, respec-tively. Ammonia sold at US$200/t FOB. 901 plant utilization was used inthe base case economic evaluations. Sensitivities at 80S utlization weredeveloped.
Cost of Gas
The mission estimates the cost of extracting gas from Pande andfeeding it to a pipeline for supplying the ammonia plant, averaged overthe lifetime of the plant, to be US$0.46/MCF (page 4 of this Annex).
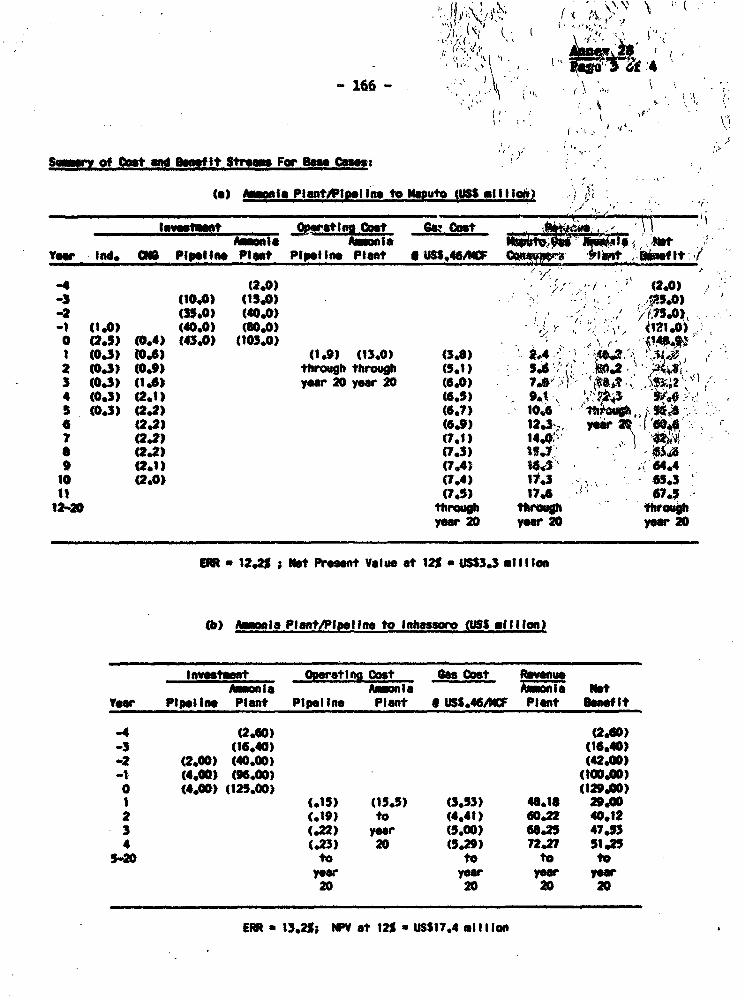
Amn Ia R Amn I. *jtVeer Ind, Co Pipelime Pleat Pipel Ine, Plant *USS,46mw C Y1MFIt iItt '
-4 (2.0) , (2.0)-3 (10.0) (15.0) : 3.0)
-2 (35.0) (40.0) / ,
-1 (1.0) ( ) (800) , i , )
0 (2.5) (0.4) (43.0) (103.0) .4
1 (0.3) (0.6) (1.9) (13.0 (3.6) 2.*4 -'A2 (0.3) (0.9) through through (3I) 54 O.3 (0o3) (1.6) year 20 yer 20 (6 ; 4 (0.3) (2.1) (6.5) 9j4 ,25 (0.3) (2.2) (6.7) 10,6 1tnMiaoeg~~* (2.2) (6.9) 12.3',, year 207 (2.2) (7.1) 14 ; a (2.2) (7.3) W!4'9 M.) (724) -3 4 64.410 (2.0) (7'4) 11.3 '65.3
12-20 Through throug " " ' gyewy 20 y 20 Y.e'20
-rn. 1225 Net Preset Value at 12% a USS3.3 of II too
(b) Auomla iPlant/Piet In* to iessoro (USS f -I Ion)
invest~t Opeatin I scost ane cost RevenueMuonia Amu ia Ammone Nert
Year Pipel Ine Plantt Pipelilne Plant * USS,46MV Plant SenefIt
-4 (2.00) (2.00)-3 (16940) (16.40)'2 (2.00) (40.00) (42.00)-1 (4.00) (96.00) (100.00)0 (4.0) (123.00) (129.00)1 (.15) (13.5) (3.33) 48.16 29'002 (019) to (4.41) 60.22 40.123 (.22) year (5.00) G6.25 47.534 (.23) 20 (5."2) 72.2? 31.
520 to to to toyear Yar yea year20 20 20 20
ERR 13.2%; WV at 12%. USS17A. mill I Ion
Annex 28Page 4 of 4
-167 -
CALCULATION OF WILL-HRAD G0 COST IN PANDE
Assumptions
- Investment: YEAR 1 Seismic and Appraisal wellst US$5.iO millionYEAR 2 Workover wells and Reservoir
Survey: US$5.3 millionYEAR 3 Production Wells, Gathering
& Treatment: US$13.0 million
- Operating Cost: Use "rule-of-thumb" US$0.O5/ICF.
- Financing Costs: Use 10 interest charge recovery in costs.
- Field Life: Based on various consultants reports (Franlab, Rankin,Dusk, Rompetral and Petrobras), proven reserves are 0.4 to 1.3 TCP -more than adequate for a 35 MHCFD production for 20 years.
- Required ERR: Accepted level for government owned and operatedexploration facilities is 10%.
Conclusion
Based on a 101 IRR, a 20 year evaluation yields a well-head gascost of US$O.46/NCF. Well-head gas cost would be US$0.51/MCP for a 15-year evaluation.
Sensitivity
In order to provide additional gas production from 35 MMCFD to50 MNCFD to be able to aupply other gas demand, such as in Kaputo if apipeline were to be constructed, the next stage of development wasassumed with 10 wells costing US$10 million. The well-head gas cost wasessentially unchanged at US$0.45/NCF.
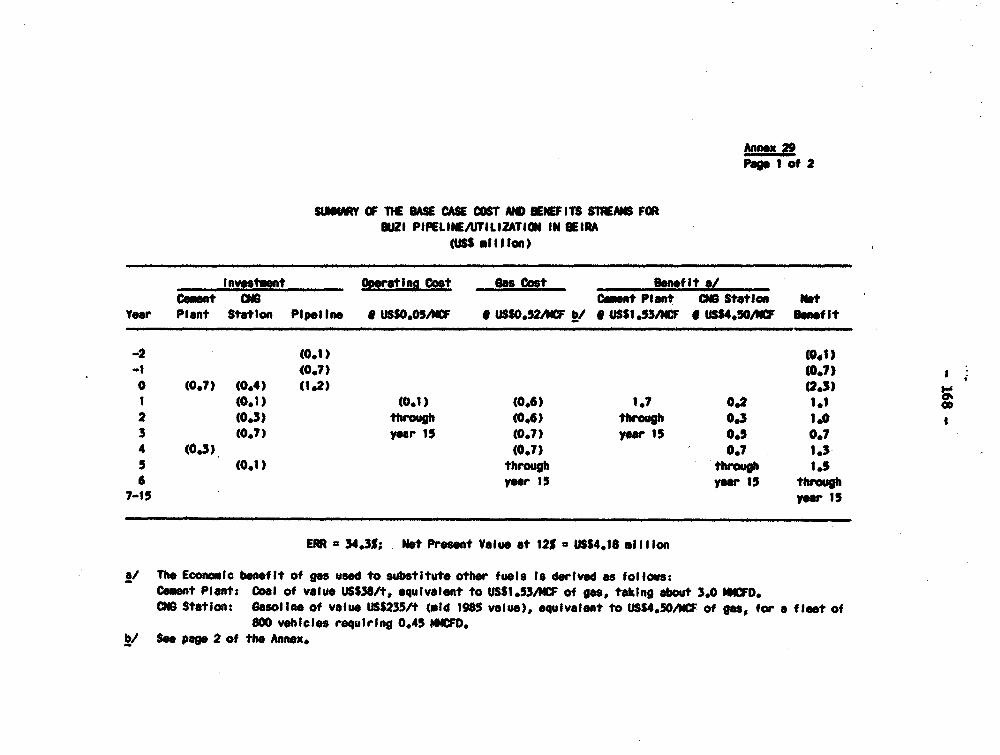
Annex 29Pag I of 2
SU OF TME SE CAS OST A BENEFITS SWIES FOROUZI PIPELIEAJTILlZTATION IN BEIRA
(USS mI Iton)
Investuat Opereting Cost ax Cost eoef it O/Cemt e04 C fet Plant C04 Sttio NotYear Plant Station PIpl Ine USS.05AF U USS0.2AF bl USSI.53M * US"0,50,W beef It
-2 (0.1) (9.1)-1 (0.7) (0.?)0 (0.7) (0.4) (1.2) (2.3) 1 (0.1) (0.1) (0.6) 1.7 0.2 1.12 (0.3) through (0.6) thro 0.3 1.03 (0.7) year 15 (0.7) yr 15 0.5 0.?4 (0.3) (0.7) 0.7 1.35 (0.1) through through 1.S6 year 15 yewr IS thugh
7-15 yea 1S
ERR s34.3; Net Presnt Value at '12% USS4.8 sillion
a/ The Economic bonef it of gas used to substitute other fuels Is derived as follows:Cement Plent: Coal of value US$38/It equivalent to USS1 .S3ACF of gas, taking about 3.0 MFD.CNB Station: Gasoline of value USS235/t (oid 1985 value), equivalent to USS4.SOIMCF of 9SSf for a fleot of
800 vehicles requirlng 0.45 lHCFD.b/ See page 2 of the Annex.
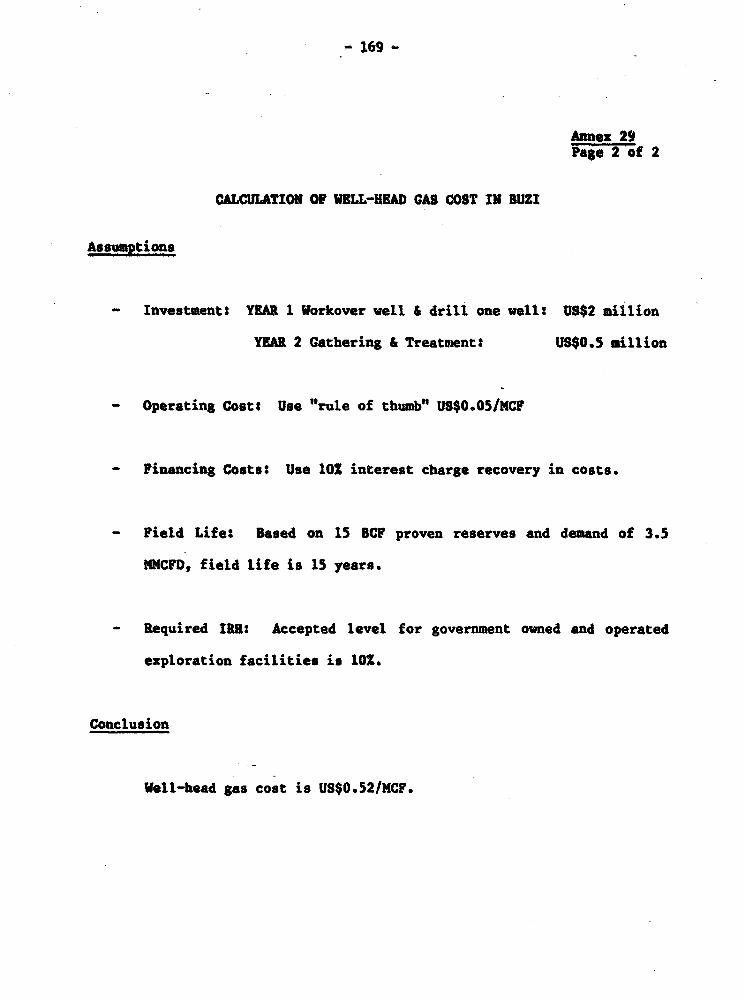
Annex 29PaFe 2 of 2
CALCULATION 0F V8LL-iBAD GAS COST IN BUZI
Assumptions
- Investment: YEAR 1 Workover well & drill one well: US$2 million
YEAR 2 Gathering & Treatment: US$0.5 million
- Operating Cost: Use "rule of thumb" US$0.05/MCF
- Financing Costs: Use 10Z interest charge recovery in costs.
- Field Life: Based on 15 BCF proven reserves and demand of 3.5
MMCFD, field life is 15 years.
- Required IRR: Accepted level for government owned and operated
exploration facilities is 1oX.
Conclusion
Well-head gas cost is US$0.52/MCF.
Annex 30
-170 - Page l of 2
MAJOR GAS CONSUNING POSSIBILITIES
Other major gas consuming possibilities, besides the manufac-ture of ammonia, reviewed by the NORCONSULT Report include:
(a) Methanol: The current worldwide surplus capacity and pro-duction introduces too much risk in forecasting methanol pricesfor export sales. The possibility of producing ethanol for agasohol market has economic problem_s
- 20Z (amount blended to gasoline) of Mozambique gasoline marketis only about 7,000 t/y
- most economical sized plant is about 660,000 tly- having to export surplus alcohol runs headlong into world
surplus capacity.
(b) Urea: There are significant downside market risks in thismarket from the presence of very large producers in the MiddleEast and Eastern Europe with the capability of exertingconsiderable downward pressure on prices.
(c) Liquefied Natural Gas (LNG): LEG is expected to remain a"buyers market".
(d) Natural Gas: There may be a market for natural gas in SouthAfrica. However, for steam generation, gas would be competingwith cheap locally produced coal which would not be an economicuser for gas. Cost estimates have been made by the mission fora pipeline from the Vilanculos area to Johannesburg which indi-cate that 545 NMCFD (this amount used to obtain the benefits ofeconomy of scale) of gas could be delivered for a cost of aboutUS$1.40/KCF plus well-head cost. This is too expensive to com-pete with locally produced gas from coal where coal gasifi-cation facilities are already in place. However, because coalgasification facilities are highly capital intensive, gas fromMozambique could be a viable competitor with the next genera-tion of such investments in South Africa. There may be someindustrial petroleum conversion possibilities that could affordto pay US$4.00 to US$4.50/MCF. However, a comprehensive reviewof potential economical gas consumers in South Africa isrequired to determine whether an economic market for Mozambiquegas exists there.
(e) Synthetic Liquid Fuels: The possibility of a syn-fuels plantin Mozambique is only worth considering at some future date.The current technology for the conversion processes still makethis very capital intensive and economies of scale areessential. At this stage of their development, they must beviewed as being too risky for consideration by Mozambique. TheNORCONSULT Report indicates that the proven Fischer-Tropsch

Annex 30-171- Pa-e2 of 2
process plant would typically produce 900,000 t/y of gaso-linelges oil at an investment of US$1,200 million. Anotherprocess, the Mobil MTC, is relatively new with its first plantjust starting production in New Zealand (570,000 tly ofgasoline costing US$1,475 million). A new process, still inpilot plant stage, is aimed at reducing current investmentlevels by 55-651. This process, TOPSOE, when perfected may beworthwhile for consideration at that time.
Annex 31Page I of 5
EXISTING POWER SYSTEM FACILITIES IN MOZAMBIQUE
1. The principal features of the power facilities in Mozambigueare the Cahora Bassa complex and BDM'* generating stations and trans-mission grids that serve the southern, central and central-northernsystems. The Cahora Bassa complex is located on the Zambesi river nearto the border with Zimbabwe$ and it consists of an arch concrete dam of163 m height, a reservoir with a useful storage capacity of 52 thousandmillion m , and a power station located on the south bank with aninstallation of five turbo-generator units each rated at 415 MW, total-ling 2,075 MW. The firm power output is 1,660 MW. Annual average eiergygeneration capacity of the station is 11,900 GWh, and the complex wascomuissioned between 1975 and 1979. The average flow of the Zambeziriver at the site of the complex is 2,750 m /sec. The complex wasdeveloped to export power to RSA through two 533 kV DC transmission linesover 1,400 km of which 860 km lies in Mozambique. *The total deliverycapacity of these lines is 2,720 MW from Cahora Bassa, 2,460 MW deliveredto the Apollo substation located between Johannesburg and Pretoria inRSA.
2. EDM's southern system is based on Maputo and has two mainsources of power, the Maputo power station and transmitted power fromRSA. The Maputo power station contains old thermal units, comprisingfive coal-fired steam units and two gas turbines, that have had to bederated due to age, poor maintenance and lack of proper operating guide-lines, from a combined installed capacity of 142 MW to a combined ratingof 94 MV (50 MW coal, 44 MW gas turbines). The actual capacity of thestation has been far less due to lack of spare parts, and the station hasbeev operated only for peak load duty and as a back-up source of powerfor many years. At the time of the mission, four of the coal units andthe 38 MS gas turbine were out of service and required major maintenancework, so that the station was able to send out only 27 MW. EDM keeps thecoal units on spinning reserve in case of interruption to the powersupply from RSA. During 1985, EDM received foreign assistance for theoverhaul of some of the plant, especially the gas turbines, as emergencyaid following a cyclone in March 1985 which severely damaged the trans-mission line from RSA. Nevertheless, 1DM would require additional tech-nical assistance to restore all the plant to full operating condition, totrain staff, introduce a degree of automation to the operations andimplement correct operating procedures. The justification for suchassistance should be assessed in the context of the anticipated duty ofthe station units in EDM's system.
3. The 275 kV transmission line from RSA to Maputo, whichtraverses about 75 km route length inside Mozambique, has been the mainsource of power for Maputo since the early 1970s. The line was built toenable Mozambique to benefit from the Cahora Bassa project by makingavailable power from the ESCOM (RSA) Eastern Transvaal system as anindirect link with the supply from Cahora Bassa to the Johannesburg/Pretoria area (Apollo substation). The line has a capacity to deliver
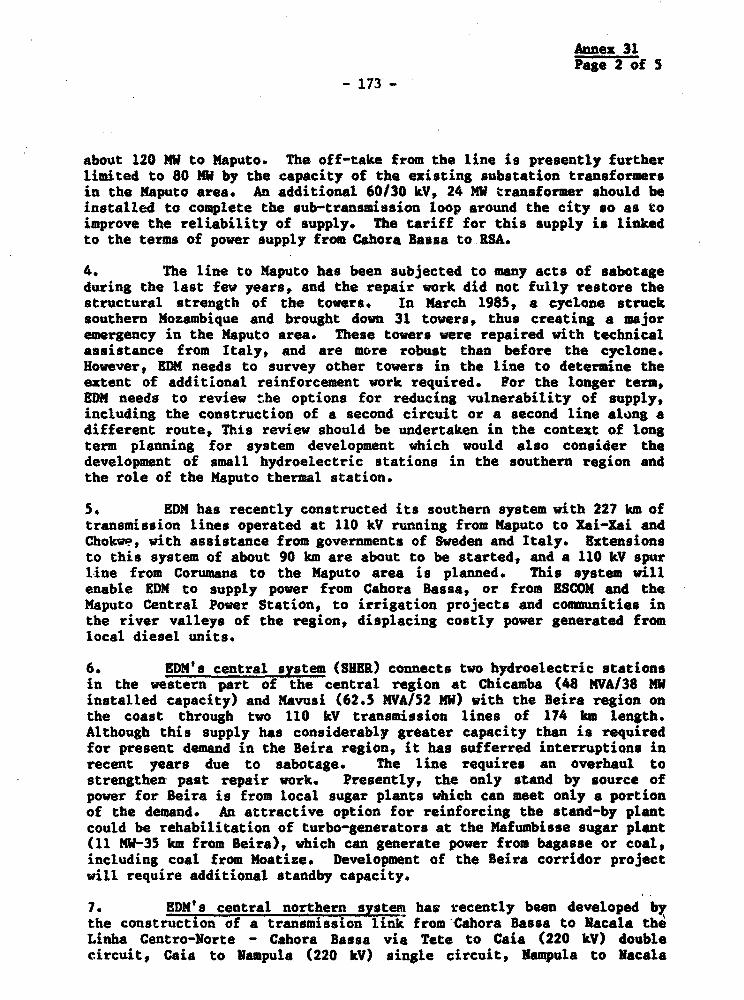
Annex 31Page 2 of 5
- 173 -
about 120 MS to Maputo. The off-take from the line is presently furtherlimited to 80 MW by the capacity of the existing substation transformersin the Maputo area. An additional 60/30 kV, 24 MW transformer should beinstalled to complete the sub-transmission loop around the city so as toimprove the reliability of supply. The tariff for this supply is linkedto the terms of power supply from Cahora Bassa to-RSA.
4. The line to Maputo has been subjected to many acts of sabotageduring the last few years, and the repair work did not fully restore thestructural strength of the towers. In March 1985, a cyclone strucksouthern Mozambique and brought down 31 towers, thus creating a majoremergency in the Maputo area. These towers were repaired with technicalassistance from Italy, and are more robust than before the cyclone.However, EDM needs to survey other towers in the line to determine theextent of additional reinforcement work required. For the longer term,EDM needs to review the options for reducing vulnerability of supply,including the construction of a second circuit or a second line along adifferent route, This review should be undertaken in the context of longterm planning for system development which would also consider thedevelopment of small hydroelectric stations in the southern region andthe role of the Maputo thermal station.
5. EDM has recently constructed its southern system with 227 km oftransmission lines operated at 110 kV running from Maputo to Xai-Xai andChokwe, with assistance from governments of Sweden and Italy. Eitensionsto this system of about 90 km are about to be started, and a 110 kV spurline from Corumana to the Maputo area is planned. This system willenable EDM to supply power from Cahora Bassa, or from ESCOM and theMaputo Central Power Station, to irrigation projects and communities inthe river valleys of the region, displacing costly power generated fromlocal diesel units.
6. EDM's central system (SHER) connects two hydroelectric stationsin the western part of the central region at Chicamba (48 MVA/38 MWinstalled capacity) and Mavusi (62.5 MVA/52 MV) with the Beira region onthe coast through two 110 kV transmission lines of 174 km length.Although this supply has considerably greater capacity than is requiredfor present demand in the Beira region, it has sufferred interruptions inrecent years due to sabotage. The line requires an overhaul tostrengthen past repair work. Presently, the only stand by source ofpower for Beira is from local sugar plants which can meet only a portionof the demand. An attractive option for reinforcing the stand-by plantcould be rehabilitation of turbo-generators at the Mafumbisse sugar plant(11 MQ-35 km from Beira), which can generate power from bagasse or coal,including coal from Moatize. Development of the Beira corridor projectwill require additional standby capacity.
7. EDM's central northern system has recently been developed bythe construction of a transmission link from-Cahora Bassa to Nacala theLinha Centro-Norte - Cahora Bassa via Tete to Caia (220 kV) doublecircuit, Caia to Nampula (220 kV) single circuit, Nampula to Nacala

Annex 31Page 3 of 5
-174 -
(110 kY) with assistance from Sweden, Italy, France and DDI. The lineruns for 910 km at 220 kV and 200 km at 110 kW. . capital cost of theline and associated substations is the equivaleat of about US$150million. This link will enable 3DM to utilise a larger proportion ofMozambique's entitlement to the output of Cahora Bassa and will displacecostly diesel-generated power at a number of load centers. The secondcircuit from Cahora Bassa to Caia is required for line stabilityreasons. The sizing of the capacity of the substation at Caia isrequired only for some future large load, envisaged possibly as analuminium plant. A spur 110 kV line is being constructed from AltoMolocue to Gurue with Swedish and Italian assistance. Stand-by dieseland fuel-oil burning generating plant was installed in Macala withassistance from the Dutch Government, and at Quelimane with assistancefrom the British Government.
8. A 220 kV transmission line runs from Tete to Chimoio (220 kY)and was built by MCB in 1980 to take power from Cahora Bassa to the SUERsys-Lem and to eastern Zimbabwe. The line has not yet been used. Itsterminal is scheduled to be connected to the SHER system by 1988.
9. The northern part of the country (Cabo Delgado and Viassaprovinces) is the least well served and most isolated area and has thelowest demand for power, Consumers in this area suffer from unreliabilityof diesel supplies due to the dilapidated condition of the Nampula-Cuamba-Lichinga railway facilities, interruptions to road traffic duringthe monsoon season and due to security problems, and the lack of foreigncurrency. Problems with power supplies have had high economic costs interms of lost agroindustrial output. 3DM has built a hydroelectricstation at Lichinga (680 kW) with a local construction force. EDM isalso building a dam and hydropower station at Cuamba (1 MS, 5.6 CWh/yearaverage) which is due to be commissioned in 1987. Stand-by dieselgenerators will be required since there will not be water available atthese stations during annual dry seasons. EDM is building a workshop atCuamba. Imported items for these works costing about US$9 millionequivalent, were provided under a Norwegian Government grant. 3DN hasrecently installed new diesel units at Pemba with British assistance.
10. There are a variety of distribution voltages in use which wereinherited by EDM from old systems. The princirl1 standards in use are 33kV, 22 kV, 11 kV and 6.6 kV. The capacities of urban distributionsystems are generally adequate to meet present demand since they wereestablished to meet substantially higher demands pertaining to the early1970's. The need to standardize the multiplicity of distributionvoltages is an issue for power system development in the long term toimprove overall operating efficiency by reducing costs, but it is not anissue that is as pressing as other issues for 3DM in the short to mediumterm. Nevertheless, a long-term program for standardization should beprepared to enable implementation to proceed in coordination withreplacement of equipment and system development.
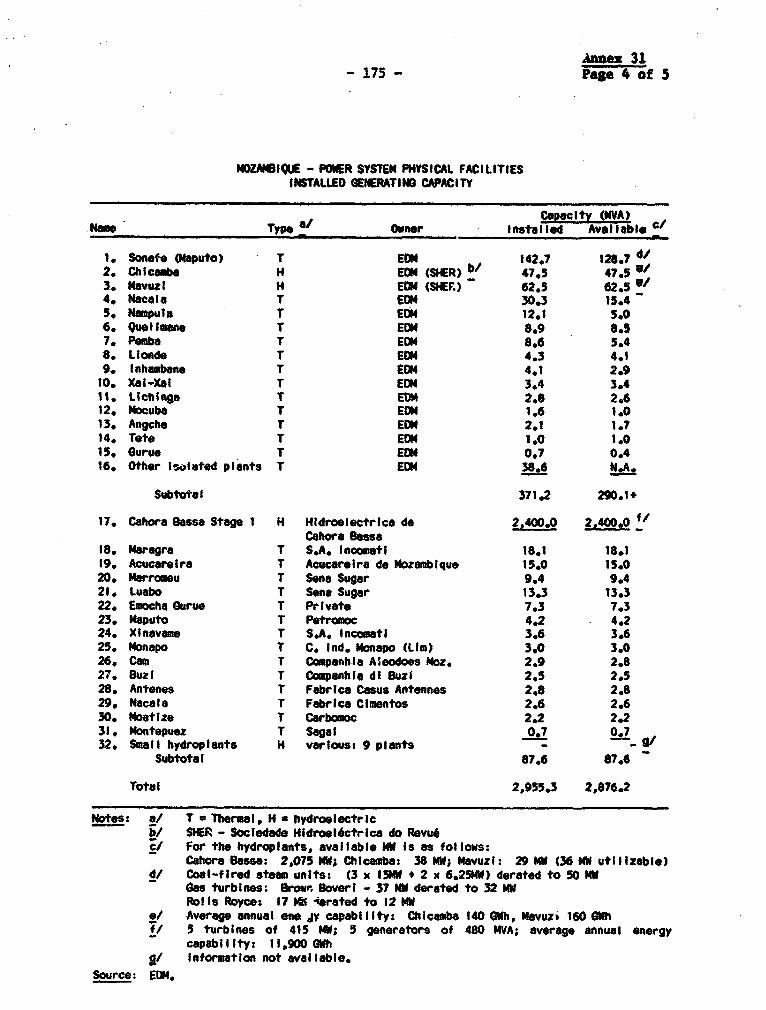
Annex 31-175- Page 4 of 5
NDZANBIE - POR SYSEM PHYSICAL FACILITIESINSTALLED GERATING CAPACITY
Memo Type a/ O wer Installed Available cl
I. Sonofe Qbaputo) T EOH 142.7 128.7 dJ2. Chics 1 H EOM (SHER) bJ 47.5 47.53. mIvuui H EON (S1fF.) 62.5 62.54. Nocala T EOH 30.3 15.45. Nampula T EON 12.1 5.06. OueI lamne T EON 8.9 8.57. Pemba T EON 8.6 5.48. Linde T EOM 4.3 4.19, Inhambane T EON 4.1 2.910. Xai-Xai T EON 3.4 3.4t . LIchinga T EON 2.8 2.612. Mocuba T EOM 1,6 1.013. Aegche T EON 2.1 1.714, Tote T EON 1.0 1.015. Gurue T EOM 0.7 0.416. Other isolated plants T EOM 38.6 N-A.
Subtotal 371.2 290.1+
17. Cahora Bassa Stage 1 1 Hidroelectrlca de 2,400.0 2,400.0Cahoa Bass*
18. Maragra T S.A. Inoo matl 18.1 18.119. Acucarelra T Acucareira de Mozambique 15.0 15.020, Marroamu T Sena Sugar 9.4 9.421. Luabo T Sona Sugar 13.3 13.322. Emoch Guru.e T Private 7.3 7.323. Maputo T Petrtmooc 4.2 - 4.224. Xlnavane T S.A. Incomatl 3.6 3.625. ibtapo T C. Ind. ionapo (LIm) 3.0 3.026. Cam T Coapankla Aleodoes Moz. 2.9 2.827. BuzI T Companhla di iuzi 2.5 2.528. Antenes T Fabrica Casus Antennes 2.8 2.629. Macela T Fabrica Cimentos 2.6 2.630. Noatize T Carbomoc 2.2 2.231. Montepuez T Sagal 0.7 0.732. Small hydroplants H various: 9 plants - _- Si
Subtotal 87.6 87.6
Total 2,955.3 2,816.2
Notes: a/ T * Thermal, 14 - hydroelectrIcb/ SHER - Sociedade 1l1droel6etrica do Revucf For the hydroplants, available MN is as follows:
Cahora Besse: 2,075 NW; Chicatba: 38 NW; Navuzl: 29 MN (36 NW utilizable)y Coal-f Itred steam unIts: (3 x 15W + 2 x 6.25MW) derated to 50 NW
Gas turbines: Brow'r Beverl - 37 NW derated to 32 NWRolls Royce: 17 MW lroted to 12 N1W
a/ Average annual one Jy capabIlity: ChIcamba 140 GWh, Navuz. 160 6WhT/ 5 turbines of 415 MW; S generators of 480 WVA; average annual energy
capabIlIty: 11900 GWhg/ Information not available.
Source: EDO.
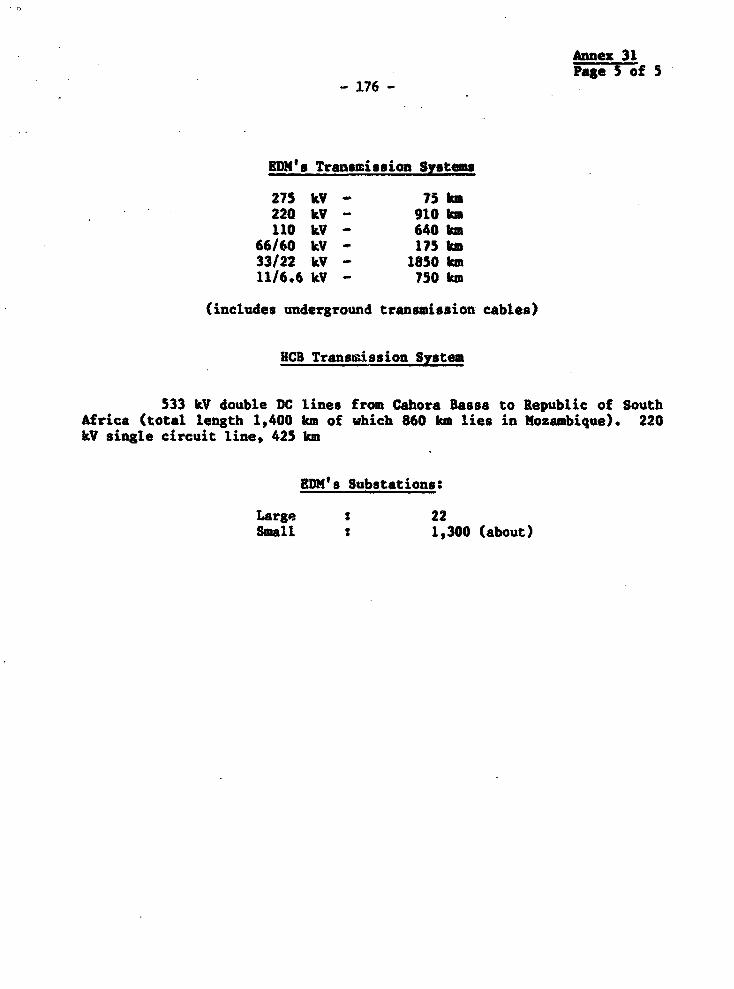
Annex 31Page 5 of 5
- 176 -
gM's Transmission Systems
275 kV - 75 km220 kV - 910 km110 kV - 640 km
66/60 kV - 175 ka33/22 kV - 1850 km11/6.6 kV - 750 km
(includes underground transmission cables)
HCB Transmission System
533 kV double DC lines from Cahora Bassa to Republic of SouthAfrica (total length 1,400 km of which 860 km lies in Mosambique). 220kV single circuit line, 425 km
WDM's Substations:
Large s 22small : 1,300 (about)
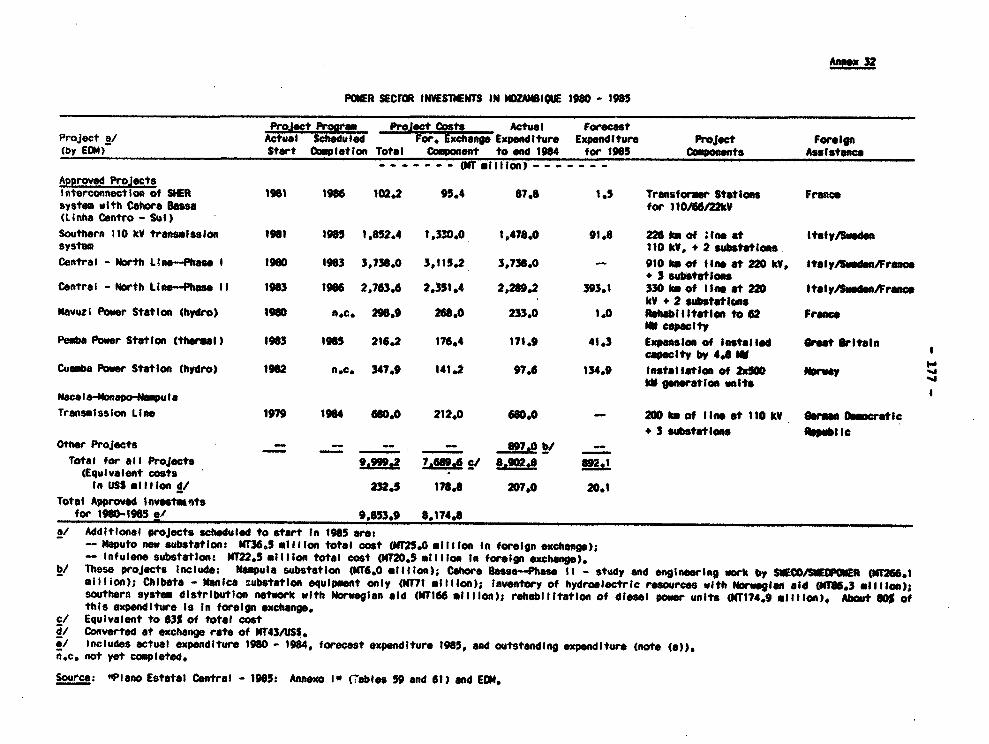
Annex 32
POSER SECrOR INVESTSEiTS IN 1ZZANSIQUE 1980 - 1985
PoetaProct Prram ProJoct Costs Actual ForecastProject a/ Actual Scheduled For* Exchange Expenditure Expenditure Project Foreign(by EOM) Start Completion Total Component to end 1984 for 1965 Componnts Assistonco
- - - - ~-- - T*illon)-Approved ProjectsInterconnection of SHER 1981 1986 102.2 95.4 87*8 1.5 Transformes Stations Francesystem with Cohora BoSee for 110J/660MkV(Linha Centro - Sul)Southern 110 kV transmission 1901 1985 1,852.4 1,330.0 1,478.0 91.8 226 km of Isne at Italy/Swedonsystem 110 kW, + 2 subs_ttiosCentral - North Llne-Phose I 1960 1963 3,730.0 3,115.2 3,736.0 -- 910 km of tine at 220 kV, Italy/SmodeniFrance
+ 3 substetlomsCentral - North LIlne-Phase 11 1983 1986 2,763.6 2,351.4 2,289.2 393.1 330 km of line at 220 ItaIy5wedsio)rIncF
kV + 2 substattonsNovuzi Power Station (hydro) 1980 n.c. 298.9 268.0 233.0 1.0 Rohobilltotlon to 62 Franro
Mo capacityPemba Power Station (th"emal) 1903 1968 216.2 176.4 171.9 41.3 Expansion of installed Gret Britain
caocity by 4.8 MCuamba Power Station (hydro) 1982 n.c. 347.9 141.2 97.6 134.9 Installation of 2x500 no rwy
KW _eation units,Naca lo-anapo-NbmpuoTraonsission Line 1979 1914 680.0 212.0 68.. - 200 km of lne at 110 kY Owsn Domocratic
+ 3 substatlons pubiCOther Projects - _ -- - b/ -
Total for all ProJects 9_9_9_ __.6_ _/ 8.90. anI(Equivalent costs 8-
in USS ml l ion d/ 232.5 178.8 207.0 20.1Total Approved lnv9s0tfnts
for 1960-1905 o1 9,853.9 ,$174.8
a/ Additional projects schoduled to start In 1985 are:- Moputo new substation: Mn36.5 milion total cost nfr25.0 million In forelgn exchango);- Infuleno substation: MT22.5 mlliIon total cost (NT2O.5 mlliton In forelign exchange).
b/ These projects Include: Nompula substation (MT6.0 *illion); Cahora Basso-Phese It - study and engineeoing work by SIEAO/SSEDPOWER 010266.1million); Chibata - Mnalca substatlon equlpment only (1T71 millon); Inventory of hydroelectric resources with Norweglan aid WM166.3 million),southern system distrlbution network with Norwegan aid (MT166 mIllion); rehabilitation of diesel power units 0NT174.9 million). About NS ofthis expendituro Is in foretgn exchange.
c/ Equivalent to 83S of total costd/ Converted at exchange rate of MT43/USS.e/ Includes actual expenditure 1980 - 984, forecast expenditure 1985, and outstanding expenditure (note (a)).n.c. not yet completed.
Source "Piano Estatai Central - 1985: Annexo I" (Tables 59 and 61) and EON.
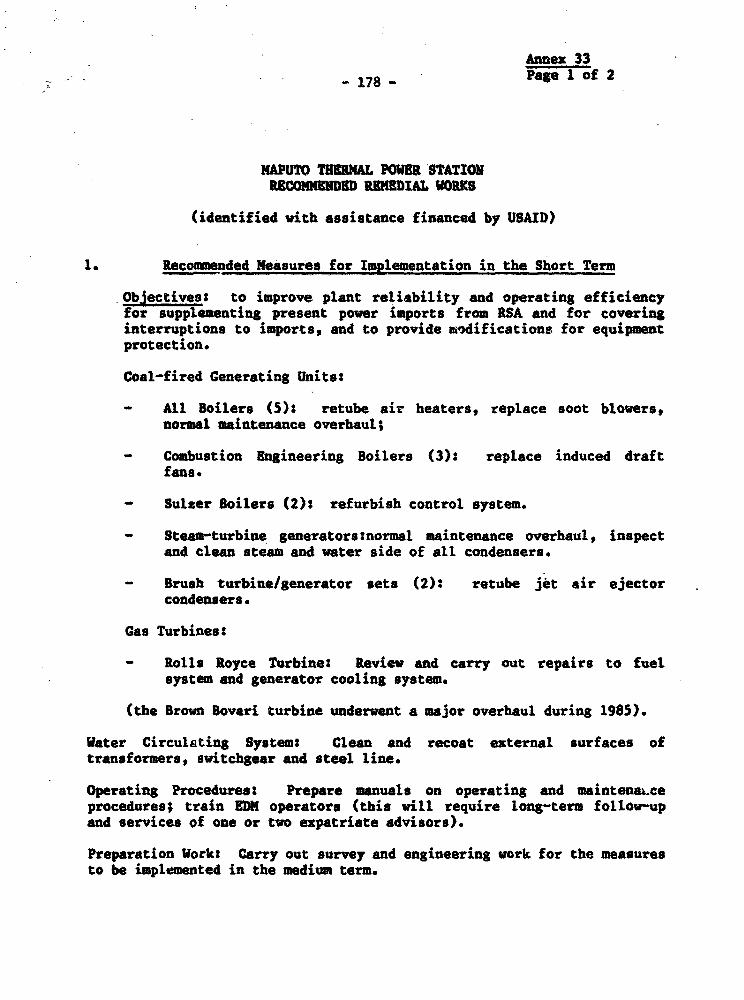
Annex 33
-178- Page 1 of 2
MAPUTO THERMAL POWER STATIONRECOMMENDED REMEDIAL WORKS
(identified with assistance financed by USAID)
1. Recoumended Measures for Implementation in the Short Term
Objectives: to improve plant reliability and operating efficiencyfor supplementing present power imports from RSA and for coveringinterruptions to imports, and to provide wodifications for equipmentprotection.
Coal-fired Generating Units:
- All Boilers (5): retube air heaters, replace soot blowers,normal maintenance overhaul;
- Combustion Engineering Boilers (3): replace induced draftfans.
- Sulzer Boilers (2): refurbish control system.
- Steam-turbine generators:normal maintenance overhaul, inspectand clean steam and water side of all condensers.
- Brush turbine/generator sets (2): retube jet air ejectorcondensers.
Gas Turbines:
- Rolls Royce Turbine: Review and carry out repairs to fuelsystem and generator cooling system.
(the Brown Bovari turbine underwent a major overhaul during 1985).
Water Circulating System: Clean and recoat external surfaces oftransformers, switchgear and steel line.
Operating Procedures: Prepare manuals on operating and maintenaLceprocedures; train EDM operators (this will require long-term follow-upand services of one or two expatriate advisors).
Preparation Work: Carry out survey and engineering work for the measuresto be implemented in the medium term.

Annex 33Page 2 of 2
- 179 -
2. Recomended Measures for Implementation in the Nedium Term
Objectivess to further improve plant reliability andefficiency. with cost effective measures that have lowerpriority/economic returns than the recommended short termmeasures and/or require long lead times for preparation andsupply of materials.
Coal-fired Generating Units:
- All boilers (M): retube the tubular air heaters.
- Combustion Engineering boilers (3): replace superheaters,spreader stokers, gays panel and instrumentation, travelinggrates.
- Ash handling system (all boilers): review and upgrade.
Substation: Purchase and install one 60/30 kV of 24 MW capacitytransformer at the Maputo water works substation.
Water Circulating System: repair traveling screens, replace the concretecirculating water line, repair valves in the Power House.
Instruments and Controls: survey I & C equipment to establish stationrequirements in light of modern standards, install control roomindicators and alarm systems.
Valves: inspect and repair isolation and control valves.
3. Measures for Consideration for Future Work at the Station
Objectives$ to enable the plant to be operated continually atnear to full capacity if such duty accords with the least-costmethod of meeting future demand in the Maputo region.
Coal-fired Generating Units:
- Ash handling system (all boilers): replace equipment.
- Steam turbine generators: carry out survey of plugged tubes ineach condenser.
Water Circulating System: redesign or replace traveling screens.
Water Treatment Plant: Engineer and increase eapacity of plant (ifoperated at high capacity utilisation).
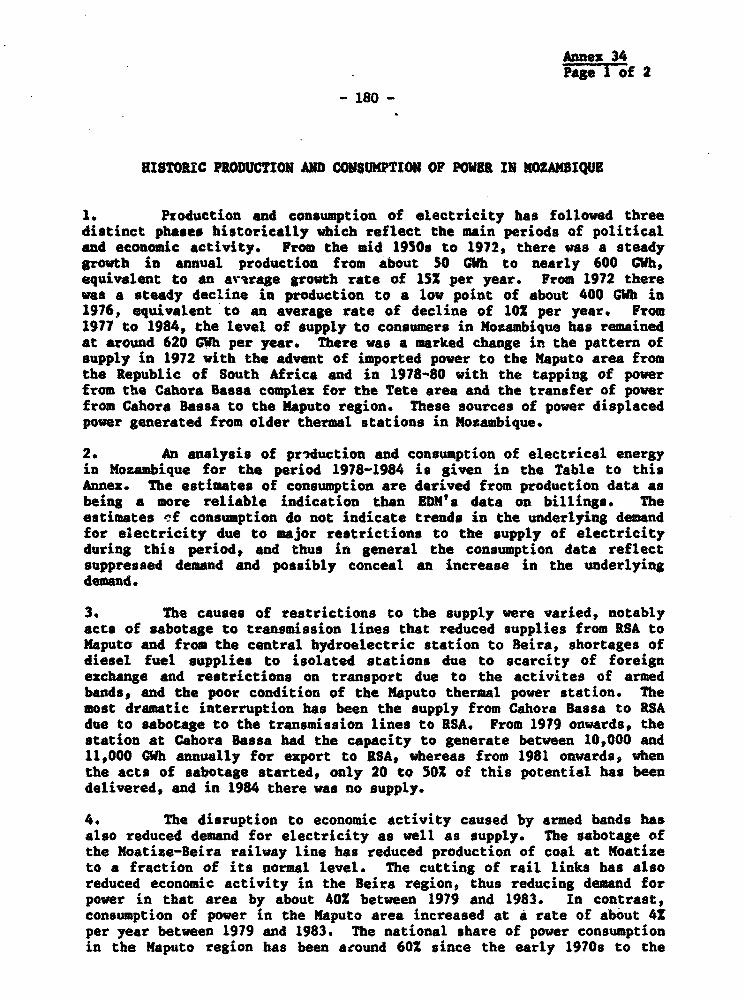
Annex 34PaeI of 2
180 -
HISTORIC PRODUCTION AND CONSUMPTION OF POWER IN MOZMASIQUE
1. Production and consumption of electricity has followed threedistinct phases historically Which reflect the main periods of politicaland economic activity. From the mid 19SO to 1972, there was a steadygrowth in annual production from about 50 GWh to nearly 600 GWh,equivalent to an artrage growth rate of 152 per year. From 1972 therewas a steady decline in production to a low point of about 400 6Wh in1976, equivalent to an average rate of decline of 1OX per year. From1977 to 1984, the level of supply to consumers in Mozambique has remainedat around 620 GWh per year. There was a marked change in the pattern ofsupply in 1972 with the advent of imported power to the Maputo area fromthe Republic of South Africa and in 1978-80 with the tapping of powerfrom the Cahora Bassa complex for the Tete area and the transfer of powerfrom Cahora Bassa to the Maputo region. These sources of power displacedpower generated from older thermal stations in Mozambique.
2. An analysis of priduction and consumption of electrical energyin Mozambique for the period 1978-1984 is given in the Table to thisAnnex. The estimates of consumption are derived from production data asbeing a more reliable indication than IDN's data on billings. Theestimates ef consumption do not indicate trends in the underlying demandfor electricity due to major restrictions to the supply of electricityduring this period, and thus in general the consumption data reflectsuppressed demand and possibly conceal an increase in the underlyingdemand.
3. The causes of restrictions to the supply were varied, notablyacts of sabotage to transmission lines that reduced supplies from RSA toMaputo and from the central hydroelectric station to Beira, shortages ofdiesel fuel supplies to isolated stations due to scarcity of foreignexchange and restrictions on transport due to the activites of armedbands, and the poor condition of the Maputo thermal power station. Themost dramatic interruption has been the supply from Cahora Bassa to RSAdue to sabotage to the transmission lines to RSA. From 1979 onwards, thestation at Cahora Bassa had the capacity to generate between 10,000 and11,000 GWh annually for export to RSA, whereas from 1981 onwards, whenthe acts of sabotage started, only 20 to 502 of this potential has beendelivered, and in 1984 there was no supply.
4. The disruption to economic activity caused by armed bands hasalso reduced demand for electricity as well as supply. The sabotage ofthe Moatise-Beira railway line has reduced production of coal at Moatizeto a fraction of its normal level. The cutting of rail links has alsoreduced economic activity in the Beira region, thus reducing demand forpower in that area by about 402 between 1979 and 1983. In contrast,consumption of power in the Maputo area increased at A rate of about 4Xper year between 1979 and 1983. The national share of power consumptionin the Maputo region has been aeound 60% since the early 1970. to the
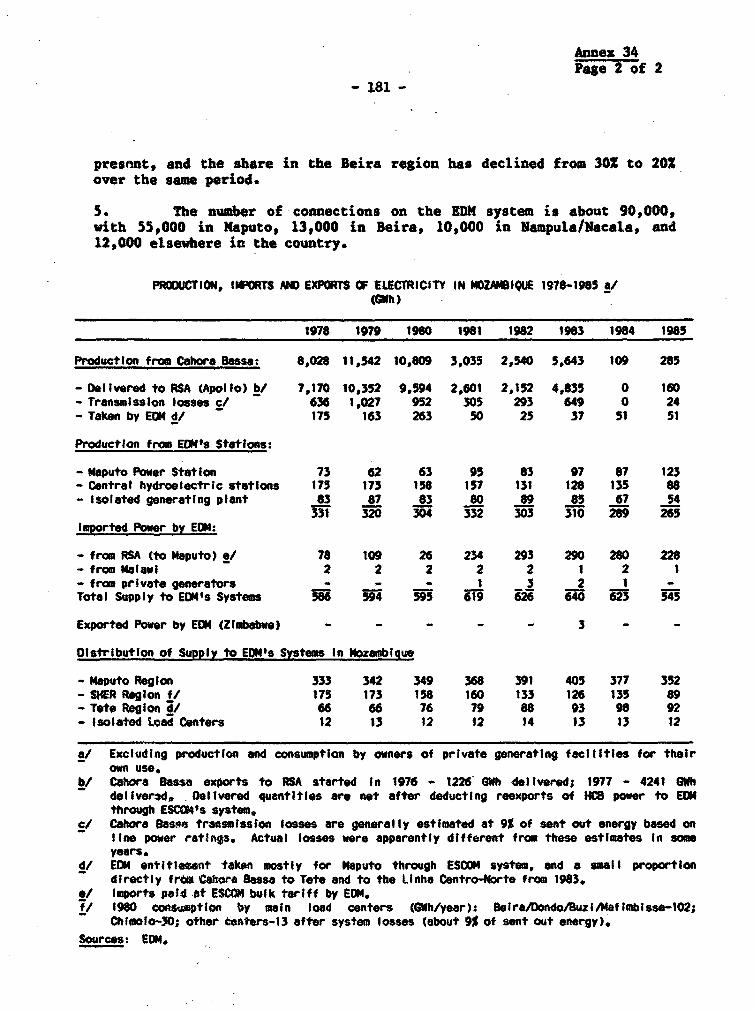
Annex 34Page 2 of 2
-181-
present, and the share in the Beira region has declined from 30S to 201over the same period.
5. The number of connections on the EDM system is about 90,000,with 55,000 in Maputo, 13,000 in Beira, 10,000 in Nampula/Nacala, and12,000 elsewhere in the country.
PROCUCTION, IWOMRS AND EXPORtS OF ELECTRICITY IN NOZAMBIQUE 1978-1985 a/
1978 1979 1980 1961 1982 1983 1984 1985
Production from Cahore Bessa: 8,028 11,542 10,809 3,035 2,540 5,643 109 285
- Delivered to RSA (Apollo) b/ 7,170 10,352 9,594 2,601 2,152 4,835 0 160- Transmission losses cZ 636 1,027 952 305 293 649 0 24- Taken by EOM d/ 175 163 263 50 25 37 51 51
Production from EDMIs Stations:
- Maputo Power Station 73 62 63 95 83 97 87 123- Central hydroelectric stations 175 173 158 157 131 128 135 88- Isolated generating plant 83 87 83 80 89 es 67 54
331 320 304 332 303 310 269 265Imported Power by EON:
- from RSA (to Maputo) e/ 78 109 26 234 293 290 280 228- from Malawi 2 2 2 2 2 1 2 1- from private generators - - - 1 3 2 1 -Total Supply to EE04's Systems S9 WI 61 621 I7 Wi3 Wi5
Exported Power by EDN (Zimbabwe) - - - - 3 - -
Distribution of Supply to EDMts Systems In Mozembigue
- Mbputo Region 333 342 349 368 391 405 377 352- SHER Region fI 175 173 158 160 133 126 135 89- Teto Reglon a/ 66 66 76 79 68 93 98 92- Isolated Lead Centers 12 13 12 12 14 13 13 12
a/ Excluding production and consumption by owners of private generating facilities for theirown use.
b/ Cahora Bassa exports to RSA started In 1976 - 1226 GWh delivered; 1977 - 4241 GWhdeliverd, Delivered quantities are net after deducting reexports of HC3 power to EOMthrough ESC4k#s system.
ct Cahora Ssse transmtssion losses are generally estimated at 9% of sent out energy based online power ratings. Actual losses were apparently different from these estimates In someyears.
d/ EOM entitlesent takon mostly for Maputo through ESCOM system, and a small proportiondirectly from Clora Ebssa to Tote and to the Linha Centro-Norte from 1983.
*J Imports peaW at ESCOM bulk tariff by EOM.f/ 1980 consu*ption by main load centers (GWh/year): SeiraA0ondo/BuziRMafimbisse-102;
Chlolo-30; other ceftaers-13 after system losses (about 95 of sent out energy).
Sources: EDN.
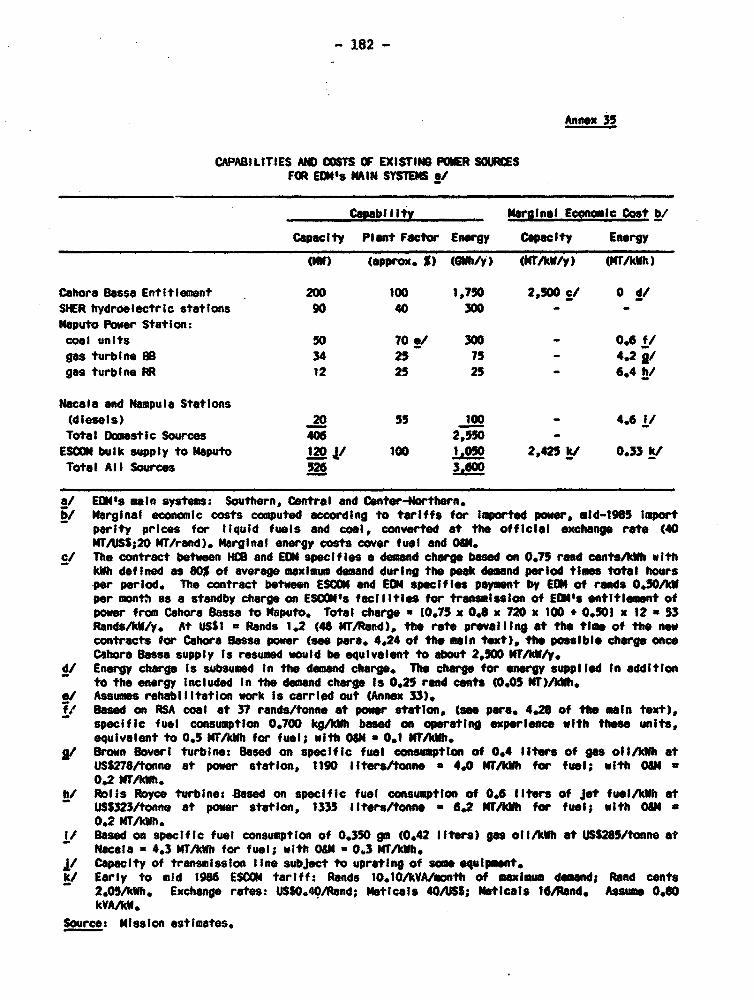
- 182 -
Annex 35
CAPABILITIES AND COSTS OF EXISTING FOER SOURS6SFOR EDO's MAIN SYSIEMS a/
CapabilIty MargInal Economic Cost b/
Capacity Plant Factor Enorgy Capacity Energy
OM) (approx. %) (Wh/y) (CTA/k/y) (NT/kAh)
Cahora Basse Entitlement 200 100 1,750 2,500 c/ 0 d/SHER tydroeiectric stations 90 40 300 - -Maputo Power Station:coal units 50 70 ./ 300 - 0.6 f/gas turbine EB 34 25 75 - 4.2 g/gas turbine RR 12 25 25 - 6.4 hI
Nacala and Nbmpula Stations(diesels) 20 55 100 - 4.6 I/Total Dowistic Sources 406 2,550 -ESON bulk supply to Maputo 120 I/ 100 l,OSO 2,425 k/ 0.33 k/Total All Sources 526 3.600
S/ EOMNs main systems: Southern, Central and Center-Northern.b/ Marginal economic costs computed according to tariffs for Imported power, mid-1985 Import
parity prices for liquid fuels and coal, converted at the official exchange rate (40MT/USS;20 Mr/rand). Marginal energy costs cover fuel and OAN.
c/ The contract betwoen HaBC and EON specif les a demand charge based on 0.75 rand conts/kWh wIthkWh defined as 80% of average maximum demand during the peak demand perlod times total hours-per period. The contract between ESCON and EON specifles payment by EOW of rands 0.50/kWper month as a standby charge on ESCOM's faciIlties for transmission of EON's entitlement ofpower from Cohors Bassa to Maputo. Total charge a 10.75 x 0.8 x 720 x 100 + 0.501 x 12 a 53Rands/kW/y. At USS1 = Rands 1.2 (48 MT/Rand), the rate prevealing at the time of the newcontracts for Cahora Bessa power (see para. 4.24 of the main text), the possible charge onceCahora Basso supply Is resumed would be equivalent to about 2,500 NT/kW/y.
d/ Energy charge Is subsumed In the demand charge. The charge fo energy suppl led In additionto the energy Included In the demand charge Is 0.25 rand cents (0.05 NT)/kWh.
*I Assumes rehabilitation work Is carried out (Annox 33).f/ Based on RSA coal at 37 rands/tonne at power station, (see para. 4.28 of the main text),
specific fuel consumption 0.700 kg/kWh based an operating experience with these units,equivalent to 0.5 MTAkWh for fuel; with 04M a O. MT/kWh.
g/ Brown Govern turbine: Based on specific fuel consumption of 0.4 liters of gas ol/AkWh atUSS278/tonne at power station, 1190 ilters/tonne a 4.0 MT/kWh for fuel; with 0W *
0,2 MT/kWh.h/ Rolls Royce turbines Based on specific fuel consutlon of 0.6 lites of Jet fuel/kWh at
US3323/tonno at power station, 1335 liters/tonne a 6.2 KT/kWh for fuel; with OI a0.2 MT/kWh.
I/ Based on specific fuel consumption of 0.350 go (0.42 llters) gas olI/kh at UJSS25/tonne atNacala a 4.3 MTkAWh for fuel; with 04 u 0.3 MT/kWh.
I/ Capacity of transmission IIne subject to uprating of som equipet.k/ Early to mid 1986 ESCON tariff: Rands 10.10/kVA/month of mailwm demand; Rand cents
2.05/kWh. Exchange rates: USSO.4JO/Rnd; Mtlicals 40AJSS; Meoticais 16Rarnd. Assume 0.80kVA/kA.
Source: mission estimates.
- 183 -
Annex 36
EDM'S TARIFF - ASSESSMENT MISSION'S COMMN NS
1. The proposed tariff structure and levels are unif.,rm across thecountry and do not reflect the wide differences in costs between theinterconnected system and the isolated systems. Energy costs are far lesssignificant on the interconnected systems supplied from hydroelectric plantsor RSCOM's system relative to capacity (demand) costs than is the case inisolated systems supplied from diesel generators. The tariff structureshould treat consumers served from interconnected systems as a differentcategory than consumers supplied from isolated systems.
2. The southern system will be constrained from meeting increases indemand by limitations on supply capacity to meet peak demand (MW) ratherthan energy demand (kWh), and hence there is a case for introducingtime-of-day rates for the larger consumers to signal the additional capacityand energy costs incurred in meeting increases to system peak demand.
3. The proposed tariff for domestic consumers is needlessly complexby being structured on eleven grades of load limiters which involve the useof 18 different ratings of meters. A more appropriate structure would bebased on an energy charge that incorporates a maximum demand charge.However, load limiters could be used appropriately for the category ofconsumers with low rates of consumption to avoid the cost of reading metersand to provide a subsidized tariff rate for the poorest category ofconsumers.
4. The differences in energy rates between the different supplyvoltages should be reduced to reflect the order of difference in systemenergy losses between the supply voltage levels.
5. There should be no difference in energy charges between theGeneral Tariff and Domestic Tariff categories since the costs of supply aresimilar.
6. The unit demand charges at higher supply voltage levels should belower than the charges for lower voltage levels instead of higher asproposed, to reflect the relative costs of meeting increases in powerdemand.
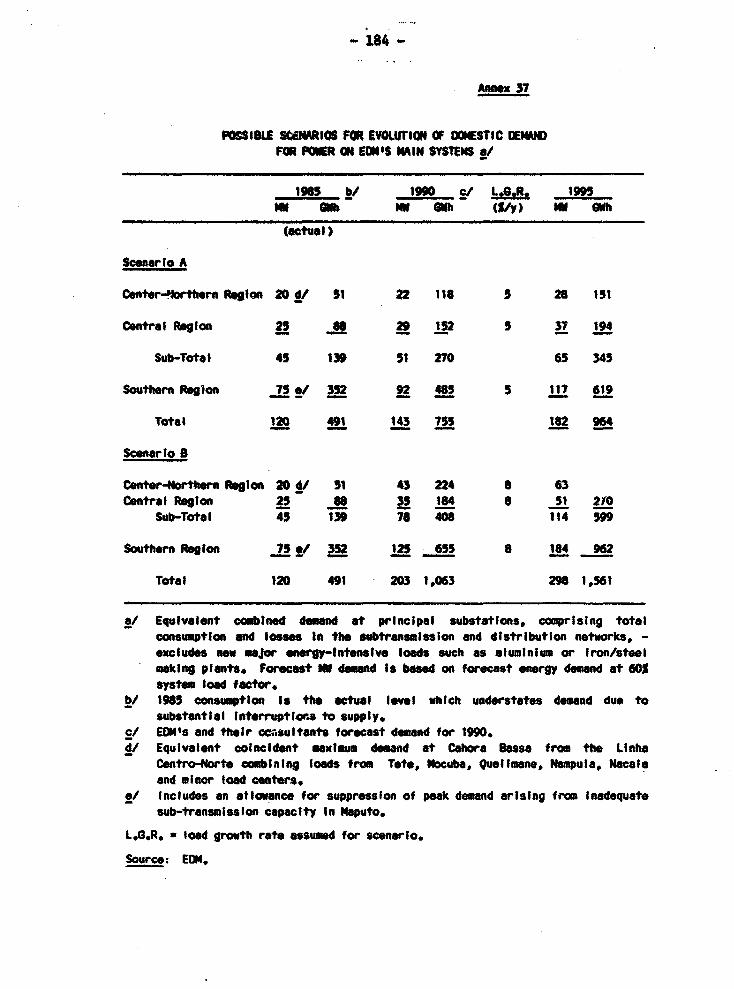
- 184 -
Annex 37
POCSI9EL SWWtRtOS FOR EVOLUTION Of OFIESTIC ODMANDFOR POSER ON ECu'S MAIN SYSTEMS o/
1965 b/ 1990 c/ L.6.R. 1995MW GoIS 6 ($lY) MW OWh
(actual)
Scenarto A
C.nt.r-Nworthrn Reglon 20 d/ 51 22 118 5 28 151
Central Region 25 Us 29 152 5 37 194
Sub-Total 45 139 51 270 65 345
Southern Region 75 4/ 352 92 U5 5 117 619
Total 120 491 143 755 182 964
Scenearo B
Center-Northern Rbgion 20 4/ 51 43 224 8 63Central Regoln 25 Us 35 184 8 51 2ro
Sub-Total 45 139 78 408 114 59
Southern Region is */ 352 125 655 8 184 962
Total 120 491 203 1,063 298 1,561
a/ Equivalent oo binad demand at principal substations, comprising totalconsuption and loss.s In th subtranminssion and distribution networks, -excludes new major energy-latonsive loads such as aluminium or iron/steelmaking plants. Forecast IS demand Is based on forecast energy demand at 605system load factor.
b/ 1985 consumption Is the actual level which understates demand due tosubstantial Interruptions to supply.
c/ EDN's and their ccasultants forecast demand for 1990.i/ Equivalent colncident maxmum demand at Cahoro BEssa from the Linho
Centro-Norte combining loads from Tote, Nocuba, Quelimane, Nampula, NMcalaand minor load ceoters.
e/ Includes an oallowance for suppression of peak demand arising from Inadequatesub-transmission capacity In Maputo.
L.G.R. a lood growth rate assumed for scenario.
Source: EON.
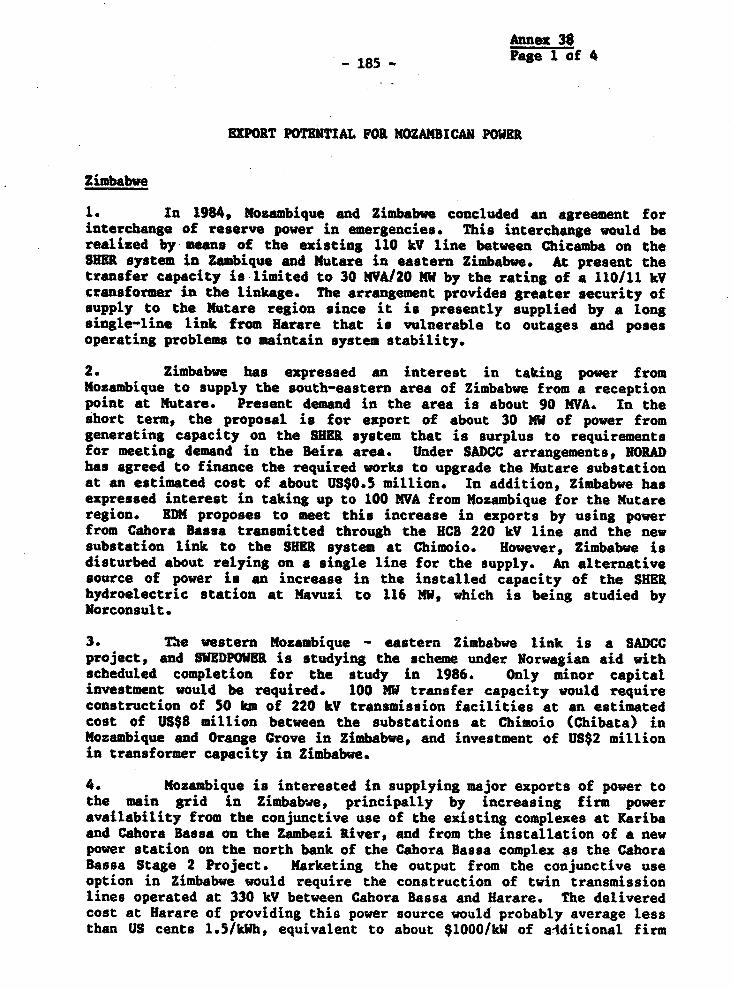
Annex 38
-185- Page I of 4
8XPORT POTENTIAL FOR XOZAMBICAN POWER
Zimbabwe
1. In 1984, Mozambique and Zimbabwe concluded an agreement forinterchange of reserve power in emergencies. This interch"age would berealized by means of the existing 110 kV line between Chicamba on theSEMR system in Zambique and Nutare in eastern Zimbabwe. At present thetransfer capacity is limited to 30 MVA/20 MS by the rating of a 110/11 kVcransformer in the linkage. The arrangement provides greater security ofsupply to the Mutare region since it is presently supplied by a longsingle-line link from Harare that is vulnerable to outages and posesoperating problems to maintain system stability.
2. Zimbabwe has expressed an interest in taking power fromMozambique to supply the south-eastern area of Zimbabwe from a receptionpoint at Nutare. Present demand in the area is about 90 NWA. In theshort term, the proposal is for export of about 30 MW of power fromgenerating capacity on the SURM system that is surplus to requirementsfor meeting demand in the Beira area. Under SADCC arrangements, NORADhas agreed to finance the required works to upgrade the Mutare substationat an estimated cost of about US$0.5 million. In addition, Zimbabwe hasexpressed interest in taking up to 100 WVA from Mozambique for the Nutareregion. EDM proposes to meet this increase in exports by using powerfrom Cahora Bassa transmitted through the HCB 220 kV line and the newsubstation link to the SHER system at Chimoio. However, Zimbabwe isdisturbed about relying on a single line for the supply. An alternativesource of power is an increase in the installed capacity of the SHERhydroelectric station at Navuzi to 116 MW, which is being studied byNorconsult.
3. The western Mozambique - eastern Zimbabwe link is a SADCCproject, and SWEDPOWER is studying the scheme under Norwagian aid withscheduled completion for the study in 1986. Only minor capitalinvestment would be required. 100 MW transfer capacity would requireconstruction of 50 km of 220 kV transmission facilities at an estimatedcost of US$8 million between the substations at Chimoio (Chibata) inMozambique and Orange Grove in Zimbabwe, and investment of US$2 millionin transformer capacity in Zimbabwe.
4. Mozambique is interested in supplying major exports of power tothe main grid in Zimbabwe, principally by increasing firm poweravailability from the conjunctive use of the existing complexes at Karibaand Cahora Bassa on the Zambezi River, and from the installation of a newpower station on the north bank of the Cahora Bassa complex as the CahoraBassa Stage 2 Project. Marketing the output from the conjunctive useoption in Zimbabwe would require the construction of twin transmissionlines operated at 330 kV between Cahora Bassa and Harare. The deliveredcost at Harare of providing this power source would probably average lessthan US cents 1.5/kWh, equivalent to about $1000/kW of additional firm
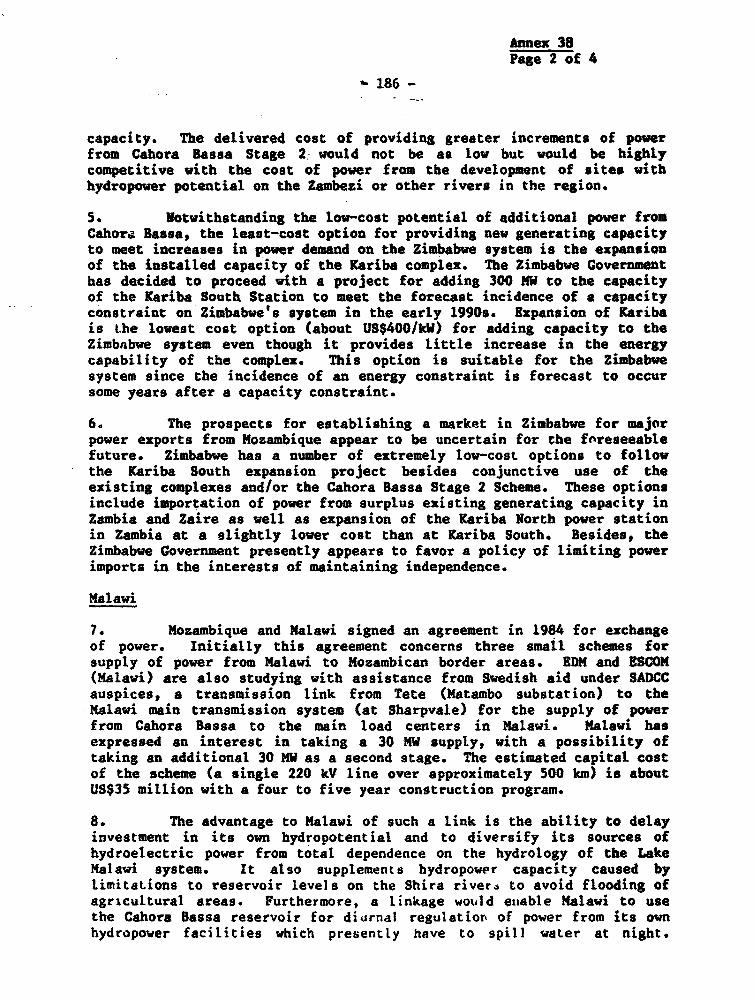
Annex 38Page 2 of 4
186 -
capacity. The delivered cost of providing greater increments of powerfrom Cahora Bassa Stage 2- would not be as low but would be highlycompetitive with the cost of power from the development of sites withhydropower potential on the Zambezi or other rivers in the region.
S. Notwithstanding the low-cost potential of additional power fromCahora Bassa, the least-cost option for providing new generating capacityto meet increases in power demand on the Zimbabwe system is the expansionof the installed capacity of the Kariba complex. The Zimbabwe Governmenthas decided to proceed with a project for adding 300 MW to the capacityof the Kariba South Station to meet the forecast incidence of a capacityconstraint on Zimbabwe's system in the early 1990s. Expansion of Karibais tlhe lowest cost option (about US$400/kW) for adding capacity to theZimbabwe system even though it provides little increase in the energycapability of the complex. This option is suitable for the Zimbabwesystem since the incidence of an energy constraint is forecast to occursome years after a capacity constraint.
6. The prospects for establishing a market in Zimbabwe for majorpower exports from Mozambique appear to be uncertain for the foreseeablefuture. Zimbabwe has a number of extremely low-cost options to followthe Kariba South expansion project besides conjunctive use of theexisting complexes and/or the Cahora Bassa Stage 2 Scheme. These optionsinclude importation of power from surplus existing generating capacity inZambia and Zaire as well as expansion of the Kariba North power stationin Zambia at a slightly lower cost than at Kariba South. Besides, theZimbabwe Government presently appears to favor a policy of limiting powerimports in the interests of maintaining independence.
Malawi
7. Mozambique and Malawi signed an agreement in 1984 for exchangeof power. Initially this agreement concerns three small schemes forsupply of power from Malawi to Mozambican border areas. EDM and ESCON(Malawi) are also studying with assistance from Swedish aid under SADCCauspices, a transmission link from Tete (Matambo substation) to theMalawi main transmission system (at Sharpvale) for the supply of powerfrom Cahora Bassa to the main load centers in Malawi. Malawi hasexpressed an interest in taking a 30 MW supply, with a possibility oftaking an additional 30 MW as a second stage. The estimated capital costof the scheme (a single 220 kV line over approximately 500 km) is aboutUS$35 million with a four to five year construction program.
8. The advantage to Malawi of such a link is the ability to delayinvestment in its own hydropotential and to diversify its sources ofhydroelectric power from total dependence on the hydrology of the LakeMalawi system. It also supplements hydropower capacity caused bylimitaLions to reservoir levels on the Shira river4 to avoid flooding ofagriLcultural areas. Furthermore, a linkage would etiable Malawi to usethe Cahors Bassa reservoir for diurnal regulatiort of power from its ownhydropower facilities which presently have to spill water at night.
Annex 38
- 187 - Page 3 of 4
Under such an arrangement, Halawi would export power to Hozambique atnight, and Mozambique would return an equivalent amount of power duringthe day. The arrangement would also allow Malawi to reduce the amount ofits capacity held an spinning reserve. This scheme would probably onlyhave an economic attraction for Mozambique while a substantial excess ofcapacity existed unless EDM could come to an arrangement with HCB for useof additional capacity to EDM's entitlement at Cahora Bassa for thispurpose.
9. An extension of this line to join the new Linha Centro-Norte inMozambique on the other side of Malawi, possibly at Alto Molocu& with asupply to Guru& en route, should also be evaluated as part of thescheme. Consideration should be given to implementation eithersimultaneously or subsequently to the line to Malawi. Such an extensionwould reinforce and increase the reliability of supply to theNampula/lacala region and prospective mining loads in Niasa province.The extension would also provide a transmission ring to serve future keyeconomic power users in Zambezia province. It would have to be evaluatedagainst a second 220 kV circuit between Caia and Alto Molocue as thealternatives for improving the reliability of supply. The justificationfor this extension rests primarily on the rate of development of newindustrial and agroindustsrial plants, which at present is subject togreat uncertainty.
Republic of South Africa
10. The ESCO( system is the only power market in Southern Africawhich has the capacity to absorb a large proportion of the output of theproposed Cahora Bassa Stage 2 project (1200 MW). ESCOM stated to themission that RSA would be interested in principle in taking more firmpower from Cshora Bassa in the long term subject to the prospect of anadequate reliability of supply. ESBOM follows a policy for future importcontracts of limiting the supply from any one source of power external toRSA to less than 42 of the maximum demand on ESCOM's system. Under thispolicy, it would require a growth in demand of nearly 100l before ESCOMcould take on a new firm supply of power from an external source,equivalent to annual growth of 52 over 15 years.
11. The selection of 42 as the limiting proportion is related tothe size of the largest coal-fired units in ESCOM's system (750-800MW). Each of the two existing transmission lines from Cahora Bassa isconsidered to be a source of half the maximum firm power that iscontracted from Cahora Bassa Stage 1, presently equal to 725 MW perline. Thus,, 8SCOM has to keep one large coal unit on spinning reserve tocover the firm supply on each line from Cahora Bassa. The capacity ofthe two lines could be increased to transmit the additional power fromCahora Bassa Stage 2 with expansion of ,he capacities of the terminalconnector stations. This arrangement would require ESCOM to put onadditional coal units as spinning reserve. The alternative would be toinstall one or two more lines to keep the firm power provided by eachline to within the capacity of ESCOM's largest generating unis that are

Annex 38
- 188 - Page 4 of 4
in service. Detailed system studies and a comparison of the economiccosts of these alternatives would be required to determine the optimalconfiguration and hence, the total investment required for developingCahora Bassa Stage 2 for power exports to RSA.
Swaziland
12. The interlinking of Mozambique's southern system with theSwasilantd power system is presently being studied under CIDA assistanceas a SADCC project. One of Swazilan1's immediate interests is to obtainpower during peak periods from the Waputo Thermal Station to reduce thedemand charge for ESCOM's bulk supply to Swaziland. Presently Swazilandgenerates power from local hydroelectric facilities and imports power onbulk supply terms from ESCOM. Swaziland faces the issue of defining thenext source of generation capacity under its least cost power developmentprogram. The options available are thermal units fueled from local coalresources, additional transmission capacity and further reliance onESCOM, and importation from Mozambique. A further option forconsideration is to displace the ESCON supply with power from Mozambiqueto reap economies of scale on investment in new facilities for supplyingpower from Mozambique. The study will evaluate the option of exportingpower to meet growth in demand in Swaziland from Mozambique's southernregion. The study will also evaluate other options for the intertie,including the importation of power to Maputo from new coal-firedgenerating units in Swaziland.
Annex 39Page 1 of 3
- 189 -
PROJECTED AVAILABILITY OP POWER FOR EXPORT FROMEXISTING SURPLUS AND LOW-COST SOURCES
1. Presently the total availability of power to EDM's three meintransmission systems greatly exceeds the demands in Mozambique on thesesystems, and a strategy is required for taking advantage of thissurplus. The main domestic option is to expand household use ofelectricity in urban areas to reduce the pressure on renewable energyresources (Chapter 2), and in rural areas where electrical infrastructurealready exists. This option would be a gradual and capital-intensivemeans of increasing the demand. The only available option for bringingabout quickly a substantial increase in demand is to promote exports.The present prices of exported power in the Southern Africa Region arelow and exports from Mosambique would have to be competitive with thesesources in the future. EDM needs to clarify its strategy for exportpromotion. It should assess the implications of long-term comnitmentsfor export in the context of the possible availability of surpluslow-cost power in the country in which the three Moxambique systemsshould be treated as an integrated system for purposes of formulating astrategy for exports. All the components of demand except for thesouthern system are directly linked to the Cahora Bassa station and theSHER stations through EDM's transmission systems. EDM's southern systemis indirectly linked to Cahora Bassa through the arrangement with ESCOMand HCB. This assessment will determine when EDM has to use higher costpower sources, such as thermrl generation units or new hydroelectricinvestments, to meet increases in domestic demand and hence, the economiccosts to Mozambique of power exports.
2. The strategy for promoting exports, which would be implementedin terms of contracted quantity, period and tariff, should be formulatedin the light of this assessment. In a situation of great uncertaintyabout the duration of capacity surpluses due to the unpredictability offuture demand, the preferred strategy is to promote short-term exportcontracts or to include provisions for periodic reviews of key parametersin long-term contracts. This strategy would minimize the risk thatMozambique would obtain negative benefits from exports, but Mozambiquemay be obliged to agree to a low tariff as a trade-off for thisprotection. In a situation of reasonable certainty about the duration ofsurpluses, the preferred strategy would be to maximize benefits fromexports in terms of higher tariffs and longer contract periods.
3. The mission has sketched balances between supply and demand togive an indication of the rate at which surplus generating capacity,particularly Mozambique's present entitlement to power from Cahora Bassa,could become fully committed. The projected balances are based on thedemand scenarios in Annex 4.7 and the available hydroelectric supply toEDMts systems (Annex 4.4), and they are summarized in the Table to thisAnnex. It is emphasized that these projections are only indicative toillustrate the recommended approach. Linkages between EDM's systems and
Annex 39Page 2 of 3
- 190 -
Zimbabwe, Malawi and Swaziland are being studied under SADCC auspices(Annex 4.8).
4. Under the projected demand scenarios, Mozambique's availablecapacity for exporting power from hydroelectric sources would be betweenabout 150 MW and 80 MW in 1990, and it would decline to between 100 MWand zero MW by 1995. There would be some, but not critical, restrictionsimposed by system configurations on the flexibility for allocatingavailable power between the neighboring power systems. After 1990, peakdemands on EDMN' southern system would have to be met from thermal unitsin the Maputo Central Power Station. Uith reference to EDM's proposalsfor exports (Annex 4.8), projected exports of 30 KW to Zimbabwe and 30 MWto Malawi and/or Swaziland could probably be maintained fromhydroelectric sources to about 1995. EDM would have to be able tonegotiate a larger entitlement to power from Cahora Bassa to fulfill amuch larger export commitment than 30 MW beyond the mid 1990s. Apotentially advantageous arrangement to both countries that requiresvirtually no incremental investment to provide a long-term low-costsupply of 100 NW to Eastern Zimbabwe would be to supply some of theadditional power available from conjuctive use of the Kariba and CahoraBassa complexes to Eastern Zimbabwe through the Mozambican transmissionsystem. The mission recommends that these --tions, together with othersthat might become apparent from the proposed global approach to systemplanning, be evaluated as part of power system planning and exportpromotion in Mozambique.

Anne: 39Page 3 of 3
191 -
INDICATIVE AVAILABILITY OF POWER FOR EXPORT FROMHWYCROELCTRIC FACILITIES, I9M0 AND 1995 a/
tMW) 6/
Scenario A Scenario B1990 1995 1990 1995
Mozambique's entitlement to Cahtora Bssa: 200 200 200 200Serves projected demand on - Central-Worth System 22 28 43 63
- Southern System cf 92 117 d/ 125 184 d/Available for Expot to Zimbabwe, Mulawi efand Swaziland f/ 86 55 32 -47
Capability of SHER Stations: 90 90 90 90Serves projected demand on Central Systam 29 37 35 51Available for Export to Zimbabwe and Malawi I/ 61 53 55 39
Maximm Available for Export hf- to Zimbabwe, Malawi and/or Swaziland 147 108 77 NIL- to NaIlawI and Swaz land wIth 30 MW exported
to Zimbabwe 117 78 47 NIL
a/ Based on existing Mozambican hydroelectric power capability only (Annex 35) and EDN'spower demand projections (Annex 37).
b/ Balance for energy Is not Included since energy constraints would occur substantiallylater than capacity constraints due mainly to the high plant factor of the CohoraBassa Installation.
c/ Limitation to supply of Cohora Bass. power to Maputo Is the capacity of thetransmission lIne from RSA to Maputo (120 MW). Some investments In line equlpment andsub-transmission system would be required to upgrade the linkage to Its full capacity.
I/ The projected demand of the Southern system Is greater In 1995 than the capacity ofilne from RSA to transmit power from Cahor Basae. The balance of demond (6 MW InScenario A, 42 MW In Scenario B) would be met from Matuto Central Power Station -could not be from ESCOM since transmission caparity Is already fully utilized.A new 220 kV transmission link would have to be constructed to supply Malawi fromCahora Bmss. This option Is presently being studied as a SADCC project (Annex 39).
f/ Exports to Swaziland require construction of a transmission link wit" Maputo that IsIndependent of the existing RSA/Waputo linkage. This option Is a SADOC project(Annex 39).
g/ Assuming that the Llnha Centro-Sul could be equipped to transmit power from SHERstations northwards to supply the Linha Centro-Nworte, thus allowing Cahora oassa powerto be diverted to Molrtl, If necessary.
h/ In principle, there should not be an economic Incentive for M*zambique to lmport fromESCOO to EDN's Southern system to enable Mozambique to export more hydropower toZimbabwe or Swaziland, since the power systems In both of these countrles also lmportbulk power from ESCOM, In practice, this possibillty depends on the relative levelsof export tariffs from Mozambique and RSA.
Source: Mission.Mate: The projected total ovaldolliity of power for export Is higher than shown on this
page since Mozambique also has substantlal thermal and Imported sources of power.
Anner 40Page 1 of 6
- 192 -
PROPOSED SMALL HYDROELECTRIC PROJECTS IN SOUTHERN MOZAMBIQUE
1. Government of Mozambique aims to reduce Mozambique's dependenceon RSA for power supplies to EDM's southern region. RNM's consultants,Norconsult, carried out under Norwegian aid in 1983 and 1984 a study ofthe potential hydropower developments in the Incomati, Umbeluzi andLimpopo river basins. The principoal objective of these schemes would beto supply the Maputo region through EDM's 110 kV regional transmissionnetwork, but they would also serve local agricultural demand for power.The main schemes evaluated were as follows:
Incomati liver Basin:- Corumana Irrigation Dam on the Sabie River.- Moamba Major Multipurpose Scheme on the Incomati River.
Umbeluzi River Basin:- Pequenos Libombos Multipurpose Project on the Umbelulzi
River.
Limpopo River Basin:- Massingir Multipurpose Dam on the Elefantes River.- Macarretane Lam on the Limpopo River.
2. The dams at Corumana and Pequenos Libombos are presently underconstruction, the Moamba Major project is in the planning stage, and theMassingir and Macarretane Dams have been constructed. The main objectiveof the Pequenos Libombos project is to improve the supply of drinkingwater to Maputo with irrigation as a secondary objective. A hydropowerinstallation would be small and intended only to improve the security ofpower supply to the water pumping and treatment works. The preliminaryevaluation of the project by Norconsult shows that a lower cost optionfor the intended role of the project would be diesel units. All theother dams serve or will serve irrigation projects. Any hydropowerdevelopment would take a lower priority than irrigation on demand forwater. Flood control and raising the level of seasonal low flows inrivers to benefit agricultural activities are also objectives for theseprojects.
3. The main characteristics of the small hydropwer cts aresummarized in the Table below.
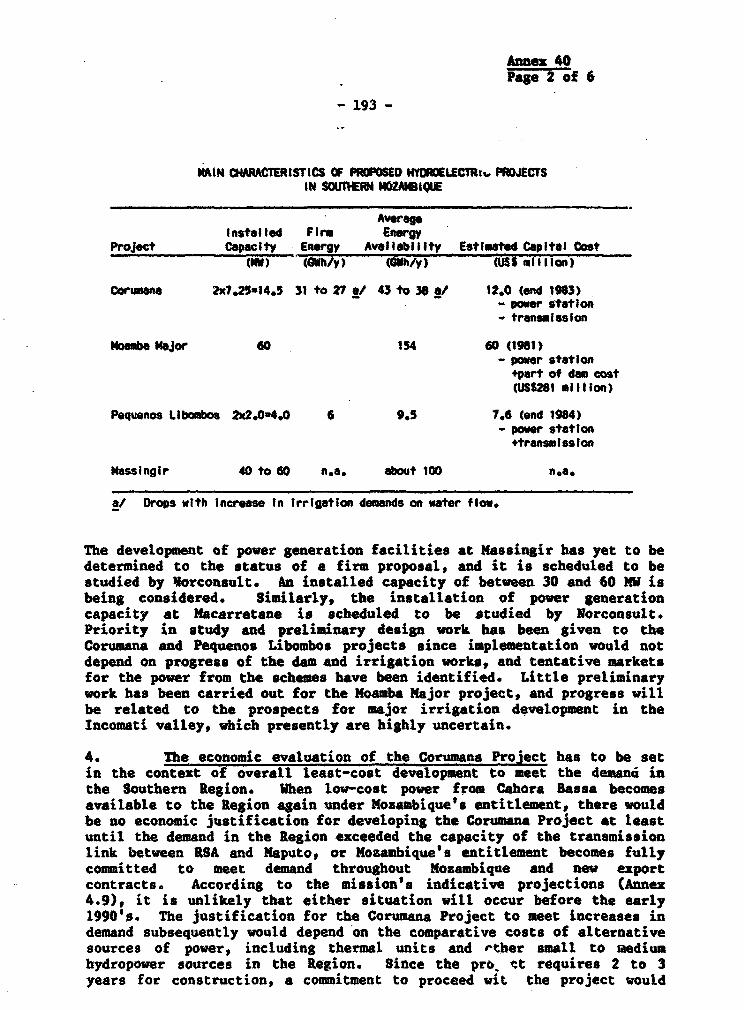
Annex 40Page 2 of 6
- 193 -
MAIN EtARAERISTICS OF PROPOSED HWCOELECTRI.. PROJECTSIN SOUTHERN MbZAIIQUE
AveregInstolled Firm Energy
Project Capacity Energy Avellability Estimted Capital Cost(MW) (GWh/y) (GMh/y) (tUES *illon)
Corumana 20x.25314.5 31 to 27 a/ 43 to 36 / 12.0 (end 1963)- power station- transmission
Moembe Major 60 154 60 (1981)- power statlon+part of den cost(US26* 1mIl lon)
Pequenos ULbombos 2x2.0=4.0 6 9.5 7.6 (end 1984)- power station
+transmission
Massingir 40 to 60 n.a. about 100 n.o.
a/ Drops with Increase In Irrigation demands on water flow.
The development of power generation facilities at Massingir has yet to bedetermined to the status of a firm proposal, and it is scheduled to bestudied by Morconsult. An installed capacity of between 30 and 60 MW isbeing considered. Similarly, the installation of power generationcapacity at Macarretane is scheduled to be studied by Norconsult.Priority in study and preliminary design work has been given to theCorumana and Pequenos Libombos projects since implementation would notdepend on progress of the dam and irrigation works, and tentative marketsfor the power from the schemes have been identified. Little preliminarywork has been carried out for the Moamba Major project, and progress willbe related to the prospects for major irrigation development in theIncomati valley, which presently are highly uncertain.
4. The economic evaluation of the Corumans Project has to be setin the context of overall least-cost development to meet the deman4 inthe Southern Region. When low-cost power from Cahora Bassa becomesavailable to the Region again under Mozambique's entitlement, there wouldbe no economic justification for developing the Corumana Project at leastuntil the demand in the Region exceeded the capacity of the transmissionlink between RSA and Naputop or Mozambique's entitlement becomes fullycommitted to meet demand throughout Mosambique and new exportcontracts. According to the mission's indicative projections (Annex4.9), it is unlikely that either situation will occur before the early1990's. The justification for the Corumana Project to meet increases indemand subsequently would depend on the comparative costs of alternativesources of power, including thermal units and ether small to taediumhydropower sources in the Region. Since the pro. et requires 2 to 3years for construction, a commitment to proceed wit the project would

Annex 40Page 3 of 6
-194 -
not be required until 1989 or tlter provided the firm power from CahoraBassa was available to the Region.
5. If there were prospects of a delay of some years beforeresumption of a firm supply from Cahora Bases to iSA, or of prolongedinterruptions to the firm supply, the evaluation of the Corumana projectshould be undertake,n within the frmework of the Regional system. Theevaluation would also cover the use of the existing thermal units inMaputo and the B8COM bulk supply to meet demand at least cost during theanticipated outage periods of supply from Cahora Bases. The evaluationwould require assumptions about the outage periods and about theformulation of the merit order utilization of the available power sourcesto meet the projected growth in demand. This is a complex exercise, anda comprehensive evaluation of alternative programs for meeting demand isrequired.
6. An indication of the economic comparison of the Corumanaproject with existing sources of supply to the Southern Region is givenfor three selected cases at the and of this Annex. 1/ Data on theCorumana project has been taken from Norconsult'a reports on theirpreliminary assessment of the project. A comparison with new thermalgenerating facilities would be inappropriate since the existing units inMaputo Power Station together with the 0SCOM link have sufficientcapacity to meet demand probably until at least the late 199O's (Annexes4.4 and 4.7). This evaluation is a simplified comparison of marginalsources of power primarily for peak load duty since the costs of meetingpeak loads are far higher than those of base loads*. It is clear frominspection of unit costs that the Corummna project is too expensive tocompete with imported power or the existing coal-fired units in MaputoPower Station as a base load power source.
7. In cases A and B that are evaluated in thisi Anne, the costs ofmeeting system peak demand from the Corusena project io compared firstwith the SCOM bulk supply and then with the existing diesel-fuelled gasturbine in Maputo Power Station. It is concluded that the Corumanaproject would be a substantially more costly rource than either of thetwo comparators. In Case C, it it concluded that the Corumana pro4jcctwould be justified if it displaced at least 13.5 Ch sannually of energythat would otherwise be supplied from the diesel-fuelled gas turbine.However, this shotsil be viewed as a prelimniruy coaclusion that hMs to betested by means of a load-stacking simaiatiun exercise that takes fullacco'int of hydrological factors at the site of the Corumana project andthe anticipated availability of the thermal units at Maputo PowerStation.
11 This evaluation is done at riCes for foel an-i imported power thatprevailed in mid 1985. By mid 1986, coal prices from RSA hadincreased and world petroleum product prices, h%d fallen, but thechanges were not sufficient to alter substantially the conclusionsof this analysis.
Annex 40
Page 4 of 6
8. C;G0 tqr6ines would only be used once demand exceeded thecombined availability of the SSCOK supply and the coal-fired units at theMaputo Power Station (170 MW - Annex 35). According to iEN's projectionsfor demand (Annex 37), this situation is unlikely to occur until after1995 even if an agreement to export 30 MK to Swasiland were to be con-cl%d&edbeforehand, by whicb time many of the thermal units will protiablybk du* Lor retisrement Thus,, even in the absence of a firm supply fromCahora Ie*wa to RSA there does not appear to be an economic case for theproposed Corumana project before the mi4-1990', when it could beconsidered as a serious candidate to rep'ace retired thermal units.
Indicative Evaluation of the Corumana ydroelectric ProjectwIth xsisting Sources of Power for the Southern Resion
Case A: The Corumana Power Station is used for peak load duty todispMace 14 MN of maximum demand on the ESCON bulk supply:
Benefits from the Corumana Projects
Savings in ESt maximum demand charge - 14 MW @ MT 1441kv monthN MT 2.02 million/month
Savings in ESCON energy charge - 2 GMh/month average @ MT 0.3/kWha MT 0.6 million/month
Total savings in 1SCOK charges MT 2.62 million/montha US$0.72 million/year
Discounted present value of savings to 1987: US$5.18 million at anopportunity cost of capital of 121 over a project lifetime of 30 years.
Cost of Corumana ProjecttCapital CostS US$12.0 millionAnnual 0&N Costs: US$0.20 millionAssum that the capital costs are incurred over 3 years, 40X each in 1988and 1989s, 201 in 1990 (firat year of operation)Discounted present value of total costs to 1987 e 121 = US$12.50 million
Conclusion. The Corumana project is a higher cost source of power thanthe,iSCON bulk tariff.
Case Bs The Corumana Power Station is used only to supply 14 MW at peakloat, displacing power from the existing diesel-fuelled gas turbine.
The Benefit of the Corumana project is the avoided costs of gas turbinege'e t42on .
-- 'I .
Annex 40Page 5 of 6
- 196 -
Assume that the system annual minimum demand is 25 of the annual maximumdemand (D) within a system annual load factor of about 551.
The energy displaced in the peak 14 KW of maximum demand (D) is(14x14x8.76/2 X 0.75 x D) - 1145/D GWh/year.
Assume that the maximm demand on the southern system is 1990 assumeddate of cominssioning the Corumana project is 103 NV and increasesthereafter at an annual rate of 6.52 (average of Scenarios A and B forthe mission's forecast - Annex 4.7).
The projected energy in the peak 14 KW will be as follows:
Year: 1990 1995 2000 2005 2010 2015 2020
Energy (GChfyear) 11.1 8.0 5.8 4.2 3.1 2.3 1.7
The discounted present value to 1987 of displaced energy valued at NT4.0IkWh - US cents 9.3/kWh (marginal cost of energy from the gas turbine- Annex 4.4) at an opportunity cost of capital of 121 - US$5.;02 million.
Assume also that the existing gas turbine has to be replaced in 1995, andthe new turbine has a 25 year life under peak load duty. Replacementcost is US$400/kW for 15 NW - US$6 million. The discounted present valueto 1987 at 121 = US$2.43 million.
The discounted present value of total benefit in terms of avoided costUS 7.45 million.
The Cost of the Corumana project is the discounted present value of thecapital cost of US$12 million and O&M costs (Case A) - US$12.50 million.
Conclusion. The Corumana project would be a significantly more expensivesource for purely peak load duty than the existing diesel-burning gasturbine in Maputo Power Station.
Case C. The Corumana Power Station is used to displace the equivalent ofits firm energy capability from the existing diesel-burning gas turbinein Maputo Power Station. In this case, the Corumana Station is usedprogressively less for peak load duty as system demand increases, and theincrement of system demand served from the station also diminishes as theenergy served remains constant at 31 CWhlyear.
The benefit of the Corumana project is the avoided coats of gas turbinegenerations
31 GWh/year @ US cents 9.3/kWh - US$2.88 million/year
Present value of avoided energy costs Q 121 to 1987 - US$23.20 millionPresent value of replacement costs for gas turbine (Case B) a US$2.43Total pres nt value of benefits - US$25.63 million
Annex 40Page 6 of 6
- 197 -
Present value of costs of the Corumana Project (Case A) US$12.50million
Conclusion: The -Corumana project would be a substantially lover costsource of energy than the existing diesel-powered gas turbine at MaputoPower Station.
This conclusion would hold provided that the average annual displacedenergy from the gas turbine exceeded 13.5 GVh.(12.50 - 2.43) x 31123.20.
- 198 -
Annex 41
MINOR COAL OCCURBICES IN MoZAMnIQUR
A number of minor coal occurances are known at severallocations in the country. They are always connected with Karroo-agerocks. Of these, the better known ones are:
(a) Naniamba
Outcrops of thin coal seams are found on the east side of LakeNyassa. In the period 1977 to 1980 some pits were dug andholes drilled but teatwork on the samples taken was only doneafter the coal had been left lying around for considerabletime. As a result, very little is known about the quality ofthe coal. The scant available data seems to indicate that thecoal here occurs in thin seems of rather low quality with some35X to 40X ash. No infrastructure is available in this part ofthe country.
(b) Lugenda
A few outcrops of coal seams were found along the Lugenda riverby Germans# sailing up the river from the then Germanprotectorate of Tanganyika. Since then some surface geologicalmapping has taken place but no detailed studies have beencarried out. These would appear to be coal occurrences of verylimited extent in isolated areas of the country without anyinfrastructure.
Further south, near the southern tip of alawi and aJong theZimbabwe border, minor coal occurances are known in the form of outcropswhich have been observed, but where no work has been done on them.
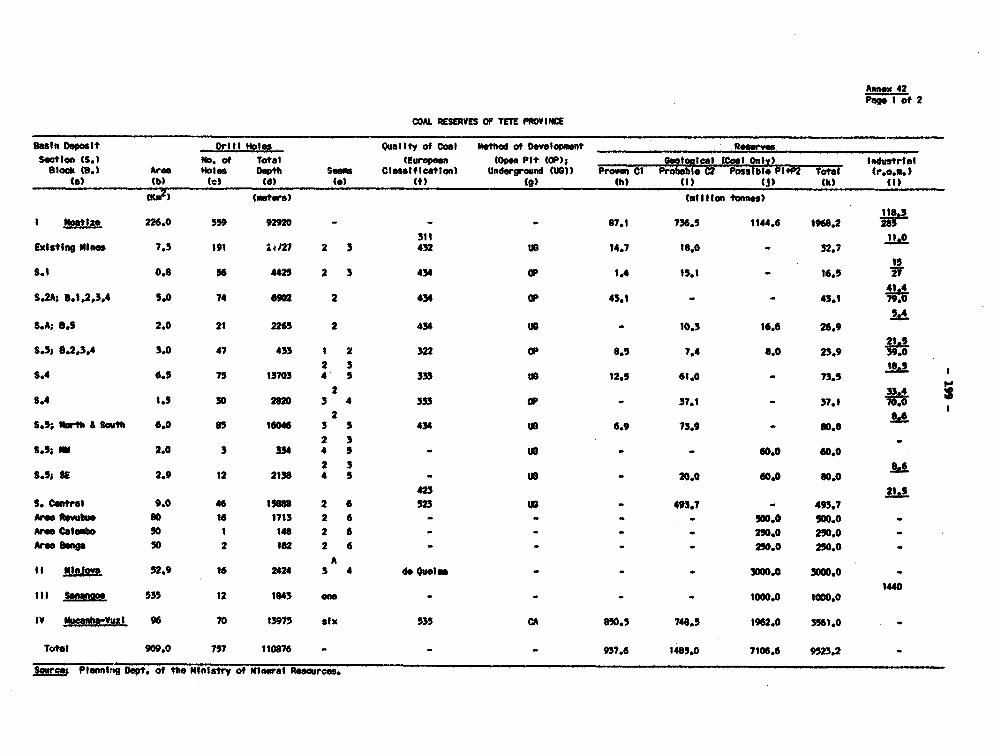
Anpe 42Pop I of 2
COAL RESERVES OF TETE PROVINCE
Bastn Deposit OQ, II "oles ounaity of cool I tNO!d of oevlpnt
Setion (S.t No. of Total (Europeen (Open Pit tOP); rvolo@ial (Cool Only) _ IndustrialBlock (B.) Area ROles Onph Sam Classifation) Underground MtP)) Pro Cl Probebe C2 Posible PI4f tal r...)
(a) tb) (c) (d) (e) (4) t) h) t() CJ) (k) (I)
0CW) (motors) (at Il lon tonnes)
I Neotlz* 226.0 S59 92920 - - ^ 81.1 36.5 1144.6 196S.2
311 11.0Existing Mtines 7.3 191 WiV 2 3 432 Us 14.7 18.0 - 32.7
S.1 08 56 4425 2 3 434 OP 1.4 13.1 - 16.5 1241.4
S.2A; 8.1,2,3,4 5.0 74 6902 2 434 OP 43.1 - - 43.1 79.0
S.A; 3.5 2.0 21 2265 2 434 US 10.3 16.6 26.9
S.3: 6.2,3,4 3.0 47 433 1 2 322 OP 8.5 7.4 8.0 23.9 39.0
2 3 18. I
S.4 6.75 13703 4 5 333 US 12.5 61.0 - 73.5 H
2 3b.4 S.4 1.5 30 2820 3 4 333 OP - 37.1 - 37.j 70.0
2S.J; aibm& S""t 6.0 8S 16046 3 S 434 Ut 6.9 73.9 ^ 0.8
2 3S.5 IW 2.0 3 34 4 5 - US - - 60.0 60.0
2 3 8.6S.5 St 2.9 12 213# 4 5 u US - 20.0 60.0 s0.0
423 21.2
S. Central 9.0 46 1588s 2 6 523 U - 49.7 - 493.7
Area Rsvtu so 16 1713 2 6 - - - 900.0 900.0 -
AreaCale** so 1 148 2 6 - - - - 250.0 250.0 -
Arean so 2 182 2 6 - - - _ 250.0 250.0
AII mJove 52.9 16 2424 3 4 de qulmo - -. 3000.0 300.0O
1440III SJog"j 535 12 1843 one - - - - 14tO0. 1000.0
IV Ihoanhalui 96 70 13973 six 535 CA 80.5 748.5 1962.0 3561.0 -
Tot"l 909.0 757 110876 3- - 97.6 1485.0 7106.6 9523.2
Sourcs PlannPfig DOept. of the MInil otf Mineral Rogurces.
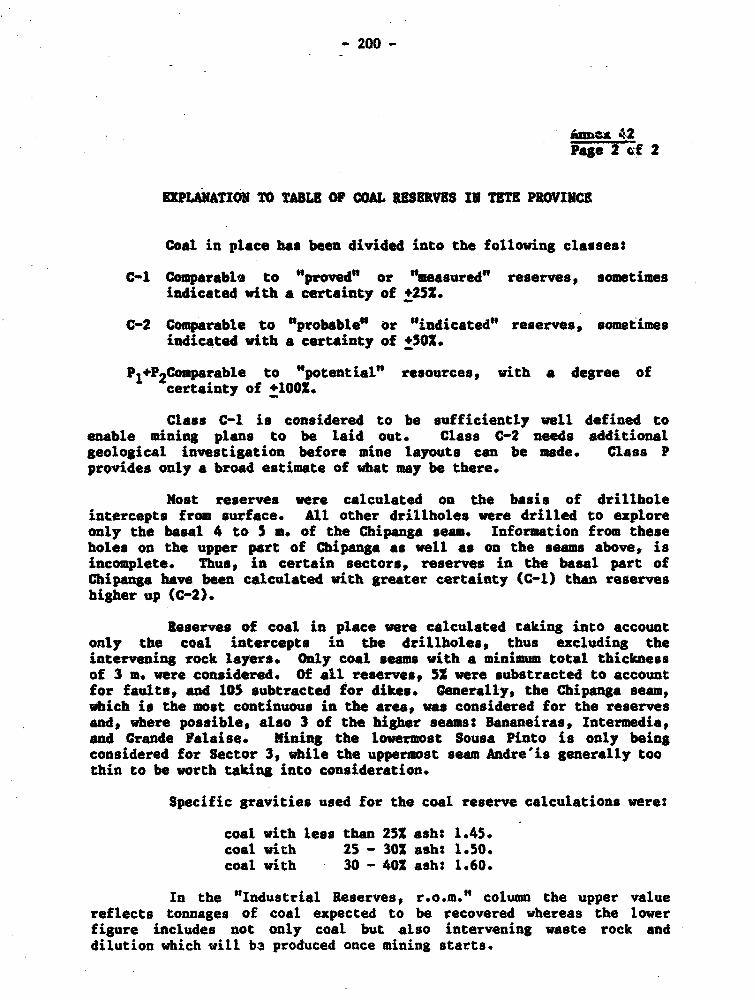
- 200 -
Page 2 7f 2
EXPLANATION TO TABLE OF COAL RESERVES IN TETU PROVINCE
Coal in place has been divided into the following classes:
C-1 Comparable to "provede or "measured" reserves, sometimesindicated with a certainty of +252.
C-2 Comparable to "probable" or "indicatede reserves, sometimesindicated with a certainty of +502.
P1 *P2 Comparable to "potential" resources, with a degree ofcertainty of +1001.
Class C-1 is considered to be sufficiently well defined toenable mining plans to be laid out. Class C-2 needs additionalgeological investigation before mine layouts can be made. Class Pprovides only a broad estimate of what may be there.
Most reserves were calculated on the basis of drillholeintercepts from surface. All other drillholes were drilled to exploreonly the basal 4 to 5 m. of the Chipanga seam. Information from theseholes on the upper part of Chipanga as well as on the seams above, isincomplete. Thus, in certain sectors, reserves in the basal part ofChipanga have been calculated with greater certainty (C-1) than reserveshigher up (C-2).
Reserves of coal in place were calculated taking into accountonly the coal intercepts in the drillholes, thus excluding theintervening rock layers. Only coal seams with a minimum total thicknessof 3 m. were considered. Of all reserves, 52 were substracted to accountfor faults, and 105 subtracted for dikes. Generally, the Chipanga seam,which is the most continuous in the area, was considered for the reservesand, where possible, also 3 of the higher seams: Bananeiras, Intermedia,and Grande Falaise. Mining the lowermost Sousa Pinto is only beingconsidered for Sector 3, while the uppermost seam Andre'is generally toothin to be worth taking into consideration.
Specific gravities used for the coal reserve calculations were:
coal with less than 251 ash: 1.45.coal with 25 - 302 ash: 1.50.coal with 30 - 401 ash: 1.60.
In the "Industrial Reserves, r.o.m." column the upper valuereflects tonnages of coal expected to be recovered whereas the lowerfigure includes not only coal but also intervening waste rock anddilution which will bA produced once mining starts.
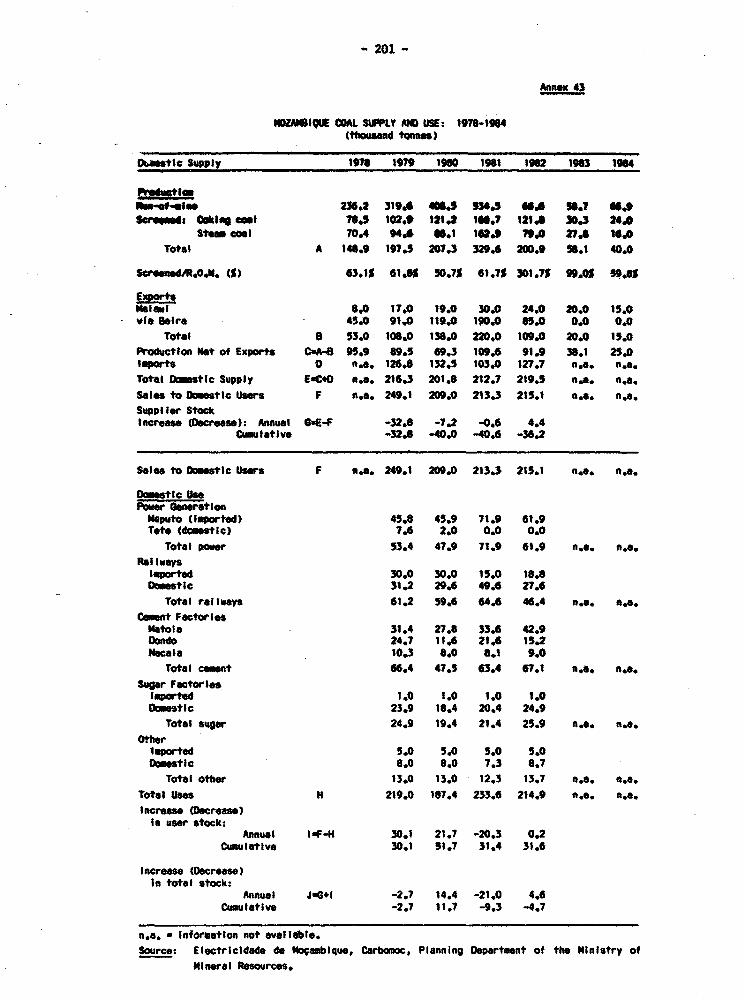
- 201 -
Annex 43
NDZAMI1QUE COAL SUFPLY AND UE: 1978-1964(thousand tonas)
otlC Supply 1976 1979 1960 1961 196 19 1964
kse-of-elm 236.2 319. 4014 W3.5 WA .J 9.9serait WOdAS co 764. 102.t 121X. 16.7 121.0 30.3 24.0
Ste coal 70.4 94A 5.1 162.9 79.0 2A1 10.0Total A 146.9 1975 2D7.3 329.6 200.9 36.1 40.0
ScreeaeddR.0.M. (S) 3.1% 61.6A S0.7 61.7% 301.7 9S .0 39.6
Exportsbllai 8.0 17.0 19.0 30.0 24.0 20.0 15.0via B1rr- 45.0 91.0 119.0 190.0 05.0 0.0 0.0
Total 8 53.0 106.0 136.0 220.0 109.0 20.0 15.0Production Net of Exports CA- 95.9 869.5 69.3 109.6 91.9 36.1 25.0ISpMrts 0 n.o. 126.8 132.5 103.0 127.7 n.e. na.Total Dk stic Supply EuC40 n.a. 216.3 201.8 212.7 219.5 n.m. n.a.Satds to Domestic Users F n.s 249.1 209.0 213.3 215.1 n.e. n.e.Supplier StockIncreass (Decrease): Annual G.E-F -32.8 -7.2 -0.6 4.4
Cumulative -32.8 -40.0 -40.6 -36.2
Sales to Domestic Users F n.e. 249.1 209.0 213.3 215.1 n.s. n.o.
DomestIc UsePower Generationmaputo (lmported) 45.8 45.9 71.9 61.9Tfto (doest Ic) 7.6 2.0 0.0 0.0
Total pow 53.4 47.9 71.9 61.9 n.e. n.e.Rail wayslepWrted 30.0 30.0 15.0 18.8Domestic 31.2 29.6 49.6 27.6
Total raIlways 61.2 59.6 64.6 46.4 n.s. n.e.Cement FwctoriesNetole 31.4 27.8 33.6 42.9Oando 24.7 11.6 21.6 15.2"Ocala 10,3 8.0 6.1 9.0
Total cent 66.4 47.5 6304 67.1 n.e. n.e.Suapr Fctor tesipowted 1.0 1.0 1.0 1.0DOmestic 23.9 16.4 20.4 24.9
Total sugar 24.9 19.4 21.4 25.9 n.e. ne.OtherImported 5.0 5.0 5.0 5.0Domestic 8.0 8.0 7.3 8.7
Total other 13.0 13.0 12.3 13.7 n.e. n.e.Total US"s II 219.0 187.4 233.6 214.9 n,e. n.o.Incroese (Decrease)
In user stock:Annual IF-H 30.1 21.7 -20.3 0.2
Cumulative 30.1 51.7 31.4 31.6
Increase (Dtcrease)In total stock:
Annual JWG*I -2.7 14.4 -21.0 4.6Cumulative -2.7 11.7 -9.3 -4.7
n.e. a Information not evellabile.Source: Electricidade de ogambique, Carbamoc, Planning Departmnt of the Ministry of
Mineral Resources.
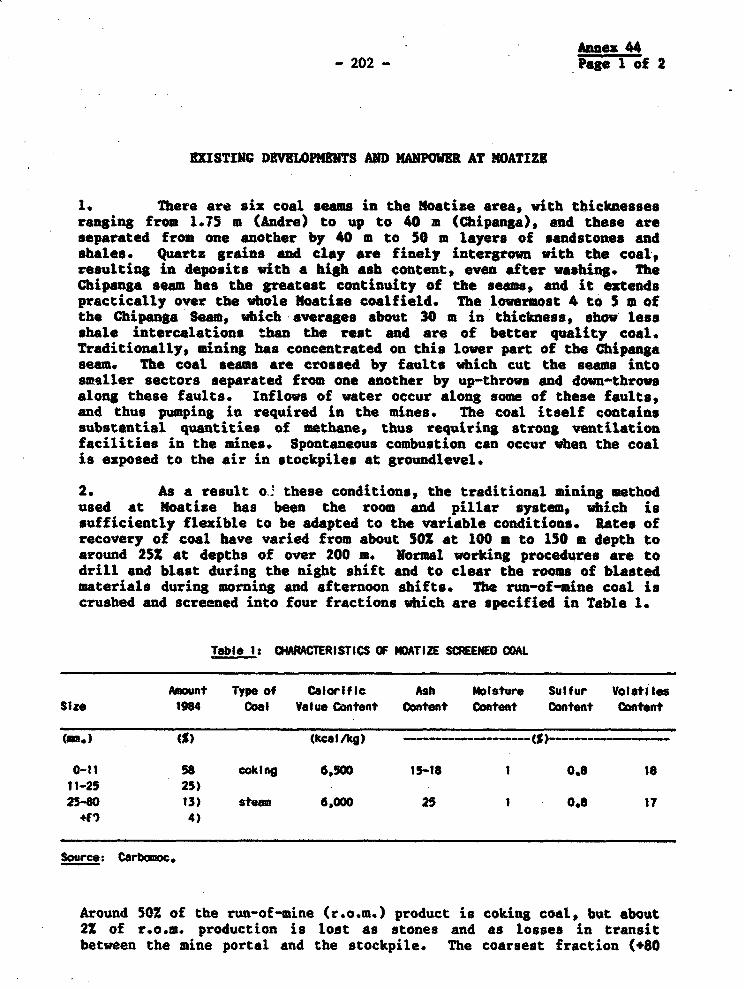
Anex 44-202- Pagel of 2
EXISTING DEVRWPMENTS AND MANPOMER AT NOATIZI
1. There are six coal seams in the Moatize area, with thicknessesranging from 1.75 m (Andre) to up to 40 a (Chipanga), and these areseparated from one another by 40 m to 50 m layers of sandstones andshales. Quartz grains and clay are finely intergrown with the coaltresulting in deposits with a high ash content, even after washing. TheChipanga seam has the greatest continuity of the seams, and it extendspractically over the whole loatize coalfield. The lowermost 4 to 5 m ofthe Chipanga Seam, which averages about 30 m in thickness, show lessshale intercalations than the rest and are of better quality coal.Traditionally, mining has concentrated on this lower part of the Chipangaseam. The coal seams are crossed by faults which cut the seams intosmaller sectors separated from one another by up-throws and down-throwsalong these faults. Inflows of water occur along some of these faults,and thus pumping in required in the mines. The coal itself containssubstantial quantities of methane, thus requiring strong ventilationfacilities in the mines. Spontaneous combustion can occur when the coalis exposed to the air in stockpiles at groundlevel.
2. As a result o. these conditions, the traditional mining methodused at Moatize has been the room and pillar system, which issufficiently flexible to be adapted to the variable conditions. Rates ofrecovery of coal have varied from about 50X at 100 m to 150 a depth toaround 25Z 8t depths of over 200 n. Normal working procedures are todrill and blast during the night shift and to clear the rooms of blastedmaterials during morning and afternoon shifts. The run-of-mine coal iscrushed and screened into four fractions which are specified in Table 1.
Table 1: CARCTERISTICS OF iOTIZE SCREENED COAL
Amount Type of Colorif Ic Ash Moisture Sulfur VolatilesSize 1984 Coal Value Content Content Content Content Content
(mu.) (%) (kcsl/Ag) -
0-11 S8 coking 6,S00 15-18 1 0.8 1811-25 25)25-80 13) steam 6.000 25 1 0.8 17
1) 4)
Source: Carbomoc.
Around 50X of the run-of-mine (r.o.m.) product is coking coaL, but about22 of r.o.m. production is l-ost as stones and as losses in transitbetween the mine portal and the stockpile. The coarsest fraction (+80
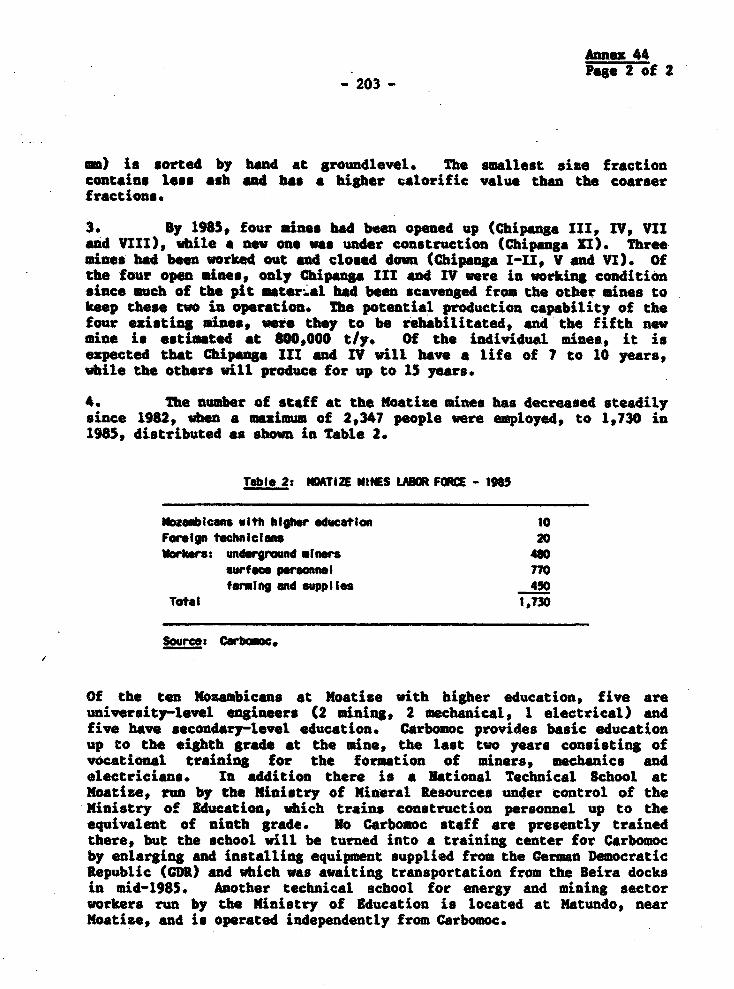
Annex 44Page 2 of 2
-203 -
mm) is sorted by hbnd at groundlevel. The smallest size fractioncont*ins less sh and has a higher calorific value than the coarserfractions.
3. By 1985, four mines had been opened up (Chipanga III, IV, VIIad VIII), while a new one was under construction (Chipanga XI). Threemines had been worked out and closed down (Chipanga I-II, V and VI). Ofthe four open mines, only Chipang III and IV were in working conditionsince much of the pit materal had been scavenged from the other mines tokeep these two in operation. The potential production capability of thefour existing mines, were they to be rehabilitated, and the fifth newmine is estimted at 800,000 t/y. Of the individual mines, it isezpected that Chipanga III and IV will have a life of 7 to 10 years,while the others will produce for up to 15 years.
4. The number of staff at the Moatize mines has decreased steadilysince 1982, when a maximum of 2,347 people were employed, to 1,730 in1985, distributed as shown in Table 2.
Table 2: NMTIZE MINES LABOR FORCE - 1985
Notembicens wIth higheo ducation 10Foreign technicians 20Workers: udrground miners 480
surffac pernnel 770faming and supplies 450
TOta 1,730
Source: Cabaem.
Of the ten Kosambicans at Noatize with higper education, five areuniversity-level engineers (2 mining, 2 mechanical, 1 electrical) andfive have secondary-level education. Carbomoc provides basic educationup to the eighth grade at the mine, the last two years consisting ofvocational training for the formation of miner., mechanics andelectricians. In addition there is a National Technical School atMoatize, run by the Ministry of Mineral Resources under control of theMinistry of Lducation, which trains construction personnel up to theequivalent of ninth grade. No Carbomoc staff are presently trainedthere, but the school will be turned into a training center for Carbomocby enlarging and installing equipment supplied from the German DemocraticRepublic (CDR) and which was awaiting transportation from the Beira docksin mid-1985. Another technical scbool for energy and mining sectorworkers run by the Ministry of Bducation is located at Matundo, nearMostise, and is operated independently from Carbomoc.

- 204
Annex .4
OMESTIC AND EXP0rT FtICES F ODAL
Coklng Coat C -stoamoo - lxedSize Frectioo Coal 0-1 - 11-25 2540 m .60 - unsorted
Oomstsc pries (MT/t)
1: ai 210 - 1,030Nto - 21f1 - -
2: Comet fwtoriesCondo 1,800 - - 1.030omacla 1,800 - -
3: Sugar factorlesHof ambo - 250 ---
marrmeu - 250 20 -
4: OtherSogere Beira - 300 - -
Lavanderia Super - - 300No" Industriatl - 3 -
Prom 1 -
Maga FIorestal - 300 -
CJrtonasem _ 300 -
Feb. Oleo-Chimolo - 220 -
Fab, Rbrigedos - - - 300 -Diversos 1600 220 220 220 1,030
5: Exports to Mulawi (paid 1,700 1,300 - - -to Carbomoc)
6: Domestic pric of RSA steam coalsold In Sbuthern Mozamblque) 420-50
International Malawi Export Prices(USS/t) "
Is Fob train deliveredat border 48 38 28 -
2: Fot truck at mtne 40 30 24
a/ Official exchange rate May 1985: USSI M Mr43.
Source: Carbomoc office at Moatize mine.

Annex 46~jT of 2
- 205 -
ILLUSTRATIVE ECONOMIC COST OF ELECTRICITY PROM A 60 KW THERMALPOWER PLANT BURNING MOATIZE COAL
This is an order of magnitude estimated based on the followingassumptions:
1. Ninemouth power plant located at Noatise using 6,200 kcal/kg*20X ash steam coal produced by the proposed Moatize I minedevelopment.
2. Minemouth cost of coal: US$18.46/tonne (source: Annex 5.8). 1/
3. Power plant: - 2 units of 30 MK each- overall thermal efficiency, 331- capital cost per installed kW, US$1,800- operating (excluding fuel) and maintenancecosts, 2 US0/kWh
- annual load factor, 701- 25 year life, 122 opportunity cost of capital(capital recovery factor 0.1275)
Estimated costs per kWh
1. Plant capital cost:
(a) The energy produced is 8,760 * 103 s 0.7 - 6,132 MWh per kV ofinstalled capacity per year.
(b) Annuitized capital cost - US$1800 x 0.1275 a US$229.5 per kVper year.
(c) Capital cost per kWh = (229.5)/(6.132 x }03) $/kWh 3.74US'/kfh.
2. Fuel cost:
1 kWh is equivalent to 860 kilo calories1 kWh needs 860/0.33 u 2606 kcal of coal
- 2606/6200 - 0.42 kg of coal
Fuel cost - (0.42 : 18.46)/1OO US$/kWh- 0.775 USV/kWh
1/ Average price of all products.
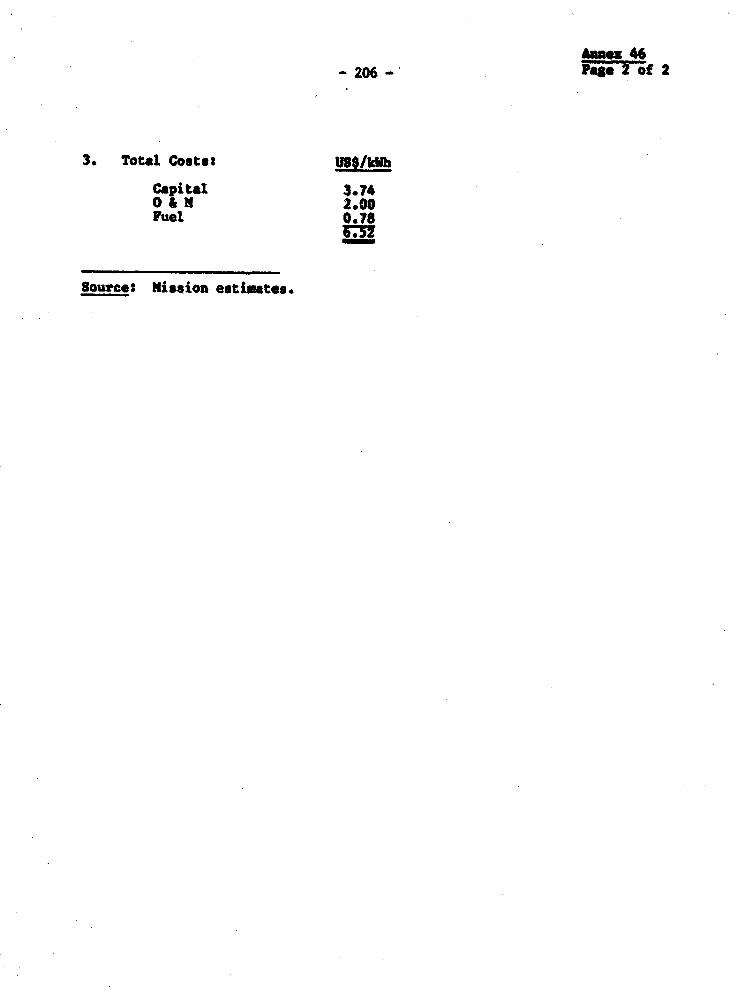
A.am 46-206- Pae 2 of 2
3. Total Costat US§/kWh
capital 3 74O&aN 2.00Fuel 0.78
S.tn
80urces mission eatiates.
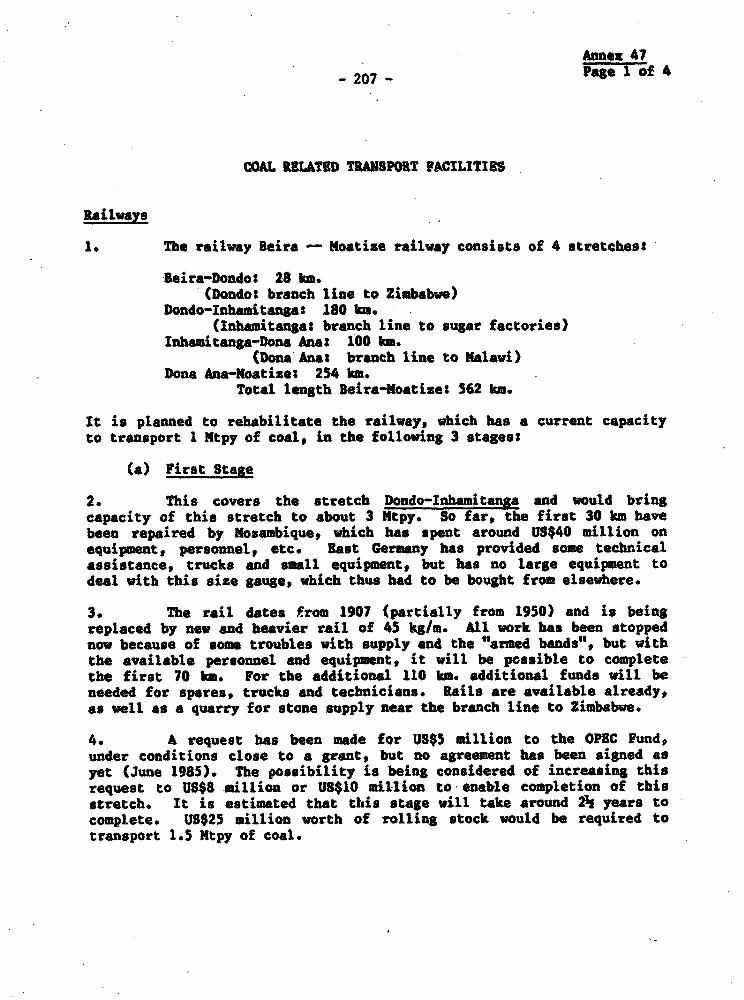
Annex 47
-207 - Page I of 4
COAL RELATED TRANSPORT FACILITIES
Railways
1. The railway Beira - Mostize railway consists of 4 stretches:
Beira-Dondos 28 km.(Dondot branch line to Zimbabwe)
Dondo-Inhamitanga: 180 km.,(Inhamitanga: branch line to sugar factories)
Inhamitanga-fona Ana: 100 km.(Dona Ana: branch line to Malawi)
Dona Ana-Noatize: 254 km.Total length Beira-Moatize: 562 km.
It is planned to rehabilitate the railway, which has a current capacityto transport 1 Ntpy of coal, in the following 3 stages:
(a) First Stage
2. This covers the stretch Dondo-Inhamitanga and would bringcapacity of this stretch to about 3 Ntpy. So far, the first 30 km havebeen repaired by Mosambique, which has spent around US$40 million onequipment, personnel, etc. East Germany has provided some technicalassistance, trucks and small equipment, but has no large equipment todeal with this size gauge, which thus had to be bought from elsewhere.
3. The rail dates from 1907 (partially from 1950) and is beingreplaced by new and heavier rail of 45 kg/m. All work has been stoppednow because of some troubles with supply and the "armed bands", but withthe available personnel and equipment, it will be possible to completethe first 70 km. For the additional 110 km. additional funds will beneeded for spgres, trucks and technicians. Rails are available already,as well as a quarry for stone supply near the branch line to Zimbabwe.
4. A request has been made for US$5 million to the OPEC Fund,under conditions close to a grant, but no agreement has been signed asyet (June 1985). The possibility is being considered of increasing thisrequest to US$8 million or US$10 million to enable completion of thisstretch. It is estimated that this stage will take around 2½ years tocomplete. US$25 million worth of rolling stock would be required totransport 1.5 Ntpy of coal.
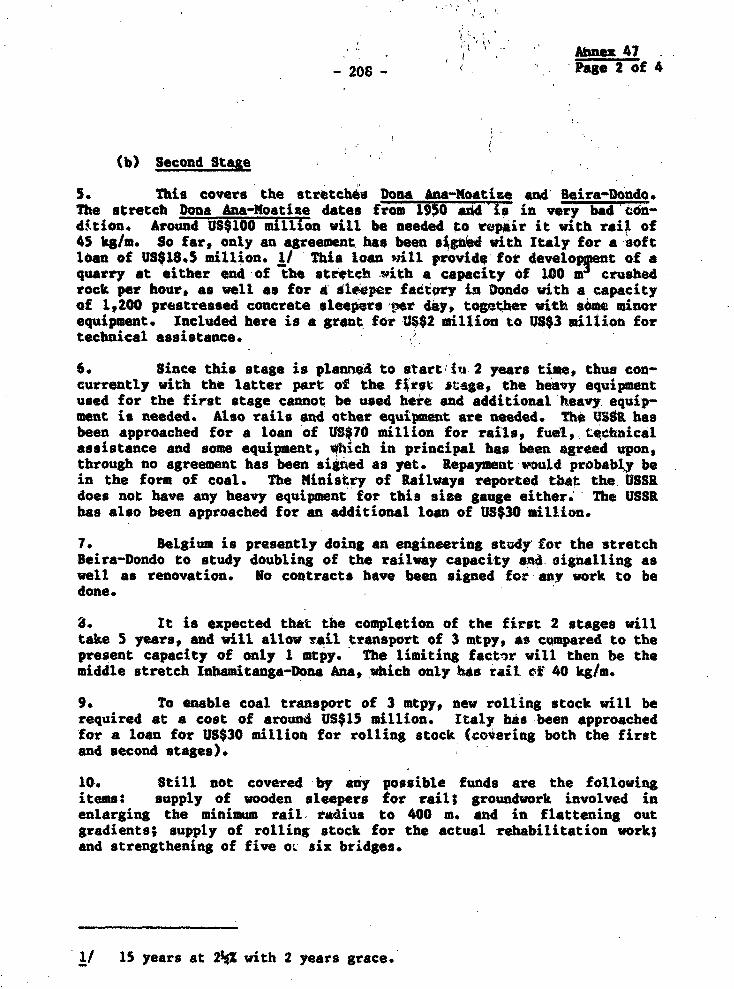
Abnez 47-208 - ag2o 4
(b) Second Stage
5. This covers the str6tches Dona AMa-Noatize and Beira-Dondo.The stretch bona Ana-Moatise dates from 1950 add is in very bad con-dltion. Around US$100 million will be needed to r'pair it with rail of45 kg/m. So far, only an agreement has been s9Igned with Italy for a softloan of US$18.5 million. 1/ This loan *7ill provid; for develop!ent of aquarry at either end of the stitteh -with a capacity of 100 m crushedrock per hour, as well as for a dle4per fadtory in Dondo with a capacityof 14200 prestressed concrete sleepers ,er diy, tog.ther with some minorequipment. Included here is a grant for 1$$2 million to US$3 miltioa fortechnical assistance.
6. Since this stage is planned to start in 2 years time, thus con-currently with the latter part of the first stage, the heavy equipmentused for the first stage cannot be used here and additional heavy. equip-ment is needed. Atso rails and qther equipment are needed. The UStL hasbeen approached for a loan of USg70 million for rails, fuel, tzez.hnicalassistance and some equipment, Which in principal has been agreed upon,through no agreement has been sigiued as yet. Repayment would probably bein the form of coal. the Ministry of Railways reported thet the. USSRdoes not have any heavy equipment for this sise gauge either. The USSRhas also been approached for an additional loan of US$30 million.
7. Belgium is presently doing an engineering study for the stretchBeira-Dondo to study doubling of the railway capacity *$. signalling aswell as renovation. No contracts have been signed for any work to bedone.
S. It is expected that the completion of the first 2 stages willtake 5 years, and will allow rail transport of 3 mtpy, as compared to thepresent capacity of only 1 mtpy. The limiting facttor will then be themiddle stretch Inhamitanga-Dona Ana, which only has rail. cfT40 kg/m.
9. To enable coal transport of 3 mtpy, new rolling stock will berequired at a cost of around US$15 million. Italy has been approachedfor a loan for US$30 million for rolling stock (covering both the firstand second stages).
10. Still not covered by any possible funds are the followingitems: supply of wooden sleepers for rail; groundwork involved inenlarging the minimum rail. tadius to 400 m. and in flattening outgradients; supply of rolling stock for the actual rehabilitation work;and strengthening of five oa. six bridges.
1/ 15 years at 2W2 with 2 years grace.
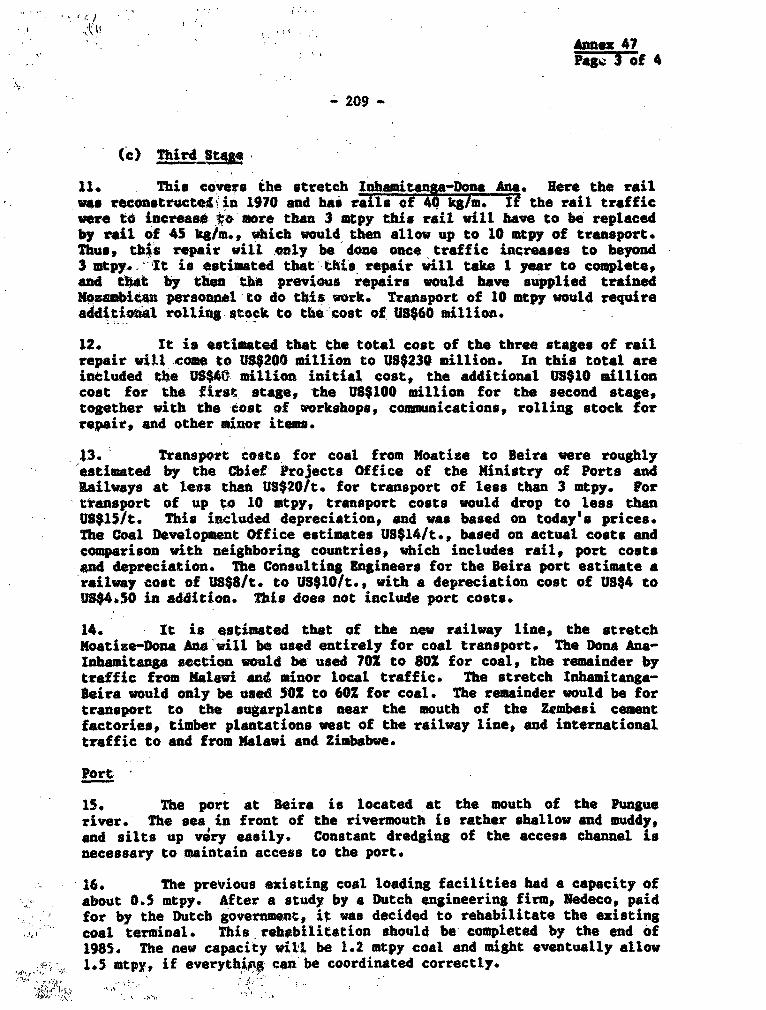
Annex 47PagtB 3 of 4
- 209 -
(c) Third St^
11. This covers the stretch Inhamitnga-Dona Ana. Here the railwas reconstructe,in 1970 and has rails of 40 kg/m. If the rail trafficwere td increase to more than 3 mtpy this rail will have to be replacedby rail of 45 kg/m., which would then allow up to 10 mtpy of transport.Thus, this repair will .@aly be done once traffic increases to beyond3 mtpy.. It is estimated that this repair will take 1 year to complete,and that by then the previous repairs would have supplied trainedNosambitan personnel to do tlSis work. Transport of 10 mtpy would requireadditional rolling stock to thO cost of US$60 million.
12. It is estimated that the total cost of the three stages of railrepair will come to US$200 million to US$230 million. In this total areintluded the US$43 million initial cost, the additional US$10 millioncost for the first stage, the US$100 million for the second stage,together with the cost of workshops, communications, rolling stock forrepair, and other minor item.
13.' Transport costs for coal from Noatize to Beira were roughlyestimated by the Cbief Projects Office of the Ministry of Ports andRailways at less than US$20/t. for transport of less than 3 mtpy. Fortransport of up to 10 mtpy, transport costs would drop to less thanUS$1S/t. This included depreciation, and was based on today's prices.The Coal Development Office estimates US$14/t., based on actual costs andcomparison with neighboring countries, which includes rail, port costsand depreciation. The Consulting Engineers for the Beira port estimate arailway cost of US$8/t. to US$10/t., with a depreciation cost of US$4 toUS$4.50 in addition. This does not include port costs.
14. It is estimated that of the new railway line, the stretchMoatize-Dona Ana will be used entirely for coal transport, The Dona Ana-Inhamitanga section would be used 70M to 80X for coal, the remainder bytraffic from Malawi ant minor local traffic. The stretch Inhamitanga-Beira would only be used SO0 to 60Z for coal. The remainder would be fortransport to the sugarplants near the mouth of the Zambesi cementfactories, timber plantations west of the railway line, and internationaltraffic to and from Malawi and Zimbabwe.
Port
15. The port at Beira is located at the mouth of the Pungueriver. The sea in front of the rivermouth is rather shallow ant muddy,and silts up very easily. Constant dredging of the access channel isnecessary to maintain access to the port.
16. The previous existing coal loading facilities had a capacity ofabout 0.5 mtpy. After a study by a Dutch engineering firm, Nedeco, paidfor by the Dutch government, it was decided to rehabilitate the existingcoal terminal. This rehabilitation should be- completed by the end of1985. The new capacity witJ be 1.2 mtpy coal and might eventually allow1.5 mtpy, if everythipn can be coordinated correctly.
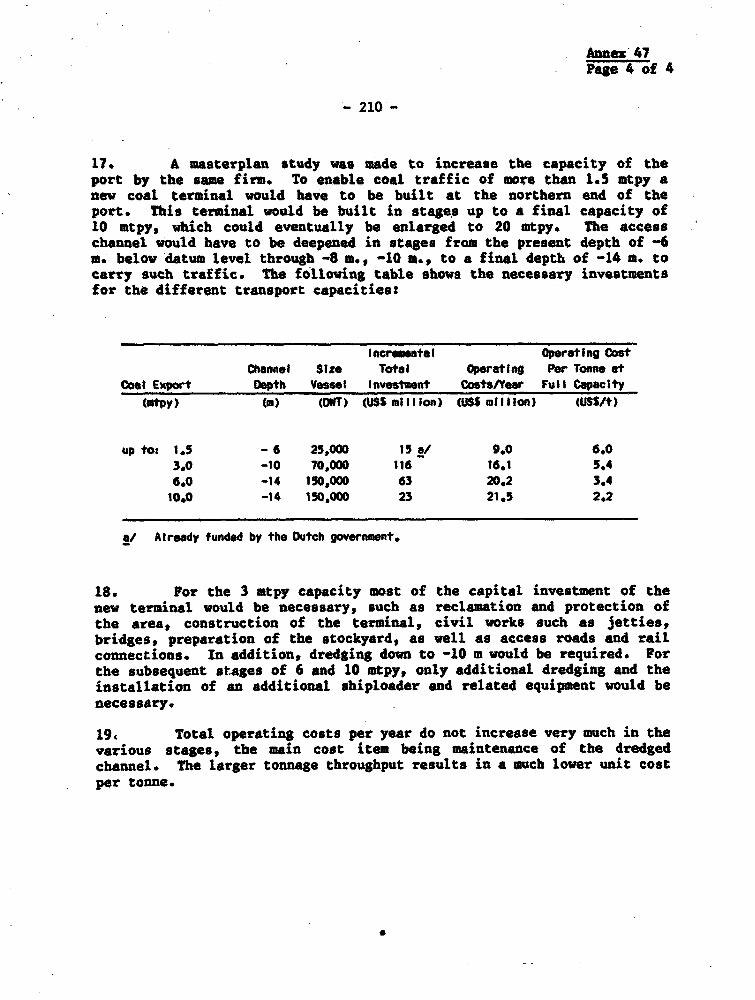
Annez 47Page 4 of 4
- 210 -
17. A masterplan study was made to increase the capacity of theport by the same firm. To enable coal traffic of more than 1.5 mtpy anew coal terminal would have to be built at the northern end of theport. This terminal would be built in stages up to a final capacity of10 mtpy, which could eventually be enlarged to 20 mtpy. The accesschannel would have to be deepened in stages from the present depth of -6m. below datum level through -8 m., -10 m., to a final depth of -14 m. tocarry suCh traffic. The following table shows the necessary investmentsfor the different transport capacities:
Incremental Opeating CostChannel Size Totel Operating Per Tcnne at
Cost Export Depth Vessel Investment Costs/Year Full Capacity(utpy) (U) (MD) (USS million) (USS miliIon) (iJSS/t)
up to: 1.5 - 6 25,000 15 a/ 9.0 6.03.0 -10 70,000 116 16.1 5.48*0 -14 150,000 63 20.2 3.4
10.0 -14 150,000 23 21.5 2.2
a/ Already funded by the Dutch govermnt.
18. For the 3 mtpy capacity most of the capital investment of thenew terminal would be necessary, such as reclamation and protection ofthe area, construction of the terminal, civil works such as jetties,bridges, preparation of the stockyard, as well as access roads and railconnections. In addition, dredging down to -10 m would be required. Forthe subsequent stages of 6 and 10 mtpy, only additional dredging and theinstallation of an additional shiploader and related equipment would benecessary.
19. Total operating costs per year do not increase very much in thevarious stages, the main cost item being maintenance of the dredgedchannel. The larger tonnage throughput results in a much lower unit costper tonne.
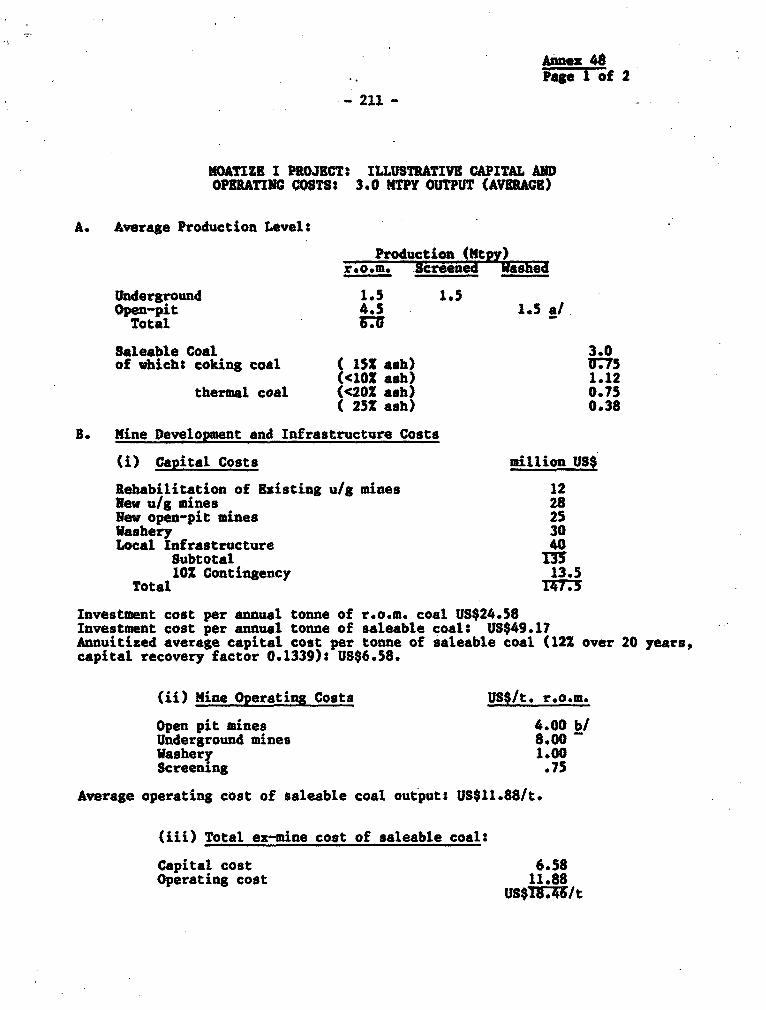
Annex 4Page I of 2
- 211 -
!OATIZE I PROJECT: ILLUSTRATIVE CAPITAL ANDOPERATING COSTS: 3.0 MTPY OUTPUT (AVERAGE)
A. Average Production Level:
Production (Mtpy)r.o*.m. Screened WashQe
Underground 1.5 1.5Open-pit 4.5 1.5 alTotal
Saleable Coal 3.0of whichs coking coal ( 152 ash) U;75
(<TO% ash) 1.12thermal coal (c20X ash) 0.75
( 25Z ash) 0.38
B. Mine Development and Infrastructure Costs
'i) Capital Costs million US$
Rehabilitation of Existing u/g mines 12New u/g mines 28New open-pit mines 25Washery 30Local Infrastructure 40
Subtotal ml102 Contingency 13.5
Total L4715
Investment cost per annual tonne of r.o.m. coal US$24.58Investment cost per annual tonne of saleable coal: US$49.17Annuitized average capital cost per tonne of saleable coal (12X over 20 years,capital recovery factor 0.1339): US$6.58.
(ii) mine Operating Costs US$tt. r.o.m.
Open pit mines 4.00 b/Underground mines 8.00Washery 1.00Screening .75
Average operating cost of saleable coal output: US$11.881t.
(iii) Total ex-mine cost of saleable coal:
Capital cost 6*58Operating cost 11.88
us$sT7Z/t
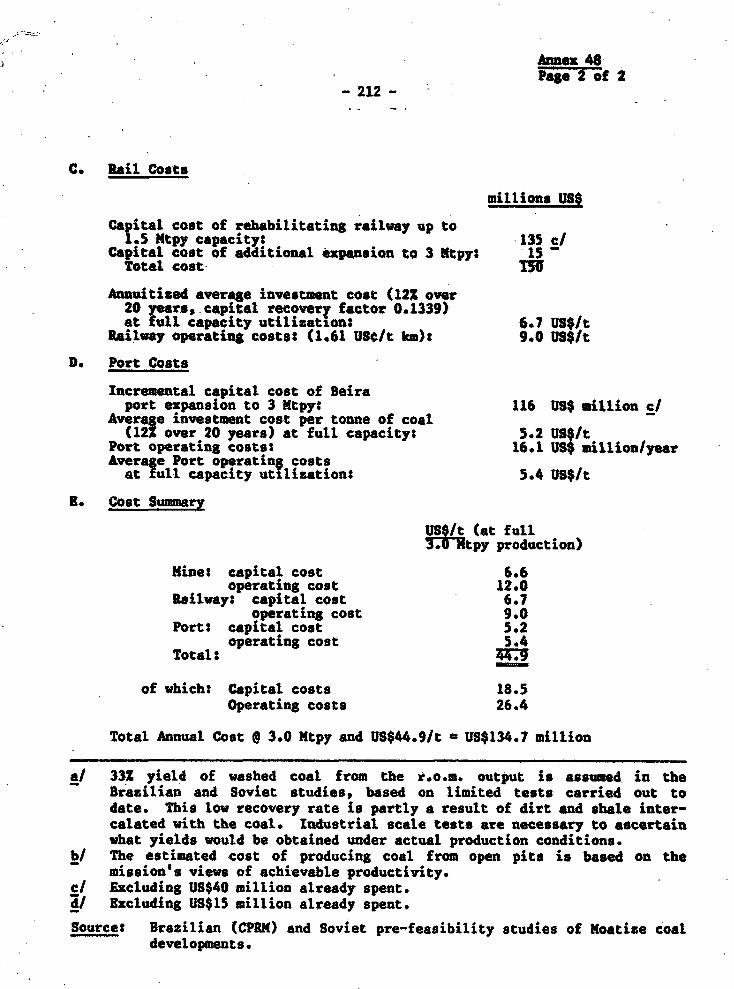
Annex 48i Pge 2 of 2
-212-
C. Rail Costs
millions WS$
Ca pital cost of rehabilitating railway up to1.5 Ntpy capacity: 135 cl
Capital cost of additional expansion to 3 [tpy: 15 -Total cost 15i
Annuitized average investment cost (12X over20 years,.capital recovery factor 0.1339)at full capacity utilization: 6.7 US$It
Railway operating costs: (1.61 US8/t km): 9.0 US$/t
D. Port Costs
Incremental capital cost of Beiraport expansion to 3 Ntpy: 116 US$ million c/
Average investment cost per tonne of coal(12% over 20 years) at full capacity: 5.2 US$/t
Port operating costs: 16.1 US$ millionlyearAverage Port operatin; costsat full capacity utilizationt 5.4 US$It
E. Cost Summary
U8$/t (at full3-.0 tpy production)
Mine: capital cost 6.6operating cost 12.0
Railway: capital cost 6.7operating cost 9.0
Port: capital cost 5.2operating cost 5.4
Total: WZ9
of which: Capital costs 18.5Operating costs 26.4
Total Annual Cost @ 3.0 Mtpy and US$44.9/t US$134.7 million
a/ 33X yield of washed coal from the r.o.m. output is assumed in theBrazilian and Soviet studies, based on limited tests carried out todate. This low recovery rate is partly a result of dirt and shale inter-calated with the coal. Industrial scale tests are necessary to ascertainwhat yields would be obtained under actual production conditions.
b/ The estimated cost of producing coal from open pits is based on themissions' views of achievable productivity.
cl Excluding US$40 million already spent.dl Excluding US$15 million already spent.
Source: Brazilian (CPRM) and Soviet pre-feasibility studies of Moatize coaldevelopments.
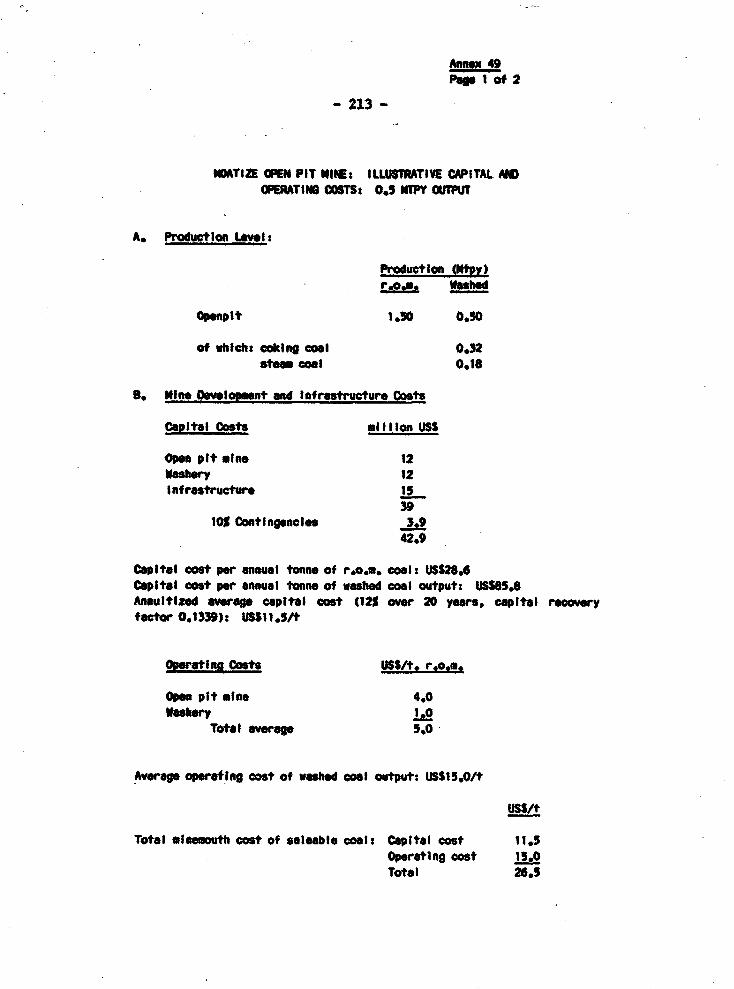
Anntx 49Pap I of 2
- 213 -
NATIZE MO PIT 1iNEs ILLUSTAMTIVE CAPITAL ANDOPERTINN COSTS 05 MMY OUTPUT
A. Production Level:
Production qNt,y)r.o.r. Washed
Openopt 1.50 0.50
of which: cking coal 0.32st coal 0.18
S. Nine Ovelozgmnt an Infrastructure Costs
Capital Costs o 1lIon USS
On pit Wine 12washery 12Infrastructure I 5
3910% Contingencies 3.9
42.9
Capital cost per annual tonne of r.o.m. coal: USS28d6Capital cost per annual tonne of washed coal output: USS8S.8Annultized averae capital cost (12% over 20 yeors, capital recoswryfactor 0.1339): USS$1.5/I
Operating Costs USS/t. r.o.m.
open pit mine 4.0washer 1.0
Totl averae 5.0
Average operefting cost of w*shed coal outut: USS15.0/t
USS/t
Total mInemouth cost of saleable coal: Capital cost 11.SOperating cost 15.0Total 28.5
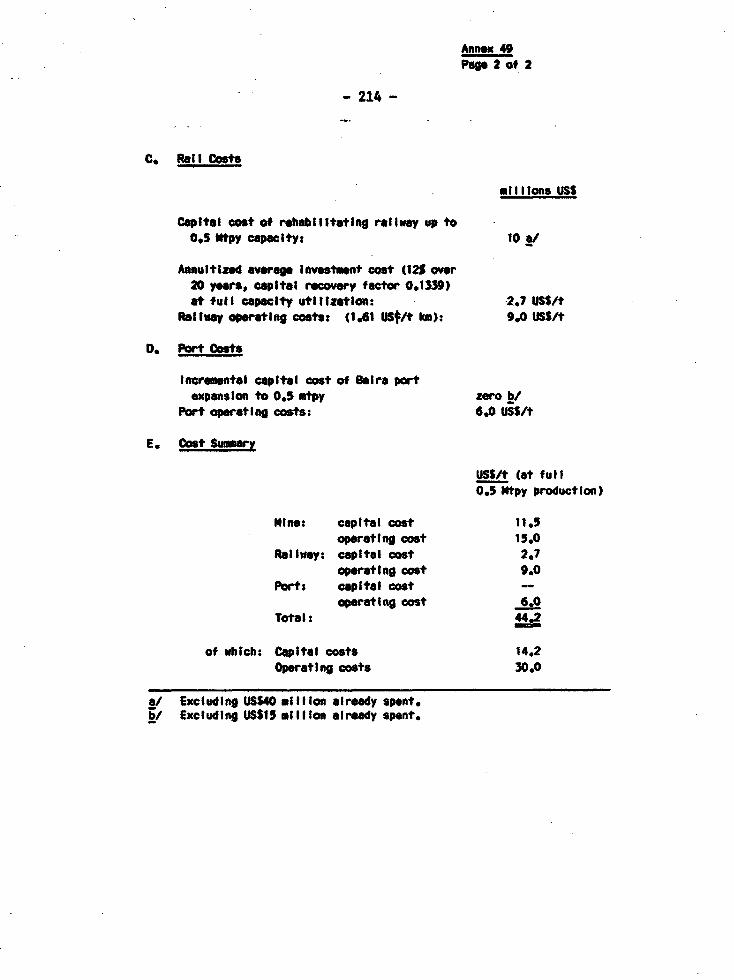
Annex 49Pop 2 of 2
- 214 -
C, Ratl costs
millions USS
Capital cost of rebabilitating railway up to0.5 ltpy capecity: 10 a/
Annultized vereag investment cost (125 over20 years, capital recovery factor 0.1339)at full capacity utilization: 2.7 USS/t
Railway operating costs: (1.61 USt/t ik): 9.0 USS/t
D. Part Costs
Incremental capital cost of Beira portexpansion to O.S mtpy zero b/
Port operating costs: 6.0 USS/t
E. Oost Summary
USS/t (at full0.5 ltpy production)
Nine: capital cost tl.SOperatina cost 15.0
Raolway: capital cost 2.7operatIng cost 9.0
Parts capital cost operatin ag cost 6.0
Total: 44.2
of which: Capital costs 14.2Operatin costs 30.0
a/ Excluding USS40 million already seint.bf Excluding USS115 million already spent.
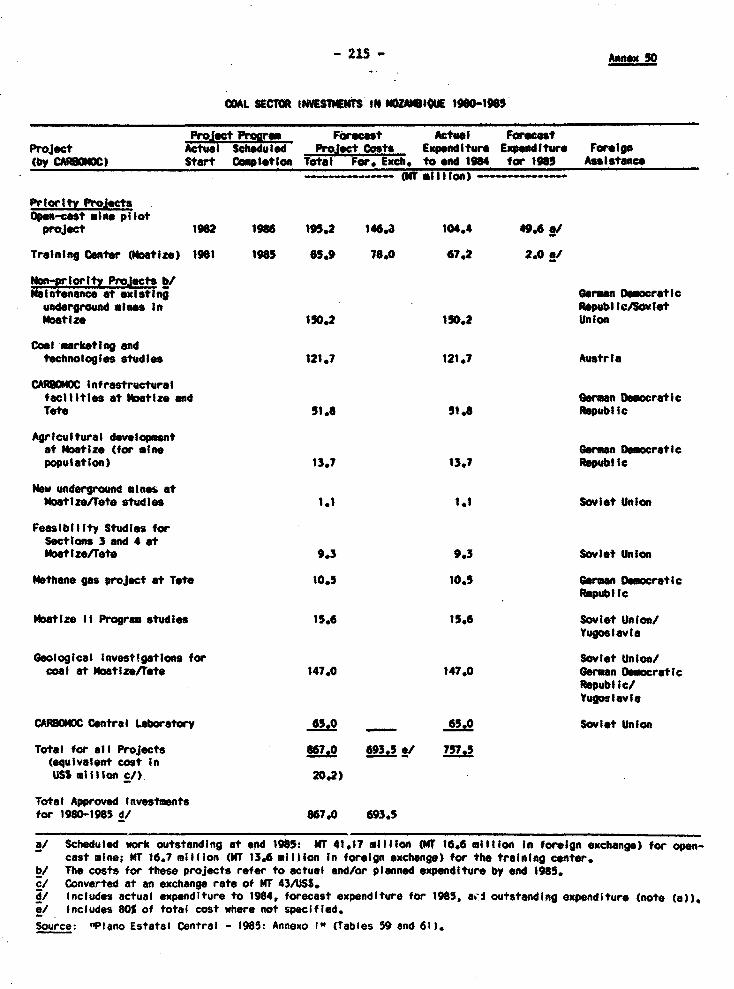
-215 Ann x 50
COAL SECTfR tl5muETS IN NZm<I|UE 1960-1965
Project Prcoqrm ForAcct Atual ForecastProject Actusl Sceuled Prolect Costs Expenditure Expenditure ForeIgn(by CANOC) Start Comptetion Total For. Euch. to and 1984 for 1985 Assistanc
~~ ~ ---(Mt millilon)
Priority ProjectsOpen-cast mine pIlot
project 1982 1966 195.2 146d. 104.4 49.6 a/
Training Center (Ooatize) 1961 1985 85.9 78.0 67.2 2.0 g/
Mon-priority Prolects b/Maintenonce at existing German Deoraticundergrouncd sins In RPpubilc/SovietMstize 150.2 150.2 Union
Coal morketing andtechnologoes studies 121.7 121.7 Austria
CA3OMOC I nfrostructurasfacilitles at Mootize and German DemocraticTote 51.6 51.0 Republic
Agricultural developmentat Mostize (for mine Germn DemocratIcpopulation) 13.7 13.7 Republic
New underground ines atMoatiz/eTete studies 1.1 1.1 Soviet Union
Feasibility Studles forSections 3 and 4 atNoatize/Tete 9.3 9.3 Soviet Union
Methane gas project at Tote 10.5 10.5 German DemocraticRepubilc
Moatize It Program studies 15.6 15.6 Soviet Unlon/Yugoslavia
Geological investigations for Soviet Union/coal at aoatize/Tete 147.0 147.0 German Democratic
Republic/Yugoslavia
CAFROMOC Central Laboratory 65.0 65.0 Soviet Union
Total for all Projects 867.0 693.5 1/ 757.5(equivalent cost InUSS million c/) 20.2)
Total Approved investmentsfor 1960-1985 d/ 867.0 693.5
a/ Scheduled work outstanding at end 1985: WT 41.17 lillion (MT 16.6 million in foreign exchange) for open-cost nine; MT 16.7 million (MT 13.6 million in foreign exchange) for the training center.
b/ The costs for these projects refer to actual and/or planned expenditure by end 1985.c/ Converted at an exchange rate of NT 43/USS.4/ Includes actual expenditure to 1984, forecast expenditure for 1985S ai'$ outstanding expenditure (note (a)).0/ Includes 80% of total cost where not specified.Source: "Piano Estatal Central - 1985: Annexo I" (Tables 59 and 61).
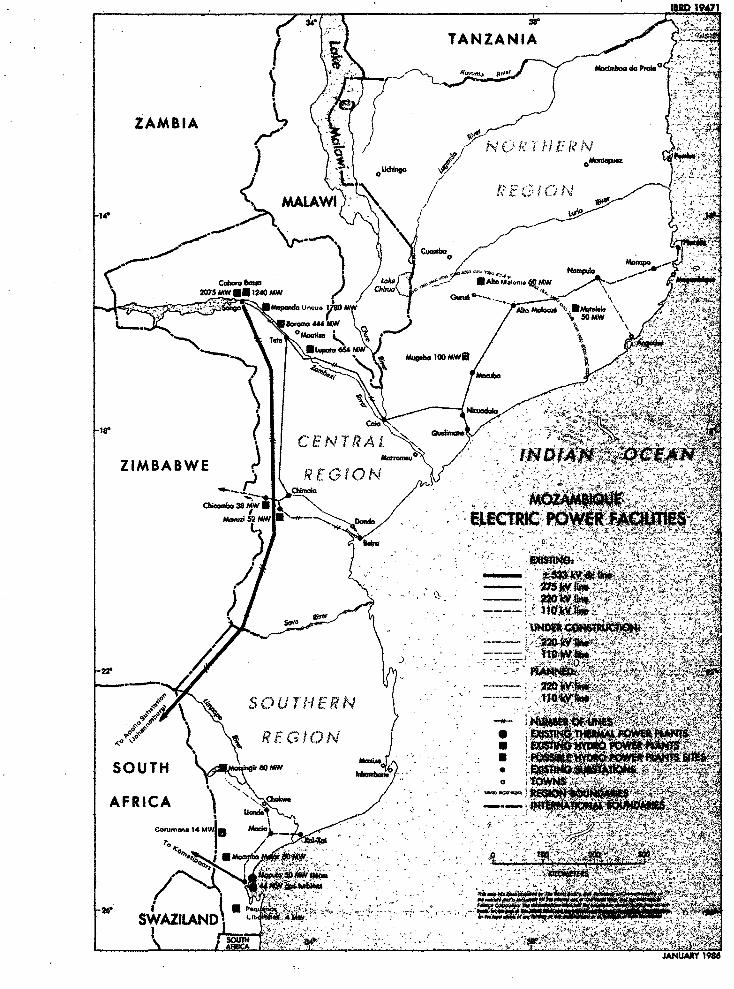
tURD 194J1
TANZANIA
ZAMBIA ( Ro . .
) %' \~~~~~~~~~~~~ I F Ate{f E/ s , N
0) - '- W&2UJL I Ci N'.MALAW, / _
\ 2075 1NW 1240 *AW j,,A # *Mweœng.*M Na -- +
2O7SAWdUU)2AOMW O,i,
-. EN T ALMW
) S ( ' ' . -' ,
ZIMBABWE DMAk
I~~~~~~W~TI , WS ^ %A___ThS <,~~~ ~ tG ., R N
t A ON J .......... ~~~A4 *~A - .}-2r~~~~~~~~~~~~~~~~~~~~~~~~~~~~~~~~~~~~~~~~~~~~~~~~~~~-
SOUTH SOUMWTH . * I p$
AFRICA
SWAZIILAND L .,.~
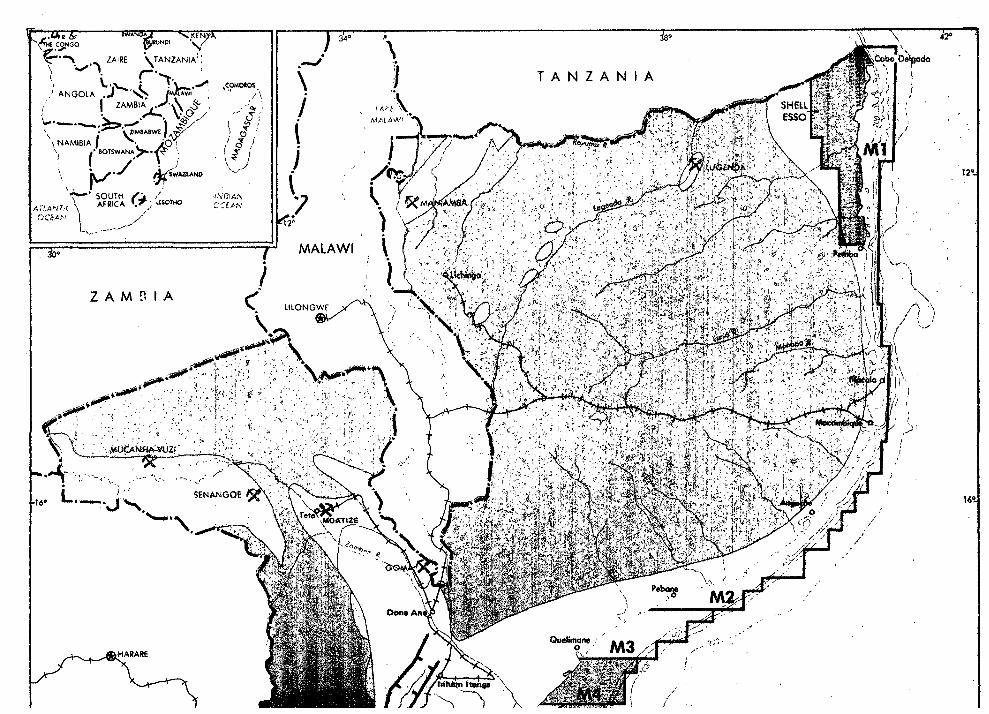
.1hz6' WANOJNKEYA4
A N G O L A ! Z A M B I A .T A N Z A N I
ANG$LA LAMWLAW\ N A M t B I ZA M I ; :~ ~ iI--
> ~ M
\NMBAFRC * '(NBOTASWAN
Z AM t~~~~~ I A MALAW 00i ,12'
ULONGWE~~~~.0
SOTV'NA
Z AiM I
HARARE ~ ~ ~ ~ LIONW
0110~~~~~~~
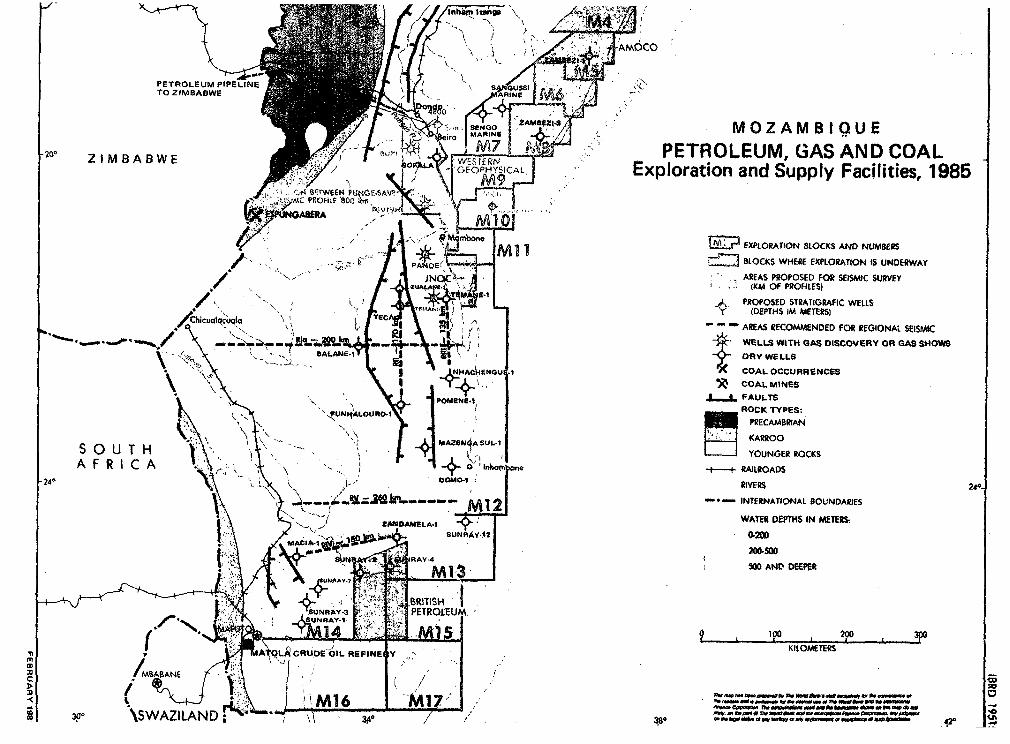
\ .~~ ~ AMO CO
PETROLE UM PIPEEINE
To ZIMBABWE
ARIN6 ~MOZAMBIQUE200 ZXMBABWE t *zn;,ts 4a ; PETROLEUM, GAS AND COAL
ZIMBABWE , * LA GEOPHYSCAL ;Exploration and Supply Facilities, 1985
.M. lX I MP] X EXPLORATION 8LOCKS AND NUMBeRS
- 'E BLOCKS WHERE EXPLORATION IS UNDERWAY
AREAS PROPOSED FOR SEISMIC SURVEY
(KM OF PROFILES)/ ;' >' , , 'T l ATSt IE 1 _ +. ~~~~~~~~~~~~~PROPOSED 5TRATIGRAflC WELLS
(DEDPTHS IMMETERS)
*/5 s ni si) t TECt \ ",) S ,0 ,1 -- ~~~~~~~~~~AREAS RECOMMENDED fOR REG40NAL StISMtC
WELLS WITH GAS DISCOVERY OR GAS SHOWS
\ \/97AR \ i\_ _ ' > i 6ALANE 1 a \ I O URY WELLS
\ LNHA \ t S¢tlENGU I COAL OCCURRENCES
I ___ ~~~~~~~~~~~~~~~5 (IOAI.MIN4ES
;_, FAULTS~~gHAC~~~4ENOU S ~~~~ROCK TYPES:
W j N001PRECAMBRIAN
MAZEN SUL-1 ~~~~~~~~KARROOS O U T H 'A SYOUNGER K ROCKS
A F R I C A t ,.- i\s.1+.eeWRAAFRICA ne -h---+ ~~~~~~~~~~~~~~~~~~~~~~~~~~RAILROADS 4
24° K -RIVERS 244
@*_ ~- INTERNATIONAL BOUNDARIES
12 \ k>> >,_ ,,./ ZMtDELA.1 9 ' _WATER DEPTHS IN METERSWZANDAMELA.1
> 1 A />ec>1 a ,;1tOl!&4~~~~~~SUN sIY. 12 0 20W
RAY-4 ~~~~~~~~~~~~~~~~~0 ANt' DEEPER
r * R: SUNFtAV .~ ?PETROLEUM
KILOMETERSCRUDE OIL FREFINE ZY
1MBASAtw^NE ,M 6 :/ ,A... _
8 xt° XsW<ILAND ^ t X ' t\M16 , ,,' wo =-- .Jt t/t
Copyright © 2022 FDOKUMEN