Andy James Louis Harveson Borderlands Research Institute ...
37
Andy James Louis Harveson Borderlands Research Institute Sul Ross State University
-
Upload
khangminh22 -
Category
Documents
-
view
3 -
download
0
Transcript of Andy James Louis Harveson Borderlands Research Institute ...

Andy James Louis Harveson
Borderlands Research Institute
Sul Ross State University

Mule deer are becoming more popular in the state of Texas
Very few studies of any type on mule deer in the Trans Pecos

Basic mule deer ecology
Annual & seasonal home ranges
Effects of supplemental feed on home ranges
Determine daily movement patterns
Evaluate habitat use
Effects of supplemental feed and water on habitat use
Better understanding of antler development
Aging techniques from teeth wear and replacement and cementum annuli
Comparison of deer density, fawn production, & sex ratios between fed and non-fed sites

Annual & Seasonal Home Ranges
Effects of supplemental feed on home range and habitat use

Brewster Co. (Lawrence et al. 1994)
Male mule deer had home ranges of 4.3 square miles (2,750 ac)
Longfellow Ranch – Pecos Co (Wampler 1980)
Male mule deer had home ranges of 3.0 square miles (1,920 ac)

Deer were captured annually from 2006-2010
Animals were aged based on teeth wear
Antler measurements taken using Gross B&C method
GPS collars were placed around neck
Collected data every 5 hours

GPS Collars remained on deer from 1-4 years.
Collar data was then entered into ArcGIS for spatial analysis
Hawths Tools was used to determine home range size
50% Fixed Kernel (Core Area)
95% Fixed Kernel (Home Range)

An Annual Home Range was determined March 1 – February 28
4 Seasonal Home Ranges were determined Spring (March 1 – May 31)
Summer (June 1 – August 31)
Fall (September 1 – November 30)
Winter (December 1 – February 28) – Includes breeding season

63 Collar Years
40 Unique Deer
98,492 Total Locations
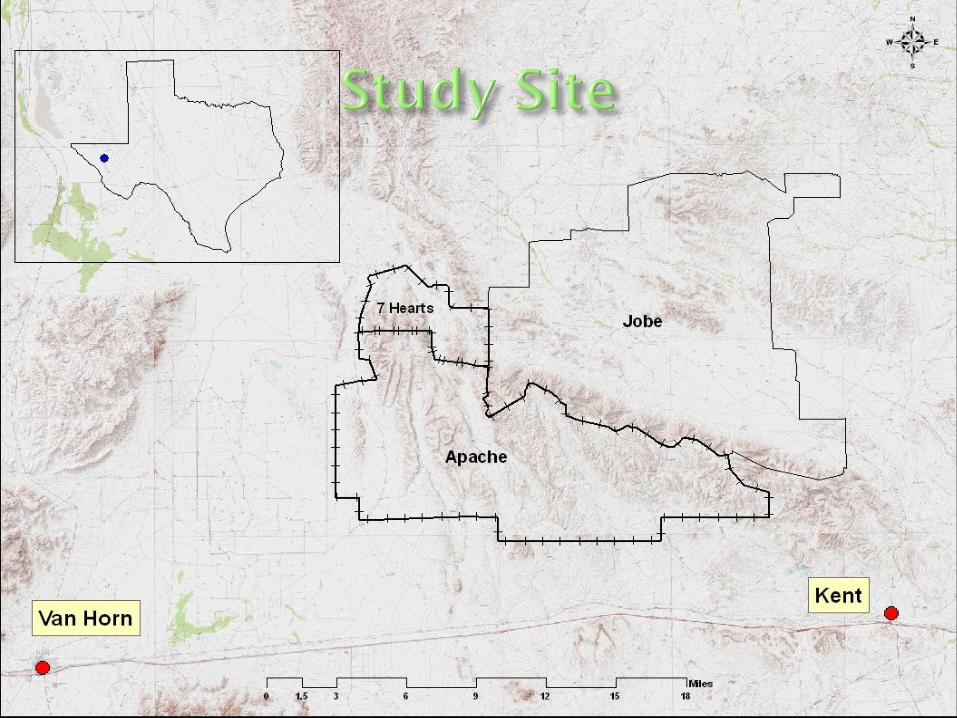
Approx. 45 miles across Over 300,000 acres

Ranches
Apache
Jobe
Years
2006 -2010
Seasons
Spring, Summer, Winter, Fall
Age
4 – 8 years of age

2006 2007 2008 2009 2010
Apache 10,708 9,143 7,371 7,190 8,974
Jobe 11,026 9,202 11,249 15,152
4,000
6,000
8,000
10,000
12,000
14,000
16,000
18,000
Acr
es
Apache vs. Jobe Annual Mule Deer Home Ranges (95% Kernel)
n=6 n=10 n=6 n=4 n=8 n=6 n= 4 n=2 n=10

Spring Summer Fall Winter Annual
2006 7,787 7,347 7,067 8,739 10,708
2007 7,760 6,966 5,213 7,269 9,143
2008 6,238 5,526 4,256 7,641 7,371
2009 4,922 5,372 4,952 8,319 7,190
2010 6,804 5,337 4,577 11,285 8,974
3,000
5,000
7,000
9,000
11,000
13,000
Acr
es
Seasonal Home Ranges Of Mature Mule Deer Bucks On The Apache Ranch From 2006-2010

Spring Summer Fall Winter Annual
2006 7,134 7,099 6,232 10,439 11,026
2007 7,550 5,846 6,511 7,446 9,202
2008 8,648 7,496 6,561 11,297 11,249
2009 9,180 6,684 5,984 10,892 15,152
4,000
6,000
8,000
10,000
12,000
14,000
16,000
18,000
20,000
Acr
es
Seasonal Home Ranges Of Mature Mule Deer Bucks On The Jobe Ranch From 2006-2010

Spring Summer Fall Winter Annual
Apache 6,839 6,014 5,097 8,970 8,723
Jobe 7,845 6,942 6,350 10,157 11,130
2,000
4,000
6,000
8,000
10,000
12,000
14,000
Acr
es
Apache vs Jobe Average Seasonal Home Ranges From 2006-2010 (95% Kernel)


Where each deer spends approximately 50% of his time
Based on the density of known locations

2006 2007 2008 2009 2010
Apache 2,363 1,956 1,332 1,389 1,597
Jobe 2,354 2,028 2,681 2,646
0
500
1,000
1,500
2,000
2,500
3,000
3,500
4,000
Acr
es
Apache vs Jobe Annual Core Area (50% Kernel)
n=6 n=10 n=6 n=4 n=8 n=6 n=4 n=2 n=10

Spring Summer Fall Winter Annual
Apache 1487 1330 1139 1727 1709
Jobe 1752 1665 1451 2244 2410
500
1000
1500
2000
2500
3000
Acr
es
Apache vs. Jobe Average Seasonal Core Area Size From 2006-2010 (50% Kernel)
n=39 n=23 n=35 n=22 n=34 n=22 n=30 n=21 n= 34 n=22

How do home ranges change as deer grow older?

4 yrs 5 yrs 6 yrs 7 yrs 8 yrs
95% Kernel 10,244 9,980 9,477 8,686 6,939
50% Kernel 1,903 2,152 1,947 1,599 1,634
0
2,000
4,000
6,000
8,000
10,000
12,000
Acr
es
Annual Home Ranges Of Mature Mule Deer Based On Age From 2006-2010
n=8 n=22 n=20 n=5 n=1

Spring Summer Fall Winter
4 yrs 7,891 6,271 5,367 13,577
5 yrs 7,721 6,566 5,864 8,646
6 yrs 6,755 6,345 5,626 8,868
7 yrs 6,216 5,917 4,688 8,067
8 yrs 7,157 5,746 5,071 5,049
2,000
4,000
6,000
8,000
10,000
12,000
14,000
16,000
Acr
es
Seasonal Home Ranges Of Mature Mule Deer Based On Age


0.00%
10.00%
20.00%
30.00%
40.00%
50.00%
60.00%
70.00%
80.00%
50 150 250 350 450 550 650 750 850 950 1050 1150 1250 1350 1450 1550 1650 1750 1850 1950 2050 2150 2250 2350 2450
2010 Cumulative Mule Deer Locations In Relation To Water With Feed Sites
(Distance in Meters)
Mar/Apr/May Jun/Jul/Aug Sept/Oct/Nov Dec/Jan/Feb Random Points

Habitat Use (Ecological Sites, Slope, Aspect)
Influence of Ag production
Effects of supplemental feed on immigration, emigration, nutrition, & fawn recruitment
Movements & dispersal of 1.5 yr – 3.5 yr old deer
Fawn survival & recruitment
Home ranges on female mule deer
Breeding efficiency of mule deer bucks (paternity/genetics) & antler development of bucks (10 yr study across multiple ranches)

Daily Movements
15.9 Miles Over 25 Hours
6.8 Miles Over 5 hours

Management of Mule deer may have to take place on much larger scale than previously thought
Supplemental feeders may increase fawn crops and deer densities

Seasonal home ranges vary
Largest home range during the winter
Smallest home range during the fall
Habitat selectivity may be affected by supplemental feed and water
Deer appear to spend a significant amount of time near feed and water locations

Apache Ranch Dan Allen & Peggy Hughes
Will Hughes
George Strickhausen
P.J. Fouche
Jobe Ranch Stanley Jobe
Misty Sumner
Lane Sumner
Borderlands Research Institute
Various Grad Students

Juanita Hughes Foundation Nunley Brothers Texas Bighorn Society John T. Saunders Plack Carr Wagner Construction Bud Christy H. M. Palm Robert & Tracy Herrin Albert Nance III Steve Dutton Coastal Conservation Assoc. And Many Others
Houston Safari Club Dallas Safari Club John Poindexter Chris Moser San Antonio Livestock Show Steve C. Lewis Circle Ranch Dr. Bill Eikenhorst DF Ranch Brad Everett Nelson Puett Foundation Hill Country Safari Club