2014 - Louis Dreyfus Company
66
INTERIM REPORT 2014
-
Upload
khangminh22 -
Category
Documents
-
view
1 -
download
0
Transcript of 2014 - Louis Dreyfus Company

I N T E R I M R E P O R T 2 0 1 4

Unless otherwise indicated, “Louis Dreyfus Commodities”, “Group”, “Louis Dreyfus Commodities Group” and related terms such as “our”,“we”, etc., mean the Louis Dreyfus Commodities B.V. Group.
An IntegrAted CommodItIes CompAny 02
Our Distinctive Profile 02
Our Business Model 04
mAnAgement dIsCussIon & AnAlysIs 06
Management Discussion & Analysis 08
Financial Highlights 09
Income Statement Analysis 10
Balance Sheet Analysis 12
InterIm Condensed ConsolIdAted 16 FInAnCIAl stAtements
Auditor’s Report on Review of Interim 18 Financial Information
Interim Consolidated Income Statement 19
Interim Consolidated Balance Sheet 20
Interim Consolidated Statement of 22 Comprehensive Income
Interim Consolidated Statement of Cash Flows 23
Interim Consolidated Statement of Changes 24 in Equity
Notes to the Interim Condensed Consolidated 25 Financial Statements
CorporAte goVernAnCe 61
regIonAl HeAd oFFICes 62
CONTENTS
Management Discussion & Analysis
Interim Condensed Consolidated Financial Statements
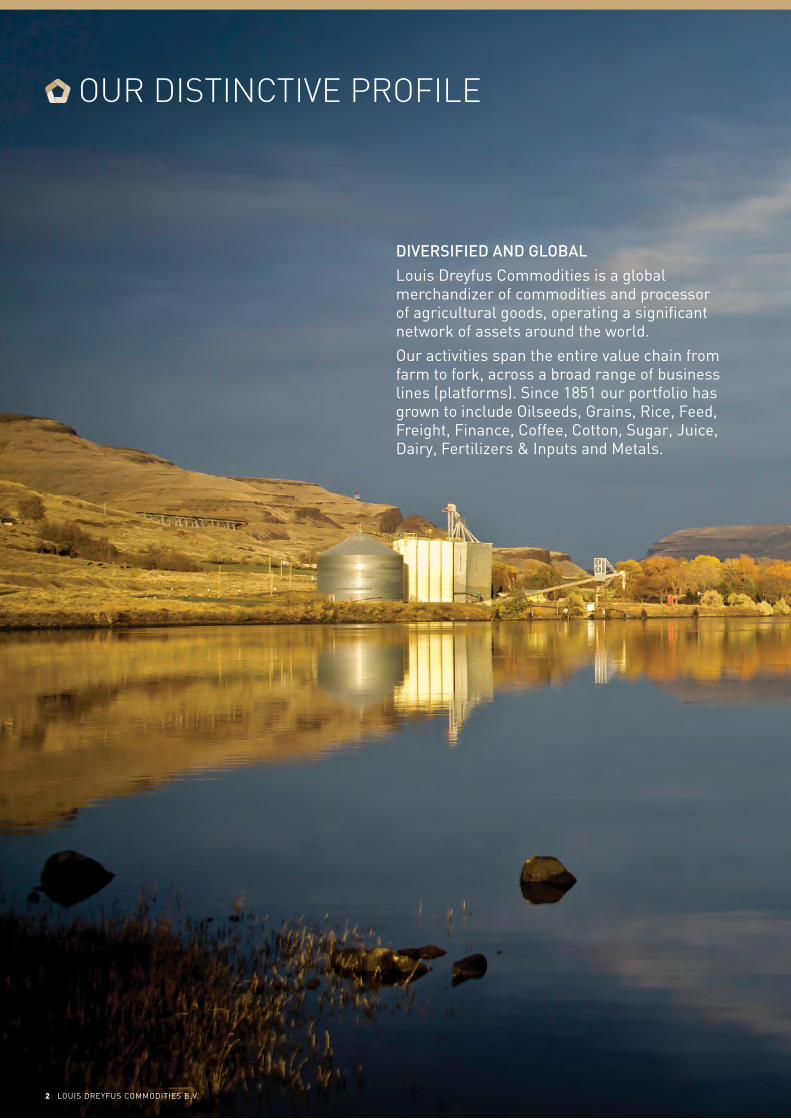
DiversifieD anD Global
Louis Dreyfus Commodities is a global merchandizer of commodities and processor of agricultural goods, operating a significant network of assets around the world.
Our activities span the entire value chain from farm to fork, across a broad range of business lines (platforms). Since 1851 our portfolio has grown to include Oilseeds, Grains, Rice, Feed, Freight, Finance, Coffee, Cotton, Sugar, Juice, Dairy, Fertilizers & Inputs and Metals.
OUR DISTINCTIVE PROFILE
2 LOuIS DREyFuS COMMODItIES B.V.

An IntegrAted CommodItIes CompAny
our dIstInCtIVe proFIle
OuR BuSINESS MODEL
We help feed and clothe some 500 million people every year by originating, processing and transporting approximately 77 million tons of commodities. In our efforts to help sustain a growing global population, we rely on our worldwide presence, responsible practices, sophisticated risk management and in-depth market knowledge.
the commitment of our employees is essential to those efforts, which is reflected in their ownership of approximately 15% of the Group.n 163 years of experiencen Continued sustainable expansion
Key FACts
22 000+People employed globally at peak season100
Countries
Operating in over
Logistic asset – Pasco WA, uS
85%owned by the louis Dreyfus
Group
approx.
15%employee
owned
approx.
6 13Regions Platforms
Matrix organization of
2014 inTeriM rePorT 3
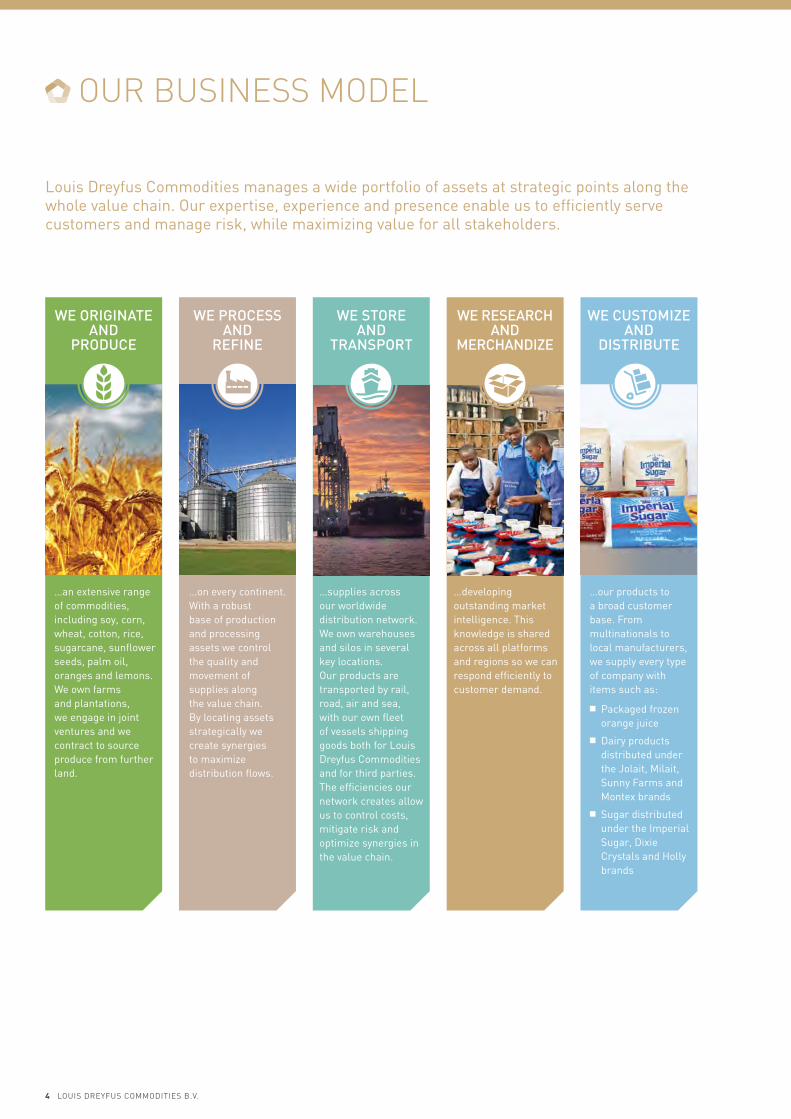
Louis Dreyfus Commodities manages a wide portfolio of assets at strategic points along the whole value chain. Our expertise, experience and presence enable us to efficiently serve customers and manage risk, while maximizing value for all stakeholders.
We oriGinaTe anD
ProDuce
…an extensive range of commodities, including soy, corn, wheat, cotton, rice, sugarcane, sunflower seeds, palm oil, oranges and lemons. We own farms and plantations, we engage in joint ventures and we contract to source produce from further land.
We sTore anD
TransPorT
…supplies across our worldwide distribution network. We own warehouses and silos in several key locations. Our products are transported by rail, road, air and sea, with our own fleet of vessels shipping goods both for Louis Dreyfus Commodities and for third parties. the efficiencies our network creates allow us to control costs, mitigate risk and optimize synergies in the value chain.
We Process anD
refine
…on every continent. With a robust base of production and processing assets we control the quality and movement of supplies along the value chain. By locating assets strategically we create synergies to maximize distribution flows.
…our products to a broad customer base. From multinationals to local manufacturers, we supply every type of company with items such as:
n Packaged frozen orange juice
n Dairy products distributed under the Jolait, Milait, Sunny Farms and Montex brands
n Sugar distributed under the Imperial Sugar, Dixie Crystals and Holly brands
We cusToMize anD
DisTribuTe
We research anD
MerchanDize
…developing outstanding market intelligence. this knowledge is shared across all platforms and regions so we can respond efficiently to customer demand.
OUR BUSINESS MODEL
4 LOuIS DREyFuS COMMODItIES B.V.

An IntegrAted CommodItIes CompAny
OuR DIStINCtIVE PROFILE
our busIness model
Our thirteen dedicated platforms are organized into two segments: Value Chain Platforms and Merchandizing Platforms. Spanning the entire value chain, these diverse platforms drive volume growth and underpin our expansion strategy.
value chain PlaTforMs MerchanDizinG PlaTforMs
Grains suGarWe originate and merchandize wheat, corn, sorghum, barley, rye, oats and ethanol.
We originate raw and white sugar, mainly from Brazil, thailand and Central America.
Juice financeWe process and merchandize orange, grapefruit, lime, lemon and apple juices as well as citrus by-products.
We support our platforms by providing foreign exchange risk mitigation.
freiGhT coffeeOur global footprint is expanding with our extended network and involvement in new trade flows.
We originate, process, and merchandize Arabica and Robusta green coffee worldwide via our extensive origin presence and marketing offices.
ferTilizers & inPuTs riceWe trade and distribute fertilizers, crop protection products, seeds and basic chemicals.
We merchandize paddy, brown and milled rice from multiple origins.
feeD DairY
MeTals
We operate mills and merchandize livestock feed for hogs, broilers and layers, by leveraging synergies with the Oilseeds and Grains Platforms.
We merchandize the full range of dairy commodities, including milk powders, whey powders, fat filled powders, specialized ingredients, fats and cheeses.
We originate, consolidate, process, merchandize and transport base and precious metals in raw and refined form.
oilseeDs coTTonWe process and merchandize soybeans, soybean meal and oil, seeds (rapeseed, sunflower, cottonseed), seed meal and oil, palm oil, biodiesel and glycerin.
We source cotton from all major producers, and serve all key global consumer markets.
2014 inTeriM rePorT 5

MaNagEMENT DISCUSSION & aNaLySIS
Balikpapan, Indonesia
For most of the agricultural markets, the first half of the year was marked by forecasts of excellent crops. Geopolitical turmoil and climatic uncertainties in specific regions partially affected fundamentals in a context of record or near-record surpluses. During this period, Louis Dreyfus Commodities expanded its shipped volumes, increased its income before tax and secured a sound net income.
Net sales reached uS$33.7 billion, up by 16% from the previous year. Louis Dreyfus Commodities B.V. reported a consolidated net income, Group Share, of uS$260 million for the six-month period ended 30 June 2014, a performance in line with the same period in the previous year.
Price and volatility levels have been affected by substantial inventories for most of the platforms and fast growing supply, especially for Oilseeds and Grains. Political turmoil in the Black Sea region and weather-related uncertainties have only periodically influenced those levels of prices and volatility.
Our business model, based on a broad and geographically diversified portfolio, enabled us to deliver good performance and increase our volumes. Our balanced product mix yielded solid contributions in each segment with the Merchandizing segment’s varied range of platforms seizing market opportunities, and the Value Chain segment benefiting from good processing margins and efficient assets. Demand has been resilient over the first half, while our Group harnessed a 6% rise in shipped volumes year-on-year.
With uS$315 million selectively invested across the platforms during the first six months of 2014, the Group pursued a targeted capital expenditure plan, aimed at growing its asset base throughout the value chain in order to be able to respond to rising demand. We entered into the business of processing corn and merchandizing corn grits, pet food, and other corn products, through the acquisition of Kowalski Alimentos S.A., one of the largest Brazilian corn dry milling players. We also expanded our logistics network for Rice, Grains, Oilseeds and Coffee in various locations including Brazil, Australia, Senegal, Europe, Vietnam and the uS.
In 2013, we reinforced our capital structure while diversifying funding sources by entering European debt capital markets with the issuance of two Eurobonds for an aggregate amount of €900 million (approx. uS$1.2 billion equivalent). During the first half of 2014, some of the Eurobond proceeds allowed regional subsidiaries to repay in advance some term Loans that were about to become current during 2014, showing a more balanced duration between short- and long-term debt. Long-term debt average maturity now stands at 4.8 years compared to 4.4 years in December 2013. Covering 43% of the balance sheet, liquidity remained very strong throughout the semester.
Over the period, the overall economic context has been characterized by a duality where advanced economies gradually strengthened, while developing countries enjoyed vibrant but still transitioning growth. South America being a key origination market for the Group, we are closely monitoring recent macroeconomic evolution in this region, notably in Argentina.
the fundamentals of our business remain strong. In terms of total GDP, emerging markets have now surpassed developed economies and consumption habits are consequently evolving. Feeding this changing population is both an opportunity and a challenge for agribusinesses as food production will have to double by 2050.(1)
We believe the Group, capitalizing on its 163-year track record through various market cycles, is well positioned in the value chain, and in key geographies, to translate this global potential into strong and sustainable results. With a return on equity of 11% over the period, the Group remains committed to addressing both the current and the future challenges faced by agricultural markets.
Finally, I would like to warmly thank all our employees for their unfailing commitment and hard work. their ability to make the most of every opportunity is essential to Louis Dreyfus Commodities’ success.
Claude ehlinger Interim Chief Executive Officer and Chief Financial Officer
MaNagEMENT DISCUSSION aND aNaLySIS
(1) FAO Report “How to Feed the World in 2050”
8 LOuIS DREyFuS COMMODItIES B.V.
mAnAgement dIsCussIon & AnAlysIs
mAnAgement dIsCussIon & AnAlysIs
FInAnCIAl HIgHlIgHts
INCOME StAtEMENt ANALySIS
BALANCE SHEEt ANALySIS
(2) Volumes shipped to destination.(3) Purchase of fixed assets and additional investments, net of cash acquired.(4) Cash and cash equivalents, other current financial assets at fair value, readily marketable inventories (RMI) and undrawn committed bank lines.(5) Adjusted net debt (net debt less RMI) on total equity.(6) Annualized, beginning of period – excluding perpetual hybrid capital securities.
financial hiGhliGhTsthe following discussion of the Group’s operational results and financial position should be read in conjunction with the interim condensed consolidated financial statements of the Group as at and for the six-month period ended 30 June 2014.
n Net sales of uS$33.7 billion, compared to uS$29.2 billion over the same period in 2013
n Income before tax at uS$315 million, up by 10% compared to June 2013
n Net income, Group Share, at uS$260 million, unchanged compared to the same semester one year before
n Volumes(2) up by 6% compared to the first six months of 2013
n total assets: uS$21.4 billion, versus uS$20.6 billion in June 2013 and uS$19.2 billion at the end of December 2013
n Capital expenditure(3) of uS$315 million over the semester
n Working capital usage: uS$10.2 billion, up by 9% compared to June 2013
n Strong liquidity(4) covering 43% of the balance sheet as of 30 June 2014
n Adjusted net Gearing(5) at 0.78
n Return on equity(6) of 11% – Group Share
2014 inTeriM rePorT 9
incoMe sTaTeMenT analYsisA new organizational model set and implemented by Louis Dreyfus Commodities during the six-month period ended 30 June 2014 resulted in the reorganization of platforms into two newly created segments.
the Value Chain segment comprises the following platforms: Oilseeds, Grains, Juice, Fertilizers & Inputs and Feed. these platforms have a fully-integrated asset network ranging from production to distribution. the segment also includes the Freight Platform, which supports the Group’s businesses with its international presence covering all major commodities’ flows, and particularly the Grains and Oilseeds platforms. Products commercialized in this segment encompass commodities for both human and animal consumption.
the Merchandizing segment consists of platforms that have a more merchant-oriented business model within the Group: Cotton, Sugar, Finance, Coffee, Rice, Dairy and Metals. Merchandizing activities can take place for a wide range of products among these platforms, from raw to processed commodities, sometimes sold under the Group’s own brands.
neT salesNet sales for the first semester of 2014 totaled uS$33,686 million, 16% higher than the uS$29,161 million recorded over the first semester of 2013, while the Group grew its shipped volumes by 6%.
Fueled by abundant crops and supported by good efficiency from logistic and processing assets, the Grains and Oilseeds platforms booked a great part of the increased volumes among the Value Chain segment.
Price levels remained globally stable over the period, influenced only sporadically by uncertain weather conditions and recent events in the Black Sea region.
Volumes shipped by the Metals Platform increased significantly, positively contributing to the Merchandizing segment. Increased supply and substantial inventories for most of its platforms led to muted prices and volatility levels.
Sales to emerging markets(7) represented 64% of total sales, the same level as in the same period one year ago.
Gross MarGinGross margin reached uS$842 million, compared to uS$753 million a year ago, a 12% increase year-on-year.
seGMenT oPeraTinG resulTs(8)
the Group closed the first semester with total Segment Operating Results of uS$831 million, up by 13% from uS$738 million one year earlier.
the Value Chain segment benefited from increasing volumes and good management of global supply and demand. the Merchandizing segment has also positively contributed to the Group’s profits during the first semester, taking advantage of a broad portfolio and good market knowledge.
Furthermore, both segments have similarly contributed to the significant increase in Segment operating results.
value chainthe Value Chain segment booked uS$403 million in Operating Results, up by 4% from the uS$389 million posted for the first semester of 2013. the overall environment was mainly marked by abundant crop expectations throughout the Americas and Europe. Markets continued to follow fundamentals, as supply was expected to surpass demand growth, despite being periodically influenced by political turmoil in the Black Sea region.
the Oilseeds Platform recorded strong profits, benefiting from the performance of processing and elevation assets, fueled by the high level of crops.
(7) Asia, Latin America, Middle East and Africa.(8) Gross margin plus share of income in associates and joint ventures.
10 LOuIS DREyFuS COMMODItIES B.V.

mAnAgement dIsCussIon & AnAlysIs
MANAGEMENt DISCuSSION & ANALySIS
FINANCIAL HIGHLIGHtS
InCome stAtement AnAlysIs
BALANCE SHEEt ANALySIS
Over the period, the Grains Platform’s good results were supported by increasing shipped volumes and good margins on ethanol, taking the benefit of continuously developing previous years’ investments.
Lower orange juice consumption and large inventory levels in an environment of decreasing prices affected the performance of the Juice Platform during this off-seasonal semester. Lower volumes were processed over the period, notably after citrus greening disease led to a reduced crop in the uS.
Albeit securing its flows, the Fertilizers & Inputs Platform faced a challenging environment of pressurized margins with increasing competition in Africa.
the Freight Platform booked sound results, efficiently supporting the Group’s expanding activities.
MerchanDizinGIn the first half of 2014, the Merchandizing segment posted Operating Results of uS$428 million, up by 23% from the uS$349 million for the previous year. Over the period, all its platforms except Coffee have experienced near-record or projected near-record inventory levels. Good market knowledge and enhanced geographical diversification have enabled the Group to benefit in this context.
Constrained by an oversupplied global market, despite strong net sales, the Sugar Platform’s performance was tempered due to tight domestic margins.
the Cotton Platform realized strong profits, benefiting from a solid export pace in the uS attributable to tighter free inventories outside of China. Logistics assets performed well, especially in Australia. With inventories expected to reach absolute highs, and limited market visibility towards Chinese regulatory policies, prices have weakened over the period.
Coffee merchandizing activities generated positive results and improved volumes in a highly volatile environment. uncertainty remains regarding the extent of the damage caused by the drought that has affected Brazil, where tree development for the following crop might also be negatively impacted. As a result of these lower crop estimates, Arabica prices have reached a three-year high.
Although rice market conditions were difficult following an expected record-breaking level of surpluses, the Platform’s strategy enabled the Group to book positive margins. Prices firmed up at the end of the first half following concerns about consequences of a potential El Nino phenomenon as well as changes in regulations in India affecting exporters.
the Metals Platform performed soundly, notably in merchandizing copper, refined copper, zinc and lead concentrates. the Platform capitalized on opportunities to expand into new origination and destination markets and increase its volumes significantly.
Over the semester, the Dairy Platform merchandized higher volumes but suffered from a difficult environment resulting from both rapidly increasing inventories at destination and declining prices.
the Finance Platform efficiently managed the Group’s overall financial exposures.
coMMercial anD aDMinisTraTive exPensesCommercial and administrative expenses came in at uS$372 million, versus uS$347 million during the first six months of 2013. this 7% increase year-on-year reflects the Group’s increasing shipped volumes and the scope effect following the acquisitions completed in 2014 and in 2013. Although they increased, costs were monitored with discipline as part of a strategy towards operational efficiency.
2014 inTeriM rePorT 11
neT finance cosTsInterest expenses stood at uS$168 million, up by a slight 4% compared to the first half of 2013, despite an 8% increase of average gross debt and a substantial lengthening of average long-term debt maturity.
this positive performance was made possible by improved funding conditions, especially throughout the Americas.
Net finance costs reached uS$111 million, compared to uS$103 million a year ago; a moderate increase considering that Argentine legislation enacted in November 2013 deeply reduced Peso-denominated funding, hence negatively impacting the Foreign Exchange recorded in the income statement.
incoMe before TaxIncome before tax stood at uS$315 million for the semester ended 30 June 2014, up 10% compared to the uS$287 million reached one year earlier.
neT incoMeNet income, Group Share, settled at uS$260 million for the six-month period ended 30 June 2014, at the same level as at the same point last year.
balance sheeT analYsisfixeD asseTs anD invesTMenTs in associaTes anD JoinT venTuresAt the end of June 2014, total non-current assets stood at uS$5.0 billion, with fixed assets and investments in associates and joint ventures representing 82% of the total. Compared to December 2013, and chiefly related to the acquisition of Kowalski Alimentos S.A. in Brazil, Fixed Assets increased by 4%.
caPiTal exPenDiTure(3)
During the first half of 2014, Louis Dreyfus Commodities pursued its selective expansion strategy by investing uS$315 million over the period, compared to uS$298 million a year ago.
the Group’s capital expenditure strategy aims at targeted growth, expanding into new geographies and diversifying into new product lines. taking full advantage of a broad portfolio, Louis Dreyfus Commodities’ activities are supported by strategic assets located in key production and consumption areas. the Group continued to execute its selective and flexible investment plan while remaining committed to safety, health and the environment.
the Value Chain segment invested uS$255 million over the period, both vertically expanding its asset base and enhancing its geographical presence. through the acquisition, in March, of Kowalski Alimentos S.A., one of the largest Brazilian corn milling players, Louis Dreyfus Commodities extended its footprint along the grains value chain: the Group is further entering into the business of processing and merchandizing corn grits and pet food, as well as other corn products.
In Australia, the Grains Platform continued to invest in rail access to its upcountry assets in New South Wales, aimed at gaining efficiency and increasing its volumes. Ongoing projects within the Oilseeds Platform included completion of the construction of an oil refinery in Lampung, Indonesia, as well as the completion of a new lecithin plant and improvements to assets in General Lagos, Argentina. In terms of logistics, Louis Dreyfus Commodities is further consolidating its origination network for the Grains and Oilseeds platforms in Brazil, building a new silo located in the state of Mato Grosso. Aiming at increasing its origination capacity and extending its global reach, the Group also continued its investment in its existing elevators located in North America. the Fertilizers & Inputs Platform continued to enhance its logistic footprint with additional warehouses located in West African countries.
12 LOuIS DREyFuS COMMODItIES B.V.

mAnAgement dIsCussIon & AnAlysIs
MANAGEMENt DISCuSSION & ANALySIS
FINANCIAL HIGHLIGHtS
InCome stAtement AnAlysIs
bAlAnCe sHeet AnAlysIs
the Merchandizing segment invested uS$60 million over the first semester of 2014. In February, Louis Dreyfus Commodities acquired the shares of Ilomar Holding N.V. Group, a leading Belgian commodities supply chain company with branches in Belgium, Spain, Vietnam and the uS. the Coffee Platform continued its ongoing investment in a brownfield warehouse in Villanueva, Honduras. the Sugar Platform completed the construction and carried out improvement works at its refinery in Fujian, China, as well as at its plants in the uS. Within the Rice Platform, Louis Dreyfus Commodities contributed a capital injection to Orient Rice Company (Vietnam) in January, further developing the joint venture agreement signed in 2013 with a view to processing and merchandizing rice products and by-products. the Group also acquired a warehouse in Dakar, Senegal, aiming to expand its West African distribution network for Rice. Servicing the Metals Platform, Louis Dreyfus Commodities started operations in its warehouse located in Callao, Peru. In addition to an off-take agreement signed with a Canadian mining corporation and its Peruvian subsidiary, this represents an important step in Louis Dreyfus Commodities’ continued development in South America as well as in copper concentrates.
WorkinG caPiTal usaGeWorking capital usage (“WCu”) stood at uS$10.2 billion at the end of June 2014, a seasonal increase over the uS$8.5 billion reported at the end of December 2013 due to high inventory levels at this time in the year, and above the uS$9.4 billion reported in June 2013. this 9% increase year-on-year comes from the Merchandizing segment where inventories have increased, especially for the Metals Platform, whose growing activity has been enabled by higher financial debt.
Due to their highly liquid nature, certain agricultural inventories are treated as Readily Marketable Inventories (“RMI”).
RMIs are readily convertible into cash because of widely available markets and international pricing mechanisms. Louis Dreyfus Commodities considers that trading inventories of fewer than three months can qualify as RMI. At the end of June 2014, RMI represented 83% of total inventories, in line with the 84% of June 2013.
financinGLouis Dreyfus Commodities’ financial model is designed to support the Group’s long-term strategy. to match uses with financial resources and preserve a balanced capital structure, the Group’s key guidelines are that short-term debt is used to support on-going business, financing its main working capital needs, while long-term debt mainly provides support for long-term investments. to further enhance its funding model, the Group implements a sound funding policy based on four pillars: maintaining resilience of its funding model, diversifying its sources of funds, extending its debt maturity profile and increasing the level of its committed facilities.
Debt and leverage
In 2013, we reinforced our capital structure while diversifying funding sources by entering European debt capital markets for the first time with the issuance of two Eurobonds for an aggregate amount of €900 million (approx. uS$1.2 billion equivalent). During the first half of the year, some of the Eurobond proceeds allowed regional subsidiaries to repay in advance some term Loans that were about to become current during 2014. As a result, long-term debt stood at uS$3.1 billion at the end of June 2014 versus uS$3.6 billion in December 2013, showing a more balanced duration between short- and long-term debt. Debt capital markets now provide 39% of Louis Dreyfus Commodities’ long-term debt and long-term debt average maturity has strongly improved, standing at 4.8 years as at the end of June 2014 compared to 4.4 years in December 2013.
As at 30 June 2014, short-term debt amounted to uS$7.2 billion, compared to uS$4.8 billion in December 2013 or uS$6.9 billion in June 2013. the evolution of short-term debt is closely linked to the seasonally higher level of working capital financing requirements. Readily Marketable Inventories represented 74% of short-term debt as at 30 June 2014.
the Group’s consolidated adjusted net debt stood at uS$4.0 billion at the end of June 2014 and adjusted net Gearing(5) was of 0.78 at the end of the semester.
2014 inTeriM rePorT 13
liquidity
the Group maintains, at all times, sufficient available liquidity to cover short-term liabilities and provide constant access to liquidity, which remained very strong throughout the semester, covering 43% of the balance sheet. At the end of June 2014, uS$2.5 billion of undrawn facilities were committed, of which uS$2.4 billion have a maturity greater than one year. Committed lines represented 31% of total facilities.
financing arrangements
During the first half of the year, Louis Dreyfus Commodities LLC, the North American subsidiary of Louis Dreyfus Commodities B.V. amended and extended one of its syndicated revolving credit facilities (“RCF”). As a result, as at 30 June 2014 Louis Dreyfus Commodities LLC had a uS$800 million RCF maturing in October 2016 and a uS$834 million RCF maturing in May 2017.
Post-closing, in August 2014, and in addition to the existing uS$400 million 3-year RCF maturing in December 2016, Louis Dreyfus Commodities Asia successfully refinanced the RCF of its 2011 syndicated loan that was maturing in March 2015 into a 3-year uS$500 million RCF. the loan is guaranteed by Louis Dreyfus Commodities B.V.
equiTYFollowing dividend payments of uS$119 million, total equity stood at uS$5,179 million (uS$5,029 million at 31 December 2013), with uS$5,160 million attributable to Owners of the Parent (uS$4,980 million at 31 December 2013). the change in Equity attributable to Owners of the Parent includes a uS$49 million increase, mainly related to cash flow hedges and to fair valuation of available-for-sale financial assets.
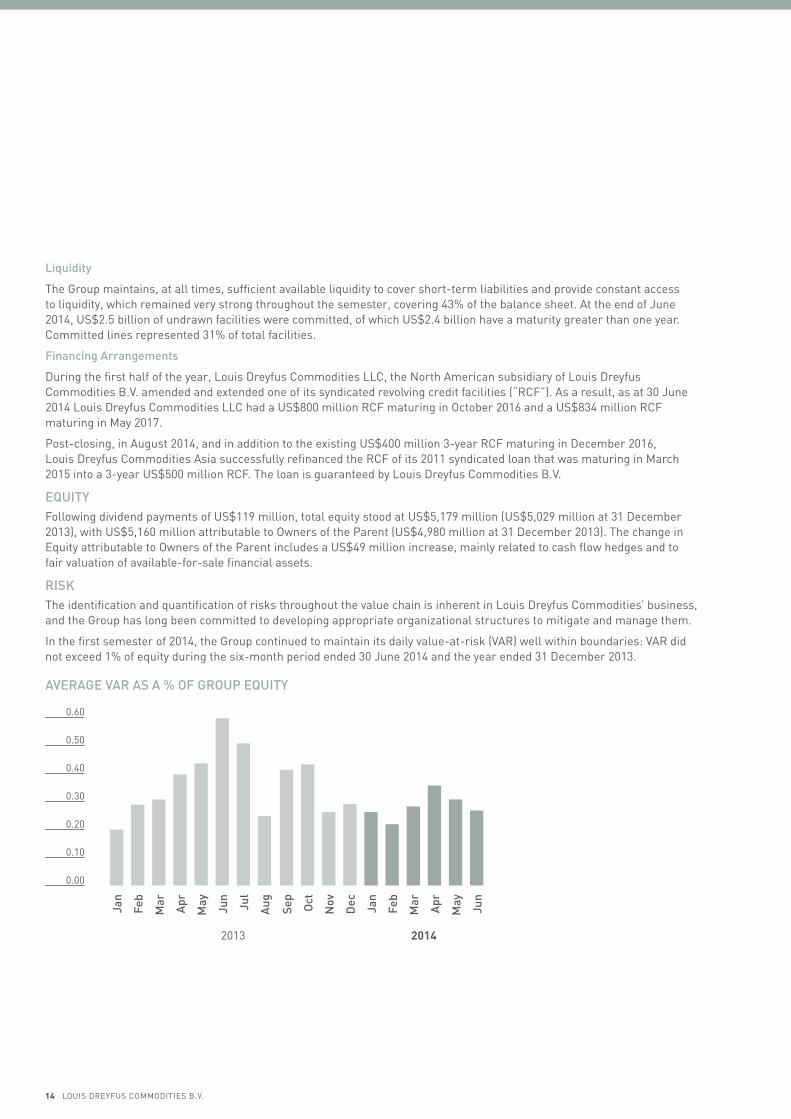
riskthe identification and quantification of risks throughout the value chain is inherent in Louis Dreyfus Commodities’ business, and the Group has long been committed to developing appropriate organizational structures to mitigate and manage them.
In the first semester of 2014, the Group continued to maintain its daily value-at-risk (VAR) well within boundaries: VAR did not exceed 1% of equity during the six-month period ended 30 June 2014 and the year ended 31 December 2013.
averaGe var as a % of GrouP equiTY
Jan
Sep
Apr
Dec
Feb
Oct
May
Jan
Jul
Mar
Jun
Mar
Nov
Jun
Feb
May
Aug Apr
2013 2014
0.00
0.10
0.20
0.30
0.40
0.50
0.60
0.70
14 LOuIS DREyFuS COMMODItIES B.V.
mAnAgement dIsCussIon & AnAlysIs
MANAGEMENt DISCuSSION & ANALySIS
FINANCIAL HIGHLIGHtS
INCOME StAtEMENt ANALySIS
bAlAnCe sHeet AnAlysIs
subsequenT evenTsIn July 2014, the Group exited its joint venture with Green Eagle Resources Ltd in Green Eagle Plantations Pte Ltd. the non-recurring contribution of this sale in the income statement of the second half of 2014 should be around uS$100 million.
the Group remains committed to developing its presence at various stages of the palm oil value chain, including processing, logistics, plantations and origination.
2014 inTeriM rePorT 15


Seattle WA, uS
INTERIM CONDENSED CONSOLIDaTED FINaNCIaL STaTEMENTS

To the Managing Directors of louis Dreyfus commodities b.v.
inTroDucTionWe have reviewed the accompanying interim condensed consolidated financial statements of Louis Dreyfus Commodities B.V. and subsidiaries as at 30 June 2014, which comprise the interim consolidated balance sheet as at 30 June 2014 and the related interim consolidated income statement, interim consolidated statement of comprehensive income, interim consolidated statement of cash flows and interim consolidated statement of changes in equity for the six-month period then ended, and a summary of significant accounting policies and other explanatory notes. Management is responsible for the preparation and fair presentation of these interim condensed consolidated financial statements in accordance with International Financial Reporting Standard IAS 34 Interim Financial Reporting (“IAS 34”), as adopted by the European union applicable to interim financial information. Our responsibility is to express a conclusion on these interim condensed consolidated financial statements based on our review.
scoPe of revieWWe conducted our review in accordance with International Standard on Review Engagements 2410, Review of Interim Financial Information Performed by the Independent Auditor of the Entity. A review of interim financial information consists of making inquiries, primarily of persons responsible for financial and accounting matters, and applying analytical and other review procedures. A review is substantially less in scope than an audit conducted in accordance with International Standards on Auditing and consequently does not enable us to obtain assurance that we would become aware of all significant matters that might be identified in an audit. Accordingly, we do not express an audit opinion.
conclusionBased on our review, nothing has come to our attention that causes us to believe that the accompanying interim condensed consolidated financial statements are not prepared, in all material respects, in accordance with IAS 34 – standard of IFRS as adopted by the European union applicable to interim financial information.
Neuilly-sur-Seine, France, 26 September 2014
Deloitte & associés
François-Xavier Ameye
Period from 1 January 2014 to 30 June 2014
aUDITOR’S REPORT ON REVIEw OF INTERIM FINaNCIaL INFORMaTION
18 LOuIS DREyFuS COMMODItIES B.V.
30 June 2014 30 June 2013 (in millions of uS dollars) notes 6 months 6 months
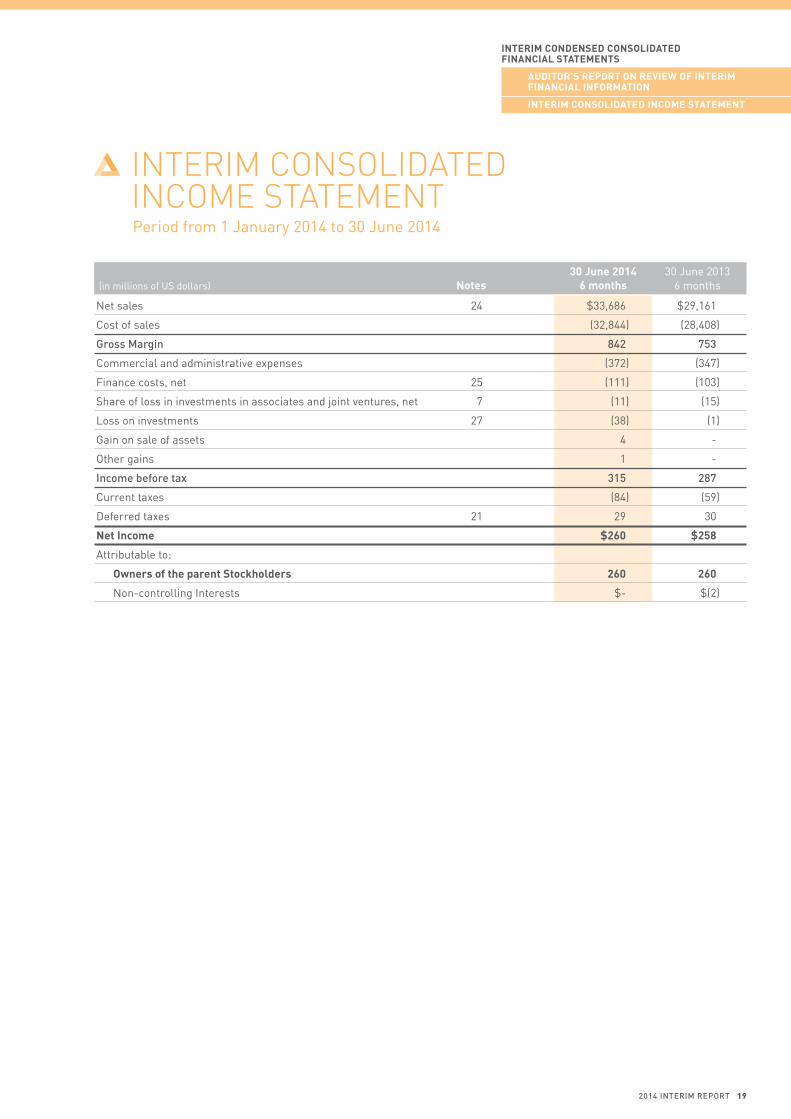
Net sales 24 $33,686 $29,161
Cost of sales (32,844) (28,408)
Gross Margin 842 753
Commercial and administrative expenses (372) (347)
Finance costs, net 25 (111) (103)
Share of loss in investments in associates and joint ventures, net 7 (11) (15)
Loss on investments 27 (38) (1)
Gain on sale of assets 4 -
Other gains 1 -
income before tax 315 287
Current taxes (84) (59)
Deferred taxes 21 29 30
net Income $260 $258
Attributable to:
owners of the parent stockholders 260 260
Non-controlling Interests $- $(2)
InterIm Condensed ConsolIdAted FInAnCIAl stAtements
AudItor’s report on reVIew oF InterIm FInAnCIAl InFormAtIon
InterIm ConsolIdAted InCome stAtement
Period from 1 January 2014 to 30 June 2014
INTERIM CONSOLIDaTED INCOME STaTEMENT
2014 inTeriM rePorT 19
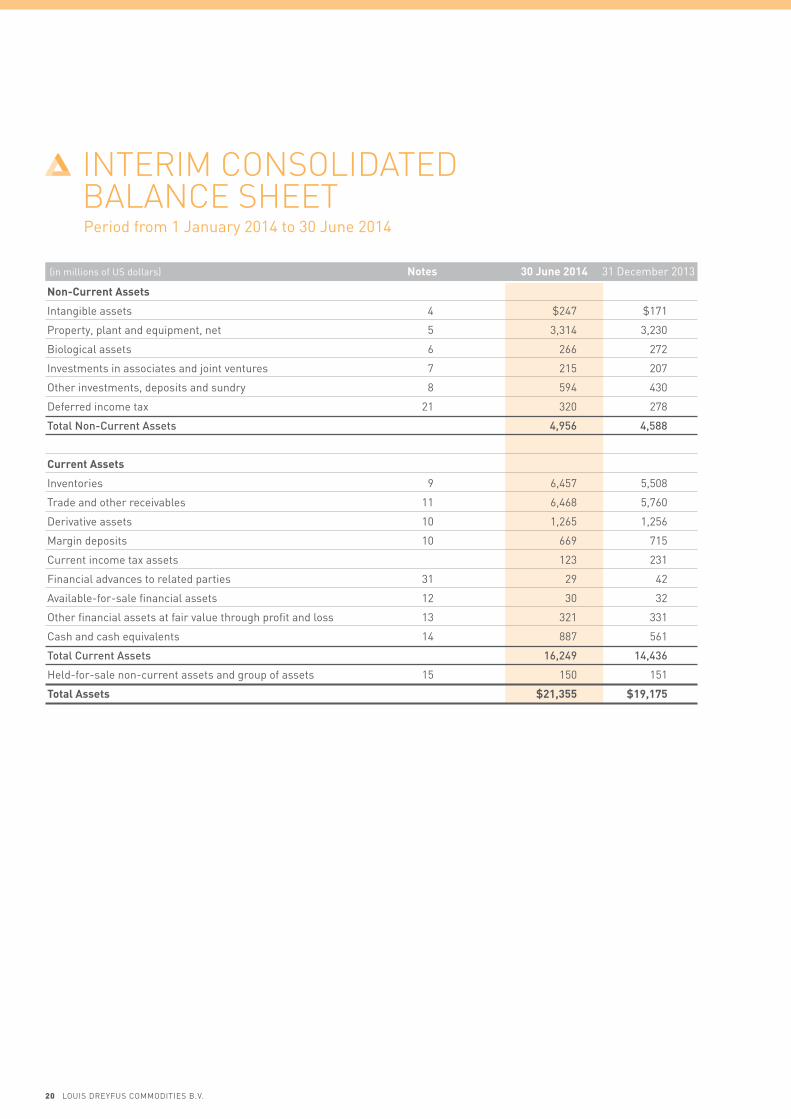
(in millions of uS dollars) notes 30 June 2014 31 December 2013
non-Current Assets
Intangible assets 4 $247 $171
Property, plant and equipment, net 5 3,314 3,230
Biological assets 6 266 272
Investments in associates and joint ventures 7 215 207
Other investments, deposits and sundry 8 594 430
Deferred income tax 21 320 278
Total non-current assets 4,956 4,588
Current Assets
Inventories 9 6,457 5,508
trade and other receivables 11 6,468 5,760
Derivative assets 10 1,265 1,256
Margin deposits 10 669 715
Current income tax assets 123 231
Financial advances to related parties 31 29 42
Available-for-sale financial assets 12 30 32
Other financial assets at fair value through profit and loss 13 321 331
Cash and cash equivalents 14 887 561
Total current assets 16,249 14,436
Held-for-sale non-current assets and group of assets 15 150 151
total Assets $21,355 $19,175
Period from 1 January 2014 to 30 June 2014
INTERIM CONSOLIDaTED BaLaNCE SHEET
20 LOuIS DREyFuS COMMODItIES B.V.
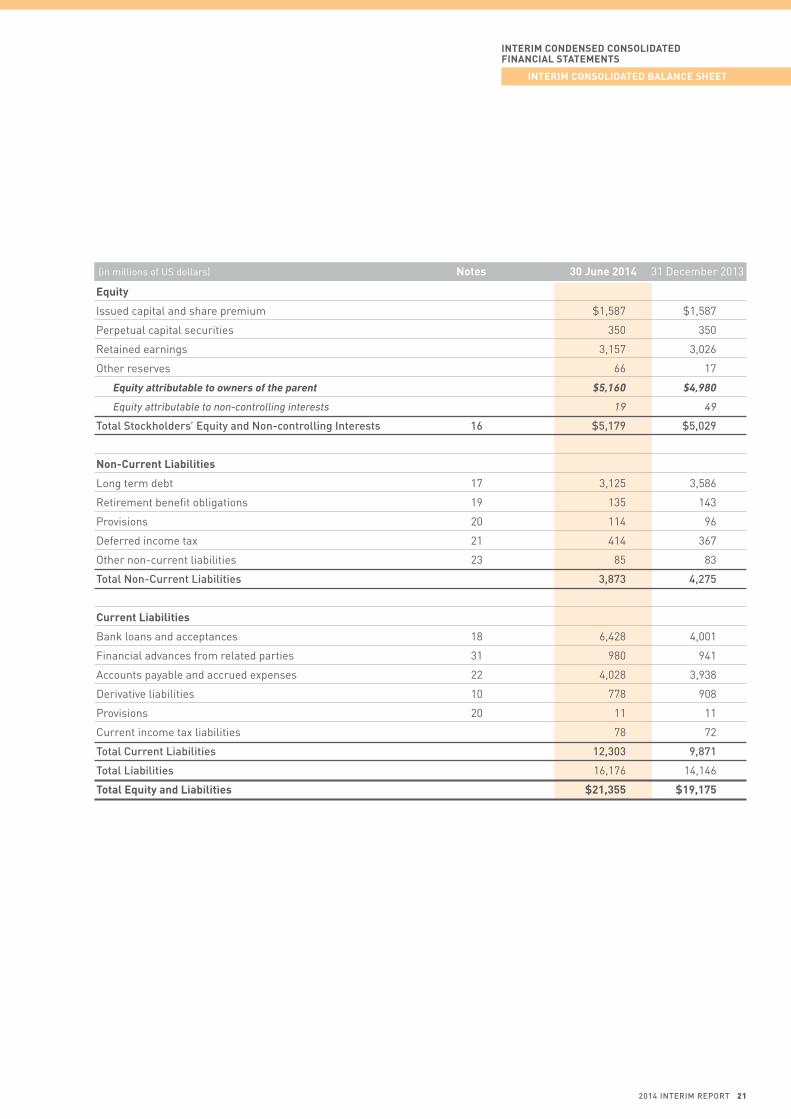
(in millions of uS dollars) notes 30 June 2014 31 December 2013
equity
Issued capital and share premium $1,587 $1,587
Perpetual capital securities 350 350
Retained earnings 3,157 3,026
Other reserves 66 17
Equity attributable to owners of the parent $5,160 $4,980
Equity attributable to non-controlling interests 19 49
Total stockholders’ equity and non-controlling interests 16 $5,179 $5,029
non-Current liabilities
Long term debt 17 3,125 3,586
Retirement benefit obligations 19 135 143
Provisions 20 114 96
Deferred income tax 21 414 367
Other non-current liabilities 23 85 83
Total non-current liabilities 3,873 4,275
Current liabilities
Bank loans and acceptances 18 6,428 4,001
Financial advances from related parties 31 980 941
Accounts payable and accrued expenses 22 4,028 3,938
Derivative liabilities 10 778 908
Provisions 20 11 11
Current income tax liabilities 78 72
Total current liabilities 12,303 9,871
Total liabilities 16,176 14,146
total equity and liabilities $21,355 $19,175
InterIm Condensed ConsolIdAted FInAnCIAl stAtements
InterIm ConsolIdAted bAlAnCe sHeet
2014 inTeriM rePorT 21
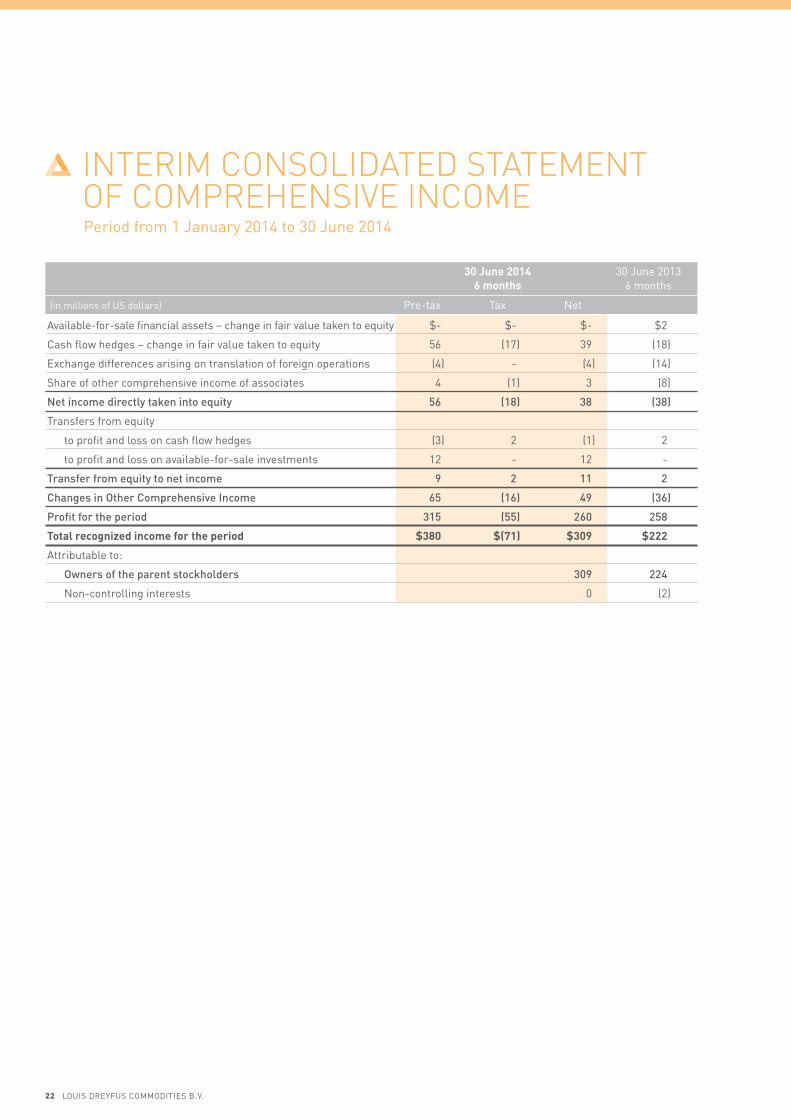
30 June 2014 30 June 2013 6 months 6 months
(in millions of uS dollars) Pre-tax tax Net
Available-for-sale financial assets – change in fair value taken to equity $- $- $- $2
Cash flow hedges – change in fair value taken to equity 56 (17) 39 (18)
Exchange differences arising on translation of foreign operations (4) - (4) (14)
Share of other comprehensive income of associates 4 (1) 3 (8)
net income directly taken into equity 56 (18) 38 (38)
transfers from equity
to profit and loss on cash flow hedges (3) 2 (1) 2
to profit and loss on available-for-sale investments 12 - 12 -
Transfer from equity to net income 9 2 11 2
changes in other comprehensive income 65 (16) 49 (36)
Profit for the period 315 (55) 260 258
total recognized income for the period $380 $(71) $309 $222
Attributable to:
owners of the parent stockholders 309 224
Non-controlling interests 0 (2)
Period from 1 January 2014 to 30 June 2014
INTERIM CONSOLIDaTED STaTEMENT OF COMPREHENSIVE INCOME
22 LOuIS DREyFuS COMMODItIES B.V.
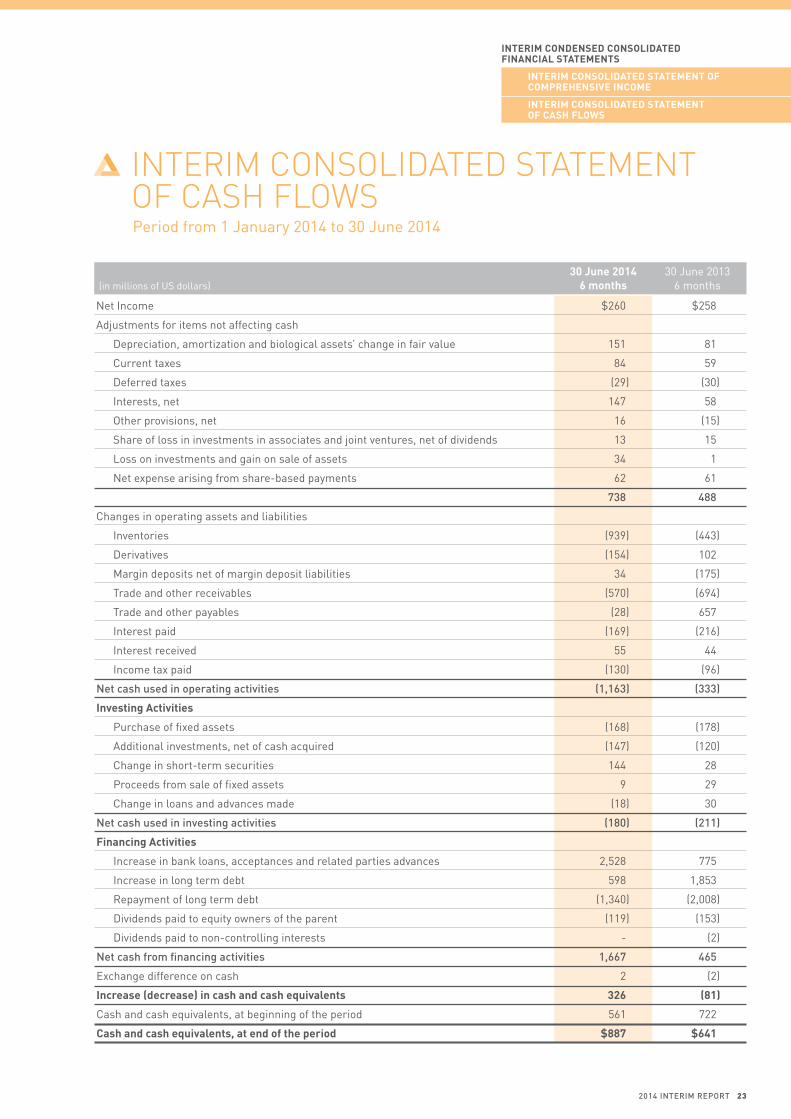
30 June 2014 30 June 2013 (in millions of uS dollars) 6 months 6 months
Net Income $260 $258
Adjustments for items not affecting cash
Depreciation, amortization and biological assets’ change in fair value 151 81
Current taxes 84 59
Deferred taxes (29) (30)
Interests, net 147 58
Other provisions, net 16 (15)
Share of loss in investments in associates and joint ventures, net of dividends 13 15
Loss on investments and gain on sale of assets 34 1
Net expense arising from share-based payments 62 61
738 488
Changes in operating assets and liabilities
Inventories (939) (443)
Derivatives (154) 102
Margin deposits net of margin deposit liabilities 34 (175)
trade and other receivables (570) (694)
trade and other payables (28) 657
Interest paid (169) (216)
Interest received 55 44
Income tax paid (130) (96)
net cash used in operating activities (1,163) (333)
Investing Activities
Purchase of fixed assets (168) (178)
Additional investments, net of cash acquired (147) (120)
Change in short-term securities 144 28
Proceeds from sale of fixed assets 9 29
Change in loans and advances made (18) 30
net cash used in investing activities (180) (211)
Financing Activities
Increase in bank loans, acceptances and related parties advances 2,528 775
Increase in long term debt 598 1,853
Repayment of long term debt (1,340) (2,008)
Dividends paid to equity owners of the parent (119) (153)
Dividends paid to non-controlling interests - (2)
net cash from financing activities 1,667 465
Exchange difference on cash 2 (2)
Increase (decrease) in cash and cash equivalents 326 (81)
Cash and cash equivalents, at beginning of the period 561 722
Cash and cash equivalents, at end of the period $887 $641
Period from 1 January 2014 to 30 June 2014
INTERIM CONSOLIDaTED STaTEMENT OF CaSH FLOwS
InterIm Condensed ConsolIdAted FInAnCIAl stAtements
InterIm ConsolIdAted stAtement oF CompreHensIVe InCome
InterIm ConsolIdAted stAtement oF CAsH Flows
2014 inTeriM rePorT 23

Equity Issued equity attributable Capital and Perpetual attributable to Non- Share Capital Retained Other to owners of Controlling total (in millions of uS dollars) Premium Securities Earnings Reserves the parent Interests equity
balance at 1 January 2013 $1,587 $350 $2,764 $8 $4,709 $57 $4,766
Net income 260 260 (2) 258
Dividends (153) (153) (2) (155)
Accrued capital securities (11) (11) (11) distribution, net of tax
Available-for-sale financial assets – change in fair value, 2 2 2 net of tax
Cash flow hedges – change (18) (18) (18) in fair value, net of tax
Foreign currency translation (19) (19) - (19) adjustment
transactions with - (6) (6) non-controlling interests
balance at 30 June 2013 $1,587 $350 $2,860 $(27) $4,770 $47 $4,817
balance at 1 January 2014 $1,587 $350 $3,026 $17 $4,980 $49 $5,029
Net income 260 260 - 260
Dividends (119) (119) - (119)
Accrued capital securities (11) (11) (11) distribution, net of tax
Available-for-sale financial assets – change in fair value, 12 12 - 12 net of tax
Cash flow hedges – change 39 39 39 in fair value, net of tax
Foreign currency translation (2) (2) - (2) adjustment
transactions with 1 1 (30) (29) non-controlling interests
balance at 30 June 2014 $1,587 $350 $3,157 $66 $5,160 $19 $5,179
Period from 1 January 2014 to 30 June 2014
INTERIM CONSOLIDaTED STaTEMENT OF CHaNgES IN EQUITy
24 LOuIS DREyFuS COMMODItIES B.V.
Louis Dreyfus Commodities B.V. (“LDC”) is a privately owned company incorporated in the Netherlands on 28 December 2004. the address of its registered office is Westblaak 92, 3012 KM Rotterdam – Netherlands. It is an indirect subsidiary of Louis Dreyfus Holding B.V. (“LDH”), a privately owned Dutch company controlled by the family foundation established by Robert Louis-Dreyfus.
At 31 December 2011, LDC was a direct subsidiary of Louis Dreyfus Commodities Holdings B.V. (“LDCH”), a company incorporated in the Netherlands. Effective 4 December 2012, LDCH contributed all its shares and voting rights in LDC to the newly formed intermediate holding company Louis Dreyfus Commodities Netherlands Holding B.V. (“LDCNH”) to which LDC distributed by way of a dividend in kind, all its shares and voting rights in Biosev S.A.’s holding company. In the 31 December 2012 consolidated financial statements of LDC, Biosev S.A. and its subsidiaries (“Biosev”) were presented as discontinued operations. Subsequent to such internal reorganization, LDCH remains the indirect shareholder of both LDC and Biosev.
Since December 2007, a non-controlling share of LDCH was taken by employees in the execution of the equity participation plan described in note 29.
In September 2012, LDC priced an inaugural uS$350 million, 8.25% coupon hybrid capital securities transaction. the structure of the perpetual hybrid capital securities qualifies the instrument to be classified as equity under IFRS. the securities are perpetual, but LDC has the right to redeem them in certain circumstances. they are not rated, and are listed on the Official List of the Singapore Exchange.
In 2013, LDC completed the issuance of two unrated Eurobonds: one in July for €400 million (5-year, 3.875%) and one in December for €500 million (7-year, 4%). Both instruments are listed on the Luxembourg Stock Exchange.
LDC and its subsidiaries (the “Group”) is a global merchandizer of commodities and processor of agricultural goods, operating a significant network of assets around the world. the Group’s activities span the entire value chain from farm to fork, across a broad range of business lines (platforms). Since 1851 the Group’s portfolio has grown to include Oilseeds, Grains, Juice, Freight, Fertilizers & Inputs, Feed, Cotton, Sugar, Finance, Coffee, Rice, Dairy and Metals.
1. accounTinG Policiesthe interim condensed consolidated financial statements of LDC are prepared in the functional currency of LDC, which is the uS Dollar.
the interim condensed consolidated financial statements have been established by the Board of Directors of LDC on 26 September 2014.
the June 2014 consolidated financial statements of LDC have been prepared in accordance with International Financial Reporting Standards (“IFRS”) adopted by the European union at 30 June 2014. these sets of consolidated financial statements for the first half of 2014 have been prepared in accordance with IAS 34 “Interim Financial Reporting”.
the preparation of financial statements in accordance with IFRS requires management to make estimates and assumptions that affect the amounts reported in the financial statements and accompanying notes. Actual results could differ from those estimates.
these financial statements do not include all the information required for full annual financial statements, and are to be read in conjunction with the consolidated financial statements at 31 December 2013. the accounting policies used to prepare these financial statements are the same as those used to prepare the consolidated financial statements at and for the year ended 31 December 2013, except for the adoption of new amendments, standards and interpretations at 1 January 2014 detailed below.
Period from 1 January 2014 to 30 June 2014
NOTES TO THE INTERIM CONDENSED CONSOLIDaTED FINaNCIaL STaTEMENTS
InterIm Condensed ConsolIdAted FInAnCIAl stAtements
InterIm ConsolIdAted stAtement oF CHAnges In eQuIty
notes to tHe InterIm Condensed ConsolIdAted FInAnCIAl stAtements
2014 inTeriM rePorT 25

neW anD aMenDeD accounTinG sTanDarDs anD inTerPreTaTions in effecT sTarTinG froM 2014n IFRS 10 “Consolidated Financial Statements” supersedes the parts of IAS 27 “Consolidated and Separate Financial
Statements” relating to consolidated financial statements, and SIC-12 “Consolidation – Special Purpose Entities”. the new standard redefines the concept of control. In accordance with IFRS 10, the Group’s consolidated financial statements include all types of entity that the Group controls directly or indirectly, regardless of the level of its interest in the equity of the entity. the Group controls an entity when it has power over that entity, is exposed to or has rights to variable returns from its involvement with that entity, and has the ability to use its power over that entity to affect the amount of those returns. Entities consolidated by the Group are referred to as “subsidiaries” or, in the case of certain entities which the Group controls by means other than voting rights, as “consolidated structured entities”. IFRS 10 had no impact on the scope of consolidation of the Group.
n IFRS 11 “Joint Arrangements” supersedes IAS 31 “Interests in Joint Ventures” and SIC-13 “Jointly Controlled Entities – Non-Monetary Contributions by Venturers”. the new standard establishes principles that are applicable to the accounting for arrangements under which two or more parties exercise joint control. Depending on the rights and obligations of the parties, a joint arrangement is classified either as a joint operation (in which the Group recognizes its assets and liabilities in proportion to its rights to those assets and obligations for those liabilities) or as a joint venture (accounted for by the equity method). the Group exercises joint control if decisions relating to the relevant activities of the entity require the unanimous consent of the Group and of the other parties who share control. under IFRS 11, proportionate consolidation is no longer a permitted option; the Group had not made use of this option. the Group has completed its assessment of IFRS 11, which had no impact on the scope of consolidation.
n IFRS 12 “Disclosures of Interests in Other Entities” covers all the disclosures required when an entity holds interests in subsidiaries, associates or unconsolidated structured entities, regardless of the level of control or influence over the entity. IFRS 12 does not apply to interim financial reporting, unless significant events have occurred during the interim period. An assessment of the impact of IFRS 12 on the notes to the financial statements is ongoing. No significant event occurred during the first half of 2014 that would require any change to the Group’s financial information.
n two further standards – IAS 27 “Consolidated and Separate Financial Statements” and IAS 28 “Investments in Associates” have been amended, to bring them into line with the changes introduced by the publication of IFRS 10, IFRS 11 and IFRS 12:
– IAS 27 “Separate Financial Statements” now only includes requirements for separate financial statements and is thus no longer applicable to LDC, and
– IAS 28 “Investments in Associates and Joint Ventures” prescribes the accounting for investments in associates and sets out the requirements for the application of the equity method when accounting for investments in associates and joint ventures.
n Amendments to IFRS 10, IAS 27 and IFRS 12 “Investment Entities”. these amendments define an investment entity, provide an exception to the consolidation requirement in IFRS 10 “Consolidated Financial Statements” for investment entities and require that an investment entity should not consolidate investments in entities that it controls, but measure those investments at fair value, with changes in fair value recognized in the income statement. Furthermore, the amendment requires an investment entity to provide additional disclosures for IFRS about entities that it controls when it measures investments in those entities at fair value. these amendments which should be applied for annual periods beginning on or after 1 January 2014 had no effect on the balance sheet nor performance of the Group.
n Amendment to IAS 32 “Offsetting Financial Assets and Financial Liabilities”. this amendment clarifies the requirement for offsetting financial instruments. this amendment which should be applied for annual periods beginning on or after 1 January 2014 had no effect on the balance sheet nor performance of the Group.
n Amendment to IAS 36 “Recoverable Amount Disclosures for Non-Financial Assets”. this amendment clarifies the IASB’s original intention: that the scope of those disclosures is limited to the recoverable amount of impaired assets that is based on fair value less costs of disposal. this amendment which should be applied for annual periods beginning on or after 1 January 2014 had no effect on the balance sheet nor performance of the Group.
26 LOuIS DREyFuS COMMODItIES B.V.
InterIm Condensed ConsoLIdAted FInAnCIAL stAtements
notes to tHe InterIm Condensed ConsoLIdAted FInAnCIAL stAtements
n Amendment to IAS 39 and IFRS 9 “Novation of derivatives and continuation of hedge accounting”. this amendment allows hedge accounting to continue in a situation where a derivative, which has been designated as a hedging instrument, is novated to effect clearing with a central counterparty as a result of laws or regulation, if specific conditions are met. this amendment which should be applied for annual periods beginning on or after 1 January 2014 had no effect on the balance sheet nor performance of the Group.
the other improvements to IFRS and amendments to IFRS effective 1 January 2014 had no effect on the balance sheet nor performance of the Group.
the Group has not early adopted any other standard, interpretation or amendment, which were issued but are not yet effective.
neW anD aMenDeD accounTinG sTanDarDs anD inTerPreTaTions aPProveD bY The euroPean union WiTh effecT in fuTure PerioDsn IFRIC 21 “Levies”. the interpretation is applicable to all levies imposed by governments under legislation, other than
outflows that are within the scope of other standards (e.g., IAS 12 Income taxes) and fines or other penalties for breaches of legislation. this interpretation clarifies that an entity recognizes a liability for a levy no earlier than when the activity that triggers payment, as identified by the relevant legislation, occurs. It also clarifies that a levy liability is accrued progressively only if the activity that triggers payment occurs over a period of time, in accordance with the relevant legislation. For a levy that is triggered upon reaching a minimum threshold, no liability is recognized before the specified minimum threshold is reached. the interpretation requires these same principles to be applied in interim financial statements. the application of this interpretation will be mandatory for annual periods beginning on or after 17 June 2014. the potential impact of this interpretation is currently under review by the Group.
accounTinG sTanDarDs anD inTerPreTaTions issueD bY iasb buT noT YeT aPProveD bY The euroPean unionthe following standards and interpretations issued by IASB are not yet approved by the European union. their potential impact is currently under review by the Group:
n IFRS 9 “Financial instruments”. the standard aims at replacing IAS 39 “Financial instruments – Recognition and Measurement”. It is a 3-phase project where only phase 1, “Classification and Measurement” was issued. Phase 2, “Impairment Methodology”, and phase 3 “Hedge Accounting”, have not been issued yet. the endorsement process by the European union has been placed on hold, pending the completion of the whole project by the IASB.
n Amendments to IFRS 9 and IFRS 7 “Mandatory Effective Date and transition Disclosures”. these amendments postpone the mandatory application date of IFRS to annual periods beginning on or after 1 January 2015 and modify the requirements on transition disclosures.
n Amendment to IFRS 9 “Hedge Accounting” and amendments to IFRS 9, IFRS 7 and IAS 39:
– bring into effect a substantial overhaul of hedge accounting that will allow entities to better reflect their risk management activities in the financial statements;
– allow the changes to address the “own credit” issue included in IFRS 9 Financial Instruments to be applied in isolation without applying the other changes introduced by IFRS 9 ; and
– remove the January 1, 2015 mandatory effective date of IFRS 9, to provide sufficient time for preparers of financial statements to make the transition to the new requirements.
n Amendments to IAS 16 and IAS 41 “Bearer Plants”. the amendments require bearer plants to be accounted for as property, plant and equipment and included within the scope of IAS 16 Property, Plant and Equipment, instead of IAS 41 Agriculture. the produce growing on bearer plants will remain within the scope of IAS 41 and will be thus measured at fair value less costs to sell.
n Amendments to IAS 16 and IAS 38 “Clarification of Acceptable Methods of Depreciation and Amortization”. these amendments clarify that the use of revenue-based methods to calculate the depreciation of an asset is not appropriate because revenue generated by an activity that includes the use of an asset generally reflects factors other than the consumption of the economic benefits embodied in the asset.
2014 inTeriM rePorT 27

n Amendments to IFRS 11 “Accounting for Acquisitions of Interests in Joint Operations”. the amendments clarifies that an entity that acquires an interest in a joint operation in which the activity constitutes a business should apply the relevant principles of business combination accounting and related disclosure requirements in IFRS 3 Business Combinations and other Standards, that do not conflict with the guidance in IFRS 11.
n Amendment to IAS 19 “Defined Benefit Plans: Employee Contributions”. the narrow scope amendments apply to contributions from employees or third parties to defined benefit plans. the objective of the amendments is to simplify the accounting for contributions that are independent of the number of years of employee service, for example, employee contributions that are calculated according to a fixed percentage of salary.
n IFRS 15 “Revenue from Contracts with Customers”. the new standard supersedes IAS 11 “Construction Contracts” and IAS 18 “Revenue” on revenue recognition. Revenue will be recognized to depict the transfer of goods or services to customers in amounts that reflect the payment to which the company expects to be entitled in exchange for those goods or services by applying the following steps:
– Step 1: Identify the contract with a customer
– Step 2: Identify the performance obligations in the contract
– Step 3: Determine the transaction price
– Step 4: Allocate the transaction price to the performance obligations in the contract
– Step 5: Recognize revenue when (or as) the entity satisfies a performance obligationn IFRS 14 “Regulatory Deferral Accounts”. the aim of this interim Standard is to enhance the comparability of financial
reporting by entities that are engaged in rate-regulated activities. the standard is not applicable to the Group and therefore is expected not to have any impact on the Group’s financial statements.
In addition, in December 2013, IASB issued Annual Improvement to IFRSs (2010-2012 and 2011-2013 Cycles) including:
n Annual Improvement to IFRSs 2010-2012
– Amendment to IFRS 2 “Share-based Payment” clarifying the definition of vesting condition.
– Amendment to IFRS 3 “Business Combination” clarifying the accounting for contingent consideration in a business combination.
– Amendments to IFRS 8 “Operating Segments” clarifying that a reconciliation of the total of the reportable segments’ assets to the entity’s assets should be disclosed, if that amount is regularly provided to the chief operating decision maker and clarifying the requirement to disclose those factors that are used to identify the entity’s reportable segments when operating segments have been aggregated.
– Amendment to IFRS 13 “Fair value measurement” clarifying the rationale for removing from IFRS 9 “Financial Instruments” and from IAS 39 “Financial Instruments” the guidance related to the measurement of short-term receivables and payables with no stated interest rate at invoice amounts.
– Amendment to IAS 16 “Property, Plant and Equipment” clarifying the requirements for the revaluation method in IAS 16 Property, Plant and Equipment and IAS 38 Intangible Assets to address concerns about the calculation of the accumulated depreciation or amortization at the date of the revaluation.
– Amendment to IAS 24 “Related Party Disclosures” clarifying that an entity providing key management personnel services to the reporting entity is a related party of the reporting entity.
– Amendment to IAS 38 “Intangible Assets” clarifying that for intangible assets measured using the revaluation method, the gross carrying amount is adjusted in a manner that is consistent with the revaluation of the carrying amount and the accumulated amortization is calculated as the difference between the gross carrying amount and the carrying amount after taking into account accumulated impairment losses.
n Annual Improvement to IFRSs 2011-2013 – Amendment to IFRS 1 “First-time Adoption of International Financial Reporting Standards” clarifying the meaning of
each IFRS effective at the end of an entity’s first IFRS reporting period. – Amendment to IFRS 3 “Business Combination” clarifying that the scope exception only applies to the financial
statements of the joint venture or the joint operation itself and that IFRS 3 does not apply to the formation of all type of joint arrangements as defined in IFRS 11 Joint Arrangements.
28 LOuIS DREyFuS COMMODItIES B.V.
InterIm Condensed ConsoLIdAted FInAnCIAL stAtements
notes to tHe InterIm Condensed ConsoLIdAted FInAnCIAL stAtements
– Amendment to IFRS 13 “Fair Value Measurement” clarifying that the portfolio exception applies to all contracts within the scope of IAS 39 Financial Instruments: Recognition and Measurement or IFRS 9 Financial Instruments, regardless of whether they meet the definitions of financial assets or financial liabilities as defined in IAS 32 Financial Instruments: Presentation.
– Amendment to IAS 40 “Investment Property” clarifying that judgement is needed to determine whether the acquisition of investment property is the acquisition of an asset, a group of assets or a business combination in the scope of IFRS 3 and that this judgement is based on the guidance in IFRS 3.
2. seGMenT inforMaTionthe Group operates its business worldwide under two segments: Value Chain and Merchandizing, organized around products that have similar economic characteristics.
Each reportable segment is responsible for the farming, origination, processing, refining, storage, transport and distribution of the products (where applicable).
A new organizational model set and implemented by LDC during the six-month period ended 30 June 2014 resulted in the reorganization of platforms into two newly created segments.
the Value Chain segment comprises the following platforms: Oilseeds, Grains, Juice, Fertilizers & Inputs and Feed. these platforms have a fully-integrated asset network ranging from production to distribution. the segment also includes the Freight Platform, which supports the Group’s businesses with its international presence covering all major commodities’ flows, and particularly the Grains and Oilseeds platforms. Products commercialized in this segment encompass commodities for both human and animal consumption.
the Merchandizing segment consists of platforms that have a more merchant-oriented business model within the Group: Cotton, Sugar, Finance, Coffee, Rice, Dairy and Metals. Merchandizing activities can take place on a wide range of products among these platforms, from raw to processed commodities, sometimes sold under the Group’s own brands.
the financial performance of the segments is principally evaluated with reference to the Segment Operating Results, which is the Net Sales, less Cost of Sales plus Share of profit (loss) in investments in associates and joint ventures, net.
the accounting policies of the operating segments are the same as those described in the summary of significant accounting policies. Inter-segment sales and transfers where applicable are generally valued at market.
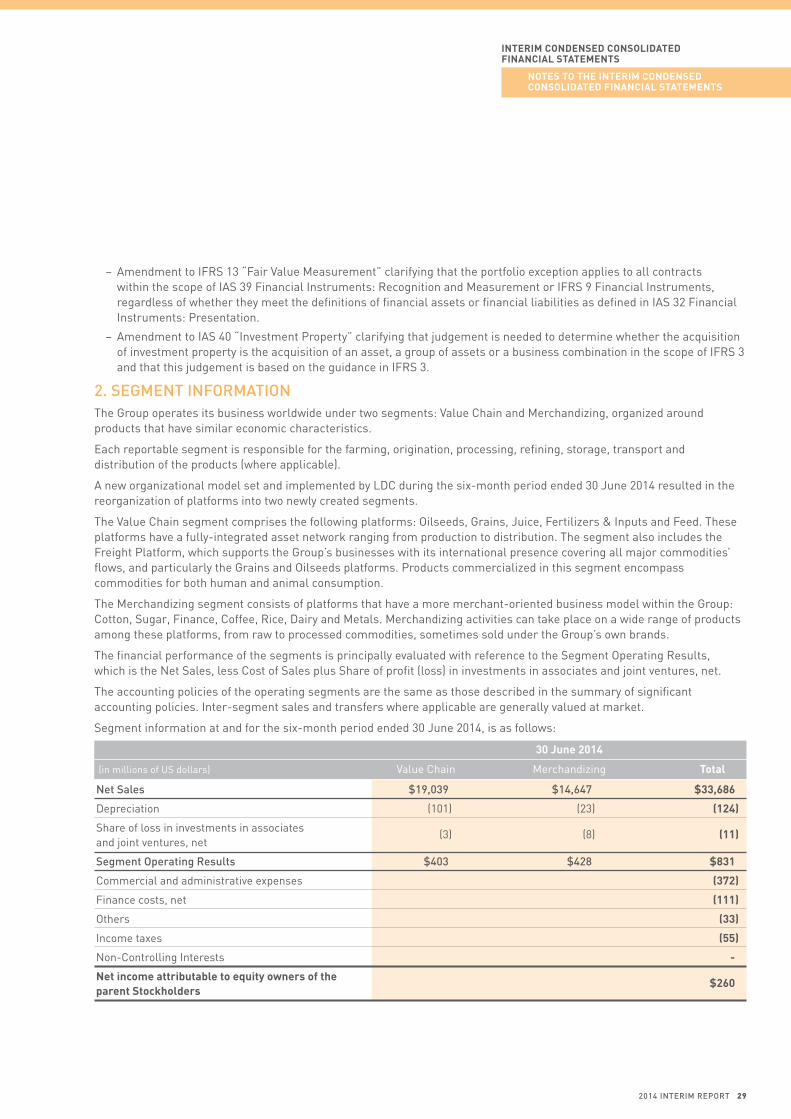
Segment information at and for the six-month period ended 30 June 2014, is as follows:
30 June 2014
(in millions of uS dollars) Value Chain Merchandizing total
net sales $19,039 $14,647 $33,686
Depreciation (101) (23) (124)
Share of loss in investments in associates (3) (8) (11) and joint ventures, net
segment operating results $403 $428 $831
Commercial and administrative expenses (372)
Finance costs, net (111)
Others (33)
Income taxes (55)
Non-Controlling Interests -
net income attributable to equity owners of the $260 parent stockholders
2014 inTeriM rePorT 29

30 June 2014
(in millions of uS dollars) Value Chain Merchandizing total
segment assets $11,507 $7,573 $19,080
segment liabilities (3,085) (1,721) (4,806)
Other Assets(1) 2,275
Other Liabilities(2) (11,370)
total net Assets $8,422 $5,852 $5,179
Additions to Fixed Assets(3) $255 $60 $315
(1) Other Assets include other investments, deposits and sundry, deferred and current income tax assets, available-for-sale financial assets, other financial assets at fair value through profit and loss, cash and cash equivalents;
(2) Other Liabilities include non-current liabilities, bank loans and acceptances, financial advances from related parties, provisions, current income tax liabilities;(3) Additions to Fixed Assets include purchase of fixed assets and additional investments net of cash acquired.
Segment information for the six-month period ended 30 June 2013, and at 31 December 2013, is as follows:
30 June 2013
(in millions of uS dollars) Value Chain Merchandizing total
net sales $17,955 $11,206 $29,161
Depreciation (63) (21) (84)
Share of loss in investments in associates (8) (7) (15) and joint ventures, net
segment operating results $389 $349 $738
Commercial and administrative expenses (347)
Finance costs, net (103)
Others (1)
Income taxes (29)
Non-Controlling Interests 2
net income attributable to equity owners of $260 the parent stockholders
30 LOuIS DREyFuS COMMODItIES B.V.
InterIm Condensed ConsoLIdAted FInAnCIAL stAtements
notes to tHe InterIm Condensed ConsoLIdAted FInAnCIAL stAtements
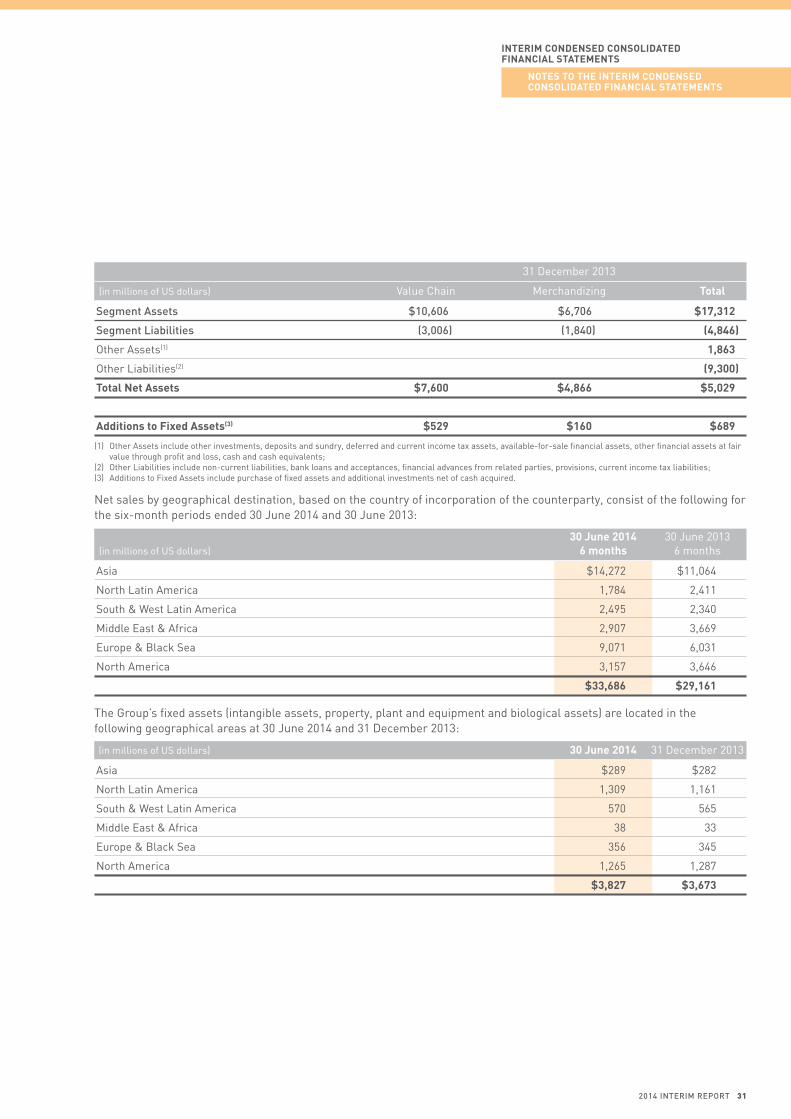
31 December 2013
(in millions of uS dollars) Value Chain Merchandizing total
segment assets $10,606 $6,706 $17,312
segment liabilities (3,006) (1,840) (4,846)
Other Assets(1) 1,863
Other Liabilities(2) (9,300)
total net Assets $7,600 $4,866 $5,029
Additions to Fixed Assets(3) $529 $160 $689
(1) Other Assets include other investments, deposits and sundry, deferred and current income tax assets, available-for-sale financial assets, other financial assets at fair value through profit and loss, cash and cash equivalents;
(2) Other Liabilities include non-current liabilities, bank loans and acceptances, financial advances from related parties, provisions, current income tax liabilities;(3) Additions to Fixed Assets include purchase of fixed assets and additional investments net of cash acquired.
Net sales by geographical destination, based on the country of incorporation of the counterparty, consist of the following for the six-month periods ended 30 June 2014 and 30 June 2013:
30 June 2014 30 June 2013 (in millions of uS dollars) 6 months 6 months
Asia $14,272 $11,064
North Latin America 1,784 2,411
South & West Latin America 2,495 2,340
Middle East & Africa 2,907 3,669
Europe & Black Sea 9,071 6,031
North America 3,157 3,646
$33,686 $29,161
the Group’s fixed assets (intangible assets, property, plant and equipment and biological assets) are located in the following geographical areas at 30 June 2014 and 31 December 2013:
(in millions of uS dollars) 30 June 2014 31 December 2013
Asia $289 $282
North Latin America 1,309 1,161
South & West Latin America 570 565
Middle East & Africa 38 33
Europe & Black Sea 356 345
North America 1,265 1,287
$3,827 $3,673
2014 inTeriM rePorT 31
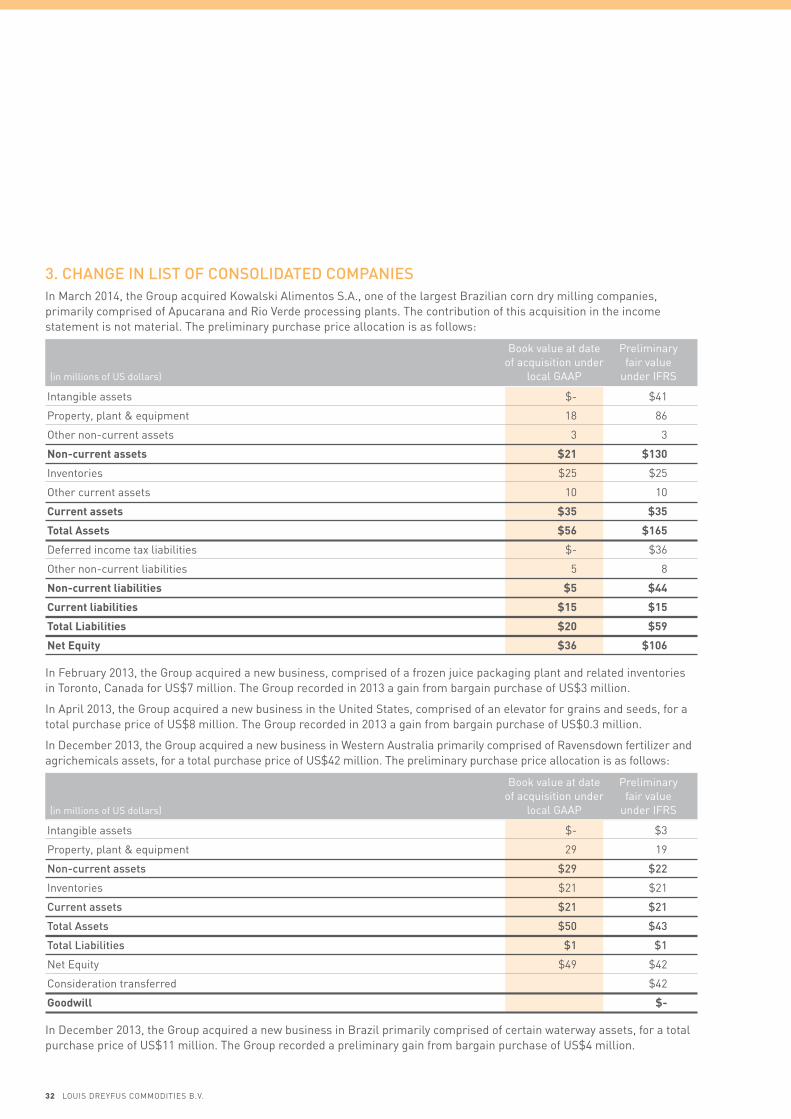
3. chanGe in lisT of consoliDaTeD coMPaniesIn March 2014, the Group acquired Kowalski Alimentos S.A., one of the largest Brazilian corn dry milling companies, primarily comprised of Apucarana and Rio Verde processing plants. the contribution of this acquisition in the income statement is not material. the preliminary purchase price allocation is as follows:
Book value at date Preliminary of acquisition under fair value (in millions of uS dollars) local GAAP under IFRS
Intangible assets $- $41
Property, plant & equipment 18 86
Other non-current assets 3 3
non-current assets $21 $130
Inventories $25 $25
Other current assets 10 10
Current assets $35 $35
total Assets $56 $165
Deferred income tax liabilities $- $36
Other non-current liabilities 5 8
non-current liabilities $5 $44
Current liabilities $15 $15
total liabilities $20 $59
net equity $36 $106
In February 2013, the Group acquired a new business, comprised of a frozen juice packaging plant and related inventories in toronto, Canada for uS$7 million. the Group recorded in 2013 a gain from bargain purchase of uS$3 million.
In April 2013, the Group acquired a new business in the united States, comprised of an elevator for grains and seeds, for a total purchase price of uS$8 million. the Group recorded in 2013 a gain from bargain purchase of uS$0.3 million.
In December 2013, the Group acquired a new business in Western Australia primarily comprised of Ravensdown fertilizer and agrichemicals assets, for a total purchase price of uS$42 million. the preliminary purchase price allocation is as follows:
Book value at date Preliminary of acquisition under fair value (in millions of uS dollars) local GAAP under IFRS
Intangible assets $- $3
Property, plant & equipment 29 19
non-current assets $29 $22
Inventories $21 $21
current assets $21 $21
Total assets $50 $43
Total liabilities $1 $1
Net Equity $49 $42
Consideration transferred $42
goodwill $-
In December 2013, the Group acquired a new business in Brazil primarily comprised of certain waterway assets, for a total purchase price of uS$11 million. the Group recorded a preliminary gain from bargain purchase of uS$4 million.
32 LOuIS DREyFuS COMMODItIES B.V.
InterIm Condensed ConsoLIdAted FInAnCIAL stAtements
notes to tHe InterIm Condensed ConsoLIdAted FInAnCIAL stAtements
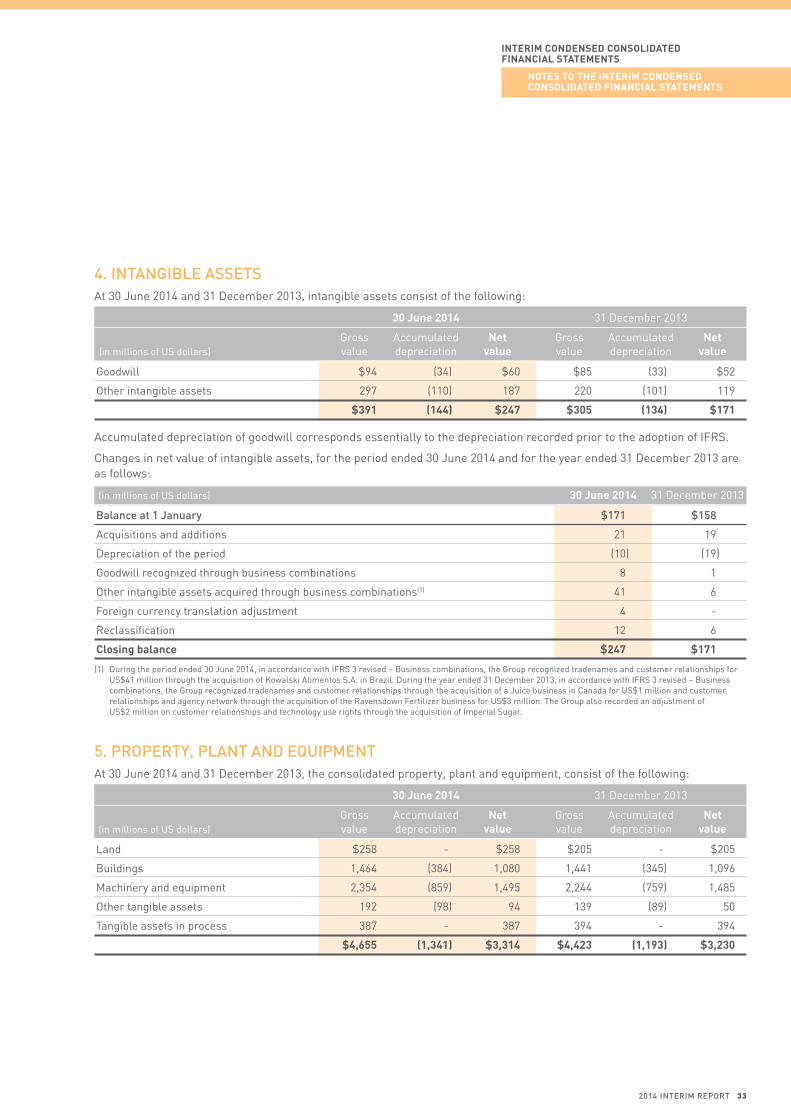
4. inTanGible asseTsAt 30 June 2014 and 31 December 2013, intangible assets consist of the following:
30 June 2014 31 December 2013
Gross Accumulated net Gross Accumulated net (in millions of uS dollars) value depreciation value value depreciation value
Goodwill $94 (34) $60 $85 (33) $52
Other intangible assets 297 (110) 187 220 (101) 119
$391 (144) $247 $305 (134) $171
Accumulated depreciation of goodwill corresponds essentially to the depreciation recorded prior to the adoption of IFRS.
Changes in net value of intangible assets, for the period ended 30 June 2014 and for the year ended 31 December 2013 are as follows:
(in millions of uS dollars) 30 June 2014 31 December 2013
balance at 1 January $171 $158
Acquisitions and additions 21 19
Depreciation of the period (10) (19)
Goodwill recognized through business combinations 8 1
Other intangible assets acquired through business combinations(1) 41 6
Foreign currency translation adjustment 4 -
Reclassification 12 6
Closing balance $247 $171
(1) During the period ended 30 June 2014, in accordance with IFRS 3 revised – Business combinations, the Group recognized tradenames and customer relationships for uS$41 million through the acquisition of Kowalski Alimentos S.A. in Brazil. During the year ended 31 December 2013, in accordance with IFRS 3 revised – Business combinations, the Group recognized tradenames and customer relationships through the acquisition of a Juice business in Canada for uS$1 million and customer relationships and agency network through the acquisition of the Ravensdown Fertilizer business for uS$3 million. the Group also recorded an adjustment of uS$2 million on customer relationships and technology use rights through the acquisition of Imperial Sugar.
5. ProPerTY, PlanT anD equiPMenTAt 30 June 2014 and 31 December 2013, the consolidated property, plant and equipment, consist of the following:
30 June 2014 31 December 2013
Gross Accumulated net Gross Accumulated net (in millions of uS dollars) value depreciation value value depreciation value
Land $258 - $258 $205 - $205
Buildings 1,464 (384) 1,080 1,441 (345) 1,096
Machinery and equipment 2,354 (859) 1,495 2,244 (759) 1,485
Other tangible assets 192 (98) 94 139 (89) 50
tangible assets in process 387 - 387 394 - 394
$4,655 (1,341) $3,314 $4,423 (1,193) $3,230
2014 inTeriM rePorT 33

Changes in net value of property, plant and equipment, for the period ended 30 June 2014 and for the year ended 31 December 2013 are as follows:
(in millions of uS dollars) 30 June 2014 31 December 2013
balance at 1 January $3,230 $2,924
Acquisitions and additions(1) 143 456
Disposals (2) (24)
Depreciation of the period (104) (184)
Impairment(2) (25) -
Change directly accounted through Other Reserves - (1)
Acquisitions through business combinations(3) 86 68
Foreign currency translation adjustment (2) (3)
Reclassification (12) (6)
Closing balance $3,314 $3,230
(1) During the period ended 30 June 2014 main acquisitions and additions include the investments for elevation complexes in the Port of Portland, Oregon and in Rosedale, Mississippi (uS) that will both benefit the Oilseeds and Grains platforms, the construction of a new silo located in the state of Mato Grosso (Brazil), the completion of the construction of and the start of improvement works in the sugar refinery in Fujian (China), and the completion of the construction of an oil refinery in Lampung (Indonesia) and of a new lecithin plant in General Lagos (Argentina).
(2) An impairment loss of uS$(25) million was recognized at 30 June 2014 to reflect the fact that LDC’s plant located in Indiantown, Florida, will process significantly lower volumes from 2015 onwards.
(3) In accordance with IFRS 3 revised – Business combinations, the Group recorded during the period ended 30 June 2014 the preliminary fair value of land, equipment and buildings through the acquisition of Kowalski Alimentos S.A. in Brazil for uS$86 million. In accordance with IFRS 3 revised – Business combinations, the Group recorded during the year ended 31 December 2013 the preliminary fair value of water way assets through the acquisition of a new business in Brazil for uS$37 million; the preliminary fair value of land, plant, equipment and buildings through the acquisition of the Ravensdown Fertilizer business for uS$19 million and of Direct Farm Inputs Pty Limited for uS$1 million; the preliminary fair value of land, machinery, equipment and buildings (primarily elevator) through the acquisition of the Hardeman Grain and Seed business for uS$8 million; the preliminary fair value of land, machinery, equipment and buildings through the acquisition of a Juice business in Canada for uS$6 million. the Group also recorded an adjustment of uS$(3) million on the tangible assets recognized in December 2012 through the acquisition of Imperial Sugar.
6. bioloGical asseTsthe Group owns biological assets located in Brazil. they consist, at 30 June 2014, in 44 orange groves of which 38 are mature. Mature orange groves sustain 15 to 18 years of production.
Changes in biological assets, for the period ended 30 June 2014 and for the year ended 31 December 2013 are as follows:
(in millions of uS dollars) 30 June 2014 31 December 2013
balance at 1 January $272 $288
Acquisitions and additions 6 24
Disposals - (21)
Change in fair value (12) (19)
Closing balance $266 $272
34 LOuIS DREyFuS COMMODItIES B.V.
InterIm Condensed ConsoLIdAted FInAnCIAL stAtements
notes to tHe InterIm Condensed ConsoLIdAted FInAnCIAL stAtements
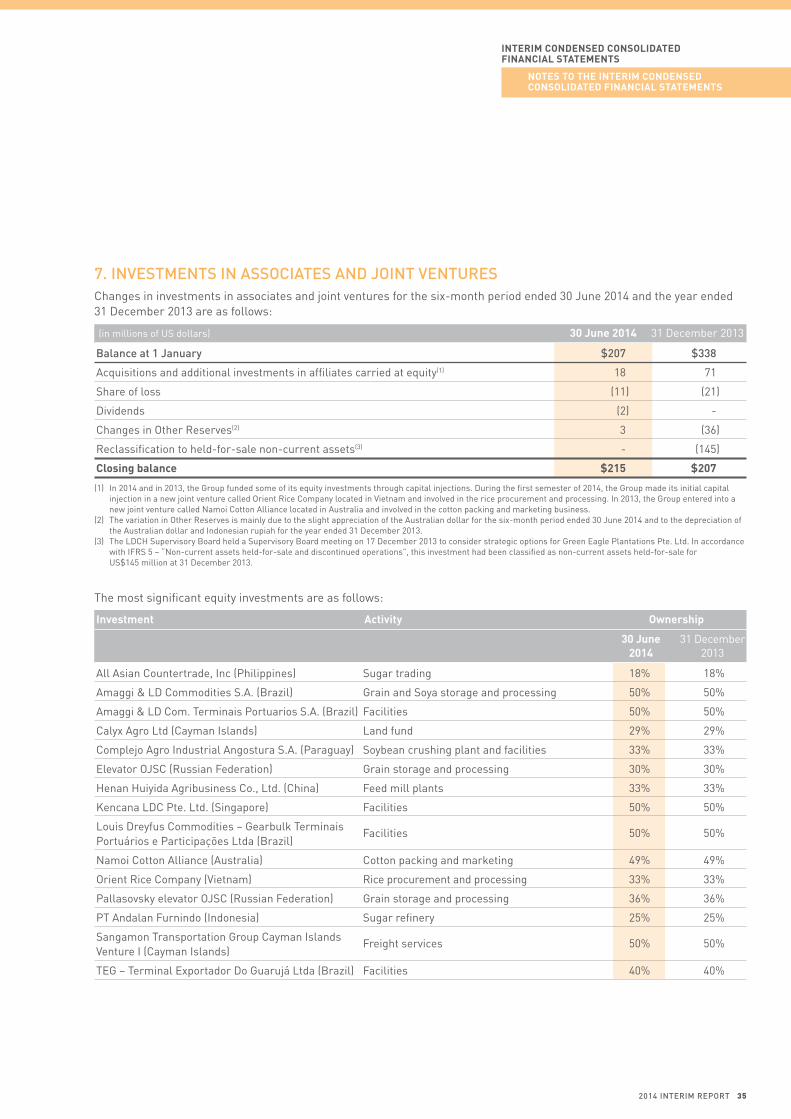
7. invesTMenTs in associaTes anD JoinT venTuresChanges in investments in associates and joint ventures for the six-month period ended 30 June 2014 and the year ended 31 December 2013 are as follows:
(in millions of uS dollars) 30 June 2014 31 December 2013
balance at 1 January $207 $338
Acquisitions and additional investments in affiliates carried at equity(1) 18 71
Share of loss (11) (21)
Dividends (2) -
Changes in Other Reserves(2) 3 (36)
Reclassification to held-for-sale non-current assets(3) - (145)
Closing balance $215 $207
(1) In 2014 and in 2013, the Group funded some of its equity investments through capital injections. During the first semester of 2014, the Group made its initial capital injection in a new joint venture called Orient Rice Company located in Vietnam and involved in the rice procurement and processing. In 2013, the Group entered into a new joint venture called Namoi Cotton Alliance located in Australia and involved in the cotton packing and marketing business.
(2) the variation in Other Reserves is mainly due to the slight appreciation of the Australian dollar for the six-month period ended 30 June 2014 and to the depreciation of the Australian dollar and Indonesian rupiah for the year ended 31 December 2013.
(3) the LDCH Supervisory Board held a Supervisory Board meeting on 17 December 2013 to consider strategic options for Green Eagle Plantations Pte. Ltd. In accordance with IFRS 5 – “Non-current assets held-for-sale and discontinued operations”, this investment had been classified as non-current assets held-for-sale for uS$145 million at 31 December 2013.
the most significant equity investments are as follows:
Investment Activity ownership
30 June 31 December 2014 2013
All Asian Countertrade, Inc (Philippines) Sugar trading 18% 18%
Amaggi & LD Commodities S.A. (Brazil) Grain and Soya storage and processing 50% 50%
Amaggi & LD Com. terminais Portuarios S.A. (Brazil) Facilities 50% 50%
Calyx Agro Ltd (Cayman Islands) Land fund 29% 29%
Complejo Agro Industrial Angostura S.A. (Paraguay) Soybean crushing plant and facilities 33% 33%
Elevator OJSC (Russian Federation) Grain storage and processing 30% 30%
Henan Huiyida Agribusiness Co., Ltd. (China) Feed mill plants 33% 33%
Kencana LDC Pte. Ltd. (Singapore) Facilities 50% 50%
Louis Dreyfus Commodities – Gearbulk terminais Facilities 50% 50% Portuários e Participações Ltda (Brazil)
Namoi Cotton Alliance (Australia) Cotton packing and marketing 49% 49%
Orient Rice Company (Vietnam) Rice procurement and processing 33% 33%
Pallasovsky elevator OJSC (Russian Federation) Grain storage and processing 36% 36%
Pt Andalan Furnindo (Indonesia) Sugar refinery 25% 25%
Sangamon transportation Group Cayman Islands Freight services 50% 50% Venture I (Cayman Islands)
tEG – terminal Exportador Do Guarujá Ltda (Brazil) Facilities 40% 40%
2014 inTeriM rePorT 35

A summary of the financial information of the companies listed above is as follows:
balance sheet (in millions of uS dollars) 30 June 2014 31 December 2013
Non-current assets $694 $686
Current assets 746 506
Total assets 1,440 1,192
Non-current liabilities 157 184
Current liabilities 759 525
Total liabilities 916 709
net equity 524 483
equity – group’s share $199 $179
Income statement 30 June 2014 30 June 2013 (in millions of uS dollars) 6 months 6 months
Revenue $602 $825
Net income (5) (24)
group’s share of loss(1) $(2) $(11)
(1) the revenue, net income and Group’s share of loss for the six-month period ended 30 June 2013 include Green Eagle Plantations Pte. Ltd, that was reclassified to held-for-sale non-current assets from 31 December 2013 (note 15).
Investments in associates and joint ventures can be summarized as follows:
balance sheet (in millions of uS dollars) 30 June 2014 31 December 2013
Entities as listed above $199 $179
Other entities 16 28
Investments in associates and joint ventures(1) $215 $207
(1) the Investments in associates and joint ventures include a goodwill of uS$9 million at 30 June 2014 (uS$10 million at 31 December 2013).
Income statement 30 June 2014 30 June 2013 (in millions of uS dollars) 6 months 6 months
Entities as listed above $(2) $(11)
Others (9) (4)
share of loss in associates and joint ventures $(11) $(15)
8. oTher invesTMenTs, DePosiTs anD sunDrYAt 30 June 2014 and 31 December 2013, Other investments, deposits and sundry consist of the following:
(in millions of uS dollars) 30 June 2014 31 December 2013
Long-term loans to associates and joint ventures $11 $29
Long-term loans to commercial partners 212 204
Long-term deposits and advances(1) 360 181
Others 11 16
$594 $430
(1) the increase of long-term deposits and advances mainly regards certain income tax credits in Brazil considered as current assets at 31 December 2013 and classified as non-current assets at 30 June 2014 for a total amount of uS$123 million, since the Group does not expect to monetize them before 30 June 2015. Besides, long-term deposits include judicial deposits (Refer to Note 20 – Provisions – tax and social risks), for uS$39 million at 30 June 2014 (uS$34 million at 31 December 2013).
36 LOuIS DREyFuS COMMODItIES B.V.
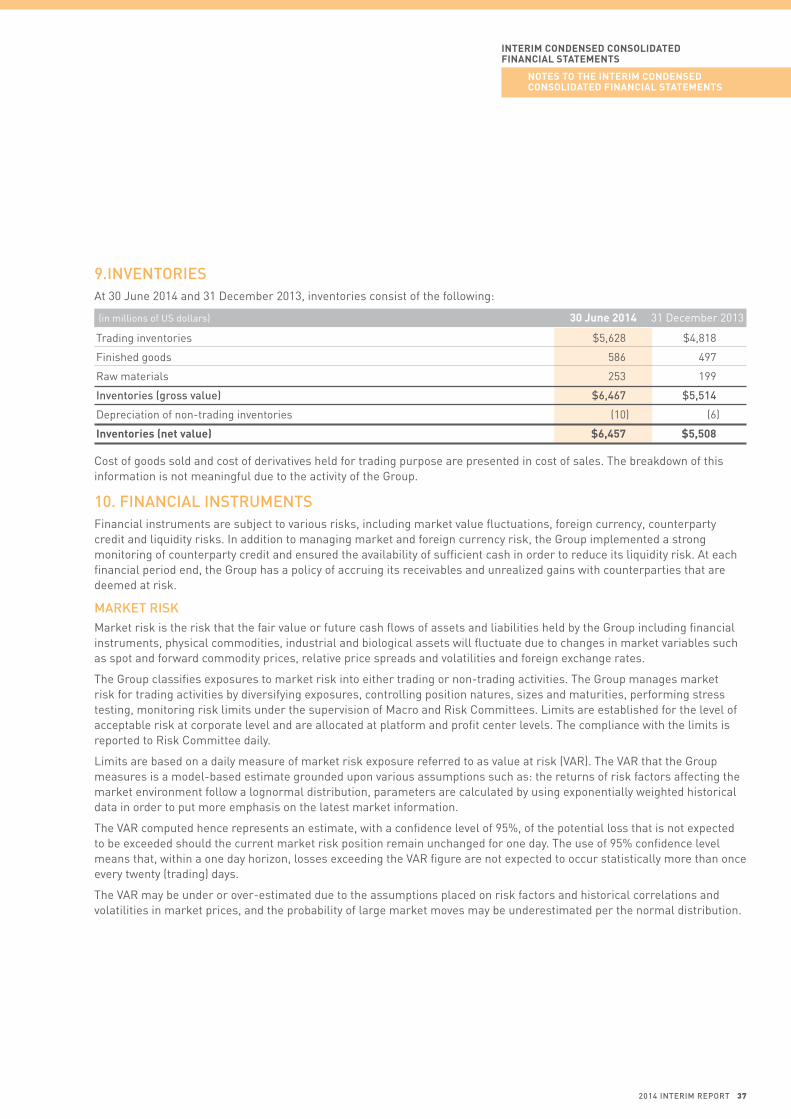
InterIm Condensed ConsoLIdAted FInAnCIAL stAtements
notes to tHe InterIm Condensed ConsoLIdAted FInAnCIAL stAtements
9.invenToriesAt 30 June 2014 and 31 December 2013, inventories consist of the following:
(in millions of uS dollars) 30 June 2014 31 December 2013
trading inventories $5,628 $4,818
Finished goods 586 497
Raw materials 253 199
inventories (gross value) $6,467 $5,514
Depreciation of non-trading inventories (10) (6)
Inventories (net value) $6,457 $5,508
Cost of goods sold and cost of derivatives held for trading purpose are presented in cost of sales. the breakdown of this information is not meaningful due to the activity of the Group.
10. financial insTruMenTsFinancial instruments are subject to various risks, including market value fluctuations, foreign currency, counterparty credit and liquidity risks. In addition to managing market and foreign currency risk, the Group implemented a strong monitoring of counterparty credit and ensured the availability of sufficient cash in order to reduce its liquidity risk. At each financial period end, the Group has a policy of accruing its receivables and unrealized gains with counterparties that are deemed at risk.
MarkeT riskMarket risk is the risk that the fair value or future cash flows of assets and liabilities held by the Group including financial instruments, physical commodities, industrial and biological assets will fluctuate due to changes in market variables such as spot and forward commodity prices, relative price spreads and volatilities and foreign exchange rates.
the Group classifies exposures to market risk into either trading or non-trading activities. the Group manages market risk for trading activities by diversifying exposures, controlling position natures, sizes and maturities, performing stress testing, monitoring risk limits under the supervision of Macro and Risk Committees. Limits are established for the level of acceptable risk at corporate level and are allocated at platform and profit center levels. the compliance with the limits is reported to Risk Committee daily.
Limits are based on a daily measure of market risk exposure referred to as value at risk (VAR). the VAR that the Group measures is a model-based estimate grounded upon various assumptions such as: the returns of risk factors affecting the market environment follow a lognormal distribution, parameters are calculated by using exponentially weighted historical data in order to put more emphasis on the latest market information.
the VAR computed hence represents an estimate, with a confidence level of 95%, of the potential loss that is not expected to be exceeded should the current market risk position remain unchanged for one day. the use of 95% confidence level means that, within a one day horizon, losses exceeding the VAR figure are not expected to occur statistically more than once every twenty (trading) days.
the VAR may be under or over-estimated due to the assumptions placed on risk factors and historical correlations and volatilities in market prices, and the probability of large market moves may be underestimated per the normal distribution.
2014 inTeriM rePorT 37

the monthly average of VAR as percentage of Group Equity corresponds to the average over a month of the VAR computed daily as percentage of Group Equity at the beginning of each quarter. It consists of the following:
averaGe var as a % of GrouP equiTY
Jan
Sep
Apr
Dec
Feb
Oct
May
Jan
Jul
Mar
Jun
Mar
Nov
Jun
Feb
May
Aug Apr
2013 2014
0.00
0.10
0.20
0.30
0.40
0.50
0.60
0.70
During the period ended 30 June 2014 and the year ended 31 December 2013, the Group VAR for trading activities has been less than 1% of Stockholders’ equity.
foreiGn currencY riskthe Group operates internationally and is therefore exposed to changes in foreign currency exchange for its assets and liabilities denominated in a currency different from the functional currency of each entity. Each entity within the Group enters into foreign exchange derivative contracts to hedge its exposures back to its own functional currency.
the operating current assets and liabilities are denominated in the following currencies before hedge at 30 June 2014 and 31 December 2013:
30 June 2014
Brazilian Chinese Other (in millions of uS dollars) uS Dollar Real yuan Euro currencies total
Inventories – gross value $5,453 $11 $397 $271 $335 $6,467
trade and other receivables – gross value 5,115 380 152 343 653 6,643
Derivative assets – gross value 1,118 79 27 11 64 1,299
Margin deposits 495 - 100 23 51 669
Current income tax assets 54 3 3 13 50 123
assets $12,235 $473 $679 $661 $1,153 $15,201
Accounts payable and accrued expenses 2,992 217 191 140 488 4,028
Derivative liabilities 663 53 17 12 33 778
Current income tax liabilities 26 1 2 4 45 78
liabilities $3,681 $271 $210 $156 $566 $4,884
net Current Assets and liabilities $8,554 $202 $469 $505 $587 $10,317
38 LOuIS DREyFuS COMMODItIES B.V.

InterIm Condensed ConsoLIdAted FInAnCIAL stAtements
notes to tHe InterIm Condensed ConsoLIdAted FInAnCIAL stAtements
31 December 2013
Brazilian Chinese Other (in millions of uS dollars) uS Dollar Real yuan Euro currencies total
Inventories – gross value $4,712 $- $261 $324 $217 $5,514
trade and other receivables – gross value 4,600 276 85 451 534 5,946
Derivative assets – gross value 1,151 69 34 41 25 1,320
Margin deposits 587 2 98 28 - 715
Current income tax assets 19 125 4 13 70 231
assets $11,069 $472 $482 $857 $846 $13,726
Accounts payable and accrued expenses 2,830 304 150 184 470 3,938
Derivative liabilities 728 77 30 9 64 908
Current income tax liabilities 25 23 - 7 17 72
liabilities $3,583 $404 $180 $200 $551 $4,918
net Current Assets and liabilities $7,486 $68 $302 $657 $295 $8,808
At 30 June 2014, around 90% of the Net Current Assets and Liabilities are denominated in the same currency before hedge than the functional currency of the legal entity they relate to (around 90% at 31 December 2013).
counTerParTY riskthe Group is engaged in the business of trading diversified commodities and commodity related products. Accordingly, a substantial portion of the Group’s trade receivables is with other commodity trading companies. Margin deposits generally consist of uS treasury bills and are on deposit with commodity exchanges and brokers which hold such deposits in a custodial capacity. the Group’s counterparty risk exposure from derivative financial instruments is limited to the current fair value of contracts with a positive fair value.
Performance risk on an open contract measures the risk of non-performance by the counterpart and is composed of:
n the mark-to-market exposure to date (if any) reflecting the cost to the Group if the contract is not fulfilled and has to be replaced in the open market under prevailing market conditions, and;
n the potential future mark-to-market exposure reflecting the fact that the market price can move from the day of exposure calculation to the delivery date/payment date versus the current market price.
the Group has implemented risk management procedures to monitor its exposures and to minimize counterparty risk. these procedures include initial credit and limit approvals, margin requirements, master netting arrangements, letters of credit and other guarantees.
the Group’s trade receivables include debtors with a carrying amount of uS$397 million which are past due at 30 June 2014. the credit quality of financial assets that are neither past due nor impaired is assessed by reference to credit ratings or to historical information about counterparty default rates.
2014 inTeriM rePorT 39

30 June 2014 31 December 2013
(in millions of uS dollars) Gross value Provision net value Gross value Provision net value
Not due $4,641 $(3) $4,638 $4,316 $(4) $4,312
Due since < 3 months 340 (4) 336 515 (23) 492
Due since 3-6 months 37 (10) 27 47 (3) 44
Due since 6 months–1 year 24 (11) 13 36 (10) 26
Due since > 1 year 124 (103) 21 114 (93) 21
Closing balance $5,166 $(131) $5,035 $5,028 $(133) $4,895
Including:
Trade receivables $3,434 $(121) $3,313 $3,344 $(121) $3,223
Prepayments and advances to suppliers 915 (3) 912 816 (5) 811
Receivables on sale of assets 3 - 3 3 - 3
Other receivables 116 (7) 109 108 (7) 101
Margin deposits 669 - 669 715 - 715
Financial advances to related parties 29 - 29 42 - 42
PoliTical anD counTrY riskIn its cross-border operations, the Group is exposed to country risk associated with a country’s overall political, economic, financial, regulatory and commercial situations. the Group does not seek to retain country risk and it is the trade finance, insurance and credit risk departments’ duty to seek to mitigate political and country risk by transferring or covering them with major financial institutions or insurance.
liquiDiTY riskLiquidity risk arises in the general funding of the Group’s commodity trading activities and in the management of positions. It includes both the risk of being unable to fund the Group’s portfolio of assets at appropriate maturities and rates, and the risk of being unable to liquidate a position in a timely manner at a reasonable price.
Management of the liquidity profile is designed to ensure that the Group has access to the funds necessary to cover maturing liabilities. Sources of funds include interest-bearing and non-interest-bearing deposits, bank notes, trading account liabilities, repurchase agreements, long term debt, and borrowing arrangements.
the Group holds derivative contracts for the sale of physical commodities and derivative assets that are expected to generate cash inflows that will be available to meet cash outflows on purchases and liabilities. In the trading business, settling commodity contracts and liquidating trading inventories, by exchanging the commodity for cash before the contractual maturity term is a usual practice. the liquidity risk is consequently measured by allocating liabilities to the earliest estimated period on which the counterparty can require repayment, and assets to the earliest estimated period on which the Group can realize in cash these assets without any significant discount from market value. this measurement takes into consideration the market depth and price sensitivity to significant transaction volumes. the inclusion of information on non-financial items is necessary to understand the Group’s liquidity risk management, as the liquidity is managed on a net asset and liability basis. the table below summarizes the maturity profile of the Group’s financial liabilities and assets at 30 June 2014 and 31 December 2013.
40 LOuIS DREyFuS COMMODItIES B.V.
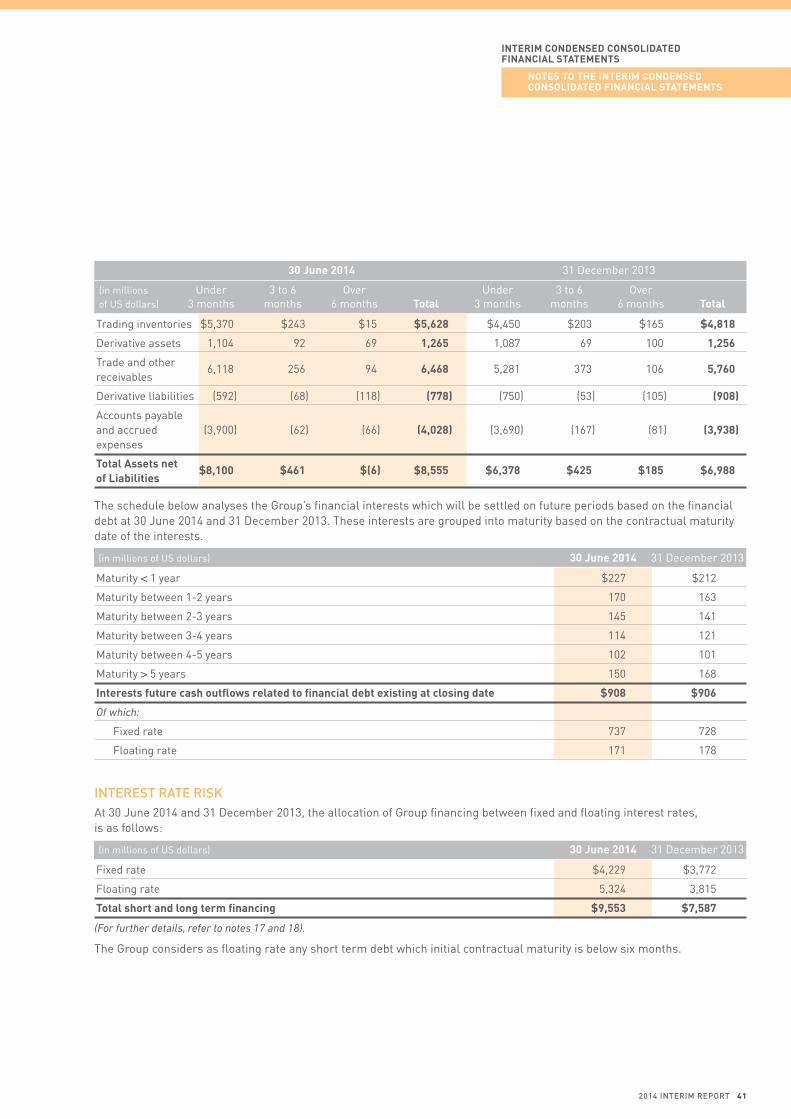
InterIm Condensed ConsoLIdAted FInAnCIAL stAtements
notes to tHe InterIm Condensed ConsoLIdAted FInAnCIAL stAtements
30 June 2014 31 December 2013
(in millions under 3 to 6 Over under 3 to 6 Over of uS dollars) 3 months months 6 months total 3 months months 6 months total
trading inventories $5,370 $243 $15 $5,628 $4,450 $203 $165 $4,818
Derivative assets 1,104 92 69 1,265 1,087 69 100 1,256
trade and other 6,118 256 94 6,468 5,281 373 106 5,760 receivables
Derivative liabilities (592) (68) (118) (778) (750) (53) (105) (908)
Accounts payable and accrued (3,900) (62) (66) (4,028) (3,690) (167) (81) (3,938) expenses
total Assets net $8,100 $461 $(6) $8,555 $6,378 $425 $185 $6,988 of liabilities
the schedule below analyses the Group’s financial interests which will be settled on future periods based on the financial debt at 30 June 2014 and 31 December 2013. these interests are grouped into maturity based on the contractual maturity date of the interests.
(in millions of uS dollars) 30 June 2014 31 December 2013
Maturity < 1 year $227 $212
Maturity between 1-2 years 170 163
Maturity between 2-3 years 145 141
Maturity between 3-4 years 114 121
Maturity between 4-5 years 102 101
Maturity > 5 years 150 168
Interests future cash outflows related to financial debt existing at closing date $908 $906
Of which:
Fixed rate 737 728
Floating rate 171 178
inTeresT raTe riskAt 30 June 2014 and 31 December 2013, the allocation of Group financing between fixed and floating interest rates, is as follows:
(in millions of uS dollars) 30 June 2014 31 December 2013
Fixed rate $4,229 $3,772
Floating rate 5,324 3,815
total short and long term financing $9,553 $7,587
(For further details, refer to notes 17 and 18).
the Group considers as floating rate any short term debt which initial contractual maturity is below six months.
2014 inTeriM rePorT 41

caTeGories of financial asseTs anD liabiliTiesAt 30 June 2014, the different categories of financial assets and liabilities are as follows:
Assets at Assets at fair value fair value Other through through financial (in millions of uS dollars) profit & loss OCI assets total
Other investments, deposits and sundry $- $- $594 $594
Total non-current assets $- $- $594 $594
Financial advances to related parties - - 29 29
trade and other receivables - - 6,468 6,468
Margin deposits - - 669 669
Derivative assets 1,247 18 - 1,265
Available-for-sale financial assets - - 30 30
Other financial assets at fair value through profit & loss 321 - - 321
Cash and cash equivalents 160 - 727 887
Total current assets $1,728 $18 $7,923 $9,669
total Financial Assets $1,728 $18 $8,517 $10,263
Assets at fair value through profit & loss, derivative assets and listed available-for-sale financial assets are measured at fair value. unlisted available-for-sale financial assets are measured at cost, unless a fair value is available.
All other financial assets (for which the net booked value is deemed to correspond to the fair value) are measured at amortized cost.
Liabilities Liabilities at fair value at fair value Other through through financial (in millions of uS dollars) profit & loss OCI liabilities total
Long term debt $- $- $3,125 $3,125
Other non-current liabilities - - 85 85
Total non-current liabilities $- $- $3,210 $3,210
Bank loans and acceptances - - 6,428 6,428
Financial advances from related parties - - 980 980
Accounts payable and accrued expenses - - 3,993 3,993 (except Margin deposit liabilities)
Derivative liabilities 756 22 - 778
Margin deposit liabilities - - 35 35
Total current liabilities $756 $22 $11,436 $12,214
total Financial liabilities $756 $22 $14,646 $15,424
Derivative liabilities are measured at fair value. Other financial liabilities are measured at amortized cost.
42 LOuIS DREyFuS COMMODItIES B.V.

InterIm Condensed ConsoLIdAted FInAnCIAL stAtements
notes to tHe InterIm Condensed ConsoLIdAted FInAnCIAL stAtements
At 31 December 2013, the different categories of financial assets and liabilities were as follows:
Assets at Assets at fair value fair value Other through through financial (in millions of uS dollars) profit & loss OCI assets total
Other investments, deposits and sundry $- $- $430 $430
Total non-current assets $- $- $430 $430
Financial advances to related parties - - 42 42
trade and other receivables - - 5,760 5,760
Margin deposits - - 715 715
Derivative assets 1,242 14 - 1,256
Available-for-sale financial assets - - 32 32
Other financial assets at fair value through profit & loss 331 - - 331
Cash and cash equivalents 293 - 268 561
Total current assets $1,866 $14 $6,817 $8,697
total Financial Assets $1,866 $14 $7,247 $9,127
Liabilities Liabilities at fair value at fair value Other through through financial (in millions of uS dollars) profit & loss OCI liabilities total
Long term debt $- $- $3,586 $3,586
Other non-current liabilities - - 83 83
Total non-current liabilities $- $- $3,669 $3,669
Bank loans and acceptances - - 4,001 4,001
Financial advances from related parties - - 941 941
Accounts payable and accrued expenses - - 3,895 3,895 (except Margin deposit liabilities)
Derivative liabilities 881 27 - 908
Margin deposit liabilities - - 43 43
Total current liabilities $881 $27 $8,880 $9,788
total Financial liabilities $881 $27 $12,549 $13,457
2014 inTeriM rePorT 43
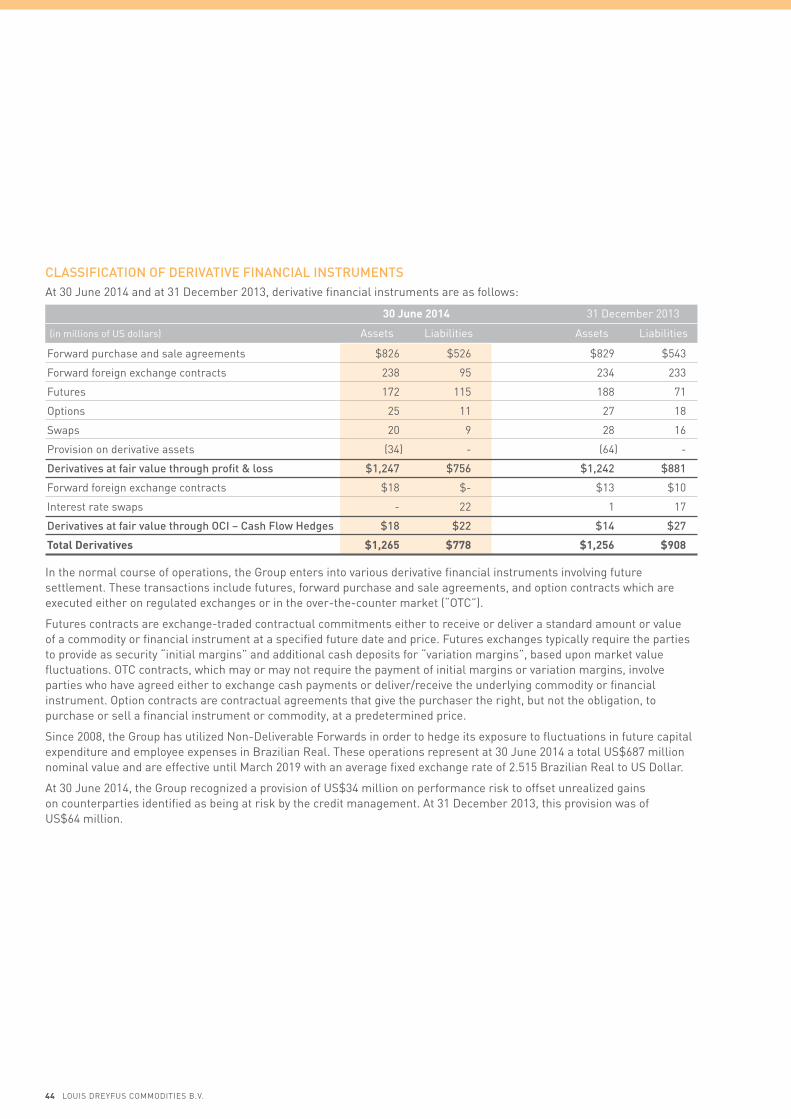
classificaTion of DerivaTive financial insTruMenTsAt 30 June 2014 and at 31 December 2013, derivative financial instruments are as follows:
30 June 2014 31 December 2013
(in millions of uS dollars) Assets Liabilities Assets Liabilities
Forward purchase and sale agreements $826 $526 $829 $543
Forward foreign exchange contracts 238 95 234 233
Futures 172 115 188 71
Options 25 11 27 18
Swaps 20 9 28 16
Provision on derivative assets (34) - (64) -
Derivatives at fair value through profit & loss $1,247 $756 $1,242 $881
Forward foreign exchange contracts $18 $- $13 $10
Interest rate swaps - 22 1 17
Derivatives at fair value through oci – cash flow hedges $18 $22 $14 $27
total derivatives $1,265 $778 $1,256 $908
In the normal course of operations, the Group enters into various derivative financial instruments involving future settlement. these transactions include futures, forward purchase and sale agreements, and option contracts which are executed either on regulated exchanges or in the over-the-counter market (“OtC”).
Futures contracts are exchange-traded contractual commitments either to receive or deliver a standard amount or value of a commodity or financial instrument at a specified future date and price. Futures exchanges typically require the parties to provide as security “initial margins” and additional cash deposits for “variation margins”, based upon market value fluctuations. OtC contracts, which may or may not require the payment of initial margins or variation margins, involve parties who have agreed either to exchange cash payments or deliver/receive the underlying commodity or financial instrument. Option contracts are contractual agreements that give the purchaser the right, but not the obligation, to purchase or sell a financial instrument or commodity, at a predetermined price.
Since 2008, the Group has utilized Non-Deliverable Forwards in order to hedge its exposure to fluctuations in future capital expenditure and employee expenses in Brazilian Real. these operations represent at 30 June 2014 a total uS$687 million nominal value and are effective until March 2019 with an average fixed exchange rate of 2.515 Brazilian Real to uS Dollar.
At 30 June 2014, the Group recognized a provision of uS$34 million on performance risk to offset unrealized gains on counterparties identified as being at risk by the credit management. At 31 December 2013, this provision was of uS$64 million.
44 LOuIS DREyFuS COMMODItIES B.V.

InterIm Condensed ConsoLIdAted FInAnCIAL stAtements
notes to tHe InterIm Condensed ConsoLIdAted FInAnCIAL stAtements
fair value hierarchYEffective 1 January 2009, the Group adopted the amendment to IFRS 7 – “Improving Disclosures about Financial Instruments”, for financial instruments that are measured in the balance sheet at fair value. the amendments were issued to enhance fair value and liquidity disclosures. With respect to fair value, the amendments require disclosure of a three-level fair value hierarchy, by class, for all financial instruments recognized at fair value.
the Group uses the following hierarchy for determining and disclosing the fair value of financial instruments by valuation technique:
n Level 1: quoted (unadjusted) prices in active markets for identical assets or liabilities;n Level 2: other techniques for which all inputs which have a significant effect on the recorded fair value are observable,
either directly or indirectly; andn Level 3: techniques which use inputs which have a significant effect on the recorded fair value that are not based on
observable market data.
the following table shows an analysis of financial instruments recorded at fair value by level of the fair value hierarchy at 30 June 2014 and 31 December 2013:
(in millions of uS dollars) 30 June 2014 31 December 2013
Level 1 Level 2 Level 3 total Level 1 Level 2 Level 3 total
Biological assets $- $- $266 $266 $- $- $272 $272
trading inventories 203 5,131 294 5,628 209 4,360 249 4,818
Derivative assets 211 990 64 1,265 217 978 61 1,256
Available-for-sale 28 - 2 30 30 - 2 32 financial assets
Other financial assets at fair value 274 13 34 321 201 86 44 331 through profit and loss
Cash and cash 887 - - 887 561 - - 561 equivalents
total Assets $1,603 $6,134 $660 $8,397 $1,218 $5,424 $628 $7,270
Derivative liabilities $164 $608 $6 $778 $127 $773 $8 $908
total liabilities $164 $608 $6 $778 $127 $773 $8 $908
11. TraDe anD oTher receivablesAt 30 June 2014 and 31 December 2013, trade and other receivables consist of the following:
30 June 2014 31 December 2013
Gross net Gross net (in millions of uS dollars) value Provision value value Provision value
trade receivables $3,434 $(121) $3,313 $3,344 $(121) $3,223
Staff and tax receivables 504 (44) 460 402 (53) 349
Prepayments and advances to suppliers 915 (3) 912 816 (5) 811
Prepaid expenses 136 - 136 54 - 54
Receivables on sale of assets 3 - 3 3 - 3
Accrued receivables 1,535 - 1,535 1,219 - 1,219
Other receivables 116 (7) 109 108 (7) 101
$6,643 $(175) $6,468 $5,946 $(186) $5,760
2014 inTeriM rePorT 45
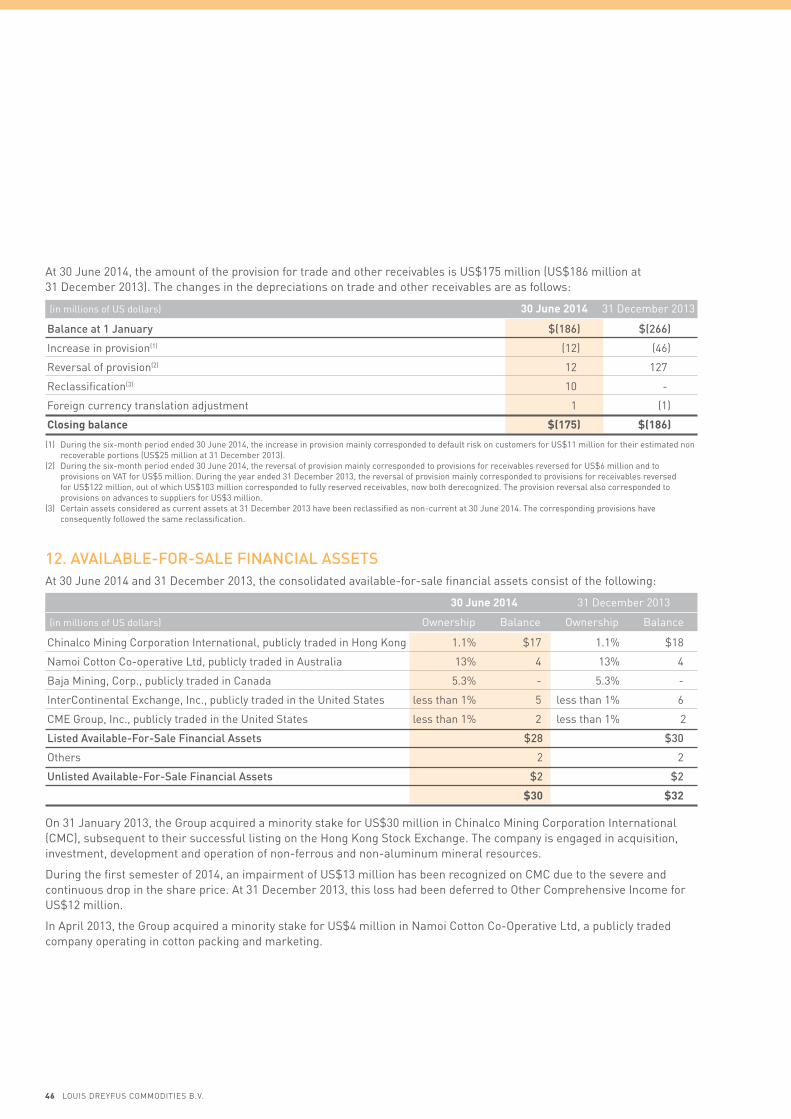
At 30 June 2014, the amount of the provision for trade and other receivables is uS$175 million (uS$186 million at 31 December 2013). the changes in the depreciations on trade and other receivables are as follows:
(in millions of uS dollars) 30 June 2014 31 December 2013
balance at 1 January $(186) $(266)
Increase in provision(1) (12) (46)
Reversal of provision(2) 12 127
Reclassification(3) 10 -
Foreign currency translation adjustment 1 (1)
Closing balance $(175) $(186)
(1) During the six-month period ended 30 June 2014, the increase in provision mainly corresponded to default risk on customers for uS$11 million for their estimated non recoverable portions (uS$25 million at 31 December 2013).
(2) During the six-month period ended 30 June 2014, the reversal of provision mainly corresponded to provisions for receivables reversed for uS$6 million and to provisions on VAt for uS$5 million. During the year ended 31 December 2013, the reversal of provision mainly corresponded to provisions for receivables reversed for uS$122 million, out of which uS$103 million corresponded to fully reserved receivables, now both derecognized. the provision reversal also corresponded to provisions on advances to suppliers for uS$3 million.
(3) Certain assets considered as current assets at 31 December 2013 have been reclassified as non-current at 30 June 2014. the corresponding provisions have consequently followed the same reclassification.
12. available-for-sale financial asseTsAt 30 June 2014 and 31 December 2013, the consolidated available-for-sale financial assets consist of the following:
30 June 2014 31 December 2013
(in millions of uS dollars) Ownership Balance Ownership Balance
Chinalco Mining Corporation International, publicly traded in Hong Kong 1.1% $17 1.1% $18
Namoi Cotton Co-operative Ltd, publicly traded in Australia 13% 4 13% 4
Baja Mining, Corp., publicly traded in Canada 5.3% - 5.3% -
InterContinental Exchange, Inc., publicly traded in the united States less than 1% 5 less than 1% 6
CME Group, Inc., publicly traded in the united States less than 1% 2 less than 1% 2
listed available-for-sale financial assets $28 $30
Others 2 2
unlisted available-for-sale financial assets $2 $2
$30 $32
On 31 January 2013, the Group acquired a minority stake for uS$30 million in Chinalco Mining Corporation International (CMC), subsequent to their successful listing on the Hong Kong Stock Exchange. the company is engaged in acquisition, investment, development and operation of non-ferrous and non-aluminum mineral resources.
During the first semester of 2014, an impairment of uS$13 million has been recognized on CMC due to the severe and continuous drop in the share price. At 31 December 2013, this loss had been deferred to Other Comprehensive Income for uS$12 million.
In April 2013, the Group acquired a minority stake for uS$4 million in Namoi Cotton Co-Operative Ltd, a publicly traded company operating in cotton packing and marketing.
46 LOuIS DREyFuS COMMODItIES B.V.

InterIm Condensed ConsoLIdAted FInAnCIAL stAtements
notes to tHe InterIm Condensed ConsoLIdAted FInAnCIAL stAtements
13. oTher financial asseTs aT fair value ThrouGh ProfiT anD lossAt 30 June 2014 and 31 December 2013, other financial assets consist of the following:
(in millions of uS dollars) 30 June 2014 31 December 2013
Financial assets held for trading purpose $283 $142
Short-term securities (maturity > 3 months)(1) 38 179
Reverse repurchase agreement loan - 10
$321 $331
(1) there are no securities pledged as collaterals for exchange at 30 June 2014 (uS$16 million at 31 December 2013).
Short-term securities are instruments with a maturity greater than three months acquired with the purpose of selling or repurchasing.
14. cash anD cash equivalenTsCash and cash equivalents at 30 June 2014 and 31 December 2013 are as follows:
(in millions of uS dollars) 30 June 2014 31 December 2013
Short term securities (maturity < 3 months)(1) $160 $293
Cash 727 268
$887 $561
(1) Including uS$15 million at 30 June 2014 of securities pledged as collaterals for exchange (uS$11 million at 31 December 2013).
At 30 June 2014 and 31 December 2013, there is no material difference between the historical value of cash and cash equivalents and their fair value.
15. helD-for-sale non-currenT asseTsAccording to IFRS 5 – “Non-current assets held-for-sale and discontinued operations”, the investment in Green Eagle Plantations Pte. Ltd has been classified as non-current assets held-for-sale for uS$145 million at 31 December 2013 and maintained unchanged at 30 June 2014.
As a reminder, the balance sheet of this investment at 31 December 2013 was as follows:
(in millions of uS dollars) 31 December 2013
balance sheet data
Non-current assets $535
Current assets 76
Total assets 611
Non-current liabilities 253
Current liabilities 69
Total liabilities 322
net equity 289
equity – group’s share $145
In July 2014, the Group exited its joint venture with Green Eagle Resources Ltd in Green Eagle Plantations Pte Ltd (Refer to note 32).
2014 inTeriM rePorT 47

16. equiTY
(in millions of uS dollars) 30 June 2014 31 December 2013
Issued capital $1 $1
Share premium 1,586 1,586
Perpetual capital securities 350 350
Retained earnings 3,157 3,026
Other reserves 66 17
equity attributable to owners of the Parent $5,160 $4,980
Non-Controlling interests 19 49
total equity $5,179 $5,029
the stockholder’s equity and non-controlling interests disclosed in the financial statements correspond to the equity used by the management when assessing performance.
capital
At 30 June 2014 and 31 December 2013, the capital of LDC is composed of 100,000,000 shares, with a 0.01 euro nominal value each, that are issued and fully paid. During the half-year ended 30 June 2014, LDC distributed uS$119 million as dividends to LDCNH (uS$360 million during the year ended 31 December 2013).
In September 2012, the Group priced an inaugural uS$350 million (uS$345 million, less costs net of tax), 8.25% coupon hybrid capital securities transaction. the securities are perpetual but the Group has the right to redeem them in certain circumstances. the perpetual capital securities are not rated and are listed on the Official List of the Singapore Exchange.
At 30 June 2014, accrued interests amount to uS$11 million net of tax (uS$22 million, net of tax at 31 December 2013).
other reserves
Other Reserves at 30 June 2014 and 31 December 2013 relate to:
30 June 2014 31 December 2013
owners owners Non- of the Non- of the (in millions controlling parent controlling parent of uS dollars) Pre-tax tax share share Pre-tax tax share share
other comprehensive $57 $(30) $(2) $29 $(8) $(14) $(2) $(20) income
Deferred 37 - - 37 37 - - 37 compensation
other reserves $94 $(30) $(2) $66 $29 $(14) $(2) $17
48 LOuIS DREyFuS COMMODItIES B.V.
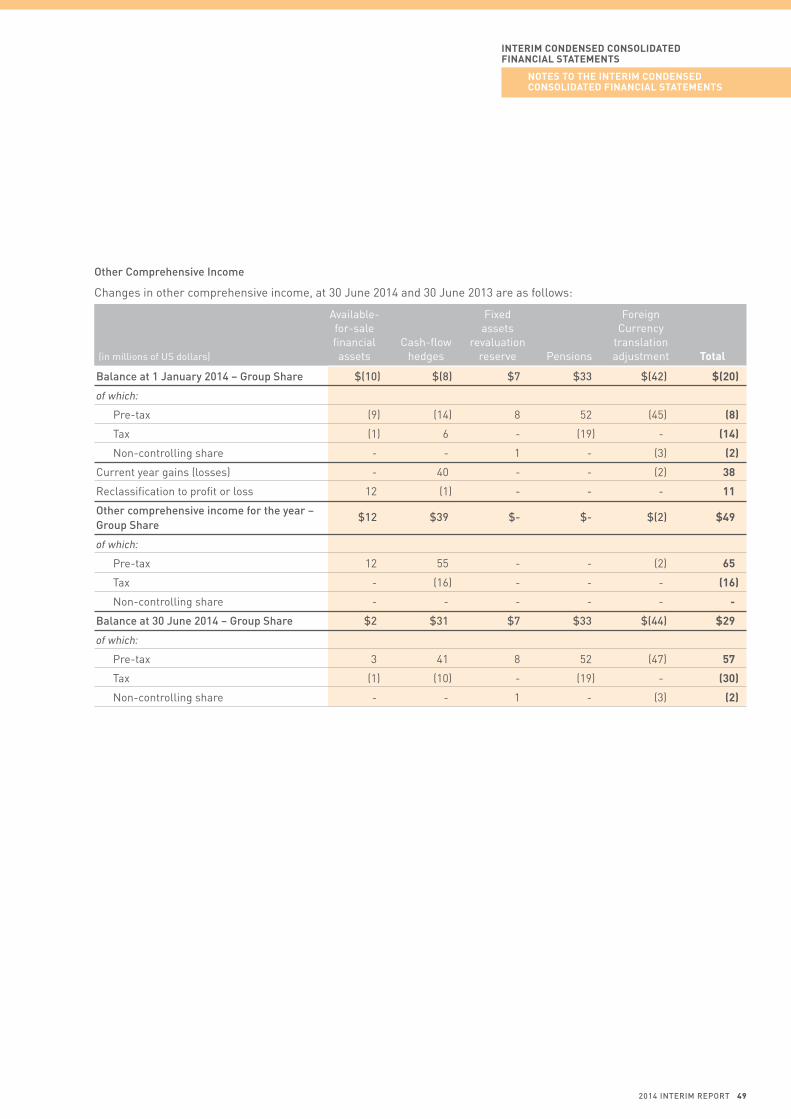
InterIm Condensed ConsoLIdAted FInAnCIAL stAtements
notes to tHe InterIm Condensed ConsoLIdAted FInAnCIAL stAtements
other comprehensive income
Changes in other comprehensive income, at 30 June 2014 and 30 June 2013 are as follows:
Available- Fixed Foreign for-sale assets Currency financial Cash-flow revaluation translation (in millions of uS dollars) assets hedges reserve Pensions adjustment total
balance at 1 January 2014 – Group share $(10) $(8) $7 $33 $(42) $(20)
of which:
Pre-tax (9) (14) 8 52 (45) (8)
tax (1) 6 - (19) - (14)
Non-controlling share - - 1 - (3) (2)
Current year gains (losses) - 40 - - (2) 38
Reclassification to profit or loss 12 (1) - - - 11
other comprehensive income for the year – $12 $39 $- $- $(2) $49 Group share
of which:
Pre-tax 12 55 - - (2) 65
tax - (16) - - - (16)
Non-controlling share - - - - - -
balance at 30 June 2014 – Group share $2 $31 $7 $33 $(44) $29
of which:
Pre-tax 3 41 8 52 (47) 57
tax (1) (10) - (19) - (30)
Non-controlling share - - 1 - (3) (2)
2014 inTeriM rePorT 49
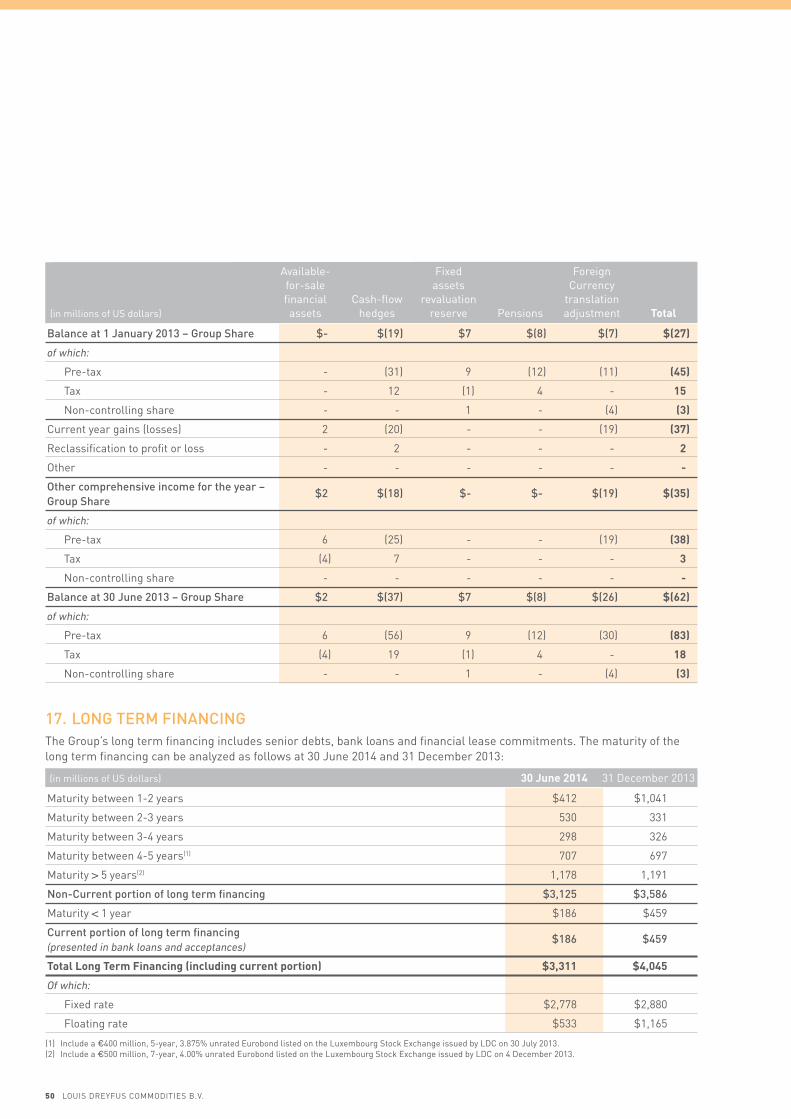
Available- Fixed Foreign for-sale assets Currency financial Cash-flow revaluation translation (in millions of uS dollars) assets hedges reserve Pensions adjustment total
balance at 1 January 2013 – Group share $- $(19) $7 $(8) $(7) $(27)
of which:
Pre-tax - (31) 9 (12) (11) (45)
tax - 12 (1) 4 - 15
Non-controlling share - - 1 - (4) (3)
Current year gains (losses) 2 (20) - - (19) (37)
Reclassification to profit or loss - 2 - - - 2
Other - - - - - -
other comprehensive income for the year – $2 $(18) $- $- $(19) $(35) Group share
of which:
Pre-tax 6 (25) - - (19) (38)
tax (4) 7 - - - 3
Non-controlling share - - - - - -
balance at 30 June 2013 – Group share $2 $(37) $7 $(8) $(26) $(62)
of which:
Pre-tax 6 (56) 9 (12) (30) (83)
tax (4) 19 (1) 4 - 18
Non-controlling share - - 1 - (4) (3)
17. lonG TerM financinGthe Group’s long term financing includes senior debts, bank loans and financial lease commitments. the maturity of the long term financing can be analyzed as follows at 30 June 2014 and 31 December 2013:
(in millions of uS dollars) 30 June 2014 31 December 2013
Maturity between 1-2 years $412 $1,041
Maturity between 2-3 years 530 331
Maturity between 3-4 years 298 326
Maturity between 4-5 years(1) 707 697
Maturity > 5 years(2) 1,178 1,191
non-current portion of long term financing $3,125 $3,586
Maturity < 1 year $186 $459
current portion of long term financing $186 $459 (presented in bank loans and acceptances)
total long term Financing (including current portion) $3,311 $4,045
Of which:
Fixed rate $2,778 $2,880
Floating rate $533 $1,165
(1) Include a €400 million, 5-year, 3.875% unrated Eurobond listed on the Luxembourg Stock Exchange issued by LDC on 30 July 2013.(2) Include a €500 million, 7-year, 4.00% unrated Eurobond listed on the Luxembourg Stock Exchange issued by LDC on 4 December 2013.
50 LOuIS DREyFuS COMMODItIES B.V.

InterIm Condensed ConsoLIdAted FInAnCIAL stAtements
notes to tHe InterIm Condensed ConsoLIdAted FInAnCIAL stAtements
Certain portions of this debt, aggregating uS$27 million at 30 June 2014 and uS$28 million at 31 December 2013, are secured by mortgages on assets.
Certain senior debt and bank loans contain covenants which require maintenance of levels of working capital, net worth, ratios of debt to equity, dividend restrictions and limit of indebtedness.
the debt outstanding is comprised of loans in the following currencies at 30 June 2014 and 31 December 2013:
(in millions of uS dollars) 30 June 2014 31 December 2013
uS Dollar $3,249 $3,961
Chinese yuan 23 24
Euro 32 24
Other currencies 7 36
total long term Financing (including current portion) $3,311 $4,045
the following is a comparative summary of long term debt outstanding, current and non-current portion:
(in millions of uS dollars) 30 June 2014 31 December 2013
Bank loans, from 2.2% to 4.5% over LIBOR due through 2015 $42 $913
Bank loans, from 2.85% to 4.75% over LIBOR due through 2016 20 140
Bank loans, from 1.65% to 3.50% over LIBOR due through 2017 406 11
Bank loans, from 2.50% to 5.80% over tJLP due through 2018 26 30
Other variable rates through 2019 39 71
Fixed rate through 2023 2,778 2,880
total long term Financing (including current portion) $3,311 $4,045
At 30 June 2014 and 31 December 2013, there is no significant difference between the historical value of long term financing and its fair value.
18. bank loans anD accePTancesthe Group finances most of its short-term requirements with bank loans and acceptances. the underlying agreements require certain companies to maintain minimum levels of net worth and to meet various liquidity tests.
At 30 June 2014 and 31 December 2013, bank loans and acceptances consist of the following:
(in millions of uS dollars) 30 June 2014 31 December 2013
Bank loans $4,623 $2,391
Bank loans secured on LDC Metals Suisse SA inventories and trade receivables 1,217 801
Bank overdrafts 240 204
Repurchase agreements 162 136
Securities short positions - 10
total short term Financing $6,242 $3,542
Current portion of long term financing 186 459
total bank loans and Acceptances $6,428 $4,001
Of which:
Fixed rate $1,568 $1,195
Floating rate $4,860 $2,806
2014 inTeriM rePorT 51

the Group enters into repurchase agreements which are arrangements involving the sale of securities at a specified price with an irrevocable commitment to repurchase the same or similar securities at a fixed price, on a specified future date or with an open maturity.
At 30 June 2014 and 31 December 2013, there is no significant difference between the historical value of bank loans and acceptances and their fair value.
the debt outstanding is comprised of loans in the following currencies at 30 June 2014 and 31 December 2013:
(in millions of uS dollars) 30 June 2014 31 December 2013
uS Dollar $5,336 $3,399
Chinese yuan 583 235
Euro 121 134
Other currencies 388 233
total bank loans and Acceptances $6,428 $4,001
19. reTireMenT benefiT obliGaTionsAt 30 June 2014 and 31 December 2013, retirement benefit obligations consist of the following:
(in millions of uS dollars) 30 June 2014 31 December 2013
Long-term pension benefit $93 $101
Post-retirement benefit 35 35
Other long-term employee benefits 7 7
retirement benefit obligations $135 $143
Current pension benefit and net plan asset are almost nil at 31 December 2013 and 30 June 2014.
the Group maintains pension plans in various countries as prescribed by local laws and customs. the obligations of the Group to pay benefits upon retirement are provided for on an estimated annual basis. the estimates reflect assumptions as to future salary increases, employee turnover and mortality rates. the most significant retirement plans which require funding are in the united States.
20. ProvisionsAt 30 June 2014 and 31 December 2013, provisions consist of the following:
(in millions of uS dollars) 30 June 2014 31 December 2013
Current provisions $11 $11
Non-current provisions 114 96
$125 $107
52 LOuIS DREyFuS COMMODItIES B.V.

InterIm Condensed ConsoLIdAted FInAnCIAL stAtements
notes to tHe InterIm Condensed ConsoLIdAted FInAnCIAL stAtements
Changes in provisions for 30 June 2014 and 31 December 2013 are as follows:
(in millions of uS dollars) 30 June 2014 31 December 2013
tax and Provisions for: social risks Litigations Other total total
balance at 1 January $67 $26 $14 $107 $109
Allowance 19 2 1 22 28
Reversal of used portion (1) - (2) (3) (5)
Reversal of unused portion (3) (3) - (6) (15)
Reclassification - 2 - 2 (12)
Change in list of consolidated companies 3 - - 3 2
Closing balance $85 $27 $13 $125 $107
21. incoMe TaxesDeferred income tax assets and liabilities are offset when there is a legally enforceable right to offset the potential future equivalent of current tax assets and liabilities.
the consolidated deferred income tax assets (liabilities) at 30 June 2014 and 31 December 2013, are as follows:
(in millions of uS dollars) 30 June 2014 31 December 2013
Deferred income tax assets $320 $278
Deferred income tax liabilities (414) (367)
$(94) $(89)
the consolidated net deferred income tax assets (liabilities) recorded at 30 June 2014 and 31 December 2013 arise from:
(in millions of uS dollars) 30 June 2014 31 December 2013
timing differences $(332) $(239)
tax benefits from carry forward losses 245 161
Valuation allowance for deferred tax assets (7) (11)
$(94) $(89)
the 30 June 2014 valuation allowance is ascribed to available loss carry forwards for approximately uS$7 million against uS$5 million at 31 December 2013.
Changes in net deferred income tax assets (liabilities) are as follows:
(in millions of uS dollars) 30 June 2014 31 December 2013
balance at 1 January $(89) $(37)
Deferred tax recognized in income 29 (26)
Change in list of consolidated companies (36) (3)
Deferred taxes recognized in equity 2 (19)
Purchase price accounting adjustment - (3)
Exchange differences - (1)
Closing balance $(94) $(89)
2014 inTeriM rePorT 53

the provision for income tax differs from the computed “expected” income tax provision using the Netherlands statutory tax rate of 25% during the six-month periods ended 30 June 2014 and 30 June 2013 for the following reasons:
30 June 2014 30 June 2013 (in millions of uS dollars) 6 months 6 months
Theoretical tax on income $79 $72
Differences in income tax rates (20) (34)
Difference between local currency and functional currency (6) 10
Change in valuation of tax assets and net operating losses (16) (27)
Permanent differences on investments (6) (4)
Other permanent differences 24 12
reported tax expense $55 $29
22. accounTs PaYable anD accrueD exPensesAccounts payable and accrued expenses at 30 June 2014 and 31 December 2013, consist of the following:
(in millions of uS dollars) 30 June 2014 31 December 2013
trade payables $2,111 $1,751
Accrued payables 1,232 1,393
Staff and tax payables 283 285
Margin deposits 35 43
Prepayments and advances received 261 319
Other payables 59 111
Deferred income 18 10
Payable on purchase of assets 29 26
$4,028 $3,938
23. oTher non-currenT liabiliTiesOther non-current liabilities at 30 June 2014 and 31 December 2013 consist of the following:
(in millions of uS dollars) 30 June 2014 31 December 2013
Non-current tax and social liabilities $21 $21
Debts associated to business combinations and put options 49 47
Other non-current liabilities 15 15
$85 $83
24. neT salesNet sales consist of the following:
30 June 2014 30 June 2013 (in millions of uS dollars) 6 months 6 months
Sales of goods $33,454 $28,966
Income from services rendered 166 150
Other income 66 45
$33,686 $29,161
54 LOuIS DREyFuS COMMODItIES B.V.
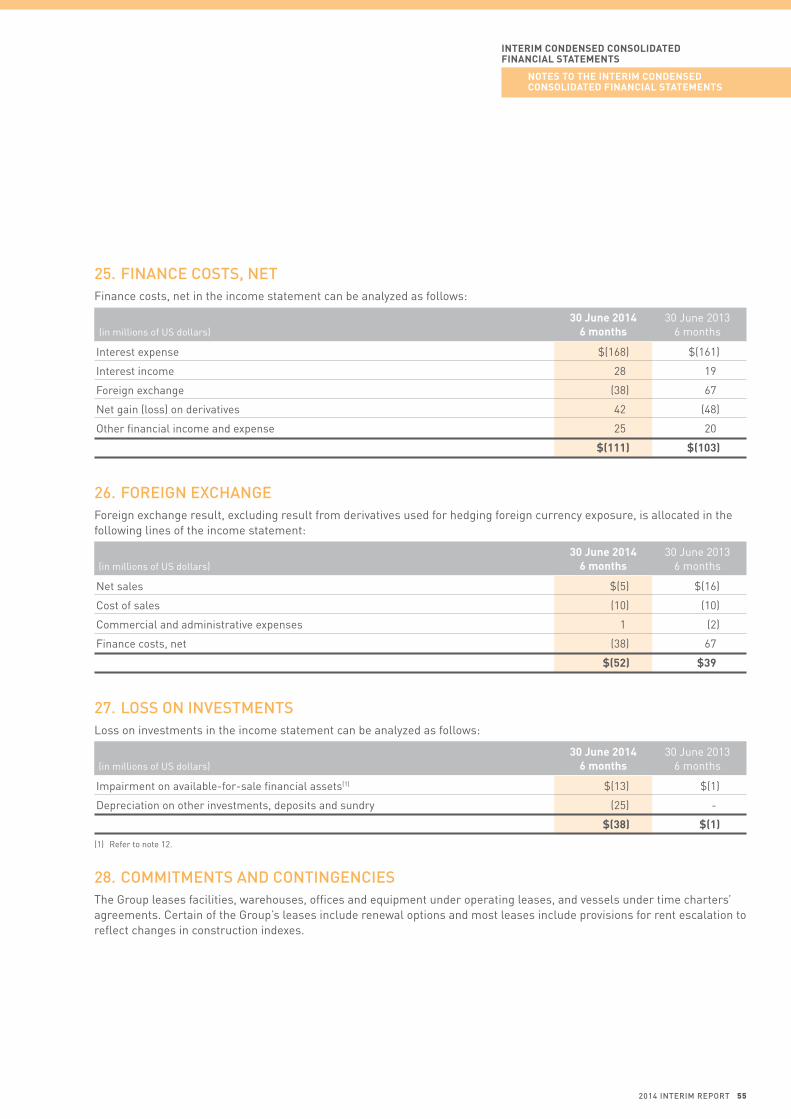
InterIm Condensed ConsoLIdAted FInAnCIAL stAtements
notes to tHe InterIm Condensed ConsoLIdAted FInAnCIAL stAtements
25. finance cosTs, neTFinance costs, net in the income statement can be analyzed as follows:
30 June 2014 30 June 2013 (in millions of uS dollars) 6 months 6 months
Interest expense $(168) $(161)
Interest income 28 19
Foreign exchange (38) 67
Net gain (loss) on derivatives 42 (48)
Other financial income and expense 25 20
$(111) $(103)
26. foreiGn exchanGeForeign exchange result, excluding result from derivatives used for hedging foreign currency exposure, is allocated in the following lines of the income statement:
30 June 2014 30 June 2013 (in millions of uS dollars) 6 months 6 months
Net sales $(5) $(16)
Cost of sales (10) (10)
Commercial and administrative expenses 1 (2)
Finance costs, net (38) 67
$(52) $39
27. loss on invesTMenTsLoss on investments in the income statement can be analyzed as follows:
30 June 2014 30 June 2013 (in millions of uS dollars) 6 months 6 months
Impairment on available-for-sale financial assets(1) $(13) $(1)
Depreciation on other investments, deposits and sundry (25) -
$(38) $(1)
(1) Refer to note 12.
28. coMMiTMenTs anD conTinGenciesthe Group leases facilities, warehouses, offices and equipment under operating leases, and vessels under time charters’ agreements. Certain of the Group’s leases include renewal options and most leases include provisions for rent escalation to reflect changes in construction indexes.
2014 inTeriM rePorT 55
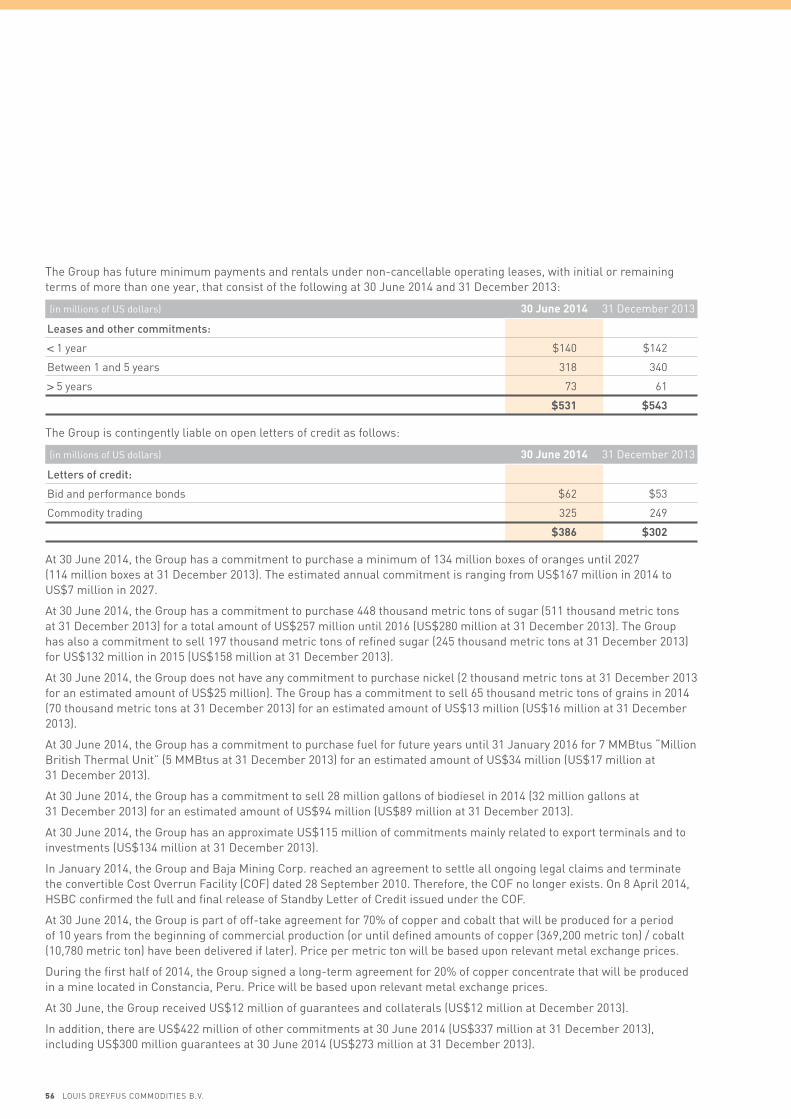
the Group has future minimum payments and rentals under non-cancellable operating leases, with initial or remaining terms of more than one year, that consist of the following at 30 June 2014 and 31 December 2013:
(in millions of uS dollars) 30 June 2014 31 December 2013
leases and other commitments:
< 1 year $140 $142
Between 1 and 5 years 318 340
> 5 years 73 61
$531 $543
the Group is contingently liable on open letters of credit as follows:
(in millions of uS dollars) 30 June 2014 31 December 2013
letters of credit:
Bid and performance bonds $62 $53
Commodity trading 325 249
$386 $302
At 30 June 2014, the Group has a commitment to purchase a minimum of 134 million boxes of oranges until 2027 (114 million boxes at 31 December 2013). the estimated annual commitment is ranging from uS$167 million in 2014 to uS$7 million in 2027.
At 30 June 2014, the Group has a commitment to purchase 448 thousand metric tons of sugar (511 thousand metric tons at 31 December 2013) for a total amount of uS$257 million until 2016 (uS$280 million at 31 December 2013). the Group has also a commitment to sell 197 thousand metric tons of refined sugar (245 thousand metric tons at 31 December 2013) for uS$132 million in 2015 (uS$158 million at 31 December 2013).
At 30 June 2014, the Group does not have any commitment to purchase nickel (2 thousand metric tons at 31 December 2013 for an estimated amount of uS$25 million). the Group has a commitment to sell 65 thousand metric tons of grains in 2014 (70 thousand metric tons at 31 December 2013) for an estimated amount of uS$13 million (uS$16 million at 31 December 2013).
At 30 June 2014, the Group has a commitment to purchase fuel for future years until 31 January 2016 for 7 MMBtus “Million British thermal unit” (5 MMBtus at 31 December 2013) for an estimated amount of uS$34 million (uS$17 million at 31 December 2013).
At 30 June 2014, the Group has a commitment to sell 28 million gallons of biodiesel in 2014 (32 million gallons at 31 December 2013) for an estimated amount of uS$94 million (uS$89 million at 31 December 2013).
At 30 June 2014, the Group has an approximate uS$115 million of commitments mainly related to export terminals and to investments (uS$134 million at 31 December 2013).
In January 2014, the Group and Baja Mining Corp. reached an agreement to settle all ongoing legal claims and terminate the convertible Cost Overrun Facility (COF) dated 28 September 2010. therefore, the COF no longer exists. On 8 April 2014, HSBC confirmed the full and final release of Standby Letter of Credit issued under the COF.
At 30 June 2014, the Group is part of off-take agreement for 70% of copper and cobalt that will be produced for a period of 10 years from the beginning of commercial production (or until defined amounts of copper (369,200 metric ton) / cobalt (10,780 metric ton) have been delivered if later). Price per metric ton will be based upon relevant metal exchange prices.
During the first half of 2014, the Group signed a long-term agreement for 20% of copper concentrate that will be produced in a mine located in Constancia, Peru. Price will be based upon relevant metal exchange prices.
At 30 June, the Group received uS$12 million of guarantees and collaterals (uS$12 million at December 2013).
In addition, there are uS$422 million of other commitments at 30 June 2014 (uS$337 million at 31 December 2013), including uS$300 million guarantees at 30 June 2014 (uS$273 million at 31 December 2013).
56 LOuIS DREyFuS COMMODItIES B.V.
InterIm Condensed ConsoLIdAted FInAnCIAL stAtements
notes to tHe InterIm Condensed ConsoLIdAted FInAnCIAL stAtements
Louis Dreyfus Commodities LLC and certain of its affiliates (including LDC) were named as defendants in a consolidated action in united States federal court in New york alleging manipulation and artificial inflation of the ICE Cotton No. 2 futures contracts for May 2011 and July 2011. the plaintiffs have proposed to bring the action as a class action. the defendants have filed an answer denying the claims in the action. No trial date has been scheduled in the case. this matter is in its early stages and the Company cannot predict its ultimate outcome.
there are various claims and ongoing regulatory investigations asserted against and by the Group which, in the opinion of counsels, based on a review of the present stages of such claims in the aggregate, should not have a material effect on the Group’s financial position or future operating results.
During 2001 and 2002 Argentina went through a period of a severe political, economic and social crisis. Among other consequences the crisis resulted in the Argentine government defaulting on its foreign debt obligations. In 2005, Argentina restructured part of the defaulted sovereign debt. In June 2014, the uS Supreme Court rejected an Argentine appeal to renegotiate its debts and the full consequences of this on Argentina’s political and economic landscape are still unclear. Argentina being a key origination market for the Group, Louis Dreyfus Commodities is closely monitoring these recent evolutions.
29. share-baseD PaYMenTIn December 2006, the terms of a stock-based compensation arrangement referred to as the Equity Participation Plan (“EPP”), which is sponsored by LDCH became operational and the arrangement was fully implemented in December 2007 with the issuance of the first shares relating to the awards. the EPP provides for the granting of securities and options to purchase securities in LDCH (collectively “Awards”) to employees of the Group. EPP awards granted to employees of the Group generally vest on a graduated basis over a four year period. Additional awards have been granted to employees during each first semester starting in 2008, with the corresponding securities and options to purchase securities to be issued during the second semester of the same calendar year.
the Group accounts for the EPP as an equity-settled plan: the fair value of the awards granted, determined at attribution date, is recorded in the income statement ratably over the vesting period of the awards. the value of the awards granted is not revalued in subsequent periods.
the Group and LDCH have entered into reimbursement agreements under which certain subsidiaries of the Group will reimburse LDCH for the awards attributed to their employees. Depending on the reimbursement agreement, the Group is liable for vested awards at attribution or fair value. Amounts due under these reimbursement agreements are recorded by the Group as a distribution of equity to LDCH. Accordingly, amounts payable under the reimbursement agreements give rise to a reclassification from equity to liabilities up to the amount of stock compensation already recorded. Any excess of the amounts due under the reimbursement agreements over the attribution value of the awards is recorded as an additional debit to retained earnings. Certain reimbursement agreements provide for a payment anticipating the accounting vesting schedule and give rise to a prepaid asset. the Group paid uS$0 million in 2014 (uS$32 million in H1 2013) to LDCH relating to reimbursement agreements, and recorded a liability of uS$25 million at 30 June 2014 (prepaid asset of uS$37 million at 31 December 2013).
Awards granted to employees during 2014 are of uS$114 million while awards forfeited by employees represent uS$2 million. During the H1 2014 transfer window period, LDCH purchased shares from employees corresponding to uS$87 million in attribution value bringing the attribution value of outstanding EPP awards granted to employees to uS$462 million. At 31 December 2013, the attribution value of outstanding EPP awards granted to employees was uS$437 million, of which uS$113 million corresponded to awards granted in 2013, and uS$6 million to awards forfeited by employees. During the 2013 transfer window period, LDCH purchased shares from employees corresponding to uS$60 million in attribution value.
At 1 July 2014, EPP awards fully vested represent uS$174 million and awards vesting ratably over periods ranging from three months to four years are of uS$288 million. At 31 December 2013, they were respectively of uS$148 million and uS$289 million vesting ratably over periods ranging from three months to four years.
During the first semester, compensation costs recognized in commercial and administrative expenses are of uS$62 million in 2014 and of uS$61 million in 2013.
unrecognized compensation costs expected to be recognized from 2014 to 2018 are of uS$164 million at 30 June 2014 and of uS$111 million at 31 December 2013.
2014 inTeriM rePorT 57

30. nuMber of eMPloYees anD Personnel exPensesFor the six-month period ended 30 June 2014, personnel expenses reached uS$488 million for an average number of employees of 17,635. For the six-month period ended 30 June 2013, they were of uS$463 million for 18,006 employees.
the average number of employees is as follows:
30 June 2014 30 June 2013
Managers and traders 1,646 1,505
Supervisors 1,253 1,125
Employees 4,330 4,320
Workers 9,041 8,306
Seasonal workers 1,365 2,750
17,635 18,006
the decrease in the average number of seasonal workers results mainly from the size and the timing of the juice crop season. that decrease is partially compensated by the continuing expansion of trading and processing activities in Asia.
31. relaTeD ParTies TransacTionstransactions with related parties are reflected as follows:
Income statement 30 June 2014 30 June 2013 (in millions of uS dollars) 6 months 6 months
Sales(1) $115 $220
Cost of goods sold(1) (398) (393)
Other income net of expenses 7 15
Finance costs, net 4 7
balance sheet (in millions of uS dollars) 30 June 2014 31 December 2013
Other investments, deposits & sundry(1) $11 $29
Financial advances to related parties(1) 29 42
trade and other receivables(1) 458 255
Margin deposits(1) - 3
Derivatives(1) 20 21
total Assets $518 $350
Financial advances from related parties(2) $980 $941
trade and other payables(1) 154 67
Derivatives(1) 6 18
total liabilities $1,140 $1,026
(1) Mainly correspond to transactions with associates and joint ventures and/or with entities included in Biosev.(2) Include financing from LDCNH of uS$168 million at 30 June 2014 (uS$242 million at 31 December 2013) and financing from LDCH of uS$806 million at 30 June 2014
(uS$697 million at 31 December 2013), net of transactions relating to reimbursement agreements with LDCH of uS$(25) million at 30 June 2014 (uS$37 million at 31 December 2013 – Refer to note 29).
58 LOuIS DREyFuS COMMODItIES B.V.
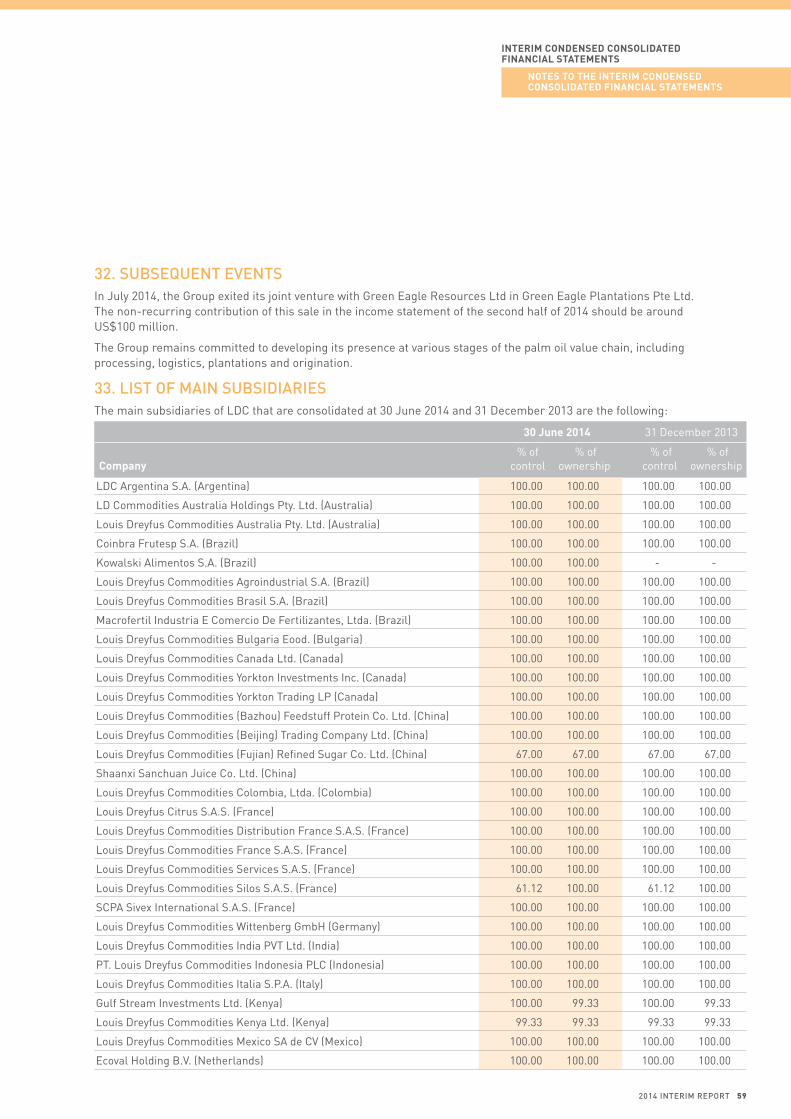
InterIm Condensed ConsoLIdAted FInAnCIAL stAtements
notes to tHe InterIm Condensed ConsoLIdAted FInAnCIAL stAtements
32. subsequenT evenTsIn July 2014, the Group exited its joint venture with Green Eagle Resources Ltd in Green Eagle Plantations Pte Ltd. the non-recurring contribution of this sale in the income statement of the second half of 2014 should be around uS$100 million.
the Group remains committed to developing its presence at various stages of the palm oil value chain, including processing, logistics, plantations and origination.
33. lisT of Main subsiDiariesthe main subsidiaries of LDC that are consolidated at 30 June 2014 and 31 December 2013 are the following:
30 June 2014 31 December 2013
% of % of % of % of Company control ownership control ownership
LDC Argentina S.A. (Argentina) 100.00 100.00 100.00 100.00
LD Commodities Australia Holdings Pty. Ltd. (Australia) 100.00 100.00 100.00 100.00
Louis Dreyfus Commodities Australia Pty. Ltd. (Australia) 100.00 100.00 100.00 100.00
Coinbra Frutesp S.A. (Brazil) 100.00 100.00 100.00 100.00
Kowalski Alimentos S.A. (Brazil) 100.00 100.00 - -
Louis Dreyfus Commodities Agroindustrial S.A. (Brazil) 100.00 100.00 100.00 100.00
Louis Dreyfus Commodities Brasil S.A. (Brazil) 100.00 100.00 100.00 100.00
Macrofertil Industria E Comercio De Fertilizantes, Ltda. (Brazil) 100.00 100.00 100.00 100.00
Louis Dreyfus Commodities Bulgaria Eood. (Bulgaria) 100.00 100.00 100.00 100.00
Louis Dreyfus Commodities Canada Ltd. (Canada) 100.00 100.00 100.00 100.00
Louis Dreyfus Commodities yorkton Investments Inc. (Canada) 100.00 100.00 100.00 100.00
Louis Dreyfus Commodities yorkton trading LP (Canada) 100.00 100.00 100.00 100.00
Louis Dreyfus Commodities (Bazhou) Feedstuff Protein Co. Ltd. (China) 100.00 100.00 100.00 100.00
Louis Dreyfus Commodities (Beijing) trading Company Ltd. (China) 100.00 100.00 100.00 100.00
Louis Dreyfus Commodities (Fujian) Refined Sugar Co. Ltd. (China) 67.00 67.00 67.00 67.00
Shaanxi Sanchuan Juice Co. Ltd. (China) 100.00 100.00 100.00 100.00
Louis Dreyfus Commodities Colombia, Ltda. (Colombia) 100.00 100.00 100.00 100.00
Louis Dreyfus Citrus S.A.S. (France) 100.00 100.00 100.00 100.00
Louis Dreyfus Commodities Distribution France S.A.S. (France) 100.00 100.00 100.00 100.00
Louis Dreyfus Commodities France S.A.S. (France) 100.00 100.00 100.00 100.00
Louis Dreyfus Commodities Services S.A.S. (France) 100.00 100.00 100.00 100.00
Louis Dreyfus Commodities Silos S.A.S. (France) 61.12 100.00 61.12 100.00
SCPA Sivex International S.A.S. (France) 100.00 100.00 100.00 100.00
Louis Dreyfus Commodities Wittenberg GmbH (Germany) 100.00 100.00 100.00 100.00
Louis Dreyfus Commodities India PVt Ltd. (India) 100.00 100.00 100.00 100.00
Pt. Louis Dreyfus Commodities Indonesia PLC (Indonesia) 100.00 100.00 100.00 100.00
Louis Dreyfus Commodities Italia S.P.A. (Italy) 100.00 100.00 100.00 100.00
Gulf Stream Investments Ltd. (Kenya) 100.00 99.33 100.00 99.33
Louis Dreyfus Commodities Kenya Ltd. (Kenya) 99.33 99.33 99.33 99.33
Louis Dreyfus Commodities Mexico SA de CV (Mexico) 100.00 100.00 100.00 100.00
Ecoval Holding B.V. (Netherlands) 100.00 100.00 100.00 100.00
2014 inTeriM rePorT 59

30 June 2014 31 December 2013
% of % of % of % of Company control ownership control ownership
Louis Dreyfus Commodities Metals B.V. (Netherlands) 100.00 100.00 100.00 100.00
Louis Dreyfus Commodities Participations B.V. (Netherlands) 100.00 100.00 100.00 100.00
Nethgrain B.V. (Netherlands) 100.00 100.00 100.00 100.00
Coinbra International trading N.V. (Netherlands Antilles) 100.00 100.00 100.00 100.00
LDC Paraguay S.A. (Paraguay) 100.00 100.00 100.00 100.00
Louis Dreyfus Commodities Peru S.R.L (Peru) 100.00 100.00 100.00 100.00
Louis Dreyfus Commodities Polska SP. z.o.o. (Poland) 100.00 100.00 100.00 100.00
Louis Dreyfus Commodities Portugal Lda (Portugal) 100.00 100.00 100.00 100.00
Louis Dreyfus Commodities Vostok LLC (Russian Federation) 100.00 100.00 100.00 100.00
GKE Metal Logistics Pte Ltd (Singapore) 51.00 51.00 51.00 51.00
Louis Dreyfus Commodities Asia Pte Ltd. (Singapore) 100.00 100.00 100.00 100.00
Louis Dreyfus Commodities Africa (Proprietary) Ltd. (South Africa) 100.00 100.00 100.00 100.00
Coffee Agency S.A. (Spain) 100.00 100.00 100.00 100.00
Louis Dreyfus Commodities Espana S.A. (Spain) 100.00 100.00 100.00 100.00
Louis Dreyfus Commodities Metals Suisse S.A. (Switzerland) 100.00 100.00 100.00 100.00
Louis Dreyfus Commodities Suisse S.A. (Switzerland) 100.00 100.00 100.00 100.00
Sungrain Holding S.A. (Switzerland) 100.00 100.00 100.00 100.00
Louis Dreyfus Commodities tanzania Ltd. (tanzania) 100.00 100.00 100.00 100.00
LD Commodities uganda Ltd. (uganda) 100.00 100.00 100.00 100.00
Louis Dreyfus Commodities ukraine Ltd. (ukraine) 100.00 100.00 100.00 100.00
Louis Dreyfus Commodities MEA trading (united Arab Emirates) 100.00 100.00 100.00 100.00
Louis Dreyfus Financial Management Ltd. (united Kingdom) 100.00 100.00 100.00 100.00
Ruselco LLP (united Kingdom) 100.00 100.00 100.00 100.00
Elkhorn Valley Ethanol LLC (u.S.A.) 100.00 100.00 100.00 100.00
Imperial Sugar Company (u.S.A.) 100.00 100.00 100.00 100.00
LD Commodities Interior Elevators LLC (u.S.A.) 100.00 100.00 100.00 100.00
LDC Holding Inc. (u.S.A.) 100.00 100.00 100.00 100.00
Louis Dreyfus Agricultural Industries LLC (u.S.A.) 100.00 100.00 100.00 100.00
Louis Dreyfus Biofuels Holdings LLC (u.S.A.) 100.00 100.00 100.00 100.00
Louis Dreyfus Citrus Inc. (u.S.A.) 100.00 100.00 100.00 100.00
Louis Dreyfus Claypool Holdings LLC (u.S.A.) 100.00 100.00 100.00 100.00
Louis Dreyfus Commodities Investment Holdings LLC (u.S.A.) 100.00 100.00 100.00 100.00
Louis Dreyfus Commodities LLC (u.S.A.) 100.00 100.00 100.00 100.00
Louis Dreyfus Commodities Port Allen Export Elevator LLC (u.S.A.) 100.00 100.00 100.00 100.00
Louis Dreyfus Norfolk LLC (u.S.A.) 100.00 100.00 100.00 100.00
term Commodities Inc. (u.S.A.) 100.00 100.00 100.00 100.00
LDC uruguay S.A. (uruguay) 100.00 100.00 100.00 100.00
urugrain S.A. (uruguay) 100.00 100.00 100.00 100.00
Louis Dreyfus Commodities Vietnam Company Ltd. (Vietnam) 100.00 100.00 100.00 100.00
60 LOuIS DREyFuS COMMODItIES B.V.

CORPORaTE gOVERNaNCE
suPervisorY boarDlouis Dreyfus commodities holdings b.v.serge schoen ChairmanMargarita louis-Dreyfus Deputy ChairpersonJean-rené angeloglouMichel DemaréMehdi el Glaouisteven J. WischDr. Jörg Wolle
suPervisorY boarD coMMiTTeesn audit committee Jean-rené angeloglou Chairperson Mehdi el Glaoui steven J. Wisch
n strategy committee Michel Demaré Chairperson Margarita louis-Dreyfus serge schoen Dr. Jörg Wolle
n compensation, nomination and Governance committee
Dr. Jörg Wolle Chairperson Michel Demaré Margarita louis-Dreyfus serge schoen
ManaGinG boarDlouis Dreyfus commodities holdings b.v. and louis Dreyfus commodities b.v.claude ehlingerJohannes schol
GrouP auDiTorsfrançois-xavier ameye Deloitte & Associés
execuTive GrouPserge schoen Executive ChairmanLouis Dreyfus Commodities Holdings Group
claude ehlinger Interim Chief Executive Officer and Chief Financial Officer
Paul akroyd Senior Head, Metals PlatformMiguel catella Senior Head, Finance PlatformJacques Gillaux Senior Head, Sugar Platformadrian isman Senior Head, Juice Platform, North Latin America Region, Chairman of the Board, Calyx Agro Ltdnigel Mamalis Senior Head, Merchandizing PlatformsTrishul Mandana Senior Head, Coffee Platformandrea Maserati Global HR Director and Senior Head, Corporate FunctionsJoe nicosia Senior Head, Merchandizing PlatformsDavid ohayon Senior Head, Grains and Value Chain Platformsfrançois-Philippe Pic Senior Head, Industry, Execution and Procurementandré roth Senior Head, Oilseeds and Value Chain PlatformsGert-Jan van den akker Senior Head of Regionsrohit aggarwal Head, Asia Regionciro echesortu Head, Business StrategyPeter ensink Head, Freight PlatformJean-Marc foucher Head, Europe & Black Sea RegionGuy de Montulé Head, Rice PlatformMikael Mörn Head, North America RegionGaston nogues Head, Fertilizers & Inputs PlatformGonzalo ramírez Martiarena Head, South & West Latin America Regionanthony Tancredi Head, Cotton PlatformPaul van Wagensveld Head, Dairy PlatformJames Wild Head, Middle East & Africa Regionsilvia Taurozzi Advisor to the Interim CEO
2014 inTeriM rePorT 61
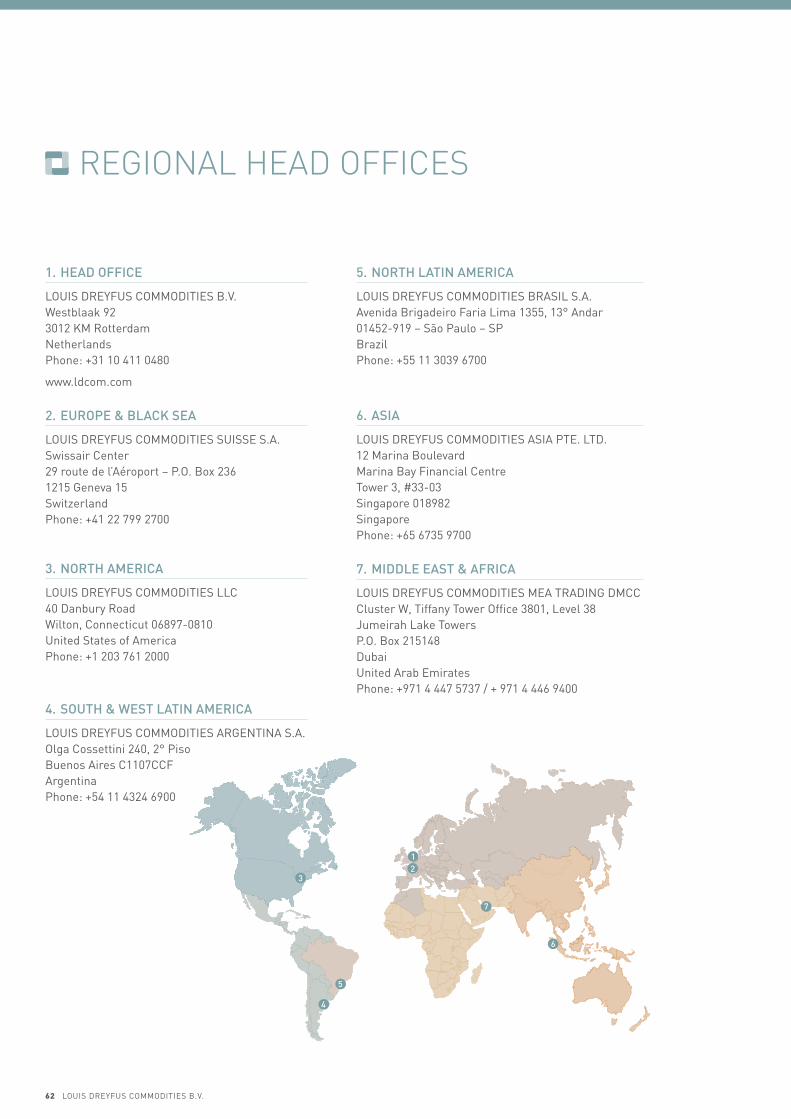
1. heaD office
LOuIS DREyFuS COMMODItIES B.V. Westblaak 92 3012 KM Rotterdam Netherlands Phone: +31 10 411 0480
www.ldcom.com
2. euroPe & black sea
LOuIS DREyFuS COMMODItIES SuISSE S.A. Swissair Center 29 route de l’Aéroport – P.O. Box 236 1215 Geneva 15 Switzerland Phone: +41 22 799 2700
3. norTh aMerica
LOuIS DREyFuS COMMODItIES LLC 40 Danbury Road Wilton, Connecticut 06897-0810 united States of America Phone: +1 203 761 2000
4. souTh & WesT laTin aMerica
LOuIS DREyFuS COMMODItIES ARGENtINA S.A. Olga Cossettini 240, 2° Piso Buenos Aires C1107CCF Argentina Phone: +54 11 4324 6900
5. norTh laTin aMerica
LOuIS DREyFuS COMMODItIES BRASIL S.A. Avenida Brigadeiro Faria Lima 1355, 13° Andar 01452-919 – São Paulo – SP Brazil Phone: +55 11 3039 6700
6. asia
LOuIS DREyFuS COMMODItIES ASIA PtE. LtD. 12 Marina Boulevard Marina Bay Financial Centre tower 3, #33-03 Singapore 018982 Singapore Phone: +65 6735 9700
7. MiDDle easT & africa
LOuIS DREyFuS COMMODItIES MEA tRADING DMCC Cluster W, tiffany tower Office 3801, Level 38 Jumeirah Lake towers P.O. Box 215148 Dubai united Arab Emirates Phone: +971 4 447 5737 / + 971 4 446 9400
12
3
4
5
6
7
REgIONaL HEaD OFFICES
62 LOuIS DREyFuS COMMODItIES B.V.

©Design and production by Reluctantly Brave (London, UK) ©All photos Copyright Louis Dreyfus Commodities unless otherwise indicated. All rights reserved.
Credit for photography that illustrates this report:
©Photographers: David Hundley / María Inés Albín / Mark Wilson
Cover photo: David Hundley
©Shutterstock: Iryna Denysova / Cristina Negoita / InnaFelker / Andrey_Popov / AVprophoto / MillaF / SeDmi / Valentyn Volkov / SARIN KUNTHONG / Zeljko Radojko /
This report is printed on Heaven 42 paper which is FSC® Certified.

LOUIS DReyFUS COMMODITIeS B.V.Westblaak 923012 KM RotterdamNetherlands
www.ldcom.com