and Development - ECORFAN®
54
ISSN 2444-4987 Journal of Research and Development
-
Upload
khangminh22 -
Category
Documents
-
view
1 -
download
0
Transcript of and Development - ECORFAN®

ISSN 2444-4987
Journal of Research
and Development

RINOE-Spain
Chief Editor
VARGAS-DELGADO, Oscar. PhD
Executive Director
RAMOS-ESCAMILLA, María. PhD
Editorial Director
PERALTA-CASTRO, Enrique. MsC
Web Designer
ESCAMILLA-BOUCHAN, Imelda. PhD
Web Diagrammer
LUNA-SOTO, Vladimir. PhD
Editorial Assistant
REYES-VILLAO, Angélica. BsC
Translator
DÍAZ-OCAMPO, Javier. BsC
Philologist
RAMOS-ARANCIBIA, Alejandra. BsC
Journal of Research and Development,
Volume 7, Issue 20, July – December
2021, is a journal edited semestral by
ECORFAN-Spain. 38 Matacerquillas,
CP-28411. Moralzarzal –Madrid-España.
WEB: www.ecorfan.org/spain,
[email protected]. Editor in Chief:
VARGAS-DELGADO, Oscar. PhD.
ISSN: 2444-4987. Responsible for the
last update of this number of the
ECORFAN Computing Unit.
ESCAMILLA–BOUCHÁN, Imelda.
PhD, LUNA-SOTO, Vladimir. PhD,
updated to December 31, 2021.
The opinions expressed by authors do not
necessarily reflect the opinions of the
editor of the publication.
It is strictly prohibited total or partial
reproduction of contents and images of
the publication without permission of the
Center Spanish of Science and
Technology.
Journal of Research and Development
Definition of Journal
Scientific Objectives
Support the international scientific community in its written production Science, Technology and
Innovation in the Field of Humanities and Behavioral Sciences, in Subdisciplines of industrial
development, project model, computer application, research production, systems development, research
networks, application design, programming and development proposals.
ECORFAN-Mexico SC is a Scientific and Technological Company in contribution to the Human
Resource training focused on the continuity in the critical analysis of International Research and is
attached to CONACYT-RENIECYT number 1702902, its commitment is to disseminate research and
contributions of the International Scientific Community, academic institutions, agencies and entities of
the public and private sectors and contribute to the linking of researchers who carry out scientific
activities, technological developments and training of specialized human resources with governments,
companies and social organizations.
Encourage the interlocution of the International Scientific Community with other Study Centers in
Mexico and abroad and promote a wide incorporation of academics, specialists and researchers to the
publication in Science Structures of Autonomous Universities - State Public Universities - Federal IES -
Polytechnic Universities - Technological Universities - Federal Technological Institutes - Normal
Schools - Decentralized Technological Institutes - Intercultural Universities - S & T Councils -
CONACYT Research Centers.
Scope, Coverage and Audience
Journal of Research and Development is a Journal edited by ECORFAN-Mexico S.C in its Holding with
repository in Spain, is a scientific publication arbitrated and indexed with semester periods. It supports a
wide range of contents that are evaluated by academic peers by the Double-Blind method, around subjects
related to the theory and practice of industrial development, project model, computer application,
research production, systems development, research networks, application design, programming and
development proposals with diverse approaches and perspectives , That contribute to the diffusion of the
development of Science Technology and Innovation that allow the arguments related to the decision
making and influence in the formulation of international policies in the Field of Humanities and
Behavioral Sciences. The editorial horizon of ECORFAN-Mexico® extends beyond the academy and
integrates other segments of research and analysis outside the scope, as long as they meet the
requirements of rigorous argumentative and scientific, as well as addressing issues of general and current
interest of the International Scientific Society.
Editorial Board
ARELLANEZ - HERNÁNDEZ, Jorge Luis. PhD
Universidad Nacional Autónoma de México
OROZCO - RAMIREZ, Luz Adriana. PhD
Universidad de Sevilla
MARTINEZ - LICONA, José Francisco. PhD
University of Lehman College
BOJÓRQUEZ - MORALES, Gonzalo. PhD
Universidad de Colima
SANTOYO, Carlos. PhD
Universidad Nacional Autónoma de México
MOLAR - OROZCO, María Eugenia. PhD
Universidad Politécnica de Catalunya
GARCIA, Silvia. PhD
Universidad Agraria del Ecuador
MERCADO - IBARRA, Santa Magdalena. PhD
Universidad de Barcelona
MONTERO - PANTOJA, Carlos. PhD
Universidad de Valladolid
HERNANDEZ-PADILLA, Juan Alberto. PhD
Universidad de Oviedo
Arbitration Committee
MEDA - LARA, Rosa Martha. PhD
Universidad de Guadalajara
FIGUEROA - DÍAZ, María Elena. PhD
Universidad Nacional Autónoma de México
GARCÍA - Y BARRAGÁN, Luis Felipe. PhD
Universidad Nacional Autónoma de México
CORTÉS, María de Lourdes Andrea. PhD
Instituto Tecnológico Superior de Juan Rodríguez
VILLALOBOS - ALONZO, María de los Ángeles. PhD
Universidad Popular Autónoma del Estado de Puebla
ROMÁN - KALISCH, Manuel Arturo. PhD
Universidad Nacional Autónoma de México
CHAVEZ - GONZALEZ, Guadalupe. PhD
Universidad Autónoma de Nuevo León
GARCÍA - VILLANUEVA, Jorge. PhD
Universidad Nacional Autónoma de México
DE LA MORA - ESPINOSA, Rosa Imelda. PhD
Universidad Autónoma de Querétaro
PADILLA - CASTRO, Laura. PhD
Universidad Autónoma del Estado de Morelos
DELGADO - CAMPOS, Genaro Javier. PhD
Universidad Nacional Autónoma de México
Assignment of Rights
The sending of an Article to Journal of Research and Development emanates the commitment of the
author not to submit it simultaneously to the consideration of other series publications for it must
complement the Originality Format for its Article.
The authors sign the Authorization Format for their Article to be disseminated by means that ECORFAN-
Mexico, S.C. In its Holding Spain considers pertinent for disclosure and diffusion of its Article its Rights
of Work.
Declaration of Authorship
Indicate the Name of Author and Coauthors at most in the participation of the Article and indicate in
extensive the Institutional Affiliation indicating the Department.
Identify the Name of Author and Coauthors at most with the CVU Scholarship Number-PNPC or SNI-
CONACYT- Indicating the Researcher Level and their Google Scholar Profile to verify their Citation
Level and H index.
Identify the Name of Author and Coauthors at most in the Science and Technology Profiles widely
accepted by the International Scientific Community ORC ID - Researcher ID Thomson - arXiv Author
ID - PubMed Author ID - Open ID respectively.
Indicate the contact for correspondence to the Author (Mail and Telephone) and indicate the Researcher
who contributes as the first Author of the Article.
Plagiarism Detection
All Articles will be tested by plagiarism software PLAGSCAN if a plagiarism level is detected Positive
will not be sent to arbitration and will be rescinded of the reception of the Article notifying the Authors
responsible, claiming that academic plagiarism is criminalized in the Penal Code.
Arbitration Process
All Articles will be evaluated by academic peers by the Double Blind method, the Arbitration Approval
is a requirement for the Editorial Board to make a final decision that will be final in all cases. MARVID®
is a derivative brand of ECORFAN® specialized in providing the expert evaluators all of them with
Doctorate degree and distinction of International Researchers in the respective Councils of Science and
Technology the counterpart of CONACYT for the chapters of America-Europe-Asia- Africa and
Oceania. The identification of the authorship should only appear on a first removable page, in order to
ensure that the Arbitration process is anonymous and covers the following stages: Identification of the
Journal with its author occupation rate - Identification of Authors and Coauthors - Detection of plagiarism
PLAGSCAN - Review of Formats of Authorization and Originality-Allocation to the Editorial Board-
Allocation of the pair of Expert Arbitrators-Notification of Arbitration -Declaration of observations to
the Author-Verification of Article Modified for Editing-Publication.
Instructions for Scientific, Technological and Innovation Publication
Knowledge Area
The works must be unpublished and refer to topics of industrial development, project model, computer
application, research production, systems development, research networks, application design,
programming and development proposals and other topics related to Humanities and Behavioral
Sciences.

Presentation of the Content
In the first chapter we present, Energy efficiency using Distributed Generation; Cafeteria of
Engineer Faculty Campeche, Mexico, by CHAN-GONZALEZ, Jorge J., SARAVIA-PÉREZ, Isaac A.,
LEZAMA-ZÁRRAGA, Francisco and SHIH, Meng Yen, with adscription in the Universidad Autónoma
De Campeche, as next article we present, Lean Manufacturing: Efficiency improvement application in
multi-product area of the Aerospace Industry, by CANO-CARRASCO, Adolfo, FORNÉS-RIVERA,
René Daniel, VÁSQUEZ-TORRES, María del Carmen and GUERRERO-PORTILLO, Arlene Amalia,
with adscription in the Instituto Tecnológico de Sonora, as next article we present, Ergonomic culture
level in managers and supervisors in manufacturing centers, by LÓPEZ-ACOSTA, Mauricio,
CHACARA-MONTES, Allán, VELARDE-CANTÚ, José Manuel and RAMIREZ-CARDENAS,
Ernesto, with adscription in the Instituto Tecnológico de Sonora, as next article we present, Proposals to
improve the coaxial cable assembly process in an aerospace company, PORTUGAL-VÁSQUEZ, Javier,
SANDOVAL-GAMEZ, Melissa, LAGARDA-LEYVA, Ernesto Alonso and NARANJO-FLORES,
Arnulfo Aurelio, with adscription in the Instituto Tecnológico de Sonora.
Content
Article Page
Energy efficiency using Distributed Generation; Cafeteria of Engineer Faculty
Campeche, Mexico
CHAN-GONZALEZ, Jorge J., SARAVIA-PÉREZ, Isaac A., LEZAMA-ZÁRRAGA,
Francisco and SHIH, Meng Yen
Universidad Autónoma De Campeche
1-12
Lean Manufacturing: Efficiency improvement application in multi-product area of
the Aerospace Industry
CANO-CARRASCO, Adolfo, FORNÉS-RIVERA, René Daniel, VÁSQUEZ-TORRES,
María del Carmen and GUERRERO-PORTILLO, Arlene Amalia
Instituto Tecnológico de Sonora
13-20
Ergonomic culture level in managers and supervisors in manufacturing centers
LÓPEZ-ACOSTA, Mauricio, CHACARA-MONTES, Allán, VELARDE-CANTÚ, José
Manuel and RAMIREZ-CARDENAS, Ernesto
Instituto Tecnológico de Sonora
21-26
Proposals to improve the coaxial cable assembly process in an aerospace company
PORTUGAL-VÁSQUEZ, Javier, SANDOVAL-GAMEZ, Melissa, LAGARDA-LEYVA,
Ernesto Alonso and NARANJO-FLORES, Arnulfo Aurelio
Instituto Tecnológico de Sonora
27-38
1
Article Journal of Research and Development December, 2021 Vol.7 No.20 1-12
Energy efficiency using Distributed Generation; Cafeteria of Engineer Faculty
Campeche, Mexico
Eficiencia energética con Generación Distribuida Fotovoltaica (GD-PV); Cafetería
de la Facultad de Ingeniería de la Universidad Autónoma de Campeche, México
CHAN-GONZALEZ, Jorge J†*, SARAVIA-PÉREZ, Isaac A., LEZAMA-ZÁRRAGA, Francisco and
SHIH, Meng Yen
Universidad Autónoma De Campeche, Campus V, Predio s/n por Av. Humberto Lanz Cárdenas y Unidad Habitacional
Ecológica Ambiental, Col. Ex-Hacienda Kalá, CP 24085, San Francisco de Campeche, Cam., México.
ID 1st Author: Jorge J., Chan-Gonzalez / ORC ID: 0000-0002-8638-1646, CVU CONACYT ID: 89415
ID 1st Co-author: Isaac A., Saravia-Pérez / ORC ID: 0000-0003-1839-8013
ID 2nd Co-author: Francisco, Lezama-Zárraga / ORC ID: 0000-0001-7475-6458, CVU CONACYT ID: 408617
ID 3rd Co-author: Meng Yen, Shih / ORC ID: 0000-0003-3397-7881, Research ID Thomson: U-1229-2018, CVU
CONACYT ID: 205493
DOI: 10.35429/JRD.2021.20.7.1.12 Received July 02, 2021; Accepted October 29, 2021
Abstract
In the present work, an integral design of the cafeteria located at
Faculty of Engineering of Autonomous University of Campeche
is carried out. Four scenarios of Photo Voltaic (PV) generation
have been studied. A 14 PV modules arrangement of 440 each,
with azimuthal angle of 180º and a slope angle of 15º; the other
is similar to the previous, but the slope angle was 19.85º. The
following was a 24 PV modules arrangement of 440, with an
azimuthal angle of 218º and a slope angle of 15º. The last
arrangement consists of 24 PV modules arrangement of 440, with
azimuthal angle of 218º and a slope angle of 19.85º. Where all of
them are associated with the economic aspect to obtain greater
efficiency of the plant with minimum recovery time. The free
software System Advisor Model (SAM) developed by the
National Renewable Energy Laboratory (NREL) has been
employed. Complete seasonal analysis has also been performed
considering Gran Demanda Media Ordinaria en México (GDMO
de CFE in Mexico) within the period January 2020 to March
2021. The best results are energy generation 17,570 kWh.
Capacity factor 19%. Energy performance 1,671 kWh/kW.
Performance relation 0.74. Leveled cost 5.39 ¢/kWh. And return
on investment in 0.6 years. The GD-PV plant prevents the
emission into the atmosphere of 778.85 kg of CO2 equivalent.
Distributed generation, Energy efficiency, Grid-connected
photovoltaic systems, Photovoltaic distributed generation
Resumen
En el presente trabajo se realizó un diseño integral de eficiencia
energética en la cafetería de la Facultad de Ingeniería de la
Universidad Autónoma de Campeche, México. Se analizaron 4
esquemas diferentes: un arreglo fotovoltaico de 14 módulos de
440 cada uno, ángulo azimutal de 180º y ángulo de inclinación
de 15º; el otro fue similar al anterior pero con ángulo de
inclinación de 19.85º. El siguiente fue de 24 módulos de 440,
ángulo azimutal de 218º y ángulo de inclinación de 15º; por
último arreglo fotovoltaico de 24 módulos de 440, ángulo
azimutal de 218º y ángulo de inclinación de 19.85, asociados al
aspecto económico, para obtener la mayor eficiencia de planta en
el menor tiempo de recuperación. Se empleó el software libre
System Advisor Model (SAM) desarrollado por el National
Renewable Energy Laboratory (NREL). Contempló las tarifas
económicas con análisis temporal completo, horario en tarifa
Gran Demanda Media Ordinaria en México (GDMO de CFE en
México). Los datos de facturación de la Comisión Federal de
Electricidad fueron de enero de 2020 a marzo de 2021. Los
mejores resultados son: Generación de energía, 17,570 kWh.
Factor de capacidad 19%. Rendimiento energético 1,671
kWh/kW. Relación de desempeño 0.74. Costo nivelado 5.39
¢/kWh. Retorno de inversión 0.6 años. La planta GD-PV
previene la emisión a la atmósfera de 778.85 kg of CO2
equivalente.
Generación distribuida, Eficiencia energética, Sistemas
fotovoltaicos interconectados a red, Generación distribuida
fotovoltaica
Citation: CHAN-GONZALEZ, Jorge J., SARAVIA-PÉREZ, Isaac A., LEZAMA-ZÁRRAGA, Francisco and SHIH, Meng
Yen. Energy efficiency using Distributed Generation; Cafeteria of Engineer Faculty Campeche, Mexico. Journal of Research
and Development. 2021. 7-20: 1-12
† Researcher contributing as first author.
© ECORFAN Journal-Spain www.ecorfan.org/spain

2
Article Journal of Research and Development December, 2021 Vol.7 No.20 1-12
ISSN 2444-4987
ECORFAN® All rights reserved CHAN-GONZALEZ, Jorge J., SARAVIA-PÉREZ, Isaac A., LEZAMA-
ZÁRRAGA, Francisco and SHIH, Meng Yen. Energy efficiency using Distributed Generation; Cafeteria of Engineer Faculty Campeche,
Mexico. Journal of Research and Development. 2021
Introduction
The Faculty of Engineering of the Universidad
Autónoma de Campeche currently has an
outdoor cafeteria. It currently has a transparent
polycarbonate roof. However, the accrediting
institutions of the Bachelor's degree programs
have made the recommendation that the Faculty
should have a more adequate cafeteria with,
among other things, an air conditioning system.
A multidisciplinary cabinet projected the
construction of a new cafeteria that has all the
amenities for a healthy recreation and relaxation
of students, teachers and administrative staff. In
this work an integral design was made to
guarantee energy efficiency in the cafeteria of
the Faculty of Engineering of the Autonomous
University of Campeche, Mexico.
The architectural project consists of
designing an enclosed space with capacity for
approximately 80 people (diners and
dependents). For these infrastructure
dimensions, the number of people contemplated
and that the building was planned with few
windows that are exposed to solar radiation. It is
considered to have a total heat gain of
approximately 16 kW-thermal (4.5 TR, 54,000
BTU/h). So with 2 units of 10.6 kW-thermal (3
TR, 36,000 BTU/h, commercial capacities) we
will have a total of 21.2 kW-thermal (6 TR,
72,000 BTU/h) sufficient to remove the total
heat from the cooler.
During the engineering project
development stage, it is very necessary to
visualize different possible scenarios in the
installation of a photovoltaic generating plant,
such as the optimal inclination, the minimum
height of the modules with respect to the surface,
among others, and in turn all of them invariably
associated to the economic aspect, in such a way
that the highest plant efficiency is obtained in the
shortest recovery time. To plan all these
scenarios is an arduous task that requires the help
of a computer program. In this sense, we used
the System Advisor Model (SAM) software
developed by the National Renewable Energy
Laboratory (NREL) of the United States of
America, for two important reasons: it is free and
contemplates the economic rates that allow us to
analyze the optimal performance of the plant, as
well as its return on investment. The SAM
program allowed the complete temporal, hourly
analysis of the Gran Demanda Media Ordinaria
en México (GDMO of CFE in Mexico) tariff
during the 8760 hours of the year.
The tariff part is the most complex part
of the programming, but it allows to do it; other
similar programs do not have this analysis
capacity. It allowed a finer analysis by relating
the energy yield equations to an economic
analysis (cash flow, net present value, payback
time, cost benefit and internal rate of return).
Distributed Generation (DG) from renewable
energies has increased worldwide as an efficient
tool to lower electric energy costs, since it
reduces transmission costs, as well as increases
the electric efficiency of the Load Center where
it is installed. It represents a direct help to
companies and governmental institutions to be
more competitive on the one hand and to reduce
their operating expenses on the other hand; this
favors economic development.
Distributed Photovoltaic Generation
(DG-PV) has become one of the main ways to
generate electricity with renewable sources
(Pinargote, D. F. G., et al 2021). In addition to
delivering electric power directly to the grid, it
provides other added values such as mitigating
greenhouse gases and performing as a thermal
barrier on the roofs of the buildings that house
them. In other words, they prevent solar
radiation gain in buildings, a fact that is
especially relevant in hot-humid climates such as
that of the state of Campeche, Mexico. By taking
advantage of DG-PV in an educational
institution in the state of Campeche where the
reduction of energy consumption for air
conditioning is imperative, and one of the main
challenges to overcome is to curb heat gains
from solar radiation, it becomes very attractive.
These actions generate net economic
benefits to justify the payment of the initial
investment. Distributed Generation (DG) is
defined as: "the generation of electric energy that
is interconnected to a distribution circuit
containing a high concentration of Load Centers
(CRE 2017)", according to the Electricity
Industry Law and the Interconnection Manual of
DG Plants with capacity less than 0.5 MW. DG
includes that which is performed by an exempt
generator, in other words, the owner of one or
more power plants with capacity less than 0.5
MW that do not require a permit to generate
electric power. DG can be located in the facilities
of Load Centers or outside them (SENER,
2016). It is estimated that the world distributed
solar PV, will establish itself at more than twice
its capacity in the next lustrum.

3
Article Journal of Research and Development December, 2021 Vol.7 No.20 1-12
ISSN 2444-4987
ECORFAN® All rights reserved CHAN-GONZALEZ, Jorge J., SARAVIA-PÉREZ, Isaac A., LEZAMA-
ZÁRRAGA, Francisco and SHIH, Meng Yen. Energy efficiency using Distributed Generation; Cafeteria of Engineer Faculty Campeche,
Mexico. Journal of Research and Development. 2021
It accounts for almost half of the total
solar PV expansion. DG-PV installations in
educational and government institutions,
residential homes, commercial buildings and
industry will bring major changes to electrical
systems. The accelerating expansion in the
ability of consumers to generate their own
electricity represents a niche opportunity for
service providers.
Justification
Electricity consumption for air conditioning in
educational institutions in Campeche and in
general with hot humid climates represents one
of the highest costs during operation. During the
last five years, electricity consumption at the
Universidad Autónoma de Campeche represents
60% of the total consumed each month.
In Mexico, in recent years, the
contracting of DG-PV has increased
considerably. Up to 2019, 35,661 new PV-GD
contracts were signed, which is equivalent to just
over 233 MW new installed in Mexico; this
represents an average annual growth rate of
approximately 20%.
Figure 1 Evolution of contracts and installed capacity in
Mexico
Monitor of commercial information and price index of
Distributed Solar Generation in Mexico, March 2019
(Monitor of commercial information and
price index of Distributed Solar Generation in
Mexico, 2020). Figure 1.
Taking as a reference the Monitor of
commercial information and price index of
Distributed Solar Generation in Mexico, March
2020, from 2017 to the first semester of 2019, we
present the regions that installed the largest
amounts of DG-PV where it is very clear that the
states of the Mexican Republic with the largest
accumulated installed capacity are Jalisco, North
Gulf, North, Bajio and South Valley of Mexico,
Figure 2.
We also observe from Figure 2 that the
state of Campeche has a very small accumulated
installed capacity, less than 5 MW. However,
the state of Campeche has a good solar radiation
resource, with irradiation ranging from 4.5 to 6
kWh/m2 per day. Data provided by NREL.
Figure 2 Evolution of DG-PV capacity in Mexico by
region of the country
Commercial information monitor and price index for
Distributed Solar Generation in Mexico, March 2021
The conditions of good irradiance in the
state of Campeche as well as the energy needs
and a small accumulated installed capacity, leads
us to the conclusion that there is a large niche of
opportunities for the installation of Photovoltaic
Distributed Generation Systems.
On the other hand, the state of Campeche
has a humid-warm climate; therefore, it is very
necessary to use large amounts of electrical
energy for high, medium and low temperature
refrigeration processes. In a study conducted by
the Autonomous University of Campeche to the
Secretary of Economic Development of the state
of Campeche in 2020 (Victor-Lanz et al),
indicates that at least 60% of electricity
consumption in small and medium industries,
homes, schools and universities, is due to
cooling processes in any of its forms.
Particularly the state's educational institutions
spend large amounts of their annual budget for
the payment of electricity for air conditioning.
For example the Faculty of Engineering
of the Autonomous University of Campeche,
during 2019 had an average monthly billing of
150,000 Mexican pesos (approximately 7,500
U.S. dollars). Data taken from CFE receipts). In
that sense, a circumstance that is very relevant is
to avoid excessive heat gain from solar radiation
on roofs and walls. It is known (Victorio
Santiago Díaz et al, 2005) that approximately 50
to 60% of the total gain in buildings is due to
solar radiation from roofs and walls.

4
Article Journal of Research and Development December, 2021 Vol.7 No.20 1-12
ISSN 2444-4987
ECORFAN® All rights reserved CHAN-GONZALEZ, Jorge J., SARAVIA-PÉREZ, Isaac A., LEZAMA-
ZÁRRAGA, Francisco and SHIH, Meng Yen. Energy efficiency using Distributed Generation; Cafeteria of Engineer Faculty Campeche,
Mexico. Journal of Research and Development. 2021
In air conditioning engineering
applications, an average solar gain per roof of
550 w/m2 can be considered as the energy
captured in a square meter of surface, in a
horizontal position with the sun at the zenith and
considering a clean atmosphere with a low
degree of turbidity.
We conclude that GD-PV systems have
an added value in hot-humid climates, and
installed on roofs; they operate as thermal
barriers that absorb direct solar radiation,
avoiding excessive heat gains from solar
radiation in buildings. As a direct consequence
of the above, less electrical energy is required for
air conditioning processes. In this way, energy
efficiency is promoted.
With regard to energy efficiency,
according to Deutsche Gesellschaft fur
Internationale Zusammenarbeit (GIZ-2014) in
its guide of good practices for energy saving and
efficient use of energy, it is defined as: obtaining
the same energy goods and services, but with
much less energy, with the same or higher
quality of life, with less pollution, at a lower
price than at present, extending the life of
resources and with less conflict.
Objective
To demonstrate that by implementing
Distributed Generation with photovoltaic
systems (DG-PV) together with aspects of
bioclimatic architecture, energy efficiency is
achieved in the cafeteria of the Faculty of
Engineering of the Autonomous University of
Campeche.
Hypothesis
By implementing a GD-PV plant, with its most
optimal configuration, in the cafeteria of the
Faculty of Engineering of the Autonomous
University of Campeche, energy efficiency and
reduction of its production costs are achieved; as
well as avoiding the emission of CO2 equivalent
to the atmosphere.
Problem Statement
It is desired to reduce the energy consumption of
the cafeteria located in the Faculty of
Engineering of the Autonomous University of
Campeche, in the state of Campeche.
The state of Campeche is geographically
located in the Yucatan Peninsula between
parallels 17°49' and 20°51' north latitude; and
between meridians 89°06' and 92°27' west; air
conditioning processes demand high energy
values to be carried out. The environmental
conditions at the site are important adverse
factors during this process.
The location of the cafeteria is in the
Faculty of Engineering of the Universidad
Autónoma de Campeche. It is geographically
right at 19°.84'58'' north latitude, -90°.47'74''
longitude (west), less than 1000 meters from the
coast with an average temperature of 31±0.1ºC
and a relative humidity of 75±1%, also average
(INEGI, 2015), at 50 meters with respect to sea
level. The architectural project consists of design
an enclosed space with capacity for
approximately 80 people (diners and
dependents).
For these infrastructure dimensions, the
number of people contemplated and that the
building was planned with few windows that are
exposed to solar radiation. It is considered to
have a total heat gain of approximately 16
kWthermal (4.5 TR, 54,000 BTU/h). So with 2
units of 10.6 kWthermal (3 TR, 36,000 BTU/h,
commercial capacities) we will have a total of
21.2 kWthermal (6 TR, 72,000 BTU/h) sufficient
to remove the total heat from the cooler. The
cafeteria has 2 cassette type air conditioning
units, which allow a better distribution of the
cold air conditioning, which have an elegant
presentation, which are very quiet (53/51/48
dB(A) continuous ambient noise level should not
exceed 68 decibels, measured at the worker's ear
position through the use of a sound level meter).
According to, 01-13-95 Mexican Official
Standard NOM-081-ECOL-1994, which
establishes the maximum permissible noise
emission limits for fixed sources and their
measurement method.
Two 16 SEER high energy efficiency
mini-split condensing units are also installed for
this project. Ceiling mounted, with ecological
refrigerant R410a. It also has lighting and
miscellaneous equipment. Given this situation of
energy demand, the possibility of installing a
Photovoltaic Distributed Generation plant (GD-
PV) was considered.
5
Article Journal of Research and Development December, 2021 Vol.7 No.20 1-12
ISSN 2444-4987
ECORFAN® All rights reserved CHAN-GONZALEZ, Jorge J., SARAVIA-PÉREZ, Isaac A., LEZAMA-
ZÁRRAGA, Francisco and SHIH, Meng Yen. Energy efficiency using Distributed Generation; Cafeteria of Engineer Faculty Campeche,
Mexico. Journal of Research and Development. 2021
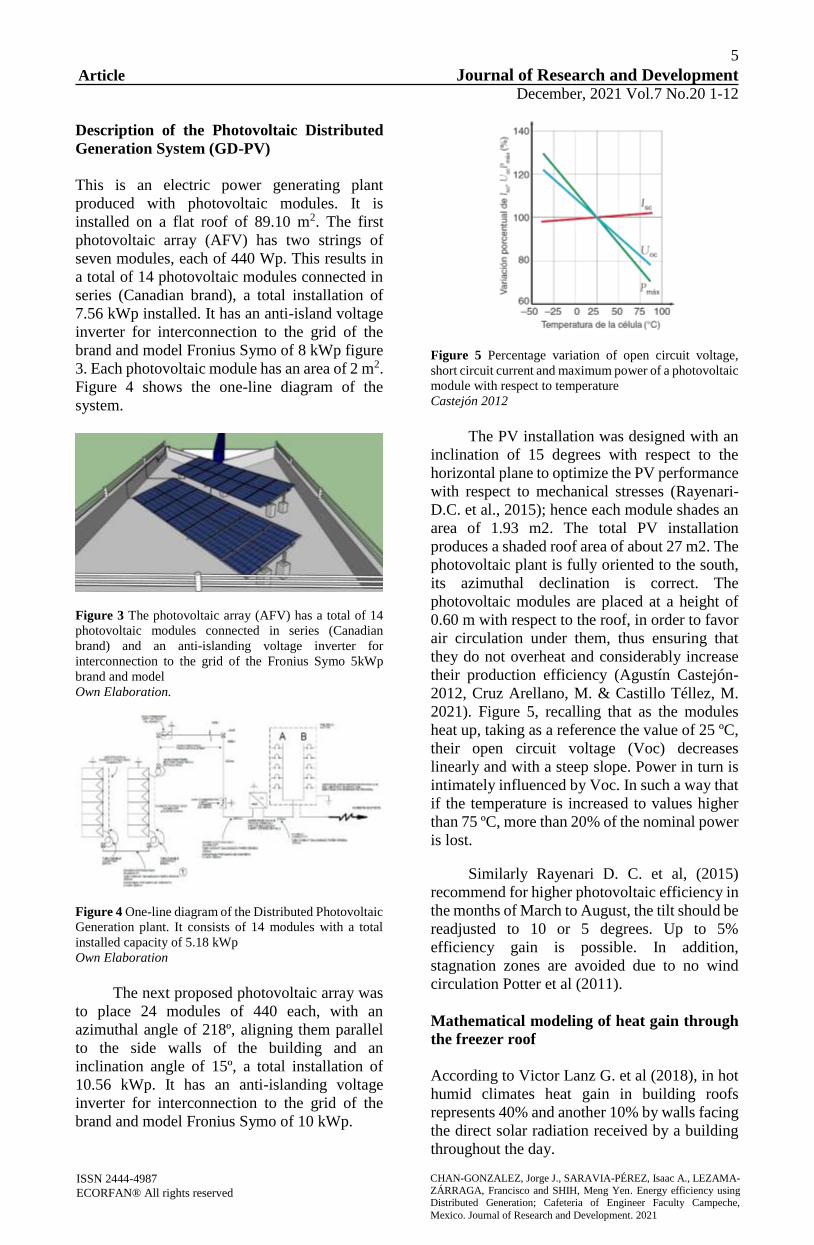
Description of the Photovoltaic Distributed
Generation System (GD-PV)
This is an electric power generating plant
produced with photovoltaic modules. It is
installed on a flat roof of 89.10 m2. The first
photovoltaic array (AFV) has two strings of
seven modules, each of 440 Wp. This results in
a total of 14 photovoltaic modules connected in
series (Canadian brand), a total installation of
7.56 kWp installed. It has an anti-island voltage
inverter for interconnection to the grid of the
brand and model Fronius Symo of 8 kWp figure
3. Each photovoltaic module has an area of 2 m2.
Figure 4 shows the one-line diagram of the
system.
Figure 3 The photovoltaic array (AFV) has a total of 14
photovoltaic modules connected in series (Canadian
brand) and an anti-islanding voltage inverter for
interconnection to the grid of the Fronius Symo 5kWp
brand and model
Own Elaboration.
Figure 4 One-line diagram of the Distributed Photovoltaic
Generation plant. It consists of 14 modules with a total
installed capacity of 5.18 kWp
Own Elaboration
The next proposed photovoltaic array was
to place 24 modules of 440 each, with an
azimuthal angle of 218º, aligning them parallel
to the side walls of the building and an
inclination angle of 15º, a total installation of
10.56 kWp. It has an anti-islanding voltage
inverter for interconnection to the grid of the
brand and model Fronius Symo of 10 kWp.
Figure 5 Percentage variation of open circuit voltage,
short circuit current and maximum power of a photovoltaic
module with respect to temperature
Castejón 2012
The PV installation was designed with an
inclination of 15 degrees with respect to the
horizontal plane to optimize the PV performance
with respect to mechanical stresses (Rayenari-
D.C. et al., 2015); hence each module shades an
area of 1.93 m2. The total PV installation
produces a shaded roof area of about 27 m2. The
photovoltaic plant is fully oriented to the south,
its azimuthal declination is correct. The
photovoltaic modules are placed at a height of
0.60 m with respect to the roof, in order to favor
air circulation under them, thus ensuring that
they do not overheat and considerably increase
their production efficiency (Agustín Castejón-
2012, Cruz Arellano, M. & Castillo Téllez, M.
2021). Figure 5, recalling that as the modules
heat up, taking as a reference the value of 25 ºC,
their open circuit voltage (Voc) decreases
linearly and with a steep slope. Power in turn is
intimately influenced by Voc. In such a way that
if the temperature is increased to values higher
than 75 ºC, more than 20% of the nominal power
is lost.
Similarly Rayenari D. C. et al, (2015)
recommend for higher photovoltaic efficiency in
the months of March to August, the tilt should be
readjusted to 10 or 5 degrees. Up to 5%
efficiency gain is possible. In addition,
stagnation zones are avoided due to no wind
circulation Potter et al (2011).
Mathematical modeling of heat gain through
the freezer roof
According to Victor Lanz G. et al (2018), in hot
humid climates heat gain in building roofs
represents 40% and another 10% by walls facing
the direct solar radiation received by a building
throughout the day.

6
Article Journal of Research and Development December, 2021 Vol.7 No.20 1-12
ISSN 2444-4987
ECORFAN® All rights reserved CHAN-GONZALEZ, Jorge J., SARAVIA-PÉREZ, Isaac A., LEZAMA-
ZÁRRAGA, Francisco and SHIH, Meng Yen. Energy efficiency using Distributed Generation; Cafeteria of Engineer Faculty Campeche,
Mexico. Journal of Research and Development. 2021
Therefore, it is very important to quantify
the heat gain from roofs. The following
equations are presented to quantify roof heat
gains as a combined effect of conduction,
convection and radiation (Ҁéngel et al-2012).
�̇� = �̇� ℎ𝑎𝑏𝑖−𝑡𝑒𝑐ℎ𝑜,𝑐𝑜𝑛𝑣+𝑟𝑎𝑑 = �̇�𝑐𝑜𝑛𝑑,𝑡𝑒𝑐ℎ𝑜
= �̇�𝑡𝑒𝑐ℎ𝑜−𝑎𝑚𝑏,𝑐𝑜𝑛𝑑+𝑟𝑎𝑑̇
(1)
�̇� ℎ𝑎𝑏𝑖−𝑡𝑒𝑐ℎ𝑜,𝑐𝑜𝑛𝑣+𝑟𝑎𝑑 =
ℎ𝑖𝐴(𝑇ℎ𝑎𝑏𝑖 − 𝑇𝑠,𝑖𝑛𝑡) + 𝜀𝐴𝜎(𝑇ℎ𝑎𝑏𝑖𝑡4 − 𝑇𝑠,𝑖𝑛𝑡
4 )
(2)
�̇�𝑐𝑜𝑛𝑑,𝑡𝑒𝑐ℎ𝑜 = 𝑘𝐴𝑇𝑠,𝑖𝑛𝑡 − 𝑇𝑠,𝑒𝑥𝑡
𝐿
(3)
�̇�𝑡𝑒𝑐ℎ𝑜−𝑎𝑙𝑟𝑒𝑑𝑒𝑑𝑜𝑟,𝑐𝑜𝑛𝑑+𝑟𝑎𝑑 =̇
ℎ𝑜𝐴(𝑇𝑠,𝑒𝑥𝑡 − 𝑇𝑎𝑚𝑏) + 𝜀𝐴𝜎(𝑇𝑠,𝑒𝑥𝑡4 − 𝑇𝑎𝑚𝑏
4 )
− 𝛼�̇�𝑠𝑜𝑙𝑎𝑟
(4)
Where �̇� is the total heat flux, k thermal
conductivity, α absorptivity, h=kW/m2 ºC
convective heat transfer coefficient, σ the
Steffan-Boltzman constant, A heat transfer area,
�̇�𝑠𝑜𝑙𝑎𝑟solar radiation and T temperature. It is
estimated that, each square meter of roof
receives a radiation of 550 w/m2 x day, and there
are 27 and 46.32 m2 of area shaded by the PV
plant for the cases of 14 and 24 modules
respectively. It can then be estimated that a daily
roof heat gain of approximately 14.85 kW is
avoided for the 14-module case and 25.48 kW
for the 24-module case. As a reference, mini split
air conditioners of one ton of refrigeration have
a thermal capacity to remove heat of 3.54 kWh.
The shaded area represents approximately 30%
of the total roof for the case of 14 modules and
51% when we have 24 modules.
Bioclimatic aspects of energy efficiency in the
cafeteria
Another aspect considered to increase the energy
efficiency of the cafeteria was to place green
roofs and walls in the areas with the highest
incidence of solar radiation. The proposal for
green roofs and walls was made with vegetation
native to the Yucatan Peninsula that can
withstand the climatic conditions of the region.
Figure 6 Overall view of the cafeteria with the proposed
SFV, roofs and green walls
Own Elaboration
Figure 7 View of the rear wall of the cafeteria with the
SFV proposals and green wall
Own Elaboration
Proposed methodology for the analysis of
photovoltaic electric energy production.
In this work we used the free software called
System Advisor Model (SAM) created by the
National Renewable Energy Laboratory (NREL)
of the United States of America. With this
program we evaluated the energy capacity of
several photovoltaic configurations to compare
them and decide which one is the most optimal
for installation.
During the engineering project
development stage, it is very necessary to
visualize different possible scenarios in the
installation of a photovoltaic generating plant,
such as the optimal inclination, the minimum
height of the modules with respect to the surface,
among others, and in turn all of them invariably
associated to the economic aspect, in such a way
that the highest plant efficiency is obtained in the
shortest recovery time. To plan all these
scenarios is an arduous task; this task is easier
with the help of a computer program. In this
sense, we use the SAM software for two
important reasons: it is free and it contemplates
economic rates.

7
Article Journal of Research and Development December, 2021 Vol.7 No.20 1-12
ISSN 2444-4987
ECORFAN® All rights reserved CHAN-GONZALEZ, Jorge J., SARAVIA-PÉREZ, Isaac A., LEZAMA-
ZÁRRAGA, Francisco and SHIH, Meng Yen. Energy efficiency using Distributed Generation; Cafeteria of Engineer Faculty Campeche,
Mexico. Journal of Research and Development. 2021
This allows us to analyze the optimal
performance of the plant, as well as its return on
investment. The SAM program allowed the
complete temporal analysis of the Great
Ordinary Mean Demand in Mexico (GDMO of
CFE in Mexico) during the 8760 hours of the
year. The tariff part is the most complex part of
the programming, but it allows to do it; other
similar programs do not have this analysis
capacity. It allowed a more accurate analysis by
relating the energy yield equations to an
economic analysis (cash flow, net present value,
payback time, cost benefit and internal rate of
return). Four different schemes were analyzed,
firstly, it was a photovoltaic array of 14 modules
of 440 each, with an optimal azimuthal angle
(Castejón & Santamaría, 2010) of 180º (i.e.
aligned to the true north-south axis) and a tilt
angle of 15º (Rayenari-D.C. et al., 2015), the
other was similar to the previous one but the tilt
angle was 19.85º equivalent to the latitude of
Campeche.
The next was to place the PV array of 24
modules of 440 each, with an azimuthal angle of
218º, aligning them parallel to the side walls of
the building and a tilt angle of 15º and finally the
PV array of 24 modules of 440 each, azimuthal
angle of 218º and tilt angle of 19.85º. The
program was fed with the billing data issued by
the Federal Electricity Commission (CFE), in
GDMO tariff, for the period from January 2020
to March 2021. It corresponds to the
consumption of the Faculty of Engineering
during that period, Table 1. Costs are expressed
in U.S. dollars.
Billing month Total consumption
(kwh)
January 2020 21,238
February 2020 22,803
March 2020 30,881
April 2020 28,791
May 2020 9,469
June 2020 10,752
July 2020 10,124
August 2020 10,686
September 2020 10,938
October 2020 14,400
November 2020 15,788
December 2020 15,996
January 2021 14,418
February 2021 15.441
March 2021 13.953
Table 1 Details of the energy consumption used in the
SAM Program to make the economic estimates. Taken
from CFE receipts
Own Elaboration
Two subarrays: 1 2
Strings 1 1
Modules per string 7 7
String Voc (DC V) 340.90 340.90
Tilt (deg from horizontal) 15.00 15.00
Azimuth (deg E of N) 180 180
Tracking no no
Backtracking - -
Self shading no no
Rotation limit (deg) - -
Shading no no
Snow no no
Soiling yes yes
DC losses (%) 4.44 4.44
Table 2 Details of the photovoltaic installation with 14
modules of 440 each, azimuth angle of 180º and tilt angle
of 15º. SAM program.
The first two options considered were
because they were placed at the optimum
azimuthal angle. However, arranged in this way
and for space reasons, only 14 modules fit. The
last two options allow a greater number of
modules to be placed, although a small
percentage of efficiency is lost (5%).
Analysis of the information and results
obtained
After the four scenarios were proposed and the
program was fed with the necessary data, we
proceeded to run the program with each of them.
The results obtained are presented in the
following tables.
Metrics Values
Annual energy (year 1) 10.451 kWh
Capacity factor (year 1) 19.40%
Energy yield (year 1) 1.696
kWh/kW
Performance ratio (year 1) 0.77
COE level (nominal) 5.40 ¢/kWh
Electricity payment without the system
(year 1) $314,513
Electricity payment with the system (year
1) $303,184
Net savings with system (year 1) $11,329
Net present value $202,761
Simple return period 0.6 años
Net capital cost $8,256
Table 3 Simulation results, PV installation with 14
modules of 440 each, azimuth angle of 180º and tilt angle
of 15º. SAM program.
8
Article Journal of Research and Development December, 2021 Vol.7 No.20 1-12
ISSN 2444-4987
ECORFAN® All rights reserved CHAN-GONZALEZ, Jorge J., SARAVIA-PÉREZ, Isaac A., LEZAMA-
ZÁRRAGA, Francisco and SHIH, Meng Yen. Energy efficiency using Distributed Generation; Cafeteria of Engineer Faculty Campeche,
Mexico. Journal of Research and Development. 2021
Metrics Values
Annual energy (year 1) 10.465 kWh
Capacity factor (year 1) 19.40%
Energy yield (year 1) 1.699kWh/k
W
Performance ratio (year 1) 0.77
COE level (nominal) 5,39 ¢/kWh
Electricity payment without the system
(year 1)
$314,513
Electricity payment with the system (year
1)
$303,156
Net savings with system (year 1) $11,357
Net present value $203,283
Simple return period 0.6 años
Net capital cost $8.256
Table 4 Simulation results, PV system with 14 modules of
440 each, azimuth angle of 180º and tilt angle of 19.85º.
SAM program.
Metrics Values
Annual energy (year 1) 17.649 kWh
Capacity factor (year 1) 19.10%
Energy yield (year 1) 1.671kWh/k
W
Performance ratio (year 1) 0,78
COE level (nominal) 5.48 ¢/kWh
Electricity payment without the system
(year 1)
$314.513
Electricity payment with the system
(year 1)
$295.398
Net savings with system (year 1) $19.115
Net present value $342.210
Simple return period 0.6 años
Net capital cost $14.153
Table 5. Simulation results, PV system with 24 modules
of 440 each, azimuth angle of 218º and tilt angle of 15º.
SAM program.
Metrics Values
Annual energy (year 1) 17.570 kWh
Capacity factor (year 1) 19.00%
Energy yield (year 1) 1.664
kWh/kW
Performance ratio (year 1) 0.78
COE level (nominal) 5,50 ¢/kWh
Electricity payment without the system
(year 1)
$314,513
Electricity payment with the system
(year 1)
$295,467
Net savings with system (year 1) $19,046
Net present value $340,946
Simple return period 0.6 años
Net capital cost $14,153
Table 6. Simulation results, PV installation with 24
modules of 440 each, azimuth angle of 218º and
inclination angle of 19.85º. SAM program.
Some of the results obtained in this section are
specified.
Capacity factor (CF) is defined by NREL as:
𝐶𝐹 =𝐴𝑛𝑛𝑢𝑎𝑙 𝑒𝑛𝑒𝑟𝑔𝑦 𝑝𝑟𝑜𝑑𝑢𝑐𝑡𝑖𝑜𝑛 [
𝑘𝑊ℎ𝑦𝑒𝑎𝑟
]
𝐼𝑛𝑠𝑡𝑎𝑙𝑙𝑒𝑑 𝑐𝑎𝑝𝑎𝑐𝑖𝑡𝑦 𝑥 24 [ℎ𝑜𝑢𝑟𝑠
𝑑𝑎𝑦] 𝑥 365 [
𝑑𝑎𝑦𝑦𝑒𝑎𝑟
]
Energy yield is given by (Theristis et al.,
2018) as the energy produced between each
installed peak kilowatt.
The performance or performance ratio
(performance ratio) is a magnitude, independent
of the location, of the quality of a PV installation.
It is a quality factor. It is expressed as a
percentage and shows the ratio between the
actual yield and the nominal yield of the PV
system. It indicates what proportion of the
energy is actually available after deduction of
energy losses (thermal and cable losses) and own
consumption for operation. The coefficient of
performance provides information on the energy
efficiency and reliability of the PV system.
The levelized cost (LCOE) is given by (Lai et al.,
2019), equation 6.
𝐿𝐶𝑂𝐸 =
𝑠𝑢𝑚 𝑜𝑓 𝑤ℎ𝑜𝑙𝑒 𝑙𝑖𝑓𝑒 𝑐𝑜𝑠𝑡𝑠
𝑠𝑢𝑚 𝑜𝑓 𝑡ℎ𝑒 𝑒𝑙𝑒𝑐𝑡𝑟𝑖𝑐𝑎𝑙 𝑒𝑛𝑒𝑟𝑔𝑦 𝑝𝑟𝑜𝑑𝑢𝑐𝑒𝑑 𝑖𝑛 𝑖𝑡𝑠 𝑒𝑛𝑡𝑖𝑟𝑒 𝑢𝑠𝑒𝑓𝑢𝑙 𝑙𝑖𝑓𝑒
𝐿𝐶𝑂𝐸 =∑
𝐼𝑡+𝑀𝑡+𝐹𝑡(1+𝑟)𝑡
𝑛𝑡=1
∑𝐸𝑡
(1+𝑟)𝑡𝑛𝑡=1
(6)
Where:
It: Investment expenses in year t.
Mt: Operating and maintenance expenses in year t.
Ft: fuel expenses in year t.
Et: electric power generated in year t.
r: discount ratio.
n: expected life time.
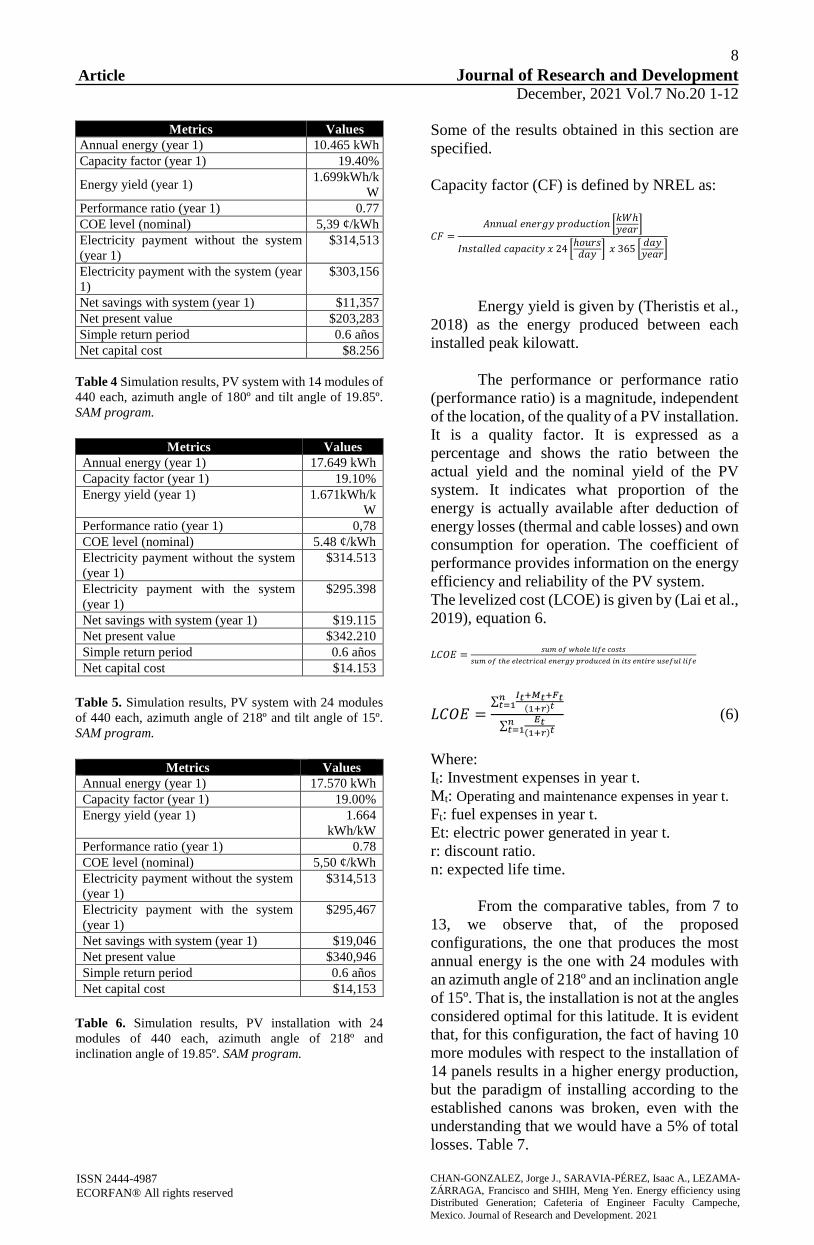
From the comparative tables, from 7 to
13, we observe that, of the proposed
configurations, the one that produces the most
annual energy is the one with 24 modules with
an azimuth angle of 218º and an inclination angle
of 15º. That is, the installation is not at the angles
considered optimal for this latitude. It is evident
that, for this configuration, the fact of having 10
more modules with respect to the installation of
14 panels results in a higher energy production,
but the paradigm of installing according to the
established canons was broken, even with the
understanding that we would have a 5% of total
losses. Table 7.
9
Article Journal of Research and Development December, 2021 Vol.7 No.20 1-12
ISSN 2444-4987
ECORFAN® All rights reserved CHAN-GONZALEZ, Jorge J., SARAVIA-PÉREZ, Isaac A., LEZAMA-
ZÁRRAGA, Francisco and SHIH, Meng Yen. Energy efficiency using Distributed Generation; Cafeteria of Engineer Faculty Campeche,
Mexico. Journal of Research and Development. 2021
14 modules,
azimuth angle
180, inclination
15º.
14 modules,
azimuth angle
180, inclination
19.8º.
24 modules,
azimuth angle
218, inclination
15º.
24 modules,
azimuth angle
218, inclination
19.8º.
10,451 kWh 10,465 kWh 17,649 kWh 17,570 kWh
Table 7 Simulation results, PV installation. Energy
generation. SAM program.
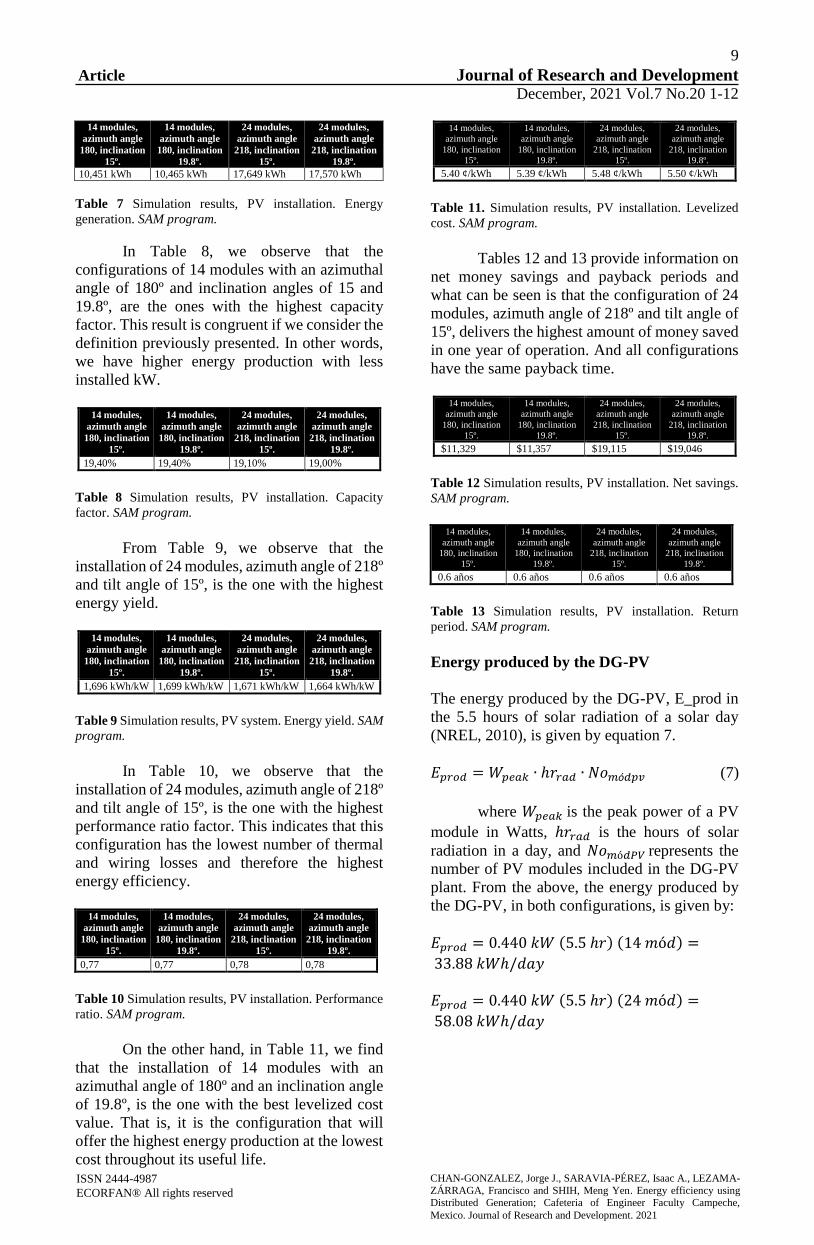
In Table 8, we observe that the
configurations of 14 modules with an azimuthal
angle of 180º and inclination angles of 15 and
19.8º, are the ones with the highest capacity
factor. This result is congruent if we consider the
definition previously presented. In other words,
we have higher energy production with less
installed kW.
14 modules,
azimuth angle
180, inclination
15º.
14 modules,
azimuth angle
180, inclination
19.8º.
24 modules,
azimuth angle
218, inclination
15º.
24 modules,
azimuth angle
218, inclination
19.8º.
19,40% 19,40% 19,10% 19,00%
Table 8 Simulation results, PV installation. Capacity
factor. SAM program.
From Table 9, we observe that the
installation of 24 modules, azimuth angle of 218º
and tilt angle of 15º, is the one with the highest
energy yield.
14 modules,
azimuth angle
180, inclination
15º.
14 modules,
azimuth angle
180, inclination
19.8º.
24 modules,
azimuth angle
218, inclination
15º.
24 modules,
azimuth angle
218, inclination
19.8º.
1,696 kWh/kW 1,699 kWh/kW 1,671 kWh/kW 1,664 kWh/kW
Table 9 Simulation results, PV system. Energy yield. SAM
program.
In Table 10, we observe that the
installation of 24 modules, azimuth angle of 218º
and tilt angle of 15º, is the one with the highest
performance ratio factor. This indicates that this
configuration has the lowest number of thermal
and wiring losses and therefore the highest
energy efficiency.
14 modules,
azimuth angle
180, inclination
15º.
14 modules,
azimuth angle
180, inclination
19.8º.
24 modules,
azimuth angle
218, inclination
15º.
24 modules,
azimuth angle
218, inclination
19.8º.
0,77 0,77 0,78 0,78
Table 10 Simulation results, PV installation. Performance
ratio. SAM program.
On the other hand, in Table 11, we find
that the installation of 14 modules with an
azimuthal angle of 180º and an inclination angle
of 19.8º, is the one with the best levelized cost
value. That is, it is the configuration that will
offer the highest energy production at the lowest
cost throughout its useful life.
14 modules,
azimuth angle
180, inclination
15º.
14 modules,
azimuth angle
180, inclination
19.8º.
24 modules,
azimuth angle
218, inclination
15º.
24 modules,
azimuth angle
218, inclination
19.8º.
5.40 ¢/kWh 5.39 ¢/kWh 5.48 ¢/kWh 5.50 ¢/kWh
Table 11. Simulation results, PV installation. Levelized
cost. SAM program.
Tables 12 and 13 provide information on
net money savings and payback periods and
what can be seen is that the configuration of 24
modules, azimuth angle of 218º and tilt angle of
15º, delivers the highest amount of money saved
in one year of operation. And all configurations
have the same payback time.
14 modules,
azimuth angle
180, inclination
15º.
14 modules,
azimuth angle
180, inclination
19.8º.
24 modules,
azimuth angle
218, inclination
15º.
24 modules,
azimuth angle
218, inclination
19.8º.
$11,329 $11,357 $19,115 $19,046
Table 12 Simulation results, PV installation. Net savings.
SAM program.
14 modules,
azimuth angle
180, inclination
15º.
14 modules,
azimuth angle
180, inclination
19.8º.
24 modules,
azimuth angle
218, inclination
15º.
24 modules,
azimuth angle
218, inclination
19.8º.
0.6 años 0.6 años 0.6 años 0.6 años
Table 13 Simulation results, PV installation. Return
period. SAM program.
Energy produced by the DG-PV
The energy produced by the DG-PV, E_prod in
the 5.5 hours of solar radiation of a solar day
(NREL, 2010), is given by equation 7.
𝐸𝑝𝑟𝑜𝑑 = 𝑊𝑝𝑒𝑎𝑘 ∙ ℎ𝑟𝑟𝑎𝑑 ∙ 𝑁𝑜𝑚ó𝑑𝑝𝑣 (7)
where 𝑊𝑝𝑒𝑎𝑘 is the peak power of a PV
module in Watts, ℎ𝑟𝑟𝑎𝑑 is the hours of solar
radiation in a day, and 𝑁𝑜𝑚ó𝑑𝑃𝑉 represents the
number of PV modules included in the DG-PV
plant. From the above, the energy produced by
the DG-PV, in both configurations, is given by:
𝐸𝑝𝑟𝑜𝑑 = 0.440 𝑘𝑊 (5.5 ℎ𝑟) (14 𝑚ó𝑑) =
33.88 𝑘𝑊ℎ/𝑑𝑎𝑦
𝐸𝑝𝑟𝑜𝑑 = 0.440 𝑘𝑊 (5.5 ℎ𝑟) (24 𝑚ó𝑑) =
58.08 𝑘𝑊ℎ/𝑑𝑎𝑦

10
Article Journal of Research and Development December, 2021 Vol.7 No.20 1-12
ISSN 2444-4987
ECORFAN® All rights reserved CHAN-GONZALEZ, Jorge J., SARAVIA-PÉREZ, Isaac A., LEZAMA-
ZÁRRAGA, Francisco and SHIH, Meng Yen. Energy efficiency using Distributed Generation; Cafeteria of Engineer Faculty Campeche,
Mexico. Journal of Research and Development. 2021
Estimated CO2 avoided to be sent to the
environment due to DG-PV
Within an energy efficiency study, the amount of
carbon dioxide (CO2) emissions released into the
environment due to electricity generation must
be included. In Mexico, the Energy Regulatory
Commission (CRE) and the Ministry of
Environment and Natural Resources
(SEMARNAT) annually estimate the National
Electric System Emission Factor based on
Article 12 of the Energy Transition Law
Regulation (Chamber of Deputies, 2017). The
last factor published in the Official Journal of the
Federation was in 2017 being this of:
0.582 kg de CO2 / kWh
In addition, an emission factor caused by
the production of energy with photovoltaic
modules has been considered; an analysis model
called Global Emissions Model for Integrated
Systems (GEMIS, 2018) was used in the
calculations, which applies a factor of:
0.135 kg de CO2 / kWh
And Reich, et al. (2007), invites to choose
a value from a range of emissions between:
0.030-0.317 kg de CO2 / kWh
Empirically we choose the GEMIS factor
for our calculations, because it is within Reich's
range. During a billing month, the total energy
consumed by the Faculty of Engineering and
purchased from DG-PV is:
𝐸𝑐𝑜𝑛𝑠 = 58.08𝑘𝑊ℎ
𝑑𝑎𝑦(30 𝑑𝑎𝑦𝑠) = 1742.4 𝑘𝑊ℎ
Then, the CO2 emissions avoided to be
sent to the 𝜖𝑐𝑜𝑛𝑠ϵ_cons by the energy consumed
through DG-PV is:
𝜖𝑐𝑜𝑛𝑠 = 0.582𝑘𝑔 𝐶𝑂2
𝑘𝑊ℎ(1742.4 𝑘𝑊ℎ) = 1014.07 𝑘𝑔 𝐶𝑂2
The CO2 emissions produced𝜖𝑝𝑟𝑜𝑑
caused by energy production with DG-PV are:
𝜖𝑝𝑟𝑜𝑑 = 0.135 𝑘𝑔 𝐶𝑂2
𝑘𝑊ℎ(1742.4 𝑘𝑊ℎ) = 235.22 𝑘𝑔 𝐶𝑂2
Finally, the net CO2 emissions ϵ_net
avoided to be sent to the atmosphere is the
difference between 𝜖𝑐𝑜𝑛𝑠 y 𝜖𝑝𝑟𝑜𝑑 :
𝜖𝑛𝑒𝑡 = 𝜖𝑐𝑜𝑛𝑠 − 𝜖𝑝𝑟𝑜𝑑 = 1014.07 𝑘𝑔 𝐶𝑂2 −
235.22 𝑘𝑔 𝐶𝑂2 = 778.85 𝑘𝑔 𝐶𝑂2
This is a significant figure, as it shows
that 778.85 kg of CO2 are no longer being
emitted into the environment, which is a
significant contribution to the reduction of the
carbon footprint.
Conclusions
This article presents an energy efficiency study
of the Cafeteria of the Faculty of Engineering of
the Autonomous University of Campeche with
the proposal of a Photovoltaic Distributed
Generation plant (GDF-PV) analyzing several
proposed configurations with the help of the
open program called System Advisor Model
(SAM) developed by the National Renewable
Energy Laboratory (NREL).
Four different schemes were analyzed:
one PV array of 14 modules of 440 each, with an
azimuthal angle of 180º and a tilt angle of 15º,
the other was similar to the previous one but the
tilt angle was 19.85º equivalent to the latitude of
Campeche. The next two were arrays of 24
modules of 440 each, with azimuthal angles of
218º and inclination angles of 15º and 19.85º.
It is estimated that a daily roof heat gain
of 14.85 kW is avoided in the case of 14
modules and 25.48 kW in the case of 24
modules. The shaded area represents
approximately 30% of the total roof for
14 modules and 51% for 24 modules.
The best annual energy generation of the
DG-PV plants is obtained with a value of
17,649 kWh in the configuration of 24
modules of 440 W, with azimuth angle of
218º and tilt angle of 15º. According to
the simulations with the SAM program.
The 24-module photovoltaic system,
with an azimuth angle of 218º and an
inclination angle of 15º, has the highest
energy yield with a value of 1,671
kWh/kW, understood as the energy
produced for each kilowatt peak
installed.

11
Article Journal of Research and Development December, 2021 Vol.7 No.20 1-12
ISSN 2444-4987
ECORFAN® All rights reserved CHAN-GONZALEZ, Jorge J., SARAVIA-PÉREZ, Isaac A., LEZAMA-
ZÁRRAGA, Francisco and SHIH, Meng Yen. Energy efficiency using Distributed Generation; Cafeteria of Engineer Faculty Campeche,
Mexico. Journal of Research and Development. 2021
The 24-module photovoltaic plant, with
azimuth angle of 218º and tilt angle of
15º, is the one with the highest
performance ratio factor, indicating that
it has the lowest number of thermal and
wiring losses and is therefore the one
with the highest energy efficiency.
All four DG-PV plant configurations
have the same payback time of 0.6 years.
The best PV plant configuration was the
24-module configuration, with azimuth
angle of 218º and tilt angle of 15º, which
has the highest number of favorable
factors and is therefore the most energy
efficient.
The GD-PV plant avoids the emission of
778.85 kg of CO2 equivalent into the
atmosphere.
To increase the energy efficiency of the
cafeteria, green roofs and walls were
installed in the areas with the highest
incidence of solar radiation. The roofs
and green walls were built with
vegetation native to the Yucatan
Peninsula to withstand the climatic
conditions of the region.
Acknowledgements
The authors would like to thank the Universidad
Autónoma de Campeche for the support and
effort given during the development of this work
to its researchers to disseminate the research
topics in which they are involved.
References
Agustín Castejón, Germán Santamaría. (2012).
Instalaciones solares fotovoltaicas. Editex.
ISBN eBook 978-84-9771-749-6.
Cámara de Diputados. “Reglamento de la Ley de
Transición Energética”. Art. 12. Año 2017.
Consultado en:
http://www.diputados.gob.mx/LeyesBiblio/y/R
eg_LTE_040517.pdfregle
Cruz Arellano, M. & Castillo Tellez, M. (2021).
Planteamiento de un modelo energético
descriptivo aplicable a la instalación de
sistemas solares fotovoltaicos interconectados a
la red mediante generación distribuida: caso de
estudio en Nuevo Laredo. Project, Design and
Management, 3(1), 112-137. doi:
10.29314/pdm.v3i1.587
Delgado A. J. S. Villalón, O. R. & Sánchez, M.
M. L. (2020). Análisis tecno-económico de la
operación en esquema de red inteligente y
reserve energética en usuarios conectados a
paneles fotovoltaicos. Red internacional de
Investigadores en Competitividad, 13, 736-756.
DOF: 07/03/2017 RESOLUCIÓN de la
Comisión Reguladora de Energía por la que
expide las disposiciones administrativas de
carácter general, los modelos de contrato, la
metodología de cálculo de contraprestación y
las especificaciones técnicas generales,
aplicables a las centrales eléctricas de
generación distribuida y generación limpia
distribuida.
GEMIS. “Modelo de Emisiones Globales para
Sistemas integrados”. Consultado en
https://ghgprotocol.org/Third-Party-
Databases/GEMIS
Global Energy Trade, reporte marzo-abril,
(2020). Monitor de información comercial e
índice de Precios de Generación Solar
Distribuida en México.
https://www.worldenergytrade.com/energias-
alternativas/general/generacion-distribuida-
potencial-de-crecimiento
INEGI (2015)
http://www.beta.inegi.org.mx/app/areasgeografi
cas/?ag=04.U.S. Department of Energy.
National Renewable Energy Laboratory, (2010).
https://maps.nrel.gov/rede-
mexico/?aL=wn05da%255Bv%255D%3Dt%26
u-o1v1%255Bv%255D%3Dt%26u-
o1v1%255Bd%255D%3D1%26mwBW5c%25
5Bv%255D%3Dt%26mwBW5c%255Bd%255
D%3D2%26mwBW5c%255Br%255D%3Dt%2
6tpot_result_mexico_145835%255Bv%255D%
3Dt%26tpot_result_mexico_145835%255Bd%
255D%3D3%26tpot_result_mexico_145835%2
55Br%255D%3Dt&bL=clight&cE=0&lR=0&
mC=21.861498734372567%2C-
87.4951171875&zL=5

12
Article Journal of Research and Development December, 2021 Vol.7 No.20 1-12
ISSN 2444-4987
ECORFAN® All rights reserved CHAN-GONZALEZ, Jorge J., SARAVIA-PÉREZ, Isaac A., LEZAMA-
ZÁRRAGA, Francisco and SHIH, Meng Yen. Energy efficiency using Distributed Generation; Cafeteria of Engineer Faculty Campeche,
Mexico. Journal of Research and Development. 2021
León Llanos J. A. (2020). Generación
distribuida mediante el diseño de un Sistema
fotovoltaico conectado a la red de distribución
en el Instituto ISA-Chiclayo.
Lezama Zárraga, F. R, Andrade Durán, J. E.,
Ovando Sierra, J. C. & Castillo Téllez, M.
Aplicación de Eficiencia Energética para
optimizar el Sistema de Iluminación en una
Institución de Nivel Superior. Revista de
aplicaciones de la Ingeniería. ISSN 2523-6873.
Edit. Ecorfan Bolivia, Vol. 2, No. 8, páginas 27-
34. 2018.
Luis C. A., A. R., & María Beatriz, P. (2020).
Proyectos fotovoltaicos en generación
distribuida. ¿Rentabilidad Privada o
Sustentabildad Ambiental? Revista politécnica,
45(2), 31-40.
Mayra Robles López et al. La eficiencia
energética en microempresas mexicanas.
https://www.uv.mx/iiesca/files/2017/03/19CA21
602.pdf
Merle Potter, David Wiggert, Bassem
Ramadam, (2012). Mecánica de Fluidos 4ª
edición. Editorial CENGAGE Learning, ISBN
13:978-607-519-450-9.
N.H. Reich, E.A. Alsema, W.G.J.H.M. van Sark,
E. Nieuwlaar. “CO2 Emissions of PV in the
perspective of a renewable energy economy”.
22nd European Photovoltaic Solar Energy
Conference, pp. 3538-3542. Milan, Italy.
September 2007.
Pinargote, D. F. G., Sornoza, G. J. B., Pérez, A.
V., & Gámez, M. R. (2021). La generación
distribuida y su regulación en el ecuador.
Brazilian Journal of Business, 3(3).
Ramos, E. (2020). La generación distribuida: el
camino hacia la producción descentralizada de
electricidad y pautas para su reglamentación.
Forseti. Revista de derecho, 8(11), 07-35.
Rayenari D. C., J. Chan-González, Roger C.,
Jesús Contreras, M. Margarita Castillo-Téllez,
Francisco Lezama, Víctor Lanz, J. Ortega (2015)
Sistema fotovoltaico interconectado a red
instalado en el estacionamiento de la Facultad
de Ingeniería de la Universidad Autónoma de
Campeche. Memorias del Congreso Nacional de
Energía Solar.
Terol Calvo, S. (2020) El acceso de la energía
distribuida en conjuntos residenciales.
Evaluación de sistemas fotovoltaicos
comunitarios en la villa olímpica (Doctoral
dissertation).
Víctor Lanz Gutierrez de Velazco, Manuel
Cervera, (2018) Auditorías Energéticas a las
Instalaciones de la Universidad Autónoma de
Campeche, Comunicado Personal.
Victorio Santiago Díaz, Raúl Oscar. (2005)
Acondicionamiento termico de edificios/
Thermal Preparation of Buildings. Editorial
NOBUKO, ISBN 987-1135-94-7.
Yunus Ҁengel, Afshin J. Ghajar, (2011)
Transferencia de Calor y Masa 4ª edición.
Editorial McGraw Hill, ISBN 978-607-15-0540-
8.
13
Article Journal of Research and Development December, 2021 Vol.7 No.20 13-20
Lean Manufacturing: Efficiency improvement application in multi-product area of
the Aerospace Industry
Manufactura esbelta: Aplicación de mejora de la eficiencia en área multiproducto
de la Industria Aeroespacial
CANO-CARRASCO, Adolfo†*, FORNÉS-RIVERA, René Daniel, VÁSQUEZ-TORRES, María del
Carmen and GUERRERO-PORTILLO, Arlene Amalia
Instituto Tecnológico de Sonora
ID 1st Author: Adolfo, Cano-Carrasco / ORC ID: 0000-0002-3392-3667, Researcher ID Thomson: G-5035-2018, arXiv
Author ID: adolfo.cano, CVU CONACYT ID: 266064
ID 1st Co-author: René Daniel, Fornés-Rivera / ORC ID: 0000-0002-7438-0056, Researcher ID Thomson: G-3906-2018,
arXiv Author ID: rene_fornes, CVU CONACYT ID: 280435
ID 2nd Co-author: María Del Carmen, Vásquez-Torres / ORC ID: 0000-0003-0938-4955, Researcher ID Thomson: X-2104-
2018, CVU CONACYT ID: 286266
ID 3rd Co-author: Arlene Amalia, Guerrero-Portillo / ORC ID: 0000-0002-7967-5777
DOI: 10.35429/JRD.2021.20.7.13.20 Received March 27, 2021; Accepted June 30, 2021
Abstract
This research addresses the problem of leveling
workloads in a multi-product final assembly
area. In which it was found that 27.4% of the
time is used for set up and the current
distribution presents areas of opportunity. The
target was to implement improvement actions to
make use of resources more efficient in the
production process in the aforementioned area
through Lean Manufacturing tools. The results
obtained consist of eight products generated with
the support of lean manufacturing support tools
such as SMED, Workload Balancing and
MUDA waste identification, achieving
important results among which productivity in
the area stands out from 109% to 125%, as well
as a reduction in set-up time from 17 min to 4.4
min.
Lean, Productivity, Kaizen, Manufacturing
Resumen
Esta investigación aborda el problema de nivelar
cargas de trabajo, en un área de ensamble final
de multiproducto. En la cual se encontró que un
27.4 % del tiempo es utilizado para set up y la
distribución actual presenta áreas de
oportunidad. El objetivo fue implementar
acciones de mejora para eficientar el uso de los
recursos en el proceso de producción dicha área
a través de herramientas de Manufactura
Esbelta. Los resultados obtenidos consisten de
ocho productos generados con el apoyo de las
herramientas de soporte de la manufactura
esbelta tales como SMED, Balanceo de cargas
de trabajo, e identificación de desperdicios
MUDA, logrando importantes resultados entre
los que sobresale una productividad en el área
que va de 109 a 125 %, así como una reducción
del tiempo de set up de 17 a 4.4 min.
Esbelta, Productividad, Kaizen, Manufactura
Citation: CANO-CARRASCO, Adolfo, FORNÉS-RIVERA, René Daniel, VÁSQUEZ-TORRES, María del Carmen and
GUERRERO-PORTILLO, Arlene Amalia. Lean Manufacturing: Efficiency improvement application in multi-product area
of the Aerospace Industry. Journal of Research and Development. 2021. 7-20: 13-20
† Researcher contributing as first author.
© ECORFAN Journal-Spain www.ecorfan.org/spain
14
Article Journal of Research and Development December, 2021 Vol.7 No.20 13-20
ISSN 2444-4987
ECORFAN® All rights reserved CANO-CARRASCO, Adolfo, FORNÉS-RIVERA, René Daniel, VÁSQUEZ-
TORRES, María del Carmen and GUERRERO-PORTILLO, Arlene Amalia. Lean Manufacturing: Efficiency improvement application in multi-product
area of the Aerospace Industry. Journal of Research and Development. 2021
1. Introduction
Sonora has 53 manufacturing companies for
blades and components for turbines and wind
motors. This entity stands out due to the unique
activities that are carried out in it, such as die
casting, lost wax and sand mold, as well as heat
and surface treatments. (De la Madrid, s/f).
The level of Lean Manufacturing
Implementation in the maquiladora industry of
Hermosillo and Guaymas-Empalme, Sonora
(Piña et al., 2018) presents 14 common
practices: level production, continuous flow,
product quality, continuous improvement, order
and cleanness, process control, lead time
reduction, standardization, delivery on time,
flexible production system, line balancing, direct
personnel training, adherence to the production
plan and customer satisfaction. Likewise,
benefits are consequently reported in the areas of
increased productivity, scrap reduction, cost
reduction in quality, inventories, customer
guarantee, raw material, improvement in
deliveries on time, among others. (Monge et al.,
2013).
The company under study manufactures
electrical connectors, coaxial cables, fiber optic
cables and communication antennas, its main
customers are Boeing Company, Airbus S.E.,
Embraer S.A. and Safran Aircraft Engines (PRO
MÉXICO, 2016). The object under study is the
area of Final Assembly "Coaxial, Packaging and
Others"; this has the objective of assembling a
great variety of coaxial connectors, accessory
packaging, installation of screws in rails and the
elaboration of other varied products.
P E P S U
War
ehouse
• K
anban
, •
Man
ufa
cturi
ng
ord
ers
(MO
)
• Laser marking, • Rail, • Coaxial - Manual
press, • Coaxial - Pneumatic press, • Resin
for coaxial, • Painted, • Riveting, • Screw
installation, • Accessories packaging • Parts
packaging
, P
roduct
s (D
iffe
rent
par
t
no.)
, •
Pac
kag
ing
• E
nd
cust
om
er,
• S
ub
-
asse
mbly
, •
War
ehouse
Table 1 PEPSU diagram of the final assembly area
Regarding personnel, the number of
necessary operators has not been established, nor
their leveling of workloads. There are 9
operators on shift 1, 6 on shift 2 and a leader.
The times of change and preparation of the "laser
marking" bottleneck, is approximately 3 hrs
causing less production and capacity.
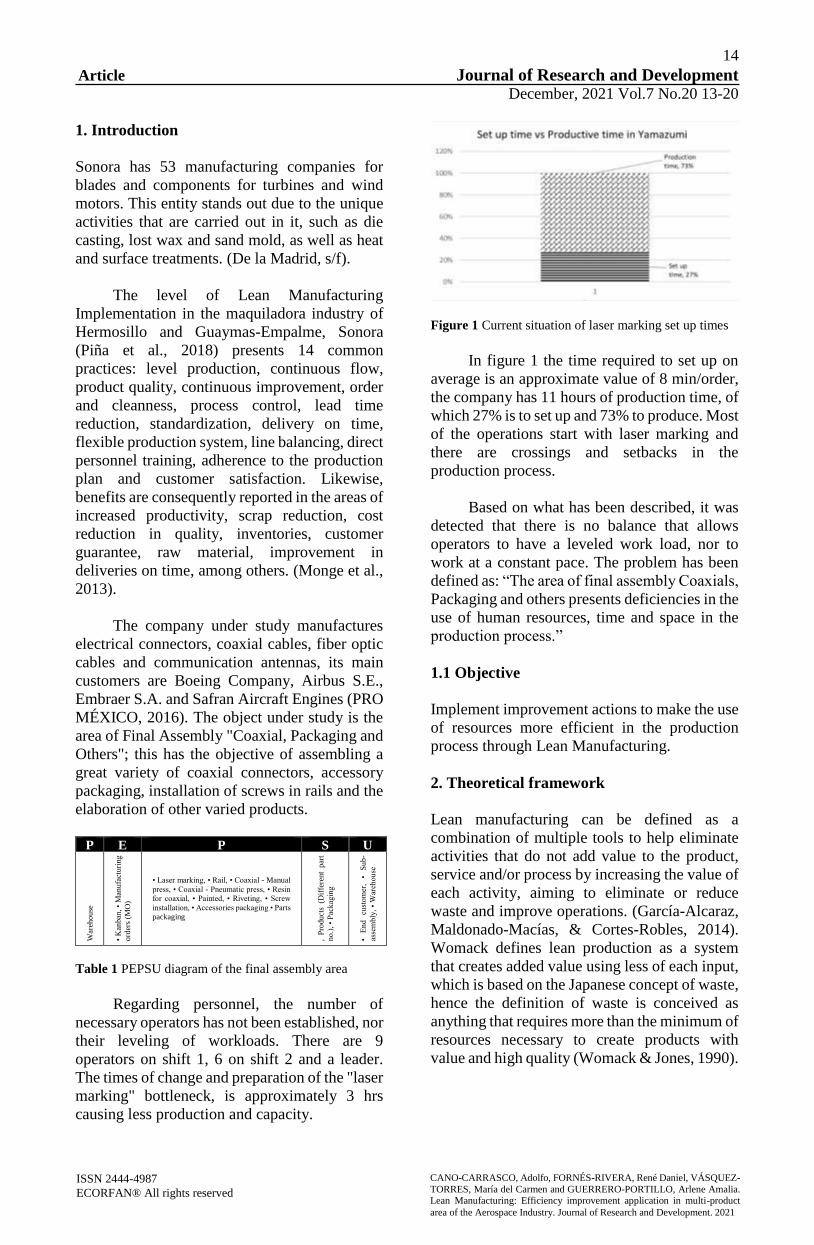
Figure 1 Current situation of laser marking set up times
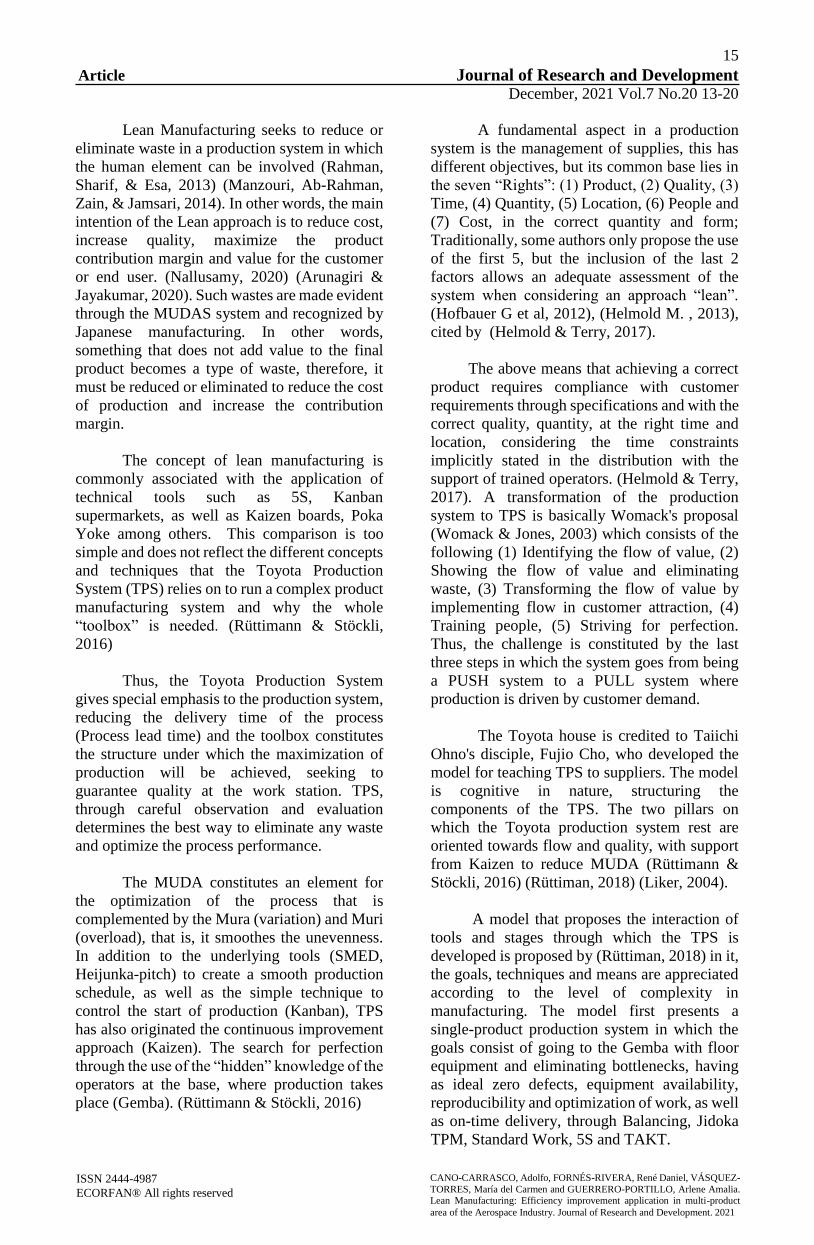
In figure 1 the time required to set up on
average is an approximate value of 8 min/order,
the company has 11 hours of production time, of
which 27% is to set up and 73% to produce. Most
of the operations start with laser marking and
there are crossings and setbacks in the
production process.
Based on what has been described, it was
detected that there is no balance that allows
operators to have a leveled work load, nor to
work at a constant pace. The problem has been
defined as: “The area of final assembly Coaxials,
Packaging and others presents deficiencies in the
use of human resources, time and space in the
production process.”
1.1 Objective
Implement improvement actions to make the use
of resources more efficient in the production
process through Lean Manufacturing.
2. Theoretical framework
Lean manufacturing can be defined as a
combination of multiple tools to help eliminate
activities that do not add value to the product,
service and/or process by increasing the value of
each activity, aiming to eliminate or reduce
waste and improve operations. (García-Alcaraz,
Maldonado-Macías, & Cortes-Robles, 2014).
Womack defines lean production as a system
that creates added value using less of each input,
which is based on the Japanese concept of waste,
hence the definition of waste is conceived as
anything that requires more than the minimum of
resources necessary to create products with
value and high quality (Womack & Jones, 1990).
15
Article Journal of Research and Development December, 2021 Vol.7 No.20 13-20
ISSN 2444-4987
ECORFAN® All rights reserved CANO-CARRASCO, Adolfo, FORNÉS-RIVERA, René Daniel, VÁSQUEZ-
TORRES, María del Carmen and GUERRERO-PORTILLO, Arlene Amalia. Lean Manufacturing: Efficiency improvement application in multi-product
area of the Aerospace Industry. Journal of Research and Development. 2021
Lean Manufacturing seeks to reduce or
eliminate waste in a production system in which
the human element can be involved (Rahman,
Sharif, & Esa, 2013) (Manzouri, Ab-Rahman,
Zain, & Jamsari, 2014). In other words, the main
intention of the Lean approach is to reduce cost,
increase quality, maximize the product
contribution margin and value for the customer
or end user. (Nallusamy, 2020) (Arunagiri &
Jayakumar, 2020). Such wastes are made evident
through the MUDAS system and recognized by
Japanese manufacturing. In other words,
something that does not add value to the final
product becomes a type of waste, therefore, it
must be reduced or eliminated to reduce the cost
of production and increase the contribution
margin.
The concept of lean manufacturing is
commonly associated with the application of
technical tools such as 5S, Kanban
supermarkets, as well as Kaizen boards, Poka
Yoke among others. This comparison is too
simple and does not reflect the different concepts
and techniques that the Toyota Production
System (TPS) relies on to run a complex product
manufacturing system and why the whole
“toolbox” is needed. (Rüttimann & Stöckli,
2016)
Thus, the Toyota Production System
gives special emphasis to the production system,
reducing the delivery time of the process
(Process lead time) and the toolbox constitutes
the structure under which the maximization of
production will be achieved, seeking to
guarantee quality at the work station. TPS,
through careful observation and evaluation
determines the best way to eliminate any waste
and optimize the process performance.
The MUDA constitutes an element for
the optimization of the process that is
complemented by the Mura (variation) and Muri
(overload), that is, it smoothes the unevenness.
In addition to the underlying tools (SMED,
Heijunka-pitch) to create a smooth production
schedule, as well as the simple technique to
control the start of production (Kanban), TPS
has also originated the continuous improvement
approach (Kaizen). The search for perfection
through the use of the “hidden” knowledge of the
operators at the base, where production takes
place (Gemba). (Rüttimann & Stöckli, 2016)
A fundamental aspect in a production
system is the management of supplies, this has
different objectives, but its common base lies in
the seven “Rights”: (1) Product, (2) Quality, (3)
Time, (4) Quantity, (5) Location, (6) People and
(7) Cost, in the correct quantity and form;
Traditionally, some authors only propose the use
of the first 5, but the inclusion of the last 2
factors allows an adequate assessment of the
system when considering an approach “lean”.
(Hofbauer G et al, 2012), (Helmold M. , 2013),
cited by (Helmold & Terry, 2017).
The above means that achieving a correct
product requires compliance with customer
requirements through specifications and with the
correct quality, quantity, at the right time and
location, considering the time constraints
implicitly stated in the distribution with the
support of trained operators. (Helmold & Terry,
2017). A transformation of the production
system to TPS is basically Womack's proposal
(Womack & Jones, 2003) which consists of the
following (1) Identifying the flow of value, (2)
Showing the flow of value and eliminating
waste, (3) Transforming the flow of value by
implementing flow in customer attraction, (4)
Training people, (5) Striving for perfection.
Thus, the challenge is constituted by the last
three steps in which the system goes from being
a PUSH system to a PULL system where
production is driven by customer demand.
The Toyota house is credited to Taiichi
Ohno's disciple, Fujio Cho, who developed the
model for teaching TPS to suppliers. The model
is cognitive in nature, structuring the
components of the TPS. The two pillars on
which the Toyota production system rest are
oriented towards flow and quality, with support
from Kaizen to reduce MUDA (Rüttimann &
Stöckli, 2016) (Rüttiman, 2018) (Liker, 2004).
A model that proposes the interaction of
tools and stages through which the TPS is
developed is proposed by (Rüttiman, 2018) in it,
the goals, techniques and means are appreciated
according to the level of complexity in
manufacturing. The model first presents a
single-product production system in which the
goals consist of going to the Gemba with floor
equipment and eliminating bottlenecks, having
as ideal zero defects, equipment availability,
reproducibility and optimization of work, as well
as on-time delivery, through Balancing, Jidoka
TPM, Standard Work, 5S and TAKT.

16
Article Journal of Research and Development December, 2021 Vol.7 No.20 13-20
ISSN 2444-4987
ECORFAN® All rights reserved CANO-CARRASCO, Adolfo, FORNÉS-RIVERA, René Daniel, VÁSQUEZ-
TORRES, María del Carmen and GUERRERO-PORTILLO, Arlene Amalia. Lean Manufacturing: Efficiency improvement application in multi-product
area of the Aerospace Industry. Journal of Research and Development. 2021
Second, for a multiproduct system the
goals lie in the area of leveling, flexibility and
lay out, through Heijunka, SMED and Cellular
Design. A third place is meant for Complex
Products in which the goals reside in the use of
cells and the logistics of decoupling through the
creation of supermarkets, finally, the Supply
Chain level in which the goals reside in Linked
Cells, Production Activated and Just in Time
through 7's Rights and Kan Ban systems.
To achieve survival, an organization
needs to be competitive; it is through improving
various aspects such as costs, quality, delivery
service and flexibility. One of the approaches to
achieve improvement is provided by Lean
Manufacturing (Shah & Ward, 2002).
Implementing Lean Manufacturing generates
observable benefits in various areas and sectors,
therefore, Lean Manufacturing emerges as an
approach that provides ways to improve quality,
meet customer expectations, reduce every form
of waste, improve the employees satisfaction
and shorten delivery times (Braglia, Carmignani,
& Zammori, 2006) (Bakas, Govaert, & Van
Landeghem, 2011)
In the research from (Ghizoni Pereira &
Luz Tortorella, 2018) is noted that the
application of Lean Manufacturing practices
occurs within companies at the strategic, tactical
and operational levels regardless of the size of
the organization. The key is to identify the
appropriate practices for the objective context in
which the company finds itself. Among the most
frequent practices found are: (1) Pull system, (2)
Total Productive Maintenance, (3) Kaizen
Continuous Improvement, (4) 5s, (5) Just in
Time, (6) Cycle Time Reduction, (7) Total
Quality Management , (8) Cellular
Manufacturing, (9) Rapid Changes, (10) Staff
Empowerment, (11) Value Stream Mapping,
(12) Standardized Work, (13) Six Sigma, (14)
Cross Functional Teams, (15 ) Statistical Process
Control, (16) Visual Management, (17)
Continuous Flow (18) Poka Yoke and (19)
PDCA.
3. Methodology to be developed
Object of study
The object under study is the Final Assembly
Area "Coaxials, Packaging and Others".
Materials
Digital stopwatch, Microsoft Excel, Camera,
Flexometer, AutoCAD Software, Solidworks
Software.
Procedure: (1) Analyze the production
process. An 80-20 analysis was made to obtain
the parts with the highest contribution in the area
(High runners). (2) Determine average operating
times. At this stage, the High runners' times were
taken. (3) Balance. The Takt, the contribution
percentage of each part and time weighted was
calculated:
𝑊𝑒𝑖𝑔ℎ𝑡𝑒𝑑 𝑇𝑖𝑚𝑒 = (𝐶𝑜𝑛𝑡𝑟𝑖𝑏𝑢𝑡𝑖𝑜𝑛 𝑃𝑒𝑟𝑐𝑒𝑛𝑡𝑎𝑔𝑒) (𝑂𝑝𝑒𝑟𝑎𝑡𝑖𝑜𝑛 𝑇𝑖𝑚𝑒) (1)
The number of operators was obtained
and subsequently the balancing was carried out
assigning tasks to each operator. (5) Reduce
change and preparation times. In this step, the
SMED methodology was followed (Socconini,
2019) with the support of the Yamazumi tool;
the new method was finally standardized. (6)
Redistribute the area under study. The waste and
areas of opportunity were detected, the
redistribution proposals were designed where
the families of parts, crossings, setbacks, areas
of opportunity and waste found were considered.
4. Results
Result of the 80/20 analysis, the High Runners
of each product family were obtained with their
average times shown in table 2.
Table 2 Matrix of average operating times
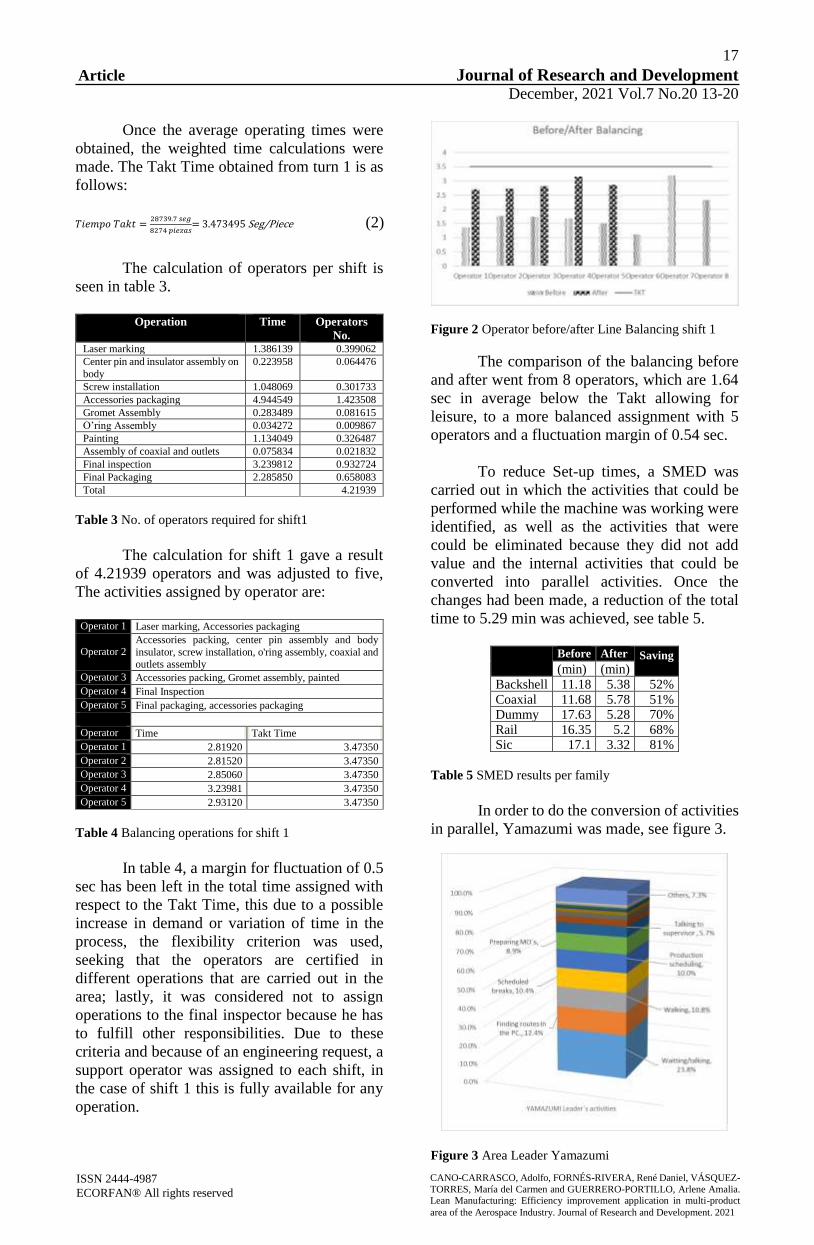
17
Article Journal of Research and Development December, 2021 Vol.7 No.20 13-20
ISSN 2444-4987
ECORFAN® All rights reserved CANO-CARRASCO, Adolfo, FORNÉS-RIVERA, René Daniel, VÁSQUEZ-
TORRES, María del Carmen and GUERRERO-PORTILLO, Arlene Amalia. Lean Manufacturing: Efficiency improvement application in multi-product
area of the Aerospace Industry. Journal of Research and Development. 2021
Once the average operating times were
obtained, the weighted time calculations were
made. The Takt Time obtained from turn 1 is as
follows:
The calculation of operators per shift is
seen in table 3.
Operation Time Operators
No. Laser marking 1.386139 0.399062
Center pin and insulator assembly on
body
0.223958 0.064476
Screw installation 1.048069 0.301733
Accessories packaging 4.944549 1.423508
Gromet Assembly 0.283489 0.081615
O’ring Assembly 0.034272 0.009867
Painting 1.134049 0.326487
Assembly of coaxial and outlets 0.075834 0.021832
Final inspection 3.239812 0.932724
Final Packaging 2.285850 0.658083
Total
4.21939
Table 3 No. of operators required for shift1
The calculation for shift 1 gave a result
of 4.21939 operators and was adjusted to five,
The activities assigned by operator are:
Operator 1 Laser marking, Accessories packaging
Operator 2 Accessories packing, center pin assembly and body
insulator, screw installation, o'ring assembly, coaxial and outlets assembly
Operator 3 Accessories packing, Gromet assembly, painted
Operator 4 Final Inspection
Operator 5 Final packaging, accessories packaging
Operator Time Takt Time
Operator 1 2.81920 3.47350
Operator 2 2.81520 3.47350
Operator 3 2.85060 3.47350
Operator 4 3.23981 3.47350
Operator 5 2.93120 3.47350
Table 4 Balancing operations for shift 1
In table 4, a margin for fluctuation of 0.5
sec has been left in the total time assigned with
respect to the Takt Time, this due to a possible
increase in demand or variation of time in the
process, the flexibility criterion was used,
seeking that the operators are certified in
different operations that are carried out in the
area; lastly, it was considered not to assign
operations to the final inspector because he has
to fulfill other responsibilities. Due to these
criteria and because of an engineering request, a
support operator was assigned to each shift, in
the case of shift 1 this is fully available for any
operation.
Figure 2 Operator before/after Line Balancing shift 1
The comparison of the balancing before
and after went from 8 operators, which are 1.64
sec in average below the Takt allowing for
leisure, to a more balanced assignment with 5
operators and a fluctuation margin of 0.54 sec.
To reduce Set-up times, a SMED was
carried out in which the activities that could be
performed while the machine was working were
identified, as well as the activities that were
could be eliminated because they did not add
value and the internal activities that could be
converted into parallel activities. Once the
changes had been made, a reduction of the total
time to 5.29 min was achieved, see table 5.
Before After Saving
(min) (min)
Backshell 11.18 5.38 52%
Coaxial 11.68 5.78 51% Dummy 17.63 5.28 70%
Rail 16.35 5.2 68% Sic 17.1 3.32 81%
Table 5 SMED results per family
In order to do the conversion of activities
in parallel, Yamazumi was made, see figure 3.
Figure 3 Area Leader Yamazumi
𝑇𝑖𝑒𝑚𝑝𝑜 𝑇𝑎𝑘𝑡 =28739.7 𝑠𝑒𝑔
8274 𝑝𝑖𝑒𝑧𝑎𝑠= 3.473495 Seg/Piece (2)
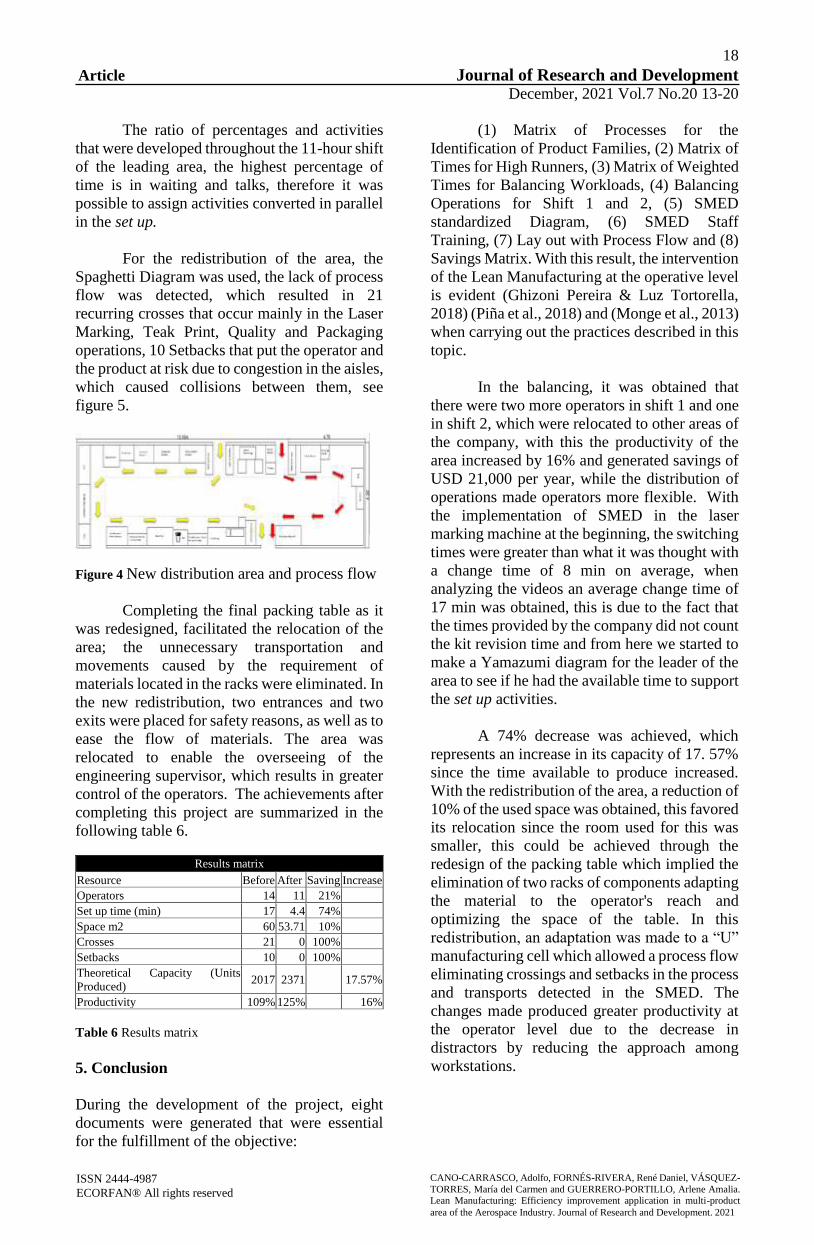
18
Article Journal of Research and Development December, 2021 Vol.7 No.20 13-20
ISSN 2444-4987
ECORFAN® All rights reserved CANO-CARRASCO, Adolfo, FORNÉS-RIVERA, René Daniel, VÁSQUEZ-
TORRES, María del Carmen and GUERRERO-PORTILLO, Arlene Amalia. Lean Manufacturing: Efficiency improvement application in multi-product
area of the Aerospace Industry. Journal of Research and Development. 2021
The ratio of percentages and activities
that were developed throughout the 11-hour shift
of the leading area, the highest percentage of
time is in waiting and talks, therefore it was
possible to assign activities converted in parallel
in the set up.
For the redistribution of the area, the
Spaghetti Diagram was used, the lack of process
flow was detected, which resulted in 21
recurring crosses that occur mainly in the Laser
Marking, Teak Print, Quality and Packaging
operations, 10 Setbacks that put the operator and
the product at risk due to congestion in the aisles,
which caused collisions between them, see
figure 5.
Figure 4 New distribution area and process flow
Completing the final packing table as it
was redesigned, facilitated the relocation of the
area; the unnecessary transportation and
movements caused by the requirement of
materials located in the racks were eliminated. In
the new redistribution, two entrances and two
exits were placed for safety reasons, as well as to
ease the flow of materials. The area was
relocated to enable the overseeing of the
engineering supervisor, which results in greater
control of the operators. The achievements after
completing this project are summarized in the
following table 6.
Results matrix
Resource Before After Saving Increase
Operators 14 11 21%
Set up time (min) 17 4.4 74%
Space m2 60 53.71 10%
Crosses 21 0 100%
Setbacks 10 0 100%
Theoretical Capacity (Units
Produced) 2017 2371 17.57%
Productivity 109% 125% 16%
Table 6 Results matrix
5. Conclusion
During the development of the project, eight
documents were generated that were essential
for the fulfillment of the objective:
(1) Matrix of Processes for the
Identification of Product Families, (2) Matrix of
Times for High Runners, (3) Matrix of Weighted
Times for Balancing Workloads, (4) Balancing
Operations for Shift 1 and 2, (5) SMED
standardized Diagram, (6) SMED Staff
Training, (7) Lay out with Process Flow and (8)
Savings Matrix. With this result, the intervention
of the Lean Manufacturing at the operative level
is evident (Ghizoni Pereira & Luz Tortorella,
2018) (Piña et al., 2018) and (Monge et al., 2013)
when carrying out the practices described in this
topic.
In the balancing, it was obtained that
there were two more operators in shift 1 and one
in shift 2, which were relocated to other areas of
the company, with this the productivity of the
area increased by 16% and generated savings of
USD 21,000 per year, while the distribution of
operations made operators more flexible. With
the implementation of SMED in the laser
marking machine at the beginning, the switching
times were greater than what it was thought with
a change time of 8 min on average, when
analyzing the videos an average change time of
17 min was obtained, this is due to the fact that
the times provided by the company did not count
the kit revision time and from here we started to
make a Yamazumi diagram for the leader of the
area to see if he had the available time to support
the set up activities.
A 74% decrease was achieved, which
represents an increase in its capacity of 17. 57%
since the time available to produce increased.
With the redistribution of the area, a reduction of
10% of the used space was obtained, this favored
its relocation since the room used for this was
smaller, this could be achieved through the
redesign of the packing table which implied the
elimination of two racks of components adapting
the material to the operator's reach and
optimizing the space of the table. In this
redistribution, an adaptation was made to a “U”
manufacturing cell which allowed a process flow
eliminating crossings and setbacks in the process
and transports detected in the SMED. The
changes made produced greater productivity at
the operator level due to the decrease in
distractors by reducing the approach among
workstations.
19
Article Journal of Research and Development December, 2021 Vol.7 No.20 13-20
ISSN 2444-4987
ECORFAN® All rights reserved CANO-CARRASCO, Adolfo, FORNÉS-RIVERA, René Daniel, VÁSQUEZ-
TORRES, María del Carmen and GUERRERO-PORTILLO, Arlene Amalia. Lean Manufacturing: Efficiency improvement application in multi-product
area of the Aerospace Industry. Journal of Research and Development. 2021
6. References
Arunagiri, P., & Jayakumar, V. (2020).
Assesment of hypothetical correlation between
the various critical factors for lean systems in
automobile industries, Mater. Today Proc.
Bakas, O., Govaert, T., & Van Landeghem, H.
(2011). Challenges and success factors for
implementation of lean manufacturing in
European SMES. In 13th International
conference on the Modern Information
Technology in the Innovation Processes of the
industria Entrprise Vol 1. Tapir Academic Press.
Braglia, M., Carmignani, G., & Zammori, F.
(2006). A new value stream mapping approach
for complex production systems. International
Journal of Production Research, 44, 18-19.
De la Madrid, C. E. (s/f). La industria
Aeroespacial y el despegue de la productividad
en México. Obtenido de Este articulo se elaboro
con informacion de Aregional, INEGI,
ProMéxico y Secretaría de Economía:
http://www.revistacomercioexterior.com/articul
o.php?id=54&t=la-industria-
#:~:text=De%20acuerdo%20con%20la%20Aso
ciaci%C3%B3n,en%20promedio%205.3%25%
20por%20a%C3%B1o.
García-Alcaraz, J., Maldonado-Macías, A., &
Cortes-Robles, G. (2014). Lean Manufacturing
in the Developing World. Methodology, Case
Studies and Trends from Latin America.
Switzerland: Springer International Publishing.
Ghizoni Pereira, L., & Luz Tortorella, G. (2018).
A Literature Review on Lean Manufacturing in
Small Manufacturing Companies. Progress in
lean manufacturing. En J. Paulo Davim (Ed).,
Springer, 69-89.
Helmold, M. (2013). Establishing a best-practice
model of supplier relationship management
(SRM) in multinational companies in the
European transportation industry. Berlin:
Wissenschaftlicher Verlag.
Helmold, M., & Terry, B. (2017). Global
Sourcing and Supply Management Excellence in
China. Procurement Guide for Supply Experts.
Springer Science+Business Media Singapore.
Hofbauer G et al. (2012).
Lieferantenmanagement. Die wertorientierte
Gestaltung der Lieferbeziehung. Munich:
Oldenbourg Verlag.
Liker, J. (2004). The Toyota Way: 14
Management Principles from the World's
Greatest Manufacturer. United States of
America: McGraw-Hill.
Manzouri, M., Ab-Rahman, M., Zain, C., &
Jamsari, E. (2014). Increasing Production and
Eliminating Waste through Lean. sustainability ,
6, 9179-9204.
Monge, C., Cruz, J., & López, F. (2013).
Impacto de la Manufactura Esbelta, Manufactura
sustentable y Mejora Contínua en la Eficiencia
Operacional y Responsabilidad Ambiental en
México. información tecnológica, vol.24, n.4,
15-32.
Nallusamy, S. (2020). Execution of lean and
Industria techniques for productivity
enhancement in a manufactury industry,
MATER. . Today Proc.
Piña Domínguez, R., León Balderrama, J., &
Preciado Rodríguez, J. (2018). Nivel de
implementación de la manufactura esbelta en la
industria maquiladora de Hermosillo y
Guaymas-Empalme, Sonora. RECAI. Revista de
estudios en Contaduria Administración e
Informática., 36-51.
Rahman, N., Sharif, S. M., & Esa, M. M. (2013).
Lean Manufacturing Case study with Kanban
System Implementario. Procedia Economics and
Finance 7.
Rüttiman, B. (2018). Lean Compendium
Introduction to Modern Manufacturing Theory.
Zürich, Switzerland: Springer.
Rüttimann, ,. B. (2015). Von Lean zu Industrie
4.0 – eine Evolution? Von einer visiona¨ren Idee
zum. Presentation held at:
Fertigungstechnisches Kolloquium.
Rüttimann, B. G.; Stöckli, M. (2016). Going
beyond triviality: The Toyota production
system—lean Going beyond triviality: The
Toyota production system—lean. J. Serv. Sci.
Manag., 9, 140–149.

20
Article Journal of Research and Development December, 2021 Vol.7 No.20 13-20
ISSN 2444-4987
ECORFAN® All rights reserved CANO-CARRASCO, Adolfo, FORNÉS-RIVERA, René Daniel, VÁSQUEZ-
TORRES, María del Carmen and GUERRERO-PORTILLO, Arlene Amalia. Lean Manufacturing: Efficiency improvement application in multi-product
area of the Aerospace Industry. Journal of Research and Development. 2021
Rüttimann, B., & Stöckli, M. (2016). Production
System-Lean Manufacturing beyond MUDA
and Kaizen. Journal of Service Science and
Management, 140-149.
Shah, R., & Ward, P. (2002). Lean
manufacturing: context, practice bundles and
performance. Journal of Operations
Management. Elsevier, 21, 129–149.
Socconini, L. (2019). Lean Manufacturing Paso
a Paso. Barcelona: Alfaomega Marge.
Womack, J., & Jones, D. (1990). The Machine
that Changed the World: The Triumph of Lean
Production. New York, U.S.A.: Rawson
Macmillan.
Womack, J., & Jones, D. (2003). Lean Thinking.
New York: Free Press.
21
Article Journal of Research and Development December, 2021 Vol.7 No.20 21-26
Ergonomic culture level in managers and supervisors in manufacturing centers
Nivel de cultura ergonómica en supervisores y alta direccion en una empresa
manufacturera
LÓPEZ-ACOSTA, Mauricio, CHACARA-MONTES, Allán, VELARDE-CANTÚ, José Manuel and
RAMIREZ-CARDENAS, Ernesto
Instituto Tecnológico de Sonora
ID 1st Author: Mauricio, López-Acosta / ORC ID: 0000-0003-3728-9576
ID 1st Co-Author: Allán, Chacara-Montes / ORC ID: 0000-0002-0567-0017
ID 2nd Co-Author: José Manuel, Velarde-Cantú / ORC ID: 0000-0002-1697-8551
ID 3rd Co-author: Ernesto Ramírez-Cárdenas / ORC ID: 00-0002-5248-724X
DOI: 10.35429/JRD.2021.20.7.21.26 Received July 26, 2021; Accepted October 24, 2021
Abstract
The purpose of the following project is to
measure the level of ergonomic culture of a
manufacturing company that is dedicated to the
development of cables, fiber optics, cabling
systems and related services for the automotive
sector and cable systems; To carry out this study,
the ergonomic culture questionnaire in work
centers (CCE-T) was used as a tool and it was
applied to a sample of 26 people between
supervisors and managers. This questionnaire
made it possible to measure the level of
development of ergonomic culture in work
centers from the perspective of supervisors and
senior management (managers) and to know
their perception of the development and
application of ergonomics in their company.
Therefore,
Ergonomic Culture, Management,
Evaluation
Resumen
El siguiente proyecto tiene como propósito
medir el nivel de cultura ergonómica de una
empresa manufacturera que se dedica a la
elaboración de cables, fibra óptica, sistemas de
cableados y servicio relacionados para el sector
automotriz y sistemas de cable; para realizar
dicho estudio se utilizó como herramienta el
cuestionario de cultura ergonómica en centros de
trabajo (CCE-T) y fue aplicado a una muestra de
26 personas entre supervisores y gerentes. Este
cuestionario permitió medir el nivel de
desarrollo de la cultura ergonómica en centros de
trabajo desde la óptica de los que supervisores y
la alta dirección (gerentes) y conocer la
percepción que tienen sobre el desarrollo y
aplicación de la ergonomía en su empresa. Por
consiguiente, este instrumento se considera un
elemento valioso como mecanismo de
realimentación de procesos en salud colectiva y
como herramienta diagnóstica.
Cultura Ergonómica, Dirección, Evaluación
Citation: LÓPEZ-ACOSTA, Mauricio, CHACARA-MONTES, Allán, VELARDE-CANTÚ, José Manuel and RAMIREZ-
CARDENAS, Ernesto. Ergonomic culture level in managers and supervisors in manufacturing centers. Journal of Research
and Development. 2021. 7-20: 21-26
† Researcher contributing as first author.
© ECORFAN Journal-Spain www.ecorfan.org/spain

22
Article Journal of Research and Development December, 2021 Vol.7 No.20 21-26
ISSN 2444-4987
ECORFAN® All rights reserved LÓPEZ-ACOSTA, Mauricio, CHACARA-MONTES, Allán, VELARDE-CANTÚ, José Manuel and RAMIREZ-CARDENAS,
Ernesto. Ergonomic culture level in managers and supervisors in
manufacturing centers. Journal of Research and Development. 2021
Introduction
The automotive industry has a high production
volume, meaning that components are
assembled at a speed of 50 seconds per
workstation and even when this industry is
technology-based, parts of the process persist
where the assemblies are manual or almost
artisanal. Making the calculations based on this
data and assuming that a component is
assembled or used every five seconds, in total:
every second 18 million components would be
used, only for the industry in Mexico, this can be
interpreted as that every second moving the
workers’ upper extremities 18 million times;
fingers, hands, elbows, shoulders, neck and back
(Millán, 2016).
Postural overload is an important factor
for the appearance of musculoskeletal injuries in
the worker, it is characterized by the fact that the
body is out of the neutral position for a certain
time, which favors the presence of symptoms of
pain, inflammation, dysesthesia, paresthesia and
limitation to carry out their work, preventing
them from carrying out daily activities. (Tapia,
Buenrostro, Cabrera, Pérez and Malagón (2017).
Faced with the real demand for these
needs, industrial society demands from
production engineering and ergonomics an effort
to work together to provide solutions through
concepts, methods, techniques and tools
(Gomes, 2014).
The International Ergonomics
Association (IEA) defines ergonomics as a
scientific discipline that deals with
understanding the interactions between users
and other elements of a system, and the
profession that applies theory, principles, data
and methods to design in order to optimize the
well-being and performance of the system (IEA,
2021)
In this way, the aim of ergonomics is that
employees are comfortable in their workplaces.
This objective is not only an ethical premise, but
it will also have to do with the optimization of
the usual processes of a company. If in a
company the precise conditions are given so that
its workers are comfortable in their positions, an
increase in their performance will lead to an
increase in productivity. Consequently, the
company will be the main beneficiary of the
implementation of ergonomic measures, which
will be profitable over time (ARSAM, 2020).
Some reviews have provided data on the
benefits that ergonomic interventions bring to
these factors, underlining the importance of
including not only workers, but also supervisors
and senior management in these intervention
strategies. That said, a company is then expected
to develop a high degree of ergonomic culture,
as the cornerstone of what is considered the
primary intervention in ergonomics (Guzmán,
2010).
The term ergonomic culture is
understood as "the set of forms and expressions
applied to transform work, which characterize an
organization" therefore, for a true ergonomic
culture to exist, a "favorable environment, a
thought collective and social reaffirmation of
needs in the workplace ”(Gómez, 2002).
Ardila & Rodríguez, (2018) after a
review of the literature, they made a theoretical
construct based on the Scott, Kogi and McPhee
model and that contemplates the macro-
ergonomic and micro-ergonomic dimensions
and the organizational design, facilities design,
training / education components, job title, task
design, equipment / products and tools. They
obtained a questionnaire of 26 items with Likert-
type responses, validated by 5 experts (who
made adjustments for relevance and adequacy),
an analysis was carried out by main components
(KMO, 0.804) and with a Cronbach's alpha of
0.901 in its internal consistency. The questions
are outlined so that they can be answered in any
business context. The definitive name of the
instrument was assigned as:
For the assignment of values, the
categories taken from the Likert scale raised in
the questionnaire lead the evaluator to weigh
each item. Thus, the total of the totally agreed
answers are multiplied by one; partially agree,
by two; partially disagree, by three; and totally
disagree, by four. To determine the
classification, from the results the total of the
sum of responses of each of the four categories
is taken, and it is transferred to a weighted table
that allows, finally, to give the result of the level
at which the worker classifies your company.
When evaluating the level of ergonomic
culture, it is expected that a company can
develop four levels of ergonomic culture: low,
medium, high and very high, product of the sum
of the partial totals already weighted.
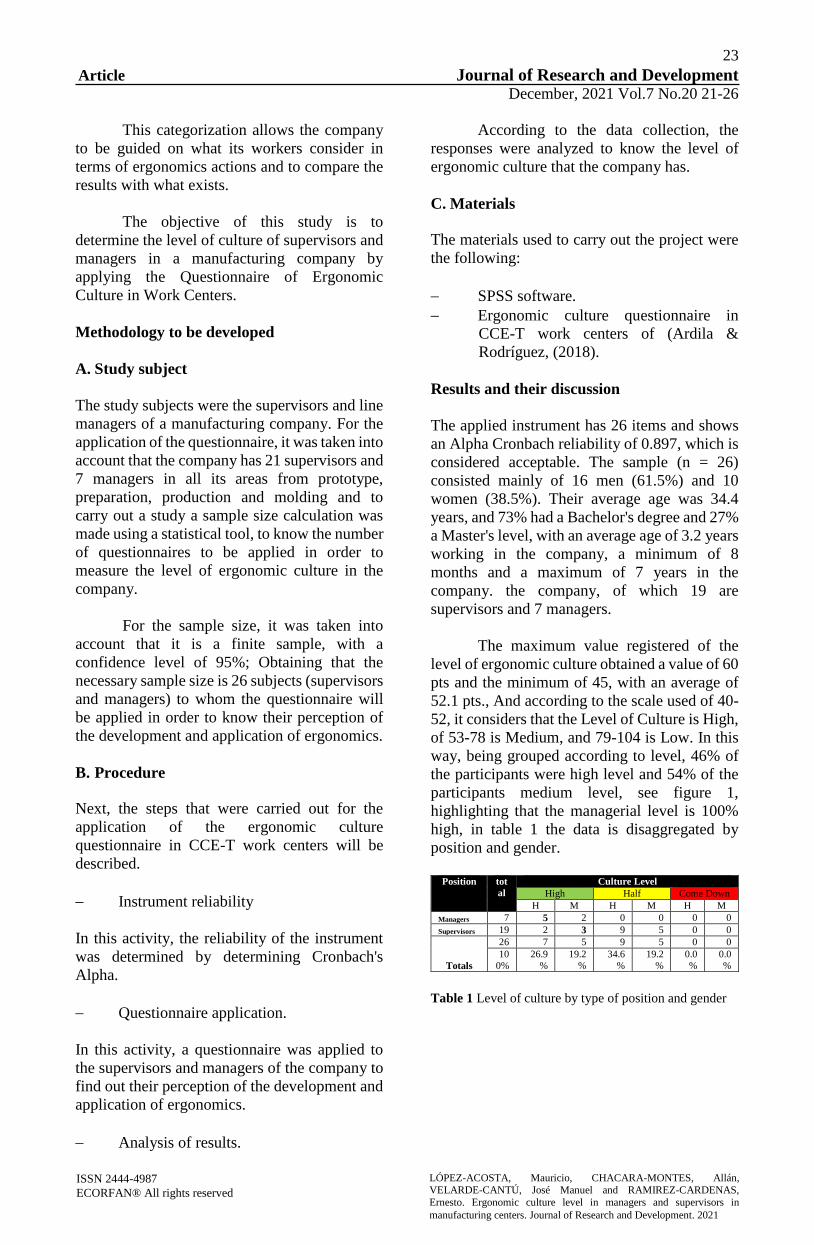
23
Article Journal of Research and Development December, 2021 Vol.7 No.20 21-26
ISSN 2444-4987
ECORFAN® All rights reserved LÓPEZ-ACOSTA, Mauricio, CHACARA-MONTES, Allán, VELARDE-CANTÚ, José Manuel and RAMIREZ-CARDENAS,
Ernesto. Ergonomic culture level in managers and supervisors in
manufacturing centers. Journal of Research and Development. 2021
This categorization allows the company
to be guided on what its workers consider in
terms of ergonomics actions and to compare the
results with what exists.
The objective of this study is to
determine the level of culture of supervisors and
managers in a manufacturing company by
applying the Questionnaire of Ergonomic
Culture in Work Centers.
Methodology to be developed
A. Study subject
The study subjects were the supervisors and line
managers of a manufacturing company. For the
application of the questionnaire, it was taken into
account that the company has 21 supervisors and
7 managers in all its areas from prototype,
preparation, production and molding and to
carry out a study a sample size calculation was
made using a statistical tool, to know the number
of questionnaires to be applied in order to
measure the level of ergonomic culture in the
company.
For the sample size, it was taken into
account that it is a finite sample, with a
confidence level of 95%; Obtaining that the
necessary sample size is 26 subjects (supervisors
and managers) to whom the questionnaire will
be applied in order to know their perception of
the development and application of ergonomics.
B. Procedure Next, the steps that were carried out for the
application of the ergonomic culture
questionnaire in CCE-T work centers will be
described.
Instrument reliability
In this activity, the reliability of the instrument
was determined by determining Cronbach's
Alpha.
Questionnaire application.
In this activity, a questionnaire was applied to
the supervisors and managers of the company to
find out their perception of the development and
application of ergonomics.
Analysis of results.
According to the data collection, the
responses were analyzed to know the level of
ergonomic culture that the company has.
C. Materials
The materials used to carry out the project were
the following:
SPSS software.
Ergonomic culture questionnaire in
CCE-T work centers of (Ardila &
Rodríguez, (2018).
Results and their discussion
The applied instrument has 26 items and shows
an Alpha Cronbach reliability of 0.897, which is
considered acceptable. The sample (n = 26)
consisted mainly of 16 men (61.5%) and 10
women (38.5%). Their average age was 34.4
years, and 73% had a Bachelor's degree and 27%
a Master's level, with an average age of 3.2 years
working in the company, a minimum of 8
months and a maximum of 7 years in the
company. the company, of which 19 are
supervisors and 7 managers.
The maximum value registered of the
level of ergonomic culture obtained a value of 60
pts and the minimum of 45, with an average of
52.1 pts., And according to the scale used of 40-
52, it considers that the Level of Culture is High,
of 53-78 is Medium, and 79-104 is Low. In this
way, being grouped according to level, 46% of
the participants were high level and 54% of the
participants medium level, see figure 1,
highlighting that the managerial level is 100%
high, in table 1 the data is disaggregated by
position and gender.
Position tot
al
Culture Level
High Half Come Down
H M H M H M
Managers 7 5 2 0 0 0 0
Supervisors 19 2 3 9 5 0 0
Totals
26 7 5 9 5 0 0
10
0%
26.9
%
19.2
%
34.6
%
19.2
%
0.0
%
0.0
%
Table 1 Level of culture by type of position and gender
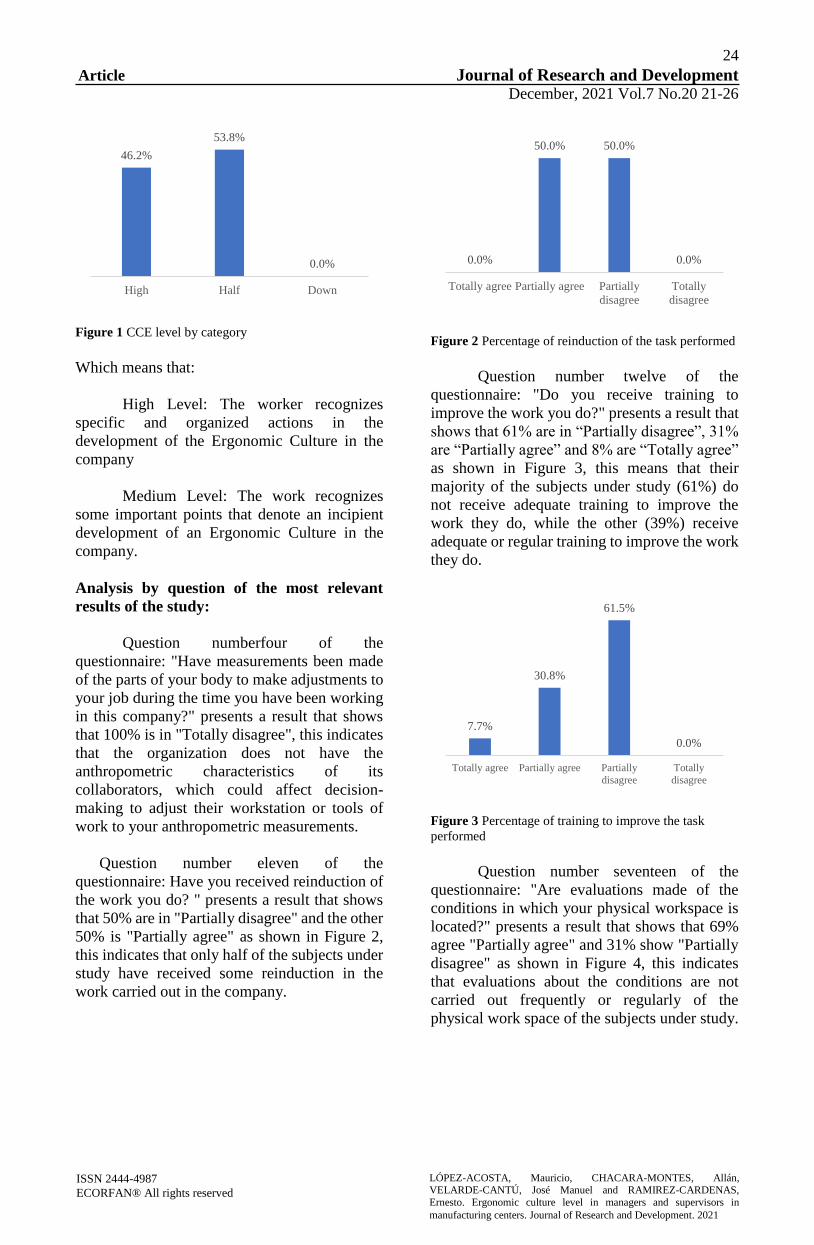
24
Article Journal of Research and Development December, 2021 Vol.7 No.20 21-26
ISSN 2444-4987
ECORFAN® All rights reserved LÓPEZ-ACOSTA, Mauricio, CHACARA-MONTES, Allán, VELARDE-CANTÚ, José Manuel and RAMIREZ-CARDENAS,
Ernesto. Ergonomic culture level in managers and supervisors in
manufacturing centers. Journal of Research and Development. 2021
Figure 1 CCE level by category
Which means that:
High Level: The worker recognizes
specific and organized actions in the
development of the Ergonomic Culture in the
company
Medium Level: The work recognizes
some important points that denote an incipient
development of an Ergonomic Culture in the
company.
Analysis by question of the most relevant
results of the study:
Question numberfour of the
questionnaire: "Have measurements been made
of the parts of your body to make adjustments to
your job during the time you have been working
in this company?" presents a result that shows
that 100% is in "Totally disagree", this indicates
that the organization does not have the
anthropometric characteristics of its
collaborators, which could affect decision-
making to adjust their workstation or tools of
work to your anthropometric measurements.
Question number eleven of the
questionnaire: Have you received reinduction of
the work you do? " presents a result that shows
that 50% are in "Partially disagree" and the other
50% is "Partially agree" as shown in Figure 2,
this indicates that only half of the subjects under
study have received some reinduction in the
work carried out in the company.
Figure 2 Percentage of reinduction of the task performed
Question number twelve of the
questionnaire: "Do you receive training to
improve the work you do?" presents a result that
shows that 61% are in “Partially disagree”, 31%
are “Partially agree” and 8% are “Totally agree”
as shown in Figure 3, this means that their
majority of the subjects under study (61%) do
not receive adequate training to improve the
work they do, while the other (39%) receive
adequate or regular training to improve the work
they do.
Figure 3 Percentage of training to improve the task
performed
Question number seventeen of the
questionnaire: "Are evaluations made of the
conditions in which your physical workspace is
located?" presents a result that shows that 69%
agree "Partially agree" and 31% show "Partially
disagree" as shown in Figure 4, this indicates
that evaluations about the conditions are not
carried out frequently or regularly of the
physical work space of the subjects under study.
46.2%
53.8%
0.0%
High Half Down
0.0%
50.0% 50.0%
0.0%
Totally agree Partially agree Partially
disagree
Totally
disagree
7.7%
30.8%
61.5%
0.0%
Totally agree Partially agree Partially
disagree
Totally
disagree

25
Article Journal of Research and Development December, 2021 Vol.7 No.20 21-26
ISSN 2444-4987
ECORFAN® All rights reserved LÓPEZ-ACOSTA, Mauricio, CHACARA-MONTES, Allán, VELARDE-CANTÚ, José Manuel and RAMIREZ-CARDENAS,
Ernesto. Ergonomic culture level in managers and supervisors in
manufacturing centers. Journal of Research and Development. 2021
Figure 4 Percentage of people who have been considered,
to improve their work area
Question number eighteen of the
questionnaire: Have changes been made in the
tasks that you carry out in a way that generates
less risk of illness or injury? " presents a result
that shows that 69% agree "Partially agree", 23%
are "Partially disagree" and 8% are "Totally
agree" as shown in Figure 5, this indicates that
in the Most of the subjects under study have
made changes in the tasks they perform on a
regular basis changes in the tasks they perform
in a way that generates less risk of illness or
injury while only 23% show that no changes are
made in the tasks regularly.
Figure 5 Percentage of workers who find less risk in the
task performed
Question number twenty of the
questionnaire: "Have adjustments been made to
the functions and tasks in your position in order
to reduce the risk of illness or accident?"
presents a result that shows that 65% are
"Partially agree", 27% are "Partially disagree"
and 8% are "Totally agree" as shown in Figure
6, this tells us that their majority of the subjects
under study (73%) have made adjustments to the
functions and tasks in their position in order to
reduce the risk of illness or accident while 27%
have not made adjustments to their functions or
tasks on a regular basis in your position in favor
of reducing the risk of illness or accident.
Figure 6 Percentages of perception of risk or illness of the
worker in the work area
Question number twenty two of the
questionnaire: "Have evaluations been made to
determine the need to use elements that facilitate
the work you do?" presents a result that shows
that 54% are in "Partially disagree" and the other
46% are "Totally disagree" as shown in Figure
7, this indicates that more than half of the
subjects under study do not agree. An evaluation
has been made to determine if they have the need
to use elements that facilitate the work they do,
while the remaining (46%) have had no
evaluation to determine the need to use elements
that facilitate the work they do.
Figure 7 Percentage of workers who have not been
evaluated to facilitate or reduce risk In tasks performed.
Question number twenty-three of the
questionnaire: Do you use elements that
facilitate the work that you do? " presents a result
that shows that 96% are in "Totally disagree"
while 4% are "Partially disagree" as shown in
Figure 8, this indicates that a large part almost
entirely (96%) of the Subjects under study do not
use elements that facilitate the work they do,
while the remaining (4%) have used very little
elements that help them to facilitate the work
they do.
0.0%
69.2%
30.8%
0.0%
Totally agree Partially agree Partially
disagree
Totally
disagree
7.7%
69.2%
23.1%
0.0%
Totally agree Partially agree Partially
disagree
Totally
disagree
7.7%
65.4%
26.9%
0.0%
Totally agree Partially agree Partially
disagree
Totally
disagree
0.0% 0.0%
53.8%
46.2%
Totally agree Partially agree Partially
disagree
Totally
disagree
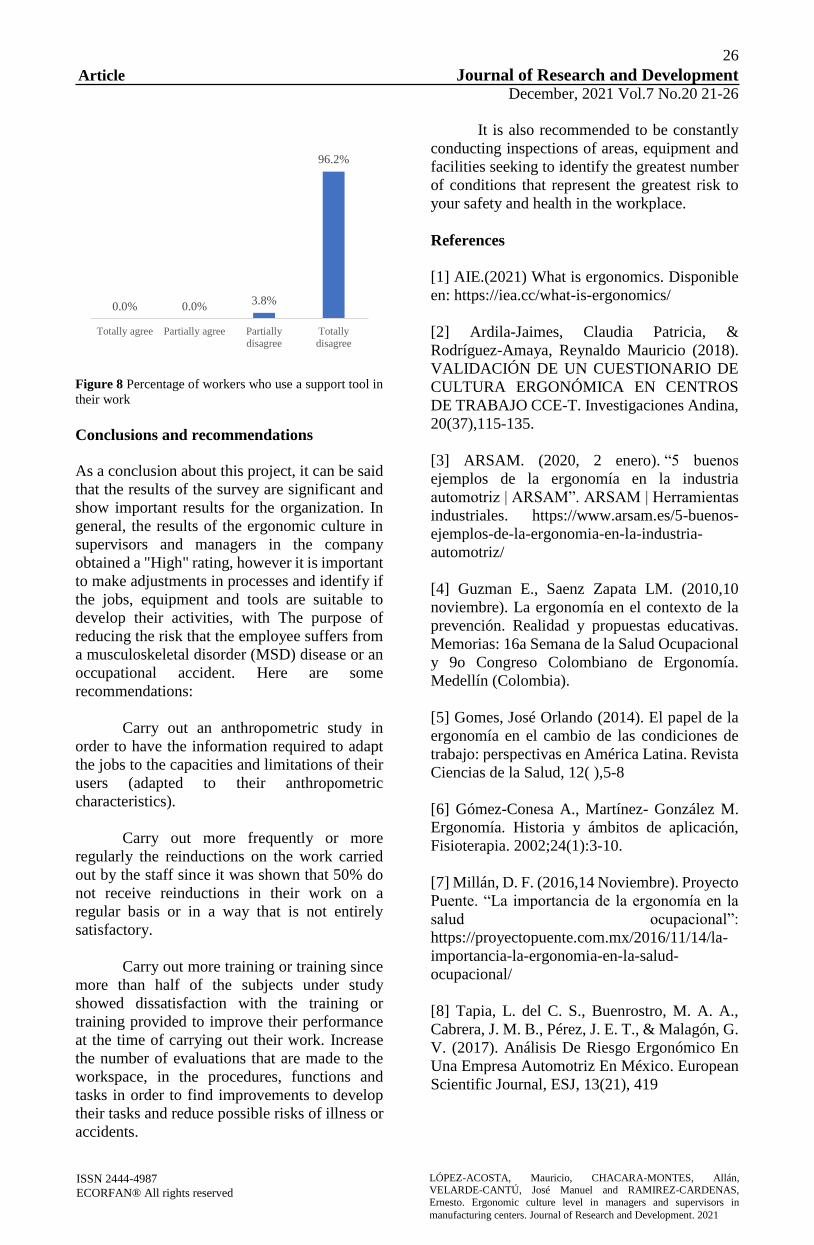
26
Article Journal of Research and Development December, 2021 Vol.7 No.20 21-26
ISSN 2444-4987
ECORFAN® All rights reserved LÓPEZ-ACOSTA, Mauricio, CHACARA-MONTES, Allán, VELARDE-CANTÚ, José Manuel and RAMIREZ-CARDENAS,
Ernesto. Ergonomic culture level in managers and supervisors in
manufacturing centers. Journal of Research and Development. 2021
Figure 8 Percentage of workers who use a support tool in
their work
Conclusions and recommendations
As a conclusion about this project, it can be said
that the results of the survey are significant and
show important results for the organization. In
general, the results of the ergonomic culture in
supervisors and managers in the company
obtained a "High" rating, however it is important
to make adjustments in processes and identify if
the jobs, equipment and tools are suitable to
develop their activities, with The purpose of
reducing the risk that the employee suffers from
a musculoskeletal disorder (MSD) disease or an
occupational accident. Here are some
recommendations:
Carry out an anthropometric study in
order to have the information required to adapt
the jobs to the capacities and limitations of their
users (adapted to their anthropometric
characteristics).
Carry out more frequently or more
regularly the reinductions on the work carried
out by the staff since it was shown that 50% do
not receive reinductions in their work on a
regular basis or in a way that is not entirely
satisfactory.
Carry out more training or training since
more than half of the subjects under study
showed dissatisfaction with the training or
training provided to improve their performance
at the time of carrying out their work. Increase
the number of evaluations that are made to the
workspace, in the procedures, functions and
tasks in order to find improvements to develop
their tasks and reduce possible risks of illness or
accidents.
It is also recommended to be constantly
conducting inspections of areas, equipment and
facilities seeking to identify the greatest number
of conditions that represent the greatest risk to
your safety and health in the workplace.
References
[1] AIE.(2021) What is ergonomics. Disponible
en: https://iea.cc/what-is-ergonomics/
[2] Ardila-Jaimes, Claudia Patricia, &
Rodríguez-Amaya, Reynaldo Mauricio (2018).
VALIDACIÓN DE UN CUESTIONARIO DE
CULTURA ERGONÓMICA EN CENTROS
DE TRABAJO CCE-T. Investigaciones Andina,
20(37),115-135.
[3] ARSAM. (2020, 2 enero). “5 buenos
ejemplos de la ergonomía en la industria
automotriz | ARSAM”. ARSAM | Herramientas
industriales. https://www.arsam.es/5-buenos-
ejemplos-de-la-ergonomia-en-la-industria-
automotriz/
[4] Guzman E., Saenz Zapata LM. (2010,10
noviembre). La ergonomía en el contexto de la
prevención. Realidad y propuestas educativas.
Memorias: 16a Semana de la Salud Ocupacional
y 9o Congreso Colombiano de Ergonomía.
Medellín (Colombia).
[5] Gomes, José Orlando (2014). El papel de la
ergonomía en el cambio de las condiciones de
trabajo: perspectivas en América Latina. Revista
Ciencias de la Salud, 12( ),5-8
[6] Gómez-Conesa A., Martínez- González M.
Ergonomía. Historia y ámbitos de aplicación,
Fisioterapia. 2002;24(1):3-10.
[7] Millán, D. F. (2016,14 Noviembre). Proyecto
Puente. “La importancia de la ergonomía en la
salud ocupacional”:
https://proyectopuente.com.mx/2016/11/14/la-
importancia-la-ergonomia-en-la-salud-
ocupacional/
[8] Tapia, L. del C. S., Buenrostro, M. A. A.,
Cabrera, J. M. B., Pérez, J. E. T., & Malagón, G.
V. (2017). Análisis De Riesgo Ergonómico En
Una Empresa Automotriz En México. European
Scientific Journal, ESJ, 13(21), 419
0.0% 0.0%3.8%
96.2%
Totally agree Partially agree Partially
disagree
Totally
disagree

27
Article Journal of Research and Development December, 2021 Vol.7 No.20 27-38
Proposals to improve the coaxial cable assembly process in an aerospace company
Propuestas para mejorar el proceso de montaje de cables coaxiales en una empresa
aeroespacial
PORTUGAL-VÁSQUEZ, Javier†*, SANDOVAL-GAMEZ, Melissa, LAGARDA-LEYVA, Ernesto
Alonso and NARANJO-FLORES, Arnulfo Aurelio
Instituto Tecnológico de Sonora. Departamento de Ingeniería Industrial
ID 1st Author: Javier, Portugal-Vásquez / ORC ID: 0000-0002-8986-2023, CVU CONACYT ID: 249136
ID 1st Co-author: Melissa, Sandoval-Gamez / ORC ID: 0000-0002-2318-897X
ID 2nd Co-author: Ernesto Alonso, Lagarda-Leyva / ORC ID: 0000-0001-9552-9908, CVU CONACYT ID: 433524
ID 3rd Co-author: Arnulfo Aurelio, Naranjo-Flores / ORC ID: 0000-0002-5654-6091, CVU CONACYT ID: 276441
DOI: 10.35429/JRD.2021.20.7.27.38 Received July 17, 2021; Accepted October 30, 2021
Abstract
For any company it is of utmost importance to have quality
processes and products to deliver to its customers and that
they are satisfied with them. In the same way, take care of
your economy and the expenses that you have for this.
This project revolves around the quality that is presented
in the products. In the company under study there was a
problem specifically in the area of coaxial cable assembly,
in which a considerable number of defects were identified
from the electrical and continuity test. To solve the
problem, the objective is to develop an improvement
proposal that helps to minimize the defects found in the
aforementioned area. Regarding the applied method, the
modified Six Sigma DMAIC procedure was followed.
Statistical tools were used to analyze the results obtained,
to have evidence of their behavior for the problem posed
and that the best decision could be made to improve the
coaxial cable assembly process. Having as a main result a
proposal to improve the coaxial cable assembly process
which will significantly reduce the defects generated in the
electrical and conductivity test.
DMAIC, Continuous improvement, Quality
Resumen
Para cualquier empresa es de suma importancia el tener
procesos y productos de calidad que entregarles a sus
clientes y que estos estén conformes con ellos. De igual
manera cuidar su economía y los gastos que se tiene por
esto. El presente proyecto gira entorno a la calidad que se
presenta en los productos. En la empresa bajo estudio se
presentó un problema específicamente en el área de
ensamble de cables coaxiales, en la cual se identificaban
una cantidad considerable de defectos provenientes de la
prueba eléctrica y continuidad. Para resolver el problema
se plantea el objetivo de desarrollar propuesta de mejora
que ayuden a minimizar los defectos que se encuentran en
el área antes mencionada. En cuanto al método aplicado se
siguió el procedimiento DMAIC de Seis Sigma
modificada. Se utilizaron herramientas estadísticas para
analizar los resultados obtenidos, para tener evidencias del
comportamiento de los mismos para el problema
planteado y que se pudiera tomar la mejor decisión para
mejorar el proceso de ensamble de cables coaxiales.
Teniéndose como resultado principal una propuesta de
mejora al proceso de ensamble de cables coaxiales la cual
reducirá significativamente los defectos generados en la
prueba eléctrica y conductividad.
DMAIC, Mejora continua, Calidad
Citation: PORTUGAL-VÁSQUEZ, Javier, SANDOVAL-GAMEZ, Melissa, LAGARDA-LEYVA, Ernesto Alonso and
NARANJO-FLORES, Arnulfo Aurelio. Proposals to improve the coaxial cable assembly process in an aerospace company.
Journal of Research and Development. 2021. 7-20: 27-38
* Correspondence to Author (e-mail: [email protected])
† Researcher contributing as first author.
© ECORFAN Journal-Spain www.ecorfan.org/spain
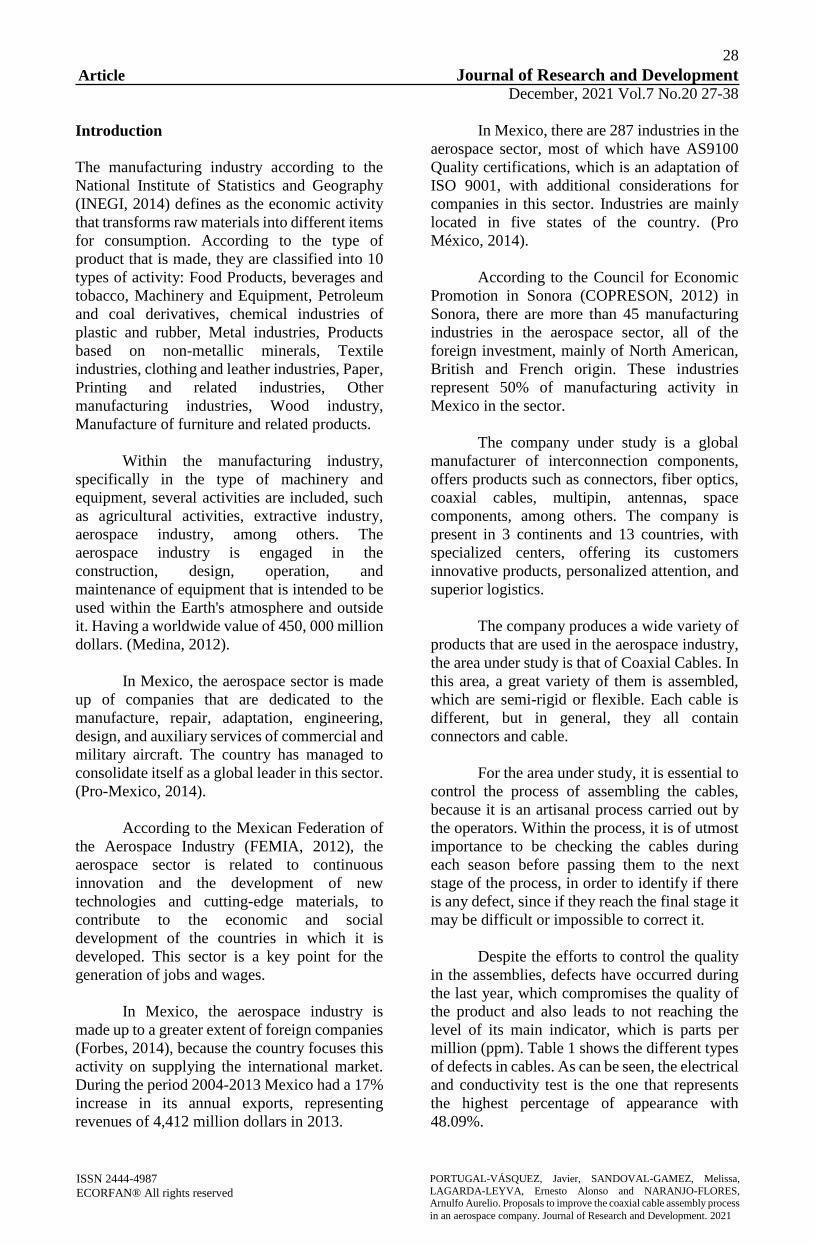
28
Article Journal of Research and Development December, 2021 Vol.7 No.20 27-38
ISSN 2444-4987
ECORFAN® All rights reserved PORTUGAL-VÁSQUEZ, Javier, SANDOVAL-GAMEZ, Melissa,
LAGARDA-LEYVA, Ernesto Alonso and NARANJO-FLORES, Arnulfo Aurelio. Proposals to improve the coaxial cable assembly process
in an aerospace company. Journal of Research and Development. 2021
Introduction
The manufacturing industry according to the
National Institute of Statistics and Geography
(INEGI, 2014) defines as the economic activity
that transforms raw materials into different items
for consumption. According to the type of
product that is made, they are classified into 10
types of activity: Food Products, beverages and
tobacco, Machinery and Equipment, Petroleum
and coal derivatives, chemical industries of
plastic and rubber, Metal industries, Products
based on non-metallic minerals, Textile
industries, clothing and leather industries, Paper,
Printing and related industries, Other
manufacturing industries, Wood industry,
Manufacture of furniture and related products.
Within the manufacturing industry,
specifically in the type of machinery and
equipment, several activities are included, such
as agricultural activities, extractive industry,
aerospace industry, among others. The
aerospace industry is engaged in the
construction, design, operation, and
maintenance of equipment that is intended to be
used within the Earth's atmosphere and outside
it. Having a worldwide value of 450, 000 million
dollars. (Medina, 2012).
In Mexico, the aerospace sector is made
up of companies that are dedicated to the
manufacture, repair, adaptation, engineering,
design, and auxiliary services of commercial and
military aircraft. The country has managed to
consolidate itself as a global leader in this sector.
(Pro-Mexico, 2014).
According to the Mexican Federation of
the Aerospace Industry (FEMIA, 2012), the
aerospace sector is related to continuous
innovation and the development of new
technologies and cutting-edge materials, to
contribute to the economic and social
development of the countries in which it is
developed. This sector is a key point for the
generation of jobs and wages.
In Mexico, the aerospace industry is
made up to a greater extent of foreign companies
(Forbes, 2014), because the country focuses this
activity on supplying the international market.
During the period 2004-2013 Mexico had a 17%
increase in its annual exports, representing
revenues of 4,412 million dollars in 2013.
In Mexico, there are 287 industries in the
aerospace sector, most of which have AS9100
Quality certifications, which is an adaptation of
ISO 9001, with additional considerations for
companies in this sector. Industries are mainly
located in five states of the country. (Pro
México, 2014).
According to the Council for Economic
Promotion in Sonora (COPRESON, 2012) in
Sonora, there are more than 45 manufacturing
industries in the aerospace sector, all of the
foreign investment, mainly of North American,
British and French origin. These industries
represent 50% of manufacturing activity in
Mexico in the sector.
The company under study is a global
manufacturer of interconnection components,
offers products such as connectors, fiber optics,
coaxial cables, multipin, antennas, space
components, among others. The company is
present in 3 continents and 13 countries, with
specialized centers, offering its customers
innovative products, personalized attention, and
superior logistics.
The company produces a wide variety of
products that are used in the aerospace industry,
the area under study is that of Coaxial Cables. In
this area, a great variety of them is assembled,
which are semi-rigid or flexible. Each cable is
different, but in general, they all contain
connectors and cable.
For the area under study, it is essential to
control the process of assembling the cables,
because it is an artisanal process carried out by
the operators. Within the process, it is of utmost
importance to be checking the cables during
each season before passing them to the next
stage of the process, in order to identify if there
is any defect, since if they reach the final stage it
may be difficult or impossible to correct it.
Despite the efforts to control the quality
in the assemblies, defects have occurred during
the last year, which compromises the quality of
the product and also leads to not reaching the
level of its main indicator, which is parts per
million (ppm). Table 1 shows the different types
of defects in cables. As can be seen, the electrical
and conductivity test is the one that represents
the highest percentage of appearance with
48.09%.
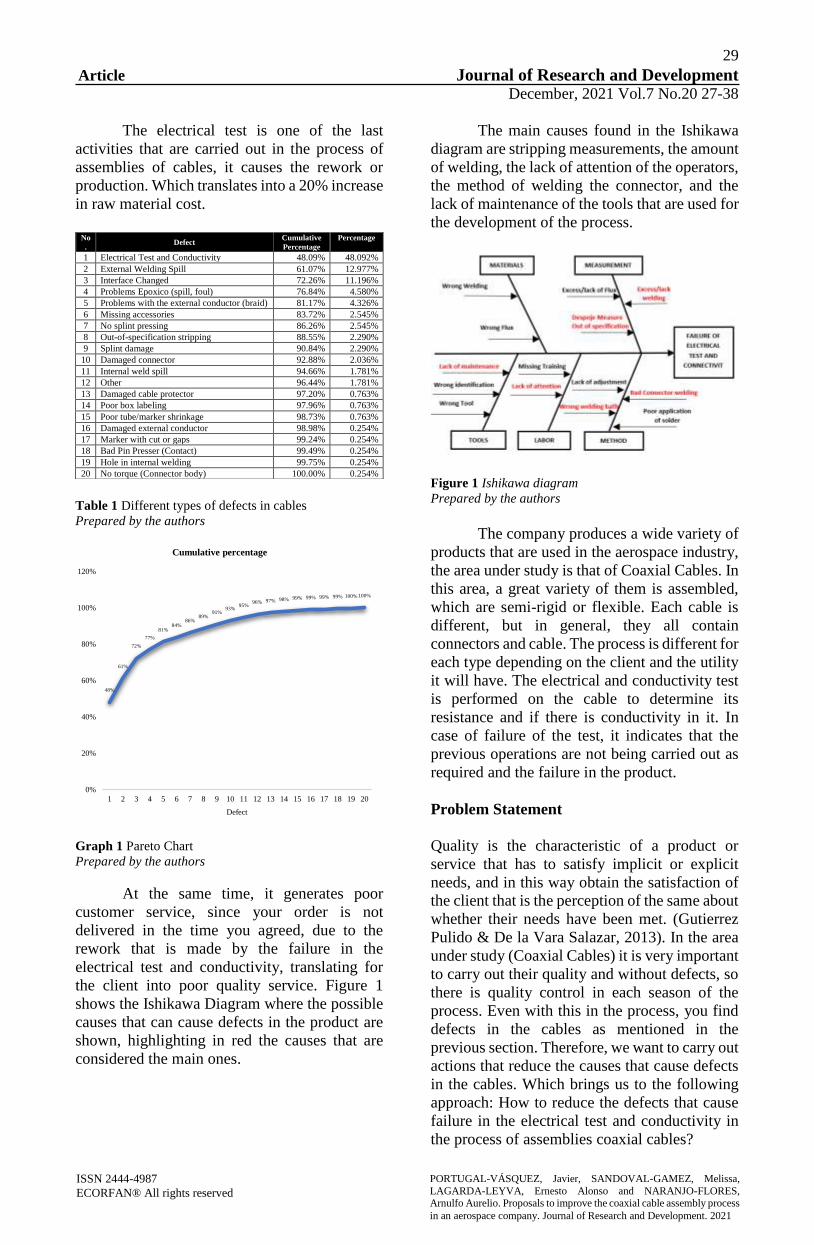
29
Article Journal of Research and Development December, 2021 Vol.7 No.20 27-38
ISSN 2444-4987
ECORFAN® All rights reserved PORTUGAL-VÁSQUEZ, Javier, SANDOVAL-GAMEZ, Melissa,
LAGARDA-LEYVA, Ernesto Alonso and NARANJO-FLORES, Arnulfo Aurelio. Proposals to improve the coaxial cable assembly process
in an aerospace company. Journal of Research and Development. 2021
The electrical test is one of the last
activities that are carried out in the process of
assemblies of cables, it causes the rework or
production. Which translates into a 20% increase
in raw material cost.
Table 1 Different types of defects in cables
Prepared by the authors
Graph 1 Pareto Chart
Prepared by the authors
At the same time, it generates poor
customer service, since your order is not
delivered in the time you agreed, due to the
rework that is made by the failure in the
electrical test and conductivity, translating for
the client into poor quality service. Figure 1
shows the Ishikawa Diagram where the possible
causes that can cause defects in the product are
shown, highlighting in red the causes that are
considered the main ones.
The main causes found in the Ishikawa
diagram are stripping measurements, the amount
of welding, the lack of attention of the operators,
the method of welding the connector, and the
lack of maintenance of the tools that are used for
the development of the process.
Figure 1 Ishikawa diagram
Prepared by the authors
The company produces a wide variety of
products that are used in the aerospace industry,
the area under study is that of Coaxial Cables. In
this area, a great variety of them is assembled,
which are semi-rigid or flexible. Each cable is
different, but in general, they all contain
connectors and cable. The process is different for
each type depending on the client and the utility
it will have. The electrical and conductivity test
is performed on the cable to determine its
resistance and if there is conductivity in it. In
case of failure of the test, it indicates that the
previous operations are not being carried out as
required and the failure in the product.
Problem Statement
Quality is the characteristic of a product or
service that has to satisfy implicit or explicit
needs, and in this way obtain the satisfaction of
the client that is the perception of the same about
whether their needs have been met. (Gutierrez
Pulido & De la Vara Salazar, 2013). In the area
under study (Coaxial Cables) it is very important
to carry out their quality and without defects, so
there is quality control in each season of the
process. Even with this in the process, you find
defects in the cables as mentioned in the
previous section. Therefore, we want to carry out
actions that reduce the causes that cause defects
in the cables. Which brings us to the following
approach: How to reduce the defects that cause
failure in the electrical test and conductivity in
the process of assemblies coaxial cables?
48%
61%
72%
77%
81%84%
86%89%
91%93%
95%96% 97% 98% 99% 99% 99% 99% 100% 100%
0%
20%
40%
60%
80%
100%
120%
1 2 3 4 5 6 7 8 9 10 11 12 13 14 15 16 17 18 19 20
Defect
Cumulative percentage
No
. Defect
Cumulative
Percentage
Percentage
1 Electrical Test and Conductivity 48.09% 48.092%
2 External Welding Spill 61.07% 12.977%
3 Interface Changed 72.26% 11.196%
4 Problems Epoxico (spill, foul) 76.84% 4.580%
5 Problems with the external conductor (braid) 81.17% 4.326%
6 Missing accessories 83.72% 2.545%
7 No splint pressing 86.26% 2.545%
8 Out-of-specification stripping 88.55% 2.290%
9 Splint damage 90.84% 2.290%
10 Damaged connector 92.88% 2.036%
11 Internal weld spill 94.66% 1.781%
12 Other 96.44% 1.781%
13 Damaged cable protector 97.20% 0.763%
14 Poor box labeling 97.96% 0.763%
15 Poor tube/marker shrinkage 98.73% 0.763%
16 Damaged external conductor 98.98% 0.254%
17 Marker with cut or gaps 99.24% 0.254%
18 Bad Pin Presser (Contact) 99.49% 0.254%
19 Hole in internal welding 99.75% 0.254%
20 No torque (Connector body) 100.00% 0.254%
30
Article Journal of Research and Development December, 2021 Vol.7 No.20 27-38
ISSN 2444-4987
ECORFAN® All rights reserved PORTUGAL-VÁSQUEZ, Javier, SANDOVAL-GAMEZ, Melissa,
LAGARDA-LEYVA, Ernesto Alonso and NARANJO-FLORES, Arnulfo Aurelio. Proposals to improve the coaxial cable assembly process
in an aerospace company. Journal of Research and Development. 2021
Objective
Develop proposals for improvements to the
coaxial cable assembly process, using the Six
Sigma methodology, to reduce product defects
that cause failure in the electrical test and
conductivity.
Justification
With the above, the company will be able to
reduce the defects of the Coaxial Cables product
that cause electrical failure and conductivity,
significantly reducing the production time of the
same by eliminating rework and additional
production, and in this way, the company will be
able to increase its efficiency in production by
being able to increase the number of orders it
serves per day. In the same way, the company
will have a reduction in its costs production.
Theoretical Foundation
SixSigma is a philosophy that is oriented to
customer satisfaction, using facts and data to
generate solutions to problems that affect them.
It is aimed at improving customer satisfaction,
reducing cycle time and defects. (Pande &
Holpp, 2002). Six Sigma is a statistical measure
of the level of performance of a process or
product, which aims to achieve almost
perfection, providing a management system to
achieve leadership in the business where it is
applied to have world-class quality. (Pande &
Holpp, 2002)
It is a disciplined approach that is based
on the use of statistics to improve business
performance, by eliminating defects in an
organization's products, processes, and
transactions, by decreasing the cost of operation
and that of products sold, and by increasing
customer satisfaction. (Cantú Delgado, 2011). It
is a methodology that is focused on eliminating
the defects of a process or product, and in this
way reduce the costs of the company where it is
applied and most importantly exceed the
expectations of the client.
The name Six Sigma is due to the one that
refers to six standard deviations from the mean,
which is a goal to reduce defects by 99.9997%,
or in other words to achieve no more than 3.4
defects per million opportunities (DPMO).
One of the pin companies in the
application of the six-sigma methodology was
Motorola managed to reduce defects in
electronic products and save about 1,000 million
dollars during 3 years after implementation and
won the Malcolm Baldrige quality award in
1988. At that time, it was adopted, enriched, and
generalized by a large number of companies.
In addition to Motorola, two companies
contributed significantly to the consolidation of
the strategy, Allied Signal that first implemented
it in 1994 achieving savings of more than 2,000
million dollars between 1994 and 1999, and
General Electric (GE), which made its
implemented in 1995 who managed to save
around 2,570 million dollars in the following 3
years. In Latin America, the company MABE is
the one that has managed to carry out and
implement one of the most successful Six Sigma
programs. (Gutierrez & De la Vara, 2013)
There are many reasons that can justify
implementing Six Sigma in companies. (Cantu
Delgado, 2011)
1. It helps improve the way the business is
operated.
2. It helps to visualize the company as an
interrelated system of processes and
customers.
3. Troubleshoot problems.
4. Decision-making is made based on data.
5. Establish a system that can generate
significant revenue, in order to satisfy
both internal and external customers.
With the above, better competitiveness
is ensured and benefits are obtained in
less time.
6. You can increase employee productivity
with the same resources.
7. Revenue is improved.
8. Customer expectations are exceeded.
9. Give your staff a culture of quality, so
they support the changes and be able to
maintain the results.
10. If a process has a quality level of Six
Sigma, this means that it is capable of
generating no more than 3 or 4 defects
per million opportunities.
Six Sigma has a wide variety of tools that
serve as support in the implementation of the
methodology, according to Gutierrez & De la
Vara, (2013) and Pande, Neuman & Cavanagh,
(2004) the basic tools are shown below:
31
Article Journal of Research and Development December, 2021 Vol.7 No.20 27-38
ISSN 2444-4987
ECORFAN® All rights reserved PORTUGAL-VÁSQUEZ, Javier, SANDOVAL-GAMEZ, Melissa,
LAGARDA-LEYVA, Ernesto Alonso and NARANJO-FLORES, Arnulfo Aurelio. Proposals to improve the coaxial cable assembly process
in an aerospace company. Journal of Research and Development. 2021
DMAIC Project Chart Worksheet: This
helps the team understand what they want to
achieve and identify areas where further
clarification is required from the project sponsor.
Pareto Chart: This is a graph that aims to
help identify the vital problems you have, as well
as the possible causes of them. It helps to
prioritize the causes to focus first on the main
one and so on to analyze the causes. The
usefulness of it is based on the so-called "Pareto
Principle", which is known as "Law 80-20" or
"Few Vital, Many Trivial", which establishes
that few elements (represented by 20%) generate
most of the effect (representing 80%), and the
rest of the pampering has a smaller contribution.
Stratification: Stratification means analyzing
problems, failures, complaints, or data,
classifying them according to the factors that are
inferred that may be affecting them, and in this
way identify the best ways to solve the problems
that arise in a process. This tool makes it easier
to understand how the different factors that
generate a problematic situation influence.
Ishikawa Diagram: Also called Cause-
Effect. This is a graphical method that helps to
relate a problem (Effect) with the possible
causes that generate it. The diagram forces us to
look for different causes under analysis and thus
avoids looking directly for solutions without
analyzing the true causes.
Method of the 6M: This is the most
common to build an Ishikawa diagram, it
consists of grouping the possible causes into 6
main branches: Working Methods, Labor,
Materials, Machinery, Measurement, and
Environment. These six elements represent the
entire process in a global way since each one
contributes part of the variability of the final
product.
SIPOC Diagram: The acronym SIPOC
comes from suppliers, inputs, processes, outputs,
and customers. This diagram aims to analyze the
process and its environment, by them the
suppliers, inputs, process, outputs, and the
customers must be identified. This helps us to
know in detail the process that is being analyzed,
by identifying what is needed for it to work
correctly, the specifications of the users of the
process, identify who will provide what is
necessary for the process and that is expected to
leave the process studied. (Gutierrez, Quality
and Productivity, 2014)
CTQ Tree: This helps to relate the measurements
to an important output of the process; it is used
in data collection to ensure that the information
obtained is important for the project.
Hypothesis Testing
The interest in performing a hypothesis test lies
in comparing the strength of two formulations
(null and alternative hypothesis), one with the
equal variable and the other with the modified
variable. It is used to test a hypothesis, for this,
it is necessary to perform a procedure to take a
random sample, calculate a test statistic that is
appropriate, and then reject or not reject the null
hypothesis. You must specify the set of test
statistic values that will be the rejection region.
(Montgomery, 2016)
Design of Experiments
The design of experiments is the application of
the scientific method to generate knowledge
about a system or process, through planned tests.
This methodology has been consolidated as a set
of statistical and engineering techniques, which
allow a better understanding of situations of
cause-and-effect relationship.
Methodology
For the realization of this project and the
fulfillment of the proposed objective, the
DMAIC methodology was followed. The
following points describe the activities that were
carried out at each stage and the products that
were obtained from each of them.
Define the opportunity areas of the coaxial cable
assembly process
First, a meeting was held with the stakeholders
of the project to collect the relevant information,
where the problem that arose in the process of
assembling coaxial cables and why it was
wanted to be addressed was exposed. With the
information obtained, the project charter (Project
Charter) was made and the work team was
formed. After this, a tour of the area of assembly
of coaxial cables was carried out in order to
know in detail what is done and identify the
workstations, and based on this a SIPOC map
was elaborated. The main variables that affect
the process and that cause the problem of failure
in the electrical test and conductivity were
identified.

32
Article Journal of Research and Development December, 2021 Vol.7 No.20 27-38
ISSN 2444-4987
ECORFAN® All rights reserved PORTUGAL-VÁSQUEZ, Javier, SANDOVAL-GAMEZ, Melissa,
LAGARDA-LEYVA, Ernesto Alonso and NARANJO-FLORES, Arnulfo Aurelio. Proposals to improve the coaxial cable assembly process
in an aerospace company. Journal of Research and Development. 2021
Finally, the customer who was affected
was identified and their needs and complaints
were identified. With the above, a table was
made that contained the declaration of the
client's requirements of the problem raised.
Measure the critical variables of the coaxial
cable assembly process
Once the project was defined, the work team
carried out an analysis of the possible causes that
caused the problem, for this an Ishikawa diagram
(Cause-Effect) was made. After this, the
relationship between the customer requirements,
raised in the previous stage, and the causes that
were identified, were identified through a CTQ
tree (Critiques for Quality). After this, a
mapping of the coaxial cable assembly process
was carried out to analyze what the true
magnitude of the problem was, all the process
variables and the outputs of the same that could
affect the electrical test and conductivity were
identified, and a cause-and-effect matrix was
made, where the critical variables that were had
within the process were found.
After this, a verification of the MEFAs of
the process stations was carried out and an
EFSM of the preparation station was created and
with this, the critical variables of the process
were obtained. Finally, the plan for the
collection of data was made, which consisted of
a database where all the defects they presented
were placed, analyzing them with the
microscope to identify the possible cause of it.
With the data obtained, the performance of the
CTQ of the process was measured. The results
obtained from the data collection are shown in a
table.
Analyze data from critical variables of the
coaxial cable assembly process
In this stage, the data obtained in the
measurement phase were taken and analyzed to
determine which connectors were what had the
highest percentage of appearance in the problem,
for this a Pareto diagram was made, where the
connectors with the highest percentage of
appearance of the problem were found, which
are connector A and B. As a result of this phase,
you have a Pareto chart and the most important
causes that contribute to the problem. To later
perform the statistical analysis of the CTQ, from
which the variables that were related to the
output variable were obtained.
Implement improvement actions for the coaxial
cable assembly process
At this stage, solutions that could help achieve
the stated objective were established, this was
done through brainstorming with team members
and identifying changes that could be made to
the process. A Design of Experiments was
carried out to verify the behavior of different
factors on the variables that affect the process.
The executions of the design of experiments
were carried out. And after this, proposals for
improvement were developed for the process of
assemblies coaxial cables. Having as a result of
this phase the definition of the Designs of
Experiments and proposals for improvement to
the process.
Results
Definition of the areas of opportunity of the
coaxial cable assembly process.
Through meetings with interested persons and
observation of the coaxial cable assembly area,
the results were the Project Charter, a SIPOC
map of the coaxial cable assembly process, and
the identification of the client and his
requirements. Table 2 shows the Project Charter
summarized.
Project Charter
Business Case:
Find and reduce the causative
variation that causes products to fail at the electrical and conductivity test
station
Team Members:
Quality Engineer
Process Engineer
Problem/Opportunity Statement:
Variations in assembly in the area of
cables have contributed to the increase
in electrical failure, increasing the level of ppm, production costs and
delivery times, according to quality
records.
Objective Statement:
To reduce to 70% the
defects of the assembly
process in the area of coaxial cables in order to
control the failure in the
electrical test in the electrical test station and
conductivity.
Project Scope:
The project will be carried out in the
Coaxial Cables Area specifically the
Welding and Preparation stations. Aspects of the project will be
reviewed daily and whether it will
have a progress meeting on Mondays.
Stakeholders:
Supervisor of the area.
Process Engineer
AVP Manager
Table 2 Project Charter (summarized)
Prepared by the authors
After the tour of the coaxial cable
assembly area, the SIPOC Map was obtained,
which is divided by the activities carried out
throughout the process. Table 3 shows the
SIPOC map of the Contact Welding (PIN)
process.

33
Article Journal of Research and Development December, 2021 Vol.7 No.20 27-38
ISSN 2444-4987
ECORFAN® All rights reserved PORTUGAL-VÁSQUEZ, Javier, SANDOVAL-GAMEZ, Melissa,
LAGARDA-LEYVA, Ernesto Alonso and NARANJO-FLORES, Arnulfo Aurelio. Proposals to improve the coaxial cable assembly process
in an aerospace company. Journal of Research and Development. 2021
Suppliers
Inputs
Process
Outputs
Costumers
External
Suppliers
Welding
specified
in MO
Contact
welding
(PIN)
Cable with
welded
contact
External
Customer
Correct
delivery of
your product
On-time
delivery
Quality
product
Contact
placement
Flux
specified
in MO
No spills
Human
resources
Cable
with
suitable
contact
Contact
glued to
the
insulator
Tooling
Operator Inspection
window
full of
welding Welding
tweezers
Table 3 SIPOC Map, Contact Welding Process (PIN)
Prepared by the authors
Customer Requirements Statement
In this section, the client who was affected by the
problem was identified, being the Electrical and
Conductivity Test Station, and based on this the
Client's Requirements statement was obtained,
which requires a cable with transmission and
continuity. Table 4 shows the Voice of the
Customer.
The Customer Says Meaning Requirement
There is no transmission
in the cable.
The central conductor is
making physical contact
with the body or with the
braid. The central
conductor does not make
contact with the
connector.
Perform cable assembly
processes properly to
avoid the existence of the
problem.
When the high-voltage
discharge is realized the
cable has no continuity.
The ideal distance
between the connector
and the braid is not being
respected.
Perform the process of
assembling the cable
taking care of the
distance between the
connector and the central
conductor.
Table 4 Voice of the Customer
Prepared by the authors
Measurement of the critical variables of the
coaxial cable assembly process
In this phase, through observation of the process
and active participation of those involved in the
coaxial cable process, an Ishikawa diagram was
obtained with the possible causes that generate
the problem, a CTQ tree (Critics for quality, for
its acronym in English), and the database where
the defects that were presented are shown.
Ishikawa diagram making
This section shows the Ishikawa diagram that
was obtained from the observation of the coaxial
cable assembly process, as well as questions,
were asked to the operators about what could
cause the failure in the electrical test.
Figure 2 shows the Ishikawa diagram of
the possible causes that generate the failure. The
diagram shows a view of all the possible causes
that affect the Failure of Electrical Test and
Connectivity With this vision we can analyze in
detail each cause and the effect it has on the
process.
Figure 2 Ishikawa diagram of the process
Prepared by the authors
Elaboration of a tree of criticisms for quality.
After determining the client's requirements, an
analysis was carried out to know what
relationship they have with the causes found in
the Ishikawa diagram. Figure 5 shows the CTQ
tree that was validated by the Process Quality
Engineer.
Failure in electrical test
and conductivity
Cable cutting
Excess
Welding
Bad cable preparation
Open electrical
conductor
Lack of welding
Bad cable preparation
Electric arc
generation
Electrical distance not
respected between connectors
Lack of welding
Bad cable
preparation
Despoje
Insufficient
Figure 5 CTQ Tree. Prepared by the authors
Mapping of the process of assemblies of coaxial
cables
At this point, a process mapping was carried out
to identify all the variables that existed in each
workstation, as well as their outputs, which
could affect the electrical test and conductivity.
Table 6 shows the variables and outputs of the
process
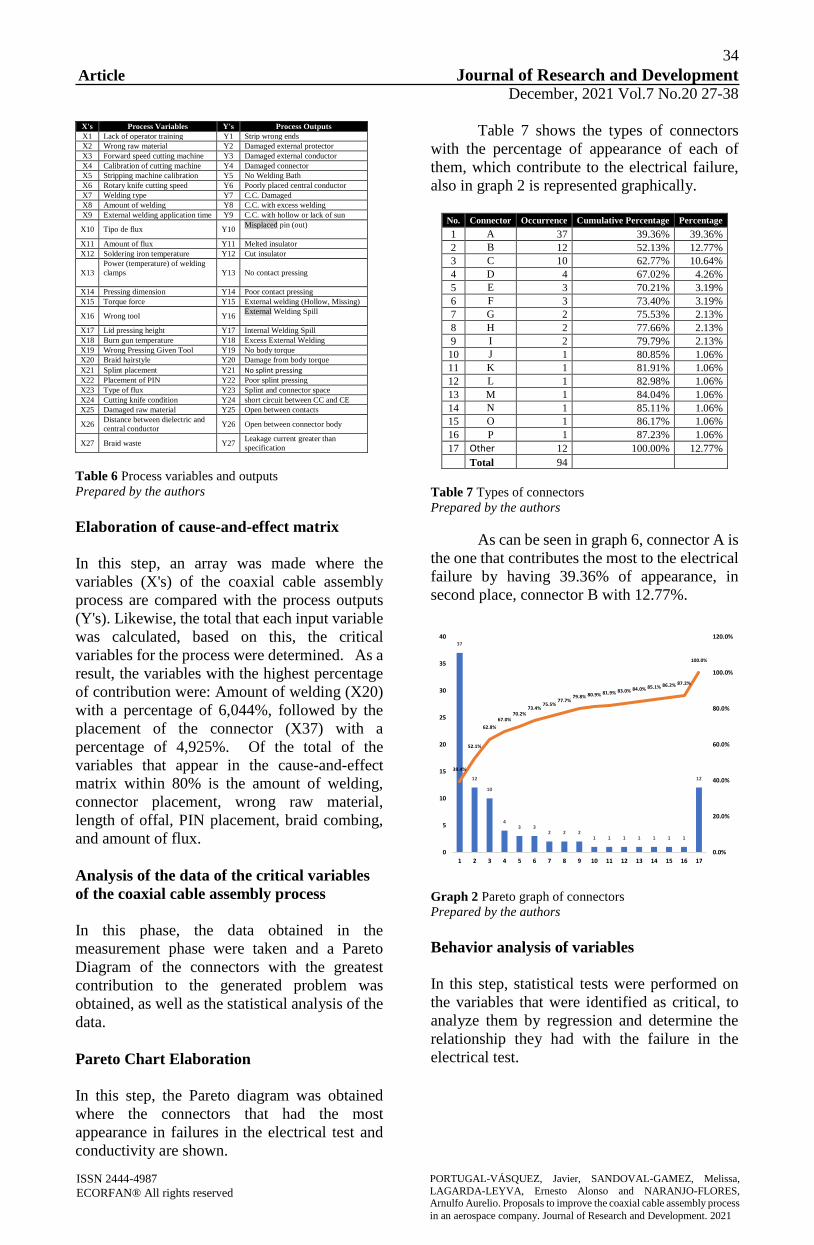
34
Article Journal of Research and Development December, 2021 Vol.7 No.20 27-38
ISSN 2444-4987
ECORFAN® All rights reserved PORTUGAL-VÁSQUEZ, Javier, SANDOVAL-GAMEZ, Melissa,
LAGARDA-LEYVA, Ernesto Alonso and NARANJO-FLORES, Arnulfo Aurelio. Proposals to improve the coaxial cable assembly process
in an aerospace company. Journal of Research and Development. 2021
X's Process Variables Y's Process Outputs
X1 Lack of operator training Y1 Strip wrong ends
X2 Wrong raw material Y2 Damaged external protector
X3 Forward speed cutting machine Y3 Damaged external conductor
X4 Calibration of cutting machine Y4 Damaged connector
X5 Stripping machine calibration Y5 No Welding Bath
X6 Rotary knife cutting speed Y6 Poorly placed central conductor
X7 Welding type Y7 C.C. Damaged
X8 Amount of welding Y8 C.C. with excess welding
X9 External welding application time Y9 C.C. with hollow or lack of sun
X10 Tipo de flux Y10 Misplaced pin (out)
X11 Amount of flux Y11 Melted insulator
X12 Soldering iron temperature Y12 Cut insulator
X13
Power (temperature) of welding
clamps
Y13 No contact pressing
X14 Pressing dimension Y14 Poor contact pressing
X15 Torque force Y15 External welding (Hollow, Missing)
X16 Wrong tool Y16 External Welding Spill
X17 Lid pressing height Y17 Internal Welding Spill
X18 Burn gun temperature Y18 Excess External Welding
X19 Wrong Pressing Given Tool Y19 No body torque
X20 Braid hairstyle Y20 Damage from body torque
X21 Splint placement Y21 No splint pressing
X22 Placement of PIN Y22 Poor splint pressing
X23 Type of flux Y23 Splint and connector space
X24 Cutting knife condition Y24 short circuit between CC and CE
X25 Damaged raw material Y25 Open between contacts
X26 Distance between dielectric and
central conductor Y26 Open between connector body
X27 Braid waste Y27 Leakage current greater than
specification
Table 6 Process variables and outputs
Prepared by the authors
Elaboration of cause-and-effect matrix
In this step, an array was made where the
variables (X's) of the coaxial cable assembly
process are compared with the process outputs
(Y's). Likewise, the total that each input variable
was calculated, based on this, the critical
variables for the process were determined. As a
result, the variables with the highest percentage
of contribution were: Amount of welding (X20)
with a percentage of 6,044%, followed by the
placement of the connector (X37) with a
percentage of 4,925%. Of the total of the
variables that appear in the cause-and-effect
matrix within 80% is the amount of welding,
connector placement, wrong raw material,
length of offal, PIN placement, braid combing,
and amount of flux.
Analysis of the data of the critical variables
of the coaxial cable assembly process
In this phase, the data obtained in the
measurement phase were taken and a Pareto
Diagram of the connectors with the greatest
contribution to the generated problem was obtained, as well as the statistical analysis of the
data.
Pareto Chart Elaboration
In this step, the Pareto diagram was obtained
where the connectors that had the most
appearance in failures in the electrical test and
conductivity are shown.
Table 7 shows the types of connectors
with the percentage of appearance of each of
them, which contribute to the electrical failure,
also in graph 2 is represented graphically.
No. Connector Occurrence Cumulative Percentage Percentage
1 A 37 39.36% 39.36%
2 B 12 52.13% 12.77%
3 C 10 62.77% 10.64%
4 D 4 67.02% 4.26%
5 E 3 70.21% 3.19%
6 F 3 73.40% 3.19%
7 G 2 75.53% 2.13%
8 H 2 77.66% 2.13%
9 I 2 79.79% 2.13%
10 J 1 80.85% 1.06%
11 K 1 81.91% 1.06%
12 L 1 82.98% 1.06%
13 M 1 84.04% 1.06%
14 N 1 85.11% 1.06%
15 O 1 86.17% 1.06%
16 P 1 87.23% 1.06%
17 Other 12 100.00% 12.77%
Total 94
Table 7 Types of connectors
Prepared by the authors
As can be seen in graph 6, connector A is
the one that contributes the most to the electrical
failure by having 39.36% of appearance, in
second place, connector B with 12.77%.
Graph 2 Pareto graph of connectors
Prepared by the authors
Behavior analysis of variables
In this step, statistical tests were performed on
the variables that were identified as critical, to
analyze them by regression and determine the
relationship they had with the failure in the
electrical test.
37
12
10
43 3
2 2 21 1 1 1 1 1 1
12
39.4%
52.1%
62.8%
67.0%70.2%
73.4%75.5%
77.7%79.8% 80.9% 81.9% 83.0% 84.0% 85.1% 86.2% 87.2%
100.0%
0.0%
20.0%
40.0%
60.0%
80.0%
100.0%
120.0%
0
5
10
15
20
25
30
35
40
1 2 3 4 5 6 7 8 9 10 11 12 13 14 15 16 17
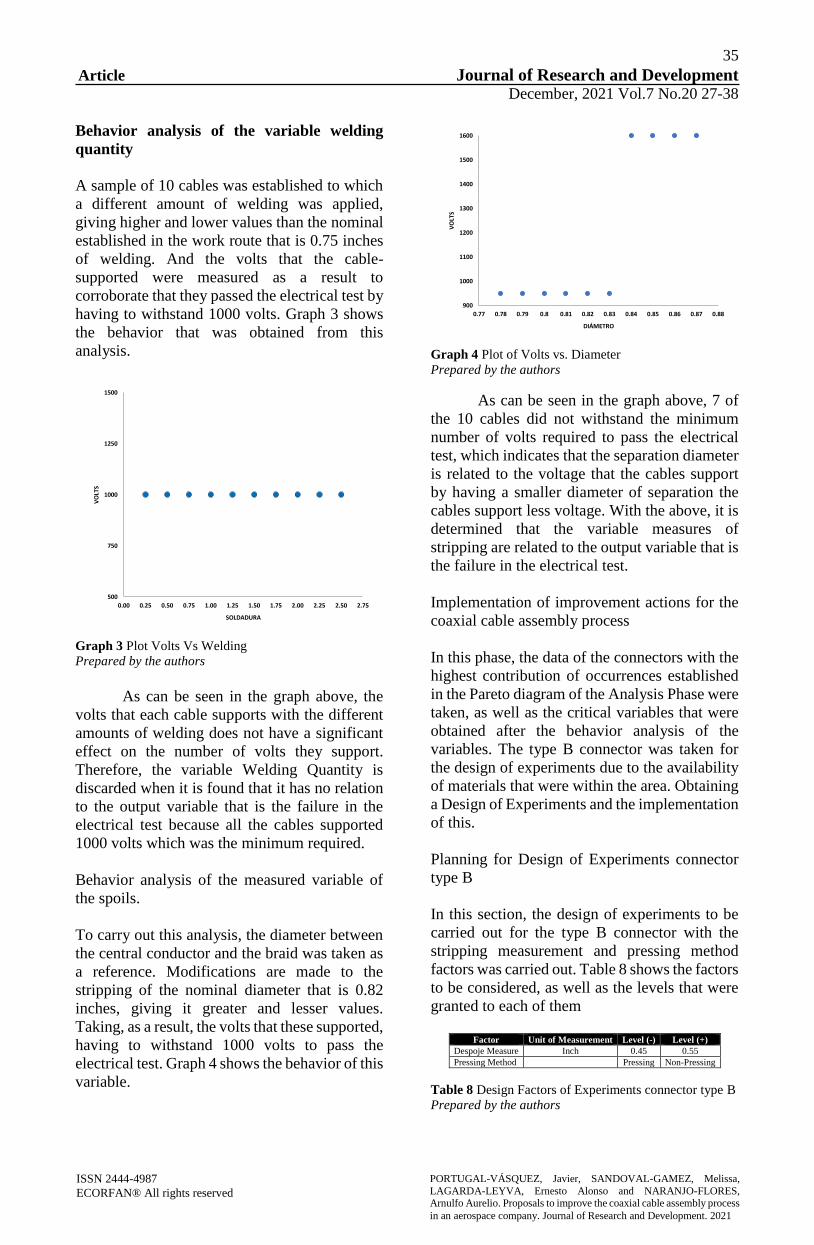
35
Article Journal of Research and Development December, 2021 Vol.7 No.20 27-38
ISSN 2444-4987
ECORFAN® All rights reserved PORTUGAL-VÁSQUEZ, Javier, SANDOVAL-GAMEZ, Melissa,
LAGARDA-LEYVA, Ernesto Alonso and NARANJO-FLORES, Arnulfo Aurelio. Proposals to improve the coaxial cable assembly process
in an aerospace company. Journal of Research and Development. 2021
Behavior analysis of the variable welding
quantity
A sample of 10 cables was established to which
a different amount of welding was applied,
giving higher and lower values than the nominal
established in the work route that is 0.75 inches
of welding. And the volts that the cable-
supported were measured as a result to
corroborate that they passed the electrical test by
having to withstand 1000 volts. Graph 3 shows
the behavior that was obtained from this
analysis.
Graph 3 Plot Volts Vs Welding
Prepared by the authors
As can be seen in the graph above, the
volts that each cable supports with the different
amounts of welding does not have a significant
effect on the number of volts they support.
Therefore, the variable Welding Quantity is
discarded when it is found that it has no relation
to the output variable that is the failure in the
electrical test because all the cables supported
1000 volts which was the minimum required.
Behavior analysis of the measured variable of
the spoils.
To carry out this analysis, the diameter between
the central conductor and the braid was taken as
a reference. Modifications are made to the
stripping of the nominal diameter that is 0.82
inches, giving it greater and lesser values.
Taking, as a result, the volts that these supported,
having to withstand 1000 volts to pass the
electrical test. Graph 4 shows the behavior of this
variable.
Graph 4 Plot of Volts vs. Diameter
Prepared by the authors
As can be seen in the graph above, 7 of
the 10 cables did not withstand the minimum
number of volts required to pass the electrical
test, which indicates that the separation diameter
is related to the voltage that the cables support
by having a smaller diameter of separation the
cables support less voltage. With the above, it is
determined that the variable measures of
stripping are related to the output variable that is
the failure in the electrical test.
Implementation of improvement actions for the
coaxial cable assembly process
In this phase, the data of the connectors with the
highest contribution of occurrences established
in the Pareto diagram of the Analysis Phase were
taken, as well as the critical variables that were
obtained after the behavior analysis of the
variables. The type B connector was taken for
the design of experiments due to the availability
of materials that were within the area. Obtaining
a Design of Experiments and the implementation
of this.
Planning for Design of Experiments connector
type B
In this section, the design of experiments to be
carried out for the type B connector with the
stripping measurement and pressing method
factors was carried out. Table 8 shows the factors
to be considered, as well as the levels that were
granted to each of them
Factor Unit of Measurement Level (-) Level (+)
Despoje Measure Inch 0.45 0.55
Pressing Method Pressing Non-Pressing
Table 8 Design Factors of Experiments connector type B
Prepared by the authors
500
750
1000
1250
1500
0.00 0.25 0.50 0.75 1.00 1.25 1.50 1.75 2.00 2.25 2.50 2.75
VO
LTS
SOLDADURA
900
1000
1100
1200
1300
1400
1500
1600
0.77 0.78 0.79 0.8 0.81 0.82 0.83 0.84 0.85 0.86 0.87 0.88
VO
LTS
DIÁMETRO
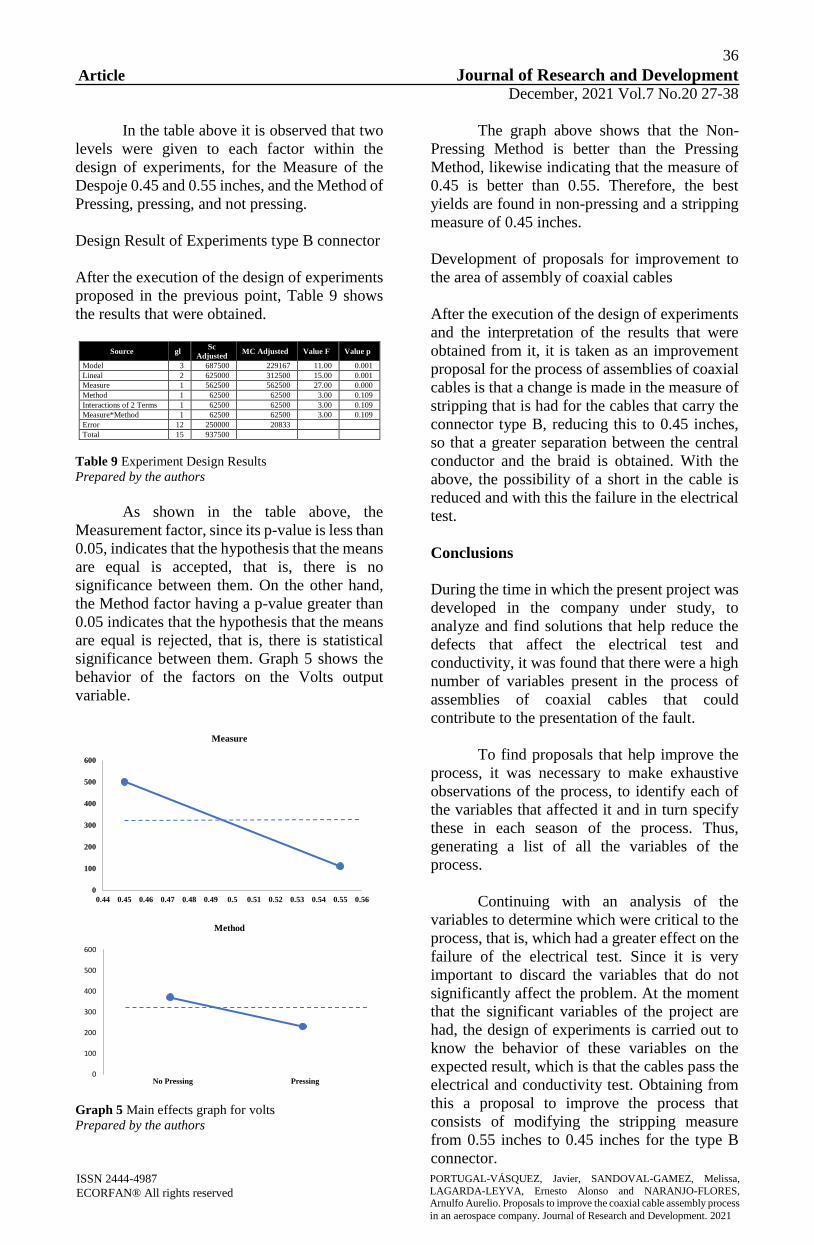
36
Article Journal of Research and Development December, 2021 Vol.7 No.20 27-38
ISSN 2444-4987
ECORFAN® All rights reserved PORTUGAL-VÁSQUEZ, Javier, SANDOVAL-GAMEZ, Melissa,
LAGARDA-LEYVA, Ernesto Alonso and NARANJO-FLORES, Arnulfo Aurelio. Proposals to improve the coaxial cable assembly process
in an aerospace company. Journal of Research and Development. 2021
In the table above it is observed that two
levels were given to each factor within the
design of experiments, for the Measure of the
Despoje 0.45 and 0.55 inches, and the Method of
Pressing, pressing, and not pressing.
Design Result of Experiments type B connector
After the execution of the design of experiments
proposed in the previous point, Table 9 shows
the results that were obtained.
Source gl
Sc
Adjusted MC Adjusted Value F Value p
Model 3 687500 229167 11.00 0.001
Lineal 2 625000 312500 15.00 0.001
Measure 1 562500 562500 27.00 0.000
Method 1 62500 62500 3.00 0.109
Interactions of 2 Terms 1 62500 62500 3.00 0.109
Measure*Method 1 62500 62500 3.00 0.109
Error 12 250000 20833
Total 15 937500
Table 9 Experiment Design Results
Prepared by the authors
As shown in the table above, the
Measurement factor, since its p-value is less than
0.05, indicates that the hypothesis that the means
are equal is accepted, that is, there is no
significance between them. On the other hand,
the Method factor having a p-value greater than
0.05 indicates that the hypothesis that the means
are equal is rejected, that is, there is statistical
significance between them. Graph 5 shows the
behavior of the factors on the Volts output
variable.
Graph 5 Main effects graph for volts
Prepared by the authors
The graph above shows that the Non-
Pressing Method is better than the Pressing
Method, likewise indicating that the measure of
0.45 is better than 0.55. Therefore, the best
yields are found in non-pressing and a stripping
measure of 0.45 inches.
Development of proposals for improvement to
the area of assembly of coaxial cables
After the execution of the design of experiments
and the interpretation of the results that were
obtained from it, it is taken as an improvement
proposal for the process of assemblies of coaxial
cables is that a change is made in the measure of
stripping that is had for the cables that carry the
connector type B, reducing this to 0.45 inches,
so that a greater separation between the central
conductor and the braid is obtained. With the
above, the possibility of a short in the cable is
reduced and with this the failure in the electrical
test.
Conclusions
During the time in which the present project was
developed in the company under study, to
analyze and find solutions that help reduce the
defects that affect the electrical test and
conductivity, it was found that there were a high
number of variables present in the process of
assemblies of coaxial cables that could
contribute to the presentation of the fault.
To find proposals that help improve the
process, it was necessary to make exhaustive
observations of the process, to identify each of
the variables that affected it and in turn specify
these in each season of the process. Thus,
generating a list of all the variables of the
process.
Continuing with an analysis of the
variables to determine which were critical to the
process, that is, which had a greater effect on the
failure of the electrical test. Since it is very
important to discard the variables that do not
significantly affect the problem. At the moment
that the significant variables of the project are
had, the design of experiments is carried out to
know the behavior of these variables on the
expected result, which is that the cables pass the
electrical and conductivity test. Obtaining from
this a proposal to improve the process that
consists of modifying the stripping measure
from 0.55 inches to 0.45 inches for the type B
connector.
0
100
200
300
400
500
600
0.44 0.45 0.46 0.47 0.48 0.49 0.5 0.51 0.52 0.53 0.54 0.55 0.56
Measure
0
100
200
300
400
500
600
No Pressing Pressing
Method
37
Article Journal of Research and Development December, 2021 Vol.7 No.20 27-38
ISSN 2444-4987
ECORFAN® All rights reserved PORTUGAL-VÁSQUEZ, Javier, SANDOVAL-GAMEZ, Melissa,
LAGARDA-LEYVA, Ernesto Alonso and NARANJO-FLORES, Arnulfo Aurelio. Proposals to improve the coaxial cable assembly process
in an aerospace company. Journal of Research and Development. 2021
References
Aguirre Sigala, K. & Pereyda Martinez, J.
(2010). Implementar la Metodología Seis Sigma
para Reducir el Desperdicio en el Proceso de
Fundición a Presión en Radver. (Tesis de
Licenciatura, Instituto Politécnico Nacional).
México, DF. Recuperado de
http://tesis.ipn.mx/bitstream/handle/123456789/
7364/I7.1904.pdf?sequence=1
Cantú Delgado, J. H. (2011). Desarrollo de una
Cultura de Calidad (4 ed.). México, DF:
McGraq-Hill Interamericana.
COPRESON. (2012). Consejo para la
Promoción Económica en Sonora. Obtenido de
http://es.sonora.org.mx/index.php/industria#
FAM, & SEDENA. (2015). Fuerza Area
Mexicana. Obtenido de http://www.f-
airmexico.com.mx/feria-aeroespacial-mexico-
2015/aeronautica-en-mexico/industria-
aeroespacial-mexicana
FEMIA, & Económia, S. d. (2013). Secretaría
de Económia. Obtenido de
http://www.economia.gob.mx/files/comunidad_
negocios/industria_comercio/proaereo_bueno.p
df
Forbes. (2014). Forbes México. Obtenido de
http://www.forbes.com.mx/industria-
aeroespacial-un-nuevo-reto-para-las-empresas-
mexicanas/
García, D. (s.f.). Solucion de Problemas: 8
Disciplinas. TÜV RHEINLAND DE MÉXICO.
Gutierrez Pulido, H., & De la Vara Salazar, R.
(2013). Control Estadistico de la Calidad y Seis
Sigma (Tercera ed.). México D.F: McGRAW-
HILL.
Gutierrez, H. (2014). Calidad y Productividad (4
ed.). México, D.F: Mc Graw Hill.
Gutierrez, H., & De la Vara, R. (2012). Analisis
y Diseño de Experimentos (3 ed.). México, D.F:
Mc Graw Hill.
Gutierrez, H., & De la Vara, R. (2012). Análisis
y Diseño de Experimentos. McGraw-Hill
Interamericana.
Gutierrez, H., & De la Vara, R. (2013). Control
Estadístico de la Calidad y Seis Sigma (3 ed.).
McGraw Hill Education.
INEGI. (2012). Cuentame INEGI. Recuperado el
23 de Enero de 2015, de
http://cuentame.inegi.org.mx/monografias/infor
macion/son/economia/pib.aspx?tema=me&e=2
6
INEGI. (2012). INEGI. Recuperado el 23 de
Enero de 2015, de
http://www3.inegi.org.mx/sistemas/mexicocifra
s/default.aspx?e=26
INEGI. (2014). INEGI. Obtenido de
http://cuentame.inegi.org.mx/economia/secunda
rio/manufacturera/default.aspx?tema=E#uno
Ingeniería, O. d. (2011). Observatorio de la
Ingeniería. Obtenido de
http://www.observatoriodelaingenieria.org.mx/i
ng_det.php?Tema=Nichos&Nicho=1
LRQA. (2015). LRQA México. Recuperado el 26
de Enero de 2015, de
http://www.lrqamexico.com/certificaciones/AS-
9100-Gestion-Aeroespacial/
Medina, S. (2012). Bancomext. Obtenido de
http://revistas.bancomext.gob.mx/rce/magazine
s/151/1/Nov-Dic_3-9.pdf
Montgomery, D. (2004). Diseño y Análisis de
Experimentos (2 ed.). Limusa Wiley.
Pande, P., & Holpp, L. (2002). ¿Que es Seis
Sigma? McGRAW-HILL.
Pande, P., Neuman, R., & Cavanagh, R. (2004).
Las Claves Prácticas de Seis Sigma. McGraw
Hill.
ProMéxico. (2014). ProMéxico. Obtenido de
http://mim.promexico.gob.mx/wb/mim/perfil_d
el_sector
Santiago, A., Pérez, I., Ruíz, M., & Guevara, N.
(2014). Reducción de Defectos por Medio de
Seis Sigma. En I. Pérez Olguín, Ingenieria de
Procesos: Casos Prácticos (págs. 76-83).
Universidad Tenologica Ciudad Juarez.
Sobek, D., & Smalley, A. (2008). Understanding
A3 Thinking: A Critical Component of Toyota's
PDCA Management System. CRC Press.

38
Article Journal of Research and Development December, 2021 Vol.7 No.20 27-38
ISSN 2444-4987
ECORFAN® All rights reserved PORTUGAL-VÁSQUEZ, Javier, SANDOVAL-GAMEZ, Melissa,
LAGARDA-LEYVA, Ernesto Alonso and NARANJO-FLORES, Arnulfo Aurelio. Proposals to improve the coaxial cable assembly process
in an aerospace company. Journal of Research and Development. 2021
Tolamatl, J., Gallardo, D., Varela, J., & Flores,
E. (2011). Aplicación de Seis Sigma en una
Microempresa del Ramo Automotriz.
Conciencia Tecnologica, 11-18.
Instructions for Scientific, Technological and Innovation Publication
[Title in Times New Roman and Bold No. 14 in English and Spanish]
Surname (IN UPPERCASE), Name 1st Author†*, Surname (IN UPPERCASE), Name 1st Coauthor,
Surname (IN UPPERCASE), Name 2nd Coauthor and Surname (IN UPPERCASE), Name 3rd Coauthor
Institutional Affiliation of Author including Dependency (No.10 Times New Roman and Italic)
International Identification of Science - Technology and Innovation
ID 1st Author: (ORC ID - Researcher ID Thomson, arXiv Author ID - PubMed Author ID - Open ID) and CVU 1st author:
(Scholar-PNPC or SNI-CONACYT) (No.10 Times New Roman)
ID 1st Coauthor: (ORC ID - Researcher ID Thomson, arXiv Author ID - PubMed Author ID - Open ID) and CVU 1st coauthor:
(Scholar or SNI) (No.10 Times New Roman)
ID 2nd Coauthor: (ORC ID - Researcher ID Thomson, arXiv Author ID - PubMed Author ID - Open ID) and CVU 2nd coauthor:
(Scholar or SNI) (No.10 Times New Roman)
ID 3rd Coauthor: (ORC ID - Researcher ID Thomson, arXiv Author ID - PubMed Author ID - Open ID) and CVU 3rd coauthor:
(Scholar or SNI) (No.10 Times New Roman)
(Report Submission Date: Month, Day, and Year); Accepted (Insert date of Acceptance: Use Only ECORFAN)
Abstract (In English, 150-200 words)
Objectives
Methodology
Contribution
Keywords (In English)
Indicate 3 keywords in Times New Roman and Bold No.
10
Abstract (In Spanish, 150-200 words)
Objectives
Methodology
Contribution
Keywords (In Spanish)
Indicate 3 keywords in Times New Roman and Bold No.
10
Citation: Surname (IN UPPERCASE), Name 1st Author, Surname (IN UPPERCASE), Name 1st Coauthor, Surname (IN
UPPERCASE), Name 2nd Coauthor and Surname (IN UPPERCASE), Name 3rd Coauthor. Paper Title. Journal of Research
and Development. Year 1-1: 1-11 [Times New Roman No.10]
* Correspondence to Author ([email protected])
† Researcher contributing as first author.
© ECORFAN-Spain www.ecorfan.org/spain
Instructions for Scientific, Technological and Innovation Publication
ISSN 2444-4987
ECORFAN® All rights reserved
Surname (IN UPPERCASE), Name 1st Author†*, Surname (IN
UPPERCASE), Name 1st Coauthor, Surname (IN UPPERCASE), Name 2nd Coauthor and Surname (IN UPPERCASE), Name 3rd Coauthor.
Paper Title Journal of Research and Development. Year [Times New
Roman No. 8]
Introduction
Text in Times New Roman No.12, single space.
General explanation of the subject and explain
why it is important.
What is your added value with respect to other
techniques?
Clearly focus each of its features
Clearly explain the problem to be solved and the
central hypothesis.
Explanation of sections Article.
Development of headings and subheadings of
the article with subsequent numbers
[Title No.12 in Times New Roman, single
spaced and bold]
Products in development No.12 Times New
Roman, single spaced.
Including graphs, figures and tables-Editable
In the article content any graphic, table and
figure should be editable formats that can change
size, type and number of letter, for the purposes
of edition, these must be high quality, not
pixelated and should be noticeable even
reducing image scale.
[Indicating the title at the bottom with No.10 and
Times New Roman Bold]
Graphic 1 Title and Source (in italics)
Should not be images-everything must be editable.
Figure 1 Title and Source (in italics)
Should not be images-everything must be editable.
Table 1 Title and Source (in italics)
Should not be images-everything must be editable.
Each article shall present separately in 3 folders:
a) Figures, b) Charts and c) Tables in .JPG
format, indicating the number and sequential
Bold Title.
For the use of equations, noted as follows:
Yij = α + ∑ βhXhijrh=1 + uj + eij (1)
Must be editable and number aligned on the right
side.
Methodology
Develop give the meaning of the variables in
linear writing and important is the comparison of
the used criteria.
Results
The results shall be by section of the article.
Annexes
Tables and adequate sources
Thanks
Indicate if they were financed by any institution,
University or company.
Conclusions
Instructions for Scientific, Technological and Innovation Publication
ISSN 2444-4987
ECORFAN® All rights reserved
Surname (IN UPPERCASE), Name 1st Author†*, Surname (IN
UPPERCASE), Name 1st Coauthor, Surname (IN UPPERCASE), Name 2nd Coauthor and Surname (IN UPPERCASE), Name 3rd Coauthor.
Paper Title Journal of Research and Development. Year [Times New
Roman No. 8]
Explain clearly the results and possibilities of
improvement.
References
Use APA system. Should not be numbered, nor
with bullets, however if necessary numbering
will be because reference or mention is made
somewhere in the Article.
Use Roman Alphabet, all references you
have used must be in the Roman Alphabet, even
if you have quoted an Article, book in any of the
official languages of the United Nations
(English, French, German, Chinese, Russian,
Portuguese, Italian, Spanish, Arabic), you must
write the reference in Roman script and not in
any of the official languages.
Technical Specifications
Each article must submit your dates into a Word
document (.docx):
Journal Name
Article title
Abstract
Keywords
Article sections, for example:
1. Introduction
2. Description of the method
3. Analysis from the regression demand curve
4. Results
5. Thanks
6. Conclusions
7. References
Author Name (s)
Email Correspondence to Author
References
Intellectual Property Requirements for
editing:
-Authentic Signature in Color of Originality
Format Author and Coauthors
-Authentic Signature in Color of the Acceptance
Format of Author and Coauthors
Reservation to Editorial Policy
Journal of Research and Development reserves the right to make editorial changes required to adapt the
Articles to the Editorial Policy of the Journal. Once the Article is accepted in its final version, the Journal
will send the author the proofs for review. ECORFAN® will only accept the correction of errata and
errors or omissions arising from the editing process of the Journal, reserving in full the copyrights and
content dissemination. No deletions, substitutions or additions that alter the formation of the Article will
be accepted.
Code of Ethics - Good Practices and Declaration of Solution to Editorial Conflicts
Declaration of Originality and unpublished character of the Article, of Authors, on the obtaining
of data and interpretation of results, Acknowledgments, Conflict of interests, Assignment of rights
and Distribution
The ECORFAN-Mexico, S.C Management claims to Authors of Articles that its content must be
original, unpublished and of Scientific, Technological and Innovation content to be submitted for
evaluation.
The Authors signing the Article must be the same that have contributed to its conception, realization and
development, as well as obtaining the data, interpreting the results, drafting and reviewing it. The
Corresponding Author of the proposed Article will request the form that follows.
Article title:
– The sending of an Article to Journal of Research and Development emanates the commitment of
the author not to submit it simultaneously to the consideration of other series publications for it
must complement the Format of Originality for its Article, unless it is rejected by the Arbitration
Committee, it may be withdrawn.
– None of the data presented in this article has been plagiarized or invented. The original data are
clearly distinguished from those already published. And it is known of the test in PLAGSCAN
if a level of plagiarism is detected Positive will not proceed to arbitrate.
– References are cited on which the information contained in the Article is based, as well as
theories and data from other previously published Articles.
– The authors sign the Format of Authorization for their Article to be disseminated by means that
ECORFAN-Mexico, S.C. In its Holding Spain considers pertinent for disclosure and diffusion
of its Article its Rights of Work.
– Consent has been obtained from those who have contributed unpublished data obtained through
verbal or written communication, and such communication and Authorship are adequately
identified.
– The Author and Co-Authors who sign this work have participated in its planning, design and
execution, as well as in the interpretation of the results. They also critically reviewed the paper,
approved its final version and agreed with its publication.
– No signature responsible for the work has been omitted and the criteria of Scientific
Authorization are satisfied.
– The results of this Article have been interpreted objectively. Any results contrary to the point of
view of those who sign are exposed and discussed in the Article.

Copyright and Access
The publication of this Article supposes the transfer of the copyright to ECORFAN-Mexico, SC in its
Holding Spain for its Journal of Research and Development, which reserves the right to distribute on the
Web the published version of the Article and the making available of the Article in This format supposes
for its Authors the fulfilment of what is established in the Law of Science and Technology of the United
Mexican States, regarding the obligation to allow access to the results of Scientific Research.
Article Title:
Name and Surnames of the Contact Author and the Coauthors Signature
1.
2.
3.
4.
Principles of Ethics and Declaration of Solution to Editorial Conflicts
Editor Responsibilities
The Publisher undertakes to guarantee the confidentiality of the evaluation process, it may not disclose
to the Arbitrators the identity of the Authors, nor may it reveal the identity of the Arbitrators at any time.
The Editor assumes the responsibility to properly inform the Author of the stage of the editorial process
in which the text is sent, as well as the resolutions of Double-Blind Review.
The Editor should evaluate manuscripts and their intellectual content without distinction of race, gender,
sexual orientation, religious beliefs, ethnicity, nationality, or the political philosophy of the Authors.
The Editor and his editing team of ECORFAN® Holdings will not disclose any information about
Articles submitted to anyone other than the corresponding Author.
The Editor should make fair and impartial decisions and ensure a fair Double-Blind Review.
Responsibilities of the Editorial Board
The description of the peer review processes is made known by the Editorial Board in order that the
Authors know what the evaluation criteria are and will always be willing to justify any controversy in
the evaluation process. In case of Plagiarism Detection to the Article the Committee notifies the Authors
for Violation to the Right of Scientific, Technological and Innovation Authorization.
Responsibilities of the Arbitration Committee
The Arbitrators undertake to notify about any unethical conduct by the Authors and to indicate all the
information that may be reason to reject the publication of the Articles. In addition, they must undertake
to keep confidential information related to the Articles they evaluate.
Any manuscript received for your arbitration must be treated as confidential, should not be displayed or
discussed with other experts, except with the permission of the Editor.
The Arbitrators must be conducted objectively, any personal criticism of the Author is inappropriate.
The Arbitrators must express their points of view with clarity and with valid arguments that contribute
to the Scientific, Technological and Innovation of the Author.
The Arbitrators should not evaluate manuscripts in which they have conflicts of interest and have been
notified to the Editor before submitting the Article for Double-Blind Review.
Responsibilities of the Authors
Authors must guarantee that their articles are the product of their original work and that the data has been
obtained ethically.
Authors must ensure that they have not been previously published or that they are not considered in
another serial publication.
Authors must strictly follow the rules for the publication of Defined Articles by the Editorial Board.
The authors have requested that the text in all its forms be an unethical editorial behavior and is
unacceptable, consequently, any manuscript that incurs in plagiarism is eliminated and not considered
for publication.
Authors should cite publications that have been influential in the nature of the Article submitted to
arbitration.
Information services
Indexation - Bases and Repositories
LATINDEX (Scientific Journals of Latin America, Spain and Portugal)
RESEARCH GATE (Germany)
GOOGLE SCHOLAR (Citation indices-Google)
REDIB (Ibero-American Network of Innovation and Scientific Knowledge- CSIC)
MENDELEY (Bibliographic References Manager)
Publishing Services
Citation and Index Identification H
Management of Originality Format and Authorization
Testing Article with PLAGSCAN
Article Evaluation
Certificate of Double-Blind Review
Article Edition
Web layout
Indexing and Repository
ArticleTranslation
Article Publication
Certificate of Article
Service Billing
1Editorial Policy and Management
38 Matacerquillas, CP-28411. Moralzarzal –Madrid-España. Phones: +52 1 55 6159 2296, +52 1 55 1260
0355, +52 1 55 6034 9181; Email: [email protected] www.ecorfan.org
ECORFAN®
Chief Editor
VARGAS-DELGADO, Oscar. PhD
Executive Director
RAMOS-ESCAMILLA, María. PhD
Editorial Director
PERALTA-CASTRO, Enrique. MsC
Web Designer
ESCAMILLA-BOUCHAN, Imelda. PhD
Web Diagrammer
LUNA-SOTO, Vladimir. PhD
Editorial Assistant
REYES-VILLAO, Angélica. BsC
Translator
DÍAZ-OCAMPO, Javier. BsC
Philologist
RAMOS-ARANCIBIA, Alejandra. BsC
Advertising & Sponsorship
(ECORFAN® Spain), [email protected]
Site Licences
03-2010-032610094200-01-For printed material ,03-2010-031613323600-01-For Electronic
material,03-2010-032610105200-01-For Photographic material,03-2010-032610115700-14-For the
facts Compilation,04-2010-031613323600-01-For its Web page,19502-For the Iberoamerican and
Caribbean Indexation,20-281 HB9-For its indexation in Latin-American in Social Sciences and
Humanities,671-For its indexing in Electronic Scientific Journals Spanish and Latin-America,7045008-
For its divulgation and edition in the Ministry of Education and Culture-Spain,25409-For its repository
in the Biblioteca Universitaria-Madrid,16258-For its indexing in the Dialnet,20589-For its indexing in
the edited Journals in the countries of Iberian-America and the Caribbean, 15048-For the international
registration of Congress and Colloquiums. [email protected]
Management Offices
38 Matacerquillas, CP-28411. Moralzarzal –Madrid-España.
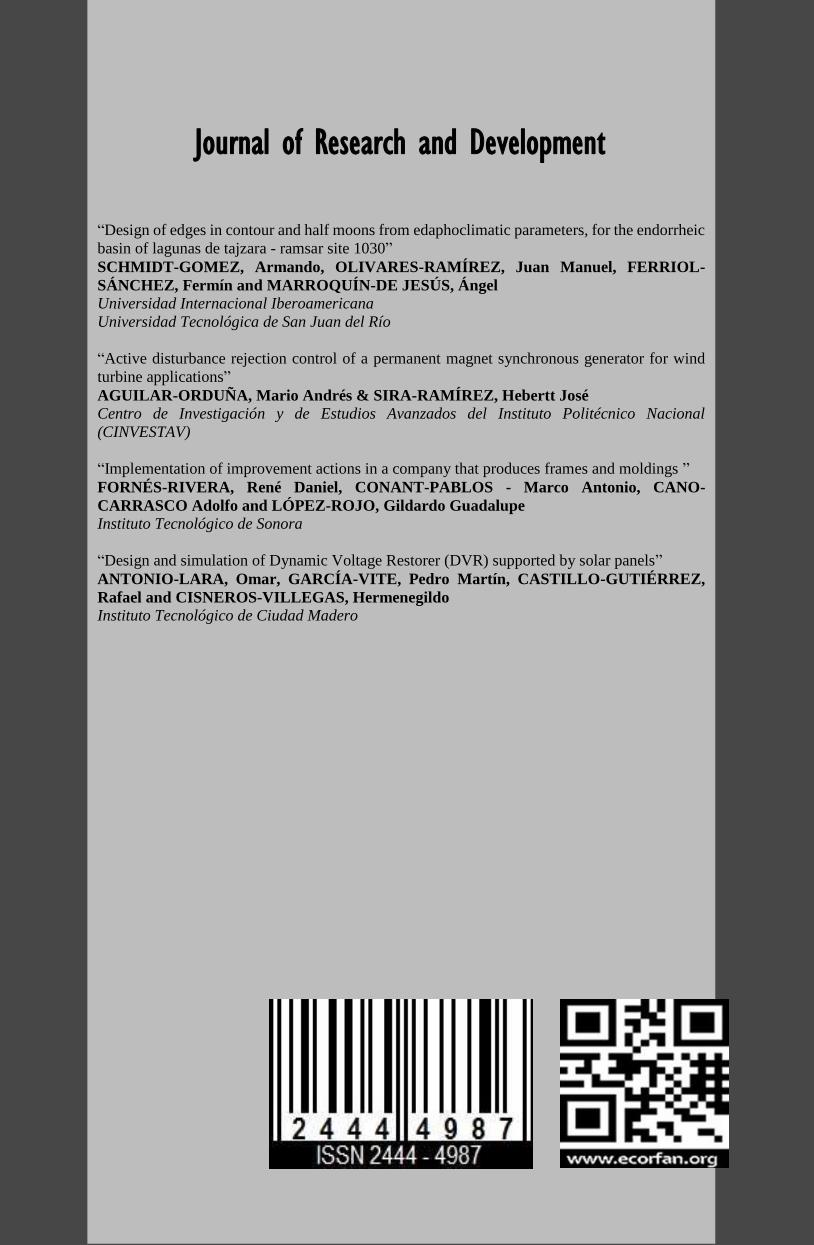
Journal of Research and Development
“Design of edges in contour and half moons from edaphoclimatic parameters, for the endorrheic
basin of lagunas de tajzara - ramsar site 1030”
SCHMIDT-GOMEZ, Armando, OLIVARES-RAMÍREZ, Juan Manuel, FERRIOL-
SÁNCHEZ, Fermín and MARROQUÍN-DE JESÚS, Ángel
Universidad Internacional Iberoamericana
Universidad Tecnológica de San Juan del Río
“Active disturbance rejection control of a permanent magnet synchronous generator for wind
turbine applications”
AGUILAR-ORDUÑA, Mario Andrés & SIRA-RAMÍREZ, Hebertt José
Centro de Investigación y de Estudios Avanzados del Instituto Politécnico Nacional
(CINVESTAV)
“Implementation of improvement actions in a company that produces frames and moldings ”
FORNÉS-RIVERA, René Daniel, CONANT-PABLOS - Marco Antonio, CANO-
CARRASCO Adolfo and LÓPEZ-ROJO, Gildardo Guadalupe
Instituto Tecnológico de Sonora
“Design and simulation of Dynamic Voltage Restorer (DVR) supported by solar panels”
ANTONIO-LARA, Omar, GARCÍA-VITE, Pedro Martín, CASTILLO-GUTIÉRREZ,
Rafael and CISNEROS-VILLEGAS, Hermenegildo
Instituto Tecnológico de Ciudad Madero