Arm® Development Studio Morello Edition
205
Arm ® Development Studio Morello Edition Version 2020.1M0 Commands Reference Guide Copyright © 2020 Arm Limited or its affiliates. All rights reserved. 102272_2020.1M0_00_en
-
Upload
khangminh22 -
Category
Documents
-
view
1 -
download
0
Transcript of Arm® Development Studio Morello Edition
Arm® Development Studio MorelloEdition
Version 2020.1M0
Commands Reference Guide
Copyright © 2020 Arm Limited or its affiliates. All rights reserved.102272_2020.1M0_00_en

Arm® Development Studio Morello EditionCommands Reference GuideCopyright © 2020 Arm Limited or its affiliates. All rights reserved.
Release Information
Document History
Issue Date Confidentiality Change
2020.1M0-00 29 October 2020 Non-Confidential First release for Arm Development Studio Morello Edition
Non-Confidential Proprietary Notice
This document is protected by copyright and other related rights and the practice or implementation of the information contained inthis document may be protected by one or more patents or pending patent applications. No part of this document may bereproduced in any form by any means without the express prior written permission of Arm. No license, express or implied, byestoppel or otherwise to any intellectual property rights is granted by this document unless specifically stated.
Your access to the information in this document is conditional upon your acceptance that you will not use or permit others to usethe information for the purposes of determining whether implementations infringe any third party patents.
THIS DOCUMENT IS PROVIDED “AS IS”. ARM PROVIDES NO REPRESENTATIONS AND NO WARRANTIES,EXPRESS, IMPLIED OR STATUTORY, INCLUDING, WITHOUT LIMITATION, THE IMPLIED WARRANTIES OFMERCHANTABILITY, SATISFACTORY QUALITY, NON-INFRINGEMENT OR FITNESS FOR A PARTICULAR PURPOSEWITH RESPECT TO THE DOCUMENT. For the avoidance of doubt, Arm makes no representation with respect to, and hasundertaken no analysis to identify or understand the scope and content of, third party patents, copyrights, trade secrets, or otherrights.
This document may include technical inaccuracies or typographical errors.
TO THE EXTENT NOT PROHIBITED BY LAW, IN NO EVENT WILL ARM BE LIABLE FOR ANY DAMAGES,INCLUDING WITHOUT LIMITATION ANY DIRECT, INDIRECT, SPECIAL, INCIDENTAL, PUNITIVE, ORCONSEQUENTIAL DAMAGES, HOWEVER CAUSED AND REGARDLESS OF THE THEORY OF LIABILITY, ARISINGOUT OF ANY USE OF THIS DOCUMENT, EVEN IF ARM HAS BEEN ADVISED OF THE POSSIBILITY OF SUCHDAMAGES.
This document consists solely of commercial items. You shall be responsible for ensuring that any use, duplication or disclosure ofthis document complies fully with any relevant export laws and regulations to assure that this document or any portion thereof isnot exported, directly or indirectly, in violation of such export laws. Use of the word “partner” in reference to Arm’s customers isnot intended to create or refer to any partnership relationship with any other company. Arm may make changes to this document atany time and without notice.
If any of the provisions contained in these terms conflict with any of the provisions of any click through or signed writtenagreement covering this document with Arm, then the click through or signed written agreement prevails over and supersedes theconflicting provisions of these terms. This document may be translated into other languages for convenience, and you agree that ifthere is any conflict between the English version of this document and any translation, the terms of the English version of theAgreement shall prevail.
The Arm corporate logo and words marked with ® or ™ are registered trademarks or trademarks of Arm Limited (or itssubsidiaries) in the US and/or elsewhere. All rights reserved. Other brands and names mentioned in this document may be thetrademarks of their respective owners. Please follow Arm’s trademark usage guidelines at http://www.arm.com/company/policies/trademarks.
Copyright © 2020 Arm Limited (or its affiliates). All rights reserved.
Arm Limited. Company 02557590 registered in England.
110 Fulbourn Road, Cambridge, England CB1 9NJ.
(LES-PRE-20349)
Arm® Development Studio Morello Edition
102272_2020.1M0_00_en Copyright © 2020 Arm Limited or its affiliates. All rights reserved. 2Non-Confidential

Confidentiality Status
This document is Non-Confidential. The right to use, copy and disclose this document may be subject to license restrictions inaccordance with the terms of the agreement entered into by Arm and the party that Arm delivered this document to.
Unrestricted Access is an Arm internal classification.
Product Status
The information in this document is Final, that is for a developed product.
Web Address
developer.arm.com
Arm® Development Studio Morello Edition
102272_2020.1M0_00_en Copyright © 2020 Arm Limited or its affiliates. All rights reserved. 3Non-Confidential
ContentsArm® Development Studio Morello EditionCommands Reference Guide
PrefaceAbout this book ...................................................... ...................................................... 6
Chapter 1 Arm® Debugger commands1.1 Conformance and usage rules for Arm® Debugger commands ................ ................ 1-91.2 Arm® Debugger commands listed in groups ............................................................ 1-221.3 Arm® Debugger commands listed in alphabetical order ..................... ..................... 1-50
Chapter 2 CMM-style commands supported by the debugger2.1 Conformance and usage of CMM-style commands ....................... ....................... 2-1842.2 CMM-style commands groups: All .................................... .................................... 2-1852.3 CMM-style commands listed in alphabetical order ................................................ 2-188
Chapter 3 GNU Free Documentation License Details3.1 GNU Free Documentation License ........................................................................ 3-2003.2 ADDENDUM: How to use this License for your documents .................................. 3-205
102272_2020.1M0_00_en Copyright © 2020 Arm Limited or its affiliates. All rights reserved. 4Non-Confidential

Preface
This preface introduces the Arm® Development Studio Morello Edition Commands Reference Guide.
It contains the following:• About this book on page 6.
102272_2020.1M0_00_en Copyright © 2020 Arm Limited or its affiliates. All rights reserved. 5Non-Confidential
About this bookThis book contains a full list of Arm® Debugger commands with usage instructions and examples.
Using this book
This book is organized into the following chapters:
Chapter 1 Arm® Debugger commandsArm Debugger commands are a comprehensive set of commands to debug embeddedapplications. This is an overview of the conformance and usage rules for Arm DevelopmentStudio Debugger commands and describes how to use each of the commands with examples.
Chapter 2 CMM-style commands supported by the debuggerDescribes how to use each of the commands with examples.
Chapter 3 GNU Free Documentation License Details
Glossary
The Arm® Glossary is a list of terms used in Arm documentation, together with definitions for thoseterms. The Arm Glossary does not contain terms that are industry standard unless the Arm meaningdiffers from the generally accepted meaning.
See the Arm® Glossary for more information.
Typographic conventions
italicIntroduces special terminology, denotes cross-references, and citations.
boldHighlights interface elements, such as menu names. Denotes signal names. Also used for termsin descriptive lists, where appropriate.
monospaceDenotes text that you can enter at the keyboard, such as commands, file and program names,and source code.
monospaceDenotes a permitted abbreviation for a command or option. You can enter the underlined textinstead of the full command or option name.
monospace italicDenotes arguments to monospace text where the argument is to be replaced by a specific value.
monospace boldDenotes language keywords when used outside example code.
<and>Encloses replaceable terms for assembler syntax where they appear in code or code fragments.For example:
MRC p15, 0, <Rd>, <CRn>, <CRm>, <Opcode_2>
SMALL CAPITALS
Used in body text for a few terms that have specific technical meanings, that are defined in theArm® Glossary. For example, IMPLEMENTATION DEFINED, IMPLEMENTATION SPECIFIC, UNKNOWN, andUNPREDICTABLE.
Feedback
Preface About this book
102272_2020.1M0_00_en Copyright © 2020 Arm Limited or its affiliates. All rights reserved. 6Non-Confidential

Feedback on this product
If you have any comments or suggestions about this product, contact your supplier and give:• The product name.• The product revision or version.• An explanation with as much information as you can provide. Include symptoms and diagnostic
procedures if appropriate.
Feedback on content
If you have comments on content then send an e-mail to [email protected]. Give:
• The title Arm Development Studio Morello Edition Commands Reference Guide.• The number 102272_2020.1M0_00_en.• If applicable, the page number(s) to which your comments refer.• A concise explanation of your comments.
Arm also welcomes general suggestions for additions and improvements. Note
Arm tests the PDF only in Adobe Acrobat and Acrobat Reader, and cannot guarantee the quality of therepresented document when used with any other PDF reader.
Other information
• Arm® Developer.• Arm® Documentation.• Arm Morello Program.• Arm Morello Program Community.• Arm® Glossary.
Preface About this book
102272_2020.1M0_00_en Copyright © 2020 Arm Limited or its affiliates. All rights reserved. 7Non-Confidential

Chapter 1Arm® Debugger commands
Arm Debugger commands are a comprehensive set of commands to debug embedded applications. Thisis an overview of the conformance and usage rules for Arm Development Studio Debugger commandsand describes how to use each of the commands with examples.
It contains the following sections:• 1.1 Conformance and usage rules for Arm® Debugger commands on page 1-9.• 1.2 Arm® Debugger commands listed in groups on page 1-22.• 1.3 Arm® Debugger commands listed in alphabetical order on page 1-50.
102272_2020.1M0_00_en Copyright © 2020 Arm Limited or its affiliates. All rights reserved. 1-8Non-Confidential

1.1 Conformance and usage rules for Arm® Debugger commands
This section contains the following subsections:• 1.1.1 Syntax of Arm® Debugger commands on page 1-9.• 1.1.2 Usage of special characters and environment variables in paths within Arm® Development
Studio on page 1-10.• 1.1.3 Expressions within Arm® Development Studio on page 1-10.• 1.1.4 Built-in functions within Arm® Development Studio expressions on page 1-11.• 1.1.5 Usage of wildcards within Arm® Debugger expressions on page 1-13.• 1.1.6 Usage of regular expressions in the C expression parser within Arm® Development Studio
on page 1-13.• 1.1.7 Usage of the scoping resolution operator on page 1-14.• 1.1.8 Usage of printf() style format string within Arm® Development Studio on page 1-15.• 1.1.9 Address space prefixes on page 1-17.• 1.1.10 Memory parameters on page 1-19.
1.1.1 Syntax of Arm® Debugger commands
Arm Debugger commands accept arguments and flags. A flag acts as an optional switch and is specifiedusing a forward slash character. Where a command supports flags, the flags are described as part of thecommand syntax.
command [<argument>] [/<flag>]...`
Note
• Commands are not case sensitive.• Abbreviations are underlined.• When you specify an address as an argument to a command, you can also specify the address space
on page 1-17, for example N:0x80000000. If you do not specify the address space, Arm Debuggerassumes the current address space.
In commands that use /<flag>, the position of /<flag> should generally be as shown in the commandsyntax. The commands you submit to the debugger must follow these rules:
• Each command line can contain only one debugger command.• When referring to symbols, you must use the same case as the source code.
You can execute the commands by entering them in the debugger command-line console or by runningdebugger script files. Alternatively, in the IDE, you can open the Development Studio perspective whereyou can use the menus, icons, and toolbars provided, or you can enter Arm Debugger commands in theCommands view.
The debugger requires enough letters to uniquely identify the command you enter. Many commands havealternative names, or aliases, that you might find easier to remember. For example, backtrace and whereare aliases for the info stack command.
Some command names and aliases can be abbreviated. For example, info stack can be abbreviated to is. The syntax definition for each command shows how it can be abbreviated by underlining it forexample:
info stack.
In the syntax definition of each command:• square brackets [...] enclose optional parameters• braces {...} enclose required parameters• a vertical pipe | indicates alternatives from which you must choose one• parameters that can be repeated are followed by an ellipsis (...).
1 Arm® Debugger commands1.1 Conformance and usage rules for Arm® Debugger commands
102272_2020.1M0_00_en Copyright © 2020 Arm Limited or its affiliates. All rights reserved. 1-9Non-Confidential

Do not type square brackets, braces, or the vertical pipe. Replace parameters in italics with the value youwant. When you supply more than one parameter, use the separator as shown in the syntax definition foreach command. If a parameter is a name that includes spaces, enclose it in double quotation marks.
You can add descriptive comments to either the end of a command or on a separate line. You can use the# character to identify a descriptive comment.
1.1.2 Usage of special characters and environment variables in paths within Arm® DevelopmentStudio
List of characters and variables that you can use for path shortcuts in Arm Debugger commands.
When specifying paths, you can use any of the following:• a tilde character (~) at the start of a path to refer to your home directory• an environment variable, for example:
— %LOG_DIRECTORY%— ${LOG_DIRECTORY}— $LOG_DIRECTORY
• a backslash () or forward slash (/) as a directory separator.
Related references1.3.134 set escapes-in-filenames on page 1-134
1.1.3 Expressions within Arm® Development Studio
Some Arm Development Studio commands accept expressions. There are many types of expressionsaccepted by the debugger that enable you to extend the operation of a command. For example, binarymathematical expressions, references to module names, or calls to functions.
Usage of $ character to access registers and variables within Arm® Development Studioexpressions
In an expression you can access the content of registers by using the $ character and the register name,for example:
print 4+$R0 # add 4 to the content of R0 register and print result
Results from the print commands are recorded in debugger variables. Other commands, such asbreakpoint or watchpoint creating commands, the start command, and the memory command, also usedebugger variables to record the ID of the new resource. Each of these debugger variables is assigned anumber and can be used subsequently in expressions by using the $ character.
You can access print results or resource IDs using the debugger variables:
$
Print result or ID in the last assigned debugger variable.
$$
Print result or ID in the second-to-last debugger variable.
$<n>
Print result or ID in the debugger variable with number n.
You can also use the following debugger variables:
$cwd
Current working directory.
$cdir
Current compilation directory.
1 Arm® Debugger commands1.1 Conformance and usage rules for Arm® Debugger commands
102272_2020.1M0_00_en Copyright © 2020 Arm Limited or its affiliates. All rights reserved. 1-10Non-Confidential

$entrypoint
Entry point of the current image.
$idir
Current image directory.
$sdir
Current script directory.
$datetime
Current date and time in string format.
$timems
Number of milliseconds since 1st Jan 1970.
$pid
Current operating system process ID.
$thread
Current thread ID for a multi-threaded application.
$core
Current processor ID for Symmetric MultiProcessing (SMP) systems.
$vmid
Current Virtual Machine ID (VMID) for systems that support hypervisor / virtual machinedebugging.
Note
• $thread is uniquely assigned by the debugger for the current context reported by the OS awarenessplugin. If no OS awareness plugin is loaded, $thread tracks the current core, $core.
• $pid is assigned for the debugger for the current context by the OS awareness plugin. If no OSawareness plugin is loaded, $pid tracks the current core, $core.
Related references1.1.4 Built-in functions within Arm® Development Studio expressions on page 1-111.1.8 Usage of printf() style format string within Arm® Development Studio on page 1-151.3.31 echo on page 1-741.3.140 set print on page 1-1371.3.177 show print on page 1-1531.3.3 append on page 1-561.3.6 break on page 1-601.3.197 thread, core on page 1-1651.3.218 x on page 1-1811.3.2 advance on page 1-54Related informationAbout OS Awareness
1.1.4 Built-in functions within Arm® Development Studio expressions
In an Arm Debugger expression, you can use built-in functions to provide more functionality.
You can use the following built-in functions within Arm Debugger expressions:
int strcmp(const char *str1, const char *str2);
1 Arm® Debugger commands1.1 Conformance and usage rules for Arm® Debugger commands
102272_2020.1M0_00_en Copyright © 2020 Arm Limited or its affiliates. All rights reserved. 1-11Non-Confidential

Compares two strings and returns an integer.
Return values are:
<0
Indicates that the second argument string value comes after the first argument stringvalue in the machine collating sequences, str1 < str2.
0
Indicates that the two strings are identical in content.
>0
Indicates that the first argument string value comes after the second argument stringvalue in the machine collating sequences, str2 < str1.
int strncmp(const char *str1, const char *str2, size_t n);
Compares at most n characters of two strings and returns an integer.
Return values are:
<0
Indicates that the second argument string value comes after the first argument stringvalue in the machine collating sequences, str1 < str2.
0
Indicates that the two strings are identical in content.
>0
Indicates that the first argument string value comes after the second argument stringvalue in the machine collating sequences, str2 < str1.
char *strcpy(char *str1, const char *str2);
Copies str2 to str1 including “\0” and returns str1.
char *strncpy(char *str1, const char *str2, size_t n);
Copies at most n characters of str2 to str1 including “\0” and returns str1. If str2 has fewerthan n characters then fill with "\0".
void *memcpy(void *s, const void *cs, size_t n);
Copies at most n characters from cs to s and returns s.
Examplesbreak main.c:45 if strcmp(myVar, "10") == 0 # Set conditional breakpoint that stops # when strings are identical
Related references1.1.3 Expressions within Arm® Development Studio on page 1-101.1.8 Usage of printf() style format string within Arm® Development Studio on page 1-151.3.31 echo on page 1-741.3.140 set print on page 1-1371.3.177 show print on page 1-1531.3.3 append on page 1-561.3.6 break on page 1-601.3.197 thread, core on page 1-1651.3.218 x on page 1-181
1 Arm® Debugger commands1.1 Conformance and usage rules for Arm® Debugger commands
102272_2020.1M0_00_en Copyright © 2020 Arm Limited or its affiliates. All rights reserved. 1-12Non-Confidential
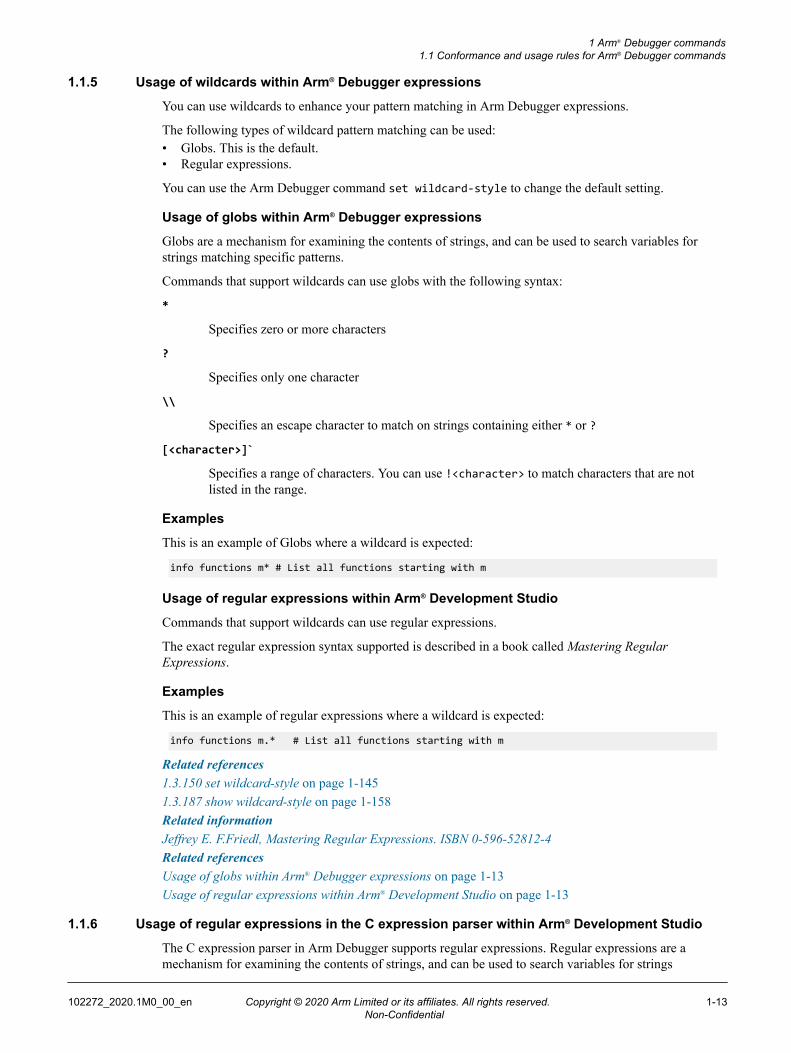
1.1.5 Usage of wildcards within Arm® Debugger expressions
You can use wildcards to enhance your pattern matching in Arm Debugger expressions.
The following types of wildcard pattern matching can be used:• Globs. This is the default.• Regular expressions.
You can use the Arm Debugger command set wildcard-style to change the default setting.
Usage of globs within Arm® Debugger expressions
Globs are a mechanism for examining the contents of strings, and can be used to search variables forstrings matching specific patterns.
Commands that support wildcards can use globs with the following syntax:
*
Specifies zero or more characters
?
Specifies only one character
\\
Specifies an escape character to match on strings containing either * or ?
[<character>]`
Specifies a range of characters. You can use !<character> to match characters that are notlisted in the range.
Examples
This is an example of Globs where a wildcard is expected:
info functions m* # List all functions starting with m
Usage of regular expressions within Arm® Development Studio
Commands that support wildcards can use regular expressions.
The exact regular expression syntax supported is described in a book called Mastering RegularExpressions.
Examples
This is an example of regular expressions where a wildcard is expected:
info functions m.* # List all functions starting with m
Related references1.3.150 set wildcard-style on page 1-1451.3.187 show wildcard-style on page 1-158Related informationJeffrey E. F.Friedl, Mastering Regular Expressions. ISBN 0-596-52812-4Related referencesUsage of globs within Arm® Debugger expressions on page 1-13Usage of regular expressions within Arm® Development Studio on page 1-13
1.1.6 Usage of regular expressions in the C expression parser within Arm® Development Studio
The C expression parser in Arm Debugger supports regular expressions. Regular expressions are amechanism for examining the contents of strings, and can be used to search variables for strings
1 Arm® Debugger commands1.1 Conformance and usage rules for Arm® Debugger commands
102272_2020.1M0_00_en Copyright © 2020 Arm Limited or its affiliates. All rights reserved. 1-13Non-Confidential

matching specific patterns. The debugger extends C expression syntax to support regular expressionsusing the =~ and !~ operators in the style of Perl, as shown in the following examples:
This example evaluates to 1 if the regular expression that uses =~ matches anywhere in the string and 0 ifit does not match:
expression =~ regular_expression
This example evaluates to 0 if the regular expression that uses !~ matches anywhere in the string and 1 ifit does not match:
expression !~ regular_expression
Where:
expression
is any expression of type char * or char[]. For example, a variable name.
regular_expression
is a regular expression in the form /regex/modifiers or m/regex/modifiers.
For example, if str is a variable of type char*, the following are valid expressions:
str =~ /abc/
((char *) void_pointer) !~ m/abc/i
The exact regular expression syntax supported is described by the Mastering Regular Expressions bookin the chapter discussing Java regex support. An exception to this is the parsing of the handling ofmodifiers. The following modifiers are supported by the debugger:
i
Enable case insensitive matching.
m
Multiline mode (^ and $ match embedded newline).
s
Dotall mode (. matches line terminators).
x
Comments mode (permit whitespace and comments).
Related informationJeffrey E. F.Friedl, Mastering Regular Expressions. ISBN 0-596-52812-4
1.1.7 Usage of the scoping resolution operator
In Arm Development Studio, the :: (scope resolution) operator is a global identifier for variable orfunction names that are out of scope. The expression evaluator supports scoping operations using thescope resolution, member and member pointer operators. This can be used to reference variables andfunctions within images, files, namespaces, or classes.
The following is an example which references image.axf created using demo.c below:
static int FILE_STATIC_VARIABLE = 20;class OuterClass{ public: OuterClass(int i) { value = i; } class InnerClass { public:
1 Arm® Debugger commands1.1 Conformance and usage rules for Arm® Debugger commands
102272_2020.1M0_00_en Copyright © 2020 Arm Limited or its affiliates. All rights reserved. 1-14Non-Confidential

int demoFunction() { return 25; } }; void increment() { value++; } int value;};namespace NAME_SPACE_OUTER{ const int TEST_VAR = 20; namespace NAME_SPACE_INNER { const int TEST_VAR = 19; int nameSpaceFoo () { return 60; } };};int main(){ OuterClass oc(14); OuterClass *ptr_oc = &oc; ptr_oc->increment();}
You can query this example by using any of the following expressions:
OuterClass::InnerClass::demoFunction"image.axf"::main"image.axf"::"demo.c"::FILE_STATIC_VARIABLE"demo.c"::FILE_STATIC_VARIABLENAME_SPACE_OUTER::TEST_VARNAME_SPACE_OUTER::NAME_SPACE_INNER::TEST_VARNAME_SPACE_OUTER::NAME_SPACE_INNER::TEST_VAR
If you set a breakpoint at ptr_oc->increment() and run to it, then the following expressions can also beused to query the instances of the outer class:
oc.valueptr_oc->valueptr_oc->value
1.1.8 Usage of printf() style format string within Arm® Development Studio
Certain commands use printf() style format strings to specify how to format values. For example theand commands specify how to format floating-point values. It works in a similar way to the ANSI Cstandard library function printf().
Format string syntax
The commands specify the format using a string. If there are no % characters in the string, the message iswritten out and any arguments are ignored. The % symbol is used to indicate the start of an argumentconversion specification.
The syntax of the format string is:
%[flag...][fieldwidth][precision]format
where:
flag
An optional conversion modification flag.
"-"
result is left-justified
"#"
result uses a conversion-dependent alternate form
1 Arm® Debugger commands1.1 Conformance and usage rules for Arm® Debugger commands
102272_2020.1M0_00_en Copyright © 2020 Arm Limited or its affiliates. All rights reserved. 1-15Non-Confidential

"+"
result includes a sign
" "
result includes a leading space for positive values
"0"
result is zero-padded
","
result includes locale-specific grouping separator
"("
result encloses negative numbers in parentheses.
fieldwidth
An optional minimum field width specified in decimal.
precision
An optional precision specified in decimal, with a preceding . (period character) to identify it.
format
The possible conversion specifier characters are:
%
A literal % character.
a, A, e, E, f, g, or G
Results in a decimal number formatted using scientific notation or floating pointnotation. The capital letter forms use a capital E in scientific notation rather than an e.
d or u
Results in a decimal integer. d indicates a signed integer. u indicates an unsignedinteger.
h or H
Results in a Hexadecimal character in lower or upper case.
x or X
Results in an unsigned Hexadecimal character in lower or upper case.
o
Results in an octal integer.
c or C
Results in a Unicode character in lower or upper case.
s
Results in a string.
b or B
Results in a string containing either “true” or “false” in lower or upper case.
n
Results in a platform-specific line separator.
1 Arm® Debugger commands1.1 Conformance and usage rules for Arm® Debugger commands
102272_2020.1M0_00_en Copyright © 2020 Arm Limited or its affiliates. All rights reserved. 1-16Non-Confidential

t or T
Prefix for date and time conversion specifier characters. For example:
"%ta %tb %td %tT" results in “Sun Jul 2016:17:00”
Related references1.1.3 Expressions within Arm® Development Studio on page 1-101.1.4 Built-in functions within Arm® Development Studio expressions on page 1-111.3.31 echo on page 1-741.3.140 set print on page 1-1371.3.177 show print on page 1-1531.3.3 append on page 1-561.3.6 break on page 1-601.3.197 thread, core on page 1-1651.3.218 x on page 1-181
1.1.9 Address space prefixes
Use address space prefixes in Arm Debugger to refer to different address spaces. You can use theseaddress space prefixes for various debugging activities.
Default
If no address space prefix is specified, then the debugger defaults to the current address space.
Syntax
<address_space_prefix>[<parameter>=<value>,<parameter>=<value>,...]:<address>
1 Arm® Debugger commands1.1 Conformance and usage rules for Arm® Debugger commands
102272_2020.1M0_00_en Copyright © 2020 Arm Limited or its affiliates. All rights reserved. 1-17Non-Confidential

Parameters
address_space_prefix
The address space prefix. Address spaces can vary on different targets. The availability of anaddress space depends on what architecture features are implemented, such as securityextensions.
The following address space prefixes might be available for Armv7-based processors:
• S: This corresponds to the Secure address space.• H: This corresponds to the hypervisor address space.• N: This corresponds to the Non-secure address space.• SP: This corresponds to Secure World physical memory.• NP: This corresponds to Non-secure World physical memory.
The following address space prefixes might be available for Armv8-based processors when inthe AArch32 execution state:
• S: This corresponds to the EL3, Secure EL1, and Secure EL0 translation regimes.• H: This corresponds to the EL2 translation regime. This is a Non-secure address space.• N: This corresponds to the Non-secure EL1 and Non-secure EL0 translation regimes.• SP: This corresponds to Secure World physical memory.• NP: This corresponds to Non-secure World physical memory.
The following address space prefixes might be available for Armv8-based processors when inthe AArch64 execution state:• EL3: This corresponds to the EL3 translation regime. This is a secure address space.• EL2S: This corresponds to the Secure EL2 translation regime.• EL2N: This corresponds to the Non-secure EL2 translation regime.• EL1S: This corresponds to the Secure EL1 and Secure EL0 translation regimes.• EL1N: This corresponds to the Non-secure EL1 and Non-secure EL0 translation regimes.• SP: This corresponds to Secure World physical memory.• NP: This corresponds to Non-secure World physical memory.
parameter
Optional. The parameter you want to specify.
When you are using an address space as part of an expression, you can use memory parametersto specify additional behavior. Use the info memory-parameters on page 1-92 command to seethe available parameters.
value
The value that you want to set for the parameter.
address
There address where you want to apply the operation.
Example: break command with address space prefix for Armv7
This example sets an execution breakpoint in the main function in the secure address space.
break S:main
Example: add-symbol-file command with address space prefix for Armv8
This example loads additional debug information into the secure physical address space.
add-symbol-file foo.axf SP:0
1 Arm® Debugger commands1.1 Conformance and usage rules for Arm® Debugger commands
102272_2020.1M0_00_en Copyright © 2020 Arm Limited or its affiliates. All rights reserved. 1-18Non-Confidential

Example: x command with address space prefix for Armv8
This example displays the content of the memory at address 0x80000000 in the secure EL1 and EL0translation regimes.
x EL1S:0x80000000
Example: Address space parameters with the set commandset*((int*)SP<verify=0>:0x8000)=0x1234
This command writes an integer, 0x1234, to the secure physical address, 0x8000, but does not verify thewrite.
Related references1.3.62 info memory-parameters on page 1-921.3.6 break on page 1-601.3.1 add-symbol-file on page 1-541.3.218 x on page 1-1811.2.19 Set on page 1-41Related informationAbout address spaces
1.1.10 Memory parameters
When using an address space as part of an expression, you can use memory parameters to specifyadditional behavior. There are many commands where you can apply memory parameters.
Different address spaces support different parameters. Use the info memory-parameters on page 1-92command to see which parameters apply to an address space.
Note
Sometimes the info memory-parameters command returns parameters that might not be implementedby your processor. See the documentation for your processor to find out which parameters are supported.
Syntax
<command> <address_space_prefix><memory_parameter1=value,memory_parameter2=value>:<address>
Parameters
<memory_parameterN=value> is either a single parameter pairing, or a comma-separated list ofparameter pairings:
verify=<value>
When performing a write operation, the debugger must read back what was written and verifythat it was written correctly.
Possible values are:
0 - Do not verify.
1 - Verify. This is the default.
width=<value>
Specifies the access width that is used to perform the access.
Where value can be one of 8, 16, 32, 40, or 64. If you do not specify a value for width, ArmDebugger sets the value to 0, which is equivalent to not specifying the parameter.
1 Arm® Debugger commands1.1 Conformance and usage rules for Arm® Debugger commands
102272_2020.1M0_00_en Copyright © 2020 Arm Limited or its affiliates. All rights reserved. 1-19Non-Confidential

use_image=<value>
When fetching data, specify from where the debugger reads data.
Possible values are:
0 - Read data from the target.
1 - Read data from the loaded image.
view=<option>
View data for a feature that is associated with the address space.
Where option is:
CapTagAccess the capability tags associated with the address space.
Note
• Access to the Morello features is determined by the highest Exception level that isassociated with the address space. You can access the capability tags only if thesystem register controls, for the Exception level, have not trapped the access.
• The Morello translation table descriptors further restrict the capability tags you canaccess.
stages=<value>
Specify the MMU translation stage to disable for a physical address.
Where value is:
1
Disable stage 1, and treat the address as an Intermediate Physical Address (IPA).
Example: Apply view=CapTag to the print command
Print, in hexadecimal, the data in the specified address space:
print /x *(EL3:0xe000f12f)
Print, in hexadecimal, the capability tag at the specified address:
print /x *(EL3<view=CapTag>:0xe000f12f)
Example: Apply verify to the memory set_typed command
Write a 128-bit unsigned integer to the specified address, but do not check that the integer is writtencorrectly:
memory set_typed N<verify=0>:0x00000000E000F110 (unsigned __int128)(0x05050505050505050505050505050505)
Related references1.3.62 info memory-parameters on page 1-921.1.9 Address space prefixes on page 1-17Related informationIntroduction to MorelloRelated references1.1.1 Syntax of Arm® Debugger commands on page 1-91.1.2 Usage of special characters and environment variables in paths within Arm® Development Studioon page 1-101.1.3 Expressions within Arm® Development Studio on page 1-10
1 Arm® Debugger commands1.1 Conformance and usage rules for Arm® Debugger commands
102272_2020.1M0_00_en Copyright © 2020 Arm Limited or its affiliates. All rights reserved. 1-20Non-Confidential
1.1.4 Built-in functions within Arm® Development Studio expressions on page 1-111.1.5 Usage of wildcards within Arm® Debugger expressions on page 1-131.1.6 Usage of regular expressions in the C expression parser within Arm® Development Studioon page 1-131.1.7 Usage of the scoping resolution operator on page 1-141.1.8 Usage of printf() style format string within Arm® Development Studio on page 1-151.1.9 Address space prefixes on page 1-171.1.10 Memory parameters on page 1-19
1 Arm® Debugger commands1.1 Conformance and usage rules for Arm® Debugger commands
102272_2020.1M0_00_en Copyright © 2020 Arm Limited or its affiliates. All rights reserved. 1-21Non-Confidential

1.2 Arm® Debugger commands listed in groupsDisplays all the commands in functional groups according to specific tasks.
This section contains the following subsections:• 1.2.1 Breakpoints and watchpoints on page 1-22.• 1.2.2 Execution control on page 1-24.• 1.2.3 Tracing on page 1-26.• 1.2.4 Scripts on page 1-27.• 1.2.5 Call stack on page 1-28.• 1.2.6 Operating System (OS) on page 1-29.• 1.2.7 Files on page 1-31.• 1.2.8 Data on page 1-32.• 1.2.9 Memory group on page 1-33.• 1.2.10 Cache on page 1-35.• 1.2.11 Registers on page 1-35.• 1.2.12 mmu on page 1-35.• 1.2.13 MMU list on page 1-36.• 1.2.14 mpu on page 1-37.• 1.2.15 mpu list on page 1-37.• 1.2.16 Display on page 1-37.• 1.2.17 Information on page 1-38.• 1.2.18 log on page 1-40.• 1.2.19 Set on page 1-41.• 1.2.20 set elf on page 1-43.• 1.2.21 show group on page 1-44.• 1.2.22 show elf on page 1-47.• 1.2.23 flash on page 1-47.• 1.2.24 Support on page 1-47.
1.2.1 Breakpoints and watchpoints
List of all the Arm Debugger commands that enable you to control the starting and stopping of thedebugger using breakpoints and watchpoints.
awatch
Sets a watchpoint for a data symbol. The debugger stops the target when the memory at thespecified address is read or written.
break
Sets an execution breakpoint at a specific location.
break-script
Assigns a script file to a specific breakpoint. The script executes when the breakpoint istriggered.
break-set-property
Updates the properties of an existing breakpoint.
break-stop-on-threads, break-stop-on-cores
Applies an existing breakpoint to one or more threads or processors.
break-stop-on-vmid
Applies an existing hardware breakpoint to a Virtual Machine (VM).
1 Arm® Debugger commands1.2 Arm® Debugger commands listed in groups
102272_2020.1M0_00_en Copyright © 2020 Arm Limited or its affiliates. All rights reserved. 1-22Non-Confidential

clear
Deletes a breakpoint at a specific location.
clearwatch
Deletes a watchpoint at a specific location.
condition
Sets a stop condition for a specific breakpoint or watchpoint.
delete breakpoints
Deletes one or more breakpoints or watchpoints.
disable breakpoints
Disables one or more breakpoints or watchpoints.
enable breakpoints
Enables one or more breakpoints or watchpoints by number.
hbreak
Sets a hardware execution breakpoint at a specific location.
ignore
Sets the ignore counter for a breakpoint or watchpoint condition.
info breakpoints, info watchpoints
Displays information about the status of all breakpoints and watchpoints.
info breakpoints capabilities, info watchpoints capabilities
Displays a list of parameters that you can use with breakpoint and watchpoint commands for thecurrent connection.
resolve
Re-evaluates the specified breakpoints or watchpoints and those with addresses that can beresolved are set.
rwatch
Sets a watchpoint for a data symbol. The debugger stops the target when the memory at thespecified address is read.
set breakpoint
Controls the automatic behavior of breakpoints and watchpoints.
silence
Disables the printing of stop messages for a specific breakpoint.
tbreak
Sets an execution breakpoint at a specific location and deletes the breakpoint when it is hit.
thbreak
Sets a hardware execution breakpoint at a specific location and deletes the breakpoint when it ishit.
unsilence
Enables the printing of stop messages for a specific breakpoint.
1 Arm® Debugger commands1.2 Arm® Debugger commands listed in groups
102272_2020.1M0_00_en Copyright © 2020 Arm Limited or its affiliates. All rights reserved. 1-23Non-Confidential

watch
Sets a watchpoint for a data symbol. The debugger stops the target when the memory at thespecified address is written.
watch-set-property
Updates the properties of an existing watchpoint.
Enter help followed by a command name for more information on a specific command.
Related references1.3.6 break on page 1-601.3.41 hbreak on page 1-801.3.195 tbreak on page 1-1621.3.196 thbreak on page 1-1641.3.112 resolve on page 1-1201.3.15 clear on page 1-651.3.214 watch on page 1-1781.3.115 rwatch on page 1-1221.3.16 clearwatch on page 1-661.3.5 awatch on page 1-591.3.122 set breakpoint on page 1-1271.3.23 disable breakpoints on page 1-701.3.20 delete breakpoints on page 1-681.3.47 info breakpoints, info watchpoints on page 1-851.3.49 info capabilities on page 1-861.3.48 info breakpoints capabilities, info watchpoints capabilities on page 1-851.3.7 break-script on page 1-611.3.9 break-stop-on-threads, break-stop-on-cores on page 1-631.3.10 break-stop-on-vmid on page 1-631.3.17 condition on page 1-671.3.44 ignore on page 1-841.3.188 silence on page 1-1581.3.207 unsilence on page 1-174
1.2.2 Execution control
List of all the Arm Debugger commands that enable you to control the starting and stopping of thedebugger.
advance
Sets a temporary breakpoint at the specified address and calls the debugger continue command.Use the advance command to halt execution at a particular point in your code, for example aspecific function, source code line number, or instruction memory address.
continue
Continues running the target.
finish
Continues running the device to the next instruction after the selected stack frame finishes.
handle
Controls the handler settings for one or more signals or exceptions.
1 Arm® Debugger commands1.2 Arm® Debugger commands listed in groups
102272_2020.1M0_00_en Copyright © 2020 Arm Limited or its affiliates. All rights reserved. 1-24Non-Confidential

info signals, info handle
Displays information about the handling of signals or processor exceptions.
interrupt, stop
Interrupts the target and stops the application if it is running.
next
Steps through an application at the source level stopping at the first instruction of each sourceline but stepping over all function calls.
nexti
Steps through an application at the instruction level but stepping over all function calls.
nexts
Steps through an application at the source level stopping at the first instruction of each sourcestatement but stepping over all function calls.
reset
Performs a reset on the target.
run
Starts running the target.
set blocking-run-control
Controls whether run control operations such as stepping and running are blocked until thetarget stops or released immediately.
set debug-from
Specifies the address of the temporary breakpoint for subsequent use by the start command.
set step-mode
Controls the default behavior of the step and steps commands.
show blocking-run-control
Displays the setting for blocking run control operations such as stepping and running.
show debug-from
Displays the setting for the expression that is used by the start command to set a temporarybreakpoint.
show step-mode
Displays the step setting for functions without debug information.
start
Sets a temporary breakpoint, calls the debugger run command, and then deletes the temporarybreakpoint when it is hit. By default, the temporary breakpoint is set at the address of the globalfunction main().
step
Steps through an application at the source level stopping on the first instruction of each sourceline including stepping into all function calls.
stepi
Steps through an application at the instruction level including stepping into all function calls.
1 Arm® Debugger commands1.2 Arm® Debugger commands listed in groups
102272_2020.1M0_00_en Copyright © 2020 Arm Limited or its affiliates. All rights reserved. 1-25Non-Confidential

steps
Steps through an application at the source level stopping on the first instruction of each sourcestatement (for example, statements in a for() loop) including stepping into all function calls.
thread, core
Displays information about the current thread or processor.
thread apply, core apply
Switches control to a specific thread or processor to execute a debugger command and thenswitches back to the original state.
wait
Instructs the debugger to wait until the target stops.
Enter help followed by a command name for more information on a specific command.
Related references1.3.190 start on page 1-1601.3.121 set blocking-run-control on page 1-1261.3.158 show blocking-run-control on page 1-1481.3.126 set debug-from on page 1-1291.3.163 show debug-from on page 1-1491.3.18 continue on page 1-671.3.2 advance on page 1-541.3.81 interrupt, stop on page 1-1001.3.213 wait on page 1-1771.3.111 reset on page 1-1191.3.192 step on page 1-1611.3.193 stepi on page 1-1611.3.194 steps on page 1-1621.3.100 next on page 1-1141.3.101 nexti on page 1-1141.3.102 nexts on page 1-1151.3.197 thread, core on page 1-1651.3.198 thread apply, core apply on page 1-1661.3.144 set step-mode on page 1-1421.3.181 show step-mode on page 1-1561.3.57 info signals, info handle on page 1-891.3.40 handle on page 1-79
1.2.3 Tracing
List of all the Arm Debugger commands that can be used to capture trace.
trace start
Starts the trace capture on the specified trace capture device.
trace stop
Stops the trace capture on the specified trace capture device.
trace clear
Clears the trace on the specified trace capture device.
1 Arm® Debugger commands1.2 Arm® Debugger commands listed in groups
102272_2020.1M0_00_en Copyright © 2020 Arm Limited or its affiliates. All rights reserved. 1-26Non-Confidential

trace list
Lists the trace capture devices and trace sources.
trace info
Displays details about trace capture devices and trace sources.
trace dump
Dumps raw trace data to a directory, along with target trace configuration metadata, from a tracecapture device or a trace source.
trace report
Produces a trace report, containing the decoded trace data, for the currently selected core.
Enter help followed by a command name for more information on a specific command.
Related references1.3.199 trace clear on page 1-1671.3.200 trace dump on page 1-1671.3.201 trace info on page 1-1681.3.202 trace list on page 1-1691.3.203 trace report on page 1-1691.3.204 trace start on page 1-1721.3.205 trace stop on page 1-173
1.2.4 Scripts
List of all the Arm Debugger commands that can be used to control the debugger using script files.
define
Enables you to derive new user-defined commands from existing commands.
document
Enables you to add integrated help for a new user-defined command.
newvar
Declares and initializes a new debugger convenience variable.
end
Enables you to terminate conditional blocks when using the define, if, and while commands.
if
Enables you to write scripts that conditionally execute debugger commands.
source
Loads and runs a script file to control and debug your target.
while
Enables you to write scripts with conditional loops that execute debugger commands.
usecase help
Displays help for a use case script.
usecase list
Lists use case scripts.
1 Arm® Debugger commands1.2 Arm® Debugger commands listed in groups
102272_2020.1M0_00_en Copyright © 2020 Arm Limited or its affiliates. All rights reserved. 1-27Non-Confidential

usecase run
Runs a use case script.
Enter help followed by a command name for more information on a specific command.
Related references1.3.19 define on page 1-681.3.27 document on page 1-721.3.34 end on page 1-751.3.43 if on page 1-831.3.217 while on page 1-1801.3.189 source on page 1-1581.3.99 newvar on page 1-1131.3.210 usecase help on page 1-1751.3.211 usecase list on page 1-1761.3.212 usecase run on page 1-176
1.2.5 Call stack
List of all the Arm Debugger commands that display information about the call stack and others thatcontrol the current position in the call stack.
down
Moves and displays the current frame pointer down the call stack towards the bottom frame.
down-silently
Moves the current frame pointer down the call stack towards the bottom frame.
frame
Sets the current frame pointer in the call stack and also displays the function name and sourceline number for the specified frame.
info frame
Displays stack frame information at the selected position.
info stack, backtrace, where
Displays a numbered list of the calling stack frames including the function names and sourceline numbers.
select-frame
Moves the current frame pointer in the callstack.
set backtrace
Controls the default behavior when using the info info stack command.
show backtrace
Displays the behavior settings for use with the info stack command.
up
Moves and displays the current frame pointer up the call stack towards the top frame.
up-silently
Moves the current frame pointer up the call stack towards the top frame.
Enter help followed by a command name for more information on a specific command.
1 Arm® Debugger commands1.2 Arm® Debugger commands listed in groups
102272_2020.1M0_00_en Copyright © 2020 Arm Limited or its affiliates. All rights reserved. 1-28Non-Confidential

Related references1.3.120 set backtrace on page 1-1261.3.74 info stack, backtrace, where on page 1-971.3.157 show backtrace on page 1-1471.3.39 frame on page 1-791.3.55 info frame on page 1-891.3.28 down on page 1-721.3.29 down-silently on page 1-721.3.208 up on page 1-1741.3.209 up-silently on page 1-1751.3.116 select-frame on page 1-123
1.2.6 Operating System (OS)
List of all the Arm Debugger commands that enable you to debug applications running on a target withan operating system.
sharedlibrary
Loads symbols from shared libraries.
nosharedlibrary
Discards all loaded shared library symbols.
info os
Displays the current state of the Operating System (OS) support. If OS support is enabled, alsolists all available OS data tables.
info os-log
Displays the contents of the Operating System (OS) log buffer for connections that support thisfeature.
info os-modules
Displays a list of loadable kernel modules for connections that support this feature.
info os-version
Displays the version of the Operating System (OS)for connections that support this feature.
info processes
Displays information about the user space processes.
info sharedlibrary
Displays the names of the loaded shared libraries, the base address, and whether the debugsymbols of the shared libraries are loaded or not.
info threads
Displays information about the available threads.
set auto-solib-add
Controls the automatic loading of shared library symbols.
set os
Controls Operating System (OS) settings in the debugger. An OS-aware connection must beestablished before you can use this command.
1 Arm® Debugger commands1.2 Arm® Debugger commands listed in groups
102272_2020.1M0_00_en Copyright © 2020 Arm Limited or its affiliates. All rights reserved. 1-29Non-Confidential
set solib-search-path
Specifies additional directories to search for shared library symbols.
set stop-on-solib-events
Controls whether the debugger stops execution when a shared object is loaded or unloaded.
set sysroot, set solib-absolute-prefix
Specifies the system root directory to search for shared library symbols.
show auto-solib-add
Displays the automatic setting for use when loading shared library symbols.
show os
Displays the Operating System (OS) control settings.
show solib-search path
Displays the search paths in use by the debugger when searching for shared libraries.
show stop-on-solib-events
Displays the debugger setting that controls whether execution stops when shared library eventsoccur.
show sysroot, show solib-absolute-prefix
Displays the system root directory in use by the debugger when searching for shared librarysymbols.
thread apply, core apply
Switches control to a specific thread or processor to execute a debugger command and thenswitches back to the original state.
thread, core
Displays information about the current thread or processor.
Enter help followed by a command name for more information on a specific command.
Related references1.3.151 sharedlibrary on page 1-1451.3.103 nosharedlibrary on page 1-1151.3.71 info sharedlibrary on page 1-961.3.138 set os on page 1-1361.3.176 show os on page 1-1531.3.142 set sysroot, set solib-absolute-prefix on page 1-1411.3.179 show sysroot, show solib-absolute-prefix on page 1-1551.3.119 set auto-solib-add on page 1-1251.3.156 show auto-solib-add on page 1-1471.3.143 set solib-search-path on page 1-1411.3.180 show solib-search-path on page 1-1561.3.197 thread, core on page 1-1651.3.145 set stop-on-solib-events on page 1-1421.3.182 show stop-on-solib-events on page 1-1561.3.198 thread apply, core apply on page 1-1661.3.77 info threads on page 1-991.3.68 info processes on page 1-941.3.63 info os on page 1-92
1 Arm® Debugger commands1.2 Arm® Debugger commands listed in groups
102272_2020.1M0_00_en Copyright © 2020 Arm Limited or its affiliates. All rights reserved. 1-30Non-Confidential
1.3.64 info os-log on page 1-931.3.65 info os-modules on page 1-931.3.66 info os-version on page 1-94
1.2.7 Files
List of Arm Debugger commands that enable you to control the loading and unloading of executableimages on to a target and debug information into the debugger.
add-symbol-file
Loads additional debug information into the debugger.
append
Reads data from memory or the result of an expression and appends it to an existing file.
cd
Changes the current working directory.
directory
Defines additional directories to search for source files.
discard-symbol-file
Discards debug information relating to a specific file.
dump
Reads data from memory or the result of an expression and writes it to a file.
file, symbol-file
Loads debug information from an image into the debugger and records the entry point addressfor future use by the run and start commands.
info files, info target
Displays information about the loaded image and symbols.
info sources
Displays the names of the source files used in the current image being debugged.
load
Loads an image on to the target and records the entry point address for future use by the run andstart commands.
loadfile
Loads debug information into the debugger, an image on to the target and records the entry pointaddress for future use by the run and start commands.
pwd
Displays the current working directory.
reload-symbol-file
Reloads debug information from an already loaded image into the debugger using the samesettings as the original load operation.
restore
Reads data from a file and writes it to memory.
1 Arm® Debugger commands1.2 Arm® Debugger commands listed in groups
102272_2020.1M0_00_en Copyright © 2020 Arm Limited or its affiliates. All rights reserved. 1-31Non-Confidential

set substitute-path
Modifies the search paths used by the debugger when it executes any of the commands that lookup and display source code.
show directories
Displays the list of directories to search for source files.
show substitute-path
Displays the search path substitution rules in use by the debugger when searching for sourcefiles.
Enter help followed by a command name for more information on a specific command.
Related references1.3.83 load on page 1-1021.3.84 loadfile on page 1-1021.3.35 file, symbol-file on page 1-761.3.110 reload-symbol-file on page 1-1191.3.1 add-symbol-file on page 1-541.3.3 append on page 1-561.3.113 restore on page 1-1211.3.73 info sources on page 1-971.3.14 cd on page 1-651.3.108 pwd on page 1-1181.3.22 directory, set directories on page 1-691.3.164 show directories on page 1-1501.3.146 set substitute-path on page 1-1431.3.183 show substitute-path on page 1-157
1.2.8 Data
List of all the Arm Debugger commands that enables you to display source code, expressions, variables,functions, classes, memory, and other data.
disassemble
Displays the disassembly for the function surrounding a specific address or the disassembly fora specific address range.
info address
Displays the location of a symbol.
info classes
Displays C++ class names.
info functions
Displays the name and data types for all functions.
info locals
Displays all local variables for the current stack frame.
info members
Displays the name and data types for all class member variables that are accessible in thefunction corresponding to the selected stack frame.
1 Arm® Debugger commands1.2 Arm® Debugger commands listed in groups
102272_2020.1M0_00_en Copyright © 2020 Arm Limited or its affiliates. All rights reserved. 1-32Non-Confidential

info symbol
Displays the symbol name at a specific address.
info variables
Displays the name and data types for all global and static variables.
list
Displays lines of source code surrounding the current or specified location.
set listsize
Modifies the default number of source lines that the list command displays.
set variable
Evaluates an expression and assigns the result to a variable, register or memory.
show listsize
Displays the number of source lines that the list command displays.
whatis
Displays the data type of an expression.
x
Displays the content of memory at a specific address.
Enter help followed by a command name for more information on a specific command.
Related references1.3.25 disassemble on page 1-711.3.117 set variable on page 1-1241.3.216 whatis on page 1-1801.3.218 x on page 1-1811.3.45 info on page 1-841.3.51 info classes on page 1-871.3.56 info functions on page 1-891.3.59 info locals on page 1-901.3.60 info members on page 1-901.3.57 info signals, info handle on page 1-891.3.75 info symbol on page 1-981.3.78 info variables on page 1-991.3.82 list on page 1-1011.3.136 set listsize on page 1-1351.3.174 show listsize on page 1-152
1.2.9 Memory group
List of all the Arm Debugger commands that controls memory accesses and displays information aboutspecific memory regions.
append
Reads data from memory or the result of an expression and appends it to an existing file.
assemble
Writes assembler instructions to memory.
1 Arm® Debugger commands1.2 Arm® Debugger commands listed in groups
102272_2020.1M0_00_en Copyright © 2020 Arm Limited or its affiliates. All rights reserved. 1-33Non-Confidential

delete memory
Deletes one or more user-defined memory regions.
disable memory
Disables one or more user-defined memory regions.
disassemble
Displays the disassembly for the function surrounding a specific address or the disassembly fora specific address range.
dump
Reads data from memory or the result of an expression and writes it to a file.
enable memory
Enables one or more user-defined memory regions.
info memory
Displays the currently defined memory regions.
info mem-params
Displays the memory parameters applicable to an address space.
memory
Defines a memory region and specifies its attributes and size.
memory auto
Resets the memory regions to the default target settings and discards all user-defined regions.
memory debug-cache
Controls the caching by the debugger for all memory regions.
memory fill
Writes a specific pattern of bytes to memory.
memory set
Writes to memory.
memory set_typed
Writes a list of values to memory.
restore
Reads data from a file and writes it to memory.
x
Displays the content of memory at a specific address.
Enter help followed by a command name for more information on a specific command.
Related references1.3.87 memory on page 1-1041.3.3 append on page 1-561.3.4 assemble on page 1-571.3.21 delete memory on page 1-691.3.33 enable memory on page 1-751.3.24 disable memory on page 1-70
1 Arm® Debugger commands1.2 Arm® Debugger commands listed in groups
102272_2020.1M0_00_en Copyright © 2020 Arm Limited or its affiliates. All rights reserved. 1-34Non-Confidential

1.3.61 info memory on page 1-911.3.62 info memory-parameters on page 1-921.3.88 memory auto on page 1-1061.3.30 dump on page 1-731.3.90 memory fill on page 1-1061.3.91 memory set on page 1-1071.3.25 disassemble on page 1-711.3.92 memory set_typed on page 1-1091.3.89 memory debug-cache on page 1-1061.3.113 restore on page 1-1211.3.218 x on page 1-181
1.2.10 Cache
List of all the Arm Debugger commands that provide information on the available caches.
cache flush
Flushes the caches of the current CPU.
cache list
Lists the caches and related information available for the current core. The output isimplementation defined.
cache print
Provides a structured view of the cache data in the current core. The output is implementationdefined.
Enter help followed by a command name for more information on a specific command.
Related references1.3.12 cache list on page 1-641.3.13 cache print on page 1-641.3.11 cache flush on page 1-64
1.2.11 Registers
List of all the Arm Debugger commands that provide register information.
info all-registers
Displays the name and content of grouped registers for the current stack frame.
info registers
Displays the name and content of all application level registers for the current stack frame.
Enter help followed by a command name for more information on a specific command.
Related references1.3.46 info all-registers on page 1-841.3.69 info registers on page 1-95
1.2.12 mmu
List of all the Arm Debugger commands that provide information on the Memory Management Unit.
mmu list tables
Lists the available translation tables and their associated parameters.
1 Arm® Debugger commands1.2 Arm® Debugger commands listed in groups
102272_2020.1M0_00_en Copyright © 2020 Arm Limited or its affiliates. All rights reserved. 1-35Non-Confidential

mmu list translations
Lists the available translations and their associated parameters.
mmu list memory-maps
Lists the available memory maps and their associated parameters.
mmu print
Prints the contents of a translation table.
mmu translate
Performs translations between virtual and physical addresses.
mmu memory-map
Prints the memory map.
set mmu use-cache-for-phys-reads
Instructs the debugger to, where possible, ensure that the translation table entries it reads fromphysical memory are coherent with the contents of data caches.
show mmu use-cache-for-phys-reads
Displays the MMU setting that controls the coherency between translation table memory readsand cache data.
Enter help followed by a command name for more information on a specific command.
Related references1.3.93 mmu list memory-maps, mpu list memory-maps on page 1-1091.3.94 mmu list tables, mpu list tables on page 1-1101.3.95 mmu list translations on page 1-1101.3.98 mmu translate on page 1-1121.3.96 mmu memory-map, mpu memory-map on page 1-1101.3.97 mmu print, mpu print on page 1-1111.3.137 set mmu use-cache-for-phys-reads on page 1-1351.3.175 show mmu use-cache-for-phys-reads on page 1-152
1.2.13 MMU list
mmu list commands in Arm Debugger.
mmu list tables
Lists the available translation tables and their associated parameters.
mmu list translations
Lists the available translations and their associated parameters.
mmu list memory-maps
Lists the available memory maps and their associated parameters.
Enter help followed by a command name for more information on a specific command.
Related references1.3.93 mmu list memory-maps, mpu list memory-maps on page 1-1091.3.94 mmu list tables, mpu list tables on page 1-1101.3.95 mmu list translations on page 1-110
1 Arm® Debugger commands1.2 Arm® Debugger commands listed in groups
102272_2020.1M0_00_en Copyright © 2020 Arm Limited or its affiliates. All rights reserved. 1-36Non-Confidential

1.2.14 mpu
List of all the Arm Debugger commands that provide information on the Memory Protection Unit.
mpu list tables
Lists the available translation tables and their associated parameters.
mpu list memory-maps
Lists the available memory maps and their associated parameters.
mpu print
Prints the contents of a translation table.
mpu memory-map
Prints the memory map.
set idau-region
Specifies the Implementation Defined Attribution Unit (IDAU) region parameters for eachmemory range.
show idau-region
Displays the currently specified Implementation Defined Attribution Unit (IDAU) regionparameters.
Enter help followed by a command name for more information on a specific command.
Related references1.3.93 mmu list memory-maps, mpu list memory-maps on page 1-1091.3.94 mmu list tables, mpu list tables on page 1-1101.3.96 mmu memory-map, mpu memory-map on page 1-1101.3.97 mmu print, mpu print on page 1-111
1.2.15 mpu list
mpu list commands in Arm Debugger.
mpu list tables
Lists the available translation tables and their associated parameters.
mpu list memory-maps
Lists the available memory maps and their associated parameters.
Enter help followed by a command name for more information on a specific command.
Related references1.3.93 mmu list memory-maps, mpu list memory-maps on page 1-1091.3.94 mmu list tables, mpu list tables on page 1-110
1.2.16 Display
List of all the Arm Debugger commands that enable you to display specific output on the command-line.
echo
Displays only textual strings.
output
Displays only the result of an expression.
1 Arm® Debugger commands1.2 Arm® Debugger commands listed in groups
102272_2020.1M0_00_en Copyright © 2020 Arm Limited or its affiliates. All rights reserved. 1-37Non-Confidential

print, inspect
Displays the output of an expression (128 character limit) and also records the result in a newdebugger variable, $<n>, where <n> is a number.
set print
Controls the current debugger print settings.
show print
Displays the debugger print settings.
x
Displays the content of memory at a specific address.
Enter help followed by a command name for more information on a specific command.
Related references1.3.31 echo on page 1-741.3.104 output on page 1-1151.3.107 print, inspect on page 1-1171.3.140 set print on page 1-1371.3.177 show print on page 1-1531.3.218 x on page 1-181
1.2.17 Information
List of all the Arm Debugger commands that enables you to display information about breakpoints,watchpoints, running processors, variables, functions, classes, registers, memory regions, stack frames,and other data.
info address
Displays the location of a symbol.
info all-registers
Displays the name and content of grouped registers for the current stack frame.
info breakpoints, info watchpoints
Displays information about the status of all breakpoints and watchpoints.
info breakpoints capabilities, info watchpoints capabilities
Displays a list of parameters that you can use with breakpoint and watchpoint commands for thecurrent connection.
info capabilities
Displays a list of capabilities for the target device that is currently connected to the debugger.
info classes
Displays C++ class names.
info cores
Displays information about the running processors.
info files, info target
Displays information about the loaded image and symbols.
info flash
Displays information about the flash devices on the current target.
1 Arm® Debugger commands1.2 Arm® Debugger commands listed in groups
102272_2020.1M0_00_en Copyright © 2020 Arm Limited or its affiliates. All rights reserved. 1-38Non-Confidential

info frame
Displays stack frame information at the selected position.
info functions
Displays the name and data types for all functions.
info inst-sets
Displays the available instruction sets.
info locals
Displays all local variables for the current stack frame.
info members
Displays the name and data types for all class member variables that are accessible in thefunction corresponding to the selected stack frame.
info memory
Displays the currently defined memory regions.
info mem-params
Displays the memory parameters applicable to an address space.
info os
Displays the current state of the Operating System (OS) support. If OS support is enabled, alsolists all available OS data tables.
info os-log
Displays the contents of the Operating System (OS) log buffer for connections that support thisfeature.
info os-modules
Displays a list of loadable kernel modules for connections that support this feature.
info os-version
Displays the version of the Operating System (OS)for connections that support this feature.
info overlays
Displays information about the currently loaded overlays.
info processes
Displays information about the user space processes.
info registers
Displays the name and content of all application level registers for the current stack frame.
info semihosting
Displays semihosting information.
info sharedlibrary
Displays the names of the loaded shared libraries, the base address, and whether the debugsymbols of the shared libraries are loaded or not.
info signals, info handle
Displays information about the handling of signals or processor exceptions.
1 Arm® Debugger commands1.2 Arm® Debugger commands listed in groups
102272_2020.1M0_00_en Copyright © 2020 Arm Limited or its affiliates. All rights reserved. 1-39Non-Confidential

info sources
Displays the names of the source files used in the current image being debugged.
info stack, backtrace, where
Displays a numbered list of the calling stack frames including the function names and sourceline numbers.
info symbol
Displays the symbol name at a specific address.
info threads
Displays information about the available threads.
info variables
Displays the name and data types for all global and static variables.
Enter help followed by a command name for more information on a specific command.
Related references1.3.46 info all-registers on page 1-841.3.47 info breakpoints, info watchpoints on page 1-851.3.57 info signals, info handle on page 1-891.3.63 info os on page 1-921.3.64 info os-log on page 1-931.3.65 info os-modules on page 1-931.3.66 info os-version on page 1-941.3.68 info processes on page 1-941.3.69 info registers on page 1-951.3.70 info semihosting on page 1-951.3.71 info sharedlibrary on page 1-961.3.73 info sources on page 1-971.3.74 info stack, backtrace, where on page 1-971.3.75 info symbol on page 1-981.3.77 info threads on page 1-991.3.78 info variables on page 1-991.3.58 info inst-sets on page 1-901.3.49 info capabilities on page 1-861.3.51 info classes on page 1-871.3.52 info cores on page 1-881.3.59 info locals on page 1-901.3.60 info members on page 1-901.3.61 info memory on page 1-911.3.62 info memory-parameters on page 1-921.3.53 info files, info target on page 1-88
1.2.18 log
List of all the Arm Debugger commands that enable you to control runtime messages from the debugger.
log config
Specifies the type of logging configuration to output runtime messages from the debugger.
1 Arm® Debugger commands1.2 Arm® Debugger commands listed in groups
102272_2020.1M0_00_en Copyright © 2020 Arm Limited or its affiliates. All rights reserved. 1-40Non-Confidential
log file
Specifies an output file to receive runtime messages from the debugger.
Enter help followed by a command name for more information on a specific command.
Related references1.3.85 log config on page 1-1031.3.86 log file on page 1-103
1.2.19 Set
List of all the Arm Debugger commands that enable you to control the default debugger settings.
set
set is an alias for set variable.
set arm
Controls the behavior of the debugger when selecting the instruction set for disassembly andsetting breakpoints.
set auto-solib-add
Controls the automatic loading of shared library symbols.
set backtrace
Controls the default behavior when using the info command.
set blocking-run-control
Controls whether run control operations such as stepping and running are blocked until thetarget stops or released immediately.
set breakpoint
Controls the automatic behavior of breakpoints and watchpoints.
set case-insensitive-source-matching
Controls the case sensitivity of debugger file matching operations.
set cde-coprocessors
Specify the coprocessors that are associated with the Arm Custom Datapath Extension (CDE).
set debug-agent
Sets an internal configuration parameter for the debug agent.
set debug-from
Specifies the address of the temporary breakpoint for subsequent use by the start command.
set directories
Defines additional directories to search for source files.
set dtsl-options
Sets a parameter in the DTSL configuration.
set dtsl-temporary-directory
Specifies the path for the temporary directory to store trace data.
set elf cache-uninitialized-sections
Controls whether the debugger caches uninitialized sections.
1 Arm® Debugger commands1.2 Arm® Debugger commands listed in groups
102272_2020.1M0_00_en Copyright © 2020 Arm Limited or its affiliates. All rights reserved. 1-41Non-Confidential

set elf load-segments-at-p_paddr
Enables loading to the specified load offset + p_paddr when loading segments of ELF images tothe target.
set elf zero-extra-segment-bytes
Enables zeroing of bytes from p_filesz to p_memsz when loading segments of ELF images tothe target.
set endian
Specifies the byte order for use by the debugger.
set escape-strings
Controls how special characters in strings are printed on the debugger command-line.
set escapes-in-filenames
Controls the use of special characters in paths.
set idau-region
Specifies the Implementation Defined Attribution Unit (IDAU) region parameters for eachmemory range.
set listsize
Modifies the default number of source lines that the list command displays.
set mmu use-cache-for-phys-reads
Instructs the debugger to, where possible, ensure that the translation table entries it reads fromphysical memory are coherent with the contents of data caches.
set os
Controls OperatingSystem (OS) settings in the debugger. An OS-aware connection must beestablished before you can use this command.
set overlays enabled
Enables or disables overlay support.
set print
Controls the current debugger print settings.
set semihosting
Controls the semihosting settings in the debugger.
set solib-search-path
Specifies additional directories to search for shared library symbols.
set step-mode
Controls the default behavior of the and commands.
set stop-on-solib-events
Controls whether the debugger stops execution when a shared object is loaded or unloaded.
set substitute-path
Modifies the search paths used by the debugger when it executes any of the commands that lookup and display source code.
set sysroot, set solib-absolute-prefix
Specifies the system root directory to search for shared library symbols.
1 Arm® Debugger commands1.2 Arm® Debugger commands listed in groups
102272_2020.1M0_00_en Copyright © 2020 Arm Limited or its affiliates. All rights reserved. 1-42Non-Confidential

set trust-ro-sections-for-opcodes
Controls whether the debugger can read opcodes from read-only sections of images on the hostworkstation rather than from the target itself.
set variable
Evaluates an expression and assigns the result to a variable, register or memory.
set wildcard-style
Specifies the type of wildcard pattern matching you can use for examining the contents ofstrings.
Enter help followed by a command name for more information on a specific command.
Related references1.3.117 set variable on page 1-1241.3.118 set arm on page 1-1241.3.119 set auto-solib-add on page 1-1251.3.120 set backtrace on page 1-1261.3.121 set blocking-run-control on page 1-1261.3.122 set breakpoint on page 1-1271.3.123 set case-insensitive-source-matching on page 1-1281.3.124 set cde-coprocessors on page 1-1281.3.125 set debug-agent on page 1-1291.3.126 set debug-from on page 1-1291.3.22 directory, set directories on page 1-691.3.127 set dtsl-options on page 1-1301.3.128 set dtsl-temporary-directory on page 1-1301.3.129 set elf cache-uninitialized-sections on page 1-1311.3.130 set elf load-segments-at-p_paddr on page 1-1321.3.131 set elf zero-extra-segment-bytes on page 1-1321.3.132 set endian on page 1-1331.3.133 set escape-strings on page 1-1331.3.134 set escapes-in-filenames on page 1-1341.3.136 set listsize on page 1-1351.3.138 set os on page 1-1361.3.140 set print on page 1-1371.3.141 set semihosting on page 1-1391.3.142 set sysroot, set solib-absolute-prefix on page 1-1411.3.143 set solib-search-path on page 1-1411.3.144 set step-mode on page 1-1421.3.145 set stop-on-solib-events on page 1-1421.3.146 set substitute-path on page 1-1431.3.148 set trust-ro-sections-for-opcodes on page 1-1441.3.150 set wildcard-style on page 1-1451.3.137 set mmu use-cache-for-phys-reads on page 1-135
1.2.20 set elf
set elf commands in Arm Debugger.
set elf cache-uninitialized-sections
Controls whether the debugger caches uninitialized sections.
1 Arm® Debugger commands1.2 Arm® Debugger commands listed in groups
102272_2020.1M0_00_en Copyright © 2020 Arm Limited or its affiliates. All rights reserved. 1-43Non-Confidential
set elf load-segments-at-p_paddr
Enables loading to the specified load offset + p_paddr when loading segments of ELF images tothe target.
set elf zero-extra-segment-bytes
Enables zeroing of bytes from p_filesz to p_memsz when loading segments of ELF images tothe target.
Enter help followed by a command name for more information on a specific command.
Related references1.3.129 set elf cache-uninitialized-sections on page 1-1311.3.130 set elf load-segments-at-p_paddr on page 1-1321.3.131 set elf zero-extra-segment-bytes on page 1-132
1.2.21 show group
List of all the Arm Debugger commands that enable you to view the default debugger settings.
show
Displays the debugger settings.
show architecture
Displays the architecture of the target.
show arm
Displays the instruction set settings in use by the debugger for disassembly and settingbreakpoints.
show auto-solib-add
Displays the automatic setting for use when loading shared library symbols.
show backtrace
Displays the behavior settings for use with the info stack command.
show blocking-run-control
Displays the setting for blocking run control operations such as stepping and running.
show breakpoint
Displays the breakpoint and watchpoint behavior settings.
show case-insensitive-source-matching
Displays the case sensitivity setting for the debugger file matching operations.
show cde-coprocessors
Displays the encoding associated with each coprocessor.
show debug-agent
Displays the value of an internal configuration parameter for the debug agent.
show debug-from
Displays the setting for the expression that is used by the start command to set a temporarybreakpoint.
show directories
Displays the list of directories to search for source files.
1 Arm® Debugger commands1.2 Arm® Debugger commands listed in groups
102272_2020.1M0_00_en Copyright © 2020 Arm Limited or its affiliates. All rights reserved. 1-44Non-Confidential
show dtsl-options
Displays the value of a parameter in the DTSL configuration.
show dtsl-temporary-directory
Displays the current path for the temporary directory which stores trace data.
show elfcache-uninitialized-sections
Displays the debugger setting that controls whether uninitialized sections are cached.
show elf load-segments-at-p_paddr
Displays the debugger setting that controls the location for loading segments of ELF images.
show elf zero-extra-segment-bytes
Displays the debugger setting that controls zeroing of bytes when loading segments of ELFimages to the target.
show endian
Displays the byte order setting in use by the debugger.
show escape-strings
Displays the setting for controlling how special characters in strings are printed on the debuggercommand line.
show escapes-in-filenames
Displays the setting for controlling the use of special characters in paths.
show listsize
Displays the number of source lines that the list command displays.
show idau-region
Displays the currently specified Implementation Defined Attribution Unit (IDAU) regionparameters.
show mmu use-cache-for-phys-reads
Displays the MMU setting that controls the coherency between translation table memory readsand cache data.
show os
Displays the Operating System (OS) control settings.
show print
Displays the debugger print settings.
show semihosting
Displays the semihosting settings in the debugger.
show solib-search-path
Displays the search paths in use by the debugger when searching for shared libraries.
show step-mode
Displays the step setting for functions without debug information.
show stop-on-solib-events
Displays the debugger setting that controls whether execution stops when shared library eventsoccur.
1 Arm® Debugger commands1.2 Arm® Debugger commands listed in groups
102272_2020.1M0_00_en Copyright © 2020 Arm Limited or its affiliates. All rights reserved. 1-45Non-Confidential

show substitute-path
Displays the search path substitution rules in use by the debugger when searching for sourcefiles.
show sysroot, show solib-absolute-prefix
Displays the system root directory in use by the debugger when searching for shared librarysymbols.
show trust-ro-sections-for-opcodes
Displays the debugger setting that controls whether the debugger can read opcodes from read-only sections of images on the host workstation rather than from the target itself.
show version
Displays the version number of the debugger.
show wildcard-style
Displays the wildcard style for pattern matching.
Enter help followed by a command name for more information on a specific command.
Related references1.3.153 show on page 1-1461.3.154 show architecture on page 1-1461.3.155 show arm on page 1-1461.3.156 show auto-solib-add on page 1-1471.3.157 show backtrace on page 1-1471.3.158 show blocking-run-control on page 1-1481.3.159 show breakpoint on page 1-1481.3.160 show case-insensitive-source-matching on page 1-1481.3.162 show debug-agent on page 1-1491.3.163 show debug-from on page 1-1491.3.164 show directories on page 1-1501.3.165 show dtsl-options on page 1-1501.3.166 show dtsl-temporary-directory on page 1-1501.3.167 show elf cache-uninitialized-sections on page 1-1501.3.168 show elf load-segments-at-p_paddr on page 1-1511.3.169 show elf zero-extra-segment-bytes on page 1-1511.3.170 show endian on page 1-1511.3.171 show escape-strings on page 1-1511.3.172 show escapes-in-filenames on page 1-1521.3.174 show listsize on page 1-1521.3.176 show os on page 1-1531.3.177 show print on page 1-1531.3.178 show semihosting on page 1-1541.3.179 show sysroot, show solib-absolute-prefix on page 1-1551.3.180 show solib-search-path on page 1-1561.3.181 show step-mode on page 1-1561.3.182 show stop-on-solib-events on page 1-1561.3.183 show substitute-path on page 1-1571.3.185 show trust-ro-sections-for-opcodes on page 1-1571.3.186 show version on page 1-158
1 Arm® Debugger commands1.2 Arm® Debugger commands listed in groups
102272_2020.1M0_00_en Copyright © 2020 Arm Limited or its affiliates. All rights reserved. 1-46Non-Confidential

1.3.187 show wildcard-style on page 1-1581.3.175 show mmu use-cache-for-phys-reads on page 1-152
1.2.22 show elf
show elf commands in Arm Debugger.
show elf cache-uninitialized-sections
Displays the debugger setting that controls whether uninitialized sections are cached.
show elf load-segments-at-p_paddr
Displays the debugger setting that controls the location for loading segments of ELF images.
show elf zero-extra-segment-bytes
Displays the debugger setting that controls zeroing of bytes when loading segments of ELFimages to the target.
Enter help followed by a command name for more information on a specific command.
Related references1.3.167 show elf cache-uninitialized-sections on page 1-1501.3.168 show elf load-segments-at-p_paddr on page 1-1511.3.169 show elf zero-extra-segment-bytes on page 1-151
1.2.23 flash
List of all the Arm Debugger commands that controls flash accesses and displays information aboutspecific flash devices.
flash load
Loads sections from an image into one or more flash devices.
flash load-multiple
Simultaneously load multiple flash image sections from multiple images, to one or more flashdevices.
info flash
Displays information about the flash devices on the current target.
Enter help followed by a command name for more information on a specific command. Note
To use this command you must check that flash device support is available for your target. If it is notavailable, you must write your own flash algorithm for this command to work.
Related references1.3.54 info flash on page 1-881.3.37 flash load on page 1-771.3.38 flash load-multiple on page 1-77
1.2.24 Support
List of all the miscellaneous Arm Debugger commands.
define
Enables you to derive new user-defined commands from existing commands.
1 Arm® Debugger commands1.2 Arm® Debugger commands listed in groups
102272_2020.1M0_00_en Copyright © 2020 Arm Limited or its affiliates. All rights reserved. 1-47Non-Confidential

help
Displays help information for a specific command or a group of commands listed according tospecific debugging tasks.
info capabilities
Displays a list of capabilities for the target device that is currently connected to the debugger.
info inst-sets
Displays the available instruction sets.
pause
Pauses the execution of a script for a specified period of time.
preprocess
Displays the preprocessed expression, not the evaluated expression.
quit, exit
Quits the debugger session.
set arm
Controls the behavior of the debugger when selecting the instruction set for disassembly andsetting breakpoints.
set endian
Specifies the byte order for use by the debugger.
set semihosting
Controls the semihosting settings in the debugger.
shell
Runs a shell command within the debug session.
show architecture
Displays the architecture of the target.
show arm
Displays the instruction set settings in use by the debugger for disassembly and settingbreakpoints.
show semihosting
Displays the semihosting settings in the debugger.
show version
Displays the version number of the debugger.
show endian
Displays the byte order setting in use by the debugger.
stdin
Specifies semihosting input requested by application code.
unset
Modifies the current debugger settings.
Enter help followed by a command name for more information on a specific command.
1 Arm® Debugger commands1.2 Arm® Debugger commands listed in groups
102272_2020.1M0_00_en Copyright © 2020 Arm Limited or its affiliates. All rights reserved. 1-48Non-Confidential

Related references1.3.106 preprocess on page 1-1171.3.105 pause on page 1-1161.3.152 shell on page 1-1461.3.109 quit, exit on page 1-1191.3.186 show version on page 1-1581.3.154 show architecture on page 1-1461.3.118 set arm on page 1-1241.3.155 show arm on page 1-1461.3.132 set endian on page 1-1331.3.170 show endian on page 1-1511.3.141 set semihosting on page 1-1391.3.178 show semihosting on page 1-1541.3.191 stdin on page 1-1601.3.206 unset on page 1-173
1 Arm® Debugger commands1.2 Arm® Debugger commands listed in groups
102272_2020.1M0_00_en Copyright © 2020 Arm Limited or its affiliates. All rights reserved. 1-49Non-Confidential
1.3 Arm® Debugger commands listed in alphabetical orderDisplays all the commands in alphabetical order.
This section contains the following subsections:• 1.3.1 add-symbol-file on page 1-54.• 1.3.2 advance on page 1-54.• 1.3.3 append on page 1-56.• 1.3.4 assemble on page 1-57.• 1.3.5 awatch on page 1-59.• 1.3.6 break on page 1-60.• 1.3.7 break-script on page 1-61.• 1.3.8 break-set-property on page 1-62.• 1.3.9 break-stop-on-threads, break-stop-on-cores on page 1-63.• 1.3.10 break-stop-on-vmid on page 1-63.• 1.3.11 cache flush on page 1-64.• 1.3.12 cache list on page 1-64.• 1.3.13 cache print on page 1-64.• 1.3.14 cd on page 1-65.• 1.3.15 clear on page 1-65.• 1.3.16 clearwatch on page 1-66.• 1.3.17 condition on page 1-67.• 1.3.18 continue on page 1-67.• 1.3.19 define on page 1-68.• 1.3.20 delete breakpoints on page 1-68.• 1.3.21 delete memory on page 1-69.• 1.3.22 directory, set directories on page 1-69.• 1.3.23 disable breakpoints on page 1-70.• 1.3.24 disable memory on page 1-70.• 1.3.25 disassemble on page 1-71.• 1.3.26 discard-symbol-file on page 1-71.• 1.3.27 document on page 1-72.• 1.3.28 down on page 1-72.• 1.3.29 down-silently on page 1-72.• 1.3.30 dump on page 1-73.• 1.3.31 echo on page 1-74.• 1.3.32 enable breakpoints on page 1-74.• 1.3.33 enable memory on page 1-75.• 1.3.34 end on page 1-75.• 1.3.35 file, symbol-file on page 1-76.• 1.3.36 finish on page 1-77.• 1.3.37 flash load on page 1-77.• 1.3.38 flash load-multiple on page 1-77.• 1.3.39 frame on page 1-79.• 1.3.40 handle on page 1-79.• 1.3.41 hbreak on page 1-80.• 1.3.42 help on page 1-82.• 1.3.43 if on page 1-83.• 1.3.44 ignore on page 1-84.• 1.3.45 info on page 1-84.• 1.3.46 info all-registers on page 1-84.• 1.3.47 info breakpoints, info watchpoints on page 1-85.• 1.3.48 info breakpoints capabilities, info watchpoints capabilities on page 1-85.• 1.3.49 info capabilities on page 1-86.• 1.3.50 info capability on page 1-86.• 1.3.51 info classes on page 1-87.
1 Arm® Debugger commands1.3 Arm® Debugger commands listed in alphabetical order
102272_2020.1M0_00_en Copyright © 2020 Arm Limited or its affiliates. All rights reserved. 1-50Non-Confidential

• 1.3.52 info cores on page 1-88.• 1.3.53 info files, info target on page 1-88.• 1.3.54 info flash on page 1-88.• 1.3.55 info frame on page 1-89.• 1.3.56 info functions on page 1-89.• 1.3.57 info signals, info handle on page 1-89.• 1.3.58 info inst-sets on page 1-90.• 1.3.59 info locals on page 1-90.• 1.3.60 info members on page 1-90.• 1.3.61 info memory on page 1-91.• 1.3.62 info memory-parameters on page 1-92.• 1.3.63 info os on page 1-92.• 1.3.64 info os-log on page 1-93.• 1.3.65 info os-modules on page 1-93.• 1.3.66 info os-version on page 1-94.• 1.3.67 info overlays on page 1-94.• 1.3.68 info processes on page 1-94.• 1.3.69 info registers on page 1-95.• 1.3.70 info semihosting on page 1-95.• 1.3.71 info sharedlibrary on page 1-96.• 1.3.72 info signals, info handle on page 1-97.• 1.3.73 info sources on page 1-97.• 1.3.74 info stack, backtrace, where on page 1-97.• 1.3.75 info symbol on page 1-98.• 1.3.76 info files, info target on page 1-98.• 1.3.77 info threads on page 1-99.• 1.3.78 info variables on page 1-99.• 1.3.79 info breakpoints, info watchpoints on page 1-99.• 1.3.80 info breakpoints capabilities, info watchpoints capabilities on page 1-100.• 1.3.81 interrupt, stop on page 1-100.• 1.3.82 list on page 1-101.• 1.3.83 load on page 1-102.• 1.3.84 loadfile on page 1-102.• 1.3.85 log config on page 1-103.• 1.3.86 log file on page 1-103.• 1.3.87 memory on page 1-104.• 1.3.88 memory auto on page 1-106.• 1.3.89 memory debug-cache on page 1-106.• 1.3.90 memory fill on page 1-106.• 1.3.91 memory set on page 1-107.• 1.3.92 memory set_typed on page 1-109.• 1.3.93 mmu list memory-maps, mpu list memory-maps on page 1-109.• 1.3.94 mmu list tables, mpu list tables on page 1-110.• 1.3.95 mmu list translations on page 1-110.• 1.3.96 mmu memory-map, mpu memory-map on page 1-110.• 1.3.97 mmu print, mpu print on page 1-111.• 1.3.98 mmu translate on page 1-112.• 1.3.99 newvar on page 1-113.• 1.3.100 next on page 1-114.• 1.3.101 nexti on page 1-114.• 1.3.102 nexts on page 1-115.• 1.3.103 nosharedlibrary on page 1-115.• 1.3.104 output on page 1-115.• 1.3.105 pause on page 1-116.• 1.3.106 preprocess on page 1-117.• 1.3.107 print, inspect on page 1-117.
1 Arm® Debugger commands1.3 Arm® Debugger commands listed in alphabetical order
102272_2020.1M0_00_en Copyright © 2020 Arm Limited or its affiliates. All rights reserved. 1-51Non-Confidential

• 1.3.108 pwd on page 1-118.• 1.3.109 quit, exit on page 1-119.• 1.3.110 reload-symbol-file on page 1-119.• 1.3.111 reset on page 1-119.• 1.3.112 resolve on page 1-120.• 1.3.113 restore on page 1-121.• 1.3.114 run on page 1-122.• 1.3.115 rwatch on page 1-122.• 1.3.116 select-frame on page 1-123.• 1.3.117 set variable on page 1-124.• 1.3.118 set arm on page 1-124.• 1.3.119 set auto-solib-add on page 1-125.• 1.3.120 set backtrace on page 1-126.• 1.3.121 set blocking-run-control on page 1-126.• 1.3.122 set breakpoint on page 1-127.• 1.3.123 set case-insensitive-source-matching on page 1-128.• 1.3.124 set cde-coprocessors on page 1-128.• 1.3.125 set debug-agent on page 1-129.• 1.3.126 set debug-from on page 1-129.• 1.3.127 set dtsl-options on page 1-130.• 1.3.128 set dtsl-temporary-directory on page 1-130.• 1.3.129 set elf cache-uninitialized-sections on page 1-131.• 1.3.130 set elf load-segments-at-p_paddr on page 1-132.• 1.3.131 set elf zero-extra-segment-bytes on page 1-132.• 1.3.132 set endian on page 1-133.• 1.3.133 set escape-strings on page 1-133.• 1.3.134 set escapes-in-filenames on page 1-134.• 1.3.135 set idau-region on page 1-134.• 1.3.136 set listsize on page 1-135.• 1.3.137 set mmu use-cache-for-phys-reads on page 1-135.• 1.3.138 set os on page 1-136.• 1.3.139 set overlays enabled on page 1-137.• 1.3.140 set print on page 1-137.• 1.3.141 set semihosting on page 1-139.• 1.3.142 set sysroot, set solib-absolute-prefix on page 1-141.• 1.3.143 set solib-search-path on page 1-141.• 1.3.144 set step-mode on page 1-142.• 1.3.145 set stop-on-solib-events on page 1-142.• 1.3.146 set substitute-path on page 1-143.• 1.3.147 set sysroot, set solib-absolute-prefix on page 1-143.• 1.3.148 set trust-ro-sections-for-opcodes on page 1-144.• 1.3.149 set variable on page 1-144.• 1.3.150 set wildcard-style on page 1-145.• 1.3.151 sharedlibrary on page 1-145.• 1.3.152 shell on page 1-146.• 1.3.153 show on page 1-146.• 1.3.154 show architecture on page 1-146.• 1.3.155 show arm on page 1-146.• 1.3.156 show auto-solib-add on page 1-147.• 1.3.157 show backtrace on page 1-147.• 1.3.158 show blocking-run-control on page 1-148.• 1.3.159 show breakpoint on page 1-148.• 1.3.160 show case-insensitive-source-matching on page 1-148.• 1.3.161 show cde-coprocessors on page 1-149.• 1.3.162 show debug-agent on page 1-149.• 1.3.163 show debug-from on page 1-149.
1 Arm® Debugger commands1.3 Arm® Debugger commands listed in alphabetical order
102272_2020.1M0_00_en Copyright © 2020 Arm Limited or its affiliates. All rights reserved. 1-52Non-Confidential

• 1.3.164 show directories on page 1-150.• 1.3.165 show dtsl-options on page 1-150.• 1.3.166 show dtsl-temporary-directory on page 1-150.• 1.3.167 show elf cache-uninitialized-sections on page 1-150.• 1.3.168 show elf load-segments-at-p_paddr on page 1-151.• 1.3.169 show elf zero-extra-segment-bytes on page 1-151.• 1.3.170 show endian on page 1-151.• 1.3.171 show escape-strings on page 1-151.• 1.3.172 show escapes-in-filenames on page 1-152.• 1.3.173 show idau-region on page 1-152.• 1.3.174 show listsize on page 1-152.• 1.3.175 show mmu use-cache-for-phys-reads on page 1-152.• 1.3.176 show os on page 1-153.• 1.3.177 show print on page 1-153.• 1.3.178 show semihosting on page 1-154.• 1.3.179 show sysroot, show solib-absolute-prefix on page 1-155.• 1.3.180 show solib-search-path on page 1-156.• 1.3.181 show step-mode on page 1-156.• 1.3.182 show stop-on-solib-events on page 1-156.• 1.3.183 show substitute-path on page 1-157.• 1.3.184 show sysroot, show solib-absolute-prefix on page 1-157.• 1.3.185 show trust-ro-sections-for-opcodes on page 1-157.• 1.3.186 show version on page 1-158.• 1.3.187 show wildcard-style on page 1-158.• 1.3.188 silence on page 1-158.• 1.3.189 source on page 1-158.• 1.3.190 start on page 1-160.• 1.3.191 stdin on page 1-160.• 1.3.192 step on page 1-161.• 1.3.193 stepi on page 1-161.• 1.3.194 steps on page 1-162.• 1.3.195 tbreak on page 1-162.• 1.3.196 thbreak on page 1-164.• 1.3.197 thread, core on page 1-165.• 1.3.198 thread apply, core apply on page 1-166.• 1.3.199 trace clear on page 1-167.• 1.3.200 trace dump on page 1-167.• 1.3.201 trace info on page 1-168.• 1.3.202 trace list on page 1-169.• 1.3.203 trace report on page 1-169.• 1.3.204 trace start on page 1-172.• 1.3.205 trace stop on page 1-173.• 1.3.206 unset on page 1-173.• 1.3.207 unsilence on page 1-174.• 1.3.208 up on page 1-174.• 1.3.209 up-silently on page 1-175.• 1.3.210 usecase help on page 1-175.• 1.3.211 usecase list on page 1-176.• 1.3.212 usecase run on page 1-176.• 1.3.213 wait on page 1-177.• 1.3.214 watch on page 1-178.• 1.3.215 watch-set-property on page 1-179.• 1.3.216 whatis on page 1-180.• 1.3.217 while on page 1-180.• 1.3.218 x on page 1-181.
1 Arm® Debugger commands1.3 Arm® Debugger commands listed in alphabetical order
102272_2020.1M0_00_en Copyright © 2020 Arm Limited or its affiliates. All rights reserved. 1-53Non-Confidential

1.3.1 add-symbol-file
Loads additional debug information into the debugger.
Syntax
add-symbol-file <filename> [<offset>] [-s <section> <address>]...
Where:
<filename>Specifies the image, shared library, or Operating System (OS) module.
Note
Shared library and OS modules depend on connections that support loading these types of files.This option pends the file until the library or OS module is loaded.
<offset>Specifies the offset that is added to all addresses within the image. If <offset> is not specifiedthen the default for:• An image is zero.• A shared library is the load address of the library. If the application has not currently loaded
the specified library then the request is pended until the library is loaded and the offset canbe determined.
s
For relocatable objects, this specifies the address to which a section was relocated.
<section>
Specifies the name of the relocated section.
<address>
Specifies the address of the section. This can be either an address or an expression that evaluatesto an address. You can also specify the address space.
You can use the info files command to display information about the loaded files.
Examplesadd-symbol-file myFile.axf # Load symbols at entry point+0x0000add-symbol-file myLib.so # Pends symbol file for shared libraryadd-symbol-file myModule.ko # Pends symbol file for OS moduleadd-symbol-file myFile.axf 0x2000 # Load symbols at entry point+0x2000add-symbol-file relocate.o -s .text 0x1000 -s .data 0x2000 # Load symbols from relocate.o with # section .text relocated to 0x1000 and # section .data relocated to 0x2000add-symbol-file vmlinux N:0 # Load symbols at the non-secure address 0x00add-symbol-file vmlinux EL2N:0x4080000000 # Load symbols for the non-secure address space EL2N:0x4080000000
Related references1.2.7 Files on page 1-31
1.3.2 advance
Sets a temporary breakpoint at the specified address and calls the debugger continue command. Use theadvance command to halt execution at a particular point in your code, for example a specific function,source code line number, or instruction memory address.
Execution continues until it hits the temporary breakpoint (or until execution halts for another reason, forexample the end of the program is reached).
Temporary breakpoints are deleted when hit.
1 Arm® Debugger commands1.3 Arm® Debugger commands listed in alphabetical order
102272_2020.1M0_00_en Copyright © 2020 Arm Limited or its affiliates. All rights reserved. 1-54Non-Confidential

Syntax
advance [-p] [<filename>:]<line_num>
advance [-p] [<filename>:]<function>
advance [-p] [<filename>:]<label>
advance [-p] *<address>
advance +<offset> | -<offset>
Where:
-p
Creates pending breakpoints for unrecognized locations.
By default, specifying an unrecognized breakpoint location (for example, a non-existentfunction name) results in an error.
The -p option creates pending breakpoints for unrecognized locations instead. This is usefulwhen debugging shared libraries. Shared libraries are loaded on demand, so locations areunrecognized until the library is loaded. For more information, see Pending breakpoints andwatchpoints.
Note
If you want to debug a shared library, you must load debug symbols from the shared library aswell as the application itself. For more information, see About debugging shared libraries.
<filename>
Sets a temporary breakpoint on a function, label, or line number in the specified source file.
Functions and labels are usually unique, so the debugger can identify the breakpoint locationfrom the name alone.
However, if you have ambiguous function or label names in your source code, for example staticfunctions named myfunc in both file_a.c and file_b.c, use the filename to identify theprecise function. For example, advance file_a.c:myfunc.
<line_num>
Sets a breakpoint at the specified line number in the source file <filename>.
If no <filename> is specified, the debugger assumes the source file containing the currentlocation.
<function>
Sets a breakpoint on the specified function name.
<label>Sets a breakpoint on the specified assembly label.
Note
You can only set breakpoints on labels that are present in the executable image. Toolchainsmight not preserve all symbol names in the final image by default. For example, with ArmCompiler 5 you must specify either the KEEP assembler directive or the armasm --keep optionto retain local symbols.
1 Arm® Debugger commands1.3 Arm® Debugger commands listed in alphabetical order
102272_2020.1M0_00_en Copyright © 2020 Arm Limited or its affiliates. All rights reserved. 1-55Non-Confidential

*<address>
Sets a breakpoint at the specified address. Specify either an address (for example advance*0x8000024C) or an expression that evaluates to an address (for example advance *$R4+64 oradvance *$PC+256). For more information about expressions, see Expressions within ArmDevelopment Studio on page 1-10.
+<offset> | -<offset>
Sets a breakpoint on the source code line offset from the current location by the specifiedamount.
Usage
The advance command returns control as soon as the target is running. You can use the wait commandto block the debugger from returning control until, for example, the application completes or abreakpoint is hit. This is useful if you are scripting Arm Development Studio commands and do not wantsubsequent commands to run until after the breakpoint has been reached.
Examplesadvance func1 # To set a temporary breakpoint at func1, then resume executionadvance -p lib.c:foo # To set a temporary breakpoint on function foo() in lib.c, then resume execution. # If lib.c is unrecognized (for example, if lib.c is compiled to a shared library), # the debugger creates a pending breakpoint.
Related references1.2.2 Execution control on page 1-241.3.18 continue on page 1-671.3.213 wait on page 1-1771.1.3 Expressions within Arm® Development Studio on page 1-10Related informationKEEP directive - (armasm)–keep command-line option (armasm)About debugging shared librariesPending breakpoints and watchpoints
1.3.3 append
Reads data from memory or the result of an expression and appends it to an existing file.
Syntax
append [<format>] memory <filename> <start_address> {<end_address> | +<size>}
append [<format>] value <filename> <expression>
Where:
<format>
Specifies the output format:
binary
Binary. This is the default setting.
<filename>
Specifies the file.
<start_address>
Specifies the start address for the memory.
1 Arm® Debugger commands1.3 Arm® Debugger commands listed in alphabetical order
102272_2020.1M0_00_en Copyright © 2020 Arm Limited or its affiliates. All rights reserved. 1-56Non-Confidential

<end_address>
Specifies the inclusive end address for the memory.
+<size>
Specifies the size of the region.
<expression>
Specifies an expression that is evaluated and the result is returned.
Examplesappend memory myFile.bin 0x8000 0x8FFF # Append content of memory 0x8000-0x8FFF # to binary file myFile.binappend value myFile.bin myArray # Append content of myArray # to binary file myFile.bin
Related references1.2.7 Files on page 1-311.2.9 Memory group on page 1-331.1.3 Expressions within Arm® Development Studio on page 1-101.1.4 Built-in functions within Arm® Development Studio expressions on page 1-111.1.8 Usage of printf() style format string within Arm® Development Studio on page 1-15
1.3.4 assemble
Writes assembler instructions to memory.
The debugger performs inline assembly of the instructions between the assemble and end commands,using the specified instruction set, and then writes them to the specified memory location.
This command is useful for making small changes to your code without recompiling. For larger codechanges or to make use of a wider set of assembler directives you must use the standalone assembler toolprovided by your compiler toolchain.
Note
The assemble command does not change the processor state. You must ensure that the processor is in thecorrect state to execute the new instructions.
Syntax
assemble <address> [<InstructionSet>] # comment
[<Instruction>] ; comment
...
end # comment
Where:
<address>
Specifies the address to write the first instruction to. Subsequent instructions are written tofollowing memory.
1 Arm® Debugger commands1.3 Arm® Debugger commands listed in alphabetical order
102272_2020.1M0_00_en Copyright © 2020 Arm Limited or its affiliates. All rights reserved. 1-57Non-Confidential

<InstructionSet>Specifies the instruction set to assemble to. This can be:• ARM• Thumb• A32• T32• A64
You can only specify an instruction set that is available for the processor. If you do not specifythe instruction set, it defaults to the instruction set state at the specified address.
<Instruction>
Assembler instruction to write to memory. You can specify multiple instructions. Eachinstruction must be on a separate line.
You can also specify supported directives. The supported directives are:• ARM• THUMB• CODE32• CODE16• A64• DCB• DCD• DCDU• DCDO• DCFD• DCFDU• DCFS• DCFSU• DCI• DCQ• DCQU• DCW• DCWU
Note
The syntax for the instructions and directives follows the Arm assembly language syntax.
<end>
Specifies the end of the assemble command. The list of assembler instructions are written tomemory only when you enter end.
<comment>
For comments after an assemble or end command, use the hash # character at the beginning ofyour comment.
For comments after an instruction or directive, use the semicolon ; character at the beginning ofyour comment.
Examplesassemble $pc ARM # Assemble the following Arm instructions ADD r1,r2,r3 ; Write the A32 add instruction to address $PC SUB r2,r3,r4 ; Write the A32 sub instruction to address $PC+4 DMB ; Write Data Memory Barrier to $PC+8 THUMB ; Assemble the following Thumb instructions MOVS r0,#10 ; Write T32 move instruction to $PC+12end # End of the assemble commandassemble 0x00008000 # Assemble the following directives
1 Arm® Debugger commands1.3 Arm® Debugger commands listed in alphabetical order
102272_2020.1M0_00_en Copyright © 2020 Arm Limited or its affiliates. All rights reserved. 1-58Non-Confidential

DCB 0,1,2,3 ; Write four bytes to 0x00008000 DCD 7,8 ; Write two words to 0x00008004 and 0x00008008end # End of the assemble command
Related references1.2.9 Memory group on page 1-33Related informationArm Compiler armasm User GuideSyntax of source lines in assembly language
1.3.5 awatch
Sets a watchpoint for a data symbol. The debugger stops the target when the memory at the specifiedaddress is read or written.
This command records the ID of the watchpoint in a new debugger variable, $<n> , where <n> is anumber. You can use this variable, in a script, to delete or modify the watchpoint behavior. If $<n> is thelast or second-to-last debugger variable, then you can also access the ID using $ or $$, respectively.
Watchpoints are only supported on scalar values.
The availability of watchpoints depends on your target. In the case of Linux application debug usinggdbserver, the availability of watchpoints also depends on the Linux kernel version and configuration.
The address of the instruction that triggers the watchpoint might not be the address shown in the PCregister. This is because of pipelining effects.
Syntax
awatch [-d] [-p][-w <width>] {[<filename>:]<symbol> | *<address>} [vmid <number>] [if<condition>]
Where:
-d
Creates the watchpoint disabled.
-p
Specifies whether or not the resolution of an unrecognized watchpoint location results in apending watchpoint being created.
-w <width>
Specifies the width to watch at the given address, in bits. Accepted values are: 8, 16, 32, and 64if supported by the target. This parameter is optional.
The width defaults to:• 32 bits for an address.• The width corresponding to the type of the symbol or expression, if entered.
<filename>
Specifies the file.
<symbol>
Specifies a global/static data symbol. For arrays or structs you must specify the element ormember.
*<address>
Specifies the address. This can be either an address or an expression that evaluates to an address.
1 Arm® Debugger commands1.3 Arm® Debugger commands listed in alphabetical order
102272_2020.1M0_00_en Copyright © 2020 Arm Limited or its affiliates. All rights reserved. 1-59Non-Confidential

vmid <number>
Specifies the Virtual Machine ID (VMID) to apply the watchpoint to. This can be either aninteger or an expression that evaluates to an integer. Applicable only on targets which supporthypervisor / virtual machine debugging.
if <condition>
Specifies the condition which must evaluate to true at the time the watchpoint is triggered forthe target to stop. You can create several conditional watchpoints, but when a conditionalwatchpoint is enabled, no other watchpoints (regardless of whether they are conditional) can beenabled.
Examplesawatch myVar1 # Set read/write watchpoint on myVar1awatch *0x80D4 # Set read/write watchpoint on address 0x80D4awatch myVar1 if myVar1 == 2 # Set read/write watchpoint on myVar1 which # will only be hit if myVar1 evaluates to 2awatch myVar1 if $LR & 0xFF == 0x12 # Set read/write watchpoint on myVar1 which # will only be hit if ($LR & 0xFF) evaluates # to 0x12 when myVar1 is accessed
Related references1.3.214 watch on page 1-1781.3.115 rwatch on page 1-1221.3.16 clearwatch on page 1-661.2.1 Breakpoints and watchpoints on page 1-22
1.3.6 break
Sets an execution breakpoint at a specific location. You can also specify a conditional breakpoint byusing an if statement that stops only when the conditional expression evaluates to true.
This command records the ID of the breakpoint in a new debugger variable, $<n> , where <n> is anumber. You can use this variable, in a script, to delete or modify the breakpoint behavior. If $<n> is thelast or second-to-last debugger variable, then you can also access the ID using $ or $$ respectively.
Note
Breakpoints that are set within a shared object or kernel module become pending when the shared objector kernel module is unloaded.
Use set breakpoint to control the automatic breakpoint behavior when using this command.
Syntax
break [-d] [-p] [[<filename>:] <location> | *<address>][[thread|core] <number>...][if <expression>]
Where:
-d
Disables the breakpoint immediately after creation.
-p
Specifies whether or not the resolution of an unrecognized breakpoint location results in apending breakpoint being created.
<filename>
Specifies the file.
1 Arm® Debugger commands1.3 Arm® Debugger commands listed in alphabetical order
102272_2020.1M0_00_en Copyright © 2020 Arm Limited or its affiliates. All rights reserved. 1-60Non-Confidential

<location>
Specifies the location:
<line_num>
is a line number.
<function>
is a function name.
<label>
is a label name.
+<offset> | -<offset>
Specifies the line offset from the current location.
*<address>
Specifies the address. This can be either an address or an expression that evaluates to an address.
<number>
Specifies one or more threads or processors to apply the breakpoint to. You can use $thread torefer to the current thread. If <number> is not specified then all threads are affected.
<expression>
Specifies an expression that is evaluated when the breakpoint is hit.
If no arguments are specified then a breakpoint is set at the current PC.
You can use info breakpoints to display the number and status of all breakpoints and watchpoints.
Examplesbreak *0x8000 # Set breakpoint at address 0x8000break *0x8000 thread $thread # Set breakpoint at address 0x8000 on # current threadbreak *0x8000 thread 1 3 # Set breakpoint at address 0x8000 on # threads 1 and 3break main # Set breakpoint at address of main()break SVC_Handler # Set breakpoint at address of label SVC_Handlerbreak +1 # Set breakpoint at address of next source linebreak my_File.c:main # Set breakpoint at address of main() in my_File.cbreak my_File.c:10 # Set breakpoint at address of line 10 in my_File.cbreak function1 if x>0 # Set conditional breakpoint that stops when x>0break *0x80000000 if $thread==32 # Set conditional breakpoint that stops execution # when thread ID is 32.break *0x80000000 if $pid==928 # Set conditional breakpoint that stops execution # when process ID is 928.
Related references1.3.41 hbreak on page 1-801.3.195 tbreak on page 1-1621.3.196 thbreak on page 1-1641.3.112 resolve on page 1-1201.3.15 clear on page 1-651.2.1 Breakpoints and watchpoints on page 1-221.1.3 Expressions within Arm® Development Studio on page 1-101.1.4 Built-in functions within Arm® Development Studio expressions on page 1-111.1.8 Usage of printf() style format string within Arm® Development Studio on page 1-15
1.3.7 break-script
Assigns a script file to a specific breakpoint. The script executes when the breakpoint is triggered.
1 Arm® Debugger commands1.3 Arm® Debugger commands listed in alphabetical order
102272_2020.1M0_00_en Copyright © 2020 Arm Limited or its affiliates. All rights reserved. 1-61Non-Confidential

Syntax
break-script <number> [<filename>]
Where:
<number>
Specifies the breakpoint number. This is the number assigned by the debugger when it is set.You can use info breakpoints to display the number and status of all breakpoints andwatchpoints.
<filename>
Specifies the script file that you want to execute when the specified breakpoint is triggered. If<filename> is not specified then the currently assigned <filename> is removed from thebreakpoint.
UsageBe aware of the following when using scripts with breakpoints:• You must not assign a script to a breakpoint that has sub-breakpoints. If you do, the debugger
attempts to execute the script for each sub-breakpoint. If this happens, an error message is displayed.• Take care with the commands you use in a script that is attached to a breakpoint. For example, if you
use the quit command in script, the debugger disconnects from the target when the breakpoint is hit.• If you put the continue command at the end of a script, this has the same effect as setting the
Continue Execution checkbox on the Breakpoint Properties dialog box.
Examplesbreak-script 1 myScript.ds # Run myScript.ds when breakpoint 1 is triggered
Related references1.2.1 Breakpoints and watchpoints on page 1-22
1.3.8 break-set-property
Updates the properties of an existing breakpoint.
Syntax
break-set-property <number> <property>
Where:
<number>
Specifies the breakpoint number. This is the number assigned by the debugger when it is set.You can use info breakpoints to display the number and status of all breakpoints.
<property>
Specifies the property to set. The valid properties are:
if[<expression>]
Specifies an expression that is evaluated when the breakpoint is hit. If the value of theexpression evaluates to true, then the debugger stops the target, otherwise executionresumes. If no expression is specified then the breakpoint condition is deleted.
<core[id]>
The current core ID. You can use info cores, info processes, or info threads todisplay the ID numbers.
1 Arm® Debugger commands1.3 Arm® Debugger commands listed in alphabetical order
102272_2020.1M0_00_en Copyright © 2020 Arm Limited or its affiliates. All rights reserved. 1-62Non-Confidential

<thread[id]>
The current thread ID. You can use info cores, info processes, or info threads todisplay the ID numbers.
Note
This command supports other <properties> depending on your target. Use the info breakpointscapabilities command to display a list of <properties> that you can use for the current connection.
Examplesbreak-set-property 4 if myVar1 == 2 # Update the 'if' property of breakpoint 4, # meaning the breakpoint will only be hit if # myVar1 evaluates to 2
1.3.9 break-stop-on-threads, break-stop-on-cores
Applies an existing breakpoint to one or more threads or processors.
Syntax
break-stop-on-threads <number> [<id>]...
break-stop-on-cores <number> [<id>]...
Where:
<number>
Specifies the breakpoint number. This is a unique breakpoint number assigned by the debuggerwhen it is set. You can use info breakpoints to display the breakpoint numbers and status.
<id>
Specifies one or more threads or processors to apply the breakpoint to. You can use $thread or$core to refer to the current thread or processor. If <id> is not specified then apply thebreakpoint to all threads or processors. You can use info cores, or info threads to displaythe <id> numbers.
Examplesbreak-stop-on-threads 1 2 # Apply breakpoint 1 to thread 2break-stop-on-threads 4 9 11 # Apply breakpoint 4 to threads 9 and 11break-stop-on-cores 4 # Apply breakpoint 4 to all processors
Related references1.2.1 Breakpoints and watchpoints on page 1-22
1.3.10 break-stop-on-vmid
Applies an existing hardware breakpoint to a Virtual Machine (VM).
Syntax
break-stop-on-vmid <number> [<vmid>]
Where:
<number>
Specifies the hardware breakpoint number. This is a unique breakpoint number assigned by thedebugger when it is set. You can use info breakpoints to display the breakpoint numbers andstatus.
1 Arm® Debugger commands1.3 Arm® Debugger commands listed in alphabetical order
102272_2020.1M0_00_en Copyright © 2020 Arm Limited or its affiliates. All rights reserved. 1-63Non-Confidential

<vmid>
Specifies the Virtual Machine ID (VMID) to apply the breakpoint to. This can be either aninteger or an expression that evaluates to an integer. If <vmid> is not specified then the VMeffect is removed from the breakpoint.
Examplesbreak-stop-on-vmid 1 2 # Apply hardware breakpoint 1 to vmid 2
Related references1.2.1 Breakpoints and watchpoints on page 1-22
1.3.11 cache flush
Flushes the caches of the current CPU. This might affect the caches of the other CPUs depending on thecache hierarchy. The precise behavior is implementation defined.
Note
This command might be slow depending on the size of the caches and the available flush methods.
Syntax
cache flush
Examplescache flush # Flush the caches of the current CPU.
Related references1.2.10 Cache on page 1-35Related informationAbout debugging MMUs
1.3.12 cache list
Lists the caches and related information available for the current core. The output is implementationdefined.
Syntaxcache list
Note
The availability of the command and the available caches depend on the specific device that thedebugger is connected to.
Examplescache list # Lists the available caches and views. An example output is: L1D: L1 data cache, size=32k, views: [tags, tlb] ... L1I: L1 instruction cache, size=2k, views: [tags, tlb] ...
Related references1.2.10 Cache on page 1-35
1.3.13 cache print
Provides a structured view of the cache data in the current core. The output is implementation defined.
1 Arm® Debugger commands1.3 Arm® Debugger commands listed in alphabetical order
102272_2020.1M0_00_en Copyright © 2020 Arm Limited or its affiliates. All rights reserved. 1-64Non-Confidential

Syntax
cache print <cache> [<view>]...
Where:
<cache>
Specifies the cache name.
<view>
Specifies the view name for the selected cache. For each cache, views provide access todifferent sets of data, or data presented in different formats.
Note
The availability of the command and the available caches depend on the specific device that thedebugger is connected to.
Examplescache print L1D # Prints L1 data cache. An example output is: tags: ... tlb: ...cache print L1D tags # Prints L1 data cache. An example output is: tags: ...
Related references1.2.10 Cache on page 1-35
1.3.14 cd
Changes the current working directory.
Syntax
cd <dir>
Where:
<dir>
Specifies the directory.
Examplescd "\usr\source" # Change the current working directory
Related references1.2.7 Files on page 1-31
1.3.15 clear
Deletes a breakpoint at a specific location.
Syntax
clear [[<filename>:]<location> | *<address>]
Where:
<filename>
Specifies the file.
1 Arm® Debugger commands1.3 Arm® Debugger commands listed in alphabetical order
102272_2020.1M0_00_en Copyright © 2020 Arm Limited or its affiliates. All rights reserved. 1-65Non-Confidential

<location>
Specifies the location:
<line_num>
is a line number.
<function>
is a function name.
<label>
is a label name.
+<offset> | -<offset>
is a line offset from the current location.
*<address>
Specifies the address. This can be either an address or an expression that evaluates to an address.
If no arguments are specified then the breakpoint at the current PC is deleted.
Examplesclear *0x8000 # Clear breakpoint at address 0x8000clear main # Clear breakpoint at address of main()clear SVC_Handler # Clear breakpoint at address of label SVC_Handlerclear +1 # Clear breakpoint at address of next source lineclear my_File.c:main # Clear breakpoint at address of main() in my_File.cclear my_File.c:10 # Clear breakpoint at address of line 10 in my_File.c
Related references1.3.6 break on page 1-601.3.41 hbreak on page 1-801.3.195 tbreak on page 1-1621.3.196 thbreak on page 1-1641.3.112 resolve on page 1-1201.2.1 Breakpoints and watchpoints on page 1-22
1.3.16 clearwatch
Deletes a watchpoint at a specific location.
Syntax
clearwatch [[<filename>:]<symbol> | *<address>]
Where:
<filename>
Specifies the file.
<symbol>
Specifies a global/static data symbol. For arrays or structs you must specify the element ormember.
*<address>
Specifies the address. This can be either an address or an expression that evaluates to an address.
Examplesclearwatch *0x8000 # Clear watchpoint at address 0x8000clearwatch my_File.c:myVar # Clear watchpoint at address of myVar in my_File.c
1 Arm® Debugger commands1.3 Arm® Debugger commands listed in alphabetical order
102272_2020.1M0_00_en Copyright © 2020 Arm Limited or its affiliates. All rights reserved. 1-66Non-Confidential

Related references1.3.214 watch on page 1-1781.3.115 rwatch on page 1-1221.3.5 awatch on page 1-591.2.1 Breakpoints and watchpoints on page 1-22
1.3.17 condition
Sets a stop condition for a specific breakpoint or watchpoint. If the value of a specific expressionevaluates to true then the debugger stops the target otherwise execution resumes.
Syntax
condition <number> [<expression>]
Where:
<number>
Specifies the breakpoint or watchpoint number. This is the number assigned by the debuggerwhen it is set. You can use info breakpoints to display the number and status of allbreakpoints and watchpoints.
<expression>
Specifies an expression that is evaluated when the breakpoint or watchpoint is hit. If no<expression> is specified then the breakpoint or watchpoint condition is deleted.
Examplescondition 1 myVar<5 # Set break condition myVar<5 for breakpoint number 1
Related references1.2.1 Breakpoints and watchpoints on page 1-22
1.3.18 continue
Continues running the target. fg is an alias for the continue command.
Note
Control is returned as soon as the target is running. You can use the wait command to block the debuggerfrom returning control until either the application completes or a breakpoint is hit.
Syntax
continue [<count>]
Where:
<count>
Specifies the number of times to ignore the breakpoint or watchpoint at the current location.
Examplescontinue # Continue running targetcontinue 5 # Continue running target, ignoring current breakpoint 5 times
Related references1.2.2 Execution control on page 1-241.3.2 advance on page 1-54
1 Arm® Debugger commands1.3 Arm® Debugger commands listed in alphabetical order
102272_2020.1M0_00_en Copyright © 2020 Arm Limited or its affiliates. All rights reserved. 1-67Non-Confidential

1.3.19 define
Enables you to derive new user-defined commands from existing commands.
User-defined commands accept arguments separated by whitespace.
Syntax
define <cmd>
...
end
Where:
<cmd>Specifies the command name followed by one or more debugger commands. Enter eachdebugger command on a new line and terminate the define command by using the endcommand. You can use arguments by using $arg0...$argn, or $argv for all arguments.
Note
Existing built in commands cannot be redefined.
Examples# Define add-args command to print sum of first 3 argumentsdefine add-args print $arg0+$arg1+$arg2end# Define echo-all command to echo all argumentsdefine echo-all echo $argvend
Related references1.2.4 Scripts on page 1-27
1.3.20 delete breakpoints
Deletes one or more breakpoints or watchpoints.
Syntax
delete [breakpoints] <number>...
Where:
<number>Specifies the breakpoint or watchpoint number. This is the number assigned by the debuggerwhen it is set. You can use info breakpoints to display the number and status of all breakpointsand watchpoints.
Note
Multiple-statements on a single line of source code are assigned sub-numbers, for example n.n.You can specify all multiple-statement breakpoints by specifying n.0 or individually byspecifying n.n.
If no number is specified, then all breakpoints and watchpoints are deleted.
Examplesdelete breakpoints 1 # Delete breakpoint number 1delete breakpoints 1 2 # Delete breakpoints number 1 and 2delete breakpoints # Delete all breakpoints and watchpoints
1 Arm® Debugger commands1.3 Arm® Debugger commands listed in alphabetical order
102272_2020.1M0_00_en Copyright © 2020 Arm Limited or its affiliates. All rights reserved. 1-68Non-Confidential

delete breakpoints $ # Delete breakpoint whose number is in the # most recently created debugger variable
Related references1.3.122 set breakpoint on page 1-1271.3.23 disable breakpoints on page 1-701.3.47 info breakpoints, info watchpoints on page 1-851.3.49 info capabilities on page 1-861.3.48 info breakpoints capabilities, info watchpoints capabilities on page 1-851.2.1 Breakpoints and watchpoints on page 1-22
1.3.21 delete memory
Deletes one or more user-defined memory regions.
Syntax
delete memory <number>...
Where:
<number>
Specifies the region number. This is the number assigned by the debugger when the region isset. You can use info mem to display the number and status of all regions.
Examplesdelete memory 1 # Delete region number 1delete memory 1 2 # Delete regions number 1 and 2delete memory $ # Delete memory region whose number is in # the most recently created debugger variable
Related references1.2.9 Memory group on page 1-33
1.3.22 directory, set directories
Defines additional directories to search for source files. If you use this command without an argumentthen the search directories are reset to the default settings. You can use the show command to display thecurrent settings.
Syntax
directory [<path>]...
set directories [<path>]...
Where:
<path>
Specifies an additional directory to search for source files. This is appended to the beginning ofthe list.
Multiple directories can be specified but must be separated with either:• a space• a colon (Unix)• a semi-colon (Windows).
DefaultThe default directories for searching are:• compilation directory, $cdir• current working directory, $cwd• current image directory, $idir.
1 Arm® Debugger commands1.3 Arm® Debugger commands listed in alphabetical order
102272_2020.1M0_00_en Copyright © 2020 Arm Limited or its affiliates. All rights reserved. 1-69Non-Confidential

Examplesdirectory "\usr\source" # Add directory to search listdirectory "\usr" "\My Src" # Add two directories to search list, # first takes precedencedirectory # Reset to the default directories
Related references1.2.7 Files on page 1-311.2.19 Set on page 1-41
1.3.23 disable breakpoints
Disables one or more breakpoints or watchpoints.
Syntax
disable [breakpoints] <number>...
Where:
<number>Specifies the breakpoint or watchpoint number. This is the number assigned by the debuggerwhen it is set. You can use info breakpoints to display the number and status of allbreakpoints and watchpoints.
Note
Multiple-statements on a single line of source code are assigned sub-numbers, for example<n.n>. You can specify all multiple-statement breakpoints by specifying <n>.0 or individuallyby specifying <n.n>.
If no <number> is specified, then all breakpoints and watchpoints are disabled. Note
The breakpoints sub-command is optional.
Examplesdisable breakpoints 1 # Disable breakpoint number 1disable breakpoints 1 2 # Disable breakpoints number 1 and 2disable breakpoints # Disable all breakpoints and watchpointsdisable breakpoints $ # Disable the breakpoint whose number is in the # most recently created debugger variable
Related references1.3.122 set breakpoint on page 1-1271.3.20 delete breakpoints on page 1-681.3.47 info breakpoints, info watchpoints on page 1-851.3.49 info capabilities on page 1-861.3.48 info breakpoints capabilities, info watchpoints capabilities on page 1-851.2.1 Breakpoints and watchpoints on page 1-22
1.3.24 disable memory
Disables one or more user-defined memory regions.
Syntax
disable memory <number>...
Where:
1 Arm® Debugger commands1.3 Arm® Debugger commands listed in alphabetical order
102272_2020.1M0_00_en Copyright © 2020 Arm Limited or its affiliates. All rights reserved. 1-70Non-Confidential

<number>
Specifies the region number. This is the number assigned by the debugger when the region isset. You can use info memory to display the number and status of all regions.
Examplesdisable memory 1 # Disable region number 1disable memory 1 2 # Disable regions number 1 and 2disable memory $ # Disable memory region whose number is in # the most recently created debugger variable
Related references1.2.9 Memory group on page 1-33
1.3.25 disassemble
Displays the disassembly for the function surrounding a specific address or the disassembly for a specificaddress range.
Syntax
disassemble [<address> [<address> | +<size>]]
Where:
<address>
Specifies an expression that evaluates to an address. Two <address> arguments specify aninclusive address range. If no <address> argument is specified then the debugger displays thedisassembly for the function surrounding the program counter for the current frame.
+<size>
Specifies the size of the region.
Examplesdisassemble # Display disassembly for current functiondisassemble 0x8140 0x8157 # Display disassembly for address range 0x8140-0x8157disassemble 0x8140 +0x18 # Display disassembly for address range 0x8140-0x8157disassemble 0xC0040AC0 # Display disassembly for address range 0xC0040AC0-0xC0040ADC
Related references1.2.9 Memory group on page 1-33
1.3.26 discard-symbol-file
Discards debug information relating to a specific file.
Syntax
discard-symbol-file <filename>
Where:
<filename>Specifies the image, shared library, or Operating System (OS) module.
Note
Shared library and OS modules depend on connections that support loading these types of files.
You can use the info files command to display information about the loaded files.
1 Arm® Debugger commands1.3 Arm® Debugger commands listed in alphabetical order
102272_2020.1M0_00_en Copyright © 2020 Arm Limited or its affiliates. All rights reserved. 1-71Non-Confidential

Examplesdiscard-symbol-file myFile.axf # Discard symbols relating to myFile.axfdiscard-symbol-file myLib.so # Discard symbols relating to shared librarydiscard-symbol-file myModule.ko # Discard symbols relating to OS module
1.3.27 document
Enables you to add integrated help for a new user-defined command.
Syntax
document <cmd>
...
end
Where:
<cmd>
Specifies the user-defined command name. Enter the description on one of more lines of textand terminate the document command by using the end command.
Examples# Documentation for the new user-defined add-args commanddocument add-args This user-defined command prints the sum of the first 3 argumentsend
Related references1.2.4 Scripts on page 1-27
1.3.28 down
Moves and displays the current frame pointer down the call stack towards the bottom frame. It alsodisplays the function name and source line number for the specified frame.
Note
Each frame is assigned a number that increases from the bottom frame (zero) through the call stack to thetop frame that is the start of the application.
Syntax
down [<offset>]
Where:
<offset>
Specifies a frame offset from the current frame pointer in the call stack. If no <offset> isspecified then the default is one.
Examplesdown # Move and display information 1 frame down from current frame pointerdown 2 # Move and display information 2 frames down from current frame pointer
Related references1.2.5 Call stack on page 1-28
1.3.29 down-silently
Moves the current frame pointer down the call stack towards the bottom frame.
1 Arm® Debugger commands1.3 Arm® Debugger commands listed in alphabetical order
102272_2020.1M0_00_en Copyright © 2020 Arm Limited or its affiliates. All rights reserved. 1-72Non-Confidential

Note
Each frame is assigned a number that increases from the bottom frame (zero) through the call stack to thetop frame that is the start of the application.
Syntax
down-silently [<offset>]
Where:
<offset>
Specifies a frame offset from the current frame pointer in the call stack. If no <offset> isspecified then the default is one.
Examplesdown-silently # Move 1 frame down from current frame pointerdown-silently 2 # Move 2 frames down from current frame pointer
Related references1.2.5 Call stack on page 1-28
1.3.30 dump
Reads data from memory or the result of an expression and writes it to a file.
Syntax
dump [<format>] memory <filename> [-r] <start_address> {<end_address> | <+size>}
dump [<format>] value <filename> [-r] <expression>
Where:
<format>
Specifies the output format:
binary
Binary. This is the default.
elf
32-bit Arm ELF.
elf64
64-bit Arm ELF.
ihex
Intel Hex-32.
srec
Motorola 32-bit (S-records).
vhx
Byte oriented hexadecimal (Verilog Memory Model).
<filename>
Specifies the file to write to. Specify -r to overwrite an existing file.
1 Arm® Debugger commands1.3 Arm® Debugger commands listed in alphabetical order
102272_2020.1M0_00_en Copyright © 2020 Arm Limited or its affiliates. All rights reserved. 1-73Non-Confidential

-r
Use this option with <filename> to overwrite an existing file.
<start_address>
Specifies the start address for the memory.
<end_address>
Specifies the inclusive end address for the memory.
<size>
Specifies the size of the region.
<expression>
Specifies an expression that is evaluated to an address and the data from that address is writtento the file.
Examplesdump memory myFile.bin 0x8000 0x8FFF # Write content of memory 0x8000-0x8FFF # to binary file myFile.bindump srec value myFile.m32 &myArray # Write contents of myArray to # Motorola 32-bit file myFile.m32
Related references1.2.9 Memory group on page 1-33
1.3.31 echo
Displays only textual strings.
Backslashes can be used as follows:• C escape sequences, for example, “\n” can be used to print a new line.• Leading and trailing spaces are not displayed unless escaped with a backslash.• Quoted strings are printed literally including the quote marks.
Syntax
echo <string>
Where:
<string>
Specifies a string of characters.
Examplesecho " initializing..." # Display: " initializing..." (includes quotes)echo Stage 1\n # Display: Stage 1 (followed by a new line)echo \ Init # Display: Init (includes leading spaces)echo 4+4 # Display: 4+4
Related references1.2.16 Display on page 1-371.1.3 Expressions within Arm® Development Studio on page 1-101.1.4 Built-in functions within Arm® Development Studio expressions on page 1-111.1.8 Usage of printf() style format string within Arm® Development Studio on page 1-15
1.3.32 enable breakpoints
Enables one or more breakpoints or watchpoints by number.
1 Arm® Debugger commands1.3 Arm® Debugger commands listed in alphabetical order
102272_2020.1M0_00_en Copyright © 2020 Arm Limited or its affiliates. All rights reserved. 1-74Non-Confidential

Syntax
enable [breakpoints] [<number>...]
Where:
<number>Specifies the breakpoint or watchpoint number. This is the number assigned by the debuggerwhen it is set. You can use info breakpoints to display the number and status of allbreakpoints and watchpoints.
Note
Multiple-statements on a single line of source code are assigned sub-numbers, for example<n.n>. You can specify all multiple-statement breakpoints by specifying <n>.0 or individuallyby specifying <n.n> .
If no <number> is specified then all breakpoints and watchpoints are disabled. Note
The breakpoints sub-command is optional.
Examplesenable breakpoints 1 # Enable breakpoint number 1enable breakpoints 1 2 # Enable breakpoints number 1 and 2enable breakpoints # Enable all breakpoints and watchpointsenable breakpoints $ # Enable the breakpoint whose number is in the # most recently created debugger variable
1.3.33 enable memory
Enables one or more user-defined memory regions.
Syntax
enable memory <number>...
Where:
<number>
Specifies the region number. This is the number assigned by the debugger when the region isset. You can use info memory to display the number and status of all regions.
Examplesenable memory 1 # Enable region number 1enable memory 1 2 # Enable regions number 1 and 2enable memory $ # Enable memory region whose number is in # the most recently created debugger variable
Related references1.2.9 Memory group on page 1-33
1.3.34 end
Enables you to terminate conditional blocks when using the define, if, and while commands.
Examples# Define a while loop containing commands to conditionally execute# myVar is a variable in the application codewhile myVar<10 step wait x
1 Arm® Debugger commands1.3 Arm® Debugger commands listed in alphabetical order
102272_2020.1M0_00_en Copyright © 2020 Arm Limited or its affiliates. All rights reserved. 1-75Non-Confidential

set myVar++end
Related references1.2.4 Scripts on page 1-27
1.3.35 file, symbol-file
Loads debug information from an image into the debugger and records the entry point address for futureuse by the run and start commands. Subsequent use of the file command discards existinginformation before loading the new debug information. The debug information is loaded when requiredby the debugger.
If you want to append debug information instead of replacing it, you can use the add-symbol-filecommand.
Note
This command does not set the PC register.
Syntax
file [<filename>] [<offset>] [-s <section> <address>]...
symbol-file [<filename>] [<offset>] [-s <section> <address>]...
Where:
<filename>
Specifies the image. If no <filename> is specified then the debug information is discarded.
<offset>Specifies the offset that is added to all addresses within the image. If <offset> is not specifiedthen the default for:• An image is zero.• A shared library is the load address of the library. If the application has not loaded the
specified library then the request is pended until the library is loaded and the offset can bedetermined.
s
For relocatable objects, this specifies the address to which a section was relocated.
<section>
Specifies the name of the relocated section.
<address>
Specifies the address of the section. This can be either an address or an expression that evaluatesto an address. You can also specify the address space.
Examplesfile "myFile.axf" # Load debug information on demand.file "images\myFile.axf" # Load debug information on demand.file # Discard debug information.file "myFile.axf" -s .text 0x1000 -s .data 0x2000 # Load debug information on demand with # section .text relocated to 0x1000 and # section .data relocated to 0x2000.file "vmlinux" N:0 # Load debug information for the non-secure address 0x00file "vmlinux" EL2N:0x4080000000 # Load debug information for the non-secure address space EL2N:0x4080000000
1 Arm® Debugger commands1.3 Arm® Debugger commands listed in alphabetical order
102272_2020.1M0_00_en Copyright © 2020 Arm Limited or its affiliates. All rights reserved. 1-76Non-Confidential

Related references1.2.7 Files on page 1-31
1.3.36 finish
Continues running the device to the next instruction after the selected stack frame finishes.
Syntax
finish [<n>]
Where:
<n>
Specifies the number of stack frames to finish executing. The default is one.
Examplesfinish # Continues running until the current stack frame finishesfinish 5 # Continues running until 5 stack frames finish
1.3.37 flash load
Loads sections from an image into one or more flash devices.
Note
To use this command you must check that flash device support is available for your target. If it is notavailable, you must write your own flash algorithm for this command to work.
flash load <filename> [<device> [:parameter=<value>]...]...
Where:
<filename>
Specifies the image.
<device>
Specifies the flash device name. Use this option to restrict the load to the specified device only.
<parameter>
Specifies a parameter or comma separated list of parameters to override.
If no device is specified then all devices can be loaded. This is dependent on the sections in the imagethat correspond to the flash device regions.
You can use info flash to display information about the flash devices on the current target.
Examplesflash load "foo.axf" # loads the file to flashflash load "foo.axf" MainFlash:ramAddress=0x20000100,ramSize=0xFF00 # Loads the file to a flash device and overrides the parameters
Related references1.2.23 flash on page 1-47
1.3.38 flash load-multiple
Load multiple images on to your target.
When loading multiple images on to your target, before it writes the images to flash memory, flashload-multiple checks that there are no overlaps in the memory address ranges that are specified in theimage files. Arm recommends using this option instead of running the flash load command multiple
1 Arm® Debugger commands1.3 Arm® Debugger commands listed in alphabetical order
102272_2020.1M0_00_en Copyright © 2020 Arm Limited or its affiliates. All rights reserved. 1-77Non-Confidential

times, to prevent data corruption. With the flash load command, the debugger does not check formemory overlap and you might accidentally overwrite the existing data.
Note
To use this command you must check that flash device support is available for your target. If it is notavailable, you must write your own flash algorithm for this command to work.
Syntax
flash load-multiple "<image>"<device_parameters> "<another_image>"<device_parameters>
For each image, you can optionally provide device parameter information. If you do not provide deviceparameter information, the image is loaded on to all flash devices on the target, using the default valuesfor each device.
<device_parameters> uses the following syntax:@<device_name>:<parameter1>=<value>,<parameter2>=<value>|@<device_name>:<parameter3>=<value>
Note
• You must not have any spaces between an image and its associated device parameters. Spaces areused to indicate a new image.
Parameters
The parameters vary between the different targets. Use info flash to find out which device parametersare available on your target.
Examples: flash load-multiple
Consider the following command:
flash load-multiple "image1.axf"@MainFlash "image2.axf"@OtherFlash:ramAddress=0x2image3.axf
First, the debugger checks that there are no overlaps between the memory address ranges that arespecified in each image. If there is an overlap, an error is reported in the console and the operation isterminated.
If there is no overlap, this command does the following:
• Loads image1.axf on to the MainFlash device only, using the default values for this device.• Loads image2.axf on to the OtherFlash device only, starting at RAM address 0x2.• Loads image3.axf on to all available devices, using the default values for each device.
Consider another command:
flash load-multiple image4.axf image5.axf@Device2|Device3image6.axf@Device4:size=512,type=2
If there are no overlaps in the memory address ranges, this command does the following:• Loads image4.axf on to all available devices, using the default values for each device.• Loads image5.axf on to Device2 and Device3 only, using the default values for both devices.• Loads image6.axf on to Device4 only, and overrides the default values for size and type.
Restrictions• Images must be valid .axf files.• You must specify one or more images when you use this command.
1 Arm® Debugger commands1.3 Arm® Debugger commands listed in alphabetical order
102272_2020.1M0_00_en Copyright © 2020 Arm Limited or its affiliates. All rights reserved. 1-78Non-Confidential

• Image paths can be relative or absolute.• If there is an overlap between the memory address ranges that are specified in the images, an error is
reported in the console.
Related references1.3.37 flash load on page 1-771.3.54 info flash on page 1-88
1.3.39 frame
Sets the current frame pointer in the call stack and also displays the function name and source linenumber for the specified frame.
Note
Each frame is assigned a number that increases from the bottom frame (zero) through the call stack to thetop frame that is the start of the application.
Syntax
frame [<number>]
Where:
<number>
Specifies the frame number. The default is the current frame.
Examplesframe 1 # Move to and display information for stack frame 1frame # Display stack frame information at current frame pointer
Related references1.2.5 Call stack on page 1-28
1.3.40 handle
Controls the handler settings for one or more signals or exceptions. The default handler settings dependon the type of debug activity. For example, by default on a Linux kernel connection, all signals arehandled by Linux on the target. You can use to display the current settings.
When connected to an application running on a remote target using gdbserver, the debugger handlesUnix signals but on bare-metal it handles processor exceptions.
Syntax
handle [<name>]...<keyword>...
Where:
<name>
Specifies the signal or processor exception name.
<keyword>
Specifies the following keywords:
noprint
Disables the print property so the occurrence of an event is not indicated at all. Usingthe noprint keyword implies the properties of the nostop keyword as well.
1 Arm® Debugger commands1.3 Arm® Debugger commands listed in alphabetical order
102272_2020.1M0_00_en Copyright © 2020 Arm Limited or its affiliates. All rights reserved. 1-79Non-Confidential

nostop
Disables the stop property so the occurrence of an event does not stop execution.
Enables the print property. The debugger prints a message and continues executionwhen the event occurs. When using gdbserver the debugger can only print if stop isenabled.
stop
Enables the stop and print properties. The debugger stops execution and prints amessage when the event occurs. Using the stop keyword implies the properties of theprint keyword as well.
If no name is specified then all handler settings are modified.
Exampleshandle SVC stop # When an SVC exception occurs, stop execution and # print a message.handle IRQ print # When an IRQ exception occurs, print a message, but # continue execution.handle IRQ noprint # When an IRQ exception occurs, do not print a message.handle noprint nostop # Do not stop execution at any event and do not print # a message.
Related references1.2.2 Execution control on page 1-24
1.3.41 hbreak
Sets a hardware execution breakpoint at a specific location. You can also specify a conditional breakpointby using an if statement that stops only when the conditional expression evaluates to true.
This command records the ID of the breakpoint in a new debugger variable, $<n> , where <n> is anumber. You can use this variable, in a script, to delete or modify the breakpoint behavior. If $<n> is thelast or second-to-last debugger variable, then you can also access the ID using $ or $$, respectively.
Note
The number of hardware breakpoints is processor limited. If you run out of hardware breakpoints, thendelete or disable one that you no longer use.
Note
Breakpoints that are set within a shared object or kernel module become pending when the shared objector kernel module is not loaded.
You can use info breakpoints capabilities to display a list of parameters that you can use withbreakpoint commands for the current connection.
Syntax
hbreak [-d] [-p][{[<filename>:]<location>|*<address>}] [[{thread|core}]<number>...][vmid <vmid>] [context <contextid>] [if <expression>]
Where:
-d
Disables the breakpoint immediately after creation.
1 Arm® Debugger commands1.3 Arm® Debugger commands listed in alphabetical order
102272_2020.1M0_00_en Copyright © 2020 Arm Limited or its affiliates. All rights reserved. 1-80Non-Confidential

-p
Specifies whether or not the resolution of an unrecognized breakpoint location results in apending breakpoint being created.
<filename>
Specifies the file.
<location>
Specifies the location:
<line_num>
Is a line number.
<function>
Is a function name.
<label>
Is a label name.
{+<offset> | -<offset>}
Specifies the line offset from the current location.
*<address>
Specifies the address. This can be either an address or an expression that evaluates to an address.
<number>
Specifies one or more threads or processors to apply the breakpoint to. You can use $thread torefer to the current thread. If <number> is not specified then all threads are affected.
<vmid>
Specifies the Virtual Machine ID (VMID) to apply the breakpoint to. This can be either aninteger or an expression that evaluates to an integer.
<contextid>
Specifies the context ID to apply the breakpoint to. This can be either an integer or anexpression that evaluates to an integer. You can only use the context parameter if your hardwaresupports it and your application makes use of the CONTEXTIDR register. For moreinformation, see CONTEXTIDR in the Arm Architecture Reference Manual .
<expression>
Specifies an expression that is evaluated when the breakpoint is hit.
If no arguments are specified, then a hardware breakpoint is set at the current PC.
Exampleshbreak *0x8000 # Set breakpoint at address 0x8000hbreak *0x8000 thread $thread # Set breakpoint at address 0x8000 on current threadhbreak *0x8000 thread 1 3 # Set breakpoint at address 0x8000 on threads 1 and 3hbreak main # Set breakpoint at address of main()hbreak SVC_Handler # Set breakpoint at address of label SVC_Handlerhbreak +1 # Set breakpoint at address of next source linehbreak my_File.c:main # Set breakpoint at address of main() in my_File.chbreak my_File.c:8 # Set breakpoint at address of line 8 in my_File.chbreak function1 if x>0 # Set conditional breakpoint that stops at address of # function1() when x>0hbreak context 257 0x80000000 # Set conditional breakpoint at address 0x80000000 # that stops when CONTEXTIDR=257
Related references1.3.6 break on page 1-60
1 Arm® Debugger commands1.3 Arm® Debugger commands listed in alphabetical order
102272_2020.1M0_00_en Copyright © 2020 Arm Limited or its affiliates. All rights reserved. 1-81Non-Confidential
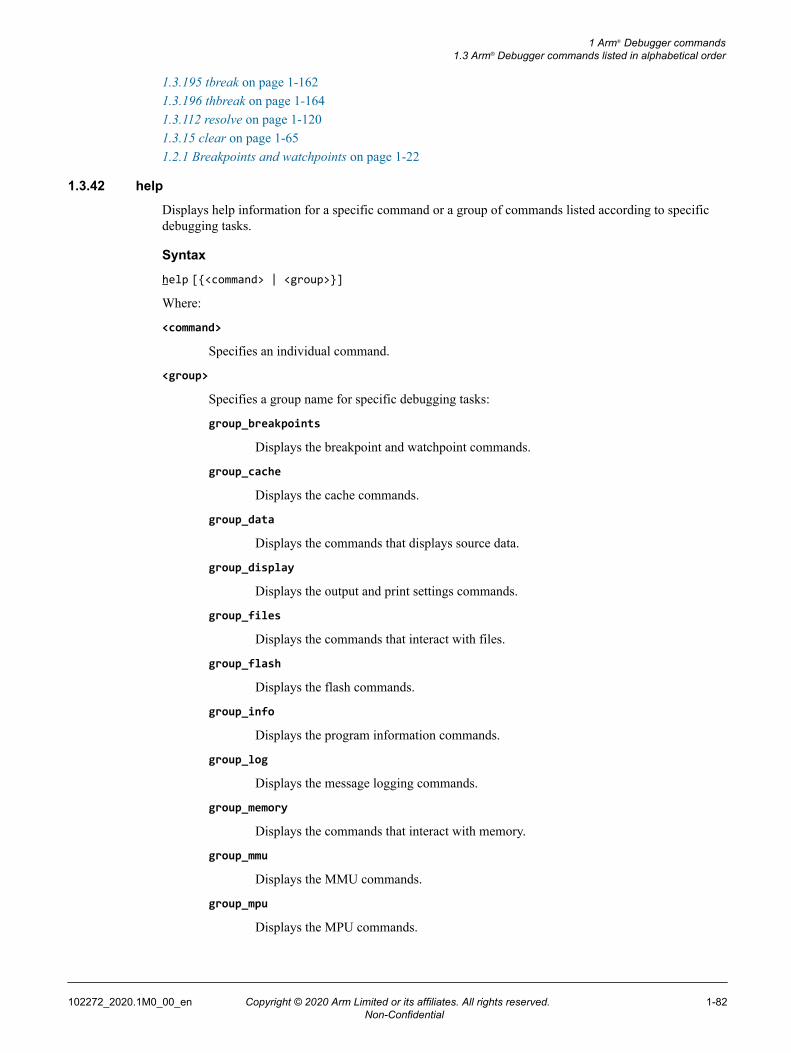
1.3.195 tbreak on page 1-1621.3.196 thbreak on page 1-1641.3.112 resolve on page 1-1201.3.15 clear on page 1-651.2.1 Breakpoints and watchpoints on page 1-22
1.3.42 help
Displays help information for a specific command or a group of commands listed according to specificdebugging tasks.
Syntax
help [{<command> | <group>}]
Where:
<command>
Specifies an individual command.
<group>
Specifies a group name for specific debugging tasks:
group_breakpoints
Displays the breakpoint and watchpoint commands.
group_cache
Displays the cache commands.
group_data
Displays the commands that displays source data.
group_display
Displays the output and print settings commands.
group_files
Displays the commands that interact with files.
group_flash
Displays the flash commands.
group_info
Displays the program information commands.
group_log
Displays the message logging commands.
group_memory
Displays the commands that interact with memory.
group_mmu
Displays the MMU commands.
group_mpu
Displays the MPU commands.
1 Arm® Debugger commands1.3 Arm® Debugger commands listed in alphabetical order
102272_2020.1M0_00_en Copyright © 2020 Arm Limited or its affiliates. All rights reserved. 1-82Non-Confidential

group_os
Displays the operating system commands.
group_registers
Displays the register commands.
group_running
Displays the target execution and stepping group.
group_scripts
Displays the commands for use in script files.
group_set
Displays the set commands for debugger settings.
group_show
Displays the show commands for debugger settings.
group_stack, stack
Displays the call stack commands.
group_support
Displays the supporting commands.
Exampleshelp load # Display help information for load commandhelp print # Display help information for print commandhelp group_breakpoints # Display group of breakpoint and watchpoint commandshelp group_files # Display group of file commands
1.3.43 if
Enables you to write scripts that conditionally execute debugger commands.
Syntax
if <condition>
...
else
...
end
Where:
<condition>Specifies a conditional expression. Follow the if statement with one or more debuggercommands that execute when the expression evaluates to true.
Note
The else statement is optional and the debugger commands that follow it only execute when<condition> evaluates to false.
Enter each debugger command on a new line and terminate the if command by using the end command.
1 Arm® Debugger commands1.3 Arm® Debugger commands listed in alphabetical order
102272_2020.1M0_00_en Copyright © 2020 Arm Limited or its affiliates. All rights reserved. 1-83Non-Confidential

Examples# Define an if statement containing commands to conditionally executeif $pc==0x80000 break info stack fullend
Related references1.2.4 Scripts on page 1-27
1.3.44 ignore
Sets the ignore counter for a breakpoint or watchpoint condition.
Syntax
ignore <number> <count>
Where:
<number>
Specifies the breakpoint or watchpoint number. This is the number assigned by the debuggerwhen it is set.
<count>
Specifies the number of times to ignore the specified breakpoint or watchpoint. The ignorecounter is incremented only when the condition evaluates to true.
You can use info breakpoints to display the number and status of all breakpoints and watchpoints.
Examplesignore 2 3 # Ignore breakpoint 2 for 3 hitsignore $ 3 # Ignore breakpoint, whose number is in the # most recently created debugger variable, for 3 hits
Related references1.2.1 Breakpoints and watchpoints on page 1-22
1.3.45 info
Displays the location of a symbol.
Syntax
info address <symbol>
Where:
<symbol>
Specifies the symbol.
Examples
info address mySymbol # Display location of symbol
1.3.46 info all-registers
Displays the name and content of grouped registers for the current stack frame.
Unless you specify otherwise, the registers listed by this command are the full set made available by thetarget, including co-processor and floating-point registers where available. You can use theinforegisters command to display a subset of registers that are most useful when debugging C/C++applications. When application code calls a function it is common for any existing register values to besaved, so that the registers can be used by the callee function for other purposes. The original register
1 Arm® Debugger commands1.3 Arm® Debugger commands listed in alphabetical order
102272_2020.1M0_00_en Copyright © 2020 Arm Limited or its affiliates. All rights reserved. 1-84Non-Confidential

values are then restored when the function returns. When displaying register values the debugger tries toshow the value of the actual registers prior to each function call, according to the currently selected stackframe. A consequence of this is that some registers might be shown with undefined values because thedebugger is unable to determine the actual value.
Syntax
info all-registers [<group>]
Where:
<group>
Specifies a group name for a specific register. If no <group> is specified then all registers andgroups are displayed.
Examplesinfo all-registers # Display info for all registersinfo all-registers USR # Display info for all user mode registers
Related references1.2.11 Registers on page 1-351.2.17 Information on page 1-38
1.3.47 info breakpoints, info watchpoints
Displays information about the status of all breakpoints and watchpoints.
Note
This command sets a default address variable to the location of the last breakpoint or watchpoint listed.Some commands, such as x, use this default value if no address is specified.
Syntax
info breakpoints
info watchpoints
Examplesinfo breakpoints # Display status for all breakpoints and watchpointsinfo watchpoints # Display status for all breakpoints and watchpoints
Related references1.3.122 set breakpoint on page 1-1271.3.23 disable breakpoints on page 1-701.3.20 delete breakpoints on page 1-681.3.49 info capabilities on page 1-861.3.48 info breakpoints capabilities, info watchpoints capabilities on page 1-851.2.1 Breakpoints and watchpoints on page 1-221.2.17 Information on page 1-38
1.3.48 info breakpoints capabilities, info watchpoints capabilities
Displays a list of parameters that you can use with breakpoint and watchpoint commands for the currentconnection.
Syntax
info breakpoints capabilities
1 Arm® Debugger commands1.3 Arm® Debugger commands listed in alphabetical order
102272_2020.1M0_00_en Copyright © 2020 Arm Limited or its affiliates. All rights reserved. 1-85Non-Confidential
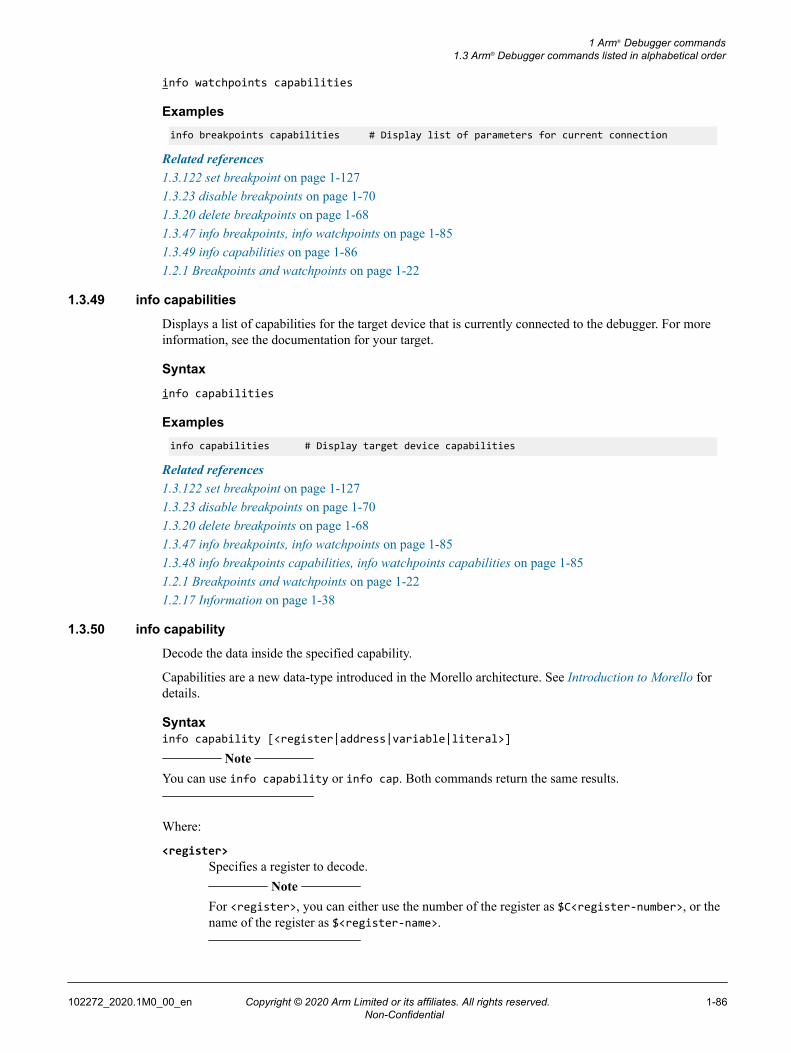
info watchpoints capabilities
Examplesinfo breakpoints capabilities # Display list of parameters for current connection
Related references1.3.122 set breakpoint on page 1-1271.3.23 disable breakpoints on page 1-701.3.20 delete breakpoints on page 1-681.3.47 info breakpoints, info watchpoints on page 1-851.3.49 info capabilities on page 1-861.2.1 Breakpoints and watchpoints on page 1-22
1.3.49 info capabilities
Displays a list of capabilities for the target device that is currently connected to the debugger. For moreinformation, see the documentation for your target.
Syntax
info capabilities
Examplesinfo capabilities # Display target device capabilities
Related references1.3.122 set breakpoint on page 1-1271.3.23 disable breakpoints on page 1-701.3.20 delete breakpoints on page 1-681.3.47 info breakpoints, info watchpoints on page 1-851.3.48 info breakpoints capabilities, info watchpoints capabilities on page 1-851.2.1 Breakpoints and watchpoints on page 1-221.2.17 Information on page 1-38
1.3.50 info capability
Decode the data inside the specified capability.
Capabilities are a new data-type introduced in the Morello architecture. See Introduction to Morello fordetails.
Syntaxinfo capability [<register|address|variable|literal>]
Note
You can use info capability or info cap. Both commands return the same results.
Where:
<register>Specifies a register to decode.
Note
For <register>, you can either use the number of the register as $C<register-number>, or thename of the register as $<register-name>.
1 Arm® Debugger commands1.3 Arm® Debugger commands listed in alphabetical order
102272_2020.1M0_00_en Copyright © 2020 Arm Limited or its affiliates. All rights reserved. 1-86Non-Confidential
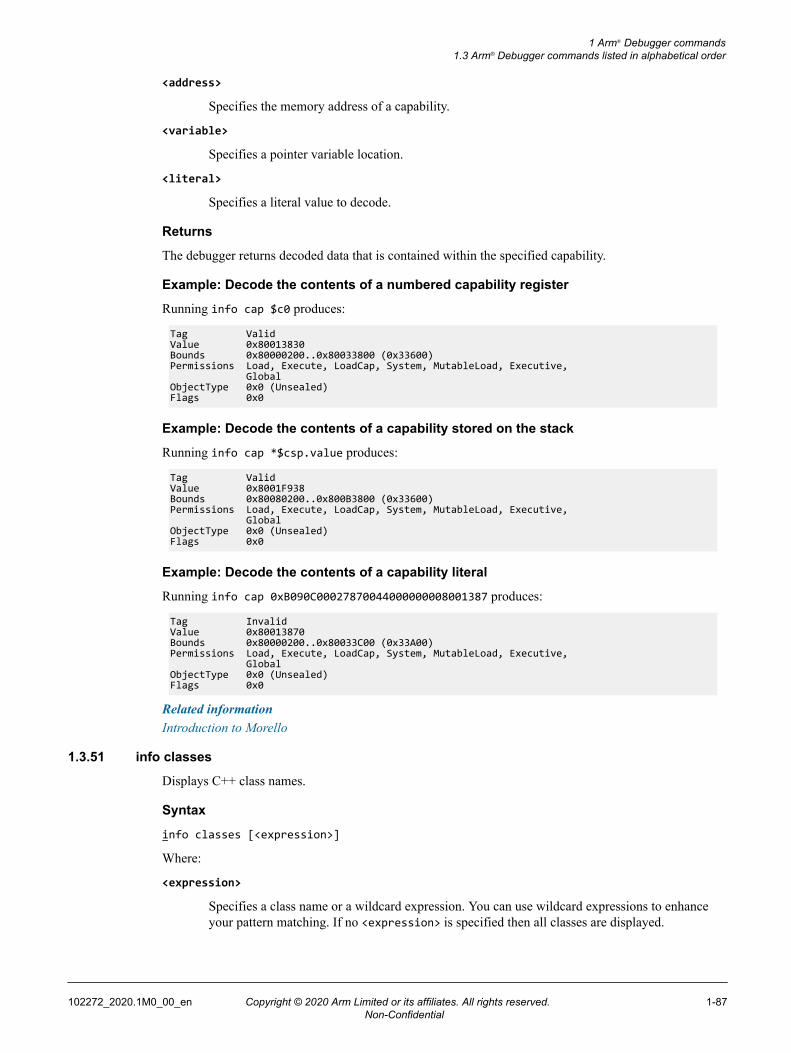
<address>
Specifies the memory address of a capability.
<variable>
Specifies a pointer variable location.
<literal>
Specifies a literal value to decode.
Returns
The debugger returns decoded data that is contained within the specified capability.
Example: Decode the contents of a numbered capability register
Running info cap $c0 produces:
Tag ValidValue 0x80013830Bounds 0x80000200..0x80033800 (0x33600)Permissions Load, Execute, LoadCap, System, MutableLoad, Executive, GlobalObjectType 0x0 (Unsealed)Flags 0x0
Example: Decode the contents of a capability stored on the stack
Running info cap *$csp.value produces:
Tag ValidValue 0x8001F938Bounds 0x80080200..0x800B3800 (0x33600)Permissions Load, Execute, LoadCap, System, MutableLoad, Executive, GlobalObjectType 0x0 (Unsealed)Flags 0x0
Example: Decode the contents of a capability literal
Running info cap 0xB090C00027870044000000008001387 produces:
Tag InvalidValue 0x80013870Bounds 0x80000200..0x80033C00 (0x33A00)Permissions Load, Execute, LoadCap, System, MutableLoad, Executive, GlobalObjectType 0x0 (Unsealed)Flags 0x0
Related informationIntroduction to Morello
1.3.51 info classes
Displays C++ class names.
Syntax
info classes [<expression>]
Where:
<expression>
Specifies a class name or a wildcard expression. You can use wildcard expressions to enhanceyour pattern matching. If no <expression> is specified then all classes are displayed.
1 Arm® Debugger commands1.3 Arm® Debugger commands listed in alphabetical order
102272_2020.1M0_00_en Copyright © 2020 Arm Limited or its affiliates. All rights reserved. 1-87Non-Confidential

Examplesinfo classes # Display info for all classesinfo classes m* # Display info for names starting with m # (use when set wildcard-style=glob)info classes my_class[0-9]+ # Display info for names with my_class followed # by a number (use when set wildcard-style=regex)
Related references1.2.17 Information on page 1-38
1.3.52 info cores
Displays information about the running processors. It shows the number (a unique number assigned bythe debugger), name, current state, and related stack frame including the function names and source linenumber.
Syntax
info cores
Examplesinfo cores # Display all processors
Related references1.2.17 Information on page 1-38
1.3.53 info files, info target
Displays information about the loaded image and symbols.
Syntax
info files
info target
Examplesinfo files # Display information for loaded image and symbols
Related references1.2.17 Information on page 1-38
1.3.54 info flash
Displays information about the flash devices on the current target.
Note
To use this command, you need to check that flash device support is available for your target. If it is notavailable, you need to write your own flash algorithm for this command to work.
Syntax
info flash
Examplesinfo flash # Display information about the current flash devices.
Related references1.2.23 flash on page 1-47
1 Arm® Debugger commands1.3 Arm® Debugger commands listed in alphabetical order
102272_2020.1M0_00_en Copyright © 2020 Arm Limited or its affiliates. All rights reserved. 1-88Non-Confidential

1.3.55 info frame
Displays stack frame information at the selected position.
• Stack frame address.• Current PC address.• Saved PC address.• Calling frame address.• Source language.• Frame arguments and associated addresses.• Address of the local variables.• Stack pointer address for the previous frame.• Saved registers and associated location.
Note
Each frame is assigned a number that increases from the bottom frame (zero) through the call stack to thetop frame that is the start of the application.
Syntax
info frame [<number>]
Where:
<number>
Specifies the frame number.
If no arguments are specified, then the stack frame information for the current frame pointer is displayed.
Examplesinfo frame 1 # Display information for stack frame 1info frame # Display information for stack frame at current location
Related references1.2.5 Call stack on page 1-28
1.3.56 info functions
Displays the name and data types for all functions.
Syntax
info functions [<expression>]
Where:
<expression>
Specifies a function name or a wildcard expression. You can use wildcard expressions toenhance your pattern matching.
If no <expression> is specified then all functions are displayed.
Examplesinfo functions # Display info for all functionsinfo functions m* # Display info for names starting with m # (use when set wildcard-style=glob)info functions my_func[0-9]+ # Display info for names with my_func followed # by a number (use when set wildcard-style=regex)
1.3.57 info signals, info handle
Displays information about the handling of signals or processor exceptions.
1 Arm® Debugger commands1.3 Arm® Debugger commands listed in alphabetical order
102272_2020.1M0_00_en Copyright © 2020 Arm Limited or its affiliates. All rights reserved. 1-89Non-Confidential

When connected to an application running on a remote target using gdbserver, the debugger handlesUnix signals but on bare-metal it handles processor exceptions.
Syntax
info signals [<name>]
info handle [<name>]
Where:
<name>
Specifies the signal name. If no <name> is specified then all handler settings are displayed.
Examplesinfo signals # Display info for all signalsinfo signals IRQ # Display info for IRQ signal
Related references1.2.2 Execution control on page 1-241.2.17 Information on page 1-38
1.3.58 info inst-sets
Displays the available instruction sets.
Syntax
info inst-sets
Examplesinfo inst-sets # Display available instruction sets
Related references1.2.17 Information on page 1-38
1.3.59 info locals
Displays all local variables for the current stack frame.
Syntax
info locals
Examplesinfo locals # Display all local variables for the current stack frame
Related references1.2.17 Information on page 1-38
1.3.60 info members
Displays the name and data types for all class member variables that are accessible in the functioncorresponding to the selected stack frame.
Syntax
info members [<expression>]
Where:
1 Arm® Debugger commands1.3 Arm® Debugger commands listed in alphabetical order
102272_2020.1M0_00_en Copyright © 2020 Arm Limited or its affiliates. All rights reserved. 1-90Non-Confidential

<expression>Specifies the name of a class member or a C expression that evaluates to a struct, union, or classvariable. If no <expression> is specified, then all members of the current function identified bythis pointer are displayed.
Note
Using high compiler optimization levels such as -O2 with --debug can produce a less thansatisfactory debug view because the mapping of object code to source code is not always clear.If the compiler optimizes away the this pointer, then using the info members command withoutan expression produces an error.
Examplesinfo members # Display members for the current functioninfo members my_Struct[0-9]+ # Display members for matching struct variables
Related references1.2.17 Information on page 1-38
1.3.61 info memory
Displays the currently defined memory regions.
This command also shows the currently defined attributes for the memory regions. When you specify anaddress as an argument to a command, you can also specify the attributes defined for the memory regionif needed.
Syntax
info memory
You can define new memory regions using the memory command. To discover the additional set ofattributes applicable for a region of address space, you can use the info memory-parameters command.
Examplesinfo memory # Display attributes for all memory regionsNum Enb Low Addr High Addr Attributes Description1: y SP:0x0000000000 SP:0xFFFFFFFFFF rw, nocache, verify Memory accessed using secure world physical addresses2: y S:0x00000000 S:0xFFFFFFFF rw, nocache, verify Memory accessed using secure world addresses8: y S:0x80000000 S:0x80001DCB cache [EXEC]C:\Arm_DS_Workspace\smp_primes_A15x2-CoreTile\primes.axf9: y S:0x80001DCC S:0x80001E33 cache [EXEC]C:\Arm_DS_Workspace\smp_primes_A15x2-CoreTile\primes.axf10: y S:0x80001E34 S:0x8000229F cache [EXEC]C:\Arm_DS_Workspace\smp_primes_A15x2-CoreTile\primes.axf11: y S:0x800022A0 S:0x8000429F cache [ARM_LIB_HEAP]C:\Arm_DS_Workspace\smp_primes_A15x2-CoreTile\primes.axf12: y S:0x800042A0 S:0x8000829F cache [ARM_LIB_STACK]C:\Arm_DS_Workspace\smp_primes_A15x2-CoreTile\primes.axf13: y S:0x800082A0 S:0x8000869F cache [IRQ_STACKS]C:\Arm_DS_Workspace\smp_primes_A15x2-CoreTile\primes.axf14: y S:0x80500000 S:0x805FFFFF cache [PAGETABLES]C:\Arm_DS_Workspace\smp_primes_A15x2-CoreTile\primes.axf3: y NP:0x0000000000 NP:0xFFFFFFFFFF rw, nocache, verify Memory accessed using normal world physical addresses4: y N:0x00000000 N:0xFFFFFFFF rw, nocache, verify Memory accessed using normal world addresses5: y H:0x00000000 H:0xFFFFFFFF rw, nocache, verify Memory accessed via hypervisor address6: y APB:0x00000000 APB:0xFFFFFFFF rw, nobp, nohbp, nocache, noverify APB bus accessed via AP_17: y AHB:0x00000000 AHB:0xFFFFFFFF rw, nobp, nohbp, nocache, noverify AHB bus accessed via AP_0
Related references1.2.9 Memory group on page 1-33
1 Arm® Debugger commands1.3 Arm® Debugger commands listed in alphabetical order
102272_2020.1M0_00_en Copyright © 2020 Arm Limited or its affiliates. All rights reserved. 1-91Non-Confidential

1.2.17 Information on page 1-38
1.3.62 info memory-parameters
Displays the memory parameters applicable to an address space.
Syntax
info memory-parameters
info mem-params
Operation
When using the debugger to interact with target memory, you can specify the memory address using anexpression. The debugger also allows other aspects of the memory operation to be controlled using extraparameters within the expression. Different address spaces support different parameters. You can use theinfo memory-parameters command to list the parameters applicable to an address space on page 1-17.
Example: info mem-params command
Enter info mem-params. The output looks similar to this:
Address Space | Parameter | Description--------------------------------------------------------------------------------------------------------------------------------------------------------------------N: | width | Specifies the access width used to perform the access, note that this is independent from the total amount of data read. | verify | Controls whether or not a write operation must verify the value written by reading the value back and comparing it to the value written.--------------------------------------------------------------------------------------------------------------------------------------------------------------------NP: | width | Specifies the access width used to perform the access, note that this is independent from the total amount of data read. | verify | Controls whether or not a write operation must verify the value written by reading the value back and comparing it to the value written.--------------------------------------------------------------------------------------------------------------------------------------------------------------------S: | width | Specifies the access width used to perform the access, note that this is independent from the total amount of data read. | verify | Controls whether or not a write operation must verify the value written by reading the value back and comparing it to the value written.--------------------------------------------------------------------------------------------------------------------------------------------------------------------SP: | width | Specifies the access width used to perform the access, note that this is independent from the total amount of data read. | verify | Controls whether or not a write operation must verify the value written by reading the value back and comparing it to the value written.
Related references1.2.9 Memory group on page 1-331.2.17 Information on page 1-381.3.117 set variable on page 1-1241.1.9 Address space prefixes on page 1-171.1.10 Memory parameters on page 1-19Related informationAbout address spacesAbout debugging caches
1.3.63 info os
Displays the current state of the Operating System (OS) support. If OS support is enabled, also lists allavailable OS data tables. To print the contents of a data table, pass its name as an argument.
1 Arm® Debugger commands1.3 Arm® Debugger commands listed in alphabetical order
102272_2020.1M0_00_en Copyright © 2020 Arm Limited or its affiliates. All rights reserved. 1-92Non-Confidential
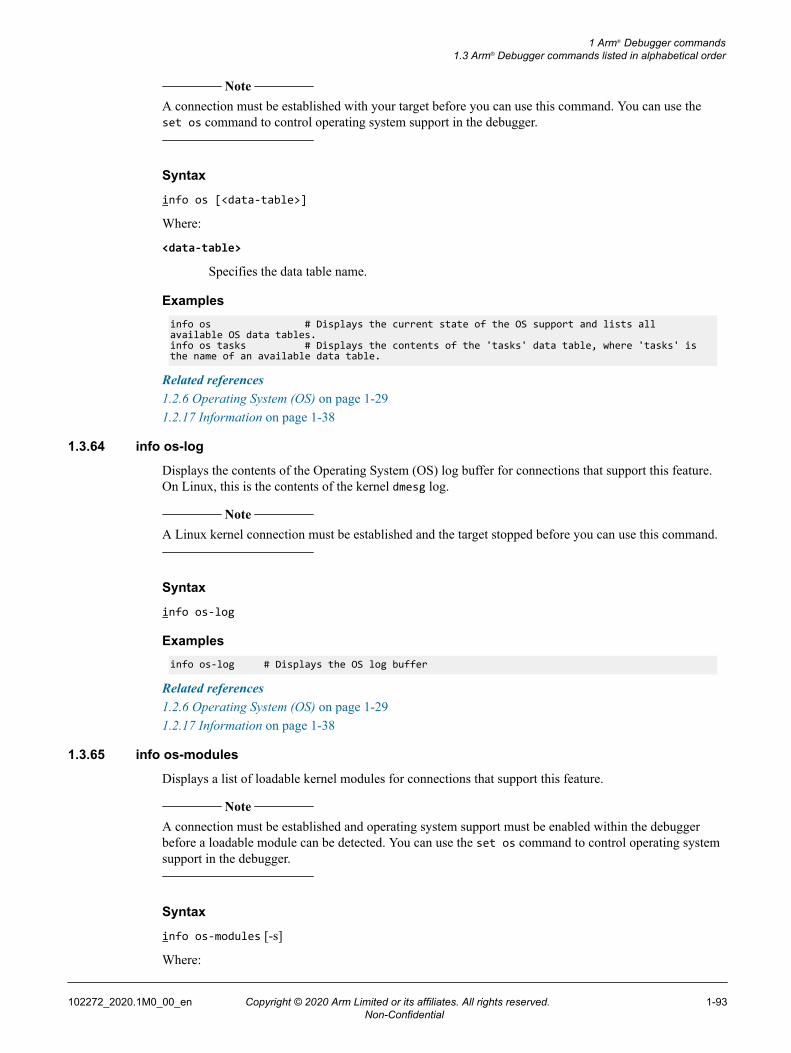
Note
A connection must be established with your target before you can use this command. You can use theset os command to control operating system support in the debugger.
Syntax
info os [<data-table>]
Where:
<data-table>
Specifies the data table name.
Examplesinfo os # Displays the current state of the OS support and lists all available OS data tables.info os tasks # Displays the contents of the 'tasks' data table, where 'tasks' is the name of an available data table.
Related references1.2.6 Operating System (OS) on page 1-291.2.17 Information on page 1-38
1.3.64 info os-log
Displays the contents of the Operating System (OS) log buffer for connections that support this feature.On Linux, this is the contents of the kernel dmesg log.
Note
A Linux kernel connection must be established and the target stopped before you can use this command.
Syntax
info os-log
Examplesinfo os-log # Displays the OS log buffer
Related references1.2.6 Operating System (OS) on page 1-291.2.17 Information on page 1-38
1.3.65 info os-modules
Displays a list of loadable kernel modules for connections that support this feature.
Note
A connection must be established and operating system support must be enabled within the debuggerbefore a loadable module can be detected. You can use the set os command to control operating systemsupport in the debugger.
Syntax
info os-modules [-s]
Where:
1 Arm® Debugger commands1.3 Arm® Debugger commands listed in alphabetical order
102272_2020.1M0_00_en Copyright © 2020 Arm Limited or its affiliates. All rights reserved. 1-93Non-Confidential

-s
Displays the section information of the modules.
Examplesinfo os-modules # Displays info for loaded OS modules
Related references1.2.6 Operating System (OS) on page 1-291.2.17 Information on page 1-38
1.3.66 info os-version
Displays the version of the Operating System (OS) for connections that support this feature.
Syntax
info os-version
Examplesinfo os-version # Displays the version of the OS
Related references1.2.6 Operating System (OS) on page 1-291.2.17 Information on page 1-38
1.3.67 info overlays
Displays information about the currently loaded overlays. It shows the ID, the load address, execaddress, and size for each overlay, and whether it is loaded or not.
Syntax
info overlays [functions]
Where:
functions
Displays the details of functions in the overlay.
Examplesinfo overlays # Displays the details of overlays in the application.info overlays functions # Displays the details of functions in each overlay.
1.3.68 info processes
Displays information about the user space processes. It shows the number (a unique number assigned bythe debugger), OS ID (pid), OS Parent ID, kind, OS state, current state, and related stack frame includingthe function names and source line number.
Syntax
info processes
Examplesinfo processes # Display all user space processes
Related references1.2.6 Operating System (OS) on page 1-291.2.17 Information on page 1-38
1 Arm® Debugger commands1.3 Arm® Debugger commands listed in alphabetical order
102272_2020.1M0_00_en Copyright © 2020 Arm Limited or its affiliates. All rights reserved. 1-94Non-Confidential

1.3.69 info registers
Displays the name and content of all application level registers for the current stack frame. The registerslisted by this command are a subset that are most useful when debugging C/C++ applications. You canuse the info all-registers command to list the full set of registers.
When application code calls a function it is common for any existing register values to be saved, so thatthe registers can be used by the callee function for other purposes. The original register values are thenrestored when the function returns. When displaying register values the debugger tries to show the valueof the actual registers prior to each function call, according to the currently selected stack frame. Aconsequence of this is that some registers might be shown with undefined values because the debugger isunable to determine the actual value.
Syntax
info registers [<register>]
Where:
<register>
Specifies the register name. If no <register> is specified then all application level registers aredisplayed.
Examplesinfo registers # Display info for all application level registersinfo registers pc # Display info for PC register
Related references1.2.11 Registers on page 1-351.2.17 Information on page 1-38
1.3.70 info semihosting
Displays semihosting information.
Syntax
info semihosting [server | clients | all]
Where:
all
Displays information on the semihosting server listener port, a list of the connected clients, andthe heap and stack. This is the default.
server
Displays information on the semihosting server listener port.
clients
Displays information on each of the semihosting streams stdin, stdout, stderr. This includesa list of the connected clients.
heapDisplays the heap information that the debugger used to initialize the heap.
Note
This information is only displayed if the debugger performs the initialization.
1 Arm® Debugger commands1.3 Arm® Debugger commands listed in alphabetical order
102272_2020.1M0_00_en Copyright © 2020 Arm Limited or its affiliates. All rights reserved. 1-95Non-Confidential

stackDisplays the stack information that the debugger used to initialize the stack.
Note
This information is only displayed if the debugger performs the initialization.
Examplesinfo semihosting # Displays all semihosting informationinfo semihosting clients # Display clients info for semihosting streams
Related references1.2.17 Information on page 1-38
1.3.71 info sharedlibrary
Displays the names of the loaded shared libraries, the base address, and whether the debug symbols ofthe shared libraries are loaded or not.
• You must launch the debugger with --target_os command-line option before you can use thisfeature. In Arm DS, this option is automatically selected when you connect to a target usinggdbserver.
• This command is only supported for Linux application debug, for example, connections usinggdbserver. It is not supported for Linux kernel debug, for example, connections using JTAG.
Syntax
info sharedlibrary [/<order>] [/<sort_by>] [/<group>]
Where:
/<order>
Specifies the sorting order:
a
Ascending order. This is the default.
d
Descending order.
/<sort_by>
Specifies the sorting order of the shared objects:
b
Sort by base addresses. This is the default.
n
Sort by library names.
/<group>
Specifies whether to group the debug symbols:
s
Group loaded symbols followed by unloaded symbols.
sn
Group unloaded symbols followed by loaded symbols.
1 Arm® Debugger commands1.3 Arm® Debugger commands listed in alphabetical order
102272_2020.1M0_00_en Copyright © 2020 Arm Limited or its affiliates. All rights reserved. 1-96Non-Confidential

Examplesinfo sharedlibrary # Display shared libraries by base address, ascinfo sharedlibrary /n # Display shared libraries by library name, ascinfo sharedlibrary /d # Display shared libraries by base address, descinfo sharedlibrary /n /a /s # Display shared libraries grouped loaded->unloaded # and by library name, asc
Related references1.2.6 Operating System (OS) on page 1-291.2.17 Information on page 1-38
1.3.72 info signals, info handle
Displays information about the handling of signals or processor exceptions.
When connected to an application running on a remote target using gdbserver, the debugger handlesUnix signals but on bare-metal it handles processor exceptions.
Syntax
info signals [<name>]
info handle [<name>]
Where:
<name>
Specifies the signal name. If no <name> is specified then all handler settings are displayed.
Examplesinfo signals # Display info for all signalsinfo signals IRQ # Display info for IRQ signal
Related references1.2.2 Execution control on page 1-241.2.17 Information on page 1-38
1.3.73 info sources
Displays the names of the source files used in the current image being debugged. Where possible thenames are resolved to the location on the host system.
Syntax
info sources
Examplesinfo sources # Display the names of source files
Related references1.2.7 Files on page 1-311.2.17 Information on page 1-38
1.3.74 info stack, backtrace, where
Displays a numbered list of the calling stack frames including the function names and source linenumbers. You can use to control the default call stack display settings.
1 Arm® Debugger commands1.3 Arm® Debugger commands listed in alphabetical order
102272_2020.1M0_00_en Copyright © 2020 Arm Limited or its affiliates. All rights reserved. 1-97Non-Confidential

Note
Each frame is assigned a number that increases from the bottom frame (zero) through the call stack to thetop frame that is the start of the application.
Syntax
info stack [<n> | -<n>] [full]
backtrace [<n> | -<n>] [full]
where [<n> | -<n>] [full]
Where:
<n>
Specifies <n> frames from the bottom of the call stack.
-<n>
Specifies <n> frames from the top of the call stack.
full
Specifies the additional display of local variables.
Examplesinfo stack # Display call stackbacktrace -5 # Display top 5 frames of the call stackbacktrace full # Display call stack including local variableswhere # Display call stack
Related references1.2.5 Call stack on page 1-281.2.17 Information on page 1-38
1.3.75 info symbol
Displays the symbol name at a specific address.
Syntax
info symbol <address>
Where:
<address>
Specifies the address.
Examplesinfo symbol 0x8000 # Display symbol name at address0x8000
Related references1.2.17 Information on page 1-38
1.3.76 info files, info target
Displays information about the loaded image and symbols.
Syntax
info files
info target
1 Arm® Debugger commands1.3 Arm® Debugger commands listed in alphabetical order
102272_2020.1M0_00_en Copyright © 2020 Arm Limited or its affiliates. All rights reserved. 1-98Non-Confidential

Examplesinfo files # Display information for loaded image and symbols
Related references1.2.17 Information on page 1-38
1.3.77 info threads
Displays information about the available threads. It shows the number (a unique number assigned by thedebugger), OS ID (pid), OS Parent ID, kind, OS state, current state, and related stack frame including thefunction names and source line number.
Note
When kernel debugging this command displays kernel threads only. For user space processes you can usethe info processes command.
Syntax
info threads
Examplesinfo threads # Display all threads
Related references1.2.6 Operating System (OS) on page 1-291.2.17 Information on page 1-38
1.3.78 info variables
Displays the name and data types for all global and static variables.
Syntax
info variables [<expression>]
Where:
<expression>
Specifies a symbol name or a wildcard expression. You can use wildcard expressions to enhanceyour pattern matching.
If no <expression> is specified, then all global and static variables are displayed.
Examplesinfo variables # Display info for all variablesinfo variables num # Display info for num variableinfo variables m* # Display info for names starting with m # (use when set wildcard-style=glob)info variables my_var[0-9]+ # Display info for names with my_var followed # by a number (use when set wildcard-style=regex)
Related references1.2.17 Information on page 1-38
1.3.79 info breakpoints, info watchpoints
Displays information about the status of all breakpoints and watchpoints.
1 Arm® Debugger commands1.3 Arm® Debugger commands listed in alphabetical order
102272_2020.1M0_00_en Copyright © 2020 Arm Limited or its affiliates. All rights reserved. 1-99Non-Confidential

Note
This command sets a default address variable to the location of the last breakpoint or watchpoint listed.Some commands, such as x, use this default value if no address is specified.
Syntax
info breakpoints
info watchpoints
Examplesinfo breakpoints # Display status for all breakpoints and watchpointsinfo watchpoints # Display status for all breakpoints and watchpoints
Related references1.3.122 set breakpoint on page 1-1271.3.23 disable breakpoints on page 1-701.3.20 delete breakpoints on page 1-681.3.49 info capabilities on page 1-861.3.48 info breakpoints capabilities, info watchpoints capabilities on page 1-851.2.1 Breakpoints and watchpoints on page 1-221.2.17 Information on page 1-38
1.3.80 info breakpoints capabilities, info watchpoints capabilities
Displays a list of parameters that you can use with breakpoint and watchpoint commands for the currentconnection.
Syntax
info breakpoints capabilities
info watchpoints capabilities
Examplesinfo breakpoints capabilities # Display list of parameters for current connection
Related references1.3.122 set breakpoint on page 1-1271.3.23 disable breakpoints on page 1-701.3.20 delete breakpoints on page 1-681.3.47 info breakpoints, info watchpoints on page 1-851.3.49 info capabilities on page 1-861.2.1 Breakpoints and watchpoints on page 1-22
1.3.81 interrupt, stop
Interrupts the target and stops the application if it is running.
Syntax
interrupt
stop
1 Arm® Debugger commands1.3 Arm® Debugger commands listed in alphabetical order
102272_2020.1M0_00_en Copyright © 2020 Arm Limited or its affiliates. All rights reserved. 1-100Non-Confidential

Examplesinterrupt # Interrupt application.stop # Interrupt application.
Related references1.2.2 Execution control on page 1-24
1.3.82 list
Displays lines of source code surrounding the current or specified location. The default listing is 10 linesof source code unless you specify start and finish line numbers. You can use the set listsizecommand to modify the default settings.
Repeated commands display successive source lines in the same direction through the source file.
Syntax
list [[<filename>:]<location> | + | - | +<offset> | -<offset>]| [*<address>]
Where:
<filename>
Specifies the file.
<location>
Specifies the location:
<line_num>
is a line number
<first>, <last>
are start and finish line numbers
<function>
is a function.
+
Displays the source lines after the current location.
-
Displays the source lines before the current location.
<offset>
Specifies the line offset from the current location.
*<address>
Specifies the address. This can be either an address or an expression that evaluates to an address.
DefaultThe default directories for searching are:• compilation directory, $cdir• current working directory, $cwd• current image directory, $idir.
You can use the directory command to define additional search directories.
Exampleslist main # Set current location to main() and display sourcelist +3 # Increment current location then display sourcelist - # Decrement current location then display source
1 Arm® Debugger commands1.3 Arm® Debugger commands listed in alphabetical order
102272_2020.1M0_00_en Copyright © 2020 Arm Limited or its affiliates. All rights reserved. 1-101Non-Confidential

list *0x8120 # Set current location to address 0x8120 and display sourcelist 35 # Set current location to line 35 and display sourcelist dhry_1.c:10,23 # Display source lines 10 to 23 in dhry_1.clist *main # Set current location to address of main and display source
1.3.83 load
Loads an image on to the target and records the entry point address for future use by the run and startcommands.
The PC register is not set with this command.
Debug information is not loaded with this command. You can use either the add-symbol-file, file, orloadfile command to load debug information.
Syntax
load [<filename>][<offset>]
Where:
<filename>
Specifies the image. If no <filename> is specified then the executable image specified by theprevious command is loaded. You can use info files to display information about the currentimage and symbols.
<offset>
Specifies the offset that is added to all addresses within the image.
Examplesload "myFile.axf" # Load imageload "images\myFile.axf" # Load imageload myFile.axf 0x2000 # Load image with offset 0x2000load "myV8File.axf" EL3:0x0 # Load image in the EL3 address space with offset 0x0
Related references1.2.7 Files on page 1-31
1.3.84 loadfile
Loads debug information into the debugger, an image on to the target and records the entry point addressfor future use by the run and start commands.
The debug information is loaded when required by the debugger. Note
This command does not set the PC register.
Syntax
loadfile <filename> [<offset>]
Where:
<filename>
Specifies the image.
<offset>
Specifies the offset that is added to all addresses within the image.
1 Arm® Debugger commands1.3 Arm® Debugger commands listed in alphabetical order
102272_2020.1M0_00_en Copyright © 2020 Arm Limited or its affiliates. All rights reserved. 1-102Non-Confidential

Examplesloadfile "myFile.axf" # Load image and debug information when requiredloadfile "images\myFile.axf" # Load image and debug information when requiredloadfile myFile.axf 0x2000 # Load image with offset 0x2000 and load debug # information when requiredloadfile "myV8File.axf" EL3:0x0 # Load image in the EL3 address space with offset 0x0 # and load debug information when required.
Related references1.2.7 Files on page 1-31
1.3.85 log config
Specifies the type of logging configuration to output runtime messages from the debugger.
Syntax
log config <option>
Where:
<option>
Specifies a predefined logging configuration or a user-defined logging configuration file:
error
Output messages using the predefined ERROR level configuration. This only reportserrors.
info
Output messages using the predefined INFO level configuration. This reports errors andother debugger information. This is the default.
debug
Output messages using the predefined DEBUG level configuration. This reports errorsand more information than the INFO configuration.
<filename>
Specifies a user-defined logging configuration file to customize the output of messages.The debugger supports log4j configuration files.
You can use this command with the log file command to output messages to a file in addition to theconsole.
Exampleslog config debug # Display all debug messages
Related references1.2.18 log on page 1-40Related informationLog4j in Apache Logging Services
1.3.86 log file
Specifies an output file to receive runtime messages from the debugger.
Syntax
log file [<filename>]
Where:
1 Arm® Debugger commands1.3 Arm® Debugger commands listed in alphabetical order
102272_2020.1M0_00_en Copyright © 2020 Arm Limited or its affiliates. All rights reserved. 1-103Non-Confidential

<filename>
Specifies the output file. If no <filename> is specified then output messages are sent only to theconsole.
Exampleslog file myOutput.log # Output debugger messages to myOutput.log and console
Related references1.2.18 log on page 1-40
1.3.87 memory
Defines a memory region and specifies its attributes and size.
This command records the ID of the memory region in a new debugger variable, $<n> , where <n> is anumber. You can use this variable, in a script, to delete or modify the status of the memory region. If$<n> is the last or second-to-last debugger variable, then you can also access the ID using $ or $$respectively.
User-defined memory regions are higher-numbered, and they override lower-numbered memory regions.Use the info memory command to view the available memory regions.
Syntax
memory <start_address> <end_address> | +<size> [<attributes>]...
Where:
<start_address>
Specifies the start address for the region.
<end_address>
Specifies the inclusive end address for the region. You can use 0x0 as a shortcut to represent theend of the address space.
+<size>
Specifies the size of the region.
<attributes>
Specifies additional attributes:
<access_mode>
Specifies the access mode for the region:
na
no access
ro
read-only
wo
write-only
rw
read/write. This is the default.
<width>
Specifies the access width:
1 Arm® Debugger commands1.3 Arm® Debugger commands listed in alphabetical order
102272_2020.1M0_00_en Copyright © 2020 Arm Limited or its affiliates. All rights reserved. 1-104Non-Confidential

8
8-bit
16
16-bit
32
32-bit
64
64-bit.
It is only necessary to specify a specific access width where the memory region issensitive to this, for example, when accessing some peripherals.
If no <width> is specified then the debugger uses any available access width andgenerally provides the highest performance.
bp | nobp
Controls whether or not software breakpoints can be set in the region. bp is the default.
hbp | nohbp
Controls whether or not hardware breakpoints can be set in the region. hbp is thedefault.
cache | nocache
Controls whether the debugger can cache data read from the memory region. Enablingthe caching of memory can improve debugger performance. Memory regions that canbe modified by external sources should not be cached by the debugger. For examplevolatile peripherals.
nocache is the default.
verify | noverify
Controls whether or not a write operation must verify the value written by reading thevalue back and comparing it to the value written. The verify option also requires therw attribute to be specified so that the verify operation to be performed. Armrecommends that you mark areas of memory containing peripherals as noverify,because some peripheral registers are volatile such that reading their value changestheir contents as a side-effect.
verify is the default.
unwind | nounwind
Controls whether the debugger should read from this area of memory when unwindingthe stack.
By default, when unwinding the stack, the debugger accesses any area of memorymarked as readable.
Examplesmemory 0x1000 0x2FFF cache # specify RW region 0x1000-0x2FFF (cache)memory 0x3000 0x7FFF ro 8 # specify 8-bit RO region 0x3000-0x7FFF (nocache)memory 0x8000 0x0 # specify RW region 0x8000-0xFFFF (nocache)memory 0 0xFFFFFFFF ro nobp # specify RO region 0-0xFFFFFFFF no breakpoints
Related references1.2.9 Memory group on page 1-331.3.61 info memory on page 1-91
1 Arm® Debugger commands1.3 Arm® Debugger commands listed in alphabetical order
102272_2020.1M0_00_en Copyright © 2020 Arm Limited or its affiliates. All rights reserved. 1-105Non-Confidential

1.3.24 disable memory on page 1-701.3.33 enable memory on page 1-751.3.21 delete memory on page 1-69
1.3.88 memory auto
Resets the memory regions to the default target settings and discards all user-defined regions.
Syntax
memory auto
Examplesmemory auto # reset default memory regions
Related references1.2.9 Memory group on page 1-33
1.3.89 memory debug-cache
Controls the caching by the debugger for all memory regions. You can use info mem to display thecaching attributes.
Syntax
memory debug-cache <option>
Where:
<option>
Specifies additional options:
off
Globally disables debugger caching of memory regions. All memory accesses areperformed directly on the target.
on
Globally enables debugger caching of memory regions. When caching is globallyenabled the debugger might cache the results of read operations from memory regionsthat allow caching. This is the default.
invalidate
Invalidates all the caches, so that the next subsequent read from memory is performedon the target and not the cache.
Examplesmemory debug-cache off # Disable cachingmemory debug-cache invalidate # Invalidates all caches
Related references1.2.9 Memory group on page 1-33
1.3.90 memory fill
Writes a specific pattern of bytes to memory.
Syntax
memory fill [<verify=flag>:]<start_address> {<end_address> | +<offset>} <fill_size><pattern>
1 Arm® Debugger commands1.3 Arm® Debugger commands listed in alphabetical order
102272_2020.1M0_00_en Copyright © 2020 Arm Limited or its affiliates. All rights reserved. 1-106Non-Confidential

Where:
verify
Qualifies the address with a flag to specify whether the operation must perform a verify actionor not. The values for flag are:
0
There is no need to verify whether the operation executed correctly.
1
The operation must verify whether it executed correctly. This is the default.
<start_address>
Specifies the start address for the region. This can be either an address or an expression thatevaluates to an address.
For example:
memory fill EL1N<verify=0>:0x0 0xFFFFFFFF 4 0x12345678
If there is only one (anonymous) address space, then use:
memory fill <verify=0>:0x00xFFFFFFFF 4 0x12345678
<end_address>
Specifies the inclusive end address for the region. This can be either an address or an expressionthat evaluates to an address.
+<offset>
Specifies the length of the region in bytes.
<fill_size>
Specifies the size of the fill pattern in bytes.
<pattern>
Specifies an expression that defines the fill pattern. If the pattern does not fit exactly into thespecified region, then the remaining bytes are filled with partial bytes from the pattern.
Examplesmemory fill 0x0 0xFFFFFFFF 4 0x12345678 # Fill 0x0 to 0xFFFFFFFF inclusive with int # value 0x12345678 using default access widthmemory fill main (main+15) 1 (char)0x0 # Fill 16 bytes from symbol main with byte # value 0x0
Related references1.2.9 Memory group on page 1-33
1.3.91 memory set
Writes to memory.
Syntax
memory set [<verify=flag>:]<address> <width> <expression>
Where:
verify
Qualifies the address with a flag to specify whether the operation must perform a verify actionor not. The values for flag are:
1 Arm® Debugger commands1.3 Arm® Debugger commands listed in alphabetical order
102272_2020.1M0_00_en Copyright © 2020 Arm Limited or its affiliates. All rights reserved. 1-107Non-Confidential

0
There is no need to verify whether the operation executed correctly.
1
The operation must verify whether it executed correctly. This is the default.
<address>
Specifies an address at which to write the first value. The address must be correctly aligned forthe type of the specified expression.
For example:
memory set EL1N<verify=0>:0x8000 32 0x1234
If there is only one (anonymous) address space, then use:
memory set <verify=0>:0x8000 32 0x1234
<width>
Specifies the access width (bits) to use when writing to memory. If the width is narrower thanthe value being written then more than one access is used to write the value. For example:
0
enables the debugger to determine the access width
8
8-bit
16
16-bit
32
32-bit
64
64-bit.
Widths depend on the target, address region, and address alignment. Some access sizes mightnot be supported.
<expression>
Specifies either a single expression or an aggregate of expressions with the same size enclosedin curly braces. If there is more than one expression, then the values are written to memorysequentially with the addresses determined by the width of the type of the values.
Note
This command sets a default address variable to the value of the memory address. Some commands, suchas x, use this default value if no address is specified.
Examplesmemory set 0x8000 0 "Hello" # Writes a string to memorymemory set 0x1000 0 {(char)0x10,(char)0xFF,(char)1,(char)2,(char)3,(char)42} # Is equivalent to the following commands: # set variable *(char*)0x1000 = (char)0x10 # set variable *(char*)0x1001 = (char)0xFF # set variable *(char*)0x1002 = (char)1 # set variable *(char*)0x1003 = (char)2 # set variable *(char*)0x1004 = (char)3 # set variable *(char*)0x1005 = (char)42
1 Arm® Debugger commands1.3 Arm® Debugger commands listed in alphabetical order
102272_2020.1M0_00_en Copyright © 2020 Arm Limited or its affiliates. All rights reserved. 1-108Non-Confidential

memory set 0x1008 0 0x1234 # Equivalent to set variable *(int*)0x1008 = 0x1234memory set 0x1008 8 0x1234 # Same effect but forces use of 4 writes of one byte each
Related references1.2.9 Memory group on page 1-33
1.3.92 memory set_typed
Writes a list of values to memory.
Syntax
memory set_typed <address> <type> <expressions>
Where:
<address>
Specifies an address at which to write the first value. The address must be correctly aligned forthe specified <type>.
<type>
Specifies the data type to which each of the series of expressions is converted and the width ofeach value in memory. For example, long.
<expressions>
Specifies a space separated list of expressions. If an expression contains spaces it must beenclosed in parentheses. The expressions are evaluated, converted to the specified type, and thenwritten to memory sequentially.
Note
This command sets a default address variable to the value of the memory address. Some commands, suchas x, use this default value if no address is specified.
Examplesmemory set_typed 0x8000 (long long) 0x100 0x200 # Is equivalent to the following commands: # set variable *((long long*)0x8000) = (long long)0x100 # set variable *((long long*)0x8008) = (long long)0x200
Related references1.2.9 Memory group on page 1-33
1.3.93 mmu list memory-maps, mpu list memory-maps
Lists the available memory maps and their associated parameters.
Syntax
mmu list memory-maps
mpu list memory-maps
Examplesmmu list memory-mapsAvailable memory maps: PL1S_S1 parameters: S_SCTLR, S_TTBCR, S_TTBR0, S_TTBR1 PL1N_S1 parameters: N_TTBR1, N_TTBCR, N_SCTLR, N_TTBR0mpu list memory-mapsAvailable memory maps: MPU
1 Arm® Debugger commands1.3 Arm® Debugger commands listed in alphabetical order
102272_2020.1M0_00_en Copyright © 2020 Arm Limited or its affiliates. All rights reserved. 1-109Non-Confidential
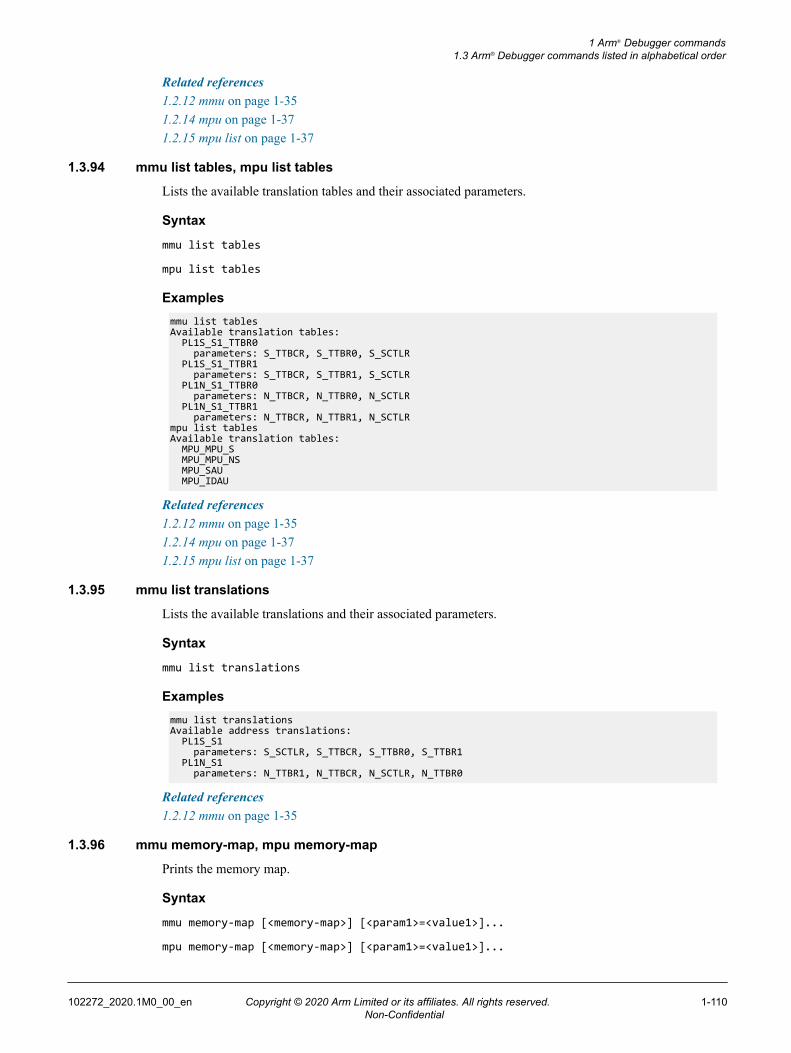
Related references1.2.12 mmu on page 1-351.2.14 mpu on page 1-371.2.15 mpu list on page 1-37
1.3.94 mmu list tables, mpu list tables
Lists the available translation tables and their associated parameters.
Syntax
mmu list tables
mpu list tables
Examplesmmu list tablesAvailable translation tables: PL1S_S1_TTBR0 parameters: S_TTBCR, S_TTBR0, S_SCTLR PL1S_S1_TTBR1 parameters: S_TTBCR, S_TTBR1, S_SCTLR PL1N_S1_TTBR0 parameters: N_TTBCR, N_TTBR0, N_SCTLR PL1N_S1_TTBR1 parameters: N_TTBCR, N_TTBR1, N_SCTLRmpu list tablesAvailable translation tables: MPU_MPU_S MPU_MPU_NS MPU_SAU MPU_IDAU
Related references1.2.12 mmu on page 1-351.2.14 mpu on page 1-371.2.15 mpu list on page 1-37
1.3.95 mmu list translations
Lists the available translations and their associated parameters.
Syntax
mmu list translations
Examplesmmu list translationsAvailable address translations: PL1S_S1 parameters: S_SCTLR, S_TTBCR, S_TTBR0, S_TTBR1 PL1N_S1 parameters: N_TTBR1, N_TTBCR, N_SCTLR, N_TTBR0
Related references1.2.12 mmu on page 1-35
1.3.96 mmu memory-map, mpu memory-map
Prints the memory map.
Syntax
mmu memory-map [<memory-map>] [<param1>=<value1>]...
mpu memory-map [<memory-map>] [<param1>=<value1>]...
1 Arm® Debugger commands1.3 Arm® Debugger commands listed in alphabetical order
102272_2020.1M0_00_en Copyright © 2020 Arm Limited or its affiliates. All rights reserved. 1-110Non-Confidential
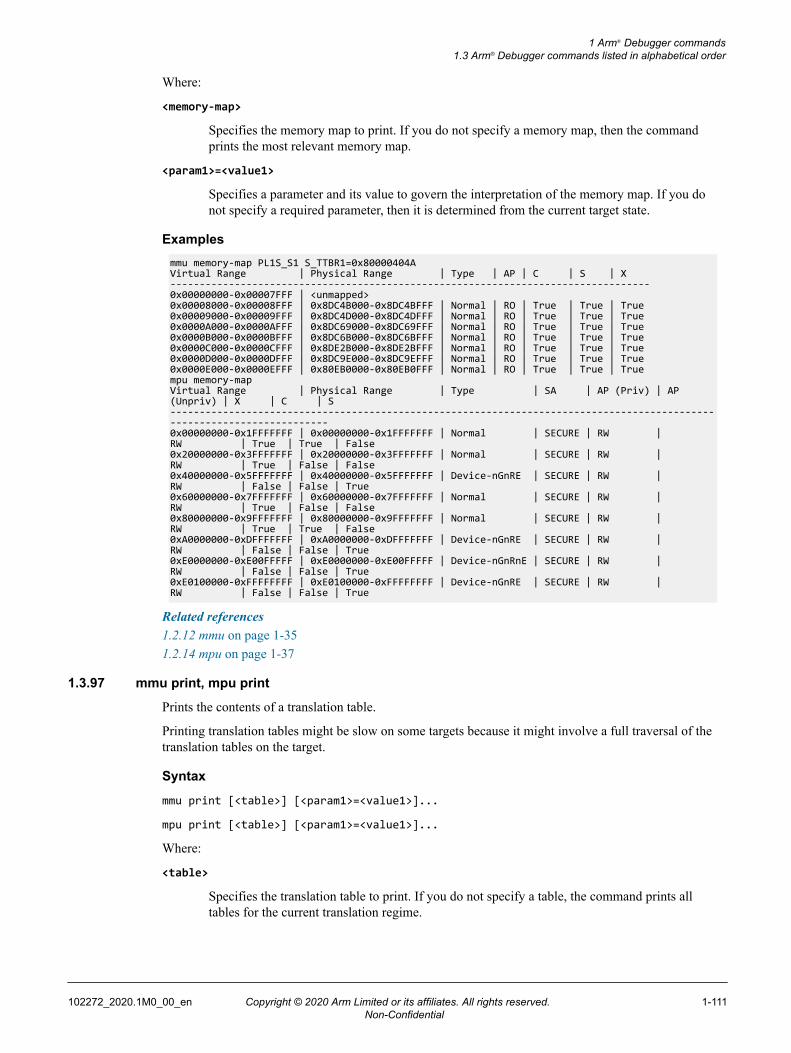
Where:
<memory-map>
Specifies the memory map to print. If you do not specify a memory map, then the commandprints the most relevant memory map.
<param1>=<value1>
Specifies a parameter and its value to govern the interpretation of the memory map. If you donot specify a required parameter, then it is determined from the current target state.
Examplesmmu memory-map PL1S_S1 S_TTBR1=0x80000404AVirtual Range | Physical Range | Type | AP | C | S | X----------------------------------------------------------------------------------0x00000000-0x00007FFF | <unmapped>0x00008000-0x00008FFF | 0x8DC4B000-0x8DC4BFFF | Normal | RO | True | True | True0x00009000-0x00009FFF | 0x8DC4D000-0x8DC4DFFF | Normal | RO | True | True | True0x0000A000-0x0000AFFF | 0x8DC69000-0x8DC69FFF | Normal | RO | True | True | True0x0000B000-0x0000BFFF | 0x8DC6B000-0x8DC6BFFF | Normal | RO | True | True | True0x0000C000-0x0000CFFF | 0x8DE2B000-0x8DE2BFFF | Normal | RO | True | True | True0x0000D000-0x0000DFFF | 0x8DC9E000-0x8DC9EFFF | Normal | RO | True | True | True0x0000E000-0x0000EFFF | 0x80EB0000-0x80EB0FFF | Normal | RO | True | True | Truempu memory-mapVirtual Range | Physical Range | Type | SA | AP (Priv) | AP (Unpriv) | X | C | S------------------------------------------------------------------------------------------------------------------------0x00000000-0x1FFFFFFF | 0x00000000-0x1FFFFFFF | Normal | SECURE | RW | RW | True | True | False0x20000000-0x3FFFFFFF | 0x20000000-0x3FFFFFFF | Normal | SECURE | RW | RW | True | False | False0x40000000-0x5FFFFFFF | 0x40000000-0x5FFFFFFF | Device-nGnRE | SECURE | RW | RW | False | False | True0x60000000-0x7FFFFFFF | 0x60000000-0x7FFFFFFF | Normal | SECURE | RW | RW | True | False | False0x80000000-0x9FFFFFFF | 0x80000000-0x9FFFFFFF | Normal | SECURE | RW | RW | True | True | False0xA0000000-0xDFFFFFFF | 0xA0000000-0xDFFFFFFF | Device-nGnRE | SECURE | RW | RW | False | False | True0xE0000000-0xE00FFFFF | 0xE0000000-0xE00FFFFF | Device-nGnRnE | SECURE | RW | RW | False | False | True0xE0100000-0xFFFFFFFF | 0xE0100000-0xFFFFFFFF | Device-nGnRE | SECURE | RW | RW | False | False | True
Related references1.2.12 mmu on page 1-351.2.14 mpu on page 1-37
1.3.97 mmu print, mpu print
Prints the contents of a translation table.
Printing translation tables might be slow on some targets because it might involve a full traversal of thetranslation tables on the target.
Syntax
mmu print [<table>] [<param1>=<value1>]...
mpu print [<table>] [<param1>=<value1>]...
Where:
<table>
Specifies the translation table to print. If you do not specify a table, the command prints alltables for the current translation regime.
1 Arm® Debugger commands1.3 Arm® Debugger commands listed in alphabetical order
102272_2020.1M0_00_en Copyright © 2020 Arm Limited or its affiliates. All rights reserved. 1-111Non-Confidential

<param1>=<value1>
Specifies a parameter and its value to govern the interpretation of the table. If you do not specifya required parameter, then it is determined from the current target state.
Examplesmmu print PL1S_S1_TTBR0SP:0x80F15000Input Address | Type | Next Level | Output Address | Properties------------------------------------------------------------------------------+ 0x00000000 | TTBR0 | SP:0x0080500000 | | - 0x00000000 | Fault (x704) | | | - 0x2C000000 | Section | | SP:0x002C000000 | NS=0, nG=0, S=0 - 0x2C100000 | Fault (x1343) | | | - 0x80000000 | Section | | SP:0x0080000000 | NS=0, nG=0, S=1 - 0x80100000 | Fault (x2047) | | |+ 0xFFFFFFFF | TTBR1 | SP:0x009082C300 | |mpu printBase | Limit | Type | Properties-----------------------------------------------------------------------------------------------------+ MPU (Secure) | | | ENABLE=0, HFNMIENA=0, PRIVDEFENA=0, MAIR 0=0x0, MAIR 1=0x0 - 0x00000000 | 0x00000000 | Region | SH=0, AP=0, XN=0, AttrIndex=0, EN=0 - 0x00000000 | 0x00000000 | Region | SH=0, AP=0, XN=0, AttrIndex=0, EN=0 - 0x00000000 | 0x00000000 | Region | SH=0, AP=0, XN=0, AttrIndex=0, EN=0 - 0x00000000 | 0x00000000 | Region | SH=0, AP=0, XN=0, AttrIndex=0, EN=0 - 0x00000000 | 0x00000000 | Region | SH=0, AP=0, XN=0, AttrIndex=0, EN=0 - 0x00000000 | 0x00000000 | Region | SH=0, AP=0, XN=0, AttrIndex=0, EN=0+ MPU (Non-Secure) | | | ENABLE=0, HFNMIENA=0, PRIVDEFENA=0, MAIR 0=0x0, MAIR 1=0x0 - 0x00000000 | 0x00000000 | Region | SH=0, AP=0, XN=0, AttrIndex=0, EN=0 - 0x00000000 | 0x00000000 | Region | SH=0, AP=0, XN=0, AttrIndex=0, EN=0 - 0x00000000 | 0x00000000 | Region | SH=0, AP=0, XN=0, AttrIndex=0, EN=0 - 0x00000000 | 0x00000000 | Region | SH=0, AP=0, XN=0, AttrIndex=0, EN=0 - 0x00000000 | 0x00000000 | Region | SH=0, AP=0, XN=0, AttrIndex=0, EN=0 - 0x00000000 | 0x00000000 | Region | SH=0, AP=0, XN=0, AttrIndex=0, EN=0+ SAU | | | ALLNS=0, ENABLE=0 - 0x00000000 | 0x00000000 | Region | NSC=0, ENABLE=0 - 0x00000000 | 0x00000000 | Region | NSC=0, ENABLE=0 - 0x00000000 | 0x00000000 | Region | NSC=0, ENABLE=0 - 0x00000000 | 0x00000000 | Region | NSC=0, ENABLE=0 - 0x00000000 | 0x00000000 | Region | NSC=0, ENABLE=0 - 0x00000000 | 0x00000000 | Region | NSC=0, ENABLE=0+ IDAU | | | [Not Configured]
Related references1.2.12 mmu on page 1-351.2.14 mpu on page 1-37
1.3.98 mmu translate
Performs translations between virtual and physical addresses.
It translates either:• From a virtual address to a physical address.• From a physical address to one or more virtual addresses.
Physical to virtual address translation might be slow on some targets because it might involve a fulltraversal of the translation tables on the target.
Syntax
mmu translate <address> [<translation>][<param1>=<value1>]...
Where:
<address>
Specifies the address to translate. If this is a virtual address then a virtual to physical addresstranslation is performed. If this is a physical address then a physical to virtual address translationis performed.
1 Arm® Debugger commands1.3 Arm® Debugger commands listed in alphabetical order
102272_2020.1M0_00_en Copyright © 2020 Arm Limited or its affiliates. All rights reserved. 1-112Non-Confidential

<translation>
Specifies the translation to perform.
<param1>=<value1>
Specifies a parameter and its value to govern the interpretation of the table. If you do not specifya required parameter, then it is determined from the current target state.
Examplesmmu translate 0x00008000 PL1S_S1 S_TTBR1=0x80000404ASP:0x80F15000mmu translate SP:0x80F15000Address SP:0x80F15000 maps to0x000080000x80F15000
Related references1.2.12 mmu on page 1-35
1.3.99 newvar
Declares and initializes a new debugger convenience variable.
Syntax
newvar [global] $<name>[=<initial_value>]
Where:
global
Specifies that the variable has global scope. If global is not specified, then the variable is onlyaccessible within its enclosing lexical scope.
<name>
Specifies the name of the new variable. The name must be a valid C identifier but prefixed with$.
<initial_value>
Specifies the initial value of the variable. If an initial value is not specified, then by default, thevariable is of integer type with value 0.
• Debugger scripts and the top-level interactive interpreter are considered separate lexical scopes wherenon-global convenience variables are not visible to any child or parent debugger script
• The if, else, and while commands define new lexical scopes that inherit parent lexical scopes up tothe level of a script, top-level interpreter, or user-defined command.
• Any non-global convenience variables, declared within a lexical scope, are destroyed at the end of thelexical scope.
Examplesdefine advance_hw # This defines a new command that runs # to an address using a hardware breakpoint. hbreak $arg0 # Set a hardware breakpoint at the value of the first parameter. newvar $bp_num = $ # Save the number of the breakpoint in a new variable. continue wait delete $bp_num # Delete the hardware breakpoint.endadvance_hw 0x00008000
Related references1.2.4 Scripts on page 1-27
1 Arm® Debugger commands1.3 Arm® Debugger commands listed in alphabetical order
102272_2020.1M0_00_en Copyright © 2020 Arm Limited or its affiliates. All rights reserved. 1-113Non-Confidential

1.3.100 next
Steps through an application at the source level stopping at the first instruction of each source line butstepping over all function calls. You must compile your code with debug information to use thiscommand successfully.
Syntax
next [<count>]
Where:
<count>Specifies the number of source lines to execute.
Note
Execution stops immediately if a breakpoint is reached, even if fewer than <count> source linesare executed.
Examplesnext # Execute one source linenext 5 # Execute five source lines
Related references1.3.192 step on page 1-1611.3.193 stepi on page 1-1611.3.194 steps on page 1-1621.3.101 nexti on page 1-1141.3.102 nexts on page 1-1151.2.2 Execution control on page 1-24
1.3.101 nexti
Steps through an application at the instruction level but stepping over all function calls.
Syntax
nexti [<count>]
Where:
<count>Specifies the number of instructions to execute.
Note
Execution stops immediately if a breakpoint is reached, even if fewer than <count> instructionsare executed.
Examplesnexti # Execute one instructionnexti 5 # Execute five instructions
Related references1.3.192 step on page 1-1611.3.193 stepi on page 1-1611.3.194 steps on page 1-1621.3.100 next on page 1-1141.3.102 nexts on page 1-115
1 Arm® Debugger commands1.3 Arm® Debugger commands listed in alphabetical order
102272_2020.1M0_00_en Copyright © 2020 Arm Limited or its affiliates. All rights reserved. 1-114Non-Confidential

1.2.2 Execution control on page 1-24
1.3.102 nexts
Steps through an application at the source level stopping at the first instruction of each source statementbut stepping over all function calls. You must compile your code with debug information to use thiscommand successfully.
Syntax
nexts [<count>]
Where:
<count>Specifies the number of source statements to execute.
Note
Execution stops immediately if a breakpoint is reached, even if fewer than <count> sourcestatements are executed.
Examplesnexts # Execute one source statementnexts 5 # Execute five source statements
Related references1.3.192 step on page 1-1611.3.193 stepi on page 1-1611.3.194 steps on page 1-1621.3.100 next on page 1-1141.3.101 nexti on page 1-1141.2.2 Execution control on page 1-24
1.3.103 nosharedlibrary
Discards all loaded shared library symbols.
Note
You must launch the debugger with --target_os command-line option before you can use this feature.In Arm DS, this option is automatically selected when you connect to a target using gdbserver.
Syntax
nosharedlibrary
Examplesnosharedlibrary # Discards loaded shared library symbols
Related references1.2.6 Operating System (OS) on page 1-29
1.3.104 output
Displays only the result of an expression. This is similar to the print command but it does not record theresults in a debugger variable.
1 Arm® Debugger commands1.3 Arm® Debugger commands listed in alphabetical order
102272_2020.1M0_00_en Copyright © 2020 Arm Limited or its affiliates. All rights reserved. 1-115Non-Confidential

Syntax
output [/<flag>] <expression>
Where:
<flag>
Specifies the output format:
x
Hexadecimal (casts the value to an unsigned integer prior to printing in hexadecimal)
d
Signed decimal. This is the default.
u
Unsigned decimal
o
Octal
t
Binary
a
Absolute hexadecimal address
c
Character
f
Floating-point
s
Default format from the expression.
<expression>Specifies an expression that is evaluated and the result is returned.
Note
If your expression accesses memory then a default address variable is set to the location after thelast accessed address. Some commands, such as x, use this default value if no address isspecified.
Examplesoutput (int*)8 # Cast a number as a pointeroutput 4+4 # Display result of expression in decimaloutput "initializing..." # Display progress informationoutput /x $PC # Display address in PC register (hexadecimal)
Related references1.2.16 Display on page 1-37
1.3.105 pause
Pauses the execution of a script for a specified period of time.
1 Arm® Debugger commands1.3 Arm® Debugger commands listed in alphabetical order
102272_2020.1M0_00_en Copyright © 2020 Arm Limited or its affiliates. All rights reserved. 1-116Non-Confidential

Syntax
pause <number> [ms|s]
Where:
<number>
Specifies the period of time.
ms
Specifies the time in milliseconds. This is the default.
s
Specifies the time in seconds.
Examplespause 1000 # Pause for 1 secondpause 0.5s # Pause for half a second
Related references1.2.24 Support on page 1-47
1.3.106 preprocess
Displays the preprocessed expression, not the evaluated expression.
Syntaxpreprocess [<expression>]
Note
This functionality is dependent on the compiler generating accurate macro debug information.
Examples
If your application contained the following code:
#define BASE_ADDRESS (0x1000)#define REG_ADDRESS (BASE_ADDRESS + 0x10)int main () { return REG_ADDRESS;}
During a debug session, you can display the REG_ADDRESS by using:
>preprocess REG_ADDRESS((0x1000) + 0x10)
This compares with the expression value as output by the print command:
>print/x REG_ADDRESS0x1010
Related references1.2.24 Support on page 1-47
1.3.107 print, inspect
Displays the output of an expression (128 character limit) and also records the result in a new debuggervariable, $<n>, where <n> is a number. Results from the print command can be used successively inexpressions using the $ character. If you do not want the results recorded in a debugger variable, use theoutput command instead.
1 Arm® Debugger commands1.3 Arm® Debugger commands listed in alphabetical order
102272_2020.1M0_00_en Copyright © 2020 Arm Limited or its affiliates. All rights reserved. 1-117Non-Confidential

Syntax
print [/<flag>] [<expression>]
inspect [/<flag>] [<expression>]
Where:
<flag>
Specifies the output format:
x
Hexadecimal (casts the value to an unsigned integer prior to printing in hexadecimal)
d
Signed decimal. This is the default.
u
Unsigned decimal
o
Octal
t
Binary
a
Absolute hexadecimal address
c
Character
f
Floating-point
s
Default format from the expression.
<expression>Specifies an expression that is evaluated and the result is returned. If no <expression> isspecified then the last expression is repeated.
Note
If your expression accesses memory then a default address variable is set to the location after thelast accessed address. Some commands, such as x, use this default value if no address isspecified.
Examplesprint (int*)8 # Cast a number as a pointerprint 4+4 # Display result of expression in decimalprint "initializing..." # Display progress informationprint /x $PC # Display address in PC register (hexadecimal)
Related references1.2.16 Display on page 1-37
1.3.108 pwd
Displays the current working directory.
1 Arm® Debugger commands1.3 Arm® Debugger commands listed in alphabetical order
102272_2020.1M0_00_en Copyright © 2020 Arm Limited or its affiliates. All rights reserved. 1-118Non-Confidential

Syntax
pwd
Examplespwd # Display current working directory
Related references1.2.7 Files on page 1-31
1.3.109 quit, exit
Quits the debugger session.
Syntax
quit
exit
Examplesquit # Quit debugger session
Related references1.2.24 Support on page 1-47
1.3.110 reload-symbol-file
Reloads debug information from an already loaded image into the debugger using the same settings asthe original load operation. For example, you can use this command to reload debug information into thedebugger after you have rebuilt your image.
Note
The PC register is not set with this command.
Syntax
reload-symbol-file [<filename>]
Where:
<filename>
Specifies the image to reload. If it is not already loaded then an error is generated.
Examplesreload-symbol-file "myFile.axf" # Reload debug information
Related references1.2.7 Files on page 1-31
1.3.111 reset
Performs a reset on the target. The exact behavior of the reset command depends on the debug agentand the target.
For example:
• A debug agent can be configured to reset the target in different ways.• The position of the switches on the target.• A gdbserver connection can be configured to restart gdbserver and run scripts.
1 Arm® Debugger commands1.3 Arm® Debugger commands listed in alphabetical order
102272_2020.1M0_00_en Copyright © 2020 Arm Limited or its affiliates. All rights reserved. 1-119Non-Confidential

For more information, see the documentation for your target or debug agent. Note
reset does not affect the symbols loaded in the debugger. Registers and memory might contain differentvalues after a reset.
Syntax
reset [<key>]
Where:
<key>
Specifies the reset key. The reset capabilities are target dependent and might not all be enabled.You can use info capabilities to display a list of capability settings for the target device thatis currently connected to the debugger.
Possible options for the reset key are:
app
Application restart.
bus
Bus reset.
jtag
JTAG reset, applied to the nTRST signal.
system
General hardware reset that is not specific to a bus or processor.
If no key is specified, then the first enabled reset capability is performed.
Examplesreset # Performs the first enabled reset capabilityreset app # Performs an application restartreset system # Performs a general hardware resetreset bus # Performs a bus resetreset jtag # Performs a JTAG (nTRST) reset
Related references1.2.2 Execution control on page 1-24
1.3.112 resolve
Re-evaluates the specified breakpoints or watchpoints and those with addresses that can be resolved areset. Unresolved addresses remain pending.
Syntax
resolve [<number>] ...
Where:
<number>
Specifies the breakpoint or watchpoint number. This is the number assigned by the debuggerwhen it is set. You can use info breakpoints to display the number and status of allbreakpoints and watchpoints.
If no <number> is specified, then all breakpoints and watchpoints are re-evaluated.
1 Arm® Debugger commands1.3 Arm® Debugger commands listed in alphabetical order
102272_2020.1M0_00_en Copyright © 2020 Arm Limited or its affiliates. All rights reserved. 1-120Non-Confidential
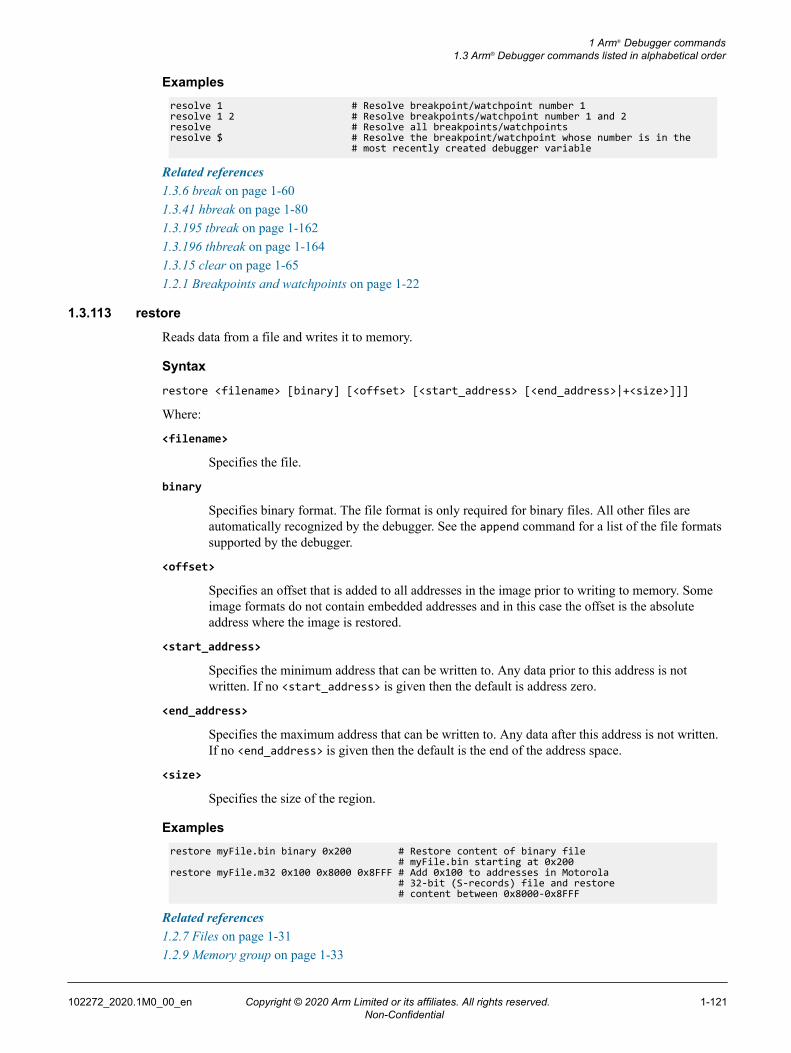
Examplesresolve 1 # Resolve breakpoint/watchpoint number 1resolve 1 2 # Resolve breakpoints/watchpoint number 1 and 2resolve # Resolve all breakpoints/watchpointsresolve $ # Resolve the breakpoint/watchpoint whose number is in the # most recently created debugger variable
Related references1.3.6 break on page 1-601.3.41 hbreak on page 1-801.3.195 tbreak on page 1-1621.3.196 thbreak on page 1-1641.3.15 clear on page 1-651.2.1 Breakpoints and watchpoints on page 1-22
1.3.113 restore
Reads data from a file and writes it to memory.
Syntax
restore <filename> [binary] [<offset> [<start_address> [<end_address>|+<size>]]]
Where:
<filename>
Specifies the file.
binary
Specifies binary format. The file format is only required for binary files. All other files areautomatically recognized by the debugger. See the append command for a list of the file formatssupported by the debugger.
<offset>
Specifies an offset that is added to all addresses in the image prior to writing to memory. Someimage formats do not contain embedded addresses and in this case the offset is the absoluteaddress where the image is restored.
<start_address>
Specifies the minimum address that can be written to. Any data prior to this address is notwritten. If no <start_address> is given then the default is address zero.
<end_address>
Specifies the maximum address that can be written to. Any data after this address is not written.If no <end_address> is given then the default is the end of the address space.
<size>
Specifies the size of the region.
Examplesrestore myFile.bin binary 0x200 # Restore content of binary file # myFile.bin starting at 0x200restore myFile.m32 0x100 0x8000 0x8FFF # Add 0x100 to addresses in Motorola # 32-bit (S-records) file and restore # content between 0x8000-0x8FFF
Related references1.2.7 Files on page 1-311.2.9 Memory group on page 1-33
1 Arm® Debugger commands1.3 Arm® Debugger commands listed in alphabetical order
102272_2020.1M0_00_en Copyright © 2020 Arm Limited or its affiliates. All rights reserved. 1-121Non-Confidential

1.3.114 run
Starts running the target.
Bare-metal
This command sets the PC register to the entry point address previously recorded by the load,loadfile, or file command and starts running the target. Subsequent run commands alsoreload the executable image if it follows a previous load operation.
Linux application
This command sends a request to the server to restart the application and then start running it.
Note
Control is returned as soon as the target is running. You can use the wait command to block thedebugger from returning control until either the application completes or a breakpoint is hit.
Syntax
run [<args>]
Where:
<args>
Specifies the command-line arguments that are passed to the main() function in the applicationusing the argv parameter. The name of the image is always implicitly passed in argv[0] and itis not necessary to pass this as an argument to the run command.
Examplesrun # Start running the device
1.3.115 rwatch
Sets a watchpoint for a data symbol. The debugger stops the target when the memory at the specifiedaddress is read.
This command records the ID of the watchpoint in a new debugger variable, $<n> , where <n> is anumber. You can use this variable, in a script, to delete or modify the watchpoint behavior. If $<n> is thelast or second-to-last debugger variable, then you can also access the ID using $ or $$, respectively.
Watchpoints are only supported on scalar values.
The availability of watchpoints depends on your target. In the case of Linux application debug usinggdbserver, the availability of watchpoints also depends on the Linux kernel version and configuration.
The address of the instruction that triggers the watchpoint might not be the address shown in the PCregister. This is because of pipelining effects.
Syntax
rwatch [-d] [-p] [-w <width>] [<filename>:]<symbol> | <*address> [vmid <number>] [if<condition>]
Where:
-d
Creates the watchpoint disabled.
-p
Specifies whether or not the resolution of an unrecognized watchpoint location results in apending watchpoint being created.
1 Arm® Debugger commands1.3 Arm® Debugger commands listed in alphabetical order
102272_2020.1M0_00_en Copyright © 2020 Arm Limited or its affiliates. All rights reserved. 1-122Non-Confidential

-w <width>
Specifies the width to watch at the given address, in bits. Accepted values are: 8, 16, 32, and 64if supported by the target. This parameter is optional.
The width defaults to:• 32 bits for an address.• The width corresponding to the type of the symbol or expression, if entered.
<filename>
Specifies the file.
<symbol>
Specifies a global/static data symbol. For arrays or structs you must specify the element ormember.
<address>
Specifies the address. This can be either an address or an expression that evaluates to an address.
vmid <number>
Specifies the Virtual Machine ID (VMID) to apply the watchpoint to. This can be either aninteger or an expression that evaluates to an integer. Applicable only on targets which supporthypervisor / virtual machine debugging.
if <condition>
Specifies the condition which must evaluate to true at the time the watchpoint is triggered forthe target to stop. You can create several conditional watchpoints, but when a conditionalwatchpoint is enabled, no other watchpoints (regardless of whether they are conditional) can beenabled.
Examplesrwatch myVar1 # Set read watchpoint on myVar1rwatch *0x80D4 # Set read watchpoint on address 0x80D4rwatch myVar1 if myVar1 == 2 # Set read watchpoint on myVar1 which # will only be hit if myVar1 evaluates to 2rwatch myVar1 if $LR & 0xFF == 0x12 # Set read watchpoint on myVar1 which # will only be hit if ($LR & 0xFF) evaluates # to 0x12 when myVar1 is accessed
Related references1.3.214 watch on page 1-1781.3.16 clearwatch on page 1-661.3.5 awatch on page 1-591.2.1 Breakpoints and watchpoints on page 1-22
1.3.116 select-frame
Moves the current frame pointer in the call stack.
Note
Each frame is assigned a number that increases from the bottom frame (zero) through the call stack to thetop frame that is the start of the application.
Syntax
select-frame <number>
Where:
1 Arm® Debugger commands1.3 Arm® Debugger commands listed in alphabetical order
102272_2020.1M0_00_en Copyright © 2020 Arm Limited or its affiliates. All rights reserved. 1-123Non-Confidential

<number>
Specifies the frame number.
Examplesselect-frame 1 # Move to stack frame 1
Related references1.2.5 Call stack on page 1-28
1.3.117 set variable
Evaluates an expression and assigns the result to a variable, register, or memory address.
Syntax
set [variable] <expression>
Where:
<expression>
Specifies an expression and assigns the result to a variable, register, or memory address.
Examplesset variable myVar=10 # Assign 10 to variable myVarset variable $PC=0x8000 # Assign address 0x8000 to # PC registerset variable $CPSR.N=0 # Clear N bitset variable (*(int*)0x8000)=1 # Assign 1 to address 0x8000set variable *0x8000=1 # Assign 1 to address 0x8000set variable strcpy((char*)0x8000,"My String") # Assign string to address 0x8000set variable memcpy(void*)0x8000,{10,20,30,40},4) # Assign array to address 0x8000
Related references1.2.19 Set on page 1-411.3.62 info memory-parameters on page 1-92Related informationArm Architecture Reference Manual
1.3.118 set arm
Controls the behavior of the debugger when selecting the instruction set for disassembly and settingbreakpoints.
Note
Available instruction sets depend on the target that the debugger is connected to.
Syntax
set arm <option>
Where:
<option>
Specifies additional options:
force-mode
Controls the default debugger behavior overriding the fallback-mode setting.
a32|arm
Forces the debugger to use the A32 instruction set.
1 Arm® Debugger commands1.3 Arm® Debugger commands listed in alphabetical order
102272_2020.1M0_00_en Copyright © 2020 Arm Limited or its affiliates. All rights reserved. 1-124Non-Confidential

a64
Forces the debugger to use the A64 instruction set.
t32|thumb
Forces the debugger to use the T32 instruction set.
auto
Forces the debugger to use debug information when available or thefallback-mode if this is not available. This is the default.
fallback-mode
Controls the default debugger behavior when force-mode is set to auto and debuginformation is not available.
a32|arm
Forces the debugger to use the A32 instruction set when debug information isnot available.
a64
Forces the debugger to use the A64 instruction set when debug information isnot available.
t32|thumb
Forces the debugger to use the T32 instruction set when debug information isnot available.
auto
Forces the debugger to use the current instruction set of the target. This is thedefault.
Examplesset arm force-mode t32 # Force the use of T32set arm fallback-mode a32 # When force-mode is auto, use A32 # if no debug information is available
Related references1.2.19 Set on page 1-411.2.24 Support on page 1-47
1.3.119 set auto-solib-add
Controls the automatic loading of shared library symbols.
Note
You must launch the debugger with the --target_os command-line option before you can use thisfeature. In Arm DS, this option is automatically selected when you connect to a target using gdbserver.
Syntax
set auto-solib-add {off|on}
Where:
off
No automatic loading. When automatic loading is off you must explicitly load shared librarysymbols using the sharedlibrary command.
1 Arm® Debugger commands1.3 Arm® Debugger commands listed in alphabetical order
102272_2020.1M0_00_en Copyright © 2020 Arm Limited or its affiliates. All rights reserved. 1-125Non-Confidential

on
Loads shared library symbols automatically. This is the default.
Examplesset auto-solib-add off # No automatic loading of shared library symbols
Related references1.2.6 Operating System (OS) on page 1-291.2.19 Set on page 1-41
1.3.120 set backtrace
Controls the default behavior when using the info stack command.
Syntax
set backtrace <option>
Where:
<option>
Specifies additional options:
limit <n>
Specifies the maximum limit when displaying the call stack. You can specify zero asthe maximum limit to display the entire call stack.
The default call stack limit is 100.
Examplesset backtrace limit 10 # Limit the call stack display to 10 framesset backtrace limit 0 # No limit, display the entire call stack
Related references1.2.5 Call stack on page 1-281.2.19 Set on page 1-41
1.3.121 set blocking-run-control
Controls whether run control operations such as stepping and running are blocked until the target stops orreleased immediately.
Syntax
set blocking-run-control {off|on|script-only}
Where:
off
Specifies asynchronous, control is returned before the target stops.
on
Specifies synchronous, run control operations are blocked until the target stops. This has thesame effect as issuing a wait command after each run control operation.
script-only
Specifies that run control operations block only when executed as commands from within ascript.
This is the default.
1 Arm® Debugger commands1.3 Arm® Debugger commands listed in alphabetical order
102272_2020.1M0_00_en Copyright © 2020 Arm Limited or its affiliates. All rights reserved. 1-126Non-Confidential

Examplesset blocking-run-control on # Block run control operations until target stops
Related references1.2.2 Execution control on page 1-241.2.19 Set on page 1-41
1.3.122 set breakpoint
Controls the automatic behavior of breakpoints and watchpoints.
Syntax
set breakpoint [<option>]
Where:
<option>
Specifies additional options:
auto-hw
Controls the automatic breakpoint selection when using the break command:
off
Disables automatic breakpoint selection.
on
Uses the memory map attributes to decide if hardware or software breakpointsmust be used. This is the default.
auto-remove
Controls the automatic removal of breakpoints and watchpoints when disconnectingfrom the target:
off
Disables automatic removal.
onEnables automatic removal. This is the default.
Note
If the target is running, the debugger temporarily stops the target beforeremoving breakpoints and watchpoints.
skipmode
Controls whether to skip all breakpoints and watchpoints:
off
Disables skip mode. This is the default.
on
Enables skip mode.
Examplesset breakpoint auto-hw off # No automatic breakpoint selectionset breakpoint skipmode on # Skip all breakpoints and watchpointsset breakpoint auto-remove off # No automatic removal of breakpoints and watchpoints
1 Arm® Debugger commands1.3 Arm® Debugger commands listed in alphabetical order
102272_2020.1M0_00_en Copyright © 2020 Arm Limited or its affiliates. All rights reserved. 1-127Non-Confidential

Related references1.3.23 disable breakpoints on page 1-701.3.20 delete breakpoints on page 1-681.3.47 info breakpoints, info watchpoints on page 1-851.3.49 info capabilities on page 1-861.3.48 info breakpoints capabilities, info watchpoints capabilities on page 1-851.2.1 Breakpoints and watchpoints on page 1-221.2.19 Set on page 1-41
1.3.123 set case-insensitive-source-matching
Controls the case sensitivity of debugger file matching operations.
Syntax
set case-insensitive-source-matching [off|on]
Where:
off
Specifies case sensitive file matching. This is the default.
on
Specifies case insensitive file matching. This is useful if the file paths or filenames in the debugdata have a different case to those in the filesystem.
Examples# By default the debugger performs case sensitive file matching.# Assume that the debug data contains the filename main.c.break -p "C:/example/Main.c":2 # This fails because Main.c does not match main.c.WARNING(CMD452-COR167):! Breakpoint 8 has been pended! No compilation unit matching "C:/example/Main.c" was found.set case-insensitive-source-matching on # case insensitive matching.break -p "C:/EXAmple/Main.c" # This file matching operation succeeds.Breakpoint 9 at S:0x000080A8 on file main.c, line 2
Related references1.2.19 Set on page 1-41
1.3.124 set cde-coprocessors
Specify the coprocessors that are associated with the Arm Custom Datapath Extension (CDE).
Default
By default, coprocessors are associated with the General CoProcessor (GCP) encoding.
Syntax
set cde-coprocessors <coprocessor>=<type>[, <coprocessor>=<type>[, ...]]
Where:
<coprocessor>
Specifies the coprocessor. Valid values are P0 to P7.
<type>
Specifies the encoding pattern the coprocessor supports. The types are:
1 Arm® Debugger commands1.3 Arm® Debugger commands listed in alphabetical order
102272_2020.1M0_00_en Copyright © 2020 Arm Limited or its affiliates. All rights reserved. 1-128Non-Confidential

CDE
Support the CDE encoding pattern.
GCP
Support the GCP encoding pattern.
Note
You can provide multiple coprocessor associations in a single command, separated by commas.
Example: specify a single coprocessor associationset cde-coprocessors p1=cde # Associates coprocessor P1 with the CDE. # All other coprocessors default to the # general coprocessor encoding.
Example: specify multiple coprocessor associationsset cde-coprocessors p1=cde, p4=gcp, p5=cde # Associates coprocessor P1 and P5 with # the CDE.
Related references1.3.161 show cde-coprocessors on page 1-149
1.3.125 set debug-agent
Sets an internal configuration parameter for the debug agent. The available parameters depend on thedebug agent, such as the DSTREAM family of devices or gdbserver.
Syntax
set debug-agent <name> <value>
Where:
<name>
Specifies the name of the parameter to set.
<value>
Specifies the value of the parameter. Values depend on the parameter being set. An error isreported if the value is not valid.
Examplesset debug-agent UserOut_P1 1# Set value of USER OUT pin1 to 1.# This parameter is available for DSTREAM connections.
Related references1.2.19 Set on page 1-41
1.3.126 set debug-from
Specifies the address of the temporary breakpoint for subsequent use by the start command. If you donot specify this command then the default value used by the start command is the address of the globalfunction main().
Syntax
set debug-from <expression>
Where:
1 Arm® Debugger commands1.3 Arm® Debugger commands listed in alphabetical order
102272_2020.1M0_00_en Copyright © 2020 Arm Limited or its affiliates. All rights reserved. 1-129Non-Confidential

<expression>
Specifies an expression that evaluates to an address. The expression is only evaluated when thestart command is processed, therefore, you can refer to symbols that might not exist yet butmight be made available in the future. You can use the debugger variable $entrypoint to referto the entry point for the currently loaded image.
Examplesset debug-from *0x8000 # Set start-at setting to address 0x8000set debug-from *$entrypoint # Set start-at setting to address of $entrypointset debug-from main+8 # Set start-at setting to address of main+8set debug-from function1 # Set start-at setting to address of function1
Related references1.2.2 Execution control on page 1-241.2.19 Set on page 1-41
1.3.127 set dtsl-options
Sets a parameter in the DTSL configuration.
Syntax
set dtsl-options <name> <value>
Where:
<name>
Specifies a name of the parameter to set.
<value>
Specifies the value of the parameter. Values depend on the parameter being set. An error isreported if the value is not valid.
Examplesset dtsl-options options.cortexA9.coreTrace.cycleAccurate False# Set DTSL configuration cycle Accurate parameter to false
Related references1.2.19 Set on page 1-41
1.3.128 set dtsl-temporary-directory
Specifies the path for the temporary directory to store trace data.
Syntax
set dtsl-temporary-directory <path>
Where:
1 Arm® Debugger commands1.3 Arm® Debugger commands listed in alphabetical order
102272_2020.1M0_00_en Copyright © 2020 Arm Limited or its affiliates. All rights reserved. 1-130Non-Confidential

<path>
Specifies the location of your temporary directory, for example, C:my_temp_dir.
Note
This command can only set the path to an existing directory location. You must create thedirectory before using this command.
To clear the setting and revert to the default system directory, enter set dtsl-temporary-directory "".
You can also use the Arm DS Preferences dialog box to set trace data temporary directory. Todo this:1. From the Arm DS menu, select Window > Preferences.2. Browse to Arm DS > Debugger > Trace.3. Select the Use custom directory for temporary trace data files option.4. Enter or Browse the path to your temporary directory.
Examplesset dtsl-temporary-directory C:\my_temp_dir # Set DTSL temporary directory path as C:\my_temp_dir.
Related references1.2.19 Set on page 1-41
1.3.129 set elf cache-uninitialized-sections
Controls whether the debugger caches uninitialized sections.
After the symbols for an image are loaded, the debugger by default marks regions corresponding to ELFsections as cacheable if:• The section has sht_type that is set to one of:
— SHT_PROGBITS— SHT_INIT_ARRAY— SHT_FINI_ARRAY— SHT_PREINIT_ARRAY— SHT_NOBITS.
• The SHF_ALLOC flag in sh_flags is set for the section.
This can result in uninitialized sections, or volatile regions of the address space, for example peripherals,being set to cacheable by default. To overcome this problem, you can use set elf cache-uninitialized-sections off to disable the debugger from caching such ELF sections.
Syntax
set elf cache-uninitialized-sections {off|on}
Where:
off
Disables caching of uninitialized sections.
on
Enables caching of uninitialized sections. This is the default.
Examplesset elf cache-uninitialized-sections off # Disable caching of uninitialized sections
1 Arm® Debugger commands1.3 Arm® Debugger commands listed in alphabetical order
102272_2020.1M0_00_en Copyright © 2020 Arm Limited or its affiliates. All rights reserved. 1-131Non-Confidential

Related references1.2.19 Set on page 1-41
1.3.130 set elf load-segments-at-p_paddr
Enables loading to the specified load offset + p_paddr when loading segments of ELF images to thetarget.
When loading segments of ELF images to the target, by default, the debugger loads to the specified loadoffset + p_vaddr . If you want the debugger to load to the specified load offset + p_paddr then enableelf load-segments-at-p_addr. (as specified in the ELF Program Header for that segment).
Note
The ELF Program Header for the corresponding segment specifies the p_vaddr.
Syntax
set elf load-segments-at-p_paddr {off|on}
Where:
off
Loads to the specified load offset + p_vaddr. This is the default.
on
Loads to the specified load offset + p_paddr.
Examplesset elf load-segments-at-p_paddr on # Loads to the specified load offset + p_paddr
Related references1.2.19 Set on page 1-41
1.3.131 set elf zero-extra-segment-bytes
Enables zeroing of bytes from p_filesz to p_memsz when loading segments of ELF images to the target.
When loading segments of ELF images to the target, by default, the debugger only writes p_fileszbytes to the target. If p_filesz is less than p_memsz, and you want the debugger to pad the region fromp_filesz to p_memsz with zero then enable elf zero-extra-segment-bytes.
Note
The ELF Program Header for the corresponding segment specifies the p_filesz.
Syntax
set elf zero-extra-segment-bytes {off|on}
Where:
off
Disables zeroing. This is the default.
on
Enables zeroing the region from p_filesz to``p_memsz``.
Examplesset elf zero-extra-segment-bytes on # Enable zeroing from p_filesz to p_memsz
1 Arm® Debugger commands1.3 Arm® Debugger commands listed in alphabetical order
102272_2020.1M0_00_en Copyright © 2020 Arm Limited or its affiliates. All rights reserved. 1-132Non-Confidential

Related references1.2.19 Set on page 1-41
1.3.132 set endian
Specifies the byte order for use by the debugger. The endianness of the target is not modified by thiscommand.
Syntax
set endian {auto|be8|big|little}
Where:
auto
Uses the same byte order as the image where possible, otherwise it uses the current endiannessof the target. This is the default.
be8
Specifies Byte Invariant Addressing big-endian mode introduced in the Armv6 architecture(data is big endian and code is little endian).
big
Specifies big endian mode.
little
Specifies little endian mode.
Examplesset endian little # Debug using little endian
Related references1.2.19 Set on page 1-411.2.24 Support on page 1-47
1.3.133 set escape-strings
Controls how special characters in strings are printed on the debugger command-line.
Syntax
set escape-strings {off|on}
Where:
off
Specifies that any backslash characters in strings are treated as escape sequences. For example,if the string contains “\t” then this is printed as a tab character.
This is the default.
on
Specifies that any backslashes in strings are not treated as escape sequences and are insteadoutput literally. For example, if the string contains “\t” then this is printed as a “\” characterfollowed by a “t” character.
Examplesset escape-strings onoutput "Say \"hello\"""Say \"hello\""set escape-strings off
1 Arm® Debugger commands1.3 Arm® Debugger commands listed in alphabetical order
102272_2020.1M0_00_en Copyright © 2020 Arm Limited or its affiliates. All rights reserved. 1-133Non-Confidential

output "Say \"hello\"""Say "hello""
Related references1.2.19 Set on page 1-41
1.3.134 set escapes-in-filenames
Controls the use of special characters in paths.
Syntax
set escapes-in-filenames {off|on}
Where:
off
Specifies that a backslash in a path is treated as a directory separator (with the exception that itcan be used to escape spaces). For example:
C:\test\file.c
The first backslash is treated as a separator followed by a t, not an escape sequence representingthe tab character. The second backslash escapes the space.
This is the default.
on
Specifies that a backslash is to be treated as part of an escape sequence to indicate that thecharacter following is a special character. For example:
C:\\test\\file.c
The backslash in this example is a directory separator and must be identified as a specialcharacter.
Examplesset escapes-in-filenames on # Use backslash as an escape character in paths
Related references1.2.19 Set on page 1-41
1.3.135 set idau-region
Specifies the Implementation Defined Attribution Unit (IDAU) region parameters for each memoryrange. Targets with Armv8-M Security Extension can provide an IDAU which constrains securityattribution for an address in an implementation defined manner. To instruct Arm Debugger to take theIDAU into consideration, you must specify the IDAU region using the set idau-region command.
Syntax
set idau-region <region_number> <base_address> <limit_address> <region_type>
Where:
<region_number>
Specifies the number of the IDAU region.
To delete an existing IDAU region, specify the region number without any additionalparameters.
<base_address>
Specifies the base address of the IDAU region.
1 Arm® Debugger commands1.3 Arm® Debugger commands listed in alphabetical order
102272_2020.1M0_00_en Copyright © 2020 Arm Limited or its affiliates. All rights reserved. 1-134Non-Confidential

<limit_address>
Specifies the last address of the IDAU region.
<region_type>
Specifies the type of security attribution that is provided by the IDAU region. The types are:
EXEMPT
Specifies if the region is exempt from security attribution.
SECURE
Specifies if the region is a secure region.
SECURE_NSC
Specifies if the region is a Non-secure Callable (NSC) memory region.
NON_SECURE
Specifies if the region is a Non-secure memory region.
Examplesset idau-region 10 0x80000000 0x8000ffff SECURE # Set IDAU region 10,with base address # 0x80000000, limit address 0x8000ffff, # and specify the region as SECURE.set idau-region 10 # Delete IDAU region 10
1.3.136 set listsize
Modifies the default number of source lines that the list command displays.
Syntax
set listsize <n>
Where:
<n>
Specifies the number of source lines.
Examplesset listsize 20 # Set listing size for list command
Related references1.2.19 Set on page 1-41
1.3.137 set mmu use-cache-for-phys-reads
Instructs the debugger to, where possible, ensure that the translation table entries it reads from physicalmemory are coherent with the contents of data caches.
Syntax
set mmu use-cache-for-phys-reads {off|on}
Where:
off
Does not ensure coherency between physical memory reads and data caches. This is the default.
on
Ensures coherency between physical memory reads and data caches.
1 Arm® Debugger commands1.3 Arm® Debugger commands listed in alphabetical order
102272_2020.1M0_00_en Copyright © 2020 Arm Limited or its affiliates. All rights reserved. 1-135Non-Confidential

Examplesset mmu use-cache-for-phys-reads on # Ensure coherent physical memory reads
Related references1.2.12 mmu on page 1-351.2.19 Set on page 1-41Related informationAbout debugging MMUs
1.3.138 set os
Controls Operating System (OS) settings in the debugger. An OS-aware connection must be establishedbefore you can use this command.
Syntax
set os <option>
Where:
<option>
Specifies additional options:
enabled
Controls OS support:
auto
Automatically stops the target and enables OS support when an OS image isloaded into the debugger. For example, Linux kernel images are detected byreading the members for the structure returned by the expressioninit_nsproxy.uts_ns->name. Unloading the image disables OS support.
This is the default for Linux kernel connections.
deferred
Automatically enables OS support when an OS image is loaded into thedebugger, but only when the target next stops. Unloading the image disablesOS support.
This is the default for Real-Time Operating System (RTOS) awareconnections.
off
Disables OS support.
on
Enables OS support. Use this option when the OS image is already loaded intothe debugger and the target is stopped.
kernel-stack-size <bytes>
Specifies the number of bytes to use for the stack size.
log-captureControls logging to the console:
off
Disables OS log capture and printing of Linux kernel dmesg logs to theconsole. This is the default.
1 Arm® Debugger commands1.3 Arm® Debugger commands listed in alphabetical order
102272_2020.1M0_00_en Copyright © 2020 Arm Limited or its affiliates. All rights reserved. 1-136Non-Confidential

on
Enables OS log capture and printing to the console.
Note
This option automatically checks the connection state and, if required, stops the targetbefore changing this setting.
physical-address
Specifies the physical address of where the kernel is loaded.
read-all-threads-on-stop
Controls the OS reading of threads:
off
Disables OS reading of threads when the target is stopped. This is the default.
on
Enables OS reading of threads when the target is stopped.
Examplesset os log-capture on # Enable OS log capture and printing to the consoleset os enabled off # Disable OS support in the debuggerset os physical-address 0x80080000 # Specifies the physical address # of where the kernel is loaded as 0x80080000.
Related references1.2.6 Operating System (OS) on page 1-291.2.19 Set on page 1-41
1.3.139 set overlays enabled
Enables or disables overlay support. The default setting is auto.
Syntax
set overlays enabled [on | off | auto]
Where:
on
Enables overlay support.
off
Disables overlay support.
auto
If the required symbols are present in an image during load time, automatically enables overlaysupport. This is the default.
Examplesset overlays enabled on # Enable overlay supportset overlays enabled off # Disable overlay supportset overlays enabled auto # Enable overlay support if overlay symbols are detected
1.3.140 set print
Controls the current debugger print settings.
1 Arm® Debugger commands1.3 Arm® Debugger commands listed in alphabetical order
102272_2020.1M0_00_en Copyright © 2020 Arm Limited or its affiliates. All rights reserved. 1-137Non-Confidential

Syntax
set print <option>
Where:
<option>
Specifies additional options:
library-not-found-warnings
Controls the printing of “unable to find library…” messages.
off
Disables these messages. This is the default.
on
Enables these messages.
full-source-path
Controls the printing of source file names in messages.
off
Disables printing the full path. This is the default.
on
Enables printing the full path.
stop-info
Controls the printing of event messages when the target stops.
off
Disables printing of event messages. This setting takes precedence over thesilence and unsilence commands.
on
Enables printing of event messages. This is the default.
current-vmid
Controls the printing of current VMID messages when the target stops.
off
Disables printing of VMID messages. This is the default.
on
Enables printing of VMID messages.
double-format <format>
Controls the formatting of double precision floating-point values. <format> is aprintf() style format string. The default is “%,.16g”.
float-format <format>
Controls the formatting of single precision floating-point values. <format> is aprintf() style format string. The default is “%,.6g”.
Examplesset print library-not-found-warnings off # Disable unfound library messagesset print full-source-path on # Display full source path in messages
1 Arm® Debugger commands1.3 Arm® Debugger commands listed in alphabetical order
102272_2020.1M0_00_en Copyright © 2020 Arm Limited or its affiliates. All rights reserved. 1-138Non-Confidential

set print double-format %+g # Print decimal scientific notation with signset print float-format %08.4e # Print decimal scientific notation, zero-pad # min 8 characters, 4 digit precision
Related references1.2.16 Display on page 1-371.2.19 Set on page 1-411.1.3 Expressions within Arm® Development Studio on page 1-101.1.4 Built-in functions within Arm® Development Studio expressions on page 1-111.1.8 Usage of printf() style format string within Arm® Development Studio on page 1-15
1.3.141 set semihosting
Controls the semihosting settings in the debugger. Semihosting is used to communicate input/outputrequests from application code to the host workstation running the debugger.
Note
These settings only apply if the target supports semihosting and they cannot be changed while the targetis running.
Syntax
set semihosting <option>
Where:
<option>
Specifies additional options:
args <arguments>
Specifies the command-line arguments that are passed to the main() function in theapplication using the argv parameter. The name of the image is always implicitlypassed in argv[0] and it is not necessary to pass this as an argument.
file-base <directory>
Specifies the base directory where the files that the application opens are relative to.
stderr "stderr "|<filename>
Specifies either console streams or a file to write stderr for semihosting operations.
stdin "stdin "|<filename>
Specifies either console streams or a file to read stdin for semihosting operations.
stdout "stdout "|<filename>
Specifies either console streams or a file to write stdout for semihosting operations.
top-of-memory <address>
Specifies the top of memory.
<stack_heap_options>
Specifies finer controls to manually configure the base address and limits for the stackand heap. If you use <stack_heap_options>, then these settings take precedence overthe top-of-memory and all of the following options must be specified:
stack-base <address>
The base address of the stack.
1 Arm® Debugger commands1.3 Arm® Debugger commands listed in alphabetical order
102272_2020.1M0_00_en Copyright © 2020 Arm Limited or its affiliates. All rights reserved. 1-139Non-Confidential

stack-limit <address>
The end address of the stack.
heap-base <address>
The base address of the heap.
heap-limit <address>
The end address of the heap.
enabled
Controls semihosting operations:
auto
Automatically enables semihosting operations if appropriate when an image isloaded. This is the default.
off
Disables all semihosting operations.
on
Enables all semihosting operations.
You might have to configure semihosting addresses before you enablesemihosting. For example:
set semihosting top-of-memory addressset semihosting enabled on
vectorAllows you to specify the semihosting trap mechanism to use on your target.
ADDR <trap_address>
Specifies a breakpoint address for the vector catch. This instructs the debuggerto set a breakpoint at the specified address. When the breakpoint is hit, thedebugger takes control to perform the semihosting operation.
SVC
Uses SVC vector catch to trap semihosting operations.
UNDEF
Uses UNDEF vector catch to trap semihosting operations.
SVC+UNDEF
Uses SVC+UNDEF vector catch to trap semihosting operations.
Note
• On M-Profile targets, this command produces an error since semihosting isimplemented using a compiled in software breakpoint (BKPT) on these targets.
• On Armv7 A or R profiles and classic Arm targets, you can use SVC, UNDEF, SVC+UNDEF, or the ADDR <trap_address> options to switch between vector catchoperations.
• On Armv8-A targets, use ADDR <trap_address> to enable instruction breakpointbased semihosting.
1 Arm® Debugger commands1.3 Arm® Debugger commands listed in alphabetical order
102272_2020.1M0_00_en Copyright © 2020 Arm Limited or its affiliates. All rights reserved. 1-140Non-Confidential

Examplesset semihosting args 500 # Set 500 as command-line argumentset semihosting stdout output.log # Write stdout to output.logset semihosting enabled on # Enable semihosting operationsset semihosting vector svc # Set the semihosting vector catch to SVCset semihosting vector ADDR 0x800 # Set the semihosting vector catch to 0x00000800
Related references1.2.19 Set on page 1-411.2.24 Support on page 1-47Related informationUsing semihosting to access resources on the host computer
1.3.142 set sysroot, set solib-absolute-prefix
Specifies the system root directory to search for shared library symbols.
The debugger uses this directory to search for a copy of the debug versions of target shared libraries. Thesystem root on the host workstation must contain an exact representation of the libraries on the targetroot filesystem.
Note
You must launch the debugger with the --target_os command-line option before you can use thisfeature. In Arm DS, this option is automatically selected when you connect to a target using gdbserver.
Syntax
set sysroot <path>
set solib-absolute-prefix <path>
Where:
<path>
Specifies the system root directory.
Examplesset sysroot "\mySystem" # Set system root directory "\mySystem"
Related references1.2.6 Operating System (OS) on page 1-291.2.19 Set on page 1-41
1.3.143 set solib-search-path
Specifies additional directories to search for shared library symbols. If you use this command without anargument then any additional search directories, previously added using this command, are removed. Youcan use show solib-search-path command to display the current settings.
Note
You must launch the debugger with --target_os command-line option before you can use this feature.In Arm DS, this option is automatically selected when you connect to a target using gdbserver.
Syntax
set solib-search-path [<path>]...
Where:
1 Arm® Debugger commands1.3 Arm® Debugger commands listed in alphabetical order
102272_2020.1M0_00_en Copyright © 2020 Arm Limited or its affiliates. All rights reserved. 1-141Non-Confidential

<path>
Specifies an additional directory to search for shared libraries. The debugger uses the systemroot directory first, then it searches the additional directories specified with this command. Youcan use set sysroot to specify the system root directory.
Multiple directories can be specified but must be separated with either:• a colon (Unix)• a semi-colon (Windows).
Examplesset solib-search-path "\usr\lib" # Specify search directoryset solib-search-path "/lib":"/My Lib" # Specify two search directories(Unix)
Related references1.2.6 Operating System (OS) on page 1-291.2.19 Set on page 1-41
1.3.144 set step-mode
Controls the default behavior of the step and steps commands.
Syntax
setstep-mode {step-over|stop|step-until-source}
Where:
step-over
If the instruction is a function call then the debugger performs a step-over. Otherwise, it stops.This is the default.
stop
The debugger stops when execution reaches an address with no source.
step-until-source
The debugger performs steps until it reaches source. To speed up the execution, the debuggermight use abstract interpretation and break or run until the line of source is reached.
Examplesset step-mode step-over # Step over a function call and stop. # Otherwise stop
Related references1.2.2 Execution control on page 1-241.2.19 Set on page 1-41
1.3.145 set stop-on-solib-events
Controls whether the debugger stops execution when a shared object is loaded or unloaded.
Note
You must launch the debugger with the --target_os command-line option before you can use thisfeature. In Arm DS, this option is automatically selected when you connect to a target using gdbserver.
Syntax
set stop-on-solib-events {off|on}
1 Arm® Debugger commands1.3 Arm® Debugger commands listed in alphabetical order
102272_2020.1M0_00_en Copyright © 2020 Arm Limited or its affiliates. All rights reserved. 1-142Non-Confidential

Where:
off
Ignore event. This is the default.
on
Stop execution. Use this option only when you want the debugger to stop execution. Forexample, you might want to set a breakpoint in a shared library prior to use or perhaps youmight want to check the initialization of global variables.
Examplesset stop-on-solib-events on # Stop execution when event occurs
Related references1.2.6 Operating System (OS) on page 1-291.2.19 Set on page 1-41
1.3.146 set substitute-path
Modifies the search paths used by the debugger when it executes any of the commands that look up anddisplay source code. This command is useful when the source files have moved from the originallocation used during compilation.
Subsequent use of the set substitute-path command appends rules to the current list.
Syntax
set substitute-path <path1> <path2>
Where:
<path1>
Specifies the existing search path.
<path2>
Specifies the replacement search path.
Examplesset substitute-path "\src" "\My Src" # Substitute "\src" with "\My Src"
Related references1.2.7 Files on page 1-311.2.19 Set on page 1-41
1.3.147 set sysroot, set solib-absolute-prefix
Specifies the system root directory to search for shared library symbols.
The debugger uses this directory to search for a copy of the debug versions of target shared libraries. Thesystem root on the host workstation must contain an exact representation of the libraries on the targetroot filesystem.
Note
You must launch the debugger with the --target_os command-line option before you can use thisfeature. In Arm DS, this option is automatically selected when you connect to a target using gdbserver.
Syntax
set sysroot <path>
1 Arm® Debugger commands1.3 Arm® Debugger commands listed in alphabetical order
102272_2020.1M0_00_en Copyright © 2020 Arm Limited or its affiliates. All rights reserved. 1-143Non-Confidential

set solib-absolute-prefix <path>
Where:
<path>
Specifies the system root directory.
Examplesset sysroot "\mySystem" # Set system root directory "\mySystem"
Related references1.2.6 Operating System (OS) on page 1-291.2.19 Set on page 1-41
1.3.148 set trust-ro-sections-for-opcodes
Controls whether the debugger can read opcodes from read-only sections of images on the hostworkstation rather than from the target itself.
Syntax
set trust-ro-sections-for-opcodes {off|on}
Where:
offDisables this behavior. Use this option to trace self-modifying code or when the code on thetarget is modified before being loaded to the target.
Note
The Linux kernel often contains self-modifying code.
on
Enables reading opcodes from read-only sections of images on the host machine. Readingopcodes from the host workstation is usually faster than reading them from the target. This is thedefault.
Examplesset trust-ro-sections-for-opcodes on # Enable reading opcodes from host
Related references1.2.19 Set on page 1-41
1.3.149 set variable
Evaluates an expression and assigns the result to a variable, register, or memory address.
Syntax
set [variable] <expression>
Where:
<expression>
Specifies an expression and assigns the result to a variable, register, or memory address.
Examplesset variable myVar=10 # Assign 10 to variable myVarset variable $PC=0x8000 # Assign address 0x8000 to # PC register
1 Arm® Debugger commands1.3 Arm® Debugger commands listed in alphabetical order
102272_2020.1M0_00_en Copyright © 2020 Arm Limited or its affiliates. All rights reserved. 1-144Non-Confidential

set variable $CPSR.N=0 # Clear N bitset variable (*(int*)0x8000)=1 # Assign 1 to address 0x8000set variable *0x8000=1 # Assign 1 to address 0x8000set variable strcpy((char*)0x8000,"My String") # Assign string to address 0x8000set variable memcpy(void*)0x8000,{10,20,30,40},4) # Assign array to address 0x8000
Related references1.2.19 Set on page 1-411.3.62 info memory-parameters on page 1-92Related informationArm Architecture Reference Manual
1.3.150 set wildcard-style
Specifies the type of wildcard pattern matching you can use for examining the contents of strings.
Syntax
set wildcard-style glob|regex
Where:
glob
Specifies a simpler style of pattern matching using glob expressions to refine your search. Forexample, you can use m* to search for strings starting with m.
This is the default.
regex
Specifies a more complex style of pattern matching using regular expressions to refine yoursearch. For example, you can use my_lib[0-9]+ to search for strings starting with my_libfollowed by an integer.
Examplesset wildcard-style regex # Use regular expression pattern matching
Related references1.2.19 Set on page 1-41
1.3.151 sharedlibrary
Loads symbols from shared libraries. It can only load symbols for shared libraries that are already loadedby the application.
Note
You must launch the debugger with --target_os command-line option before you can use this feature.In Arm DS, this option is automatically selected when you connect to a target using gdbserver.
Syntax
sharedlibrary [<expression>]
Where:
<expression>
Specifies a library path or a wildcard expression. You can use wildcard expressions to enhanceyour pattern matching.
If no <expression> is specified then the symbols from all shared libraries are loaded.
1 Arm® Debugger commands1.3 Arm® Debugger commands listed in alphabetical order
102272_2020.1M0_00_en Copyright © 2020 Arm Limited or its affiliates. All rights reserved. 1-145Non-Confidential

Examplessharedlibrary # Load symbols from all shared libraries.sharedlibrary m* # Load symbols matching path starting with m # (use when set wildcard-style=glob).sharedlibrary .*my_lib[0-9]+ # Load symbols matching path that ends with my_lib # followed by a number(use when set wildcard-style=regex).
Related references1.2.6 Operating System (OS) on page 1-29
1.3.152 shell
Runs a shell command within the debug session. The command is launched in the working directory. Youcan use to display the working directory.
Syntax
shell <cmd>
Where:
<cmd>
Specifies the command and associated arguments.
Examplesshell dir # On Windows, list files in directory.shell cat my_script.ds # On Linux, list contents of my_script.ds file.
Related references1.2.24 Support on page 1-47
1.3.153 show
Displays the debugger settings.
Syntax
show
Examplesshow # Display debugger settings.
Related references1.2.21 show group on page 1-44
1.3.154 show architecture
Displays the architecture of the target.
Syntax
show architecture
Examplesshow architecture # Display target architecture.
Related references1.2.21 show group on page 1-441.2.24 Support on page 1-47
1.3.155 show arm
Displays the instruction set settings in use by the debugger for disassembly and setting breakpoints.
1 Arm® Debugger commands1.3 Arm® Debugger commands listed in alphabetical order
102272_2020.1M0_00_en Copyright © 2020 Arm Limited or its affiliates. All rights reserved. 1-146Non-Confidential

Syntax
show arm <option>
Where:
<option>
Specifies additional options:
force-mode
Display the current force-mode behavior.
fallback-mode
Display the current fallback-mode behavior.
Examplesshow arm # Display the instruction set settings.show arm force-mode # Display the force-mode setting.
Related references1.2.21 show group on page 1-441.2.24 Support on page 1-47
1.3.156 show auto-solib-add
Displays the automatic setting for use when loading shared library symbols. You can use the set auto-solib-add command to modify this setting.
Note
You must launch the debugger with the target_os command-line option before you can use this feature.In Arm DS, this option is automatically selected when you connect to a target using gdbserver.
Syntax
show auto-solib-add
Examplesshow auto-solib-add # Display automatic setting for loading # shared library symbols.
Related references1.2.6 Operating System (OS) on page 1-291.2.21 show group on page 1-44
1.3.157 show backtrace
Displays the behavior settings for use with the info stack command. You can use the set backtracecommands to modify these settings.
Syntax
show backtrace <option>
Where:
<option>
Specifies additional options:
1 Arm® Debugger commands1.3 Arm® Debugger commands listed in alphabetical order
102272_2020.1M0_00_en Copyright © 2020 Arm Limited or its affiliates. All rights reserved. 1-147Non-Confidential

limit
Displays the limit when listing the call stack.
Examplesshow backtrace limit # Display current call stack limit.
Related references1.2.5 Call stack on page 1-281.2.21 show group on page 1-44
1.3.158 show blocking-run-control
Displays the setting for blocking run control operations such as stepping and running. You can use theset blocking-run-control command to modify this setting.
Syntax
show blocking-run-control
Examplesshow blocking-run-control # Display run control setting.
Related references1.2.2 Execution control on page 1-241.2.21 show group on page 1-44
1.3.159 show breakpoint
Displays the breakpoint and watchpoint behavior settings. You can use the set breakpoint commandsto modify these settings.
Syntax
show breakpoint <option>
Where:
<option>
Specifies additional options:
auto-hw
Displays the automatic breakpoint selection setting. This sets the type of breakpoint touse for the break command.
skipmode
Displays the breakpoint and watchpoint skipmode setting.
Examplesshow breakpoint auto-hw # Display automatic breakpoint selection setting.show breakpoint skipmode # Display breakpoint and watchpoint skipmode setting.
Related references1.2.21 show group on page 1-44
1.3.160 show case-insensitive-source-matching
Displays the case sensitivity setting for the debugger file matching operations. You can use the setcase-insensitive-source-matching command to modify this setting.
1 Arm® Debugger commands1.3 Arm® Debugger commands listed in alphabetical order
102272_2020.1M0_00_en Copyright © 2020 Arm Limited or its affiliates. All rights reserved. 1-148Non-Confidential

Syntax
show case-insensitive-source-matching
Examplesshow case-insensitive-source-matching # Display case sensitivity setting.
Related references1.2.21 show group on page 1-44
1.3.161 show cde-coprocessors
Displays the encoding associated with each coprocessor.
Coprocessors are associated with either the General CoProcessor (GCP) encoding, or the CustomDatapath Extension (CDE) encoding.
Syntax
show cde-coprocessors
Examplesshow cde-coprocessors # Display the coprocessor encodings> P0 = CDE, P1 = GCP, P2 = GCP, P3 = GCP, P4 = GCP, P5 = GCP, P6 = GCP,P7 = GCP # Outputs the coprocessor encodings. # Here, only the P0 coprocessor is associated # with the CDE encoding. The other coprocessors # are associated with the GCP encoding.
Related references1.2.21 show group on page 1-441.3.124 set cde-coprocessors on page 1-128
1.3.162 show debug-agent
Displays the value of an internal configuration parameter for the debug agent. You can use the setdebug-agent command to modify this setting. The available parameters depend on the debug agent,such as DSTREAM or gdbserver.
Syntax
show debug-agent [<name>]
Where:
<name>
Specifies the parameter to display.
Examplesshow debug-agent # Display all debug agent configuration parameters.
Related references1.2.21 show group on page 1-44
1.3.163 show debug-from
Displays the setting for the expression that is used by the start command to set a temporary breakpoint.You can use the set debug-from command to modify this setting.
Syntax
show debug-from
1 Arm® Debugger commands1.3 Arm® Debugger commands listed in alphabetical order
102272_2020.1M0_00_en Copyright © 2020 Arm Limited or its affiliates. All rights reserved. 1-149Non-Confidential

Examplesshow debug-from # Display expression used by start command.
Related references1.2.2 Execution control on page 1-241.2.21 show group on page 1-44
1.3.164 show directories
Displays the list of directories to search for source files. You can use the directory command to modifythis list.
Syntax
show directories
Examplesshow directories # Display list of search paths.
Related references1.2.7 Files on page 1-311.2.21 show group on page 1-44
1.3.165 show dtsl-options
Displays the value of a parameter in the DTSL configuration. You can use the set dtsl-optionscommand to modify this setting.
Syntax
show dtsl-options[<name>]
Where:
<name>
Specifies the parameter to display.
Examplesshow dtsl-options # Display all DTSL configuration parameters.
Related references1.2.21 show group on page 1-44
1.3.166 show dtsl-temporary-directory
Displays the current path for the temporary directory which stores trace data. You can modify thetemporary directory path using the set dtsl-temporary-directory command.
Syntax
show dtsl-temporary-directory
Examplesshow dtsl-temporary-directory # Shows the current trace data temporary directory path.
Related references1.2.21 show group on page 1-44
1.3.167 show elf cache-uninitialized-sections
Displays the debugger setting that controls whether uninitialized sections are cached.
1 Arm® Debugger commands1.3 Arm® Debugger commands listed in alphabetical order
102272_2020.1M0_00_en Copyright © 2020 Arm Limited or its affiliates. All rights reserved. 1-150Non-Confidential

Syntax
show elf cache-uninitialized-sections
Examplesshow elf cache-uninitialized-sections #Display whether uninitialized sections are cached
Related references1.2.21 show group on page 1-44
1.3.168 show elf load-segments-at-p_paddr
Displays the debugger setting that controls the location for loading segments of ELF images.
Syntax
show elf load-segments-at-p_paddr
Examplesshow elf load-segments-at-p_paddr # Displays whether the load location is # the specified load offset + p_paddr.
Related references1.2.21 show group on page 1-44
1.3.169 show elf zero-extra-segment-bytes
Displays the debugger setting that controls zeroing of bytes when loading segments of ELF images to thetarget.
Syntax
show elf zero-extra-segment-bytes
Examplesset elf zero-extra-segment-bytes # Display whether the debugger writes zeros # if p_filesz is smaller than p_memsz.
Related references1.2.21 show group on page 1-44
1.3.170 show endian
Displays the byte order setting in use by the debugger. You can use the set endian command to modifythis setting.
Syntax
show endian
Examplesshow endian # Display byte order setting.
Related references1.2.21 show group on page 1-441.2.24 Support on page 1-47
1.3.171 show escape-strings
Displays the setting for controlling how special characters in strings are printed on the debuggercommand line. You can use the set escape-strings command to modify this setting.
1 Arm® Debugger commands1.3 Arm® Debugger commands listed in alphabetical order
102272_2020.1M0_00_en Copyright © 2020 Arm Limited or its affiliates. All rights reserved. 1-151Non-Confidential

Syntax
show escape-strings
Examplesshow escape-strings # Display setting for controlling how # special characters in strings are printed.
Related references1.2.21 show group on page 1-44
1.3.172 show escapes-in-filenames
Displays the setting for controlling the use of special characters in paths. You can use the set escapes-in-filenames command to modify this setting.
Syntax
show escapes-in-filenames
Examplesshow escapes-in-filenames # Display setting for controlling the use of # special characters in paths.
Related references1.2.21 show group on page 1-44
1.3.173 show idau-region
Displays the currently specified Implementation Defined Attribution Unit (IDAU) region parameters.
Syntax
show idau-region
Examplesshow idau-region # Display the currently specified IDAU region parameters.
1.3.174 show listsize
Displays the number of source lines that the list command displays. You can use the set listsizecommand to modify the display size.
Syntax
show listsize
Examplesshow listsize # Display listing size for list command.
Related references1.2.21 show group on page 1-44
1.3.175 show mmu use-cache-for-phys-reads
Displays the MMU setting that controls the coherency between translation table memory reads and cachedata.
Syntax
show mmu use-cache-for-phys-reads
1 Arm® Debugger commands1.3 Arm® Debugger commands listed in alphabetical order
102272_2020.1M0_00_en Copyright © 2020 Arm Limited or its affiliates. All rights reserved. 1-152Non-Confidential

Examplesshow mmu use-cache-for-phys-reads # Displays the MMU coherency setting.
Related references1.2.12 mmu on page 1-351.2.21 show group on page 1-44Related informationAbout debugging MMUs
1.3.176 show os
Displays the Operating System (OS) control settings. You can use the set os command to modify thesesettings.
Note
An OS aware connection must be established before you can use this command.
Syntax
show os <option>
Where:
<option>
Specifies additional options:
enabled
Displays the setting for controlling OS support.
kernel-stack-size
Displays the stack size of the kernel.
log-capture
Displays the setting for controlling the capturing and printing of OS logging messages.
read-all-threads-on-stop
Displays the setting for the reading of threads when the target is stopped.
Examplesshow os log-capture # Display setting for controlling os log capture.show os enabled # Display OS enabled setting.
Related references1.2.6 Operating System (OS) on page 1-291.2.21 show group on page 1-44
1.3.177 show print
Displays the debugger print settings. You can use the set print commands to modify these settings.
Syntax
show print <option>
Where:
<option>
Specifies additional options:
1 Arm® Debugger commands1.3 Arm® Debugger commands listed in alphabetical order
102272_2020.1M0_00_en Copyright © 2020 Arm Limited or its affiliates. All rights reserved. 1-153Non-Confidential
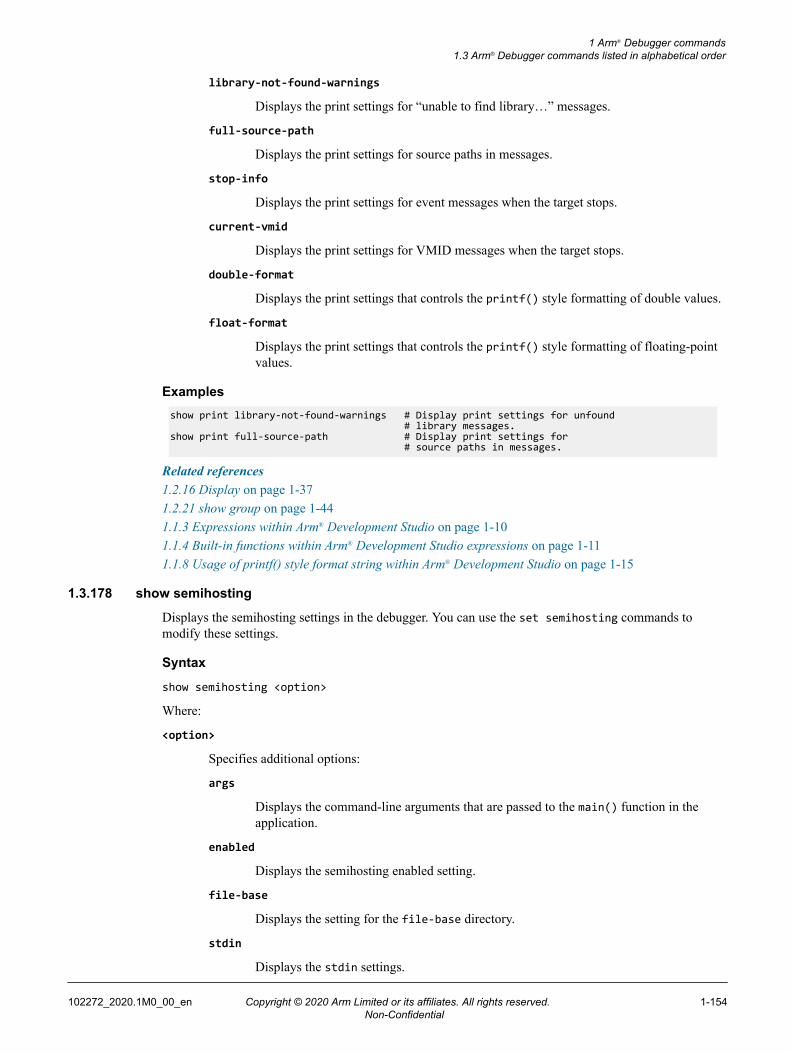
library-not-found-warnings
Displays the print settings for “unable to find library…” messages.
full-source-path
Displays the print settings for source paths in messages.
stop-info
Displays the print settings for event messages when the target stops.
current-vmid
Displays the print settings for VMID messages when the target stops.
double-format
Displays the print settings that controls the printf() style formatting of double values.
float-format
Displays the print settings that controls the printf() style formatting of floating-pointvalues.
Examplesshow print library-not-found-warnings # Display print settings for unfound # library messages.show print full-source-path # Display print settings for # source paths in messages.
Related references1.2.16 Display on page 1-371.2.21 show group on page 1-441.1.3 Expressions within Arm® Development Studio on page 1-101.1.4 Built-in functions within Arm® Development Studio expressions on page 1-111.1.8 Usage of printf() style format string within Arm® Development Studio on page 1-15
1.3.178 show semihosting
Displays the semihosting settings in the debugger. You can use the set semihosting commands tomodify these settings.
Syntax
show semihosting <option>
Where:
<option>
Specifies additional options:
args
Displays the command-line arguments that are passed to the main() function in theapplication.
enabled
Displays the semihosting enabled setting.
file-base
Displays the setting for the file-base directory.
stdin
Displays the stdin settings.
1 Arm® Debugger commands1.3 Arm® Debugger commands listed in alphabetical order
102272_2020.1M0_00_en Copyright © 2020 Arm Limited or its affiliates. All rights reserved. 1-154Non-Confidential

stdout
Displays the stdout settings.
stderr
Displays the stderr settings.
top-of-memory
Displays the address for the top of memory.
stack-base
Displays the address for the stack base.
stack-limit
Displays the address for the stack limit.
heap-base
Displays the address for the heap base.
heap-limit
Displays the address for the heap limit.
vector
When using a semihosting breakpoint, the address is displayed otherwise a message isdisplayed indicating that a vector is in use.
Examplesshow semihosting args # Display command-line arguments.show semihosting enabled # Display semihosting enabled setting.show semihosting top-of-memory # Display the top of memory address.
Related references1.2.21 show group on page 1-441.2.24 Support on page 1-47
1.3.179 show sysroot, show solib-absolute-prefix
Displays the system root directory in use by the debugger when searching for shared library symbols.You can use the set sysroot command to specify a system root directory on the host workstation.
The debugger uses this directory to search for a copy of the debug versions of target shared libraries. Thesystem root on the host workstation must contain an exact representation of the libraries on the targetroot filesystem.
Note
You must launch the debugger with target_os command-line option before you can use this feature. InArm DS, this option is automatically selected when you connect to a target using gdbserver.
Syntax
show sysroot
show solib-absolute-prefix
Examplesshow sysroot # Display system root directory.
1 Arm® Debugger commands1.3 Arm® Debugger commands listed in alphabetical order
102272_2020.1M0_00_en Copyright © 2020 Arm Limited or its affiliates. All rights reserved. 1-155Non-Confidential

Related references1.2.6 Operating System (OS) on page 1-291.2.21 show group on page 1-44
1.3.180 show solib-search-path
Displays the search paths in use by the debugger when searching for shared libraries. You can use theset sysroot command to specify a system root directory on the host workstation and you can also usethe set solib-search-path command to specify additional directories.
Note
You must launch the debugger with --target_os command-line option before you can use this feature.In Arm DS, this option is automatically selected when you connect to a target using gdbserver.
Syntax
show solib-search-path
Examplesshow solib-search-path # Display search path for shared libraries.
Related references1.2.6 Operating System (OS) on page 1-291.2.21 show group on page 1-44
1.3.181 show step-mode
Displays the step setting for functions without debug information. You can use the set step-modecommand to modify this setting.
Syntax
show step-mode
Examplesshow step-mode # Display step setting (function without debug).
Related references1.2.2 Execution control on page 1-241.2.21 show group on page 1-44
1.3.182 show stop-on-solib-events
Displays the debugger setting that controls whether execution stops when shared library events occur.You can use the set stop-on-solib-events command to modify this setting.
Note
You must launch the debugger with --target_os command-line option before you can use this feature.In Arm DS, this option is automatically selected when you connect to a target using gdbserver.
Syntax
show stop-on-solib-events
Examplesshow stop-on-solib-events # Display stop setting for shared library events.
1 Arm® Debugger commands1.3 Arm® Debugger commands listed in alphabetical order
102272_2020.1M0_00_en Copyright © 2020 Arm Limited or its affiliates. All rights reserved. 1-156Non-Confidential

Related references1.2.6 Operating System (OS) on page 1-291.2.21 show group on page 1-44
1.3.183 show substitute-path
Displays the search path substitution rules in use by the debugger when searching for source files. Youcan use the set substitute-path command to modify these substitution rules.
Syntax
show substitute-path
Examplesshow substitute-path # Display all substitution rules.
Related references1.2.7 Files on page 1-311.2.21 show group on page 1-44
1.3.184 show sysroot, show solib-absolute-prefix
Displays the system root directory in use by the debugger when searching for shared library symbols.You can use the set sysroot command to specify a system root directory on the host workstation.
The debugger uses this directory to search for a copy of the debug versions of target shared libraries. Thesystem root on the host workstation must contain an exact representation of the libraries on the targetroot filesystem.
Note
You must launch the debugger with target_os command-line option before you can use this feature. InArm DS, this option is automatically selected when you connect to a target using gdbserver.
Syntax
show sysroot
show solib-absolute-prefix
Examplesshow sysroot # Display system root directory.
Related references1.2.6 Operating System (OS) on page 1-291.2.21 show group on page 1-44
1.3.185 show trust-ro-sections-for-opcodes
Displays the debugger setting that controls whether the debugger can read opcodes from read-onlysections of images on the host workstation rather than from the target itself.
Syntax
show trust-ro-sections-for-opcodes
Examplesshow trust-ro-sections-for-opcodes # Display trust-ro-sections-for-opcodes setting.
1 Arm® Debugger commands1.3 Arm® Debugger commands listed in alphabetical order
102272_2020.1M0_00_en Copyright © 2020 Arm Limited or its affiliates. All rights reserved. 1-157Non-Confidential

Related references1.2.21 show group on page 1-44
1.3.186 show version
Displays the version number of the debugger.
Syntax
show version
Examplesshow version # Display debugger version number.
Related references1.2.21 show group on page 1-441.2.24 Support on page 1-47
1.3.187 show wildcard-style
Displays the wildcard style for pattern matching. You can use the set wildcard-style command tomodify this setting.
Syntax
show wildcard-style
Examplesshow wildcard-style # Display wildcard style.
Related references1.2.21 show group on page 1-44
1.3.188 silence
Disables the printing of stop messages for a specific breakpoint.
Syntax
silence[<number>]
Where:
<number>
Specifies the breakpoint number. This is the number assigned by the debugger when it is set.You can use info breakpoints to display the number and status of all breakpoints andwatchpoints.
If no <number> is specified, then all stop messages are disabled.
Examplessilence 2 # Disable printing of stop messages for breakpoint 2.silence $ # This applies to the breakpoint whose number is in # the most recently created debugger variable.
Related references1.2.1 Breakpoints and watchpoints on page 1-22
1.3.189 source
Loads and runs a script file to control and debug your target.
1 Arm® Debugger commands1.3 Arm® Debugger commands listed in alphabetical order
102272_2020.1M0_00_en Copyright © 2020 Arm Limited or its affiliates. All rights reserved. 1-158Non-Confidential

The following types of script are available:
Arm DS
Arm Debugger commands.
CMM
CMM is a scripting language supported by some third-party debuggers. Arm DevelopmentStudio supports a small subset of CMM-style commands, sufficient for running small targetinitialization scripts.
Jython
Jython is a Java implementation of the Python scripting language. It provides extensive supportfor data types, conditional execution, loops, and organization of code into functions, classes, andmodules, as well as access to the standard Jython libraries. Jython is an ideal choice for larger ormore complex scripts.
Note
Debugger views are not updated when commands issued in a script are executed.
Syntax
source [/v]<filename>[<args>]
Where:
v
specifies verbose output. Script commands are interleaved with the debugger output.
<filename>
specifies the script file. Use these file extensions to identify the script type:
.ds
for Arm Development Studio scripts.
.cmm, .t32
for CMM scripts.
.py
for Jython scripts.
<args>
specifies the number of arguments (zero or more) to pass to the script (only supported for Jythonscripts).
Examplessource myScripts\myFile.ds # Run |debugger| commands from myFile.ds.source myScripts\myFile.cmm # Run CMM-style commands from myFile.cmm.source myScripts\myFile.t32 # Run CMM-style commands from myFile.t32.source /v myFile.ds # Run |debugger| commands from myFile.ds and # display commands interleaved with debugger output.source myScripts\myFile.py # Run a Jython script from file myFile.py.
Related references1.2.4 Scripts on page 1-27
1 Arm® Debugger commands1.3 Arm® Debugger commands listed in alphabetical order
102272_2020.1M0_00_en Copyright © 2020 Arm Limited or its affiliates. All rights reserved. 1-159Non-Confidential

1.3.190 start
Sets a temporary breakpoint, calls the debugger run command, and then deletes the temporarybreakpoint when it is hit. By default, the temporary breakpoint is set at the address of the global functionmain().
You can use the set debug-from command to change the breakpoint location. If the breakpoint locationcannot be found then the breakpoint is set at the image entry point.
This command records the ID of the breakpoint in a new debugger variable, $<n> , where <n> is anumber. If $<n> is the last or second-to-last debugger variable, then you can also access the ID using $ or$$, respectively.
Note
Control is returned as soon as the target is running. You can use the wait command to block thedebugger from returning control until either the application completes or a breakpoint is hit.
Syntax
start[<args>]
Where:
<args>
Specifies the command-line arguments that are passed to the main() function in the applicationusing the argv parameter. The name of the image is always implicitly passed in argv[0] and itis not necessary to pass this as an argument.
Examplesstart # Start running the target to the # temporary breakpoint.
Related references1.2.2 Execution control on page 1-24
1.3.191 stdin
Specifies semihosting input requested by application code.
Note
This command is not required if you launch the debugger within Arm DS, or if you use a telnet sessionto interact directly with the application.
Syntax
stdin [<input>]
Where:
<input>
Specifies semihosting input requested by application code. This must be terminated by \n to tellthe debugger that the input is complete.
You can use this command before the input is required by the application code. All input is buffered bythe debugger until requested and then discarded when the semihosting operation finishes.
Examplesstdin 10000\n # Pass the number 10000 to the application.
1 Arm® Debugger commands1.3 Arm® Debugger commands listed in alphabetical order
102272_2020.1M0_00_en Copyright © 2020 Arm Limited or its affiliates. All rights reserved. 1-160Non-Confidential

Related references1.2.24 Support on page 1-47
1.3.192 step
Steps through an application at the source level stopping on the first instruction of each source lineincluding stepping into all function calls. You must compile your code with debug information to use thiscommand successfully.
You can modify the behavior of this command with the set step-mode command.
Syntax
step [<count>]
Where:
<count>Specifies the number of source lines to execute.
Note
Execution stops immediately if a breakpoint is reached, even if fewer than <count> source linesare executed.
Examplesstep # Execute one source line.step 5 # Execute five source lines.
Related references1.3.193 stepi on page 1-1611.3.194 steps on page 1-1621.3.100 next on page 1-1141.3.101 nexti on page 1-1141.3.102 nexts on page 1-1151.2.2 Execution control on page 1-24
1.3.193 stepi
Steps through an application at the instruction level including stepping into all function calls.
Syntax
stepi [<count>]
Where:
<count>Specifies the number of instructions to execute.
Note
Execution stops immediately if a breakpoint is reached, even if fewer than <count> instructionsare executed.
Examplesstepi # Execute one instruction.stepi 5 # Execute five instructions.
Related references1.3.192 step on page 1-161
1 Arm® Debugger commands1.3 Arm® Debugger commands listed in alphabetical order
102272_2020.1M0_00_en Copyright © 2020 Arm Limited or its affiliates. All rights reserved. 1-161Non-Confidential

1.3.194 steps on page 1-1621.3.100 next on page 1-1141.3.101 nexti on page 1-1141.3.102 nexts on page 1-1151.2.2 Execution control on page 1-24
1.3.194 steps
Steps through an application at the source level stopping on the first instruction of each source statement(for example, statements in a for() loop) including stepping into all function calls. You must compileyour code with debug information to use this command successfully.
Syntax
You can modify the behavior of this command with the set step-mode command.
steps [<count>]
Where:
<count>Specifies the number of source statements to execute.
Note
Execution stops immediately if a breakpoint is reached, even if fewer than <count> sourcestatements are executed.
Examplessteps # Execute one source statement.steps 5 # Execute five source statements.
Related references1.3.192 step on page 1-1611.3.193 stepi on page 1-1611.3.100 next on page 1-1141.3.101 nexti on page 1-1141.3.102 nexts on page 1-1151.2.2 Execution control on page 1-24
1.3.195 tbreak
Sets an execution breakpoint at a specific location and deletes the breakpoint when it is hit. You can alsospecify a conditional breakpoint by using an if statement that stops only when the conditionalexpression evaluates to true.
This command records the ID of the breakpoint in a new debugger variable, $<n> , where <n> is anumber. You can use this variable, in a script, to delete or modify the breakpoint behavior. If $<n> is thelast or second-to-last debugger variable, then you can also access the ID using $ or $$, respectively.
Note
Breakpoints that are set within a shared object or kernel module become pending when the shared objector kernel module is unloaded.
Use set breakpoint to control the automatic breakpoint behavior when using this command.
1 Arm® Debugger commands1.3 Arm® Debugger commands listed in alphabetical order
102272_2020.1M0_00_en Copyright © 2020 Arm Limited or its affiliates. All rights reserved. 1-162Non-Confidential

Syntax
tbreak [-d] [-p] [[<filename>:]<location><address>] [[threadcore] <number>...] [if<expression>]
Where:
d
disables the breakpoint immediately after creation.
p
specifies whether or not the resolution of an unrecognized breakpoint location results in apending breakpoint being created.
<filename>
specifies the file.
<location>
specifies the location:
<line_num>
is a line number.
<function>
is a function name.
<label>
is a label name.
+<offset>|-<offset>
specifies the line offset from the current location.
<address>
specifies the address. This can be either an address or an expression that evaluates to an address.
<number>
specifies one or more threads or processors to apply the breakpoint to. You can use $thread torefer to the current thread. If <number> is not specified then all threads are affected.
<expression>
specifies an expression that is evaluated when the breakpoint is hit.
If no arguments are specified then a breakpoint is set at the PC.
Examplestbreak *0x8000 # Set breakpoint at address 0x8000.tbreak *0x8000 thread $thread # Set breakpoint at address 0x8000 on # current thread.tbreak *0x8000 thread 1 3 # Set breakpoint at address 0x8000 on # threads 1 and 3.tbreak main # Set breakpoint at address of main().tbreak SVC_Handler # Set breakpoint at address of label SVC_Handler.tbreak +1 # Set breakpoint at address of next source line.tbreak my_File.c:main # Set breakpoint at address of main() in my_File.c.tbreak my_File.c:8 # Set breakpoint at address of line 8 in my_File.c.tbreak function1 if x>0 # Set conditional breakpoint that stops when x>0.
Related references1.3.6 break on page 1-601.3.41 hbreak on page 1-80
1 Arm® Debugger commands1.3 Arm® Debugger commands listed in alphabetical order
102272_2020.1M0_00_en Copyright © 2020 Arm Limited or its affiliates. All rights reserved. 1-163Non-Confidential

1.3.196 thbreak on page 1-1641.3.112 resolve on page 1-1201.3.15 clear on page 1-651.2.1 Breakpoints and watchpoints on page 1-22
1.3.196 thbreak
Sets a hardware execution breakpoint at a specific location and deletes the breakpoint when it is hit. Youcan also specify a conditional breakpoint by using an if statement that stops only when the conditionalexpression evaluates to true.
This command records the ID of the breakpoint in a new debugger variable, $<n> , where <n> is anumber. You can use this variable, in a script, to delete or modify the breakpoint behavior. If $<n> is thelast or second-to-last debugger variable, then you can also access the ID using $ or $$, respectively.
Note
The number of hardware breakpoints are usually limited. If you run out of hardware breakpoints, thendelete or disable one that you no longer use.
Note
Breakpoints that are set within a shared object or kernel module become pending when the shared objector kernel module is unloaded.
You can use info breakpoints capabilities to display a list of parameters that you can use withbreakpoint commands for the current connection.
Syntax
thbreak [-d] [-p] [[<filename>:]<location>|*<address>] [[thread|core] <number>...][vmid <vmid>] [context <contextid>] [if <expression>]
Where:
-d
Disables the breakpoint immediately after creation.
-p
Specifies whether or not the resolution of an unrecognized breakpoint location results in apending breakpoint being created.
<filename>
Specifies the file.
<location>
Specifies the location:
<line_num>
Is a line number.
<function>
Is a function name.
<label>
Is a label name.
1 Arm® Debugger commands1.3 Arm® Debugger commands listed in alphabetical order
102272_2020.1M0_00_en Copyright © 2020 Arm Limited or its affiliates. All rights reserved. 1-164Non-Confidential

{+<offset>|-<offset>}
Specifies the line offset from the current location.
<number>
Specifies one or more threads or processors to apply the breakpoint to. You can use $thread torefer to the current thread. If <number> is not specified then all threads are affected.
<address>
Specifies the address. This can be either an address or an expression that evaluates to an address.
<vmid>
Specifies the Virtual Machine ID (VMID) to apply the breakpoint to. This can be either aninteger or an expression that evaluates to an integer.
<contextid>
Specifies the context ID to apply the breakpoint to. This can be either an integer or anexpression that evaluates to an integer. You can only use the context parameter if your hardwaresupports it and your application makes use of the CONTEXTIDR register. For more information,see CONTEXTIDR in the Arm Architecture Reference Manual.
<expression>
Specifies an expression that is evaluated when the breakpoint is hit.
If no arguments are specified, then a hardware breakpoint is set at the next instruction.
Examplesthbreak *0x8000 # Set breakpoint at address 0x8000.thbreak *0x8000 thread $thread # Set breakpoint at address 0x8000 on # current threadthbreak *0x8000 thread 1 3 # Set breakpoint at address 0x8000 on # threads 1 and 3thbreak main # Set breakpoint at address of main()thbreak SVC_Handler # Set breakpoint at address of label SVC_Handlerthbreak +1 # Set breakpoint at address of next source linethbreak my_File.c:main # Set breakpoint at address of main(), my_File.cthbreak my_File.c:8 # Set breakpoint at address of line 8, my_File.cthbreak function1 if x>0 # Set conditional breakpoint that stops when x>0thbreak context 257 0x80000000 # Set conditional breakpoint at address 0x80000000 # that stops when CONTEXTIDR=257
Related references1.3.6 break on page 1-601.3.41 hbreak on page 1-801.3.195 tbreak on page 1-1621.3.112 resolve on page 1-1201.3.15 clear on page 1-651.2.1 Breakpoints and watchpoints on page 1-22
1.3.197 thread, core
Displays information about the current thread or processor.
It displays:• The unique id number assigned by the debugger.• The thread or processor state (for example stopped or running).• The current stack frame, including function names and source line numbers.
Syntax
thread [<id>]`
1 Arm® Debugger commands1.3 Arm® Debugger commands listed in alphabetical order
102272_2020.1M0_00_en Copyright © 2020 Arm Limited or its affiliates. All rights reserved. 1-165Non-Confidential

core [<id>]`
Where:
<id>
Specifies the unique thread or processor number.
If <id> is not specified, then the debugger switches control to the current thread or processorbefore displaying information. You can use infocores, info processes, or info threads todisplay the <id> numbers.
If <id> is specified, then the debugger switches control to that thread or processor beforedisplaying the information. Registers and call stacks are associated with a particular thread orprocessor. This means that switching context also switches the registers and call stack to thosebelonging to the current thread or processor.
Examplesthread 699 # Set current thread to number 699.core 2 # Set current processor to number 2.
Related references1.2.2 Execution control on page 1-241.2.6 Operating System (OS) on page 1-291.1.3 Expressions within Arm® Development Studio on page 1-101.1.4 Built-in functions within Arm® Development Studio expressions on page 1-111.1.8 Usage of printf() style format string within Arm® Development Studio on page 1-15
1.3.198 thread apply, core apply
Switches control to a specific thread or processor to execute a debugger command and then switchesback to the original state.
If an error occurs then the debugger stops processing the command and switches back to the originalstate.
Syntax
thread apply all|<id> <command>
core apply all|<id> <command>
Where:
all
Specifies all threads or all processors.
<id>
Specifies the unique thread or processor number. You can use infocores, info processes, orinfo threads to display the <id> numbers.
<command>
Specifies the debugger command that you want to execute.
If all is specified then the command is executed on each thread or processor successively beforeswitching back.
Examplesthread apply all print /x $pc # Cycle through all threads and print address # in PC register (hexadecimal).
1 Arm® Debugger commands1.3 Arm® Debugger commands listed in alphabetical order
102272_2020.1M0_00_en Copyright © 2020 Arm Limited or its affiliates. All rights reserved. 1-166Non-Confidential

Related references1.2.2 Execution control on page 1-241.2.6 Operating System (OS) on page 1-29
1.3.199 trace clear
Clears the trace on the specified trace capture device. If no device is specified, clears the trace on allconnected trace capture devices.
Note
Trace capture devices do not support clearing while capture is active.
Syntax
trace clear [<trace_capture_device>]
Where:
<trace_capture_device>
Specifies the trace capture device.
If no <trace_capture_device> is specified, then all trace capture devices are cleared.
Examplestrace clear # Clears all connected trace capture devices.trace clear ETB # Clears trace capture device named ETB.
Related references1.2.3 Tracing on page 1-26
1.3.200 trace dump
Dumps raw trace data to a directory, along with target trace configuration metadata, from a trace capturedevice or a trace source.
Syntax
trace dump <output_path> [-<option>] [<trace_capture_device>|<trace_source>]...
Where:
<output_path>Specifies the destination of the trace dump. It creates a directory named <output_path>. Itcreates the metadata and trace data within this directory. It generates an error if this directoryalready exists.
Note
If you specify a folder name only or a relative path, then it creates the output directory in, orrelative to, the current working directory.
<option>
Is one of:
raw
Dumps raw data. Raw data is the captured trace data with trace device specificformatting. The raw option only applies to trace capture devices.
1 Arm® Debugger commands1.3 Arm® Debugger commands listed in alphabetical order
102272_2020.1M0_00_en Copyright © 2020 Arm Limited or its affiliates. All rights reserved. 1-167Non-Confidential

no_metadata
Suppresses the metadata.
no_tracedata
Suppresses the trace data.
split_file_size=<value>
Specifies the maximum file size (in bytes) of the trace data files generated by the tracedump command. If the size of the file exceeds this amount, a new trace data file isgenerated. Specify -1 to keep trace data in a single file. Default value is 1073741824.Minimum value is 65536.
<trace_capture_device>
Specifies the trace capture device.
<trace_source>
Specifies a trace source.
• If no <trace_capture_device> or <trace_source> is specified, then all trace capture devicebuffers are dumped.
• If a trace capture device is specified and a trace source from that device is also specified then thetrace data for that source will be dumped twice. Once within the complete buffer for the device andagain as a dump of just the specified trace source.
Examplestrace dump TraceDump # Creates a directory named TraceDump. Dumps the buffers of all active # trace capture devices into TraceDump, along with the metadata # describing them.trace dump TraceDump ETB # ETB is the name of a trace capture device. Dumps the contents of the # ETB buffer to TraceDump.trace dump TraceDump DSTREAM -raw # DSTREAM is the name of a trace capture device. Dumps the contents of # the DSTREAM buffer to TraceDump in raw format.trace dump TraceDump PTM_1 # PTM_1 is the name of a trace source. Extracts the trace data for PTM_1 # from the trace device buffer and dumps it to TraceDump.trace dump TraceDump ETB -no_metadata # Dumps the contents of the ETB buffer to TraceDump, but does not write # the metadata.trace dump TraceDump ETB -no_tracedata # Writes the metadata for ETB in TraceDump, but does not write the trace # data.trace dump TraceDump ETB -no_tracedata -no_metadata # Creates an empty directory named TraceDump.
Related references1.2.3 Tracing on page 1-26
1.3.201 trace info
Displays details about trace capture devices and trace sources.
Syntax
traceinfo [-<option>] [<trace_capture_device>|<trace_source>]
Where:
<trace_capture_device>
specifies the trace capture device.
1 Arm® Debugger commands1.3 Arm® Debugger commands listed in alphabetical order
102272_2020.1M0_00_en Copyright © 2020 Arm Limited or its affiliates. All rights reserved. 1-168Non-Confidential

<trace_source>
specifies the trace capture source.
If no <trace_capture_device> or <trace_source> is specified, then all trace capture devicesand sources are displayed.
<option>
specifies how information is displayed:
show disabled
displays disabled devices and sources.
Examplestrace info# Display all the enabled trace capture devices and trace sources.trace info -showdisabled# Display all trace capture devices and trace sources including disabled ones.trace info ETB# Display the trace capture device or trace source named ETB.
Related references1.2.3 Tracing on page 1-261.3.166 show dtsl-temporary-directory on page 1-1501.3.128 set dtsl-temporary-directory on page 1-130
1.3.202 trace list
Lists the trace capture devices and trace sources.
Syntax
trace list
Examplestrace list # List all of the trace capture devices and trace sources
Related references1.2.3 Tracing on page 1-26
1.3.203 trace report
Produces a trace report, containing the decoded trace data, for the currently selected core.
Syntax
trace report [<option> = <value>]...
Where:
<option>
Specifies the name of a trace report option to set.
<value>
Specifies the new value of the option.
The option names are not case sensitive. The options are:
OUTPUT_PATH
Specifies the directory to save the trace report files in. The default value is the current workingdirectory.
1 Arm® Debugger commands1.3 Arm® Debugger commands listed in alphabetical order
102272_2020.1M0_00_en Copyright © 2020 Arm Limited or its affiliates. All rights reserved. 1-169Non-Confidential

FILE
Specifies the base file name of the trace report. If trace report generates multiple files, then eachfile will have a zero-padded number inserted before the file name extension. The default value isTrace_Report.txt.
SPLIT_FILE_SIZE
Specifies the maximum file size, in bytes, that trace report generates. If the file size is largerthan SPLIT_FILE_SIZE, trace report generates a new report file. Specifying -1 indicates thatthere is no maximum file size, so the trace report is not split into separate files. The defaultvalue is 1073741824.
START
Specifies the position in the trace buffer to start decoding trace from. The default value is 0,which starts the decoding from the beginning of the buffer.
END
Specifies the position in the trace buffer to stop decoding trace. Specifying -1 indicates that thetrace report should decode to the end of the buffer. The default value is -1.
FORMAT
Specifies the format of the report. Valid values are CSV (Comma-Separated Values) and TSV (TabSeparated Values). The default value is TSV. Format values are not case sensitive.
SOURCE
Specifies the trace source to report. Execute the trace list command to view the list of availabletrace sources. The default is to dump the trace source associated with the current core.
CORE
Specifies the core to report. Execute the info cores command to view the list of coresavailable. This option is analogous to the SOURCE option, except that the source for the givencore will be discovered automatically. You can specify either a SOURCE or CORE but not both.
CONFIG
Specifies a configuration file. This is used to specify decoding details for STM and ITM tracesources. The default configuration is to decode all Ports, Masters, and Channels as binary data.This file is created by exporting it from the Event Viewer Settings dialog box.
COLUMNS
Specifies a comma separated list of columns to include in the report. The column names are notcase sensitive.
Valid values for instruction trace sources are:
RECORD_TYPE
The type of the record.
INDEX
The index of the instruction. Canceled instructions do not have an index.
ADDRESS
The address of the instruction.
OPCODE
The opcode of the instruction, in hexadecimal, with no prefix.
1 Arm® Debugger commands1.3 Arm® Debugger commands listed in alphabetical order
102272_2020.1M0_00_en Copyright © 2020 Arm Limited or its affiliates. All rights reserved. 1-170Non-Confidential

OPCODE_WITH_PREFIX
The opcode of the instruction, in hexadecimal, with a 0x prefix.
CYCLES
The cycle count of the instruction.
DETAIL
For instruction records, this gives the disassembly of the instruction. For other recordtypes, this gives various information.
FUNCTION
The function of the instruction.
BRANCH
This is true if the instruction is a branch. Otherwise, this is false.
For instruction trace sources, the default is ADDRESS, OPCODE, DETAIL.
Valid values for STM trace sources are:
MASTER
The master number can be 0 to 128.
CHANNEL
The channel number can be 0 to 65535.
TIMESTAMP
An approximate timestamp for each record, if available.
SIZE
Size of the row in bytes.
DATA
The row data.
For STM trace sources, the default is MASTER, CHANNEL, DATA.
Valid values for ITM trace sources are:
PORT
The port number can be 0 to 255.
TIMESTAMP
The global timestamp for the record, if available (M-profile only). This column name issynonymous with the global time stamp (GTS).
DATA
The row data.
LTS
The local timestamp for the record, if available.
GTS
The global timestamp for the record, if available (M-profile only).
1 Arm® Debugger commands1.3 Arm® Debugger commands listed in alphabetical order
102272_2020.1M0_00_en Copyright © 2020 Arm Limited or its affiliates. All rights reserved. 1-171Non-Confidential

COMP
For DWT data trace packets, the number of the matching DWT comparator (M-profileonly). This column is only useful if the DWT option is specified as true.
For ITM trace sources, the default is PORT,DATA.
DWT
For M-profile ITM trace sources, specifies whether to include DWT packets in the report. Thedefault value is false. To include DWT packets, specify true.
PORTS
For ITM trace sources, specifies a comma-separated list of stimulus ports to include. Outputfrom stimulus ports not listed is suppressed from the report. If the option is not present, outputfrom all stimulus ports is included.
DECODERS
For ITM trace sources, specifies a comma-separated list of decoder assignments. Each decoderassignment has the form P<n>:<decoder_name> where <n> is a stimulus port number, and<decoder_name> is one of the names available in the Encoding drop-down list in the EventViewer Settings dialog box. The decoders available by default are TAE, Text, and Binary. If nodecoder is assigned to a stimulus port, the default is Binary.
HEADERS
Specifies whether to include the column headers in the report. The default value is false. Toinclude headers, specify true.
Examplestrace report # Produces a default trace report named "Trace_Report.txt" in the # current working directory. # Instruction trace for the current core is reported.trace report FILE=MyReport.csv OUTPUT_PATH=C:/files/trace_reports FORMAT=CSV # Produces a comma-separated value trace report named "MyReport.csv" # in C:/files/trace_reports.trace report COLUMNS=RECORD_TYPE,INDEX,ADDRESS,OPCODE_WITH_PREFIX,DETAIL HEADERS=true # Produces a trace report with alternate columns. # The first line of the report contains the column names.trace report SOURCE=ITM COLUMNS=PORT,DATA HEADERS=true # Produces an ITM trace report with alternate columns. # The first line of the report contains the column names.trace report SOURCE=ITM PORTS=1,2 DECODERS=P1:Text,P2:TAE HEADERS=true # Specifies custom decoders for stimulus ports 1 and 2, and suppresses # output from all other stimulus ports. # The first line of the report contains the column names.trace report SOURCE=CSITM DWT=true COLUMNS=PORT,COMP,DATA HEADERS=true # Produces an ITM trace report with DWT packets included, and DWT # comparator numbers for data trace packets. # The first line of the report contains the column names.
Related references1.2.3 Tracing on page 1-26
1.3.204 trace start
Starts trace capture on the specified trace capture device. If no device is specified, starts trace capture onall connected trace capture devices.
Syntax
trace start [<trace_capture_device>]
Where:
1 Arm® Debugger commands1.3 Arm® Debugger commands listed in alphabetical order
102272_2020.1M0_00_en Copyright © 2020 Arm Limited or its affiliates. All rights reserved. 1-172Non-Confidential

<trace_capture_device>
Specifies the trace capture device.
If no <trace_capture_device> is specified, then all trace capture devices are started.
Examplestrace start # starts all connected trace capture devicestrace start ETB # starts trace capture device named ETB
Related references1.2.3 Tracing on page 1-26
1.3.205 trace stop
Stops trace capture on the specified trace capture device. If no device is specified, stops trace capture onall connected trace capture devices.
Syntax
trace stop [<trace_capture_device>]
Where:
<trace_capture_device>
Specifies the trace capture device.
If no <trace_capture_device> is specified, then all trace capture devices are stopped.
Examplestrace stop # stops all connected trace capture devicestrace stop ETB # stops trace capture device named ETB
Related references1.2.3 Tracing on page 1-26
1.3.206 unset
Modifies the current debugger settings.
Syntax
unset <option>
Where:
<option>
Specifies additional options:
substitute-path [<path>]
Deletes all the substituted source paths. If <path> is specified then only the substitutionfor <path> is deleted.
semihosting heap-base
Deletes the base address of the heap.
semihosting heap-limit
Deletes the end address of the heap.
semihosting stack-base
Deletes the base address of the stack.
1 Arm® Debugger commands1.3 Arm® Debugger commands listed in alphabetical order
102272_2020.1M0_00_en Copyright © 2020 Arm Limited or its affiliates. All rights reserved. 1-173Non-Confidential
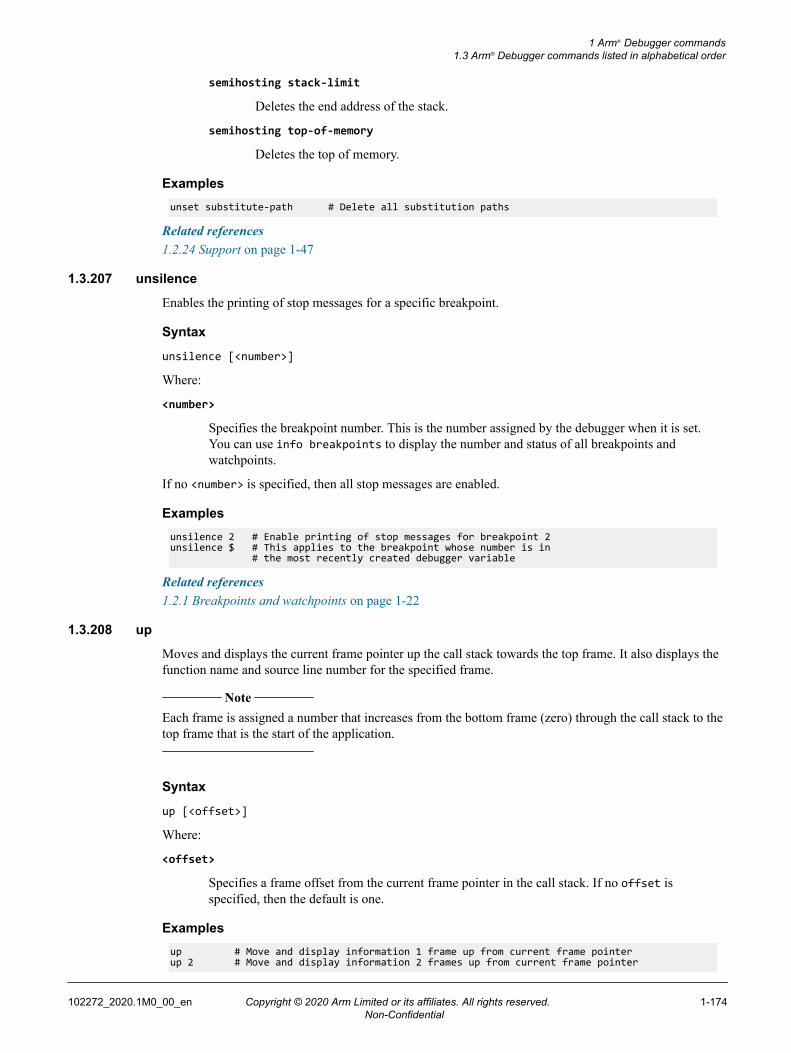
semihosting stack-limit
Deletes the end address of the stack.
semihosting top-of-memory
Deletes the top of memory.
Examplesunset substitute-path # Delete all substitution paths
Related references1.2.24 Support on page 1-47
1.3.207 unsilence
Enables the printing of stop messages for a specific breakpoint.
Syntax
unsilence [<number>]
Where:
<number>
Specifies the breakpoint number. This is the number assigned by the debugger when it is set.You can use info breakpoints to display the number and status of all breakpoints andwatchpoints.
If no <number> is specified, then all stop messages are enabled.
Examplesunsilence 2 # Enable printing of stop messages for breakpoint 2unsilence $ # This applies to the breakpoint whose number is in # the most recently created debugger variable
Related references1.2.1 Breakpoints and watchpoints on page 1-22
1.3.208 up
Moves and displays the current frame pointer up the call stack towards the top frame. It also displays thefunction name and source line number for the specified frame.
Note
Each frame is assigned a number that increases from the bottom frame (zero) through the call stack to thetop frame that is the start of the application.
Syntax
up [<offset>]
Where:
<offset>
Specifies a frame offset from the current frame pointer in the call stack. If no offset isspecified, then the default is one.
Examplesup # Move and display information 1 frame up from current frame pointerup 2 # Move and display information 2 frames up from current frame pointer
1 Arm® Debugger commands1.3 Arm® Debugger commands listed in alphabetical order
102272_2020.1M0_00_en Copyright © 2020 Arm Limited or its affiliates. All rights reserved. 1-174Non-Confidential

Related references1.2.5 Call stack on page 1-28
1.3.209 up-silently
Moves the current frame pointer up the call stack towards the top frame.
Note
Each frame is assigned a number that increases from the bottom frame (zero) through the call stack to thetop frame that is the start of the application.
Syntax
up-silently [<offset>]
Where:
<offset>
Specifies a frame offset from the current frame pointer in the call stack. If no offset isspecified, then the default is one.
Examplesup-silently # Move 1 frame up from current frame pointerup-silently 2 # Move 2 frames up from current frame pointer
Related references1.2.5 Call stack on page 1-28
1.3.210 usecase help
Displays help for a use case script.
The command prints information about the use case script and gives a list of options that can be providedwhen invoking the script.
Syntax
usecase help [<flag>] <script_name> [<entry_point>]
Where:
<script_name>
Name of the use case script to print help for.
<flag>
Specifies the location of the use case script. This can be one of:
-p
The directory associated with the current platform in the Development StudioConfiguration databases.
-s
The Scripts\usecase directory in the Development Studio Configuration databases.
<entry_point>
Specifies a named entry point in the use case script. If there is only one entry point defined inthe use case script, it is not necessary to specify the entry point on the command line. If the usecase script contains more than one entry point, then you must specify which one to use, as aparameter to this command.
1 Arm® Debugger commands1.3 Arm® Debugger commands listed in alphabetical order
102272_2020.1M0_00_en Copyright © 2020 Arm Limited or its affiliates. All rights reserved. 1-175Non-Confidential

Examplesusecase help script.py # Print help for script.py from the current working directoryusecase help -p db_script.py # Print help for db_script.py from the current platform directoryusecase help multi_usecase.py mainOne # Print help for the mainOne entry point in multi_usecase.pyusecase help multi_usecase.py mainTwo # Print help for the mainTwo entry point in multi_usecase.py
Related references1.2.4 Scripts on page 1-27
1.3.211 usecase list
Lists use case scripts.
By default, the command lists all the use case scripts in the current working directory.
Syntax
usecase list [-p | -s | -a | <directory>]
Where:
-p
Lists all the use case scripts associated with the current platform. The use case scripts must be inthe same directory where the DTSL scripts and .rvc file for the current platform are stored inthe Arm Development Studio Configuration databases.
-s
Lists all the use case scripts in the Scripts\\usecase directory in the Arm Development StudioConfiguration databases.
-aLists all the use case scripts that are in any of these categories:• In the current working directory.• Associated with the current platform.• In the Scripts directory in the Arm Development Studio Configuration databases.
<directory>
Lists all the use case scripts in the specified directory.
Examplesusecase list # Lists all the use case scripts in the current working directoryusecase list -p # Lists all the use case scripts for the current platformusecase list -s # Lists all the use case scripts in the Scripts\usecase folder in the # |armdsshort| Configuration databasesusecase list c:\usecase\scripts # Lists all the use case scripts in c:\usecase\scriptsusecase list scripts # Lists all the use case scripts in the scripts folder in the current # working directory
Related references1.2.4 Scripts on page 1-27
1.3.212 usecase run
Runs a use case script.
1 Arm® Debugger commands1.3 Arm® Debugger commands listed in alphabetical order
102272_2020.1M0_00_en Copyright © 2020 Arm Limited or its affiliates. All rights reserved. 1-176Non-Confidential

Syntax
usecase run [<flag>] <script_name> [<entry_point>][--<option> |<positional_argument>]...
Where:
<script_name>
Name of the use case script to run.
<flag>
Specifies the location of the use case script. This can be one of:
-p
The directory associated with the current platform in the Development StudioConfiguration databases.
-s
The Scripts\usecase directory in the Development Studio Configuration databases.
<entry_point>
Specifies a named entry point in the use case script. If there is only one entry point defined inthe use case script, it is not necessary to specify the entry point on the command line. If the usecase script contains more than one entry point, then you must specify which one to use, as aparameter to this command.
<option>
Specifies a named option defined in the use case script and its value. You can specify more thanone <option>.
<positional_argument>
Specifies a positional argument to the entry point. You can specify more than one<positional_argument>.
Examplesusecase run myscript.py # Runs a script named myscript.py in the current directoryusecase run -p platform_script.py entry # Runs platform_script.py in the current platform directory in the # |armdsshort| Configuration database, with entry point set to entryusecase run -s db_script.py --opts.x=1 # Runs db_script.py in the Scripts\usecase directory in the |armdsshort| # Configuration database, with the option opt.x defined as 1usecase run second_script.py main x y z # Runs second_script.py passing in x, y, and z as positional arguments # to the entry point mainusecase run -s myscript.py --cores=4 --target="run" t.txt # Runs myscript.py in the Scripts\usecase directory with options cores # and target and a positional argument t.txt
Related references1.2.4 Scripts on page 1-27
1.3.213 wait
Instructs the debugger to wait until the target stops. For example, when the application completes or abreakpoint is hit. Arm recommends that you specify a time-out parameter to generate an error if the time-out value is reached.
Syntax
wait [<time-out>[ms | s]]
1 Arm® Debugger commands1.3 Arm® Debugger commands listed in alphabetical order
102272_2020.1M0_00_en Copyright © 2020 Arm Limited or its affiliates. All rights reserved. 1-177Non-Confidential
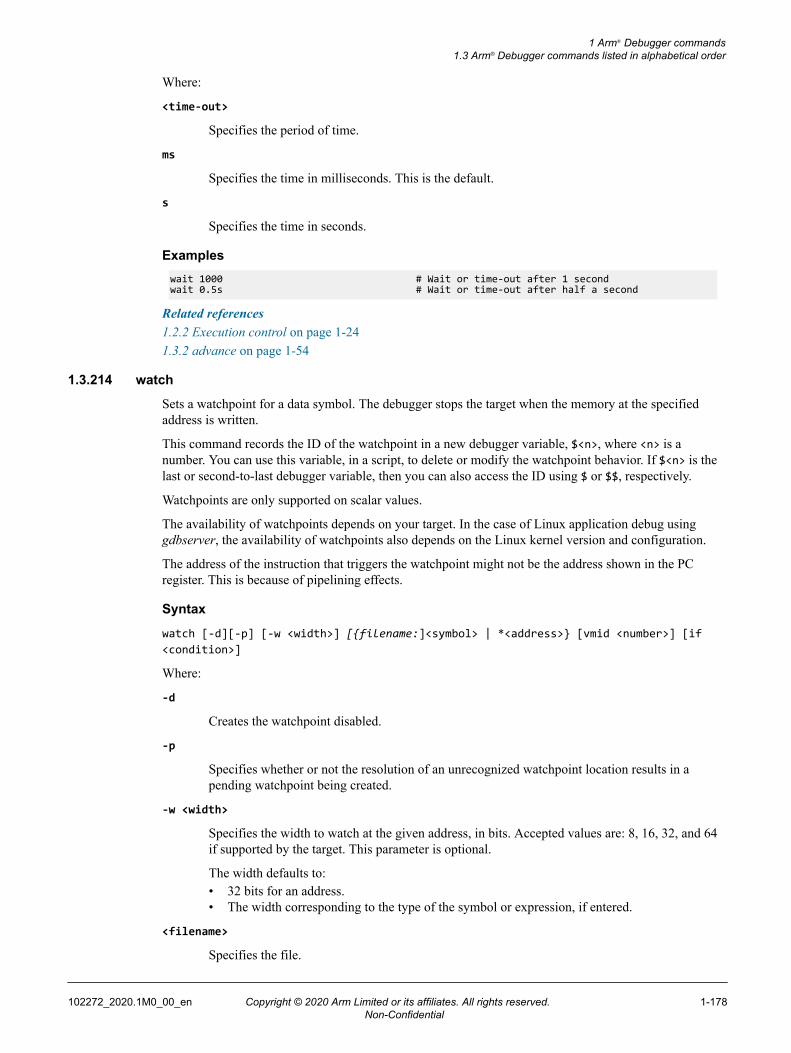
Where:
<time-out>
Specifies the period of time.
ms
Specifies the time in milliseconds. This is the default.
s
Specifies the time in seconds.
Exampleswait 1000 # Wait or time-out after 1 secondwait 0.5s # Wait or time-out after half a second
Related references1.2.2 Execution control on page 1-241.3.2 advance on page 1-54
1.3.214 watch
Sets a watchpoint for a data symbol. The debugger stops the target when the memory at the specifiedaddress is written.
This command records the ID of the watchpoint in a new debugger variable, $<n>, where <n> is anumber. You can use this variable, in a script, to delete or modify the watchpoint behavior. If $<n> is thelast or second-to-last debugger variable, then you can also access the ID using $ or $$, respectively.
Watchpoints are only supported on scalar values.
The availability of watchpoints depends on your target. In the case of Linux application debug usinggdbserver, the availability of watchpoints also depends on the Linux kernel version and configuration.
The address of the instruction that triggers the watchpoint might not be the address shown in the PCregister. This is because of pipelining effects.
Syntax
watch [-d][-p] [-w <width>] [{filename:]<symbol> | *<address>} [vmid <number>] [if<condition>]
Where:
-d
Creates the watchpoint disabled.
-p
Specifies whether or not the resolution of an unrecognized watchpoint location results in apending watchpoint being created.
-w <width>
Specifies the width to watch at the given address, in bits. Accepted values are: 8, 16, 32, and 64if supported by the target. This parameter is optional.
The width defaults to:• 32 bits for an address.• The width corresponding to the type of the symbol or expression, if entered.
<filename>
Specifies the file.
1 Arm® Debugger commands1.3 Arm® Debugger commands listed in alphabetical order
102272_2020.1M0_00_en Copyright © 2020 Arm Limited or its affiliates. All rights reserved. 1-178Non-Confidential

<symbol>
Specifies a global/static data symbol. For arrays or structs you must specify the element ormember.
<address>
Specifies the address. This can be either an address or an expression that evaluates to an address.
vmid <number>
Specifies the Virtual Machine ID (VMID) to apply the watchpoint to. This can be either aninteger or an expression that evaluates to an integer. Applicable only on targets which supporthypervisor / virtual machine debugging.
if <condition>
Specifies the condition which must evaluate to true at the time the watchpoint is triggered forthe target to stop. You can create several conditional watchpoints, but when a conditionalwatchpoint is enabled, no other watchpoints (regardless of whether they are conditional) can beenabled.
Exampleswatch myVar1 # Set read/write watchpoint on myVar1watch *0x80D4 # Set read/write watchpoint on address 0x80D4watch myVar1 if myVar1 == 2 # Set read/write watchpoint on myVar1 which # will only be hit if myVar1 evaluates to 2watch myVar1 if $LR & 0xFF == 0x12 # Set read/write watchpoint on myVar1 which # will only be hit if ($LR & 0xFF) evaluates # to 0x12 when myVar1 is accessed
Related references1.3.115 rwatch on page 1-1221.3.16 clearwatch on page 1-661.3.5 awatch on page 1-591.2.1 Breakpoints and watchpoints on page 1-22
1.3.215 watch-set-property
Updates the properties of an existing watchpoint.
Syntax
watch-set-property<number><property>
Where:
<number>
Specifies the watchpoint number. This is the number assigned by the debugger when it is set.You can use info watchpoints to display the number and status of all watchpoints.
<property>
Specifies the property to set. The valid properties are:
if[expression]
Specifies an expression that is evaluated when the watchpoint is hit. If the value of theexpression evaluates to true, then the debugger stops the target, otherwise executionresumes. If no expression is specified then the watchpoint condition is deleted.
1 Arm® Debugger commands1.3 Arm® Debugger commands listed in alphabetical order
102272_2020.1M0_00_en Copyright © 2020 Arm Limited or its affiliates. All rights reserved. 1-179Non-Confidential

data-width[bits]
Specifies the width to watch at the given address, in bits. Accepted values are: 8, 16,32, and 64 if supported by the target. This parameter is optional.
The width defaults to:• 32 bits for an address.• The width corresponding to the type of the symbol or expression, if entered.
Other target-dependent properties
This command supports other <properties> depending on your target. Use the infowatchpoints capabilities command to display a list of <properties> that you canuse for the current connection.
Exampleswatch-set-property 4 if myVar1 == 2 # Update the 'if' property of watchpoint 4, # meaning the watchpoint will only be hit if # myVar1 evaluates to 2
1.3.216 whatis
Displays the data type of an expression.
Syntax
whatis[<expression>]
Where:
<expression>Specifies an expression. If no <expression> is specified then the last expression is repeated.
Note
This command does not execute the expression.
Exampleswhatis 4+4 # Display data type of expression resultwhatis myVar # Display data type of variable (myVar)
1.3.217 while
Enables you to write scripts with conditional loops that execute debugger commands.
Syntax
while <condition>
...
<optional_commands>
...
end
Where:
<condition>
Specifies a conditional expression. Follow the while statement with one or more debuggercommands that execute repeatedly while <condition> evaluates to true.
<optional_commands>
1 Arm® Debugger commands1.3 Arm® Debugger commands listed in alphabetical order
102272_2020.1M0_00_en Copyright © 2020 Arm Limited or its affiliates. All rights reserved. 1-180Non-Confidential

Specifies optional commands that can also be used inside the while statement to change theloop behavior:
loop_break
Exit the loop.
loop_continue
Skip the remaining commands and return to the start of the loop.
Enter each debugger command on a new line and terminate the while command by using the endcommand.
Examples# Define a while loop containing commands to conditionally execute# myVar is a variable in the application codewhile myVar<10 step wait x set myVar++end
Related references1.2.4 Scripts on page 1-27
1.3.218 x
Displays the content of memory at a specific address.
Syntax
x[/<flag>]...[/<flag>]...[<address>]
Where:
<flag>
Specifies additional flags:
<count>
Specifies the number of values to display. If none specified, then the default is 1.
Size of memory:
b
1 byte
h
2 bytes
w
4 bytes (default)
g
8 bytes.
Note
If you specify either x/b, x/h, or x/g, and then in a later x command you remove the specifiedsize, the debugger uses the previous size that you specified; it does not revert to the default sizeof x/w.
1 Arm® Debugger commands1.3 Arm® Debugger commands listed in alphabetical order
102272_2020.1M0_00_en Copyright © 2020 Arm Limited or its affiliates. All rights reserved. 1-181Non-Confidential
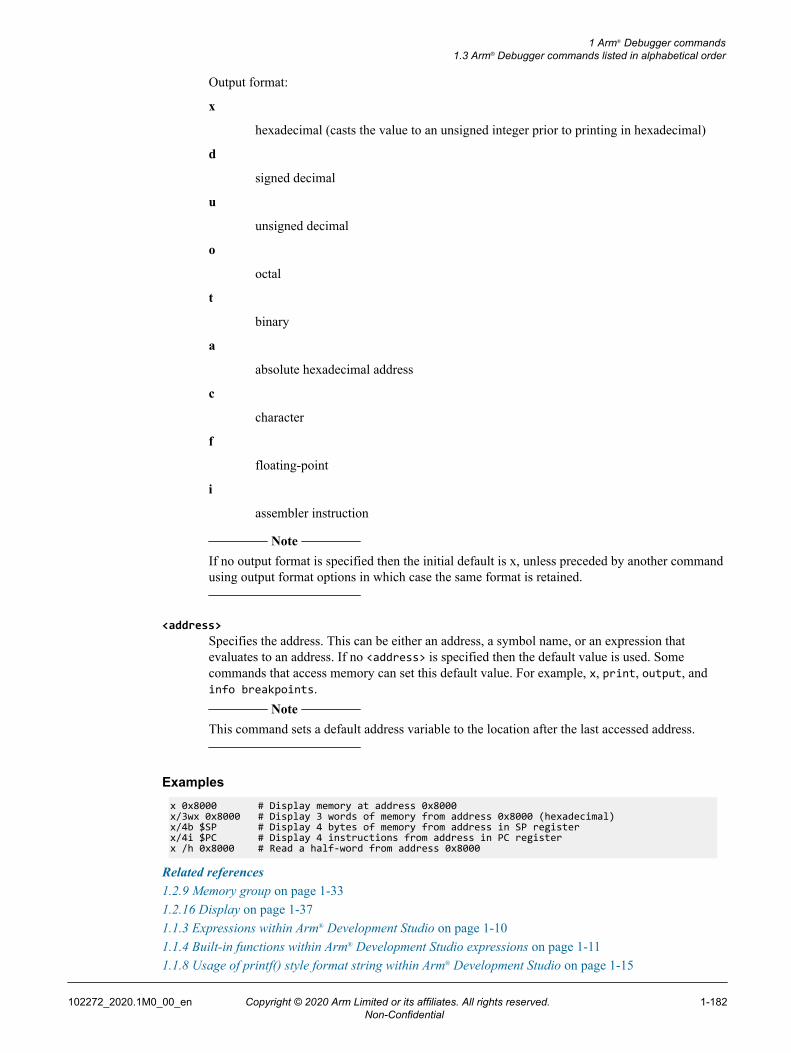
Output format:
x
hexadecimal (casts the value to an unsigned integer prior to printing in hexadecimal)
d
signed decimal
u
unsigned decimal
o
octal
t
binary
a
absolute hexadecimal address
c
character
f
floating-point
i
assembler instruction
Note
If no output format is specified then the initial default is x, unless preceded by another commandusing output format options in which case the same format is retained.
<address>Specifies the address. This can be either an address, a symbol name, or an expression thatevaluates to an address. If no <address> is specified then the default value is used. Somecommands that access memory can set this default value. For example, x, print, output, andinfo breakpoints.
Note
This command sets a default address variable to the location after the last accessed address.
Examplesx 0x8000 # Display memory at address 0x8000x/3wx 0x8000 # Display 3 words of memory from address 0x8000 (hexadecimal)x/4b $SP # Display 4 bytes of memory from address in SP registerx/4i $PC # Display 4 instructions from address in PC registerx /h 0x8000 # Read a half-word from address 0x8000
Related references1.2.9 Memory group on page 1-331.2.16 Display on page 1-371.1.3 Expressions within Arm® Development Studio on page 1-101.1.4 Built-in functions within Arm® Development Studio expressions on page 1-111.1.8 Usage of printf() style format string within Arm® Development Studio on page 1-15
1 Arm® Debugger commands1.3 Arm® Debugger commands listed in alphabetical order
102272_2020.1M0_00_en Copyright © 2020 Arm Limited or its affiliates. All rights reserved. 1-182Non-Confidential

Chapter 2CMM-style commands supported by the debugger
Describes how to use each of the commands with examples.
It contains the following sections:• 2.1 Conformance and usage of CMM-style commands on page 2-184.• 2.2 CMM-style commands groups: All on page 2-185.• 2.3 CMM-style commands listed in alphabetical order on page 2-188.
102272_2020.1M0_00_en Copyright © 2020 Arm Limited or its affiliates. All rights reserved. 2-183Non-Confidential
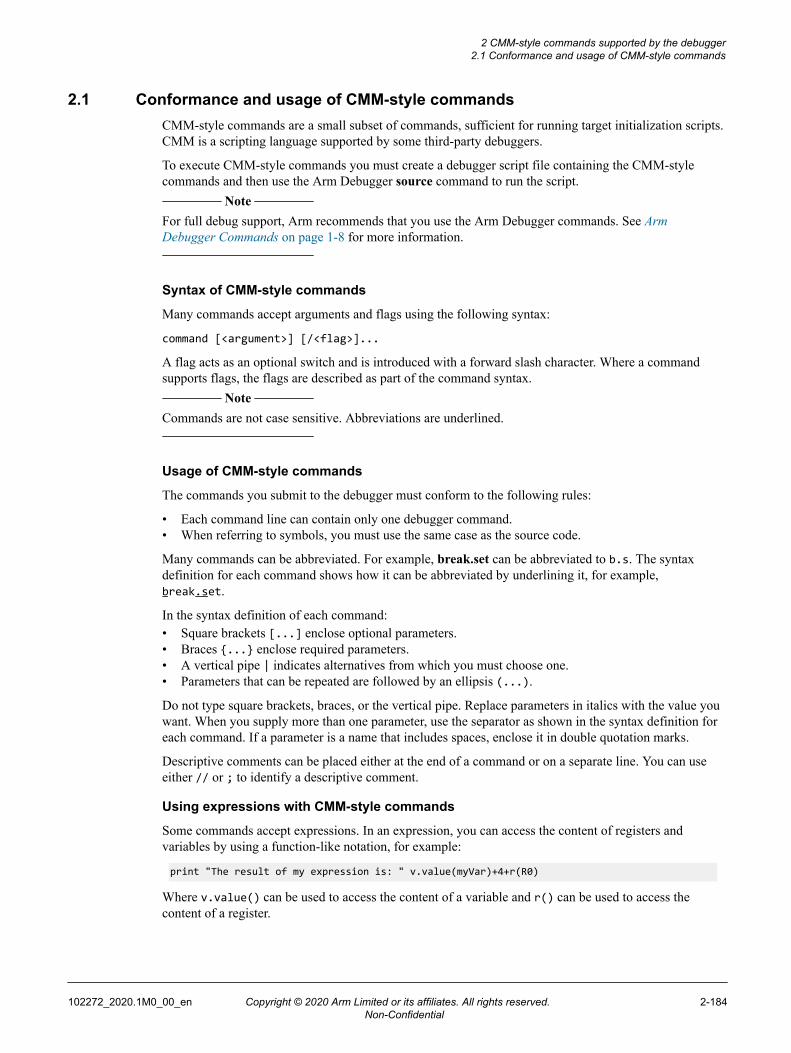
2.1 Conformance and usage of CMM-style commandsCMM-style commands are a small subset of commands, sufficient for running target initialization scripts.CMM is a scripting language supported by some third-party debuggers.
To execute CMM-style commands you must create a debugger script file containing the CMM-stylecommands and then use the Arm Debugger source command to run the script.
Note
For full debug support, Arm recommends that you use the Arm Debugger commands. See ArmDebugger Commands on page 1-8 for more information.
Syntax of CMM-style commands
Many commands accept arguments and flags using the following syntax:
command [<argument>] [/<flag>]...
A flag acts as an optional switch and is introduced with a forward slash character. Where a commandsupports flags, the flags are described as part of the command syntax.
Note
Commands are not case sensitive. Abbreviations are underlined.
Usage of CMM-style commands
The commands you submit to the debugger must conform to the following rules:
• Each command line can contain only one debugger command.• When referring to symbols, you must use the same case as the source code.
Many commands can be abbreviated. For example, break.set can be abbreviated to b.s. The syntaxdefinition for each command shows how it can be abbreviated by underlining it, for example,break.set.
In the syntax definition of each command:• Square brackets [...] enclose optional parameters.• Braces {...} enclose required parameters.• A vertical pipe | indicates alternatives from which you must choose one.• Parameters that can be repeated are followed by an ellipsis (...).
Do not type square brackets, braces, or the vertical pipe. Replace parameters in italics with the value youwant. When you supply more than one parameter, use the separator as shown in the syntax definition foreach command. If a parameter is a name that includes spaces, enclose it in double quotation marks.
Descriptive comments can be placed either at the end of a command or on a separate line. You can useeither // or ; to identify a descriptive comment.
Using expressions with CMM-style commands
Some commands accept expressions. In an expression, you can access the content of registers andvariables by using a function-like notation, for example:
print "The result of my expression is: " v.value(myVar)+4+r(R0)
Where v.value() can be used to access the content of a variable and r() can be used to access thecontent of a register.
2 CMM-style commands supported by the debugger2.1 Conformance and usage of CMM-style commands
102272_2020.1M0_00_en Copyright © 2020 Arm Limited or its affiliates. All rights reserved. 2-184Non-Confidential

2.2 CMM-style commands groups: AllDisplays all the CMM-style commands by group.
This section contains the following subsections:• 2.2.1 Controlling breakpoints on page 2-185.• 2.2.2 Controlling data and display settings on page 2-185.• 2.2.3 Controlling images, symbols, and libraries on page 2-186.• 2.2.4 Controlling target execution and connections on page 2-186.• 2.2.5 Displaying the call stack and associated variables on page 2-186.• 2.2.6 Controlling the debugger and program information on page 2-186.• 2.2.7 Supporting commands on page 2-186.
2.2.1 Controlling breakpoints
List of CMM-style commands that enable you to control the starting and stopping of the debugger usingbreakpoints.
break.delete
Deletes a breakpoint at the specified address.
break.disable
Disables a breakpoint at the specified address.
break.enable
Enables a breakpoint at the specified address.
break.set
Sets a software breakpoint at the specified address.
Type help followed by a command name for more information on a specific command.
2.2.2 Controlling data and display settings
List of all the CMM-style commands that enable you to display specific output on the command-line.
data.dump
Displays data at a specific address or address range.
data.set
Writes data to memory.
Concatenates the results of one or more expressions.
register.set
Sets the value of a register.
var.global
Displays all global variables.
var.local
Displays all local variables in a function.
var.print
Concatenates the results of one or more expressions.
Type help followed by a command name for more information on a specific command.
2 CMM-style commands supported by the debugger2.2 CMM-style commands groups: All
102272_2020.1M0_00_en Copyright © 2020 Arm Limited or its affiliates. All rights reserved. 2-185Non-Confidential

2.2.3 Controlling images, symbols, and libraries
List of all the CMM-style commands that enable you to load files:
data.load.binary
Loads a binary image file.
data.load.elf
Arm Executable and Linking Format (ELF) file.
Type help followed by a command name for more information on a specific command.
2.2.4 Controlling target execution and connections
List of all the CMM-style commands that enable you to connect to a target:
break
Stops running the target.
go
Starts running the device.
system.down
Disconnects the debugger from the target.
system.up
Connects to the specified target.
Type help followed by a command name for more information on a specific command.
2.2.5 Displaying the call stack and associated variables
List of all the CMM-style commands that enable you to display stacks and variables:
var.frame
Displays the stack frame.
Type help followed by a command name for more information on a specific command.
2.2.6 Controlling the debugger and program information
List of all the CMM-style commands that enable you to control scripts:
var.new
Creates a new script variable and zero-initializes it. Script variables are for use at runtime only.
var.set
Sets and displays the value of an existing script variable.
Type help followed by a command name for more information on a specific command.
2.2.7 Supporting commands
List of all the miscellaneous CMM-style commands
help
Displays help information for a specific command or a group of commands listed according tospecific debugging tasks.
wait
Pauses the execution of a script for a specified period of time.
2 CMM-style commands supported by the debugger2.2 CMM-style commands groups: All
102272_2020.1M0_00_en Copyright © 2020 Arm Limited or its affiliates. All rights reserved. 2-186Non-Confidential

Type help followed by a command name for more information on a specific command.
2 CMM-style commands supported by the debugger2.2 CMM-style commands groups: All
102272_2020.1M0_00_en Copyright © 2020 Arm Limited or its affiliates. All rights reserved. 2-187Non-Confidential

2.3 CMM-style commands listed in alphabetical orderDisplays all the commands in alphabetical order.
This section contains the following subsections:• 2.3.1 CMM-style commands: break on page 2-188.• 2.3.2 CMM-style commands: break.delete on page 2-188.• 2.3.3 CMM-style commands: break.disable on page 2-189.• 2.3.4 CMM-style commands: break.enable on page 2-189.• 2.3.5 CMM-style commands: break.set on page 2-189.• 2.3.6 CMM-style commands: data.dump on page 2-190.• 2.3.7 CMM-style commands: data.load.binary on page 2-191.• 2.3.8 CMM-style commands: data.load.elf on page 2-191.• 2.3.9 CMM-style commands: data.set on page 2-192.• 2.3.10 CMM-style commands: go on page 2-193.• 2.3.11 CMM-style commands: help on page 2-193.• 2.3.12 CMM-style commands: print on page 2-194.• 2.3.13 CMM-style commands: register.set on page 2-194.• 2.3.14 CMM-style commands: system.down on page 2-195.• 2.3.15 CMM-style commands: system.up on page 2-195.• 2.3.16 CMM-style commands: var.frame on page 2-195.• 2.3.17 CMM-style commands: var.global on page 2-196.• 2.3.18 CMM-style commands: var.local on page 2-196.• 2.3.19 CMM-style commands: var.new on page 2-196.• 2.3.20 CMM-style commands: var.print on page 2-197.• 2.3.21 CMM-style commands: var.set on page 2-197.• 2.3.22 CMM-style commands: wait on page 2-198.
2.3.1 CMM-style commands: break
Stops running the target.
Syntax
break
Examplesbreak ; Stop running the target
2.3.2 CMM-style commands: break.delete
Deletes a breakpoint at the specified address.
Syntax
break.delete <expression>
Where:
<expression>
Specifies the breakpoint address. This can be either an address, a symbol name, or an expressionthat evaluates to an address. You can use the syntax symbol\line to refer to a specific sourceline offset from a symbol.
Examplesbreak.delete 0x8000 ; Delete breakpoint at address 0x8000break.delete main ; Delete breakpoint at address of main()break.delete main+4 ; Delete breakpoint 4 bytes after address of main()break.delete main\2 ; Delete breakpoint 2 source lines after address of main()
2 CMM-style commands supported by the debugger2.3 CMM-style commands listed in alphabetical order
102272_2020.1M0_00_en Copyright © 2020 Arm Limited or its affiliates. All rights reserved. 2-188Non-Confidential

2.3.3 CMM-style commands: break.disable
Disables a breakpoint at the specified address.
Syntax
break.disable <expression>
Where:
<expression>
Specifies the breakpoint address. This can be either an address, a symbol name, or an expressionthat evaluates to an address. You can use the syntax symbol\line to refer to a specific sourceline offset from a symbol.
Examplesbreak.disable 0x8000 ; Disable breakpoint at address 0x8000break.disable main ; Disable breakpoint at address of main()break.disable main+4 ; Disable breakpoint 4 bytes after address of main()break.disable main\2 ; Disable breakpoint 2 source lines after address of main()
2.3.4 CMM-style commands: break.enable
Enables a breakpoint at the specified address.
Syntax
break.enable.<expression>
Where:
<expression>
Specifies the breakpoint address. This can be either an address, a symbol name, or an expressionthat evaluates to an address. You can use the syntax symbol\line to refer to a specific sourceline offset from a symbol.
Examplesbreak.enable 0x8000 ; Enable breakpoint at address 0x8000break.enable main ; Enable breakpoint at address of main()break.enable main+4 ; Enable breakpoint 4 bytes after address of main()break.enable main\2 ; Enable breakpoint 2 source lines after address of main()
2.3.5 CMM-style commands: break.set
Sets a software breakpoint at the specified address.
Syntax
break.set <expression> [/<flag>]
Where:
<expression>
Specifies the breakpoint address. This can be either an address, a symbol name, or an expressionthat evaluates to an address. You can use the syntax symbol\line to refer to a specific sourceline offset from a symbol.
/<flag>
Specifies an additional flag:
disable
Disables the breakpoint immediately after setting it.
2 CMM-style commands supported by the debugger2.3 CMM-style commands listed in alphabetical order
102272_2020.1M0_00_en Copyright © 2020 Arm Limited or its affiliates. All rights reserved. 2-189Non-Confidential

Examplesbreak.set 0x8000 ; Set breakpoint at address 0x8000break.set main ; Set breakpoint at address of main()break.set main+4 ; Set breakpoint 4 bytes after address of main()break.set main\2 ; Set breakpoint 2 source lines after address of main()
2.3.6 CMM-style commands: data.dump
Displays data at a specific address or address range. By default, the display size is 0x20 bytes of dataunless an address range is specified.
Syntax
data.dump <expression> [/<flag>]'...
Where:
<expression>
Specifies the address or address range. This can be either an address, an address range, or anexpression that evaluates to an address. You can use -- to specify an address range and ++ tospecify an offset from an address.
/<flag>
Specifies additional flags:
byte
Formats the data as 1 byte
word
Formats the data as 2 bytes
long
Formats the data as 4 bytes
quad
Formats the data as 8 bytes
width
Specifies the number of columns
nohex
Suppresses the hexadecimal output
noascii
Suppresses the ASCII output
le
Formats the data as little endian
be
Formats the data big endian.
If no endianness is specified then the debugger looks for information at the start address of theloaded image otherwise little endian is used
Examplesdata.dump 0x8000 ; Display 0x20 bytes (default) from address 0x8000data.dump 0x8000--0x8170 ; Display data in address range 0x8000--0x8170data.dump r(PC)++0x100 ; Display 0x100 bytes from address in PC register
2 CMM-style commands supported by the debugger2.3 CMM-style commands listed in alphabetical order
102272_2020.1M0_00_en Copyright © 2020 Arm Limited or its affiliates. All rights reserved. 2-190Non-Confidential

2.3.7 CMM-style commands: data.load.binary
Loads a binary image file.
Note
Loading a binary image does not change the program counter or any symbols that are currently loaded.
Syntax
data.load.binary <filename> <expression>
Where:
<filename>
Specifies the image file.
<expression>
Specifies the load address. This can be either an address, a symbol name, or an expression thatevaluates to an address. If none specified, then the default is 0x0.
Examplesdata.load.binary "myFile.bin" ; Load image at address 0x0data.load.binary "../my directory/myFile.bin" ; Load image at address 0x0data.load.binary "myFile.bin" 0x8000 ; Load image at address 0x8000
2.3.8 CMM-style commands: data.load.elf
Arm Executable and Linking Format (ELF) file. This format is described in the Arm ELF specificationand uses the .axf file extension.
Note
Loading an ELF image sets the program counter to the entry point of the image, if present.
Syntax
data.load.elf <filename> [/<flag>]...
Where:
<filename>
Specifies the image file.
/<flag>
Specifies additional flags:
nocode
Do not load code and data to the target.
nosymbol
Do not load symbols.
noclear
Symbol table is not cleared before loading the image.
noreg
Do not set register values, for example, PC and status registers.
2 CMM-style commands supported by the debugger2.3 CMM-style commands listed in alphabetical order
102272_2020.1M0_00_en Copyright © 2020 Arm Limited or its affiliates. All rights reserved. 2-191Non-Confidential
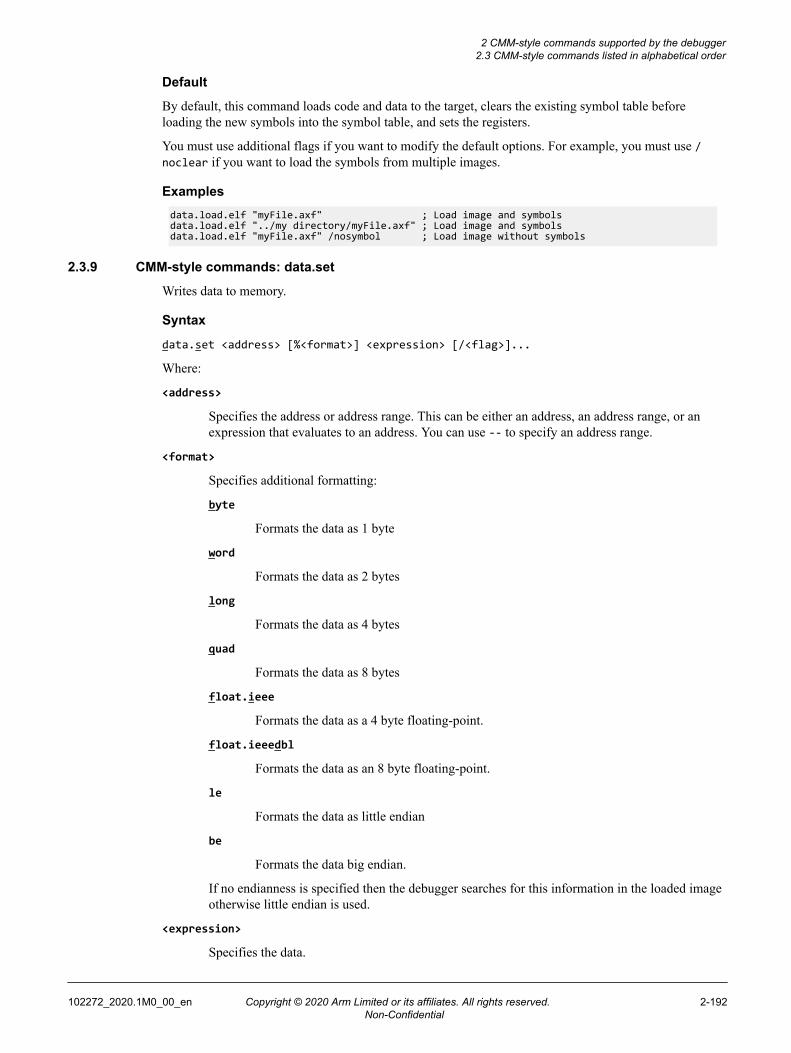
Default
By default, this command loads code and data to the target, clears the existing symbol table beforeloading the new symbols into the symbol table, and sets the registers.
You must use additional flags if you want to modify the default options. For example, you must use /noclear if you want to load the symbols from multiple images.
Examplesdata.load.elf "myFile.axf" ; Load image and symbolsdata.load.elf "../my directory/myFile.axf" ; Load image and symbolsdata.load.elf "myFile.axf" /nosymbol ; Load image without symbols
2.3.9 CMM-style commands: data.set
Writes data to memory.
Syntax
data.set <address> [%<format>] <expression> [/<flag>]...
Where:
<address>
Specifies the address or address range. This can be either an address, an address range, or anexpression that evaluates to an address. You can use -- to specify an address range.
<format>
Specifies additional formatting:
byte
Formats the data as 1 byte
word
Formats the data as 2 bytes
long
Formats the data as 4 bytes
quad
Formats the data as 8 bytes
float.ieee
Formats the data as a 4 byte floating-point.
float.ieeedbl
Formats the data as an 8 byte floating-point.
le
Formats the data as little endian
be
Formats the data big endian.
If no endianness is specified then the debugger searches for this information in the loaded imageotherwise little endian is used.
<expression>
Specifies the data.
2 CMM-style commands supported by the debugger2.3 CMM-style commands listed in alphabetical order
102272_2020.1M0_00_en Copyright © 2020 Arm Limited or its affiliates. All rights reserved. 2-192Non-Confidential

<flag>
Specifies additional flags:
verify
Verifies the write operation.
compare
Compares the data in memory but does not write to memory.
Examplesdata.set r(PC) 0x10 ; Write 0x10 to address in PC registerdata.set 0x100--0x3ff 0x0 ; Zero initialize memorydata.set 0x8000--0x100 %w 0x2000 /compare ; Compare data in memory with 0x2000data.set 0x100--0x3ff 0x0 /verify ; Zero initialize memory and verify
2.3.10 CMM-style commands: go
Starts running the device.
Syntax
go
Examplesgo ; Start running the device
2.3.11 CMM-style commands: help
Displays help information for a specific command or a group of commands listed according to specificdebugging tasks.
Syntax
help [<command> | <group>]
Where:
<command>
Specifies an individual command.
<group>
Specifies a group name for specific debugging tasks:
all
Displays all the commands
breakpoints
Controlling breakpoints.
data
Controlling data and display settings.
files
Controlling images, symbols and libraries.
running
Controlling target execution and stepping.
2 CMM-style commands supported by the debugger2.3 CMM-style commands listed in alphabetical order
102272_2020.1M0_00_en Copyright © 2020 Arm Limited or its affiliates. All rights reserved. 2-193Non-Confidential

stack
Displaying the call stack and associated variables.
status
Controlling the default settings and program status information.
support
Additional supporting commands.
Exampleshelp var.frame # Display help information for var.frame commandhelp print # Display help information for print commandhelp breakpoints # Display group of breakpoint commandshelp status # Display group of status commands
2.3.12 CMM-style commands: print
Concatenates the results of one or more expressions.
Syntax
print [%<printing_format>] <expression>...
Where:
<printing_format>
Specifies one of [ascii | binary | decimal | hex]. If none specified, then the default is decimalformat.
<expression>
Specifies an expression that is evaluated and the result is returned.
Examplesprint %h r(R0) ; Display R0 register in hexadecimalprint %d r(PC) ; Display PC register in decimalprint 4+4 ; Display result of expression in decimalprint "Result is " 4+4 ; Display string and result of expressionprint "Value is: " myVar ; Display string and variable valueprint v.value(myVar) ; Display variable value
2.3.13 CMM-style commands: register.set
Sets the value of a register.
Syntax
register.set <name> <expression>
Where:
<name>
Specifies the name of a register.
<expression>
Specifies an expression that is evaluated and the result assigned to a register.
Examplesregister.set R0 15 ; Set value of R0 register to 15register.set R0 (10*10) ; Set value of R0 register to result of expressionregister.set R0 r(R0)+1 ; Increment the value of R0 registerregister.set PC main ; Set value of PC register to address of main()
2 CMM-style commands supported by the debugger2.3 CMM-style commands listed in alphabetical order
102272_2020.1M0_00_en Copyright © 2020 Arm Limited or its affiliates. All rights reserved. 2-194Non-Confidential

2.3.14 CMM-style commands: system.down
Disconnects the debugger from the target.
Syntax
system.down
Examplessystem.down ; Disconnect from target
2.3.15 CMM-style commands: system.up
Connects to the specified target.
Syntax
system.up
Examplessystem.up ; Connect to target
2.3.16 CMM-style commands: var.frame
Displays the stack frame.
Syntax
var.frame [%<printing_format>][/<flag>]'...
Where:
%<printing_format>
Specifies one of [ascii | binary | decimal | hex]. If none specified, then the default is decimalformat.
/<flag>
Specifies additional flags:
novar
Disables the display of variables.
nocaller
Disables the display of function callers. This is the default.
args
Displays arguments. This is the default.
locals
Displays local variables.
caller
Displays function callers.
json
Specifies an output option to display messages in JSON format.
Examplesvar.frame /locals /caller ; Display variables and function callersvar.frame %hex /locals /caller ; Display variables and callers in hexadecimal
2 CMM-style commands supported by the debugger2.3 CMM-style commands listed in alphabetical order
102272_2020.1M0_00_en Copyright © 2020 Arm Limited or its affiliates. All rights reserved. 2-195Non-Confidential

var.frame /novar ; Do not display any variablesvar.frame /json ; Display stack frame in JSON format
2.3.17 CMM-style commands: var.global
Displays all global variables.
Syntax
var.global [%<printing_format>] [/<flag>]
Where:
%<printing_format>
Specifies one of [ascii | binary | decimal | hex]. If none specified, then the default is decimalformat.
/<flag>
Specifies an additional flag:
json
Specifies an output option to display messages in JSON format.
Examplesvar.global ; Display all global variablesvar.global %h ; Display all global variables in hexadecimal
2.3.18 CMM-style commands: var.local
Displays all local variables in a function.
Syntax
var.local [%<printing_format>] [/<flag>]
Where:
%<printing_format>
Specifies one of [ascii | binary | decimal | hex]. If none specified, then the default is decimalformat.
/<flag>
Specifies an additional flag:
json
Specifies an output option to display messages in JSON format.
Examplesvar.local ; Display all local variablesvar.local %h ; Display all local variables in hexadecimal
2.3.19 CMM-style commands: var.new
Creates a new script variable and zero-initializes it. Script variables are for use at runtime only.
Syntax
var.new <name>
Where:
2 CMM-style commands supported by the debugger2.3 CMM-style commands listed in alphabetical order
102272_2020.1M0_00_en Copyright © 2020 Arm Limited or its affiliates. All rights reserved. 2-196Non-Confidential

<name>
Specifies the name of a script variable.
Examplesvar.new \myVar ; Create new script variable
2.3.20 CMM-style commands: var.print
Concatenates the results of one or more expressions.
Syntax
var.print [%<printing_format>] <expression>'... [/<flag>]
Where:
%<printing_format>
Specifies one of [ascii | binary | decimal | hex]. If none specified, then the default is decimalformat.
<expression>
Specifies an expression that is evaluated and the result is returned. You can use script variablesin an expression by preceding the name with a backslash. Script variables are for use at runtimeonly.
/<flag>
Specifies an additional flag:
json
Specifies an output option to display messages in JSON format.
Examplesvar.print "Value is: " myVar1 ; Display string and myVar1var.print myVar1 " and " myVar2 ; Display concatenated string/variablesvar.print %h myVar1 ; Display myVar1 in hexadecimalvar.print \myVar ; Display value of script variable
2.3.21 CMM-style commands: var.set
Sets and displays the value of an existing script variable. It can also display the result of an expression.Script variables are for use at runtime only.
Syntax
var.set [<name>=]<expression>
Where:
<name>Specifies the name of an existing script variable.
Note
If you specify the name of an existing script variable then you must use this command after thevar.new command.
<expression>
Specifies an expression that is evaluated and the result is returned. If you specify an expressionwith the name option, then the value of that script variable is also updated with the result of theexpression.
2 CMM-style commands supported by the debugger2.3 CMM-style commands listed in alphabetical order
102272_2020.1M0_00_en Copyright © 2020 Arm Limited or its affiliates. All rights reserved. 2-197Non-Confidential

Examplesvar.set \myVar ; Display value of script variablevar.set \myVar=3+3 ; Set value of script variable and display resultvar.set 3+3 ; Display result
2.3.22 CMM-style commands: wait
Pauses the execution of a script for a specified period of time.
Syntax
wait <number>{m|s}
Where:
<number>
Specifies the period of time.
m
Specifies the time in milliseconds.
s
Specifies the time in seconds.
Exampleswait 1s ; Wait one secondwait 0.5s ; Wait half a secondwait 1000m ; Wait one thousand milliseconds
2 CMM-style commands supported by the debugger2.3 CMM-style commands listed in alphabetical order
102272_2020.1M0_00_en Copyright © 2020 Arm Limited or its affiliates. All rights reserved. 2-198Non-Confidential

Chapter 3GNU Free Documentation License Details
It contains the following sections:• 3.1 GNU Free Documentation License on page 3-200.• 3.2 ADDENDUM: How to use this License for your documents on page 3-205.
102272_2020.1M0_00_en Copyright © 2020 Arm Limited or its affiliates. All rights reserved. 3-199Non-Confidential

3.1 GNU Free Documentation LicenseVersion 1.2, November 2002
Copyright (C) 2000,2001,2002 Free Software Foundation, Inc. 51 Franklin Street, Fifth Floor, Boston,MA 02110-1301, USA.
Everyone is permitted to copy and distribute verbatim copies of this license document, but changing it isnot allowed.
0. PREAMBLE
The purpose of this License is to make a manual, textbook, or other functional and useful document‘free’ in the sense of freedom: to assure everyone the effective freedom to copy and redistribute it, withor without modifying it, either commercially or noncommercially. Secondarily, this License preserves forthe author and publisher a way to get credit for their work, while not being considered responsible formodifications made by others.
This License is a kind of “copy left”, which means that derivative works of the document mustthemselves be free in the same sense. It complements the GNU General Public License, which is a copyleft license designed for free software.
We have designed this License in order to use it for manuals for free software, because free softwareneeds free documentation: a free program should come with manuals providing the same freedoms thatthe software does. But this License is not limited to software manuals; it can be used for any textualwork, regardless of subject matter or whether it is published as a printed book. We recommend thisLicense principally for works whose purpose is instruction or reference.
1. APPLICABILITY AND DEFINITIONS
This License applies to any manual or other work, in any medium, that contains a notice placed by thecopyright holder saying it can be distributed under the terms of this License. Such a notice grants aworld-wide, royalty-free license, unlimited in duration, to use that work under the conditions statedherein. The “Document”, below, refers to any such manual or work. Any member of the public is alicensee, and is addressed as “you”. You accept the license if you copy, modify or distribute the work in away requiring permission under copyright law.
A “Modified Version” of the Document means any work containing the Document or a portion of it,either copied verbatim, or with modifications and/or translated into another language.
A “Secondary Section” is a named appendix or a front-matter section of the Document that dealsexclusively with the relationship of the publishers or authors of the Document to the Document’s overallsubject (or to related matters) and contains nothing that could fall directly within that overall subject.(Thus, if the Document is in part a textbook of mathematics, a Secondary Section may not explain anymathematics.) The relationship could be a matter of historical connection with the subject or with relatedmatters, or of legal, commercial, philosophical, ethical or political position regarding them.
The “Invariant Sections” are certain Secondary Sections whose titles are designated, as being those ofInvariant Sections, in the notice that says that the Document is released under this License. If a sectiondoes not fit the above definition of Secondary then it is not allowed to be designated as Invariant. TheDocument may contain zero Invariant Sections. If the Document does not identify any Invariant Sectionsthen there are none.
The “Cover Texts” are certain short passages of text that are listed, as Front-Cover Texts or Back-CoverTexts, in the notice that says that the Document is released under this License. A Front-Cover Text maybe at most 5 words, and a Back-Cover Text may be at most 25 words.
A “Transparent” copy of the Document means a machine-readable copy, represented in a format whosespecification is available to the general public, that is suitable for revising the documentstraightforwardly with generic text editors or (for images composed of pixels) generic paint programs or(for drawings) some widely available drawing editor, and that is suitable for input to text formatters orfor automatic translation to a variety of formats suitable for input to text formatters. A copy made in an
3 GNU Free Documentation License Details3.1 GNU Free Documentation License
102272_2020.1M0_00_en Copyright © 2020 Arm Limited or its affiliates. All rights reserved. 3-200Non-Confidential
otherwise Transparent file format whose markup, or absence of markup, has been arranged to thwart ordiscourage subsequent modification by readers is not Transparent. An image format is not Transparent ifused for any substantial amount of text. A copy that is not “Transparent” is called “Opaque”.
Examples of suitable formats for Transparent copies include plain ASCII without markup, Texinfo inputformat, LaTeX input format, SGML or XML using a publicly available DTD, and standard-conformingsimple HTML, PostScript or PDF designed for human modification. Examples of transparent imageformats include PNG, XCF and JPG. Opaque formats include proprietary formats that can be read andedited only by proprietary word processors, SGML or XML for which the DTD and/or processing toolsare not generally available, and the machine-generated HTML, PostScript or PDF produced by someword processors for output purposes only.
The “Title Page” means, for a printed book, the title page itself, plus such following pages as are neededto hold, legibly, the material this License requires to appear in the title page. For works in formats whichdo not have any title page as such, “Title Page” means the text near the most prominent appearance of thework’s title, preceding the beginning of the body of the text.
A section “Entitled XYZ” means a named subunit of the Document whose title either is precisely XYZor contains XYZ in parentheses following text that translates XYZ in another language. (Here XYZstands for a specific section name mentioned below, such as “Acknowledgements”, “Dedications”,“Endorsements”, or “History”.) To “Preserve the Title” of such a section when you modify the Documentmeans that it remains a section “Entitled XYZ” according to this definition.
The Document may include Warranty Disclaimers next to the notice which states that this Licenseapplies to the Document. These Warranty Disclaimers are considered to be included by reference in thisLicense, but only as regards disclaiming warranties: any other implication that these WarrantyDisclaimers may have is void and has no effect on the meaning of this License.
2. VERBATIM COPYING
You may copy and distribute the Document in any medium, either commercially or noncommercially,provided that this License, the copyright notices, and the license notice saying this License applies to theDocument are reproduced in all copies, and that you add no other conditions whatsoever to those of thisLicense. You may not use technical measures to obstruct or control the reading or further copying of thecopies you make or distribute. However, you may accept compensation in exchange for copies. If youdistribute a large enough number of copies you must also follow the conditions in section 3.
You may also lend copies, under the same conditions stated above, and you may publicly display copies.
3. COPYING IN QUANTITY
If you publish printed copies (or copies in media that commonly have printed covers) of the Document,numbering more than 100, and the Document’s license notice requires Cover Texts, you must enclose thecopies in covers that carry, clearly and legibly, all these Cover Texts: Front-Cover Texts on the frontcover, and Back-Cover Texts on the back cover. Both covers must also clearly and legibly identify you asthe publisher of these copies. The front cover must present the full title with all words of the title equallyprominent and visible. You may add other material on the covers in addition. Copying with changeslimited to the covers, as long as they preserve the title of the Document and satisfy these conditions, canbe treated as verbatim copying in other respects.
If the required texts for either cover are too voluminous to fit legibly, you should put the first ones listed(as many as fit reasonably) on the actual cover, and continue the rest onto adjacent pages.
If you publish or distribute Opaque copies of the Document numbering more than 100, you must eitherinclude a machine-readable Transparent copy along with each Opaque copy, or state in or with eachOpaque copy a computer-network location from which the general network-using public has access todownload using public-standard network protocols a complete Transparent copy of the Document, free ofadded material. If you use the latter option, you must take reasonably prudent steps, when you begindistribution of Opaque copies in quantity, to ensure that this Transparent copy will remain thus accessibleat the stated location until at least one year after the last time you distribute an Opaque copy (directly orthrough your agents or retailers) of that edition to the public.
3 GNU Free Documentation License Details3.1 GNU Free Documentation License
102272_2020.1M0_00_en Copyright © 2020 Arm Limited or its affiliates. All rights reserved. 3-201Non-Confidential

It is requested, but not required, that you contact the authors of the Document well before redistributingany large number of copies, to give them a chance to provide you with an updated version of theDocument.
4. MODIFICATIONS
You may copy and distribute a Modified Version of the Document under the conditions of sections 2 and3 above, provided that you release the Modified Version under precisely this License, with the ModifiedVersion filling the role of the Document, thus licensing distribution and modification of the ModifiedVersion to whoever possesses a copy of it. In addition, you must do these things in the Modified Version:• Use in the Title Page (and on the covers, if any) a title distinct from that of the Document, and from
those of previous versions (which should, if there were any, be listed in the History section of theDocument). You may use the same title as a previous version if the original publisher of that versiongives permission.
• List on the Title Page, as authors, one or more persons or entities responsible for authorship of themodifications in the Modified Version, together with at least five of the principal authors of theDocument (all of its principal authors, if it has fewer than five), unless they release you from thisrequirement.
• State on the Title page the name of the publisher of the Modified Version, as the publisher.• Preserve all the copyright notices of the Document.• Add an appropriate copyright notice for your modifications adjacent to the other copyright notices.• Include, immediately after the copyright notices, a license notice giving the public permission to use
the Modified Version under the terms of this License, in the form shown in the Addendum below.• Preserve in that license notice the full lists of Invariant Sections and required Cover Texts given in
the Document’s license notice.• Include an unaltered copy of this License.• Preserve the section Entitled “History”, Preserve its Title, and add to it an item stating at least the
title, year, new authors, and publisher of the Modified Version as given on the Title Page. If there isno section Entitled “History” in the Document, create one stating the title, year, authors, andpublisher of the Document as given on its Title Page, then add an item describing the ModifiedVersion as stated in the previous sentence.
• Preserve the network location, if any, given in the Document for public access to a Transparent copyof the Document, and likewise the network locations given in the Document for previous versions itwas based on. These may be placed in the “History” section. You may omit a network location for awork that was published at least four years before the Document itself, or if the original publisher ofthe version it refers to gives permission.
• For any section Entitled “Acknowledgements” or “Dedications”, Preserve the Title of the section, andpreserve in the section all the substance and tone of each of the contributor acknowledgements and/ordedications given therein.
• Preserve all the Invariant Sections of the Document, unaltered in their text and in their titles. Sectionnumbers or the equivalent are not considered part of the section titles.
• Delete any section Entitled “Endorsements”. Such a section may not be included in the ModifiedVersion.
• Do not retitle any existing section to be Entitled “Endorsements” or to conflict in title with anyInvariant Section.
• Preserve any Warranty Disclaimers.
If the Modified Version includes new front-matter sections or appendices that qualify as SecondarySections and contain no material copied from the Document, you may at your option designate some orall of these sections as invariant. To do this, add their titles to the list of Invariant Sections in theModified Version’s license notice. These titles must be distinct from any other section titles.
You may add a section Entitled “Endorsements”, provided it contains nothing but endorsements of yourModified Version by various parties-for example, statements of peer review or that the text has beenapproved by an organization as the authoritative definition of a standard.
You may add a passage of up to five words as a Front-Cover Text, and a passage of up to 25 words as aBack-Cover Text, to the end of the list of Cover Texts in the Modified Version. Only one passage of
3 GNU Free Documentation License Details3.1 GNU Free Documentation License
102272_2020.1M0_00_en Copyright © 2020 Arm Limited or its affiliates. All rights reserved. 3-202Non-Confidential

Front-Cover Text and one of Back-Cover Text may be added by (or through arrangements made by) anyone entity. If the Document already includes a cover text for the same cover, previously added by you orby arrangement made by the same entity you are acting on behalf of, you may not add another; but youmay replace the old one, on explicit permission from the previous publisher that added the old one.
The author(s) and publisher(s) of the Document do not by this License give permission to use theirnames for publicity for or to assert or imply endorsement of any Modified Version.
5. COMBINING DOCUMENTS
You may combine the Document with other documents released under this License, under the termsdefined in section 4 above for modified versions, provided that you include in the combination all of theInvariant Sections of all of the original documents, unmodified, and list them all as Invariant Sections ofyour combined work in its license notice, and that you preserve all their Warranty Disclaimers.
The combined work need only contain one copy of this License, and multiple identical Invariant Sectionsmay be replaced with a single copy. If there are multiple Invariant Sections with the same name butdifferent contents, make the title of each such section unique by adding at the end of it, in parentheses,the name of the original author or publisher of that section if known, or else a unique number. Make thesame adjustment to the section titles in the list of Invariant Sections in the license notice of the combinedwork.
In the combination, you must combine any sections Entitled “History” in the various original documents,forming one section Entitled “History”; likewise combine any sections Entitled “Acknowledgements”,and any sections Entitled “Dedications”. You must delete all sections Entitled “Endorsements.”
6. COLLECTIONS OF DOCUMENTS
You may make a collection consisting of the Document and other documents released under this License,and replace the individual copies of this License in the various documents with a single copy that isincluded in the collection, provided that you follow the rules of this License for verbatim copying of eachof the documents in all other respects.
You may extract a single document from such a collection, and distribute it individually under thisLicense, provided you insert a copy of this License into the extracted document, and follow this Licensein all other respects regarding verbatim copying of that document.
7. AGGREGATION WITH INDEPENDENT WORKS
A compilation of the Document or its derivatives with other separate and independent documents orworks, in or on a volume of a storage or distribution medium, is called an “aggregate” if the copyrightresulting from the compilation is not used to limit the legal rights of the compilation’s users beyond whatthe individual works permit. When the Document is included in an aggregate, this License does not applyto the other works in the aggregate which are not themselves derivative works of the Document.
If the Cover Text requirement of section 3 is applicable to these copies of the Document, then if theDocument is less than one half of the entire aggregate, the Document’s Cover Texts may be placed oncovers that bracket the Document within the aggregate, or the electronic equivalent of covers if theDocument is in electronic form. Otherwise they must appear on printed covers that bracket the wholeaggregate.
8. TRANSLATION
Translation is considered a kind of modification, so you may distribute translations of the Documentunder the terms of section 4. Replacing Invariant Sections with translations requires special permissionfrom their copyright holders, but you may include translations of some or all Invariant Sections inaddition to the original versions of these Invariant Sections. You may include a translation of thisLicense, and all the license notices in the Document, and any Warranty Disclaimers, provided that youalso include the original English version of this License and the original versions of those notices anddisclaimers. In case of a disagreement between the translation and the original version of this License ora notice or disclaimer, the original version will prevail.
3 GNU Free Documentation License Details3.1 GNU Free Documentation License
102272_2020.1M0_00_en Copyright © 2020 Arm Limited or its affiliates. All rights reserved. 3-203Non-Confidential
If a section in the Document is Entitled “Acknowledgements”, “Dedications”, or “History”, therequirement (section 4) to Preserve its Title (section 1) will typically require changing the actual title.
9. TERMINATION
You may not copy, modify, sublicense, or distribute the Document except as expressly provided for underthis License. Any other attempt otherwise to copy, modify, sublicense, or distribute the Document isvoid, and will automatically terminate your rights under this License. However, parties who havereceived copies, or rights, from you under this License will not have their licenses terminated so long assuch parties remain in full compliance.
10. FUTURE REVISIONS OF THIS LICENSE
The Free Software Foundation may publish new, revised versions of the GNU Free DocumentationLicense from time to time. Such new versions will be similar in spirit to the present version, but maydiffer in detail to address new problems or concerns. See http://www.gnu.org/copyleft/.
Each version of the License is given a distinguishing version number. If the Document specifies that aparticular numbered version of this License “or any later version” applies to it, you have the option offollowing the terms and conditions either of that specified version or of any later version that has beenpublished (not as a draft) by the Free Software Foundation. If the Document does not specify a versionnumber of this License, you may choose any version ever published (not as a draft) by the Free SoftwareFoundation.
3 GNU Free Documentation License Details3.1 GNU Free Documentation License
102272_2020.1M0_00_en Copyright © 2020 Arm Limited or its affiliates. All rights reserved. 3-204Non-Confidential

3.2 ADDENDUM: How to use this License for your documentsTo use this License in a document you have written, include a copy of the License in the document andput the following copyright and license notices just after the title page:
Copyright (C) YEAR YOUR NAME.Permission is granted to copy, distribute and/or modify this documentunder the terms of the GNU Free Documentation License, Version 1.2or any later version published by the Free Software Foundation;with no Invariant Sections, no Front-Cover Texts, and no Back-Cover Texts.A copy of the license is included in the section entitled "GNU Free Documentation License".
If you have Invariant Sections, Front-Cover Texts and Back-Cover Texts, replace the “with…Texts.” linewith this:
with the Invariant Sections being <list their titles>, with the
FrontCover Texts being <list>, and with the Back-Cover Texts being <list>.`
If you have Invariant Sections without Cover Texts, or some other combination of the three, merge thosetwo alternatives to suit the situation.
If your document contains nontrivial examples of program code, we recommend releasing theseexamples in parallel under your choice of free software license, such as the GNU General PublicLicense, to permit their use in free software.
3 GNU Free Documentation License Details3.2 ADDENDUM: How to use this License for your documents
102272_2020.1M0_00_en Copyright © 2020 Arm Limited or its affiliates. All rights reserved. 3-205Non-Confidential