analysis of urban agriculture as a tool for increasing - Moi ...
122
ANALYSIS OF URBAN AGRICULTURE AS A TOOL FOR INCREASING FOOD SECURITY WITHIN ELDORET TOWN, UASIN GISHU COUNTY, KENYA BY YEGO WILSON CHERUIYOT THESIS SUBMITTED TO THE DEPARTMENT OF GEOGRAPHY IN PARTIAL FULFILLMENT OF THE REQUIREMENTS FOR AWARD OF MASTER OF ART DEGREE IN GEOGRAPHY OF MOI UNIVERSITY OCTOBER 2017
-
Upload
khangminh22 -
Category
Documents
-
view
0 -
download
0
Transcript of analysis of urban agriculture as a tool for increasing - Moi ...
ANALYSIS OF URBAN AGRICULTURE AS A TOOL FOR INCREASING
FOOD SECURITY WITHIN ELDORET TOWN, UASIN GISHU COUNTY,
KENYA
BY
YEGO WILSON CHERUIYOT
THESIS SUBMITTED TO THE DEPARTMENT OF GEOGRAPHY IN
PARTIAL FULFILLMENT OF THE REQUIREMENTS FOR AWARD OF
MASTER OF ART DEGREE IN GEOGRAPHY OF
MOI UNIVERSITY
OCTOBER 2017
ii
DECLARATION
Declaration by the student
This thesis is my original work and has not been presented for the award of a degree
or any other award or purpose in any other University. No part of this thesis can be
reproduced without the prior permission of the author and/or Moi University.
………………………..…………… ………………………….………
Wilson Cheruiyot Yego Date
(SSC/PGG/04/2003)
Declaration by the supervisors
This thesis has been presented for examination with our approval as the University
supervisors.
………………………..…………… ………………………….………
Prof. Paul Omondi Date
Department of Geography, School of Arts and Social Science
Moi University
………………………..……………… ………………………….………
Mr. William K. Kiplagat Date
Department of Geography, School of Arts and Social Science
Moi University

iii
DEDICATION
This thesis is dedicated to all those who are dear to me: my parents Mr. and Mrs. J.
Yego, my wife, Ann and our children (Grace and Precious).
iv
ACKNOWLEDGEMENTS
This project was possible only with the support and participation of many people, for
whom I express my deepest gratitude. First, I would like to thank my thesis
supervisors’ Prof. Paul Omondi and Mr William K. Kiplagat for their constant
guidance, encouraging advice, unlimited support and professional criticisms they
exercised during my entire fieldwork and during the final thesis write-up. I also
extend my sincere gratitude to Prof. Gilbert Nduru and the other members of
Geography Department for their input during my research. I am also grateful to Mr
Luka Kanda for his assistance in image processing using Geographic Information
System (GIS). I cannot forget to pass my regards to Moi University for granting me
the opportunity to study for my Master Degree. Sincere gratitude must go to my
classmates whom we shared a good cordial working relations during coursework and
field excursions.
I sincerely thank the respondents who sacrificed their time to answer the
questionnaires during the study. I cannot forget Prof. Anne Nangulu, who was then
the Dean, School of Arts and Social Science for her advise on academic issues. My
family members deserve the highest recognition for their moral and spiritual support
and encouragement throughout my study days. Last but not least, may the Almighty
God bless all those who assisted me in one-way or the other in making this study to be
successful.

v
ABSTRACT
There have been increased trend of rural-urban migration that has created food
security issues and necessitated growth of urban agriculture. Recognizing the limited
information on the urban agriculture in Kenya, this study analyzed urban agriculture
as a tool of increasing food security within Eldoret Town. Despite growing awareness
about urban agriculture as a strategy of food security and poverty alleviation in urban
areas, it remains an informal undertaking and is not integrated to urban and
agricultural policies in Kenya, making it vulnerable and its sustainability is
jeopardized. The study objectives were: To determine the extent to which urban
households practice agriculture in Eldoret Town, evaluate the contribution of urban
agriculture to food production and income in Eldoret and, to identify technological
innovations used in urban agriculture in Eldoret town. The study relied on sustainable
livelihood approach propounded by Carney (2003), which focuses on the link between
poverty and food production for the poor urban farmers. From a target population of
3550, only 188 were purposely sampled (those who practiced agriculture) and 10 key
informants were used. The study was based on mixed research design using
interviews, questionnaires and content analysis. Both quantitative and qualitative data
analysis was utilised. Results indicate that most farmers practiced mixed farming for
subsistence consumption and for sale in small sized farmlands. Maize was grown by
highest number of respondents (54.3%) followed by vegetables (46.2%) while wheat
(33.2%), fruits (24.8%), beans (15.4%), and cowpeas (4.1%) were also grown. At the
same time, majority of the farmers owned poultry (75.5%), dairy cattle (59.3%), and
goats (31.5%). Urban agriculture was practiced for food (68.2%), or to increase
household income (49.6%). Individual farmers produced 315.2 ± 37.2 kgs of maize,
110.4 ± 25.4 kgs of vegetables, and 20.1 ± 2.7 kgs of cowpeas. But in terms of overall
production among all households, the production of maize was 105,943 ± 14,239 kg,
followed by vegetables (28,641 ± 4,477 kgs) whiles the harvest of wheat, cowpeas
(2,531 ± 189.2 kgs) and beans (5,088 ± 477 kgs) were low. Beef production was
estimated at 25 tonnes followed by eggs, milk and chicken (range 6 tonnes to 10
tonnes). In terms of individual household income, vegetable yielded the highest
income (Kshs 3.02 ± 0.32 million) followed by fruits (Kshs 2.41 ± 0.21) and then
maize (Kshs 2.01 ± 0.11) whiles income from wheat, bean and cowpeas were low
(Kshs 540,000 to 130,000). Beef contributed Kshs 9500 ± 120 to income, followed by
chicken (Kshs 7000 ± 870) and income from milk was Kshs 6020 ± 860. In terms of
overall income from the all the farmers, the highest contribution was from chicken
and beef estimated at Kshs 1.2 million followed by milk (Kshs 1.02 million) while
income from eggs, honey and bacon were low (estimated at below Kshs 300,000).
The innovations among the urban farmers were in the areas of improved crop
varieties/breeds, agrochemicals/veterinary drugs, machinery, water, feed, housing,
land preparation, supermarket, grocery point, credit management, urban market and
ICT (mobile phone). The study concludes that Urban Agriculture is an important
engagement among the urban dwellers because it provides food, employment and
income. However government's support, farming skills and modern farm inputs are
totally lacking and, generally unsupportive towns' bylaws. The recommends that; the
county authority to come up with supportive bylaws to urban agriculture, integrate
urban agriculture to Eldoret development plan in the future and encourage livestock
and animal diversification among urban farmers' while maintaining aesthetics of the
town. Further research on the effect of urban policies on urban agriculture is also
recommended by the study.
vi
TABLE OF CONTENTS
DECLARATION ............................................................................................................ i
DECLARATION ........................................................................................................... ii
DEDICATION ..............................................................................................................iii
ACKNOWLEDGEMENTS .......................................................................................... iv
ABSTRACT ................................................................................................................... v
TABLE OF CONTENTS .............................................................................................. vi
LIST OF TABLES ........................................................................................................ ix
LIST OF FIGURES ....................................................................................................... x
LIST OF ACRONYMS/ABBREVIATIONS .............................................................. xii
OPERATIONAL DEFINITION OF TERMS ............................................................xiii
CHAPTER ONE ............................................................................................................ 1
1.0 INTRODUCTION ................................................................................................... 1
1.1 Background of the study ...................................................................................... 1
1.2 Statement of the problem ..................................................................................... 4
1.3 Objectives of the study ........................................................................................ 6
1.3.1. Main objective ............................................................................................. 6
1.3.2. Specific objectives ....................................................................................... 6
1.4 Research questions ............................................................................................... 6
1.5 Significance of the study ...................................................................................... 7
1.6 Scope of the study ................................................................................................ 8
1.7 Limitation of the study ......................................................................................... 8
1.9 Assumptions during the study .............................................................................. 9
1.10 Study Area ....................................................................................................... 10
CHAPTER TWO ......................................................................................................... 13
vii
2.0 LITERATURE REVIEW ...................................................................................... 13
2.1 Introduction ........................................................................................................ 13
2.2 Urbanisation and development of urban agriculture .......................................... 13
2.3 Extent of urban agriculture ................................................................................ 16
2.4 Contribution of urban agriculture to food production ....................................... 21
2.5 Contribution of urban agriculture to household income .................................... 26
2.6 Technological innovations in urban agriculture ................................................ 30
2.7 Theoretical framework ....................................................................................... 34
2.8 Conceptual Framework ...................................................................................... 37
CHAPTER THREE ..................................................................................................... 40
3.0 RESEARCH DESIGN AND METHODOLOGY ................................................. 40
3.1 Introduction ........................................................................................................ 40
3.2. Preparation for the research .............................................................................. 40
3.3 Research Design ................................................................................................ 40
3.4 Nature and sources of data ................................................................................. 41
3.4.1 Nature of data .............................................................................................. 41
3.4.2 Sources of data ............................................................................................ 42
3.5 Target Population ............................................................................................... 42
3.6 Sample size ........................................................................................................ 43
3.7 Sampling strategy .............................................................................................. 43
3.8 Research instruments ......................................................................................... 43
3.8.1 Questionnaires ............................................................................................. 44
3.8.2 Photography ................................................................................................ 44
3.8.3 Content Analysis ......................................................................................... 44
3.8.4 Key informants ............................................................................................ 45
viii
3.9 Validity and Reliability of the Research Tools .................................................. 45
3.10 Data Analysis ................................................................................................... 46
CHAPTER FOUR ........................................................................................................ 48
4.0 DATA ANALYSES, RESULTS AND DISCUSSION ......................................... 48
4.1 Overview ............................................................................................................ 48
4.2 Respondents socio-demographic characteristics ............................................... 48
4.2.1 Age Distribution of Respondents ................................................................ 48
4.2.2 Education .................................................................................................... 49
4.2.3 Gender of the respondents........................................................................... 49
4.2.4 Main occupation .......................................................................................... 50
4.3 Extent of urban agriculture among households in Eldoret Town ...................... 50
4.4 Overall contribution of urban agriculture food production from Eldoret Town 56
4.5 Overall contribution of urban agriculture to household income in Eldoret Town
................................................................................................................................. 65
4.6 Technological innovations used in urban agriculture within Eldoret Town ...... 69
CHAPTER FIVE ......................................................................................................... 78
5.0 SUMMARY, CONCLUSION AND RECOMMENDATIONS ............................ 78
5.1 Introduction ........................................................................................................ 78
5.2 Summary ............................................................................................................ 78
5.3 Conclusion ......................................................................................................... 82
5.4 Recommendations of the study .......................................................................... 84
5.5 Recommendation for further research ............................................................... 85
REFERENCES ............................................................................................................ 86
APPENDICES ........................................................................................................... 101
ix
LIST OF TABLES
Table 4.1: Age distribution of households practicing urban agriculture ..................... 48
Table 4.2: Educational background of households practicing urban agriculture ......... 49
Table 4.3: Gender of the households practicing urban agriculture .............................. 49
Table 4.4: Main occupation of household practicing urban agriculture ...................... 50
Table 4.5: Agricultural activities practices in the study during the initial survey of
households (n = 188) ........................................................................................ 52
Table 4.6: Reasons for practising urban agriculture .................................................... 55
Table 4.7: Distribution in the quantity of farm crop production from the urban
agriculture in Eldoret Town during the study period ....................................... 59
Table 4.8: Sources of innovation in urban agriculture in Eldoret Town during the
study period ...................................................................................................... 70
Table 4.9: Specific farmer innovation areas, sources and years introduced ................ 73
Table 4.10: The types of farming practices in urban agriculture in Eldoret Town ...... 74
Table 4.11: The average cost of inputs used by the farmers ........................................ 76
Table 4.12: Food production (both crops and livestock) among farmers using various
forms of inputs per year ................................................................................... 77
x
LIST OF FIGURES
Figure 1.1: Map of Kenya showing location of Uasin Gishu County ......................... 11
Figure 1.2: Map of Eldoret Town Boundaries since 1959 –1988. ............................... 12
Figure 1.1: Conceptual framework for the study. ........................................................ 38
Figure 4.1: Type of farming activities practiced by farmers in the urban agriculture in
Eldoret Town (n = 188) ................................................................................... 51
Figure 4.2: Proportion of farmers cultivating the various types of crops .................... 53
Figure 4.3: Ownership of livestock in the household of the farmers respondents from
the urban agriculture in Eldoret Town per year ............................................... 54
Figure 4.4: Proportion of farm sizes by farmers during the survey in Eldoret Town .. 56
Figure 4.5: Mean production of various crops by farmers from urban agriculture in
Eldoret Town. .................................................................................................. 58
Figure 4.6: Total crops production from urban agriculture in Eldoret Town (Kgs) .... 60
Figure 4.7: Reasons for and total amount of Food crop production (kgs/household)
among different types of farming activities in Eldoret Town .......................... 61
Figure 4.8: Livestock and livestock production from urban agriculture in Eldoret
Town per year during the year 2007. ............................................................... 63
Figure 4.9: Total food production per year in the urban agriculture from the livestock
owned by the farmers. ...................................................................................... 64
Figure 4.10: Overall food production from livestock based on different types of
farming was related with the in Eldoret Town................................................. 65
Figure 4.11: Average income per household from the sales of crops produced during
urban agriculture in Eldoret Town. .................................................................. 66
Figure 4.12: Total income from urban agriculture in Eldoret Town. .......................... 67
xi
Figure 4.13: Average household income from livestock products obtained from urban
agriculture in Eldoret Town per year during the year 2007. ............................ 68
Figure 4.14: Overall food production per year in the urban agriculture from the
livestock owned by the farmers. ...................................................................... 69
xii
LIST OF ACRONYMS/ABBREVIATIONS
ASTI Agricultural Science Technology and Innovation
CBD Central Business District
DfID Department for International Development
EPA Environmental Protection Agency
FASDEP Food and Agriculture Sector Development Policy
FBO Farmer Based Organization
GDP Gross Domestic Product
GEA Government Extension Agent
GoK Government of Kenya
HH Household head
IDRC International Development Research Centre
IDRC International Development Research Centre
IDRC International Development Research Centre
IWMI International Water Management Institute
KNBS Kenya National Bureau of Statistics
RUAF Resource Centres for Urban Agriculture and Food Security
SIDA Swedish International Development Agency
SL Sustainable Livelihoods
SLA Sustainable Livelihood Approach
SRID Statistical Research and Information Directorate
SSA Sub Saharan Africa
STEPRI Science Technology Policy and Research Institute
UA Urban Agriculture
UNDESA United Nations, Department of Economic and Social Affairs
UNDP United Nations Development Programme
xiii
OPERATIONAL DEFINITION OF TERMS
Agricultural Input: Any items used with a sole aim of enhancing agricultural
production e.g. material, money and labour
By-law: Rules and regulations governing the operation of an area
Food insecurity: A situation arising from uncertainty in food provision
Food security: A situation where majority has enough foods to eat
Household: A household includes all the persons who occupy a housing
unit. A housing unit is a house, an apartment, a mobile home, a
group of rooms, or a single room that is occupied (or if vacant,
is intended for occupancy) as separate living quarters..
Urbanization: The conventional definition for urbanization used in this thesis
entails a shift in settlement patterns from dispersed to more
dense settlement.
Urban Agriculture: The practice of growing crops and keeping livestock, poultry
and bees within an urban area
Small Scale farmers: Are the farmers whose production systems are extensive/semi-
intensive utility-oriented
1
CHAPTER ONE
1.0 INTRODUCTION
1.1 Background of the study
The world’s population is becoming increasingly urban. In the last five decades,
growth of the urban population, in particular caused by rural-urban migration and
natural population growth has been dramatic (Kyle et al., 2016). In the year 2000,
33.4% of the world’s the population was living in urban areas which increased to 54%
by 2015 (Desa, 2015). Projections show that urbanization combined with the natural
growth of the world’s population could increase the proportion of people living in
urban areas to 66% by 2050 adding about 2.5 billion people to urban populations
(Siyuan, 2014; Cohen, 2016). Close to 90% of the increasing urban population is
concentrated in Asia and Africa (Foeken, 2012; Ravallion et al., 2017). The speed and
the scale of this growth, especially in developing countries, pose enormous challenges
to individual countries as well as to the world community creating high rate of
unemployment, increasing poverty levels, increasing food insecurity and malnutrition
as well as deterioration of the environmental conditions (Bellows, 2011; Birley and
Lock, 2012; Hardoy et al. 2013; Maxwell, 2015).
The problem of urban food security in Africa has been a fact of life for many low-
income urban dwellers for decades (Lee-Smith and Cole, 2008). It is not that there is
no food; it’s that poor urban consumers cannot afford it since most of the urban poor
in Africa receive incomes that are too low to purchase what they need for long-term
food security (Egziabher et al., 2014). This is the stark but simple truth that has
contributed to many of the urban poor within and around African urban centers
seeking alternative food production sources to sustain their livelihoods (Ellis and
2
Sumberg, 2015). As a result, the contribution of food production within the urban
areas in solving the problems of food security among the poor households in African
urban areas has been largely recognized (Gutman, 2013; Atkinson, 2014; Sanyal,
2016).
Urban agriculture flourish within or on the fringe of a town, city or metropolis, in
which a diverse range of food is grown, processed and distributed using largely
human and material resources, products and services found in and around that urban
area (Maxwell et al., 2013; Maxwell, 2015). Activities like horticulture, floriculture,
forestry, aquaculture, apiculture and livestock production as well as related activities
like the delivery of inputs, processing and marketing of products fit in the realm of
urban agriculture (Companioni et al., 2013; Ellis and Sumberg, 2015). Although it is a
world-wide phenomenon with an engagement of approximately 800 million people
around the world, the scale of urban agriculture varies widely between the developing
and developed countries and within each eco-regions (Bouraoui, 2005; Brunori and
Orsini, 2010; Bomans et al., 2011). Accurate statistics of the scale of urban
agriculture in Africa is lacking but was estimated at about 50 million household by the
year 2015 (Rogerson, 2016). Nevertheless, urban agriculture is currently increasing at
fast rate in African urban centers than in the developed countries (Bishwapriya, 2010;
Gündel, 2016).
The significance of urban agriculture to the livelihoods of urban households in Sub-
Saharan Africa (SSA) has gained increasing recognition in recent years (Drescher et
al., 2011; Atukunda, 2013; Bryld, 2013; Prain and Lee-Smith, 2014; Drechsel and
Dongus, 2015). As a result there has been an increased proportion of the households
3
in SSA that are involved in urban food production. For example, the proportion of
households practicing urban agriculture is 54% in Addis Ababa, Ethiopia (Yilma,
2003; Tegegne, 2004), 50% in Accra, Ghana (Obuobie et al., 2012), 45% in Lusaka,
Zambia (Bishwapriya, 2010), and 32.4% in Yaoundé, Cameroon (UNDP, 2006), 27%
in Maputo, Mozambique (UNDP, 2006), 28.2-30.2% in Kampala, Uganda (Maxwell,
1994; Nabulo et al., 2006) and 38.2% in Dar-es-Saalam (Sawio, 2008). These studies
appropriately demonstrate the importance of urban agriculture for food security in
urban areas of the SSA.
In Kenya, urban agriculture (UA) has emerged as an important means of improving
household food security and nutritional status, a source of complementary income and
alternative employment in times of increasing economic hardships, and as a means to
social and economic empowerment (Foeken, 2006). Although data on area under
urban production for different urban centers in Kenya are scanty, a previous national
survey of six urban centres revealed that 29% of all urban households cultivated food
crops while 17% kept livestock (Memon and Lee-Smith, 1993). The towns analyzed
and households found to practice UA were: Kitui (57%), Kakamega (51%), Isiolo
(50%), Kisumu (30%), Mombasa (26%) and Nairobi (20%). Later studies between
2006 and 2010 have also indicated that 29.4% of urban dwellers in Nakuru (Foeken,
2006) and 32.1% in Nairobi (Lee-Smith, 2010) practiced UA. Yet until recently, the
Kenyan governments and urban authorities viewed the practiced as unfavourable and
hence omitted it from urban land-use planning, restricted, and even criminalized its
practice through prohibitive and punitive policies, citing public health and aesthetic
concerns (Zarina, 2015). Nevertheless, the contribution of UA in Kenya towards
4
alleviating food insecurity is now well recognized and in some instances supported,
but most often there is lack of policy towards the same (Musonga, 2004).
In Eldoret Town, UA started much earlier than in other urban centres due to the
agricultural nature of the town (Korir et al., 2015), but due to the rapid expansion of
the town, more residential building are constructed often, the practice of UA appear to
have declined. For example a survey of urban agriculture in 1990 indicated that upto
64% of the urban dwellers practiced one or another form of UA (Murimi et al., 1991)
while a later study by Korir et al. (2015) suggested that the household practicing
urban agriculture have declined to 52%. However, there is currently lack of
information on the practice of urban agriculture within the town and how this
contributes to food production and household income. Against this background, this
study was formulated to determine the contribution of UA to the food security
situation within Eldoret Municipality
1.2 Statement of the problem
While there is a growing awareness about the role of urban agriculture in the context
of food security and poverty alleviation for the urban populations, urban agriculture
still largely remains an informal sector that is not being integrated to agricultural
policies or urban planning (Mougeot, 1999) making it vulnerable while jeopardizing
its sustainability. A number of studies have suggested that urban agriculture will
continue to increasingly play an important livelihood activity in developing countries
by contributing significantly to the household livelihood systems and the urban
informal economy (e.g. Jonathan et al., 2014; DiDomenica, 2015), yet there are very
few studies that have attempted to quantify the food production levels and how much
5
household income is earned from such activities in many parts of Kenya. Also, the
development programmes have tried to put UA onto the policy agenda through the
development of policy sheets, planning guidelines, in a number of countries. Despite
these programmes that promote urban agriculture, there is still no relatively in-depth
information and analyses available on who is conducting urban agriculture and the
extent to which low income groups within smaller towns use urban agriculture
(Memon and Lee-Smith, 1993; Musonga, 2004; Hide and Kimani, 2012). In Eldoret
Town, there are few other recent studies available which indicate that the current
infrastructure is not conducive for sustainable urban agriculture practices and
therefore the contribution of urban agriculture to livelihood and household food
security may be low or underestimated (Kadenyeka et al., 2013). Simiyu and Foeken
(2014) also evaluated urban crop production and poverty alleviation in the town.
However, the study by Kadenyeka et al. (2013) only involved the horticultural
producers while that of Simiyu and Foeken only looked at the gender aspect of urban
production and therefore the production from and contribution of urban agriculture to
food security, and income in the town still remains scanty and unclear. More
importantly, studies on the use of technology in urban agriculture within Eldoret
Town have not been done. Existence of in-depth information on urban agricultural
practices with regards to the status, contribution to food production and income as
well as technological advancement in Eldoret Town is inadequate hence the need for
the study.
6
1.3 Objectives of the study
1.3.1. Main objective
The main objective of this study was to analyze the use of urban agriculture as a tool
for increasing food security within Eldoret Town, Kenya.
1.3.2. Specific objectives
The specific objectives were to:
1. Determine the extent of urban agriculture among households in Eldoret Town
2. Evaluate the overall contribution of urban agriculture to food production
within Eldoret Town.
3. Estimate the overall contribution of urban agriculture to household income
within Eldoret Town
4. Identify the technological innovations used in urban agriculture within Eldoret
Town
1.4 Research questions
The following research questions guided this study:
1. What is the extent of urban agriculture among households in Eldoret Town?
2. What is the overall contribution of urban agriculture to food production within
Eldoret Town?
3. What is the overall contribution of urban agriculture to household income
within Eldoret Town?
4. What are the technological innovations used in urban agriculture within
Eldoret Town?
7
1.5 Significance of the study
The study aims at assessing the contribution of urban agriculture to households’
livelihoods in Eldoret Town. It suggests measures and recommendations that can lead
to sustainable urban agriculture in Eldoret Town, which can be replicated to other
urban areas of which share similar characteristics. The findings of the study are also
beneficial to the local residents since it will stimulate Government and other
institutions to appreciate how urban agriculture affects households’ livelihoods in
Eldoret Town and in Nairobi County in general. Documentation of the findings adds
to the pool of knowledge which is vital for development and for use by current and
future scholars.
Policy makers, planners, environmentalists, agriculturists and other professionals are
expected to take advantage of the findings of this study to improve their strategies
towards solving the existing challenges facing sustainability of urban agriculture for
today’s and future generations.
In Kenya, urban agriculture is conducted in several urban centres with very little
documentation. In the context of growing advocacy for policy support in favor of
urban agriculture, it is necessary to provide an assessment of the contribution of urban
agriculture research to poverty alleviation in Kenya. This information is currently
lacking in Kenya. By channelling such information to relevant decision makers, there
will be adequate support and improved funding for urban agriculture and development
geared towards improvement of urban environment.
8
Previous studies that observed that urban farming plays a critical role towards
improved livelihoods of the urban poor in several SSA associated it with few
indicators such as improved food security and improved nutritional status (Morgan
and Sonnino, 2010; Pothukuchi and Kaufman, 2013; Atkinson, 2014; Romero-Lankao
and Dodman, 2015). This study explored the extent to which urban agriculture affect
livelihood outcome indicators.
1.6 Scope of the study
The content of the study was limited to the of urban UA in terms of food production,
household income and technology involved in the practice of UA in Eldoret Town.
The scope of the study was limited geographically to Eldoret Town of Kenya. This
study sought to identify production of food in Eldoret Town and its immediate
environs as well. In terms of data collection, the study was limited to the use of
questionnaires and the duration covered a period of 1 year.
1.7 Limitation of the study
The problem of infrastructural networks was a major issue encountered in the course
of the research in Eldoret Town. Accessibility to some remote location using a vehicle
was a major drawback experienced during the study. As such many of the households’
interviews were mostly done by walking on foot through muddy routes by the
researcher and the research assistants.
Prejudice – Suspicions from most of the respondents who wanted to know if we had
been sent by the Eldoret Municipal Council. This was because the Council 'askaris'
have been harassing them since the Municipal by laws have not recognized any urban
9
farming in the town. However our public relations initiatives overcame this as well as
interventions by Government officers. This was reversed by assuring them that the
study was for academic purpose and that no part of the information was to be
disclosed to anyone.
Budgetary constraints – The study involved a lot of travelling and interviewing which
involved money. However Government officers on the ground were very helpful
especially in identification of respondents and field guides. Sampling minimized
movements and hence reduced the overall expenses.
Sometimes the respondents took time to understand the questions. This caused delays
in administration of the questionnaires. However, attempts to ask the questions in
Kiswahili and in some cases mother tongue ensured the situation was improved
during the research
1.9 Assumptions during the study
1. The answers given in the questionnaires were true reflections of the
respondents’ answers and that utmost honesty guided the answering of the
questions.
2. The respondents gave accurate and relevant information as required regarding
urban agriculture in the region.
3. All variables not included in the study did not affect the response.
10
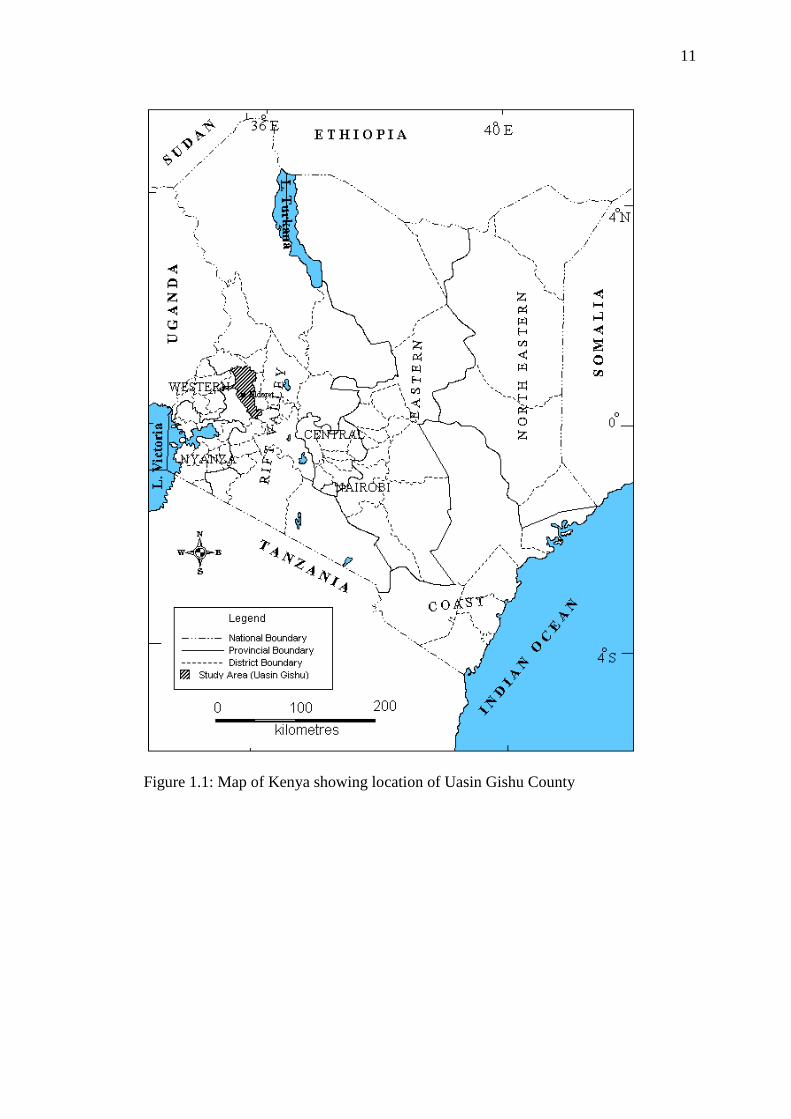
1.10 Study Area
This study was conducted in Eldoret Town (Figures 1.1) situated about 320 km from
Nairobi City at latitude 0°30’N to 0°25’S and longitude 35°45’E to 35°50’E. Eldoret
Town is the headquarters of Uasin Gishu County within former Rift Valley Province
of Kenya. It lies at an average altitude of 2100 meters above sea level in the high
altitude area. The Town has grown over time from a small centre to a large urban area
with population of 450,000 people (Kenya National Bureau of Statistics, [KNBS],
2010). The population comprises residents from different Kenyan ethnic groups,
mainly from Rift Valley, Western and Central Kenya region. There are also few
residents of Asian descent. Eldoret Town was chosen for this study because it is one
of the fastest growing towns in Kenya (Uasin Gishu Development Plan [UGDP]
(2008‒2012).
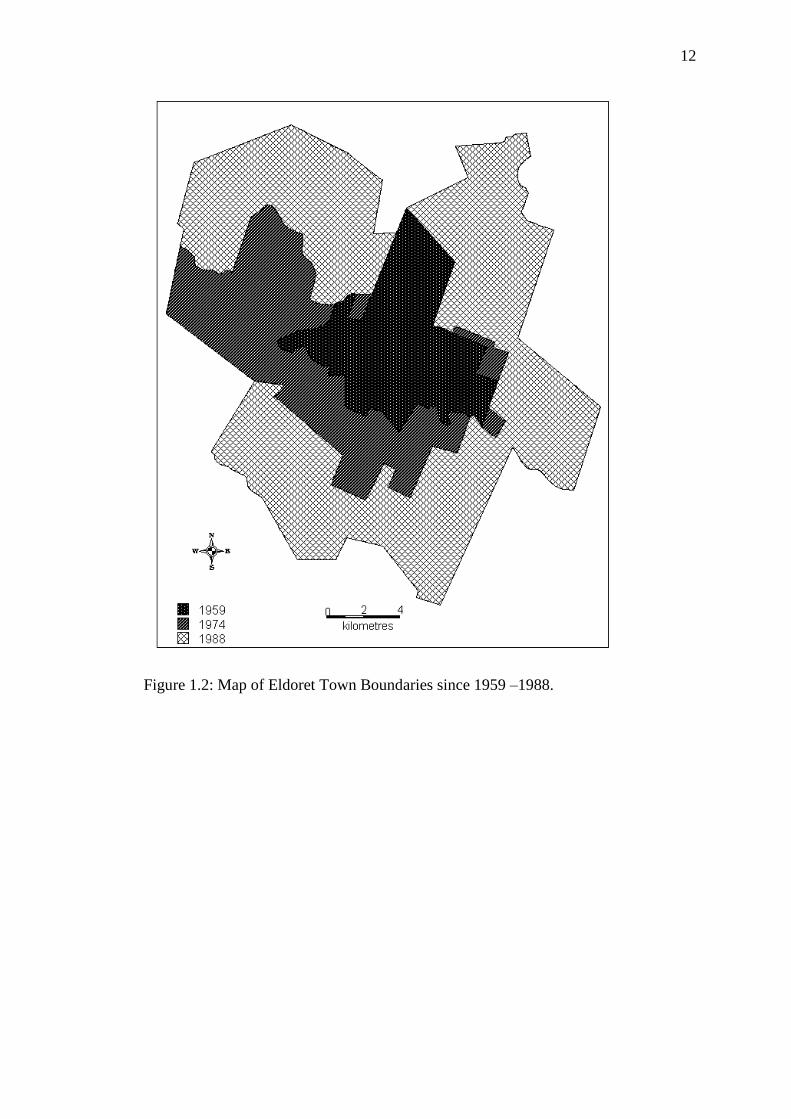
Due to the low cost of housing within certain residential estates of the Town, many
low-income earners have been attracted to these residential areas which have now
become overpopulated (Kwedho, 2013). Shabby buildings have come up haphazardly
within the entire surroundings.
11
Figure 1.1: Map of Kenya showing location of Uasin Gishu County
12
Figure 1.2: Map of Eldoret Town Boundaries since 1959 –1988.
13
CHAPTER TWO
2.0 LITERATURE REVIEW
2.1 Introduction
This chapter reviews literature on urban agriculture, from the global, regional and
local context. The chapter presents synthesized information related to urban
agriculture and its importance; as a source of food, income and employment
opportunities. It starts with a review of the concept of urbanisation and development
of urban agriculture, and then provides a critical review of the extent of urban
agriculture followed by the contribution of urban agriculture to food production and
later to household income. The empirical literature is summarized by the
technological innovations to urban agriculture. The theoretical and conceptual
framework for this study is also highlighted in latter sections of the chapter.
2.2 Urbanisation and development of urban agriculture
The demographic definition of urbanization is the increasing share of a nation’s
population living in urban areas and leading to a declining share living in rural areas
(Satterthwaite, 2007). Urbanizations also encompass urban sprawl; the physical
conversion of open, non-built areas for settlement purposes (Hovorka, 2014), as well
as socio-cultural transitions of the rural countryside, such as the adoption of urban
lifestyles by the rural population or the immigration of urban dwellers (Dittrich and
Krueger, 2011). Differences in rural and urban rates of natural population increase
may also influence urbanization, although generally these act to reduce urbanization.
In effect, the term urbanization is being used to refer to two opposing spatial shifts in
settlement patterns, likely to have opposing effects (Satterthwaite, 2007).
14
An urban population can increase from natural increase (births‒deaths), net rural to
urban migration and reclassification as a result of urban expansion or extension of
boundaries bringing in what was initially termed rural settlement and it becomes
urban settlement bringing in population which was previously classified as rural.
Nations with rapid economic growth and relatively low rates of natural increase have
most of their urban population growth from urbanization; nations with little or no
economic growth and high rates of natural increase including many Sub Saharan
Africa (SSA) nations during the 1990s have most of their urban population growth
from natural increase (Potts, 2009; Foeken and Owuor, 2011). By way of contrast,
much of the expansion of urban landuse is the result of a shift from dense to more
dispersed settlement (Satterthwaite, 2007).
Over the past few decades, many countries of the world have experienced a rapid
process of urbanization beyond former limits. In 1900, there were 6.7 rural dwellers to
each urban dweller worldwide, now there is less than one and projections suggest
close to three urban dwellers to two rural dwellers by 2025 (Siyuan, 2014; Cohen,
2016; Sanyal, 2016). This has been underpinned by the rapid growth in the world
economy and in the proportion of gross world product and of the economically active
population working in industry and services (Sebastian et al., 2008; Ravallion et al.,
2017).
Much is made of the fact that in 2008, the world’s urban population exceeded its rural
population for the first time. Less attention has been given to two other transitions:
around 1980, the economically active population employed in industry and services
exceeded that employed in the primary sector (agriculture, forestry, mining and
15
fishing); and around 1940, the economic value generated by industry and services
exceeded that generated by the primary sector (Satterthwaite, 2007). UN projections
suggest that the world’s urban population will grow by more than a billion people
between 2010 and 2025, while the rural population will hardly grow at all (United
Nations, Department of Economic and Social Affairs, 2014). Two key demographic
changes currently under way and likely to continue in the next few decades are the
decline in population growth rates and the ageing of the population (Kyle et al.,
2016). An ageing population in wealthier nations may produce more people that want
to and can live in ‘rural’ areas, but this is best understood not as de-urbanization but
as the urbanization of rural areas; most such people will also cluster around urban
centres with advanced medical services and other services that they want and value
(Satterthwaite, 2007).
Growing poverty, hunger and lack of formal employment opportunities, as well as the
special opportunities provided by the urban areas – including the growing demand for
food, proximity to markets and availability of cheap resources have stimulated the
development of diverse agricultural production systems in and around the developing
urban areas (Potts, 2009; Pothukuchi and Kaufman, 2013). These farming activities
include the cultivation of mainly food crops, animal husbandry, forestry, horticulture
including the production of flowers and garden plants and usually take place along
roadsides, in the middle of roundabouts, between railway lines, in open spaces and
parks, along rivers and river valleys, under power lines, within backyards of
residential plots (Smit et al., 2001; Rogerson, 2016; Ravallion et al., 2017).
16
There are numerous instances of the practice of urban agriculture with genesis/origin
that date back decades or centuries but have evolved to accommodate contemporary
conditions such as the allotment gardens in Europe that were invented in the second
half of the 19th century, vegetable patches in African colonial cities with their origin
in ancient communal practices, the centuries-old Chinese system of reusing the night
soil of cities to fertilize nearby farms, or Mexico City’s chinampas, which represent a
specific farming system predating the arrival of Columbus (Smit et al., 2001;
Satterthwaite, 2007). In recent decades, urban agriculture was further dissociated from
urban locations by well-intentioned and well-funded development experts. Addressing
the expansion of urbanization and urban agriculture, the dynamic character of the
urban land-use change has been highlighted by early commentators. Sebastian et al.
(2008) found that many urban lands are capable of producing much food for urban
dwellers. Therefore studies on urbanization and the associated urban agriculture will
most likely to continue.
2.3 Extent of urban agriculture
Urban agriculture has a long tradition in many cities worldwide, contributing to the
lives of many people and providing food to about 15‒20% of the world's population
(FAO, 2014). Globally, conventional production from urban agriculture has managed
to meet food demand from a rapid growth in the proportion of the workforce not
producing food and rapid changes in food demands (Simon et al., 2006; Rogerson,
2016). However, by existence of perceptions of urban agriculture, it is difficult to
estimate its local, regional and global extent. Several reviews have been published on
the global extent of urban agriculture in developing and developed countries
(Hamilton et al., 2014; Mok et al., 2014). About 800 million people may have been
17
previously engaged actively in urban agriculture (Smit et al., 2001). However,
uncertainty and accuracy of this previous estimate are not well known (Hamilton et
al., 2014). Currently, transparent estimates of the global extent of urban agriculture
have not been published.
In the developed world, agriculture in urban areas was the norm because of the high
populations and the need to supply the urban population with food and other
necessities such as income (Bomans et al., 2011). Most of the cultivation of crops and
rearing of livestock was done intensively within and at the edge of cities contributing
to the urban livelihood (Smit, 1996). However, the actual extend of the practice
remains unknown. In the developing countries, urban agriculture was non existence in
the past (Mbiba, 2005) and statistics available indicate that in developing countries,
about 266 million households may be engaged in urban crop production, that is, 29
million households in Africa, 182 million in Asia and 39 million in Latin America
(Hamilton et al., 2014).
Thebo et al. (2014) estimated that around the year 2000, the global area of urban
cropland was 67.4 Mha (5.9% of all cropland), with 23.6 Mha irrigated (11.0% of
global irrigated cropland) and 43.8 Mha rain fed (4.7% of global rain-fed cropland).
The per-capita area of urban cropland was more than 300 m2 per capita in developed
countries, Commonwealth of Independent States, and South Asia and less than 100 m2
per capita in Sub-Saharan Africa. By the turn of the millennium, that percentage had
more than doubled (UN-Habitat, 2004). However, the rural urban migration has
played a big role in the development of urban agriculture, with more increased trends
being observed in recent years (Walter et al., 2016). Urban agriculture was based on
18
this rural-dominated trend by concentrating on local markets, barter trade and
currency trade and household as well as community organization (Waddington, 2006)
deeply rooted in local concepts of community, and in local societal and cultural
practices (Smit et al., 2001; Lee-Smith and Cole, 2008).
The major crops in urban croplands are rice (Oryza spp.), wheat (Triticum spp.),
maize (Zea mays) and fodder grasses. However, urban agriculture has only a limited
potential to contribute to global cereal production as the global annual harvested area
for cereals is 10 times larger than the global urban area (Martellozzo et al., 2014).
This global urban area data set aimed to exclude large urban parks but did include
some permeable surfaces (Martellozzo et al., 2014). How much urban area may
actually be suitable and available for urban agriculture was however not considered.
For example, vegetable yields in urban areas may be lower than rural yields because
of naturally low soil fertility and soil degradation. On the other hand, vegetable yields
in urban agriculture can also be considerably higher than rural yields because of the
use of irrigation, relatively high input levels, and the use of best management
practices (Morgan and Sonnino, 2010). Most importantly, more science-based
information must be generated and distributed among urban farmers to improve the
cultivation of plants in urban environments (Wortman and Lovell, 2013). Martellozzo
et al. (2014) and Thebo et al. (2014) also highlighted that small urban areas (<100
km2) with lower population densities can contribute substantially more to urban
agriculture production than large urban areas. Specifically, small and medium urban
areas constitute most of the global urban area, and small urban areas can probably
devote a higher proportion of their area to urban agriculture because of lower
19
population densities compared with large areas (Sheriff, 2005; Waddington, 2006;
Martellozzo et al., 2014).
However, the scale of urban food production may generally be underestimated. There
is a very large urban population worldwide with incomes so low that their and
nutritional status is at risk from any staple food price rise—as became evident with
the rising hunger among urban populations after the food price rises in 2007 and the
first half of 2008 (Bebbington, 2009). It is likely that the proportion of the global
population not producing food will continue to grow, as will the number of middle
and upper income consumers whose dietary choices are more energy intensive (and
often more land-intensive) and where such changes in demand also bring major
changes in agriculture and in the supply chain.
Urban agriculture in Africa presents a contradiction since it has a relatively long
tradition and is widely practiced, yet in most African countries urban agriculture has
been undervalued and resisted by generations of public officials (Murimi et al., 1991;
Bryld, 2013; Hardoy et al., 2013; Atkinson, 2014) infact criminalized by city by-laws.
This attitude has only recently begun to change as leaders realize the potential of
urban agriculture to alleviate the growing hunger, economic, and environmental crisis
in the ever-expanding metropolitan areas of Africa (Jonathan et al., 2014). There has
been only limited continuity of urban agricultural practices in Sub-Saharan Africa
from the pre-colonial period to modern times (Smit et al., 2001; Foeken and Owuor,
2011; Egziabher et al., 2014; Drechsel and Dongus, 2015).
20
There is general recognition of the importance or urban agriculture in most countries
in Eastern African region (Freeman, 1991; Memon and Lee-Smith, 1993; Mbiba,
2005; Mireri et al., 2007; Maingi, 2010). Many low income households as well as
higher income households are constantly turning to urban agriculture for the
production of food for own consumption and at times for extra income. It is argued
that the principal reason why people are engaging in urban and agriculture in the
region is in response to inadequate, unreliable and irregular access to food supplies
from the hinterland. Surveys in Dar-es-Salaam, Tanzania in 1967 and 1991 showed an
increase of family agriculture from 18% to 67% (Murimi et al., 1991). Reports from
Kampala, speak of massive shifts of urban land from open space, and from
institutional and transportation use to agricultural production (Nabulo et al., 2006).
There are also reports of the extent of urban agriculture in Kenya (Foeken and Owuor,
2011; Foeken, 2012; Hide and Kimani, 2012; Kadenyeka et al., 2013; Hamilton et al.,
2014; Korir et al., 2015). Most of these studies in Kenya have found that three of
every five families in towns and cities are engaged in urban agriculture. Much of this
urban agriculture in Kenya is limited by the problem of access to land in urban area.
However, people of all socio-economic classes usually grow food whenever and
wherever possible. The significance of urban agriculture as an important and growing
sector of the urban space economy in Kenya is also appreciated at individual
household, community, and national levels with its widespread practice intensifying
in Kenya only in the late 1980s and during the 1990s due to rising food prices and
rising unemployment (Hide and Kimani, 2012). Roadsides, portions of streets,
electrical utility rights-of-way, golf courses, hospital grounds, and airport land beyond
the runway are used to grow food for the poor.
21
The reviews from the foregoing section makes it clear that the extent to which urban
agriculture is practiced is not clearly know in the global context. Many African
countries lack data and also the few studies done in Kenya does not clearly
demonstrate the extent of urban agriculture. The situation is more acute in Eldoret
Town despite the rapid growth it has experienced in population and urbanization in
recent years. Therefore studies on the extent of urban agriculture in Eldoret Town are
justifiably welcomed in the international literature.
2.4 Contribution of urban agriculture to food production
There is considerable research that has attempted to quantify food produced from
urban agriculture including from staple crops like maize, cassava and vegetables, such
as local varieties of tomatoes, peppers, leafy vegetables and the more exotic lettuce,
cucumbers, cauliflowers and carrots as well as production from livestock such as
cattle, goats, poultry and small ruminants (Maxwell et al., 2013; Pothukuchi and
Kaufman, 2013; Martellozzo et al., 2014; Maxwell, 2015). Achievable yields of up to
3‒70 tons ha−1 year−1 have been reported in urban food production (Cohen et al.,
2012; Egziabher et al., 2014; Ellis and Sumberg, 2015), but estimates of yields in
urban agriculture are generally not well known and highly variable (DiDomenica,
2015). Although, a little has been directed at quantifying its scale based on data that
can be projected to show its contribution to food production, most studies which have
done actual measurements of food production from agriculture generally tend to
support the hypothesis that urban agriculture does improve food production of
vulnerable households. In 1998, it was estimated that by 2020, 50‒190 kg m−2 year−1
million could be realized in urban food production, based on data available at that
22
time (Smit et al., 1996; Morgan and Sonnino, 2010) which relied on the estimates of
International Development Research Centre (IDRC) (Egziabher et al., 1994).
City case studies indicate a considerable degree of self-sufficiency in fresh vegetable
and poultry products as well as other animal byproducts. Using a productivity level of
10.7 tonne per ha per year, London is estimated to produce around 232,000 tonnes of
fruit and vegetables (Brunori and Orsini, 2010). Other have estimated the production
at about 12 tonnes per ha per year (Ellis and Sumberg, 2015). Dakar produces 60% of
its vegetable consumption estimated at 7 tonnes per ha. per year, whilst poultry
production amounts to 65‒70% of the national demand estimated at 6 tonnes per ha.
per year (Foeken, 2012). In Accra, 90% of the city’s fresh vegetable consumption is
from production within the city estimated to produce 5.5 tonne per ha. per year for the
locals (Potts, 2009; Lee-Smith, 2010; Jonathan et al., 2014). In Dar es Salaam, more
than 90% of leafy vegetables coming to the markets have their origin in the open
spaces and home gardens contributing to 6.1 tonne per ha. er year of food (Prain and
Lee-Smith, 2014; Rogerson, 2016).
Mwangi (1995) compares farming and non-farming households in low-income
neighborhoods in Nairobi and notes that, while mean consumption is well below
estimated requirements in all cases, farming households are better off in terms of both
energy and protein consumption, and that farmers participating in an organized urban
agriculture support program are significantly better off in both categories. The
farming households produce 20-25% of their food requirements. Sawio (2008) reports
that nearly 50% of Dar es Salaam residents indicated that urban agriculture provided
20-30% or more of their household’s food supply. In Kampala, earlier studies indicate
23
that residents living within a 5 km radius of the city centre produced about 20% of the
staple foods consumed within that same area (Maxwell, 1994), later 55% of 150
producers obtained 40% or more and 32% obtained 60% or more of their household
food needs from their own urban garden (Maxwell, 2015). In Harare, a disaggregated
profile of self-produced food consumption and its variation by income indicated that
60% of food consumed by a quarter of the low-income group was self-produced
(Sebastian et al., 2008). In terms of meeting household food needs, urban agriculture
in Harare is estimated to provide families engaged in the activity with staple food for
up to four months in a year (Mbiba 2005).
Clearly, urban agriculture makes a vital contribution to the food self-reliance of many
major cities. As reiterated by Mougeot (1999), food self-reliance is not self-
sufficiency, but it can go a long way towards reducing the food insecurity of
vulnerable groups. Urban agriculture cannot be expected to satisfy the urban demand
for food, which can easily be stored and transported with limited losses from rural
areas. What must be recognized and appreciated is that urban agriculture, with limited
support, already supplies a significant share of food, especially the more easily
perishable vegetables and poultry products, to many cities. Being mindful of the fact
that food security encompasses quality and not only quantity, local food production is
an important component of food security and must be seen as complementary rather
than competitive to other urban food supply systems (Sawio, 2008).
To be useful for quantitative projection, surveys need to be based on urban household
samples. Many studies only sample urban farmers without situating them in the
broader population. The book Cities Feeding People provided rich data based on
24
studies in the four capital cities of Ethiopia (Addis Ababa), Kenya (Nairobi), Tanzania
(Dar-es-Salaam) and Uganda (Kampala) in the 1980s and 1990s (Egziabher et al.,
1994) The Addis Ababa study only sampled vegetable growers, but quoted a 1983
household survey that included questions about vegetable growing. The Kenyan study
was based on a national urban sample (Lee-Smith and Memon, 1994) including data
specific to Nairobi. The Kampala data were based on random samples of households
in several selected neighbourhoods. The study of Dar-es-Salaam only sampled
farmers, but luckily a study in the same area a few years later provided comparative
data.
These data describe a period in the 1980s and early 1990s when the economic
situation in these countries was quite bad and many might be expected to turn to
farming for survival. Although not based on a comparative method, the relatively high
proportions of farming households meant these data were taken seriously. The
Kenyan study used the most systematic sampling techniques and suggested a steady
continuum linking urban farming with population size, with a higher proportion of
farmers in the smaller urban centres and the lowest proportion (although still high at
one-fifth of all households) in the capital (Lee-Smith and Memon, 1994). Maxwell’s
observation that more than half the land within Kampala’s municipal boundaries was
being used for agriculture was likewise telling, as was the fact that 70% of poultry
products consumed in the city were also produced there (Maxwell, 1994). Despite the
fact that these figures needed to be validated and updated as economic conditions
changed, reliable surveys were expensive to undertake and were few and far between.
The work of Foeken and Owour in Nakuru showed that 35% of Nakuru’s population
engaged in urban farming in 1998, with 27% of all households growing crops and 2%
25
keeping livestock in town (Foeken and Owour, 2000). The overall figure for Nakuru
placed it in the Kenyan urban continuum, close to Kisumu, which had 30 % of
households farming some years earlier (Lee-Smith and Memon, 1994).
In Kampala, the Urban Harvest studies carried out in 2003 provided an indication of
the proportion of households engaged in both urban agriculture (David et al., 2010)
percentages found in the urban zones were not inconsistent with those documented by
Maxwell in the early 1990s, averaging 26.5%. However, the figures for the peri-urban
zones were much higher, averaging 56%. These figures beg many questions, not least
the need for validation, for they suggest an active – mostly peri-urban – household
agriculture system that could provide good opportunities for intensification of
production close to urban markets (Nyapendi et al., 2010). This pattern accords well
with observational data from Dar-es-Salaam in Tanzania (Jacobi et al., 1999) and
historical data from Yaoundé in Cameroon, (Bopda and Awono, 2010) which both
show how these patterns move outwards with the growth of a city, suggesting that
urban agriculture is a form of “shifting cultivation”.
Three important conclusions can be drawn from these studies. First, agriculture is
practiced in so many place, even near the centre. Second, there is an urban agriculture
gradient with a higher proportion of farmers towards the periphery. Third, the overall
proportion of urban farming households could be higher than previously thought
because more space is occupied by urban areas due to the concentric spatial pattern of
urban centres (David et al., 2010). However, this may be a faulty assumption, as
urban densities are also lower. A fourth important conclusion to be drawn from this
these studies is that the proportion of urban households that are farming have not
26
diminished with urban growth. Thus, the overall numbers of urban farmers, and by
implication the amounts of food they produce, must be adequately addressed.
2.5 Contribution of urban agriculture to household income
For almost all urban farming activities in urban areas, agricultural produce is for
eating as well as selling. The growth of urban agriculture has stimulated research into
the economics of such production to the households in urban centers and now there is
clear evidence that urban agriculture is no longer the single activity that only provide
subsistence for the family but generate income as well (Bebbington 2009; Ellis and
Sumberg, 2015). In many urban areas of the developing world, the diversity of
income from urban agriculture is even more in evidence. It has been clear from
several studies that urban agriculture is clearly only a part of diverse livelihoods while
still providing a significant contribution to household income (Hovorka, 2014).
Formal employment, business, and trade tend to occur in areas where urban
agriculture is practiced, where many dwellers can sell food throughout and earn
income from such. Few employment alternatives are as lucrative and incomes are
estimated to be about 50% above the minimum wage. Likewise, the several studies
notes that its findings, of 70% of heads of farming households earning more than US$
330‒6000 per year from urban farming (Wortman and Lovell, 2013).
The spatial pattern in income distribution, with intensive commercial food production
in the urban centers is another example of how location within the urban environment
affects opportunity and strategy and the types of households involved in household
income distribution (Potts, 2009; Lee-Smith, 2010). Urban agriculture has been found
to be the major livelihood strategy for producers in the well-endowed urban areas,
27
where many still depend on rain-fed agriculture to supplements other income sources.
Consequently, urban agriculture may play a bigger part both in the deployment of
household labour and in generating income than in the built-up urban areas. In many
areas, women are the primary household members involved in farming and several
studies have established that households in which women are active participants, there
is more income obtained from the practice (Hovorka, 2014). This latter variable has
been strongly associated positively with lower levels of poverty in many areas (Bopda
and Awono, 2010) and underlines the need to look at crop and animal production in
the broader context of income and social capital.
Foeken (2012) has noted that even though the rural poor today still out number the
urban poor in absolute terms, the latter have been increasing in number at an alarming
rate, a phenomenon commonly described as the ‘urbanization of poverty’. The
increasing urbanization and growing poverty trends in Sub-Saharan Africa has meant
that families have to consider alternative means of supplementing their diets and
incomes. Kekana (2016) notes that farming in urban environments recently has been
found to benefit poor households through direct savings on food purchases and
income generation through the sale of produce, which can be used by the household to
purchase relevant items for the members of the household including paying school
fees. Meanwhile, Reuther and Dewar (2015) recognize that the greatest proportion of
urban agriculture is undertaken as a survival strategy by individual households,
generally in backyards to augment household real income. Smit et al. (2001)
maintains that urban agriculture is not a luxury if it can augment incomes in urban
areas. Although these income may appear low, sustainable urban systems need to

28
recognize an approach that will result in improvement of the income of most of the
urban households while at the same time tackling them in a holistic manner.
Unfortunately, researchers for a long time have ignored the contribution of urban
agriculture to income and the link to reduced urban poverty. This is because for a long
time urban areas have been perceived as oases of employment and modernity and less
with agricultural activities. This has led to the potential of urban agriculture as a food
source and a means of income provision being overlooked. Jonathan et al. (2014) and
Rogerson (2016) attributes this lack of oversight to three basic reasons: 1. Urban land-
use planning strategies for the activity have not been given the due attention that they
deserve; 2. There has been lackluster support for the activity by planners, policy
makers, politicians, researchers, and other stakeholders. But this is beginning to
change due to failure of present poverty alleviation strategies; 3. There has been a
glaring lack of an integrated approach to solving income and food shortages in
poverty prone regions of urban areas.
An underlying explanation as to why the sector has long been ignored has been the
view that urban agriculture has no relevance to modern economics of the family and
households like white collar job. For many countries, the official policy has deemed
the activity to be illegal, on the basis that it constitutes environmental and health risks
and also violates formal town planning and therefore the income obtained from the
activity may not mask the underlying problems from the activity (Mbiba, 2005).
Foeken (2012) has observed that by-laws in most African cities forbid all agricultural
activity within the boundaries of urban centers, as it does not fit in the western
perception of what constitutes ‘urban’ (e.g. the city-is-beautiful idea) and because it
29
supposedly causes all kinds of environmental hazards and thus many do not value the
income derived from the activity. But the activity is seen by Reuther and Dewar
(2015) as being one of the many diverse livelihood strategies enabling low income
households to increase their share of income. Farrington (2002) notes that some
governments have been open enough to invite farmers, social organizations and other
stakeholders into a planning process in order to achieve some plurality of thinking as
a strategy to boost income. This has resulted in the appreciation of urban agriculture
as a way of providing employment and boosting income for the urban residents.
Some survey data are available about the level of income earned from urban farming.
However, it is risky to generalize because the farming conditions vary enormously
from season to season and city to city. Examples are given here primarily as
illustrations of the variability of earnings from urban farming. In African countries, it
is generally the poor who are cultivating in urban areas, but the Harare survey of 720
households shows that higher-income farmers engage in more gardening and cropping
activity, such as maize growing and get more income (Brunori and Orsini, 2010). The
highest income earned was the equivalent of 7 months’ salary at the industry
minimum wage, while the average earnings were equivalent to about two weeks of an
industrial salary (US$ 7).
In several African cities, income earned by urban farmers was found to be a
significant contributor to household maintenance. Home gardens in Lusaka produced
an average of three months’ income (120 US $ in 1992), but was extremely seasonal
(Von Hippel, 2005). An earlier study found that low-income households in Lusaka
obtained one-third of their total food consumption from farming (Sanyal 1986, cited
30
in Drechsel and Dongus, 2015). Farmers in Accra earned very little cash, but
produced 1‒8 months’ supply of staple food for their families, and used their farm
output as a consumption-smoothing and income-diversification strategy. Especially
for vegetable growers, income from farming could represent significant amounts and
proportions of total income. Estimates from Dar es Salaam indicate that full-time
production of certain vegetables or keeping a few dairy cattle and a garden can
produce an income of US$ 60 per month – 30% greater than the average salary
(Jacobi et al., 1999). The same is true for Eldoret families in slum areas, although
they sold relatively little and consumed their own output but no actual figure was
provided (Kadenyeka et al., 2013). These families’ standard of living exceeded that of
neighbouring non-farming families. Official statistics show 12.6% of total income
comes from this source, but this likely excludes a large number of the informally
employed in agriculture (Morgan and Sonnino, 2010). Although these are just few
statistics available from surveys, there is still lack of comprehensive information on
the contribution of urban agriculture to household income in many countries including
in Eldoret Town and therefore the need to supplement such information with up date
data on the contribution of urban agriculture to household income.
2.6 Technological innovations in urban agriculture
Innovation is defined as the process of creating something new, coming up with better
solutions for existing needs or meeting new unspecified requirements (Chesbrough,
2003). Innovations can be technical, involving new improved or adapted products or
services or they can be more social or organizational and institutional, entailing new
practices or improvements in strategies of entrepreneurship, farmers or organizations.
Innovations are to be distinguished from inventions, or novelties which as just new
31
ideas, devices or methods (Pauli, 2010). Therefore innovations are new ideas that
have certain impacts socially or economically and can be translated into practice. The
innovation landscape has become much more diverse and dynamic. Traditionally,
ideas for new products or methods are generated in a research environment, selected
and elaborated in a development environment and commercialized in a marketing
environment or disseminated by demonstrations and extensions (Prain and De Zeeuw,
2007). The innovation process ensures that new ideas stay within the knowledge
infrastructure. This idea has given way to much more open innovation process, which
ideas that are not selected internally spin off outside the boundaries of the firm or
knowledge infrastructure to be picked up by other parties that may develop new
applications for new markets (Chesbrough, 2003). It is also possible for new ideas to
develop from actual practice as is often the case when the users of a certain
technology such as urban farmer know that immediate needs, termed leader use
innovation (Von Hippel, 2005).
The innovation landscape is diverse and dynamic in urban agriculture, which is
practiced by people even without knowledge and practice or even background in
agriculture (Walter et al., 2016). Novel solutions may be developed, shared through
the internet or social media yet may not be recognized by the formal knowledge
system. Traditionally, government and market parties have played a leading role in
financing agricultural innovations (Morgan and Sonnino, 2010). The increasing
popularity of more distributed models of agricultural innovations coincides with the
emergence of new actors who are able and willing to take part in financing these
innovations. New ideas only gain impact and thus become innovation, if they are
properly resourced (Cohen et al., 2012).
32
Because urban agriculture is very diverse activity, innovations have very different
expressions. Several typologies have been proposed previously (Bhatt and
Kongshaung, 2005; Van Veenhuizen, 2006) which are flexible and are based on such
divergent characteristics such as organizational form (e.g. backyard garden, allotment
garden, community garden, institutional garden, commercial garden) and spatial
forms (micro-garden, low space, scattered in neighborhood, food boulevard,
integrated in public green infrastructure). An alternative typology can be created on
the basis of spatial considerations (in or around buildings, inner city, suburbs, city
fringe, periurban) and agronomic considerations (full control as in closed green house,
permanently confined in stables, to some control as in open field crops and livestock
ranging in meadows, to hunting and gathering in wild or redeveloped nature) (Cohen
et al., 2012). This variety within urban agriculture implies a wide range of possible
manifestations, and hence innovations, each having its own unique form with the
physical and socioeconomic environment. This range of practices encompass inner
city initiatives where the food grown is naturally adapted to the microclimates in and
around buildings (Pauli, 2010; Dubbeling et al., 2013), and different varieties of
community and market gardens to peri-urban greenhouses and precision farming, to
highly controlled production circumstances such as LED cabinets used in vertical
farming (Chesbrough, 2003). Sometimes it is claimed that only high tech initiatives
are sufficiently adapted to the urban areas and can solve the issue of urban food
provisioning (Cohen et al., 2012). However, it has been suggested that low tech
solutions may be equally important.
Urban agriculture in itself is an innovation of more conventional models of
agriculture, which are situated in rural rather than urban areas, which tend to be based
33
on linear rather than circular models of nutrient and water resource use (Chesbrough,
2003). In urban context, the need as well as the opportunity for innovation is high
leading to a higher intensity of technical innovations, more diversity in farming types
and new forms of organization and cooperation (Dubbeling et al., 2013). Urban farms
may become special micro-units of intensive livestock raising or horticultural
production, sometimes without the need of cultivated land (as in rooftops, hydroponic
and container production). However, the innovative nature of urban agriculture
concern a number of different yet interrelated dimensions: confined landscape, urban
metabolism, organizational production and participation in urban designs and
planning. Innovations also encompass simple landless farming techniques such as
gardening in sacks, hydroponics, and vertical farming (Bhatt and Kongshaung, 2005;
Prain and De Zeeuw, 2007). Such methods include hydroponics, use of organic
pesticides and composting with organic waste. Hydroponics, for instance, is gaining
popularity as a solution to the problem of access to land for urban farming.
Urban agriculture may integrates a wide variety of production systems, ranging from
models familiar to a typical rural farmer to techniques that push the limits of the
definition of agriculture. This diversity includes both very high-tech approaches, such
as nutrient film technology, and low-tech methods, such as planting into soil-filled
recycled buckets (Dubbeling et al., 2013). Composting of organic waste from
harvested produce of farms, markets and urban households to enhance soil fertility is
not only gaining popularity but is also being recognized and strongly advocated as a
viable alternative to dealing with the problem of municipal waste disposal (Cohen et
al., 2012).
34
In Kenya, limited access to productive resources in terms of access to land,
availability of water and other inputs are major constraints to local food production,
with very little or no documented innovations (Lee-Smith, 2010). The characterization
of the various urban agriculture farming systems in Kenya is yet to be done.
Consequently, inadequate urban agriculture technologies have been developed
limiting crop choices and adaptation of production technologies. However, there is
generally insufficient technical capacity to keep abreast with changing trends in
technology. Moreover, limited awareness creation of the available urban technologies
has also been an impediment to improved productivity.
2.7 Theoretical framework
This study relied on the Sustainable Livelihood Theory (Carney, 2003). One of the
more well-known development theories called Sustainable Livelihoods (SL), serve as
an umbrella term for thinking and methods regarding livelihood security and
associated topics. It became a popular tool of analysis from 1998 onwards, and spread
beyond organizations like Oxfam and UNDP around the 1990s, who each adapted this
theory to their own views and standards. The SL approach is increasingly helpful in
linking macro-level trends to the micro-level groundwork of reality. It therefore
contributed a lot the academic transformation of the notion of poverty, veering away
from the traditional top-down perspective of applying a band aid to bottom-up
differentiating root causes of poverty. People’s assets, their vulnerability, the policies
and institutions imposed on them and the interaction of these three aspects exemplify
the root causes of poverty, instead of the other way around. Thus, the general goal of
the SL approach is to alleviate poverty, by getting a good understanding of the forces
behind this phenomenon.
35
Its framework was designed by the Department for International Development (DFID)
in 1999, and has been used ever since in academic literature and development policy
worldwide. According to Garney (2003) and Benson and Twigg, (2007) its the main
elements are:
- Vulnerability context: The situational environment in which poor people
live and work, which is the source for many elements of their day-to-
day struggle;
- Responsive and participatory: Poor people themselves are the best actors
to identify and addressing the relevant livelihood priorities;
- Capital: The assets and capabilities of the poor, which they have access to
and use to gain a livelihood (i.e.: seeds);
- Policies, institutions and processes: The institutions, organizations, policies
and legislation that influence access to assets and choice of livelihood
strategies (i.e.: water policy);
-Livelihood strategies: The manner in which the poor organize and use their
assets and capabilities to safeguard and improve their livelihoods (i.e.:
community farming);
- Livelihood outcomes: The possible and desired results of livelihood
strategies (i.e.: improved food security).
Applying SLA can form a link between research or policy and people’s priorities. The
analysis can result in either promoting livelihoods, protecting livelihoods or providing
livelihoods with essential needs (Benson and Twigg, 2007). At the grass-roots or
community level, the SLA guides research in exploring the types of ‘capital’ (natural,
social, human, financial and physical) that exist for the urban poor to earn a livelihood
36
(Thornton, 2008). As this approach focuses on people and on people’s strengths,
whilst having its roots in community resource management, SLA serves as an
important framework for both household and community development (Brocklesby
and Fisher, 2003).
This is why it is a relevant academic theory for the case of urban agriculture.
Agricultural practice and interventions are rooted in the capacity and strategies of
both households and communities. Before introducing a framework such as urban
agriculture in a poor neighborhood, the situational environment needs to be examined,
the assets and capabilities of the poor need to be researched, just as the institutions,
organizations, policies and legislation that influence these assets, how the poor use
these assets and the possible and desired results of this framework introduction. Each
individual has his own view on the extent to which he or she is poor, and to which
extent other people are living in poverty (Viljoen and Sekhampu, 2013). Gharajedghi
(1986) accordingly states that urban poverty does not only have to be inherently
economic in perspective, but is actually psychological in nature as well. Thus, he
subdivides the term into five different components: powerlessness, incompetence,
meaningfulness, exploitation and conflicting values. Also, some individuals or
communities may adopt strategies to cope with these barriers, while others won’t or
simply are not able to (Viljoen and Sekhampu, 2013). In short, urban poverty is a
diverse and inherently contextual phenomenon, and needs to be approached
accordingly.
The aim is to make this farmer’s livelihood sustainable, so that he or she – along with
his or her household – can cope with and recover from stress and shocks. Moreover,
37
the aim is also to uphold or improve its capabilities and assets, and provide
sustainable livelihood opportunities for generations to come. Other livelihoods should
be able to contribute from these benefits, for example through knowledge transfer,
and the whole framework should involve various actors, including local government
and relevant organizations and institutions, in decision-making and policy formulation
and implementation (Majale, 2002).
The framework is also subject to some critiques in the context of urban agriculture.
For example, the definition of ‘natural capital’ in the framework largely applies to
rural areas, and needs reorientation for it to seamlessly apply to an urban
environment, when used here. Also, the emphasis in the model is put on the poor
themselves, which introduces the danger of ignoring the importance of policy and
governance from the top-down (Carney, 2003). Also, a number of authors have stated
that weak local or municipal governments are often unable to address the needs of the
urban poor, in some cases even by exclusion or discrimination. The above described
link between the government and people’s priorities is therefore a vital element of
preventing bad urban governance, thereby contributing to safeguarding sustainable
livelihoods and improving community development (Farrington, 2002). The farmer’s
social resources are a vital requisite for this development.
2.8 Conceptual Framework
For the poor urbanites in a cash intensive environment, low incomes, gender
disparities, and lack of amenities are likely to propel them into food insecurity and
poverty cycle. One way to escape the cycle is for such households to engage in urban
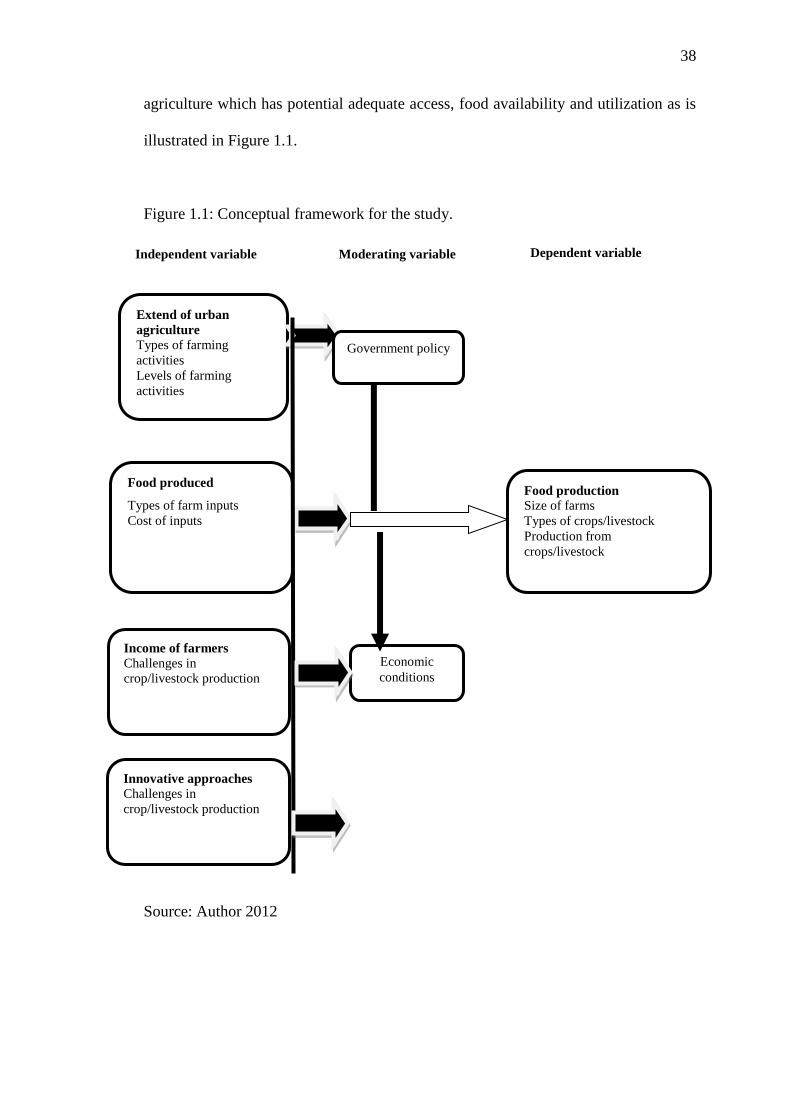
38
agriculture which has potential adequate access, food availability and utilization as is
illustrated in Figure 1.1.
Figure 1.1: Conceptual framework for the study.
Source: Author 2012
Extend of urban
agriculture
Types of farming
activities
Levels of farming
activities
Food produced
Types of farm inputs
Cost of inputs
Income of farmers
Challenges in
crop/livestock production
Government policy
Food production Size of farms
Types of crops/livestock
Production from
crops/livestock
Economic
conditions
Dependent variable Independent variable Moderating variable
Innovative approaches
Challenges in
crop/livestock production
39
Regarding availability, urban agriculture has potential to ensure that supply of food is
consistently available to urban households. Urban farming households are able to
produce their own food for household consumption and for sale. With income earned
from the sale of urban agricultural produce; these households are able to mobilize
resources to access appropriate foods for a nutritious diet.
40
CHAPTER THREE
3.0 RESEARCH DESIGN AND METHODOLOGY
3.1 Introduction
This chapter describes methods and methodology employed. First, the research
design, nature of data, target population and sample size are presented followed by the
sampling strategy and research instruments consisting of questionnaires, interviews,
observation and content analysis. Pilot survey, validity and reliability of the
instruments and data analysis were also undertaken.
3.2. Preparation for the research
Preceding the main study, a pilot study was carried out to standardize data collection
methodologies as well as other measurements. More particularly: to test the
questionnaires which were used in the study, to get an impression of the urban
agriculture conditions in the region and to help identify problems during the study and
which may not be seen during the planning stage. The pilot study took a period of one
week and relied on a group of twenty people facing similar characteristics in Kitale
Town and thereafter adjustments were made on the questionnaires.
Also a research permit was obtained from the county government and to further
facilitate the process, an introductory letter from the Head of Department of
Geography of Moi University was sought.
3.3 Research Design
This study employed a mixed method design. Mixed method research design is
defined as research in which the investigator collects and analyzes data, integrates the
41
findings, and draws inferences using both qualitative and quantitative approaches and
methods in a single study or a program of inquiry to understand a research problem
(Creswell and Tashakkori, 2007). The philosophical foundations underpinning a
mixed method research design are embedded in pragmatism. Tashakkori and Teddlie,
(2010) remarks that pragmatism is the best paradigm for mixed methods research.
Pragmatic perspective stems from the fact that inquiry can make a practical difference
in the world. A pragmatic perspective draws on employing what works, using diverse
approaches, giving primacy to the importance of the research problem and question,
and valuing both objective and subjective knowledge.
According to Creswell (2007), mixed method design is appropriate when both
quantitative and qualitative data together provide a better understanding of a research
problem than either type by itself. Therefore, mixed method investigations may be
used to enhance a better understanding of a research problem by converging numeric
trends from quantitative data and specific details from qualitative data, identify
variables/constructs that may be measured subsequently through the use of existing
instruments or the development of new ones and obtain statistical, quantitative data
and results from a sample of a population and use them to identify individuals who
may expand on the results through qualitative data.
3.4 Nature and sources of data
3.4.1 Nature of data
Two types of data were collected, primary and secondary data. The primary data was
collected from the field to give first-hand information about the extent of urban
agriculture and food production as well as to determine the income levels in Eldoret
42
Town. Data on types of farm enterprises, farm sizes, farm inputs and methods of farm
waste disposal as well as innovations applied in the field were also collected.
Secondary data from documented information was used to review policy and legal
framework, and any relevant documents relating to the effects of urban households
livelihood and challenges to urban agricultural development in Kenya’s urban centre
and beyond.
3.4.2 Sources of data
Primary data sources included household surveys, resource persons and focus group
discussions. Resource persons included officers (experts) from the county
governments in various related disciplines i.e. Environment, Planning, Agriculture
and Lands. NGO’s and CBO’s in the area were also interviewed. Field observations
were also done. Secondary data was obtained from various sources which included
published books, documented information from relevant line ministries like strategic,
annual, quarterly and other reports, relevant publications, Government policy
documents and electronic data.
3.5 Target Population
Target population is defined as all the members of a real or hypothetical set of people,
events or objects to which a researcher wishes to generalize the results of the research
study (Gall et al., 2003). The population from which the study sample was drawn was
varied. The entire number of households in Eldoret Town and experts in the field of
agriculture and urban planning comprised the target population. Within Eldoret Town
there is a total of 3,550 households including those in rental houses. Another 30 key
43
informants comprising of expert government/NGO officials and elders from the
region also formed part of the population.
3.6 Sample size
From the population of 3,550 households, the numbers of those practising urban
agriculture was established to be 188 after the initial survey. Therefore the sample
size for this study was 188 households practising urban agriculture. In addition 30%
of the key informants were included in the study, which resulted in the choice of 10
key informants which were picked purposively.
3.7 Sampling strategy
This is the description of the strategy used to select representative respondents from
the target population. The researcher used multi-stage sampling technique. In the
multi-stage sampling technique, the entire study area was stratified into smaller units
using stratified sampling technique. Household practising urban agriculture were
sampled from each of the selected strata. Household were sampled using simple
random sampling techniques. In simple random sampling every household in the sub-
sampling unit had equal chance of being selected.
3.8 Research instruments
The study used four main types of instruments to collect data. These included:
questionnaires, interviews, photography and document analysis. The selections of
these tools were guided by the objectives of the study, nature of the data collected as
well as the time available for the study.
44
3.8.1 Questionnaires
The questionnaires were justified because they enabled study coverage of a wide area
and extensive contents within a short period of time. The questionnaires were
distributed to various households’ heads and members since distance to some of the
local communities’ households were quite far. The targeted members were asked to
fill the questionnaires before they were collected for analysis and presentation. The
questionnaires covered a wide range of issues on food production, types of inputs,
type of farming activities and challenges to UA (Appendix 1 and 2). A total of 188
questionnaires were administered to the targeted respondents with an introductory
letter. Questionnaires would also avail the opportunity for the respondents to give
frank response while maintaining anonymity.
3.8.2 Photography
Data collection by way of direct observation and significant aspect of the study
captured using a photograph. Using photographs, the researcher recorded situations as
they occurred without having to rely on retrospection or anticipation of the reported
situation.
3.8.3 Content Analysis
Content analysis is generally invoked when the research is interested in studying an
issue that can be examined, analyzed and documented and entails a research technique
for the objectives’, objective description of the manifest content. It targeted published
and documented data sources such as reports, development plans, research papers,
statistical abstracts and other periodicals. These were from libraries,
government/NGOs/municipal offices, national archives, documentation and resource
45
centres etc. With content analysis, the data was in permanent form hence provided
chances of re-analyzing the same thus allowed reliability checks and replication. Also
non print media was used to beef up this section.
3.8.4 Key informants
This method involved situations where, by chance or training there were persons who
would provide the most knowledgeable information possible on any topic of the
study. The key informants for this study were 10 local experts who comprised of 5
elders who had lived in the region for a long time in fact over 20 years and other 6
local government experts, member of NGO working in the region. The key informants
were chosen simply because they were having in depth understanding of urban
agriculture due to their direct involvement in matters of concern to the study. The key
informant technique took the form of face-to-face interviews. This method was
advantageous in the sense that it provided, expounded and even probed precisely on
content of the study.
3.9 Validity and Reliability of the Research Tools
Validity refers to the extent to which a test measures what was actually measured. It
is the accuracy and meaningfulness of inferences, which are based on the research
results, the degree to which the results obtained from the analysis of the data actually
represent the phenomenon under study (Mugenda and Mugenda, 2003). In this
research study the focus was on urban agriculture in the Eldoret Town. Thus the
validity in this study was tested by providing it to a panel of persons with technical
knowledge (experts and key informants) on urban agriculture.
46
To measure the degree to which the research instruments would yield consistent
results or data after repeated trials, the reliability coefficient was computed and if it
would have a coefficient of 0.65 or more then it would indicate that the instrument has
a high degree of reliability (Kothari, 2008). In this study, the test and re-test method
of assessing the reliability was employed to few selected individual local experts and
households to capture reliability of the questionnaires. This was so in order to reduce
the chance of errors that may have arisen if the instruments were administered to the
same respondents during the actual research study. The reliability coefficient was 0.89
which was adjudged to be high.
3.10 Data Analysis
After data collection, qualitative and quantitative methods of data analysis were used.
Qualitative analysis employed the use of inferences whereas quantitative analysis
involved the derivation of descriptions and interpretation of data by use of descriptive
interpretations that rely purely on numerical values. Responses from all the open
ended and closed ended questions were examined to facilitate coding, processing and
entry into the computer in preparation for the analysis. Data processing exercise
commenced with the coding of all the responses obtained to facilitate easy analysis
using computer Statistical Package for Social Sciences (SPSS).
Chi-square (χ2) test of goodness of fit, bivariate Spearman Correlation and descriptive
as well as % distribution techniques were used to analyze the data. The % frequencies
of respondents were used to show the particular frequency of respondents preferring a
particular alternative and to give the face values of implications of the urban
agriculture. Chi-square test is a statistical technique used to compare the differences
47
between categorical frequencies when data is categorical and drawn from a population
with uniform distribution in which all alternative responses are equally likely. Chi-
square test was suitable here since it enabled the researcher to identify whether there
were any significant differences in the frequencies of the alternative responses.
Spearman Bivariate Correlations was used to analyze strengths of cross-tabulated
significant relationships. Apart from Chi-square test, the researcher also used % rank
score as a mean of comparing the responses to variables under study based on the
Likert Scale scoring. All data were analyzed at a level of 95% or α = 0.05.
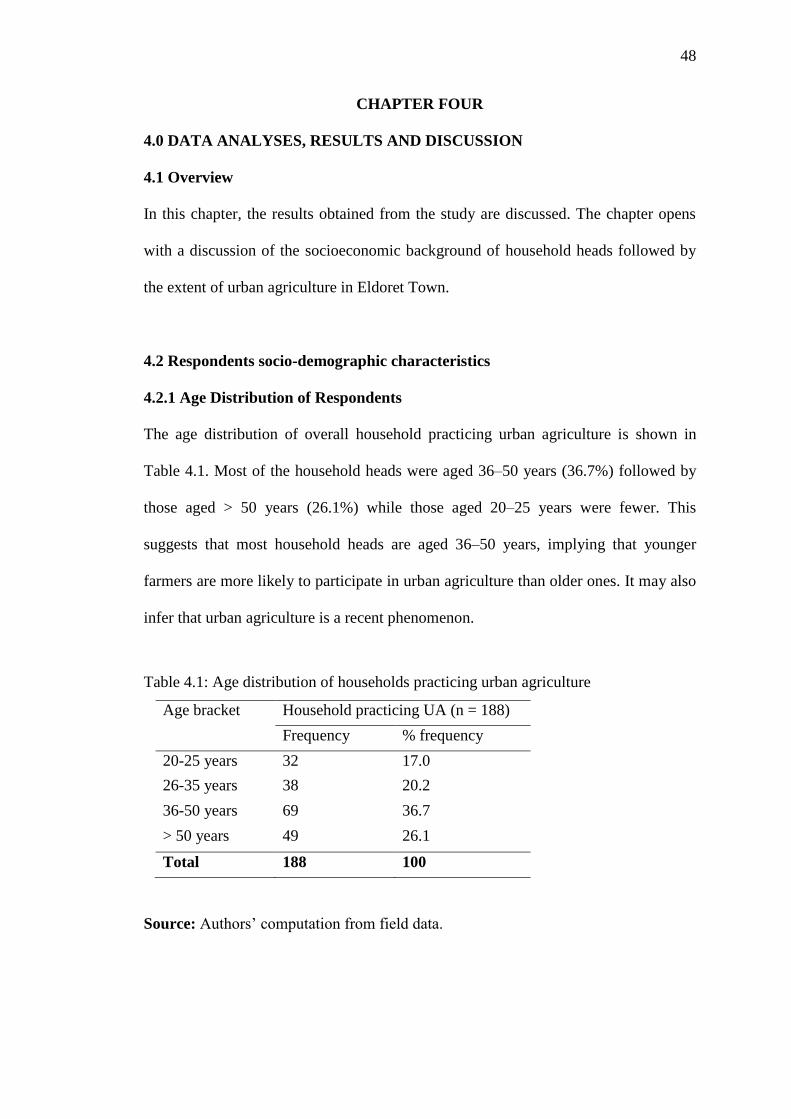
48
CHAPTER FOUR
4.0 DATA ANALYSES, RESULTS AND DISCUSSION
4.1 Overview
In this chapter, the results obtained from the study are discussed. The chapter opens
with a discussion of the socioeconomic background of household heads followed by
the extent of urban agriculture in Eldoret Town.
4.2 Respondents socio-demographic characteristics
4.2.1 Age Distribution of Respondents
The age distribution of overall household practicing urban agriculture is shown in
Table 4.1. Most of the household heads were aged 36‒50 years (36.7%) followed by
those aged > 50 years (26.1%) while those aged 20‒25 years were fewer. This
suggests that most household heads are aged 36‒50 years, implying that younger
farmers are more likely to participate in urban agriculture than older ones. It may also
infer that urban agriculture is a recent phenomenon.
Table 4.1: Age distribution of households practicing urban agriculture
Age bracket Household practicing UA (n = 188)
Frequency % frequency
20-25 years 32 17.0
26-35 years 38 20.2
36-50 years 69 36.7
> 50 years 49 26.1
Total 188 100
Source: Authors’ computation from field data.
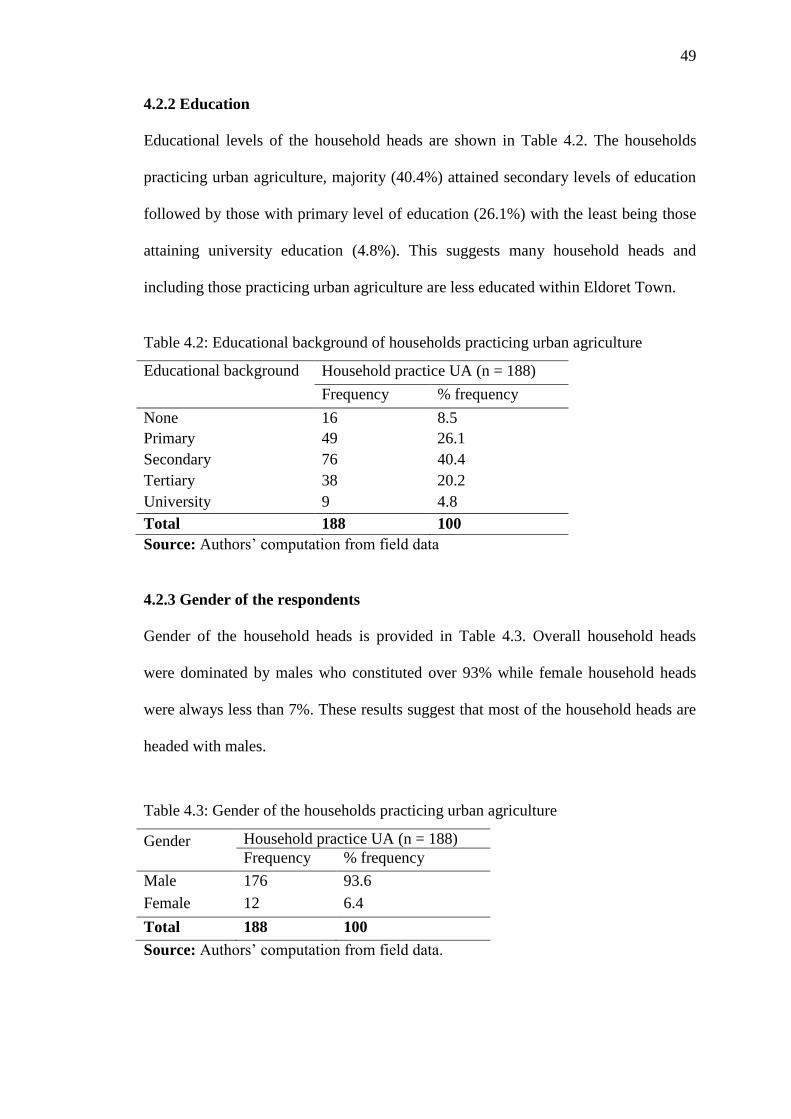
49
4.2.2 Education
Educational levels of the household heads are shown in Table 4.2. The households
practicing urban agriculture, majority (40.4%) attained secondary levels of education
followed by those with primary level of education (26.1%) with the least being those
attaining university education (4.8%). This suggests many household heads and
including those practicing urban agriculture are less educated within Eldoret Town.
Table 4.2: Educational background of households practicing urban agriculture
Educational background Household practice UA (n = 188)
Frequency % frequency
None 16 8.5
Primary 49 26.1
Secondary 76 40.4
Tertiary 38 20.2
University 9 4.8
Total 188 100
Source: Authors’ computation from field data
4.2.3 Gender of the respondents
Gender of the household heads is provided in Table 4.3. Overall household heads
were dominated by males who constituted over 93% while female household heads
were always less than 7%. These results suggest that most of the household heads are
headed with males.
Table 4.3: Gender of the households practicing urban agriculture
Gender Household practice UA (n = 188)
Frequency % frequency
Male 176 93.6
Female 12 6.4
Total 188 100
Source: Authors’ computation from field data.
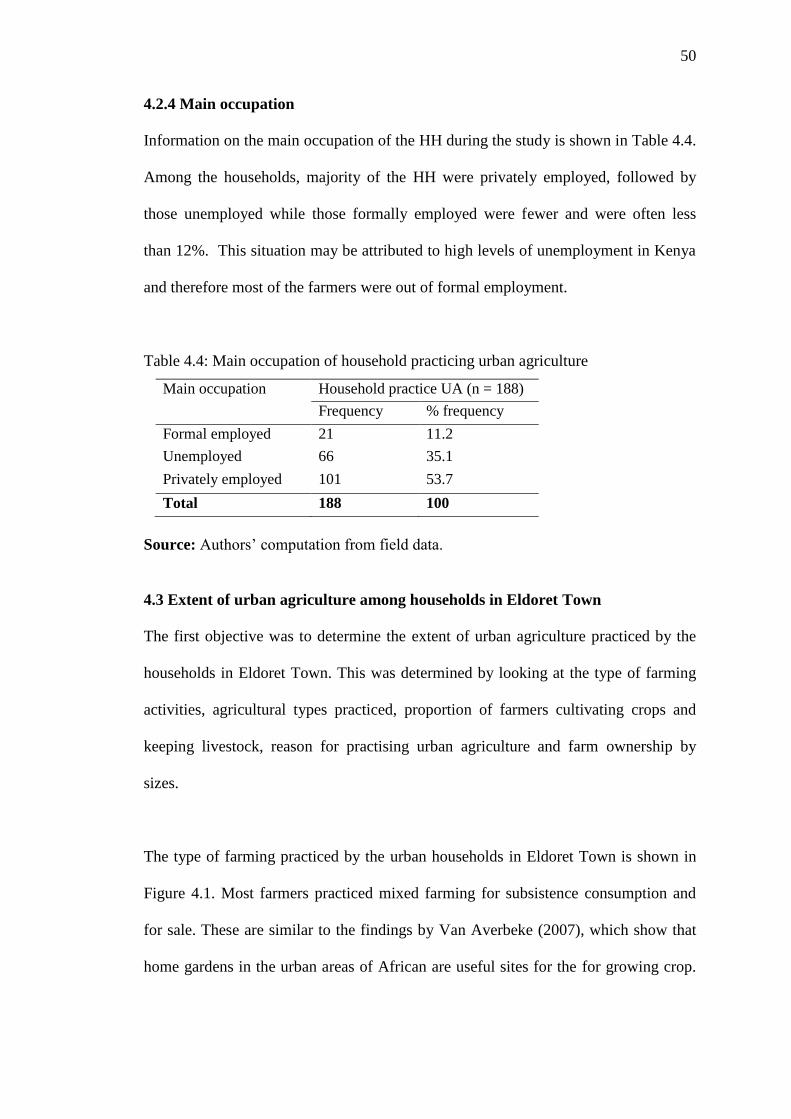
50
4.2.4 Main occupation
Information on the main occupation of the HH during the study is shown in Table 4.4.
Among the households, majority of the HH were privately employed, followed by
those unemployed while those formally employed were fewer and were often less
than 12%. This situation may be attributed to high levels of unemployment in Kenya
and therefore most of the farmers were out of formal employment.
Table 4.4: Main occupation of household practicing urban agriculture
Main occupation Household practice UA (n = 188)
Frequency % frequency
Formal employed 21 11.2
Unemployed 66 35.1
Privately employed 101 53.7
Total 188 100
Source: Authors’ computation from field data.
4.3 Extent of urban agriculture among households in Eldoret Town
The first objective was to determine the extent of urban agriculture practiced by the
households in Eldoret Town. This was determined by looking at the type of farming
activities, agricultural types practiced, proportion of farmers cultivating crops and
keeping livestock, reason for practising urban agriculture and farm ownership by
sizes.
The type of farming practiced by the urban households in Eldoret Town is shown in
Figure 4.1. Most farmers practiced mixed farming for subsistence consumption and
for sale. These are similar to the findings by Van Averbeke (2007), which show that
home gardens in the urban areas of African are useful sites for the for growing crop.
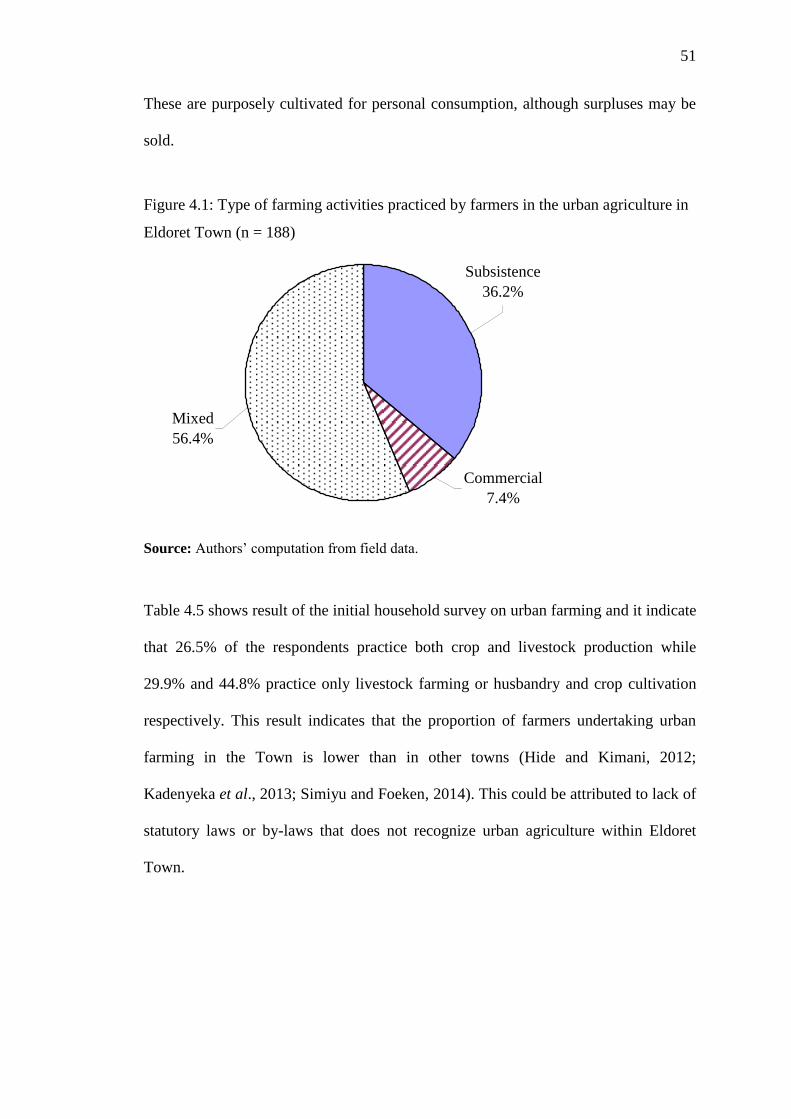
51
These are purposely cultivated for personal consumption, although surpluses may be
sold.
Figure 4.1: Type of farming activities practiced by farmers in the urban agriculture in
Eldoret Town (n = 188)
Commercial
7.4%
Subsistence
36.2%
Mixed
56.4%
Source: Authors’ computation from field data.
Table 4.5 shows result of the initial household survey on urban farming and it indicate
that 26.5% of the respondents practice both crop and livestock production while
29.9% and 44.8% practice only livestock farming or husbandry and crop cultivation
respectively. This result indicates that the proportion of farmers undertaking urban
farming in the Town is lower than in other towns (Hide and Kimani, 2012;
Kadenyeka et al., 2013; Simiyu and Foeken, 2014). This could be attributed to lack of
statutory laws or by-laws that does not recognize urban agriculture within Eldoret
Town.
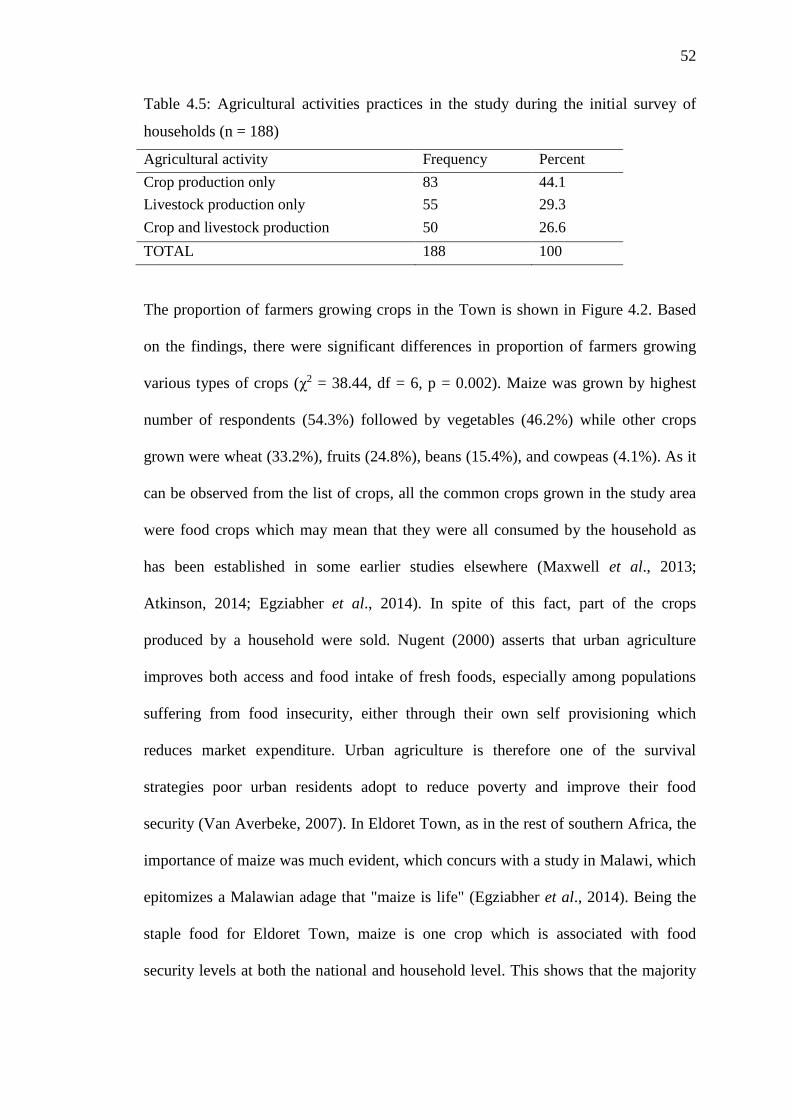
52
Table 4.5: Agricultural activities practices in the study during the initial survey of
households (n = 188)
Agricultural activity Frequency Percent
Crop production only 83 44.1
Livestock production only 55 29.3
Crop and livestock production 50 26.6
TOTAL 188 100
The proportion of farmers growing crops in the Town is shown in Figure 4.2. Based
on the findings, there were significant differences in proportion of farmers growing
various types of crops (χ2 = 38.44, df = 6, p = 0.002). Maize was grown by highest
number of respondents (54.3%) followed by vegetables (46.2%) while other crops
grown were wheat (33.2%), fruits (24.8%), beans (15.4%), and cowpeas (4.1%). As it
can be observed from the list of crops, all the common crops grown in the study area
were food crops which may mean that they were all consumed by the household as
has been established in some earlier studies elsewhere (Maxwell et al., 2013;
Atkinson, 2014; Egziabher et al., 2014). In spite of this fact, part of the crops
produced by a household were sold. Nugent (2000) asserts that urban agriculture
improves both access and food intake of fresh foods, especially among populations
suffering from food insecurity, either through their own self provisioning which
reduces market expenditure. Urban agriculture is therefore one of the survival
strategies poor urban residents adopt to reduce poverty and improve their food
security (Van Averbeke, 2007). In Eldoret Town, as in the rest of southern Africa, the
importance of maize was much evident, which concurs with a study in Malawi, which
epitomizes a Malawian adage that "maize is life" (Egziabher et al., 2014). Being the
staple food for Eldoret Town, maize is one crop which is associated with food
security levels at both the national and household level. This shows that the majority
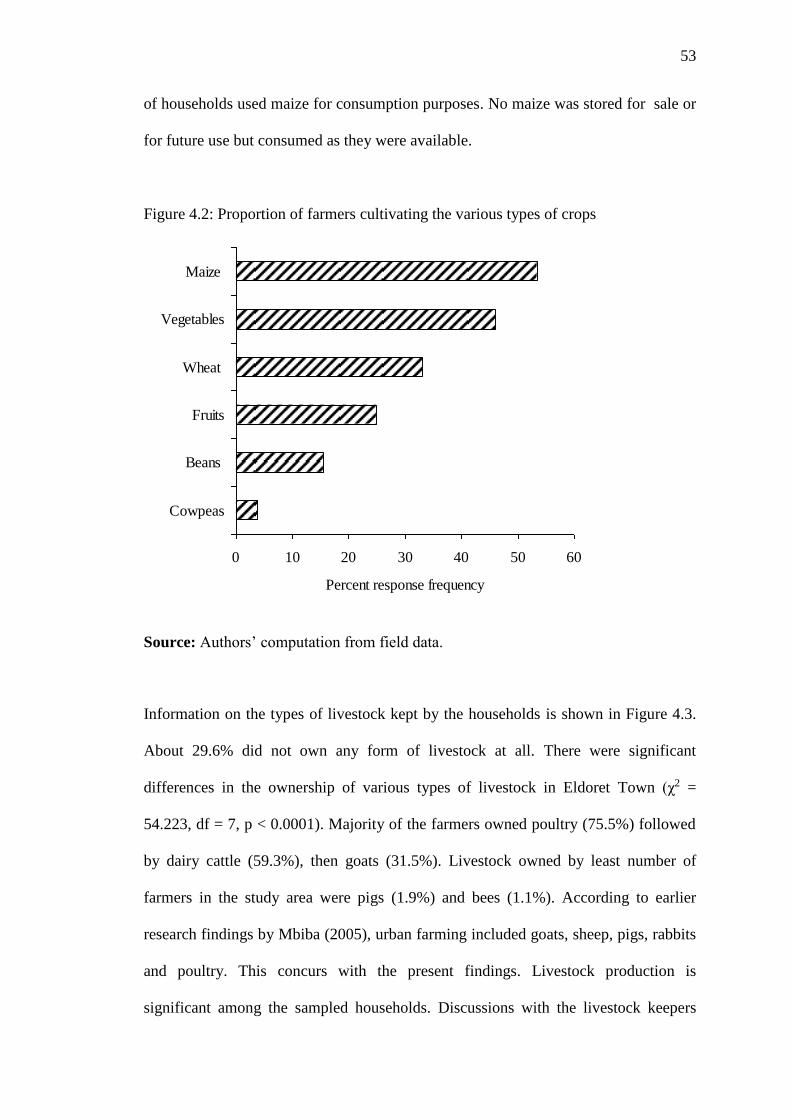
53
of households used maize for consumption purposes. No maize was stored for sale or
for future use but consumed as they were available.
Figure 4.2: Proportion of farmers cultivating the various types of crops
0 10 20 30 40 50 60
Cowpeas
Beans
Fruits
Wheat
Vegetables
Maize
Percent response frequency
Source: Authors’ computation from field data.
Information on the types of livestock kept by the households is shown in Figure 4.3.
About 29.6% did not own any form of livestock at all. There were significant
differences in the ownership of various types of livestock in Eldoret Town (χ2 =
54.223, df = 7, p < 0.0001). Majority of the farmers owned poultry (75.5%) followed
by dairy cattle (59.3%), then goats (31.5%). Livestock owned by least number of
farmers in the study area were pigs (1.9%) and bees (1.1%). According to earlier
research findings by Mbiba (2005), urban farming included goats, sheep, pigs, rabbits
and poultry. This concurs with the present findings. Livestock production is
significant among the sampled households. Discussions with the livestock keepers
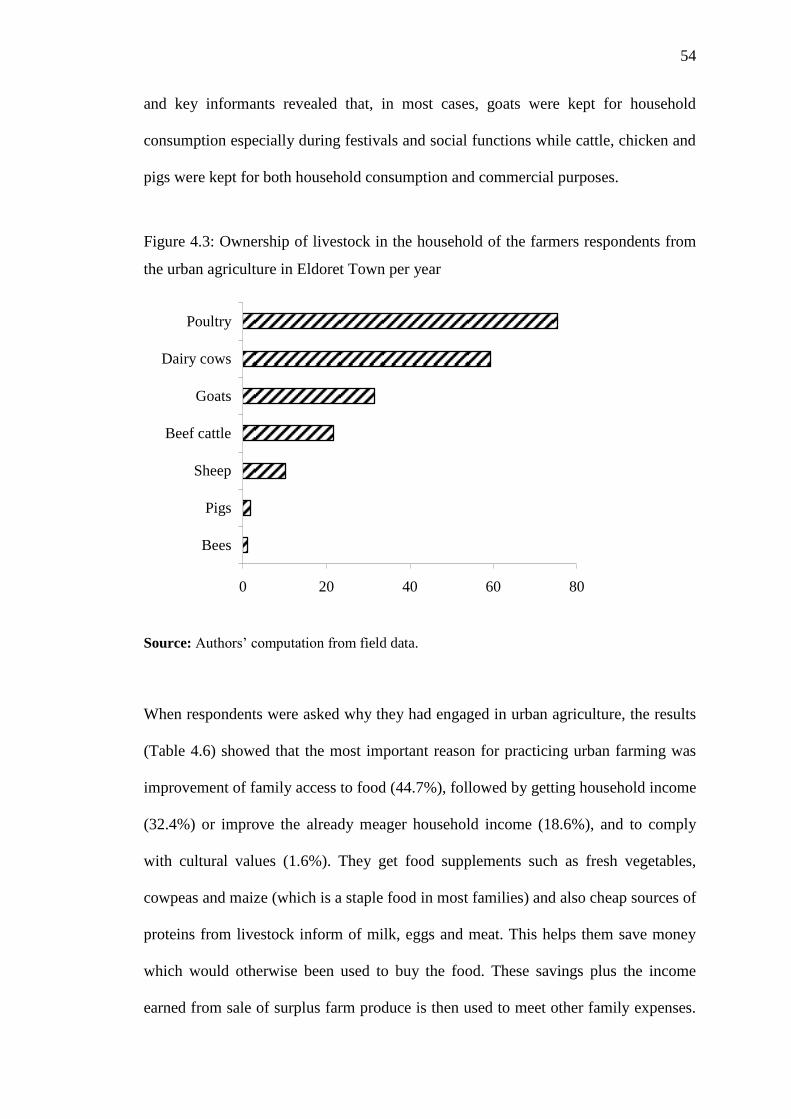
54
and key informants revealed that, in most cases, goats were kept for household
consumption especially during festivals and social functions while cattle, chicken and
pigs were kept for both household consumption and commercial purposes.
Figure 4.3: Ownership of livestock in the household of the farmers respondents from
the urban agriculture in Eldoret Town per year
0 20 40 60 80
Bees
Pigs
Sheep
Beef cattle
Goats
Dairy cows
Poultry
Source: Authors’ computation from field data.
When respondents were asked why they had engaged in urban agriculture, the results
(Table 4.6) showed that the most important reason for practicing urban farming was
improvement of family access to food (44.7%), followed by getting household income
(32.4%) or improve the already meager household income (18.6%), and to comply
with cultural values (1.6%). They get food supplements such as fresh vegetables,
cowpeas and maize (which is a staple food in most families) and also cheap sources of
proteins from livestock inform of milk, eggs and meat. This helps them save money
which would otherwise been used to buy the food. These savings plus the income
earned from sale of surplus farm produce is then used to meet other family expenses.
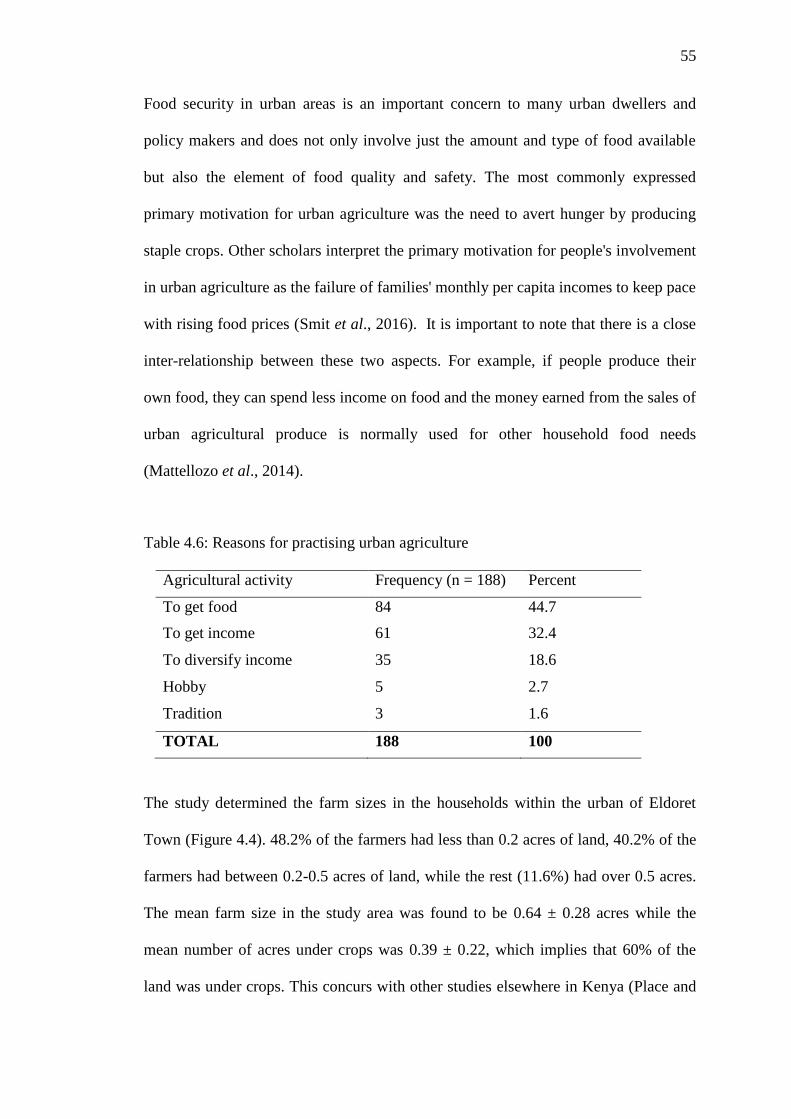
55
Food security in urban areas is an important concern to many urban dwellers and
policy makers and does not only involve just the amount and type of food available
but also the element of food quality and safety. The most commonly expressed
primary motivation for urban agriculture was the need to avert hunger by producing
staple crops. Other scholars interpret the primary motivation for people's involvement
in urban agriculture as the failure of families' monthly per capita incomes to keep pace
with rising food prices (Smit et al., 2016). It is important to note that there is a close
inter-relationship between these two aspects. For example, if people produce their
own food, they can spend less income on food and the money earned from the sales of
urban agricultural produce is normally used for other household food needs
(Mattellozo et al., 2014).
Table 4.6: Reasons for practising urban agriculture
Agricultural activity Frequency (n = 188) Percent
To get food 84 44.7
To get income 61 32.4
To diversify income 35 18.6
Hobby 5 2.7
Tradition 3 1.6
TOTAL 188 100
The study determined the farm sizes in the households within the urban of Eldoret
Town (Figure 4.4). 48.2% of the farmers had less than 0.2 acres of land, 40.2% of the
farmers had between 0.2-0.5 acres of land, while the rest (11.6%) had over 0.5 acres.
The mean farm size in the study area was found to be 0.64 ± 0.28 acres while the
mean number of acres under crops was 0.39 ± 0.22, which implies that 60% of the
land was under crops. This concurs with other studies elsewhere in Kenya (Place and
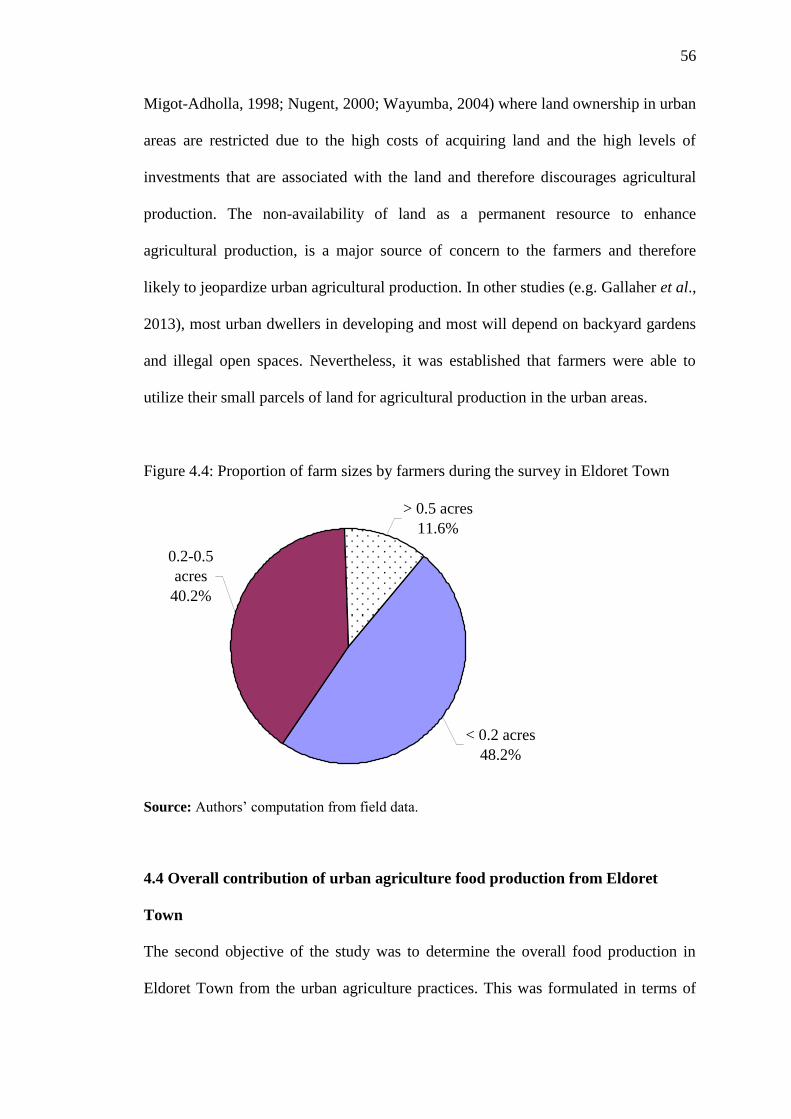
56
Migot-Adholla, 1998; Nugent, 2000; Wayumba, 2004) where land ownership in urban
areas are restricted due to the high costs of acquiring land and the high levels of
investments that are associated with the land and therefore discourages agricultural
production. The non-availability of land as a permanent resource to enhance
agricultural production, is a major source of concern to the farmers and therefore
likely to jeopardize urban agricultural production. In other studies (e.g. Gallaher et al.,
2013), most urban dwellers in developing and most will depend on backyard gardens
and illegal open spaces. Nevertheless, it was established that farmers were able to
utilize their small parcels of land for agricultural production in the urban areas.
Figure 4.4: Proportion of farm sizes by farmers during the survey in Eldoret Town
> 0.5 acres
11.6%
0.2-0.5
acres
40.2%
< 0.2 acres
48.2%
Source: Authors’ computation from field data.
4.4 Overall contribution of urban agriculture food production from Eldoret
Town
The second objective of the study was to determine the overall food production in
Eldoret Town from the urban agriculture practices. This was formulated in terms of
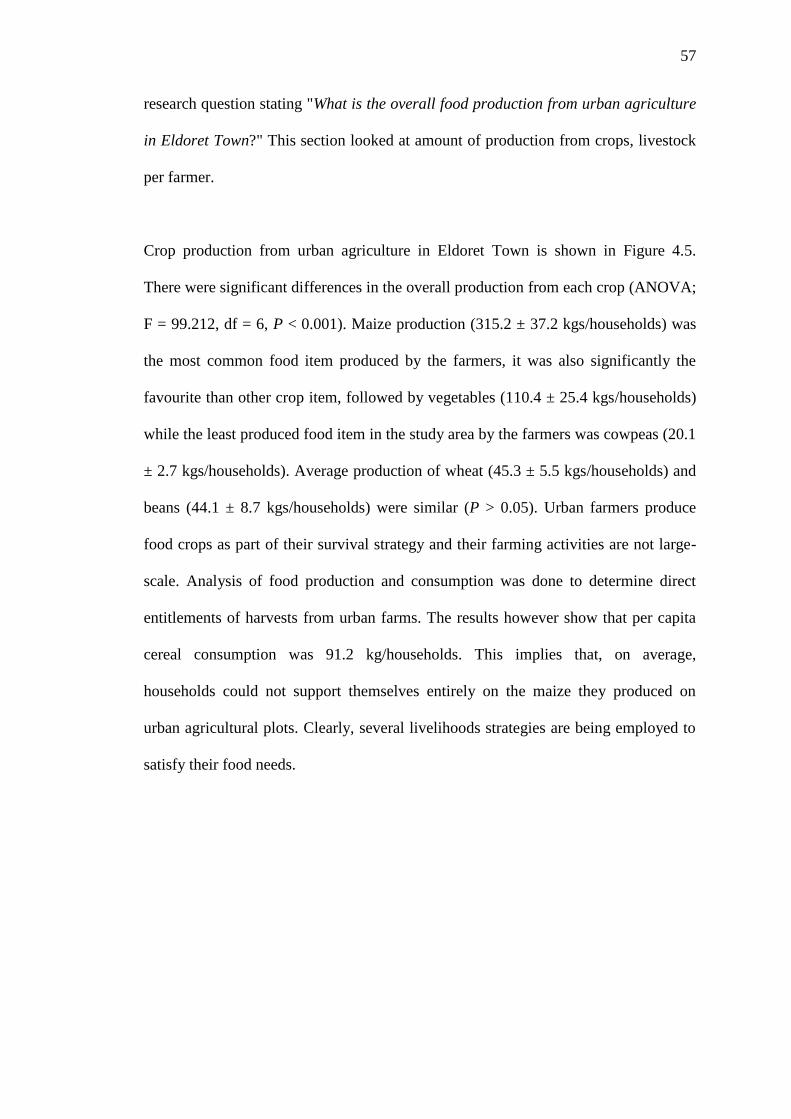
57
research question stating "What is the overall food production from urban agriculture
in Eldoret Town?" This section looked at amount of production from crops, livestock
per farmer.
Crop production from urban agriculture in Eldoret Town is shown in Figure 4.5.
There were significant differences in the overall production from each crop (ANOVA;
F = 99.212, df = 6, P < 0.001). Maize production (315.2 ± 37.2 kgs/households) was
the most common food item produced by the farmers, it was also significantly the
favourite than other crop item, followed by vegetables (110.4 ± 25.4 kgs/households)
while the least produced food item in the study area by the farmers was cowpeas (20.1
± 2.7 kgs/households). Average production of wheat (45.3 ± 5.5 kgs/households) and
beans (44.1 ± 8.7 kgs/households) were similar (P > 0.05). Urban farmers produce
food crops as part of their survival strategy and their farming activities are not large-
scale. Analysis of food production and consumption was done to determine direct
entitlements of harvests from urban farms. The results however show that per capita
cereal consumption was 91.2 kg/households. This implies that, on average,
households could not support themselves entirely on the maize they produced on
urban agricultural plots. Clearly, several livelihoods strategies are being employed to
satisfy their food needs.
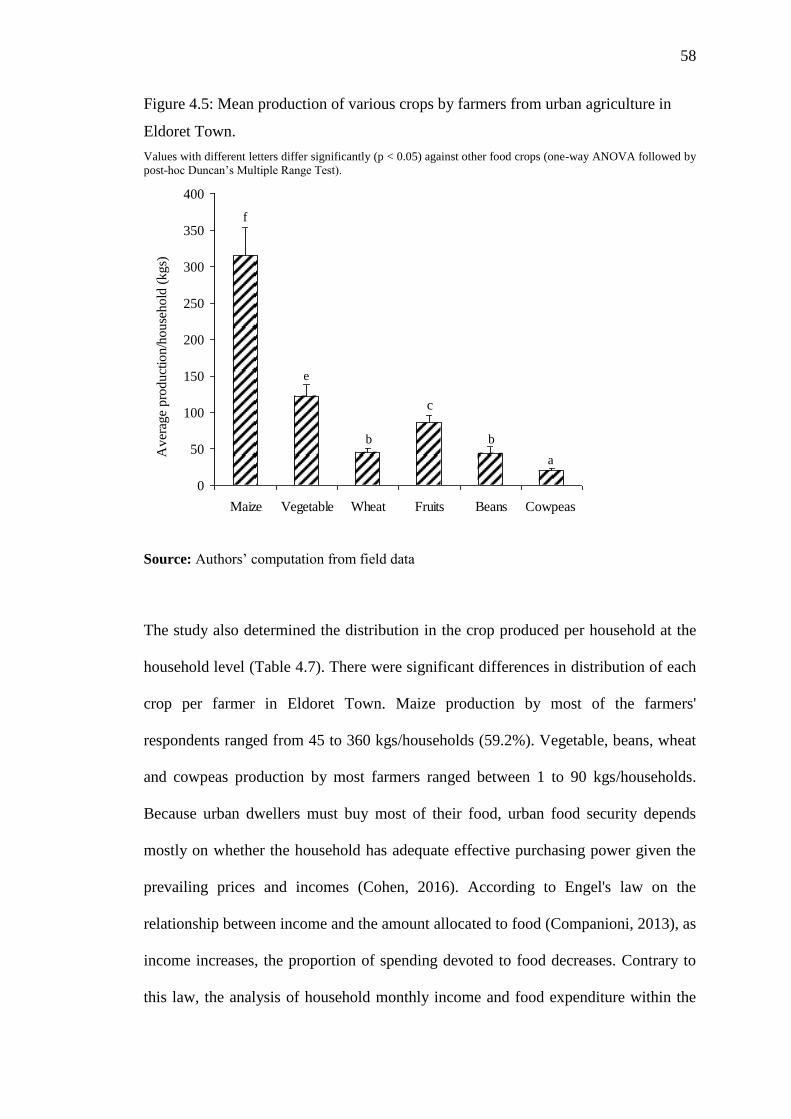
58
Figure 4.5: Mean production of various crops by farmers from urban agriculture in
Eldoret Town.
Values with different letters differ significantly (p < 0.05) against other food crops (one-way ANOVA followed by
post-hoc Duncan’s Multiple Range Test).
0
50
100
150
200
250
300
350
400
Maize Vegetable Wheat Fruits Beans Cowpeas
Aver
age
pro
du
ctio
n/h
ou
sehold
(kgs)
.
a
b b
c
e
f
Source: Authors’ computation from field data
The study also determined the distribution in the crop produced per household at the
household level (Table 4.7). There were significant differences in distribution of each
crop per farmer in Eldoret Town. Maize production by most of the farmers'
respondents ranged from 45 to 360 kgs/households (59.2%). Vegetable, beans, wheat
and cowpeas production by most farmers ranged between 1 to 90 kgs/households.
Because urban dwellers must buy most of their food, urban food security depends
mostly on whether the household has adequate effective purchasing power given the
prevailing prices and incomes (Cohen, 2016). According to Engel's law on the
relationship between income and the amount allocated to food (Companioni, 2013), as
income increases, the proportion of spending devoted to food decreases. Contrary to
this law, the analysis of household monthly income and food expenditure within the
59
sampled households revealed that food expenditure increased with an increase in
household income. In general, the findings from literature show that the urban poor
spend between 60-80% of their income on food (Bellows, 2011).
Table 4.7: Distribution in the quantity of farm crop production from the urban
agriculture in Eldoret Town during the study period
Levels of production (kgs/household/season)
0 1-45 45-90 91-180 181-360 361-1440 > 1440
Maize 10.2 16.3 27.2 18.5 13.5 8.9 5.4
Vegetable 25.0 32.4 29.6 8.3 2.8 1.9 0.0
Wheat 40.7 30.6 16.7 8.3 3.7 0.0 0.0
Fruits 21.3 31.5 26.9 15.7 2.8 1.9 0.0
Beans 42.2 28.4 17.4 9.2 2.8 0.0 0.0
Cowpeas 35.2 29.6 18.5 12.0 3.7 0.9 0.0
Source: Authors’ computation from field data.
The estimated crop production in Eldoret Town is shown in Figure 4.6. There were
significant differences in the overall food crop production among farmers in Eldoret
Town (ANOVA; F = 102.212, df = 6, P < 0.001). Maize was the highest harvested
crop in the area (105,943 ± 14,239 kg/household) followed by vegetables (28,641 ±
4,477 kgs/household) whiles the harvest of wheat, cowpeas (2,531 ± 189.2
kgs/household) and beans (5,088 ± 477 kgs/household) were overally the lowest food
crops harvested from the urban agriculture in Eldoret Town. Kogi-Makau (1998)
found that about 20% of the food budget is spent on vegetables and fruits. These
results agree with earlier studies by Korir et al. (2105). This suggests that any
contribution from home production has a direct impact either on the nutrition level of
the family or on the budget by reducing expenditures or earning additional income.
Savings can be between 5-7% of a low-income household budget.
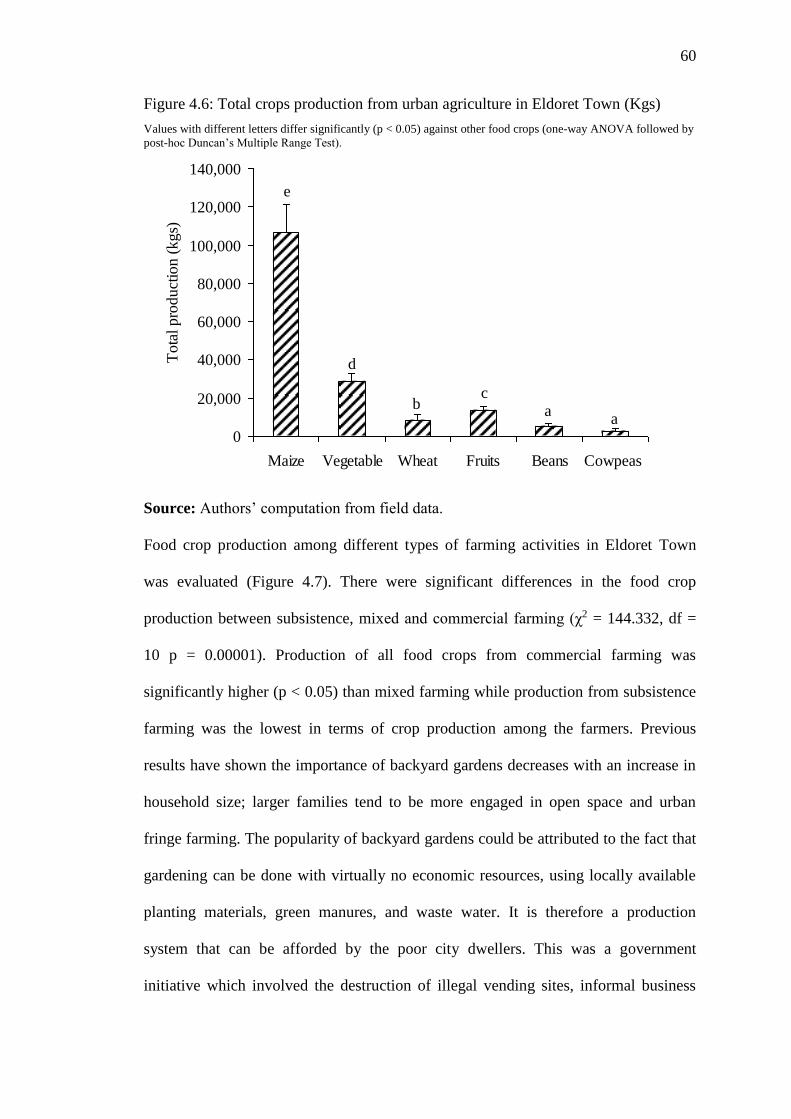
60
Figure 4.6: Total crops production from urban agriculture in Eldoret Town (Kgs)
Values with different letters differ significantly (p < 0.05) against other food crops (one-way ANOVA followed by
post-hoc Duncan’s Multiple Range Test).
0
20,000
40,000
60,000
80,000
100,000
120,000
140,000
Maize Vegetable Wheat Fruits Beans Cowpeas
To
tal p
rod
uct
ion
(k
gs)
.
aba
c
e
d
Source: Authors’ computation from field data.
Food crop production among different types of farming activities in Eldoret Town
was evaluated (Figure 4.7). There were significant differences in the food crop
production between subsistence, mixed and commercial farming (χ2 = 144.332, df =
10 p = 0.00001). Production of all food crops from commercial farming was
significantly higher (p < 0.05) than mixed farming while production from subsistence
farming was the lowest in terms of crop production among the farmers. Previous
results have shown the importance of backyard gardens decreases with an increase in
household size; larger families tend to be more engaged in open space and urban
fringe farming. The popularity of backyard gardens could be attributed to the fact that
gardening can be done with virtually no economic resources, using locally available
planting materials, green manures, and waste water. It is therefore a production
system that can be afforded by the poor city dwellers. This was a government
initiative which involved the destruction of illegal vending sites, informal business
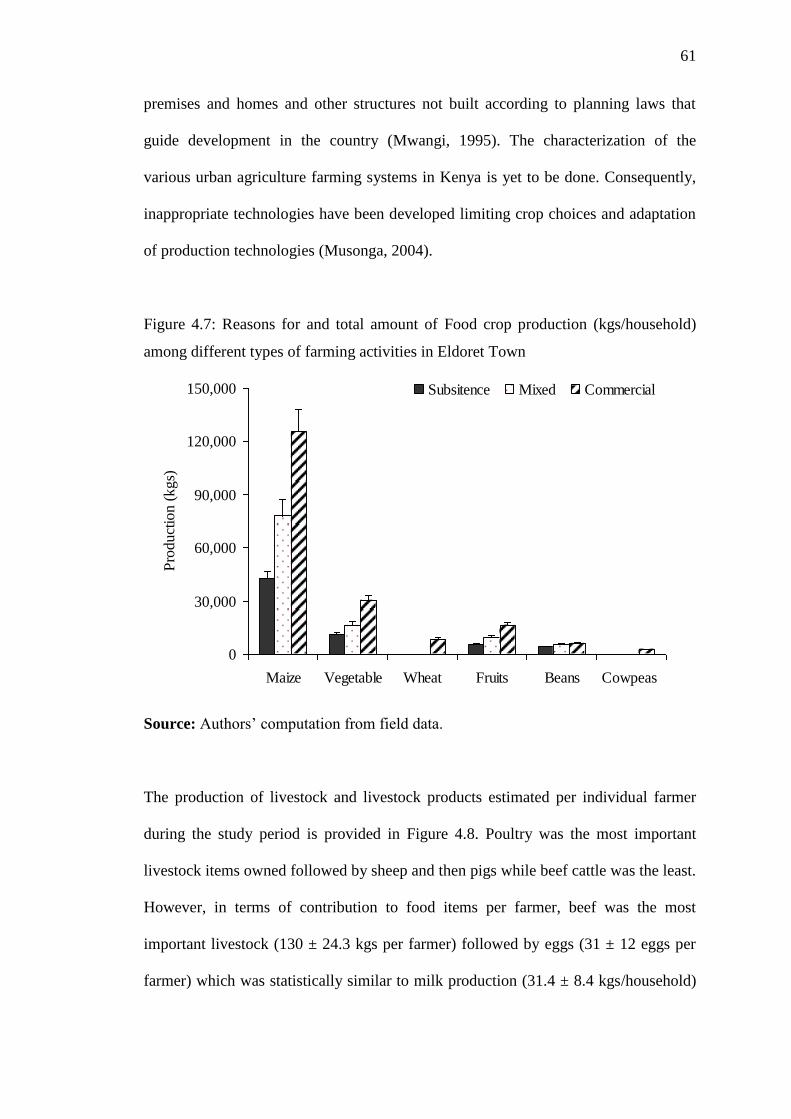
61
premises and homes and other structures not built according to planning laws that
guide development in the country (Mwangi, 1995). The characterization of the
various urban agriculture farming systems in Kenya is yet to be done. Consequently,
inappropriate technologies have been developed limiting crop choices and adaptation
of production technologies (Musonga, 2004).
Figure 4.7: Reasons for and total amount of Food crop production (kgs/household)
among different types of farming activities in Eldoret Town
0
30,000
60,000
90,000
120,000
150,000
Maize Vegetable Wheat Fruits Beans Cowpeas
Pro
duct
ion
(k
gs)
.
Subsitence Mixed Commercial
Source: Authors’ computation from field data.
The production of livestock and livestock products estimated per individual farmer
during the study period is provided in Figure 4.8. Poultry was the most important
livestock items owned followed by sheep and then pigs while beef cattle was the least.
However, in terms of contribution to food items per farmer, beef was the most
important livestock (130 ± 24.3 kgs per farmer) followed by eggs (31 ± 12 eggs per
farmer) which was statistically similar to milk production (31.4 ± 8.4 kgs/household)
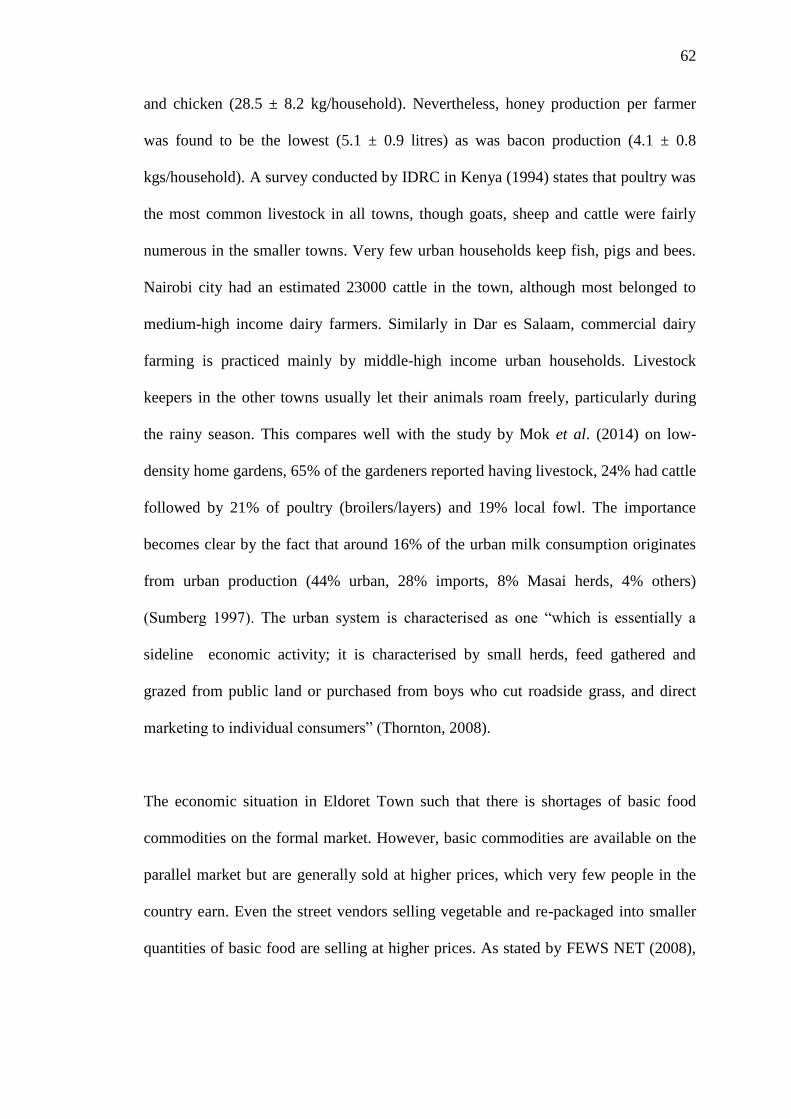
62
and chicken (28.5 ± 8.2 kg/household). Nevertheless, honey production per farmer
was found to be the lowest (5.1 ± 0.9 litres) as was bacon production (4.1 ± 0.8
kgs/household). A survey conducted by IDRC in Kenya (1994) states that poultry was
the most common livestock in all towns, though goats, sheep and cattle were fairly
numerous in the smaller towns. Very few urban households keep fish, pigs and bees.
Nairobi city had an estimated 23000 cattle in the town, although most belonged to
medium-high income dairy farmers. Similarly in Dar es Salaam, commercial dairy
farming is practiced mainly by middle-high income urban households. Livestock
keepers in the other towns usually let their animals roam freely, particularly during
the rainy season. This compares well with the study by Mok et al. (2014) on low-
density home gardens, 65% of the gardeners reported having livestock, 24% had cattle
followed by 21% of poultry (broilers/layers) and 19% local fowl. The importance
becomes clear by the fact that around 16% of the urban milk consumption originates
from urban production (44% urban, 28% imports, 8% Masai herds, 4% others)
(Sumberg 1997). The urban system is characterised as one “which is essentially a
sideline economic activity; it is characterised by small herds, feed gathered and
grazed from public land or purchased from boys who cut roadside grass, and direct
marketing to individual consumers” (Thornton, 2008).
The economic situation in Eldoret Town such that there is shortages of basic food
commodities on the formal market. However, basic commodities are available on the
parallel market but are generally sold at higher prices, which very few people in the
country earn. Even the street vendors selling vegetable and re-packaged into smaller
quantities of basic food are selling at higher prices. As stated by FEWS NET (2008),
63
not only are the food crisis urban areas a food availability crisis, it has become an
access crisis as well.
Figure 4.8: Livestock and livestock production from urban agriculture in Eldoret
Town per year during the year 2007.
Values with different letters differ significantly (p < 0.05) against other livestock items (one-way ANOVA
followed by post-hoc Duncan’s Multiple Range Test).
0
20
40
60
80
100
120
140
160
Poult
ry
Shee
p
Pig
s
Goat
s
Dai
ry c
ow
sB
eef
catt
le
Bee
f
Eggs
Mil
k
Chic
ken
Honey
Livestock Production
Livestock owned Production
Qu
anti
ty (
kg
)/n
um
ber
of
pro
du
ct
.
Source: Authors’ computation from field data.
The contribution of urban agriculture to the livestock based food supply was
determined to establish its contribution to food production (Figure 4.9). In the figure,
the items considered were beef, eggs, milk, chicken and honey and the livestock
ownership excluded from the analysis as they were not considered food at the
ownership stage. Significant differences in the quantity of production from the
livestock was discerned (F = 34.221, df = 6, p = 0.0042). The highest contribution
from the livestock industry was beef that was estimated at 25 tonnes per year from the
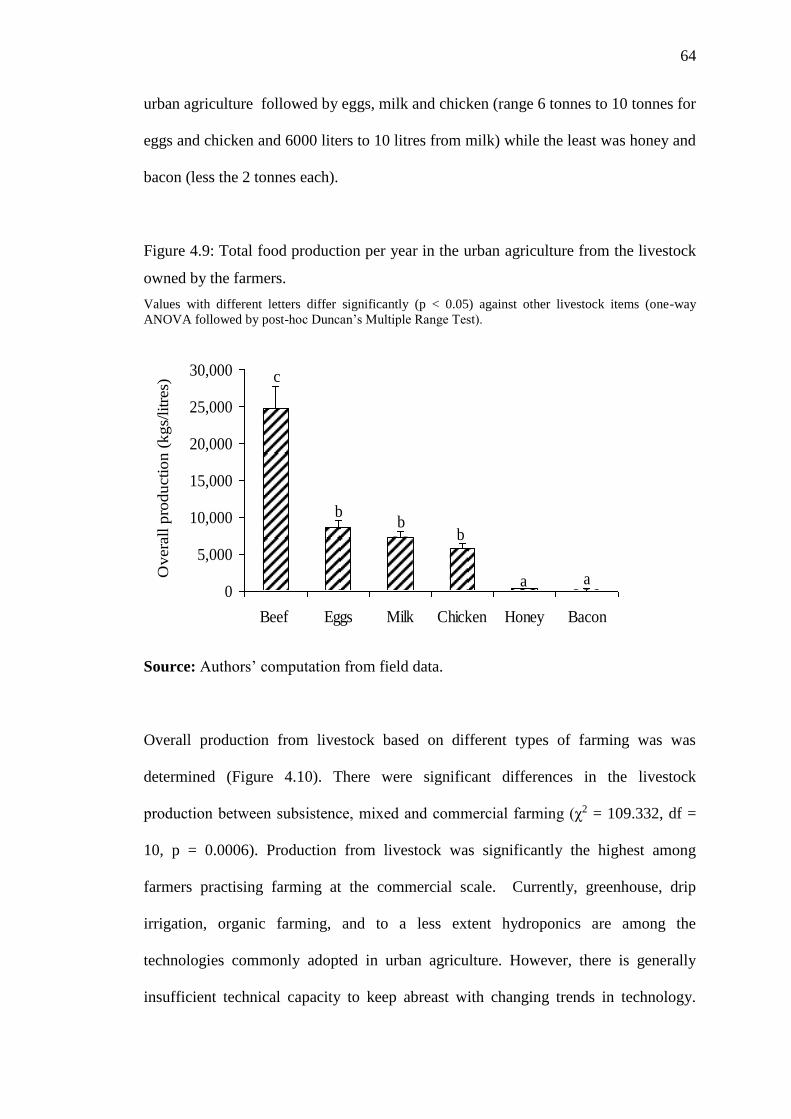
64
urban agriculture followed by eggs, milk and chicken (range 6 tonnes to 10 tonnes for
eggs and chicken and 6000 liters to 10 litres from milk) while the least was honey and
bacon (less the 2 tonnes each).
Figure 4.9: Total food production per year in the urban agriculture from the livestock
owned by the farmers.
Values with different letters differ significantly (p < 0.05) against other livestock items (one-way
ANOVA followed by post-hoc Duncan’s Multiple Range Test).
Source: Authors’ computation from field data.
Overall production from livestock based on different types of farming was was
determined (Figure 4.10). There were significant differences in the livestock
production between subsistence, mixed and commercial farming (χ2 = 109.332, df =
10, p = 0.0006). Production from livestock was significantly the highest among
farmers practising farming at the commercial scale. Currently, greenhouse, drip
irrigation, organic farming, and to a less extent hydroponics are among the
technologies commonly adopted in urban agriculture. However, there is generally
insufficient technical capacity to keep abreast with changing trends in technology.
0
5,000
10,000
15,000
20,000
25,000
30,000
Beef Eggs Milk Chicken Honey Bacon
Ov
era
ll p
rod
uctio
n (
kg
s/litr
es)
.
a
b
a
bb
c
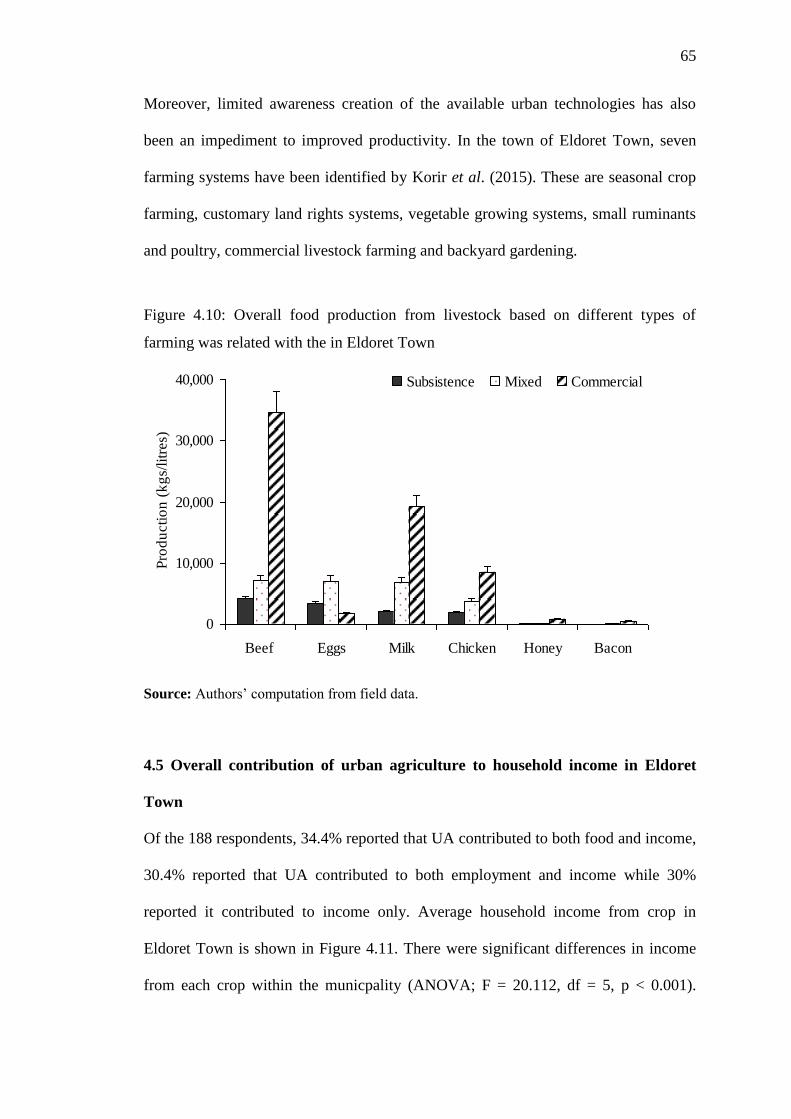
65
Moreover, limited awareness creation of the available urban technologies has also
been an impediment to improved productivity. In the town of Eldoret Town, seven
farming systems have been identified by Korir et al. (2015). These are seasonal crop
farming, customary land rights systems, vegetable growing systems, small ruminants
and poultry, commercial livestock farming and backyard gardening.
Figure 4.10: Overall food production from livestock based on different types of
farming was related with the in Eldoret Town
0
10,000
20,000
30,000
40,000
Beef Eggs Milk Chicken Honey Bacon
Pro
du
cti
on
(k
gs/
litr
es)
.
Subsistence Mixed Commercial
Source: Authors’ computation from field data.
4.5 Overall contribution of urban agriculture to household income in Eldoret
Town
Of the 188 respondents, 34.4% reported that UA contributed to both food and income,
30.4% reported that UA contributed to both employment and income while 30%
reported it contributed to income only. Average household income from crop in
Eldoret Town is shown in Figure 4.11. There were significant differences in income
from each crop within the municpality (ANOVA; F = 20.112, df = 5, p < 0.001).
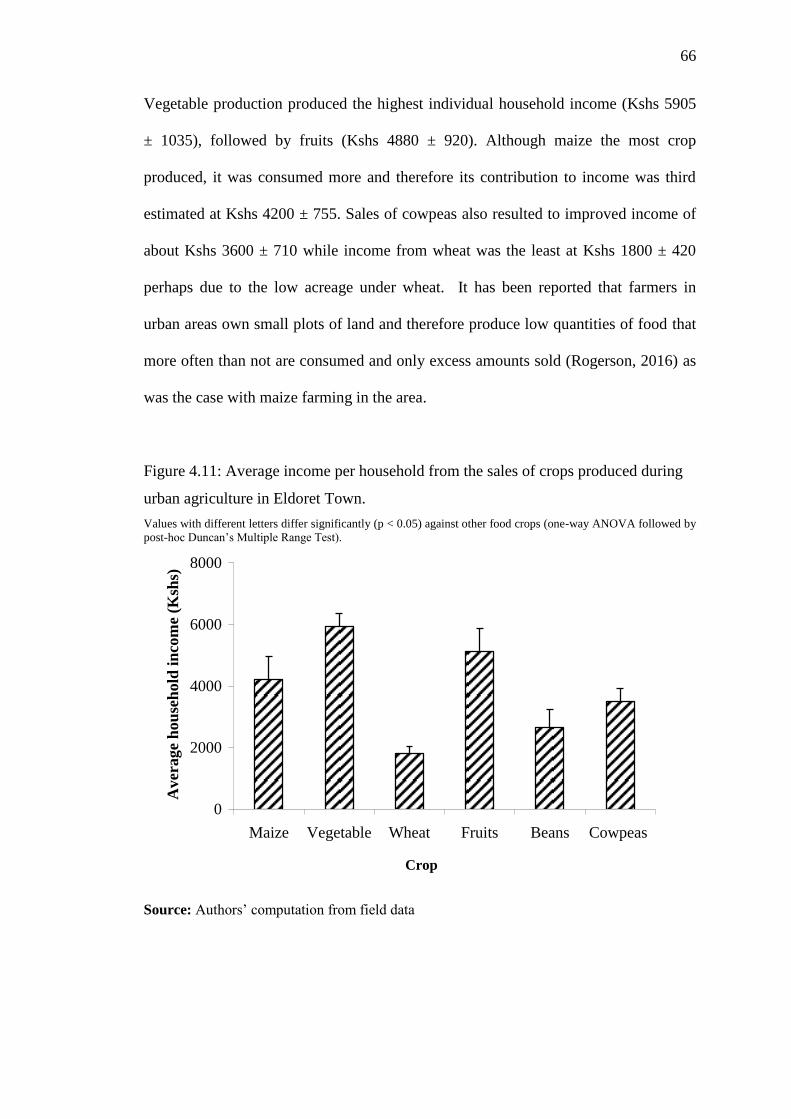
66
Vegetable production produced the highest individual household income (Kshs 5905
± 1035), followed by fruits (Kshs 4880 ± 920). Although maize the most crop
produced, it was consumed more and therefore its contribution to income was third
estimated at Kshs 4200 ± 755. Sales of cowpeas also resulted to improved income of
about Kshs 3600 ± 710 while income from wheat was the least at Kshs 1800 ± 420
perhaps due to the low acreage under wheat. It has been reported that farmers in
urban areas own small plots of land and therefore produce low quantities of food that
more often than not are consumed and only excess amounts sold (Rogerson, 2016) as
was the case with maize farming in the area.
Figure 4.11: Average income per household from the sales of crops produced during
urban agriculture in Eldoret Town.
Values with different letters differ significantly (p < 0.05) against other food crops (one-way ANOVA followed by
post-hoc Duncan’s Multiple Range Test).
0
2000
4000
6000
8000
Maize Vegetable Wheat Fruits Beans Cowpeas
Crop
Av
era
ge
ho
use
ho
ld i
nco
me
(Ksh
s)
.
Source: Authors’ computation from field data
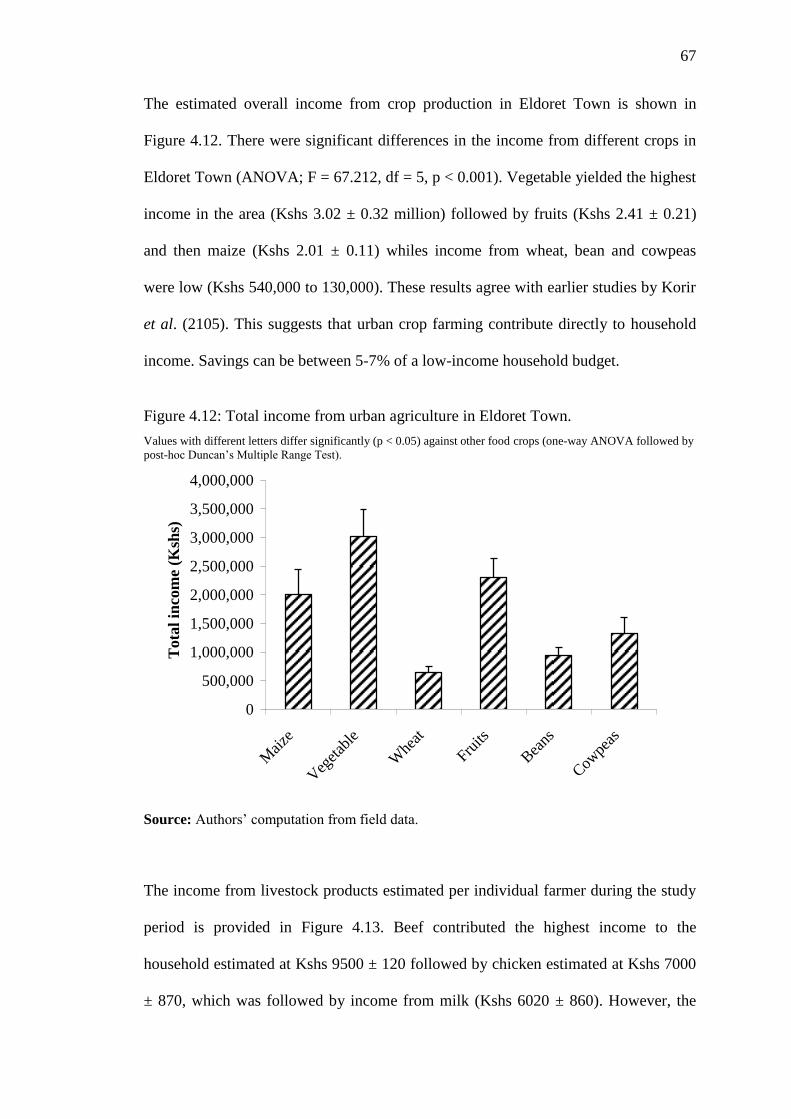
67
The estimated overall income from crop production in Eldoret Town is shown in
Figure 4.12. There were significant differences in the income from different crops in
Eldoret Town (ANOVA; F = 67.212, df = 5, p < 0.001). Vegetable yielded the highest
income in the area (Kshs 3.02 ± 0.32 million) followed by fruits (Kshs 2.41 ± 0.21)
and then maize (Kshs 2.01 ± 0.11) whiles income from wheat, bean and cowpeas
were low (Kshs 540,000 to 130,000). These results agree with earlier studies by Korir
et al. (2105). This suggests that urban crop farming contribute directly to household
income. Savings can be between 5-7% of a low-income household budget.
Figure 4.12: Total income from urban agriculture in Eldoret Town.
Values with different letters differ significantly (p < 0.05) against other food crops (one-way ANOVA followed by
post-hoc Duncan’s Multiple Range Test).
0
500,000
1,000,000
1,500,000
2,000,000
2,500,000
3,000,000
3,500,000
4,000,000
Mai
ze
Veg
etab
le
Whe
at
Fruits
Bea
ns
Cow
peas
To
tal
inco
me
(Ksh
s)
.
Source: Authors’ computation from field data.
The income from livestock products estimated per individual farmer during the study
period is provided in Figure 4.13. Beef contributed the highest income to the
household estimated at Kshs 9500 ± 120 followed by chicken estimated at Kshs 7000
± 870, which was followed by income from milk (Kshs 6020 ± 860). However, the
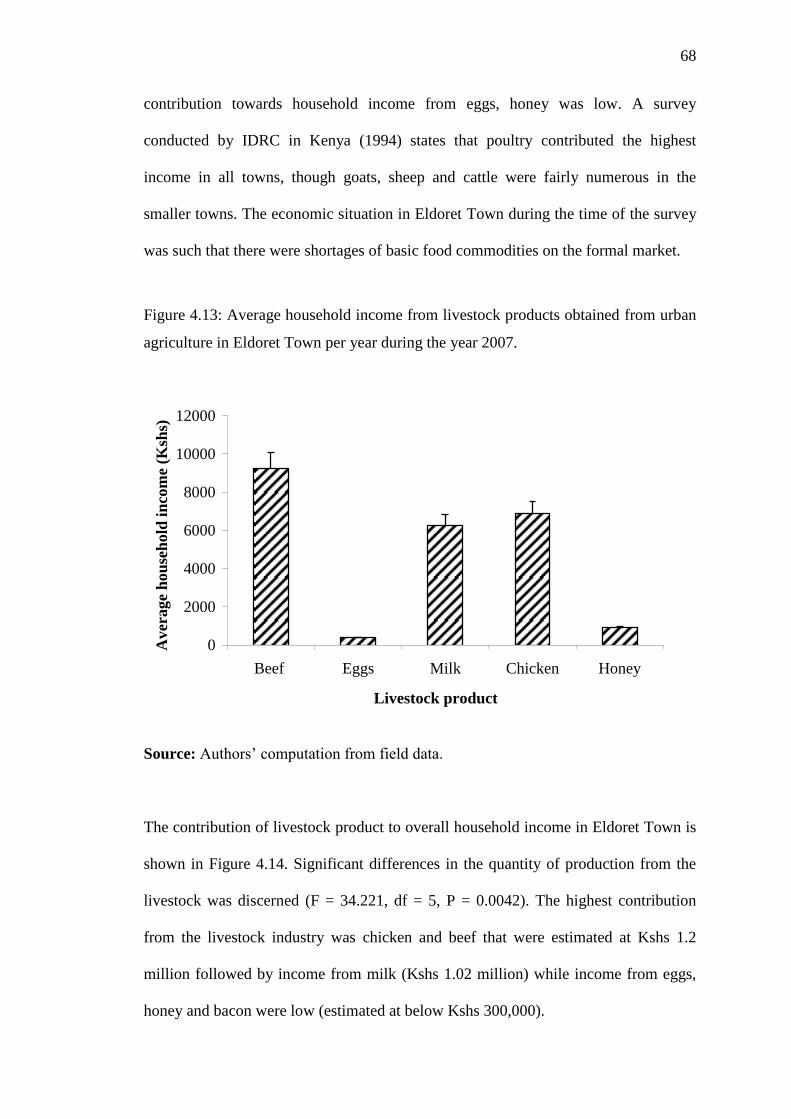
68
contribution towards household income from eggs, honey was low. A survey
conducted by IDRC in Kenya (1994) states that poultry contributed the highest
income in all towns, though goats, sheep and cattle were fairly numerous in the
smaller towns. The economic situation in Eldoret Town during the time of the survey
was such that there were shortages of basic food commodities on the formal market.
Figure 4.13: Average household income from livestock products obtained from urban
agriculture in Eldoret Town per year during the year 2007.
0
2000
4000
6000
8000
10000
12000
Beef Eggs Milk Chicken Honey
Livestock product
Av
era
ge
ho
use
ho
ld i
nco
me
(Ksh
s)
Source: Authors’ computation from field data.
The contribution of livestock product to overall household income in Eldoret Town is
shown in Figure 4.14. Significant differences in the quantity of production from the
livestock was discerned (F = 34.221, df = 5, P = 0.0042). The highest contribution
from the livestock industry was chicken and beef that were estimated at Kshs 1.2
million followed by income from milk (Kshs 1.02 million) while income from eggs,
honey and bacon were low (estimated at below Kshs 300,000).
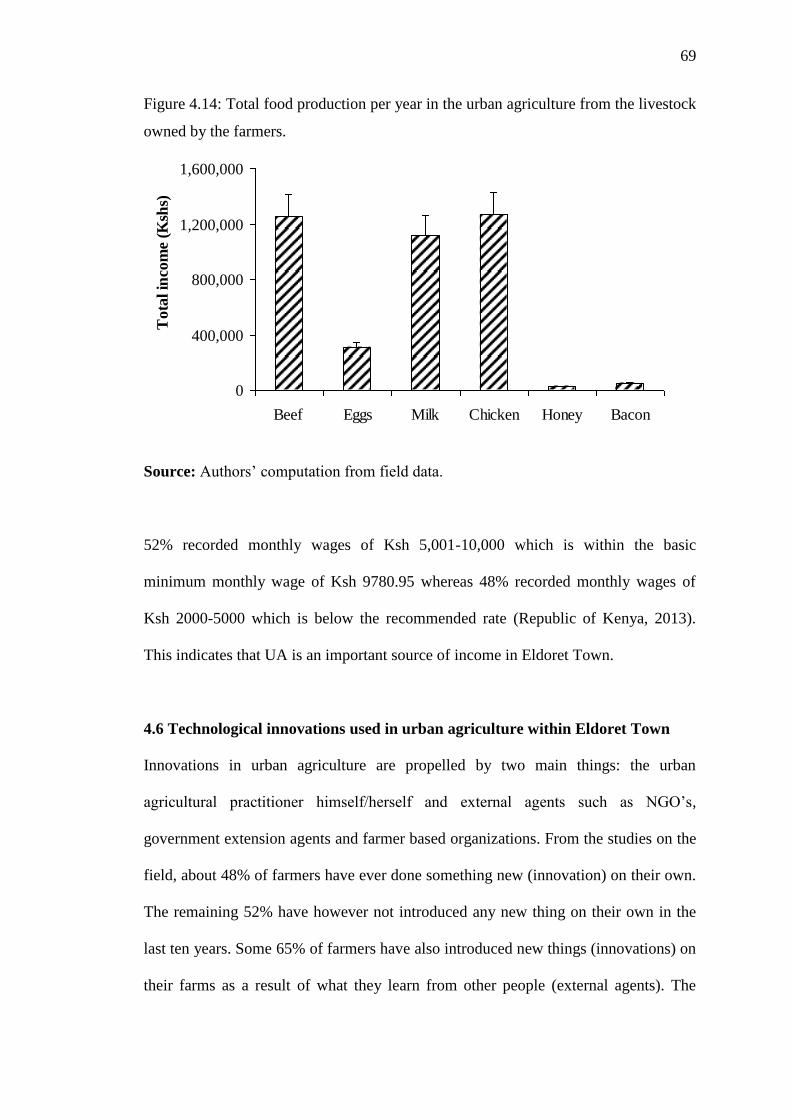
69
Figure 4.14: Total food production per year in the urban agriculture from the livestock
owned by the farmers.
0
400,000
800,000
1,200,000
1,600,000
Beef Eggs Milk Chicken Honey Bacon
Tota
l in
com
e (K
shs)
.
Source: Authors’ computation from field data.
52% recorded monthly wages of Ksh 5,001-10,000 which is within the basic
minimum monthly wage of Ksh 9780.95 whereas 48% recorded monthly wages of
Ksh 2000-5000 which is below the recommended rate (Republic of Kenya, 2013).
This indicates that UA is an important source of income in Eldoret Town.
4.6 Technological innovations used in urban agriculture within Eldoret Town
Innovations in urban agriculture are propelled by two main things: the urban
agricultural practitioner himself/herself and external agents such as NGO’s,
government extension agents and farmer based organizations. From the studies on the
field, about 48% of farmers have ever done something new (innovation) on their own.
The remaining 52% have however not introduced any new thing on their own in the
last ten years. Some 65% of farmers have also introduced new things (innovations) on
their farms as a result of what they learn from other people (external agents). The
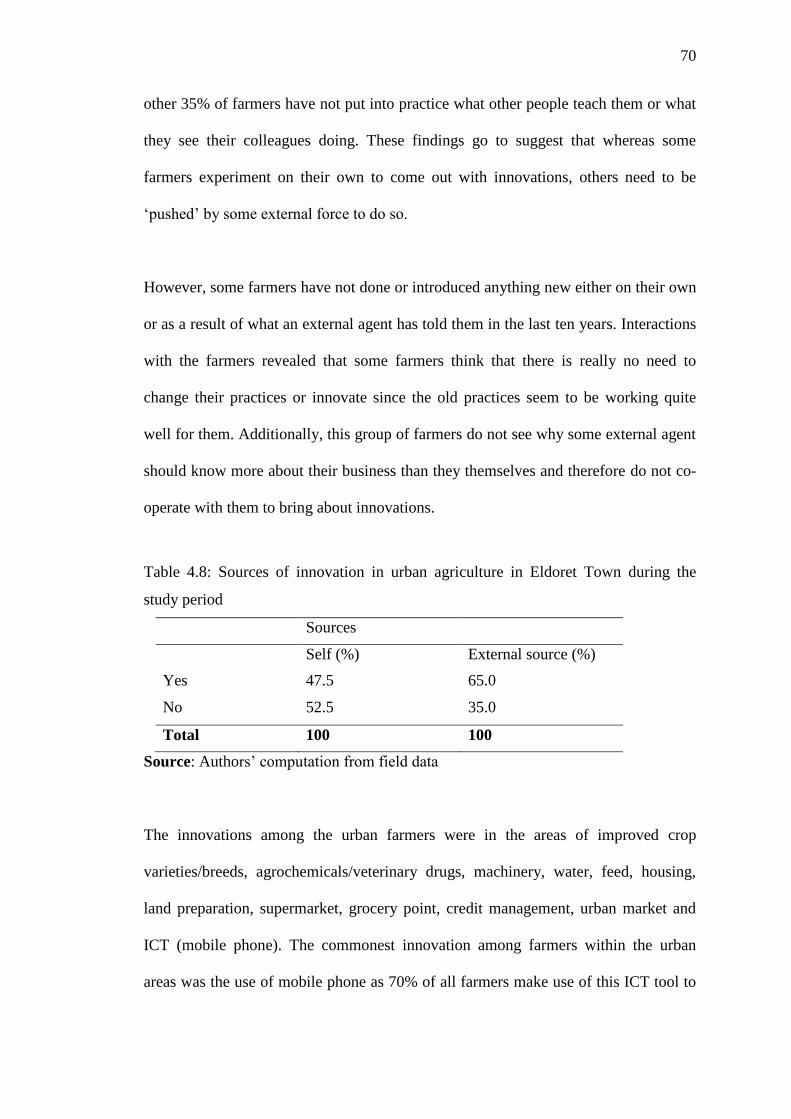
70
other 35% of farmers have not put into practice what other people teach them or what
they see their colleagues doing. These findings go to suggest that whereas some
farmers experiment on their own to come out with innovations, others need to be
‘pushed’ by some external force to do so.
However, some farmers have not done or introduced anything new either on their own
or as a result of what an external agent has told them in the last ten years. Interactions
with the farmers revealed that some farmers think that there is really no need to
change their practices or innovate since the old practices seem to be working quite
well for them. Additionally, this group of farmers do not see why some external agent
should know more about their business than they themselves and therefore do not co-
operate with them to bring about innovations.
Table 4.8: Sources of innovation in urban agriculture in Eldoret Town during the
study period
Sources
Self (%) External source (%)
Yes 47.5 65.0
No 52.5 35.0
Total 100 100
Source: Authors’ computation from field data
The innovations among the urban farmers were in the areas of improved crop
varieties/breeds, agrochemicals/veterinary drugs, machinery, water, feed, housing,
land preparation, supermarket, grocery point, credit management, urban market and
ICT (mobile phone). The commonest innovation among farmers within the urban
areas was the use of mobile phone as 70% of all farmers make use of this ICT tool to
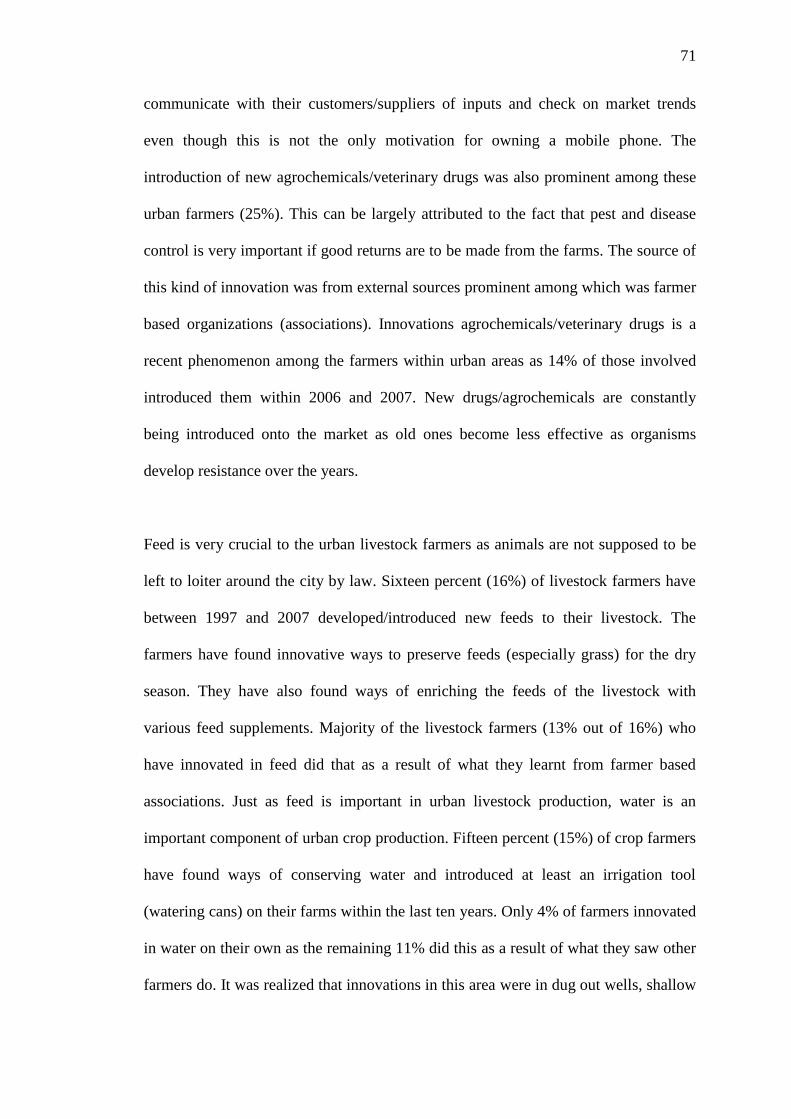
71
communicate with their customers/suppliers of inputs and check on market trends
even though this is not the only motivation for owning a mobile phone. The
introduction of new agrochemicals/veterinary drugs was also prominent among these
urban farmers (25%). This can be largely attributed to the fact that pest and disease
control is very important if good returns are to be made from the farms. The source of
this kind of innovation was from external sources prominent among which was farmer
based organizations (associations). Innovations agrochemicals/veterinary drugs is a
recent phenomenon among the farmers within urban areas as 14% of those involved
introduced them within 2006 and 2007. New drugs/agrochemicals are constantly
being introduced onto the market as old ones become less effective as organisms
develop resistance over the years.
Feed is very crucial to the urban livestock farmers as animals are not supposed to be
left to loiter around the city by law. Sixteen percent (16%) of livestock farmers have
between 1997 and 2007 developed/introduced new feeds to their livestock. The
farmers have found innovative ways to preserve feeds (especially grass) for the dry
season. They have also found ways of enriching the feeds of the livestock with
various feed supplements. Majority of the livestock farmers (13% out of 16%) who
have innovated in feed did that as a result of what they learnt from farmer based
associations. Just as feed is important in urban livestock production, water is an
important component of urban crop production. Fifteen percent (15%) of crop farmers
have found ways of conserving water and introduced at least an irrigation tool
(watering cans) on their farms within the last ten years. Only 4% of farmers innovated
in water on their own as the remaining 11% did this as a result of what they saw other
farmers do. It was realized that innovations in this area were in dug out wells, shallow
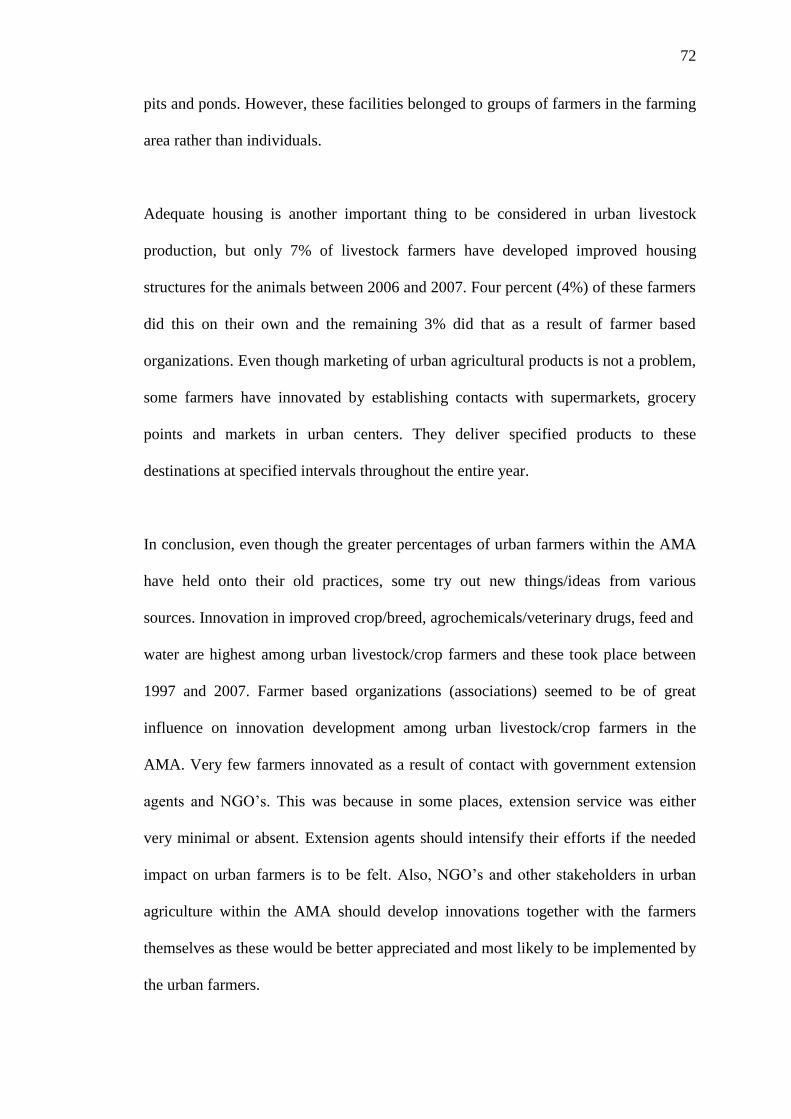
72
pits and ponds. However, these facilities belonged to groups of farmers in the farming
area rather than individuals.
Adequate housing is another important thing to be considered in urban livestock
production, but only 7% of livestock farmers have developed improved housing
structures for the animals between 2006 and 2007. Four percent (4%) of these farmers
did this on their own and the remaining 3% did that as a result of farmer based
organizations. Even though marketing of urban agricultural products is not a problem,
some farmers have innovated by establishing contacts with supermarkets, grocery
points and markets in urban centers. They deliver specified products to these
destinations at specified intervals throughout the entire year.
In conclusion, even though the greater percentages of urban farmers within the AMA
have held onto their old practices, some try out new things/ideas from various
sources. Innovation in improved crop/breed, agrochemicals/veterinary drugs, feed and
water are highest among urban livestock/crop farmers and these took place between
1997 and 2007. Farmer based organizations (associations) seemed to be of great
influence on innovation development among urban livestock/crop farmers in the
AMA. Very few farmers innovated as a result of contact with government extension
agents and NGO’s. This was because in some places, extension service was either
very minimal or absent. Extension agents should intensify their efforts if the needed
impact on urban farmers is to be felt. Also, NGO’s and other stakeholders in urban
agriculture within the AMA should develop innovations together with the farmers
themselves as these would be better appreciated and most likely to be implemented by
the urban farmers.
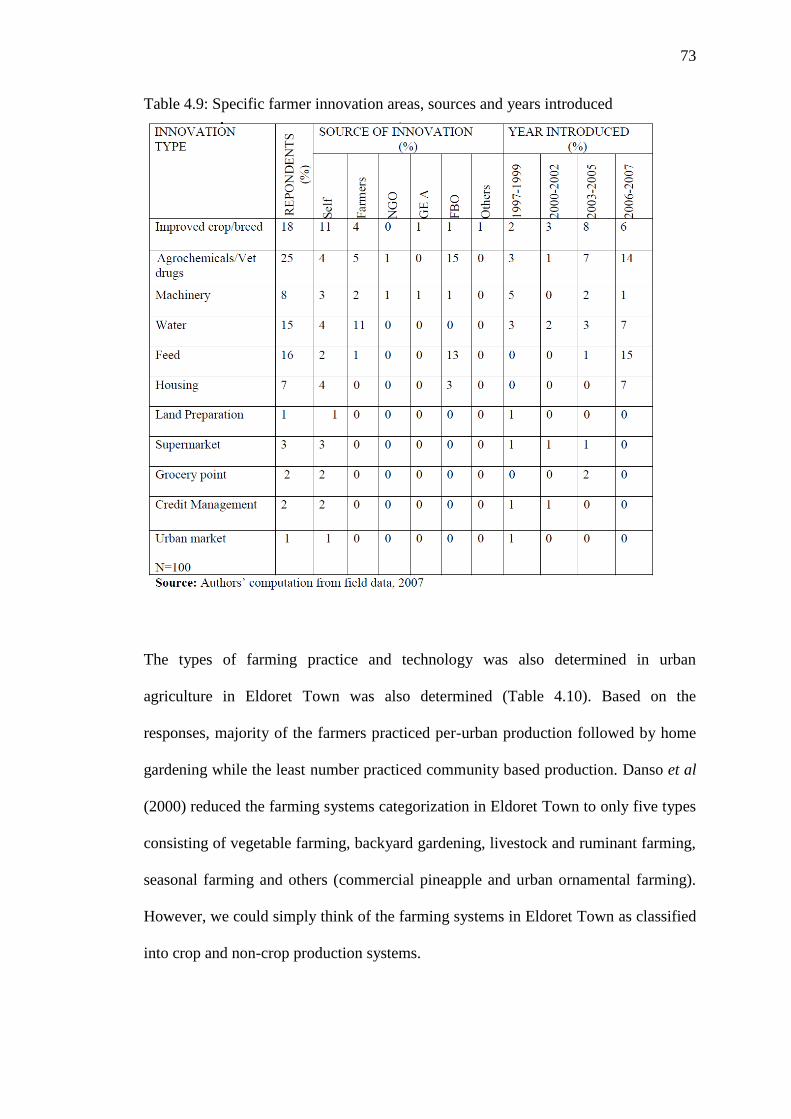
73
Table 4.9: Specific farmer innovation areas, sources and years introduced
The types of farming practice and technology was also determined in urban
agriculture in Eldoret Town was also determined (Table 4.10). Based on the
responses, majority of the farmers practiced per-urban production followed by home
gardening while the least number practiced community based production. Danso et al
(2000) reduced the farming systems categorization in Eldoret Town to only five types
consisting of vegetable farming, backyard gardening, livestock and ruminant farming,
seasonal farming and others (commercial pineapple and urban ornamental farming).
However, we could simply think of the farming systems in Eldoret Town as classified
into crop and non-crop production systems.
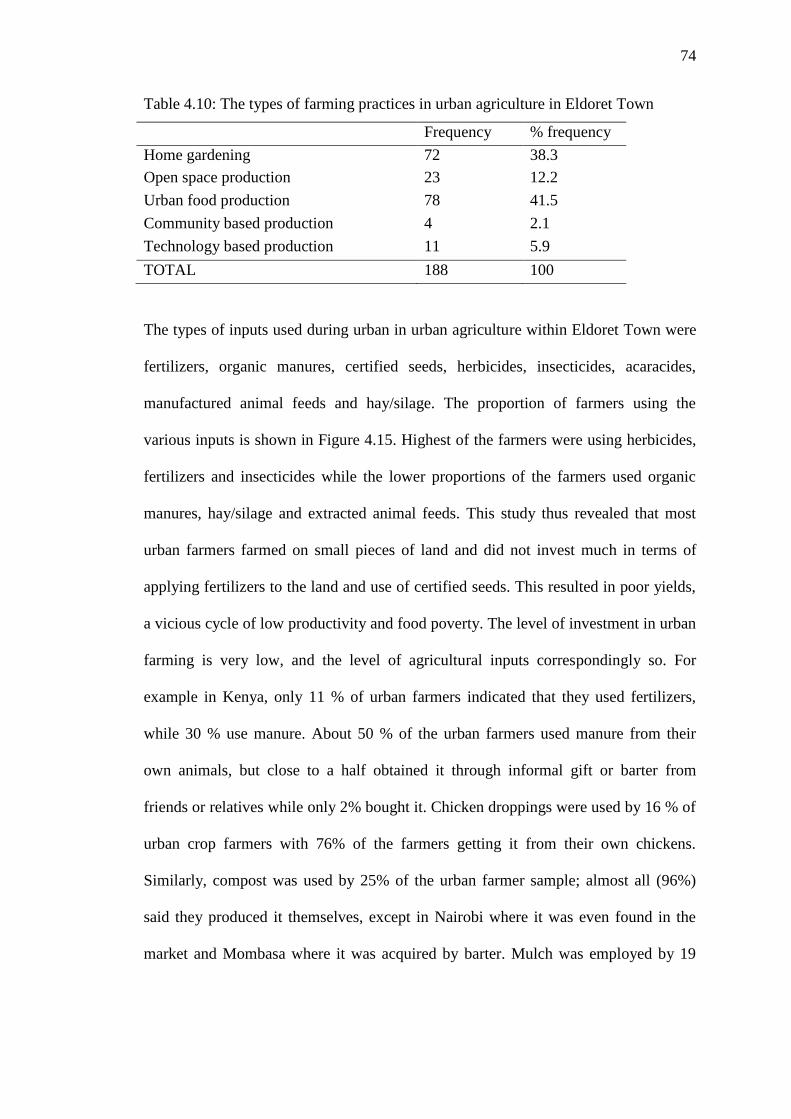
74
Table 4.10: The types of farming practices in urban agriculture in Eldoret Town
Frequency % frequency
Home gardening 72 38.3
Open space production 23 12.2
Urban food production 78 41.5
Community based production 4 2.1
Technology based production 11 5.9
TOTAL 188 100
The types of inputs used during urban in urban agriculture within Eldoret Town were
fertilizers, organic manures, certified seeds, herbicides, insecticides, acaracides,
manufactured animal feeds and hay/silage. The proportion of farmers using the
various inputs is shown in Figure 4.15. Highest of the farmers were using herbicides,
fertilizers and insecticides while the lower proportions of the farmers used organic
manures, hay/silage and extracted animal feeds. This study thus revealed that most
urban farmers farmed on small pieces of land and did not invest much in terms of
applying fertilizers to the land and use of certified seeds. This resulted in poor yields,
a vicious cycle of low productivity and food poverty. The level of investment in urban
farming is very low, and the level of agricultural inputs correspondingly so. For
example in Kenya, only 11 % of urban farmers indicated that they used fertilizers,
while 30 % use manure. About 50 % of the urban farmers used manure from their
own animals, but close to a half obtained it through informal gift or barter from
friends or relatives while only 2% bought it. Chicken droppings were used by 16 % of
urban crop farmers with 76% of the farmers getting it from their own chickens.
Similarly, compost was used by 25% of the urban farmer sample; almost all (96%)
said they produced it themselves, except in Nairobi where it was even found in the
market and Mombasa where it was acquired by barter. Mulch was employed by 19
75
per cent, almost all of whom (90%) had their own source, except in Nairobi, where it
was exchanged.
Figure 4.15: The proportion of farmers using the various inputs
0 10 20 30 40 50 60 70 80 90
Organic manures
Hay/sillage
Extruded animal feeds
acaracides
Insecticides
Certified seeds
Fertilizers
Herbicides
Percent frequency
Source: Authors’ computation from field data.
The average cost of inputs used by the farmers was also determined as a way of
determining the extent to which farmers are likely to use them during food
production. Their prices are as shown in Table 4.11. Based on the price of the items,
the most expensive input among the farmers was fertilizers followed by acaricides and
insecticides while organic manure was the cheapest for the farmers.
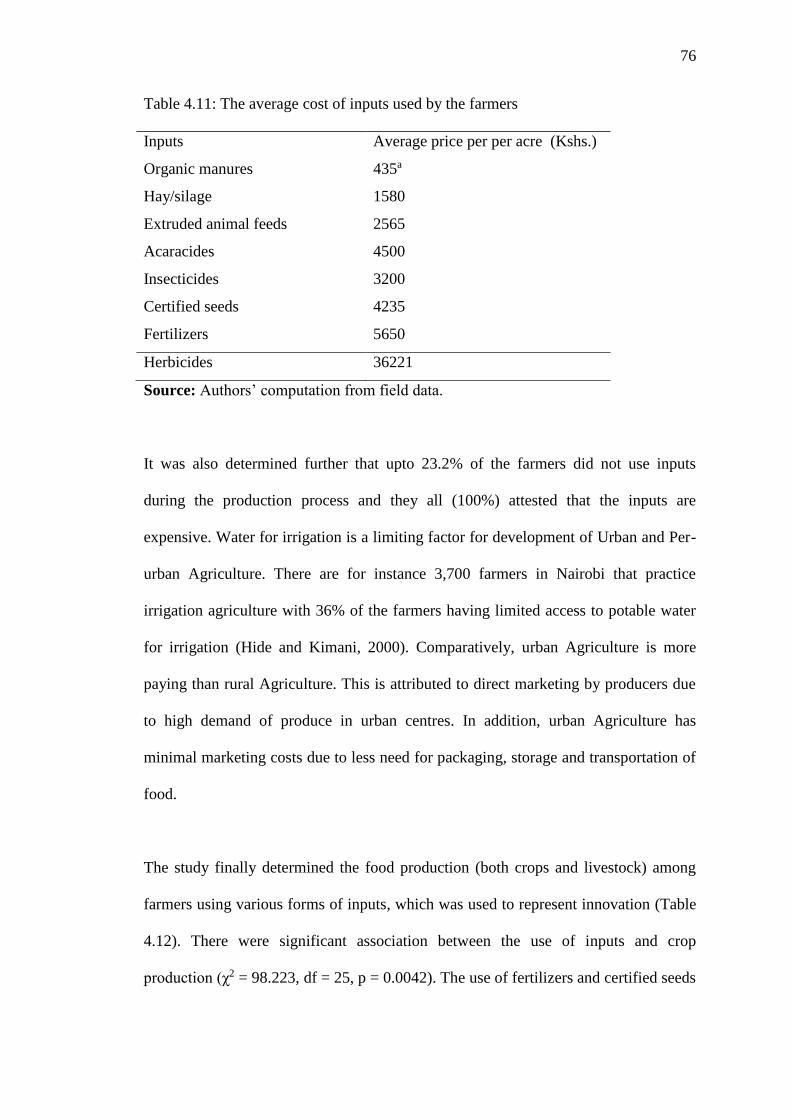
76
Table 4.11: The average cost of inputs used by the farmers
Inputs Average price per per acre (Kshs.)
Organic manures 435a
Hay/silage 1580
Extruded animal feeds 2565
Acaracides 4500
Insecticides 3200
Certified seeds 4235
Fertilizers 5650
Herbicides 36221
Source: Authors’ computation from field data.
It was also determined further that upto 23.2% of the farmers did not use inputs
during the production process and they all (100%) attested that the inputs are
expensive. Water for irrigation is a limiting factor for development of Urban and Per-
urban Agriculture. There are for instance 3,700 farmers in Nairobi that practice
irrigation agriculture with 36% of the farmers having limited access to potable water
for irrigation (Hide and Kimani, 2000). Comparatively, urban Agriculture is more
paying than rural Agriculture. This is attributed to direct marketing by producers due
to high demand of produce in urban centres. In addition, urban Agriculture has
minimal marketing costs due to less need for packaging, storage and transportation of
food.
The study finally determined the food production (both crops and livestock) among
farmers using various forms of inputs, which was used to represent innovation (Table
4.12). There were significant association between the use of inputs and crop
production (χ2 = 98.223, df = 25, p = 0.0042). The use of fertilizers and certified seeds
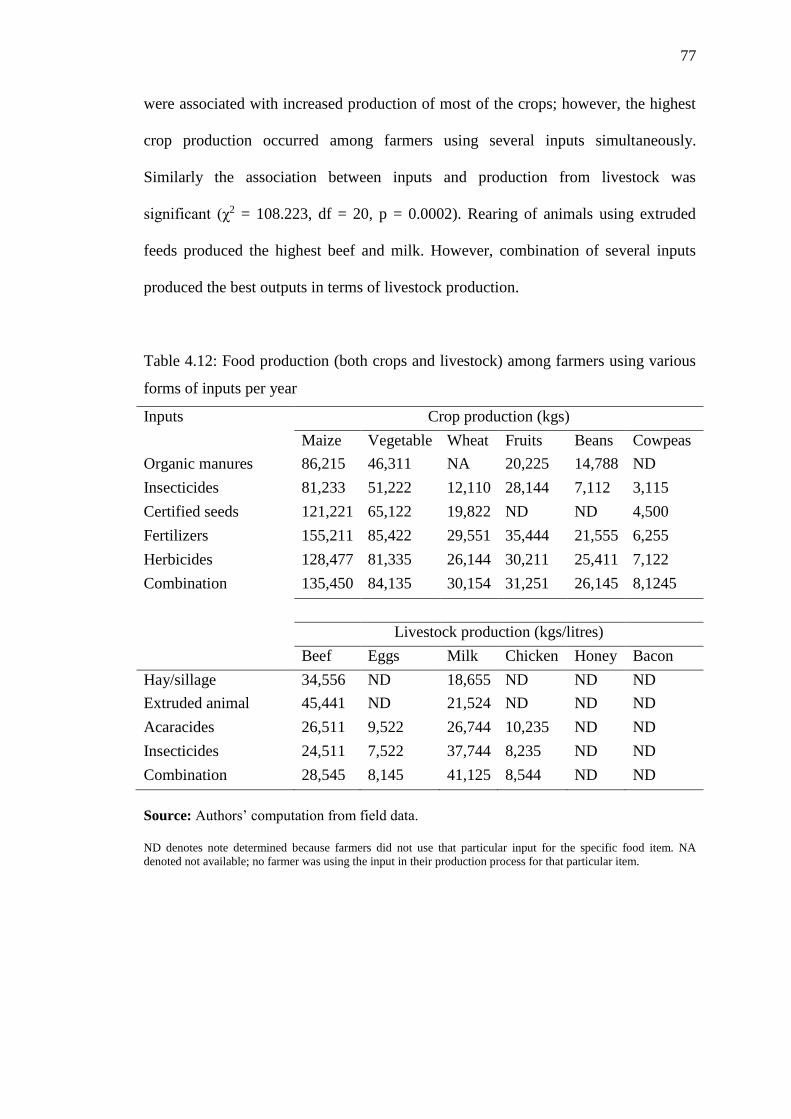
77
were associated with increased production of most of the crops; however, the highest
crop production occurred among farmers using several inputs simultaneously.
Similarly the association between inputs and production from livestock was
significant (χ2 = 108.223, df = 20, p = 0.0002). Rearing of animals using extruded
feeds produced the highest beef and milk. However, combination of several inputs
produced the best outputs in terms of livestock production.
Table 4.12: Food production (both crops and livestock) among farmers using various
forms of inputs per year
Inputs Crop production (kgs)
Maize Vegetable Wheat Fruits Beans Cowpeas
Organic manures 86,215 46,311 NA 20,225 14,788 ND
Insecticides 81,233 51,222 12,110 28,144 7,112 3,115
Certified seeds 121,221 65,122 19,822 ND ND 4,500
Fertilizers 155,211 85,422 29,551 35,444 21,555 6,255
Herbicides 128,477 81,335 26,144 30,211 25,411 7,122
Combination 135,450 84,135 30,154 31,251 26,145 8,1245
Livestock production (kgs/litres)
Beef Eggs Milk Chicken Honey Bacon
Hay/sillage 34,556 ND 18,655 ND ND ND
Extruded animal
feeds
45,441 ND 21,524 ND ND ND
Acaracides 26,511 9,522 26,744 10,235 ND ND
Insecticides 24,511 7,522 37,744 8,235 ND ND
Combination 28,545 8,145 41,125 8,544 ND ND
Source: Authors’ computation from field data.
ND denotes note determined because farmers did not use that particular input for the specific food item. NA
denoted not available; no farmer was using the input in their production process for that particular item.
78
CHAPTER FIVE
5.0 SUMMARY, CONCLUSION AND RECOMMENDATIONS
5.1 Introduction
This chapter contains the conclusions and recommendations of the study. The
objectives have been linked to the research questions and conclusions and
recommendations made.
5.2 Summary
Research in urban agriculture continues to be of interest to many stakeholders around
the globe including Kenya. The current study has investigated the following critical
issues in urban agriculture in the Eldoret Town: extent of urban agriculture, overall
contribution of urban agriculture to food production, overall contribution of urban
agriculture to household income and technological innovations used in urban
agriculture within Eldoret Town. Primary data was collected from respondents within
the urban agricultural sites within the Edoret Town. A largely structured questionnaire
sought answers concerning the various issues raised in this study from 188 households
practicing urban agriculture. Secondary data included the review of relevant literature
to understand the body of knowledge on urban agriculture and methodological issues
in systems analysis.
The results of the study suggest that:
1. Most farmers practiced mixed farming for subsistence consumption and for sale.
Also 26.5% of the respondents practice both crop and livestock production while
29.9% and 44.8% practice only livestock keeping and crop production
respectively. It was also established that maize was grown by highest number of
79
respondents (54.3%) followed by vegetables (46.2%) while other crops grown
were wheat (33.2%), fruits (24.8%), beans (15.4%), and cowpeas (4.1%). As for
livestock, majority of the farmers owned poultry (75.5%) followed by ownership
of dairy cattle (59.3%), then goats (31.5%). Livestock owned by least number of
farmers in the study area were pigs (1.9%) and bees (1.1%). About 50% of the
farmers had less than 0.2 acres of land, 40% of the farmers had between 0.2-0.5
acres of land, while the rest (11%) had over 0.5 acres. The mean farm size in the
study area was found to be 0.64 ± 0.28 acres
2. Most important reason for practicing urban farming was improvement of family
access to food (68.2%), followed by getting household income (49.6%) or
improve the already meager household income (28.7%), and to comply with
cultural values (2.8%).
3. Maize production per farmer (315.2 ± 37.2 kgs range 45‒360 kgs]) was the was
the most abundant food item produced by the urban households (59.2%), by
vegetables (110.4 ± 25.4 kgs) while the least produced food item was cowpeas
(20.1 ± 2.7 kgs). Vegetable, beans, wheat and cowpeas production by most
farmers ranged between 1 to 90 kgs.
4. Maize was the highest harvested crop in the area (105,943 ± 14,239 kg) followed
by vegetables (28,641 ± 4,477 kgs) whiles the harvest of wheat, cowpeas (2,531 ±
189.2 kgs) and beans (5,088 ± 477 kgs). Kogi-Makau (1998) found that about
20% of the food budget is spent on vegetables and fruits. These results agree with
earlier studies by Korir et al. (2015). Production of all food crops from
commercial farming was significantly higher (p < 0.05) than mixed farming while
production from subsistence farming was the lowest in terms of crop production
among the farmers. Poultry was the most important livestock items owned
80
followed by sheep and then pigs while beef cattle was the least. However, in terms
of contribution to food items per farmer, beef was the most important livestock
(130 ± 24.3 kgs per farmer) followed by eggs (31 ± 12 eggs per farmer) which
was statistically similar to milk production (31.4 ± 8.4 kgs) and chicken (28.5 ±
8.2 kg).
5. The highest contribution from the livestock industry was beef that was estimated
at 25 tonnes from the urban agriculture followed by eggs, milk and chicken
(range 6 tonnes to 10 tonnes for eggs and chicken and 6000 liters to 10 litres from
milk) while the least was honey and bacon (less the 2 tonnes each). Production
from livestock was significantly the highest among farmers practising farming at
the commercial scale.
6. 34.4% reported that UA contributed to both food and income, 30.4% reported that
UA contributed to both employment and income while 30% reported it
contributed to income only. Vegetable production produced the highest individual
household income (Kshs 5905 ± 1035), followed by fruits (Kshs 4880 ± 920).
Although maize the most crop produced, it was consumed more and therefore its
contribution to income was third estimated at Kshs 4200 ± 755. Sales of cowpeas
also resulted to improved income of about Kshs 3600 ± 710 while income from
wheat was the least at Kshs 1800 ± 420 perhaps due to the low acreage under
wheat. Vegetable yielded the highest income in the area (Kshs 3.02 ± 0.32
million) followed by fruits (Kshs 2.41 ± 0.21) and then maize (Kshs 2.01 ± 0.11)
whiles income from wheat, bean and cowpeas were low (Kshs 540,000 to
130,000). Beef contributed the highest income to the household estimated at Kshs
9500 ± 120 followed by chicken estimated at Kshs 7000 ± 870, which was
followed by income from milk (Kshs 6020 ± 860). However, the contribution
81
towards household income from eggs, honey was low. The highest contribution
from the livestock industry was chicken and beef that were estimated at Kshs 1.2
million followed by income from milk (Kshs 1.02 million) while income from
eggs, honey and bacon were low (estimated at below Kshs 300,000).
7. From the field studies, about 48% of farmers have ever done something new
(innovation) on their own. The remaining 52% have however not introduced any
new thing on their own in the last ten years. Some 65% of farmers have also
introduced new things (innovations) on their farms as a result of what they learn
from other people (external agents). The other 35% of farmers have not put into
practice what other people teach them or what they see their colleagues doing.
These findings go to suggest that whereas some farmers experiment on their own
to come out with innovations, others need to be ‘pushed’ by some external force
to do so. The innovations among the urban farmers were in the areas of improved
crop varieties/breeds, agrochemicals/veterinary drugs, machinery, water, feed,
housing, land preparation, supermarket, grocery point, credit management, urban
market and ICT (mobile phone). The commonest innovation among farmers was
the use of mobile phone as 70% of all farmers make use of this ICT tool to
communicate with their customers/suppliers of inputs and check on market trends
even though this is not the only motivation for owning a mobile phone.
Innovations agrochemicals/veterinary drugs is a recent phenomenon among the
farmers as 14% of those involved introduced them within 2006 and 2007.
Majority of the farmers practiced per-urban production followed by home
gardening while the least number practiced community based production. The
types of inputs used during urban in urban agriculture within Eldoret Town were
fertilizers, organic manures, certified seeds, herbicides, insecticides, acaracides,
82
manufactured animal feeds and hay/silage. The use of fertilizers and certified
seeds were associated with increased production of most of the crops; however,
the highest crop production occurred among farmers using several inputs
simultaneously. Rearing of animals using extruded feeds produced the highest
beef and milk. However, combination of several inputs produced the best outputs
in terms of livestock production.
While specific statistical findings in this study cannot be generalized beyond Eldoret
Town, some important points should be considered in other low income urban
households. The first is the importance and growing reliance on urban farming for
household food consumption and income. The second is the need to just food supply
and access to include the environmental context in which the food is obtained. The
thesis therefore concludes that although urban agriculture is not a panacea to
economic decline or poverty alleviation, it is a positive and appropriate way of
improving urban livelihoods. The success and expansion of urban agriculture will
therefore depend on the ability of policy makers, administrators and urban farmers to
use integrated social, economic and environmental strategies that effectively address
food security and urban poverty.
5.3 Conclusion
Farmers owned small sizes of land, but nevertheless practiced urban agriculture on
them. The main cultivated crops were maize, fruits, beans, wheat, vegetables and
cowpeas. Maize and vegetable production was the most abundant food item produced
by the farmers. Farmers also owned several livestock including: poultry dairy cattle,
beef cattle, goats, sheep, pigs and bees and produced high quantity of beef, eggs, and
83
chicken, with low production of honey and bacon. Majority of the farmers practiced
mixed farming where they grew crops and kept livestock for subsistence consumption
and for sale, yet production of all food crops and livestock from commercial farming
was significantly the highest higher (p < 0.05) than mixed farming. It was also noted
that majority of the farmers practiced per-urban production and home gardening, the
highest farm production of all crops occurred when the technology based production
was used for crop production.
The types of inputs used during production in urban agriculture within Eldoret Town
were fertilizers, organic manures, certified seeds, herbicides, insecticides, acaracides,
manufactured animal feeds and hay/silage. Highest usage of the farmers was using
herbicides, fertilizers and insecticides. However, the fertilizers followed by acaricides
and insecticides were more expensive inputs for most farmers resulting to high %age
of farmers not using the inputs. It was also established that the use of fertilizers and
certified seeds were associated with increased production of most of the crops.
However, the highest crop and livestock production occurred when combination of
inputs were used simultaneously.
Despite the fact that urban agriculture has the proven capacity to contribute to food
security and income generation, it faces a large number of constraints that impede the
achievement of these goals. These constraints included: lack of government support,
lack of space, lack of agricultural skills, lack of farm inputs and poor council by-laws.
84
5.4 Recommendations of the study
The following recommendations are given based on the implications of the results
presented.
i. Since urban agriculture is a strategy that has been adopted in response to the
availability of favourable resource and policy conditions more efforts are
needed to improve upon the situation.
ii. Integrating urban agriculture into Eldoret Town development plans by re-
zoning the city and incorporating agro-residential planning in Eldoret
development plans. Local authorities should devise policies for community
gardens or allotments.
iii. Urban agricultural diversification which promotes production of high-valued
speciality foods, which require little space for production but provide good
monetary returns should be encouraged. Urban farmers should be capacitated
to produce protein rich pulses such as soya beans in their gardens to improve
the dietary quality of their households.
iv. Farmers’ associations have been found to be a very important source of
innovation and platform for diffusion. Farmers are therefore encouraged to
join farmers associations in order to stay abreast with new happenings in the
industry as well as improve upon advocacy for a favourable policy
framework.
v. Since urban agriculture provides a good source of food to farmers and
improves livelihoods, modern techniques of production that make use of
minimal space and enhances productivity should be promoted. Vegetable
production and raising of grass cutter and rabbits are suggested.
85
5.5 Recommendation for further research
i. Future research would be needed to establish innovation and policy needs of
urban farmers which this study did not focus on.
ii. A specific urban agricultural policy that mandates specific areas to be
demarcated for food crop production and small animal keeping should be
developed by government and implementation facilitated by the key actors.
For instance, to sustain good agricultural practices, government extension
agents should collaborate and reach out to more urban farmers;
iii. Any agricultural innovations should be designed together with practitioners
to make them more acceptable to the practitioners.
86
REFERENCES
Atkinson, S. (2014). Approaches and actors in urban food security in developing
countries. Habitat International 27: 151‒63.
Atukunda, G. (2013). Urban agriculture in Kampala, Uganda: reviewing research
impacts. CFP Report 29B, IDRC, Ottawa. http://www.idrc.ca/en/ev-201-
1-DO_TOPIC.html. Accessed 03-09-2015.
Bebbington, A. (2009). Livelihoods, capitals and capabilities: a framework for
analyzing peasant viability, rural livelihoods and poverty. World
Development. 27: 2021–2044.
Bellows, A.C. (2011). Urban food, health, and the environment: The case of Upper
Silesia, Poland. In for hunger proof cities; Sustainable Urban Food
Systems (ed. Koc, M., MacRae, R., Mougeot, L. and Welsh, J.), pp.
131‒135. Ottawa: International Development Research Centre (IDRC).
Benson C. Twigg J. (2007). Tools for mainstreaming disaster risk reduction:
Guidance notes for development organizations. Geneva: ProVention
Consortium.
Bhatt, V. and Kongshaung, R. (2005). Making the edible landscape: A study of urban
agriculture in Montreal. Minimal Cost Housing Group. Montreal, McGill
University. www.mcgill.ca/mchg/pastproject/el.
Birley, M.H. and Lock, K. (2012). The health impacts of peri-urban natural resource
development. Trowbridge, Cromwell Press.
Bishwapriya, S. (2010). Urban agriculture: Who cultivates and why? A case study of
Lusaka, Zambia. Food and Nutrition Bulletin. 7: 15‒24.
87
Bomans, K., Steenberghen, T., Dewaelheyns, V., Leinfelder, H. and Gulinck, H.
(2011). Underrated transformations in the open space: The case of an
urbanized and multifunctional area. Landscape and Urban Planning. 95:
196‒205.
Bopda, A. and Awono, L. (2010). Institutional development of urban agriculture – an
ongoing history of Yaoundé. In: Prain, G, N K Karanja and D Lee-Smith
(editors), African Urban Harvest: Agriculture in the Cities of Cameroon,
Kenya and Uganda, Springer, New York, and IDRC, Ottawa.
Bouraoui, M. (2005). Agri-urban development from a land-use planning perspective.
In: Mougeot, L.J.A. (Ed.). Agropolis: The social, political and
environmental dimensions of urban agriculture. Earthscan, London, pp.
203‒238.
Brocklesby, M.A. and Fisher, E. (2003). Community development in sustainable
livelihoods approaches – an introduction, Community Development
Journal. 38: 185‒198.
Brunori, G. and Orsini, S. (2010). Food for the cities: urban policies and the role of
farmers. In: Galli, M., Lardon, S., Marraccini, E. and Bonari, E. (Eds.).
Agricultural management in peri-urban areas: The experience of an
international workshop. Felici Editore, Ghezzano, pp. 45-52.
Bryld, E. (2013). Potentials, problems and policy implications for urban agriculture in
developing countries. Agriculture and Human Values. 30: 79–86.
Carney, D. (2003). Sustainable livelihoods approaches: progress and possibilities for
change. London: Department for International Development.
Chesbrough, H.W. (2003). Open innovation. The new imperative for creating and
profiting from technology. Boston: Havard Business School Press.
88
Cohen, B. (2016). Urbanization in developing countries: current trends, future
projections, and key challenges for sustainability. Technology and
Society. 28: 63‒80.
Cohen, N., Reynolds, K. and Sanghvi, R. (2012). Five borough farm: Seeding the
future of urban agriculture in New York. Design for public space and
added value.
Companioni, N., Hernandez, Y.O., Paez, E. and Murphy, C. (2013). The growth of
urban agriculture. Sustainable Agriculture and Food: Agriculture and
Food Systems. 13: 1344‒1354.
Creswell, J.W. (2007). Qualitative inquiry and research design: Choosing among five
approaches (2nd ed.). Thousand Oaks, CA: Sage.
Creswell, J.W. and Tashakkori, A. (2007). Developing publishable mixed methods
manuscripts. Journal of Mixed Methods Research. 1: 107‒111.
David, S., Lee-Smith, D., Kyaligonza, J., Mangeni, W., Kimeze, S., Aliguma, S.,
Lubowa, A. and Nasinyama, G.W. (2010). Changing trends in urban
agriculture in Kampala. In: Prain, G. and De Zeeuw, H. (2011).
Enhancing technical, organizational and institutional innovations in
urban agriculture. UA Magazine. No. 19 Stimulating innovation in urban
agriculture.
DiDomenica, B. (2015). Food policy: Urban farming as a supplemental food source.
Published Dissertation, Walden University. Available online at:
http://scholarworks.waldenu.edu/dissertations.
Dittrich, C. and Krueger, F. (2011). Urbanization and polarization in developing
countries; a theoretical framework. In: Urbanization, Vulnerability and
89
Resource Management in Developing Countries (ed.: Drescher, A.,
Dittrich, C. and Krueger, F.), Freiburg, 34‒40.
Drechsel, P. and Dongus, S. (2015). Dynamics and sustainability of urban agriculture:
examples from Sub-Saharan Africa. Sustainability Science. 5:69.
doi:10.1007/s11625-009-0097-x.
Drescher, A.W., Iaquinta, D.K. and Holmer, R.J. (2011). Urban homegardens and
allotment gardens for sustainable livelihoods: management strategies and
institutional environments In: Nair PK, Kumar B (eds) Tropical
homegardens: a time tested example of sustainability. Series: Advances
in Agroforestry 3, Springer, Dordrecht.
Dubbeling, M., De Zeeuw, H. and Van Veenhuizen, R. (2013). Cities, poverty and
food: Multi-stakeholders policy and planning on urban agriculture.
Practical Action Publishing, UK.
Egziabher, A., Lee-Smith, D., Maxwell, D., Memon, P., Mougeot, L. and Sawio, C.
(2014). Cities feeding people: An examination of urban agriculture in
East Africa, Ottawa: International Development Research Centre
(IDRC).
Egziabher, A.G., Lee-Smith, D., Maxwell, D.G., Memon P.A., Mougeot, L.J.A. and
Sawio, C.J (editors) (1994). Cities Feeding People: An Examination of
Urban Agriculture in East Africa, IDRC, Ottawa.
Ellis, F. and Sumberg, J. (2015). Food production, urban areas and policy responses.
World Development. 26: 221‒229.
FAO. (2014). Growing Greener Cities in Latin America and the Caribbean. FAO,
Rome, Italy.
90
Farrington, J. (2002). Sustainable livelihoods approaches in urban areas: General
Lessons, with Illustrations from Indian Cases, Working Paper 162.
Overseas Development Institute, London, United Kingdom.
Foeken, D. (2012). Urban agriculture and the urban poor in East Africa: Does policy
matter? In Rutten, M., Leliveld, A., Foeken, D. (2012). Inside Poverty
and Development in Africa: Critical reflections on pro-poor policies.
Leiden: Brill.
Foeken, D. (ed) (2006). To subsidise my income: urban farming in an East-African
town, Africa Studies Centre, no. 7, The Netherlands.
Foeken, D. and Owour, S. (2000). Urban farmers in Nakuru, Kenya. ASC Working
Paper No 45, Africa Studies Centre, Leiden and Centre for Urban
Research, University of Nairobi.
Foeken, D. and Owuor, S.O. (2011). Multi-spatial livelihoods in Sub-Saharan Africa:
Rural farming by urban households. The case of Nakuru Town, Kenya.
In de Bruijn, M., van Dijk, R. and Foeken D. (eds), Mobile Africa:
Changing patterns of movement in Africa and beyond, pp. 125-140.
Leiden: Brill.
Freeman, D.B. (1991). A city of farmers: Informal urban agriculture in the open
spaces of Nairobi, Kenya. Montreal and Kingston: McGill-Queen's
University Press.
Gall, J., Borg, W. and Gall, M. (2003). Educational research: An introduction (7th
ed.). Boston: Pearson Education.
Gharajedghi, S. (1986). A prologue to national development planning. New York:
Greenworld Press.
91
Gündel, S. (2016). Urban and peri-urban agricultural productivity in Africa - a coping
strategy for the poor? Scoping study July 2002. Natural Resources
International Limited, Aylesford, UK. 31 pp.
Gutman, P. (2013). Urban agriculture: The potential and limitations of an urban self-
reliance strategy. Food and Nutrition Bulletin. 29: 123‒132.
Hamilton, A.J., Burry, K., Mok, H.F., Barker, F., Grove, J.R. and Williamson, V.G.
(2014). Give peas a chance? Urban agriculture in developing countries.
A review. Agronomy and Sustainable Development. 34: 45–73.
Hardoy, J.E., Mitlin, D. and Satterthwaite, D. (2013). Environmental problems in an
urbanizing world - Finding solutions for cities in Africa, Asia and Latin
America, London, Earthscan.
Desa, U.N. (2012). World urbanization prospects, the 2011 revision. Final Report
with Annex Tables. New York, NY: United Nations Department of
Economic and Social Affairs.
Hide, F. and Kimani, M. (2012). In: Ayaga, G., Kibata, G., Lee-Smith, D., Njenga, M.
and Rege, R. (eds). Policy prospects for urban and peri-urban agriculture
in Kenya. Urban Harvest–International Potato Center, Lima, Peru.
Hovorka, A.J. (2014). Gender and urban agriculture: emerging trends and areas for
future research. In: Annotated bibliography on urban and periurban
agriculture. Compiled for the Swedish International Development
Agency (SIDA). Leusden, Netherlands: ETC Ecoculture.165-176.
http://www.ruaf.org/bibliography/annotated/007.pdf.
Jacobi, P., Amend, J. and Kiango, S. (1999). Urban agriculture in Dar-es-Salaam:
providing an indispensable part of the diet. In: Prain, G, N K Karanja
and D Lee-Smith (editors), African Urban Harvest: Agriculture in the
92
Cities of Cameroon, Kenya and Uganda, Springer, New York, and
IDRC, Ottawa.
Jonathan, C., Hovorka, A. and Tevera, D. (2014). Urban food production, income and
household food security in African cities. Urban Food Security Series
No. 4. Queen’s University and AFSUN: Kingston and Cape Town.
Kadenyeka, M.V., Omutimba, D. and Harriet, N. (2013). Urban agriculture
livelihoods and household food security: a case of Eldoret, Kenya. ARPN
Journal of Agricultural and Biological Science. 8: 90‒96.
Kekana, H. (2016). The intrinsic role of urban farming to local community livelihood
strategies. Journal of Human Environment. 23: 44‒53.
Kenya National Bureau of Statistics. (2010). Population census results of Kenya by
the year 2009. Government Printers: Nairobi, Kenya.
http://www.afdevinfo.com/htmlreports/org/org_33469.html.
Korir, S.C.R. Rotich, J.K. and Mining, P. (2015). Urban agriculture and food security
in developing countries: a case study of Eldoret Town, Kenya. European
Journal of Basic and Applied Sciences. 2: 27‒35.
Kothari, R.C. (2008). Research Methodology Methods and Techniques. New Delhi
International Publishers.
Kwedho, G.O. (2013). Influence of commercialization of water services to work
culture in Eldoret Water and Sanitation. Unpublished PhD thesis Moi
University.
Kyle, D.L., Presyn, K.P. and Newland, I.K. (2016). City limits: emerging constraints
on urban growth. World Watch Paper 6. Washington DC: World Watch
Institute.
93
Lee-Smith, D. (2010). Cities feeding people: an update on urban agriculture in
equatorial Africa. Environment and Urbanization. 22: 483–499.
Lee-Smith, D. and Cole, D. (2008). Can the city produce safe food?’, In Cole, DC,
Lee-Smith, D. and Nasinymama, G.W. (eds), Healthy city harvests:
Generating evidence to guide policy on urban agriculture, CIP/Urban
Harvest and Makerere University Press, Lima, Peru pp. 3–13.
Lee-Smith, D. and Memon, P.A. (1994). Urban agriculture in Kenya. In: Egziabher,
A.G., Lee-Smith, D., Maxwell, D.G., Memon, P.A., Mougeot, L.J.A. and
Sawio, C.J. (editors) (1994), Cities Feeding People: An Examination of
Urban Agriculture in East Africa, IDRC, Ottawa.
Maingi, M. (2010). Status of urban agriculture and its implication for policy changes
in urban land use in Nairobi, Kenya. Unpublished Thesis, Kenyatta
University.
Majale, M. (2002). Towards pro-poor regulatory guidelines for urban upgrading. A
Review of Papers presented at the International Workshop on Regulatory
Guidelines for Urban Upgrading, Intermediate Technology Development
Group (ITDG), May 17-18, 2001.
Martellozzo, F., Landry, J.S., Plouffe, D., Seufert, V., Rowhani, P. and Ramankutty,
N. (2014). Urban agriculture: A global analysis of the space constraint to
meet urban vegetable demand. Environmental Research Letters.
9:064025.
Maxwell, D. (2015). Alternative food security strategy: a household analysis of urban
agriculture in Kampala. World Development. 23: 1669‒1681.
Maxwell, D., Armar-Klemesu, M. and Levin, C. (2013). The impact of urban
agriculture on food security and nutrition. In: Armar-Klemesu, M. and
94
Maxwell, D. (eds), Urban agriculture in the metropolitan areas: report to
IDRC. Legon: NMIMR.
Maxwell, D.G. (1994). The household logic of urban farming in Kampala. Egziabher,
A.G., Lee-Smith, D., Maxwell, D.G., Memon, P.A., Mougeot, L.J.A. and
Sawio, C.J. (editors), Cities Feeding People: An Examination of Urban
Agriculture in East Africa, IDRC Ottawa, 146 pp.
Mbiba, B. (2005). Urban and peri-urban agriculture in Eastern and Southern Africa:
Economic, Planning and Social Dimensions. In A. Viljoen (ed). 2005.
continuous productive urban landscapes: Designing urban agriculture for
sustainable Development.
Memon, P.A. and Lee-Smith, D. (1993). Urban agriculture in Kenya. Canadian
Journal of African Studies. 27: 25‒42.
Mireri, C., Atekyereza, P., Kyessi, A. and Mushi, N. (2007). Environmental risks of
urban agriculture in the Lake Victoria Drainage Basin, A Case of
Kisumu Town. Habitat International. 31: 375‒386.
Mok, H.F., Williamson, V.G., Grove J.R., Burry, K., Barker, S.F. and Hamilton, A.J.
(2014). Strawberry fields forever? A review of urban agriculture in
developed countries. Agronomy and Sustainable Development. 34: 21–
34.
Morgan, K. and Sonnino, R. (2010). The urban foodscape: World cities and the new
food equation. Cambridge Journal of Regions, Economy and Society.
Oxford University Press, UK.
Mougeot, L.J.A. (1999). Urban Agriculture: Definition, presence, potential and risks,
main policy challenges. CFP Report Series 31, IDRC, Ottawa.
95
Mugenda, O. and Mugenda A. (2003). Research methods; quantitative and qualitative
approach. Nairobi act press.
Place, F. and Migot-Adholla, S. E. (1998). The economic effects of land registration
on smallholder farms in Kenya: evidence from Nyeri and Kakamega
districts. Land Economics. 21: 360-373.
Wayumba, G. (2004). A review of special land tenure issues in Kenya. In Expert
Group Meeting on Secure Land Tenure: New Legal Frameworks and
Tools, UNEP, Nairobi, Kenya.
Murimi, J.N., Munguti, T.Y. and Omonde, S.D. (1991). Urban agriculture in Africa:
Papers for networking and evaluation workshop. www.idrc.ca/en/ev-
6383-201-1-Do-Topcs.htlm.
Musonga, H. (2004). Incorporating UPA in urban land use planning. In George
Ayaga, Gilbert Kibata, Diana Lee-Smith, Mary Njenga and Racheal
Rege (eds). Policy prospects for urban and Periurban agriculture in
Kenya. Workshop Proceedings, Kari Headquarters, Nairobi. Kenya.
Mwangi, AM. (1995). The role of urban agriculture for food security in low income
areas in Nairobi. Food and Nutrition Studies Programme Report 54.
Nairobi/Leiden: Ministry of Planning and National Development/African
Studies Centre.
Nabulo, G., Oryem-Origa, H. and Diamond, M. (2006). Assessment of lead,
cadmium, and zinc contamination of roadside soils, surface films, and
vegetables in Kampala City, Uganda. Environmental Research. 101: 42–
52.
96
Gallaher, C.M., Kerr, J.M., Njenga, M., Karanja, N.K. and WinklerPrins, A.M.
(2013). Urban agriculture, social capital, and food security in the Kibera
slums of Nairobi, Kenya. Agriculture and Human Values. 30: 389–404.
Nugent, R. (2000). The impact of urban agriculture on the household and local
economies. In growing cities, growing food: Urban agriculture on the
policy agenda. A reader on urban agriculture (eds Bakker, N.,
Dubbeling, M., Gündel, S., Sabel-Koschella, U. and De Zeeuw, H.), pp.
67–97. Felda"ng, Germany: DSE/ETC.
Nyapendi, R., Best, R., Ferris, S. and Jagwe, J. (2010). Identifying market
opportunities for urban and peri-urban farmers in Kampala. In: Prain, G.
and De Zeeuw, H. (2011). Enhancing technical, organizational and
institutional innovations in urban agriculture. UA Magazine. No. 19
Stimulating innovation in urban agriculture.
Obuobie, E., Dreschel, P. and Danso, G. (2012). ‘Gender in open-space irrigated
urban vegetable farming in Ghana. Urban Agriculture Magazine, no. 12,
RUAF, Leusden.
Pauli, G. (2010). The blue economy: 10 years – 100 innivations – 100 million job.
Paradigm Publications.
Pothukuchi, P. and Kaufman, J.L. (2013). Placing the food system on the urban
agenda: The role of municipal institutions in food systems planning.
Agriculture and Human Values. 16: 213–224.
Potts, D. (2009). The slowing of Sub-Saharan Africa’s urbanization: evidence and
implications for urban livelihoods. Environment and Urbanization. 21:
253–259.
97
Prain, G. and De Zeeuw, H. (2007). Enhancing technical, organizational and
institutional innovations in urban agriculture. UA Magazine. No. 19
Stimulating innovation in urban agriculture.
Prain, G. and Lee-Smith, D. (2014). Urban agriculture in Africa: What has been
learned? In: Prain, G., Lee-Smith, D. and Karanja, N (eds.), African
Urban Harvest: Agriculture in the cities of Cameroon, Kenya and
Uganda. pp. 13‒35.
Ravallion, M., Chen, S. and Sangraula, P. (2017). New evidence on the urbanization.
Technology and People. 23: 144‒151.
Reuther, S.A and Dewar, M.P. (2015). Urban agriculture as a survival strategy by
individual households: The paradox unraveled. Urban Planning and
Management. 90: 1898‒1906.
Rogerson, C. (2016). Feeding world cities: The role and potential for urban
agriculture. World Insight. 22: 229‒234.
Romero-Lankao, P. and Dodman, D. (2015). Cities in transition: Transforming urban
centers from hotbeds of GHG emissions and vulnerability to seedbeds of
sustainability and resilience. Current Opinion in Environmental
Sustainability. 34: 155‒193.
Sanyal, B. (2016). Urban cultivation amidst modernisation: How should we interpret
it? Journal of Planning Education and Research. 16: 187‒207.
Satterthwaite, D. (2007). The transition to a predominantly urban world and its
underpinnings. London, UK: IIED.
Sawio, C (2008). Managing urban agriculture in Dar es Salaam. Cities feeding people,
Report 20, IDRC, Ottawa, ON.
98
Sebastian, R., Lubowa, A., Yeudall, F., Cole, D.C. and Ibrahim, S. (2008). The
association between household food security and urban farming. In:
Cole, D.C., Lee-Smith, D. and Nasinymama, G.W. (eds), Healthy city
harvests: Generating evidence to guide policy on urban agriculture,
CIP/Urban Harvest and Makerere University Press, Lima, Peru, pp. 69–
87.
Sheriff, G. (2005). Permaculture and productive urban landscapes. In A. Viljoen (ed).
2005. Continuous Productive Urban landscapes: Designing Urban
Agriculture for Sustainable Cities. Oxford: Elsevier.
Simiyu, R.R. and Foeken, D.W.J. (2014). Urban crop production and poverty
alleviation in Eldoret, Kenya: Implications for policy and gender
planning. Urban Studies. 51: 2613‒2628.
Simon, D., McGregor, D. and Thomson, D. (2006). Contemporary perspectives on the
peri-urban zones of cities in developing areas. In McGregor, D., Simon,
D. and Thomson, D. (eds) The peri-urban interface. Approaches to
sustainable natural and human resource use, Earthscan, London, pp. 3–
12.
Siyuan. T. (2014). Livestock keeping in urbanised areas does history repeat itself:
Urban farming and Development. 21: 34‒43.
Smit J., Ratta, A. and Nasr, J. (2001). Urban agriculture: Food, jobs and sustainable
cities. (2001 ed.) New York, NY, UNDP.
Smit, J. (1996). Urban Agriculture: Progress and Prospects: 1975 – 2005. The urban
agriculture network cities feeding people report. Washington.
Smit, J., Ratta, A. and Nasr, J. (1996). Urban Agriculture: Food, Jobs and Sustainable
Cities, UNDP Habitat II Series Vol 1, UNDP, New York, 302 pages.
99
Smit, J., Ratta, A. and Nasr, J. (2016). Urban agriculture: Food, jobs and sustainable
cities. New York: UNDP.
Tashakkori, A., and Teddlie, C. (2010). Mixed methodology: Combining qualitative
and quantitative approaches. Thousand Oaks, CA: Sage.
Tegegne, A. (2004). Urban livestock production and gender in Addis Ababa, Ethiopia.
Urban Agriculture Magazine. 12: 30–31.
Thebo A.L., Drechsel, P. and Lambin, E.F. (2014). Global assessment of urban and
peri-urban agriculture: Irrigated and rainfed croplands. Environmental
Research Letters. 9:114002.
Thornton, A. (2008). Beyond the metropolis: small town case studies of urban and
peri-urban agriculture in South Africa, Urban Forum. 19: 243‒262.
Uasin Gishu Development Plan [UGDP] (2008‒2012). Government printers. Kenya
UN- Habitat. (2004). The State of World’s Cities. Globalisation and urban culture.
UN-Habitat, Nairobi, Kenya.
United Nations Development Programme [UNDP]. (2006). Urban agriculture: food,
jobs and sustainable cities, United Nations Development Program
Publication Series for Habitat II, vol. 1, UNDP, New York.
United Nations, Department of Economic and Social Affairs [UNDESA]. (2014).
World Urbanization Prospects: The 2014 Revision, Highlights
(ST/ESA/SER.A/352).
Van Averbeke, W. (2007). Urban farming in the informal settlements of
Atteridgeville, Pretoria, South Africa. Water SA. 33: 337‒342.
Van Veenhuizen, R. (2006). Cities farming for the future, urban agriculture for green
and productive cities. Published by RUAF/IIRR/DRC.
100
Viljoen, D. and Sekhampu, T.J. (2013). the impact of apartheid on urban poverty in
South Africa: What we can learn from History. Mediterranean Journal
of Social Sciences. 4: 729‒734.
Von Hippel, E. (2005). Democratizing innovation. Cambridge: MIT Press.
Waddington P. (2006). 21st century smallholder - From window boxes to allotments:
how to go back to the land without leaving home. London: Transworld
publishers.
Walter, B., Arkin, L. and Crenshaw, R. (2016). Sustainable cities: Concepts and
strategies for eco-city development. Los Angeles: Eco-home media.
Wortman, S.E. and Lovell, S.T. (2013). Environmental challenges threatening the
growth of urban agriculture in the United States. Journal of
Enviromental Quality. 42:1283–1294.
Yamane, T. (1967). Statistics, introductory Analysis of problems. Happer Collins
Publisher Inc. U.S.A.
Yilma, G. (2003). Micro-technologies for congested urban centers in Ethiopia. Urban
Agriculture Magazine. http://www.ruaf.org/node/327 [Accessed 18 June
2009].
Zarina I. (2015). The perils of urban farming in East African towns. Bulletin of
Agriculture, Environment and Development. 32: 156‒163.
101
APPENDICES
Appendix 1: Questionnaires for farmers
Part 1: Respondents socio-demographic characteristics
1. What is your age: < 18 years [ ] 18-25 years [ ] 26-35 years [ ]
36-50 years [ ] > 50 years [ ]
2. Education: None [ ] Primary [ ] Secondary [ ] Tertiary [ ]
University [ ]
3. Gender: Male [ ] Female [ ]
4. Marital status: Single [ ] Married [ ] Widow [ ] Divorced [ ]
5. Main occupation: Formal employed [ ] Unemployed [ ]
Privately employed [ ]
Part 2: Overall food production
1. Do you engage in urban agriculture Yes [ ] No [ ]
2. What is your land size: < 2 acres [ ] 2-5 acres [ ] > 5 acres [ ]
3. What are the main types of crops that you cultivate?: Cowpeas [ ] Beans [ ]
Fruits [ ] Wheat [ ] Vegetables [ ] Maize [ ]
4. Estimate the production (in kg) from the above crops
Crops Production (in kgs)
Maize
Vegetable
Wheat
Fruits
Beans
Cowpeas
102
5. What are the types of livestock that you keep? Bees [ ] Pigs [ ]
Sheep [ ] Beef cattle [ ] Goats [ ] Dairy cows [ ]
Poultry [ ]
6. Estimate the number of livestock owned
Number
Poultry
Sheep
Pigs
Goats
Dairy cows
Beef cattle
7. Estimate the production from the livestock above
Livestock product Overall production
Beef
Egg
Milk
Chicken
Honey
Bacon
Part 3: Type of farming
1. What is the scale of farming in the area?
Subsistence [ ] Commercial farming [ ] Mixed farming [ ]
2. What is the types of crops do you plant in the various types of farming?
Subsistence Commercial farming Mixed farming
Crops
Maize
Vegetable
Wheat
Fruits
Beans
Cowpeas
103
3. What is the production (kg) of the following crops from the following types of
farming activities?
Subsistence Commercial farming Mixed farming
Livestock
Beef
Eggs
Milk
Chicken
Honey
Bacon
4. What is the types of livestock do you have in the various types of farming?
Subsistence Commercial farming Mixed farming
Livestock
Beef
Eggs
Milk
Chicken
Honey
Bacon
5. What is the production do you obtain from the various types of farming?
Subsistence Commercial farming Mixed farming
Livestock
Beef
Eggs
Milk
Chicken
Honey
Bacon
6. What is the type of farming production in urban agriculture in Eldoret Town:
Home gardening [ ] Open space production [ ]
Urban production [ ] Community based production [ ]
Technology based production [ ]
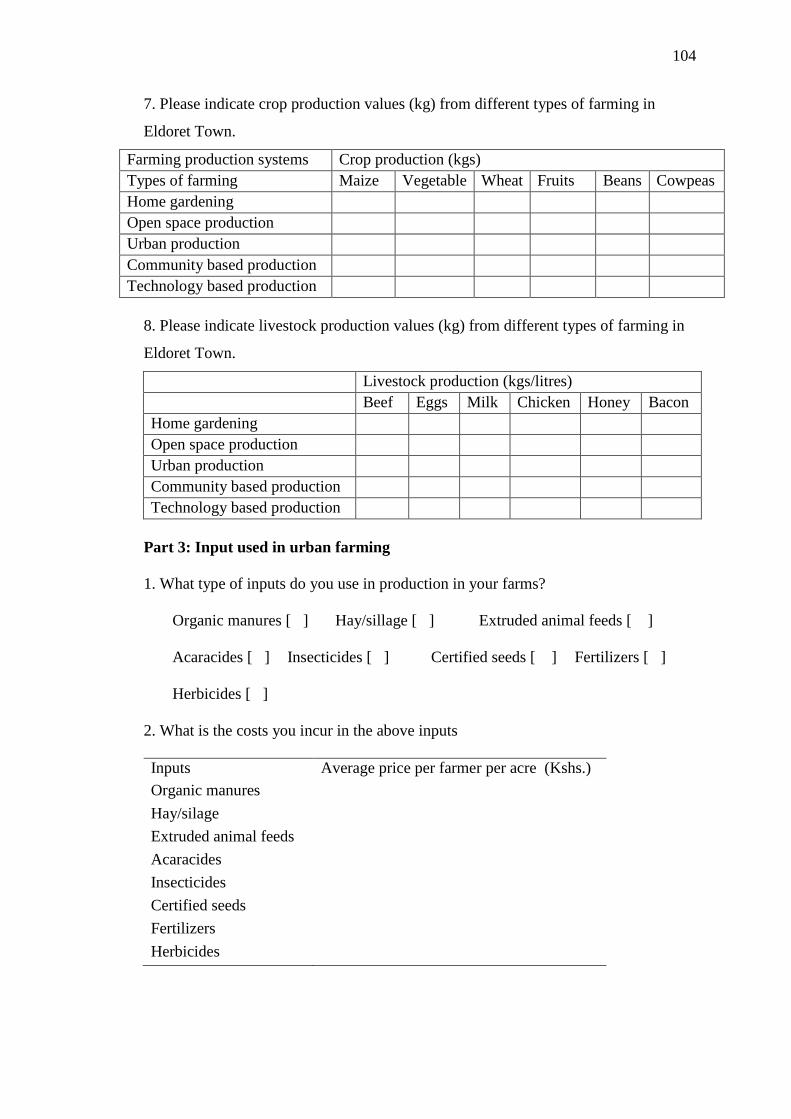
104
7. Please indicate crop production values (kg) from different types of farming in
Eldoret Town.
Farming production systems Crop production (kgs)
Types of farming Maize Vegetable Wheat Fruits Beans Cowpeas
Home gardening
Open space production
Urban production
Community based production
Technology based production
8. Please indicate livestock production values (kg) from different types of farming in
Eldoret Town.
Livestock production (kgs/litres)
Beef Eggs Milk Chicken Honey Bacon
Home gardening
Open space production
Urban production
Community based production
Technology based production
Part 3: Input used in urban farming
1. What type of inputs do you use in production in your farms?
Organic manures [ ] Hay/sillage [ ] Extruded animal feeds [ ]
Acaracides [ ] Insecticides [ ] Certified seeds [ ] Fertilizers [ ]
Herbicides [ ]
2. What is the costs you incur in the above inputs
Inputs Average price per farmer per acre (Kshs.)
Organic manures
Hay/silage
Extruded animal feeds
Acaracides
Insecticides
Certified seeds
Fertilizers
Herbicides
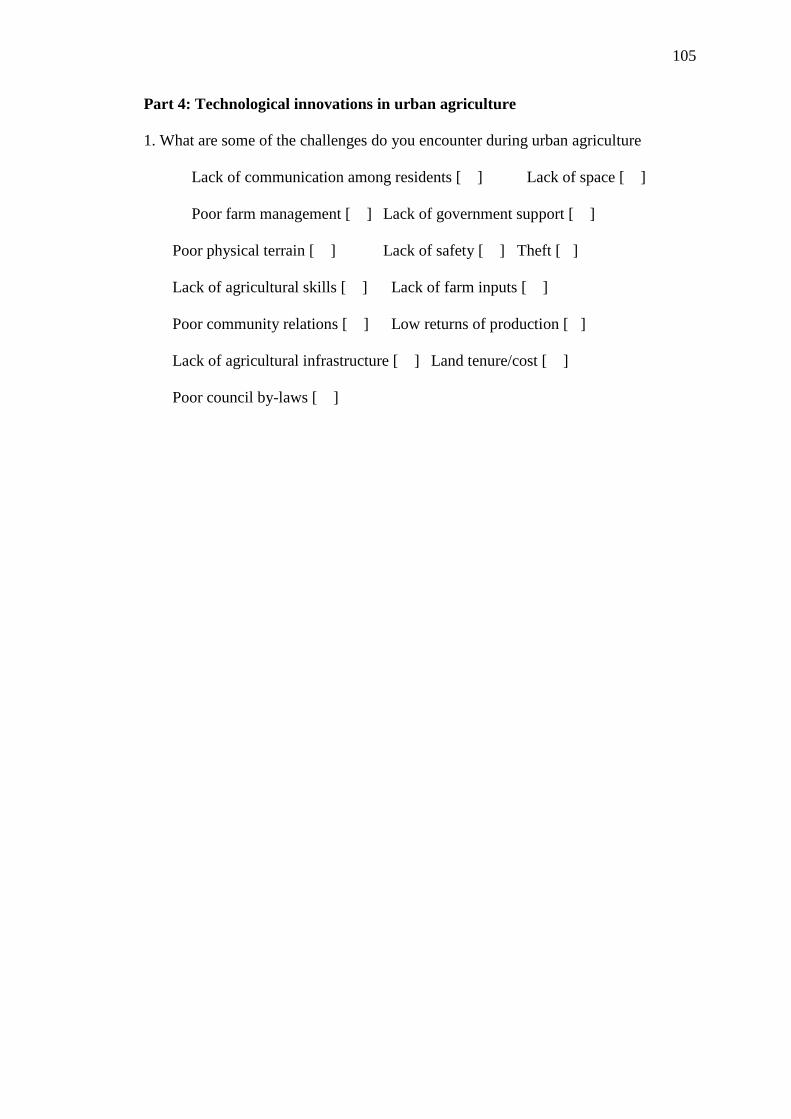
105
Part 4: Technological innovations in urban agriculture
1. What are some of the challenges do you encounter during urban agriculture
Lack of communication among residents [ ] Lack of space [ ]
Poor farm management [ ] Lack of government support [ ]
Poor physical terrain [ ] Lack of safety [ ] Theft [ ]
Lack of agricultural skills [ ] Lack of farm inputs [ ]
Poor community relations [ ] Low returns of production [ ]
Lack of agricultural infrastructure [ ] Land tenure/cost [ ]
Poor council by-laws [ ]
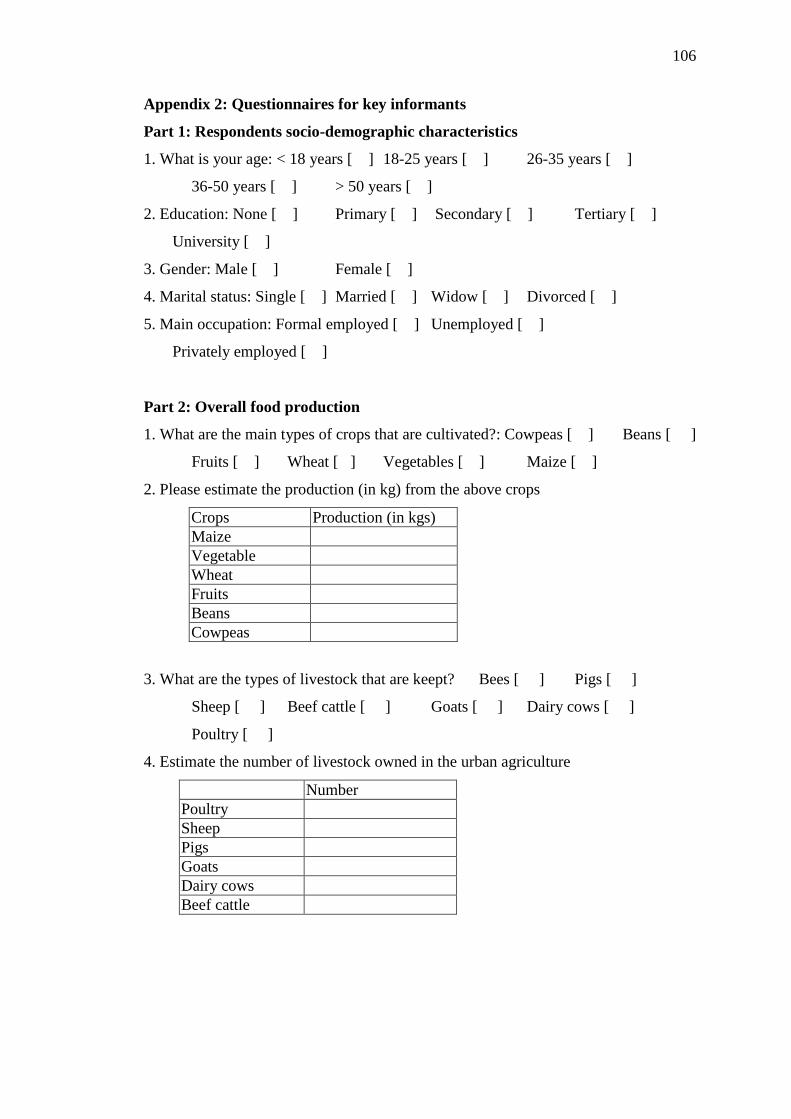
106
Appendix 2: Questionnaires for key informants
Part 1: Respondents socio-demographic characteristics
1. What is your age: < 18 years [ ] 18-25 years [ ] 26-35 years [ ]
36-50 years [ ] > 50 years [ ]
2. Education: None [ ] Primary [ ] Secondary [ ] Tertiary [ ]
University [ ]
3. Gender: Male [ ] Female [ ]
4. Marital status: Single [ ] Married [ ] Widow [ ] Divorced [ ]
5. Main occupation: Formal employed [ ] Unemployed [ ]
Privately employed [ ]
Part 2: Overall food production
1. What are the main types of crops that are cultivated?: Cowpeas [ ] Beans [ ]
Fruits [ ] Wheat [ ] Vegetables [ ] Maize [ ]
2. Please estimate the production (in kg) from the above crops
Crops Production (in kgs)
Maize
Vegetable
Wheat
Fruits
Beans
Cowpeas
3. What are the types of livestock that are keept? Bees [ ] Pigs [ ]
Sheep [ ] Beef cattle [ ] Goats [ ] Dairy cows [ ]
Poultry [ ]
4. Estimate the number of livestock owned in the urban agriculture
Number
Poultry
Sheep
Pigs
Goats
Dairy cows
Beef cattle
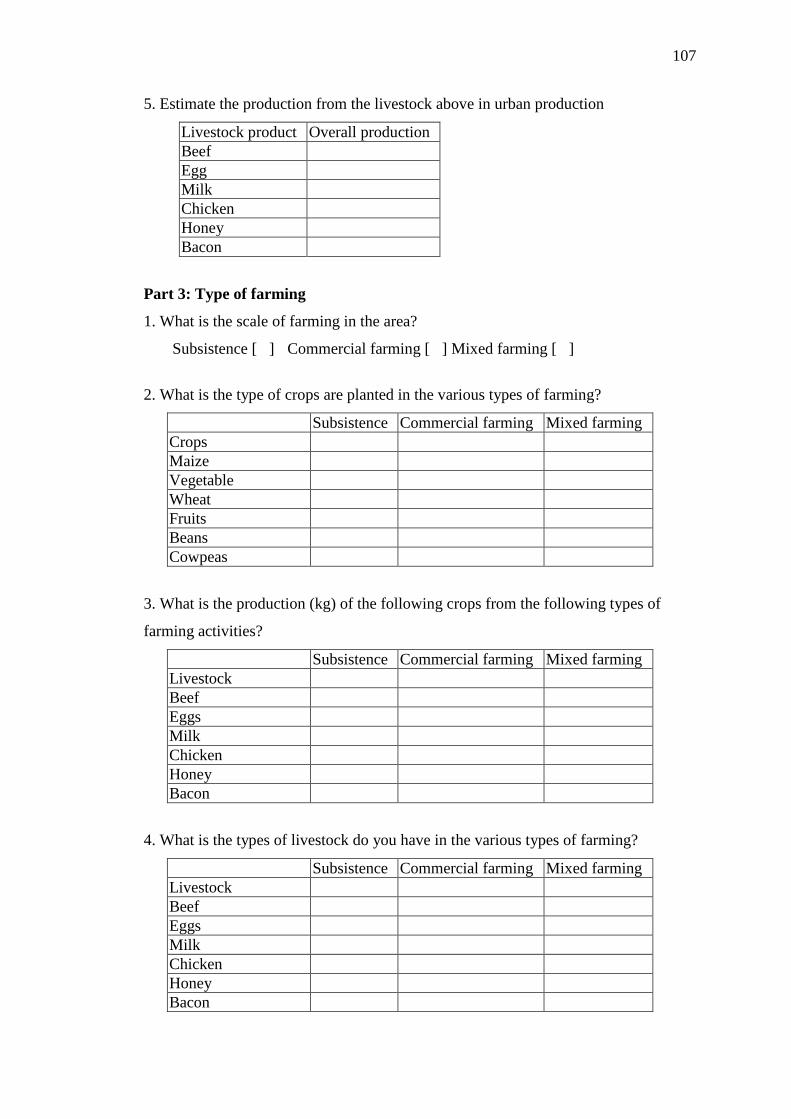
107
5. Estimate the production from the livestock above in urban production
Livestock product Overall production
Beef
Egg
Milk
Chicken
Honey
Bacon
Part 3: Type of farming
1. What is the scale of farming in the area?
Subsistence [ ] Commercial farming [ ] Mixed farming [ ]
2. What is the type of crops are planted in the various types of farming?
Subsistence Commercial farming Mixed farming
Crops
Maize
Vegetable
Wheat
Fruits
Beans
Cowpeas
3. What is the production (kg) of the following crops from the following types of
farming activities?
Subsistence Commercial farming Mixed farming
Livestock
Beef
Eggs
Milk
Chicken
Honey
Bacon
4. What is the types of livestock do you have in the various types of farming?
Subsistence Commercial farming Mixed farming
Livestock
Beef
Eggs
Milk
Chicken
Honey
Bacon
108
5. What is the production do you obtain from the various types of farming?
Subsistence Commercial farming Mixed farming
Livestock
Beef
Eggs
Milk
Chicken
Honey
Bacon
6. What is the type of farming production in urban agriculture in Eldoret Town:
Home gardening [ ] Open space production [ ]
Urban production [ ] Community based production [ ]
Technology based production [ ]
7. Please indicate crop production values (kg) from different types of farming in
Eldoret Town.
Farming production systems Crop production (kgs)
Types of farming Maize Vegetable Wheat Fruits Beans Cowpeas
Home gardening
Open space production
Urban production
Community based production
Technology based production
8. Please indicate livestock production values (kg) from different types of farming in
Eldoret Town.
Livestock production (kgs/litres)
Beef Eggs Milk Chicken Honey Bacon
Home gardening
Open space production
Urban production
Community based production
Technology based production
Part 3: Input used in urban farming
1. What type of inputs do you use in production in your farms?
Organic manures [ ] Hay/sillage [ ] Extruded animal feeds [ ]
Acaracides [ ] Insecticides [ ] Certified seeds [ ] Fertilizers [ ]
Herbicides [ ]
109
2. What is the costs you incur in the above inputs
Inputs Average price per farmer per acre (Kshs.)
Organic manures
Hay/silage
Extruded animal feeds
Acaracides
Insecticides
Certified seeds
Fertilizers
Herbicides
Part 4: Technological innovations in urban agriculture
1. What are some of the challenges do you encounter during urban agriculture
Lack of communication among residents [ ] Lack of space [ ]
Poor farm management [ ] Lack of government support [ ]
Poor physical terrain [ ] Lack of safety [ ] Theft [ ]
Lack of agricultural skills [ ] Lack of farm inputs [ ]
Poor community relations [ ] Low returns of production [ ]
Lack of agricultural infrastructure [ ] Land tenure/cost [ ]
Poor council by-laws [ ]