Analysis of the Sources of Farm Investment Credit in the Upper West Region of Ghana
20
Analysis of the Sources of Farm Investment Credit in the Upper West Region of Ghana Abstract: Among business organizations, farm enterprises predominate in rural areas in Ghana. Successive governments have made several efforts to provide agricultural credit to farmers. However, farm enterprises in the Upper West Region are still faced with the challenge of accessing credit. The study therefore, sought to identify: the sources from which farmers’ access credit, test the hypothesis that average credit allocated to farmers is independent of the source of credit and ascertain the extent of credit allocation to the farm sector. Data were obtained from a survey conducted by the International Food Programme and Research Institute. Descriptive statistics and Analysis of Variance test were the methods of analysis. The Primary data were basically collected from two hundred and fifty (250) food crop farmers selected using a multistage sampling procedure. The study points out that sources of farm investment credit in the region are mainly informal. Average amount of credit given to farmers is independent of the source of credit. Famers allocate credit resources to activities they considered important. It is recommended that any policy aim at increasing the value of farm investment credit to farmers should concentrate on the informal sources. All credit resources should be converted to physical inputs and other services and delivered to farmers to minimize credit diversion from the farm sector. Keywords: Farm Investment Credit; ANOVA; Farming activities, Upper West Region. Motin Bashiru Department of Agricultural Economics and Agribusiness, College of Agriculture and Consumer Sciences, University of Ghana, Legon Moses Dumayiri Department of Banking and Finance, School of Business and Law, University for Development Studies, Ghana Dr. Gordon Terkpeh Sabutey Head of Department & Lecturer, Department of Procurement and Marketing, School of Business and Law, University for Development Studies, Wa Ghana / Inst. of Distance Learning, Kwame Nkrumah University of Science and Technology, Kumasi, Ghana ISSN 2319-9725
-
Upload
universityfordevelopmentstudies -
Category
Documents
-
view
3 -
download
0
Transcript of Analysis of the Sources of Farm Investment Credit in the Upper West Region of Ghana
Analysis of the Sources of Farm Investment Credit in
the Upper West Region of Ghana
Abstract: Among business organizations, farm enterprises predominate in rural areas in Ghana.
Successive governments have made several efforts to provide agricultural credit to farmers.
However, farm enterprises in the Upper West Region are still faced with the challenge of accessing
credit. The study therefore, sought to identify: the sources from which farmers’ access credit, test the
hypothesis that average credit allocated to farmers is independent of the source of credit and
ascertain the extent of credit allocation to the farm sector. Data were obtained from a survey
conducted by the International Food Programme and Research Institute. Descriptive statistics and
Analysis of Variance test were the methods of analysis. The Primary data were basically collected
from two hundred and fifty (250) food crop farmers selected using a multistage sampling procedure.
The study points out that sources of farm investment credit in the region are mainly informal.
Average amount of credit given to farmers is independent of the source of credit. Famers allocate
credit resources to activities they considered important. It is recommended that any policy aim at
increasing the value of farm investment credit to farmers should concentrate on the informal
sources. All credit resources should be converted to physical inputs and other services and delivered
to farmers to minimize credit diversion from the farm sector.
Keywords: Farm Investment Credit; ANOVA; Farming activities, Upper West Region.
Motin Bashiru
Department of Agricultural Economics and Agribusiness,
College of Agriculture and Consumer Sciences, University of
Ghana, Legon
Moses Dumayiri
Department of Banking and Finance, School of Business and
Law, University for Development Studies, Ghana
Dr. Gordon Terkpeh Sabutey
Head of Department & Lecturer, Department of Procurement
and Marketing, School of Business and Law, University for
Development Studies, Wa Ghana / Inst. of Distance Learning,
Kwame Nkrumah University of Science and Technology,
Kumasi, Ghana
ISSN 2319-9725

April, 2014 www.ijirs.com Vol3 Issue 4
International Journal of Innovative Research and Studies Page 957
1. Introduction:
Ghana is an agrarian economy with majority of poor households earning their livelihood from
agricultural activities. As a result, both past and present agricultural development strategies
concentrated much on the delivery of investment capital to rural farmers in particular. In
1968 the Agricultural Development Bank (ADB) was established to provide farm investment
credit to farmers (Asuming-Brempong, 2003). However, rural households who were largely
farmers did not gain from this intervention (National Development Planning Commission,
2003). Later in 2005, the Microfinance and Small Loans Centre (MASLOC) was created by
government to enhance groups and individuals including smallholder farmers’ access to
credit. This is because enhancing farmer access to credit remains a strategy for agricultural
modernisation (National Development Planning Commission, 2005). Several efforts are
being put in place towards developing financial institutions to offer credit to producers. These
credit institutions include State Banks, Private Banks, Cooperatives, Government Agencies,
NGOs, Business firms, Moneylenders and Relatives (Ghana Statistical Service, 2008).
In the Upper West Region, about 86% of the population is engaged in farm businesses as
their source of livelihood (Inkoom and Nanguo, 2011). These farm enterprises are still faced
with the problem of accessing investment credit for production activities despite the
availability of financial institutions. Quaye (2008) observes this and indicates that only 19%
of households in the region have access to credit. Even when access is possible at all, they
receive an average of GH₵150.00 (Ansoglenang, 2006) which is inadequate compared to
their input requirement (Abdulai and Huffman, 2000; Seidu, 2008 and Quaye, 2008). Most
financial institutions offer credit to economic agents in other sectors than those in crop
production. Famers therefore, have a challenge in locating institutions willing to offer
substantial credit for crop production. Reasons with respect to lack of collateral and the
perceived risky nature of crop production resulting from weather, disease and price
uncertainties make value of credit to farmers uncertain. Other credit institutions are of the
view that resource constraint poor farmers often divert loans into other non-farming
activities. Hence the expected returns on investment (ROI) in farming activities is often not
realized thus resulting in loan default. This study therefore, sought to identify the sources
from which farmers access credit and test the hypothesis that average credit allocated to
farmers is independent of the source of credit. The study also sought to ascertain the extend
of credit allocation to farming activities.
April, 2014 www.ijirs.com Vol3 Issue 4
International Journal of Innovative Research and Studies Page 958
1.1. Past Studies on Rural Credit Market in Ghana:
The Ghanaian credit market is decomposed into three segments comprising of formal, semi-
formal and informal institutions (Steel and Andah, 2003; Andah, 2005; and Bending et al.,
2009). The banking sector in Ghana accounts for about 75% of total financial system assets
(Yartey, 2006). This encompasses the Bank of Ghana as the mother bank, commercial banks,
merchant banks and development banks. Others include Social Security Trust, discount
houses, credit unions and rural banks. All formal credit institutions are registered and
regulated by the bank of Ghana. The semi-formal and informal credit institutions are not
regulated by the Bank of Ghana (Andah, 2005). Like other developing economies, credit
market in Ghana is heterogeneous which provides different forms of financial intervention
(Ekumah and Essel, 2001; and Mensah, 2004). This heterogeneity is featured as different
sources of credit exist in the market. As noted by the Ghana Statistical Service (2008),
sources of credit in Ghana compose of State Banks, Private Banks, Cooperatives,
Government Agencies, NGOs, Business firms, Money lenders and Relatives. Those found in
the Upper West Region are NGOs, micro-credit institutions, private lenders and banks
(Ansoglenang, 2006). Despite segmentation of the financial market, there exist significant
interactions between the formal and informal segments in allocation and mobilization of
credit (Aryeetey, 1992).
In Ghana, formal financial institutions are incorporated under the companies code 1963 (Act
179) and licensed by the central bank (Steel and Andah, 2003). These formal institutions
include universal banks, rural and community banks and non-banking financial institutions
such as savings and loans companies (Andah, 2005; Bendig et al, 2009; Awunyo-Victor and
Abankwah, 2012). Credit from formal sources in Ghana is limited and come with huge
collateral. This is because banks are unwilling to lend to smallholder farmers who lack these
collateral and operate in risky ventures (Ghana Statistical Service, 2008; Quartey et al, 2012).
Universal banks such as Agricultural Development Bank have limited coverage within rural
Ghana thus limiting farmers from accessing credit from them, hence lending credit to farmers
is then left to rural banks to play as a major role (Awunyo-Victor and Abankwah, 2012).
Consistent with this premise, Yartey (2006) explains that these rural banks are owned and
managed by rural communities which mobilize savings and extend credit to households in
rural areas. This suggests that where Rural Banks exist, owned and managed by rural
dwellers themselves, access to credit by farmers will be relatively easier.
April, 2014 www.ijirs.com Vol3 Issue 4
International Journal of Innovative Research and Studies Page 959
Semi-formal financial sector are those financial institutions that are formally registered but
not licensed by Bank of Ghana (Steel and Andah, 2003). This implies that their activities are
not very much regulated under the financial sector regulations of Ghana. They fall between
the formal and informal financial markets and include credit unions, village banks and other
credit schemes run by non-governmental organizations. Savings and Loans Companies
(SLCs) also fall under the semi-formal sector which operates under the Financial Institution
(Non- Banking) law 1993 (PNDCL 328) (ISSER, 2011). NGOs are incorporated as
companies limited by guarantee (not for profit) under the Companies Code. They focus on
poverty alleviation using different mechanisms. NGOs in Ghana rely heavily on the use of
external funds for micro credit which are usually provided by donors. This is because they are
not licensed to take deposits from the public. The role and operations of Credit Unions as a
source of credit also appear vital under semi-formal credit institutions. These institutions
according to Aryeetey and Gockel (1991) were first introduced in Ghana by Roman Catholic
fathers. Credit Unions operate as cooperative societies aimed at providing savings and loans
facilities only to their members (Andah, 2005). Individual members make predetermined
periodic deposits into their accounts and may borrow up to two times their savings balance.
Most Credit Unions require borrowers to provide security in a form of a guarantee from a co-
member (Steel and Andah, 2003).
Informal credit financial activities are usually demand-driven generated entirely by the needs
of the market place. They consist of a large number of activities of unregulated transactions
carried out by individuals and intermediaries such as moneylenders, private finance firms,
savings and credit institutions, traders, landlords and households (Montiel et al., 1993). In
their analysis of the rural credit market in Ghana, Owusu-Antwi and Antwi (2010) identify
major components of the informal market as group lenders, moneylenders, “Susu” Collector
and Warehouse Receipt Credit. Susu collectors usually deposit money collected with the
bank, invest in their own business or lend to others (Aryeetey, 1992). This creates linkages
with the formal credit markets (banks) through savings and within informal operators through
lending. Alabi et al., (2007) recognise the role of the traditional informal banking system
such as the “Susu” credit scheme in enterprise development. They agreed that participants in
such schemes develop some kind of interpersonal relationships beyond financial product to a
welfare product where individuals have some kind of belongingness. This implies that the
informal financial market in Ghana do not only performs financial role but socio-cultural
roles as well. This according to Aryeetey (2008) is a mechanism of minimizing loan default

April, 2014 www.ijirs.com Vol3 Issue 4
International Journal of Innovative Research and Studies Page 960
since informal institutions establish good relationships with their borrowers and by Montiel et
al., (1993) perspective; minimize moral hazards and lowering monitoring cost.
Credit market in Ghana is faced with a number of challenges which affect growth in other
sectors of the economy. Easterling et al., (2008) analyse factors affecting economic growth of
Ghana. In their analysis, they identify weaknesses associated with the financial market to
include slow expansion of the rural banking sector, limited banking coverage, limited
financial instruments and limited collateral. Due to the absence of collateral, households in
the agricultural sector are limited in taking credit from the formal market. This according to
Easterling et al., (2008) limits agricultural development. In their analysis of factors hindering
the effectiveness of the rural credit market in Ghana, Owusu-Antwi and Antwi (2010)
emphasize the role of high interest rate, lack of collateral, inadequate innovation and high
delinquency as major challenges. Schremer and Colombet (2001) point out that, credit
institutions often give loans to only rich people, when they are unable to repay, it reduces
access for all. This suggests that the conditions of credit delivery for investment are not
reinforcing effective supply of investment funds. These supply side challenges result in
limited access to credit by producers. Government policies such as tax systems in many
African countries tend to constraint informal markets (Tripp, 2001). What this implies is that
appropriate policies have not been put in place towards the development of the sector. The
informal credit sector has therefore, been neglected to survive on its own as such credit
institutions are under no regulation or formal registration (Andah, 2005). The operators of the
“Susu” system for instance are not insured, characterised by irregular payment by
contributors and fraudulent people who default the vulnerable (Alabi et al., 2007). Earlier
studies such as Mensah (2004) indicate that informal financing schemes in Ghana have not
been effective due to inadequate institutional framework, lack of legal and regulatory
framework, low managerial capacity and training. Informal sources of credit are therefore
very expensive because of high interest rates (Quartey et al., 2012) and moneylenders in
particular require collateral and strict loan recovery procedures which deter farmers from
accessing credit (Awunyo-Victor and Abankwah, 2012).
Agricultural institutions especially in the developing world sometimes fail to achieve their
goal of enhancing farmer productivity through resource allocation to the farm sector. Efforts
to enhance farmers’ access to inputs such as credit are often limited through diversion of
agricultural loans into non-farming activities. Several empirical studies report that farmers
often allocate some portion of borrowed funds into non-farming activities as against the
purpose of which such loans have been obtained. Consistent with this observation, Anyiro
April, 2014 www.ijirs.com Vol3 Issue 4
International Journal of Innovative Research and Studies Page 961
and Oriaku’s (2011) results indicate that only 16.66% of small holder farmers in Abia State
(Nigeria) used their loans on crop production as in line with the purpose of which the loans
were given. Some diverted into crop and animal production (19.79%). The rest diverted into
other agricultural activities but not related to crop production. Henri-Ukoha et al., (2011)
report low (12.15%) diversion of loans into non-farming activities in Abia State, South East
Nigeria. The rest invested in purchasing farm tools, buying inputs such as seeds, chemicals,
fertilizers and land preparation. Mishra and Nayak (2004) are of the view that the effect of
credit on the individual borrower depends on the utilization of the loan. Farmers often have
the tendency to misuse agricultural credit and therefore will not feel its impact on their
livelihood. They underutilize credit for investment purposes by devoting it to personal
consumption (Waheed, 2009). This indicates misdirection of loans since agricultural credit is
to serve as an investment capital and not meant for personal consumption. Besides, Oboh and
Ekpebu (2011) report that 56.1% of loans obtained by arable crop farmers in the Benue State
in Nigeria are used for the purpose in which such loans were obtained while 43.9% diverted
to non-farming purpose. A further analysis of the average budget share as a measure of the
percentage of total credit spent on farming activities shows that age of the farmer, farm size,
years of education, and frequency of bank visit have direct influence on credit allocation to
the farm sector.
Amonoo et al., (2003) postulate that when beneficiaries receive loans late, they tend to
misused them which translate into low output and inability to repay. Oboh and Ekpebu
(2011) share the same opinion when they argue that increase in length of loan delayed and
household size reduce the percentage of loan allocation to the farm sector. Oboh et al., (2011)
support that the marginal budget shares of credit for farm and non-farm sectors are 55.5% and
45.5% respectively. They argue that small loan size disbursement to resource poor farmers
have high tendency for diversion to settle minor non-farm expenses hence, the rate of loan
diversion was observed to increase with decreasing loan size, partial disbursement and loan
management training. Eze and Ibekwe (2007), however, share a divergent view about loan
diversion. They argue that if an approve loan is larger than the farmer can manage, there will
be a high tendency for loan diversion. Nimoh et al., (2011) investigated into the effect of
formal credit on the performance of the poultry industry in urban and pre-urban Kumasi in
Ghana. They, however, observe no diversion of loans into non-farming activities among the
farmers. They maintain that, formal credit institutions place much emphasis on how credit
received should be utilized thus minimizing the rate of loan diversion.
April, 2014 www.ijirs.com Vol3 Issue 4
International Journal of Innovative Research and Studies Page 962
It has been observed that different researchers share varied opinion on what actually cause
loan diversion. As some attribute it to inadequate loan amount, others believe that larger loan
size causes its diversion. This implies that credit allocation to the farm sector is influence by
several factors which may vary from institution to institution at different places. This
underscores the need to investigate into credit allocation to the farm sector among farmers in
the Upper West Region.
2. Materials And Methods:
2.1. Data and Variables:
Data were obtained from a survey conducted by the International Food Programme and
Research Institute (IFPRI) in December, 2012 to cover production activities for the 2011
agricultural year. The Primary data were basically collected from two hundred and fifty (250)
food crop farmers selected using a multistage sampling procedure. On the first stage, one
municipality and three (3) districts in the Upper West Region were selected based on their
significant production activities. They were the Wa Municipality, Wa West District, Wa East
District and Nadowli District. Twenty-five (25) farming communities in these municipality
and districts were selected at random in the second stage and finally, ten (10) farmers were
randomly selected as respondents from each community. This constitutes a total sample size
of two hundred and fifty (250) respondents.
2.2. Analytical Framework:
To analyse the sources from which farmers’ access credit descriptive statistics was employed.
Besides, the one way Analysis of Variance (ANOVA) technique was used to test the null
hypothesis that average credit receive by farmers is independent of the source. The
hypothesis tested is stated below:
:
:
ANOVA uses F-statistics for the validation of hypothesis. Opoku (2006) specifies the F-
statistics for this type of computational procedure as:

April, 2014 www.ijirs.com Vol3 Issue 4
International Journal of Innovative Research and Studies Page 963
( )
Where:
and
The variation of the observations about the sample grand mean is the Sum Squares
Total( ) specified as:
∑ (∑ )
Where:
N is the size of the sample (total number of farmers), is number of farmers from an ith
source and X is the amount of credit received. The sum squares between groups ( )
measures the departure from the null hypothesis which is the variation in the sample means
(average credit from source i) about the sample grand mean measured by:
[(∑ )
(∑ )
(∑ )
(∑ )
]
(∑ )
While the sum of the variations of the individual observations about the corresponding
sample means is the Sum Squares within groups ( ) specified as:
[∑
(∑ )
] [∑
(∑ )
] [∑
(∑ )
]
The decision is to reject the null hypothesis if F-calculated value is greater than its
tabulated/critical value at a particular significance level.
Farmers sometimes do not invest the entire amount of credit obtained in the farm sector as
proposed by most credit schemes. The percentage of loan allocated to the farm sector by the
farmer is the measure of farm investment. Credit allocation to farming activities is believed to
have varied according to the farm enterprise characteristics. This was described using
descriptive statistics.

April, 2014 www.ijirs.com Vol3 Issue 4
International Journal of Innovative Research and Studies Page 964
3. Results And Discussions:
3.1. Summary Statistics:
Out of two hundred and fifty (250) farmers investigated, male farmers constitute 68.4% of the
sample and female farmers represent 31.6%. In the Upper West Region farming is
predominantly done by men while females are more into petty trading and agro-processing
thus accounting for the relatively larger representation of male population in the sample than
that of female. More married people (95.6%) are engaged in farming than those not currently
married. Only 0.8% of the sample is divorced, 1.2% widowed/widower and 2.4% not entered
into marital relationship at all (single). The preponderance of married people over other
groups in farming implies that the farmers are responsible. The Upper West Region is
inhabited by farmers of several ethnic backgrounds but the dominant ones are the Wala and
Dagaabas. Wala constitute lager proportion of the sample (56.0%) while Dagaabas represent
41.6%. other groups are the Brefor and Sissala who constitute 1.6% and 0.8% respectively.
Sissala are much concentrated in the Sissala East and Sissala West Districts which are not
included in the sample districts thus explaining their smaller representation in the sample.
Each farmer belongs to one of the three main religions in the region. However, majority
(61.6%) of those in the sample practise Islam followed by Christianity (30.4%) while only
small proportion (8.0%) practise African Traditional Religion (ATR).
3.2. Sources of Credit:
Empirical studies have shown that farmers receive credit largely from informal and semi-
formal credit institutions. This study obtains similar results with an exception that no
evidence of credit received by a farmer from a microfinance institution, Credit Union or a
moneylender is recorded. Precisely, the sources of credit to farmers in the region include
relatives/friends, traders, “susu”, non-Governmental Organization and credit from
Government. These findings agree with empirical studies that access to bank credit in
particular by rural households in the region is out of reach (Ansoglenang, 2006; Ghana
Statistical Service, 2008; Marchetta, 2011). These institutions give the credit in kind or cash
to farmers. Credit in kind is usually in the form of inputs or services such as extension. Credit
can also be given to farmers in a form of group or individual credit. Group credit is when two
or more farmers belonging to the same social group receive credit for the same purpose.
Credit institutions may require collateral in the form of assets or membership to a Farmer
Based Organization. Besides, credit institutions may require payment in kind or cash at

April, 2014 www.ijirs.com Vol3 Issue 4
International Journal of Innovative Research and Studies Page 965
different repayment periods. All these distinct features including the amount of credit given
vary from institution to institution as evidenced from the survey. Summary statistics of these
sources is presented in Table 1.
Credit Source Frequency Percentage
Relatives/Friends 51 33.1
Traders 24 15.6
“Susu” 12 7.8
NGO 19 12.3
Government 48 31.2
Total 154 100
Source: Field Survey, 2012
Table 1: Summary of Sources of Credit
From Table 1, majority (33.1%) of the farmers access credit from relatives and friends. Nest
to this category is credit from government (31.2%). Farmers who access credit from traders
constitute 15.6% while those accessing credit from NGOs constitute 12.3%. It was
discovered that only 7.8% of credit beneficiaries access it from “Susu”. Further discussions
of the sources of credit available to farmers in the region are as follows:
3.3. Relatives/ Friends:
Credit from relatives and friends of households is a form of informal credit in the region. Out
of the 154 respondents who accessed credit 33.1% of them received it from relatives/friends.
The proportion of farmers accessing credit from this source is relatively higher than any other
source thus making it the predominant source among farmers. The survey has revealed that
credit from relatives/friends is often in the form of cash, requires no collateral and given to
farmers as individuals. From Table 2, average credit given is GH₵293.60 with standard
deviation of 185.0 ranging from GH₵40.0 to GH₵1000.0. This finding agrees with the
submission made by Abdulai and Huffman (2000), Seidu (2008) and Quaye (2008) that
average credit available to farmers in the region is inadequate compared to their input
requirement. This source of credit is basically short term of 5.3 months on average ranging
from 3 to 12 months. The average repayment period being 5.3 months imply that
relatives/friends offer credit to farmers just to assist them carry some specific short term
activities rather than the entire farm operation which will cover a period of one year. Farmers

April, 2014 www.ijirs.com Vol3 Issue 4
International Journal of Innovative Research and Studies Page 966
who received credit from this source have average farm size, farm asset, farm income, total
household income and farming experience lower than the sample averages.
Source of
Credit
N Mean Std.
Deviatio
n
Std.
Error
95%
Confidence for
Mean
Min Maxi
Lower
Bound
Upper
Bound
Relatives/Friend
s
51 293.5
7 185.01 25.91
241.5
3 345.60
40.00 1000.00
Trader 24 291.3
3 164.27 33.53
221.9
7 360.70
100.0
0
900.00
Susu 12 235.4
2 249.19 71.94 77.09 393.75
75.00 1000.00
NGO 19 376.1
9 556.05
127.5
7
108.1
8 644.20
40.00 2483.60
Government 48 851.8
5 2845.29
410.6
8 25.67
1678.0
4
72.00 20000.0
0
Total 15
4
472.8
9 1615.40
130.1
7
215.7
3 730.06
40.00 20000.0
0
Source: Field Survey, 2012
Table 2: Descriptive Statistics of Credit Amount Received by Source (GH₵)
3.4. Trader Credit:
Traders here are usually market women who often buy farm produce from farmers at the farm
gate or some organised market centres. From Table 1, 15.6% among credit beneficiaries
accessed it from traders. Trader credit is the third dominant credit sources to farmers. From
Table 2, average credit obtained by farmers from traders is GH₵ 291.30 with a standard
deviation of 164.3. The minimum and maximum amount received are GH₵ 100.0 and GH₵
900.0 respectively. Farmers in the region find trader credit convenient because such traders
serve as source of effective demand for their produce. Traders know the exact location of
farmers and therefore can purchase the produce at the farm gate thus reducing the
transportation cost of farmers.
April, 2014 www.ijirs.com Vol3 Issue 4
International Journal of Innovative Research and Studies Page 967
3.5. Non-Governmental Organization:
Non-Governmental Organizations (NGOs) exist in the region with some of their objectives
being to provide credit support to farmers. For instance, Pronet North, WIDO, Centre for
Indigenous Knowledge and Organisational Development (CIKOD), and Rural Women
Farmers Association of Ghana (RUWFAG) can be mentioned in this regard. They are non-
profit making organizations seeking to raise the average income of farmers through adoption
of better farming practices. They provide credit in kind to farmers usually in the form of input
supply such as seeds, fertilizer, tractor service and insecticides. Apart from credit from
Government, average credit given to farmers in the region by NGOs is higher than other
sources of credit. Farmers received an average of GH₵376.19 with repayment done in either
cash or in kind. Payment in kind is in the form of farm produce usually cereals.
3.6. “Susu”:
It is a common practice among farmers in the region to come together and make contributions
in the form of savings. Members can therefore take credit from this contribution for
enterprise development. This kind of credit source is slightly different from what has been
described by Owusu-Antwi and Antwi (2010) that “Susu” collectors are informal financial
providers who supply farmers with short-term financial needs suggesting that the collectors
are on one side; providing credit to farmers on the other side. However, this kind of “Susu”
exists in the region but what is accessible to farmers is the one formed by the farmers
themselves. The survey has shown that the value of credit given to a farmer depends on the
level of contribution made. All credit received from this source was in a form of cash,
required no collateral with no repayment in kind accepted. This however, is not a dominant
source of credit as it is not found in many of the study communities. Out of the 154 farmers
who received credit only 7.8% of them sourced credit from this kind of “Susu” formation.
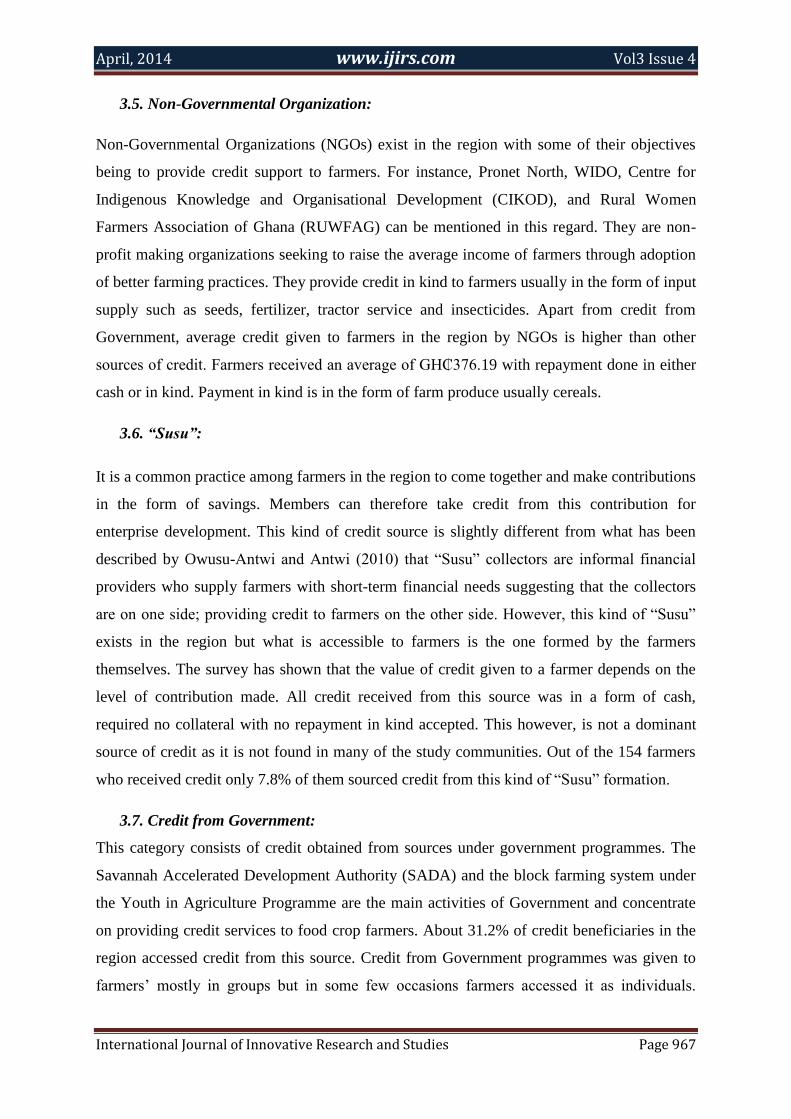
3.7. Credit from Government:
This category consists of credit obtained from sources under government programmes. The
Savannah Accelerated Development Authority (SADA) and the block farming system under
the Youth in Agriculture Programme are the main activities of Government and concentrate
on providing credit services to food crop farmers. About 31.2% of credit beneficiaries in the
region accessed credit from this source. Credit from Government programmes was given to
farmers’ mostly in groups but in some few occasions farmers accessed it as individuals.
April, 2014 www.ijirs.com Vol3 Issue 4
International Journal of Innovative Research and Studies Page 968
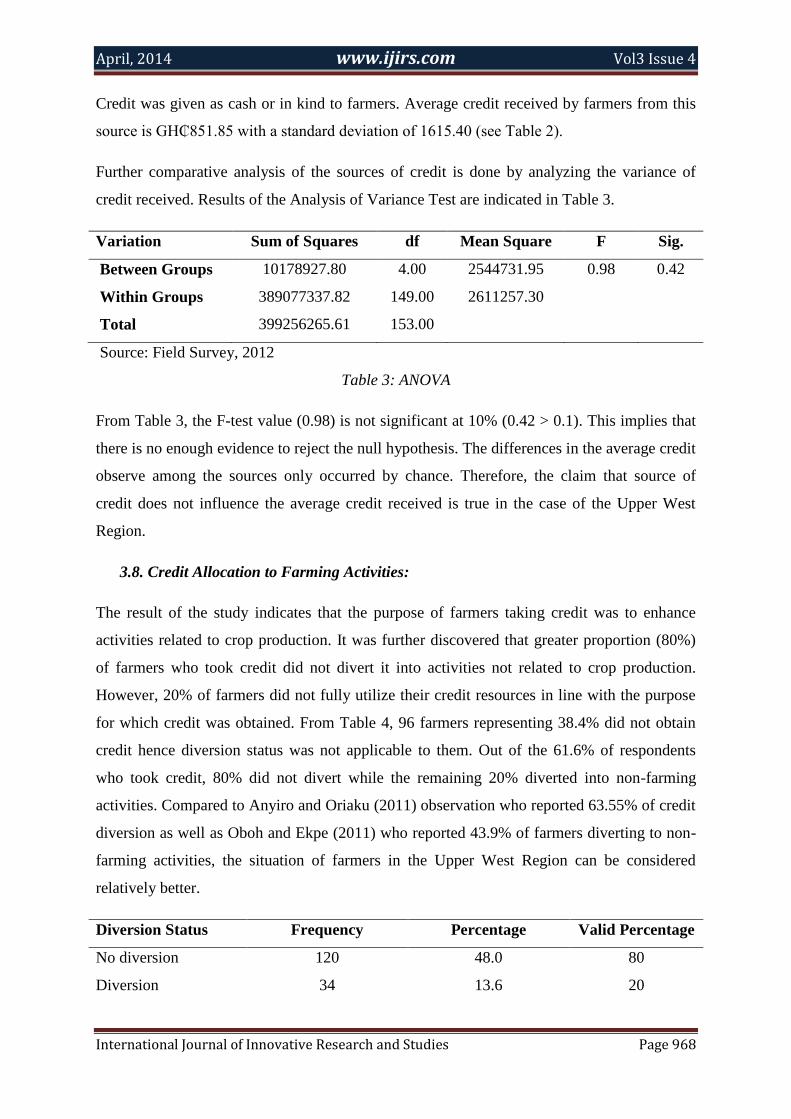
Credit was given as cash or in kind to farmers. Average credit received by farmers from this
source is GH₵851.85 with a standard deviation of 1615.40 (see Table 2).
Further comparative analysis of the sources of credit is done by analyzing the variance of
credit received. Results of the Analysis of Variance Test are indicated in Table 3.
Variation Sum of Squares df Mean Square F Sig.
Between Groups 10178927.80 4.00 2544731.95 0.98 0.42
Within Groups 389077337.82 149.00 2611257.30
Total 399256265.61 153.00
Source: Field Survey, 2012
Table 3: ANOVA
From Table 3, the F-test value (0.98) is not significant at 10% (0.42 > 0.1). This implies that
there is no enough evidence to reject the null hypothesis. The differences in the average credit
observe among the sources only occurred by chance. Therefore, the claim that source of
credit does not influence the average credit received is true in the case of the Upper West
Region.
3.8. Credit Allocation to Farming Activities:
The result of the study indicates that the purpose of farmers taking credit was to enhance
activities related to crop production. It was further discovered that greater proportion (80%)
of farmers who took credit did not divert it into activities not related to crop production.
However, 20% of farmers did not fully utilize their credit resources in line with the purpose
for which credit was obtained. From Table 4, 96 farmers representing 38.4% did not obtain
credit hence diversion status was not applicable to them. Out of the 61.6% of respondents
who took credit, 80% did not divert while the remaining 20% diverted into non-farming
activities. Compared to Anyiro and Oriaku (2011) observation who reported 63.55% of credit
diversion as well as Oboh and Ekpe (2011) who reported 43.9% of farmers diverting to non-
farming activities, the situation of farmers in the Upper West Region can be considered
relatively better.
Diversion Status Frequency Percentage Valid Percentage
No diversion 120 48.0 80
Diversion 34 13.6 20

April, 2014 www.ijirs.com Vol3 Issue 4
International Journal of Innovative Research and Studies Page 969
Non-Response 96 38.4 -
Total 250 100 100
Source: Field Survey, 2012
Table 4: Diversion Status of Credit Beneficiaries
Farmers received an average of GH₵472.90, spent an average of GH₵448.14 of credit on
farming activities and diverted an average of GH₵25.39 of credit to non-farming activities.
Descriptive statistics of credit received, spent and diverted is shown in Table 5.
Variable N Minimum
Value
Maximum
Value
Mean
Value
Standard
Deviation
Credit Amount 154 40 20000 472.90 1615.40
Amount Spent 154 40 20000 448.14 1609.65
Amount Diverted 154 0 980 25.39 108.87
Source: Field Survey, 2012
Table 5: Descriptive Statistics of the Amount of Credit Received, Spent and Diverted
A further analysis of credit -allocation to the farm sector is done. From Table 6, there exists
no evidence of credit diversion from “Susu” and NGO. The non-diversion from NGO may be
associated with credit given in kind accompanied by strict supervision. The case of “Susu”
can be associated with the small value of credit received thus agreeing to the argument
postulated by Eze and Ibekwe (2007) that if an approved loan is higher than the farmer can
manage, there will be a high tendency for loan diversion. The reverse may hold for other
sources of credit where there was evidence of credit diversion.
Source of Credit Amount
Received
Amount
Spent
Amount
Diverted
Percent Spent Percent
Diverted
Relatives/Friends 293.57 278.24 15.33 94.78 5.22
Traders 291.33 267.17 24.17 91.70 8.30
“Susu” 235.42 235.42 0.00 100 0.00
NGO 376.19 376.19 0.00 100 0.00
Government 85 1.85 800.81 51.04 94.00 6.00
Total 472.89 448.14 24.75 94.77 5.23
Source: Field Survey, 2010
Table 6: Average Credit (GH₵) Allocated to the farm Sector by Sources
April, 2014 www.ijirs.com Vol3 Issue 4
International Journal of Innovative Research and Studies Page 970
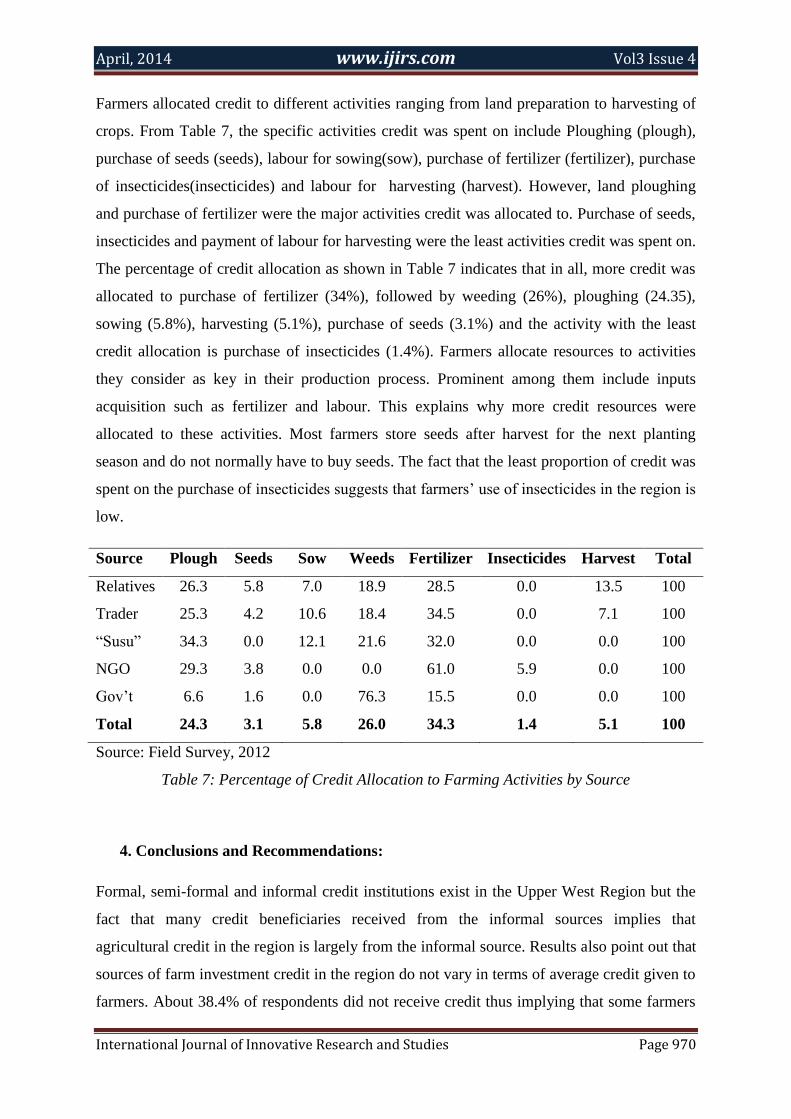
Farmers allocated credit to different activities ranging from land preparation to harvesting of
crops. From Table 7, the specific activities credit was spent on include Ploughing (plough),
purchase of seeds (seeds), labour for sowing(sow), purchase of fertilizer (fertilizer), purchase
of insecticides(insecticides) and labour for harvesting (harvest). However, land ploughing
and purchase of fertilizer were the major activities credit was allocated to. Purchase of seeds,
insecticides and payment of labour for harvesting were the least activities credit was spent on.
The percentage of credit allocation as shown in Table 7 indicates that in all, more credit was
allocated to purchase of fertilizer (34%), followed by weeding (26%), ploughing (24.35),
sowing (5.8%), harvesting (5.1%), purchase of seeds (3.1%) and the activity with the least
credit allocation is purchase of insecticides (1.4%). Farmers allocate resources to activities
they consider as key in their production process. Prominent among them include inputs
acquisition such as fertilizer and labour. This explains why more credit resources were
allocated to these activities. Most farmers store seeds after harvest for the next planting
season and do not normally have to buy seeds. The fact that the least proportion of credit was
spent on the purchase of insecticides suggests that farmers’ use of insecticides in the region is
low.
Source Plough Seeds Sow Weeds Fertilizer Insecticides Harvest Total
Relatives 26.3 5.8 7.0 18.9 28.5 0.0 13.5 100
Trader 25.3 4.2 10.6 18.4 34.5 0.0 7.1 100
“Susu” 34.3 0.0 12.1 21.6 32.0 0.0 0.0 100
NGO 29.3 3.8 0.0 0.0 61.0 5.9 0.0 100
Gov’t 6.6 1.6 0.0 76.3 15.5 0.0 0.0 100
Total 24.3 3.1 5.8 26.0 34.3 1.4 5.1 100
Source: Field Survey, 2012
Table 7: Percentage of Credit Allocation to Farming Activities by Source
4. Conclusions and Recommendations:
Formal, semi-formal and informal credit institutions exist in the Upper West Region but the
fact that many credit beneficiaries received from the informal sources implies that
agricultural credit in the region is largely from the informal source. Results also point out that
sources of farm investment credit in the region do not vary in terms of average credit given to
farmers. About 38.4% of respondents did not receive credit thus implying that some farmers

April, 2014 www.ijirs.com Vol3 Issue 4
International Journal of Innovative Research and Studies Page 971
still face challenges in accessing credit. Famers allocate credit resources more to activities
they considered more important and these include purchasing of fertilizer, weeding,
ploughing, purchase of seeds, insecticides and harvesting. Some farmers diverted some
portion of credit resources to non-farming activities thus implying that they will not be able
to generate the expected returns from the purpose for which credit was obtained. This reduces
farmers’ access to credit from some institutions. It is therefore, recommended that any policy
aim at increasing the value of farm investment credit to farmers should be directed to the
informal. To minimize credit diversion to non-farming activities, credit institutions should
not give credit in cash to farmers. All credit resources should be converted to physical inputs
and other services and delivered to farmers.
Acknowledgement
The authors therefore, acknowledged the International Food Programme and Research
Institute (IFPRI) for making its survey data available to carry out this study.
April, 2014 www.ijirs.com Vol3 Issue 4
International Journal of Innovative Research and Studies Page 972
References:
1. Abdulai, A. and Huffman, W. (2000). Structural adjustment and economic efficiency
of rice farmers in Northern Ghana. Economic Development and Cultural Change,
48(3): 503–20.
2. Alabi, G., Alabi, J., and Akrobo, S. T. (2007). The Role Of “Susu” A Traditional
Informal Banking System In The Development Of Micro And Small Scale Enterprises
(MSEs) In Ghana, International Business & Economic Research journal 6(12), 99-
116.
3. Amonoo, E., Acquah, P. K. and Ansmah, E. E (2003). The Impact of Interest Rate on
Demand for Credit and Loan Repayment by the Poor and SMEs in Ghana. IFLIP
Research Paper, 03-10, International Labour Organization
4. Andah, D. O. (2005). Regulation, Supervision and Access to Micrifinance: The case
of Ghana. Essays on Regulation and Supervision, No. 10, The Microfinance
Regulation And Supervision Resource Center.
5. Ansoglenang, G. (2006) Rural Women and Micro-credit Schemes: Cases from the
Lawra District of Ghana. MPhil Thesis Submitted to the Faculty of Social Science,
University of Tromsø, Norway.
6. Anyiro, C.O. and Oriaku, B.N. (2011). Access to and Investment of Formal Micro
Credit by Small holder Farmers in Abia State, Nigeria. A case Study of Absu Micro
finance Bank, Uturu. The Journal of Agricultural Sciences, 2011, vol.6, no. 2
7. Aryeetey, E. (1992). The Relationship between the Formal and Informal Sectors of
the Financial Market in Ghana. Centre for the Study of African Economies, Oxford
8. Aryeetey, E. (2008). From Informal Finance to Formal Finance in Sub-Saharan
Africa: Lessons from Linkage Efforts. African Finance for the 21st Century High-
Level Seminar organized by the IMF Institute in collaboration with the Joint Africa
Institute Tunis, Tunisia, March 4–5, 2008
9. Aryeetey, E. and Gockel, F. (1991). Mobilizing domestic resource for capital
formation in Ghana; The role of the informal financial sectors. The African
Economic Research Consortium, AERC Research Paper 3
10. Asuming-Brempong, S. (2003). Economic and Agricultural Policy Reforms and their
Effects on the Role of Agriculture in Ghana. Roles of Agriculture Project International
Conference 20-22 October, 2003, Rome: Italy
April, 2014 www.ijirs.com Vol3 Issue 4
International Journal of Innovative Research and Studies Page 973
11. Awunyo-Vitor D. and Abankwah, V. (2012). Substitutes or Complements? Formal
and Informal Credit Demand by Maize Farmers in Ashanti and Brong Ahafo Regions
of Ghana. International Journal of Agriculture and Forestry, 2(3): 105-112
12. Bending, M., Giesbert, L. and Steiner, S. (2009). Savings, Credit and Insurance:
Household Demand for Formal Financial Services in Rural Ghana. German Institute
of Global and Area Studies, Research Programme: working papers, No. 94.
13. Easterling, T., Fox, J. W. and Sands, F. B. (2008). Factors Affecting Economic
Growth in Ghana: Bases for a New USAID Approach to Economic Growth.Prepared
for USAID/Ghana, Sibley International
14. Ekumah, E.K. and Essel, T.T. (2001). Gender Access to Credit under Ghana's
Financial Sector Reform: A Case Study of Two Rural Banks in the Central Region of
Ghana. IFLIP Research Paper 01-4, International Labour Organization.
15. Eze, C. C. and Ibekwe, U. C. (2007). Determinants of Loan Repayment under
Indigenous Financial System in South East Nigeria. Soc. Sci., 2(2). 116-120Lyne2
16. Ghana Statistical Service, (2008). Ghana Living Standards Survey, Report of the Fifth
Round. Republic of Ghana Statistical Service, Accra, Ghana.
17. Henri-Ukoha, A., Orebiyi, J. S., Obasi, P. C., Oguoma, N. N., Ohajianya, D. O.,
Ibekwe, U. C. and Ukoha I. I. (2011). Determinants of Loan Acquisition from the
Financial Institutions by Small-scale Farmers in Ohafia Agricultural Zone of Abia
State, South East Nigeria. Journal of Development and Agricultural Economics Vol.
3(2): 69-74.
18. Inkoom, B. K. and Nanguo, Z. C. (2011). Utilization of Irrigation Facilities Towards
Poverty Reduction in the Upper West Region of Ghana. Journal of Sustainable
Development in Africa, 13, 335-351
19. Institute of Statistical, Social and Economic Research (2011). The State of the
Ghanaian Economy in 2010. Institute of Statistical, Social and Economic Research,
University of Ghana, Legon.
20. Marchetta, F. (2011). On the Move Livelihood Strategies in Northern Ghana. Post-
Doctorante CNRS, Clermont Université, Universitéd’Auvergne, CNRS, UMR 6587,
Centre d’Etudes et de Recherchessur le Développement International (CERDI), F-
63009 Clermont-Ferrand, France.
21. Mensah, S. (2004). A Review of Some Financing Schemes in Ghana. Presented at the
UNIDO Regional Workshop of Financing Small and Medium Scale Enterprises,
Accra, Ghana, 15-16 March 2004

April, 2014 www.ijirs.com Vol3 Issue 4
International Journal of Innovative Research and Studies Page 974
22. Mishra, B. and Nayak (2004). Limits of Micro Credit for Rural Development: A
Cursory Look. Published in J.K. Gogoi (eds.) Rural Indebtedness in North East India,
Dibrugarh University, Assam, 2004, pp.185-200
23. Montiel, P. J., Agenor, P. and Nadeem, H. U. (1993). Informal Financial Markets in
Developing Countries. A Macroeconomic Analysis, Blackwell Publishers, UK
24. National Development Planning Commission, (2003), Ghana Poverty Reduction
Strategy (Volume I): 2003 -2005, An Agenda for Growth and Prosperity, Republic of
Ghana, Accra.
25. National Development Planning Commission, (2005), Growth and Poverty Reduction
Strategy (GPRS II): 2006 -2009, National Development Planning Commission,
Republic of Ghana, Accra.
26. Nimoh, F., Kwasi, A. and Tham-Agyekum, E. K. (2011). Effect of Formal credit on
the Performance of the Poultry Industry: The case of Urban and Peri-urban Kumasi in
the Ashanti Region. Journal of Development and Agricultural Economics Vol. 3(6):
236-240.
27. Oboh, V. U. and Ekpebu, I. D. (2011). Determinants of Formal Agricultural Credit
Allocation to the Farm Sector by Arable Crop Farmers in Benue State, Nigeria.
African Journal of Agricultural Research Vol. 6(1), 181-185
28. Oboh, V. U., Nagarajan, L. and Ekpebu, I. D. (2011). A Marginal Analysis of
Agricultural Credit Allocation by Arable Crop Farmers in Benue State, Nigeria.
Current Research Journal of Social Sciences 3(2): 81-86, 2011
29. Opoku, J. Y. (2006). Tutorials in Inferential Social Statistics (Second ed.). Ghana
Universities Press, Accra.
30. Owusu-Antwi, G. and Antwi, J. (2010). The Analysis of the Rural Credit Market in
Ghana. International Business and Economics Research Journal.Vol, 9 (8).
31. Quartey, P. Udry, C. Al-hassan S. and Seshie H. (2012). Agricultural financing and
credit constraints: the role of middlemen in marketing and credit outcomes in Ghana.
Institute of Statistical, Social and Economic Research, University of Ghana: Ghana.
32. Quaye, W. (2008). Food Security Situation in Northern Ghana, Coping Strategies and
Related Constraints. African Journal of Agricultural Research 3 (5), 334-342.
33. Schreiner, M. and Colombet, H. H. (2001). From Urban to Rural: Lessons for
Microfinance from Argentina. Development Policy Review Vol. 19 (3): 339-354
34. Seidu, A. (2008). Technical Efficiency of Rice Farmers in Northern Ghana. African
Research Consortium, Nairobi
April, 2014 www.ijirs.com Vol3 Issue 4
International Journal of Innovative Research and Studies Page 975
35. Steel, W. F. and Andah, D. O. (2003). Review of Rural and Micro Finance Regulation
in Ghana: Implication for Rural development and Performance of the Industry. Africa
Region Working Paper Series No. 49
36. Tripp, A. M. (2001). Non-formal Institutions, Informal Economies and the Politics of
Inclusion. World Institute for Development Economics Research Discussion Paper
No. 2001 / 108
37. Waheed, S. (2009). Does rural micro credit improve well-being of borrowers in the
punjab (pakistan )? Pakistan Economic and Social Review, 47(1), 31-47.
38. Yartey, A. (2006). The Stock Market and the Financing of Corporate Growth in
Africa: The Case of Ghana. IMF Working Paper. International Monetary Fund.