Analysis of the Cycling Flow Between Origin and Destination ...
13
International Journal of Geo-Information Article Analysis of the Cycling Flow Between Origin and Destination for Dockless Shared Bicycles Based on Singular Value Decomposition Min Cao 1,2,3 , Boqin Cai 1,2,3 , Shangjing Ma 1,2,3 , Guonian Lü 1,2,3 and Min Chen 1,2,3, * 1 Key Laboratory of Virtual Geographic Environment, Nanjing Normal University, Ministry of Education, Nanjing 210023, China; [email protected] (M.C.); [email protected] (B.C.); [email protected] (S.M.); [email protected] (G.L.) 2 State Key Laboratory Cultivation Base of Geographical Environment Evolution, Nanjing 210023, China 3 Jiangsu Center for Collaborative Innovation in Geographical Information Resource Development and Application, Nanjing 210023, China * Correspondence: [email protected] Received: 18 October 2019; Accepted: 9 December 2019; Published: 11 December 2019 Abstract: Recently, an increasing number of cities have deployed bicycle-sharing systems to solve the first/last mile connection problem, generating a large quantity of data. In this paper, singular value decomposition (SVD) was used to extract the main features of the cycling flow from the origin and destination (OD) data of shared bicycles in Beijing. The results show that (1) pairs of OD flow clusters can be derived from the pairs of vectors after SVD, and each pair of clusters represents a small part of an area with dockless shared bicycles; (2) the spatial clusters derived from the top vectors of SVD are highly coincident with the hot spot areas in the heatmap of shared bicycles; (3) approximately 30% of the study area accounts for nearly 80% of bike riding; (4) nearly 70% of the clustered area derived from the top 1000 vectors of SVD is associated with subway stations; and (5) the types of point of interest (POI) differ between the origin area and destination area for the clustered area of the top 1000 vectors. Keywords: singular value decomposition (SVD); dockless bicycle sharing; origin and destination (OD); OD flow 1. Introduction The public bike-sharing (PBS) system has received increasing attention as a potential way to improve the first and last mile connections to other modes of transit and lessen the environmental impact of transportation activities [1–3]. There are two main types of shared bicycle systems, namely docked and dockless bike. The docked bike-sharing system only allows users to ride bikes from one dock to another and the bikes should be locked in place. In recent years, dockless shared bicycles have become increasingly popular among urban residents due to their advantages of being unlocked by smart phones and parked anywhere within the service area. Regular spatial patterns may be concealed under the seemingly disordered movement of the bikes. Additionally, commuting regularities are usually linked to the spatial distribution or the transfer routing of bikes [4]. Many methods have been proposed to identify the regular pattern of bike movements, such as the fast-greedy algorithm [5], the Poisson mixture model, the Markov chain [6], the expectation maximization algorithm [7], and geographical business intelligence [8]. Usage patterns and impact factors have been compared between a city’s downtown and suburban district [9]. These studies show that spatial analysis of the bicycle-sharing system is conducive to research on urban planning, urban traffic management, bicycle layout optimization, and urban population migration. ISPRS Int. J. Geo-Inf. 2019, 8, 573; doi:10.3390/ijgi8120573 www.mdpi.com/journal/ijgi
-
Upload
khangminh22 -
Category
Documents
-
view
2 -
download
0
Transcript of Analysis of the Cycling Flow Between Origin and Destination ...
International Journal of
Geo-Information
Article
Analysis of the Cycling Flow Between Origin andDestination for Dockless Shared Bicycles Based onSingular Value Decomposition
Min Cao 1,2,3 , Boqin Cai 1,2,3, Shangjing Ma 1,2,3, Guonian Lü 1,2,3 and Min Chen 1,2,3,*1 Key Laboratory of Virtual Geographic Environment, Nanjing Normal University, Ministry of Education,
Nanjing 210023, China; [email protected] (M.C.); [email protected] (B.C.);[email protected] (S.M.); [email protected] (G.L.)
2 State Key Laboratory Cultivation Base of Geographical Environment Evolution, Nanjing 210023, China3 Jiangsu Center for Collaborative Innovation in Geographical Information Resource Development and
Application, Nanjing 210023, China* Correspondence: [email protected]
Received: 18 October 2019; Accepted: 9 December 2019; Published: 11 December 2019�����������������
Abstract: Recently, an increasing number of cities have deployed bicycle-sharing systems to solve thefirst/last mile connection problem, generating a large quantity of data. In this paper, singular valuedecomposition (SVD) was used to extract the main features of the cycling flow from the origin anddestination (OD) data of shared bicycles in Beijing. The results show that (1) pairs of OD flow clusterscan be derived from the pairs of vectors after SVD, and each pair of clusters represents a small part ofan area with dockless shared bicycles; (2) the spatial clusters derived from the top vectors of SVDare highly coincident with the hot spot areas in the heatmap of shared bicycles; (3) approximately30% of the study area accounts for nearly 80% of bike riding; (4) nearly 70% of the clustered areaderived from the top 1000 vectors of SVD is associated with subway stations; and (5) the types ofpoint of interest (POI) differ between the origin area and destination area for the clustered area of thetop 1000 vectors.
Keywords: singular value decomposition (SVD); dockless bicycle sharing; origin and destination(OD); OD flow
1. Introduction
The public bike-sharing (PBS) system has received increasing attention as a potential way toimprove the first and last mile connections to other modes of transit and lessen the environmental impactof transportation activities [1–3]. There are two main types of shared bicycle systems, namely dockedand dockless bike. The docked bike-sharing system only allows users to ride bikes from one dockto another and the bikes should be locked in place. In recent years, dockless shared bicycles havebecome increasingly popular among urban residents due to their advantages of being unlocked bysmart phones and parked anywhere within the service area. Regular spatial patterns may be concealedunder the seemingly disordered movement of the bikes. Additionally, commuting regularities areusually linked to the spatial distribution or the transfer routing of bikes [4].
Many methods have been proposed to identify the regular pattern of bike movements, such asthe fast-greedy algorithm [5], the Poisson mixture model, the Markov chain [6], the expectationmaximization algorithm [7], and geographical business intelligence [8]. Usage patterns and impactfactors have been compared between a city’s downtown and suburban district [9]. These studiesshow that spatial analysis of the bicycle-sharing system is conducive to research on urban planning,urban traffic management, bicycle layout optimization, and urban population migration.
ISPRS Int. J. Geo-Inf. 2019, 8, 573; doi:10.3390/ijgi8120573 www.mdpi.com/journal/ijgi
ISPRS Int. J. Geo-Inf. 2019, 8, 573 2 of 13
However, there is limited research on the cycling flow between origin and destination (OD)pairs for dockless shared bicycles. Research on cycling flow could present the spatial distributionand movements of sharing bicycles on a smaller scale [10]. In this paper, the OD flow is definedas the cycling flow between a pair of OD points. The analysis of the OD flows of taxi traces [11],mobile phones [12,13], and Integrated Circuit (IC) cards [14,15] can help to explore human mobilityand location characteristics and provide necessary data for traffic planning, road construction, as wellas traffic control and management [16,17]. An analysis of cycling flow between OD pairs is requiredfor the spatial distribution and movements for dockless shared bicycles.
Many studies have focused on finding clusters of origin and destination points by consideringthe attributes and spatial distributions of the OD points [18]. Among them, spatial statistics-basedmethods such as Moran’s I [19], hierarchical clustering methods such as K-nearest-neighbors [20],and density-based clustering methods including Density-Based Spatial Clustering of Applicationswith Noise (DBSCAN) [21] can be used for clustering origin and destination points. Some studieshave proposed many methods for extracting OD clusters using long-distance OD data, such as taxitrips. Bicycles are not suitable for long-distance commuting due to the restrictions of the bicycleitself. Some methods include, for example, the simple line clustering method [22], based on the ODline to find spatial linkage. However, this research attempts to construct an OD matrix to specifythe travel demand from origin points to destination points microscopically from the perspective ofshort-distance commuting.
Usually, an OD matrix is a large sparse matrix [23]. A dimensionality reduction method, which iscalled feature extraction, is necessary on such a large matrix to simplify the data without losing toomuch information [24]. Many methods are used to mine information from the OD matrix, such asaffinity propagation, which is used to cluster the dimensionality-reduced matrix [25]. The tensordecomposition model is also widely used to handle taxi OD data from multiple dimensions [26].The main purpose of the above operation is to simplify the dataset and extract the main feature froma matrix. These existing methods have good performance in OD clustering and spatial distributionanalysis. In order to further analyze the characteristics of shared bicycle flow microscopically, a simpleand fast algorithm called singular value decomposition (SVD) is widely used in data mining to easilyextract information in pairs [27,28].
SVD, a factorization of a real or complex matrix, is commonly used for dimensionalityreduction [25], and has been widely used in many applications, such as recommender systems [29],feature recognition [28], and machine fault diagnosis [30]. These studies show that SVD can findthe main components from matrix-shaped data. In particular, SVD has been used to extract featuresfrom the OD matrix of smart card records of Shenzhen, China [31]. Currently, little research exists onapplying SVD directly to OD data mining and extraction. Theoretically, SVD is suitable for discoveringthe main clusters of cycling flow between short-distance OD pairs from the singular values.
This study aimed to analyze the characteristics of cycling flow between OD pairs for docklessshared bicycles. SVD was applied to extract the features of the paired clusters from the OD matrix.The remainder of this paper is organized into the following sections. Section 2 introduces the researcharea and the data and preprocessing methods, followed by the SVD methodology and the results inSection 3. Section 4 analyzes the results of SVD and discusses the spatial features of cycling flows.Finally, Section 5 draws conclusions and presents future research prospects.
2. Research Area and Data
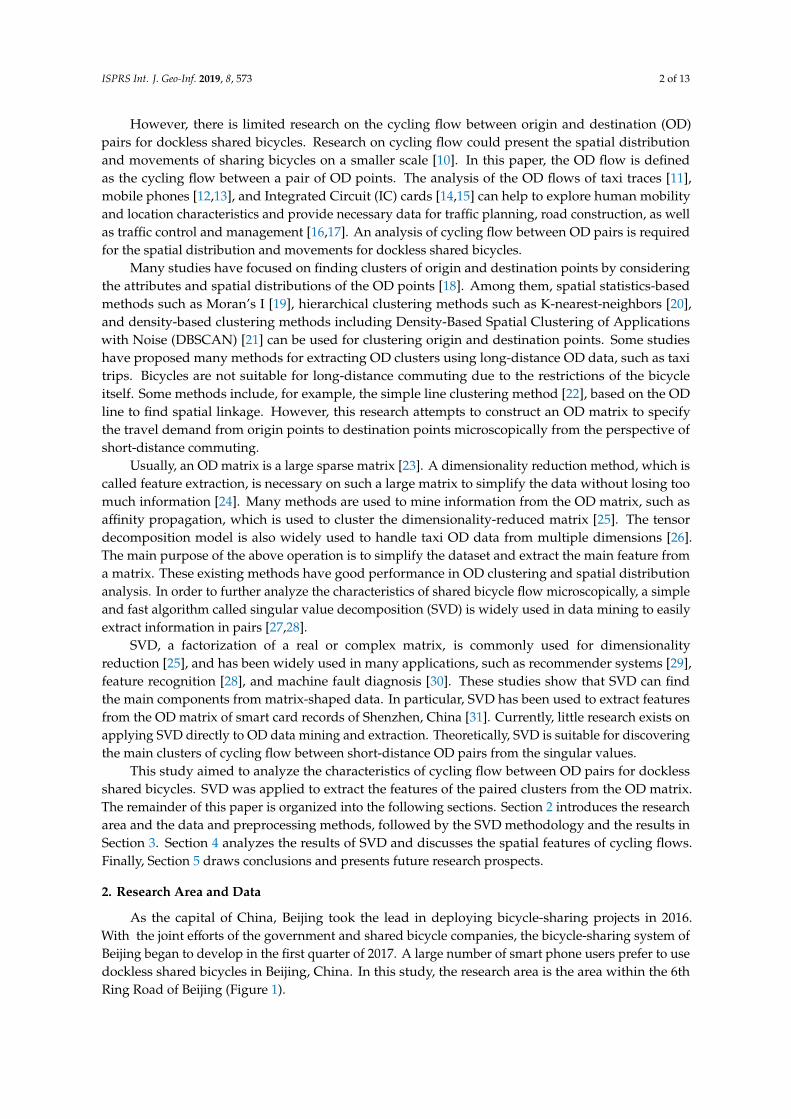
As the capital of China, Beijing took the lead in deploying bicycle-sharing projects in 2016.With the joint efforts of the government and shared bicycle companies, the bicycle-sharing system ofBeijing began to develop in the first quarter of 2017. A large number of smart phone users prefer to usedockless shared bicycles in Beijing, China. In this study, the research area is the area within the 6thRing Road of Beijing (Figure 1).
ISPRS Int. J. Geo-Inf. 2019, 8, 573 3 of 13ISPRS Int. J. Geo-Inf. 2019, 8, x FOR PEER REVIEW 3 of 14
Figure 1. Research area.
In all, 3,104,089 rows of bicycle-sharing data were collected for Beijing from 10 May 2017 to 24 May 2017 (with missing data on 17 May 2017). The records came from Mobike, a leading bicycle-sharing company in China. Some sample data are shown in Table 1. Each record is generated from a passenger ride, which contains a unique number to identify the record (order_id), a unique user number (user_id), a unique bicycle number (bike_id), a time stamp when the user unlocked the bicycle and started cycling (start_time), and the location coordinates where the user started (geohashed_start_loc) and stopped (geohashed_end_loc) cycling. A geo-hash decoding algorithm was applied to the last two columns to decompress the latitude and longitude coordinates from the encrypted string.
Table 1. Sample data.
order_id user_id bike_id start_time geohashed_start_loc
geohashed_end_loc
1,893,973 451,147 210,617 5/14/17 22:16 wx4snhx wx4snhj 4,657,992 1,061,133 465,394 5/14/17 22:16 wx4dr59 wx4dquz 2,965,085 549,189 310,572 5/14/17 22:16 wx4fgur wx4fu5n
In addition, we collected point of interest (POI) information within the 6th Ring Road in Beijing. Excluding some POI categories that were not related to bicycle travel, such as Auto Service, we finally collected more than 900,000 POIs in 13 major categories. Table 2 shows the names of the different POI categories and basic descriptions.
Table 2. Point of interest (POI) types and descriptions.
Type code
Type name Description
1 Food and Beverages Food restaurant, café, and other catering places
2 Shopping Shopping mall, supermarket, and store
3 Daily Life Service Information center, ticket office, job center, etc.
4 Sports and Recreation Sports stadium and recreation center 5 Medical Service Hospital, clinic, and pharmacy 6 Accommodation Service Hotel and hostel 7 Tourist Attraction Park, square, and scenery spot
Figure 1. Research area.
In all, 3,104,089 rows of bicycle-sharing data were collected for Beijing from 10 May 2017 to 24 May2017 (with missing data on 17 May 2017). The records came from Mobike, a leading bicycle-sharingcompany in China. Some sample data are shown in Table 1. Each record is generated from a passengerride, which contains a unique number to identify the record (order_id), a unique user number (user_id),a unique bicycle number (bike_id), a time stamp when the user unlocked the bicycle and started cycling(start_time), and the location coordinates where the user started (geohashed_start_loc) and stopped(geohashed_end_loc) cycling. A geo-hash decoding algorithm was applied to the last two columns todecompress the latitude and longitude coordinates from the encrypted string.
Table 1. Sample data.
order_id user_id bike_id start_time geohashed_start_loc geohashed_end_loc
1,893,973 451,147 210,617 5/14/17 22:16 wx4snhx wx4snhj
4,657,992 1,061,133 465,394 5/14/17 22:16 wx4dr59 wx4dquz
2,965,085 549,189 310,572 5/14/17 22:16 wx4fgur wx4fu5n
In addition, we collected point of interest (POI) information within the 6th Ring Road in Beijing.Excluding some POI categories that were not related to bicycle travel, such as Auto Service, we finallycollected more than 900,000 POIs in 13 major categories. Table 2 shows the names of the different POIcategories and basic descriptions.
Table 2. Point of interest (POI) types and descriptions.
Type Code Type Name Description
1 Food and Beverages Food restaurant, café, and other catering places
2 Shopping Shopping mall, supermarket, and store
3 Daily Life Service Information center, ticket office, job center, etc.
4 Sports and Recreation Sports stadium and recreation center
5 Medical Service Hospital, clinic, and pharmacy
6 Accommodation Service Hotel and hostel
7 Tourist Attraction Park, square, and scenery spot
8 Commercial House Industry park, building, and residential area
ISPRS Int. J. Geo-Inf. 2019, 8, 573 4 of 13
Table 2. Cont.
Type Code Type Name Description
9 Governmental Organizationand Social Group Governmental organization and social group
10 Science/Cultureand Education Service Museum, exhibition hall, gallery, library, school, etc.
11 Transportation Service Airport, railway station, port, bus station,and parking lot
12 Finance and Insurance Service Bank, Automatic Teller Machine (ATM),and insurance company
13 Enterprises Company and factory
3. Singular Value Decomposition and Results
3.1. OD Matrix Construction
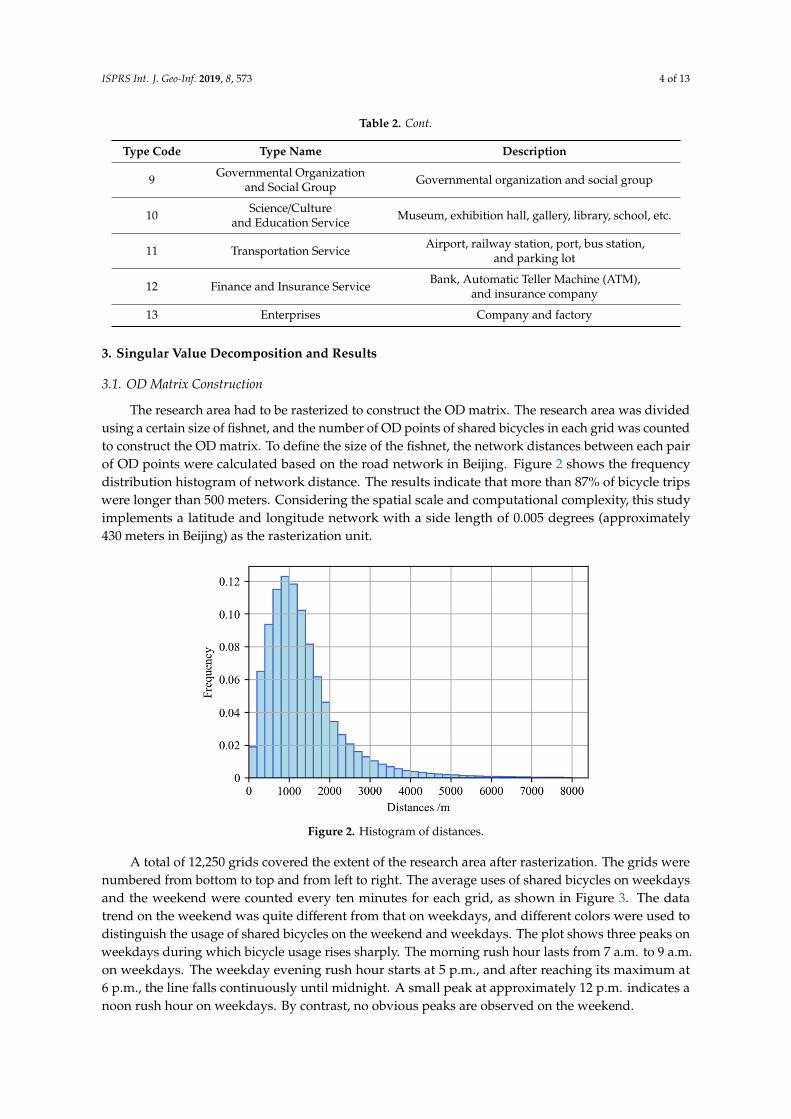
The research area had to be rasterized to construct the OD matrix. The research area was dividedusing a certain size of fishnet, and the number of OD points of shared bicycles in each grid was countedto construct the OD matrix. To define the size of the fishnet, the network distances between each pairof OD points were calculated based on the road network in Beijing. Figure 2 shows the frequencydistribution histogram of network distance. The results indicate that more than 87% of bicycle tripswere longer than 500 meters. Considering the spatial scale and computational complexity, this studyimplements a latitude and longitude network with a side length of 0.005 degrees (approximately430 meters in Beijing) as the rasterization unit.
ISPRS Int. J. Geo-Inf. 2019, 8, x FOR PEER REVIEW 4 of 14
8 Commercial House Industry park, building, and residential area
9 Governmental Organization and Social Group Governmental organization and social group
10 Science/Culture and Education Service
Museum, exhibition hall, gallery, library, school, etc.
11 Transportation Service Airport, railway station, port, bus station, and parking lot
12 Finance and Insurance Service Bank, Automatic Teller Machine (ATM), and insurance company
13 Enterprises Company and factory
3. Singular Value Decomposition and Results
3.1 OD Matrix Construction
The research area had to be rasterized to construct the OD matrix. The research area was divided using a certain size of fishnet, and the number of OD points of shared bicycles in each grid was counted to construct the OD matrix. To define the size of the fishnet, the network distances between each pair of OD points were calculated based on the road network in Beijing. Figure 2 shows the frequency distribution histogram of network distance. The results indicate that more than 87% of bicycle trips were longer than 500 meters. Considering the spatial scale and computational complexity, this study implements a latitude and longitude network with a side length of 0.005 degrees (approximately 430 meters in Beijing) as the rasterization unit.
Figure 2. Histogram of distances.
A total of 12,250 grids covered the extent of the research area after rasterization. The grids were numbered from bottom to top and from left to right. The average uses of shared bicycles on weekdays and the weekend were counted every ten minutes for each grid, as shown in Figure 3. The data trend on the weekend was quite different from that on weekdays, and different colors were used to distinguish the usage of shared bicycles on the weekend and weekdays. The plot shows three peaks on weekdays during which bicycle usage rises sharply. The morning rush hour lasts from 7 a.m. to 9 a.m. on weekdays. The weekday evening rush hour starts at 5 p.m., and after reaching its maximum at 6 p.m., the line falls continuously until midnight. A small peak at approximately 12 p.m. indicates a noon rush hour on weekdays. By contrast, no obvious peaks are observed on the weekend.
Figure 2. Histogram of distances.
A total of 12,250 grids covered the extent of the research area after rasterization. The grids werenumbered from bottom to top and from left to right. The average uses of shared bicycles on weekdaysand the weekend were counted every ten minutes for each grid, as shown in Figure 3. The datatrend on the weekend was quite different from that on weekdays, and different colors were used todistinguish the usage of shared bicycles on the weekend and weekdays. The plot shows three peaks onweekdays during which bicycle usage rises sharply. The morning rush hour lasts from 7 a.m. to 9 a.m.on weekdays. The weekday evening rush hour starts at 5 p.m., and after reaching its maximum at6 p.m., the line falls continuously until midnight. A small peak at approximately 12 p.m. indicates anoon rush hour on weekdays. By contrast, no obvious peaks are observed on the weekend.

ISPRS Int. J. Geo-Inf. 2019, 8, 573 5 of 13ISPRS Int. J. Geo-Inf. 2019, 8, x FOR PEER REVIEW 5 of 14
Figure 3. Average uses of shared bicycles on weekdays and the weekend.
To study the travel characteristics of shared bicycles during different time periods, two OD matrices were constructed for the morning and evening rush hours on weekdays. The shape of the OD matrix was 12,250 × 12,250, where the longitudinal dimension represents each origin grid and the transverse is the destination grid (Figure 4). The elements M(m,n) in the matrix represent the number of bicycles that migrate from the grid O(m) to the grid D(n).
Figure 4. Origin and destination (OD) matrix construction.
3.2. Singular Value Decomposition
In linear algebra, SVD is a factorization of a matrix and has been used extensively for dimensionality reduction in pattern recognition and information retrieval applications [32]. SVD is a generalization of the eigendecomposition of a positive semidefinite normal matrix to any matrix via an extension of polar decomposition [33]. Figure 5 is a schematic diagram of SVD.
Figure 3. Average uses of shared bicycles on weekdays and the weekend.
To study the travel characteristics of shared bicycles during different time periods, two ODmatrices were constructed for the morning and evening rush hours on weekdays. The shape of theOD matrix was 12,250 × 12,250, where the longitudinal dimension represents each origin grid and thetransverse is the destination grid (Figure 4). The elements M(m,n) in the matrix represent the numberof bicycles that migrate from the grid O(m) to the grid D(n).
ISPRS Int. J. Geo-Inf. 2019, 8, x FOR PEER REVIEW 5 of 14
Figure 3. Average uses of shared bicycles on weekdays and the weekend.
To study the travel characteristics of shared bicycles during different time periods, two OD matrices were constructed for the morning and evening rush hours on weekdays. The shape of the OD matrix was 12,250 × 12,250, where the longitudinal dimension represents each origin grid and the transverse is the destination grid (Figure 4). The elements M(m,n) in the matrix represent the number of bicycles that migrate from the grid O(m) to the grid D(n).
Figure 4. Origin and destination (OD) matrix construction.
3.2. Singular Value Decomposition
In linear algebra, SVD is a factorization of a matrix and has been used extensively for dimensionality reduction in pattern recognition and information retrieval applications [32]. SVD is a generalization of the eigendecomposition of a positive semidefinite normal matrix to any matrix via an extension of polar decomposition [33]. Figure 5 is a schematic diagram of SVD.
Figure 4. Origin and destination (OD) matrix construction.
3.2. Singular Value Decomposition
In linear algebra, SVD is a factorization of a matrix and has been used extensively for dimensionalityreduction in pattern recognition and information retrieval applications [32]. SVD is a generalization ofthe eigendecomposition of a positive semidefinite normal matrix to any matrix via an extension ofpolar decomposition [33]. Figure 5 is a schematic diagram of SVD.
ISPRS Int. J. Geo-Inf. 2019, 8, 573 6 of 13ISPRS Int. J. Geo-Inf. 2019, 8, x FOR PEER REVIEW 6 of 14
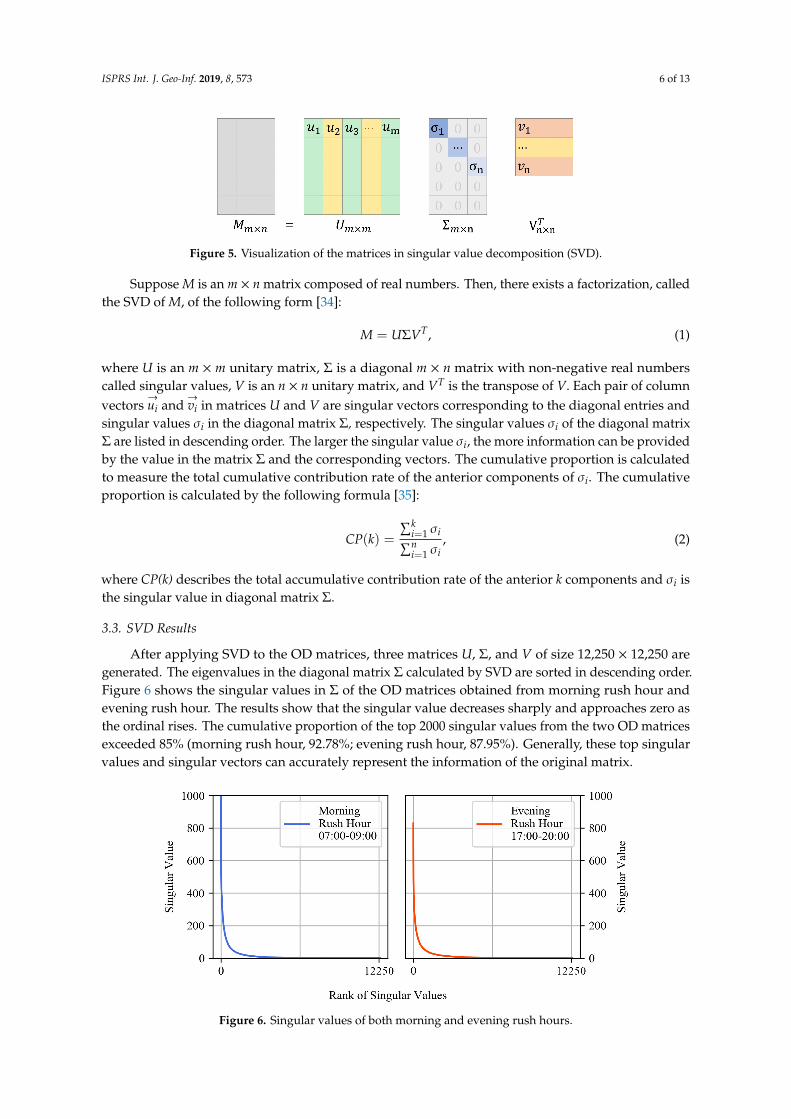
Figure 5. Visualization of the matrices in singular value decomposition (SVD).
Suppose M is an m × n matrix composed of real numbers. Then, there exists a factorization, called the SVD of M, of the following form [34]: 𝑀 = 𝑈𝛴𝑉 , (1) where U is an m × m unitary matrix, Σ is a diagonal m × n matrix with non-negative real numbers called singular values, V is an n × n unitary matrix, and 𝑉 is the transpose of V. Each pair of column vectors 𝑢⃗ and 𝑣 in matrices U and V are singular vectors corresponding to the diagonal entries and singular values σi in the diagonal matrix Σ, respectively. The singular values σi of the diagonal matrix Σ are listed in descending order. The larger the singular value σi, the more information can be provided by the value in the matrix Σ and the corresponding vectors. The cumulative proportion is calculated to measure the total cumulative contribution rate of the anterior components of σi. The cumulative proportion is calculated by the following formula [35]: 𝐶𝑃 𝑘 = , (2)
where CP(k) describes the total accumulative contribution rate of the anterior k components and σi is the singular value in diagonal matrix Σ.
3.3. SVD Results
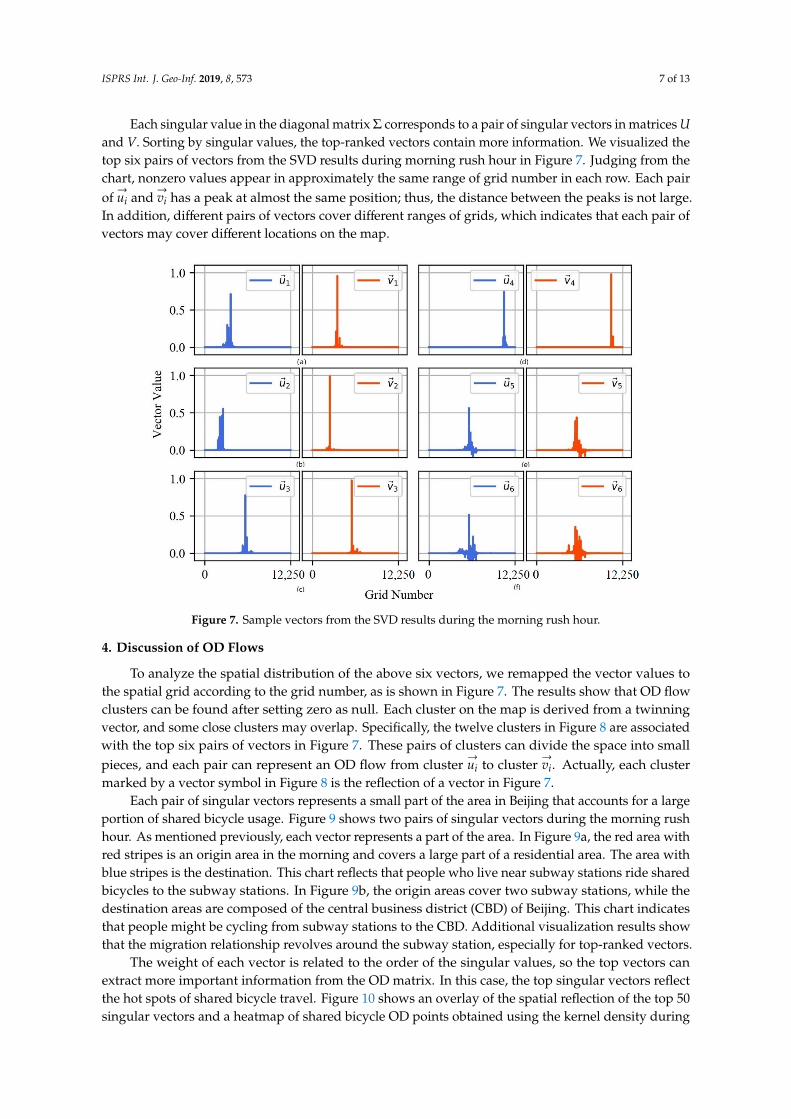
After applying SVD to the OD matrices, three matrices U, Σ, and V of size 12,250 × 12,250 are generated. The eigenvalues in the diagonal matrix Σ calculated by SVD are sorted in descending order. Figure 6 shows the singular values in Σ of the OD matrices obtained from morning rush hour and evening rush hour. The results show that the singular value decreases sharply and approaches zero as the ordinal rises. The cumulative proportion of the top 2000 singular values from the two OD matrices exceeded 85% (morning rush hour, 92.78%; evening rush hour, 87.95%). Generally, these top singular values and singular vectors can accurately represent the information of the original matrix.
Figure 6. Singular values of both morning and evening rush hours.
Each singular value in the diagonal matrix Σ corresponds to a pair of singular vectors in matrices U and V. Sorting by singular values, the top-ranked vectors contain more information. We visualized
Figure 5. Visualization of the matrices in singular value decomposition (SVD).
Suppose M is an m × n matrix composed of real numbers. Then, there exists a factorization, calledthe SVD of M, of the following form [34]:
M = UΣVT, (1)
where U is an m × m unitary matrix, Σ is a diagonal m × n matrix with non-negative real numberscalled singular values, V is an n × n unitary matrix, and VT is the transpose of V. Each pair of columnvectors
→ui and
→vi in matrices U and V are singular vectors corresponding to the diagonal entries and
singular values σi in the diagonal matrix Σ, respectively. The singular values σi of the diagonal matrixΣ are listed in descending order. The larger the singular value σi, the more information can be providedby the value in the matrix Σ and the corresponding vectors. The cumulative proportion is calculatedto measure the total cumulative contribution rate of the anterior components of σi. The cumulativeproportion is calculated by the following formula [35]:
CP(k) =∑k
i=1 σi∑ni=1 σi
, (2)
where CP(k) describes the total accumulative contribution rate of the anterior k components and σi isthe singular value in diagonal matrix Σ.
3.3. SVD Results
After applying SVD to the OD matrices, three matrices U, Σ, and V of size 12,250 × 12,250 aregenerated. The eigenvalues in the diagonal matrix Σ calculated by SVD are sorted in descending order.Figure 6 shows the singular values in Σ of the OD matrices obtained from morning rush hour andevening rush hour. The results show that the singular value decreases sharply and approaches zero asthe ordinal rises. The cumulative proportion of the top 2000 singular values from the two OD matricesexceeded 85% (morning rush hour, 92.78%; evening rush hour, 87.95%). Generally, these top singularvalues and singular vectors can accurately represent the information of the original matrix.
ISPRS Int. J. Geo-Inf. 2019, 8, x FOR PEER REVIEW 6 of 14
Figure 5. Visualization of the matrices in singular value decomposition (SVD).
Suppose M is an m × n matrix composed of real numbers. Then, there exists a factorization, called the SVD of M, of the following form [34]: 𝑀 = 𝑈𝛴𝑉 , (1) where U is an m × m unitary matrix, Σ is a diagonal m × n matrix with non-negative real numbers called singular values, V is an n × n unitary matrix, and 𝑉 is the transpose of V. Each pair of column vectors 𝑢⃗ and 𝑣 in matrices U and V are singular vectors corresponding to the diagonal entries and singular values σi in the diagonal matrix Σ, respectively. The singular values σi of the diagonal matrix Σ are listed in descending order. The larger the singular value σi, the more information can be provided by the value in the matrix Σ and the corresponding vectors. The cumulative proportion is calculated to measure the total cumulative contribution rate of the anterior components of σi. The cumulative proportion is calculated by the following formula [35]: 𝐶𝑃 𝑘 = , (2)
where CP(k) describes the total accumulative contribution rate of the anterior k components and σi is the singular value in diagonal matrix Σ.
3.3. SVD Results
After applying SVD to the OD matrices, three matrices U, Σ, and V of size 12,250 × 12,250 are generated. The eigenvalues in the diagonal matrix Σ calculated by SVD are sorted in descending order. Figure 6 shows the singular values in Σ of the OD matrices obtained from morning rush hour and evening rush hour. The results show that the singular value decreases sharply and approaches zero as the ordinal rises. The cumulative proportion of the top 2000 singular values from the two OD matrices exceeded 85% (morning rush hour, 92.78%; evening rush hour, 87.95%). Generally, these top singular values and singular vectors can accurately represent the information of the original matrix.
Figure 6. Singular values of both morning and evening rush hours.
Each singular value in the diagonal matrix Σ corresponds to a pair of singular vectors in matrices U and V. Sorting by singular values, the top-ranked vectors contain more information. We visualized
Figure 6. Singular values of both morning and evening rush hours.
ISPRS Int. J. Geo-Inf. 2019, 8, 573 7 of 13
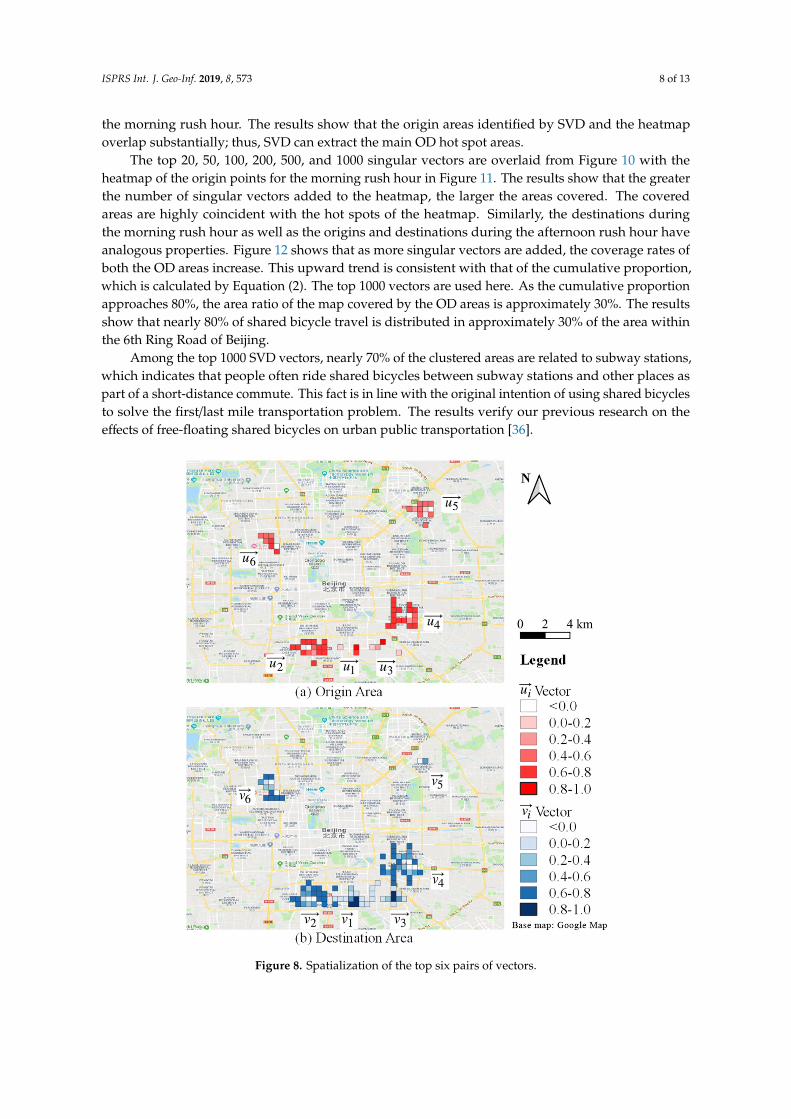
Each singular value in the diagonal matrix Σ corresponds to a pair of singular vectors in matrices Uand V. Sorting by singular values, the top-ranked vectors contain more information. We visualized thetop six pairs of vectors from the SVD results during morning rush hour in Figure 7. Judging from thechart, nonzero values appear in approximately the same range of grid number in each row. Each pairof→ui and
→vi has a peak at almost the same position; thus, the distance between the peaks is not large.
In addition, different pairs of vectors cover different ranges of grids, which indicates that each pair ofvectors may cover different locations on the map.
ISPRS Int. J. Geo-Inf. 2019, 8, x FOR PEER REVIEW 7 of 14
the top six pairs of vectors from the SVD results during morning rush hour in Figure 7. Judging from the chart, nonzero values appear in approximately the same range of grid number in each row. Each pair of 𝑢⃗ and 𝑣 has a peak at almost the same position; thus, the distance between the peaks is not large. In addition, different pairs of vectors cover different ranges of grids, which indicates that each pair of vectors may cover different locations on the map.
Figure 7. Sample vectors from the SVD results during the morning rush hour.
4. Discussion of OD Flows
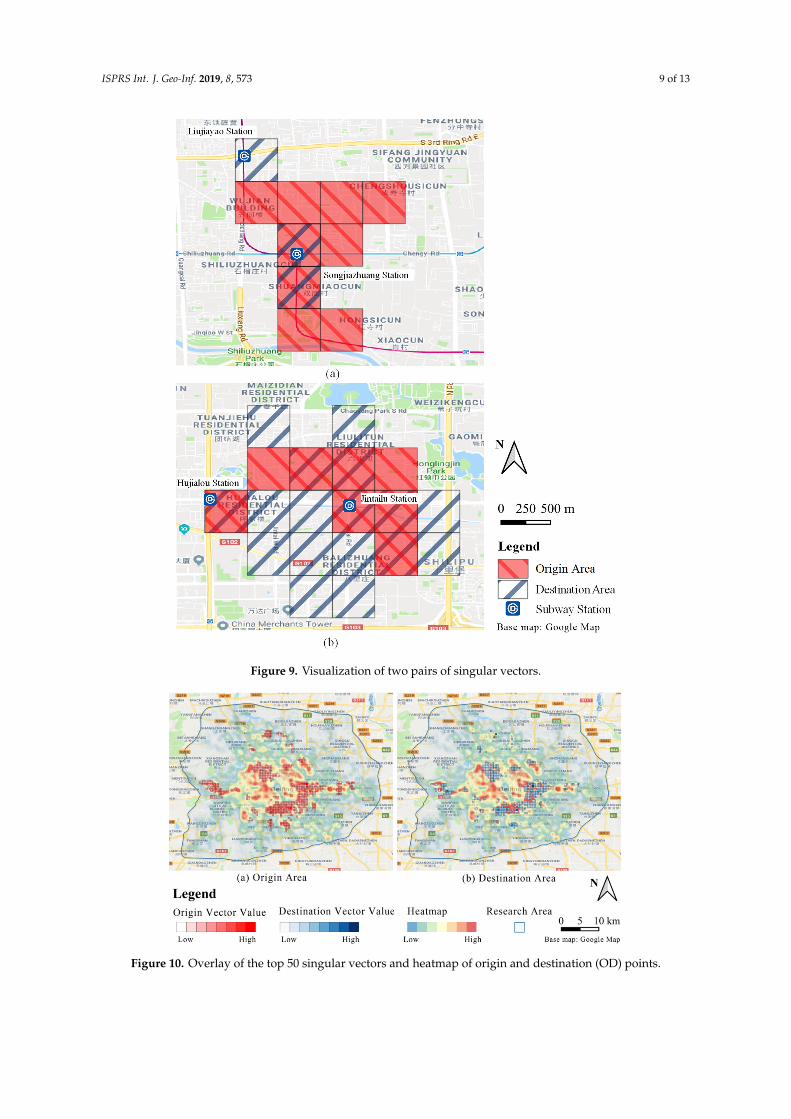
To analyze the spatial distribution of the above six vectors, we remapped the vector values to the spatial grid according to the grid number, as is shown in Figure 7. The results show that OD flow clusters can be found after setting zero as null. Each cluster on the map is derived from a twinning vector, and some close clusters may overlap. Specifically, the twelve clusters in Figure 8 are associated with the top six pairs of vectors in Figure 7. These pairs of clusters can divide the space into small pieces, and each pair can represent an OD flow from cluster 𝑢⃗ to cluster 𝑣 . Actually, each cluster marked by a vector symbol in Figure 8 is the reflection of a vector in Figure 7.
Figure 7. Sample vectors from the SVD results during the morning rush hour.
4. Discussion of OD Flows
To analyze the spatial distribution of the above six vectors, we remapped the vector values tothe spatial grid according to the grid number, as is shown in Figure 7. The results show that OD flowclusters can be found after setting zero as null. Each cluster on the map is derived from a twinningvector, and some close clusters may overlap. Specifically, the twelve clusters in Figure 8 are associatedwith the top six pairs of vectors in Figure 7. These pairs of clusters can divide the space into smallpieces, and each pair can represent an OD flow from cluster
→ui to cluster
→vi. Actually, each cluster
marked by a vector symbol in Figure 8 is the reflection of a vector in Figure 7.Each pair of singular vectors represents a small part of the area in Beijing that accounts for a large
portion of shared bicycle usage. Figure 9 shows two pairs of singular vectors during the morning rushhour. As mentioned previously, each vector represents a part of the area. In Figure 9a, the red area withred stripes is an origin area in the morning and covers a large part of a residential area. The area withblue stripes is the destination. This chart reflects that people who live near subway stations ride sharedbicycles to the subway stations. In Figure 9b, the origin areas cover two subway stations, while thedestination areas are composed of the central business district (CBD) of Beijing. This chart indicatesthat people might be cycling from subway stations to the CBD. Additional visualization results showthat the migration relationship revolves around the subway station, especially for top-ranked vectors.
The weight of each vector is related to the order of the singular values, so the top vectors canextract more important information from the OD matrix. In this case, the top singular vectors reflectthe hot spots of shared bicycle travel. Figure 10 shows an overlay of the spatial reflection of the top 50singular vectors and a heatmap of shared bicycle OD points obtained using the kernel density during
ISPRS Int. J. Geo-Inf. 2019, 8, 573 8 of 13
the morning rush hour. The results show that the origin areas identified by SVD and the heatmapoverlap substantially; thus, SVD can extract the main OD hot spot areas.
The top 20, 50, 100, 200, 500, and 1000 singular vectors are overlaid from Figure 10 with theheatmap of the origin points for the morning rush hour in Figure 11. The results show that the greaterthe number of singular vectors added to the heatmap, the larger the areas covered. The coveredareas are highly coincident with the hot spots of the heatmap. Similarly, the destinations duringthe morning rush hour as well as the origins and destinations during the afternoon rush hour haveanalogous properties. Figure 12 shows that as more singular vectors are added, the coverage rates ofboth the OD areas increase. This upward trend is consistent with that of the cumulative proportion,which is calculated by Equation (2). The top 1000 vectors are used here. As the cumulative proportionapproaches 80%, the area ratio of the map covered by the OD areas is approximately 30%. The resultsshow that nearly 80% of shared bicycle travel is distributed in approximately 30% of the area withinthe 6th Ring Road of Beijing.
Among the top 1000 SVD vectors, nearly 70% of the clustered areas are related to subway stations,which indicates that people often ride shared bicycles between subway stations and other places aspart of a short-distance commute. This fact is in line with the original intention of using shared bicyclesto solve the first/last mile transportation problem. The results verify our previous research on theeffects of free-floating shared bicycles on urban public transportation [36].
ISPRS Int. J. Geo-Inf. 2019, 8, x FOR PEER REVIEW 8 of 14
Figure 8. Spatialization of the top six pairs of vectors.
Each pair of singular vectors represents a small part of the area in Beijing that accounts for a large portion of shared bicycle usage. Figure 9 shows two pairs of singular vectors during the morning rush hour. As mentioned previously, each vector represents a part of the area. In Figure 9a, the red area with red stripes is an origin area in the morning and covers a large part of a residential area. The area with blue stripes is the destination. This chart reflects that people who live near subway stations ride shared bicycles to the subway stations. In Figure 9b, the origin areas cover two subway stations, while the destination areas are composed of the central business district (CBD) of Beijing. This chart indicates that people might be cycling from subway stations to the CBD. Additional visualization results show that the migration relationship revolves around the subway station, especially for top-ranked vectors.
Figure 8. Spatialization of the top six pairs of vectors.
ISPRS Int. J. Geo-Inf. 2019, 8, 573 9 of 13ISPRS Int. J. Geo-Inf. 2019, 8, x FOR PEER REVIEW 9 of 14
Figure 9. Visualization of two pairs of singular vectors.
The weight of each vector is related to the order of the singular values, so the top vectors can extract more important information from the OD matrix. In this case, the top singular vectors reflect the hot spots of shared bicycle travel. Figure 10 shows an overlay of the spatial reflection of the top 50 singular vectors and a heatmap of shared bicycle OD points obtained using the kernel density during the morning rush hour. The results show that the origin areas identified by SVD and the heatmap overlap substantially; thus, SVD can extract the main OD hot spot areas.
Figure 9. Visualization of two pairs of singular vectors.
ISPRS Int. J. Geo-Inf. 2019, 8, x FOR PEER REVIEW 10 of 14
Figure 10. Overlay of the top 50 singular vectors and heatmap of origin and destination ( OD) points.
The top 20, 50, 100, 200, 500, and 1000 singular vectors are overlaid from Figure 10 with the heatmap of the origin points for the morning rush hour in Figure 11. The results show that the greater the number of singular vectors added to the heatmap, the larger the areas covered. The covered areas are highly coincident with the hot spots of the heatmap. Similarly, the destinations during the morning rush hour as well as the origins and destinations during the afternoon rush hour have analogous properties. Figure 12 shows that as more singular vectors are added, the coverage rates of both the OD areas increase. This upward trend is consistent with that of the cumulative proportion, which is calculated by Equation (2). The top 1000 vectors are used here. As the cumulative proportion approaches 80%, the area ratio of the map covered by the OD areas is approximately 30%. The results show that nearly 80% of shared bicycle travel is distributed in approximately 30% of the area within the 6th Ring Road of Beijing.
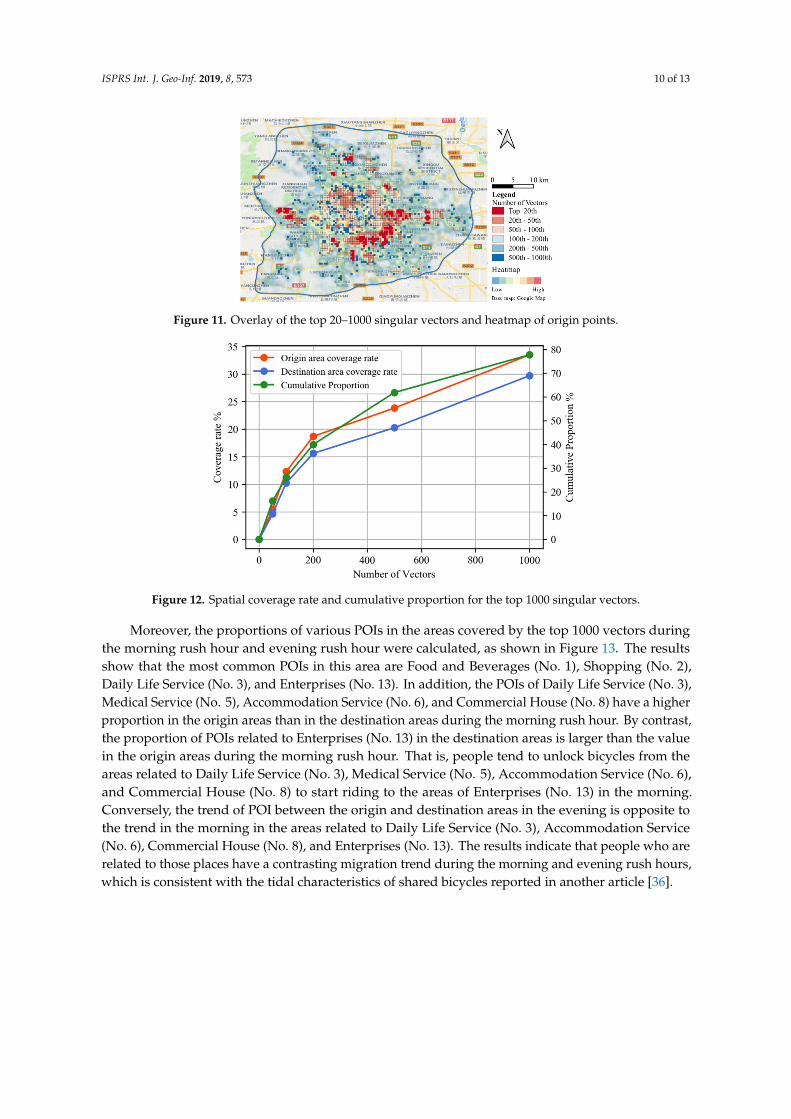
Figure 11. Overlay of the top 20–1000 singular vectors and heatmap of origin points.
Figure 10. Overlay of the top 50 singular vectors and heatmap of origin and destination (OD) points.
ISPRS Int. J. Geo-Inf. 2019, 8, 573 10 of 13
ISPRS Int. J. Geo-Inf. 2019, 8, x FOR PEER REVIEW 10 of 14
Figure 10. Overlay of the top 50 singular vectors and heatmap of origin and destination ( OD) points.
The top 20, 50, 100, 200, 500, and 1000 singular vectors are overlaid from Figure 10 with the heatmap of the origin points for the morning rush hour in Figure 11. The results show that the greater the number of singular vectors added to the heatmap, the larger the areas covered. The covered areas are highly coincident with the hot spots of the heatmap. Similarly, the destinations during the morning rush hour as well as the origins and destinations during the afternoon rush hour have analogous properties. Figure 12 shows that as more singular vectors are added, the coverage rates of both the OD areas increase. This upward trend is consistent with that of the cumulative proportion, which is calculated by Equation (2). The top 1000 vectors are used here. As the cumulative proportion approaches 80%, the area ratio of the map covered by the OD areas is approximately 30%. The results show that nearly 80% of shared bicycle travel is distributed in approximately 30% of the area within the 6th Ring Road of Beijing.
Figure 11. Overlay of the top 20–1000 singular vectors and heatmap of origin points.
Figure 11. Overlay of the top 20–1000 singular vectors and heatmap of origin points.ISPRS Int. J. Geo-Inf. 2019, 8, x FOR PEER REVIEW 11 of 14
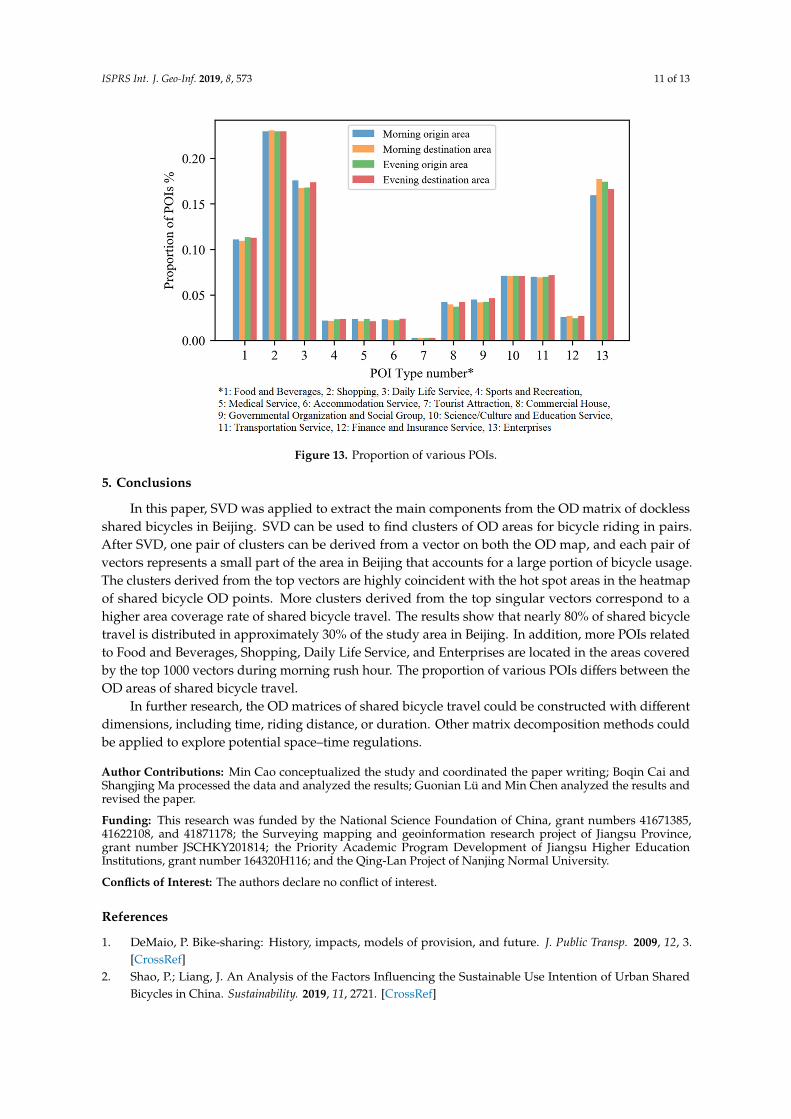
Figure 12. Spatial coverage rate and cumulative proportion for the top 1000 singular vectors.
Among the top 1000 SVD vectors, nearly 70% of the clustered areas are related to subway stations, which indicates that people often ride shared bicycles between subway stations and other places as part of a short-distance commute. This fact is in line with the original intention of using shared bicycles to solve the first/last mile transportation problem. The results verify our previous research on the effects of free-floating shared bicycles on urban public transportation [36].
Moreover, the proportions of various POIs in the areas covered by the top 1000 vectors during the morning rush hour and evening rush hour were calculated, as shown in Figure 13. The results show that the most common POIs in this area are Food and Beverages (No. 1), Shopping (No. 2), Daily Life Service (No. 3), and Enterprises (No. 13). In addition, the POIs of Daily Life Service (No. 3), Accommodation Service (No. 6), and Commercial House (No. 8) have a higher proportion in the origin areas than in the destination areas during the morning rush hour. By contrast, the proportion of POIs related to Enterprises (No. 13) in the destination areas is larger than the value in the origin areas during the morning rush hour. That is, people tend to unlock bicycles from the areas related to Daily Life Service (No. 3), Accommodation Service (No. 6). and Commercial House (No. 8) to start riding to the areas of Enterprises (No. 13) in the morning. Conversely, the trend of POI between the origin and destination areas in the evening is opposite to the trend in the morning in the areas related to Daily Life Service (No. 3), Accommodation Service (No. 6), Commercial House (No. 8), and Enterprises (No. 13). The results indicate that people who are related to those places have a contrasting migration trend during the morning and evening rush hours, which is consistent with the tidal characteristics of shared bicycles reported in another article [36].
Figure 12. Spatial coverage rate and cumulative proportion for the top 1000 singular vectors.
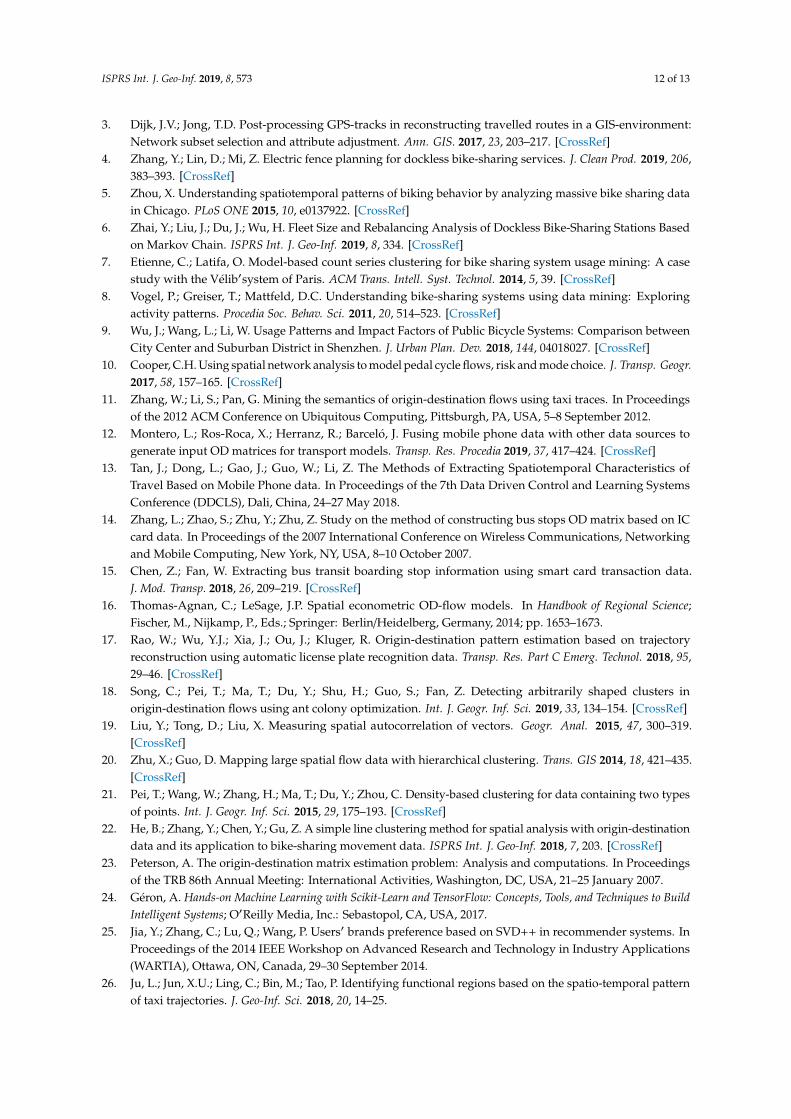
Moreover, the proportions of various POIs in the areas covered by the top 1000 vectors duringthe morning rush hour and evening rush hour were calculated, as shown in Figure 13. The resultsshow that the most common POIs in this area are Food and Beverages (No. 1), Shopping (No. 2),Daily Life Service (No. 3), and Enterprises (No. 13). In addition, the POIs of Daily Life Service (No. 3),Medical Service (No. 5), Accommodation Service (No. 6), and Commercial House (No. 8) have a higherproportion in the origin areas than in the destination areas during the morning rush hour. By contrast,the proportion of POIs related to Enterprises (No. 13) in the destination areas is larger than the valuein the origin areas during the morning rush hour. That is, people tend to unlock bicycles from theareas related to Daily Life Service (No. 3), Medical Service (No. 5), Accommodation Service (No. 6),and Commercial House (No. 8) to start riding to the areas of Enterprises (No. 13) in the morning.Conversely, the trend of POI between the origin and destination areas in the evening is opposite tothe trend in the morning in the areas related to Daily Life Service (No. 3), Accommodation Service(No. 6), Commercial House (No. 8), and Enterprises (No. 13). The results indicate that people who arerelated to those places have a contrasting migration trend during the morning and evening rush hours,which is consistent with the tidal characteristics of shared bicycles reported in another article [36].
ISPRS Int. J. Geo-Inf. 2019, 8, 573 11 of 13ISPRS Int. J. Geo-Inf. 2019, 8, x FOR PEER REVIEW 12 of 14
Figure 13. Proportion of various POIs.
5. Conclusions
In this paper, SVD was applied to extract the main components from the OD matrix of dockless shared bicycles in Beijing. SVD can be used to find clusters of OD areas for bicycle riding in pairs. After SVD, one pair of clusters can be derived from a vector on both the OD map, and each pair of vectors represents a small part of the area in Beijing that accounts for a large portion of bicycle usage. The clusters derived from the top vectors are highly coincident with the hot spot areas in the heatmap of shared bicycle OD points. More clusters derived from the top singular vectors correspond to a higher area coverage rate of shared bicycle travel. The results show that nearly 80% of shared bicycle travel is distributed in approximately 30% of the study area in Beijing. In addition, more POIs related to Food and Beverages, Shopping, Daily Life Service, and Enterprises are located in the areas covered by the top 1000 vectors during morning rush hour. The proportion of various POIs differs between the OD areas of shared bicycle travel.
In further research, the OD matrices of shared bicycle travel could be constructed with different dimensions, including time, riding distance, or duration. Other matrix decomposition methods could be applied to explore potential space–time regulations.
Author Contributions: Min Cao conceptualized the study and coordinated the paper writing; Boqin Cai and Shangjing Ma processed the data and analyzed the results; Guonian Lü and Min Chen analyzed the results and revised the paper.
Funding: This research was funded by the National Science Foundation of China, grant numbers 41671385, 41622108, and 41871178; the Surveying mapping and geoinformation research project of Jiangsu Province, grant number JSCHKY201814; the Priority Academic Program Development of Jiangsu Higher Education Institutions, grant number 164320H116; and the Qing-Lan Project of Nanjing Normal University.
Conflicts of Interest: The authors declare no conflict of interest.
References
1. DeMaio, P. Bike-sharing: History, impacts, models of provision, and future. J. Public Transp. 2009, 12, 3. 2. Shao, P.; Liang, J. An Analysis of the Factors Influencing the Sustainable Use Intention of Urban Shared
Bicycles in China. Sustainability. 2019, 11, 2721. 3. Dijk,J.V.; Jong,T.D. Post-processing GPS-tracks in reconstructing travelled routes in a GIS-environment:
network subset selection and attribute adjustment. Ann. GIS. 2017, 23, 203–217.
Figure 13. Proportion of various POIs.
5. Conclusions
In this paper, SVD was applied to extract the main components from the OD matrix of docklessshared bicycles in Beijing. SVD can be used to find clusters of OD areas for bicycle riding in pairs.After SVD, one pair of clusters can be derived from a vector on both the OD map, and each pair ofvectors represents a small part of the area in Beijing that accounts for a large portion of bicycle usage.The clusters derived from the top vectors are highly coincident with the hot spot areas in the heatmapof shared bicycle OD points. More clusters derived from the top singular vectors correspond to ahigher area coverage rate of shared bicycle travel. The results show that nearly 80% of shared bicycletravel is distributed in approximately 30% of the study area in Beijing. In addition, more POIs relatedto Food and Beverages, Shopping, Daily Life Service, and Enterprises are located in the areas coveredby the top 1000 vectors during morning rush hour. The proportion of various POIs differs between theOD areas of shared bicycle travel.
In further research, the OD matrices of shared bicycle travel could be constructed with differentdimensions, including time, riding distance, or duration. Other matrix decomposition methods couldbe applied to explore potential space–time regulations.
Author Contributions: Min Cao conceptualized the study and coordinated the paper writing; Boqin Cai andShangjing Ma processed the data and analyzed the results; Guonian Lü and Min Chen analyzed the results andrevised the paper.
Funding: This research was funded by the National Science Foundation of China, grant numbers 41671385,41622108, and 41871178; the Surveying mapping and geoinformation research project of Jiangsu Province,grant number JSCHKY201814; the Priority Academic Program Development of Jiangsu Higher EducationInstitutions, grant number 164320H116; and the Qing-Lan Project of Nanjing Normal University.
Conflicts of Interest: The authors declare no conflict of interest.
References
1. DeMaio, P. Bike-sharing: History, impacts, models of provision, and future. J. Public Transp. 2009, 12, 3.[CrossRef]
2. Shao, P.; Liang, J. An Analysis of the Factors Influencing the Sustainable Use Intention of Urban SharedBicycles in China. Sustainability. 2019, 11, 2721. [CrossRef]
ISPRS Int. J. Geo-Inf. 2019, 8, 573 12 of 13
3. Dijk, J.V.; Jong, T.D. Post-processing GPS-tracks in reconstructing travelled routes in a GIS-environment:Network subset selection and attribute adjustment. Ann. GIS. 2017, 23, 203–217. [CrossRef]
4. Zhang, Y.; Lin, D.; Mi, Z. Electric fence planning for dockless bike-sharing services. J. Clean Prod. 2019, 206,383–393. [CrossRef]
5. Zhou, X. Understanding spatiotemporal patterns of biking behavior by analyzing massive bike sharing datain Chicago. PLoS ONE 2015, 10, e0137922. [CrossRef]
6. Zhai, Y.; Liu, J.; Du, J.; Wu, H. Fleet Size and Rebalancing Analysis of Dockless Bike-Sharing Stations Basedon Markov Chain. ISPRS Int. J. Geo-Inf. 2019, 8, 334. [CrossRef]
7. Etienne, C.; Latifa, O. Model-based count series clustering for bike sharing system usage mining: A casestudy with the Vélib′system of Paris. ACM Trans. Intell. Syst. Technol. 2014, 5, 39. [CrossRef]
8. Vogel, P.; Greiser, T.; Mattfeld, D.C. Understanding bike-sharing systems using data mining: Exploringactivity patterns. Procedia Soc. Behav. Sci. 2011, 20, 514–523. [CrossRef]
9. Wu, J.; Wang, L.; Li, W. Usage Patterns and Impact Factors of Public Bicycle Systems: Comparison betweenCity Center and Suburban District in Shenzhen. J. Urban Plan. Dev. 2018, 144, 04018027. [CrossRef]
10. Cooper, C.H. Using spatial network analysis to model pedal cycle flows, risk and mode choice. J. Transp. Geogr.2017, 58, 157–165. [CrossRef]
11. Zhang, W.; Li, S.; Pan, G. Mining the semantics of origin-destination flows using taxi traces. In Proceedingsof the 2012 ACM Conference on Ubiquitous Computing, Pittsburgh, PA, USA, 5–8 September 2012.
12. Montero, L.; Ros-Roca, X.; Herranz, R.; Barceló, J. Fusing mobile phone data with other data sources togenerate input OD matrices for transport models. Transp. Res. Procedia 2019, 37, 417–424. [CrossRef]
13. Tan, J.; Dong, L.; Gao, J.; Guo, W.; Li, Z. The Methods of Extracting Spatiotemporal Characteristics ofTravel Based on Mobile Phone data. In Proceedings of the 7th Data Driven Control and Learning SystemsConference (DDCLS), Dali, China, 24–27 May 2018.
14. Zhang, L.; Zhao, S.; Zhu, Y.; Zhu, Z. Study on the method of constructing bus stops OD matrix based on ICcard data. In Proceedings of the 2007 International Conference on Wireless Communications, Networkingand Mobile Computing, New York, NY, USA, 8–10 October 2007.
15. Chen, Z.; Fan, W. Extracting bus transit boarding stop information using smart card transaction data.J. Mod. Transp. 2018, 26, 209–219. [CrossRef]
16. Thomas-Agnan, C.; LeSage, J.P. Spatial econometric OD-flow models. In Handbook of Regional Science;Fischer, M., Nijkamp, P., Eds.; Springer: Berlin/Heidelberg, Germany, 2014; pp. 1653–1673.
17. Rao, W.; Wu, Y.J.; Xia, J.; Ou, J.; Kluger, R. Origin-destination pattern estimation based on trajectoryreconstruction using automatic license plate recognition data. Transp. Res. Part C Emerg. Technol. 2018, 95,29–46. [CrossRef]
18. Song, C.; Pei, T.; Ma, T.; Du, Y.; Shu, H.; Guo, S.; Fan, Z. Detecting arbitrarily shaped clusters inorigin-destination flows using ant colony optimization. Int. J. Geogr. Inf. Sci. 2019, 33, 134–154. [CrossRef]
19. Liu, Y.; Tong, D.; Liu, X. Measuring spatial autocorrelation of vectors. Geogr. Anal. 2015, 47, 300–319.[CrossRef]
20. Zhu, X.; Guo, D. Mapping large spatial flow data with hierarchical clustering. Trans. GIS 2014, 18, 421–435.[CrossRef]
21. Pei, T.; Wang, W.; Zhang, H.; Ma, T.; Du, Y.; Zhou, C. Density-based clustering for data containing two typesof points. Int. J. Geogr. Inf. Sci. 2015, 29, 175–193. [CrossRef]
22. He, B.; Zhang, Y.; Chen, Y.; Gu, Z. A simple line clustering method for spatial analysis with origin-destinationdata and its application to bike-sharing movement data. ISPRS Int. J. Geo-Inf. 2018, 7, 203. [CrossRef]
23. Peterson, A. The origin-destination matrix estimation problem: Analysis and computations. In Proceedingsof the TRB 86th Annual Meeting: International Activities, Washington, DC, USA, 21–25 January 2007.
24. Géron, A. Hands-on Machine Learning with Scikit-Learn and TensorFlow: Concepts, Tools, and Techniques to BuildIntelligent Systems; O′Reilly Media, Inc.: Sebastopol, CA, USA, 2017.
25. Jia, Y.; Zhang, C.; Lu, Q.; Wang, P. Users′ brands preference based on SVD++ in recommender systems. InProceedings of the 2014 IEEE Workshop on Advanced Research and Technology in Industry Applications(WARTIA), Ottawa, ON, Canada, 29–30 September 2014.
26. Ju, L.; Jun, X.U.; Ling, C.; Bin, M.; Tao, P. Identifying functional regions based on the spatio-temporal patternof taxi trajectories. J. Geo-Inf. Sci. 2018, 20, 14–25.
ISPRS Int. J. Geo-Inf. 2019, 8, 573 13 of 13
27. Zhang, D.; Chen, S.; Zhou, Z.H. A new face recognition method based on SVD perturbation for singleexample image per person. Appl. Math. Comput. 2005, 163, 895–907. [CrossRef]
28. de Wit, J.J.M.; Harmanny, R.I.A.; Molchanov, P. Radar micro-Doppler feature extraction using the singularvalue decomposition. In Proceedings of the 2014 International Radar Conference, Lille, France, 16–18 June2014.
29. Wang, L.; Lu, T.; Gu, H.; Ding, X.; Gu, N. Influential user recommendation through SVD based topicdiversification. In Proceedings of the 2015 IEEE 19th International Conference on Computer SupportedCooperative Work in Design (CSCWD), Calabria, Italy, 6–8 May 2015.
30. Jiang, Y.; Tang, B.; Qin, Y.; Liu, W. Feature extraction method of wind turbine based on adaptive Morletwavelet and SVD. Renew. Energy 2011, 36, 2146–2153. [CrossRef]
31. Yang, C.; Yan, F.F.; Xu, X.D. Clustering Daily Metro Origin-Destination Matrix in Shenzhen China.Appl. Mech. Mater. 2015, 743, 422–432. [CrossRef]
32. Sergios, T.; Konstantinos, K. Pattern Recognition, 4th ed.; Academic Press: Cambridge, UK, 2009.33. Banerjee, S.; Roy, A. Linear Algebra and Matrix Analysis for Statistics; Chapman and Hall/CRC: New York, NY,
USA, 2014.34. Golub, G.; Kahan, W. Calculating the singular values and pseudo-inverse of a matrix. J. Soc. Ind. Appl. Math.
Ser. B Numer. Anal. 1965, 2, 205–224. [CrossRef]35. Tusell, L.; Pérez-Rodríguez, P.; Forni, S.; Wu, X.L.; Gianola, D. Genome-enabled methods for predicting litter
size in pigs: A comparison. Animal 2013, 7, 1739–1749. [CrossRef]36. Cao, M.; Ma, S.; Huang, M.; Lü, G.; Chen, M. Effects of Free-Floating Shared Bicycles on Urban Public
Transportation. ISPRS Int. Geo-Inf. 2019, 8, 323. [CrossRef]
© 2019 by the authors. Licensee MDPI, Basel, Switzerland. This article is an open accessarticle distributed under the terms and conditions of the Creative Commons Attribution(CC BY) license (http://creativecommons.org/licenses/by/4.0/).