Analysis of temperature measurement for monitoring radio-frequency brain lesioning
8
# Analysis of temperature measurement for monitoring radio-frequency brain lesioning J. Wren I O. Eriksson z K. W&rdell z D. Loyd 1 1Department of Mechanical Engineering, Link6ping University, Link6ping, Sweden 2Department of Biomedical Engineering, Link6ping University, Link6ping, Sweden Abstract--During ablative neurosurgery of movement disorders, for instance therapy of Parkinson's disease, temperature monitoring is crucial This study aims at a quantitative comparison of measurement deviations between the maximum tempera- ture located outside the lesioning electrode and two possible thermocouple locations inside the electrode. In order to obtain the detailed temperature field necessary for the analysis, four finite element models associated with different surroundings and with different power supplies are studied. The results from the simulations show that both the power level and the power density as well as the surrounding medium affect the temperature measurement and the temperature field in general. Since the maximum temperature is located outside the electrode there will always be a deviation in time and level between the measured and the maximum temperature. The deviation is usually 2-7 s and 3-12°C, depending on, for example, the thermo- couple location and surrounding medium. Therefore, not only the measured temperature but also the relation between measured and maximum temperature must be accounted for during therapy and device design. Keywords--Ablative neurosurgery, Radio-frequency brain electrodes, Thermal modelling, Temperature measurement Med. Biol. Eng. Comput., 2001, 39, 255-262 J 1 Introduction ABLATIVE STEREOTACTICneurosurgery is used for therapy of several brain disorders, for instance movement disorders caused by Parkinson's disease. A small area in the subcortical part of the brain is destroyed during the therapy. One useful way of achieving this destruction is by the use of radio-frequency (RF) current lesioning. The current, delivered from an electrode typically 1-2 mm in diameter, heats the tissue intensively in the proximity of the electrode tip and causes protein denaturation followed by tissue coagulation. The abnormal brain activity in the target area is thereby terminated (GILDENBERG, 1998; BAKAY, 1998). The size and shape and also the degree of tissue coagulation of a lesion created in brain tissue depends on several factors, some of which have been studied intensively over recent decades. An attempt to set up a theoretical model for the prediction of lesion size in brain tissue was made in 1962 (VAN DEN BERG and VAN MANEN, 1962). This paper was followed by many investigations of both the influence on the lesions of the technical design of the etectrodes and RF generators (ORGAN, 1976; VINAS et al., 1992) as well as physiological parameters such as tissue impedance (SHALIT and MAHLER, 1966; COSMAN et al., 1988; DADD et al., 1996), blood perfusion (WUST et al., 1995), heat flux and tissue Correspondence should be addressed to Mr J. Wren; e-marl: [email protected] First received 9 March 2000 and in final form 18 December 2000 MBEC online number: 20013554 ,~~ IFMBE: 2001 Medical & Biological Engineering & Computing 2001, Vol. 39 sensitivity to heat (SHITZER, 1985). Attempts to study the size and shape of the RF lesions generated with brain electrodes have been made with both in vitro models using hens' egg white as test solution and animal models (VON BONIN et al., 1965; PETTY and EDSALL, 1967; MORINGLANE et al., 1989). Moringlane and colleagues investigated the relation between lesion size in fresh egg white and rabbit brain for different temperature settings of the RF generator. Due to heterogeneity in the egg white, however, repeatability in size and shape creation is unsatisfac- tory. To overcome this problem, a homogeneous, transparent and reusable mixture of albumin was developed and used as test solution in a recent study (ERIKSSON et al., 1999a). Using a computer-assisted video system, accurate evaluation of the length, width and volume of albumin clots generated with various designs of brain electrodes was carded out for different temperature settings of the RF generator. To create a lesion in a safe and efficient way, intense and relatively short-term heating is necessary to diminish unneces- sary heat diffusion to the surrounding normal tissue, but to ensure sufficient heating of the target area. Temperature varies with both time and location during the procedure, and large temperature gradients exist, it is therefore important to be aware of the temperature distribution both inside and outside the target area and to continuously monitor and regulate the procedure. One very important parameter is tissue temperature, but due to the temperature gradients, temperature deviations between the measured and the maximum temperature can be expected. GOLDBERG et al. (1996a) investigated this phenom- enon by integrating thermocouples at three different sites in the 255
Transcript of Analysis of temperature measurement for monitoring radio-frequency brain lesioning
#
Analysis of temperature measurement for monitoring radio-frequency brain
lesioning
J. Wren I O. Eriksson z K. W&rdell z D. Loyd 1
1Department of Mechanical Engineering, Link6ping University, Link6ping, Sweden 2Department of Biomedical Engineering, Link6ping University, Link6ping, Sweden
Abstract--During ablative neurosurgery of movement disorders, for instance therapy of Parkinson's disease, temperature monitor ing is crucial This study aims at a quantitative comparison of measurement deviations between the max imum tempera- ture located outside the lesioning electrode and two possible thermocouple locations inside the electrode. In order to obtain the detailed temperature f ield necessary for the analysis, four finite element models associated with different surroundings and with different power supplies are studied. The results from the simulat ions show that both the power level and the power density as well as the surrounding medium affect the temperature measurement and the temperature field in general. Since the max imum temperature is located outside the electrode there wi l l always be a deviation in t ime and level between the measured and the max imum temperature. The deviation is usually 2-7 s and 3-12°C, depending on, for example, the thermo- couple location and surrounding medium. Therefore, not only the measured temperature but also the relation between measured and max imum temperature must be accounted for during therapy and device design.
Keywords--Ablat ive neurosurgery, Radio-frequency brain electrodes, Thermal modell ing, Temperature measurement
Med. Biol. Eng. Comput., 2001, 39, 255-262
J
1 Introduction
ABLATIVE STEREOTACTIC neurosurgery is used for therapy of several brain disorders, for instance movement disorders caused by Parkinson's disease. A small area in the subcortical part of the brain is destroyed during the therapy. One useful way of achieving this destruction is by the use of radio-frequency (RF) current lesioning. The current, delivered from an electrode typically 1-2 mm in diameter, heats the tissue intensively in the proximity of the electrode tip and causes protein denaturation followed by tissue coagulation. The abnormal brain activity in the target area is thereby terminated (GILDENBERG, 1998; BAKAY, 1998).
The size and shape and also the degree of tissue coagulation of a lesion created in brain tissue depends on several factors, some of which have been studied intensively over recent decades. An attempt to set up a theoretical model for the prediction of lesion size in brain tissue was made in 1962 (VAN DEN BERG and VAN MANEN, 1962). This paper was followed by many investigations of both the influence on the lesions of the technical design of the etectrodes and RF generators (ORGAN, 1976; VINAS et al., 1992) as well as physiological parameters such as tissue impedance (SHALIT and MAHLER, 1966; COSMAN et al., 1988; DADD et al., 1996), blood perfusion (WUST et al., 1995), heat flux and tissue
Correspondence should be addressed to Mr J. Wren; e-marl: [email protected] First received 9 March 2000 and in final form 18 December 2000 MBEC online number: 20013554
,~~ IFMBE: 2001
Medical & Biological Engineering & Computing 2001, Vol. 39
sensitivity to heat (SHITZER, 1985). Attempts to study the size and shape of the RF lesions generated with brain electrodes have been made with both in vitro models using hens' egg white as test solution and animal models (VON BONIN et al., 1965; PETTY and EDSALL, 1967; MORINGLANE et al., 1989). Moringlane and colleagues investigated the relation between lesion size in fresh egg white and rabbit brain for different temperature settings of the RF generator. Due to heterogeneity in the egg white, however, repeatability in size and shape creation is unsatisfac- tory.
To overcome this problem, a homogeneous, transparent and reusable mixture of albumin was developed and used as test solution in a recent study (ERIKSSON et al., 1999a). Using a computer-assisted video system, accurate evaluation of the length, width and volume of albumin clots generated with various designs of brain electrodes was carded out for different temperature settings of the RF generator.
To create a lesion in a safe and efficient way, intense and relatively short-term heating is necessary to diminish unneces- sary heat diffusion to the surrounding normal tissue, but to ensure sufficient heating of the target area. Temperature varies with both time and location during the procedure, and large temperature gradients exist, it is therefore important to be aware of the temperature distribution both inside and outside the target area and to continuously monitor and regulate the procedure. One very important parameter is tissue temperature, but due to the temperature gradients, temperature deviations between the measured and the maximum temperature can be expected. GOLDBERG et al. (1996a) investigated this phenom- enon by integrating thermocouples at three different sites in the
255
tip of RF electrodes with tip lengths up to 7 cm, in this case used for lesioning in the muscle and liver tissue of pigs. They also studied the temperature by putting thermocouples at 0.5 cm increments up to 2 cm perpendicular from the tip of the electrode (GOLDBERG et al., 1996b). Similar investigations have been carried out by CHUA et al., (1999), who studied temperature variations with millimetre precision using bare thermocouples perpendicular to the RF electrode. However, an arrangement with actuators along a needle perpendicular to the electrode cannot exclude interference with the RF and temperature fields and thus the lesioning process. Nor can the total temperature distribution around electrode tip be mapped.
This present study aims at investigating the temperature variations around the electrode tip during lesioning with brain electrodes, using finite element models. Of special interest are the measurement deviations associated with the time- and space-varying temperature fields and the thermo- couple location. These temperature measurement deviations are quantified for different power supplies and surrounding thermal characteristics.
2.2 Governing equations, initial and boundar), conditions
The temperature distribution in the electrode and its surround- ings is obtained using the heat conduction equation, i f the properties of the domain are isotropic and homogeneous, the heat conduction equation in cylindrical coordinates (CARSLAW and JAEGER, 1959) is given by
pc at ,. a,. \ j
1 a ( a T ) + 0 (1) + 7 k°5-g
where T T(r, ®, z, t) is the temperature, r, ®, z the cylin- drical coordinates, p the density, c the specific heat, r the radius and t the time. The term Q is used to model the heat generated by the electric current in the vicinity of the electrode tip. Eqn 1 is solved numerically using the finite element method (LOYD et al., 1985). The initial temperature of the entire domain is set to 37 ° C and a prescribed boundary temperature of 37 ° C is used over the entire outer domain boundary of the albumin solution.
2 Mater ia l and m e t h o d s
To obtain accurate information from the temperature measurement, the connection between temperature measure- ment, temperature field and lesion growth must be fully under- stood. The detailed information on the temperature field, necessary for a thorough thermal analysis, is acquired by use of a finite element method (ZIENKIEWICZ, 1977). Four finite element models with different power supplies and surrounding materials are studied. Thus, the impact of the surrounding thermal characteristics and power supplies, which interact with the temperature measurement, can be elucidated.
2.1 The lesioning electrode
in this study a monopolar brain electrode* was used; diameter 2mm, tip length 4mm and total length 190mm. By using a CT system'S, detailed information on the inner structure of the individual electrode can be obtained. X-ray and CT images of the electrode tip are shown in Figs la and lb, respectively. Inside the electrode an electric conductor tube leads the electric current to the rounded tip of the electrode. The electric conductor tube is soldered to the tip, which is insulated from the rest of the electrode via a biocompatible insulation material. The thermocouple is embedded in epoxy near the end of the tip. The space inside the conductor tube is air-filled.
During the creation of a lesion, a Leksell + Neuro Generator S delivers an electric current (512 kHz) to the electrode tip which causes Joule heating in the proximity of the tip. A neutral plate, serving as a return path for the electric current, is used together with the monopolar electrode. The current output is obtained from a current-limited constant voltage source. The output power is limited by the temperature measured by a thermocouple (usual treatment temperatures are 70, 80 and 90 °C), as well as the temperature gradient, which is not allowed to exceed 6 °C/s. When the preset coagulating time has elapsed the RF output power is terminated. The electrode must be cooled for a period of 60 s before retraction to prevent the tissue sticking to the electrode.
* LNG M3-2, Elekta Instrument AB, Sweden.
-~ Tomohawk 2, Ois Engineering Ltd, UK. LNG 30-1, Elekta Instruments AB, Sweden.
256
2.3 Thermal modelling of blood perfiused brain
During modelling of the thermal properties of blood perfused tissue the convective heat flux must be accounted for. However, in practice it is not possible to use equations including convec- tive movements of the blood, instead, the bio-heat equation of Pennes or the ~ f equation can be used to approximate the thermal effect of blood perfusion (see the Appendix). In the current study, the grey matter of the central part of the brain is studied. This implies that the blood perfusion is referred to the microcirculation with a vessel architecture dominated by capil- laries (DUVERNOY et al., 1981). Therefore, the A~f equation, which uses an increased (effective) thermal conductivity to account for the heat flux due to blood perfusion (ZHU et al., 1995), has been selected to describe perfused brain.
2.4 Finite element models
A basic finite element model was built from the X-ray and the CT images shown in Figs la and lb. The surroundings were simulated as four different materials: albumin solution (Model i), gelatinous albumin solution (Model ii), brain tissue without blood perfusion (Model iii) and brain tissue with blood perfu- sion (Model IV). The heat sources were assigned, geometrically and with power level, to give a lesion growth similar to the experimental lesion growth for Models i and ii (ERIKSSON et al., 1999b).
Joule heating was included as a constant level heat source. The source has a constant level (specific absorption rate, SAR) in space, but the level varies between models. The vast majority of Joule heating occurs outside the electrode tip, since the conduc- tivity of the electrode is much larger than the conductivity of the albumin solution and the brain tissue. Consequently, no heat is supplied inside the electrode. The Joule heating which corre- sponds to the heat source decreases in accordance with 1 / 4 where r is the radius (WREN, 2000). This implies that most of the Joule heating occurs very close to the electrode tip, which in this case admits a relatively small extension of the heat source in the radial direction. From a heat transfer point of view, the effect of an average value instead of a distributed heat source is small.
In addition to Joule heating, convective movements due to, for instance, natural convection in the albumine solution or blood perfusion in brain tissue significantly affects lesion growth. The gelatinous albumin solution, which has a high viscosity and therefore less convective movements than the albumin solution, is assumed to be more similar to solid brain tissue than the plain
Medical & Biological Engineering & Computing 2001, Vol. 39

~' e ' ,+jR;" 7 ":'¢,~:¢ , ' :- 9 ~ D = 2 m m " ,' ; , ~ ,
, : ? ; . . - . - . - j :
e l e c t r i c '5 i ' . ' ~ c o n d u c t o r :
: " t u b e ' z-
; ~ t h e r m o c o u p l e ..
• " w i r e s
F i g . 1
a b
(a) X-ray image of the electrode tip viewing the electrode covet: the electric current conductor and the thermocouple wires glued to the inside of the electrode tip and conductor tube. The outer electrode diameter (D) is 2 mm, and the radius o f curvature o f the electrode tip (R) is i mm. (b) Computed tomograpl(v image of a slice o f the electrode tip. The cover and electric conductor tube together with the two thermocouple wires are shown. Note the solder Ovhite) and the gaps with air (dark grey) comwcting the conductor tube to the tip (light grey)
F i g . 2
i i
i i i i i i i
=,,,,=,~,=,,,,= i,i ~ i,i i,i ~ i
i i i i i i i
i i i
a
power distribution 1
D insulation
D heat source B 1
i
R_ i
7 power distribution 2
~ insulation
I heat source
(a) Power distribution used in tile simulation with albumin solution as surtvtmding material (Model 1). The power densiO: of area A is twice that o f area B. (b) Power distribution used in the simulations with gelatinous albumin solution, brain tissue without blood petfitsion and brain tissue with blood petfusion as sttrrottndings (Models IL III and IV, respectively)
albumin solution. Therefore, the power distribution o f Model ii (gelatinous albumin solution) is also used with Models iii and IV (brain tissue without and with blood perfusion, respectively). Altogether, two geometrically different power distributions were used in the simulations, one for Model i (Fig. 2a) and the other for Models I I - IV (Fig. 2b).
All models are symmetric about the electrode axis, which makes the temperature a fimction o f r, z and t only; i.e. T T(r, z, t). The electrode parts shown in Figs la and lb, with the exception o f the solder, are modelled. The thermal data
for the materials o f the electrode used in the simulations are taken from HOLMAN, (1992) and given in Table 1. Electrodes with other dimensions than those used here (2 mm in diameter; tip length 4 mm), can be studied (GOLDBERG et al., 1995), but, in principle, no new information will be added.
The thermal properties o f the albumin solution were experi- mentally determined using an indirect energy balance method including a phase term; k 0.68 0 . 0 3 W m 1K 1 and k / p . c p ( 1 . 7 + 0 . 1 ) x10 7m2s 1. These values are used with Models i and ii. For tmperfused brain tissue (Model iii),
Table 1 Sttrrottnding densiO; specific heat, thermal conductiviO.', supplied power (6-18s) and associated power densin; o f Models I - IV
Stainless Insulation steel material Model I
Surroundings in
Model II Model III Model IV
Density [kgm 3] 1 1 Specific heat [Jkg K ]
1 1 Thermalcond. [Wm K ] Supplied power 6-18 s [W] Power density [MWm 3]
8240 1500 1000 1000 1000 1000 470 1300 4000 4000 4000 4000
16 0.16 0.68 0.68 0.32 1.30 - - 1.4 2.1 1.4 3.1 - - 238 70 45 101
Medical & Biological Engineering & Computing 2001, Vol. 39 257

the heat conductivity varies over a large span (0.16 ~<k~<0.57 W m ~ K ~) according to CHATO (1985). In this study, k is set to 0.32 W m 1K 1. For brain tissue with blood perfusion (Model IV), the A~df equation is used with an effective conductivity of 1.3 W m 1K~. Thus, in Models I-IV, the thermal conductivities are 0.68, 0.68, 0.32 and 1.3 W m 1 K 1, respectively. The latter value may be too high for perfused brain, but is chosen as a maximum value.
2.5 Simulations
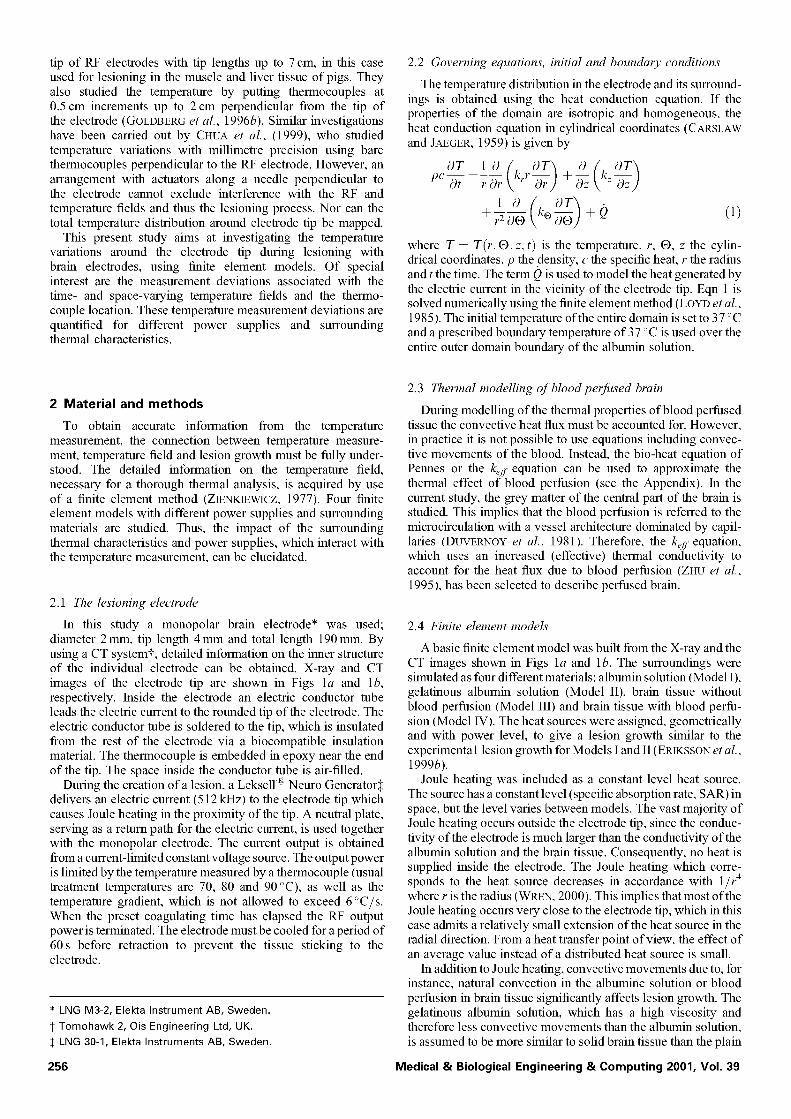
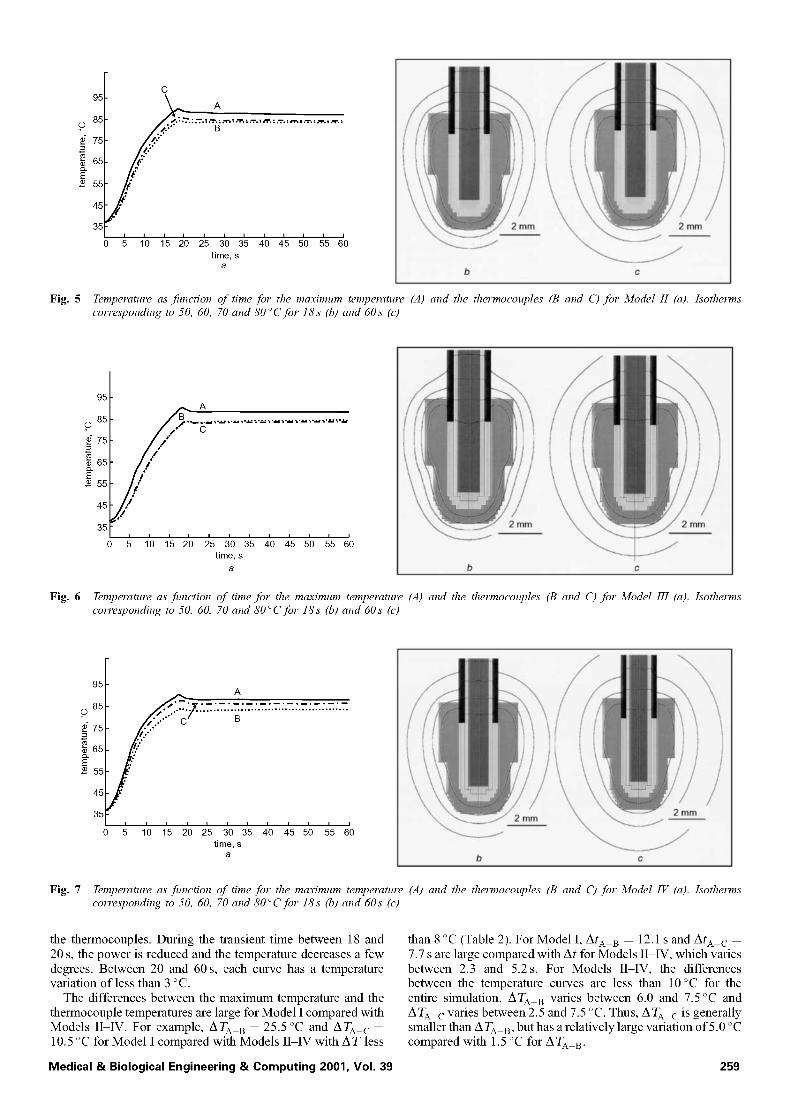
Simulations of the entire temperature field were carried out (0-60 s) for all models. The results are presented as temperature profiles for the entire simulation, in addition, isotherms are shown to give information about the temperature field. The isotherms correspond to the 50, 60, 70 and 80 °C isotherms associated with 18 and 60 s of simulation.
The locations of the temperatures marked A, B and C are given in Fig. 3a. Thermocouples (B and C) are located at the same place for all models. The maximum temperature (A) is a function of time and space. Point A is located approximately 0.3 mm from the electrode for all models (determined from the simulations), and moves a few tenths ofa millimetre in the axial direction during the simulation. The differences between the temperature profiles are quantified using the temperature differ- ence (AT) and the time difference (At), which are defined in Fig. 3b. ATis the temperature difference between any two curves
after 18 s of simulation. At is the time from to (when the maximum temperature overshoots the maximum thermocouple temperature) to t~ (when the maximum temperature is obtained). The differences between two curves are denoted by the indices A - B and A - C , respectively.
The amount of power supplied in the simulations is similar to the power supply logged by the RF generator. For the first 6 s the supplied power increases linearly, and between 6 and 18 s the supplied power is constant (see Table 1). After approximately 18 s of the experiment, the preset temperature was reached and the mean power was adjusted to maintain a constant temperature until 60 s (the end of the simulation), when the power was turned off. Between 18 and 60 s the supplied power to the respective Models I-IV was reduced to 69, 65, 61 and 73% of the power supplied between 6 and 18 s. For the simulations shown here, the power level was chosen to obtain a maximum temperature of 90 °C.
3 Resul ts
The results are shown in Figs 4-7 for the respective Models I - IV. Figs 4a-7a show the temperature plotted against time for the maximum temperature (A) and the two thermocouple tempera- tures (B and C). The location of the points A-C are given in Fig. 3a. During the first 18 s a rapid temperature increase is obtained and the maximum temperature diverges from the temperature of
3.5 mm
4.0 mm
i
i
i
i
i
i
i
i C i k ~
i
i
ic
i
A
oF B
T
i i
t o t e
b
Fig. 3 (a) Location o f the simulated temperatures. A is the maximum temperature location and B and C are the thermocouple locations. (b) Definition of AT and At used to quanta' the temperature difference. AT is the temperature difference between two curves after 18s. At is the time fi'om to Or'hen the maximum temperature overshoots the maximum thermocouple temperature) to t~ Or'hen the maximum temperature is obtained), hMices A B and A C are used for the difference between curve A (the maximum temperature) and B or C (the respective thermocouples)
95
85 ? 75
65 E
55
45
35
Fig. 4
A
i ° ° , , . . . . . . . . . . . . . . . . . . . . . . . . . . . . . . . . . . . . . . . . . .
' 1'o . . . . . 2o 3o ; o ' do ' 6 time, s
a C
\ \
I J
/
/ 1
Temperature as function o f time for tile maximum temperature (A) and tile thermocouples (B and C) for Model I (a). Isotherms corresponding to 50, 60, 70 and 80~-'C for 18s (b) and 60s (c)
258 Medical & Biological Engineering & Computing 2001, Vol. 39
95
85 ? 75
65 & E
55
45
Fig. 5
35
0
c
~..7..,.:'" a
¢
; 1'0 1'5 210 2; 310 3; 20 4'5 5'0 55 6'0 time, s
a
/ , \ i \
i I
/ /
i
b c
Temperature as ftmction of time for the maximum temperature (A) and the thermocouples (B and C) for Model H (a). Isotherms corresponding to 50, 60, 70 and 80 ~-'C for 18s (b) and 60s (c)
Fig. 6
95
85 ? 75
2 & 65
E 55
45
35
///./.- c
,/,,," //.,'
i i i i i i
I'0 & 20 2~ 30 & 4'0 4~ ~'0 ~ o'0 time, s
a b c
\
\
/ / 1
Temperature as fimction o f time for the maximum temperature (A) and the thermocouples (B and C) for Model III (a). Isotherms corresponding to 50, 60, 70 and 80~-'C for 18s (b) and 60s ((9
95
85 ? 75
& 65
E .,.e ¢ 55
45
35 0 ~ 110 115 2'0 215
A
/~,. "..- :..-. :.~ J.7. :.7. :..- "..- :..- :..-. :..'~ :..-
' ' 4' ' '0 ' '0 30 35 0 45 5 55 6 time, s
a
/' /
/ i
.. ~__ _ ~ z mm
~ - ~ _ _ _ _ ~
\
C
"4. . \
\ ' \
I )
/ I it
/ / 2 mm
Fig. 7 Temperature as fimction of time for tile maximum temperature (A) and tile thermocouples (B and C) for Model IV (a). Isotherms corresponding to 50, 60, 70 and 80~-'C for 18s (b) and 60s (c)
the thermocouples. During the transient time between 18 and 20 s, the power is reduced and the temperature decreases a few degrees. Between 20 and 60 s, each curve has a temperature variation of less than 3 °C.
The differences between the maximum temperature and the thermocouple temperatures are large for Model i compared with Models II-IV. For example, A T a B 25.5 °C and A T a c 10.5 °C for Model i compared with Models I I - IV with A T less
than 8 °C (Table 2). For Model i, AtA B 12 .1sandAtA c 7.7 s are large compared with At for Models I I -IV, which varies between 2.3 and 5.2s. For Models I I -IV, the differences between the temperature curves are less than 10 °C for the entire simulation. A T a B varies between 6.0 and 7.5 °C and ATA c varies between 2.5 and 7.5 °C. Thus, A T a c is generally smaller than A T a B, but has a relatively large variation of 5.0 °C compared with 1.5 °C for A T a B.
Medical & Biological Engineering & Comput ing 2001, Vol. 39 259
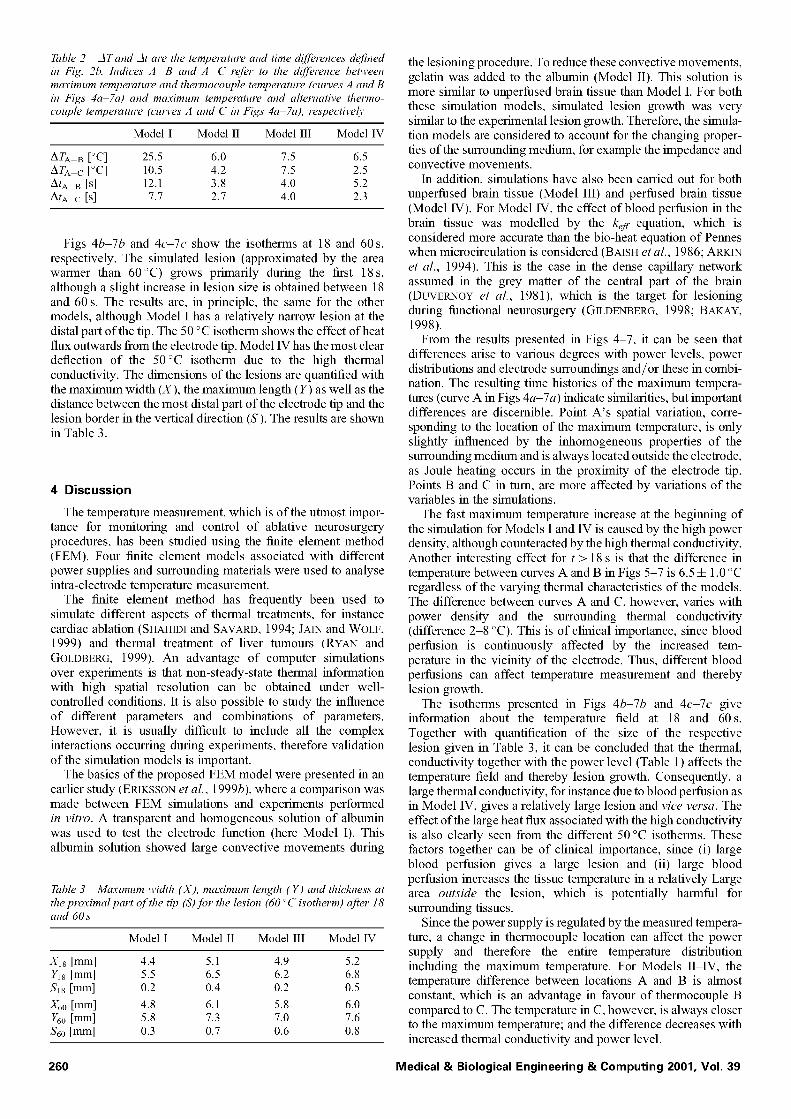
Table 2 ATand At are the temperature and time differences defined in Fig. 2b. hMices A B and A C refer to the difference between maximum temperature and thermocouple temperature (craves A and B in Figs" 4a-7a) and maximum temperature and alternative thermo- couple temperature (curves A and C in Figs" 4a-7a), respectively
Model I Model II Model III Model IV
ATA t3 [°C] 25.5 6.0 7.5 6.5 ATA c [~-~C] 10.5 4.2 7.5 2.5 AtA t3 [s] 12.1 3.8 4.0 5.2 AtA C [S] 7.7 2.7 4.0 2.3
Figs 4b -7b and 4c-7c show the isotherms at 18 and 60 s, respectively. The simulated lesion (approximated by the area warmer than 60°C) grows primarily during the first 18s, although a slight increase in lesion size is obtained between 18 and 60 s. The results are, in principle, the same for the other models, although Model i has a relatively narrow lesion at the distal part of the tip. The 50 °C isotherm shows the effect of heat flux outwards from the electrode tip. Model IV has the most clear deflection of the 50°C isotherm due to the high thermal conductivity. The dimensions of the lesions are quantified with the maximum width (X), the maximum length (Y) as well as the distance between the most distal part of the electrode tip and the lesion border in the vertical direction (S). The results are shown in Table 3.
4 Discussion
The temperature measurement, which is of the utmost impor- tance for monitoring and control of ablative neurosurgery procedures, has been studied using the finite element method (FEM). Four finite element models associated with different power supplies and surrounding materials were used to analyse intra-electrode temperature measurement.
The finite element method has frequently been used to simulate different aspects of thermal treatments, for instance cardiac ablation (SHAHIDI and SAVARD, 1994; JAIN and WOLF, 1999) and thermal treatment of liver tumours (RYAN and GOLDBERG, 1999). An advantage of computer simulations over experiments is that non-steady-state thermal information with high spatial resolution can be obtained under well- controlled conditions, it is also possible to study the influence of different parameters and combinations of parameters. However, it is usually difficult to include all the complex interactions OCCulTing during experiments, therefore validation of the simulation models is important.
The basics of the proposed FEM model were presented in an earlier study (ERIKSSON et al., 1999b), where a comparison was made between FEM simulations and experiments performed in vitro. A transparent and homogeneous solution of albumin was used to test the electrode function (here Model i). This albumin solution showed large convective movements during
Table 3 Maximum width ()0, maximum length ( Y) and thickness at the proximal part o f the tip (S) for the lesion (60 ~-'C isotherm) after 18 and 60 s
Model I Model II Model III Model IV
X1, [mm] 4.4 5.1 4.9 5.2 Yl* [mm] 5.5 6.5 6.2 6.8 S1, [mm] 0.2 0.4 0.2 0.5 A;oO [mm] 4.8 6.1 5.8 6.0 116o [mm] 5.8 7.3 7.0 7.6 $6o [mm] 0.3 0.7 0.6 0.8
the lesioning procedure. To reduce these convective movements, gelatin was added to the albumin (Model ii). This solution is more similar to unperfused brain tissue than Model i. For both these simulation models, simulated lesion growth was very similar to the experimental lesion growth. Therefore, the simula- tion models are considered to account for the changing proper- ties of the surrounding medium, for example the impedance and convective movements.
In addition, simulations have also been carried out for both unperfused brain tissue (Model iii) and perfused brain tissue (Model IV). For Model IV, the effect of blood perfusion in the brain tissue was modelled by the ~)-equation, which is considered more accurate than the bio-heat equation of Pennes when microcirculation is considered (BAISH et al., 1986; ARKIN et al., 1994). This is the case in the dense capillary network assumed in the grey matter of the central part of the brain (DUVERNOY et al., 1981), which is the target for lesioning during functional neurosurgery (GIEDENBERG, 1998; BAKAY, 1998).
From the results presented in Figs 4-7, it can be seen that differences arise to various degrees with power levels, power distributions and electrode surroundings and/or these in combi- nation. The resulting time histories of the maximum tempera- rares (curve A in Figs 4a-7a) indicate similarities, but important differences are discernible. Point A's spatial variation, corre- sponding to the location of the maximum temperature, is only slightly influenced by the inhomogeneous properties of the surrounding medium and is always located outside the electrode, as Joule heating occurs in the proximity of the electrode tip. Points B and C in turn, are more affected by variations of the variables in the simulations.
The fast maximum temperature increase at the beginning of the simulation for Models i and IV is caused by the high power density, although counteracted by the high thermal conductivity. Another interesting effect for t > 18 s is that the difference in temperature between curves A and B in Figs 5-7 is 6.5 4- 1.0 °C regardless of the varying thermal characteristics of the models. The difference between curves A and C, however, varies with power density and the surrounding thermal conductivity (difference 2-8 °C). This is of clinical importance, since blood perfusion is continuously affected by the increased tem- perature in the vicinity of the electrode. Thus, different blood perfusions can affect temperature measurement and thereby lesion growth.
The isotherms presented in Figs 4b-7b and 4c-7c give information about the temperature field at 18 and 60s. Together with quantification of the size of the respective lesion given in Table 3, it can be concluded that the thermal, conductivity together with the power level (Table 1 ) affects the temperature field and thereby lesion growth. Consequently, a large thermal conductivity, for instance due to blood perfusion as in Model IV, gives a relatively large lesion and vice versa. The effect of the large heat flux associated with the high conductivity is also clearly seen from the different 50 °C isotherms. These factors together can be of clinical importance, since (i) large blood perfusion gives a large lesion and (ii) large blood perfusion increases the tissue temperature in a relatively Large area outside the lesion, which is potentially harmful for surrounding tissues.
Since the power supply is regulated by the measured tempera- rare, a change in thermocouple location can affect the power supply and therefore the entire temperature distribution including the maximum temperature. For Models II-IV, the temperature difference between locations A and B is almost constant, which is an advantage in favour of thermocouple B compared to C. The temperature in C, however, is always closer to the maximum temperature; and the difference decreases with increased thermal conductivity and power level.
260 Medical & Biological Engineering & Computing 2001, Vol. 39

in conclusion, the temperature inside the electrode can be used for control o f the therapy as long as the surgeon is aware of the variation of the temperature in space and time, e.g. the difference between maximum tissue temperature and measured tempera- ture as well as which factors affect the temperature distribution. This is an important finding which is directly connected to the clinical situation.
5 Conclusions
To control the lesioning process effectively, temperature monitoring is crucial. The temperature measurement carried out inside the electrode is connected both with the maximum temperature outside the electrode and lesion growth. However, the connection varies with the power supply and thermal characteristics o f the medium surrounding the electrode. This has been studied using the finite element method, which has proven to be useful for the detailed thermal evaluation necessary.
The thermal conductivity of the surrounding medium has been concluded to be of special importance. A large heat flux in the surroundings, for instance due to high blood perfusion, increases the area heated during therapy. A large heat flux also affects the temperature measurement, but to different extents depending on where in the electrode tip the measurement takes place. Thus, the actions undertaken by the neurogenerator to control the proce- dure are dependent on both the surrounding media and the location of the temperature measurement, which in turn affects the power supply and thereby the entire lesioning process.
influences from, for example, different vessel configurations and blood flow velocities. The main advantage of Pennes' equation is its simplicity.
The A~yeqztation
A bio-heat equation can be obtained by an approximation of the effect o f blood perfusion with an increased (effective) heat conductivity (CHEN and HOLMES, 1980; LAGENDIJK, 1984; CREZEE and LAGENDIJK, 1990). This gives the equation
OT 1 0 (k~ffrOZ) 0 ( ~ _ ) pc Ot r Or & + Oz k~j) 2 "Z
1 0 (k~) ,OT)+02 (3) +75-g oo
All temperatures are tissue temperatures, L,~# is the effective conduct ivi ty in direction i and Q2 is a heat sink or source.
The effective conductivity is, as in Pennes' equation related to the volumetric blood perfusion rate. The relation is more complex, however, and experimental determination of the conductivity increase for each tissue is preferable. An advantage is that the equation gives an estimate of the maximum tempera- rare spreading for temperature-controlled therapies.
Acknowledgments--The authors axe very grateful to Dr Peter Haxnmersberg and research engineers Ms Annette Billenius and Mr Nils Laxsson for all their help in capturing X-ray and CT images with the computer tomograph. This study was supported by the Swedish Competence Centre of Non-invasive Medical Measurements (NIMED).
Appendix
Regarding collective modelling of blood perfusion, two widely used continuum models that fulfil this demand are the bio-heat equation (BHE) of Pennes and the 1)y equation. Only the 1~f equation is used in the simulations, but both equations are described here. Other bio-heat equations exist for many different applications, see the review given by WREN (2000).
The bio-heat equation of Pennes
in Pennes' bio-heat equation (PENNES, 1948), the effect of blood perfusion is approximated with a heat sink directly proportional to the volumetric blood perfusion (the last term in eqn 2), and the following equation is obtained
P("W +7N \ '-b-7,j k: 1 0 ( OT)
+ 7 " ~ k ° ~ @Ol@(°S('h(Ta T) (2)
where T T(r, O, z, t) is the temperature, r, O, z the cylind- rical coordinates, p the density, c the specific heat, t the tin)e and L the thermal conductivity (i is the direction). The term Q1 is a heat sink or source, co [kgm 3s 1] is the volumetric blood perfusion, cb is the specific heat of blood and T ' is the arterial blood temperature.
in PENNES' (1948) original work, a dimensionless coefficient S (0<S~< 1) was included in the last term to account for the temperature equilibration between capillary blood and the surrounding tissue. In most work where the BHE of Pelmes has been used, it has been assumed than S is equal to 1, which corresponds to temperature equilibration in the capillaries alone. No heat spreading by blood perfusion is accounted for by this equation. Additionally the equation does not account for
References
ARKIN, H., XU, L. X., and HOLMES, K. R. (1994): 'Recent develop- ments in modelling tissue heat transfer in blood perfused tissues', IEEE-Trans. Biorned. Eng., 41, pp. 97-107
BAISH, J. W., AYYASWAMY, P. S., and FOSTER, K. R. (1986): 'Heat transport mechanisms in vascular tissues: a model comparison', ASME-J Biornech. Eng., 108, pp. 324-331
BAKAY, R. A. E. (Ed) (1998): 'Neurosurgical clinics of North America: surgical treament of movement disorders, Vol. 9' (Harcourt Brace)
CARSLAW, H., and JAEGER, J. (1959): 'Conduction of heat in solids', 2nd edn (Oxford University Press)
CHATO, J. C. (1985): 'Heat transfer in medicine and biology', (Plenum Press, New York), Chap. 8
CHEN, M. M., and HOLMES, K. e. (1980): 'Micro-vasculax contribu- tion in tissue heat transfer', Ann. New York Acad. Sci., 355, pp. 137-150
CHUA, E., GOSE, E., VINAS, E C., DUJOVNY, M., and STAR, J. (1999): 'Temperature distribution produced in brain tissue and other media by a radiofrequency hyperthermia generator', Stereotactic Func- tional Neurosurg., 72, pp. 22-34
COSMAN, E. R., RITTMAN, W. J., NASHOLD, B. S., and MAKACHINAS, T. T. (1988): 'Radio-frequency lesion generation and its effect on tissue impedance', Appl. Neurophysiol., 51, pp. 230-242
CREZEE, J., and LAGENDIJK, J. J. (1990): 'Experimental verification of bio-heat transfer theories: measurement of temperature profiles around large artificial vessels in perfused tissue', Phys. Med. Biol., 35, pp. 905-923
DADD, J. S., RYAN, T. R, and PLATT, R. (1996): 'Tissue impedance as a function of temperature and time', Biorned. Sci. Instl:, 32, pp. 205-214
DUVERNOY, H. M., DELON, S., and VANNSON, J. L. (1981): 'Cortical blood vessels of the human brain', Brain Res. Bull., 77, pp. 519-579
ERIKSSON, O., WARDELL, K., ERIKSSON, BYLUND, N., KULLBERG, G., and REHNCRONA, S. (1999a): 'In vitro evaluation of brain lesioning
Medical & Biological Engineering & Computing 2001, Vol. 39 261
electrodes (Leksell '~') using a computer-assisted video system', Neurological Res., 21, pp. 89-95
ERIKSSON, O., WREN, J., LOYD, D., and WARDELL, K. (1999b): 'A comparison between in vitro studies of protein lesions generated by brain electrodes and FEM simulations', Med. Biol. Eng. Comput., 37, pp. 737-741
GILDENBERG, P. L. (Ed) (1998): 'Neurosurgical clinics of North America: functional neurosurgery, Vol. 6' (Harcourt Brace)
GOLDBERG, S. N., GAZELLE, G. S., DAWSON, S. L., RITTMAN, W. J., MUELLER, P. R., and ROSENTHAL, D. I. (1995): 'Tissue ablation with radiofrequency: Effect of probe size, gauge, duration and temperature on lesion volume', Academic Radiology, 2, pp. 399- 404
GOLDBERG, S. N., GAZELLE, G. S., HALPERN, E. E, RITTMAN, W. J., MUELLER, P. R., and ROSENTHAL, D. I. (1996a): 'Radiofrequency tissue ablation: Importance of local temperature along the electrode tip exposure in determining lesion shape arid size', Academic Radiology, 3, pp. 212-218
GOLDBERG, S. N., GAZELLE, G. S., SOLBATI, L., RITTMAN, W. J., and MUELLER, R R. (1996b): 'Radiofrequency tissue ablation: increased lesion diameter with a perfused electrode', Academic Radiol., 3, pp. 636-644
HOLMAN J. P. (1992 ): 'Heat transfer' (McGraw-Hill) JAN, M. K., and WOLF, R D. (1999): 'Temperature-controlled and
constant-power radio-frequency ablation: what affects lesion growth?', IEEE-Trans. Biomed. Eng., 46, pp. 1405-1412
LAGENDIJK, J. J. W. (1984): 'A new theory to calculate temperature distributions in tissues, or why the "bio-heat transfer" equation does not work' in OVERGAARD J. (Ed.)'Hyperthermic Oncology' (Taylor and Francis, Basingstoke, Great Britain)
LOYD, D., ANDERSSON, G., and FR(3IER, M. (1985): 'THAFEM - a finite element program for heat transfer analysis' in BREBBIA, C. (Ed): 'Finite element systems - a handbook' 3rd edn (Springer- Verlag, Berlin), pp. 721-732
MORINGLANE, J. R., KOCH, R., SCHAFER, H., and OSTERTAG, C. B. (1989): 'Experimental radio-frequency (RF) coagulation with com- puter-based on line monitoring of temperature and power', Acta Neurochirulgica, 96, pp. 126-131
ORGAN, L. W. (1976): 'Electro-physiologic principles of radio- frequency lesion making', Appl. Neurophysio[., 39, pp. 69-76
PENNES, H. H. (1948): 'Analysis of tissue and arterial blood tempera- rares in the resting human forearm', J Appl. Physiol., 1, pp. 93-122
PETTY, P. G., and EDSALL, G. (1967): 'Alternating current electro- coagulation with bipolar electrodes', J. Nettroslt/:, 26, pp. 399-405
RYAN, T. P., and GOLDBERG, S. N. (1999): 'Comparison of simulation and experimental results for rf thermal treatment devices with or without cooling'. Proc. Conf. Thermal Treatment of Tissue with Image Guidance', SPIE
SHAHIDI, A. V, and SAVARD, P. (1994): 'A finite element model for radiofrequency ablation of the myocaxdium', IEEE-Transactions oil Biomedical Engineering, 41, pp. 963-968
SHALIT, M. N., and MAHLER, Y. (1966): 'Brain impedance measure- ment by the use of small bipolar needle electrodes', J. Appl. Physiol., 21, pp. 1237-1242
SHITZER, A. (1985): 'Temperature fields and lesion sizes in electro- surgery and induction thermocoagulation', in SHITZER A., and EBERHART, e. C. (Eds): 'Heat Transfer in Medicine and Biology', (Plenum Press, New York), Vol. 2, Chap. 17 pp. 55-84
VAN DEN BERG, J., and VAN MANEN, J. (1962): 'Graded coagulation of brain tissue', Acta Physiol. Pharmacol. NeeHandica, 10, pp. 353- 377
VINAS, E C., ZAMORANO, L., DUJOVNY, M., ZHAO, J. Z., HODGKIN- SON, D., HO, K. L., and AUSMAN, J. I. (1992): ' In vivo and in vitro studies of the lesions produced with a computerized radiofrequency system', Stereotactic and ftmctional neurosulgel T, 58, pp. 121-133
VON BONIN, G., ALBERTS, W. W., WRIGHT, E. W., and FEINSTEIN, B. (1965): 'Radio-frequency brain lesions', Alchives Neurol., 12, pp. 25-29
WREN, J. (2000): 'On modelling and simulation of perfused tissue during thermal treatment-thermal analysis of blood perfusion and lesioning during ablative neurosurgery'. Lic. Eng. Thesis, LinkGpings Univeristet, ISBN: 91-7219-690-4
WUST P., STAHL, H., LOFFEL, J., SEEBASS, M., RIESS, H., and FELbX:, R. (1995): 'Clinical, physiological and anatomical determinants for radio-frequency hyperthermia', hit. J. Hyperthermia, 11, pp. 151- 167
ZHU, L., LEMONS, D. E., and WEINBAUM, S. (1995): 'A new approach for predicting the enhancement in the effective conductivity of perfused muscle tissue due to hyperthermia', Aim. Biomed. Eng., 23, pp. 1-12
ZIENKIEWCZ, O. C. (1977): 'The finite element method' (McGraw-Hill)
Author's biography
JOAKIM WREN was born in Sweden in 1973. He received his MSc and Licentiate in Engineering in Mechanical Engineering in 1997 and 2000, respectively, and is currently working on his PhD at LinkGpings Universitet. His research inter- est includes medical and bio- medical thermal problems, for example neurosur- gical ablation and thermal modelling of perfused tissue.
262 Medical & Biological Engineering & Computing 2001, Vol. 39