ANALYSIS OF STEEL BUILDING USING MOMENT DISTRIBUTION AND SAP2000 COMPUTER SOFTWARE
24
COLLEGE of ENGINEERING & COMPUTER SCIENCE DEPERTMENT of CIVIL ENGINEERNG Class Project –Finite Element Analysis: ENGR 5600 ANALYSIS OF STEEL BUILDING USING MOMENT DISTRIBUTION AND SAP2000 COMPUTER SOFTWARE By Khalafalla, Mohamed (MSc in Engineering: Civil) Class Instructor: Dr. Wu, Weidong.., PhD A project submitted in fulfillment of the requirements for the class, Indeterminate Structural Analysis, Spring 2014. The University of Tennessee at Chattanooga April, 2014
Transcript of ANALYSIS OF STEEL BUILDING USING MOMENT DISTRIBUTION AND SAP2000 COMPUTER SOFTWARE
COLLEGE of ENGINEERING & COMPUTER SCIENCE
DEPERTMENT of CIVIL ENGINEERNG
Class Project –Finite Element Analysis: ENGR 5600
ANALYSIS OF STEEL BUILDING USING MOMENT DISTRIBUTION AND
SAP2000 COMPUTER SOFTWARE
By
Khalafalla, Mohamed
(MSc in Engineering: Civil)
Class Instructor: Dr. Wu, Weidong.., PhD
A project submitted in fulfillment of the requirements for the class, Indeterminate
Structural Analysis, Spring 2014.
The University of Tennessee at Chattanooga
April, 2014

2
DECLARATION, CERTIFICATION
AND
COPYRIGHT
I, Khalafalla Mohamed declare that this poject is my original work and that it has not been
presented and will not be pesented in any other University or institution for a similar way
unless I’m concerted.
Khalafalla, Mohamed: Signature: ..................................
Date: ..........................................
Dr. Wu, Weidong.., PhD
(Class Instructor)
Date: ……………………

3
ABSTRACT
The main purpose of this project is to analyze a beam part of a steel building indeterminate
structural analysis. The geometry and loading conditions of the building are sized to mimic
a real world environment. The analysis is performed using SAP2000, and Moment
distribution hand calculation.
Analysis was performed using the above mentioned methods. The results was
approximately the same.

4
ACKNOWLEDGEMENTS
I’m Mohamed would like to thank God Almighty who make us alive up to date, and
enabled us to join the University of Tennessee at Chattanooga.
My special thanks go out to our class instructor, Dr. Weidong Wu, for his guidance
throughout the spring semester while taking this class. He has been very kind, and nice
to us at every step of this class.
I would like to thank everyone who has contributed in this project for one way or another
throughout the duration of this project.

5
DEDICATION
Finally, the authors would like to dedicate this project work to all people who strive for
intellectual achievements especially at Engineering.
CONTENTS
Acknowledgements……………………………………………..
Abstract…………………………………………………………
Contents…………………………………………………………
1.0 Introduction………………………………………………………………………………..6
2.0 Moment Distribution Method……………………………………………………………..6
3.0 CSI…………………………………………………………………………………………7
4.0 About the Project …………………………………………………………………….……8
5.0 Objective and Scope……………………………………………………………………….8
6.0 Project Problem: Geometry………………………………………..………………………8
7.0 Loading…………………………………………………………………………………..11
8.0 Hand calculation using moment distribution method……………………………………16
9.0 SAP2000 Results…………………………………………………………………………21
10.0 General Results…………………………………………………………………………23
10.0 Conclusion and recommendations……..………………………….……………………23
References ……………………..……………………………………………………………24

6
1.0 Introduction
It is customary to divide structures into statically determinate and statically indeterminate.
By a statically determinate system we mean a system for which all the reactions of supports
can be determined by means of equations of equilibrium, and the internal forces also can
be found by method of sections.
A statically indeterminate system means that the reactions and internal forces cannot be
analyzed by the application of the equations of static alone.
The indeterminacy of the structure may be either external, internal, or both. The space
structure is externally indeterminate if the number of the reaction components is more than
six. The corresponding number in a plane structure is three.
2.0 Moment distribution method
The moment distribution method is a structural analysis method for statically indeterminate
beams and frames developed by Hardy Cross. It was published in 1930 in an ASCE journal.
The method only accounts for flexural effects and ignores axial and shear effects. From the
1930s until computers began to be widely used in the design and analysis of structures, the
moment distribution method was the most widely practiced method.
In the moment distribution method, every joint of the structure to be analyzed is fixed so
as to develop the fixed-end moments. Then each fixed joint is sequentially released and
the fixed-end moments are distributed to adjacent members until equilibrium is achieved.
The moment distribution method in mathematical terms can be demonstrated as the
process of solving a set of simultaneous equations by means of iteration.
The moment distribution method falls into the category of displacement method of
structural analysis.
In order to apply the moment distribution method to analyze a structure, the following
things must be considered.
Fixed end moments
Fixed end moments are the moments produced at member ends by external loads
when the joints are fixed.
Flexural stiffness

7
The flexural stiffness (EI/L) of a member is represented as the product of the
modulus of elasticity (E) and the second moment of area (I) divided by the length (L) of
the member. What is needed in the moment distribution method is not the exact value but
the ratio of flexural stiffness of all members.
Distribution factors
When a joint is released and begins to rotate under the unbalanced moment,
resisting forces develop at each member framed together at the joint. Although the total
resistance is equal to the unbalanced moment, the magnitudes of resisting forces
developed at each member differ by the members' flexural stiffness. Distribution factors
can be defined as the proportions of the unbalanced moments carried by each of the
members. In mathematical terms, distribution factor of member k framed at joint j is
given as:
3.0 CSI
Computers and Structures, Inc. (CSI) is a structural and earthquake engineering Software
Company founded in 1975 and based in Berkeley, California. Additional office locations
include New York, Houston, Madrid, New Delhi, and the Caribbean. The structural
analysis and design software CSI produce include SAP2000, CSiBridge, ETABS, SAFE,
PERFORM-3D, and CSiCOL.
One of Computer and Structure, Inc.'s software, ETABS, was used to create the
mathematical model of the Burj Khalifa, currently the world's tallest building, designed by
Chicago, Illinois-based Skidmore, Owings & Merrill LLP (SOM). In the Structural
analysis section of their December 2009 Structural Engineer magazine article entitled
Design and construction of the world's tallest building: The Burj Dubai, since renamed to
Burj Khalifa, William F. Baker, S.E. and James J. Pawlikowski, S.E. mention that gravity,

8
wind, and seismic response were all characterized using ETABS. Further, ETABS'
geometric nonlinear capability provided for P-Delta Effect consideration.
4.0 About the project
The project is to re analyze existing building of steel composed of 20 stories placed in
Khartoum, Sudan which is the Head Quarter of Arabic company for production of meat
and chicken products (ARAPPCO).
5.0 Objective and Scope
The objective of this project is to analyze the beam element using the indeterminate
structural Approach so as to obtain all the parameters needed for the design.
The project will be limited to analyzing the problem using hand calculation and SAP2000
computer software based on the indeterminate structural approach. Finally, the project
concluded with the overview discussion and recommendation on the analysis of the beam
element by the two approaches in performing the structural analysis.
6.0 Project Problem: Geometry
The main purpose of the project is to design so we will take the steel strength of
275 N/mm2
The second moment of area and cross-sectional area will be unknown but we
assume that the section is the same in all members.
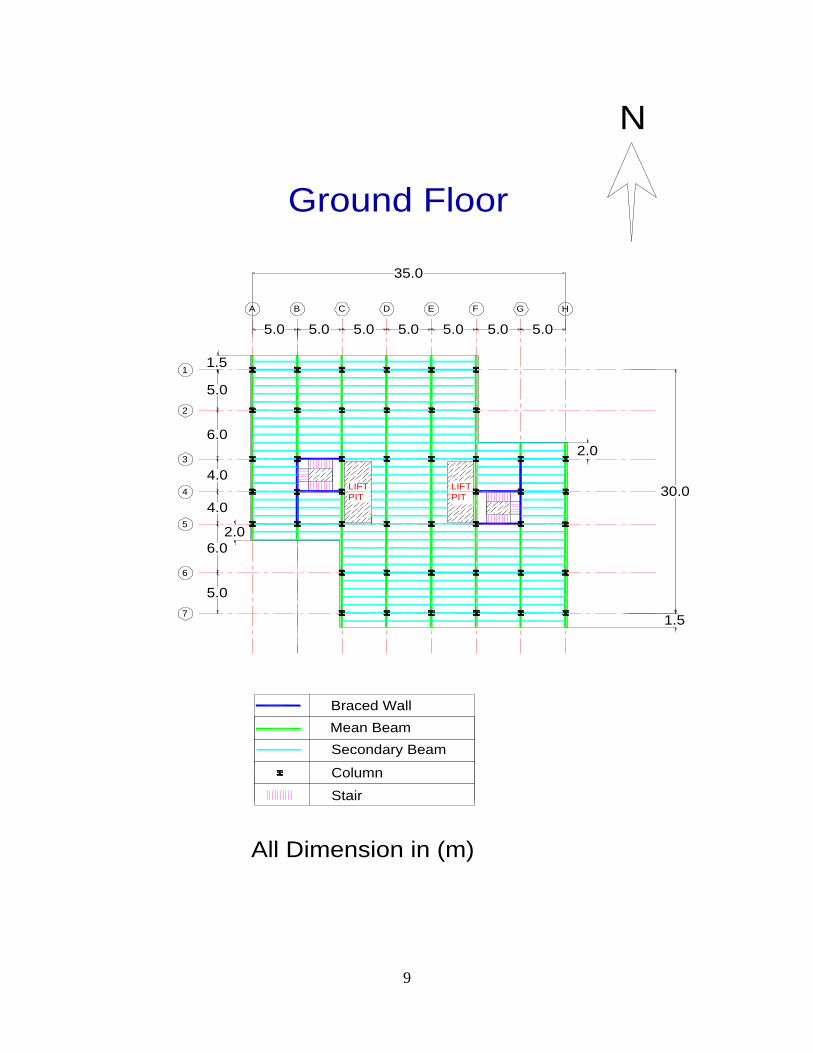
9
A B C D E F G H
1
2
3
4
5
6
7
5.0 5.0 5.0 5.0 5.0 5.0 5.0
5.0
6.0
4.0
4.0
6.0
5.0
2.0
2.0
30.0
35.0
LIFT
PIT
LIFT
PIT
1.5
1.5
Ground Floor
All Dimension in (m)
Mean Beam
Secondary Beam
Column
Stair
Braced Wall
N

10
Lift 1
Lift 2
Lift 3
Lift 4
5.05.05.05.05.05.05.01.5
1.5
1.5
5.0
6.0
4.0
4.0
6.0
5.0
1.51.5
1.51.5
1.51.5
Typical Floor
38.0
33.0
Mean Beam
Secondary Beam
Column
Stair
Braced Wall
All Dimension in (m)
Void
A B C D E F G H
1
2
3
4
5
6
7
N
11
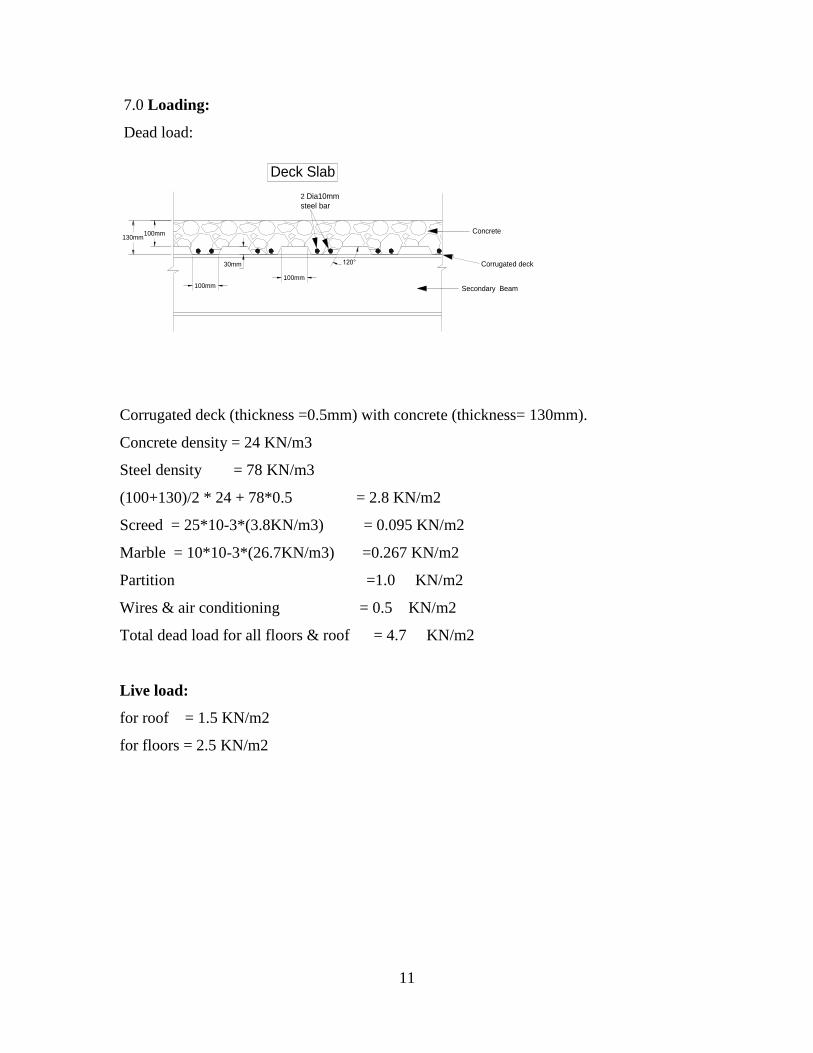
7.0 Loading:
Dead load:
30mm
100mm
100mm
120° Corrugated deck
Concrete
2 Dia10mm
steel bar
Secondary Beam
100mm130mm
Deck Slab
Corrugated deck (thickness =0.5mm) with concrete (thickness= 130mm).
Concrete density = 24 KN/m3
Steel density = 78 KN/m3
(100+130)/2 * 24 + 78*0.5 = 2.8 KN/m2
Screed = 25*10-3*(3.8KN/m3) = 0.095 KN/m2
Marble = 10*10-3*(26.7KN/m3) =0.267 KN/m2
Partition =1.0 KN/m2
Wires & air conditioning = 0.5 KN/m2
Total dead load for all floors & roof = 4.7 KN/m2
Live load:
for roof = 1.5 KN/m2
for floors = 2.5 KN/m2
12
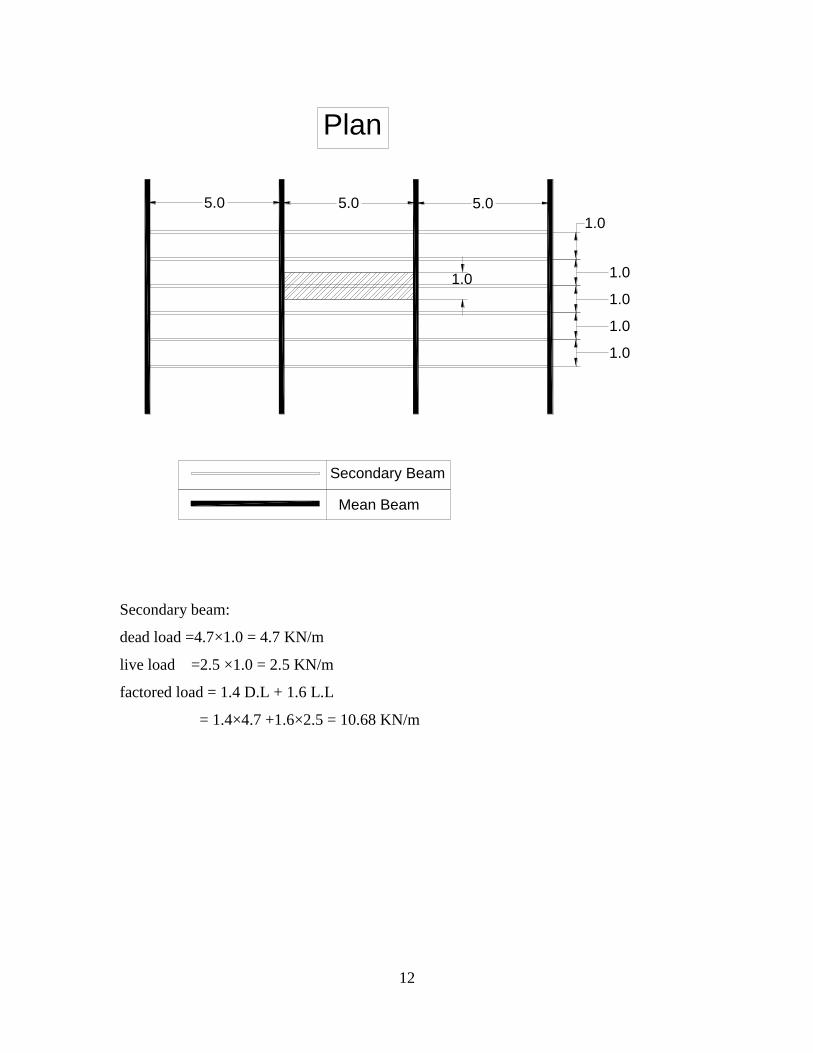
1.0
5.0
Secondary Beam
Mean Beam
Plan
5.0 5.0
1.0
1.0
1.0
1.0
1.0
Secondary beam:
dead load =4.7×1.0 = 4.7 KN/m
live load =2.5 ×1.0 = 2.5 KN/m
factored load = 1.4 D.L + 1.6 L.L
= 1.4×4.7 +1.6×2.5 = 10.68 KN/m

13
10.68 KN/m
26.7 KN26.7 KN 5.0
B.M.D
S.F.D
Max Moment
=33.38 KN.m
Max Shear
=26.7 KN
Max. shear = 10.68×5/2 = 26.7 KN
Max. bending moment = 10.68×52/8 = 33.38 KN.m
Try section 254×146 UB 43
Properties:
D= 259.6 mm B= 147.3mm t= 7.3mm T=12.7mm r= 7.6mm d=218.9mm Sx=568
cm3 rmin=ry= 3.51 cm A= 55.1 cm2
b/T = 5.8 d/t = 30.0 u= 0.889 X= 21.1
147.3
12.7
259.6
7.3
218.9
R7.6
12.7
14
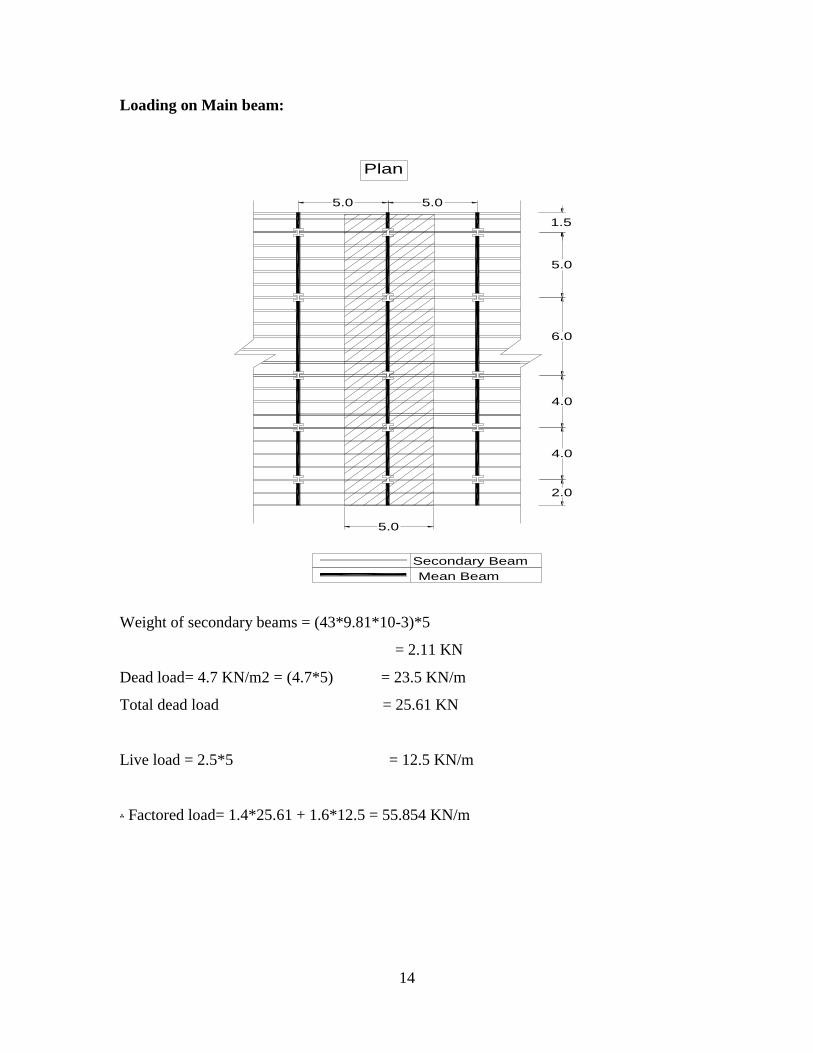
Loading on Main beam:
5.05.0
1.5
5.0
6.0
4.0
4.0
2.0
5.0
Secondary Beam
Mean Beam
Plan
Weight of secondary beams = (43*9.81*10-3)*5
= 2.11 KN
Dead load= 4.7 KN/m2 = (4.7*5) = 23.5 KN/m
Total dead load = 25.61 KN
Live load = 2.5*5 = 12.5 KN/m
Factored load= 1.4*25.61 + 1.6*12.5 = 55.854 KN/m ؞

15
1.5 5.0 6.0 4.0 4.0 2.0
1.5
1.5
c1 c3
A B C D E
c5 c7 c9
c10c8c6c4c2
55.854 KN/m

16
8.0 Hand calculation using moment distribution method:
Fixed end moments:
MF = WL2/12 (for distributed load)
MFAB= - 55.854*52/12 = - 116.36 KN.m
MFBA = 55.854*52/12 = 116.36 KN.m
MFBC =- 55.854*52/12 = -167.56 KN.m
MFCB = 55.854*52/12 = 167.56 KN.m
MFCD = - 55.854*52/12 = -74.47 KN.m
MFDC = 55.854*52/12 = 74.47 KN.m
MFDE = - 55.854*52/12 = -74.47 KN.m
MFED = 55.854*52/12 = 74.47 KN.m
MFcant.L.= 55.854*1.52/2 = 62.84 KN.m
MFcant.R.= 55.854*22/2 = 111.71 KN.m
Distribution factors:
...
.
2
2
1
1
1
1
1
LI
LI
LI
FD
Joint A:
13.0
5.11
5.11
51
51
.
ABFD
43.0
5.11
5.11
51
5.11
. 1
ACFD
43.0
5.11
5.11
51
5.11
. 2
ACFD
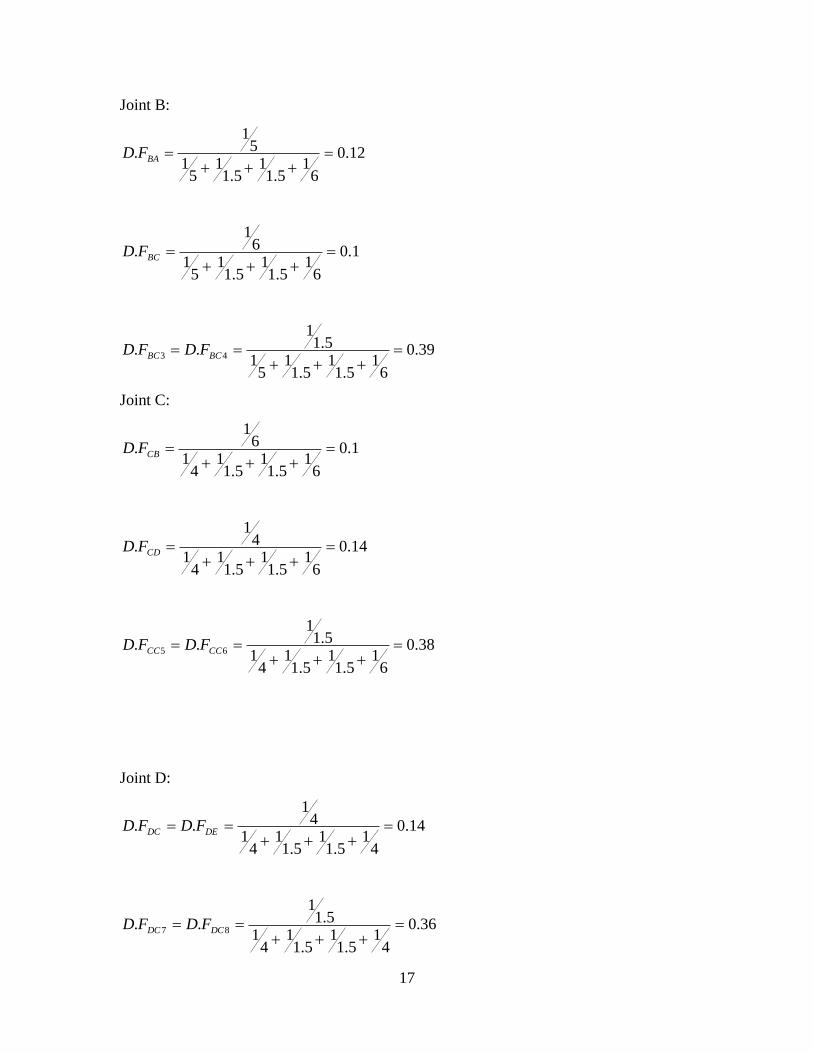
17
Joint B:
12.0
61
5.11
5.11
51
51
.
BAFD
1.0
61
5.11
5.11
51
61
.
BCFD
39.0
61
5.11
5.11
51
5.11
.. 43
BCBC FDFD
Joint C:
1.0
61
5.11
5.11
41
61
.
CBFD
14.0
61
5.11
5.11
41
41
.
CDFD
38.0
61
5.11
5.11
41
5.11
.. 65
CCCC FDFD
Joint D:
14.0
41
5.11
5.11
41
41
..
DEDC FDFD
36.0
41
5.11
5.11
41
5.11
.. 87
DCDC FDFD

18
Joint E:
16.0
5.11
5.11
41
41
.
EDFD
42.0
5.11
5.11
41
5.11
.. 109
ECEC FDFD
D.F for:
C1A = C2A = C3B =C4B = C5C =C6C= C7D =C8D =C9E =C10E = 1.0 (pin end)

19

20
62.84 104.3 128.3 166.7 154.7 90.0 76.4 70.2 83.5 111.17
58.5 90.833.4 35.0
1.5 5.0 6.0 4.0 4.0 2.0
1.5
1.5
c1 c3
A B C D E
c5 c7 c9
c10c8c6c4c2
55.854 KN/m
20.4 19.2 32.4 1.5 14.2
218.61 314.01 283.0 214.44 226.74
83.8
134.83 169.57
144.4
117.45
165.56
108.47
105.97
111.71
114.95
S.F.D
in (KN)
(B.M.D) in
Columns in
(KN.m)
(B.M.D) in
Beams in
(KN.m)

21
9.0 SAP2000 Results
Moment diagram
Shear force diagram

22

23
11.0 Summary of the results:
Hand
Calculations
SAP2000
Max Moments -166.7 kN.m -165.93 kN.m
Max Shear -169.57 kN -168.197 kN
12.0 Conclusion & Recommendations
The results found from hand calculation and the computer software are very
close to other. So I recommend the use of the software but with the full knowledge
of the theory because sometimes you may get wrong results from the software due
to wrong inputs but unless you know the theory behind that you will not discover
the problem.

24
References
1. Aristizabal-Ochoa, J.D., Elastic Stability and Second-Order Analysis of Three-
Dimensional Frames: Effects of Column Orientation, J. Engrg. Mech., Volume 129,
Issue 11, pp. 1254-1267 (November 2003)
2. Salonikios, T., Karakostas, C., Lekidis, V., Anthoine, A., Comparative Inelastic Pushover
Analysis of Masonry Frames, Engineering Structures, Volume 25, Issue 12, pp. 1515-
1523, October 2003.
3. Romero, M.L., and Museros, P., Structural Analysis Education through Model
Experiments and Computer Simulation, J. Profl. Issues in Engrg. Educ. and Pract.,
Volume 128, Issue 4, pp. 170-175 (October 2002)
4. Mabsout, M.E., Baddaf, I.Y., Tarhini, K.M., and Frederick, G.R., Load Reduction in Steel
Girder Bridges, Pract. Periodical on Struct. Des. and Constr., Volume 7, Issue 1, pp. 37-
43 (February 2002)
5. Mylonakis, G., Papastamatiou, D., Psycharis, J, and Mahmoud, K., Simplified Modeling
of Bridge Response on Soft Soil to Nonuniform Seismic Excitation, J. Bridge Engrg.,
Volume 6, Issue 6, pp. 587-597 (November/December 2001