ANALYSIS OF STABILITY OF TALL BUILDING BY ... - IRJMETS
13
e-ISSN: 2582-5208 International Research Journal of Modernization in Engineering Technology and Science Volume:02/Issue:11/November -2020 Impact Factor- 5.354 www.irjmets.com www.irjmets.com @International Research Journal of Modernization in Engineering, Technology and Science [819] ANALYSIS OF STABILITY OF TALL BUILDING BY CONCRETE TRUSS BELT SUPPORTED SYSTEM UNDER THE LATERAL LOADS Pawan Sharma *1 , Dr. J.N. Vyas *2 *1 PG Student, Department of Civil Engineering, Mahakal Institute of Technology & Management, Ujjain, MP, India. *2 Professor & Director, Department of Civil Engineering, Mahakal Institute of Technology & Management, Ujjain, MP, India. ABSTRACT The economical stability of structure is most impotant for any structure so that it is required to have resisting force to enhance structural stability. The outrigger structural elements is the best way to provide lateral loads resistance to structure and thus making it more stable with safe behaviour. When the buildings with high rise or tall structures are built then its resistance to different lateral forces is required and thus outriggers belt support system is needed to be introduced. The Structural element addition to building as a single unit make it more resisting towards lateral forces and enhancing its structural stability as a whole. In this research a G+15 storey structure is taken with the plinth area of 40m x 64 m( 1245 m 2 ). The total 8 models are modeled on the software with the grid spacing 8 m in both X & Z directions. The 5 bay & 8 bays are taken in X & Z direction to generate the plan for the building. The concrete belts truss are introduced in the combination of 1, 2, 3 & 4 group of concrete belt in a single structure. The position on different storey by different models such as Model 2 at 8th storey, Model 3 at 12th storey, Model 4 at 4 & 8 storey, Model 5 at 8 & 12 storey, Model 6 at 4, 8 & 12 storey, Model 7 at 8 12 ,16 storey, Model 8 at 4 , 8, 12 & 16 storey. The Response spectrum method(RSA) is adopted for the analysis of these tall building for Zone III. We concluded that on providing the concrete truss belt system in the building the effect of lateral forces is reduced. The resisting capacity is also enhanced with increment in number of truss belt system into it. In G+15 Storey Building the most effective building is MODEL 8 with 4 truss belt system is provide in it. Under the economical and minimum truss belt system adopted is 2 which is effectively work in MODEL 4 & 5. Keywords: concrete, G+ 15 storey’s, STAAD Pro, Response spectrum method (RSA). I. INTRODUCTION Due to quality and architecturally effective structures, as well as the growing demand for personalized roundabouts and roundabouts, the increase in various topics and daily heights is leading to new challenges and the need for new safety systems. In order to withstand the earthquakes and strong winds caused by the growth of the building, such as the increased instability of the building and the high altitude, we need to destroy some protection measures. Mild examples include stiffeners, shear wall, support system and more. Pull-out body Pull- out and wall belts as the race observation is still going on in the country. This is because when the structural load is applied with a vertical and horizontal support system, it has received a huge amount of combined load generated by the structure and this load must be supported by the structure itself. Because the earthquake triggers vibrations from the ground, they are attached to the structure and the most effective way to resist the structure is by using this combined system with stabilizers, system-supported straps, and a stabilizer and system consisting of a support belt. Belt supported system: The best technique used in huge-story houses is to maintain the body whether it is a bar belt or a truss belt system. It representatives to the structural nodal points & communicate through it. They are termed as belt support systems the reason is the belt is usually made of trusses or bolts, connecting the structure line. The load departs from each member being distributed equally housing. In order to adapt to the force of the wave and to maintain the stability of the structure, the outer straps and straps are used. The Policy is that the outer poles are fitted with the centre of the bar with the braces and straps in one or more positions. The truss straps are attached to the outside pillar of the house while the outside holds them to the main or
-
Upload
khangminh22 -
Category
Documents
-
view
1 -
download
0
Transcript of ANALYSIS OF STABILITY OF TALL BUILDING BY ... - IRJMETS
e-ISSN: 2582-5208 International Research Journal of Modernization in Engineering Technology and Science Volume:02/Issue:11/November -2020 Impact Factor- 5.354 www.irjmets.com
www.irjmets.com @International Research Journal of Modernization in Engineering, Technology and Science
[819]
ANALYSIS OF STABILITY OF TALL BUILDING BY CONCRETE TRUSS BELT
SUPPORTED SYSTEM UNDER THE LATERAL LOADS
Pawan Sharma*1, Dr. J.N. Vyas*2
*1PG Student, Department of Civil Engineering, Mahakal Institute of Technology & Management,
Ujjain, MP, India.
*2Professor & Director, Department of Civil Engineering, Mahakal Institute of Technology &
Management, Ujjain, MP, India.
ABSTRACT
The economical stability of structure is most impotant for any structure so that it is required to have resisting
force to enhance structural stability. The outrigger structural elements is the best way to provide lateral loads
resistance to structure and thus making it more stable with safe behaviour. When the buildings with high rise
or tall structures are built then its resistance to different lateral forces is required and thus outriggers belt
support system is needed to be introduced. The Structural element addition to building as a single unit make it
more resisting towards lateral forces and enhancing its structural stability as a whole. In this research a G+15
storey structure is taken with the plinth area of 40m x 64 m( 1245 m2). The total 8 models are modeled on the
software with the grid spacing 8 m in both X & Z directions. The 5 bay & 8 bays are taken in X & Z direction to
generate the plan for the building. The concrete belts truss are introduced in the combination of 1, 2, 3 & 4
group of concrete belt in a single structure. The position on different storey by different models such as Model 2
at 8th storey, Model 3 at 12th storey, Model 4 at 4 & 8 storey, Model 5 at 8 & 12 storey, Model 6 at 4, 8 & 12
storey, Model 7 at 8 12 ,16 storey, Model 8 at 4 , 8, 12 & 16 storey. The Response spectrum method(RSA) is
adopted for the analysis of these tall building for Zone III. We concluded that on providing the concrete truss
belt system in the building the effect of lateral forces is reduced. The resisting capacity is also enhanced with
increment in number of truss belt system into it. In G+15 Storey Building the most effective building is MODEL
8 with 4 truss belt system is provide in it. Under the economical and minimum truss belt system adopted is 2
which is effectively work in MODEL 4 & 5.
Keywords: concrete, G+ 15 storey’s, STAAD Pro, Response spectrum method (RSA).
I. INTRODUCTION Due to quality and architecturally effective structures, as well as the growing demand for personalized
roundabouts and roundabouts, the increase in various topics and daily heights is leading to new challenges and
the need for new safety systems. In order to withstand the earthquakes and strong winds caused by the growth
of the building, such as the increased instability of the building and the high altitude, we need to destroy some
protection measures. Mild examples include stiffeners, shear wall, support system and more. Pull-out body Pull-
out and wall belts as the race observation is still going on in the country. This is because when the structural
load is applied with a vertical and horizontal support system, it has received a huge amount of combined load
generated by the structure and this load must be supported by the structure itself. Because the earthquake
triggers vibrations from the ground, they are attached to the structure and the most effective way to resist the
structure is by using this combined system with stabilizers, system-supported straps, and a stabilizer and
system consisting of a support belt.
Belt supported system: The best technique used in huge-story houses is to maintain the body whether it is a
bar belt or a truss belt system. It representatives to the structural nodal points & communicate through it. They
are termed as belt support systems the reason is the belt is usually made of trusses or bolts, connecting the
structure line. The load departs from each member being distributed equally housing. In order to adapt to the
force of the wave and to maintain the stability of the structure, the outer straps and straps are used. The Policy
is that the outer poles are fitted with the centre of the bar with the braces and straps in one or more positions.
The truss straps are attached to the outside pillar of the house while the outside holds them to the main or
e-ISSN: 2582-5208 International Research Journal of Modernization in Engineering Technology and Science Volume:02/Issue:11/November -2020 Impact Factor- 5.354 www.irjmets.com
www.irjmets.com @International Research Journal of Modernization in Engineering, Technology and Science
[820]
central vertical wall. The reason behind is this approach due to reduction value is occurs in interference
structure with respect to the conventional method.
II. METHODOLOGY Earthquake analysis is carried out using a G+15 Storey building on Staad. Pro software. The total 8 models are
created on the staad.pro. The model 1 having regular building and from model 2 to 8 are created with
introducing concrete truss belt system in to the building at different storey levels. The analysis part consist the
effect on building under the different loads such dead load, live load and lateral loads (earthquake and wind)
etc into it based on software mechanism. The seismic data is taken as per the IS 1893(PART1):2016. The
response spectrum analysis method is adopted for analysis of building.
Table 1: Model Description S. No. Models Descriptions
1 Model 1 RB: Regular building (No concrete truss belt system)
2 Model 2 Building with concrete truss belts system at 8th storey
3 Model 3 Building with concrete truss belts system at 12th storey
4 Model 4 Building with concrete truss belts system at 4 & 8th storey
5 Model 5 Building with concrete truss belts system at 8 & 12th storey
6 Model 6 Building with concrete truss belts system at 4, 8 & 12th storey
7 Model 7 Building with concrete truss belts system at 8.12 & 16th storey
8 Model 8 Building with concrete truss belts system at 4, 8, 12 & 16th storey
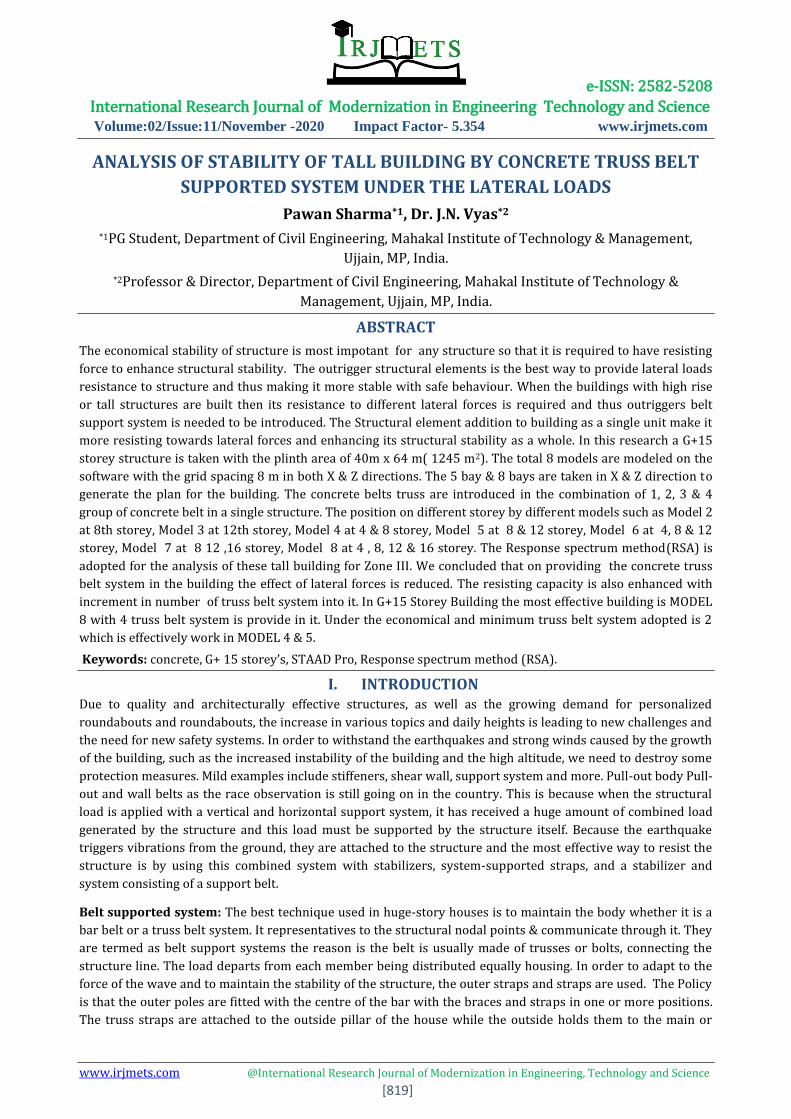
III. MODELING AND ANALYSIS G + 15 storey’s regular building and building with concrete truss belt system is taken into account for the
analysis. Eight various types of building models with bay width of 8m in X-direction, 8m in Z-direction and
story height of 3.5 m were taken into consideration for this analysis. The structure was modeled by using
STAAD.PRO V8i computer software. All the selected models were designed with M-30 grade of concrete is used
and Fe-500 grade of reinforcing steel as per IS code of practice. The concrete belt truss system can be taken
with group of 1, 2, 3 & 4 in a single structure of G+15 Storey Building. The truss belt is taking at 4, 8, 12 & 16
position of storey. The model description is tabulated on table no 3.1 are as follows:
Fig. 1: Grid Plan View Fig. 2: Plan view with position of concrete truss belt & shear wall

e-ISSN: 2582-5208 International Research Journal of Modernization in Engineering Technology and Science Volume:02/Issue:11/November -2020 Impact Factor- 5.354 www.irjmets.com
www.irjmets.com @International Research Journal of Modernization in Engineering, Technology and Science
[821]
Model 1:
a)Elevation @ X direction b)Elevation @ Z direction c) 3D view Fig. 3: Model 1- G+15 Storey Regular Building (No concrete truss belt system)
Model 2:
a)Elevation @ X direction b)Elevation @ Z direction c) 3D view Fig. 4: Model 2- G+15 Storey Building with concrete truss belts system at 8th storey
Model 3:
a)Elevation @ X direction b)Elevation @ Z direction c) 3D view Fig. 5: Model 3: G+15 Storey Building with concrete truss belts system at 12th storey
e-ISSN: 2582-5208 International Research Journal of Modernization in Engineering Technology and Science Volume:02/Issue:11/November -2020 Impact Factor- 5.354 www.irjmets.com
www.irjmets.com @International Research Journal of Modernization in Engineering, Technology and Science
[822]
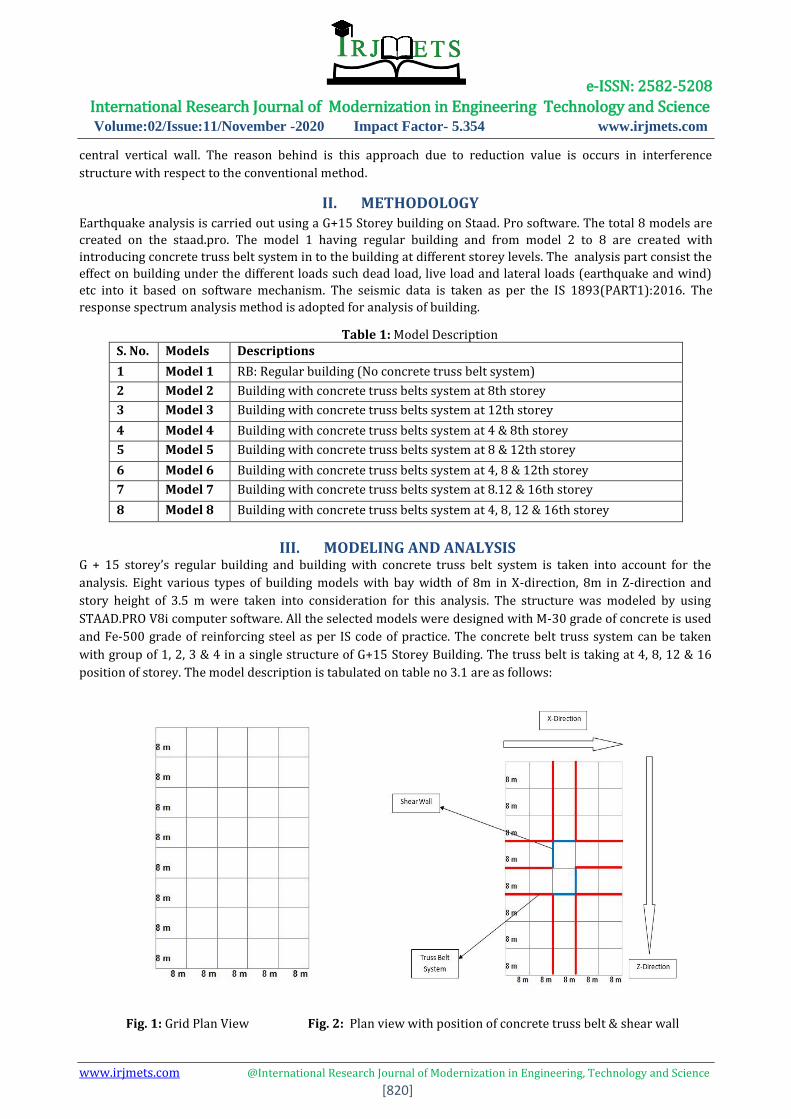
Model 4:
a)Elevation @ X direction b)Elevation @ Z direction c) 3D view Fig. 6: Model 4- G+15 Storey Building with concrete truss belts system at 4 & 8th storey
Model 5:
a)Elevation @ X direction b)Elevation @ Z direction c) 3D view
Fig. 7: Model 5- G+15 Storey Building with concrete truss belts system at 8 & 12th storey
Model 6:
a)Elevation @ X direction b)Elevation @ Z direction c) 3D view
Fig. 8: Model 6- G+15 Storey Building with concrete truss belts system at 4, 8 & 12th storey
e-ISSN: 2582-5208 International Research Journal of Modernization in Engineering Technology and Science Volume:02/Issue:11/November -2020 Impact Factor- 5.354 www.irjmets.com
www.irjmets.com @International Research Journal of Modernization in Engineering, Technology and Science
[823]
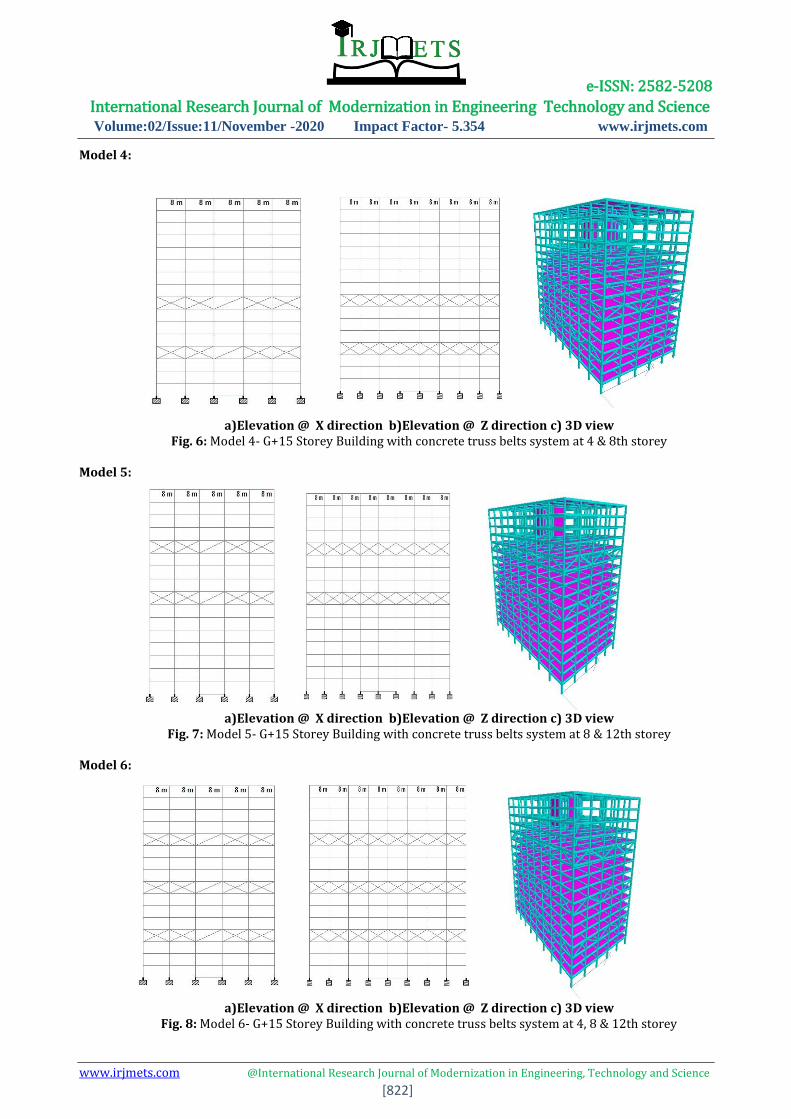
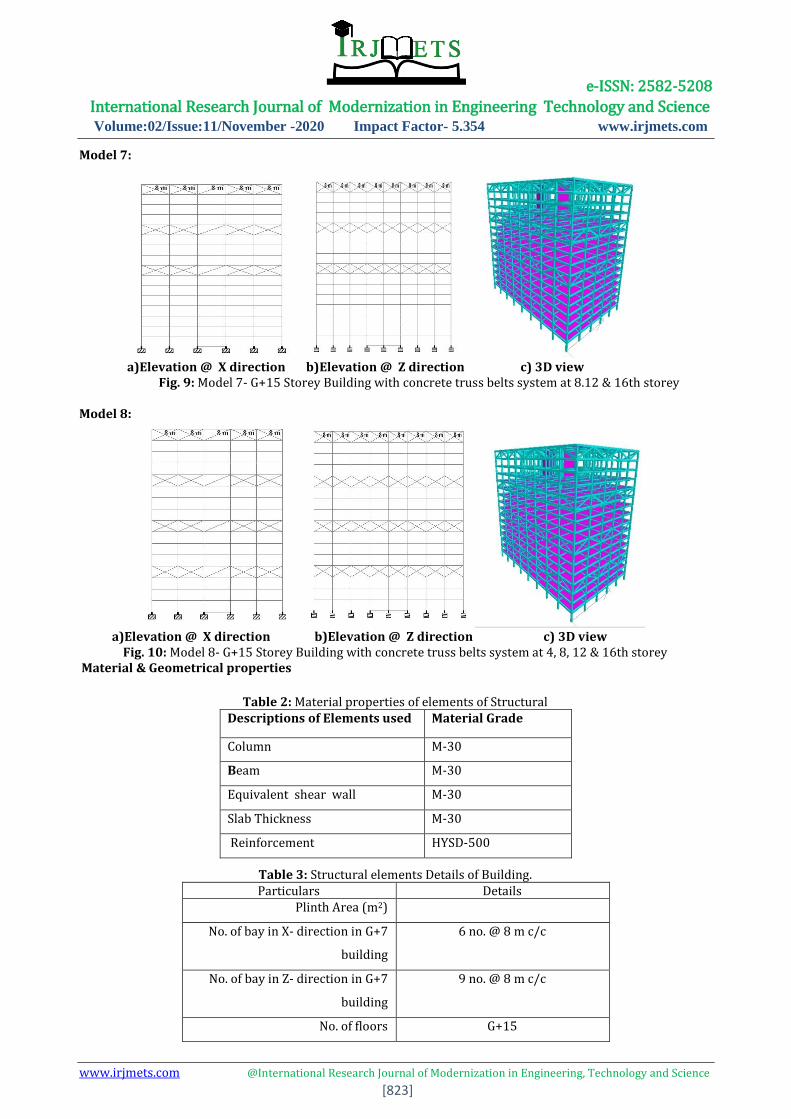
Model 7:
a)Elevation @ X direction b)Elevation @ Z direction c) 3D view
Fig. 9: Model 7- G+15 Storey Building with concrete truss belts system at 8.12 & 16th storey
Model 8:
a)Elevation @ X direction b)Elevation @ Z direction c) 3D view
Fig. 10: Model 8- G+15 Storey Building with concrete truss belts system at 4, 8, 12 & 16th storey IMaterial & Geometrical properties
Table 2: Material properties of elements of Structural Descriptions of Elements used Material Grade
Column M-30
Beam M-30
Equivalent shear wall M-30
Slab Thickness M-30
Reinforcement HYSD-500
Table 3: Structural elements Details of Building. Particulars Details
Plinth Area (m2)
No. of bay in X- direction in G+7
building
6 no. @ 8 m c/c
No. of bay in Z- direction in G+7
building
9 no. @ 8 m c/c
No. of floors G+15

e-ISSN: 2582-5208 International Research Journal of Modernization in Engineering Technology and Science Volume:02/Issue:11/November -2020 Impact Factor- 5.354 www.irjmets.com
www.irjmets.com @International Research Journal of Modernization in Engineering, Technology and Science
[824]
Storey height 3.5 m each
Beam Size in X direction 550 mm x 500 mm
Beam Size in Z direction 500 mm x 550 mm
Column Size 550 mm x 500 mm
Slab Thickness 180 mm
shear wall Thickness 150 mm
Concrete truss belt bracing size 230 mm x 450 mm
Earthquake Data
Table 4: Earthquake Data Earthquake Zone III
Importance Factor 1
Types of Soil Medium Soil
Response Reduction Factor 4
Time period both X & Z
Direction 1.53533
Damping 0.05
Method of Analysis Response Spectrum
Analysis
IV. CONCLUSION The results are evaluated based on modeling and analysis of the G+15 Storey Building having eight different models. The model 1 to model 8 is based on the placing of concrete belt on different location on storey. The details of modeling are as follows: Maximum Storey Displacement:- The maximum displacement value will be taken for all 8 models which is obtained on the top storey of each models. Table 4.1 tabulated the results of maximum storey displacements. The fig. 4.1 shows the bar chart representation of maximum displacement of all models.
Table 5 : Maximum Storey Displacement Results
Maximum Storey Displacement (mm)
S. No. Models X - Direction Z -Direction
1 Model 1 166.784 144.253
2 Model 2 140.215 121.282
3 Model 3 141.182 122.783
4 Model 4 129.017 110.736
5 Model 5 120.967 104.692
6 Model 6 110.672 94.835
7 Model 7 113.638 98.458
8 Model 8 103.572 88.754

e-ISSN: 2582-5208 International Research Journal of Modernization in Engineering Technology and Science Volume:02/Issue:11/November -2020 Impact Factor- 5.354 www.irjmets.com
www.irjmets.com @International Research Journal of Modernization in Engineering, Technology and Science
[825]
Fig. 11: Bar chart Representations of Max. Storey Displacement Results
Maximum Shear Force in Building: The Maximum Shear Force in Building value will be taken for all 8 models for each models. Table 4.2 tabulated the results of Maximum Shear Force in Building. The fig. 4.2 shows the bar chart representation of Maximum Shear Force in Building of all models.
Table 6: Maximum Shear Force in Building
Maximum Shear Force in Building (KN)
S. No. Model Description X-Direction Z-Direction
1 Model 1 497.658 607.941
2 Model 2 475.411 562.693
3 Model 3 450.983 516.487
4 Model 4 471.969 555.467
5 Model 5 436.563 487.309
6 Model 6 434.155 482.148
7 Model 7 396.961 384.262
8 Model 8 395.024 380.799
0
20
40
60
80
100
120
140
160
180 166.784
140.215 141.182
129.017 120.967
110.672 113.638 103.572
Sto
rey
Dis
pla
cem
en
t(m
m)
Models
Maximum Storey Displacement Results
X - Direction
Z -Direction
e-ISSN: 2582-5208 International Research Journal of Modernization in Engineering Technology and Science Volume:02/Issue:11/November -2020 Impact Factor- 5.354 www.irjmets.com
www.irjmets.com @International Research Journal of Modernization in Engineering, Technology and Science
[826]
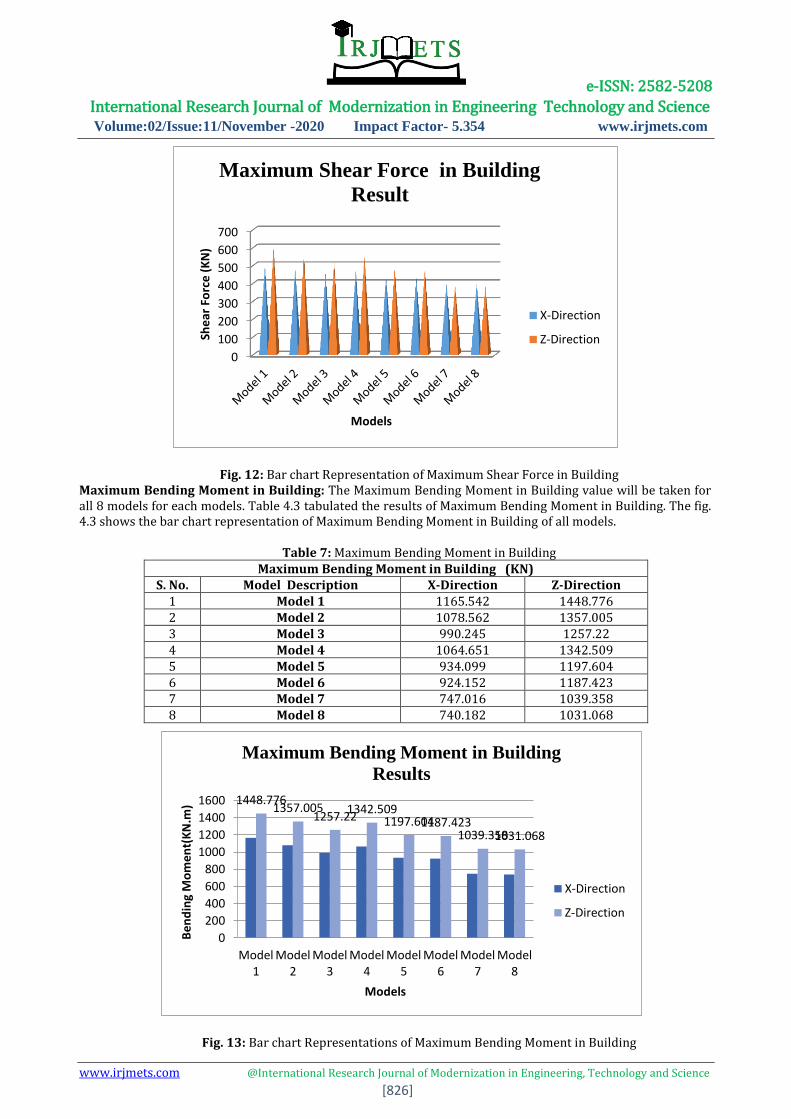
Fig. 12: Bar chart Representation of Maximum Shear Force in Building Maximum Bending Moment in Building: The Maximum Bending Moment in Building value will be taken for all 8 models for each models. Table 4.3 tabulated the results of Maximum Bending Moment in Building. The fig. 4.3 shows the bar chart representation of Maximum Bending Moment in Building of all models.
Table 7: Maximum Bending Moment in Building
Maximum Bending Moment in Building (KN) S. No. Model Description X-Direction Z-Direction
1 Model 1 1165.542 1448.776 2 Model 2 1078.562 1357.005 3 Model 3 990.245 1257.22 4 Model 4 1064.651 1342.509 5 Model 5 934.099 1197.604 6 Model 6 924.152 1187.423 7 Model 7 747.016 1039.358 8 Model 8 740.182 1031.068
Fig. 13: Bar chart Representations of Maximum Bending Moment in Building
0
100
200
300
400
500
600
700
She
ar F
orc
e (
KN
)
Models
Maximum Shear Force in Building
Result
X-Direction
Z-Direction
1448.776 1357.005
1257.22 1342.509
1197.604 1187.423 1039.358 1031.068
0
200
400
600
800
1000
1200
1400
1600
Model1
Model2
Model3
Model4
Model5
Model6
Model7
Model8
Be
nd
ing
Mo
me
nt(
KN
.m)
Models
Maximum Bending Moment in Building
Results
X-Direction
Z-Direction

e-ISSN: 2582-5208 International Research Journal of Modernization in Engineering Technology and Science Volume:02/Issue:11/November -2020 Impact Factor- 5.354 www.irjmets.com
www.irjmets.com @International Research Journal of Modernization in Engineering, Technology and Science
[827]
Column Axial Force Results
Table 8: Column Axial Force Results
Column Axial Force (KN)
S.No. Model Description Axial Force(KN)
1 Model 1 26673.76
2 Model 2 26199.385
3 Model 3 25985.225
4 Model 4 26293.084
5 Model 5 25687.826
6 Model 6 25738.936
7 Model 7 25510.219
8 Model 8 25510.41
Fig. 14: Bar chart Representations of Column Axial Force Base Shear Result
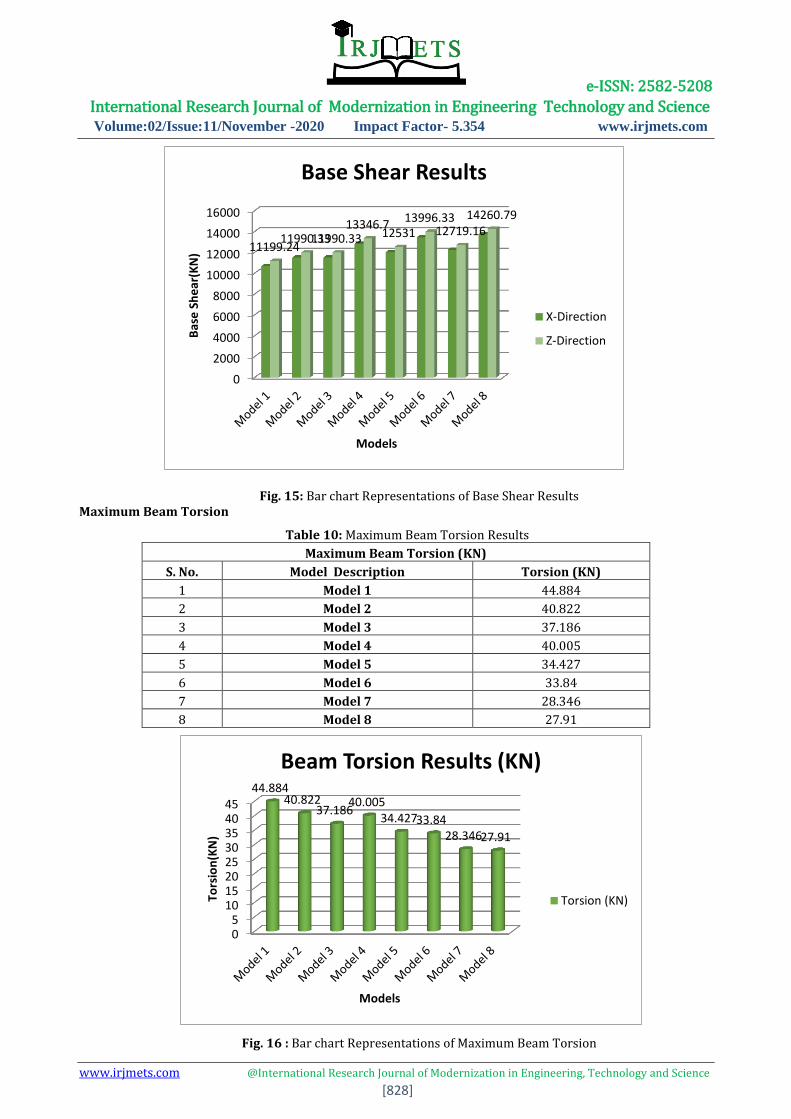
Table 9: Base Shear Results
Base Shear Result (KN)
S. No. Model Description X-Direction Z-Direction
1 Model 1 10674.02 11199.24
2 Model 2 11511.18 11990.33
3 Model 3 11511.18 11990.33
4 Model 4 12825.56 13346.7
5 Model 5 12020.04 12531
6 Model 6 13441.48 13996.33
7 Model 7 12242.88 12719.16
8 Model 8 13756.31 14260.79
24500
25000
25500
26000
26500
27000 26673.76
26199.385 25985.225
26293.084
25687.826 25738.936 25510.219 25510.41
Axi
al F
orc
e(K
N)
Models
Column Axial Force Results (KN)
Axial Force(KN)
e-ISSN: 2582-5208 International Research Journal of Modernization in Engineering Technology and Science Volume:02/Issue:11/November -2020 Impact Factor- 5.354 www.irjmets.com
www.irjmets.com @International Research Journal of Modernization in Engineering, Technology and Science
[828]
Fig. 15: Bar chart Representations of Base Shear Results Maximum Beam Torsion
Table 10: Maximum Beam Torsion Results
Maximum Beam Torsion (KN)
S. No. Model Description Torsion (KN)
1 Model 1 44.884
2 Model 2 40.822
3 Model 3 37.186
4 Model 4 40.005
5 Model 5 34.427
6 Model 6 33.84
7 Model 7 28.346
8 Model 8 27.91
Fig. 16 : Bar chart Representations of Maximum Beam Torsion
0
2000
4000
6000
8000
10000
12000
14000
16000
11199.24 11990.33 11990.33
13346.7 12531
13996.33 12719.16
14260.79
Bas
e S
he
ar(K
N)
Models
Base Shear Results
X-Direction
Z-Direction
05
1015202530354045
44.884 40.822
37.186 40.005
34.427 33.84 28.346 27.91
Tors
ion
(KN
)
Models
Beam Torsion Results (KN)
Torsion (KN)
e-ISSN: 2582-5208 International Research Journal of Modernization in Engineering Technology and Science Volume:02/Issue:11/November -2020 Impact Factor- 5.354 www.irjmets.com
www.irjmets.com @International Research Journal of Modernization in Engineering, Technology and Science
[829]
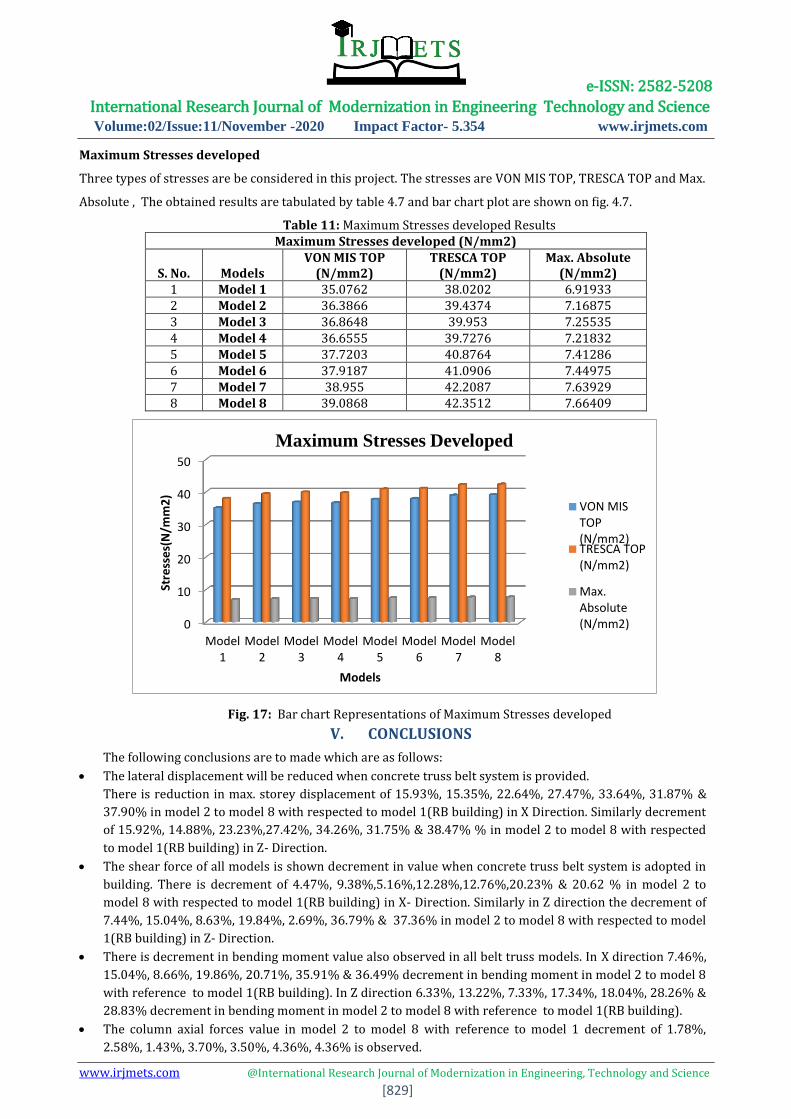
Maximum Stresses developed
Three types of stresses are be considered in this project. The stresses are VON MIS TOP, TRESCA TOP and Max.
Absolute , The obtained results are tabulated by table 4.7 and bar chart plot are shown on fig. 4.7.
Table 11: Maximum Stresses developed Results Maximum Stresses developed (N/mm2)
S. No. Models VON MIS TOP
(N/mm2) TRESCA TOP
(N/mm2) Max. Absolute
(N/mm2) 1 Model 1 35.0762 38.0202 6.91933 2 Model 2 36.3866 39.4374 7.16875 3 Model 3 36.8648 39.953 7.25535 4 Model 4 36.6555 39.7276 7.21832 5 Model 5 37.7203 40.8764 7.41286 6 Model 6 37.9187 41.0906 7.44975 7 Model 7 38.955 42.2087 7.63929 8 Model 8 39.0868 42.3512 7.66409
Fig. 17: Bar chart Representations of Maximum Stresses developed
V. CONCLUSIONS
The following conclusions are to made which are as follows:
The lateral displacement will be reduced when concrete truss belt system is provided.
There is reduction in max. storey displacement of 15.93%, 15.35%, 22.64%, 27.47%, 33.64%, 31.87% &
37.90% in model 2 to model 8 with respected to model 1(RB building) in X Direction. Similarly decrement
of 15.92%, 14.88%, 23.23%,27.42%, 34.26%, 31.75% & 38.47% % in model 2 to model 8 with respected
to model 1(RB building) in Z- Direction.
The shear force of all models is shown decrement in value when concrete truss belt system is adopted in
building. There is decrement of 4.47%, 9.38%,5.16%,12.28%,12.76%,20.23% & 20.62 % in model 2 to
model 8 with respected to model 1(RB building) in X- Direction. Similarly in Z direction the decrement of
7.44%, 15.04%, 8.63%, 19.84%, 2.69%, 36.79% & 37.36% in model 2 to model 8 with respected to model
1(RB building) in Z- Direction.
There is decrement in bending moment value also observed in all belt truss models. In X direction 7.46%,
15.04%, 8.66%, 19.86%, 20.71%, 35.91% & 36.49% decrement in bending moment in model 2 to model 8
with reference to model 1(RB building). In Z direction 6.33%, 13.22%, 7.33%, 17.34%, 18.04%, 28.26% &
28.83% decrement in bending moment in model 2 to model 8 with reference to model 1(RB building).
The column axial forces value in model 2 to model 8 with reference to model 1 decrement of 1.78%,
2.58%, 1.43%, 3.70%, 3.50%, 4.36%, 4.36% is observed.
0
10
20
30
40
50
Model1
Model2
Model3
Model4
Model5
Model6
Model7
Model8
Stre
sse
s(N
/mm
2)
Models
Maximum Stresses Developed
VON MISTOP(N/mm2)TRESCA TOP(N/mm2)
Max.Absolute(N/mm2)
e-ISSN: 2582-5208 International Research Journal of Modernization in Engineering Technology and Science Volume:02/Issue:11/November -2020 Impact Factor- 5.354 www.irjmets.com
www.irjmets.com @International Research Journal of Modernization in Engineering, Technology and Science
[830]
The placing of concrete truss belt system increment in base shear value is observed due to the self weight
of the structure is increases. The increment range lies between 7 to 29 % with respect to increment in no.
of truss belt system.
The concrete truss belt system also reduces the beam Torsional in the building. The decrement of 9.05%,
17.15%, 10.87%, 23.30%, 24.61%, 36.85% & 37.82% in model 2 to model 8 with respected to model 1(RB
building).
There is increment in stresses is observed in the range of 3 to 12 % with placing of concrete truss belt
system with respect to increment in no. of truss belt system.
The overall concluded that on provided the concrete truss belt system in the building the effect of lateral
forces in reduces due to it. The resisting capacity also enhance with increment in no. of truss belt system into
it. In G+15 Storey Building the most effective building is MODEL 8 with 4 truss belt system is provide in it.
Under the economical and minimum truss belt system adopted is 2 which is effectively work in MODEL 4 & 5.
VI. REFRENCES
[1] Patel N. & Jamle S. (Aug.-2019) “Use of Shear Wall Belt at Optimum Height to Increase Lateral Load
Handling Capacity in Multi-story Building: A Review” International Journal of Advanced Engineering
Research and Science (IJAERS), Vol-6, Issue-4, Apr-2019,ISSN:2349-6495(P),2456-1908(O),pp310-314.
https://dx.doi.org/10.22161/ijaers.6.4.36,
[2] Soni P., Tamrakar P.L. & et. al. (Feb.-2016) “Structural Analysis of Multi-story Building of Different shear
Walls Location and Heights” International Journal of Engineering Trends and Technology (IJETT)
,Volume 32, Number 1- ISSN: 2231-5381, pp 50-57.
[3] Dangi A. & Jamle S. (Sept.- 2018) “Determination of Seismic parameters of R.C.C. Building Using Shear
Core Outrigger, Wall Belt and Truss Belt Systems” International Journal of Advanced Engineering
Research and Science (IJAERS),Vol-5, Issue-9, Sept- 2018,ISSN:2349-6495(P),2456-1908(O),PP-305-309.
https://dx.doi.org/10.22161/ijaers.5.9.36
[4] Alhaddad W., Halabi Y., & et.al. (Feb.-2020) “Outrigger and Belt-Truss System Design for High-Rise
Buildings: A Comprehensive Review Part II—Guideline for Optimum Topology and Size Design” Hindawi
Advances in Civil Engineering, Volume 2020, Article ID 2589735, pp 1-30,
https://doi.org/10.1155/2020/2589735-
[5] Tae‑ Sung Eom, Hiubalt Murmu and Weijian Yi (2019) Behavior and Design of Distributed Belt Walls as
Virtual Outriggers for Concrete High-Rise Buildings, International Journal of Concrete Structures and
Materials, Eom et al. Int J Concr Struct Mater (2019) 13:1https://doi.org/10.1186/s40069-018-0311-2,
pp 1-13.
[6] Ddd Fawzia S. , Nasir A. & et. al. (2011)Study of the Effectiveness of Outrigger System for High-Rise
Composite Buildings for Cyclonic Region, World Academy of Science, Engineering and Technology 60 , pp
937-943
[7] Bayati Z,, M. Mahdikhani & et.al.(Oct.-2008) “Optimized Use Of Multi-Outriggers System To Stiffen Tall
Buildings” The 14th World Conference on Earthquake Engineering Beijing, China , pp- 12-17, 2008,
[8] Alhaddad W., Halabi Y. & et. al.(2020) “Outrigger and Belt-Truss System Design for High-Rise Buildings:
A Comprehensive Review” Part II—Guideline for Optimum Topology and Size Design, Hindawi Advances
in Civil Engineering,Volumev,Article-ID-2589735,pp-1-30, https://doi.org/10.1155/2020/2589735
[9] Mathew M., (June-2017) Optimum Position of Outrigger with Belt Wall International Journal of
Innovative Research in Science, Engineering and Technology, Vol. 6, Issue 6, June 2017, ISSN(Online) :
2319-8753, ISSN (Print) : 2347-6710, pp 10376-10372, DOI:10.15680/IJIRSET.2017.0606033
[10] Herath N., Haritos N. & et. al. (2009) “Behavior of Outrigger Beams in High rise Buildings under
Earthquake Loads” Australian Earthquake Engineering Society 2009 Conference
[11] Nadh V.S., Sumanth B.H. (Feb.- 2020 ) Ideal Location Of Outrigger System And Its Efficiency For
Unsymmetrical Tall Buildings Under Lateral Loadings, International Journal Of Scientific & Technology
Research volume 9, ISSUE 02, ISSN 2277-8616, Pp 2917-2920.
e-ISSN: 2582-5208 International Research Journal of Modernization in Engineering Technology and Science Volume:02/Issue:11/November -2020 Impact Factor- 5.354 www.irjmets.com
www.irjmets.com @International Research Journal of Modernization in Engineering, Technology and Science
[831]
[12] Gadkari A.P. , Gore N. G. (2016) “Review on Behavior of Outrigger Structural System in High-Rise
Building” IJEDR 2016 , Volume 4, Issue 2, ISSN: 2321 -9939
[13] Kogilgeri S. , Shanthapriya B. (July-2015) “A Study On Behavior Of Outrigger System On High Rise Steel
Structure By Varying Outrigger Depth Srinivas” International Journal of Research in Engineering and
Technology Volume-04 Issue: 07, e ISSN: 2319-1163, p ISSN: 2321-7308, pp 434-438.
[14] Shah N.K., Gore N.G (June-2016) “Review on Behaviors of Outrigger System in High Rise Building”
International Research Journal of Engineering and Technology (IRJET), e-ISSN: 2395 -0056, Volume-03,
Issue-06, p-ISSN: 2395-0072, Pp 2803-2809.
[15] Salman K. , Kim D. & et. al. (2020)Optimal control on structural response using outrigger braced frame
system under lateral loads , Journal of Structural Integrity and Maintenance ISSN: 2470-5314 (Print)
2470-5322 (Online) vol. 5, no. 1, Pp 40–50 https://doi.org/10.1080/24705314.2019.1701799
[16] Tavakoli R. , Kamgar R. (Feb.-2019) “Seismic performance of outrigger–belt truss system considering
soil–structure interaction” International Journal of Advanced Structural Engineering, pp 45-54,
https://doi.org/10.1007/s40091-019-0215-7
[17] Lalit Balhar, Dr. J.N. Vyas ,“Comparative Analysis of Flat slabs & Conventional RC slabs with and without
Shear wall”, International Research Journal of Engineering and Technology (IRJET) Issue 01,Vol 6 ( January
2019).
[18] Lalit Balhar, Dr. J.N. Vyas, “Review paper on Comparative Analysis of Flat slabs & Conventional Rc slabs
with and without Shear wall”, International Journal of Engineering and Technology (IRJET) Issue 02,Vol 6
(February 2019).
[19] Dhiraj Kaul,Sagar Jamle, Lalit Balhar, “An Immense Review on Comparative Analysis between Regulate &
Irregular Multistoried Building Under Seismic loading “,”, International Journal of Advanced Engineering
Research and Science Vol-7, Issue-11, Nov- 2020,ISSN:2349-6495(P),2456-1908(O),PP-305-309.
https://dx.doi.org/10.22161/ijaers.711.25