A Model for Locating Tall Buildings through a Visual Analysis ...
25
applied sciences Article A Model for Locating Tall Buildings through a Visual Analysis Approach Mehrdad Karimimoshaver 1, * , Hatameh Hajivaliei 1 , Manouchehr Shokri 2 , Shakila Khalesro 1,3 , Farshid Aram 4 and Shahab Shamshirband 5,6, * 1 Department of Architecture, Bu-Ali Sina University, Hamedan 65167-38695, Iran; [email protected] (H.H.); [email protected] (S.K.) 2 Institute of Structural Mechanics, Faculty of Civil Engineering, Bauhaus University, 99423 Weimar, Germany; [email protected] 3 Department of Urbanism, University of Kurdistan, Sanandaj 66177-15175, Iran 4 Higher Technical School of Architecture, Technical University of Madrid (UPM), 28040 Madrid, Spain; [email protected] 5 Institute of Research and Development, Duy Tan University, Da Nang 550000, Vietnam 6 Future Technology Research Center, College of Future, National Yunlin University of Science and Technology 123, University Road, Section 3, Douliou, Yunlin 64002, Taiwan * Correspondence: [email protected] (M.K.); [email protected] or [email protected] (S.S.) Received: 25 July 2020; Accepted: 25 August 2020; Published: 2 September 2020 Abstract: Tall buildings have become an integral part of cities despite all their pros and cons. Some current tall buildings have several problems because of their unsuitable location; the problems include increasing density, imposing traffic on urban thoroughfares, blocking view corridors, etc. Some of these buildings have destroyed desirable views of the city. In this research, different criteria have been chosen, such as environment, access, social-economic, land-use, and physical context. These criteria and sub-criteria are prioritized and weighted by the analytic network process (ANP) based on experts’ opinions, using Super Decisions V2.8 software. On the other hand, layers corresponding to sub-criteria were made in ArcGIS 10.3 simultaneously, then via a weighted overlay (map algebra), a locating plan was created. In the next step seven hypothetical tall buildings (20 stories), in the best part of the locating plan, were considered to evaluate how much of theses hypothetical buildings would be visible (fuzzy visibility) from the street and open spaces throughout the city. These processes have been modeled by MATLAB software, and the final fuzzy visibility plan was created by ArcGIS. Fuzzy visibility results can help city managers and planners to choose which location is suitable for a tall building and how much visibility may be appropriate. The proposed model can locate tall buildings based on technical and visual criteria in the future development of the city and it can be widely used in any city as long as the criteria and weights are localized. Keywords: tall building; locating criteria; fuzzy visibility; visual impact 1. Introduction 1.1. Importance of Tall Buildings and Their Various Dimensions Tall buildings have always been one of the most critical elements of a city’s visual appearance and research on the visual impact of tall buildings is underdeveloped. Tall buildings need more attention due to the growing number of tall buildings all over the world and their high impact on the city—e.g., “they cannot be ignored” [1]. Appl. Sci. 2020, 10, 6072; doi:10.3390/app10176072 www.mdpi.com/journal/applsci
-
Upload
khangminh22 -
Category
Documents
-
view
5 -
download
0
Transcript of A Model for Locating Tall Buildings through a Visual Analysis ...

applied sciences
Article
A Model for Locating Tall Buildings through a VisualAnalysis Approach
Mehrdad Karimimoshaver 1,* , Hatameh Hajivaliei 1, Manouchehr Shokri 2,Shakila Khalesro 1,3, Farshid Aram 4 and Shahab Shamshirband 5,6,*
1 Department of Architecture, Bu-Ali Sina University, Hamedan 65167-38695, Iran;[email protected] (H.H.); [email protected] (S.K.)
2 Institute of Structural Mechanics, Faculty of Civil Engineering, Bauhaus University, 99423 Weimar, Germany;[email protected]
3 Department of Urbanism, University of Kurdistan, Sanandaj 66177-15175, Iran4 Higher Technical School of Architecture, Technical University of Madrid (UPM), 28040 Madrid, Spain;
[email protected] Institute of Research and Development, Duy Tan University, Da Nang 550000, Vietnam6 Future Technology Research Center, College of Future, National Yunlin University of Science and
Technology 123, University Road, Section 3, Douliou, Yunlin 64002, Taiwan* Correspondence: [email protected] (M.K.);
[email protected] or [email protected] (S.S.)
Received: 25 July 2020; Accepted: 25 August 2020; Published: 2 September 2020�����������������
Abstract: Tall buildings have become an integral part of cities despite all their pros and cons.Some current tall buildings have several problems because of their unsuitable location; the problemsinclude increasing density, imposing traffic on urban thoroughfares, blocking view corridors, etc.Some of these buildings have destroyed desirable views of the city. In this research, differentcriteria have been chosen, such as environment, access, social-economic, land-use, and physicalcontext. These criteria and sub-criteria are prioritized and weighted by the analytic network process(ANP) based on experts’ opinions, using Super Decisions V2.8 software. On the other hand, layerscorresponding to sub-criteria were made in ArcGIS 10.3 simultaneously, then via a weighted overlay(map algebra), a locating plan was created. In the next step seven hypothetical tall buildings(20 stories), in the best part of the locating plan, were considered to evaluate how much of theseshypothetical buildings would be visible (fuzzy visibility) from the street and open spaces throughoutthe city. These processes have been modeled by MATLAB software, and the final fuzzy visibility planwas created by ArcGIS. Fuzzy visibility results can help city managers and planners to choose whichlocation is suitable for a tall building and how much visibility may be appropriate. The proposedmodel can locate tall buildings based on technical and visual criteria in the future development of thecity and it can be widely used in any city as long as the criteria and weights are localized.
Keywords: tall building; locating criteria; fuzzy visibility; visual impact
1. Introduction
1.1. Importance of Tall Buildings and Their Various Dimensions
Tall buildings have always been one of the most critical elements of a city’s visual appearance andresearch on the visual impact of tall buildings is underdeveloped.
Tall buildings need more attention due to the growing number of tall buildings all over the worldand their high impact on the city—e.g., “they cannot be ignored” [1].
Appl. Sci. 2020, 10, 6072; doi:10.3390/app10176072 www.mdpi.com/journal/applsci

Appl. Sci. 2020, 10, 6072 2 of 25
Short [2] believes that the impact of tall buildings on the city can be studied based on eightcategories including context, the effect on the historic environment, the effect on the local environment,the relationship to transport, permeability, architectural quality, contributions, and sustainability.To study the tall buildings’ roles in the cities, Al-Kodmany and Ali [3] consider tall buildings’relationships to the city in various dimensions including infrastructure, city skyline, place making,architectural and engineering quality, and iconic role. Another study evaluates the triple effects of tallbuildings, and their impact on the city based on aesthetic, semantic, and visual criteria, and presenteda framework to measure their impact.
1.2. Definition of Tall Buildings
There are different words for defining tall buildings worldwide, including high-rise, skyscraper,tower, and super tall buildings. Tall buildings’ categories can be different around the world; for example,one city can consider more than 12 stories as tall buildings, but another city does not categorize30–40 stories as tall buildings.
Tall buildings’ definitions can differ due to the time and place conditions of this type. Different citiesof the world have specific descriptions of tall buildings in different periods concerning urban criteria,fire stations, structure, and installation.
Al-Kodmany and Ali [2] classified these buildings as tall buildings: high-rise buildings, ultra-high-risebuildings, towers, and skyscrapers. Other definitions are based on the countries’ internal regulations.For example, in Germany, some of the high-rise construction criteria are determined by the country’sfirefighting system’s available equipment. Howeler (2003) categorized skyscrapers based on appearanceinto media-oriented, environmental, kinetic, etc. These buildings are defined according to each countryand city’s local regulations [4].
However, it seems to be an unsaid contract that tall buildings are taller than their context in theirlocation in the world [5]. Therefore, the definition of tall buildings in this study is 20-story buildingsthat are considered taller than the context in Hamedan.
1.3. Tall Buildings and Visibility
Al-Kodmany and Ali [2] believe that “the visual impact of tall buildings on urban form extendsfar beyond their footprints”. In architecture and urban studies, visibility is a criterion that deals withwhether a building or an urban structure is visible from urban public spaces, to analyze its impact onthe viewers [6]. This analysis calculates the visual impact of structures and buildings with the aim ofcontrolling their impacts on the city.
London is one of the cities that has specific regulations on controlling the impact of tall buildings onurban views. The London View Management Framework (LVMF) includes strict regulations that controlthe possible effects of proposals for new buildings on the skyline and views in London. It proposesfour kinds of views, including London Panoramas, Linear Views, River Prospect, and TownscapeViews. Proposals for new buildings are assessed for their impact on the protected views within theforeground, middle ground, or background of those views [7].
Tall buildings and city skylines are essential components of these views, and in most cases, tallbuildings are the most prominent parts of the city skyline [8]. Rod and Van der Meer [9] evaluated thedominance of tall buildings in new developments. They considered how much a tall building couldinfluence visibility, using both traditional and modern methods. They believe visibility and dominanceare fundamental options for locating tall buildings in cities. The question that “a building how muchand how long would be visible for citizens” will be examined in analyzing visibility and dominance.
Zarghami et al [10] developed a method to study the impact of the form and the physical featuresof tall buildings on citizens based on Height, width, and height-to-width ratio. Karimimoahaver [11]provided and evaluated different methods of describing a building’s visual impact on the city.Karimimoshaver et al. [12] examined the relationship between tall buildings’ locations and the urban

Appl. Sci. 2020, 10, 6072 3 of 25
landscape. They evaluated the effectiveness of single and cluster tall buildings based on functional,identity, and aesthetic purposes.
Traditional visibility considers if urban elements are visible or non-visible; however, Fisher [13]does not agree with this definition. She believes, instead, that visibility is how much of a tall buildingis visible, and considers that as a measure using fuzzy logic [13]. In another study, Oh [14] examinesthe percentage of visibility and its importance as two critical things in visual analysis.
Rød and van der Meer [9] showed how a planned tall building’s impact can be evaluated throughGIS-based visibility and dominance analysis. To make the visibility of tall buildings more practical, theyexplain the dominance concept based on the distance of the building from the observation viewpoint.They believe that traditional visibility analysis calculates the relationship between buildings and theexisting situation in the urban landscape, in which visual obstacles, trees or other disturbing elementsare considered. However, dominance analysis adds the criterion of how a building dominates visually,taking into account the distance from the building and the degree to which the building is visible fromany point of view [9].
Another study did a visibility analysis of high-rise building development, using a GIS-based mapto present visual coverage and cumulative visibility of tall buildings through the study of visibility ofexisting single and cluster buildings in the city of Rotterdam, and the impact of those buildings on thecity skyline during the time [15]. They considered a tall building’s performance in the cluster, whichis perceived visually instead of obtaining it individually; this offered a new way to characterize thevisibility of a tall building. Czynska and Rubinowicz [16] offer the visual impact size (VIS) methodto recognize tall buildings’ locations and to determine how much tall buildings are visible throughvirtual city models.
Today visibility analysis is performed in both binary and fuzzy forms. The binary form presentsthe possibility of seeing the building only, while the fuzzy method determines the percentage ofvisibility. Since binary visibility only examines whether a building is seen or not, it can only be usefulin certain cases. The purpose of visibility in this research is fuzzy visibility in order to determinethe amount of visibility of tall buildings from urban spaces, and based on this to be able to measuretheir impact.
1.4. Locating Tall Buildings
Locating is a kind of spatial planning that locates certain activities [17]. Hence projects can exploitthe identification of the most economical places, and its competitiveness should be considered as oneof the critical goals. These decisions must be in line with the investors’ and government’s specificpolicies, and will primarily meet environmental needs [18].
Results from tall buildings’ physical-spatial effects of Farmanieh and Kamranieh neighborhoods inthe city of Tehran designate that creating tall buildings must occur based on pre-planned principles andmacro-policies [19]. Azizi and Fallah [20] presented suitable areas for the tall building development byproviding location criteria (social, economic, environmental, and physical) in the city of Shiraz.
Adeli and Sardarre [21] evaluated proper locations for tall buildings in the city of Qazvin byconsidering social, economic, environmental, and physical criteria, weighting them, and producing thecorresponding layers. Sedaghati [22] studied the existing location of one of the tall building complexesin the city of Tabriz. This study evaluated the impact of distance from pollutants, faults, traffic points,highways, etc., on these buildings.
Thomasetin et al., [23] desired to turn the process of developing tall buildings into a purposefulendeavor by categorizing existing tall buildings by location (city center, middle texture, surrounding ring,next to the big ones, and close to the industrial areas) and type of accumulation (single-scattered) [23].They concluded that urban planners must keep developing tall buildings in centralized clusters aroundthe historic part of the city, and that constructing individual buildings near the historic center of the cityshould be avoided. The investigation of location methods during the last two decades in Iran reveals thatexisting approaches are mostly simplistic and rudimentary. Over that time period, there has not been a

Appl. Sci. 2020, 10, 6072 4 of 25
significant achievement in advancing the urban planning profession in Iran [24]. Another study suggestedlocation for nine regions of the city of Mashhad by using criteria (physical-spatial, environmental) thathave been extracted from the smart growth theory. This paper declares that existing tall buildings arelocated in inappropriate locations and defines appropriate points [25]. Salehi and Ghadiri [26] believe thatthe criteria required for locating and constructing tall buildings in Iran are in line with building regulationsof the city of Toronto in Canada. These regulations considered “rule”, “tower”, and “communication withadjacent areas” in terms of shading, neighborhood, aesthetics, and urban landscape. These rules can alsobe used in Iranian metropolises.
Zista consulting engineering [27] considered urban planning principles, citizen orientation,and urban visualization for building locations in Tehran. Anabestani et al., [28] estimated appropriatelocations for constructing tall buildings in Mashhad’s 9th region. Zareian [29] studied social issues oftall buildings. He defines the most critical social problems of these buildings as increased congestion,lack of cultural compatibility, reduced neighborhood identity, difficulty in ensuring security, and weakneighborly relations.
1.5. Research Question
Previous studies that dealt with tall buildings’ locations suggested appropriate locations only forspecific sites and failed to provide a comprehensive model including the weight of the criteria andconsideration of the two- and three-dimensional impacts of tall buildings on the city, therefore themain research question is:
What is the weight of the criteria affecting the location of tall buildings and how to create aneffective combination of two-dimensional and three-dimensional criteria for locating tall buildings,as a comprehensive model?
2. Materials and Methods
The research method consists of three main stages including weighting and prioritizing criteria,applying criteria to the GIS layer, and visibility analysis.
2.1. Weighting and Prioritizing Criteria
The first stage was prioritizing criteria (Figures 1–3 and Table 1). Twenty registered and reputableexperts, including twelve urban designers, five architects, and three urban planners, completed asurvey through the analytic network process (ANP) technique (Figure 4). Criteria were narrowed downbased on the current information and the general situation of Hamedan. The relationship betweenthem and inhibiting sub-criteria, and their importance compared to one another, were measured.Finally, the weighting and priority of criteria were provided by using Super Decisions V2.8 software.Super Decisions software is a tool for making decisions based on multi-criteria methods including theanalytic hierarchy process (AHP) and the analytic network process (ANP) [30] which is applied inthis research.

Appl. Sci. 2020, 10, 6072 5 of 25Appl. Sci. 2020, 10, x FOR PEER REVIEW 5 of 25
Figure 1. The structure of the criteria study including criteria (environmental, physical, accessibility, socio-economic, and land use), sub-criteria (soil, channel, fault, slope, texture, parcels, traffic, nodes, population density, social type, land price, per capita service, buffer, and compatibility), and data sources.
Figure 2. The network relations between the criteria, based on expert opinion. (The colors in this figure are simply due to the better readability of the relationships between the criteria and have no special meaning).
Figure 1. The structure of the criteria study including criteria (environmental, physical, accessibility,socio-economic, and land use), sub-criteria (soil, channel, fault, slope, texture, parcels, traffic, nodes,population density, social type, land price, per capita service, buffer, and compatibility), and data sources.
Appl. Sci. 2020, 10, x FOR PEER REVIEW 5 of 25
Figure 1. The structure of the criteria study including criteria (environmental, physical, accessibility, socio-economic, and land use), sub-criteria (soil, channel, fault, slope, texture, parcels, traffic, nodes, population density, social type, land price, per capita service, buffer, and compatibility), and data sources.
Figure 2. The network relations between the criteria, based on expert opinion. (The colors in this figure are simply due to the better readability of the relationships between the criteria and have no special meaning).
Figure 2. The network relations between the criteria, based on expert opinion. (The colors in thisfigure are simply due to the better readability of the relationships between the criteria and have nospecial meaning).

Appl. Sci. 2020, 10, 6072 6 of 25Appl. Sci. 2020, 10, x FOR PEER REVIEW 6 of 25
Figure 3. The internal relations between the sub-criteria, based on expert opinion. In this figure, the relationships between each of the sub-criteria (related to the five criteria introduced in Figure 2) with other sub-criteria related to other categories are demonstrated (The colors in this figure are simply due to the better readability of the relationships between the criteria and have no special meaning).
Figure 4. The result of the pairwise comparison of the criteria presented in Figure 4 from Super Decisions V2.8 software.
Figure 3. The internal relations between the sub-criteria, based on expert opinion. In this figure,the relationships between each of the sub-criteria (related to the five criteria introduced in Figure 2)with other sub-criteria related to other categories are demonstrated (The colors in this figure are simplydue to the better readability of the relationships between the criteria and have no special meaning).
Appl. Sci. 2020, 10, x FOR PEER REVIEW 6 of 25
Figure 3. The internal relations between the sub-criteria, based on expert opinion. In this figure, the relationships between each of the sub-criteria (related to the five criteria introduced in Figure 2) with other sub-criteria related to other categories are demonstrated (The colors in this figure are simply due to the better readability of the relationships between the criteria and have no special meaning).
Figure 4. The result of the pairwise comparison of the criteria presented in Figure 4 from Super Decisions V2.8 software.Figure 4. The result of the pairwise comparison of the criteria presented in Figure 4 from SuperDecisions V2.8 software.

Appl. Sci. 2020, 10, 6072 7 of 25
Table 1. The criteria and sub-criteria for locating tall buildings and their weights based on expert opinion, formulated using the ANP method and Super DecisionsV2.8 software.
Criterion Criterion Weight Sub-Criteria Sub-CriteriaWeight Measure Priority
1Environmental
(natural-geologicalfactors)
0.04384
Slope 0.04355
0–5% 15.1–10% 2
10.1–15% 3>15% 4
Channel (surface andunderground sewage) 0.00062
0–25 m 325–150 m 2>150 m 1
Fault 0.028510–500 m 3
500–1000 m 2>1000 m 1
Soil type 0.00026Clay soil 1
Sandy soil 2
2 Physical 0.41614
Texture 0.2445
Low density 1Medium density 2
dense 3Non-residential 4
Land parcels 0.00328
>1000 m 1800–1000 m 2600–800 m 3
Others 4
3Accessibility and
transportation 0.2547
Traffic 0.11677
Primary road 130 m street 2
Street 3Others 4
Nodes 0.03184short distance (first line) 3
Medium distance (second line) 2Long distance (third line and so on) 1

Appl. Sci. 2020, 10, 6072 8 of 25
Table 1. Cont.
Criterion Criterion Weight Sub-Criteria Sub-CriteriaWeight Measure Priority
4 Socio-economic 0.07933
Land price 0.25698
2375–3125 U.S. dollars /m2 41625–2375 U.S. dollars/m2 2875–1625 U.S. dollars/m2 1250–875 U.S. dollars/m2 3
Social type 0.00398
Educated/ low population 4Educated/medium population 3
Educated/relatively large 2Educated/large population 1
Population density 0.18223
dense 4Medium density 3Medium density 2
Low density 1
5 Land-use 0.20598
Buffer 0.04608short distance 2Long distance 1
Land-use compatibility 0.00446Incompatible land-use 3
Semi-compatible land-use 2Compatible land-use 1
Per capita urban services 0.03695
Low service 4Medium service 3
Acceptable service 2Optimal service 1

Appl. Sci. 2020, 10, 6072 9 of 25
2.2. Developing GIS Layers
In the second stage, the GIS layers of Hamedan’s characteristics (Figures 5–18) are applied basedon the sub-criteria mentioned in Table 1. The Map Algebra tool in ArcGIS V10.3 software was appliedto create the layers so that it was possible to include the weight of the criteria obtained in the firststage. Then a map (Figure 19) is provided by the ArcGIS software that shows the best locations for theproposed tall buildings in the city.
Appl. Sci. 2020, 10, x FOR PEER REVIEW 9 of 25
2.2. Developing GIS Layers
In the second stage, the GIS layers of Hamedan’s characteristics (Figures 5–18) are applied based on the sub-criteria mentioned in Table 1. The Map Algebra tool in ArcGIS V10.3 software was applied to create the layers so that it was possible to include the weight of the criteria obtained in the first stage. Then a map (Figure 19) is provided by the ArcGIS software that shows the best locations for the proposed tall buildings in the city.
Figure 5. The slope map of Hamedan based on the sub-criteria measures in Table 1.
Figure 6. The channels map of Hamedan based on the sub-criteria measures in Table 1.
Figure 5. The slope map of Hamedan based on the sub-criteria measures in Table 1.
Appl. Sci. 2020, 10, x FOR PEER REVIEW 9 of 25
2.2. Developing GIS Layers
In the second stage, the GIS layers of Hamedan’s characteristics (Figures 5–18) are applied based on the sub-criteria mentioned in Table 1. The Map Algebra tool in ArcGIS V10.3 software was applied to create the layers so that it was possible to include the weight of the criteria obtained in the first stage. Then a map (Figure 19) is provided by the ArcGIS software that shows the best locations for the proposed tall buildings in the city.
Figure 5. The slope map of Hamedan based on the sub-criteria measures in Table 1.
Figure 6. The channels map of Hamedan based on the sub-criteria measures in Table 1. Figure 6. The channels map of Hamedan based on the sub-criteria measures in Table 1.

Appl. Sci. 2020, 10, 6072 10 of 25
Appl. Sci. 2020, 10, x FOR PEER REVIEW 10 of 25
Figure 7. The fault map of Hamedan based on the sub-criteria measures in Table 1.
Figure 8. The soil type map of Hamedan based on the sub-criteria measures in Table 1.
Figure 7. The fault map of Hamedan based on the sub-criteria measures in Table 1.
Appl. Sci. 2020, 10, x FOR PEER REVIEW 10 of 25
Figure 7. The fault map of Hamedan based on the sub-criteria measures in Table 1.
Figure 8. The soil type map of Hamedan based on the sub-criteria measures in Table 1. Figure 8. The soil type map of Hamedan based on the sub-criteria measures in Table 1.

Appl. Sci. 2020, 10, 6072 11 of 25
Appl. Sci. 2020, 10, x FOR PEER REVIEW 11 of 25
Figure 9. The texture map of Hamedan based on the sub-criteria measures in Table 1.
Figure 10. The land parcels map of Hamedan based on the sub-criteria measures in Table 1.
Figure 9. The texture map of Hamedan based on the sub-criteria measures in Table 1.
Appl. Sci. 2020, 10, x FOR PEER REVIEW 11 of 25
Figure 9. The texture map of Hamedan based on the sub-criteria measures in Table 1.
Figure 10. The land parcels map of Hamedan based on the sub-criteria measures in Table 1. Figure 10. The land parcels map of Hamedan based on the sub-criteria measures in Table 1.

Appl. Sci. 2020, 10, 6072 12 of 25
Appl. Sci. 2020, 10, x FOR PEER REVIEW 12 of 25
Figure 11. The traffic map of Hamedan based on the sub-criteria measures in Table 1.
Figure 12. The nodes map of Hamedan based on the sub-criteria measures in Table 1.
Figure 11. The traffic map of Hamedan based on the sub-criteria measures in Table 1.
Appl. Sci. 2020, 10, x FOR PEER REVIEW 12 of 25
Figure 11. The traffic map of Hamedan based on the sub-criteria measures in Table 1.
Figure 12. The nodes map of Hamedan based on the sub-criteria measures in Table 1. Figure 12. The nodes map of Hamedan based on the sub-criteria measures in Table 1.

Appl. Sci. 2020, 10, 6072 13 of 25
Appl. Sci. 2020, 10, x FOR PEER REVIEW 13 of 25
Figure 13. The land price map of Hamedan based on the sub-criteria measures in Table 1.
Figure 14. The social type map of Hamedan based on the sub-criteria measures in Table 1.
Figure 13. The land price map of Hamedan based on the sub-criteria measures in Table 1.
Appl. Sci. 2020, 10, x FOR PEER REVIEW 13 of 25
Figure 13. The land price map of Hamedan based on the sub-criteria measures in Table 1.
Figure 14. The social type map of Hamedan based on the sub-criteria measures in Table 1. Figure 14. The social type map of Hamedan based on the sub-criteria measures in Table 1.
Appl. Sci. 2020, 10, 6072 14 of 25
Appl. Sci. 2020, 10, x FOR PEER REVIEW 14 of 25
Figure 15. The population density map of Hamedan based on the sub-criteria measures in Table 1.
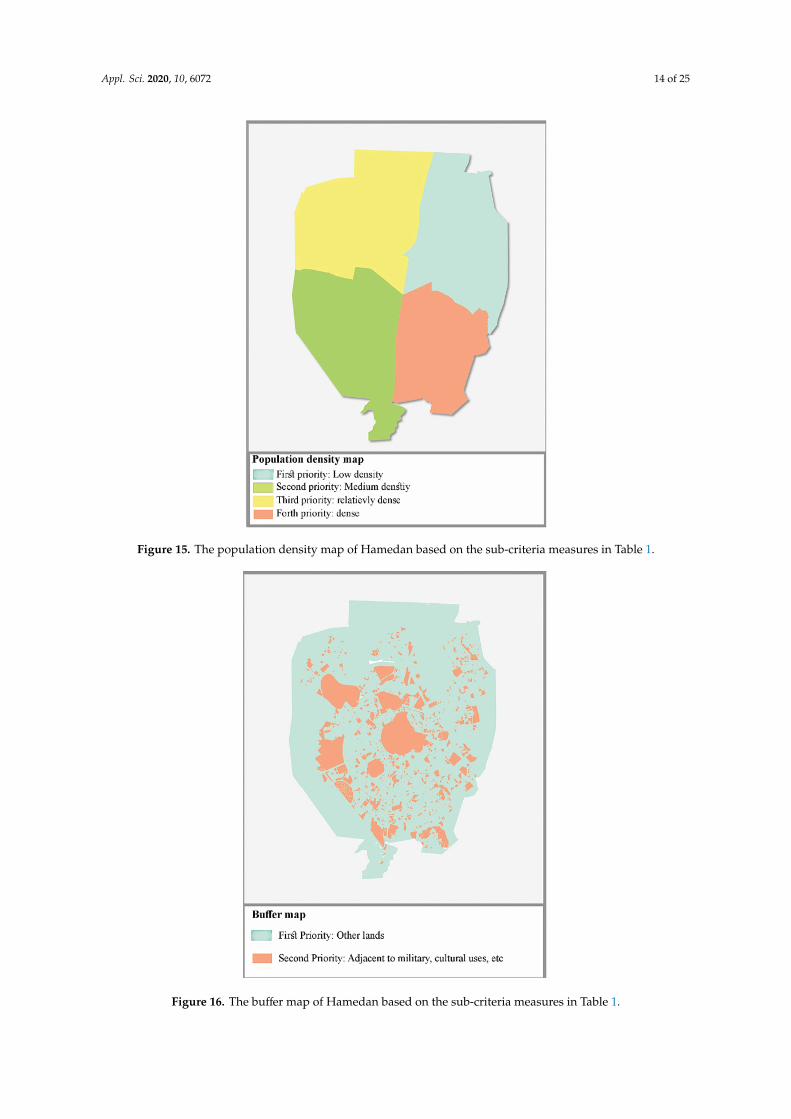
Figure 16. The buffer map of Hamedan based on the sub-criteria measures in Table 1.
Figure 15. The population density map of Hamedan based on the sub-criteria measures in Table 1.
Appl. Sci. 2020, 10, x FOR PEER REVIEW 14 of 25
Figure 15. The population density map of Hamedan based on the sub-criteria measures in Table 1.
Figure 16. The buffer map of Hamedan based on the sub-criteria measures in Table 1. Figure 16. The buffer map of Hamedan based on the sub-criteria measures in Table 1.

Appl. Sci. 2020, 10, 6072 15 of 25
Appl. Sci. 2020, 10, x FOR PEER REVIEW 15 of 25
Figure 17. The land-use compatibility map of Hamedan based on the sub-criteria measures in Table 1.
Figure 18. The per capta service map of Hamedan based on the sub-criteria measures in Table 1.
Figure 17. The land-use compatibility map of Hamedan based on the sub-criteria measures in Table 1.
Appl. Sci. 2020, 10, x FOR PEER REVIEW 15 of 25
Figure 17. The land-use compatibility map of Hamedan based on the sub-criteria measures in Table 1.
Figure 18. The per capta service map of Hamedan based on the sub-criteria measures in Table 1. Figure 18. The per capta service map of Hamedan based on the sub-criteria measures in Table 1.
Appl. Sci. 2020, 10, 6072 16 of 25
Appl. Sci. 2020, 10, x FOR PEER REVIEW 16 of 25
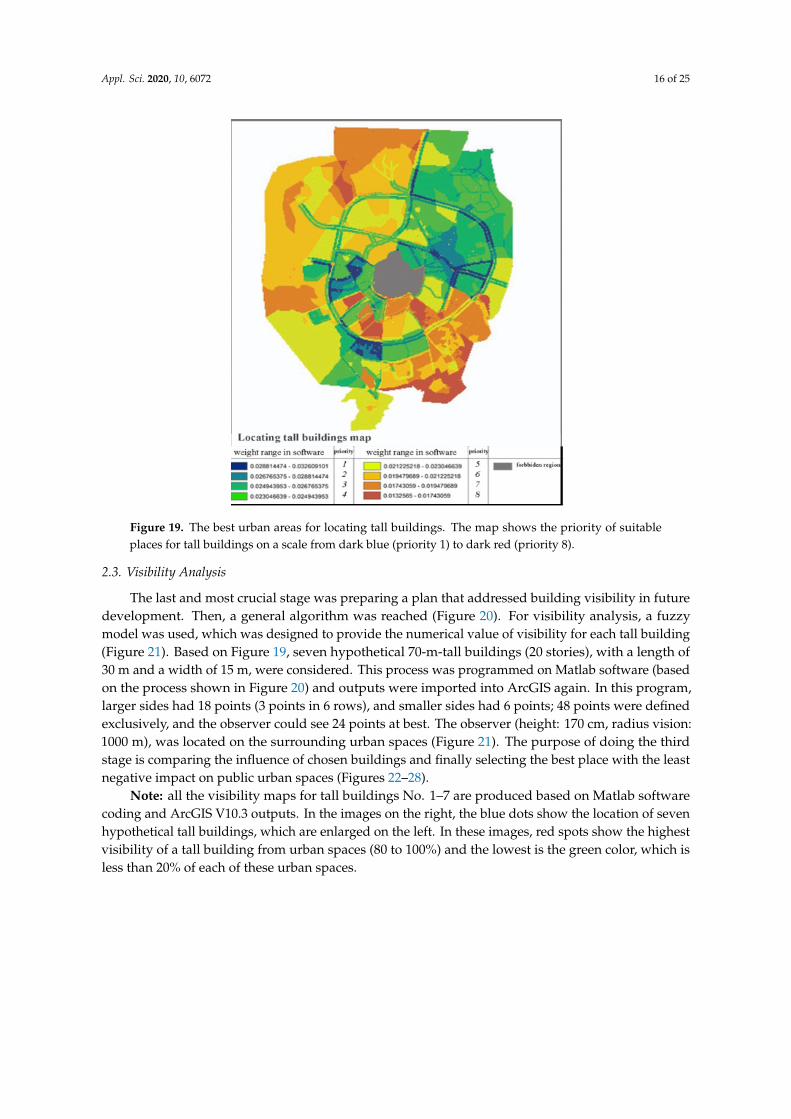
Figure 19. The best urban areas for locating tall buildings. The map shows the priority of suitable places for tall buildings on a scale from dark blue (priority 1) to dark red (priority 8).
2.3. Visibility Analysis
The last and most crucial stage was preparing a plan that addressed building visibility in future development. Then, a general algorithm was reached (Figure 20). For visibility analysis, a fuzzy model was used, which was designed to provide the numerical value of visibility for each tall building (Figure 21). Based on Figure 19, seven hypothetical 70-m-tall buildings (20 stories), with a length of 30 m and a width of 15 m, were considered. This process was programmed on Matlab software (based on the process shown in Figure 20) and outputs were imported into ArcGIS again. In this program, larger sides had 18 points (3 points in 6 rows), and smaller sides had 6 points; 48 points were defined exclusively, and the observer could see 24 points at best. The observer (height: 170 cm, radius vision: 1000 m), was located on the surrounding urban spaces (Figure 21). The purpose of doing the third stage is comparing the influence of chosen buildings and finally selecting the best place with the least negative impact on public urban spaces (Figures 22–28).
Figure 19. The best urban areas for locating tall buildings. The map shows the priority of suitableplaces for tall buildings on a scale from dark blue (priority 1) to dark red (priority 8).
2.3. Visibility Analysis
The last and most crucial stage was preparing a plan that addressed building visibility in futuredevelopment. Then, a general algorithm was reached (Figure 20). For visibility analysis, a fuzzymodel was used, which was designed to provide the numerical value of visibility for each tall building(Figure 21). Based on Figure 19, seven hypothetical 70-m-tall buildings (20 stories), with a length of30 m and a width of 15 m, were considered. This process was programmed on Matlab software (basedon the process shown in Figure 20) and outputs were imported into ArcGIS again. In this program,larger sides had 18 points (3 points in 6 rows), and smaller sides had 6 points; 48 points were definedexclusively, and the observer could see 24 points at best. The observer (height: 170 cm, radius vision:1000 m), was located on the surrounding urban spaces (Figure 21). The purpose of doing the thirdstage is comparing the influence of chosen buildings and finally selecting the best place with the leastnegative impact on public urban spaces (Figures 22–28).
Note: all the visibility maps for tall buildings No. 1–7 are produced based on Matlab softwarecoding and ArcGIS V10.3 outputs. In the images on the right, the blue dots show the location of sevenhypothetical tall buildings, which are enlarged on the left. In these images, red spots show the highestvisibility of a tall building from urban spaces (80 to 100%) and the lowest is the green color, which isless than 20% of each of these urban spaces.

Appl. Sci. 2020, 10, 6072 17 of 25Appl. Sci. 2020, 10, x FOR PEER REVIEW 17 of 25
Figure 20. The fuzzy visibility’s programmed process used in the Matlab software.
Figure 21. A 3-D image of the fuzzy visibility’s programmed process. To do this, the larger side of tall buildings has 18 points (3 points in 6 rows), and the smaller side has 6 points; 48 points are defined exclusively, and the observer could see 24 points at best.
Figure 20. The fuzzy visibility’s programmed process used in the Matlab software.
Appl. Sci. 2020, 10, x FOR PEER REVIEW 17 of 25
Figure 20. The fuzzy visibility’s programmed process used in the Matlab software.
Figure 21. A 3-D image of the fuzzy visibility’s programmed process. To do this, the larger side of tall buildings has 18 points (3 points in 6 rows), and the smaller side has 6 points; 48 points are defined exclusively, and the observer could see 24 points at best.
Figure 21. A 3-D image of the fuzzy visibility’s programmed process. To do this, the larger side of tallbuildings has 18 points (3 points in 6 rows), and the smaller side has 6 points; 48 points are definedexclusively, and the observer could see 24 points at best.

Appl. Sci. 2020, 10, 6072 18 of 25Appl. Sci. 2020, 10, x FOR PEER REVIEW 18 of 25
Figure 22. Visibility map of hypothetical tall building No. 1.
Figure 23. Visibility map of hypothetical tall building No. 2.
Figure 22. Visibility map of hypothetical tall building No. 1.
Appl. Sci. 2020, 10, x FOR PEER REVIEW 18 of 25
Figure 22. Visibility map of hypothetical tall building No. 1.
Figure 23. Visibility map of hypothetical tall building No. 2. Figure 23. Visibility map of hypothetical tall building No. 2.

Appl. Sci. 2020, 10, 6072 19 of 25Appl. Sci. 2020, 10, x FOR PEER REVIEW 19 of 25
Figure 24. Visibility map of hypothetical tall building No. 3.
Figure 25. Visibility map of hypothetical tall building No. 4.
Figure 24. Visibility map of hypothetical tall building No. 3.
Appl. Sci. 2020, 10, x FOR PEER REVIEW 19 of 25
Figure 24. Visibility map of hypothetical tall building No. 3.
Figure 25. Visibility map of hypothetical tall building No. 4. Figure 25. Visibility map of hypothetical tall building No. 4.

Appl. Sci. 2020, 10, 6072 20 of 25Appl. Sci. 2020, 10, x FOR PEER REVIEW 20 of 25
Figure 26. Visibility map of hypothetical tall building No. 5.
Figure 27. Visibility map of hypothetical tall building No. 6.
Figure 26. Visibility map of hypothetical tall building No. 5.
Appl. Sci. 2020, 10, x FOR PEER REVIEW 20 of 25
Figure 26. Visibility map of hypothetical tall building No. 5.
Figure 27. Visibility map of hypothetical tall building No. 6. Figure 27. Visibility map of hypothetical tall building No. 6.

Appl. Sci. 2020, 10, 6072 21 of 25Appl. Sci. 2020, 10, x FOR PEER REVIEW 21 of 25
Figure 28. Visibility map of hypothetical tall building No. 7.
Note: all the visibility maps for tall buildings No. 1–7 are produced based on Matlab software coding and ArcGIS V10.3 outputs. In the images on the right, the blue dots show the location of seven hypothetical tall buildings, which are enlarged on the left. In these images, red spots show the highest visibility of a tall building from urban spaces (80 to 100%) and the lowest is the green color, which is less than 20% of each of these urban spaces.
2.4. Case Study: City of Hamedan
The city of Hamedan is located on the west side of Iran and on the slope of Alvand Mountain. The northern side of the city’s height is 1780 m, and at the end of the southern side, it reaches 1950 m; this causes a steeper slope on the northern side of the city. Hamedan’s soil categories are composed of two types: clay and sandy soil. In this city, two main faults exist that begin from the southeast and continue to the center and northwest; they are named Yelfan and Kashin [31]. Five rivers have flowed through the city. However, today their surface is covered in some places, and they turned into sewers [31], which explains surface and groundwater criteria. Urban texture, based on the maps prepared by the municipality, is divided into three sections: dense, medium density, and low density, and city parcels more significant than 600 m2 are identified and categorized by ArcGIS V10.3 software. Road maps were prepared to cover accessibility and transportation criteria, and adjacent layers of these roads have been prioritized based on the street width. A traffic node map was arranged through field study and surveys at different hours of the day. Socio-economic features were prepared by referring to the Statistics Organization, and land price information was requested from the experts of the land pricing department and field study. The calculation and prioritization of the region’s per capita area in treatment, training, green space, and urban facilities provided functional and land-use maps. The detailed plan explained land-use, buffers, and their compatibility.
3. Results
The research’s findings are presented in three main sections. The first section provides criteria and sub-criteria and their weights. The second section shows the appropriate regions in the city for
Figure 28. Visibility map of hypothetical tall building No. 7.
2.4. Case Study: City of Hamedan
The city of Hamedan is located on the west side of Iran and on the slope of Alvand Mountain.The northern side of the city’s height is 1780 m, and at the end of the southern side, it reaches 1950 m;this causes a steeper slope on the northern side of the city. Hamedan’s soil categories are composedof two types: clay and sandy soil. In this city, two main faults exist that begin from the southeastand continue to the center and northwest; they are named Yelfan and Kashin [31]. Five rivers haveflowed through the city. However, today their surface is covered in some places, and they turnedinto sewers [31], which explains surface and groundwater criteria. Urban texture, based on the mapsprepared by the municipality, is divided into three sections: dense, medium density, and low density,and city parcels more significant than 600 m2 are identified and categorized by ArcGIS V10.3 software.Road maps were prepared to cover accessibility and transportation criteria, and adjacent layers ofthese roads have been prioritized based on the street width. A traffic node map was arranged throughfield study and surveys at different hours of the day. Socio-economic features were prepared byreferring to the Statistics Organization, and land price information was requested from the expertsof the land pricing department and field study. The calculation and prioritization of the region’s percapita area in treatment, training, green space, and urban facilities provided functional and land-usemaps. The detailed plan explained land-use, buffers, and their compatibility.
3. Results
The research’s findings are presented in three main sections. The first section provides criteriaand sub-criteria and their weights. The second section shows the appropriate regions in the city forconstructing tall buildings through GIS maps. The third section clarifies proposed tall buildings’ visualimpacts in proper lands.
3.1. Findings of the First Section: Criteria, Sub-Criteria and Their Weight
This section specifies the essential criteria and sub-criteria based on experts’ opinions for choosingproper lands as a main target (Figure 1).

Appl. Sci. 2020, 10, 6072 22 of 25
The criteria weights and priorities are clarified based on the experts’ viewpoints. To do this,experts are asked to compare all the related criteria and sub-criteria in a pairwise manner to determinewhich criteria in each comparison have priority over other criteria. Figures 2 and 3 show the criteriaand sub-criteria inter-relationships respectively. The method of comparison between criteria andsub-criteria is that the criteria and sub-criteria are compared in pairs and each of them, which have moreimportance and priority than the other, is awarded more points, in a scale of 1 to 9, which ultimatelydetermines how important each criterion is compared to the other (Figure 4). Then, Super DecisionsV2.8 software has been used to achieve Figure 4, this image is an example of the output of this software,which shows the pairwise comparison of the criteria expressed in Figure 2. These analyses have beenimplemented for all the sub-criteria mentioned in Figure 3, and the results of all these analyses arepresented numerically in Table 1.
3.2. Findings of the Second Section: Appropriate Locations for Tall Buildings
In this phase, essential sub-criteria (based on Table 1) for locating tall buildings are presented viaGIS layers (Figures 5–19); by overlapping them, (Figure 20) the suitable areas for erecting tall buildingsare identified.
In the next step, the GIS layers, shown in Figures 5–19, were overlapped together; consequently,the best areas for tall buildings locations, as shown in Figure 20, are obtained.
3.3. Findings of the Third Section: Tall Building Visual Impacts
In this phase, seven tall buildings are placed in seven more suitable zones, based on the besturban area for locating tall buildings (Figure 20), and their visual impact is determined by GIS maps.By comparing these maps and the visual impact of these buildings, the most appropriate place for tallbuildings can be obtained.
Figures 23–28 show the visual impact of each of the proposed buildings. In this article, we donot intend to judge which mode is better, and we are only trying to provide a method for cities to actaccording to their plan and vision. Whether visibility is more or less better depends on the urban plansand visions of each city. In some cities, managers and planners need to find a way to increase thevisibility of tall buildings, and in some other cities, they need to minimize the visual impact of tallbuildings as much as possible.
4. Discussion
The model presented in this research can help to locate tall buildings. The method presented inthis research is a combination of the two methods of planning and visual analysis. In the planningsection, the criteria and sub-criteria are considered to determine the appropriate areas for the erectionof tall buildings. Visual analysis is done in three dimensions based on fuzzy visibility; the positiveand negative effects of tall buildings on the city are identified and help to decide on the appropriatelocation of the tall buildings. This model can be used for every desirable region and it suggests properspots for all of them, provided there is localization of criteria.
In most previous researches, the influential factors in locating tall buildings have beenmentioned [32,33], but the prioritization and weighting of these criteria have not been studiedin detail. In this study, according to the results, land price, urban texture, population density, and trafficsub-criteria are at the highest level, and surface and groundwater sub-criteria are at the lowest levelin locating tall buildings by prioritization. Other criteria like buffer, slope, per capita service, trafficnodes, fault, compatibility, and parcels are also placed among the list.
Lack of access to accurate 3D images and maps of the city was one of the main limitations ofthis research. Although we tried to develop a comprehensive model, further studies can examinedesigning adjacent sidewalks criteria, facades and their details, a building’s 3D model, parametricdesign according to the background characteristics, etc. The effects of vegetation have not been appliedin the fuzzy visibility analysis in this research. By minimizing the study area, this factor can be included.
Appl. Sci. 2020, 10, 6072 23 of 25
Another thing to consider is the amount of visibility from inside of the yard. The visual analysis couldaccommodate different factors such as increasing legibility, making memories, and preparing maps toprotect visually valuable axes.
5. Conclusions
In this research, a model is presented so that the role of the tall buildings’ visual impacts in the citycan be properly considered in decision-making for the location of tall buildings in the city. The centralhypothesis of this research was that a set of criteria is vital in locating tall buildings.
The main question of this research was how to find a solution that is reproducible and can beused in any other city based on many heterogeneous criteria. To do this, the criteria were dividedinto two-dimensional criteria and three-dimensional criteria. In two-dimensional criteria, technicalissues affecting the location of tall buildings were identified and weighted and prioritized based on theopinion of experts by the ANP method in Super Decisions V2.8 software. In the three-dimensionalsection, the fuzzy visual analysis was applied by MATLAB software considering how much of a tallbuilding can be seen from urban spaces. In this way, this research provided a model that was ableto examine a large number of heterogeneous variables affecting the location of tall buildings and todetermine their weight and priority.
After evaluating the criteria, locations should be chosen that not only do not negatively impactthe city, but also positively impact it. The final filter for locating tall buildings is a visual criterion thatis very important in the city. In other words, in addition to evaluating technical criteria, the visualimpact and its positive influence should be considered. Due to the complexity of three-dimensionalanalysis, the proposed model in this research is formed in two stages: the first stage is reviewingtechnical criteria to narrow the possible urban area for locating tall buildings, and the second stage isreviewing visual criteria in which only areas of the city that have been identified as suitable for theconstruction of tall buildings in terms of two dimensions are examined in the first stage.
In this study, the main limitation is the unavailability of 3D images of the city with sufficientaccuracy. This limitation might change the research results. We tried to get as close as possible to theexisting reality through field research. However, observing correct height codes for both the land andthe building requires more accurate mapping data.
This research generally seeks to find the appropriate framework for locating tall buildings.This research’s framework presented in two main steps. In the first step, technically suitable locationsof the city for constructing tall buildings were recognized. In the second step, parts of the city that hadboth a positive visual impact on the city and positive technical criteria were identified. The methodand framework used in this research can be used in all cities around the world. In fact, in each city,the criteria and sub-criteria and their weights can be reviewed based on the city’s priority.
This model can be considered individually for areas considered more desirable, and offers aproper location in each zone.
The designed program can evaluate a building’s visibility in future development plans if the inputdata is accurate enough. In this program, one of the essential requirements for preparing a preciseoutput is the accuracy and precision of the information. In further studies, vegetation and distanceimpact can also be considered and can be focused on providing a set of regulations.
Author Contributions: Conceptualization, M.K.; methodology, M.K.; software, H.H., S.S., M.S. and F.A.;validation, M.K. and H.H.; formal analysis, H.H. and F.A.; investigation, M.K.; resources, S.K.; data curation, F.A.;writing—Original draft preparation, M.K. and H.H.; writing—Review and editing, M.K. and S.K.; visualization,S.S.; supervision, M.K.; funding acquisition, S.S. All authors have read and agreed to the published version ofthe manuscript.
Funding: We acknowledge the support of the German Research Foundation (DFG) and the Bauhaus-UniversitätWeimar within the Open-Access Publishing Programme.
Conflicts of Interest: The authors declare no conflict of interest.
Appl. Sci. 2020, 10, 6072 24 of 25
References
1. Short, M. Planning for Tall Buildings; Routledge: Abingdon, UK, 2012.2. Al-Kodmany, K.; Ali., M.M. The Future of the City: Tall Buildings and Urban Design; WIT Press: Chicago, IL,
USA, 2013; pp. 11–44 & 68–98.3. Karimimoshaver, M.; Winkemann, P. A framework for assessing tall buildings’ impact on the city skyline:
Aesthetic, visibility, and meaning dimensions. Environ. Impact Assess. Rev. 2018, 73, 164–176. [CrossRef]4. Howeler, E. Skyscraper: Design of the Recent Past and for the Near Future; Thames & Hudson: London, UK, 2003.5. Council on Tall Buildings and Urban Habitat. Ctbuh.org. 2017. Available online: http://ctbuh.org/ (accessed on
30 October 2017).6. Karimimoshaver, M. Methods, Techniques and Tools in Urban Visual Analysis. Bagh-e Nazar 2014, 11, 73–80.7. London View Management Framework. Available online: https://www.london.gov.uk/what-we-do/planning/
implementing-london-plan/planning-guidance/london-view-management (accessed on 12 November 2017).8. Heath, T.; Smith, S.G.; Lim, B. Tall Buildings and the Urban Skyline. Environ. Behav. 2000, 32, 541–556.
[CrossRef]9. Rød, J.K.; Van Der Meer, D. Visibility and Dominance Analysis: Assessing a High-Rise Building Project in
Trondheim. Environ. Plan. B Plan. Des. 2009, 36, 698–710. [CrossRef]10. Zarghami, E.; Karimimoshaver, M.; Ghanbaran, A.; SaadatiVaghar, P. Assessing the oppressive impact of the
form of tall buildings on citizens: Height, width, and height-to-width ratio. Environ. Impact Assess. Rev.2019, 79, 106287. [CrossRef]
11. Karimimoshaver, M. Approaches and methods in urban aesthetics. Sci. J. NAZAR Res. Cent. (NRC) ArtArchit. Urban. 2013, 10, 63–72.
12. Karimimoshaver, M.; Mansouri, S.A.; Adibi, A. Relationship between the Urban Landscape and Position ofTall Buildings in the City. Sci. J. NAZAR Res. Cent. (NRC) Art Archit. Urban. 2010, 7, 89–99.
13. Fisher, P.F. Probable and fuzzy models of the viewshed operation. In Innovations in GIS; Worboys, M.F., Ed.;Taylor and Francis: London, UK, 1994; pp. 161–175.
14. Oh, K. Visual threshold carrying capacity (VTCC) in urban landscape management: A case study of Seoul,Korea. Landsc. Urban Plan. 1998, 39, 283–294. [CrossRef]
15. Van der Hoeven, F.; Nijhuis, S. Developing Rotterdam’s skyline. CTBUH J. 2012, 2, 32–37.16. Czynska, K.; Rubinowicz, P. Visual impact size method in planning tall buildings. In Education for Research,
Research for Creativity; Słyk, J., Bezerra, L., Eds.; Faculty of Architecture, Warsaw University of Technology:Warsaw, Poland, 2016; pp. 169–174.
17. Sahami, H. Preparation and Location; Malek-e-Ashtar Industrial University: Tehran, Iran, 2010.18. Forghani, A.; Akhundi, A.; Sharifyazdi, M. Industry and Service Facility Location with a Practical Approach;
Sharif University Press: Tehran, Iran, 2009.19. Azizi, M.M. Evaluation of physical-spatial effects of tower construction in Tehran (Farmanieh-Kamranieh).
Honar-Ha-Ye-Ziba 1999, 4–5, 33–46.20. Azizi, M.M.; Fallah, E. Determining and Applying the Criteria for Locating Tall Buildings in Metropolitan Areas
(Case Study: Shiraz); University of Tehran: Tehran, Iran, 2008.21. Adeli, Z.; Sardare, A. Locating of Tall buildings in Qazvin City using the hierarchical process of G.I.S.,
AHP. In Proceedings of the Third Conference on Urban Planning and Management, Mashhad, Iran,20–23 April 2011; pp. 1–12.
22. Sedaghati, H. Study and Analysis of Location Criteria for Tall Buildings in Cities, Tabriz City Residential Tower.In Proceedings of the National Conference on Urban Development, Sanandaj, Iran, 15–16 October 2011.
23. Tamošaitiene, J.; Šipalis, J.; Banaitis, A.; Gaudutis, E. Complex model for the assessment of the location ofhigh-rise buildings in the city urban structure. Int. J. Strat. Prop. Manag. 2013, 17, 93–109. [CrossRef]
24. Aminzadeh Goharrizi, B.; Roshan, M.; Badr, S. A Comparative Analysis of Site Selection Methods for NewTowns in Iran. Sci. J. NAZAR Res. Cent. (NRC) Art Archit. Urban. 2013, 9, 21–32.
25. Rahnama, M.R.; Razaghian, F. Locating of High-Rise Buildings with Emphasis on Smart Growth Theory.Geogr. Plan. Space Q. J. 2014, 3, 45–64.
26. Salehi, N.; Ghadiri, H. An analysis of the design criteria for Toronto high-rise buildings for use in Iran.In Proceedings of the First National Conference on the Landscape of Natanz in the Pattern of IslamicArchitecture and Urban Planning on the Horizon of 1404, Natanz, Iran, 25 February 2014.

Appl. Sci. 2020, 10, 6072 25 of 25
27. Zista Consulting Engineers. Tehran High-Rise Buildings: Criteria and Location; Urban Planning and ProcessingCompany Publications: Tehran, Iran, 2004.
28. Anabestani, A.; Javanshiri, M.; Anabestani, Z. Adaptive comparison of multi-criteria decision-makingmethods in optimal locating of tall buildings (case study: Region 9 Mashhad Municipility). J. Spat. Plan.2015, 5, 1–24.
29. Zareian, M. Tall buildings’ social issues. In Proceedings of the Sixteenth Conference on Housing DevelopmentPolicies in Iran (Economy Faculty of Tehran University), Tehran, Iran, 3–4 October 2016; pp. 3–11.
30. Saaty, T.L. Theory and Applications of the Analytic Network Process: Decision Making Benefits, Opportunities, Costsand Risks; RWS Publications: Pittsburgh, PA, USA, 2005; ISBN 1-888603-06-2.
31. Hamadan Municipality. Statistics and Technology Center. Available online: http://www.hamedan.ir/(accessed on 25 November 2019).
32. Dimic, V.; Miloševic, M.; Miloševic, D.; Stevic, D. Adjustable Model of Renewable Energy Projects forSustainable Development: A Case Study of the Nišava District in Serbia. Sustainability 2018, 10, 775.[CrossRef]
33. Faroughi, M.; Karimimoshaver, M.; Aram, F.; Solgi, E.; Mosavi, A.; Nabipour, N.; Chau, K.-W.Computational modeling of land surface temperature using remote sensing data to investigate the spatialarrangement of buildings and energy consumption relationship. Eng. Appl. Comput. Fluid Mech. 2020, 14,254–270. [CrossRef]
© 2020 by the authors. Licensee MDPI, Basel, Switzerland. This article is an open accessarticle distributed under the terms and conditions of the Creative Commons Attribution(CC BY) license (http://creativecommons.org/licenses/by/4.0/).