Analysis of Selection, Mutation and Recombination in Genetic Algorithms
27
-
Upload
fraunhoferizb -
Category
Documents
-
view
2 -
download
0
Transcript of Analysis of Selection, Mutation and Recombination in Genetic Algorithms
Analysis of Selection� Mutation andRecombination in Genetic Algorithms
Heinz M�uhlenbein and Dirk Schlierkamp�Voosen
GMD Schlo� BirlinghovenD������ Sankt Augustin� Germany
Abstract� Genetic algorithms have been applied fairly successful to anumber of optimization problems Nevertheless� a common theory whyand when they work is still missing In this paper a theory is outlinedwhich is based on the science of plant and animal breeding A centralpart of the theory is the response to selection equation and the concept ofheritability A fundamental theorem states that the heritability is equalto the regression coecient of parent to o�spring The theory is appliedto analyze selection� mutation and recombination The results are usedin the Breeder Genetic Algorithm whose performance is shown to besuperior to other genetic algorithms
� Introduction
Evolutionary algorithms which model natural evolution processes were alreadyproposed for optimization in the ���s� We cite just one representative example�the outstanding work of Bremermann� He wrote in �� �The major purposeof the work is the study of the e�ects of mutation� mating� and selection onthe evolution of genotypes in the case of non�linear tness functions� In viewof the mathematical di�culties involved� computer experimentation has beenutilized in combination with theoretical analysis��� In a new series of experimentswe found evolutionary schemes that converge much better� but with no knownbiological counterpart��These remarks are still valid� The designer of evolutionary algorithms should
be inspired by nature� but he should not intend a one�to�one copy� His majorgoal should be to develop powerful optimization methods� An optimization ispowerful if it is able to solve di�cult optimization problems� Furthermore thealgorithm should be based on a solid theory� We object popular arguments alongthe lines� �This is a good optimization method because it is used in nature�� andvice versa� �This cannot be a good optimization procedure because you do not nd it in nature��Modelling the evolution process and applying it to optimization problems
is a challenging task� We see at least two families of algorithms� one modelling
���� In� Wolfgang Banzhaf and Frank H Eeckman� Eds� Evolution as a Computational
Process� Lecture Notes in Computer Science� pages ���� �� Springer� Berlin� ���

natural and self�organized evolution� the other is based on rational selection asdone by human breeders� In principle arti cial selection of animals for breedingand arti cicial selection of virtual animals on a computer is the same prob�lem� Therefore the designer of an evolutionary algorithm can pro t from theknowledge accumulated by human breeders� But in the course of applying thealgorithm to di�cult tness landscapes� the human breeder may also pro t fromthe experience gained by applying the algorithm�Bremermann notes �� �One of the results was unexpected� The evolution
process may stagnate far from the optimum� even in the case of a smooth convex tness function���It can be traced to the bias that is introduced into the samplingof directions by essentially mutating one gene at a time� One may think thatmating would o�set this bias� however� in many experiments mating did little toimprove convergence of the process��Bremermann used the term mating for recombining two �or more� parent
strings into an o�spring� The stagnation problem will be solved in this paper�Bremermann�s algorithm contained most of the ingredients of a good evolution�ary algorithm� But because of limited computer experiments and a misssingtheory� he did not nd a good combination of the ingredients�In the ���s two di�erent evolutionary algorithms independently emerged �
the genetic algorithm of Holland �� and the evolution strategies of Rechen�berg �� and Schwefel ��� Holland was not so much interested in optimization�but in adaptation� He investigated the genetic algorithm with decision theoryfor discrete domains� Holland emphasized the importance of recombination inlarge populations� whereas Rechenberg and Schwefel mainly investigated nor�mally distributed mutations in very small populations for continuous parameteroptimization�Evolutionary algorithms are random search methods which can be applied to
both discrete and continuous functions� In this paper the theory of evolutionaryalgorithms will be based on the answers to the following questions�
� Given a population� how should the selection be done�� Given a mutation scheme� what is the expected progress of successful muta�tions�
� Given a selection and recombination schedule� what is the expected progressof the population�
� How can selection� mutation and recombination be combined in synergisticmanner�
This approach is opposite to the standard GA analysis initiated by Holland�which starts with the schema theorem ��� The theorem predicts the e�ect ofproportionate selection� Later mutation and recombination are introduced asdisruptions of the population� Our view is the opposite� We regard mutationand recombination as constructive search operators� They have to be evaluatedaccording to the probability that they create better solutions�The search strategies of mutation and recombination are di�erent� Mutation
is based on chance� It works most e�ciently in small populations� The progress

for a single mutation step is almost unpredictable� Recombination is a moreglobal search based on restricted chance� The bias is implicitly given by the pop�ulation� Recombination only shu�es the substrings contained in the population�The substrings of the optimum have to be present in the population� Otherwisea search by recombination is not able to locate the optimum�Central themes of plant and animal breeding as well as of genetic algorithms
can be phrased in statistical terms and can make substantial use of statisticaltechniques� In fact� problems of breeding have been the driving forces behind thedevelopment of statistics early in this century� The English school of biometryintroduced a variety of now standard statistical techniques� including those ofcorrelation and regression� We will use these techniques in order to answer theabove questions� A central role plays the response to selection equation developedin quantitative genetics�The outline of the paper is as follows� In section � some popular evolutionary
algorithms are surveyed� Truncation selection and proportionate selection areinvestigated in section �� In section � a fundamental theorem is proven whichconnects the response to selection equation with parent�o�spring regression� Re�combination�crossover and mutation are theoretically analyzed in sections � and�� In section � mutation vs� crossover is investigated by means of a competitionbetween these two strategies� Then numerical results are given for a test suiteof discrete functions�
� Evolutionary Algorithms
A previous survey of search strategies based on evolution has been done in ���Evolutionary algorithms for continuous parameter optimization are surveyed in��Algorithms which are driven mainly by mutation and selection have been
developed by Rechenberg �� and Schwefel �� for continuous parameter opti�mization� Their algorithms are called evolution strategies�
��� �� Evolution Strategy
STEP�� Create an initial population of size �STEP�� Compute the tness F �xi� i � �� � � � � �STEP�� Select the � � � best individualsSTEP�� Create ��� o�spring of each of the � individuals by small variationSTEP�� If not nished� return to STEP�
An evolution strategy is a random search which uses selection and variation�The small variation is done by randomly choosing a number of a normal dis�tribution with zero mean� This number is added to the value of the continuousvariable� The algorithm adapts the amount of variation by changing the varianceof the normal distribution� The most popular algorithm uses � � � � �In biological terms� evolution strategies model natural evolution by asexual
reproduction with mutation and selection� Search algorithms which model sexual

reproduction are called genetic algorithms� Sexual reproduction is characterizedby recombining two parent strings into an o�spring� The recombination is calledcrossover� Genetic algorithms were invented by Holland ��� Recent surveys canbe found in �� and the proceedings of the international conferences on geneticalgorithms �� � ���
Genetic Algorithm
STEP�� De ne a genetic representation of the problemSTEP�� Create an initial population P ��� � x��� � � � � x
�N
STEP�� Compute the average tness F �PN
i F �xi��N � Assign each individualthe normalized tness value F �xti��F
STEP�� Assign each xi a probability p�xi� t� proportional to its normalized tness� Using this distribution� select N vectors from P �t�� This givesthe set S�t�
STEP�� Pair all of the vectors in S�t� at random forming N�� pairs� Applycrossover with probability pcross to each pair and other genetic oper�ators such as mutation� forming a new population P �t� ��
STEP�� Set t � t� �� return to STEP�
In the simplest case the genetic representation is just a bitstring of length n�the chromosome� The positions of the strings are called loci of the chromosome�The variable at a locus is called gene� its value allele� The set of chromosomesis called the genotype which de nes a phenotype �the individual� with a certain tness�The genetic operatormutation changes with a given probability pm each bit of
the selected string� The crossover operator works with two strings� If two stringsx � �x�� � � � � xn� and y � �y�� � � � � yn� are given� then the uniform crossoveroperator �� combines the two strings as follows
z � �z�� � � � � zn� zi � xi or zi � yi
Normally xi or yi are chosen with equal probability�In genetic algorithms many di�erent crossover operators are used� Most pop�
ular are one�point and two�point crossover� One or two loci of the string arerandomly chosen� Between these loci the parent strings are exchanged� This ex�change models crossover of chromosomes found in nature� The disruptive uniformcrossover is not used in nature� It can be seen as n�point crossover�The crossover operator links two probabilistically chosen searches� The in�
formation contained in two strings is mixed to generate a new string� Instead ofcrossing�over I prefer to use the general term recombination for any method ofcombining two or more strings�A genetic algorithm is a parallel random search with centralized control�
The centralized part is the selection schedule� The selection needs the average tness of the population� The result is a highly synchronized algorithm� whichis di�cult to implement e�ciently on parallel computers� In the parallel geneticalgorithm PGA ������ a distributed selection scheme is used� This is achieved

as follows� Each individual does the selection by itself� It looks for a partner inits neighborhood only� The set of neighborhoods de nes a spatial populationstructure�The second major change can also easily be understood� Each individual
is active and not acted on� It may improve its tness during its lifetime byperforming a local search�The parallel genetic algorithm PGA can be described as follows� �
Parallel Genetic Algorithm
STEP�� De ne a genetic representation of the problemSTEP�� Create an initial population and its population structureSTEP�� Each individual does local hill�climbingSTEP�� Each individual selects a partner for mating in its neighborhoodSTEP�� An o�spring is created with genetic operators working on the geno�
types of its parentsSTEP�� The o�spring does local hill�climbing� It replaces the parent� if it is
better than some criterion �acceptance�STEP� If not nished� return to STEP��
It has to be noticed that each individualmay use a di�erent local hill�climbingmethod� This feature will be important for problems� where the e�ciency of aparticular hill�climbing method depends on the problem instance�In the PGA the information exchange within the whole population is a di�u�
sion process because the neighborhoods of the individuals overlap� All decisionsare made by the individuals themselves� Therefore the PGA is a totally dis�tributed algorithm without any central control� The PGA models the naturalevolution process which self�organizes itself�The next algorithm� the breeder genetic algorithm BGA �� is inspired by
the science of breeding animals� In this algorithm� each one of a set of virtualbreeders has the task to improve its own subpopulation� Occasionally the breederimports individuals from neighboring subpopulations� The DBGA models ratio�nal controlled evolution� We will describe the breeder genetic algorithm only�
Breeder Genetic Algorithm
STEP�� De ne a genetic representation of the problemSTEP�� Create an initial population P ���STEP�� Each individual may perform local hill�climbingSTEP�� The breeder selects T of the population for mating� This gives set
S�t�STEP�� Pair all the vectors in S�t� at random forming N pairs� Apply the
genetic operators crossover and mutation� forming a new populationP �t� ���
STEP�� Set t � t � �� return to STEP� if it is better than some criterion�acceptance�
STEP� If not nished� return to STEP��

The major di�erence between the genetic algorithm and the breeder geneticalgorithm is the method of selection� The breeders have developed many dif�ferent selection strategies� We only want to mention truncation selection whichbreeders usually apply for large populations� In truncation selection the T bestindividuals of a population are selected as parents�The di�erent evolutionary algorithms described above put di�erent emphasis
on the three most important evolutionary forces� namely selection� mutation andrecombination� We will in the next sections analyze these evolutionary forces bymethods developed in quantitative genetics� One of the most important aspectof algorithms inspired by processes found in nature is the fact that they can beinvestigated by the methods proven usefully in the natural sciences�
� Natural vs� Arti�cial Selection
The theoretical analysis of evolution centered in the last �� years on under�standing evolution in a natural environment� It tried to model natural selection�The term natural selection was informally introduced by Darwin in his famousbook �On the origins of species by means of natural selection�� He wrote� �Thepreservation of favourable variations and the rejection of injurious variations� Icall Natural Selection�� Modelling natural selection mathematically is di�cult�Normally biologist introduce another term� the tness of an individual whichis de ned as the number of o�spring of that individual� This tness de nitioncannot be used for prediction� It can only be measured after the individual isnot able to reproduce any more� Arti�cial selection as used by breeders is seldominvestigated in textbooks on evolution� It is described in more practical booksaimed for the breeders� We believe that this is a mistake� Arti cial selection isa controlled experiment� like an experiment in physics� It can be used to iso�late and understand speci c aspects of evolution� Individuals are selected by thebreeder according to some trait� In arti cial selection predicting the outcome ofa breeding programme plays a major role�Darwin recognized the importance of arti cial selection� He devoted the whole
rst chapter of his book to arti cial selection by breeders� In fact� arti cialselection independently done by a number of breeders served as a model fornatural selection� Darwin wrote� �I have called this principle by the term NaturalSelection in order to mark its relation to man�s power of selection��In this section we will rst analyze arti cial selection by methods found
in quantitative genetics ��� � and �� A mathematically oriented book onquantitative genetics and natural selection is !� We will show at the end ofthis section that natural selection can be investigated by the same methods� Adetailed investigation can be found in ���
�� Arti�cial Selection
The change produced by selection that mainly interests the breeder is the re�sponse to selection� which is symbolized by R� R is de ned as the di�erence be�

tween the population mean tness M �t��� of generation t�� and the populationmean of generation t� R�t� estimates the expected progress of the population�
R�t� �M �t� ���M �t� ���
Breeders measure the selection with the selection di�erential� which is symbol�ized by S� It is de ned as the di�erence between the average tness of the selectedparents and the average tness of the population�
S�t� �Ms�t� �M �t� ���
These two de nitions are very important� They quantify the most importantvariables� The breeder tries to predict R�t� from S�t�� Breeders often use trun�cation selection or mass selection� In truncation selection with threshold Trunc�the Trunc best individuals will be selected as parents� Trunc is normallychosen in the range �� to �� �The prediction of the response to selection starts with
R�t� � bt � S�t� ���
bt is called the realized heritability� The breeder either measures bt in previousgenerations or estimates bt by di�erent methods ��� It is normally assumedthat bt is constant for a certain number of generations� This leads to
R�t� � b � S�t� ���
There is no genetics involved in this equation� It is simply an extrapolation fromdirect observation� The prediction of just one generation is only half the story�The breeder �and the GA user� would like to predict the cumulative responseRn for n generations of his breeding scheme�
Rn �nX
t��
R�t� ���
In order to compute Rn a second equation is needed� In quantitative genetics�several approximate equations for S�t� are proposed �� ��� Unfortunately theseequations are only valid for diploid organisms� Diploid organisms have two setsof chromosomes� Most genetic algorithms use one set of chromosomes� i�e� dealwith haploid organisms� Therefore� we can only apply the research methods ofquantitative genetics� not the results�If the tness values are normal distributed� the selection di�erential S�t� in
truncation selection is approximately given by
S � I � �p ���
where �p is the standard deviation� I is called the selection intensity� The for�mula is a feature of the normal distribution� A derivation can be found in �� Intable � the relation between the truncation threshold Trunc and the selectionintensity I is shown� A decrease from �� to � leads to an increase of the

Trunc �� � �� � �� � �� � � � �
I ��� �� ��� � �� ���
Table �� Selection intensity
selection intensity from ��� to �����
If we insert ��� into ��� we obtain the well�known response to selection equation���
R�t� � b � I � �p�t� ���
The science of arti cial selection consists of estimating b and �p�t�� The estimatesdepend on the tness function� We will use as an introductory example the binaryONEMAX function of size n� Here the tness is given by the number of ��s inthe binary string�We will rst estimate b� A popular method for estimation is to make a re�
gression of the midparent tness value to the o�spring� The midparent tnessvalue is de ned as the average of the tness of the two parents� We assume uni�form crossover for recombination� For the simple ONEMAX function a simplecalculation shows that the probability of the o�spring being better than the mid�parent is equal to the probability of them being worse� Therefore the average tness of the o�spring will be the same as the average of the midparents� Butthis means that the average of the o�spring is the same as the average of theselected parents� This gives b � � for ONEMAX�Estimating �p�t� is more di�cult� We make the assumption that uniform
crossover is a random process which creates a binomial tness distribution withprobability p�t�� p�t� is the probability that there is a � at a locus� Therefore thestandard deviation is given by
�p�t� �pn � p�t� � ��� p�t�� ���
Theorem� If the population is large enough that it converges to the optimumand if the selection intensity I is greater than �� then the reponse to selection isgiven for the ONEMAX function by
R�t� �Ipn�pp�t���� p�t�� �!�
The number of generations needed until equilibrium is approximate
GENe ����� arcsin��p� � ��
��pn
I����
p� � p��� denotes the probability of the advantageous bit in the initial popu�lation�

Proof� Noting that R�t� � n�p�t � ��� p�t�� we obtain the di�erence equation
p�t� �� � p�t� �Ipn�pp�t� � ��� p�t�� ����
The di�erence equation can be approximated by a di�erential equation
dp�t�
dt�
Ipn�pp�t� � ��� p�t�� ����
The initial condition is p��� � p�� The solution of the di�erential equation isgiven by
p�t� � ���
�� � sin
�Ipnt� arcsin��p� � ��
������
The convergence of the total population is characterized by p�GENe� � ��GENe
can be easily computed from the above equation� One obtains
GENe ����� arcsin��p� � ��
��pn
I����
The number of generations needed until convergence is proportional topn
and inversely proportional to the selection intensity� Note that the equations areonly valid if the size of the population is large enough so that the populationconverges to the optimum�The most e�cient breeder genetic algorithm runs withthe minimal popsize N�� so that the population still converges to the optimum�N� depends on the size of the problem n� the selection intensity I and theprobability of the advantageous bit p�� This problem will be discussed in section��Remark� The above theorem assumes that the variance of the tness is binomialdistributed� Simulations show that the phenotypic variance is slightly less thangiven by the binomial distribution� The empirical data is better tted if thebinomial variance is reduced by a a factor ������ Using this variance one obtainsthe equations
"R�t� ��
���� Ip
n�pp�t��� � p�t�� ����
"GEN e ����
�
���� arcsin��p� � ��
��pn
I����
Equation �� is a good prediction for the mean tness of the population� Thisis demonstrated in gure �� The mean tness versus the number of generations isshown for three popsizes N � ����� ���� ���The selection intensity is I � ���� thesize of the problem n � ��� The initial population was generated with p� � �����The t of equation �� and the simulation run with N � ���� is very good� ForN � ��� and N � �� the population does not converge to the optimum� Thesepopsizes are less than the critical popsize N��I� n� p���A more detailed evaluation of equation �� can be found in ���

0 10 20 30 40Gen
10
20
30
40
50
60
MeanFit
TheorySimulation (N=1024)Simulation (N= 256)Simulation (N= 64)
Fig� �� Mean �tness for theory and simulations for various N
�� Natural Selection
Natural selection is modelled by proportionate selection in quantitative genetics�Proportionate selection is de ned as follows� Let � � gi�t� � � be the proportionof genotype i in a population of size N at generation t� Fi its tness� Then thephenotype distribution of the selected parents is given by
gi�S�t� �gi�t�Fi
M �t�����
where M �t� is the average tness of the population
M �t� �NXi��
gi�t�Fi ����
Note that proportionate selection is also used by the simple genetic algorithm���
Theorem� In proportionate selection the selection di�erential is given by
S�t� ���p�t�
M �t���!�
For the ONEMAX function of size n the response to selection is given by
R�t� � �� p�t� ����
If the population is large enough� the number of generations until p�t� � ��is given for large n by
GEN��� � n � ln�� p�
����
p� is the probability of the advantageous allele in the initial population�

Proof�
S�t� �NXi��
pi�SFi �M �t�
�NXi��
pi�t�F�i � pi�t�M
��t�
M �t�
��
M �t��
nXi��
pi�t��Fi �M �t���
For ONEMAX�n� we have R�t � �� � S�t�� Furthermore we approximate
��p�t� � np�t���� p�t�� ����
Because M �t� � np�t�� equation �� is obtained� From R�t� � n�p�t � ��� p�t��we get the di�erence equation
p�t � �� ��
n� ��� �
n�p�t� ����
This equation has the solution
p�t� ��
n�� � ��� �
n� � � � �� ��� �
n�t��� � ��� �
n�tp�
This equation can be simpli ed to
p�t� � �� ��� �n�t��� p��
By setting p�GEN���� � �� equation �� is easily obtained�
Remark� If we assume R�t� � S�t� we obtain from equation �! a version ofFisher�s fundamental theorem of natural selection �� !�
By comparing truncation selection and proportionate selection one observesthat proportionate selection gets weaker when the population approaches theoptimum� An in nite population will need an in nite number of generationsfor convergence� In contrast� with truncation selection the population will con�verge in at most O�
pn� generations independent of the size of the population�
Therefore truncation selection as used by breeders is much more e�ective thanproportionate selection for optimization�The major results of these investigations can be summarized as follows� A
genetic algorithm using recombination�crossover only is most e�cient if run withthe minimal population size N� so that the population converges to the optimum�Proportionate selection as used by the simple genetic algorithm is ine�cient�

� Statistics and Genetics
Central themes of plant and animal breeding as well as of genetic algorithmscan be phrased in statistical terms and can make substantial use of statisticaltechniques� In fact� problems of breeding have been the driving forces behind thedevelopment of statistics early in this century� The English school of biometryintroduced a variety of now standard statistical techniques� including those ofcorrelation and regression� In this section we will only prove the fundamentaltheorem� which connects the rather arti cial factor b�t� with the well knownregression coe�cient of parent�o�spring�
Theorem� Let X�t� � �x��t�� � � �xN �t�� be the population at generation t�where xi denotes the phenotypic value of individual i� Assume that an o�springgeneration X��t � �� is created by random mating� without selection� If the re�gression equation
x�ij�t � �� � a�t� � bX�X�t� �xi�t� � xj�t�
�� ij ����
with
E�ij� � �
is valid� where x�ij is the o�spring of xi and xj � then
bX�X �t� � b�t� ����
Proof� From the regression equation we obtain for the averages
E�x��t � ��� � a�t� � bX�X �t�M �t�
Because the o�spring generation is created by random mating without selec�tion� the expected average tness remains constant
E�x��t� ��� �M �t�
Let us now select a subsetXS �t� � X�t� as parents� The parents are randomlymated� producing the o�spring generation X�t� ��� If the subset XS �t� is largeenough� we may use the regression equation and get for the averages
E�x�t� ��� � a�t� � bX�X �t� � �Ms�t��M �t��
Subtracting the above equations we obtain
M �t� �� �M �t� � bX�X �t�S�t�

For the proof we have used some additional statistical assumptions� It isoutside the scope of this paper to discuss these assumptions in detail�The problem of computing a good regression coe�cient is solved by the
theorem of Gauss�Markov� The proof can be found in any textbook on statistics�
Theorem� A good estimate for the regression coe�cient is given by
bX�X �t� � � �cov�x��t�� x�t��
var�x�t������
These two theorems allow the estimation of the factor b�t� without doing aselection experiment� In quantitative genetics b�t� is called the heritability of thetrait to be optimized� We have shown in �� how to apply these theorems to thebreeder genetic algorithm�
� Analysis of recombination and selection
In this section we will make a detailed analysis of selection and crossover bysimulations� First we will explain the performance of the crossover operator in nite populations by a diagram� We will use ONEMAX as tness function� In gure � the number of generations GENe until equilibrium and the size of thepopulation are displayed� At equilibrium the whole population consists of onegenotype only� The initial population was randomly generated with probabilityp� � ��� of the advantageous allele� The data are averages over ��� runs�
16 32 64 96 128 256N
p=0.2
25
50
75
100
125
150
175
200
GEN
I=0.12I=0.2I=0.4I=0.8I=1.6
Fig� �� GENe vs population size N for p� � ��� and p� � ���
The gure can be divided into three areas� The rst area we name saturationregion� The population size is large enough so that the population converges to

the optimum value� In this area GENe is constant� This is an important result�because it is commonly believed in population genetics that GENe increaseswith the population size �!� This is only the case in the second region� Here thepopulation size is too small� The population does not converge to the optimum�GENe increases with the population size because the quality of the nal solutiongets better�
The two regions are separated by the critical population size N�� It is theminimal population size so that the population converges to the optimum� N�
depends on the selection intensity I� the size of the problem and the initial pop�ulation� The relation between N� and I is esspecially di�cult� N� increases forsmall selection intensities I and for large ones� The increase for large I can beeasily understood� If only one individual is selected as parent� then the popula�tion converges in one generation� In this case the genotype of the optimum hasto be contained in the initial population� So the population size has to be verylarge�
The increase of N� with small selection intensity is more di�cult to un�derstand� It is related to the genetic drift� It has been known for quite a timethat the population converges also without any kind of selection just becauseof random sampling in a nite population� In � it has been shown that GENe
increases proportional to the size of the population N and to the logarithm ofthe size of the problem n� Thus GENe is surprisingly small�
This important result demonstrates that chance alone is su�cient to drivea �nite population to an equilibrium� The formula has been proven for one genein !� It lead to the development of the neutral theory of evolution �!� Thistheory states that many aspects of natural evolution can be explained by neutralmutations which got xed because of the nite population size� Selection seemsto be not as important as previously thought for explaining natural evolution�
We are now able to understand why N� has to increase for small selectionintensities� The population will converge in a number of generations proportionalto the size of the population� Therefore the size of the population has to be largeenough that the best genotype is randomly generated during this time�
From GENe the number of trials till convergence can be easily computed by
FEe � N �GENe
In order to minimize FEe� the BGA should be run with the minimal popsizeN��I� n� p��� The problem of predicting N
� is very di�cult because the transitionfrom region � to the saturation region is very slow� In this paper we will onlymake a qualitative comparison of mutation and crossover� Therefore a closedexpression for N� is not needed� In �� some formulas for N� are derived�
The major results of this section can be summarized as follows� A genticalgorithms with recombination�crossover is only e�ective in large populations� Itruns most e�ciently with the critical population size N��I� n� p��� The responseto selection can be accurately predicted for the saturation region�
� Analysis of Mutation
The mutation operator in small populations is well understood� The analysis ofmutation in large populations is more di�cult� In principle it is just a problemof statistics � doing N trials in parallel instead of a sequence� But the selectionconverts the problem to a nonstandard statistical problem� We will solve thisproblem by an extension of the response to selection equation�In �� we have computed the probability of a successful mutation for a single
individual� From this analysis the optimal mutation rate has been obtained� Theoptimal mutation rate maximizes the probability of a success� We just state themost important results�
Theorem� For the ONEMAX function of size n the optimal mutation rate mis proportional to the size of the problem�
m ��
n
This important result has been independently discovered several times� Theimplications of this result to biology and to evolutionary algorithms have been rst investigated by Bremermann ��The performance of crossover was measured by GENe� the number of gener�
ations until equilibrium� This measure cannot be used for mutation because thepopulation will never converge to a unique genotype� Therefore we will use asperformance measure for mutation GENopt� It is de ned as the average numberof generations till the optimumhas been found for the rst time� For a populationwith two individuals �one parent and one o�spring� GENopt has been computedby a Markov chain analysis ��� In this case GENopt is equal to FEopt� thenumber of trials to reach the optimum�
Theorem Let p� be the probability of the advantageous allelle in the initialstring� Then the �� evolutionary algorithm needs on the average the followingnumber of trials FEopt
FEopt � e � n���p��nXj��
�
j����
to reach the optimum� The mutation rate is set to m � ��n�
Proof� We only sketch the proof� Let the given string have one incorrect bit left�Then the probability of switching this bit is given by
s� � m � ���m�n�� � e�� �m ����
The number of trials to obtain the optimum is given by e � ��m� Similarly iftwo bits are incorrect� then the number of trials needed to get one bit correct isgiven by e�� � ��m� The total number is obtained by summation�

For � � p� � ��! the above equation can be approximated by
FEopt � e � n � ln ���� p��n� ��!�
We have con rmed the formula by intensive simulations ��� Recently B�ack� has shown that FEopt can be only marginally reduced if a theoretically opti�mal variable mutation rate is used� This mutation rate depends on the numberof bits which are still wrong� This result has been predicted in ��� Mutationspends most of the time in adjusting the very last bits� But in this region theoptimal mutation rate is m � ��n�Next we will extend the analysis to large populations� First we will use simu�
lation results� In gure � the relation between GENopt� FEopt� and the popsizeN is displayed for two selection methods� The selection thresholds are T � �� and the smallest one possible� T � ��N � In the latter case only the best individ�ual is selected as parent� In large populations the strong selection outperformsthe xed selection scheme by far� These results can easily be explained� The mu�tation operator will change one bit on the average� The probability of a successgets less the nearer the population comes to the optimum� Therefore the beststrategy is to take just the best individual as parent of the next generation�
8 16 32 64 128N
50
100
150
200
250
300
Gen
T=0.5T=1/N
8 16 32 64 128N
2000
4000
6000
8000
10000
FE
T=0.5T=1/N
Fig� �� GENopt and function evaluations �FE� for various N and di�erent T
From GENopt the expected number of trials needed to nd the optimum canbe computed
FEopt � N �GENopt
For both selection methods� FEopt increases linearly with N for large N �The increase is much smaller for the strong selection� The smallest number offunction evaluations are obtained for N � �� �� ��We now turn to the theoretical analysis� It depends on an extension of the
response to selection equation�
Theorem� Let ut be the probability of a mutation success� imp the averageimprovement of a successful mutation� Let vt be the probability that the o�spring
is worse than the parent� red the average reduction of the �tness� Then theresponse to selection for small mutations in large populations is given by
R�t� � S�t� � ut � imp� vt � red ����
S�t� is the average �tness of the selected parents�
Proof� Let Ms�t� be the average of the selected parents� Then
M �t � �� � ut�Ms�t� � imp� � vt�Ms�t� � red� � ��� ut � vt�Ms�t�
Subtracting M �t� from both sides of the equation we obtain the theorem�
The response to selection equation for mutation contains no heritability� In�stead there is an o�set� de ned by the di�erence of the probabilities of gettingbetter or worse� The importance of ut and vt has been independently discoveredby Scha�er et al� ��� They did not use the di�erence of the probabilities� butthe quotient which they called the safety factor�
F �utvt
In order to apply the theorem we have to estimate S�t�� ut and vt� Thelast two variables can be estimated by using the results of ��� The estimationnneeds the average number i of wrong bits of the parent strings as input� But i canbe easily transformed into a variable depending on the state of the populationat generation t� This variable is the marginal probability p�t� that there is theadvantageous allele at a locus� p�t� was already used in the previous theorems�i and p�t� are connected by
i � n � ��� p�t�� � n�M �t� ����
We have been not able to estimate S�t� analytically� For the next result wehave used simulations� Therefore we call it an empirical law�
Empirical Law � For the ONEMAX function� a truncation threshold of T ��� � a mutation rate of m � ��n� and n� � the response to selection of a largepopulation changing by mutation is approximate
R�t� � � � ��� p�t��e�p�t� � p�t�e����p�t�� ����
Proof� Let the parents have i bits wrong� let si be the probability of a success bymutation� fi be the probability of a defect mutation� si is approximately givenby the product of changing at least one of the wrong bits and not changing thecorrect bit ��� Therfore
si � ���m�n�i��� �� �m�i�
Similarlyfi � ���m�i��� �� �m�n�i�
From equation �� and �� ���m�i � i �m we obtain
st � ��� p�t����� �n�np�t�
ft � p�t��� � �n�n���p�t��
Because �� � �n�n � e�� we get
st � ��� p�t�� e�p�t�
ft � p�t�e����p�t��
We are left with the problem to estimate imp and red� In a rst approxima�tion we set both to � because a mutation rate of m � ��n changes one bit on theaverage� We have not been able to estimate S�t� analytically� Simulations showthat for T � �� S�t� decreases from about ���� at the beginning to about ��!at GENopt� Therefore S�t� � � is a resonable approximation� This completesthe proof�
Equation �� de nes a di�erence equation for p�t � ��� We did not succeedto solve it analytically� We have found that the following linear approximationgives almost the same results
Empirical Law � Under the asssumptions of empirical law the response toselection can be approximated by
R�t� � �� �p�t� ����
The number of generations until p�t� � �� is reached is given by
GEN��� �n
�� ln�� p�
����
Proof� The proof is identical to the proof of theorem ��
In gure � the development of the mean tness is shown� The simulationshave been done with two popsizes �N � ����� ��� and two mutation rates�m � ��n� ��n�� The agreement between the theory and the simulation is verygood� The evolution of the mean tness of the large population and the smallpopulation is almost equal� This demonstrates that for mutation a large popu�lation is ine�cient�A large mutation rate has an interesting e�ect� The mean tness increases
faster at the beginning� but it never nds the optimum� This observation againsuggests to use a variable mutation rate� But we have already mentioned thatthe increase in performance by using a variable mutation rate will be rathersmall� Mutation spends most of its time in getting the last bits correct� But inthis region a mutation rate of m � ��n is optimal�The major results of this section can be summarized as follows�Mutation in
large populations is not e�ective� It is more e�cient with very strong selection�The response to selection becomes very small when the population is approachingthe optimum� The e�ciency of the mutation operator critically depends on themutation rate�

0 20 40 60 80 100Gen
10
20
30
40
50
60
MeanFit
TheorySimulation (N=1024, M=1/n)Simulation (N=1024, M=4/n)Simulation (N= 64, M=1/n)Simulation (N= 64, M=4/n)
Fig� �� Mean �tness for theory and simulations for various N and mutation probabili�ties
Competition between Mutation and Crossover
The previous sections have qualitatively shown that the crossover operator andthe mutation operator are performing good in di�erent regions of the parameterspace of the BGA� In gure � crossover and mutation are compared quantita�tively for a popsize of N � ����� The initial population was generated withp� � ����� The mean tness of the population with mutation is larger than thatof the population with crossover until generation ��� Afterwards the populationwith crossover performs better� This was predicted by the analysis�
0 20 40 60 80 100Gen
10
20
30
40
50
60
MeanFit
CrossoverMutation
Fig� �� Comparison of mutation and crossover
The question now arises how to best combine mutation and crossover� Thiscan be done by two di�erent methods at least� First one can try to use bothoperators in a single genetic algorithm with their optimal parameter settings�This means that a good mutation rate and a good population size has to bepredicted� This method is used for the standard breeder genetic algorithmBGA�Results for popular test functions will be given later�
Another method is to apply a competition between subpopulations usingdi�erent strategies� Such a competition is in the spirit of population dynamics�It is the foundation of the Distributed Breeder Genetic Algorithm�
Competition of strategies can be done on di�erent levels� for example thelevel of the individuals� the level of subpopulations or the level of populations�B�ack et al� � have implemented the adaptation of strategy parameters on theindividual level� The strategy parameters of the best individuals are recombined�giving the new stepsize for the mutation� Herdy �� uses an competition on thepopulation level� In this case whole populations are evaluated at certain intervals�The strategies of the succesful populations proliferate� strategies in populationswith bad performance die out� Our adaptation lies between these two extremecases� The competition is done between subpopulations�
Competition requires a quality criterion to rate a group� a gain criterion toreward or punish the groups� an evaluation interval� and a migration interval�The evaluation interval gives each strategy the chance to demonstrate its perfor�mance in a certain time window� By occasional migration of the best individualsgroups which performed badly are given a better chance for the next competi�tion� The sizes of the subgoups have a lower limit� Therefore no strategy is lost�The rationale behind this algorithm will be published separately�
In the experiments the mean tness of the species was used as quality cri�terion� The isolation interval was four generations� the migration interval eightgenerations� The gain was four individuals� In the case of two groups the popu�lation size of the better group increases by four� the population size of the worsegroup decreases by four� If there are more than two groups competing� then aproportional rating is used�
Figure � shows a competition race between two groups� one using mutationonly� the other crossing�over� The initial population was randomly generated withp� � ����� The initial population is far away from the optimum� Therefore rstthe population using mutation only grows� then the crossover population takesover� The rst gure shows the mean tness of the two groups� The migrationstrategy ensures that the mean tness of both populations are almost equal�
In gure � competition is done between three groups using di�erent mutationrates� At the beginning the group with the highest mutation rate grows� thenboth the middle and the lowest mutation rate grow� At the end the lowestmutation rate takes over� These experiments con rm the results of the previoussections�
In the next section we will compare the e�ciency of a BGA using mutation�crossover and an optimal combination of both�

25 50 75 100 125 150 175 2000
10
20
30
40
50
60
1MAX, n=64
Gen
MeanFit
MutationCrossover
25 50 75 100 125 150 175 2000
10
20
30
40
50
60
1MAX, n=64
Gen
N
MutationCrossover
Fig� �� Competition between mutation and crossover
25 50 75 100 125 150 175 2000
10
20
30
40
50
60
1MAX, n=64
Gen
MeanFit
p= 1/np= 4/np=16/n
25 50 75 100 125 150 175 2000
10
20
30
40
1MAX, n=64
Gen
N
p= 1/np= 4/np=16/n
Fig� � Competition between di�erent mutation rates
The Test Functions
The outcome of a comparison of mutation and crossover depends on the tnesslandscape� Therefore a carefully chosen set of test functions is necessary� We willuse test functions which we have theoretically analyzed in ��� They are similarto the test functions used by Scha�er ��� The test suite consists of
ONEMAX�n�MULTIMAX�n�PLATEAU�k�l�SYMBASIN�k�l�DECEPTION�k�l�
The tness of ONEMAX is given by the number of ��s in the string�MULTIMAX�n�is similar to ONEMAX� but its global optima have exactly n�� ��s containedin the string� It is de ned as follows
MULTIMAX�n�X� �
�Pn
i�� xiPn
i�� xi � n��n�Pn
i�� xiPn
i�� xi � n��

We have included theMULTIMAX�n� function in the test suite to show thedependence of the performance of the crossover operator on the tness function�MULTIMAX�n� poses no di�culty for mutation� Mutation will nd one ofthe many global optima in O�n� time� But crossover has di�culties when twodi�erent optimal strings are recombined� This will lead with high probability toa worse o�spring� An example is shown below for n � �
����O
����
With probability P � ����� will crossover create an o�spring worse thanthe midparent� The average tness of an o�spring is ���� Therefore the pop�ulation will need many generations in order to converge� More precisely� Thenumber of generations between the time when an optimum is rst found andthe convergence of the whole population is very high�MULTIMAX is equal toONEMAX away from the global optima� In this region the heritability is one�When the population approaches the optima� the heritability drops sharply tozero� The response to selection is almost ��For the PLATEAU function k bits have to be #ipped in order that the tness
increases by k� The DECEPTION function has been de ned by Goldberg ���The tness of DECEPTION�k�l� is given by the sum of l deceptive functions ofsize k� A deceptive function and a smoothed version of order k � � is de ned inthe following table
bit DECEP SYMBA bit DECEP SYMBA��� �� �� ��� �� ����� � �� ��� �� ����� � �� ��� �� ����� � �� ��� �� ��
A DECEPTION function has �l local maxima� Neighboring maxima are kbits apart� Their tness value di�ers by two� The basin of attraction of the globaloptimum is of size kl� the basin of attraction of the smallest optimum is of size��k � ��l� The DECEPTION function is called deceptive because the search ismislead to the wrong maximum ��� �� � � � � ��� The global optimum is particularlyisolated�The SYMBASIN�k�l� function is like a deceptive function� but the basins of
attraction of the two peaks are equal� In the simulations we used the values givenin the above table for SYMBA�
� Numerical Results
All simulations have been done with the breeder genetic algorithm BGA� Inorder to keep the number of simulations small� several parameters were xed�The mutation rate was set to m � ��n where n denotes the size of the problem�The parents were selected with a truncation threshold of T � �� � SometimesT � �� was used�
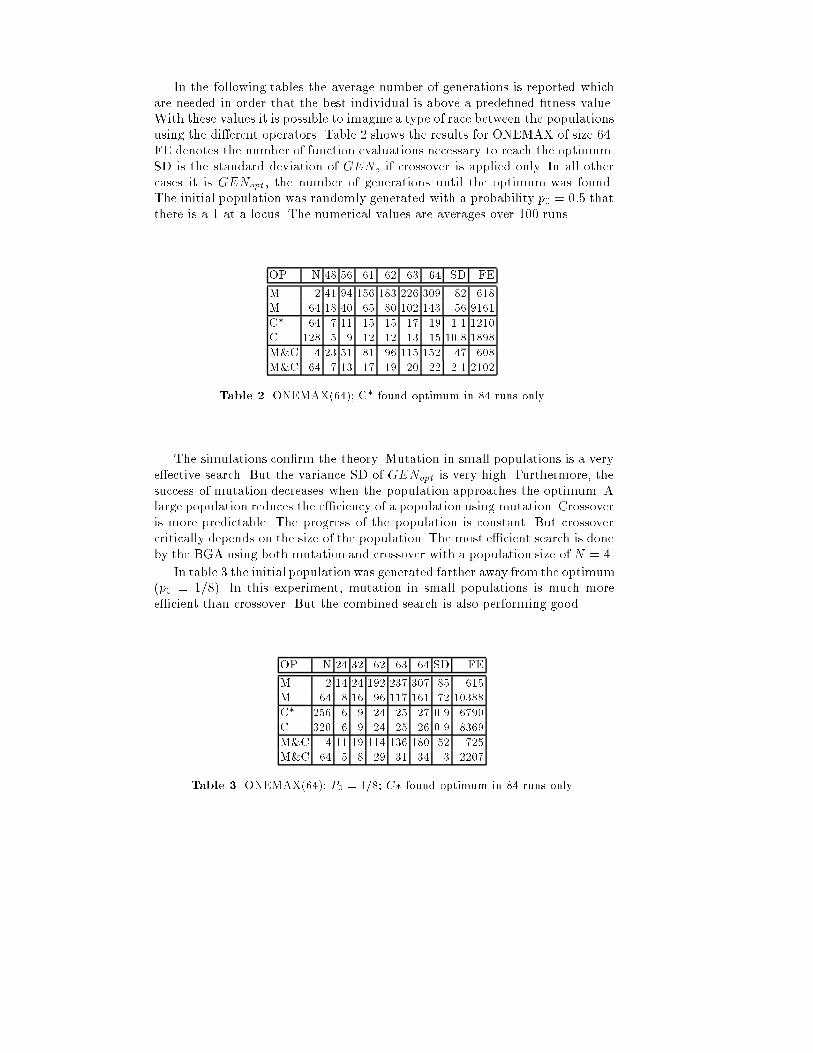
In the following tables the average number of generations is reported whichare needed in order that the best individual is above a prede ned tness value�With these values it is possible to imagine a type of race between the populationsusing the di�erent operators� Table � shows the results for ONEMAX of size ���FE denotes the number of function evaluations necessary to reach the optimum�SD is the standard deviation of GENe if crossover is applied only� In all othercases it is GENopt� the number of generations until the optimum was found�The initial population was randomly generated with a probability p� � ��� thatthere is a � at a locus� The numerical values are averages over ��� runs�
OP N �� �� � �� �� �� SD FE
M � � �� �� �� ��� ��� �� � �M �� � �� �� �� �� �� �� � � C� �� � � � � � � �C �� � � � � � � �� ���M�C � �� � � �� � �� �� ���M�C �� � � � � �� �� � � ��
Table �� ONEMAX����� C� found optimum in �� runs only
The simulations con rm the theory� Mutation in small populations is a verye�ective search� But the variance SD of GENopt is very high� Furthermore� thesuccess of mutation decreases when the population approaches the optimum� Alarge population reduces the e�ciency of a population using mutation� Crossoveris more predictable� The progress of the population is constant� But crossovercritically depends on the size of the population� The most e�cient search is doneby the BGA using both mutation and crossover with a population size of N � ��
In table � the initial population was generated farther away from the optimum�p� � ����� In this experiment� mutation in small populations is much moree�cient than crossover� But the combined search is also performing good�
OP N �� �� �� �� �� SD FE
M � � �� �� ��� ��� �� � �M �� � � �� � � �� ����C� ��� � � �� �� �� �� ����C ��� � � �� �� �� �� ����M�C � � � �� �� �� ���M�C �� � � �� � �� � ����
Table �� ONEMAX����� P� � ��� C� found optimum in �� runs only
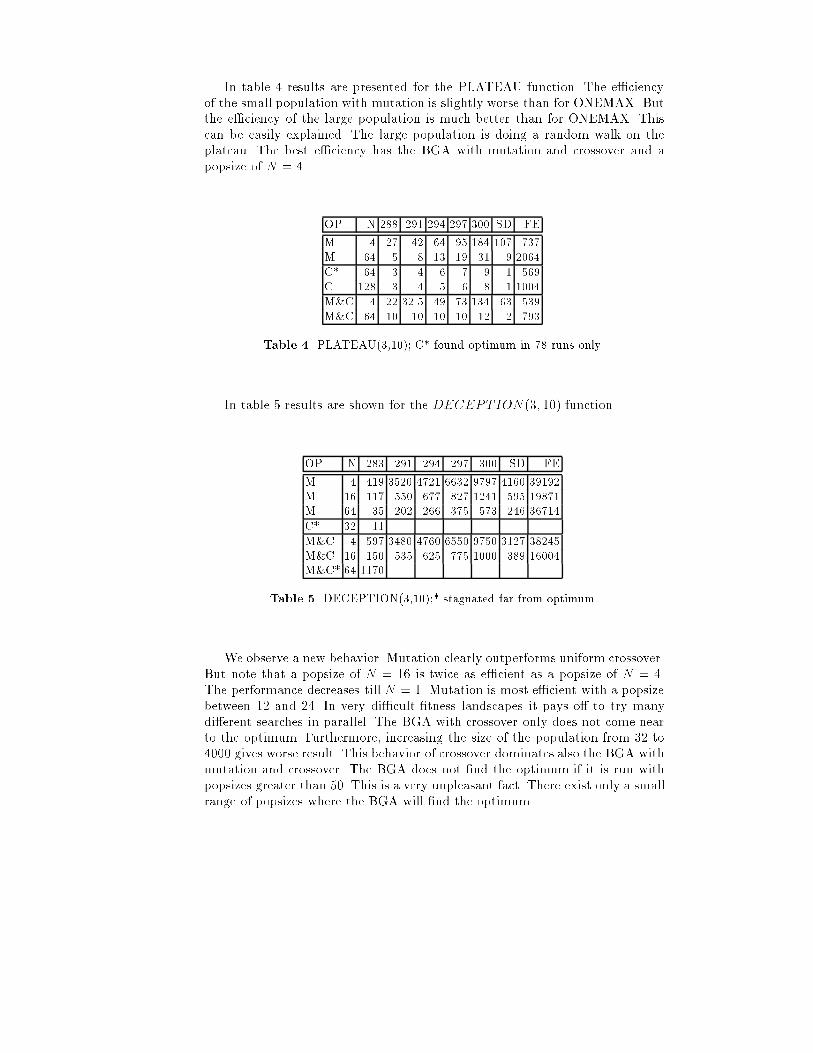
In table � results are presented for the PLATEAU function� The e�ciencyof the small population with mutation is slightly worse than for ONEMAX� Butthe e�ciency of the large population is much better than for ONEMAX� Thiscan be easily explained� The large population is doing a random walk on theplateau� The best e�ciency has the BGA with mutation and crossover and apopsize of N � ��
OP N ��� �� ��� ��� ��� SD FE
M � �� �� �� �� �� �� ���M �� � � � � � � ����C� �� � � � � � ���C �� � � � � � ���M�C � �� ��� �� �� �� �� ���M�C �� � � � � � � ���
Table �� PLATEAU��� ��� C� found optimum in �� runs only
In table � results are shown for the DECEPTION ��� ��� function�
OP N ��� �� ��� ��� ��� SD FE
M � � � ���� ��� ���� ���� � �� �� ��M � � ��� ��� ��� �� ��� ��� M �� �� ��� ��� ��� ��� ��� ��� �
C� �� M�C � ��� ���� ���� ���� ���� � �� �����M�C � �� ��� ��� ��� ��� ��� ����M�C� �� ��
Table �� DECEPTION��� ���� stagnated far from optimum
We observe a new behavior� Mutation clearly outperforms uniform crossover�But note that a popsize of N � �� is twice as e�cient as a popsize of N � ��The performance decreases till N � �� Mutation is most e�cient with a popsizebetween �� and ��� In very di�cult tness landscapes it pays o� to try manydi�erent searches in parallel� The BGA with crossover only does not come nearto the optimum� Furthermore� increasing the size of the population from �� to���� gives worse result� This behavior of crossover dominates also the BGA withmutation and crossover� The BGA does not nd the optimum if it is run withpopsizes greater than ��� This is a very unpleasant fact� There exist only a smallrange of popsizes where the BGA will nd the optimum�
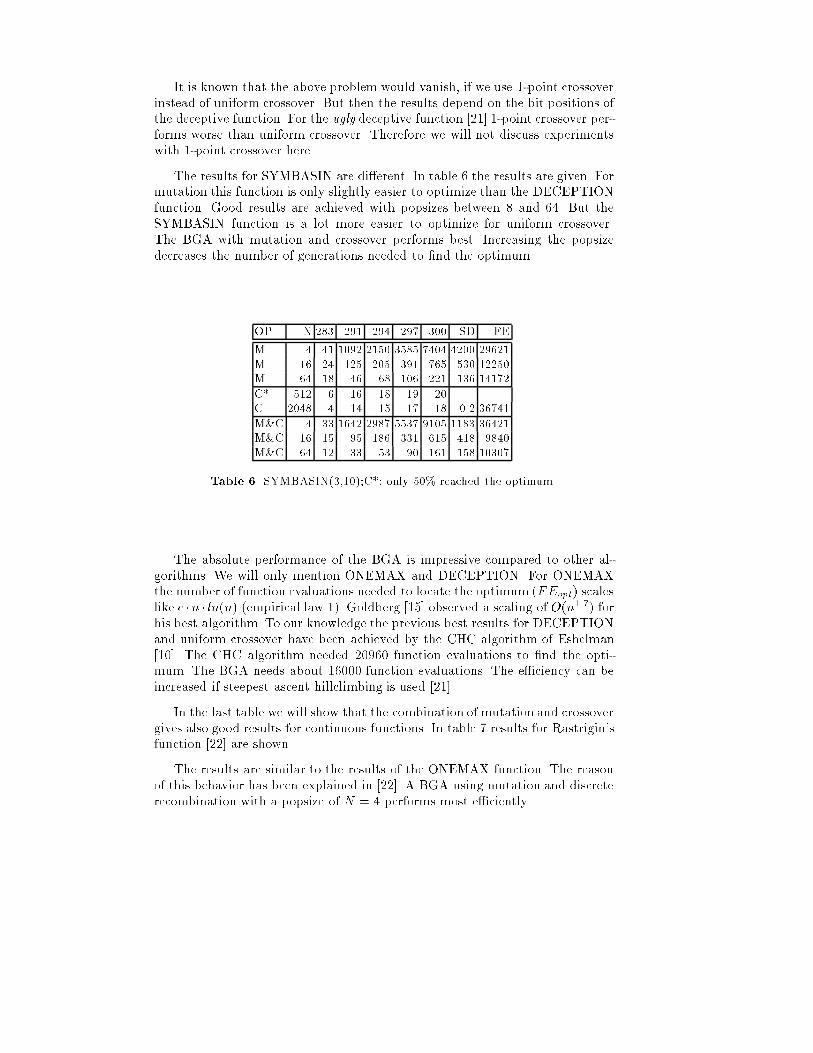
It is known that the above problem would vanish� if we use ��point crossoverinstead of uniform crossover� But then the results depend on the bit positions ofthe deceptive function� For the ugly deceptive function �� ��point crossover per�forms worse than uniform crossover� Therefore we will not discuss experimentswith ��point crossover here�
The results for SYMBASIN are di�erent� In table � the results are given� Formutation this function is only slightly easier to optimize than the DECEPTIONfunction� Good results are achieved with popsizes between � and ��� But theSYMBASIN function is a lot more easier to optimize for uniform crossover�The BGA with mutation and crossover performs best� Increasing the popsizedecreases the number of generations needed to nd the optimum�
OP N ��� �� ��� ��� ��� SD FE
M � � ��� � �� ���� ���� ���� ���� M � �� �� ��� �� ��� ��� ����M �� � �� �� �� �� �� � ��
C� � � � � � � ��C ���� � � � � � �� ����
M�C � �� ��� ���� ���� � �� �� ���� M�C � � �� �� �� � � � � ����M�C �� � �� �� �� � �� ����
Table �� SYMBASIN��� ���C�� only ��� reached the optimum
The absolute performance of the BGA is impressive compared to other al�gorithms� We will only mention ONEMAX and DECEPTION� For ONEMAXthe number of function evaluations needed to locate the optimum �FEopt� scaleslike e �n � ln�n� �empirical law ��� Goldberg �� observed a scaling of O�n���� forhis best algorithm� To our knowledge the previous best results for DECEPTIONand uniform crossover have been achieved by the CHC algorithm of Eshelman��� The CHC algorithm needed ��!�� function evaluations to nd the opti�mum� The BGA needs about ����� function evaluations� The e�ciency can beincreased if steepest ascent hillclimbing is used ���
In the last table we will show that the combination of mutation and crossovergives also good results for continuous functions� In table � results for Rastrigin�sfunction �� are shown�
The results are similar to the results of the ONEMAX function� The reasonof this behavior has been explained in ��� A BGA using mutation and discreterecombination with a popsize of N � � performs most e�ciently�
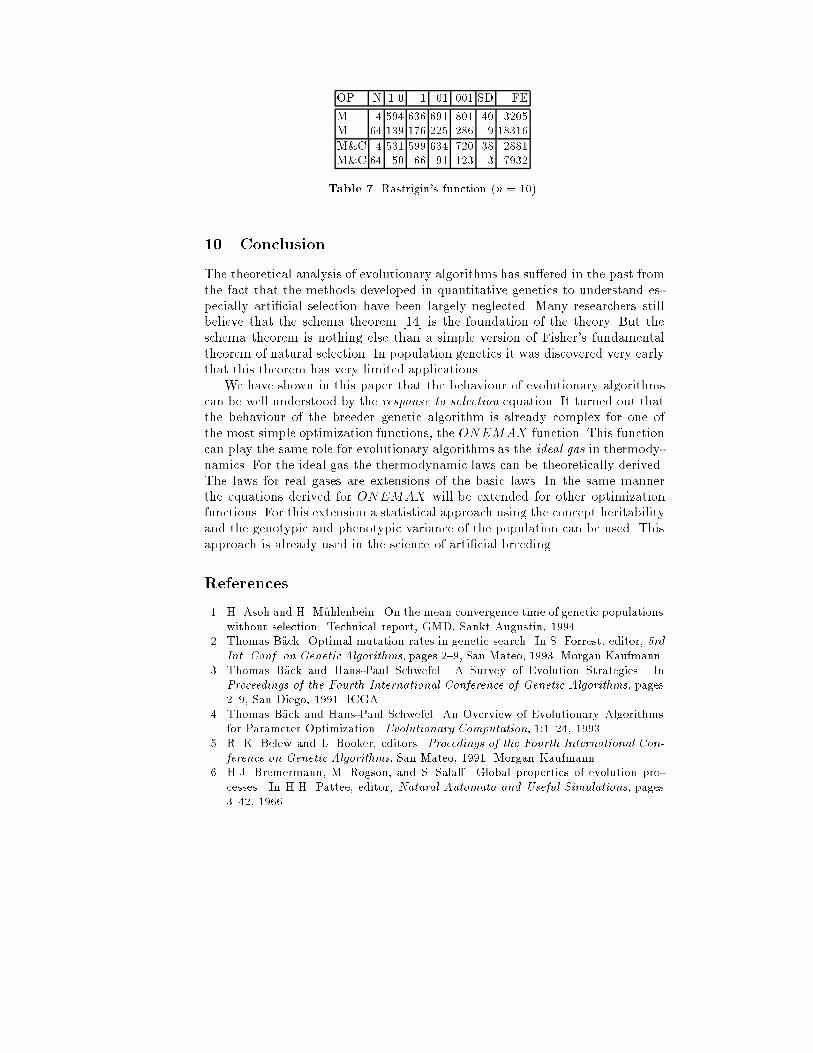
OP N � � �� SD FE
M � ��� ��� �� �� �� ����M �� �� �� ��� ��� � �� �
M�C � �� ��� ��� ��� �� ��� M�C �� �� �� � �� � ����
Table � Rastrigin�s function �n � ��
�� Conclusion
The theoretical analysis of evolutionary algorithms has su�ered in the past fromthe fact that the methods developed in quantitative genetics to understand es�pecially arti cial selection have been largely neglected� Many researchers stillbelieve that the schema theorem �� is the foundation of the theory� But theschema theorem is nothing else than a simple version of Fisher�s fundamentaltheorem of natural selection� In population genetics it was discovered very earlythat this theorem has very limited applications�We have shown in this paper that the behaviour of evolutionary algorithms
can be well understood by the response to selection equation� It turned out thatthe behaviour of the breeder genetic algorithm is already complex for one ofthe most simple optimization functions� the ONEMAX function� This functioncan play the same role for evolutionary algorithms as the ideal gas in thermody�namics� For the ideal gas the thermodynamic laws can be theoretically derived�The laws for real gases are extensions of the basic laws� In the same mannerthe equations derived for ONEMAX will be extended for other optimizationfunctions� For this extension a statistical approach using the concept heritabilityand the genotypic and phenotypic variance of the population can be used� Thisapproach is already used in the science of arti cial breeding�
References
H Asoh and H M�uhlenbein On the mean convergence time of genetic populationswithout selection Technical report� GMD� Sankt Augustin� ���
� Thomas B�ack Optimal mutation rates in genetic search In S Forrest� editor� �rdInt� Conf� on Genetic Algorithms� pages ���� San Mateo� ��� Morgan Kaufmann
� Thomas B�ack and Hans�Paul Schwefel A Survey of Evolution Strategies InProceedings of the Fourth International Conference of Genetic Algorithms� pages���� San Diego� �� ICGA
� Thomas B�ack and Hans�Paul Schwefel An Overview of Evolutionary Algorithmsfor Parameter Optimization Evolutionary Computation� � ���� ���
� R K Belew and L Booker� editors Procedings of the Fourth International Con�
ference on Genetic Algorithms� San Mateo� �� Morgan Kaufmann� HJ Bremermann� M Rogson� and S Sala� Global properties of evolution pro�
cesses In HH Pattee� editor� Natural Automata and Useful Simulations� pages����� ���

� M G Bulmer �The Mathematical Theory of Quantitative Genetics� ClarendonPress� Oxford� ���
� J F Crow Basic Concepts in Population� Quantitative and Evolutionary Genet�
ics Freeman� New York� ���� J F Crow and M Kimura An Introduction to Population Genetics Theory
Harper and Row� New York� ��� � LJ Eshelman The CHC Adaptive Search Algorithm� How to Have Safe Search
when Engaging in Nontraditional Genetic Recombination In G Rawlins� editor�Foundations of Genetic Algorithms� pages �������� San Mateo� �� Morgan�Kaufman
D S Falconer Introduction to Quantitative Genetics Longman� London� �� � R A Fisher The Genetical Theory of Natural Selection Dover� New York� ��� � S Forrest� editor Procedings of the Fifth International Conference on Genetic
Algorithms� San Mateo� ��� Morgan Kaufmann � David E Goldberg Genetic Algorithms in Search� Optimization and Machine
Learning Addison�Wesley� Reading� ��� � DE Goldberg Genetic algorithms� noise� and the sizing of populations Complex
Systems� ���������� ��� � DE Goldberg� K Deb� and B Korb Messy genetic algorithms revisited� Studies
in mixed size and scale Complex Systems� ��� ������ ��� � Michael Herdy Reproductive Isolation as Strategy Parameter in Hierarchical Or�
ganized Evolution Strategies In PPSN � Bruxelles� pages ����� �� September ���
� JH Holland Adaptation in Natural and Arti�cial Systems Univ of MichiganPress� Ann Arbor� ���
� M Kimura The neutral theory of molecular evolution Cambridge UniversityPress� Cambridge University Press� ���
�� H M�uhlenbein� M Gorges�Schleuter� and O Kr�amer Evolution Algorithms inCombinatorial Optimization Parallel Computing� �������� ���
� Heinz M�uhlenbein Evolution in time and space � the parallel genetic algorithm InG Rawlins� editor� Foundations of Genetic Algorithms� pages � ������ San Mateo� �� Morgan�Kaufman
�� Heinz M�uhlenbein and Dirk Schlierkamp�Voosen Predictive Models for theBreeder Genetic Algorithm� Continuous Parameter Optimization Evolutionary
Computation� � �������� ����� Heinz M�uhlenbein and Dirk Schlierkamp�Voosen The science of breeding and its
application to the breeder genetic algorithm Evolutionary Computation� ������������ ���
�� Ingo Rechenberg Evolutionsstrategie � Optimierung technischer Systeme nach
Prinzipien der biologischen Information Fromman Verlag� Freiburg� ����� H Scha�er� editor Procedings of the Third International Conference on Genetic
Algorithms� San Mateo� ��� Morgan Kaufmann�� JD Scha�er and LJ Eshelman On crossover as an evolutionary viable strategy
In R K Belew and L Booker� editors� Procedings of the Fourth International Con�ference on Genetic Algorithms� pages � ���� San Mateo� �� Morgan Kaufmann
�� H�P Schwefel Numerical Optimization of Computer Models Wiley� Chichester� ��
�� G Syswerda Uniform crossover in genetic algorithms In H Scha�er� editor� rdInt� Conf� on Genetic Algorithms� pages ���� San Mateo� ��� Morgan Kaufmann