Multielement isotopic analysis of single presolar SiC grains
Upload
independentCategory
view
0download
0
Composites Engineering. Vol. 3, No 4, pp. 287-312, 1993. Printed in Great Britain.
0961-9526/93 $6.00+ .OO Pergamon Press Ltd
ANALYSIS OF PUSHOUT TESTS ON AN Sic-FIBER-REINFORCED REACTION-BONDED
Si3N4 COMPOSITE+
SAURIN MAJUMDAR, DILEEP SINGH and JITENDRA P. SINGH Materials and Components Technology Division, Argonne National Laboratory,
Argonne, IL 60439, U.S.A.
(Received 1 May 1992; final version accepted 19 August 1992)
Abstract-Fiber pushout tests on a silicon carbide (Sic) fiber-reinforced reaction-bonded silicon nitride (RBSN) composite were analyzed on the basis of a model using shear-lag theory applied to a partially debonded composite. It is shown that significant debonded zones can develop due to thermal stresses during cooldown after fabrication. Although these debonded zones are small compared to composite thicknesses for usual engineering applications, they may be significant compared to the thicknesses of the composite specimens used in the fiber pushout tests. Friction coefficients of 0.1-0.16 appear to fit the data on both the maximum pushout loads and the initial slopes of the load-displacement curves for composites with various embedded fiber lengths and fiber volume fractions.
1. INTRODUCTION
The importance of the brittle fiber/matrix interface on the mechanical behavior of ceramic composites has led to several recent studies measuring the force necessary to slip a fiber by pushing on its end with an indenter [by Marshall and Oliver (1987), Mandell et al. (1987), Brun and Singh (1988) and Morscher et al. (1990)] and with a flat-ended probe [by Bright et al. (1989)]. Most of the analyses assumed the fiber/matrix interface to be fully debonded so that the only resistance to slippage was friction. Rigorous analytical solutions to the fiber slippage problem carried out by Dollar and Steif (1988) are restricted to cases in which the fiber and matrix have the same elastic properties and the initial residual stress present in the composite is a constant clamping pressure. An analytical model for the transfer of stress between fiber and matrix at an interface where there is either perfect bonding or where friction is governed by Coulomb’s law was given by McCartney (1989). A simplified model for fiber pushout tests based on a shear-lag theory was proposed by Hsueh (1990a).
Recently, the problem of fiber/matrix interface debonding has received much attention. There have been two approaches to the debonding problem-one based on a maximum shear-stress criterion, as carried out by Hsueh (1990b) and Li et al. (1991), and the other based on a fracture-mechanics (mode II crack growth) approach, as conducted by Gao et al. (1988), Hutchinson and Jensen (1990) and Kerans and Parthasarathy (1991). When a fiber is partially debonded, clamping stresses due to mismatch in the thermal expansion coefficients of the fiber and the matrix act on the fiber, giving rise to frictional shear stresses at the fiber/matrix interface. Gao et a/. (1988) analyzed the problem, including the effects of friction, using a model based on shear-lag theory. However, they ignored the effects of axial or shear residual stresses in the specimens. Effects of the axial and radial residual stresses on the fiber pullout stresses were considered by Hsueh (199Oc). Hsueh (1990d) also analyzed debonding due to residual thermal stresses using the inter- facial bond strength as the criterion for debonding. Hutchinson and Jensen (1990) used a fracture-mechanics approach to give a comprehensive treatment of the fiber pullout problem for a semi-infinite composite including all residual stresses due to thermal cool- down. The effects of axial residual stresses on fiber pullout and pushout problems were taken into account by Kerans and Parthasarathy (1991), who also included the effects of fiber surface roughness in their model.
‘Work benefitted from the use of the Intense Pulsed Neutron Source at Argonne National Laboratory and was supported by U.S. Department of Energy under Contract W-31-109-Eng-38.
287
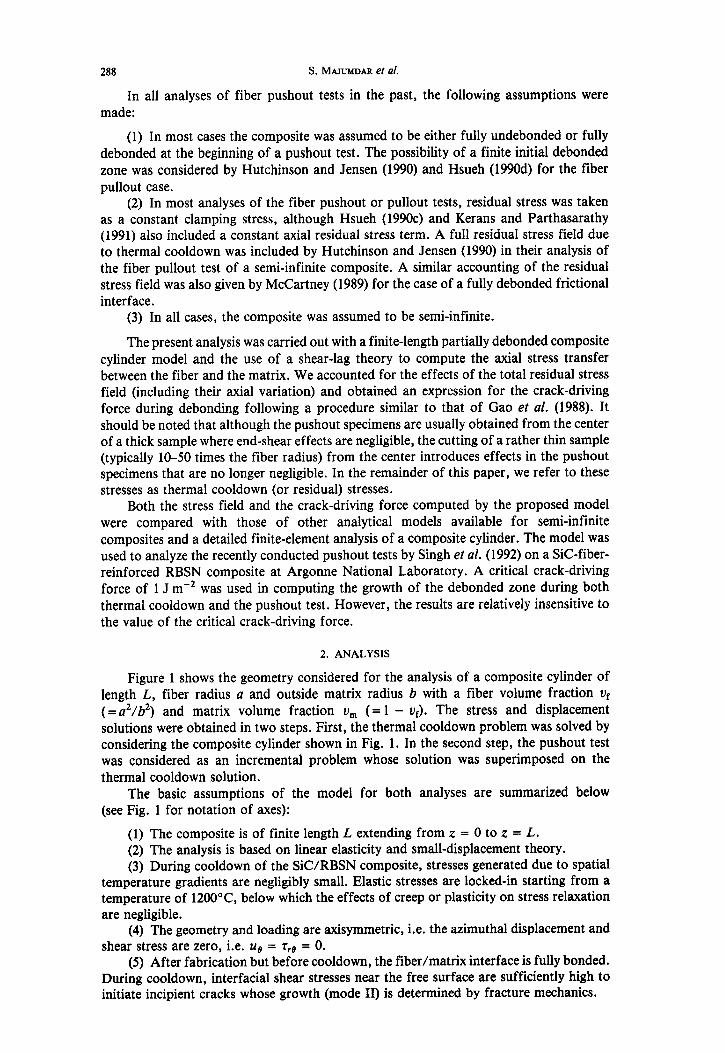
288 S. MAJUMDAR et al.
In all analyses of fiber pushout tests in the past, the following assumptions were made:
(1) In most cases the composite was assumed to be either fully undebonded or fully debonded at the beginning of a pushout test. The possibility of a finite initial debonded zone was considered by Hutchinson and Jensen (1990) and Hsueh (1990d) for the fiber pullout case.
(2) In most analyses of the fiber pushout or pullout tests, residual stress was taken as a constant clamping stress, although Hsueh (199Oc) and Kerans and Parthasarathy (1991) also included a constant axial residual stress term. A full residual stress field due to thermal cooldown was included by Hutchinson and Jensen (1990) in their analysis of the fiber pullout test of a semi-infinite composite. A similar accounting of the residual stress field was also given by McCartney (1989) for the case of a fully debonded frictional interface.
(3) In all cases, the composite was assumed to be semi-infinite.
The present analysis was carried out with a finite-length partially debonded composite cylinder model and the use of a shear-lag theory to compute the axial stress transfer between the fiber and the matrix. We accounted for the effects of the total residual stress field (including their axial variation) and obtained an expression for the crack-driving force during debonding following a procedure similar to that of Gao et al. (1988). It should be noted that although the pushout specimens are usually obtained from the center of a thick sample where end-shear effects are negligible, the cutting of a rather thin sample (typically lo-50 times the fiber radius) from the center introduces effects in the pushout specimens that are no longer negligible. In the remainder of this paper, we refer to these stresses as thermal cooldown (or residual) stresses.
Both the stress field and the crack-driving force computed by the proposed model were compared with those of other analytical models available for semi-infinite composites and a detailed finite-element analysis of a composite cylinder. The model was used to analyze the recently conducted pushout tests by Singh et al. (1992) on a SiC-fiber- reinforced RBSN composite at Argonne National Laboratory. A critical crack-driving force of 1 J me2 was used in computing the growth of the debonded zone during both thermal cooldown and the pushout test. However, the results are relatively insensitive to the value of the critical crack-driving force.
2. ANALYSIS
Figure 1 shows the geometry considered for the analysis of a composite cylinder of length L, fiber radius a and outside matrix radius b with a fiber volume fraction uf ( =a2/b2) and matrix volume fraction v, (= 1 - trf). The stress and displacement solutions were obtained in two steps. First, the thermal cooldown problem was solved by considering the composite cylinder shown in Fig. 1. In the second step, the pushout test was considered as an incremental problem whose solution was superimposed on the thermal cooldown solution.
The basic assumptions of the model for both analyses are summarized below (see Fig. 1 for notation of axes):
(1) The composite is of finite length L extending from z = 0 to z = L. (2) The analysis is based on linear elasticity and small-displacement theory. (3) During cooldown of the SiC/RBSN composite, stresses generated due to spatial
temperature gradients are negligibly small. Elastic stresses are locked-in starting from a temperature of 12OO”C, below which the effects of creep or plasticity on stress relaxation are negligible.
(4) The geometry and loading are axisymmetric, i.e. the azimuthal displacement and shear stress are zero, i.e. ue = qe = 0.
(5) After fabrication but before cooldown, the fiber/matrix interface is fully bonded. During cooldown, interfacial shear stresses near the free surface are sufficiently high to initiate incipient cracks whose growth (mode II) is determined by fracture mechanics.
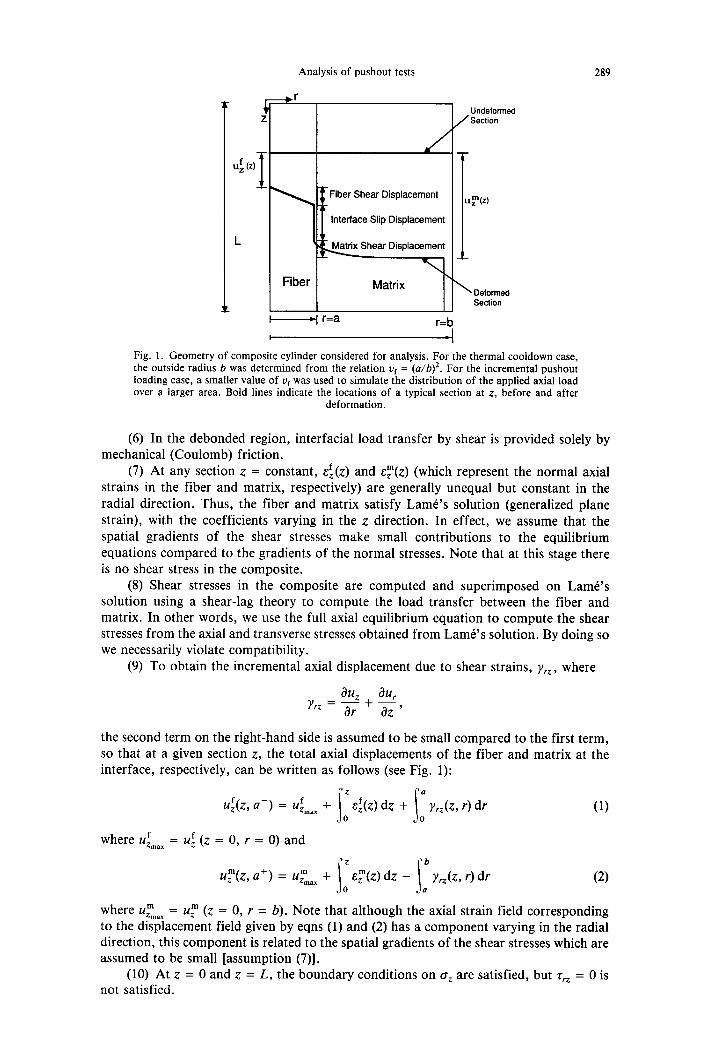
Analysis of pushout tests 289
r Undeformed
/Section
\ Deformed Section
,-_I ,=a
I r=b
Fig. 1. Geometry of composite cylinder considered for analysis. For the thermal cooldown case, the outside radius b was determined from the relation uf = (u/@~. For the incremental pushout loading case, a smaller value of ur was used to simulate the distribution of the applied axial load over a larger area. Bold lines indicate the locations of a typical section at z, before and after
deformation.
(6) In the debonded region, interfacial load transfer by shear is provided solely by mechanical (Coulomb) friction.
(7) At any section z = constant, E:(Z) and E:(Z) (which represent the normal axial strains in the fiber and matrix, respectively) are generally unequal but constant in the radial direction. Thus, the fiber and matrix satisfy Lame’s solution (generalized plane strain), with the coefficients varying in the z direction. In effect, we assume that the spatial gradients of the shear stresses make small contributions to the equilibrium equations compared to the gradients of the normal stresses. Note that at this stage there is no shear stress in the composite.
(8) Shear stresses in the composite are computed and superimposed on Lame’s solution using a shear-lag theory to compute the load transfer between the fiber and matrix. In other words, we use the full axial equilibrium equation to compute the shear stresses from the axial and transverse stresses obtained from Lame’s solution. By doing so we necessarily violate compatibility.
(9) To obtain the incremental axial displacement due to shear strains, yrz, where
the second term on the right-hand side is assumed to be small compared to the first term, so that at a given section z, the total axial displacements of the fiber and matrix at the interface, respectively, can be written as follows (see Fig. 1):
where uz”,,, = u,” (z = 0, r = b). Note that although the axial strain field corresponding to the displacement field given by eqns (1) and (2) has a component varying in the radial direction, this component is related to the spatial gradients of the shear stresses which are assumed to be small [assumption (7)].
(10) At z = 0 and z = L, the boundary conditions on oZ are satisfied, but trZ = 0 is not satisfied.
290 S. MANMDAR et al.
(11) The lateral boundary of the composite cylinder is stress-free, i.e. at r = b, 6, = r,, = 0 for all z.
(12) During thermal cooldown, overall equilibrium in the axial (z) direction at any cross-section requires [consistent with assumptions (7) and (1 l)]
m OZ Uf f=-- (3) OZ urn *
However, since a single fiber is axially loaded at any one time, the incremental pushout problem is solved for a composite cylinder with a larger outer matrix radius (i.e. an effec- tive volume fraction vfA much less than the actual volume fraction vf), so that the incremental axial stresses are distributed over a larger area than in the thermal cooldown case. Thus, for an applied fiber axial stress of oA,
where v,A = 1 - UrA (for a fiber radius of 75 pm, vrA = 0.0001 corresponds to a specimen width of ~52 cm).
(13) The growth of the debonded zone is treated as a shear crack growth. A crack- driving force G can be defined [see eqn (1 S)] that depends on the length of debonded zone and the applied loading. It is assumed that a material constant G, exists such that as long as G c G,, the crack will not grow. Further, we ignore all dynamic effects and assume that the value of G, for crack initiation is the same as that for crack arrest, so that the value of G at the tip of the growing crack is maintained at G, . During thermal cooldown the debond zone length zth is determined from (applied load is zero)
WA zth) = G,.
During subsequent pushout loading at an applied stress oA, the debond length z1 is determined from
AG E G(oA, Zl) - G(0, Zth) = 0.
After the whole interface is debonded, the value of G at the tip of the slipping zone is maintained at zero.
2.1. Thermal cooldown stress analysis
From Lame’s solution, the radial distributions of radial (0,) and hoop (a,) stresses in the matrix satisfying the boundary condition B, = 0 at r = b are given by
(54
(5b)
where &z) is the radial stress at the fiber/matrix interface. Similarly, the hoop and radial stresses in the fiber at any section z are given by
of = of = 01 e r I.* (54
The corresponding axial, radial and hoop strains in the matrix and fiber at any section z = constant are given by
1 1 =- -v Em m
-ym
-(l - v-)2 l + vm
vm
-(l - vrn)ff -+
m m
T (W

Analysis of pushout tests 291
(6b)
E; = Ef r (6~)
where (11, and CY,,,~ are the longitudinal and transverse thermal expansion coefficients of the matrix, of and oft are the longitudinal and transverse thermal expansion coefficients of the fiber, T is the temperature change during cooldown, E,,, and v, are the Young’s modulus and Poisson’s ratio of the matrix, and Ef and vf are the Young’s modulus and Poisson’s ratio of the fiber.
With the continuity of radial displacement at r = Q, eqns (3), @a)-(5c) and (6a)-(6c) can be solved to give
0; = pt,,: - 0:” (7a) where
Pth = (VfJ%n/~f) + hn Vf/4IJ
(1 - V,)(E,/Ef) + 1 + v, + (2vr/u,) (7b)
and
th - K&m - 4T or -- (1 - v&?&/E,) + 1 + v, + (2u,/v,) * (74
The shear-lag analysis was performed by integrating the axial equilibrium equation of the fiber in the radial direction:
a r zo 3
c&r dr = rsf,(z, r).
With the boundary conditions on the fiber shear stress rf, = 0 at r = 0 and rfZ = r, at r = a, the above equation can be solved to give
so:(z)- 2%(Z) a74 a (8)
and
(9)
Similarly, the boundary conditions on the matrix shear stress (rz = 0 at r = b and rm = T, at r = a) can be used to give the shear-stress distribution in the matrix as rz
uf b= - r= 5:Q.P z) = 70(z) ; --&--- *
m
The axial displacements of the fiber and matrix during thermal cooldown can be obtained from eqns (l)-(3), (6a)-(6c), and (7a)-(7c):
and
The interfacial slip displacement at any section z is obtained by using eqns (l)-(2), (9), (lo), and (lla)-(llb):
dz)a uslip = r&z, a-) - u,“(z, a+) = Z&Z, 0) - 47~~ b) - ~GK m
(1 lc)
where K=+‘“o
%I and Gf and G, are the fiber and matrix shear moduli, respectively.
(114
292 S. MAJUMDAR et al.
For the thermal cooldown case, slippage between the fiber and the matrix occurs in the regions 0 < z < zth and L - z& < z < L [by assumption (5)]. The variation of axial stress in the fiber in these regions is given in terms of the interfacial shear stress r,, eqns (7a) and (8), and Coulomb’s law (with friction coefficient p) by
da: 2~ dz
- --$&,~; - f,ih).
Note that the -ve sign on the right-hand side of eqn (12) corresponds to cases (which include thermal cooldown of SiC/RBSN composite) where
(q - a,)T < -2vfa:h[l + (v,ufEf)/(vfu,E,)]/Er.
It would be reversed (i.e. +ve) if the above inequality were reversed. With eqn (12) solved in the slipping region 0 < z < zth , and the boundary condition
of = 0 at 2 = 0,
o;=ZF[l -exp(-F)] W)
(13c)
Because of the symmetry of the problem, the stresses in the region L > z > L - zth are also given by eqns (13a)-(13c), with z replaced by L - z and the sign of the shear stress reversed.
In the nonslipping or undebonded region, i.e. L - zth > z > zth, Uslip = 0. Differentiating eqn (11~) and with eqns (3), (6a)-(6c), (7b) and (8),
where
v,,,$ m
and
th _ 4 Cm Of -7 - &t(~tn - af)T - 20;~ .
Yth KG,
With eqn (14a) solved, eqn (8) and the symmetry condition T, = 0 at z = L/2
a: = Bth[exp(-ythy) + exp(-ythi)] + o:h, and with eqns (7a) and (8).
c!(Z) = Bthbth[ exp(- y F) + exP(%h i)] + &hdh - 0P (15b)
TM = y [exp(-ythe) - exp(-hi)] (15c)
&, can be determined from the condition of COntinUity of axial Stress at z = zth:
WW
(14b)
(14c)
W)
Bth =
o;“[ 1 - exp(-%!!/!!I)]
(L izth,> + exp(-yth:)] * (1W
Analysis of pushout tests
2.2. Fiber pushout stress analysis
293
Incremental stresses and strains for the pushout loading are also related by equations analogous to (5a)-(5c) and (6a)-(6c) (with T = 0). As in the case of thermal cooldown loading, use of eqn (4) and the continuity of radial incremental displacement at the fiber/matrix interface allows the following equation [analogous to eqn (7a)] to be derived for an applied fiber axial stress a,:
Au,’ = ,8Aaf - bAaA UW where
P= (VfJ%J~f) + %@f,4~%A)
(1 - v,)(E,/E,) + 1 + v, + (2r+*/u&J and
%(~fA/4L4)
pA = (1 - v,)(&,/.&) + 1 + v, + (&A/t]& *
(16b)
Similarly, the following incremental axial and interfacial slip displacements of the fiber and the matrix during pushout loading can be obtained analogously to eqns (lla)-(lld):
UW A&z, 0) = Au;,,
AZ.& b) = huEax
AU,lip(Z) = Auf(z> 0) - Au,“(z, b) - 2~ A q,(z)a K *
m
(17b)
The starting point for the pushout analysis is a composite cylinder that is partially debonded along a length zth at both ends and has the built-in residual stress field given by eqns (13a)-( 13c) and (15a)-( 15c). Thus, after initial thermal cooldown, a central un- debonded region of length L - 2&h is present. With the applied fiber axial stress aA at z = 0, the debonded region grows to a length z1 > zth . As long as zi < L - zth, a central residual undebonded region remains. For z1 L L - zth, the full length of the composite cylinder is debonded. Thus, depending on the value of zi relative to L - zth, two cases arise. The stresses corresponding to these cases are given in Appendix A.
2.3. Analysis of growth of debonded region
A criterion for the growth of the debonded zone is needed as long as zi < L - zth. Like Gao et al. (1988) and Kerans and Parthasarathy (1991), we treat the growth of the debonded zone as a shear-crack growth. Because of the presence of the Coulomb friction zone, the problem is generally nonlinear and path-dependent; consequently, a unique potential energy function does not exist. Moreover, a detailed crack-tip solution for this geometry is not available. However, the stability of a debonded zone at a given loading can be tested by treating it as a crack and defining a crack-driving force G,
aw au aw, G=z-z-aA, (18)
where A (= azI) is the crack area (per radian), W is the external work, U is the elastic strain energy, and W, is the frictional energy dissipation; it is assumed that the crack will not grow as long as G c G,.
With eqns (5a)-(5c) and (6a)-(6c) and differentiating, the strain energy rate in the fiber and the matrix are given by (ignoring the shearing-strain-energy component)
au, a2 L az,=2E, z, s[
b:(z) - 2VfdZ)) az, * - 2(Vf&Z) - (1 - v,>af(z)> 2 dz (19a) 1 I
294 S. MAJUMDAR et al.
and
WW
Details of the calculations for the thermal cooldown and pushout loadings are given in Appendix B.
The external work rate (per radian) is given by (ignoring axial displacement due to shear stresses)
aw a2uA d Auf,, ----. 2& - 2 a2, (20)
With the boundary condition of zero axial displacement of the matrix at z = L, and noting that as long as zr c L, the fiber axial displacement at z = L is also equal to zero, eqn (17a) gives
aa,, 1 - 2pv, -=- L aA&z)
az, Ef s 0 az d2* 1 (21)
Because the derivative of the incremental axial stress is nonzero only in the region z > zr , and with its value from eqn (B4) of Appendix B,
aAd,, _ x1 - WV,) -_- az, vEf [Aso - Ar,(z:)] 1 - exp - [ ( ytL ; ““>I (22)
where Ato and Aso represent the discontinuous change in the incremental shear stress at z = zr .
For the thermal cooldown case (zr = zth), the dissipation rate per radian is given by
z’ awD-a az, 5
ahip -dz 0
TO(z) az, (23)
where the slip displacement is given by eqn (1 lc). Differentiating eqns (1 la) and (1 lb), using eqns (8) and (15c), and noting that the derivative of the shear stress with respect to zr is zero in the region 0 < z < z1 ,
aw, a2 pf(zJ
[
ad,,, ae, -= az,
7 - - 1 az, 1 (24)
where
(25)
and
aa, _ Uf 1 - wthhn ---- aZl urn YthEm
[ exp(-y,h+) - exp(-hh?)] 2a’ t2@
By differentiation of eqn (15d) and the use of eqns (13~) and (UC),
(27)
where ro(z;) and ro(z:) represent the discontinuous change in the interfacial shear stress at z = zl.
Analysis of pushout tests
For the pushout loading case, the dissipation rate per radian is given by
295
aw, 21 az,=a s
aAu,li,, [TO(Z) + AT,(z)] az, -dz
0 03)
where the expression for interfacial slip displacement is given by eqn (17~). Differentiating w UW,
aAQz9 0) _ au,, az, azl
(29)
which is given by eqn (22). Similarly, differentiation of eqn (17b) allows the following equation to be derived for the matrix:
aAu,“,= -= az,
2 [ATo - Ai,(z:,][ 1 - ‘=P(-‘@ ; ““>]. (30)
Because the derivative of the incremental shear stress with respect to zr is zero in the region 0 < z < zr, and with eqn (8),
aw, a2 - = 2 [&) + Aa; - oA] az,
+ - $$ . 1 1 1 (31)
Note that all energy rate terms are directly proportional to the jump in the interfacial shear stress at the end of the debonded zone, z = zr . When the full composite cylinder becomes debonded, i.e. zr 1 L - &, the slipping zone extends to such a length that the interfacial shear stress becomes continuous and the crack-driving force is zero. The rest of the interface (z > L - zl), although debonded, remains nonslipping.
3. COMPARISON WITH OTHER MODELS
3.1. Analytical models
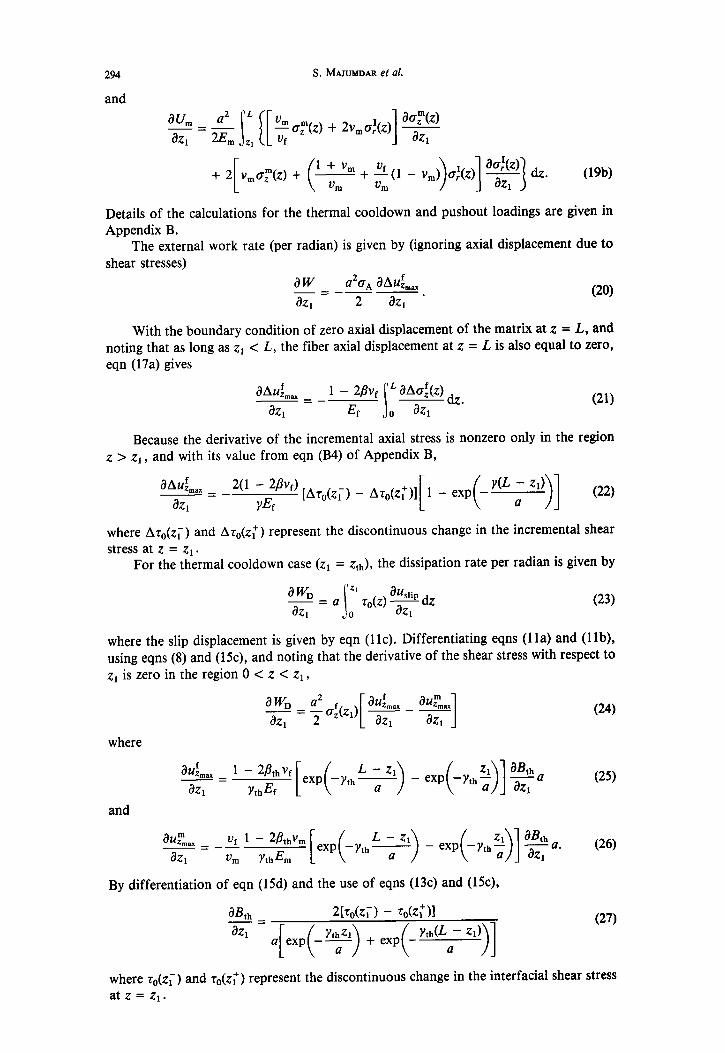
Analytical solutions due to McCartney (1989) and Hutchinson and Jensen (1990) are available for semi-infinite composites. McCartney (1989) developed a model that satisfied the equilibrium equations exactly while some of the stress-strain-temperature relations were satisfied in an average sense. His results are compared with the present model for the case of a fully debonded frictional interface with the following properties:
E, = 70 GPa, v, = 0.2, CY, = 10s5 “C-l Vf = 0.4 p = 0.3
Ef = 220 GPa Vf = 0.1 CYf = 5.5 x lo+ “c-l T = -550°C.
For comparison, the present model was analyzed with L/a = 100. Figure 2 shows a comparison of the axial variations of the interfacial shear stress at zero applied strain and at an applied strain of 0.4% between the two models. Except near the free surface, where McCartney’s model satisfies the free-shear-stress boundary condition, the stress distribu- tions predicted by the two models are virtually identical. The lengths of the slippage zones predicted by the two models are also quite close.
Hutchinson and Jensen (1990) analyzed a partially debonded semi-infinite composite material during fiber pullout loading. They gave an exact closed-form solution for the crack-driving force for the case when the fiber and matrix have identical elastic properties and the friction coefficient p = 0. We checked that the crack-driving force predicted by our model (for L/a = 100) under such conditions agrees very closely with the exact solution. For p > 0, Hutchinson and Jensen (1990) gave an equation for the variation of the debonded zone length with applied pullout loading. We compared our results (with L/a = 100 and vf = vrA) with this equation using the following material properties:
E, = Ef = 310 GPa, v, = vf = 0.24, Vf = 0.4 p = 0.3
af = 2.63 x 1O-6 ‘C--l cy, = 3.30 x lo+ “C-’ T = -550°C G, = 1 J m-‘.
Figure 3 shows that the debond zone lengths predicted by our model agree very closely with those predicted by Hutchinson and Jensen (1990).
296 S. MANMD~ et al.
Fig. 2. Comparison of the predicted axial variations of interfacial shear stress normalized by the matrix stress at infinity by the proposed model (solid line) with those (symbols) by McCartney (1989). The slipped zone length, fiber radius, and the mechanical tensile axial strain imposed on
the fiber are denoted by z, , a, and E’, respectively.
6
3
0 -400 -300 -200 -100 0 100 200 300
Applied Axial Stress on Fiber (MPa)
Fig. 3. Comparison of the predicted variations of the normalized debond length with applied axial stress during a fiber pullout test by the proposed model (solid line) with those (symbols) by
Hutchinson and Jensen (1990).
3.2. Comparison with finite element method
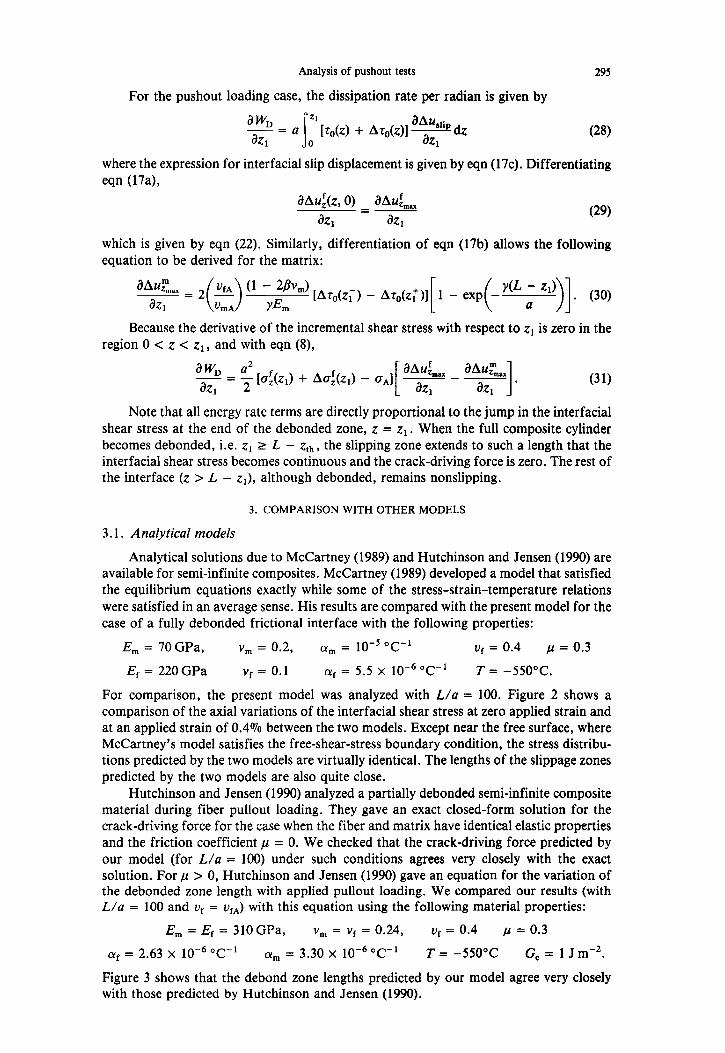
Finite element (ANSYS) calculations (small displacements using linear elasticity) were performed on a 12.6 vol.% Sic-fiber-reinforced dense S&N4 matrix with an axisym- metric composite cylinder geometry of L/a = 40. To reduce the size of the problem, only half the length of the composite was modeled by using 5930 nodes and 5601 elements (STIF42) and a symmetry boundary condition was used at z/a = 20. A slip zone extend- ing from zl/a = 0 to zl/a = 10 was modeled by 100 two-dimensional interface elements (STIF12) of equal length. The interface element can support only compression in the normal direction (gap can open when the normal stress is zero) and shear in the tangential direction with sliding occurring when the standard Coulomb friction criterion is satisfied. The same slip-zone length (zfr, = zr) was used both for thermal cooldown from 1350 to 20°C and a fiber pushout loading of lOOMPa. The rest of the interface, which was assumed to be bonded, was modeled by 100 regular solid elements on either side of the interface with their common nodes coupled at the interface. The mechanical properties used for the analyses were as follows:
CYf = 4.7 x 1o-6 “c-l aft = 2.63 x 1O-6 ‘C-l Ef = 400 GPa Vf = 0.19
a, = 3.3 x 1o-6 “C’ a,, = 3.3 x 1o-6 Oc-’ E,,, = 310GPa v, = 0.24
,u = 0.1.
Analysis of pushout tests 297
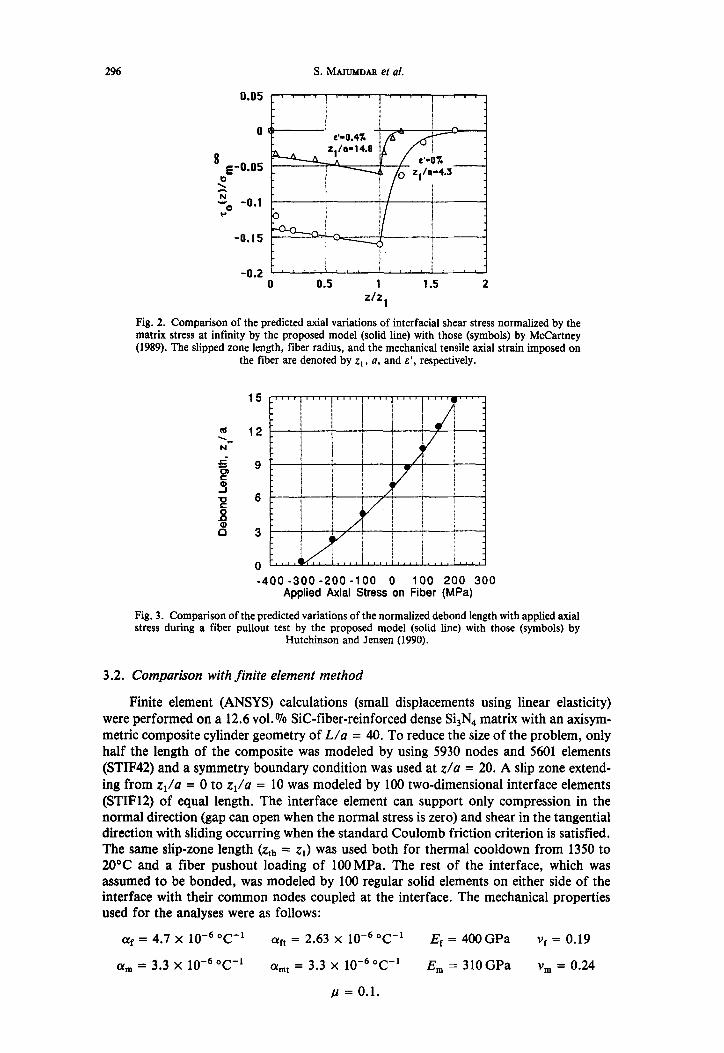
9 9.5 10 10.5 11 11.5 12 z/a
Fig. 4. Comparison of the axial distributions of the interfacial shear stress in a 12.6% SiC-fiber- reinforced S&N, matrix after cooldown from 1350 to 2O”C, as computed by the proposed model
and finite element method.
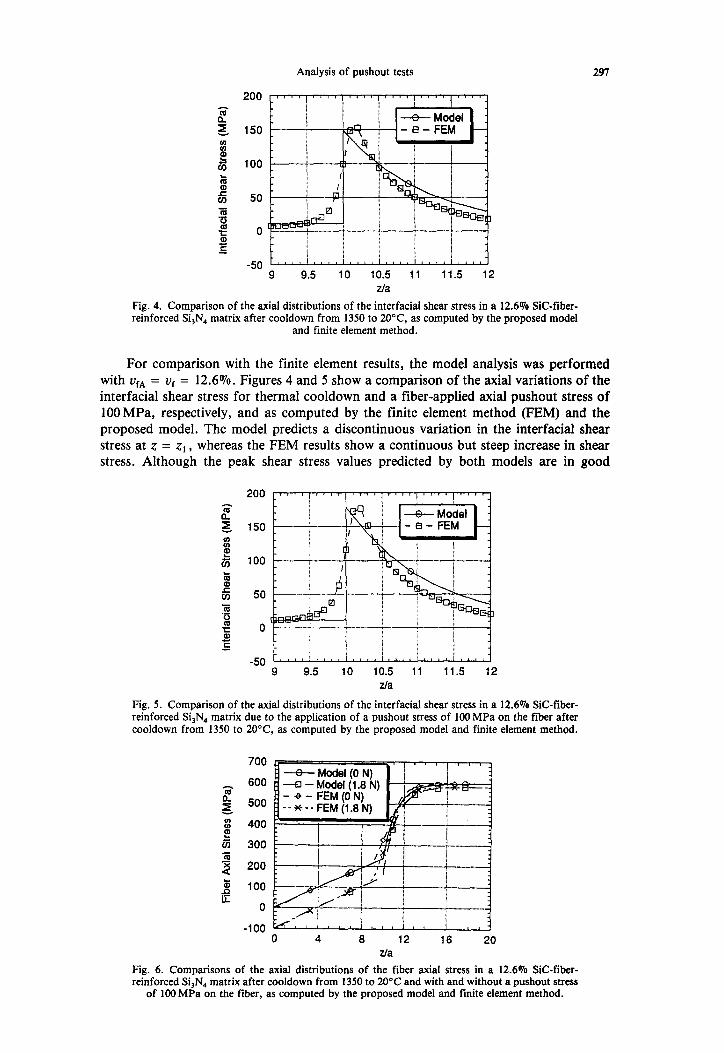
For comparison with the finite element results, the model analysis was performed with ufA = vf = 12.6%. F igures 4 and 5 show a comparison of the axial variations of the interfacial shear stress for thermal cooldown and a fiber-applied axial pushout stress of 100 MPa, respectively, and as computed by the finite element method (FEM) and the proposed model. The model predicts a discontinuous variation in the interfacial shear stress at z = zr , whereas the FEM results show a continuous but steep increase in shear stress. Although the peak shear stress values predicted by both models are in good
200
z z 150
I E
67 100
5 ig 50
3 0 f 0
s -50
9 9.5 10 10.5 11 11.5 12 z/a
Fig. 5. Comparison of the axial distributions of the interfacial shear stress in a 12.6% SiC-fiber- reinforced Si,N, matrix due to the application of a pushout stress of 100 MPa on the fiber after cooldown from 1350 to 2O”C, as computed by the proposed model and finite element method.
2
600
3 500
D 400 F
5 300 I 2 200
z g 100
0
-100 0 4 8 12 16 20
2/a Fig. 6. Comparisons of the axial distributions of the fiber axial stress in a 12.6% SiC-fiber- reinforced Si,N., matrix after cooldown from 1350 to 2O“C and with and without a pushout stress
of 100 MPa on the fiber, as computed by the proposed model and finite element method.
298 S. MAJUMD~ ei al.
4 - Model (1.8 N)
0 5 10 15 20 25 zla
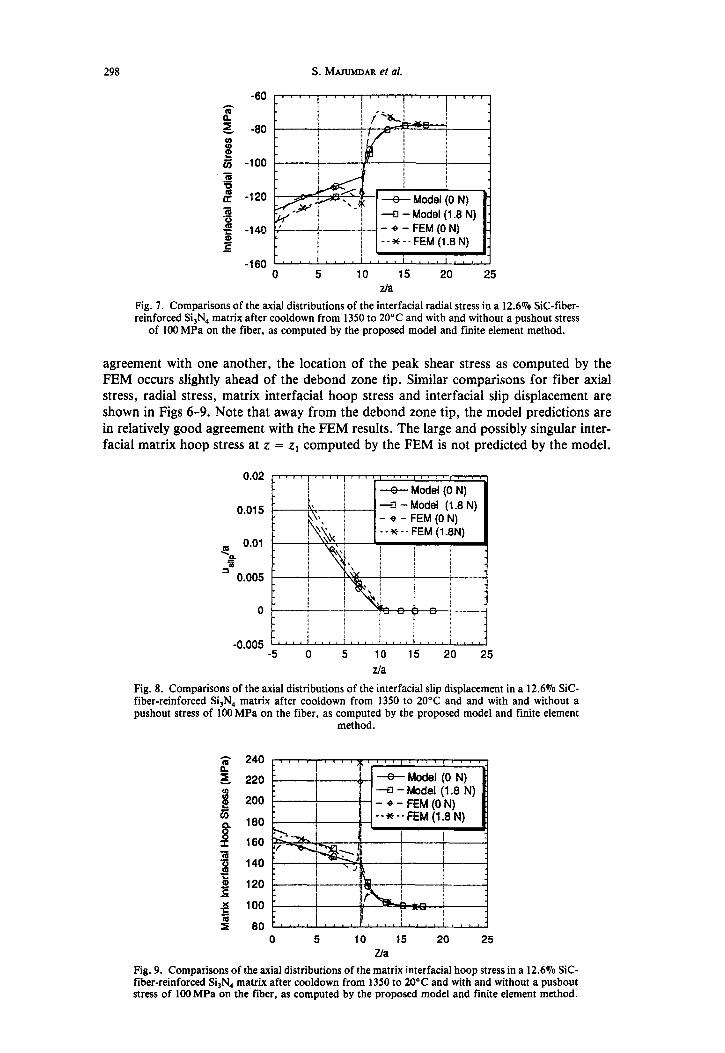
Fig. 7. Comparisons of the axial distributions of the interfacial radial stress in a 12.6% SiC-fiber- reinforced Si,N, matrix after cooldown from 1350 to 20°C and with and without a pushout stress
of 100 MPa on the fiber, as computed by the proposed model and finite element method.
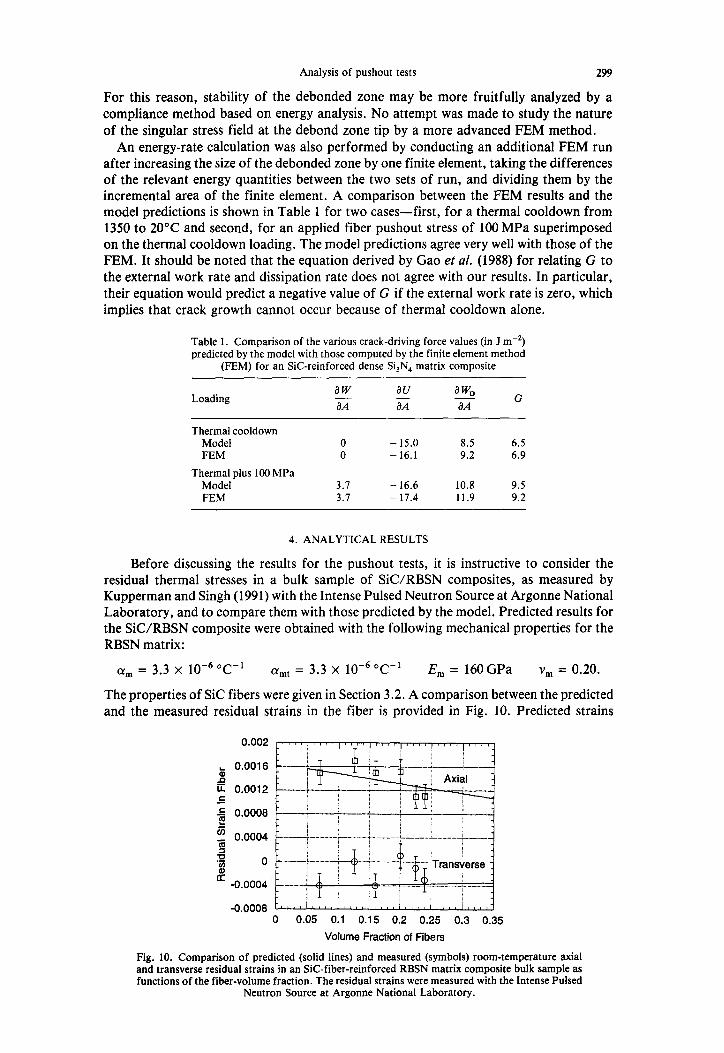
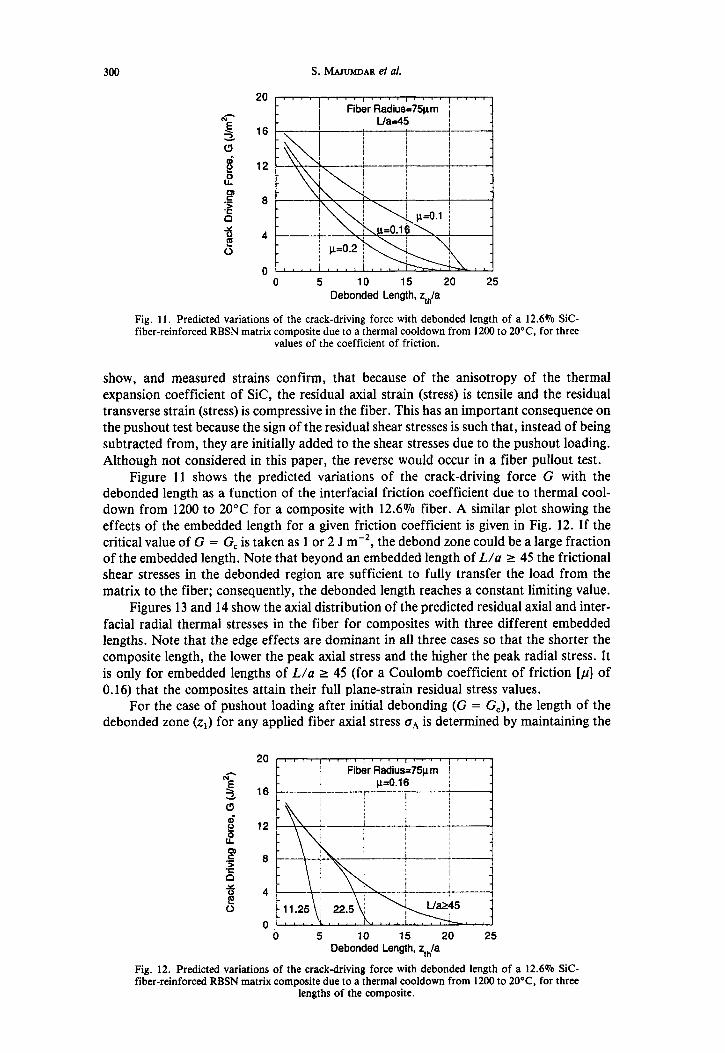
agreement with one another, the location of the peak shear stress as computed by the FEM occurs slightly ahead of the debond zone tip. Similar comparisons for fiber axial stress, radial stress, matrix interfacial hoop stress and interfacial slip displacement are shown in Figs 6-9. Note that away from the debond zone tip, the model predictions are in relatively good agreement with the FEM results. The large and possibly singular inter- facial matrix hoop stress at z = z, computed by the FEM is not predicted by the model.
m 0.01 ‘*
ro.oo5
0
-0.005
-a -Model (1.8N)
I,II I -5 o 5 10 15 20 25
z/a
Fig. 8. Comparisons of the axial distributions of the interfacial slip displacement in a 12.6% SiC- fiber-reinforced S&N, matrix after cooldown from 1350 to 20°C and and with and without a pushout stress of 100 MPa on the fiber, as computed by the proposed model and finite element
method.
B 240
z 220 2 it 200
co Q 180
I 160 z
c 140
2 120 E 2 100
9 80 0 5 10 15 20 25
z/a
Fig. 9. Comparisons of the axial distributions of the matrix interfacial hoop stress in a 12.6% SiC- fiber-reinforced S&N, matrix after cooldown from 1350 to 20°C and with and without a pushout stress of 100 MPa on the fiber, as computed by the proposed model and finite element method.
Analysis of pushout tests 299
For this reason, stability of the debonded zone may be more fruitfully analyzed by a compliance method based on energy analysis. No attempt was made to study the nature of the singular stress field at the debond zone tip by a more advanced FEM method.
An energy-rate calculation was also performed by conducting an additional FEM run after increasing the size of the debonded zone by one finite element, taking the differences of the relevant energy quantities between the two sets of run, and dividing them by the incremental area of the finite element. A comparison between the FEM results and the model predictions is shown in Table 1 for two cases-first, for a thermal cooldown from 1350 to 20°C and second, for an applied fiber pushout stress of 100 MPa superimposed on the thermal cooldown loading. The model predictions agree very well with those of the FEM. It should be noted that the equation derived by Gao et al. (1988) for relating G to the external work rate and dissipation rate does not agree with our results. In particular, their equation would predict a negative value of G if the external work rate is zero, which implies that crack growth cannot occur because of thermal cooldown alone.
Table 1. Comparison of the various crack-driving force values (in J m-‘) predicted by the model with those computed by the finite element method
(FEM) for an Sic-reinforced dense Si,N, matrix composite
Loading aw - aA
au zi
awi - G aA
Thermal cooldown Model FEM
Thermal plus 100 MPa Model FEM
0 - 15.0 8.5 6.5 0 - 16.1 9.2 6.9
3.7 - 16.6 10.8 9.5 3.1 - 17.4 11.9 9.2
4. ANALYTICAL RESULTS
Before discussing the results for the pushout tests, it is instructive to consider the residual thermal stresses in a bulk sample of SiC/RBSN composites, as measured by Kupperman and Singh (1991) with the Intense Pulsed Neutron Source at Argonne National Laboratory, and to compare them with those predicted by the model. Predicted results for the SiC/RBSN composite were obtained with the following mechanical properties for the RBSN matrix:
cYm = 3.3 x 10⁻⁶”c-’ %t = 3.3 x 10⁻⁶”c-’ E,,, = 160GPa v, = 0.20.
The properties of Sic fibers were given in Section 3.2. A comparison between the predicted and the measured residual strains in the fiber is provided in Fig. 10. Predicted strains
0.002
G 0.0016
Et 0.0012 .E .$ 0.0006
g 0.0004 2 e ii
0
= -0.0004
0 0.05 0.1 0.15 0.2 0.25 0.3 0.35
Volume Fraction of Fibers
Fig. 10. Comparison of predicted (solid lines) and measured (symbols) room-temperature axial and transverse residual strains in an Sic-fiber-reinforced RBSN matrix composite bulk sample as functions of the fiber-volume fraction. The residual strains were measured with the Intense Pulsed
Neutron Source at Argonne National Laboratory.
300 S. MAJWDAR et al.
0 5 10 15 20 25 Debonded Length, z,,,/a
Fig. 11. Predicted variations of the crack-driving force with debonded length of a 12.6% BC- fiber-reinforced RBSN matrix composite due to a thermal cooldown from 1200 to 2O”C, for three
values of the coefficient of friction.
show, and measured strains confirm, that because of the anisotropy of the thermal expansion coefficient of Sic, the residual axial strain (stress) is tensile and the residual transverse strain (stress) is compressive in the fiber. This has an important consequence on the pushout test because the sign of the residual shear stresses is such that, instead of being subtracted from, they are initially added to the shear stresses due to the pushout loading. Although not considered in this paper, the reverse would occur in a fiber pullout test.
Figure 11 shows the predicted variations of the crack-driving force G with the debonded length as a function of the interfacial friction coefficient due to thermal cool- down from 1200 to 20°C for a composite with 12.6% fiber. A similar plot showing the effects of the embedded length for a given friction coefficient is given in Fig. 12. If the critical value of G = G, is taken as 1 or 2 J m -2, the debond zone could be a large fraction of the embedded length. Note that beyond an embedded length of L/a 1 45 the frictional shear stresses in the debonded region are sufficient to fully transfer the load from the matrix to the fiber; consequently, the debonded length reaches a constant limiting value.
Figures 13 and 14 show the axial distribution of the predicted residual axial and inter- facial radial thermal stresses in the fiber for composites with three different embedded lengths. Note that the edge effects are dominant in all three cases so that the shorter the composite length, the lower the peak axial stress and the higher the peak radial stress. It is only for embedded lengths of L/a 1 45 (for a Coulomb coefficient of friction [p] of 0.16) that the composites attain their full plane-strain residual stress values.
For the case of pushout loading after initial debonding (G = G,), the length of the debonded zone (zi) for any applied fiber axial stress oA is determined by maintaining the
20 1111,1111,11111.,,/[I(,I- Fiber Radius=75pm I
16 - p=O.16 i
-------------?- -- ---.&--
b 5 10 15 20 25 Debonded Length, $,,/a
Fig. 12. Predicted variations of the crack-driving force with debonded length of a 12.6% SiC- fiber-reinforced RBSN matrix composite due to a thermal cooldown from 1200 to 2O”C, for three
lengths of the composite.
Analysis of pushout tests 301
600
500
400
300
200
100
0
-100 .lO 0 10 20 30 40 50
z/a
Fig. 13. Predicted axial variations of the fiber axial stress in a 12.6% SiC-fiber-reinforced RBSN matrix composite due to a thermal cooldown from 1200 to 2O”C, for three lengths of the
composite.
ii
i\ I\ j / \ E
-80 t,,,,v,',,i,,,,l,,,,l,,,.l,,.,~ -10 0 10 20 30 40 50
z/a
Fig. 14. Predicted axial variations of the interfacial radial stress in a 12.6% Sic-fiber-reinforced RBSN matrix composite due to a thermal cooldown from 1200 to 2O”C, for three lengths of the
composite.
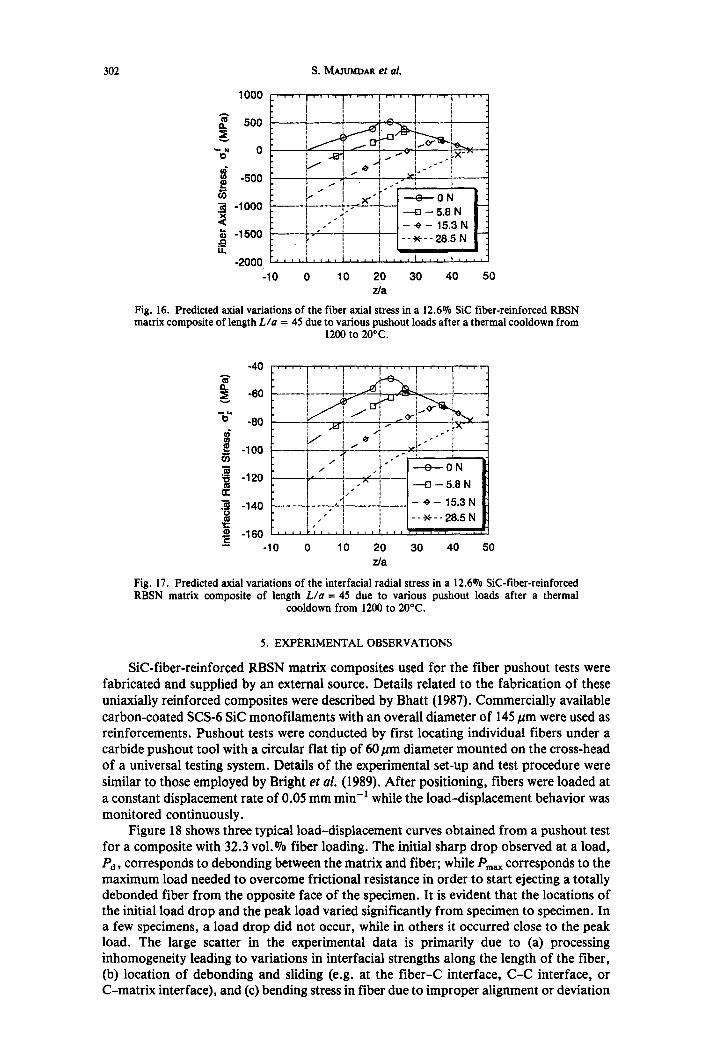
incremental AG = 0. Figure 15 shows the axial distribution of the predicted interfacial shear stress for different values of pushout loadings for a composite of length L/a = 45, Of = 12.6% and ,u = 0.16. At an axial load of 5.9 N, the debonded zone punches through the central undebonded region, and the distribution of shear stress becomes continuous. The variations of the axial and interfacial radial stresses in the fiber with applied loading are shown in Figs 16 and 17, respectively.
-10 0 10 20 30 40 50 zla
Fig. 15. Predicted axial variations of the interfacial shear stress in a 12.6% Sic-fiber-reinforced RBSN matrix composite of length L/a = 45 due to various pushout loads after a thermal
cooldown from 1200 to 20°C.
COE 3:4-o
302
~~~
.lO 0 10 20 30 40 50 z/a
Fig. 16. Predicted axial variations of the fiber axial stress in a 12.6% Sic fiber-reinforced RBSN matrix composite of length L/a = 45 due to various pushout loads after a thermal cooldown from
1200 to 20°C.
-10 0 10 20 30 40 50 z/a
Fig. 17. Predicted axial variations of the interfacial radial stress in a 12.6% Sic-fiber-reinforced RBSN matrix composite of length L/a = 45 due to various pushout loads after a thermal
cooldown from 1200 to 20°C.
5. EXPERIMENTAL OBSERVATIONS
W-fiber-reinforced RBSN matrix composites used for the fiber pushout tests were fabricated and supplied by an external source. Details related to the fabrication of these uniaxially reinforced composites were described by Bhatt (1987). Commercially available carbon-coated SCS-6 Sic monofilaments with an overall diameter of 145 pm were used as reinforcements. Pushout tests were conducted by first locating individual fibers under a carbide pushout tool with a circular flat tip of 60 pm diameter mounted on the cross-head of a universal testing system. Details of the experimental set-up and test procedure were similar to those employed by Bright et al. (1989). After positioning, fibers were loaded at a constant displacement rate of 0.05 mm min-’ while the load-displacement behavior was monitored continuously.
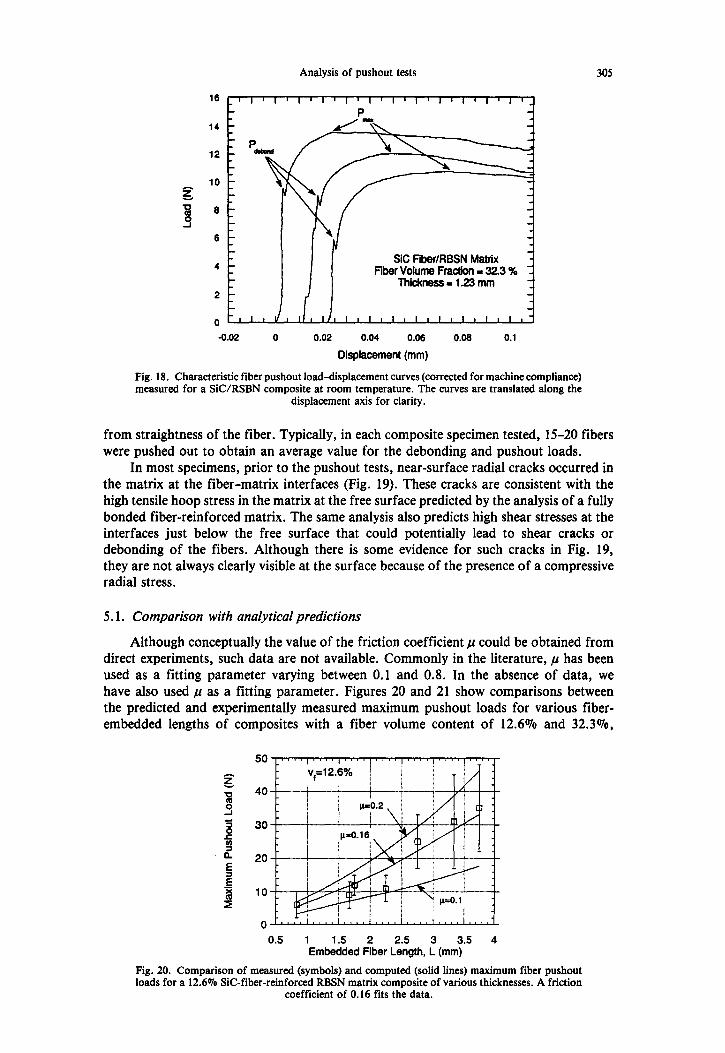
Figure 18 shows three typical load-displacement curves obtained from a pushout test for a composite with 32.3 vol.% fiber loading. The initial sharp drop observed at a load, Pa, corresponds to debonding between the matrix and fiber; while Pm, corresponds to the maximum load needed to overcome frictional resistance in order to start ejecting a totally debonded fiber from the opposite face of the specimen. It is evident that the locations of the initial load drop and the peak load varied significantly from specimen to specimen. In a few specimens, a load drop did not occur, while in others it occurred close to the peak load. The large scatter in the experimental data is primarily due to (a) processing inhomogeneity leading to variations in interfacial strengths along the length of the fiber, (b) location of debonding and sliding (e.g. at the fiber-C interface, C-C interface, or C-matrix interface), and (c) bending stress in fiber due to improper alignment or deviation
Analysis of pushout tests 303
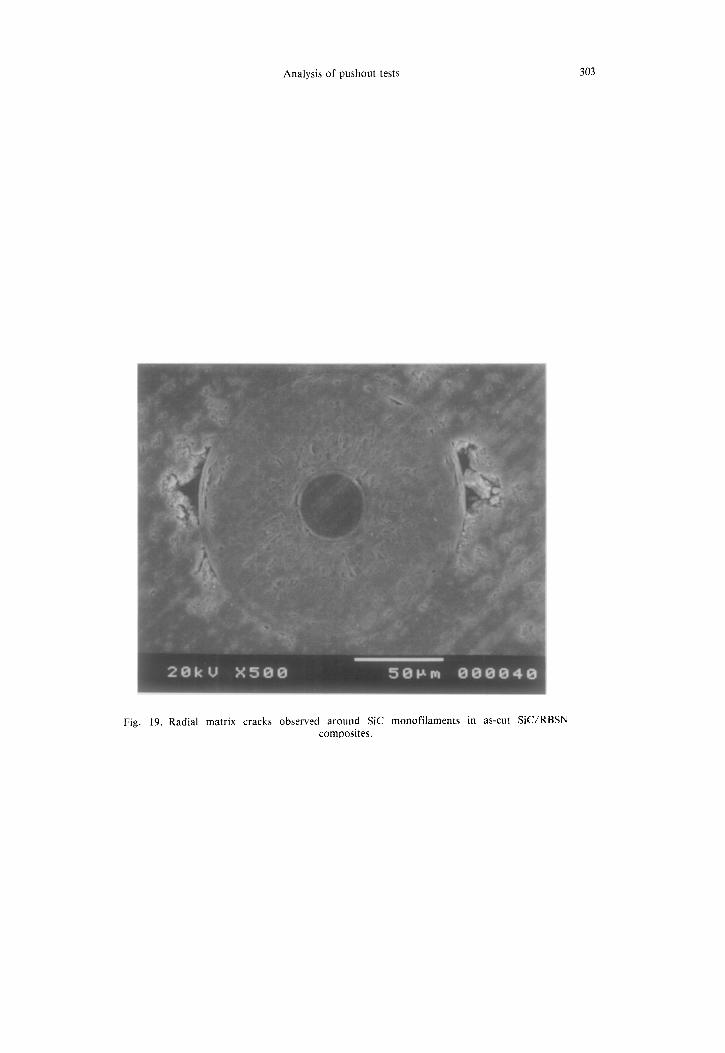
Fig. 19. Radial matrix cracks observed around Sic monofilaments in as-cut SiC/RBSN composites.
Analysis of pushout tests 305
6
-0.02 0 0.02 0.04 0.06 0.06 0.1
Displacement (mm)
Fig. 18. Characteristic fiber pushout load-displacement curves (corrected for machine compliance) measured for a SICYRSBN composite at room temperature. The curves are translated along the
displacement axis for clarity.
from straightness of the fiber. Typically, in each composite specimen tested, 15-20 fibers were pushed out to obtain an average value for the debonding and pushout loads.
In most specimens, prior to the pushout tests, near-surface radial cracks occurred in the matrix at the fiber-matrix interfaces (Fig. 19). These cracks are consistent with the high tensile hoop stress in the matrix at the free surface predicted by the analysis of a fully bonded fiber-reinforced matrix. The same analysis also predicts high shear stresses at the interfaces just below the free surface that could potentially lead to shear cracks or debonding of the fibers. Although there is some evidence for such cracks in Fig. 19, they are not always clearly visible at the surface because of the presence of a compressive radial stress.
5.1. Comparison with analytical predictions
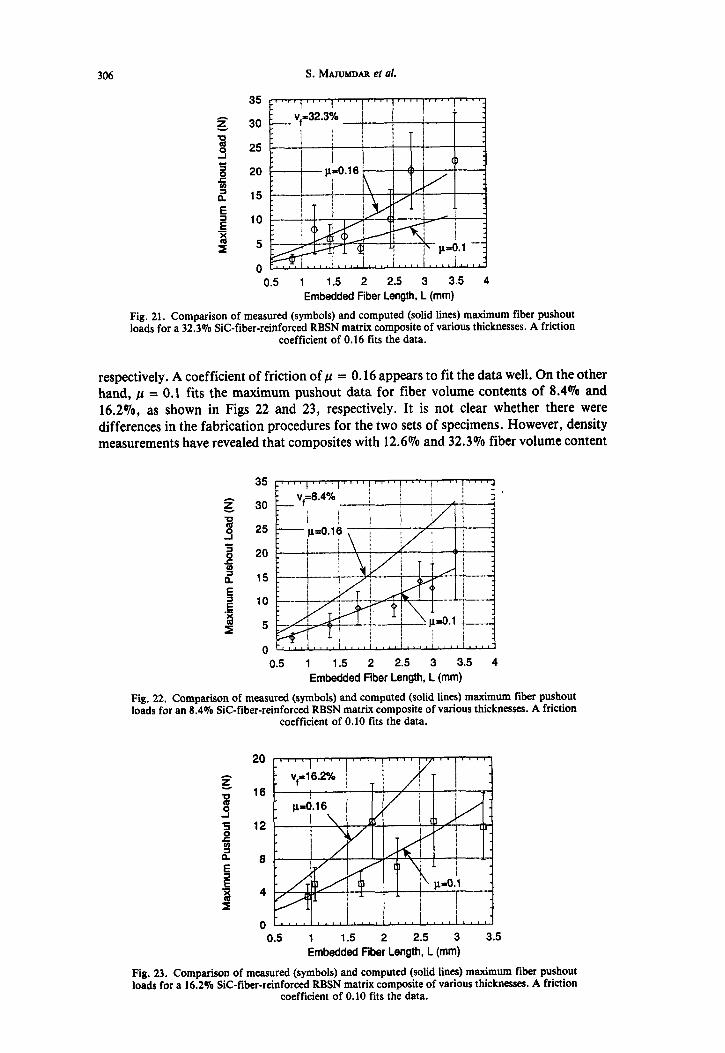
Although conceptually the value of the friction coefficient p could be obtained from direct experiments, such data are not available. Commonly in the literature, p has been used as a fitting parameter varying between 0.1 and 0.8. In the absence of data, we have also used b as a fitting parameter. Figures 20 and 21 show comparisons between the predicted and experimentally measured maximum pushout loads for various fiber- embedded lengths of composites with a fiber volume content of 12.6% and 32.3070,
0.5 1 1.5 2 2.5 3 3.5 4 Embedded Fiber Length, L (mm)
Fig. 20. Comparison of measured (symbols) and computed (solid lines) maximum fiber pushout loads for a 12.6% Sic-fiber-reinforced RBSN matrix composite of various thicknesses. A friction
coefficient of 0.16 fits the data.
306 S. MAJUMDAR et al.
0.5 1 1.5 2 2.5 3 3.5 4 Embedded Fiber Length, L (mm)
Fig. 21. Comparison of measured (symbols) and computed (solid lines) maximum fiber pushout loads for a 32.3% Sic-fiber-reinforced RBSN matrix composite of various thicknesses. A friction
coefficient of 0.16 fits the data.
respectively. A coefficient of friction of p = 0.16 appears to fit the data well. On the other hand, p = 0.1 fits the maximum pushout data for fiber volume contents of 8.4% and 16.2’70, as shown in Figs 22 and 23, respectively. It is not clear whether there were differences in the fabrication procedures for the two sets of specimens. However, density measurements have revealed that composites with 12.6% and 32.3% fiber volume content
0.5 1 1.5 2 2.5 3 3.5 4 Embedded Fiber Length, L (mm)
Fig. 22. Comparison of measured (symbols) and computed (solid lines) maximum fiber pushout loads for an 8.4% Sic-fiber-reinforced RBSN matrix composite of various thicknesses. A friction
coefficient of 0.10 fits the data.
20
0 0.5 1 1.5 2 2.5 3 3.5
Embedded Fiber Length, L (mm)
Fig. 23. Comparison of measured (symbols) and computed (solid lines) maximum fiber pushout loads for a 16.2% Sic-fiber-reinforced RBSN matrix composite of various thicknesses. A friction
coefficient of 0.10 fits the data.
6
Analysis of pushout tests 307
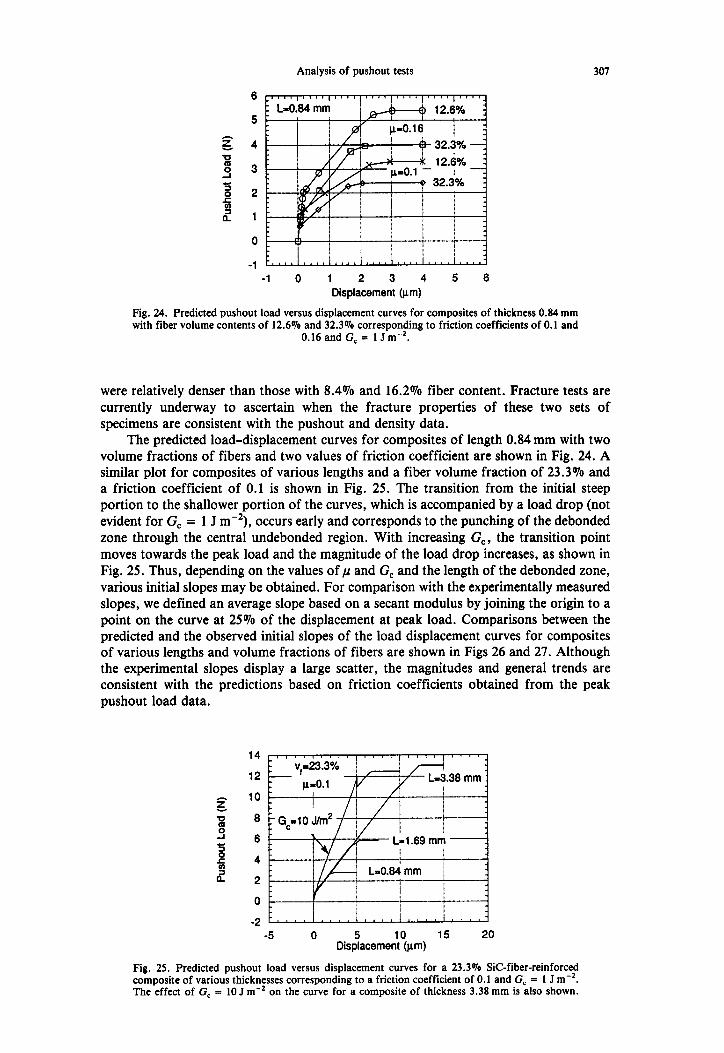
LA84 mm / i i u 12.6%
-1 -1 0 1 2 3 4 5 6
Displacement (pm)
Fig. 24. Predicted pushout load versus displacement curves for composites of thickness 0.84 mm with fiber volume contents of 12.6% and 32.3% corresponding to friction coefficients of 0.1 and
0.16 and G, = 1 J m-*.
were relatively denser than those with 8.4% and 16.2% fiber content. Fracture tests are currently underway to ascertain when the fracture properties of these two sets of specimens are consistent with the pushout and density data.
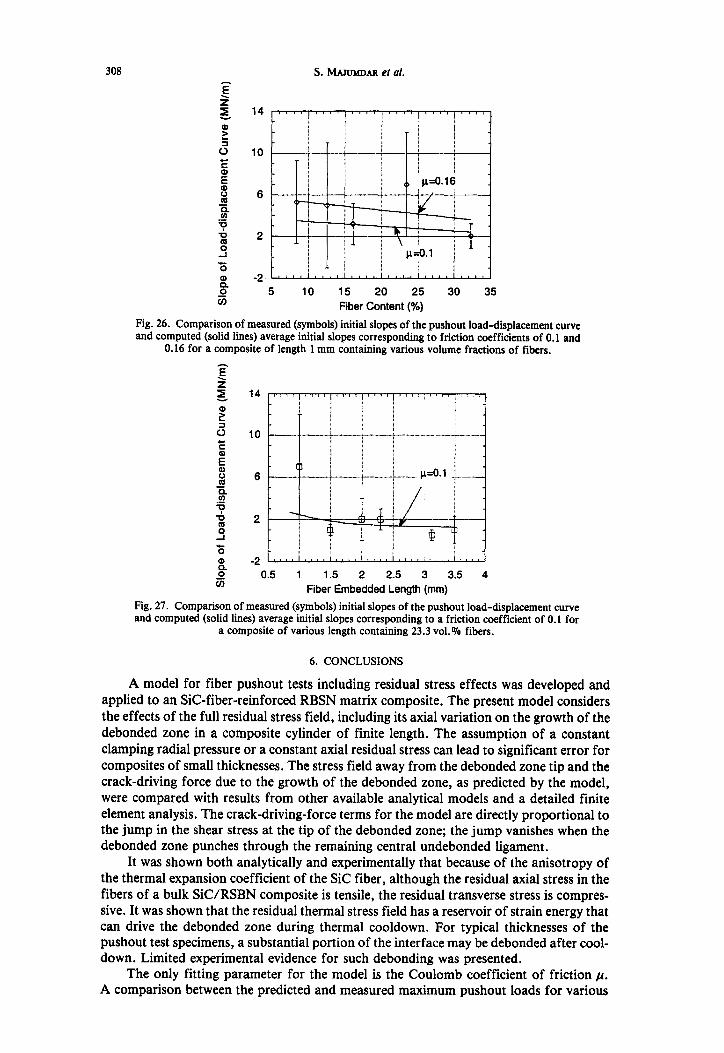
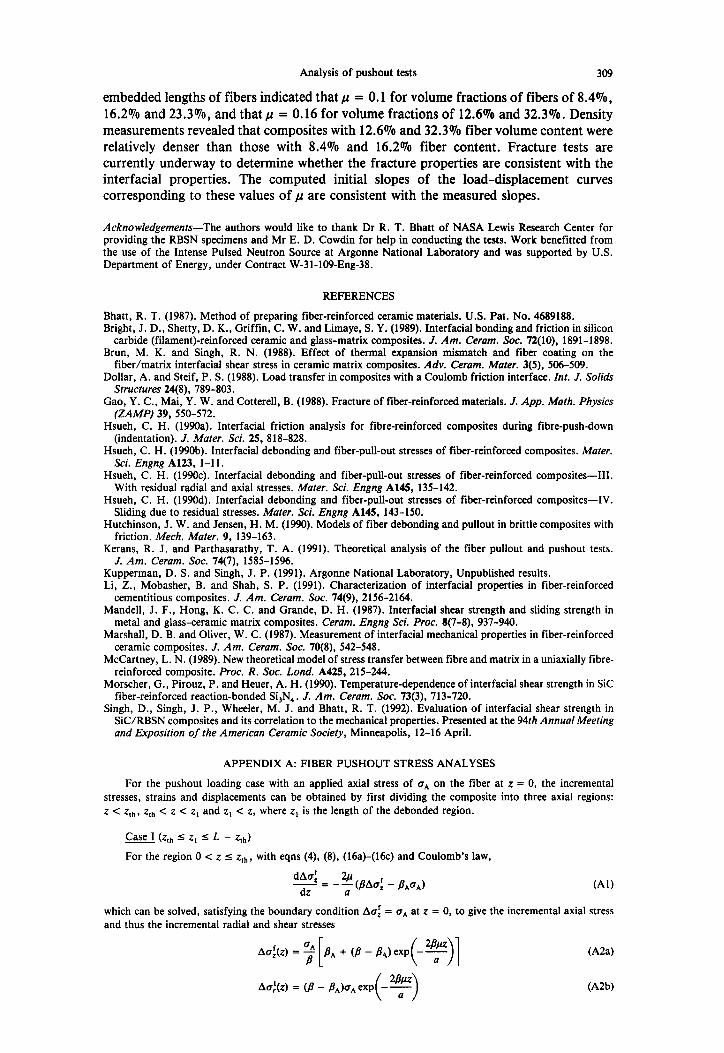
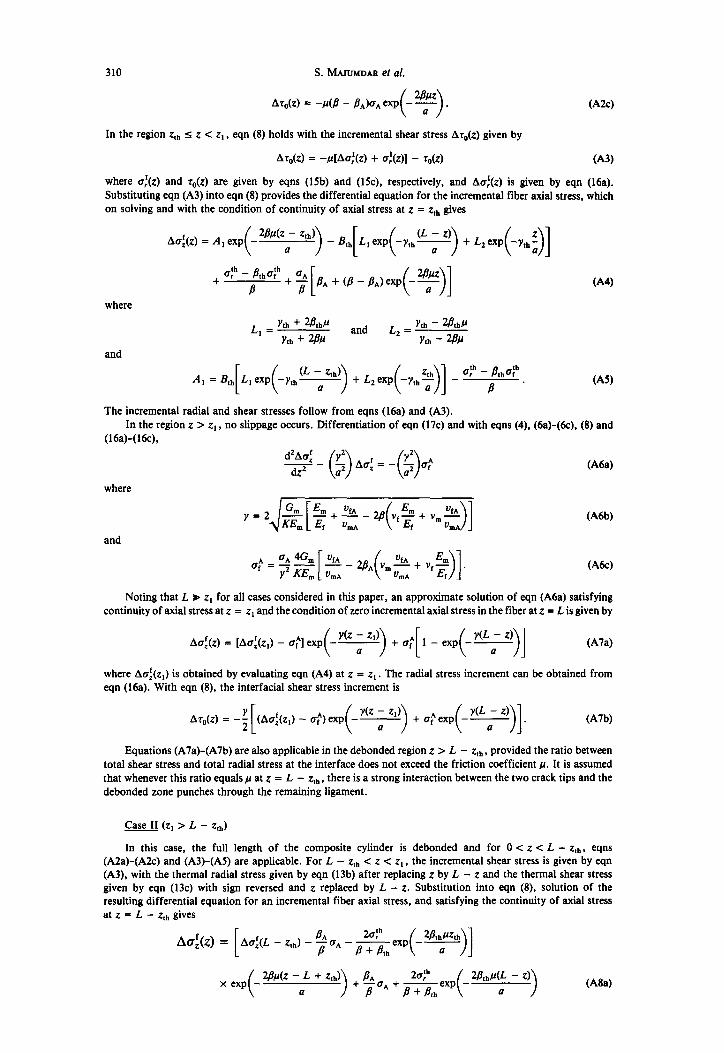
The predicted load-displacement curves for composites of length 0.84 mm with two volume fractions of fibers and two values of friction coefficient are shown in Fig. 24. A similar plot for composites of various lengths and a fiber volume fraction of 23.3% and a friction coefficient of 0.1 is shown in Fig. 25. The transition from the initial steep portion to the shallower portion of the curves, which is accompanied by a load drop (not evident for G, = 1 J mm2), occurs early and corresponds to the punching of the debonded zone through the central undebonded region. With increasing G,, the transition point moves towards the peak load and the magnitude of the load drop increases, as shown in Fig. 25. Thus, depending on the values of ,U and G, and the length of the debonded zone, various initial slopes may be obtained. For comparison with the experimentally measured slopes, we defined an average slope based on a secant modulus by joining the origin to a point on the curve at 25% of the displacement at peak load. Comparisons between the predicted and the observed initial slopes of the load displacement curves for composites of various lengths and volume fractions of fibers are shown in Figs 26 and 27. Although the experimental slopes display a large scatter, the magnitudes and general trends are consistent with the predictions based on friction coefficients obtained from the peak pushout load data.
14
12
10
8
6
4
2
0
-2 - -5 0
Dis~aceme~tqpm) 15 20
Fig. 25. Predicted pushout load versus displacement curves for a 23.3% Sic-fiber-reinforced composite of various thicknesses corresponding to a friction coefficient of 0.1 and G, = 1 J m-*. The effect of G, = 10 J m-* on the curve for a composite of thickness 3.38 mm is also shown.
308 S. MJWMD~ et 01.
Fig. and
6
2
-2 5 10 15 20 25 30 35
Fiber Content (%) 26. Comparison of measured (symbols) initial slopes of the pushout load-displacement curve computed (solid lines) average initial slopes corresponding to friction coefficients of 0.1 and
0.16 for a composite of length 1 mm containing various volume fractions of fibers.
z z t t z 14 IIII,IIII,III/,I~II,llliil II, z 14 IIII,IIII,III/,I~II,llliil II,
! : ! : E E j f ; j j f ; j
5 5 0 0 10 - 10 -
: ( : ( __.._- -T- -._... -.~--.-- ----__.____. _.-._r .--.. -- __.._- -T- -._... -.~--.-- ----__.____. _.-._r .--.. -- E E
i i
it it i : i i : i
0 0 6 6 --:L--.;---.,-- _.__._ +. .___. --:L--.;---.,-- _.__._ +. .___. i I i I
po.1 .L.. ____ po.1 .L.. ____
5 5 T T
3 3 2 2
s s ii ii ! j ! j / / E E -2 l,,,ll,l,ll,,lllllllll,ll.,,l,~l., -2 l,,,ll,l,ll,,lllllllll,ll.,,l,~l.,
z z 0.5 1 0.5 1 1.5 2 2.5 3 3.5 4 1.5 2 2.5 3 3.5 4
Fiber Embedded Length (mm) Fiber Embedded Length (mm)
Fig. 27. Comparison of measured (symbols) initial slopes of the pushout load-displacement curve Fig. 27. Comparison of measured (symbols) initial slopes of the pushout load-displacement curve and computed (solid lines) average initial slopes corresponding to a friction coefficient of 0.1 for and computed (solid lines) average initial slopes corresponding to a friction coefficient of 0.1 for
a composite of various length containing 23.3 vol.% fibers. a composite of various length containing 23.3 vol.% fibers.
6. CONCLUSIONS
A model for fiber pushout tests including residual stress effects was developed and applied to an Sic-fiber-reinforced RBSN matrix composite. The present model considers the effects of the full residual stress field, including its axial variation on the growth of the debonded zone in a composite cylinder of finite length. The assumption of a constant clamping radial pressure or a constant axial residual stress can lead to significant error for composites of small thicknesses. The stress field away from the debonded zone tip and the crack-driving force due to the growth of the debonded zone, as predicted by the model, were compared with results from other available analytical models and a detailed finite element analysis. The crack-driving-force terms for the model are directly proportional to the jump in the shear stress at the tip of the debonded zone; the jump vanishes when the debonded zone punches through the remaining central undebonded ligament.
It was shown both analytically and experimentally that because of the anisotropy of the thermal expansion coefficient of the Sic fiber, although the residual axial stress in the fibers of a bulk SiC/RSBN composite is tensile, the residual transverse stress is compres- sive. It was shown that the residual thermal stress field has a reservoir of strain energy that can drive the debonded zone during thermal cooldown. For typical thicknesses of the pushout test specimens, a substantial portion of the interface may be debonded after cool- down. Limited experimental evidence for such debonding was presented.
The only fitting parameter for the model is the Coulomb coefficient of friction fi. A comparison between the predicted and measured maximum pushout loads for various
Analysis of pushout tests 309
embedded lengths of fibers indicated that p = 0.1 for volume fractions of fibers of 8.49’0, 16.2% and 23.3070, and that p = 0.16 for volume fractions of 12.6% and 32.3%. Density measurements revealed that composites with 12.6% and 32.3% fiber volume content were relatively denser than those with 8.4% and 16.2% fiber content. Fracture tests are currently underway to determine whether the fracture properties are consistent with the interfacial properties. The computed initial slopes of the load-displacement curves corresponding to these values of p are consistent with the measured slopes.
Acknowledgemenrs-The authors would like to thank Dr R. T. Bhatt of NASA Lewis Research Center for providing the RBSN specimens and Mr E. D. Cowdin for help in conducting the tests. Work benefitted from the use of the Intense Pulsed Neutron Source at Argonne National Laboratory and was supported by U.S. Department of Energy, under Contract W-31-109-Eng-38.
REFERENCES
Bhatt, R. T. (1987). Method of preparing fiber-reinforced ceramic materials. U.S. Pat. No. 4689188. Bright, J. D., Shetty, D. K., Griffin, C. W. and Limaye, S. Y. (1989). Interfacial bonding and friction in silicon
carbide (filament)-reinforced ceramic and glass-matrix composites. J. Am. Cerum. Sot. 72(10), 1891-1898. Brun, M. K. and Singh, R. N. (1988). Effect of thermal expansion mismatch and fiber coating on the
fiber/matrix interfacial shear stress in ceramic matrix composites. A&. Ceram. Mufer. 3(5), 506-509. Dollar, A. and Steif, P. S. (1988). Load transfer in composites with a Coulomb friction interface. Int. J. So/ids
Structures 24(S), 789-803. Gao, Y. C., Mai, Y. W. and Cotterell, B. (1988). Fracture of fiber-reinforced materials. J. App. Math. Physics
(ZAMP) 39, 550-572. Hsueh, C. H. (199Oa). Interfacial friction analysis for fibre-reinforced composites during Iibre-push-down
(indentation). J. Mater. Sci. 25, 818-828. Hsueh, C. H. (199Ob). Interfacial debonding and fiber-pull-out stresses of fiber-reinforced composites. Muter.
Sci. Engng A123, l-l 1. Hsueh, C. H. (1990~). Interfacial debonding and fiber-pull-out stresses of fiber-reinforced composites-III.
With residual radial and axial stresses. Muter. Sci. Engng AM, 135-142. Hsueh, C. H. (1990d). Interfacial debonding and fiber-pull-out stresses of fiber-reinforced composites-IV.
Sliding due to residual stresses. Muter. Sci. Engng A145, 143-150. Hutchinson, J. W. and Jensen, H. M. (1990). Models of fiber debonding and pullout in brittle composites with
friction. Mech. Mater. 9, 139-163. Kerans, R. J. and Parthasarathy, T. A. (1991). Theoretical analysis of the fiber pullout and pushout tests.
J. Am. Ceram. Sot. 74(7), 1585-1596. Kupperman, D. S. and Singh, J. P. (1991). Argonne National Laboratory, Unpublished results. Li, Z., Mobasher, B. and Shah, S. P. (1991). Characterization of interfacial properties in fiber-reinforced
cementitious composites. J. Am. Ceram. Sot. 74(9), 2156-2164. Mandell, J. F., Hong, K. C. C. and Grande, D. H. (1987). Interfacial shear strength and sliding strength in
metal and glass-ceramic matrix composites. Ceram. Engng Sci. Proc. 8(7-S), 937-940. Marshall, D. B. and Oliver, W. C. (1987). Measurement of interfacial mechanical properties in fiber-reinforced
ceramic composites. J. Am. Ceram. Sot. 70(S), 542-548. McCartney, L. N. (1989). New theoretical model of stress transfer between fibre and matrix in a uniaxially fibre-
reinforced composite. Proc. R. Sot. Lond. A425,215-244. Morscher, G., Pirouz, P. and Heuer, A. H. (1990). Temperature-dependence of interfacial shear strength in SIC
fiber-reinforced reaction-bonded S&N,. J. Am. Cerum. Sot. 73(3), 713-720. Singh, D., Singh, J. P., Wheeler, M. J. and Bhatt, R. T. (1992). Evaluation of interfacial shear strength in
SiC/RBSN composites and its correlation to the mechanical properties. Presented at the 94th Annual Meeting and Exposition of the American Ceramic Society, Minneapolis, 12-16 April.
APPENDIX A: FIBER PUSHOUT STRESS ANALYSES
For the pushout loading case with an applied axial stress of aA on the fiber at t = 0, the incremental stresses, strains and displacements can be obtained by first dividing the composite into three axial regions: z < z,,,. z,,, < z c zr and z, < z, where z, is the length of the debonded region.
Case (z,, 5 ZI 5 L - z,,) For the region 0 < z I z,s, with eqns (4), (S), (16a)-(16-c) and Coulomb’s law,
F dAa: dz - - y- Wa: - /&a,)
which can be solved, satisfying the boundary condition ha: = aA at z = 0, to give the incremental axial stress and thus the incremental radial and shear stresses
Wa)
310 S. MAKIMDAR et al.
A?,,(z) = wd
In the region zfh zz z < zr , eqn (8) holds with the incremental shear stress AT,,(Z) given by
AT,(Z) = -AA&z) + u;(z)] - 70(z) (A3)
where u:(z) and r,,(z) are given by eqns (15b) and (UC), respectively, and A&z) is given by eqn (16a). Substituting eqn (A3) into eqn (8) provides the differential equation for the incremental fiber axial stress, which on solving and with the condition of continuity of axial stress at z = zth gives
where
and
A&z) = ,4iexp(-2”(zi ‘Ih)) - B,,[L,exP(-&,y) + &exP(-Ytt,z)]
L I
= Yth + 28th~
Yth + 2& and L, = Yth - 2&hp
Yth - 28p
A, = B,,[L,exp(-y,,?) + L,exp(-y,,?)] - “” -puih.
(A4)
(AS)
The incremental radial and shear stresses follow from eqns (16a) and (A3). In the region z > zr , no slippage occurs. Differentiation of eqn (17~) and with eqns (4), (6a)-(6c), (8) and
(16a)-(16c),
NW
and
where
(AW
Noting that L * z, for all cases considered in this paper, an approximate solution of eqn (A6a) satisfying continuity of axial stress at z = zi and the condition of zero incremental axial stress in the fiber at z = L is given by
A&z) = [Aui(z,) - utlexp(-v) + ot[l - exp(-y)]
where Aa: is obtained by evaluating eqn (A4) at z = zi . The radial stress increment can be obtained from eqn (16a). With eqn (8), the interfacial shear stress increment is
AT,,(z) = -i[(Aoi(z,) - ut)exp(-T) + urexp(-y)].
Equations (A7a)-(A7b) are also applicable in the debonded region z > L - zth, provided the ratio between total shear stress and total radial stress at the interface does not exceed the friction coefficient p. It is assumed that whenever this ratio equals p at z = L - zth, there is a strong interaction between the two crack tips and the debonded zone punches through the remaining ligament.
Case II (z, > L - zth)
In this case, the full length of the composite cylinder is debonded and for 0 < z < L - zth, eqns (A2a)-(A2c) and (A3)-(AS) are applicable. For L - zth < z < z, , the incremental shear stress is given by eqn (A3), with the thermal radial stress given by eqn (13b) after replacing z by L - z and the thermal shear stress given by eqn (13~) with sign reversed and z replaced by L - z. Substitution into eqn (8), solution of the resulting differential equation for an incremental fiber axial stress, and satisfying the continuity of axial stress at z = L - zth gives
A&) = A& - zth) - $uA - +$ th
exp(-?!+)]
2,$4z - L + Zth)
>
8A 2u;s x exp 2,&h/@ - z)
a +~“A’~ex”P
a > Wa)
Analysis of pushout tests 311
where A& - zu,) is obtained by evaluating eqn (A4) at z = L - zc, . The incremental radial stress is obtained from eqn (16a) and the incremental shear stress is obtained from eqn (A3) to give
Ar,(z) = -p[PAoi(z) - B,cr, - 20~hexp(-28’bP(~ - ‘))I. (-4
For z > z, , solution of the differential equation (A6a). satisfying continuity of axial stress at z = zI , and axial stress = 0 at z = 15, gives
Au:(z) = AJexp(--f) - exp(-v)] + o:[ 1 - -(--)I Wd
where
*’ =
Ao:(z,) - /$[I - e;P(-q)]
exp(-$ - exp(-y(=; ‘1)) WW
and A&z,) is obtained by evaluating eqn (ASa) at z = z, . The incremental radial stress is obtained from eqn (16a) and the incremental shear stress is obtained from eqn (8) to give
A 70(z) = -5 bj[exp(-f) + exp(-F)] + otexp(-?)I . (A9c)
APPENDIX B: STRAIN-ENERGY CALCULATIONS
Because of symmetry, only half the length of the cylinder need be considered; with z, = zu, for this case, eqns (3) and (7a) can be substituted into eqns (19a) and (19b) and added to give the total rate of change of the strain energy with debonded length as
where
@lb)
(Bid)
We)
With eqns (15a) and (lSd), integrations of eqns (Bid)-(Ble) give
1, = &? bgP[exp(-y) - exp(-y’L(Li “))]
+ s,,[ exp(-??JfL) - exp(-2y’h(Lf ‘I)) + 2yshr+) eXP(- y)]]
I2 = ;2[exp(-y) - exp(-Y’h(Li “‘>I
Wa)
VW
where U&,/azr is given by eqn (27).
Pushout loading
By substitution of eqns (4) and (16a) into eqns (19a)-(19b) and adding,
g = i pi, + S,,)I,
i-l
Wa)
312
where
S. MAJUMDAR et al.
4, = f [l - w + 4h)h + mLl(1 - Vf)l f
VW
1 - 2v,(j + &) + 2 We)
(B3f)
(B3g)
I, = s
L ,aaa:
azaz, dz @3h)
LI
z, = (B3i)
s
L aha’ z, = Ldz.
4, azl @3j)
With L * zl, eqn (A7a) can be differentiated to give the following derivative (note that the derivative for the fiber axial stress is zero for z < z,):
aAu::(z) 2 - = a [AtO - Ar,(z:)l exp az,
W)
By substitution of eqns (B4), (A7a) and (Ha) into eqns (B3h)-(B3j),
alI exp(-%h(~ - zl)/d
2[Az,(z;) - A70(z:ll
aZ2 ~PQ(z;) - A~,(z:)l 2~
WW
(B3c)
2[A,c,;PI-’ A&)] = f [’ - exp(-+))]’ WC)
Copyright © 2022 FDOKUMEN