Analysis of Policies of Railway Operators Using SWOT Criteria ...
21
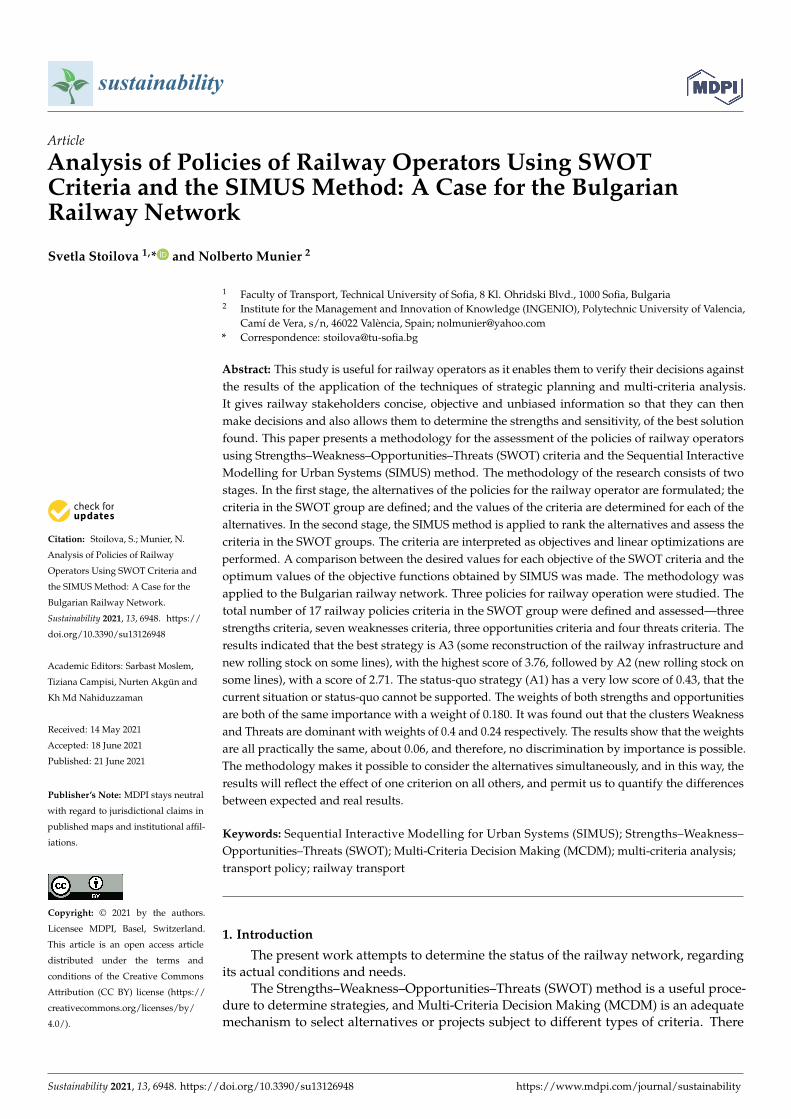
sustainability Article Analysis of Policies of Railway Operators Using SWOT Criteria and the SIMUS Method: A Case for the Bulgarian Railway Network Svetla Stoilova 1, * and Nolberto Munier 2 Citation: Stoilova, S.; Munier, N. Analysis of Policies of Railway Operators Using SWOT Criteria and the SIMUS Method: A Case for the Bulgarian Railway Network. Sustainability 2021, 13, 6948. https:// doi.org/10.3390/su13126948 Academic Editors: Sarbast Moslem, Tiziana Campisi, Nurten Akgün and Kh Md Nahiduzzaman Received: 14 May 2021 Accepted: 18 June 2021 Published: 21 June 2021 Publisher’s Note: MDPI stays neutral with regard to jurisdictional claims in published maps and institutional affil- iations. Copyright: © 2021 by the authors. Licensee MDPI, Basel, Switzerland. This article is an open access article distributed under the terms and conditions of the Creative Commons Attribution (CC BY) license (https:// creativecommons.org/licenses/by/ 4.0/). 1 Faculty of Transport, Technical University of Sofia, 8 Kl. Ohridski Blvd., 1000 Sofia, Bulgaria 2 Institute for the Management and Innovation of Knowledge (INGENIO), Polytechnic University of Valencia, Camí de Vera, s/n, 46022 València, Spain; [email protected] * Correspondence: stoilova@tu-sofia.bg Abstract: This study is useful for railway operators as it enables them to verify their decisions against the results of the application of the techniques of strategic planning and multi-criteria analysis. It gives railway stakeholders concise, objective and unbiased information so that they can then make decisions and also allows them to determine the strengths and sensitivity, of the best solution found. This paper presents a methodology for the assessment of the policies of railway operators using Strengths–Weakness–Opportunities–Threats (SWOT) criteria and the Sequential Interactive Modelling for Urban Systems (SIMUS) method. The methodology of the research consists of two stages. In the first stage, the alternatives of the policies for the railway operator are formulated; the criteria in the SWOT group are defined; and the values of the criteria are determined for each of the alternatives. In the second stage, the SIMUS method is applied to rank the alternatives and assess the criteria in the SWOT groups. The criteria are interpreted as objectives and linear optimizations are performed. A comparison between the desired values for each objective of the SWOT criteria and the optimum values of the objective functions obtained by SIMUS was made. The methodology was applied to the Bulgarian railway network. Three policies for railway operation were studied. The total number of 17 railway policies criteria in the SWOT group were defined and assessed—three strengths criteria, seven weaknesses criteria, three opportunities criteria and four threats criteria. The results indicated that the best strategy is A3 (some reconstruction of the railway infrastructure and new rolling stock on some lines), with the highest score of 3.76, followed by A2 (new rolling stock on some lines), with a score of 2.71. The status-quo strategy (A1) has a very low score of 0.43, that the current situation or status-quo cannot be supported. The weights of both strengths and opportunities are both of the same importance with a weight of 0.180. It was found out that the clusters Weakness and Threats are dominant with weights of 0.4 and 0.24 respectively. The results show that the weights are all practically the same, about 0.06, and therefore, no discrimination by importance is possible. The methodology makes it possible to consider the alternatives simultaneously, and in this way, the results will reflect the effect of one criterion on all others, and permit us to quantify the differences between expected and real results. Keywords: Sequential Interactive Modelling for Urban Systems (SIMUS); Strengths–Weakness– Opportunities–Threats (SWOT); Multi-Criteria Decision Making (MCDM); multi-criteria analysis; transport policy; railway transport 1. Introduction The present work attempts to determine the status of the railway network, regarding its actual conditions and needs. The Strengths–Weakness–Opportunities–Threats (SWOT) method is a useful proce- dure to determine strategies, and Multi-Criteria Decision Making (MCDM) is an adequate mechanism to select alternatives or projects subject to different types of criteria. There Sustainability 2021, 13, 6948. https://doi.org/10.3390/su13126948 https://www.mdpi.com/journal/sustainability
-
Upload
khangminh22 -
Category
Documents
-
view
3 -
download
0
Transcript of Analysis of Policies of Railway Operators Using SWOT Criteria ...
sustainability
Article
Analysis of Policies of Railway Operators Using SWOTCriteria and the SIMUS Method: A Case for the BulgarianRailway Network
Svetla Stoilova 1,* and Nolberto Munier 2
�����������������
Citation: Stoilova, S.; Munier, N.
Analysis of Policies of Railway
Operators Using SWOT Criteria and
the SIMUS Method: A Case for the
Bulgarian Railway Network.
Sustainability 2021, 13, 6948. https://
doi.org/10.3390/su13126948
Academic Editors: Sarbast Moslem,
Tiziana Campisi, Nurten Akgün and
Kh Md Nahiduzzaman
Received: 14 May 2021
Accepted: 18 June 2021
Published: 21 June 2021
Publisher’s Note: MDPI stays neutral
with regard to jurisdictional claims in
published maps and institutional affil-
iations.
Copyright: © 2021 by the authors.
Licensee MDPI, Basel, Switzerland.
This article is an open access article
distributed under the terms and
conditions of the Creative Commons
Attribution (CC BY) license (https://
creativecommons.org/licenses/by/
4.0/).
1 Faculty of Transport, Technical University of Sofia, 8 Kl. Ohridski Blvd., 1000 Sofia, Bulgaria2 Institute for the Management and Innovation of Knowledge (INGENIO), Polytechnic University of Valencia,
Camí de Vera, s/n, 46022 València, Spain; [email protected]* Correspondence: [email protected]
Abstract: This study is useful for railway operators as it enables them to verify their decisions againstthe results of the application of the techniques of strategic planning and multi-criteria analysis.It gives railway stakeholders concise, objective and unbiased information so that they can thenmake decisions and also allows them to determine the strengths and sensitivity, of the best solutionfound. This paper presents a methodology for the assessment of the policies of railway operatorsusing Strengths–Weakness–Opportunities–Threats (SWOT) criteria and the Sequential InteractiveModelling for Urban Systems (SIMUS) method. The methodology of the research consists of twostages. In the first stage, the alternatives of the policies for the railway operator are formulated; thecriteria in the SWOT group are defined; and the values of the criteria are determined for each of thealternatives. In the second stage, the SIMUS method is applied to rank the alternatives and assess thecriteria in the SWOT groups. The criteria are interpreted as objectives and linear optimizations areperformed. A comparison between the desired values for each objective of the SWOT criteria and theoptimum values of the objective functions obtained by SIMUS was made. The methodology wasapplied to the Bulgarian railway network. Three policies for railway operation were studied. Thetotal number of 17 railway policies criteria in the SWOT group were defined and assessed—threestrengths criteria, seven weaknesses criteria, three opportunities criteria and four threats criteria. Theresults indicated that the best strategy is A3 (some reconstruction of the railway infrastructure andnew rolling stock on some lines), with the highest score of 3.76, followed by A2 (new rolling stock onsome lines), with a score of 2.71. The status-quo strategy (A1) has a very low score of 0.43, that thecurrent situation or status-quo cannot be supported. The weights of both strengths and opportunitiesare both of the same importance with a weight of 0.180. It was found out that the clusters Weaknessand Threats are dominant with weights of 0.4 and 0.24 respectively. The results show that the weightsare all practically the same, about 0.06, and therefore, no discrimination by importance is possible.The methodology makes it possible to consider the alternatives simultaneously, and in this way, theresults will reflect the effect of one criterion on all others, and permit us to quantify the differencesbetween expected and real results.
Keywords: Sequential Interactive Modelling for Urban Systems (SIMUS); Strengths–Weakness–Opportunities–Threats (SWOT); Multi-Criteria Decision Making (MCDM); multi-criteria analysis;transport policy; railway transport
1. Introduction
The present work attempts to determine the status of the railway network, regardingits actual conditions and needs.
The Strengths–Weakness–Opportunities–Threats (SWOT) method is a useful proce-dure to determine strategies, and Multi-Criteria Decision Making (MCDM) is an adequatemechanism to select alternatives or projects subject to different types of criteria. There
Sustainability 2021, 13, 6948. https://doi.org/10.3390/su13126948 https://www.mdpi.com/journal/sustainability

Sustainability 2021, 13, 6948 2 of 21
are papers published where both methods have been used jointly; in this sense, SWOTidentifying strategies and MCDM determine the best strategy. This paper, even whenusing both procedures jointly, employs only the SWOT factors, that is Strengths–Weakness–Opportunities and Threats, the first two as internal or exogenous factors and the last twoas external or endogenous factors, which constitute the criteria This approach is differentfrom the normal procedure where the strategies are subject to a set of criteria.
This is not only a procedural novelty, but what is important about it is that usingSWOT factors, the result, obtained by MCDM, incorporates something valuable, whichis the analysis of the current situation, made by managers, as well as future decisions, toaddress a complex railway problem. In this case, performance factors are real, obtainedfrom railway archives and statistics. These factors are not subjective, since they are basedon the daily operation of the railway, and thus incorporate the goals of the management.
It is important to determine quantitatively how much an improvement in one of thesefactors affects the others, and how this is related to the needs of the company and thenecessity to get the best service, compared with other railways networks in Europeancountries. Consequently, using numbers for performance factors is not enough: thosenumbers must somehow incorporate the opinion, suggestions, results from discussions,etc., from stakeholders. This is the reason why we can consider this proposed procedureto be different from others as it uses SWOT factors as criteria to evaluate policies in anMCDM method.
The objective of this paper is to develop a methodology that can help to determinethe impact of one factor on the others, and how they are related in their influence. Thisinformation is needed for the management to have balanced information of the railwaystatus, i.e., which sectors need maximum improvement and which need to have lesserdegrees of development or service.
The hypothesis of this research is that a suitable transport policy can be successfullyidentified using the SWOT group criteria and Sequential Interactive Modelling for UrbanSystems (SIMUS) method which presents the criteria as objectives and uses the linear pro-gramming method. The ranking of alternatives is performed taking into account multipleobjectives. The linear optimization models for each objective are solved consistently [1–3].The research questions consist of the following issues: how to eliminate subjectivismwhen assessing the SWOT group criteria; how to assess the current situation as well asfuture consequences.
The aim of this research is to increase the level of decision making by integrating theadvantages of SWOT analysis with the advantages of the SIMUS method; to assess theSWOT criteria and alternatives of strategic planning; to help transport managers in theirdecisions on the analysis, comparison and the selection of a suitable strategy.
The application of a novel SWOT-SIMUS approach in this paper is presented in therailway transport system. The importance of rail transport as a service is that it is anecological means of transport with a low carbon footprint as compared to road transport.
The case of the Bulgarian railway network is presented. The current situation showsthat the average technical speed of passenger trains is one of the lowest in Europe, whichis the reason for the low quality of the service offered. The low quality and capabilities ofrolling stock hinder the innovative development of railway infrastructure. A significantproportion of the rolling stock operated on the national railway infrastructure is obsoleteand needs to be renewed and modernized. The existing structure of trains by type couldbe improved through the implementation of new types of trains. The alternatives for theimprovement of the Bulgarian railway transport are presented and the best one is selectedon the basis of the proposed approach.
The advantages of the novel SWOT-SIMUS approach are as follows: it does notuse expert assessments to evaluate the criteria and rank the alternatives; it uses linearoptimization for each objective which allows us to determine the score of each objective;it gives a ranking of the alternatives; the multi-criteria and multi-objective approaches to
Sustainability 2021, 13, 6948 3 of 21
decision making are combined to increase the adequacy of the results; it also allows for theweights of the criteria to be determined if the decision-maker wants to analyse them.
This paper is structured as follows. Section 2 shows the literature review; Section 3presents the material and methods and explains the proposed new SWOT-SIMUS approach.Section 4 shows the obtained results for the Bulgarian railway network and discussion.
2. Literature Review
Some authors consider only the problem with the formulation of the SWOT factors andtheir assignment to the relevant group as strengths, opportunities, threats, and weaknesses.The weights of the criteria in these cases are not determined. The application of SWOTanalysis is presented in [4]. The SWOT analysis of railway freight transport is conductedin [5]. In [6] a SWOT analysis of China’s High-speed Rail was made. The strengths,opportunities, threats, and weaknesses were formulated. The SWOT analysis was usedto develop city public transport strategies [7]. The SWOT analysis was applied to spatialplanning in the field of environmental resources management [8]. The railway sectorperformance with 130 companies in Turkey was studied. The authors have elaboratedmethodology to determine the most influenced factors on companies’ competitivenessperformances based on four approaches SWOT Analysis [9]. The data for analysis werecollected based on questionnaires. The different approaches have different dimensions, butit was found that the results given are similar. The SWOT analysis was also applied to studythe development strategy of automobile reverse logistics [10]; to analyse the undergroundpedestrian systems [11].
Some authors integrated the SWOT analysis with the Quantitative Strategic PlanningMatrix (QSPM) approach. This approach has been applied to investigate ecotourismdevelopment [12]. The model of sustainable urban development based on SWOT analysisand quantitative strategic planning matrix (QSPM) was performed in [13]. A large numberof SWOT criteria were introduced. Eleven strengths criteria, nine weaknesses criteria,fourteen opportunities criteria and ten threats criteria were listed and assessed through theexpert method with scores from 1 to 5. The SWOT strategies were evaluated and the mostattractive one was selected.
Some of the researchers combined the SWOT analysis with methods of multi-criteriaanalysis. Many researchers combined SWOT analysis and Analytic Hierarchy Process(AHP) or Analytic Network Process (ANP) methods. The combination of the AHP methodand SWOT analysis was applied to study the strategy of development of railway transportin West Africa [14]. The authors formulated sub-criteria in each SWOT group. A total offourteen sub-criteria was studied. The weights of the sub-criteria were determined by usingAHP. The extension of SWOT analysis, named TOWS analysis, was used to determine therelationships between the internal and external factors. Four different relationships, suchas SO, WO, ST, and WT were analysed through a combination of sub-criteria from thesegroups. So, different strategies were formulated. The air, rail, water, truck, and intermodalmodes were studied to determine the transport strategy for Cape Breton Island [15]. ASWOT matrix was formed, and SWOT factors in each group were defined. The authorsselected 20 factors (out of 55) to make a decision. The factors were ranked by using twomethods and expert assessment (multifactor process, and AHP method). The weightswere determined as average values of both methods. Finally, the transport strategieswere ranked. A hybrid “three-stage” SWOT model was elaborated in [16]. The modelwas experimented with for the Worldwide Express Mail Service in China. The AHPmethod was applied to evaluate the factors in each SWOT group and the priorities. Thestrategic quadrilateral model and the gravity center were used to represent the marketposition. The effective strategy was determined taking into account the maximum andsub-maximum sub-array techniques. In [17], the authors used a combination of the AHPmethod and SWOT analysis with the purpose to prepare an external analysis evaluation.The SWOT matrix was applied to identify the opportunities and threats for the company.The Long-Distance Passenger Transportation on a Highway Network was analysed by

Sustainability 2021, 13, 6948 4 of 21
using the SWOT-AHP model [18]. Five strengths criteria, four weaknesses criteria, threeopportunities criteria and three threats criteria were defined and assessed by the AHPmethod. The logistics strategy factors in terms of Strengths, Weaknesses, Opportunitiesand Threats were defined and assessed in [19]. The combination of SWOT and AHPmethods was used. In each SWOT group were introduced three criteria. Their weightswere determined by applying the AHP method. In [20] the authors used a combinationof the AHP and SWOT methods to investigate urban planning. The best strategy for thedevelopment of Urmia City was chosen. The tourism sector in Turkey was evaluatedthrough a combination of the SWOT and AHP methods. Four strengths criteria, fiveweaknesses criteria, five opportunities criteria and five threats criteria were defined. Theweights of criteria were determined through the AHP method [21]. The SWOT alternativeswere examined. The combination of Analytic Network Process (ANP) and SWOT wereapplied for ranking the energy automobile industry in China [22]; for evaluating naturalgas strategies [23].
In order to improve the decision-making process, another group of authors integratedmore multi-criteria methods with SWOT analysis. The SWOT analysis was combinedwith the Decision-Making Trial and Evaluation Laboratory (DEMATEL), analytic networkprocess (ANP), and TOPSIS and VIKOR methods [24]. The DEMATEL method was usedto determine the relationship between the criteria in the SWOT group. The weights ofcriteria were calculated by using the ANP method. The strategies were prioritized with theTOPSIS method, and compared through the VIKOR method. The SWOT analysis was alsocombined with ANP and VIKOR methods in [25].
Some authors used fuzzy sets and fuzzy multicriteria methods to take into accountthe uncertainty of the processes. In these cases, some research combined fuzzy variantsof the AHP method with SWOT analysis. The SWOT analysis was integrated with theneutrosophic (N-AHP) approach for Strategic Planning [26]. The triangular neutrosophicnumbers were used. In [27] there was proposed a new combined model including theSWOT analysis and intuitionistic fuzzy AHP (IF-AHP) methods to determine the weightsof the criteria in the SWOT groups. The model was applied in reverse logistics. Sixstrengths criteria, five weaknesses criteria, five opportunities criteria and five threatscriteria were defined and assessed through the IF-AHP method. An integrated approachbased on axiomatic fuzzy set (AFS) theory, analytic hierarchy process (AHP), simpleadditive weighting (SAW) and SWOT analysis was proposed in strategic planning [28]. Acase study of the tourism industry was presented. The SWOT group criteria included fourstrengths criteria, four weaknesses criteria, three opportunities criteria and four threatscriteria. Six alternatives were evaluated.
A hybrid approach based on Fuzzy AHP, Fuzzy TOPSIS methods and SWOT analysiswas applied in [29] to assess alternative railway lines. The criteria in the SWOT group weredetermined through Focus Group Discussion. The combination of AHP and fuzzy TOPSISwith SWOT analysis was also demonstrated in [30]. The most appropriate strategic planfor energy cooperation was proposed, by evaluating four alternatives identified from theSWOT analysis. The methodology was used for the case of Morocco and Egypt. In [31] theauthors applied the integration of the AHP method, fuzzy TOPSIS and SWOT analysis toevaluate the electricity supply chain. The total number of 48 criteria in the SWOT groupwere studied and ranked—12 strengths criteria, 15 weaknesses criteria, 12 opportunitiescriteria and 9 threats criteria. The SWOT analysis was integrated with the Fuzzy PreferenceRanking Organization Method for Enrichment Evaluations (F-PROMETHEE) method forthe selection of the optimal toll collection system [32]. The alternatives were analysed basedon the SWOT analysis according to their strengths, weaknesses, opportunities and threats.Five groups of criteria and sub-criteria in each group were defined and assessed throughfuzzy numbers and pair-wise comparison. The alternatives were ranked according to thePROMETHEE method. The city’s transportation system strategies were evaluated andprioritized based on SWOT analysis and fuzzy complex proportional assessment (COPRAS)method [33]. The authors defined six strengths criteria, eight weaknesses criteria, four
Sustainability 2021, 13, 6948 5 of 21
opportunities and four threats criteria. Based on SWOT analysis, the strategies of transportdevelopment were proposed and evaluated using the economic, environmental, and socialindices of the COPRAS method.
An integrated SWOT-FUZZY PIPRECIA model was formed to analyse and improvelogistics performances [34]. The transport of goods was studied. The internal and externalfactors were determined. The authors listed six strengths factors, six weaknesses factors,five opportunities factors and six threats factors. The criteria evaluation was performedusing a linguistic scale and fuzzy triangle numbers. The ranking of SWOT group criteriawas performed. A complex model for strategic planning for a holding car manufacturercompany was elaborated in [35] on the basis of a fuzzy quantitative strategic planningmatrix (FQSPM) and SWOT analysis. The FQSPM method was applied to assess the un-certainty of the criteria. A large number of SWOT criteria were analysed. Their numberwas reduced on the basis of their weights using Gap analysis with fuzzy data ranking.Five alternatives were compared. The evaluation of the performance of the alternativesand the selection of the best one was made through a comparison using several fuzzymulti-criteria methods—ARAS-F, COPRAS-F, Fuzzy MOORA, and Fuzzy TOPSIS methods.In [36] the authors combined three methods, SWOT analysis, Hesitant Fuzzy LinguisticAnalytic Hierarchical Process (HFL-AHP) and Hesitant Fuzzy Linguistic Multi-AttributiveBorder Approximation Area Comparison (HFL-MABAC) to prioritize health tourism strate-gies. The authors defined twenty-four criteria for SWOT analysis and eight alternatives.The hesitant fuzzy linguistic approach was used to take into account the uncertainty ofthe process.
Some authors combined the SWOT approach with mathematical optimization [37,38].The fuzzy SWOT analysis and fuzzy linear programming were used together for supplierselection [37]. The weights of criteria in the SWOT groups were determined using linguisticvariables and expert assessment. The fuzzy linear mathematical model was elaborated todetermine the quantity from each supplier. The weights were used as an input to the model.Another model for supplier selection was elaborated on in [38]. The authors combined theSWOT analysis and integer linear programming (ILP). The experts assessed the criteria inthe SWOT groups. The weights of criteria were calculated based on Shannon entropy. Theresults were applied as input for the ILP model to select a supplier. It can be concludedthat in the cases of combination of SWOT analysis with mathematical optimization, theexpert evaluation was also used to determine the weights of the criteria, which increasesthe subjectivity of decision-making.
Some authors applied a combination of SWOT analysis and political, economic, social,technological, legal and environmental (PESTLE) analysis to identify both the internal andexternal factors that have an impact on the studied system. In [39], the SWOT/PESTLEanalysis was used to determine the factors that have a positive or negative effect on theadoption and successful implementation of a port energy management system. In [40] aSWOT/PESTLE analysis was utilized to show different policies and initiatives, related toe-mobility, renewable energies and information and communication technology, collectedfrom five European regions. The Drain Water Heat Recovery Units in Poland were studiedusing a SWOT/PESTLE analysis [41].
The common denominator in all cited studies is the evaluation of the SWOT criteria; thesubjective approach by using expert assessments; the application of the multi-criteria approach.
SIMUS is a multi-criteria method that does not use experts and evaluation scales. It isbased on the linear programming method and this is its main advantage. The criteria areconsidered as objectives. The difference between this study and related research is in theabsence of subjectivity, which is a novelty in this field.
3. Materials and Methods
Figure 1 shows the scheme of the methodology.

Sustainability 2021, 13, 6948 6 of 21Sustainability 2021, 13, x FOR PEER REVIEW 6 of 21
Figure 1. Scheme of the methodology.
The methodology of the research consists of two stages: - In the first stage, the alternatives for the policies of the railway operator are formu-
lated; the criteria in the SWOT group are defined; the values of the criteria are deter-mined for each alternative. In this stage, the decision matrix is formed. It should be noted that the alternatives are not SWOT strategies which are pairs of factors, for example, Strength–Opportunities strategy or another.
- In the second stage, the SIMUS method is applied to rank the alternatives and assess the criteria in the SWOT groups. A comparison is made of the desired values for each objective of the SWOT criteria and the optimum values of the objective functions ob-tained by SIMUS.
3.1. Determination of the Alternatives The alternatives in this research represent strategies of the railway operator about the
policies for railway transport. The case for the Bulgarian railway is considered as follows: there are three alternatives, or strategies, the first of which is to maintain the state of affairs as it is; the second, to replace the rolling stock only on some lines of the network, which is a partial improvement; the third, partial improvement on some lines with replacement of some of the rolling stock and also partial improvement of the railway infrastructure.
The characteristics of the alternatives are presented as follows: A1—Maintain the current situation in the railway service, or status quo. In this alter-
native, nothing is done. Only some sections are rehabilitated to increase speed according to [42].
A2—New rolling stock on some lines. It means a staged update of rolling stocks. At the moment the government has decided to purchase new rolling stock (locomotives and electric multiple units) The delivery of new locomotives is part of BDZ’s (Bulgarian State
Figure 1. Scheme of the methodology.
The methodology of the research consists of two stages:
- In the first stage, the alternatives for the policies of the railway operator are formulated;the criteria in the SWOT group are defined; the values of the criteria are determinedfor each alternative. In this stage, the decision matrix is formed. It should be notedthat the alternatives are not SWOT strategies which are pairs of factors, for example,Strength–Opportunities strategy or another.
- In the second stage, the SIMUS method is applied to rank the alternatives and assessthe criteria in the SWOT groups. A comparison is made of the desired values foreach objective of the SWOT criteria and the optimum values of the objective functionsobtained by SIMUS.
3.1. Determination of the Alternatives
The alternatives in this research represent strategies of the railway operator about thepolicies for railway transport. The case for the Bulgarian railway is considered as follows:there are three alternatives, or strategies, the first of which is to maintain the state of affairsas it is; the second, to replace the rolling stock only on some lines of the network, which isa partial improvement; the third, partial improvement on some lines with replacement ofsome of the rolling stock and also partial improvement of the railway infrastructure.
The characteristics of the alternatives are presented as follows:A1—Maintain the current situation in the railway service, or status quo. In this alter-
native, nothing is done. Only some sections are rehabilitated to increase speed accordingto [42].
A2—New rolling stock on some lines. It means a staged update of rolling stocks.At the moment the government has decided to purchase new rolling stock (locomotivesand electric multiple units) The delivery of new locomotives is part of BDZ’s (Bulgarian
Sustainability 2021, 13, 6948 7 of 21
State Railways) plans for modernization and improvement of the railway service. Withthe purchase of new rolling stock, the goal is to replace 50% of the rolling stock by 2024.BDZ already has three new locomotives, which run on trains on the Sofia–Burgas–Sofia,Sofia–Varna–Sofia and Sofia–Svilengrad–Sofia routes. It is planned that up to 16 newelectric multiple units will serve fast intercity trains for trips over 3 h along the mainBulgarian railways.
A3—Some reconstruction of the railway infrastructure and new rolling stock onseveral lines. It means the rehabilitation of the railway lines financed under [42], and it iscurrently underway.
3.2. Defining the Criteria in SWOT Groups
The definition of the criteria depends on the transport policy assessment. It is nec-essary to define the criteria in the SWOT groups that are related to the capabilities of thetransport operator and the requirements of passengers for transport. The main criteria toevaluate the transport plan in railway transport are defined in [43] as follows: transportsatisfaction, trains/day; operating costs, EUR/day; the average number of train stops;reliability; average operational speed, km/h; directness. The main criteria for evaluationof the transport plan by railway and road transport in parallel routes were defined asfollows: environmental criteria refer to the carbon dioxide and pollutant emissions duringtransportation; economic criteria include operational costs, fares, infrastructure charges,ticket price; technological criteria including the time spent travelling in hours, possibility oftransportation from door to door, duration of transshipment operations; and social criteriarefer to comfort, safety and reliability [43]. The criteria in the SWOT groups are definedtaking into account the criteria defined in [43] related to railway planning.
In this study the SWOT criteria can be defined as quantitative and qualitative. Thequantitative criteria are set with their values for each of the studied alternatives. Thequality criteria are set in the following ways: with a scale for evaluating the performance ofthe respective criterion or by using the answer “yes” or “no”. In the first case, the followingrating scale is selected: 0, 1, 2 or 3. The value “0” indicates non-fulfilment of the respectiveindicator; a value of “1”, “2” or “3” means low, medium or high performance respectively.In the second case, if the answer is “yes”—“1”is written, otherwise—“0”.
In this study, the following criteria in the SWOT groups (clusters) are proposed:
3.2.1. Internal to the Railway
Strengths (S), in the network, with the following criteria:S1—Ecological transport with low CO2 emissions. The values of CO2 emissions are
determined according to the electricity generated for railway traction. The electric-multipleunit trains have lower energy consumption, which allows for a reduction of the emissionswith approximately the same number of trains on the lines. Naturally, power consumptionincreases proportionally to the speed increment; consequently, the goal of this criterion isto minimize electric consumption.
S2—Security in the network. The values of this criterion are 1 or 2, which shows thelevel of security. The current situation (A1) has a value of 1, while A2 and A3 have a valueof 2, taking into account that the new rolling stock and the reconstructions on railwayinfrastructure increase the level of security of transport. The objective of this criterion is tomaximize security.
S3—Reliability of the network. This criterion is assessed as 1, 2 and 3. A1 is valued as 1.A2 is assigned 2, considering that the renovation of rolling stock increases the reliability oftransport. The value of 3 is appropriate A3 because it offers increased reliability—on theone hand by the rolling stock and on the other by the railway. The objective of this criterionis to maximize reliability.
Weakness (W), with the following criteria:W1—Weak position in the transport market. This criterion can have values of 1, 2 or 3.
A1 is assessed as 1. The position of railway transport on the market of transport services
Sustainability 2021, 13, 6948 8 of 21
improves, with the improvement of the condition of the rolling stock and railway infras-tructure, as quality, comfort, safety and reliability of transport increase. Value 2 denotesimproving the market position of the railway due to rolling stock renewal. Value 3 showsan increase in the railway market position. The objective of this criterion is maximization.
W2—Low frequency of transportation (pair trains/day). This criterion shows thepossibilities of the rail operator to meet the needs of passengers for transport. The numberof trains increases when the railway infrastructure is improved. The objective of thiscriterion is maximization.
W3—Low operating speed (km/h). The operating speed is determined as an averageof all fast and high-speed trains in the railway network. The operating speed includes thetrain speed and the duration of the stops at the stations along the route. In the currentsituation (A1), the operating speed is low, because many sections of the railway have a lowpermissible speed. The increase of the operational speed is achieved with the reconstructionof the infrastructure. The renovation of rolling stock allows for the reduction of downtimedue to accidents, technical failures, and an insufficient number of locomotives. The valueof this criterion increases when there are conditions for some trains to run at high speed.The objective of this criterion is maximization.
W4—High operating costs (EUR/day). Operating costs depend on the number oftrains. Costs for investment in rolling stock, as well as for reconstruction are not taken intoaccount. The objective of this criterion is minimization.
W5—Few direct trains. This means services between the start and endpoints with areduced number of intermediate stops. This criterion may have the following values: 0 or 1.The current situation (A1) is characterized by two categories: Fast trains with mandatoryreservation, which serve big administrative and transportation centres. Fast trains whichdo not require mandatory reservation and also serve additional municipal centres. Thevalue of this criterion for the current situation (A1) is 0. The introduction of direct expressintercity trains, which have reduced stops in only a few places along the route, increasesthe directness of the journey and reduces travel time. The renewal of the rolling stock,as well as the reconstruction of the infrastructure, increases directness, therefore, A2 andA3 have a value of 1, which means direct express routes. The objective of this criterionis maximization.
W6—Increased average number of stops. This refers to the average number of stopsper train, taking into account all fast and accelerated fast trains on the railway network.Two aspects of this criterion must be considered. The first one is that the increased numberof stops provides a better frequency of service to the settlements. The second is that dueto the decrease in the number of stops, the operating speed increases, and the travel timebetween the start and end point decreases. In addition, it should be borne in mind thatexpress intercity trains with a mandatory reservation must ensure the directness of travel,i.e., reduced number of stops along the route. In this research, the objective of this criterionis maximization as the reduced number of stops on express trains increases the directnessand speed of travel.
W7—Low comfort. Travel comfort is expressed by ensuring the convenience oftravelling in clean, renovated or renewed rolling stock. The values of this criterion are 0,1 or 2; the higher the values the greater the comfort. The value of the criterion for A1is 0;for A2 is 1; and for A3 is 2, as increasing speed increases the stability of the journey. Theobjective under this criterion is maximization.
3.2.2. External to the Railway
Opportunities (O), with the following criteria:O1—Possibility of a European Rail Traffic Management System (ERTMS) system.
ERTMS is a new train signaling and traffic management system, created to assist interoper-ability by using a unique signaling and communication standard throughout Europe. Thereare three levels of the application of ERTMS. The new rolling stock and the reconstructionof railway infrastructure to increase the maximum speeds allow for the application of a

Sustainability 2021, 13, 6948 9 of 21
higher level of ERTMS—level 2. Currently, the level on the main lines of the Bulgarianrailway network is 1. This criterion may have the following values: 0 or 1. The objective ofthis criterion is maximization.
O2—Increase the speed of trains. Increasing speed depends on the quality andcapabilities of the railway infrastructure. The values of this criterion are 0, 1 or 2. A highvalue indicates high speed. The new rolling stock allows for increased speed when thereare no restrictions on the railway infrastructure. In this case, the value of the criterion is 1.When, in addition to renewed rolling stock, there is also a reconstruction of the railwayinfrastructure, the possibilities for high speeds increase significantly. The value of thecriterion is 2 for alternative A3. The objective under this criterion is maximization.
O3—Opportunities for additional services. The values of this criterion are 0 or 1. Thenew rolling stock has equipment with modern information systems, and WI-FI networkson the trains. The objective under this criterion is maximization.
Threats (T), with the following criteria:T1—Delayed purchase of rolling stock. This means a delay in the scheduled purchas-
ing time due to financial and other reasons by the railway operator. The values of thiscriterion are 0 or 1. The value of 1 indicates a lack of purchase of rolling stock or delay inthe purchase plan. The delayed purchase affects alternatives A2 and A3. Value 1 shows theimplementation of the new rolling stock in operation on the planned routes in the railwaynetwork. Value 0 is set for the current situation (A1). The objective under this criterionis minimization.
T2—Increasing the quality of road infrastructure. Improving the condition of roadinfrastructure makes it possible to increase the speed of cars and buses in parallel routesto railway transport. The current situation indicates priority use of road transport. Thepossible values of this criterion are 0 or 1. Value 1 shows a preference for road operators.The attractiveness of railway transport services increases when it offers comfortable, high-speed and safe transport. Road infrastructure affects A1 and A2. In these cases, therailway infrastructure has to be competitive on parallel lines with road infrastructure.Alternative A3 is competitive on parallel lines with road infrastructure because the railwayinfrastructure was improved. The objective under this criterion is minimization.
T3—Increasing the speed of road transport. The increase in speed on motorwayssuccessfully competes with the low speeds on rail transport in the current situation. Thevalues of this criterion are 0 or 1. The objective is minimization.
T4—Decline in traffic. The reduction of traffic may be due to various reasons suchas pandemics, natural conditions and others. The reduction is not the same for differentmodes of transport. The value of the traffic reduction depends on the conditions offeredby the carrier and the transport infrastructure. Passengers’ preferences for rail transportin pandemic conditions are reduced in favor of car travel. The values of this criterion are0 or 1. It is equal to 0 when the reduction in traffic does not affect the position of railwaytransport on the transport market. The value of 1 applied otherwise. The objective hereis minimization.
3.3. SIMUS Method Application and Selecting the Best Strategy
The SIMUS method is based on Linear Programming, Weighted Sum and Outrank-ing [1–3]. This approach considered the criteria as objectives in Linear optimization models.The initial decision matrix is formed with alternatives in columns and criteria in rows, andthe normalization of the matrix is performed. Then, the linear optimization models areformed taking each criterion as an objective, and the optimal scores for the alternativesare determined. These scores are placed in an Efficient Result Matrix (ERM). This matrixis considered to be a new decision matrix, composed of the optimal values. The SIMUSprocedure applies two different multi-criteria procedures to rank the alternatives. The firstis based on the Weighted Sum method and the second one uses an outranking approachforming a new matrix, called Project Dominance Matrix (PDM), that determines the bestalternative. The results of both methods give the same ranking. This approach serves to
Sustainability 2021, 13, 6948 10 of 21
validate the results. The SIMUS method also gives the marginal utilities for each criterion,and allows us to determine the robustness of the solution.
Once defined the alternatives and the corresponding criteria are defined, it is necessaryto bear in mind that this MCDM analysis is not looking for optimality, because normally itdoes not exist in multi-criteria problems, but to reach a compromise solution, i.e., a balancebetween all demands established by the alternatives (strategies). The reason lies in thefact that normally criteria or objectives are sometimes opposite, and because the method isaimed at maximizing some, while minimizing others, as in the case of maximizing benefits,and at the same time minimizing costs, consequently, an intermediate solution needs tobe found. This is a complex problem and there is a large array of mathematical methodsto solve it. In this work, the SIMUS method was chosen among them, since it allows formodelling the scenario as close as possible, and this is of paramount importance becauseif the modelling is imperfect, incomplete or biased, the result or the selection of the beststrategy is not reliable or credible.
4. Results and Discussion
This research includes the following technical limitations: infrastructure restrictionson the maximum permitted train speed; restrictions on the maximum number of trainson railway lines; limitations on the available number of rolling stock for train service;restrictions for implementation of the rehabilitation of the sections of the railway lines,according to the operational program transport. From the software point of view, there areno limitations. It can work with hundreds of alternatives and criteria.
4.1. Determination of the Initial Decision Matrix. Performing the SIMUS Procedure
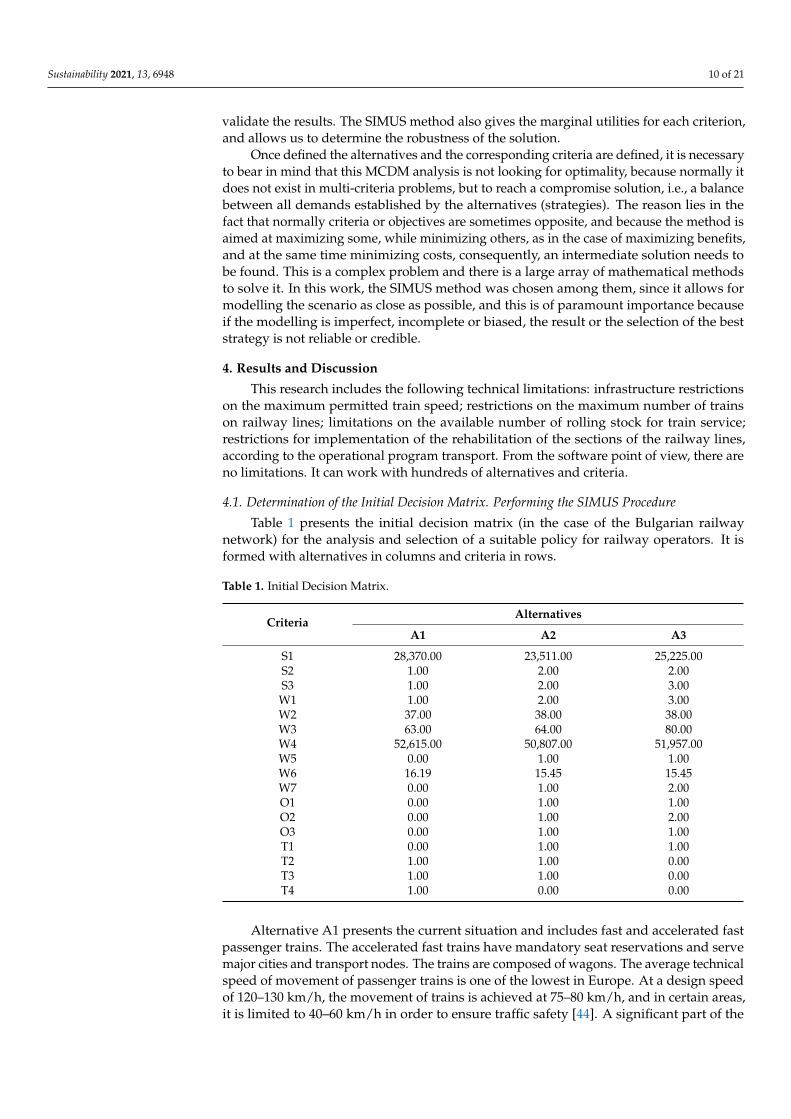
Table 1 presents the initial decision matrix (in the case of the Bulgarian railwaynetwork) for the analysis and selection of a suitable policy for railway operators. It isformed with alternatives in columns and criteria in rows.
Table 1. Initial Decision Matrix.
CriteriaAlternatives
A1 A2 A3
S1 28,370.00 23,511.00 25,225.00S2 1.00 2.00 2.00S3 1.00 2.00 3.00W1 1.00 2.00 3.00W2 37.00 38.00 38.00W3 63.00 64.00 80.00W4 52,615.00 50,807.00 51,957.00W5 0.00 1.00 1.00W6 16.19 15.45 15.45W7 0.00 1.00 2.00O1 0.00 1.00 1.00O2 0.00 1.00 2.00O3 0.00 1.00 1.00T1 0.00 1.00 1.00T2 1.00 1.00 0.00T3 1.00 1.00 0.00T4 1.00 0.00 0.00
Alternative A1 presents the current situation and includes fast and accelerated fastpassenger trains. The accelerated fast trains have mandatory seat reservations and servemajor cities and transport nodes. The trains are composed of wagons. The average technicalspeed of movement of passenger trains is one of the lowest in Europe. At a design speedof 120–130 km/h, the movement of trains is achieved at 75–80 km/h, and in certain areas,it is limited to 40–60 km/h in order to ensure traffic safety [44]. A significant part of the

Sustainability 2021, 13, 6948 11 of 21
rolling stock does not meet European standards regarding comfort and quality. The existingstructure of trains by type could be improved through the implementation of new typesof trains.
Alternative A2 offers three categories of trains—fast trains, accelerated fast trains anddirect express trains. The direct express trains are intercity trains that have also mandatoryseat reservations and serve major transport and administrative centres. They have a lowernumber of stops in comparison to accelerated fast trains. Express trains and acceleratedfast trains in alternatives A2 and A3 are composed of novel EMUs. As Alternatives A2and A3 include fewer stops the value of criterion W6 decreases. The number of trains foralternatives A2 and A3 increases due to the replacement of old rolling stock with new ones.The new electric multiple unit trains (EMU) are characterized by lower electricity consump-tion compared to trains composed of wagons and locomotives due to their lower mass.The inclusion in the scheme of transport of a new generation of trains leads to a reductionof electricity costs and, accordingly, of carbon dioxide emissions for the production ofelectricity by the power plants. The increase in electricity consumption for alternative A3 isdue to the movement of trains with increased maximum speed 100–120 km in the directionSofia–Plovdiv–Burgas (this is part of the core TEN-T network). The introduction of novelEMUs leads to a reduction of direct operating costs by 3.44% for A2, and upon completionof the rehabilitation of the railway infrastructure by 1.25% for A3 (Table 1—criterion S1).
Figure 2 shows the scheme of the itineraries of the passenger trains in the Bulgarianrailway network.
Sustainability 2021, 13, x FOR PEER REVIEW 11 of 21
T1 0.00 1.00 1.00 T2 1.00 1.00 0.00 T3 1.00 1.00 0.00 T4 1.00 0.00 0.00
Alternative A1 presents the current situation and includes fast and accelerated fast passenger trains. The accelerated fast trains have mandatory seat reservations and serve major cities and transport nodes. The trains are composed of wagons. The average tech-nical speed of movement of passenger trains is one of the lowest in Europe. At a design speed of 120–130 km/h, the movement of trains is achieved at 75–80 km/h, and in certain areas, it is limited to 40–60 km/h in order to ensure traffic safety [44]. A significant part of the rolling stock does not meet European standards regarding comfort and quality. The existing structure of trains by type could be improved through the implementation of new types of trains.
Alternative A2 offers three categories of trains—fast trains, accelerated fast trains and direct express trains. The direct express trains are intercity trains that have also mandatory seat reservations and serve major transport and administrative centres. They have a lower number of stops in comparison to accelerated fast trains. Express trains and accelerated fast trains in alternatives A2 and A3 are composed of novel EMUs. As Alternatives A2 and A3 include fewer stops the value of criterion W6 decreases. The number of trains for alternatives A2 and A3 increases due to the replacement of old rolling stock with new ones. The new electric multiple unit trains (EMU) are characterized by lower electricity consumption compared to trains composed of wagons and locomotives due to their lower mass. The inclusion in the scheme of transport of a new generation of trains leads to a reduction of electricity costs and, accordingly, of carbon dioxide emissions for the produc-tion of electricity by the power plants. The increase in electricity consumption for alterna-tive A3 is due to the movement of trains with increased maximum speed 100–120 km in the direction Sofia–Plovdiv–Burgas (this is part of the core TEN-T network). The introduc-tion of novel EMUs leads to a reduction of direct operating costs by 3.44% for A2, and upon completion of the rehabilitation of the railway infrastructure by 1.25% for A3 (Table 1—criterion S1).
Figure 2 shows the scheme of the itineraries of the passenger trains in the Bulgarian railway network.
Figure 2. Scheme of the itineraries of the passenger trains. Figure 2. Scheme of the itineraries of the passenger trains.
The values of criteria W5, O1, O3, T1–T4 are determined using scale 0, 1. The valuesof criteria S2, S3, W1, W7, O2 and O3 are determined using a scale of 0, 1, 2, 3.
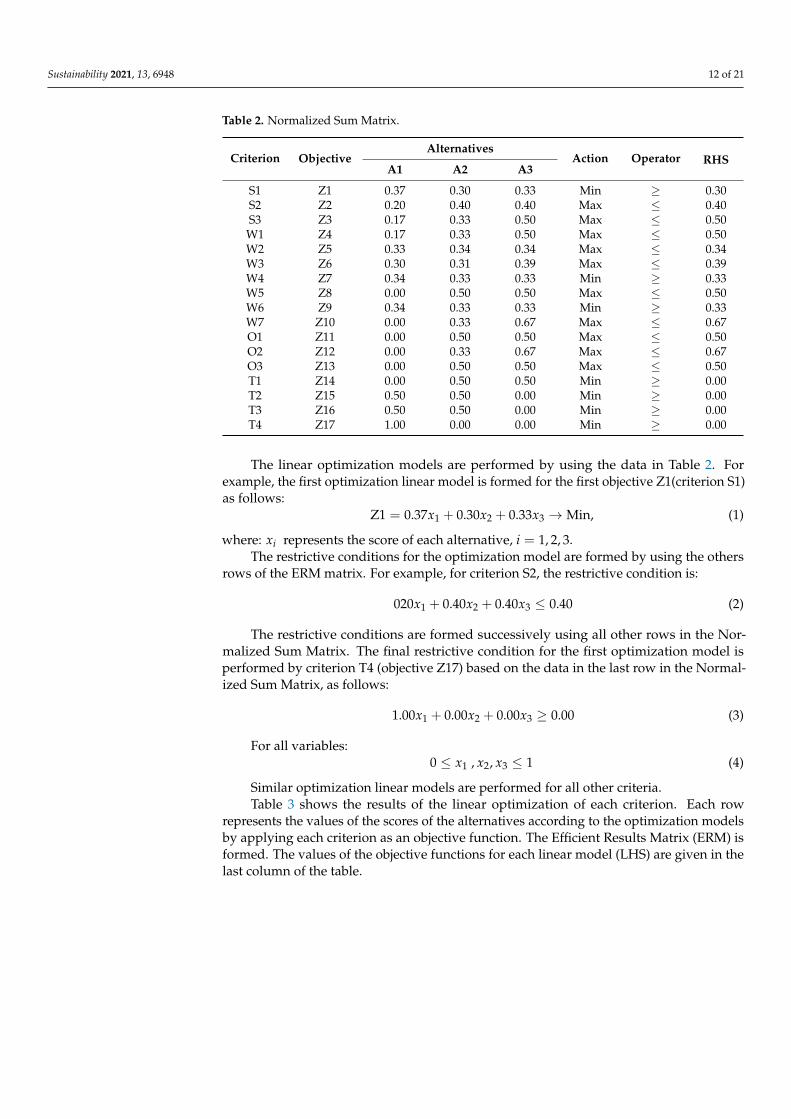
The next step in the model is to form the normalized matrix. The normalization couldbe performed in different ways. This study uses the Sum of All Values method. Table 2shows the normalized matrix, the type of actions for each criterion, the type of the operatorfor the restrictive conditions, the limits called “Right Hand Side” (RHS). The values of theRHS are obtained from the left normalized values and the type of action. In the case ofminimum, RHS is equal to the minimum value of the row; in the case of maximum, theRHS value is equal to the maximum value of the row in the normalized matrix. The type ofoperator depends on the type of objective function. In the case of maximum, the operatoris “≤”; in the case of minimum, the operator is “≥”.
Sustainability 2021, 13, 6948 12 of 21
Table 2. Normalized Sum Matrix.
Criterion ObjectiveAlternatives
Action Operator RHSA1 A2 A3
S1 Z1 0.37 0.30 0.33 Min ≥ 0.30S2 Z2 0.20 0.40 0.40 Max ≤ 0.40S3 Z3 0.17 0.33 0.50 Max ≤ 0.50W1 Z4 0.17 0.33 0.50 Max ≤ 0.50W2 Z5 0.33 0.34 0.34 Max ≤ 0.34W3 Z6 0.30 0.31 0.39 Max ≤ 0.39W4 Z7 0.34 0.33 0.33 Min ≥ 0.33W5 Z8 0.00 0.50 0.50 Max ≤ 0.50W6 Z9 0.34 0.33 0.33 Min ≥ 0.33W7 Z10 0.00 0.33 0.67 Max ≤ 0.67O1 Z11 0.00 0.50 0.50 Max ≤ 0.50O2 Z12 0.00 0.33 0.67 Max ≤ 0.67O3 Z13 0.00 0.50 0.50 Max ≤ 0.50T1 Z14 0.00 0.50 0.50 Min ≥ 0.00T2 Z15 0.50 0.50 0.00 Min ≥ 0.00T3 Z16 0.50 0.50 0.00 Min ≥ 0.00T4 Z17 1.00 0.00 0.00 Min ≥ 0.00
The linear optimization models are performed by using the data in Table 2. Forexample, the first optimization linear model is formed for the first objective Z1(criterion S1)as follows:
Z1 = 0.37x1 + 0.30x2 + 0.33x3 → Min, (1)
where: xi represents the score of each alternative, i = 1, 2, 3.The restrictive conditions for the optimization model are formed by using the others
rows of the ERM matrix. For example, for criterion S2, the restrictive condition is:
020x1 + 0.40x2 + 0.40x3 ≤ 0.40 (2)
The restrictive conditions are formed successively using all other rows in the Nor-malized Sum Matrix. The final restrictive condition for the first optimization model isperformed by criterion T4 (objective Z17) based on the data in the last row in the Normal-ized Sum Matrix, as follows:
1.00x1 + 0.00x2 + 0.00x3 ≥ 0.00 (3)
For all variables:0 ≤ x1 , x2, x3 ≤ 1 (4)
Similar optimization linear models are performed for all other criteria.Table 3 shows the results of the linear optimization of each criterion. Each row
represents the values of the scores of the alternatives according to the optimization modelsby applying each criterion as an objective function. The Efficient Results Matrix (ERM) isformed. The values of the objective functions for each linear model (LHS) are given in thelast column of the table.

Sustainability 2021, 13, 6948 13 of 21
Table 3. Efficient Results Matrix (ERM).
Criterion ObjectiveAlternatives Objective Function
Value (LHS)A1 A2 A3
S1 Z1 0.00 0.00 0.00 0.30S2 Z2 0.00 0.00 0.00 0.40S3 Z3 0.00 0.00 1.00 0.50W1 Z4 0.00 0.00 1.00 0.50W2 Z5 0.52 0.00 0.00 0.42W3 Z6 0.00 0.00 1.00 0.39W4 Z7 0.95 0.00 0.00 0.32W5 Z8 0.00 1.00 0.00 0.50W6 Z9 0.00 0.00 0.98 0.32W7 Z10 0.00 0.00 1.00 0.67O1 Z11 0.00 0.00 0.00 0.50O2 Z12 0.00 0.00 1.00 0.67O3 Z13 0.00 1.00 0.00 0.50T1 Z14 0.97 0.00 0.00 0.00T2 Z15 0.00 0.00 1.00 0.00T3 Z16 0.00 0.00 1.00 0.00T4 Z17 0.00 1.00 0.00 0.00
4.2. Preliminary Analysis
Table 4 shows a preliminary analysis and makes a comparison between the desiredvalues for each objective for SWOT criteria, which are identified as RHS, and the optimumvalues of the objective functions obtained through SIMUS (LHS). The optimal values forthe criteria must not be confused with the lack of optimal values for the strategies. Whenthere is equality of the LHS and RHS, it means that the objective is satisfied 100%.
Table 4. Preliminary analysis.
Criterion Objective Option LHS RHS ObjectiveSatisfied? Comment
S1 Z1 Min 0.30 0.30 Yes The objective is satisfied 100%S2 Z2 Max 0.40 0.40 Yes The objective is satisfied 100%S3 Z3 Max 0.50 0.50 Yes The objective is satisfied 100%W1 Z4 Max 0.50 0.50 Yes The objective is satisfied 100%
W2 Z5 Max 0.42 0.34 No The maximum value found is greaterthan the established value
W3 Z6 Max 0.39 0.39 Yes The objective is satisfied 100%
W4 Z7 Min 0.32 0.33 No The minimum value found is lowerthat the established one
W5 Z8 Max 0.50 0.50 Yes The objective is satisfied 100%
W6 Z9 min 0.32 0.33 No The minimum value found is lowerthan the minimum established
W7 Z10 Max 0.67 0.67 Yes The objective is satisfied 100%O1 Z11 Max 0.50 0.50 Yes The objective is satisfied 100%O2 Z12 Max 0.67 0.67 Yes The objective is satisfied 100%O3 Z13 Max 0.50 0.50 Yes The objective is satisfied 100%
T1 Z14 Min 0 0 Yes Purchasing of rolling stock does notshow any advance
T2 Z15 Min 0.50 0 Yes The minimum value found is greaterthan the minimum established
T3 Z16 Min 0.48 0 Yes The minimum value found is greaterthan established
T4 Z17 Min 0 0 Yes No variation
In bold are very important objectives.
Sustainability 2021, 13, 6948 14 of 21
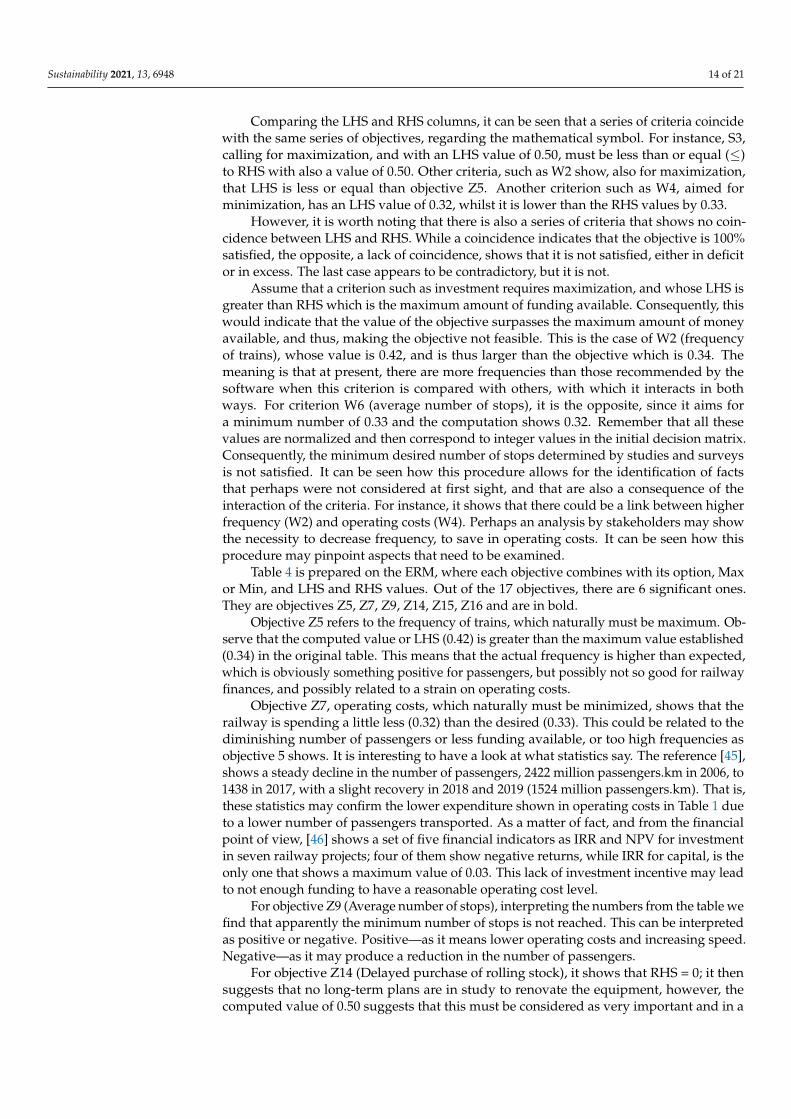
Comparing the LHS and RHS columns, it can be seen that a series of criteria coincidewith the same series of objectives, regarding the mathematical symbol. For instance, S3,calling for maximization, and with an LHS value of 0.50, must be less than or equal (≤)to RHS with also a value of 0.50. Other criteria, such as W2 show, also for maximization,that LHS is less or equal than objective Z5. Another criterion such as W4, aimed forminimization, has an LHS value of 0.32, whilst it is lower than the RHS values by 0.33.
However, it is worth noting that there is also a series of criteria that shows no coin-cidence between LHS and RHS. While a coincidence indicates that the objective is 100%satisfied, the opposite, a lack of coincidence, shows that it is not satisfied, either in deficitor in excess. The last case appears to be contradictory, but it is not.
Assume that a criterion such as investment requires maximization, and whose LHS isgreater than RHS which is the maximum amount of funding available. Consequently, thiswould indicate that the value of the objective surpasses the maximum amount of moneyavailable, and thus, making the objective not feasible. This is the case of W2 (frequencyof trains), whose value is 0.42, and is thus larger than the objective which is 0.34. Themeaning is that at present, there are more frequencies than those recommended by thesoftware when this criterion is compared with others, with which it interacts in bothways. For criterion W6 (average number of stops), it is the opposite, since it aims fora minimum number of 0.33 and the computation shows 0.32. Remember that all thesevalues are normalized and then correspond to integer values in the initial decision matrix.Consequently, the minimum desired number of stops determined by studies and surveysis not satisfied. It can be seen how this procedure allows for the identification of factsthat perhaps were not considered at first sight, and that are also a consequence of theinteraction of the criteria. For instance, it shows that there could be a link between higherfrequency (W2) and operating costs (W4). Perhaps an analysis by stakeholders may showthe necessity to decrease frequency, to save in operating costs. It can be seen how thisprocedure may pinpoint aspects that need to be examined.
Table 4 is prepared on the ERM, where each objective combines with its option, Maxor Min, and LHS and RHS values. Out of the 17 objectives, there are 6 significant ones.They are objectives Z5, Z7, Z9, Z14, Z15, Z16 and are in bold.
Objective Z5 refers to the frequency of trains, which naturally must be maximum. Ob-serve that the computed value or LHS (0.42) is greater than the maximum value established(0.34) in the original table. This means that the actual frequency is higher than expected,which is obviously something positive for passengers, but possibly not so good for railwayfinances, and possibly related to a strain on operating costs.
Objective Z7, operating costs, which naturally must be minimized, shows that therailway is spending a little less (0.32) than the desired (0.33). This could be related to thediminishing number of passengers or less funding available, or too high frequencies asobjective 5 shows. It is interesting to have a look at what statistics say. The reference [45],shows a steady decline in the number of passengers, 2422 million passengers.km in 2006, to1438 in 2017, with a slight recovery in 2018 and 2019 (1524 million passengers.km). That is,these statistics may confirm the lower expenditure shown in operating costs in Table 1 dueto a lower number of passengers transported. As a matter of fact, and from the financialpoint of view, [46] shows a set of five financial indicators as IRR and NPV for investmentin seven railway projects; four of them show negative returns, while IRR for capital, is theonly one that shows a maximum value of 0.03. This lack of investment incentive may leadto not enough funding to have a reasonable operating cost level.
For objective Z9 (Average number of stops), interpreting the numbers from the table wefind that apparently the minimum number of stops is not reached. This can be interpretedas positive or negative. Positive—as it means lower operating costs and increasing speed.Negative—as it may produce a reduction in the number of passengers.
For objective Z14 (Delayed purchase of rolling stock), it shows that RHS = 0; it thensuggests that no long-term plans are in study to renovate the equipment, however, thecomputed value of 0.50 suggests that this must be considered as very important and in a
Sustainability 2021, 13, 6948 15 of 21
high value. This is confirmed by the study in [47] which says, about Bulgaria, that morethan 75% of all transport funding should be allocated for: 1—Public urban transport system;2—Integrated regional and suburban public transport systems 3—Railways (infrastructureand passenger rolling stock), 4—Intermodal infrastructure for shifting freight from road torail, 5—Bicycle lanes and paths, and 6—Traffic management systems. We believe that forthe development of the sustainable transport system in the country and for reversing thecurrent dangerous trends of the predominant use of road transport there is a need for anew approach in transport investment.
For objective Z15 (Increasing Road quality), Bulgaria has about 20,000 km of pavedroutes, which seems very high in a country of 7,300,000 inhabitants with only one majorcity—Sofia, with about 1,300,000 people, and several low medium-size cities of about350,000 inhabitants each. The territory of Bulgaria is not very large; it is about 111,000 km2
and ranks in 16th place among 51 European countries. This fact means that its densityis 266 people/km2, which is low, and decreasing. Thus, it would be worth examiningthe occupancy rate of the wagons which is linked with criterion W1 in the transportationmarket, and W4, operating cost. This objective is ambitious, and speaks very well of theroad infrastructure whose value of 0.50 is higher than the RHS value of 0 (or no plans).Nevertheless, railways have the advantage of the larger quantity of passengers and freightthey can transport in comparison with busses, from the point of view of weight (and thusroad conservation), passengers’ comfort, fuel consumption and contamination.
Objective Z16 (Increasing speed of road transportation), with a value greater thanRHS, suggests the advantage of the road system.
Objective Z17 (Decline in traffic), shows no plans since RHS = 0, and then that whateverplan comes is OK.
The results show that the areas that must be improved are related to service (speed,number of stops, travel time, directness, costs, etc.) as well as those areas where it isnecessary to work together with the country road development program, due to thecompetition between the two systems in those zones where the road and the rails run inparallel. The case is interesting since Bulgaria has some highways with a maximum speedof 140 km/h, while new rolling stock can reach 160 km/h.
4.3. Determination of the Weights of Criteria
The SIMIUS method does not use the weights of criteria for ranking the alternatives.This method is based on Linear Programming (LP) and the use of the Simplex algorithm.Linear Programming does not use any type of weights, and for that reason, they are notneeded in the SIMUS method. LP works following an iterative process until it finds theoptimal solution (if it exists). LP uses a vector procedure to establish a ranking betweencriteria, and thus, for each iteration, every criterion gets a new significance. In this way,the criteria significance is dependent on the set of alternatives to evaluate. It is a similarconcept to using Shannon entropy, to evaluate criteria weights. There is no subjectivity here,everything is objective, and then, it does not matter who or how many decision-makersintervene. The result is always the same, and based on the initial data.
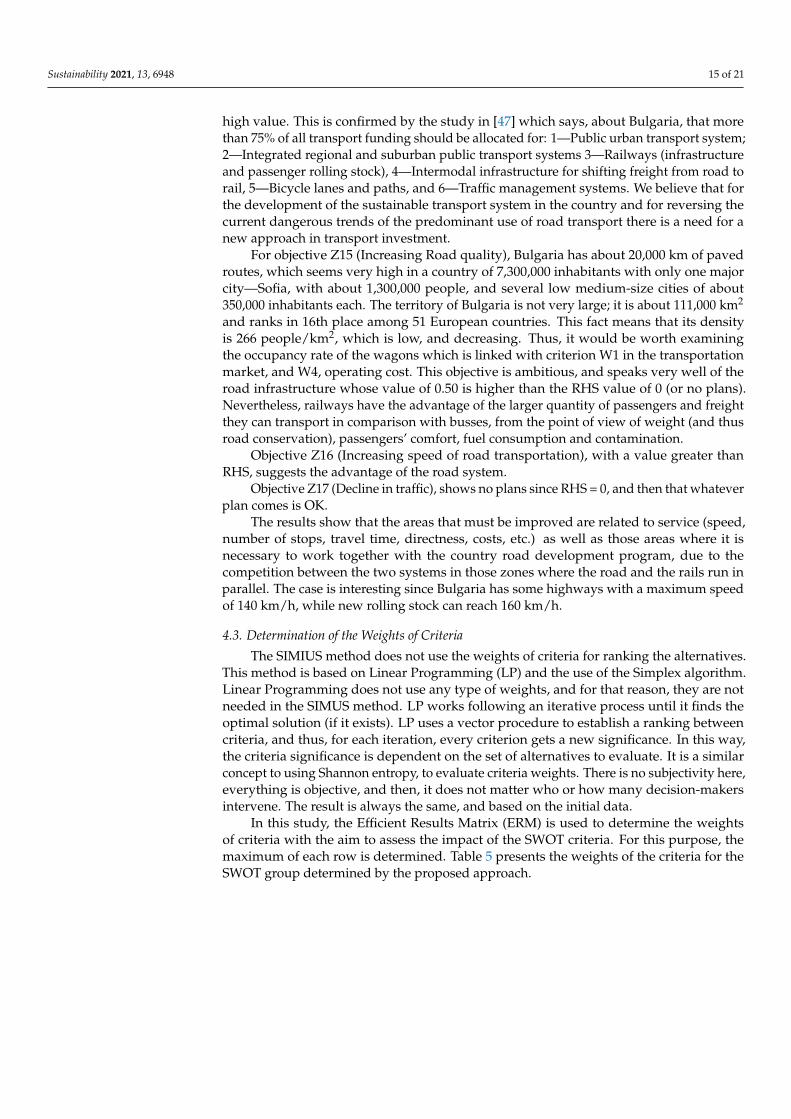
In this study, the Efficient Results Matrix (ERM) is used to determine the weightsof criteria with the aim to assess the impact of the SWOT criteria. For this purpose, themaximum of each row is determined. Table 5 presents the weights of the criteria for theSWOT group determined by the proposed approach.

Sustainability 2021, 13, 6948 16 of 21
Table 5. Weights of objectives using the SIMUS method.
SWOT CriteriaAlternatives Max of
the RowNormalized
ValueWeightsSWOTA1 A2 A3
SS1 0.00 1.00 0.00 1.00 0.060S2 0.00 1.00 0.00 1.00 0.060S3 0.00 0.00 1.00 1.00 0.060 0.180
W
W1 0.00 0.00 1.00 1.00 0.060
0.401
W2 0.52 0.74 0.00 0.74 0.045W3 0.00 0.00 1.00 1.00 0.060W4 0.95 0.00 0.00 0.95 0.057W5 0.00 1.00 0.00 1.00 0.060W6 0.00 0.00 0.98 0.98 0.059W7 0.00 0.00 1.00 1.00 0.060
OO1 0.00 1.00 0.00 1.00 0.060
0.180O2 0.00 0.00 1.00 1.00 0.060O3 0.00 1.00 0.00 1.00 0.060
W
T1 0.97 0.00 0.00 0.97 0.058
0.238T2 0.00 0.00 1.00 1.00 0.060T3 0.00 0.00 1.00 1.00 0.060T4 0.00 1.00 0.00 1.00 0.060
Total 16.64 1.000 1.000
The global weights are calculated by dividing these values by the sum of the maximumof the rows. Then, the weights of the SWOT groups are calculated. The results from thedifferent SWOT clusters clearly show that weaknesses and threats are prevalent in theBulgarian rail network. Both SWOT factors show sharp quantitative differences with theircounterparts, i.e., strength and opportunities, both with the same importance or weightof 0.180, as shown in Table 5. However, this is also significant since it shows that bothfavorable conditions exist in the network. Consequently, there is room for improvement. Ifthe criteria are considered, it can be seen that the weights in Table 5 are all practically thesame, about 0.060, and therefore, no discrimination by importance is possible. However,observe that it is shown that although clusters Weakness and Threats are dominant, theircriteria have the same weights as those of Opportunities and Strength.
4.4. Ranking of the Alternatives
The SIMUS algorithm produces an efficient matrix, where each of its rows is a ParetoEfficient solution, and thus, optimal. From this matrix, which is a mapping of the originalmatrix, SIMUS obtains two results. The first, following the Weighted sum procedure, andthe second, based on Outranking. Both results coincide in their rankings, and then theymutually check their results.
The results obtained in the Efficient Results Matrix are applied to start the procedureof ranking the alternatives. The normalization sum method was applied to the EfficientResults Matrix. The results of the normalization are given in the first part of Table 6. Thesecond part presents the steps in obtaining the ranking. First, the sum of the column isdetermined. Then, the participation factors, which indicate the number of satisfactions ofeach alternative by each objective, are determined. The normalization of the participationfactor is carried out by dividing the number of criteria. The final score of the alternatives iscalculated by multiplying the sum of the columns by the normalized participation factor.
Sustainability 2021, 13, 6948 17 of 21
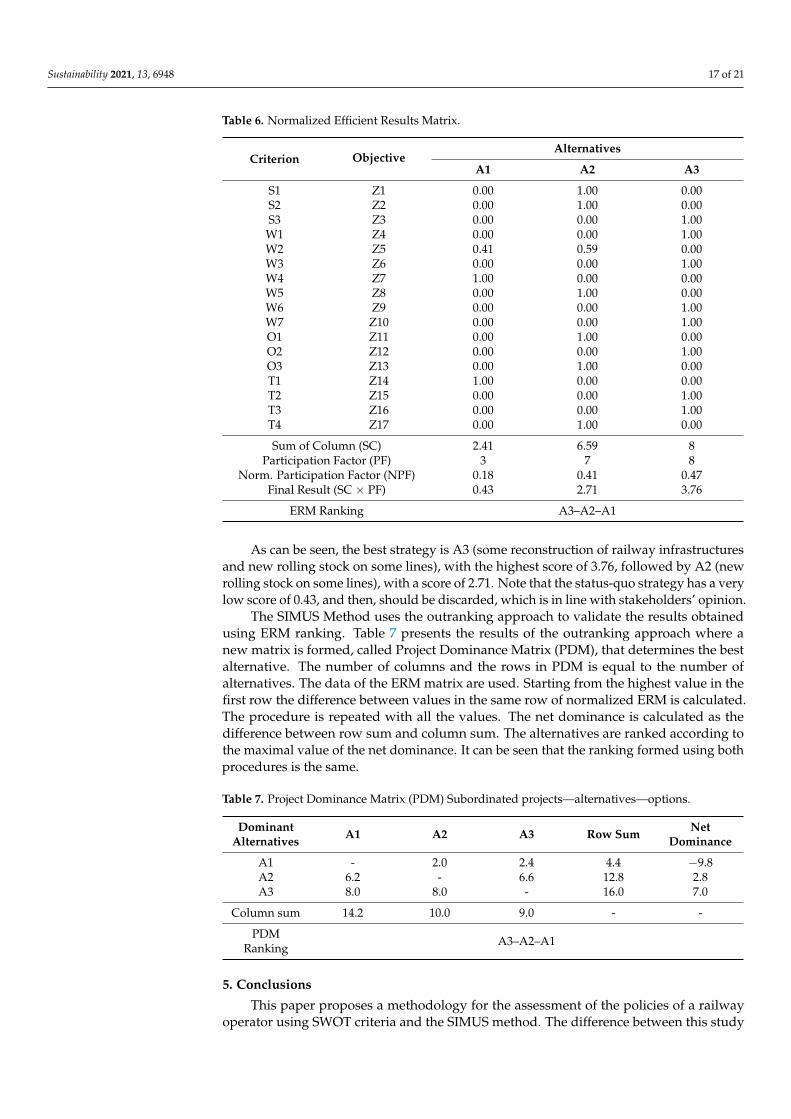
Table 6. Normalized Efficient Results Matrix.
Criterion ObjectiveAlternatives
A1 A2 A3
S1 Z1 0.00 1.00 0.00S2 Z2 0.00 1.00 0.00S3 Z3 0.00 0.00 1.00W1 Z4 0.00 0.00 1.00W2 Z5 0.41 0.59 0.00W3 Z6 0.00 0.00 1.00W4 Z7 1.00 0.00 0.00W5 Z8 0.00 1.00 0.00W6 Z9 0.00 0.00 1.00W7 Z10 0.00 0.00 1.00O1 Z11 0.00 1.00 0.00O2 Z12 0.00 0.00 1.00O3 Z13 0.00 1.00 0.00T1 Z14 1.00 0.00 0.00T2 Z15 0.00 0.00 1.00T3 Z16 0.00 0.00 1.00T4 Z17 0.00 1.00 0.00
Sum of Column (SC) 2.41 6.59 8Participation Factor (PF) 3 7 8
Norm. Participation Factor (NPF) 0.18 0.41 0.47Final Result (SC × PF) 0.43 2.71 3.76
ERM Ranking A3–A2–A1
As can be seen, the best strategy is A3 (some reconstruction of railway infrastructuresand new rolling stock on some lines), with the highest score of 3.76, followed by A2 (newrolling stock on some lines), with a score of 2.71. Note that the status-quo strategy has a verylow score of 0.43, and then, should be discarded, which is in line with stakeholders’ opinion.
The SIMUS Method uses the outranking approach to validate the results obtainedusing ERM ranking. Table 7 presents the results of the outranking approach where anew matrix is formed, called Project Dominance Matrix (PDM), that determines the bestalternative. The number of columns and the rows in PDM is equal to the number ofalternatives. The data of the ERM matrix are used. Starting from the highest value in thefirst row the difference between values in the same row of normalized ERM is calculated.The procedure is repeated with all the values. The net dominance is calculated as thedifference between row sum and column sum. The alternatives are ranked according tothe maximal value of the net dominance. It can be seen that the ranking formed using bothprocedures is the same.
Table 7. Project Dominance Matrix (PDM) Subordinated projects—alternatives—options.
DominantAlternatives A1 A2 A3 Row Sum Net
Dominance
A1 - 2.0 2.4 4.4 −9.8A2 6.2 - 6.6 12.8 2.8A3 8.0 8.0 - 16.0 7.0
Column sum 14.2 10.0 9.0 - -
PDMRanking A3–A2–A1
5. Conclusions
This paper proposes a methodology for the assessment of the policies of a railwayoperator using SWOT criteria and the SIMUS method. The difference between this study
Sustainability 2021, 13, 6948 18 of 21
and related research is in the elaborated approach where the SWOT criteria are presentedas objectives and the ranking of the alternatives of strategic planning is conducted withoutthe use of subjective expert evaluation.
This is a novel procedure but the important thing is that using SWOT factors the result,obtained through the SIMUS method, incorporates something valuable—the analysis ofthe current situation.
A methodology was suggested and applied to an actual case, and results obtainedare discussed to demonstrate that the procedure is able to determine the most convenientstrategy, but perhaps more importantly, to point out and quantify the strong and weakpoints of the Bulgarian railway network, and determine the effects that one SWOT subfactormay have on the others.
The results can be summarized as follows:
(1) The best strategy is A3 (some reconstruction of the railway infrastructures and newrolling stock on some lines), with the highest score of 3.76, followed by A2 (new rollingstock on some lines), with a score of 2.71. The status-quo strategy has a very low scoreof 0.43, and then, should be discarded, which is in line with stakeholders’ opinion.
(2) The results of the selection of the best alternative clearly show that the current situationor status-quo cannot be supported; it needs improvement and suggests on whatsectors. This conclusion is really important since it confirms something that mostrailway and research people already know. It is evident that a scenario like theoperation of railways is a very complex undertaking, where different factors arecombined to produce several and differentiated effects. This procedure allows for aquantitative general evaluation of this complicated scenario.
(3) The results from the different clusters clearly show that weaknesses (0.4) and threats(0.24) are prevalent in the Bulgarian rail network. Both SWOT factors show sharpquantitative differences with their counterpart, i.e., strengths and opportunities, bothwith the same importance or weight of 0.180. However, this is also significant sinceit shows that both favorable conditions exist in the network. Consequently, there isroom for improvement.
(4) If the criteria in the SWOT groups are considered, the results show that the weights areall practically the same, about 0.06, and therefore, no discrimination by importance ispossible. However, it is worth noting that although clusters Weaknesses and Threatsare dominant, their subfactors have the same weights as those of Opportunitiesand Strengths.
The main contribution and advantages of this procedure are as follows: (1) All alter-natives are independent, and therefore, their respective results are not linked, and thusthey are enclosed in their own areas. (2) The advantage of this procedure, using the Linearprogramming method and the SIMUS method, is that the results are found to link thefour SWOT factors. (3) This real-life case makes it possible to consider the three strategiessimultaneously, and thus, the results incorporate the influences of one criterion or factoron all others, and allows for quantification of the differences between the expected andreal results.
This study is useful because it gives railway stakeholders concise, objective andunbiased information to enable them to take decisions. In addition, it makes it possible todetermine the strength, sensitivity-wise, of the best solution found. The results presentedin this paper could be useful for railway operators to identify the strong and weak pointsof the Bulgarian railway network, to determine the effects that one SWOT subfactor mayhave on the other, to determine the areas that must be improved, and to analyse whetherthe current situation is appropriate or needs to be improved. The results presented are alsouseful for the stakeholders, since they give not only values related to the best selectionof the alternative, but also because each of them can be justified. These results may helpstakeholders in obtaining international funding and credits for railway improvement.
Sustainability 2021, 13, 6948 19 of 21
For further research, the proposed procedure could be extended with other strategicanalysis techniques to assess the policies for railway operators. The criteria for assessmentof the transport policy could be specified and expanded according to the studied areas.
Author Contributions: Conceptualization, S.S.; methodology, S.S.; literature review, S.S.; validation,S.S., formal analysis, S.S. and N.M.; data curation, S.S.; investigation, S.S. and N.M.; writing—originaldraft preparation, S.S.; writing—review and editing, S.S. and N.M. All authors have read and agreedto the published version of the manuscript.
Funding: This work was supported by the National Science Fund of the Ministry of Education andScience of Bulgaria [project number No.KP-06-H27/12 of 11.12.2018 “Modelling and elaboration ofcomplex system for selection of transport technology in transport network”].
Institutional Review Board Statement: Not applicable.
Informed Consent Statement: Not applicable.
Data Availability Statement: Data is contained within the article.
Conflicts of Interest: The authors declare no conflict of interest.
References1. Munier, N. A Strategy for Using Multi-Criteria Analysis in Decision-Making; Springer: Berlin/Heidelberg, Germany, 2011. [CrossRef]2. Munier, N. A new approach to the rank reversal phenomenon in MSDM with the SIMUS method. Mult. Criteria Decis. Mak. 2016,
11, 137–152. [CrossRef]3. Munier, N.; Hontoria, E.; Jimenez-Saez, F. Strategic Approach in Multi-Criteria Decision Making. A Practical Guide for Complex
Scenarios; Springer Nature: Cham, Switzerland, 2019. [CrossRef]4. Benzaghta, M.A.; Elwalda, A.; Mousa, M.M.; Erkan, I.; Rahman, M. SWOT analysis applications: An integrative literature review.
J. Glob. Bus. Insights 2021, 6, 55–73. [CrossRef]5. Ploywarin, S.; Song, Y. Analysis and development strategy of freight transportation market of Thailand railway network. In
Proceedings of the 2016 International Conference on Management Science & Engineering, Olten, Switzerland, 18–20 August 2016;pp. 401–406.
6. Ma, H. SWOT Analysis on China’s High-speed Rail to the Overseas. In Proceedings of the International Conference on LogisticsEngineering, Management and Computer Science (LEMCS 2015), Shenyang, China, 29–31 July 2015; pp. 1259–1265.
7. Makarova, I.; Shubenkova, K.; Gabsalikhova, L. Analysis of the city transport system’s development strategy design principleswith account of risks and specific features of spatial development. Transp. Probl. 2017, 12, 125–138. [CrossRef]
8. Comino, E.; Ferretti, V. Indicators-based spatial SWOT analysis: Supporting the strategic planning and management of complexterritorial systems. Ecol. Indic. 2016, 60, 1104–1117. [CrossRef]
9. Ahi, M.; Yildiz, K. Determining performance criteria of railway market: A case study. J. Open Innov. Technol. Mark. Complex. 2018,4, 6. [CrossRef]
10. Zhikang, L. Research on Development Strategy of Automobile Reverse. Logistics Based on SWOT Analysis. Procedia Eng. 2017,174, 324–330. [CrossRef]
11. Cui, J.; Allan, A.; Lin, D. SWOT analysis and development strategies for underground pedestrian Systems. Tunn. Undergr. SpaceTechnol. 2019, 87, 127–133. [CrossRef]
12. Mallik, S.; Rudra, S.; Samanta, R. Sustainable ecotourism development using SWOT and QSPM approach. A study onRameswaram, Tamil Nadu. Int. J. Geoheritage Rarks 2020, 8, 185–193. [CrossRef]
13. Pazouki, M.; Jozi, S.A.; Ziari, Y.A. Strategic management in urban environment using SWOT and QSPM model. Glob. J. Environ.Sci. Manag. 2017, 3, 207–216.
14. Bouraima, M.; Qiu, Y.; Yusupov, B.; Ndjegwes, C. Study on the development strategy of the railway transportation system in theWest African Economic and Monetary Union (WAEMU) based on the SWOT/AHP technique. Sci. Afr. 2020, 8, e00388. [CrossRef]
15. Amin, S.H.; Yan, N.; Morris, D. Analysis of Transportation Modes by Evaluating SWOT Factors and Pairwise Comparisons: ACase Study. Multi-Criteria Methods Tech. Appl. Supply Chain Manag. 2018, 57. [CrossRef]
16. Wang, X.P.; Zhang, J.; Yang, T. Hybrid SWOT Approach for Strategic Planning and Formulation in China Worldwide ExpressMail Service. J. Appl. Res. Technol. 2014, 12, 230–238. [CrossRef]
17. Bartuskova, T.; Kresta, A. Application of AHP method in external strategic analysis of the selected organization. Procedia Econ.Financ. 2015, 30, 146–154. [CrossRef]
18. Xia, Z.; Yu, Z.; Pan, X.; Chen, F.; Zhang, N. Analysis of Long-Distance Passenger Transportation Based on a Highway NetworkUsing the SWOT-AHP Method. ICTE 2015, 2778–2786. [CrossRef]
19. Wang, X.; Wu, P.; Huang, T. Analysis of Logistic Strategy based on SWOT and AHP Methods. In Proceedings of the 2ndInternational Symposium on Mechanical Engineering and Material Science (ISMEMS 2017), Suzhou, China, 17–19 November 2017;Volume 134, pp. 70–74.

Sustainability 2021, 13, 6948 20 of 21
20. Mobaraki, O. Strategic planning and urban development by using the SWOT analysis. The case of Urmia city. Rom. Rev. Reg.Stud. 2014, 10, 47–54.
21. Ozdemir, Y.; Demirel, T. Prioritization of Tourism Strategies in Turkey Using a SWOT-AHP Analysis. Int. J. Bus. Ind. Mark. 2018,3, 34–45. Available online: http://www.aascit.org/journal/ijbim (accessed on 11 May 2021).
22. Wang, X.; Li, C.; Shang, J.; Yang, C.; Zhang, B.; Ke, X. Strategic Choices of China’s New Energy Vehicle Industry: An AnalysisBased on ANP and SWOT. Energies 2017, 10, 537. [CrossRef]
23. Genc, T.; Kabak, M.; Özceylan, E.; Cetinkaya, C. Evaluation of natural gas strategies of Turkey in East Mediterranean Region: Astrengths-weaknesses-opportunities-threats and analytic network process approach. Technol. Econ. Dev. Econ. 2018, 24, 1041–1062.[CrossRef]
24. Chaghooshi, A.J.; Rahmani, M.; Zarchi, M.K. Formulation and Prioritization of Strategies in Tile and Ceramic Industry: A CaseStudy New York. Sci. J. 2012, 5, 79–87.
25. Azimi, R.; Chamzini, A.J.; Fooladgar, M.; Basir, M.H. Evaluating the strategies of the Iranian mining sector using a integratedmodel. Int. J. Manag. Sci. Eng. Manag. 2011, 6, 459–466. [CrossRef]
26. Basset, M.A.; Mohamed, M.; Smarandache, F. An Extension of Neutrosophic AHP-SWOT Analysis for Strategic Planning andDecision-Making. Symmetry 2018, 10, 116. [CrossRef]
27. Tavana, M.; Zareinejad, M.; Di Caprio, M.; Kavia, M.A. An integrated intuitionistic fuzzy AHP and SWOT method foroutsourcingreverse logistics. Appl. Soft Comput. 2016, 40, 544–557. [CrossRef]
28. Singh, S.P.; Singh, P. An Integrated AFS-Based SWOT Analysis Approach for Evaluation of Strategies Under MCDM Environment.J. Oper. Strateg. Plan. 2018, 1, 1–19. [CrossRef]
29. Wadjdi, A.F.; Firdaus, Y. Hybrid framework of decision making in military: Case study of railway planning. IOP Conf. Ser. EarthEnviron. Sci. 2018, 195, 012006. [CrossRef]
30. Papapostolou, A.; Karakosta, C.; Apostolidis, G.; Doukas, H. An AHP-SWOT-Fuzzy TOPSIS Approach for Achieving Cross-BorderRES Cooperation. Sustainability 2020, 12, 2886. [CrossRef]
31. Zare, K.; Tekmeh, J.M.; Karimi, S. A SWOT framework for analyzing the electricity supply chain using an integrated AHPmethodology combined with fuzzy-TOPSIS. Int. Strateg. Manag. Rev. 2015, 3, 66–80. [CrossRef]
32. Milenkovi, M.; Glavi, D.; Mladenovi, M. Decision-Support Framework for Selecting the Optimal Road Toll Collection System. J.Adv. Transp. 2018, 2018, 4949565. [CrossRef]
33. Hatefi, S.M. Strategic planning of urban transportation system based on sustainable development dimensions using an integratedSWOT and fuzzy COPRAS approach. Glob. J. Environ. Sci. Manag. 2018, 4, 99–112. [CrossRef]
34. Ðalic, I.; Ateljevic, J.; Stevic, Z.; Terzic, S. An integrated SWOT—FUZZY PIPRECIA model for analysis of competitiveness inorder to improve logistics performances. Facta Univ. Ser. Mech. Eng. 2020, 18, 439–451. [CrossRef]
35. Akhavan, P.; Barak, S.; Maghsoudlou, H.; Antucheviciene, J. FQSPM-SWOT for strategic alliance planning and partner selection;case study in a holding car manufacturer company. Technol. Econ. Dev. Econ. 2015, 21, 165–185. [CrossRef]
36. Büyükozkan, G.; Mukul, E.; Kongar, E. Health tourism strategy selection via SWOT analysis and integrated hesitant fuzzylinguistic AHP-MABAC approach. Socio Econ. Plan. Sci. 2021, 74, 100929. [CrossRef]
37. Amin, S.H.; Razmi, J.; Zhang, G. Supplier selection and order allocation based on fuzzy SWOT analysis and fuzzy linearprogramming. Expert Syst. Appl. 2011, 38, 334–342. [CrossRef]
38. Ghorbani, M.; Bahrami, M.; Arabzad, M.M. An Integrated Model For Supplier Selection and Order Allocation, Using ShannonEntropy, SWOT and Linear Programming, International Conference on Leadership, Technology and Innovation Management.Procedia Soc. Behav. Sci. 2012, 41, 521–527. [CrossRef]
39. Christodoulou, A.; Cullinane, K. Identifying the Main Opportunities and Challenges from the Implementation of a Port EnergyManagement System: A SWOT/PESTLE Analysis. Sustainability 2019, 11, 6046. [CrossRef]
40. Petrauskiene, K.; Dvarioniene, J.; Kaveckis, G.; Kliaugaite, D.; Chenadec, J.; Hehn, L.; Pérez, B.; Bordi, C.; Scavino, G.;Vignoli, A.; et al. Situation Analysis of Policies for Electric Mobility Development: Experience from Five European Regions.Sustainability 2020, 12, 2935. [CrossRef]
41. Kordana, S.; Pochwat, K.; Słýs, D.; Starzec, M. Opportunities and Threats of Implementing Drain Water Heat Recovery Units inPoland. Resources 2019, 8, 88. [CrossRef]
42. Operational Programme on Transport and Transport Infrastructure in Bulgaria 2014–2020. Available online: http://www.optransport.bg/en/index.php (accessed on 11 May 2021).
43. Stoilova, S. Methodology for Multi-criteria Selection of Transportation Technology in Transport Network. Modelling of the Interaction ofthe Different Vehicles and Various Transport Modes. Lecture Notes in Intelligent Transportation and Infrastructure; Sładkowski, A., Ed.;Springer: Cham, Switzerland, 2020; pp. 1–103. [CrossRef]
44. Integrated Transport Strategy for the Period Until 2030. Ministry of Transport, Information Technology and Communications.Bulgaria. 2017. Available online: https://www.mtitc.government.bg/sites/default/files/integrated_transport_strategy_2030_eng.pdf (accessed on 11 May 2021).
45. Statista. Passenger Rail Transport in Bulgaria 2006–2019. 2021. Available online: www.statista.com/statistics/436986/passengers-transported-by-rail-in-bulgaria-in-million-passenger-kilometres/Statista (accessed on 11 May 2021).
46. Jelesov, E. Ex-Ante Comparative Analysis of Cost and Benefits of Essential Railway Infrastructure Projects in Bulgaria. 17Medzinárodná Vedecká Konferencia Riešenie Krízových Situácií v Špecifickom Prostredí, Fakulta Špeciálneho Inžinierstva,

Sustainability 2021, 13, 6948 21 of 21
ŽU, Žilina, 30–31. maj 2012. Available online: http://fbiw.uniza.sk/rks/2012/articles/clanky/ZZA_jelezov.pdf (accessed on11 May 2021).
47. NGO Comments on Bulgarian Operational Program Transport and the List of Transport Priority Projects for the Period 2007–2013.Available online: https://bankwatch.org/wp-content/uploads/2007/03/comments_on_TOP_en_March_2007_final.pdf (ac-cessed on 11 May 2021).