spesifikasi teknis - medium bus mobil bus buy the service (bts)
Upload
independentCategory
view
1download
0
4th Responsive Space Conference April 24–27, 2006
Los Angeles, CA
Analysis of Modular Spacecraft Bus Design for Rapid Response Missions Lucy E. Cohan, Richard-Duane Chambers, Rachel K. Lee, and Col. John E. Keesee Massachusetts Institute of Technology
4th Responsive Space Conference RS4-2006-3001
AIAA-RS4 2006-3001
ANALYSIS OF MODULAR SPACECRAFT BUS DESIGN FOR RAPID RESPONSE MISSIONS*
Lucy E. Cohan†, Richard-Duane Chambers‡, Rachel K. Lee§, and Col. John E. Keesee**
Massachusetts Institute of Technology 77 Massachusetts Ave, Cambridge, MA 02139
* Copyright © 2006 by Lucy Cohan. Published by AIAA 4th Responsive Space Conference 2006 with permission. † SM Candidate, Department of Aeronautics and Astronautics, Space Systems Laboratory, Room 37-346, [email protected] ‡ SM Candidate, Engineering Systems Division, Technology and Policy Program, [email protected] § BS Candidate, Department of Aeronautics and Astronautics, [email protected] ** Senior Lecturer, Department of Aeronautics and Astronautics, Space Systems Laboratory, [email protected]
ABSTRACT Rapid response spacecraft are becoming imperative due to current conflicts that arise with little warning and require space-based capabilities. The long development and testing times of typical satellites necessitate a change of paradigm to accommodate responsive space timeline requirements, which call for systems to be operational within a month. One necessary component of this paradigm shift is a standardized bus, which allows for minimal bus redesign and testing for each mission. Instead of forcing the bus to conform to the payload, the payload must conform to a set of predetermined standards imposed by the bus. By reducing the need for satellite redesign and test, standardized buses allow for mission readiness in weeks rather than years. However, utilizing standardized buses reduces payload flexibility and leads to buses that are oversized, over-designed, or otherwise inappropriate for a particular payload. This study proposes that a modular bus might provide standardized interfaces conducive to responsiveness, yet still provide some flexibility to match the needs of the payload. However, modularity comes at a price, introducing inefficiencies and increased testing costs. This paper presents a quantitative analysis of the cost and efficiency of two competing standardized bus options: a traditional monolithic design and an emerging modular architecture. The study further attempts to quantify this tradeoff and determine the optimal degree of modularity for a responsive satellite bus. The degree of modularity is determined by specifying which, if any, subsystems should be
considered as separate modules that can be upgraded or replaced, and which subsystems should be a part of an integrated portion of the bus common to every mission. The study has been undertaken using MATLAB® simulations. The individual simulation components represent various satellite subsystems, as well as satellite demand, cost, testing time, and inventory size. The simulations are run to determine the efficiency, cost, reliability, response time, and inventory of each configuration of modular and integrated subsystems across a range of payloads, which are defined by basic payload requirements such as mass, power, pointing accuracy, and data rates. The inefficiency is defined as being the percentage of excess mass, power, and volume capacity created by utilizing the standardized bus that is designed to work with many payloads as opposed to a monolithic bus designed specifically for the given payload. The response time is defined as the time from the mission call to the time that the satellite is ready for launch. The study establishes the optimal combination of modular and integrated subsystems, as well as testing strategy and inventory for responsive space. The optimal system is a combination of modular and integrated subsystems, with about half of the system being modular.
INTRODUCTION
Space assets and satellites are invaluable to the current military. Capabilities such as GPS, blue force tracking, communications, and intelligence are all made possible through the use of satellites. However, current satellites, particularly military satellites, are generally large, expensive, and slow to develop. Typically, development of a satellite takes between five and ten
1 of 9 AIAA- 4th Responsive Space Conference 2006
2 of 9 AIAA- 4th Responsive Space Conference 2006
years. If a satellite is lost, it is not currently possible to quickly launch a replacement. Similarly, if new military conflicts arise and more space assets are needed, there are currently no means to fulfill this need. Therefore, it is necessary to develop smaller, cheaper satellites that can be rapidly deployed, giving the nation a responsive space capability1. Commercial and scientific customers would also benefit from the capabilities developed for a responsive space program. The responsive space initiative includes the development of a low-cost, flexible bus, which, by definition, could be used to support many payloads. The standardized bus would provide a low cost, pre-defined platform, leaving the developer’s focus on the payload In order to acquire a responsive space capability, three areas of development have been identified: micro-satellite development, quick launch, and control and data flow via SIPRNET (Secure IP Router Network)2,3. Specifically, micro-satellite development includes the development of a flexible bus that can be used to support several different payloads. The quick launch capability involves developing less expensive rockets that can be rapidly deployed. The SIPRNET allows secure communication between the satellite and the field commanders that will make use of the system. This study focuses on the development of a standardized bus, and specifically, the degree to which the bus should be modular.
SCOPE This scope of this study is the design of a flexible bus that enables responsive space. The bus is designed to operate with at least three distinct types of payloads: a communications payload in low earth orbit, a communications payload in highly elliptical orbit, and an optics payload in low earth orbit. These payloads were chosen because they represent a range of capabilities that may be desired in tactical situations, and are thus representative of the types of payloads that would be used with a responsive space capability. The bus could also be used with any other payloads that conform to the standards set forth by the bus. In developing the standardized bus, the effect of utilizing modularity is of particular interest, and is consequently the focus of this study. Modularity allows for greater flexibility, permitting the designer to select the most appropriate modules for a given payload. However, modularity can also introduce extra costs. This suggests the existence of an optimal level of modularity which ought to be determined.
This study attempts to discover an optimal level by considering discrete degrees of modularity. Specifically, each of five subsystems – Attitude Determination and Control (ADCS), Command and Data Handling (CDH), Communications, Power, and Propulsion - can either be modular, or a part of a standardized module common to every mission. These five subsystems were determined to be the most conducive to modularity. Other subsystems such as thermal and structure are not considered to be potentially modular due to the nature of the subsystems. The study also models the effects of economic demand and satellite testing strategy on bus feasibility. Customer demand for the satellite bus characterizes the economic wisdom of designing, manufacturing, and maintaining an inventory for the designed system. Testing strategy affects the responsiveness of the system, since up to half of satellite development time can be spent on testing4; fully testing an integrated system in the traditional manner does not allow the desired lead-times of a few weeks to be achieved. As both satellite demand and inventory size are functions that may vary with the level of modularity, both are considered here. Cost, lead-time, efficiency, and reliability are considered to be the distinguishing metrics in determining the optimal level of modularity for a responsive bus. Lead-time is defined as the time from when the mission is called to the time when the satellite is ready to launch, and is taken to be the assembly and system test time. Lead-time is calculated assuming that all necessary modules are developed, manufactured, and tested in advance and are waiting in an inventory at the time the mission is called. Inefficiency is defined as the percentage of excess mass, volume, and power capacity created by using the standardized bus as opposed to using a bus specifically designed for the given payload; efficiency is the difference between the inefficiency and 100%. Reliability of the system is defined relative to current satellite designs, assuming that a satellite which has undergone a full set of system tests has a reliability value of one. This metric captures the effect of testing strategy on the overall reliability of the system. The decrease in reliability due to components of the system and launch are not considered within the scope of this study. Conclusions drawn from the study should help determine which subsystems within the standardized bus should be modular, and which should not, based on the performance metrics discussed above.
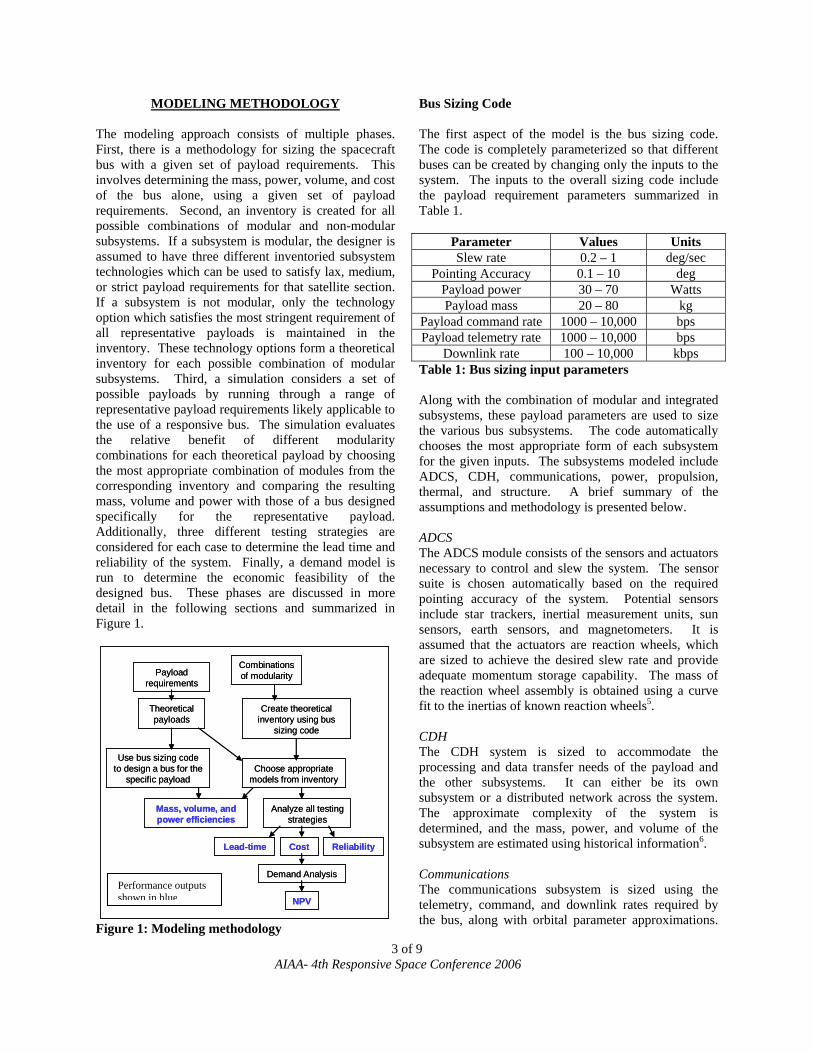
MODELING METHODOLOGY The modeling approach consists of multiple phases. First, there is a methodology for sizing the spacecraft bus with a given set of payload requirements. This involves determining the mass, power, volume, and cost of the bus alone, using a given set of payload requirements. Second, an inventory is created for all possible combinations of modular and non-modular subsystems. If a subsystem is modular, the designer is assumed to have three different inventoried subsystem technologies which can be used to satisfy lax, medium, or strict payload requirements for that satellite section. If a subsystem is not modular, only the technology option which satisfies the most stringent requirement of all representative payloads is maintained in the inventory. These technology options form a theoretical inventory for each possible combination of modular subsystems. Third, a simulation considers a set of possible payloads by running through a range of representative payload requirements likely applicable to the use of a responsive bus. The simulation evaluates the relative benefit of different modularity combinations for each theoretical payload by choosing the most appropriate combination of modules from the corresponding inventory and comparing the resulting mass, volume and power with those of a bus designed specifically for the representative payload. Additionally, three different testing strategies are considered for each case to determine the lead time and reliability of the system. Finally, a demand model is run to determine the economic feasibility of the designed bus. These phases are discussed in more detail in the following sections and summarized in Figure 1.
Combinations of modularity
Create theoretical inventory using bus
sizing code
Theoretical payloads
Choose appropriate models from inventory
Use bus sizing code to design a bus for the
specific payload
Analyze all testing strategies
CostLead-time Reliability
Mass, volume, and power efficiencies
Demand Analysis
NPV
Payload requirements
Fig
Bus Sizing Code The first aspect of the model is the bus sizing code. The code is completely parameterized so that different buses can be created by changing only the inputs to the system. The inputs to the overall sizing code include the payload requirement parameters summarized in Table 1.
Parameter Values Units Slew rate 0.2 – 1 deg/sec
Pointing Accuracy 0.1 – 10 deg Payload power 30 – 70 Watts Payload mass 20 – 80 kg
Payload command rate 1000 – 10,000 bps Payload telemetry rate 1000 – 10,000 bps
Downlink rate 100 – 10,000 kbps Table 1: Bus sizing input parameters Along with the combination of modular and integrated subsystems, these payload parameters are used to size the various bus subsystems. The code automatically chooses the most appropriate form of each subsystem for the given inputs. The subsystems modeled include ADCS, CDH, communications, power, propulsion, thermal, and structure. A brief summary of the assumptions and methodology is presented below. ADCS The ADCS module consists of the sensors and actuators necessary to control and slew the system. The sensor suite is chosen automatically based on the required pointing accuracy of the system. Potential sensors include star trackers, inertial measurement units, sun sensors, earth sensors, and magnetometers. It is assumed that the actuators are reaction wheels, which are sized to achieve the desired slew rate and provide adequate momentum storage capability. The mass of the reaction wheel assembly is obtained using a curve fit to the inertias of known reaction wheels5. CDH The CDH system is sized to accommodate the processing and data transfer needs of the payload and the other subsystems. It can either be its own subsystem or a distributed network across the system. The approximate complexity of the system is determined, and the mass, power, and volume of the subsystem are estimated using historical information6. Communications
The communications subsystem is sized using the
Performance outputsshown in blue3 of 9 AIAA- 4th Responsive Space Conference 2006
ure 1: Modeling methodology
telemetry, command, and downlink rates required by the bus, along with orbital parameter approximations.
4 of 9 AIAA- 4th Responsive Space Conference 2006
There is also communications capabilities set aside for the payload. In the case that the payload is a communications payload, this capability would not be utilized. The link equation is used to determine the gain and power required for the desired communications capability. The gain and power are translated into an aperture diameter with a mass and volume. Power The power subsystem sizes the solar arrays and the batteries necessary to operate the satellite. It sums the power required from each subsystem and determines the array size using a lifetime of one year, 25% efficient gallium-arsenide solar cells, and lithium-ion batteries. Propulsion Through a staged process, the propulsion module determines the thruster requirement to perform ADCS reaction wheel desaturation, minor orbit changes, and a series of pre-defined slewing maneuvers. The module searches a limited list of modern devices for the most appropriate thruster for the given inputs, and produces a heat, weight, and power footprint for the thruster and propellant. Structure The structure subsystem determines the mass and volume of the entire system. It assumes constant diameter stacking modules. The degree of modularity affects which subsystems are combined into an integrated section and which are kept as separate modules. The integrated section has a higher volumetric efficiency due to the fact that components can be arranged to better fit within the single integrated volume. The cross-sectional area and volume of each module determine the height of the module and the size of the overall system. Thermal The thermal module utilizes inputs regarding the orbit and thermal environment, maximum and minimum operating temperatures of internal equipment, and internal heat generation. Using a heat balance, the module determines the required radiator size in order to maintain spacecraft temperature within limits. It also chooses from a limited variety of passive cooling techniques, including reflective paints and materials. In the case in which active heating/cooling is required, the module notifies the user. The outcomes of these seven codes are used to estimate the mass, volume, power, and cost of a bus necessary to support the particular payload. The bus sizing code is then used to create an inventory.
Inventory For a responsive space system, the satellite must be ready to launch in only a few weeks. Therefore, the satellite modules, whether they are subsystems or entire buses, must be manufactured in advance and placed in an inventory. The model assumes that if a subsystem is modular, it is its own separate entity, and if it is integrated, then the subsystem is a part of a module containing all integrated subsystems. For a modular subsystem, the model assumes that there will be three distinct modules in the inventory. When a mission is called, the most appropriate module for that payload is chosen. However, the model assumes only one integrated module. Therefore, if a subsystem is a part of the integrated module, it is sized to accommodate the strictest payload requirements in the range under consideration. This scheme means that as the number of modular subsystems increases, the number of modules that must be kept on the shelf increases significantly. If a system is completely integrated, then there is only one type of bus in the inventory; if it is completely modular, then there are 15 different modules in the inventory. The simulation uses the bus sizing code described above to assemble a theoretical inventory for all 32 possible combinations of the modular and integrated subsystems. The costs, masses, volumes, and powers of each module are stored for each inventory. Then, an assortment of payload requirement values, representing a broad range of payload capabilities, can be simulated. The appropriate modules for the mission are chosen from the inventory and assembled for each theoretical payload, and the efficiencies and costs of each combination of modularity can be evaluated and compared. Testing The responsiveness of the system can be represented by the amount of time it takes to assemble and test the system. It is assumed that all design, manufacturing, and module testing takes place in advance, so the modules only need to be assembled and tested as an integrated system after the mission is called. In addition to the responsiveness, the testing of the system also affects the reliability of the system; eliminating tests in order to increase responsiveness must be done cautiously as to not drastically reduce satellite reliability. This study considers three distinct testing schemes. All testing schemes assume that subsystems are fully tested during development; only system level tests are
5 of 9 AIAA- 4th Responsive Space Conference 2006
considered. The first option involves performing a full set of system tests on all possible combinations of modules during the design phase. This should eliminate design flaws. When a system is called, only a system checkout test must be performed7. However, the number of configurations and therefore, the amount of testing and testing cost, significantly increases as the level of modularity increases. The second testing option involves performing a full set of system tests on the flight configuration after the mission is called. This is a strategy similar to that under which most programs operate today. While it is reliable and reasonably cost effective, it requires extremely long lead times. The third strategy involves testing a set number of configurations (the analysis here used 10 cases) during the development phase. Then, the flight configuration undergoes an initial system checkout test, a thermal vacuum test and a final system checkout test. These tests were chosen because they statistically uncover the most issues. This strategy allows for mid-range lead-times and costs. However, it is possible to have certain configurations that never undergo a full set of system tests. Therefore, it is possible for design flaws to go undiscovered, reducing the reliability of the system. For each of these testing strategies, and for each theoretical payload, the testing cost, lead-time, and reliability are calculated. The testing cost is calculated using parametric cost relationships for micro-satellite system tests.3 When considering lead time, in addition to the actual testing time, there is also time allocated to fixing any problems or abnormalities that arise during testing. The values used for time spent resolving discrepancies are based on statistical data of satellite system testing discrepancies broken down by type, cause, and result8. It is assumed that in the first testing strategy, all design problems are found during development, and thus those problems do not occur during system testing. Likewise, in the third testing strategy, the percentage of configurations tested during the development phase represents the corresponding percentage of the design flaws found during that phase. The percentage not found represents the potential design flaws that remain undiscovered at the time the mission is called. Also, for all strategies, it is assumed that only 60% of discrepancies would actually need resolution. The other 40% are due to testing errors or minor problems that would not require corrective action. Utilizing the percentage of modularity of system and the testing strategy, the approximate number of discrepancies encountered and the recovery time can be calculated and added to the testing time to obtain the lead-time.
Some assumptions were necessary to calculate the average amount of time it takes to fix a discrepancy, and to establish how this time varies with modularity. It is assumed that a more modular system takes less time to repair because a malfunctioning module can more easily be replaced with a spare than an integrated section. The reliability is calculated as a relative reliability, considering only the loss of reliability due to the chosen testing strategy. It is based on the assumption that a system that undergoes a full set of integrated tests, as in the second test strategy, has a reliability of 1. Then, statistical data is used to determine the number of possible problems that would not be discovered by the given testing strategy. Also, the statistical percentage of undiscovered problems that would result in mission failure is available. Together, these numbers can be used to calculate the relative reliability of the system. Cost The cost module sums the cost of each of the subsystems, the cost of testing, the cost of launch, an approximate upgrade cost, and the cost of the inventory. The costs of the subsystems include the development costs and are calculated in the bus sizing code. The cost of testing is calculated in the testing model and is discussed above. The launch cost is approximated using the system mass9. The upgrade cost is approximated as a percentage of the development cost that must be incurred every few years to upgrade technologies. The inventory cost accounts for the assumption that if a subsystem is modular, then three modules for that subsystem must be paid for and put into inventory. Therefore, the inventory cost is the sum of the costs of all modules in the inventory. Considered together, these values represent the expense involved in implementing a responsive space program. Demand In order to become a reality, the responsive, standardized bus must be economically feasible. Therefore, a final phase of the model is a demand model that simulates the effect of selling price, cost of the satellite, and modularity on the demand and profit margin for developing the specific inventory10. This calculation is completed for each combination of integrated and modular subsystems. The demand module uses stochastic models to create a probabilistic distribution of future military and commercial demand for responsive satellites. Assuming that any developed satellite bus can satisfy
all military demand of this type as well as 20% of commercial demand, the module calculates total future revenues in present values. Each stepwise increase in modularity is assumed to increase serviceable commercial demand. The module also accounts for increases in satellite cost resulting from modularizing the system.
6 of 9 AIAA- 4th Responsive Space Conference 2006
ANALYSIS
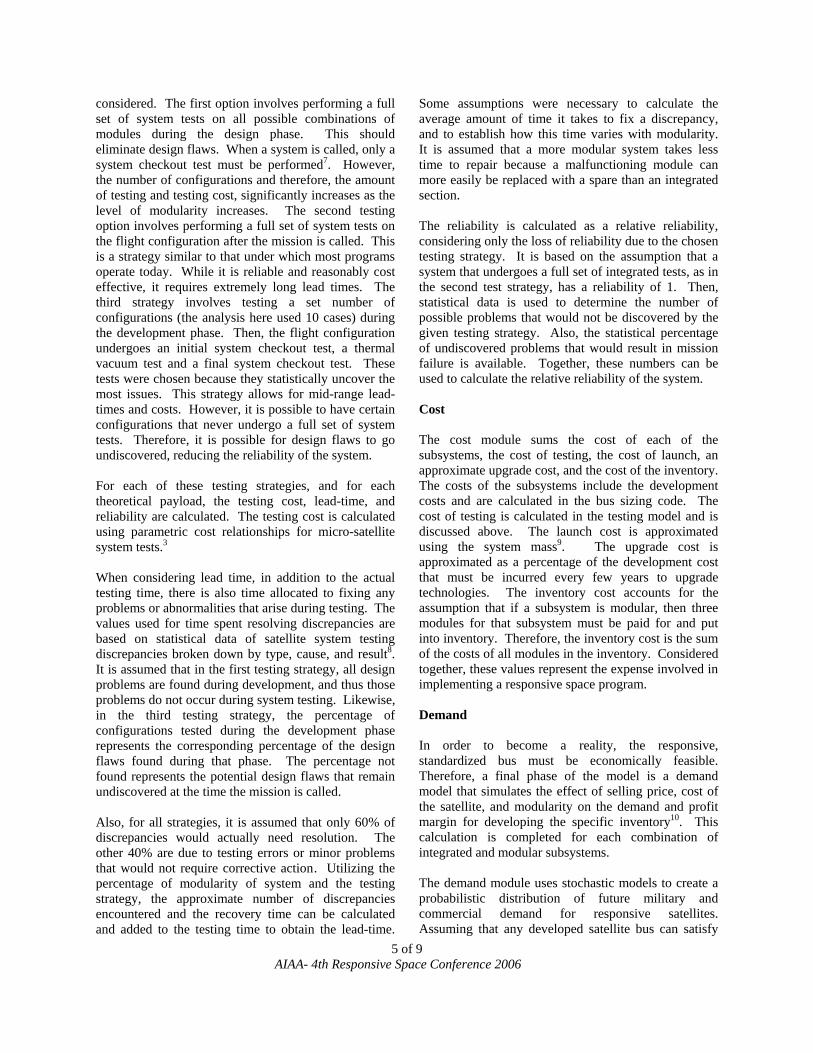
The simulations described in the preceding sections are run to create a large trade space. The performance metrics used to weigh different responsive bus architectures against one another are cost, lead-time, reliability, efficiency, and net present value. The total cost includes the cost of the satellite, testing, launch, and maintaining an inventory. The lead-time is assumed to be the time it takes to complete the integrated system tests and resolve any discrepancies. The reliability is a relative reliability resulting only from the testing method utilized. The efficiency is defined for mass, volume, and power as the percent of each that a monolithic bus designed specifically for the given payload would have compared with the mass, volume, and power of the designed standardized system. The net present value is calculated using demand data and stochastic models. Each of these performance metrics can be plotted against the others to determine the optimal responsive bus architecture. Reliability versus Lead-time Both system reliability and lead-times are functions of the chosen testing option and modularity level. Therefore, there are only as many data points as there are testing options and combinations of modularity. The data can be seen Figure 2. Options with reliabilities below 95% are immediately discarded, as systems with reliabilities lower than that threshold would not be viable options. Also, a maximum lead time is set at 90 days. The responsive space goal is to have a system ready in about a month, so any designs that have lead-times greater than three months do not qualify as responsive. Options that have lead times between one and three months are kept because, even though they do not meet the goal of one month, they represent a significant improvement over current satellite architectures. The region containing viable options is then shown in the upper left corner of Figure 2.
Figure 2: Reliability versus le The first thing to note is that alfirst testing strategy (completof modules during the designregion. These designs havmaking them the most respooption is the completely modutesting strategy (test the full sycalled). However, this option90 day cut-off, so it is one of tdesigns. Finally, the 0 and 2the third testing strategy (configurations during design aafter the mission is called) aretesting strategy, the percentagenot undergo a full set of increases as the system becomthe system is not modular orconfigurations are tested becaten possible configurations. issues are all found during threlative reliability is high. Thlead-times than the options tesbecause they undergo more tcalled. Cost versus Lead-time The next metrics examined wthe lead-time. The entire seFigure 3.
x Testing Strategy 1 * Testing Strategy 2 o Testing Strategy 3
* 0% Modular * 20% Modular * 40% Modular * 60% Modular * 80% Modular * 100% Modular
ad-time
l of the designs using the ely test all combinations phase) are in the viable e the lowest lead-time, nsive. Another viable
lar case using the second stem after the mission is
has a lead-time near the he least responsive viable 0% modular cases using test a set number of nd complete limited tests feasible. With the third of configurations that do integrated system tests es more modular. When only 20% modular, all use there are fewer than Therefore, the design e design phase, and the ese designs have longer
ted with the first strategy ests after the mission is
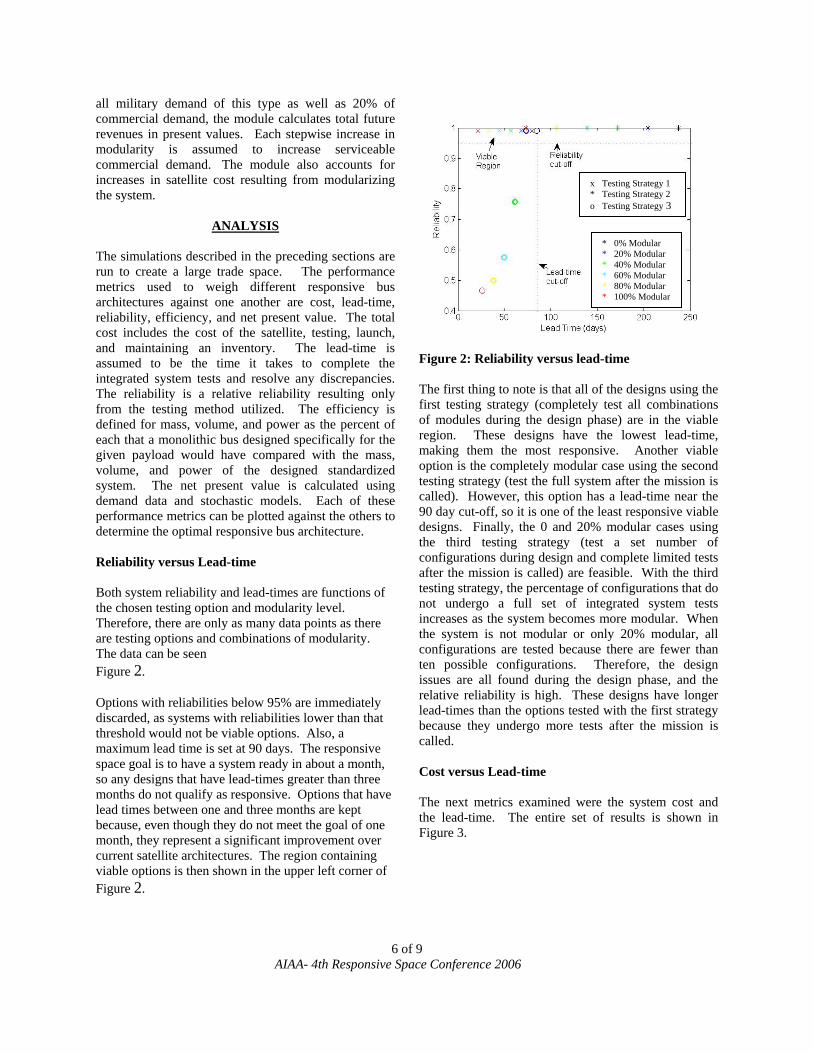
ere the system cost and t of results is shown in
7 of 9 AIAA- 4th Responsive Space Conference 2006
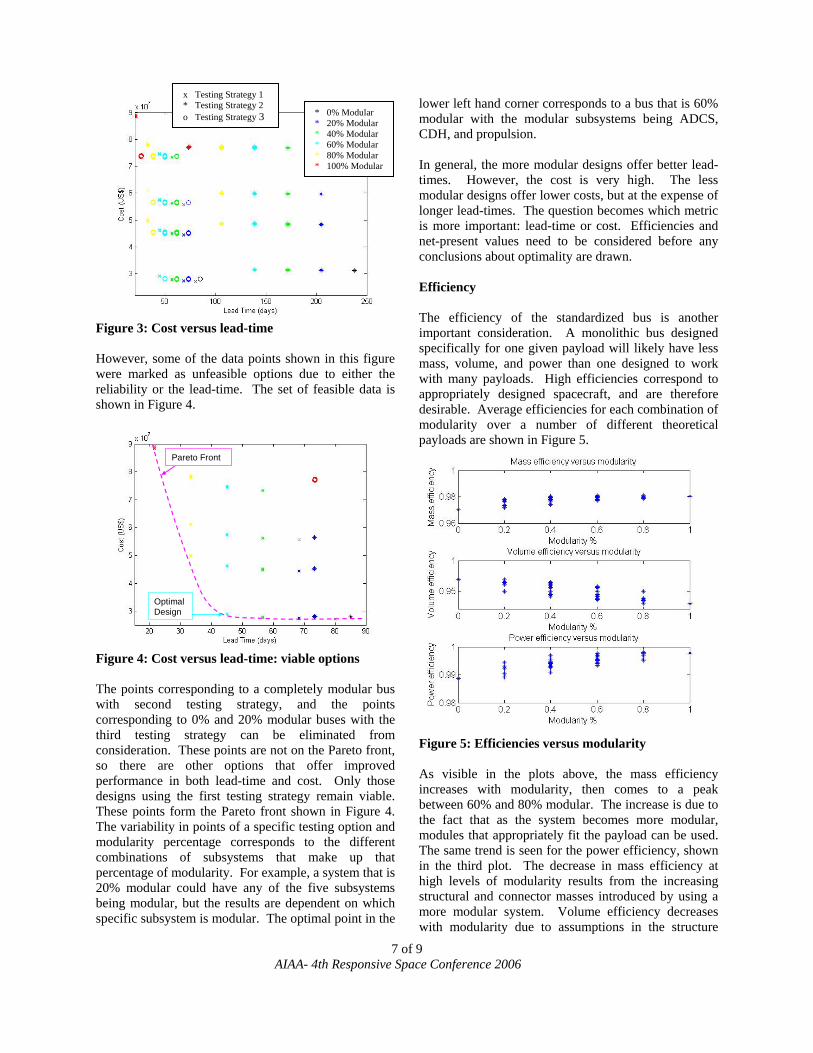
Figure 3: Cost versus lead-time However, some of the data points shown in this figure were marked as unfeasible options due to either the reliability or the lead-time. The set of feasible data is shown in Figure 4.
Pareto Front
Optimal Design
Pareto Front
Optimal Design
Figure 4: Cost versus lead-time: viable options The points corresponding to a completely modular bus with second testing strategy, and the points corresponding to 0% and 20% modular buses with the third testing strategy can be eliminated from consideration. These points are not on the Pareto front, so there are other options that offer improved performance in both lead-time and cost. Only those designs using the first testing strategy remain viable. These points form the Pareto front shown in Figure 4. The variability in points of a specific testing option and modularity percentage corresponds to the different combinations of subsystems that make up that percentage of modularity. For example, a system that is 20% modular could have any of the five subsystems being modular, but the results are dependent on which specific subsystem is modular. The optimal point in the
lower left hand corner corresponds to a bus that is 60% modular with the modular subsystems being ADCS, CDH, and propulsion.
x Testing Strategy 1 * Testing Strategy 2 o Testing Strategy 3 * 0% Modular
* 20% Modular * 40% Modular * 60% Modular * 80% Modular * 100% Modular
In general, the more modular designs offer better lead-times. However, the cost is very high. The less modular designs offer lower costs, but at the expense of longer lead-times. The question becomes which metric is more important: lead-time or cost. Efficiencies and net-present values need to be considered before any conclusions about optimality are drawn. Efficiency The efficiency of the standardized bus is another important consideration. A monolithic bus designed specifically for one given payload will likely have less mass, volume, and power than one designed to work with many payloads. High efficiencies correspond to appropriately designed spacecraft, and are therefore desirable. Average efficiencies for each combination of modularity over a number of different theoretical payloads are shown in Figure 5.
Figure 5: Efficiencies versus modularity As visible in the plots above, the mass efficiency increases with modularity, then comes to a peak between 60% and 80% modular. The increase is due to the fact that as the system becomes more modular, modules that appropriately fit the payload can be used. The same trend is seen for the power efficiency, shown in the third plot. The decrease in mass efficiency at high levels of modularity results from the increasing structural and connector masses introduced by using a more modular system. Volume efficiency decreases with modularity due to assumptions in the structure
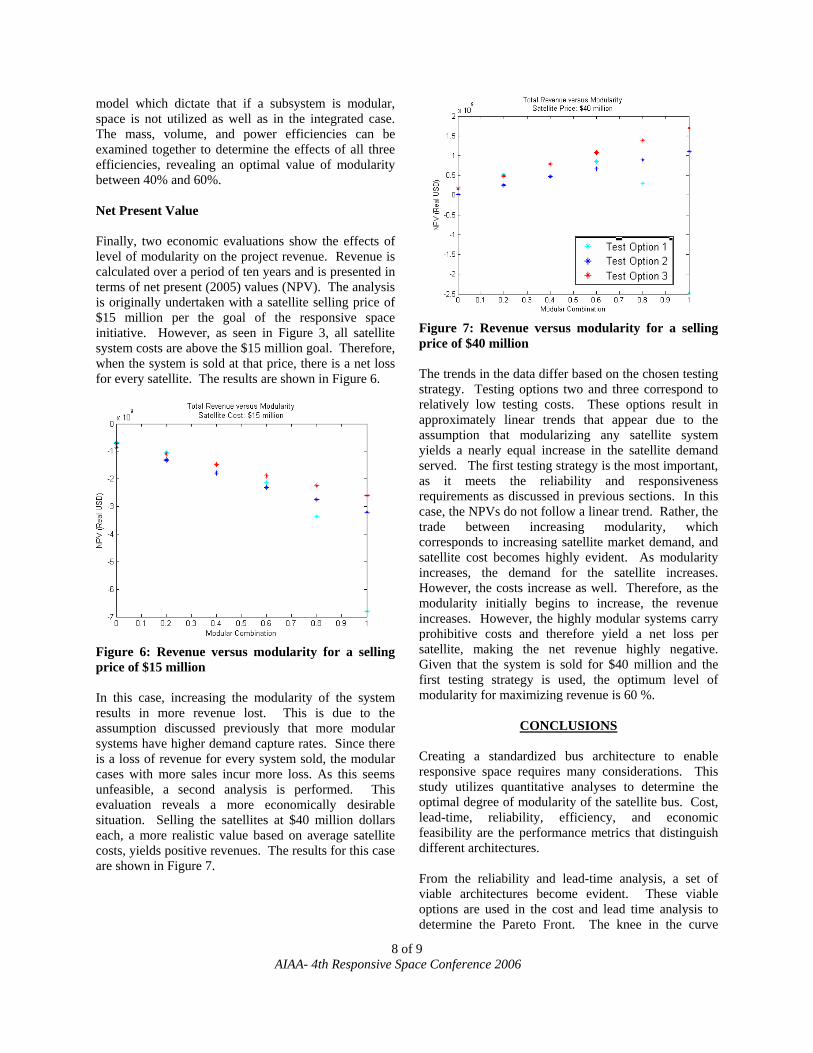
model which dictate that if a subsystem is modular, space is not utilized as well as in the integrated case. The mass, volume, and power efficiencies can be examined together to determine the effects of all three efficiencies, revealing an optimal value of modularity between 40% and 60%. Net Present Value Finally, two economic evaluations show the effects of level of modularity on the project revenue. Revenue is calculated over a period of ten years and is presented in terms of net present (2005) values (NPV). The analysis is originally undertaken with a satellite selling price of $15 million per the goal of the responsive space initiative. However, as seen in Figure 3, all satellite system costs are above the $15 million goal. Therefore, when the system is sold at that price, there is a net loss for every satellite. The results are shown in Figure 6.
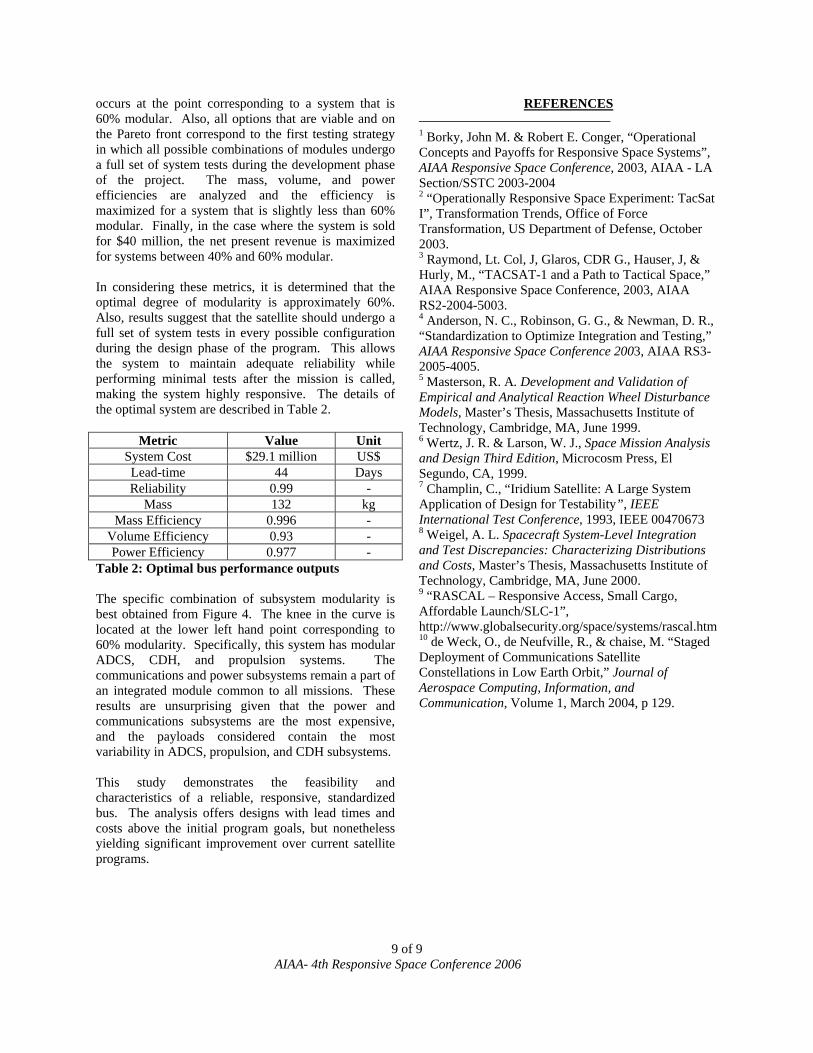
Figure 6: Revenue versus modularity for a selling price of $15 million In this case, increasing the modularity of the system results in more revenue lost. This is due to the assumption discussed previously that more modular systems have higher demand capture rates. Since there is a loss of revenue for every system sold, the modular cases with more sales incur more loss. As this seems unfeasible, a second analysis is performed. This evaluation reveals a more economically desirable situation. Selling the satellites at $40 million dollars each, a more realistic value based on average satellite costs, yields positive revenues. The results for this case are shown in Figure 7.
Figure 7: Revenue versus modularity for a selling price of $40 million The trends in the data differ based on the chosen testing strategy. Testing options two and three correspond to relatively low testing costs. These options result in approximately linear trends that appear due to the assumption that modularizing any satellite system yields a nearly equal increase in the satellite demand served. The first testing strategy is the most important, as it meets the reliability and responsiveness requirements as discussed in previous sections. In this case, the NPVs do not follow a linear trend. Rather, the trade between increasing modularity, which corresponds to increasing satellite market demand, and satellite cost becomes highly evident. As modularity increases, the demand for the satellite increases. However, the costs increase as well. Therefore, as the modularity initially begins to increase, the revenue increases. However, the highly modular systems carry prohibitive costs and therefore yield a net loss per satellite, making the net revenue highly negative. Given that the system is sold for $40 million and the first testing strategy is used, the optimum level of modularity for maximizing revenue is 60 %.
CONCLUSIONS Creating a standardized bus architecture to enable responsive space requires many considerations. This study utilizes quantitative analyses to determine the optimal degree of modularity of the satellite bus. Cost, lead-time, reliability, efficiency, and economic feasibility are the performance metrics that distinguish different architectures. From the reliability and lead-time analysis, a set of viable architectures become evident. These viable options are used in the cost and lead time analysis to determine the Pareto Front. The knee in the curve
8 of 9 AIAA- 4th Responsive Space Conference 2006
9 of 9 AIAA- 4th Responsive Space Conference 2006
occurs at the point corresponding to a system that is 60% modular. Also, all options that are viable and on the Pareto front correspond to the first testing strategy in which all possible combinations of modules undergo a full set of system tests during the development phase of the project. The mass, volume, and power efficiencies are analyzed and the efficiency is maximized for a system that is slightly less than 60% modular. Finally, in the case where the system is sold for $40 million, the net present revenue is maximized for systems between 40% and 60% modular. In considering these metrics, it is determined that the optimal degree of modularity is approximately 60%. Also, results suggest that the satellite should undergo a full set of system tests in every possible configuration during the design phase of the program. This allows the system to maintain adequate reliability while performing minimal tests after the mission is called, making the system highly responsive. The details of the optimal system are described in Table 2.
Metric Value Unit System Cost $29.1 million US$ Lead-time 44 Days Reliability 0.99 -
Mass 132 kg Mass Efficiency 0.996 -
Volume Efficiency 0.93 - Power Efficiency 0.977 -
Table 2: Optimal bus performance outputs The specific combination of subsystem modularity is best obtained from Figure 4. The knee in the curve is located at the lower left hand point corresponding to 60% modularity. Specifically, this system has modular ADCS, CDH, and propulsion systems. The communications and power subsystems remain a part of an integrated module common to all missions. These results are unsurprising given that the power and communications subsystems are the most expensive, and the payloads considered contain the most variability in ADCS, propulsion, and CDH subsystems. This study demonstrates the feasibility and characteristics of a reliable, responsive, standardized bus. The analysis offers designs with lead times and costs above the initial program goals, but nonetheless yielding significant improvement over current satellite programs.
REFERENCES 1 Borky, John M. & Robert E. Conger, “Operational Concepts and Payoffs for Responsive Space Systems”, AIAA Responsive Space Conference, 2003, AIAA - LA Section/SSTC 2003-2004 2 “Operationally Responsive Space Experiment: TacSat I”, Transformation Trends, Office of Force Transformation, US Department of Defense, October 2003. 3 Raymond, Lt. Col, J, Glaros, CDR G., Hauser, J, & Hurly, M., “TACSAT-1 and a Path to Tactical Space,” AIAA Responsive Space Conference, 2003, AIAA RS2-2004-5003. 4 Anderson, N. C., Robinson, G. G., & Newman, D. R., “Standardization to Optimize Integration and Testing,” AIAA Responsive Space Conference 2003, AIAA RS3-2005-4005. 5 Masterson, R. A. Development and Validation of Empirical and Analytical Reaction Wheel Disturbance Models, Master’s Thesis, Massachusetts Institute of Technology, Cambridge, MA, June 1999. 6 Wertz, J. R. & Larson, W. J., Space Mission Analysis and Design Third Edition, Microcosm Press, El Segundo, CA, 1999. 7 Champlin, C., “Iridium Satellite: A Large System Application of Design for Testability”, IEEE International Test Conference, 1993, IEEE 00470673 8 Weigel, A. L. Spacecraft System-Level Integration and Test Discrepancies: Characterizing Distributions and Costs, Master’s Thesis, Massachusetts Institute of Technology, Cambridge, MA, June 2000. 9 “RASCAL – Responsive Access, Small Cargo, Affordable Launch/SLC-1”, http://www.globalsecurity.org/space/systems/rascal.htm 10 de Weck, O., de Neufville, R., & chaise, M. “Staged Deployment of Communications Satellite Constellations in Low Earth Orbit,” Journal of Aerospace Computing, Information, and Communication, Volume 1, March 2004, p 129.
Copyright © 2022 FDOKUMEN