Analysis of impacts on urban air quality by restricting the operation of passenger vehicles during...
16
Atmospheric Environment 39 (2005) 2323–2338 Analysis of impacts on urban air quality by restricting the operation of passenger vehicles during Asian Game events in Busan, Korea Byeong-Kyu Lee a, , Na-Young Jun a , Haengah Kim Lee b,c a Department of Civil and Environmental Engineering, University of Ulsan, Ulsan 680-749, Republic of Korea b Environmental Studies Ph.D. Program, University of Massachusetts, Lowell, MA 01854, USA c Ulsan Environmental Management, Ulsan Development Institute, Buk-gu, Yeonam-dong, Ulsan 683-804, Korea Received 26 July 2004; accepted 19 November 2004 Abstract This study is an analysis of the impacts on urban air quality of restricting the operation of passenger vehicles during the 24th Asian Games (AG). Passenger vehicles in Busan were not allowed to operate on the alternative days during the AG period. This restricted operation of passenger vehicles was enforced to improve an urban air quality in Busan during the AG period. The average usage rate of passenger vehicles under an alternate (or restricted) operation was 95.4% and thus the average traffic flow rate (vehicle operation speed) increased approximately 28.1% as compared to normal periods. We analyzed the ambient concentrations of criteria air pollutants measured at 13 air-monitoring stations in Busan (Pusan), Korea, for the three periods of ‘‘before (13–28 September 2002)’’, ‘‘during (29 September–14 October 2002)’’ and ‘‘after (15–30 October 2002)’’ the AG. The 1-h, 24-h and 16-day averages or median concentrations of each classified term were compared to those of other terms. The median concentrations, based on 24-h average data of each day, of PM 10 , CO, NO 2 , and SO 2 in the ambient during the alternate operation period of 16 days substantially increased as compared to the terms before or after. However, the median concentration of O 3 during the AG period was slightly less than that of the term before. The ambient O 3 concentrations during daytime (12:00–19:00) under alternate operation substantially increased as compared to the terms before or after. However, the ambient O 3 concentrations during nighttime (22:00–07:00) under alternate operation decreased when compared to the terms before or after. For the alternate operation period of passenger vehicles, the average concentrations of PM 10 , NO 2 , SO 2 , and daytime O 3 measured at the air-monitoring stations near the stadiums were much higher than those of the other areas excluding the stadium areas. However, average CO concentrations at the other areas were higher than those nearby the stadiums during the alternate operation period. r 2005 Elsevier Ltd. All rights reserved. Keywords: Asian Game; Vehicle emission; Alternate operation; Air pollution; Monitoring 1. Introduction The Asian Games (AG) are one of the biggest international sporting events, held in Asia, similar to the Olympic Games. National or local governments that ARTICLE IN PRESS www.elsevier.com/locate/atmosenv 1352-2310/$ - see front matter r 2005 Elsevier Ltd. All rights reserved. doi:10.1016/j.atmosenv.2004.11.044 Corresponding author. Tel.: +82 52 259 2864; fax: +82 52 259 2629. E-mail address: [email protected] (B.-K. Lee).
-
Upload
independent -
Category
Documents
-
view
3 -
download
0
Transcript of Analysis of impacts on urban air quality by restricting the operation of passenger vehicles during...
ARTICLE IN PRESS
1352-2310/$ - se
doi:10.1016/j.at
�Correspondfax: +8252 259
E-mail addr
Atmospheric Environment 39 (2005) 2323–2338
www.elsevier.com/locate/atmosenv
Analysis of impacts on urban air quality by restricting theoperation of passenger vehicles during Asian Game events
in Busan, Korea
Byeong-Kyu Leea,�, Na-Young Juna, Haengah Kim Leeb,c
aDepartment of Civil and Environmental Engineering, University of Ulsan, Ulsan 680-749, Republic of KoreabEnvironmental Studies Ph.D. Program, University of Massachusetts, Lowell, MA 01854, USA
cUlsan Environmental Management, Ulsan Development Institute, Buk-gu, Yeonam-dong, Ulsan 683-804, Korea
Received 26 July 2004; accepted 19 November 2004
Abstract
This study is an analysis of the impacts on urban air quality of restricting the operation of passenger vehicles during
the 24th Asian Games (AG). Passenger vehicles in Busan were not allowed to operate on the alternative days during the
AG period. This restricted operation of passenger vehicles was enforced to improve an urban air quality in Busan
during the AG period. The average usage rate of passenger vehicles under an alternate (or restricted) operation was
95.4% and thus the average traffic flow rate (vehicle operation speed) increased approximately 28.1% as compared to
normal periods. We analyzed the ambient concentrations of criteria air pollutants measured at 13 air-monitoring
stations in Busan (Pusan), Korea, for the three periods of ‘‘before (13–28 September 2002)’’, ‘‘during (29 September–14
October 2002)’’ and ‘‘after (15–30 October 2002)’’ the AG. The 1-h, 24-h and 16-day averages or median concentrations
of each classified term were compared to those of other terms. The median concentrations, based on 24-h average data
of each day, of PM10, CO, NO2, and SO2 in the ambient during the alternate operation period of 16 days substantially
increased as compared to the terms before or after. However, the median concentration of O3 during the AG period was
slightly less than that of the term before. The ambient O3 concentrations during daytime (12:00–19:00) under alternate
operation substantially increased as compared to the terms before or after. However, the ambient O3 concentrations
during nighttime (22:00–07:00) under alternate operation decreased when compared to the terms before or after. For
the alternate operation period of passenger vehicles, the average concentrations of PM10, NO2, SO2, and daytime O3
measured at the air-monitoring stations near the stadiums were much higher than those of the other areas excluding the
stadium areas. However, average CO concentrations at the other areas were higher than those nearby the stadiums
during the alternate operation period.
r 2005 Elsevier Ltd. All rights reserved.
Keywords: Asian Game; Vehicle emission; Alternate operation; Air pollution; Monitoring
e front matter r 2005 Elsevier Ltd. All rights reserve
mosenv.2004.11.044
ing author. Tel.: +8252 259 2864;
2629.
ess: [email protected] (B.-K. Lee).
1. Introduction
The Asian Games (AG) are one of the biggest
international sporting events, held in Asia, similar to
the Olympic Games. National or local governments that
d.

ARTICLE IN PRESSB.-K. Lee et al. / Atmospheric Environment 39 (2005) 2323–23382324
hold the Olympic Games, the Football World Cup or
the AG try to keep their environment clean through a
variety of activities, such as reducing air emissions from
stationary or mobile sources (EMC, 2002; Kazimi, 1997;
Santarelli et al., 2003). The 24th FIFA World Cup
Matches and the 14th AG were held in Busan, which is
the second biggest city in Korea, having a population of
3.8 million. Busan Metropolitan City attempted to
reduce emissions from its fleet by reducing vehicle
operation volumes during the two big sports event
periods. Passenger vehicles were allowed to operate in
Busan Metropolitan City areas only on alternate days
during the FIFA World Cup in Busan from 1–6 June
2002. However, the effect on air pollution levels of the
alternate day operation of passenger vehicles (Krawack,
1993; Recker and Parimi, 1999) during the FIFA World
Cup was not as good as expected (Lee and Lee, 2003).
Alternate operation during the short world cup period
of 6 days in early summer or late spring resulted in
increased air pollution levels except in ambient ozone
levels in Busan. The cause of the increase in air pollution
levels had not been identified or analyzed before the
Busan AG started on 29 September 2002. However, the
governments of Busan Metropolitan City had decided to
use the alternate day operation of passenger vehicles
again during the Busan AG period of 29 September–14
October 2002. This was because there was a slight
reduction in air pollution levels in most of the cities
where alternate day operation of passenger vehicles was
used during the FIFA World Cup from 31 May to 29
June, 2002. This study reports the impact analysis on
urban air quality found in the alternative daily use of
passenger vehicles in Busan during the 24th AG period.
We also compare the air pollution levels in Busan during
the alternate operation of passenger vehicles to those in
normal periods (before and after the AG) when alternate
operation was not conducted.
Fig. 1. A location map of air-monitoring stations in Pusan
(Busan), Korea.
2. Methods
About 18,000 participants and officials from 43
countries under the Olympic Council of Asia (OCA)
participated in the 14th Busan AG for 16 days from 29
September to 14 October, 2002. Also, spectators
numbering several tens of thousands per day visited
the AG stadiums to watch games. Passenger vehicles in
Busan were not allowed to operate on the alternative
days during the AG period. This restricted operation of
passenger vehicles was enforced to improve an urban air
quality in Busan during the AG period. The even
number cars, based on the last title number of a car,
were only allowed to operate on the even days and the
odd number cars were also only allowed to operate on
the odd days in Busan during the AG period. The
average use of road vehicles of the alternate day
operations in Busan during the AG period was
calculated by counting the number of passenger vehicles
passing through the measurement points of 6 sites
during the alternate operation periods for the 16 days
and compared to measurements made immediately
before and after the games. The counting of passenger
vehicles passing through the points was conducted
during three periods of the day; morning rush hour
(07:30–09:30), day hour (12:00–14:00), and afternoon
rush hour (17:30–19:30), using manual counts at less
busy traffic points and closed-circuit television (CCTV)
analysis at busy traffic points for every alternate 10min
(10min count and then 10min break). Vehicle speeds
during alternate operation were measured at major
roads including the central and outer areas of the cities
with vehicle speed measurement guns.
This study classified the study periods as ‘‘before’’
(13–28 September 2002), ‘‘during’’ (29 September–14
October 2002), and ‘‘after’’ (15–30 October 2002) the
AG period for the purpose of comparing air pollution
levels. The alternate operation of passenger vehicles was
only conducted during the AG period and is termed
‘‘during’’. Continuous measurements of criteria air
pollutants, such as CO, NO2, SO2, PM10 and O3, were
conducted at 13 monitoring sites in Busan during the
study periods, from 13 September to 30 October 2002.
The air measurement equipment at the monitoring sites
was regularly checked for operation status and cali-
brated according to the preventative maintenance
schedule (DOE, 2003a; MOE, 2003).
This study obtained 1-h average concentrations for
criteria air pollutants as a function of the diurnal
variation at 13 air-monitoring stations in Busan (Pusan)
during the three terms (Fig. 1). The 24-h and 16-day
average levels, based on the information of 1-h average
concentrations of the criteria air pollutants for each
term, were analyzed and compared with those of other
classified terms. In a comparison of the air pollution
levels of the three terms, the concentrations measured on
rainy days with precipitation above 3.5mm per day were

ARTICLE IN PRESSB.-K. Lee et al. / Atmospheric Environment 39 (2005) 2323–2338 2325
excluded to evaluate the net effects of the alternate
operation of passenger vehicles. Simple meteorological
data, such as wind speed, relative humidity, and
temperature, were obtained from each air-monitoring
station and compared to the data measured at the Busan
Regional Meteorological Office (BRMO). Major me-
teorological data including average daily maximum
mixing height, ambient ventilation index, sunshine
duration time, precipitation and wind information were
obtained from the data measured at the BRMO located
in Myengryun-dong near the Bugok air-monitoring
station. The wind roses of the three compared periods
were drawn from the wind velocity and direction
measured at the BRMO.
Finally, this study compared the air pollution levels
between two monitoring sites near the AG main
stadiums and at other monitoring sites excluding two
sites near the stadiums. Since PM10 emission informa-
tion from gasoline vehicles is currently not available in
Busan, the emission changes for PM10 could not be
calculated. Also, ozone (O3) is not usually considered as
a primary air pollutant, but a secondary air pollutant
combined with sunlight radiation, nitrogen dioxide
(NO2), nitric oxide (NO), etc (Palmgren et al., 1996).
In this paper, the measured O3 levels are simply matched
with the hydrocarbon emission estimate.
3. Results and discussion
3.1. Vehicle emission analysis and control strategy
Table 1 summarizes a source contribution pattern on
emissions of air pollutants in Busan Metropolitan City
in 2002 (DOE, 2003a; DOE, 2003b). The air emissions
from ships were the most prominent source followed by
emissions from road vehicles. This is because Busan is
the largest port in Korea, as well as one of the busiest
international port cities. This source contribution
pattern is totally different from that of Seoul, in which
85% of the total air emissions come from vehicles
operating on roads. This means that the first priority in
reducing the total air pollution levels in Busan should be
the control of ship emissions. In fact, however, it is not
easy to apply emission control measures to ships because
Table 1
A summary of air pollutant emissions in Busan metropolitan city
Source Vehicle Ship
Air emissions (1000 ton year�1) 120.6 168.3
Relative contribution (wt%) 38.7 54.0
Note: Vehicle means only mobile vehicles operated on roads and ship e
boats, trains, and air planes.
of technological difficulties concerning the fuels, engines,
and air pollution control devices of ships.
Table 2 shows the contribution of mobile vehicles
operated on roads to the total air emissions of each air
pollutant in Busan. The road vehicles were the most
significant sources of the air emissions of carbon
monoxide (CO) and NO2 in Busan. However, the
contribution from the road vehicles to the total air
emissions of hydrocarbons (HCs), fine particulate
(PM10), and sulfur dioxide (SO2) was much less than
that of CO or NO2 in Busan.
Table 3 analyzes emissions of air pollutants from road
vehicles in Busan in 2002 as a function of vehicle type.
About 91% of passenger vehicles, excluding taxies, used
gasoline as a fuel in 2002. These passenger vehicles were
responsible for about 25.5% of the total carbon
monoxide emissions in Busan. Almost 100% of the
taxies used LPG as a fuel and these LPG taxies were
responsible for about 20.9% of the total CO emissions in
Busan. LPG taxies and passenger vehicles excluding
LPG taxies were 7.4% and 56.0% of the total number of
vehicles registered in Busan in October 2002, while air
emissions from them were 18.0 and 23.5wt% of the total
air emissions from road vehicles, respectively. The
contribution of LPG taxies to the total air emissions
from road vehicles was high when compared to the
registered number of LPG taxies. This was due to a
much longer operation period of LPG taxies (about
22 h day�1) compared with the passenger vehicles that
operate 1.0–1.5 h day�1.
About 62% and 36% of the buses registered in Busan
in October 2002, used diesel (430 ppm S in 2002) and
LPG (200 ppm S in 2002), respectively, as their fuel.
Almost 100% of the large buses and 89% of the trucks
operated in Busan used diesel as their fuel. Even though
diesel buses and trucks are only about 24.3% of the total
road vehicle numbers registered in Busan, they were
responsible for 48.5wt% of the total air emissions from
the road vehicles in Busan. About 9.1 and 45.3wt% of
the total air emissions from the road vehicles in Busan
came from all buses and trucks, respectively. Also, all
buses and trucks were responsible for 45.0, 83.0, 39.8,
100, 100wt% of the total emissions of CO, NO2, HCs,
PM10, SO2, respectively, emitted from all the road
vehicles in Busan in 2002. Even though this study
Heating Industry Electricity Total
11.9 11.0 0 311.8
3.8 3.5 0 100
missions include all of the emissions from the operation of ships,

ARTICLE IN PRESS
Table 2
Contribution of vehicle emissions to the total emissions of each air pollutant based on mass in Busan
CO NOx HC PM10 SO2
Total air emissions of pollutant from all sources (1000 ton year�1) 83.0 71.6 54.0 42.3 60.9
Total air emissions of pollutant from vehicles (1000 ton year�1) 70.1 35.3 9.3 5.3 0.6
Vehicle contribution to the total air emissions of pollutant (wt%) 84.5 49.3 17.2 12.5 9.9
Note: Vehicle means only mobile vehicles operated on roads.
Table 3
Contribution of vehicle emissions to the total air emissions of each pollutant in Busan
CO NOx HC PM10 SO2
Total air emissions from passenger cars (1000 ton year�1) 21.2 3.7 3.5 0 0.04
Contribution to total air emissions of pollutant (wt%) 25.5 5.2 6.5 0 0.07
Total air emissions from LPG taxies (1000 ton year�1) 17.3 2.3 2.1 0 0
Contribution to total air emissions of pollutant (wt%) 20.9 3.1 3.9 0 0
Total air emissions from buses (1000 ton year�1) 7.6 6.1 0.9 1.1 0.2
Contribution to total air emissions of pollutant (wt%) 9.1 8.6 1.6 2.6 0.3
Total air emissions from trucks (1000 ton year�1) 24.0 23.2 2.8 4.2 0.4
Contribution to total air emissions of pollutant (wt%) 28.9 32.4 5.3 9.9 0.6
Table 4
Estimated reduction effects of air pollution levels by alternate operation of passenger vehicles in Busan
Degree of reduction (�) or increase (+) of pollutant (%)
CO NO2 HC PM10 SO2 Average
Estimation by participation and emission info.a �12.2 �2.5 �3.1 0 �0.03 �3.6
Estimation by participation and emission info.b �11.3 �1.6 �2.9 0 0 �3.2
aEstimation based on the emissions from all passenger cars including LPG taxies.bEstimation based on the emissions from all passenger cars excluded LPG taxies.
B.-K. Lee et al. / Atmospheric Environment 39 (2005) 2323–23382326
analyzed the impacts on urban air quality (UAQ) by
controlling operation of passenger vehicles, the control
of air emissions from buses and trucks would be a more
effective way to improve the UAQ in Busan. In reality,
however, it is not easy to implant the operation
reduction of buses and trucks for the UAQ improve-
ment of a short period. This is because most buses and
trucks are used as a means for public and industrial
transportation, respectively, which were essential even
during the AG period. Reductions of HCs from
passenger vehicles, however, are more important than
buses or trucks.
3.2. Estimated emission reduction of the alternate
operation
The average usage rate of the alternate operation of
passenger vehicles during the AG period in Busan, based
on the passenger vehicle numbers registered in Busan
until October 2002 was 95.370.8%. Table 4 represents
the estimated emission reduction rates of air pollutants
based on both the contribution of passenger vehicles to
the total emissions of each air pollutant shown in Table
3 and the average usage rates of passenger vehicles of
alternate operation (Lee and Longhurst, 1993). If the
alternate operation of passenger vehicles, excluding
LPG taxies, were conducted in Busan, the greatest
emission reduction effects would be observed in CO
levels followed by HC and NO2 levels.
When evaluated on the basis of the emission factors of
unleaded gasoline vehicles in Korea (Haan and Keller,
2000; NIER, 1990), there would be no reductions in
PM10 and SO2 levels. The average estimated emission
reductions of all criteria air pollutants by the alternate
operation of passenger vehicles would decrease from 3.6
to 3.2wt%. However, these estimated reduction levels

ARTICLE IN PRESSB.-K. Lee et al. / Atmospheric Environment 39 (2005) 2323–2338 2327
would be affected by changes in vehicle speed accom-
panied by traffic volume reductions, meteorological
conditions, type of vehicle and fuel, etc, which are not
included in this simple estimate. Also, the increases in
buses and taxies to make up reduction in transportation
means by the alternate operation of passenger vehicles
can offset the air emission reduction effects by the
alternate operation. Even though there might be errors
included in the estimate, it would be still useful for the
purpose of a simple evaluation estimate in air emission
reduction of the alternate operation effects of passenger
vehicles.
3.3. Rain precipitation and wind effect
Table 5 summarizes the meteorological conditions,
excluding the data observed on rainy days with
precipitation of above 3.5mm per day, of the three
periods compared in this study. All three terms had
rainy days ranging from 2 to 3 days which had rain
precipitation above 3.5mm and the total rain precipita-
tion during these heavy rainy days ranged from 44.0 to
78.0mm. The authors have found that precipitation,
such as rainfall, significantly affected air pollution levels
under a similar alternate operation of passenger vehicles
during the FIFA World Cup (Lee and Lee, 2003). This
study also found that heavy rain precipitations during
the alternate operation as well as normal periods which
did not have alternate operation, significantly affected
air pollution levels (Fig. 2).
Fig. 2 shows the rainfall effects on air pollution levels
during the study period by comparing air pollution
levels on rainy days, which had rain precipitation above
8.0mm per day, with those on the days that did not have
a significant amount of rain. The degree of air pollution
reduction effects by rainfall under the alternate opera-
tion (during) was lower than that under the normal
periods (before and after). The relatively low rainfall
Table 5
A summary of the meteorological conditions of three compared perio
Meteorological conditions Before
Average sunshine duration time (h)a 6.173.5
Average daily temperature (1C)a 20.770.8
Average daily relative humidity (%)a 67.574.1
Average daily rainfall (mm), (dayp3.5mm) 0.370.1,
Average daily rainfall (mm), (day43.5mm) 39.0725.
Total rain precipitation (mm), (dayp3.5mm) 0.9, (3)
Total rain precipitation (mm), (day43.5mm) 78.0, (2)
Average daily maximum mixing height (m) 1612.576
Average daily ventilation index (m2 s�1) 3743.871
Average daily wind speed (m s�1)a 3.671.0
aExcluded the data measured on days with precipitation above 3.5
effects during the alternate operation, as compared to
that during the normal periods, was due to a significant
increase of air pollution levels observed during the
alternate operation period (discussed below). Rain
precipitation had the largest effect on the reduction in
SO2 levels and the least on the ambient O3 levels. The
average levels of ambient O3 on the days with significant
rain precipitation above 3.5mmday�1 during the
normal periods were not lower, but slightly increased,
depending upon monitoring sites and meteorological
conditions, as compared to those on the days that did
not have significant rainfall.
Fig. 3 shows the average wind roses of three compared
periods. The wind patterns in the term during the
alternate operation were quite different from those in
the normal periods (terms before and after). Thus, the
alternate operation period might have different sources
of air pollutants from the normal periods. In particular,
the normal periods might have a more dilution effect by
winds blowing from the sea than the alternate operation
periods. This fact was identified in detailed analysis of
the average daily maximum mixing height and ambient
ventilation index of two terms shown in Table 5. This
study was based on the average values of the measure-
ment data obtained at 13 monitoring sites, which well
represent various areas through Busan city for 16 days
in each term. However, there might be a little difference
in air pollution sources between the normal and
alternate operation periods because of quite different
wind patterns between them.
3.4. Measured effects of air pollution levels under the
alternate operation
3.4.1. Total effects
In order to evaluate the net effect on air pollution
levels under the alternate operation of passenger
vehicles, this study excluded the measurement data
ds
During After
7.671.3 7.372.0
19.672.2 12.873.9
66.378.1 50.0710.0
(3) 0.470.2, (2) 1.872.4, (2)
5, (2) 22.074.2, (2) 20.3716.4, (3)
0.7, (2) 3.6, (2)
44.0, (2) 61.0, (3)
52.0 1268.87541.3 —
826.6 3243.871634.2 —
2.970.9 3.671.3
mm in Busan.

ARTICLE IN PRESS
- 40
- 30
- 20
- 10
0
10
20
CO NO2 O3 PM10 SO2
Air Pollutant
Dec
reas
e / I
ncre
ase
(%)
before during after
Fig. 2. Rain precipitation effect of air pollution levels under the study period.
Fig. 3. Average wind roses of the three compared periods.
B.-K. Lee et al. / Atmospheric Environment 39 (2005) 2323–23382328
obtained on rainy days, having precipitation of above
3.5mm per day, from the air pollution levels obtained in
the period of each term. Figs. 4a,5a,6a,7a,and 8a
compare the average CO, NO2, O3, PM10, and SO2
levels measured at 13 air-monitoring sites under the
study periods, that is, before, during, and after the
alternate operation period of passenger vehicles in
Busan. Figs. 4b,5b,6b,7b and 8b represent the average
levels of CO, NO2, O3, PM10, and SO2, based on a
combination of the data measured at 13 air-monitoring
sites in Busan, as a function of diurnal variation during
the study periods. Even though there was a variation
among the monitoring sites, all the average air pollution
levels measured in Busan during the alternate operation
period significantly increased as compared to those
measured during the normal periods (terms before and
after) that did not have alternate operation.
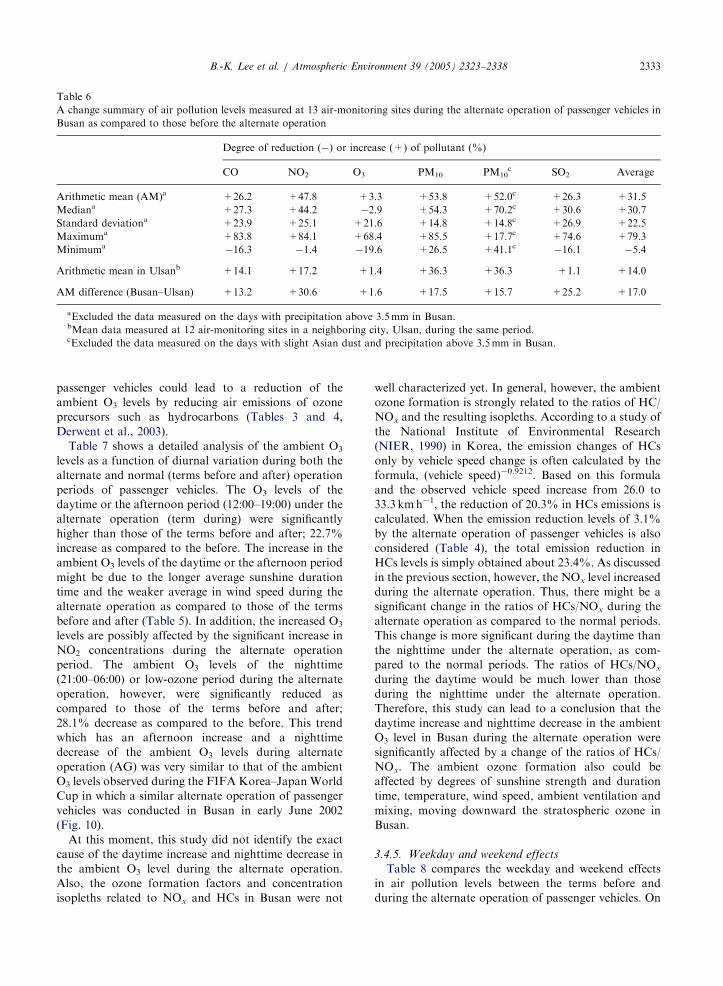
Table 6 summarizes the change effects of air pollution
levels measured at 13 air-monitoring sites during the
alternate operation of passenger vehicles in Busan. The
highest increase during alternate operation was observed
in average levels of PM10 followed by NO2 levels. There
was a significant increase in SO2 and CO levels, too.
These increases are almost opposite to the estimated
results (Table 4) based on the relative contribution of
passenger vehicles to the total emissions of air pollutants
in Busan and the average usage rates of passenger
vehicles of alternate operation. All the air pollution
levels (based on each 24-h average) measured during the
term after the alternate operation period, except O3
levels, were similar to or slightly higher than those
measured during the term before. However, the average
O3 levels of the daytime during the term before were
higher than those during the term after. These phenom-
ena are well matched with an increasing trend in criteria
air pollution levels, except ozone levels that had a
decreasing trend, with the time progress of the fall
season in Korea.
Table 6 also presents the mean data of air pollution
levels measured at 12 monitoring stations in Ulsan, a
neighboring city in which a similar alternate operation
was not conducted during the alternate operation period

ARTICLE IN PRESS
0.0
2.0
4.0
6.0
8.0
10.0
12.0
1 2 3
(a)
4 5 6 7 8 9 10 11 12 13 14
Monitoring Site
Avg
. Con
c.(p
pm)
before during after
0.0
2.0
4.0
6.0
8.0
10.0
1 2 3 4 5 6 7 8 9 10 11 12 13 14 15 16 17 18 19 20 21 22 23 24
Time (hour)
Avg
. Con
c.(p
pm)
before during after
(b)
Fig. 4. (a) Average CO concentrations at monitoring sites of the compared three periods and (b) average diurnal CO concentrations of
the compared three periods.
B.-K. Lee et al. / Atmospheric Environment 39 (2005) 2323–2338 2329
in Busan. Ulsan is a port city located in about 30 km
from Busan and meteorological conditions in Ulsan are
usually quite similar to those in Busan. The measured
average daily wind speed and ambient ventilation index
decreases were 15.4% and 9.8%, respectively, in Ulsan;
those decreases were 19.4% and 13.3%, respectively,
during the alternate operation in Busan. The air
pollution levels in Ulsan during the AG also increased
as compared to those before the AG like Busan. This
increase might be related to a change of meteorological
conditions, such as decrease in wind speed and ambient
ventilation index. However, the degree of increase in
Ulsan was much less than that in Busan. The more
significant increase of air pollution levels in Busan than
that in Ulsan during the AG might be related to the
alternate operation of passenger vehicles in Busan.
3.4.2. Vehicle speed and type effects
A significant increase in average PM10 and NO2 levels
was observed during the alternate operation. One of the
causes of increases in PM10 and NO2 levels may have
been associated with increases in vehicle speed due to
traffic volume reductions. The average vehicle speed
during normal periods without alternate operation in
Busan was approximately 24.6 kmh�1 (an average of
central and suburban areas) and during alternate
operation was approximately 28.3 kmh�1. Emission
changes of nitrogen oxides (NOx) only by vehicle speed
change is often evaluated by the following empirical
formula (NIER, 1990):
NOx ¼ aV2 þ bV2 þ cV þ d,
where, a ¼ �6:4611� 10�5; b ¼ 0:00578; c ¼ �0:1584;d ¼ 1:87638:When evaluated by this formula, the NOx concentra-
tions under alternate operation in Busan would increase
approximately 17.9% (Palmgren et al., 1996). In a
simple calculation excluded the NOx emission reduction
estimate of 2.5% by the alternate operation of passenger
vehicles, the net increase of NOx concentrations by a
vehicle speed increase could be 15.4%. However, this
evaluation is easily affected by the NOx emission
increase by operation volume increase of LPG taxies
and diesel vehicles to make up the operation decrease of
passenger vehicles during the alternate operation. In
addition, increase of diesel vehicles such as buses and
trucks can significantly increase the PM10 level (Table 3).
According to a recent study of road dust concentrations

ARTICLE IN PRESS
0.
(a)
0
10.0
20.0
30.0
40.0
50.0
60.0
1 2 3 4 5 6 7 8 9 10 11 12 13 14
Monitoring Site
Avg
. Con
c.(p
pb)
before during after
before during after
0.0
10.0
20.0
30.0
40.0
50.0
1 2 3 4 5 6 7 8 9 10 11 12 13 14 15 16 17 18 19 20 21 22 23 24
Time(hour)
Avg
. Con
c.(p
pb)
(b)
Fig. 5. (a) Average NO2 concentrations at monitoring sites of the compared three periods and (b) average diurnal NO2 concentrations
of the compared three periods.
B.-K. Lee et al. / Atmospheric Environment 39 (2005) 2323–23382330
as a function of vehicle speed, a vehicle speed increase
can significantly increase particulate concentration
including PM10 level due to the increased suspension
of road dust or particulate (Kuhns et al., 2003; Harrison
et al., 2003). Thus vehicle speed improvement by
alternate operation of passenger vehicles might have
affected the increase of PM10 and NO2 levels.
According to the Seoul government (Kat News, 2003),
the traffic volume of total vehicles by alternate operation
during the FIFA World Cup in Seoul was reduced by
approximately 19.2%. The alternate operation situa-
tions during the FIFA World Cup in Seoul would have
been very similar to those during the AG in Busan. Also,
the traffic volume of LPG taxies and diesel vehicles
during the AG in Busan increased by approximately
10% to make up for a reduction in passenger vehicle
operation for transportation of spectators or visitors to
the games, and to transport more freight due to vehicle
speed increases (Lenschow et al, 2001; Romilly, 1999).
In addition, the relative contribution from diesel vehicles
to the total air emissions in Busan was higher than that
in Seoul. When simply calculated based on a 10%
operation volume increase of LPG taxies, buses, and
trucks under the alternate operation of passenger
vehicles in Busan, the degree of the increase of CO,
NO2, O3, PM10, and SO2 levels would be 5.9, 4.4, 1.1,
and 1.3, and 0.1wt%, respectively. Therefore, an
increase of air pollution levels during alternate operation
in Busan might be partially related to the operation
volume increases of other vehicles such as taxies and
buses. In particular, increased levels in NO2, PM10, and
SO2 concentrations accompanied by increases in LPG
taxies, buses and trucks substantially exceeded the
reduction levels expected by the alternate operation of
passenger vehicles in Busan (Carslaw and Beevers,
2002).
3.4.3. Comparison of air pollution levels between the
stadium and other areas
Figs. 9a–e compare the averaged diurnal variation of
CO, NO2, O3 PM10, and SO2 levels measured at the
monitoring sites near two large stadiums for the AG and
at other sites excluding the two sites near the stadiums.
The average CO levels near the stadiums were higher
than those at other areas during normal periods
(Fig. 9a). There was a significant increase of average
ARTICLE IN PRESS
0.0
10.0
20.0
30.035.0
5.0
15.0
25.0
40.0
1 2 3 4 5 6 7 8 9 10 11 12 13 14Monitoring Site
Avg
. Con
c.(p
pb)
0.0
10.0
20.0
30.0
40.0
50.0
60.0
1 2 3 4 5 6 7 8 9 10 11 12 13 14 15 16 17 18 19 20 21 22 23 24
Time(hour)
Avg
. Con
c.(p
pb)
(a)
before during after
before during after
(b)
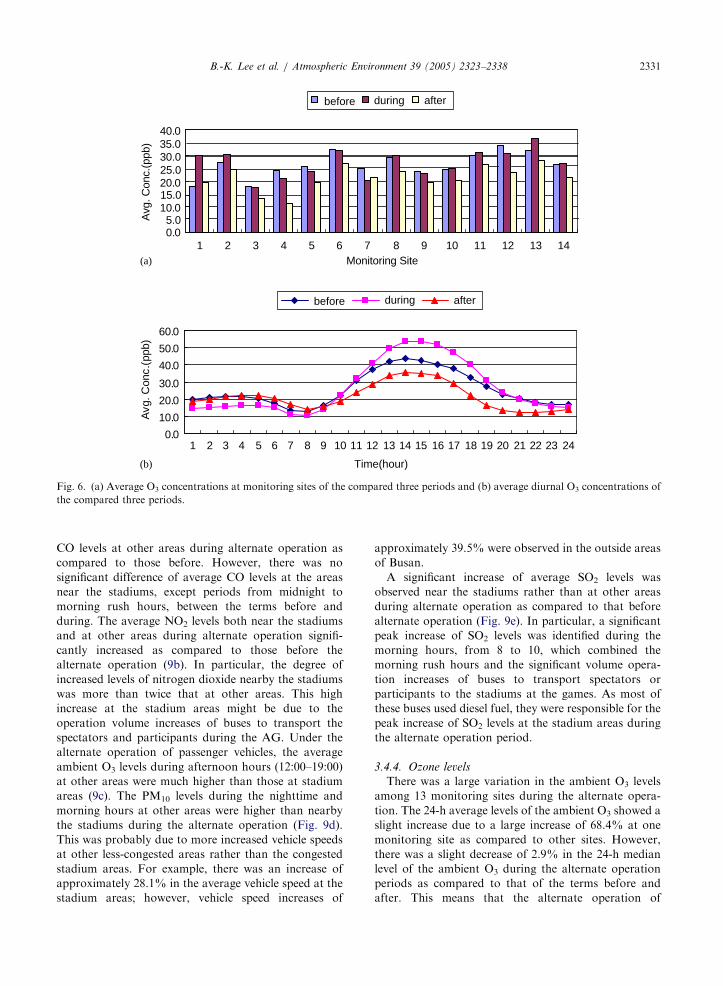
Fig. 6. (a) Average O3 concentrations at monitoring sites of the compared three periods and (b) average diurnal O3 concentrations of
the compared three periods.
B.-K. Lee et al. / Atmospheric Environment 39 (2005) 2323–2338 2331
CO levels at other areas during alternate operation as
compared to those before. However, there was no
significant difference of average CO levels at the areas
near the stadiums, except periods from midnight to
morning rush hours, between the terms before and
during. The average NO2 levels both near the stadiums
and at other areas during alternate operation signifi-
cantly increased as compared to those before the
alternate operation (9b). In particular, the degree of
increased levels of nitrogen dioxide nearby the stadiums
was more than twice that at other areas. This high
increase at the stadium areas might be due to the
operation volume increases of buses to transport the
spectators and participants during the AG. Under the
alternate operation of passenger vehicles, the average
ambient O3 levels during afternoon hours (12:00–19:00)
at other areas were much higher than those at stadium
areas (9c). The PM10 levels during the nighttime and
morning hours at other areas were higher than nearby
the stadiums during the alternate operation (Fig. 9d).
This was probably due to more increased vehicle speeds
at other less-congested areas rather than the congested
stadium areas. For example, there was an increase of
approximately 28.1% in the average vehicle speed at the
stadium areas; however, vehicle speed increases of
approximately 39.5% were observed in the outside areas
of Busan.
A significant increase of average SO2 levels was
observed near the stadiums rather than at other areas
during alternate operation as compared to that before
alternate operation (Fig. 9e). In particular, a significant
peak increase of SO2 levels was identified during the
morning hours, from 8 to 10, which combined the
morning rush hours and the significant volume opera-
tion increases of buses to transport spectators or
participants to the stadiums at the games. As most of
these buses used diesel fuel, they were responsible for the
peak increase of SO2 levels at the stadium areas during
the alternate operation period.
3.4.4. Ozone levels
There was a large variation in the ambient O3 levels
among 13 monitoring sites during the alternate opera-
tion. The 24-h average levels of the ambient O3 showed a
slight increase due to a large increase of 68.4% at one
monitoring site as compared to other sites. However,
there was a slight decrease of 2.9% in the 24-h median
level of the ambient O3 during the alternate operation
periods as compared to that of the terms before and
after. This means that the alternate operation of

ARTICLE IN PRESS
0.0
20.0
40.0
60.0
80.0
100.0
120.0
1 2 3 4 5 6 7 8 9 10 11 12 13 14
Monitoring Site
0.0
20.0
40.0
60.0
80.0
100.0
1 3 5 7 9 11 13 15 17 19 21 23
Time(hour)
Avg
. Con
c.(u
g/m
3 )A
vg. C
onc.
(ug/
m3 )
before during after
before during after
(a)
(b)
Fig. 7. (a) Average PM10 concentrations at monitoring sites of the compared three periods and (b) average diurnal PM10
concentrations of the compared three periods.
0.02.04.06.08.0
10.012.014.0
1 2 3 4 5 6 7 8 9 10 11 12 13 14Monitoring Site
0.0
2.0
4.0
6.0
8.0
10.0
1 2 3 4 5 6 7 8 9 10 11 12 13 14 15 16 17 18 19 20 21 22 23 24
Time (hour)
Avg
. Con
c.(p
pb)
Avg
. Con
c.(p
pb)
before during after
before during after
(a)
(b)
Fig. 8. (a) Average SO2 concentrations at monitoring sites of the compared three periods and (b) average diurnal SO2 concentrations
of the compared three periods.
B.-K. Lee et al. / Atmospheric Environment 39 (2005) 2323–23382332
ARTICLE IN PRESS
Table 6
A change summary of air pollution levels measured at 13 air-monitoring sites during the alternate operation of passenger vehicles in
Busan as compared to those before the alternate operation
Degree of reduction (�) or increase (+) of pollutant (%)
CO NO2 O3 PM10 PM10c SO2 Average
Arithmetic mean (AM)a +26.2 +47.8 +3.3 +53.8 +52.0c +26.3 +31.5
Mediana +27.3 +44.2 �2.9 +54.3 +70.2c +30.6 +30.7
Standard deviationa +23.9 +25.1 +21.6 +14.8 +14.8c +26.9 +22.5
Maximuma +83.8 +84.1 +68.4 +85.5 +17.7c +74.6 +79.3
Minimuma�16.3 �1.4 �19.6 +26.5 +41.1c �16.1 �5.4
Arithmetic mean in Ulsanb +14.1 +17.2 +1.4 +36.3 +36.3 +1.1 +14.0
AM difference (Busan–Ulsan) +13.2 +30.6 +1.6 +17.5 +15.7 +25.2 +17.0
aExcluded the data measured on the days with precipitation above 3.5mm in Busan.bMean data measured at 12 air-monitoring sites in a neighboring city, Ulsan, during the same period.cExcluded the data measured on the days with slight Asian dust and precipitation above 3.5mm in Busan.
B.-K. Lee et al. / Atmospheric Environment 39 (2005) 2323–2338 2333
passenger vehicles could lead to a reduction of the
ambient O3 levels by reducing air emissions of ozone
precursors such as hydrocarbons (Tables 3 and 4,
Derwent et al., 2003).
Table 7 shows a detailed analysis of the ambient O3
levels as a function of diurnal variation during both the
alternate and normal (terms before and after) operation
periods of passenger vehicles. The O3 levels of the
daytime or the afternoon period (12:00–19:00) under the
alternate operation (term during) were significantly
higher than those of the terms before and after; 22.7%
increase as compared to the before. The increase in the
ambient O3 levels of the daytime or the afternoon period
might be due to the longer average sunshine duration
time and the weaker average in wind speed during the
alternate operation as compared to those of the terms
before and after (Table 5). In addition, the increased O3
levels are possibly affected by the significant increase in
NO2 concentrations during the alternate operation
period. The ambient O3 levels of the nighttime
(21:00–06:00) or low-ozone period during the alternate
operation, however, were significantly reduced as
compared to those of the terms before and after;
28.1% decrease as compared to the before. This trend
which has an afternoon increase and a nighttime
decrease of the ambient O3 levels during alternate
operation (AG) was very similar to that of the ambient
O3 levels observed during the FIFA Korea–Japan World
Cup in which a similar alternate operation of passenger
vehicles was conducted in Busan in early June 2002
(Fig. 10).
At this moment, this study did not identify the exact
cause of the daytime increase and nighttime decrease in
the ambient O3 level during the alternate operation.
Also, the ozone formation factors and concentration
isopleths related to NOx and HCs in Busan were not
well characterized yet. In general, however, the ambient
ozone formation is strongly related to the ratios of HC/
NOx and the resulting isopleths. According to a study of
the National Institute of Environmental Research
(NIER, 1990) in Korea, the emission changes of HCs
only by vehicle speed change is often calculated by the
formula, (vehicle speed)�0.9212. Based on this formula
and the observed vehicle speed increase from 26.0 to
33.3 kmh�1, the reduction of 20.3% in HCs emissions is
calculated. When the emission reduction levels of 3.1%
by the alternate operation of passenger vehicles is also
considered (Table 4), the total emission reduction in
HCs levels is simply obtained about 23.4%. As discussed
in the previous section, however, the NOx level increased
during the alternate operation. Thus, there might be a
significant change in the ratios of HCs/NOx during the
alternate operation as compared to the normal periods.
This change is more significant during the daytime than
the nighttime under the alternate operation, as com-
pared to the normal periods. The ratios of HCs/NOx
during the daytime would be much lower than those
during the nighttime under the alternate operation.
Therefore, this study can lead to a conclusion that the
daytime increase and nighttime decrease in the ambient
O3 level in Busan during the alternate operation were
significantly affected by a change of the ratios of HCs/
NOx. The ambient ozone formation also could be
affected by degrees of sunshine strength and duration
time, temperature, wind speed, ambient ventilation and
mixing, moving downward the stratospheric ozone in
Busan.
3.4.5. Weekday and weekend effects
Table 8 compares the weekday and weekend effects
in air pollution levels between the terms before and
during the alternate operation of passenger vehicles. On

ARTICLE IN PRESS
0.0
2.0
4.0
6.0
8.0
10.0
1 2 3 4 5 6 7 8 9 10 11 12 13 14 15 16 17 18 19 20 21 22 23 24A
vg. C
onc.
(ppm
)
0.0
10.0
20.0
30.0
40.0
50.0
60.0
1 2 3 4 5 6 7 8 9 10 11 12 13 14 15 16 17 18 19 20 21 22 23 24
Avg
. Con
c.(p
pb)
0.0
10.0
20.0
30.0
40.0
50.0
60.0
1 2 3 4 5 6 7 8 9 10 11 12 13 14 15 16 17 18 19 20 21 22 23 24
Avg
. Con
c.(p
pb)
0.0
20.0
40.0
60.0
80.0
100.0
1 2 3 4 5 6 7 8 9 10 11 12 13 14 15 16 17 18 19 20 21 22 23 24
Avg
. Con
c.(u
g/m
3 )
0.0
5.0
10.0
15.0
1 3 5 7 9 11 13 15 17 21 23
Time(hour)
Time(hour)
Time(hour)
Time(hour)
Time(hour)
Avg
. Con
c.(p
pb)
(a)
(b)
(c)
(d)
(e)
19
before-others during-others before-stadium during-stadium
Fig. 9. (a–e) Average diurnal concentrations of air pollutants nearby the stadiums and at other areas of the compared two periods
(before and during).
B.-K. Lee et al. / Atmospheric Environment 39 (2005) 2323–23382334
Saturday of the study period, more than 50% of the
workers in Busan worked from 9:00 to 13:00 and the rest
of the people did not go to work. Thus, Saturday was
not categorized as a weekday or a weekend in this study.
The weekend shown in Table 8 means only Sunday and
the weekday means Monday to Friday. Busan had a
distinct weekend effect which shows a significant
decrease in average air pollution levels as compared to
weekdays. The largest weekend reductions in NO2 and
SO2 levels, 32% and 32% reduction, respectively, as
compared to weekdays, and the least weekend reduction
in O3 levels, 5% reduction, were observed during the

ARTICLE IN PRESS
0.0010.0020.0030.0040.0050.0060.0070.00
1 2 3 4 5 6 7 8 9 10 11 12 13 14 15 16 17 18 19 20 21 22 23 24
Time (hour)
Avg
. Con
c. (p
pb)
Normal (June) Alternate operation Normal (May)
Fig. 10. Average diurnal O3 concentrations of the three periods associated with the FIFA World Cup Game period [May (before) and
June (after): monthly average, alternate (during): 6-day average].
Table 7
Statistical analysis of hourly ozone data of three compared periods for 13 sites (n ¼ 208)
Hourly average ozone data of low ozone period (morning hour)
Hour 1 2 3 4 5 6 7 8 Average
Before 20.6711.6 21.7711.7 22.6711.8 22.5712.2 21.7712.0 19.0712.0 14.9710.7 13.879.8 19.6711.5
During 14.4711.9 15.0712.5 15.4712.5 15.6712.5 15.4713.7 14.0714.0 10.9711.8 12.0711.7 14.1712.6
After 20.7715.1 22.4716.2 23.5716.6 24.1716.3 23.8716.2 22.2715.5 18.4713.1 15.9711.5 21.4715.1
Hourly average ozone data of high ozone period (afternoon hour)
Hour 11 12 13 14 15 16 17 18 Average
Before 29.4711.3 35.6713.5 40.0714.0 41.4715.1 40.0715.0 38.4714.7 36.2715.9 32.1714.4 36.6714.2
During 30.8714.8 39.8715.2 48.4716.8 52.1717.9 52.1719.4 50.2719.7 46.5718.7 39.5717.7 44.9717.5
After 24.4711.3 28.6710.4 32.6710.8 34.2711.9 33.7711.9 32.6712.0 28.7712.1 22.8711.8 29.7711.5
B.-K. Lee et al. / Atmospheric Environment 39 (2005) 2323–2338 2335
term before. Even though the average NO2, SO2, and
PM10 levels on Saturday were not reduced as much as
the reduction on Sunday, they were also significantly
reduced as compared to those during the weekdays of
the term before. The average O3 levels on Saturday were
almost the same as those on the weekdays. The average
CO levels on Saturday increased as compared to those
on the weekdays of the term before.
Even though the reduction levels in air pollution on
the weekends under the alternate operation were smaller
than those in the term before, Busan had also a distinct
weekend reduction effect, ranging from 4% to 12%
reduction, except CO (2% increase) as compared to
weekdays. The reduction in the weekend effect of the air
pollution levels under the alternate operation might be
related to the lower maximum mixing height (32.9%
reduction as compared to weekdays) on the Sundays of
the alternate operation than that (12.6% reduction) on
the Sundays of the normal periods. All the air pollution
levels, except O3 levels, on the Saturdays under the
alternate operation significantly increased as compared
to those in the weekdays under the alternate operation.
The highest increase of 22.3% in CO levels and the
lowest increase of 9.6% in PM10 levels were observed on
the Saturdays. The average O3 levels on the Saturdays
under the alternate operation slightly decreased (7.9%)
as compared to those in the weekdays. The increase on
the Saturdays under the alternate operation was
probably due to the significant reduction in average
daily ambient ventilation index and maximum mixing
height, 63.0% and 33.2%, respectively, as compared to
those on weekdays.
3.4.6. Ambient mixing and ventilation effects
One of main causes of the large difference in air
pollution levels between the normal periods and the
during the alternate operation of passenger vehicles was
due to the change of meteorological factors such as
sunshine duration time, wind velocity, maximum mixing
height (MMH) and ambient ventilation index (AVI)
(Table 5). The term during under the alternate operation
showed significantly lower values in average daily wind
velocity, MMH, and AVI than the term before. Thus the
ambient mixing or dilution effect significantly reduced

ARTICLE IN PRESS
Table 8
A summary of air pollution levels as a function of week days and weekend variations between the terms of before and during the
alternate operation of passenger vehicles in Busan
Period Air pollutant CO NO2 O3 PM10 SO2
Concentration unit ppm ppb ppb mgm�3 ppb
Time breakdown Avg7SD Avg7SD Avg7SD Avg7SD Avg7SD
Before Period total 5.571.3 23.376.9 26.474.3 44.0712.9 4.771.2
Weekdaya 5.971.4 25.376.9 26.674.2 47.5714.1 5.071.2
Saturday 4.570.4 19.875.5 26.476.7 38.375.0 4.670.4
Sunday 4.971.0 17.173.6 25.373.8 33.771.5 3.470.8
Weekend/weeka 0.83 0.68 0.95 0.71 0.68
During Period total 6.971.1 33.874.8 26.676.4 78.3730.0 6.672.0
Weekdaya 6.771.1 34.075.3 27.776.6 68.5716.0 6.772.3
Saturday 8.270.3 37.572.5 25.574.7 75.171.0 7.471.8
Sunday 6.671.1 30.771.1 23.377.1 65.878.6 6.071.0
Weekend/weeka 1.02 0.90 0.88 0.96 0.90
Ratio (during/before) Period total 1.25 1.45 1.01 1.78 1.40
Weekdaya 1.14 1.34 1.05 1.44 1.34
Saturday 1.82 1.89 1.01 1.96 1.61
Sunday 1.35 1.79 0.92 1.95 1.76
Weekend/weeka 1.23 1.32 0.93 1.35 1.32
aOn Saturday of the study period, more than 50% of the workers in Busan worked from 9:00 to 13:00 and the rest of people did not
work (The weekend: only Sunday, the week days: Monday through Friday).
B.-K. Lee et al. / Atmospheric Environment 39 (2005) 2323–23382336
during the alternate operation. Even though there were
lower air emissions resulting from significant reduction
in volume of passenger vehicles as compared to the
normal operation periods, the emission reduction effect
from passenger vehicles would not exceed the increase
effect resulting from the lower ambient dilution or
mixing.
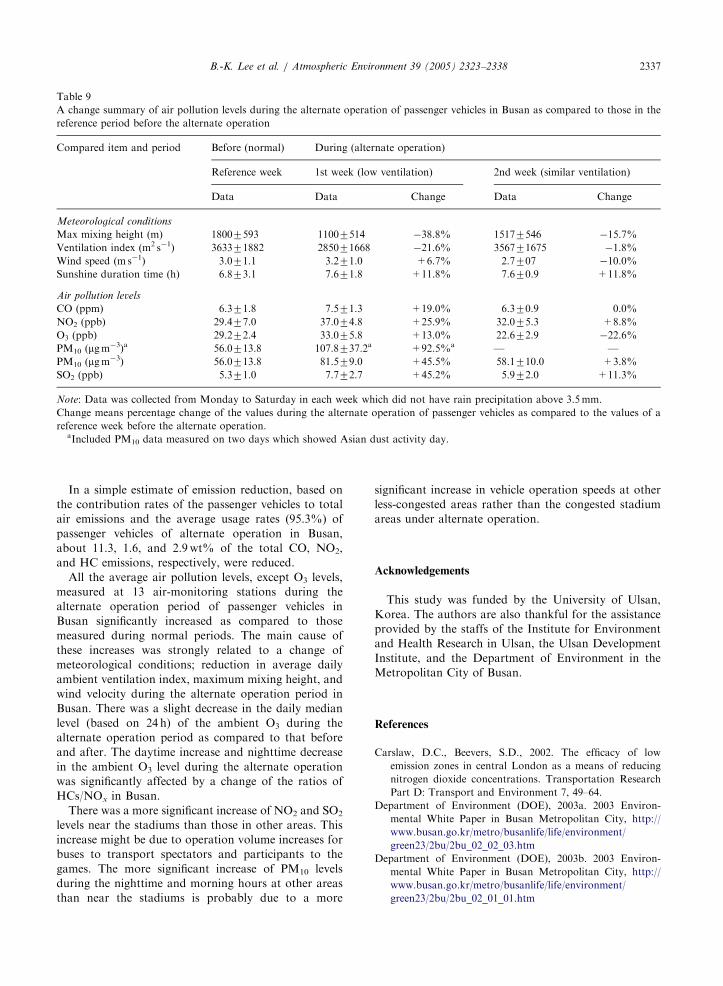
There was also a significant difference in major
meteorological conditions, which greatly affect in air
pollution levels, between the first week and the second
week under the alternate operation (Table 9). The first
week under the alternate operation had significantly
lower values in average daily MMH and AVI, but
slightly higher values in average daily ground wind
speed and sunshine duration time as compared to the
reference week under the normal operation. Thus, the
first week showed significant increases in all the air
pollution levels as compared to the reference week. The
largest increase during the alternate operation was
observed in average levels of PM10 followed by SO2
and NO2 levels. There was a slight Asian dust activity
for 2 days of the first week. Thus, the largest increase in
PM10 might be due to the Asian dust effect. Even though
the PM10 data measured on the days, which was affected
by the Asian dust activity, were excluded for a net
evaluation of an average PM10 level increase, there was a
significant increase of 45.5% in PM10 level, which is
similar to the SO2 increase level of 45.2%, during the
first week under the alternate operation.
The second week under the alternate operation
showed slightly lower values in average daily MMH
and ground wind speed, but almost same average AVI as
compared to the reference week under the normal
operation. Thus, the second week would be a good
week for a net evaluation of change in air pollution
levels under the alternate operation of passenger
vehicles. The observed increase effect in air pollution
levels for the second week, as compared to the reference
week under the normal operation of passenger vehicles,
was much smaller than the first week. There was slight
increase in SO2, NO2 and PM10 levels during the second
week, but there was no increase in CO levels as
compared to the reference week. Because the second
week was still under the alternate operation period, the
significant air emission reduction would be expected.
Thus, this slight increase also could be considered as a
significant increase in air pollution levels. The 24 h-
average O3 levels during the second week significantly
reduced. This reduction in O3 levels during the second
week might be due to the shortening in the sunshine
duration time as compared to the reference week.
4. Summary of findings
An analysis of the impact on urban air quality of
alternate operation of passenger vehicles during the 14th
Busan Asian Games in Korea, resulted in the following.
ARTICLE IN PRESS
Table 9
A change summary of air pollution levels during the alternate operation of passenger vehicles in Busan as compared to those in the
reference period before the alternate operation
Compared item and period Before (normal) During (alternate operation)
Reference week 1st week (low ventilation) 2nd week (similar ventilation)
Data Data Change Data Change
Meteorological conditions
Max mixing height (m) 18007593 11007514 �38.8% 15177546 �15.7%
Ventilation index (m2 s�1) 363371882 285071668 �21.6% 356771675 �1.8%
Wind speed (m s�1) 3.071.1 3.271.0 +6.7% 2.7707 �10.0%
Sunshine duration time (h) 6.873.1 7.671.8 +11.8% 7.670.9 +11.8%
Air pollution levels
CO (ppm) 6.371.8 7.571.3 +19.0% 6.370.9 0.0%
NO2 (ppb) 29.477.0 37.074.8 +25.9% 32.075.3 +8.8%
O3 (ppb) 29.272.4 33.075.8 +13.0% 22.672.9 �22.6%
PM10 (mgm�3)a 56.0713.8 107.8737.2a +92.5%a — —
PM10 (mgm�3) 56.0713.8 81.579.0 +45.5% 58.1710.0 +3.8%
SO2 (ppb) 5.371.0 7.772.7 +45.2% 5.972.0 +11.3%
Note: Data was collected from Monday to Saturday in each week which did not have rain precipitation above 3.5mm.
Change means percentage change of the values during the alternate operation of passenger vehicles as compared to the values of a
reference week before the alternate operation.aIncluded PM10 data measured on two days which showed Asian dust activity day.
B.-K. Lee et al. / Atmospheric Environment 39 (2005) 2323–2338 2337
In a simple estimate of emission reduction, based on
the contribution rates of the passenger vehicles to total
air emissions and the average usage rates (95.3%) of
passenger vehicles of alternate operation in Busan,
about 11.3, 1.6, and 2.9wt% of the total CO, NO2,
and HC emissions, respectively, were reduced.
All the average air pollution levels, except O3 levels,
measured at 13 air-monitoring stations during the
alternate operation period of passenger vehicles in
Busan significantly increased as compared to those
measured during normal periods. The main cause of
these increases was strongly related to a change of
meteorological conditions; reduction in average daily
ambient ventilation index, maximum mixing height, and
wind velocity during the alternate operation period in
Busan. There was a slight decrease in the daily median
level (based on 24 h) of the ambient O3 during the
alternate operation period as compared to that before
and after. The daytime increase and nighttime decrease
in the ambient O3 level during the alternate operation
was significantly affected by a change of the ratios of
HCs/NOx in Busan.
There was a more significant increase of NO2 and SO2
levels near the stadiums than those in other areas. This
increase might be due to operation volume increases for
buses to transport spectators and participants to the
games. The more significant increase of PM10 levels
during the nighttime and morning hours at other areas
than near the stadiums is probably due to a more
significant increase in vehicle operation speeds at other
less-congested areas rather than the congested stadium
areas under alternate operation.
Acknowledgements
This study was funded by the University of Ulsan,
Korea. The authors are also thankful for the assistance
provided by the staffs of the Institute for Environment
and Health Research in Ulsan, the Ulsan Development
Institute, and the Department of Environment in the
Metropolitan City of Busan.
References
Carslaw, D.C., Beevers, S.D., 2002. The efficacy of low
emission zones in central London as a means of reducing
nitrogen dioxide concentrations. Transportation Research
Part D: Transport and Environment 7, 49–64.
Department of Environment (DOE), 2003a. 2003 Environ-
mental White Paper in Busan Metropolitan City, http://
www.busan.go.kr/metro/busanlife/life/environment/
green23/2bu/2bu_02_02_03.htm
Department of Environment (DOE), 2003b. 2003 Environ-
mental White Paper in Busan Metropolitan City, http://
www.busan.go.kr/metro/busanlife/life/environment/
green23/2bu/2bu_02_01_01.htm

ARTICLE IN PRESSB.-K. Lee et al. / Atmospheric Environment 39 (2005) 2323–23382338
Derwent, R.G., Jenkin, M.E., Saunders, S.M., Pilling, M.J.,
Simmonds, P.G., Passant, N.R., Dollard, G.J., Dumitrean,
P., Kent, A., 2003. Photochemical ozone formation in north
west Europe and its control. Atmospheric Environment 37,
1983–1991.
EMC (Environment Management Corporation), 2002. Strate-
gies for clean the World Cup. Environmental News Spring.
http://emc.or.kr/information2002/spring/sp_news.htm.
Haan, P., Keller, M., 2000. Emission factors for passenger cars:
application of instantaneous emission modeling. Atmo-
spheric Environment 34, 4629–4638.
Harrison, R.M., Tilling, R., Callen Romero, M.S., Harrad, S.,
Jarvis, K., 2003. A study of trace metals and polycyclic
aromatic hydrocarbons in the roadside environment. Atmo-
spheric Environment 37, 2391–2402.
Kat News, 2003. Reduction of traffic volume and air emissions
in Seoul: http://katt.co.kr/news/image/news.asp?sn_-
no=1405&table_name=bbs_news.
Kazimi, C., 1997. Evaluating the environmental impact of
alternative-fuel vehicles. Journal of Environmental Eco-
nomics and Management 33, 163–185.
Krawack, S., 1993. Traffic management and emissions. The
Science of the Total Environment 134, 305–314.
Kuhns, H., Etyemezian, V., Green, M., Hendrickson, K.,
McGown, M., Barton, K., Pitchford, M., 2003. Vehicle-
based road dust emission measurement—Part II: effect of
precipitation, wintertime road sanding, and street sweepers
on inferred PM10 emission potentials from paved and
unpaved roads. Atmospheric Environment 37, 4573–4582.
Lee, B.K., Lee, H.K., 2003. Improvement of air quality by
restricting operation of passenger cars during the period of
Korea–Japan World Cup. 96th Annual Conference of Air
and Waste Management Association, San Diego, CA, 22–26
June, Paper No. 69550.
Lee, D.S., Longhurst, J.W.S., 1993. Estimates of emissions of
SO2, NOx, HCl and NH3 from a densely populated region
of the UK. Environmental Pollution 79, 37–44.
Lenschow, P., Abraham, H.-J., Kutzner, K., Lutz, M., PreuX,
J.-D., Reichenbacher, W., 2001. Some ideas about the
sources of PM10. Atmospheric Environment 35, 23–33.
Ministry of Environment (MOE), 2003. Annual Report of
Ambient Air Quality in Korea, 2002. http://lib.me.go.kr/lib/
imginfo/imagemanager/imgview_detail.asp?im-
g_id=1386&ref=10462.
NIER, 1990. Related equations between exhaust emission and
fuel economy and vehicle speed for kind of vehicle. Report
of Improvement of Urban Air Quality (II): Emission
Estimate from Mobile Sources. National Institute of
Environmental Research (NIER), Incheon, Korea, Table
I-13.
Palmgren, F., Berkowicz, R., Hertel, O., Vignati, E., 1996.
Effects of reduction of NOx on the NO2 levels in urban
streets. The Science of the Total Environment 189–190,
409–415.
Recker, W.W., Parimi, A., 1999. Development of a microscopic
activity-based framework for analyzing the potential
impacts of transportation control measures on vehicle
emissions. Transportation Research Part D: Transport
and Environment 4, 357–378.
Romilly, P., 1999. Substitution of bus for car travel in urban
Britain: an economic evaluation of bus and car exhaust
emission and other costs. Transportation Research Part D:
Transport and Environment 4, 109–125.
Santarelli, M.G.L., Calı, M., Bertonasco, A., 2003. Different
fuelling technologies for urban transport bus service in an
Italian big town: economic, environmental and social
considerations. Energy Conversion and Management 44,
2353–2370.