Analysis of free and bound phenolics in wine and grapes by GC–MS after automated SPE
11
1 23 Analytical and Bioanalytical Chemistry ISSN 1618-2642 Volume 405 Number 30 Anal Bioanal Chem (2013) 405:9869-9877 DOI 10.1007/s00216-013-7405-0 Analysis of free and bound phenolics in wine and grapes by GC–MS after automated SPE David Allen, Anh Duyen Bui, Nicole Cain, Gavin Rose & Mark Downey
-
Upload
independent -
Category
Documents
-
view
1 -
download
0
Transcript of Analysis of free and bound phenolics in wine and grapes by GC–MS after automated SPE

1 23
Analytical and BioanalyticalChemistry ISSN 1618-2642Volume 405Number 30 Anal Bioanal Chem (2013)405:9869-9877DOI 10.1007/s00216-013-7405-0
Analysis of free and bound phenolicsin wine and grapes by GC–MS afterautomated SPE
David Allen, Anh Duyen Bui, NicoleCain, Gavin Rose & Mark Downey
1 23
Your article is protected by copyright and
all rights are held exclusively by Springer-
Verlag Berlin Heidelberg. This e-offprint is
for personal use only and shall not be self-
archived in electronic repositories. If you wish
to self-archive your article, please use the
accepted manuscript version for posting on
your own website. You may further deposit
the accepted manuscript version in any
repository, provided it is only made publicly
available 12 months after official publication
or later and provided acknowledgement is
given to the original source of publication
and a link is inserted to the published article
on Springer's website. The link must be
accompanied by the following text: "The final
publication is available at link.springer.com”.
Anal Bioanal Chem (2013) 405:9869–9877DOI 10.1007/s00216-013-7405-0
RESEARCH PAPER
Analysis of free and bound phenolics in wine and grapesby GC–MS after automated SPE
David Allen · Anh Duyen Bui · Nicole Cain ·Gavin Rose · Mark Downey
Received: 24 June 2013 / Revised: 17 September 2013 / Accepted: 30 September 2013 / Published online: 15 October 2013© Springer-Verlag Berlin Heidelberg 2013
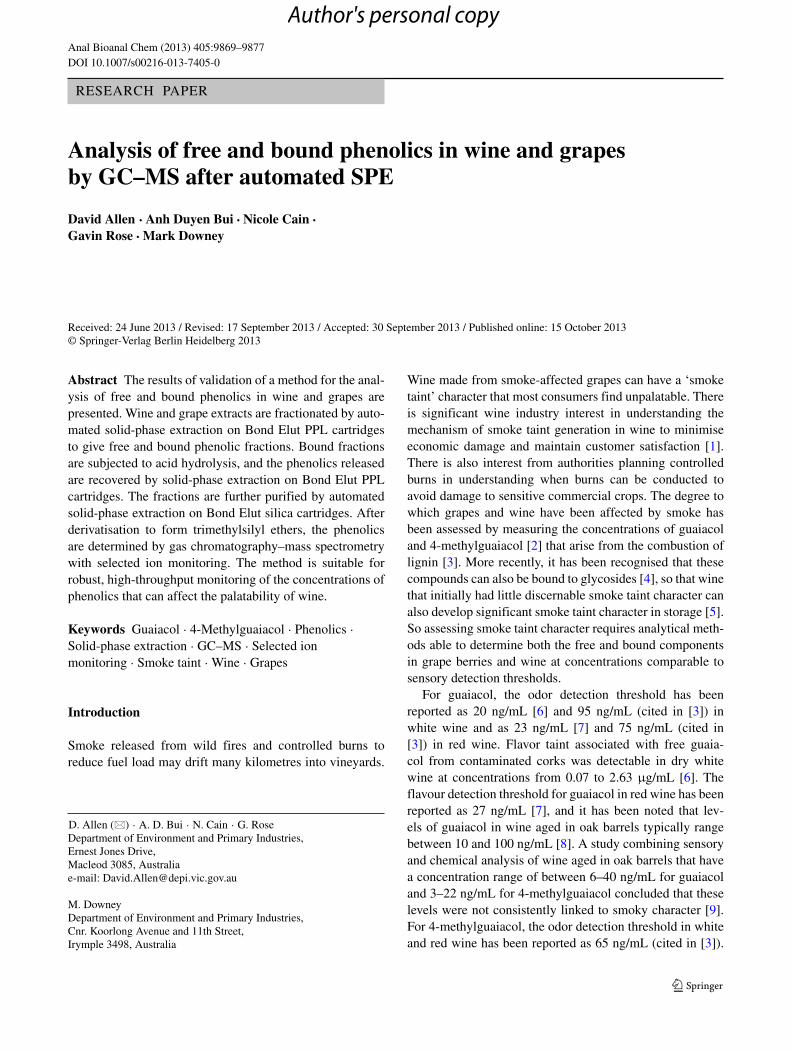
Abstract The results of validation of a method for the anal-ysis of free and bound phenolics in wine and grapes arepresented. Wine and grape extracts are fractionated by auto-mated solid-phase extraction on Bond Elut PPL cartridgesto give free and bound phenolic fractions. Bound fractionsare subjected to acid hydrolysis, and the phenolics releasedare recovered by solid-phase extraction on Bond Elut PPLcartridges. The fractions are further purified by automatedsolid-phase extraction on Bond Elut silica cartridges. Afterderivatisation to form trimethylsilyl ethers, the phenolicsare determined by gas chromatography–mass spectrometrywith selected ion monitoring. The method is suitable forrobust, high-throughput monitoring of the concentrations ofphenolics that can affect the palatability of wine.
Keywords Guaiacol · 4-Methylguaiacol · Phenolics ·Solid-phase extraction · GC–MS · Selected ionmonitoring · Smoke taint · Wine · Grapes
Introduction
Smoke released from wild fires and controlled burns toreduce fuel load may drift many kilometres into vineyards.
D. Allen (�) · A. D. Bui · N. Cain · G. RoseDepartment of Environment and Primary Industries,Ernest Jones Drive,Macleod 3085, Australiae-mail: [email protected]
M. DowneyDepartment of Environment and Primary Industries,Cnr. Koorlong Avenue and 11th Street,Irymple 3498, Australia
Wine made from smoke-affected grapes can have a ‘smoketaint’ character that most consumers find unpalatable. Thereis significant wine industry interest in understanding themechanism of smoke taint generation in wine to minimiseeconomic damage and maintain customer satisfaction [1].There is also interest from authorities planning controlledburns in understanding when burns can be conducted toavoid damage to sensitive commercial crops. The degree towhich grapes and wine have been affected by smoke hasbeen assessed by measuring the concentrations of guaiacoland 4-methylguaiacol [2] that arise from the combustion oflignin [3]. More recently, it has been recognised that thesecompounds can also be bound to glycosides [4], so that winethat initially had little discernable smoke taint character canalso develop significant smoke taint character in storage [5].So assessing smoke taint character requires analytical meth-ods able to determine both the free and bound componentsin grape berries and wine at concentrations comparable tosensory detection thresholds.
For guaiacol, the odor detection threshold has beenreported as 20 ng/mL [6] and 95 ng/mL (cited in [3]) inwhite wine and as 23 ng/mL [7] and 75 ng/mL (cited in[3]) in red wine. Flavor taint associated with free guaia-col from contaminated corks was detectable in dry whitewine at concentrations from 0.07 to 2.63 μg/mL [6]. Theflavour detection threshold for guaiacol in red wine has beenreported as 27 ng/mL [7], and it has been noted that lev-els of guaiacol in wine aged in oak barrels typically rangebetween 10 and 100 ng/mL [8]. A study combining sensoryand chemical analysis of wine aged in oak barrels that havea concentration range of between 6–40 ng/mL for guaiacoland 3–22 ng/mL for 4-methylguaiacol concluded that theselevels were not consistently linked to smoky character [9].For 4-methylguaiacol, the odor detection threshold in whiteand red wine has been reported as 65 ng/mL (cited in [3]).
Author's personal copy

9870 D. Allen et al.
The flavour detection threshold for 4-methylguaiacol in redwine has been reported as 27 ng/mL [7]. Other compoundsassociated with ashy aftertaste and smoke aroma are phe-nol, 4-methylsyringol, m-cresol and o-cresol. Phenol and4-methylsyringol have high sensory thresholds and so areunlikely to be contributing to flavour [7]. For m-cresol ando-cresol, the odor detection thresholds in red wine have beenreported as 20 and 62 ng/mL, respectively [7].
These methods should also be able to determine a broaderrange of compounds that could potentially be contribut-ing to smoke taint character [10]. In addition, experimentsthat investigate variables such as smoke density, durationof exposure, fuel type, stage of fruit ripening, wine fer-mentation methods and effect of wine storage can generatelarge numbers of samples, so the analytical methods mustbe robust and reliable as well as capable of being performedin a timely and cost-effective manner.
The analysis of free phenolics in wine after liquid–liquid extraction has been reported [8]. This methodol-ogy was extended to include solid-phase extraction onOasis® HLB plates followed by acid hydrolysis for theanalysis of bound phenolics [11], but requires significantmanual handling and is not amenable to automation. Ithas also been found that the extracts taken for analy-sis contain very high levels of organic acids that ariseas fermentation products. The repeated injection of theseextracts causes the build-up of activity in the gas chro-matography system resulting in degraded peak shape, low-ered sensitivity and poor reproducibility. The analysis ofintact bound phenolics in whole fruit homogenates andberry juice by liquid chromatography–mass spectrometryafter solid-phase extraction on C18-HF has been reported[12].
Solid-phase extraction for the analysis of wine has beeninvestigated using phases based on C18-bonded silica [13–16] as well as various polymer-based phases [13–17]. Ithas generally been concluded that styrene–divinylbenzenepolymer-based phases provide best overall performance forthis application.
The method presented here is based on solid-phaseextraction utilising Bond Elut PPL phase (described by themanufacturer as a styrene–divinylbenzene polymer that hasbeen modified with a proprietary non-polar surface) forextraction of phenols from water [18]. A feature of usingBond Elut PPL is that by drying the cartridge prior to elu-tion with ethyl acetate, the aqueous matrix is eliminated andthe final extract is available in a solvent amenable to fur-ther normal-phase solid-phase extraction, purification andsubsequent gas chromatography.
This report presents the results of validation studies ona method using automated solid-phase extraction and chro-matographic separation on the Bond Elut PPL phase for theisolation of free and bound phenolic compounds from wine
and grapes. The bound phenolic compounds are released byacid hydrolysis. The phenolic compounds are further puri-fied by normal-phase chromatography on silica to removeorganic acids and then derivatised to trimethylsilyl ethers[19] for determination by gas chromatography–mass spec-trometry (GC–MS) with selected ion monitoring.
Experimental
Chemicals
Solvents Acetonitrile (LiChrosolv®), ethyl acetate (Supra-Solv®) and n-hexane (SupraSolv®) were from Merck.Methanol (Optima®) was from Fisher Scientific. Deionisedwater was from Milli-Q Synthesis A10 (Millipore).
Standards The free analytes, phenol, o-, m- and p-cresol,4-methylguaiacol, 4-n-propylphenol, 4-ethyl-2-methoxy-phenol(4-ethylguaiacol), 4-n-propyl-2-methoxyphenol (4-n-propylguaiacol), 2-methoxy-4-vinylphenol (4-vinylguaia-col), 2,6-dimethoxyphenol (syringol), 2,6-dimethoxy-4-methylphenol (4-methylsyringol), 4-allyl-2,6-dimethoxy-phenol (4-allylsyringol), acetovanillone and syringalde-hyde, were acquired from BioScientific Pty. Ltd. (Gymea,NSW, Australia) while cineole, 2,4-dimethylphenol,eugenol, isoeugenol (estimated ratio of E/Z isomers, 9:1),guaiacol, 4-ethylphenol, vanillin and acetosyringone werefrom Sigma-Aldrich (St. Louis, MO, USA). The free ana-lytes were obtained as neat compounds with stated puritiesof 98 % or greater, and no further corrections for puritywere made. The internal standard, 2-methoxy-d3-phenol(d3-guaiacol), was from C/D/N Isotopes (Pointe-Claire,QB, Canada). The bound analytes, aqueous solutions ofguaiacyl-β-D-glucopyranoside (100 μg/mL) and syringyl-β-D-gentiobioside (128 μg/mL), were kind gifts from DrYoji Hayasaka (The Australian Wine Research Institute,South Australia).
Standard solutions The internal standard solution used forspiking solutions for presentation to solid-phase extrac-tion was d3-guaiacol (100 ng/μL in acetonitrile). Theacetonitrile solution used for spiking free analytes con-tained syringaldeyde (150 μg/mL), vanillin (60 μg/mL)and all other free analytes (30 μg/mL). Calibration ofthe GC–MS was conducted by injecting solutions (deriva-tised as for samples) at five concentrations prepared bydilution of the spiking standard with ethyl acetate (1:30,1:120; 1:240; 1:600; 1:1,200). The solutions used for spik-ing bound analytes were the originally supplied solutionsor an aqueous solution containing both analytes diluted1:10.
Author's personal copy

Analysis of free and bound phenolics in wine and grapes 9871
Reagents Bis-silyltrifluoroacetamide/1 % trimethylchloro-silane (BSTFA/1 % TMCS) was from Supelco (Product33148). Phosphate buffer (1 Maq at pH = 7.2) was pre-pared using disodium hydrogen orthophosphate anhydrous(BDH Product 10249) and sodium dihydrogen orthophos-phate (Ajax Chemicals Univar® Product 471). Bond ElutPPL (500 mg, 3 mL) and Bond Elut SI (500 mg, 3 mL)solid-phase extraction (SPE) cartridges were from AgilentTechnologies (Part Nos. 12105006 and 12102037, respec-tively). Sodium hydroxide and sulfuric acid were from BDH(AnalR®).
Samples The samples used were taint-free commercialMerlot wine (Trentham Estate Merlot, 2009), smoke-taintedShiraz wine from grapes from the King Valley after2007 bushfires (research wine S170, 2007 [11]) as wellas Sauvignon Blanc wine and whole berry homogenates(stored frozen until analysis) supplied by David Kelly(Curtin University, Margaret River, Western Australia)as control samples from a larger study to be reportedseparately.
Sample preparation
Wine samples were prepared for analysis by combiningwine (3 mL) with phosphate buffer (1 mL) and internalstandard solution (10 μL). It was found that young winescontained a significant amount of fine particulate matter thatcaused blocking of the SPE cartridges, so these wines werecentrifuged before being sampled for analysis.
Berry homogenates (∼40 g) were filtered using glassfibre filters, and the filter paper and retained sample wereblended with methanol (50 mL) before being filtered again.The initial aqueous filtrate and second methanol filtratewere combined and the volume was recorded. From this, analiquot (2 mL) was combined with phosphate buffer (2 mL),water (6 mL) and internal standard solution (10 μL).
Solid-phase extraction was conducted using RapidTraceapparatus (Biotage, Sweden), and all sample elutions wereconducted using a flow rate of 2 mL/min. Sample wasapplied to a Bond Elut PPL SPE cartridge that had beenconditioned with methanol (3 × 2 mL) and then water(3 × 2 mL). After washing with water (3 × 1 mL) andmethanol/water (3:7, 3×1 mL), a fraction containing boundphenolics was collected by eluting with methanol/water(3:2, 3 × 1 mL). After drying the cartridge with nitrogengas flow, a fraction containing free phenolics was collectedby eluting with ethyl acetate (2 × 1 mL). An aliquot ofinternal standard solution (10 μL) was added to the boundfraction prior to hydrolysis by heating at 100 ◦C with 5 NH2SO4 (5 mL) for 1 h. After cooling to room tempera-ture, phosphate buffer (1 mL) was added and excess acidwas neutralised with 10 N NaOH (∼2.5 mL) until the pH
rose to the buffer region as measured using pH indicatorstrips. The liberated phenolics were recovered by repeatingthe Bond Elut PPL SPE cartridge procedure but changingthe 3:7 methanol/water wash to washing the column with3:2 methanol/water (3 × 1 mL) to remove more polar mate-rial prior to drying the cartridge. For both free and bound
Fig. 1 Schematic diagram of sample preparation
Author's personal copy
9872 D. Allen et al.
fractions, the ethyl acetate solution was diluted with hex-ane (1 mL) and applied to a Bond Elut SI cartridge that hadbeen conditioned with ethyl acetate (2 × 2 mL) and hex-ane (3 × 2 mL). The eluate was collected together with theeluate from further elution with ethyl acetate/hexane (3:1,3 × 1 mL). An aliquot of the eluate was combined withBSTFA/1 % TMCS in the ratio 3:1 and heated at 60 ◦C for30 min. The preparation sequence is shown schematically inFig. 1.
GC–MS analysis
An aliquot (1 μL) was injected in splitless mode (purgeafter 1 min) onto a 30-m × 0.25-mm (ID) 0.25-μm HP-5MSUltra Inert column that was temperature-programmed after1 min from 40 to 200 ◦C at 10 ◦C/min and then to 300 ◦Cat 25 ◦C/min with a final hold of 3 min. The helium carriergas flow was constant at 1 mL/min; injector and interfacetemperatures were 250 and 280 ◦C, respectively. Phenolics(as trimethylsilyl ethers) were detected by selected ion mon-itoring after electron impact ionisation using a Varian 1200
single quadrupole mass spectrometer interfaced with a Var-ian 3800 gas chromatograph equipped with a Combi PALautosampler (CTC Analytics). Data was acquired in 11 seg-ments that monitored either three, six or nine signals withdwell times of 100, 50 or 40 ms per signal, respectively.Acquisition commenced after 6.5 min, and segments wereswitched at 9.06, 10.56, 11.86, 13.00, 13.79, 14.25, 14.81,16.00, 16.75 and 17.52 min. Tuning was conducted usingthe vendor-supplied autotune software.
Results and discussion
Instrumental sensitivity
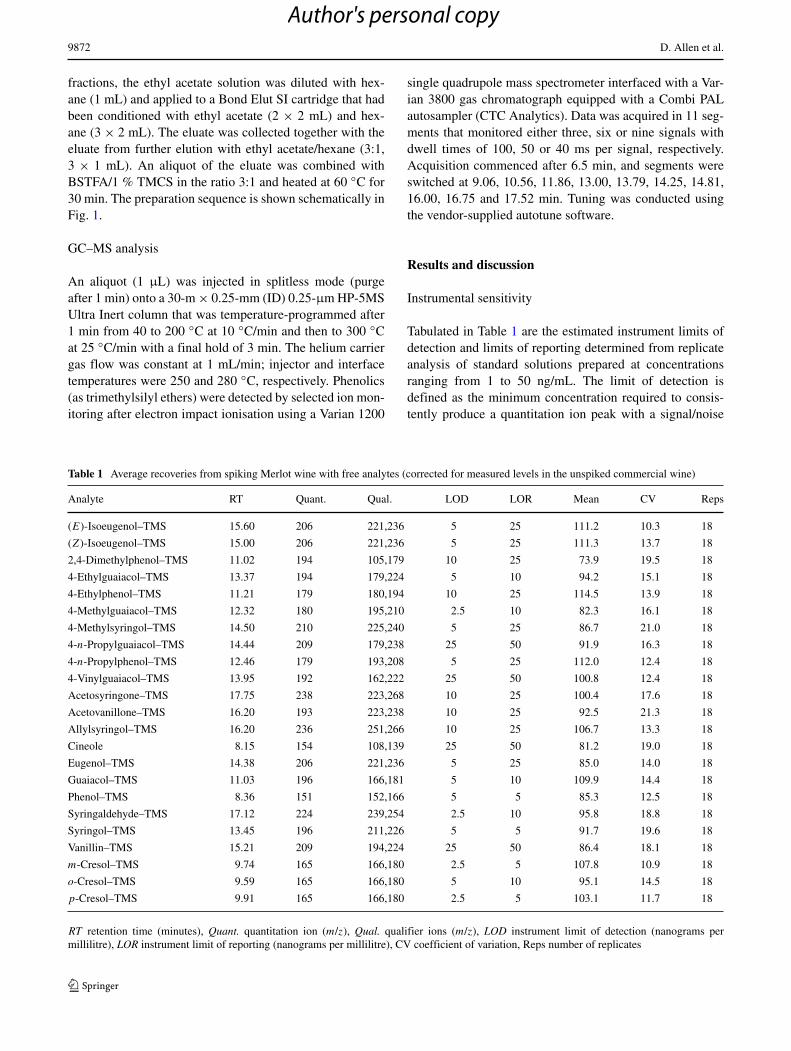
Tabulated in Table 1 are the estimated instrument limits ofdetection and limits of reporting determined from replicateanalysis of standard solutions prepared at concentrationsranging from 1 to 50 ng/mL. The limit of detection isdefined as the minimum concentration required to consis-tently produce a quantitation ion peak with a signal/noise
Table 1 Average recoveries from spiking Merlot wine with free analytes (corrected for measured levels in the unspiked commercial wine)
Analyte RT Quant. Qual. LOD LOR Mean CV Reps
(E)-Isoeugenol–TMS 15.60 206 221,236 5 25 111.2 10.3 18
(Z)-Isoeugenol–TMS 15.00 206 221,236 5 25 111.3 13.7 18
2,4-Dimethylphenol–TMS 11.02 194 105,179 10 25 73.9 19.5 18
4-Ethylguaiacol–TMS 13.37 194 179,224 5 10 94.2 15.1 18
4-Ethylphenol–TMS 11.21 179 180,194 10 25 114.5 13.9 18
4-Methylguaiacol–TMS 12.32 180 195,210 2.5 10 82.3 16.1 18
4-Methylsyringol–TMS 14.50 210 225,240 5 25 86.7 21.0 18
4-n-Propylguaiacol–TMS 14.44 209 179,238 25 50 91.9 16.3 18
4-n-Propylphenol–TMS 12.46 179 193,208 5 25 112.0 12.4 18
4-Vinylguaiacol–TMS 13.95 192 162,222 25 50 100.8 12.4 18
Acetosyringone–TMS 17.75 238 223,268 10 25 100.4 17.6 18
Acetovanillone–TMS 16.20 193 223,238 10 25 92.5 21.3 18
Allylsyringol–TMS 16.20 236 251,266 10 25 106.7 13.3 18
Cineole 8.15 154 108,139 25 50 81.2 19.0 18
Eugenol–TMS 14.38 206 221,236 5 25 85.0 14.0 18
Guaiacol–TMS 11.03 196 166,181 5 10 109.9 14.4 18
Phenol–TMS 8.36 151 152,166 5 5 85.3 12.5 18
Syringaldehyde–TMS 17.12 224 239,254 2.5 10 95.8 18.8 18
Syringol–TMS 13.45 196 211,226 5 5 91.7 19.6 18
Vanillin–TMS 15.21 209 194,224 25 50 86.4 18.1 18
m-Cresol–TMS 9.74 165 166,180 2.5 5 107.8 10.9 18
o-Cresol–TMS 9.59 165 166,180 5 10 95.1 14.5 18
p-Cresol–TMS 9.91 165 166,180 2.5 5 103.1 11.7 18
RT retention time (minutes), Quant. quantitation ion (m/z), Qual. qualifier ions (m/z), LOD instrument limit of detection (nanograms permillilitre), LOR instrument limit of reporting (nanograms per millilitre), CV coefficient of variation, Reps number of replicates
Author's personal copy

Analysis of free and bound phenolics in wine and grapes 9873
ratio greater than 3. The limit of reporting is defined as theminimum concentration required to consistently produce aresponse with all qualifier ions present and ion ratios metaccording to the following criteria: qualifier intensity >
50 %, then ion ratio agrees within ±20 %; qualifier inten-sity 25 < 50 %, then ion ratio agrees within ± 25 %;
qualifier intensity <25 %, then ion ratio agrees within±30 %.
For samples, either a multiplier value of 2 (3-mL aliquotof wine made to 6 mL of analytical solution) or a multipliervalue of ∼5 (2-mL aliquot from ∼70 mL of extract derivedfrom ∼40 g of berry homogenate) was applied to calculate
9 10 11 12 13 14 15 16 17 Ret.Time (min)
0.00
0.25
(a) 0.50
0.75
1.00 MCounts
0.00
0.25
(b) 0.50
0.75
1.00 MCounts
0.00
0.25
(c) 0.50
0.75
1.00 MCounts
0.00
0.25
(d) 0.50
0.75
1.00 MCounts
0.00
0.25
(e) 0.50
0.75
1.00 MCounts
0.00
0.25
(f) 0.50
0.75
1.00 MCounts
d3-G
uaia
col -T
MS
Phe
nol- T
MS
o-C
reso
l-TM
S
m-C
reso
l- TM
S
p-C
reso
l- TM
S
Gua
iaco
l -TM
S
Syr
ingo
l-TM
S
Eug
enol
- TM
S
Ace
tova
nillo
ne-T
MS
Ally
lsyr
ingo
l-TM
S
Syr
inga
ldeh
yde -
TM
S
Ace
tosy
ringo
ne-T
MS
d3-G
uaia
col- T
MS
Phe
nol- T
MS
o-C
reso
l-TM
S
m-C
reso
l-TM
S
p-C
reso
l -TM
S
Gua
iaco
l-T
MS
4-E
thyl
phen
ol-T
MS
4 -M
ethy
lgua
iaco
l-TM
S
Syr
ingo
l- TM
S
Van
illin
-TM
S
Syr
inga
ldeh
yde-
TM
S
Ace
tosy
ringo
ne-T
MS
d3-G
uaia
col- T
MS
Phe
nol-T
MS
o-C
reso
l-TM
S
m-C
reso
l-TM
S
Gua
iaco
l-TM
S
4 -E
thyl
phen
ol-T
MS
Syr
ingo
l -TM
S
Van
illin
-TM
S
Ace
tova
nillo
ne- T
MS
Syr
inga
ldeh
yde-
TM
S
Ace
tosy
ringo
ne-T
MS
d3-G
uaia
col-T
MS
Phe
nol- T
MS
o -C
reso
l -TM
S
m-C
reso
l-TM
S
p-C
reso
l -TM
S
Eug
enol
-TM
S
Van
illin
- TM
S
Syr
inga
ldeh
yde-
TM
S
Ace
tosy
ringo
ne-T
MS
d3-G
uaia
col- T
MS
Phe
nol-T
MS
o-C
reso
l-TM
S
m-C
reso
l-TM
S
p-C
reso
l-TM
S
Van
illin
- TM
S
Syr
inga
ldeh
yde-
TM
S
Ace
tosy
ringo
ne-T
MS
d3-G
uaia
col- T
MS
Cin
eole P
heno
l -TM
S
o-C
reso
l- TM
S
m-C
reso
l-TM
S
p-C
reso
l-TM
S
2,4-
Dim
ethy
lphe
nol-T
MS
4 -E
thyl
phen
ol-T
MS
4-M
ethy
lgua
iaco
l-TM
S
4-n-
Pro
pylp
heno
l -TM
S
4-E
thyl
guai
acol
-TM
S
Syr
ingo
l- TM
S
4-V
inyl
guai
acol
-TM
S
4-M
ethy
lsyr
ingo
l- TM
S
(Z)-
Isoe
ugen
ol-T
MS
Van
illin
-TM
S
(E)-
Isoe
ugen
ol-T
MS
Ace
tova
nillo
ne-T
MS
Ally
lsyr
ingo
l-TM
S
Syr
inga
ldeh
yde-
TM
S
Ace
tosy
ringo
ne-T
MS
Fig. 2 Total ion current profiles from Merlot berry samples:(a) bound fraction from unexposed control, (b) bound frac-tion after exposure to oat straw smoke, (c) bound fraction fromcontrol spiked with guaiacyl-β-D-glucopyranoside (0.33 μg/g)
and syringyl-β-D-gentiobioside (0.43 μg/g), (d) free fractionfrom unexposed control, (e) free fraction after exposure to oat strawsmoke and (f) free fraction from control spiked with free analytes(∼0.2 μg/g)
Author's personal copy
9874 D. Allen et al.
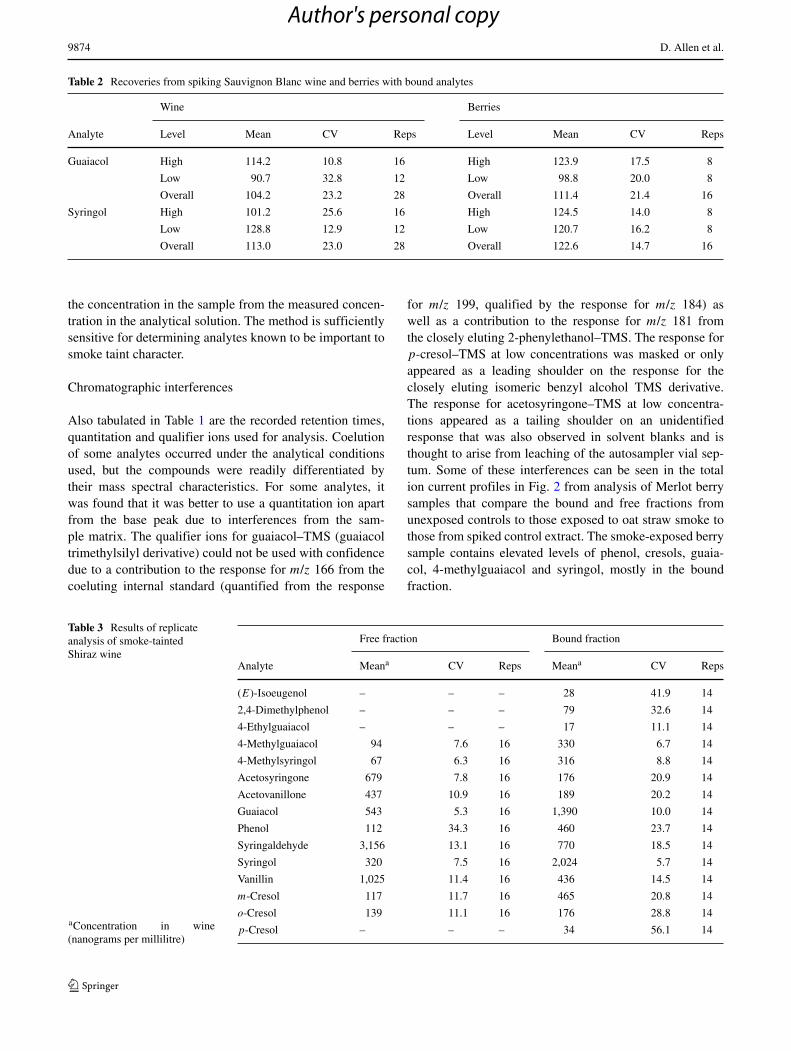
Table 2 Recoveries from spiking Sauvignon Blanc wine and berries with bound analytes
Wine Berries
Analyte Level Mean CV Reps Level Mean CV Reps
Guaiacol High 114.2 10.8 16 High 123.9 17.5 8
Low 90.7 32.8 12 Low 98.8 20.0 8
Overall 104.2 23.2 28 Overall 111.4 21.4 16
Syringol High 101.2 25.6 16 High 124.5 14.0 8
Low 128.8 12.9 12 Low 120.7 16.2 8
Overall 113.0 23.0 28 Overall 122.6 14.7 16
the concentration in the sample from the measured concen-tration in the analytical solution. The method is sufficientlysensitive for determining analytes known to be important tosmoke taint character.
Chromatographic interferences
Also tabulated in Table 1 are the recorded retention times,quantitation and qualifier ions used for analysis. Coelutionof some analytes occurred under the analytical conditionsused, but the compounds were readily differentiated bytheir mass spectral characteristics. For some analytes, itwas found that it was better to use a quantitation ion apartfrom the base peak due to interferences from the sam-ple matrix. The qualifier ions for guaiacol–TMS (guaiacoltrimethylsilyl derivative) could not be used with confidencedue to a contribution to the response for m/z 166 from thecoeluting internal standard (quantified from the response
for m/z 199, qualified by the response for m/z 184) aswell as a contribution to the response for m/z 181 fromthe closely eluting 2-phenylethanol–TMS. The response forp-cresol–TMS at low concentrations was masked or onlyappeared as a leading shoulder on the response for theclosely eluting isomeric benzyl alcohol TMS derivative.The response for acetosyringone–TMS at low concentra-tions appeared as a tailing shoulder on an unidentifiedresponse that was also observed in solvent blanks and isthought to arise from leaching of the autosampler vial sep-tum. Some of these interferences can be seen in the totalion current profiles in Fig. 2 from analysis of Merlot berrysamples that compare the bound and free fractions fromunexposed controls to those exposed to oat straw smoke tothose from spiked control extract. The smoke-exposed berrysample contains elevated levels of phenol, cresols, guaia-col, 4-methylguaiacol and syringol, mostly in the boundfraction.
Table 3 Results of replicateanalysis of smoke-taintedShiraz wine
Free fraction Bound fraction
Analyte Meana CV Reps Meana CV Reps
(E)-Isoeugenol – – – 28 41.9 14
2,4-Dimethylphenol – – – 79 32.6 14
4-Ethylguaiacol – – – 17 11.1 14
4-Methylguaiacol 94 7.6 16 330 6.7 14
4-Methylsyringol 67 6.3 16 316 8.8 14
Acetosyringone 679 7.8 16 176 20.9 14
Acetovanillone 437 10.9 16 189 20.2 14
Guaiacol 543 5.3 16 1,390 10.0 14
Phenol 112 34.3 16 460 23.7 14
Syringaldehyde 3,156 13.1 16 770 18.5 14
Syringol 320 7.5 16 2,024 5.7 14
Vanillin 1,025 11.4 16 436 14.5 14
m-Cresol 117 11.7 16 465 20.8 14
o-Cresol 139 11.1 16 176 28.8 14
p-Cresol – – – 34 56.1 14aConcentration in wine(nanograms per millilitre)
Author's personal copy

Analysis of free and bound phenolics in wine and grapes 9875
Table 4 Comparison ofmeasured levels of free analytesin unspiked commercial Merlotwine with levels calculatedfrom the results of spiking withfree analytes
Measured in unspiked wine Calculated from spiking results
Compound Meana CV Reps Intercept se
4-Ethylphenol 150 8.1 10 193.3 40.4
4-Methylguaiacol 55 3.5 10 28.2 37.4
4-Methylsyringol 60 4.0 10 38.8 56.5
Acetosyringone 110 4.5 10 124.4 51.0
Acetovanillone 107 5.9 10 72.2 53.0
Eugenol 58 2.7 10 31.1 33.2
Phenol 13 26.7 10 19.1 26.5
Syringaldehyde 372 4.2 10 370.3 250.2
Syringol 76 4.5 10 62.6 51.5
Vanillin 189 5.0 10 153.7 87.4
se standard error of interceptaConcentration in wine(nanograms per millilitre)
Precision
Also tabulated in Table 1 are the overall mean percentagerecoveries (corrected for measured levels in the unspikedwine in Table 4) recorded after spiking with free analytes(either 25 or 50 μL of spiking standard) into taint-free com-mercial Merlot wine. The results indicate that the proceduregives quantitative recovery with good precision.
Two authentic standards of bound analytes, a monogluco-side and a diglucoside of guaiacol and syringol, respectively,were available for spiking trials. The results of spiking attwo levels into Sauvignon Blanc wine and whole berryhomogenates are shown in Table 2. The precision recordedfor the bound analytes was less than that recorded for thefree analytes due to the greater complexity of the analyticalprocedure but is still considered to be acceptable.
The precision of the method was also assessed by repli-cate analysis for incurred residues in Shiraz wine thatwas known to have moderate smoke taint character. Theresults in Table 3 show excellent precision for all analytesdetected in the free fraction, apart from phenol, which wasaffected by the presence of a small and variable responsealso observed in procedural blanks. Acceptable precisionwas found for analytes occurring in the bound fraction atconcentrations above the limit of quantitation (estimated as
instrumental LOR multiplied by a factor of 2 to accountfor sample processing) for most analytes. The higher coef-ficients of variation recorded for phenol and cresols maybe in part due to their higher volatility, causing greatervariability in losses while undergoing heating during thehydrolysis step. The results for p-cresol are also affectedby the incomplete chromatographic separation from a rel-atively high amount of matrix-derived benzyl alcohol thatmade peak integration less reliable. The results for 2,4-dimethylphenol are thought to be affected by the presenceof a high amount of 2-phenylethanol, a known fermenta-tion product. This wine was assayed in 2010 and found tocontain free guaiacol (184 ng/mL) and 4-methylguaiacol(24 ng/mL) as well as bound guaiacol (907 ng/mL) and4-methylguaiacol (349 ng/mL) [11]. The results reportedhere after assay in 2012 are higher than those reported pre-viously. This may be due to the solid-phase extraction onPPL being more efficient than the liquid–liquid partitioningextraction used previously.
Accuracy
As some of the analytes occurred naturally in the taint-freecommercial Merlot wine, it was possible to conduct a linearregression on the results of the spiking with free analytes
Table 5 Comparison of measured levels of bound guaiacol in Sauvignon Blanc wine and berries with levels calculated from the results of spikingwith bound guaiacol
Measured in unspiked matrix Calculated from spiking results
Matrix Meana CV Reps Intercept se
Wine 82 − 2 57.6 28.4
Berries 20 47.2 6 −6.2 56.1
se standard error of interceptaConcentration in wine (nanograms per millilitre) or berries (nanograms per gram)
Author's personal copy
9876 D. Allen et al.
and extrapolate to an intercept where the added spike waszero, as would be done for an analysis using standard addi-tions. As shown in Table 4, the mean levels measured inthe unspiked wine and the calculated intercept terms gen-erally agree within 1 standard error of the intercept term,indicating that the method is accurate.
A small guaiacol response was observed in the boundfractions from the analysis of Sauvignon Blanc wine andberries. As shown in Table 5, again the mean levels mea-sured and the calculated intercept terms agree within 1standard error of the intercept term, indicating that themethod is accurate.
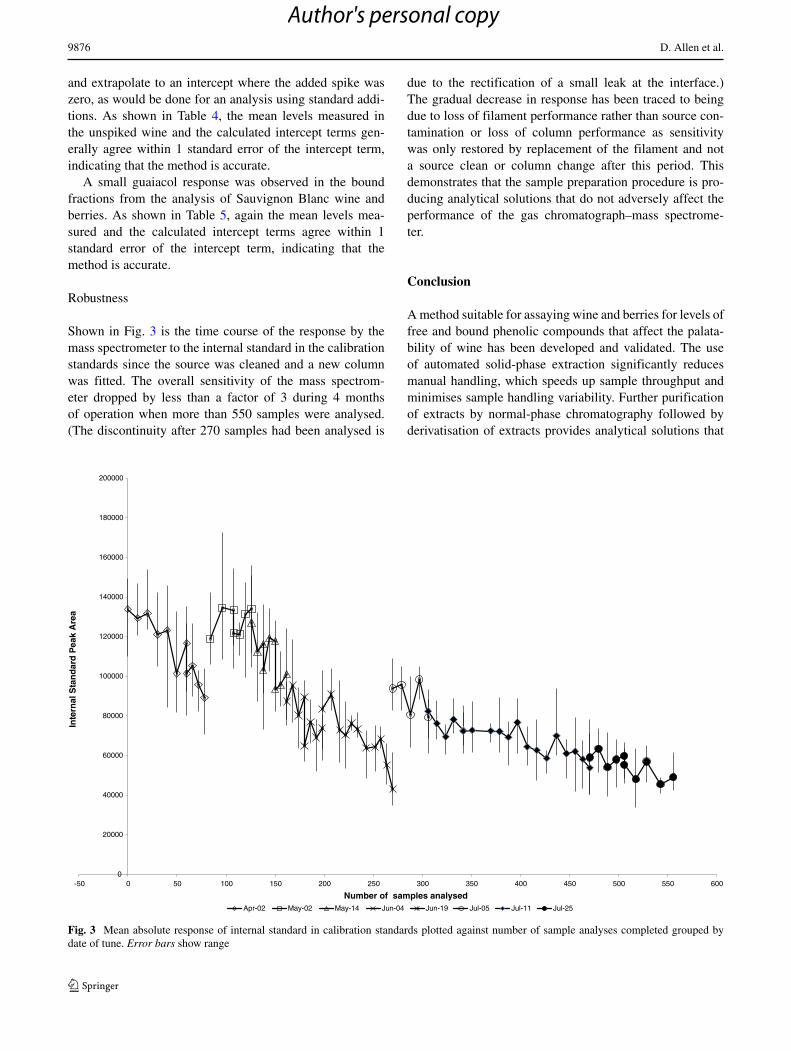
Robustness
Shown in Fig. 3 is the time course of the response by themass spectrometer to the internal standard in the calibrationstandards since the source was cleaned and a new columnwas fitted. The overall sensitivity of the mass spectrom-eter dropped by less than a factor of 3 during 4 monthsof operation when more than 550 samples were analysed.(The discontinuity after 270 samples had been analysed is
due to the rectification of a small leak at the interface.)The gradual decrease in response has been traced to beingdue to loss of filament performance rather than source con-tamination or loss of column performance as sensitivitywas only restored by replacement of the filament and nota source clean or column change after this period. Thisdemonstrates that the sample preparation procedure is pro-ducing analytical solutions that do not adversely affect theperformance of the gas chromatograph–mass spectrome-ter.
Conclusion
A method suitable for assaying wine and berries for levels offree and bound phenolic compounds that affect the palata-bility of wine has been developed and validated. The useof automated solid-phase extraction significantly reducesmanual handling, which speeds up sample throughput andminimises sample handling variability. Further purificationof extracts by normal-phase chromatography followed byderivatisation of extracts provides analytical solutions that
0
20000
40000
60000
80000
100000
120000
140000
160000
180000
200000
-50 0 50 100 150 200 250 300 350 400 450 500 550 600
Inte
rnal
Sta
nd
ard
Pea
k A
rea
Number of samples analysed Apr-02 May-02 May-14 Jun-04 Jun-19 Jul-05 Jul-11 Jul-25
Fig. 3 Mean absolute response of internal standard in calibration standards plotted against number of sample analyses completed grouped bydate of tune. Error bars show range
Author's personal copy
Analysis of free and bound phenolics in wine and grapes 9877
minimise the build-up of activity in the gas chromatographysystem. The method presented here has been used to analysehundreds of samples with minimal changes in instrumen-tal sensitivity and minimal degradation of chromatographicpeak shape, showing the method to be robust.
Acknowledgments The authors gratefully acknowledge the provi-sion of Sauvignon Blanc grape and wine samples by David Kelly(Department of Environment and Agriculture, Curtin University,Margaret River, Western Australia) and the kind gift of analytical stan-dards by Dr Yoji Hayasaka (The Australian Wine Research Institute,Glen Osmond, South Australia).
References
1. Scollary GR (2012) Smoke gets in your wine. Chemistry inAustralia (May), p 37
2. Kennison KR, Gibberd MR, Pollnitz AP, Wilkinson KL (2008)Smoke-derived taint in wine: The release of smoke-derivedvolatile phenols during fermentation of Merlot juice followinggrapevine exposure to smoke. J Agric Food Chem 56(16):7379–7383
3. Kennison KR, Wilkinson KL, Williams HG, Smith JH, GibberdMR (2007) Smoke-derived taint in wine: Effect of postharvestsmoke exposure of grapes on the chemical composition and sen-sory characteristics of wine. J Agric Food Chem 55:10897–10901
4. Hayasaka Y, Baldock GA, Pardon KH, Jeffery DW, HerderichMJ (2010) Investigation into the formation of guaiacol conjugatesin berries and leaves of grapevine Vitis vinifera L. Cv. CabernetSauvignon using stable isotope tracers combined with HPLC-MSand MS/MS analysis. J Agric Food Chem 58(4):2076–2081
5. Wilkinson KL, Ristic R, Pinchbeck KA, Fudge AL, Singh DP,Pitt KM, Downey MO, Baldock GA, Hayasaka Y, Parker M,Herderich MJ (2011) Comparison of methods for the analysis ofsmoke related phenols and their conjugates in grapes and wine.Aust J Grape Wine Res 17(2):S22–S28
6. Simpson RF, Amon JM, Daw AJ (1986) Off-flavour in winecaused by guaiacol. Food Tech Aust 38:31-33
7. Parker M, Osidacz P, Baldock GA, Hayasaka Y, Black CA,Pardon KH, Jeffery DW, Geue JP, Herderich MJ, Francis IL(2012) Contribution of several volatile phenols and their glycocon-jugates to smoke-related sensory properties of red wine. J AgricFood Chem 60(10):2629–2637
8. Pollnitz AP, Pardon KH, Sykes M, Sefton MA (2004) The effectsof sample preparation and gas chromatograph injection techniqueson the accuracy of measuring guaiacol, 4-methylguaiacol andother volatile oak compounds in oak extracts by stable isotopedilution analyses. J Agric Food Chem 52(11):3244–3252
9. Prida A, Chatonnet P (2010) Impact of oak-derived compoundson the olfactory perception of barrel-aged wines. Am J Enol Vitic61(3):408–413
10. Singh DP, Zerihun A, Kelly D, Cain NM, Nankervis P, DowneyMO (2012) A GC-MS based analytical method for detection ofsmoke taint associated phenols in smoke affected wines. CurrBioact Compd 8(3):190–199
11. Singh DP, Chong HH, Pitt KM, Cleary M, Dokoozlian NK,Downey MO (2011) Guaiacol and 4-methylguaiacol accumulatein wines made from smoke-affected fruit because of hydrolysis oftheir conjugates. Aust J Grape Wine Res 17(2):S13–S21
12. Dungey KA, Hayasaka Y, Wilkinson KL (2011) Quantitative anal-ysis of glycoconjugate precursors of guaiacol in smoke-affectedgrapes using liquid chromatography–tandem mass spectrometrybased stable isotope dilution analysis. Food Chem 126(2):801–806
13. Matejıcek D, Klejdus B, Mikes O, Sterbova D, Kuban V (2003)Application of solid-phase extraction for determination of pheno-lic compounds in barrique wines. Anal Bioanal Chem 377:340–345
14. del Alamo M, Casado L, Hernandez V, Jimenez JJ (2004) Deter-mination of free molecular phenolics and catechins in wineby solid phase extraction on polymeric cartridges and liquidchromatography with diode array detection. J Chromatogr A1049(12):97–105
15. Pineiro Z, Palma M, Barroso CG (2004) Determination of ter-penoids in wines by solid phase extraction and gas chromatogra-phy. Anal Chim Acta 513(1):209–214
16. Metafa M, Economou A (2013) Comparison of solid-phase extrac-tion sorbents for the fractionation and determination of importantfree and glycosidically-bound varietal aroma compounds in winesby gas chromatography-mass spectrometry. Cent Eur J Chem11:228–247
17. Domınguez C, Guillen DA, Barroso CG (2002) Determination ofvolatile phenols in fino sherry wines. Anal Chim Acta 458(1):95–102
18. Munch JW (2000) Method 528—Determination of phenols indrinking water by solid phase extraction and capillary column gaschromatography/mass spectrometry (GC/MS). US EnvironmentalProtection Agency, Cincinnati, Ohio
19. Kornreich MR, Issenberg P (1972) Determination of phenolicwood smoke components as trimethylsilyl ethers. J Agric FoodChem 20:1109–1113
Author's personal copy