
Analysis and Design of an X-Band Reflectarray Antenna for ...
18
Citation: Soliman, S.A.M.; Eldesouki, E.M.; Attiya, A.M. Analysis and Design of an X-Band Reflectarray Antenna for Remote Sensing Satellite System. Sensors 2022, 22, 1166. https://doi.org/10.3390/s22031166 Academic Editors: Raed A. Abd-Alhameed, Naser Ojaroudi Parchin and Chan Hwang See Received: 30 December 2021 Accepted: 26 January 2022 Published: 3 February 2022 Publisher’s Note: MDPI stays neutral with regard to jurisdictional claims in published maps and institutional affil- iations. Copyright: © 2022 by the authors. Licensee MDPI, Basel, Switzerland. This article is an open access article distributed under the terms and conditions of the Creative Commons Attribution (CC BY) license (https:// creativecommons.org/licenses/by/ 4.0/). sensors Article Analysis and Design of an X-Band Reflectarray Antenna for Remote Sensing Satellite System Shimaa A. M. Soliman * , Eman M. Eldesouki and Ahmed M. Attiya † Microwave Engineering Department, Electronics Research Institute, Joseph Tito St., Huckstep, El Nozha, Cairo 11843, Egypt; [email protected] (E.M.E.); [email protected] (A.M.A.) * Correspondence: [email protected] † Ahmed M. Attiya, Member, IEEE. Abstract: This paper presents the analysis and design of an X-band reflectarray. The proposed antenna can be used for a medium Earth orbit (MEO) remote sensing satellite system in the 8.5 GHz band. To obtain a nearly constant response along the coverage area of this satellite system, the proposed antenna was designed with a flat-top radiation pattern with a beam width of around 29 ◦ for the required MEO system. In addition, broadside pencil beam and tilted pencil beam reflectarrays were also investigated. The feeding element of the proposed reflectarray antennas is a Yagi–Uda array. The amplitude and phase distribution of the fields due to the feeding element on the aperture of the reflectarray antenna are obtained directly by numerical simulation without introducing any approximation. The required phase distribution along the aperture of the reflectarray to obtain the required flat-top radiation pattern is obtained using the genetic algorithm (GA) optimization method. The reflecting elements of the reflectarray are composed of stacked circular patches. This stacked configuration was found to be appropriate for obtaining a wide range of reflection phase shift, which is required to implement the required phase distribution on the reflectarray aperture. The antenna was fabricated and measured for verification. Keywords: reflectarray antenna; flat-top radiation pattern; remote sensing satellite system; genetic algorithm 1. Introduction Recently, satellite communication systems in low and medium Earth orbit (LEO/MEO) have experienced rapid development. Satellites are characterized by their design-and- deployment cost, power consumption, and down-link bandwidth [1]. In order to increase the down-link data rate of the satellite, a high gain antenna with a low profile, light weight, and small volume, in addition to a cheap assembly process, is required. These prerequisites can be obtained by utilizing a reflectarray antenna, which comprises a spatial feed and a planar structure. Reflectarray antennas are based on focusing the incident fields from an antenna feeding element to obtain the required radiation pattern by compensating for the phase differences between the reflectarray elements. There are different types of reflectar- rays, such as planar microstrip reflectarrays [2–6] and dielectric resonator reflectarrays [7–9]. The main feature of the reflectarray is that its radiation characteristics can be manipulated by tuning the geometrical dimensions of its unit cells [10–12]. Although reflectarrays for high-gain pencil beam patterns in a certain direction can be easily designed using analytical equations [13], the synthesis of shaped or contoured beams is a challenging problem. These shaped or contoured beams are required in many satellite communication systems for better power management [14]. In order to generate a specific radiation pattern, different algorithms have been used to synthesize and optimize the phase distribution on the reflectarray elements. The optimization methods used to synthesis the reflectarray pattern are classified into two main categories: local search algorithms, Sensors 2022, 22, 1166. https://doi.org/10.3390/s22031166 https://www.mdpi.com/journal/sensors
-
Upload
khangminh22 -
Category
Documents
-
view
4 -
download
0
Transcript of Analysis and Design of an X-Band Reflectarray Antenna for ...
�����������������
Citation: Soliman, S.A.M.; Eldesouki,
E.M.; Attiya, A.M. Analysis and
Design of an X-Band Reflectarray
Antenna for Remote Sensing Satellite
System. Sensors 2022, 22, 1166.
https://doi.org/10.3390/s22031166
Academic Editors: Raed
A. Abd-Alhameed, Naser Ojaroudi
Parchin and Chan Hwang See
Received: 30 December 2021
Accepted: 26 January 2022
Published: 3 February 2022
Publisher’s Note: MDPI stays neutral
with regard to jurisdictional claims in
published maps and institutional affil-
iations.
Copyright: © 2022 by the authors.
Licensee MDPI, Basel, Switzerland.
This article is an open access article
distributed under the terms and
conditions of the Creative Commons
Attribution (CC BY) license (https://
creativecommons.org/licenses/by/
4.0/).
sensors
Article
Analysis and Design of an X-Band Reflectarray Antenna forRemote Sensing Satellite SystemShimaa A. M. Soliman * , Eman M. Eldesouki and Ahmed M. Attiya †
Microwave Engineering Department, Electronics Research Institute, Joseph Tito St., Huckstep, El Nozha,Cairo 11843, Egypt; [email protected] (E.M.E.); [email protected] (A.M.A.)* Correspondence: [email protected]† Ahmed M. Attiya, Member, IEEE.
Abstract: This paper presents the analysis and design of an X-band reflectarray. The proposedantenna can be used for a medium Earth orbit (MEO) remote sensing satellite system in the 8.5 GHzband. To obtain a nearly constant response along the coverage area of this satellite system, theproposed antenna was designed with a flat-top radiation pattern with a beam width of around 29◦
for the required MEO system. In addition, broadside pencil beam and tilted pencil beam reflectarrayswere also investigated. The feeding element of the proposed reflectarray antennas is a Yagi–Udaarray. The amplitude and phase distribution of the fields due to the feeding element on the apertureof the reflectarray antenna are obtained directly by numerical simulation without introducing anyapproximation. The required phase distribution along the aperture of the reflectarray to obtain therequired flat-top radiation pattern is obtained using the genetic algorithm (GA) optimization method.The reflecting elements of the reflectarray are composed of stacked circular patches. This stackedconfiguration was found to be appropriate for obtaining a wide range of reflection phase shift, whichis required to implement the required phase distribution on the reflectarray aperture. The antennawas fabricated and measured for verification.
Keywords: reflectarray antenna; flat-top radiation pattern; remote sensing satellite system; geneticalgorithm
1. Introduction
Recently, satellite communication systems in low and medium Earth orbit (LEO/MEO)have experienced rapid development. Satellites are characterized by their design-and-deployment cost, power consumption, and down-link bandwidth [1]. In order to increasethe down-link data rate of the satellite, a high gain antenna with a low profile, light weight,and small volume, in addition to a cheap assembly process, is required. These prerequisitescan be obtained by utilizing a reflectarray antenna, which comprises a spatial feed and aplanar structure. Reflectarray antennas are based on focusing the incident fields from anantenna feeding element to obtain the required radiation pattern by compensating for thephase differences between the reflectarray elements. There are different types of reflectar-rays, such as planar microstrip reflectarrays [2–6] and dielectric resonator reflectarrays [7–9].The main feature of the reflectarray is that its radiation characteristics can be manipulatedby tuning the geometrical dimensions of its unit cells [10–12].
Although reflectarrays for high-gain pencil beam patterns in a certain direction can beeasily designed using analytical equations [13], the synthesis of shaped or contoured beamsis a challenging problem. These shaped or contoured beams are required in many satellitecommunication systems for better power management [14]. In order to generate a specificradiation pattern, different algorithms have been used to synthesize and optimize the phasedistribution on the reflectarray elements. The optimization methods used to synthesisthe reflectarray pattern are classified into two main categories: local search algorithms,
Sensors 2022, 22, 1166. https://doi.org/10.3390/s22031166 https://www.mdpi.com/journal/sensors
Sensors 2022, 22, 1166 2 of 18
such as the alternating projections method [15,16], and evolutionary algorithms, suchas GA [17–20], particle swarm optimization (PSO) [21], and the semidefinite relaxationtechnique [22]. These different optimization algorithms vary in terms of their computationcomplexity and final convergence rate. It is shown in [23] that the evolutional optimizationalgorithms are capable of better performance and providing more flexible solutions thanthe classical optimization algorithms.
Because a reflectarray antenna consists mainly of a large number of reflecting elements,which contribute to the generation of the required radiation pattern, the required optimiza-tion algorithm must be computationally efficient to manage a large number of variables.The reflectarray synthesis problem depends only on phase synthesis, which involves onlythe phase of the reflected field due to each element in the optimization process. The startingpoint for the optimization process has a significant effect on the convergence rate. As notedin [24], a good initial point is the phase distribution of a broadside pencil beam pattern. Inthe present work, three different patterns were investigated: a broadside pencil beam, atilted pencil bean, and a flat-top beam. Conventional pencil beam and tilted pencil beamreflectarray antennas were designed analytically. The flat-top beam reflectarray antennawas designed using GA optimization. This flat-top pattern is important in remote sens-ing systems and in different communication technologies, such as 2G/3G/LET cellularbands [25–28].
The reflectarray antenna is usually fed by a horn antenna. However, in this paper, aYagi–Uda antenna array [29] is used as the feeding antenna for the proposed reflectarray.This Yagi–Uda antenna is characterized by a lower profile and less weight compared to astandard horn antenna [30,31]. Commonly, the incident field distribution on the surface ofa reflectarray is approximately represented by an ideal feed model cosq θ [32]. The value ofthe power factor “q” is determined by the directivity of the feeding antenna. In the presentpaper, a more accurate approach is used based on determining the exact field distributiondue to the feeding element at the plane of the reflectarray, by separately simulating thefeeding element and obtaining its corresponding feed distribution in the required plane.
By comparison, the reflecting unit cell of the proposed reflectarray antenna is assumedto consist of two stacked circular patches backed by a ground plane. The unit cell issimulated as a periodic structure using Floquet modes [33,34]. Varying the dimensionof the unit cell changes the corresponding equivalent surface impedance boundary andtherefore the reflection phase shift. The advantage of using this stacked configuration is thatit allows the acquisition of a wide range of nearly linear phase-shift changes of more than360◦. This property is important for the implementation of any required phase distributionalong the designed reflectarray.
In this study, GA was chosen to optimize the phases of the reflecting elements toobtain a flat-top radiation pattern with a beam width of around 29◦, side lobe level (SLL)of less than −20 dB, and allowable ripple level (ARL) of around −3 dB. The contributionof this work is the optimization of these phases to achieve the desired performance of anoptimized flat-top pattern for an MEO system.
This paper is organized as follows. Section 2 introduces the complete reflectarray an-tenna design, specifications, and modeling procedure. Section 3 presents the analysis of thefeeding antenna. In Section 4, the incident field distribution on the plane of the reflectarray,and the corresponding reflection phase distribution for both pencil beam and tilted beamradiation patterns, are obtained. Section 5 introduces the procedures for obtaining thereflection phase distribution for a reflectarray with a flat-top radiation pattern using GA.Section 6 discusses the analysis of the unit cell of the reflectarray. Section 7 presents theresults and discussions of three reflectarray designs: broadside pencil beam, tilted pencilbeam, and flat-top radiation pattern. The reflectarray of the flat-top radiation pattern wasfabricated and measured to show the experimental verification. Finally, Section 8 presentsthe conclusion.
Sensors 2022, 22, 1166 3 of 18
2. Reflectarray Antenna
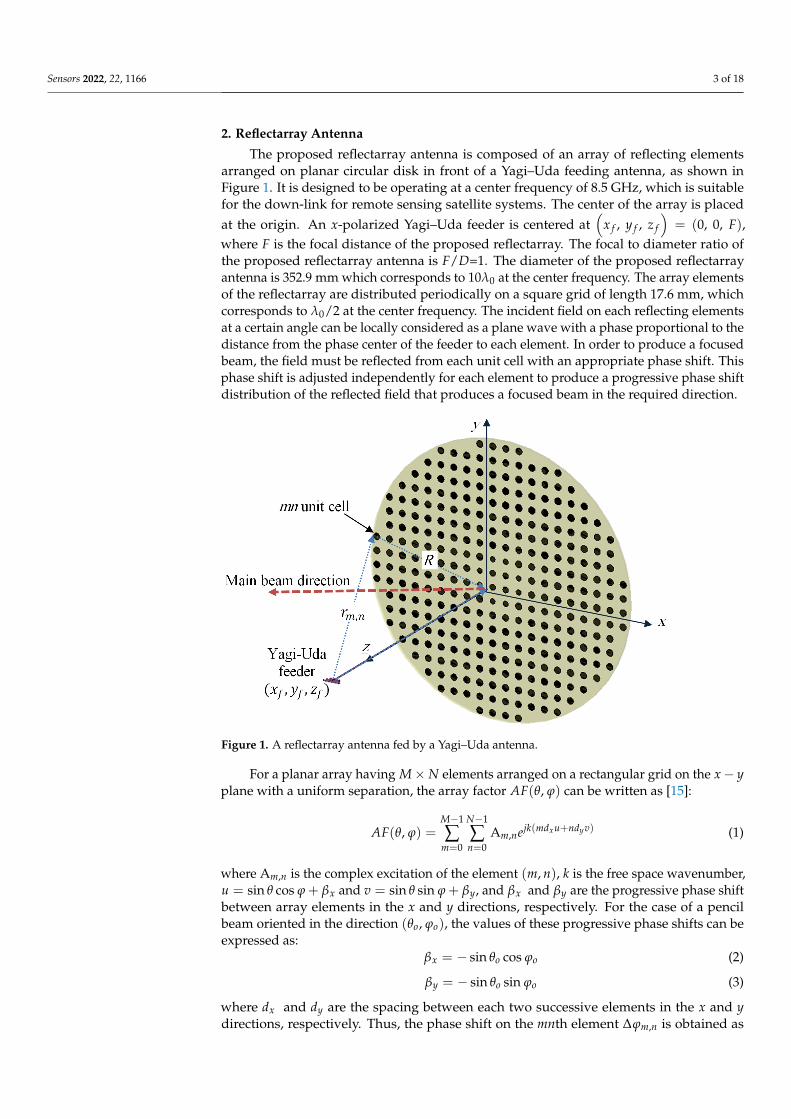
The proposed reflectarray antenna is composed of an array of reflecting elementsarranged on planar circular disk in front of a Yagi–Uda feeding antenna, as shown inFigure 1. It is designed to be operating at a center frequency of 8.5 GHz, which is suitablefor the down-link for remote sensing satellite systems. The center of the array is placedat the origin. An x-polarized Yagi–Uda feeder is centered at
(x f , y f , z f
)= (0, 0, F),
where F is the focal distance of the proposed reflectarray. The focal to diameter ratio ofthe proposed reflectarray antenna is F/D=1. The diameter of the proposed reflectarrayantenna is 352.9 mm which corresponds to 10λ0 at the center frequency. The array elementsof the reflectarray are distributed periodically on a square grid of length 17.6 mm, whichcorresponds to λ0/2 at the center frequency. The incident field on each reflecting elementsat a certain angle can be locally considered as a plane wave with a phase proportional to thedistance from the phase center of the feeder to each element. In order to produce a focusedbeam, the field must be reflected from each unit cell with an appropriate phase shift. Thisphase shift is adjusted independently for each element to produce a progressive phase shiftdistribution of the reflected field that produces a focused beam in the required direction.
Sensors 2022, 22, x FOR PEER REVIEW 3 of 19
2. Reflectarray Antenna The proposed reflectarray antenna is composed of an array of reflecting elements ar-
ranged on planar circular disk in front of a Yagi–Uda feeding antenna, as shown in Figure 1. It is designed to be operating at a center frequency of 8.5 GHz, which is suitable for the down-link for remote sensing satellite systems. The center of the array is placed at the origin. An 𝑥-polarized Yagi–Uda feeder is centered at (𝑥 , 𝑦 , 𝑧 ) = (0, 0, 𝐹), where 𝐹 is the focal distance of the proposed reflectarray. The focal to diameter ratio of the proposed reflectarray antenna is 𝐹/𝐷=1 . The diameter of the proposed reflectarray antenna is 352.9 mm which corresponds to 10𝜆 at the center frequency. The array elements of the reflectarray are distributed periodically on a square grid of length 17.6 mm, which corre-sponds to 𝜆 /2 at the center frequency. The incident field on each reflecting elements at a certain angle can be locally considered as a plane wave with a phase proportional to the distance from the phase center of the feeder to each element. In order to produce a focused beam, the field must be reflected from each unit cell with an appropriate phase shift. This phase shift is adjusted independently for each element to produce a progressive phase shift distribution of the reflected field that produces a focused beam in the required direc-tion.
Figure 1. A reflectarray antenna fed by a Yagi–Uda antenna.
For a planar array having 𝑀 × 𝑁 elements arranged on a rectangular grid on the 𝑥 − 𝑦 plane with a uniform separation, the array factor 𝐴𝐹(𝜃, 𝜑) can be written as [15]:
𝐴𝐹(𝜃, 𝜑) = A , 𝑒 ( ) (1)
where A , is the complex excitation of the element (𝑚, 𝑛), 𝑘 is the free space wave-number, 𝑢 = sin 𝜃 cos 𝜑 + 𝛽 and 𝑣 = sin 𝜃 sin 𝜑 + 𝛽 , and 𝛽 and 𝛽 are the progres-sive phase shift between array elements in the 𝑥 and 𝑦 directions, respectively. For the case of a pencil beam oriented in the direction (𝜃 , 𝜑 ), the values of these progressive phase shifts can be expressed as: 𝛽 = − sin 𝜃 cos 𝜑 (2)𝛽 = − sin 𝜃 sin 𝜑 (3)
Figure 1. A reflectarray antenna fed by a Yagi–Uda antenna.
For a planar array having M× N elements arranged on a rectangular grid on the x− yplane with a uniform separation, the array factor AF(θ, ϕ) can be written as [15]:
AF(θ, ϕ) =M−1
∑m=0
N−1
∑n=0
Am,nejk(mdxu+ndyv) (1)
where Am,n is the complex excitation of the element (m, n), k is the free space wavenumber,u = sin θ cos ϕ + βx and v = sin θ sin ϕ + βy, and βx and βy are the progressive phase shiftbetween array elements in the x and y directions, respectively. For the case of a pencilbeam oriented in the direction (θo, ϕo), the values of these progressive phase shifts can beexpressed as:
βx = − sin θo cos ϕo (2)
βy = − sin θo sin ϕo (3)
where dx and dy are the spacing between each two successive elements in the x and ydirections, respectively. Thus, the phase shift on the mnth element ∆ϕm,n is obtained as
Sensors 2022, 22, 1166 4 of 18
∆ϕm,n = βx + βy. For the case of a reflectarray, the magnitude of the excitation at theelements |Am,n| is determined by the amplitude distribution of the fields due to the feedingelement on the aperture of the reflectarray. On the other hand, the total phase at the mnthelement is the summation of the phase of the field distribution of the feeding element plusthe phase distribution of the reflection coefficient on the aperture of the reflectarray. Thekey point in the design of the reflectarray antenna is to determine the required total phasedistribution for the obtained amplitude distribution by the feeding element to obtain therequired radiation pattern. The next step is the implementation of the reflecting elements ofthe reflectarray antenna to verify this total phase distribution. For simple radiation patternssuch as a broadside pencil beam or a tilted pencil beam, this phase distribution can beobtained analytically in a closed form as follows:
∆ϕm,n = 2πN′ − k(
rm,n −→R· ˆ
ro
)(4)
where N′ = 1, 2, 3, . . ., rm,n is the distance from the feed to each array element, R̂ is theposition vector from each element to the array center (0, 0, 0) and r̂o is the position vectorin the direction of the main beam of the reflectarray. However, for reflectarray antennashaving beams with more complicated shapes, this phase distribution is obtained usingoptimization techniques.
3. Feeding Antenna
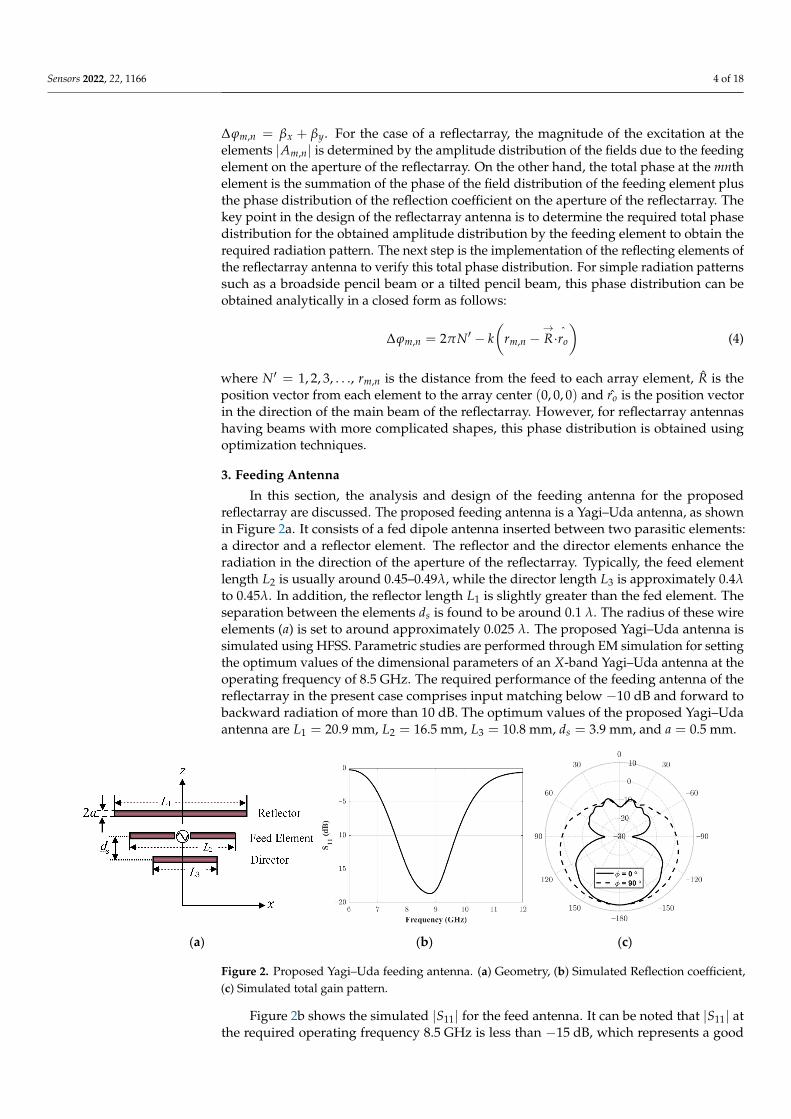
In this section, the analysis and design of the feeding antenna for the proposedreflectarray are discussed. The proposed feeding antenna is a Yagi–Uda antenna, as shownin Figure 2a. It consists of a fed dipole antenna inserted between two parasitic elements:a director and a reflector element. The reflector and the director elements enhance theradiation in the direction of the aperture of the reflectarray. Typically, the feed elementlength L2 is usually around 0.45–0.49λ, while the director length L3 is approximately 0.4λto 0.45λ. In addition, the reflector length L1 is slightly greater than the fed element. Theseparation between the elements ds is found to be around 0.1 λ. The radius of these wireelements (a) is set to around approximately 0.025 λ. The proposed Yagi–Uda antenna issimulated using HFSS. Parametric studies are performed through EM simulation for settingthe optimum values of the dimensional parameters of an X-band Yagi–Uda antenna at theoperating frequency of 8.5 GHz. The required performance of the feeding antenna of thereflectarray in the present case comprises input matching below −10 dB and forward tobackward radiation of more than 10 dB. The optimum values of the proposed Yagi–Udaantenna are L1 = 20.9 mm, L2 = 16.5 mm, L3 = 10.8 mm, ds = 3.9 mm, and a = 0.5 mm.
Sensors 2022, 22, x FOR PEER REVIEW 5 of 19
(a) (b) (c)
Figure 2. Proposed Yagi–Uda feeding antenna. (a) Geometry, (b) Simulated Reflection coefficient, (c) Simulated total gain pattern.
4. Field Distribution of the Feeding Antenna on the Aperture of the Reflectarray In order to obtain the required beam pattern of the reflectarray, the amplitudes and
phase distribution on the plane of the reflectarray should be determined. In previous stud-ies of reflectarray antennas, the field distribution is presented as a simple analytical ap-proximation based on (cos 𝜃) , where the value of 𝑞 is chosen to obtain the correspond-ing approximate radiation pattern of the feeding antenna. In addition, the phase distribu-tion of the field on the aperture of the reflectarray is calculated in terms of the distance from the center of the feeding point to each point on the aperture of the reflectarray. In this paper, this approximation is replaced by directly calculating this field distribution numerically using the commercially EM simulation software HFSS. The advantage of this method is that it does not require any assumptions. Figure 3a shows the 2D distribution of the magnitude of the complex total field on an aperture located at a distance 𝐹 =352.9 mm from the center of the fed element of the Yagi–Uda antenna. It should be noted that this is only a calculation plane and it does not represent any additional boundary to the simulation problem. This plane and the feeding antenna are included inside a common radiation boundary in the simulation process. This distribution can be presented as a ra-dial function of the magnitude around the 𝑧-axis. Figure 3b shows the 1D distribution of the normalized amplitudes along the 𝑥-axis at the plane of the reflectarray. In addition, one can also obtain the corresponding phase distribution using the argument for this com-plex field, as shown in Figure 3b. These amplitude and phase distributions are discretized along the proposed grid of the reflectarray to obtain the amplitude and phase of the inci-dent field on each element of the reflectarray.
Figure 2. Proposed Yagi–Uda feeding antenna. (a) Geometry, (b) Simulated Reflection coefficient,(c) Simulated total gain pattern.
Figure 2b shows the simulated |S11| for the feed antenna. It can be noted that |S11| atthe required operating frequency 8.5 GHz is less than −15 dB, which represents a good
Sensors 2022, 22, 1166 5 of 18
matching. The simulated realized gain pattern is shown in Figure 2c. The peak gain isobtained in the –ve z direction towards the aperture of the reflectarray. The peak gain isgreater than 6 dBi and the backward radiation is less than −12 dBi; thus, the front to backratio is around 18 dB. Thus, the proposed Yagi–Uda antenna is suitable for the proposedrequirements for the feeding antenna of the reflectarray.
4. Field Distribution of the Feeding Antenna on the Aperture of the Reflectarray
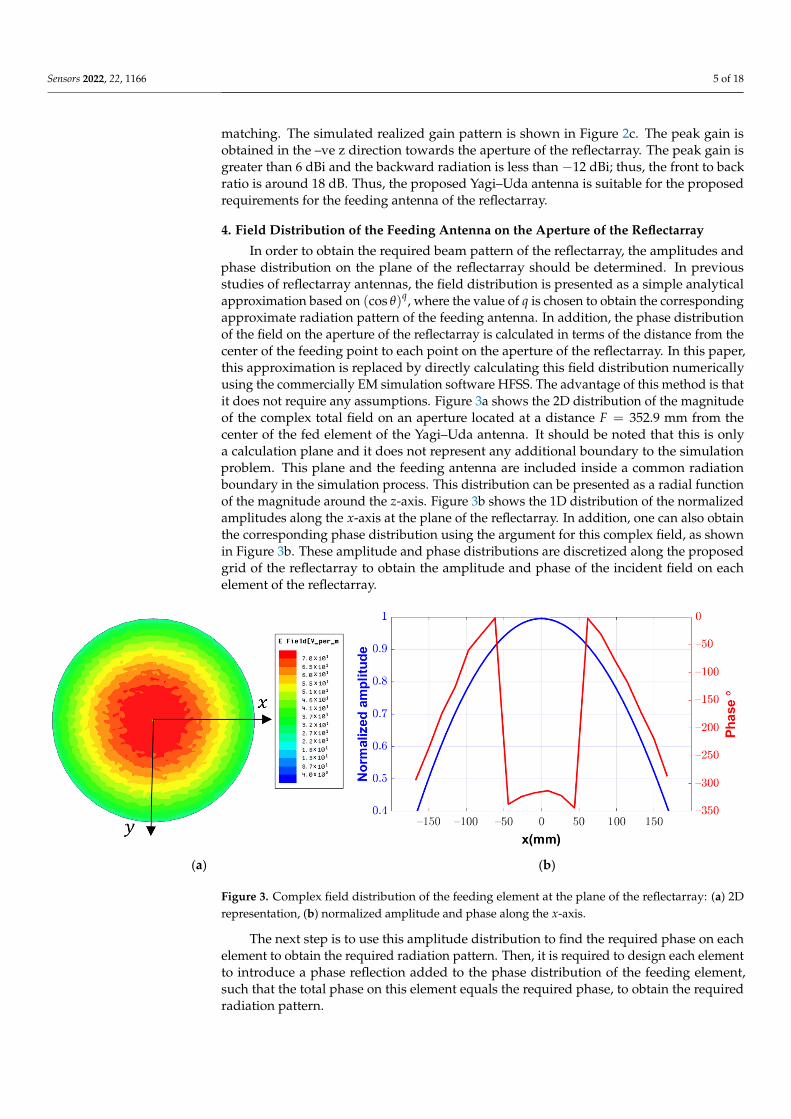
In order to obtain the required beam pattern of the reflectarray, the amplitudes andphase distribution on the plane of the reflectarray should be determined. In previousstudies of reflectarray antennas, the field distribution is presented as a simple analyticalapproximation based on (cos θ)q, where the value of q is chosen to obtain the correspondingapproximate radiation pattern of the feeding antenna. In addition, the phase distributionof the field on the aperture of the reflectarray is calculated in terms of the distance from thecenter of the feeding point to each point on the aperture of the reflectarray. In this paper,this approximation is replaced by directly calculating this field distribution numericallyusing the commercially EM simulation software HFSS. The advantage of this method is thatit does not require any assumptions. Figure 3a shows the 2D distribution of the magnitudeof the complex total field on an aperture located at a distance F = 352.9 mm from thecenter of the fed element of the Yagi–Uda antenna. It should be noted that this is onlya calculation plane and it does not represent any additional boundary to the simulationproblem. This plane and the feeding antenna are included inside a common radiationboundary in the simulation process. This distribution can be presented as a radial functionof the magnitude around the z-axis. Figure 3b shows the 1D distribution of the normalizedamplitudes along the x-axis at the plane of the reflectarray. In addition, one can also obtainthe corresponding phase distribution using the argument for this complex field, as shownin Figure 3b. These amplitude and phase distributions are discretized along the proposedgrid of the reflectarray to obtain the amplitude and phase of the incident field on eachelement of the reflectarray.
Sensors 2022, 22, x FOR PEER REVIEW 6 of 19
(a) (b)
Figure 3. Complex field distribution of the feeding element at the plane of the reflectarray: (a) 2D representation, (b) normalized amplitude and phase along the 𝑥-axis.
The next step is to use this amplitude distribution to find the required phase on each element to obtain the required radiation pattern. Then, it is required to design each ele-ment to introduce a phase reflection added to the phase distribution of the feeding ele-ment, such that the total phase on this element equals the required phase, to obtain the required radiation pattern.
For the case of a pencil beam radiation pattern, the required total phase distribution on the aperture of the reflectarray antenna can be obtained analytically, as shown in Equa-tion (4). Thus, the reflection phase of each reflecting element can be obtained by subtract-ing the phase of the feeding element from the required phase distribution of the aperture of the reflectarray. For the present reflectarray structure mentioned in Section 2 and the proposed Yagi–Uda feeding element, the required reflection phases on the aperture of the reflectarray for both broadside and tilted pencil beams with a tilting angle 15° are shown in Figure 4a,b, respectively. It should be noted that the total number of reflecting elements is equal to 316 unit cells, arranged uniformly in a planar grid with 𝑀 × 𝑁 = 20 × 20 ele-ments.
(a) (b)
Figure 4. Phase distribution of the pencil beam reflectarray: (a) broadside beam, (b) tilted beam with a tilting angle of 15°.
Figure 3. Complex field distribution of the feeding element at the plane of the reflectarray: (a) 2Drepresentation, (b) normalized amplitude and phase along the x-axis.
The next step is to use this amplitude distribution to find the required phase on eachelement to obtain the required radiation pattern. Then, it is required to design each elementto introduce a phase reflection added to the phase distribution of the feeding element,such that the total phase on this element equals the required phase, to obtain the requiredradiation pattern.
Sensors 2022, 22, 1166 6 of 18
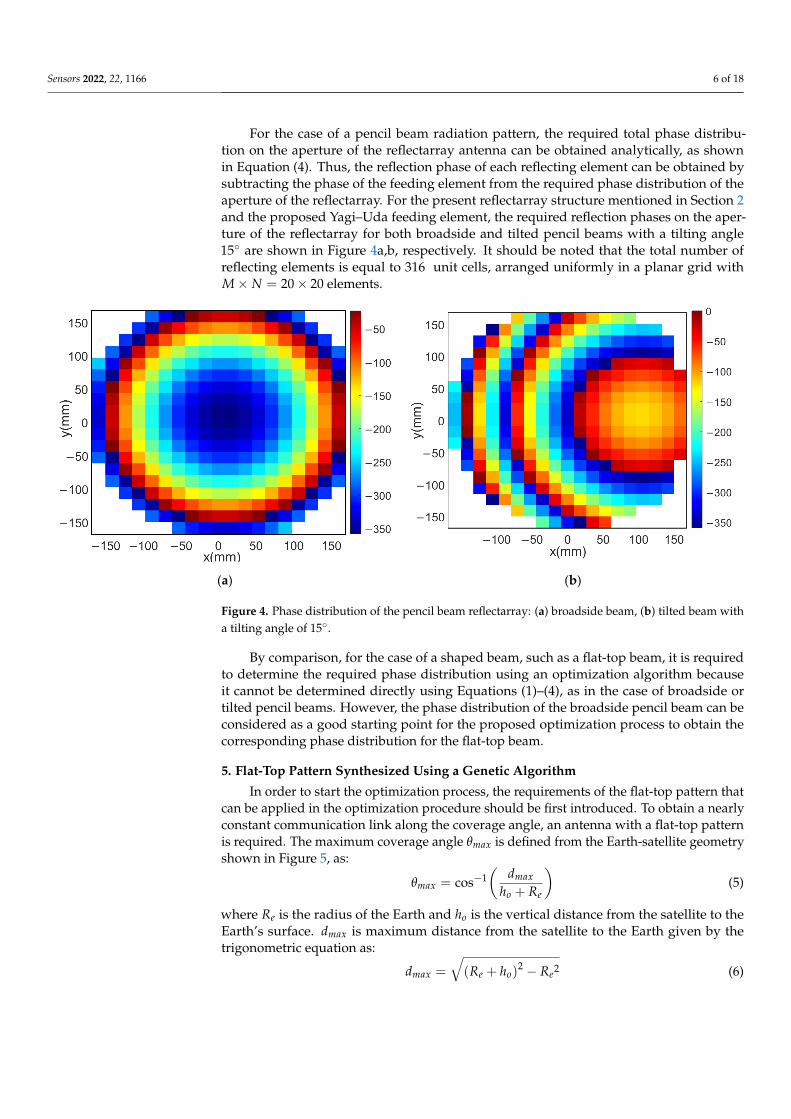
For the case of a pencil beam radiation pattern, the required total phase distribu-tion on the aperture of the reflectarray antenna can be obtained analytically, as shownin Equation (4). Thus, the reflection phase of each reflecting element can be obtained bysubtracting the phase of the feeding element from the required phase distribution of theaperture of the reflectarray. For the present reflectarray structure mentioned in Section 2and the proposed Yagi–Uda feeding element, the required reflection phases on the aper-ture of the reflectarray for both broadside and tilted pencil beams with a tilting angle15◦ are shown in Figure 4a,b, respectively. It should be noted that the total number ofreflecting elements is equal to 316 unit cells, arranged uniformly in a planar grid withM× N = 20× 20 elements.
Sensors 2022, 22, x FOR PEER REVIEW 6 of 19
(a) (b)
Figure 3. Complex field distribution of the feeding element at the plane of the reflectarray: (a) 2D representation, (b) normalized amplitude and phase along the 𝑥-axis.
The next step is to use this amplitude distribution to find the required phase on each element to obtain the required radiation pattern. Then, it is required to design each ele-ment to introduce a phase reflection added to the phase distribution of the feeding ele-ment, such that the total phase on this element equals the required phase, to obtain the required radiation pattern.
For the case of a pencil beam radiation pattern, the required total phase distribution on the aperture of the reflectarray antenna can be obtained analytically, as shown in Equa-tion (4). Thus, the reflection phase of each reflecting element can be obtained by subtract-ing the phase of the feeding element from the required phase distribution of the aperture of the reflectarray. For the present reflectarray structure mentioned in Section 2 and the proposed Yagi–Uda feeding element, the required reflection phases on the aperture of the reflectarray for both broadside and tilted pencil beams with a tilting angle 15° are shown in Figure 4a,b, respectively. It should be noted that the total number of reflecting elements is equal to 316 unit cells, arranged uniformly in a planar grid with 𝑀 × 𝑁 = 20 × 20 ele-ments.
(a) (b)
Figure 4. Phase distribution of the pencil beam reflectarray: (a) broadside beam, (b) tilted beam with a tilting angle of 15°. Figure 4. Phase distribution of the pencil beam reflectarray: (a) broadside beam, (b) tilted beam witha tilting angle of 15◦.
By comparison, for the case of a shaped beam, such as a flat-top beam, it is requiredto determine the required phase distribution using an optimization algorithm becauseit cannot be determined directly using Equations (1)–(4), as in the case of broadside ortilted pencil beams. However, the phase distribution of the broadside pencil beam can beconsidered as a good starting point for the proposed optimization process to obtain thecorresponding phase distribution for the flat-top beam.
5. Flat-Top Pattern Synthesized Using a Genetic Algorithm
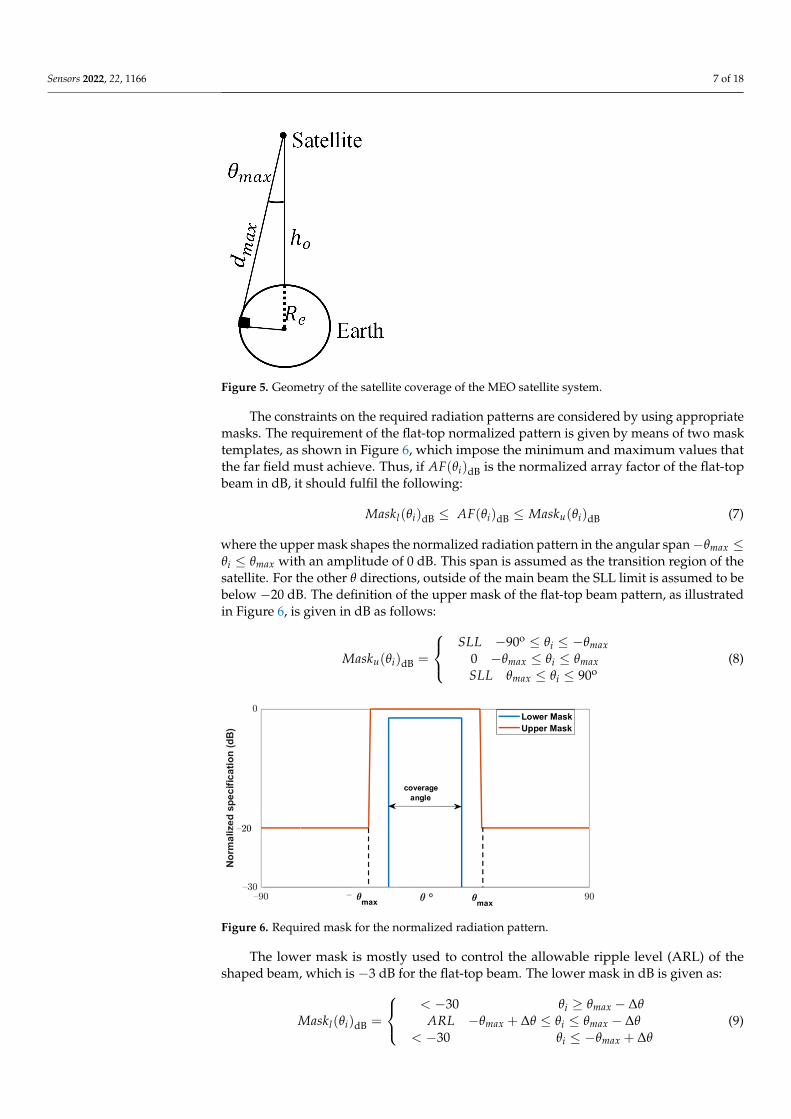
In order to start the optimization process, the requirements of the flat-top pattern thatcan be applied in the optimization procedure should be first introduced. To obtain a nearlyconstant communication link along the coverage angle, an antenna with a flat-top patternis required. The maximum coverage angle θmax is defined from the Earth-satellite geometryshown in Figure 5, as:
θmax = cos−1(
dmax
ho + Re
)(5)
where Re is the radius of the Earth and ho is the vertical distance from the satellite to theEarth’s surface. dmax is maximum distance from the satellite to the Earth given by thetrigonometric equation as:
dmax =
√(Re + ho)
2 − Re2 (6)
Sensors 2022, 22, 1166 7 of 18Sensors 2022, 22, x FOR PEER REVIEW 8 of 19
Figure 5. Geometry of the satellite coverage of the MEO satellite system.
Figure 6. Required mask for the normalized radiation pattern.
To achieve the flat-top radiation pattern, the phase distribution on the reflectarray elements should be determined through an optimization of a properly defined cost func-tion. The cost function is defined as the error between the obtained normalized array fac-tor 𝐴𝐹 and the required upper and lower masks. The cost function is normalized for 𝑁 angles for both the upper and lower limits of the mask as follows: 𝑐𝑜𝑠𝑡 = 𝜀 (𝜃 ) + 𝜀 (𝜃 )𝑁 (10)
where 𝜀 (𝜃 ) and 𝜀 (𝜃 ) are given by Equations (11) and (12), respectively:
𝜀 (𝜃 ) = 𝐴𝐹(𝜃 ) − 𝑀𝑎𝑠𝑘 (𝜃 ) 1 + sgn(𝐴𝐹(𝜃 ) − 𝑀𝑎𝑠𝑘 (𝜃 ) )2 (11)
𝜀 (𝜃 ) = 𝑀𝑎𝑠𝑘 (𝜃 ) − 𝐴𝐹(𝜃 ) 1 + sgn(𝑀𝑎𝑠𝑘 (𝜃 ) − 𝐴𝐹(𝜃 ) )2 (12)
where 𝐴𝐹(𝜃 ) = 20log (|𝐴𝐹(𝜃 )|) and sgn(𝑥) = 1 for 𝑥 0 and sgn(𝑥) = −1 for 𝑥 < 0. Thus, a better match between the obtained pattern and the required pattern is obtained for the minimum value of this cost function.
After determining the required radiation pattern for the proposed MEO satellite com-munication system and the amplitude distribution of the fields due to the feeding element, the corresponding phase distribution on the aperture of the reflectarray must be deter-mined. This phase distribution is obtained using GA. In GA, the optimization starts with
Figure 5. Geometry of the satellite coverage of the MEO satellite system.
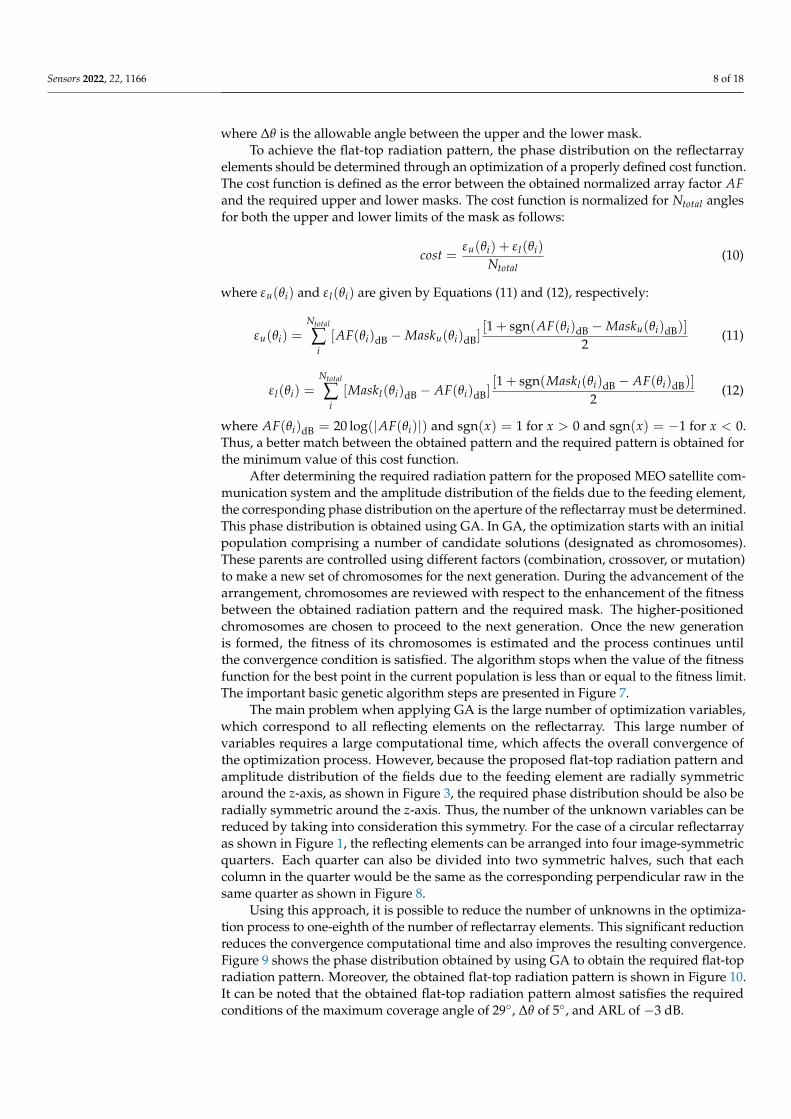
The constraints on the required radiation patterns are considered by using appropriatemasks. The requirement of the flat-top normalized pattern is given by means of two masktemplates, as shown in Figure 6, which impose the minimum and maximum values thatthe far field must achieve. Thus, if AF(θi)dB is the normalized array factor of the flat-topbeam in dB, it should fulfil the following:
Maskl(θi)dB ≤ AF(θi)dB ≤ Masku(θi)dB (7)
where the upper mask shapes the normalized radiation pattern in the angular span−θmax ≤θi ≤ θmax with an amplitude of 0 dB. This span is assumed as the transition region of thesatellite. For the other θ directions, outside of the main beam the SLL limit is assumed to bebelow −20 dB. The definition of the upper mask of the flat-top beam pattern, as illustratedin Figure 6, is given in dB as follows:
Masku(θi)dB =
SLL −90o ≤ θi ≤ −θmax
0 −θmax ≤ θi ≤ θmaxSLL θmax ≤ θi ≤ 90o
(8)
Sensors 2022, 22, x FOR PEER REVIEW 8 of 19
Figure 5. Geometry of the satellite coverage of the MEO satellite system.
Figure 6. Required mask for the normalized radiation pattern.
To achieve the flat-top radiation pattern, the phase distribution on the reflectarray elements should be determined through an optimization of a properly defined cost func-tion. The cost function is defined as the error between the obtained normalized array fac-tor 𝐴𝐹 and the required upper and lower masks. The cost function is normalized for 𝑁 angles for both the upper and lower limits of the mask as follows: 𝑐𝑜𝑠𝑡 = 𝜀 (𝜃 ) + 𝜀 (𝜃 )𝑁 (10)
where 𝜀 (𝜃 ) and 𝜀 (𝜃 ) are given by Equations (11) and (12), respectively:
𝜀 (𝜃 ) = 𝐴𝐹(𝜃 ) − 𝑀𝑎𝑠𝑘 (𝜃 ) 1 + sgn(𝐴𝐹(𝜃 ) − 𝑀𝑎𝑠𝑘 (𝜃 ) )2 (11)
𝜀 (𝜃 ) = 𝑀𝑎𝑠𝑘 (𝜃 ) − 𝐴𝐹(𝜃 ) 1 + sgn(𝑀𝑎𝑠𝑘 (𝜃 ) − 𝐴𝐹(𝜃 ) )2 (12)
where 𝐴𝐹(𝜃 ) = 20log (|𝐴𝐹(𝜃 )|) and sgn(𝑥) = 1 for 𝑥 0 and sgn(𝑥) = −1 for 𝑥 < 0. Thus, a better match between the obtained pattern and the required pattern is obtained for the minimum value of this cost function.
After determining the required radiation pattern for the proposed MEO satellite com-munication system and the amplitude distribution of the fields due to the feeding element, the corresponding phase distribution on the aperture of the reflectarray must be deter-mined. This phase distribution is obtained using GA. In GA, the optimization starts with
Figure 6. Required mask for the normalized radiation pattern.
The lower mask is mostly used to control the allowable ripple level (ARL) of theshaped beam, which is −3 dB for the flat-top beam. The lower mask in dB is given as:
Maskl(θi)dB =
< −30 θi ≥ θmax − ∆θ
ARL −θmax + ∆θ ≤ θi ≤ θmax − ∆θ< −30 θi ≤ −θmax + ∆θ
(9)
Sensors 2022, 22, 1166 8 of 18
where ∆θ is the allowable angle between the upper and the lower mask.To achieve the flat-top radiation pattern, the phase distribution on the reflectarray
elements should be determined through an optimization of a properly defined cost function.The cost function is defined as the error between the obtained normalized array factor AFand the required upper and lower masks. The cost function is normalized for Ntotal anglesfor both the upper and lower limits of the mask as follows:
cost =εu(θi) + ε l(θi)
Ntotal(10)
where εu(θi) and ε l(θi) are given by Equations (11) and (12), respectively:
εu(θi) =Ntotal
∑i
[AF(θi)dB −Masku(θi)dB][1 + sgn(AF(θi)dB −Masku(θi)dB)]
2(11)
ε l(θi) =Ntotal
∑i
[Maskl(θi)dB − AF(θi)dB][1 + sgn(Maskl(θi)dB − AF(θi)dB)]
2(12)
where AF(θi)dB = 20 log(|AF(θi)|) and sgn(x) = 1 for x > 0 and sgn(x) = −1 for x < 0.Thus, a better match between the obtained pattern and the required pattern is obtained forthe minimum value of this cost function.
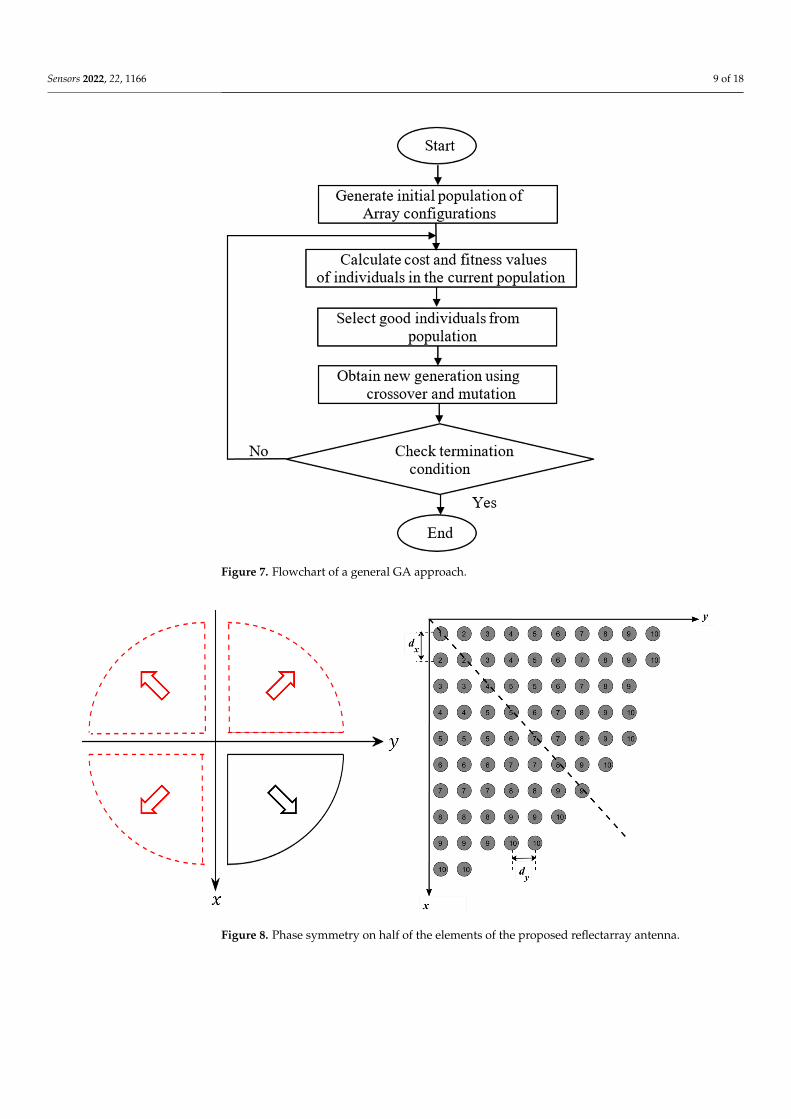
After determining the required radiation pattern for the proposed MEO satellite com-munication system and the amplitude distribution of the fields due to the feeding element,the corresponding phase distribution on the aperture of the reflectarray must be determined.This phase distribution is obtained using GA. In GA, the optimization starts with an initialpopulation comprising a number of candidate solutions (designated as chromosomes).These parents are controlled using different factors (combination, crossover, or mutation)to make a new set of chromosomes for the next generation. During the advancement of thearrangement, chromosomes are reviewed with respect to the enhancement of the fitnessbetween the obtained radiation pattern and the required mask. The higher-positionedchromosomes are chosen to proceed to the next generation. Once the new generationis formed, the fitness of its chromosomes is estimated and the process continues untilthe convergence condition is satisfied. The algorithm stops when the value of the fitnessfunction for the best point in the current population is less than or equal to the fitness limit.The important basic genetic algorithm steps are presented in Figure 7.
The main problem when applying GA is the large number of optimization variables,which correspond to all reflecting elements on the reflectarray. This large number ofvariables requires a large computational time, which affects the overall convergence ofthe optimization process. However, because the proposed flat-top radiation pattern andamplitude distribution of the fields due to the feeding element are radially symmetricaround the z-axis, as shown in Figure 3, the required phase distribution should be also beradially symmetric around the z-axis. Thus, the number of the unknown variables can bereduced by taking into consideration this symmetry. For the case of a circular reflectarrayas shown in Figure 1, the reflecting elements can be arranged into four image-symmetricquarters. Each quarter can also be divided into two symmetric halves, such that eachcolumn in the quarter would be the same as the corresponding perpendicular raw in thesame quarter as shown in Figure 8.
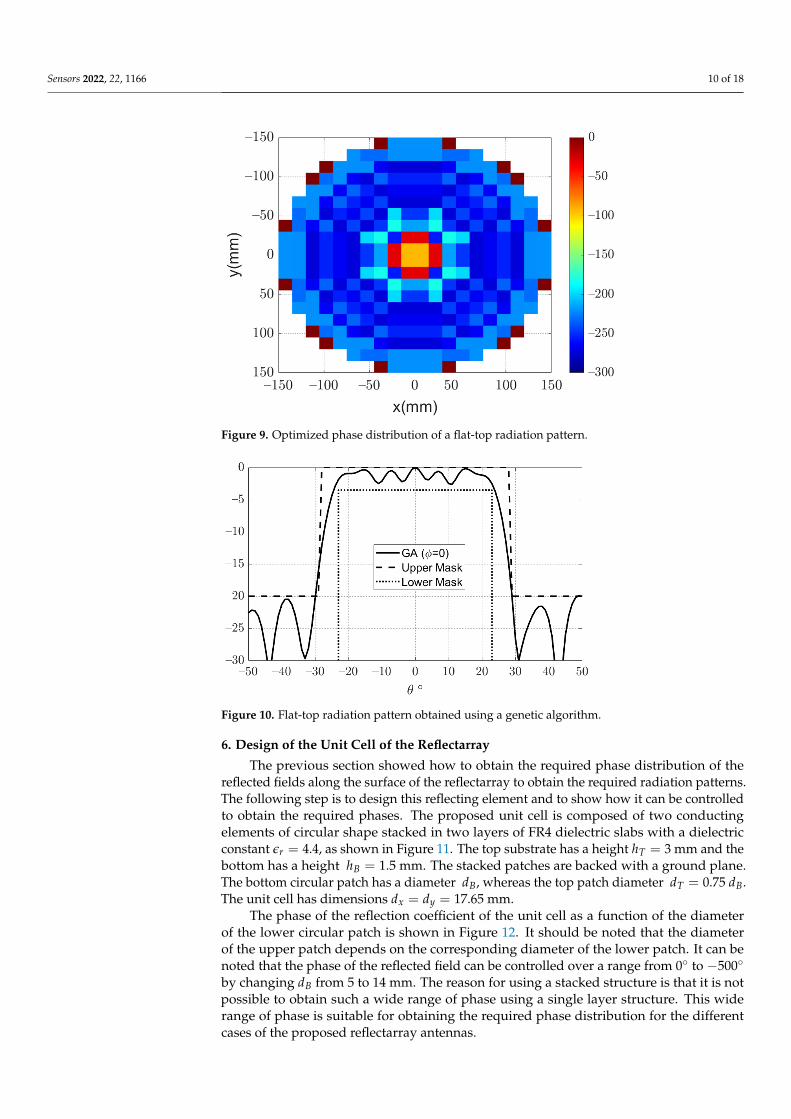
Using this approach, it is possible to reduce the number of unknowns in the optimiza-tion process to one-eighth of the number of reflectarray elements. This significant reductionreduces the convergence computational time and also improves the resulting convergence.Figure 9 shows the phase distribution obtained by using GA to obtain the required flat-topradiation pattern. Moreover, the obtained flat-top radiation pattern is shown in Figure 10.It can be noted that the obtained flat-top radiation pattern almost satisfies the requiredconditions of the maximum coverage angle of 29◦, ∆θ of 5◦, and ARL of −3 dB.
Sensors 2022, 22, 1166 9 of 18
Sensors 2022, 22, x FOR PEER REVIEW 9 of 19
an initial population comprising a number of candidate solutions (designated as chromo-somes). These parents are controlled using different factors (combination, crossover, or mutation) to make a new set of chromosomes for the next generation. During the advance-ment of the arrangement, chromosomes are reviewed with respect to the enhancement of the fitness between the obtained radiation pattern and the required mask. The higher-positioned chromosomes are chosen to proceed to the next generation. Once the new gen-eration is formed, the fitness of its chromosomes is estimated and the process continues until the convergence condition is satisfied. The algorithm stops when the value of the fitness function for the best point in the current population is less than or equal to the fitness limit. The important basic genetic algorithm steps are presented in Figure 7.
Figure 7. Flowchart of a general GA approach.
The main problem when applying GA is the large number of optimization variables, which correspond to all reflecting elements on the reflectarray. This large number of var-iables requires a large computational time, which affects the overall convergence of the optimization process. However, because the proposed flat-top radiation pattern and am-plitude distribution of the fields due to the feeding element are radially symmetric around the 𝑧-axis, as shown in Figure 3, the required phase distribution should be also be radially symmetric around the 𝑧-axis. Thus, the number of the unknown variables can be reduced by taking into consideration this symmetry. For the case of a circular reflectarray as shown in Figure 1, the reflecting elements can be arranged into four image-symmetric quarters. Each quarter can also be divided into two symmetric halves, such that each column in the quarter would be the same as the corresponding perpendicular raw in the same quarter as shown in Figure 8.
Figure 7. Flowchart of a general GA approach.Sensors 2022, 22, x FOR PEER REVIEW 10 of 19
Figure 8. Phase symmetry on half of the elements of the proposed reflectarray antenna.
Using this approach, it is possible to reduce the number of unknowns in the optimi-zation process to one-eighth of the number of reflectarray elements. This significant re-duction reduces the convergence computational time and also improves the resulting con-vergence. Figure 9 shows the phase distribution obtained by using GA to obtain the re-quired flat-top radiation pattern. Moreover, the obtained flat-top radiation pattern is shown in Figure 10. It can be noted that the obtained flat-top radiation pattern almost satisfies the required conditions of the maximum coverage angle of 29°, ∆𝜃 of 5°, and ARL of −3 dB.
Figure 9. Optimized phase distribution of a flat-top radiation pattern.
Figure 8. Phase symmetry on half of the elements of the proposed reflectarray antenna.
Sensors 2022, 22, 1166 10 of 18
Sensors 2022, 22, x FOR PEER REVIEW 10 of 19
Figure 8. Phase symmetry on half of the elements of the proposed reflectarray antenna.
Using this approach, it is possible to reduce the number of unknowns in the optimi-zation process to one-eighth of the number of reflectarray elements. This significant re-duction reduces the convergence computational time and also improves the resulting con-vergence. Figure 9 shows the phase distribution obtained by using GA to obtain the re-quired flat-top radiation pattern. Moreover, the obtained flat-top radiation pattern is shown in Figure 10. It can be noted that the obtained flat-top radiation pattern almost satisfies the required conditions of the maximum coverage angle of 29°, ∆𝜃 of 5°, and ARL of −3 dB.
Figure 9. Optimized phase distribution of a flat-top radiation pattern. Figure 9. Optimized phase distribution of a flat-top radiation pattern.
Sensors 2022, 22, x FOR PEER REVIEW 11 of 19
Figure 10. Flat-top radiation pattern obtained using a genetic algorithm.
6. Design of the Unit Cell of the Reflectarray The previous section showed how to obtain the required phase distribution of the
reflected fields along the surface of the reflectarray to obtain the required radiation pat-terns. The following step is to design this reflecting element and to show how it can be controlled to obtain the required phases. The proposed unit cell is composed of two con-ducting elements of circular shape stacked in two layers of FR4 dielectric slabs with a dielectric constant 𝜖 = 4.4, as shown in Figure 11. The top substrate has a height ℎ =3 mm and the bottom has a height ℎ = 1.5 mm. The stacked patches are backed with a ground plane. The bottom circular patch has a diameter 𝑑 , whereas the top patch diam-eter 𝑑 = 0.75 𝑑 . The unit cell has dimensions 𝑑 = 𝑑 = 17.65 mm.
The phase of the reflection coefficient of the unit cell as a function of the diameter of the lower circular patch is shown in Figure 12. It should be noted that the diameter of the upper patch depends on the corresponding diameter of the lower patch. It can be noted that the phase of the reflected field can be controlled over a range from 0° to −500° by changing 𝑑 from 5 to 14 mm. The reason for using a stacked structure is that it is not possible to obtain such a wide range of phase using a single layer structure. This wide range of phase is suitable for obtaining the required phase distribution for the different cases of the proposed reflectarray antennas.
Figure 11. Geometry of the proposed unit cell.
Figure 10. Flat-top radiation pattern obtained using a genetic algorithm.
6. Design of the Unit Cell of the Reflectarray
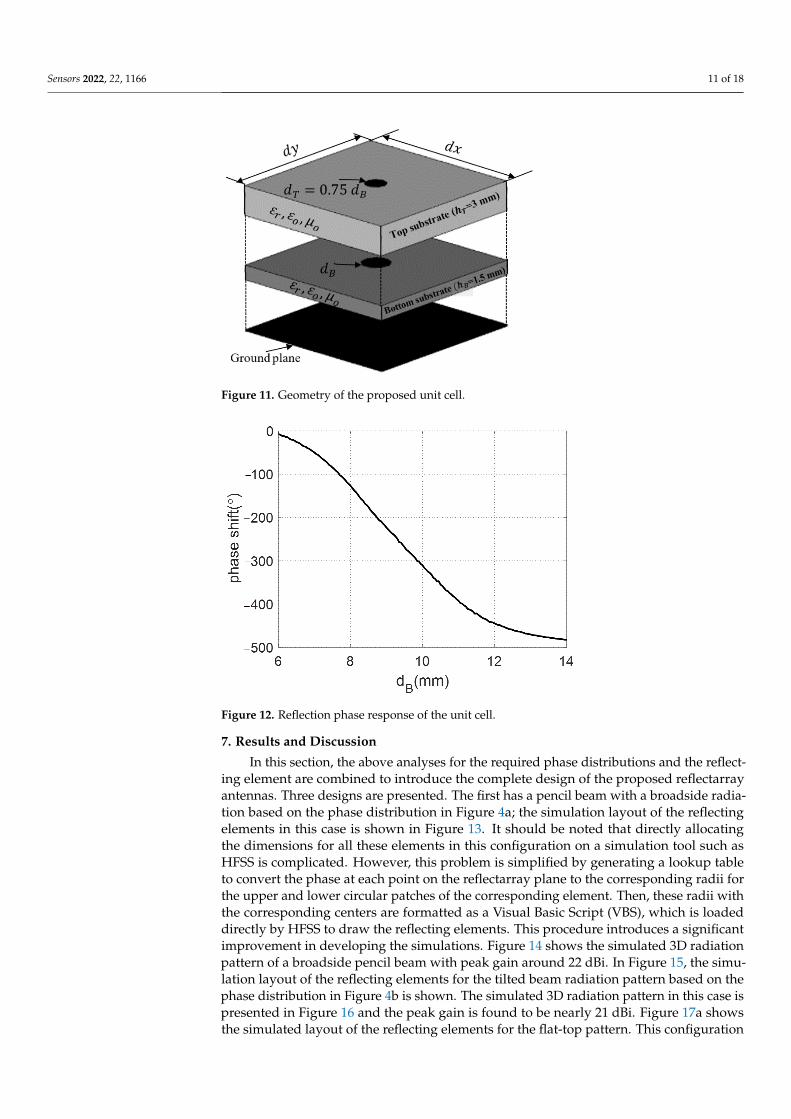
The previous section showed how to obtain the required phase distribution of thereflected fields along the surface of the reflectarray to obtain the required radiation patterns.The following step is to design this reflecting element and to show how it can be controlledto obtain the required phases. The proposed unit cell is composed of two conductingelements of circular shape stacked in two layers of FR4 dielectric slabs with a dielectricconstant εr = 4.4, as shown in Figure 11. The top substrate has a height hT = 3 mm and thebottom has a height hB = 1.5 mm. The stacked patches are backed with a ground plane.The bottom circular patch has a diameter dB, whereas the top patch diameter dT = 0.75 dB.The unit cell has dimensions dx = dy = 17.65 mm.
The phase of the reflection coefficient of the unit cell as a function of the diameterof the lower circular patch is shown in Figure 12. It should be noted that the diameterof the upper patch depends on the corresponding diameter of the lower patch. It can benoted that the phase of the reflected field can be controlled over a range from 0◦ to −500◦
by changing dB from 5 to 14 mm. The reason for using a stacked structure is that it is notpossible to obtain such a wide range of phase using a single layer structure. This widerange of phase is suitable for obtaining the required phase distribution for the differentcases of the proposed reflectarray antennas.
Sensors 2022, 22, 1166 11 of 18
Sensors 2022, 22, x FOR PEER REVIEW 11 of 19
Figure 10. Flat-top radiation pattern obtained using a genetic algorithm.
6. Design of the Unit Cell of the Reflectarray The previous section showed how to obtain the required phase distribution of the
reflected fields along the surface of the reflectarray to obtain the required radiation pat-terns. The following step is to design this reflecting element and to show how it can be controlled to obtain the required phases. The proposed unit cell is composed of two con-ducting elements of circular shape stacked in two layers of FR4 dielectric slabs with a dielectric constant 𝜖 = 4.4, as shown in Figure 11. The top substrate has a height ℎ =3 mm and the bottom has a height ℎ = 1.5 mm. The stacked patches are backed with a ground plane. The bottom circular patch has a diameter 𝑑 , whereas the top patch diam-eter 𝑑 = 0.75 𝑑 . The unit cell has dimensions 𝑑 = 𝑑 = 17.65 mm.
The phase of the reflection coefficient of the unit cell as a function of the diameter of the lower circular patch is shown in Figure 12. It should be noted that the diameter of the upper patch depends on the corresponding diameter of the lower patch. It can be noted that the phase of the reflected field can be controlled over a range from 0° to −500° by changing 𝑑 from 5 to 14 mm. The reason for using a stacked structure is that it is not possible to obtain such a wide range of phase using a single layer structure. This wide range of phase is suitable for obtaining the required phase distribution for the different cases of the proposed reflectarray antennas.
Figure 11. Geometry of the proposed unit cell. Figure 11. Geometry of the proposed unit cell.
Sensors 2022, 22, x FOR PEER REVIEW 12 of 19
Figure 12. Reflection phase response of the unit cell.
7. Results and Discussion In this section, the above analyses for the required phase distributions and the re-
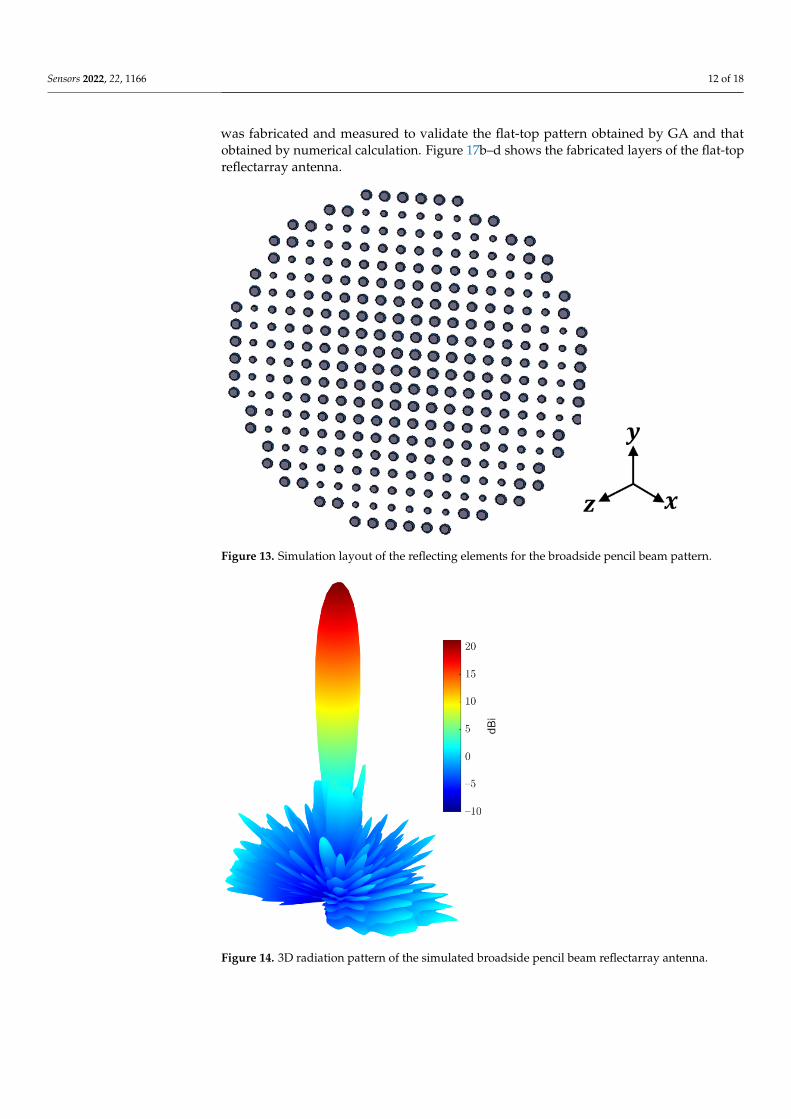
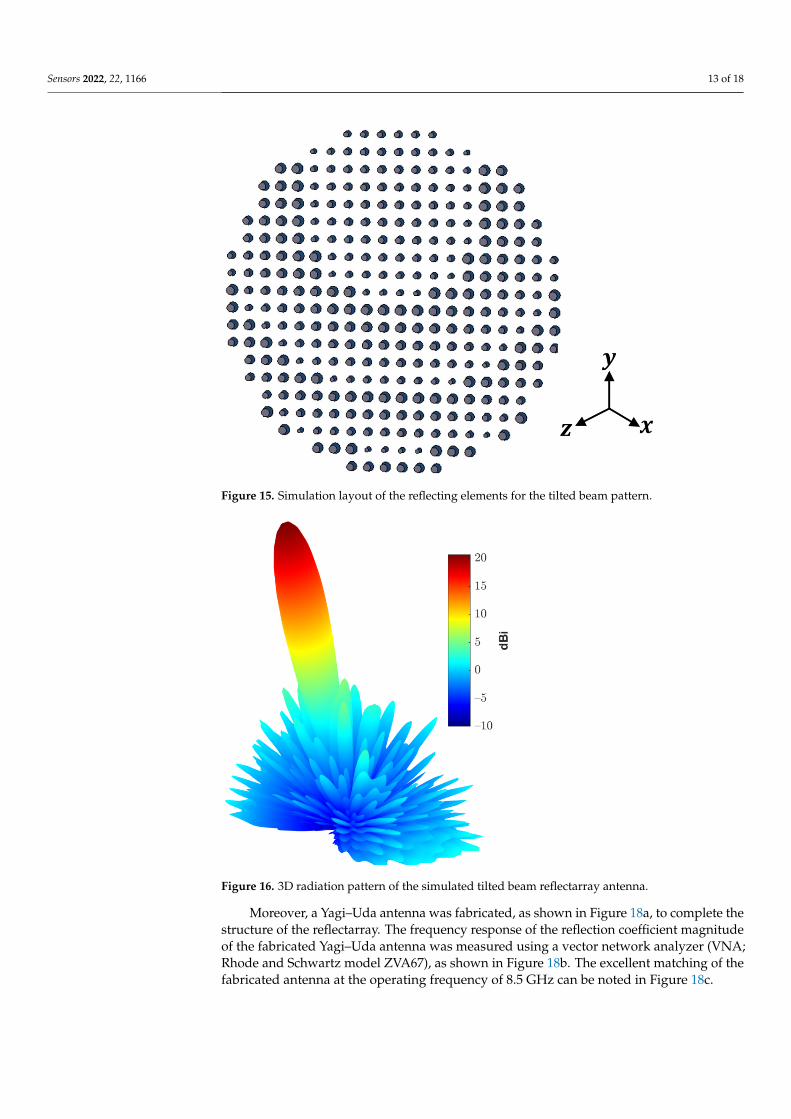
flecting element are combined to introduce the complete design of the proposed reflectar-ray antennas. Three designs are presented. The first has a pencil beam with a broadside radiation based on the phase distribution in Figure 4a; the simulation layout of the reflect-ing elements in this case is shown in Figure 13. It should be noted that directly allocating the dimensions for all these elements in this configuration on a simulation tool such as HFSS is complicated. However, this problem is simplified by generating a lookup table to convert the phase at each point on the reflectarray plane to the corresponding radii for the upper and lower circular patches of the corresponding element. Then, these radii with the corresponding centers are formatted as a Visual Basic Script (VBS), which is loaded di-rectly by HFSS to draw the reflecting elements. This procedure introduces a significant improvement in developing the simulations. Figure 14 shows the simulated 3D radiation pattern of a broadside pencil beam with peak gain around 22 dBi. In Figure 15, the simu-lation layout of the reflecting elements for the tilted beam radiation pattern based on the phase distribution in Figure 4b is shown. The simulated 3D radiation pattern in this case is presented in Figure 16 and the peak gain is found to be nearly 21 dBi. Figure 17a shows the simulated layout of the reflecting elements for the flat-top pattern. This configuration was fabricated and measured to validate the flat-top pattern obtained by GA and that obtained by numerical calculation. Figure 17b–d shows the fabricated layers of the flat-top reflectarray antenna.
Figure 12. Reflection phase response of the unit cell.
7. Results and Discussion
In this section, the above analyses for the required phase distributions and the reflect-ing element are combined to introduce the complete design of the proposed reflectarrayantennas. Three designs are presented. The first has a pencil beam with a broadside radia-tion based on the phase distribution in Figure 4a; the simulation layout of the reflectingelements in this case is shown in Figure 13. It should be noted that directly allocatingthe dimensions for all these elements in this configuration on a simulation tool such asHFSS is complicated. However, this problem is simplified by generating a lookup tableto convert the phase at each point on the reflectarray plane to the corresponding radii forthe upper and lower circular patches of the corresponding element. Then, these radii withthe corresponding centers are formatted as a Visual Basic Script (VBS), which is loadeddirectly by HFSS to draw the reflecting elements. This procedure introduces a significantimprovement in developing the simulations. Figure 14 shows the simulated 3D radiationpattern of a broadside pencil beam with peak gain around 22 dBi. In Figure 15, the simu-lation layout of the reflecting elements for the tilted beam radiation pattern based on thephase distribution in Figure 4b is shown. The simulated 3D radiation pattern in this case ispresented in Figure 16 and the peak gain is found to be nearly 21 dBi. Figure 17a showsthe simulated layout of the reflecting elements for the flat-top pattern. This configuration
Sensors 2022, 22, 1166 12 of 18
was fabricated and measured to validate the flat-top pattern obtained by GA and thatobtained by numerical calculation. Figure 17b–d shows the fabricated layers of the flat-topreflectarray antenna.
Sensors 2022, 22, x FOR PEER REVIEW 13 of 19
Figure 13. Simulation layout of the reflecting elements for the broadside pencil beam pattern.
Figure 14. 3D radiation pattern of the simulated broadside pencil beam reflectarray antenna.
Figure 13. Simulation layout of the reflecting elements for the broadside pencil beam pattern.
Sensors 2022, 22, x FOR PEER REVIEW 13 of 19
Figure 13. Simulation layout of the reflecting elements for the broadside pencil beam pattern.
Figure 14. 3D radiation pattern of the simulated broadside pencil beam reflectarray antenna. Figure 14. 3D radiation pattern of the simulated broadside pencil beam reflectarray antenna.
Sensors 2022, 22, 1166 13 of 18Sensors 2022, 22, x FOR PEER REVIEW 14 of 19
Figure 15. Simulation layout of the reflecting elements for the tilted beam pattern.
Figure 16. 3D radiation pattern of the simulated tilted beam reflectarray antenna.
Figure 15. Simulation layout of the reflecting elements for the tilted beam pattern.
Sensors 2022, 22, x FOR PEER REVIEW 14 of 19
Figure 15. Simulation layout of the reflecting elements for the tilted beam pattern.
Figure 16. 3D radiation pattern of the simulated tilted beam reflectarray antenna. Figure 16. 3D radiation pattern of the simulated tilted beam reflectarray antenna.
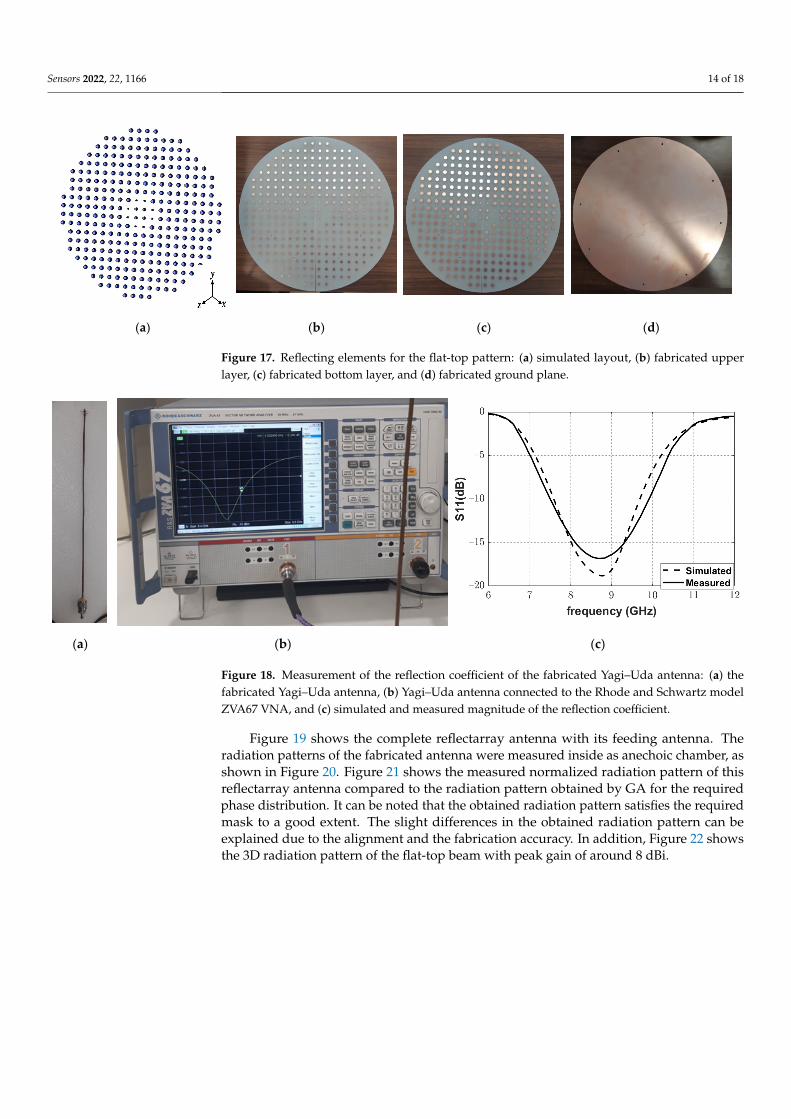
Moreover, a Yagi–Uda antenna was fabricated, as shown in Figure 18a, to complete thestructure of the reflectarray. The frequency response of the reflection coefficient magnitudeof the fabricated Yagi–Uda antenna was measured using a vector network analyzer (VNA;Rhode and Schwartz model ZVA67), as shown in Figure 18b. The excellent matching of thefabricated antenna at the operating frequency of 8.5 GHz can be noted in Figure 18c.
Sensors 2022, 22, 1166 14 of 18Sensors 2022, 22, x FOR PEER REVIEW 15 of 19
(a) (b) (c) (d)
Figure 17. Reflecting elements for the flat-top pattern: (a) simulated layout, (b) fabricated upper layer, (c) fabricated bottom layer, and (d) fabricated ground plane.
Moreover, a Yagi–Uda antenna was fabricated, as shown in Figure 18a, to complete the structure of the reflectarray. The frequency response of the reflection coefficient mag-nitude of the fabricated Yagi–Uda antenna was measured using a vector network analyzer (VNA; Rhode and Schwartz model ZVA67), as shown in Figure 18b. The excellent match-ing of the fabricated antenna at the operating frequency of 8.5 GHz can be noted in Figure 18c.
(a) (b) (c)
Figure 18. Measurement of the reflection coefficient of the fabricated Yagi–Uda antenna: (a) the fab-ricated Yagi–Uda antenna, (b) Yagi–Uda antenna connected to the Rhode and Schwartz model ZVA67 VNA, and (c) simulated and measured magnitude of the reflection coefficient.
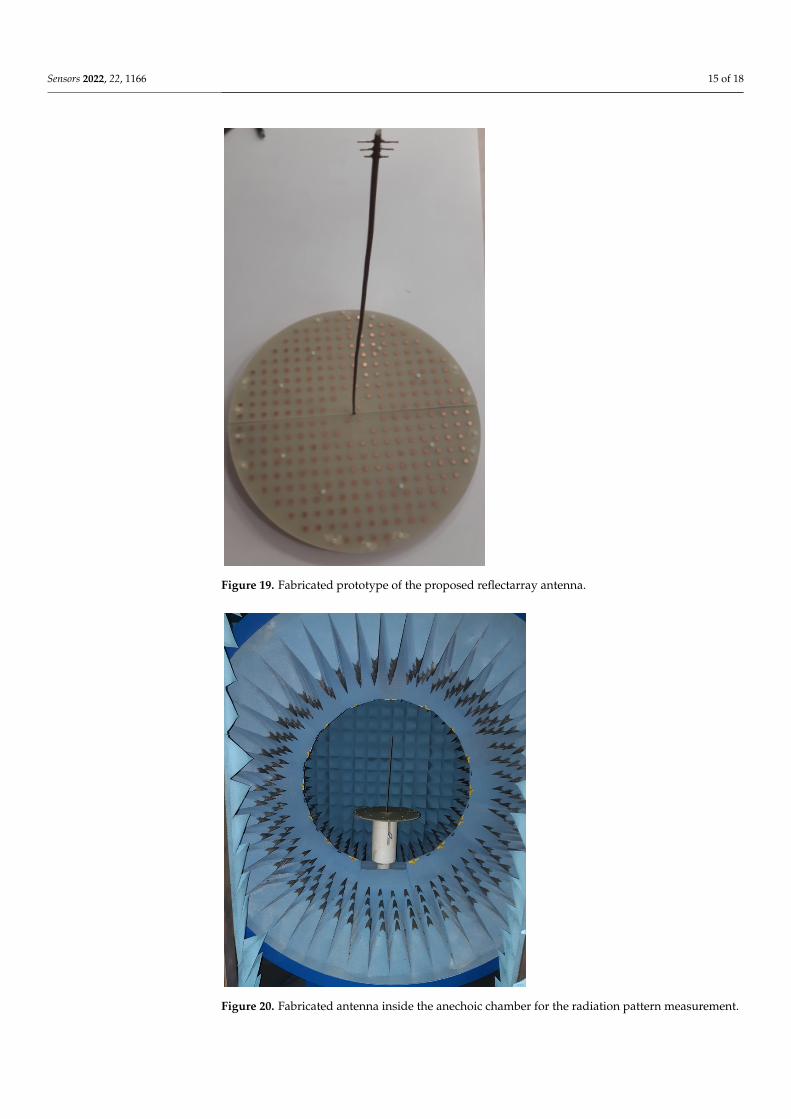
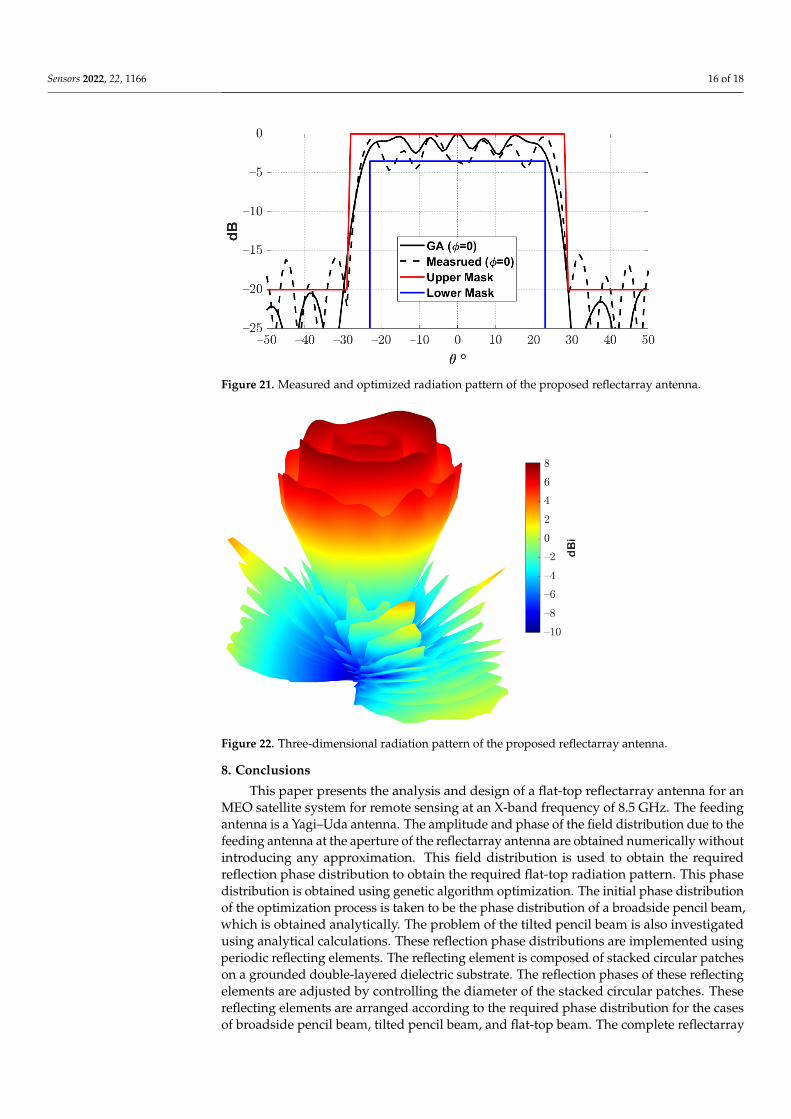
Figure 19 shows the complete reflectarray antenna with its feeding antenna. The ra-diation patterns of the fabricated antenna were measured inside as anechoic chamber, as shown in Figure 20. Figure 21 shows the measured normalized radiation pattern of this reflectarray antenna compared to the radiation pattern obtained by GA for the required phase distribution. It can be noted that the obtained radiation pattern satisfies the required mask to a good extent. The slight differences in the obtained radiation pattern can be ex-plained due to the alignment and the fabrication accuracy. In addition, Figure 22 shows the 3D radiation pattern of the flat-top beam with peak gain of around 8 dBi.
Figure 17. Reflecting elements for the flat-top pattern: (a) simulated layout, (b) fabricated upperlayer, (c) fabricated bottom layer, and (d) fabricated ground plane.
Sensors 2022, 22, x FOR PEER REVIEW 15 of 19
(a) (b) (c) (d)
Figure 17. Reflecting elements for the flat-top pattern: (a) simulated layout, (b) fabricated upper layer, (c) fabricated bottom layer, and (d) fabricated ground plane.
Moreover, a Yagi–Uda antenna was fabricated, as shown in Figure 18a, to complete the structure of the reflectarray. The frequency response of the reflection coefficient mag-nitude of the fabricated Yagi–Uda antenna was measured using a vector network analyzer (VNA; Rhode and Schwartz model ZVA67), as shown in Figure 18b. The excellent match-ing of the fabricated antenna at the operating frequency of 8.5 GHz can be noted in Figure 18c.
(a) (b) (c)
Figure 18. Measurement of the reflection coefficient of the fabricated Yagi–Uda antenna: (a) the fab-ricated Yagi–Uda antenna, (b) Yagi–Uda antenna connected to the Rhode and Schwartz model ZVA67 VNA, and (c) simulated and measured magnitude of the reflection coefficient.
Figure 19 shows the complete reflectarray antenna with its feeding antenna. The ra-diation patterns of the fabricated antenna were measured inside as anechoic chamber, as shown in Figure 20. Figure 21 shows the measured normalized radiation pattern of this reflectarray antenna compared to the radiation pattern obtained by GA for the required phase distribution. It can be noted that the obtained radiation pattern satisfies the required mask to a good extent. The slight differences in the obtained radiation pattern can be ex-plained due to the alignment and the fabrication accuracy. In addition, Figure 22 shows the 3D radiation pattern of the flat-top beam with peak gain of around 8 dBi.
Figure 18. Measurement of the reflection coefficient of the fabricated Yagi–Uda antenna: (a) thefabricated Yagi–Uda antenna, (b) Yagi–Uda antenna connected to the Rhode and Schwartz modelZVA67 VNA, and (c) simulated and measured magnitude of the reflection coefficient.
Figure 19 shows the complete reflectarray antenna with its feeding antenna. Theradiation patterns of the fabricated antenna were measured inside as anechoic chamber, asshown in Figure 20. Figure 21 shows the measured normalized radiation pattern of thisreflectarray antenna compared to the radiation pattern obtained by GA for the requiredphase distribution. It can be noted that the obtained radiation pattern satisfies the requiredmask to a good extent. The slight differences in the obtained radiation pattern can beexplained due to the alignment and the fabrication accuracy. In addition, Figure 22 showsthe 3D radiation pattern of the flat-top beam with peak gain of around 8 dBi.
Sensors 2022, 22, 1166 15 of 18Sensors 2022, 22, x FOR PEER REVIEW 16 of 19
Figure 19. Fabricated prototype of the proposed reflectarray antenna.
Figure 20. Fabricated antenna inside the anechoic chamber for the radiation pattern measurement.
Figure 19. Fabricated prototype of the proposed reflectarray antenna.
Sensors 2022, 22, x FOR PEER REVIEW 16 of 19
Figure 19. Fabricated prototype of the proposed reflectarray antenna.
Figure 20. Fabricated antenna inside the anechoic chamber for the radiation pattern measurement. Figure 20. Fabricated antenna inside the anechoic chamber for the radiation pattern measurement.
Sensors 2022, 22, 1166 16 of 18Sensors 2022, 22, x FOR PEER REVIEW 17 of 19
Figure 21. Measured and optimized radiation pattern of the proposed reflectarray antenna.
Figure 22. Three-dimensional radiation pattern of the proposed reflectarray antenna.
8. Conclusions This paper presents the analysis and design of a flat-top reflectarray antenna for an
MEO satellite system for remote sensing at an X-band frequency of 8.5 GHz. The feeding antenna is a Yagi–Uda antenna. The amplitude and phase of the field distribution due to the feeding antenna at the aperture of the reflectarray antenna are obtained numerically without introducing any approximation. This field distribution is used to obtain the re-quired reflection phase distribution to obtain the required flat-top radiation pattern. This phase distribution is obtained using genetic algorithm optimization. The initial phase dis-tribution of the optimization process is taken to be the phase distribution of a broadside pencil beam, which is obtained analytically. The problem of the tilted pencil beam is also investigated using analytical calculations. These reflection phase distributions are imple-mented using periodic reflecting elements. The reflecting element is composed of stacked circular patches on a grounded double-layered dielectric substrate. The reflection phases of these reflecting elements are adjusted by controlling the diameter of the stacked circular patches. These reflecting elements are arranged according to the required phase distribu-tion for the cases of broadside pencil beam, tilted pencil beam, and flat-top beam. The
Figure 21. Measured and optimized radiation pattern of the proposed reflectarray antenna.
Sensors 2022, 22, x FOR PEER REVIEW 17 of 19
Figure 21. Measured and optimized radiation pattern of the proposed reflectarray antenna.
Figure 22. Three-dimensional radiation pattern of the proposed reflectarray antenna.
8. Conclusions This paper presents the analysis and design of a flat-top reflectarray antenna for an
MEO satellite system for remote sensing at an X-band frequency of 8.5 GHz. The feeding antenna is a Yagi–Uda antenna. The amplitude and phase of the field distribution due to the feeding antenna at the aperture of the reflectarray antenna are obtained numerically without introducing any approximation. This field distribution is used to obtain the re-quired reflection phase distribution to obtain the required flat-top radiation pattern. This phase distribution is obtained using genetic algorithm optimization. The initial phase dis-tribution of the optimization process is taken to be the phase distribution of a broadside pencil beam, which is obtained analytically. The problem of the tilted pencil beam is also investigated using analytical calculations. These reflection phase distributions are imple-mented using periodic reflecting elements. The reflecting element is composed of stacked circular patches on a grounded double-layered dielectric substrate. The reflection phases of these reflecting elements are adjusted by controlling the diameter of the stacked circular patches. These reflecting elements are arranged according to the required phase distribu-tion for the cases of broadside pencil beam, tilted pencil beam, and flat-top beam. The
Figure 22. Three-dimensional radiation pattern of the proposed reflectarray antenna.
8. Conclusions
This paper presents the analysis and design of a flat-top reflectarray antenna for anMEO satellite system for remote sensing at an X-band frequency of 8.5 GHz. The feedingantenna is a Yagi–Uda antenna. The amplitude and phase of the field distribution due to thefeeding antenna at the aperture of the reflectarray antenna are obtained numerically withoutintroducing any approximation. This field distribution is used to obtain the requiredreflection phase distribution to obtain the required flat-top radiation pattern. This phasedistribution is obtained using genetic algorithm optimization. The initial phase distributionof the optimization process is taken to be the phase distribution of a broadside pencil beam,which is obtained analytically. The problem of the tilted pencil beam is also investigatedusing analytical calculations. These reflection phase distributions are implemented usingperiodic reflecting elements. The reflecting element is composed of stacked circular patcheson a grounded double-layered dielectric substrate. The reflection phases of these reflectingelements are adjusted by controlling the diameter of the stacked circular patches. Thesereflecting elements are arranged according to the required phase distribution for the casesof broadside pencil beam, tilted pencil beam, and flat-top beam. The complete reflectarray

Sensors 2022, 22, 1166 17 of 18
systems for the three cases are investigated. Details of simulation steps are discussed. Theflat-top beam reflectarray was fabricated and measured for verification. Good agreementsbetween the obtained results and the simulated results were obtained. The results ofthe reflection coefficient of the designed and fabricated feeding antenna showed a goodagreement. Moreover, the obtained radiation pattern of the complete reflectarray antennawas found to satisfy the required radiation mask to a good extent.
Author Contributions: S.A.M.S., E.M.E. and A.M.A. have contributed to the conceptualization,methodology, software, validation, formal analysis, investigation, resources, data curation, writing,review, editing and visualizations. All authors have read and agreed to the published version ofthe manuscript.
Funding: This research received no external funding.
Institutional Review Board Statement: Not applicable.
Informed Consent Statement: Not applicable.
Data Availability Statement: Data sharing not applicable.
Conflicts of Interest: The authors declare no conflict of interest.
References1. Rahmat-Samii, Y.; Densmore, A.C. Technology trends and challenges of antennas for satellite communication systems. IEEE Trans.
Antennas Propag. 2014, 63, 1191–1204. [CrossRef]2. Imaz-Lueje, B.; Prado, D.R.; Arrebola, M.; Pino, M.R. Reflectarray antennas: A smart solution for new generation satellite
mega-constellations in space communications. Sci. Rep. 2020, 10, 21554. [CrossRef] [PubMed]3. Prado, D.R.; Arrebola, M.; Pino, M.R. Reflectarray pattern optimization for advanced wireless communications. In Advances in
Array Optimization; IntechOpen: London, UK, 2019.4. Martinez-De-Rioja, D.; Martinez-De-Rioja, E.; Rodriguez-Vaqueiro, Y.; Encinar, J.A.; Pino, A. Multibeam reflectarrays in Ka-band
for efficient antenna farms onboard broadband communication satellites. Sensors 2020, 21, 207. [CrossRef] [PubMed]5. Dahri, M.H.; Jamaluddin, M.H.; Seman, F.C.; Abbasi, M.I.; Ashyap, A.Y.I.; Kamarudin, M.R.; Hayat, O. A Novel Asymmetric
Patch Reflectarray Antenna with Ground Ring Slots for 5G Communication Systems. Electronics 2020, 9, 1450. [CrossRef]6. Su, W.; Luo, W.; Nie, Z.; Liu, W.-W.; Cao, Z.-H.; Wang, Z. A Wideband Folded Reflectarray Antenna Based on Single-Layered
Polarization Rotating Metasurface. IEEE Access 2020, 8, 158579–158584. [CrossRef]7. Zhao, X.; Wei, F.; Li, B.; Shi, X. Design of circularly polarized dielectric resonator reflectarray antenna. In Proceedings of the 2018
Asia-Pacific Microwave Conference (APMC), Kyoto, Japan, 6–9 November 2018.8. Sun, Y.-X.; Leung, K.W. Millimeter-wave substrate-based dielectric reflectarray. IEEE Antennas Wirel. Propag. Lett. 2018, 17,
2329–2333. [CrossRef]9. Zhang, S. Three-dimensional printed millimetre wave dielectric resonator reflectarray. IET Microw. Antennas Propag. 2017, 11,
2005–2009. [CrossRef]10. Han, C.; Zhang, Y.; Yang, Q. A novel single-layer unit structure for broadband reflectarray antenna. IEEE Antennas Wirel. Propag.
Lett. 2016, 16, 681–684. [CrossRef]11. Li, W.; Gao, S.; Zhang, L.; Luo, Q.; Cai, Y. An ultra-wide-band tightly coupled dipole reflectarray antenna. IEEE Trans. Antennas
Propag. 2017, 66, 533–540. [CrossRef]12. Bodur, H.; Çimen, S. Reflectarray antenna design with double cutted ring element for X-band applications. Microw. Opt. Technol.
Lett. 2020, 62, 3248–3254. [CrossRef]13. Huang, J.; Encinar, J.A. Reflectarray Antennas; John Wiley & Sons: Hoboken, NJ, USA, 2008.14. Henderson, K.Q.; Ghalichechian, N. Triangular and Rectangular Lattices for Cosecant-squared Shaped Beam Reflectarrays. IEEE
Antennas Wirel. Propag. Lett. 2021, 20, 2058–2062. [CrossRef]15. Liu, C.; Li, C.; Yang, B. Improved alternating projection algorithm for pattern synthesis with dual polarised conformal arrays. IET
Microw. Antennas Propag. 2020, 14, 891–896. [CrossRef]16. Quijano, J.L.A.; Vecchi, G. Alternating adaptive projections in antenna synthesis. IEEE Trans. Antennas Propag. 2009, 58, 727–737.
[CrossRef]17. Rahmat-Samii, Y.; Michielssen, E. Electromagnetic optimization by genetic algorithms. Microw. J. 1999, 42, 232.18. Ares-Pena, F.J.; González, J.A.R.; Villanueva-Lopez, E.; Rengarajan, S.R. Genetic algorithms in the design and optimization of
antenna array patterns. IEEE Trans. Antennas Propag. 1999, 47, 506–510. [CrossRef]19. Haupt, R.L. Genetic algorithm applications for phased arrays. Appl. Comput. Electromagn. Soc. J. 2006, 21, 325.20. Sallam, T.; Attiya, A.M. Low sidelobe cosecant-squared pattern synthesis for large planar array using genetic algorithm. Prog.
Electromagn. Res. 2020, 93, 23–34. [CrossRef]

Sensors 2022, 22, 1166 18 of 18
21. Greda, L.A.; Winterstein, A.; Lemes, D.L.; Heckler, M.V.T. Beamsteering and beamshaping using a linear antenna array based onparticle swarm optimization. IEEE Access 2019, 7, 141562–141573. [CrossRef]
22. Fuchs, B. Application of convex relaxation to array synthesis problems. IEEE Trans. Antennas Propag. 2013, 62, 634–640. [CrossRef]23. Angell, T.S.; Kirsch, A. Optimization Methods in Electromagnetic Radiation; Springer Science & Business Media: Berlin/Heidelberg,
Germany, 2004.24. Zornoza, J.A.; Encinar, J.A. Efficient phase-only synthesis of contoured-beam patterns for very large reflectarrays. Int. J. RF
Microw. Comput.-Aided Eng. 2004, 14, 415–423. [CrossRef]25. Wang, C.; Chen, Y.; Yang, S. Dual-band dual-polarized antenna array with flat-top and sharp cutoff radiation patterns for
2G/3G/LTE cellular bands. IEEE Trans. Antennas Propag. 2018, 66, 5907–5917. [CrossRef]26. Rahman, M.; Naghshvarianjahromi, M.; Mirjavadi, S.S.; Hamouda, A.M. Resonator based switching technique between ultra
wide band (UWB) and single/dual continuously tunable-notch behaviors in UWB radar for wireless vital signs monitoring.Sensors 2018, 18, 3330. [CrossRef] [PubMed]
27. Naqvi, S.I.; Hussain, N.; Iqbal, A.; Rahman, M.; Forsat, M.; Mirjavadi, S.S.; Amin, Y. Integrated LTE and millimeter-wave 5GMIMO antenna system for 4G/5G wireless terminals. Sensors 2020, 20, 3926. [CrossRef]
28. Rahman, M.; Naghshvarianjahromi, M.; Mirjavadi, S.S.; Hamouda, A.M. Bandwidth enhancement and frequency scanning arrayantenna using novel UWB filter integration technique for OFDM UWB radar applications in wireless vital signs monitoring.Sensors 2018, 18, 3155. [CrossRef] [PubMed]
29. Visser, H.J. Array and Phased Array Antenna Basics; John Wiley & Sons: Hoboken, NJ, USA, 2006.30. Balanis, C.A. Antenna Theory: Analysis and Design, 4th ed.; John Wiley & Sons, Inc.: New York, NY, USA, 2016.31. Lo, Y.-T.; Lee, S.-W. (Eds.) Antenna Handbook; Van Nostrand Reinhold: New York, NY, USA, 1993; Volume 1, Chapter 1; pp. 28–29.32. Arrebola, M.; Álvarez, Y.; Encinar, J.; Las-Heras, F. Accurate analysis of printed reflectarrays considering the near field of the
primary feed. IET Microw. Antennas Propag. 2009, 3, 187–194. [CrossRef]33. E’qab, R.F.; McNamara, D.A. Angle of Incidence Effects in Reflectarray Antenna Design: Making gain increases possible by
including incidence angle effects. IEEE Antennas Propag. Mag. 2016, 58, 52–64.34. Bhattacharyya, A.K. Phased array antennas. In Floquet Analysis, Synthesis, BFNs, and Active Array Systems; John Wiley & Sons Inc.
Publication: Hoboken, NJ, USA, 2006.


![Patch Antenna[1]](https://static.fdokumen.com/doc/165x107/63158e4cc32ab5e46f0d5c89/patch-antenna1.jpg)