An Unmanned Aircraft System for Maritime Search and Rescue
374
An Unmanned Aircraft System for Maritime Search and Rescue by Andre Paul Meredith March 2011 Thesis presented in partial fulfilment of the requirements for the degree of Master of Science in Engineering at Stellenbosch University Supervisor: Prof Thomas Jones Department of Electrical and Electronic Engineering
-
Upload
khangminh22 -
Category
Documents
-
view
1 -
download
0
Transcript of An Unmanned Aircraft System for Maritime Search and Rescue

An Unmanned Aircraft System for Maritime Search and Rescue
by Andre Paul Meredith
March 2011
Thesis presented in partial fulfilment of the requirements for the degree of Master of Science in Engineering at Stellenbosch University
Supervisor: Prof Thomas JonesDepartment of Electrical and Electronic Engineering

i
DeclarationBy submitting this thesis electronically, I declare that the entirety of the work contained therein is my own, original work, that I am the sole author thereof (save to the extent explicitly otherwise stated), that reproduction and publication thereof by Stellenbosch University will not infringe any third party rights and that I have not previously in its entirety or in part submitted it for obtaining any qualification.
Date: March 2011
Copyright © 2011 Stellenbosch UniversityAll rights reserved

ii
AbstractSearch and Rescue is an essential service provided by States and Militaries to
search for, locate and rescue survivors of accidents and incidents. Civil Search and
Rescue utilizes a system of well-trained professionals or volunteers, an effective
Search and Rescue organization, supported by industry and other providers of
infrastructure and assets. The service is rendered to save the lives of civilian
individuals in imminent danger of losing their lives. Military (Combat) Search and
Rescue is provided by militaries to save the lives of military practitioners in a similar
predicament. In addition, Search and Rescue is performed over land and over the
sea.
All forms of Search and Rescue rely on capable, specialized assets for efficiency en
affectivity. Assets are specified and chosen on the grounds of various factors,
amongst others operating environment, operational profile, performance and special
abilities.
This thesis has determined the need for a Search and Rescue asset, capable of
performing effective and efficient Search and Rescue over the entire national
maritime Search and Rescue Region, up to the Region extremities. An analysis was
performed to prove this deficit, and quantify the key performance and special
equipment requirements for such an asset. An analysis was also performed which
proves that an Unmanned Aircraft System should be an ideal choice to meet this
need. Finally, an Unmanned Aircraft System concept was specified that could
potentially meet this need.

iii
OpsommingSoek en Redding is ‘n essentiële diens wat deur State en militere organisasies
gebied word om oorlewendes van ongelukke en insidente te soek, op te spoor en na
veiligheid te bring. Siviele Soek en Redding maak gebruik van ‘n stelsel van goed-
opgeleide professionele persone, sowel as vrywilligers, asook ‘n effektiewe Soek en
Reddingsorganisasie, ondersteun deur die industrie en ander voorsieners van
infrastruktuur en toerusting. Derglike dienste word daargestel om die lewens van
siviele persone, wie se lewens in gevaar is, te red. Militere Soek en Redding word
deur militere organisasies daargetel om die lewens van militere persone, wie in
gevaar is, te red. Soek en Redding word oor land sowel as oor die see uitgevoer.
Alle vorms van Soek en Redding maak staat op die beskikbaarheid van
gespesialiseerde toerusting met gespesialiseerde gebruiksaanwending, vir
maksimale effektiwiteit en doeltreffendheid. Toerusting word gekies op grond van
verskeie faktore, onder meer die gebruiksomgewing, operasionele profiele, verlangde
prestasie en spesiale vermoëns.
Hierdie tesis het die behoefte aan ‘n gespesialiseerde Soek en Redding platform, wat
die vermoë het om effektiewe en doeltreffende Soek en Redding uit te voer oor die
hele nationale Soek en Redding Gebied, tot en met die ekstreme daarvan, vasgestel.
‘n Analise is uitgevoer om hierdie tekortkoming uit te wys, asook om die sleutel
prestasie- en gespesialiseerde toerustingbehoeftes vir so ‘n platform te kwantifiseer.
‘n Verdere analise is uitgevoer om te bewys dat ‘n Onbemande Vliegtuig die beste
opsie sou wees vir ‘n platform om aan hierdie behoeftes te voldoen. Ten slotte is ‘n
konsep vir ‘n Onbemande Vliegtuig Stelsel voorgetsel wat potensieel hierdie
behoefte sou kon vervul.

iv
AcknowledgmentsI would like to thank the University of Stellenbosch for giving me the opportunity to undertake and complete this thesis.
I thank my promoter, Prof Thomas Jones, for inspiring and guiding me, always displaying a positive attitude towards results obtained and believing in the success of this study.
I thank my wife, Marlene, for supporting me and believing in the success of this study.
I thank the engineering and technical personnel at Denel Dynamics, and in particular Mr Wilhelm Lutz, Mr Dave Jackson, Mr Tobie de Beer and Mr Henk Terblanche, for the provision of essential information and mentoring me in many of the finer technical details employed in this study.
I thank the National Ports Authority, and in particular Capt Edward Bremner and Mr Peter Meredith, for providing me with essential information used in this study.
I thank the South African Search and Rescue Organisation, and in particular Mr Cassie Carstens, for providing me with essential information used in this study.
I thank the SA Naval Engineering Section, and in particular S Lt R. Riekert and Mid J.A. Coetzer, for providing me with essential information used in this study.
I thank the Institute for Maritime Technology, and in particular Mr Joe Kramer and Mr Carl Wainman, for providing me with essential information used in this study.
I thank the SA Navy Hydrographic Office, and in particular Capt (SAN) Abri Kampfer, for providing me with essential information used in this study.
I thank the personnel from the Directorate Air Transport and Maritime Systems, Directorate Helicopter Systems and Directorate Technical Support Services in the SA Air Force for the provision of essential information used in this study.
I thank Mr Anton Maneschijn for the use of his book on light aircraft design as reference material for this study.
I thank my Heavenly Father for this opportunity and His eternal guidance and wisdom.

v
Contents
Declaration…………………………………………………………………………iAbstract…………………………………………………………………………….iiOpsomming………………………………………………………………………..iiiAcknowledgements……………………………………………………………….ivContents……………………………………………………………………………vList of Figures…………………………………………………………………….. xivList of Tables………………………………………………………………………xviiAbbreviations………………………………………………………………………xixPart 11. Introduction .............................................................................................1-1
1.1. Aim .....................................................................................................1-21.2. Scope .................................................................................................1-21.3. Outline ................................................................................................1-2
1.3.1. Part 1 ...........................................................................................1-21.3.2. Part 2 ...........................................................................................1-3
2. National Oceanographic Characteristics..............................................2-12.1. Environmental, Physical and Climatic Characteristics........................2-1
2.1.1. Coastline Length and Limits.........................................................2-12.1.2. Coastal Populace.........................................................................2-12.1.3. Sea States and Wave Height.......................................................2-22.1.4. Wind Speeds ...............................................................................2-22.1.5. Oceanic Currents .........................................................................2-22.1.6. Tides ............................................................................................2-32.1.7. Ocean Surface Temperatures......................................................2-32.1.8. Air Temperatures .........................................................................2-32.1.9. A Case Study: The Marion and Prince Edward Island Group ......2-3
2.2. National Demarcated Maritime Zones (Maritime Claims) ...................2-52.2.1. General ........................................................................................2-52.2.2. Territorial Waters (TW) ................................................................2-62.2.3. Contiguous Zone (CZ) .................................................................2-72.2.4. Maritime Cultural Zone (MCZ) .....................................................2-72.2.5. Exclusive Economic Zone (EEZ) .................................................2-72.2.6. Continental Shelf (CS) .................................................................2-8
2.3. Conclusion..........................................................................................2-93. Marine Activity ........................................................................................3-1
3.1. Marine Resources ..............................................................................3-13.1.1. Living Resources: Fish and Shellfish ...........................................3-13.1.2. Minerals and Energy ....................................................................3-3
3.2. Commercial Shipping .........................................................................3-33.2.1. Major Ports ..................................................................................3-33.2.2. Commercial Shipping Activity ......................................................3-4
3.3. Naval Operations................................................................................3-63.4. Maritime Police Services ....................................................................3-73.5. Leisure................................................................................................3-7
3.5.1. Coastal Tourism...........................................................................3-73.5.2. Oceanic Cruises ..........................................................................3-8
3.6. Aeronautical Activity ...........................................................................3-93.6.1. Military Aeronautical Operations over the Sea.............................3-9

vi
3.6.2. Commercial Flights over the Sea.................................................3-93.6.3. Civil Recreational Flight over the Sea........................................3-10
3.7. Recorded Maritime Incidents............................................................3-103.7.1. Shipwrecks ................................................................................3-103.7.2. Aeronautical Incidents................................................................3-11
3.8. Conclusion........................................................................................3-114. National Maritime Search and Rescue Responsibilities......................4-1
4.1. An Introduction to Search and Rescue in South Africa.......................4-14.1.1. International Recognition .............................................................4-14.1.2. International Search and Rescue Standards ...............................4-24.1.3. National Recognition....................................................................4-5
4.2. South African Search and Rescue Organisation ................................4-54.2.1. SASAR Objectives .......................................................................4-5
4.3. Additional International and Regional Maritime Agreements ..............4-74.3.1. International Agreements and Memberships ...............................4-74.3.2. Regional Cooperation ..................................................................4-8
4.4. National Rescue Centres....................................................................4-84.4.1. National Maritime Rescue Coordination Centre (MRCC).............4-84.4.2. National Aeronautical Rescue Coordination Centre (ARCC) .......4-94.4.3. National Rescue Sub-Centres .....................................................4-9
4.5. National Maritime Search and Rescue Region...................................4-94.5.1 Search and Rescue Region Allotment ..........................................4-94.5.2. Coastal Demarcation .................................................................4-104.5.3. Northern Demarcation................................................................4-104.5.4. Southern Demarcation ...............................................................4-104.5.5. Western Demarcation ................................................................4-114.5.6. Eastern Demarcation .................................................................4-114.5.7. Major Distances .........................................................................4-14
4.6. National Organisations Equipped to Perform Maritime Search and Rescue Activities .....................................................................................4-14
4.6.1. The National Sea Rescue Institute (NSRI).................................4-144.6.2. South African Police Services (SAPS) .......................................4-154.6.3. South African National Defence Force (SANDF) .......................4-154.6.3.1. SA Navy..................................................................................4-154.6.3.2. SA Air Force ...........................................................................4-164.6.4. National Ports Authority (NPA) ..................................................4-164.6.5. Titan Helicopter Group...............................................................4-16
4.7 Conclusion.........................................................................................4-165. Quantifying the Key Performance Requirements ................................5-1
5.1. Generic Requirements for Maritime Search and Rescue Aircraft .......5-15.1.1. Airborne Assets: Typical Advantages ..........................................5-15.1.2 Aircraft Configuration, Specialisation and Application...................5-2
5.2. Factors Influencing the Key Performance Requirements ...................5-25.3. Key Performance Requirements ........................................................5-2
5.3.1. Generic Requirements .................................................................5-25.3.2. Speed Quantification....................................................................5-35.3.3. Search Time and Endurance Quantification ................................5-45.3.4. Range Quantification ...................................................................5-4
5.4. Quantifying the Key Performance Requirements ...............................5-55.5. Key Performance Requirement Summary ..........................................5-5

vii
5.5.1. Territorial Waters .........................................................................5-55.5.2. Contiguous and Maritime Cultural Zone.......................................5-55.5.3. Exclusive Economic Zone............................................................5-55.5.4. Continental Shelf .........................................................................5-65.5.5. Marion Island Rim........................................................................5-65.5.6. Search Extremities.......................................................................5-6
5.6. Conclusion..........................................................................................5-66. Determining the Special SAR Equipment Requirement ......................6-1
6.1. Special SAR Equipment .....................................................................6-16.1.1. Search Equipment .......................................................................6-16.1.1.1. Forward Looking Infra Red (FLIR) Sensor ................................6-16.1.1.2. Maritime Search Radar (MSR)..................................................6-26.1.1.3. Search and Rescue Direction Finder (SAR DF)........................6-26.1.1.4. Search Light..............................................................................6-36.1.2. Rescue Equipment.......................................................................6-36.1.2.1. Satellite Communication (SATCOM).........................................6-46.1.2.2. Marine Location Markers ..........................................................6-46.1.2.3. Aid Life Supply Canisters..........................................................6-46.1.2.4. Rescue Hoist ............................................................................6-5
6.2. Special SAR Equipment: Minimum Equipment Configuration ............6-56.2.1 Minimum Search Equipment.........................................................6-56.2.2. Minimum Rescue Equipment .......................................................6-5
6.3. Conclusion..........................................................................................6-67. Maritime Search and Rescue Aircraft: Domestic .................................7-1
7.1. Domestic Aircraft Types Currently Available for Maritime Search and Rescue ......................................................................................................7-1
7.1.1 South African Air Force (SAAF) ....................................................7-27.1.2. South African Navy (SAN) ...........................................................7-27.1.3. South African Police Services (SAPS) .........................................7-27.1.4. The National Ports Authority (NPA) .............................................7-27.1.5. Titan Helicopter Group.................................................................7-2
7.2. Domestic Search and Rescue Aircraft: Key Performance Figures .....7-37.3. Domestic Search and Rescue Aircraft: Special SAR Equipment........7-37.4. Conclusion..........................................................................................7-4
8. Maritime Search and Rescue Aircraft: Foreign ....................................8-18.1. Foreign Search and Rescue Aircraft: Key Performance Figures ........8-18.2. Foreign Search and Rescue Aircraft: Special SAR Equipment ..........8-38.3. Conclusion..........................................................................................8-5
9. Maritime Search and Rescue Aircraft: Unmanned...............................9-19.1. Unmanned Search and Rescue Aircraft: Key Performance Figures...9-19.2. Unmanned Search and Rescue Aircraft: Special SAR Equipment .....9-29.3. Conclusion..........................................................................................9-3
10. Existing Search and Rescue Aircraft: Shortcomings ......................10-110.1. Existing Search and Rescue Aircraft Shortcomings: Performance.10-1
10.1.1. Territorial Waters .....................................................................10-110.1.2. Contiguous and Maritime Cultural Zone...................................10-110.1.3. Exclusive Economic Zone........................................................10-210.1.4. Continental Shelf .....................................................................10-210.1.5. Marion Island Rim....................................................................10-210.1.6. Search Extremities...................................................................10-3

viii
10.2. Existing Search and Rescue Aircraft Shortcomings: Special SAR Equipment ...............................................................................................10-3
10.2.1. Special SAR Equipment...........................................................10-310.3 The Need.........................................................................................10-310.4. Conclusion......................................................................................10-3
Part 211. Introduction to Unmanned Aerial Vehicles.......................................11-1
11.1. Definition of an Unmanned Aerial Vehicle ......................................11-111.2. History of Unmanned Aircraft[106] ....................................................11-411.3. Typical Uses for Unmanned Aircraft ...............................................11-511.4. UA Categorisation (Types of UAs) .................................................11-6
11.4.1 TIER System.............................................................................11-611.4.2. Function, Purpose, Mission, Task or Role ...............................11-611.4.3. Performance ............................................................................11-7
11.5. Conclusion......................................................................................11-812. Advantages and Disadvantages of Unmanned Aircraft...................12-1
12.1. Advantages of Unmanned Aircraft..................................................12-112.1.1. The Three D’s: Dull, Dangerous and Dirty ...............................12-112.1.1.1. Dull Missions.........................................................................12-112.1.1.2. Dangerous Missions .............................................................12-212.1.1.3. Dirty Missions........................................................................12-212.1.2. System Complexity ..................................................................12-312.1.3. Aircraft Size and Weight ..........................................................12-512.1.4. Expendability ...........................................................................12-512.1.5. Development Time and Cost ...................................................12-512.1.6. Advantages Compared with Satellites .....................................12-612.1.7. Pilot Abilities and Training Cost ...............................................12-6
12.2. Disadvantages of Unmanned Aircraft .............................................12-612.2.1. Mission Flexibility .....................................................................12-612.2.2. Aircraft Manoeuvrability ...........................................................12-712.2.3. Command and Control.............................................................12-712.2.4. Disadvantages Compared with Satellites.................................12-712.2.5. Sense and Avoid......................................................................12-8
12.3 Long Range Maritime Search and Rescue: Scoring........................12-912.4. Conclusion....................................................................................12-12
13. The Unmanned Aircraft System.........................................................13-113.1 UAS Elements .................................................................................13-113.2. Conclusion......................................................................................13-2
14. Unmanned Aircraft..............................................................................14-114.1. Presentation ...................................................................................14-114.2. Layout.............................................................................................14-2
14.2.1. Layout: Design Method 1 .........................................................14-214.2.2. Layout: Design Method 2 .........................................................14-3
14.3. Weights ..........................................................................................14-314.3.1. Basic Weights: Design Method 1 .............................................14-314.3.2. Basic Weights: Design Method 2 .............................................14-4
14.4. Dimensions.....................................................................................14-414.4.1. Dimensions: Design Method 1 .................................................14-414.4.2. Dimensions: Design Method 2 .................................................14-5
14.5. Powerplant .....................................................................................14-6

ix
14.5.1. Powerplant: Design Method 1..................................................14-614.5.1. Powerplant: Design Method 2..................................................14-7
14.6. Performance...................................................................................14-714.6.1. Performance: Design Method 1 ...............................................14-714.6.2. Performance: Design Method 2 ...............................................14-8
14.3. Conclusion......................................................................................14-815. Payloads ..............................................................................................15-1
15.1. Fixed Payloads...............................................................................15-115.2. Deployable Payloads......................................................................15-215.3. Payload Weight ..............................................................................15-315.4. Payload Dimensions.......................................................................15-415.5. Conclusion......................................................................................15-7
16. Data Links............................................................................................16-116.1. Data Link Functions........................................................................16-116.2. BLOS Data Link Service.................................................................16-216.3. Data Link Redundancy ...................................................................16-316.4. Conclusion......................................................................................16-4
17. UA Recovery........................................................................................17-117.1. Recovery Methods .........................................................................17-117.2. Recovery System Concept .............................................................17-2
17.2.1. Automatic Recovery System....................................................17-217.2.2. Flight Termination System .......................................................17-3
17.3. Conclusion......................................................................................17-318. Ground Elements ................................................................................18-1
18.1. Ground Control Station...................................................................18-118.1.1. Aircraft Workstation..................................................................18-218.1.2. Payload Workstation ................................................................18-318.1.3. Mission Specialist Workstation ................................................18-4
18.2. Ground Control Station Layout and Ergonomics ............................18-418.3. Launch............................................................................................18-518.4. Recovery ........................................................................................18-618.5 Logistic Support...............................................................................18-6
18.5.1 Ground Power...........................................................................18-618.5.2. Storage ....................................................................................18-718.5.3. Transportation..........................................................................18-7
18.6. Conclusion......................................................................................18-7Conclusions and Future Work .................................................................19-1References for Part 1……………………………………………………LOR-PT1-2References for Part 2……………………………………………………LOR-PT2-2Appendices for Part 1A.Oceanographic Characteristics ............................................................ A-1
A.1. Sea States and Wave Height ............................................................ A-1A.2. Wind Speed ...................................................................................... A-6A.3. Oceanic Currents .............................................................................. A-8A.4 Tides ................................................................................................ A-12A.5 Ocean Surface Temperatures.......................................................... A-12A.6 Air Temperatures ............................................................................. A-15
B.Fish Habitats........................................................................................... B-1C.Minerals and Energy .............................................................................. C-1
C.1. Annual Production ............................................................................ C-1

x
C.2. Marine Activity .................................................................................. C-1C.2.1. Titanium ..................................................................................... C-1C.2.2. Zirconium ................................................................................... C-2C.2.3. Diamonds (marine)..................................................................... C-2C.2.4. Oil (crude petroleum).................................................................. C-2C.2.5. Natural Gas ................................................................................ C-3
D.Commercial Airline Routes.................................................................... D-1E.Aeronautical Incidents over the Sea..................................................... E-1F.National RSC’s and Secondary RSC’s...................................................F-1
F.1. RSC 1: Port Control Walvis Bay.........................................................F-1F.2. RSC 2: Port Control Saldanha Bay ....................................................F-1F.3. RSC 3: Port Control Cape Town ........................................................F-1F.4. RSC 4: Port Control Port Elizabeth ....................................................F-2F.5. RSC 5: Port Control East London ......................................................F-2F.6. RSC 6: Port Control Durban...............................................................F-2F.7. RSC 7: Port Control Richards Bay .....................................................F-3
G.Maritime Search and Rescue Aircraft: Domestic ................................G-1G.1. South African Air Force (SAAF)........................................................G-1G.2. South African Navy (SAN) ................................................................G-2G.3. South African Police Services (SAPS)..............................................G-2G.4. The National Ports Authority (NPA) ..................................................G-3G.5. Titan Helicopter Group......................................................................G-3
H.RSE Analysis Tables............................................................................. H-1H.1. Selection Logic ................................................................................. H-1
H.1.1. Original Equipment Manufacturer (OEM) ................................... H-1H.1.2. World Aircraft Information Files, Bright Star Publishing (WAIF) . H-1H.1.3. World Airnews Magazine............................................................ H-2H.1.4. Other Sources: World Wide Web ............................................... H-2H.1.5. Other Sources: Hardware Operators.......................................... H-2
H.2. Performance Data............................................................................. H-2H.3. Tables ............................................................................................... H-3H.4. General ............................................................................................. H-4
I.Key Performance Requirement per Search Location .............................I-1I.1. Search Location 1: Territorial Waters (TW) ..........................................I-1
I.1.1. Location BoundariesTW ..................................................................I-1I.1.2. SpeedTW.........................................................................................I-1I.1.3. RangeTW ........................................................................................I-2I.1.4. EnduranceTW..................................................................................I-2
I.2. Search Location 2: Contiguous and Maritime Cultural Zone (C&MCZ) I-3I.2.1. Location BoundariesC&MCZ..............................................................I-3I.2.2. SpeedC&MCZ....................................................................................I-3I.2.3. RangeC&MCZ....................................................................................I-3I.2.4. EnduranceC&MCZ .............................................................................I-4
I.3. Search Location 3: Exclusive Economic Zone (EEZ) ...........................I-4I.3.1. Location BoundariesEEZ .................................................................I-4I.3.2. SpeedEEZ........................................................................................I-4I.3.3. RangeEEZ........................................................................................I-5I.3.4. EnduranceEEZ.................................................................................I-5
I.4. Search Location 4. Continental Shelf (CS) ...........................................I-5I.4.1. Location BoundariesCS...................................................................I-6

xi
I.4.2. SpeedCS .........................................................................................I-6I.4.3. RangeCS.........................................................................................I-6I.4.4. EnduranceCS ..................................................................................I-6
I.5. Search Location 5. Marion Island Rim (MIR)........................................I-7I.5.1. Location BoundariesMIR..................................................................I-7I.5.2. SpeedMIR ........................................................................................I-7I.5.3. RangeMIR........................................................................................I-7I.5.4. EnduranceMIR .................................................................................I-8
I.6. Search Location 6. Search Extremities (SE) ........................................I-8I.6.1. Location BoundariesSE ...................................................................I-8I.6.2. SpeedSE .........................................................................................I-8I.6.3. RangeSE .........................................................................................I-9I.6.4. EnduranceSE ..................................................................................I-9
J.Performance Shortcomings....................................................................J-1J.1. Domestic SAR Aircraft ........................................................................J-1
J.1.1. SpeedDom...................................................................................... J-1J.1.2. RangeDom ..................................................................................... J-1J.1.3. EnduranceDom............................................................................... J-2J.1.4. Combined Effects TableDom.......................................................... J-3
J.2. Foreign SAR Aircraft........................................................................... J-4J.2.1. SpeedFor ....................................................................................... J-4J.2.2. RangeFor ....................................................................................... J-5J.2.3 EnduranceFor ................................................................................. J-6J.2.4. Combined Effects TableFor ........................................................... J-7
J.3. Unmanned SAR Assets ...................................................................... J-9J.3.1. SpeedUAV...................................................................................... J-9J.3.2. Range (Communications)UAV........................................................ J-9J.3.3. RangeUAV ................................................................................... J-10J.3.4. EnduranceUAV.............................................................................J-11J.3.5. Combined Effects TableUAV........................................................ J-12
Appendices for Part 2K.Unmanned Aircraft Design Analysis: A. Maneschijn .......................... K-1
K.1. Method 1: Experimental Light Aircraft Design, 1st and 2nd Editions... K-1K.1.1. Performance Prediction .............................................................. K-1K.1.1.1. Maximum All-Up (Take-off) Weight.......................................... K-1K.1.1.2. Stall Speeds ............................................................................ K-2K.1.1.3. Basic Dimensions.................................................................... K-4K.1.1.4. Aerodynamic Drag................................................................... K-6K.1.1.5. Maximum and Cruising Speeds............................................... K-8K.1.1.6. Maximum Fuel Weight........................................................... K-10K.1.1.7. Take-off Distance .................................................................. K-13K.1.1.8. Landing Distance................................................................... K-15K.1.2. Aerodynamic Characteristics and Sizing .................................. K-16K.1.2.1 Horizontal Tail Surfaces ......................................................... K-16K.1.2.2 Vertical Tail Surface ............................................................... K-19K.1.2.3 Flaps....................................................................................... K-21
L.Unmanned Aircraft Design Analysis: Daniel P. Raymer......................L-1L.1. Method 2: Daniel P. Raymer: Aircraft Design – A Conceptual Approach..................................................................................................................L-1
L.1.1. Mission Profile .............................................................................L-1

xii
L.1.2. Predefined Performance Figures .................................................L-2L.1.3. Historical Data .............................................................................L-2L.1.4. Lift-to-Drag Ratio Estimation........................................................L-3L.1.5. Thrust-to-Weight Ratio Estimation ...............................................L-4L.1.6. Wing Loading...............................................................................L-5L.1.6.1. Wing Loading: Historical Value .................................................L-6L.1.6.2. Wing Loading: Stall ...................................................................L-6L.1.6.3. Wing Loading: Take-off.............................................................L-7L.1.6.4. Wing Loading: Landing .............................................................L-8L.1.6.5. Wing Loading: Cruise................................................................L-9L.1.6.6. Wing Loading: Loiter .................................................................L-9L.1.6.7. Wing Loading: Selection .........................................................L-10L.1.7. Take-off Weight .........................................................................L-11L.1.7.1. Basic Process .........................................................................L-12L.1.7.2. Weights...................................................................................L-13L.1.7.3. W0 Determination: W0 Guess..................................................L-14L.1.7.4. W0 Determination: Mission Segment Weight Fractions...........L-14L.1.7.5. W0 Determination: Fuel Weight per Mission Segment ............L-22L.1.7.6. W0 Determination: Total Fuel Weight......................................L-28L.1.7.7. W0 Determination: Empty Weight Fraction..............................L-29L.1.7.8. W0 Determination: Take-off Weight Calculation......................L-30L.1.7.9. W0 Determination: Weight Summary ......................................L-30L.1.8. Geometry ...................................................................................L-31L.1.8.1. Geometry: Fuselage ...............................................................L-31L.1.8.2. Geometry: Wing......................................................................L-32L.1.8.3. Geometry: Tail ........................................................................L-34L.1.9. Powerplant.................................................................................L-40L.1.9.1. Powerplant: Thrust Determination...........................................L-40L.1.9.2. Powerplant: Engine Selection .................................................L-41L.1.9.3. Powerplant: Inlet Geometry ....................................................L-41L.1.9.4. Powerplant: Nozzle Geometry ................................................L-43L.1.10. Additional Performance Results...............................................L-43L.1.10.1. Additional Performance Results: Total Range ......................L-43L.1.10.2. Additional Performance Results: Total Endurance................L-44
M.Maritime Search and Rescue UAS Communications Scenario.........M-1N.Unmanned Aircraft History................................................................... N-1
N.1. Pre-World War I Era ...................................................................... N-1N.2. World War I ................................................................................... N-1N.3. Interwar Period.............................................................................. N-1N.4. World War II .................................................................................. N-2N.5. Post WWII, Korean War and Vietnam War.................................... N-2N.6. The Cold War ................................................................................ N-3N.7. Modern-day UAs ........................................................................... N-3
O.Unmanned Aircraft Categorisation.......................................................O-1O.1. TIER System.................................................................................O-1O.1.1. TIER N/A UA..............................................................................O-1O.1.2. TIER I UA...................................................................................O-1O.1.3. TIER II UA..................................................................................O-2O.1.4. TIER II+ UA................................................................................O-2O.1.5. TIER III- UA................................................................................O-2

xiii
O.1.6. TIER III UA.................................................................................O-3O.2. Function, Purpose, Mission, Task or Role.....................................O-3O.2.1 Target and/or Decoy UA .............................................................O-3O.2.1.1 Target UA.................................................................................O-3O.2.1.2. Decoy UA................................................................................O-4O.2.2. Reconnaissance/Surveillance UA ..............................................O-4O.2.3. Combat UA ................................................................................O-5O.2.4. Logistic Supply UA.....................................................................O-5O.2.5. Research and Development UA.................................................O-5O.2.6. Civil and Commercial UAs .........................................................O-6O.3. Performance .................................................................................O-7O.3.1. Handheld....................................................................................O-7O.3.2. Close..........................................................................................O-7O.3.3. NATO Type ................................................................................O-7O.3.4. Tactical.......................................................................................O-8O.3.5. Medium Altitude, Long Endurance (MALE) ................................O-8O.3.6. High Altitude, Long Endurance (HALE)......................................O-9O.3.7. High Speed ................................................................................O-9O.3.8. Orbital ...................................................................................... O-10O.3.9. CIS-Lunar.................................................................................O-10

xiv
List of Figures
Figure Title PageFigure 2.1 Marion and METAREA VII 2-5Figure 2.2 South African Maritime Claims 2-6Figure 2.3 South African Exclusive Economic Zone 2-8Figure 3.1 Primary Shipping Lanes 3-5Figure 3.2 Primary Shipping Lanes 3-5Figure 4.1 South African Search and Rescue Region 4-11Figure 4.2 Global Maritime Search and Rescue Regions 4-12Figure 4.3 Summed National Maritime Search and Rescue Region 4-13Figure A.1 Sea State 1 A-2Figure A.2 Sea State 2 A-2Figure A.3 Sea State 3 A-2Figure A.4 Sea State 4 A-2Figure A.5 Sea State 5 A-2Figure A.6 Sea State 6 A-2Figure A.7 Sea State 7 A-3Figure A.8 Sea State 8 A-3Figure A.9 Sea State 9 A-3Figure A.10 Sea State 10 A-3Figure A.11 Significant Wave Height, Global, 19 November 2009 A-4Figure A.12 Significant Wave Height, South Atlantic, 19 November 2009 A-4Figure A.13 Significant Wave Height, 19 November 2009 A-5Figure A.14 Global Annual Sea Level Wind Speed (Averaged) A-6Figure A.15 Southern African Annual Wind Sea Level Speed (Averaged) A-7Figure A.16 Global Oceanic Wind-driven Surface Currents A-8Figure A.17 Surface Currents around Southern Africa A-9Figure A.18 Antarctic Circumpolar Current A-10Figure A.19 Agulhas Current A-11Figure A.20 Benguela Current A-11Figure A.21 Global Ocean Tides as Measured in 2006 A-12Figure A.22 Annual Mean Sea Surface Temperatures A-13Figure A.23 Sea Surface Temperatures over Period 21 to 24 November
2009A-14
Figure A.24 Southern Sea Surface Temperatures as on 24 November 2009
A-15
Figure A.25 Mean Air Temperature at Sea Level over Period January 2008 to October 2009
A-16
Figure A.26 Mean Air Temperature at Sea Level for Southern Ocean over Period January 2008 to October 2009
A-17
Figure B.1 Natural Habitat of Deepwater Hake B-2Figure B.2 Natural Habitat of Shallow-water Cape Hake B-3Figure B.3 Natural Habitat of Atlantic Little Tuna B-3Figure B.4 Natural Habitat of Bigeye Tuna B-4Figure B.5 Natural Habitat of Bullet Tuna B-4Figure B.6 Natural Habitat of Yellowfin Tuna B-5Figure B.7 Natural Habitat of Longfin Tuna B-5Figure B.8 Natural Habitat of Skipjack Tuna B-6Figure B.9 Natural Habitat of Slender Tuna B-6Figure B.10 Natural Habitat of Southern Bluefin Tuna B-7Figure B.11 Natural Habitat of Swordfish B-7

xv
Figure B.12 Natural Habitat of Buccaneer Anchovy B-8Figure B.13 Natural Habitat of Cape Anchovy B-8Figure B.14 Natural Habitat of Indian Anchovy B-9Figure B.15 Natural Habitat of Thorny Anchovy B-9Figure B.16 Natural Habitat of European Anchovy B-10Figure B.17 Natural Habitat of South American Pilchard B-10Figure B.18 Natural Habitat of Round Sardinelle B-11Figure B.19 Natural Habitat of Cape Horse Mackerel B-11Figure B.20 Natural Habitat of Bigscale Mackerel B-12Figure B.21 Natural Habitat of Black Mackerel B-12Figure B.22 Natural Habitat of Indian Mackerel B-13Figure B.23 Natural Habitat of King Mackerel B-13Figure B.24 Natural Habitat of Chub Mackerel B-14Figure B.25 Natural Habitat of Mackerel Scad B-14Figure B.26 Natural Habitat of Spotted Mackerel/Natal Snoek B-15Figure B.27 Natural Habitat of Snake Mackerel B-15Figure B.28 Natural Habitat of Patagonian Toothfish B-16Figure B.29 Natural Habitat of Cape Kingklip B-16Figure B.30 Natural Habitat of Blackhand Sole B-17Figure B.31 Natural Habitat of Cape Sole B-17Figure B.32 Natural Habitat of East Coast Solepo B-18Figure B.33 Natural Habitat of Lace Sole B-18Figure B.34 Natural Habitat of Speckled Sole B-19Figure B.35 Natural Habitat of Twoline Tonguesole B-19Figure B.36 Natural Habitat of Wedge Sole B-20Figure B.37 Natural Habitat of West Coast Sole B-20Figure B.38 Natural Habitat of Zebra Sole B-21Figure B.39 Natural Habitat of Redeye Herring B-21Figure B.40 Natural Habitat of Black Snoek B-22Figure B.41 Natural Habitat of Butter Snoek B-22Figure B.42 Natural Habitat of Natal Snoek B-23Figure B.43 Natural Habitat of Snoek B-23Figure B.44 Natural Habitat of Cape Yellowtail B-24Figure B.45 Natural Habitat of Dusky Yellowtail B-24Figure B.46 Natural Habitat of Longfin Yellowtail B-25Figure B.47 Natural Habitat of Yellowtail Rockcod B-25Figure B.48 Natural Habitat of Banded Galjoen B-26Figure B.49 Natural Habitat of Koester B-26Figure B.50 Natural Habitat of Elf/Shad B-27Figure B.51 Natural Habitat of Red Stumpnose B-27Figure B.52 Natural Habitat of Roman Seabream B-28Figure B.53 Natural Habitat of Bronze Seabream B-28Figure B.54 Natural Habitat of Cape Stumpnose B-29Figure B.55 Natural Habitat of Black Musselcracker B-29Figure B.56 Natural Habitat of White Musselcracker B-30Figure B.57 Natural Habitat of Carpenter Seabream B-30Figure B.58 Natural Habitat of Kabeljou/Silver Cob B-31Figure B.59 Natural Habitat of Slinger Seabream B-31Figure B.60 Natural Habitat of White Steenbras B-32Figure B.61 Natural Habitat of Dorado/Mahi Mahi B-32Figure B.62 Natural Habitat of Striped Bonito B-33Figure B.63 Natural Habitat of Atlantic Bonito B-33Figure B.64 Natural Habitat of South Coast Rock Lobster B-34

xvi
Figure B.65 Natural Habitat of Chokker Squid B-35Figure B.66 Natural Habitat of Abalone (haliotis midae) B-35Figure B.67 Natural Habitat of European Blue Mussel B-36Figure C.1 Oil and Gas Fields in South Africa C-3Figure C.2 The Bredasdorp Basin C-4Figure D.1 SAA International D-1Figure D.2 SAA Domestic D-1Figure D.3 SA Airlink D-2Figure D.4 SA Express D-2Figure D.5 Kulula D-3Figure D.6 1-Time D-3Figure D.7 BA Comair D-4Figure D.8 Delta Airlines D-4Figure D.9 Air France and KLM D-5Figure D.10 British Airways D-6Figure D.11 Lufthansa D-6Figure D.12 Cathay Pacific D-7Figure D.13 Malaysia Airlines D-7Figure D.14 Singapore Airlines D-8Figure D.15 Quatar Airways D-8Figure D.16 Emirates D-9Figure D.17 Quantas D-9Figure F.1 National Maritime Rescue Sub-Centres F-3Figure L.1 Basic Mission Profile L-2Figure M.1 Line-of-Sight Communications M-2Figure M.2 Beyond-Line-of-Sight Communications M-3

xvii
List of TablesTable Title PageTable 7.1 Domestic Maritime Search and Rescue Aircraft: Key Performance
Figures7-3
Table 7.2 Domestic Maritime Search and Rescue Aircraft: Special SAR Equipment Configurations
7-4
Table 8.1 Foreign Maritime Search and Rescue Aircraft: Key Performance Figures
8-2
Table 8.2 Foreign Maritime Search and Rescue Aircraft: Special SAR Equipment Configurations
8-3
Table 9.1 Unmanned Maritime Search and Rescue Aircraft: Key Performance Figures
9-2
Table 9.2 Unmanned Maritime Search and Rescue Aircraft: Special SAR Equipment Configurations
9-3
Table 12.1 Summary of Elements and Categories in terms of UAVs 12-9Table 12.2 Weighting, focus on Long Range Maritime Search and Rescue 12-10Table 12.3 Summary of Elements and Sub-categories in terms of UAVs, focus
on Long Range Maritime Search and Rescue12-10
Table 12.4 UAV Asset for Maritime SAR: Impact 12-11Table 12.5 Summed Scores 12-11Table A.1 World Meteorological Organization Sea State Code A-1Table G.1a South African Air Force Aircraft Equipped and Deployable for
Maritime SARG-1
Table G.1b South African Air Force Aircraft Potentially Deployable for Maritime SAR
G-2
Table G.2 South African Navy Aircraft Equipped and Deployable for Maritime SAR
G-2
Table G.3 South African Police Services Aircraft Equipped and Deployablefor Maritime SAR
G-3
Table G.4 National Ports Authority Aircraft Equipped and Deployable for Maritime SAR
G-3
Table G.5 Titan Helicopter Group Aircraft Equipped and Deployable for Maritime SAR
G-3
Table H.1 Performance Figure Analysis for Domestic Aircraft Deployable for Maritime Search and Rescue Tasks
H-4
Table H.2 Performance Figure Analysis for Foreign Aircraft Deployable for Maritime Search and Rescue Tasks
H-7
Table H.3 Performance Figure Analysis for Unmanned Aircraft Deployable for Maritime Search and Rescue Tasks
H-12
Table J.1 Maximum Cruise Speed vs Search Location Requirement (Domestic Aircraft)
J-1
Table J.2 Maximum Range vs Search Location Requirement (Domestic Aircraft) Maximum Endurance vs Search Location Requirement (Domestic Aircraft)
J-2
Table J.3 Maximum Endurance vs Search Location Requirement (Domestic Aircraft)
J-3
Table J.4 Combined Performance Effects vs Search Location Requirements (Domestic Aircraft)
J-4
Table J.5 Maximum Cruise Speed vs Search Location Requirement (Foreign Aircraft)
J-5
Table J.6 Maximum Range vs Search Location Requirement (Foreign Aircraft)
J-6

xviii
Table J.7 Maximum Endurance vs Search Location Requirement (Foreign Aircraft)
J-7
Table J.8 Combined Performance Effects vs Search Location Requirements (Foreign Aircraft)
J-8
Table J.9 Maximum Cruise Speed vs Search Location Requirement (Unmanned Aircraft)
J-9
Table J.10 Maximum Communications Range vs Search Location Requirement (Unmanned Aircraft)
J-10
Table J.11 Maximum Range vs Search Location Requirement (Unmanned Aircraft)
J-11
Table J.12 Maximum Endurance vs Search Location Requirement (Unmanned Aircraft)
J-12
Table J.13 Combined Performance Effects vs Search Location Requirements (Unmanned Aircraft)
J-13
Table K.1 G550 Performance Comparison K-2Table K.2 Effective Lift Coefficient Values K-22

xix
Abbreviations
Abbreviation ExplanationACAS Airborne Collision and Avoidance SystemADS-B Automatic Dependent Surveillance BroadcastAEC Africa Economic CommunityAEW&C Airborne Early Warning and ControlALSC Aid Life Supply CanisterARCC Aeronautical Rescue Coordination CentreARS Automatic Recovery SystemASAS Association of Southern African StatesASL Above Sea LevelATC Air Traffic ControlAU African UnionAVWS Air Vehicle WorkstationBAMS Broad Area Maritime SurveillanceBLOS Beyond Line-of-SightC&C Command and ControlC&MCZ Contiguous & Maritime Cultural ZoneCAR Civil Aviation RegulationsCM Continental MarginCS Continental ShelfCZ Contiguous ZoneDF Direction FinderDOT Department of TransportE-W East-WestEEZ Exclusive Economic ZoneELT Emergency Locator TransmitterEO/IR Electro-Optical InfraredEPIRB Emergency Position Indicator Radio BeaconEUROCAE European Organisation for Civil Aviation EquipmentFLIR Forward Looking Infraredft FeetFTS Flight Termination SystemFY Fiscal YearGbit/s Gigabits per secondGCS Ground Control StationGDP Gross Domestic ProductGHz Gigahertzh HoursHALE High Altitude and Long EnduranceHF High FrequencyICAO International Civil Aviation OrganisationIHO International Hydrographic OrganisationILS Instrument Landing SystemIMO International Maritime Organisationin InchesIR Infrared

xx
ISDSC Inter-State Defence and Security CommitteeIUCN International Union for Conservation of Nature and Natural
Resourceskg Kilogramkn KnotLALE Low Altitude and Long Endurancelb Poundslbf Pounds-forceL/D Lift-to-Drag RatioLOS Line-of-SightLRLE Long Range and Long EnduranceMALE Medium Altitude and Long EnduranceMAUW Maximum All-Up WeightMAV Micro Air VehicleMbit/s Megabits per secondMCZ Maritime Cultural ZoneMETAREA Meteorological AreaMHz Megahertzmin MinutesMIR Marion Island RimMLM Marine Location MarkerMRCC Maritime Rescue Coordination CentreMSR Maritime Search Radar or Maritime Surveillance RadarMSWS Mission Specialist WorkstationN NewtonNATO North Atlantic Treaty OrganisationNEPAD New Partnership for African Developmentnmi Nautical MileNOAA National Oceanic and Atmospheric AdministrationNPA National Ports AuthorityNSRI National Sea Rescue InstituteOAU Organisation of African UnityOBOGS On-Board Oxygen Generation and SupplyOEM Original Equipment ManufacturerPECSAR Permanent Executive Committee for Search and RescuePLB Personal Locator BeaconPWS Payload WorkstationRCC Rescue Coordination CentreRSC Rescue Sub-centreRSE Range, Speed, EnduranceSAA South African AirwaysSAAF South African Air ForceSADC Southern African Development CommunitySAFAIR South African Freight AirSAN South African NavySANAP South African National Antarctic ProgramSANDF South African National Defence ForceSAPS South African Police Services

xxi
SAR Search and RescueSASAR South African Search and Rescue OrganisationSATCOM Satellite CommunicationSE Search ExtremitiesSMC Standing Maritime CommitteeSOLAS Safety of Life at SeaRPV Remotely Piloted VehicleSRR Search and Rescue RegionSRS Search and Rescue Sub-regionTCAS Terrain Collision Avoidance SystemTW Territorial WatersT/W Thrust-to-Weight RatioUA Unmanned AircraftUAS Unmanned Aircraft SystemUAV Unmanned Aerial VehicleUCAV Unmanned Combat Air VehicleUHF Ultra High FrequencyUS United StatesUNCLOS United Nations Convention on the Law of the SeaUSAF United States Air ForceUSMC United States Marine CorpsVHF Very High FrequencyWMO World Meteorological OrganisationW/S Wing LoadingWWI World War IWWII World War II

PART 1
Maritime Search and Rescue in South Africa

1-1
Chapter 1
1. Introduction
The importance and usefulness of aircraft, both military and civilian, has been
well known for decades; they have been used for a myriad of tasks and in
various roles and configurations, by numerous users, in all possible
environments. The marine environment is no different and has also benefited
from aircraft; they have been instrumental in the safeguarding and
preservation of South Africa’s oceans, marine resources, coastlines, protected
areas, coastal infrastructure and trade routes, and in the provision of essential
civil services.
One of the primary roles attributed to aircraft is the provision of airborne
Search and Rescue (SAR) capabilities. Airborne systems are capable of
covering large areas in a short time span, thereby improving the chances for
success of a SAR mission.
Maritime Search and Rescue poses a unique set of problems when compared
with overland Search and Rescue. Oceans have no landing strips, airports,
fuel stops or other such facilities where rescue aircraft can land to replenish or
be repaired. The oceans provide no shade, drinkable water, warmth, hard
ground to sleep on, or shelter at night, for those in distress. Furthermore, the
oceans are harsh and largely unpredictable, and cover a huge expanse of
uncharted area of the planet.
For these reasons, countries bordering the oceans are given the responsibility
to provide essential maritime Search and Rescue services for the portion they
border. The area of responsibility differs from county to country, depending on
the coastline length and geographic location.
At present, South Africa utilises a varied contingency of aircraft to provide
maritime Search and Rescue services. Most of these assets provide short to
medium range and short to medium endurance capabilities, and are duly
employed. The problem is that, due to its vastness, no airborne asset is

1-2
currently available capable of providing effective and efficient SAR services
across the entire South African SAR region.
1.1. Aim
This thesis aims at providing a solution to this problem by developing and
specifying a concept for an Unmanned Aircraft System that could fulfil South
Africa’s Long Range and Long Endurance (LRLE) maritime Search and
Rescue requirements.
1.2. Scope
The following primary objectives were set for this thesis:
Evaluation of the marine environment of South Africa;
Evaluation of the South African Search and Rescue organisation,
structures and responsibilities;
Determination of the deficit in the long range, persistent search
environment;
Concept specification of an Unmanned Aircraft System capable of
bridging the deficit and fulfilling the aim of this thesis.
1.3. Outline
The thesis is broken into two Parts.
1.3.1. Part 1
Part 1 contains much of the results of the literature study leading up to the
actual System Specification. Part 1 contains ten chapters.
Chapter 1 contains the Introduction, Aim, Scope and Outline.
Chapter 2 contains an analysis of the environmental, climatic and physical
characteristics of our bordering oceans.

1-3
Chapter 3 contains an analysis of the diverse marine-related activities in and
around our oceans, with their potential influence on Search and Rescue
requirements.
Chapter 4 discusses our National Search and Rescue Organisation and
affiliated systems, defines our Search and Rescue Region, and highlights our
associated Search and Rescue responsibilities.
Chapter 5 formulates the performance requirement, in terms of key
performance parameters, for an aircraft capable of meeting the Aim of this
thesis.
Chapter 6 defines the special Search and Rescue special equipment
minimums for a SAR aircraft capable of meeting the Aim of this thesis.
Chapter 7 provides a consolidation of national airborne assets available for
maritime Search and Rescue.
Chapter 8 provides a consolidation of foreign airborne assets available for
maritime Search and Rescue.
Chapter 9 provides a consolidation of unmanned aircraft assets available for
maritime Search and Rescue.
Chapter 10 contains a comparative analysis between performance- and
special equipment level requirements, and existing national, foreign and
unmanned systems. The comparative study is used to determine shortfalls,
and act as motivator for the continuation of the concept specification for an
aircraft capable of bridging the shortfalls.
1.3.2. Part 2
Part 2 contains the System Specification and Concept for an Unmanned
Aircraft System capable of meeting the Aim of this thesis.
Chapter 11 provides background on Unmanned Aircraft, including the
definition of an Unmanned Aircraft and Unmanned Aircraft System; history of
Unmanned Aircraft; and UAV categorisation methods.

1-4
Chapter 12 analyses the advantages and disadvantages of Unmanned
Aircraft, when compared with manned aircraft.
Chapter 13 provides a summary of the Unmanned Aircraft System elements
as analysed for this thesis.
Chapter 14 provides a summary of the results obtained from the analytical
processes followed for the determination of the basic weights, dimensions and
powerplant requirements for the Aircraft.
Chapter 15 provides a summary of the payloads selected for this concept, as
well as basic characteristic for each payload.
Chapter 16 provides the concept for the data links employed.
Chapter 17 discusses the aircraft emergency recovery and flight termination
concepts.
Chapter 18 discusses conceptual characteristics of the ground elements,
including the Ground Control Station, launch and recovery, emergency ground
power, storage and transportation elements.

2-1
Chapter 2
2. National Oceanographic Characteristics
South Africa is bordered by one of the longest coastlines in Africa, possesses
extensive marine and offshore mineral resources and, due to its location
halfway between the West and the East, supports a significant and very active
shipping industry. It is also notorious amongst seafarers for its rough and
often unpredictable offshore weather conditions, which has led to the demise
of a multitude of ships.
The focus of this thesis is on maritime Search and Rescue (SAR). It is
therefore necessary to study and analyse the marine environment of Southern
Africa, with particular focus on aspects that could potentially complicate SAR
operations. This section provides an outline of some of the natural
characteristics and political boundaries associated with the nation’s coasts
and oceans.
2.1. Environmental, Physical and Climatic Characteristics
2.1.1. Coastline Length and Limits
The official length of the South African coastline is 2,798km[1]. The coastline
stretches from the border between South Africa and Namibia on the west
(near Alexander Bay), to the border between South Africa and Mozambique
on the east (near Kosi Bay).
Our coasts are bordered by three major oceans and oceanic currents:
In the west by the Atlantic Ocean;
In the south by the Benguela Upwelling and Agulhas Current;
In the east by the Indian Ocean.
2.1.2. Coastal Populace
The percentage of the national population living within the 100km-wide
Coastal Band is close on 40%[2] of the total national populace. A significant

2-2
number of people therefore live very close to the sea, requiring a strong focus
on essential services and support to these regions.
2.1.3. Sea States and Wave Height
The seas around Southern Africa are among the roughest in the World. Wave
height measured in the seas around the Cape Peninsula and the Southern
Oceans reaches 7 to 8 meters on a typical summer’s day, and well beyond 8
meters further out to sea, beyond the Continental Shelf. Appendix A provides
detailed information and references.
2.1.4. Wind Speeds
Although coastal conditions appear moderate, average wind speeds between
South Africa and Antarctica are above 11 meters per second, among the
highest in the World. Appendix A provides detailed information and
references.
2.1.5. Oceanic Currents
Southern Africa is bordered by three major ocean currents: the Antarctic
Circumpolar, Agulhas and Benguela[16][17][18]. The Antarctic Circumpolar
Current, which runs in an easterly direction above Antarctica, is the largest
wind-driven ocean current in the World. The Agulhas Current requires ships to
closely navigate the eastern coast of Southern Africa, when travelling from
west to east. This coastal region abounds with many sharp submerged rocks
and coral reefs, requiring navigation with great care[17][19][20]. Modern ships
with sophisticated navigational aides still end up wrecked along this
treacherous stretch of coastline from time to time, due to these
conditions[17][19][20]. The cold Benguela Current runs along the west coast.
Where the Agulhas and Bengula currents meet, there is a strong upwelling[20],
further exacerbated by prevailing strong Westerly winds (known as the
“Roaring Forties”) and the cold Antarctic Circumpolar Current flowing in the
same direction. The results[20] are powerful winter storms and mammoth freak
waves, which can range up to 30 metres[20] high, capable of severely
damaging or sinking large ships. Appendix A provides detailed information
and references.

2-3
2.1.6. Tides
African tides are at their most extreme at the very southern tip of South Africa,
and on the African east coast, reaching maximum amplitude differences of up
to 80cm. This is equivalent to some the larger tidal changes found across the
globe. Appendix A provides detailed information and references.
2.1.7. Ocean Surface Temperatures
The average annual sea surface temperatures around Southern Africa, up to
the Continental Shelf, ranges between 16 and 30oC. However, temperatures
drop sharply beyond the Continental Shelf, falling to a minimum of -2oC
between the Shelf and Antarctic coastline[22]. Furthermore, the presence of ice
is abundant in this oceanic region. Appendix A provides detailed information
and references.
2.1.8. Air Temperatures
Air temperatures at sea level for the oceanic region below South Africa,
between the Continental Shelf and the Antarctic coastline, ranges between 10
and -15oC[24]. The combined effect of low air and water temperatures for this
region is potentially lethal, should anyone find themselves in such a
predicament. Appendix A provides detailed information and references.
2.1.9. A Case Study: The Marion and Prince Edward Island Group
The Marion/Prince Edward Island Group lies at 46°52'34" South 37°51'32"
East in the Southern Indian Ocean[25], approximately 1770km south-east of
Port Elizabeth[26]. This Island Group forms part of the territorial claim of South
Africa[247][248], including its surrounding Oceanic Territory (blue zones in Figure
2.2). Marion Island lies within the notorious “Roaring Forties” (the band
between 40o and 50o South[25][27][28]) in METAREA VII[29], illustrated in Figure
2.1[29] below. The climatic summary for Marion Island is as follows[27][30]:
Temperatures
o Average Annual Outside Air Temperature: 5oC
o Average Annual Maximum Outside Air Temperature: 8.1oC

2-4
o Average Annual Minimum Outside Air Temperature: 2.8oC
o Absolute Minimum Outside Air Temperature: -6.8oC
o Average Annual Maximum Sea Surface Temperature: 10oC
o Average Annual Minimum Sea Surface Temperature: 3oC
Wind Speeds
o 55km/h+ Gale Force wind: 107 days per year average
o 160km/h+ Gusts: frequently
o 200km/h+ Gusts: periodically
o Cyclones: 100 to 130 per year
Tidal swells: ranging from small (70cm) to exceptionally large (12m)
Ocean Currents: borders the Antarctic Circumpolar Current
This is representative of the climatic and oceanic conditions within areas
around the Marion/Prince Edward Island Group, for which South Africa is
custodian and ultimately responsible. It is also largely representative of the
climatic and oceanic conditions encountered within the band between 40o and
50o south. This is evident when comparing data (wind speed, sea surface-
and air temperatures) in this band with that provided for Marion Island. This
band of rough and unpredictable Ocean is used by Antarctic supply- and
research vessels and vessels tending the Islands in or near this zone
(typically Marion, Crozet, St Paul, Tristan da Cunha, Bouvet and Gough
Islands)[31].

2-5
Figure 2.1: Marion and METAREA VII[29]
2.2. National Demarcated Maritime Zones (Maritime Claims)
2.2.1. General
Countries bordering the oceans have certain “ownership rights” to the
bordering portions of the sea[32][33]. The ownership rights are coupled to pre-
defined zones, also known as Maritime Claims. With ownership comes
responsibility, and nations bordering the oceans are responsible for
conservation within and management of these zones. The four Maritime Claim
zones are[34][35]:

2-6
Territorial Waters
Contiguous Zone
Exclusive Economic Zone
Continental Shelf
South Africa has expanded on the concept of the Contiguous Zone, and adds
to it the Maritime Cultural Zone[38].
Figure 2.2: South African Maritime Claims[45]
2.2.2. Territorial Waters (TW)
Under the United Nations Convention on the Law of the Sea (UNCLOS), a
State bordered by the sea retains full territorial sovereignty up to 12nmi
offshore. This 12nmi band is known as the Territorial Waters[36].

2-7
2.2.3. Contiguous Zone (CZ)
Under the UNCLOS, the Contiguous Zone (CZ) extends from the coastline of
a Coastal State, up to 24nmi seaward. The bordering nation shall have the
right to exercise all the powers which may be considered necessary to prevent
contravention of any fiscal law or any customs, emigration, immigration or
sanitary law and to make such contravention punishable, within this zone[37].
2.2.4. Maritime Cultural Zone (MCZ)
Under the Maritime Zones Act no 15 of 1994, the Contiguous and Maritime
Cultural Zone extends from the coastline of a Coastal State, up to 24nmi
seaward. The bordering nation has full control over any archaeological and
historic finds within this zone[38].
For the purposes of this analysis, the Contiguous Zone and Maritime Cultural
Zone will be viewed as the singular Contiguous and Maritime Cultural Zone
(C&MCZ), due to the equal size of the two zones.
2.2.5. Exclusive Economic Zone (EEZ)
Under the UNCLOS, the Exclusive Economic Zone is defined as a 200nmi
zone bordering a Coastal State. Coastal States may claim this zone for
exploration, exploitation, conservation and management of all natural
resources in the seabed, its subsoil and overlaying waters[39]. The EEZ for
South Africa covers an oceanographic area of approximately 1,553,000km2[40],
and includes[32][41] the EEZ area around the Marion and Prince Edward Island
Group.

2-8
Figure 2.3: South African Exclusive Economic Zone[40]
2.2.6. Continental Shelf (CS)
According to UNCLOS, the Continental Shelf of a coastal State comprises the
submerged prolongation of the land territory of the Coastal State[42]. This
portion is the seabed and subsoil of the undersea area that extends beyond
its Territorial Waters, to the outer edge of the Continental Margin (CM), or to a
distance of 200nmi, where the real outer edge of the CM is short and does not
extend up to that distance. It does not include the Deep Ocean floor with its
oceanic ridges or its subsoil. According to Article 76 of the UNCLOS, the
Coastal State may establish the outer limits of its Continental Shelf wherever
the CM extends beyond 200nmi, by establishing the foot of the continental
slope, and by meeting the requirements of Article 76 of the UNCLOS,
paragraphs 4 – 7[42].

2-9
Following this process, South Africa has established the limits of its
Continental Shelf, and it is published in the Maritime Zones Act no 15 of
1994[43]. From Figure 2.2 it can be seen that our Continental Shelf extends to
350nmi, on average, from the coastline[44][45].
The CS is important for the Economy, since the Maritime Zones Act no 15 of
1994 states that the South African CS claim may be utilised for exploration
and exploitation of natural resources and mining of precious stones, metals or
minerals, including natural oil[46].
2.3. Conclusion
In conclusion, it is evident that the oceans bordering Southern Africa are
amongst the roughest, coldest and most hostile in the world. This is
particularly true for the portions beyond the Continental Shelf, where high sea
states, giant waves, strong currents, icy water and air temperatures and
strong (often gale force) winds are commonplace. Persons in distress in such
conditions do not stand a chance of survival, unless an effective and efficient
Search and Rescue system, with highly specialised and capable assets, are
on hand.
Chapter 2 will investigate the levels of marine activity in and around our
coasts and oceans, to determine where maritime SAR should be focused.

3-1
Chapter 3
3. Marine Activity
Chapter 1 concluded with certainty that South Africa is bordered by some of
the most hostile oceans in the World, requiring a definite maritime Search and
Rescue capability. Search and Rescue services are employed to search for
and save the lives of people in distress. It would therefore be beneficial to
know which portions of our oceans are frequented by humans; any area
where humans could possibly enter or pass through should be reachable and
effectively and efficiently serviced by SAR services.
3.1. Marine Resources
3.1.1. Living Resources: Fish and Shellfish
The oceans around Southern Africa are home to some of the richest and most
productive fishing zones in the World[47][48], and as a result attract large
volumes of commercial, recreational and sustenance fishing annually. South
Africa provides the right for the exploitation of 20 different commercial
fisheries[49]. These include the following species of fish and marine life[49]:
Hake
South Coast and West Coast Rock Lobster
Abalone, mussels and oysters
Tuna and Swordfish (large pelagic fish)
Anchovies and Pilchards (small pelagic fish)
Squid and prawns
Mackerel
Patagonian Toothfish
150 species of Line Fish

3-2
The richness of our fish resources is predominantly the result of prevalent
features in our oceans, such as the presence of upwelling, ocean
temperatures, large biomass production, currents and ocean topography[47][48].
South Africa has promulgated the Sea Fisheries Act, Act 12 of 1988, which
includes as policy guidelines the conservation of marine ecosystems and the
optimal and sustainable utilisation of marine resources
Most commercial fishing takes place between the coast and the Continental
Shelf, since this is where the greatest volumes of fish are found[48][51]. Some
species (tunas, Patagonian toothfish, shad, dorado, mackerels) are, however,
found outside this zone[50], and this implies that certain fishing vessel types do
move beyond the CS, into the roughest seas, very far from the coast. Refer to
Appendix B contains a detailed analysis of the natural habitats of fish species
around Southern Africa.
A large and healthy fishing industry[247] implies many fishing vessels and
boats, and plenty of activity in the sea. The following are some facts and
figures wrt boats, ships and vessels used for fishing in South Africa:
Number of fishing vessels above 25 gross tons on the National register:
approximately 600[31]
Number of licensed fishing vessels below 25 gross tons: in the tens of
thousands (8285 boats for Cape Town only)[31]
Between 2002 and 2007, 93 SA-registered fishing vessels were
involved in incidents at sea, resulting in 56 fatalities[52]
It is very difficult to estimate the number of illegal fishing vessels
entering our Oceans each year, although high numbers are
estimated[31]
Annual fishing capture statistics:
o Total capture (pelagic and demersal) (2007 figures): 670,571
tons[53]

3-3
o Total capture (pelagic and demersal) (2005 figures): 817,666
tons[53]
o Total pelagic capture (sardines, redeye, anchovy, horse
mackerel) (2005 figures): 569,083 tons[54]
3.1.2. Minerals and Energy
South Africa is the World’s top producer of platinum, manganese, chrome and
vanadium, and second-largest producer of gold, zirconium and titanium[55].
South Africa is also the World’s fourth largest diamond producer[55]. A
significant portion of the Gross Domestic Product (GDP) of South Africa is
dependant on its extensive mining resources and associated programs. In
2007, mining contributed R135.6 billion, or 7.7%, to the GDP[56]. Continued
exploitation of these resources is therefore vital to the sustainability and
growth of the economy.
South Africa has large quantities of shore-based and offshore minerals and
other natural resources, with primary focus on oil (crude petroleum), natural
gas, diamonds (marine), titanium and zirconium[57][247].
Of the five primary marine mining operations, only marine diamond mining,
and oil and natural gas excavation, exposes ships and personnel to potential
maritime dangers, and all well within the Exclusive Economic Zone. Appendix
C contains a detailed analysis of the locations and methods used for the five
marine mining activities.
3.2. Commercial Shipping
3.2.1. Major Ports
Seven[72] major ports and ten[72] dry docks, repair quays and slipways serve as
berthing and repair facilities for commercial shipping docking in South Africa.
An eighth major port (Port of Ngqura) is currently under construction adjacent
the Coega Industrial Development Zone in the Eastern Cape[73]. Additionally,
Simonstown is host to a Naval dock. The major ports, dry docks and repair
facilities are as follows[72]:

3-4
Port of Saldanha Bay
Port of Cape Town (includes two Dry Docks and one Repair Quay)[74]
Port of Mossel Bay (includes one Repair Slipway)[75]
Port of Port Elizabeth (includes one Repair Slipway)[76]
Port of East London (includes one Dry Dock)[77]
Port of Durban (includes one Graving Dock, one Floating Dock and one
Repair Slipway)[78]
Port of Richards Bay (includes one Repair Slipway)[79]
SA Naval Dockyard Simonstown (includes one Dry Dock and one
Synchro Lift)[80]
The greatest concentration of commercial shipping around our coasts and in
our seas is found in and around the major ports and along the shipping lanes.
3.2.2. Commercial Shipping Activity
Due to its location halfway between the West and the East, South Africa is
host to one of the busiest shipping routes in the World[247]. Figures 3.1 and 3.2
show how the primary East-West shipping lanes pass via South Africa[81][82].
The only viable alternative[83][85][86] for ships travelling between the East and
the West is via the Suez Canal in North Africa. The alarming increase in
piracy near the Horn of Africa has forced many major shipping operators to
reconsider choosing to take the longer trip around the Cape[84][87][88]; this could
lead to an increase of between 15,000 and 40,000 vessels per year, the
estimated number of ships currently using the Suez Canal annually[84].

3-5
Figure 3.1: Primary Shipping Lanes[81]
Figure 3.2: Primary Shipping Lanes[82]
The transportation of crude oil is one of the primary categories[81] of shipping
witnessed along the southern shipping routes. Navigating valuable oil-laden
tanker ships via the Cape of Good Hope avoids the dangerous North-Eastern
chokepoints and is generally a safer alternative[84]. In addition, the Suez Canal
can only handle ships with a maximum dead weight tonnage of 240,000
tons[85][86]. Currently, most Very Large Crude Carriers (VLCCs) and all Ultra
Large Crude Carriers (ULCCs) have to navigate via the Cape of Good
Hope[85][86]. Other valuable cargo types frequenting our oceans include dry
and wet bulk, containerised loads, chemical and LP-Gas[89].

3-6
South Africa ranks among the top 12[90] Maritime Trading Nations,
commanding 6%[90] of the total World Sea Trade. The following statistics
provide an idea of the level of commercial marine shipping activity prevalent
around our coasts:
Commercial ships passing the Cape of Good Hope annually without
docking, taking cargo from the East to the West and vice versa:
4,000+[91]
Commercial ships docking in South African ports annually: 13,074[92]
Gross tonnage of cargo handled in South Africa’s seven major ports
annually: 182,735,369 metric tons[93]
Total number of containers handled in South Africa’s seven major ports
annually: 4,334,612[94]
Revenue generated by National Port Authority as a result of bulk cargo
throughput (in- and exports) in 2008/09FY: R7.11 Billion[95]
Revenue generated by Port Terminals as a result of container cargo
throughput (in- and exports) in 2008/09FY: R5.037 Billion[95]
98% of National exports by weight, is shipped by sea annually[96]
3.3. Naval Operations
The role of the SA Navy involves the safeguarding, patrolling, policing and
protecting of our national maritime borders and zones. These include the
Territorial-, Contiguous-, Excusive Economic- and Continental Shelf zones of
the country, and includes the Prince Edward/Marion Island Group[45]. Other
specilised roles include hydrographic and surveying services, search and
rescue, regional naval cooperation, international exercises, relief operations,
and humanitarian assistance[45].
This requires a Naval Fleet capable of operating anywhere within our
sovereign waters, and beyond. The Search and Rescue role alone
necessitates the Navy to operate the entire national Search and Rescue

3-7
Region, which, according to the Navy, covers an area of more than 17.2
million km2[45], and extends well beyond the Continental Shelf. The survey
ship also undertakes regular trips to Antarctica, almost 3000nmi form South
Africa’s coast.
The SA Navy currently operates a mixed fleet of four frigates, three
submarines, four coastal minesweeprs, four coastal minehunters, one fleet
replenishment ship, five missile fast attack craft, three inshore patrol vessels,
twenty-six harbour patrol boats and one survey ship[97]. The SA Navy currently
owns no aircraft of its own, but utilises the services of the SA Air Force for
maritime air support.
3.4. Maritime Police Services
The SA Police Service roles include the policing and safeguarding of our
national borders against crime. This includes the maritime borders and
maritime zones, up to and including the Exclusive Economic Zone[98].
3.5. Leisure
3.5.1. Coastal Tourism
The South African coast is dotted with hundreds of resorts, hotels and holiday
venues. Tourism accounted for R194.5 billion of our national GDP in 2008[99].
Our coasts attract thousands of tourists, holiday-goers and business people
annually. Approximately 9.6 million foreigners visited the country in 2008[100],
and a large percentage of those visitors are likely to have paid visits to the
coastal regions. Approximately 14 million adult domestic tourists also travelled
the country in 2008[101], adding to the potential percentage visiting coastal
regions. One of the top three leisure activities undertaken annually by
domestic tourists is visiting the coast (the beach)[102].
Associated leisure activities are primarily concentrated to the shoreline and
shallow waters (wind surfing, surfing, para-sailing, swimming, surf-skiing, jet-
skiing, in-shore boating, angling, whale watching, snorkelling, wreck and reef
diving, cage diving), but a small percentage of activities take place beyond the
inshore zone. This includes deep sea angling, yachting and deep sea diving.

3-8
Despite this, all marine leisure activities take place well within the 12nmi
Territorial Waters zone, one notable exception being oceanic cruises.
3.5.2. Oceanic Cruises
Oceanic cruises are another form of marine leisure, operating on a global
scale and on the open ocean. Travellers arrive at and depart from South
African ports on a variety of cruise ships, operated by various cruise lines
offering this service. Leading cruise corporations operating to and from South
Africa are[103]:
Royal Caribbean, operating 38 ships and offering five cruise brands:
Celebrity Cruises, Royal Caribbean International Cruises, Pullmantur
Cruises, CDF Cruises and Azamara Cruises.
Carnival Corporation, operating 89 ships and offering eleven cruise
brands: Carnival Cruise Lines, Princess Cruises, Cunard Cruises,
Seabourn Cruise Lines, Holland America Cruises, Costa Cruise,
Iberocruceros Cruises, AIDA Cruises, P&O Cruises UK, P&O Cruises
Australia and Ocean Village Cruises.
NCL/STAR Cruises, operating 16 ships and offering three cruise
brands: NCL Cruises, NCL America Cruises and Star Cruises.
MSC Cruises, operating one ship, and offering one cruise brand: MSC
Cruises.
The most popular cruising regions are the Caribbean, West Coast of America,
Alaska, South America, the Mediterranean, Asia/Pacific regions and North
and Western Europe[104]. Southern African cruises focus predominately on
visits to southern ocean islands (Mauritius, Seychelles, Reunion, St Helena),
but also many World destinations[105].
The demand has doubled within each decade, and trends indicate this will
continue[106]. This has led to a greater demand in numbers of and capacity on
cruise ships. Royal Caribbean Cruises has recently started operating the

3-9
“Oasis of the Seas”, with a capacity for 5,400 passengers, more than double
those carried on board previous modern liners[107][108].
Due to the nature of the industry, cruise ships operate across vast stretches of
open ocean between destinations.
3.6. Aeronautical Activity
3.6.1. Military Aeronautical Operations over the Sea
The primary mandate of the SANDF is to protect the national borders, defend
and protect the Republic, its territorial integrity and its people[109]. The national
maritime borders effectively stretch the length of the coastline, and extend out
to sea up to the edge of the Continental Shelf zone. This marine area is
therefore safeguarded by the SANDF, and utilises airborne (Air Force) and
surface vessel (Navy) assets.
In addition, the SANDF is mandated to provide essential services, which
includes humanitarian assistance, Search and Rescue, and national border
control[110]. Search and Rescue is provided across the entire national maritime
Search and Rescue Region. This Region will be defined in detail in Chapter 4,
but suffice to say it is an enormous area, effectively stretching all the way to
Antarctica, and halfway to South America and Australia in the west and east
respectively.
3.6.2. Commercial Flights over the Sea
From Appendix D[111][112][113], it is apparent that many major airlines, operating
to and from South Africa, have routes overflying the oceans around Southern
Africa. In particular, many SAA flights, as well as SA Airlink (to Madagascar),
Delta Airlines, British Airways all the Far Eastern and Near Eastern airlines,
and Quantas, have significant portions of their routes operating over the seas
around Southern Africa, within our national maritime zones and our Search
and Rescue Region. Refer to Appendix D for details of these airlines and
routes.

3-10
3.6.3. Civil Recreational Flight over the Sea
The Civil Aviation Regulations Part 91[114] provides the guidelines for, amongst
others, the operation for civil and commercial aircraft over the sea. Certain
restrictions and limitations are imposed, depending on the configuration of the
aircraft and equipment carried on board. Civil aircraft operating over the sea
are required to be equipped with life rafts and survival equipment, and, in the
case of helicopters, floatation gear[114].
Extended over-water flights are permitted, but emphasis is placed on the
inclusion of life rafts amongst the survival equipment carried on board. This is
particularly aimed at twin and single engine aircraft, which often falls within the
“light civil recreational” category. If such aircraft are not equipped with a life
raft, the maximum distance over water from the coast is 30 minutes of flight or
100 miles, whichever is reached sooner.
In essence, if a civil aircraft, commercial or recreational, is equipped with
sufficient survival equipment and/or floatation gear, the distance it can fly over
the sea is a function of the performance limit of the aircraft in terms of fuel
capacity[114] [115].
Many civil recreational aircraft may not be equipped with all survival
equipment, as specified by CAR Part 91, limiting the distance from shore to
around 100 nmi. This is within the EEZ. Many others, equipped with all
essential survival equipment, could potentially operate even further out to sea,
well beyond the EEZ.
3.7. Recorded Maritime Incidents
3.7.1. Shipwrecks
The Southern African coastline is littered with thousands[116] of shipwrecks, a
testimony to the rough and unpredictable nature of its bordering oceans. Over
2700[117] shipwrecks have been recorded to date around the coast. The Cape
of Good Hope alone is home to more than 400[118] shipwrecks.

3-11
3.7.2. Aeronautical Incidents
Most aeronautical incidents in and around South Africa have occurred over
land, as most of the routes and the greatest percentage of flying takes place
here. However, twelve notable exceptions are listed in Appendix E, all
occurring in our oceans, the most infamous of which is arguably the South
African Airways Helderberg incident of 1987.
3.8. Conclusion
It is evident that human activity is found across all national oceanic regions,
and also well beyond our maritime borders and claims. In summary, the
following activity types are prevalent per maritime claim zone:
Coastal
o Commercial Fishing
o Zirconium and Titanium mining
o Commercial Shipping
o Naval Operations
o Maritime Police Services
o Marine-related leisure and recreation
o Military Aeronautical Operations
o Commercial Flights
o Civil Recreational Flight
Territorial Waters
o Commercial Fishing
o Diamond mining (marine)
o Commercial Shipping

3-12
o Naval Operations
o Maritime Police Services
o Marine-related leisure and recreation
o Oceanic Cruises
o Military Aeronautical Operations
o Commercial Flights
o Civil Recreational Flight
Exclusive Economic Zone
o Commercial Fishing
o Oil and Natural Gas mining
o Commercial Shipping
o Naval Operations
o Maritime Police Services
o Oceanic Cruises
o Military Aeronautical Operations
o Commercial Flights
o Civil Recreational Flight
Continental Shelf
o Commercial Fishing
o Commercial Shipping
o Naval Operations

3-13
o Oceanic Cruises
o Military Aeronautical Operations
o Commercial Flights
o Civil Recreational Flight
Beyond the Continental Shelf
o Commercial Fishing
o Commercial Shipping
o Naval Operations
o Oceanic Cruises
o Military Aeronautical Operations
o Commercial Flights
Although the greater concentration of marine-related human activity takes
place within the 200nmi Exclusive Economic Zone, Search and Rescue
services should be provided for to cater for all possible situations. Therefore,
in a national context, maritime Search and Rescue services should be
provided within, as well as beyond, our maritime claim zones, up to our
defined maritime Search and Rescue Region extremities.
Chapter 4 will look in more detail at Search and Rescue in South Africa, with
strong focus on our obligated Search and Rescue responsibilities.

4-1
Chapter 4
4. National Maritime Search and Rescue Responsibilities
4.1. An Introduction to Search and Rescue in South Africa
From the previous Chapters, it is clear that South Africa is host to extensive
and highly active commercial shipping and fishing industries, recreational
maritime activities, naval, and military and commercial aeronautical
operations. All these activities take place within our often volatile,
unpredictable and hostile marine environment, resulting in numerous incidents
and close calls each year[31].
South Africa borders the ocean on 41.5%[125] of its external borders, bringing
to bear certain “automatic” responsibilities concerning maritime Search and
Rescue. These responsibilities rest upon every ocean-bordering state
worldwide[126][127], and are not unique to South Africa.
This Chapter will examine in more detail the International trends in Search
and Rescue, our obligations and responsibilities towards Search and Rescue,
define our national maritime Search and Rescue Region and report on the
basic composition of the national Search and Rescue Organisation.
4.1.1. International Recognition
In International context, the need for well-established, dedicated Search and
Rescue capabilities was first addressed at the International Convention on
Maritime Search and Rescue (the “SAR Convention”), convened in 1979 in
Hamburg[91][128][129]. This Convention aimed at developing an International
Search and Rescue Plan, to guide and facilitate Search and Rescue
establishment efforts worldwide. The Plan called, amongst others, for member
States to ensure the following:
The provisioning of adequate Search and Rescue services within their
bordering coastal waters and designated maritime Search and Rescue
Regions[91][130][131];

4-2
The provisioning of adequate facilities, resources, procedures and
training to execute Search and Rescue in a coordinated, professional
and efficient manner[91][130][131];
Encouragement of neighbouring States to enter into agreements
concerning bordering Search and Rescue Regions, as well as the
pooling of Search and Rescue resources[91][132][133].
In addition to these requirements, the SAR Convention set out measures and
guidelines for the establishment of Rescue Coordination Centres, Rescue
Sub-Centres and automated ship reporting systems[91]134][135][136][137].
Following prolonged use, the Plan, as set out by the 1979 SAR Convention,
was significantly amended, and finally adopted in its new form in 1998 by the
International Maritime Organisation (IMO)[91]. In addition to the original
requirements and stipulations, the amended 1998 Plan:
Clarified Government responsibilities[91];
Placed greater emphasis on regional cooperation[91]; and
Aimed at harmonising Maritime and Aeronautical Search and Rescue
operations performed over the sea[91].
4.1.2. International Search and Rescue Standards
The following are some of the Internationally recognised and accepted Search
and Rescue terminology and standards as set out by the IMO, ICAO and
other organisations:
Definition of Search and Rescue: The term “Search and Rescue” is the
process of searching for and providing rescue services to persons who are
believed to be in imminent danger of losing their lives[162].
Definition of an Aeronautical Incident over the Sea: It is broadly recognised
that an aeronautical incident over the sea becomes, and is duly treated as, a
maritime incident[163].

4-3
Primary Need: The primary need is for the rapid location and rescuing of
survivors of accidents[164].
Search and Rescue Region: States are to accept the moral responsibility for
the Search and Rescue Regions established within their Maritime area[91][165].
Search and Rescue Region: States are required to provide Search and
Rescue services within their territories and over their portions of the High
Seas and within their Coastal Waters[166][167].
Government Responsibility: The Search and Rescue function is a
Government responsibility following on the acceptance of the obligations
bestowed upon it through membership to ICAO, the International Convention
on Maritime Search and Rescue, and SOLAS[162].
Government Responsibility: The Safety of Life at Sea (SOLAS) Convention
requires that “each Contracting Government should undertake to ensure that
necessary arrangements are made for distress communication and co-
ordination in their area of responsibility and for the rescue of persons in
distress at sea around its coasts [91].”
State Responsibility: The implementation of an efficient Search and Rescue
system is a fundamental obligation of all ICAO and IMO Contracting
States[168][169][170][247].
State Responsibility: States are required to establish and formulate the basic
elements of SAR services, including the definition of the legal framework, the
assignment of a responsible Search and Rescue Authority, the establishment
and organising of Search and Rescue resources, adequate communications
infrastructure and facilities, the setting up of operational functions, setting up
of domestic and international cooperative relationships, and a training
basis[171][172].
State Responsibility: States are required to set up Rescue Coordination
Centres (RCC’s) and Rescue Sub-centres (RSC’s) to coordinate National and
joint Search and Rescue efforts[173].

4-4
Rescue Coordination Centres: Rescue Coordination Centres are to be
established to coordinate resources to perform searching and effect a rescue
operation in a particular SRR[174][175][176].
Rescue Coordination Centres: The prompt receipt of information by a Rescue
Coordination Centre is vital to ensure effective evaluation and immediate
decision-making on the best course of action, and timely activation of rescue
assets to enable location, support and rescuing of persons in distress, in the
shortest possible time[164].
International Impact: National Search and Rescue services and methods are
considered to form an integral part of the Worldwide SAR System[177].
Harmonised Operations: The harmonisation of Aeronautical and Maritime
Search and Rescue is a requirement for effective and efficient SAR operations
over the seas[178][179].
Search and Rescue Resources: Rescue Coordination Centres are to assist
each other in the provision of personnel, aircraft, vessels, equipment and
other resources, as and when required[180][181].
Search and Rescue Resources: Nations shall use all available means,
methods, resources, facilities and other Search and Rescue units to provide
assistance during a search and during the rescue effort[182].
Search and Rescue Resources: Search and Rescue units shall be provided
with the necessary equipment to enable efficient and effective execution of all
tasks[183][184][185][186].
Search Termination: Search and Rescue operations are to continue until all
reasonable hope of rescuing survivors has passed[187][188][189].
Search Termination: The suspension of a search during a SAR operation shall
only be considered once all assigned areas have been thoroughly searched,
all probable locations have been investigated and all means of obtaining
information concerning the whereabouts of those in distress have been
exhausted[189].

4-5
4.1.3. National Recognition
In line with these requirements and standards, and as a member nation to the
SAR Convention, South Africa has agreed to provide effective, efficient and
professional Search and Rescue services within its designated Search and
Rescue Region[126][127].
4.2. South African Search and Rescue Organisation
In answer to South Africa’s moral and humanitarian obligation to provide an
effective, efficient, well organised and professional Search and Rescue
service, and in consideration of Search and Rescue standards being observed
worldwide, the South African Search and Rescue Organisation (SASAR) was
promulgated in 1979[138][139]. The origins of SASAR actually stretch as far back
as 1958[138][139] when the Permanent Committee for Search and Rescue was
established. In 1961[138][139], the Committee changed its name to the
Permanent Executive Committee for Search and Rescue (PECSAR).
The PECSAR National SAR Manual was developed the same year[139]. In
1979, following the SAR Convention, PECSAR underwent a further name
change and became SASAR[138][139]. The revised SASAR Manual came into
effect in 1993[139].
4.2.1. SASAR Objectives
According to the South African Maritime and Aeronautical Search and Rescue
Bill, the objective[140] of SASAR is “to ensure a co-ordinated and effective
maritime and aeronautical search and rescue service within the South African
search and rescue regions.” The Bill continues to say that SASAR executives
are to “ensure that search and rescue operations are conducted in
accordance with laid down standards and recommended practices as
reflected in the SASAR Manual and as considered the norm in terms of
international agreements [141].”
Other statements concerning SASAR, as contained in the Bill, are[142] that
“SASAR must within its means and capabilities co-ordinate its resources to
search for … survivors of aircraft crashes … vessels in distress … survivors of

4-6
maritime accidents or incidents … survivors of any military aircraft or vessel
accident or incident…” The Bill also states that[143] “SASAR must perform its
functions in a manner which promotes efficient, economic and effective use of
all resources.”
In the SASAR Constitution (preamble) it states[144] that Government is
“Conscious of South Africa’s obligations in terms of the International
Convention on Maritime Search and Rescue, 1979 and Annex 12 to the
Convention on International Civil Aviation, 1944 and other relevant
Conventions”, while also[144] being “Conscious of an established international
practice based on traditional humanitarian obligations to assist any aircraft,
vessel or person in distress.”
The SASAR Constitution provides the same objective[145] for SASAR as the
SAR Bill, while adding other objectives, including[146] “To minimise time spent
searching for persons in distress by using technology, research and
development, education, regulation and enforcement.”
The SASAR National SAR Manual (draft), Chapter 1, states that the National
Search and Rescue organisation was established[147] “to provide South Africa
with a world-renowned Search and Rescue capability or function.”
To summarise, therefore, it is clear that as a nation, we are expected to:
Ensure that we have in place a co-ordinated, efficient and effective
maritime and aeronautical Search and Rescue service, on a par with
International norms and standards;
Co-ordinate resources to search for survivors of any and all
commercial, recreational and military aircraft accidents and vessels in
distress within our national Search and Rescue Region, in other words,
survivors of all maritime accidents or incidents;
Conduct Search and Rescue operations in accordance with laid down
standards and recommended practices;

4-7
Conduct Search and Rescue operations in a manner considered the
norm in terms of International standards;
Conduct such operations while minimising time spent searching for
persons in distress by using technology, research and development,
education, regulation and enforcement.
4.3. Additional International and Regional Maritime Agreements
4.3.1. International Agreements and Memberships
As mentioned in the aforementioned section, South Africa has agreed to
provide World-class Search and Rescue services, in accordance with the
requirements set out in the 1979 and 1998 Plans drafted by the SAR
Convention. In addition to the SAR Convention, South Africa is a member of
the following Search and Rescue- or Maritime-related Organisations,
Conventions, Committees and Bodies, incurring similar levels of responsibility:
International Maritime Organisation (IMO) [91][148][149] (Member State,
since 1995)
International Civil Aviation Organisation (ICAO) [149][150] (Contracting
State)
United Nations Convention on the Law of the Seas (UNCLOS) [151]
(Subscriber, treaty ratified 23 December 1997)
Convention on Safety of Life at Sea (SOLAS) [152][153] (Signatory, treaty
ratified under auspices of the IMO)
Standing Maritime Committee (SMC) [154][155] (Member)
International Hydrographic Organisation (IHO) [156] (Member State)
South Africa is morally, humanitarianly and, in certain cases legally, bound
and obliged to observe the guidelines, strategies, plans, treaties and laws, for
which it is a co-signatory, subscriber or member.

4-8
4.3.2. Regional Cooperation
The SAR Convention places great emphasis on regional cooperation[132][133].
In a regional context, South Africa is a member nation of:
African Union (AU) [157] (Member)
Southern African Development Community (SADC) [158] (Member)
Inter-State Defence and Security Committee (ISDSC) [159] (Member)
Africa Economic Community (AEC) [160] (Member since 1997)
In terms of cooperative Search and Rescue, the SADC Search and Rescue
Region coastal border stretches from the northern border of the Democratic
Republic of Congo on the west coast around the southern tip of Africa to the
northern border of Tanzania on the east coast. It also includes Madagascar,
Mauritius and Seychelles. The combined SADC coastline length is in excess
of 15,300km[1] and presents a combined Exclusive Economic Zone of
7,572,680km2[161][247]. Although this thesis focuses on the national (South
African) Search and Rescue Region, and associated responsibilities and
capabilities, the “regionally cooperative” Search and Rescue responsibilities
cannot be disregarded.
4.4. National Rescue Centres
In alignment with the International requirements for Search and Rescue,
South Africa has established a number of Rescue Centres to coordinate
Search and Rescue efforts.
4.4.1. National Maritime Rescue Coordination Centre (MRCC)
The national Maritime Rescue Coordination Centre (MRCC) is situated in
Cape Town[91][190]. This MRCC also acts as a regional MRCC and training
centre for Angola, the Comoros, Madagascar, Mozambique and Namibia[91].
The national MRCC was officially opened on 16 January 2007 by Efthimios E.
Mitropoulos, Secretary-General of the International Maritime Organization [91].

4-9
4.4.2. National Aeronautical Rescue Coordination Centre (ARCC)
The national Aeronautical Rescue Coordination Centre (ARCC) is situated at
OR Thambo International Airport, Johannesburg[191].
4.4.3. National Rescue Sub-Centres
The SASAR national SAR Manual (draft), Chapter 2, provides details
concerning the location of the seven permanent Rescue Sub-Centres
(RSC’s), and associated Secondary Rescue Sub-Centres (Secondary
RSC’s)[192]. In the event of a maritime emergency, the MRCC may delegate
responsibility to the Rescue Sub-Centre in the sub-region affected, to
coordinate the Search and Rescue effort. Appendix F provides a summary of
the National RSC’s and their associated Secondary RSC’s.
4.5. National Maritime Search and Rescue Region
The previous paragraphs have highlighted South Africa’s responsibilities and
willingness towards Search and Rescue. Furthermore, it is evident that South
Africa wants to be ranked among the foremost nations as far as Search and
Rescue is concerned, providing effective, efficient, well-organised and
professional services within its allocated Search and Rescue Region.
4.5.1 Search and Rescue Region Allotment
Following the 1979 International Convention on Maritime Search and Rescue,
the IMO Maritime Safety Committee divided the entire World oceanographic
surface into thirteen[194] primary Search and Rescue areas. Within each
primary area, countries bordering the ocean are required and encouraged to
perform Search and Rescue duties within a delimited and allotted Search and
Rescue Region (SRR). The 1998 amendment of the SAR Convention further
emphasised the relevance of Search and Rescue Regions, and associated
national responsibilities. The amendment clearly stipulates that once a Search
and Rescue Region has been defined, neighbouring States accept
responsibility for providing Search and Rescue services within that
Region[194][195][196].

4-10
The geographic location of the State in question determines the size and
borders of the allotted Region. Additionally, the national Search and Rescue
Region is divided into an Aeronautical Area, defined and controlled by the
International Civil Aviation Organisation (ICAO)[191][195][196][197], and a Maritime
Area, defined and controlled by the International Maritime Organisation
(IMO)[190][195][196][197]. The Maritime Area of the Search and Rescue Region is
restricted to the ocean, while the Aeronautical Area covers the entire overland
part, as well as parts over the ocean[198].
In most cases, the Maritime Area and Aeronautical Area over the sea overlaps
(the amount of overlap is dependent on the level of cooperation decided upon
between ICAO and the IMO, as well as other political considerations and
agreements between neighbouring ocean-bordering States). This is true for
our national Search and Rescue Region as well. For the purposes of this
thesis, the “maritime Search and Rescue Region” is the summation of both
the Maritime and Aeronautical Areas over the sea. This equates into a
combined national maritime Search and Rescue Region with an
oceanographic area of 8,051,392.6nmi2 (27,615,503.7km2)[40].
The borders of the summed national maritime Search and Rescue Region are
as follows:
4.5.2. Coastal Demarcation
The Coastal Demarcation is from the border between Angola and Namibia in
the west (17o51’S-latitude), along the coast to the border between South
Africa and Mozambique in the east (26o51’S-latitude)[40][165][197][199].
4.5.3. Northern Demarcation
The Northern Demarcation is the 117o51’S-latitude in the west, and the
26o51’S-latitude in the east. In the east, the Northern Demarcation steps down
to the 30oS-latitude when passing the 40oE-longitude, and steps down again
to the 50oS-latitude when passing the 57oE-longitude[40][165][197][199].
4.5.4. Southern Demarcation
The Southern Demarcation is the Antarctic Coastline[40][165][197][199].
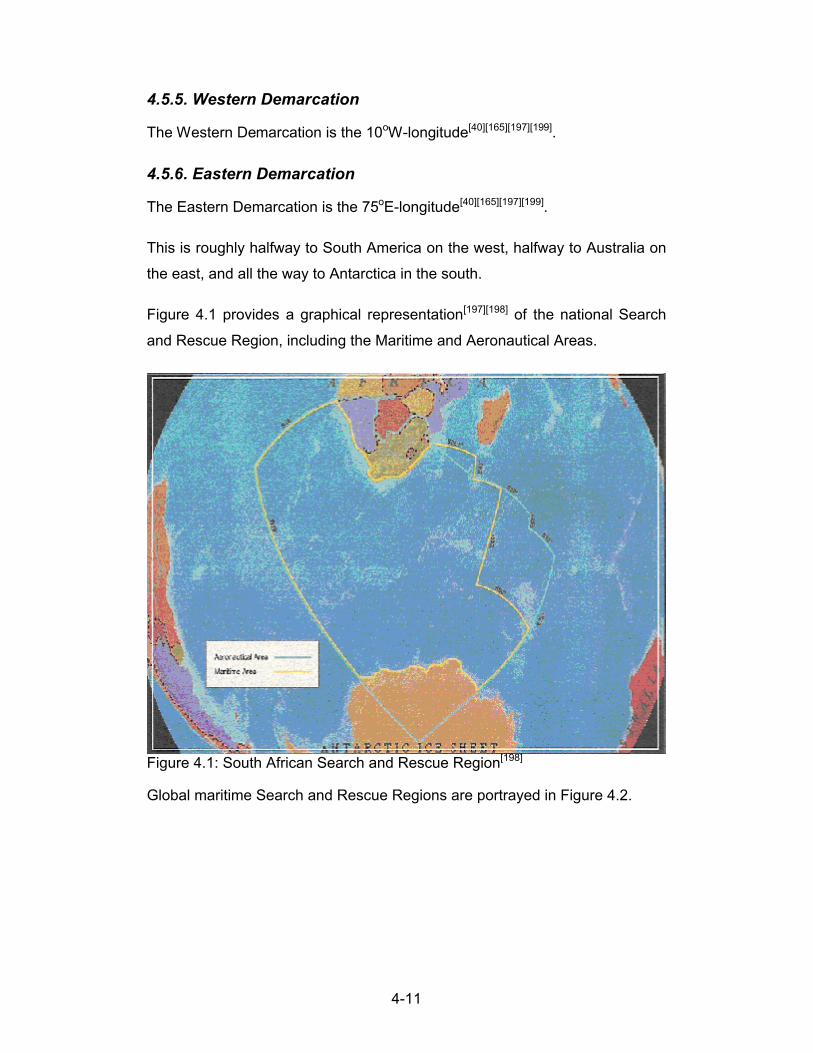
4-11
4.5.5. Western Demarcation
The Western Demarcation is the 10oW-longitude[40][165][197][199].
4.5.6. Eastern Demarcation
The Eastern Demarcation is the 75oE-longitude[40][165][197][199].
This is roughly halfway to South America on the west, halfway to Australia on
the east, and all the way to Antarctica in the south.
Figure 4.1 provides a graphical representation[197][198] of the national Search
and Rescue Region, including the Maritime and Aeronautical Areas.
Figure 4.1: South African Search and Rescue Region[198]
Global maritime Search and Rescue Regions are portrayed in Figure 4.2.

4-12
Figure 4.2: Global Maritime Search and Rescue Regions[200]
From the Figure 4.2[200] it is evident that South Africa has been allotted one of
the five largest maritime Search and Rescue Regions in the World, with only
Australia, New Zealand, Chile and the United States having larger or similar
sized Regions.
Figure 4.3 provides a graphical representation of the summed national
maritime Search and Rescue Region, highlighting a number of key elements.
The map includes distances from two main ports to the outermost extremities
of the national maritime Search and Rescue Region. The distances calculated
take into account the curvature of the Earth, and are presented in Nautical
Miles[40].

4-13
Figure 4.3: Summed National Maritime Search and Rescue Region[40]

4-14
4.5.7. Major Distances
From Figure 4.3[40]:
The furthest point from Cape Town is to the 69o20’.5S//75oE intersection, a
distance of 2,898.4nmi.
The furthest point from Durban is also to the 69o20’.5S//75oE intersection, a
distance of 2,848.8nmi.
4.6. National Organisations Equipped to Perform Maritime Search and Rescue Activities
Organisations like SASAR and the Maritime Rescue Coordination Centre are
actively involved in Search and Rescue, but are themselves not equipped to
physically carry out these activities. These Organisations typically generate
and enforce policy, plans and guidelines, or perform a coordinating
function[201]. There are, however, a number of Organisations who are
equipped to interpret these policies, plans and guidelines and carry them
through into practicality, and actively partake in Search and Rescue activities
when called upon.
Such Organisations are equipped with specialised assets (vehicles,
equipment, skilled personnel, facilities and infrastructure, etc) to enable them
to carry out and fulfil the required tasks.
This section provides a shortlist of the major Organisations in South Africa
equipped to perform maritime Search and Rescue activities.
4.6.1. The National Sea Rescue Institute (NSRI)
The National Sea Rescue Institute (NSRI) was promulgated on 12 June
1967[202]. It remains one of the foremost Organisations involved with maritime
Search and Rescue. The following statistics[203] provide an overview of the
scale of efforts and accomplishments, calculated from date of inception to the
publication of this thesis:
Sea rescue Operations performed: 14,540

4-15
Persons assisted: 26,023
4.6.2. South African Police Services (SAPS)
The SA Police Service roles include the policing and safeguarding of our
national borders against crime. This includes the maritime border and
maritime zones, up to and including the Exclusive Economic Zone[98]. The
police assist the South African National Defence Force and NSRI in providing
rescue services within these zones[204]. This includes the provision of aircraft,
boats and personnel[205].
4.6.3. South African National Defence Force (SANDF)
The primary mandate of the South African National Defence Force (SANDF)
is to protect the national borders, defend and protect the Republic, its
territorial integrity and its people [109]. In addition, the SANDF is mandated to
provide essential services, which includes humanitarian assistance, Search
and Rescue, and national border control [110]. The SANDF is regarded as the
primary and most critical national Search and Rescue asset[206]. This includes
the provision of ships and aircraft, crews and personnel, communications
infrastructure, bases, facilities and special equipment[207]. The primary Arms of
Service providing maritime Search and Rescue services are the SA Navy and
the SA Air Force.
4.6.3.1. SA Navy
The role of the SA Navy involves the safeguarding, patrolling, policing and
protecting of our national maritime borders and zones. These include the
Territorial-, Contiguous-, Excusive Economic- and Continental Shelf zones of
the country, and includes the Prince Edward/Marion Island Group [45]. Other
specialised roles include Search and Rescue[45].
This requires a Naval Fleet capable of operating anywhere within our
sovereign waters, and beyond. The Search and Rescue role alone
necessitates the Navy to operate the entire national Search and Rescue
Region, which, according to the Navy, covers an area of more than 17.2

4-16
million km2 [45]. The SA Navy currently owns no aircraft of its own, but utilises
the services of the SA Air Force for maritime air support.
4.6.3.2. SA Air Force
In addition to protecting the sovereignty of the nation and safeguarding our
borders, the SA Air Force is to provide essential services (as for the SA navy).
This includes the provision of Search and Rescue services across the entire
national maritime Search and Rescue Region.
4.6.4. National Ports Authority (NPA)
Although the National Ports Authority (NPA) core business is not Search and
Rescue, it plays an important role in this regard. This includes ensuring that
Port Control centres perform their duties as Rescue Sub-Centres and
Secondary Rescue Sub-Centres; ensuring that all light houses act as alerting
posts; and providing essential communications during Search and Rescue
activities[208]. NPA do operate three light helicopters for transporting of
personnel to and from ships, primarily in the Harbour Pilot Shuttle (HPS)
service[209][210]. These assets are employed for maritime Search and Rescue
services, should the need arise.
4.6.5. Titan Helicopter Group
Titan Helicopter Group is a global initiative, with a regional head office in Cape
Town, and operating bases in Cape Town docks and George. Operations
include oil rig support, heli-ship services, diamond production vessel support,
marine pilot services, surveys, ad-hoc charters and Rescue Services[211]. Titan
Helicopters places a strong focus on Search and Rescue and Emergency
Medical Services, providing well-trained crews and specialist rotorcraft
assets[212].
4.7 Conclusion
It is evident that South Africa is legally and morally bound to provide a World
class Search and Rescue service; this includes its maritime regions. South
Africa has pledged to provide an effective, efficient, well-organised and
professional Search and Rescue service within the full scope of its Search

4-17
and Rescue Regions. The South African Search and Rescue Organisation
has been created to effect and coordinate this service, along with several
Organisations capable of providing specialised assets to the cause.
The South African maritime Search and Rescue Region is one of the five
largest worldwide. Surface and airborne Search and Rescue assets are
required to be able to operate effectively and efficiently to the extremities of
this region, a distance of more than 2800nmi from the nearest major port or
airfield. Although assets are grouped into classes, and thus not all assets are
required to be able to meet this demand, at least one such an asset should be
available to fulfil this requirement.
The next chapter will examine in more detail the minimum performance
requirements for a Search and Rescue asset required to operate effectively
up to the national maritime Search and Rescue Region extremities.

5-1
Chapter 5
5. Quantifying the Key Performance Requirements
The previous Chapter determined the necessity for Search and Rescue
assets to be able to operate effectively within the entire South African
maritime Search and Rescue Region, up to and including the Region
extremities[143][176][182][213][214][215][216][217][218]. A comparative study will be
performed in later Chapters to determine whether any existing Search and
Rescue assets currently meet this requirement. As a precursor to this
comparative study, the key performance requirements for such an asset need
to be determined. This Chapter will examine the factors influencing these key
performance requirements, and quantify them.
5.1. Generic Requirements for Maritime Search and Rescue Aircraft
5.1.1. Airborne Assets: Typical Advantages
Aircraft are essential assets to any Search and Rescue mission. Aircraft can
be either fixed wing, rotary wing (helicopters), or a combination, typically tilt-
rotors. Aircraft possess unique design features enabling them to perform
certain tasks more effectively than surface vessels (ships and boats). Typical
advantages offered by aircraft employed for Search and Rescue operations
include[242][243][244][247][248][249]:
The ability to cover great distances and large areas in a short time;
The ability to carry and deliver stores (rescue supplies, dinghies,
markers, etc) with high accuracy to those in distress;
The ability to act as an airborne command post or communications
relay during the operation;
The ability to detect objects beyond the natural horizon for ships or
vehicles (early detection).

5-2
5.1.2 Aircraft Configuration, Specialisation and Application
Aircraft are often specialised, specifically configured or purpose-designed for
specific roles, tasks or missions. As a result, aircraft rarely have equal
abilities; some are designed to operate over specific ranges (either long or
short); some are designed with Vertical Take-off and Landing capabilities;
some have the ability to stay airborne for many hours (endurance and
persistence); others are designed for high speed. The same holds true for
Search and Rescue; aircraft are chosen and applied within the Search and
Rescue environment to exploit inherent design characteristics to the
maximum.
5.2. Factors Influencing the Key Performance Requirements
Many factors influence the choice of performance characteristics for aircraft.
The following are typical factors having a direct influence on the key
performance requirements for aircraft employed in Search and Rescue:
Size of the Search Area (range, endurance, persistence);
National oceanographic characteristics (hostility, visibility, average sea
state, etc);
Marine weather patterns and climatic conditions (surface air
temperatures, wind speed, precipitation levels, etc);
General activity involving humans across the Search and Rescue
Region (shipping, leisure, mining, aeronautical, etc);
Level of interaction and cooperation between neighbouring States
(potential extension of Search Area).
As a result, each nation’s requirements will be unique to some extent.
5.3. Key Performance Requirements
5.3.1. Generic Requirements
Rescue missions imply that people are in imminent danger of losing their
lives. As a result, time is always of the essence, as those in distress need to

5-3
be located and rescued in the shortest time possible. Additionally, it is
essential that search parties remain in the search area for as long as possible,
and cover as large an area as possible, implying endurance and persistence.
These basic generic requirements will always be associated with Search and
Rescue assets, regardless of specific national requirements. More specifically,
all Search and Rescue assets feature the following key performance
requirements[243][244][248]:
Speed: Speed is essential in order to reach the search area or rescue
scene in the shortest time possible. The speed of the asset should
therefore be as high as possible.
Endurance: Endurance is essential to afford assets to stay in the
search area and prolong searches for as long as possible. The
endurance and persistence of the asset should therefore be as long as
possible.
Range: Depending on the extent and limits of the search area, reach,
or range, might also be of vital importance. In consideration of the
vastness of the national Search and Rescue Region, and the great
distances to its extremities, the reach and range capability of the asset
should be as great as possible.
5.3.2. Speed Quantification
Hypothermia sets in rapidly in cold water, and a large portion of the national
maritime Search and Rescue Region is replete with icy water. The average
annual sea surface temperatures around Southern Africa ranges between 16
and 26oC[12][22][23], while the average annual sea surface temperature around
Marion Island is between 3 and 10oC[27][30]; and this is only halfway to the
Antarctic.
Hypothermia Charts indicate that, for water at a temperature of 50 to 60
degrees Fahrenheit (10 to 15.5oC), exhaustion or unconsciousness occurs in
1 to 2 hours, while expected time of survival is between 1 and 6 hours[237].
Survival times rapidly diminish below 10oC. In consideration of these facts, it

5-4
is therefore imperative that Search and Rescue assets be capable of reaching
the specified search area within 6 hours at most.
5.3.3. Search Time and Endurance Quantification
Before attempting to quantify endurance, the Search Time needs to be
quantified. The Search Time is the time the asset needs to stay in the search
area, looking for survivors. This figure is not specifically defined by major
Search and Rescue Organisations, but remains important for this study, as it
potentially constitutes a considerable percentage of the overall endurance of
the Search and Rescue asset.
The South African Air Force Directorate Air Capability and Plans has specified
a four-hour Search Time (loiter) requirement for SAAF Search and Rescue
operations[238], while operating at the maximum specified range. Therefore, as
a benchmark, and for the purposes of this thesis, the Search Time is
quantified as four hours minimum, at the required search range.
The total endurance is therefore quantified as the time required to reach the
search area, plus four hours search time, plus the time required to return to
base, plus an additional hour to cater for emergencies.
5.3.4. Range Quantification
The range requirement of the asset is dependent on the extent and limits of
the search area, and projected location of those in distress. The total range is
quantified as the distance to the search location, plus the distance travelled
during the four hour loiter, plus the distance travelled back to base, plus the
distance travelled in one hour (emergencies), all at maximum cruise speed.
The primary aim of this thesis is the specification of an airborne asset useful
at the Search and Rescue Region extremities[248] (i.e. maximum search
location). However, for completeness, six search locations will be considered,
and the speed, endurance and total range will be calculated for each of these
locations. The six search locations are the following:
Limit of the Territorial Waters (12nmi)

5-5
Limit of the Contiguous and Maritime Cultural Zone (24nmi)
Limit of the Exclusive Economic Zone (200nmi)
Limit of the Continental Shelf (350nmi)
Limit of the Marion Island Rim (1770nmi)
Limit of the national maritime Search and Rescue Region (search
extremities) (2800nmi).
5.4. Quantifying the Key Performance Requirements
Appendix I contains the detail calculations and train of thought for each of the
six search locations identified above.
5.5. Key Performance Requirement Summary
In summary, the key performance requirement minimums (speed, range and
endurance) for aircraft performing Search and Rescue activities to the limits of
each of the six search locations, as defined above, are as follows:
5.5.1. Territorial Waters
Speed: 50kn
Range: 274nmi
Endurance: 5h 29m
5.5.2. Contiguous and Maritime Cultural Zone
Speed: 50kn
Range: 298nmi
Endurance: 5h 58m
5.5.3. Exclusive Economic Zone
Speed: 50kn

5-6
Range: 650nmi
Endurance: 13h
5.5.4. Continental Shelf
Speed: 58.3kn
Range: 1166.4nmi
Endurance: 17h
5.5.5. Marion Island Rim
Speed: 295kn
Range: 4425nmi
Endurance: 17h
5.5.6. Search Extremities
Speed: 466.7kn
Range: 7933.5nmi
Endurance: 17h
5.6. Conclusion
The key performance requirements, i.e. speed, range and endurance, for
maritime Search and Rescue aircraft operating at the limits of six pre-defined
search locations, have been quantified. These key performance requirement
figures will be used in a later chapter to compare with performance figures of
existing maritime Search and Rescue aircraft, and to determine deficits and
shortcomings, if any.

6-1
Chapter 6
6. Determining the Special SAR Equipment Requirement
Chapter 5 identified and quantified the key performance requirements for a
Search and Rescue aircraft operating over the entire national maritime Search
and Rescue Region. In addition, due to the nature of the tasks to be
performed, Search and Rescue aircraft are highly specialised vehicles, and
are ideally equipped with special Search and Rescue equipment. The
technological enhancements provided by special SAR equipment assist
search parties in locating survivors in poor weather conditions, high sea
states, over long distances or in the dark. Although the use of such technology
is no guarantee for success, the addition of such equipment provides search
parties with essential tools to help them and to greatly enhance the chances
of mission success[10]. Without the added benefit of technology, search parties
are required to rely only on natural or binocular-enhanced eye-sight. This
could lead to longer search times, putting survivors at risk of not being located
in time, or at all, resulting in a potentially failed operation.
This chapter examines the special SAR equipment available and determines
the minimum equipment configuration required to conduct effective maritime
Search and Rescue operations.
6.1. Special SAR Equipment
6.1.1. Search Equipment
Primary special Search equipment available for maritime Search and Rescue
aircraft includes Forward Looking Infra Red sensors, Electro-Optical & Infra
Red sensors, Maritime Search Radar and Search and Rescue Direction
Finders[225][226][247][248].
6.1.1.1. Forward Looking Infra Red (FLIR) Sensor
A FLIR sensor operates in the Infrared (IR) bandwidth of the light spectrum. It
is used to detect and identify warm objects under low light conditions[222], and
is therefore ideal and essential for locating objects or persons at night or in
bad weather conditions, offering low visibility. An IR sensor can distinguish

6-2
between cold and warm objects, and is therefore helpful in detecting survivors
(warm bodies) in the colder surrounding ocean[222].
An EO/IR sensor turret incorporates an IR thermal sensor and a high
resolution optical colour camera[223]. Both the IR sensor and colour camera
are housed in the same turret, and can be coupled with additional laser
payloads. Once radar has detected and located an object, the sensor turret
can be slaved to the radar[241][249], and, depending on range, light and
environmental conditions, either the IR, or the optical camera, or both, can be
directed and zoomed onto the object for detail identification.
For the purposes of this thesis, the optical sensor will be referred to as “FLIR”,
and incorporates both an IR sensor, a high resolution optical colour camera
and laser payloads.
6.1.1.2. Maritime Search Radar (MSR)
Maritime Search- or Surveillance Radar[246] is high resolution radar designed
to detect objects as small as periscopes, humans and small dinghies in rough
sea conditions. Complex algorithms and powerful processing techniques are
employed to enable these radars to distinguish between wave clutter and
physical objects[224]. Radar has far superior detection ranges over FLIR or
EO/IR sensors, and therefore remains the primary search, locate and detect
sensor. Depending on the system design, once an object has been detected
with radar, the FLIR or EO/IR sensor can be slaved[224][241][249] to it and be
directed onto the object for detail identification.
6.1.1.3. Search and Rescue Direction Finder (SAR DF)
A Search and Rescue Direction Finder (SAR DF) is designed to intercept and
pinpoint emergency beacon signals, emanating from vessels, aircraft or
individuals in distress[225][226]. For a SAR DF to be effective, the vessel, aircraft
or individual being searched for must be in possession of an operative
Emergency Position Indicator Radio Beacon (EPIRB), Emergency Locator
Transmitter (ELT) or a Personal Locator Beacon (PLB)[225][226][227]. EPIRBS are
buoyant and are carried aboard ships, ELTs are carried aboard aircraft, and

6-3
PLBs are usually man-portable and employed predominantly for land-based
applications[226][227][228].
Emergency beacons operate on specific frequencies. Prior to 1 February
2009, emergency beacons operated on 121.5 MHz (or 243 MHz for military
applications) VHF and 406 MHz UHF[226][227]. Due to accuracy and reliability
issues, and the fact that no GPS or other digital data can be sent, satellite
detection of the 121.5 and 243 MHz beacons have been
discontinued[226][227][228]. These frequencies are now only used for short-range
location during SAR operations. Satellite detection of emergency signals has
now been superseded by the 406 MHz beacon[226][227]. For maritime
applications, distress signals can also be transmitted on dedicated maritime
channels, operating over the frequency range 156 – 162.025 MHz[225][226].
406 MHz signals are intercepted by COSPAS-SARSAT satellites, transmitted
to satellite ground receivers, and relayed to rescue centres. By using the
original GPS position provided by the satellites as a starting point, search
aircraft or vessels equipped with SAR DF can home in on the signal and
locate survivors[228].
A modern SAR DF should be able to intercept all emergency locator
transmitter frequencies.
6.1.1.4. Search Light
Although not as effective as an EO/IR or FLIR sensor, a powerful search
light[248] is valuable in low light conditions, particularly at very close ranges
during the actual rescue. It also provides light to survivors and rescuers, and
to those interacting with them, during the rescue.
6.1.2. Rescue Equipment
Complementing Search equipment is Rescue equipment. In terms of maritime
Search and Rescue, Search and Rescue aircraft are primarily used in the
“Search” role, to locate survivors; actual rescuing is primarily performed by
surface vessels. Rotary wing and tilt-rotor aircraft are a notable exception.
This aside, all maritime Search and Rescue aircraft should be equipped with

6-4
certain Rescue equipment as a minimum, capable of assisting survivors at
sea until additional aid arrives.
Primary special Rescue equipment employed on maritime Search and Rescue
aircraft includes Satellite Communication, Location Markers, Aid Life Supply
Canisters and Rescue Hoists[227][228][235][247][248].
6.1.2.1. Satellite Communication (SATCOM)
Communication is vital during the Search and Rescue operation, but even
more so during the actual rescue effort. Maritime Search and Rescue aircraft
operate over an environment devoid of repeater antennas to cover the
potentially vast distances. As long as there is satellite coverage, SATCOM will
provide maritime Search and Rescue aircraft unlimited communications
capability (voice and data), irrespective the location or range from
base[229][230][231].
Broadband SATCOM provides the capability to not only transfer voice and low
volume data, but medium- to high definition, or near-real-time, picture and
video as well[248]. SATCOM is also particularly useful for the relaying of the
location of survivors to surface vessels or other aircraft, and is essential for
seamless communication between Search and Rescue parties during the
search effort.
6.1.2.2. Marine Location Markers
Marine Location Markers typically[234] include smoke markers and/or smoke
markers incorporating flares, and are used to mark the physical location of
survivors at sea. Visible over great distances, the markers provide a visual
homing cue for surface vessels and aircraft tasked to perform the rescue. New
types incorporate a 406 MHz emergency beacon, or employ only the beacon
and exclude the smoke generation component[234].
6.1.2.3. Aid Life Supply Canisters
Aid Life Supply Canisters are dropped near to survivors at sea and contain life
support gear. Typical gear included in Aid Life Supply Canisters are[235]:

6-5
Life Raft
Life Vest
Thermal Blanket
Medical Supplies
Locator Transmitter
Dry clothing and towel
Food supplies
6.1.2.4. Rescue Hoist
A rescue hoist is only usable on an aircraft type capable of entering into a
hover. Many Search and Rescue helicopters are equipped with a rescue hoist,
or can be easily configured with one. The hoist is used during the rescue
operation to transfer survivors to the rescue vehicle.
6.2. Special SAR Equipment: Minimum Equipment Configuration
6.2.1 Minimum Search Equipment
As a minimum, and as deduced for this thesis, the following Search
equipment should form part of the standard fitment for an aircraft deployed for
maritime Search and Rescue operations:
Forward-looking Infrared (FLIR) sensor
Maritime Search Radar (MSR)
Search and Rescue Direction Finder (SAR DF)
6.2.2. Minimum Rescue Equipment
As a minimum, and as deduced for this thesis, the following Rescue
equipment should form part of the standard fitment for an aircraft deployed for
maritime Search and Rescue operations:

6-6
Satellite Communication (SATCOM)
Marine Location Markers (MLM)
Aid Life Supply Canisters (ALSC)
6.3. Conclusion
The minimum special maritime Search and Rescue equipment configuration
has been defined for an aircraft to be effective during maritime Search and
Rescue operations. This configuration will be used in a later chapter to
compare with the equipment configuration of existing maritime Search and
Rescue aircraft, and to determine deficits and shortcomings, if any.

7-1
Chapter 7
7. Maritime Search and Rescue Aircraft: Domestic
Aircraft form an essential part of any Search and Rescue operation,
particularly when those in distress are located in a remote or hostile
environment. This chapter examines which aircraft types are currently
available in South Africa, and are deployable for maritime Search and Rescue
tasks. Special attention will be given to their key performance figures, as well
as special SAR equipment configurations.
7.1. Domestic Aircraft Types Currently Available for Maritime Search and Rescue
The SASAR Assets Manual contains details of all domestically available
assets (aircraft, ships, etc) deployable for Search and Rescue operations.
Unfortunately, SASAR was unable to provide an up-to-date version of the
SASAR Assets Manual before the completion of this thesis. Asset availability
was therefore confirmed verbally with personnel at SASAR and from
information provided by Operators. SASAR did confirm that, although they do
make use of civilian operators to supply assets, their foremost supplier for
aircraft for SAR operations remains the South African Air Force.Other
potential suppliers (of civilian aircraft) include the South African Police
Services, National Port Authority and Titan Helicopter Group.
Civil rotor wing aircraft not equipped with floatation gear are prohibited from
operating far from the coast[114]. Such operations are restricted to the
Territorial Waters, and often even closer, within the Littoral Zone. Rotor wing
aircraft equipped with floatation gear are restricted in range from the coast
primarily due to fuel limits. For the purposes of this study, the effect due to
LACK of floatation gear was ignored. In other words, it has been assumed that
any aircraft not equipped with floatation gear as standard could be modified
accordingly, thereby allowing maximum range from shore limited only by the
fuel supply.
Appendix G contains a detailed summary of the available airborne assets.

7-2
7.1.1 South African Air Force (SAAF)
The South African Air Force is the primary supplier of aircraft for domestic
Search and Rescue. The SAAF have at their disposal 83 rotary wing and 35
fixed wing aircraft, deployable for maritime Search and Rescue operations. As
explained in detail in Appendix G, these aircraft include both deployable
(dedicated, equipped types with fully trained crews) and potentially deployable
(remote chance) types.
7.1.2. South African Navy (SAN)
Although the South African Navy does not own any aircraft, it does have at its
disposal 4 rotary wing aircraft, deployable for maritime Search and Rescue
operations.
7.1.3. South African Police Services (SAPS)
According to SASAR, the South African Police Services are not primary
suppliers of aircraft for maritime Search and Rescue. Due to the lack of
floatation gear, all potential rescue work is carried out very close to the
shoreline (maximum 2nmi from the cost). Appendix G contains a summary of
the types potentially deployable, in the remote event of this being a
requirement. As mentioned, the lack of floatation gear has been ignored in the
range analysis.
7.1.4. The National Ports Authority (NPA)
Acher Aviation operates a fleet of 3 helicopters on behalf of the National Ports
Authority. The helicopters are primarily used for Marine Pilot Services, but are
also employed for maritime SAR, within a 100nm radius from either Durban or
Richards Bay, when required[31][221]. Appendix G contains a detailed list of the
types available.
7.1.5. Titan Helicopter Group
Titan Helicopter Group have at their disposal 12 rotary wing and 2 fixed wing
assets, deployable for maritime Search and Rescue operations. Appendix G
contains a detailed list of the types available.

7-3
7.2. Domestic Search and Rescue Aircraft: Key PerformanceFigures
Table 7.1 summarises the key performance figures (maximum cruise speed
and maximum range and endurance at maximum at cruise speed) for each
aircraft type. Refer to Appendix H for a detailed analysis of how these figures
were derived.
Aircraft TypeDomestic SMax (nmi) VCruise (kn) TMax (h)Agusta Westland A109 LUH 500 153 3h16mAgusta Westland A109E Power 512 154 3h19mAgusta Westland A109S Grand 424 156 2h43mBeech King Air 200/B200C 1974.3 289.4 6h49mBeech King Air 300 1960.4 315.4 6h12mBell 212 Twin Huey 236.4 100 2h21mCASA 212-200/300 800 180 4h26mCASA CN-235 (prototype) 2000 230 8h42mCessna C208A Caravan 869 175 5hConvair 580 1200 280 4h17mDenel Oryx M1/M2 827 120 6h53mDouglas C47-TP MP&NT 1300 160 8h7mEurocopter AS 350 B3 359 140 2h33mEurocopter EC 120B Colibri 383 120 3h11mKamov Ka-32A 475 118.8 4hLockheed C-130BZ Hercules 2699.8 300 9hMBB BO105 CBS-5 600 134 4h28mMBB/Kawasaki BK117 307.6 133.8 2h17mMD Helicopters MD-500E 287 170 1h41mMil Mi-8 MTV 567 116 4h53mMil Mi-8 P 737 116 6h21mPilatus PC-6 Porter 500 125 4hPilatus PC-12 1560 280 5h34mRobinson R44 Raven II 304.1 117 2h35mSikorsky S-61N MkII 400.6 114.4 3h30mSikorsky S-76A++ Spirit 411 137 3hWestland Super Lynx 300 280 132 2h7m
Table 7.1: Domestic Maritime Search and Rescue Aircraft: Key Performance Figures
7.3. Domestic Search and Rescue Aircraft: Special SAR Equipment
Table 7.2 summarises the special SAR equipment configurations as standard
fitment on the aircraft types as operated locally and as identified in Table 7.1.
Only Special SAR equipment types as specified in Chapter 6 par 6.2 has been
considered.

7-4
Aircraft TypeDomestic ESearch ERescueAgusta Westland A109 LUH FLIR
SAR DFnone
Agusta Westland A109E Power Radar (weather only) noneAgusta Westland A109S Grand Radar (weather only) SATCOMBeech King Air 200/B200C Radar (weather only)Beech King Air 300 Radar (weather only)Bell 212 Twin Huey Radar (weather only) noneCASA 212-200/300 Radar (weather only) noneCASA CN-235 (prototype) Radar (weather only)Cessna C208A Caravan Radar (weather only) noneConvair 580 Radar (weather only) NoneDenel Oryx M1/M2 Radar (weather only)
SAR DFDouglas C47-TP MP&NT Radar (weather only) MLM
ALSCEurocopter AS 350 B3 FLIR (SAPS) noneEurocopter EC 120B Colibri none noneKamov Ka-32A MSR noneLockheed C-130BZ Hercules Radar (weather only) MLM
ALSCMBB BO105 CBS-5 FLIR (SAPS) noneMBB/Kawasaki BK117 FLIR (SAPS) noneMD Helicopters MD-500E LEH FLIR noneMil Mi-8 MTV Radar (weather only) noneMil Mi-8 P none nonePilatus PC-6 Porter FLIR nonePilatus PC-12 Radar (weather only)Robinson R44 Raven II FLIR noneSikorsky S-61N MkII Radar (weather only) noneSikorsky S-76A++ Spirit Radar (weather only) SATCOMWestland Super Lynx 300 FLIR
MSRSAR DF
SATCOM
Table 7.2: Domestic Maritime Search and Rescue Aircraft: Special SAR
Equipment Configurations
7.4. Conclusion
South Africa is in possession of a number of capable aircraft types deployable
for maritime Search and Rescue operations. The full extent of the capability
will be measured in Chapter 10, by comparing these key performance figures
and special SAR equipment configurations with the requirements derived in
Chapters 5 and 6.

8-1
Chapter 8
8. Maritime Search and Rescue Aircraft: Foreign
This chapter examines which aircraft types are currently available on the
International front, and are deployable for maritime Search and Rescue
missions. As for the domestic analysis in the previous chapter, special
attention will be given to their key performance figures, as well as special SAR
equipment configurations.
8.1. Foreign Search and Rescue Aircraft: Key Performance Figures
Table 8.1 summarises the key performance figures (maximum cruise speed
and maximum range and endurance at maximum at cruise speed) for each
aircraft type. To avoid duplication, domestic types already covered in Chapter
7, but which are also used by foreign operators, have not been repeated in
this table. Additionally, unmanned systems are covered in a separate chapter.
Refer to Appendix H for a detailed analysis of how these figures were derived.
It should furthermore be note that the following aircraft are either proposed
development models or are still in development and therefore performance
figures are best estimates supplied by the respective Design Organisations:
Alenia/ATR 72 ASW
Dassault Falcon 900 MPA

8-2
Aircraft TypeForeign SMax (nmi) VCruise (kn) TMax (h)Agusta Westland AW139 573 165 3h28mAgusta Westland Merlin HM1 900 136 6h37mAlenia/ATR 42 MP Surveyor 2020 190 10h37mAlenia/ATR 72 ASW 1505 145 10h22mAlenia C27J Spartan 3200 325 9h50mBAe Nimrod MRA4 6000 442.8 13h33mBell 214 ST 435.4 140 3h6mBell 407 383 118 3h14mBell 412 EP 423 131 3h13mBell 427 400 133 3hBell 429 350 142 2h27mBell/Agusta BA 609 700 275 2h32mBell/Boeing MV-22B Osprey 1800 250 7h12mBell UH-1Y Venom 260 135 1h55mBoeing P-8A Poseidon 3160 490 6h26mBombardier/DHC Dash 8 Q200 973 290 3h21mBombardier/DHC Dash 8 Q400 1526 361 4h13mCASA CN-235MP Persuader 2300 130 17h41mCASA C-295 Persuader 2400 145 16h33mDassault Atlantique ATL2 4900.2 299.8 16h20mDassault Falcon 900 MPA 4100 496.1 8h15mEmbraer P-99 (EMB 145 MP) 2050 444.1 4h36mEurocopter AS 332 L2 Super Puma 446 150 3hEurocopter AS 365 N3 Dauphin 427 145 3hEurocopter AS 532 SC Cougar 492 136 3h37mEurocopter AS 555 Fennec 375 118 3h10mEurocopter AS 565 Panther 427 145 3hEurocopter EC 225 Super Puma 506 141.5 3h34mEurocopter EC 725 Cougar 692 141 4h54mEurocopter MH-65C Dolphin 300 165 1h49mFairchild-Dornier Do-228-101 MPA 1722.3 165.1 10h25mFokker 50 Maritime 2340 150 15h36mIlyushin Il-38 May 4049.4 348.5 11h37mKaman SH-2G Super Seasprite 540 120 4h30mLockheed HC-130J Hercules 5500 339 16h13mLockheed P-3C OrionLockheed CP-140 Aurora
4760 328 14h30m
MD Helicopters MD-600N 423 115 3h40mNH Industries NH90 FSH/NFH 659 132 5hReims-Cessna F406 1200 246 4h52mShaanxi Y-8X MPA 4211 350 12h1mSikorsky CH-148 Cyclone (MH-92) 525 137 3h49mSikorsky CH-53E Super Stallion 1119.9 150.1 7h27mSikorsky MH-53E Sea Dragon 1050 150 7hSikorsky MH-60J Jayhawk 300 170 1h45mSikorsky S-70B Sea Hawk 450 146 3h4mTupolev Tu-142M Bear-F 6775 500 13h33m
Table 8.1: Foreign Maritime Search and Rescue Aircraft: Key Performance
Figures

8-3
8.2. Foreign Search and Rescue Aircraft: Special SAR Equipment
Table 8.2 summarises the special SAR equipment configurations as standard
fitment on the aircraft types identified in Table 8.1, and as configured for
Maritime SAR. The best-case scenario was chosen for each aircraft type; it is
very difficult to provide a generic configuration, since it is largely customer
driven. Only Special SAR equipment types as specified in Chapter 6 par 6.2
has been considered. Options in italics indicate equipment features presumed
standard, but for which no substantiation could be found.
Aircraft TypeForeign ESearch ERescueAgusta Westland AW139 FLIR
MSRAgusta Westland Merlin HM1 FLIR
MSRSAR DF
SATCOM
Alenia/ATR 42 MP Surveyor FLIRMSRSAR DF
MLM (by hand)ALSC
Alenia/ATR 72 ASW FLIRMSRSAR DF
MLM (by hand)ALSC
Alenia C27J Spartan Radar (weather and tactical)SAR DF
SATCOM
BAe Nimrod MRA4 FLIRMSRSAR DF
SATCOM
Bell 214 ST Radar (weather only) noneBell 407 FLIR noneBell 412 EP FLIR
Radar (weather only)none
Bell 427 Radar (weather only) noneBell 429 FLIR NoneBell/Agusta BA 609 Radar (weather only) noneBell/Boeing MV-22B Osprey FLIR
Radar (weather and tactical)SAR DF
SATCOM
Bell UH-1Y Venom FLIR SATCOMBoeing P-8A Poseidon FLIR
MSRSAR DF
SATCOM
Bombardier/DHC Dash 8 Q200 FLIR (MSA version)ESM (MSA version)SAR DF (MSA version)
SATCOM (MSA version)MLM (MSA version, by hand)ALSC (MSA version, by hand)
Bombardier/DHC Dash 8 Q400 Radar (weather only) noneCASA CN-235MP Persuader FLIR
MSRSAR DF
SATCOMMLM (by hand)ALSC (by hand)
CASA C-295 Persuader FLIRMSRSAR DF
SATCOMMLM (by hand)ALSC (by hand)
Dassault Atlantique ATL2 FLIRMSR
SATCOMMLM
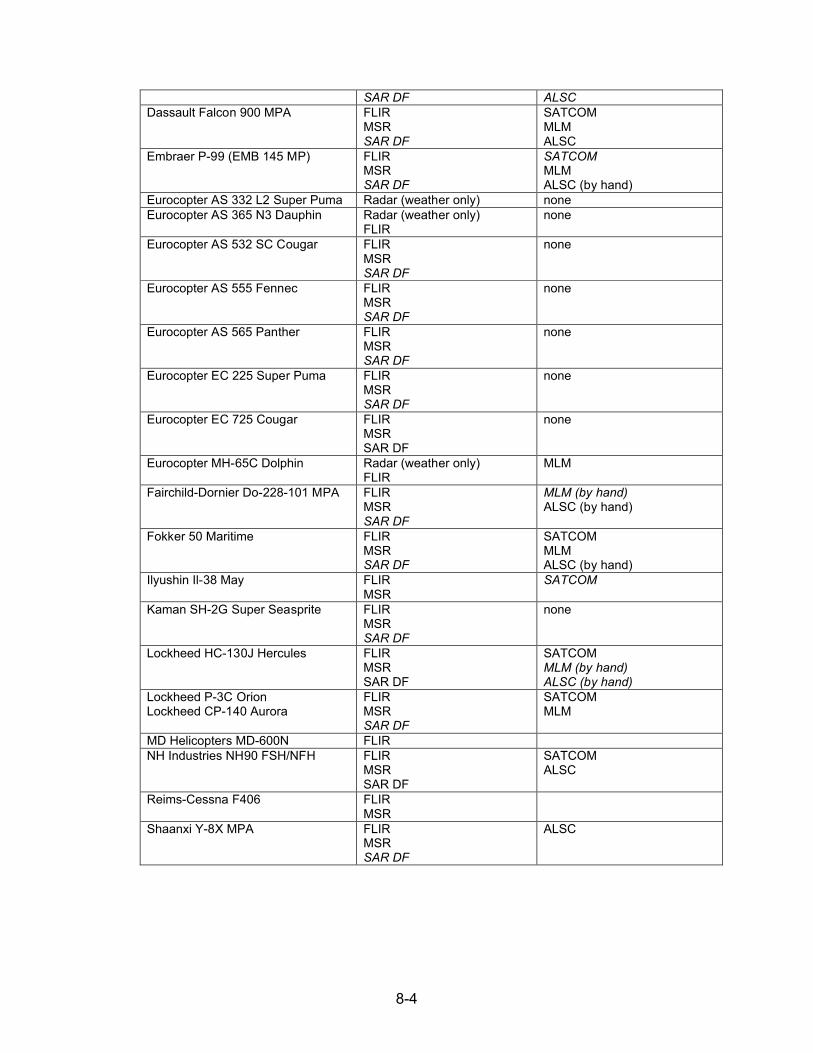
8-4
SAR DF ALSCDassault Falcon 900 MPA FLIR
MSRSAR DF
SATCOMMLMALSC
Embraer P-99 (EMB 145 MP) FLIRMSRSAR DF
SATCOMMLMALSC (by hand)
Eurocopter AS 332 L2 Super Puma Radar (weather only) noneEurocopter AS 365 N3 Dauphin Radar (weather only)
FLIRnone
Eurocopter AS 532 SC Cougar FLIRMSRSAR DF
none
Eurocopter AS 555 Fennec FLIRMSRSAR DF
none
Eurocopter AS 565 Panther FLIRMSRSAR DF
none
Eurocopter EC 225 Super Puma FLIRMSRSAR DF
none
Eurocopter EC 725 Cougar FLIRMSRSAR DF
none
Eurocopter MH-65C Dolphin Radar (weather only)FLIR
MLM
Fairchild-Dornier Do-228-101 MPA FLIRMSRSAR DF
MLM (by hand)ALSC (by hand)
Fokker 50 Maritime FLIRMSRSAR DF
SATCOMMLMALSC (by hand)
Ilyushin Il-38 May FLIRMSR
SATCOM
Kaman SH-2G Super Seasprite FLIRMSRSAR DF
none
Lockheed HC-130J Hercules FLIRMSRSAR DF
SATCOMMLM (by hand)ALSC (by hand)
Lockheed P-3C OrionLockheed CP-140 Aurora
FLIRMSRSAR DF
SATCOMMLM
MD Helicopters MD-600N FLIRNH Industries NH90 FSH/NFH FLIR
MSRSAR DF
SATCOMALSC
Reims-Cessna F406 FLIRMSR
Shaanxi Y-8X MPA FLIRMSRSAR DF
ALSC

8-5
Sikorsky CH-148 Cyclone (MH-92) FLIRMSRSAR DF
SATCOM
Sikorsky CH-53E Super Stallion FLIRRadar (weather and tactical)
none
Sikorsky MH-53E Sea Dragon Radar (weather and tactical) noneSikorsky MH-60T Jayhawk FLIR
MSRSAR DF
ALSC
Sikorsky S-70B Sea Hawk FLIRMSRSAR DF
ALSC
Tupolev Tu-142M Bear-F FLIRMSR
SATCOM
Table 8.2: Foreign Maritime Search and Rescue Aircraft: Special SAR
Equipment Configurations
8.3. Conclusion
Foreign operators are in possession of a number of capable aircraft types
deployable for maritime Search and Rescue operations. The full extent of the
capability will be measured in Chapter 10, by comparing these key
performance figures and special SAR equipment configurations with the
requirements derived in Chapters 5 and 6.

9-1
Chapter 9
9. Maritime Search and Rescue Aircraft: Unmanned
Many countries employ unmanned aircraft for various tasks. This chapter
examines which unmanned aircraft types are currently available and
deployable for maritime[243][244] Search and Rescue tasks. As for the domestic
and foreign analysis in the previous chapters, special attention will be given to
their key performance figures, as well as special SAR equipment
configurations.
9.1. Unmanned Search and Rescue Aircraft: Key Performance Figures
Table 9.1 summarises the key performance figures (maximum cruise speed
and maximum range and endurance at maximum at cruise speed) for each
aircraft type. In addition to these three figures, the maximum communications
range for each unmanned aircraft system has been included. Many unmanned
aircraft are limited in range simply due to limits in communications range.
Unmanned aircraft typically employ either a line-of-sight link, or a beyond-
visual-range satellite link[236][245], or a combination. Line-of-sight links limit the
operational radius (and therefore the maximum search range) to around
110nmi (~200km)[236] from the base of operations. Many of these aircraft can,
however, remain in the air at this limited range for many hours, thereby
increasing Search Time and endurance.
Refer to Appendix H for a detailed analysis of how these figures were derived.
It should furthermore be note that the following aircraft are either proposed
development models or are still in development and therefore performance
figures are best estimates supplied by the respective Design Organisations:
Denel Dynamics Bateleur

9-2
Aircraft TypeUnmanned SComms
(nmi)SMax
(nmi)VCruise
(kn)TMax (h)
AAI RQ-7B Shadow 200 68 540 90 6hBAe HERTI Range max 2250 90 25hBell TR916 Eagle Eye 100 800 200 4hBoeing A160T Hummingbird 110 2250 112.5 20hDenel Dynamics Bateleur Satcom 2430 135 18hEADS ORKA-1200 Tactical 110 842 105.3 8hElbit Hermes 450 108 (std) 1400 70 20hElbit Hermes 1500 108 (std) 2080 80 26hGeneral Atomics RQ-1/MQ-1 Predator Satcom 4800 120 40hGeneral Atomics MQ-9 Reaper Satcom 7200 240 30hGeneral Atomics Mariner Satcom 7100 157 45h13mIAI Heron TP (Eitan) Satcom 7200 200 36hIAI/EADS Eagle 1/Heron 1/Harfang Satcom 2400 80 30hIAI/EADS Eagle 2 Satcom 4320 180 24hIAI/PUI RQ-2 Pioneer 100 495 110 4h30mInSitu/Boeing ScanEagle Range max 980 49 20hNorthrop Grumman MQ-8B Fire Scout 110 880 110 8hNorthrop Grumman RQ-4A Global Hawk Satcom 12000 343 35hRUAG Ranger 97 630 70 9hSAAB Skeldar V-200 81 350 70 5hSagem Sperwer B 108 972 81 12hSchiebel Camcopter 97 330 55 6Swift Killer Bee 50 972 64.8 15Warrior/Aero-Marine Gull 68 100 1124 100 11h14m
Table 9.1: Unmanned Maritime Search and Rescue Aircraft: Key Performance
Figures
9.2. Unmanned Search and Rescue Aircraft: Special SAR Equipment
Table 9.2 summarises the special SAR equipment configurations as standard
fitment on the aircraft types identified in Table 9.1, and as configured for
Maritime SAR. The best-case scenario was chosen for each aircraft type; it is
very difficult to provide a generic configuration, since it is largely customer
driven. Only Special SAR equipment types as specified in Chapter 6 par 6.2
has been considered. Options in italics indicate equipment features presumed
standard, but for which no substantiation could be found.

9-3
Aircraft TypeUnmanned ESearch ERescueAAI RQ-7B Shadow 200 FLIRBAe HERTI FLIRBell TR916 Eagle Eye FLIR
MSRBoeing A160T Hummingbird FLIR or
Radar (tactical)Denel Dynamics Bateleur FLIR
MSRSATCOM
EADS ORKA-1200 FLIRMSR
Elbit Hermes 450 FLIR orRadar (tactical)
SATCOM
Elbit Hermes 1500 FLIRMSR
SATCOM
General Atomics RQ-1/MQ-1 Predator FLIRMSR
SATCOM
General Atomics MQ-9 Reaper FLIRMSR
SATCOM
General Atomics Mariner FLIRMSR
SATCOM
IAI Heron TP (Eitan) FLIRMSR
SATCOM
IAI/EADS Eagle 1/Heron 1/Harfang FLIRMSR
SATCOM
IAI/EADS Eagle 2 FLIRMSR
SATCOM
IAI/PUI RQ-2 Pioneer FLIRInSitu/Boeing ScanEagle FLIRNorthrop Grumman MQ-8B Fire Scout FLIR or
Radar (tactical)Northrop Grumman RQ-4A Global Hawk FLIR
MSRSATCOM
RUAG Ranger FLIR orRadar (tactical)
SAAB Skeldar V-200 FLIR orRadar (tactical)
Sagem Sperwer B FLIRRadar (tactical)
Schiebel Camcopter FLIR orRadar (tactical)
Swift Killer Bee FLIRWarrior/Aero-Marine Gull 68 FLIR
MSRMLM, ALSC
Table 9.2: Unmanned Maritime Search and Rescue Aircraft: Special SAR
Equipment Configurations
9.3. Conclusion
Foreign and domestic operators are in possession of a number of capable
unmanned aircraft types deployable for maritime Search and Rescue

9-4
operations. The full extent of the capability will be measured in Chapter 10, by
comparing these key performance figures and special SAR equipment
configurations with the requirements derived in Chapters 5 and 6.

10-1
Chapter 10
10. Existing Search and Rescue Aircraft: Shortcomings
The quantified key performance requirements and defined special SAR
equipment will now be mapped against those of the existing maritime Search
and Rescue aircraft, as identified and listed in Chapters 7, 8 and 9.
Shortcomings will be shown for each aircraft type, per search location.
The detailed analysis is contained in Appendix J.
10.1. Existing Search and Rescue Aircraft Shortcomings: Performance
From this analysis, a summary of shortcomings can be presented concerning
the performance of all existing aircraft types currently deployable for maritime
Search and Rescue tasks. Shortcomings are shown per search location.
10.1.1. Territorial Waters
Of those analysed, 29.6% of Domestic, 41.3% of Foreign and 37.5% of
Unmanned types exhibit inherent performance characteristics to enable them
to perform effective Search and Rescue within the Territorial Waters.
To conclude, there are sufficient aircraft types available to perform effective
maritime Search and Rescue within the boundaries of the Territorial Waters.
10.1.2. Contiguous and Maritime Cultural Zone
Of those analysed, 25.9% of Domestic, 41.3% of Foreign and 37.5% of
Unmanned types exhibit inherent performance characteristics to enable them
to perform effective Search and Rescue within the Contiguous and maritime
Cultural Zone.
To conclude, there are sufficient aircraft types available to perform effective
maritime Search and Rescue within the boundaries of the Contiguous and
Maritime Cultural Zone.

10-2
10.1.3. Exclusive Economic Zone
Of those analysed, 0% of Domestic, 17.4% of Foreign and 37.5% of
Unmanned types exhibit inherent performance characteristics to enable them
to perform effective Search and Rescue within the Exclusive Economic Zone.
To conclude, there are sufficient Unmanned aircraft types available to perform
effective maritime Search and Rescue within the boundaries of the Exclusive
Economic Zone. There are only marginally sufficient Foreign types available
for this task, and none of the Domestic aircraft types analysed are capable of
performing effective maritime Search and Rescue beyond the boundaries of
the C&MCZ.
10.1.4. Continental Shelf
Of those analysed, 0% of Domestic, 2.2% of Foreign and 37.5% of Unmanned
types exhibit inherent performance characteristics to enable them to perform
effective Search and Rescue within the Continental Shelf zone.
To conclude, there are sufficient Unmanned aircraft types available to perform
effective maritime Search and Rescue within the boundaries of the
Continental Shelf zone. Only one Foreign type analysed is capable of
performing this task efficiently, and none of the Domestic aircraft types
analysed are capable of performing effective maritime Search and Rescue
beyond the boundaries of the C&MCZ.
10.1.5. Marion Island Rim
Of those analysed, 0% of Domestic, 0% of Foreign and 3.7% of Unmanned
types exhibit inherent performance characteristics to enable them to perform
effective Search and Rescue within the Continental Shelf zone
To conclude, only one of the Unmanned aircraft types analysed is capable of
performing this task efficiently. None of the Foreign aircraft types analysed are
capable of performing effective maritime Search and Rescue beyond the
boundaries of the CS. None of the Domestic aircraft types analysed are
capable of performing effective maritime Search and Rescue beyond the
boundaries of the C&MCZ.

10-3
10.1.6. Search Extremities
In consideration of key performance, none of the 97 aircraft types analysed
are capable of performing effective maritime Search and Rescue to the
extremities of the national Search and Rescue Region.
10.2. Existing Search and Rescue Aircraft Shortcomings: Special SAR Equipment
From this analysis, a summary of shortcomings can be presented concerning
the special SAR equipment configurations of all existing aircraft types
currently deployable for maritime Search and Rescue tasks.
10.2.1. Special SAR Equipment
In consideration of special equipment, none of the 27 Domestic aircraft types
analysed are equipped (as standard) with the full compliment of the special
SAR equipment types required for effective maritime Search and Rescue.
In consideration of special equipment, none of the 24 Unmanned aircraft types
analysed are equipped (as standard) with the full compliment of the special
SAR equipment types required for effective maritime Search and Rescue.
Of the 46 Foreign aircraft types analysed, eight types are potentially fully
equipped. This remains inconclusive and an estimation only (refer par 8.2 for
clarification).
10.3 The Need
The greatest need, in terms of the national maritime Search and Rescue asset
capability, is therefore to find an asset capable of meeting the key
performance requirements for the region beyond the Marion Island Rim and
up to the Search Extremities, whilst meeting the full special SAR equipment
configuration requirement.
10.4. Conclusion
In conclusion, the analysis contained in Part 1 has provided an overview of
the conditions, including natural, environmental, political, legal, organisational
and physical, which have an impact on maritime Search and Rescue in South

10-4
Africa. The analysis has determined the performance and equipment
requirements for airborne maritime Search and Rescue assets, and the
specific environment in which these aircraft will be required to function.
The analysis has taken a specific in-depth look into the performance figures
and equipment levels for existing aircraft currently deployable foe Search and
Rescue, and has considered domestic, foreign and unmanned types. A
comparison was made, and consideration was given to six locations across
the national maritime Search and Rescue Region. Finally, shortcomings were
identified, and the greatest need concerning airborne assets for maritime
Search and Rescue in South Africa has been deduced.
In consideration of the above and the deductions made, it has been
determined that the greatest immediate need is for an asset capable of
providing effective and efficient Search and Rescue services beyond the
1770nmi Marion Island Rim and up to the Search Extremities, whilst meeting
the full special SAR equipment configuration requirement.
Part 2 of this thesis focuses on presenting a concept specification for an
aircraft system capable of fulfilling this need.

PART 2
Unmanned Aircraft System Specification and Concept

11-1
Chapter 11
11. Introduction to Unmanned Aerial Vehicles
11.1. Definition of an Unmanned Aerial Vehicle
There are various definitions for an Unmanned Aerial Vehicle (UAV)[96]. The
list below summarises a few of the most acceptable variations:
“A powered, aerial vehicle that does not carry a human operator, uses
aerodynamic forces to provide vehicle lift, can fly autonomously or be
piloted remotely, can be expendable or recoverable, and can carry a
lethal or nonlethal payload. Ballistic or semi-ballistic vehicles, cruise
missiles, and artillery projectiles are not considered unmanned aerial
vehicles. Also called UAV.”[1]
“An unmanned aerial vehicle is a remotely controlled or autonomous
aircraft used for surveillance and strike missions. Known as UAV's,
these aircraft are useful in situations where it is too dangerous to use
manned aircraft.”[2]
“The UAV is an aircraft designed form the outset to be flown without an
onboard pilot. The UAV is aerodynamically supported.”[3]
“A UAV is an aircraft which is designed to operate with no human pilot
on board, and more generally here with no human being on board.”[4]
“A device used or intended to be used for flight in the air that has no
onboard pilot. This includes all classes of airplanes, helicopters,
airships, and translational lift aircraft that have no onboard pilot.
Unmanned aircraft are understood to exclude traditional balloons.”[5]
“A device that is used or intended to be used for flight in the air that has
no onboard pilot. This includes all classes of airplanes, helicopters,
airships, and translational lift aircraft that have no onboard pilot.”[6]
“An aircraft which is designed to operate with no human pilot on board
and which does not carry personnel. Moreover a UAV is capable of

11-2
sustained flight by aerodynamic means; is remotely piloted or
automatically flies a pre-programmed flight profile; is reusable; is not
classified as a guided weapon or similar one shot device designed for
the delivery of munitions.”[7]
From the above definitions, it is clear that a UAV exhibits the following basic
characteristics:
It is remotely piloted, operated and controlled;
It contains no crew on-board;
It is reusable (excludes missiles and ballistics);
It excludes traditional balloons;
It includes unmanned aircraft, helicopters, airships and translational lift
aircraft;
It is capable of sustained, controlled flight;
It is aerodynamically supported;
UAVs may be used where it is too dangerous to use manned aircraft;
Similarly, various definitions exist for an Unmanned Aerial System
(UAS)[74][105]. The following provide examples:
“The UAV System comprises all those surface borne and airborne
elements necessary to achieve the specified operational objectives.
The system shall ensure that the UAV is always under control. It will be
commanded by internal system and/or external communications
links.”[3]
“A UAV System comprises individual UAV System elements consisting
of the air vehicle (UAV), the remote control station and any other UAV
System elements necessary to enable flight such as a command and
control data link, communication system and launch and recovery

11-3
elements. There may be multiple UAV, remote control stations, or
launch and recovery elements within a UAV System[8].”
“The combination of unmanned aircraft (UA), system elements
necessary to enable the taxiing, takeoff/launch, flight and
recovery/landing of UA, and the elements required to accomplish its
mission objectives. The system elements include control stations,
software, health monitoring, communication, control and data links,
data terminals, payloads, launch & recovery elements, flight termination
systems, support & maintenance equipment, power generation,
distribution & supply, ATC communications equipment, handling,
storage & transport equipment, and related documentation[9].”
“A UAV System comprises individual UAV System elements consisting
of the aerial vehicle (UAV), the UAV control station and any other UAV
System elements necessary to enable flight such as a command and
control data link, communication system and take-off and landing
element. There may be multiple UAV, UCS, or takeoff and landing
elements within a UAV System[7].”
From the above definitions, it is clear that a UAV System includes at least the
following basic elements[105]:
The air vehicle (aircraft);
Payloads;
Communications Links (command & control, voice, data, ATC);
Air vehicle Command & Control (flight control) station(s);
Payload control and payload data reception, recording, manipulation,
analysis and distribution workstation(s);
Taxi elements;
Launch elements;

11-4
Recovery elements;
System health monitoring;
Flight termination elements;
Scheduled and unscheduled maintenance elements;
Aircraft, payload and equipment handling elements;
Transportation elements;
Storage elements;
Ground power generation, distribution and supply elements;
Training elements;
Logistic supply and support elements;
Documentation
As of 2009, ICAO has indicated that the various terms used for UAVs
(Unmanned Aerial Vehicle, Remotely Piloted Vehicle, Remotely Piloted
Aircraft, etc) will be replaced by the single generic term “Unmanned Aircraft”
(UA)[74]. Similarly, the System will be known as an “Unmanned Aircraft
System” (UAS)[74]. This terminology has henceforth been adopted throughout
this thesis.
11.2. History of Unmanned Aircraft[106]
Unmanned Aircraft have been in use since 1849[10]. World Wars I and II saw
varied experimentation with unmanned versions of manned aircraft[11][12][13][15]
as well as guided weapons[16][17]. It was during the 1980’s, however, that true
unmanned aircraft were first put to use in large numbers. The first effective
use of modern UAs was undertaken by the Israelis in the early 1980’s during
the Syrian War[21].

11-5
Since then, Unmanned Aircraft have proliferated and are being utilised by
both military and civil operators for numerous functions and missions. The
following sub-section will touch on the varied uses for Unmanned Aircraft
Systems.
11.3. Typical Uses for Unmanned Aircraft
Unmanned Aircraft are versatile, with many uses, both military and civil. As
shown in the previous section, the first uses were of a military nature, and
included aerial bombs and torpedoes, target drones, decoys and
reconnaissance work.
Modern uses include, but are by no means limited to, the
following[29][81][84][93][95][96][101][104][105][107]:
Surveillance;
Reconnaissance;
Intelligence gathering;
Airborne targets;
Battlefield targeting;
Battlefield damage assessment;
Military strike and attack;
Meteorological and environmental information;
Search and Rescue;
Provision of situational awareness;
Communications relay;
Command and Control.

11-6
11.4. UA Categorisation (Types of UAs)
There is no single standard for categorisation of UAs. Various methods are
used, of which the following prove to be useful:
The United States military “TIER” system;
Function, purpose, mission, task or role;
Performance.
All three these methods do exhibit some commonality or “overlap”, and a
single UA could be categorised by combining all three methods, if required.
11.4.1 TIER System
The United States Air Force (USAF), United States Marine Corps (USMC) and
United States Army (US Army) have developed and adopted the “TIER”
system to categorise their UAs[29]. The TIER system is not standardised
among the three Arms of Force, each one differing to a degree from the
other[29]. The TIERs are as follows[29]:
TIER N/A
TIER I
TIER II
TIER II+
TIER III-
TIER III
Appendix O provides additional details of how the various TIERs related to the
various Arms of Force, with examples.
11.4.2. Function, Purpose, Mission, Task or Role
UAs can also be categorised by function, purpose, mission, task or role (in
short, its intended use)[29]:

11-7
Target
Decoy
Reconnaissance and/or Surveillance
Combat
Logistic Supply
Research and Development
Civil and Commercial
Appendix O provides additional details of each usage type, with examples.
11.4.3. Performance
UAs can also be categorised by altitude, range and/or endurance, and/or
other basic performance parameters[29][83]:
Handheld
Close
NATO
Tactical
Medium Altitude, Long Endurance (MALE)
High Altitude, Long Endurance (HALE)
High Speed
Orbital
CIS Lunar

11-8
Appendix O provides additional details of each performance category, with
examples.
The performance figures per category are not rigid, but serve as a guide.
Some UAs falling within a specific performance category may have other
performance figures that fall outside the limits, but remain eligible for that
category. An example is the Denel Dynamics Seeker II, which falls within the
“Tactical” category, but which has a range figure in excess of the specified
“limit”.
A single UA can be categorised either according to one, or a combination of,
categorisation methods. As an example, the Northrop Grumman RQ-4 Global
Hawk can be categorised as a TIER II+ Reconnaissance/Surveillance
AND/OR Civil/Commercial HALE UA, or any combination thereof, depending
on the circumstances.
11.5. Conclusion
This Chapter has evaluated and provided a definition for an Unmanned
Aircraft (UA) and Unmanned Aircraft System (UAS). Furthermore, it has been
determined that UAs have been in development and in use since before World
War I and are utilised for many tasks, amongst others Search and Rescue.
Following the study into the categorisation of UAs, it can be predicted that the
UA/UAS being envisaged for this concept can be categorised as a Civil High
Speed HALE SAR UAS.

12-1
Chapter 12
12. Advantages and Disadvantages of Unmanned Aircraft
This section discusses the advantages and disadvantages of unmanned
aircraft when compared manned aircraft, in context of similar utilisation.
12.1. Advantages of Unmanned Aircraft
UAs have certain inherent advantages over manned aircraft. The following
section will define and discuss these advantages.
12.1.1. The Three D’s: Dull, Dangerous and Dirty
Arguably the top three advantages UAs exhibit over manned aircraft are
summarised by the “Three D’s” – dull, dangerous an dirty[95][96][101][105][107]. UAs
are ideally suited to operate in missions or carry out tasks involving any one,
or combinations, of these three aspects.
12.1.1.1. Dull Missions
Dull missions usually involve lengthy transit times, and/or some element of
persistence or endurance[58]. The “dull” portions are those parts of the mission
requiring little or no direct interaction between the pilot and the aircraft. Typical
dull missions, or missions segments, include:
Ferry flights
Long cargo haul flights
International commercial airline flights
The search and transit portions of Search and Rescue
Intelligence, surveillance, reconnaissance (ISR)
Airborne communications relay
Airborne early warning and control (AEW&C)
In-flight refuelling (loiter phase)

12-2
Dull missions can lead to fatigue and a lapse in concentration by the pilot,
which in turn has a direct impact on the safety of rest of the crew and
passengers, and the overall success of the mission itself. To counter this,
manned aircraft and missions falling into this category require crew duty
cycles and rest facilities to afford critical crew members the opportunity to
recover strength, as well as multiple swap-out critical crew members on-
board. Many aircraft do operate on auto-pilot during tedious stretches of a
mission, but still require the pilot to take over at short notice. UAs have the
advantage of being able to operate autonomously[74][95][97], while affording
pilots to exchange with fresh crews in the middle of an operation and at
regular intervals without interfering with or negatively affecting the mission.
12.1.1.2. Dangerous Missions
Dangerous military and paramilitary missions are those involving possible
engagement with enemy forces. It may involve engagement with enemy
forces on own territory, or require entry into enemy territory for the purposes
of reconnaissance, surveillance, peace enforcement, or weapons
delivery[79][82].
Dangerous non-military (civil) missions include flight into geographically
challenging and potentially hazardous terrain, or into extreme weather[78][79][82].
Examples include flight in or around volcanoes, the Polar Regions,
mountainous areas, extreme altitudes, extreme wind conditions, flight over the
Open Ocean, flights into hurricanes, cyclones and blizzards, flight into known
icing conditions, as well as sustained flight into conditions of poor visibility,
e.g. sleet, fog, heavy rain, smoke or haze[101].
UAs are essentially expendable and do not expose airborne crews to these
dangers[58][59][60]. They can also be designed with less “damage tolerance” or
survivability features (depending on the precise nature of its use) due to the
absence of humans on-board.
12.1.1.3. Dirty Missions
These involve entry into contaminated places[58], typically radiated and
biologically or chemically polluted areas. As with Dangerous missions, use of

12-3
an unmanned aircraft in these conditions will safeguard conventional crews
and ground personnel from exposure and contamination[59][60].
12.1.2. System Complexity
UAs tend to be less complex when compared with manned systems[60],
primarily due to the fact that support for human occupancy is completely
eliminated from the design. The following systems and sub-systems are
omitted when designing UAS air vehicles:
Cockpit (Ground Control Centre contains the “cockpit”)
Cabin (Ground Control Centre contains the “cabin”)
Pressurisation systems
G-suit system
Oxygen supply (bottles or OBOGS) and distribution system
Cockpit and cabin lighting systems
Crew fresh air supply and ventilation
Crew water supply
Galleys
Ablution facilities
Crew rest facilities
Item stowage (baggage, manuals, personal gear)
Emergency backup systems, including:
o Emergency oxygen supply
o Cockpit and cabin fire protection systems
o Emergency lighting

12-4
o Engine fire suppression (unless specified by the user)
Crew survival system
o Dinghies
o Emergency beacons (ELT, EPIRB, PLB)
o Emergency rations
o First aid kit
o Crew escape system
In addition, the following simplified design approaches are also followed:
Omission of crash-condition design requirements for crew and
occupants.
Structural design is not limited by human flight load limits.
Sensitive electronic systems may require some degree of local cooling or
atmospheric conditioning, but this is in addition to crew conditioning, which is
eliminated from the unmanned aircraft.
The omission of complex systems will greatly benefit any aircraft. A reduction
in complexity usually translates into a reduction in unscheduled maintenance
activities and improved maintainability and reliability, leading to overall higher
system availability. Alternatively, “unoccupied volume” may be utilised by
adding fuel or mission payload, thereby increasing range and endurance, or
expanding on capabilities.
Despite the apparent advantage of having a simpler aircraft, Unmanned
Aircraft Systems can become quite complex, due to the inherent complexity of
data links, remotely located controls, sense-and-avoid technologies and the
like. In addition, many of the systems omitted from the air vehicle are required
in the Ground Control Station.

12-5
12.1.3. Aircraft Size and Weight
Due to the omission of many systems essential for manned aircraft, UAs tend
to be smaller and weigh less than their equivalent manned counterparts[59][60].
A reduction in size and weight improves and simplifies transportability, storage
requirements and manhandling, while offering easier deployment. It also
translates into fuel efficiency, due to reduced powerplant requirements.
For certain roles, the smaller size of a UA may provide an added tactical
advantage, in that it is more difficult to detect visually and electronically[59][60].
Reduced weight also potentially translates into shorter runways. Many UAs
require no runways, being small or light enough to be launched with catapults
and recovered with arrester wires or nets. Vertical take-off types obviously
require no runways, but also benefit from a reduction in weight.
12.1.4. Expendability
Unlike manned assets, UAs do not carry human occupants, therefore the loss
of such a system, although expensive, is less traumatic due to the omission of
the “human factor”[58][59][60]. UAs are essentially expendable, negating the need
to deal with the added trauma of human casualties, injuries or prisoners of
war.
12.1.5. Development Time and Cost
Development and maintenance costs are potentially less for
UAs[59][60][76][81][105][107 due to lower complexity. UAs also tend to be cheaper to
procure, as well as to operate and support. Overall Life Cycle Cost is
effectively less for unmanned aircraft systems.
Due to lower complexity levels, UAs are often developed far quicker than
conventional manned systems[75][90]. Many UAs (even complex machines)
have been designed and developed in mere months[60][61][62]. This is
strategically advantageous to any potential customer wishing to field a
solution in the shortest possible time, while cutting on development cost.

12-6
12.1.6. Advantages Compared with Satellites
Surveillance and reconnaissance UAs offer much the same capabilities as
many surveillance and reconnaissance satellites, with the added advantage of
providing cover at short notice, rather than having to wait for a scheduled
pass. Additionally, UAs can scan below cloud cover, fly close to the surface if
required and are far cheaper to develop and deploy than satellites[59][60]. UAs
also provide information at high-resolution, whereas satellites provide
information only at mid-resolution[72].
12.1.7. Pilot Abilities and Training Cost
Due to the nature of their work, and the risks involved, pilots trained to operate
manned systems are highly skilled and expensively trained individuals.
Manned pilots require more rigorous training to help endure long or dangerous
missions, and have to be fit to endure flight loads. This does not imply
complete lack of airmanship – UA pilots still need to know and follow the same
rules of the air as for manned systems, and understand the fundamentals of
flying. However, UAs are often pre-programmed and operated autonomously,
and therefore require less pilot intervention and lower-skilled personnel to
interact with or operate them[63][73][76][77][86][100].
12.2. Disadvantages of Unmanned Aircraft
UAs also exhibit certain inherent disadvantages over manned aircraft. The
following section will define and discuss these disadvantages.
12.2.1. Mission Flexibility
Manned aircraft offer greater mission flexibility at present; a human pilot is can
think and make intelligent choices intuitively, altering the current mission
profile, or switching roles, as required[59][60]. Currently, no form of Artificial
Intelligence is powerful or complete enough to offer this level of autonomy to
UAs.
Although the ground-based UA pilot can make these decisions, technology
currently prevents UAs from operating with full autonomy and “intuitiveness” to
the same extent. At present, mission flexibility is offered through human

12-7
interaction, where the ground pilot re-programs the flight path, selects new
payloads, sends the coordinates and instructions to the UA, and similarly
manually re-adjusts the flight path and payloads on completion of the altered
mission.
12.2.2. Aircraft Manoeuvrability
Coupled with flexibility is manoeuvrability[59][60]. Manned aircraft, piloted from
within, offer their occupants full situational awareness and these pilots have a
natural “feel” for manoeuvres and flight loads. Manned aircraft pilots are
therefore capable of inducing a greater degree of manoeuvrability into their
aircraft, than do unmanned aircraft ground pilots confined to a two-
dimensional screen as their only feedback.
12.2.3. Command and Control
Unmanned aircraft have to be controlled and/or piloted remotely, via a
command and control (C&C) Data Link. Long range (over-the-horizon, or
beyond-line-of-sight) C&C is achievable only via satellite link[59][60] or a relay
station. Data links can be sensitive to directionality, sensitivity, signal strength,
signal footprint, external electromagnetic interferences and deliberate
interference (“hacking”). This requires additional security, design robustness
and redundancy, plus additional safety measures, including “auto-return-
home” flight modes, in case the link is permanently lost, to save the air vehicle
and payloads. Satellite links are also expensive, due to the nature of the
infrastructure requirements, and, depending on the service, coverage and
bandwidth requirements are potentially limited.
12.2.4. Disadvantages Compared with Satellites
The previous section highlighted the advantages UAs have when compared
with satellites. As true as these may be, satellites also have some inherent
advantages over UAs. In short:
Satellites can cover a larger footprint in a shorter time span, and certain
satellites can be permanently positioned above a certain point (full-time
persistence), whereas even the most persistent UAs cannot[59][60];

12-8
UAs are more vulnerable to ground based air defences than are
satellites[59][60].
12.2.5. Sense and Avoid
The absence of a human pilot onboard the UA removes the added “cover”
provided by a pair of human eyes when taking into consideration the
avoidance of obstacles. Obstacles include terrain and other air traffic. To try
and overcome this problem, UAs are equipped with equipment also essential
on manned aircraft. Typical essential equipment includes[68][70]:
For areas within ground-based radar (ATC) coverage (up to
approximately 10 nmi offshore)[70]:
o ATC mode C/A/S Transponder [mode S can send data to ATC as well];
o VHF AM radio (“ATC radio”) in aircraft to relay voice communications between ATC and aircraft;
o LOS Data Link “voice” carrier to relay ATC communicationsbetween aircraft and GCS;
o LOS Data Link “voice” carrier to relay aircraft communicationsbetween aircraft and GCS.
For ranges beyond ground-based radar (ATC) coverage[70]:
o Airborne Collision and Avoidance System (ACAS);
o Automatic Dependent Surveillance Broadcast (ADS-B)[95];
o BLOS (satellite) Data Link “voice” carrier to relay aircraftcommunications between aircraft, satellite and GCS.
For all ranges[70]:
o V/UHF and HF radios in aircraft to relay voice communications between other aircraft and aircraft
o Navigation and anti-collision lights
o Rotating beacon
o Paint and external markings for high visibility

12-9
UA obstacle detection and avoidance technology, commonly referred to as
“Sense and Avoid” (or “Detect and Avoid”), has developed somewhat over
time, but still has a long way to go, both technologically and legislatively
speaking, before becoming commonplace and fully
trustworthy[74][88][95][102][104][105][108]. Various User Groups have been created to
tackle this daunting task, of which the EUROCAE WG-73 Working
Group[69][102][104][105][108] is an example. Sense and Avoid remains a developing
field, and the primary means of avoidance is currently still vested in human
intervention via the Ground Control Centre.
12.3 Long Range Maritime Search and Rescue: Scoring
The question now remains: in consideration of an airborne system for
maritime Search and Rescue, which would be more advantageous to pursue:
manned or unmanned. This section analyses the previously discussed
advantages and disadvantages, and provides a means of scoring to
determine the way forward.
Table 12.1 below provides a summary of all elements discussed in the
aforementioned section, and categorises each as either an advantage or
disadvantage.
Element UA: CategoryDull Missions AdvantageDangerous Missions AdvantageDirty Missions AdvantageSystem Complexity AdvantageAircraft Size and Weight AdvantageExpendability AdvantageDevelopment Time and Cost AdvantageSatellites AdvantagePilot Abilities and Training Cost AdvantageMission Flexibility DisadvantageAircraft Manoeuvrability DisadvantageCommand and Control DisadvantageSatellites DisadvantageSense and Avoid Disadvantage
Table 12.1: Summary of Elements and Categories in terms of UAs

12-10
Table 12.2 provides weighting for each element, in terms of its importance to
Long Range Maritime Search and Rescue. Weights are from 1 to 5, with 1
being least important, and 5 being essential.
Element UA: Category WeightsDull Missions Advantage 4Dangerous Missions Advantage 4Dirty Missions Advantage 1System Complexity Advantage 2Aircraft Size and Weight Advantage 1Expendability Advantage 3Development Time and Cost Advantage 3Satellites Advantage 4Pilot Abilities and Training Cost Advantage 2Mission Flexibility Disadvantage 3Aircraft Manoeuvrability Disadvantage 1Command and Control Disadvantage 5Satellites Disadvantage 3Sense and Avoid Disadvantage 1
Table 12.2: Weighting, focus on Long Range Maritime Search and Rescue
Table 12.3 expands on each category by sub-categorising each advantage
and each disadvantage into Major, Minor and Neutral. The focus is on how
advantageous, or disadvantageous, each element will be in consideration of
Long Range Maritime Search and Rescue missions.
Element Category Sub-categoryDull Missions Advantage MajorDangerous Missions Advantage MajorDirty Missions Advantage NeutralSystem Complexity Advantage MinorAircraft Size and Weight Advantage MinorExpendability Advantage MajorDevelopment Time and Cost Advantage MajorSatellites Advantage MajorPilot Abilities and Training Cost Advantage Minor
Mission Flexibility Disadvantage MinorAircraft Manoeuvrability Disadvantage MinorCommand and Control Disadvantage MajorSatellites Disadvantage MajorSense and Avoid Disadvantage Minor
Table 12.3: Summary of Elements and Sub-categories in terms of UAs, focus
on Long Range Maritime Search and Rescue

12-11
Table 12.4 provides a score to each sub-category. A major advantage is
provided a score of 2, a minor advantage 1, minor disadvantage a –1 and a
major disadvantage is scored –2. A neutral impact is scored 0.
Element Category Sub-cat ScoreDull Missions Advantage Major 2Dangerous Missions Advantage Major 2Dirty Missions Advantage Neutral 0System Complexity Advantage Minor 1Aircraft Size and Weight Advantage Minor 1Expendability Advantage Major 2Development Time and Cost Advantage Major 2Satellites Advantage Major 2Pilot Abilities and Training Cost Advantage Minor 1Mission Flexibility Disadvantage Minor -1Aircraft Manoeuvrability Disadvantage Minor -1Command and Control Disadvantage Major -2Satellites Disadvantage Major -2Sense and Avoid Disadvantage Minor -1Table 12.4: UA Asset for Maritime SAR: Impact
Table 12.5 sums the scores and weights into a single figure for each element.
Element Category Summed Scores
Dull Missions Advantage 8Dangerous Missions Advantage 8Dirty Missions Advantage 0System Complexity Advantage 2Aircraft Size and Weight Advantage 1Expendability Advantage 6Development Time and Cost Advantage 6Satellites Advantage 8Pilot Abilities and Training Cost Advantage 2
Mission Flexibility Disadvantage -3Aircraft Manoeuvrability Disadvantage -1Command and Control Disadvantage -10Satellites Disadvantage -6Sense and Avoid Disadvantage -1
Table 12.5: Summed Scores
The total score adds up to:
8+8+0+2+1+6+6+8+2-3-1-10-6-1 = 41-21 = +20

12-12
The final scoring indicates that an overall advantage should be achieved in
utilising an unmanned aircraft over a manned aircraft for long range maritime
Search and Rescue missions[91]. It would therefore be advantageous to further
pursue this avenue in more detail[84][93][95][101][107].
12.4. Conclusion
This Chapter has shown that UAs exhibit certain inherent advantages over
manned aircraft when employed for certain tasks and when operated in
certain conditions. The final assessment has shown that this is true for long
range maritime Search and Rescue. Although the categories selected, as well
as the scoring method, may prove to be subjective, the unmanned system
surpasses manned flight for maritime operations by a factor of two. It is
therefore concluded that the assessment is sufficiently accurate and that an
unmanned aircraft should be ideal for long range maritime Search and
Rescue. It would, therefore, be advantageous to further pursue this avenue in
more detail.

13-1
Chapter 13
13. The Unmanned Aircraft System
The first Section in Part 2 of this thesis provided a definition of an Unmanned
Aircraft (UA), as well as the Unmanned Aircraft System (UAS). The aircraft
(the UA) is only one aspect of the UAS. Therefore, a concept specification will
be provided for the full UAS, capable of satisfying the performance and
equipment level requirements analysed in Part 1, for long range maritime
Search and Rescue missions.
13.1 UAS Elements
The following UAS elements will be further investigated and specified[105]:
Aircraft (UA)
Payloads
Data Links, comprising:
o Voice Communications Link (radio, ATC)
o Data Communications Link (air vehicle command & control,
payload control, air vehicle status and health)
o Payload Data Link (acquired payload data)
UA Recovery
Ground Elements, including:
o Ground Control Station, incorporating:
Aircraft Workstation (radio, ATC, command & control,
status and health)
Payload Workstation (data reception, recording,
manipulation, analysis, distribution)
13-2
o Launch
o Recovery
o Logistic Support, including:
Ground Power
Storage
Transportation
13.2. Conclusion
All of the elements up for discussion in this Chapter have some form of
physical, functional or operational interaction, and cannot be viewed (or
specified) in isolation. An integrated approach will be followed in the
development of the concept specification for the various elements.

14-1
Chapter 14
14. Unmanned Aircraft
This Chapter provides a summary of key parameters describing the concept
for the Unmanned Aircraft (the “Aircraft”). Parameters determined are basic
weights, basic sizing and basic powerplant requirements. The intent of this
chapter is not to provide results for a full-on design, but to develop an
estimation and a “feel” for the size aircraft expected for such a mission.
Two methods were followed to obtain the results presented in this Chapter.
Method 1 made use of the reference material “An Introduction to Experimental
Light Aircraft Design”, First Edition, by Mr Anton Maneschijn[109]. As this
reference material focuses primarily on design for light and experimental
aircraft, the method was used as a first-order iteration and to serve, in some
respects, as input for Method 2.
Method 2 made use of the reference material “Aircraft Design – A Conceptual
Approach”, Second Edition, by Mr Daniel P. Raymer[110]. Although this
reference provides very comprehensive material on Concept Design, including
structures, performance, aerodynamics and trade studies, the aim of the
thesis was only to determine basic parameters, and the results presented in
this Chapter reflect this aim. Additional design effort shall be required to refine
the design concept before Preliminary and Detail design studies commence.
This Chapter provides a summary of the key values derived. Details on how
these values were derived are available in Appendices K and L.
14.1. Presentation
Results are presented along the following structure:
Layout
Weights
Dimensions

14-2
Powerplant
Performance
Payloads are discussed in some detail in Chapter 15.
14.2. Layout
The purpose of the aircraft is to serve as a stable platform to carry the special
mission equipment into and throughout the search area. Due to the nature of
its mission and application, the aircraft will not be subjected to extreme
manoeuvres (combat- or aerobatic), and therefore did not require such design
features.
Aircraft configuration and layout is largely dependent on three factors:
functional requirements, performance requirements and personal preference.
Both design methods require the designer to select general layouts – position
of wings, engines, etc – on commencement of design; the design process is
largely dependent on the initial layout chosen. The layouts described below,
as chosen for this concept, should not be regarded as the only solutions to
meet the requirements. Many other design layouts and configurations, based
on personal preference and experience, could be presented offering even
better results. The layouts chosen serve to act as input for the two concept
designs and offer potential solutions that will meet the requirements.
14.2.1. Layout: Design Method 1
Design Method 1 is based on a largely conventional layout. An initial
comparison was made to find an existing aircraft having similar performance
characteristics as those specified for this requirement. The Gulfstream G550
was found to be the quite close and was thus used as a basis and comparison
throughout the concept design phase to validate the general layout for Method
1.
The aircraft as developed via Method 1 exhibits a centrally located, low
mounted swept wing, a rear located, low mounted horizontal tail, a single rear
located, centrally mounted vertical tail and tricycle landing gear. The

14-3
powerplant is located in two nacelle pods mounted on the rearward portion of
the fuselage, behind the main wing, above the horizontal tail surface and both
sides of the vertical tail. The nose contains the satellite communication
equipment and nose landing gear. The FLIR sensor and Maritime Search
Radar (MSR) are located in a faired conformal pod below the centre fuselage
to reduce drag. Fuel is carried in the wings and in a centrally-located fuselage
fuel tank. Deployable payloads (markers and canisters) are carried in the
lower, rear fuselage portion to afford maximum release clearance.
14.2.2. Layout: Design Method 2
Design Method 2 is also based on a largely conventional layout. No initial
comparisons were made with any specific existing aircraft; however Historical
Data selected, as per the reference material[110], matches data for commercial
jet transport aircraft in general. The selection of layout and data for Method 2
stems primarily from the output of Method 1.
The aircraft as developed via Method 2 exhibits a centrally located, low
mounted swept wing, a rear located T-tail and tricycle landing gear. The
powerplant is located in two nacelle pods mounted on the rearward portion of
the fuselage, behind the main wing and below the horizontal tail surface of the
T-tail. The nose contains the satellite communication equipment and nose
landing gear. The FLIR sensor and Maritime Search Radar (MSR) are located
in a faired conformal pod below the centre fuselage to reduce drag. Fuel is
carried in the wings and in a centrally-located fuselage fuel tank. Deployable
payloads (markers and canisters) are carried in the lower, rear fuselage
portion to afford maximum release clearance.
14.3. Weights
This sub-section summarises the basic weights derived from the two design
methods.
14.3.1. Basic Weights: Design Method 1
Basic aircraft weights as derived from Design Method 1 are as follows:
Maximum all-up (take-off) weight: 45,000 kg

14-4
Maximum fuel weight: 27,334 kg
Maximum payload weight (only deployable payloads): 1,400 kg
Total powerplant weight (engines x 2, basic, dry): 3,266 kg
Additional weights are available in Appendix K.
14.3.2. Basic Weights: Design Method 2
Basic aircraft weights as derived from Design Method 2 are as follows:
Maximum take-off weight: 64,700 kg
Maximum fuel weight: 29,071.6 kg
Maximum payload weight (includes fixed and deployable payloads, and
avionics): 2,903 kg
Zero-fuel weight: 35,628.4 kg
Empty weight: 32,725.4 kg
Total powerplant weight (engines x 2, basic, dry): 4,726.4 kg
14.4. Dimensions
This sub-section summarises the basic dimensions derived from the two
design methods.
14.4.1. Dimensions: Design Method 1
Basic aircraft dimensions as derived from Method 1 are as follows:
Length: 22 m
Wing span: 27.57 m
Wing area: 108.55 m2
Wing Aspect Ratio: 7

14-5
Wing root chord: 5.5 m
Wing tip chord: 2.38 m
Wing leading edge sweep angle: 27o
Wing Lift Coefficient (Clmax): 2
Flap type: Fowler
Horizontal tail span: 10.36 m
Horizontal tail area: 25.56 m2
Horizontal tail Aspect Ratio: 4.2
Vertical tail height (above fuselage): 4.06 m
Vertical tail area: 8.91 m2
Additional dimensions are available in Appendix K.
14.4.2. Dimensions: Design Method 2
Basic aircraft dimensions as derived from Method 2 are as follows:
Length: 33.6 m
Wing span: 27.77 m
Wing area: 110.43 m2
Wing Aspect Ratio: 7.0
Wing root chord: 6.46 m
Wing tip chord: 1.49 m
Wing leading edge sweep angle: 30o
Wing quarter chord sweep angle: 27o

14-6
Wing Mean Aerodynamic Chord: 4.5 m
Wing Lift Coefficient (Clmax): 2
Flap type: Slotted
Horizontal tail (T-tail) span: 10.6 m
Horizontal tail area: 28.07 m2
Horizontal tail Aspect Ratio: 4.0
Vertical tail (T-tail) height (above fuselage): 4.56 m
Vertical tail area: 17.34 m2
Vertical tail Aspect Ratio: 1.2
Additional dimensions are available in Appendix L.
14.5. Powerplant
The design incorporates two engines, primarily for the following reasons[83][99]:
Two engines will provide sufficient thrust to achieve the required
performance levels
Two engines will provide additional redundancy and increase the
chances of mission success, in the event of a single engine failure.
The added redundancy will ensure the recovery of the aircraft in the
event of a single engine failure.
14.5.1. Powerplant: Design Method 1
The engine selected for the concept design developed under Method 1 is the
BMW/Rolls-Royce BR710. The selected engine exhibits the following
performance properties (the values below are for a single engine):
Maximum power at sea level: 65,610 N

14-7
Maximum power at cruise altitude: 15,750 N
Specific Fuel Consumption at sea level: 0.39 lb/lbf.h
Specific Fuel Consumption at cruise altitude: 0.681 lb/lbf.h
Additional properties are available in Appendix K.
14.5.1. Powerplant: Design Method 2
The engine selected for the concept design developed under Method 1 is the
International Aero Engines IAE V2500-A1. The selected engine exhibits the
following performance properties (the values below are for a single engine):
Maximum power at sea level: 111,205.5 N
Maximum power at cruise altitude: 22,552.48 N
Specific Fuel Consumption at sea level: 0.35 lb/lbf.h
Specific Fuel Consumption at cruise altitude: 0.581 lb/lbf.h
Additional properties are available in Appendix L.
14.6. Performance
This sub-section summarises the basic performance values derived from the
two design methods. Values are basic estimations, and refinement of these
figures is only possible utilising more complex means, including additional
concept design refinement, detail design methods, Computational Fluid
Dynamics, wind tunnel testing and scale model testing
14.6.1. Performance: Design Method 1
In summary, the design delivers the following performance values, as
determined from Method 1:
Stall speed at sea level: 207 km/h
Maximum speed at cruise altitude: 869 km/h

14-8
Cruise speed at cruise altitude: 801 km/h
Maximum range: 7,856 nmi
Total endurance: 17 h
Time to reach Search Extremities: 6.4 h (6 h 24 min)
Additional performance details are available in Appendix K.
14.6.2. Performance: Design Method 2
In summary, the design delivers the following performance values, as
determined from Method 2:
Stall speed at sea level: 252.37 km/h
Maximum speed at cruise altitude: 961.82 km/h
Cruise speed at cruise altitude: 864.88 km/h
Maximum range: 7,487.73 nmi
Total endurance: 18 h
Time to reach Search Extremities: 6.0 h
Additional performance details are available in Appendix L.
14.3. Conclusion
This Chapter has produced the basic concept for the Unmanned Aircraft. Two
methods were employed, both yielding satisfactory results in terms of meeting
the previously-established key performance requirements. General aircraft
layout, weights and dimensions have been established.
At first observation, the maximum take-off weight (MTOW)-to-payload-weight
ratio appears high for an unmanned aircraft. However, the high MTOW values
are understandable when considering the large quantities (and weight) of fuel
required to sustain the high speeds across the vast ranges. The payloads are

14-9
relatively standard for maritime surveillance applications, and therefore
standard in terms of weight, when considered in isolation.
As a final note, despite the very different approaches followed by the two
design methods, it is interesting to note how similar the results are. Method 1
yields an aircraft similar in size and weight to a Gulfstream G550, while
Method 2 yields an aircraft similar in size and weight to an Embraer E-190 or
Airbus A319. It is therefore evident that an Unmanned Aircraft designed for
this purpose will be fairly large[80][99], regardless the design method employed.

15-1
Chapter 15
15. Payloads
This section describes the concept for the payloads to be carried on board the
Unmanned Aircraft. Payloads are group into fixed and deployable types.
15.1. Fixed Payloads
Fixed payloads encompass those that are not dispensable during the mission.
For this concept, fixed payloads are limited to the following:
Electro-optical Infrared (FLIR) sensor
Maritime Search Radar (MSR)
Search and Rescue Direction Finder (SAR DF)
As mentioned in Chapter 14, the FLIR sensor and MSR are located in a faired
conformal pod below the centre fuselage. In order to cut drag and save fuel,
particularly during the transit portions of flight, between the point of departure
and the search location, the FLIR sensor shall be retractable into the
conformal pod. The only portion of the SAR DF located on the external
fuselage is the antenna. The antenna should be located optimally to locate
distress signals emanating from locator transmitters. A full Antenna Placement
Study is required to determine the best position for the antenna, but for the
purposes of this design concept, it is located below the rear fuselage, behind
the conformal pod.
Many FLIR sensors, radars and SAR Direction Finders are available as off-
the-shelf units and would be ideal for this concept. For the purpose of this
study, the following equipment has been selected, based on performance,
weight, size, impact on local industry and general supportability:
FLIR sensor: Denel Optronics LEO-III-HD Stabilised Turret Assembly,
incorporating:
o Thermal Imager

15-2
o High Definition colour and near-infrared TV camera
o Eye-safe laser rangefinder
o Laser illuminator
o Geo-pointing and Geo-location functions
MSR: Thales Ocean Master maritime radar, incorporating:
o Antenna Unit
o Transmitter Unit
o Exciter/Receiver/Processing Unit
SAR DF. RhoTheta RT-600 (also referred to as SAR-DF 517)
15.2. Deployable Payloads
Deployable payloads are those kinds that are capable of being ejected,
launched, dropped, thrown or deployed during the mission. The range of
deployable payloads for this concept has been limited to the following:
Marine Location Markers (MLM)
Aid Life Supply Canisters (ALSC)
As mentioned in Chapter 14, all deployable payloads are located in the lower
rearmost fuselage portion for this concept to afford maximum release
clearance.
The Marine Location Marker (MLM) specified for this design is the La Croix
D6060A2A 90 minute day & night marker, with the following capabilities:
Smoke and light effects emitted and visible for 90 minutes, day and
night
Sea surface colouring effect emitted for 90 minutes and visible for up to
120 minutes

15-3
Aid Life Supply Canisters (ALSC) are usually customer-specified. For the
purposes of this study, the ALSC shall be equipped with the following items:
Life raft
Life vests
Thermal blankets
Medical supplies
Emergency Locator Transmitter
Dry clothing and towels
Food supplies
The design and configuration will be similar to the Life Support International
SUR-3812-00 UNI-PAC air droppable life raft system.
Both the MLMs and ALSCs shall be capable of being air-dropped via launch
tubes, exiting in the lower rear fuselage. The concept shall cater for numerous
units, typically eight MLMs and six ALSCs.
Due to the unmanned nature of this concept, all deployable payloads are to be
jettisonable remotely from the Ground Control Station.
15.3. Payload Weight
Weight is a potentially crippling property of airborne systems, and should be
kept within the prescribed maximum limits so as not to incur performance
restrictions. The total weight limit for all payloads for this concept is 1,400 kg
(specified during the design process – refer Appendices K and L). The
individual weight limits are specified as follows:
FLIR sensor: 100 kg
MSR: 100 kg
Deployable Payloads: 1,200 kg

15-4
The weight of the SAR DF is negligibly small compared with that of the above
mentioned systems, and is therefore not individually specified. It shall form
part of the avionics package weight budget.
The payloads as specified for this concept weigh as follows:
FLIR sensor: Denel Optronics LEO-III-HD
o 45 kg (maximum, equipped with all sensor simultaneously)
MSR: Thales Ocean Master
o 85 kg (all units)
MLM: La Croix D6060A2A
o 9.9 kg each (excluding launcher)
o 79.2 kg for total of eight units
ALSC: As for Life Support International SUR-3812-00 UNI-PAC
o 45.5 kg each (excluding launcher)
o 273 kg for total of six units
The total weight for all payloads, as specified for this concept, adds up to
482.2 kg, which is far below the maximum limit. The weight of the ALSC is
most variable, since the internal configuration may dictate a new design,
resulting in a heavier configuration. However, even if each ALSC ends up
weighing 100 kg, the total payload weight adds up to 809.2, which is still well
within the specified limit.
15.4. Payload Dimensions
Payloads are carried aboard or inside the aircraft airframe, which has to be
large enough to accommodate the payloads. The following provides a
summary of the primary and/or critical dimensions for the selected payloads,
to determine airframe capacity.

15-5
FLIR sensor: Denel Optronics LEO-III-HD
o Diameter: 500mm
o Height: 523 mm
o Retractable depth: 550 mm (maximum, into fairing/fuselage)
MSR: Thales Ocean Master
o Antenna Unit (sizeable to fit any radome, but typically
Width: 950 mm
Height: 626 mm
o Transmitter Unit (w x h x d)
389 x 280 x 446 mm
o Exciter/Receiver/Processor (ERP) Unit (w x h x d)
572 x 222 x 420 mm
o PDB Unit (w x h x d)
250 x 232 x 297 mm
SAR DF: RhoTheta RT-600
o Bearing Antenna
Diameter: 270 mm
Height: 185 mm
MLM: La Croix D6060A2A
o Diameter: 180 mm
o Length: 877 mm

15-6
ALSC: As for Life Support International SUR-3812-00 UNI-PAC
o Diameter: 535 mm maximum
o Length: 1070 mm
Considering each payload, and comparing the payload dimensions to the
space required in and around the fuselage, the following deductions can be
made:
FLIR sensor: Denel Optronics LEO-III-HD
o The depth of the faired conformal pod should be more than 550
mm to provide sufficient space for the LEO-III-HD sensor to
retract when stowed. The width of the conformal pod should be
more than 500 mm to provide space for the sensor diameter.
MSR: Thales Ocean Master
o The depth of the faired conformal pod should be more than 630
mm to provide sufficient space for the Ocean Master antenna
unit. The width of the conformal pod should be more than 950
mm to provide space for the antenna. Ample space is provided
inside the fuselage above the antenna unit for the Transmitter,
ERP and PDB units.
SAR DF: RhoTheta RT-600
o Ample space is provided for the Bearing Antenna to be
mounted below the fuselage, behind the main wing.
MLM: La Croix D6060A2A
o Sufficient space should be provided internally in the lower
rearmost fuselage section to accommodate four MLMs in two
rows (eight in total).
ALSC: As for Life Support International SUR-3812-00 UNI-PAC

15-7
o Sufficient space should be provided internally in the lower
rearmost fuselage section to accommodate three ALSCs in two
rows (six in total).
15.5. Conclusion
The Unmanned Aircraft concept makes provision for three fixed and two
deployable payload types. Two of the fixed payloads are carried in a
conformal pod below the fuselage. The deployable payloads are carried, and
jettisoned remotely, via internal launch tubes, behind the conformal pod in the
lower rearmost fuselage section. It has been determined that the Unmanned
Aircraft concept caters for all payload weights. Considering the size of the
aircraft as developed and specified in Chapter 14, it is deduced that the
concept comfortably caters for all payload dimensional limits.

16-1
Chapter 16
16. Data Links
This section describes the concept for the Data Link[85]. Due to the absence of
an onboard crew or pilot, all information sent to, and received from, the
aircraft, must be relayed via a “wireless” Data Link. Data Links are typically
grouped into line-of-sight (LOS) and beyond line-of-sight (BLOS)[68][92]. LOS
Data Links are only effective up to the radio horizon, approximately 150 – 200
km (80 - 110 nmi) from point of origin[68]. Due to the extreme ranges to be
covered by this aircraft, a BLOS Data Link will be essential[94].
16.1. Data Link Functions
The primary functions of the Data Link for this concept will be to:
Provide a voice communications link between flying crew/mission
specialists and other aircraft, vessels and ground-based rescue
personnel. This requires a low bandwidth up-down-link voice carrier in
the Data Link, at the specified frequency range for voice
communications.
Provide a voice communications link between ground-based flight crew
and air traffic control and other airborne traffic flight crews. This
requires a low bandwidth up-down-link voice carrier in the Data Link, at
the specified frequency range for ATC communications.
Provide a data communications link between ground-based flight crew
and aircraft for aircraft Command and Control purposes. This data is
received by the aircraft and translated into flight parameters for the UA.
This requires a low bandwidth up-link data carrier, at the specified
frequency range for command, control and telemetry data.
Provide a data communications link between the aircraft and ground-
based flight crew for UA performance status and system health. The
information is used by the flight crews and provides them with aircraft
status – speed, altitude, attitude, position, outside air temperature,

16-2
equipment temperature, remaining fuel, engine parameters, general
onboard system and equipment health, to name a few. This requires a
low bandwidth down-link data carrier, at the specified frequency range
for status and health data.
Provide a data communications link between ground-based system
operators/flight crew and aircraft for payload control. The data is
received by the UA and is used to control the payloads. Parameters
that can be sent include payload azimuth and elevation, search modes,
recording modes, focus depth, amongst others. This requires a low
bandwidth up-link data carrier, at the specified frequency range for
payload control data.
Provide a payload data stream between aircraft and ground-based
system operators/flight crew and rescue coordinators. The data
transmitted is typically medium- to high resolution images or video. This
requires a medium- to high bandwidth down-link data carrier, at the
specified frequency range for payload image data.
Appendix M provides a graphical representation of the typical communications
scenario for a maritime Search and Rescue UAS.
16.2. BLOS Data Link Service
Various satellite services (military and commercial) are available for this
function, depending on the coverage and bandwidth requirements. Common
commercial satellite services typically operate in the L-Band[85] (1 to 2 GHz)
frequency range[68]. The advantage of using such a service is that antenna
directionality is less critical, ensuring a more confident and reliable link[68]. The
disadvantage is smaller bandwidth, resulting in slower data transfer rates
(maximum of about 1Mbit/s) [68][71].
Many BLOS UAs utilise a Ku-Band[85] satellite link, which operates in the 12 to
18 GHz frequency range[68]. This requires greater attention to antenna and
radome design and very precise antenna directionality, but offers much
greater data transfer rates (up to 8 Gbit/s)[68].

16-3
Besides antenna design, the greatest problem associated with Ku-Band
satellite links is coverage, which is limited primarily to landmass in South
Africa[71]. Virtually no Ku-Band coverage is available out to sea, an essential
requirement for this application. Currently, the two largest commercial satellite
services on offer providing full coverage of the entire national maritime Search
and Rescue Region are Inmarsat and Iridium[68][71].
Iridium is a complete Global coverage option, even providing coverage over
large portions of the Polar Regions. However, this service is primarily voice-
only, providing a very low bandwidth (speed) of between 2.4 and 10kbps[64][65].
This may be sufficient for a Command & Control link, but will definitely be
insufficient for transmission of near-real-time payload data (typically video).
Inmasat’s “SwiftBroadband” service provides voice and high-speed data
simultaneously, at up to 432 kilobits per second per channel. The Inmasat
service provides coverage over the entire national maritime Search and
Rescue Region, with the exception of the Polar Regions[67].
To enable near-real-time transmission of payload image data to ground
receivers, a higher-bandwidth satellite service is ideally required. Typical data
rates required for high quality real-time video is in the order of 1.5 to 2
Mbit/s[68]. Although the Inmasat SwiftBroadband service data rate is only
about one quarter of that required for high quality real-time video, it should be
sufficient for near-real-time high quality images and low-quality video[68]. New
data compression technology currently under research has also provided
excellent results with low-bandwidth data rates[71]. In addition, intelligent
autonomous detection systems could be employed, transmitting low-quality
images until a potential target is spotted, where after it automatically switches
over to high quality for detail identification[74][95][97]. This saves on bandwidth
usage and service cost.
16.3. Data Link Redundancy
Due to the critical nature of the Data Link, redundancy is essential. During
take-off and landing, which requires secure links to ensure aircraft survival, a
Line-of-Sight (LOS) Data Link is employed[68]. This is a standard, non-satellite

16-4
microwave link, and employs an omni-directional antenna for take-off and
landing, and a directional antenna for extended range flight up to the radio
horizon. Handover between antennas usually takes place just after take-off
and prior to landing. This link will provide voice- and essential command &
control- and status data services between the UA and flying crew.
The LOS link operates up to the radio horizon, and is then handed over to
either another LOS link (relay station), or the BLOS link. Two separate LOS
Data Links will provide the required level of redundancy during take-off and
landing.
In order to facilitate a BLOS Data Link, satellite communications is
required[71][92][94]. This requires[68] a reliable satellite communications
transmitter, receiver, diplexer, modem and antenna at both the ground station
and onboard the UA, and a reliable satellite service.
As a backup to the high bandwidth Inmarsat service, to offer redundancy at
BLOS ranges, it is proposed that a second, lower-cost low-bandwidth satellite
service be operated in parallel. Typically, the Iridium service could be
employed as the backup link, offering all functions MINUS the payload control
data up-link and payload image data down-link[68][71]. The Iridium service also
operates in the L-Band frequency range (1 – 2 GHz)[64][65]. The backup link
serves as a means to recover and return the aircraft, in the event of loss of
primary BLOS Data Link.
For additional reliability and redundancy, both primary and secondary links
should be operational at all times. A selector automatically measures signal
strength and determines which service to use. In the event of a loss of one of
the services, the selector automatically switches over to the active service.
16.4. Conclusion
The airworthiness, safety and capacity of the UA to carry out and successfully
complete its mission hinges strongly on the choice, ability and reliability of the
Data Links employed. This UAS shall require both Line-of-Sight and Beyond-
Line-of-Sight Data Links. For the purposes of this study, a dual redundant

16-5
LOS link is proposed for Line-of-Sight flight, while the Inmarsat
SwiftBroadband service will be adopted for the primary BLOS Data Link, and
the Iridium service for the secondary (backup) BLOS Data Link.
The above configuration should provide the required capability, as well as
redundancy, to successfully complete a mission across the national maritime
Search and Rescue Region.
As a final note on SATCOM antenna design, it should be noted that antenna
design is in itself a very specialised field[68][71]. The final selection of antenna
type for an application such as this will only be possible following extensive
design calculations and analysis, especially if a Ku-Band antenna is selected.
To cater for all possibilities, this concept should be capable of accommodating
either a large parabolic Ku-Band antenna, or a large flat phased-array L-Band
antenna.

17-1
Chapter 17
17. UA Recovery
This Capter describes the concept for the recovery of the aircraft in the event
of a critical system failure or loss of Data Link.
17.1. Recovery Methods
Most Unmanned Aircraft are equipped with either an automatic recovery
system (ARS), a flight termination system (FTS), or both. These systems are
either activated manually from the Ground Control Station (human
intervention) or automatically in the event of a critical system failure, upon
reaching of an exception condition, or a loss of communications with the UA
(Data Link loss)[68]. The FTS is engaged in the event of a multiple engine
failure. The primary function of the ARS is to ensure that the aircraft is
recovered, while the primary function of the FTS is to ensure that the aircraft
does not endanger the lives of third parties (people in the air or on the ground)
in the event of a failure to recover the aircraft.
Data Links are often designed with added robustness or redundancy (multiple
links) to ensure that a link loss is either of very short duration or does not
occur. Similarly, critical systems are either duplicated, or designed to very
high standards, to increase the reliability and reduce the chances of failure.
However, if these measures fail, or are not in place, the ARS and/or FTS take
control[87][104].
When activated, the ARS will turn the aircraft around and return it home via a
safe route, pre-defined and pre-programmed prior to flight. Should this option
fail, or not be available, the FTS activates and essentially performs three
tasks:
Steers the UA away from potential third party sources by relocating the
UA to a safe holding area, pre-defined and pre-programmed prior to
flight;
Entering a pre-programmed loiter condition to burn off excess fuel;

17-2
Activates the mechanism for the termination of flight.
ARS and FTS both effectively steer the aircraft away from potential harm to
third parties, but only the first option ensures a safe recovery at home base.
An automatic recovery could involve an automatic landing (if the airport and
aircraft is so equipped) or manual re-establishment of the Data Link and a
manual recovery.
Flight termination systems employ various methods to reduce kinetic energy,
most notably emergency parachutes aided by airbags to cushion impact. An
FTS usually results in at least minor UA damage.
17.2. Recovery System Concept
The following recovery mechanisms have been adopted for the ARS and FTS
for this concept.
17.2.1. Automatic Recovery System
The ARS shall be designed to perform as follows:
The ARS shall be designed to activate automatically following loss of
both primary and secondary Data Links for a time period of more than
10 seconds[68], or the failure of a critical navigational system.
On activation, the ARS shall turn the UA around and return it to its point
of departure, following a pre-determined and pre-programmed route.
Should the data link be re-established during recovery, the ARS shall
return the UA to its original flight path and disengage.
Recovery at point of departure shall be (first option) via an automatic
landing.
As a second option, should the point of departure not be equipped with
the necessary navigational aids to allow an automatic landing, the flight
crew shall re-establish link with the UA and perform a manual recovery.
17-3
17.2.2. Flight Termination System
The FTS shall be designed to perform as follows:
Upon failure to automatically recover the UA, the FTS shall engage and
relocate the UA to a pre-defined and pre-programmed holding area;
When this location has been reached, the FTS shall enter the UA into a
pre-programmed loiter condition to burn off excess fuel;
Once the desired fuel level has been reached, the FTS shall reduce the
UA speed to just above stall and activate an emergency ballistic
parachute to reduce kinetic energy. At the same time, the FTS shall cut
power to the engines.
The UA shall descend to the ocean surface.
By employing these methodologies, third parties are safeguarded from injury,
and the UA is either returned and saved without loss or damage, or ditched
with the likelihood of reduced damage and potential recovery at a later stage.
17.3. Conclusion
The means of recovery to be employed for this concept shall include both
Automatic Recovery and Flight Termination. The ARS is the primary system,
handing over to the FTS only if the ARS fails. The ARS shall return the UA to
its point of origin, via a safe and pre-programmed route. The FTS shall steer
the UA to a safe location via a pre-programmed route and terminate flight so
as to minimise damage to the aircraft.
The ARS and FTS for this concept shall protect third parties form injury, while
saving the UA.

18-1
Chapter 18
18. Ground Elements
This section describes the concept for the ground-based elements of the
Unmanned Aircraft System. The ground elements are divided into the
following sub-elements[68]:
Ground Control Station
o Aircraft Workstation
o Payload Workstation
Launch
Recovery
Logistic Support Elements
o Ground Power
o Storage
o Transportation
18.1. Ground Control Station
The Ground Control Station (GCS)[89][103] effectively takes over the functions of
the traditional aircraft cockpit and mission stations. It houses the crew and all
means of interacting with the aircraft, other air traffic, vessels, rescue
coordination centres and third parties during the mission[68]. It also houses the
Data Link transmission and reception equipment and systems.
In terms of function, and for the purposes of this concept, the GCS is split up
into an Aircraft Workstation (AWS), a Payload Workstation (PWS) and a
Mission Specialist Workstation (MSWS)[68]. In reality, all these work areas are
contained in one unit, and are co-located side-by-side to enhance
interoperability and inter-communication.

18-2
18.1.1. Aircraft Workstation
The Aircraft Workstation (AWS) comprises all elements required for flight,
tracking and command & control of the UA. It is used by ground-based flight
crews to control, monitor and alter the flight path, and monitor and adjust
performance of the UA before and during missions[68].
Primary functions associated with the AWS include[68]:
Taxi, take-off and landing;
Planning, programming and altering of flight path;
Sense and Avoid;
Manual flight;
Monitoring of UA status and health;
Communication with Air Traffic Control and other air traffic;
Communication with vessels and sea surface search parties;
Manual activation of Recovery or Flight Termination systems;
Mission debrief.
Primary equipment in the AWS includes[68]:
Interface for flight path planning and programming;
Primary flight display with map and overlays for situational awareness,
flight path, flight planning, instruments and aircraft status;
Secondary display with payload data video feed;
Air Traffic Control radio equipment;

18-3
Radio equipment (“tactical radios”) to communicate with vessels,
rescue co-ordination centres and other organisations involved with the
mission;
Intercom to communicate with payload operators, mission specialists
and other personnel in the GCS.
18.1.2. Payload Workstation
The Payload Workstation (PWS) is manned by payload controllers and data
analysts. PWS equipment is used to control the onboard payloads and to
receive, process and analyse payload data, to help guide the UA to those in
distress[68]. Payload controllers also eject essential dispensable payloads to
aid those in distress, once located.
Primary functions associated with the PWS include[68]:
Payload selection and control;
Target location;
Target recognition;
Target identification;
Deployable payload operation.
Primary equipment in the PWS includes[68]:
Primary displays for radar operator and FLIR operator, each with the
capability to overlay information form adjacent displays;
Payload control interfaces;
Data reception, processing and analysis equipment;
Dispensable payload arming, disarming and ejecting equipment;

18-4
Radio equipment (“tactical radios”) to communicate with vessels,
rescue co-ordination centres and other organisations involved with the
mission;
Intercom to communicate with flight crews, mission specialists and
other personnel in the GCS.
18.1.3. Mission Specialist Workstation
The Mission Specialist Workstation (MSWS) is manned by one or more
rescue coordinators, whose primary function is to provide overall coordination
between GCS crews and other organisations involved with the mission. They
will interact with flight crews and payload operators, guiding them as the
search unfolds or changes. Information is fed to them from the rescue
coordination centres (RCCs) and other search parties, and is then passed on
to relevant GCS crews and operators.
The MSWS will typically be equipped with tactical radios, telephones and
intercom equipment for communicative purposes, as well as a data display for
relaying of information to RCCs and other search parties.
18.2. Ground Control Station Layout and Ergonomics
Traditional UA ground control stations are often small and cramped, offering
limited freedom of movement in and around the interior space. A compromise
is often sought between comfort, size and weight. For military purposes, size
and weight is of paramount importance, due air and ground mobility, footprint
and visibility. This results in small crate-sized containers, with small interior
space and little room for movement. Standard UAS control stations also
usually only allow for two persons at a time: a UA pilot and a payload
operator.
The Ground Control Station for this concept and application must cater for the
following unique conditions:
A larger compliment of personnel at one time, typically:
o 1x UA pilot

18-5
o 1x radar payload operator
o 1x FLIR payload operator
o 2x mission specialists (coordinators)
o Media observers
Potentially extraordinarily long missions (up to 18 hours per UA, with
handovers), requiring:
o Comfortable and ergonomic working environment (seats and
work stations);
o An environment allowing frequent personnel changes, including
mid-mission exchanges;
o Lighting and air conditioning simulating natural conditions to
reduce fatigue;
o Simple, well defined and ergonomically designed user
interfaces to allow fast, easy access to critical functions during
peak mission activities;
o Large, high definition colour screens for operators and crews;
o Larger moving spaces within the GCS, allowing missions to be
conducted without interruption during phases of peak activity or
during personnel exchanges.
Due to the unique application of this UAS, the GCS should be designed with
space and ergonomics as the driving factors, not reduced size and weight.
The GCS for this application will be permanently located; mobility is therefore
not an essential design constraint.
18.3. Launch
Due to the size and configuration of the UA, launch will be a conventional
rolling take-off run from well-prepared runways.

18-6
Launches will be performed automatically (autonomous take-off) as the
primary means[68][94][97][98], with manual intervention by flying crew (hands-on),
as required or during emergencies.
18.4. Recovery
Recovery of the UA is a conventional landing on a well-prepared runway.
Recoveries will be performed automatically (autonomous landing) as the
primary means[68][94][97][98]. It is therefore essential that the operational airfield
is equipped with an Instrument Landing System. In addition, recoveries can be
performed manually by the flying crew (hands-on), as required or during
emergencies.
18.5 Logistic Support
The total Logistic Support Package for the UAS includes, amongst others,
ground power, maintenance and repair, spares, support vehicles, storage
systems and transportation elements[68]. The following aspects of Logistic
Support will be looked at:
Ground Power
Storage
Transportation
18.5.1 Ground Power
In cases where the national power supply is interrupted, emergency backup
power must be available to power all ground systems, until the mission has
ended. Backup power should be available to power at least:
Ground Control Station
o Aircraft Workstation
o Payload Workstation
o Mission Specialist Workstation

18-7
Data Link elements
Backup power for this concept is to be supplied by means of a diesel
generator, capable of providing sufficient power continuously for at least 120
hours.
18.5.2. Storage
Due to its size and weight, storage of the UA will be in standard airfield
hangars. Deployable payloads are to be stored as per regulations for storage
of pyrotechnic equipment. Ground elements are to be stowed and/or secured
individually, as required.
18.5.3. Transportation
The concept behind the use of this system is built on the concept of a
permanently located Ground Control Station, with permanently located Data
Link and backup power elements. These elements will be permanently located
at an airfield of choice, supplemented with UAs as required. The UAs will be
stored in hangars at the airfield, and deployed when required for Search and
Rescue missions. UAs will be “transported” between airfields by ferrying them
by air. Should an aircraft become unserviceable prior to a ferry flight, spare
parts will be brought to the airfield and the aircraft repaired and made
serviceable.
18.6. Conclusion
The UAS comprises of numerous major ground elements. The concept of
operations for the system necessitates that most of the system be
permanently located at an airfield, equipped with a well-prepared, ILS-
equipped runway and hangar facilities. The Ground Control Station, Data Link
elements and backup power will be permanently located, with the aircraft itself
operating from and stored at the said airfield.
Furthermore, it has been determined that the Ground Control Station design
should centre on functionality, ergonomics and comfort, rather than mobility
(size and weight), visibility and footprint.

19-1
Conclusions and Future WorkThe following major Conclusions have been drawn from the Study.
The oceans bordering Southern Africa are amongst the roughest,
coldest and most hostile in the world. Persons in distress in such
conditions do not stand a chance of survival, unless an effective and
efficient Search and Rescue system, with highly specialised and
capable assets, are on hand.
Although the greater concentration of marine-related human activity
takes place within the 200nmi Exclusive Economic Zone, activity is
found across all national oceanic regions, and also well beyond our
maritime borders and claims. Maritime Search and Rescue services
should therefore be provided up to our defined maritime Search and
Rescue Region extremities.
South Africa has pledged to provide a world-class, effective, efficient,
well-organised and professional Search and Rescue service within the
full scope of its Search and Rescue Regions.
The South African maritime Search and Rescue Region is one of the
five largest worldwide, with a surface area in excess of 27 million
square kilometres. Surface and airborne Search and Rescue assets
are required to be available that can operate effectively and efficiently
to the extremities of this region, a distance of more than 2800nmi from
the nearest major port or airfield.
The three common key performance elements for Search and Rescue
assets are speed, range and endurance. A maritime Search and
Rescue aircraft operating up to the limits of the national Search and
Rescue Region will require a cruise speed of at least 466.7kn, a total
endurance of at least 17 hours, and sufficient fuel to enable a total
range of at least 7933.5nmi.

19-2
Search and Rescue assets require special Search and Rescue
equipment to enhance the chances of mission success. A maritime
Search and Rescue aircraft operating across the very hostile national
Search and Rescue Region will require at least FLIR, MSR, a SAR
Direction Finder, Satellite Communications, Marine Location Markers
and Aid Life Supply Canisters.
Currently, no airborne SAR assets are available, domestically or
internationally, manned or unmanned, to enable the execution of
efficient and effective maritime SAR in the oceanic zone between
1800nmi and the 2800nmi Search Extremities.
An Unmanned Aircraft should be ideal for long range maritime Search
and Rescue.
Long range maritime SAR aircraft exhibit high Maximum Take-off
Weight-to-Payload Weight ratios. This is due to large fuel quantities
required to satisfy the high performance requirements, versus
technological advances offering small and light payloads.
An Unmanned Aircraft for this purpose will be fairly large, regardless
the design method employed.
Fixed payloads should be retractable and/or located in a streamlined
fairing to reduce drag. Deployable payloads should be located inside
the fuselage in recessed launch tubes for the same reason, and
capable of being deployed remotely.
The airworthiness, safety and capacity of the UA to carry out and
successfully complete its mission hinges strongly on the choice, ability
and reliability of the Data Links employed.
A long range maritime UAS shall require dual redundant Line-of-Sight
and Beyond-Line-of-Sight Data Links.

19-3
Emergency UA Recovery is essential in preventing injury to third
parties as a first priority, while minimising damage to the aircraft as a
second priority.
A long range maritime UAS shall require an Automatic Recovery
System, capable of returning the UA via a safe and pre-determined
route, as well as a Flight Termination System, capable of steering the
UA to a safe location and terminating flight so as to minimise damage
to the aircraft.
The concept of operations for an Unmanned Aircraft System for long
range maritime SAR system requires most of the systems to be
permanently located at an ILS-equipped airfield, with a well-prepared
runway and hangar facilities. The Ground Control Station, Data Link
elements and backup power should be permanently located, with the
aircraft itself operating from and stored at the airfield. the Ground
Control Station design should centre on functionality, ergonomics and
comfort.
The following is regarded as Future Work, stemming from this Study.
Refinement of the Unmanned Aircraft concept design;
Determination of airspace requirements for the operation of this system
in the National Airspace;
Refinement of the Ground Control Station concept design;
Refinement of the Logistic Support and additional ground support
elements;
Detailed study to determine precise Ground Control Station and
support system placement;
Study to determine and propose aircraft and support system
availability, reliability and maintainability requirements;

19-4
Determination of aircraft fleet.

PART 1
List of References
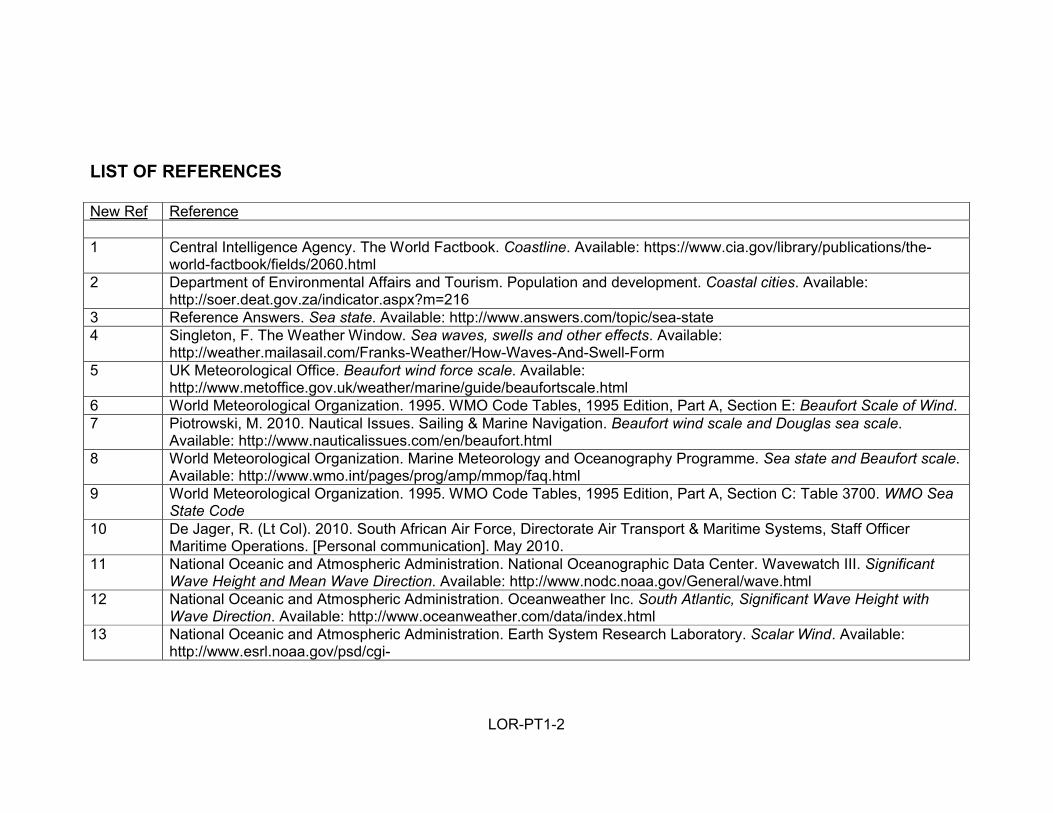
LOR-PT1-2
LIST OF REFERENCES
New Ref Reference
1 Central Intelligence Agency. The World Factbook. Coastline. Available: https://www.cia.gov/library/publications/the-world-factbook/fields/2060.html
2 Department of Environmental Affairs and Tourism. Population and development. Coastal cities. Available: http://soer.deat.gov.za/indicator.aspx?m=216
3 Reference Answers. Sea state. Available: http://www.answers.com/topic/sea-state4 Singleton, F. The Weather Window. Sea waves, swells and other effects. Available:
http://weather.mailasail.com/Franks-Weather/How-Waves-And-Swell-Form5 UK Meteorological Office. Beaufort wind force scale. Available:
http://www.metoffice.gov.uk/weather/marine/guide/beaufortscale.html6 World Meteorological Organization. 1995. WMO Code Tables, 1995 Edition, Part A, Section E: Beaufort Scale of Wind.7 Piotrowski, M. 2010. Nautical Issues. Sailing & Marine Navigation. Beaufort wind scale and Douglas sea scale.
Available: http://www.nauticalissues.com/en/beaufort.html8 World Meteorological Organization. Marine Meteorology and Oceanography Programme. Sea state and Beaufort scale.
Available: http://www.wmo.int/pages/prog/amp/mmop/faq.html9 World Meteorological Organization. 1995. WMO Code Tables, 1995 Edition, Part A, Section C: Table 3700. WMO Sea
State Code10 De Jager, R. (Lt Col). 2010. South African Air Force, Directorate Air Transport & Maritime Systems, Staff Officer
Maritime Operations. [Personal communication]. May 2010.11 National Oceanic and Atmospheric Administration. National Oceanographic Data Center. Wavewatch III. Significant
Wave Height and Mean Wave Direction. Available: http://www.nodc.noaa.gov/General/wave.html12 National Oceanic and Atmospheric Administration. Oceanweather Inc. South Atlantic, Significant Wave Height with
Wave Direction. Available: http://www.oceanweather.com/data/index.html13 National Oceanic and Atmospheric Administration. Earth System Research Laboratory. Scalar Wind. Available:
http://www.esrl.noaa.gov/psd/cgi-

LOR-PT1-3
New Ref Referencebin/db_search/DBSearch.pl?Dataset=ICOADS+2x2+Degree+Enhanced+LTMs&Variable=Scalar+Wind
14 National Aeronautics and Space Administration. Ocean Motion and Surface Currents. Wind Driven Surface Currents. American Meteorological Society. Available: http://www.oceanmotion.org/html/background/wind-driven-surface.htm
15 National Aeronautics and Space Administration. Ocean Motion and Surface Currents. Ocean Surface Currents.OSCAR Project Office. Seattle, USA. Available: http://oceanmotion.org/html/resources/oscar.htm
16 Smith, R., Desflots, M., White, S., Mariano, A.J., Ryan, E.H. 2004. The Antarctic CP Current. Ocean Surface Currents.17 Gyory, J., Beal, L.M., Bischof, B., Mariano, A.J., Ryan, E.H. 2004. The Agulhas Current. Ocean Surface Currents.18 Gyory, J., Mariano, A.J., Ryan, E.H. 2004. The Benguela Current. Ocean Surface Currents.19 Seed, P. 2008. Ocean Currents and Tides: The Treacherous Agulhas. Available:
http://www.ruf.rice.edu/~feegi/ocean.html20 Speer, K. 2008. International Polar Year. Goodbye Agulhas Current; hello Roaring 40’s. Available:
http://www.ipy.org/ipy-blogs/item/1423-fsu-ipy-cruise-says-goodbye-agulhas-current-hello-roaring-40s21 Andersen, Egbert, Erofeeva and Ray. 2006. Non-linear tides in shallow water regions from multi-mission satellite
altimetry & the Andersen 06 Global Ocean Tide Model. Presented AGU WPGM meeting, Beijing, China, July, 2006.22 Locarnini, R.A., Mishonov, A.V., Antonov, J.I., Boyer, T.P., and Garcia, H.E. 2006. Temperature. World Ocean Atlas
2005, Volume 1. NOAA Atlas NESDIS 61, U.S. Government Printing Office, Washington, D.C23 National Oceanic and Atmospheric Administration. Satellite and Information Service. Sea Surface Temperature contour
charts. Available: http://www.osdpd.noaa.gov/ml/ocean/sst/contour.html24 National Oceanic and Atmospheric Administration. Earth System Research Laboratory. Air Temperature. Available:
http://www.esrl.noaa.gov/psd/cgi-bin/DataAccess.pl?DB_dataset=CDC+Derived+NCEP+Reanalysis+Products+Surface+Level&DB_variable=Air+Temperature&DB_statistic=Mean&DB_tid=24756&DB_did=39&DB_vid=1041
25 South African National Antarctic Programme. Marion Island. Available: http://www.sanap.org.za/sanap_marion/sanap_marion.html
26 South African National Antarctic Programme. Marion Island. Available: http://marion.sanap.org.za/27 South African National Antarctic Programme. Marion Island Climate. Available: http://marion.sanap.org.za/waether.html28 WFMZ-TV Weather. 2010. Prevailing Westerlies. Available: http://www.wfmz.com/weather/23050680/detail.html29 World Meteorological Organization. Joint WMO-IOC Technical Commission for Oceanography and Marine Meteorology

LOR-PT1-4
New Ref Reference(JCOMM). Metareas. Available: http://weather.gmdss.org/metareas.html
30 South African National Antarctic Programme. Marion Island - Life at the base. Available: http://www.sanap.org.za/sanap_marion/marion_life_at_the_base.html
31 Bremner, E. 2010. Transnet, National Ports Authority, Port of Cape Town. [Personal communication]. July 2010.32 United Nations. 2009. United Nations Convention on the Law of the Sea (UNCLOS). Maritime Space: Maritime Zones
and Maritime Delimitation. Available: Link: http://www.un.org/Depts/los/LEGISLATIONANDTREATIES/africa.htm33 South Africa. 1994. South African Maritime Zones Act, no 15 of 1994.34 United Nations. 2004. United Nations Convention on the Law of the Sea. Bulletin 54, p 144. Table of Maritime Claims.
New York, 2004.35 South Africa. 1994. South African Maritime Zones Act, no 15 of 1994, p 2 to 3, par 4 to 836 South Africa. 1994. South African Maritime Zones Act, no 15 of 1994, p 2, par 437 South Africa. 1994. South African Maritime Zones Act, no 15 of 1994, p 3, par 538 South Africa. 1994. South African Maritime Zones Act, no 15 of 1994, p 3, par 639 South Africa. 1994. South African Maritime Zones Act, no 15 of 1994, p 3, par 740 Kampfer, A.K., Capt (SAN). 2010. South African Navy, SA Navy Hydrographic Office. South African Maritime
Boundaries, Mainland and Prince Edward Islands. [Personal communication]. July 2010.41 South Africa. 1994. South African Maritime Zones Act, no 15 of 1994, p 4, par 1442 United Nations. 2010. United Nations Convention on the Law of the Sea. Commission on the Limits of the Continental
Shelf (CLCS). Available: http://www.un.org/depts/los/clcs_new/continental_shelf_description.htm43 South Africa. 1994. South African Maritime Zones Act, no 15 of 1994, p 6 to 17, schedule 344 United Nations. 2010. United Nations Convention on the Law of the Sea. Commission on the Limits of the Continental
Shelf (CLCS) – Continental Shelf, Article 76. Available: http://www.un.org/depts/los/convention_agreements/texts/unclos/part6.htm
45 South African Navy. 2010. The Importance of the Sea. Available: http://www.navy.mil.za/aboutus/role/index.htm46 South Africa. 1994. South African Maritime Zones Act, no 15 of 1994, p 3, par 8(3)(a) and (b)47 United Nations. 2010. Food and Agriculture Organization. Fisheries and Aquaculture Department. Fishery and
Aquaculture Country Profiles – South Africa. Available: http://www.fao.org/fishery/countrysector/FI-CP_ZA/en48 National Oceanic and Atmospheric Administration. 2009. Ocean Service Education. Upwelling. Available:

LOR-PT1-5
New Ref Referencehttp://oceanservice.noaa.gov/education/tutorial_currents/03coastal4.html
49 Department of Environmental Affairs and Tourism. 2010. Oceans and Coasts. Commercial Fishing. Available: http://www.environment.gov.za/
50 Froese, R. and Pauly, D. (Editors). 2010. FishBase. Version 09/2010. Available: http://www.fishbase.org51 Sharples, J., Moore, C. M., Hickman, A. E., Holligan, P. M., Tweddle, J. F., Palmer, M. R. & Simpson, J. H. 2009.
Internal tidal mixing as a control on continental margin ecosystems. Geophysical Research Letters, 36, L23603.52 South Africa. 2007. South African Maritime Safety Agency (SAMSA). Annual Report, 2007, p 1353 United Nations. 2010. Food and Agriculture Organization. Fisheries and Aquaculture Department. Statistics. Available:
http://www.fao.org/fishery/statistics/en54 Department of Environmental Affairs and Tourism. 2005. Oceans and Coasts. Catch Information. Available:
http://www.deat.gov.za/55 SAInfo reporter. 2008. South Africa Info. Mining and minerals in South Africa. Available:
http://www.southafrica.info/business/economy/sectors/mining.htm56 Department of Mineral Resources. 2010. Mineral Information. Available:
http://www.dmr.gov.za/minerals/about_minerals.stm57 Department of Energy. 2010. Energy Sources. Available: http://www.energy.gov.za58 Department of Mineral Resources. 2008. Mineral Statistics Tables 2008.59 Department of Minerals and Energy. 2008. Directorate Mineral Economics. Report R71/2008: An Overview of South
Africa’s Titanium Mineral Concentrate Industry, p 1, Introduction60 Department of Minerals and Energy. 2008. Directorate Mineral Economics. Report R71/2008: An Overview of South
Africa’s Titanium Mineral Concentrate Industry, p 2, par 2.161 Department of Minerals and Energy. 2008. Directorate Mineral Economics. Report R71/2008: An Overview of South
Africa’s Titanium Mineral Concentrate Industry, p 3, par 2.162 Exxaro. 2010. Business operations, Sands. KZN Sands. Available: http://www.exxaro.com/content/ops/sands_kzn.asp63 Exxaro. 2010. Business operations, Sands. Namakwa Sands. Available:
http://www.exxaro.com/content/ops/sands_namaqua_sands.asp64 Department of Minerals and Energy. 2008. Directorate Mineral Economics. Report R71/2008: An Overview of South
Africa’s Titanium Mineral Concentrate Industry, p 3 to 4, par 2.2

LOR-PT1-6
New Ref Reference65 Department of Minerals and Energy. 2007. Directorate Mineral Economics. Report R63/2007: An Overview of South
Africa’s Zircon Industry and the Role of BEE, p 1, Introduction and p 2, par 2.166 Department of Minerals and Energy. 2007. Directorate Mineral Economics. Report R63/2007: An Overview of South
Africa’s Zircon Industry and the Role of BEE, p iv, Abstract67 De Beers Group. 2008. Marine mining. Availabe: http://www.debeersgroup.com/Exploration-and-mining/Mining-
methods/Marine-mining/68 De Beers Group. 2008. Mining operations. Available: http://www.debeersgroup.com/en/Exploration-and-mining/Mining-
operations/69 Mbendi Information Services. 2010. Extraction of Crude Petroleum in South Africa. Available:
http://www.mbendi.com/indy/oilg/ogus/af/sa/p0005.htm#1070 Madyibi, L., di Primio, R., Smith, G., Kuhlmann, G., and Anka, Z. 2009. Evidence of Petroleum System Evolution of the
Southern Bredasdorp Basin, South Africa: A Multi-Dimensional Approach. Search and Discovery. September 22, 2009. Article #10197
71 Subramoney, J. 2007. Energy Status in South Africa. Department of Minerals and Energy presentation. NEET workshop. 20 February 2007
72 National Ports Authority. South Afican Ports. Available: http://www.transnetnationalportsauthority.net/73 National Ports Authority. The Port of Ngqura. Available:
http://www.transnetnationalportsauthority.net/NPA_port_of_ngqura.html74 National Ports Authority. Cape Town: Services. Available:
http://www.transnetnationalportsauthority.net/NPA_ports_cape_town_services.html75 National Ports Authority. Mossel Bay: Berths. Available:
http://www.transnetnationalportsauthority.net/NPA_ports_mossel_bay_berths.html76 National Ports Authority. Port Elizabeth: Services. Available:
http://www.transnetnationalportsauthority.net/NPA_ports_port_elizabeth_services.html77 National Ports Authority. East London: Berth lengths and draughts. Available:
http://www.transnetnationalportsauthority.net/NPA_ports_east_london_berths.html78 National Ports Authority. Durban: Functions. Available:
http://www.transnetnationalportsauthority.net/NPA_ports_durban_Functions.html

LOR-PT1-7
New Ref Reference79 National Ports Authority. Richards Bay: Services. Available:
http://www.transnetnationalportsauthority.net/NPA_ports_richards_bay_services.html80 Coetzer, J.A. (Mid). 2010. Letter: Fleet Maintenance Support Facilities. 13 July 2010. South African Navy.81 National Center for Ecological Analysis and Synthesis. 2010. A global map of human impacts to marine ecosystems,
Impacts. Available: http://ebm.nceas.ucsb.edu/GlobalMarine/impacts/transformed/jpg/shipping.jpg82 National Geographic. 2010. State of the earth 2010. Global Shipping Intensity. Available:
http://earthpulse.nationalgeographic.com/earthpulse/earthpulse-map83 Solar Navigator. The Suez Canal, 13th Port of Call – A Wonder of the Modern World.
Available: http://www.solarnavigator.net/suez_canal.htm84 Sand, P. 2009. Avoiding piracy by sailing round the Cape of Good Hope is a costly business. Baltic and International
Maritime Council. Available: https://www.bimco.org/en/Members/News/2009/2009/11/23_Avoiding_piracy.aspx85 Suez Canal Authority. 2008. Canal Characteristics. Available: http://www.suezcanal.gov.eg/sc.aspx?show=1286 Willis, B. 2001. Supertankers. Worsley School. Available:
http://www.worsleyschool.net/science/files/supertanker/page.html87 Lloyd’s List. 2008. Svitzer picks Cape of Good Hope over Suez. 6 November 2008. Available:
http://www.lloydslist.com/ll/news/svitzer-picks-cape-of-good-hope-over-suez/20017588018.htm88 England, A. 2008. The Suez Canal: the fastest route, even in a slowdown. 16 December 2008. Available:
http://www.ft.com/cms/s/0/3a7e768a-cb0a-11dd-87d7-000077b07658.html#axzz15kXFBVge89 National Ports Authority. 2009. Port Statistics, Financial Year 2008-2009. Available:
http://www.transnetnationalportsauthority.net/NPA_Port_statistics.html90 Chasomeris, M. G. 2002. Trade and Industrial Policy Strategies 2002 Annual Forum. South Africa’s Seaborne
Commerce, Trade Flows, Transport Costs and the Maritime Transport Policy Environment. 2002, Muldersdrift91 Mitropoulos, E. E. 2007. Opening of Regional MRCC, South Africa (Speech by Secretary-General of the International
Maritime Organization) Cape Town, 16 January 200792 Bremner, E. (Capt). 2010. Vessel Arrivals at South African Ports: January-December 2009. July 2010. Transnet
93 Bremner, E. (Capt). 2010. Summary of Cargo Handled at Ports of South Africa: January-December 2009. July 2010. Transnet

LOR-PT1-8
New Ref Reference94 Bremner, E. (Capt). 2010. TEU’s: January-December 2009. July 2010. Transnet95 Transnet. 2009. Transnet Annual Results 31 March 2009. 24 June 200996 Chasomeris, M. G. 2002. Trade and Industrial Policy Strategies 2002 Annual Forum. South Africa’s Seaborne
Commerce, Trade Flows, Transport Costs and the Maritime Transport Policy Environment. 2002, Muldersdrift, p 1, Introduction
97 South African Navy. 2010. Equipment. Available: http://www.navy.mil.za/equipment/index.htm98 South African Police Services. Budget Vote 27 – Safety and Security. Available:
http://www.saps.gov.za/_dynamicModules/internetSite/newsBuild.asp?myURL=65399 South African Tourism. 2008. Annual Tourism Report, p 5100 South African Tourism. 2008. Annual Tourism Report, p 6, par 2.1101 South African Tourism. 2008. Annual Tourism Report, p 8, par 2.2102 South African Tourism. 2008. Annual Tourism Report, p 78, par 10.5103 du Plessis, M. 2008. Investigation of the Cruise Liner Industry. Mitchell du Plessis Projects (Pty) Ltd presentation.
16 July 2008, slide 8104 du Plessis, M. 2008. Investigation of the Cruise Liner Industry. Mitchell du Plessis Projects (Pty) Ltd presentation.
16 July 2008, slides 9 and 10105 du Plessis, M. 2008. Investigation of the Cruise Liner Industry. Mitchell du Plessis Projects (Pty) Ltd presentation.
16 July 2008, slide 22106 du Plessis, M. 2008. Investigation of the Cruise Liner Industry. Mitchell du Plessis Projects (Pty) Ltd presentation.
16 July 2008, slide 5107 du Plessis, M. 2008. Investigation of the Cruise Liner Industry. Mitchell du Plessis Projects (Pty) Ltd presentation.
16 July 2008, slide 14108 Burden, E., Quan, T. 2009. Royal Caribbean International takes delivery of much anticipated Oasis of the Seas. Miami,
28 October 2009. Available: http://www.oasisoftheseas.com/press-room.php109 South Africa. 1996. Constitution of South Africa, 1996, par 200.2110 South Africa. 2002. New Defence Act 42 of 2002, p 13, ch 3, par 18(b) and (d)111 Airline Route Maps. Africa. Available: http://www.airlineroutemaps.com/112 Lufthansa. 2010. Flight information, Lufthansa’s route network. Available:

LOR-PT1-9
New Ref Referencehttp://lufthansa.innosked.com/Default.aspx?lang_id=en&country=za
113 Malaysia Airlines. 2010. Destinations, our routes. Available: http://malaysiaairlines.innosked.com/(S(zossig45tfwlcofmnydqfj55))/default.aspx?show=MAP&FromMap=no
114 South Africa. Civil Aviation Regulations, Part 91, General Operating and Flight Rules, Subpart 4: Instruments and Equipment, par 91.04.27 – 91.04.29
115 South Africa. Civil Aviation Technical Standards, Part 91, Operating and Flight Rules, par 91.04.28 and 91.04.29116 Shipwrecks of South Africa. 2009. Shipwrecks of South Africa. Available: http://www.sashipwrecks.com/117 Shipwrecks of South Africa. 2009. Shipwrecks of South Africa. Available: http://www.sashipwrecks.com/118 WhyGo South Africa. 2010. Shipwreck coast. Available: http://www.southafricalogue.com/shipwreck-coast119 AirDisaster. 2008. Accident database, South Africa. Available:
http://www.airdisaster.com/cgi-bin/search_keyword.cgi?search=south+africa120 South African Civil Aviation Authority. 2010. Aircraft accident reports 1998. Available: http://www.caa.co.za/121 South African Civil Aviation Authority. 2010. Aircraft accident reports 2001. Available: http://www.caa.co.za/122 South African Civil Aviation Authority. 2010. Aircraft accident reports 2002. Available: http://www.caa.co.za/123 South African Civil Aviation Authority. 2010. Aircraft accident reports 2003. Available: http://www.caa.co.za/124 South African Civil Aviation Authority. 2010. Aircraft accident reports 2006. Available: http://www.caa.co.za/125 Central Intelligence Agency. The World Factbook. Land boundaries. Available:
https://www.cia.gov/library/publications/the-world-factbook/fields/2096.html126 South Africa. 2001. South African Maritime and Aeronautical Search and Rescue Bill, p 10, schedule 1, preamble127 South Africa. 2002. South African Maritime and Aeronautical Search and Rescue Act, 44, 2002, schedule 1, preamble128 South Africa. 2001. South African Maritime and Aeronautical Search and Rescue Bill, pp 10 to 13, schedule 1129 South Africa. 2002. South African Maritime and Aeronautical Search and Rescue Act, 44, 2002, schedule 1130 South Africa. 2001. South African Maritime and Aeronautical Search and Rescue Bill, p 14, schedule 1, annex, ch 2,
par 2.1131 South Africa. 2002. South African Maritime and Aeronautical Search and Rescue Act, 44, 2002, schedule 1, annex, ch
2, par 2.1132 South Africa. 2001. South African Maritime and Aeronautical Search and Rescue Bill, p 16, schedule 1, annex, ch 3133 South Africa. 2002. South African Maritime and Aeronautical Search and Rescue Act, 44, 2002, schedule 1, annex, ch

LOR-PT1-10
New Ref Reference3
134 South Africa. 2001. South African Maritime and Aeronautical Search and Rescue Bill, p 14, schedule 1, annex, ch 2, par 2.3
135 South Africa. 2001. South African Maritime and Aeronautical Search and Rescue Bill, p 19, schedule 1, annex, ch 5136 South Africa. 2002. South African Maritime and Aeronautical Search and Rescue Act, 44, 2002, schedule 1, annex, ch
2, par 2.3137 South Africa. 2002. South African Maritime and Aeronautical Search and Rescue Act, 44, 2002, schedule 1, annex, ch
5138 South African Search and Rescue Organisation. Origins of SASAR. Draft National SAR Manual, Appendix A139 South African Search and Rescue Organisation. Who are we. Available: http://www.sasar.gov.za/140 South Africa. 2001. South African Maritime and Aeronautical Search and Rescue Bill, p 3, par 4.(2)(a)141 South Africa. 2001. South African Maritime and Aeronautical Search and Rescue Bill, p 4, par 5.(8)142 South Africa. 2001. South African Maritime and Aeronautical Search and Rescue Bill, p 4, par 6.(1)(a)143 South Africa. 2001. South African Maritime and Aeronautical Search and Rescue Bill, p 4, par 6.(3)144 South African Search and Rescue Organisation. Constitution of the South African Search and Rescue Organisation, p
1, preamble145 South African Search and Rescue Organisation. Constitution of the South African Search and Rescue Organisation, p
4, article 5, par 5.1146 South African Search and Rescue Organisation. Constitution of the South African Search and Rescue Organisation, p
4, article 5, par 5.2(b)147 South African Search and Rescue Organisation. Draft National SAR Manual, p 9, ch 1, section 1148 International Maritime Organization. 2010. Member States. Available:
http://www.imo.org/About/Membership/Pages/MemberStates.aspx149 South Africa. 2002. South African Maritime and Aeronautical Search and Rescue Act, 44, 2002, par 3(1) and 3(2)150 International Civil Aviation Organization. 2010. Contracting States. Available: http://www.icao.int/cgi/statesDB4.pl?en151 United Nations. 2010. United Nations Convention on the Law of the Sea. Chronological list of ratifications of,
accessions and successions to the Convention and the related Agreements as at 15 November 2010.Available: http://www.un.org/Depts/los/reference_files/chronological_lists_of_ratifications.htm#The United Nations

LOR-PT1-11
New Ref ReferenceConvention on the Law of the Sea
152 International Maritime Organization. 2010. Conventions, SOLAS. Available: http://www.imo.org/About/Conventions/ListOfConventions/Pages/International-Convention-for-the-Safety-of-Life-at-Sea-%28SOLAS%29,-1974.aspx
153 International Maritime Organization. 2010. Conventions, Status of conventions. Available: http://www.imo.org/About/Conventions/StatusOfConventions/Pages/Default.aspx
154 Southern African Development Community. 1995. Standing Maritime Committee. Nodal points. Available:http://www.navy.mil.za/SMC/nodal_points.htm
155 Southern Africa Development Community. 2002. Organisation and co-operation. Standing Maritime Committee of the Interstate Security and Defence Committee, p 1-1, ch 1, section 1006, par 1.a
156 International Hydrographic Organization. 2010. IHO Member States. Available: http://www.iho-ohi.net/english/home/about-the-iho/about-iho-member-states/ms-information.html
157 African Union. Member States. Available: http://www.africa-union.org/root/au/memberstates/map.htm158 Southern Africa Development Community. 2010. SADC Member States. Available: http://www.sadc.int/159 Southern Africa Development Community. 2010. Policy on Politics, Defence and Security Cooperation, Article 7, point
1. Blantyre, August 2001. Available: http://www.sadc.int/index/browse/page/157160 Department of Foreign Affairs. 2004. African Economic Community: History and present status. Available:
http://www.dfa.gov.za/foreign/Multilateral/africa/aec.htm161 Sea Around Us Project. Exclusive Economic Zones. Available: http://www.seaaroundus.org/eez/162 South African Search and Rescue Organisation. Draft National SAR Manual, p 5, Foreword163 Edwards, D. Maritime and Aeronautical Search and Rescue Matters. U.S. Coast Guard Search and Rescue, p 1164 South African Search and Rescue Organisation. Draft National SAR Manual, p 40, ch 6, par 1165 Siko, M. 1996. South Africa's Maritime Interest and Responsibilities. Institute for Maritime Technology, p2166 South African Search and Rescue Organisation. Draft National SAR Manual, p 9, ch 1, Overview167 South Africa. 2002. South African Maritime and Aeronautical Search and Rescue Act, 44, 2002, Schedule 2, Search
And Rescue, Annex 12 to the Convention on International Civil Aviation, ch 2, Organization, par 2.1.1.1168 South Africa. 2001. South African Maritime and Aeronautical Search and Rescue Bill, p 7, par 20(1)169 South Africa. 2002. South African Maritime and Aeronautical Search and Rescue Act, 44, 2002, par 20(1)

LOR-PT1-12
New Ref Reference170 International Civil Aviation Organization. Support to NEPAD. August 2004 to April 2005, p 2171 South Africa. 2001. South African Maritime and Aeronautical Search and Rescue Bill, p 14, annex, ch 2, par 2.1.2172 South Africa. 2002. South African Maritime and Aeronautical Search and Rescue Act, 44, 2002, annex, ch 2, par 2.1.2173 South African Search and Rescue Organisation. Draft National SAR Manual, p 23, ch 3, section 2.1.1174 South Africa. 2001. South African Maritime and Aeronautical Search and Rescue Bill, p 6, par 12(1)175 South Africa. 2002. South African Maritime and Aeronautical Search and Rescue Act, 44, 2002, par 12(1)176 South African Search and Rescue Organisation. Draft National SAR Manual, p 23, ch 3, section 1177 South African Search and Rescue Organisation. Draft National SAR Manual, p 20, ch 2, section 1178 International Civil Aviation Organization. 1998. Report of the ICAO/IMO Joint Working Group on Harmonization of
Aeronautical and Maritime Search and Rescue. Sixth ICAO/IMO Joint Working Group on SAR, Victoria, B.C., 5-9 October 1998
179 Edwards, D. Maritime and Aeronautical Search and Rescue Matters. U.S. Coast Guard Search and Rescue, p 2180 South Africa. 2001. South African Maritime and Aeronautical Search and Rescue Bill, p 17, annex, ch 3, par 3.1.6.1181 South Africa. 2002. South African Maritime and Aeronautical Search and Rescue Act, 44, 2002, annex, ch 3, par
3.1.6.1182 South African Search and Rescue Organisation. Operational and Reporting Procedures. SASAR Policy Manual Vol 2,
p 8, ch 1, par 1.1c183 South Africa. 2001. South African Maritime and Aeronautical Search and Rescue Bill, p 14, annex, ch 1, par 1.3.8184 South Africa. 2001. South African Maritime and Aeronautical Search and Rescue Bill, p 16, annex, ch 2, par 2.6.1185 South Africa. 2002. South African Maritime and Aeronautical Search and Rescue Act, 44, 2002, annex, ch 1, par 1.3.8186 South Africa. 2002. South African Maritime and Aeronautical Search and Rescue Act, 44, 2002, annex, ch 2, par 2.6.1187 South Africa. 2001. South African Maritime and Aeronautical Search and Rescue Bill, p 19, annex, ch 4, par 4.8.1188 South Africa. 2002. South African Maritime and Aeronautical Search and Rescue Act, 44, 2002, annex, ch 4, par 4.8.1189 South African Search and Rescue Organisation. Draft National SAR Manual, p 49, ch 8, section 3190 South African Search and Rescue Organisation. Draft National SAR Manual, p 18, ch 1, section 6.3.2191 South African Search and Rescue Organisation. Draft National SAR Manual, p 18, ch 1, section 6.3.1192 South African Search and Rescue Organisation. Draft National SAR Manual, p 21 and 22, ch 2, section 2.3.1 and 2.3.2193 South African Search and Rescue Organisation. Harbour Master’s Areas of Responsibility (Maritime) SAR Region.

LOR-PT1-13
New Ref ReferenceDraft National SAR Manual, Appendix D
194 International Maritime Organization. 2010. Conventions, International Convention on Maritime search and rescue. Available: http://www.imo.org/About/Conventions/ListOfConventions/Pages/International-Convention-on-Maritime-Search-and-Rescue-%28SAR%29.aspx
195 South Africa. 2001. South African Maritime and Aeronautical Search and Rescue Bill, p 5, par 10(2)196 South Africa. 2002. South African Maritime and Aeronautical Search and Rescue Act, 44, 2002, par 10(2)197 South African Search and Rescue Organisation. Diagrammatical representation of SASAR's Search and Rescue
Region. Draft National SAR Manual, Appendix C198 South African Search and Rescue Organisation. Our regions. Available: http://www.sasar.gov.za/regions/main.html199 South African Search and Rescue Organisation. Draft National SAR Manual, p 20, ch 1, section 2.2200 United Nations. United Nations Atlas of the Oceans. Shipping emergencies – search and rescue, SAR Convention.
Available: http://www.oceansatlas.com/unatlas/issues/emergencies/gmdss_sar/searchrescue.htm#_Toc515946374201 South African Search and Rescue Organisation. Draft National SAR Manual, p 16, ch 1, section 6.3202 National Sea Rescue Institute. 2010. About Us – Our History. Available: http://www.nsri.org.za/about/203 National Sea Rescue Institute. 2010. Available: http://www.nsri.org.za/new/Index.asp204 South African Search and Rescue Organisation. Draft National SAR Manual, p 25, ch 3, section 2.3.1205 South African Search and Rescue Organisation. Draft National SAR Manual, p 25, ch 3, section 2.3.1 (a) to (h)206 South African Search and Rescue Organisation. Draft National SAR Manual, p 24, ch 3, section 2.2.1207 South African Search and Rescue Organisation. Draft National SAR Manual, p 24, ch 3, section 2.2.1 (a) to (h)208 South African Search and Rescue Organisation. Draft National SAR Manual, p 26, ch 3, section 2.4.1 (a) to (f)209 Skycontrol Aviation & Aerospace News. Transnet National Port Authority of South Africa Orders a Grand Helicopter for
Harbour Pilot Shuttle Operations. Available: http://www.skycontrol.net/helicopters/transnet-national-port-authority-of-south-africa-orders-a-grand-helicopter-for-harbour-pilot-shuttle-operations/
210 Acher Aviation. 2009. Marine Pilot Service. Available: http://www.acheraviation.com/?m=1211 Titan Helicopter Group. Offshore Operations. Available: http://www.titanhelicopters.com/index.php?page_id=4212 Titan Helicopter Group. Our Fleet. Available: http//www.titanhelicopters.com/index.php?page_id=11213 South Africa. 2001. South African Maritime and Aeronautical Search and Rescue Bill, p 14, annex, ch 2, par 2.1.2.3214 South Africa. 2002. South African Maritime and Aeronautical Search and Rescue Act, 44, 2002, par 6(3)

LOR-PT1-14
New Ref Reference215 South Africa. 2002. South African Maritime and Aeronautical Search and Rescue Act, 44, 2002, annex, ch 2, par
2.1.2.3216 South African Search and Rescue Organisation. Constitution of the South African Search and Rescue Organisation, p
4, article 5, par 5.2(e)217 South African Search and Rescue Organisation. Constitution of the South African Search and Rescue Organisation, p
5, article 6, par 6.2218 South African Search and Rescue Organisation Policy Manual Vol 2, Operational and Reporting Procedures, p 10, ch
1, par 1.4d,h219 Keijer, D.S. (Lt Col). 2010. South African Air Force, Directorate Helicopter Systems, DHS Helicopter Planning.
[Personal communication]. May 2010.220 South African Aircraft Register. Aviation Databases. Available: http://www.avdex.co.za/saregister/index.asp221 Acher Aviation. 2009. Gallery. Available: http://www.acheraviation.com/?m=4&idkey=540222 United Sates Army. Thermal Imaging. Night Vision and Electronic Sensors Directorate. Available:
http://www.nvl.army.mil/thermal.html223 FLIR Systems. 2010. EO/IR. Available: http://www.gs.flir.com/eoir/224 Wolff, C. Radar Sets – Ocean Master. Radar Tutorial. Available: http://www.radartutorial.eu/19.kartei/karte604.en.html225 Rhotheta. 2010. Search and rescue direction finders for airborne rescue missions. Available:
http://www.rhotheta.com/applications/sar_airborne-rescue.html226 Rhotheta. 2009. SAR & Law Enforcement Direction Finder, RT-600/SAR DF-517 (Brochure)227 Ritter, D. 2000. Equipped to Survive. Available: http://www.equipped.org/uscgsarsat.htm228 Experimental Aircraft Info. 2010. Aircraft Distress Beacons. Available:
http://www.experimentalaircraft.info/homebuilt-aircraft/avionics-emergency-locator-beacon.php229 Inmarsat. 2009. Classic services: coverage. Available:
http://www.inmarsat.com/Services/Aeronautical/Classic_Aero/Coverage.aspx?language=EN&textonly=False230 Inmarsat. 2009. Swift 64: coverage. Available:
http://www.inmarsat.com/Services/Aeronautical/Swift_64/Coverage.aspx?language=EN&textonly=False231 Inmarsat. 2009. SwiftBroadband: coverage. Available:
http://www.inmarsat.com/Services/Aeronautical/SwiftBroadband/Coverage.aspx?language=EN&textonly=False

LOR-PT1-15
New Ref Reference232 Inmarsat. 2009. SwiftBroadband: Flexible IP connectivity. Available:
http://www.inmarsat.com/Services/Aeronautical/SwiftBroadband/default.aspx?language=EN&textonly=False233 Inmarsat. 2009. SwiftBroadband: High-speed, IP-based voice and data. (Brochure)234 Ferris, G. (Lt Col). 2010. South African Air Force, Directorate Technical Support Services, Staff Officer Armament
Maintenance Capabilities. [Personal communication]. June 2010235 Life Support International. 2010. UNI-PAC, Air-Drop, Bombay. Available:
http://www.lifesupportintl.com/products/UNI_PAC_Air_Drop_Bombay-2641-257.html236 Lutz, W. 2010. Denel Dynamics, UAV Systems. [Personal communication]. June 2010237 Boatsafe. 2009. Boat Safe this Spring or Fall- avoid Hypothermia. Available:
http://boatsafe.com/nauticalknowhow/hypothermia.htm238 South African Air Force. 2006. Analysis of Maritime Tasks within the RSA Waters. Directorate Air Capability Planning.
Nov 2006239 Insitu. 2009. ScanEagle. (Brochure)240 Wainman, C. K., Egypt, R. Project Gentle- Progress report 3: Maritime Environmental Characterization of the African
EEZ – A Quantitative Analysis. Institute for Maritime Technology. October 2009241 Withington, T. 2009. The devil is in the detail. Shephard’s Unmanned Vehicles. Vol.14, no.5. Oct/Nov 2009.242 Owen, W.F. 2009. Not all spin. Shephard’s Unmanned Vehicles. Vol.14, no.6. Dec 2009 Jan 2010243 Scott, R. 2010. Finding their sea legs at last. Shephard’s Unmanned Vehicles. Vol.15, no1. Feb/Mar 2010.244 Apthorp, C. 2010. Small world. Shephard’s Unmanned Vehicles. Vol.15, no1. Feb/Mar 2010 245 Lake, D. 2010. Seeker 400 looks to broader horizons. Shephard’s Unmanned Vehicles. Vol.15, no5. Oct/Nov 2010246 Parry, D. 2007. Unmanned Aircraft Systems Briefing: Coastmaster. World Airnews. Vol. 35, no.10. December 2007247 Heitman, H.R. 2010. Patrolling Africa’s Waters Part 1. World Airnews. Vol. 37, no.11. January 2010248 Heitman, H.R. 2010. Patrolling Africa’s Waters Part 2. World Airnews. Vol. 37, no.12. February 2010.249 Hayward, K. (Prof). 2008. UAS and ISTAR. Aerospace Professional. December 2008 250 Powrie, R.S. (Lt Col). 2010. A109 LUH Deck Landing Performance. November 2010.

PART 2
List of References

LOR-PT2-2
LIST OF REFERENCES
New Ref Reference
1 The Free Dictionary. 2010. Unmanned Aerial Vehicle. Available:http://www.thefreedictionary.com/unmanned+aerial+vehicle
2 Army Technology. 2010. Term: Unmanned Aerial Vehicle. Available:http://www.army-technology.com/glossary/unmanned-aerial-vehicle.html
3 Ministry of Defence. 2008. Defence Standard 00-970 Part 9 - UAV Systems. Issue 4, amendment 1. p 184 Délégation générale pour l’Armement. 2005. UAV Systems Airworthiness Requirements (USAR). Version 3.0. January
2005. p 8. Book 1, Subpart A, 1 (b)5 Maneschijn, A. 2008. Interim Policy for Unmanned Aircraft Systems in South Africa. Second Draft, August 2008, p 9,
par 2.1.2 (gg)6 Federal Aviation Administration. 2005. Unmanned Aircraft Systems Operations in the U.S. National airspace system-
Interim operational Approval Guidance. AFS-400 UAS Policy 05-01. September 2005. par 57 North Atlantic Treaty Organization. Unmanned Aerial Vehicles Systems Airworthiness Requirements (USAR). STANAG
4671. 9 May 2007. p 11. Annex 1. Introduction: Glossary8 Délégation générale pour l’Armement. 2005. UAV Systems Airworthiness Requirements (USAR). Version 3.0. January
2005. p 8, Book 1, Subpart A, 1 (c)9 Maneschijn, A. 2008. Interim Policy for Unmanned Aircraft Systems in South Africa. Second Draft, August 2008, p 9,
par 2.1.2 (ii)10 Naughton, R. (Dr). 2002. Remote Piloted Aerial Vehicles: An Anthology. Available:
http://www.ctie.monash.edu/hargrave/rpav_home.html#Beginnings11 Yochim, J. A. (Maj). 1998. The Vulnerabilities of Unmanned Aircraft System Common Data Links to Electronic Attack.
(Master of Military Art and Science - Thesis) Utah, Weber State University. 12 Pearson, L. Developing the Flying Bomb. Naval Air Systems Command13 Parsch, A. 2005. Dayton Wright/Kettering Liberty Eagle ("Bug"). Designation Systems. Available:
http://www.designation-systems.net/dusrm/app4/bug.html

LOR-PT2-3
New Ref Reference14 Naughton, R. (Dr). 2002. The Aerial Target and Aerial Torpedo in Britain. Available:
http://www.ctie.monash.edu.au/hargrave/rpav_britain.html15 Goebel, G. 2010. The Aerial Torpedo. Available: http://www.vectorsite.net/twcruz_1.html16 Goebel, G. 2010. Early US Target Drones. Available: Website, Vectorsite, http://www.vectorsite.net/twuav_01.html17 Parsch, A. 2005. Early Missiles and Drones. Designation Systems. Available:
http://www.designation-systems.net/dusrm/app1/a-target.html18 Goebel, G. 2010. Modern US Target Drones. Available: http://www.vectorsite.net/twuav_02.html19 Goebel, G. 2010. Decoys. Available: http://www.vectorsite.net/twuav_06.html20 Goebel, G. 2010. US Battlefield UAVs (1). Available: http://www.vectorsite.net/twuav_07.html21 Kosiak, S. Heeter, E. 1997. Unmanned Aerial Vehicles – Current Plans and Prospects for the Future. UAV History.
July, 199722 Goebel, G. 2010. Modern US Endurance UAVs. Available: http://www.vectorsite.net/twuav_13.html23 National Aeronautics and Space Administration. Ikhana. Dryden Flight Research Center. Available:
http://www.nasa.gov/centers/dryden/aircraft/Ikhana/index.html24 Goebel, G. 2010. US Battlefield UAVs (2). Available: http://www.vectorsite.net/twuav_08.html25 Goebel, G. 2010. International Endurance UAVs. Available: http://www.vectorsite.net/twuav_14.html26 Goebel, G. 2010. International Battlefield UAVs (2). Available: http://www.vectorsite.net/twuav_11.html27 Goebel, G. 2010. US Battlefield UAVs (3). Available: http://www.vectorsite.net/twuav_09.html28 Goebel, G. 2010. Miniature UAVs. Available: http://www.vectorsite.net/twuav_17.html29 Simba Aviation. 2009. Unmanned Aerial-System Classification. Available:
http://www.unmanned-aerial-system.com/classification.html30 Goebel, G. 2010. International Target Drones. Available: http://www.vectorsite.net/twuav_03.html31 Merriam-Webster. 2010. Reconnaissance. Available: http://www.merriam-webster.com/dictionary/reconnaissance32 Cambridge University Press. 2010. Reconnaissance.Available:
http://dictionary.cambridge.org/dictionary/british/reconnaissance33 Merriam-Webster. 2010. Surveillance. Available: http://www.merriam-webster.com/dictionary/surveillance34 Cambridge University Press. 2010. Surveillance. Available: http://dictionary.cambridge.org/dictionary/british/surveillance35 Goebel, G. 2010. Secret US Reconnaissance Drone. Available: http://www.vectorsite.net/twuav_05.html

LOR-PT2-4
New Ref Reference36 Goebel, G. 2010. UCAVs. Available: http://www.vectorsite.net/twuav_16.html37 Goebel, G. 2010. The Prehistory of Endurance UAVs. Available: http://www.vectorsite.net/twuav_12.html38 United States Coast Guard. 2009. UAS Project Description. Acquisition Directorate. Available:
http://www.uscg.mil/acquisition/uas/projectdescription.asp39 Goebel, G. 2010. The NASA ERAST HALE UAV Program. Available: http://www.vectorsite.net/twuav_15.html40 Aerovironment. Wasp 3 Micro Air Vehicle. (Datasheet).Available: http://www.avinc.com/uas/small_uas/wasp/41 Aerovironment. 2009. Raven RQ-11B. (Datasheet). Available: http://www.avinc.com/uas/small_uas/raven/42 L3 Communications Geneva Aerospace. 2009. Viking 400. (Datasheet). Available:
http://www.l-3com.com/bai/viking400.html43 Denel Dynamics. 2007. Seeker II UAV surveillance system. (Datasheet). Available:
http://www.deneldynamics.co.za/brochures/Broc0268_Seeker%20II%20External.pdf44 Pioneer UAV Inc. RQ-2 Pioneer. (Datasheet). Available: http://www.uavforum.org/sys-aircraft.asp45 AAI Corporation. RQ-7 Shadow 200. (Datasheet). Available: http://www.aaicorp.com/products/uas/shadow_family.html46 Northrop Grummon. MQ-8B Fire Scout. (Datasheet). Available:
http://www.as.northropgrumman.com/products/p6mq8bfirescout/index.html47 INSITU. 2009. ScanEagle. (Datasheet). Available: http://www.insitu.com/scaneagle48 General Atomics. 2007. MQ-1 Predator. (Datasheet). Available: http://www.ga-asi.com/products/aircraft/predator.php49 General Atomics. 2009. Sky Warrior. (Datasheet). Available: http://www.ga-asi.com/products/aircraft/er-mp-uas.php50 Israel Aerospace Industries. 2006. Heron 1. (Datasheet). Available: http://www.iai.co.il/18900-16382-
en/BusinessAreas_UnmannedAirSystems_HeronFamily.aspx?btl=151 Denel Dynamics. 2007. Bateleur Medium-Altitude Long- Endurance Surveillance UAV. (Datasheet). Available:
http://www.deneldynamics.co.za/52 General Atomics. 2007. Predator B/ MQ-9 Reaper. (Datasheet). Available: http://www.ga-
asi.com/products/aircraft/predator_b.php53 Northrop Grumman. 2005. RQ-4A Global Hawk. (Datasheet). Available:
http://www.as.northropgrumman.com/products/ghrq4b/index.html54 Israel Aerospace Industries. Heron TP. (Datasheet). Available: http://www.iai.co.il/18900-37204-
en/BusinessAreas_UnmannedAirSystems_HeronFamily.aspx?btl=1

LOR-PT2-5
New Ref Reference55 Airforce Technology. 2010. X-45 J-UCAV Joint Unmanned Combat Air System, USA. Available: http://www.airforce-
technology.com/projects/x-45-ucav/specs.html56 Northrop Grumman. 2009. X-47B Navy UCAS. (Datasheet). Available:
http://www.as.northropgrumman.com/products/nucasx47b/index.html57 Dassault Aviation. 2006. nEUROn, A technological challenge. Available: http://www.dassault-
aviation.com/en/defense/neuron/a-technological-challenge.html?L=158 Littmann, E. 2003. Unmanned Aerial Vehicles – Key to Intelligence. European Aeronautic Defence and Space
presentation. EADS International Technology Days. 4 and 5 November 2003. Slide 359 Kosiak, S. Heeter, E. 1997. Unmanned Aerial Vehicles – Current Plans and Prospects for the Future. Advantages and
Disadvantages of UAVs. July, 199760 Kane, M. 2007. Autonomous Systems and Future Capability. BAE Systems presentation. Analysts/Fund Managers
Visit. April 2007.61 Mearns, S., Marshall, J. 2006. BAE Systems unveils the latest generation of autonomous air vehicles. BAE Systems
News Releases. 30 March 200662 Air Attack Military Aviation News and Media. BAE Corax UCAV. Avialable: http://www.air-attack.com/page/74/BAE-
Corax-UCAV.html63 Maneschijn, A. 2008. Interim Policy for Unmanned Aircraft Systems in South Africa. Second Draft, August 2008, p 29 to
3264 Iridium Communications. The rate of speed for each Iridium Data Service. Iridium Support.
Available: http://www.iridium.com/Support.aspx65 Iridium Communications. Coverage Maps. Support Library. Available:
http://www.iridium.com/support/library/CoverageMaps.aspx66 Inmarsat. 2009. Aeronautical Services. Available:
http://www.inmarsat.com/Services/Aeronautical/default.aspx?language=EN&textonly=False67 Inmarsat. 2009. SwiftBroadband: coverage. Available:
http://www.inmarsat.com/Services/Aeronautical/SwiftBroadband/Coverage.aspx?language=EN&textonly=False68 Lutz, W. 2010. Denel Dynamics, UAV Systems. [Personal communication]. June 201069 Hawkes, D., Mardiné, G., Allouche, M. 2008. Unmanned Aircraft Systems, EUROCAE Activities. EUROCAE

LOR-PT2-6
New Ref Referencepresentation. February 2008
70 Jackson, D. 2010. Denel Dynamics, UAV Systems. [Personal communication]. June 201071 De Beer, T. 2010. Denel Dynamics, UAV Systems. [Personal communication]. June 201072 la Franchi, P. 2009. Australia confirmed as MDA’s second ISR customer. Shephard’s Unmanned Vehicles. Vol.14,
no.5. Oct/Nov 200973 Gourley, S.R. 2009. Green machines. Shephard’s Unmanned Vehicles. Vol.14, no.5. Oct/Nov 200974 la Franchi, P. 2009. ICAO to standardize ‘pilot’ terminology for UAS. Shephard’s Unmanned Vehicles. Vol.14, no.5.
Oct/Nov 200975 Lake, D. 2010. The right mix. Shephard’s Unmanned Vehicles. Vol.14, no.6. Dec 2009/Jan 201076 Henderson, A. 2010. A promising year ahead?. Shephard’s Unmanned Vehicles. Vol.14, no.6. Dec 2009/Jan 201077 Ripley, T. 2010. Building the ISTAR hub. Shephard’s Unmanned Vehicles. Vol.14, no.6. Dec 2009/Jan 201078 Owen, W.F. 2010. Not all spin. Shephard’s Unmanned Vehicles. Vol.14, no.6. Dec 2009/Jan 201079 Withington, T. 2010. Power of the signal box. Shephard’s Unmanned Vehicles. Vol.14, no.6. Dec 2009/Jan 201080 Owen, W.F. 2010. Facing the near future. Shephard’s Unmanned Vehicles. Vol.15, no.1. Feb/Mar 201081 Apthorp, C. 2010. Small world. Shephard’s Unmanned Vehicles. Vol.15, no.1. Feb/Mar 201082 Lake, D. 2010. Looking for lift. Shephard’s Unmanned Vehicles. Vol.15, no.2. Apr/May 201083 Lake, D. Owen, W.F. Gourley, S.R. 2010. MALE contenders. Shephard’s Unmanned Vehicles. Vol.15, no.2. Apr/May
201084 Lake, D. 2010. Oceans of potential. Shephard’s Unmanned Vehicles. Vol.15, no.2. Apr/May 201085 Baddeley, A. 2010. Touching base. Shephard’s Unmanned Vehicles. Vol.15, no.2. Apr/May 201086 Batey, A. 2010. The UAV commander. Shephard’s Unmanned Vehicles. Vol.15, no.2. Apr/May 201087 Cantlie, J. 2010. The UAV pilot. Shephard’s Unmanned Vehicles. Vol.15, no.2. Apr/May 201088 Lake, D. 2010. Seeing the future. Shephard’s Unmanned Vehicles. Vol.15, no.3. Jun/Jul 201089 Apthorp, C. 2010. Pooling information. Shephard’s Unmanned Vehicles. Vol.15, no.3. Jun/Jul 201090 Batey, A. 2010. Brothers in arms. Shephard’s Unmanned Vehicles. Vol.15, no.3. Jun/Jul 201091 White, A. Ackerman, J. 2010. UAV’s: the sky’s the limit. Shephard’s Unmanned Vehicles. Vol.15, no.4. Aug/Sep 2010 92 Lake, D. 2010. Seeker 400 looks to broader horizons. Shephard’s Unmanned Vehicles. Vol.15, no.5. Oct/Nov 201093 White, A. 2010. Joined-up thinking. Shephard’s Unmanned Vehicles. Vol.15, no.5. Oct/Nov 2010

LOR-PT2-7
New Ref Reference94 Parry, D. 2007. Unmanned Aircraft Systems Briefing: Autonomous Performance. World Airnews. Vol.35, no.10. Dec
200795 Holden, H. M. 2008. UAV Technology – Transitioning to the Civilian Market. World Airnews. Vol.36, no.1. March 200896 World Airnews. 2008. UAV Systems under the Spotlight. World Airnews. Vol.36, no.5. July 2008 97 Parry, D. 2008. UAS Review – The Farnborough Effect: Dassault Aviation. World Airnews. Vol.36, no.7. Sep 2008 98 Parry, D. 2008. UAS Review, Watchkeeper. World Airnews. Vol. 36, no.8. Oct 200899 Heitman, H.R. 2010. Patrolling Africa’s Waters Part 2. World Airnews. Vol. 37, no.12. Feb 2010100 Robinson, T. 2009. Wings clipped: airforces search for UAV non-pilots. Aerospace International. April 2009101 Read, B. 2009. The sky’s the limit. Aerospace International. Oct 2009 102 Robinson, T. 2009. Opening the skies. Aerospace International. Sep 2009103 Gardner, R. 2009. Embracing the Xbox generation. Aerospace International. Sep 2009104 Whitehouse, R. 2010. Unlocking the civil UAV market. Aerospace International. Sep 2010 105 Hayward, K. (Prof). 2008. UAS and ISTAR. Aerospace Professional. Dec 2008106 Bratby, M. 2010. UAVs: Past, Present and Future. Aerospace Professional. Sep 2010107 Ingham, L.A. State of UAV Regulations in South Africa. University of Stellenbosch Presentation108 Maneschijn, A., Jones, T., von Backstrom, T.W., Ingham, L. A. A proposed reference framework for unmanned aerial
vehicle and system airworthiness requirements. The Aeronautical Journal. June 2007109 Maneschijn, A. 1990. An Introduction to Experimental Light Aircraft Design. First Edition. Anma Aviation. Kempton Park,
1990.110 Raymer, D.P. 1992. Aircraft Design – A Conceptual Approach. Second Edition. American Institute of Aeronautics and
Astronautics. Washington, D.C. 1992.

PART 1
Appendices

A-1
Appendix A
A.Oceanographic Characteristics
This Appendix provides a collection of oceanographic data pertaining to the
oceanic regions bordering Southern Africa.
A.1. Sea States and Wave Height
The Sea State is a consolidated figure[3][4][250] which takes into account wind,
wave height, period, swell size and general character at a certain time and
place. A number of scales[3][5][6][7][8][9] are used to depict Sea State, the most
common being the Beaufort Scale, Douglas Sea Scale, Pierson-Moskowitz
Scale and the World Meteorological Organization (WMO) Sea State Code.
Table A.1 presents various Sea States and equivalent wave height and
oceanic characteristics as per the WMO Sea State Code.
Table A.1: World Meteorological Organization Sea State Code
The following figures[10] provide a visual reference for Sea States, with
accompanying surface wind speed in knots. Sea States 1 to 10 are depicted.
Sea State Code Significant Wave Height (m) Characteristics0 0 Calm (glassy)1 0 to 0.1 Calm (rippled)2 0.1 to 0.5 Smooth (wavelets)3 0.5 to 1.25 Slight4 1.25 to 2.5 Moderate5 2.5 to 4 Rough6 4 to 6 Very rough7 6 to 9 High8 9 to 14 Very high9 Over 14 Phenomenal

A-2
Figure A.1: Sea Sate 1[10] Figure A.2: Sea State 2[10]
Figure A.3 Sea Sate 3[10] Figure A.4 Sea State 4[10]
Figure A.5 Sea Sate 5[10] Figure A.6 Sea State 6[10]

A-3
Figure A.7 Sea Sate 7[10]Figure A.8 Sea State 8[10]
Figure A.9 Sea Sate 9[10] Figure A.10 Sea State 10[10]
Figure A.11 shows the Worldwide significant Wave Height measured and
analysed using the National Oceanic and Atmospheric Administration’s
(NOAA) Wavewatch III program, as on 19 November 2009[11]. Figure A.12
shows the same analysis for the South Atlantic, on the same day. Areas
around the Cape and in the seas between Africa and Antarctica are clearly in
the yellow to orange bands, confirming that these are among the roughest in
the World. Reference 240 provides additional information regarding Sea
States for the national EEZ for Summer and Winter months, measured
between 2005 and 2009, substantiating the former[240].

A-4
Figure A.11: Significant Wave Height, Global, 19 November 2009[11]
Figure A.12: Significant Wave Height, South Atlantic, 19 November 2009[11]

A-5
Figure A.13[12] indicates that the Wave Height measured in the seas around
the Cape Peninsula and the Southern Oceans reaches 7 to 8 meters on a
typical Summers day (19 November 2009). Further out to sea, beyond the
Continental Shelf, the Wave Height reaches well beyond 8 meters, even as
high as 9 meters in places, confirming the NOAA graphs.
Figure A.13: Significant Wave Height, 19 November 2009[12]
Reference 240 provides additional information regarding Wave Height for the
national EEZ for Summer and Winter months, measured between 2005 and
2009, substantiating the former[240].

A-6
A.2. Wind Speed
Figures A.14 and A.15 below[13] (retrieved from the NOAA website subsidiary,
National Climatic Data Centre, Marine Data) provide a graphical presentation
of the average Annual Global and Southern African wind speeds measured at
sea level. Yellows, oranges and reds indicate the highest speeds. From these
graphs it is clear that, although coastal conditions appear moderate, average
wind speeds between South Africa and Antarctica are above 11.0 meters per
second, some of the highest in the World.
Figure A.14: Global Annual Sea Level Wind Speed (Averaged)[13]

A-7
Figure A.15: Southern African Annual Wind Sea Level Speed (Averaged) [13]
Reference 240 provides additional information regarding Wind Speed across
the national EEZ for Summer and Winter months, measured between 2005
and 2009, substantiating the former[240].

A-8
A.3. Oceanic Currents
Figure A.16 provides a diagrammatical illustration[14] of Ocean Currents
around the Globe.
Figure A.16: Global Oceanic Wind-driven Surface Currents[14]
Southern Africa is bordered by three main ocean currents: Antarctic
Circumpolar, Agulhas and Benguela. Figure A.17 provides a graphical
representation[15].

A-9
Figure A.17: Surface Currents around Southern Africa[15]
The Antarctic Circumpolar Current, which runs in an easterly direction above
Antarctica, is the largest wind-driven ocean current in the World[14]. Figure
A.18 provides an illustration[16].

A-10
Figure A.18: Antarctic Circumpolar Current[16]
The warm Agulhas Current runs south along the east coast, is fast and
transports large volumes of water. Figure A.19 shows the path of the Agulhas
Current[17].

A-11
Figure A.19: Agulhas Current[17]
The cold Benguela Current flows in a northerly direction along the west coast.
Figure A.20 shows the path of the Benguela Current[18].
Figure A.20: Benguela Current[18]

A-12
A.4 Tides
Figure A.21[21] provides a graphical model of World oceanic tides and their
amplitudes.
Figure A.21: Global Ocean Tides as Measured in 2006[21]
A.5 Ocean Surface Temperatures
Figure A.22 depicts the mean sea surface temperatures globally.

A-13
Figure A.22: Annual Mean Sea Surface Temperatures[22]
Figure A.23 is a further depiction of sea surface temperatures, as measured
over the time period 21 to 24 November 2009[23]. From this chart it can be
seen that surface temperatures range between 26oC and 16oC up to the
around the Continental Shelf, but drop sharply beyond that to the minimum
when moving towards the Antarctic coastline. Furthermore, it is apparent that
the presence of ice is abundant, starting halfway between the South African
coast and Antarctica. It should be noted that this is during Summer as well.
Ice formation during Winter is more severe.

A-14
Figure A.23: Sea Surface Temperatures over Period 21 to 24 November
2009[23]
Figure A.24 provides a close-up graph of the sea surface temperatures in the
Southern Ocean, and around Southern Africa. The effect of the warmer
Agulhas Current is clearly visible on the East and South Coast. The
temperature ranges are similar to those for the previous two charts[12].

A-15
Figure A.24: Southern Sea Surface Temperatures as on 24 November
2009[12]
A.6 Air Temperatures
Figure A.25 provides a graphical representation of the mean air temperature
measured at sea level over the period January 2008 to October 2009[24].

A-16
Figure A.25: Mean Air Temperature at Sea Level over Period January 2008 to October 2009[24]
Figure A.26 provides a close-up of the Southern Ocean region.

A-17
Figure A.26: Mean Air Temperature at Sea Level for Southern Ocean over
Period January 2008 to October 2009[24]

B-1
Appendix B
B.Fish Habitats
Appendix B analyses the natural habitats for some of the most important fish
species found in and around the coasts of Southern Africa. Commercial,
recreational and sustenance fishing requires hardware and personnel
resources (i.e, boats and people to man them) to accomplish the task. A
thorough knowledge of the natural habitats of fish species caught for
commercial and recreational use will indicate the most probable areas where
manned vessels will operate. This, in turn, will provide a picture of the focal
area where Search and Rescue services will be required to operate most
efficiently, as far as Fisheries is concerned.
The analysis looks at a sampling of some of the most popular fish species
targeted by commercial, recreational and sustenance fisheries in South Africa.
Approximately 150 species of fish species are targeted by line fishers in South
Africa, and only a small sample is analysed here. Although the list is by far not
exhaustive, it does provide a good indication of where most of the fishing
takes place around our coasts, i.e. where many of the boats and ships
operate on a daily basis.
The source for most of the information used in this analysis is FishBase[50].
FishBase contains habitat and other information for 31400 species of fish.
SeaLifeBase was also used to determine the habitat for certain crustaceans
fished around our shores. This information was bolstered by information found
at other sources, as indicated.
From the analysis it is obvious that most of the fish and crustacean species
targeted around our coasts live within the 350nmi Continental Shelf zone. By
far the greater portion lives very close to the shores, probably within the 24nmi
Contiguous Zone. Most fishing takes place within the Continental Shelf zone,
as the country has automatic rights to resources found within this area. The
only species (of those analysed) found beyond the Continental Shelf zone are
the tunas, mackerels, elf (shad), dorado and the Patagonian toothfish. Of
those, only the Patagonian toothfish is not found closer to shore; its habitat

B-2
starts at some point beyond the Continental Shelf zone of the continent.
However, this species is also found around the Prince Edward/Marion Islands.
Barring the fact that most fish species can be (and are) targeted within the
Exclusive Economic Zone, fishing does take place up to the extremities of the
national Search and Rescue Region. It therefore goes without saying that
Search and Rescue resources need to be capable of reaching these
extremities within reasonable time be able to respond to distressed fishing
vessels operating at those locations.
The graphs below provide a graphical presentation of the native habitats for
the species analysed[50]. The colours provide the relative probabilities of
occurrence as follows.
Figure B.1: Natural Habitat of Deepwater Hake

B-3
Figure B.2: Natural Habitat of Shallow-water Cape Hake
Figure B.3: Natural Habitat of Atlantic Little Tuna

B-4
Figure B.4: Natural Habitat of Bigeye Tuna
Figure B.5: Natural Habitat of Bullet Tuna

B-5
Figure B.6: Natural Habitat of Yellowfin Tuna
Figure B.7: Natural Habitat of Longfin Tuna

B-6
Figure B.8: Natural Habitat of Skipjack Tuna
Figure B.9: Natural Habitat of Slender Tuna

B-7
Figure B.10: Natural Habitat of Southern Bluefin Tuna
Figure B.11: Natural Habitat of Swordfish

B-8
Figure B.12: Natural Habitat of Buccaneer Anchovy
Figure B.13: Natural Habitat of Cape Anchovy

B-9
Figure B.14: Natural Habitat of Indian Anchovy
Figure B.15: Natural Habitat of Thorny Anchovy

B-10
Figure B.16: Natural Habitat of European Anchovy
Figure B.17: Natural Habitat of South American Pilchard

B-11
Figure B.18: Natural Habitat of Round Sardinelle
Figure B.19: Natural Habitat of Cape Horse Mackerel

B-12
Figure B.20: Natural Habitat of Bigscale Mackerel
Figure B.21: Natural Habitat of Black Mackerel

B-13
Figure B.22: Natural Habitat of Indian Mackerel
Figure B.23: Natural Habitat of King Mackerel

B-14
Figure B.24: Natural Habitat of Chub Mackerel
Figure B.25: Natural Habitat of Mackerel Scad

B-15
Figure B.26: Natural Habitat of Spotted Mackerel/Natal Snoek
Figure B.27: Natural Habitat of Snake Mackerel

B-16
Figure B.28: Natural Habitat of Patagonian Toothfish
Figure B.29: Natural Habitat of Cape Kingklip
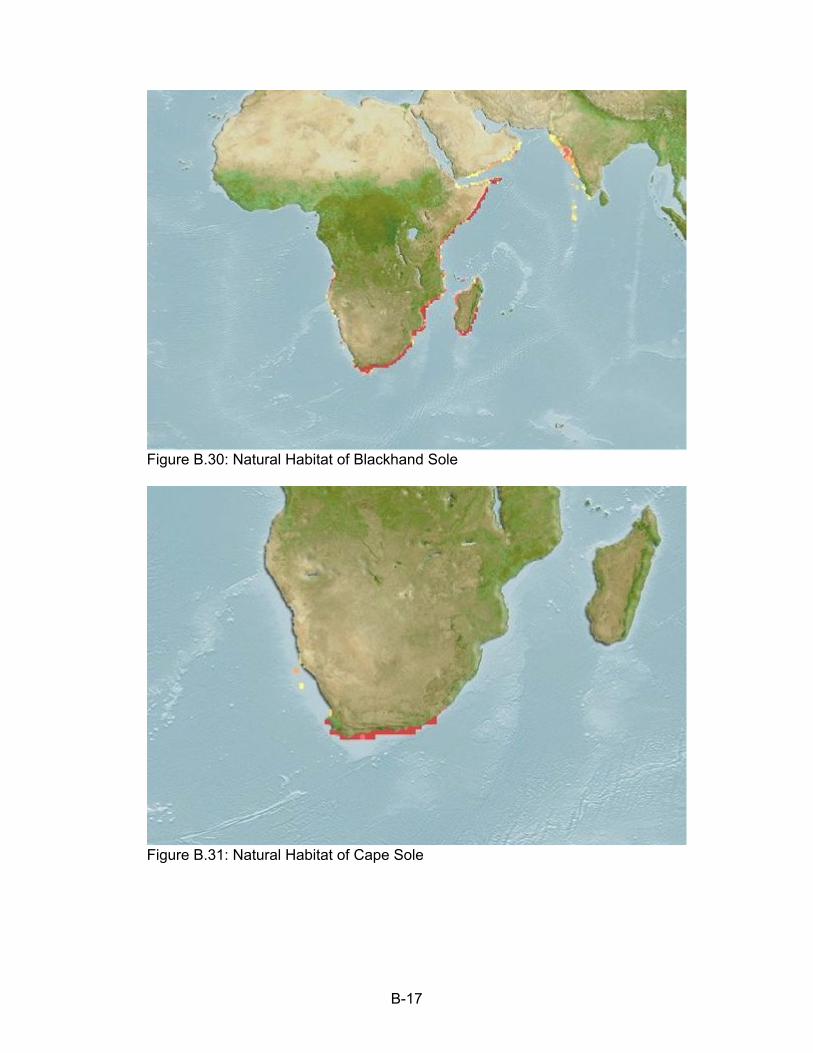
B-17
Figure B.30: Natural Habitat of Blackhand Sole
Figure B.31: Natural Habitat of Cape Sole

B-18
Figure B.32: Natural Habitat of East Coast Solepo
Figure B.33: Natural Habitat of Lace Sole

B-19
Figure B.34: Natural Habitat of Speckled Sole
Figure B.35: Natural Habitat of Twoline Tonguesole

B-20
Figure B.36: Natural Habitat of Wedge Sole
Figure B.37: Natural Habitat of West Coast Sole

B-21
Figure B.38: Natural Habitat of Zebra Sole
Figure B.39: Natural Habitat of Redeye Herring

B-22
Figure B.40: Natural Habitat of Black Snoek
Figure B.41: Natural Habitat of Butter Snoek

B-23
Figure B.42: Natural Habitat of Natal Snoek
Figure B.43: Natural Habitat of Snoek

B-24
Figure B.44: Natural Habitat of Cape Yellowtail
Figure B.45: Natural Habitat of Dusky Yellowtail

B-25
Figure B.46: Natural Habitat of Longfin Yellowtail
Figure B.47: Natural Habitat of Yellowtail Rockcod

B-26
Figure B.48: Natural Habitat of Banded Galjoen
Figure B.49: Natural Habitat of Koester

B-27
Figure B.50: Natural Habitat of Elf/Shad
Figure B.51: Natural Habitat of Red Stumpnose

B-28
Figure B.52: Natural Habitat of Roman Seabream
Figure B.53: Natural Habitat of Bronze Seabream
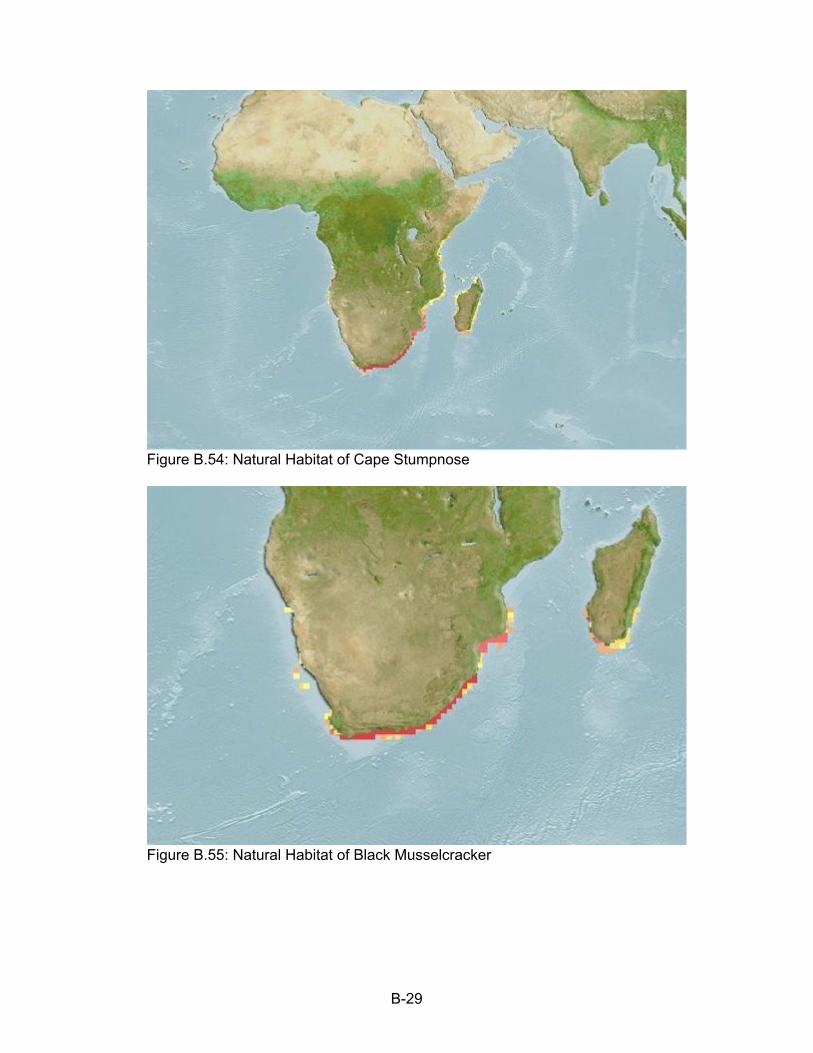
B-29
Figure B.54: Natural Habitat of Cape Stumpnose
Figure B.55: Natural Habitat of Black Musselcracker

B-30
Figure B.56: Natural Habitat of White Musselcracker
Figure B.57: Natural Habitat of Carpenter Seabream

B-31
Figure B.58: Natural Habitat of Kabeljou/Silver Cob
Figure B.59: Natural Habitat of Slinger Seabream

B-32
Figure B.60: Natural Habitat of White Steenbras
Figure B.61: Natural Habitat of Dorado/Mahi Mahi

B-33
Figure B.62: Natural Habitat of Striped Bonito
Figure B.63: Natural Habitat of Atlantic Bonito

B-34
Figure B.64: Natural Habitat of South Coast Rock Lobster (Palinurus gilchristi): deep water (360m), Agulhas Bank
Sources: Marine Lobsters of the World
http://nlbif.eti.uva.nl/bis/lobsters.php?menuentry=soorten&id=143 SeaLifeBase -
http://www.sealifebase.org/summary/SpeciesSummary.php?id=15023 FAO - http://www.fao.org/fi/oldsite/FCP/en/ZAF/body.htm
NO MAP AVAILABLENatural Habitat of West Coast/Cape Rock Lobster (Jasus lalandii): inshore, shallow water (46m)
Sources: Encyclopedia - http://en.wikipedia.org/wiki/Jasus_lalandii Marine Lobsters of the World -
http://nlbif.eti.uva.nl/bis/lobsters.php?menuentry=soorten&id=130 SeaLifeBase -
http://www.sealifebase.org/summary/SpeciesSummary.php?id=14807 FAO - http://www.fao.org/fi/oldsite/FCP/en/ZAF/body.htm
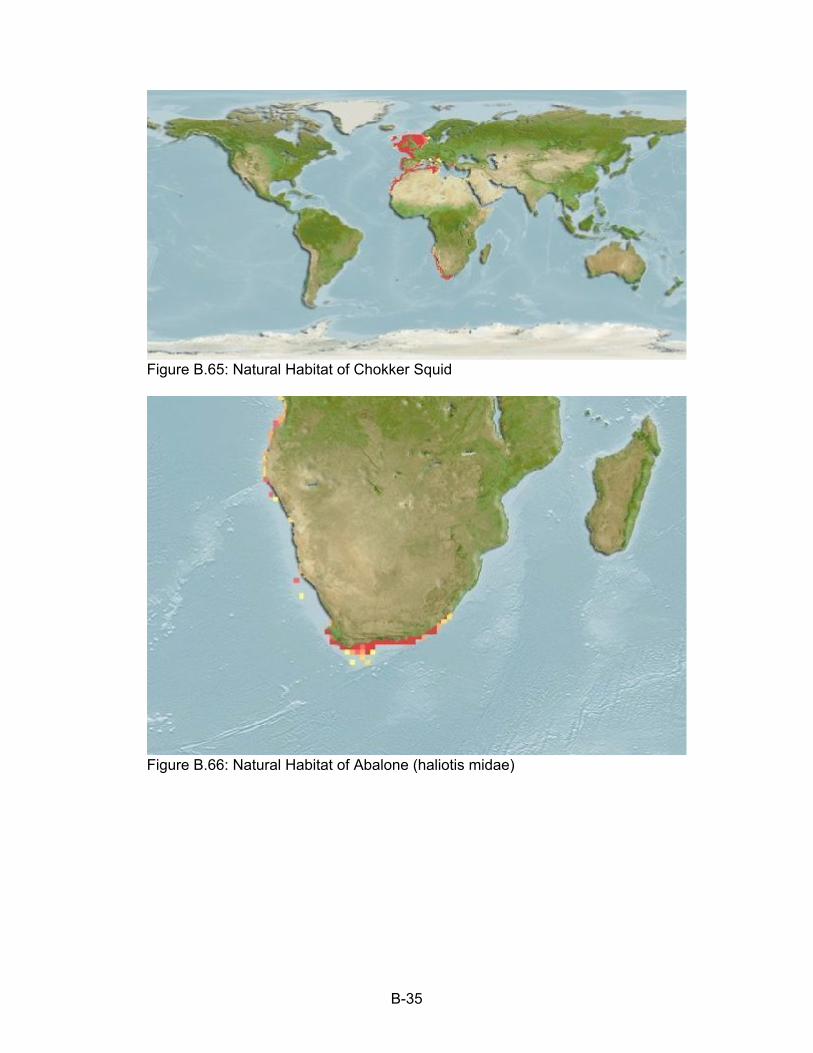
B-35
Figure B.65: Natural Habitat of Chokker Squid
Figure B.66: Natural Habitat of Abalone (haliotis midae)

B-36
Figure B.67: Natural Habitat of European Blue Mussel

C-1
Appendix C
C.Minerals and Energy
Appendix C analyses marine activities associated with each of the primary
marine-based mining industries in South Africa.
C.1. Annual Production
Annual amounts produced (2007 figures) are as follows[58]:
Oil (crude petroleum): 2,559,000 barrels (158.987l/barrel =>
406,847,733 litres)
Natural Gas: 1,243,000 tons
Diamonds (marine only): 155,000 carats
Titanium: undisclosed amount (classified)[58]
Zirconium: undisclosed amount (classified)[58]
C.2. Marine Activity
Marine activities associated with each of the primary marine-based mining
industries mentioned above, can be summarised as flows.
C.2.1. Titanium
Titanium is predominantly found in beach sand[59]. South Africa is the second-
largest producer of titanium, producing 22% of the World’s titanium[60].
Titanium minerals are sourced from beach sand deposits found along the
southern, eastern and north-eastern coasts, and additional deposits along the
west coast[60]. Three major mines recover the minerals from the sand[60]:
Richards Bay Minerals Tisand mine, located Richards Bay[60];
Exxaro Hillendale (KZN Sands) mine, located near Richards Bay[61][62];
Exxaro Namakwa Sands mine, located at Brand-se-Baai, 385km north
of Cape Town[61][63].

C-2
Titanium mining involves strip-mining techniques, requiring dredging or dry
mining[64], depending on the nature of the deposits. Despite the use of a
dredging vessel, the mines utilise on-land man-made freshwater ponds[64].
The technique therefore does not expose vessels to off-shore marine
environments.
C.2.2. Zirconium
Zircon mining is found in the same beach sand deposits and locations along
the coast as for Titanium. The same three mines used for titanium extraction
are used to extract the zirconium from its source; zirconium is a co-product of
titanium mining[65]. South Africa produces in the order of 40% of the World’s
zirconium[66].
Since zirconium is mined as a co-product of titanium mining, the same
dredging process is used during the collection of sand deposits, as is for
titanium mining. As for titanium mining, the technique does not expose
vessels to off-shore marine environments.
C.2.3. Diamonds (marine)
Marine diamond mining takes place along the western Atlantic seaboard,
along the coasts of South Africa and Namibia[67]. Namibia’s marine diamond
resources are the largest in the World, at an estimated 80 million carats[67].
Marine mining involves excavating or drilling of the ocean floor, and
operations are conducted from one of six specialised mining vessels[67]. These
operations take place up to 5km offshore, well within the Territorial Waters [68].
C.2.4. Oil (crude petroleum)
Small oil and gas fields are located offshore, in the Bredasdorp Basin south of
Mossel Bay and off the West Coast, near the Namibian border[69]. Local oil
production accounts for approximately 10% of total domestic needs[69][71]. Oil
is primarily sourced from the Oribi, Oryx and Sable oil fields located in the
Bredasdorp Basin, using floating extraction and production facilities[69][71]. The
Bredasdorp Basin lies approximately 50 to 100nmi offshore, well within the
Exclusive Economic Zone[70]. Drilling is performed using drilling rigs, and

C-3
floating oil refineries and support vessels perform additional special
functions[71].
C.2.5. Natural Gas
Small oil and gas fields are located offshore, in the Bredasdorp Basin south of
Mossel Bay and off the West Coast, near the Namibian border[69][70]. Natural
Gas is primarily sourced in gas pockets in the Bredasdorp Basin and the
offshore Ibhubezi Gas Field near the Namibain border[69][71][70]. As for crude
petroleum, drilling and sourcing of Natural Gas is performed using drilling rigs.
Gas is fed to refineries on-shore via pipelines[71].
Figure C.1: Oil and Gas Fields in South Africa[69]

C-4
Figure C.2: The Bredasdorp Basin[70]

D-1
Appendix D
D.Commercial Airline Routes
Appendix D provides a graphic summary of the routes flown by major
commercial airlines to and from South Africa. Various routes traverse vast
expanses of ocean adjacent our coasts, over our national marine claims and
our national Search and Rescue Region.
Figure D.1: SAA InternationalSource: www.airlineroutemaps.com (http://www.airlineroutemaps.com/Africa/South_African_Airways.shtml)
Figure D.2: SAA DomesticSource: www.airlineroutemaps.com (http://www.airlineroutemaps.com/Africa/South_African_Airways_2.shtml)

D-2
Figure D.3: SA AirlinkSource: www.airlineroutemaps.com (http://www.airlineroutemaps.com/Africa/South_African_Airlink.shtml)
Figure D.4: SA ExpressSource: www.airlineroutemaps.com (http://www.airlineroutemaps.com/Africa/South_African_Express.shtml)

D-3
Figure D.5: KululaSource: www.airlineroutemaps.com (http://www.airlineroutemaps.com/Africa/Kulula_south_africa.shtml)
Figure D.6: 1-TimeSource: www.airlineroutemaps.com (http://www.airlineroutemaps.com/Africa/1Time_South_Africa.shtml)

D-4
Figure D.7: BA ComairSource: www.airlineroutemaps.com (http://www.airlineroutemaps.com/Africa/BA_Comair_south_africa.shtml)
Figure D.8: Delta AirlinesSource: www.airlineroutemaps.com (http://www.airlineroutemaps.com/USA/Delta_Airlines_africa.shtml)

D-5
Figure D.9: Air France and KLMSource: www.airlineroutemaps.com (http://www.airlineroutemaps.com/Europe/Air_France_KLM_africa.shtml)

D-6
Figure D.10: British AirwaysSource: www.airlineroutemaps.com (http://www.airlineroutemaps.com/Europe/British_Airways_africa.shtml)
Figure D.11: LufthansaSource: www.lufthansa.com (http://lufthansa.innosked.com/Default.aspx?lang_id=en&country=za)

D-7
Figure D.12: Cathay PacificSource: www.airlineroutemaps.com (http://www.airlineroutemaps.com/East_Asia/Cathay_Pacific_europe.shtml)
Figure D.13: Malaysia AirlinesSource: www.malaysiaairlines.innosked.com(http://malaysiaairlines.innosked.com/(S(zossig45tfwlcofmnydqfj55))/default.aspx?show=MAP&FromMap=no)

D-8
Figure D.14: Singapore AirlinesSource: www.airlineroutemaps.com (http://www.airlineroutemaps.com/East_Asia/Singapore_Airlines_west_asia_africa.shtml)
Figure D.15: Quatar AirwaysSource: www.airlineroutemaps.com (http://www.airlineroutemaps.com/West_Asia/Qatar_Airways.shtml)

D-9
Figure D.16: EmiratesSource: www.airlineroutemaps.com (http://www.airlineroutemaps.com/West_Asia/Emirates_asia_africa.shtml)
Figure D.17: QuantasSource:www.airlineroutemaps.com (http://www.airlineroutemaps.com/Oceania/Qantas_international.shtml)

E-1
Appendix E
E. Aeronautical Incidents over the Sea
Appendix E provides details of some of the most notable aeronautical
incidents occurring in our oceans, recorded between 1967 and 2006.
13 March 1967, ZS-CVA, Vickers Viscount 818: crashed into the sea
off East London[119]
28 November 1987, ZS-SAS, Boeing 747-200B: crashed into the sea
near Mauritius[119]
31 May 1998, ZS-LIP, PA28-161: ditched into Gordons Bay[120]
11 February 2001, ZS-WTW, Windlass Trike: ditched into sea at
Umkomaas Beach[121]
24 November 2002, N36GC, Glasair II S FT: forced landing on Marion
Island due to severe ice build-up[122]
23 November 2002, ZS-RNJ, SA 330J Puma: crash on deck of
shipwreck near St Lucia[122]
10 August 2002, ZS-MBL, Zlin Z-50LA, crashed into sea off Umdloti
Beach[122]
25 June 2002, ZU-BHA, Windlass Aquila: crashed into sea off Bazley
Beach[122]
14 March 2003, ZU-CUZ, Jabiru SP: crashed into sea off St Francis
Bay[123]
10 June 2006, ZU-ARI, Windlass Aquila,: crashed into the sea near
Dwesa Nature Reserve[124]
5 June 2006, ZS-VDC, Flight Star: ditched into sea at Bonza Bay[124]

E-2
17 January 2006, ZS-RXA, Robinson R22 Beta II: crashed into the sea
off Cape Point[124]

F-1
Appendix F
F. National RSC’s and Secondary RSC’s
Appendix F provides a summary of the national RSC’s and their Secondary
RSC’s.
F.1. RSC 1: Port Control Walvis Bay
Responsibility Region: From the Kunene River to the Orange River[192].
Secondary RSC’s[192]:
Namibia NSRI
F.2. RSC 2: Port Control Saldanha Bay
Responsibility Region: From the Orange River to East-West line dividing
Dassen Island Lighthouse[192].
Secondary RSC’s[192]:
Saldanha Bay NSRI
Port Nolloth NSRI
F.3. RSC 3: Port Control Cape Town
Responsibility Region: From the East-West line dividing Dassen Island
Lighthouse to Cape Infanta[192].
Secondary RSC’s[192]:
NSRI Cape Town
NSRI Melkbos
NSRI Table Bay
NSRI Bakoven
NSRI Hout Bay

F-2
NSRI Kommetjie
NSRI Simonstown
NSRI Strandfontein
NSRI Gordons Bay
NSRI Hermanus
F.4. RSC 4: Port Control Port Elizabeth
Responsibility Region: From Cape Infanta to Great Fish Point[192].
Secondary RSC’s[192]:
NSRI Mossel Bay
NSRI Wilderness
NSRI Knysna
NSRI Plettenberg Bay
NSRI St Francis Bay
NSRI Port Elizabeth
NSRI Port Alfred
F.5. RSC 5: Port Control East London
Responsibility Region: From Great Fish Point to Port St Johns[192].
Secondary RSC’s[192]:
None
F.6. RSC 6: Port Control Durban
Responsibility Region: From Port St Johns to the Tugela River[192].
Secondary RSC’s[192]:

F-3
NSRI Shelly Beach
NSRI Durban
F.7. RSC 7: Port Control Richards Bay
Responsibility Region: From the Tugela River to Ponte de Ouro[192].
Secondary RSC’s[192]:
NSRI Richards Bay
Figure F-1[193] provides a graphical representation of the National Rescue
Sub-Centres and associated responsibility regions.
Figure F.1: National Maritime Rescue Sub-Centres[193]
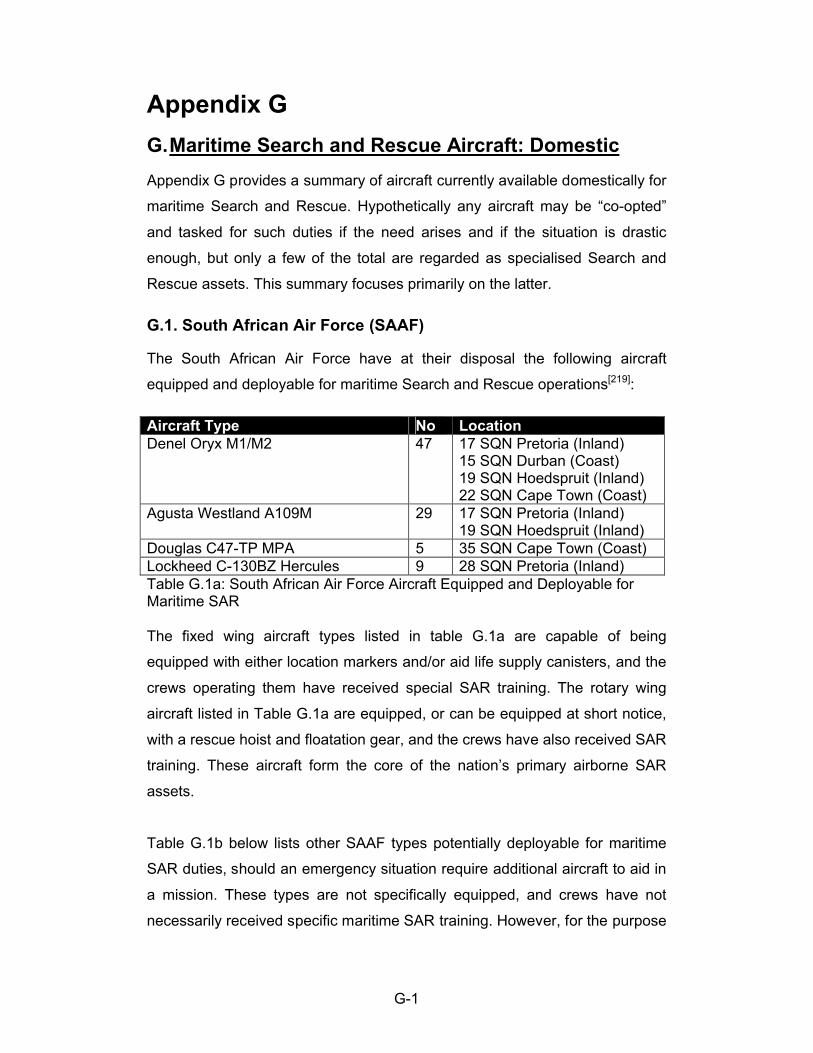
G-1
Appendix G
G.Maritime Search and Rescue Aircraft: Domestic
Appendix G provides a summary of aircraft currently available domestically for
maritime Search and Rescue. Hypothetically any aircraft may be “co-opted”
and tasked for such duties if the need arises and if the situation is drastic
enough, but only a few of the total are regarded as specialised Search and
Rescue assets. This summary focuses primarily on the latter.
G.1. South African Air Force (SAAF)
The South African Air Force have at their disposal the following aircraft
equipped and deployable for maritime Search and Rescue operations[219]:
Aircraft Type No LocationDenel Oryx M1/M2 47 17 SQN Pretoria (Inland)
15 SQN Durban (Coast)19 SQN Hoedspruit (Inland)22 SQN Cape Town (Coast)
Agusta Westland A109M 29 17 SQN Pretoria (Inland)19 SQN Hoedspruit (Inland)
Douglas C47-TP MPA 5 35 SQN Cape Town (Coast)Lockheed C-130BZ Hercules 9 28 SQN Pretoria (Inland)Table G.1a: South African Air Force Aircraft Equipped and Deployable for Maritime SAR
The fixed wing aircraft types listed in table G.1a are capable of being
equipped with either location markers and/or aid life supply canisters, and the
crews operating them have received special SAR training. The rotary wing
aircraft listed in Table G.1a are equipped, or can be equipped at short notice,
with a rescue hoist and floatation gear, and the crews have also received SAR
training. These aircraft form the core of the nation’s primary airborne SAR
assets.
Table G.1b below lists other SAAF types potentially deployable for maritime
SAR duties, should an emergency situation require additional aircraft to aid in
a mission. These types are not specifically equipped, and crews have not
necessarily received specific maritime SAR training. However, for the purpose

G-2
of this study, these types will be included in the analysis in lieu of the remote
chance of being deployed for a maritime SAR task.
Aircraft Type No LocationCessna C208A Caravan 11 41 SQN Pretoria (Inland)CASA 212-200/300 4 44 SQN Pretoria (Inland)CASA CN-235 1 44 SQN Pretoria (Inland)Beech/Raytheon King Air 200/B200C 3 41 SQN Pretoria (Inland)Beech/Raytheon King Air 300 1 41 SQN Pretoria (Inland)Pilatus PC-12 1 41 SQN Pretoria (Inland)MBB/Kawasaki BK117 7 15 SQN Durban (Coast)
15 SQN Port Elizabeth (Coast)
Table G.1b: South African Air Force Aircraft Potentially Deployable for
Maritime SAR
G.2. South African Navy (SAN)
The South African Navy have at their disposal the following aircraft equipped
and deployable for maritime Search and Rescue operations[219]:
Aircraft Type No LocationAgusta Westland Super Lynx 300 4 22 SQN/SAN Frigates Cape
Town (Coast)
Table G.2: South African Navy Aircraft Equipped and Deployable for Maritime
SAR
G.3. South African Police Services (SAPS)
As mentioned in Chapter 7, the SAPS is not a primary supplier of maritime
SAR aircraft. Table G.3 lists the types potentially deployable, in the remote
event of this being a requirement. Asset numbers are 2008 figures, and are
unconfirmed at the time of writing this thesis. The South African Police
Services have at their disposal the following aircraft potentially deployable for
maritime Search and Rescue operations[220].

G-3
Aircraft Type No LocationMBB/Kawasaki BK117 2 SAPS Air Wing, countrywideMBB BO105 12 SAPS Air Wing, countrywideEurocopter AS350 B3 13 SAPS Air Wing, countrywidePilatus PC-6 Porter 9 SAPS Air Wing, countrywideRobinson R44 Raven II 6 SAPS Air Wing, countrywideMDD MD500 (Hughes 369) 4 SAPS Air Wing, countrywide
Table G.3: South African Police Services Aircraft Potentially Deployable for
Maritime SAR
G.4. The National Ports Authority (NPA)
The National Ports Authority, as operated by Acher Aviation, have at their
disposal the following aircraft equipped and deployable for maritime Search
and Rescue operations[31][221]:
Aircraft Type No LocationAgusta Westland A109 K2 1 Durban/Richards BayAgusta Westland AW109E Power 1 Richards BayAgusta Westland A109S Grand 1 Durban
Table G.4: National Ports Authority Aircraft Equipped and Deployable for
Maritime SAR
G.5. Titan Helicopter Group
Titan Helicopter Group have at their disposal the following aircraft equipped
and deployable for maritime Search and Rescue operations[212][220]:
Aircraft Type No LocationSikorsky S-61N MkII 2 Cape Town, GeorgeSikorsky S-76A++ Spirit 2 Cape Town, GeorgeBell 212 Twin Huey 2 Cape Town, GeorgeMBB BO105 CBS-5 1 Cape Town, GeorgeMil Mi-8 MTV 1 Cape Town, GeorgeMil Mi-8 P 1 Cape Town, GeorgeKamov Ka-32A 1 Cape Town, GeorgeKamov Ka-32C 1 Cape Town, GeorgeConvair 580 2 Cape Town, GeorgeEurocopter EC120B 1 Cape Town, George
Table G.5: Titan Helicopter Group Aircraft Equipped and Deployable for
Maritime SAR

H-1
Appendix H
H.RSE Analysis Tables
Appendix H tables the process followed to determine the key performance figures for existing aircraft, currently deployable for maritime Search and Rescue duties, domestic, foreign and unmanned.
The resultant output from this Appendix appears as key performance figures in Tables 7.1, 8.1 and 9.1 in the actual thesis. Performance characteristics analysed were:
Range (in nautical miles – nmi)
Speed (maximum cruise, in knots – kn)
Endurance (in hours and minutes)
Communications range (in the case of UAV’s) (in nautical miles – nmi)
Table H.1 provides the analysis for domestic-, Table H.2 for foreign-, and Table H.3 for unmanned aircraft.
H.1. Selection Logic
The following logic was used in the determination of the final figures for the above four characteristics. Five basic sources were identified where performance figures could be obtained. The five
sources, in order of preference, are as follows.
H.1.1. Original Equipment Manufacturer (OEM)
Performance figures obtained from the OEM are usually presented in Data Sheets or Product Brochures. Although these figures are often a bit “optimistic”, the OEM figures were chosen as the
primary source.
H.1.2. World Aircraft Information Files, Bright Star Publishing (WAIF)
Published in 218 weekly parts, from early 1998 until 2002, the World Aircraft Information Files (WAIF) is a comprehensive aeronautical reference work comprising 13 categories (“parts”) and over
1000 file subjects. WAIF is probably the closest reference alternative available to Jane’s All the World’s Aircraft. Part 12, entitled the “A to Z of Aircraft”, was used to determine additional
performance figures for hardware unavailable from OEM’s. The Tables contain an extra column referencing the File and Sheet number for the data sourced from WAIF Part 12.
H.1.3. World Airnews Magazine
Two World Airnews Magazine articles were sourced to add performance figures for certain helicopters and turboprops not covered via OEM information or the WAIF reference work. For helicopter
data, “Civilian Helicopter Directory 2009” (World Airnews, April 2009, Vol 37, No 2, pages 21 – 32) was used, while for certain turboprops “The World Airnews 2008 Corporate Turboprop Review”
(World Airnews, May 2008, Vol 36, No 3, pages 17 – 32) was used. The Tables contain an extra column referencing the page number for data sourced from either of the publications.

H-2
H.1.4. Other Sources: World Wide Web
Failing any of the above three sources, the World Wide Web was used to source figures. Reputable Web Sites were identified for this task. This source was only used failing the first three.
H.1.5. Other Sources: Hardware Operators
As a last resort, operators of hardware equipment were contacted for performance figures “as reported”, or as derived from Operating Manuals. This was used as a final resort, due to the potentially
long lead times to obtain information. This source was only used failing the first four.
H.2. Performance Data
The following is applicable to the actual performance data:
In virtually all cases (unless where noted), Range and Speed were derived from the source material, and Endurance was calculated using these two figures. A notable variation from this
procedure was applied for virtually all UAV performance figures, where Endurance and Speed was derived from source material, and Range calculated (as noted).
In all cases, Maximum Cruise Speed was selected where source material provided both this and Maximum Speed. In certain cases, other speed figures (e.g. Long Range Cruise, Search
Speed, etc) were used, as noted.
For conversion between units, the following was used:
o 1 mile [international] = 0.868 976 241 9 mile [nautical, international]
o 1 kilometer = 0.539 956 803 46 mile [nautical, international]
o 1 mile/hour (mph) = 0.868 976 241 91 knot
o 1 kilometer/hour = 0.539 956 803 46 knot
o 1 nautical mile/hour = 1 knot
Final figures are rounded.
H.3. Tables
The following logic is applicable to the Tables:
Available Data appears per aircraft type in GREEN coloured cells. Where no data is available from a specific source, the cell is coloured RED.

H-3
Irrespective of how many available data sources there are per aircraft type, the logic for choosing which data to use is always as described above in H.1. If, for example, Aircraft Type A has
available performance data from an OEM, the WAIF as well as the WWW, the OEM source will be used, as this is the first option, when available.
The final selections appear in the last columns with the black and white header cells. These also contain the calculated “third performance element”, albeit Endurance, or Range (or Speed in
a very few instances).
H.4. General
Additional information and details, pertaining to each Table and certain aircraft types, are listed below each applicable Table.
Finally, it should be remembered that printed/published performance figures in general are often estimated and could differ from actually tested figures. Additionally, in most cases not all figures are
published for all possible conditions, weights, configurations and mission types. Consequently, the available data was either used or sound deductions were made to achieve the best possible
outcomes. In many cases the results offered indicate “ultimate performance under pristine conditions”, however in the greater context of this thesis the results are more than adequate to solidify and
add value to the outcome.

H-4
Aircraft TypeDomestic OEM R OEM S WAIF R WAIF S File, Sheet AN R AN S Page Other R Other S R Final S Final T FinalAgusta Westland A109 LUH 500 153 289.4 142.5 889, 32 500 153 3h16mAgusta Westland A109E Power 512 154 512 154 21 512 154 3h19mAgusta Westland A109S Grand 424 156 424 156 2h43mBeech King Air 200/B200C 1974.3 289.4 890, 10 1974.3 289.4 6h49mBeech King Air 300 1960.4 315.4 890, 11 1960.4 315.4 6h12mBell 212 Twin Huey 236.4 100 890, 21 225 100 236.4 100 2h21mCASA 212-200/300 n/a 191.2 891, 13 800 180 800 180 4h26mCASA CN-235 (prototype) 2000 230 2000 230 8h42mCessna C208A Caravan 869 175 1371.2 184.2 891, 22 869 175 5hConvair 580 1200 280 1200 280 4h17mDenel Oryx M1/M2 827 120 827 120 6h53mDouglas C47-TP MP&NT 1300 160 1300 160 8h7mEurocopter AS 350 B3 359 140 360 140 25 359 140 2h33mEurocopter EC 120B Colibri 383 120 394.5 123.4 893, 10 383 120 25 383 120 3h11mKamov Ka-32A 475 118.8 475 118.8 4hLockheed C-130BZ Hercules 2699.8 300 2699.8 300 9hMBB BO105 CBS-5 600 134 600 134 4h28mMBB/Kawasaki BK117 307.6 133.8 893, 8 307.6 133.8 2h17mMD Helicopters MD-500E LEH 287 170 n/a 117.3 901, 13 287 170 1h41mMil Mi-8 MTV 567 116 567 116 4h53mMil Mi-8 P 737 116 737 116 6h21mPilatus PC-6 Porter 500 125 500 125 4hPilatus PC-12 1560 280 1573 280 37 1560 280 5h34mRobinson R44 Raven II 304.1 117 346 117 32 304.1 117 2h35mSikorsky S-61N MkII 400.6 114.4 400.6 114.4 3h30mSikorsky S-76A++ Spirit 411 137 411 155 32 411 137 3hWestland Super Lynx 300 280 132 280 132 2h7mTable H.1: Performance Figure Analysis for Domestic Aircraft Deployable for Maritime Search and Rescue Tasks
Specifics pertaining to Table H.1
CASA 212-200/300
Data source: SAAF Directorate Transport & Maritime Systems
CASA CN-235 (prototype)
Data source: SAAF Directorate Transport & Maritime Systems
Convair 580
Data source: Titan Helicopters Group
Denel Oryx

H-5
Data source: SAAF Directorate Helicopter Systems Group
Range option: with sponson tanks plus 4x ferry tanks
Douglas C47-TP MP&NT
Data source: 35 Squadron C47-TP Flight Manual Part 5 Section 1 p 5-111
Kamov Ka-32A
Data source: Titan Helicopters Group
Range option: with auxiliary fuel tanks
Lockheed C-130BZ Hercules
Data source: SAAF Product System Support Manager
MBB BO105 CBS-5
Data source: Titan Helicopters Group
Range option: with auxiliary fuel tanks
MD Helicopters MD-500E
OEM source Range options: 3000lbs, 5000ft, C20R engine
OEM source Speed options: Speed for best range, C20R engine
Mil Mi-8 MTV
Data source: Titan Helicopter Group
Range option: with auxiliary fuel tanks
Mil Mi-8 P
Data source: Titan Helicopter Group

H-6
Range option: with auxiliary fuel tanks
Pilatus PC-6 Porter
OEM source Range option: No under-wing tanks
Sikorsky S-61N MkII
Data source: Titan Helicopter Group
Sikorsky S-76A++ Spirit
Data for S-76C++ used
OEM source Range option: No reserve
Westland Super Lynx 300
OEM source Range options: Empty cabin, standard tanks only

H-7
Aircraft TypeForeign OEM R OEM S WAIF R WAIF S File, Sheet AN R AN S Page Other R Other S R Final S Final T FinalAgusta Westland AW139 573 165 306 165 21 573 165 3h28mAgusta Westland Merlin HM1 900 136 570.1 150.3 893, 11 900 136 6h37mAlenia/ATR 42 MP Surveyor 2020 190 2020 190 10h37mAlenia/ATR 72 ASW 1505 145 1505 145 10h22mAlenia C27J Spartan 3200 325 3200 325 9h50mBAe Nimrod MRA4 6000 442.8 6000 442.8 13h33mBell 214 ST 435.4 140 890, 21 435.4 140 3h6mBell 407 383 118 330 133 22 383 118 3h14mBell 412 EP 423 131 356 126 22 423 131 3h13mBell 427 400 133 390 138 22 400 133 3hBell 429 350 142 350 142 22 350 142 2h27mBell/Agusta BA 609 700 275 750 275 22 700 275 2h32mBell/Boeing MV-22B Osprey 1800 250 1800 250 7h12mBell UH-1Y Venom 260 135 260 135 1h55mBoeing P-8A Poseidon 3160 490 3160 490 6h26mBombardier/DHC Dash 8 Q200 973 290 973 290 3h21mBombardier/DHC Dash 8 Q400 1526 361 1526 361 4h13mCASA CN-235MP Persuader 2300 130 2300 130 17h41mCASA C-295 Persuader 2400 145 2400 145 16h33mDassault Atlantique ATL2 4900.2 299.8 892, 2 4900 349.3 4900.2 299.8 16h20mDassault Falcon 900 MPA 4100 496.1 4100 496.1 8h15mEmbraer P-99 (EMB 145 MP) 2050 444.1 n/a 444.1 893, 3 2050 444.1 4h36mEurocopter AS 332 L2 Super Puma 446 150 26 446 150 3hEurocopter AS 365 N3 Dauphin 427 145 428 145 26 427 145 3hEurocopter AS 532 SC Cougar 492 136 492 136 3h37mEurocopter AS 555 Fennec 375 118 379.7 120.8 893, 9 375 118 3h10mEurocopter AS 565 Panther 427 145 n/a 147.7 893, 9 427 145 3hEurocopter EC 225 Super Puma 506 141.5 443 141 26 506 141.5 3h34mEurocopter EC 725 Cougar 692 141 692 141 4h54mEurocopter MH-65C Dolphin 300 165 300 165 1h49mFairchild-Dornier Do-228-101 MPA 1722.3 165.1 894, 5 1722.3 165.1 10h25mFokker 50 Maritime 2340 150 2340 150 15h36mIlyushin Il-38 May 4049.4 348.5 897, 4 4049.4 348.5 11h37mKaman SH-2G Super Seasprite 540 120 434.5 120 899, 2 540 120 4h30mLockheed HC-130J Hercules 5500 339 5500 339 16h13mLockheed P-3C OrionLockheed CP-140 Aurora
4760 328 4760 328 14h30m
MD Helicopters MD-600N 423 115 380 130 28 423 115 3h40mNH Industries NH90 FSH/NFH 659 132 659 132 5hReims-Cessna F406 1200 246 1200 246 4h52mShaanxi Y-8X MPA 4211 350 4211 350 12h1mSikorsky CH-148 Cyclone (MH-92) 525 137 525 137 3h49mSikorsky CH-53E Super Stallion 1119.9 150.1 1119.9 150.1 7h27mSikorsky MH-53E Sea Dragon 1050 150 1050 150 7hSikorsky MH-60T Jayhawk 300 170 300 170 1h45mSikorsky S-70B Sea Hawk 450 146 450 146 3h4mTupolev Tu-142M Bear-F 6775 500 6775 500 13h33mTable H.2: Performance Figure Analysis for Foreign Aircraft Deployable for Maritime Search and Rescue Tasks

H-8
Specifics pertaining to Table H.2
Agusta Westland Merlin HM1
OEM source Range options: 2 engine cruise, 0lbs
Alenia/ATR 42 MP Surveyor
OEM source Range option: Ferry range
OEM source Speed option: Max range cruise speed
Alenia/ATR 72 ASW
OEM source Range deduction: At 100nmi from Base: 9hrs at 145 kn = 1305nmi + 200nmi = 1505nmi
OEM source Speed option: Patrol speed
Alenia C27J Spartan
OEM source Range options: Ferry range, 0lbs
BAe Nimrod MRA4
Data source: WWW, http://www.armedforces.co.uk/projects/raq3f561ff8f3fb4
Bell 407
OEM source Range options: 4000lbs, 4000ft, Long Range Cruise (LRC)
Bell 412 EP
OEM source Range options: 9500lbs, 5000ft, LRC
Bell 429
OEM source Range options: 5500lbs, Sea Level (SL), LRC
Bell/Boeing MV-22B Osprey

H-9
OEM source Range options: Self-deploy, 3MAT, 0lbs
Bell UH-1Y Venom
OEM source Range options: 2182lbs, 3000ft
OEM source Speed option: LRC
Boeing P-8A Poseidon
OEM source Range deduction: 1200nmi + range covered in 4hrs at 490kn
Bombardier/DHC Dash 8 Q200
OEM source Range option: Full pax (big brochure used)
Bombardier/DHC Dash 8 Q400
OEM source Range option: Full pax (big brochure used)
CASA CN-235MP Persuader
OEM source Range deductions and options: Max transit distance x2, 0 search time, 0 search distance
OEM source Speed deduction: At 200nmi from Base: 10 hr endurance, 1300nmi search distance = 130kn
CASA C-295 Persuader
OEM source Range deduction and options: Max transit distance x2, 0 search time, 0 search distance
OEM source Speed deduction: At 200nmi from Base: 10 hr endurance, 1450nmi search distance = 145kn
Dassault Falcon 900 MPA
Multiple sources:
o Falcon 900 MPA ~ Falcon 900DX: http://www.dassault-aviation.com/en/defense/multi-mission-falcon/main-features.html?L=1
o Falcon 900DX performance pt 1: http://www.dassaultfalcon.com/aircraft/900dx/performance.jsp

H-10
o Falcon 900DX performance pt 2: http://www.airliners.net/aircraft-data/stats.main?id=175
Embraer P-99 (EMB 145 MP)
OEM source Range options: 0 pax, 0lbs, (taken from ERJ 145LR data sheet)
Speed source: Use WAIF info for ERJ 145
Eurocopter MH-65C Dolphin
Data source: United States Coast Guard (USCG) Article
Fokker 50 Maritime
OEM source Range option: Ferry range with pylon tanks
OEM source Speed option: Search speed
Endurance calculated by using Patrol Fuel Consumption (479 kg/h) and maximum fuel load with pylon tanks (7,511 kg)
Range calculated from endurance and search speed
Lockheed HC-130J Hercules
Data source: USCG fact sheet
Lockheed P-3C Orion
Source data: WWW, http://www.navy.mil/navydata/fact_display.asp?cid=1100&tid=1400&ct=1
MD Helicopters MD-600N
OEM source Range options: 3100lbs, 5000ft
OEM source Speed options: Speed for best range, 3100lbs, 5000ft
NH Industries NH90 FSH/NFH
OEM source Range option: Ferry range

H-11
OEM source Speed option: Economical cruise
Sikorsky CH-148 Cyclone (MH-92)
OEM source Range option: 0 pax/payload
Speed source: WWW, http://en.wikipedia.org/wiki/CH-148_Cyclone
WWW source Speed option: Cruise Speed
Sikorsky CH-53E Super Stallion
Data source: WWW, http://www.naval-technology.com/projects/ch-53e/specs.html
Sikorsky MH-53E Sea Dragon
Data source: WWW, http://www.navy.mil/navydata/fact_display.asp?cid=1200&tid=400&ct=1
Tupolev Tu-142M Bear-F
Data source: WWW, http://www.bharat-rakshak.com/NAVY/aviation/aircraft/119-tupolev-tu142m.html

H-12
Aircraft TypeUnmanned
OEM CR OEM R OEM S Other CR Other R Other S CR Final R Final S Final T Final
AAI RQ-7B Shadow 200 68 540 90 68 540 90 6hBAe HERTI Range max 2250 90 Range max 2250 90 25hBell TR916 Eagle Eye 100 800 200 100 800 200 4hBoeing A160T Hummingbird 2250 112.5 110 110 2250 112.5 20hDenel Dynamics Bateleur Satcom 2430 135 Satcom 2430 135 18hEADS ORKA-1200 Tactical (110) 842 105.3 Tactical (110) 842 105.3 8hElbit Hermes 450 108 (std) 1400 70 108 (std) 1400 70 20hElbit Hermes 1500 108 (std) 2080 80 108 (std) 2080 80 26hGeneral Atomics RQ-1/MQ-1 Predator 4800 120 Satcom Satcom 4800 120 40hGeneral Atomics MQ-9 Reaper Satcom 7200 240 Satcom 7200 240 30hGeneral Atomics Mariner Satcom 7100 157 Satcom 7100 157 45h13mIAI Heron TP (Eitan) Satcom 7200 200 Satcom 7200 200 36hIAI/EADS Eagle 1/Heron 1/Harfang Satcom 2400 80 Satcom 2400 80 30hIAI/EADS Eagle 2 Satcom 4320 180 Satcom 4320 180 24hIAI/PUI RQ-2 Pioneer 100 495 110 100 495 110 4h30mInSitu/Boeing ScanEagle Range max 980 49 Range max 980 49 20hNorthrop Grumman MQ-8B Fire Scout 110 880 110 110 880 110 8hNorthrop Grumman RQ-4A Global Hawk Satcom 12000 343 Satcom 12000 343 35hRUAG Ranger 97 630 70 97 630 70 9hSAAB Skeldar V-200 81 350 70 81 350 70 5hSagem Sperwer B 108 972 81 108 972 81 12hSchiebel Camcopter 97 330 55 97 330 55 6hSwift Killer Bee 50 972 64.8 50 972 64.8 15hWarrior/Aero-Marine Gull 68 100 1124 100 100 1124 100 11h14mTable H.3: Performance Figure Analysis for Unmanned Aircraft Deployable for Maritime Search and Rescue Tasks
Specifics pertaining to Table H.3
General
Neither World Aircraft Information Files (WAIF), nor any of the two World Airnews articles referenced, contain any performance data for Unmanned Aerial Vehicles. These columns have
therefore been removed from Table A-3.
AAI RQ-7B Shadow 200
Range calculated from Speed (90kn) and Endurance (6h)
BAe HERTI
Data source for Communications Range: WWW, http://www.baesystems.com/ProductsServices/HERTI.html
Data used for other data: WWW, http://www.flightglobal.com/directory/uav/bae-systems-3199/herti-xpa-1b-7478.html

H-13
Range calculated from Speed (90kn) and Endurance (25hrs)
Bell TR916 Eagle Eye
Range calculated from Speed (200kn) and Endurance (4hrs)
Boeing A160T Hummingbird
Speed calculated from Range (2250nmi) and Endurance (20hrs)
Communications range is estimated to 110nmi, as it is understood the A160T does not incorporate a satellite link
Denel Dynamics Bateleur
General: Not an International UAV (although being co-developed with International parties), this National is still in development, and estimated performance figures have been included for
comparison only.
Range calculated from Max cruise speed and min endurance (18 hrs)
OEM source Speed option: Max cruise speed
EADS ORKA-1200
Data source for Communications Range: WWW, http://www.aviationweek.com/shownews/03paris/aircraft3_05.htm
Data used for other data: WWW, http://www.eads.com/1024/en/pressdb/archiv/2003/2003/en_20030614_lbsysde.html
Range calculated from Speed (195km/h = 105.3kn) and Endurance (8hrs)
Elbit Hermes 450
Range calculated from Speed (70kn) and Endurance (20hrs)
Elbit Hermes 1500
Range calculated from Speed (80kn) and Endurance (26hrs)
General Atomics RQ-1/MQ-1 Predator

H-14
Data source for Communications Range: WWW, http://www.airforce-technology.com/projects/predator/
Data used for other data: OEM source
Range calculated from Speed (120kn) and Endurance (40hrs)
General Atomics MQ-9 Reaper
Range calculated from Speed (240kn) and Endurance (30hrs)
General Atomics Mariner
Speed calculated from maximum Endurance (45.2hrs) and Range (7100nmi)
IAI Heron TP (Eitan)
Speed is estimated to be similar to similarly sized, -proportioned and -powered Reaper and Mariner – averaged to 200kn
Range is calculated from endurance (36h) and Speed (200kn)
IAI/EADS Eagle 1/Heron 1/Harfang
Range calculated from Speed (80kn) and Endurance (30hrs)
IAI/EADS Eagle 2
Range calculated from Speed (180kn) and Endurance (24hrs)
IAI/PUI RQ-2 Pioneer
Data source: WWW, http://www.uavforum.com/vehicles/production/pioneer.htm
InSitu/Boeing ScanEagle
Range calculated from Cruise Speed (49kn) and Endurance (20hrs)
Northrop Grumman MQ-8B Fire Scout
Range calculated from 6hrs @ 110kn + 220nmi

H-15
Speed calculated from Total Endurance = 8hrs, with 6 hours for searching, which leaves 1hr to cover 110nmi = 110kn
RUAG Ranger
Range calculated from Speed (70kn) and Endurance (9hrs)
SAAB Skeldar V-200
Range calculated from Speed (70kn) and Endurance (5hrs)
Sagem Sperwer B
OEM source available, but contains no relevant or useful performance data EXCEPT for communications range
Data source used for other data: WWW, http://www.army-technology.com/projects/sperwer-uav/specs.html
Range calculated from Speed (150km/h = 81kn) and Endurance (12hrs)
Schiebel Camcopter
Range calculated from Cruise Speed (55kn) and Endurance (6hrs)
Swift Killer Bee
Speed calculated from endurance (15hrs) and maximum range (972nmi)
Warrior/Aero-Marine Gull 68
Endurance calculated from Range (1124nmi) and Speed (100kn)

I-1
Appendix I
I. Key Performance Requirement per Search Location
Appendix I provides the detail calculations and train of thought for the
determination of the key performance requirements (speed, range and
endurance) for each of six search locations. The following assumptions have
been made in determination of these key performance requirements:
Range is calculated along a straight line from a point on the coast
up to the location limits (refer Figure 4.3).
The effect of wind is ignored.
It is assumed the asset will be capable of performing the entire
mission at maximum cruise speed (transit and search).
I.1. Search Location 1: Territorial Waters (TW)
The key performance requirements for assets operating to the limits of this
location are calculated and deduced as follows.
I.1.1. Location BoundariesTW
From Shoreline to 12nmi offshore.
I.1.2. SpeedTW
The most important factor influencing the speed requirement is that the
Search and Rescue asset must reach the search location limit within 6 hours
(point 5.3.2). The minimum required cruise speed is calculated as follows:
6T
SV TW
Cruise
h
nmiVCruiseCalc 6
12
knhnmiVCruiseCalc 2/2

I-2
Considering that the lowest cruise speed for any Search and Rescue asset,
as listed in Tables 7.1, 8.1 and 9.1, is 49 knots[239], the very low calculated
requirement of 2kn will be ignored. A cruise speed of at least 50kn will form
the basis for this and all subsequent calculations.
The minimum required cruise speed is therefore accepted as:
knhnmiVCruiseAcc 50/50
I.1.3. RangeTW
The total range is calculated as follows:
+Distance from coast to TW limit
+Distance traveled in 4 hours at accepted cruise speed
+Distance from TW limit to coast
+Distance traveled in 1 hour at accepted cruise speed
which equates to:
TotalS 12+ 504 +12+ 501
TotalS 274nmi
I.1.4. EnduranceTW
The total endurance is calculated as follows:
+Travel time at accepted cruise speed from coast to TW limit
+Maximum Search Time
+Travel time at accepted cruise speed from TW limit to coast
+1 hour emergency time
which equates to:
TotalT
hnmi
nmi
/50
12+4+
hnmi
nmi
/50
12+1
TotalT 5.48h

I-3
TotalT 5h 29m
I.2. Search Location 2: Contiguous and Maritime Cultural Zone (C&MCZ)
The key performance requirements for assets operating to the limits of this
location are calculated and deduced as follows:
I.2.1. Location BoundariesC&MCZ
From Shoreline to 24nmi offshore.
I.2.2. SpeedC&MCZ
The minimum required cruise speed is calculated as follows:
6
&
T
SV MCZC
Cruise
h
nmiVCruiseCalc 6
24
knhnmiVCruiseCalc 4/4
As explained in the previous sub-section for the Territorial Waters, the
minimum required cruise speed is accepted as:
knhnmiVCruiseAcc 50/50
I.2.3. RangeC&MCZ
The total range is calculated as follows:
+Distance from coast to C&MCZ limit
+Distance traveled in 4 hours at accepted cruise speed
+Distance from C&MCZ limit to coast
+Distance traveled in 1 hour at accepted cruise speed
which equates to:
TotalS 24 + 504 + 24 + 501

I-4
TotalS 298nmi
I.2.4. EnduranceC&MCZ
The total endurance is calculated as follows:
+Travel time at accepted cruise speed from coast to C&MCZ limit
+Maximum Search Time
+Travel time at accepted cruise speed from C&MCZ limit to coast
+1 hour emergency time
which equates to:
TotalT
hnmi
nmi
/50
24+4+
hnmi
nmi
/50
24+1
TotalT 5.96h
TotalT 5h 58m
I.3. Search Location 3: Exclusive Economic Zone (EEZ)
The key performance requirements for assets operating to the limits of this
location are calculated and deduced as follows:
I.3.1. Location BoundariesEEZ
From Shoreline to 200nmi offshore.
I.3.2. SpeedEEZ
The minimum required cruise speed is calculated as follows:
6T
SV EEZ
Cruise
h
nmiVCruiseCalc 6
200
knhnmiVCruiseCalc 3.33/3.33

I-5
As explained in the sub-section for the Territorial Waters, the minimum
required cruise speed is accepted as:
knhnmiVCruiseAcc 50/50
I.3.3. RangeEEZ
The total range is calculated as follows:
+Distance from coast to EEZ limit
+Distance traveled in 4 hours at accepted cruise speed
+Distance from EEZ limit to coast
+Distance traveled in 1 hour at accepted cruise speed
which equates to:
TotalS 200 + 504 + 200 + 501
TotalS 650nmi
I.3.4. EnduranceEEZ
The total endurance is calculated as follows:
+Travel time at accepted cruise speed from coast to EEZ limit
+Maximum Search Time
+Travel time at accepted cruise speed from EEZ limit to coast
+1 hour emergency time
which equates to:
TotalT
hnmi
nmi
/50
200+4+
hnmi
nmi
/50
200+1
TotalT 13h
I.4. Search Location 4. Continental Shelf (CS)
The key performance requirements for assets operating to the limits of this
location are calculated and deduced as follows:
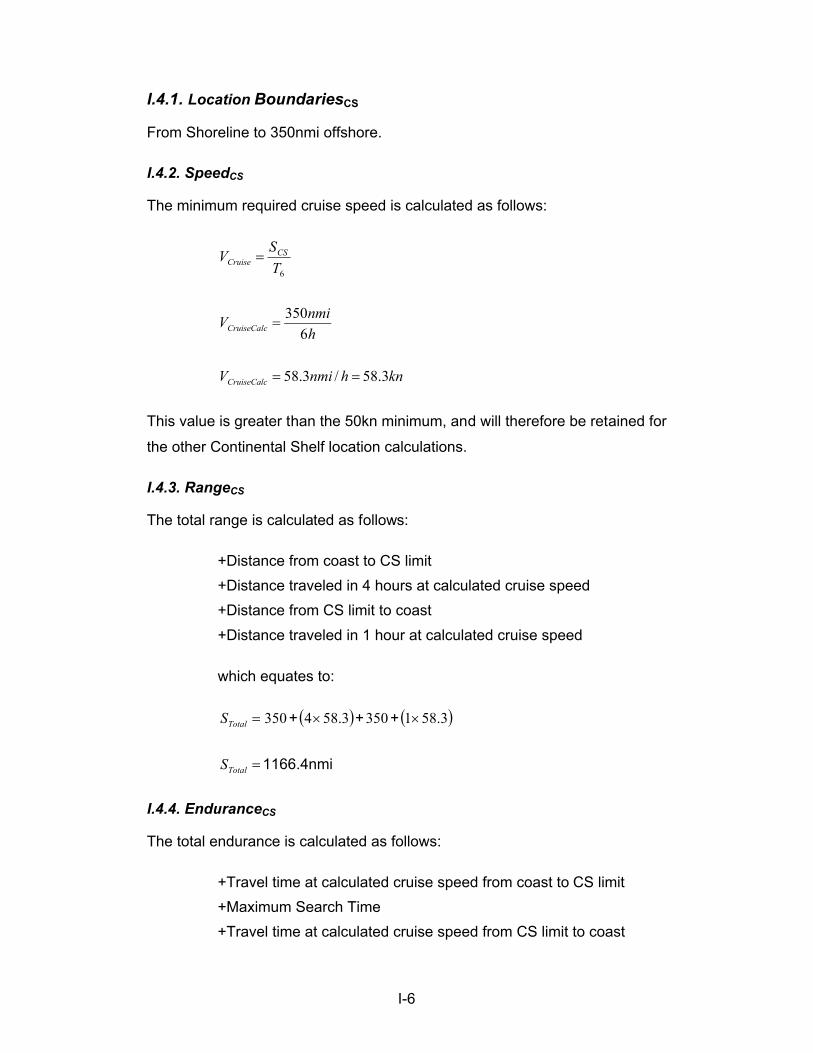
I-6
I.4.1. Location BoundariesCS
From Shoreline to 350nmi offshore.
I.4.2. SpeedCS
The minimum required cruise speed is calculated as follows:
6T
SV CS
Cruise
h
nmiVCruiseCalc 6
350
knhnmiVCruiseCalc 3.58/3.58
This value is greater than the 50kn minimum, and will therefore be retained for
the other Continental Shelf location calculations.
I.4.3. RangeCS
The total range is calculated as follows:
+Distance from coast to CS limit
+Distance traveled in 4 hours at calculated cruise speed
+Distance from CS limit to coast
+Distance traveled in 1 hour at calculated cruise speed
which equates to:
TotalS 350 + 3.584 +350 + 3.581
TotalS 1166.4nmi
I.4.4. EnduranceCS
The total endurance is calculated as follows:
+Travel time at calculated cruise speed from coast to CS limit
+Maximum Search Time
+Travel time at calculated cruise speed from CS limit to coast

I-7
+1 hour emergency time
which equates to:
TotalT
hnmi
nmi
/3.58
350+4+
hnmi
nmi
/3.58
350+1
TotalT 6+4+6+1
TotalT 17h
I.5. Search Location 5. Marion Island Rim (MIR)
The key performance requirements for assets operating to the limits of this
location are calculated and deduced as follows:
I.5.1. Location BoundariesMIR
From Shoreline to 1770nmi offshore.
I.5.2. SpeedMIR
The minimum required cruise speed is calculated as follows:
6T
SV MIR
Cruise
h
nmiVCruiseCalc 6
1770
knhnmiVCruiseCalc 295/295
This value is more than the 50kn minimum, and will therefore be retained for
the other Marion Island Rim location calculations.
I.5.3. RangeMIR
The total range is calculated as follows:
+Distance from coast to MIR limit
+Distance traveled in 4 hours at calculated cruise speed
+Distance from MIR limit to coast

I-8
+Distance traveled in 1 hour at calculated cruise speed
which equates to:
TotalS 1770 + 2954 +1770 + 2951
TotalS 4425nmi
I.5.4. EnduranceMIR
The total endurance is calculated as follows:
+Travel time at calculated cruise speed from coast to MIR limit
+Maximum Search Time
+Travel time at calculated cruise speed from MIR limit to coast
+1 hour emergency time
which equates to:
TotalT
hnmi
nmi
/295
1770+4+
hnmi
nmi
/295
1770+1
TotalT 6+4+6+1
TotalT 17h
I.6. Search Location 6. Search Extremities (SE)
The key performance requirements for assets operating to the limits of this
location are calculated and deduced as follows:
I.6.1. Location BoundariesSE
From Shoreline to 2800nmi offshore
I.6.2. SpeedSE
The minimum required cruise speed is calculated as follows:
6T
SV SE
Cruise

I-9
h
nmiVCruiseCalc 6
2800
knhnmiVCruiseCalc 7.466/7.466
This value is more than the 50kn minimum, and will therefore be retained for
the other Search Extremities location calculations
I.6.3. RangeSE
The total range is calculated as follows:
+Distance from coast to SE limit
+Distance traveled in 4 hours at calculated cruise speed
+Distance from SE limit to coast
+Distance traveled in 1 hour at calculated cruise speed
which equates to:
TotalS 2800 + 7.4664 + 2800 + 7.4661
TotalS 7933.5nmi
I.6.4. EnduranceSE
The total endurance is calculated as follows:
+Travel time at calculated cruise speed from coast to SE limit
+Maximum Search Time
+Travel time at calculated cruise speed from SE limit to coast
+1 hour emergency time
which equates to:
TotalT
hnmi
nmi
/7.466
2800+4+
hnmi
nmi
/7.466
2800+1
TotalT 6+4+6+1
TotalT 17h

J-1
Appendix J
J. Performance Shortcomings
Appendix J provides the detail analysis tables to determine the performance
“deltas” per search location, for existing Search and Rescue aircraft.
J.1. Domestic SAR Aircraft
J.1.1. SpeedDom
Table J.1 plots each domestic aircraft’s maximum cruise speed (VCruiseMax)
against the speed requirement for each of the six search locations.
TW C&MCZ EEZ CS MIR SEAircraft TypeDomestic VCruiseMax 50 50 50 58.3 295 466.7Agusta Westland A109 LUH 153Agusta Westland A109E Power 154Agusta Westland A109S Grand 156Beech King Air 200/B200C 289.4Beech King Air 300 315.4Bell 212 Twin Huey 100CASA 212-200/300 180CASA CN-235 (prototype) 230Cessna C208A Caravan 175Convair 580 280Denel Oryx M1/M2 120Douglas C47-TP MP&NT 160Eurocopter AS 350 B3 140Eurocopter EC 120B Colibri 120Kamov Ka-32A 118.8Lockheed C-130BZ Hercules 300MBB BO105 CBS-5 134MBB/Kawasaki BK117 133.8MD Helicopters MD-500E LEH 170Mil Mi-8 MTV 116Mil Mi-8 P 116Pilatus PC-6 Porter 125Pilatus PC-12 280Robinson R44 Raven II 117Sikorsky S-61N MkII 114.4Sikorsky S-76A++ Spirit 137Westland Super Lynx 300 132
Table J.1: Maximum Cruise Speed vs Search Location Requirement (Domestic Aircraft)
Green shaded cells indicate the search locations where existing aircraft are
capable of reaching the required cruise speed. Red shaded cells indicate the
converse. All speeds are in knots.
J.1.2. RangeDom
Table J.2 plots each domestic aircraft’s maximum range (SMax) against the
range requirement for each of the six search locations.

J-2
TW C&MCZ EEZ CS MIR SEAircraft TypeDomestic SMax 274 298 650 1166.4 4425 7933.5Agusta Westland A109 LUH 500Agusta Westland A109E Power 512Agusta Westland A109S Grand 424Beech King Air 200/B200C 1974.3Beech King Air 300 1960.4Bell 212 Twin Huey 236.4CASA 212-200/300 800CASA CN-235 (prototype) 2000Cessna C208A Caravan 869Convair 580 1200Denel Oryx M1/M2 827Douglas C47-TP MP&NT 1300Eurocopter AS 350 B3 359Eurocopter EC 120B Colibri 383Kamov Ka-32A 475Lockheed C-130BZ Hercules 2699.8MBB BO105 CBS-5 600MBB/Kawasaki BK117 307.6MD Helicopters MD-500E LEH 287Mil Mi-8 MTV 567Mil Mi-8 P 737Pilatus PC-6 Porter 500Pilatus PC-12 1560Robinson R44 Raven II 304.1Sikorsky S-61N MkII 400.6Sikorsky S-76A++ Spirit 411Westland Super Lynx 300 280
Table J.2 Maximum Range vs Search Location Requirement (Domestic Aircraft)
Green shaded cells indicate the search locations where existing aircraft are
capable of reaching the required range. Red shaded cells indicate the
converse. All ranges are in nautical miles.
J.1.3. EnduranceDom
Table J.3 plots each domestic aircraft’s maximum endurance (TMax) against
the endurance requirement for each of the six search locations.

J-3
TW C&MCZ EEZ CS MIR SEAircraft TypeDomestic TMax 5h28m 5h58m 13 17 17 17Agusta Westland A109 LUH 3h16mAgusta Westland A109E Power 3h19mAgusta Westland A109S Grand 2h43mBeech King Air 200/B200C 6h49mBeech King Air 300 6h12mBell 212 Twin Huey 2h21mCASA 212-200/300 4h26mCASA CN-235 (prototype) 8h42mCessna C208A Caravan 5hConvair 580 4h17mDenel Oryx M1/M2 6h53mDouglas C47-TP MP&NT 8h7mEurocopter AS 350 B3 2h33mEurocopter EC 120B Colibri 3h11mKamov Ka-32A 4hLockheed C-130BZ Hercules 9hMBB BO105 CBS-5 4h28mMBB/Kawasaki BK117 2h17mMD Helicopters MD-500E LEH 1h41mMil Mi-8 MTV 4h53mMil Mi-8 P 6h21mPilatus PC-6 Porter 4hPilatus PC-12 5h34mRobinson R44 Raven II 2h35mSikorsky S-61N MkII 3h30mSikorsky S-76A++ Spirit 3hWestland Super Lynx 300 2h7m
Table J.3: Maximum Endurance vs Search Location Requirement (Domestic Aircraft)
Green shaded cells indicate the search locations where existing aircraft are
capable of reaching the required endurance. Red shaded cells indicate the
converse. All endurance figures are in hours and minutes.
J.1.4. Combined Effects TableDom
Table J.4 plots each domestic aircraft’s maximum speed, range and
endurance in combined effect against each of the six search locations and
their requirements. A red cell in any of the three tables above merits a red cell
in the combined effects table.

J-4
Aircraft TypeDomestic TW C&MCZ EEZ CS MIR SEAgusta Westland A109 LUHAgusta Westland A109E PowerAgusta Westland A109S GrandBeech King Air 200/B200CBeech King Air 300Bell 212 Twin HueyCASA 212-200/300CASA CN-235 (prototype)Cessna C208A CaravanConvair 580Denel Oryx M1/M2Douglas C47-TP MP&NTEurocopter AS 350 B3Eurocopter EC 120B ColibriKamov Ka-32ALockheed C-130BZ HerculesMBB BO105 CBS-5MBB/Kawasaki BK117MD Helicopters MD-500E LEHMil Mi-8 MTVMil Mi-8 PPilatus PC-6 PorterPilatus PC-12Robinson R44 Raven IISikorsky S-61N MkIISikorsky S-76A++ SpiritWestland Super Lynx 300
Table J.4: Combined Performance Effects vs Search Location Requirements (Domestic Aircraft)
From Table J.4 it is evident that only 30% of the available domestic aircraft
types, currently deployable for maritime Search and Rescue, are capable of
meeting all key performance requirements, and this for primarily the TW and
C&MCZ search locations.
This leaves a very large shortcoming in terms of airborne maritime Search
and Rescue, particularly for situations involving incidents beyond the 24nmi
C&MCZ.
J.2. Foreign SAR Aircraft
J.2.1. SpeedFor
Table J.5 plots each foreign aircraft’s maximum cruise speed (VCruiseMax)
against the speed requirement for each of the six search locations.

J-5
TW C&MCZ EEZ CS MIR SEAircraft TypeForeign VCruiseMax 50 50 50 58.3 295 466.7Agusta Westland AW139 165Agusta Westland Merlin HM1 136Alenia/ATR 42 MP Surveyor 190Alenia/ATR 72 ASW 145Alenia C27J Spartan 325BAe Nimrod MRA4 442.8Bell 214 ST 140Bell 407 118Bell 412 EP 131Bell 427 133Bell 429 142Bell/Agusta BA 609 275Bell/Boeing MV-22B Osprey 250Bell UH-1Y Venom 135Boeing P-8A Poseidon 490Bombardier/DHC Dash 8 Q200 290Bombardier/DHC Dash 8 Q400 361CASA CN-235MP Persuader 130CASA C-295 Persuader 145Dassault Atlantique ATL2 299.8Dassault Falcon 900 MPA 496.1Embraer P-99 (EMB 145 MP) 444.1Eurocopter AS 332 L2 Super Puma 150Eurocopter AS 365 N3 Dauphin 145Eurocopter AS 532 SC Cougar 136Eurocopter AS 555 Fennec 118Eurocopter AS 565 Panther 145Eurocopter EC 225 Super Puma 141.5Eurocopter EC 725 Cougar 141Eurocopter MH-65C Dolphin 165Fairchild-Dornier Do-228-101 MPA 165.1Fokker 50 Maritime 150Ilyushin Il-38 May 348.5Kaman SH-2G Super Seasprite 120Lockheed HC-130J Hercules 339Lockheed P-3C OrionLockheed CP-140 Aurora
328
MD Helicopters MD-600N 115NH Industries NH90 FSH/NFH 132Reims-Cessna F406 246Shaanxi Y-8X MPA 350Sikorsky CH-148 Cyclone (MH-92) 137Sikorsky CH-53E Super Stallion 150.1Sikorsky MH-53E Sea Dragon 150Sikorsky MH-60T Jayhawk 170Sikorsky S-70B Sea Hawk 146Tupolev Tu-142M Bear-F 500
Table J.5: Maximum Cruise Speed vs Search Location Requirement (Foreign Aircraft)
Green shaded cells indicate the search locations where existing aircraft are
capable of reaching the required cruise speed. Red shaded cells indicate the
converse. All speeds are in knots.
J.2.2. RangeFor
Table J.6 plots each foreign aircraft’s maximum range (SMax) against the
range requirement for each of the six search locations.
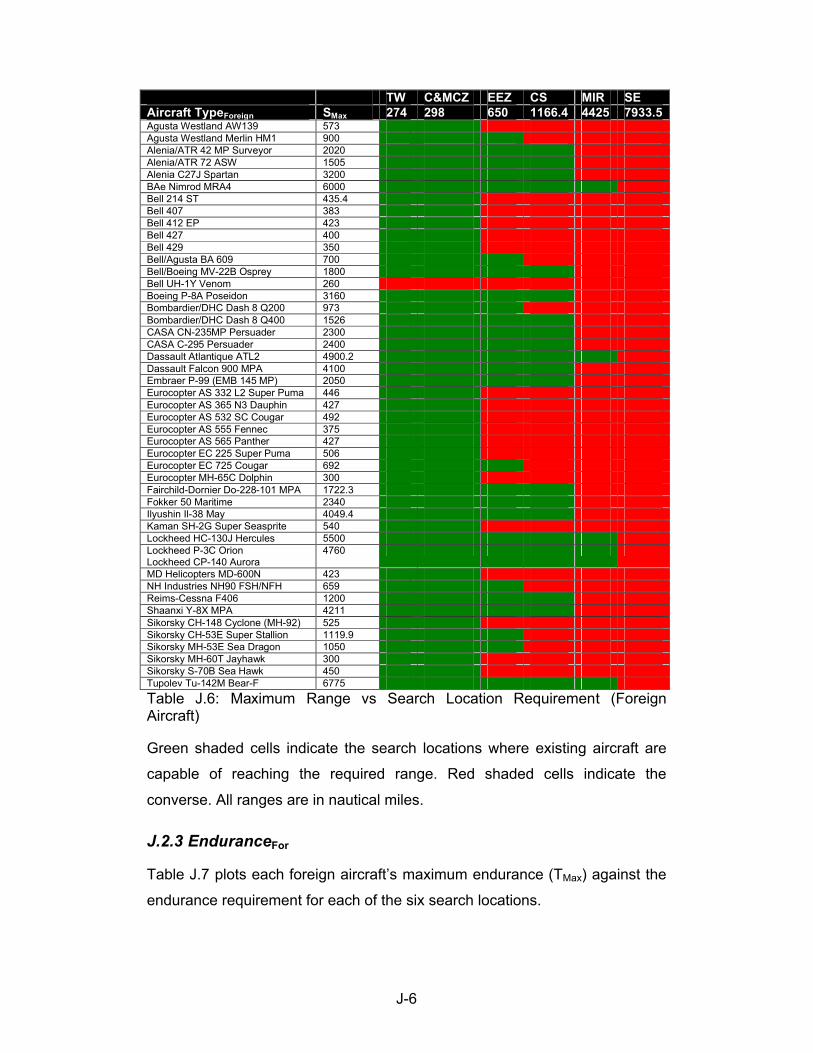
J-6
TW C&MCZ EEZ CS MIR SEAircraft TypeForeign SMax 274 298 650 1166.4 4425 7933.5Agusta Westland AW139 573Agusta Westland Merlin HM1 900Alenia/ATR 42 MP Surveyor 2020Alenia/ATR 72 ASW 1505Alenia C27J Spartan 3200BAe Nimrod MRA4 6000 Bell 214 ST 435.4Bell 407 383Bell 412 EP 423Bell 427 400Bell 429 350Bell/Agusta BA 609 700Bell/Boeing MV-22B Osprey 1800Bell UH-1Y Venom 260Boeing P-8A Poseidon 3160Bombardier/DHC Dash 8 Q200 973Bombardier/DHC Dash 8 Q400 1526CASA CN-235MP Persuader 2300CASA C-295 Persuader 2400Dassault Atlantique ATL2 4900.2Dassault Falcon 900 MPA 4100 Embraer P-99 (EMB 145 MP) 2050Eurocopter AS 332 L2 Super Puma 446Eurocopter AS 365 N3 Dauphin 427Eurocopter AS 532 SC Cougar 492Eurocopter AS 555 Fennec 375Eurocopter AS 565 Panther 427Eurocopter EC 225 Super Puma 506Eurocopter EC 725 Cougar 692Eurocopter MH-65C Dolphin 300Fairchild-Dornier Do-228-101 MPA 1722.3Fokker 50 Maritime 2340Ilyushin Il-38 May 4049.4Kaman SH-2G Super Seasprite 540Lockheed HC-130J Hercules 5500Lockheed P-3C OrionLockheed CP-140 Aurora
4760
MD Helicopters MD-600N 423NH Industries NH90 FSH/NFH 659Reims-Cessna F406 1200Shaanxi Y-8X MPA 4211Sikorsky CH-148 Cyclone (MH-92) 525Sikorsky CH-53E Super Stallion 1119.9Sikorsky MH-53E Sea Dragon 1050 Sikorsky MH-60T Jayhawk 300Sikorsky S-70B Sea Hawk 450Tupolev Tu-142M Bear-F 6775
Table J.6: Maximum Range vs Search Location Requirement (Foreign Aircraft)
Green shaded cells indicate the search locations where existing aircraft are
capable of reaching the required range. Red shaded cells indicate the
converse. All ranges are in nautical miles.
J.2.3 EnduranceFor
Table J.7 plots each foreign aircraft’s maximum endurance (TMax) against the
endurance requirement for each of the six search locations.

J-7
TW C&MCZ EEZ CS MIR SEAircraft TypeForeign TMax 5h28m 5h58m 13 17 17 17Agusta Westland AW139 3h28mAgusta Westland Merlin HM1 6h37mAlenia/ATR 42 MP Surveyor 10h37mAlenia/ATR 72 ASW 10h22mAlenia C27J Spartan 9h50mBAe Nimrod MRA4 13h33mBell 214 ST 3h6mBell 407 3h14mBell 412 EP 3h13mBell 427 3hBell 429 2h27mBell/Agusta BA 609 2h32mBell/Boeing MV-22B Osprey 7h12mBell UH-1Y Venom 1h55mBoeing P-8A Poseidon 6h26mBombardier/DHC Dash 8 Q200 3h21mBombardier/DHC Dash 8 Q400 4h13mCASA CN-235MP Persuader 17h41mCASA C-295 Persuader 16h33mDassault Atlantique ATL2 16h20mDassault Falcon 900 MPA 8h15mEmbraer P-99 (EMB 145 MP) 4h36mEurocopter AS 332 L2 Super Puma 3hEurocopter AS 365 N3 Dauphin 3hEurocopter AS 532 SC Cougar 3h37mEurocopter AS 555 Fennec 3h10mEurocopter AS 565 Panther 3hEurocopter EC 225 Super Puma 3h34mEurocopter EC 725 Cougar 4h54mEurocopter MH-65C Dolphin 1h49mFairchild-Dornier Do-228-101 MPA 10h25mFokker 50 Maritime 15h36mIlyushin Il-38 May 11h37mKaman SH-2G Super Seasprite 4h30mLockheed HC-130J Hercules 16h13mLockheed P-3C OrionLockheed CP-140 Aurora
14h30m
MD Helicopters MD-600N 3h40mNH Industries NH90 FSH/NFH 5hReims-Cessna F406 4h52mShaanxi Y-8X MPA 12h1mSikorsky CH-148 Cyclone (MH-92) 3h49mSikorsky CH-53E Super Stallion 7h27mSikorsky MH-53E Sea Dragon 7hSikorsky MH-60T Jayhawk 1h45mSikorsky S-70B Sea Hawk 3h4mTupolev Tu-142M Bear-F 13h33m
Table J.7: Maximum Endurance vs Search Location Requirement (Foreign Aircraft)
Green shaded cells indicate the search locations where existing aircraft are
capable of reaching the required endurance. Red shaded cells indicate the
converse. All endurance figures are in hours and minutes.
J.2.4. Combined Effects TableFor
Table J.8 plots each foreign aircraft’s maximum speed, range and endurance
in combined effect against each of the six search locations and their
requirements. A red cell in any of the three tables above merits a red cell in
the combined effects table.

J-8
Aircraft TypeForeign TW C&MCZ EEZ CS MIR SEAgusta Westland AW139Agusta Westland Merlin HM1Alenia/ATR 42 MP SurveyorAlenia/ATR 72 ASWAlenia C27J SpartanBAe Nimrod MRA4Bell 214 STBell 407Bell 412 EPBell 427Bell 429Bell/Agusta BA 609Bell/Boeing MV-22B OspreyBell UH-1Y VenomBoeing P-8A PoseidonBombardier/DHC Dash 8 Q200Bombardier/DHC Dash 8 Q400CASA CN-235MP PersuaderCASA C-295 PersuaderDassault Atlantique ATL2Dassault Falcon 900 MPAEmbraer P-99 (EMB 145 MP)Eurocopter AS 332 L2 Super PumaEurocopter AS 365 N3 DauphinEurocopter AS 532 SC CougarEurocopter AS 555 FennecEurocopter AS 565 PantherEurocopter EC 225 Super PumaEurocopter EC 725 CougarEurocopter MH-65C DolphinFairchild-Dornier Do-228-101 MPAFokker 50 MaritimeIlyushin Il-38 MayKaman SH-2G Super SeaspriteLockheed HC-130J HerculesLockheed P-3C OrionLockheed CP-140 AuroraMD Helicopters MD-600NNH Industries NH90 FSH/NFHReims-Cessna F406Shaanxi Y-8X MPASikorsky CH-148 Cyclone (MH-92)Sikorsky CH-53E Super StallionSikorsky MH-53E Sea DragonSikorsky MH-60T JayhawkSikorsky S-70B Sea HawkTupolev Tu-142M Bear-F
Table J.8: Combined Performance Effects vs Search Location Requirements (Foreign Aircraft)
From Table J.8 it is evident that only about 40% of the available foreign
aircraft types, currently deployable for maritime Search and Rescue, are
capable of meeting all key performance requirements, and this for primarily
the TW and C&MCZ search locations. Only 8 types are capable of meeting all
key performance requirements within the EEZ, and only one type within the
CS.

J-9
This leaves a very large shortcoming in terms of airborne maritime Search
and Rescue, particularly for situations involving incidents beyond the 200nmi
EEZ.
J.3. Unmanned SAR Assets
J.3.1. SpeedUAV
Table J.9 plots each unmanned aircraft’s maximum cruise speed (VCruiseMax)
against the speed requirement for each of the six search locations.
TW C&MCZ EEZ CS MIR SEAircraft TypeUnmanned VCruiseMax 50 50 50 58.3 295 466.7AAI RQ-7B Shadow 200 90BAe HERTI 90Bell TR916 Eagle Eye 200Boeing A160T Hummingbird 112.5Denel Dynamics Bateleur 135EADS ORKA-1200 105.3Elbit Hermes 450 70Elbit Hermes 1500 80General Atomics RQ-1/MQ-1 Predator 120General Atomics MQ-9 Reaper 240General Atomics Mariner 157IAI Heron TP (Eitan) 200IAI/EADS Eagle 1/Heron 1/Harfang 80IAI/EADS Eagle 2 180IAI/PUI RQ-2 Pioneer 110InSitu/Boeing ScanEagle 49Northrop Grumman MQ-8B Fire Scout 110Northrop Grumman RQ-4A Global Hawk 343RUAG Ranger 70SAAB Skeldar V-200 70Sagem Sperwer B 81Schiebel Camcopter 55Swift Killer Bee 64.8Warrior/Aero-Marine Gull 68 100
Table J.9: Maximum Cruise Speed vs Search Location Requirement (Unmanned Aircraft)
Green shaded cells indicate the search locations where existing aircraft are
capable of reaching the required cruise speed. Red shaded cells indicate the
converse. All speeds are in knots.
J.3.2. Range (Communications)UAV
Table J-10 plots each unmanned aircraft’s maximum communications range
(SCommsMax) against the range requirement for each of the six search locations.

J-10
TW C&MCZ EEZ CS MIR SEAircraft TypeUnmanned SCommsMax 274 298 650 1166.4 4425 7933.5AAI RQ-7B Shadow 200 68BAe HERTI Range maxBell TR916 Eagle Eye 100Boeing A160T Hummingbird 110Denel Dynamics Bateleur SatcomEADS ORKA-1200 Tactical 110Elbit Hermes 450 108 (std)Elbit Hermes 1500 108 (std)General Atomics RQ-1/MQ-1 Predator SatcomGeneral Atomics MQ-9 Reaper SatcomGeneral Atomics Mariner SatcomIAI Heron TP (Eitan) SatcomIAI/EADS Eagle 1/Heron 1/Harfang SatcomIAI/EADS Eagle 2 SatcomIAI/PUI RQ-2 Pioneer 100InSitu/Boeing ScanEagle Range maxNorthrop Grumman MQ-8B Fire Scout 110Northrop Grumman RQ-4A Global Hawk SatcomRUAG Ranger 97SAAB Skeldar V-200 81Sagem Sperwer B 108Schiebel Camcopter 97Swift Killer Bee 50Warrior/Aero-Marine Gull 68 100
Table J.10: Maximum Communications Range vs Search LocationRequirement (Unmanned Aircraft)
Green shaded cells indicate the search locations where existing aircraft are
capable of reaching the required range. Red shaded cells indicate the
converse. All ranges are in nautical miles.
J.3.3. RangeUAV
Table J.11 plots each unmanned aircraft’s maximum range (SMax) against the
range requirement for each of the six search locations.

J-11
TW C&MCZ EEZ CS MIR SEAircraft TypeUnmanned SMax 274 298 650 1166.4 4425 7933.5AAI RQ-7B Shadow 200 540BAe HERTI 2250 Bell TR916 Eagle Eye 800Boeing A160T Hummingbird 2250Denel Dynamics Bateleur 2430EADS ORKA-1200 842Elbit Hermes 450 1400Elbit Hermes 1500 2080General Atomics RQ-1/MQ-1 Predator 4800General Atomics MQ-9 Reaper 7200General Atomics Mariner 7100IAI Heron TP (Eitan) 7200IAI/EADS Eagle 1/Heron 1/Harfang 2400IAI/EADS Eagle 2 4320IAI/PUI RQ-2 Pioneer 495InSitu/Boeing ScanEagle 980Northrop Grumman MQ-8B Fire Scout 880Northrop Grumman RQ-4A Global Hawk 12000RUAG Ranger 630SAAB Skeldar V-200 350Sagem Sperwer B 972Schiebel Camcopter 330Swift Killer Bee 972Warrior/Aero-Marine Gull 68 1124
Table J.11: Maximum Range vs Search Location Requirement (Unmanned Aircraft)
Green shaded cells indicate the search locations where existing aircraft are
capable of reaching the required range. Red shaded cells indicate the
converse. All ranges are in nautical miles.
J.3.4. EnduranceUAV
Table J.12 plots each unmanned aircraft’s maximum endurance (TMax) against
the endurance requirement for each of the six search locations.

J-12
TW C&MCZ EEZ CS MIR SEAircraft TypeUnmanned TMax 5h28m 5h58m 13 17 17 17AAI RQ-7B Shadow 200 6hBAe HERTI 25hBell TR916 Eagle Eye 4hBoeing A160T Hummingbird 20hDenel Dynamics Bateleur 18hEADS ORKA-1200 8hElbit Hermes 450 20hElbit Hermes 1500 26hGeneral Atomics RQ-1/MQ-1 Predator 40hGeneral Atomics MQ-9 Reaper 30hGeneral Atomics Mariner 45h13mIAI Heron TP (Eitan) 36hIAI/EADS Eagle 1/Heron 1/Harfang 30hIAI/EADS Eagle 2 24hIAI/PUI RQ-2 Pioneer 4h30mInSitu/Boeing ScanEagle 20hNorthrop Grumman MQ-8B Fire Scout 8hNorthrop Grumman RQ-4A Global Hawk 35hRUAG Ranger 9hSAAB Skeldar V-200 5hSagem Sperwer B 12hSchiebel Camcopter 6hSwift Killer Bee 15hWarrior/Aero-Marine Gull 68 11h14m
Table J.12: Maximum Endurance vs Search Location Requirement (Unmanned Aircraft)
Green shaded cells indicate the search locations where existing aircraft are
capable of reaching the required endurance. Red shaded cells indicate the
converse. All endurance figures are in hours and minutes.
J.3.5. Combined Effects TableUAV
Table J.13 plots each unmanned aircraft’s maximum cruise speed,
communications range, range and endurance in combined effect against each
of the six search locations and their requirements. A red cell in any of the four
tables above merits a red cell in the combined effects table.

J-13
Aircraft TypeUnmanned TW C&MCZ EEZ CS MIR SEAAI RQ-7B Shadow 200BAe HERTIBell TR916 Eagle EyeBoeing A160T HummingbirdDenel Dynamics BateleurEADS ORKA-1200Elbit Hermes 450Elbit Hermes 1500General Atomics RQ-1/MQ-1 PredatorGeneral Atomics MQ-9 ReaperGeneral Atomics MarinerIAI Heron TP (Eitan)IAI/EADS Eagle 1/Heron 1/HarfangIAI/EADS Eagle 2IAI/PUI RQ-2 PioneerInSitu/Boeing ScanEagleNorthrop Grumman MQ-8B Fire ScoutNorthrop Grumman RQ-4A Global HawkRUAG RangerSAAB Skeldar V-200Sagem Sperwer BSchiebel CamcopterSwift Killer BeeWarrior/Aero-Marine Gull 68
Table J.13: Combined Performance Effects vs Search Location Requirements (Unmanned Aircraft)
From Table J.13 it is evident that only about 37% of the available unmanned
aircraft types, currently deployable for maritime Search and Rescue, are
capable of meeting all key performance requirements, and this for primarily
the TW, C&MCZ, EEZ and CS search locations. Only one type is capable of
meeting all performance requirements for the MIR.
This leaves a large shortcoming in terms of airborne maritime Search and
Rescue, particularly for situations involving incidents beyond the 350nmi CS.

PART 2
Appendices

K-1
Appendix K
K.Unmanned Aircraft Design Analysis: A. Maneschijn
Appendix K provides the detail analysis for the concept design of the
Unmanned Aircraft, as presented in the book by Mr A. Maneschijn, entitled
“An Introduction to Experimental Light Aircraft Design”[109].
K.1. Method 1: Experimental Light Aircraft Design, 1st Edition[109]
The first method for determining the conceptual design for the UA centered
primarily on concepts for the design of experimental light aircraft, as contained
in the reference material by Mr A. Maneschijn[109]. Although this design is not
strictly for a light aircraft, it is largely “conventional”, and as such the principles
and approach remain largely coherent with that provided in the reference
material. Where assumptions were made, it has been clearly stated, with
logical deductions.
The actual calculations were performed in Excel. Results are summarized in
Chapter 14.
K.1.1. Performance Prediction
The first calculation set focuses on the performance prediction for the UA.
K.1.1.1. Maximum All-Up (Take-off) Weight
Initial performance predictions involve the estimation of maximum all-up
weight, maximum fuel weight and payload weight. In order to start
somewhere, an existing manned aircraft was sought having similar
performance as the three key performance requirements determined for this
study. As it has already been shown, currently no single aircraft employed in
the maritime search and rescue role exhibits all three key performance
characteristics. However, a few aircraft utilized for other functions do come
close. The Gulfstream G550 was selected as a comparative platform to aide
with initial sizing and weights. The key performance requirements for this
design compares with those of the G550 as follows:

K-2
Aircraft Type VMax Cruise (kn) SMax (nmi) TMax (h)Design Requirement 466.7 7,933.5 17Gulfstream G550 459 6,750 14.7Difference 7.7 1,183.5 2.3% Difference 1.68% 17.53% 15.66%
Table K.1: G550 Performance Comparison
The differences in speed are negligibly small. The primary difference lies with
range and endurance, an average 17% higher requirement for this design
over the G550. All things being equal, including speed, the primary design trait
providing the increase in range and endurance should a greater fuel load,
which should influence the maximum all-up weight.
The maximum all-up weight for the G550 is 41,277 kg. A 16% increase in this
weight takes it up to 47,881 kg. The UA for this design is unmanned,
eliminating the cockpit and cabin from the weight equation. Therefore, as an
initial estimate, a maximum all-up weight of 45,000 kg is adopted for this
design.
Before calculating the maximum fuel weight, a number of other parameters
will be calculated. Some of these parameters are required for the calculation
of maximum fuel weight.
K.1.1.2. Stall Speeds
The stall speeds will be calculated at two altitudes: sea level and cruise
altitude of 40,000 ft. The air density differs substantially at these altitudes, and
is as follows:
Air density at sea level: ρsea = 1.225 kg/m3
Air density at 40,000 ft: ρalt = 0.244 x ρsea = 0.299 kg/m3
The following speeds will be determined in this sub-section:
VstallSea, the stall speed at sea level
VstallAlt, the stall speed at cruising altitude

K-3
A critical element in the calculation of many following values is the wing area.
To calculate this value, we first estimate the stall speed at sea level to be 112
knots (207.424 km/h; 57.62 m/s). The wing area is calculated form:
2max5.0 stallSealsea
wingVC
gWS
, where
W is the maximum all-up weight
Clmax is the maximum lift coefficient, and typically ranges as follows:
o 1.0 to 1.5 for an un-flapped wing
o 1.8 to 3.0 for a flapped wing
For this design, Clmax is estimated to be 2.0.
Therefore, the wing area for this design is:
262.57*2*225.1*5.0
81,9*000,45wingS
Swing is 108.55 m2, which checks well with the G550, which has a wing
area of 106 m2.
Stall speed at cruising altitude is calculated by rearranging the wing area
formula into:
max5.0
)(
lalt
wingstallAlt C
SgWV
Therefore, the stall speed at cruising altitude for this design is:
2*299.0*5.0
55.108/)81.9*000,45(stallAltV
VstallAlt is 116.64 m/s (419.92 km/h; 226.74 kn)

K-4
K.1.1.3. Basic Dimensions
The following basic dimensions will be determined in this sub-section:
L, the total length of the fuselage
ARwing, the wing aspect ratio
bwing, the wing span
caWing, the average chord of the wing
crWing, the root chord of the wing
ctWing, the tip chord of the wing
The length of the fuselage is initially chosen as 22 m, based on the G550.
The aspect ratio of the wing is the ratio of the wing span to the average chord;
the greater the span, the greater the ratio. High aspect ratios (6 to 10) deliver
lower cruising speeds, higher rates of climb and greater endurance. Lower
aspect ratios (4 to 6) deliver faster cruising speeds, lower rates of climb and
lower endurance. This design requires a high sub-sonic cruising speed with
very long endurance. An aspect ration of 7 is chosen, matching well to that of
the similarly-performing G550.
The wing span can be estimated from:
wingwingwing SARb
Therefore, the wing span is:
55.108*7wingb
bwing is 27.57 m, which correlates well with the 28.5 m wing span of the
G550.
The average wing chord can be estimated from:

K-5
wing
wingaWing bn
Sc
, where
n is the number of wings
Therefore, the average wing chord is:
57.27*1
55.108aWingc
caWing is 3.94 m
The wing root and tip chords can be determined from the average chord. The
wing root chord is selected to be 5.5 m. The wing tip chord is then calculated
from:
2tWingrWing
aWing
ccc
Therefore, the wing tip chord is:
5.5)2*94.3( tWingc
ctWing is 2.38 m
The fuselage and nose width and height are required as input for estimation of
drag, which is required as input for the verification of the key performance
requirements. Determination of fuselage diameters for unmanned aircraft
differs from manned aircraft primarily in the sense that manned aircraft require
larger diameters to accommodate passengers. The reference material
used[109] provides guidelines for the development of manned light aircraft, and
the Gulfstream G550 used as a reference is also a manned, passenger-
carrying VIP aircraft. These figures are therefore randomly selected, based on
estimated capacity for fuel, equipment and payload to be accommodated
inside the fuselage:
bfuse is 2 m

K-6
hfuse is 2.5 m
bnose is 2 m
hnose is 2.5 m
The values are rough and conservative estimates, and deliver a fuselage of
good proportions, capable of supporting the wing, equipment and internal fuel.
K.1.1.4. Aerodynamic Drag
This sub-section calculates the drag as a result of aerodynamic forces acting
on various key portions of the UA. The procedure desirbed in the reference
material for this Chapter is used, and, although it does not include all forms of
drag (e.g. it excludes parasitic drag), the estimation is sufficient for the
purposes of this concept design.
The zero lift drag coefficient is calculated from:
wing
ndfdwdtuc
d S
SCSCSCrrrC
Re
0 , where
rRe is the airflow correction factor, assumed to be 1.65
ruc is the drag due to undercarriage, taken as 1.0 for fully retractable
undercarriage
rt is the drag due the empennage, taken as 1.24 for conventional
tailplane configurations
(CdS)w is the drag due to the wing
(CdS)f is the drag due to the fuselage
(CdS)n is the drag due to the cowling, or the nose in this instance
The drag due to the wing is calculated from:
wingwwd SrSC 0054.0)( , where

K-7
rw is 1.0 for a cantilever wing, 1.1 for a strut-braced design, and 1.2 for
a biplane with struts and wires
Therefore, drag due to the wing is:
55.108*1*0054.0)( wd SC
(CdS)w is 0.586
The drag due to the fuselage is calculated from:
)(0031.0)( fusefuseffd hbLrSC , where
rf is 1.0 for a circular fuselage cross-section, 1.15 for a semi-circular or
semi-rectangular fuselage cross-section, and 1.3 for a rectangular
fuselage cross-section
Therefore, drag due to the fuselage is:
)5.22(*22*15.1*0031.0)( fd SC
(CdS)f is 0.353
The drag due to the nose is calculated from:
nhbSC nosenosend 015.0)( , where
n is the number of engines
Therefore, drag due to the nose is:
2*5.2*2*015.0)( nd SC
(CdS)n is 0.15
The zero lift drag coefficient is therefore calculated as:
55.108
15.0353.0586.0*24.1*1*65.10
dC

K-8
Cd0 is 0.02
This value will be used to help calculate amongst others the maximum- and
cruising speeds, at sea level and cruising altitude.
K.1.1.5. Maximum and Cruising Speeds
This sub-section determines the following speeds:
VmaxSea100, the maximum speed at sea level, at 100% engine power
VmaxAlt100, the maximum speed at cruising altitude, at 100% engine
power
VcruiseSea85, the cruise speed at sea level, at 85% engine power
VcruiseAlt85, the cruise speed at cruising altitude, at 85% engine power
As for the stall speed, maximum and cruise speeds will be calculated at sea
level and cruising altitude.
Both maximum and cruise speeds are calculated using the following equation:
wingd
p
SC
fPV
0
2
, where
ηp is the overall propulsive efficiency
P is the engine power (thrust in Newton, for this design)
f is the fraction of power selected – 1 (100% engine power) for
maximum speeds; 0.85 (85% engine power) for cruise speeds
Propulsive efficiency of turbine engines increases as altitude increases. The
reference work “Synthesis of Subsonic Airplane Design” by Egbert Torenbeek,
p 114, contains a graph indicating the propulsive efficiency for various types of
turbine engines at various Mach numbers. This indicates that at around Mach
0.8, which is the cruise speed at cruising altitude for the equivalent G550, the
efficiency for a bypass turbofan is around 60%, while at Mach 0.3 (near stall

K-9
speed at sea level) the efficiency is around 35%. Therefore, the following
propulsive efficiencies are adopted for this concept design:
ηpSea is 0.35
ηpAlt is 0.6
The engine of choice, the BMW/Rolls-Royce BR710, delivers a maximum if
14,750 lbf of thrust at sea level. This design incorporates two engines,
therefore maximum thrust at sea level is 29,500 lbf (131,220 N). The
reference work “A Preliminary Design Porposal for a maritime Strike Aircraft”,
University of Kansas, p 74, contains a graph indicating variation of engine
thrust at various Mach numbers and altitudes. At cruising altitude of 40,000 ft,
the available engine power is around one quarter of full available engine
power at sea level. For this study, the available engine power at cruising
altitude is estimated at 3,540 lbf per engine, or 7,080 lbf (31,500 N) total.
The maximum speed at sea level is roughly estimated as follows:
55.10802.0225.1
1*131200*35.0*2100max
SeaV
VmaxSea100 is 185.93 m/s (669.39 km/h; 361.43 kn)
This figure is probably a bit optimistic, as the maximum power is delivered at
near-zero speed, at take-off, and the thrust diminishes as speed increases.
But it serves as a starting point, and works toward the most critical speed,
which is the cruise speed at cruising altitude.
The maximum speed at cruising altitude is calculated as follows:
55.10802.0299.0
1*31500*6.0*2100max
AltV
VmaxAlt100 is 241.47 m/s (869.29 km/h; 469.38 kn)
The cruise speed at sea level is roughly estimated as follows:

K-10
55.10802.0225.1
85.0*131200*35.0*285 cruiseSeaV
VcruiseSea85 is 171.42 m/s (617.12 km/h; 333.22 kn)
This figure is also probably optimistic, for the same reasons given above for
the maximum speed at sea level.
The most critical speed figure is the cruise speed at cruising altitude. It is
calculated as follows:
55.10802.0299.0
85.0*31500*6.0*285 cruiseAltV
VcruiseAlt85 is 222.62 m/s (801.44 km/h; 432.75 kn)
This figure is around 7.8% below the target cruise speed of 466.7 kn.
Considering that the propulsive efficiency, power at cruising altitude and drag
coefficient have all been roughly estimated (and mostly conservatively),
additional detail optimisation should see this target reached. A slightly smaller
wing will also result in a speed increase. For the purposes of this concept
design, the calculated figure is acceptably close.
K.1.1.6. Maximum Fuel Weight
The determination of the total fuel load is calculated utilising a method
detailed in Desktop Aeronautics “Aircraft Design: Synthesis and Analysis”,
version 1.2, September 2006. Chapter 11.4 of this tool details the method
used to determine the range at cruise speed, and utilises the fuel load to do
this. Since we know the range we want to attain, as well as the cruise speed,
we can now determine the fuel load required. The final equation used is:
f
i
W
W
D
L
c
VR ln , where
R is the cruise range (7,933.5 nmi)
V is the cruise speed at cruising altitude (222.62 m/s; 432.75 nmi/h)

K-11
c is the Specific Fuel Consumption of the powerplant at cruising altitude
L/D is lift-to-drag ratio
Wi is the estimated weight at the beginning of the cruise segment
Wf is the estimated weight at the end of the cruise segment
The Specific Fuel Consumption for the BMW/Rolls-Royce BR710 is 0.681
lb/lbf.h at cruise altitude (sourced from document “European Commission –
State aid N 195/2007 (Germany), Individual R&D-aid for Rolls-Royce
Deutschland – BR725 project”).
The value for V/c is calculated as:
681.0
75.432
c
V
V/c is 635.5 nmi
The lift-to drag ratio is calculated from:
0
8.0
2
1
Cd
AR
D
L wing
Therefore, the lift-to-drag ratio for this design is:
02.0
8.0*7**5.0
D
L
L/D is 14.84
Wi and Wf are calculated from:
clmaneuvertowi WxWWW 2
1, and
maneuverreserveszfwf xWWWW2
1 , where

K-12
Wtow is the maximum take-off (all-up) weight (45,000 kg)
Wmaneuver is estimated as 0.7% of the take-off weight (315 kg)
Wcl is taken as 1.3% of the take-off weight (from the plot in Section
11.3 of the reference material) (585 kg)
Wzfw is the zero-fuel weight, or weight of the aircraft minus fuel (17,666
kg)
Wreserves is estimated as 8% of the zero fuel weight (1,413 kg)
Using Excel, and through an iterative process, a value of 27,480 kg is
determined for the total fuel required to reach a value for R of 7,933.64 nmi.
This value is virtually equal to (marginally better than) the target value of
7,933.5 nmi. This provides a zero fuel weight of 17,520 kg (WMAU – Wfuel).
For completeness, the values for Wi and Wf are provided as follows:
585315*5.045000 iW
Wi is 44,257.5 kg
315*5.0413,1520,17 fW
Wf is 19,079.1 kg
In addition:
Wi/ Wf is 2.32
Then:
32.2ln*84.14*5.635R
This provides the aforementioned cruise range of 7,933.64 nmi.

K-13
To summarise, a fuel load of 27,480 kg is required to allow the UA to travel a
total of 7,933.64 nmi at a cruise speed of 222.62 m/s (801.44 km/h; 432.75
kn), at a cruising altitude of 40,000 ft.
K.1.1.7. Take-off Distance
The total take-off distance is the summation of the ground run, plus the
horizontal distance required by the aircraft while airborne until it clears a
height of 15.3 m (50 ft). This height is a standard, and is specified to ensure
the ascending aircraft clears obstacles (trees, power lines, etc) at the end of
the runway.
Therefore:
airrunTO SSS , where
STO is the total take-off distance
Srun is the ground run portion
Sair is the distance from lift-off to the 15.3 m clearance
The ground run portion is calculated from:
1
2
)(
)2(
WT
gVS lof
run , where
Vlof is the lift-off speed, calculated as 1.2 x VstallSea
W is the maximum take-off (all-up) weight (45,000 kg)
T is the take-off thrust at sea level
μ1 is the friction factor, calculated from:
max
01 72.0l
d
C
C , where

K-14
μ is 0.02 for concrete runways and 0.05 for short-grass runways. The
UA under consideration for this design study will operate from concrete
runways, hence μ is 0.02. Therefore, μ1 is calculated as:
2
02.072.002.01
μ1 is 0.027
Therefore, the ground run portion is calculated as:
027.0)45000/)81.9/131220((
)81.9*2/()62.57*2.1( 2
runS
Srun is 910 m (rounded)
The airborne portion is calculated from:
lof
tolofair v
h
g
VS
2
2
, where
hto is the height to clear, i.e. 15.3 m
vlof is calculated from:
Winglof ARW
Tv
3.09.0 , therefore
7
3.0
45000
)81.9/131220(*9.0lofv
vlof is 0.225
Therefore, the airborne portion is calculated as:
225.0
3.15
)81.9*2(
)62.57*2.1( 2
airS
Sair is 320 m (rounded)

K-15
The total take-off distance, STO, is therefore calculated as:
320910 TOS
STO is 1,230 m
K.1.1.8. Landing Distance
As for the take-of run, the total landing distance is the summation of the
horizontal distance covered by the aircraft from a height of 15.3 m (50 ft) until
touchdown, plus the ground run.
Therefore:
runairLAND SSS , where
SLAND is the total landing distance
Sair is the distance from 15.3 m to touchdown
Srun is the ground run portion to standstill
The airborne portion is calculated from:
landtda
air hg
VVS
21.0
122
, where
Va is the approach speed, estimated as 1.3 x VstallSea
Vtd is the touchdown speed, calculated as:
29.0 atd VV , therefore
2)62.57*3.1(*9.0tdV
Vtd is 71.06 m/s
hland is the 15.3 m height to clear
Therefore, the airborne portion is calculated as:

K-16
3.15
81.9*2
06.71)62.57*3.1(*
1.0
1 22
airS
Sair is 440 m (rounded)
The ground run portion is calculated from:
a
VS td
run
2
2
, where
a is 9,81 x fr
fr is the retardation factor, estimated as 0.2 for aircraft without brakes,
and 0.3 for an aircraft equipped with brakes
Therefore, the ground run is calculated as:
3.0*81.9*2
06.71 2
runS
Srun is 860 m (rounded)
The total landing distance, SLAND, is therefore calculated as:
860440 LANDS
SLAND is 1,300 m
K.1.2. Aerodynamic Characteristics and Sizing
The second calculation set focuses on determining the aerodynamic
characteristics and associated design for the UA.
K.1.2.1 Horizontal Tail Surfaces
The tail surfaces are primarily used to provide longitudinal stability, directional
stability and yawing and pitching control. The method employed for the
calculation of the tail surface aerodynamic characteristics and sizes uses the
statistically-determined “tail-volume coefficient”.

K-17
The tail-volume coefficient is calculated from:
cS
ISV tt
t
, where
Vt is the horizontal tail volume coefficient. This value has been
determined statistically to be 0.35 to 0.4 for an aircraft with an un-
flapped main wing, and 0.45 to 0.55 for an aircraft with a flapped main
wing. This UA will have a flapped main wing, thus Vt lies between 0.45
and 0.55; 0.55 for STOL configurations, 0.45 for high-speed racing
applications. We select Vt as 0.5 for this application as a first iteration.
St is the area of the horizontal tail
It is the distance between the UA centre of gravity and the quarter
chord position on the horizontal tail surface
S is the main wing area
c is the mean aerodynamic chord of the main wing
For the calculation of It, the position of the centre of gravity is required. Since
this position is as yet unknown, it is estimated to be at the quarter-chord
position of the main wing. The position of the main wing, where it attaches to
the fuselage, is chosen to be similar to the position of the Gulfstream G550. In
this configuration, the quarter chord position, and thus the centre of gravity,
lies 10.4 m from the front of the UA.
Many of the dimensions used henceforth are estimated (chosen), or are
graphically determined (measured).
The average chord of the main wing was previously calculated as 3.94 m,
using the wing area and wing span. This value is better expressed as the
mean aerodynamic chord, or MAC, and is calculated from:
tr
trtr cc
ccccMAC
3
2, where

K-18
cr is the wing root chord, and is 5.5 m for the main wing
ct is the wing tip chord, and is 2.38 m for the main wing
Therefore, the MAC for the main wing is calculated as:
38.25.5
38.2*5.538.25.5*
3
2MACC
CMAC is 4.14 m
The value for It is determined graphically as 8.8 m. It is measured from the
estimated centre of gravity, to the quarter-chord position of the horizontal tail
surface.
The area of the horizontal tail surface is calculated by rearranging the tail-
volume coefficient formula into:
t
MACtt I
CSVS
Therefore, the area of the horizontal tail is calculated as:
8.8
14.4*55.108*5.0tS
St is 25.56 m2
The span of the horizontal tail is determined from:
ttt SARb , where
Art is the horizontal tail aspect ratio. Statistically determined, the
horizontal tail aspect ratio is 50 to 70% of the main wing. Using a value
of 60%, ARt is 4.2.
Therefore, the span of the horizontal tail is calculated as:
56.25*2.4tb

K-19
bt is 10.36 m
The average chord of the horizontal tail is calculated from:
t
taHor b
Sc
Therefore, the average chord of the horizontal tail is calculated as:
36.10
56.25aHorc
caHor is 2.47 m
The root chord crHor for the horizontal tail is chosen as 3.2 m. The tip chord
ctHor is calculated from:
rHoraHortHor ccc )2(
Therefore, the tip chord of the horizontal tail is calculated as:
2.3)2*47.2( tHorc
ctHor is 1.73 m
The average elevator chord for the horizontal tail is estimated at 40% of the
average chord for the horizontal tail. Therefore:
caElev is 0.99 m
For the purposes of this concept design, trim tabs will not be calculated.
K.1.2.2 Vertical Tail Surface
For the purposes of this concept design, a conventional single vertical tail is
adopted. The tail-volume coefficient method is also used to determine the
aerodynamic characteristics of the vertical tail fin.
The area of the vertical tail fin surface is calculated by rearranging the tail-
volume coefficient formula into:

K-20
f
wingwingff I
bSVS
, where
Vf is the vertical tail fin volume coefficient. This value has been
determined statistically to be 0.035 to 0.04; 0.035 for longer tail
sections, up to 0,04 for short tail sections, pusher- and multi-engine
wing-mounted arrangements. We select Vf as 0.035 for this application
as a first iteration.
bwing is the main wing span, calculated as 27.57 m
If is the distance between the UA centre of gravity and the quarter
chord position on the vertical tail surface
The value for If is determined graphically as 8.9 m. It is measured from the
estimated centre of gravity, to the quarter-chord position of the vertical tail fin
surface.
Therefore, the area of the vertical tail fin is calculated as:
9.8
57.27*55.108*035.0fS
Sf is 11.77 m2
The height of the vertical tail fin is determined from:
fff SARh , where
ARf is the vertical tail fin aspect ratio. Statistically determined, most
vertical tail fin aspect ratios are between 1 and 1.8, with small aspect
ratios producing short, and larger aspects rations producing taller fins.
For the purposes of this concept design an ARt is chosen as 1.4.
Therefore, the height of the vertical tail fin is calculated as:
77.11*4.1fh

K-21
hf is 4.06 m
This is the height above the fuselage.
The average chord of the vertical tail fin is calculated from:
f
faFin b
Sc
Therefore, the average chord of the horizontal tail is calculated as:
06.4
77.11aFinc
caFin is 2.9 m
The root chord crFin for the vertical tail fin is chosen as 4.1 m. The tip chord
ctFin is calculated from:
rFinaFintFin ccc )2(
Therefore, the tip chord of the horizontal tail is calculated as:
1.4)2*9.2( tHorc
ctFin is 1.7 m
The average rudder chord for the vertical tail fin is estimated at 30% of the
average chord for the vertical tail fin. Therefore:
caRud is 0.87 m
K.1.2.3 Flaps
Flaps are used to increase lift and drag during certain crucial stages of flight,
including take-off, landing and low speed flight. Flaps generally increase the
wing area, thereby increasing lift. Flaps are divided into two primary
categories:
Leading Edge flaps

K-22
Trailing Edge flaps
For the purposes of this concept design, Leading Edge flaps will not be
considered.
Trailing Edge flaps are further divided into several types, the most prominent
and widely used being:
Plain flaps
Split flaps
Slotted (single, double, triple) flaps
Fowler flaps
Although relatively complex, Fowler flaps provide the greatest benefit of lift
over drag. Fowler flaps extend rearwards on tracks an only deflect downward
at the very end of travel, thereby reducing drag, while continuously increasing
lift, during extension. The desired lift coefficient for the UA is 2.0, and Table
K.2[110] shows that, without a Leading Edge flap (slat), only a Fowler flap will
provide this for both take-off and landing.
Table K.2: Effective Lift Coefficient Values[110]

K-23
For the purposes of this concept design, a Fowler flap, with a chord 25% of
the main wing chord (as for the ailerons), is chosen. The flaps will run from the
aileron root to the fuselage.

L-1
Appendix L
L. Unmanned Aircraft Design Analysis: Daniel P. Raymer
Appendix L provides the detail analysis for the concept design of the
Unmanned Aircraft, as presented in the book by Daniel P. Raymer entitled
“Aircraft Design – A Conceptual Approach”[110].
L.1. Method 2: Daniel P. Raymer: Aircraft Design – A Conceptual Approach[110]
The second method used to determined the general size, weights and power
requirements for the UA utilised the methods as described in Daniel P.
Raymer’s book “Aircraft Design – A Conceptual Approach” [110]. As for the first
method, where assumptions were made, it has been clearly stated, with
logical deductions.
The actual calculations were performed in Excel. Results are summarized in
Chapter 14.
L.1.1. Mission Profile
As a prelude to the design work, the basic Mission Profile is defined.
Parameters are deduced from the performance requirements, as set out in
Part 1 of this thesis. The Mission Profile is graphically depicted in Figure L.1.

L-2
Figure L.1: Basic Mission Profile
L.1.2. Predefined Performance Figures
In conjunction with the definition of the Mission Profile, the following
performance figures are predefined:
Cruise Altitude: 35,000 ft
Maximum Cruise Speed Vcruise: 467 kn (788.3 ft/s, M 0.81 at 35,000 ft)
Maximum Speed: M 0.9 (estimated)
L.1.3. Historical Data
The Source Material utilised for this design method makes use of Historical
Data for many of the calculations. Method 1 revealed that the UA will be
similar in size and weight to a large Business Jet. As a result, in selection of
Historical Data from the tables and graphs provided, the data for “Jet
Transport”, “Airliner”, “Commercial” or “Large Transport” was used in all but a
few cases. One exception was the selection of Historical Data for “Bomber” in
calculation of the wing aspect ratio, as this data provided a slightly larger
0 1
2
34 5
6
7
89
W/up & T/off
Climb
Cruise: 2800nm
Cruise: 2800nm
Search (loiter): 4h
SAR drop
Reserve (loiter): 1h
Descent
Land

L-3
aspect ratio, which was seen to be potentially beneficial for the long loiter time
required over the Search Location.
L.1.4. Lift-to-Drag Ratio Estimation
The Lift-to-Drag Ratio (L/D) is estimated as follows:
The Aspect Ratio for the wing (ARw) is determined from historical data as
follows (Table 4.1):
cw MaAR max
Values for a and c are chosen from Table 4.1 as follows:
a is 5.57
c is -1.075
Therefore:
075.19.0*57.5 wAR
ARw is 7.0
From Figure 3.5, the Wetted Area Ratio (Swet/Sref) is selected for the Airliner
and interpolated to be 6.3.
From Figure 3.6, the Wetted Aspect Ratio (WAR) is calculated as:
)/( refwet
w
SS
ARWAR
Therefore:
3.6
0.7WAR
WAR is 1.11

L-4
From Figure 3.6, the maximum L/D is read off as 16.5, using the curve for
Civil Jets as a guide.
Therefore:
loiterDLDL // max for jet aircraft (p. 23)
L/Dloiter is 16.5
loitercruise DLDL /866.0/ for jet aircraft (p. 23)
L/Dcruise = 14.3
These L/D values are first-order of estimation, and are used for initial Thrust-
to-Weight Ratio estimations.
L.1.5. Thrust-to-Weight Ratio Estimation
The Thrust-to-Weight Ratio (T/W) is estimated as follows:
Equation 5.2 provides an estimation of the Cruise T/W (T/Wcruise) as follows:
cruisecruise DL
WT/
1/
Therefore:
3.14
1/ cruiseWT
T/Wcruise is 0.070
The T/W at take-off (T/W0) is calculated from Equation 5.3:
cruise
to
to
cruisecruise T
T
W
WWTWT // 0
The ratio between initial cruise weight (Wcruise) and take-off weight (Wt/o) is
estimated to be in the order of 0.956 (p. 82). The ratio between take-off thrust
and cruise thrust for a jet engine varies between different engine models.

L-5
However, an average value of 5.2 has been calculated by comparing nine
different high bypass ratio turbofan engines.
Therefore:
2.5*956.0*070.0/ 0 WT
T/W0 is 0.35
L.1.6. Wing Loading
This sub-section calculates the Wing Loading (W/S) at take-off. The W/S is
used, along with the estimated T/W0 and L/D, to determine the maximum
Take-off Weight, and other key parameters.
Wing Loading is calculated for different portions of flight, typically at Stall,
during landing and take-off, during cruise, loiter, at instantaneous turn,
sustained turn, combat, etc. In consideration of the mission profile and
projected operational requirements for this UA, only the following portions
were considered:
Stall
Take-off
Landing
Cruise
Loiter
All values are compared with Historical Values (Table 5.5). Calculated values
differing far from the Historical Value are ignored – this is particularly true for
those calculated during cruise and loiter (p. 94). The lowest remaining
calculated value is then chosen as the benchmark. The Wing Loading chosen
for the design should always be ≤ the smallest calculated value (p. 100),
barring those far from the Historical Value.

L-6
L.1.6.1. Wing Loading: Historical Value
From Table 5.5, the Historical Value for W/Sto is 120 lb/ft2.
L.1.6.2. Wing Loading: Stall
The wing loading at stall speed is calculated from Equation 5.6 as follows:
max25.0/ Lstallstall CVSW , where:
Vstall is the stall speed in ft/s;
CLmax is the Maximum Lift Coefficient
For take-off conditions (stall can take place during take-off) the air density is
taken at sea-level conditions. Therefore:
ρsea is 1.225 kg/m3, or 0.00238 slugs/ft3
The stall speed is calculated as a factor of the approach speed (p. 85). The
approach speed (Vappr) is estimated to be 299 ft/s. The stall speed is
estimated as follows:
3.1appr
stall
VV
Therefore:
3.1
299stallV
Vstall is 230 ft/s
The Maximum Lift Coefficient (CLmax) is estimated from Figure 5.3 as 2, using
a value of 27 degrees for the Quarter Chord Angle (initial estimate).
Therefore:
2*230*00238.0*5.0/ 2stallSW

L-7
W/Sstall at take-of conditions is 125.9 lb/ft2
L.1.6.3. Wing Loading: Take-off
The wing loading at take-off is calculated from Equation 5.9 as follows:
0// WTCTOPSW Ltoto , where:
TOP is the Take-Off Parameter
CLto is the Take-Off Lift Coefficient
Figure 5.4 is used to determine the Take-off Parameter (TOP). The take-off
distance is required for this, and is estimated as slightly less than the landing
distance. The landing distance is estimated as follows (p. 90):
2)(3.0 knotsVS apprlanding
Vappr is 299 ft/s = 177.307 kn
Therefore:
2307.177*3.0landingS
Slanding is 9431.33 ft
Therefore, Sto is estimated at 9000ft
Thus, from Figure 5.4, for a 2-engined aircraft and balanced field length
conditions, the TOP is estimated at 220.
The density ratio (σ) at sea level is 1.
The Take-off Lift Coefficient (CLto) is calculated as follows (p. 89):
21.1maxL
Lto
CC
Therefore:

L-8
21.1
2LtoC
CLto is 1.653
Therefore:
35.0*653.1*1*220/ toSW
W/Sto is 126.82 lb/ft2
L.1.6.4. Wing Loading: Landing
The wing loading at landing is calculated from Equation 5.11 (and reference
on p. 91) as follows:
aL
landinglanding SC
SWSmax
1/8067.1
, where:
Sa is the obstacle clearing distance in ft
Re-arranging equation 5.11, the Wing Loading is calculated as:
max6.080
1/ Lalandinglanding CSSSW
Sa is 1000 ft for an Airliner descending with a 3 degree glide slope (p. 91).
Therefore:
2*1*100033.9431*6.0*80
1/
landingSW
W/Slanding is 116.47 lb/ft2
Converting to take-off conditions (p. 91):
85.0
// landing
to
SWSW
W/Slanding at take-off conditions is 137.024 lb/ft2

L-9
L.1.6.5. Wing Loading: Cruise
The wing loading at cruise is calculated from Equation 5.14 as follows:
3/ 0Dw
cruise
CeARqSW
, where:
q is the Dynamic Pressure (0.5ρV2) at cruise conditions (Equation
12.3);
e is the Oswald Efficiency Factor, estimated to 0.8 for non-fighter-type
aircraft for Initial Sizing (p. 92);
CD0 is the Zero-lift Drag Coefficient, and is estimated as 0.015 for Initial
Sizing (p. 92)
The air density (ρ) at cruise altitude (35,000 ft) is 0.0007382 slugs/ft3.
Therefore:
3
015.0*8.0*0.7*3.788*0007382.0*5.0/ 2
cruiseSW
W/Scruise is 67.955 lb/ft2
Converting to take-off conditions (p. 94):
85.0
// cruise
to
SWSW
W/Scruise at take-off conditions is 79.947 lb/ft2
This value is far lower than the Historical Value (120 lb/ft2) and is therefore
IGNORED for final selection of W/S.
L.1.6.6. Wing Loading: Loiter
The wing loading at loiter is calculated from Equation 5.15 as follows:
0/ Dwloiter CeARqSW , where:

L-10
q is the Dynamic Pressure (0.5ρV2) at loiter conditions (Equation 12.3).
The loiter speed (Vloiter) is estimated at 200 kn, or 337 ft/s (p. 94).
Therefore:
015.0*8.0*0.7*337*0007382.0*5.0/ 2 loiterSW
W/Sloiter is 21.51 lb/ft2
Converting to take-off conditions (p. 94):
85.0
// loiter
to
SWSW
W/Sloiter at take-off conditions is 25.307 lb/ft2
This value is far lower than the Historical Value (120 lb/ft2) and is therefore
IGNORED for final selection of W/S.
L.1.6.7. Wing Loading: Selection
From the above calculations, four values for W/Sto are presented for final
selection:
Historical: 120 lb/ft2
Stall: 125.9 lb/ft2
Take-off: 126.82 lb/ft2
Landing: 137.024 lb/ft2
The lowest value from the four values calculated and listed above is 125.9
lb/ft2. Therefore, W/Sto should be selected to be ≤ 125.9 (p. 100).
W/Sto is selected to be 120 lb/ft2

L-11
L.1.7. Take-off Weight
The estimation of maximum take-off weight follows an iterative process,
utilising one of two methods. The first method makes use of the following
equations (Equation 6.1 and Table 6.1):
000 //1 WWWW
WWW
ef
payloadcrew
, and
VSCC
toCC
wC
e KMSWWTARWbaWW 5max
430
2100 ///
The second method makes use of the following equations (Equation 6.4 and
Table 6.1):
0
__0 /1 WW
WWWWW
e
fuelpayloaddroppedpayloadfixedcrew
, and
VSCC
toCC
wC
e KMSWWTARWbaWW 5max
430
2100 ///
The first method assumes no dropped payloads, and the fuel weight is
expressed as a fraction of the take-off weight –
00 /1/ WWWW xf , where:
x is the number of “segments” defined for the entire Mission Profile (9
for this design)
The second method takes into account the weight of dropped payloads, and
calculates the fuel weight directly.
The second method is preferable if dropped payloads are to be accounted for,
and leads to more accurate results. For this design, both methods gave the
same result. The second method will be described in this text, although both
were employed and the first method process is accessible in the Excel
spreadsheet.

L-12
L.1.7.1. Basic Process
The basic iterative process followed was as follows.
Two main Equations were utilised in the iteration to determine take-off weight
(W0). An initial value for W0 is guessed, say “GUESS1”. This value is inserted
into the following equation to determine the Empty Weight Fraction (We/W0)
(Table 6.1):
VSCC
toCC
wC
e KMSWWTARWbaWW 5max
430
2100 /// , where:
a is 0.32 for a Jet Transport
b is 0.66 for a Jet Transport
C1 is -0.13 for a Jet Transport
C2 is 0.3 for a Jet Transport
C3 is 0.06 for a Jet Transport
C4 is -0.05 for a Jet Transport
C5 is 0.05 for a Jet Transport
KVS is 1 for a non-variable-sweep wing aircraft
ARw is 7.0, as previously determined
T/W0 is 0.35, as previously determined
W/Sto is 120 lb/ft2, as previously determined
Mmax is 0.9, as previously selected
W0 is “GUESS1”
The Empty Weight Fraction (We/W0) as calculated is inserted into the
following equation, along with the other weights, to determine W0_calc
(Equation 6.4):

L-13
0
___0 /1 WW
WWWWW
e
fuelpayloaddroppedpayloadfixedcrewcalc
W0 “calculated” is compared with W0 “GUESS1”. The value “GUESS1” for W0
is changed to another value (“GUESS2”), a new value for We/W0 is calculated,
and a new value for W0 is calculated using Equation 6.4. This process is
repeated until W0 “GUESSX” = W0 “calculated”, which then yields the final
value for take-off weight, W0.
L.1.7.2. Weights
The values for the weights in Equation 6.4 are determined as follows:
Wcrew is 0 lb, as this is an unmanned vehicle
Wfixed_payload is estimated at 3,500 lb (FLIR sensor, Maritime Search
Radar components, SAR Direction Finder, general avionics, radios,
SATCOM and Line-of-Sight antenna equipment)
Wdropped_payload is estimated at 2,900 lb (8x Marine Location Markers, 6x
Aid Life Supply Canisters)
Wfuel is calculated directly by using the initial guessed value for W0
(“GUESS1”). Wfuel is calculated by firstly determining the Mission
Segment Weight Fractions, i.e. the weight of the aircraft at the end of
each Mission Segment vs the weight at the start of each Mission
Segment (Wx/Wx-1 for each of x Mission Segments – 9 for this design).
The fuel burned (weight lost) per Mission Segment is then calculated
as 1-Wx/Wx-1 for each Segment. The actual fuel weight (lb) per
Segment is then determined using the initial value for take-off weight
(W0) “GUESS1” at the start of Segment 1, re-calculating the weight for
Section 2, determining the fuel weight for Section 2, and so on, until all
Segments (9) have been covered. The total fuel burned for the entire
Mission Profile is then the sum of the fuel burned during each of the
Segments. This value is multiplied by 1.06 to account for reserves, and
is used as the value for Wfuel in equation 6.4. The entire process is

L-14
repeated for each guess of W0 “GUESS” – Excel makes the process
easier.
L.1.7.3. W0 Determination: W0 Guess
Using an iterative process in Excel, many values for W0 Guess were selected
until W0 Guess equalled W0 Calculated. To help illustrate the process, the
final value for W0 will be used.
Therefore, for the purposes of this description:
W0 GUESS is 142,639 lb
L.1.7.4. W0 Determination: Mission Segment Weight Fractions
The Mission Profile for this design designates 9 distinct Mission Segments
(MS):
MS0-1: Warm-up and Take-off
MS1-2: Climb
MS2-3: Cruise
MS3-4: Search (loiter)
MS4-5: SAR drop
MS5-6: Cruise
MS6-7: Reserve (loiter)
MS7-8: Descent
MS8-9: Land
During each MS weight-loss is due to fuel being burned, except for MS4-5,
where weight-loss is due to SAR equipment being dropped to survivors. The
weight difference per MS is expressed as a fraction of the total weight at the
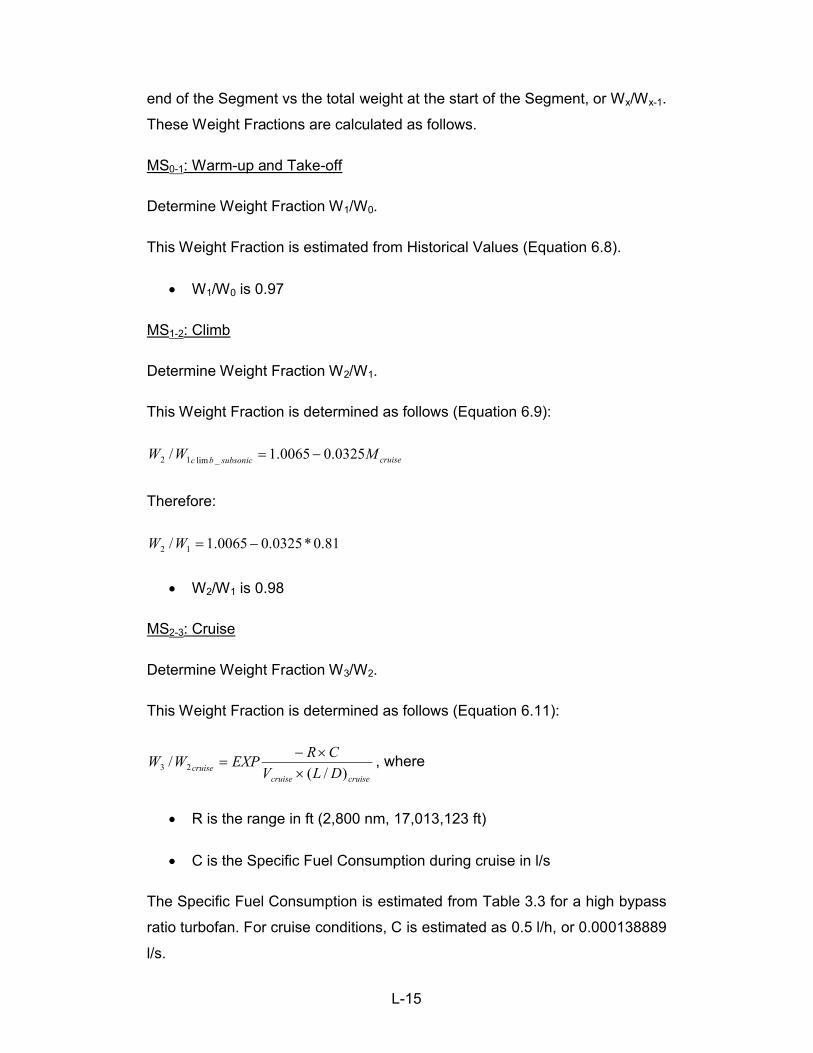
L-15
end of the Segment vs the total weight at the start of the Segment, or Wx/Wx-1.
These Weight Fractions are calculated as follows.
MS0-1: Warm-up and Take-off
Determine Weight Fraction W1/W0.
This Weight Fraction is estimated from Historical Values (Equation 6.8).
W1/W0 is 0.97
MS1-2: Climb
Determine Weight Fraction W2/W1.
This Weight Fraction is determined as follows (Equation 6.9):
cruisesubsonicbc MWW 0325.00065.1/ _lim12
Therefore:
81.0*0325.00065.1/ 12 WW
W2/W1 is 0.98
MS2-3: Cruise
Determine Weight Fraction W3/W2.
This Weight Fraction is determined as follows (Equation 6.11):
cruisecruisecruise DLV
CREXPWW
)/(/ 23
, where
R is the range in ft (2,800 nm, 17,013,123 ft)
C is the Specific Fuel Consumption during cruise in l/s
The Specific Fuel Consumption is estimated from Table 3.3 for a high bypass
ratio turbofan. For cruise conditions, C is estimated as 0.5 l/h, or 0.000138889
l/s.

L-16
A more accurate value for L/Dcruise can now be calculated, now that the take-
off Wing Loading (W/Sto) is known. The W/Sto, however, needs to be
converted to the equivalent W/S for cruise first, since the Wing Loading
decreases as fuel is burned and total weight decreases (p. 106, p. 610, p.
611).
1/// xxtocruise WWSWSW
Therefore:
98.0*97.0*120/ cruiseSW
W/Scruise is 114.09 lb/ft2
L/Dcruise is determined as follows (Equation 6.13):
eARqSW
SW
CqDL
wcruise
cruise
D
cruise
1
//
1/
0
, where
q is the Dynamic Pressure at cruise conditions
CD0 is 0.015, as previously estimated
e is 0.8, as previously estimated
W/Scruise is 114.09 lb/ft2
ARw is 7.0, as previously estimated
Therefore:
8.0*0.7**3.788*0007382.0*5.0
1*09.114
09.114
015.0*3.788*0007382.0*5.0
1/
2
2
cruiseDL
L/Dcruise is 17.1
Therefore:

L-17
1.173.788
000138889.017013123/ 23
EXPWW
W3/W2 is 0.84
MS3-4: Search (loiter)
Determine Weight Fraction W4/W3.
This Weight Fraction is determined as follows (Equation 6.14):
loitersearchloitersearch DL
CEEXPWW
__34 )/(
/
, where
E is the search loiter time in seconds (4 h, 14,400 s)
More accurate values for Vsearch_loiter and L/Dsearch_loiter can also be calculated,
using the W/Ssearch_loiter. W/Ssearch_loiter is determined as follows (p. 106, p. 610,
p. 611):
1_ /// xxtoloitersearch WWSWSW
Therefore:
84.0*98.0*97.0*120/ _ loitersearchSW
W/Ssearch_loiter is 95.74 lb/ft2
Vsearch_loiter is determined as follows (Equation 17.13, Equation 12.48, p. 613):
0__ /
2
Dloitersearchloitersearch C
KSWV
, where
K is eARw
1
Therefore:

L-18
015.0*8.0*0.7*
1*74.95*
0007382.0
2_
loitersearchV
Vsearch_loiter is 710.98 ft/s
This value is only slightly less than the cruise velocity of 788.3 ft/s. For this
reason the value for Specific Fuel Consumption during this portion of loiter will
be kept the same as for cruise, i.e. 0.5 l/h (0.000138889 l/s).
L/Dsearch_loiter is determined as follows (Equation 6.13):
eARqSW
SW
CqDL
wloitersearch
loitersearch
D
loitersearch
1
//
1/
__
0
_ , where
q is the Dynamic Pressure at search loiter conditions
CD0 is 0.015, as previously estimated
e is 0.8, as previously estimated
W/Ssearch_loiter is 95.74 lb/ft2
ARw is 7.0, as previously estimated
Vsearch_loiter is 710.98 ft/s
Therefore:
8.0*0.7**98.710*0007382.0*5.0
1*74.95
74.95
015.0*98.710*0007382.0*5.0
1/
2
2_
loitersearchDL
L/Dsearch_loiter is 17.1
Therefore:
1.17
000138889.014400/ 34
EXPWW

L-19
W4/W3 is 0.89
MS4-5: SAR drop
Determine Weight Fraction W5/W4.
It is assumed that the weight drop due to the release of the SAR equipment is
instantaneous and that no weight loss due to fuel burn takes place. For his
reason, the effect of W5/W4 can be IGNORED (p. 612).
MS5-6: Cruise
Determine Weight Fraction W6/W5.
Due to similarity, W6/W5 ≈ W3/W2.
W6/W5 is 0.84
MS6-7: Reserve (loiter)
Determine Weight Fraction W7/W6.
This Weight Fraction is determined as follows (Equation 6.14):
loiterresloiterres DL
CEEXPWW
__67 )/(
/
, where
E is the reserve loiter time in seconds (1 h, 3,600 s)
More accurate values for Vres_loiter and L/Dres_loiter can also be calculated, using
the W/Sres_loiter. W/Sres_loiter is determined as follows (p. 106, p. 610, p. 611):
1_ /// xxtoloiterres WWSWSW
Therefore:
84.0*89.0*84.0*98.0*97.0*120/ _ loiterresSW
W/Sres_loiter is 71.48 lb/ft2

L-20
Vres_loiter is determined as follows (Equation 17.13, Equation 12.48, p. 613):
0__ /
2
Dloiterresloiterres C
KSWV
, where
K is eARw
1
ρ is at sea level
Therefore:
015.0*8.0*0.7*
1*48.71*
00238.0
2_
loiterresV
Vres_loiter is 342.13 ft/s
This value is far less than the cruise velocity of 788.3 ft/s. For this reason the
value for Specific Fuel Consumption (Table 3.3) during this portion of loiter will
taken as 0.4 l/h (0.000111111 l/s).
L/Dres_loiter is determined as follows (Equation 6.13):
eARqSW
SW
CqDL
wloiterres
loiterres
D
loiterres
1
//
1/
__
0
_ , where
q is the Dynamic Pressure at reserve loiter conditions
CD0 is 0.015, as previously estimated
e is 0.8, as previously estimated
W/Sres_loiter is 71.48 lb/ft2
ARw is 7.0, as previously estimated
Vsearch_loiter is 342.13 ft/s
Therefore:

L-21
8.0*0.7**13.342*00238.0*5.0
1*48.71
48.71
015.0*13.342*00238.0*5.0
1/
2
2_
loiterresDL
L/Dres_loiter is 17.1
Therefore:
1.17
000111111.03600/ 67
EXPWW
W7/W6 is 0.98
MS7-8: Descent
Determine Weight Fraction W8/W7.
This Weight Fraction is estimated from Historical Values (Equation 6.22).
W8/W7 is 0.993
MS8-9: Land
Determine Weight Fraction W9/W8.
This Weight Fraction is estimated from Historical Values (Equation 6.23, p.
16).
W9/W8 is 0.997
To summarise the Mission Segment Weight Fractions:
W1/W0 is 0.97
W2/W1 is 0.98
W3/W2 is 0.84
W4/W3 is 0.89
W5/W4 IGNORE

L-22
W6/W5 is 0.84
W7/W6 is 0.98
W8/W7 is 0.993
W9/W8 is 0.997
L.1.7.5. W0 Determination: Fuel Weight per Mission Segment
MS0-1: Warm-up and Take-off
Mission Segment Weight Fraction
W1/W0 is 0.97
Fuel Burned Weight Fraction
1- W1/W0 is 0.03
Segment Start Weight (W0)
W0 is W0 “GUESS”, and is guessed at 142,639 lb
Fuel Burned Weight MS0-1
03.0010
WW f
03.0*14269310
fW
Wf0-1 is 4,279.17 lb
Segment End Weight (W1)
1001 fWWW
W1 is 138,359.83 lb
MS1-2: Climb
Mission Segment Weight Fraction

L-23
W2/W1 is 0.98
Fuel Burned Weight Fraction
1- W2/W1 is 0.02
Segment Start Weight (W1)
W1 is 138,359.83 lb
Fuel Burned Weight MS1-2
02.0121
WW f
02.0*83.13835921
fW
Wf1-2 is 2,743.38 lb
Segment End Weight (W2)
2112 fWWW
W2 is 135,616.45 lb
MS2-3: Cruise
Mission Segment Weight Fraction
W3/W2 is 0.84
Fuel Burned Weight Fraction
1- W3/W2 is 0.16
Segment Start Weight (W2)
W2 is 135,616.45 lb
Fuel Burned Weight MS2-3

L-24
16.0232
WW f
16.0*45.13561632
fW
Wf2-3 is 21,808.94 lb
Segment End Weight (W3)
3223 fWWW
W3 is 113,807.52 lb
MS3-4: Search (loiter)
Mission Segment Weight Fraction
W4/W3 is 0.89
Fuel Burned Weight Fraction
1- W4/W3 is 0.11
Segment Start Weight (W3)
W3 is 113,807.52 lb
Fuel Burned Weight MS3-4
11.0343
WW f
11.0*52.11380743
fW
Wf3-4 is 12,558.08 lb
Segment End Weight (W4)
4334 fWWW
W4 is 101,249.44 lb

L-25
MS4-5: SAR drop
As no fuel is used during this Mission Segment, Wf4-5 is IGNORED. The
weight of the SAR stores dropped is also negligible compared to the weight of
fuel burned, so is also ignored for the ensuing calculations.
MS5-6: Cruise
Mission Segment Weight Fraction
W6/W5 is 0.84
Fuel Burned Weight Fraction
1- W6/W5 is 0.16
Segment Start Weight (W5)
W5 is equal to W4, which is 101,249.44 lb
Fuel Burned Weight MS5-6
16.0565
WW f
16.0*44.10124965
fW
Wf5-6 is 16,282.26 lb
Segment End Weight (W6)
6556 fWWW
W6 is 84,967.18 lb
MS6-7: Reserve (loiter)
Mission Segment Weight Fraction
W7/W6 is 0.98

L-26
Fuel Burned Weight Fraction
1- W7/W6 is 0.02
Segment Start Weight (W6)
W6 is 84,967.18 lb
Fuel Burned Weight MS6-7
02.0676
WW f
02.0*18.8496776
fW
Wf6-7 is 1,963.85 lb
Segment End Weight (W7)
7667 fWWW
W7 is 83,003.33 lb
MS7-8: Descent
Mission Segment Weight Fraction
W8/W7 is 0.993
Fuel Burned Weight Fraction
1- W8/W7 is 0.007
Segment Start Weight (W7)
W7 is 83,003.33 lb
Fuel Burned Weight MS7-8
007.0787
WW f

L-27
007.0*33.8300387
fW
Wf7-8 is 581.02 lb
Segment End Weight (W8)
8778 fWWW
W8 is 82,422.31 lb
MS8-9: Land
Mission Segment Weight Fraction
W9/W8 is 0.997
Fuel Burned Weight Fraction
1- W9/W8 is 0.003
Segment Start Weight (W8)
W8 is 82,422.31 lb
Fuel Burned Weight MS8-9
003.0898
WW f
003.0*31.8242298
fW
Wf8-9 is 247.27 lb
Segment End Weight (W9)
9889 fWWW
W9 is 82,175.04 lb
To summarise the Fuel Weights per Mission Segment (for W0 “GUESS” =
177,826.33 lb):

L-28
Wf0-1 is 4,279.17 lb
Wf1-2 is 2,743.38 lb
Wf2-3 is 21,808.94 lb
Wf3-4 is 12,558.08 lb
Wf4-5 is IGNORED
Wf5-6 is 16,282.26 lb
Wf6-7 is 1,963.85 lb
Wf7-8 is 581.02 lb
Wf8-9 is 247.27 lb
L.1.7.6. W0 Determination: Total Fuel Weight
The total fuel weight is the sum of the fuel weights per Mission Segment, plus
a small amount for reserves and “unusable fuel”.
Therefore (Equation 6.6):
9
1xxfmissionf WW
Or, for this design:
988776655443322110 fffffffffmissionf WWWWWWWWWW
Therefore, for W0 “GUESS” = 142,639 lb:
27.24702.58185.196326.16282008.1255894.2180838.274317.4279 missionfW
Wfmission (all MS) is 60,463.96 lb

L-29
To account for unusable fuel in the tanks, a 6% “reserve factor” is applied to
the total (Equation 6.7). Therefore, the total fuel weight for all MS (for W0
“GUESS” = 142,639 lb) is:
missionff WW 06.1
Wf is 64,091.79 lb
L.1.7.7. W0 Determination: Empty Weight Fraction
As mentioned in sub-section M.1.7.1., the Empty Weight Fraction (We/W0) is
calculated according to the following Equation from Table 6.1:
VSCC
toCC
wC
e KMSWWTARWbaWW 5max
430
2100 /// , where:
a is 0.32 for a Jet Transport
b is 0.66 for a Jet Transport
C1 is -0.13 for a Jet Transport
C2 is 0.3 for a Jet Transport
C3 is 0.06 for a Jet Transport
C4 is -0.05 for a Jet Transport
C5 is 0.05 for a Jet Transport
KVS is 1 for a non-variable-sweep wing aircraft
ARw is 7.0, as previously determined
T/W0 is 0.35, as previously determined
W/Sto is 120 lb/ft2, as previously determined
Mmax is 0.9, as previously selected

L-30
W0 is W0 “GUESS”, and is 142,639 lb
Therefore:
1*9.0*120*35.0*0.7*142639*66.032.0/ 05.005.006.03.013.00
WWe
We/W0 is 0.505803
L.1.7.8. W0 Determination: Take-off Weight Calculation
As described under sub-section M.1.7.1., the take-off weight (W0_calc) is now
calculated using Equation 6.4:
0
___0 /1 WW
WWWWW
e
fuelpayloaddroppedpayloadfixedcrewcalc
Therefore, for W0 “GUESS” = 142,639 lb:
505803.01
79.64091290035000_0
calcW
W0_calc is 142,639.001 lb
This value is then compared with W0 GUESS. New values for W0 GUESS are
chosen, until W0_calc = W0 GUESS. When this situation has been reached, W0
has been determined.
For the purposes of this concept design, W0 is 142,639.001 lb
L.1.7.9. W0 Determination: Weight Summary
This concept design therefore yields the following key weights:
Take-off Weight (W0): 142,639.001 lb
Fuel Weight (Wf): 64,091.79 lb
Zero Fuel Weight (Wzfw): 78,547.21 lb
Empty Weight (We) (W0 less all payloads): 72,147.21

L-31
L.1.8. Geometry
The following sub-sections determine the approximate geometry for the
concept design, as per the methods described in Daniel P. Raymer’s source
material. Geometries determined include:
Fuselage
Wing
Tail
o Horizontal
o Vertical
L.1.8.1. Geometry: Fuselage
The fuselage geometry is determined from Historical Data for Initial Sizing as
follows (Table 6.3):
clength WaF 0 , where
a is 0.67 for a Jet Transport
c is 0.43 for a Jet Transport
Therefore:
43.0001.142639*67.0lengthF
Flength is 110.25 ft
As mentioned in Appendix K, determination of fuselage diameters for
unmanned aircraft differs from manned aircraft primarily in the sense that
manned aircraft require larger diameters to accommodate passengers. Suffice
to say, unmanned aircraft tend to have smaller diameter fuselages. However,
since fuselage diameter is not required as input to any further calculations
using this method, it will not be calculated for this concept.

L-32
L.1.8.2. Geometry: Wing
The Reference Area for the wing (Sw) is calculated from the following
Equation (Figure 4.15 and p. 84):
)/(0
tow SW
WS
Therefore:
120
001.142639wS
Sw is 1188.66 ft2
The Wing Span (bw) is calculated from (Equation 7.5):
www SARb
Therefore:
66.1188*0.7wb
bw is 91.12 ft
The Taper Ratio for the wing (λw) is determined from historical data to lie
between 0.2 and 0.3 for a swept wing. For the purposes of this design, λw is
selected to be 0.23.
The Root Chord for the wing (cw_root) is calculated from (Equation 7.6):
ww
wrootw b
Sc
1
2_
Therefore:
23.01*12.91
66.1188*2_
rootwc
cw_root is 21.21 ft

L-33
The Tip Chord for the wing (cw_tip) is calculated from (Equation 7.7):
rootwwtipw cc __
Therefore:
21.21*23.0_ tipwc
cw_tip is 4.88 ft
The Wing Leading Edge Sweep angle (Λw_LE) is determined from Historical
Data (Figure 4.19). From this figure, for a maximum Mach number of 0.9,
Λw_LE is determined to be ~ 30o.
The Wing Quarter Chord Sweep angle (Λw_C/4) is calculated from (Figure
4.16):
ww
wLEwCw AR
1
1tanarctan _4/_
Therefore:
23.01*0.7
23.0130tanarctan4/_ radians
oCw
Λw_C/4 is 26o
The Mean Aerodynamic Chord for the wing (cw_MAC) is calculated from
(Equation 7.8):
w
wwrootwMACw cc
1
1)3/2(
2
__
Therefore:
23.01
23.023.01*21.21*)3/2(
2
_ MACwc

L-34
cw_MAC is 14.75 ft
The Aerodynamic Centre for the wing (AeroCw) lies on the Mean Aerodynamic
Chord, at a distance of 0.25 times the Mean Aerodynamic Chord from the
leading edge, for subsonic flight (Figure 4.17).
Therefore:
AeroCw is 3.69 ft from the leading edge, along the cw_MAC
The Mean Aerodynamic Chord (and Aerodynamic Centre) lies at a distance Y
from the fuselage centreline. Yw is calculated from (Equation 7.9):
www
w
bY 121
6
Therefore:
23.01*23.0*21*6
12.91wY
Yw is 27.27 ft
For the purposes of this concept design, the following parameters are
selected as 0:
Wing Twist (0o)
Angle of Incidence (0o)
The Wing Location is selected as a Low Wing.
The Dihedral is selected from Table 4.2 to be 3o (for a Low Wing).
A Drooped Wing Tip is selected.
L.1.8.3. Geometry: Tail
The Tail is a combination of the Horizontal and Vertical tail surfaces. The
geometries of both horizontal and vertical surfaces are described in the
following sub-sections.

L-35
The concept design places the engines in pods at the rear of the fuselage (as
per Method 1). However, this concept utilises a “T-tail” layout, to lift the
horizontal tail surface above the wing wake and engine pods (p. 69 and Figure
4.29).
The tail areas are calculated utilising the Historical Values for the Tail Volume
Coefficient (Table 6.4):
Tail Volume Coefficient for Horizontal Tail (cHT) is 1 (Jet Transport)
Tail Volume Coefficient for Vertical Tail (cVT) is 0.09 (Jet Transport)
The above values are for a conventional tail layout. A T-tail reduces the Tail
Volume Coefficients for both surfaces by about 5% (p. 112). Therefore:
cHT is 0.95
cVT is 0.0855
The tail areas (SHT and SVT) are calculated as follows (Equations 6.29 and
6.28):
HT
wMACwHTHT L
SccS
_
VT
wwVTVT L
SbcS
, where
LHT is the Horizontal Tail Arm (distance between the wing Aerodynamic
Centre and the horizontal tail Aerodynamic Centre); for Initial Sizing,
this value is determined from Historical Values as ~50% of the fuselage
length, or 55.13 ft for this design. This is approximately 3½ times the
Mean Aerodynamic Chord (Figure 4.29).
LVT is the Vertical Tail Arm (distance between the wing Aerodynamic
Centre and the vertical tail Aerodynamic Centre); for Initial Sizing, this
value is determined from Historical Values as ~45% of the fuselage
length, or 49.61 ft for this design.

L-36
Therefore:
13.55
66.1188*75.14*95.0HTS
SHT is 302.11 ft2
61.49
66.1188*12.91*0855.0VTS
SVT is 186.65 ft2
The values for tail Aspect Ratio (ARHT and ARVT) and Taper Ratio (λHT and
λVT) are determined from Historical Values for Initial Sizing (Table 4.3).
Therefore:
ARHT is 4
ARVT is 1.2
λHT is 0.5
λVT is 0.7
Tail spans (horizontal tail width bHT and vertical tail height bVT) are calculated
from (Equation 7.5):
SARb
Therefore:
11.302*4HTb
bHT is 34.76 ft
65.186*2.1VTb
bVT is 14.97 ft

L-37
As a check for horizontal tail positioning, from Figure 4.29: a horizontal T-tail
with a Tail Arm of approximately 3½ times the Mean Aerodynamic Chord
(cw_MAC), should be placed approximately 1.5 x cw_MAC ABOVE the wing. This
is to avoid tail blanking by the wing during high angles of attack. Therefore:
MACwVT cb _*5.1
75.14*5.1VTb
ftbVT 12.22
The calculated tail height (bVT) of 14.97 is approximately 7 ft (or ~30%) lower
than the check value. Since this UA will not be operated at high angles of
attack, for the purposes of this concept design the calculated value will be
kept, but should be re-evaluated during trade studies and additional design
studies.
Root (cHT_root and cVT_root) and Tip (cHT_tip and cVT_tip) Chords for the tail
surfaces are calculated as follows (Equations 7.6 and 7.7):
1
2
b
Scroot
roottip cc
Therefore:
5.01*76.34
11.302*2_
rootHTc
cHT_root is 11.59 ft
7.01*97.14
65.186*2_
rootVTc
cVT_root is 14.67 ft
59.11*5.0_ tipHTc

L-38
cHT_tip is 5.79 ft
67.14*7.0_ tipVTc
cVT_tip is 10.27 ft
The Leading Edge Sweep angle on the horizontal tail surface (ΛHT_LE) is
estimated to be ~5o more than the wing Leading Edge Sweep angle (Λw_LE)
(p. 76). Therefore:
ΛHT_LE is 35o
The Leading Edge Sweep angle on the vertical tail surface (ΛVT_LE) is
estimated to ~35 to 55o (p. 76). Therefore, for this design:
ΛVT_LE is 50o
The Quarter Chord Sweep angles (ΛHT_C/4 and ΛVT_C/4) for the tail surfaces are
calculated as follows (Figure 4.16):
1
1tanarctan4/ ARLEC
Therefore:
5.01*4
5.0135tanarctan4/_ radians
oCHT
ΛHT_C/4 is 31.7o
7.01*2.1
7.0150tanarctan 0
4/_ radiansCVT
ΛVT_C/4 is 46.3o
The Mean Aerodynamic Chords (cHT_MAC and cVT_MAC) for the tail surfaces are
calculated as follows (Equation 7.8):

L-39
1
1)3/2(
2
rootMAC cc
Therefore:
5.01
5.05.0159.11)3/2(
2
_ MACHTc
cHT_MAC is 9.01 ft
7.01
7.07.0167.14)3/2(
2
_ MACHTc
cVT_MAC is 12.6 ft
The Aerodynamic Centres for the tail surfaces (AeroCHT and AeroCVT) lie on
the tail surface Mean Aerodynamic Chords, at a distance of 0.25 times the
Mean Aerodynamic Chord from the tail surface leading edge, for subsonic
flight (Figure 4.17).
Therefore:
AeroCHT is 2.25 ft from the horizontal tail surface leading edge, along
the cHT_MAC
AeroCVT is 3.15 ft from the vertical tail surface leading edge, along the
cVT_MAC
The Mean Aerodynamic Chord (and Aerodynamic Centre) of each tail surface
lie at a distance Y from the fuselage centreline. YHT and YHT are calculated
from (Equation 7.9):
1216
bY
Therefore:
5.01*5.0*21*6
76.34HTY

L-40
YHT is 17.38 ft
7.01*7.0*21*6
97.14VTY
YVT is 10.18 ft
L.1.9. Powerplant
A twin-turbofan-engine arrangement is selected for this concept design (same
arguments as for Method 1).
Each engine is pod-mounted on the rear fuselage, as for Method 1. The pitch
and cant angles with regards to the fuselage centreline for the engine pods
are as follows (p. 209):
Pitch angle: 2o up
Cant angle: 2o out
L.1.9.1. Powerplant: Thrust Determination
The total minimum required take-off power (thrust, T0_tot) at sea level is
calculated from the previously determined Thrust-to-Weight Ratio at take-off
(T/W0) and Take-off Weight (W0):
00_0 /WTWT tot , where
T/W0 is 0.35
W0 is 142,639.001 lb
Therefore:
35.0*001.142639_0 totT
T0_tot is 49,746.02 lbf
The minimum take-off thrust requirement per engine (T0_engine) is therefore:

L-41
2_0
_0tot
engine
TT
T0_engine is 24,873.01 lbf
This figure is rounded up to:
T0_engine is 25,000 lbf
L.1.9.2. Powerplant: Engine Selection
The engine selected for this concept design is the International Aero Engines
IAE V2500 A1 turbofan. This engine satisfies the minimum take-off power
requirement, and has the following characteristics:
Maximum take-off thrust at sea level (Tmax): 25,000 lbf
Cruise thrust at 35,000 ft (Tcruise): 5,070 lbf
Specific Fuel Consumption at take-off thrust at sea level (Cmax): 0.35
lb/h/lbf (0.197 l/h/lbf)
Specific Fuel Consumption at cruise thrust at 35,000 ft (Ccruise): 0.581
lb/h/lbf (0.326 l/h/lbf)
Fan diameter (Dengine_fan): 1.681 m (66.18 in)
Fan (engine front) area (Aengine): 3,439.98 in2
Length (Lengine): 3.200 m (125.98 in)
Basic weight (Wengine): 5,210 lb
L.1.9.3. Powerplant: Inlet Geometry
The inlet geometry (inlet capture area (Athroat)) for a jet engine operating in
subsonic airflow is determined from the following (Equations 10.16 and
10.17):

L-42
engine
throatenginethroat AA
AAAA
*/
*/ , where
32
2.1
2.011*/
M
MAA , where
For (A/A*)throat, M is 0.6 (p. 211)
For (A/A*)engine, M is 0.4 (p. 211)
The air is slowed down from Mcruise (M0.71) to M0.6 outside the engine inlet
(M0.6 at the throat/inlet face), and then to M0.4 inside the inlet. The engine
fan face then receives air at M0.4.
Therefore:
32
2.1
6.0*2.01*
6.0
1*/
throatAA
(A/A*)throat is 1.1882
32
2.1
4.0*2.01*
4.0
1*/
engineAA
(A/A*)engine is 1.5901
Therefore:
5901.1
1882.1*98.3439throatA
Athroat is 2,570.46 in2
Inlet (throat) diameter (Dinlet) is 57.21 in (1.453 m)

L-43
L.1.9.4. Powerplant: Nozzle Geometry
The nozzle exit area (Anozzle) for a non-afterburning subsonic jet engine is ~ 50
to 70% of the inlet capture area (Athroat) (p. 220). For the purposes of this
design, a value of 70% Athroat was taken. Therefore:
Anozzle is 1,799.32 in2
Nozzle diameter (Dnozzle) is 47.86 in (1.216 m)
L.1.10. Additional Performance Results
The total Range and Endurance can be calculated from the results obtained in
previous calculations.
L.1.10.1. Additional Performance Results: Total Range
The total Range (Rtot) is determined as follows:
loiterreservecruiseloitersearchcruisetot RRRRR _2_1 , where:
Rcruise1 is 2,800 nm
Rcruise2 is 2,800 nm
It is assumed that climb and descent takes place over a vertical column,
adding no additional useful range to the total.
Rsearch_loiter and Rreserve_loiter are determined from the respective loiter speeds
and times as follows:
loitersearchloitersearchloitersearch EVR ___ , where
Vsearch_loiter is 710.98 ft/s (421.25 kn)
Esearch_loiter is 4 h
Therefore:
4*25.421_ loitersearchR

L-44
Rsearch_loiter is 1,685.02 nm
loiterreserveloiterreserveloiterreserve EVR ___ , where
Vreserve_loiter is 342.13 ft/s (202.71 kn)
Ereserve_loiter is 1 h
Therefore:
1*71.202_ loiterreserveR
Rreserve_loiter is 202.71 nm
Therefore:
71.202280002.16852800 totR
Rtot is 7,487.73 nm
L.1.10.2. Additional Performance Results: Total Endurance
The total Endurance (Etot) is determined as follows
descentloiterreservecruiseloitersearhcruisebctot EEEEEEE _2_1lim , where
Eclimb is 0.5 h (estimated time to climb from sea level to 35,000 ft)
Esearch_loiter is 4 h
Ereserve_loiter is 1 h
Edescent is 0.5 h (estimated time to descend to sea level from 35,000 ft)
Ecruise1 and Ecruise2 are determined from the respective cruise range and speed
as follows:
cruise
cruisecruisecruise V
REE 21 , where

L-45
Rcruise is 2,800 nm
Vcruise is 467 kn
Therefore:
467
280021 cruisecruise EE
Ecruise1 = Ecruise2 is 6 h
Therefore:
5.016465.0 totE
Etot is 18 h

M-1
Appendix M
M.Maritime Search and Rescue UAS Communications Scenario
Appendix M provides a graphical representation of the communications
scenario for both Line-of-Sight and Beyond-Line-of-Sight situations, for a
typical maritime Search and Rescue mission involving an unmanned aircraft.

M-2
SAR UAS Line-of-Sight Communications
RCCGCS
V/UHF VoiceHF Voice
Direct Voice / Direct Data/ Direct Data
Voice / PL Con / Status / C&C / PL Data
ATC
V/UHF VoiceHF Voice
V/UHF VoiceHF Voice
ATC
UAS Data Link
Figure M.1: Line-of-Sight Communications

M-3
SAR UAS Beyond Line-of-Sight Communications
RCCGCS
ATC
Inmarsat:PRIMARY BLOS link[HBW voice and data]
Iridium:SECONDARY BLOS link[LBW voice and data]
V/UHF VoiceHF Voice
Direct Voice / Direct Data/ Direct Data
Voice / PL Con / Status / C&C / PL Data
GCS
C&C / Status / VoiceATC
RCC
Direct Voice / Direct Data/ Direct Data
V/UHF VoiceHF Voice
V/UHF VoiceHF Voice
UAS Data LinkUAS Data Link
ATC(if within range of ATC Coverage)
ATC(if within range of ATC Coverage)
ATC: Optional via satellite – only if
direct comms with UAS is not possibleATC: Optional via
satellite – only if direct comms with
UAS is not possible
Figure M.2: Beyond-Line-of-Sight Communications

N-1
Appendix N
N.Unmanned Aircraft History
Appendix N provides additional details concerning the history of Unmanned
Aircraft.
N.1. Pre-World War I Era
Although balloons are not regarded as true UAs, the first recorded use of
unmanned aerial platforms was on 22 August 1849. The Austrians used
unmanned balloons, filled with a payload of explosives, to bomb Venice. The
balloons were launched from some distance away, and carried by wind
currents to Venice, where they were detonated (with limited success)[10].
N.2. World War I
World War I (WWI) introduced the concept of unmanned flying torpedoes and
flying bombs. Effectively pilotless radio controlled aircraft, three types were
developed between 1916 and 1917 – the Ruston Proctor “Aerial Target”, the
Hewitt-Sperry Automatic Airplane (“Flying Bomb”), and the Dayton-Wright
Kettering Bug (“Aerial Torpedo”). None of these designs were used
operationally; the most successful of these being the Kettering Bug, which
entered production as the War ended, thus never entering active
service[11][12][13][15].
N.3. Interwar Period
Between World Wars I and II, the US and Britain developed a number of
pilotless air vehicles, the most notable being[14]:
Larynx autopilot-controlled monoplane aircraft, launched from a
warship and intended to act as an anti-ship weapon; it was developed
between 1927 and 1929 by the British;
Fairey “Queen” radio-controlled target, developed in 1931 by the British
from the Fairey III floatplane;

N-2
DH.82B “Queen Bee” radio-controlled target, developed in 1935 by the
British from the DeHavilland Tiget Moth;
N.4. World War II
World War II (WWII) saw the first large scale production and use of pilotless
aircraft (drones). The first of these was the Radioplane Company RP-1 aerial
target, a radio controlled airplane developed in 1935 to provide an affordable
means to train anti-aircraft gunners. Between 1938 and 1939 the RP-2, RP-3
and RP-4 were developed, leading to the development and deployment of
nearly 15,000 Radioplane OQ-1 and OQ-2 drones (derivatives of the RP-4
and RP-5 respectively) during WWII. The US Navy derivative was the TDD-1
target drone. The Radioplane Company was bought by Northrop in 1952[16].
The Curtiss N2C-2 target drone was developed between 1937 and 1938.
N2C-2’s were remotely piloted from another aircraft, the TG-2. Culver PQ-8
and PQ-14 target drones were also used by the US Army Air Force during the
War. Meanwhile, the naval Aircraft Factory developed the first pilotless assault
drones of WWII, although it never reached full operational status, having only
limited “operational” tests conducted on beached targets by 1944. The
concept involved an RCA television camera in the drone and a television
screen in the TG-2 control aircraft. Torpedo and direct attacks were carried
out with the TG-2 around 20 miles from the assault drone[16][17].
Around the middle of WWII, McDonnell developed the T2D2-1 Katydid, an air-
launched pulsejet powered target. It was later developed into the KDD-1 and
KDH-1. The Curtiss KD2C Skeet was another 1940’s pulsejet design, but was
put into service only after WWII had ended[16].
N.5. Post WWII, Korean War and Vietnam War
During this period, the Radioplane Company developed a number of new
target drones. These drones proved very successful and remained in service
for the remainder of the 20th century, the most notable being the OQ-
19/KD2R Quail, the MQM-33/MQM-36 Shelduck and the MQM-57 Falconer.
The Globe Company developed the KDxG-series of target drones, the most
notable being the KD6G drone[16].

N-3
By 1952, Northrop had bought the Radioplane Company, and developed the Northrop
Crossbow decoy drone. In 1957, McDonnell Aircraft Company developed the
ADM-20 Quail air-launched decoy drone, which was produced in some
numbers[16][19].
In order to keep pace with the development of supersonic aircraft, Northrop
developed the GE J85-powered AQM-35 supersonic target drone in 1956[10].
Northrop also developed the BQM-74 Chukar series subsonic target drones in
1965, with the F-series still in operation[16][18].
Various unmanned reconnaissance aircraft were developing during this period
due to the success of the unmanned target drones. The most notable of these
were the Aerojet-General MQM-58 “Overseer", the very successful Ryan
Model 147 Lightning Bug series (developed from the equally successful Ryan
BGM-34 Firebee unmanned platform), the Ryan "Model 154", the
Ryan/Boeing "Compass Copes" and the Lockheed D-21[18].
N.6. The Cold War
The Cold War, stretching from 1945 to 1991, saw a number of major conflicts,
most notably the Korean and Vietnam wars, which led to the development of
numerous unmanned target drones, reconnaissance and decoy drones, and
attack drones, many of which have been mentioned in the preceding
paragraphs. The 1980’s saw the proliferation of genuine Battlefield UAs[20].
N.7. Modern-day UAs
As mentioned, the 1980’s saw a proliferation of true unmanned aircraft, most
of them for military use. The first effective use of modern UAs was undertaken
by the Israelis in the early 1980’s during the Syrian War. The Israelis used
UAs to gather information about Syrian air defence sites, and used Mastiff and
Scout UAs to as decoys to draw enemy fire, allowing manned warplanes to
destroy enemy surface-to-air missile sites. This prompted the USA to co-
develop the RQ-2 Pioneer with Israel in 1984, which was introduced by
1986[21].

N-4
The General Atomics Predator was the first UA to be deployed, in the Balkan
conflict in 1995[22], and it has seen extensive service in Afghanistan, Pakistan,
Bosnia, Serbia, Iraq, and Yemen[22]. Other UAs of note which have seen
development and operational use during and since the 1980’s include:
Northrop Grumman RQ-4 Global Hawk (USA, 2006)[22];
General Atomics MQ-9 Reaper (USA, first flight 2001)[22];
General Atomics Ikhana (NASA civil UAV)[23];
General Atomics MQ-1C Sky Warrior (USA, first flight 2008)[22];
Israel Aircraft Industries RQ-5 Hunter (Israel)[20];
AAI Corporation RQ-7 Shadow (USA, first flight 1991)[24];
AAI/IAI RQ-2 Pioneer (Israel/USA, introduced in 1986)[20];
Israel Aircraft Industries Heron (Israel)[25];
Kentron Seeker I and II (South Africa, saw active service during Bush
War in 1987)[26];
Northrop Grumman MQ-8 Fire Scout (USA, first flight 2002)[24];
Bell HV-911 Eagle Eye (USA, first flight 1998)[27];
The 21st century also saw the development of many man-portable micro-UAs,
capable of being hand- or shoulder-launched[H17]. An example of an in-service
micro-UA is the US-developed AeroVironment RQ-11 Raven, introduced into
active service in 2003[28].

O-1
Appendix O
O.Unmanned Aircraft Categorisation
Appendix O provides additional details concerning the categorisation of
Unmanned Aircraft.
O.1. TIER System
The United States Air Force (USAF), United States Marine Corps (USMC) and
United States Army (US Army) have developed and adopted the “TIER”
system to categorise their UAs[29]. Problem is, even the TIER system is not
standardised among the three Arms of Force, each one differing to a degree
from the other[29]. The following provides a brief summary of the various TIER-
categories for all three Arms of Force, with examples[29].
O.1.1. TIER N/A UA
USAF: Small or Micro UA
o AeroVironment Wasp III Micro Air Vehicle (MAV)
USMC: Micro UA
o AeroVironment Wasp III MAV
US Army: Currently not used
O.1.2. TIER I UA
USAF: Low altitude, long endurance (LALE) UA
o General Atomics GNAT 750
USMC: Similar to US Army TIER I - Small UA
o AeroVironment Dragon Eye
o AeroVironment RQ-11B Raven B
US Army: Small UA

O-2
o AeroVironment RQ-11B Raven B
O.1.3. TIER II UA
USAF: Medium altitude, long endurance (MALE) UA
o General Atomics MQ-1 Predator
o General Atomics MQ-9 Reaper
USMC: Similar to US Army TIER II - Short range tactical UA
o Insitu/Boeing ScanEagle
o AAI/IAI RQ-2 Pioneer
US Army: Short range tactical UA
o AAI Corporation RQ-7B Shadow 200
O.1.4. TIER II+ UA
USAF: High altitude, long endurance (HALE) UA – typical
specifications include 60,000 to 65,000ft altitude, 3,000nmi operational
radius, 24hr time-on-station, 300kn maximum airspeed.
o Northrop Grumman RQ-4 Global Hawk
USMC: Currently not used
US Army: Currently not used
O.1.5. TIER III- UA
USAF: High altitude, long endurance (HALE) low-observable (stealth)
UA – typical specifications include 60,000 to 65,000ft altitude, 3,000nmi
operational radius, 24hr time-on-station, 300kn maximum airspeed.
o Lockheed Martin RQ-3 DarkStar
USMC: Currently not used

O-3
US Army: Currently not used
O.1.6. TIER III UA
USAF: Currently not used
USMC: Medium range tactical UA
o AAI/IAI RQ-2 Pioneer
o AAI Corporation RQ-7B Shadow 200
US Army: Medium range tactical UA
o Israel Aircraft Industries RQ/MQ-5 Hunter
o General Atomics I-GNAT ER
o General Atomics MQ-1C Sky Warrior
O.2. Function, Purpose, Mission, Task or Role
UAs can also be categorised by function, purpose, mission, task or role (in
short, its intended use). The following provides a brief summary of how this
categorisation method is applied, with examples[29].
O.2.1 Target and/or Decoy UA
O.2.1.1 Target UA
Provides a physical and visual cue to ground and aerial gunnery for training
purposes; it simulates and aircraft or weapon[18][30].
Northrop Grumman BQM-74F Chukar III
Beech BQM-107E Streaker
Composite Engineering Inc BQM-167A Skeeter
Meteor Mirach 100/5
Denel Dynamics Skua

O-4
O.2.1.2. Decoy UA
Provides a decoy to ground-based- or airborne air defences, thereby drawing
attention away from allied manned or unmanned aircraft pursuing a particular
mission[19].
Brunswick ADM-141C ITALD
Northrop Grumman ADM-160B MALD
O.2.2. Reconnaissance/Surveillance UA
These UAs are deployed to scout areas and provide vital information to
interested parties. It is synonymous with military operations, where
reconnaissance parties are sent into enemy territories to scout and report
back vital information necessary for the successful execution of an operation.
Information includes location of logistic supply lines, ammunition depots,
bases, personnel strengths and movements, defences, assets and current
tactics. It is usually of short duration, and takes a “snap-shot” of the current
situation[31][32].
Surveillance also involves the gathering of vital information, but is focussed on
long-term behaviour and activity, and other changing information. It takes
place over a prolonged period of time. It is often used to recognise and
monitor potential threats, and to prevent or investigate criminal activity[33][34].
Lockheed D-21 Tagboard (strategic recon)[35]
Tupolev Tu-300 Korshun (strategic recon)[35]
AAI/IAI RQ-2 Pioneer (tactical surv & recon)[20]
AAI Corporation RQ-7B Shadow 200 (tactical surv & recon)[24]
Northrop Grumman MQ-8B Fire Scout (tactical surv & recon)[24]
Insitu/Boeing ScanEagle (tactical surv & recon)[27]
Denel Dynamics Seeker (tactical surv & recon)

O-5
General Atomics RQ/MQ-1 Predator (strategic surv & recon)[22]
General Atomics MQ-1C Sky Warrior (strategic surv & recon)[22]
Lockheed Martin RQ-3 DarkStar (strategic surv & recon)[22]
Northrop Grumman RQ-4 Global Hawk (strategic surv & recon)[22]
EADS/IAI Eagle 2 (strategic surv & recon)[25]
O.2.3. Combat UA
Combat-capable UAs are designed to carry and deliver weapons, usually
precision strike. They are commonly referred to as Unmanned Combat Air
Vehicles, or UCAVs. They are typically employed in situations proving too
risky or outright dangerous for manned combat aircraft[29].
Boeing X-45A (technology demonstrator only)[36]
Northrop Grumman X-47B (in development)[36]
BAE Systems Mantis (mock-up only)[36]
BAE Systems Taranis (in development)[36]
General Atomics MQ-9 Reaper[22]
O.2.4. Logistic Supply UA
These UAs are designed to carry cargo and provide support to logistics
operations.
Boeing A160 Hummingbird[24]
AAI Corporation RQ-7B Shadow 200 with Quick-MEDS[24]
O.2.5. Research and Development UA
These UAs are used solely to develop new technologies, to be integrated at
some later stage in operational systems.

O-6
Boeing X-45A (UCAV technology)[36]
Northrop Grumman X-47A Pegasus (UCAV technology)[36]
Boeing X-50A Dragonfly (rotor-wing technology)[24]
Sikorsky Cypher (VTOL technology)[27]
NextGen Aeronautics MFX-1 (morphing wings)[27]
Boeing Condor (endurance)[37]
Lockheed Martin RQ-3 DarkStar (low observability with endurance)[22]
AeroVironment Helios (solar powered UA)[39]
AeroVironment Global Observer (hydrogen powered UA)[39]
O.2.6. Civil and Commercial UAs
These are used for civilian and commercial purposes.
General Atomics Ikhana (USFS/NASA; forest fire observation)[22]
Insitu Aerosonde (metrological/weather observations)[27]
Bell HV-911 Eagle Eye (US Coast Guard; considering)[27]
Northrop Grumman RQ-4A Global Hawk (NASA; earth sciences)[22]
Northrop Grumman RQ-4A Global Hawk (US Coast Guard;
considering)[38]
Elbit Systems Hermes 450 (US Border Patrol)[25]
Aurora Flight Services Perseus-A/B (NASA; high altitude environmental
impact studies)[39]
Aurora Flight Services Theseus (NASA; environmental observation)[39]

O-7
General Atomics Altus II (NASA; high altitude propulsion and
performance)[39]
O.3. Performance
UAs can also be categorised by altitude, range and/or endurance, and/or
other basic performance parameters. The following provides a brief summary
of how this categorisation method is applied, with examples[29][83].
O.3.1. Handheld
Altitude: 2,000ft
Range: 2km
Endurance: unspecified
Other: unspecified
Examples:
o AeroVironment Wasp III[40]
O.3.2. Close
Altitude: 5,000ft
Range: 10km
Endurance: unspecified
Other: unspecified
Examples:
o AeroVironment Raven RQ-11B[41]
O.3.3. NATO Type
Altitude: 10,000ft
Range: 50km

O-8
Endurance: unspecified
Other: unspecified
Examples:
o BAI Aerosystems BQM-147 Dragon Drone[24]
o BAI Aerosystems Viking 400[42]
O.3.4. Tactical
Altitude: 18,000ft
Range: 160km
Endurance: unspecified
Other: unspecified
Examples: Denel Dynamics Seeker II[43]
o AAI/IAI RQ-2 Pioneer[44]
o AAI Corporation RQ-7B Shadow 200[45]
o Northrop Grumman MQ-8B Fire Scout[45]
o Insitu/Boeing ScanEagle[47]
O.3.5. Medium Altitude, Long Endurance (MALE)
Altitude: 30,000ft
Range: over 200km
Endurance: “long endurance” (but unspecified)
Other: unspecified
Examples:

O-9
o General Atomics RQ/MQ-1 Predator[48]
o General Atomics MQ-1C Sky Warrior[49]
o IAI Malat Heron 1[50]
o Denel Dynamics Bateleur[51]
O.3.6. High Altitude, Long Endurance (HALE)
Altitude: over 30,000ft
Range: indefinite
Endurance: “long endurance” (but unspecified)
Other: unspecified:
Examples:
o General Atomics MQ-9 Reaper (also “Advanced MALE”)[52]
o Lockheed Martin RQ-3A DarkStar[22]
o Northrop Grumman RQ-4 Global Hawk[53]
o IAI Malat Heron TP (also “Advanced MALE”)[54]
o Aurora Flight Services Theseus[39]
o General Atomics Altus II[39]
O.3.7. High Speed
Altitude: 50,000ft to sub-orbital
Range: over 200km
Endurance: unspecified
Other: subsonic: up to Mach 1; supersonic: Mach 1 to 5; hypersonic:
over Mach 5

O-10
Examples:
o Boeing X-45A/B – subsonic[55]
o Northrop Grumman X-47B – subsonic[56]
o Dassault Neuron – subsonic[57]
o Composite Engineering Inc BQM-167A Skeeter – subsonic[18]
o Beech AQM-37C Jayhawk – supersonic[18]
O.3.8. Orbital
Altitude: low-earth orbit
Range: unspecified
Endurance: unspecified
Other: over Mach 25
Examples:
o n/a
O.3.9. CIS-Lunar
Altitude: Earth-Moon transfer
Range: Moon
Endurance: unspecified
Other: unspecified
Examples:
o n/a
The performance figures per category are not rigid, but serve as a guide.
Some UAs falling within a specific performance category may have other

O-11
performance figures that fall outside the limits, but remain eligible for that
category. An example is the Denel Dynamics Seeker II, which falls within the
“Tactical” category, but which has a range figure in excess of the specified
“limit”.
A single UA can be categorised either according to one, or a combination of,
categorisation methods. As an example, the Northrop Grumman RQ-4 Global
Hawk can be categorised as a TIER II+ Reconnaissance/Surveillance
AND/OR Civil/Commercial HALE UA, or any combination thereof, depending
on the circumstances.