An Overview of the New Zealand Tertiary Education System
31
An Overview of the New Zealand Tertiary Education System Presented to the Fiji Education Delegation Dr Dafydd Davies and Dr Daniel Haines University Investment Tertiary Education Commission 14 May 2014
Transcript of An Overview of the New Zealand Tertiary Education System
An Overview of the New Zealand Tertiary Education System
Presented to the Fiji Education Delegation
Dr Dafydd Davies and Dr Daniel HainesUniversity Investment
Tertiary Education Commission 14 May 2014

Overview» New Zealand is a small country ~ 4.5 million » Investment in tertiary education:
› NZ$ 3 billion per annum – support to providers› NZ$ 1.5 billion per annum - support to
students › 1.7% of GDP spent on tertiary education, the
OECD average is 1.2% of GDP» More than half of New Zealanders aged 15 to 29
hold a tertiary qualification » Policy, funding and quality assurance are part
of a unified and integrated system

The education pipeline

Who pays?» Gradually moving toward free education
for all learners up to Level 2 (high school equivalent), whether accessed through school or tertiary education
» Co-contribution (student and government) model from Level 3 and above
» Employer contribution to Industry (workplace) Training

Tertiary Education Organisations:
TEOs
Public TEOs: Tertiary Education
Institutions (TEIs)
8 universities155,500
enrolments (42%)
18 polytechnics130,800
enrolments (35%)
3 wānanga38,900
enrolments (10%)
Private TEOs
Private Training Establishments (~400 funded by TEC)
48,600 enrolments
(13%)
20 Industry Training Organisations 140,700 enrolments
Community organisations ACE providers and schools (~300
funded by TEC)
“Providers”

Our Policy Framework» A small number of agencies work with students, providers and
employers to achieve outcomes
» Policy, funding and quality assurance are part of a unified and integrated system
» Focus of system moving over time: Access >> Outcomes >> Value-Add
Students
ProvidersEmployers
Government
Policy
Funding
Quality Assuran
ce
Outcomes

Tertiary Education Commission (TEC)
Ministry of Education (MoE) and
Ministry of Business, Innovation and
Employment (MBIE)
Role of Government agenciesPolicy
New Zealand Qualifications Authority (NZQA) and Committee on University Academic Programmes (CUAP)
Quality AssuranceFunding
A world-leading education system that equips all New Zealanders with the knowledge, skills and values to be
successful citizens in the 21st century
Policy: Ministry of Education Working closely with the Ministry of Business, Innovation and Employment» Forms basis of Performance-Linked Funding
calculations for SAC funding» Government's lead advisor on the New Zealand
education system» Responsible for strategic leadership, policy
development and monitoring and evaluation» Shapes direction for sector agencies (including
monitoring of TEC, NZQA and Careers NZ) and, at arm’s length, for providers
» Operational role in the compulsory education sector

Funding: Tertiary Education Commission» Plan-based investment approach:
» Performance Linked Funding: 5% from 2012» Research: Performance-Based Research Fund
(~$335m) and CoRES (~$35m)
Minister (via Ministries)
Tertiary Education Commission TEOs
Tertiary Education Strategy
Funding Determinations
Plan Guidance Plans
Governme
nt Pol
icy

Educational Performance Indicators» Four key measures focused on most important
learner outcomes:› Course completion› Qualification completion› Progression to higher levels› Retention in study
» Published annually for all TEIs, PTEs, and ITOs
» Forms basis of Performance-Linked Funding calculations for SAC funding


Quality Assurance: New Zealand Qualifications Authority and Committee on University Academic Programmes (CUAP)
» Ensures that New Zealand qualifications are of high quality and fit for purpose
» NZQA: › Manages the New Zealand Qualifications
Framework› Administers the secondary school assessment
system› Provides quality assurance for non-
university tertiary education› Recognises qualifications and sets
standards» CUAP: Provides quality assurance for
university education
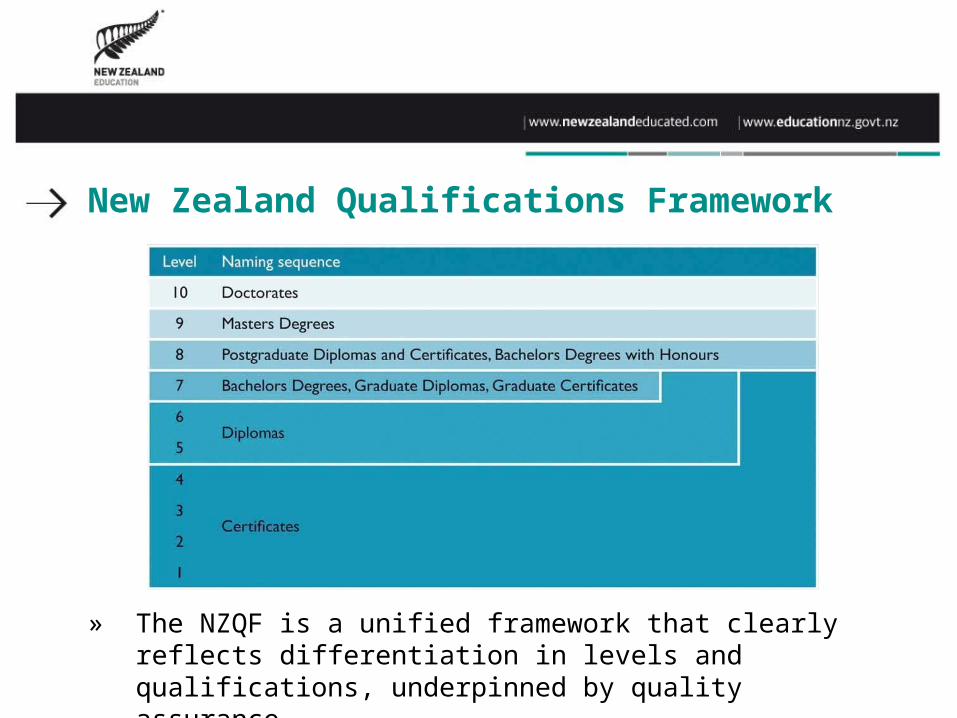
New Zealand Qualifications Framework
» The NZQF is a unified framework that clearly reflects differentiation in levels and qualifications, underpinned by quality assurance

Key areas of current activity:» Better Public Services: 2
tertiary goals» Vocational Pathways

Better Public Services Goal 1: 85% of 18 year olds will have NCEA level 2 (High School) or equivalent in 2017 (currently 74%).
Key initiatives:» Vocational Pathways» More options for senior secondary
students, e.g. trades academies, fees-free tertiary places (Youth Guarantee)
» Better careers education and pastoral care
» More effective tracking and monitoring of students

Better Public Services Goal 2: 55% of 25–34 year-olds with a qualification at Level 4 or above in 2017 (currently 52%)
Key initiatives:» Fund more places at higher levels
(provider-based + industry training)» Publish information about employment
outcomes and demand for skills» Improve flows of students from lower
levels of study» Attract back “partial completers”

Vocational Pathways» Better
information for learners about where their study choices can take them
» A very easy way to understand a complex set of information

Any questions?

Features of New Zealand Education
» High proportion of tertiary qualified adults› One in four NZ adults aged 25 to 64 hold a degree or higher, and
New Zealand is ranked 8th in the OECD on this measure
» High percentage of population enters high-level study › The rate of entry to degree-level study was 72% (with
international students included)
» Very high number of part-time students› One of the highest in the OECD. Contributing factors: open access
for adult students; and lots of adult students who left school without qualifications come back to tertiary study while working.
» A net importer of tertiary students
Using the “information” lever» Occupational Outlook reports» Employment Outcomes of Tertiary
Education work» Review of Careers Information,
Advice, Guidance and Education (CIAGE)
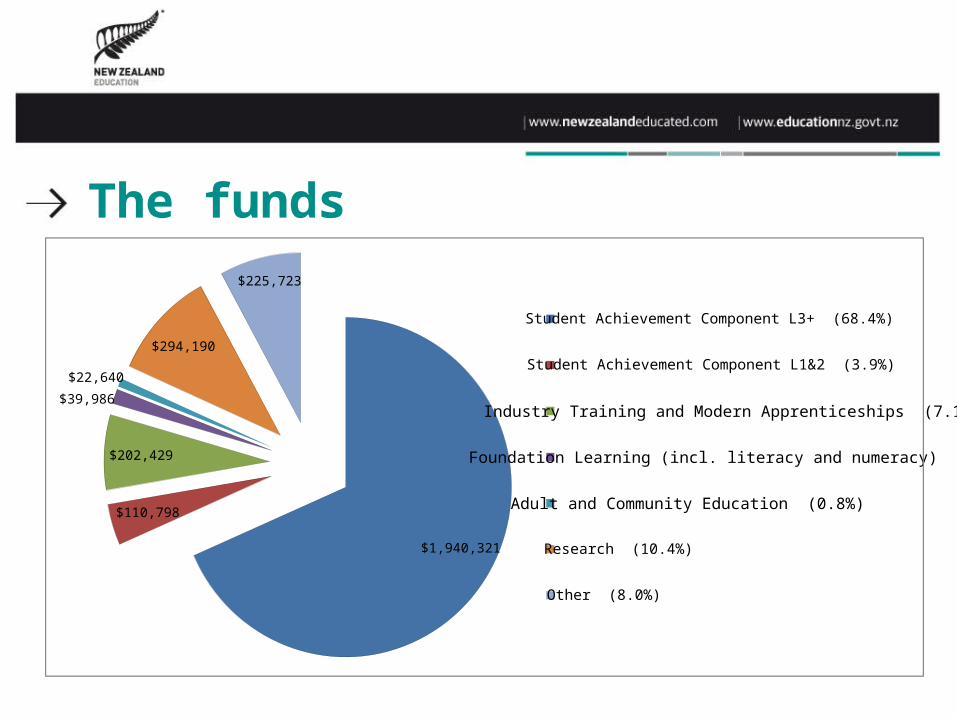
The funds
$1,940,321
$110,798
$202,429
$39,986 $22,640
$294,190
$225,723
Student Achievement Component L3+ (68.4%)
Student Achievement Component L1&2 (3.9%)
Industry Training and Modern Apprenticeships (7.1%)
Foundation Learning (incl. literacy and numeracy) (1.4%)
Adult and Community Education (0.8%)
Research (10.4%)
Other (8.0%)

Government funding by subsector: chart
Government funding by institution
53%
22%
6%
5%
14%
2013 Total Funding (as at 28/2/13)
8 Universities18 ITPs3 W ānanga20 ITOs733 PTEs and Others

Government funding by subsector: data
$000 2013 2012 Change2013
count8 Universities $1,453,040 $1,421,322 $31,718 818 ITPs $598,818 $628,118 ($29,300) 183 W ānanga $170,268 $169,335 $933 320 ITOs $139,689 $162,370 ($22,681) 20733 PTEs and Others $377,701 $354,500 $23,201 733
$2,739,515 $2,735,644 $3,871 782

TEC’s main appropriations: chart
42%
19%
6%
7%
5%
21%
2013 Funding SAC & ITF/M A breakdown
SAC - UnisSAC - ITPsSAC - W ānSAC - PTEsITF & M AOther Funds

TEC’s main appropriations: dataSAC Skills for Canterbury included with "other funds"$000 2013 2012 ChangeSAC - Unis $1,143,304 $1,118,595 $24,708 SAC - ITPs $534,902 $554,034 ($19,132) SAC - W ān $160,565 $160,844 ($280) SAC - PTEs $191,063 $172,092 $18,971 ITF & M A $139,166 $161,556 ($22,389) Other Funds $570,517 $568,524 $1,993
$2,739,515 $2,735,644 $3,871
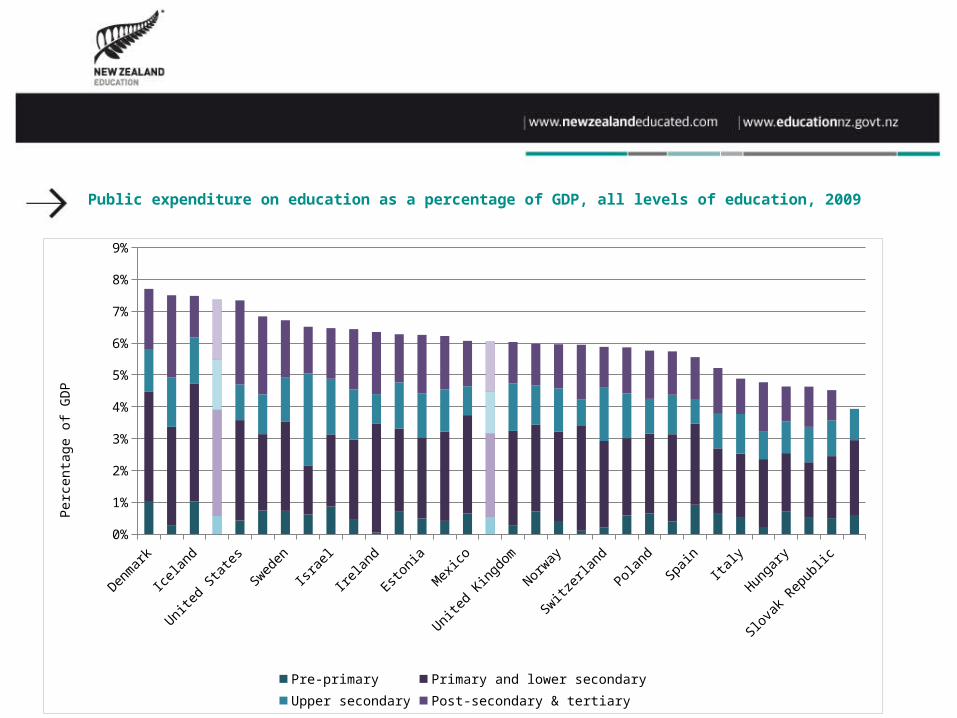
Public expenditure on education as a percentage of GDP, all levels of education, 2009
Denmark
Iceland
United States
Sweden
Israel
Ireland
Estonia
Mexico
United Kingdom
Norway
Switzerland
Poland
Spain
Italy
Hungary
Slovak Republic
0%
1%
2%
3%
4%
5%
6%
7%
8%
9%
Pre-primary Primary and lower secondaryUpper secondary Post-secondary & tertiary
Perc
entage
of
GDP

Public expenditure on tertiary education as a percentage of GDP, 2009
Unit
ed .
..Ko
rea
Chil
eIr
elan
dFi
nlan
dDe
nmar
kNe
w Ze
a...
Esto
nia
Swed
enAu
stra
lia
Neth
erl.
..Is
rael
OECD
av.
..Ja
pan
Pola
ndFr
ance
Belg
ium
Aust
ria
Germ
any
Mexi
coNo
rway
Port
ugal
Spai
nUn
ited
...
Slov
enia
Icel
and
Swit
zer.
..Cz
ech
R...
Ital
yHu
ngar
ySl
ovak
...
0.0%
0.5%
1.0%
1.5%
2.0%
2.5%
3.0%
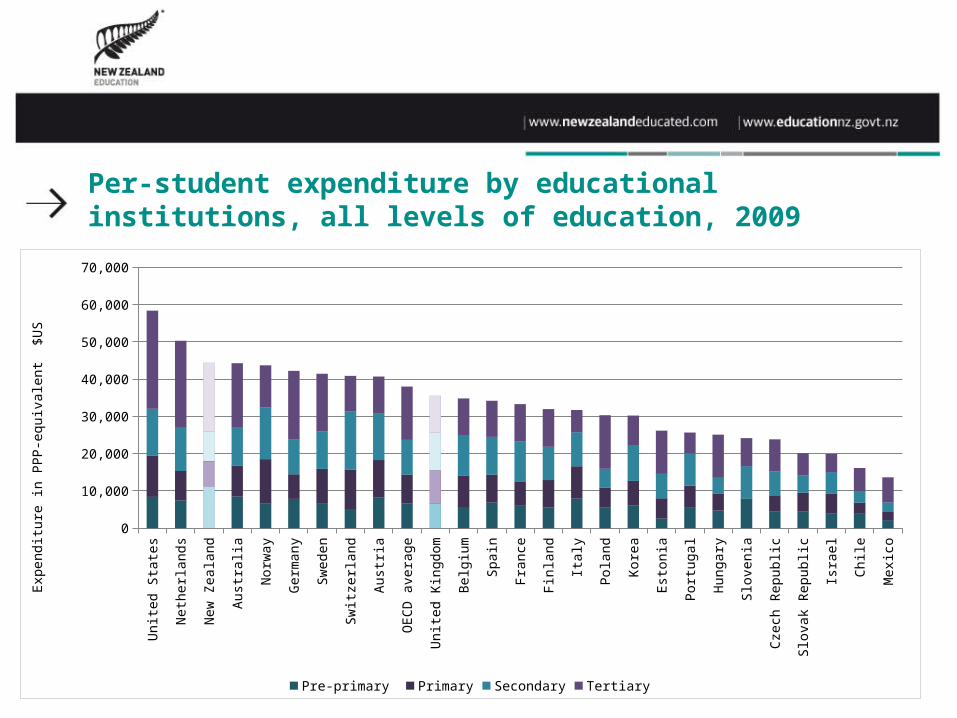
Per-student expenditure by educational institutions, all levels of education, 2009
Unit
ed Sta
tes
Neth
erla
nds
New
Zeal
and
Aust
ralia
Norw
ay
Germ
any
Swed
en
Swit
zerlan
d
Aust
ria
OECD
avera
ge
Unit
ed Kin
gdom
Belg
ium
Spai
n
Fran
ce
Finl
and
Ital
y
Pola
nd
Kore
a
Esto
nia
Port
ugal
Hung
ary
Slov
enia
Czech
Repu
blic
Slov
ak R
epubli
c
Isra
el
Chil
e
Mexi
co
0
10,000
20,000
30,000
40,000
50,000
60,000
70,000
Pre-primary Primary Secondary Tertiary
Expe
ndit
ure
in P
PP-equ
ival
ent
$US

Per-student expenditure by tertiary educational institutions, tertiary education
Unit
ed Sta
tes
Neth
erland
s
Germ
any
New
Zeal
and
Aust
rali
a
Swed
en
Pola
nd
OECD
avera
ge
Estoni
a
Hungar
y
Norway
Finl
and
Fran
ce
Belg
ium
Unit
ed Kin
gdom
Aust
ria
Spai
n
Swit
zerl
and
Czec
h Re
publ
ic
Kore
a
Slov
enia
Mexi
co
Chil
e
Ital
y
Slov
ak R
epub
lic
Port
ugal
Isra
el
0
5000
10000
15000
20000
25000
30000
Expe
ndit
ure
in P
PP-e
quiv
alen
t $
US

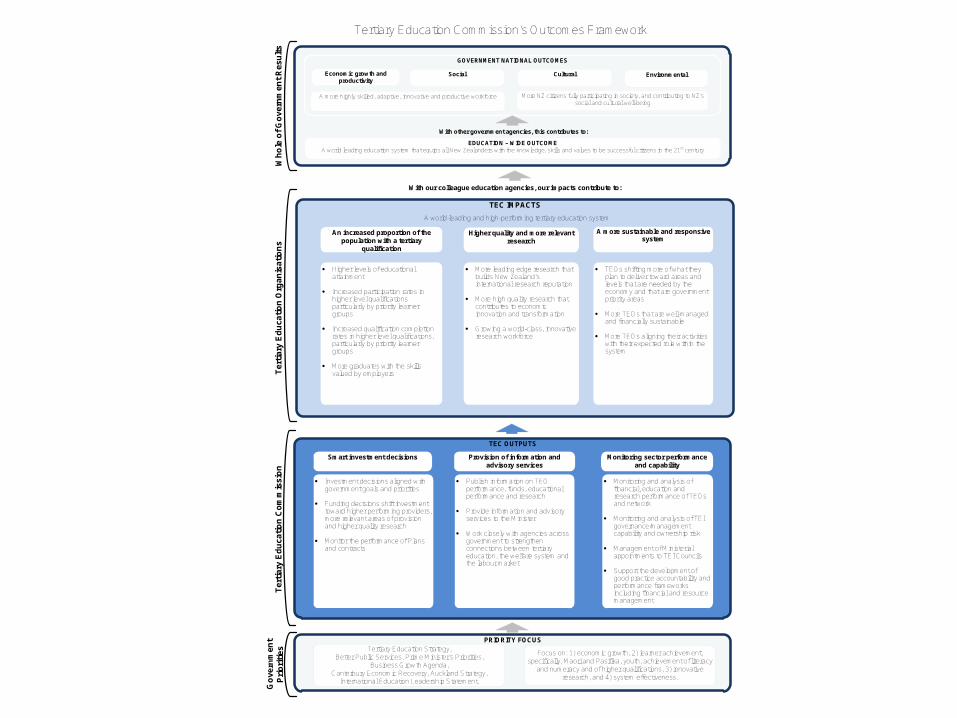
PRIO RITY FOCUS
TEC O UTPUTS
Focus on: 1) econom ic growth, 2) learner achievem ent, specifically; M aori and Pasifika, youth, achievem ent of literacy
and num eracy and of higher qualifications, 3) innovative research, and 4) system effectiveness.
Sm art investm ent decisions Provision of inform ation and advisory services
M onitoring sector perform ance and capability
· Investm ent decisions aligned with governm ent goals and priorities
· Funding decisions shift investm ent toward higher perform ing providers, m ore relevant areas of provision and higher quality research
· M onitor the perform ance of Plans and contracts
· Publish inform ation on TEO perform ance, funds, educational perform ance and research
· Provide inform ation and advisory services to the M inister
· W ork closely with agencies across governm ent to strengthen connections between tertiary education, the welfare system and the labour m arket
· M onitoring and analysis of financial, education and research perform ance of TEOs and network
· M onitoring and analysis of TEI governance/m anagem ent capability and ownership risk
· M anagem ent of M inisterial appointm ents to TEI Councils
· Support the developm ent of good practice accountability and perform ance fram eworks including financial and resource m anagem ent
TEC IM PACTS
A m ore sustainable and responsive system
An increased proportion of the population with a tertiary
qualification
· Higher levels of educational attainm ent
· Increased participation rates in higher level qualifications particularly by priority learner groups
· Increased qualification com pletion rates in higher level qualifications, particularly by priority learner groups
· M ore graduates with the skills valued by em ployers
· M ore leading edge research that builds New Zealand’s international research reputation
· M ore high quality research that contributes to econom ic innovation and transform ation
· Growing a world-class, innovative research workforce
Higher quality and m ore relevant research
· TEOs shifting m ore of what they plan to deliver toward areas and levels that are needed by the econom y and that are governm ent priority areas
· M ore TEO s that are well-m anaged and financially sustainable
· M ore TEO s aligning their activities with their expected role within the system
Tertiary Education Strategy,Better Public Services, Prim e M inister’s Priorities,
Business G rowth Agenda,Canterbury Econom ic Recovery, Auckland Strategy,
International Education Leadership Statem ent.
Econom ic growth and productivity
W ith our colleague education agencies, our im pacts contribute to:
Social Cultural Environm ental
A m ore highly skilled, adaptive, innovative and productive workforce M ore NZ citizens fully participating in society, and contributing to NZ’s social and cultural well-being
Tertiary Ed
ucation Co
mmission
Tertiary Ed
ucation Organisatio
nsWho
le of G
overnm
ent R
esults
A world-leading and high-perform ing tertiary education system
GOVERNM ENT NATIONAL OUTCOM ES
W ith other governm ent agencies, this contributes to:EDUCATION – W IDE OUTCOM E
A world leading education system that equips all New Zealanders with the knowledge, skills and values to be successful citizens in the 21st century
Government
Priorities
Tertiary Education Com m ission’s Outcom es Fram ework