An Overview of the 2010 Hazardous Weather Testbed Experimental Forecast Program Spring Experiment
29
An Overview of the 2010 Hazardous Weather Testbed Experimental Forecast Program Spring Experiment Adam J. Clark 2 , Steven J. Weiss 1 , John S. Kain 2 , Israel L. Jirak 1 , Michael Coniglio 2 , Christopher J. Melick 1,9 , Christopher Siewert 1,9 , Ryan A. Sobash 3 , Patrick T. Marsh 2,3 , Andrew R. Dean 1 , Ming Xue 3,4 , Fanyou Kong 4 , Kevin W. Thomas 4 , Yunheng Wang 4 , Keith Brewster 4 , Jidong Gao 2 , Xuguang Wang 3,4 , Jun Du 5 , David R. Novak 6 , Faye E. Barthold 6,10 , Michael J. Bodner 6 , Jason J. Levit 7 , C. Bruce Entwistle 7 , Tara L. Jensen 8 , and James Correia, Jr. 1,9 1 NOAA/Storm Prediction Center, Norman, OK 2 NOAA/National Severe Storms Laboratory, Norman, OK 3 University of Oklahoma School of Meteorology, Norman, OK 4 Center for Analysis and Prediction of Storms, Norman, OK 5 NOAA/Environmental Modeling Center, Camp Springs, MD 6 NOAA/Hydrometeorological Prediction Center, Camp Springs, MD 7 NOAA/Aviation Weather Center, Kansas City, MO 8 Developmental Testbed Center, Boulder, CO 9 Cooperative Institute for Mesoscale Meteorological Studies, Norman, OK 10 I. M. Systems Group, Inc., Rockville, MD Submitted as an article to Bulletin of the American Meteorological Society January 2011 Revised May 2011 Accepted July 2011 * Corresponding author’s address: Adam J. Clark National Weather Center, NSSL/FRDD 120 David L. Boren Blvd., Norman, OK, 73072 email: [email protected] Phone: 405-325-6731 Abstract The NOAA Hazardous Weather Testbed (HWT) conducts annual Spring Forecasting Experiments organized by the Storm Prediction Center and National Severe Storms Laboratory to test and evaluate emerging scientific concepts and technologies for improved analysis and prediction of hazardous mesoscale weather. A primary goal is to accelerate the transfer of promising new scientific concepts and tools from research to operations through the use of intensive real-time experimental forecasting and evaluation activities conducted during the spring and early summer convective storm period. The 2010 NOAA/HWT Spring Forecasting Experiment (SE2010), conducted 17 May through 18 June, was particularly noteworthy because of its relatively broad focus. Specifically, while the focus of previous spring experiments has been mostly confined to severe storms and their associated high winds, large hail, and tornadoes, SE2010 included emphases on heavy rainfall and aviation weather, through collaboration with the Hydrometeorological Prediction Center (HPC) and Aviation
Transcript of An Overview of the 2010 Hazardous Weather Testbed Experimental Forecast Program Spring Experiment

An Overview of the 2010 Hazardous Weather Testbed Experimental Forecast Program Spring Experiment
Adam J. Clark2, Steven J. Weiss1, John S. Kain2, Israel L. Jirak1, Michael Coniglio2, Christopher J.
Melick1,9, Christopher Siewert1,9, Ryan A. Sobash3, Patrick T. Marsh2,3, Andrew R. Dean1, Ming Xue3,4, Fanyou Kong4, Kevin W. Thomas4, Yunheng Wang4, Keith Brewster4, Jidong Gao2, Xuguang Wang3,4,
Jun Du5, David R. Novak6, Faye E. Barthold6,10, Michael J. Bodner6, Jason J. Levit7, C. Bruce Entwistle7, Tara L. Jensen8, and James Correia, Jr.1,9
1NOAA/Storm Prediction Center, Norman, OK
2NOAA/National Severe Storms Laboratory, Norman, OK 3University of Oklahoma School of Meteorology, Norman, OK
4Center for Analysis and Prediction of Storms, Norman, OK 5NOAA/Environmental Modeling Center, Camp Springs, MD
6NOAA/Hydrometeorological Prediction Center, Camp Springs, MD 7NOAA/Aviation Weather Center, Kansas City, MO
8Developmental Testbed Center, Boulder, CO 9Cooperative Institute for Mesoscale Meteorological Studies, Norman, OK
10I. M. Systems Group, Inc., Rockville, MD
Submitted as an article to Bulletin of the American Meteorological Society
January 2011 Revised May 2011 Accepted July 2011
* Corresponding author’s address:
Adam J. Clark National Weather Center, NSSL/FRDD
120 David L. Boren Blvd., Norman, OK, 73072
email: [email protected] Phone: 405-325-6731
Abstract
The NOAA Hazardous Weather Testbed (HWT) conducts annual Spring Forecasting Experiments organized by the Storm Prediction Center and National Severe Storms Laboratory to test and evaluate emerging scientific concepts and technologies for improved analysis and prediction of hazardous mesoscale weather. A primary goal is to accelerate the transfer of promising new scientific concepts and tools from research to operations through the use of intensive real-time experimental forecasting and evaluation activities conducted during the spring and early summer convective storm period. The 2010 NOAA/HWT Spring Forecasting Experiment (SE2010), conducted 17 May through 18 June, was particularly noteworthy because of its relatively broad focus. Specifically, while the focus of previous spring experiments has been mostly confined to severe storms and their associated high winds, large hail, and tornadoes, SE2010 included emphases on heavy rainfall and aviation weather, through collaboration with the Hydrometeorological Prediction Center (HPC) and Aviation

2
Weather Center (AWC), respectively. In addition, using the computing resources of the National Institute for Computational Sciences at the University of Tennessee, the Center for Analysis and Prediction of Storms at the University of Oklahoma pushed the envelope of convection-allowing NWP by providing real-time CONUS-wide forecasts from a 4-km grid-spacing, 26 member multi-model Storm-Scale Ensemble Forecast (SSEF) system, and from a 1-km grid-spacing configuration of the Weather Research and Forecasting model. Several other organizations provided additional experimental high-resolution model output. This article summarizes activities, insights, and preliminary findings from SE2010, emphasizing use of the SSEF system and successful collaboration with HPC and AWC. 1. Capsule
Annual Spring Experiments aim to accelerate the transfer of promising new concepts and tools from research to operations through intensive real-time forecast and evaluation activities. 2. Background and Introduction Each spring during the climatological peak severe-weather season in the US, the Experimental Forecast Program (EFP) of the NOAA Hazardous Weather Testbed (HWT) conducts a multi-agency collaborative forecasting experiment known as the HWT-EFP Spring Experiment. Organized by the Storm Prediction Center (SPC) and National Severe Storms Laboratory (NSSL), annual Spring Experiments test new concepts and technologies designed to improve prediction of hazardous mesoscale weather. A primary goal is to accelerate the transfer of promising new tools from research to operations, while inspiring new initiatives for operationally relevant research, through intensive real-time experimental forecasting and evaluation activities (e.g., Weiss et al. 2007). This article summarizes activities and preliminary findings from the 2010 HWT-EFP Spring Experiment (SE2010) conducted 17 May to 18 June. The HWT is jointly managed by the SPC, NSSL, and the NWS Oklahoma City/Norman Weather Forecast Office (OUN), which are all located within the National Weather Center building on the University of Oklahoma South Research Campus. HWT facilities include a combined forecast and research area situated between the SPC and OUN operations rooms (Fig. 1), and a nearby development laboratory. The proximity to operational facilities, and access to data and workstations replicating those used operationally within the SPC, creates a unique environment supporting collaboration between researchers and operational forecasters on topics of mutual interest. The HWT organizational structure is comprised of the EFP, whose specific mission is “... focused on predicting hazardous mesoscale weather events on time scales ranging from a few hours to a week in advance, and on spatial domains ranging from several counties to the CONUS”, as well as the Experimental Warning Program and GOES-R Proving Ground. SE2010 was particularly noteworthy because, in addition to the traditional severe storms component, emphases were expanded to include heavy rainfall and aviation weather, through collaboration with the Hydrometeorological Prediction Center (HPC) and Aviation Weather Center (AWC), respectively. In addition, the Center for Analysis and Prediction of Storms (CAPS) at the University of Oklahoma provided unprecedented real-time CONUS-wide forecasts from a multi-model Storm-Scale Ensemble Forecast (SSEF) system with 26 members and 4-km grid-spacing, as well as a single forecast with 1-km grid-spacing. Several other organizations provided experimental model output, and the NCAR/NOAA Developmental Testbed Center (DTC) provided objective model evaluations. The first official Spring Experiment occurred in 2000. Kain et al. (2003) detailed the pre-2003 experiments and the history of collaborative activities between NSSL scientists and local OUN

3
forecasters. Additionally, Kain et al. (2003) articulated the ingredients necessary for a collaboration that is mutually beneficial to the participating operational and research organizations – namely, “Forecasters learn to address operational challenges from a more scientific perspective, while researchers become better equipped to pursue projects that have operational relevance.” The URL http://www.nssl.noaa.gov/projects/hwt/efp provides information on past experiments. Since 2003, Spring Experiments have examined experimental high-resolution “convection-allowing” numerical weather prediction (NWP) models (hereafter called convection-allowing models or CAMs). CAMs typically use grid-spacing ≤4-km, which is about the coarsest grid-spacing at which the evolution and dominant circulations within mid-latitude mesoscale convective systems (MCSs) can be adequately represented (Weisman et al. 1997). Using 4-km grid-spacing can be viewed as a resolution compromise – it is coarse enough so that current computers can generate forecasts quickly enough to provide operational guidance, and fine enough to reasonably depict the phenomena of interest. Successful real-time experiments using CAMs like those coordinated by CAPS in the mid-1990s (e.g., Xue et al. 1996; Droegemeier et al. 1996) using the Advanced Regional Prediction System (ARPS; Xue et al. 2003), and by NCAR in 2003 using the Weather Research and Forecasting (WRF) model (Skamarock et al. 2008) in support of BAMEX [Bow echo and Mesoscale Convective Vortex (MCV) Experiment; Davis et al. (2004)] paved the way for recent experiments using CAMs. From these earlier experiments, it became clear that CAMs could depict realistic MCSs – at times with surprising accuracy – and improve forecasts of MCS frequency and convective mode relative to coarser simulations using cumulus parameterization (Done et al. 2004). Since initial explorations during 2003 and 2004 (Kain et al. 2006), testing and evaluation of CAM systems has become a recurring theme of subsequent Spring Experiments with NCAR, EMC, and CAPS providing unique convection-allowing WRF model guidance each year. Furthermore, for many SPC forecasters, involvement in Spring Experiments and the demonstrable value of CAM products have led to integration of these products into their suite of routine forecast guidance. CAMs add value because they explicitly simulate convective mode providing valuable information on potential hazards1, in contrast to coarser convection-parameterizing models from which convective hazards are mostly inferred through aspects of the forecast synoptic and mesoscale environment. It is well known that to achieve maximum value and account for forecast uncertainty – which can be large even at very short lead times because of the non-linear error growth associated with convective processes – a properly calibrated ensemble is needed (Fritsch and Carbone 2004; Eckel et al. 2009). The challenges for developing CAM ensembles include increased computational requirements, along with developing appropriate ensemble perturbation, calibration, and visualization methods. We believe that these challenges are formidable, but that the motivation for developing CAM ensembles is strong. Aspects of CAM forecasts that are improved relative to convection-parameterizing forecasts, such as statistical properties of convective rainfall (e.g., Davis et al. 2004) and depiction of the diurnal precipitation cycle (Clark et al. 2007, 2009; Weisman et al. 2008), strongly suggest that CAM ensemble forecasts would be more representative of possible future atmospheric states than coarser convection-parameterizing ensembles [e.g., NCEP's Short-Range Ensemble Forecast (SREF) system (Du et al. 2006)]. To begin addressing challenges for CAM ensembles, CAPS developed the first real-time, large domain SSEF system in collaboration with the HWT for the 2007 Spring Experiment through multi-
1 Although tornadoes, high winds, and large hail, cannot be resolved at 4-km grid-spacing, these hazards are closely related
to convective mode and morphology (Gallus et al. 2008; Duda and Gallus 2010; Smith et al. 2010) which CAMs are demonstrably capable of simulating (e.g., Done et al. 2004; Weisman et al. 2008).
4
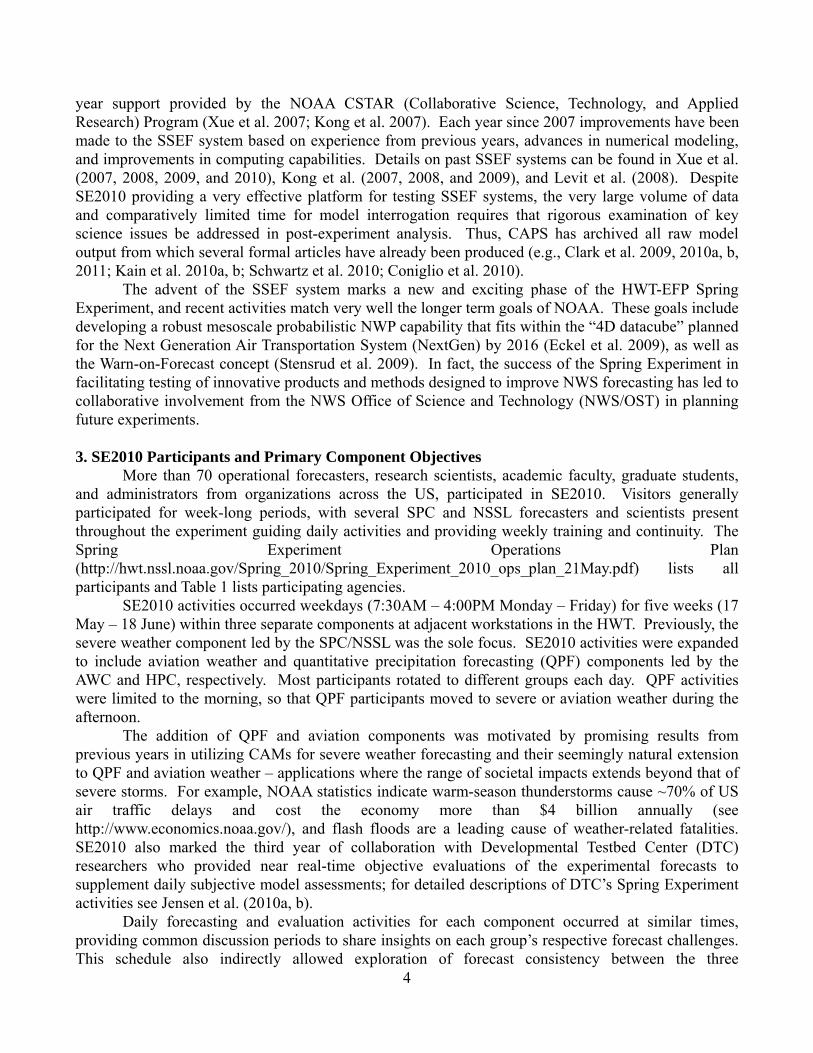
year support provided by the NOAA CSTAR (Collaborative Science, Technology, and Applied Research) Program (Xue et al. 2007; Kong et al. 2007). Each year since 2007 improvements have been made to the SSEF system based on experience from previous years, advances in numerical modeling, and improvements in computing capabilities. Details on past SSEF systems can be found in Xue et al. (2007, 2008, 2009, and 2010), Kong et al. (2007, 2008, and 2009), and Levit et al. (2008). Despite SE2010 providing a very effective platform for testing SSEF systems, the very large volume of data and comparatively limited time for model interrogation requires that rigorous examination of key science issues be addressed in post-experiment analysis. Thus, CAPS has archived all raw model output from which several formal articles have already been produced (e.g., Clark et al. 2009, 2010a, b, 2011; Kain et al. 2010a, b; Schwartz et al. 2010; Coniglio et al. 2010). The advent of the SSEF system marks a new and exciting phase of the HWT-EFP Spring Experiment, and recent activities match very well the longer term goals of NOAA. These goals include developing a robust mesoscale probabilistic NWP capability that fits within the “4D datacube” planned for the Next Generation Air Transportation System (NextGen) by 2016 (Eckel et al. 2009), as well as the Warn-on-Forecast concept (Stensrud et al. 2009). In fact, the success of the Spring Experiment in facilitating testing of innovative products and methods designed to improve NWS forecasting has led to collaborative involvement from the NWS Office of Science and Technology (NWS/OST) in planning future experiments. 3. SE2010 Participants and Primary Component Objectives More than 70 operational forecasters, research scientists, academic faculty, graduate students, and administrators from organizations across the US, participated in SE2010. Visitors generally participated for week-long periods, with several SPC and NSSL forecasters and scientists present throughout the experiment guiding daily activities and providing weekly training and continuity. The Spring Experiment Operations Plan (http://hwt.nssl.noaa.gov/Spring_2010/Spring_Experiment_2010_ops_plan_21May.pdf) lists all participants and Table 1 lists participating agencies. SE2010 activities occurred weekdays (7:30AM – 4:00PM Monday – Friday) for five weeks (17 May – 18 June) within three separate components at adjacent workstations in the HWT. Previously, the severe weather component led by the SPC/NSSL was the sole focus. SE2010 activities were expanded to include aviation weather and quantitative precipitation forecasting (QPF) components led by the AWC and HPC, respectively. Most participants rotated to different groups each day. QPF activities were limited to the morning, so that QPF participants moved to severe or aviation weather during the afternoon.
The addition of QPF and aviation components was motivated by promising results from previous years in utilizing CAMs for severe weather forecasting and their seemingly natural extension to QPF and aviation weather – applications where the range of societal impacts extends beyond that of severe storms. For example, NOAA statistics indicate warm-season thunderstorms cause ~70% of US air traffic delays and cost the economy more than $4 billion annually (see http://www.economics.noaa.gov/), and flash floods are a leading cause of weather-related fatalities. SE2010 also marked the third year of collaboration with Developmental Testbed Center (DTC) researchers who provided near real-time objective evaluations of the experimental forecasts to supplement daily subjective model assessments; for detailed descriptions of DTC’s Spring Experiment activities see Jensen et al. (2010a, b). Daily forecasting and evaluation activities for each component occurred at similar times, providing common discussion periods to share insights on each group’s respective forecast challenges. This schedule also indirectly allowed exploration of forecast consistency between the three

5
components. The primary objectives for each component were based on mission specific needs and each NCEP center's previous experience with CAMs. SPC forecasters have used CAM output since 2004, whereas most HPC and AWC forecasters have only limited experience with CAMs. Overall, primary objectives for each component were similarly designed to: 1) allow forecasters to explore potential operational uses of CAM systems, 2) test experimental probabilistic forecast products, and 3) provide feedback to model developers on strengths and weaknesses of current systems. The basic objectives and experimental forecast products (examples in Fig. 2) for each component are listed below. a. Severe Convective Storms Component Primary objectives: Continue testing and evaluation of CAM systems in providing useful guidance for generating probabilistic severe weather outlooks with a focus on improving forecasts of initiation, evolution, mode, and intensity of convective storms. Experimental forecast products: Outlooks were issued over movable domains approximately 8° lat x 14° long. The placement of the daily domain was determined based on where severe convective impacts or forecast challenges were expected to be greatest, in consultation with SPC forecasters working the operational day shift. The outlooks generated were similar to SPC's operational Day-1 convective outlooks, but with higher temporal resolution to complement the current experimental Day-1 enhanced resolution probabilistic thunderstorm product (http://www.spc.noaa.gov/products/exper/enhtstm/). The graphical outlooks consisted of probabilistic forecasts for any severe convective weather (i.e., hail diameter ≥ 1-inch, wind gusts ≥50 knots, and tornadoes) within 25 miles of a point during the 2000 – 0000 UTC and 0000 – 0400 UTC time periods. Following SPC conventions, probability contours were drawn at 5, 15, 30, 45, and 60%. In addition, hatched shading was used to delineate regions where a 10% or greater probability existed for significant severe events (i.e., EF2 or greater tornado, hail diameter ≥2-inches, and/or wind gusts≥65 knots). A text discussion (e.g., Fig. 2d) was also included providing forecast reasoning with an emphasis on CAM guidance utility. The experimental preliminary outlooks were issued daily by 1530 UTC and then updated by 1930 UTC. A team-generated outlook issued 24 May 2010 is shown in Fig. 2a. b. Aviation Weather Component Primary objectives: Explore CAM system potential to provide useful guidance for probabilistic thunderstorm forecasts emphasizing timing, location, coverage (porosity), and thunderstorm tops – critical areas for efficient management of the National Airspace System. Experimental forecast products: The human generated outlooks covered a fixed domain over the high air-traffic regions of the central and eastern US. The graphical outlooks consisted of probabilistic thunderstorm (defined as reflectivity ≥40 dBZ)forecasts for three “snapshot” times valid at 2100, 2300, and 0100 UTC (Fig. 2c). Probability contours were drawn for 25, 50, and 75%, corresponding to the descriptors Slight, Moderate, and High, respectively, which represented coverage of thunderstorms. Predictions of broken or solid lines of storms were indicated by dashed lines on the snapshot graphic. A separate product was produced for the probability of thunderstorm tops ≥25,000 feet2 using the same Slight (25%), Moderate (50%), and High (75%) probability contours. The aviation products were designed to complement AWC’s operational Collaborative Convective Forecast Product (http://aviationweather.gov/products/ccfp/). As in the severe weather component, products were issued in the morning by 1530 UTC and updated in the afternoon by 1930 UTC, and included text
2 The thunderstorm top threshold was changed to ≥ 35,000 ft midway through SE2010 based on recommendations by FAA participants.

6
providing forecast reasoning and CAM utility. During the afternoon, the aviation team split into one group focused on the aforementioned Day-1 products, and another that generated a Day-2 probabilistic thunderstorm forecast valid 1800 to 0000 UTC the following day for experimental aviation strategic planning purposes. Again, the 40 dBZ reflectivity threshold defined thunderstorms, and the same probability contours corresponding to Slight, Moderate, and High were used for the outlooks. c. QPF Component Primary objectives: Explore the utility of CAM systems in providing guidance for experimental probabilistic 6-h QPF products.
Experimental forecast products: Team-generated QPF products included probability of 6-h rainfall exceeding 0.50- and 1.00-in for the periods 1800 to 0000 UTC and 0000 to 0600 UTC. These products with text discussions were issued daily by 1530 UTC over the same movable domain as the severe weather component. The experimental probabilistic QPF graphics used categorical terms Slight, Moderate, and High to denote forecast probabilities of 25, 50, and 75%, respectively, and were a large departure from the standard deterministic QPF products issued operationally at HPC. A prediction for maximum 6-h rainfall amount within the highest probability contour for 1.00-in exceedance was also included in the graphic3. Afternoon updates were not issued for QPF products. An example outlook is shown in Fig. 2b. 4. Experimental Model Guidance and Products
SE2010 benefitted from experimental CAM guidance contributed by CAPS, EMC, the Earth Systems Research Laboratory Global Systems Division (ESRL/GSD), NSSL, and NCAR. Each of these collaborators provided 0000 UTC initialized model guidance, and most provided guidance from additional model runs initialized at 1200 UTC and/or other times. The computational domains covered from three-fourths to full CONUS regions and most 0000 UTC initialized models produced forecasts for at least 30-h lead times. The cornerstone of the SE2010 experimental model guidance was a 26 member, 4-km grid-spacing multi-model SSEF system produced by CAPS. CAPS also produced a 1-km grid-spacing 30-h CONUS domain simulation. Details on model guidance contributed by each organization are provided in online supplemental materials. CAM-derived products based on explicitly simulated storm characteristics were emphasized during the generation of outlooks for all three components. Some of these products (e.g., simulated reflectivity) have been used in previous Spring Experiments, while others were newly developed specifically for aviation and QPF components. Given the fine-scale, high amplitude, and discontinuous nature of simulated storm fields, generating useful SSEF ensemble mean fields is quite challenging. For example, consider ensemble forecasts containing individual realizations of slightly displaced convective systems. Clearly, an ensemble mean based on averaging all members would “smear out” the high-amplitude features and sharp gradients, obfuscating relevant information like system mode and intensity. To retain the amplitude of simulated model features, a technique called “probability matching” (Ebert 2001; Clark et al. 2009) was utilized as an alternative to the traditional ensemble mean for fields such as precipitation and simulated reflectivity. Probability matching basically involves replacing the ensemble mean distribution with a distribution sampled from the individual ensemble members and thus helps retain the amplitude of individual members. Further challenges in generating useful probabilistic products are caused by the inherent low probability of severe weather on the 4-km grid scale. For example, even during widespread severe weather outbreaks, the probability that a particular grid box will experience severe weather is very low. 3 If probabilities were below Slight (25%) for the entire domain, a maximum amount was not indicated.
7
These low probability events can be viewed as occurring at the tail of the forecast probability distribution function (PDF) where it would take an ensemble with much larger membership than the SSEF system to generate reliable forecast probabilities (e.g., Richardson 2001). One way to provide more useful probabilistic information from a limited size ensemble is to consider probabilities of severe weather occurring within a specified radius of each model grid point. This way, a larger area is considered over which it is inherently more likely that severe weather will occur, and the forecast event moves away from the tail of the forecast PDF where fewer members are required to generate reliable forecasts. Following this idea, for selected SSEF system fields, “neighborhood probabilities” were computed for the probability of events occurring within a 40-km radius of each grid point (this is consistent with operational SPC probabilistic severe weather outlooks). To eliminate some of the sharp circular edges in the probability fields that result from using circular areas and to account for additional spatial uncertainty, a 2D Gaussian smoother (e.g., Brooks et al. 1998) was applied to the neighborhood probabilities (weighting function, σ = 10 grid points). Methods for generating useful probabilistic information from CAM systems are still being researched (e.g., Sobash et al. 2011; Marsh et al. 2011).
A list of CAM-derived products can be found in the CAPS Spring Experiment Program plan (http://forecast.caps.ou.edu/SpringProgram2010_Plan_Brief.pdf). Generally, the fields available from the SSEF members were also available from the deterministic CAMs used in SE2010. The following sections highlight some of the more widely used and innovative products, along with some of the methods used by DTC for objective evaluation.
a. Simulated Reflectivity Computing and then adding “equivalent reflectivity factors” (e.g., Xue et al. 2003; Koch et al. 2005) for each simulated hydrometeor species yields model simulated reflectivity (after converting units to dBZ), which is a very useful product for monitoring characteristics of CAM storms and was heavily utilized during SE2010. Along with displays of simulated reflectivity from a single model, “spaghetti plots” of reflectivity exceeding a specified threshold from the SSEF members were often displayed, and SSEF-derived ensemble mean, probability matched, and neighborhood probability reflectivity products were also often utilized. Figure 3 shows simulated reflectivity from four SSEF members with only varied microphysics parameterizations (Fig. 3a-d) and the 1-km grid-spacing CAPS run (Fig. 3e) with corresponding observations (Fig. 3f) for 27-h forecasts initialized 0000 UTC 18 June. b. Model Simulated Satellite Imagery Working with scientists at both the Cooperative Institute for Research in the Atmosphere (CIRA)/Colorado State University (CSU) and the Cooperative Institute for Meteorological Satellite Studies (CIMSS)/University of Wisconsin (UW), simulated (or synthetic) satellite imagery (e.g., Grasso et al. 2008; Otkin and Greenwald 2008) was produced for SE2010. CIRA and CIMMS generated this imagery by running local versions of radiative transfer models with moisture, temperature, and hydrometeor fields in the NSSL-WRF model to create simulated radiance/brightness temperature fields. Animations of simulated satellite imagery can allow forecasters to rapidly discern simulated dynamic processes such as moisture transport, ascent and subsidence, and shallow and deep convection, improving understanding of model forecast evolution. Examples of simulated satellite imagery produced by CIRA and CIMSS are shown in Fig. 4. Real-time forecast imagery is available year-round in SPC workstations and at http://www.nssl.noaa.gov/wrf/.
c. Hourly Maximum Fields Hourly output of “traditional” fields (e.g., mean-sea-level pressure, geopotential height, 700-

8
hPa temperatures) was available from SE2010 CAM guidance. However, smaller scale features like those in explicitly simulated storms often evolve on time scales of minutes rather than hours. To monitor the behavior of such features, Kain et al. (2010a) developed a strategy to track small-scale, rapidly changing features at every model time step between regular hourly model output times. Individual grid-point temporal-maximum values from each hour are stored in two-dimensional fields that are saved at the regular hourly output intervals. These hourly maximum fields (HMFs) provide useful information on peak intensity and track of simulated storm features without storing all model fields every time step. In the SSEF system, HMFs were computed for six diagnostic fields conceptually thought to be related to CAM storm attributes and potential severe convective hazards: 1) maximum updraft and 2) maximum downdraft velocities between 3- and 6-km AGL, which indicate the intensity of convective overturning, 3) simulated reflectivity at 1-km AGL, which should also be related to the intensity of convection, 4) updraft helicity (Kain et al. 2008) – the integral of vertical vorticity times updraft velocity between 2- and 5-km AGL – which is designed to detect mesocyclones in model simulated storms, 5) wind speeds at 10-m AGL, which was tested for predicting severe surface wind gusts, and 6) vertically integrated graupel (or depth of equivalent liquid in mm), which was tested for predicting large hail. To complement HMF displays from single model forecasts, maximum values of HMFs from any SSEF member were displayed, which provided estimates of the potential peak storm intensity. Additionally, neighborhood exceedance probabilities for selected HMF thresholds were computed, providing information on the likelihood of storm attributes reaching different intensity levels. Figure 5 illustrates various updraft helicity fields including single model forecasts from the SSEF system control member (Fig. 5a) and the 1-km grid-spacing CAPS run (Fig. 6b), maximum updraft helicity from any member (Fig. 5c), and neighborhood probabilities for updraft helicity greater than 100 m2/s2 (Fig. 5d) for the 1-hr period ending 0100 UTC 11 May 2010. This high-impact event involved numerous strong supercells that tracked across Oklahoma and Kansas producing damaging tornadoes, wind, and hail. d. QPF Products To facilitate the QPF component, several SSEF-derived precipitation products were developed. Additionally, for comparison to operational guidance, corresponding products were made available from NCEP’s SREF system. These products included the traditional ensemble mean, the probability matched ensemble mean, and the maximum from any member of 6-h accumulated precipitation. Traditional (or grid-point based) forecast probabilities, as well as neighborhood probabilities, of precipitation greater than 0.5-, 1.0-, and 2.0-in were provided. Forecasts from deterministic CAMs were also compared to products from the operational NAM. For verification, NSSL’s NMQ [National Mosaic and multi-sensor Quantitative Precipitation Estimation (QPE); Zhang et al. 2009] dataset was used. Illustrating these products, forecasts of an MCS-related heavy rainfall event in Iowa are shown in Fig. 6. e. Aviation Products Several SSEF-derived products were developed to support the aviation component. One such product is “linear-mode probability”, which indicates the probability of a contiguous line of storms. Porosity of convective systems (i.e., the amount of space between individual storms) is very important for aviation because planes can often navigate through spaces in non-contiguous regions of convection, but generally have to navigate around contiguous lines. The linear-mode algorithm identifies areas where simulated reflectivity exceeds 35 dBZ, and then estimates the mean length-to-width ratio of the contiguous area, searching for ratios greater than 5:1. Grid-points are “flagged” for lengths exceeding 50, 100, and 200 miles, and probabilities are computed based on the number of flagged ensemble
9
members within 25 miles of each grid-point. Another important property of convection for aviation is thunderstorm height. For SE2010, model simulated storm heights were computed by finding the maximum height of 18 dBZ reflectivity. Then, SSEF-derived neighborhood probabilities for storm tops exceeding 25000, 35000, and 50000 feet were computed. For verification, NSSL’s NMQ dataset includes a high-resolution 3D reflectivity grid from which storm top heights can be estimated. Example aviation products are shown in Fig 7. f. DTC Objective Evaluation Products The DTC provided objective verification of several deterministic and probabilistic fields from experimental and operational models using Meteorological Evaluation Tools (MET; Developmental Testbed Center, 2010). Again, NSSL’s NMQ provided the verification dataset. Emphasis was placed on the object-based verification tool available in MET called Method for Object-based Diagnostic Evaluation (MODE; Davis et al. 2006), although traditional metrics (e.g., Gilbert Skill Score and bias) were also computed. Graphs and spatial plots illustrating output from MET were available through an interactive website under development by DTC - http://verif.rap.ucar.edu/eval/hwt/2010/ (e.g., Fig. 8). 5. Results from model evaluations Web-based forms were used to document aspects of experimental model forecasts relevant to each component. A large set of different model aspects were assessed. This section only examines a few aspects for which survey answers were mostly complete and contained interesting and meaningful results, which are summarized in Table 2. These subjective results are preliminary. More detailed work on each aspect is forthcoming. a) Evaluation of SSEF microphysics perturbations Severe weather groups compared forecasts from four SSEF members identically configured except for the microphysics parameterization. The microphysics schemes were Thompson et al. (2004), WRF single-moment 6-class (WSM-6; Hong and Lim 2006), WRF double moment 6-class (WDM6; Lim and Hong 2010), and Morrison et al. (2005). Specifically, participants were asked to: “Comment on any differences and perceived level of skill in forecasts of composite reflectivity between control member CN (Thompson), m15 (WDM6), m16 (WSM6), and m17 (Morrison), over the evaluation domain and during the 20z-04z period…” Microphysics sensitivities were of particular interest during SE2010 because two “double-moment” schemes - WDM6 and Morrison – were newly available in WRF version 3.1.1 used for the SSEF system. Double-moment schemes, which contain prognostic equations for mixing ratios and number concentrations of certain hydrometeor species, are more sophisticated and computationally expensive than single-moment schemes that only contain prognostic equations for hydrometeor mixing ratios. Survey respondents often noted large differences in the simulations with different microphysics, but no single scheme seemed to outperform the others during SE2010. On many days, the Thompson run was the outlier among the four members, generating much more extensive regions of stratiform reflectivity. Furthermore, the Thompson member was most often noted for spurious convection. On the other hand, for organized MCSs that occurred near the end of the forecast period, Thompson often had superior placement which was thought to be related to differences in simulated cold pool strength. Examination of 2-m temperatures (not shown) revealed a tendency for the non-Thompson schemes to generate stronger (i.e., colder) cold pools and associated MCSs that propagated too quickly toward the east and/or south. The Thompson forecasts had weaker cold pools that appeared more realistic and were associated with smaller MCS displacement errors.
Further evidence for these location differences was obtained objectively using a simple

10
compositing method introduced by Clark et al. (2010c) and illustrated in Fig. 9. This technique searches within a 250-km radius of each grid point with a forecast event – in this case, 1-hr rainfall ≥ 0.50-in – and finds the conditional distribution of observed events. Composite distributions of observed events are then obtained by summing over all cases (see Clark et al. 2010c for further details). At forecast hour 30, the Thompson forecasts show minimal systematic displacement error, while the non-Thompson schemes are associated with southward and eastward displacement errors. Similar differences in displacement errors and the tendency for the Thompson scheme to generate more extensive stratiform regions of reflectivity can be seen comparing the mixed microphysics members in Fig. 4.
b) Comparison of 0000 and 1200 UTC WRF forecasts from EMC and NCAR Experimental guidance from models initialized at 0000 UTC was used to generate preliminary severe weather outlooks each morning, with 1200 UTC initialized guidance becoming available in time for the afternoon outlook updates. The deadline for issuance of updates was 30 min before the 2000 – 0400 UTC forecast period began. For such short-term forecasts, SPC forecasters heavily rely on observational data for diagnostic assessments. However, as the update frequency of CAMs increases, it is hoped that guidance from such models can also provide short-term forecast value by improving upon earlier model initializations. With these issues in mind, this evaluation asked the severe weather team to rate the perceived skill of separate 1200 UTC initialized CAMs produced by EMC and NCAR relative to their 0000 UTC counterparts. For both EMC and NCAR simulations, the 1200 UTC runs were most frequently rated as either “about the same” or “superior” to the 0000 UTC runs (Q1 in Table 2). However, there were a surprisingly large number of cases in which the 1200 UTC EMC runs were rated “worse” than the corresponding 0000 UTC runs. For these “worse” cases, it is believed that poor depiction of nocturnal convection present at initialization contributed to erroneous forecasts, which was reflected in the following sample comment: “The 12Z WRF-NMM very poorly initialized ongoing convection in AR and TX resulting in misplaced boundaries and very unrealistic convective evolution. Closer inspection of the initialized fields revealed that the outflow boundaries in the ICs were too smooth and after only an hour or two into the simulation the model just got rid of the outflow boundaries”. These results were generally consistent with Weiss et al. (2008). Note, the EMC runs were “cold start” initializations using ICs from a 32-km grid of the operational NAM, which may be too coarse to resolve smaller scale boundaries. The NCAR runs used higher resolution 13-km RUC ICs which incorporate a more sophisticated initialization procedure utilizing radar data. Thus, the smaller number of “worse” cases in the NCAR relative to the EMC runs may have been related to the different ICs. As previously mentioned, details on model configurations are provided in supplementary materials. c) Comparison of simulated reflectivity in CAPS 1- and 4-km grid-spacing WRF-ARW forecasts Previous work indicates that decreasing horizontal grid spacing from 4- to 2-km provides more detailed structure, but little added value, for next-day guidance of severe convection and heavy rainfall (Kain et al. 2008; Schwartz et al. 2009). To explore whether further reductions in grid spacing are needed to begin seeing added value relative to the 4-km forecasts, CAPS began producing 1-km grid-spacing forecasts for Spring Experiments in 2009 and 2010. Thus, this evaluation assessed the additional value (if any) in the mesoscale evolution of convection by reducing grid spacing from 4- to 1-km. Considering 1-km AGL simulated reflectivity compared to corresponding observations and focusing on the 2000 – 0400 UTC period for mesoscale aspects of convection like mode, movement, and initiation, the severe weather team rated the 1-km forecast as “better”, “similar”, or “worse” than the 4-km forecast.

11
The results (Q2 in Table 2) imply little added value using 1-km grid spacing for the given forecast period. Although there were five instances in which the 1-km run was rated better than the 4-km, there were four cases in which the 1-km was rated worse. By far, the 1- and 4-km were most frequently rated similar (13 instances). In archived comments, participants often noted finer scale details present in the 1-km runs would not have added value to the types of severe weather forecasts made in SE2010. For example, 18 May comments included, “If we look hard, there are subtle differences that can be noted between 4 and 1-km. However, the forecasts were generally very similar with respect to evolution, placement, time … etc.”; on 26 May, “Both under-predict the dry-line convection along TX/NM and they both correctly predict the KS MCS. Upon close examination of the forecasts, there are many differences in some of the storm scale details, but these smaller scale details didn’t really result in differences in skill.”; and on 9 June, “There were some noticeable smaller scale differences between the 1 and 4-km, but they looked more like each other than they did the observations.”
The 10 May 2010 tornado outbreak in Oklahoma was an interesting case for comparing the 4- and 1-km runs. Comparing hourly max UH (Figs. 5a and b) clearly shows that the 1-km run developed multiple storms with strong rotation (max UH values were greater than 1000 m2s-2) in northeast Oklahoma/southeast Kansas, while the 4-km run only developed one weakly rotating storm in southeast Kansas. Although the 1-km simulated storms were displaced north and east relative to observed ones, the number and intensity of storms predicted by the 1-km run provided much better guidance than the 4-km run on this day. Clearly, the sensitivity to horizontal resolution is a complicated issue that deserves further attention.
d) Evaluation of SREF and SSEF precipitation forecasts Recent studies (e.g., Clark et al. 2009, 2010c) using objective metrics generally indicate significant added value for convection-allowing relative to convection-parameterizing precipitation forecasts, especially for precipitation associated with organized convection. However, until SE2010, the use of CAMs in a pseudo-operational environment had not been tested. Thus, SE2010 provided an ideal setting to gauge the potential usefulness of SSEF precipitation products. For example, in one survey form QPF component participants were asked, “To what degree did the SSEF 6-hr precipitation forecasts provide added value over the SREF 6-hr precipitation forecasts?”
The subjective ratings (Q3 in Table 2) strongly indicated SSEF provided added value over SREF. For the 1800 – 0000 UTC period, 16 of 22 responses rated SSEF as “much better” or “better” than SREF, with only 2 instances in which SSEF was rated “worse” or “much worse” than SREF (four ratings were “about the same”). For the 0000 – 0600 UTC period, a larger portion of the responses rated SSEF and SREF “about the same” (7 of 20), but a majority (12 of 20) rated SSEF as “better” or “much better” than SREF, with only one case where SSEF was rated “worse” than SREF. The 0000 – 0600 UTC SSEF forecasts in Fig. 6 were rated “much better” than SREF. Overall, the SSEF products offered such a large improvement that HPC forecasters described the SSEF guidance as transformational for warm season QPF. Although an operational SSEF system is several years away, based on the positive experiment results, HPC increased the number of experimental CAMs and CAM-derived fields available to forecasters. e) High Resolution Rapid Refresh (HRRR) Model evaluations The 3-km High Resolution Rapid Refresh (HRRR; Alexander et al. 2010) model being developed by GSD provides 15-h forecasts initialized hourly for users needing frequently updated short-range weather forecasts, including those in the US aviation and severe weather forecasting communities. During SE2010, the HRRR was mainly used for afternoon outlook updates, and

12
particular attention was given to whether the most recent HRRR guidance improved upon earlier HRRR initializations. Intuitively, one would expect later initialized guidance to be improved, but this issue has yet to be examined for such short-range/high-resolution forecasts. Thus, the following survey question involved comparing hourly forecasts of 1-km AGL simulated reflectivity from HRRR forecasts initialized at 1200, 1400, 1600, and 1800 UTC: Is the perceived skill of each subsequent HRRR forecast superior to the preceding forecast? The responses (Q4 in Table 2) were evenly split between later initialized forecasts being better and about the same relative to earlier forecasts. There was one occasion when later HRRR forecasts were found to be worse than earlier ones. Archived comments indicated that improvements in the later initializations were sometimes quite noticeable. For example, 8 June comments noted, “Each later initialization time seemed to get a better handle on the organization of the MCS that moved into central NE. Specifically, the 18Z initialization had a comma head structure for the forecast valid at 4Z that looked very similar to what was observed, although just slightly displaced”. However, improvements in later runs were typically small and/or for specific features. For example, 24 May comments included, “The most recent HRRR run (18Z) did slightly better with the SE US convective system. But generally, there wasn’t much difference in skill between the different initializations”, and 15 June, “The improvement is only slight with each later initialized forecast, and for only the convective system in East Oklahoma”. Additionally, sometimes later initialized forecasts were improved in certain areas, but degraded in others. For example, 21 May comments included, “Perhaps the later initialized forecasts had a better defined W-E oriented line of convection, which better corresponded to obs. However, later initialized forecasts also added spurious convection in MO and AR”. Figures 10 and 11 illustrate typical good (17 June) and bad (June 18) HRRR forecasts, respectively. 7. Concluding Remarks SE2010 marks the 11th year of annual Spring Experiments organized by the SPC and NSSL. These experiments accelerate the transfer of research tools to operations through intensive real-time forecasting and model evaluation activities and they inspire operationally relevant research initiatives. During SE2010, the traditional focus on severe weather was expanded to include important collaborations with two other NCEP centers to address a wider range of convective hazards. The HPC led an initial effort exploring high-resolution forecasts of precipitation and excessive convective rainfall, and the AWC examined new forecasting tools to improve thunderstorm forecasts for aviation. The three forecasting components operated simultaneously within the HWT.
Detailed information was collected daily to document experimental forecasts, perceived value of model guidance, and subjective model evaluations, including an assessment of newly developed experimental products and display formats. All participants shared in the challenges of making forecasts based on imperfect guidance. Because the weather each day was “live”, no one knew the correct “answer”, which created a sense of realism and operational urgency to the experiment. Next-day evaluation of products was often a humbling and instructive exercise. The HWT brings together different parts of the meteorological community to work together in real-time, addressing a variety of severe weather topics. Given the historically large separation between operational forecasting and research, the HWT provides a relatively rare opportunity for interaction between operational forecasters and/or research scientists on subjects of mutual interest. The HWT has very successfully fostered collaborative research, partially because of the public safety and societal importance of convective weather, but also because the structure of the experiments enables forecasters and researchers to better understand their respective roles. Thus, forecasters gain more knowledge about how research is conducted, and researchers are able to better understand operational requirements and constraints. In short, all participants are taken out of their respective “comfort zones”

13
when they participate in the HWT resulting in numerous benefits as a two way R2O–O2R (research-to-operations/operations-to-research) dialog emerges. Illustrating these mutual benefits, on a scale of 1 to 10 (1 “Not useful” and 10 “Extremely Useful”), nearly 90% of SE2010 participants rated their HWT experience between 8 and 10 for the degree of usefulness in contributing to “… unique and valuable perspectives and/or partnerships applicable to your current work and professional activities…” Numerous scientific challenges remain for development of accurate and reliable storm-scale guidance, which requires improvements in data assimilation, models, post-processing, and forecaster interpretation. The HWT will continue to play a key role is these tasks. Acknowledgments Many individuals contributed to the success of SE2010 including Gregg Grosshans, Jay Liang, Joe Byerly, Linda Crank, Peggy Stogsdill (SPC); Brett Morrow, Jeff Horn, Steve Fletcher, Brad Sagowitz, Linda McGuckin, and J. J. Gourley (NSSL); Morris Weisman, Wei Wang, Greg Thompson, and Jimy Dudhia (NCAR); Matt Pyle, Zavisa Janjic, Brad Ferrier, and Geoff DiMego (NCEP/EMC); Stan Benjamin, Steve Weygandt, John Brown, and Curtis Alexander (ESRL/GSD); Barbara Brown, David Ahijevich, Jamie Wolff, Michelle Harrold, Steve Sullivan, and Paul Oldenberg (NCAR/NOAA/DTC); Bill McCaul, Jon Case, and Scott Dembek (NASA/SPoRT/Huntsville); Louie Grasso and Dan Lindsey (CIRA); Jason Otkin, Justin Sieglaff, Wayne Feltz, Jason Brunner (CIMSS); John Mecikalski, Wayne MacKenzie, and John Walker (UAH); and Kris Bedka (NASA/Langley). Feedback/recommendations from Tony Eckel (NWS/OST) were especially appreciated.
In addition to NOAA CSTAR support, CAPS simulations received supplementary support from NSF grant ATM-0802888. All 2010 CAPS forecasts were produced at the National Institute of Computational Science (NICS) at the University of Tennessee, and Oklahoma Supercomputing Center for Research and Education resources were used for ensemble post-processing. Special thanks to the GOES-R Program Office, the NWS, and NSSL for visitor travel support. We recognize the full support of SPC and NSSL management; the leadership of SPC forecasters in guiding the severe weather component each year; and contributions from many participants who clearly demonstrated the value of collaborative experiments, and whose talents and enthusiasm resulted in a positive learning experience for everyone. Finally, we thank Matthew Bunkers and two anonymous reviewers for helpful suggestions that improved the manuscript. References Alexander, C. R., S. S. Weygandt, T. G. Smirnova, S. Benjamin, P. Hofmann, E. P. James, and D. A.
Koch, 2010: High resolution rapid refresh (HRRR): Recent enhancements and evaluation during the 2010 convective season. 25th Conf. on Severe Local Storms, Denver, CO, Amer. Meteor. Soc., 9.2.
Brooks, H. A., M. Kay, and J. A. Hart, 1998: Objective limits on forecasting skill of rare events. Preprints, 19th Conf. on Severe Local Storms, Minneapolis, MN, Amer. Meteor. Soc., 552-555.
Clark, A. J., W. A. Gallus, and T. C. Chen, 2007: Comparison of the diurnal precipitation cycle in convection-resolving and non-convection-resolving mesoscale models. Mon. Wea. Rev., 135, 3456–3473.
——, ——, M. Xue, and F. Kong, 2009: A comparison of precipitation forecast skill between small convection-allowing and large convection-parameterizing ensembles. Wea. Forecasting, 24, 1121-1140.
——, ——, ——, and ——, 2010a: Growth of spread in convection-allowing and convection-parameterizing ensembles. Wea. Forecasting, 25, 594-612.

14
——, ——, ——, and ——, 2010b: Convection-allowing and convection-parameterizing ensemble forecasts of a mesoscale convective vortex and associated severe weather environment. Wea. Forecasting, 25, 1052-1081.
——, ——, and M. L. Weisman, 2010c: Neighborhood-based verification of precipitation forecasts from convection-allowing NCAR WRF model simulations and the operational NAM. Wea. Forecasting, 25, 1495-1509.
——, and Coauthors, 2011: Probabilistic precipitation forecast skill as a function of ensemble size and spatial scale in a convection-allowing ensemble. Mon. Wea. Rev., 139, 1410-1418.
Coniglio, M. C., K. L. Elmore, J. S. Kain, S. J. Weiss, M. Xue, and M. L. Weisman, 2010: Evaluation of WRF model output for severe-weather forecasting from the 2008 NOAA Hazardous Weather Testbed Spring Experiment. Wea. Forecasting, 25, 408-427.
Davis, C. A., and Coauthors, 2004: The Bow Echo and MCV Experiment: Observations and opportunities. Bull. Amer. Meteor. Soc., 85, 1075–1093.
——, B. Brown, and R. Bullock, 2006: Object-based verification of precipitation forecasts. Part II: Application to convective rain systems. Mon. Wea. Rev., 134, 1785–1795.
Developmental Testbed Center, 2010: Model Evaluation Tools Version 3.0 (METv3.0) User’s Guide 3.0.1 [Available at http://www.dtcenter.org/met/users/docs/users_guide/MET_Users_Guide_v3.0.1.pdf].
Done, J., C. A. Davis, and M. L. Weisman, 2004: The next generation of NWP: Explicit forecasts of convection using the Weather Research and Forecast (WRF) Model. Atmos. Sci. Lett., 5, 110-117.
Droegemeier, K. K., and Coauthors, 1996: Realtime numerical prediction of storm-scale weather during VORTEX ’95. Part I: Goals and methodology. Preprints, 18th Conf. on Severe Local Storms, San Francisco, CA, Amer. Meteor. Soc., 6-10.
Du. J., J. McQueen, G. DiMego, Z. Toth, D. Jovic, B. Zhou, and H. Chuang, 2006: New dimension of NCEP Short-Range Ensemble Forecasting (SREF) system: Inclusion of WRF members, WMO Expert Team Meeting on Ensemble Prediction Systems, Exeter, UK, Feb. 6-10, 2006, 5 pp.
Duda, J. D. and W. A. Gallus, 2010: Spring and summer Midwestern severe weather reports in supercells compared to other morphologies. Wea. Forecasting, 25, 190-206.
Ebert, E. E., 2001: Ability of a poor man’s ensemble to predict the probability and distribution of precipitation. Mon. Wea. Rev., 129, 2461-2480.
Eckel, F. A., and C. F. Mass, 2005: Aspects of effective mesoscale, short-range ensemble forecasting. Wea. Forecasting, 20, 328–350.
——, H. R. Glahn, T. M. Hamill, S. Joslyn, W. M. Lapenta, and C. F. Mass, 2009: National Mesoscale Probabilistic Prediction: Status and the Way Forward. A White-Paper Report from the National Workshop on Mesoscale Probabilistic Prediction, 23-24 September 2009 (Available at http://www.weather.gov/ost).
Fritsch, J. M., and R.E. Carbone, 2004: Improving quantitative precipitation forecasts in the warm season: A USWRP research and development strategy. Bull. Amer. Meteor. Soc., 85, 955–965.
Gallus, W. A., N. A. Snook, E. V. Johnson, 2008: Spring and Summer severe weather reports over the Midwest as a function of convective mode: A preliminary study. Wea. Forecasting, 23, 101-113.
Grasso, L. D., M. Sengupta, J. F. Dostalek, R. Brummer, and M. DeMaria, 2008: Synthetic satellite imagery for current and future environmental satellites. Int. J. Remote Sens., 29, 4373-4384.
Hong, S.-Y, and J.-O. J. Lim, 2006: The WRF single-moment 6-class microphysics scheme (WSM6). J. Korean Meteor. Soc., 42, 129-151.
Jensen, T., B. Brown, M. Coniglio, J. S. Kain, S. J. Weiss, and L. Nance, 2010a: Evaluation of experimental forecasts from the 2009 NOAA Hazardous Weather Testbed Spring Experiment

15
using both traditional and spatial methods. 20th Conf. on Probability and Statistics, Atlanta, GA, Amer. Meteor. Soc., 527.
——, and Coauthors, 2010b: An overview of the objective evaluation performed during the Hazardous Weather Testbed (HWT) 2010 Spring Experiment. 25th Conf. on Severe Local Storms, Denver, CO, Amer. Meteor. Soc., 13B.1.
Kain, J. S., P. R. Janish, S. J. Weiss, M. E. Baldwin, R. S. Schneider, and H. E. Brooks, 2003: Collaboration between forecasters and research scientists at the NSSL and SPC: The Spring Program. Bull. Amer. Meteor. Soc., 84, 1797-1806.
——, S. J. Weiss, J. J. Levit, M. E. Baldwin, and D. R. Bright, 2006: Examination of convection-allowing configurations of the WRF model for the prediction of severe convective weather: The SPC/NSSL Spring Program 2004. Wea. Forecasting, 21, 167–181.
——, and Coauthors, 2008: Some practical considerations regarding horizontal resolution in the first generation of operational convection-allowing NWP. Wea. Forecasting, 5, 931-952.
——, S. R. Dembek, S. J. Weiss, J. L. Case, J. J. Levit, and R. A. Sobash, 2010a: Extracting unique information from high-resolution forecast models: Monitoring selected fields and phenomena every time step. Wea. Forecasting, 25, 1536-1542.
——, and Coauthors, 2010b: Assessing advances in the assimilation of radar data and other mesoscale observations within a collaborative forecasting-research environment. Wea. Forecasting, 25, 1510-1521.
Koch, S. E., B. S. Ferrier, M. Stoelinga, E. Szoke, S. J. Weiss, and J. S. Kain, 2005: The use of simulated radar reflectivity fields in the diagnosis of mesoscale phenomena from high-resolution WRF model forecasts. Preprints, 11th Conf. on Mesoscale Processes, Albuquerque, NM, Amer. Meteor. Soc., J4.7. [Available online at http://ams.confex.com/ams/pdfpapers/97032.pdf.]
Kong, F., and Coauthors, 2007: Preliminary analysis on the real-time storm-scale ensemble forecasts produced as a part of the NOAA Hazardous Weather Testbed 2007 Spring Experiment. Preprints, 22nd Conference On Weather Analysis and Forecasting/18th Conference on Numerical Weather Prediction, Park City, UT, Amer. Meteor. Soc., 3B.2.
——, and Coauthors, 2008: Real-time storm-scale ensemble forecasting during the 2008 Spring Experiment. 24th Conf. Severe Local Storms, Savannah, GA, Amer. Meteor. Soc., 12.3.
——, and Coauthors, 2009: A real-time storm-scale ensemble forecast system: 2009 Spring Experiment. Preprints, 23rd Conference On Weather Analysis and Forecasting/19th Conference on Numerical Weather Prediction, Omaha, NE, Amer. Meteor. Soc., 16A.3.
Levit, J. J., and Coauthors, 2008: The NOAA Hazardous Weather Testbed 2008 Spring Experiment: Technical and scientific challenges of creating a data visualization environment for storm-scale deterministic and ensemble forecasts. Preprints, 24th Conf. on Severe Local Storms, Savannah, GA, Amer. Meteor. Soc., P10.5.
Lim, K.-S. S., S.-Y. Hong, 2010: Development of an effective double-moment cloud microphysics scheme with prognostic cloud condensation nuclei (CCN) for weather and climate models. Mon. Wea. Rev., 138, 1587-1612.
Marsh, P. T., J. S. Kain, S. J. Weiss, I. L. Jirak, R. A. Sobash, F. Kong, K. W. Thomas, and M. Xue, 2010: Investigating a fundamental component of a Warn-on-Forecast system in a collaborative real-time experiment. Preprints, 25th Conf. Severe Local Storms, Denver CO, 14.4.
Morrison, H., J. A. Curry, and V. I. Khvorostyanov, 2005: A new double-moment microphysics parameterization for application in cloud and climate models, Part I: Description. J. Atmos. Sci., 62, 1665-1677.
Otkin, J. A., and T. J. Greenwald, 2008: Comparison of WRF Model-simulated and MODIS-derived

16
cloud data. Mon. Wea. Rev., 136, 1957-1970. Richardson, D. S., 2001: Measures of skill and value of ensemble prediction systems, their
interrelationship and the effect of ensemble size. Quart. J. Roy. Meteor. Soc., 127, 2473-2489. Schwartz, C. S., and Coauthors, 2009: Next-day convection-allowing WRF model guidance: A second
look at 2-km versus 4-km grid-spacing. Mon. Wea. Rev., 10, 3351-3372. ——, and Coauthors, 2010: Toward improved convection-allowing ensembles: Model physics
sensitivities and optimizing probabilistic guidance with small ensemble membership. Wea. Forecasting, 25, 263-280.
Skamarock, W. C., and Coauthors, 2008: A description of the Advanced Research WRF Version 2, NCAR Tech Note, NCAR/TN-475+STR, 113 pp. [Available at: http://www.mmm.ucar.edu/wrf/users/docs/arw_v3.pdf.]
Smith, B. T., R. L. Thompson, J. S. Grams, and C. Broyles, 2010: Climatology of convective modes for significant severe thunderstorms in the contiguous United States. Preprints, 25th Conf. Severe Local Storms, Denver CO, P2.7.
Sobash, R. A., J. S. Kain, D. R. Bright, A. R. Dean, M. C. Coniglio, and S. J. Weiss, 2011: Probabilistic forecast guidance for severe thunderstorms based on the identification of extreme phenomena in convection-allowing model forecasts. Wea. Forecasting, (In press).
Stensrud, D. J., and Coauthors, 2009: Convective-scale warn-on-forecast system. Bull. Amer. Meteor. Soc., 90, 1487-1499.
Thompson, G., R. M. Rasmussen, and K. Manning, 2004: Explicit forecasts of winter precipitation using an improved bulk microphysics scheme. Part I: Description and sensitivity analysis. Mon. Wea. Rev., 132, 519–542.
Weisman, M. L., W. C. Skamarock, J. B. Klemp, 1997: The resolution dependence of explicitly modeled convective systems. Mon. Wea. Rev., 125, 527–548.
——, C. Davis, W. Wang, K. W. Manning, and J. B. Klemp, 2008: Experiences with 0–36-h explicit convective forecasts with the WRF-ARW model. Wea. Forecasting, 23, 407–437.
Weiss, S. J., and Coauthors, 2007: The NOAA Hazardous Weather Testbed: Collaborative testing of ensemble and convection-allowing WRF models and subsequent transfer to operations at the Storm Prediction Center. 22nd Conf. Wea. Anal. Forecasting/18th Conf. Num. Wea. Pred., Salt Lake City, Utah, Amer. Meteor. Soc., CDROM 6B.4.
——, M. E. Pyle, Z. Janjic, D. R. Bright, J. S. Kain, and G. J. DiMego, 2008: The operational High Resolution Window WRF Model runs at NCEP: Advantages of multiple model runs for severe convective weather forecasting. 24th Conf. on Severe Local Storms, Amer. Meteor. Soc., Savannah, GA, CD-ROM P10.8.
Xue, M., and Coauthors, 1996: Real-time numerical prediction of storm-scale weather during VORTEX-95. Part II: Operation summary and example cases. Preprint, 18th Conf. on Severe Local Storms, San Francisco, CA., Amer. Meteor. Soc., 178-182.
——, D. Wang, J. Gao, K. Brewster, and K. K. Droegemeier, 2003: The advanced Regional Prediction System (ARPS), storm-scale numerical weather prediction and data assimilation. Meteor. Atmos. Phys., 82, 139-170.
——, and Coauthors, 2007: CAPS realtime storm-scale ensemble and high-resolution forecasts as part of the NOAA Hazardous Weather Testbed 2007 Spring Experiment. Preprints, 22nd Conference On Weather Analysis and Forecasting/18th Conference on Numerical Weather Prediction, Park City, UT, Amer. Meteor. Soc., 3B.1.
——, and Coauthors, 2008: CAPS realtime storm-scale ensemble and high-resolution forecasts as part of the NOAA Hazardous Weather Testbed 2008 Spring Experiment. 24th Conf. Severe Local
17
Storms, Savannah, GA, Amer. Meteor. Soc., 12.2. ——, and Coauthors, 2009: CAPS realtime multi-model convection-allowing ensemble and 1-km
convection-resolving forecasts for the NOAA Hazardous Weather Testbed 2009 Spring Experiment. 23rd Conference on Weather Analysis and Forecasting/19th Conference on Numerical Weather Prediction, Omaha, NE, Amer. Meteor. Soc., 16A.2.
——, and Coauthors, 2010: CAPS realtime storm scale ensemble and high resolution forecasts for the NOAA Hazardous Weather Testbed 2010 Spring Experiment. 25th Conf. On Severe Local Storms, Denver, CO, Amer. Meteor. Soc., 7B.3.
Zhang, J., K. Howard, S. Vasiloff, C. Langston, B. Kaney, A. Arthur, S. V. Cooten, and K. Kelleher, 2009: National Mosaic and QPE (NMQ) System – Description, results and future plans. 34th Conf. on Radar Meteorology, Williamsburg, VA, Amer. Meteor. Soc., 7A.1
18
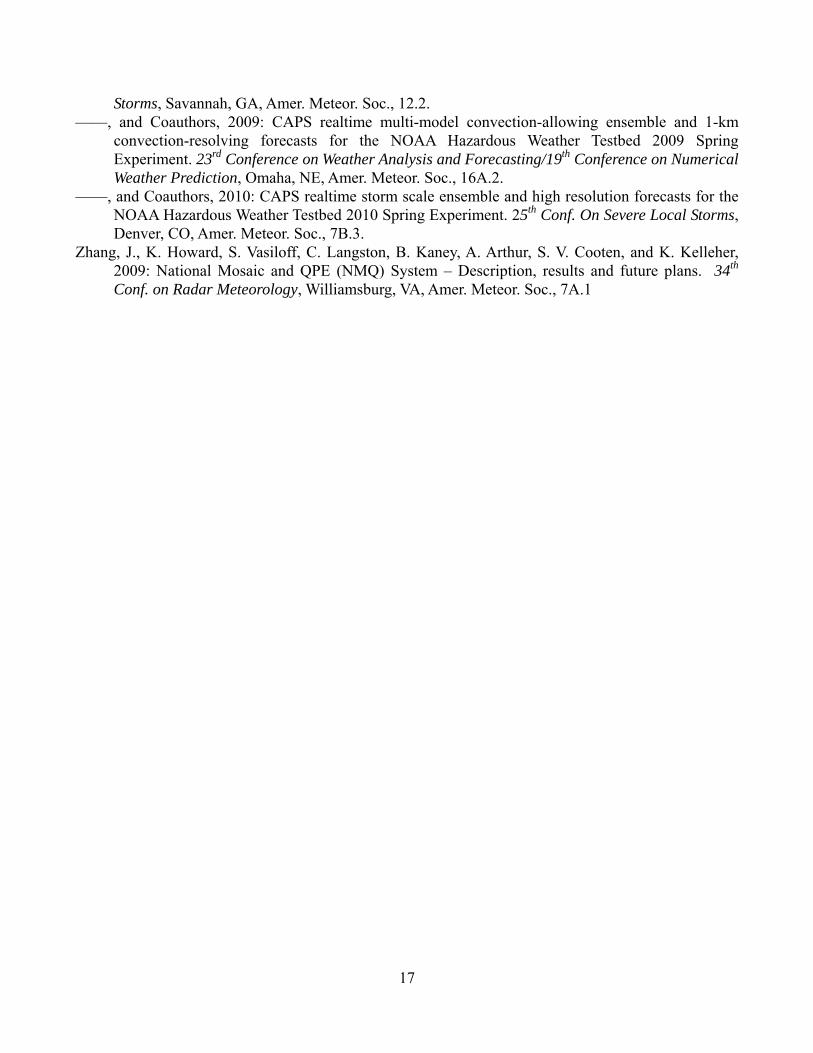
Table 1 SE2010 participating institutions. The number of multiple participants is indicated in parentheses.
NOAA Agencies Universities/
Cooperative Institutes Government
Agencies Private
NCEP/Environmental Modeling Center (2)
OAR/National Severe Storms Laboratory (4)
OAR/ESRL Global Systems Division (3)
Cooperative Institute for Meteorological Satellite Studies/University of Wisconsin-Madison (8)
NCAR/ Developmental Testbed Center (6)
Mitre Corp’s Center for Advanced Aviation Systems
NCEP/Aviation Weather Center (6)
NESDIS (2) NWS/Detroit, MI
Iowa State University FAA/Academy (2) FirstEnergy, Akron, OH
NCEP/Hydro-meteorological Prediction Center (5)
NWS/Raleigh, NC NWS/Kansas City, MO
Cooperative Institute for Research in the Atmosphere/ Colorado State University (2)
FAA/Air Traffic Control System Command Center (2)
Science Systems and Applications, Inc.
NCEP/Storm Prediction Center (7)
NWS/New York, NY NWS/Eureka, CA
Texas A&M University NASA/Short-term Prediction Research and Transition Center (4)
NCEP/Ocean Prediction Center
NWS/Charleston, WV
NWS/Tucson, AZ
MIT/Lincoln Laboratory Air Force Weather Agency (2)
NWS/Albuquerque, NM
NWS/Office of Science and Technology (5)
NWS/Flagstaff, AZ
University of Alabama-Huntsville (2)
Environment Canada (3)
NWS/Huntsville, AL
NWS/Meteorological Development Lab (2)
NWS/ Pocatello, ID
University at Albany-SUNY (3)
NWS/Anchorage, AK
NWS/Great Fall, MT NWS/ Columbia, SC
University of Oklahoma
OAR/ESRL Physical Sciences Division
Table 2 Percentage of responses to selected survey questions (frequencies in parentheses).
Q1) Percentage of responses to whether the perceived skill of the 1200 UTC forecasts were better than the 0000 UTC forecasts in the WRF-NMM simulation contributed by EMC, and the WRF-ARW simulation contributed by NCAR.
Yes, it’s better
It’s about the same
No, it’s worse
N/A
WRF-NMM (EMC) 47.4% (9) 15.8% (3) 31.6% (6) 5.3% (1) WRF-ARW (NCAR) 36.8% (7) 31.6% (6) 5.3% (1) 26.3% (5) Q2) Percentage of responses to whether the perceived skill of the CAPS 1-km grid-spacing
forecast was better than the 4 km grid-spacing forecast for mesoscale evolution of convection.
1-km better than 4-km
1-km similar to 4-km
1-km worse than 4-km
N/A
20.8% (5) 54.2% (13) 16.7% (4) 8.3% (2) Q3) Percentage of responses to the perceived level of skill in SSEF 6 hour precipitation
forecasts relative to SREF forecasts for the periods 1800 – 0000 and 0000 – 0600 UTC.

19
Much Better
Better About the Same
Worse Much Worse
N/A
1800 - 0000 UTC 34.8% (8) 34.8% (8) 17.4% (4) 4.3% (1) 4.3% (1) 4.3% (1) 0000 - 0600 UTC 28.6% (6) 28.6% (6) 33.3% (7) 4.8% (1) 0% (0) 4.8% (1) Q4) Percentage of responses to whether the perceived level of skill in subsequent HRRR
initializations is better, worse, or about the same relative to earlier initializations. Yes, it’s
better It’s about the same
No, it’s worse
N/A
44.8% (8) 44.8% (8) 5.6% (1) 5.6% (1)
Figure 1 Wide angle view of the HWT facility in the National Weather Center. The SPC Operations
Area is located beyond the glass windows on the right side, and Norman/Oklahoma City Weather Forecast Office is located beyond the windows on the left side.

20
Figure 2 (a) A preliminary (i.e., issued the morning of 24 May 2010) severe weather outlook valid for
the 4-h period 2000 UTC 24 May – 0000 UTC 25 May 2010. Contours for 5% (brown), 15% (yellow), 30% (red), and 45% (purple) probabilities of severe weather (i.e., tornadoes, hail size ≥ 1-inch, and wind gusts ≥ 50 knots) within 25 miles of a point are shown. The hatching marks areas with 10% or greater probability of significant severe weather (i.e., EF2 or greater tornadoes, hail size ≥ 2-inch, and wind gusts ≥ 65 knots) within 25 miles of a point. Locations of observed severe weather during the outlook period are marked (see legend in upper left). (b) A QPF outlook for 6-h accumulated precipitation greater than 0.5-inch for the period ending 0000 UTC 15 June 2010. Contours for 25% (slight; white), 50% (moderate; yellow), and 75% (high; purple) probabilities are shown. Areas where observed precipitation was greater than 0.5-inches during the outlook period are shaded (first shading level is for 0.5-in). (c) A preliminary aviation outlook for instantaneous reflectivity greater than 40 dBZ valid 2100 UTC 24 May 2010. Contours for 25% (slight; green) and 50% (moderate; red) are shown. Areas where observed reflectivity was greater than 40 dBZ at the valid time are shaded. d) The accompanying severe component discussion.
d) Severe Component Discussion for 24 May 2010 THE HI-RES GUIDANCE INDICATED TWO CORRIDORS OF SEVERE WEATHER POTENTIAL...ONE ALONG THE EASTWARD SURGING COLD FRONT OVER THE CENTRAL HIGH PLAINS, AND THE SECOND ALONG THE WARM FRONT AND IN THE VICINITY OF THE LIFTING SURFACE LOW OVER THE NORTHERN PLAINS. THE STORMS ALIGN FAIRLY WELL WITH THE OBSERVED PLACEMENT OF SURFACE FEATURES. A SECOND AREA OF STORMS ALSO DEVELOPS IN HI-RES GUIDANCE OVER EASTERN SD/NEB. WE ARE UNCERTAIN WHETHER THESE STORMS WILL BE REAL FEATURES IN THE ATMOSPHERE GIVEN A LACK OF LOW-LEVEL FORCING...THOUGH AN UPPER DISTURBANCE OBSERVED IN WV IMAGERY WILL APPROACH THAT REGION AND COULD PROVIDE A FAVORABLE ZONE OF ASCENT FOR STORM INITIATION. REFLECTIVITY STRUCTURES NEAR AND EAST OF THE LIFTING SURFACE LOW OVER SD/ND SHOW POSSIBLE SUPERCELL STORM TYPES, WHICH IS CONFIRMED IN HOURLY MAX UPDRAFT HELICITY. THESE STRUCTURES ARE IN LINE WITH FAVORABLE SHEAR/INSTABILITY PARAMETERS INDICATED IN 40KM OPERATIONAL NAM AND CURRENT SURFACE OA DATA. VERTICALLY INTEGRATED GRAUPEL FROM HI-RES GUIDANCE IS LARGE IN MAGNITUDE AND WIDESPREAD ACROSS THE FORECAST AREA DOMAIN, AND WIND SIGNATURES ARE DEPICTED AS WELL. THE LARGE VALUES OF UD-HELICITY ALONG WITH HAIL/WIND SIGNATURES INDICATE THAT A FEW HIGHER-END STORMS MAY BE POSSIBLE (WHICH WE ALSO DETERMINED BASED ON OBSERVED FEATURES AS WELL AS OPERATIONAL MODEL GUIDANCE)...WHICH GIVES US CONFIDENCE IN FORECASTING A SIG-SVR HATCHED AREA. OVERALL, WIDESPREAD CONVECTION IS FORECAST BY HI-RES GUIDANCE, WHICH WE BELIEVE IS LIKELY GIVEN THE STRONG FORCING ASSOCIATED WITH THE APPROACHING UPPER TROUGH OVERSPREADING A LARGE AREA OF HIGH INSTABILITY/MOISTURE.
21
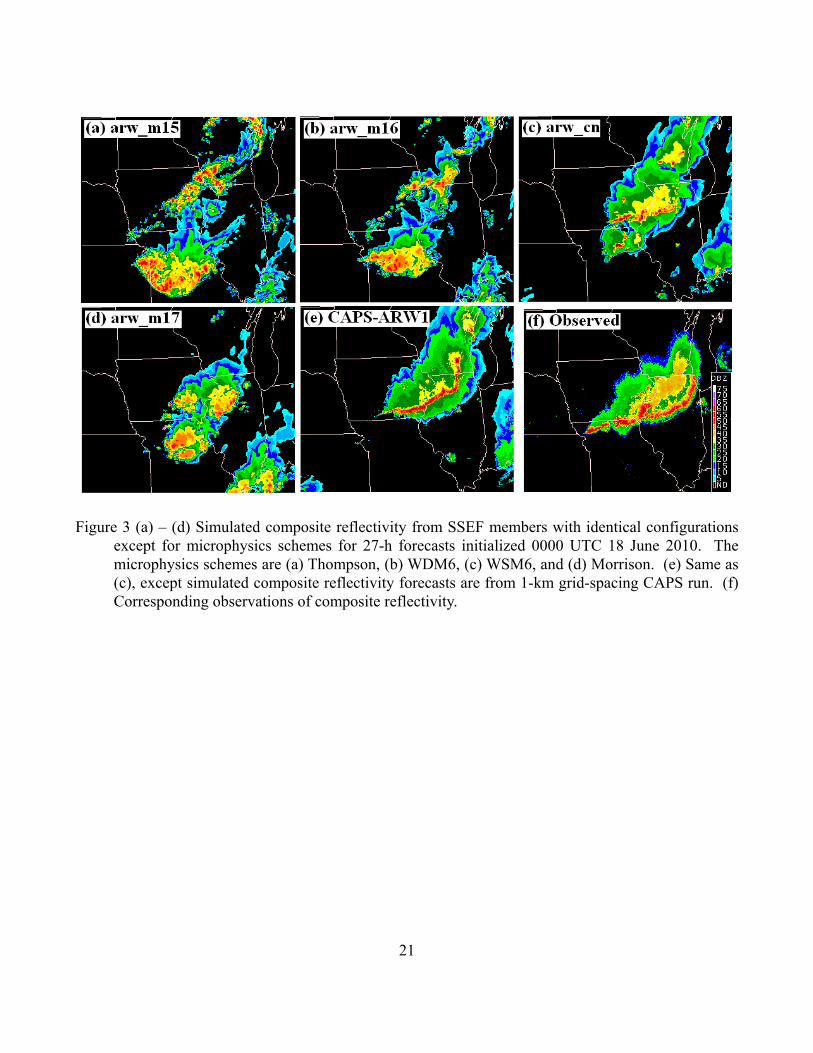
Figure 3 (a) – (d) Simulated composite reflectivity from SSEF members with identical configurations
except for microphysics schemes for 27-h forecasts initialized 0000 UTC 18 June 2010. The microphysics schemes are (a) Thompson, (b) WDM6, (c) WSM6, and (d) Morrison. (e) Same as (c), except simulated composite reflectivity forecasts are from 1-km grid-spacing CAPS run. (f) Corresponding observations of composite reflectivity.

22
Figure 4 (a) Model simulated infrared satellite imagery produced by CIRA from 27-h NSSL-WRF
forecasts initialized 0000 UTC 8 June 2010, and (b) corresponding GOES infrared satellite imagery. (c) – (d) same as (a) – (b) except for simulated water vapor imagery produced by CIMSS with the corresponding GOES imagery.

23
Figure 5 HMF updraft helicity (m2s-2) from 25-h forecasts initialized 0000 UTC 10 May 2010 from (a)
the ARW control member of the SSEF system, and (b) the 1-km grid-spacing CAPS run. (c) Maximum HMF updraft helicity from any SSEF member, and (d) neighborhood probabilities for updraft helicity greater than 100 m2s-2 and storm reports that occurred between 0000 and 0100 UTC 11 May (legend in upper-right).

24
Figure 6 Probability-matched 6-h accumulated precipitation from (a) NCEP’s SREF system at forecast
hour 33 for forecasts initialized 2100 UTC 31 May 2010, (b) the SSEF system at forecast hour 30 for forecasts initialized 0000 UTC 1 June 2010, and (c) corresponding observations. (d) - (f) same as (a) - (c) except for forecast probabilities of precipitation greater than 0.50-in, and in (f) only amounts greater than 0.50-in are shaded.

25
Figure 7 (a) SSEF-derived linear-mode probabilities for contiguous convective lines longer than 100
miles, and (b) corresponding observed reflectivity. (c) SSEF-derived neighborhood probabilities for echo top (or storm top) heights greater than 35000 feet, and (d) corresponding observed echo top heights estimated from NSSL’s NMQ dataset. Both (a) and (c) are from 27-h forecasts initialized 0000 UTC 17 June 2010.

26
Figure 8 (a) and (g) Observed 12-h accumulated precipitation for the period ending 1200 UTC June 8
2010. (b) SSEF-derived probability of precipitation greater than 0.5-in from 12-h forecasts initialized 0000 UTC June 8, (c) Same as (b) except for SREF-derived and 15-h forecasts initialized 2100 UTC June 7. (d) Same as (b) except for neighborhood probabilities. (e) Forecast 12-h accumulated precipitation from 0000 UTC June 8 initialized NAM model. (f) SSEF-derived probability-matched 12-h forecast precipitation. (h) Forecast (red shading) and observed (blue line) objects identified by MODE for probability greater than 50%. The forecast corresponds to the above panel (b). (i) – (l) same as (h) except forecast objects correspond to above panels (c) – (f) and objects for QPF are defined for accumulated precipitation greater than 0.5-in.

27
Figure 9 Composite frequencies of observed rainfall greater than 0.50-in. relative to grid-points
forecasting rainfall greater than 0.50-in. at forecast hour 30 from SSEF members using (a) Thompson, (b) WSM6, (c) WDM6, and (d) Morrison microphysics parameterizations. The boldface dot in each panel marks the center of the composite domain.

28
Figure 10 (a) Simulated 1-km AGL reflectivity at forecast hour 5 (valid 2300 UTC) from the 1800
UTC 17 June 2010 initialized HRRR, and (b) corresponding observed base reflectivity. (c) same as (a) except for forecast hourly maximum updraft helicity, and (d) observed storm reports between 2200 and 2300 UTC 17 June 2010 (green “A”s indicate hail, blue “W”s and “G”s indicate wind, and red “T”s indicate tornadoes).

29
Figure 11 Same as Fig. 10, except for 3-h HRRR forecasts (valid 2100 UTC) initialized 1800 UTC 18
June.