An operational approach for classifying storms in real-time radar rainfall estimation
17
An operational approach for classifying storms in real-time radar rainfall estimation Siriluk Chumchean a , Alan Seed b , Ashish Sharma c, * a Department of Civil Engineering, Mahanakorn University of Technology, 51 Cheum-Sampan Rd., Nong Chok, Bangkok 10530, Thailand b Centre for Australian Weather and Climate Research, Bureau of Meteorology, GPO Box 1289K, Melbourne, VIC 3001, Australia c School of Civil and Environmental Engineering, The University of New South Wales, Sydney, NSW 2052, Australia Received 11 April 2008; received in revised form 15 September 2008; accepted 29 September 2008 KEYWORDS Radar rainfall; Storm classification; Z–R conversion error; Climatological Z–R rela- tions for convective and stratiform rainfall Summary This paper presents an operational approach to integrate a storm classification method into a real-time radar rainfall estimation. A minor modification of a texturing clas- sification algorithm proposed by Steiner et al. [Steiner, M., Houze Jr., R.A., Yuter, S.E., 1995. Climatological characterisation of three-dimensional storm structure from opera- tional radar and rain gauge data. J. Appl. Meteorol. 34, 1978–2007] that can classify each pixel in the radar image as stratiform or convective is used to classify the instantaneous reflectivity field into convective and stratiform components. A method to derive the cli- matological Z–R relations for convective and stratiform rainfall is proposed. Vertical pro- files of reflectivity (VPRs) are used to verify the accuracy of the storm classification. An alternative method for verification of a storm classification scheme based on differences between probability distribution functions of rain gauge rainfall of the two rainfall categories is also presented. A 6-month record of radar and rain gauge rainfall for Sydney, Australia for November 2000–April 2001 is used for training and rainfall events during February 2007–March 2007 are used to evaluate the efficiency and applicability of the proposed methods. The results show that the proposed operational approach for classify- ing storms in real-time radar rainfall estimates reduces RMSE between radar and rain gauge rainfall from 4.63 to 4.30 mm h 1 and from 5.31 to 5.01 mm h 1 for the training and verification periods compared to the case where the rainfall is assumed to have a sin- gle Z–R relationship. Crown Copyright ª 2008 Published by Elsevier B.V. All rights reserved. 0022-1694/$ - see front matter Crown Copyright ª 2008 Published by Elsevier B.V. All rights reserved. doi:10.1016/j.jhydrol.2008.09.005 * Corresponding author. Tel.: +61 2 9385 5768; fax: +61 2 938 6139. E-mail address: [email protected] (A. Sharma). Journal of Hydrology (2008) 363,1– 17 available at www.sciencedirect.com journal homepage: www.elsevier.com/locate/jhydrol
-
Upload
independent -
Category
Documents
-
view
0 -
download
0
Transcript of An operational approach for classifying storms in real-time radar rainfall estimation
Journal of Hydrology (2008) 363, 1–17
ava i lab le a t www.sc iencedi rec t . com
journal homepage: www.elsevier .com/ locate / jhydrol
An operational approach for classifying stormsin real-time radar rainfall estimation
Siriluk Chumchean a, Alan Seed b, Ashish Sharma c,*
a Department of Civil Engineering, Mahanakorn University of Technology, 51 Cheum-Sampan Rd., Nong Chok,Bangkok 10530, Thailandb Centre for Australian Weather and Climate Research, Bureau of Meteorology, GPO Box 1289K, Melbourne,VIC 3001, Australiac School of Civil and Environmental Engineering, The University of New South Wales, Sydney, NSW 2052, Australia
Received 11 April 2008; received in revised form 15 September 2008; accepted 29 September 2008
00do
*
KEYWORDSRadar rainfall;Storm classification;Z–R conversion error;Climatological Z–R rela-tions for convective andstratiform rainfall
22-1694/$ - see front mattei:10.1016/j.jhydrol.2008.09
Corresponding author. TelE-mail address: a.sharma@
r Crown.005
.: +61 2 9unsw.ed
Summary This paper presents an operational approach to integrate a storm classificationmethod into a real-time radar rainfall estimation. A minor modification of a texturing clas-sification algorithm proposed by Steiner et al. [Steiner, M., Houze Jr., R.A., Yuter, S.E.,1995. Climatological characterisation of three-dimensional storm structure from opera-tional radar and rain gauge data. J. Appl. Meteorol. 34, 1978–2007] that can classify eachpixel in the radar image as stratiform or convective is used to classify the instantaneousreflectivity field into convective and stratiform components. A method to derive the cli-matological Z–R relations for convective and stratiform rainfall is proposed. Vertical pro-files of reflectivity (VPRs) are used to verify the accuracy of the storm classification. Analternative method for verification of a storm classification scheme based on differencesbetween probability distribution functions of rain gauge rainfall of the two rainfallcategories is also presented. A 6-month record of radar and rain gauge rainfall for Sydney,Australia for November 2000–April 2001 is used for training and rainfall events duringFebruary 2007–March 2007 are used to evaluate the efficiency and applicability of theproposed methods. The results show that the proposed operational approach for classify-ing storms in real-time radar rainfall estimates reduces RMSE between radar and raingauge rainfall from 4.63 to 4.30 mm h�1 and from 5.31 to 5.01 mm h�1 for the trainingand verification periods compared to the case where the rainfall is assumed to have a sin-gle Z–R relationship.Crown Copyright ª 2008 Published by Elsevier B.V. All rights reserved.
Copyright ª 2008 Published by Elsevier B.V. All rights reserved.
385 5768; fax: +61 2 938 6139.u.au (A. Sharma).
2 S. Chumchean et al.
Introduction
Radar rainfall is derived by converting measured radarreflectivity (Z) into rainfall intensity (R) using an appropri-ate Z–R relationship. To increase the accuracy of radarmeasurements of rainfall, two broad classes of errors needto be taken into account (Jordan et al., 2000). These are(1) reflectivity measurement errors and (2) errors intro-duced in the process of converting measured reflectivityto a rainfall rate (Z–R conversion error). Reflectivitymeasurement errors include temporal and spatial samplingerrors (Fabry et al., 1994; Jordan et al., 2000), heightsampling errors that result in a range dependent bias(Koistinen et al., 1981; Fabry et al., 1994; Kitchen et al.,1994; Andrieu and Creutin, 1995; Fabry and Zawadzki,1995; Vignal and Andrieu, 1999; Vignal and Krajewski,2001; Ryzhkov et al., 2005; Gabella et al., 2006; Morinand Gabella, 2007), ground clutter (Collier, 1996; Steinerand Smith, 2002), anomalous propagation (Steiner andSmith 2002), beam blocking (Gabella and Perona, 1998),beam attenuation (Hildebrand 1978), electrical calibrationerror and quantisation of reflectivity error (Cluckie et al.,1991; Joss and Lee, 1995).
The Z–R conversion error is an equally important sourceof error which depends on the model used to convertreflectivity to rainfall. The Z–R relationship is representedby a power law model of the form; Z = ARb where A and bare model parameters which depend on the rainfall dropsize distributions (DSDs) that have been sampled, assumingthat the terminal velocity of the raindrops is a function oftheir diameter, and that they are falling at terminal veloc-ity through still air. Joss and Waldvogel (1970) were amongthe first who pointed out uncertainty in radar rainfall esti-mates due to drop spectra variability. Recently, Lee andZawadzki (2006) also showed that the uncertainty in rain-fall estimates due to day-to-day variation in DSD, andtherefore the Z–R relationship, can be large. They sug-gested that the variation of the DSD for the day can bereduced by a broad classification of convective and strati-form rainfall or by a more refined classification usingpolarimetric radar data, if available. Differences betweenDSDs of convective and stratiform rainfall cause Z–Rparameters of these two rainfall types to be significantlydifferent (Battan, 1973; Tokay and Short, 1996; Atlas etal., 1999). The studies of Joss and Waldvogel (1970),Rogers (1971), Battan (1973), Klazura (1981), Austin(1987), Rosenfeld et al. (1992), Rosenfeld et al. (1993),Tokay and Short (1996), Sempere Torres et al. (2000), Uij-lenhoet et al. (2003) and Lee and Zawadzki (2005) re-ported that the Z–R conversion error can be substantiallyreduced if the parameters of the Z–R relationship are esti-mated using data that represent the type of events forwhich the developed relationship will be used. Zawadzki(2006) also mentioned that it is broadly believed that dis-tinct Z–R relationships for the two rainfall types will leadto an improvement in radar rainfall. Nevertheless, heshows examples where Z–R relationships of convectiveand stratiform precipitation were indistinguishable eventhough there was variability in the DSDs.
Using a single Z–R relation applied universally to all rainfields irrespective of inherent differences in rainfall DSDs
can result in erroneous estimates of radar rainfall (Atlaset al. 1999). Consequently, it is recommended that separateZ–R relations be developed for different types of rain fieldsand available information be used to classify the currentrain field into the appropriate type. While the distributionof the physical processes that produce rainfall are far moresubtle than is assumed in practice, it is usually classifiedinto the two dominant types – convective and stratiformrainfall. Once classified, the reflectivity corresponding toeach rainfall type can be grouped and the appropriate Z–R relations developed.
The aim of the paper is to present practical strategies forstorm classification and estimation of the Z–R relationshipsfor convective and stratiform rainfall based on gauge andradar data, and to evaluate the impact of such a schemeon radar rainfall estimation errors. The storm classificationmethod applied in this study is a minor modification of theclustering based approach proposed by Steiner et al.(1995). A procedure for estimating the climatological Z–Rrelations for convective and stratiform rainfall when onlyinstantaneous radar reflectivity and hourly rain gauge rain-fall are available is presented. As our interest lies in usingthe storm classification method for real-time estimation ofrainfall, we present an operational approach that integratesstorm classification and consequent estimation of hourly ra-dar rainfall in real-time.
The paper is organised as follows; Section ‘Effect ofstorm type on radar estimates’ discusses an effect ofstorm types on radar rainfall estimates. Section ‘Existingmethods for partitioning convective and stratiform rainfields’ reviews existing methods for partitioning convectiveand stratiform rainfall. Section ‘Real-time radar estima-tion based on convective and stratiform Z–R relationships’describes the procedure for integrating the instantaneousclassifications into hourly accumulations so that the hourlyrain gauge data can be partitioned. Details on the stormclassification scheme used in our study and verificationby means of an analysis of the mean VPR and the probabil-ity distributions of the gauge accumulations of hourly rain-fall for the two classes are also presented in Section ‘Real-time radar estimation based on convective and stratiformZ–R relationships’. Section ‘derivation of Z–R relationsfor convective and stratiform rainfall’ presents the meth-od to derive climatological Z–R relations for convectiveand stratiform rainfall and compares the results with thoseobtained from a single Z–R relationship. Finally, the con-clusions from this study are drawn in Section‘Conclusions’.
Effect of storm type on radar rainfall estimates
The physical differences between stratiform and convectiveprecipitation can be summarized as follows. Stratiform pre-cipitation is defined to exist when the vertical air motion isweaker than the terminal velocity of snow particles (�1–2 m s�1) (Locatelli and Hobbs, 1974). Alternatively, it canoccur as long as the ascent of saturated air is weak enoughto allow ice particles to fall out (Houze, 1997). Stratiformprecipitation usually falls from the anvils of extensive con-vective cloud systems, and from large scale uplift drivenby synoptic forcing or orography. It is characterized by light
An operational approach for classifying storms in real-time radar rainfall estimation 3
to moderate precipitation rates, weak horizontal reflectiv-ity gradients, and the existence of a radar bright band nearthe melting layer (Battan, 1973; Houze, 1993). In general,radar reflectivity in the bright band region is stronger thanin rain below or the snow directly above by about 5–10 dBZ (Stewart et al., 1984; Klaassen, 1988; Fabry et al.,1992; Williams and Ecklund, 1995).
Convective precipitation processes contrast sharply fromstratiform processes (Houze, 1993). The vertical air motionof this type of precipitation is equal or higher than the fallspeeds of the precipitation particle, and is usually charac-terized by locally strong vertical winds. Radar echoes asso-ciated with strong convective updrafts, form well-definedvertical cores of maximum reflectivity, which contrastmarkedly with the horizontal orientation of the radar brightband seen at the melting layer in stratiform precipitation.The intensity of convective precipitation exhibits strongvariability in the horizontal, significantly more than thatof stratiform precipitation. For more details on the differ-ences between convective and stratiform rainfall, inter-ested readers are referred to Houze (1993, 1997) andYuter and Houze (1997).
The DSD of convective and stratiform rainfall is signifi-cantly different due to differences in the physical processesof the two rainfall types. Yuter and Houze (1997) used air-borne DSD data to investigate the difference in DSD of con-vective and stratiform rain. They found that the small andlarge drop spectra do not correspond uniquely to convectiveand stratiform regions because the stratiform precipitationalone may comprise of large or small drops. Within strati-form precipitation, the same rain rate could be producedby a drop spectrum dominated by numerous small drops(low reflectivity) or by a few large drops (high reflectivity).The large drop spectra within stratiform regions are primar-ily associated with fallstreaks, which are likely to be themicrophysical remnants of deep convective and/or convec-tive overturning in the melting layer. Due to the variabilityof stratiform drop size spectra, they concluded that a con-vective–stratiform separation algorithm does not make thedistinction and proposed to use a single Z–R for both rainfalltypes. In contrast, Atlas et al. (2000) used the magnitude ofvertical air motion measured by aircraft while measuringthe DSD to partition the precipitation types and found thatlarge drop size characterized stratiform rain and small dropswere associated with convective rain, on average. They alsofound a statistically significant difference between the Z–Rrelations of the two rainfall types by conventional regres-sion methods. Ulbrich and Atlas (2002) used almost thesame data set as used by Yuter and Houze (1997) and Atlaset al. (2000) and found that the single PMM Z–R curve de-rived by Yuter and Houze (1997) is based upon the underly-ing stratiform and convective PMM relations derived in theirwork. They concluded that the Z–R relationship for the tworainfall types are statistically significantly different. Reflec-tivity (in unit of mm6 m�3) and rainfall intensity (mm h�1)are theoretically related to the 6th and approximately3.7th moments of the raindrop diameter, respectively (Mar-shall and Palmer, 1948). Consequently, radar reflectivity ismore sensitive to rain drop diameter rather than rainfallrate and it is possible for the same reflectivity to be pro-duced by samples having different drop size distributionsand rainfall intensities.
Existing methods for partitioning convectiveand stratiform rain fields
Many studies have proposed methods to partition rainfallfrom precipitation clouds into convective and stratiformcomponents. A simple threshold method called ‘‘the back-ground-exceedance technique’’, BET (Austin and Houze,1972; Houze, 1973) was developed to identify areas of con-vective rainfall using rain gauge data. This method was ex-tended to two-dimensional radar reflectivity by Churchilland Houze (1984). They assigned a fixed radius of influenceto each identified convective core. Tao et al. (1993) appliedtwo additional criteria - a cloud water content and the up-draft velocity to Churchill and Houze (1984) method. Xu(1995) proposed the method similar to Churchill and Houze(1984) except that vertical motion instead of the rainfallrate is used as the thresholding mechanism. Steiner et al.(1995) considered that the fixed convective radius as pro-posed by Churchill and Houze (1984) was insufficient, there-fore they proposed a rainfall classification method whichused the two-dimensional radar reflectivity and allows vari-ations in the size of the convective radius of influencearound each core.
While many classification methods involve the use of thethreshold logic outlined above, some studies have ap-proached the problem from a different viewpoint. Satelliteobserved cloud top temperature was used to denote thelocation of convective cells by Adler and Negri (1988), theinfrared brightness temperature of the core being used toidentify the associated radius of influence (Adler and Mack,1984). Rosenfeld and Amitai (1995a) formulated an objec-tive methodology to classify rain regimes by factors deemedmeaningful to variations in the distributions of rain intensityand radar-observed reflectivity. Relationships between rain-fall and three classification parameters (effective effi-ciency, bright band fraction, and the horizontal radialreflectivity gradients) were derived. The rain intensity dis-tributions were assumed to be controlled primarily by theconvection depth and by the nature of the rainfall, whetherconvective or stratiform. Tokay and Short (1996) proposedan empirical convective–stratiform classification methodbased on microphysical structure of convective and strati-form clouds. Sempere Torres et al. (2000) presented twoclassification algorithms to classify types of rainfall: (1)Yuter and Houze (1997) using horizontal reflectivity gradi-ents and (2) Sanchez-Diezma et al. (2000) using a brightband in the VPR as a signature of stratiform rainfall. Withthese algorithms the radar rainfall field were partitionedinto three categories: (i) stratiform rain, defined by thepresence of the bright band, (ii) convective rain, identifiedby the presence of strong horizontal gradients related to ac-tive convection and (iii) the absence of a marked character-istic in the rainfall field. Atlas et al. (2000) used airbornemeasurements of DSD and air motion data to partition con-vective and stratiform precipitation types. The strength ofthe vertical air motion in excess of 1 m s�1 either up ordown was used as a discriminate. Stronger drafts identifiedas convective clouds, all others were classified asstratiform. However, this method is not suitable for practi-cal application because it depends on aircraft penetrationsof the storm system (Atlas et al., 2000). Biggerstaff and
4 S. Chumchean et al.
Listemaa (2000) proposed the method that extends the Stei-ner et al. (1995) technique by using the horizontal and ver-tical gradients of reflectivity and the bright band fractionsas defined by Rosenfeld et al. (1995b) that were obtainedfrom the full three-dimensional volume of reflectivity tocorrect the original algorithm output. They concluded thattheir modified algorithm improved the performance of echoclassification by correcting two main sources of error includ-ing misclassification of: (1) heavy stratiform as convectiveand (2) convective rain on the periphery of convective coresas stratiform rain. Lang et al. (2003) introduced a newconvective–stratiform classification method based on thepremise that the terminal fall speed of precipitation parti-cles is large relative to the vertical velocity in regions ofstratiform precipitation. Recently, Caracciolo et al. (2006)proposed a convective and stratiform discrimination algo-rithm based on the knowledge of difference parameters ofa gamma DSD of each rainfall type.
The goal of a classification scheme in the context of ra-dar rainfall estimation is to reduce the variability of rainfallabout the climatological DSD and therefore the climatolog-ical Z–R relationship by partitioning the rainfall into a smallnumber of classes that have some physical basis. The classi-fication process is fraught with difficulty and Yuter andHouze (1997) suggest that the separation of Z–R relationsfor convective and stratiform precipitation is not fully justi-fied and techniques to distinguish between convective andstratiform precipitation based solely on the characteristicsof DSDs are likely to be inaccurate. On the contrary, thestudy of Atlas et al. (1999) showed that the characteristicsof the DSD are remarkably consistent within each classifica-tion. They concluded that partitioning of rainfall into a se-quence of types could be achieved by classification basedon the behaviour of the representative drop size (medianvolume diameter of raindrops) and rain rate.
Real-time radar rainfall estimation based onconvective and stratiform Z–R relationships
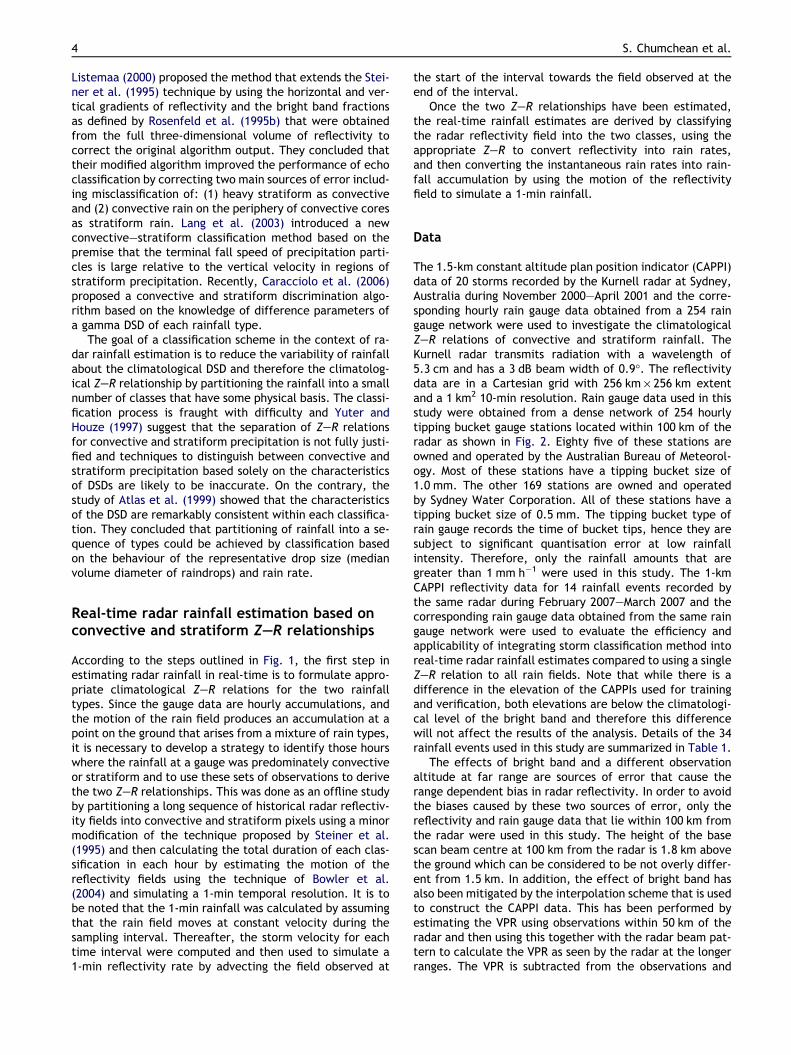
According to the steps outlined in Fig. 1, the first step inestimating radar rainfall in real-time is to formulate appro-priate climatological Z–R relations for the two rainfalltypes. Since the gauge data are hourly accumulations, andthe motion of the rain field produces an accumulation at apoint on the ground that arises from a mixture of rain types,it is necessary to develop a strategy to identify those hourswhere the rainfall at a gauge was predominately convectiveor stratiform and to use these sets of observations to derivethe two Z–R relationships. This was done as an offline studyby partitioning a long sequence of historical radar reflectiv-ity fields into convective and stratiform pixels using a minormodification of the technique proposed by Steiner et al.(1995) and then calculating the total duration of each clas-sification in each hour by estimating the motion of thereflectivity fields using the technique of Bowler et al.(2004) and simulating a 1-min temporal resolution. It is tobe noted that the 1-min rainfall was calculated by assumingthat the rain field moves at constant velocity during thesampling interval. Thereafter, the storm velocity for eachtime interval were computed and then used to simulate a1-min reflectivity rate by advecting the field observed at
the start of the interval towards the field observed at theend of the interval.
Once the two Z–R relationships have been estimated,the real-time rainfall estimates are derived by classifyingthe radar reflectivity field into the two classes, using theappropriate Z–R to convert reflectivity into rain rates,and then converting the instantaneous rain rates into rain-fall accumulation by using the motion of the reflectivityfield to simulate a 1-min rainfall.
Data
The 1.5-km constant altitude plan position indicator (CAPPI)data of 20 storms recorded by the Kurnell radar at Sydney,Australia during November 2000–April 2001 and the corre-sponding hourly rain gauge data obtained from a 254 raingauge network were used to investigate the climatologicalZ–R relations of convective and stratiform rainfall. TheKurnell radar transmits radiation with a wavelength of5.3 cm and has a 3 dB beam width of 0.9�. The reflectivitydata are in a Cartesian grid with 256 km · 256 km extentand a 1 km2 10-min resolution. Rain gauge data used in thisstudy were obtained from a dense network of 254 hourlytipping bucket gauge stations located within 100 km of theradar as shown in Fig. 2. Eighty five of these stations areowned and operated by the Australian Bureau of Meteorol-ogy. Most of these stations have a tipping bucket size of1.0 mm. The other 169 stations are owned and operatedby Sydney Water Corporation. All of these stations have atipping bucket size of 0.5 mm. The tipping bucket type ofrain gauge records the time of bucket tips, hence they aresubject to significant quantisation error at low rainfallintensity. Therefore, only the rainfall amounts that aregreater than 1 mm h�1 were used in this study. The 1-kmCAPPI reflectivity data for 14 rainfall events recorded bythe same radar during February 2007–March 2007 and thecorresponding rain gauge data obtained from the same raingauge network were used to evaluate the efficiency andapplicability of integrating storm classification method intoreal-time radar rainfall estimates compared to using a singleZ–R relation to all rain fields. Note that while there is adifference in the elevation of the CAPPIs used for trainingand verification, both elevations are below the climatologi-cal level of the bright band and therefore this differencewill not affect the results of the analysis. Details of the 34rainfall events used in this study are summarized in Table 1.
The effects of bright band and a different observationaltitude at far range are sources of error that cause therange dependent bias in radar reflectivity. In order to avoidthe biases caused by these two sources of error, only thereflectivity and rain gauge data that lie within 100 km fromthe radar were used in this study. The height of the basescan beam centre at 100 km from the radar is 1.8 km abovethe ground which can be considered to be not overly differ-ent from 1.5 km. In addition, the effect of bright band hasalso been mitigated by the interpolation scheme that is usedto construct the CAPPI data. This has been performed byestimating the VPR using observations within 50 km of theradar and then using this together with the radar beam pat-tern to calculate the VPR as seen by the radar at the longerranges. The VPR is subtracted from the observations and
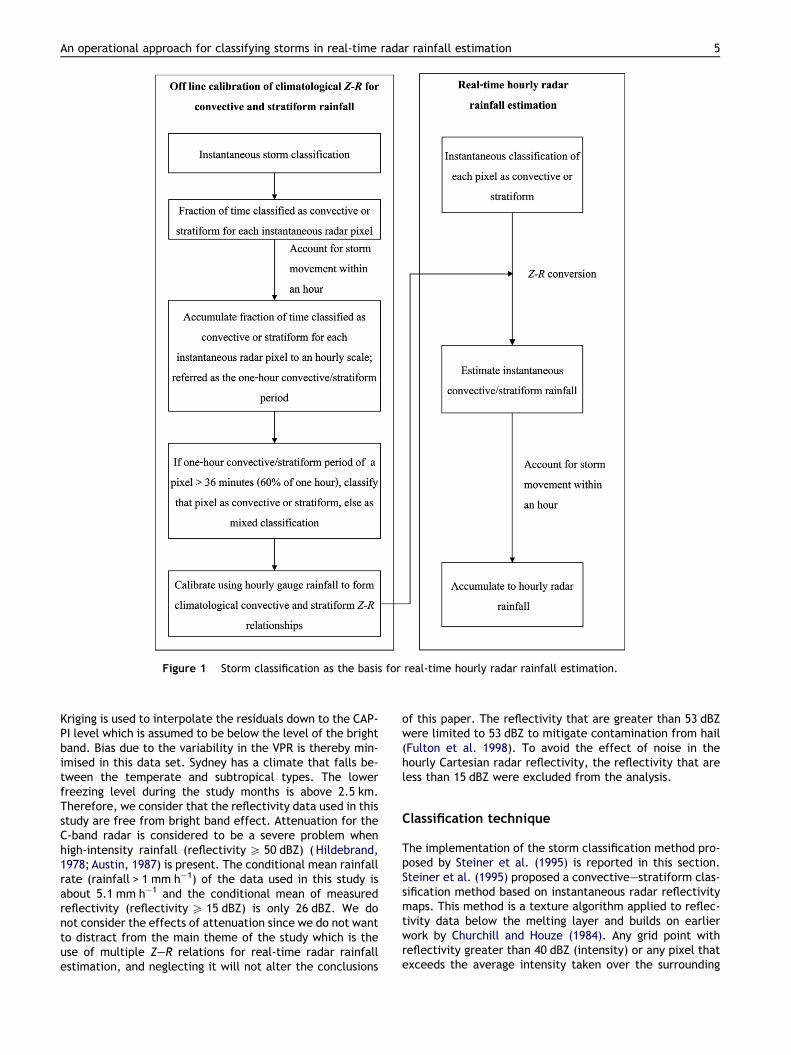
Figure 1 Storm classification as the basis for real-time hourly radar rainfall estimation.
An operational approach for classifying storms in real-time radar rainfall estimation 5
Kriging is used to interpolate the residuals down to the CAP-PI level which is assumed to be below the level of the brightband. Bias due to the variability in the VPR is thereby min-imised in this data set. Sydney has a climate that falls be-tween the temperate and subtropical types. The lowerfreezing level during the study months is above 2.5 km.Therefore, we consider that the reflectivity data used in thisstudy are free from bright band effect. Attenuation for theC-band radar is considered to be a severe problem whenhigh-intensity rainfall (reflectivity P 50 dBZ) ( Hildebrand,1978; Austin, 1987) is present. The conditional mean rainfallrate (rainfall > 1 mm h�1) of the data used in this study isabout 5.1 mm h�1 and the conditional mean of measuredreflectivity (reflectivity P 15 dBZ) is only 26 dBZ. We donot consider the effects of attenuation since we do not wantto distract from the main theme of the study which is theuse of multiple Z–R relations for real-time radar rainfallestimation, and neglecting it will not alter the conclusions
of this paper. The reflectivity that are greater than 53 dBZwere limited to 53 dBZ to mitigate contamination from hail(Fulton et al. 1998). To avoid the effect of noise in thehourly Cartesian radar reflectivity, the reflectivity that areless than 15 dBZ were excluded from the analysis.
Classification technique
The implementation of the storm classification method pro-posed by Steiner et al. (1995) is reported in this section.Steiner et al. (1995) proposed a convective–stratiform clas-sification method based on instantaneous radar reflectivitymaps. This method is a texture algorithm applied to reflec-tivity data below the melting layer and builds on earlierwork by Churchill and Houze (1984). Any grid point withreflectivity greater than 40 dBZ (intensity) or any pixel thatexceeds the average intensity taken over the surrounding
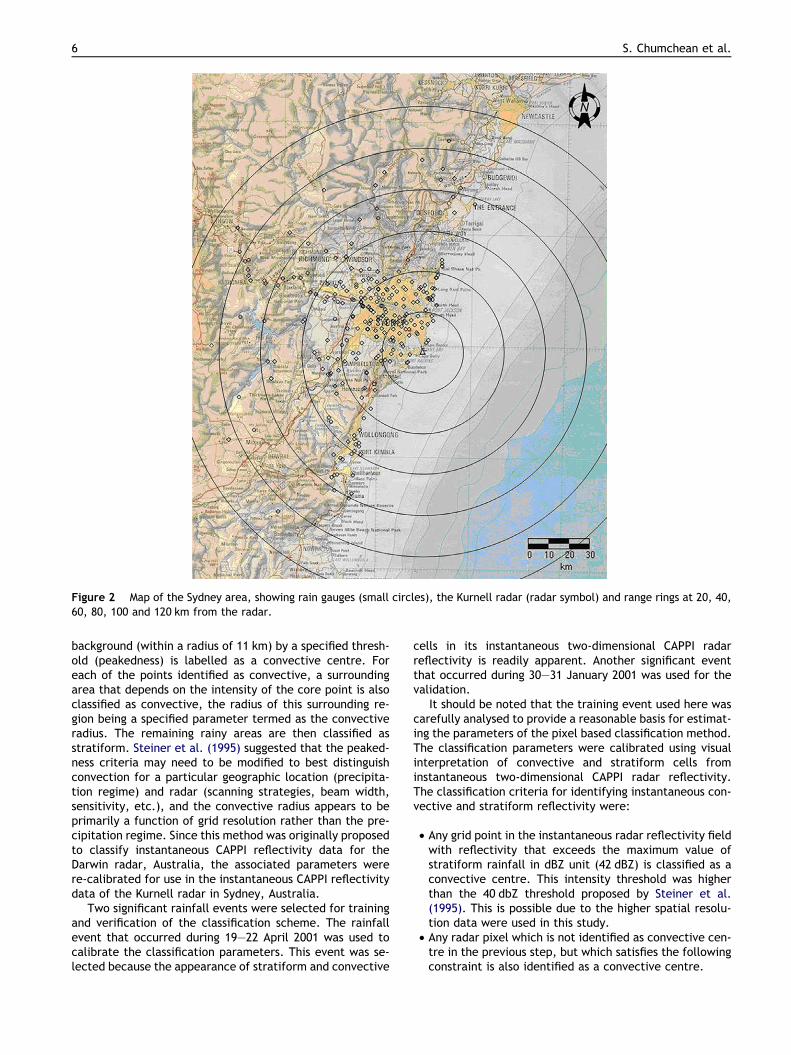
Figure 2 Map of the Sydney area, showing rain gauges (small circles), the Kurnell radar (radar symbol) and range rings at 20, 40,60, 80, 100 and 120 km from the radar.
6 S. Chumchean et al.
background (within a radius of 11 km) by a specified thresh-old (peakedness) is labelled as a convective centre. Foreach of the points identified as convective, a surroundingarea that depends on the intensity of the core point is alsoclassified as convective, the radius of this surrounding re-gion being a specified parameter termed as the convectiveradius. The remaining rainy areas are then classified asstratiform. Steiner et al. (1995) suggested that the peaked-ness criteria may need to be modified to best distinguishconvection for a particular geographic location (precipita-tion regime) and radar (scanning strategies, beam width,sensitivity, etc.), and the convective radius appears to beprimarily a function of grid resolution rather than the pre-cipitation regime. Since this method was originally proposedto classify instantaneous CAPPI reflectivity data for theDarwin radar, Australia, the associated parameters werere-calibrated for use in the instantaneous CAPPI reflectivitydata of the Kurnell radar in Sydney, Australia.
Two significant rainfall events were selected for trainingand verification of the classification scheme. The rainfallevent that occurred during 19–22 April 2001 was used tocalibrate the classification parameters. This event was se-lected because the appearance of stratiform and convective
cells in its instantaneous two-dimensional CAPPI radarreflectivity is readily apparent. Another significant eventthat occurred during 30–31 January 2001 was used for thevalidation.
It should be noted that the training event used here wascarefully analysed to provide a reasonable basis for estimat-ing the parameters of the pixel based classification method.The classification parameters were calibrated using visualinterpretation of convective and stratiform cells frominstantaneous two-dimensional CAPPI radar reflectivity.The classification criteria for identifying instantaneous con-vective and stratiform reflectivity were:
• Any grid point in the instantaneous radar reflectivity fieldwith reflectivity that exceeds the maximum value ofstratiform rainfall in dBZ unit (42 dBZ) is classified as aconvective centre. This intensity threshold was higherthan the 40 dbZ threshold proposed by Steiner et al.(1995). This is possible due to the higher spatial resolu-tion data were used in this study.
• Any radar pixel which is not identified as convective cen-tre in the previous step, but which satisfies the followingconstraint is also identified as a convective centre.
Table 1 Characteristics of rainfall events used in the analysis.
Event Start End Durationhours
Numberof gauges
Accumulated gaugerainfall (mm)
Accumulated radarrainfall Z = 103R1.5
G/R ratio Rmax (mm h�1)
Date Time Date Time
1 November, 3, 00 0100 November, 3, 00 1500 14 100 13.5 16.1 0.84 27.52 November, 30, 00 0200 December, 1, 00 1100 21 145 41.0 49.7 0.83 57.53 December, 13, 00 0200 December, 13, 00 1300 11 51 13.7 19.6 0.70 24.64 December, 18, 00 0300 December, 18,00 1300 10 52 12.7 15.7 0.81 29.05 December, 22, 00 2000 December, 23, 00 1100 15 19 10.5 10.6 0.92 10.56 January, 17, 01 0900 January, 18, 01 1600 19 115 44.5 34.8 1.28 98.57 January, 25, 01 0500 January, 26, 01 1900 26 30 16.4 16.0 1.02 42.28 January, 27, 01 0300 January, 27, 01 1100 8 121 23.7 12.5 1.89 41.59 January, 30, 01 0000 January, 31, 01 2300 47 113 201.1 115.6 1.73 59.010 February, 1,01 0000 February, 2, 01 0500 29 85 10.6 6.1 1.73 13.511 February, 4, 01 2300 February, 5, 01 0900 10 154 18.5 11.1 1.67 45.012 February, 10, 01 0200 February, 10, 01 1400 12 70 12.4 11.8 1.05 19.513 February, 14, 01 0300 February, 14, 01 1500 12 92 13.5 10.4 1.30 39.714 February, 27, 01 0400 February, 28, 01 2000 40 172 18.3 13.9 1.31 28.015 March, 2, 01 0400 March, 3, 01 1100 19 106 10.9 8.3 1.31 31.516 March, 6, 01 1600 March, 11,01 1100 115 92 62.1 26.0 2.39 48.417 March, 11,01 2000 March, 12, 01 0600 10 74 20.8 19.2 1.08 18.018 April, 2, 01 0200 April, 2, 01 1300 11 71 10.5 9.3 1.12 29.619 April, 9, 01 1500 April, 10, 01 0700 16 73 34.5 23.7 1.45 44.320 April, 19, 01 0900 April, 22, 01 1000 73 51 180.0 151.2 1.19 53.521 February, 7, 07 0400 February, 7, 07 1100 7 24 24.5 37.4 0.65 40.322 February, 10, 07 0300 February, 12, 07 1300 58 70 177.1 124.9 1.41 102.323 February, 22, 07 0200 February, 22, 07 1400 12 35 16.3 18.8 0.87 37.324 February, 24, 07 0100 February, 24, 07 1300 12 44 19.7 12.8 1.54 14.725 February, 24, 07 0800 February, 25, 07 0100 17 51 41.0 43.1 0.95 61.726 February, 25, 07 0900 February, 25, 07 1800 9 84 18.4 17.0 1.08 36.127 February, 26, 07 0300 Feb, 26, 07 2200 19 70 44.7 22.2 2.01 50.128 February, 27, 07 0000 February, 27, 07 1000 10 8 14.3 15.3 0.94 32.029 February, 28, 07 0100 February, 28, 07 1000 9 73 19.3 20.8 0.93 47.030 March, 01, 07 0300 March, 01, 07 1200 9 42 17.5 18.6 0.94 55.031 March, 04, 07 0500 March, 05, 07 0300 22 76 21.7 18.5 1.17 138.532 March, 08, 07 0200 March, 08, 07 1200 10 62 18.1 15.4 1.18 26.033 March, 17, 07 0100 March, 17, 07 1000 9 97 12.4 7.0 1.75 20.134 March, 20, 07 0300 March, 20, 07 1100 8 23 21.0 16.2 1.29 41.3
Accumulated rain gauge rainfall were averaged from rainfall > 1 mm h�1; Rmax is the maximum rain gauge rainfall.
Anoperatio
nal
approach
forclassifyin
gsto
rmsin
real-tim
erad
arrain
fallestim
ation
7
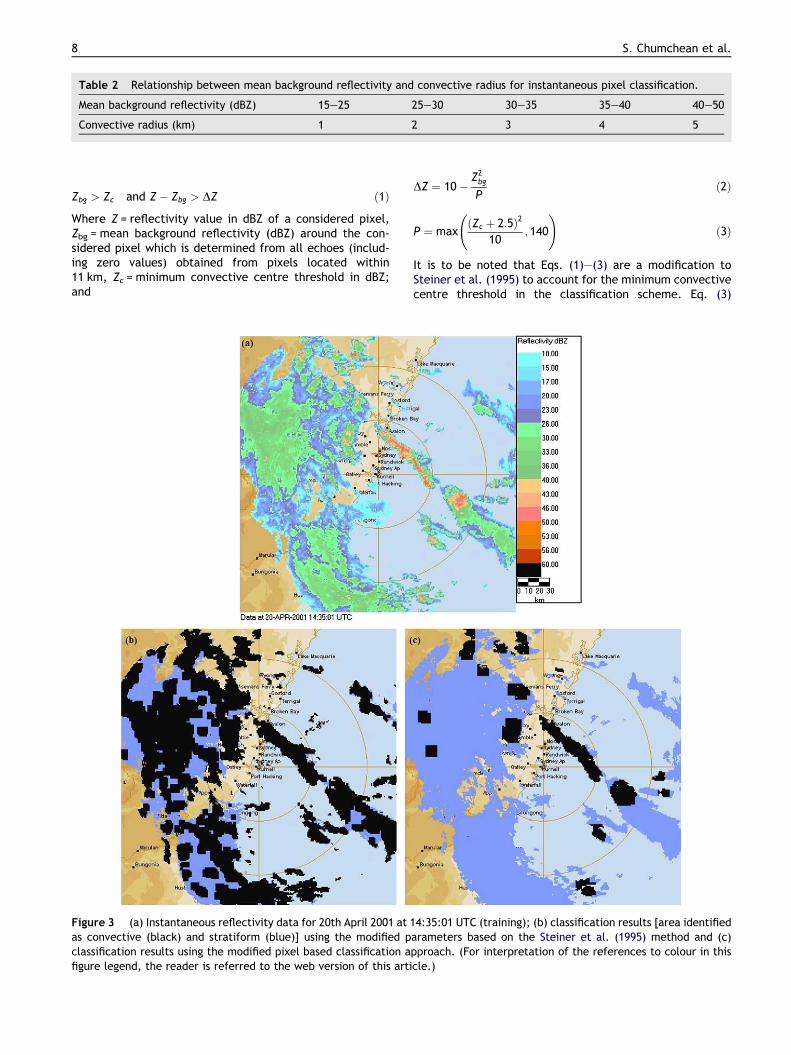
Table 2 Relationship between mean background reflectivity and convective radius for instantaneous pixel classification.
Mean background reflectivity (dBZ) 15–25 25–30 30–35 35–40 40–50
Convective radius (km) 1 2 3 4 5
8 S. Chumchean et al.
Zbg > Zc and Z � Zbg > DZ ð1Þ
Where Z = reflectivity value in dBZ of a considered pixel,Zbg = mean background reflectivity (dBZ) around the con-sidered pixel which is determined from all echoes (includ-ing zero values) obtained from pixels located within11 km, Zc = minimum convective centre threshold in dBZ;and
Figure 3 (a) Instantaneous reflectivity data for 20th April 2001 atas convective (black) and stratiform (blue)] using the modified pclassification results using the modified pixel based classification afigure legend, the reader is referred to the web version of this arti
DZ ¼ 10�Z2bg
Pð2Þ
P ¼ maxðZc þ 2:5Þ2
10; 140
!ð3Þ
It is to be noted that Eqs. (1)–(3) are a modification toSteiner et al. (1995) to account for the minimum convectivecentre threshold in the classification scheme. Eq. (3)
14:35:01 UTC (training); (b) classification results [area identifiedarameters based on the Steiner et al. (1995) method and (c)pproach. (For interpretation of the references to colour in thiscle.)
An operational approach for classifying storms in real-time radar rainfall estimation 9
defaults to the Steiner et al. (1995) algorithm when Zc isequal to 40 dBZ.
• The convective radius is a function of the mean back-ground echo. The relationship between the convectiveradius and the mean background reflectivity has beenmodified from that proposed by Steiner et al. (1995) tobe suitable for the data used in this study as presentedin Table 2.
The instantaneous pixel classification was performed byfollowing the above steps. Fig. 3a and b illustrate an exam-ple of instantaneous reflectivity field and the classificationresult of the training event (20 April 2001 at 14:35:01UTC). It is shown that using the Steiner et al. (1995) proce-dure with the modified parameters specified above exceptthe minimum convective centre threshold, one over-esti-mates the extent of the convective area as low reflectivityvalues are mis-classified as convective. This result corre-
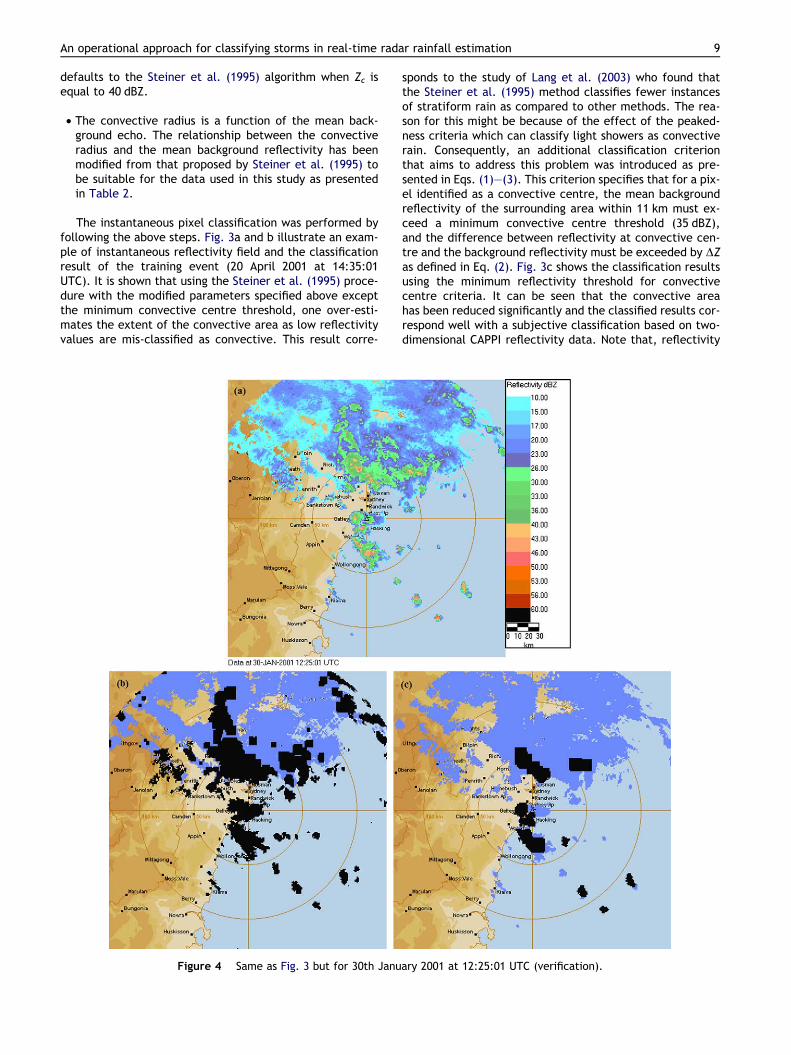
Figure 4 Same as Fig. 3 but for 30th Janu
sponds to the study of Lang et al. (2003) who found thatthe Steiner et al. (1995) method classifies fewer instancesof stratiform rain as compared to other methods. The rea-son for this might be because of the effect of the peaked-ness criteria which can classify light showers as convectiverain. Consequently, an additional classification criterionthat aims to address this problem was introduced as pre-sented in Eqs. (1)–(3). This criterion specifies that for a pix-el identified as a convective centre, the mean backgroundreflectivity of the surrounding area within 11 km must ex-ceed a minimum convective centre threshold (35 dBZ),and the difference between reflectivity at convective cen-tre and the background reflectivity must be exceeded by DZas defined in Eq. (2). Fig. 3c shows the classification resultsusing the minimum reflectivity threshold for convectivecentre criteria. It can be seen that the convective areahas been reduced significantly and the classified results cor-respond well with a subjective classification based on two-dimensional CAPPI reflectivity data. Note that, reflectivity
ary 2001 at 12:25:01 UTC (verification).
0
1
2
3
4
5
6
7
8
9
10
11
0 5 10 15 20 25 30 35Reflectivity (dBZ)
Hei
ght (
km).
.
Calibration: 20 Apr 01 at 14:35 UTC
Verification1: 30 Jan 01 at 12:25 UTC
Verification2: 10 Feb 07 at 18:35 UTC
0
1
2
3
4
5
6
7
8
9
10
11
0 5 10 15 20 25 30 35Reflectivity (dBZ)
Hei
ght (
km).
.
Calibration: 20 Apr 01 at 14:35 UTC
Verification1: 30 Jan 01 at 12:25 UTC
Verification2: 10 Feb 07 at 18:35 UTC
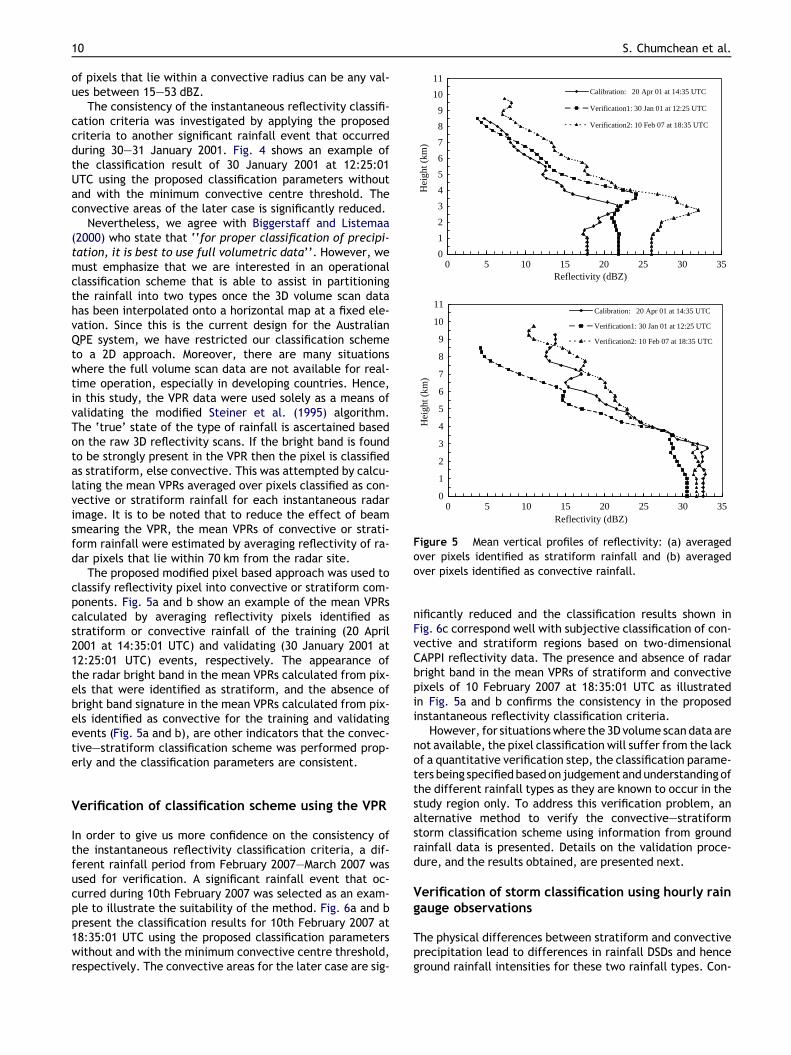
Figure 5 Mean vertical profiles of reflectivity: (a) averagedover pixels identified as stratiform rainfall and (b) averagedover pixels identified as convective rainfall.
10 S. Chumchean et al.
of pixels that lie within a convective radius can be any val-ues between 15–53 dBZ.
The consistency of the instantaneous reflectivity classifi-cation criteria was investigated by applying the proposedcriteria to another significant rainfall event that occurredduring 30–31 January 2001. Fig. 4 shows an example ofthe classification result of 30 January 2001 at 12:25:01UTC using the proposed classification parameters withoutand with the minimum convective centre threshold. Theconvective areas of the later case is significantly reduced.
Nevertheless, we agree with Biggerstaff and Listemaa(2000) who state that ‘‘for proper classification of precipi-tation, it is best to use full volumetric data’’. However, wemust emphasize that we are interested in an operationalclassification scheme that is able to assist in partitioningthe rainfall into two types once the 3D volume scan datahas been interpolated onto a horizontal map at a fixed ele-vation. Since this is the current design for the AustralianQPE system, we have restricted our classification schemeto a 2D approach. Moreover, there are many situationswhere the full volume scan data are not available for real-time operation, especially in developing countries. Hence,in this study, the VPR data were used solely as a means ofvalidating the modified Steiner et al. (1995) algorithm.The ‘true’ state of the type of rainfall is ascertained basedon the raw 3D reflectivity scans. If the bright band is foundto be strongly present in the VPR then the pixel is classifiedas stratiform, else convective. This was attempted by calcu-lating the mean VPRs averaged over pixels classified as con-vective or stratiform rainfall for each instantaneous radarimage. It is to be noted that to reduce the effect of beamsmearing the VPR, the mean VPRs of convective or strati-form rainfall were estimated by averaging reflectivity of ra-dar pixels that lie within 70 km from the radar site.
The proposed modified pixel based approach was used toclassify reflectivity pixel into convective or stratiform com-ponents. Fig. 5a and b show an example of the mean VPRscalculated by averaging reflectivity pixels identified asstratiform or convective rainfall of the training (20 April2001 at 14:35:01 UTC) and validating (30 January 2001 at12:25:01 UTC) events, respectively. The appearance ofthe radar bright band in the mean VPRs calculated from pix-els that were identified as stratiform, and the absence ofbright band signature in the mean VPRs calculated from pix-els identified as convective for the training and validatingevents (Fig. 5a and b), are other indicators that the convec-tive–stratiform classification scheme was performed prop-erly and the classification parameters are consistent.
Verification of classification scheme using the VPR
In order to give us more confidence on the consistency ofthe instantaneous reflectivity classification criteria, a dif-ferent rainfall period from February 2007–March 2007 wasused for verification. A significant rainfall event that oc-curred during 10th February 2007 was selected as an exam-ple to illustrate the suitability of the method. Fig. 6a and bpresent the classification results for 10th February 2007 at18:35:01 UTC using the proposed classification parameterswithout and with the minimum convective centre threshold,respectively. The convective areas for the later case are sig-
nificantly reduced and the classification results shown inFig. 6c correspond well with subjective classification of con-vective and stratiform regions based on two-dimensionalCAPPI reflectivity data. The presence and absence of radarbright band in the mean VPRs of stratiform and convectivepixels of 10 February 2007 at 18:35:01 UTC as illustratedin Fig. 5a and b confirms the consistency in the proposedinstantaneous reflectivity classification criteria.
However, for situationswhere the 3D volume scan data arenot available, the pixel classification will suffer from the lackof a quantitative verification step, the classification parame-ters being specifiedbasedon judgement and understanding ofthe different rainfall types as they are known to occur in thestudy region only. To address this verification problem, analternative method to verify the convective–stratiformstorm classification scheme using information from groundrainfall data is presented. Details on the validation proce-dure, and the results obtained, are presented next.
Verification of storm classification using hourly raingauge observations
The physical differences between stratiform and convectiveprecipitation lead to differences in rainfall DSDs and henceground rainfall intensities for these two rainfall types. Con-
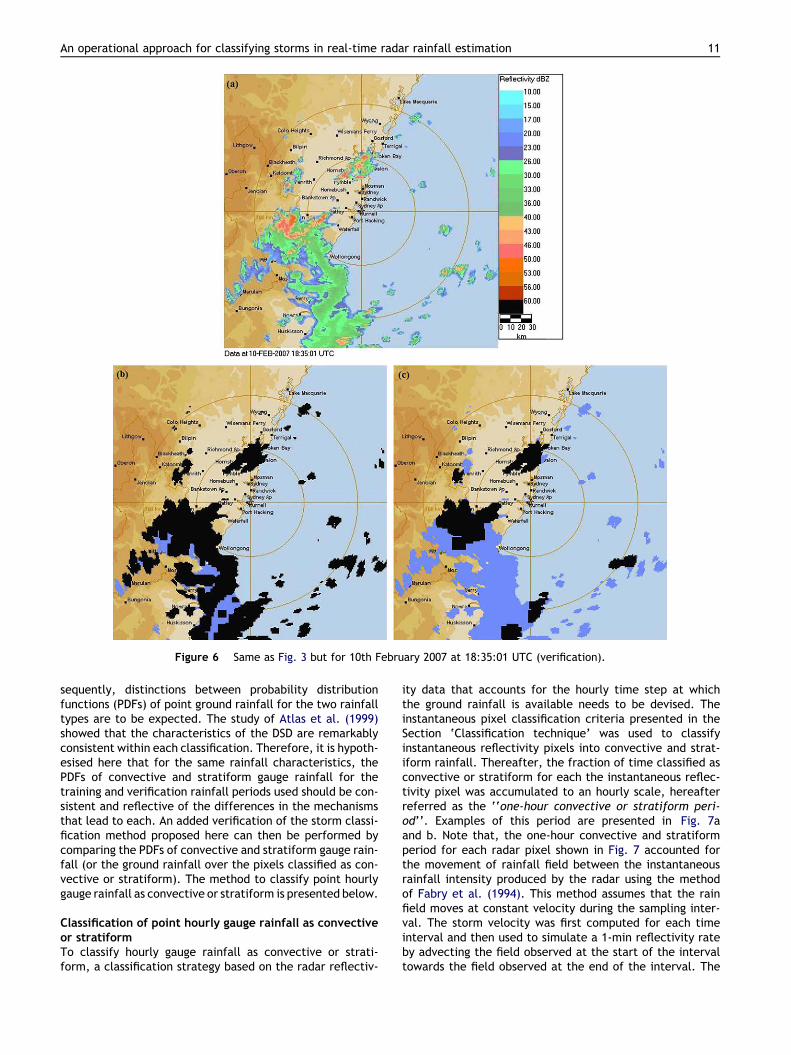
Figure 6 Same as Fig. 3 but for 10th February 2007 at 18:35:01 UTC (verification).
An operational approach for classifying storms in real-time radar rainfall estimation 11
sequently, distinctions between probability distributionfunctions (PDFs) of point ground rainfall for the two rainfalltypes are to be expected. The study of Atlas et al. (1999)showed that the characteristics of the DSD are remarkablyconsistent within each classification. Therefore, it is hypoth-esised here that for the same rainfall characteristics, thePDFs of convective and stratiform gauge rainfall for thetraining and verification rainfall periods used should be con-sistent and reflective of the differences in the mechanismsthat lead to each. An added verification of the storm classi-fication method proposed here can then be performed bycomparing the PDFs of convective and stratiform gauge rain-fall (or the ground rainfall over the pixels classified as con-vective or stratiform). The method to classify point hourlygauge rainfall as convective or stratiform is presented below.
Classification of point hourly gauge rainfall as convectiveor stratiformTo classify hourly gauge rainfall as convective or strati-form, a classification strategy based on the radar reflectiv-
ity data that accounts for the hourly time step at whichthe ground rainfall is available needs to be devised. Theinstantaneous pixel classification criteria presented in theSection ‘Classification technique’ was used to classifyinstantaneous reflectivity pixels into convective and strat-iform rainfall. Thereafter, the fraction of time classified asconvective or stratiform for each the instantaneous reflec-tivity pixel was accumulated to an hourly scale, hereafterreferred as the ‘‘one-hour convective or stratiform peri-od’’. Examples of this period are presented in Fig. 7aand b. Note that, the one-hour convective and stratiformperiod for each radar pixel shown in Fig. 7 accounted forthe movement of rainfall field between the instantaneousrainfall intensity produced by the radar using the methodof Fabry et al. (1994). This method assumes that the rainfield moves at constant velocity during the sampling inter-val. The storm velocity was first computed for each timeinterval and then used to simulate a 1-min reflectivity rateby advecting the field observed at the start of the intervaltowards the field observed at the end of the interval. The
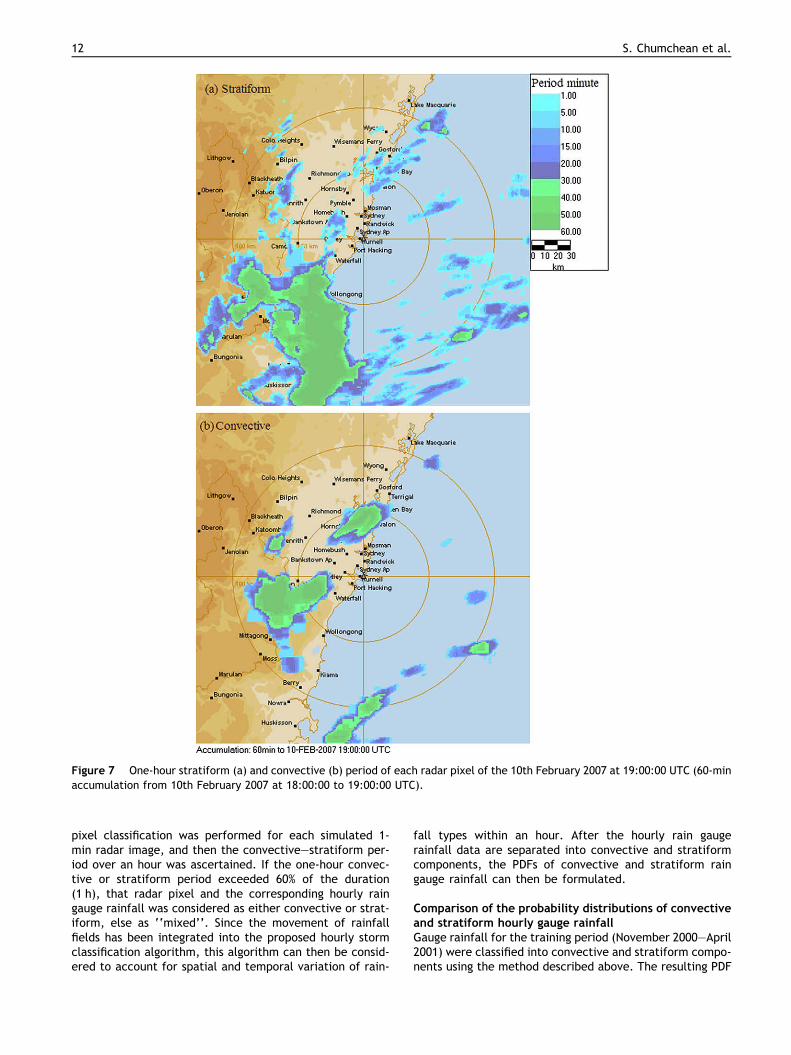
Figure 7 One-hour stratiform (a) and convective (b) period of each radar pixel of the 10th February 2007 at 19:00:00 UTC (60-minaccumulation from 10th February 2007 at 18:00:00 to 19:00:00 UTC).
12 S. Chumchean et al.
pixel classification was performed for each simulated 1-min radar image, and then the convective–stratiform per-iod over an hour was ascertained. If the one-hour convec-tive or stratiform period exceeded 60% of the duration(1 h), that radar pixel and the corresponding hourly raingauge rainfall was considered as either convective or strat-iform, else as ‘‘mixed’’. Since the movement of rainfallfields has been integrated into the proposed hourly stormclassification algorithm, this algorithm can then be consid-ered to account for spatial and temporal variation of rain-
fall types within an hour. After the hourly rain gaugerainfall data are separated into convective and stratiformcomponents, the PDFs of convective and stratiform raingauge rainfall can then be formulated.
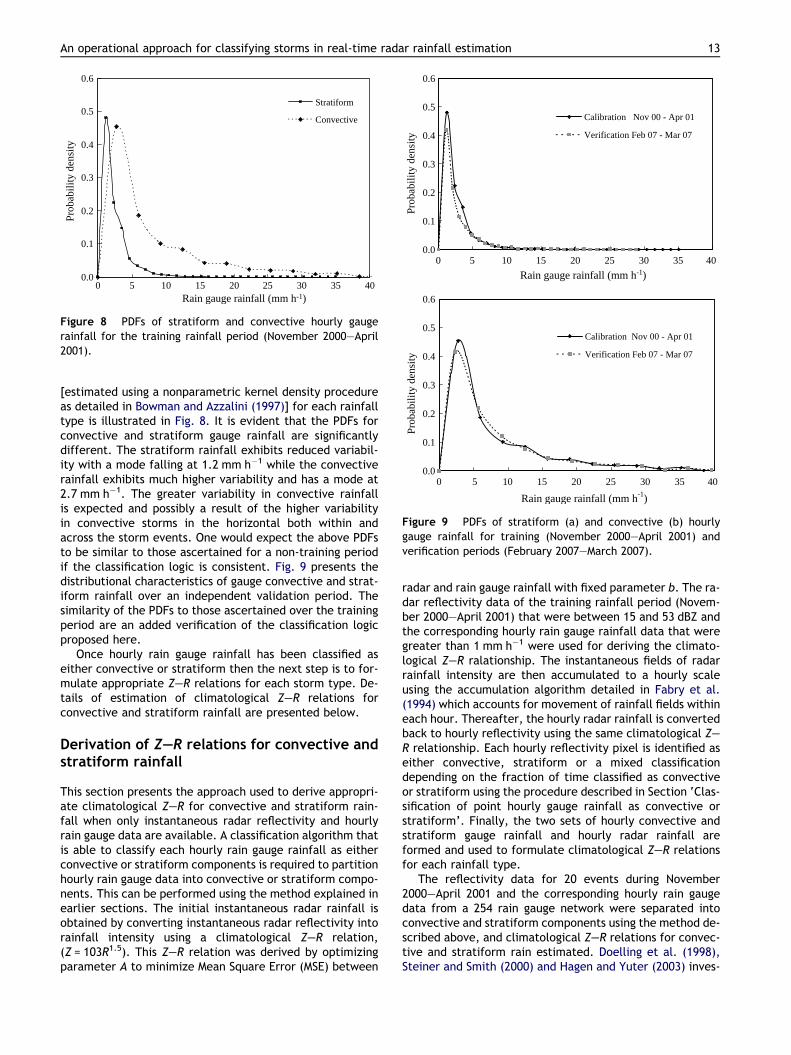
Comparison of the probability distributions of convectiveand stratiform hourly gauge rainfallGauge rainfall for the training period (November 2000–April2001) were classified into convective and stratiform compo-nents using the method described above. The resulting PDF
0.0
0.1
0.2
0.3
0.4
0.5
0.6
0 5 10 15 20 25 30 35 40Rain gauge rainfall (mm h-1)
Prob
abili
ty d
ensi
ty.
Stratiform
Convective
Figure 8 PDFs of stratiform and convective hourly gaugerainfall for the training rainfall period (November 2000–April2001).
0.0
0.1
0.2
0.3
0.4
0.5
0.6
0 5 10 15 20 25 30 35 40
Rain gauge rainfall (mm h-1)
Prob
abili
ty d
ensi
ty
Calibration Nov 00 - Apr 01
Verification Feb 07 - Mar 07
0.0
0.1
0.2
0.3
0.4
0.5
0.6
0 5 10 15 20 25 30 35 40
Rain gauge rainfall (mm h-1)
Prob
abili
ty d
ensi
ty
Calibration Nov 00 - Apr 01
Verification Feb 07 - Mar 07
Figure 9 PDFs of stratiform (a) and convective (b) hourlygauge rainfall for training (November 2000–April 2001) andverification periods (February 2007–March 2007).
An operational approach for classifying storms in real-time radar rainfall estimation 13
[estimated using a nonparametric kernel density procedureas detailed in Bowman and Azzalini (1997)] for each rainfalltype is illustrated in Fig. 8. It is evident that the PDFs forconvective and stratiform gauge rainfall are significantlydifferent. The stratiform rainfall exhibits reduced variabil-ity with a mode falling at 1.2 mm h�1 while the convectiverainfall exhibits much higher variability and has a mode at2.7 mm h�1. The greater variability in convective rainfallis expected and possibly a result of the higher variabilityin convective storms in the horizontal both within andacross the storm events. One would expect the above PDFsto be similar to those ascertained for a non-training periodif the classification logic is consistent. Fig. 9 presents thedistributional characteristics of gauge convective and strat-iform rainfall over an independent validation period. Thesimilarity of the PDFs to those ascertained over the trainingperiod are an added verification of the classification logicproposed here.
Once hourly rain gauge rainfall has been classified aseither convective or stratiform then the next step is to for-mulate appropriate Z–R relations for each storm type. De-tails of estimation of climatological Z–R relations forconvective and stratiform rainfall are presented below.
Derivation of Z–R relations for convective andstratiform rainfall
This section presents the approach used to derive appropri-ate climatological Z–R for convective and stratiform rain-fall when only instantaneous radar reflectivity and hourlyrain gauge data are available. A classification algorithm thatis able to classify each hourly rain gauge rainfall as eitherconvective or stratiform components is required to partitionhourly rain gauge data into convective or stratiform compo-nents. This can be performed using the method explained inearlier sections. The initial instantaneous radar rainfall isobtained by converting instantaneous radar reflectivity intorainfall intensity using a climatological Z–R relation,(Z = 103R1.5). This Z–R relation was derived by optimizingparameter A to minimize Mean Square Error (MSE) between
radar and rain gauge rainfall with fixed parameter b. The ra-dar reflectivity data of the training rainfall period (Novem-ber 2000–April 2001) that were between 15 and 53 dBZ andthe corresponding hourly rain gauge rainfall data that weregreater than 1 mm h�1 were used for deriving the climato-logical Z–R ralationship. The instantaneous fields of radarrainfall intensity are then accumulated to a hourly scaleusing the accumulation algorithm detailed in Fabry et al.(1994) which accounts for movement of rainfall fields withineach hour. Thereafter, the hourly radar rainfall is convertedback to hourly reflectivity using the same climatological Z–R relationship. Each hourly reflectivity pixel is identified aseither convective, stratiform or a mixed classificationdepending on the fraction of time classified as convectiveor stratiform using the procedure described in Section ‘Clas-sification of point hourly gauge rainfall as convective orstratiform’. Finally, the two sets of hourly convective andstratiform gauge rainfall and hourly radar rainfall areformed and used to formulate climatological Z–R relationsfor each rainfall type.
The reflectivity data for 20 events during November2000–April 2001 and the corresponding hourly rain gaugedata from a 254 rain gauge network were separated intoconvective and stratiform components using the method de-scribed above, and climatological Z–R relations for convec-tive and stratiform rain estimated. Doelling et al. (1998),Steiner and Smith (2000) and Hagen and Yuter (2003) inves-
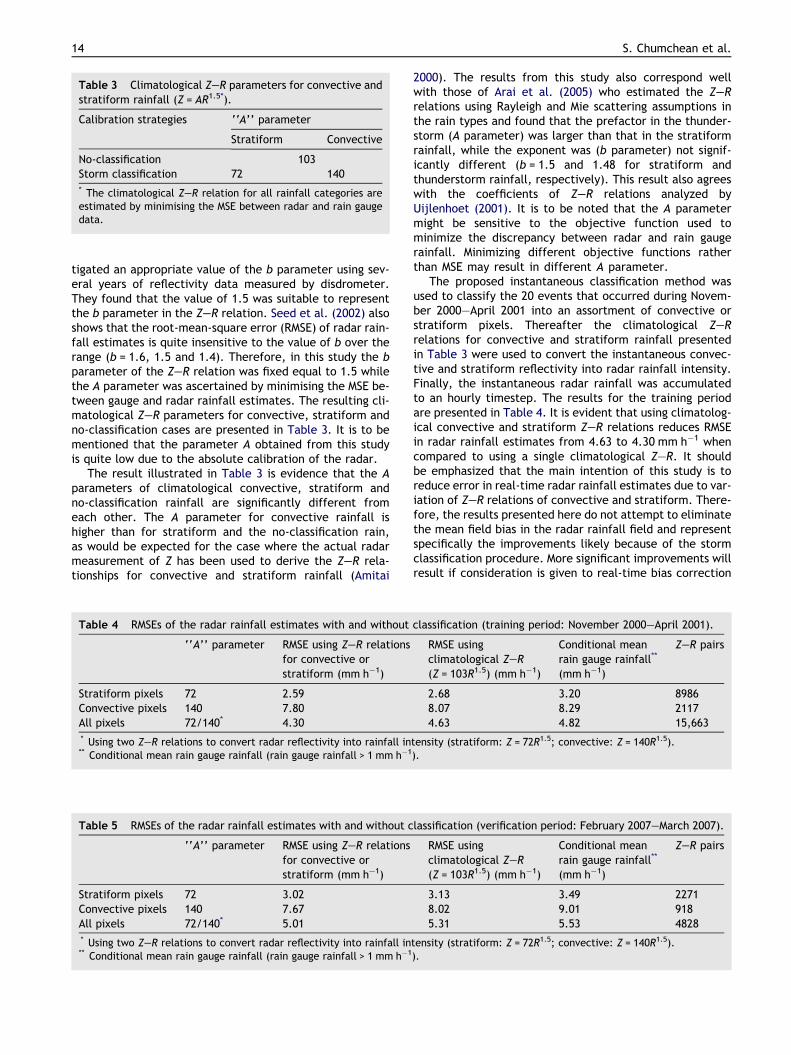
Table 3 Climatological Z–R parameters for convective andstratiform rainfall (Z = AR1.5*).
Calibration strategies ‘‘A’’ parameter
Stratiform Convective
No-classification 103Storm classification 72 140* The climatological Z–R relation for all rainfall categories areestimated by minimising the MSE between radar and rain gaugedata.
14 S. Chumchean et al.
tigated an appropriate value of the b parameter using sev-eral years of reflectivity data measured by disdrometer.They found that the value of 1.5 was suitable to representthe b parameter in the Z–R relation. Seed et al. (2002) alsoshows that the root-mean-square error (RMSE) of radar rain-fall estimates is quite insensitive to the value of b over therange (b = 1.6, 1.5 and 1.4). Therefore, in this study the bparameter of the Z–R relation was fixed equal to 1.5 whilethe A parameter was ascertained by minimising the MSE be-tween gauge and radar rainfall estimates. The resulting cli-matological Z–R parameters for convective, stratiform andno-classification cases are presented in Table 3. It is to bementioned that the parameter A obtained from this studyis quite low due to the absolute calibration of the radar.
The result illustrated in Table 3 is evidence that the Aparameters of climatological convective, stratiform andno-classification rainfall are significantly different fromeach other. The A parameter for convective rainfall ishigher than for stratiform and the no-classification rain,as would be expected for the case where the actual radarmeasurement of Z has been used to derive the Z–R rela-tionships for convective and stratiform rainfall (Amitai
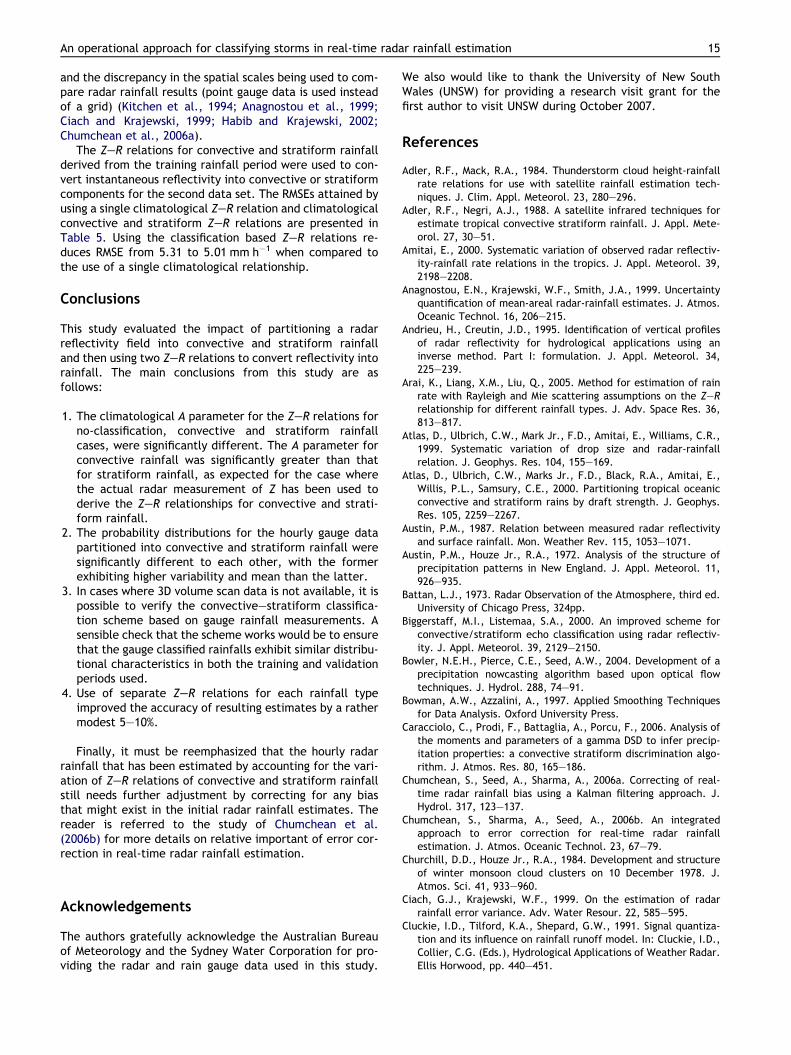
Table 4 RMSEs of the radar rainfall estimates with and without
‘‘A’’ parameter RMSE using Z–R relationsfor convective orstratiform (mm h�1)
Stratiform pixels 72 2.59Convective pixels 140 7.80All pixels 72/140* 4.30* Using two Z–R relations to convert radar reflectivity into rainfall in** Conditional mean rain gauge rainfall (rain gauge rainfall > 1 mm h�1
Table 5 RMSEs of the radar rainfall estimates with and without c
‘‘A’’ parameter RMSE using Z–R relationsfor convective orstratiform (mm h–1)
Stratiform pixels 72 3.02Convective pixels 140 7.67All pixels 72/140* 5.01* Using two Z–R relations to convert radar reflectivity into rainfall in** Conditional mean rain gauge rainfall (rain gauge rainfall > 1 mm h�1
2000). The results from this study also correspond wellwith those of Arai et al. (2005) who estimated the Z–Rrelations using Rayleigh and Mie scattering assumptions inthe rain types and found that the prefactor in the thunder-storm (A parameter) was larger than that in the stratiformrainfall, while the exponent was (b parameter) not signif-icantly different (b = 1.5 and 1.48 for stratiform andthunderstorm rainfall, respectively). This result also agreeswith the coefficients of Z–R relations analyzed byUijlenhoet (2001). It is to be noted that the A parametermight be sensitive to the objective function used tominimize the discrepancy between radar and rain gaugerainfall. Minimizing different objective functions ratherthan MSE may result in different A parameter.
The proposed instantaneous classification method wasused to classify the 20 events that occurred during Novem-ber 2000–April 2001 into an assortment of convective orstratiform pixels. Thereafter the climatological Z–Rrelations for convective and stratiform rainfall presentedin Table 3 were used to convert the instantaneous convec-tive and stratiform reflectivity into radar rainfall intensity.Finally, the instantaneous radar rainfall was accumulatedto an hourly timestep. The results for the training periodare presented in Table 4. It is evident that using climatolog-ical convective and stratiform Z–R relations reduces RMSEin radar rainfall estimates from 4.63 to 4.30 mm h�1 whencompared to using a single climatological Z–R. It shouldbe emphasized that the main intention of this study is toreduce error in real-time radar rainfall estimates due to var-iation of Z–R relations of convective and stratiform. There-fore, the results presented here do not attempt to eliminatethe mean field bias in the radar rainfall field and representspecifically the improvements likely because of the stormclassification procedure. More significant improvements willresult if consideration is given to real-time bias correction
classification (training period: November 2000–April 2001).
RMSE usingclimatological Z–R(Z = 103R1.5) (mm h�1)
Conditional meanrain gauge rainfall**
(mm h�1)
Z–R pairs
2.68 3.20 89868.07 8.29 21174.63 4.82 15,663
tensity (stratiform: Z = 72R1.5; convective: Z = 140R1.5).).
lassification (verification period: February 2007–March 2007).
RMSE usingclimatological Z–R(Z = 103R1.5) (mm h�1)
Conditional meanrain gauge rainfall**
(mm h�1)
Z–R pairs
3.13 3.49 22718.02 9.01 9185.31 5.53 4828
tensity (stratiform: Z = 72R1.5; convective: Z = 140R1.5).).
An operational approach for classifying storms in real-time radar rainfall estimation 15
and the discrepancy in the spatial scales being used to com-pare radar rainfall results (point gauge data is used insteadof a grid) (Kitchen et al., 1994; Anagnostou et al., 1999;Ciach and Krajewski, 1999; Habib and Krajewski, 2002;Chumchean et al., 2006a).
The Z–R relations for convective and stratiform rainfallderived from the training rainfall period were used to con-vert instantaneous reflectivity into convective or stratiformcomponents for the second data set. The RMSEs attained byusing a single climatological Z–R relation and climatologicalconvective and stratiform Z–R relations are presented inTable 5. Using the classification based Z–R relations re-duces RMSE from 5.31 to 5.01 mm h�1 when compared tothe use of a single climatological relationship.
Conclusions
This study evaluated the impact of partitioning a radarreflectivity field into convective and stratiform rainfalland then using two Z–R relations to convert reflectivity intorainfall. The main conclusions from this study are asfollows:
1. The climatological A parameter for the Z–R relations forno-classification, convective and stratiform rainfallcases, were significantly different. The A parameter forconvective rainfall was significantly greater than thatfor stratiform rainfall, as expected for the case wherethe actual radar measurement of Z has been used toderive the Z–R relationships for convective and strati-form rainfall.
2. The probability distributions for the hourly gauge datapartitioned into convective and stratiform rainfall weresignificantly different to each other, with the formerexhibiting higher variability and mean than the latter.
3. In cases where 3D volume scan data is not available, it ispossible to verify the convective–stratiform classifica-tion scheme based on gauge rainfall measurements. Asensible check that the scheme works would be to ensurethat the gauge classified rainfalls exhibit similar distribu-tional characteristics in both the training and validationperiods used.
4. Use of separate Z–R relations for each rainfall typeimproved the accuracy of resulting estimates by a rathermodest 5–10%.
Finally, it must be reemphasized that the hourly radarrainfall that has been estimated by accounting for the vari-ation of Z–R relations of convective and stratiform rainfallstill needs further adjustment by correcting for any biasthat might exist in the initial radar rainfall estimates. Thereader is referred to the study of Chumchean et al.(2006b) for more details on relative important of error cor-rection in real-time radar rainfall estimation.
Acknowledgements
The authors gratefully acknowledge the Australian Bureauof Meteorology and the Sydney Water Corporation for pro-viding the radar and rain gauge data used in this study.
We also would like to thank the University of New SouthWales (UNSW) for providing a research visit grant for thefirst author to visit UNSW during October 2007.
References
Adler, R.F., Mack, R.A., 1984. Thunderstorm cloud height-rainfallrate relations for use with satellite rainfall estimation tech-niques. J. Clim. Appl. Meteorol. 23, 280–296.
Adler, R.F., Negri, A.J., 1988. A satellite infrared techniques forestimate tropical convective stratiform rainfall. J. Appl. Mete-orol. 27, 30–51.
Amitai, E., 2000. Systematic variation of observed radar reflectiv-ity-rainfall rate relations in the tropics. J. Appl. Meteorol. 39,2198–2208.
Anagnostou, E.N., Krajewski, W.F., Smith, J.A., 1999. Uncertaintyquantification of mean-areal radar-rainfall estimates. J. Atmos.Oceanic Technol. 16, 206–215.
Andrieu, H., Creutin, J.D., 1995. Identification of vertical profilesof radar reflectivity for hydrological applications using aninverse method. Part I: formulation. J. Appl. Meteorol. 34,225–239.
Arai, K., Liang, X.M., Liu, Q., 2005. Method for estimation of rainrate with Rayleigh and Mie scattering assumptions on the Z–Rrelationship for different rainfall types. J. Adv. Space Res. 36,813–817.
Atlas, D., Ulbrich, C.W., Mark Jr., F.D., Amitai, E., Williams, C.R.,1999. Systematic variation of drop size and radar-rainfallrelation. J. Geophys. Res. 104, 155–169.
Atlas, D., Ulbrich, C.W., Marks Jr., F.D., Black, R.A., Amitai, E.,Willis, P.L., Samsury, C.E., 2000. Partitioning tropical oceanicconvective and stratiform rains by draft strength. J. Geophys.Res. 105, 2259–2267.
Austin, P.M., 1987. Relation between measured radar reflectivityand surface rainfall. Mon. Weather Rev. 115, 1053–1071.
Austin, P.M., Houze Jr., R.A., 1972. Analysis of the structure ofprecipitation patterns in New England. J. Appl. Meteorol. 11,926–935.
Battan, L.J., 1973. Radar Observation of the Atmosphere, third ed.University of Chicago Press, 324pp.
Biggerstaff, M.I., Listemaa, S.A., 2000. An improved scheme forconvective/stratiform echo classification using radar reflectiv-ity. J. Appl. Meteorol. 39, 2129–2150.
Bowler, N.E.H., Pierce, C.E., Seed, A.W., 2004. Development of aprecipitation nowcasting algorithm based upon optical flowtechniques. J. Hydrol. 288, 74–91.
Bowman, A.W., Azzalini, A., 1997. Applied Smoothing Techniquesfor Data Analysis. Oxford University Press.
Caracciolo, C., Prodi, F., Battaglia, A., Porcu, F., 2006. Analysis ofthe moments and parameters of a gamma DSD to infer precip-itation properties: a convective stratiform discrimination algo-rithm. J. Atmos. Res. 80, 165–186.
Chumchean, S., Seed, A., Sharma, A., 2006a. Correcting of real-time radar rainfall bias using a Kalman filtering approach. J.Hydrol. 317, 123–137.
Chumchean, S., Sharma, A., Seed, A., 2006b. An integratedapproach to error correction for real-time radar rainfallestimation. J. Atmos. Oceanic Technol. 23, 67–79.
Churchill, D.D., Houze Jr., R.A., 1984. Development and structureof winter monsoon cloud clusters on 10 December 1978. J.Atmos. Sci. 41, 933–960.
Ciach, G.J., Krajewski, W.F., 1999. On the estimation of radarrainfall error variance. Adv. Water Resour. 22, 585–595.
Cluckie, I.D., Tilford, K.A., Shepard, G.W., 1991. Signal quantiza-tion and its influence on rainfall runoff model. In: Cluckie, I.D.,Collier, C.G. (Eds.), Hydrological Applications of Weather Radar.Ellis Horwood, pp. 440–451.
16 S. Chumchean et al.
Collier, C.G., 1996. Applications of Weather Radar System A Guideto Uses of Radar in Meteorology and Hydrology, second ed. JohnWiley & Sons, 383pp.
Doelling, I.G., Joss, J., Riedl, J., 1998. Systematic variations of Z–Rrelationships from drop size distributions measured in northernGermany during seven years. Atmos. Res. 47–48, 635–649.
Fabry, F., Zawadzki, I., 1995. Long-term radar observations of themelting layer of precipitation and their interpretation. J. Atmos.Sci. 52, 838–861.
Fabry, F., Austin, G.L., Tees, D., 1992. The accuracy of rainfallestimates by radar as a function of range. Q. J. Roy. Meteorol.Soc. 118, 435–453.
Fabry, F., Bellon, A., Duncan, M.R., Austin, G.L., 1994. Highresolution rainfall measurements by radar for very small basins:the sampling problem re-examined. J. Hydrol. 116, 415–428.
Fulton, R.A., Breidenbach, J.P., Seo, D.-J., Miller, D.A., O’Brannon,T., 1998. The WSD-88D rainfall algorithm. Weather Forecast. 13,377–395.
Gabella, M., Joss, J., Perona, G., Michaelides, S., 2006. Rangeadjustment for ground-based radar, derived with spaceborneTRMM precipitation radar. IEEE Trans. Geosci. Remote Sens. 44,126–133.
Gabella, M., Perona, G., 1998. Simulation of the orographicinfluence on weather radar using geometric-optics approach.J. Atmos. Oceanic Technol. 15, 1485–1494.
Habib, E., Krajewski, W.F., 2002. Uncertainty analysis in the TRMMground-validation radar-rainfall products: application to theTEFLUN-B field campaign. J. Appl. Meteorol. 41, 558–572.
Hagen, M., Yuter, S.E., 2003. Relations between radar reflectivity,liquid water content, and rainfall rate during the MAP-SOP. Q. J.Roy. Meteorol. Soc. 128, 477–494.
Hildebrand, P.H., 1978. Iterative correction for attenuation of 5 cmradar in rain. J. Appl. Meteorol. 17, 508–514.
Houze Jr., R.A., 1973. A climatological study of vertical transportsby cumulus-scale convection. J. Atmos. Sci. 30, 1112–1123.
Houze Jr., R.A., 1993. Cloud Dynamics. Academic Press, 573pp..Houze Jr., R.A., 1997. Stratiform precipitation in regions of
convection: a meteorology paradox? Bull. Am. Meteorol. Soc.78, 2179–2195.
Jordan, P.W., Seed, A.W., Austin, G.L., 2000. Sampling errors inradar estimates rainfall. J. Geophys. Res. 105, 2247–2257.
Joss, J., Waldvogel, A., 1970. A method to improve the accuracy ofradar measured amounts of precipitation. In: 14th RadarMeteorology Conf., Am. Meteorol. Soc., Tucson, AZ, pp. 237–238.
Joss, J., Lee, R., 1995. The application of radar-gauge comparisonsto operational precipitation profile corrections. J. Appl. Mete-orol. 34, 2612–2630.
Kitchen, M., Brown, R., Davies, A.G., 1994. Real-time correction ofweather radar for the effects of bright band, range andorographic growth in widespread precipitation. Q. J. Roy.Meteorol. Soc. 120, 1231–1254.
Klaassen, W., 1988. Radar observations and simulations of themelting layer of precipitation. J. Atmos. Sci. 45, 3741–3753.
Klazura, G.E., 1981. Differences between some radar-rainfallestimation procedures in a high rate gradient storm. J. Appl.Meteorol. 20, 1376–1380.
Koistinen J., Puhakka, T., 1981. An improved spatial gauge-radaradjustment technique. In: 20th Radar Meteorology Conf., Am.Meteorol. Soc., Boston, MA, pp. 179–186.
Lang, S., Tao, W.-K., Ferrier, B., 2003. Modeling of convective–stratiform precipitation processes sensitivity to partitioningmethods. J. Appl. Meteorol. 31, 505–527.
Lee, G.W., Zawadzki, I., 2005. Variability of drop size distribution:time-scale dependence of the variability and its effects on rainestimation. J. Appl. Meteorol. 44, 241–255.
Lee, G.W., Zawadzki, I., 2006. Radar calibration by gauge,disdrometer, and polarimetry: Theoretical limit caused by the
variability of drop size distribution and application to fastscanning operational radar data. J. Hydrol. 328, 83–97.
Locatelli, J.D., Hobbs, P.V., 1974. Fall speeds and masses of solidprecipitation particles. J. Geophys. Res. 79, 2185–2197.
Marshall, J.S., Palmer, W.M., 1948. The distribution of raindropswith size. J. Meteorol. 5, 165–166.
Morin, E., Gabella, M., 2007. Radar-based quantitative precipi-tation estimation over Mediterranean and dry climateregimes. J. Geophys. Res. 112, 1–13. doi:10.1029/2006JD008206, D20108.
Rogers, R.R., 1971. The effect of variable target reflectivity onweather radar measurements. Q. J. Roy. Meteorol. Soc. 97,154–167.
Rosenfeld, D., Amitai, E., 1995a. Classification of rain regimes bythree-dimensional properties of reflectivity fields. J. Appl.Meteorol. 34, 198–211.
Rosenfeld, D., Amitai, E., Wolff, D.B., 1995b. Improved accuracy ofradar WPMM estimated rainfall upon application of objectiveclassification criteria. J. Appl. Meteorol. 34, 212–223.
Rosenfeld, D., Wolff, D.B., Amitai, E., 1992. Beamwidth effect onZ–R relations and area-integrated rainfall. J. Appl. Meteorol.31, 454–464.
Rosenfeld, D., Wolff, D.B., Atlas, D., 1993. General probability-matched relations between radar reflectivity and rain rate. J.Appl. Meteorol. 32, 50–70.
Ryzhkov, A.V., Schuur, T.J., Burgess, D.W., Heinselman, P.L.,Giangrande, S.E., Zrnic, D.S., 2005. The joint polarizationexperiment: polarimetric rainfall measurements and hydrome-teor classification. Bull. Am. Meteorol. 86, 809–824.
Sanchez-Diezma, R., Zawadzki, I., Sempere Torres, D., 2000.Identification of the bright band through the analysis ofvolumetric radar data. J. Geophys. Res. 105 (D2), 2225–2236.
Seed, A., Sirivardena, L., Sun, X., Jordan, P., Elliot, J., 2002. Onthe calibration of Australian weather radars, Technical report02/7, 40pp.
Sempere Torres, D., Sanchez-Diezma, R., Zawadzki, I., Creution,J.D., 2000. Identification of stratiform and convective areasusing radar data with application to the improvement of DSDanalysis and Z–R relations. J. Phys. Chem. Earth (B) 25, 985–990.
Steiner, M., Smith, J.A., 2000. Reflectivity, rain rate, and kineticenergy flux relationships based on raindrop spectra. J. Appl.Meteorol. 39, 1923–1940.
Steiner, M., Smith, J.A., 2002. Use of three-dimensional reflectivitystructure for automated detection and removal of nonprecipi-tating echoes in radar data. J. Atmos. Oceanic Technol. 19,673–686.
Steiner, M., Houze Jr., R.A., Yuter, S.E., 1995. Climatologicalcharacterisation of three-dimensional storm structure fromoperational radar and rain gauge data. J. Appl. Meteorol. 34,1978–2007.
Stewart, R.E., Marwitz, J.D., Pace, J.C., 1984. Characteristicsthrough the melting layer of stratiform clouds. J. Atmos. Sci. 41,3227–3237.
Tao, W.-K., Simpson, J., Sui, C.-H., Ferrier, B., Lang, S., Scala, J.,Chou, M.-D., Pickering, K., 1993. Heating, moisture, and waterbudgets of tropical and mid latitude squall lines: comparisonsand sensitivity to long wave radiation. J. Atmos. Sci. 50, 673–690.
Tokay, A., Short, D.A., 1996. Evidence from tropical raindropspectra of the origin of rain from stratiform versus convectiveclouds. J. Appl. Meteorol. 35, 355–371.
Uijlenhoet, R., 2001. Raindrop size distributions and radar reflec-tivity–rain rate relationships for radar hydrology. Hydrol. EarthSyst. Sci. 5 (4), 615–627.
Uijlenhoet, R., Steiner, M., Smith, J.A., 2003. Variability ofraindrop size distribution in a squall line and implication forradar rainfall estimation. J. Hydrometeorol. 4, 43–61.
An operational approach for classifying storms in real-time radar rainfall estimation 17
Ulbrich, C.W., Atlas, D., 2002. On the separation of tropicalconvective and stratiform rains. J. Appl. Meteorol. 41, 188–195.
Vignal, B., Andrieu, H., 1999. Identification of vertical profiles ofreflectivity from volume scan radar. J. Appl. Meteorol. 38,1214–1228.
Vignal, B., Krajewski, W.F., 2001. Large-sample evaluation of twomethods to correct range-dependent error for WSR-88D rainfallestimates. J. Hydrometeorol. 2, 490–504.
Williams, C.R., Ecklund, W.L., 1995. Classification of precipitationclouds in the tropics using 915-MHz wind profiles. J. Appl.Meteorol. 12, 996–1012.
Xu, K.-W., 1995. Partitioning mass, heat, and moisture budgets ofexplicitly simulated cumulus ensembles into convective andstratiform components. J. Atmos. Sci. 30, 1–23.
Yuter, S.E., Houze Jr., RA., 1997. Measurements of raindrop sizedistributions over the pacific warm pool and implications for Z–R relations. J. Appl. Meteorol. 36, 847–867.
Zawadzki, I., 2006. Sense and Nonsense in radar QPE. In: Proceedingof 4th European Conference on Radar in Meteorology andHydrology, Barcelona, Spain, pp. 126–129.