Road Traffic (Light Vehicle Standards)Rules 2013 - South ...
Upload
saatchiartCategory
view
4download
0
Digest 2013, December 2013, 1675-1700
An Investigation of Heavy Vehicle Effect on Traffic Circles †1 Serhan TANYEL* S. Pelin ÇALIŞKANELLİ** Metin Mutlu AYDIN*** Seçil Başak UTKU**** ABSTRACT
Composition of traffic flow is one of the most important factors which affect operations at intersections. The effect of different vehicle types in a flow may be reflected by using passenger car equivalence (PCE) values. In this study, it is intended to determine the effect of heavy vehicles, particularly buses that are the most observed heavy vehicle type in urban traffic, on traffic circles. Data of the study are obtained from five different traffic circles in İzmir. The results show that when calculating the heavy vehicle adjustment factor (fHV), different PCE values should be used for minor and major flows. Using the same PCE value for both kind of flows may lead engineers to overdesign or make inadequate designs. Furthermore, it was determined that the effect of heavy vehicles on the major flow was greater when the mean speed of the major flow was low.
Keywords: Traffic circle, passenger car equivalence, heavy vehicle, traffic flow.
1. INTRODUCTION
Vehicle types in traffic flow are one of the most important factors which affect intersection performance. The effect of different types of vehicles in the flow can generally be reflected by using passenger car equivalence (PCE) values. Heavy vehicles affect the traffic flow at an intersection in two critical ways:
i. Heavy vehicles occupy large road surfaces (gaps) at a road cross section due to their sizes, and also their durations of using an intersection are very long.
ii. Heavy vehicles are behind passenger cars especially in acceleration, deceleration, and maintaining their high velocities [1].
The heavy vehicles in the minor and major flows affect intersection performance differently. The heavy vehicles in the major flow generally obstruct the entrance of the
* Dokuz Eylül University, İzmir, Turkey - [email protected] ** Dokuz Eylül University, İzmir, Turkey - [email protected] *** The Graduate School of Natural and Applied Sciences,
Dokuz Eylül University, İzmir, Turkey - [email protected] **** Department of Technical Services at İzmir Metropolitan Municipality,
İzmir, Turkey - [email protected]
† Published in Teknik Dergi Vol. 24, No. 4 October 2013, pp: 6479-6504
An Investigation of Heavy Vehicle Effect on Traffic Circles
1676
minor flow for a long period of time, thereby increasing the amount of queuing in the minor flow. On the other hand, those heavy vehicles which will enter the major flow from the minor flow form longer queues in the minor flow than passenger cars due to their low mobility [2]. Giving rise to gap forcing or reverse priority conditions, this causes those vehicles which will enter the intersection from the minor flow to block the major flow by accepting very small gaps and leads to the decreasing of the intersection capacity. In the literature, heavy vehicles are generally used in two categories:
i. Trucks and buses
ii. Vehicles like RVs [3].
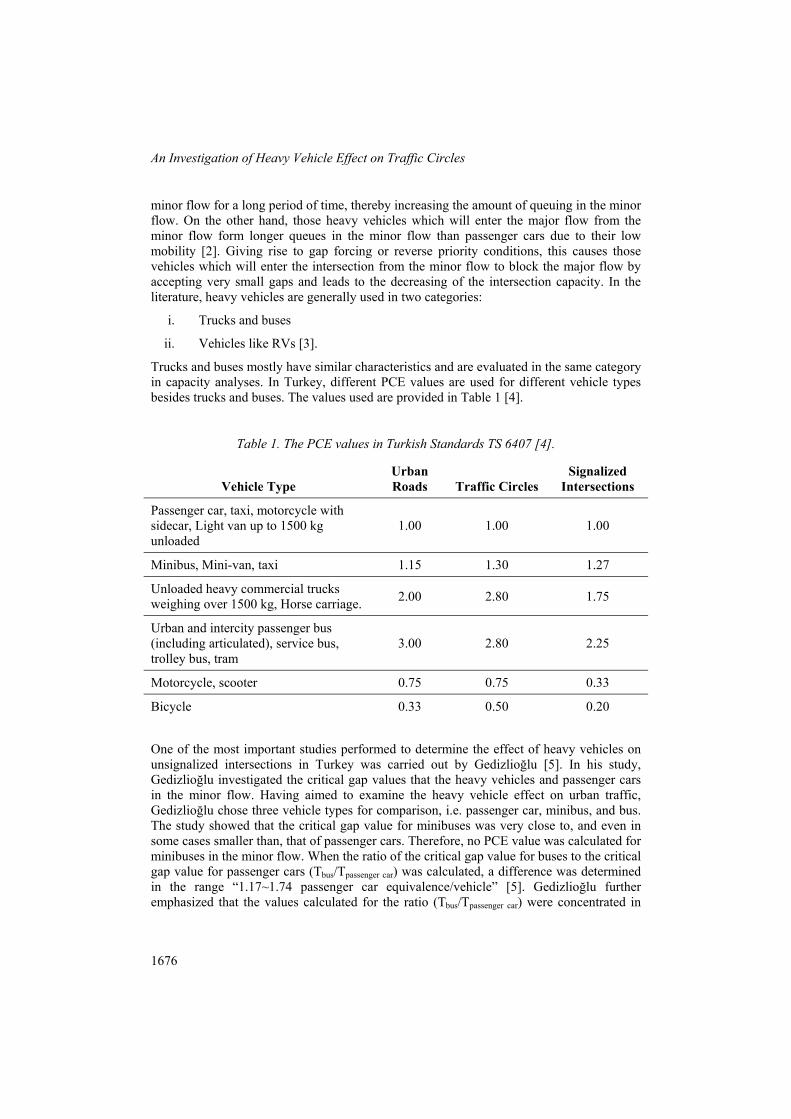
Trucks and buses mostly have similar characteristics and are evaluated in the same category in capacity analyses. In Turkey, different PCE values are used for different vehicle types besides trucks and buses. The values used are provided in Table 1 [4].
Table 1. The PCE values in Turkish Standards TS 6407 [4].
Vehicle Type Urban Roads Traffic Circles
Signalized Intersections
Passenger car, taxi, motorcycle with sidecar, Light van up to 1500 kg unloaded
1.00 1.00 1.00
Minibus, Mini-van, taxi 1.15 1.30 1.27
Unloaded heavy commercial trucks weighing over 1500 kg, Horse carriage.
2.00 2.80 1.75
Urban and intercity passenger bus (including articulated), service bus, trolley bus, tram
3.00 2.80 2.25
Motorcycle, scooter 0.75 0.75 0.33
Bicycle 0.33 0.50 0.20
One of the most important studies performed to determine the effect of heavy vehicles on unsignalized intersections in Turkey was carried out by Gedizlioğlu [5]. In his study, Gedizlioğlu investigated the critical gap values that the heavy vehicles and passenger cars in the minor flow. Having aimed to examine the heavy vehicle effect on urban traffic, Gedizlioğlu chose three vehicle types for comparison, i.e. passenger car, minibus, and bus. The study showed that the critical gap value for minibuses was very close to, and even in some cases smaller than, that of passenger cars. Therefore, no PCE value was calculated for minibuses in the minor flow. When the ratio of the critical gap value for buses to the critical gap value for passenger cars (Tbus/Tpassenger car) was calculated, a difference was determined in the range “1.17~1.74 passenger car equivalence/vehicle” [5]. Gedizlioğlu further emphasized that the values calculated for the ratio (Tbus/Tpassenger car) were concentrated in
Serhan TANYEL, S. Pelin ÇALIŞKANELLİ, Metin Mutlu AYDIN, Seçil Başak UTKU
1677
the range “1.20~1.30”. Tanyel [1][6] made studies on the heavy vehicle effect on intersections in İzmir and computed the PCE values for buses in the minor flow by comparing the critical gap values for passenger cars and buses. Tanyel [6] further found that the critical gap values for minibuses and pickup trucks were very close to each other and in some cases even smaller than that of passenger cars. These results are very close to the results obtained by Gedizlioğlu [5]. Tanyel [1][6] found the PCE value of “1.15 pce/vehicle” for minibuses and PCE values in the range “1.50~1.65 pce/vehicle” for buses in the circulating flow at roundabouts.
Various studies were made by using many methods in order to determine the heavy vehicle effect on the traffic flow in different countries. Akçelik & Associates [2] proposed 2.0 pce/vehicle for the heavy vehicle equivalent at roundabouts and 1.5 pce/vehicle used as the heavy vehicle equivalent for stop-controlled intersections. In a study in England, the researchers determined the PCE values to be 1.7 pce/vehicle for the circulating flow and 1.9 pce/vehicle for the entrance flow [7]. Some researchers such as Hoogendoorn and Bovy [8] intended to reflect the heavy vehicle effect by using the distributions of gaps by vehicle type. To improve capacity functions for unsignalized intersections, Fisk [9] and Li [10] used an approach similar to that of Hoogendoorn and Bovy.
In their study, Dahl and Lee [11] examined the heavy vehicle effect on roundabouts by using different methods of capacity analysis [2, 12, 13, 14, 15]. The obtained results showed that capacity decreased with an increase in the percentage of trucks, but the amount of decrease was greater in the circulating flow.
Modern roundabouts which are being constructed (designed) widely worldwide are taken as the basis in the majority of the studies summarized above. However, it might be stated that roundabouts which are conventional in terms of both intersection geometry and operating features are found to be in practice in our country. Conventional roundabouts may be defined as intersections at which the traffic circulates around an island located at the center; however, unlike the new type of roundabouts, the priority of passage at the intersections is not given to the vehicles within the intersection but to the vehicles entering the intersection from the minor flow, and the weaving areas are aimed to have a high capacity [1]. The conventional roundabouts will be hereinafter referred to as traffic circles, while modern roundabouts will be hereinafter referred to as roundabouts.
In this study, it was intended to determine the effect of heavy vehicles by using the data obtained from five different traffic circles located on important arterial roads in İzmir. The study concentrates on buses – the most intensively observed heavy vehicle type in the urban traffic flow. First of all to estimate the PCE values in the study, different methods and the heavy vehicle effect were examined. Later on, the observation areas were introduced, and the data collection methods were presented. In the fourth section of the study, various analyses were made for the minor and circulating flows and PCE values were proposed for heavy vehicles. The improper use of the PCE value and the effects of the possible case were stressed in the section of findings and discussions. The last section of the study contained the results and recommendations for future research.

An Investigation of Heavy Vehicle Effect on Traffic Circles
1678
2. METHODS USED TO DETERMINE THE HEAVY VEHICLE EFFECT
Although a limited number of studies were made in Turkey to determine the heavy vehicle effect on unsignalized intersections, different and important studies were conducted in various places of the world. As a common approach, it is assumed that when the percentage of heavy vehicles is below 5%, it has no significant effect on roundabout performance. To compute the heavy vehicle adjustment factor (fHV) for the case in which the heavy vehicle rate exceeds 5%, the equation provided below can be used [7]:
)05.0)(0.1(0.1
0.1
HVHVHV pPCE
f (1)
where fHV, PCEHV and pHV are used to define the heavy vehicle adjustment factor, the passenger car equivalence for a heavy vehicle (pce/vehicle), and the heavy vehicle rate, respectively. If the value of 5% is accepted to be a high rate, the equation can be written as follows:
HVHVHV pPCE
f)0.1(0.1
0.1
(2)
In [15], this equation is proposed as the heavy vehicle adjustment factor for roundabouts. Equation 2 can be generalized as follows for different vehicle types:
n
i HViHVi
HVpPCE
f1
)0.1(0.1
0.1 (3)
where “PCEHVi” denotes the PCE value for heavy vehicle type i and “pHVi” denotes the heavy vehicle rate in the traffic flow for heavy vehicle type i. As a new approach to fHV, Akçelik & Associates [3] proposed a continuous function for all heavy vehicle rates above 0%.
= 11.0 + 0.5(PCE − 1.0) (P − 0.05) + (P − 0.05) + 0.001 P(PCE − 1.0) (4)
The heavy vehicle adjustment factor (fHV) is computed individually for the major and minor flows, and the major flow rate is adjusted by using the following equation:
HVc
cca f
QQ (5)
Serhan TANYEL, S. Pelin ÇALIŞKANELLİ, Metin Mutlu AYDIN, Seçil Başak UTKU
1679
where “Qca” is the adjusted flow rate (pce/hour); “Qc” is the major flow rate (the circulating flow rate at roundabouts)(vehicle/hour); and “fHVc” is the heavy vehicle adjustment factor computed from Equation 4.
In addition, Akçelik & Associates [2] proposed the following adjustment on the critical gap and headway in the minor flow (the entry flow at roundabouts):
HVepcHV fTT (6.a)
= ⁄ (6.b)
where “Tpc” is the critical gap acceptance value for the passenger car drivers in the minor flow (seconds); “THV” is the adjusted critical gap value for heavy vehicles (seconds); “T0pc” is the headway value for passenger cars (seconds); “T0HV” is the headway time for heavy vehicles (seconds); and “fHVe” is the heavy vehicle adjustment factor calculated for the entry flow depending on Equation 4 [3].
Fisk [9] stated that showing heavy vehicles in the traffic flow with passenger car equivalence might lead to an error. She advocated that the replacement of a heavy vehicle with a different number of passenger cars impaired the number and duration of the gaps in the major flow and that the values of the gaps observed by the vehicles in the minor flow were accordingly miscalculated too. In her study, Fisk [9] proposed a new capacity model for passenger cars and heavy vehicles, assumed that the gaps in the major flow might be represented by the shifted negative exponential distribution, and stated that the capacity in the intersection approach might be computed by means of the following equations:
pcc
HVpccpcpcc
Tq
TqHV
TqpcHVHVpcpccc
epce
epepppqqq
01
1 )()(
(7)
HVc
HVHVcpcHVc
Tq
TqHV
TqpcHVHVpcpccc
eHV e
epepppqqq
01
1 )()(
(8)
where “Δpc” is the minimum gap for cars in the major flow and ΔHV is the minimum gap for the heavy vehicles in the major flow (seconds); “ppc” and “pHV” are the percentages of passenger cars and heavy vehicles in the major flow, respectively; ”qepc” is the capacity of the entry flow consisting only of passenger cars (vehicle/second); “qeHV” is the capacity of the entry flow consisting only of heavy vehicles (vehicle/second); “Tpc” and “THV” are the critical gap values for the passenger cars and the heavy vehicles in the minor flow (seconds), respectively; and “To pc” and “To HV” are the headway values for the passenger cars and the heavy vehicles in the minor flow (seconds), respectively. The saturated flow rate can be written with the following equation [9]:
An Investigation of Heavy Vehicle Effect on Traffic Circles
1680
eHV
demandHV
epc
demandpc
(9)
where “qdemandpc” is the number of passenger cars in the demand flow, and “qdemandHV” is the number of heavy vehicles in the demand flow. The total demand flow in the minor approach (qdemand) can be found with the following equation:
demandHVdemandpcdemand qqq (10)
By using the equations above, it is possible to make a more accurate judgment about the difference between the maneuvers of heavy vehicles and passenger cars.
3. OBSERVATIONS AND DATA COLLECTION
To investigate the movements of passenger cars and heavy vehicles, data were collected by recording 5 multilane roundabouts in İzmir by means of video recording. These intersections are the Alsancak-Railway Station, Lozan, Montrö, Cumhuriyet, and Bornova intersections. The geometrical drawings of the intersections are provided in Figure 1, and their geometrical characteristics are presented in Table 2. As it can also be seen from Figure 1, some approaches to the Bornova, Alsancak-Railway Station and Cumhuriyet intersections do not display characteristics appropriate for roundabout design. Therefore, data were collected from the approaches in which appropriate design conditions applied, and the approaches from which data were collected are shown in Figure 1. The intersections selected as examples were chosen since they were located on the important arterial roads in İzmir, contained a high rate of heavy vehicle traffic, and had more than one entry lane (See Table 2). All the observations were made from the tall buildings close to the intersections by using video cameras between 07:00 and 09:00 and between 18:00 and 19:30 on the weekdays with no rainfall.
Troutbeck [16] stated that the best way to determine the capacities of roundabouts was to obtain the maximum number of vehicles entering from the minor flow through observations. To obtain such data, the vehicles continuously queuing in the minor flow for 30 minutes must be found. Collection of 1- and 5-minute data groups under this condition is considered adequate for capacity analyses [16]. In the study, it was preferred to collect 1-minute data groups. Accordingly, the following data groups that contained vehicles continuously queuing in the minor flow could be obtained within the scope of the study: a 49-minute data group from the Lozan intersection, 53- (Montrö 1) and 82-minute (Montrö 2) data groups from the Montrö intersection, 84- (Cumhuriyet 1) and 49-minute (Cumhuriyet 2) data groups from the intersection of the Cumhuriyet Square, 82- (Alsancak-Railway Station Konak Approach) and 62-minute (Alsancak-Railway Station Harbor Approach) data groups from the intersection of the Alsancak Railway Station, and a 60-minute data group from the Bornova intersection. The following data were obtained regarding each approach examined from the images obtained by means of video cameras:
Serhan TANYEL, S. Pelin ÇALIŞKANELLİ, Metin Mutlu AYDIN, Seçil Başak UTKU
1681
Circulating (major flow) flow (vehicle/hour and vehicle/minute);
Entering (minor flow) flow (vehicle/hour and vehicle/minute);
Values of headway between the vehicles in the major flow (seconds);
Values of headway between the vehicles in the minor flow (seconds);
Accepted gaps (seconds);
Rejected gaps (seconds);
Types and percentages of heavy vehicles;
Service (minimum) delays for the vehicles in the minor flow (seconds); and
Queue lengths (meters).
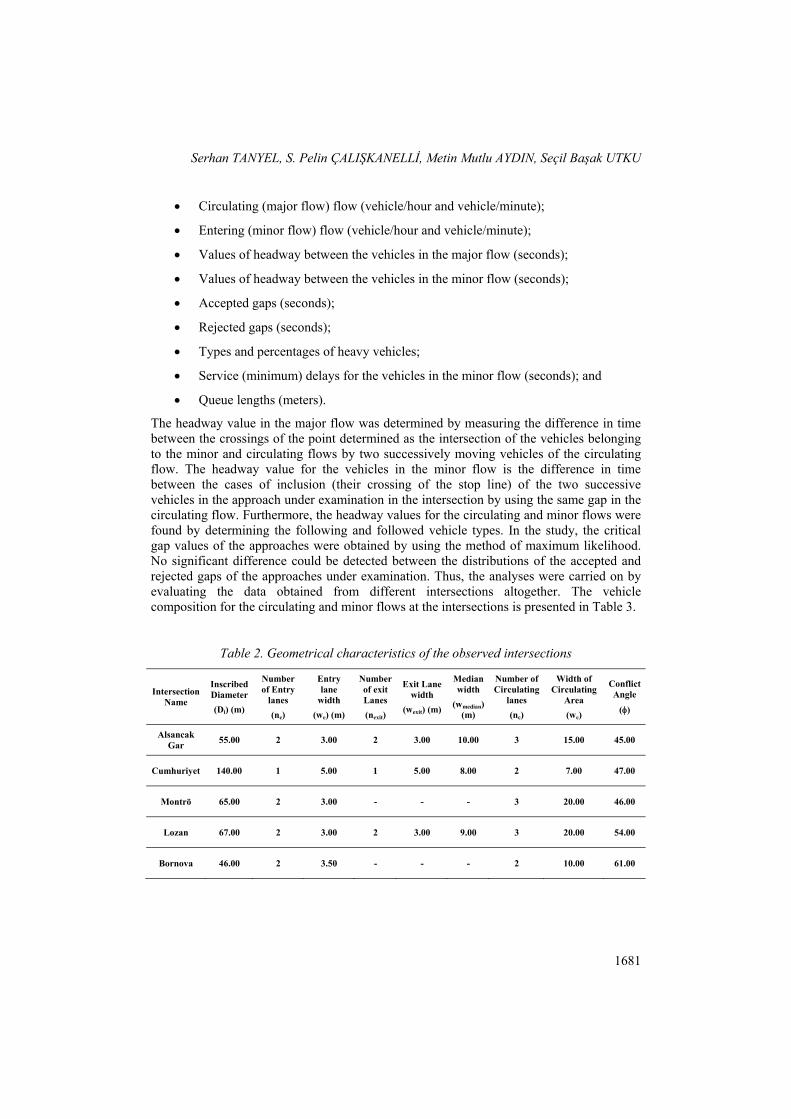
The headway value in the major flow was determined by measuring the difference in time between the crossings of the point determined as the intersection of the vehicles belonging to the minor and circulating flows by two successively moving vehicles of the circulating flow. The headway value for the vehicles in the minor flow is the difference in time between the cases of inclusion (their crossing of the stop line) of the two successive vehicles in the approach under examination in the intersection by using the same gap in the circulating flow. Furthermore, the headway values for the circulating and minor flows were found by determining the following and followed vehicle types. In the study, the critical gap values of the approaches were obtained by using the method of maximum likelihood. No significant difference could be detected between the distributions of the accepted and rejected gaps of the approaches under examination. Thus, the analyses were carried on by evaluating the data obtained from different intersections altogether. The vehicle composition for the circulating and minor flows at the intersections is presented in Table 3.
Table 2. Geometrical characteristics of the observed intersections
Intersection Name
Inscribed Diameter
(Di) (m)
Number of Entry
lanes
(ne)
Entry lane
width
(we) (m)
Number of exit Lanes
(nexit)
Exit Lane width
(wexit) (m)
Median width
(wmedian) (m)
Number of Circulating
lanes
(nc)
Width of Circulating
Area
(wc)
Conflict Angle
()
Alsancak Gar
55.00 2 3.00 2 3.00 10.00 3 15.00 45.00
Cumhuriyet 140.00 1 5.00 1 5.00 8.00 2 7.00 47.00
Montrö 65.00 2 3.00 - - - 3 20.00 46.00
Lozan 67.00 2 3.00 2 3.00 9.00 3 20.00 54.00
Bornova 46.00 2 3.50 - - - 2 10.00 61.00

An Investigation of Heavy Vehicle Effect on Traffic Circles
1682
(a) Bornova Intersection (b) Montrö Intersection
(c) Cumhuriyet Square (d) Intersection of Alsancak-Railway Station
(e) Lozan Square
Figure 1. Overall plan of the observed intersections
Serhan TANYEL, S. Pelin ÇALIŞKANELLİ, Metin Mutlu AYDIN, Seçil Başak UTKU
1683
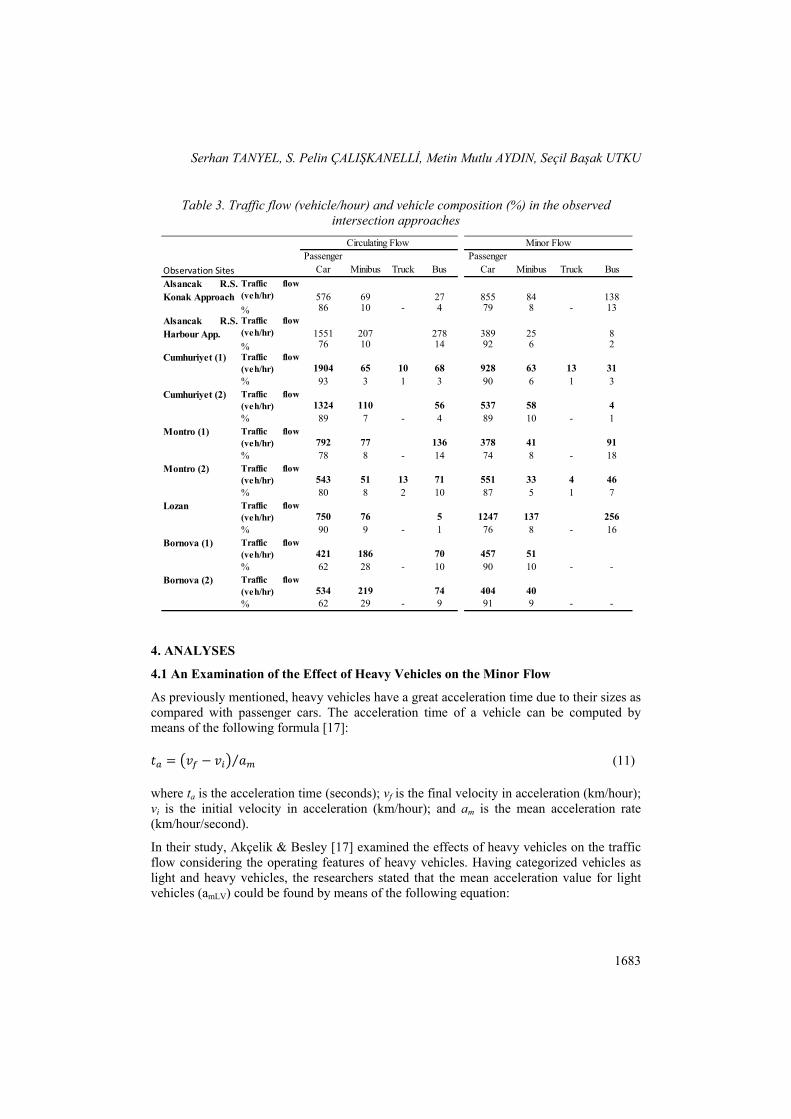
Table 3. Traffic flow (vehicle/hour) and vehicle composition (%) in the observed intersection approaches
4. ANALYSES
4.1 An Examination of the Effect of Heavy Vehicles on the Minor Flow
As previously mentioned, heavy vehicles have a great acceleration time due to their sizes as compared with passenger cars. The acceleration time of a vehicle can be computed by means of the following formula [17]: = − ⁄ (11)
where ta is the acceleration time (seconds); vf is the final velocity in acceleration (km/hour); vi is the initial velocity in acceleration (km/hour); and am is the mean acceleration rate (km/hour/second).
In their study, Akçelik & Besley [17] examined the effects of heavy vehicles on the traffic flow considering the operating features of heavy vehicles. Having categorized vehicles as light and heavy vehicles, the researchers stated that the mean acceleration value for light vehicles (amLV) could be found by means of the following equation:
Passenger Car Minibus Truck Bus
Passenger Car Minibus Truck Bus
Alsancak R.S.Konak Approach
Traffic flow(veh/hr) 576 69 27 855 84 138% 86 10 - 4 79 8 - 13
Alsancak R.S.Harbour App.
Traffic flow(veh/hr) 1551 207 278 389 25 8% 76 10 14 92 6 2
Cumhuriyet (1) Traffic flow(veh/hr) 1904 65 10 68 928 63 13 31% 93 3 1 3 90 6 1 3
Cumhuriyet (2) Traffic flow(veh/hr) 1324 110 56 537 58 4% 89 7 - 4 89 10 - 1
Montro (1) Traffic flow(veh/hr) 792 77 136 378 41 91% 78 8 - 14 74 8 - 18
Montro (2) Traffic flow(veh/hr) 543 51 13 71 551 33 4 46% 80 8 2 10 87 5 1 7
Lozan Traffic flow(veh/hr) 750 76 5 1247 137 256% 90 9 - 1 76 8 - 16
Bornova (1) Traffic flow(veh/hr) 421 186 70 457 51% 62 28 - 10 90 10 - -
Bornova (2) Traffic flow(veh/hr) 534 219 74 404 40% 62 29 - 9 91 9 - -
Circulating Flow Minor Flow
Observation Sites

An Investigation of Heavy Vehicle Effect on Traffic Circles
1684
= + − . − (12)
where amLV denotes the acceleration rate for light vehicles (km/hour/second); faLV denotes the adjustment factor for light vehicles at intersections; and p1, p2 and p3 denote the calibration parameters for the acceleration rate provided for light vehicles in Table 4. For heavy vehicles, the mean acceleration rate (amHV) can be written as follows:
= + − . + . ( − ) − ( . + )⁄ (13)
where Gr is the approach grade (%), and p1, p2, p3, p4, p5 and p6 are the calibration parameters for the acceleration rate provided for heavy vehicles in Table 4. PWR is the ratio of power to weight that can be computed with the following formula: = 1000 (14)
In Equation 14, Pmax is the engine power rate and MHV is the heavy vehicle mass (kg) [18]. Pmax and MHV values can be used as the constant values provided in Table 4 [2]. In Akçelik & Associates [2] [18], it was defined that the mass of light vehicles ranged from 1,100 to 2,700 kg, whereas the mass of heavy vehicles varied between 5,500 and 38,000 kg.
Table 4. Calibration values for the acceleration rate [16].
fa P1 P2 P3 P4 P5 P6 Pmax. MHV PWR LV 1.8 2.08 0.127 0.0050 - - - - - -
HV 2.2 0.09 0.002 0.0010 0.15 0.42 0.126 130 11000 11.8
At this stage of the study, the acceleration times to enter the intersection from the minor flow were computed depending on the vehicle type. As seen in Table 3, minibuses and buses are the most observed vehicle types in the urban traffic. In Table 5, some characteristics of the buses used for public transport in İzmir are shown and the characteristics assumed for passenger cars and minibuses are also provided.
Table 5. Characteristics of different vehicle types used in the analyses.
Vehicle Class Length
(m) Loaded
Mass (kg) Max. Engine Power (kW) PWR
Passenger Car 5.00 1,300 91 70.0
Minibus 6.20 4,500 105 23.3
Single-Unit Bus Type 1 11.88 18,000 184 10.2
Single-Unit Bus Type 2 11.91 17,500 184 10.5
Articulated Bus 17.94 28,000 260 9.3
Serhan TANYEL, S. Pelin ÇALIŞKANELLİ, Metin Mutlu AYDIN, Seçil Başak UTKU
1685
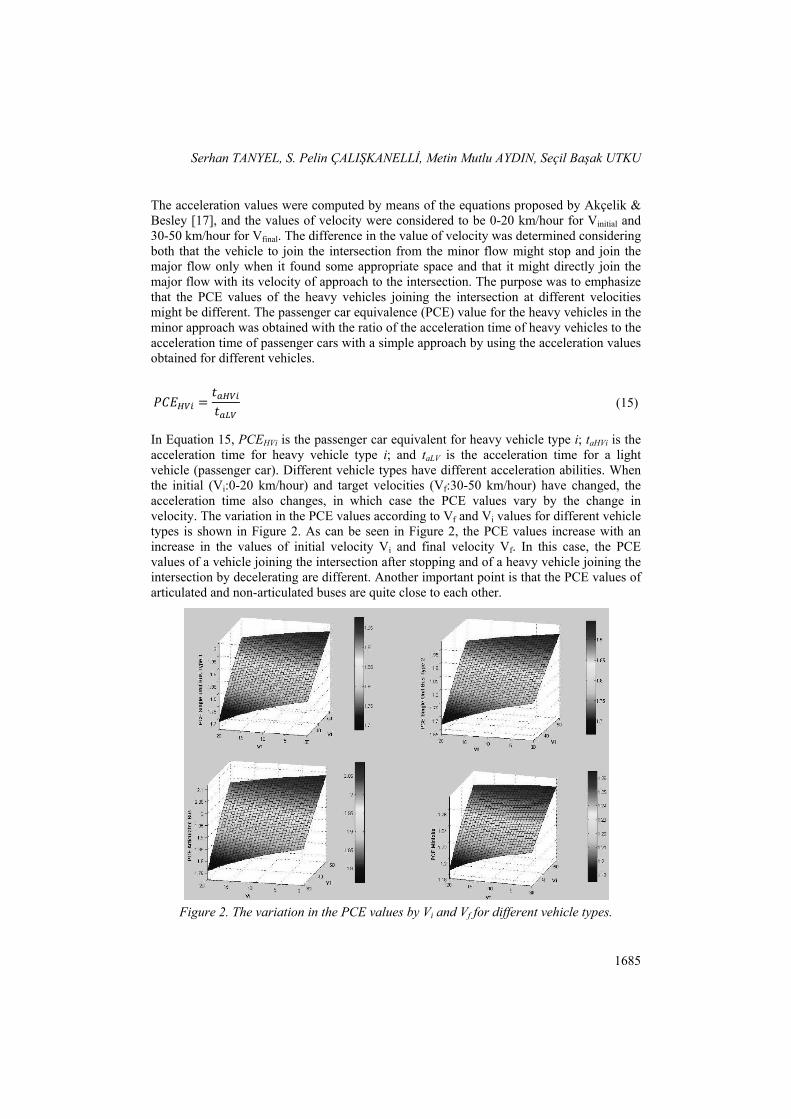
The acceleration values were computed by means of the equations proposed by Akçelik & Besley [17], and the values of velocity were considered to be 0-20 km/hour for Vinitial and 30-50 km/hour for Vfinal. The difference in the value of velocity was determined considering both that the vehicle to join the intersection from the minor flow might stop and join the major flow only when it found some appropriate space and that it might directly join the major flow with its velocity of approach to the intersection. The purpose was to emphasize that the PCE values of the heavy vehicles joining the intersection at different velocities might be different. The passenger car equivalence (PCE) value for the heavy vehicles in the minor approach was obtained with the ratio of the acceleration time of heavy vehicles to the acceleration time of passenger cars with a simple approach by using the acceleration values obtained for different vehicles.
= (15)
In Equation 15, PCEHVi is the passenger car equivalent for heavy vehicle type i; taHVi is the acceleration time for heavy vehicle type i; and taLV is the acceleration time for a light vehicle (passenger car). Different vehicle types have different acceleration abilities. When the initial (Vi:0-20 km/hour) and target velocities (Vf:30-50 km/hour) have changed, the acceleration time also changes, in which case the PCE values vary by the change in velocity. The variation in the PCE values according to Vf and Vi values for different vehicle types is shown in Figure 2. As can be seen in Figure 2, the PCE values increase with an increase in the values of initial velocity Vi and final velocity Vf. In this case, the PCE values of a vehicle joining the intersection after stopping and of a heavy vehicle joining the intersection by decelerating are different. Another important point is that the PCE values of articulated and non-articulated buses are quite close to each other.
Figure 2. The variation in the PCE values by Vi and Vf for different vehicle types.

An Investigation of Heavy Vehicle Effect on Traffic Circles
1686
The mean critical gap and follow-up headway values obtained from the observed approaches and the values of standard deviation are provided in Table 6 depending on the vehicle types. The values of buses are provided for the Montrö and Lozan intersections, where buses are used intensively, while no sound bus data could be obtained from the other intersections. In Table 6, PCE values were proposed depending on the critical gap and follow-up headway values. It is seen that the PCE values obtained depending on the critical gap and follow-up headway values are quite close to the PCE values determined depending on the acceleration characteristics provided in Figure 2. In addition, it is quite clear that a constant PCE value does not fit capacity and performance analyses. Different values can be used under different conditions.
Table 6. The PCE values obtained depending on critical gap and follow-up values
**Tpc: Mean critical gap for passenger cars (sec); T0pc: Mean follow-up headway for passenger cars (sec); Tb: Mean critical gap for buses (sec); T0b: Mean follow-up headway for buses (sec); Tmb: Mean critical gap for minibuses (sec); T0mb: Mean follow-up headway for minibuses (sec)
4.2. An Examination of the Effect of Heavy Vehicles on the Major Flow
The capacity of a signalized or an unsignalized traffic circle depends on the characteristics of the major traffic flow. Particularly the distributions of the headways between the vehicles in the major flow and the obstructed or unobstructed times observed by the driver in the entrances of yield- or stop-controlled intersections determine the capacity of the intersection approaches. In some cases, regardless of the vehicle types in the major flow, all are assumed to be of the same type. Even though this might give an idea about the capacity
Serhan TANYEL, S. Pelin ÇALIŞKANELLİ, Metin Mutlu AYDIN, Seçil Başak UTKU
1687
of the intersection, it may lead to computing a greater entry flow capacity than normal. To overcome this problem, Hoogendoorn and Bovy [8] proposed a general approach to define a headway distribution model for a mixed vehicle flow: ( ) = ∑ ( ) (16)
where F(t) is the probability density function of the gaps of all vehicle types; Pi is the rate of vehicle type i in the flow; and Fi(t) is the probability density function of vehicle type i. Hoogendoorn and Bovy [8] used the generalized queuing model (or the Cowan M4 model) to define the gaps. With various studies performed, it was shown that the Cowan M3 distribution might be used to define the gaps in the major flow in the capacity and performance analyses at the intersections in Turkey [19] [20] [21] [22] [23] [24] [25]. The general form of the Cowan M3 distribution can be written as follows:
( ) = 0 t < 0 (17) ( ) = 1 − ( ) ≥ 0
where “α” is the rate of free vehicles in the major flow; “Δ” is the minimum headway between the vehicles in the major flow; and “λ” is a coefficient that can be calculated with the following formula:
= 1 − Δ (18)
In Equation 18, qc is the major flow (vehicle/second) value. The rate of free vehicles for the circulating flows at multilane roundabouts can be computed by means of the following equation [1][19]:
If 22.0 cq cq 13.125.1 (19)
In other cases 00.1
The rate of free vehicles for the circulating flow at single-lane roundabouts can be computed by means of the following equation [23]:
If 07.0 cq cq 47.111.1 (20)
In other cases 00.1
As also seen from Equations 18, 19, and 20, parameters α and λ are computed depending on the minimum headway (Δ). From the previous studies on this subject, it is known that the minimum headway at multilane roundabouts ranges from 0.5 second to 2.5 seconds [26][27][28]. Furthermore, it is observed that when there is more than one lane in the

An Investigation of Heavy Vehicle Effect on Traffic Circles
1688
circulating flow, the gaps between the vehicles in different lanes are generally below 1.0 second. On the other hand, when the roundabout is of single-lane, the minimum headways are observed to be between 1.5 and 2.0 seconds and it is proposed that 1.8 seconds might be used as a mean value [26]. In Turkey, these values were observed to be between 1.0 second and 2.7 seconds [2].
The heavy vehicles in the major flow follow the vehicles ahead by leaving a longer distance due to their weak deceleration capabilities. The gap between a heavy vehicle and the vehicle following it is greater than that of two passenger cars following each other due to the sizes of the heavy vehicle. In conclusion, the minimum headway of heavy vehicles (ΔHV) is different from the minimum headway of passenger cars (Δpc). Therefore, even though it is a realistic approach to examine the vehicles in the major flow by grouping them according to their positions (for instance, for cases in which a passenger car follows a passenger car, in which a passenger car follows a bus, and in which a bus follows a bus), obtaining significant results entails a large number of observation data [8].
While an adequate number of data can be obtained from the observations for the case in which a passenger car is followed by a passenger car or in which a passenger car is followed by a minibus, the number of data for the case in which a bus is followed by a bus is limited (for instance, observation data of 360 vehicles were obtained for the former case at the Bornova intersection in a period of an hour. Only 4 observation data could be obtained for the latter case, in which a bus was followed by a bus, in a period of an hour).
To model queue discharge at signalized intersections, a simple method was proposed by Akçelik & Associates [3]. This method can be adapted to unsignalized intersections in the following way:
From the observations, the mean speed value of the passenger cars is observed.
By using the average speed of the passenger cars in the major flow and the minimum headway values, the minimum headway value is converted to spacing value.
The difference between the lengths of passenger car and heavy vehicle is added to spacing value.
The spacing value of the heavy vehicle is converted to headway value again by using average speed of the major flow.
The Δ values for passenger cars and heavy vehicles computed by accepting that the mean velocity of the circulating vehicles was 30 km/hour are provided in Table 7. The values in the table were obtained from the studies by Tanyel [1], Tanyel and Yayla [19], and Aydemir [28]. The vehicle lengths were obtained from Table 5. In Table 7, Δpc denotes the minimum headway for passenger cars; Δmb denotes the minimum headway for minibuses; and ΔB. and ΔAB. denote the minimum headways for non-articulated (single-unit) and articulated buses, respectively. The Δpc values were computed by using the least squares method. The details of the method can be found in Sullivan and Troutbeck [29], Troutbeck [30], Hagring [28], and Luttinen [31].
As can also be seen from Table 7, the Δmb values are quite close to the Δpc values; therefore, it is possible to assume that minibuses and passenger cars are in the same vehicle group. As expected, the main difference was observed between passenger cars and buses.

Serhan TANYEL, S. Pelin ÇALIŞKANELLİ, Metin Mutlu AYDIN, Seçil Başak UTKU
1689
Table 7. The minimum headways for heavy vehicles
Intersection pc Speed (km/h)
Spacing (m) mb B AB
Montro right 1 2.2 30 24.44 2.31 2.83 3.37
Montro left 1 1.8 30 20.00 1.91 2.43 2.97
Montro right 2 2.9 30 32.22 3.01 3.53 4.07
Montro left 2 1.9 30 21.11 2.01 2.53 3.07
Bornova right 1 2.8 30 31.11 2.91 3.43 3.97
Bornova left 1 1.9 30 21.11 2.01 2.53 3.07
Bornova right 2 2.0 30 22.22 2.11 2.63 3.17
Bornova left 2 2.0 30 22.22 2.11 2.63 3.17
Cumhuriyet left 1.6 30 17.78 1.71 2.23 2.77
Cumhuriyet right 1.8 30 20.00 1.91 2.43 2.97
Lozan left 2.1 30 23.33 2.21 2.73 3.27
Lozan right 2.5 30 27.78 2.61 3.13 3.67
Alsancak R.S. left 2.6 30 28.89 2.71 3.23 3.77
Alsancak R.S. middle 2.9 30 32.22 3.01 3.53 4.07
Alsancak R.S. right 2.6 30 28.89 2.71 3.23 3.77
Figure 3. Probability density distribution graphs for passenger cars, minibuses, and non-articulated and articulated buses

An Investigation of Heavy Vehicle Effect on Traffic Circles
1690
Figure 4. The variation in the PCE values according to the Δpc and mean velocities of the vehicles in the circulating flow

Serhan TANYEL, S. Pelin ÇALIŞKANELLİ, Metin Mutlu AYDIN, Seçil Başak UTKU
1691
The graphs of the probability density functions provided for passenger cars, minibuses, and non-articulated and articulated buses in Figure 3 were drawn to emphasize the differences among the vehicle types provided that the traffic flow was 1,000 passenger cars/hour, 1,000 minibuses/hour, 1,000 non-articulated buses/hour, and 1,000 articulated buses/hour and by accepting that Δpc was 2 seconds. It is quite clear that minibuses and passenger cars are placed almost on the same graph. However, the peak heights of the graphs for non-articulated and articulated buses were shifted rightwards due to the Δ values. In Figure 4, the variations of the PCE values according to the Δpc and mean velocities in the circulating flow are demonstrated. The PCE values increase when the Δpc and mean velocity values are low. It is seen that the effect of heavy vehicles is more evident when the traffic flow moves slowly.
5. RESULTS AND DISCUSSION
As described above, the use of a single PCE value stands out as general accepted in the literature when determining the heavy vehicle effect. In the studies performed, the inadequate design or overdesign rates that might result from the acceptance concerned are disregarded. Choosing the intersection diameter with a value greater than required and increasing the number and width of the circulating lanes as a result of overdesign will both bring about difficulties in design owing to the requirement of more space and reduce an intersection’s characteristic of being economical. Moreover, it might lead to outcomes like redefinition of the control characteristics of the intersection (e.g. joining angles, lengths of pedestrian crossings, and the differences in the mean velocities of the vehicles using the intersection). Furthermore, an overdesign might also bring about such a tendency as the conversion of an intersection into a signalized intersection instead of a traffic circle. On the other hand, an inadequate design might lead to such outcomes as congestion of the intersection and a decrease in its performance much earlier than expected. It is thought that in our country, where heavy vehicle traffic is of great importance, it is essential to understand the outcomes to be brought about by this difference in a sounder fashion. The rates of highway-based public transport are very high, which especially makes it much more important to determine the design errors concerned.
In aaSIDRA Akçelik & Associates [2] and HCM [15], the value of 2.0 is used as the passenger car equivalent for all heavy vehicle types. This value can generally be considered an acceptable value for trucks and non-articulated buses. Nevertheless, this value was taken as 2.80 pce/vehicle for roundabouts in TS6407 [4]. On the other hand, within the scope of this study, the PCE values for non-articulated and articulated buses were found to be 1.67~1.98 and 1.76~2.09 pce/vehicle in the minor flow but 1.22~1.67 and 1.41~2.25 pce/vehicle in the major flow. When the values concerned are examined, it is seen that the PCE value adopted by TS6407 [4] might lead to such an outcome as the overdesign of the system. On the other hand, the value of 2.0 pce/vehicle might lead to different design errors under different conditions.
It was thought that the case in which the heavy vehicle composition in the flow consisted only of non-articulated and articulated buses might be more elucidative to better understand the effect of different vehicle types on intersection performance. In this line, the fHV values for the conditions under which the PCE value was 1.7 (the PCE upper bound for non-

An Investigation of Heavy Vehicle Effect on Traffic Circles
1692
articulated buses), 2.0 (the generally accepted value), and 2.3 (the PCE upper bound for articulated buses) were computed for different heavy vehicle percentages (Figure 5).
In Figure 5, it was thought that even the 5% heavy vehicle rate in the flow was significant. When the figure is examined, it is seen that the PCE value of 2.0 yields a curve immediately in the middle of the two vehicle types, which shows that the value of 2.0 might yield appropriate results when the heavy vehicles are comprised only of equal articulated and non-articulated buses. Accordingly, it might be stated that the effect of the percentages of different vehicle types might be high as well.
Figure 5. The fHV curves depending on different PCE values
To better elucidate the above-mentioned assumption, an approach of a traffic circle with a single circulating lane and a single entry lane at which the major flow (circulating flow) was 600 vehicles/hour and the demand of vehicles wishing to enter the intersection from the minor flow was 700 vehicles/hour was considered to be the example in the study. At the intersection concerned, the minimum headway () between the vehicles in the major flow was taken as 1.8 seconds, whereas the critical gap acceptance value (Tpc) and the headway values (T0pc) of the drivers in the minor flow were taken as 4.0 seconds and 2.0 seconds, respectively. If it is accepted that the vehicles in the major flow followed each other with gaps in agreement with the Cowan M3 distribution, the capacity of the minor flow can be calculated from the following equation [1]:
oT
Tca
e e
eQQ
1
)(
(21)
where Qca denotes the adjusted major flow value (pce/hour), and Qe denotes the capacity of the minor flow (pce/hour). When finding the fHV value used to compute the Qca value, it was
0.4
0.5
0.6
0.7
0.8
0.9
1
0 0.1 0.2 0.3 0.4 0.5 0.6 0.7 0.8 0.9 1
f HV
Heavy vehicle ratio
fbminor fB fAB
Serhan TANYEL, S. Pelin ÇALIŞKANELLİ, Metin Mutlu AYDIN, Seçil Başak UTKU
1693
accepted that the heavy vehicles in the flow might consist of non-articulated and articulated buses and the following equation was used to relate the rates of both vehicle types in the heavy vehicles group: % = 1 − % (22)
A version of equation 4 – proposed by Akçelik & Associates [3] – that was arranged for different vehicle types was used when computing the fHV value. In the equation, it was accepted that the 5% heavy vehicle rate was also significant:
f = . ∑ . ( . ) ( ) . .
(23)
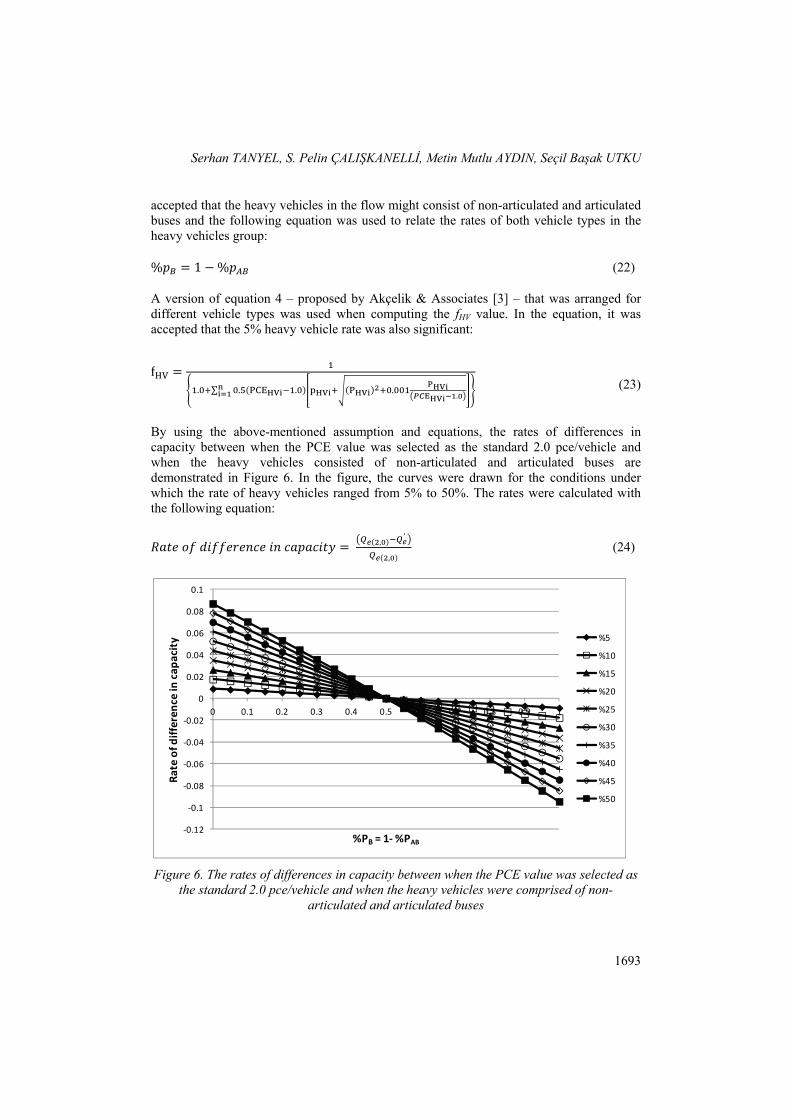
By using the above-mentioned assumption and equations, the rates of differences in capacity between when the PCE value was selected as the standard 2.0 pce/vehicle and when the heavy vehicles consisted of non-articulated and articulated buses are demonstrated in Figure 6. In the figure, the curves were drawn for the conditions under which the rate of heavy vehicles ranged from 5% to 50%. The rates were calculated with the following equation:
= ( , ) ′( , ) (24)
Figure 6. The rates of differences in capacity between when the PCE value was selected as the standard 2.0 pce/vehicle and when the heavy vehicles were comprised of non-
articulated and articulated buses
‐0.12
‐0.1
‐0.08
‐0.06
‐0.04
‐0.02
0
0.02
0.04
0.06
0.08
0.1
0 0.1 0.2 0.3 0.4 0.5 0.6 0.7 0.8 0.9 1
Rate of d
ifference in
cap
acity
%PB = 1‐%PAB
%5
%10
%15
%20
%25
%30
%35
%40
%45
%50
An Investigation of Heavy Vehicle Effect on Traffic Circles
1694
In the equation, Qe(2.0) denotes the capacity when the PCE value is 2.0 pce/vehicle, and Qe’ denotes the capacity when the percentage of heavy vehicles consists of different vehicle types. When Figure 6 is examined, it shows that when the heavy vehicles consisted only of non-articulated buses, the capacity was computed to be 10% higher than the standard condition (PCE=2.0), whereas when the heavy vehicles consisted only of articulated buses, the capacity was computed to be about 10% lower than the standard condition. Even though 10% is a significant value, it does not fully show the difference in the calculation of the heavy vehicle effect. It was thought that delay, one of the most important performance parameters of the intersection, might show the difference more obviously. For this purpose, the following delay equation, proposed by Troutbeck [30], was used [26]:
obseobsm TQ
kTdD
81)1(900 2 (25)
In the equation, D denotes the mean delay per vehicle (seconds); dm denotes the minimum delay that the drivers of the minor flow are exposed to (seconds); Tobs denotes the observation time (generally accepted as 0.25 hour); denotes the degree of saturation for the minor flow; and k denotes the delay parameter. The dm and k values can be computed as follows [7] [26]:
)5,01
)(1()(
0 oca
T
em Tq
eqTd
(26)
3600emQd
k (27)
In the equations, qe is the capacity of the minor flow (vehicle/second); and qca is the adjusted major flow (pce/second). To better define the difference between the methods, the rates of differences in the delay values were calculated in a way similar to the capacity:
= ( , ) − ′
( , ) (28)
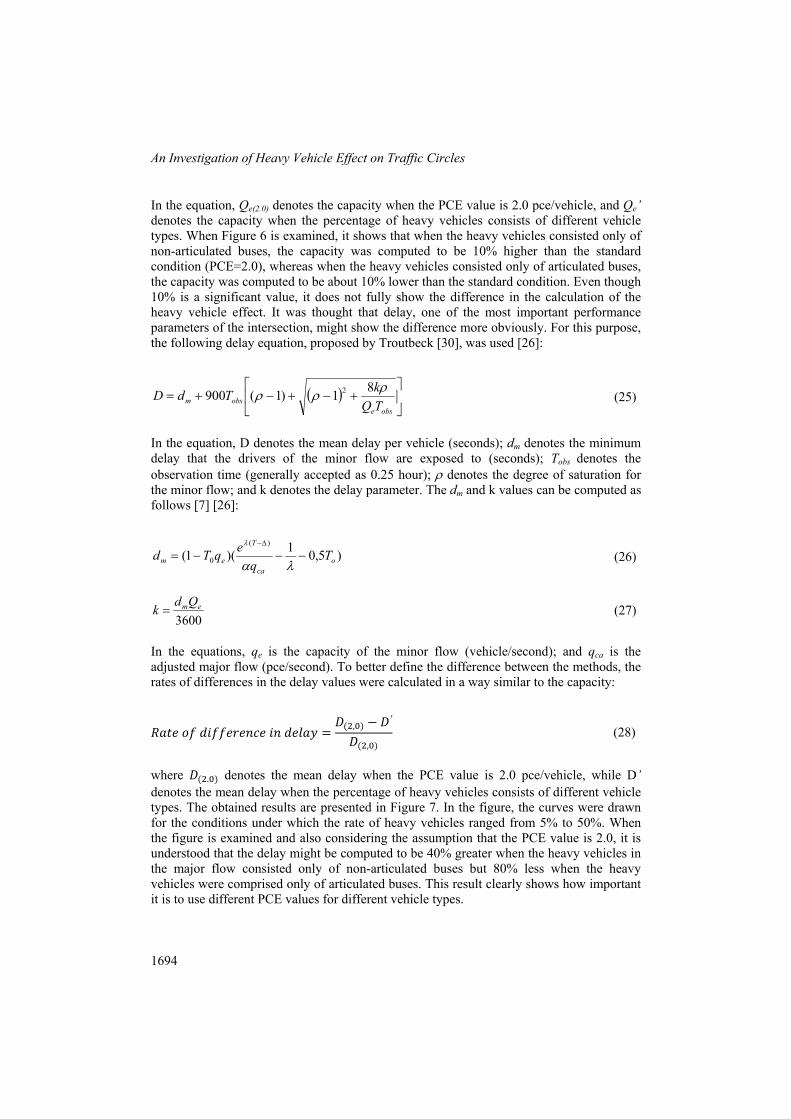
where ( . ) denotes the mean delay when the PCE value is 2.0 pce/vehicle, while D’ denotes the mean delay when the percentage of heavy vehicles consists of different vehicle types. The obtained results are presented in Figure 7. In the figure, the curves were drawn for the conditions under which the rate of heavy vehicles ranged from 5% to 50%. When the figure is examined and also considering the assumption that the PCE value is 2.0, it is understood that the delay might be computed to be 40% greater when the heavy vehicles in the major flow consisted only of non-articulated buses but 80% less when the heavy vehicles were comprised only of articulated buses. This result clearly shows how important it is to use different PCE values for different vehicle types.
Serhan TANYEL, S. Pelin ÇALIŞKANELLİ, Metin Mutlu AYDIN, Seçil Başak UTKU
1695
Figure 7. The rates of differences in delay between when the PCE value was selected as the standard 2.0 pce/vehicle and when the heavy vehicles were comprised of non-articulated
and articulated buses
6. RESULTS AND RECOMMENDATIONS
In this study, the effect of heavy vehicles at traffic circles was examined by means of the observations at 5 different traffic circles in İzmir. In the analyses, the buses and minibuses actively functioning in public transport were addressed and trucks were not included in the scope of the study. The obtained results are provided below.
To make a more detailed examination of the effect of heavy vehicles under different flow conditions, the analyses were made individually for minor and major flows. The following comments can be made depending on the analyses.
The PCE values for minibuses range from 1.18 to 1.26 (1.22 on the average) in the minor flow and from 1.04 to 1.12 (1.08 on the average) in the major flow.
In the minor flow, the PCE values for non-articulated and articulated buses are in the range of 1.67~1.98 (1.83 on the average) and in the range of 1.76~2.09 (1.93 on the average). In this case, it can be assumed that non-articulated and articulated buses create a similar effect for the minor flow. On the other hand, the PCE values in the major flow were obtained in the range of 1.22~1.67 (1.45 on the average) for non-articulated buses and in the range of 1.41~2.25 (1.83 on the average) for articulated buses.
The results provided above demonstrated that it was necessary to use different PCE values for minor and major flows when computing the rates of heavy vehicles (fHV). It is thought
‐1
‐0.8
‐0.6
‐0.4
‐0.2
0
0.2
0.4
0.6
0 0.1 0.2 0.3 0.4 0.5 0.6 0.7 0.8 0.9 1
Rate of difference in delay
%PB = 1‐%PAB
%5
%10
%15
%20
%25
%30
%35
%40
%45
%50

An Investigation of Heavy Vehicle Effect on Traffic Circles
1696
that the use of different PCE values among the values provided above in the analyses instead of a single PCE value for both major and entry flows will yield more accurate results for engineers in the analyses.
When the values obtained for minibuses were examined in the study, it was determined that the PCE values in the major flow were quite close to 1.0. In this case, the minibuses in the circulating flow seem to be acceptable as passenger cars in intersection analyses. However, it is clear that the effect of minibuses on the minor flow should be taken into consideration. In this respect, the behaviors of minibus drivers negatively affecting the traffic flow at intersections particularly like the Bornova intersection, at which the number of passenger minibuses is high, should absolutely be considered.
When the PCE values obtained in the study are examined, it is seen that results different from the values provided for buses in TS 6407 were reached. Therefore, it is thought that it will be useful to revise these values with a recent study. Another result of the study is that when the mean value of velocity in the major flow is low, the effect of heavy vehicles in the major flow is quite obvious. This also means that heavy vehicles will block the front of the entry lanes for a longer time.
This study was performed with the data obtained from 5 different intersections in İzmir. It will be possible to obtain the PCE values to be used in calculations with more data by increasing the numbers of observations and of the observed intersections in future studies. In this way, more accurate results can be obtained in the intersection and minor flow performance analyses and it will be possible to carry out the intersection design in this line.
Symbols
am : Mean acceleration rate (km/hour/second)
amHV : Mean acceleration rate for heavy vehicles (km/hour/second)
amLV : Mean acceleration rate for light vehicles (km/hour/second)
Di : Diameter of the intersection (meters)
D : Mean delay per vehicle (seconds)
D’ : Mean delay when the percentage of heavy vehicles consists of different vehicle types (second)
D(2.0) : Mean delay when the PCE value is 2.0 pce/vehicle.
PCEHV : Passenger car equivalence for a heavy vehicle
PCEHVi : PCE value for heavy vehicle type i
PWR : The ratio of power to weight
F(t) : Probability density function of the gaps for all vehicle types
faLV : An adjustment factor for light vehicles at intersections
faHV : An adjustment factor for heavy vehicles at intersections
fHVc : Heavy vehicle adjustment factor calculated by using pHV as the rate of heavy vehicles

Serhan TANYEL, S. Pelin ÇALIŞKANELLİ, Metin Mutlu AYDIN, Seçil Başak UTKU
1697
fHVe : The heavy vehicle adjustment factor for the entry flow
fb : Rate of bus at the minor approach
fAB : Rate of articulated bus at the minor approach
fB : Rate of bus (single) at the minor approach
Gr : Approach grade (%)
k : Delay parameter
MHV : Heavy vehicle mass (kg)
nc : Number of lanes within the intersection
nexiting : Number of exit lanes
nentering : Number of lanes entering the intersection
p1, p2 and p3 : Calibration parameters for the acceleration rate provided for light vehicles
ppc : Rate of passenger cars
pHV : Rate of heavy vehicles
pHVi : Rate of heavy vehicles in the traffic flow for heavy vehicle type I
pB : Rate of single unit bus
pAB : Rate of articulated bus
Pi : Rate of vehicle type i in the flow
Pmax. : Engine power rate
qc : Major flow (vehicle/second)
Qc : Major flow rate (vehicle/hour)
Qca : Adjusted flow rate (pce/hour)
qdemand : The total demand flow in the minor approach
qdemandpc : Number of passenger cars in the demand flow
qdemandHV : Number of heavy vehicles in the demand flow
qepc : Capacity of the entry flow consisting only of passenger cars (vehicle/second)
qeHV : Capacity of the entry flow consisting only of heavy vehicles (vehicle/second)
T0HV : Mean follow-up headway for heavy vehicles (seconds)
T0m : Mean follow-up headway for minibuses (seconds)
T0pc : Mean follow-up headway for passenger cars (seconds)
Tobs : Observation time (generally accepted as 0.25 hour)
ta : Acceleration time (seconds)
taHVi : Acceleration time for heavy vehicle type i
taLV : Acceleration time for a light vehicle (passenger car)

An Investigation of Heavy Vehicle Effect on Traffic Circles
1698
Tb : Mean critical gap for buses (sec)
Tpc : Mean critical gap for passenger cars (sec)
Tm : Mean critical gap for minibuses (sec)
THV : Mean critical gap value for heavy vehicles (sec)
vf : Final velocity in acceleration (km/hour)
vi : Initial velocity in acceleration (km/hour)
wc : Width of the circulating area (meters)
wexiting : Width of the exiting lanes (meters)
wentering : Widths of the lanes entering the intersection (meters)
wmedian : Median width (meters)
α : Rate of free vehicles in the flow
Δ : The minimum headways between the vehicles (seconds)
ΔB : The minimum headway for buses (single unit) (seconds)
Δpc : The minimum headway for passenger cars (seconds)
ΔHV : The minimum headway for heavy vehicles (seconds)
Δmb : The minimum headway for minibuses (seconds)
ΔAB : The minimum headway for articulated buses (seconds)
Ф : Intersection angle
Qe(2.0) : Capacity when the PCE value is 2.0 pce/vehicle
Qe : Capacity when the percentage of heavy vehicles consists of different vehicle types
: Degree of saturation for the minor flow
References
[1] Tanyel, S., Türkiye.deki Dönel Kavşaklar için Kapasite Hesap Yöntemi, Doktora Tezi, İstanbul Teknik Üniversitesi FenBilimleri Enstitüsü, İstanbul, 2001.
[2] Akcelik & Associates., aaSIDRA User Guide. Akcelik and Associates Pty Ltd, Melbourne, Australia, 2004.
[3] Roess, R., Prassas, S. and McShane, W., Traffic Engineering. Toronto: Prentice Hall., 2004.
[4] Türk Standartları Enstitüsü., Kentsel alanlarda otomobil eşdeğerliği (Türk Standartları TS6407), Ankara, 1989.
[5] Gedizlioğlu, E., Denetimsiz kavşaklarda yanyol sürücülerinin davranışlarına göre pratik kapasite saptanması için bir yöntem, Doktora Tezi, İ.T.Ü. Mühendislik-Mimarlık Fakültesi, İstanbul, 1979.
Serhan TANYEL, S. Pelin ÇALIŞKANELLİ, Metin Mutlu AYDIN, Seçil Başak UTKU
1699
[6] Tanyel, S., Yuvarlakada kavşaklarda anaakımdaki ağır araç yüzdesinin yanyol kapasitesi üzerindeki etkisi. Dokuz .Eylül Üniversitesi Mühendislik Fak. Fen ve Mühendislik Dergisi, 7(1), 19-30., 2005.
[7] Akçelik, R., Roundabouts: capacity and performance analysis. ARRB Research Report ARR 321, Vermont, Australia, 150p., 1998.
[8] Hoogendoom, S.P. and Bovy, P.H.L. A new estimation technique for vehicle~type specific headway distributions. Transportation Research Record. 1646, 18-28., 1998.
[9] Fisk, C., Traffic performance analysis at roundabouts. Transportation Research Part B, 25 (2-3), 89-102., 1991.
[10] Li, W., Wang, W., Jiang, D., Capacity of unsignalised intersections with mixed vehicle flows. Transportation Research Record, 1852, 265-270., 2003.
[11] Dahl, J., Lee, C., Factors Affecting Capacity Estimation for Roundabouts with High Truck Volume. The 3rd International Conference on Roundabouts, Carmel, Indiana, 2011.
[12] Tanner J.C. The capacity of an uncontrolled intersection. Biometrika 54 (3-4), 1967.
[13] Troutbeck R.J., Unsignalized Intersections and Roundabouts in Australia: Recent Developments, W. Brilon (ed.) Intersection without Traffic Signals II. Proceedings of an International Workshop in Bochum, Germany, 1991.
[14] Transportation Research Board (TRB). Highway capacity manual, Transportation Research Board, National Research Council, Washington D.C., U.S.A., 2000.
[15] Transportation Research Board (TRB). Highway capacity manual, Transportation Research Board, National Research Council, Washington D.C., U.S.A., 2010.
[16] Troutbeck, R., Background of HCM section on analysis of performance of roundabouts, Transportation Research Record, 1646, 54-63, 1998.
[17] Akçelik, R., Besley, M., Acceleration and deceleration models.In: 23rd Conference of Australian Institutes of Transport Research (CAITR 2001). University of South Australia, Adelaide,Australia, 2001.
[18] Akçelik & Associates., aaSIDRA User Guide. Akcelik and Associates Pty Ltd, Melbourne, Australia, 2010.
[19] Tanyel, S., Yayla, N., A discussion on the paremeters of Cowan M3 distribution for Turkey. Transp. Res. Part A: Policy Pract., 37(2), 129-143, 2003.
[20] Tanyel, S., Yayla, N., Dönel kavşakların kapasitesi üzerine bir tartışma. IMO Teknik Dergi, 4935-4958, 2010.
[21] Tanyel, S., Baran,T., Ozuysal, M., Applicability of various capacity models for sinle~lane roundabouts in Izmir, Turkey. Journal of Transportation Engineering, 133 (12), 647-653, 2007.

An Investigation of Heavy Vehicle Effect on Traffic Circles
1700
[22] Ozuysal, M., Çalıskanelli, S.P., Tanyel, S., Baran,T., Capacity prediction for traffic circles: applicability of ANN. Proceedings of the Institution of Civil Engineers, 162(4), 195-206, 2009.
[23] Çalışkanelli, P., Ozuysal, M., Tanyel, S., Yayla, N., Comparison of different capacity models for traffic circles. Transport 24(4), 257-264, 2009.
[24] Aydemir, T., Tanyel, S., Çok şeritli dönel kavşaklar üzerinde OD matrisinin etkisi, 6. Ulaştırma Kongresi, TMMOB İnşaat Mühendisleri Odası İstanbul Şubesi, Istanbul, 2005.
[25] Akçelik, R., Chung, E. Calibration of the bunched exponential distribution of arrival headways. Road ve Transport Research, 3, 42-59, 1994.
[26] Hagring, O., Roundabout entry capacity. Bulletin 135, Dept. of Traffic Planning and Engineering, Lund, Sweden., 1996.
[27] Hagring,O., Vehicle~vehicle interactions at roundabouts and their implications for the entry capacity. Bulletin 159, Dept. of Traffic Planning and Engineering, Lund, Sweden., 1998.
[28] Aydemir, T., Başlangıç-Son matrisinin İzmir’deki dönel kavşak giriş kapasitesi üzerindeki etkisinin belirlenmesi, Yüksek Lisans Tezi, Dokuz Eylül Üniversitesi Fen Bilimleri Enstitüsü, İzmir, 2006.
[29] Sullivan, D.P., Troutbeck, R.J., The use of cowan’s M3 headway distribution for modelling urban traffic flow. Traffic Eng. Control, 35(7-8), 445-450, 1994.
[30] Troutbeck, R., A review on the process to estimate the Cowan M3 headway distribution parameters. Traffic Eng. Control, 38(11), 600-603, 1997.
[31] Luttinen, R.T., Properties of Cowan’s M3 headway distribution. Transportation Research Board (Washington D.C.: Transportation Research Board), 1678, 189-196, 1999.
Copyright © 2022 FDOKUMEN