
An introduction of a direct vestibular display into a virtual environment
237
Proceedings Virtual Real it '^ I** International Symposium March 1-5, 1997 Albuquerque, New Mexico (ftß) IEEE Computer Society Press THE INSTITUTE OF ELECTRICAL AND ELECTRONICS ENGINEERS, INC.
-
Upload
independent -
Category
Documents
-
view
1 -
download
0
Transcript of An introduction of a direct vestibular display into a virtual environment

Proceedings
Virtual Real it '^
I**
International Symposium
March 1-5, 1997 Albuquerque, New Mexico
(ftß) IEEE Computer Society Press THE INSTITUTE OF ELECTRICAL AND ELECTRONICS ENGINEERS, INC.
Proceedings
IEEE 1997 Virtual Reality Annual
International Symposium
imCQW0«KWSS'EWBD3
Proceedings
IEEE 1997 Virtual Reality Annual
International Symposium
March 1-5,1997
Albuquerque, New Mexico
Sponsored by
IEEE Computer Society Technical Committee on Computer Graphics
IEEE Neural Networks Council Virtual Reality Technical Committee
miQ QUALITY INSFECTfiD 3
IEEE Computer Society Press Los Alamitos, California
Washington . Brussels • Tokyo

IEEE Computer Society Press 10662 Los Vaqueros Circle
P.O. Box 3014 Los Alamitos, CA 90720-1264
Copyright © 1997 by The Institute of Electrical and Electronics Engineers, Inc. All rights reserved.
Copyright and Reprint Permissions: Abstracting is permitted with credit to the source. Libraries may photocopy beyond the limits of US copyright law, for private use of patrons, those articles in this volume that carry a code at the bottom of the first page, provided that the per-copy fee indicated in the code is paid through the Copyright Clearance Center, 222 Rosewood Drive, Danvers, MA 01923.
Other copying, reprint, or republication requests should be addressed to: IEEE Copyrights Manager, IEEE Service Center, 445 Hoes Lane, P.O. Box 1331, Piscataway, NJ 08855-13.31.
The papers in this book comprise the proceedings of the meeting mentioned on the cover and title page. They reflect the authors' opinions and, in the interests of timely dissemination, are published as presented and without change. Their inclusion in this publication does not necessarily constitute endorsement by the editors, the IEEE Computer Society Press, or the Institute of Electrical and Electronics Engineers, Inc.
IEEE Computer Society Press Order Number PR07843 IEEE Plan Order Number 97CB35922
ISBN 0-8186-7843-7 (paper) ISBN 0-8186-7845-3 (microfiche)
Additional copies may be ordered from:
IEEE Computer Society Press Customer Service Center 10662 Los Vaqueros Circle P.O. Box 3014 Los Alamitos, CA 90720-1264 Tel: +1-714-821-8380 Fax: +1-714-821-4641 Email: [email protected]
IEEE Service Center 445 Hoes Lane P.O. Box 1331 Piscataway, NJ 08855-1331 Tel: +1-908-981-1393 Fax: +1-908-981-9667
IEEE Computer Society 13, Avenue de l'Aquilon B-1200 Brussels BELGIUM Tel: +32-2-770-2198 Fax: +32-2-770-8505
IEEE Computer Society Ooshima Building 2-19-1 Minami-Aoyama Minato-ku, Tokyo 107 JAPAN Tel: +81-3-3408-3118 Fax: +81-3-3408-3553
Editorial production by Regina Spencer Sipple Cover design by Joseph Daigle/Studio Productions
Printed in the United States of America by Technical Communication Services
The Institute of Electrical and Electronics Engineers, Inc.
Table of Contents
Virtual Reality Annual International Symposium Message from the General Chair ix Message from the Program Co-Chairs x Organizing Committee xi Program Committee Members xii
Keynote Address VR Technology and Basic Research on Humans 2
Nat Durlach, MIT and Senior Editor of Presence
Time Critical Rendering Human Behavior-Oriented Adaptive Texture Mapping: A Time Critical Approach for Image-Based Virtual Showrooms 4
Issei Fujishiro, Tomoko Maruyama, Rika Tanaka, Ochanomizu University Smooth Levels of Detail 12
Dieter Schmalstieg, Vienna University of Technology and Gernot Schaufler, Kepler University Linz
An Adaptive Multi-Resolution Modeling Technique Based on Viewing and Animation Parameters 20
Rynson W. H. Lau, Danny S.P. To, Hong Kong Polytechnic University Mark Green, University of Alberta
Interaction
Navigating Through Virtual Flight Environments Using Brain-Body-Actuated Control 30
W. Todd Nelson, Lawrence J. Hettinger, James A. Cunningham, Merry M. Roe, Logicon Technical Services, Inc. Michael W. Haas, Leon B. Dennis, Armstrong Laboratory
Evaluation of the Effects of Frame Time Variation on VR Task Performance 38 Benjamin Watson, Victoria Spaulding, Neff Walker, William Ribarsky, Georgia Institute of Technology
Travel in Immersive Virtual Environments: An Evaluation of Viewpoint Motion Control Techniques 45
Doug A. Bowman, David Koller, Larry F. Hodges, Georgia Institute of Technology
Education and Training
Virtual Reality Training Simulation for Palpation of Subsurface Tumors 54 Michael Dinsmore, Noshir Langrana, Grigore Burdea, Jumoke Ladeji, Rutgers University
Virtual Environments for Shipboard Firefighting Training 61 David L. Täte, Linda Sibert, Naval Research Laboratory Tony King, Naval Computer and Telecommunications Station

Gorillas in the Bits 69 Don Allison, Brian Wills, Larry F. Hodges, Jean Wineman, Georgia Institute of Technology
Panel — Human Performance in Virtual Environments .. ' •-.■■■ .., -.]
Panel on Human Performance in Virtual Environments — Abstract 78 Panel Organizer: Annette Sobel, Sandia National Labs
Psychological Factors in VR I An Introduction of a Direct Vestibular Display into a Virtual Environment 80
Jeffrey D. Cress, Lawrence J. Hettinger, James A. Cunningham, Logicon Technical Services, Inc. Gary E. Riccio, Gary Riccio Associates Grant R. McMillan, Michael W. Haas, Armstrong Laboratory
Development and Testing of a Measure of the Kinesthetic Position Sense Used to Assess the Aftereffects from Virtual Environment Exposure 87
Kay M. Stanney, University of Central Florida, Robert S. Kennedy, Essex Corporation
The Sensitivity of Presence to Collision Response 95 S. Uno, Canon, Inc., M. Slater, University College London
Visualization and Networked VR An Extensible Interactive Visualization Framework for the Virtual Windtunnel 106
Steve Bryson, Sandy Johan, Leslie Schlecht, NASA Ames Research Center
Visualizing the Structure of Virtual Objects Using Head Tracked Stereoscopic Displays 114
Woodrow Barfield, Claudia Hendrix, Karl Brystrom, University of Washington
Distributed Virtual Reality for Everyone — A Framework for Networked VR on the Internet 121
Wolfgang Broil, GMD FIT
Displays and Trackers Transition Between Virtual Environment and Workstation Environment with Projective Head Mounted Display 130
Ryugo Kijima, Takeo Ojika, Gifu University Factors Influencing Operator Interaction with Virtual Objects Viewed via Head-mounted See-through Displays: viewing conditions and rendering latency 138
Stephen R. Ellis, Francois Breant, Brian Menges, Richard Jacoby, Bernard D. Adelstein, NASA Ames Research Center
An Optical Tracker for Augmented Reality and Wearable Computers 146 Dohyung Kim, Scott W. Richards, Thomas P. Caudell, University of New Mexico
VI
Invited Speaker
Design Principles for Online Communities: Lessons from Early Settlements 152
Peter Kollock, UCLA
Panel -^ Virtual Humans Panel on Virtual Humans — Abstract 154
Panel Organizer: Jessica Hodgins, Georgia Institute of Technology
Virtual Humans
Interpolation Synthesis for Articulated Figure Motion 156 Douglas J. Wiley, James K. Hahn, The George Washington University
A Dead-Reckoning Algorithm for Virtual Human Figures 161 Tolga K. Capin, Daniel Thalmann, Swiss Federal Institute of Technology Igor Sunday Pandzic, Nadia Magnenat Thalmann, University of Geneva
Virtual Actors and Avatars in a Flexible User-Determined- Scenario Environment 170
Dan M. Shawver, Sandia National Laboratories
Haptics
Shape Identification Performance and Pin-matrix Density in a 3 Dimensional Tactile Display 180
Makoto Shimojo, Masami Shinohara, Yukio Fukui, National Institute ofBioscience and Human-Technology
Haptic Display of Visual Images 188 Yunling Shi, Dinesh K. Pai, University of British Columbia
Contact Sensation in the Synthetic Environment Using the ISU Force Reflecting Exoskeleton 192
Greg R. Luecke, Young-Ho Chai, Iowa State University Texture Presentation by Vibratory Tactile Display — Image based presentation of a tactile texture 199
Yasushi Ikei, Kazufumi Wakamatsu, Shuichi Fukuda, Tokyo Metropolitan Institute of Technology
Poster Papers A Distributed Virtual Driving Simulator 208
Ronald R. Mourant, Naizhong Qiu, Susan A. Chiu, Northeastern University
The Use of a Virtual Environment for FE Analysis of Vehicle Crash Worthiness 209
Sven Kuschfeldt, Martin Schulz, Thomas Ertl, University of Erlangen Thomas Rending, Michael Holzner, BMWAG
Vll

A Haptic Object-Oriented Texture Rendering System 210 Jason P. Fritz, University of Delaware I A.I. duPont Institute
Crossing Streets: A K-12 Virtual Reality Application for Understanding Knowledge Acquisition 211
F.R. Rusch, D.S. Millar, R.E. Cimera, D.h. Shelden, University of Illinois, U. Thakkar, DA. Chapman, Y.H. Khan, D.D. Moore, J.S. LeBoy, National Center for Supercomputing Applications at the University of Illinois
Color Plates 213
Tutorial Descriptions 220
Author Index 224
vin
Message from the General Chair
Welcome to Albuquerque, NM and to the 1997 Virtual Reality Annual International Symposium. It seems appropriate that the "Land of Enchantment" should host this fourth in a series of symposia dedicated to the technology of creating digital worlds, both enchanting and beneficial. Here in New Mexico, the ancient and the modern, the mystical and the technological, exist side-by-side. The birthplace of the atomic bomb is also the dwelling place of Native American Spirit Guides, and the cowboy and the engineer are as likely as not to be one and the same. So it is with Virtual Reality, a technology that allows us to visit both long-destroyed cathedrals and as-yet unrealized space stations, where the virtual entity with which you're interacting is as likely to represent the nth dimension of an abstract data set as it is a fellow cybernaut.
The science of VR is evolving rapidly and VRAIS has become the place where the technologists responsible for this evolution come together to share the latest advances in hardware, software, and applications. VRAIS, like Virtual Reality itself, is a dynamic entity, always seeking new ways to create an exciting forum for the presentation of research and the lively exchange of ideas. This year's VRAIS is not a carbon copy of last year's. Nor do we expect VRAIS '98 to look exactly like VRAIS '97. This year we have added a poster session for presentation of work not yet mature enough for papers and have reintroduced panels, where we hope to see lively discussion of the issues and interchange of ideas between the panelists and the audience. Of course the technical papers continue to be the centerpiece of our symposium, and we have held constant the high quality of all work accepted for presentation.
None of this would have been possible without the contributions of the VRAIS '97 conference committee. Thanks to each of them for their hard work and dedication. And thanks also to all of you who participate in VRAIS. It is your enthusiasm and technical excellence that make this symposium such an exciting event. I hope that you find VRAIS '97 a valuable experience: Listen, learn, interact — above all, enjoy. Oh, and if you get the chance, watch the skies for unidentified objects. VR professionals are not the only advanced technologists known to visit New Mexico :-)
Sharon Stansfield General Chair
Albuquerque, NM March, 1997
IX
Message from the Program Chairs
VRAIS '97 presents a sample of all the things that make the field of virtual reality an exciting area in which to work. We have papers this year that present quality research on a variety of topics in computing, HCI, and hardware. We also have, for the first time, a number of papers on real applications of VR that go beyond the usual entertainment and giving media interviews. VRAIS continues to attract an international audience, with authors participating from the U.S., Canada, United Kingdom, Germany, Switzerland, Austria, Japan and Hong Kong. We have made every effort to maintain the standard of excellence established by pervious program chairs. In addition to being international and broadly representative of the field, these proceedings also present some of the best research and development efforts in Virtual Reality. The credit for this goes to the authors who chose to send their work to VRAIS, and to the members of the Program Committee who provided careful reviews of the papers.
On a more personal note, this was my first experience as a program chair for VRAIS. I have learned a great deal from the experience. Although I can not top Holly Rushmeier's story as SIGGRAPH Program Chair of government shutdowns and blizzards, I did manage to have all the papers arrive in Atlanta in the middle of the Olympic Games. Since my office sat in the middle of the Olympic Village, just getting the papers to me turned out to be a challenge. An overnight package usually spent one night getting to the edge of Georgia Tech's campus (site of the Olympic Village), and then three to six more days getting through Olympic security. Then MOST of them were delivered to my office except for the ones that went to the headquarters of different Olympic teams (which we finally managed to track down). Getting the papers back off of campus to be reviewed was even more challenging since the express mail carrier was not allowed into the Olympic village. I managed by recruiting two of my students who helped me carry three (big) boxes of express mail packages out of my building, where we got on a shuttle bus, which took us to another shuttle bus, which took us to an off- campus parking lot, where we loaded it all into my car, fought our way through Olympic traffic, and eventually got the packages off to reviewers.
I would still be shuffling papers if it were not for the help of my students and the staff of the Graphics, Visualization & Usability Center. Thanks go to Joan, Tonya, Borut, Byron, Kevin, Solomon, Ben, Drew, Don, Doug, Peter, and Bill for getting me through the process. My thanks also to my program co-chair, Mark Green, and to the conference chair, Sharon Stansfield, for their support and advice.
Larry Hodges Mark Green Georgia Institute of Technology University of Alberta

Organizing Committee
General Chair Sharon Stansfield, Sandia National Laboratories
Program Co-Chairs Larry Hodges, Georgia Institute of Technology
Mark Green, University of Alberta
Video Chair Norman Badler, University of Pennsylvania
Tutorial Chair Tom Caudell, University of New Mexico
Exhibits Chair Henry Sowizral, Sun Microsystems
Press Relations Chair Linda Jacobson, Silicon Graphics Inc.
Finance Chair Nadine Miner, Sandia National Laboratories
Local Arrangements Chair Jerry VanSlambrook, Sandia National Laboratories
Student Volunteers Chair Sankar Jayaram, Washington State University
Publications Chair Larry Rosenblum, Naval Research Laboratory
XI

VRAIS '97 Program Committee
B.D. Adelstein NASA Ames Research Center
Joanna Alexander Zombie
David Anderson Mitsubishi Electric Research Laboratory
Ron Azuma Hughes Research Laboratories
Norman Badler University of Pennsylvania
Woodrow Barfield University of Washington
John Barrus Mitsubishi Electric Research Laboratory
Stephen Benton MIT Media Lab
Chuck Blanchard New Leaf Systems, Inc.
Mark Bolas Fake Space Labs
Kellogg Booth University of British Columbia
Pere Brunet Crosa Polytechnical University of Catalonia
Steve Bryson NASA Ames Research Center
Thomas P. Caudell University of New Mexico
Chris Codella IBM T.J. Watson Research Center
Carolina Cruz-Neira Iowa State University
Mike Daily Hughes Research Labs
Rae Earnshaw University of Leeds
Steve Ellis NASA Ames Research Center
Jose Encarnacao Fraunhofer / IGD
Kim Fairchild National University of Singapore
Steve Feiner Columbia University
Wolfgang Feiger Fraunhofer Institute for Computer Graphics
Scott Foster Crystal River Engineering
Thomas Fruehauf
Henry Fuchs Sitterson Hall
Thomas Funkhouser AT&T Bell Laboratories
Toshio Fukuda Nagoya University
Michael Gigante Rosanna
Martin Goebel IGD/Fraunhofer Institute for Computer Graphics
Mark Green University of Alberta
Dennis Hancock HP Labs
Hideki Hashimoto University of Tokyo
Michitaka Hirose University of Tokyo
John Hollerbach University of Utah
Phil Hubbard Cornell University
Siu-Leong Iu Rockwell, Science Center
Hiroo Iwata University of Tsukuba
Robert Jacob Tufts University
S. Janaram Washington State University
xn

Uwe Jasnoch
Mary Kaiser NASA Ames Research Center
Ken-ichi Kameyama Toshiba R&D Center
Arie Kaufman State University of New York
Evangelos Kokkevis University of Pennsylvania
Holger Kress Fraunhofer
Myron Kruger Artificial Reality
James Lackner Brandeis University
Andrew Liu Nissan Cambridge Basic Research
Nadia Magnenat-Thalmann University of Geneva
Dinesh Manocha University of North Carolina, Chapel Hill
Jed Marti University of Utah
Kevin R. Martin
Michael W. McGreevy NASA Ames Research Center
Margaret Minsky MIT
Junji Nomura Matsushita Electric Works, Ltd.
Steve Pieper Medical Media Systems
Ronald Pose Monash University / Dept. of CS
William Ribarsky Georgia Institute of Technology
Warren Robinett Virtual Reality Games, Inc.
Jannick Rolland UNC, Chapel Hill
Joseph M. Rosen, M.D. Dartmouth-Hitchcock Medical Center
Larry Rosenblum Naval Research Laboratory
Rick Satava Advanced Projects Research Agency
Luis Serra National University of Singapore
William Sherman National Center for Supercomputing Applications
Gurminder Singh National University of Singapore
Mel Slater University of London
Henry Sowizral Sun Microsystem
Mandayam Srinivasan ME Dept, MIT
Lawrence W. Stark University of California
Susumu Tachi University of Tokyo
Daniel Thalmann Swiss Federal Institute of Technology
Ben Watson
Elizabeth Wenzel NASA Ames Research Center
Alan Wexelblat MIT Media Lab
David Zeltzer MIT
RolfZiegler Fraunhofer
xiu
JUWOKJDNIQI Jh.
% ««UM -AND Ml( M5GM OH mm
Nat Durlach MIT and Senior Editor of Presence
Keynote Address:
VR TECHNOLOGY AND BASIC RESEARCH ON HUMANS
Abstract
Most previous work in VR has focused primarily on the development of enabling hardware and software, applications of VR systems to practical problems, and the use of such systems for purposes of entertainment.
Introductory remarks will focus on the definition of VR, on various types of VR, and on applications of VR. The talk will then focus on relationships between VR and research on humans. Attention will be given both to research that is needed for the development of effective systems and to research opportunities that are provided by the availability of such systems.
One topic that will be discussed concerns the conflict between developing natural systems that are easy to earn and developing unnatural systems that provide superior performance after learning. Both subjective presence and sensorimotor adaptation will be considered in connection with this discussion.
A second topic that will be considered, one that has received most attention in connection with role-playing on the Internet, concerns the user's sense of identity and the development of VME's (Virtual Me's) as well as VE's (Virtual Environments).
The talk will conclude with a series of questions for open discussion.
Nat Durlach is a senior scientist in the Department of Electrical Engineering and Computer Science at MIT. Initially trained as a mathematician, he was employed by the MIT Lincoln Laboratory from 1954 to 1963 to help develop improved radar air defense systems. Subsequently, he became interested in the study of living systems.
His research of living systems has been very broad, ranging from the study of echolocation systems in bats and necrophoric behavior in ants to topics in the social sciences; however, his main focus has been the sensorimotor performance of humans and, in particular, auditory and tactual psychophysics.
He has been co-director of the Sensory Communication Group in the Research Laboratory of Electronics at MIT for more than 20 years, and has been a visiting scientist in the Biomedical Engineering Department of Boston University for roughly five years. He is the author (or co-author) of numerous book chapters and of approximately 100 refereed articles in such journals as Perception and Psychophysics and the Journal of the Acoustical Society of America; he continues to review articles, proposals, and research programs in the field of psychophysics; and he recently received the Silver Medal Award from the Acoustical Society of America for outstanding work in psychoacoustics. He has functioned as principal or co-principal investigator for dozens of grants at MIT and has raised millions of dollars for his group's research activities. In addition, he serves on the Board of Directors of a number of high-tech companies in the Boston area.
During the past few years, Mr. Durlach's interests have focused on teleoperator and virtual- environment systems, with special emphasis on the human-machine interfaces used in such systems. He is co-founder and director of the MIT Virtual Environment and Teleoperator Research Consortium (VETREC), as well as co-founder and managing editor of the MIT Press journal PRESENCE: Teleoperators and Virtual Environments. He also recently served as chair of the committee of the National Academy of Sciences charged with establishing a national research agenda for R & D on teleoperators and virtual environments (see the book titled Virtual Reality: Scientific and Technological Challenges edited by Durlach and Mavor, 1995). Among his other duties at MIT, he is currently serving as principal investigator on a number of Navy contracts and grants concerned with the use of VR technology to improve the cost-effectiveness of training.
KKION :^r>
HIM CMnCOLMHDCMIK
Human Behavior-Oriented Adaptive Texture Mapping: A Time-Critical Approach for
Image-Based Virtual Showrooms
Issei Fujishirot t Department of Information Sciences
Ochanomizu University Tokyo 112, Japan
E-mail: {fuji, rika}(Dis.ocha.ac.jp
Rika Tanaka* Tomoko Maruyama* * Multimedia Division
Toppan Printing Co., Ltd. Tokyo 110, Japan
E-mail: tomoko.maruyamaiStoppan.co.jp
Abstract Time-Critical Rendering (TCR) has recently at-
tracted much attention as an important framework for creating immersive virtual environments. TCR trades time-indulgent pursuit of high quality rendering for di- rect control over the timing of rendering according to the variable frame rates required for participants' in- teractions, so that more responsive interactivity can be achieved to keep him/her immersed in a virtual envi- ronment.
This paper proposes a highly effective TCR approach to the level of detail control of textures used in image- based virtual reality systems. Specifically, an adaptive texture mapping strategy based on a human behavior model is presented, where both the psychological and er- gonomic aspects of interior space evaluation are taken into account to achieve more reasonable image qualities and frame rates than the conventional viewing distance- based texture mapping. The feasibility of the new strat- egy is proven through preliminary space navigation ex- periments using a simple virtual showroom.
Keywords: Time-critical rendering (TCR), levels of detail (LoDs), immersion, image-based VR, texture mapping, image pyramids, interior simulation.
1 Introduction Computer Graphics (CG)-based interior space sim-
ulation serves as an indispensable methodology for ef- fective evaluation of spaces designed with architectural CAD systems, leading to good decision-making in the earlier stages of design process. Interest has been re- cently shifted to the use of Virtual Reality (VR) sys- tems [15], which make it possible to show a design space to participants in an immersive way, and thus to allow them to evaluate the space more accurately. The effec- tiveness of such pioneer systems has been reported in the literature [19].
There exist two major criteria for the evaluation of interior space comfortableness: psychological fac- tors and ergonomic factors [16, 17]. Psychological evaluation is concerned mainly with how comfortable various attributes of a designed space, including the color/texture of used materials and the space extensity, make ones feel, while in ergonomic evaluation, physical comfort of fixtures and allowance of work spaces are dynamically investigated. Human beings are capable of considering these two aspects of evaluation results together, and making a decision on the overall quality of the space design.
In order to achieve the illusion of immersion in a virtual showroom, where the participants can per- form both of these kinds of spatial evaluation simul- taneously, a trade-off between high quality rendering and dynamical frame updating must be resolved. High quality rendering is important to produce photorealis- tic scenes for precise psychological evaluation. On the other hand, to evaluate the room ergonomically, par- ticipants might want to feel free to walk through the space, to stretch their arms to check the sufficiency of involved work subspace, or to touch the target fixtures to find the best relative positions. Obviously, real-time performance is the key to allowing the participants to interact with the virtual environment in a natural way.
For the purpose of psychological evaluation, time- consuming, but high quality, rendering methods may be employed, because the participants tend to fix their viewpoint in a space and their gaze on the target ob- jects, and hence the transformed scenes need not be re- rendered very frequently. In the case of ergonomic eval- uation, however, the quality of rendered scenes must be sacrificed to some extent to synchronize frame updat- ing with the participants' interaction with the environ- ment. Not accounting for the limitations of given com- puting resources, but relying on the use of high quality
0-8186-7843-7/97 $10.00 © 1997 IEEE
rendering, unexpected time lags of scene updating will result in the loss of immersion, and then discourage the participants from continuing further spatial evaluation.
The above consideration provides an incentive for adopting the concept of Time-Critical Render- ing(TCR) [27, 28], which has recently attracted much attention primarily from VR-related researchers. TCR trades time-indulgent pursuit of high quality rendering for direct control over the timing of rendering accord- ing to the variable frame rates required for participants' interactions. The principal idea behind TCR is that it stimulates responsive interactivity that can keep par- ticipants immersed in a virtual environment [22].
Meanwhile, recent advances in 2D image synthe- sis techniques, including image warping and morphing [10], have led to the advent of image-based VR sys- tems, where real-time interaction with virtual worlds is available even in personal computing facilities, with- out expensive and awkward equipment [5, 18]. One of the key techniques used in image-based VR systems is the well-tuned texture mapping [11], which can pro- duce photorealistic scenes more efficiently in space and time than the traditional approaches to 3D shading of geometric objects.
This paper attempts to abstract the above- mentioned human behavior in interior space evalua- tion into a hierarchical phase-state transition model, and to make use of the model to develop an adap- tive texture mapping strategy as an advanced TCR ap- proach for immersive image-based VR interior simula- tors. It is empirically demonstrated that with the new texture mapping strategy, both the psychological and ergonomic aspects of human interior space evaluation can be taken into account to achieve more reasonable image qualities and frame rates than the conventional viewing distance-based texture mapping.
2 Previous Work TCR can be regarded as a specialized notion of
Time-Critical Computing(TCC) [27, 28, 21], which shares the common background with the Quality of Service(QoS) control in distributed multimedia envi- ronments [29].
There are several known TCR-related research themes in the field of 3D raster graphics. Typical exam- ples of such themes include multi-resolution modeling [12] and progressively refining rendition [28]. For ex- ample, Tang, et al.[25] proposed a time-elastic object called pacer, whose behavior is time-critical in that the quality of its presentation is adjustable according to the amount of rendering time available. Although they implemented a direct manipulation GUI using pacers, the reported goal of the GUI is limited to the draw- ing/painting of 2D digital objects.
To the best of the authors' knowledge, only a dozen VR research reports have referred to TCR and/or TCC in the context of immersive user interaction [9, 13, 2, 21, 22, 14, 20, 26, 4].
Smets, et al. [22] conducted some experiments to compare the relative importance of spatial, intensity, and temporal resolutions of images in search-and-act spatial tasks. These experiments were carried out in an actual light and camera setting, and they arrived at an interesting conclusion that image resolution is very important in static viewing, but not in immersive VR. This provides a strong support to the validity of the TCR approaches to VR applications.
Hubbard [13,14] developed time-critical collision de- tection algorithms using specific 4D geometric models to approximate the motion of 3D objects. Collision de- tection is regarded as one of the most important VR issues relevant to autonomy [30] because it is helpful in making VR applications more believable.
Ohshima, et al. [20] devised an adaptive scheme to control the Level of Detail (LoD) of rendered ob- jects based on a human visual acuity model with gaze detection devices. Their scheme is analogous to the present approach in that the characteristics of the hu- man visual system are considered as major factors for the effective LoD decision.
Time management based on temporal complexity es- timation model is one of the key components of TCR environments [9, 21, 4]. Pan, et al. [21] presented an HPC-based TCC framework for realizing virtual envi- ronments. Bryson, et al. [4] developed TCR algorithms for interactive exploration of unstrady 3D flow fields. Funkhouser, et al. [9] proposed an adaptive display algorithm which guarantees that the LoDs of objects and rendering methods for generating the best image within a user-specified target frame rate can be cho- sen. Unlike conventional methods that just ignore the detail of scenes imprudently, they are aimed at pro- ducing a uniform rate of frame updating even under the condition that scene complexities differ from frame to frame. In this respect, their approach could give a general solution to adaptive geometry-based render- ing for large-scale VR systems. However, their cost- and-benefit optimization algorithm depends primarily on the size and accuracy of objects to be rendered, and does not fully take into account the aspect of hu- man visual perception of scenes. In contrast, adaptive image-based rendering algorithm herein (Section 3.2) relies on a simple but feasible model of participants' behavior in interior space evaluation (Section 3.1), so as to achieve more immersive environments. This is one of the salient features of the present approach to TCR for image-based VR.
3 TCR for Image-Based VR 3.1 Participant's behavior model
In order to control on-the-fly the LoD of textures used in the presented scenes, by which aspect of eval- uation, psychologically or ergonomically, participants navigate in the interior space and direct their gaze at objects must be determined dynamically. As men- tioned in Section 1, for the psychological evaluation, participants tend to fix their viewpoint in a space and their gaze on objects of particular interest, while in case of ergonomic evaluation, participants usually need to move around the space, keeping their viewpoint and gaze changed dynamically. Therefore, the dynamics of the participants' viewpoint/gaze can be used as the ef- fective outputs to predict these two aspects of interior space evaluation.
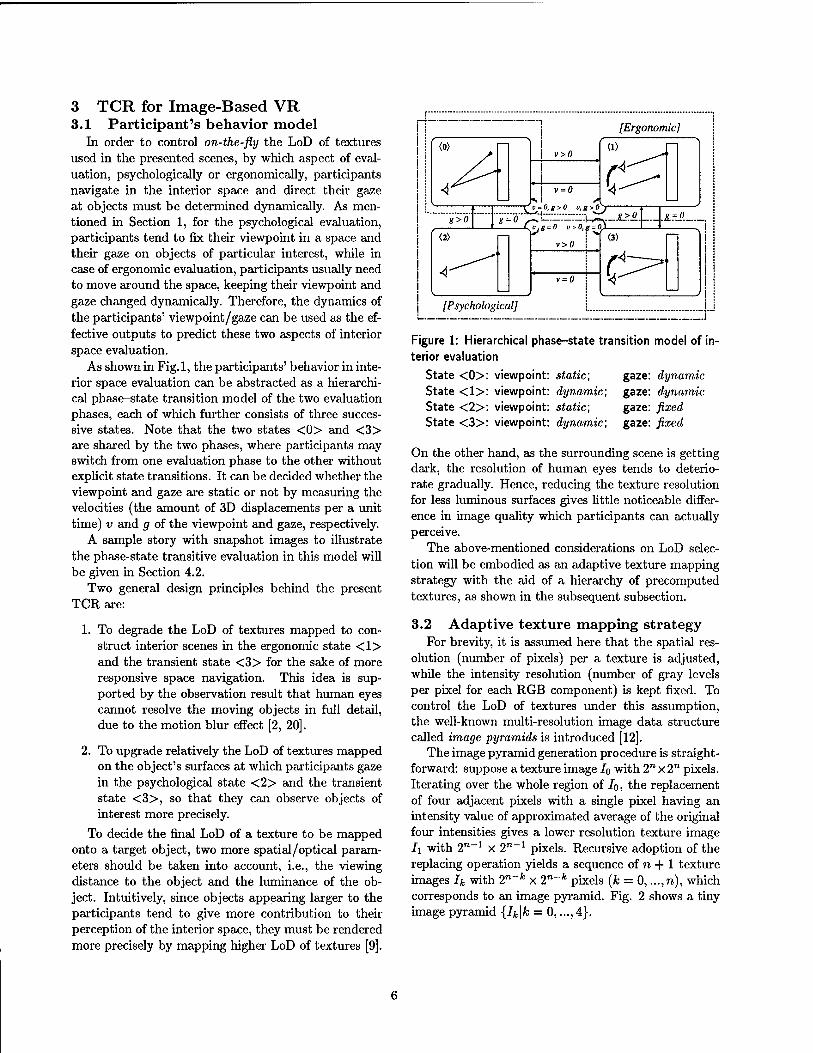
As shown in Fig.l, the participants' behavior in inte- rior space evaluation can be abstracted as a hierarchi- cal phase-state transition model of the two evaluation phases, each of which further consists of three succes- sive states. Note that the two states <0> and <3> are shared by the two phases, where participants may switch from one evaluation phase to the other without explicit state transitions. It can be decided whether the viewpoint and gaze are static or not by measuring the velocities (the amount of 3D displacements per a unit time) v and g of the viewpoint and gaze, respectively.
A sample story with snapshot images to illustrate the phase-state transitive evaluation in this model will be given in Section 4.2.
Two general design principles behind the present TCR are:
1. To degrade the LoD of textures mapped to con- struct interior scenes in the ergonomic state <1> and the transient state <3> for the sake of more responsive space navigation. This idea is sup- ported by the observation result that human eyes cannot resolve the moving objects in full detail, due to the motion blur effect [2, 20].
2. To upgrade relatively the LoD of textures mapped on the object's surfaces at which participants gaze in the psychological state <2> and the transient state <3>, so that they can observe objects of interest more precisely.
To decide the final LoD of a texture to be mapped onto a target object, two more spatial/optical param- eters should be taken into account, i.e., the viewing distance to the object and the luminance of the ob- ject. Intuitively, since objects appearing larger to the participants tend to give more contribution to their perception of the interior space, they must be rendered more precisely by mapping higher LoD of textures [9].
<o>
[Ergonomic]
v>0
g>0 g = o
v = 0
~^v = o,g>o vtg>oy-
<2> jTvg=0 v>0,g = o\.
4T • ^»
.&>. iLZ.JLrJ.
v>0
v = 0 :
<3>
C^i [Psychological]
Figure 1: Hierarchical phase-state transition model of in- terior evaluation
State <0>: viewpoint: static; gaze: dynamic State <1>: viewpoint: dynamic; gaze: dynamic State <2>: viewpoint: static; gaze: fixed State <3>: viewpoint: dynamic; gaze: fixed
On the other hand, as the surrounding scene is getting dark, the resolution of human eyes tends to deterio- rate gradually. Hence, reducing the texture resolution for less luminous surfaces gives little noticeable differ- ence in image quality which participants can actually perceive.
The above-mentioned considerations on LoD selec- tion will be embodied as an adaptive texture mapping strategy with the aid of a hierarchy of precomputed textures, as shown in the subsequent subsection.
3.2 Adaptive texture mapping strategy For brevity, it is assumed here that the spatial res-
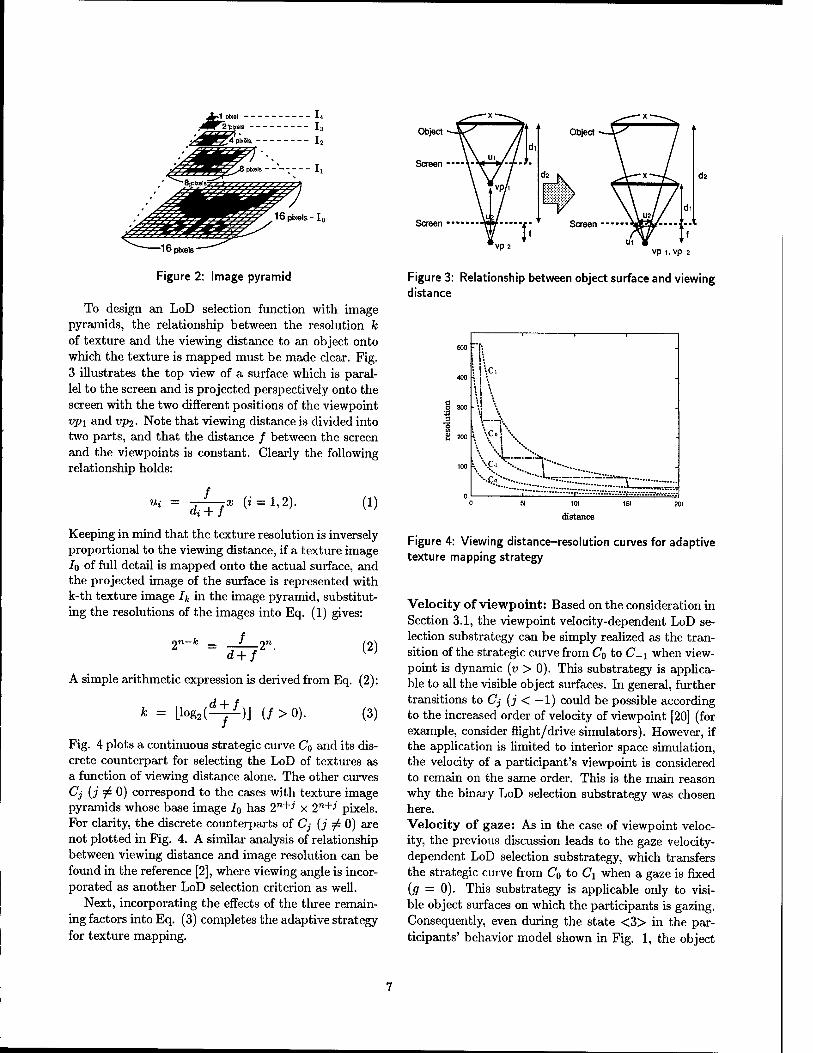
olution (number of pixels) per a texture is adjusted, while the intensity resolution (number of gray levels per pixel for each RGB component) is kept fixed. To control the LoD of textures under this assumption, the well-known multi-resolution image data structure called image pyramids is introduced [12].
The image pyramid generation procedure is straight- forward: suppose a texture image Jo with 2n x 2n pixels. Iterating over the whole region of Jo, the replacement of four adjacent pixels with a single pixel having an intensity value of approximated average of the original four intensities gives a lower resolution texture image Ji with 2n~l x 2n_1 pixels. Recursive adoption of the replacing operation yields a sequence of n + 1 texture images h with 2n~k x 2n~k pixels (k = 0, ...,n), which corresponds to an image pyramid. Fig. 2 shows a tiny image pyramid {Ik\k = 0,..., 4}.
j^A pixel I4 J^TZ^M l3
pixels-I0
"16 pixels"
Figure 2: Image pyramid
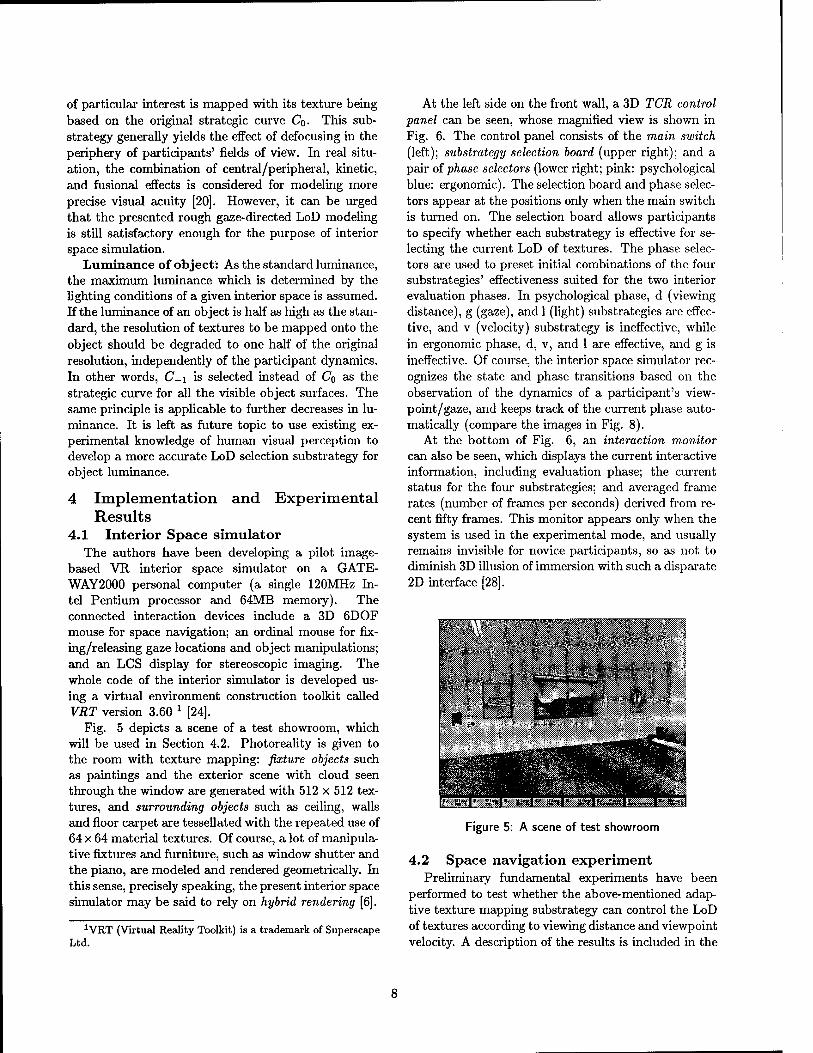
To design an LoD selection function with image pyramids, the relationship between the resolution k of texture and the viewing distance to an object onto which the texture is mapped must be made clear. Fig. 3 illustrates the top view of a surface which is paral- lel to the screen and is projected perspectively onto the screen with the two different positions of the viewpoint vp\ and vp2- Note that viewing distance is divided into two parts, and that the distance / between the screen and the viewpoints is constant. Clearly the following relationship holds:
Ui = f
di + f x (i = 1,2). (1)
Keeping in mind that the texture resolution is inversely proportional to the viewing distance, if a texture image IQ of full detail is mapped onto the actual surface, and the projected image of the surface is represented with k-th texture image Jj. in the image pyramid, substitut- ing the resolutions of the images into Eq. (1) gives:
2n- d + f
-2n. (2)
A simple arithmetic expression is derived from Eq. (2):
* = Llog2(^)J (/>0). (3)
Fig. 4 plots a continuous strategic curve Co and its dis- crete counterpart for selecting the LoD of textures as a function of viewing distance alone. The other curves Cj (j ^ 0) correspond to the cases with texture image pyramids whose base image I0 has 2n+J x 2n+J' pixels. For clarity, the discrete counterparts of Cj (j ^ 0) are not plotted in Fig. 4. A similar analysis of relationship between viewing distance and image resolution can be found in the reference [2], where viewing angle is incor- porated as another LoD selection criterion as well.
Next, incorporating the effects of the three remain- ing factors into Eq. (3) completes the adaptive strategy for texture mapping.
Object
Screen
vp 2 vp 1, vp 2
Figure 3: Relationship between object surface and viewing distance
o 300
8 2°°
"f; . i i\ • i',c. •. i \
"t-4. \ Vl\
-
- \ '■•••' ._.\*
"••..£.,'"• *—=::.—• •"—■■•»»--.. " r::::::::::""~:;::"z~££^{~. T^!£!T:::
101
distance
Figure 4: Viewing distance-resolution curves for adaptive texture mapping strategy
Velocity of viewpoint: Based on the consideration in Section 3.1, the viewpoint velocity-dependent LoD se- lection substrategy can be simply realized as the tran- sition of the strategic curve from Co to C_i when view- point is dynamic (v > 0). This substrategy is applica- ble to all the visible object surfaces. In general, further transitions to Cj (j < —1) could be possible according to the increased order of velocity of viewpoint [20] (for example, consider flight/drive simulators). However, if the application is limited to interior space simulation, the velocity of a participant's viewpoint is considered to remain on the same order. This is the main reason why the binary LoD selection substrategy was chosen here. Velocity of gaze: As in the case of viewpoint veloc- ity, the previous discussion leads to the gaze velocity- dependent LoD selection substrategy, which transfers the strategic curve from Co to C\ when a gaze is fixed (g = 0). This substrategy is applicable only to visi- ble object surfaces on which the participants is gazing. Consequently, even during the state <3> in the par- ticipants' behavior model shown in Fig. 1, the object
of particular interest is mapped with its texture being based on the original strategic curve Co. This sub- strategy generally yields the effect of defocusing in the periphery of participants' fields of view. In real situ- ation, the combination of central/peripheral, kinetic, and fusional effects is considered for modeling more precise visual acuity [20]. However, it can be urged that the presented rough gaze-directed LoD modeling is still satisfactory enough for the purpose of interior space simulation.
Luminance of object: As the standard luminance, the maximum luminance which is determined by the lighting conditions of a given interior space is assumed. If the luminance of an object is half as high as the stan- dard, the resolution of textures to be mapped onto the object should be degraded to one half of the original resolution, independently of the participant dynamics. In other words, C_i is selected instead of Co as the strategic curve for all the visible object surfaces. The same principle is applicable to further decreases in lu- minance. It is left as future topic to use existing ex- perimental knowledge of human visual perception to develop a more accurate LoD selection substrategy for object luminance.
4 Implementation and Experimental Results
4.1 Interior Space simulator The authors have been developing a pilot image-
based VR, interior space simulator on a GATE- WAY2000 personal computer (a single 120MHz In- tel Pentium processor and 64MB memory). The connected interaction devices include a 3D 6DOF mouse for space navigation; an ordinal mouse for fix- ing/releasing gaze locations and object manipulations; and an LCS display for stereoscopic imaging. The whole code of the interior simulator is developed us- ing a virtual environment construction toolkit called VRT version 3.60 x [24].
Fig. 5 depicts a scene of a test showroom, which will be used in Section 4.2. Photoreality is given to the room with texture mapping: fixture objects such as paintings and the exterior scene with cloud seen through the window are generated with 512 X 512 tex- tures, and surrounding objects such as ceiling, walls and floor carpet are tessellated with the repeated use of 64 x 64 material textures. Of course, a lot of manipula- tive fixtures and furniture, such as window shutter and the piano, are modeled and rendered geometrically. In this sense, precisely speaking, the present interior space simulator may be said to rely on hybrid rendering [6].
At the left side on the front wall, a 3D TCR control panel can be seen, whose magnified view is shown in Fig. 6. The control panel consists of the main switch (left); substrategy selection board (upper right); and a pair of phase selectors (lower right; pink: psychological blue: ergonomic). The selection board and phase selec- tors appear at the positions only when the main switch is turned on. The selection board allows participants to specify whether each substrategy is effective for se- lecting the current LoD of textures. The phase selec- tors are used to preset initial combinations of the four substrategies' effectiveness suited for the two interior evaluation phases. In psychological phase, d (viewing distance), g (gaze), and 1 (light) substrategies are effec- tive, and v (velocity) substrategy is ineffective, while in ergonomic phase, d, v, and 1 are effective, and g is ineffective. Of course, the interior space simulator rec- ognizes the state and phase transitions based on the observation of the dynamics of a participant's view- point/gaze, and keeps track of the current phase auto- matically (compare the images in Fig. 8).
At the bottom of Fig. 6, an interaction monitor can also be seen, which displays the current interactive information, including evaluation phase; the current status for the four substrategies; and averaged frame rates (number of frames per seconds) derived from re- cent fifty frames. This monitor appears only when the system is used in the experimental mode, and usually remains invisible for novice participants, so as not to diminish 3D illusion of immersion with such a disparate 2D interface [28].
1VRT (Virtual Reality Toolkit) is a trademark of Superscape Ltd.
Figure 5: A scene of test showroom
4.2 Space navigation experiment Preliminary fundamental experiments have been
performed to test whether the above-mentioned adap- tive texture mapping substrategy can control the LoD of textures according to viewing distance and viewpoint velocity. A description of the results is included in the
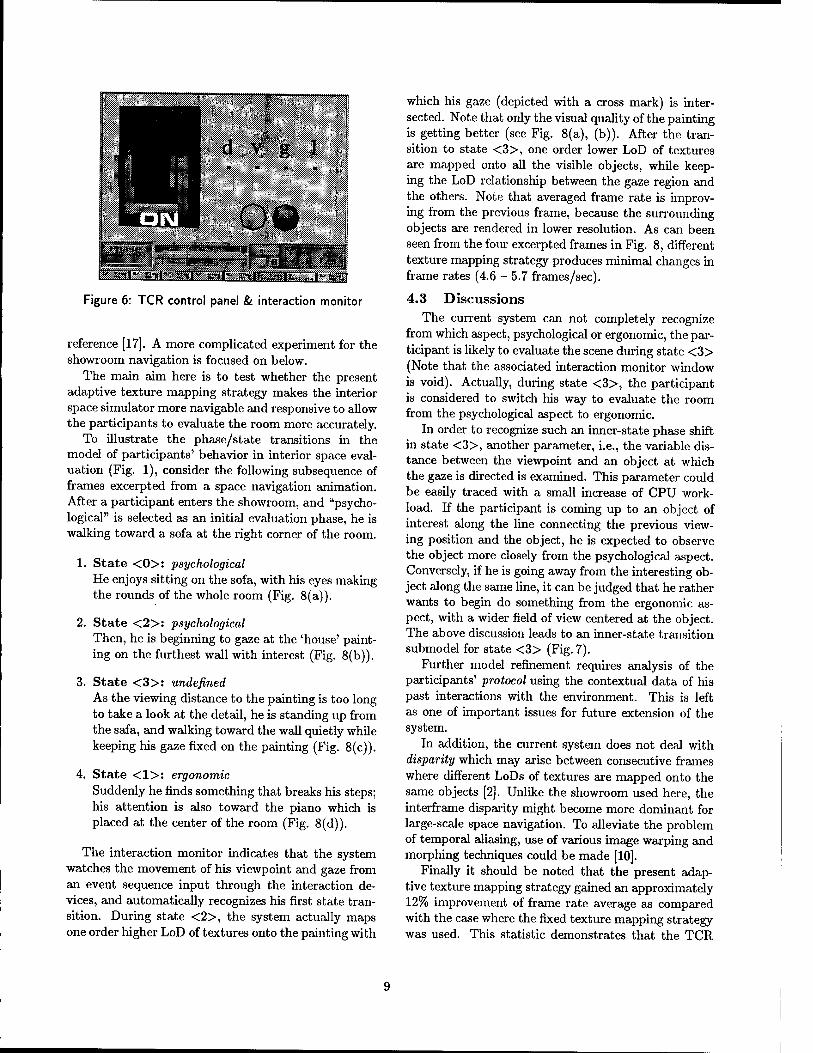
Figure 6: TCR control panel & interaction monitor
reference [17]. A more complicated experiment for the showroom navigation is focused on below.
The main aim here is to test whether the present adaptive texture mapping strategy makes the interior space simulator more navigable and responsive to allow the participants to evaluate the room more accurately.
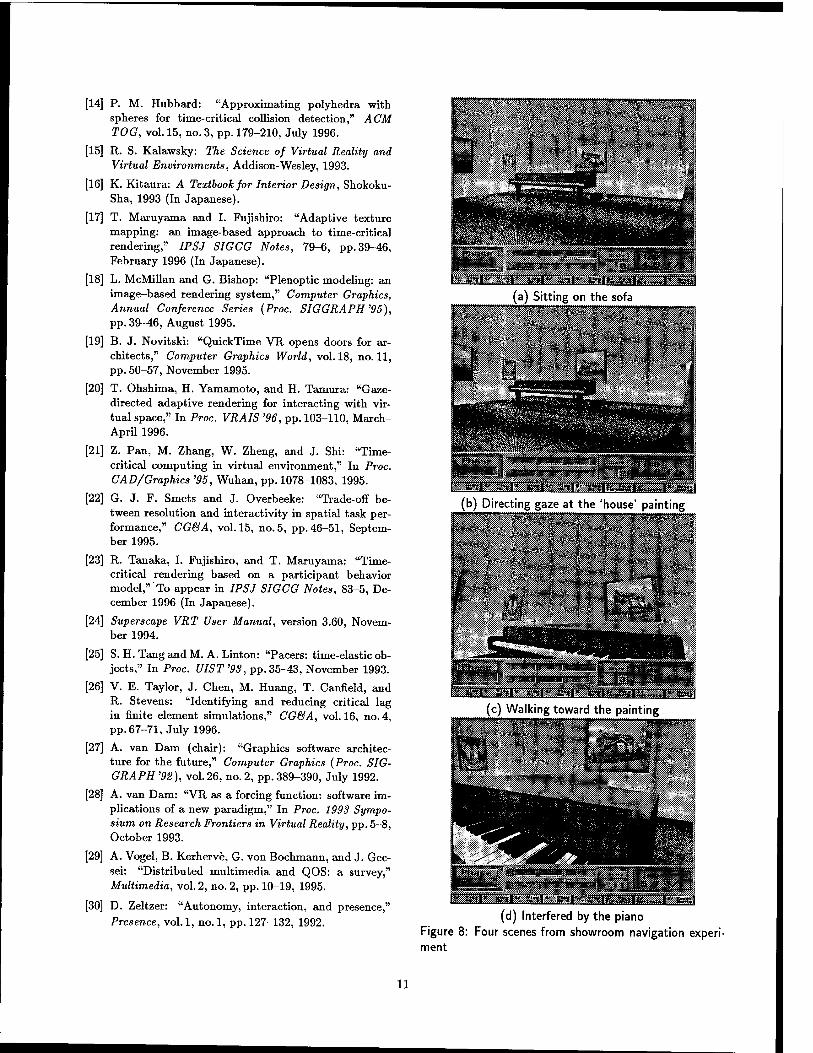
To illustrate the phase/state transitions in the model of participants' behavior in interior space eval- uation (Fig. 1), consider the following subsequence of frames excerpted from a space navigation animation. After a participant enters the showroom, and "psycho- logical" is selected as an initial evaluation phase, he is walking toward a sofa at the right corner of the room.
1. State <0>: psychological He enjoys sitting on the sofa, with his eyes making the rounds of the whole room (Fig. 8(a)).
2. State <2>: psychological Then, he is beginning to gaze at the 'house' paint- ing on the furthest wall with interest (Fig. 8(b)).
3. State <3>: undefined As the viewing distance to the painting is too long to take a look at the detail, he is standing up from the safa, and walking toward the wall quietly while keeping his gaze fixed on the painting (Fig. 8(c)).
4. State <1>: ergonomic Suddenly he finds something that breaks his steps; his attention is also toward the piano which is placed at the center of the room (Fig. 8(d)).
The interaction monitor indicates that the system watches the movement of his viewpoint and gaze from an event sequence input through the interaction de- vices, and automatically recognizes his first state tran- sition. During state <2>, the system actually maps one order higher LoD of textures onto the painting with
which his gaze (depicted with a cross mark) is inter- sected. Note that only the visual quality of the painting is getting better (see Fig. 8(a), (b)). After the tran- sition to state <3>, one order lower LoD of textures are mapped onto all the visible objects, while keep- ing the LoD relationship between the gaze region and the others. Note that averaged frame rate is improv- ing from the previous frame, because the surrounding objects are rendered in lower resolution. As can been seen from the four excerpted frames in Fig. 8, different texture mapping strategy produces minimal changes in frame rates (4.6 - 5.7 frames/sec).
4.3 Discussions The current system can not completely recognize
from which aspect, psychological or ergonomic, the par- ticipant is likely to evaluate the scene during state <3> (Note that the associated interaction monitor window is void). Actually, during state <3>, the participant is considered to switch his way to evaluate the room from the psychological aspect to ergonomic.
In order to recognize such an inner-state phase shift in state <3>, another parameter, i.e., the variable dis- tance between the viewpoint and an object at which the gaze is directed is examined. This parameter could be easily traced with a small increase of CPU work- load. If the participant is coming up to an object of interest along the line connecting the previous view- ing position and the object, he is expected to observe the object more closely from the psychological aspect. Conversely, if he is going away from the interesting ob- ject along the same line, it can be judged that he rather wants to begin do something from the ergonomic as- pect, with a wider field of view centered at the object. The above discussion leads to an inner-state transition submodel for state <3> (Fig. 7).
Further model refinement requires analysis of the participants' protocol using the contextual data of his past interactions with the environment. This is left as one of important issues for future extension of the system.
In addition, the current system does not deal with disparity which may arise between consecutive frames where different LoDs of textures are mapped onto the same objects [2]. Unlike the showroom used here, the interframe disparity might become more dominant for large-scale space navigation. To alleviate the problem of temporal aliasing, use of various image warping and morphing techniques could be made [10].
Finally it should be noted that the present adap- tive texture mapping strategy gained an approximately 12% improvement of frame rate average as compared with the case where the fixed texture mapping strategy was used. This statistic demonstrates that the TCR
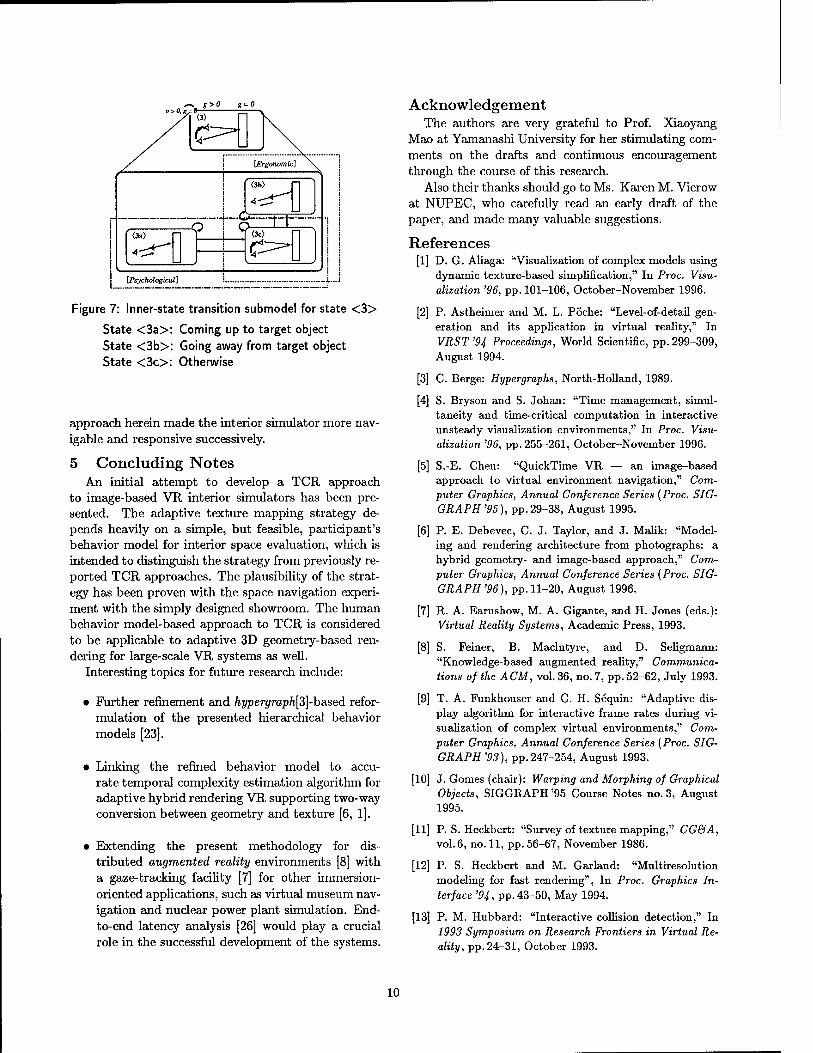
Figure 7: Inner-state transition submodel for state <3>
State <3a>: Coming up to target object State <3b>: Going away from target object State <3c>: Otherwise
approach herein made the interior simulator more nav- igable and responsive successively.
5 Concluding Notes An initial attempt to develop a TCR approach
to image-based VR interior simulators has been pre- sented. The adaptive texture mapping strategy de- pends heavily on a simple, but feasible, participant's behavior model for interior space evaluation, which is intended to distinguish the strategy from previously re- ported TCR approaches. The plausibility of the strat- egy has been proven with the space navigation experi- ment with the simply designed showroom. The human behavior model-based approach to TCR is considered to be applicable to adaptive 3D geometry-based ren- dering for large-scale VR systems as well.
Interesting topics for future research include:
• Further refinement and hypergraph[3]-based refor- mulation of the presented hierarchical behavior models [23].
• Linking the refined behavior model to accu- rate temporal complexity estimation algorithm for adaptive hybrid rendering VR supporting two-way conversion between geometry and texture [6, 1].
• Extending the present methodology for dis- tributed augmented reality environments [8] with a gaze-tracking facility [7] for other immersion- oriented applications, such as virtual museum nav- igation and nuclear power plant simulation. End- to-end latency analysis [26] would play a crucial role in the successful development of the systems.
Acknowledgement The authors are very grateful to Prof. Xiaoyang
Mao at Yamanashi University for her stimulating com- ments on the drafts and continuous encouragement through the course of this research.
Also their thanks should go to Ms. Karen M. Vierow at NUPEC, who carefully read an early draft of the paper, and made many valuable suggestions.
References [1] D. G. Aliaga: "Visualization of complex models using
dynamic texture-based simplification," In Proc. Visu- alization '96, pp. 101-106, October-November 1996.
[2] P. Astheimer and M. L. Pöche: "Level-of-detail gen- eration and its application in virtual reality," In VRST '94 Proceedings, World Scientific, pp. 299-309, August 1994.
[3] C. Berge: Hypergraphs, North-Holland, 1989.
[4] S. Bryson and S. Johan: "Time management, simul- taneity and time-critical computation in interactive unsteady visualization environments," In Proc. Visu- alization '96, pp. 255-261, October-November 1996.
[5] S.-E. Chen: "QuickTime VR — an image-based approach to virtual environment navigation," Com- puter Graphics, Annual Conference Series (Proc. SIG- GRAPH'95), pp.29-38, August 1995.
[6] P. E. Debevec, C. J. Taylor, and J. Malik: "Model- ing and rendering architecture from photographs: a hybrid geometry- and image-based approach," Com- puter Graphics, Annual Conference Series (Proc. SIG- GRAPH'96), pp. 11-20, August 1996.
[7] R. A. Earnshow, M. A. Gigante, and H. Jones (eds.): Virtual Reality Systems, Academic Press, 1993.
[8] S. Feiner, B. Maclntyre, and D. Seligmann: "Knowledge-based augmented reality," Communica- tions of the ACM, vol. 36, no. 7, pp. 52-62, July 1993.
[9] T. A. Funkhouser and C. H. Sequin: "Adaptive dis- play algorithm for interactive frame rates during vi- sualization of complex virtual environments," Com- puter Graphics, Annual Conference Series (Proc. SIG- GRAPH'93), pp.247-254, August 1993.
[10] J. Gomes (chair): Warping and Morphing of Graphical Objects, SIGGRAPH '95 Course Notes no. 3, August 1995.
[11] P. S. Heckbert: "Survey of texture mapping," CG&A, vol.6, no. 11, pp. 56-67, November 1986.
[12] P. S. Heckbert and M. Garland: "Multiresolution modeling for fast rendering", In Proc. Graphics In- terface '94, pp. 43-50, May 1994.
[13] P. M. Hubbard: "Interactive collision detection," In 1993 Symposium on Research Frontiers in Virtual Re- ality, pp. 24-31, October 1993.
10
[14] P. M. Hubbard: "Approximating polyhedra with spheres for time-critical collision detection," ACM TOG, vol. 15, no. 3, pp. 179-210, July 1996.
[15] R. S. Kalawsky: The Science of Virtual Reality and Virtual Environments, Addison-Wesley, 1993.
[16] K. Kitaura: A Textbook for Interior Design, Shokoku- Sha, 1993 (In Japanese).
[17] T. Maruyama and I. Fujishiro: "Adaptive texture mapping: an image-based approach to time-critical rendering," IPSJ SIGCG Notes, 79-6, pp. 39-46, February 1996 (In Japanese).
[18] L. McMillan and G. Bishop: "Plenoptic modeling: an image-based rendering system," Computer Graphics, Annual Conference Series (Proc. SIGGRAPH'95), pp. 39-46, August 1995.
[19] B. J. Novitski: "QuickTime VR opens doors for ar- chitects," Computer Graphics World, vol.18, no. 11, pp. 50-57, November 1995.
[20] T. Ohshima, H. Yamamoto, and B. Tamura: "Gaze- directed adaptive rendering for interacting with vir- tual space," In Proc. VRAIS '96, pp. 103-110, March- April 1996.
[21] Z. Pan, M. Zhang, W. Zheng, and J. Shi: "Time- critical computing in virtual environment," In Proc. CAD'/Graphics '95, Wuhan, pp. 1078-1083, 1995.
[22] G. J. F. Smets and J. Overbeeke: "Trade-off be- tween resolution and interactivity in spatial task per- formance," CG&A, vol.15, no. 5, pp. 46-51, Septem- ber 1995.
[23] R. Tanaka, I. Fujishiro, and T. Maruyama: "Time- critical rendering based on a participant behavior model," To appear in IPSJ SIGCG Notes, 83-5, De- cember 1996 (In Japanese).
[24] Superscape VRT User Manual, version 3.60, Novem- ber 1994.
[25] S. B. Tang and M. A. Linton: "Pacers: time-elastic ob- jects," In Proc. UIST'93, pp. 35-43, November 1993.
[26] V. E. Taylor, J. Chen, M. Buang, T. Canfield, and R. Stevens: "Identifying and reducing critical lag in finite element simulations," CG&A, vol.16, no. 4, pp. 67-71, July 1996.
[27] A. van Dam (chair): "Graphics software architec- ture for the future," Computer Graphics (Proc. SIG- GRAPH'92), vol.26, no. 2, pp.389-390, July 1992.
[28] A. van Dam: "VR as a forcing function: software im- plications of a new paradigm," In Proc. 1993 Sympo- sium on Research Frontiers in Virtual Reality, pp. 5-8, October 1993.
[29] A. Vogel, B. Kerherve, G. von Bochmann, and J. Gec- sei: "Distributed multimedia and QOS: a survey," Multimedia, vol.2, no. 2, pp. 10-19, 1995.
[30] D. Zeltzer: "Autonomy, interaction, and presence," Presence, vol. 1, no. 1, pp. 127-132, 1992.
bf...KA".«3f... <mf»'ut\"J.srtlfejwtlfc:^.f« fetei
(a) Sitting on the sofa
WÖPIP'I
Si mdmmmmmm
(b) Directing gaze at the 'house' painting
3| m^mimhiWM .
rr'xiHfl^ a^l^'Mli .Mfi
(c) Walking toward the painting
illBlilill!
(d) Interfered by the piano Figure 8: Four scenes from showroom navigation experi- ment
11
Smooth Levels of Detail
Dieter Schmalstieg Vienna University of Technology, Austria
Gernot Schaufler Kepler University Linz, Austria
Abstract Levels of detail (LODs) are used in interactive computer graphics to avoid overload of the rendering hardware with to high numbers of polygons. While conventional methods use a small set of discrete LODs, we introduce a new class of polygonal simplification: Smooth LODs. A very large number of small details encoded in a data stream allows a progressive refinement of the object from a very coarse approximation to the original high quality representation. Advantages of the new approach include progressive transmission and encoding suitable for networked applications, interactive selection of any desired quality, and compression of the data by incremental and redundancy free encoding.
1. Motivation When rendering complex three-dimensional scenes, it is commonly the case that many objects are very small or distant. The size of many geometric features of these objects falls below the perception threshold or is smaller than a pixel on the screen. To better use the effort put into rendering such features, an object should be represented at multiple levels of detail (LODs). Simpler representation of an object can be used to improve the frame rates and memory utilization during interactive rendering. This technique was first described by Clark already in 1976 [1], and has been an active area of research ever since.
Coarser levels of detail should only be used for small or distant objects, so that the difference in image quality cannot be noticed by the observer. Frequently models are too complex for the available rendering capacity, so that a coarser approximation than the one desired must be drawn to prevent a reduction of the frame rate. In such cases, switching from one level of detail to another is particularly distracting and annoying for the user.
With the increasingly widespread use of 3-D graphics in distributed applications and over the Internet, transmission of object models is a major issue as soon as the simulated environment is complex enough to make storing full copies of the environment on every computer impractical. LODs with progressively higher detail will be transmitted as the participant is approaching an object. However, only
the last completely transmitted level can be displayed. As data sizes increase with LOD quality, delays between model refinements increase rapidly. Such stalling negatively affects the participant's experience of the simulation.
Adding levels of detail partly addresses the rendering problem for large and complex objects, but makes overall model size even larger. The reason for this problem is that the standard approach of representing polygonal data as lists of vertices and triangles is not powerful enough. Instead, we need a more capable data structure that can address the mentioned shortcomings.
The model data structure should represent many levels of details (not only 3-6, but hundreds or thousands of LODs), so that a continuous (or almost continuous) refinement of the model is possible by repeatedly adding small amounts of local detail to the model. Decoding of the smooth LODs should be incremental, i. e. the next finer LOD should be represented as the difference to the current LOD. By reusing all the data from the coarser LODs, model size can be kept small despite the large number of LODs.
It should be possible to incrementally transmit the model over the network, starting from the coarsest approximation and progressing to the original model. In particular, rendering should be able to make immediate use all the data received up to a certain moment, and render a model not yet fully transmitted. This is important for progressive refinement of large models that take an extended period to transmit, and allows continuous operation in case of network failures.
The smooth LODs data structure should support selection and rendering of any specific LOD in real-time allowing to vary the level of detail (both coarser and finer) at interactive speeds (during rendering).
It is preferred if the smooth LODs data structure introduces no overhead in model size compared to the original, uncompressed polygonal model. Ideally, the introduction of smooth LODs should yield compression instead of increasing the model size.
All these properties can be addressed by a novel object representation called smooth levels of detail that is presented in this paper. After reviewing related work, we present how to create, manipulate and render smooth levels of detail. We also show how they can be used for
0-8186-7843-7/97 $10.00 © 1997 IEEE 12
geometry compression, and present some results from our implementation.
2. Related Work
Generating levels of details addresses the the problem of finding a series of progressive simplifications of a polygonal object, that have fewer primitives (polygons), but closely resemble the original object.
2.1 Topological algorithms
The methods that produce the highest quality work on the surface of polygonal objects, e.g. [4, 10, 11]. For the moment let us assume that we are only dealing with triangles. With information on which triangles are neighbors, local operations can be applied to remove triangles and fill the holes created by that process. Such algorithms can take into account local curvature and can generate simplifications with guaranteed error bounds. However, they are constrained to objects with well- connected surfaces. Unfortunately, this constraint is often not fulfilled by CAD models. Many of these algorithms are also constrained to preserve the genus of the object, and can therefore not simplify the objects beyond a model- dependent level.
2.2 Geometric algorithms
Real-world applications almost always involve ill-behaved data, and for very large scenes and slow connections, it should be possible to produce very coarse approximations as well as moderately coarse ones. More apt to this task are LOD generation methods that ignore the topology of objects and force a reduction of the data set. The key idea here is to cluster multiple vertices of the polygonal object that are close in object space into one, and remove all triangles that degenerate or collapse in the process. The problem here is that exact control over local detail is not easily possible, but such an algorithm can robustly deal with any type of input data, and produce arbitrarily high compression. Vertex clustering can either be done with a simple uniform quantization [7], octree quantization [6, 17] or a nearest neighbor search [8, 9].
2.3 Progressive representations
Two approaches have been developed concurrently, that draw from the a similar basic idea as the approach presented in this paper, namely to abandon the use of a small set of discrete levels of detail in favor of a progressive representation that efficiently encodes a large number of LODs. Eck et al. [3] develop a wavelet-based representation of polygonal geometry, which is extended in [12] to allow interactive multi-resolution surface viewing. Hoppe's representation - progressive meshes [13] - is based on incremental topological operations on the object's surface. The major difference of these algorithms to ours is that we use a geometrical rather than a
topological method to reduce object complexity, which is simpler, more robust and efficient, but does not yield as tight bounds on the visual error.
2.4 Selective refinement
The approaches presented in [12] and [13] allow selective refinement of the model as opposed to choosing one LOD per object. This property is also supported by Lindstrom et al. in their terrain rendering model [14], by the wavelet- based meshes from [16] and by the simplification enveloped presented in [15].
2.5 Compression
As far as compression of geometry for storage and transmission is concerned, some work is relevant for our approach: Deering [2] introduces a compression method for polygonal data sets. Levoy [5] proposes a combination of geometry and compressed image data to preserve bandwidth with a compressed video stream.
3. The hierarchical cluster tree representation
Hierarchical clustering for LOD generation, as first presented in [8], is based on the idea that groups of vertices which project onto a sufficiently small area in the image can be replaced by a single representative: a many- to-one mapping of vertices. As a consequence, the number of triangles is reduced. The triangles' vertices are replaced by their representatives from the reduced vertex set, and collapsed triangles are filtered out. Repeated application of the clustering operation yields a sequence of progressive simplifications (LODs). If exactly two clusters are combined in every step, the result is a binary tree, the cluster tree.
3.1 Construction of the cluster tree
The cluster tree is built by successively finding the two closest cluster in the model and combining them into one. The combined cluster is stored in a new node which has the two joined clusters as its children. The process is repeated until only one cluster containing all the vertices remains, which is the root of the cluster tree.
For each new cluster, a representative is chosen from the set of vertices in the cluster. More precisely, we chose the representative to be one of the two representatives of the child clusters. The distance of two clusters (used to find the closest clusters) is computed as the Euclidean distance of the two childrens' representatives. This value is also stored as the cluster size in the new cluster's node for further use. Finding the closest pair of clusters can efficiently be done with a BSP tree.
The algorithm starts with a cluster for each vertex, with the vertex serving as the representative. In each step, it finds the two clusters with the closest representatives, and replaces the two clusters identified in step 1 by a joint cluster. For the joint cluster, a new representative is
13
selected. This procedure is repeated until only one cluster containing all vertices remains.
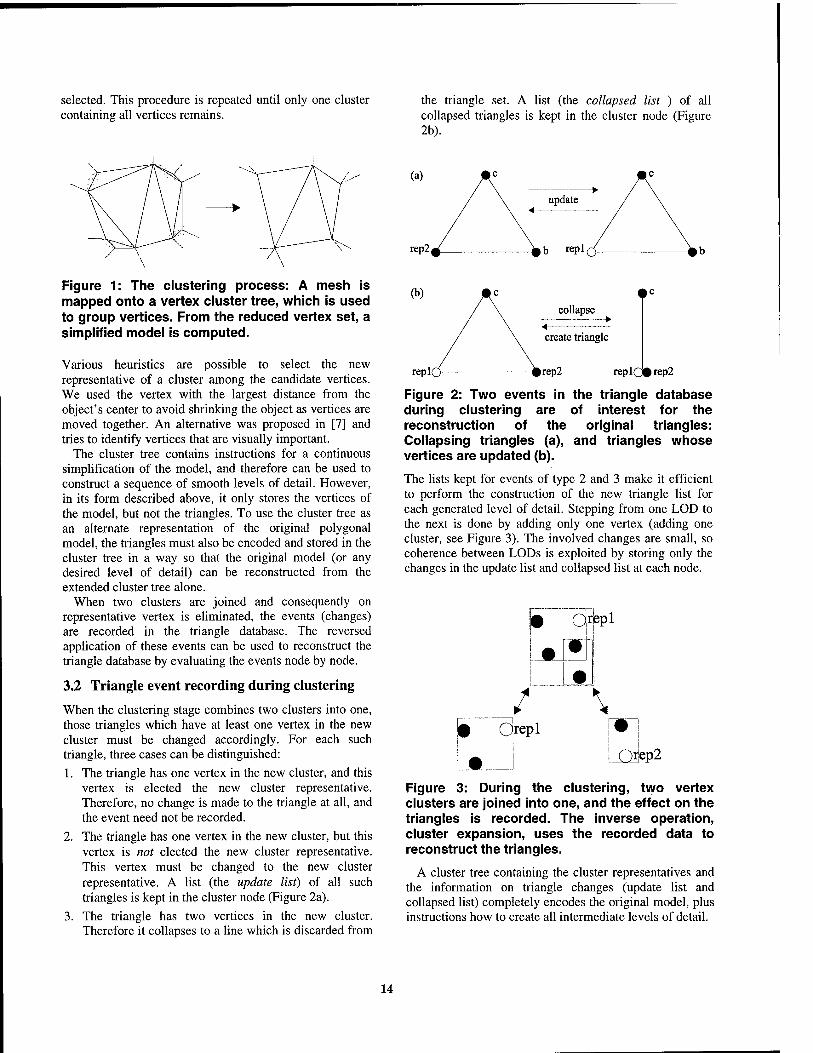
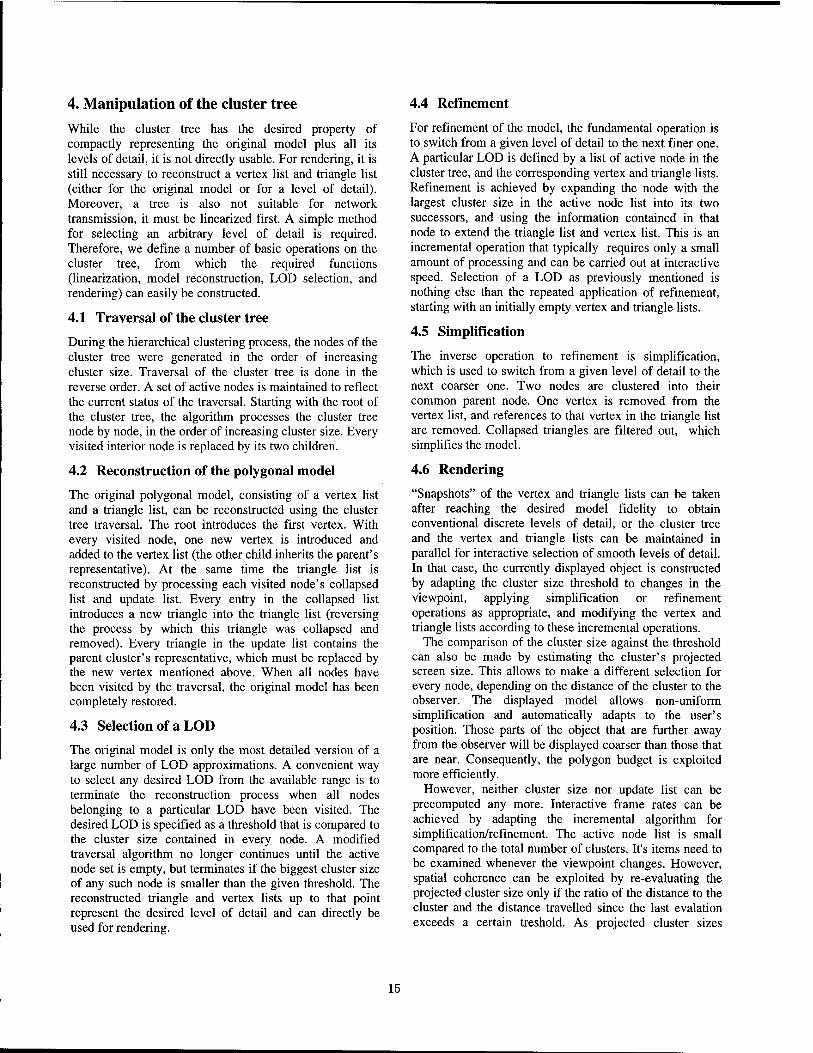
the triangle set. A list (the collapsed list ) of all collapsed triangles is kept in the cluster node (Figure 2b).
Figure 1: The clustering process: A mesh is mapped onto a vertex cluster tree, which is used to group vertices. From the reduced vertex set, a simplified model is computed.
Various heuristics are possible to select the new representative of a cluster among the candidate vertices. We used the vertex with the largest distance from the object's center to avoid shrinking the object as vertices are moved together. An alternative was proposed in [7] and tries to identify vertices that are visually important.
The cluster tree contains instructions for a continuous simplification of the model, and therefore can be used to construct a sequence of smooth levels of detail. However, in its form described above, it only stores the vertices of the model, but not the triangles. To use the cluster tree as an alternate representation of the original polygonal model, the triangles must also be encoded and stored in the cluster tree in a way so that the original model (or any desired level of detail) can be reconstructed from the extended cluster tree alone.
When two clusters are joined and consequently on representative vertex is eliminated, the events (changes) are recorded in the triangle database. The reversed application of these events can be used to reconstruct the triangle database by evaluating the events node by node.
3.2 Triangle event recording during clustering
When the clustering stage combines two clusters into one, those triangles which have at least one vertex in the new cluster must be changed accordingly. For each such triangle, three cases can be distinguished:
1. The triangle has one vertex in the new cluster, and this vertex is elected the new cluster representative. Therefore, no change is made to the triangle at all, and the event need not be recorded.
2. The triangle has one vertex in the new cluster, but this vertex is not elected the new cluster representative. This vertex must be changed to the new cluster representative. A list (the update list) of all such triangles is kept in the cluster node (Figure 2a).
3. The triangle has two vertices in the new cluster. Therefore it collapses to a line which is discarded from
collapse
repl(j#rep2
Figure 2: Two events in the triangle database during clustering are of interest for the reconstruction of the original triangles: Collapsing triangles (a), and triangles whose vertices are updated (b).
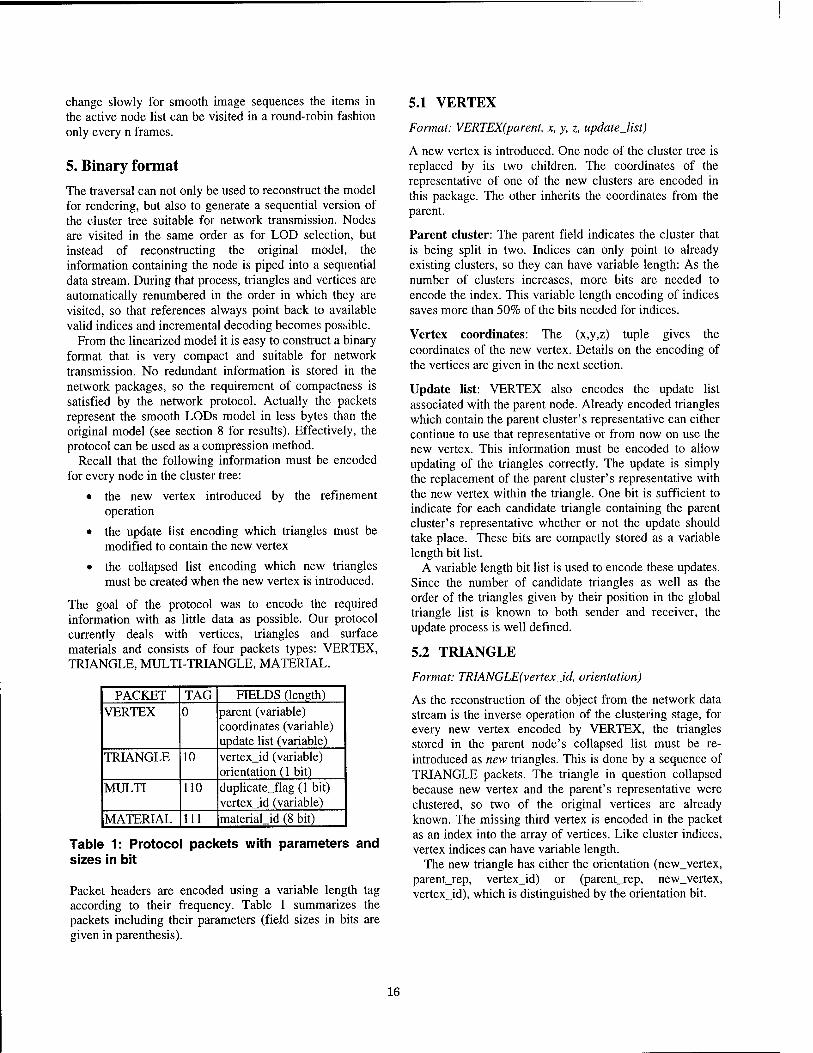
The lists kept for events of type 2 and 3 make it efficient to perform the construction of the new triangle list for each generated level of detail. Stepping from one LOD to the next is done by adding only one vertex (adding one cluster, see Figure 3). The involved changes are small, so coherence between LODs is exploited by storing only the changes in the update list and collapsed list at each node.
Q*5P2
Figure 3: During the clustering, two vertex clusters are joined into one, and the effect on the triangles is recorded. The inverse operation, cluster expansion, uses the recorded data to reconstruct the triangles.
A cluster tree containing the cluster representatives and the information on triangle changes (update list and collapsed list) completely encodes the original model, plus instructions how to create all intermediate levels of detail.
14
4. Manipulation of the cluster tree
While the cluster tree has the desired property of compactly representing the original model plus all its levels of detail, it is not directly usable. For rendering, it is still necessary to reconstruct a vertex list and triangle list (either for the original model or for a level of detail). Moreover, a tree is also not suitable for network transmission, it must be linearized first. A simple method for selecting an arbitrary level of detail is required. Therefore, we define a number of basic operations on the cluster tree, from which the required functions (linearization, model reconstruction, LOD selection, and rendering) can easily be constructed.
4.1 Traversal of the cluster tree
During the hierarchical clustering process, the nodes of the cluster tree were generated in the order of increasing cluster size. Traversal of the cluster tree is done in the reverse order. A set of active nodes is maintained to reflect the current status of the traversal. Starting with the root of the cluster tree, the algorithm processes the cluster tree node by node, in the order of increasing cluster size. Every visited interior node is replaced by its two children.
4.2 Reconstruction of the polygonal model
The original polygonal model, consisting of a vertex list and a triangle list, can be reconstructed using the cluster tree traversal. The root introduces the first vertex. With every visited node, one new vertex is introduced and added to the vertex list (the other child inherits the parent's representative). At the same time the triangle list is reconstructed by processing each visited node's collapsed list and update list. Every entry in the collapsed list introduces a new triangle into the triangle list (reversing the process by which this triangle was collapsed and removed). Every triangle in the update list contains the parent cluster's representative, which must be replaced by the new vertex mentioned above. When all nodes have been visited by the traversal, the original model has been completely restored.
4.3 Selection of a LOD
The original model is only the most detailed version of a large number of LOD approximations. A convenient way to select any desired LOD from the available range is to terminate the reconstruction process when all nodes belonging to a particular LOD have been visited. The desired LOD is specified as a threshold that is compared to the cluster size contained in every node. A modified traversal algorithm no longer continues until the active node set is empty, but terminates if the biggest cluster size of any such node is smaller than the given threshold. The reconstructed triangle and vertex lists up to that point represent the desired level of detail and can directly be used for rendering.
4.4 Refinement
For refinement of the model, the fundamental operation is to switch from a given level of detail to the next finer one. A particular LOD is defined by a list of active node in the cluster tree, and the corresponding vertex and triangle lists. Refinement is achieved by expanding the node with the largest cluster size in the active node list into its two successors, and using the information contained in that node to extend the triangle list and vertex list. This is an incremental operation that typically requires only a small amount of processing and can be carried out at interactive speed. Selection of a LOD as previously mentioned is nothing else than the repeated application of refinement, starting with an initially empty vertex and triangle lists.
4.5 Simplification
The inverse operation to refinement is simplification, which is used to switch from a given level of detail to the next coarser one. Two nodes are clustered into their common parent node. One vertex is removed from the vertex list, and references to that vertex in the triangle list are removed. Collapsed triangles are filtered out, which simplifies the model.
4.6 Rendering
"Snapshots" of the vertex and triangle lists can be taken after reaching the desired model fidelity to obtain conventional discrete levels of detail, or the cluster tree and the vertex and triangle lists can be maintained in parallel for interactive selection of smooth levels of detail. In that case, the currently displayed object is constructed by adapting the cluster size threshold to changes in the viewpoint, applying simplification or refinement operations as appropriate, and modifying the vertex and triangle lists according to these incremental operations.
The comparison of the cluster size against the threshold can also be made by estimating the cluster's projected screen size. This allows to make a different selection for every node, depending on the distance of the cluster to the observer. The displayed model allows non-uniform simplification and automatically adapts to the user's position. Those parts of the object that are further away from the observer will be displayed coarser than those that are near. Consequently, the polygon budget is exploited more efficiently.
However, neither cluster size nor update list can be precomputed any more. Interactive frame rates can be achieved by adapting the incremental algorithm for simplification/refinement. The active node list is small compared to the total number of clusters. It's items need to be examined whenever the viewpoint changes. However, spatial coherence can be exploited by re-evaluating the projected cluster size only if the ratio of the distance to the cluster and the distance travelled since the last evalation exceeds a certain treshold. As projected cluster sizes
15
change slowly for smooth image sequences the items in the active node list can be visited in a round-robin fashion only every n frames.
5. Binary format The traversal can not only be used to reconstruct the model for rendering, but also to generate a sequential version of the cluster tree suitable for network transmission. Nodes are visited in the same order as for LOD selection, but instead of reconstructing the original model, the information containing the node is piped into a sequential data stream. During that process, triangles and vertices are automatically renumbered in the order in which they are visited, so that references always point back to available valid indices and incremental decoding becomes possible.
From the linearized model it is easy to construct a binary format that is very compact and suitable for network transmission. No redundant information is stored in the network packages, so the requirement of compactness is satisfied by the network protocol. Actually the packets represent the smooth LODs model in less bytes than the original model (see section 8 for results). Effectively, the protocol can be used as a compression method.
Recall that the following information must be encoded for every node in the cluster tree:
• the new vertex introduced by the refinement operation
• the update list encoding which triangles must be modified to contain the new vertex
• the collapsed list encoding which new triangles must be created when the new vertex is introduced.
The goal of the protocol was to encode the required information with as little data as possible. Our protocol currently deals with vertices, triangles and surface materials and consists of four packets types: VERTEX, TRIANGLE, MULTI-TRIANGLE, MATERIAL.
PACKET TAG FIELDS (length) VERTEX 0 parent (variable)
coordinates (variable) update list (variable)
TRIANGLE 10 vertex_id (variable) orientation (1 bit)
MULTI 110 duplicate_flag (1 bit) vertex_id (variable)
MATERIAL 111 material_id (8 bit)
Table 1: Protocol packets with parameters and sizes in bit
Packet headers are encoded using a variable length tag according to their frequency. Table 1 summarizes the packets including their parameters (field sizes in bits are given in parenthesis).
5.1 VERTEX
Format: VERTEX(parent, x, y, z, update_list)
A new vertex is introduced. One node of the cluster tree is replaced by its two children. The coordinates of the representative of one of the new clusters are encoded in this package. The other inherits the coordinates from the parent.
Parent cluster: The parent field indicates the cluster that is being split in two. Indices can only point to already existing clusters, so they can have variable length: As the number of clusters increases, more bits are needed to encode the index. This variable length encoding of indices saves more than 50% of the bits needed for indices.
Vertex coordinates: The (x,y,z) tuple gives the coordinates of the new vertex. Details on the encoding of the vertices are given in the next section.
Update list: VERTEX also encodes the update list associated with the parent node. Already encoded triangles which contain the parent cluster's representative can either continue to use that representative or from now on use the new vertex. This information must be encoded to allow updating of the triangles correctly. The update is simply the replacement of the parent cluster's representative with the new vertex within the triangle. One bit is sufficient to indicate for each candidate triangle containing the parent cluster's representative whether or not the update should take place. These bits are compactly stored as a variable length bit list.
A variable length bit list is used to encode these updates. Since the number of candidate triangles as well as the order of the triangles given by their position in the global triangle list is known to both sender and receiver, the update process is well defined.
5.2 TRIANGLE
Format: TRIANGLE(vertexJd, orientation)
As the reconstruction of the object from the network data stream is the inverse operation of the clustering stage, for every new vertex encoded by VERTEX, the triangles stored in the parent node's collapsed list must be re- introduced as new triangles. This is done by a sequence of TRIANGLE packets. The triangle in question collapsed because new vertex and the parent's representative were clustered, so two of the original vertices are already known. The missing third vertex is encoded in the packet as an index into the array of vertices. Like cluster indices, vertex indices can have variable length.
The new triangle has either the orientation (new_vertex, parent_rep, vertex_id) or (parent_rep, new_vertex, vertex_id), which is distinguished by the orientation bit.
16
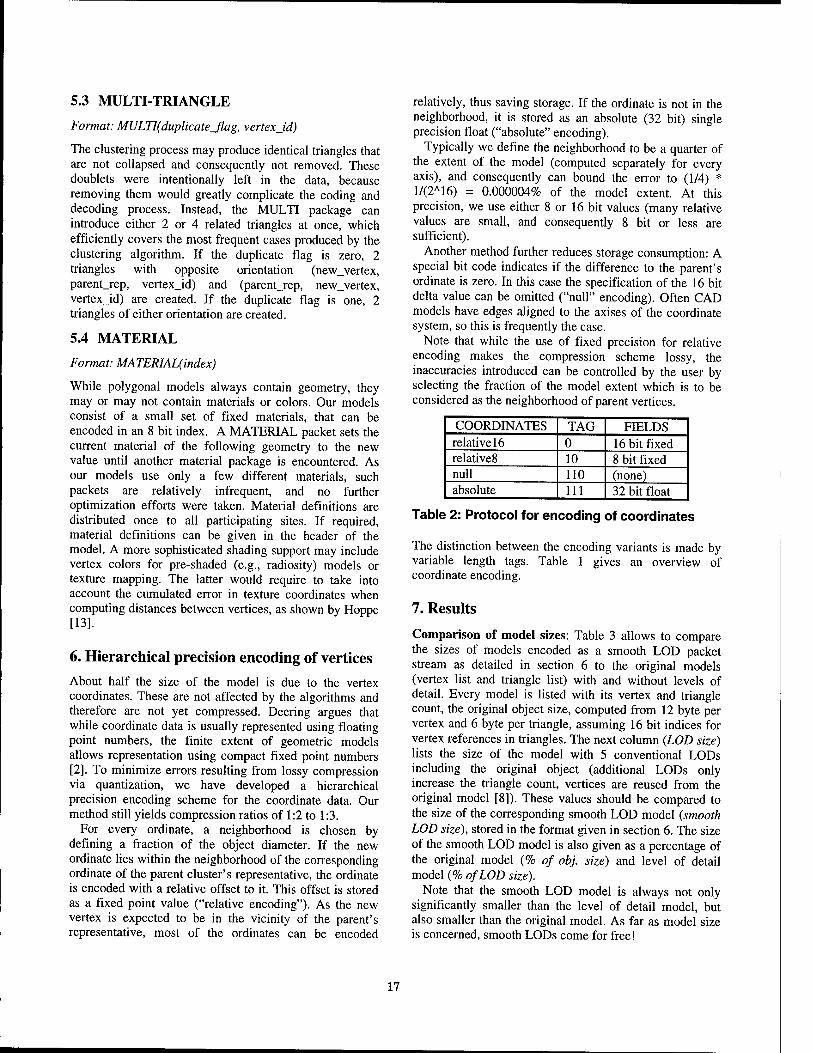
5.3 MULTI-TRIANGLE
Format: MULTI(duplicateJlag, vertexjd)
The clustering process may produce identical triangles that are not collapsed and consequently not removed. These doublets were intentionally left in the data, because removing them would greatly complicate the coding and decoding process. Instead, the MULTI package can introduce either 2 or 4 related triangles at once, which efficiently covers the most frequent cases produced by the clustering algorithm. If the duplicate flag is zero, 2 triangles with opposite orientation (new_vertex, parent_rep, vertexjd) and (parentjrep, new_vertex, vertexjd) are created. If the duplicate flag is one, 2 triangles of either orientation are created.
5.4 MATERIAL
Format: MATERIAL(index)
While polygonal models always contain geometry, they may or may not contain materials or colors. Our models consist of a small set of fixed materials, that can be encoded in an 8 bit index. A MATERIAL packet sets the current material of the following geometry to the new value until another material package is encountered. As our models use only a few different materials, such packets are relatively infrequent, and no further optimization efforts were taken. Material definitions are distributed once to all participating sites. If required, material definitions can be given in the header of the model. A more sophisticated shading support may include vertex colors for pre-shaded (e.g., radiosity) models or texture mapping. The latter would require to take into account the cumulated error in texture coordinates when computing distances between vertices, as shown by Hoppe [13].
6. Hierarchical precision encoding of vertices
About half the size of the model is due to the vertex coordinates. These are not affected by the algorithms and therefore are not yet compressed. Deering argues that while coordinate data is usually represented using floating point numbers, the finite extent of geometric models allows representation using compact fixed point numbers [2]. To minimize errors resulting from lossy compression via quantization, we have developed a hierarchical precision encoding scheme for the coordinate data. Our method still yields compression ratios of 1:2 to 1:3.
For every ordinate, a neighborhood is chosen by defining a fraction of the object diameter. If the new ordinate lies within the neighborhood of the corresponding ordinate of the parent cluster's representative, the ordinate is encoded with a relative offset to it. This offset is stored as a fixed point value ("relative encoding"). As the new vertex is expected to be in the vicinity of the parent's representative, most of the ordinates can be encoded
relatively, thus saving storage. If the ordinate is not in the neighborhood, it is stored as an absolute (32 bit) single precision float ("absolute" encoding).
Typically we define the neighborhood to be a quarter of the extent of the model (computed separately for every axis), and consequently can bound the error to (1/4) * 1/(2A16) = 0.000004% of the model extent. At this precision, we use either 8 or 16 bit values (many relative values are small, and consequently 8 bit or less are sufficient).
Another method further reduces storage consumption: A special bit code indicates if the difference to the parent's ordinate is zero. In this case the specification of the 16 bit delta value can be omitted ("null" encoding). Often CAD models have edges aligned to the axises of the coordinate system, so this is frequently the case.
Note that while the use of fixed precision for relative encoding makes the compression scheme lossy, the inaccuracies introduced can be controlled by the user by selecting the fraction of the model extent which is to be considered as the neighborhood of parent vertices.
COORDINATES TAG FIELDS relative 16 0 16 bit fixed relative8 10 8 bit fixed null 110 (none) absolute 111 32 bit float
Table 2: Protocol for encoding of coordinates
The distinction between the encoding variants is made by variable length tags. Table 1 gives an overview of coordinate encoding.
7. Results
Comparison of model sizes: Table 3 allows to compare the sizes of models encoded as a smooth LOD packet stream as detailed in section 6 to the original models (vertex list and triangle list) with and without levels of detail. Every model is listed with its vertex and triangle count, the original object size, computed from 12 byte per vertex and 6 byte per triangle, assuming 16 bit indices for vertex references in triangles. The next column (LOD size) lists the size of the model with 5 conventional LODs including the original object (additional LODs only increase the triangle count, vertices are reused from the original model [8]). These values should be compared to the size of the corresponding smooth LOD model (smooth LOD size), stored in the format given in section 6. The size of the smooth LOD model is also given as a percentage of the original model (% of obj. size) and level of detail model (% of LOD size).
Note that the smooth LOD model is always not only significantly smaller than the level of detail model, but also smaller than the original model. As far as model size is concerned, smooth LODs come for free!
17
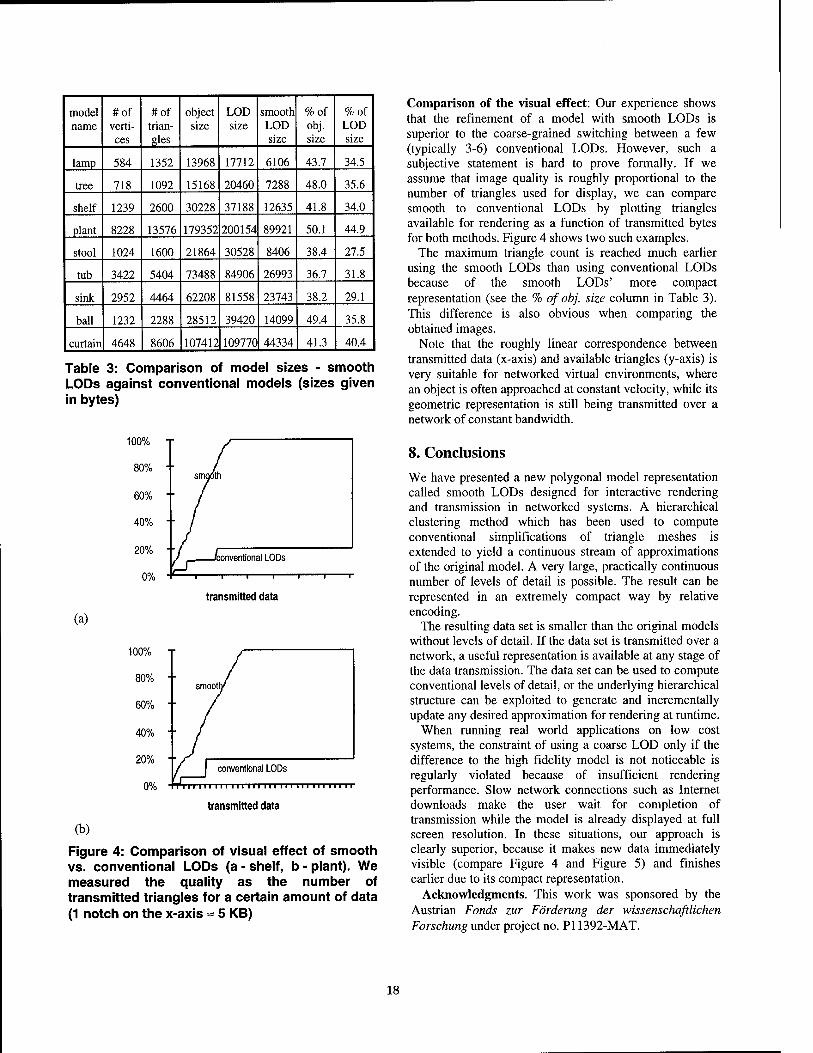
model name
#of verti- ces
#of trian- gles
object size
LOD size
smooth LOD size
%of obj. size
%of LOD size
lamp 584 1352 13968 17712 6106 43.7 34.5
tree 718 1092 15168 20460 7288 48.0 35.6
shelf 1239 2600 30228 37188 12635 41.8 34.0
plant 8228 13576 179352 200154 89921 50.1 44.9
stool 1024 1600 21864 30528 8406 38.4 27.5
tub 3422 5404 73488 84906 26993 36.7 31.8
sink 2952 4464 62208 81558 23743 38.2 29.1
ball 1232 2288 28512 39420 14099 49.4 35.8
curtain 4648 8606 107412 109770 44334 41.3 40.4
Table 3: Comparison of model sizes - smooth LODs against conventional models (sizes given in bytes)
100%
80%
60%
40%
20%
0%
srro fih
" /
-/conventional LODs
—I 1 1 1 1 r
transmitted data
(a)
conventional LODs
111111 111 11111
transmitted data
(b)
Figure 4: Comparison of visual effect of smooth vs. conventional LODs (a - shelf, b - plant). We measured the quality as the number of transmitted triangles for a certain amount of data (1 notch on the x-axis = 5 KB)
Comparison of the visual effect: Our experience shows that the refinement of a model with smooth LODs is superior to the coarse-grained switching between a few (typically 3-6) conventional LODs. However, such a subjective statement is hard to prove formally. If we assume that image quality is roughly proportional to the number of triangles used for display, we can compare smooth to conventional LODs by plotting triangles available for rendering as a function of transmitted bytes for both methods. Figure 4 shows two such examples.
The maximum triangle count is reached much earlier using the smooth LODs than using conventional LODs because of the smooth LODs' more compact representation (see the % of obj. size column in Table 3). This difference is also obvious when comparing the obtained images.
Note that the roughly linear correspondence between transmitted data (x-axis) and available triangles (y-axis) is very suitable for networked virtual environments, where an object is often approached at constant velocity, while its geometric representation is still being transmitted over a network of constant bandwidth.
8. Conclusions We have presented a new polygonal model representation called smooth LODs designed for interactive rendering and transmission in networked systems. A hierarchical clustering method which has been used to compute conventional simplifications of triangle meshes is extended to yield a continuous stream of approximations of the original model. A very large, practically continuous number of levels of detail is possible. The result can be represented in an extremely compact way by relative encoding.
The resulting data set is smaller than the original models without levels of detail. If the data set is transmitted over a network, a useful representation is available at any stage of the data transmission. The data set can be used to compute conventional levels of detail, or the underlying hierarchical structure can be exploited to generate and incrementally update any desired approximation for rendering at runtime.
When running real world applications on low cost systems, the constraint of using a coarse LOD only if the difference to the high fidelity model is not noticeable is regularly violated because of insufficient rendering performance. Slow network connections such as Internet downloads make the user wait for completion of transmission while the model is already displayed at full screen resolution. In these situations, our approach is clearly superior, because it makes new data immediately visible (compare Figure 4 and Figure 5) and finishes earlier due to its compact representation.
Acknowledgments. This work was sponsored by the Austrian Fonds zur Förderung der wissenschaftlichen Forschung under project no. PI 1392-MAT.
18
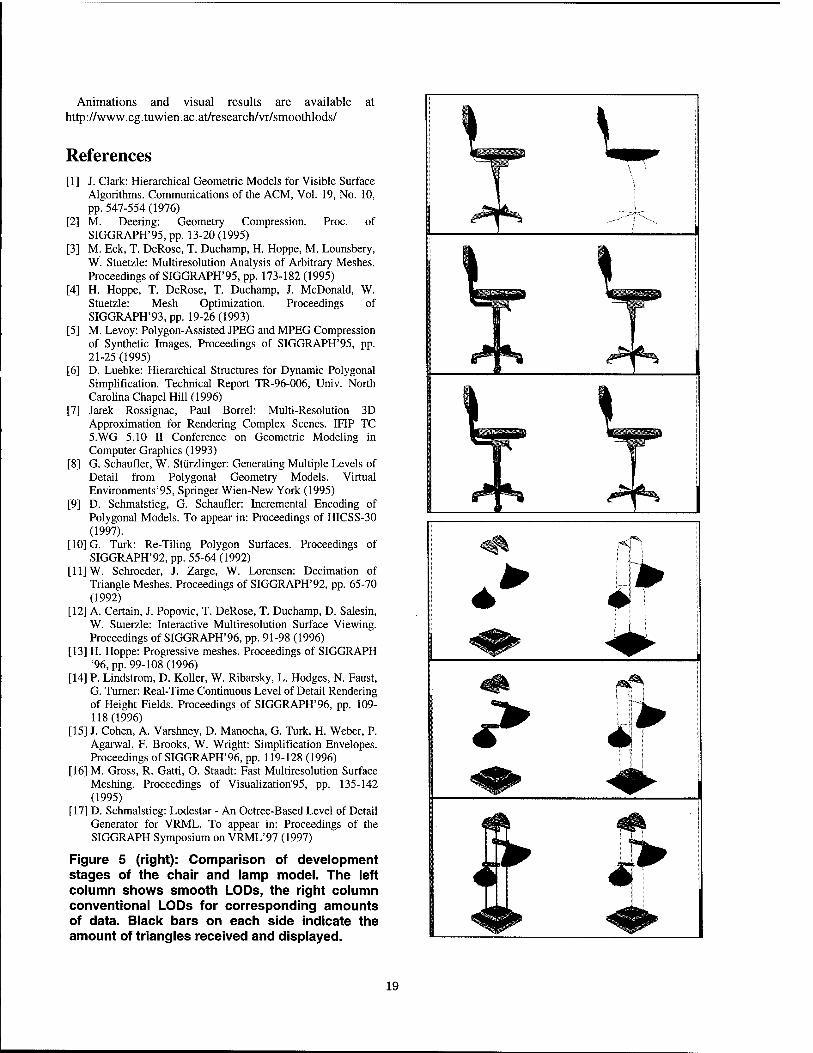
Animations and visual results are available at http://www.cg.tuwien.ac.at/research/vr/smoothlods/
References [I] J. Clark: Hierarchical Geometric Models for Visible Surface
Algorithms. Communications of the ACM, Vol. 19, No. 10, pp. 547-554 (1976)
[2] M. Deering: Geometry Compression. Proc. of SIGGRAPH'95, pp. 13-20(1995)
[3] M. Eck, T. DeRose, T. Duchamp, H. Hoppe, M. Lounsbery, W. Stuetzle: Multiresolution Analysis of Arbitrary Meshes. Proceedings of SIGGRAPH'95, pp. 173-182 (1995)
[4] H. Hoppe, T. DeRose, T. Duchamp, J. McDonald, W. Stuetzle: Mesh Optimization. Proceedings of SIGGRAPH'93, pp. 19-26 (1993)
[5] M. Levoy: Polygon-Assisted JPEG and MPEG Compression of Synthetic Images. Proceedings of SIGGRAPH'95, pp. 21-25 (1995)
[6] D. Luebke: Hierarchical Structures for Dynamic Polygonal Simplification. Technical Report TR-96-006, Univ. North Carolina Chapel Hill (1996)
[7] Jarek Rossignac, Paul Borrel: Multi-Resolution 3D Approximation for Rendering Complex Scenes. IFIP TC 5.WG 5.10 II Conference on Geometric Modeling in Computer Graphics (1993)
[8] G. Schaufler, W. Stiirzlinger: Generating Multiple Levels of Detail from Polygonal Geometry Models. Virtual Environments'95, Springer Wien-New York (1995)
[9] D. Schmalstieg, G. Schaufler: Incremental Encoding of Polygonal Models. To appear in: Proceedings of HICSS-30 (1997).
[10] G. Turk: Re-Tiling Polygon Surfaces. Proceedings of SIGGRAPH'92, pp. 55-64 (1992)
[II] W. Schroeder, J. Zarge, W. Lorensen: Decimation of Triangle Meshes. Proceedings of SIGGRAPH'92, pp. 65-70 (1992)
[12] A. Certain, J. Popovic, T. DeRose, T. Duchamp, D. Salesin, W. Stuerzle: Interactive Multiresolution Surface Viewing. Proceedings of SIGGRAPH'96, pp. 91-98 (1996)
[13] H. Hoppe: Progressive meshes. Proceedings of SIGGRAPH '96, pp. 99-108(1996)
[14] P. Lindstrom, D. Koller, W. Ribarsky, L. Hodges, N. Faust, G. Turner: Real-Time Continuous Level of Detail Rendering of Height Fields. Proceedings of SIGGRAPH'96, pp. 109- 118(1996)
[15] J. Cohen, A. Varshney, D. Manocha, G. Turk, H. Weber, P. Agarwal, F. Brooks, W. Wright: Simplification Envelopes. Proceedings of SIGGRAPH'96, pp. 119-128 (1996)
[16] M. Gross, R. Gatti, O. Staadt: Fast Multiresolution Surface Meshing. Proceedings of Visualization'95, pp. 135-142 (1995)
[17] D. Schmalstieg: Lodestar - An Octree-Based Level of Detail Generator for VRML. To appear in: Proceedings of the SIGGRAPH Symposium on VRML'97 (1997)
Figure 5 (right): Comparison of development stages of the chair and lamp model. The left column shows smooth LODs, the right column conventional LODs for corresponding amounts of data. Black bars on each side indicate the amount of triangles received and displayed.
*°N
€
19
An Adaptive Multi-Resolution Modeling Technique Based on Viewing and Animation Parameters
Rynson W.H. Lau Danny S.P. To Computer Graphics and Media Laboratory
Department of Computing The Hong Kong Polytechnic University, Hong Kong
Mark Green Department of Computer Science
University of Alberta Alberta, Canada
Abstract
Because most existing multi-resolution methods are slow, a common approach is to pre-generate a few key models of the object at different resolutions. During run-time, the object's distance from the viewer deter- mines which model to use for rendering. Although this approach is simple, it suffers from the sudden change in resolution as the object moves across the thresh- old distance. In addition, the model used to represent an object at a particular frame is not optimized for the given dynamic viewing and animation parameters. The quadtree type of methods for arranging the surface model may allow adaptive multi-resolution modeling in a simple way and it reduces the sudden change of res- olution from the object level to the node level. How- ever, the square shape of the node together with the four-time increment in size for representing surfaces limits the types of surfaces that it can handle without creating excessive nodes. In this paper, we present a real-time adaptive multi-resolution method for models of arbitrary topology.
1. Introduction
Although the performance of graphics accelerators has improved tremendously, the demand for even higher performance to handle complex environments is increasing too. To overcome this demand for ren- dering performance, multi-resolution methods are usu- ally used to reduce the rendering time by reducing the number of triangles (or polygons) needed to be pro- cessed. This is by considering the fact that distant objects occupy smaller screen areas than nearby ob- jects, and hence, most of the details in these objects are not visible to the viewer. Multi-resolution methods optimize the rendering performance by representing a
nearby object with a more detailed model, but a distant object with a simpler one.
Before we continue, let us introduce two terms here: the static visual importance (SVI) and the dynamic vi- sual importance (DVI). SVI refers to the visual impor- tance of a point on the object calculated according to its geometric importance. For example, a point at a corner of an object may have a higher SVI value than a point on a flat surface. The DVI is the visual impor- tance of a point on the object calculated according to some dynamic viewing and animation parameters. For example, a region of an object will have a higher DVI value if it intersects with the viewer's line of sight. A multi-resolution method that takes DVI into consider- ation is referred to as adaptive multi-resolution method.
Although there are many methods developed for generating multi-resolution models [1, 7, 16, 17], most of them focus on the accuracy of the simplification, and hence, are slow. Rossignac et al. in [15] proposes a very efficient multi-resolution method. However, this method does not preserve the topology of the object model. To generate accurate models without sacrificing the performance, the discrete multi-resolution method may be used. This method pre-generates a few key models of the object at different resolutions. During run-time, the object's distance from the viewer deter- mines which model to use for rendering. Although this method is fast and simple, it has two major limitations. Firstly, when the object crosses the threshold distance, there is a sudden change in model resolution and an ob- jectionable visual discontinuity effect can be observed. In [17], Turk proposes to have a transition period dur- ing which a smooth interpolation between the two suc- cessive models is performed to produce models of in- termediate resolutions. This method, however, further increases the computation cost during the transition period because of the need to process two models at the same time. Secondly, because the multi-resolution models are pre-generated, the object's DVI is not con-
0-8186-7843-7/97 $10.00 © 1997 IEEE 20
sidered. The result of this is a uniform increase or decrease in model resolution, and hence the generated models are not optimized for the given viewing and animation parameters of individual frames. Such op- timization is important when an object covers a large depth range, for example, a piece of landscape or a large building. Even though there may only be a small region of the object lying close to the viewer or inside the viewer's line of sight, we still need to use the high resolution model for rendering so that the details in the closest part of the object will not be lost. Sometimes, a small object may also have similar problem if, for example, it is close to the viewer.
To overcome the second limitation, related meth- ods developed for managing large terrain models can be used [2, 5, 12]. These methods basically divide a large terrain surface into square blocks. All the poly- gons inside a block are arranged in a quadtree structure with the root node representing the whole block and the leaf nodes representing individual polygons. Each successive lower level of the tree represents a four-time increase in resolution. With such data structure, it is possible to calculate the DVI values of individual high level nodes during run-time. A node with high DVI value can be rendered using its lower level subnodes, i.e., with more details, while a node with low DVI value can be rendered using its higher level nodes. However, the major limitation of these methods is that the ob- ject has to be divided into regular square tiles, While this may be fine for representing smooth landscape, it may not be the best way to represent objects of arbi- trary shapes because those objects may contain many sharp edges, thus, causing a lot of nodes to be gener- ated around them.
In [6], Hoppe proposes an idea called progressive meshes. A progressive mesh stores a pre-computed list of edge collapses (or edge splits). By following the list in the forward or backward direction, the resolution of the model can be modified in an efficient way. In addi- tion, if some ancestor information of each edge collapse is stored, limited selective refinement is possible to in- crease the resolution of certain region of the model.
In this paper, we describe an adaptive multi- resolution method, which calculates the DVI values of different regions of an object based on some run- time viewing and animation parameters. Hence, the resolution of the output model may be non-uniform; regions of the object with lower DVI values contain less triangles and those with higher DVI values con- tain more triangles. The new method is based on the real-time multi-resolution method that we have devel- oped [8, 11]. The rest of this paper is organized as follows. Section 2 briefly describe our real-time multi-
resolution method. Section 3 presents the adaptive multi-resolution method in detail. Section 4 discusses the management of the adaptive models. Section 5 shows some example outputs of the new method and compares the new method with other similar methods. Finally, section 6 presents conclusions of the paper and discusses some possible future work.
2. Real-Time Multi-Resolution Method
In our earlier paper [8], we presented a real-time multi-resolution method which simplifies a given trian- gle model with two efficient operators called edge col- lapse and triangle collapse. The edge collapse operator collapses a triangle edge into a point each time and removes two triangles. The triangle collapse operator collapses a triangle into a point and removes four tri- angles. The whole simplification process is divided into two stages: the pre-processing stage and the run-time stage. In the pre-processing stage, we calculate the vi- sual importance of each triangle and sort the triangles according to their importance values. During the run- time stage, we simplify the model by removing triangles from it according to the sorted triangle list.
In our recent paper [11], we presented a refined real- time multi-resolution method. The new method im- proves significantly on the performance of the simpli- fication process. The major changes are that we only provide the edge collapse operator to further simplify the algorithm, and instead of sorting all the triangles according to their importance values, we group the tri- angle edges into a table according to the edge impor- tance values. During the pre-processing stage, triangle edges are assigned importance values as follows:
Ei mp Lref
*Min(VMmp,Vr2),mp)
where Vi:imp and V^jmp are the importance values of the two vertices V\ and V2 respectively of an edge E. \E\ is the length of E and Lrej is a reference length. Hence, a short edge will have a lower edge importance, i.e., higher priority for deletion. To calculate the vertex importance, we first determine the minimum and max-
imum values (Xmin, Xmax, 2/rm'n> Vmax) zmin> Zmax) OI all triangle normal vectors around the vertex. The vertex importance can be approximated as follows:
Vi mp (» ' Xmin) T yVmax Vmin ) T \Zmax zmin )
If Vimp is smaller than a given threshold, the vertex is considered as a flat vertex. Otherwise, if the normal vectors of the triangles connected to the vertex can be classified into exactly two groups with respect to their
21
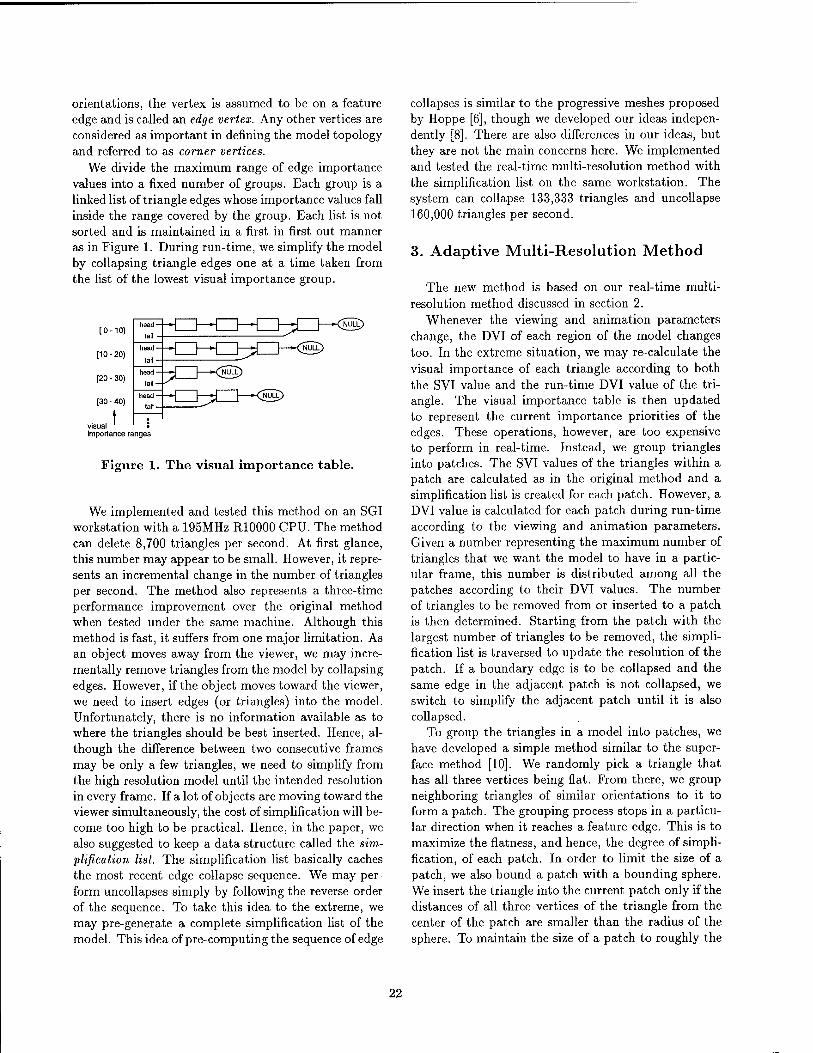
orientations, the vertex is assumed to be on a feature edge and is called an edge vertex. Any other vertices are considered as important in defining the model topology and referred to as corner vertices.
We divide the maximum range of edge importance values into a fixed number of groups. Each group is a linked list of triangle edges whose importance values fall inside the range covered by the group. Each list is not sorted and is maintained in a first in first out manner as in Figure 1. During run-time, we simplify the model by collapsing triangle edges one at a time taken from the list of the lowest visual importance group.
visual importance ranges
Figure 1. The visual importance table.
We implemented and tested this method on an SGI workstation with a 195MHz R10000 CPU. The method can delete 8,700 triangles per second. At first glance, this number may appear to be small. However, it repre- sents an incremental change in the number of triangles per second. The method also represents a three-time performance improvement over the original method when tested under the same machine. Although this method is fast, it suffers from one major limitation. As an object moves away from the viewer, we may incre- mentally remove triangles from the model by collapsing edges. However, if the object moves toward the viewer, we need to insert edges (or triangles) into the model. Unfortunately, there is no information available as to where the triangles should be best inserted. Hence, al- though the difference between two consecutive frames may be only a few triangles, we need to simplify from the high resolution model until the intended resolution in every frame. If a lot of objects are moving toward the viewer simultaneously, the cost of simplification will be- come too high to be practical. Hence, in the paper, we also suggested to keep a data structure called the sim- plification list. The simplification list basically caches the most recent edge collapse sequence. We may per- form uncollapses simply by following the reverse order of the sequence. To take this idea to the extreme, we may pre-generate a complete simplification list of the model. This idea of pre-computing the sequence of edge
collapses is similar to the progressive meshes proposed by Hoppe [6], though we developed our ideas indepen- dently [8]. There are also differences in our ideas, but they are not the main concerns here. We implemented and tested the real-time multi-resolution method with the simplification list on the same workstation. The system can collapse 133,333 triangles and uncollapse 160,000 triangles per second.
3. Adaptive Multi-Resolution Method
The new method is based on our real-time multi- resolution method discussed in section 2.
Whenever the viewing and animation parameters change, the DVI of each region of the model changes too. In the extreme situation, we may re-calculate the visual importance of each triangle according to both the SVI value and the run-time DVI value of the tri- angle. The visual importance table is then updated to represent the current importance priorities of the edges. These operations, however, are too expensive to perform in real-time. Instead, we group triangles into patches. The SVI values of the triangles within a patch are calculated as in the original method and a simplification list is created for each patch. However, a DVI value is calculated for each patch during run-time according to the viewing and animation parameters. Given a number representing the maximum number of triangles that we want the model to have in a partic- ular frame, this number is distributed among all the patches according to their DVI values. The number of triangles to be removed from or inserted to a patch is then determined. Starting from the patch with the largest number of triangles to be removed, the simpli- fication list is traversed to update the resolution of the patch. If a boundary edge is to be collapsed and the same edge in the adjacent patch is not collapsed, we switch to simplify the adjacent patch until it is also collapsed.
To group the triangles in a model into patches, we have developed a simple method similar to the super- face method [10]. We randomly pick a triangle that has all three vertices being flat. From there, we group neighboring triangles of similar orientations to it to form a patch. The grouping process stops in a particu- lar direction when it reaches a feature edge. This is to maximize the flatness, and hence, the degree of simpli- fication, of each patch. In order to limit the size of a patch, we also bound a patch with a bounding sphere. We insert the triangle into the current patch only if the distances of all three vertices of the triangle from the center of the patch are smaller than the radius of the sphere. To maintain the size of a patch to roughly the
22
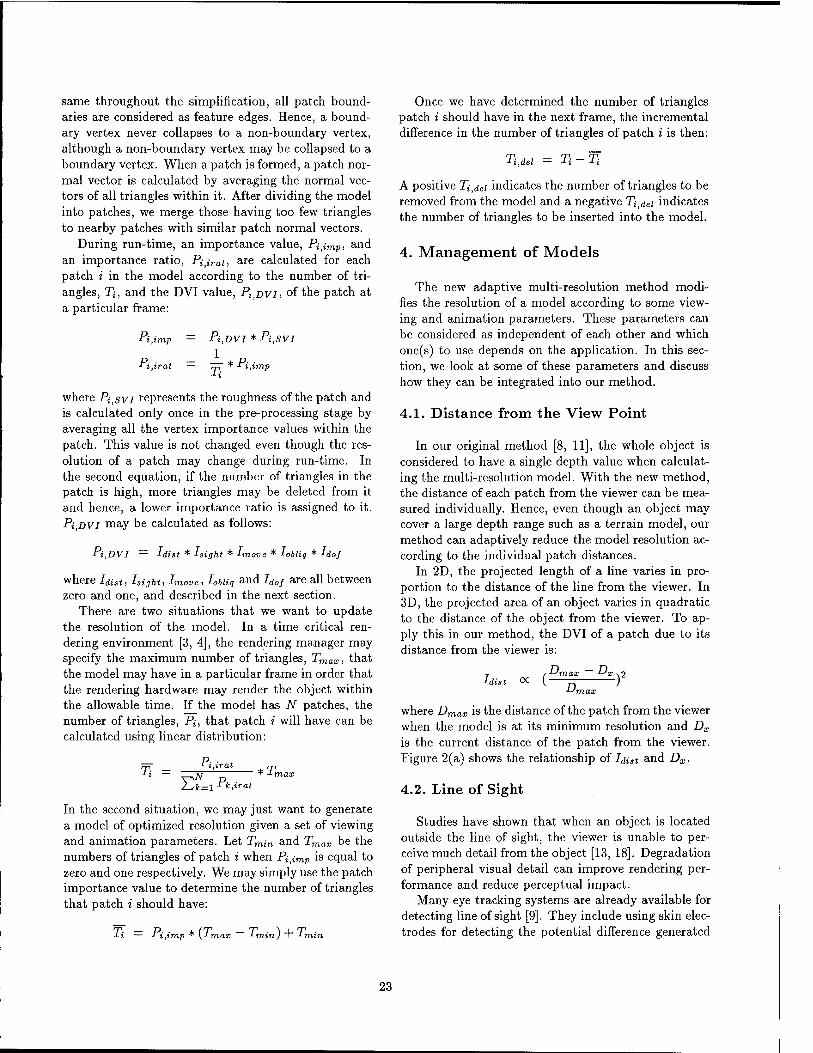
same throughout the simplification, all patch bound- aries are considered as feature edges. Hence, a bound- ary vertex never collapses to a non-boundary vertex, although a non-boundary vertex may be collapsed to a boundary vertex. When a patch is formed, a patch nor- mal vector is calculated by averaging the normal vec- tors of all triangles within it. After dividing the model into patches, we merge those having too few triangles to nearby patches with similar patch normal vectors.
During run-time, an importance value, Pijmp, and an importance ratio, Pi,irat, are calculated for each patch i in the model according to the number of tri- angles, T{, and the DVI value, PitDVi, of the patch at a particular frame:
Pi,imp = Pi.DVI * Pi.SVI
1_
Ti *i.i i.irat * *i,imp
where Pi^vi represents the roughness of the patch and is calculated only once in the pre-processing stage by averaging all the vertex importance values within the patch. This value is not changed even though the res- olution of a patch may change during run-time. In the second equation, if the number of triangles in the patch is high, more triangles may be deleted from it and hence, a lower importance ratio is assigned to it. Pi,DVi may be calculated as follows:
Pi,DVI = Idist * Light * Imove * hbliq * hof
where hist, Light, Imove, hbliq and hof are all between zero and one, and described in the next section.
There are two situations that we want to update the resolution of the model. In a time critical ren- dering environment [3, 4], the rendering manager may specify the maximum number of triangles, Tmax, that the model may have in a particular frame in order that the rendering hardware may render the object within the allowable time. If the model has N patches, the number of triangles, Pi, that patch i will have can be calculated using linear distribution:
Ti P- ■
^N 2-*/k = l ^k,irat
* 1 m
In the second situation, we may just want to generate a model of optimized resolution given a set of viewing and animation parameters. Let Tmi„ and Tmax be the numbers of triangles of patch i when Pitimp is equal to zero and one respectively. We may simply use the patch importance value to determine the number of triangles that patch i should have:
Once we have determined the number of triangles patch i should have in the next frame, the incremental difference in the number of triangles of patch i is then:
J-i,del — J-i -M
A positive T;^; indicates the number of triangles to be removed from the model and a negative TJdei indicates the number of triangles to be inserted into the model.
4. Management of Models
The new adaptive multi-resolution method modi- fies the resolution of a model according to some view- ing and animation parameters. These parameters can be considered as independent of each other and which one(s) to use depends on the application. In this sec- tion, we look at some of these parameters and discuss how they can be integrated into our method.
4.1. Distance from the View Point
In our original method [8, 11], the whole object is considered to have a single depth value when calculat- ing the multi-resolution model. With the new method, the distance of each patch from the viewer can be mea- sured individually. Hence, even though an object may cover a large depth range such as a terrain model, our method can adaptively reduce the model resolution ac- cording to the individual patch distances.
In 2D, the projected length of a line varies in pro- portion to the distance of the line from the viewer. In 3D, the projected area of an object varies in quadratic to the distance of the object from the viewer. To ap- ply this in our method, the DVI of a patch due to its distance from the viewer is:
hi; D„ DT
D„
Ti P- ■ 11.1 mp (Trr, ■1 min ) ~T J-m
where Dmax is the distance of the patch from the viewer when the model is at its minimum resolution and Dx
is the current distance of the patch from the viewer. Figure 2(a) shows the relationship of hist and Dx.
4.2. Line of Sight
Studies have shown that when an object is located outside the line of sight, the viewer is unable to per- ceive much detail from the object [13, 18]. Degradation of peripheral visual detail can improve rendering per- formance and reduce perceptual impact.
Many eye tracking systems are already available for detecting line of sight [9]. They include using skin elec- trodes for detecting the potential difference generated
23
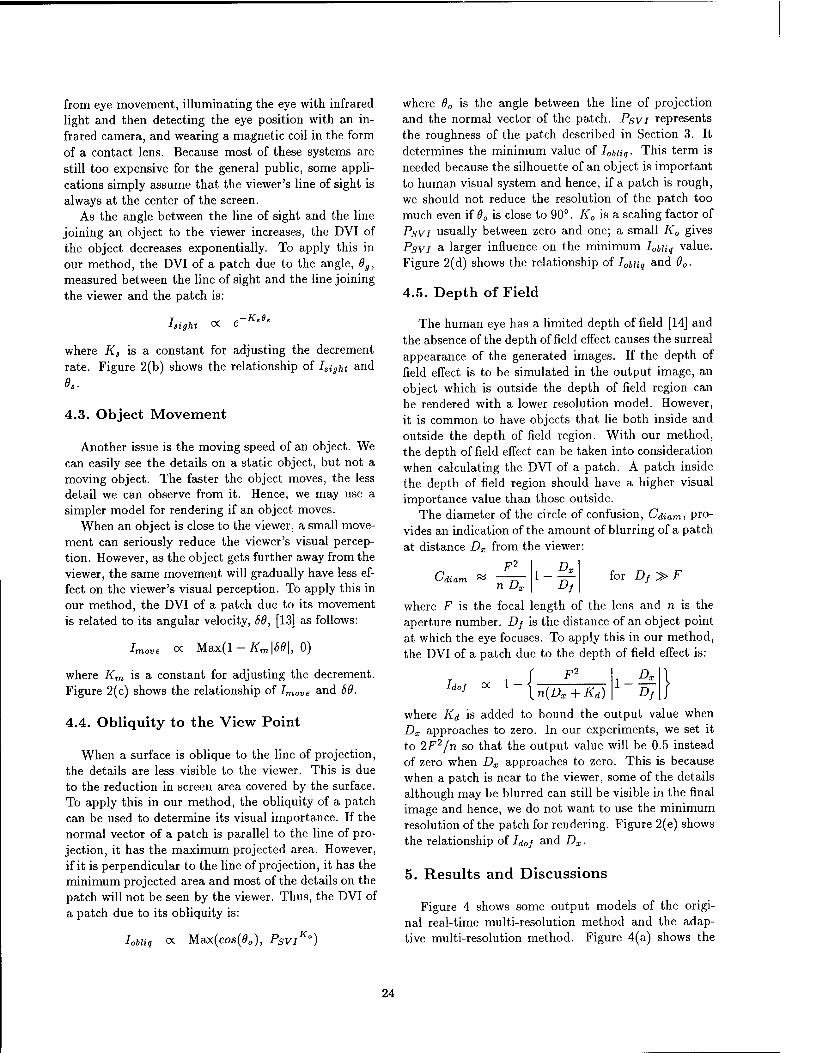
from eye movement, illuminating the eye with infrared light and then detecting the eye position with an in- frared camera, and wearing a magnetic coil in the form of a contact lens. Because most of these systems are still too expensive for the general public, some appli- cations simply assume that the viewer's line of sight is always at the center of the screen.
As the angle between the line of sight and the line joining an object to the viewer increases, the DVI of the object decreases exponentially. To apply this in our method, the DVI of a patch due to the angle, 6g, measured between the line of sight and the line joining the viewer and the patch is:
lsight (X -Ks6 B
where Ks is a constant for adjusting the decrement rate. Figure 2(b) shows the relationship of Isight and
4.3. Object Movement
Another issue is the moving speed of an object. We can easily see the details on a static object, but not a moving object. The faster the object moves, the less detail we can observe from it. Hence, we may use a simpler model for rendering if an object moves.
When an object is close to the viewer, a small move- ment can seriously reduce the viewer's visual percep- tion. However, as the object gets further away from the viewer, the same movement will gradually have less ef- fect on the viewer's visual perception. To apply this in our method, the DVI of a patch due to its movement is related to its angular velocity, 66, [13] as follows:
Imove oc Max(l - Km\60\, 0)
where Km is a constant for adjusting the decrement. Figure 2(c) shows the relationship of Imove and 69.
4.4. Obliquity to the View Point
When a surface is oblique to the line of projection, the details are less visible to the viewer. This is due to the reduction in screen area covered by the surface. To apply this in our method, the obliquity of a patch can be used to determine its visual importance. If the normal vector of a patch is parallel to the line of pro- jection, it has the maximum projected area. However, if it is perpendicular to the line of projection, it has the minimum projected area and most of the details on the patch will not be seen by the viewer. Thus, the DVI of a patch due to its obliquity is:
where 60 is the angle between the line of projection and the normal vector of the patch. Psvi represents the roughness of the patch described in Section 3. It determines the minimum value of I0bHq ■ This term is needed because the silhouette of an object is important to human visual system and hence, if a patch is rough, we should not reduce the resolution of the patch too much even if 60 is close to 90°. K0 is a scaling factor of Psvi usually between zero and one; a small K0 gives Psvi a larger influence on the minimum I0buq value. Figure 2(d) shows the relationship of I0biiq and 60.
4.5. Depth of Field
The human eye has a limited depth of field [14] and the absence of the depth of field effect causes the surreal appearance of the generated images. If the depth of field effect is to be simulated in the output image, an object which is outside the depth of field region can be rendered with a lower resolution model. However, it is common to have objects that lie both inside and outside the depth of field region. With our method, the depth of field effect can be taken into consideration when calculating the DVI of a patch. A patch inside the depth of field region should have a higher visual importance value than those outside.
The diameter of the circle of confusion, Cdiam, pro- vides an indication of the amount of blurring of a patch at distance Dx from the viewer:
(sdia n Dx 1- for Df^>F
IobUq oc Max(cos(0o), Psvi K0
where F is the focal length of the lens and n is the aperture number. Dj is the distance of an object point at which the eye focuses. To apply this in our method, the DVI of a patch due to the depth of field effect is:
T 1 f F2 1 D* Idof K l-\n(Dx+Kd) l~D]
where Kd is added to bound the output value when Dx approaches to zero. In our experiments, we set it to 2F2/n so that the output value will be 0.5 instead of zero when Dx approaches to zero. This is because when a patch is near to the viewer, some of the details although may be blurred can still be visible in the final image and hence, we do not want to use the minimum resolution of the patch for rendering. Figure 2(e) shows the relationship of Idof and Dx.
5. Results and Discussions
Figure 4 shows some output models of the origi- nal real-time multi-resolution method and the adap- tive multi-resolution method. Figure 4(a) shows the
24
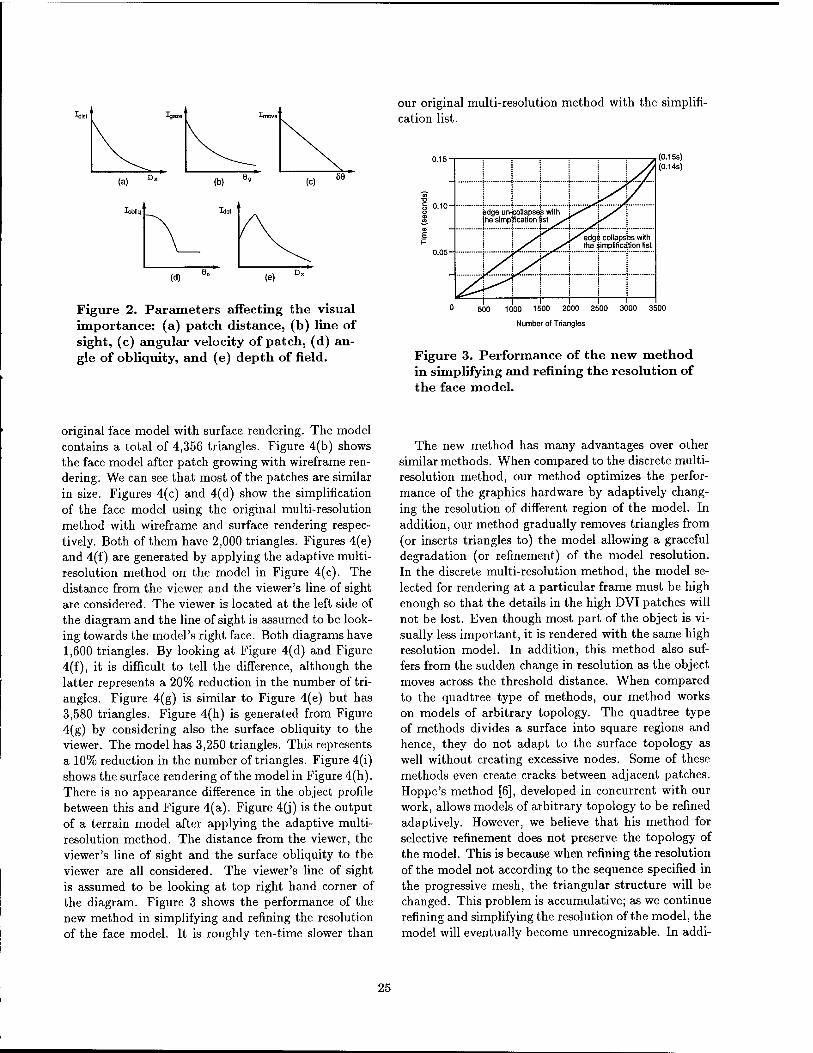
Figure 2. Parameters affecting the visual importance: (a) patch distance, (b) line of sight, (c) angular velocity of patch, (d) an- gle of obliquity, and (e) depth of field.
our original multi-resolution method with the simplifi- cation list.
(0.15s) (0.14s)
-i 1 1 r 0 500 1000 1500 2000 2500 3000 3500
Number of Triangles
Figure 3. Performance of the new method in simplifying and refining the resolution of the face model.
original face model with surface rendering. The model contains a total of 4,356 triangles. Figure 4(b) shows the face model after patch growing with wireframe ren- dering. We can see that most of the patches are similar in size. Figures 4(c) and 4(d) show the simplification of the face model using the original multi-resolution method with wireframe and surface rendering respec- tively. Both of them have 2,000 triangles. Figures 4(e) and 4(f) are generated by applying the adaptive multi- resolution method on the model in Figure 4(c). The distance from the viewer and the viewer's line of sight are considered. The viewer is located at the left side of the diagram and the line of sight is assumed to be look- ing towards the model's right face. Both diagrams have 1,600 triangles. By looking at Figure 4(d) and Figure 4(f), it is difficult to tell the difference, although the latter represents a 20% reduction in the number of tri- angles. Figure 4(g) is similar to Figure 4(e) but has 3,580 triangles. Figure 4(h) is generated from Figure 4(g) by considering also the surface obliquity to the viewer. The model has 3,250 triangles. This represents a 10% reduction in the number of triangles. Figure 4(i) shows the surface rendering of the model in Figure 4(h). There is no appearance difference in the object profile between this and Figure 4(a). Figure 4(j) is the output of a terrain model after applying the adaptive multi- resolution method. The distance from the viewer, the viewer's line of sight and the surface obliquity to the viewer are all considered. The viewer's line of sight is assumed to be looking at top right hand corner of the diagram. Figure 3 shows the performance of the new method in simplifying and refining the resolution of the face model. It is roughly ten-time slower than
The new method has many advantages over other similar methods. When compared to the discrete multi- resolution method, our method optimizes the perfor- mance of the graphics hardware by adaptively chang- ing the resolution of different region of the model. In addition, our method gradually removes triangles from (or inserts triangles to) the model allowing a graceful degradation (or refinement) of the model resolution. In the discrete multi-resolution method, the model se- lected for rendering at a particular frame must be high enough so that the details in the high DVI patches will not be lost. Even though most part of the object is vi- sually less important, it is rendered with the same high resolution model. In addition, this method also suf- fers from the sudden change in resolution as the object moves across the threshold distance. When compared to the quadtree type of methods, our method works on models of arbitrary topology. The quadtree type of methods divides a surface into square regions and hence, they do not adapt to the surface topology as well without creating excessive nodes. Some of these methods even create cracks between adjacent patches. Hoppe's method [6], developed in concurrent with our work, allows models of arbitrary topology to be refined adaptively. However, we believe that his method for selective refinement does not preserve the topology of the model. This is because when refining the resolution of the model not according to the sequence specified in the progressive mesh, the triangular structure will be changed. This problem is accumulative; as we continue refining and simplifying the resolution of the model, the model will eventually become unrecognizable. In addi-
25

tion, the program must be able to handle the change in triangular structure of the model properly; other- wise, holes may appear in the models. To overcome these two problems, we need to refine (or to simplify) the model from the lowest (or highest) resolution every time there is a change in the model resolution. This reduces the overall performance of the method. The method that we propose here solves the problems and allows the resolution of the model to be increased and decreased continuously.
Although, our method has a number of advantages, it is not as fast as those methods using the quadtree structure. In those methods, the multi-resolution mod- els are created in advance in the form of a quadtree. The operation involved during run-time is only to de- termine what nodes to use for rendering. In our method, triangles are removed on the fly. Even though the operation involved is reduced to minimal, it is still more expensive than those methods.
6. Conclusions
In this paper, we have presented an adaptive multi- resolution method, which generates multi-resolution models according to the run-time viewing and anima- tion parameters. We have also discussed some issues in managing the adaptive multi-resolution models gen- erated with the new method. Finally, we show some results from the new method and compare the new method with other similar methods.
When compared to our original real-time multi- resolution method, the new method is much slower, We have found that most of the computation time is spent on switching between patches when refining or simpli- fying the resolution of the model. We are currently looking at this to increase the overall performance of the new method.
Acknowledgements
We would like to thank the reviewers for their useful comments. We would also like to acknowledge that this work is currently supported by the University Central Research Grant, #351/084.
References
[1] M. DeHaemer and M. Zyda. Simplification of Objects Rendered by Polygonal Approximations. Computers & Graphics, 15(2):175-184, 1991.
[2] J. Falby, M. Zyda, D. Pratt, and R. Mackey. NPSNET: Hierarchical Data Structures for Real-Time Three-
Dimensional Visual Simulation. Computers & Graph- ics, 17(l):65-69, 1993.
[3] T. Funkhouser and C. Sequin. Adaptive Display Al- gorithm for Interactive Frame Rates During Visual- ization of Complex Virtual Environments. In ACM SIGGRAPH'93, volume 27, pages 247-254, August 1993.
[4] M. Green. A Framework for Real-Time Rendering in Virtual Reality. In ACM Symposium on Virtual Real- ity Software and Technology, pages 3-10, July 1996.
[5] B. Herzen and A. Barr. Accurate Triangulations of Deformed, Intersecting Surfaces. In ACM SIG- GRAPH'87, volume 21, pages 103-110, July 1987.
[6] H. Hoppe. Progressive Meshes. In ACM SIG- GRAPH'96, pages 99-108, August 1996.
[7] H. Hoppe, T. DeRose, T. Duchamp, J. McDonald, and W. Stuetzle. Mesh Optimization. In ACM SIG- GRAPH'93, volume 27, pages 19-26, August 1993.
[8] V. I§ler, R. Lau, and M. Green. Real-Time Multi- Resolution Modeling for Complex Virtual Environ- ments. In ACM Symposium on Virtual Reality Soß- ware and Technology, pages 11-20, July 1996.
[9] R. Jacob. Chapter 7: Eye tracking in advanced inter- face design. In Virtual Environments and Advanced Interface Design, W. Barfield and T. Furness (Eds.), pages 258-288. Oxford University Press, 1995.
[10] A. Kalvin and R. Taylor. Superfaces: Polygonal Mesh Simplification with Bounded Error. IEEE Computer Graphics and Applications, 16(3):64~77, May 1996.
[11] R. Lau, M. Green, D. To, and J. Wong. Real-Time Continuous Multi-Resolution Method for Models of Arbitrary Topology. Submitted for publication, 1996.
[12] P. Lindstrom, D. Koller, W. Ribarsky, L. Hodges, N. Faust, and G. Turner. Real-Time, Continuous Level of Detail Rendering of Height Fields. In ACM SIG- GRAPH'96, pages 109-118, August 1996.
[13] T. Ohshima, H. Yamamoto, and H. Tamura. Gaze- Directed Adaptive Rendering for Interacting with Vir- tual Space. In IEEE Virtual Reality Annual Interna- tional Symposium, pages 103-110, July 1996.
[14] P. Rokita. Generating Depth-of-Field Effects in Vir- tual Reality Applications. IEEE Computer Graphics and Applications, 16(2):18-21, March 1996.
[15] J. Rossignac and P. Borrel. Multi-Resolution 3D Ap- proximations for Rendering Complex Scenes. Techni- cal Report RC 17697 (#77951), IBM Research Divi- sion, T.J. Watson Research Center, 1992.
[16] W. Schroeder, J. Zarge, and W. Lorensen. Decima- tion of Triangle Meshes. In ACM SIGGRAPH'92, vol- ume 26, pages 65-70, July 1992.
[17] G. Turk. Re-tiling Polygonal Surfaces. In A CM SIG- GRAPH'92, volume 26, pages 55-64, July 1992.
[18] B. Watson, N. Walker, and L. Hodges. Effectiveness of Spatial Level of Detail Degradation in the Periphery of Head-Mounted Displays. In ACM CHI'96), pages 227-228, April 1996.
26
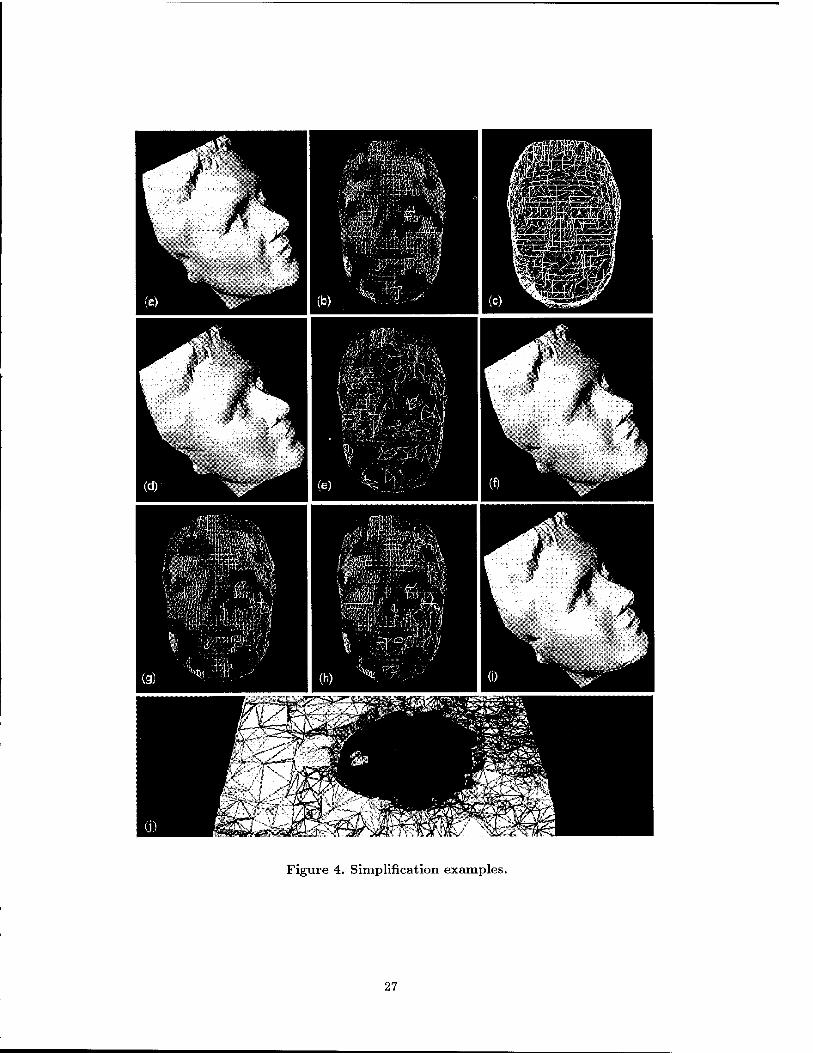
Figure 4. Simplification examples.
27
KHION
iHTaflaioH
Navigating Through Virtual Flight Environments Using Brain-Body-Actuated Control
W. Todd Nelson, Lawrence J. Hettinger, James A. Cunningham, Merry M. Roe Logicon Technical Services, Inc.
Michael W. Haas, Leon B. Dennis Fitts Human Engineering Division, Crew Systems Directorate, Armstrong Laboratory,
Wright-Patterson AFB, OH
Abstract
Alternative control technologies enable users to control human-machine systems without using their hands. For example, the Cyberlink ™ interface, a brain-body-actuated control technology, employs a combination of EEG and EMG signals produced at the user's forehead to generate computer inputs that can be used for a variety of tasks. An experiment was conducted in which participants used the CyberLink ™ interface to navigate or "fly" along a virtual flight course displayed on a wide field of view dome display. Tracking performance significantly increased across experimental sessions, while measures of perceived mental workload decreased across sessions. Ratings of cybersickness were relatively low and did not vary across experimental sessions. The results indicate that brain-body-actuated control, achieved using the CyberLink ™ interface, provides a viable means for performing simple, single-axis, continuous control tasks without using one's hands.
1: Introduction
As noted by several researchers [1] [2] [3], virtual interface technologies, including virtual visual, auditory, and haptic/tactile displays as well as a variety of alternative control devices, offer a potentially useful means for increasing the effectiveness of future tactical airborne crewstations. This hypothesis is predicated, in part, upon the idea that properly designed virtual interfaces can be used to exploit the human operator's natural perceptual, perceptual-motor, and cognitive capabilities; thereby, offsetting the ever increasing complexity and lethality of current and future air combat environments [3]. Toward this end, the Synthesized Immersion Research Environment Laboratory (SIRE), located at the USAF Armstrong Laboratory, Wright-Patterson AFB, is currently engaged in the development and evaluation of virtual display and control interfaces for tactical airborne applications. More specifically, ongoing research efforts within the SIRE Laboratory include the evaluation of a
brain-body-actuated combination of electromyographic
variety of virtual display technologies (i.e., helmet- mounted, three-dimensional acoustic, electro-vestibular, and haptic/tactile displays) as well as an array of alternative control devices - non-manual control devices that potentially offer a more efficient and intuitive way of achieving system control. Examples of alternative control technologies include devices such as eye line-of-sight trackers, body position and orientation trackers, voice and gesture recognition systems, and brain-body-actuated controllers.
The CyberLink ™ interface is a control device that uses a electroencephalographic (EEG) and (EMG) biopotentials, defined as a "brain-body signal," as control inputs [5]. The CyberLink ™ interface, illustrated in Figure 1, consists of a headband-like apparatus that contains three forehead-mounted surface electrodes, a bio- amplifier, an analog-to-digital converter, and algorithms that decompose and translate the brain-body signal into multiple control signals. Once derived, these control signals can be used as "hands-off' control inputs for tasks in which the operator attempts to control some type of system parameter. In tactical airborne applications, for example, the CyberLink ™ interface might allow pilots to perform tasks such as toggling between different radar modes, weapons or target selection, or selecting the type of information that is displayed in the crewstation. Furthermore, brain-body signals might also permit crewmembers to perform tasks that require continuous control, such as flight control, target acquisition, etc. While these examples are specific to airborne applications, it is important to note that the potential applications of brain-body-actuated control are not restricted to tactical aviation. Instead, this form of alternative control could potentially benefit any application domain in which hands- off control is desired. Indeed, one particularly exciting application of this technology would be to use it as an assistive technology to enable individuals with physical disabilities to control systems that typically require some form of manual control (i.e., PC mouse, keyboards, joysticks, etc.).
0-8186-7843-7/97 $10.00 © 1997 IEEE 30
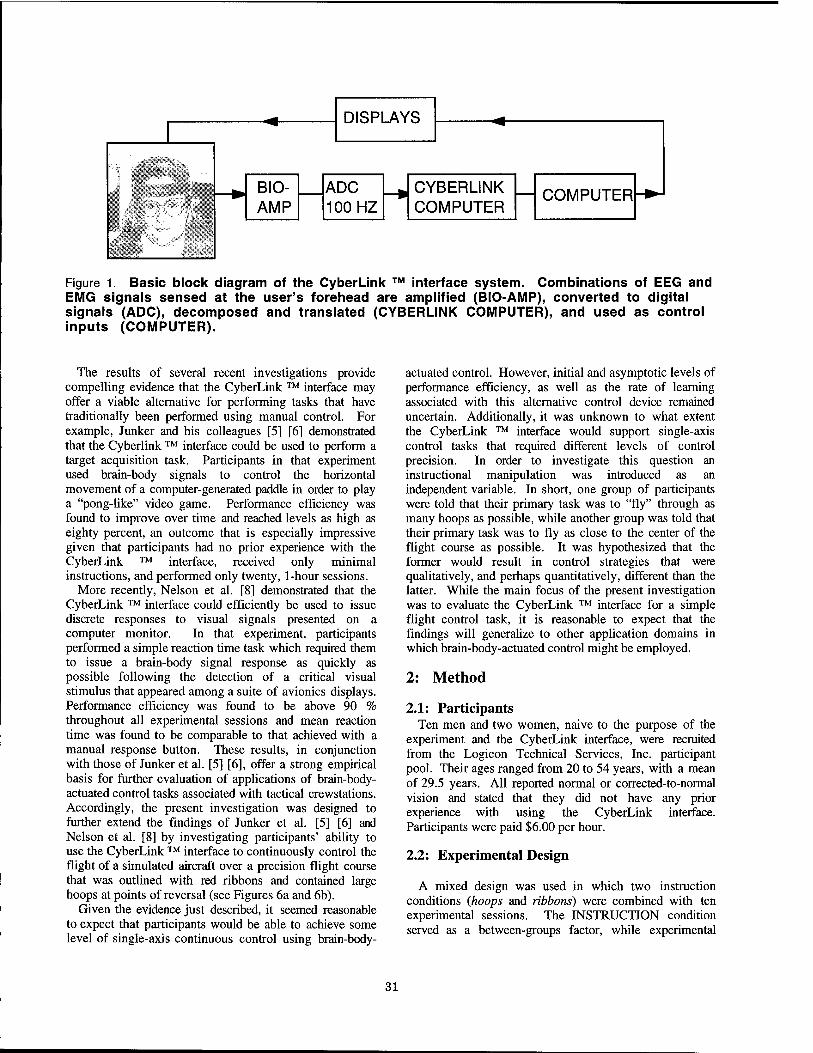
DISPLAYS
BIO- AMP
ADC 100 HZ
CYBERLINK COMPUTER
COMPUTER -J
Figure 1. Basic block diagram of the CyberLink ™ interface system. Combinations of EEG and EMG signals sensed at the user's forehead are amplified (BIO-AMP), converted to digital signals (ADC), decomposed and translated (CYBERLINK COMPUTER), and used as control inputs (COMPUTER).
The results of several recent investigations provide compelling evidence that the CyberLink ™ interface may offer a viable alternative for performing tasks that have traditionally been performed using manual control. For example, Junker and his colleagues [5] [6] demonstrated that the Cyberlink ™ interface could be used to perform a target acquisition task. Participants in that experiment used brain-body signals to control the horizontal movement of a computer-generated paddle in order to play a "pong-like" video game. Performance efficiency was found to improve over time and reached levels as high as eighty percent, an outcome that is especially impressive given that participants had no prior experience with the CyberLink ™ interface, received only minimal instructions, and performed only twenty, 1-hour sessions.
More recently, Nelson et al. [8] demonstrated that the CyberLink ™ interface could efficiently be used to issue discrete responses to visual signals presented on a computer monitor. In that experiment, participants performed a simple reaction time task which required them to issue a brain-body signal response as quickly as possible following the detection of a critical visual stimulus that appeared among a suite of avionics displays. Performance efficiency was found to be above 90 % throughout all experimental sessions and mean reaction time was found to be comparable to that achieved with a manual response button. These results, in conjunction with those of Junker et al. [5] [6], offer a strong empirical basis for further evaluation of applications of brain-body- actuated control tasks associated with tactical crewstations. Accordingly, the present investigation was designed to further extend the findings of Junker et al. [5] [6] and Nelson et al. [8] by investigating participants' ability to use the CyberLink ™ interface to continuously control the flight of a simulated aircraft over a precision flight course that was outlined with red ribbons and contained large hoops at points of reversal (see Figures 6a and 6b).
Given the evidence just described, it seemed reasonable to expect that participants would be able to achieve some level of single-axis continuous control using brain-body-
actuated control. However, initial and asymptotic levels of performance efficiency, as well as the rate of learning associated with this alternative control device remained uncertain. Additionally, it was unknown to what extent the CyberLink ™ interface would support single-axis control tasks that required different levels of control precision. In order to investigate this question an instructional manipulation was introduced as an independent variable. In short, one group of participants were told that their primary task was to "fly" through as many hoops as possible, while another group was told that their primary task was to fly as close to the center of the flight course as possible. It was hypothesized that the former would result in control strategies that were qualitatively, and perhaps quantitatively, different than the latter. While the main focus of the present investigation was to evaluate the CyberLink ™ interface for a simple flight control task, it is reasonable to expect that the findings will generalize to other application domains in which brain-body-actuated control might be employed.
2: Method
2.1: Participants Ten men and two women, naive to the purpose of the
experiment and the CyberLink interface, were recruited from the Logicon Technical Services, Inc. participant pool. Their ages ranged from 20 to 54 years, with a mean of 29.5 years. All reported normal or corrected-to-normal vision and stated that they did not have any prior experience with using the CyberLink interface. Participants were paid $6.00 per hour.
2.2: Experimental Design
A mixed design was used in which two instruction conditions {hoops and ribbons) were combined with ten experimental sessions. The INSTRUCTION condition served as a between-groups factor, while experimental
31
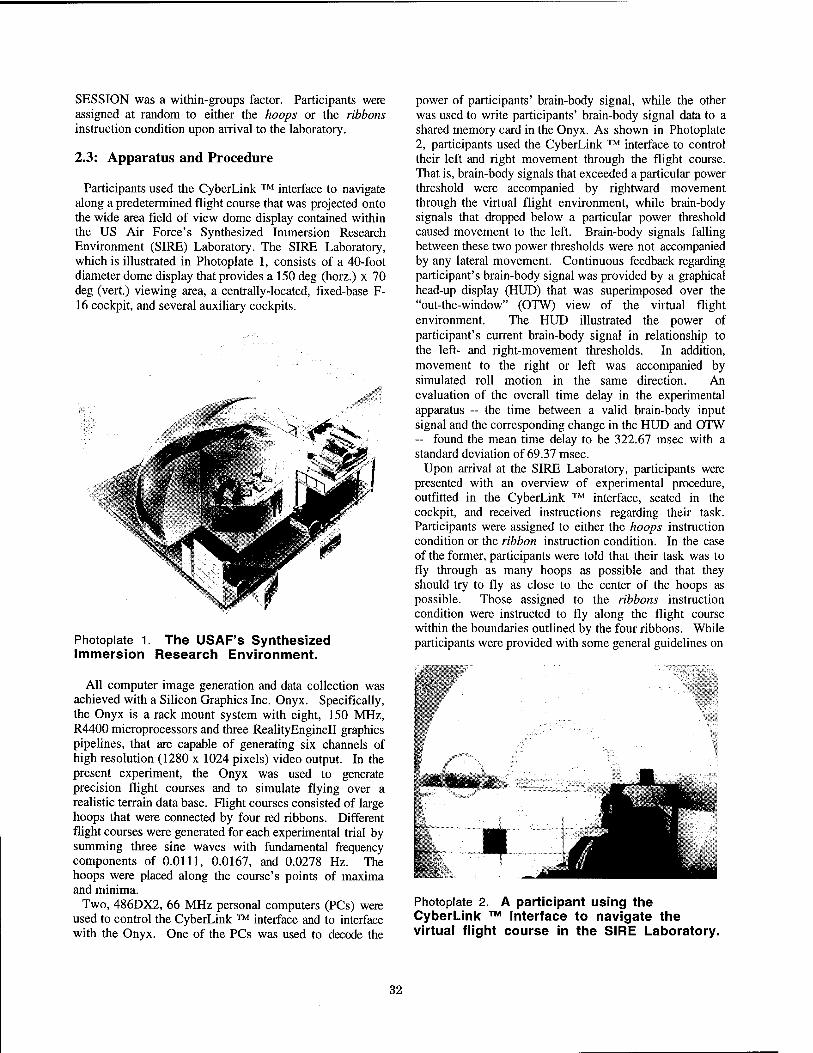
SESSION was a within-groups factor. Participants were assigned at random to either the hoops or the ribbons instruction condition upon arrival to the laboratory.
2.3: Apparatus and Procedure
Participants used the CyberLink ™ interface to navigate along a predetermined flight course that was projected onto the wide area field of view dome display contained within the US Air Force's Synthesized Immersion Research Environment (SIRE) Laboratory. The SIRE Laboratory, which is illustrated in Photoplate 1, consists of a 40-foot diameter dome display that provides a 150 deg (horz.) x 70 deg (vert.) viewing area, a centrally-located, fixed-base F- 16 cockpit, and several auxiliary cockpits.
Photoplate 1. The USAF's Synthesized Immersion Research Environment.
power of participants' brain-body signal, while the other was used to write participants' brain-body signal data to a shared memory card in the Onyx. As shown in Photoplate 2, participants used the CyberLink ™ interface to control their left and right movement through the flight course. That is, brain-body signals that exceeded a particular power threshold were accompanied by rightward movement through the virtual flight environment, while brain-body signals that dropped below a particular power threshold caused movement to the left. Brain-body signals falling between these two power thresholds were not accompanied by any lateral movement. Continuous feedback regarding participant's brain-body signal was provided by a graphical head-up display (HUD) that was superimposed over the "out-the-window" (OTW) view of the virtual flight environment. The HUD illustrated the power of participant's current brain-body signal in relationship to the left- and right-movement thresholds. In addition, movement to the right or left was accompanied by simulated roll motion in the same direction. An evaluation of the overall time delay in the experimental apparatus - the time between a valid brain-body input signal and the corresponding change in the HUD and OTW — found the mean time delay to be 322.67 msec with a standard deviation of 69.37 msec.
Upon arrival at the SIRE Laboratory, participants were presented with an overview of experimental procedure, outfitted in the CyberLink ™ interface, seated in the cockpit, and received instructions regarding their task. Participants were assigned to either the hoops instruction condition or the ribbon instruction condition. In the case of the former, participants were told that their task was to fly through as many hoops as possible and that they should try to fly as close to the center of the hoops as possible. Those assigned to the ribbons instruction condition were instructed to fly along the flight course within the boundaries outlined by the four ribbons. While participants were provided with some general guidelines on
All computer image generation and data collection was achieved with a Silicon Graphics Inc. Onyx. Specifically, the Onyx is a rack mount system with eight, 150 MHz, R4400 microprocessors and three RealityEnginell graphics pipelines, that are capable of generating six channels of high resolution (1280 x 1024 pixels) video output. In the present experiment, the Onyx was used to generate precision flight courses and to simulate flying over a realistic terrain data base. Flight courses consisted of large hoops that were connected by four red ribbons. Different flight courses were generated for each experimental trial by summing three sine waves with fundamental frequency components of 0.0111, 0.0167, and 0.0278 Hz. The hoops were placed along the course's points of maxima and minima.
Two, 486DX2, 66 MHz personal computers (PCs) were used to control the CyberLink ™ interface and to interface with the Onyx. One of the PCs was used to decode the
.sM&äm±Jr.
Err"
Photoplate 2. A participant using the CyberLink ™ interface to navigate the virtual flight course in the SIRE Laboratory.
32
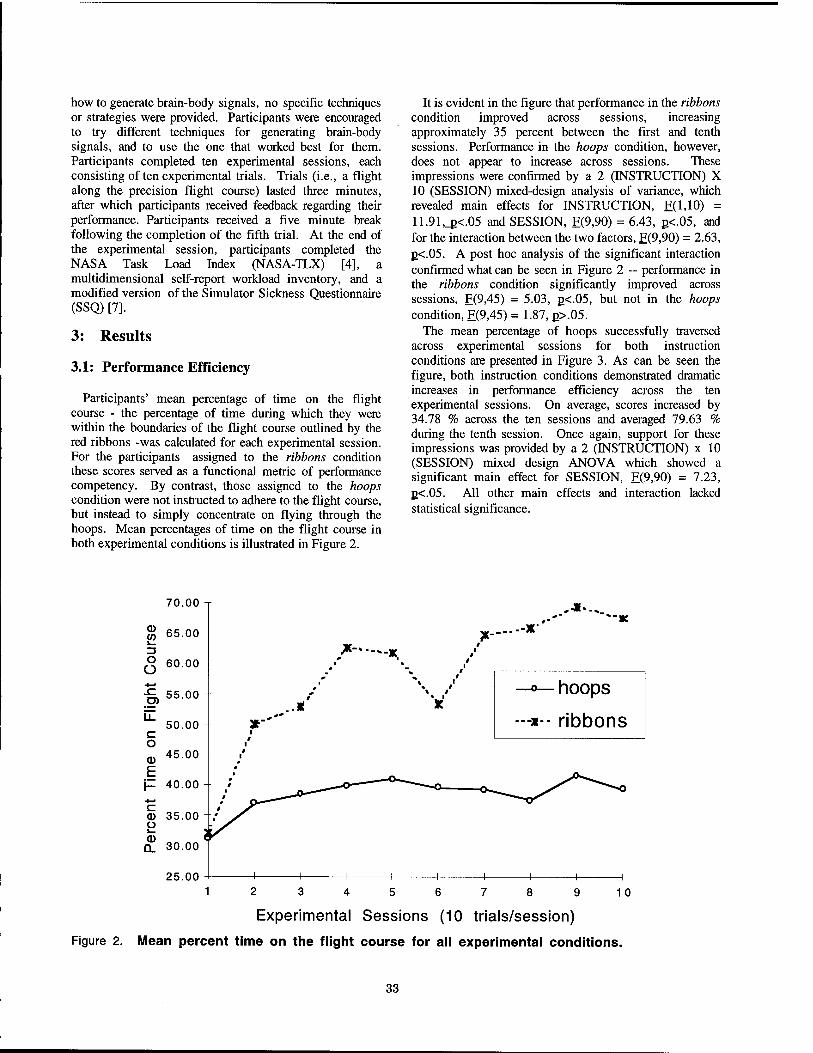
how to generate brain-body signals, no specific techniques or strategies were provided. Participants were encouraged to try different techniques for generating brain-body signals, and to use the one that worked best for them. Participants completed ten experimental sessions, each consisting of ten experimental trials. Trials (i.e., a flight along the precision flight course) lasted three minutes, after which participants received feedback regarding their performance. Participants received a five minute break following the completion of the fifth trial. At the end of the experimental session, participants completed the NASA Task Load Index (NASA-TLX) [4], a multidimensional self-report workload inventory, and a modified version of the Simulator Sickness Questionnaire (SSQ) [7].
3: Results
3.1: Performance Efficiency
Participants' mean percentage of time on the flight course - the percentage of time during which they were within the boundaries of the flight course outlined by the red ribbons -was calculated for each experimental session. For the participants assigned to the ribbons condition these scores served as a functional metric of performance competency. By contrast, those assigned to the hoops condition were not instructed to adhere to the flight course, but instead to simply concentrate on flying through the hoops. Mean percentages of time on the flight course in both experimental conditions is illustrated in Figure 2.
It is evident in the figure that performance in the ribbons condition improved across sessions, increasing approximately 35 percent between the first and tenth sessions. Performance in the hoops condition, however, does not appear to increase across sessions. These impressions were confirmed by a 2 (INSTRUCTION) X 10 (SESSION) mixed-design analysis of variance, which revealed main effects for INSTRUCTION, F(l,10) = 11.91,_B<.05 and SESSION, F(9,90) = 6.43, p<.05, and for the interaction between the two factors, F(9,90) = 2.63, JK.05. A post hoc analysis of the significant interaction confirmed what can be seen in Figure 2 — performance in the ribbons condition significantly improved across sessions, F(9,45) = 5.03, rK.05, but not in the hoops condition, F(9,45) = 1.87, p>.05.
The mean percentage of hoops successfully traversed across experimental sessions for both instruction conditions are presented in Figure 3. As can be seen the figure, both instruction conditions demonstrated dramatic increases in performance efficiency across the ten experimental sessions. On average, scores increased by 34.78 % across the ten sessions and averaged 79.63 % during the tenth session. Once again, support for these impressions was provided by a 2 (INSTRUCTION) x 10 (SESSION) mixed design ANOVA which showed a significant main effect for SESSION, F(9,90) = 7.23, p<.05. All other main effects and interaction lacked statistical significance.
70.00
65.00 - 13
£ 60.00
25.00
"~K
-*-- ribbons
23456789
Experimental Sessions (10 trials/session)
Figure 2. Mean percent time on the flight course for all experimental conditions.
10
33
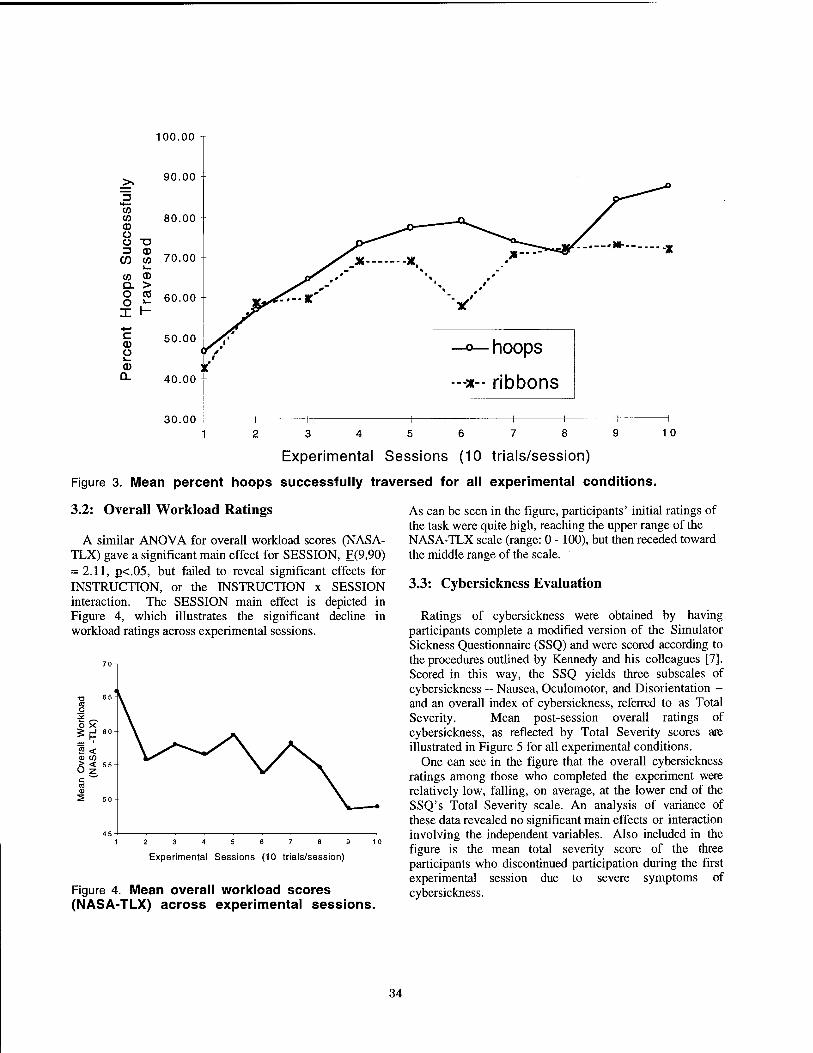
0) w CD o o ■o 13 0
CO CO 1—
co 0 QL > O CO O \— I \- ■i—»
c <D O v_ <D 0.
100.00
90.00
80.00
70.00
60.00
50.00
40.00
30.00
-
0f
*s * V ' #
1—
0
1
—-X. 0
0
V
*——-x
—°—hoops
--■*■- ribbons
1 —i 1 1_ 1 1
123456789
Experimental Sessions (10 trials/session)
Figure 3. Mean percent hoops successfully traversed for all experimental conditions,
10
3.2: Overall Workload Ratings
A similar ANOVA for overall workload scores (NASA- TLX) gave a significant main effect for SESSION, F(9,90) = 2.11, g<.05, but failed to reveal significant effects for INSTRUCTION, or the INSTRUCTION x SESSION interaction. The SESSION main effect is depicted in Figure 4, which illustrates the significant decline in workload ratings across experimental sessions.
9 10
Experimental Sessions (10 trials/session)
Figure 4. Mean overall workload scores (NASA-TLX) across experimental sessions.
As can be seen in the figure, participants' initial ratings of the task were quite high, reaching the upper range of the NASA-TLX scale (range: 0 -100), but then receded toward the middle range of the scale.
3.3: Cybersickness Evaluation
Ratings of cybersickness were obtained by having participants complete a modified version of the Simulator Sickness Questionnaire (SSQ) and were scored according to the procedures outlined by Kennedy and his colleagues [7]. Scored in this way, the SSQ yields three subscales of cybersickness — Nausea, Oculomotor, and Disorientation - and an overall index of cybersickness, referred to as Total Severity. Mean post-session overall ratings of cybersickness, as reflected by Total Severity scores are illustrated in Figure 5 for all experimental conditions.
One can see in the figure that the overall cybersickness ratings among those who completed the experiment were relatively low, falling, on average, at the lower end of the SSQ's Total Severity scale. An analysis of variance of these data revealed no significant main effects or interaction involving the independent variables. Also included in the figure is the mean total severity score of the three participants who discontinued participation during the first experimental session due to severe symptoms of cybersickness.
34
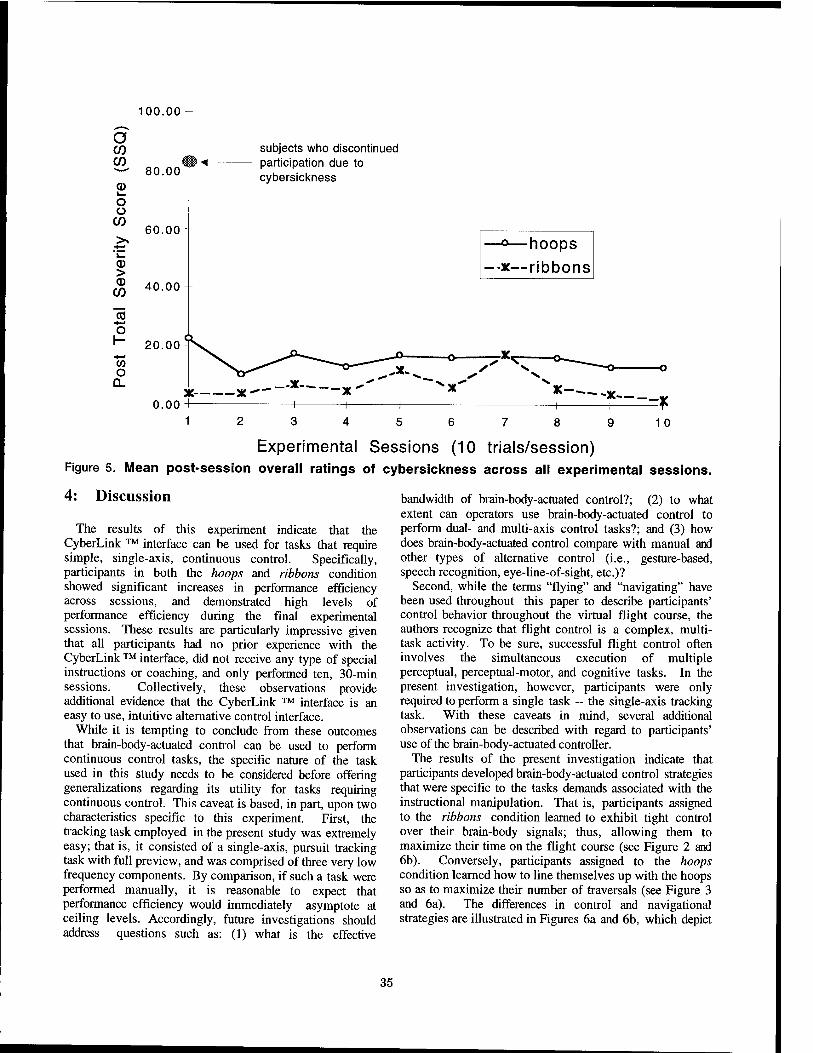
o CO CO
© 1—
o o
CO
>
CO
15 o I- ■4—'
CO o
Q_
100.00
80.00
60.00
40.00
20.00
subjects who discontinued participation due to cybersickness
-o—hoops -x—ribbons
*-—■ 5K- X "-X 0.00
10
Experimental Sessions (10 trials/session) Figure 5. Mean post-session overall ratings of cybersickness across all experimental sessions.
4: Discussion
The results of this experiment indicate that the CyberLink ™ interface can be used for tasks that require simple, single-axis, continuous control. Specifically, participants in both the hoops and ribbons condition showed significant increases in performance efficiency across sessions, and demonstrated high levels of performance efficiency during the final experimental sessions. These results are particularly impressive given that all participants had no prior experience with the CyberLink ™ interface, did not receive any type of special instructions or coaching, and only performed ten, 30-min sessions. Collectively, these observations provide additional evidence that the CyberLink ™ interface is an easy to use, intuitive alternative control interface.
While it is tempting to conclude from these outcomes that brain-body-actuated control can be used to perform continuous control tasks, the specific nature of the task used in this study needs to be considered before offering generalizations regarding its utility for tasks requiring continuous control. This caveat is based, in part, upon two characteristics specific to this experiment. First, the tracking task employed in the present study was extremely easy; that is, it consisted of a single-axis, pursuit tracking task with full preview, and was comprised of three very low frequency components. By comparison, if such a task were performed manually, it is reasonable to expect that performance efficiency would immediately asymptote at ceiling levels. Accordingly, future investigations should address questions such as: (1) what is the effective
bandwidth of brain-body-actuated control?; (2) to what extent can operators use brain-body-actuated control to perform dual- and multi-axis control tasks?; and (3) how does brain-body-actuated control compare with manual and other types of alternative control (i.e., gesture-based, speech recognition, eye-line-of-sight, etc.)?
Second, while the terms "flying" and "navigating" have been used throughout this paper to describe participants' control behavior throughout the virtual flight course, the authors recognize that flight control is a complex, multi- task activity. To be sure, successful flight control often involves the simultaneous execution of multiple perceptual, perceptual-motor, and cognitive tasks. In the present investigation, however, participants were only required to perform a single task - the single-axis tracking task. With these caveats in mind, several additional observations can be described with regard to participants' use of the brain-body-actuated controller.
The results of the present investigation indicate that participants developed brain-body-actuated control strategies that were specific to the tasks demands associated with the instructional manipulation. That is, participants assigned to the ribbons condition learned to exhibit tight control over their brain-body signals; thus, allowing them to maximize their time on the flight course (see Figure 2 and 6b). Conversely, participants assigned to the hoops condition learned how to line themselves up with the hoops so as to maximize their number of traversals (see Figure 3 and 6a). The differences in control and navigational strategies are illustrated in Figures 6a and 6b, which depict
35
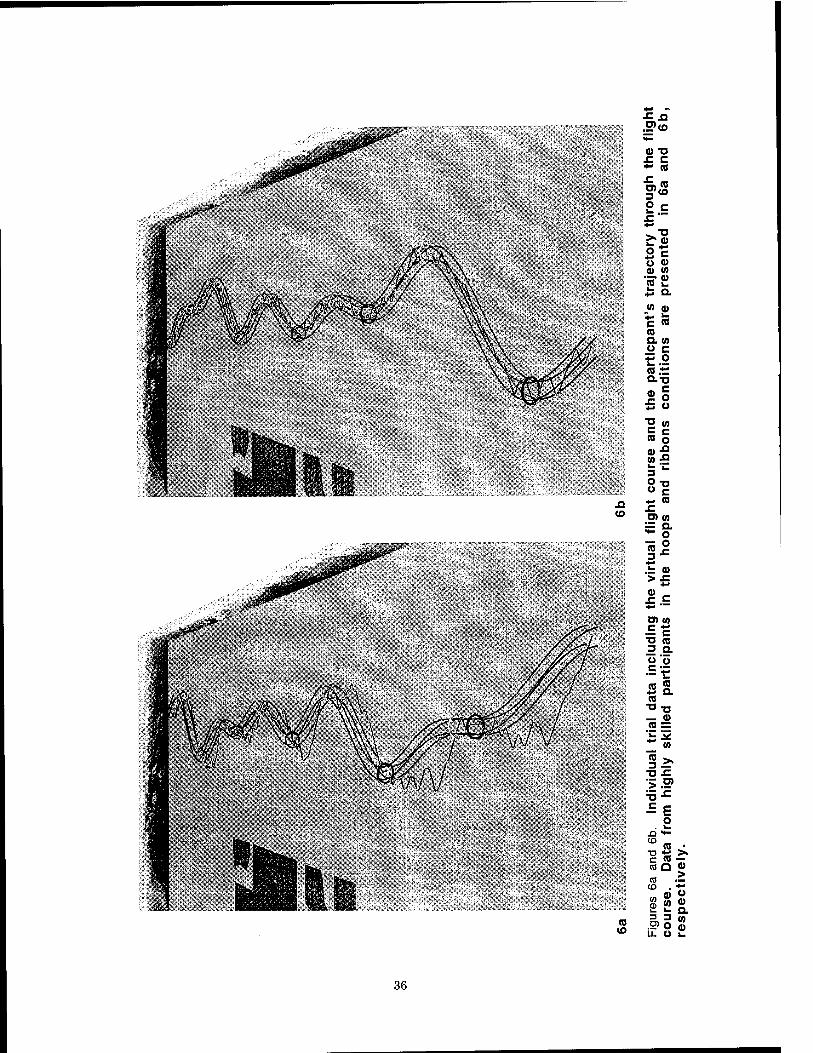
'/>■*
'£v\ It,/
w /ft (HM
7t\ ^ W " /
r /
(0
0) -o £ C ** (0
»3 2 =
°C U 0) 0) «
"ST a> SS "-
U> dJ
C « ra Q. w ü c r.2 a-o 5§ £ o "5 <o (0 o
o c 4-i 03
O) (0 E o- *■ o
1* 4-1 .!= a> > J=
4-»
+■»
ö) (0 •Ec 3 Q.
g« *- Q. <B
■o-o — <u (0 =
_ m
3 .2»
>.5> =5-= ^£ o 03 m . <0 ■ ■o ■£ >• co Q a> « >
!Ü 3 3 (A
U. U i.
36
actual trial data for highly skilled participants in the hoops and ribbons conditions, respectively.
In spite of the dramatic differences in task demands and control strategies required of the hoops and ribbons conditions, no differences were found in overall levels of workload for the two conditions. Moreover, the significant main effect for SESSION (see Figure 4) implies that participants in both conditions found the task to decrease in workload across experimental sessions. Such a result is promising for brain-body-actuated control because it implies that task performance can improve without concomitant increases in workload.
Overall levels of cybersickness were found to be at the low end of the scale and did not vary as a function of instruction condition or across experimental sessions. While the majority of participants did not report any severe symptoms of cybersickness, three participants did discontinue participation due to severe feelings of nausea and disorientation (see Figure 5). While the occurrence of cybersickness is relatively common in wide-area-view virtual environments, it is not clear what relationship, if any, exists between brain-body-actuated control and the occurrence of cybersickness.
In sum, the results of the present experiment provide compelling evidence that participants can use brain-body- actuated control to perform simple, single-axis, continuous control tasks. Future investigations should involve the evaluation of more difficult single-axis tasks, dual-axis control tasks, and tasks that require operators to simultaneously perform tasks that combine manual and brain-body-actuated control.
5: References
1. Furness, T. A. (1986). The super cockpit and it's human factors challenges. Proceedings of the Human Factors Society 30th Annual Meeting (pp. 48-52). Santa Monica, CA: Human Factors Society.
2. Haas, M. W. (1992). Multi-sensory virtual-interface technology. Proceedings of the 25th Annual NATO Defense Research Group Seminar. Imperial College of Science and Technology, South Kensington, London, United Kingdom.
3. Haas, M. W., & Hettinger, L. J. (1993). Applying virtual reality technology to cockpits of future fighter aircraft. Virtual Reality Systems. 1(2). 18-26.
4. Hart, S. G., & Staveland, L. E. (1988). Development of the NAS A-TLX (Task Load Index): Results of experimental and theoretical research. In P. A. Hancock and N. Meshkati (Eds.), Human mental workload (pp. 139-183). Amsterdam: Elsevier.
5. Junker, A. Berg, C., Schneider, P., & McMillan, G. (1995a). Evaluation of the CyberLink interface as an alternative human operator controller (AL/CF-TR-1995-0011). Wright-Patterson Air Force Base, OH: Armstrong Laboratory.
6. Junker A., Berg, C, Schneider, P., Terenzio, M., O'Conner, P., & McMillan, G. (1995b). Effects of training
and individual differences on performance with the CyberLink alternative control interface (AL/CF-TR-1995-0109). Wright- Patterson Air Force Base, OH: Armstrong Laboratory.
7. Kennedy, R. S., Lane, N. E., Berbaum, K. S., & Lilienthal, M. G. (1993). Simulator sickness questionnaire: An enhanced method for quantifying simulator sickness. The International Journal of Aviation Psychology. 3, 203-220.
8. Nelson, W. T., Hettinger, L. J., Cunningham, J. A., Roe, M. M., Haas, M. W., Dennis, L. B., Pick, H. L, Junker, A, Berg, C. (1996). Brain-body-actuated control: assessment of an alternative control technology for virtual environments. Proceedings of the 1996 IMAGE CONFERENCE (pp. 225-232). Chandler, AZ: The IMAGE Society, Inc.
37
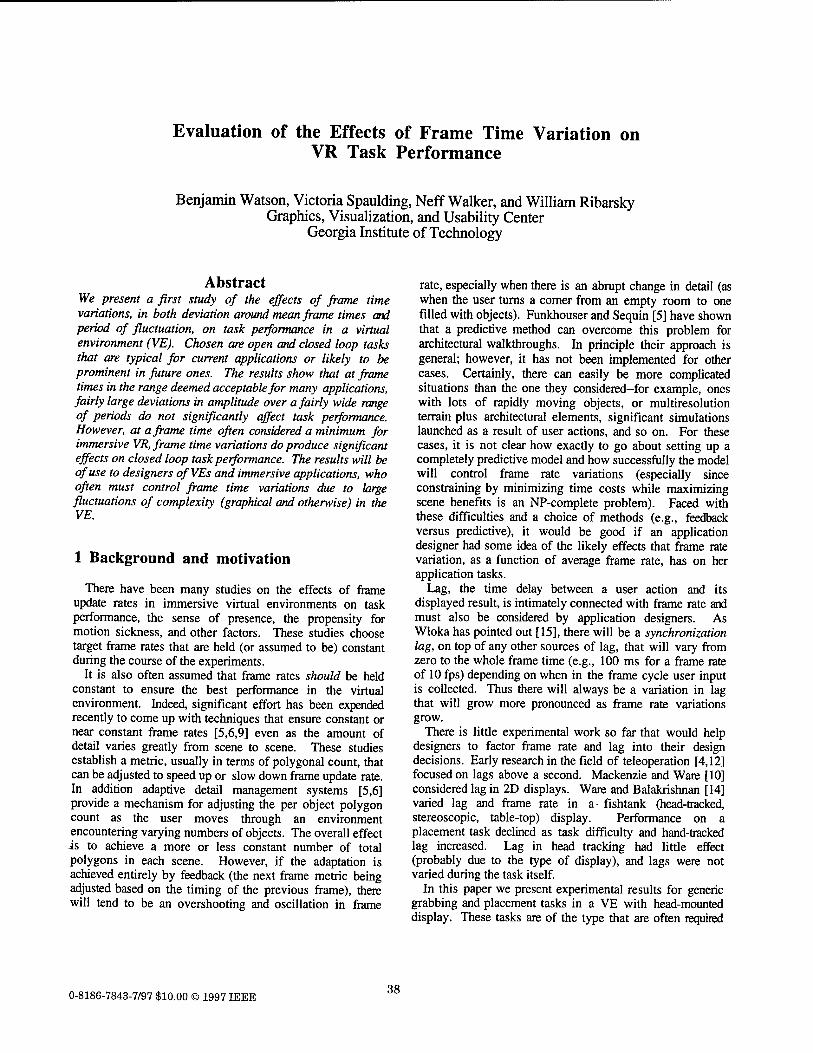
Evaluation of the Effects of Frame Time Variation on VR Task Performance
Benjamin Watson, Victoria Spaulding, Neff Walker, and William Ribarsky Graphics, Visualization, and Usability Center
Georgia Institute of Technology
Abstract We present a first study of the effects of frame time variations, in both deviation around mean frame times and period of fluctuation, on task performance in a virtual environment (VE). Chosen are open and closed loop tasks that are typical for current applications or likely to be prominent in future ones. The results show that at frame times in the range deemed acceptable for many applications, fairly large deviations in amplitude over a fairly wide range of periods do not significantly affect task performance. However, at a frame time often considered a minimum for immersive VR, frame time variations do produce significant effects on closed loop task performance. The results will be of use to designers ofVEs and immersive applications, who often must control frame time variations due to large fluctuations of complexity (graphical and otherwise) in the VE.
1 Background and motivation
There have been many studies on the effects of frame update rates in immersive virtual environments on task performance, the sense of presence, the propensity for motion sickness, and other factors. These studies choose target frame rates that are held (or assumed to be) constant during the course of the experiments.
It is also often assumed that frame rates should be held constant to ensure the best performance in the virtual environment. Indeed, significant effort has been expended recently to come up with techniques that ensure constant or near constant frame rates [5,6,9] even as the amount of detail varies greatly from scene to scene. These studies establish a metric, usually in terms of polygonal count, that can be adjusted to speed up or slow down frame update rate. In addition adaptive detail management systems [5,6] provide a mechanism for adjusting the per object polygon count as the user moves through an environment encountering varying numbers of objects. The overall effect is to achieve a more or less constant number of total polygons in each scene. However, if the adaptation is achieved entirely by feedback (the next frame metric being adjusted based on the timing of the previous frame), there will tend to be an overshooting and oscillation in frame
rate, especially when there is an abrupt change in detail (as when the user turns a comer from an empty room to one filled with objects). Funkhouser and Sequin [5] have shown that a predictive method can overcome this problem for architectural walkthroughs. In principle their approach is general; however, it has not been implemented for other cases. Certainly, there can easily be more complicated situations than the one they considered-for example, ones with lots of rapidly moving objects, or multiresolution terrain plus architectural elements, significant simulations launched as a result of user actions, and so on. For these cases, it is not clear how exactly to go about setting up a completely predictive model and how successfully the model will control frame rate variations (especially since constraining by minimizing time costs while maximizing scene benefits is an NP-complete problem). Faced with these difficulties and a choice of methods (e.g., feedback versus predictive), it would be good if an application designer had some idea of the likely effects that frame rate variation, as a function of average frame rate, has on her application tasks.
Lag, the time delay between a user action and its displayed result, is intimately connected with frame rate and must also be considered by application designers. As Wloka has pointed out [15], there will be a synchronization lag, on top of any other sources of lag, that will vary from zero to the whole frame time (e.g., 100 ms for a frame rate of 10 fps) depending on when in the frame cycle user input is collected. Thus there will always be a variation in lag that will grow more pronounced as frame rate variations grow.
There is little experimental work so far that would help designers to factor frame rate and lag into their design decisions. Early research in the field of teleoperation [4,12] focused on lags above a second. Mackenzie and Ware [10] considered lag in 2D displays. Ware and Balakrishnan [14] varied lag and frame rate in a- fishtank (head-tracked, stereoscopic, table-top) display. Performance on a placement task declined as task difficulty and hand-tracked lag increased. Lag in head tracking had little effect (probably due to the type of display), and lags were not varied during the task itself.
In this paper we present experimental results for generic grabbing and placement tasks in a VE with head-mounted display. These tasks are of the type that are often required
0-8186-7843-7/97 $10.00 © 1997 IEEE 38
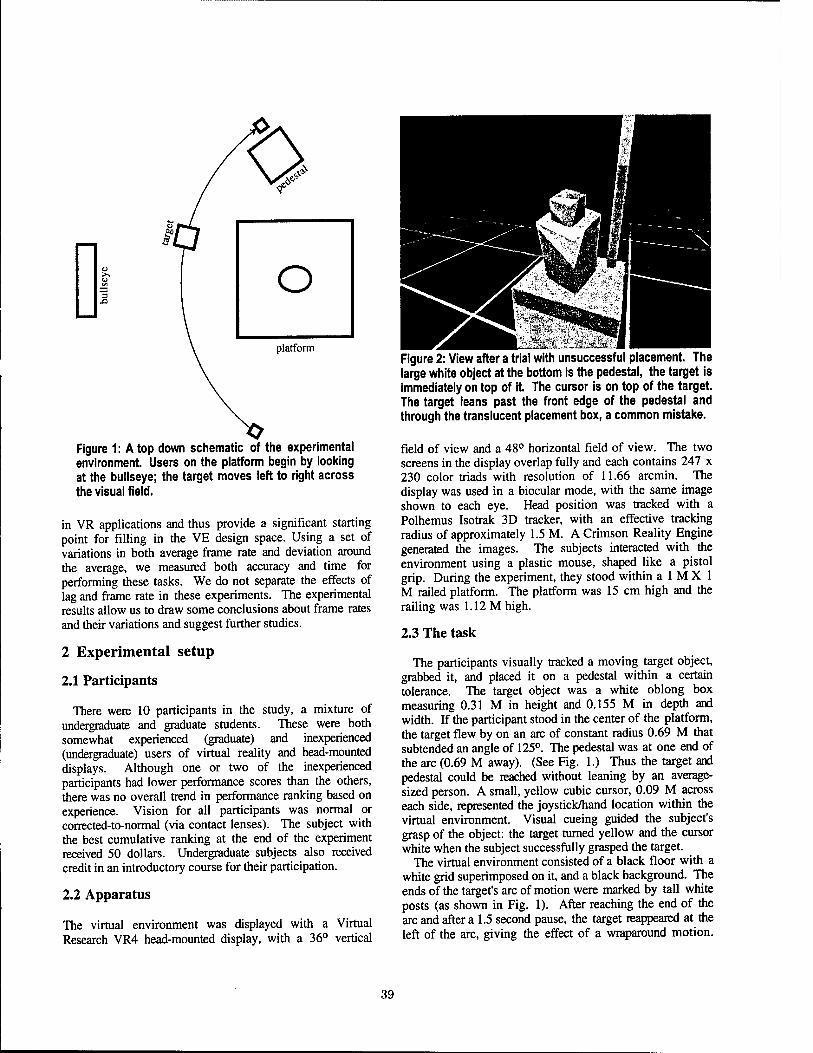
Figure 1: Atop down schematic of the experimental environment. Users on the platform begin by looking at the bullseye; the target moves left to right across the visual field.
in VR applications and thus provide a significant starting point for filling in the VE design space. Using a set of variations in both average frame rate and deviation around the average, we measured both accuracy and time for performing these tasks. We do not separate the effects of lag and frame rate in these experiments. The experimental results allow us to draw some conclusions about frame rates and their variations and suggest further studies.
2 Experimental setup
2.1 Participants
There were 10 participants in the study, a mixture of undergraduate and graduate students. These were both somewhat experienced (graduate) and inexperienced (undergraduate) users of virtual reality and head-mounted displays. Although one or two of the inexperienced participants had lower performance scores than the others, there was no overall trend in performance ranking based on experience. Vision for all participants was normal or corrected-to-normal (via contact lenses). The subject with the best cumulative ranking at the end of the experiment received 50 dollars. Undergraduate subjects also received credit in an introductory course for their participation.
2.2 Apparatus
The virtual environment was displayed with a Virtual Research VR4 head-mounted display, with a 36° vertical
Figure 2: View after a trial with unsuccessful placement. The large white object at the bottom is the pedestal, the target is immediately on top of it The cursor is on top of the target. The target leans past the front edge of the pedestal and through the translucent placement box, a common mistake.
field of view and a 48° horizontal field of view. The two screens in the display overlap fully and each contains 247 x 230 color triads with resolution of 11.66 arcmin. The display was used in a biocular mode, with the same image shown to each eye. Head position was tracked with a Polhemus Isotrak 3D tracker, with an effective tracking radius of approximately 1.5 M. A Crimson Reality Engine generated the images. The subjects interacted with the environment using a plastic mouse, shaped like a pistol grip. During the experiment, they stood within alMXl M railed platform. The platform was 15 cm high and the railing was 1.12 M high.
2.3 The task
The participants visually tracked a moving target object, grabbed it, and placed it on a pedestal within a certain tolerance. The target object was a white oblong box measuring 0.31 M in height and 0.155 M in depth and width. If the participant stood in the center of the platform, the target flew by on an arc of constant radius 0.69 M that subtended an angle of 125°. The pedestal was at one end of the arc (0.69 M away). (See Fig. 1.) Thus the target and pedestal could be reached without leaning by an average- sized person. A small, yellow cubic cursor, 0.09 M across each side, represented the joystick/hand location within the virtual environment. Visual cueing guided the subject's grasp of the object: the target turned yellow and the cursor white when the subject successfully grasped the target.
The virtual environment consisted of a black floor with a white grid superimposed on it, and a black background. The ends of the target's arc of motion were marked by tall white posts (as shown in Fig. 1). After reaching the end of the arc and after a 1.5 second pause, the target reappeared at the left of the arc, giving the effect of a wraparound motion.
39
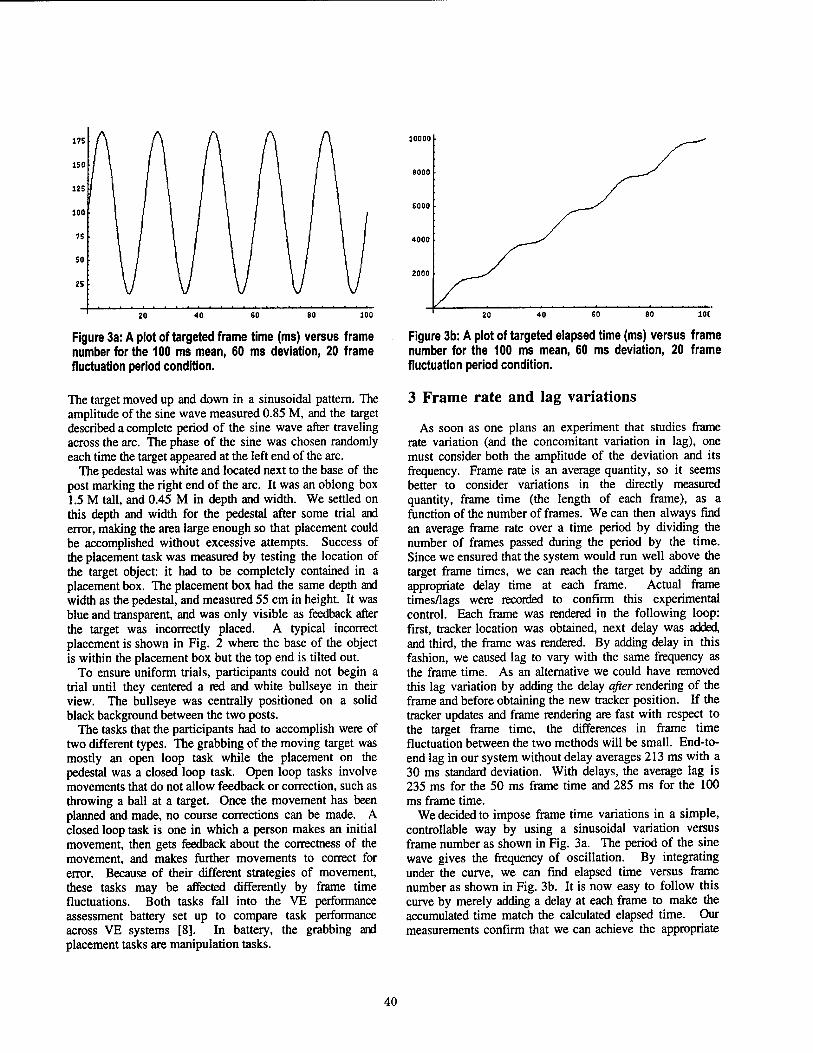
Figure 3a: A plot of targeted frame time (ms) versus frame number for the 100 ms mean, 60 ms deviation, 20 frame fluctuation period condition.
The target moved up and down in a sinusoidal pattern. The amplitude of the sine wave measured 0.85 M, and the target described a complete period of the sine wave after traveling across the arc. The phase of the sine was chosen randomly each time the target appeared at the left end of the arc.
The pedestal was white and located next to the base of the post marking the right end of the arc. It was an oblong box 1.5 M tall, and 0.45 M in depth and width. We settled on this depth and width for the pedestal after some trial and error, making the area large enough so that placement could be accomplished without excessive attempts. Success of the placement task was measured by testing the location of the target object: it had to be completely contained in a placement box. The placement box had the same depth and width as the pedestal, and measured 55 cm in height. It was blue and transparent, and was only visible as feedback after the target was incorrectly placed. A typical incorrect placement is shown in Fig. 2 where the base of the object is within the placement box but the top end is tilted out.
To ensure uniform trials, participants could not begin a trial until they centered a red and white bullseye in their view. The bullseye was centrally positioned on a solid black background between the two posts.
The tasks that the participants had to accomplish were of two different types. The grabbing of the moving target was mostly an open loop task while the placement on the pedestal was a closed loop task. Open loop tasks involve movements that do not allow feedback or correction, such as throwing a ball at a target. Once the movement has been planned and made, no course corrections can be made. A closed loop task is one in which a person makes an initial movement, then gets feedback about the correctness of the movement, and makes further movements to correct for error. Because of their different strategies of movement, these tasks may be affected differently by frame time fluctuations. Both tasks fall into the VE performance assessment battery set up to compare task performance across VE systems [8]. In battery, the grabbing and placement tasks are manipulation tasks.
Figure 3b: A plot of targeted elapsed time (ms) versus frame number for the 100 ms mean, 60 ms deviation, 20 frame fluctuation period condition.
3 Frame rate and lag variations
As soon as one plans an experiment that studies frame rate variation (and the concomitant variation in lag), one must consider both the amplitude of the deviation and its frequency. Frame rate is an average quantity, so it seems better to consider variations in the direcdy measured quantity, frame time (the length of each frame), as a function of the number of frames. We can then always find an average frame rate over a time period by dividing the number of frames passed during the period by the time. Since we ensured that the system would run well above the target frame times, we can reach the target by adding an appropriate delay time at each frame. Actual frame times/lags were recorded to confirm this experimental control. Each frame was rendered in the following loop: first, tracker location was obtained, next delay was added, and third, the frame was rendered. By adding delay in this fashion, we caused lag to vary with the same frequency as the frame time. As an alternative we could have removed this lag variation by adding the delay after rendering of the frame and before obtaining the new tracker position. If the tracker updates and frame rendering are fast with respect to the target frame time, the differences in frame time fluctuation between the two methods will be small. End-to- end lag in our system without delay averages 213 ms with a 30 ms standard deviation. With delays, the average lag is 235 ms for the 50 ms frame time and 285 ms for the 100 ms frame time.
We decided to impose frame time variations in a simple, controllable way by using a sinusoidal variation versus frame number as shown in Fig. 3a. The period of the sine wave gives the frequency of oscillation. By integrating under the curve, we can find elapsed time versus frame number as shown in Fig. 3b. It is now easy to follow this curve by merely adding a delay at each frame to make the accumulated time match the calculated elapsed time. Our measurements confirm that we can achieve the appropriate
40
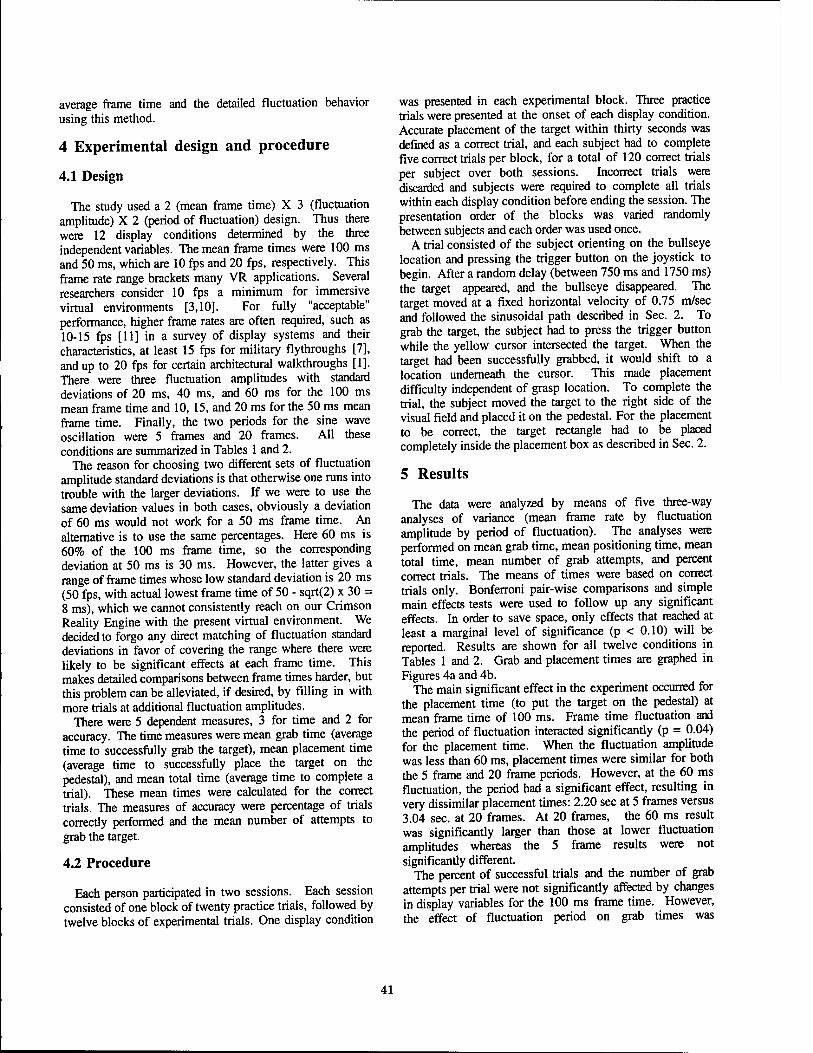
average frame time and the detailed fluctuation behavior using this method.
4 Experimental design and procedure
4.1 Design
The study used a 2 (mean frame time) X 3 (fluctuation amplitude) X 2 (period of fluctuation) design. Thus there were 12 display conditions determined by the three independent variables. The mean frame times were 100 ms and 50 ms, which are 10 fps and 20 fps, respectively. This frame rate range brackets many VR applications. Several researchers consider 10 fps a minimum for immersive virtual environments [3,10]. For fully "acceptable" performance, higher frame rates are often required, such as 10-15 fps [11] in a survey of display systems and their characteristics, at least 15 fps for military flythroughs [7], and up to 20 fps for certain architectural walkthroughs [1]. There were three fluctuation amplitudes with standard deviations of 20 ms, 40 ms, and 60 ms for the 100 ms mean frame time and 10, 15, and 20 ms for the 50 ms mean frame time. Finally, the two periods for the sine wave oscillation were 5 frames and 20 frames. All these conditions are summarized in Tables 1 and 2.
The reason for choosing two different sets of fluctuation amplitude standard deviations is that otherwise one runs into trouble with the larger deviations. If we were to use the same deviation values in both cases, obviously a deviation of 60 ms would not work for a 50 ms frame time. An alternative is to use the same percentages. Here 60 ms is 60% of the 100 ms frame time, so the corresponding deviation at 50 ms is 30 ms. However, the latter gives a range of frame times whose low standard deviation is 20 ms (50 fps, with actual lowest frame time of 50 - sqrt(2) x 30 = 8 ms), which we cannot consistently reach on our Crimson Reality Engine with the present virtual environment. We decided to forgo any direct matching of fluctuation standard deviations in favor of covering the range where there were likely to be significant effects at each frame time. This makes detailed comparisons between frame times harder, but this problem can be alleviated, if desired, by filling in with more trials at additional fluctuation amplitudes.
There were 5 dependent measures, 3 for time and 2 for accuracy. The time measures were mean grab time (average time to successfully grab the target), mean placement time (average time to successfully place the target on the pedestal), and mean total time (average time to complete a trial). These mean times were calculated for the correct trials. The measures of accuracy were percentage of trials correctly performed and the mean number of attempts to grab the target.
4.2 Procedure
Each person participated in two sessions. Each session consisted of one block of twenty practice trials, followed by twelve blocks of experimental trials. One display condition
was presented in each experimental block. Three practice trials were presented at the onset of each display condition. Accurate placement of the target within thirty seconds was defined as a correct trial, and each subject had to complete five correct trials per block, for a total of 120 correct trials per subject over both sessions. Incorrect trials were discarded and subjects were required to complete all trials within each display condition before ending the session. The presentation order of the blocks was varied randomly between subjects and each order was used once.
A trial consisted of the subject orienting on the bullseye location and pressing the trigger button on the joystick to begin. After a random delay (between 750 ms and 1750 ms) the target appeared, and the bullseye disappeared. The target moved at a fixed horizontal velocity of 0.75 m/sec and followed the sinusoidal path described in Sec. 2. To grab the target, the subject had to press the trigger button while the yellow cursor intersected the target. When the target had been successfully grabbed, it would shift to a location underneath the cursor. This made placement difficulty independent of grasp location. To complete the trial, the subject moved the target to the right side of the visual field and placed it on the pedestal. For the placement to be correct, the target rectangle had to be placed completely inside the placement box as described in Sec. 2.
5 Results
The data were analyzed by means of five three-way analyses of variance (mean frame rate by fluctuation amplitude by period of fluctuation). The analyses were performed on mean grab time, mean positioning time, mean total time, mean number of grab attempts, and percent correct trials. The means of times were based on correct trials only. Bonferroni pair-wise comparisons and simple main effects tests were used to follow up any significant effects. In order to save space, only effects that reached at least a marginal level of significance (p < 0.10) will be reported. Results are shown for all twelve conditions in Tables 1 and 2. Grab and placement times are graphed in Figures 4a and 4b.
The main significant effect in the experiment occurred for the placement time (to put the target on the pedestal) at mean frame time of 100 ms. Frame time fluctuation and the period of fluctuation interacted significantly (p = 0.04) for the placement time. When the fluctuation amplitude was less than 60 ms, placement times were similar for both the 5 frame and 20 frame periods. However, at the 60 ms fluctuation, the period had a significant effect, resulting in very dissimilar placement times: 2.20 sec at 5 frames versus 3.04 sec. at 20 frames. At 20 frames, the 60 ms result was significantly larger than those at lower fluctuation amplitudes whereas the 5 frame results were not significantly different.
The percent of successful trials and the number of grab attempts per trial were not significantly affected by changes in display variables for the 100 ms frame time. However, the effect of fluctuation period on grab times was
41
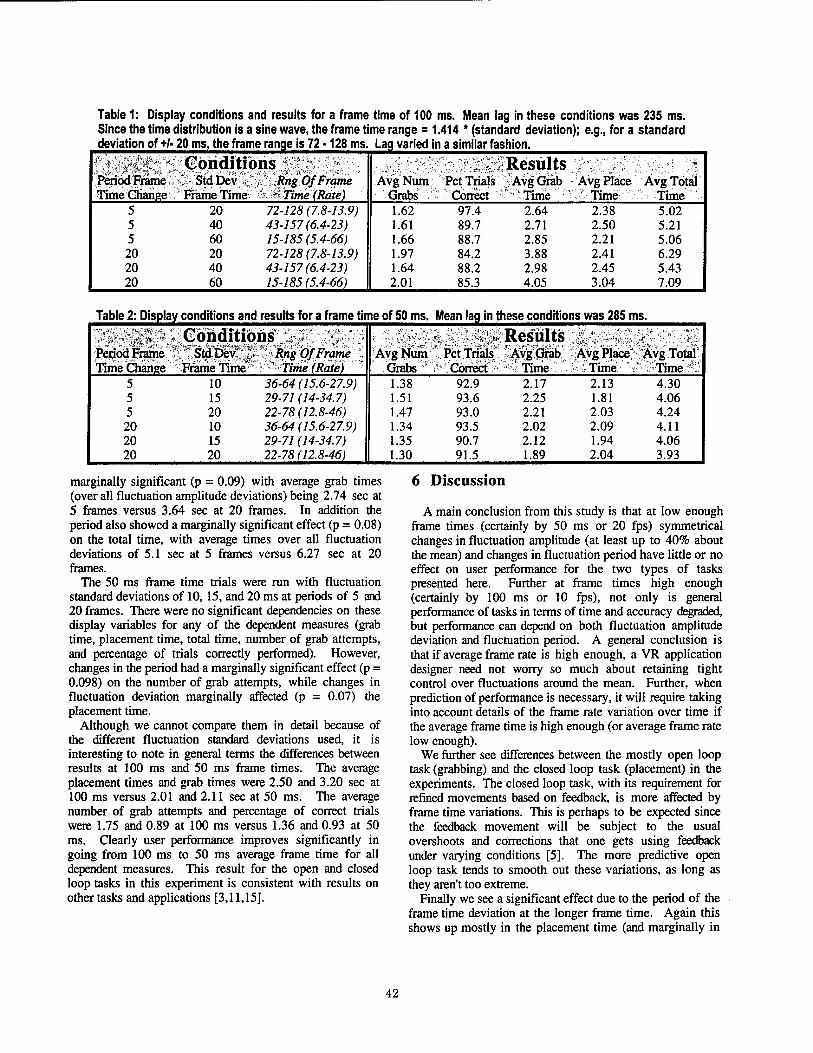
Table 1: Display conditions and results for a frame time of 100 ms. Mean lag in these conditions was 235 ms. Since the time distribution is a sine wave, the frame time range = 1.414 * (standard deviation); e.g., for a standard deviation of +/■ 20 ms, the frame range is 72 -128 ms. Lag varied in a similar fashion.
Peric^Frame Time Change
Conditions v StdDev , Rng OfFrame
Frame Time s.'WTime (Rate) Avg Num.
Grabs V
Results Pet Trials |Avg Grab
Correct Time Avg Place
Time Ävg Total
Time 5 5 5 20 20 20
20 72-725 (7.8-13.9) 40 43-157(6.4-23) 60 75-755 (5.4-66) 20 72-725 (7.8-13.9) 40 43-157(6.4-23) 60 15-185(5.4-66)
1.62 1.61 1.66 1.97 1.64 2.01
97.4 2.64 89.7 2.71 88.7 2.85 84.2 3.88 88.2 2.98 85.3 4.05
2.38 2.50 2.21 2.41 2.45 3.04
5.02 5.21 5.06 6.29 5.43 7.09
Table 2: Display conditions and results for a frame time of 50 ms. Mean lag in these conditions was 285 ms.
Period'Frame" Time Change
Conditions StdDev \ Rng Of Frame
Frame time ^ ::Time (Rate) »AvgNum
Grabs
, Results Pet Trials Avg Grab
;■ ' Correct "^ Time-''"" Avg Place4 ^ Ayg Total"
'■■/: Time / -Time *Z 5 5 5 20 20 20
10 36-64 (15.6-27.9) 15 29-77 (14-34.7) 20 22-75 (12.8-46) 10 36-64 (15.6-27.9) 15 29-77 (14-34.7) 20 22-78(12.8-46)
1.38 1.51 1.47 1.34 1.35 1.30
92.9 2.17 93.6 2.25 93.0 2.21 93.5 2.02 90.7 2.12 91.5 1.89
2.13 4.30 1.81 4.06 2.03 4.24 2.09 4.11 1.94 4.06 2.04 3.93
marginally significant (p = 0.09) with average grab times (over all fluctuation amplitude deviations) being 2.74 sec at 5 frames versus 3.64 sec at 20 frames. In addition the period also showed a marginally significant effect (p = 0.08) on the total time, with average times over all fluctuation deviations of 5.1 sec at 5 frames versus 6.27 sec at 20 frames.
The 50 ms frame time trials were run with fluctuation standard deviations of 10, 15, and 20 ms at periods of 5 and 20 frames. There were no significant dependencies on these display variables for any of the dependent measures (grab time, placement time, total time, number of grab attempts, and percentage of trials correctly performed). However, changes in the period had a marginally significant effect (p = 0.098) on the number of grab attempts, while changes in fluctuation deviation marginally affected (p = 0.07) the placement time.
Although we cannot compare them in detail because of the different fluctuation standard deviations used, it is interesting to note in general terms the differences between results at 100 ms and 50 ms frame times. The average placement times and grab times were 2.50 and 3.20 sec at 100 ms versus 2.01 and 2.11 sec at 50 ms. The average number of grab attempts and percentage of correct trials were 1.75 and 0.89 at 100 ms versus 1.36 and 0.93 at 50 ms. Clearly user performance improves significantly in going from 100 ms to 50 ms average frame time for all dependent measures. This result for the open and closed loop tasks in this experiment is consistent with results on other tasks and applications [3,11,15].
6 Discussion
A main conclusion from this study is that at low enough frame times (certainly by 50 ms or 20 fps) symmetrical changes in fluctuation amplitude (at least up to 40% about the mean) and changes in fluctuation period have little or no effect on user performance for the two types of tasks presented here. Further at frame times high enough (certainly by 100 ms or 10 fps), not only is general performance of tasks in terms of time and accuracy degraded, but performance can depend on both fluctuation amplitude deviation and fluctuation period. A general conclusion is that if average frame rate is high enough, a VR application designer need not worry so much about retaining tight control over fluctuations around the mean. Further, when prediction of performance is necessary, it will require taking into account details of the frame rate variation over time if the average frame time is high enough (or average frame rate low enough).
We further see differences between the mostly open loop task (grabbing) and the closed loop task (placement) in the experiments. The closed loop task, with its requirement for refined movements based on feedback, is more affected by frame time variations. This is perhaps to be expected since the feedback movement will be subject to the usual overshoots and corrections that one gets using feedback under varying conditions [5]. The more predictive open loop task tends to smooth out these variations, as long as they aren't too extreme.
Finally we see a significant effect due to the period of the frame time deviation at the longer frame time. Again this shows up mostly in the placement time (and marginally in
42
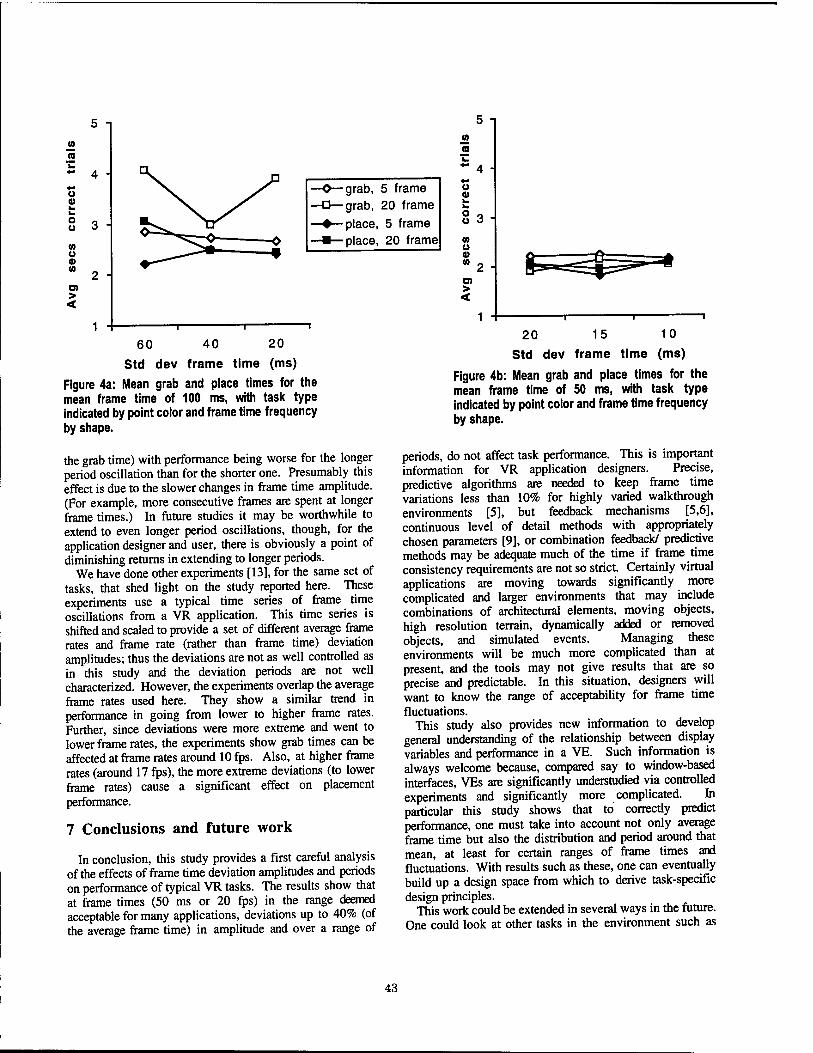
5 i
es
o Q) Im
O u
(0 u 0) (0
O) > <
grab, 5 frame grab, 20 frame
place, 5 frame place, 20 frame
60 40 20
Std dev frame time (ms)
Figure 4a: Mean grab and place times for the mean frame time of 100 ms, with task type indicated by point color and frame time frequency by shape.
the grab time) with performance being worse for the longer period oscillation than for the shorter one. Presumably this effect is due to the slower changes in frame time amplitude. (For example, more consecutive frames are spent at longer frame times.) In future studies it may be worthwhile to extend to even longer period oscillations, though, for the application designer and user, there is obviously a point of diminishing returns in extending to longer periods.
We have done other experiments [13], for the same set of tasks, that shed light on the study reported here. These experiments use a typical time series of frame time oscillations from a VR application. This time series is shifted and scaled to provide a set of different average frame rates and frame rate (rather than frame time) deviation amplitudes; thus the deviations are not as well controlled as in this study and the deviation periods are not well characterized. However, the experiments overlap the average frame rates used here. They show a similar trend in performance in going from lower to higher frame rates. Further, since deviations were more extreme and went to lower frame rates, the experiments show grab times can be affected at frame rates around 10 fps. Also, at higher frame rates (around 17 fps), the more extreme deviations (to lower frame rates) cause a significant effect on placement performance.
7 Conclusions and future work
In conclusion, this study provides a first careful analysis of the effects of frame time deviation amplitudes and periods on performance of typical VR tasks. The results show that at frame times (50 ms or 20 fps) in the range deemed acceptable for many applications, deviations up to 40% (of the average frame time) in amplitude and over a range of
u 0) im k. o u w u tt) (0
at > <
20 15 10
Std dev frame time (ms)
Figure 4b: Mean grab and place times for the mean frame time of 50 ms, with task type indicated by point color and frame time frequency by shape.
periods, do not affect task performance. This is important information for VR application designers. Precise, predictive algorithms are needed to keep frame time variations less than 10% for highly varied walkthrough environments [5], but feedback mechanisms [5,6], continuous level of detail methods with appropriately chosen parameters [9], or combination feedback/ predictive methods may be adequate much of the time if frame time consistency requirements are not so strict. Certainly virtual applications are moving towards significantly more complicated and larger environments that may include combinations of architectural elements, moving objects, high resolution terrain, dynamically added or removed objects, and simulated events. Managing these environments will be much more complicated than at present, and the tools may not give results that are so precise and predictable. In this situation, designers will want to know the range of acceptability for frame time fluctuations.
This study also provides new information to develop general understanding of the relationship between display variables and performance in a VE. Such information is always welcome because, compared say to window-based interfaces, VEs are significantly understudied via controlled experiments and significantly more complicated. In particular this study shows that to correctly predict performance, one must take into account not only average frame time but also the distribution and period around that mean, at least for certain ranges of frame times and fluctuations. With results such as these, one can eventually build up a design space from which to derive task-specific design principles.
This work could be extended in several ways in the future. One could look at other tasks in the environment such as
43

navigation involving "walking" or "flying", reaction time tasks, search tasks, and so on. Certainly the performance space should be filled in with studies at other frame times and fluctuation amplitudes. The studies begun in [13], looking at non-uniform variations in frame time or frame rate, could also be continued for other types of fluctuation patterns. Here it would be useful to come up with a measure of the fluctuation distribution so that one could classify the distributions in a quantitative way. Finally it would be useful to look at the effects of lag separately. These experiments vary lag as they vary frame time, but one could set up an environment with a fixed delay due to rendering and display and then vary the lag time. Since several researchers [2,10,14,15] say that lag is the dominant component affecting performance, a study of lag variations could be quite revealing.
8 References
6.
1.
3.
4.
J. Airey, J. Rohlf, and F. Brooks. Towards Image Realism with Interactive Update Rates in Complex Virtual Building Environments. Symposium on Interactive 3D Graphics, pp. 41-50 (1990). F. Brooks. Grasping Reality Through Illusion- Interactive Graphics Serving Science. Human Factors in Computing, SIGCHI Bulletin, pp. 1-11 (1988). S. Bryson. Implementing Virtual Reality. SIGGRAPH 1993 Course #43 Notes, 1.1.1-1.1.5; 16.1-16.12. W.R. Ferrell. Delayed force feedback. Human Factors, October, 449-455 (1966). T.A. Funkhouser and C.H. Sequin. Adaptive Display Algorithm for Interactive Frame Rates during Visualization of Complex Virtual Environments. Computer Graphics (ACM SIGGRAPH Proceedings), pp. 247-254 (August 1993).
9.
10.
11.
12.
13.
14.
15.
L.E. Hitchner and M.W. McGreevy. Methods for User- Based Reduction of Model Complexity for Virtual Planetary Exploration. Proceedings of SPIE 1993, pp. 1- 16, (February, 1993). D. Koller, P. Lindstrom, W. Ribarsky, L. Hodges, N. Faust, and G. Turner. Virtual GIS: A Real-Time 3D Geographic Information System. Proceedings Visualization '95, pp. 94-100. D. Lampton, B. Knerr, S. Goldberg, J. Bliss, M. Moshell, and B. Blau. The Virtual Environment Performance Assessment Battery (VEPAB). Presence, 3(2), pp. 145- 157 (1994). P. Lindstrom, D. Koller, W. Ribarsky, L. Hodges, N. Faust, and G. Turner. Real-Time, Continuous Level of Detail Rendering of Height Fields. Computer Graphics (SIGGRAPH '96), pp. 109-118. I.S. MacKenzie and C. Ware. Lag as a Determinant of Human Performance in Interactive Systems. Proc. INTERCH1 Conf. on Human Factors in Computing Systems, pp. 488-493 (1993). M.D. McKenna and D. Zeltzer. Three dimensional visual display systems for virtual environments. Presence, 1(4), pp. 421-458 (1992). T. Sheridan. Telerobotics, automation, and human supervisory control. Cambridge, MA: MIT Press (1992). N. Walker, V. Spaulding, B. Watson and W. Ribarsky. The effects of variation in frame rate and latency on performance in virtual environments. GVU Tech. Report GVU 96-32 (1996). C. Ware and R. Balakrishnan. Reaching for objects in VR displays: lag and frame rate. ACM Transactions on Computer-Human Interaction, 1(4), 331-357 (1994). M. Wloka. Lag in Multiprocessor VR. Tutorial: Virtual Reality for Visualization, IEEE Visualization '94, pp. 130-152.
44
Travel in Immersive Virtual Environments: An Evaluation of Viewpoint Motion Control Techniques
Doug A. Bowman, David Koller, and Larry F. Hodges Graphics, Visualization, and Usability Center
College of Computing Georgia Institute of Technology
Atlanta, GA 30332-0280 {bowman,koller,hodges}@cc.gatech.edu
Abstract
We present a categorization of techniques for first- person motion control, or travel, through immersive virtual environments, as well as a framework for evaluating the quality of different techniques for specific virtual environment tasks. We conduct three quantitative experiments within this framework: a comparison of different techniques for moving directly to a target object varying in size and distance, a comparison of different techniques for moving relative to a reference object, and a comparison of different motion techniques and their resulting sense of "disorientation" in the user. Results indicate that "pointing" techniques are advantageous relative to "gaze-directed" steering techniques for a relative motion task, and that motion techniques which instantly teleport users to new locations are correlated with increased user disorientation.
1. Introduction
Virtual environment (VE) user interfaces have not been the focus of a great deal of user testing or quantitative analysis. Travel, by which we mean the control of user viewpoint motion through a VE, is an important and universal user interface task which needs to be better understood and implemented in order to maximize users' comfort and productivity in VE systems. We distinguish travel from navigation or wayfinding, which refer to the process of determining a path through an environment to reach a goal. Our work attempts to comprehend and categorize the techniques which have been proposed and implemented, and to demonstrate an experimental method which may be used to evaluate the effectiveness of travel techniques in a structured and logical way.
There are several restrictions we place on our consideration of VE travel techniques. First, we examine only immersive virtual environments, which use head tracking and head-mounted displays or spatially immersive displays (SIDs), and use 3D spatial input devices for
interaction. Secondly, we study only first-person travel techniques, or those in which the user's view is attached to the camera point in the VE (techniques have been proposed in which the user's view is temporarily detached from this position for a more global view of the environment [e.g. 11]). Also, we do not include techniques using physical user motion, such as treadmills or adapted bicycles. Finally, we consider only techniques which are predominantly under the control of the user, and not those in which travel is carried out automatically or aided significantly by the system.
The following sections of this paper review related research in the area of VE travel interaction, and present a taxonomy of travel techniques and a framework for their evaluation. Three relevant experiments illustrating this framework and their results are then described.
2. Related work
A number of researchers have addressed issues related to navigation and travel both in immersive virtual environments and in general 3D computer interaction tasks. It has been asserted [5] that studying and understanding human navigation and motion control is of great importance for understanding how to build effective virtual environment travel interfaces [13,19]. Although we do not directly address the cognitive issues surrounding virtual environment navigation, this area has been the subject of some prior investigation and discussion [3,20].
Various metaphors for viewpoint motion and control in 3D environments have been proposed. Ware et al. [17,18] identify the "flying," "eyeball-in-hand," and "scene-in- hand" metaphors. A fourth metaphor, "ray casting," [6] has been suggested, which can be used to select targets for navigation. Others make use of a "World-in-Miniature" representation as a device for navigation and locomotion in immersive virtual environments [11,15].
Numerous implementations of non-immersive 3D travel techniques have been described. Strommen compares three different mouse-based interfaces for children to control point-of-view navigation [16]. Mackinlay et al.
0-8186-7843-7/97 $10.00 © 1997 IEEE 45
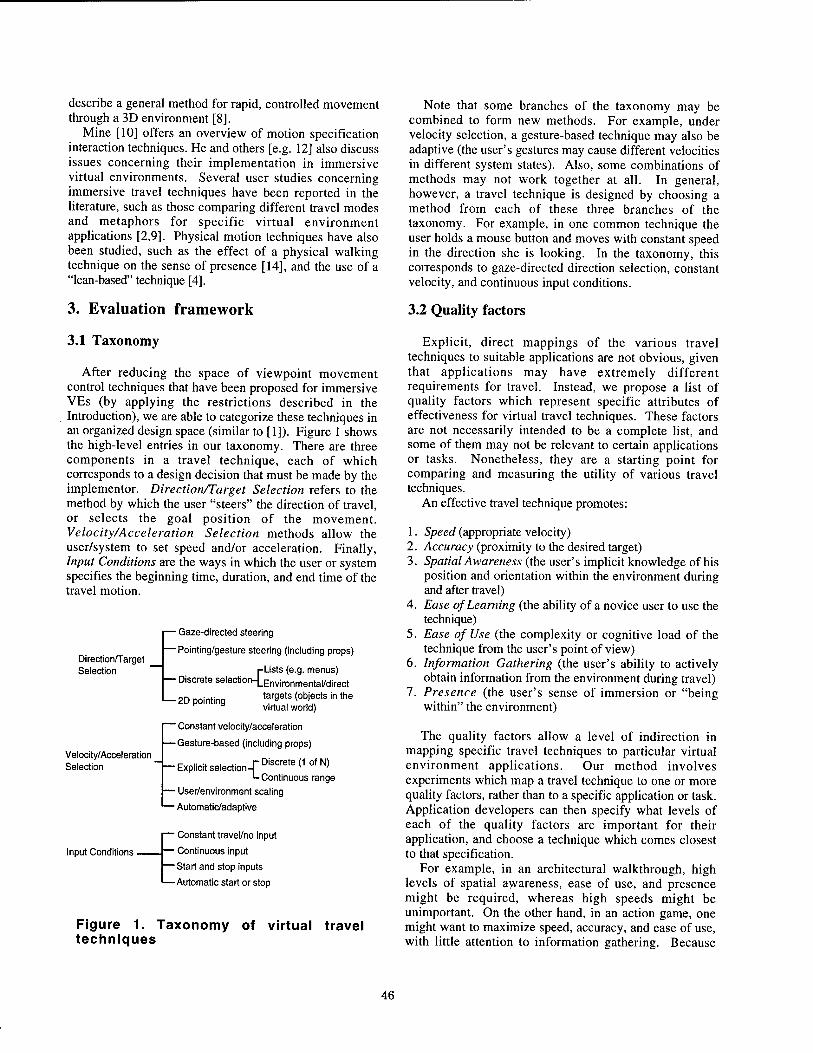
describe a general method for rapid, controlled movement through a 3D environment [8].
Mine [10] offers an overview of motion specification interaction techniques. He and others [e.g. 12] also discuss issues concerning their implementation in immersive virtual environments. Several user studies concerning immersive travel techniques have been reported in the literature, such as those comparing different travel modes and metaphors for specific virtual environment applications [2,9]. Physical motion techniques have also been studied, such as the effect of a physical walking technique on the sense of presence [14], and the use of a "lean-based" technique [4].
3. Evaluation framework
3.1 Taxonomy
After reducing the space of viewpoint movement control techniques that have been proposed for immersive VEs (by applying the restrictions described in the Introduction), we are able to categorize these techniques in an organized design space (similar to [1]). Figure 1 shows the high-level entries in our taxonomy. There are three components in a travel technique, each of which corresponds to a design decision that must be made by the implementor. Direction/Target Selection refers to the method by which the user "steers" the direction of travel, or selects the goal position of the movement. Velocity/Acceleration Selection methods allow the user/system to set speed and/or acceleration. Finally, Input Conditions are the ways in which the user or system specifies the beginning time, duration, and end time of the travel motion.
Direction/Target Selection
- Gaze-directed steering
-Pointing/gesture steering (including props)
r-Lists (e.g. menus) - Discrete selection-LEnv[ronmenta|/direct
targets (objects in the virtual world)
■ 2D pointing
Velocity/Acceleration Selection
" Constant velocity/acceleration
-Gesture-based (including props)
- Explicit selection-rDiscre,e'1ofN) '-Continuous range
- User/environment scaling
- Automatic/adaptive
■ Constant travel/no input
- Continuous input
- Start and stop inputs
- Automatic start or stop
Figure 1. Taxonomy of virtual travel techniques
Input Conditions.
Note that some branches of the taxonomy may be combined to form new methods. For example, under velocity selection, a gesture-based technique may also be adaptive (the user's gestures may cause different velocities in different system states). Also, some combinations of methods may not work together at all. In general, however, a travel technique is designed by choosing a method from each of these three branches of the taxonomy. For example, in one common technique the user holds a mouse button and moves with constant speed in the direction she is looking. In the taxonomy, this corresponds to gaze-directed direction selection, constant velocity, and continuous input conditions.
3.2 Quality factors
Explicit, direct mappings of the various travel techniques to suitable applications are not obvious, given that applications may have extremely different requirements for travel. Instead, we propose a list of quality factors which represent specific attributes of effectiveness for virtual travel techniques. These factors are not necessarily intended to be a complete list, and some of them may not be relevant to certain applications or tasks. Nonetheless, they are a starting point for comparing and measuring the utility of various travel techniques.
An effective travel technique promotes:
1. Speed (appropriate velocity) 2. Accuracy (proximity to the desired target) 3. Spatial Awareness (the user's implicit knowledge of his
position and orientation within the environment during and after travel)
4. Ease of Learning (the ability of a novice user to use the technique)
5. Ease of Use (the complexity or cognitive load of the technique from the user's point of view)
6. Information Gathering (the user's ability to actively obtain information from the environment during travel)
7. Presence (the user's sense of immersion or "being within" the environment)
The quality factors allow a level of indirection in mapping specific travel techniques to particular virtual environment applications. Our method involves experiments which map a travel technique to one or more quality factors, rather than to a specific application or task. Application developers can then specify what levels of each of the quality factors are important for their application, and choose a technique which comes closest to that specification.
For example, in an architectural walkthrough, high levels of spatial awareness, ease of use, and presence might be required, whereas high speeds might be unimportant. On the other hand, in an action game, one might want to maximize speed, accuracy, and ease of use, with little attention to information gathering. Because
46
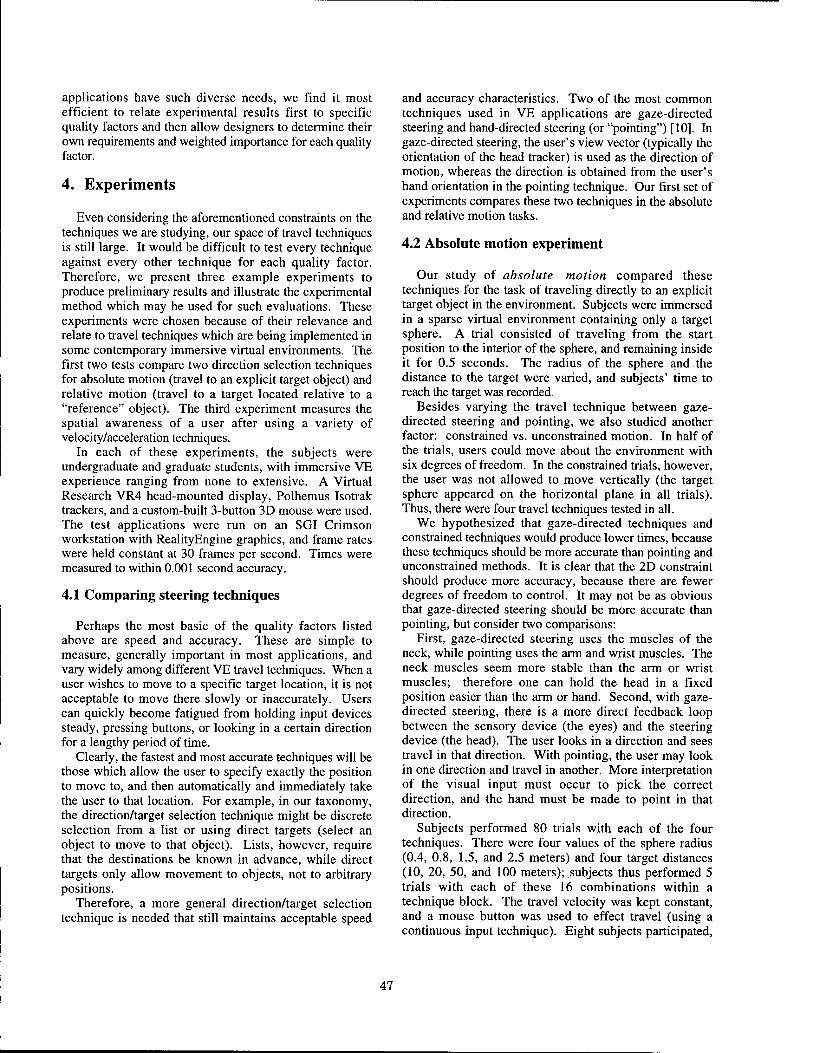
applications have such diverse needs, we find it most efficient to relate experimental results first to specific quality factors and then allow designers to determine their own requirements and weighted importance for each quality factor.
4. Experiments
Even considering the aforementioned constraints on the techniques we are studying, our space of travel techniques is still large. It would be difficult to test every technique against every other technique for each quality factor. Therefore, we present three example experiments to produce preliminary results and illustrate the experimental method which may be used for such evaluations. These experiments were chosen because of their relevance and relate to travel techniques which are being implemented in some contemporary immersive virtual environments. The first two tests compare two direction selection techniques for absolute motion (travel to an explicit target object) and relative motion (travel to a target located relative to a "reference" object). The third experiment measures the spatial awareness of a user after using a variety of velocity/acceleration techniques.
In each of these experiments, the subjects were undergraduate and graduate students, with immersive VE experience ranging from none to extensive. A Virtual Research VR4 head-mounted display, Polhemus Isotrak trackers, and a custom-built 3-button 3D mouse were used. The test applications were run on an SGI Crimson workstation with RealityEngine graphics, and frame rates were held constant at 30 frames per second. Times were measured to within 0.001 second accuracy.
4.1 Comparing steering techniques
Perhaps the most basic of the quality factors listed above are speed and accuracy. These are simple to measure, generally important in most applications, and vary widely among different VE travel techniques. When a user wishes to move to a specific target location, it is not acceptable to move there slowly or inaccurately. Users can quickly become fatigued from holding input devices steady, pressing buttons, or looking in a certain direction for a lengthy period of time.
Clearly, the fastest and most accurate techniques will be those which allow the user to specify exactly the position to move to, and then automatically and immediately take the user to that location. For example, in our taxonomy, the direction/target selection technique might be discrete selection from a list or using direct targets (select an object to move to that object). Lists, however, require that the destinations be known in advance, while direct targets only allow movement to objects, not to arbitrary positions.
Therefore, a more general direction/target selection technique is needed that still maintains acceptable speed
and accuracy characteristics. Two of the most common techniques used in VE applications are gaze-directed steering and hand-directed steering (or "pointing") [10]. In gaze-directed steering, the user's view vector (typically the orientation of the head tracker) is used as the direction of motion, whereas the direction is obtained from the user's hand orientation in the pointing technique. Our first set of experiments compares these two techniques in the absolute and relative motion tasks.
4.2 Absolute motion experiment
Our study of absolute motion compared these techniques for the task of traveling directly to an explicit target object in the environment. Subjects were immersed in a sparse virtual environment containing only a target sphere. A trial consisted of traveling from the start position to the interior of the sphere, and remaining inside it for 0.5 seconds. The radius of the sphere and the distance to the target were varied, and subjects' time to reach the target was recorded.
Besides varying the travel technique between gaze- directed steering and pointing, we also studied another factor: constrained vs. unconstrained motion. In half of the trials, users could move about the environment with six degrees of freedom. In the constrained trials, however, the user was not allowed to move vertically (the target sphere appeared on the horizontal plane in all trials). Thus, there were four travel techniques tested in all.
We hypothesized that gaze-directed techniques and constrained techniques would produce lower times, because these techniques should be more accurate than pointing and unconstrained methods. It is clear that the 2D constraint should produce more accuracy, because there are fewer degrees of freedom to control. It may not be as obvious that gaze-directed steering should be more accurate than pointing, but consider two comparisons:
First, gaze-directed steering uses the muscles of the neck, while pointing uses the arm and wrist muscles. The neck muscles seem more stable than the arm or wrist muscles; therefore one can hold the head in a fixed position easier than the arm or hand. Second, with gaze- directed steering, there is a more direct feedback loop between the sensory device (the eyes) and the steering device (the head). The user looks in a direction and sees travel in that direction. With pointing, the user may look in one direction and travel in another. More interpretation of the visual input must occur to pick the correct direction, and the hand must be made to point in that direction.
Subjects performed 80 trials with each of the four techniques. There were four values of the sphere radius (0.4, 0.8, 1.5, and 2.5 meters) and four target distances (10, 20, 50, and 100 meters); subjects thus performed 5 trials with each of these 16 combinations within a technique block. The travel velocity was kept constant, and a mouse button was used to effect travel (using a continuous input technique). Eight subjects participated,
47
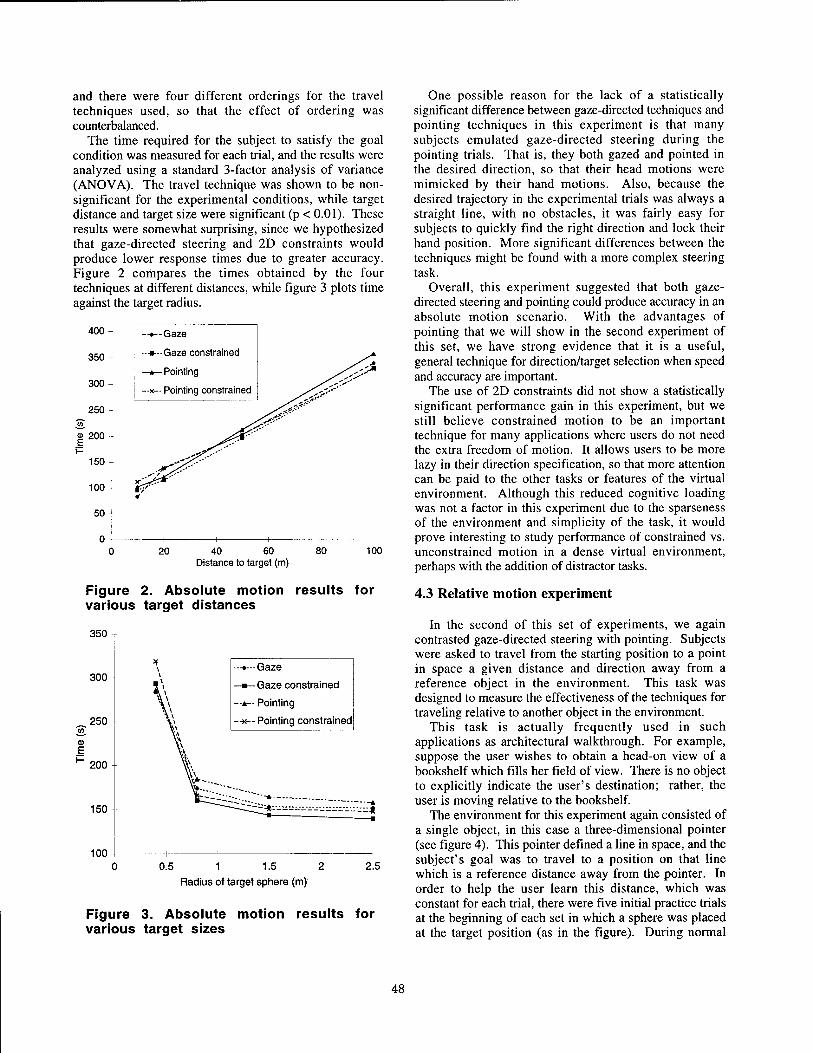
and there were four different orderings for the travel techniques used, so that the effect of ordering was counterbalanced.
The time required for the subject to satisfy the goal condition was measured for each trial, and the results were analyzed using a standard 3-factor analysis of variance (ANOVA). The travel technique was shown to be non- significant for the experimental conditions, while target distance and target size were significant (p < 0.01). These results were somewhat surprising, since we hypothesized that gaze-directed steering and 2D constraints would produce lower response times due to greater accuracy. Figure 2 compares the times obtained by the four techniques at different distances, while figure 3 plots time against the target radius.
400 n —»--Gaze
350 --■--Gaze constrained
300 —*—Pointing
—x-- Pointing constrained
/^'t* /'%''..' ./'''''''
250 - /<£*'
<S 200 - P
150
100 JrT-/' *
50-
0 ( ) 20 40
Distance to tar 60 80 10
get (m)
Figure 2. Absolute motion results for various target distances
aou
* \ --»--Gaze 300- \
\ \
—•— Gaze constrained
—*— Pointing
250 - --«--Pointing constrained
V»
\ 200 - \\\
150- ----.""* A
■
100 \ 1 1 1 1
0.5 1 1.5 2
Radius of target sphere (m)'
2.5
Figure 3. Absolute motion results for various target sizes
One possible reason for the lack of a statistically significant difference between gaze-directed techniques and pointing techniques in this experiment is that many subjects emulated gaze-directed steering during the pointing trials. That is, they both gazed and pointed in the desired direction, so that their head motions were mimicked by their hand motions. Also, because the desired trajectory in the experimental trials was always a straight line, with no obstacles, it was fairly easy for subjects to quickly find the right direction and lock their hand position. More significant differences between the techniques might be found with a more complex steering task.
Overall, this experiment suggested that both gaze- directed steering and pointing could produce accuracy in an absolute motion scenario. With the advantages of pointing that we will show in the second experiment of this set, we have strong evidence that it is a useful, general technique for direction/target selection when speed and accuracy are important.
The use of 2D constraints did not show a statistically significant performance gain in this experiment, but we still believe constrained motion to be an important technique for many applications where users do not need the extra freedom of motion. It allows users to be more lazy in their direction specification, so that more attention can be paid to the other tasks or features of the virtual environment. Although this reduced cognitive loading was not a factor in this experiment due to the sparseness of the environment and simplicity of the task, it would prove interesting to study performance of constrained vs. unconstrained motion in a dense virtual environment, perhaps with the addition of distractor tasks.
4.3 Relative motion experiment
In the second of this set of experiments, we again contrasted gaze-directed steering with pointing. Subjects were asked to travel from the starting position to a point in space a given distance and direction away from a reference object in the environment. This task was designed to measure the effectiveness of the techniques for traveling relative to another object in the environment.
This task is actually frequently used in such applications as architectural walkthrough. For example, suppose the user wishes to obtain a head-on view of a bookshelf which fills her field of view. There is no object to explicitly indicate the user's destination; rather, the user is moving relative to the bookshelf.
The environment for this experiment again consisted of a single object, in this case a three-dimensional pointer (see figure 4). This pointer defined a line in space, and the subject's goal was to travel to a position on that line which is a reference distance away from the pointer. In order to help the user learn this distance, which was constant for each trial, there were five initial practice trials at the beginning of each set in which a sphere was placed at the target position (as in the figure). During normal
48
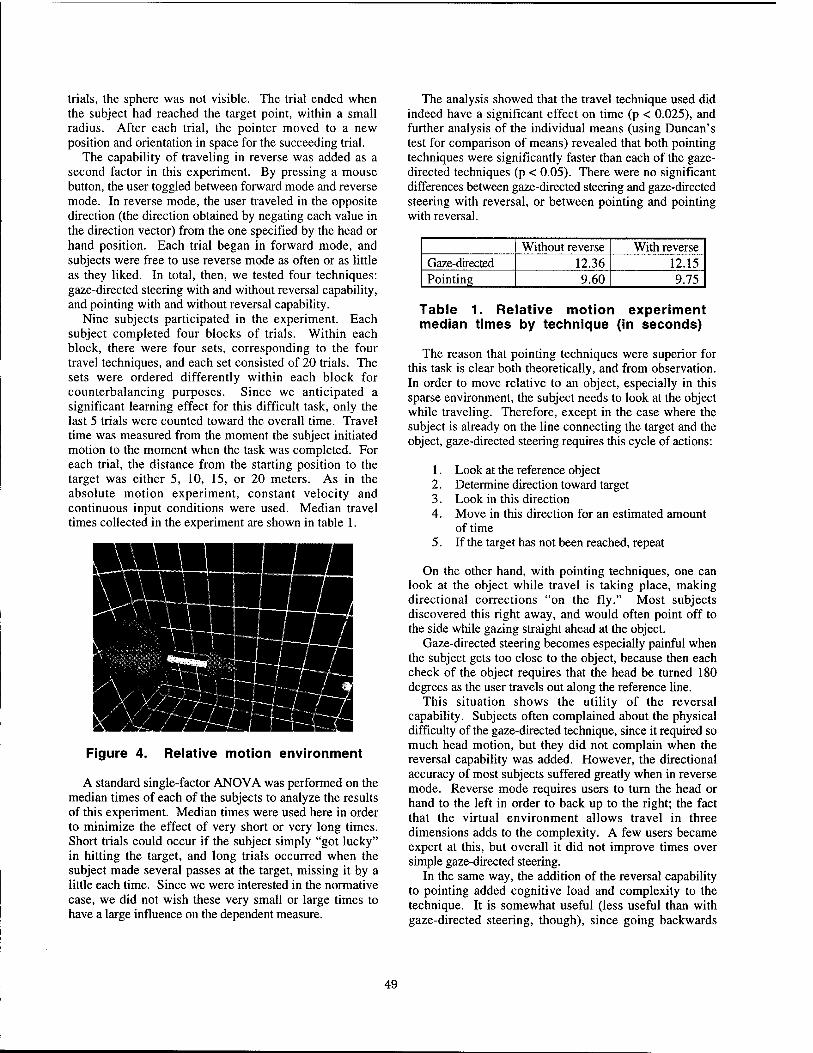
trials, the sphere was not visible. The trial ended when the subject had reached the target point, within a small radius. After each trial, the pointer moved to a new position and orientation in space for the succeeding trial.
The capability of traveling in reverse was added as a second factor in this experiment. By pressing a mouse button, the user toggled between forward mode and reverse mode. In reverse mode, the user traveled in the opposite direction (the direction obtained by negating each value in the direction vector) from the one specified by the head or hand position. Each trial began in forward mode, and subjects were free to use reverse mode as often or as little as they liked. In total, then, we tested four techniques: gaze-directed steering with and without reversal capability, and pointing with and without reversal capability.
Nine subjects participated in the experiment. Each subject completed four blocks of trials. Within each block, there were four sets, corresponding to the four travel techniques, and each set consisted of 20 trials. The sets were ordered differently within each block for counterbalancing purposes. Since we anticipated a significant learning effect for this difficult task, only the last 5 trials were counted toward the overall time. Travel time was measured from the moment the subject initiated motion to the moment when the task was completed. For each trial, the distance from the starting position to the target was either 5, 10, 15, or 20 meters. As in the absolute motion experiment, constant velocity and continuous input conditions were used. Median travel times collected in the experiment are shown in table 1.
Figure 4. Relative motion environment
A standard single-factor ANOVA was performed on the median times of each of the subjects to analyze the results of this experiment. Median times were used here in order to minimize the effect of very short or very long times. Short trials could occur if the subject simply "got lucky" in hitting the target, and long trials occurred when the subject made several passes at the target, missing it by a little each time. Since we were interested in the normative case, we did not wish these very small or large times to have a large influence on the dependent measure.
The analysis showed that the travel technique used did indeed have a significant effect on time (p < 0.025), and further analysis of the individual means (using Duncan's test for comparison of means) revealed that both pointing techniques were significantly faster than each of the gaze- directed techniques (p < 0.05). There were no significant differences between gaze-directed steering and gaze-directed steering with reversal, or between pointing and pointing with reversal.
Without reverse With reverse Gaze-directed 12.36 12.15 Pointing 9.60 9.75
Table 1. Relative motion experiment median times by technique (in seconds)
The reason that pointing techniques were superior for this task is clear both theoretically, and from observation. In order to move relative to an object, especially in this sparse environment, the subject needs to look at the object while traveling. Therefore, except in the case where the subject is already on the line connecting the target and the object, gaze-directed steering requires this cycle of actions:
1. Look at the reference object 2. Determine direction toward target 3. Look in this direction 4. Move in this direction for an estimated amount
of time 5. If the target has not been reached, repeat
On the other hand, with pointing techniques, one can look at the object while travel is taking place, making directional corrections "on the fly." Most subjects discovered this right away, and would often point off to the side while gazing straight ahead at the object.
Gaze-directed steering becomes especially painful when the subject gets too close to the object, because then each check of the object requires that the head be turned 180 degrees as the user travels out along the reference line.
This situation shows the utility of the reversal capability. Subjects often complained about the physical difficulty of the gaze-directed technique, since it required so much head motion, but they did not complain when the reversal capability was added. However, the directional accuracy of most subjects suffered greatly when in reverse mode. Reverse mode requires users to turn the head or hand to the left in order to back up to the right; the fact that the virtual environment allows travel in three dimensions adds to the complexity. A few users became expert at this, but overall it did not improve times over simple gaze-directed steering.
In the same way, the addition of the reversal capability to pointing added cognitive load and complexity to the technique. It is somewhat useful (less useful than with gaze-directed steering, though), since going backwards
49
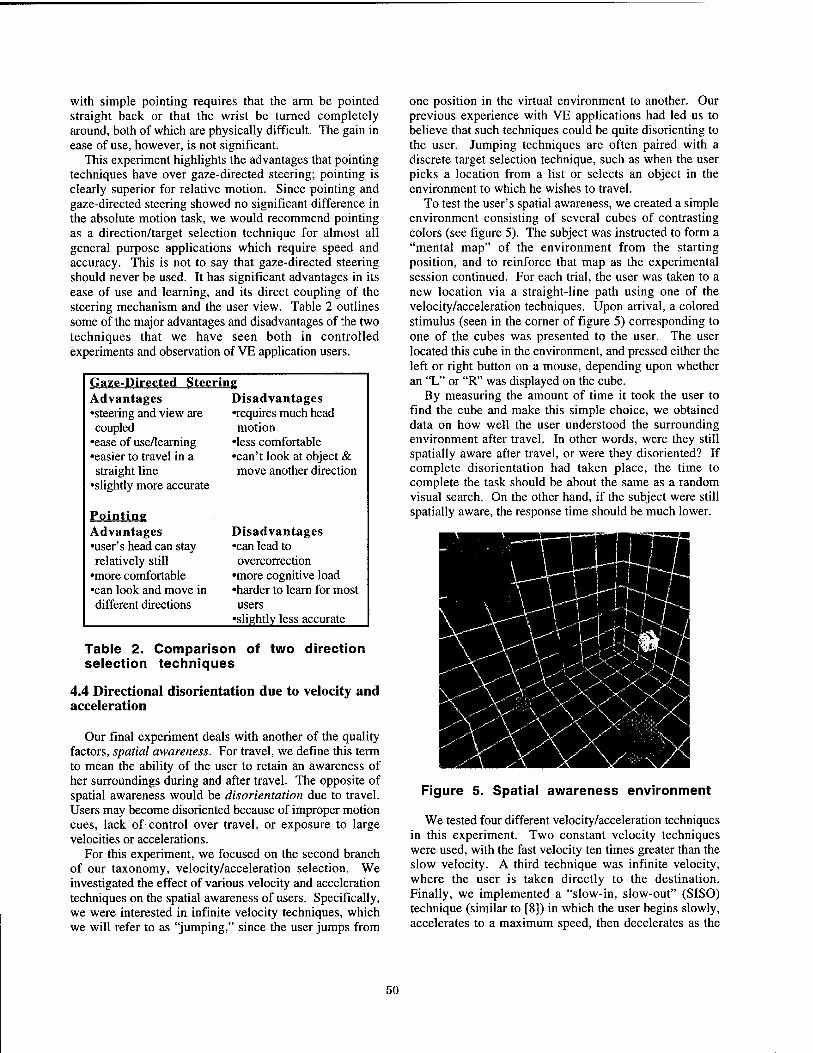
with simple pointing requires that the arm be pointed straight back or that the wrist be turned completely around, both of which are physically difficult. The gain in ease of use, however, is not significant.
This experiment highlights the advantages that pointing techniques have over gaze-directed steering; pointing is clearly superior for relative motion. Since pointing and gaze-directed steering showed no significant difference in the absolute motion task, we would recommend pointing as a direction/target selection technique for almost all general purpose applications which require speed and accuracy. This is not to say that gaze-directed steering should never be used. It has significant advantages in its ease of use and learning, and its direct coupling of the steering mechanism and the user view. Table 2 outlines some of the major advantages and disadvantages of the two techniques that we have seen both in controlled experiments and observation of VE application users.
Gaze-Directed Steering Advantages Disadvantages •steering and view are •requires much head coupled motion
•ease of use/learning •less comfortable •easier to travel in a •can't look at object & straight line move another direction
•slightly more accurate
Pointing Advantages Disadvantages •user's head can stay •can lead to relatively still overcorrection
•more comfortable •more cognitive load •can look and move in •harder to learn for most different directions users
•slightly less accurate
Table 2. Comparison of two direction selection techniques
4.4 Directional disorientation due to velocity and acceleration
Our final experiment deals with another of the quality factors, spatial awareness. For travel, we define this term to mean the ability of the user to retain an awareness of her surroundings during and after travel. The opposite of spatial awareness would be disorientation due to travel. Users may become disoriented because of improper motion cues, lack of-control over travel, or exposure to large velocities or accelerations.
For this experiment, we focused on the second branch of our taxonomy, velocity/acceleration selection. We investigated the effect of various velocity and acceleration techniques on the spatial awareness of users. Specifically, we were interested in infinite velocity techniques, which we will refer to as "jumping," since the user jumps from
one position in the virtual environment to another. Our previous experience with VE applications had led us to believe that such techniques could be quite disorienting to the user. Jumping techniques are often paired with a discrete target selection technique, such as when the user picks a location from a list or selects an object in the environment to which he wishes to travel.
To test the user's spatial awareness, we created a simple environment consisting of several cubes of contrasting colors (see figure 5). The subject was instructed to form a "mental map" of the environment from the starting position, and to reinforce that map as the experimental session continued. For each trial, the user was taken to a new location via a straight-line path using one of the velocity/acceleration techniques. Upon arrival, a colored stimulus (seen in the corner of figure 5) corresponding to one of the cubes was presented to the user. The user located this cube in the environment, and pressed either the left or right button on a mouse, depending upon whether an "L" or "R" was displayed on the cube.
By measuring the amount of time it took the user to find the cube and make this simple choice, we obtained data on how well the user understood the surrounding environment after travel. In other words, were they still spatially aware after travel, or were they disoriented? If complete disorientation had taken place, the time to complete the task should be about the same as a random visual search. On the other hand, if the subject were still spatially aware, the response time should be much lower.
Figure 5. Spatial awareness environment
We tested four different velocity/acceleration techniques in this experiment. Two constant velocity techniques were used, with the fast velocity ten times greater than the slow velocity. A third technique was infinite velocity, where the user is taken directly to the destination. Finally, we implemented a "slow-in, slow-out" (SISO) technique (similar to [8]) in which the user begins slowly, accelerates to a maximum speed, then decelerates as the
50
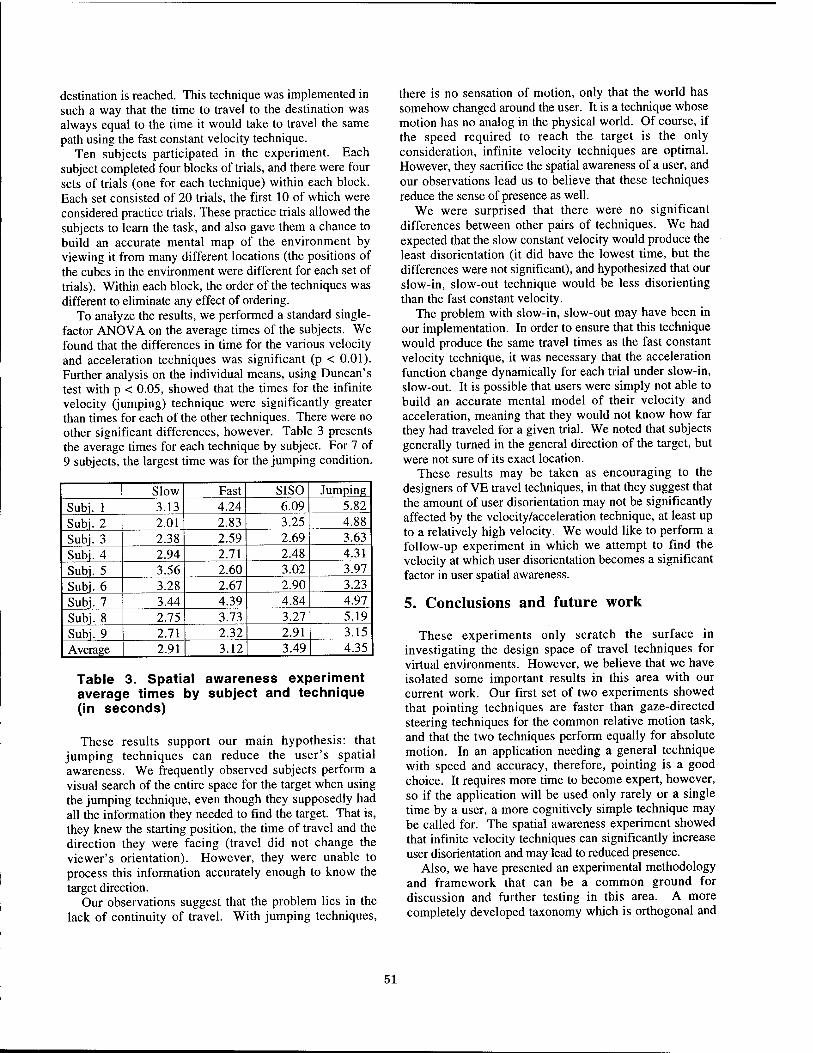
destination is reached. This technique was implemented in such a way that the time to travel to the destination was always equal to the time it would take to travel the same path using the fast constant velocity technique.
Ten subjects participated in the experiment. Each subject completed four blocks of trials, and there were four sets of trials (one for each technique) within each block. Each set consisted of 20 trials, the first 10 of which were considered practice trials. These practice trials allowed the subjects to learn the task, and also gave them a chance to build an accurate mental map of the environment by viewing it from many different locations (the positions of the cubes in the environment were different for each set of trials). Within each block, the order of the techniques was different to eliminate any effect of ordering.
To analyze the results, we performed a standard single- factor ANOVA on the average times of the subjects. We found that the differences in time for the various velocity and acceleration techniques was significant (p < 0.01). Further analysis on the individual means, using Duncan's test with p < 0.05, showed that the times for the infinite velocity (jumping) technique were significantly greater than times for each of the other techniques. There were no other significant differences, however. Table 3 presents the average times for each technique by subject. For 7 of 9 subjects, the largest time was for the jumping condition.
Slow Fast SISO Jumping Subj. 1 3.13 4.24 6.09 5.82 Subj. 2 2.01 2.83 3.25 4.88 Subj. 3 2.38 2.59 2.69 3.63 Subj. 4 2.94 2.71 2.48 4.31 Subj. 5 3.56 2.60 3.02 3.97 Subj. 6 3.28 2.67 2.90 3.23 Subj. 7 3.44 4.39 4.84 4.97 Subj. 8 2.75 3.73 3.27 5.19 Subj. 9 2.71 2.32 2.91 3.15 Average 2.91 3.12 3.49 4.35
Table 3. Spatial awareness experiment average times by subject and technique (in seconds)
These results support our main hypothesis: that jumping techniques can reduce the user's spatial awareness. We frequently observed subjects perform a visual search of the entire space for the target when using the jumping technique, even though they supposedly had all the information they needed to find the target. That is, they knew the starting position, the time of travel and the direction they were facing (travel did not change the viewer's orientation). However, they were unable to process this information accurately enough to know the target direction.
Our observations suggest that the problem lies in the lack of continuity of travel. With jumping techniques,
there is no sensation of motion, only that the world has somehow changed around the user. It is a technique whose motion has no analog in the physical world. Of course, if the speed required to reach the target is the only consideration, infinite velocity techniques are optimal. However, they sacrifice the spatial awareness of a user, and our observations lead us to believe that these techniques reduce the sense of presence as well.
We were surprised that there were no significant differences between other pairs of techniques. We had expected that the slow constant velocity would produce the least disorientation (it did have the lowest time, but the differences were not significant), and hypothesized that our slow-in, slow-out technique would be less disorienting than the fast constant velocity.
The problem with slow-in, slow-out may have been in our implementation. In order to ensure that this technique would produce the same travel times as the fast constant velocity technique, it was necessary that the acceleration function change dynamically for each trial under slow-in, slow-out. It is possible that users were simply not able to build an accurate mental model of their velocity and acceleration, meaning that they would not know how far they had traveled for a given trial. We noted that subjects generally turned in the general direction of the target, but were not sure of its exact location.
These results may be taken as encouraging to the designers of VE travel techniques, in that they suggest that the amount of user disorientation may not be significantly affected by the velocity/acceleration technique, at least up to a relatively high velocity. We would like to perform a follow-up experiment in which we attempt to find the velocity at which user disorientation becomes a significant factor in user spatial awareness.
5. Conclusions and future work
These experiments only scratch the surface in investigating the design space of travel techniques for virtual environments. However, we believe that we have isolated some important results in this area with our current work. Our first set of two experiments showed that pointing techniques are faster than gaze-directed steering techniques for the common relative motion task, and that the two techniques perform equally for absolute motion. In an application needing a general technique with speed and accuracy, therefore, pointing is a good choice. It requires more time to become expert, however, so if the application will be used only rarely or a single time by a user, a more cognitively simple technique may be called for. The spatial awareness experiment showed that infinite velocity techniques can significantly increase user disorientation and may lead to reduced presence.
Also, we have presented an experimental methodology and framework that can be a common ground for discussion and further testing in this area. A more completely developed taxonomy which is orthogonal and
51

comprehensive is desired. Particular VE travel techniques in this taxonomy may then be mapped to levels of the quality factors experimentally, in the manner described. Application designers may then specify the weight given to each of the quality factors for their specific needs and goals and choose techniques accordingly.
In addition to the follow-up experiments discussed above, we would like to create a more general testbed for VE travel techniques. Our plans call for creation of a test environment similar to the Virtual Environment Performance Assessment Battery (VEPAB) [7]. This environment would be instrumented to collect data on any or all of the quality factors we discussed. Specific travel techniques would then be used in these environments and assigned an overall score for each of the quality factors. Such a system would provide an objective measure for a travel technique that could be compared to the scores from other techniques under consideration for an application.
Acknowledgments
The authors would like to thank Neff Walker, Ben Watson, and Drew Kessler for their help and advice, and the experimental subjects who volunteered their time. This work was supported in part by the National Science Foundation.
References
[1] S. Card, J. Mackinlay, and G. Robertson. The Design Space of Input Devices. Proceedings of CHI (Seattle, WA, 1990), pp. 117-124.
[2] J. Chung. A Comparison of Head-tracked and Non-head- tracked Steering Modes in the Targeting of Radiotherapy Treatment Beams. Proceedings of 1992 Symposium on Interactive 3D Graphics (Cambridge, MA, 1992), pp. 193-196.
[3] R. Darken and J. Sibert. A Toolset for Navigation in Virtual Environments. Proceedings of ACM Symposium on User Interface Software and Technology (Atlanta, GA, 1993), pp. 157-165.
[4] K. Fairchild, L. Hai, J. Loo, N. Hern, and L. Serra. The Heaven and Earth Virtual Reality: Designing Applications for Novice Users. Proceedings of IEEE Symposium on Research Frontiers in Virtual Reality (Seattle, WA, 1993), pp. 47-53.
[5] K. Herndon, A. van Dam, and M. Gleicher. The Challenges of 3D Interaction. SIGCHI Bulletin, vol. 26, no. 4, pp. 36-43, 1994.
[6] K. Hinckley, R. Pausch, J. Goble, and N. Kassell. A Survey of Design Issues in Spatial Input. Proceedings of
ACM Symposium on User Interface Software and Technology (Marina del Rey, CA, 1994), pp. 213-222.
[7] D. Lampton, B. Knerr, S. Goldberg, J. Bliss, J. Moshell, and B. Blau. The Virtual Environment Performance Assessment Battery (VEPAB): Development and Evaluation. Presence, vol. 3, no. 2, pp. 145-157, 1994.
[8] J. Mackinlay, S. Card, and G. Robertson. Rapid Controlled Movement Through a Virtual 3D Workspace. Proceedings of SIGGRAPH (Dallas, TX, 1990), in Computer Graphics, vol. 24, no. 4, pp. 171-176.
[9] P. Mercurio, T. Erickson, D. Diaper, D. Gilmore, G. Cockton, and B. Shackel. Interactive Scientific Visualization: an Assessment of a Virtual Reality System. Proceedings of INTERACT (Cambridge, UK, 1990), pp. 741-745.
[10] M. Mine. Virtual Environment Interaction Techniques. UNC Chapel Hill Computer Science Technical Report TR95-018, 1995.
[11] R. Pausch, T. Burnette, D. Brockway, and M. Weiblen. Navigation and Locomotion in Virtual Worlds via Flight into Hand-Held Miniatures. Proceedings of SIGGRAPH (Los Angeles, CA, 1995), pp. 399-400.
[12] W. Robinett and R. Holloway. Implementation of Flying, Scaling, and Grabbing in Virtual Worlds. Proceedings of Symposium on Interactive 3D Graphics (Cambridge, MA, 1992), pp. 189-192.
[13] E.R. Schieser. Principles of Navigation. In Handbook of Modern Electronics and Electrical Engineering, C. Belove (Ed.), Wiley, 1986.
[14] M. Slater, M. Usoh, and A. Steed. Taking Steps: The Influence of a Walking Technique on Presence in Virtual Reality. ACM Transactions on Computer-Human Interaction, Vol. 2, No. 3, pp. 201-219, September 1995.
[15] R. Stoakley, M. Conway, and R. Pausch. Virtual Reality on a WIM: Interactive Worlds in Miniature. Proceedings of CHI (Denver, CO, 1995), pp. 265-272.
[16] E. Strommen. Children's Use of Mouse-Based Interfaces to Control Virtual Travel. Proceedings of CHI (Boston, MA, 1994), pp. 405-410.
[17] C. Ware and D. Jessome. Using the Bat: a Six- Dimensional Mouse for Object Placement. IEEE Computer Graphics and Applications, vol. 8, no. 6, pp. 65-70, 1988.
[18] C. Ware and S. Osborne. Exploration and Virtual Camera Control in Virtual Three Dimensional Environments. Proceedings of Symposium on Interactive 3D Graphics (Snowbird, UT, 1990), in Computer Graphics, vol. 24, no. 2, pp. 175-183.
[19] R. Warren and A. Wertheim (Eds.). Perception and Control of Self-motion. Hillsdale, NJ: Erlbaum, 1990.
[20] C. Wickens and P. Baker. Cognitive Issues in Virtual Reality. In Virtual Environments and Advanced Interface Design, W. Barfield and T. Furness (Eds.), Oxford University Press, 1995.
52

KKION
EDUCATION 4)HD mdlHINC
Virtual Reality Training Simulation for Palpation of Subsurface Tumors
Michael Dinsmore1, Noshir Langrana1, Grigore Burdea2, Jumoke Ladeji3
1 Mechanical and Aerospace Engineering 2 Electrical and Computer Engineering
3 Biomedical Engineering Human-Machine Interface Laboratory
Rutgers, The State University of New Jersey P. O. Box 909, Piscataway, NJ 08855
Abstract
In the area of medical education, there is a strong need for palpation training to address the specific need of detect- ing subsurface tumors. A virtual reality training simulation was created to address this need. Utilizing the Rutgers Mas- ter II force feedback system, the simulation allows the user to perform a patient examination and palpate (touch) the pa- tient's virtual liver to search for hard regions beneath the surface. When the user's fingertips pass over a "tumor," ex- perimentally determined force/deflection curves are used to give the user the feeling of an object beneath the surface. A graphical user interface was developed to facilitate naviga- tion as well as provide a training quiz. The trainee is asked to identify the location and relative hardness of tumors, and performance is evaluated in terms of positional and diagno- sis errors.
1. Introduction
The use of virtual reality in surgery impacts a number of distinct areas. These include anatomy and pathology train- ing, surgical procedure training for new surgeons, surgi- cal planning of complex procedures, medical visualization, navigational and informational aids during surgery, predict- ing the outcomes of surgical procedures, and rehabilitation [2, 17, 6, 19].
The sense of touch can be extremely valuable to the trained physician when diagnosing illnesses. In the area of education, there is a need for palpation training [15]. With a combination of technologies, such as VR and force feed- back, it is possible to greatly extend the capabilities and ef- fectiveness of training simulators [1]. A simulation can record kinematics, touch, and force feedback for later dis- play to a trainee. In this manner the trainee can learn the
methodology of a procedure, as well as experience the forces that will be encountered when performing that procedure. This technology could be used to train medical students be- fore they palpate a real patient, and could also be used by trained physicians to improve their skill [9].
For example, while pyloric tumors in infants are palpa- ble preoperatively in 80 percent of cases, feeling the tumor is a task which may test the patience and skill of even expe- rienced clinicians. Medical imaging is helpful, but there is an increased reliance on these diagnostic images, leading to a decline in clinical skill in palpation of the pylorus. With appropriate palpation training, diagnosis could be made on clinical grounds alone in about 80 percent of the cases, re- ducing cost and diagnostic delays [14].
The current focus in our research is to integrate image segmentation, virtual reality, and force feedback technology. The overall system schematic is shown in Figure 1 [10].
This paper focuses on the development of a virtual real- ity training simulation where the user can touch soft tissue looking for a tumor beneath the surface. When it is touched, the tumor causes a different force profile, making it feel as though something is actually beneath the surface. If this ca- pability were combined with medical imaging, the physician would be able to touch and examine organs that were not previously palpable without surgery [12].
The advantages of this combination extend to the class- room, where medical students could train for an examination with no risk. Currently, the way students learn these pro- cedures is by watching experienced surgeons and perform- ing the procedure under their supervision. If the students could be trained ahead of time to know what a tissue feels like when something is not "normal," they would gain ex- perience prior to work on actual patients.
This paper describes the groundwork for development of a clinically viable and realistic palpation trainer for lesions. The hardware used to design this simulation is described in section 2, including 3D tracking and force feedback. Sec-
0-8186-7843-7/97 $10.00 © 1997 IEEE 54
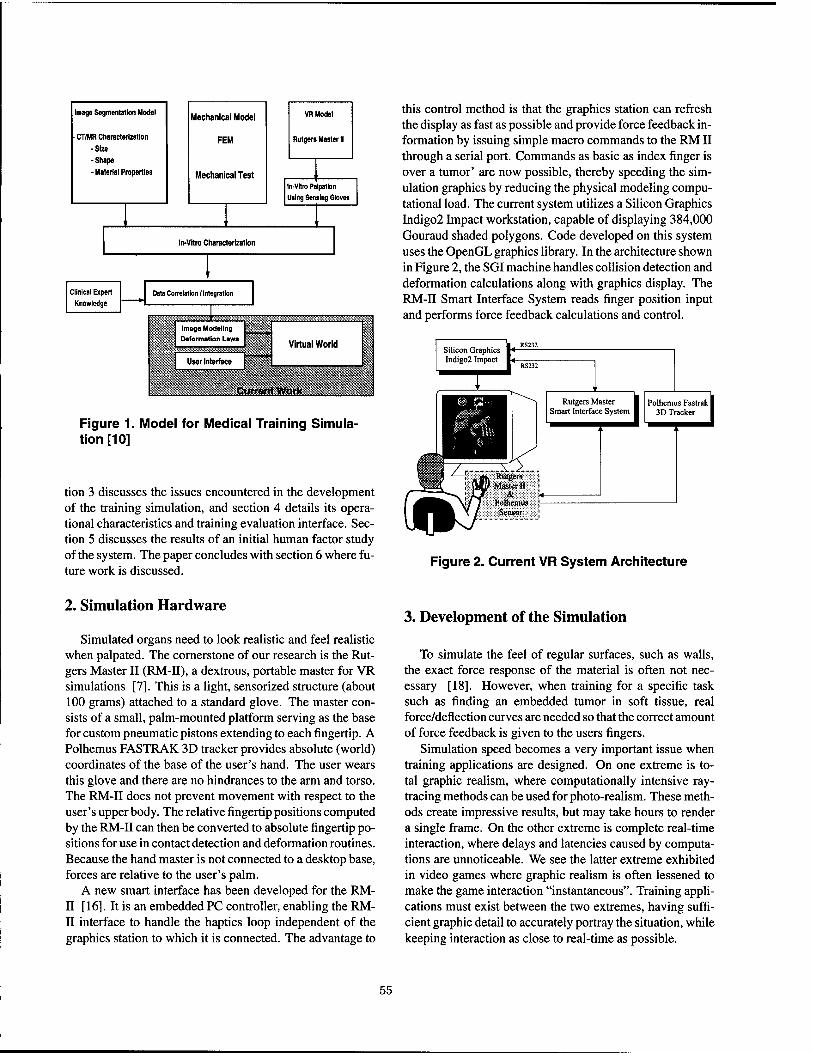
Image Segmentation Model
• CT/MR Characterization
-Size
Mechanical Model
FEM
VR Model
Rutgers Master II
■Shape
- Material Properties Mechanical Test n-VHro Palpation
Using Sensing Gloves
" 1
In-Vltro Characterization
Clinical Expert
Knowledge
Data Correlation / Integration
Image Modeling
Deformation Laws Virtual World
User Interface
Currant Work
Figure 1. Model for Medical Training Simula- tion [10]
tion 3 discusses the issues encountered in the development of the training simulation, and section 4 details its opera- tional characteristics and training evaluation interface. Sec- tion 5 discusses the results of an initial human factor study of the system. The paper concludes with section 6 where fu- ture work is discussed.
this control method is that the graphics station can refresh the display as fast as possible and provide force feedback in- formation by issuing simple macro commands to the RMII through a serial port. Commands as basic as index finger is over a tumor' are now possible, thereby speeding the sim- ulation graphics by reducing the physical modeling compu- tational load. The current system utilizes a Silicon Graphics Indigo2 Impact workstation, capable of displaying 384,000 Gouraud shaded polygons. Code developed on this system uses the OpenGL graphics library. In the architecture shown in Figure 2, the SGI machine handles collision detection and deformation calculations along with graphics display. The RM-II Smart Interface System reads finger position input and performs force feedback calculations and control.
Figure 2. Current VR System Architecture
2. Simulation Hardware
Simulated organs need to look realistic and feel realistic when palpated. The cornerstone of our research is the Rut- gers Master II (RM-II), a dextrous, portable master for VR simulations [7]. This is a light, sensorized structure (about 100 grams) attached to a standard glove. The master con- sists of a small, palm-mounted platform serving as the base for custom pneumatic pistons extending to each fingertip. A Polhemus FASTRAK 3D tracker provides absolute (world) coordinates of the base of the user's hand. The user wears this glove and there are no hindrances to the arm and torso. The RM-II does not prevent movement with respect to the user's upper body. The relative fingertip positions computed by the RM-II can then be converted to absolute fingertip po- sitions for use in contact detection and deformation routines. Because the hand master is not connected to a desktop base, forces are relative to the user's palm.
A new smart interface has been developed for the RM- II [16]. It is an embedded PC controller, enabling the RM- II interface to handle the haptics loop independent of the graphics station to which it is connected. The advantage to
3. Development of the Simulation
To simulate the feel of regular surfaces, such as walls, the exact force response of the material is often not nec- essary [18]. However, when training for a specific task such as finding an embedded tumor in soft tissue, real force/deflection curves are needed so that the correct amount of force feedback is given to the users fingers.
Simulation speed becomes a very important issue when training applications are designed. On one extreme is to- tal graphic realism, where computationally intensive ray- tracing methods can be used for photo-realism. These meth- ods create impressive results, but may take hours to render a single frame. On the other extreme is complete real-time interaction, where delays and latencies caused by computa- tions are unnoticeable. We see the latter extreme exhibited in video games where graphic realism is often lessened to make the game interaction "instantaneous". Training appli- cations must exist between the two extremes, having suffi- cient graphic detail to accurately portray the situation, while keeping interaction as close to real-time as possible.
55
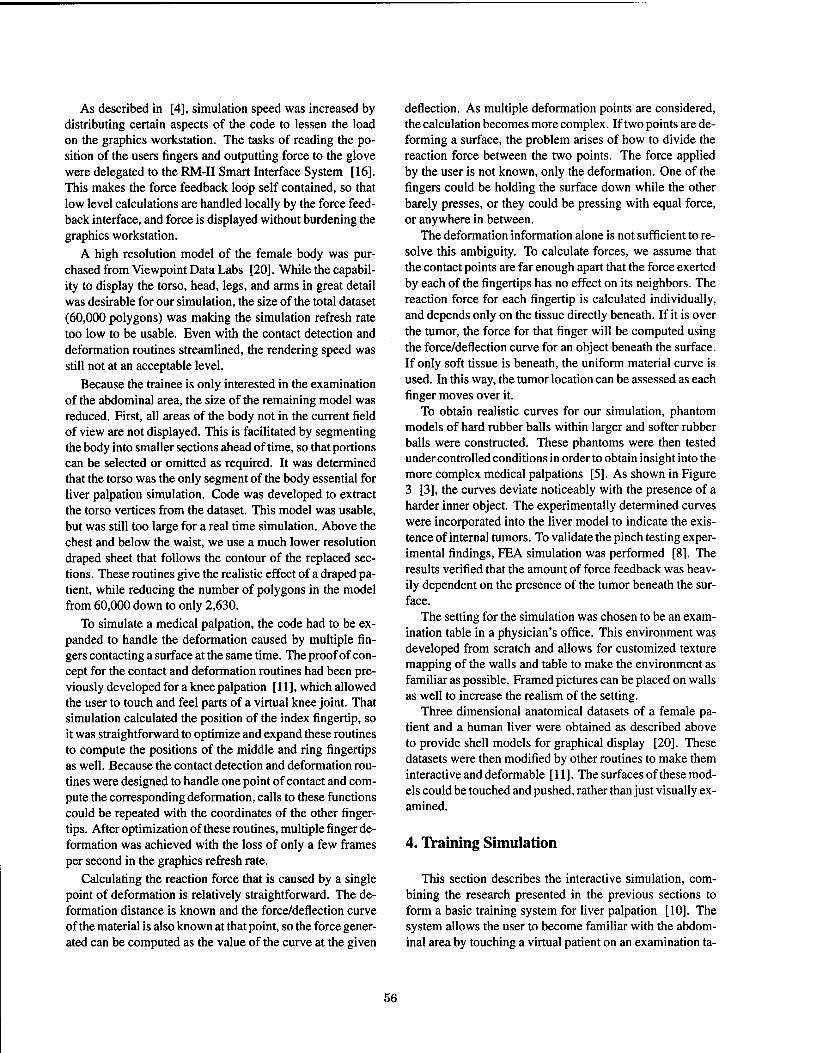
As described in [4], simulation speed was increased by distributing certain aspects of the code to lessen the load on the graphics workstation. The tasks of reading the po- sition of the users fingers and outputting force to the glove were delegated to the RM-II Smart Interface System [16]. This makes the force feedback loop self contained, so that low level calculations are handled locally by the force feed- back interface, and force is displayed without burdening the graphics workstation.
A high resolution model of the female body was pur- chased from Viewpoint Data Labs [20]. While the capabil- ity to display the torso, head, legs, and arms in great detail was desirable for our simulation, the size of the total dataset (60,000 polygons) was making the simulation refresh rate too low to be usable. Even with the contact detection and deformation routines streamlined, the rendering speed was still not at an acceptable level.
Because the trainee is only interested in the examination of the abdominal area, the size of the remaining model was reduced. First, all areas of the body not in the current field of view are not displayed. This is facilitated by segmenting the body into smaller sections ahead of time, so that portions can be selected or omitted as required. It was determined that the torso was the only segment of the body essential for liver palpation simulation. Code was developed to extract the torso vertices from the dataset. This model was usable, but was still too large for a real time simulation. Above the chest and below the waist, we use a much lower resolution draped sheet that follows the contour of the replaced sec- tions. These routines give the realistic effect of a draped pa- tient, while reducing the number of polygons in the model from 60,000 down to only 2,630.
To simulate a medical palpation, the code had to be ex- panded to handle the deformation caused by multiple fin- gers contacting a surface at the same time. The proof of con- cept for the contact and deformation routines had been pre- viously developed for a knee palpation [11], which allowed the user to touch and feel parts of a virtual knee joint. That simulation calculated the position of the index fingertip, so it was straightforward to optimize and expand these routines to compute the positions of the middle and ring fingertips as well. Because the contact detection and deformation rou- tines were designed to handle one point of contact and com- pute the corresponding deformation, calls to these functions could be repeated with the coordinates of the other finger- tips. After optimization of these routines, multiple finger de- formation was achieved with the loss of only a few frames per second in the graphics refresh rate.
Calculating the reaction force that is caused by a single point of deformation is relatively straightforward. The de- formation distance is known and the force/deflection curve of the material is also known at that point, so the force gener- ated can be computed as the value of the curve at the given
deflection. As multiple deformation points are considered, the calculation becomes more complex. If two points are de- forming a surface, the problem arises of how to divide the reaction force between the two points. The force applied by the user is not known, only the deformation. One of the fingers could be holding the surface down while the other barely presses, or they could be pressing with equal force, or anywhere in between.
The deformation information alone is not sufficient to re- solve this ambiguity. To calculate forces, we assume that the contact points are far enough apart that the force exerted by each of the fingertips has no effect on its neighbors. The reaction force for each fingertip is calculated individually, and depends only on the tissue directly beneath. If it is over the tumor, the force for that finger will be computed using the force/deflection curve for an object beneath the surface. If only soft tissue is beneath, the uniform material curve is used. In this way, the tumor location can be assessed as each finger moves over it.
To obtain realistic curves for our simulation, phantom models of hard rubber balls within larger and softer rubber balls were constructed. These phantoms were then tested under controlled conditions in order to obtain insight into the more complex medical palpations [5]. As shown in Figure 3 [3], the curves deviate noticeably with the presence of a harder inner object. The experimentally determined curves were incorporated into the liver model to indicate the exis- tence of internal tumors. To validate the pinch testing exper- imental findings, FEA simulation was performed [8]. The results verified that the amount of force feedback was heav- ily dependent on the presence of the tumor beneath the sur- face.
The setting for the simulation was chosen to be an exam- ination table in a physician's office. This environment was developed from scratch and allows for customized texture mapping of the walls and table to make the environment as familiar as possible. Framed pictures can be placed on walls as well to increase the realism of the setting.
Three dimensional anatomical datasets of a female pa- tient and a human liver were obtained as described above to provide shell models for graphical display [20]. These datasets were then modified by other routines to make them interactive and deformable [11]. The surfaces of these mod- els could be touched and pushed, rather than just visually ex- amined.
4. Training Simulation
This section describes the interactive simulation, com- bining the research presented in the previous sections to form a basic training system for liver palpation [10]. The system allows the user to become familiar with the abdom- inal area by touching a virtual patient on an examination ta-
56
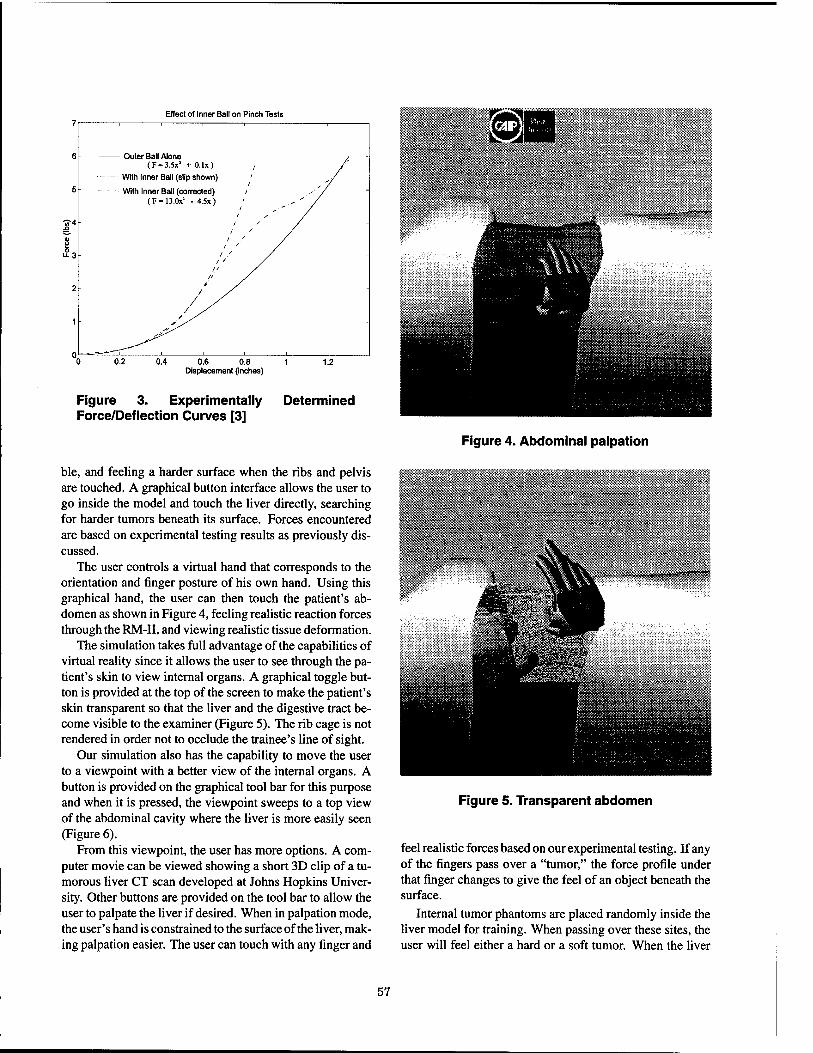
Effect of Inner Ball on Pinch Tests n
0.2 0.4 0.6 0.B 1 Displacement (inches)
Figure 3. Experimentally Determined Force/Deflection Curves [3]
ble, and feeling a harder surface when the ribs and pelvis are touched. A graphical button interface allows the user to go inside the model and touch the liver directly, searching for harder tumors beneath its surface. Forces encountered are based on experimental testing results as previously dis- cussed.
The user controls a virtual hand that corresponds to the orientation and finger posture of his own hand. Using this graphical hand, the user can then touch the patient's ab- domen as shown in Figure 4, feeling realistic reaction forces through the RM-II, and viewing realistic tissue deformation.
The simulation takes full advantage of the capabilities of virtual reality since it allows the user to see through the pa- tient's skin to view internal organs. A graphical toggle but- ton is provided at the top of the screen to make the patient's skin transparent so that the liver and the digestive tract be- come visible to the examiner (Figure 5). The rib cage is not rendered in order not to occlude the trainee's line of sight.
Our simulation also has the capability to move the user to a viewpoint with a better view of the internal organs. A button is provided on the graphical tool bar for this purpose and when it is pressed, the viewpoint sweeps to a top view of the abdominal cavity where the liver is more easily seen (Figure 6).
From this viewpoint, the user has more options. A com- puter movie can be viewed showing a short 3D clip of a tu- morous liver CT scan developed at Johns Hopkins Univer- sity. Other buttons are provided on the tool bar to allow the user to palpate the liver if desired. When in palpation mode, the user's hand is constrained to the surface of the liver, mak- ing palpation easier. The user can touch with any finger and
Figure 4. Abdominal palpation
Figure 5. Transparent abdomen
feel realistic forces based on our experimental testing. If any of the fingers pass over a "tumor," the force profile under that finger changes to give the feel of an object beneath the surface.
Internal tumor phantoms are placed randomly inside the liver model for training. When passing over these sites, the user will feel either a hard or a soft tumor. When the liver
57
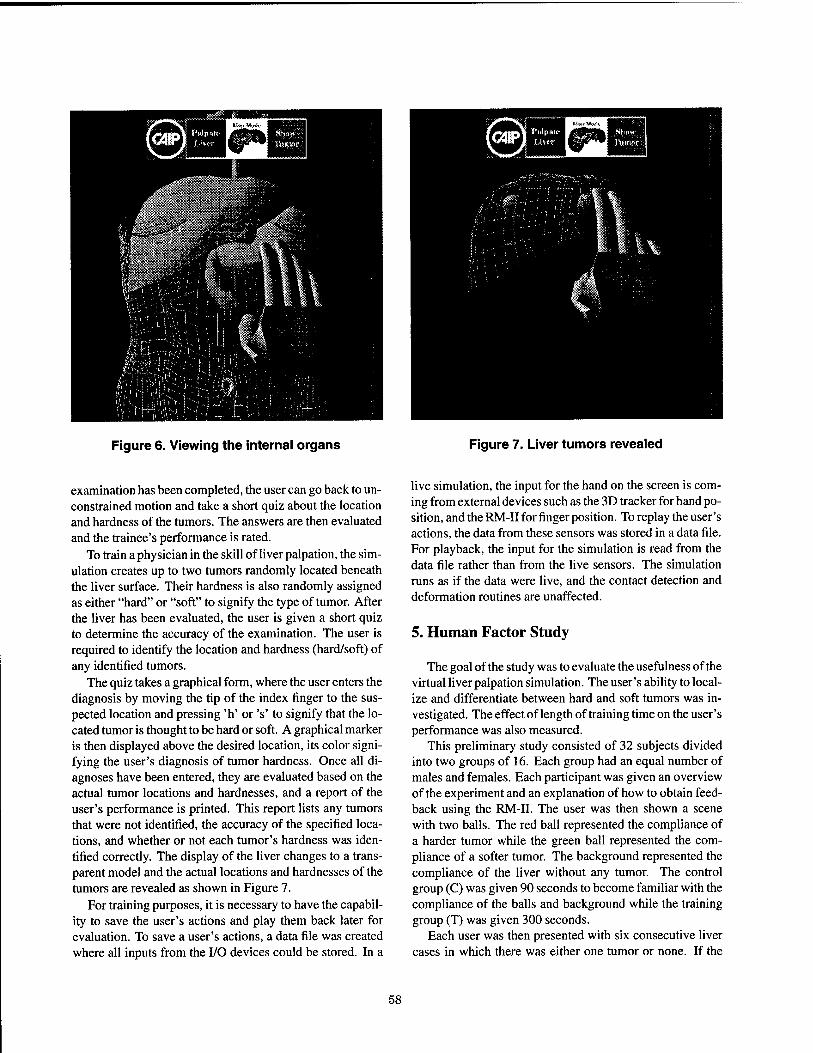
Figure 6. Viewing the internal organs Figure 7. Liver tumors revealed
examination has been completed, the user can go back to un- constrained motion and take a short quiz about the location and hardness of the tumors. The answers are then evaluated and the trainee's performance is rated.
To train a physician in the skill of liver palpation, the sim- ulation creates up to two tumors randomly located beneath the liver surface. Their hardness is also randomly assigned as either "hard" or "soft" to signify the type of tumor. After the liver has been evaluated, the user is given a short quiz to determine the accuracy of the examination. The user is required to identify the location and hardness (hard/soft) of any identified tumors.
The quiz takes a graphical form, where the user enters the diagnosis by moving the tip of the index finger to the sus- pected location and pressing 'h' or V to signify that the lo- cated tumor is thought to be hard or soft. A graphical marker is then displayed above the desired location, its color signi- fying the user's diagnosis of tumor hardness. Once all di- agnoses have been entered, they are evaluated based on the actual tumor locations and hardnesses, and a report of the user's performance is printed. This report lists any tumors that were not identified, the accuracy of the specified loca- tions, and whether or not each tumor's hardness was iden- tified correctly. The display of the liver changes to a trans- parent model and the actual locations and hardnesses of the tumors are revealed as shown in Figure 7.
For training purposes, it is necessary to have the capabil- ity to save the user's actions and play them back later for evaluation. To save a user's actions, a data file was created where all inputs from the I/O devices could be stored. In a
live simulation, the input for the hand on the screen is com- ing from external devices such as the 3D tracker for hand po- sition, and the RM-II for finger position. Toreplay the user's actions, the data from these sensors was stored in a data file. For playback, the input for the simulation is read from the data file rather than from the live sensors. The simulation runs as if the data were live, and the contact detection and deformation routines are unaffected.
5. Human Factor Study
The goal of the study was to evaluate the usefulness of the virtual liver palpation simulation. The user's ability to local- ize and differentiate between hard and soft tumors was in- vestigated. The effect of length of training time on the user's performance was also measured.
This preliminary study consisted of 32 subjects divided into two groups of 16. Each group had an equal number of males and females. Each participant was given an overview of the experiment and an explanation of how to obtain feed- back using the RM-II. The user was then shown a scene with two balls. The red ball represented the compliance of a harder tumor while the green ball represented the com- pliance of a softer tumor. The background represented the compliance of the liver without any tumor. The control group (C) was given 90 seconds to become familiar with the compliance of the balls and background while the training group (T) was given 300 seconds.
Each user was then presented with six consecutive liver cases in which there was either one tumor or none. If the
58
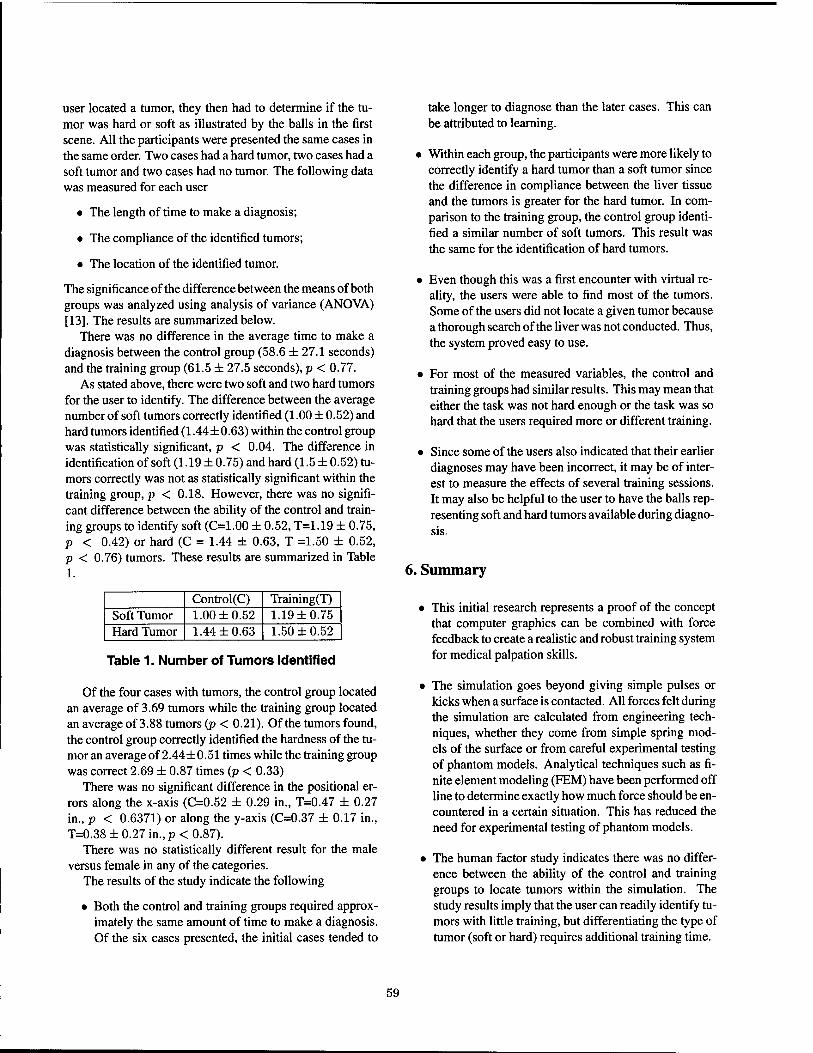
user located a tumor, they then had to determine if the tu- mor was hard or soft as illustrated by the balls in the first scene. All the participants were presented the same cases in the same order. Two cases had a hard tumor, two cases had a soft tumor and two cases had no tumor. The following data was measured for each user
• The length of time to make a diagnosis;
• The compliance of the identified tumors;
• The location of the identified tumor.
The significance of the difference between the means of both groups was analyzed using analysis of variance (ANOVA) [13]. The results are summarized below.
There was no difference in the average time to make a diagnosis between the control group (58.6 ± 27.1 seconds) and the training group (61.5 ± 27.5 seconds), p < 0.77.
As stated above, there were two soft and two hard tumors for the user to identify. The difference between the average number of soft tumors correctly identified (1.00 ± 0.52) and hard tumors identified (1.44±0.63) within the control group was statistically significant, p < 0.04. The difference in identification of soft (1.19 ± 0.75) and hard (1.5 ± 0.52) tu- mors correctly was not as statistically significant within the training group, p < 0.18. However, there was no signifi- cant difference between the ability of the control and train- ing groups to identify soft (C=1.00 ± 0.52, T=1.19 ± 0.75, p < 0.42) or hard (C = 1.44 ± 0.63, T =1.50 ± 0.52, p < 0.76) tumors. These results are summarized in Table 1.
Control(C) Training(T) Soft Tumor 1.00 ±0.52 1.19 ±0.75 Hard Tumor 1.44 ±0.63 1.50 ±0.52
Table 1. Number of Tumors Identified
Of the four cases with tumors, the control group located an average of 3.69 tumors while the training group located an average of 3.88 tumors (p < 0.21). Of the tumors found, the control group correctly identified the hardness of the tu- mor an average of 2.44±0.51 times while the training group was correct 2.69 ± 0.87 times (p < 0.33)
There was no significant difference in the positional er- rors along the x-axis (C=0.52 ± 0.29 in., T=0.47 ± 0.27 in., p < 0.6371) or along the y-axis (C=0.37 ± 0.17 in., T=0.38 ± 0.27 in., p < 0.87).
There was no statistically different result for the male versus female in any of the categories.
The results of the study indicate the following
• Both the control and training groups required approx- imately the same amount of time to make a diagnosis. Of the six cases presented, the initial cases tended to
take longer to diagnose than the later cases. This can be attributed to learning.
• Within each group, the participants were more likely to correctly identify a hard tumor than a soft tumor since the difference in compliance between the liver tissue and the tumors is greater for the hard tumor. In com- parison to the training group, the control group identi- fied a similar number of soft tumors. This result was the same for the identification of hard tumors.
• Even though this was a first encounter with virtual re- ality, the users were able to find most of the tumors. Some of the users did not locate a given tumor because a thorough search of the liver was not conducted. Thus, the system proved easy to use.
• For most of the measured variables, the control and training groups had similar results. This may mean that either the task was not hard enough or the task was so hard that the users required more or different training.
• Since some of the users also indicated that their earlier diagnoses may have been incorrect, it may be of inter- est to measure the effects of several training sessions. It may also be helpful to the user to have the balls rep- resenting soft and hard tumors available during diagno- sis.
6. Summary
• This initial research represents a proof of the concept that computer graphics can be combined with force feedback to create a realistic and robust training system for medical palpation skills.
• The simulation goes beyond giving simple pulses or kicks when a surface is contacted. All forces felt during the simulation are calculated from engineering tech- niques, whether they come from simple spring mod- els of the surface or from careful experimental testing of phantom models. Analytical techniques such as fi- nite element modeling (FEM) have been performed off line to determine exactly how much force should be en- countered in a certain situation. This has reduced the need for experimental testing of phantom models.
• The human factor study indicates there was no differ- ence between the ability of the control and training groups to locate tumors within the simulation. The study results imply that the user can readily identify tu- mors with little training, but differentiating the type of tumor (soft or hard) requires additional training time.
59

• This simulation allows the user to interact with the anatomy to touch and learn about how certain situa- tions will feel when they are encountered in a future ex- amination.
• This system has the potential to be expanded to a larger and more detailed anatomical model. Because the en- tire body model exists, the user could choose from a library of medical procedures for training. Procedures such as breast cancer examinations would be a logical next step using this technology.
Acknowledgments
The research reported here has been performed towards the partial fulfillment of the requirements for a master's dis- sertation of the first author. The authors would like to thank Daniel Gomez (PhD student, Rutgers University) and Em- manuel Pere (visiting scientist, Aerospatiale, France) for their technical assistance. The research was partially sup- ported by the New Jersey State Commission on Cancer Re- search, and by CAIP Center, Rutgers University (with funds provided by the New Jersey Commission on Science and Technology and by CAIP's industrial members).
Corresponding Author
Noshir A. Langrana, Rutgers, The State University of New Jersey, Department of Mechanical & Aerospace Engineering. P. O. Box 909, Piscataway, NJ 08855 [email protected]
References
[1] G. Burdea. Force and Touch Feedback for Virtual Reality. John Wiley & Sons, New York, 1996.
[2] G. Burdea and P. Coiffet. Virtual Reality Technology. John Wiley & Sons, New York, 1994.
[3] M. Dinsmore. Virtual reality simulation: Training for palpa- tion of subsurface tumors. Mechanical and Aerospace engi- neering, Rutgers University, October 1996.
[4] M. Dinsmore, N. Langrana, and G. Burdea. Issues related to real-time simulation of a virtual knee joint palpation. In Pro- ceedings of Virtual Reality and Medicine, The Cutting Edge, pages 16-20. SIG-Advanced Applications, Inc, September 1994.
[5] M. Dinsmore, N. Langrana, and G. Burdea. Realistic vir- tual reality simulation of touching hard tumors beneath soft tissue. In Proceedings of 1996 Advances in Bioengineering, ASME Bioengineering Symposium, volume BED - 33, pages 19-20. ASME Publications, November 1996.
[6] P. Dunkley. Virtual reality in medical training. Lancet, 343(8907): 1218, May 1994.
[7] D. Gomez, G. Burdea, and N. A. Langrana. Integration of the Rutgers Master II in a virtual reality simulation. In Pro- ceedings of IEEE VRAIS '95, pages 198-202, March 1995.
[8] E. Harper, M. Dinsmore, N. A. Langrana, and G. Burdea. Interactive graphical models of objects with varying stiff- nesses. In Proceedings of Virtual Reality in Medicine and Developers' Expo., pages 70-74. SIG-Advanced Applica- tions, Inc., June 1995.
[9] J. Keating, T. A. Matyas, and T. M. Bach. The effect of train- ing on physical therapists' ability to apply specified forces of palpation. Physical Therapy, 73(l):45-53, January 1993.
[10] N. Langrana, G. Burdea, M. Dinsmore, D. Gomez, E. Harper, D. Silver, and R. Mezrich. Virtual reality training simulation with force feedback: Palpation of lesions. In Pro- ceedings of 1996 Advances in Bioengineering, ASME Bio- engineering Symposium, volume BED - 33, pages 435-436. ASME Publications, November 1996.
[11] N. Langrana, G. Burdea, K. Lange, D. Gomez, and S. Desh- pande. Dynamic force feedback in a virtual knee palpa- tion. Journal of Artificial Intelligence in Medicine, 6:321— 333, June 1994.
[12] N. Langrana, G. Burdea, R. Mezrich, and M. Dinsmore. De- velopment of training tools for palpation of lesions. Techni- cal report, Final Report to NJ state Commission on Cancer research, 1996.
[13] The Math Works, Inc, Natick, Mass. Statistics TOOLBOX for Use with MATLAB, User's Guide, 1995.
[14] C. Merry. Palpation of a pyloric tumor. Irish Medical Jour- nal, 86(1):26, January 1993.
[15] D. Ota, B. Loftin, T. Saito, R. Lea, and J. Keller. Virtual reality in surgical education. Computers in Biology and Medicine, 25(2): 127-137, March 1995.
[16] E. Pere, D. Gomez, G. Burdea, and N. Langrana. PC-Based virtual reality system with dexterous force feedback. In ASME Winter Annual Meeting, Atlanta, GA, volume DSC - 58, pages 495-502, November 1996.
[17] F. Pinciroli and P. Valenza. An inventory of computer re- sources for the medical application of virtual reality. Com- puters in Biology and Medicine, 25(2): 115-125, March 1995.
[18] L. Rosenburg. Virtual Fixtures': Perceptual Overlays En- hance Operator Performance in Telepresence Tasks. PhD thesis, Stanford University, 1994.
[19] R. M. Satava. Virtual reality surgical simulator: The first step. In Medicine Meets Virtual Reality, 1992.
[20] Viewpoint DataLabs International, Orem, Utah. Viewpoint Catalog, SIGGRAPH '95 edition, 1995.
60
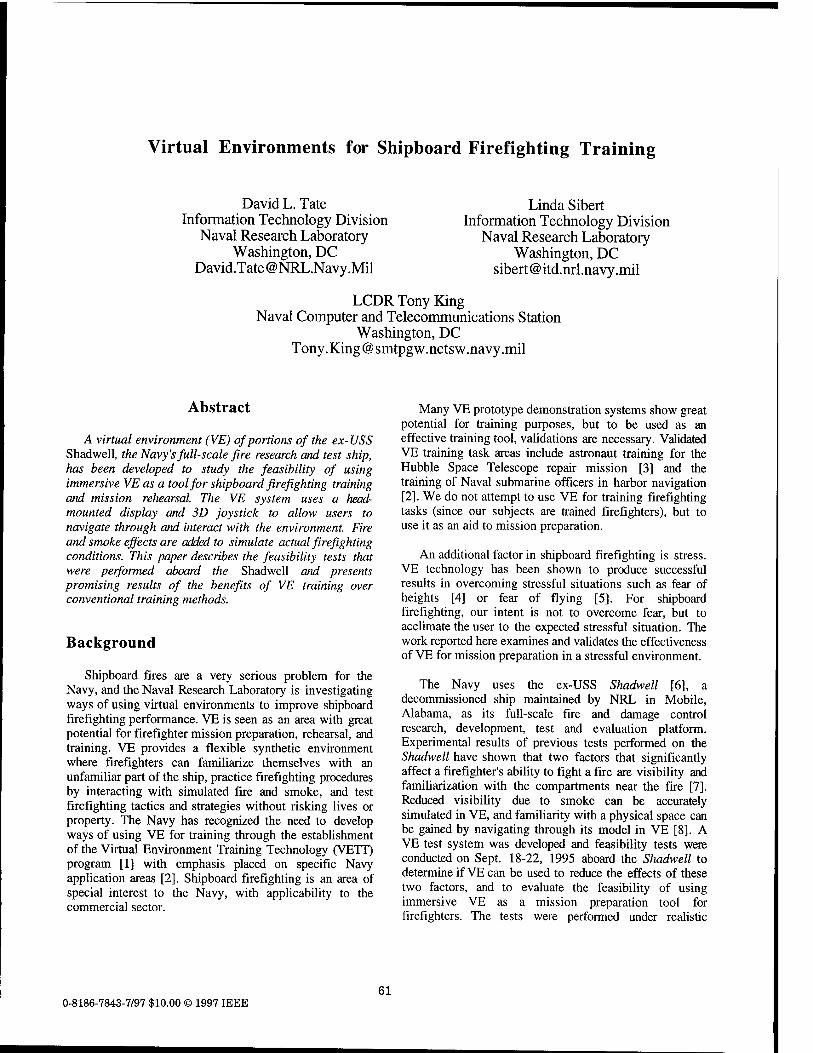
Virtual Environments for Shipboard Firefighting Training
David L. Täte Information Technology Division
Naval Research Laboratory Washington, DC
David.Tate @ NRL.Navy .Mil
Linda Sibert Information Technology Division
Naval Research Laboratory Washington, DC
LCDR Tony King Naval Computer and Telecommunications Station
Washington, DC Tony. King @ smtpg w. nctsw .navy. mil
Abstract
A virtual environment (VE) of portions of the ex- USS Shadwell, the Navy's full-scale fire research and test ship, has been developed to study the feasibility of using immersive VE as a tool for shipboard firefighting training and mission rehearsal. The VE system uses a head- mounted display and 3D joystick to allow users to navigate through and interact with the environment. Fire and smoke effects are added to simulate actual firefighting conditions. This paper describes the feasibility tests that were performed aboard the Shadwell and presents promising results of the benefits of VE training over conventional training methods.
Background
Shipboard fires are a very serious problem for the Navy, and the Naval Research Laboratory is investigating ways of using virtual environments to improve shipboard firefighting performance. VE is seen as an area with great potential for firefighter mission preparation, rehearsal, and training. VE provides a flexible synthetic environment where firefighters can familiarize themselves with an unfamiliar part of the ship, practice firefighting procedures by interacting with simulated fire and smoke, and test firefighting tactics and strategies without risking lives or property. The Navy has recognized the need to develop ways of using VE for training through the establishment of the Virtual Environment Training Technology (VETT) program [1] with emphasis placed on specific Navy application areas [2]. Shipboard firefighting is an area of special interest to the Navy, with applicability to the commercial sector.
Many VE prototype demonstration systems show great potential for training purposes, but to be used as an effective training tool, validations are necessary. Validated VE training task areas include astronaut training for the Hubble Space Telescope repair mission [3] and the training of Naval submarine officers in harbor navigation [2]. We do not attempt to use VE for training firefighting tasks (since our subjects are trained firefighters), but to use it as an aid to mission preparation.
An additional factor in shipboard firefighting is stress. VE technology has been shown to produce successful results in overcoming stressful situations such as fear of heights [4] or fear of flying [5]. For shipboard firefighting, our intent is not to overcome fear, but to acclimate the user to the expected stressful situation. The work reported here examines and validates the effectiveness of VE for mission preparation in a stressful environment.
The Navy uses the ex-USS Shadwell [6], a decommissioned ship maintained by NRL in Mobile, Alabama, as its full-scale fire and damage control research, development, test and evaluation platform. Experimental results of previous tests performed on the Shadwell have shown that two factors that significantly affect a firefighter's ability to fight a fire are visibility and familiarization with the compartments near the fire [7]. Reduced visibility due to smoke can be accurately simulated in VE, and familiarity with a physical space can be gained by navigating through its model in VE [8]. A VE test system was developed and feasibility tests were conducted on Sept. 18-22, 1995 aboard the Shadwell to determine if VE can be used to reduce the effects of these two factors, and to evaluate the feasibility of using immersive VE as a mission preparation tool for firefighters. The tests were performed under realistic
0-8186-7843-7/97 $10.00 © 1997 IEEE 61
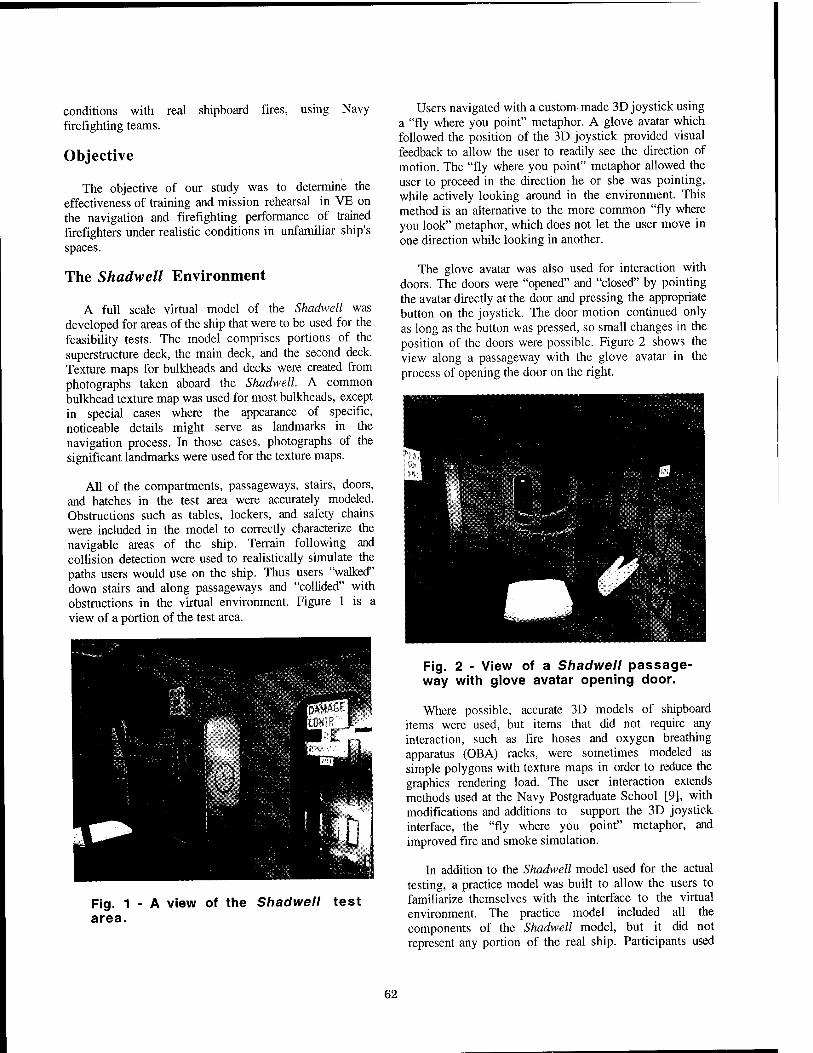
conditions with real shipboard fires, using Navy firefighting teams.
Objective
The objective of our study was to determine the effectiveness of training and mission rehearsal in VE on the navigation and firefighting performance of trained firefighters under realistic conditions in unfamiliar ship's spaces.
The Shadwell Environment
A full scale virtual model of the Shadwell was developed for areas of the ship that were to be used for the feasibility tests. The model comprises portions of the superstructure deck, the main deck, and the second deck. Texture maps for bulkheads and decks were created from photographs taken aboard the Shadwell. A common bulkhead texture map was used for most bulkheads, except in special cases where the appearance of specific, noticeable details might serve as landmarks in the navigation process. In those cases, photographs of the significant landmarks were used for the texture maps.
All of the compartments, passageways, stairs, doors, and hatches in the test area were accurately modeled. Obstructions such as tables, lockers, and safety chains were included in the model to correctly characterize the navigable areas of the ship. Terrain following and collision detection were used to realistically simulate the paths users would use on the ship. Thus users "walked" down stairs and along passageways and "collided" with obstructions in the virtual environment. Figure 1 is a view of a portion of the test area.
Users navigated with a custom-made 3D joystick using a "fly where you point" metaphor. A glove avatar which followed the position of the 3D joystick provided visual feedback to allow the user to readily see the direction of motion. The "fly where you point" metaphor allowed the user to proceed in the direction he or she was pointing, while actively looking around in the environment. This method is an alternative to the more common "fly where you look" metaphor, which does not let the user move in one direction while looking in another.
The glove avatar was also used for interaction with doors. The doors were "opened" and "closed" by pointing the avatar directly at the door and pressing the appropriate button on the joystick. The door motion continued only as long as the button was pressed, so small changes in the position of the doors were possible. Figure 2 shows the view along a passageway with the glove avatar in the process of opening the door on the right.
Fig. 1 area.
A view of the Shadwell test
Fig. 2 - View of a Shadwell passage- way with glove avatar opening door.
Where possible, accurate 3D models of shipboard items were used, but items that did not require any interaction, such as fire hoses and oxygen breathing apparatus (OBA) racks, were sometimes modeled as simple polygons with texture maps in order to reduce the graphics rendering load. The user interaction extends methods used at the Navy Postgraduate School [9], with modifications and additions to support the 3D joystick interface, the "fly where you point" metaphor, and improved fire and smoke simulation.
In addition to the Shadwell model used for the actual testing, a practice model was built to allow the users to familiarize themselves with the interface to the virtual environment. The practice model included all the components of the Shadwell model, but it did not represent any portion of the real ship. Participants used
62
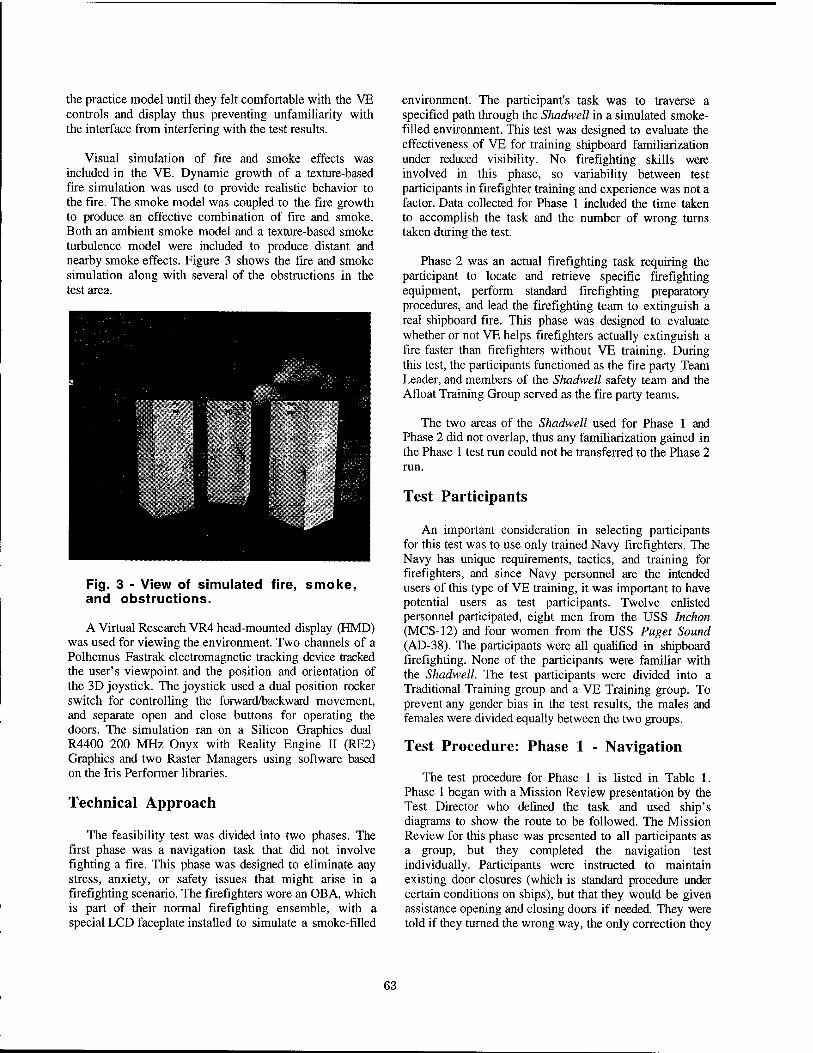
the practice model until they felt comfortable with the VE controls and display thus preventing unfamiliarity with the interface from interfering with the test results.
Visual simulation of fire and smoke effects was included in the VE. Dynamic growth of a texture-based fire simulation was used to provide realistic behavior to the fire. The smoke model was coupled to the fire growth to produce an effective combination of fire and smoke. Both an ambient smoke model and a texture-based smoke turbulence model were included to produce distant and nearby smoke effects. Figure 3 shows the fire and smoke simulation along with several of the obstructions in the test area.
Fig. 3 - View of simulated fire, smoke, and obstructions.
A Virtual Research VR4 head-mounted display (HMD) was used for viewing the environment. Two channels of a Polhemus Fastrak electromagnetic tracking device tracked the user's viewpoint and the position and orientation of the 3D joystick. The joystick used a dual position rocker switch for controlling the forward/backward movement, and separate open and close buttons for operating the doors. The simulation ran on a Silicon Graphics dual- R4400 200 MHz Onyx with Reality Engine II (RE2) Graphics and two Raster Managers using software based on the Iris Performer libraries.
Technical Approach
The feasibility test was divided into two phases. The first phase was a navigation task that did not involve fighting a fire. This phase was designed to eliminate any stress, anxiety, or safety issues that might arise in a firefighting scenario. The firefighters wore an OBA, which is part of their normal firefighting ensemble, with a special LCD faceplate installed to simulate a smoke-filled
environment. The participant's task was to traverse a specified path through the Shadwell in a simulated smoke- filled environment. This test was designed to evaluate the effectiveness of VE for training shipboard familiarization under reduced visibility. No firefighting skills were involved in this phase, so variability between test participants in firefighter training and experience was not a factor. Data collected for Phase 1 included the time taken to accomplish the task and the number of wrong turns taken during the test.
Phase 2 was an actual firefighting task requiring the participant to locate and retrieve specific firefighting equipment, perform standard firefighting preparatory procedures, and lead the firefighting team to extinguish a real shipboard fire. This phase was designed to evaluate whether or not VE helps firefighters actually extinguish a fire faster than firefighters without VE training. During this test, the participants functioned as the fire party Team Leader, and members of the Shadwell safety team and the Afloat Training Group served as the fire party teams.
The two areas of the Shadwell used for Phase 1 and Phase 2 did not overlap, thus any familiarization gained in the Phase 1 test run could not be transferred to the Phase 2 run.
Test Participants
An important consideration in selecting participants for this test was to use only trained Navy firefighters. The Navy has unique requirements, tactics, and training for firefighters, and since Navy personnel are the intended users of this type of VE training, it was important to have potential users as test participants. Twelve enlisted personnel participated, eight men from the USS Inchon (MCS-12) and four women from the USS Puget Sound (AD-38). The participants were all qualified in shipboard firefighting. None of the participants were familiar with the Shadwell. The test participants were divided into a Traditional Training group and a VE Training group. To prevent any gender bias in the test results, the males and females were divided equally between the two groups.
Test Procedure: Phase 1 - Navigation
The test procedure for Phase 1 is listed in Table 1. Phase 1 began with a Mission Review presentation by the Test Director who defined the task and used ship's diagrams to show the route to be followed. The Mission Review for this phase was presented to all participants as a group, but they completed the navigation test individually. Participants were instructed to maintain existing door closures (which is standard procedure under certain conditions on ships), but that they would be given assistance opening and closing doors if needed. They were told if they turned the wrong way, the only correction they
63
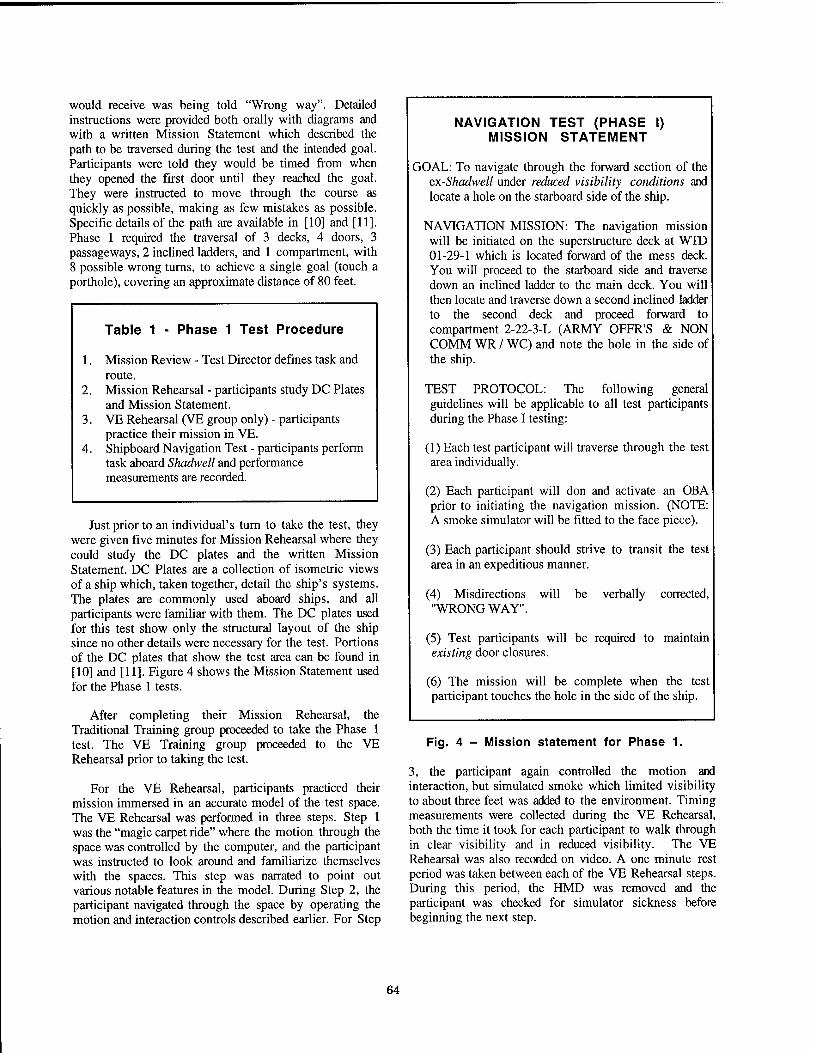
would receive was being told "Wrong way". Detailed instructions were provided both orally with diagrams and with a written Mission Statement which described the path to be traversed during the test and the intended goal. Participants were told they would be timed from when they opened the first door until they reached the goal. They were instructed to move through the course as quickly as possible, making as few mistakes as possible. Specific details of the path are available in [10] and [11]. Phase 1 required the traversal of 3 decks, 4 doors, 3 passageways, 2 inclined ladders, and 1 compartment, with 8 possible wrong turns, to achieve a single goal (touch a porthole), covering an approximate distance of 80 feet.
Table 1 - Phase 1 Test Procedure
1. Mission Review - Test Director defines task and route.
2. Mission Rehearsal - participants study DC Plates and Mission Statement.
3. VE Rehearsal (VE group only) - participants practice their mission in VE.
4. Shipboard Navigation Test - participants perform task aboard Shadwell and performance measurements are recorded.
Just prior to an individual's turn to take the test, they were given five minutes for Mission Rehearsal where they could study the DC plates and the written Mission Statement. DC Plates are a collection of isometric views of a ship which, taken together, detail the ship's systems. The plates are commonly used aboard ships, and all participants were familiar with them. The DC plates used for this test show only the structural layout of the ship since no other details were necessary for the test. Portions of the DC plates that show the test area can be found in [10] and [11]. Figure 4 shows the Mission Statement used for the Phase 1 tests.
After completing their Mission Rehearsal, the Traditional Training group proceeded to take the Phase 1 test. The VE Training group proceeded to the VE Rehearsal prior to taking the test.
For the VE Rehearsal, participants practiced their mission immersed in an accurate model of the test space. The VE Rehearsal was performed in three steps. Step 1 was the "magic carpet ride" where the motion through the space was controlled by the computer, and the participant was instructed to look around and familiarize themselves with the spaces. This step was narrated to point out various notable features in the model. During Step 2, the participant navigated through the space by operating the motion and interaction controls described earlier. For Step
NAVIGATION TEST (PHASE I) MISSION STATEMENT
GOAL: To navigate through the forward section of the ex-Shadwell under reduced visibility conditions and locate a hole on the starboard side of the ship.
NAVIGATION MISSION: The navigation mission will be initiated on the superstructure deck at WTD 01-29-1 which is located forward of the mess deck. You will proceed to the starboard side and traverse down an inclined ladder to the main deck. You will then locate and traverse down a second inclined ladder to the second deck and proceed forward to compartment 2-22-3-L (ARMY OFFR'S & NON COMM WR / WC) and note the hole in the side of the ship.
TEST PROTOCOL: The following general guidelines will be applicable to all test participants during the Phase I testing:
(1) Each test participant will traverse through the test area individually.
(2) Each participant will don and activate an OBA prior to initiating the navigation mission. (NOTE: A smoke simulator will be fitted to the face piece).
(3) Each participant should strive to transit the test area in an expeditious manner.
(4) Misdirections will be verbally corrected, "WRONG WAY".
(5) Test participants will be required to maintain existing door closures.
(6) The mission will be complete when the test participant touches the hole in the side of the ship.
Fig. 4 - Mission statement for Phase 1.
3, the participant again controlled the motion and interaction, but simulated smoke which limited visibility to about three feet was added to the environment. Timing measurements were collected during the VE Rehearsal, both the time it took for each participant to walk through in clear visibility and in reduced visibility. The VE Rehearsal was also recorded on video. A one minute rest period was taken between each of the VE Rehearsal steps. During this period, the HMD was removed and the participant was checked for simulator sickness before beginning the next step.
64
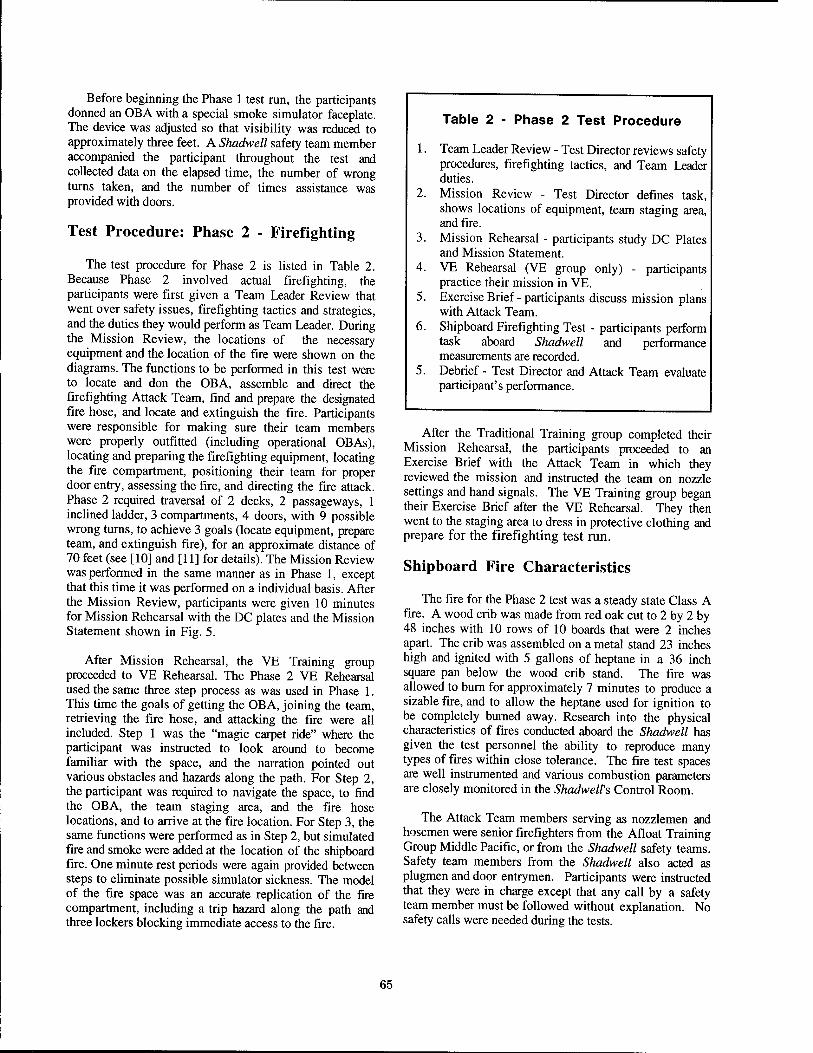
Before beginning the Phase 1 test run, the participants donned an OBA with a special smoke simulator faceplate. The device was adjusted so that visibility was reduced to approximately three feet. A Shadwell safety team member accompanied the participant throughout the test and collected data on the elapsed time, the number of wrong turns taken, and the number of times assistance was provided with doors.
Test Procedure: Phase 2 - Firefighting
The test procedure for Phase 2 is listed in Table 2. Because Phase 2 involved actual firefighting, the participants were first given a Team Leader Review that went over safety issues, firefighting tactics and strategies, and the duties they would perform as Team Leader. During the Mission Review, the locations of the necessary equipment and the location of the fire were shown on the diagrams. The functions to be performed in this test were to locate and don the OBA, assemble and direct the firefighting Attack Team, find and prepare the designated fire hose, and locate and extinguish the fire. Participants were responsible for making sure their team members were properly outfitted (including operational OBAs), locating and preparing the firefighting equipment, locating the fire compartment, positioning their team for proper door entry, assessing the fire, and directing the fire attack. Phase 2 required traversal of 2 decks, 2 passageways, 1 inclined ladder, 3 compartments, 4 doors, with 9 possible wrong turns, to achieve 3 goals (locate equipment, prepare team, and extinguish fire), for an approximate distance of 70 feet (see [10] and [11] for details). The Mission Review was performed in the same manner as in Phase 1, except that this time it was performed on a individual basis. After the Mission Review, participants were given 10 minutes for Mission Rehearsal with the DC plates and the Mission Statement shown in Fig. 5.
After Mission Rehearsal, the VE Training group proceeded to VE Rehearsal. The Phase 2 VE Rehearsal used the same three step process as was used in Phase 1. This time the goals of getting the OBA, joining the team, retrieving the fire hose, and attacking the fire were all included. Step 1 was the "magic carpet ride" where the participant was instructed to look around to become familiar with the space, and the narration pointed out various obstacles and hazards along the path. For Step 2, the participant was required to navigate the space, to find the OBA, the team staging area, and the fire hose locations, and to arrive at the fire location. For Step 3, the same functions were performed as in Step 2, but simulated fire and smoke were added at the location of the shipboard fire. One minute rest periods were again provided between steps to eliminate possible simulator sickness. The model of the fire space was an accurate replication of the fire compartment, including a trip hazard along the path and three lockers blocking immediate access to the fire.
Table 2 - Phase 2 Test Procedure
1. Team Leader Review - Test Director reviews safety procedures, firefighting tactics, and Team Leader duties.
2. Mission Review - Test Director defines task, shows locations of equipment, team staging area, and fire.
3. Mission Rehearsal - participants study DC Plates and Mission Statement.
4. VE Rehearsal (VE group only) - participants practice their mission in VE.
5. Exercise Brief-participants discuss mission plans with Attack Team.
6. Shipboard Firefighting Test - participants perform task aboard Shadwell and performance measurements are recorded.
5. Debrief - Test Director and Attack Team evaluate participant's performance.
After the Traditional Training group completed their Mission Rehearsal, the participants proceeded to an Exercise Brief with the Attack Team in which they reviewed the mission and instructed the team on nozzle settings and hand signals. The VE Training group began their Exercise Brief after the VE Rehearsal. They then went to the staging area to dress in protective clothing and prepare for the firefighting test run.
Shipboard Fire Characteristics
The fire for the Phase 2 test was a steady state Class A fire. A wood crib was made from red oak cut to 2 by 2 by 48 inches with 10 rows of 10 boards that were 2 inches apart. The crib was assembled on a metal stand 23 inches high and ignited with 5 gallons of heptane in a 36 inch square pan below the wood crib stand. The fire was allowed to burn for approximately 7 minutes to produce a sizable fire, and to allow the heptane used for ignition to be completely burned away. Research into the physical characteristics of fires conducted aboard the Shadwell has given the test personnel the ability to reproduce many types of fires within close tolerance. The fire test spaces are well instrumented and various combustion parameters are closely monitored in the Shadwell's Control Room.
The Attack Team members serving as nozzlemen and hosemen were senior firefighters from the Afloat Training Group Middle Pacific, or from the Shadwell safety teams. Safety team members from the Shadwell also acted as plugmen and door entrymen. Participants were instructed that they were in charge except that any call by a safety team member must be followed without explanation. No safety calls were needed during the tests.
65

FIREFIGHTING TEST (PHASE II) MISSION STATEMENT
GOAL: To navigate through the forward section of the ex-Shadwell under realistic shipboard fire conditions and extinguish a Class A compartment fire.
FIRE MISSION: The fire mission will be initiated on the forecastle (main deck) at WTD 1-13-1. You will proceed down an inclined ladder to the second deck into the Repair Two area. Once in the Repair Two area, you will locate compartment 2-11-2-Q (BATTLE DRESSING STATION) and retrieve and don your OBA. You will then lead the assembled attack team down the starboard passageway, locate the FPL 2-19-3 fire station, and initiate a direct attack on the Class A fire in compartment 2-15-2-A (STOREROOM).
TEST PROTOCOL: The following general guidelines will be applicable to all test participants during the Phase II testing:
(1) All test participants will function as the Attack Team Leader.
(2) Each participant will don a complete firefighting ensemble (except OBA) prior to commencing the fire mission.
(3) Each test participant will be responsible for leading the fire attack and strive to maintain a rapid, continuous, and aggressive response to the firefighting actions.
(4) Misdirections will be verbally corrected, "WRONG WAY".
(5) Maintaining existing door closures will not be required during Phase II testing.
(6) The mission will be complete when the fire is reported out or when terminated by a safety team member.
Fig. 5 - Mission statement for Phase 2.
After the Phase 2 fire, participants attended a Debrief Session where they discussed their performance with the Test Director and Attack Team. They also provided comments about whether VE Training was helpful to them.
Findings
Our results show that there was a measurable improvement in the performance of firefighters that used VE for mission rehearsal over firefighters without VE in both phases of the test. In the Phase 1 (navigation) test, the VE Training group was an average of 30 seconds faster over a two minute run (see Table 3). The VE Group averaged 1:54 (o = 1:03) while the Traditional Training group averaged 2:38 (o = 0:59). These results give an indication of benefits of VE training, although further studies with a larger group size are warranted before statistical significance is evident. In addition, all of the Traditional Training group members made at least one wrong turn, while only one VE Training group member made any wrong turns. In time-critical applications such as shipboard firefighting, both traversal time and wrong turns can contribute significantly to the outcome of the firefighting evolution. These results indicate that VE training shows promise in producing a performance improvement in shipboard familiarization and navigation.
Table 3 - Phase 1 Test Results
Subj. i VE/Trad. Wrong wav Time 1. V 0 1:13 2. V 0 1:14 3. V N.A. N.A. 4. V 0 1:35 5. V 0 1:45 6. V 3 3:43 7. T 1 1:18 8. T 1 1:49 9. T 1 2:43 10. T 2 2:50 11. T 3 3:01 12. T 2 4:07
VE average 0.6 (o=1.3) 1:54(0=1:03) Trad, average 1.6(c=0.8) 2:38(0=0:59)
*N.A. - not available due to invalid test run (restarted)
As an indicator of how fast the Phase 1 test could be traversed under ideal training conditions, five experienced firefighters from the Afloat Training Group completed the Phase 1 navigation run after rehearsing in the actual shipboard test space. They studied DC Plates for 10 minutes and were given three practice runs in the actual test space, similar to the way the VE Training group rehearsed their runs in VE. First they were guided through the route, then they walked the route under clear visibility, and third, they walked the route wearing reduced visibility goggles set to approximately three feet like the smoke simulator faceplate. After training, they ran the route
66

wearing an OBA with a smoke simulator faceplate. From only two usable runs, the average time was 1:11. This suggests that VE training is not as good as training in the actual space, which is what should be expected.
In Phase 2 (the firefighting test), the VE Training group again showed better elapsed times for arriving at the fire scene and putting the fire out (see Table 4). For the arrival time at the fire scene, the VE Group averaged 6:55 (o=0:42) while the Traditional Training group averaged 8:39 (o=2:14). For the total time to extinguish the fire, the VE Group averaged 9:26 (o=0:42) while the Traditional Training group averaged 11:43 (o=2:29). All but one of the participants in the Traditional Training group made wrong turns in Phase 2, but no one in the VE Training group did. This supports the results from Phase 1 for this metric, and statistical significance is suggested, although larger test groups need to be studied to reinforce this evidence. These results suggest that VE training can contribute to improved firefighter performance by reducing the time to extinguish fires.
In addition to the quantifiable results obtained during the tests, anecdotal evidence provided by the test participants reinforces the effectiveness of VE for mission rehearsal. Participants expressed their increased confidence in performing their firefighting tasks because of the familiarization with the spaces and situational awareness that they received through VE. They were able to concentrate on their firefighting skills (the most important part of their task) rather than the problem of navigating through unfamiliar spaces. Most members of the VE Training group used VE to actively investigate the fire
scene to locate notable landmarks and obstructions, possible ingress and egress routes, and to plan their firefighting strategies, enabling them to use their firefighting skills more effectively.
After testing, comments from one of the participants indicated that VE "helped me big time" and that he "went exactly there" [to the fire scene]. Another subject said that "VE really helped me" and that "the fire looked just like it did in VE". One of the Traditional Training group members was allowed to use VE after his testing was finished, and indicated that VE would have helped him because without it he felt like he "went in there cold".
Conclusions and Recommendations
The results suggest that virtual environments can be effectively used for training and mission rehearsal for shipboard firefighting. VE provides a flexible environment where a firefighter can not only learn an unfamiliar part of the ship, but also practice tactics and procedures for fighting a fire by interacting with simulated smoke and fire without risking lives or property.
These tests have proven to be a successful first step in the development of a new training technology for shipboard firefighting based on immersive virtual environments. The tests have also provided some insight toward potential areas of improvement that require additional research. User interaction techniques for manipulating objects in VE need further study, accompanied by usability studies to determine the
Table 4 - Phase 2 Test Results
Subj. VE/Trad. Wrong wav At Scene Fire Out 5. V 0 5:50 8:48 3. V 0 6:56 8:52 4. V 0 7:15 9:52 2. V 0 6:21 10:11 6. V 0 7:38 N.A. 1. V 0 7:30 N.A. 11. T 8:40 N.A. 7. T 7:00 9:14 10. T 6:20 9:35 9. T 9:25 11:55 8. T 7:53 12:28 12. T 2 12:36 15:23
Trad, average 1.17(a=0.41) 8:39(0=2:14) 11:43(0=2:29) VE average 0.00 (0=0.00) 6:55 (0=0:42) 9:26 (0=0:42)
*N.A. - not available due to incomplete test data
67

effectiveness or utility of those techniques. More natural and intuitive input/output devices such as 3D sound, speech and natural language input, integrated multimedia and hypermedia instruction, and multiuser interaction are all areas that could be used to provide an enhanced VE training system.
Acknowledgments
The authors would like to thank the Captains and crews of USS Inchon (MCS-12) and USS Puget Sound (AD-38) for their cooperation and participation in this test. We also thank the members of the Afloat Training Group, Middle Pacific for serving as firefighting team members throughout these tests. We also thank OPNAV N86D for providing funding for this effort.
[9] P. L. McDowell and T. E. King, "A Networked Virtual Environment for Shipboard Training," Master's Thesis, Naval Postgraduate School, Monterey, CA, March 1995.
[10] D. L. Täte et al, "Virtual Environment Firefighting / Ship Familiarization Feasibility Tests Aboard the Ex-USS Shadwell," NRL Ltr Rpt 6180/0672A. 1, Oct. 17, 1995.
[11] "Virtual Environment Firefighting / Ship Familiarization Feasibility Tests Aboard the Ex- USS Shadwell" http://www.ait.nrl.navy.mil/ DamageControl/VETest.html (Nov. 2, 1995).
References
[1] D. Zeltzer et al, "Virtual Environment Technology for Training: Core Testbed," Technical Report, Naval Air Warfare Center Training Systems Division, Orlando, FL, July 1995.
[2] D. Zeltzer and N. J. Pioch, "Validation and Verification of Virtual Environment Training Systems," Proc. IEEE Virtual Reality Annual International Symposium (VRAIS'96), Santa Clara, CA, March 30, 1996, pp. 123-130.
[3] R. B. Loftin and P. J. Kenney, 'Training the Hubble Space Telescope Flight Team," IEEE Computer Graphics and Applications, Vol. 15, No. 5, Sept. 1995, pp. 31-37.
[4] L. F. Hodges et al, "Virtual Environments for Treating the Fear of Heights," IEEE Computer, Vol. 28, No. 7, July 1995, pp. 27-34.
[5] L. F. Hodges et al, "A Virtual Airplane for Fear of Flying Therapy," Proc. IEEE Virtual Reality Annual International Symposium (VRAIS'96), Santa Clara, CA, March 30, 1996, pp. 86-93.
[6] H. W. Carhart et al, "The Ex-Shadwell— Full Scale Fire Research and Test Ship", NRL Memorandum Report 6074, Oct. 1987 (reissued Sept. 1992).
[7] J. L. Scheffey and F. W. Williams, "The Extinguishment of Fires Using Low-Flow Water Hose Streams - Part II," Fire Technology, Vol. 27, No. 4, Nov. 1991, pp. 291-320.
[8] B. G. Witmer et al, "Training Dismounted Soldiers in Virtual Environments: Route Learning and Transfer," Technical Report 1022, U.S. Army Research Institute for the Behavioral and Social Sciences, Feb. 1995.
68
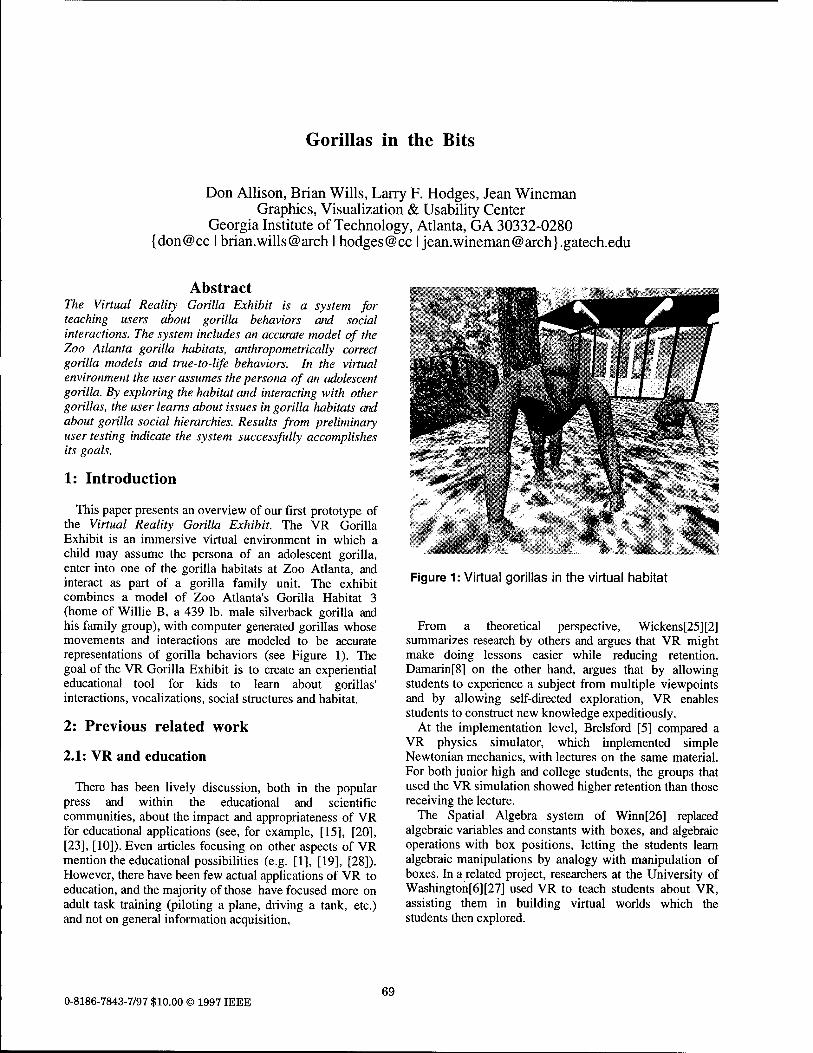
Gorillas in the Bits
Don Allison, Brian Wills, Larry F. Hodges, Jean Wineman Graphics, Visualization & Usability Center
Georgia Institute of Technology, Atlanta, GA 30332-0280 {don@cc I brian.wills@arch I hodges@cc I jean.wineman@arch}.gatech.edu
Abstract The Virtual Reality Gorilla Exhibit is a system for teaching users about gorilla behaviors and social interactions. The system includes an accurate model of the Zoo Atlanta gorilla habitats, anthropometrically correct gorilla models and true-to-life behaviors. In the virtual environment the user assumes the persona of an adolescent gorilla. By exploring the habitat and interacting with other gorillas, the user learns about issues in gorilla habitats and about gorilla social hierarchies. Results from preliminary user testing indicate the system successfully accomplishes its goals.
1: Introduction
This paper presents an overview of our first prototype of the Virtual Reality Gorilla Exhibit. The VR Gorilla Exhibit is an immersive virtual environment in which a child may assume the persona of an adolescent gorilla, enter into one of the gorilla habitats at Zoo Atlanta, and interact as part of a gorilla family unit. The exhibit combines a model of Zoo Atlanta's Gorilla Habitat 3 (home of Willie B, a 439 lb. male silverback gorilla and his family group), with computer generated gorillas whose movements and interactions are modeled to be accurate representations of gorilla behaviors (see Figure 1). The goal of the VR Gorilla Exhibit is to create an experiential educational tool for kids to learn about gorillas' interactions, vocalizations, social structures and habitat.
2: Previous related work
2.1: VR and education
There has been lively discussion, both in the popular press and within the educational and scientific communities, about the impact and appropriateness of VR for educational applications (see, for example, [15], [20], [23], [10]). Even articles focusing on other aspects of VR mention the educational possibilities (e.g. [1], [19], [28]). However, there have been few actual applications of VR to education, and the majority of those have focused more on adult task training (piloting a plane, driving a tank, etc.) and not on general information acquisition,
Figure 1: Virtual gorillas in the virtual habitat
From a theoretical perspective, Wickens[25][2] summarizes research by others and argues that VR might make doing lessons easier while reducing retention. Damarin[8] on the other hand, argues that by allowing students to experience a subject from multiple viewpoints and by allowing self-directed exploration, VR enables students to construct new knowledge expeditiously.
At the implementation level, Brelsford [5] compared a VR physics simulator, which implemented simple Newtonian mechanics, with lectures on the same material. For both junior high and college students, the groups that used the VR simulation showed higher retention than those receiving the lecture.
The Spatial Algebra system of Winn[26] replaced algebraic variables and constants with boxes, and algebraic operations with box positions, letting the students learn algebraic manipulations by analogy with manipulation of boxes. In a related project, researchers at the University of Washington[6][27] used VR to teach students about VR, assisting them in building virtual worlds which the students then explored.
0-8186-7843-7/97 $10.00 © 1997 IEEE 69
2.2: Interacting with computer-animated agents
From an implementation point of view, some recent work at the intersection of the graphics and artificial life communities on interacting with computer-animated agents is of interest. Joseph Bates and his coworkers on the Oz project at CMU have been building autonomous agents with interesting, emotional behaviors for users to interact with, called Woggles (see [3], [4]). Barbara Hayes-Roth and fellow researchers at the Knowledge Systems Laboratory at Stanford have used Bates' Woggles system as the basis for a user-directed improvisation system[14] (targeted at children) where the users specify possible scripts that control their characters' interactions. Both of these systems focus more on action selection and direction and less on the interface, which is still mouse-based. The users also view the action from a third-person point of view, controlling one of the Woggles more or less directly.
Two systems with more interesting interfaces include the Alive system[17], in which the user is tracked using silhouettes from a single camera and watches video images of himself (obtained through a variation of blue-screening) interact with computer creatures on a big screen display, andNeuroBaby[24][13] by Naoko Tosa, which does away with a computer representation of the user and user tracking, interacting with a stylized baby's head through inflections in the user's voice.
3: Motivation for virtual gorillas
Gorillas are an endangered species. Fossey[12] reports that only 242 mountain gorillas remain and the population is dropping 3% a year due to poaching and people destroying gorilla habitat for farming purposes. Zoos are spending more efforts on public education about gorillas and their plight to raise public awareness and to motivate people to take action, either through financial contributions to help fund conservation efforts, or through political activism to encourage the governments of Rwanda, Zaire, and Uganda to actively prosecute poachers and promote conservation. We felt that a well-designed virtual environment could contribute to these educational efforts, augmenting them in ways not possible through normal educational media.
There are many aspects of gorilla life that students can only learn through third hand reading. Even spending hours at the zoo observing the gorillas on exhibit won't help students observe the entire spectrum of gorilla behaviors and interactions. For example, the introduction of a new gorilla to a group is done off-exhibit, so students rarely get the chance to observe the establishment or reinforcement of the dominance hierarchy, and challenges to it. There are also things that no amount of observation will show students. For the animals' own protection from disease and because of the logistics problems it would cause the keepers, people normally are not allowed to observe the night quarters, or the routine involved in letting the gorillas out in the morning and bringing them in at night.
Given the distance separating the gorillas from the students, it is hard to observe gorilla vocalizations, although they play an important part in indicating gorilla moods. Also, gorillas are active in early morning and late afternoon, sleeping most of the middle of the day, but because of the logistics of class scheduling, most school children visit the zoo during the middle of the day. A virtual gorilla exhibit solves these logistical problems, letting students observe a broader set of gorilla behaviors, time-shifting behaviors that they would normally not see, and letting them visit areas that are normally off limits.
From a pedagogical point of view, constructivist theories of education advocate that the more viewpoints presented to the student, the better he is able to construct knowledge. With the virtual reality gorilla exhibit, the student not only gets to explore areas that are normally off limit to students, he also can assume a gorilla identity and interact with other gorillas as a peer, something not possible in the real world. By interacting with other gorillas, the student learns through first hand experience the social structure of a gorilla group and accepted social interactions. Also, the realistic but simplified environment focuses attention on the important parts of the system, guiding the student to the most important concepts to be mastered.
Before presenting information to a student, the teacher must first capture his attention. Since virtual environments are a reasonably new technology to most students, the novelty of being in a virtual environment helps hold their attention while the system presents information about gorillas and their behaviors. By presenting information in the first person instead of the third person, this information is likely to be retained longer if absorbed, and by holding the students' attention through the novelty of virtual reality, students are more likely to pay enough attention to actually absorb the knowledge.
From a teacher's viewpoint, a virtual gorilla exhibit would also be useful for several reasons. It could be used in preparation for an actual zoo field trip to help students learn what to look for and give them practice in observing and understanding gorilla behaviors. It could also be used in place of a zoo visit (when the nearest zoo is too far away, or too far away to visit often enough to develop a consistent set of observations). By bringing the zoo to the schools, it could increase interest in and awareness of the plight of the mountain gorilla. Also, since students are learning by putting themselves in someone's shoes other than their own, they are broadening their horizons and learning tolerance and understanding of others, lessons that are normally hard to teach using traditional methods.
Finally, we had available one of the world's premiere gorilla exhibits at Zoo Atlanta, along with the accompanying gorilla experts who were willing to share their expertise.
70
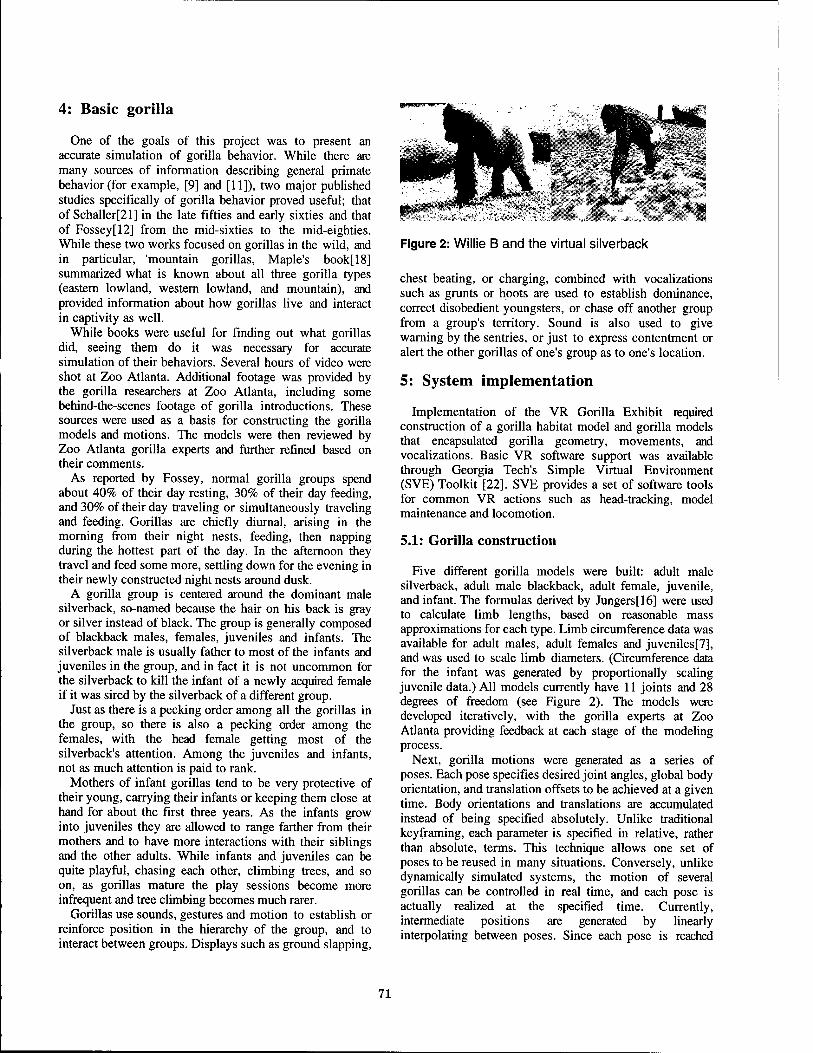
4: Basic gorilla
One of the goals of this project was to present an accurate simulation of gorilla behavior. While there ate many sources of information describing general primate behavior (for example, [9] and [11]), two major published studies specifically of gorilla behavior proved useful; that of Schaller[21] in the late fifties and early sixties and that of Fossey[12] from the mid-sixties to the mid-eighties. While these two works focused on gorillas in the wild, and in particular, 'mountain gorillas, Maple's book[18] summarized what is known about all three gorilla types (eastern lowland, western lowland, and mountain), and provided information about how gorillas live and interact in captivity as well.
While books were useful for finding out what gorillas did, seeing them do it was necessary for accurate simulation of their behaviors. Several hours of video were shot at Zoo Atlanta. Additional footage was provided by the gorilla researchers at Zoo Atlanta, including some behind-the-scenes footage of gorilla introductions. These sources were used as a basis for constructing the gorilla models and motions. The models were then reviewed by Zoo Atlanta gorilla experts and further refined based on their comments.
As reported by Fossey, normal gorilla groups spend about 40% of their day resting, 30% of their day feeding, and 30% of their day traveling or simultaneously traveling and feeding. Gorillas are chiefly diurnal, arising in the morning from their night nests, feeding, then napping during the hottest part of the day. In the afternoon they travel and feed some more, settling down for the evening in their newly constructed night nests around dusk.
A gorilla group is centered around the dominant male silverback, so-named because the hair on his back is gray or silver instead of black. The group is generally composed of blackback males, females, juveniles and infants. The silverback male is usually father to most of the infants and juveniles in the group, and in fact it is not uncommon for the silverback to kill the infant of a newly acquired female if it was sired by the silverback of a different group.
Just as there is a pecking order among all the gorillas in the group, so there is also a pecking order among the females, with the head female getting most of the silverback's attention. Among the juveniles and infants, not as much attention is paid to rank.
Mothers of infant gorillas tend to be very protective of their young, carrying their infants or keeping them close at hand for about the first three years. As the infants grow into juveniles they are allowed to range farther from their mothers and to have more interactions with their siblings and the other adults. While infants and juveniles can be quite playful, chasing each other, climbing trees, and so on, as gorillas mature the play sessions become more infrequent and tree climbing becomes much rarer.
Gorillas use sounds, gestures and motion to establish or reinforce position in the hierarchy of the group, and to interact between groups. Displays such as ground slapping,
Figure 2: Willie B and the virtual silverback
chest beating, or charging, combined with vocalizations such as grunts or hoots are used to establish dominance, correct disobedient youngsters, or chase off another group from a group's territory. Sound is also used to give warning by the sentries, or just to express contentment or alert the other gorillas of one's group as to one's location.
5: System implementation
Implementation of the VR Gorilla Exhibit required construction of a gorilla habitat model and gorilla models that encapsulated gorilla geometry, movements, and vocalizations. Basic VR software support was available through Georgia Tech's Simple Virtual Environment (SVE) Toolkit [22]. SVE provides a set of software tools for common VR actions such as head-tracking, model maintenance and locomotion.
5.1: Gorilla construction
Five different gorilla models were built: adult male silverback, adult male blackback, adult female, juvenile, and infant. The formulas derived by Jungers[16] were used to calculate limb lengths, based on reasonable mass approximations for each type. Limb circumference data was available for adult males, adult females and juveniles[7], and was used to scale limb diameters. (Circumference data for the infant was generated by proportionally scaling juvenile data.) All models currently have 11 joints and 28 degrees of freedom (see Figure 2). The models were developed iteratively, with the gorilla experts at Zoo Atlanta providing feedback at each stage of the modeling process.
Next, gorilla motions were generated as a series of poses. Each pose specifies desired joint angles, global body orientation, and translation offsets to be achieved at a given time. Body orientations and translations are accumulated instead of being specified absolutely. Unlike traditional keyframing, each parameter is specified in relative, rather than absolute, terms. This technique allows one set of poses to be reused in many situations. Conversely, unlike dynamically simulated systems, the motion of several gorillas can be controlled in real time, and each pose is actually realized at the specified time. Currently, intermediate positions are generated by linearly interpolating between poses. Since each pose is reached
71
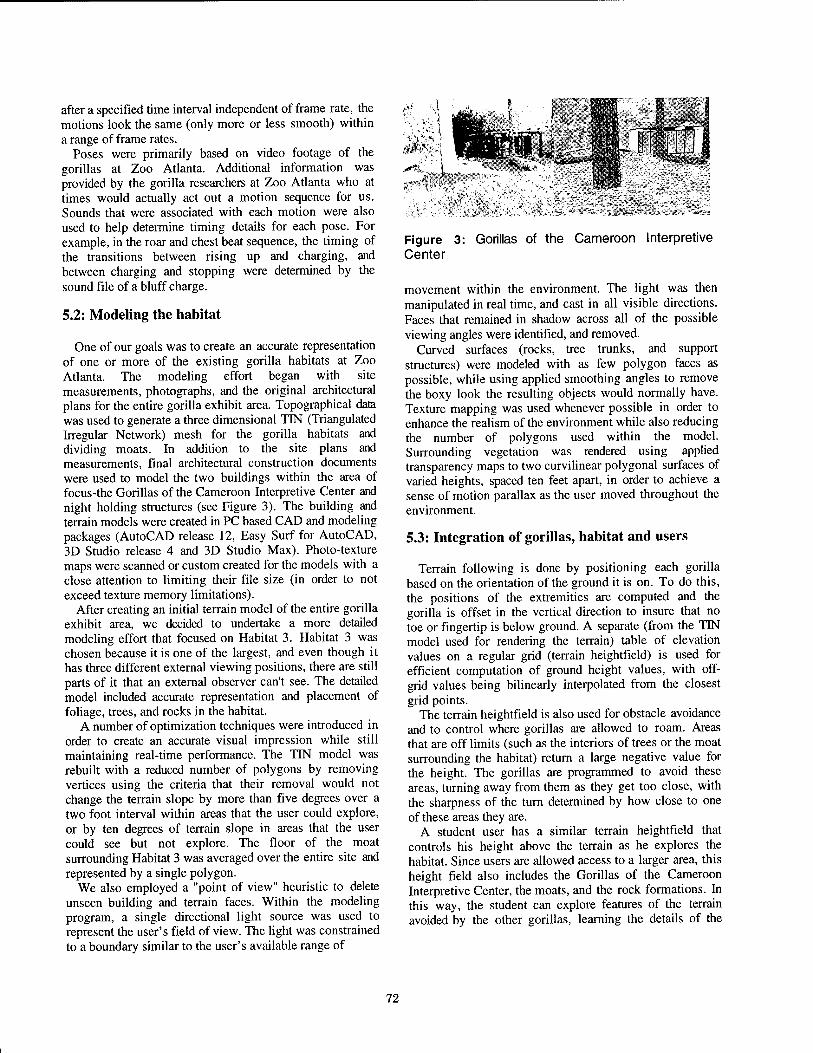
after a specified time interval independent of frame rate, the motions look the same (only more or less smooth) within a range of frame rates.
Poses were primarily based on video footage of the gorillas at Zoo Atlanta. Additional information was provided by the gorilla researchers at Zoo Atlanta who at times would actually act out a motion sequence for us. Sounds that were associated with each motion were also used to help determine timing details for each pose. For example, in the roar and chest beat sequence, the timing of the transitions between rising up and charging, and between charging and stopping were determined by the sound file of a bluff charge.
5.2: Modeling the habitat
One of our goals was to create an accurate representation of one or more of the existing gorilla habitats at Zoo Atlanta. The modeling effort began with site measurements, photographs, and the original architectural plans for the entire gorilla exhibit area. Topographical data was used to generate a three dimensional TIN (Triangulated Irregular Network) mesh for the gorilla habitats and dividing moats. In addition to the site plans and measurements, final architectural construction documents were used to model the two buildings within the area of focus-the Gorillas of the Cameroon Interpretive Center and night holding structures (see Figure 3). The building and terrain models were created in PC based CAD and modeling packages (AutoCAD release 12, Easy Surf for AutoCAD, 3D Studio release 4 and 3D Studio Max). Photo-texture maps were scanned or custom created for the models with a close attention to limiting their file size (in order to not exceed texture memory limitations).
After creating an initial terrain model of the entire gorilla exhibit area, we decided to undertake a more detailed modeling effort that focused on Habitat 3. Habitat 3 was chosen because it is one of the largest, and even though it has three different external viewing positions, there are still parts of it that an external observer can't see. The detailed model included accurate representation and placement of foliage, trees, and rocks in the habitat.
A number of optimization techniques were introduced in order to create an accurate visual impression while still maintaining real-time performance. The TIN model was rebuilt with a reduced number of polygons by removing vertices using the criteria that their removal would not change the terrain slope by more than five degrees over a two foot interval within areas that the user could explore, or by ten degrees of terrain slope in areas that the user could see but not explore. The floor of the moat surrounding Habitat 3 was averaged over the entire site and represented by a single polygon.
We also employed a "point of view" heuristic to delete unseen building and terrain faces. Within the modeling program, a single directional light source was used to represent the user's field of view. The light was constrained to a boundary similar to the user's available range of
Figure 3: Gorillas of the Cameroon Interpretive Center
movement within the environment. The light was then manipulated in real time, and cast in all visible directions. Faces that remained in shadow across all of the possible viewing angles were identified, and removed.
Curved surfaces (rocks, tree trunks, and support structures) were modeled with as few polygon faces as possible, while using applied smoothing angles to remove the boxy look the resulting objects would normally have. Texture mapping was used whenever possible in order to enhance the realism of the environment while also reducing the number of polygons used within the model. Surrounding vegetation was rendered using applied transparency maps to two curvilinear polygonal surfaces of varied heights, spaced ten feet apart, in order to achieve a sense of motion parallax as the user moved throughout the environment.
5.3: Integration of gorillas, habitat and users
Terrain following is done by positioning each gorilla based on the orientation of the ground it is on. To do this, the positions of the extremities are computed and the gorilla is offset in the vertical direction to insure that no toe or fingertip is below ground. A separate (from the TIN model used for rendering the terrain) table of elevation values on a regular grid (terrain heightfield) is used for efficient computation of ground height values, with off- grid values being bilinearly interpolated from the closest grid points.
The terrain heightfield is also used for obstacle avoidance and to control where gorillas are allowed to roam. Areas that are off limits (such as the interiors of trees or the moat surrounding the habitat) return a large negative value for the height. The gorillas are programmed to avoid these areas, turning away from them as they get too close, with the sharpness of the turn determined by how close to one of these areas they are.
A student user has a similar terrain heightfield that controls his height above the terrain as he explores the habitat. Since users are allowed access to a larger area, this height field also includes the Gorillas of the Cameroon Interpretive Center, the moats, and the rock formations. In this way, the student can explore features of the terrain avoided by the other gorillas, learning the details of the
72
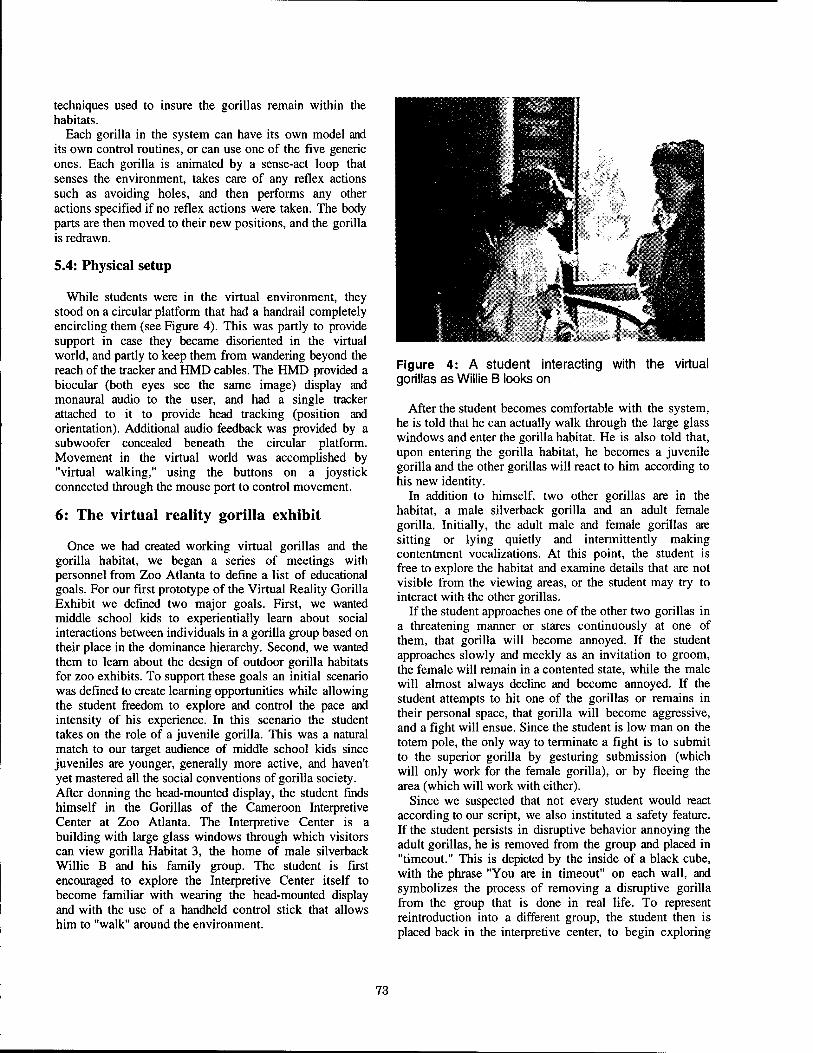
techniques used to insure the gorillas remain within the habitats.
Each gorilla in the system can have its own model and its own control routines, or can use one of the five generic ones. Each gorilla is animated by a sense-act loop that senses the environment, takes care of any reflex actions such as avoiding holes, and then performs any other actions specified if no reflex actions were taken. The body parts are then moved to their new positions, and the gorilla is redrawn.
5.4: Physical setup
While students were in the virtual environment, they stood on a circular platform that had a handrail completely encircling them (see Figure 4). This was partly to provide support in case they became disoriented in the virtual world, and partly to keep them from wandering beyond the reach of the tracker and HMD cables. The HMD provided a biocular (both eyes see the same image) display and monaural audio to the user, and had a single tracker attached to it to provide head tracking (position and orientation). Additional audio feedback was provided by a subwoofer concealed beneath the circular platform. Movement in the virtual world was accomplished by "virtual walking," using the buttons on a joystick connected through the mouse port to control movement.
6: The virtual reality gorilla exhibit
Once we had created working virtual gorillas and the gorilla habitat, we began a series of meetings with personnel from Zoo Atlanta to define a list of educational goals. For our first prototype of the Virtual Reality Gorilla Exhibit we defined two major goals. First, we wanted middle school kids to experientially learn about social interactions between individuals in a gorilla group based on their place in the dominance hierarchy. Second, we wanted them to learn about the design of outdoor gorilla habitats for zoo exhibits. To support these goals an initial scenario was defined to create learning opportunities while allowing the student freedom to explore and control the pace and intensity of his experience. In this scenario the student takes on the role of a juvenile gorilla. This was a natural match to our target audience of middle school kids since juveniles are younger, generally more active, and haven't yet mastered all the social conventions of gorilla society. After donning the head-mounted display, the student finds himself in the Gorillas of the Cameroon Interpretive Center at Zoo Atlanta. The Interpretive Center is a building with large glass windows through which visitors can view gorilla Habitat 3, the home of male silverback Willie B and his family group. The student is first encouraged to explore the Interpretive Center itself to become familiar with wearing the head-mounted display and with the use of a handheld control stick that allows him to "walk" around the environment.
Figure 4: A student interacting with the virtual gorillas as Willie B looks on
After the student becomes comfortable with the system, he is told that he can actually walk through the large glass windows and enter the gorilla habitat. He is also told that, upon entering the gorilla habitat, he becomes a juvenile gorilla and the other gorillas will react to him according to his new identity.
In addition to himself, two other gorillas are in the habitat, a male silverback gorilla and an adult female gorilla. Initially, the adult male and female gorillas are sitting or lying quietly and intermittently making contentment vocalizations. At this point, the student is free to explore the habitat and examine details that are not visible from the viewing areas, or the student may try to interact with the other gorillas.
If the student approaches one of the other two gorillas in a threatening manner or stares continuously at one of them, that gorilla will become annoyed. If the student approaches slowly and meekly as an invitation to groom, the female will remain in a contented state, while the male will almost always decline and become annoyed. If the student attempts to hit one of the gorillas or remains in their personal space, that gorilla will become aggressive, and a fight will ensue. Since the student is low man on the totem pole, the only way to terminate a fight is to submit to the superior gorilla by gesturing submission (which will only work for the female gorilla), or by fleeing the area (which will work with either).
Since we suspected that not every student would react according to our script, we also instituted a safety feature. If the student persists in disruptive behavior annoying the adult gorillas, he is removed from the group and placed in "timeout." This is depicted by the inside of a black cube, with the phrase "You are in timeout" on each wall, and symbolizes the process of removing a disruptive gorilla from the group that is done in real life. To represent reintroduction into a different group, the student then is placed back in the interpretive center, to begin exploring
73
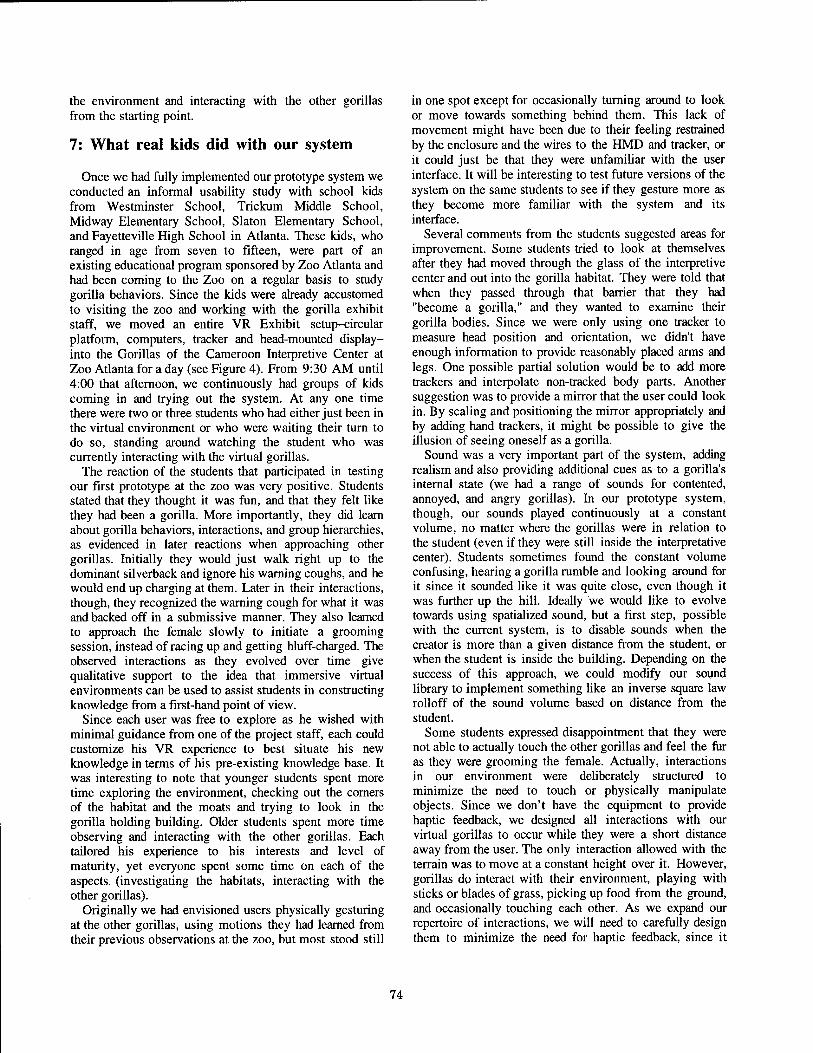
the environment and interacting with the other gorillas from the starting point.
7: What real kids did with our system
Once we had fully implemented our prototype system we conducted an informal usability study with school kids from Westminster School, Trickum Middle School, Midway Elementary School, Slaton Elementary School, and Fayetteville High School in Atlanta. These kids, who ranged in age from seven to fifteen, were part of an existing educational program sponsored by Zoo Atlanta and had been coming to the Zoo on a regular basis to study gorilla behaviors. Since the kids were already accustomed to visiting the zoo and working with the gorilla exhibit staff, we moved an entire VR Exhibit setup-circular platform, computers, tracker and head-mounted display- ing the Gorillas of the Cameroon Interpretive Center at Zoo Atlanta for a day (see Figure 4). From 9:30 AM until 4:00 that afternoon, we continuously had groups of kids coming in and trying out the system. At any one time there were two or three students who had either just been in the virtual environment or who were waiting their turn to do so, standing around watching the student who was currently interacting with the virtual gorillas.
The reaction of the students that participated in testing our first prototype at the zoo was very positive. Students stated that they thought it was fun, and that they felt like they had been a gorilla. More importantly, they did learn about gorilla behaviors, interactions, and group hierarchies, as evidenced in later reactions when approaching other gorillas. Initially they would just walk right up to the dominant silverback and ignore his warning coughs, and he would end up charging at them. Later in their interactions, though, they recognized the warning cough for what it was and backed off in a submissive manner. They also learned to approach the female slowly to initiate a grooming session, instead of racing up and getting bluff-charged. The observed interactions as they evolved over time give qualitative support to the idea that immersive virtual environments can be used to assist students in constructing knowledge from a first-hand point of view.
Since each user was free to explore as he wished with minimal guidance from one of the project staff, each could customize his VR experience to best situate his new knowledge in terms of his pre-existing knowledge base. It was interesting to note that younger students spent more time exploring the environment, checking out the corners of the habitat and the moats and trying to look in the gorilla holding building. Older students spent more time observing and interacting with the other gorillas. Each tailored his experience to his interests and level of maturity, yet everyone spent some time on each of the aspects, (investigating the habitats, interacting with the other gorillas).
Originally we had envisioned users physically gesturing at the other gorillas, using motions they had learned from their previous observations at the zoo, but most stood still
in one spot except for occasionally turning around to look or move towards something behind them. This lack of movement might have been due to their feeling restrained by the enclosure and the wires to the HMD and tracker, or it could just be that they were unfamiliar with the user interface. It will be interesting to test future versions of the system on the same students to see if they gesture more as they become more familiar with the system and its interface.
Several comments from the students suggested areas for improvement. Some students tried to look at themselves after they had moved through the glass of the interpretive center and out into the gorilla habitat. They were told that when they passed through that barrier that they had "become a gorilla," and they wanted to examine their gorilla bodies. Since we were only using one tracker to measure head position and orientation, we didn't have enough information to provide reasonably placed arms and legs. One possible partial solution would be to add more trackers and interpolate non-tracked body parts. Another suggestion was to provide a mirror that the user could look in. By scaling and positioning the mirror appropriately and by adding hand trackers, it might be possible to give the illusion of seeing oneself as a gorilla.
Sound was a very important part of the system, adding realism and also providing additional cues as to a gorilla's internal state (we had a range of sounds for contented, annoyed, and angry gorillas). In our prototype system, though, our sounds played continuously at a constant volume, no matter where the gorillas were in relation to the student (even if they were still inside the interpretative center). Students sometimes found the constant volume confusing, hearing a gorilla rumble and looking around for it since it sounded like it was quite close, even though it was further up the hill. Ideally we would like to evolve towards using spatialized sound, but a first step, possible with the current system, is to disable sounds when the creator is more than a given distance from the student, or when the student is inside the building. Depending on the success of this approach, we could modify our sound library to implement something like an inverse square law rolloff of the sound volume based on distance from the student.
Some students expressed disappointment that they were not able to actually touch the other gorillas and feel the fur as they were grooming the female. Actually, interactions in our environment were deliberately structured to minimize the need to touch or physically manipulate objects. Since we don't have the equipment to provide haptic feedback, we designed all interactions with our virtual gorillas to occur while they were a short distance away from the user. The only interaction allowed with the terrain was to move at a constant height over it. However, gorillas do interact with their environment, playing with sticks or blades of grass, picking up food from the ground, and occasionally touching each other. As we expand our repertoire of interactions, we will need to carefully design them to minimize the need for haptic feedback, since it
74
appears that there will be no general solutions in the near future to the problem of virtual touch.
Along the same lines, some students wanted a peer that they could interact with, someone that they didn't have to be subservient to. This seems like a reasonable request, but there are two potential problems that must be dealt with when implementing this. The first is that when two juveniles interact, they often do so in ways that involve touching each other, or manipulating objects in the environment. Since these types of interactions are currently difficult to implement in a virtual reality system, the allowed interactions must be carefully choreographed to minimize the need for tactile inputs.
The second problem is the less scripted nature of juvenile-juvenile interactions. When a juvenile interacts with an adult, the interaction is constrained to a fairly small set of options, due in part to the juvenile being subservient in the dominance hierarchy. However, when two juveniles interact, the dominance hierarchy is less clear. In addition, juveniles tend to be much less inhibited when interacting with their peers, which makes it harder to ensure that the behaviors exhibited are those typical of actual gorillas.
It was interesting to note that even though they were free to interact with the environment in novel ways, most users interacted as they would have if they had actually physically been in the real environment. For example, the moats were 12 feet deep, and in the real world most people don't willingly jump into 12 foot deep ditches. Even though the virtual environment was designed to allow users to easily enter and leave the moats, few did. Also, most users avoided running into the rocks on the habitat building wall, or trying to fly through trees, and had to be coaxed up to the top of the rocks initially. It seems reasonable to infer from this that the students transferred their knowledge of the real world to the virtual one quite easily, and that their sense of immersion was good.
Finally, we noticed that students seemed to do better when they had a knowledgeable guide to talk them through the first few minutes of interaction with the system. We expected that they would need a quick introduction to how to look and move around in the virtual environment, and so we started them out in the virtual interpretive center with someone there to get them used to looking around and moving about inside the building. However, it also proved useful for the guide to remain by their side once they had ventured out into the habitat to answer their questions and talk them through their first interaction with the other gorillas. It was too far outside the students' experience for them to be able to interpret the sounds and head gestures of the other gorillas without someone asking leading questions to connect what they knew with what they were experiencing, even though they had spent several weeks observing gorilla behavior from outside the habitats.
This problem illustrates one of the advantages of using virtual reality in education, and at the same time demonstrates the need for experiences to be on the fringes of what we know in order for us to learn from them. By
the time zoo visitors observe a gorilla group, the members have already been introduced and have a fairly good idea of their place in the group hierarchy, so there are not a lot of challenges for dominance. Thus most visitors don't ever get to see the dominance hierarchy in action, except indirectly (for example when one gorilla will approach another and the second will vacate its position in favor of the first), and even when they do, they often don't realize what they've seen. With virtual reality, our students were able to experience interactions that normally occur in the holding building or in the fifth, out of view, habitat and that are used to determine each gorilla's place in the group hierarchy. However, because it didn't correlate with behaviors they had observed on previous zoo visits, they had trouble interpreting what they saw and heard without a guide to help.
8: Future Work
Given that learning can be greatly enhanced by such a guide, we are investigating ways of providing an automated facilitator to help students make connections between their current experience and prior knowledge when they need it. Originally we had thought that having other students around making comments to the student in the virtual environment as they watched what was displayed in the HMD on large screen monitors would help bridge between knowledge and experience, both for the student in the virtual environment and for those still waiting their turn. It didn't work out that way, perhaps because the zoo gorilla experts and other adults standing around inhibited such interactions. In any case, we are planning to experiment with various adjuncts, such as audio annotations, scripted sequences of interactions where the student is led on a preprogrammed path through the world and shown the salient features, and even status indicators that function similar to a gorilla mood ring, to see which proves most useful in helping the student relate what they are experiencing to what they already know.
Having done a trial run with our initial prototype system, we now have a better idea of the types of questions we need to answer when building a virtual reality system for educational purposes. However, even the results of our first trials seem to indicate that it is possible to use virtual reality as a general educational tool for children, allowing them to experience the real world from viewpoints other than their own, and letting them learn from first-hand experience in environments that would normally be too dangerous or impossible for them to experience in the real world. By providing a rich, but accurate environment in which to interact, students are able to personalize their experiences, and internalize the content presented through first person interactions. Although the final conclusion is still out, some research (see, for example, [5]) seems to imply that knowledge constructed through first person interactions is retained more completely and longer than that constructed through third person presentations, such as lectures, or reading books. Given our initial success, we
75
are planning on expanding our system along some of the lines described above, adding more content and enriching the interactions. With the accelerating rate at which computer games and personal computers are driving the cost of the hardware down, virtual reality will be available as a technology to schools sooner than might be expected. Therefore it behooves us to determine appropriate uses for it now, if we are to protect tomorrow's students from bad applications of this technology to education.
Acknowledgments
Partial support for this project was provided by Zoo Atlanta and The Edutech Institute. Special thanks to Terry Maple, Debra Forthman, Lori Perkins, Kyle Burks and Kristen Lukas from Zoo Atlanta for their advice and guidance. Thanks also to Silicon Graphics for hardware support at Zoo Atlanta and to Hewlett Packard for helping us port our software to their HP/Freedom hardware.
Web page
A web page providing further information about the VR Gorilla Exhibit, Zoo Atlanta, and how the virtual gorilla is integrated with Zoo Atlanta's ongoing gorilla conservation efforts is available at:
http://atlanta.arch.gatech.edu/city/gorilla/gortop2.html.
This site provides movies of users in the environment (in QuickTime, AVI and MPEG formats). It also has QuickTime VRs of the simulated and real gorilla habitats and of the gorilla models.
References
[1] Nick Avis and Robert Macredie (1994). Problems, possibilities, and potential. Computer Bulletin, Series IV, Volume 6, Part 5, October, pp. 8-9. [2] Christopher D. Wickens and Polly Baker (1995). Cognitive issues in virtual reality. In Virtual Environments and Advanced Interface Design, Woodrow Barfield and Tom Furness eds., Oxford University Press, pp. 514-541. [3] Joseph Bates, James Altucher, Alexander Hauptman, Mark Kantrowitz, Bryan Loyall, Koichi Murakami, Paul Olbrich, Zoran Popovic, Scott Reilly, Phoebe Sengers, William Welch, Paul Weyhrauch and Andrew Witkin (1993). Edge of intention. Siggraph '93 Visual Proceedings, pp. 113-114. [4] Joseph Bates 1994. The role of emotion in believable agents. Communications of the ACM, 37:7, July, pp. 122- 125. [5] John W. Brelsford (1993). Physics education in a virtual environment. Proceedings of the Human Factors and Ergonomics Society 37th Annual Meeting, pp. 1286-1290. [6] Chris Byrne (1993). Virtual reality and education. HTTL Report Number TR-93-6. [7] Kyle Burks (1996). Personal communication.
[8] Suzanne K. Damarin (1993). Schooling and situated knowledge: travel or tourism? Educational Technology, March, pp. 27-32. [9] George B. Schaller (1972). The behavior of the mountain gorilla. In Primate Patterns, Phyllis Dolhinow, ed., Holt, Rinehart and Winston, pp. 85-124. [10] Nathaniel I. Durlach and Anne S. Mavor, eds. (1995). Virtual Reality, Scientific and Technological Challenges. National Academy of Sciences. [11] Sarel Eimerl and Irene DeVore and the editors of Time-Life Books (1974). Life Nature Library: The Primates. [12] Dian Fossey (1983). Gorillas in the Mist. Houghton Mifflin Co. [13] Gaye Graves (1993). This digital baby responds to coos and goos. Computer Graphics World, July, pp. 16-17. [14] Barbara Hayes-Roth, Lee Brownston and Erik Sincoff (1995). Directed improvisation by computer characters. Stanford University Knowledge Systems Laboratory Tech Report KSL-95-04. [15] Sandra Helsel (1992). Virtual reality and education. Educational Technology, May, pp. 38-42. [16] William L. Jüngers (1985). Body size and scaling of limb proportions in primates. In Size and Scaling in Primate Biology, William L. Jungers, ed., Plenum Press, pp. 345-381. [17] Pattie Maes, Trevor Darrell, Bruce Blumberg and Alex Pentland (1995). The ALIVE system: full-body interaction with autonomous agents. Computer Animation '95 Proceedings, IEEE Press, pp. 11-18. [18] Terry L. Maple and Michael P. Hoff (1982). Gorilla Behavior, Van Nostrand Reinhold. [19] Peter H. Lewis (1994). Sound bytes: he added 'virtual' to 'reality'. The New York Times, Section 3 (Business), September 25, page 7. [20] M. D. Roblyer (1993). Technology in our time: virtual reality, visions, and nightmares. Educational Technology, February, pp. 33-35. [21] George B. Schaller (1963). The Mountain Gorilla: Ecology and Behavior. University of Chicago Press. [22] Drew Kessler, Rob Kooper, Jouke C. Verlinden and Larry F. Hodges(1994). The simple virtual environment (SVE) library. GVU Tech Report GIT-GVU-94-34, October. [23] John Tiffin and Lalita Rajasingham (1995). In Search of the Virtual Class, Routledge. [24] Naoko Tosa (1993). Neuro Baby. Siggraph '93 Visual Proceedings, page 167. [25] Christopher D. Wickens (1992). Virtual reality and education. 1992 IEEE International Conference on Systems, Man, and Cybernetics, October, pp. 842-847. [26] William Winn and William Bricken (1992). Designing virtual worlds for use in mathematics education: the example of experiential algebra. Educational Technology, December, pp. 12-19. [27] William Winn (1995). The virtual reality roving vehicle project. T. H. E. Journal, December, 70-74. [28] (1990). Artificial reality: computer simulations one day may provide surreal experiences. The Wall Street Journal, volume CCXV, number 16, January 23, pp. Al & A9.
76
nm
JIIM MMMUM IH VIMJflUNVMMTC mtm «iML ma. OMHIZö
Sandia National Labs
Panel — Human Performance in Virtual Environments
Panel Organizer:
Jessica Hodgins, Georgia Institute of Technology
The panel titled "Human Performance in Virtual Environments" will embrace a number of pertinent design issues in this rapidly advancing technologic area. The comprehensive list of panelists includes: Richard Satava (Yale/formerly DARPA), Robert Kennedy/Stanney (Essex Corp.), Rudy Darken (NPS), Larry Hettinger (LTSI)i Gerry Higgins, Robert Johnston (IDA/U. of Houston), Suzanne Weghorst (HITL). The issues to be discussed, respectively, include: telepresence I/O device design issues to include haptic design issues for telesurgery; Cybersickness issues and perceptual inputs; general HF design issues and lessons learned in VR; perceptual-motor requirements and behavioral goals/ID of optimal display media and system object manipulation paradigms;VR issues in medical systems; VR tool development and perceptual considerations; and immersive object manipulation methods. Annette Sobel will provide an overview of issues to be discussed, followed by a brief presentation by each speaker, and a directed, open discussion period.
78
SESSION
WUOIOUKKfllMMINVJI
An Introduction of a Direct Vestibular Display into a Virtual Environment
Jeffrey D. Cress, Lawrence J. Hettinger, and James A. Cunningham Logicon Technical Services, Inc.
Dayton, Ohio
Gary E. Riccio Gary Riccio Associates
Dayton, Ohio
Grant R. McMillan and Michael W. Haas Fitts Human Engineering Division, Crew Systems Directorate, Armstrong Laboratory
Wright-Patterson AFB, Ohio
Abstract The US Air Force Armstrong Synthesized Immersion Research Environment Facility is currently investigating the development and potential application of direct vestibular displays. The Electrical Vestibular Stimulus (EVS) technology described in this paper uses electrodes located behind the ears to deliver a low-level electrical current in the vicinity of the eighth cranial nerve of the central nervous system to produce a compelling sensation of roll motion about the body's fore-aft axis. In the study described in this paper, subjects experienced the EVS display while simultaneously observing a large field-of-view visual display which depicted curvilinear motion through a tunnel. Both EVS and visual displays were driven in a sinusoidal fashion at various phase relationships relative to one another. After observing the two displays, subjects were asked to rate various aspects of quality and magnitude of self-motion. Results revealed that the fidelity of the motion experience depended upon the phase relationship between the EVS and visual displays. Results also indicated that when an appropriate phase relationship was used, the vestibular display significantly improved the fidelity of the motion experience when compared to a visual-only display.
Introduction
Virtual environment (VE) technology is a tool that can significantly enhance human interaction with complex systems by taking advantage of the natural
capabilities of the human sensory systems to extract information about system dynamics. Improving the efficacy of VE systems can be achieved by effectively exploiting the human's ability to gather information via his or her sensory systems. This can be done by providing sensory information which closely matches (as closely as possible) that which is normally available in the real world. VE technology can also be made more effective by increasing the number of sensory channels utilized as well as ensuring the temporal and spatial coherence of the multisensory information.
To date, most applications of VE technology have focused on the development of visual, auditory, haptic, and tactile displays [1]. Because of its inaccessibility, the vestibular system has been largely ignored as a possible channel of information delivery in VE systems. This is unfortunate because the perceptual output of the vestibular system is continuously used in many of our most basic behaviors and skills, including the maintenance of postural stability and spatial orientation, as well as the perception and control of self [2]. The vestibular system is also closely tied to the visual system in that information provided by it serves as one source of information for controlling eye movements in dynamic environments [3]. VEs that rely solely on the visual modality to depict dynamic situations, and that do not employ vestibular information, may induce sensory incoherence in users resulting in perceptions of motion that are inaccurate, disorienting, and potentially nauseogenic [4]. If the VE in question is an aircraft
0-8186-7843-7/97 $10.00 © 1997 IEEE 80
training simulator, these inaccurate perceptions of motion could result in compromises in the efficacy of the trainer or a reduction in the transferability of skills to an actual aircraft. If the focus of the VE is to enhance the "presence" or sense of "immersion" [5], the lack of sensation from the vestibular channel might lessen the fidelity or level of realism of the motion experience.
The Synthesized Immersion Research Laboratory (SIRE), located at the USAF Armstrong Laboratory, Wright-Patterson AFB, is currently involved in the development of a direct vestibular display to produce a compelling sensation of motion in the absence of actual inertial displacement. The Electrical Vestibular Stimulation (EVS) system discussed in this paper uses surface mounted electrodes located directly behind both ears to deliver a low-level electrical current in the vicinity of the eighth cranial nerve. The resulting experience is a very compelling tilting or rolling sensation in the frontal plane of a observer. Research efforts concerned with the psychophysics of vestibular function has examined the effects of direct vestibular stimulation for several decades. Work conducted to date indicates that EVS can modify the frequency, amplitude, and direction of postural sway [6, 7, 8], and can also produce a reliable perception of x-axis and some z-axis rotation [9, 10]. However, the same research has shown that this technology is not without limitations. Currently, we are only able to reliably generate a roll sensation which is head-centric in nature, that is, EVS as currently configured always provides roll sensation relative to the head regardless of the orientation of the body. Achieving control over other degrees of freedom may require a more sophisticated method of stimulation. We are currently applying a low-level sinusoidal current to the mastoids and, in turn, grossly manipulating neural firing rates. To gain better control over perception, it may be necessary to code the signal in order to independently manipulate specific neural firing rates.
While previous research has demonstrated the behavioral and phenomenological effects of EVS, to the best of our knowledge there have been no attempts to apply this technology and its related knowledge-base toward the development of functional vestibular displays. Recently, as part of a program of research intended to support the development of virtually- augmented interfaces for future US Air Force crew stations, we have begun to explore EVS as a potential display technology. Our intent is to establish the degree to which an EVS display can provide reliable
information to users about operationally relevant events when used in conjunction with other modality-specific displays. Toward that end, two experiments were conducted to assess the effect of pairing direct vestibular with visual stimuli on the perception of illusory self- motion. Our goal in both experiments was to obtain psychophysical data to support future development of a prototype EVS display by: (1) investigating the effect of supplementing visual information with direct vestibular stimulation, and (2) investigating the effect of varying phase relationships between visual and vestibular stimulation. For the first experiment [11], a visual display depicting roll-axis motion was coupled with the roll-inducing EVS to see if the addition of the vestibular cueing could enhance the self motion experience produced by the visual display. In the experiment, subjects observed a wide-field-of-view vection-inducing roll display while experiencing the EVS display at various phase relationships. After each exposure, subjects were asked to rate various aspects of the quality and magnitude of the self motion experience. The results of the study indicated that while the fidelity of the motion experience depended upon the phase relationship between the two displays, when the phase relationship was appropriate, both the fidelity of the motion experience and the magnitude of perceived self motion were greater when EVS was present. Based on the results of the study, it was concluded that the fidelity of the motion experience was greatest when EVS with either in phase with, or slightly led the visual display.
In the second study which is discussed in this paper, the robustness of EVS as a display was explored. In this experiment, a visual display was chosen for which the relationship between the EVS display and the visual display were relatively indirect. The display in question depicted curvilinear translational motion. The intent was to see if EVS could be provide the gravito- inertial "tilt" suggested by the curvilinear motion of the display. The goal was to determine if EVS could provide relevant motion information in a more complicated dynamic environment.
Method
Apparatus
The experiment was conducted at the USAF Armstrong Laboratory's Synthesized Immersion Research Environment Facility, located at Wright-
81
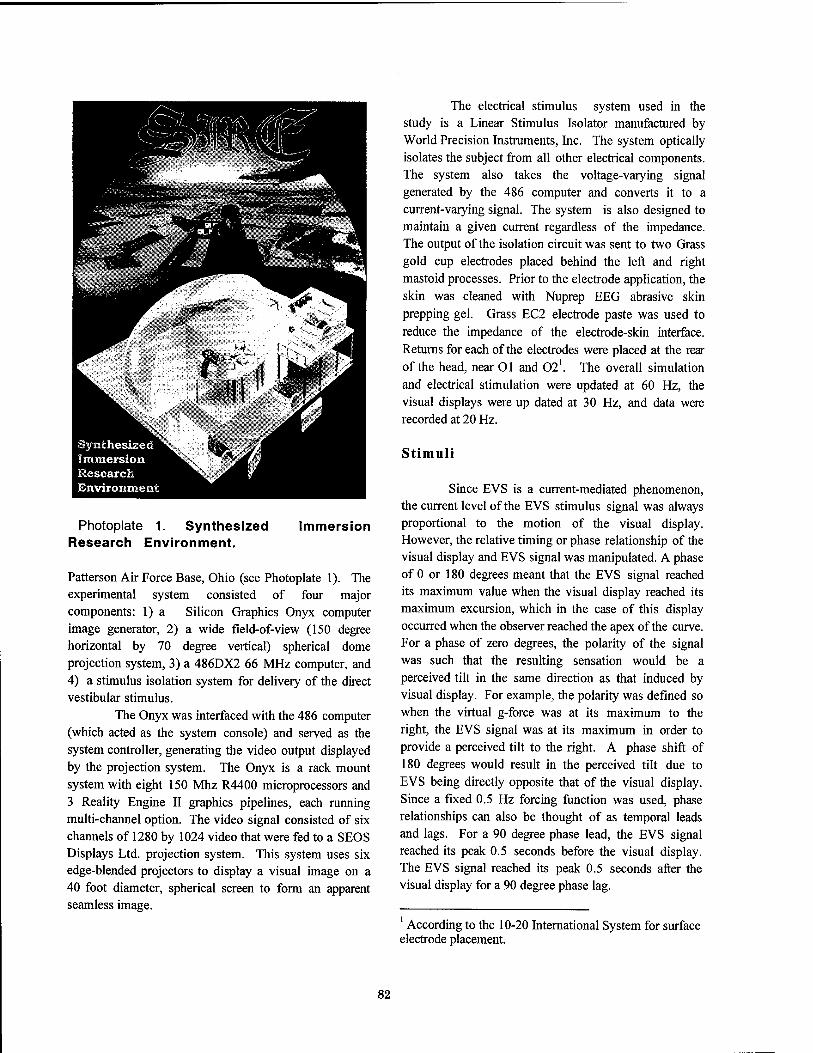
Photoplate 1. Synthesized Research Environment.
Immersion
Patterson Air Force Base, Ohio (see Photoplate 1). The experimental system consisted of four major components: 1) a Silicon Graphics Onyx computer image generator, 2) a wide field-of-view (150 degree horizontal by 70 degree vertical) spherical dome projection system, 3) a 486DX2 66 MHz computer, and 4) a stimulus isolation system for delivery of the direct vestibular stimulus.
The Onyx was interfaced with the 486 computer (which acted as the system console) and served as the system controller, generating the video output displayed by the projection system. The Onyx is a rack mount system with eight 150 Mhz R4400 microprocessors and 3 Reality Engine II graphics pipelines, each running multi-channel option. The video signal consisted of six channels of 1280 by 1024 video that were fed to a SEOS Displays Ltd. projection system. This system uses six edge-blended projectors to display a visual image on a 40 foot diameter, spherical screen to form an apparent seamless image.
The electrical stimulus system used in the study is a Linear Stimulus Isolator manufactured by World Precision Instruments, Inc. The system optically isolates the subject from all other electrical components. The system also takes the voltage-varying signal generated by the 486 computer and converts it to a current-varying signal. The system is also designed to maintain a given current regardless of the impedance. The output of the isolation circuit was sent to two Grass gold cup electrodes placed behind the left and right mastoid processes. Prior to the electrode application, the skin was cleaned with Nuprep EEG abrasive skin prepping gel. Grass EC2 electrode paste was used to reduce the impedance of the electrode-skin interface. Returns for each of the electrodes were placed at the rear of the head, near 01 and 02'. The overall simulation and electrical stimulation were updated at 60 Hz, the visual displays were up dated at 30 Hz, and data were recorded at 20 Hz.
Stimuli
Since EVS is a current-mediated phenomenon, the current level of the EVS stimulus signal was always proportional to the motion of the visual display. However, the relative timing or phase relationship of the visual display and EVS signal was manipulated. A phase of 0 or 180 degrees meant that the EVS signal reached its maximum value when the visual display reached its maximum excursion, which in the case of this display occurred when the observer reached the apex of the curve. For a phase of zero degrees, the polarity of the signal was such that the resulting sensation would be a perceived tilt in the same direction as that induced by visual display. For example, the polarity was defined so when the virtual g-force was at its maximum to the right, the EVS signal was at its maximum in order to provide a perceived tilt to the right. A phase shift of 180 degrees would result in the perceived tilt due to EVS being directly opposite that of the visual display. Since a fixed 0.5 Hz forcing function was used, phase relationships can also be thought of as temporal leads and lags. For a 90 degree phase lead, the EVS signal reached its peak 0.5 seconds before the visual display. The EVS signal reached its peak 0.5 seconds after the visual display for a 90 degree phase lag.
1 According to the 10-20 International System for surface electrode placement.
82
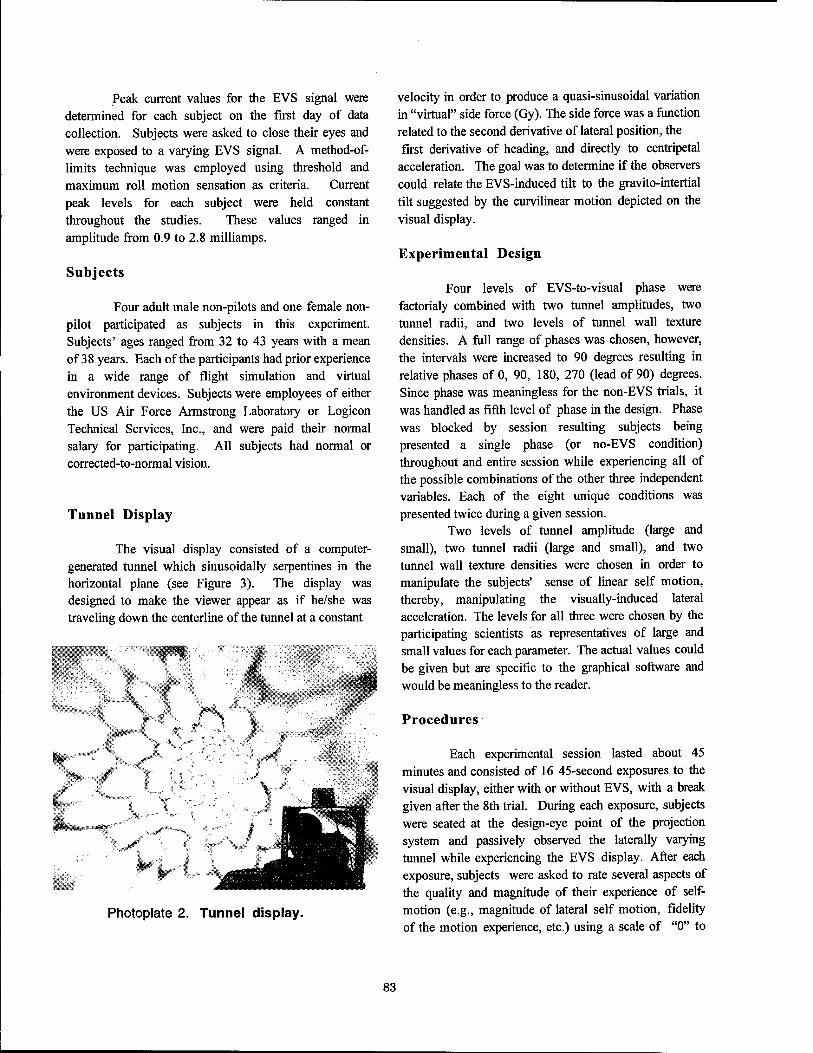
Peak current values for the EVS signal were determined for each subject on the first day of data collection. Subjects were asked to close their eyes and were exposed to a varying EVS signal. A method-of- limits technique was employed using threshold and maximum roll motion sensation as criteria. Current peak levels for each subject were held constant throughout the studies. These values ranged in amplitude from 0.9 to 2.8 milliamps.
Subjects
Four adult male non-pilots and one female non- pilot participated as subjects in this experiment. Subjects' ages ranged from 32 to 43 years with a mean of 38 years. Each of the participants had prior experience in a wide range of flight simulation and virtual environment devices. Subjects were employees of either the US Air Force Armstrong Laboratory or Logicon Technical Services, Inc., and were paid their normal salary for participating. All subjects had normal or corrected-to-normal vision.
Tunnel Display
The visual display consisted of a computer- generated tunnel which sinusoidally serpentines in the horizontal plane (see Figure 3). The display was designed to make the viewer appear as if he/she was traveling down the centerline of the tunnel at a constant
r"V f
Photoplate 2. Tunnel display.
velocity in order to produce a quasi-sinusoidal variation in "virtual" side force (Gy). The side force was a function related to the second derivative of lateral position, the first derivative of heading, and directly to centripetal
acceleration. The goal was to determine if the observers could relate the EVS-induced tilt to the gravito-intertial tilt suggested by the curvilinear motion depicted on the visual display.
Experimental Design
Four levels of EVS-to-visual phase were factorialy combined with two tunnel amplitudes, two tunnel radii, and two levels of tunnel wall texture densities. A full range of phases was chosen, however, the intervals were increased to 90 degrees resulting in relative phases of 0, 90, 180, 270 (lead of 90) degrees. Since phase was meaningless for the non-EVS trials, it was handled as fifth level of phase in the design. Phase was blocked by session resulting subjects being presented a single phase (or no-EVS condition) throughout and entire session while experiencing all of the possible combinations of the other three independent variables. Each of the eight unique conditions was presented twice during a given session.
Two levels of tunnel amplitude (large and small), two tunnel radii (large and small), and two tunnel wall texture densities were chosen in order to manipulate the subjects' sense of linear self motion, thereby, manipulating the visually-induced lateral acceleration. The levels for all three were chosen by the participating scientists as representatives of large and small values for each parameter. The actual values could be given but are specific to the graphical software and would be meaningless to the reader.
Procedures
Each experimental session lasted about 45 minutes and consisted of 16 45-second exposures to the visual display, either with or without EVS, with a break given after the 8th trial. During each exposure, subjects were seated at the design-eye point of the projection system and passively observed the laterally varying tunnel while experiencing the EVS display. After each exposure, subjects were asked to rate several aspects of the quality and magnitude of their experience of self- motion (e.g., magnitude of lateral self motion, fidelity of the motion experience, etc.) using a scale of "0" to
83
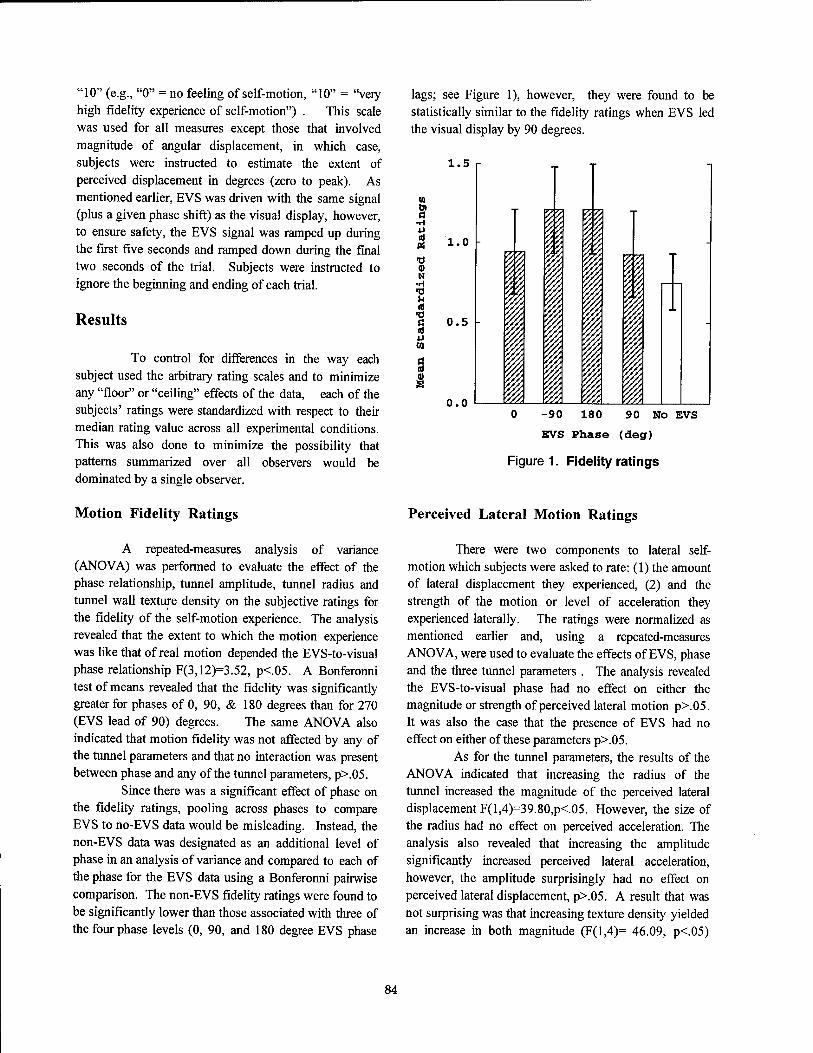
"10" (e.g., "0" = no feeling of self-motion, "10" = "very high fidelity experience of self-motion") . This scale was used for all measures except those that involved magnitude of angular displacement, in which case, subjects were instructed to estimate the extent of perceived displacement in degrees (zero to peak). As mentioned earlier, EVS was driven with the same signal (plus a given phase shift) as the visual display, however, to ensure safety, the EVS signal was ramped up during the first five seconds and ramped down during the final two seconds of the trial. Subjects were instructed to ignore the beginning and ending of each trial.
Results
To control for differences in the way each subject used the arbitrary rating scales and to minimize any "floor" or "ceiling" effects of the data, each of the subjects' ratings were standardized with respect to their median rating value across all experimental conditions. This was also done to minimize the possibility that patterns summarized over all observers would be dominated by a single observer.
Motion Fidelity Ratings
A repeated-measures analysis of variance (ANOVA) was performed to evaluate the effect of the phase relationship, tunnel amplitude, tunnel radius and tunnel wall texture density on the subjective ratings for the fidelity of the self-motion experience. The analysis revealed that the extent to which the motion experience was like that of real motion depended the EVS-to-visual phase relationship F(3,12)=3.52, p<.05. A Bonferonni test of means revealed that the fidelity was significantly greater for phases of 0, 90, & 180 degrees than for 270 (EVS lead of 90) degrees. The same ANOVA also indicated that motion fidelity was not affected by any of the tunnel parameters and that no interaction was present between phase and any of the tunnel parameters, p>.05.
Since there was a significant effect of phase on the fidelity ratings, pooling across phases to compare EVS to no-EVS data would be misleading. Instead, the non-EVS data was designated as an additional level of phase in an analysis of variance and compared to each of the phase for the EVS data using a Bonferonni pairwise comparison. The non-EVS fidelity ratings were found to be significantly lower than those associated with three of the four phase levels (0, 90, and 180 degree EVS phase
lags; see Figure 1), however, they were found to be statistically similar to the fidelity ratings when EVS led the visual display by 90 degrees.
1.5
to bi c
-rl V a vi •o (V N
■H ■a u <s •o a (d 4J CO
c a)
I
1.0
0.5
0.0 i
I ■ I li
^1
PI 1
i 0 -90 180
EVS Phase
90 No EVS
(deg)
Figure 1. Fidelity ratings
Perceived Lateral Motion Ratings
There were two components to lateral self- motion which subjects were asked to rate: (1) the amount of lateral displacement they experienced, (2) and the strength of the motion or level of acceleration they experienced laterally. The ratings were normalized as mentioned earlier and, using a repeated-measures ANOVA, were used to evaluate the effects of EVS, phase and the three tunnel parameters . The analysis revealed the EVS-to-visual phase had no effect on either the magnitude or strength of perceived lateral motion p>.05. It was also the case that the presence of EVS had no effect on either of these parameters p>.05.
As for the tunnel parameters, the results of the ANOVA indicated that increasing the radius of the tunnel increased the magnitude of the perceived lateral displacement F(l,4)=39.80,p<.05. However, the size of the radius had no effect on perceived acceleration. The analysis also revealed that increasing the amplitude significantly increased perceived lateral acceleration, however, the amplitude surprisingly had no effect on perceived lateral displacement, p>.05. A result that was not surprising was that increasing texture density yielded an increase in both magnitude (F(l,4)= 46.09, p<05)
84
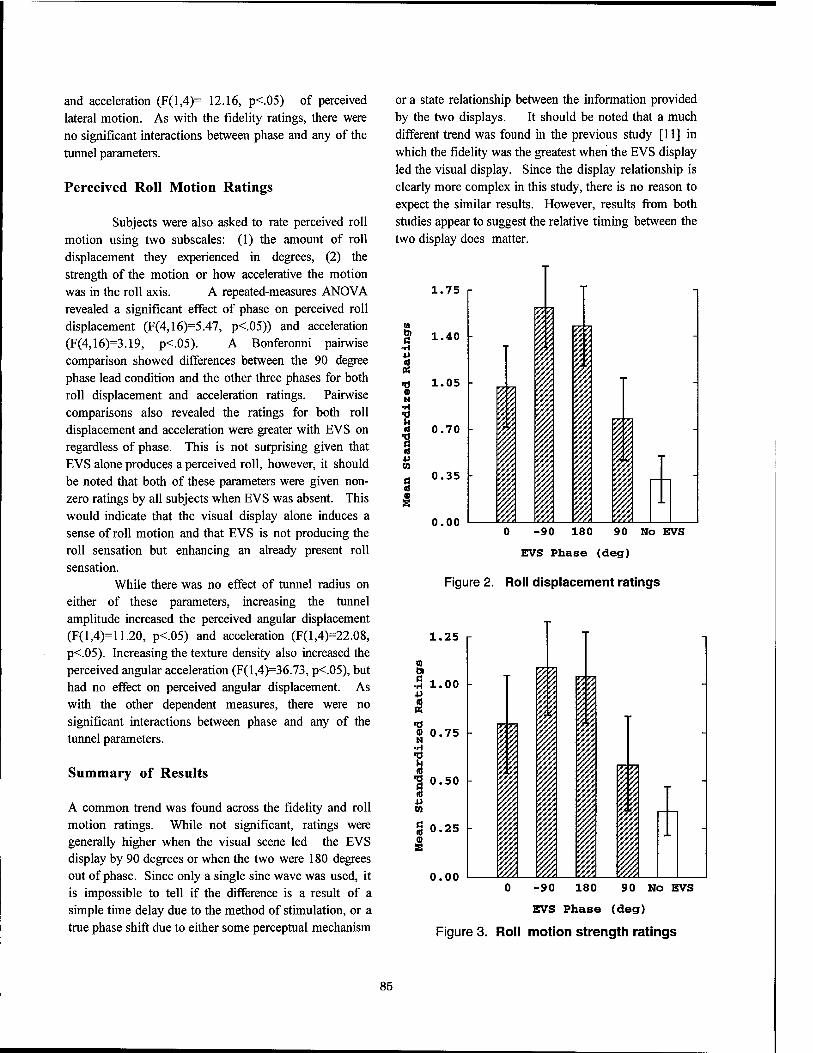
and acceleration (F(l,4)= 12.16, p<.05) of perceived lateral motion. As with the fidelity ratings, there were no significant interactions between phase and any of the tunnel parameters.
Perceived Roll Motion Ratings
Subjects were also asked to rate perceived roll motion using two subscales: (1) the amount of roll displacement they experienced in degrees, (2) the strength of the motion or how accelerative the motion was in the roll axis. A repeated-measures ANOVA revealed a significant effect of phase on perceived roll displacement (F(4,16)=5.47, p<.05)) and acceleration (F(4,16)=3.19, p<.05). A Bonferonni pairwise comparison showed differences between the 90 degree phase lead condition and the other three phases for both roll displacement and acceleration ratings. Pairwise comparisons also revealed the ratings for both roll displacement and acceleration were greater with EVS on regardless of phase. This is not surprising given that EVS alone produces a perceived roll, however, it should be noted that both of these parameters were given non- zero ratings by all subjects when EVS was absent. This would indicate that the visual display alone induces a sense of roll motion and that EVS is not producing the roll sensation but enhancing an already present roll sensation.
While there was no effect of tunnel radius on either of these parameters, increasing the tunnel amplitude increased the perceived angular displacement (F(l,4)=11.20, p<05) and acceleration (F(l,4)=22.08, p<.05). Increasing the texture density also increased the perceived angular acceleration (F(l,4)=36.73, p<.05), but had no effect on perceived angular displacement. As with the other dependent measures, there were no significant interactions between phase and any of the tunnel parameters.
Summary of Results
A common trend was found across the fidelity and roll motion ratings. While not significant, ratings were generally higher when the visual scene led the EVS display by 90 degrees or when the two were 180 degrees out of phase. Since only a single sine wave was used, it is impossible to tell if the difference is a result of a simple time delay due to the method of stimulation, or a true phase shift due to either some perceptual mechanism
or a state relationship between the information provided by the two displays. It should be noted that a much different trend was found in the previous study [11] in which the fidelity was the greatest when the EVS display led the visual display. Since the display relationship is clearly more complex in this study, there is no reason to expect the similar results. However, results from both studies appear to suggest the relative timing between the two display does matter.
1.75
m Oi a
•rl U id
•t) o N
■H ■0 u a
id v CO
a id ID s
1.40
1.05
0.70
0.35
0.00
#
1 i
Pill ii
0 -90 180 90 No EVS
EVS Phase (deg)
Figure 2. Roll displacement ratings
1.25
n a .5 1.00 V a ei ■o « 0.75
-H •o u id ^ 0.50 id v to
§ 0.25 ID E
0.00
1 1
0 -90 180 90 No EVS
EVS Phase (deg)
Figure 3. Roll motion strength ratings
85
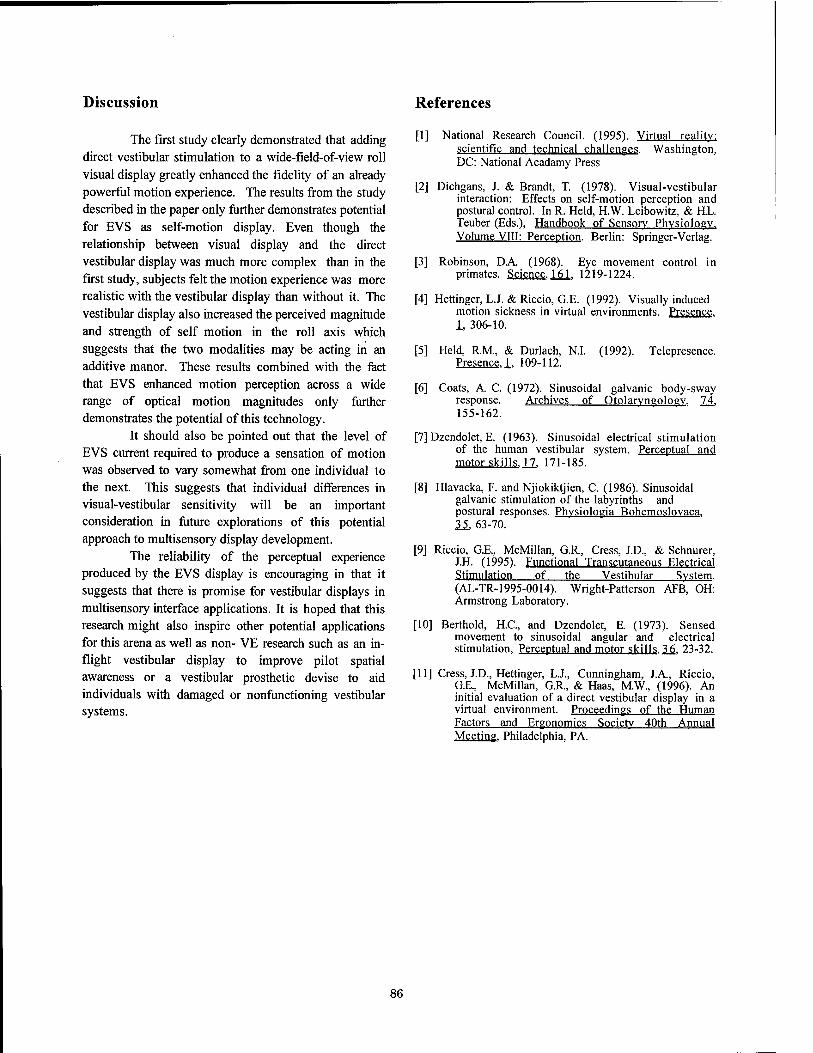
Discussion References
The first study clearly demonstrated that adding direct vestibular stimulation to a wide-field-of-view roll visual display greatly enhanced the fidelity of an already powerful motion experience. The results from the study described in the paper only further demonstrates potential for EVS as self-motion display. Even though the relationship between visual display and the direct vestibular display was much more complex than in the first study, subjects felt the motion experience was more realistic with the vestibular display than without it. The vestibular display also increased the perceived magnitude and strength of self motion in the roll axis which suggests that the two modalities may be acting in an additive manor. These results combined with the fact that EVS enhanced motion perception across a wide range of optical motion magnitudes only further demonstrates the potential of this technology.
It should also be pointed out that the level of EVS current required to produce a sensation of motion was observed to vary somewhat from one individual to the next. This suggests that individual differences in visual-vestibular sensitivity will be an important consideration in future explorations of this potential approach to multisensory display development.
The reliability of the perceptual experience produced by the EVS display is encouraging in that it suggests that there is promise for vestibular displays in multisensory interface applications. It is hoped that this research might also inspire other potential applications for this arena as well as non- VE research such as an in- flight vestibular display to improve pilot spatial awareness or a vestibular prosthetic devise to aid individuals with damaged or nonfunctioning vestibular systems.
[1] National Research Council. (1995). Virtual reality: scientific and technical challenges. Washington, DC: National Acadamy Press
[2] Dichgans, J. & Brandt, T. (1978). Visual-vestibular interaction: Effects on self-motion perception and postural control. In R. Held, H.W. Leibowitz, & H.L. Teuber (Eds.), Handbook of Sensory Physiology. Volume VIII: Perception. Berlin: Springer-Verlag.
[3] Robinson, DA (1968). Eye movement control in primates. Science. 161. 1219-1224.
[4] Hettinger, L.J. & Riccio, G.E. (1992). Visually induced motion sickness in virtual environments. Presence. L 306-10.
[5] Held, R.M, & Durlach, N.I. Presence. 1. 109-112.
(1992). Telepresence.
[6] Coats, A C. (1972). Sinusoidal galvanic body-sway response. Archives of Otolarvngologv. 74, 155-162.
[7] Dzendolet, E. (1963). Sinusoidal electrical stimulation of the human vestibular system. Perceptual and motor skills. 17. 171-185.
[8] Hlavacka, F. and Njiokiktjien, C. (1986). Sinusoidal galvanic stimulation of the labyrinths and postural responses. Phvsiologia Bohemoslovaca. 3_5_, 63-70.
[9] Riccio, G.E, McMillan, G.R, Cress, I.D., & Schnurer, J.H. (1995). Functional Transcutaneous Electrical Stimulation of the Vestibular System. (AL-TR-1995-0014). Wright-Patterson AFB, OH: Armstrong Laboratory.
[10] Berthold, H.C., and Dzendolet, E (1973). Sensed movement to sinusoidal angular and electrical stimulation, Perceptual and motor skills. 36. 23-32.
[11] Cress, I.D., Hettinger, L.I., Cunningham, J.A., Riccio, G.E., McMillan, G.R, & Haas, M.W., (1996). An initial evaluation of a direct vestibular display in a virtual environment. Proceedings of the Human Factors and Ergonomics Society 40th Annual Meeting. Philadelphia, PA.
86
Development and Testing of a Measure of the Kinesthetic Position Sense Used to Assess the Aftereffects from Virtual Environment Exposure
Kay M. Stanney University of Central Florida
Industrial Engineering & Management Systems Orlando, FL
Robert S. Kennedy Essex Corporation
Orlando, FL
Abstract
In order to assess physiological adaptation to virtual environment (VE) exposure, a measure of sensorimotor pointing errors was developed. This measure evaluated the kinesthetic position sense before and after exposure to a virtual environment. An empirical evaluation involving 34 participants revealed a statistically significant difference between the before and after pointing performance, thus implying that recalibrations had occurred. These results imply that users may have to undergo physiological adaptations in order to function appropriately in a VE, where altered perceptual information is displayed. These recalibrations can linger once interaction with the VE has concluded, rendering users physiologically maladaptivefor the real world. Such aftereffects lead to safety concerns until pre-exposure functioning has been regained. The results of this study have established the need for developing objective measures of post-VE exposure aftereffects in order to objectively determine when these effects have dissipated.
Introduction
The explosive technological progress in Virtual Reality (VR) systems has made it possible to provide users with access to sophisticated interactive "immersion" in multi-sensory, 3-dimensional (3-D) synthetic environments. If these VR systems are to be effective and well received by their users, however, usability issues such as cybersickness and transfer of maladaptive cognitive and psychomotor performance from VR to real world environments must be resolved. This problem is not unique to VR systems but is seen following protracted exposure to ships at sea [11] microgravity in space [18] and flight simulators [10].
While questionnaires have been designed to assess cybersickness and other forms of sickness, there are limited systematic means of assessing the post-exposure aftereffects from VR exposure, although several sophisticated space procedures are currently in use post- space flight [18, 19].
While recent research has evaluated the use of postural stability measures for assessing the aftereffects from VR exposure [14], we are not aware of any efforts to use measurements of hand-eye coordination in this capacity. A few reports mention the plastic nature of visually guided manual control and aiming behavior [2, 9] and studies, reviewed below, have examined eye- hand post effects from exposure to Coriolis forces [15]. None, however, so far as we know, has explored the possibility of developing a standardized objective measure of changes in the kinesthetic position sense to gauge the aftereffects of VE exposure. Yet, when wearing helmet-mounted displays (HMD) in a virtual world there are several anomalies that could lead to measurable changes in visuo-motor performance, including visual distortions and position tracking errors. These changes may be particularly driven by environments where the VE training objectives require exacting hand-eye coordination. Biocca, Barlow, and Kancherla [20] state that the "central component of medical, military, and other training systems is learning subtle, coordinated hand-eye movements." If these training environments drive adaptive changes in visuo- motor performance, then post-exposure aftereffects should be measured to determine the extent of the adaptation and if it will hinder normative functioning and training objectives.
Early observations of adaptation in VEs indicate this need for a measure of the kinesthetic position sense to gauge the aftereffects from VE exposure. Studies have shown that VE users often have to undergo considerable adaptation in order to function appropriately in the
0-8186-7843-7/97 $10.00 © 1997 IEEE 87
virtual environment. Rolland et al. [20] observed that during exposures, subjects experienced pointing errors in the y and z dimensions during first use of a see- through HMD. They also measured a 43 % decrease in the speed of performance of manual tasks when compared to baseline measures. They observed that subjects' performances slowed down immediately upon entering the virtual environment, encumbered by "short and tentative" and "uncoordinated" movements. The subjects' reaching movements were also observed as "uncertain and inaccurate." Wright [27] reported that perceived position can also be altered during exposure to a virtual environment. He demonstrated that subjects experienced a 59 % error in the perceived dimension of forward distance, 28% for height, 50% for lateral distance, and a speed perception error of 59 %. Ellis and Menges [5] conducted studies with monocular and stereoscopic displays and discovered that subjects had difficulty in judging the perceived distance of virtual objects, particularly with monoscopic displays. They found that subjects reported distances that were 25 % in error on the average. These studies demonstrate that altered perceptual information is received by users in virtual environments and rescaling is probably required in order to perform in the VE environment. This rescaling may result in measurable post-effects after exposure.
Initial errors in hand-eye coordination performance in VEs may be attributed to the difference in the visual perception of the target with the proprioceptive representation of the arm and hand [cf. e.g., 21, 20]. Mather and Lackner [16] hypothesized that while the visual perception may change in a displaced environment, the "proprioceptive position signals in the muscles and joints of the hand and arms remain unchanged." McGonigle and Flook [17] and Mather and Lackner [16], while conducting hand-eye coordination experiments under the conditions of visual displacement brought about by prisms, ascertained that the process of adapting to the displacement necessitates minimizing the conflict between the visual and proprioceptive stimuli. They believe that changes (adaptation) in visuo-motor performance are manifested when the real world proprioceptive cues are matched with the visual cues presented in the altered environment. Typically, this has been shown to be accomplished via the subjects' ability to sense their self- generated hand motion in addition to the visual information provided by targets [24, 25].
The inherent danger of altered visual and proprioceptive stimuli in VEs is that once users leave the VE and return to the real-world, their hand-eye coordination may be altered because of the adaptation
and rescaling to the visual cues in the virtual world. Rolland et al. [20] warned of and demonstrated such a problem with see-through HMDs. They stated that the subjects' perceptual system might adapt to the VE and become "miscalibrated for the real world." This miscalibration could directly affect visuo-motor (i.e., hand-eye) coordination. Their subjects reported that their altered state of hand-eye coordination did complicate their real-world performance, leading to pointing errors in all three axes upon post-exposure.
An example of the implications of such miscalibrations was cited by Dr. Frank Biocca, a University of North Carolina psychologist. He described what happened to one of his colleagues following 20 minutes exposure on a VR headset. "The [VR] device was built to show doctors how organs and muscles look inside the bodies they would be cutting open. She took off the headset and reached for a soft drink. Ordinarily one would just reach out, pick it up and raise it to the mouth. She picked it up and found that she was pouring soft drink into her eyes" [23, p. Al]. Clearly, such aftereffects need to be further explored.
The fundamental problem in addressing the above issues is that currently there is no standard approach for measuring kinesthetic position sense. Current approaches range from the simplistic to the sophisticated. Digitizing pads [1], ultrasound [8, 21, 22], video analysis optoelectronic systems [3, 4, 15], electrogoniometers [6], and the latest parallel-link drive air-magnet floating manipulandum [7] have all been used to measure motor performance. In order to evaluate the effectiveness of using a test of kinesthetic position sense to measure VE aftereffects, one of these measurement approaches or potentially a new method needed to be evaluated. Ideally, the method selected for this application would be relatively simple to administer and easily portable since it would be expected to be used at field sites and remote laboratories (e.g., after wheel stop of NASA's Shuttle). The present study evaluated the feasibility of developing a simplistic measure of kinesthetic position sense, similar to Bock et al. [1], and evaluated the measures sensitivity to changes in visually guided behavior due to VR exposure. Based on the outcome of this evaluation, the need for a more sophisticated measure could be assessed.
Method
Subjects: Thirty-four subjects, 14 females and 20 males, with an average age of 25.79 (S.D. = 4.72) years participated in this study. The subjects
88
participated after having given informed consent and verifying that they were in good health. All subjects were undergraduate or graduate students from the University of Central Florida and received class credit for their participation. The subjects were without any sensorimotor impairments that could have affected their performance on the pointing test. All subjects reported themselves to have 20/20 vision (or corrected vision) and were right-handed.
Apparatus
Past pointing task device: A prototype device was designed and assembled which is capable of measuring and scoring the kinesthetic position sense. This pointing task involved the engineering development (fabrication, hardware, software, test and evaluation) of a set of kinesthetic tests. The hardware chosen for the Past Pointing Task (PPT) data collection was a Summagraphics Summa-Sketch FX digitizing tablet. A cordless stylus (pen) was chosen for the tablet's position input device. To capture the positional data, the wireless stylus was attached to a Velcro equipped elastic band that was snugly fitted around the subjects' index finger. In the default power-on mode, when the pen is placed in close proximity to the tablet surface, the tablet controller sends out continuous positional data in 5-byte binary RS-232 serial information packets. A software driver was written to capture the digitizer output and translate it into real-world coordinates. A computer user interface was designed to control the flow and timing of the experiment, format the captured raw position data for later analysis, and display the real time data on a computer monitor. Audible tones were designed to guide subjects through the pointing exercise. A single tone was used to indicate that a subject was to touch the target in the center of the tablet. When the computer receives the tablet's position data packet a dual "beep beep" tone was used to indicate to subjects that the position data has been received. For this experiment, the PPT device was run on a 90Mhz, Pentium computer with 16MB of RAM.
Virtual environment equipment: The Kaiser Electro- Optics Virtual Immersion (VIM) 500hrpv head-mounted display (HMD) was used to display the virtual environment. It provides a 50° field of view and accepts an NTSC 2-channel stereo or 1-channel mono video signal from a VGA-NTSC converter box. The NTSC signal was projected into separate right and left color, 1.5 inch LCD screens. The HMD was operated solely in the stereoscopic mode for the duration of the experiment. A 133Mhz, Pentium computer with 32MB
of RAM was used to generate the virtual environment. WorldToolKit software was run under the Windows 95 operating system. During testing, the screen resolution was set at 640 X 480 pixels. All subjects used a standard three button mouse to move about and manipulate objects in the virtual environment.
Simulator Sickness Questionnaire (SSQ): The SSQ [13] consists of a checklist of 26 symptoms, each of which is related in terms of degree of severity (none, slight, moderate, severe), with the highest possible total score being 300. A diagnostic scoring procedure is used to obtain a global score reflecting the overall discomfort level known as the Total Severity (TS) score. The SSQ also provides scores on three subscales which represent separable dimensions of simulator sickness (i.e., nausea, oculomotor disturbances, and disorientation).
Virtual environment and tasks
The virtual environment (VE) scene content was developed using WorldToolKit for Windows, Version 2.0. The VE consisted of two rooms separated by a wall with a doorway. The first room had a set of 15 colored balls (orange, blue, green, white, yellow, three of each color) along one wall and 15 matching platforms along the opposite wall. There was a column in the center of this room. In the other room there were six large columns divided into two rows of three columns each. The columns were alternating colors of blue and red.
There were two virtual tasks to be performed. The first task required subjects to move the 15 balls on the left side of the room over to the matching 15 platforms on the right side of the room. While traversing from one side of the room to the other, the subjects were to move clockwise around the column in the center of the room one time before placing the ball over the matching platform. The second virtual task required subjects to move into the second room of the VE where they encountered the six large columns. In this room subjects had to perform a column circling task in which they traversed from one column to the next, moving clockwise around each one before continuing to the next. The task took approximately 30 minutes to perform.
Procedure
First subjects read and signed an informed consent form and filled out the SSQ. Subjects then performed
89
the past pointing task to obtain a baseline measure of pointing performance. The past pointing test experimental session was divided into center, left (30° to the left of center), and right (30° to the right of center) orientational components. The order of presentation of the orientations was center, then left, then right.
During each orientational component, 12 pointing trials were made to the target on the digitizing pad. Subjects were required to sit in a specially designed armless chair in an upright position with their dorsum against the chair back. The Velcro equipped elastic band containing the stylus was then attached to the index finger of the subjects right hand. Next, subjects were instructed to point with the stylus at the target on the digitizing pad, which was located in the frontal plane, while the pad was positioned at arms length.
Subjects were provided with instructions on the pointing tasks. They were instructed to start and stop their pointing motions with their hand resting on their right leg. The subjects were told to point to the target in a single continuous natural movement, without stopping. Subjects then practiced pointing several times. A baffle was worn around the neck of the subjects in order to occlude the view of the arm position.
There were six eyes-open trials and six eyes-closed trials; three of these trials were with no delay between the first and second touch and three of these trials were with a 5-second delay between the first and second touch. At the beginning of each trial, subjects were told to look at the target and point to it with eyes open. Then, for "eyes-open" trials subjects were told to repeat this procedure. For "eyes-closed" trials, subjects were told to close their eyes and then point to the memorized target location.
Immediately following the PPT, subjects remained in the chair used for the pointing test and were relocated in front of the computer displaying the virtual environment. The HMD was placed on the subjects' head and adjusted to fit. Subjects were shown how to use the mouse so that they could move in the VE; movements to the right, left, forward, and backward were demonstrated.
Subjects were instructed to perform the ball pick-and- place task first, until all of the balls were placed on the platforms, and then perform the column circling task until their 30 minute exposure time had expired. When subjects commenced the first virtual task, the room lights were extinguished and remained out for the duration of the VE exposure duration.
Immediately after exposure, subjects remained seated with eyes closed while the HMD was removed and they
were relocated in front of the PPT device. Then the lights were turned on and the subjects were instructed to open their eyes and immediately commence the pointing task, using the same procedure as the pre-exposure PPT. Then subjects filled out the SSQ.
Data analysis
Using the digitizing pad, the endpoint of each pointing trial was measured in both the x and the y directions with an accuracy of .001 in., and stored by the computer. For each orientation (center, left, right) and delay (none, 5-seconds), the pointing errors (i.e., difference between the first and second touch in a trial) in both the x and y directions were averaged for the three trials measured. The mean difference between the subjects' pre- and post-exposure pointing errors was used as a measure of adaptation elicited during exposure to the virtual environment. For each subject, these mean difference measurements were calculated at each orientation and for each delay. All mean measures were subjected to a "within-subject" multivariate analysis of variance (MANOVA). The independent variables included delay (none, 5-seconds) and orientation (center, left, right). The dependent variables included the mean difference measures in the x and y directions. This analysis was performed separately for the eyes-open and eyes-closed scenarios.
Results
The mean Simulator Sickness Questionnaire (SSQ) scores for the nausea, oculomotor, and disorientation subscales and total severity score are presented in Table 1. These scores are for the pre-VE exposure and post- exposure measurements. The level of total symptomatology (i.e., total severity) was significantly greater (t = 2.03, p < 0.03) after exposure as compared to before. The nausea (t= 1.76, p < 0.05), oculomotor disturbances (t = 2.01, p < 0.03), and disorientation (?=1.81, p < 0.05) subscale scores at post-exposure were all significantly greater than at pre- exposure.
The average difference between the subjects' pre- and post-exposure pointing errors was used as a measure of adaptation elicited during exposure to the virtual environment. There were no significant differences detected for the eyes-open scenario. Thus, all future results pertain to the eyes-closed scenario. The mean differences for both horizontal (x-direction) and vertical (y-direction) errors are presented in Table 2. These results indicate that, on average, there is a significant (t
90
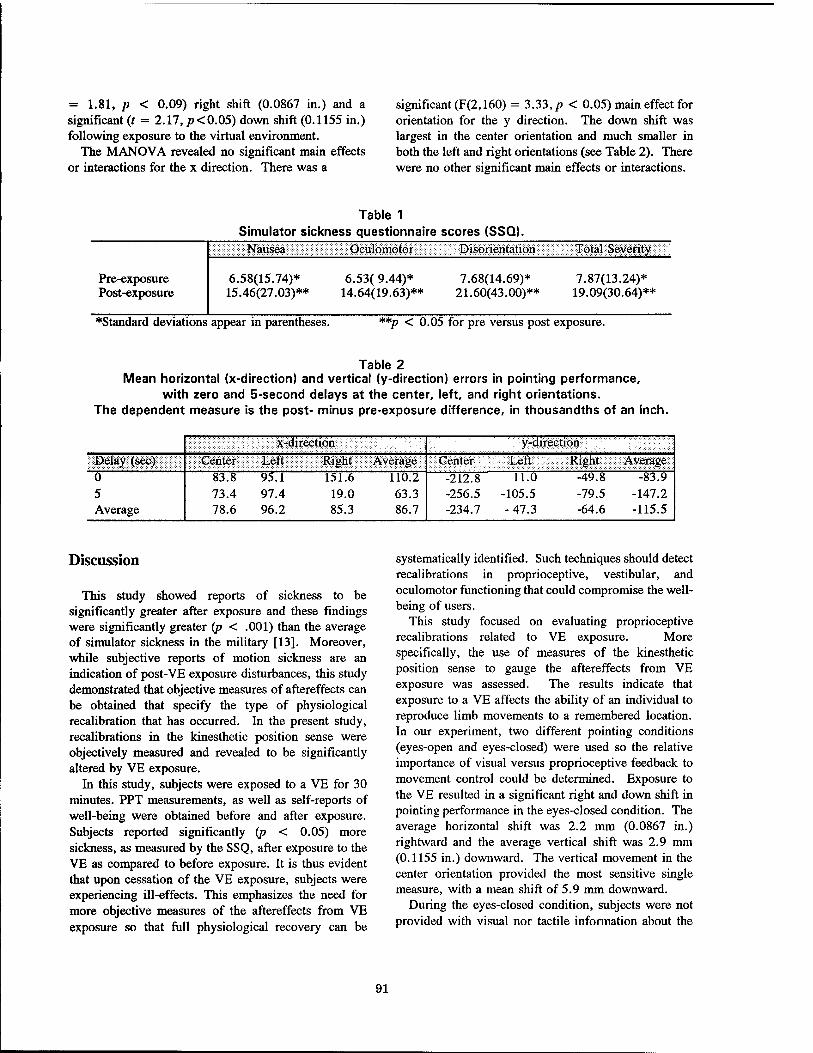
= 1.81, p < 0.09) right shift (0.0867 in.) and a significant (t = 2.17, p<0.05) down shift (0.1155 in.) following exposure to the virtual environment.
The MANOVA revealed no significant main effects or interactions for the x direction. There was a
significant (F(2,160) = 3.33, p < 0.05) main effect for orientation for the y direction. The down shift was largest in the center orientation and much smaller in both the left and right orientations (see Table 2). There were no other significant main effects or interactions.
Table 1 Simulator sickness questionnaire scores (SSQ).
Pre-exposure Post-exposure
Nausea Oculomotor Disorientation
6.58(15.74)* 15.46(27.03)**
6.53( 9.44)* 14.64(19.63)**
7.68(14.69)* 21.60(43.00)**
Total Severity
7.87(13.24)* 19.09(30.64)**
♦Standard deviations appear in parentheses. **; 'p < 0.05 for pre versus post exposure.
Table 2 Mean horizontal (x-direction) and vertical (y-direction) errors in pointing performance,
with zero and 5-second delays at the center, left, and right orientations. The dependent measure is the post- minus pre-exposure difference, in thousandths of an inch.
x-direction y-direction Delay (sec) Center Left Right Average Center Left Right Average 0 5 Average
83.8 73.4 78.6
95.1 151.6 97.4 19.0 96.2 85.3
110.2 63.3 86.7
-212.8 -256.5 -234.7
11.0 -49.8 -105.5 -79.5 - 47.3 -64.6
-83.9 -147.2 -115.5
Discussion
This study showed reports of sickness to be significantly greater after exposure and these findings were significantly greater (p < .001) than the average of simulator sickness in the military [13]. Moreover, while subjective reports of motion sickness are an indication of post-VE exposure disturbances, this study demonstrated that objective measures of aftereffects can be obtained that specify the type of physiological recalibration that has occurred. In the present study, recalibrations in the kinesthetic position sense were objectively measured and revealed to be significantly altered by VE exposure.
In this study, subjects were exposed to a VE for 30 minutes. PPT measurements, as well as self-reports of well-being were obtained before and after exposure. Subjects reported significantly (p < 0.05) more sickness, as measured by the SSQ, after exposure to the VE as compared to before exposure. It is thus evident that upon cessation of the VE exposure, subjects were experiencing ill-effects. This emphasizes the need for more objective measures of the aftereffects from VE exposure so that full physiological recovery can be
systematically identified. Such techniques should detect recalibrations in proprioceptive, vestibular, and oculomotor functioning that could compromise the well- being of users.
This study focused on evaluating proprioceptive recalibrations related to VE exposure. More specifically, the use of measures of the kinesthetic position sense to gauge the aftereffects from VE exposure was assessed. The results indicate that exposure to a VE affects the ability of an individual to reproduce limb movements to a remembered location. In our experiment, two different pointing conditions (eyes-open and eyes-closed) were used so the relative importance of visual versus proprioceptive feedback to movement control could be determined. Exposure to the VE resulted in a significant right and down shift in pointing performance in the eyes-closed condition. The average horizontal shift was 2.2 mm (0.0867 in.) rightward and the average vertical shift was 2.9 mm (0.1155 in.) downward. The vertical movement in the center orientation provided the most sensitive single measure, with a mean shift of 5.9 mm downward.
During the eyes-closed condition, subjects were not provided with visual nor tactile information about the
91
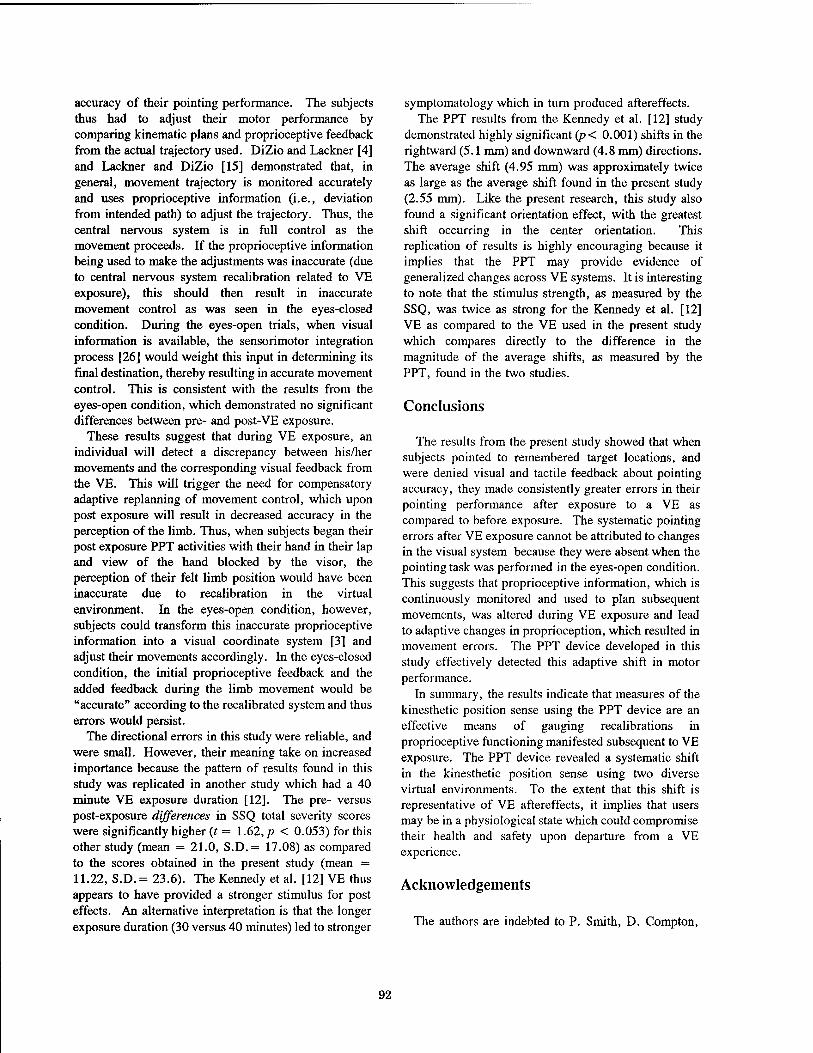
accuracy of their pointing performance. The subjects thus had to adjust their motor performance by comparing kinematic plans and proprioceptive feedback from the actual trajectory used. DiZio and Lackner [4] and Lackner and DiZio [15] demonstrated that, in general, movement trajectory is monitored accurately and uses proprioceptive information (i.e., deviation from intended path) to adjust the trajectory. Thus, the central nervous system is in full control as the movement proceeds. If the proprioceptive information being used to make the adjustments was inaccurate (due to central nervous system recalibration related to VE exposure), this should then result in inaccurate movement control as was seen in the eyes-closed condition. During the eyes-open trials, when visual information is available, the sensorimotor integration process [26] would weight this input in determining its final destination, thereby resulting in accurate movement control. This is consistent with the results from the eyes-open condition, which demonstrated no significant differences between pre- and post-VE exposure.
These results suggest that during VE exposure, an individual will detect a discrepancy between his/her movements and the corresponding visual feedback from the VE. This will trigger the need for compensatory adaptive replanning of movement control, which upon post exposure will result in decreased accuracy in the perception of the limb. Thus, when subjects began their post exposure PPT activities with their hand in their lap and view of the hand blocked by the visor, the perception of their felt limb position would have been inaccurate due to recalibration in the virtual environment. In the eyes-open condition, however, subjects could transform this inaccurate proprioceptive information into a visual coordinate system [3] and adjust their movements accordingly. In the eyes-closed condition, the initial proprioceptive feedback and the added feedback during the limb movement would be "accurate" according to the recalibrated system and thus errors would persist.
The directional errors in this study were reliable, and were small. However, their meaning take on increased importance because the pattern of results found in this study was replicated in another study which had a 40 minute VE exposure duration [12]. The pre- versus post-exposure differences in SSQ total severity scores were significantly higher {t = 1.62, p < 0.053) for this other study (mean = 21.0, S.D.= 17.08) as compared to the scores obtained in the present study (mean = 11.22, S.D.= 23.6). The Kennedy et al. [12] VE thus appears to have provided a stronger stimulus for post effects. An alternative interpretation is that the longer exposure duration (30 versus 40 minutes) led to stronger
symptomatology which in turn produced aftereffects. The PPT results from the Kennedy et al. [12] study
demonstrated highly significant (p< 0.001) shifts in the rightward (5.1 mm) and downward (4.8 mm) directions. The average shift (4.95 mm) was approximately twice as large as the average shift found in the present study (2.55 mm). Like the present research, this study also found a significant orientation effect, with the greatest shift occurring in the center orientation. This replication of results is highly encouraging because it implies that the PPT may provide evidence of generalized changes across VE systems. It is interesting to note that the stimulus strength, as measured by the SSQ, was twice as strong for the Kennedy et al. [12] VE as compared to the VE used in the present study which compares directly to the difference in the magnitude of the average shifts, as measured by the PPT, found in the two studies.
Conclusions
The results from the present study showed that when subjects pointed to remembered target locations, and were denied visual and tactile feedback about pointing accuracy, they made consistently greater errors in their pointing performance after exposure to a VE as compared to before exposure. The systematic pointing errors after VE exposure cannot be attributed to changes in the visual system because they were absent when the pointing task was performed in the eyes-open condition. This suggests that proprioceptive information, which is continuously monitored and used to plan subsequent movements, was altered during VE exposure and lead to adaptive changes in proprioception, which resulted in movement errors. The PPT device developed in this study effectively detected this adaptive shift in motor performance.
In summary, the results indicate that measures of the kinesthetic position sense using the PPT device are an effective means of gauging recalibrations in proprioceptive functioning manifested subsequent to VE exposure. The PPT device revealed a systematic shift in the kinesthetic position sense using two diverse virtual environments. To the extent that this shift is representative of VE aftereffects, it implies that users may be in a physiological state which could compromise their health and safety upon departure from a VE experience.
Acknowledgements
The authors are indebted to P. Smith, D. Compton,
92
and M. Smith who assembled the device and did data reduction. This research was supported by National Aeronautics and Space Administration contracts NAS9- 19453 (Dr. D. Harm, COTR) and NAS9-19482 (Dr. Robert Savely, COTR) and the National Science Foundation contract DMI-9400189 (Sara Nerlove, Program Official). The opinions expressed here are the authors and should not be construed to be endorsed by the sponsoring agency.
References
[1] Bock, O., Howard, I. P., Money, K. E., & Arnold, K. (1992). Accuracy of aimed arm movements in changed gravity. Aviation, Space, and Environmental Medicine, 65(11), 994-998.
[2] Crampton, G. H. (Ed.) (1990). Motion and space sickness. Boca Raton, FL: CRC Press.
[3] Darling, W. G., & Miller, G. F. (1993). Transformations between visual and kinesthetic coordinate systems in reaches to remembered object locations and orientations. Experimental Brain Research, 93, 534-547.
[4] DiZio, P., & Lackner, J. R. (1995). Motor adaptation to Coriolis force perturbations of reaching movements: Endpoint but not trajectory adaptation transfers to the nonexposed arm. Journal of Neurophysiology, 74(4), 1787-1792.
[5] Ellis, S. R., & Menges, B. M. (1995). Judged distance to virtual objects in the near visual field. Proceedings of the Human Factors and Ergonomics Society 39th Annual Meeting (pp. 1400-1404). Santa Monica, CA: Human Factors & Ergonomics Society.
[6] Fisk, J., Lackner, J. R., & DiZio, P. (1993). Gravitoinertial force level influences arm movement control. Journal of Neurophysiology, 69(2), 504-511.
[7] Gomi, H., & Kawato, M. (1996). Equilibrium- point control hypothesis examined by measured arm stiffness during multijoint movement. Science, 272, 117-120.
[8] Helms-Tillery, S. I., Flanders, M., & Soechting, J. F. (1991). A coordinate system for the synthesis of visual and kinesthetic information. The Journal ofNeuroscience, 11(3), 770-778.
[9] Kalawsky, R. S. (1993). The science of virtual reality and virtual environments. Wokingham, England: Addison-Wesley.
[10] Kennedy, R. S., Fowlkes, J. E., & Lilienthal, M.
G. (1993). Postural and performance changes in Navy and Marine Corps pilots following flight simulators. Aviation, Space, and Environmental Medicine, 64, 912-920.
[11] Kennedy, R. S., Graybiel, R. C, McDonough, R. C, & Beckwith, F. D. (1968). Symptomatology under storm conditions in the North Atlantic in control subjects and in persons with bilateral labyrinthine defects. Ada Otolaryngologica, 66, 533-540.
[12] Kennedy, R. S., Jones, M. B., Stanney, K. M., Ritter, A., & Drexler, J. M. (1996). Human factors safety testing for virtual environment mission-operations training. Final Report, Contract No. NAS9-19482. Houston, TX: NASA Johnson Space Center.
[13] Kennedy, R. S., Lane, N. E., Berbaum, K. S., & Lilienthal, M. G. (1993). Simulator Sickness Questionnaire: An enhanced method for quantifying simulator sickness. The International Journal of Aviation Psychology, 3(3), 203-220.
[14] Kennedy, R. S. & Stanney, K. M. (1996). Postural instability induced by virtual reality exposure: Development of certification protocol. International Journal of Human-Computer Interaction, 5(1), 25-47.
[15] Lackner, J. R. & DiZio, P. (1994). Rapid adaptation to Coriolis force perturbations of arm trajectory. Journal of Neurophysiology, 72(1), 299-313.
[16] Mather, J. A., & Lackner, J. R. (1980). Adaptation to visual displacement with active and passive limb movements: effect of movement frequency and predictability of movement. Quarterly Journal of Experimental Psychology, 32, 317-323.
[17] McGonigle, B. O., & Flook, J. (1978). Long- term retention of single and multistate prismaticadaptation by humans. Nature, 272, 364- 366.
[18] Paloski, W. H., Reschke, M. F., Doxey, D. D., & Black, F. O. (1992). Neurosensory adaptation associated with postural ataxia following spaceflight. In M. Woollacott & F. Horak (Eds.), Posture and Gait: Control Mechanisms, 1992: Xlth International Symposium of the Society for Postural and Gait Research (pp. 311-314). University of Oregon Books.
[19] Reschke, M. F., Huebner, W. P., Michaud, L. L., Paloski, W. H., Bloomberg, J. J., Harm, D.
93
L., & Berthoz, A. (1994). The effect of adaptation to spaceflight on strategies for target acquisition. Paper presented at the 65th Annual Aerospace Medical Association. San Antonio, TX.
[20] Rolland, J. P., Biocca, F. A., Barlow, T., & Kancherla, A. (1995). Quantification of adaptation to virtual-eye location in see-thru head- mounted displays. Proceedings of the IEEE Virtual Reality Annual International Symposium '95 (pp. 56-66).
[21] Soechting, J. F., & Flanders, M. (1989). Sensorimotor representations for pointing to targets in three-dimensional space. Journal of Neurophysiology, 62(2), 582-583.
[22] Soechting, J. F., & Flanders, M. (1993). Parallel, interdependent channels for location and orientation in sensorimotor transformations for reaching grasping. Journal of Neurophysiology, 70(3), 1137-1150.
[23] Strauss, S. (1995, March 4). Virtual reality too real for many. Toronto Globe & Mail, pp. Al, A8.
[24] Wallace, B. (1978). Visuomotor coordination and intermanual transfer for a proprioceptive reaching task. Journal of Motor Behavior, 70(2), 139-147.
[25] Welch, R. B. (1969). Adaptation to prism- displaced vision: The importance of target pointing. Perception and Psychophysics, 5(5), 305-307.
[26] Wolpert, D. M., Ghahramani, Z., & Jordan, M. I. (1995). An internal model for sensorimotor integration. Science, 269, 1880-1882.
[27] Wright, R. H. (1995). Virtual reality psychophysics: Forward and lateral distance, height, and speed perceptions with a wide-angle helmet display. Final Report No. 1025. Alexandria, VA: U.S. Army Research Institute for the Behavioral and Social Sciences.
94
The Sensitivity of Presence to Collision Response
S. Uno1
Imaging Research Centre Canon Inc.
3-30-2 Simo-maruko Ohta-ku, Tokyo, 146
Japan email:[email protected]
M. Slater Department of Computer Science
University College London Gower Street
London WC1E 6BT UK
email: [email protected]
Abstract This paper describes a new approach to collision detection and response, and an experiment to examine the sensitivity of subjective presence to varying collision response parameters. In particular, a bowling game scenario was used with 18 subjects, and parameters representing elasticity, friction and accuracy of collision detection were varied. Presence was assessed through a questionnaire following the experiment. The results suggested that presence was sensitive to variation in these parameters, and in particular to the value of the parameter representing friction.
Keywords Presence, tele-presence, collision detection, collision response, virtual environments, virtual reality.
1. Introduction In this paper we introduce a new method for handling
collisions between objects in virtual environments (VEs). The impetus for this work arose out of our first pilot experiment in virtual reality in 1992 [15], where there was an attempt to elicit factors that contribute to the subjective experience of 'presence' in an immersive VE - the sense of being in the environment depicted by the computer generated displays. The failure of the virtual world to exhibit expected physical laws (such as collision response) was reported as a factor that reduced the sense of presence. Since that first experiment our research program has been driven by an attempt to construct an empirically based model for the factors that influence presence - in particular, subjecting each technical development to a case-control experimental study to assess its potential influence on presence. For example, we have carried out such experiments in
relation to the influence of a 'virtual body', with the 'virtual treadmill' walking technique [17], with the influence of dynamic shadows [16], and the influence of degrees of immersion on presence and task performance [18]. In this paper we report an experiment to assess the sensitivity of presence to the collision detection and response methods described.
We have found it useful to distinguish between 'immersion' and 'presence'. Immersion is a term that we use to describe the extent to which the technology provides a capability for generating virtual worlds that are: • surrounding (S) : sensory data may come from any
direction to the participant's ego-centre; • extensive (E): supports multiple sensory modalities; • inclusive (I): where the real world is shut out; • vivid (V): with high resolution, richness and realism
of the information portrayed by the displays; • matching (M): where the displays depict views of
the virtual world that match in content and time the proprioceptive feedback caused by the movements and disposition of the participant's body. This should also include displayed information about the participant's virtual body.
Previously we have characterised 'subjective presence' along three orthogonal dimensions: the extent to which a participant has a sense of: 1. being there (T) - in the environment presented by
the displays; 2. reality (R) - where the information presented by the
displays is taken as more the current reality than the reality of the 'outside world';
3. place (P) - where the environment depicted by the displays becomes a 'place', recalled as a place on the same level as other real places that the participant has visited.
Formerly at QMW University of London, where the experiment described in this paper was carried out.
0-8186-7843-7/97 $10.00 © 1997 IEEE 95
Our hypothesis is that presence, considered as an amalgam p(T,R,P) is an increasing function of the degree of match between proprioception and sensory data (M), and the degree to which the displays provide a surrounding, extensive, inclusive and vivid virtual world, which filtered through the participant's sensory preferences - allows them to build an internal and consistent world model. This model is a particular distillation of current thinking on presence; the most recent debate can be found in [14; 5].
In this paper we focus primarily on 'vividness' [20] in particular the degree of realism of the dynamic physical relationships between objects in collision. In the next section we outline the physical model, and later an experimental evaluation with respect to subjective presence.
2. Collision Detection and Response
When several objects are moving in a virtual environment, there is a chance that these objects will collide with each other. Typically, collision detection is a geometric intersection problem that depends on the spatial relationships between objects, while collision response is a dynamics problem which involves predicting behaviour according to physical laws. This section outlines a new collision detection method and a new collision response method developed for virtual reality applications.
2.1 Collision Detection In a dynamic simulation environment such as virtual
reality where the application context requires the appearance of correct operation of physical laws rather than their exact simulation, the prime consideration is to calculate the collision status of objects in real time with accuracy as a secondary consideration.
(a) Previous Work [12] and [9] use a polygon-vertex collision detection
method for flexible surfaces. This method tests the penetration of each vertex of one polygon through the plane of the other, and simply testing vertices versus polygons in this manner is effective in many cases. A polyhedron-polyhedron collision detection method is also widely employed. This method can detect collisions only for convex polyhedra; however, it is presumed that with some preprocessing a concave polyhedron can be decomposed into a collection of convex ones before applying this algorithm. The most basic algorithm of this class is to check each face of each polyhedron against the faces of other polyhedra and vice versa. This algorithm is very expensive computationally. When the numbers of polygons in each object are n and m,
computation time is proportional to mxn. Therefore, a variety of techniques such as bounding boxes and bounding spheres are used to increase speed [2,6]. Methods for parametric surface collision are given in [8,13] where the surface is expressed by functions which are continuous and twice differentiable with respect to time. If the surface functions of two objects have the same root, a collision has occurred. [19] use time- dependent parametric and implicit surfaces to find collision points. This method detects simultaneous collisions at multiple contact points using an interval approach constrained minimisation. [1,2] uses a characteristic function defining a distance between two objects near the contact point. This method uses a concept of extreme distance between two objects. [10] proposes a method to calculate the smallest distance between two objects. Every polyhedron has three geometrical features, a vertex, an edge and a face. This method calculates the closest points between two objects by finding a pair of features which makes a distance minimum.
Since almost all of the collision detection methods mentioned above have to perform a collision detection test for every polygon or object surface, the collision condition cannot be decided until the last pair's test is finished. An efficient implementation might therefore employ a hierarchical method, including a rough check and an accurate check, to minimise the computational costs. However, since most objects in a virtual environment are separated from each other, an algorithm which detects non-colliding conditions could be used. A collision test can then be stopped when it is shown that a collision has not occurred. The non-colliding method for collision detection is used in the present work, which aims at providing a quick method for determining whether two convex objects do not collide. This same approach has been exploited in [3].
(b) Principle of the Method Figure 1 shows the relationship between three convex
objects A, B and C. Concentrating for the moment on A and B, Pa and Pb are points on the surfaces of object A and object B respectively, and N„ and Nb are normal vectors to the surfaces at points at Pa and Pb respectively where Pa and Pb are defined as follows: When the objects are separated, Pa is the closest point on the surface of object A to object B and similarly Ph is the closest point on the surface of object B to object A. When the objects are intersected, Pa is the point on the surface of object A which is furthest from the surface of B within the area of intersection, and Pb is the point on the surface of object B which is furthest from the surface object A within the area of intersection; in other words these define the
96
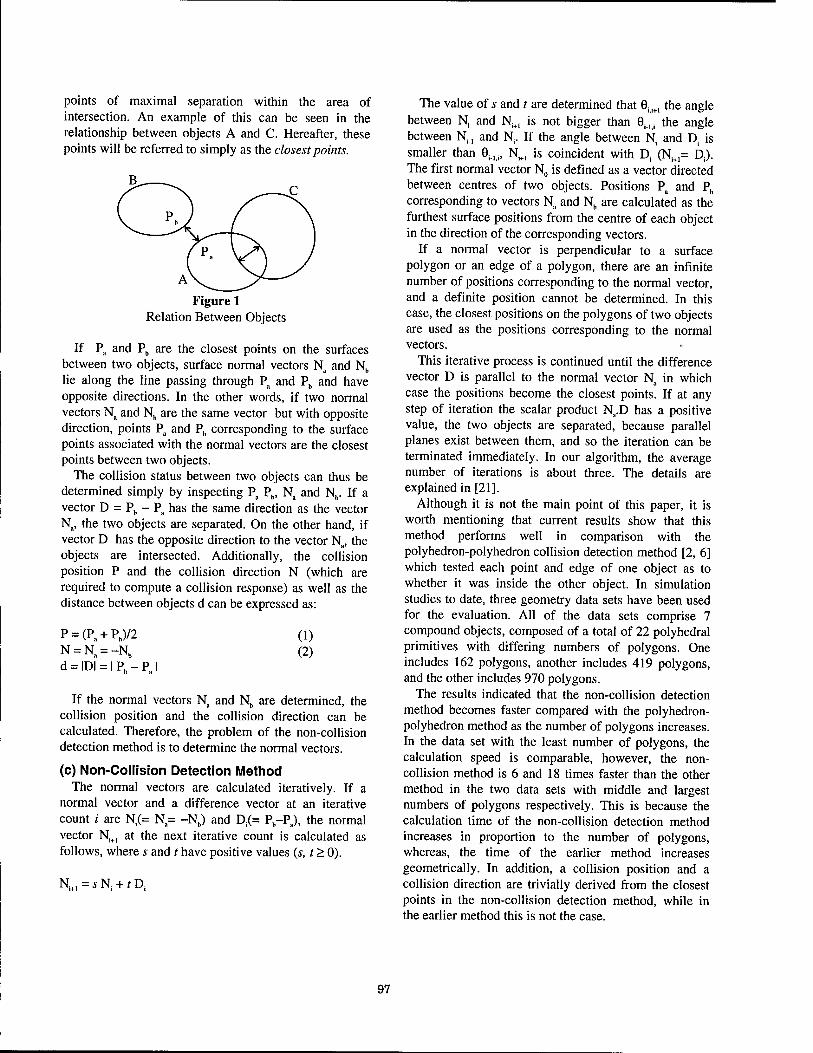
points of maximal separation within the area of intersection. An example of this can be seen in the relationship between objects A and C. Hereafter, these points will be referred to simply as the closest points.
Figure 1 Relation Between Objects
If Pa and Pb are the closest points on the surfaces between two objects, surface normal vectors Na and Nb
lie along the line passing through Pa and P„ and have opposite directions. In the other words, if two normal vectors Na and Nb are the same vector but with opposite direction, points Pa and Pb corresponding to the surface points associated with the normal vectors are the closest points between two objects.
The collision status between two objects can thus be determined simply by inspecting Pa Pb, Na and Nb. If a vector D = Pb - Pa has the same direction as the vector Na, the two objects are separated. On the other hand, if vector D has the opposite direction to the vector Na, the objects are intersected. Additionally, the collision position P and the collision direction N (which are required to compute a collision response) as well as the distance between objects d can be expressed as:
P = (Pa + Pb)/2 N = Na = -N„ d = IDI = I R. - P., I
(1) (2)
If the normal vectors Na and Nb are determined, the collision position and the collision direction can be calculated. Therefore, the problem of the non-collision detection method is to determine the normal vectors.
(c) Non-Collision Detection Method The normal vectors are calculated iteratively. If a
normal vector and a difference vector at an iterative count i are N,(= N= -N„) and D,(= P„-Pa), the normal vector Ni+, at the next iterative count is calculated as follows, where s and t have positive values (s, t > 0).
The value of s and t are determined that 0ii+1 the angle between N, and Ni+, is not bigger than 8M. the angle between N,., and N,. If the angle between N; and T>. is smaller than Qw, N.tl is coincident with D, (Ni+1= D). The first normal vector N0 is defined as a vector directed between centres of two objects. Positions Pa and Pb
corresponding to vectors Na and Nb are calculated as the furthest surface positions from the centre of each object in the direction of the corresponding vectors.
If a normal vector is perpendicular to a surface polygon or an edge of a polygon, there are an infinite number of positions corresponding to the normal vector, and a definite position cannot be determined. In this case, the closest positions on the polygons of two objects are used as the positions corresponding to the normal vectors.
This iterative process is continued until the difference vector D is parallel to the normal vector Na in which case the positions become the closest points. If at any step of iteration the scalar product Na.D has a positive value, the two objects are separated, because parallel planes exist between them, and so the iteration can be terminated immediately. In our algorithm, the average number of iterations is about three. The details are explained in [21].
Although it is not the main point of this paper, it is worth mentioning that current results show that this method performs well in comparison with the polyhedron-polyhedron collision detection method [2, 6] which tested each point and edge of one object as to whether it was inside the other object. In simulation studies to date, three geometry data sets have been used for the evaluation. All of the data sets comprise 7 compound objects, composed of a total of 22 polyhedral primitives with differing numbers of polygons. One includes 162 polygons, another includes 419 polygons, and the other includes 970 polygons.
The results indicated that the non-collision detection method becomes faster compared with the polyhedron- polyhedron method as the number of polygons increases. In the data set with the least number of polygons, the calculation speed is comparable, however, the non- collision method is 6 and 18 times faster than the other method in the two data sets with middle and largest numbers of polygons respectively. This is because the calculation time of the non-collision detection method increases in proportion to the number of polygons, whereas, the time of the earlier method increases geometrically. In addition, a collision position and a collision direction are trivially derived from the closest points in the non-collision detection method, while in the earlier method this is not the case.
97
2.2 Collision Response Collisions in dynamic simulations are usually resolved
by analytical methods. The conservative laws of linear and angular momentum are used for this purpose [12, 7;, 11] and the result depends on the collision behaviour, i.e. on parameters such as elasticity and friction.
Analytical methods attempt to solve a collision response correctly using physical laws, and special cases such as a complete inelastic collision and elastic collision without friction can be calculated correctly. However, some cases, for example the case of an elastic, rolling collision, cannot be determined correctly because the conservative law of kinetic energy is not taken into account. If a collision has occurred between two elastic objects which have completely rough surfaces, the objects roll over each other at a collision point, and as a result kinetic energy is conserved. The conservative law of kinetic energy is considered in this paper.
(a) Physical Equations To solve a collision, three kinds of equation are
typically used: the conservative laws of momentum, the conservative law of kinetic energy, and the relative velocity at the collision position after collision.
In this paper, ma and mb are masses of the objects A and B respectively, Ia and Ib are their inertial momentum matrices, Sa and Sb are rotation matrices, Va and Vb are the velocities before collision, and Wa and Wb are angular velocities before collision. If the objects are compound objects, physical parameters refer to the whole objects.
The new velocities V,', Vb' and the new angular velocities W,', Wb' are expressed by the conservative laws of momentum as follows, where the equations (5) and (6) are in the object coordinates, Ra and Rb are collision positions in the local coordinates of object A and object B, and F is the impulse at the collision point. Two impulses on object A and object B have the same magnitude and opposite directions because of Newton's third law of motion. Fa and Fb are impulses in the local coordinates of each object.
m»V;-maVH = F mbVb'-mbVb = -F W;i.-WaI, = RaxFa
Wb'I„-WbIb = RbxFb
(3) (4) (5) (6)
Equations (3)-(6) show that the new velocities and the new angular velocities are expressed by the impulse F. Therefore, if F is determined, all unknown parameters V;,Vb',Wa' and W„' can be calculated.
To determine the impulse F, the conservative law of kinetic energy and relative velocity at the collision position after collision are used. The following equation shows the conservative law of kinetic energy applied to two collided objects. The left hand side is (twice) the kinetic energy after collision and the right hand side is (twice) the kinetic energy before collision.
ma v.w; + m„ vb\v/ + w; i,w; + wb' i„.w,/ = ma Va.Va + mb Vb.V„ + Wa I,.Wa + Wb I„.Wb (7)
Relative velocity dV at the collision position after collision is also used to determine the impulse F. dV is expressed as a difference of linear velocities, V,' and Vb', and a difference of rotation velocities, Wa'xRa and Wb'xRb, as follows.
dv = v; - v; + (w;xRa)sa - (wb,xRb)sb (8)
(b) Energy Conservation Method The method to solve a collision is now described.
Physical parameters, elasticity e and friction \i, are considered to determine an impulse F. These parameters are employed in previous methods to calculate a realistic collision. The method described here simplifies the handling of elasticity and friction to give the illusion of their correct operation, but without the computational expense of full simulation.
In this method elasticity and friction values are defined for every object as coefficients between 0 and 1. Then an actual coefficient between two collided objects is determined by multiplying the two corresponding coefficients of the objects. If the product of the two friction values (0. (0 < (i < 1) is 0, the two objects slide over each other at the collision position, and impulse F corresponds to the collision direction. If ja. is 1, the two objects roll over each other at the collision position, and the components of the velocities of the two objects in the collision tangent plane are equal at the moment of collision. If the multiplied elasticity e (0 < e < 1) is 0, impulse F lies along the collision tangent plane, and the velocities of the two objects are equivalent in the collision direction after collision. If e is 1, the two objects are considered as rigid bodies, and kinetic energy is conserved if an actual friction between objects is 0 or 1. (If the friction is not 0 nor 1, kinetic energy is not conserved even if the elasticity is 1). The friction described above is not as same as the usual friction coefficient of physics, and should be called friction rate; however, the term 'friction' is used in this paper.
98
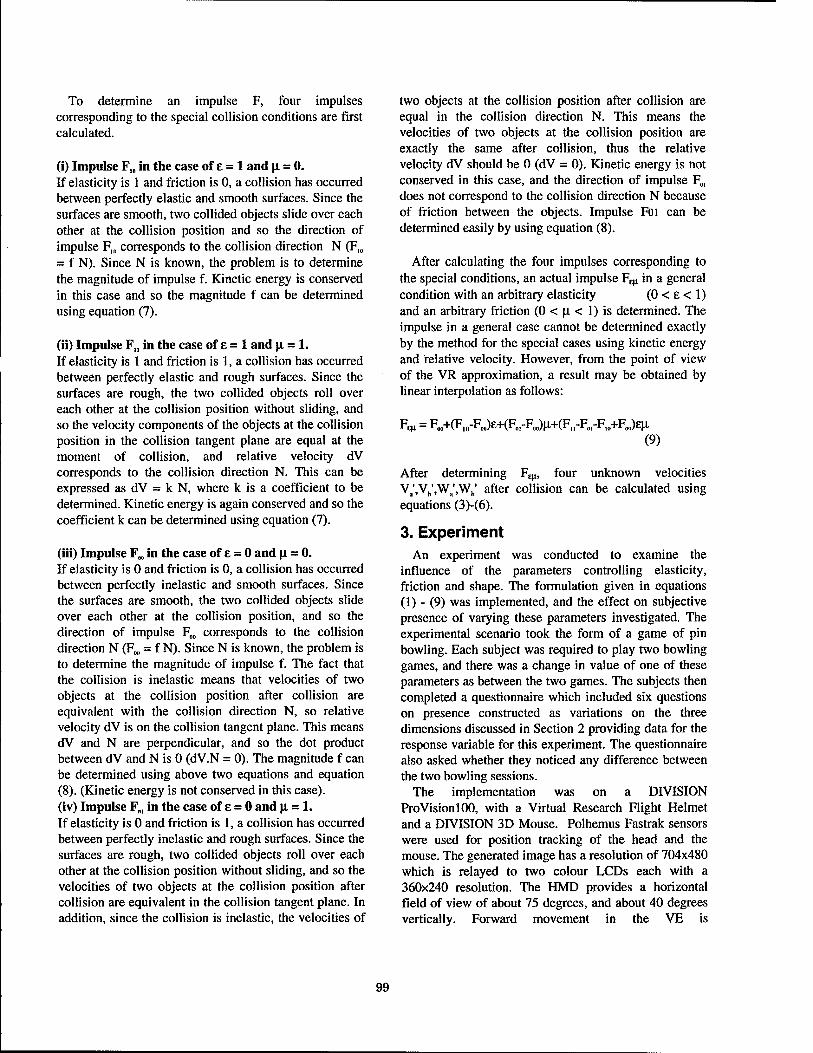
To determine an impulse F, four impulses corresponding to the special collision conditions are first calculated.
(i) Impulse F,„ in the case of e = 1 and u. = 0. If elasticity is 1 and friction is 0, a collision has occurred between perfectly elastic and smooth surfaces. Since the surfaces are smooth, two collided objects slide over each other at the collision position and so the direction of impulse F,„ corresponds to the collision direction N (FK
= f N). Since N is known, the problem is to determine the magnitude of impulse f. Kinetic energy is conserved in this case and so the magnitude f can be determined using equation (7).
(ii) Impulse F„ in the case of E = 1 and \i = 1. If elasticity is 1 and friction is 1, a collision has occurred between perfectly elastic and rough surfaces. Since the surfaces are rough, the two collided objects roll over each other at the collision position without sliding, and so the velocity components of the objects at the collision position in the collision tangent plane are equal at the moment of collision, and relative velocity dV corresponds to the collision direction N. This can be expressed as dV = k N, where k is a coefficient to be determined. Kinetic energy is again conserved and so the coefficient k can be determined using equation (7).
(iii) Impulse Fm in the case of e = 0 and u. = 0. If elasticity is 0 and friction is 0, a collision has occurred between perfectly inelastic and smooth surfaces. Since the surfaces are smooth, the two collided objects slide over each other at the collision position, and so the direction of impulse F„0 corresponds to the collision direction N (Fm = f N). Since N is known, the problem is to determine the magnitude of impulse f. The fact that the collision is inelastic means that velocities of two objects at the collision position after collision are equivalent with the collision direction N, so relative velocity dV is on the collision tangent plane. This means dV and N are perpendicular, and so the dot product between dV and N is 0 (dV.N = 0). The magnitude f can be determined using above two equations and equation (8). (Kinetic energy is not conserved in this case), (iv) Impulse F„, in the case of e = 0 and u. = 1. If elasticity is 0 and friction is 1, a collision has occurred between perfectly inelastic and rough surfaces. Since the surfaces are rough, two collided objects roll over each other at the collision position without sliding, and so the velocities of two objects at the collision position after collision are equivalent in the collision tangent plane. In addition, since the collision is inelastic, the velocities of
two objects at the collision position after collision are equal in the collision direction N. This means the velocities of two objects at the collision position are exactly the same after collision, thus the relative velocity dV should be 0 (dV = 0). Kinetic energy is not conserved in this case, and the direction of impulse F0, does not correspond to the collision direction N because of friction between the objects. Impulse Foi can be determined easily by using equation (8).
After calculating the four impulses corresponding to the special conditions, an actual impulse FEtl in a general condition with an arbitrary elasticity (0 < £ < 1) and an arbitrary friction (0 < \i < 1) is determined. The impulse in a general case cannot be determined exactly by the method for the special cases using kinetic energy and relative velocity. However, from the point of view of the VR approximation, a result may be obtained by linear interpolation as follows:
F^ = Fo„+(Fl0-FJe+(F„,-F0O)^+(F„-Fo,-F,o+FjE|x (9)
After determining F£tl, four unknown velocities V^VJ.W^W,,' after collision can be calculated using equations (3)-(6).
3. Experiment An experiment was conducted to examine the
influence of the parameters controlling elasticity, friction and shape. The formulation given in equations (1) - (9) was implemented, and the effect on subjective presence of varying these parameters investigated. The experimental scenario took the form of a game of pin bowling. Each subject was required to play two bowling games, and there was a change in value of one of these parameters as between the two games. The subjects then completed a questionnaire which included six questions on presence constructed as variations on the three dimensions discussed in Section 2 providing data for the response variable for this experiment. The questionnaire also asked whether they noticed any difference between the two bowling sessions.
The implementation was on a DIVISION Provision 100, with a Virtual Research Flight Helmet and a DIVISION 3D Mouse. Polhemus Fastrak sensors were used for position tracking of the head and the mouse. The generated image has a resolution of 704x480 which is relayed to two colour LCDs each with a 360x240 resolution. The HMD provides a horizontal field of view of about 75 degrees, and about 40 degrees vertically. Forward movement in the VE is
99
accomplished by pressing a left thumb button on the 3D mouse, and backward movement with a right thumb button. A virtual hand was slaved to the 3D mouse - there was no virtual body representation other than this. Objects could be touched by the hand and grabbed by using the trigger finger button on the 3D mouse.
The parameters controlling elasticity and friction can be between 0.0 and 1.0. A value of 0.7 for elasticity or friction results in a product of 0.49 (i.e., approximately 0.5). This was used in comparison to 0.0 for friction and 1.0 for elasticity. Objects could be represented as their actual shape or be approximated by ellipsoids. The trials prior to the experiment varied the maximum number of iterations for collision detection between 5 and 20. However, in these preliminary trials no subjects were ever able to distinguish the results of changes in the maximum number of iterations, so this was fixed at 20 throughout.
For the purposes of analysing the experimental results we treated each of elasticity (E), friction (F) and shape (S) as a binary variable, with elasticity being 0.7 or 1.0, friction as 0.0 or 0.7, and the shape being represented byan ellipsoid or by the true shape.
Table 1 L Experimental Design
(Ell. = Ellipsoid, T = = True Shape, Change parameter bold)
El Fl SI E2 F2 S3 Sub- jects
1.0 0.0 Ell. 1.0 0.0 T 2 1.0 0.0 Ell. 1.0 0.7 Ell. 2 1.0 0.0 Ell. 0.7 0.0 Ell. 2 0.7 0.0 Ell. 0.7 0.0 T 1.0 0.7 Ell. 1.0 0.7 T 0.7 0.0 Ell. 0.7 0.7 Ell. 1.0 0.0 T 1.0 0.7 T 1.0 0.7 Ell. 0.7 0.7 Ell. 1.0 0.0 T 0.7 0.0 T 0.7 0.7 Ell. 0.7 0.7 T 2 0.7 0.0 T 0.7 0.7 T 2 1.0 0.7 T 0.7 0.7 T 2
Table 1 shows the distribution of the 18 subjects in the main experiment into the cells of the factorial design. Each subject played the game twice, but the second time one of the three parameters was changed to its opposite value. The first three columns of the table show the first set of values, and the second three columns show the second set of values. The changed parameter is shown in bold in the second column. For example, the two subjects allocated to the first row carried out one bowling game with elasticity at 1.0 and friction of 0.0,
but in the first game the shapes were, for the purpose of collision response, approximated by ellipsoids, and in the second game were as their true shapes. The subjects were allocated randomly to the rows of the table.
The subjects were recruited by advertisement in the College, and consisted of 10 students, 3 research workers, 3 office staff, and 2 others. There were 12 male subjects out of the 18. None of the subjects were aware of the purpose of the experiment, nor had been in contact with the research before, although 7 answered 'yes' to the question 'Have you experienced "virtual reality" before?'.
The questionnaire included a question relating to possible experience of simulator sickness ('How dizzy, sick or nauseous did you feel resulting from the experience, if at all?'). This was rated on a 1 to 7 scale with 1 = 'not at all' and 7 = 'very much so'. The results are shown in Table 2.
Table 2 Reported Sickness Level
Level 1 2 3 4 5 6 7 Total % 28 28 17 0 17 6 6 18
The subjective presence score was constructed from the six 1 to 7 scale questions shown in Appendix A, where ' 1' indicated low presence, and '7' high presence (the term 'presence' was of course not used at all in questionnaire). These six questions are variations on the theme of the three aspects of subjective presence that we have used in previous experiments, as outlined in Section 1. The subjective presence variable was, as previously, conservatively taken as the number of high ('6' or '7') answers over the six questions, and was therefore a count between 0 and 6.
4. Results Table 3 shows the distribution of subjects according to
whether or not they noticed the changes in values for each parameter. ('There were two versions of the game, accessed by pressing the Red or Blue buttons. Could you distinguish any differences between how things worked in these two versions of the game?'). In the case when elasticity was the changing parameter value, half of the subjects noticed the change. In the case of friction, all subjects observed the change. In the case of the shape, no subjects observed the change.
The main analysis was carried out using logistic regression [4] where the response variable p is the 'high score' count out of six as explained above. This is treated as a binomially distributed variable (where 'success' = 'high score'), and the expected value of this
100
variable is related by a logistic function to a linear combination of the independent and explanatory variables (Appendix B).
Table 3 Response to Parameter Changes
Numbers of Subjects who perceived the changes:
Elasticity Friction Shape No change observed
3 0 6
Change observed
3 6 0
Total 6 6 6
Table 4 Summary of Logistic Regression Model
Parameter Changed
Fitted Linear Predictor
Elasticity Const. -0.7*sick + 2.1 *F Friction Const. - 0.7*sick + 3.8*S - 3.8*E Shape Const. -0.7*sick + 2.1 *F X1 = 12.727 d.f. = 8. Tabulated y2 = 13.362 for P = 0.10
Table 4 shows a summary for the best fit model. The overall goodness of fit is tested by a Chi-squared statistic, where a smaller value indicates a better fit. Here the overall Chi-squared value is between the 20% and 10% tail of the distribution. No variable can be removed from the model without significantly worsening the fit (at a 5% significance level). A significant explanatory factor (hidden in the constant term) included whether the subject had 'experienced VR before.' A 'yes' answer decreased the reported presence. Also the extent of reported sickness was negatively associated with reported presence under all conditions. There is no difference in results when elasticity or shape are the changing parameters. Here it is the effect of whether or not friction is at the higher (0.7) value, which is positively associated with the presence count. When friction is the changing parameter presence is positively associated with correct shape and negatively associated with elasticity (i.e., an elasticity of 1.0 is associated with higher presence than elasticity of 0.7). Since the change in friction was the only parameter always noticed by the subjects, this supports the idea that it is this parameter which had the greatest impact amongst the three for this particular experimental simulation.
5. Conclusions The aim of this paper has been to introduce a method
for collision detection and response, and to examine the
influence of the technique on reported presence. The most important result regarding presence is that there is a quantifiable and statistically significant influence at all. The collision response technique, although much simplified compared to a full simulation of these parameters nevertheless seems to give results acceptable in the circumstances of the bowling game. Subjects were invited to comment on the experiment immediately afterwards, and although there were comments on the weight of the HMD, the difficulty of object selection, the difficulty in finding the right moment to release the virtual ball after swinging the arm, there were no comments about the behaviours of the virtual objects in response to collision.
This was the first experiment where we have attempted to examine the influence of such physically based behaviour of objects in VEs. Future work will take a larger number of subjects and vary the three parameters (E, F, and S) over a wider range of values, rather than the binary choices used here. Moreover, this experiment has concentrated on the sensitivity of subjective presence. In the context of collision response there is opportunity to also examine behavioural presence; for example, in this experiment we noticed that subjects did attempt to get out of the way when objects (skittles or balls) came bouncing back towards them (one person exclaiming "This is dangerous!"). It will be possible in future work to take systematic observations of such events and include them in the analysis.
References [1] Baraff, D. (1989) Analytical methods for dynamic simulation of non-penetrating rigid bodies, Computer Graphics, 23(3):223-232. [2] Baraff, D. (1990) Curved surfaces and coherence for non- penetrating rigid body simulation, Computer Graphics (SIGGRAPH), 24(4): 19-28. [3] Chung, K. and Wang, W. (1996) Quick collision detection of polytopes in Virtual Environments, ACM Virtual Reality Systems and Technology (VRST '96), M. Green ed., Hong Kong July 1-4, 125-131. [4] Cox, D.R. [1970] Analysis of Binary Data, London: Menthuen. [5] Ellis, S.R. (1996) Presence of Mind: A Reaction to Thomas Sheridan's "Further Musings on the Psychophysics of Presence", Presence: Teleoperators and Virtual Environments, 5(2): 247-259. [6] Ganter, M.A., Isarankura, B.P. (1993) Dynamic collision detection using space partitioning, Journal of Mechanical Design, 115:150-155. [7] Hahn, J.K. (1988) Realistic animation of rigid bodies, Computer Graphics (SIGGRAPH), 22(4):299-308.
101

[8] Herzen Brian Von, Barr A.H., Zatz, H.R. (1990) Geometrie collisions for time-dependent parametric surfaces, Computer Graphics (SIGGRAPH), 24(4):39-48. [9] Lafleur, B., Magnanet-Thalmann, N., Thalmann, D. (1991) Cloth animation with self-collision detection, in Tosiyasu L. Kunii, ed., Modeling in Computer Graphics, pages 179-187, Tokyo. [10] Lin, M.C. and Canny, J.F. (1991) A fast algorithm for incremental distance calculation. In IEEE International Conference on Robotics and Automation, 1008-1014, Sacramento, California. [11] Mirtich, B. and Canny, J. (1995) Impulse-based simulation of rigid bodies, ACM SIGGRAPH Proceedings Symposium on Interactive 3D Graphics, Monterey, California, 181-188. [12] Moore, M. and Wilhelms, J. (1988) Collision detection and response for computer animation, Computer Graphics (SIGGRAPH), 22(4):289-298. [13] Sclaroff, S. and Pentland, A. (1991) Generalized implicit functions for computer graphics. Computer Graphics (SIGGRAPH), 25(4):247-250. [14] Sheridan, T.B. (1996) Further Musings on the Psychophysics of Presence, Presence: Teleoperators and Virtual Environments, 5(2): 241-246. [15] Slater, M. and M. Usoh (1992) An Experimental Exploration of Presence in Virtual Environments, Department of Computer Science, QMW University of London internal report. [16] Slater, M., M. Usoh, Y. Chrysanthou (1995) The Influence of Dynamic Shadows on Presence in Immersive Virtual Environments, Second Eurographics Workshop on Virtual Reality, M. Goebel, ed., Monte Carlo, Jan., 1995. [17] Slater, M. Usoh, M., Steed, A. (1995) Taking Steps: The Influence of a Walking Metaphor on Presence in Virtual Reality, ACM Transactions on Computer-Human Interaction (TOCHI) 2(3) September, 201-219. [18] Slater, M., Linakis, V., Usoh, M., Kooper, R. (1995) Immersion, Presence, and Performance in Virtual Environments: An Experiment with Tri-Dimensional Chess, ACM Virtual Reality Systems and Technology (VRST '96), M. Green ed., Hong Kong July 1-4. [19] Snyder, J.M., Woodbury, A.R., Fleischer, K. Currin, B., Barr, A.H. (1993) Interval methods for multi-point collisions between time-dependent curved surfaces, Computer Graphics Proceedings, Annual Conference Series, pages 321-334. [20] Steuer, J. (1992) Defining Virtual Reality: Dimensions Determining Telepresence, Journal of Communication 42(4), 73-93. [21] Uno, S. (1996) A method for rapid non-collision detection and energy reserved collision response method, in preparation.
Acknowledgements This work is partially funded by Canon Inc., and the London Parallel Applications Centre as part of a grant from the UK DTI and EPSRC. There is partial funding from the EPSRC DEVRL project, grant number GR/K38090.
Appendix A: Presence Related Questions 1. Please rate your sense of being there in the room shown by the virtual reality on the following scale from 1 to 7. 2. To what extent were there times during the experience when the virtual reality games became "reality" for you, and you almost forgot about the "real world" of the laboratory in which the whole experience was really taking place? 3. When you think back about your experience, do you think of the virtual reality more as images that you saw, or more as somewhere that you visited ? Please answer on the following 1 to 7 scale. 4. During the time of the experience, which was strongest on the whole, your sense of being in the virtual reality, or of being in the real world of the laboratory? 5. When you think about the virtual reality, to what extent is the way that you are thinking about this in a similar way that you are thinking about the various real places that you've been today? 6. During the course of the virtual reality experience, did you often think to yourself that you were actually just standing in a laboratory wearing a helmet, or did the virtual reality overwhelm you?
Appendix B: Logistic Regression The logistic regression model used is described in [18].
Table 5 Parameter Estimates and Standard Errors
(Non-significant at 5% level shown in italics).
estimate S.E. parameter 1.501 1.216 change(l)
-0.9969 1.125 change(2) 0.7149 0.8994 change(3) 2.112 0.9312 F
-0.6980 0.2461 sick -1.580 0.7133 vrbefore(2) -1.496 1.213 change(l).S 3.786 1.440 change(2).S
-3.836 1.443 change(2). E
-0.5273 1.116 change(3). E
Table 5 shows the details of the model fitted in this experiment. The levels of the factors are shown in brackets in the last column. Change(l),(2),(3) refers to whether elasticity (1), friction (2) or shape (3) are the parameters being changed, vrbefore (2) is 'no previous VR experience'. change(x).Y refers to the coefficient of Y when x is the parameter being changed. Impossible combinations are not shown.
102
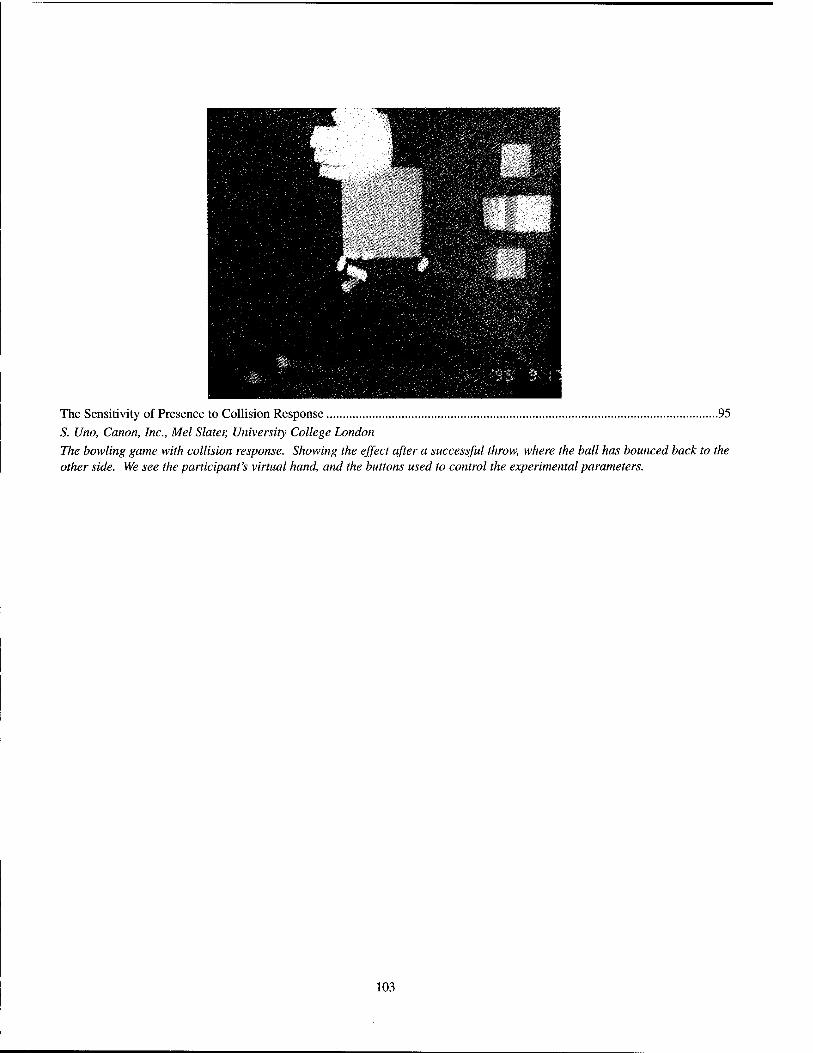
The Sensitivity of Presence to Collision Response 95 S. Uno, Canon, Inc., Mel Slater, University College London
The bowling game with collision response. Showing the effect after a successful throw, where the ball has bounced back to the other side. We see the participant's virtual hand, and the buttons used to control the experimental parameters.
103
««ION
VliUflLIZflTIOH AND NGWIMD Vft
An Extensible Interactive Visualization Framework for the Virtual Windtunnel
Steve Bryson MRJ Inc./NASA Ames Research Center
Sandy Johan NASA Ames Research Center
Leslie Schlecht MRJ Inc./NASA Ames Research Center
Abstract This paper describes a new software framework for the
virtual windtunnel, a virtual reality-based, near-real-time interactive system for scientific visualization. This frame- work meets the requirements of extensibility, interactive performance, and interface independence. Creating a framework which meets all of these requirements pre- sented a major challenge. We describe this framework's object-oriented structure and process architecture, includ- ing interprocess communications and control. Device independence of both the command and display structures are developed, providing the ability to use a wide variety of interface hardware options. The resulting framework supports a high-performance visualization environment which can be easily extended to new capabilities as desired.
1: Introduction The virtual windtunnel is the application of virtual real-
ity interface techniques to the visualization of the results of computational fluid dynamics (CFD) simulations. Simultaneously meeting the requirements of general-pur- pose fluid flow visualization and virtual reality has proven to be very challenging. Issues of extensibility, scaling of code complexity, configuration of the environment at run- time, and specified computation rates and response times all had to be addressed. These issues often result in con- flicting requirements. The software frameworks that pro- vide solutions to these problems are the subject of this paper. While these structures are designed for scientific visualization, they can also be used for other computation- ally intensive near-real-time interactive applications.
Several early prototypes of the virtual windtunnel [1][2] were developed which had very limited visualization capa- bility. These prototypes proved the concept of virtual-real- ity-based visualization of simulated fluid flow, and demonstrated the advantages of three-dimensional display and interaction provided by virtual reality. Particle integra- tion visualization techniques were implemented in both single-workstation and distributed modes of operation.
Interaction was built around the VPL Dataglove Model II and display around the FakeSpace Labs BOOM family of displays. The problems addressed by these prototypes included time-varying visualization, manipulation tech- niques, and collaborative operation though shared distrib- uted environments. Because these prototypes were dedicated to a single class of visualization techniques, they were very limited in their scope.
Two fundamental weaknesses in these prototypes were identified: lack of versatility in terms of visualization options, and the requirement of the researcher to use a par- ticular interaction hardware. Both of these weaknesses are addressed in the version of the virtual windtunnel described in this paper. Versatility in terms of visualization techniques was addressed by implementing an object-ori- ented structure that made it easy to add both new visual- ization capabilities and new visualization and environment control tools. Visualization and interface techniques that have been implemented using this framework are described in [3] and [4]. The lack of versatility in terms of interface hardware options was addressed through the implementation of a structure that abstracts interaction and display to a layer to which it is easy to add new hardware options. Both of these types of versatility have been dem- onstrated by the rapid implementation of new features by individuals with no prior knowledge of the virtual wind- tunnel.
The current version of the virtual windtunnel is imple- mented in C++ on Silicon Graphics platforms and sup- ports a variety of visualization techniques and interface hardware configurations. The virtual windtunnel has been released for evaluation purposes to two sites: NASA Lan- gley Research Center and NASA Goddard Space Flight Center. The response has been enthusiastic and the virtual windtunnel has been used by CFD researchers to investi- gate their simulations. A public release is expected in mid 1997.
This paper describes the underlying framework of the virtual windtunnel. In the next section several require- ments for the virtual windtunnel are outlined. Section 3: briefly describes related work. In section 4: the object
0-8186-7843-7/97 $10.00 © 1997 IEEE 106
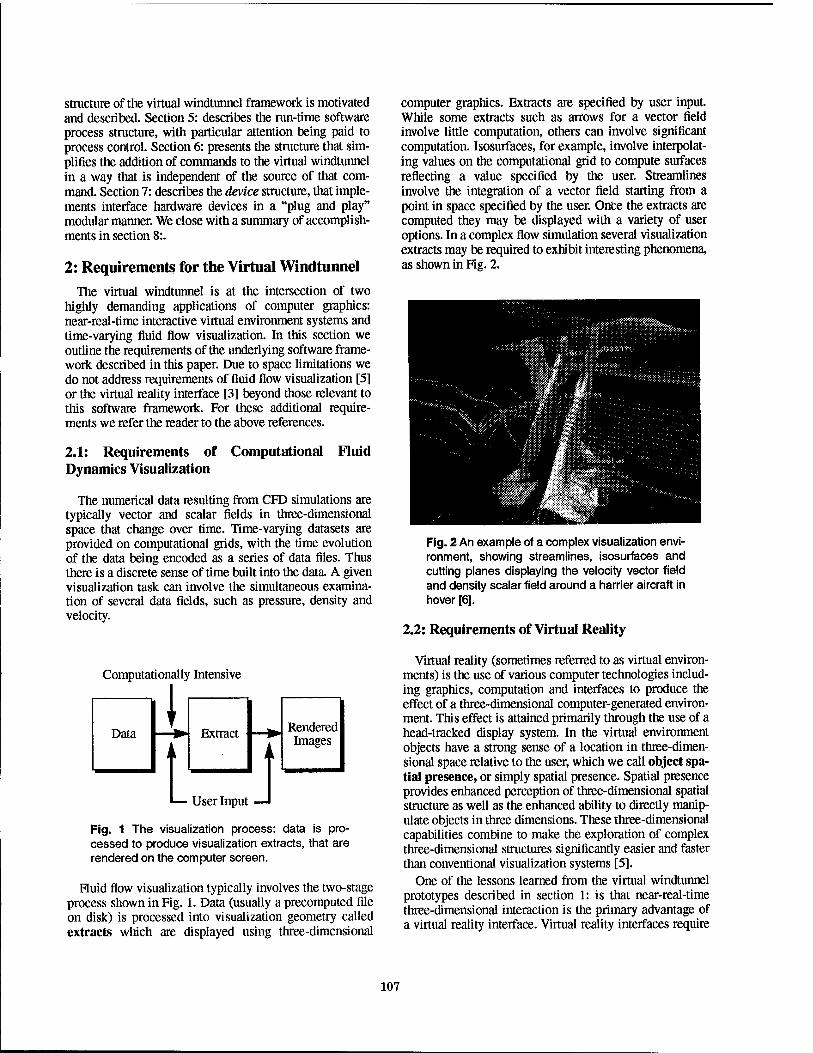
structure of the virtual windtunnel framework is motivated and described. Section 5: describes the run-time software process structure, with particular attention being paid to process control. Section 6: presents the structure that sim- plifies the addition of commands to the virtual windtunnel in a way that is independent of the source of that com- mand. Section 7: describes the device structure, that imple- ments interface hardware devices in a "plug and play" modular manner. We close with a summary of accomplish- ments in section 8:.
2: Requirements for the Virtual Windtunnel The virtual windtunnel is at the intersection of two
highly demanding applications of computer graphics: near-real-time interactive virtual environment systems and time-varying fluid flow visualization. In this section we outline the requirements of the underlying software frame- work described in this paper. Due to space limitations we do not address requirements of fluid flow visualization [5] or the virtual reality interface [3] beyond those relevant to this software framework. For these additional require- ments we refer the reader to the above references.
2.1: Requirements of Computational Fluid Dynamics Visualization
The numerical data resulting from CFD simulations are typically vector and scalar fields in three-dimensional space that change over time. Time-varying datasets are provided on computational grids, with the time evolution of the data being encoded as a series of data files. Thus there is a discrete sense of time built into the data. A given visualization task can involve the simultaneous examina- tion of several data fields, such as pressure, density and velocity.
Computationally Intensive
Data Extract
User Input
Rendered Images
Fig. 1 The visualization process: data is pro- cessed to produce visualization extracts, that are rendered on the computer screen.
Fluid flow visualization typically involves the two-stage process shown in Fig. 1. Data (usually a precomputed file on disk) is processed into visualization geometry called extracts which are displayed using three-dimensional
computer graphics. Extracts are specified by user input. While some extracts such as arrows for a vector field involve little computation, others can involve significant computation. Isosurfaces, for example, involve interpolat- ing values on the computational grid to compute surfaces reflecting a value specified by the user. Streamlines involve the integration of a vector field starting from a point in space specified by the user. Once the extracts are computed they may be displayed with a variety of user options. In a complex flow simulation several visualization extracts may be required to exhibit interesting phenomena, as shown in Fig. 2.
Fig. 2 An example of a complex visualization envi- ronment, showing streamlines, isosurfaces and cutting planes displaying the velocity vector field and density scalar field around a harrier aircraft in hover [6].
2.2: Requirements of Virtual Reality
Virtual reality (sometimes referred to as virtual environ- ments) is the use of various computer technologies includ- ing graphics, computation and interfaces to produce the effect of a three-dimensional computer-generated environ- ment. This effect is attained primarily through the use of a head-tracked display system. In the virtual environment objects have a strong sense of a location in three-dimen- sional space relative to the user, which we call object spa- tial presence, or simply spatial presence. Spatial presence provides enhanced perception of three-dimensional spatial structure as well as the enhanced ability to directly manip- ulate objects in three dimensions. These three-dimensional capabilities combine to make the exploration of complex three-dimensional structures significantly easier and faster than conventional visualization systems [5].
One of the lessons learned from the virtual windtunnel prototypes described in section 1: is that near-real-time three-dimensional interaction is the primary advantage of a virtual reality interface. Virtual reality interfaces require
107
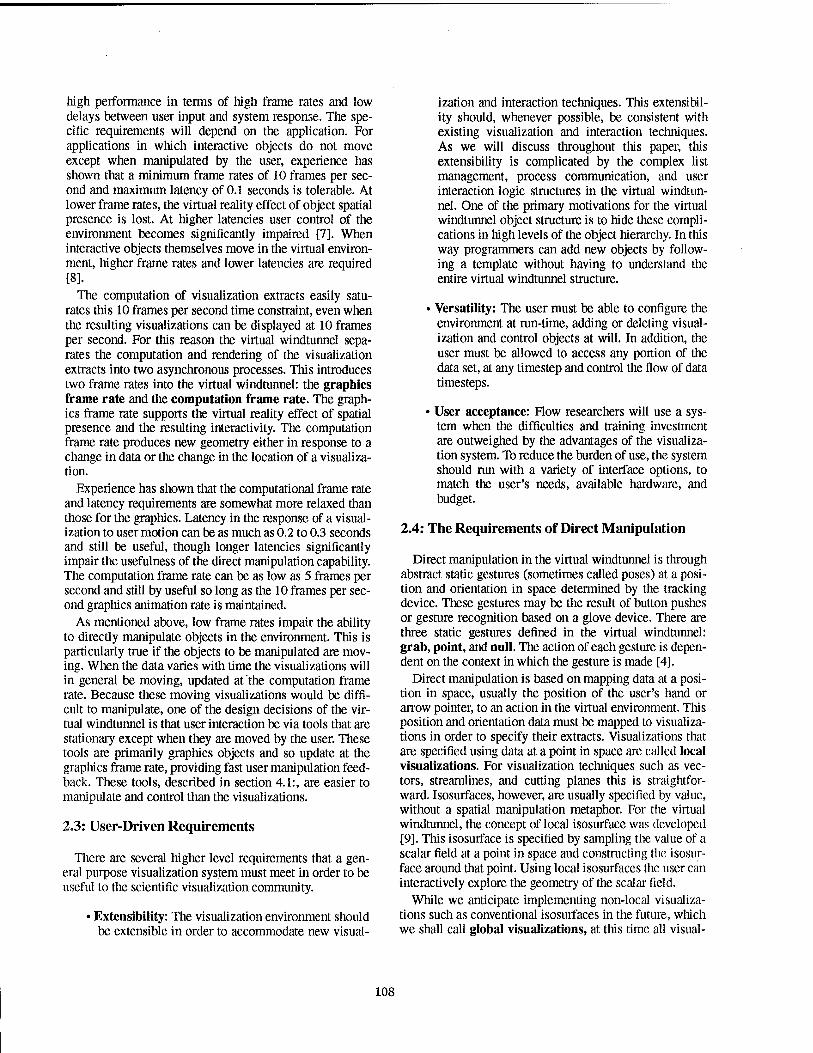
high performance in terms of high frame rates and low delays between user input and system response. The spe- cific requirements will depend on the application. For applications in which interactive objects do not move except when manipulated by the user, experience has shown that a minimum frame rates of 10 frames per sec- ond and maximum latency of 0.1 seconds is tolerable. At lower frame rates, the virtual reality effect of object spatial presence is lost. At higher latencies user control of the environment becomes significantly impaired [7]. When interactive objects themselves move in the virtual environ- ment, higher frame rates and lower latencies are required [8].
The computation of visualization extracts easily satu- rates this 10 frames per second time constraint, even when the resulting visualizations can be displayed at 10 frames per second. For this reason the virtual windtunnel sepa- rates the computation and rendering of the visualization extracts into two asynchronous processes. This introduces two frame rates into the virtual windtunnel: the graphics frame rate and the computation frame rate. The graph- ics frame rate supports the virtual reality effect of spatial presence and the resulting interactivity. The computation frame rate produces new geometry either in response to a change in data or the change in the location of a visualiza- tion.
Experience has shown that the computational frame rate and latency requirements are somewhat more relaxed than those for the graphics. Latency in the response of a visual- ization to user motion can be as much as 0.2 to 0.3 seconds and still be useful, though longer latencies significantly impair the usefulness of the direct manipulation capability. The computation frame rate can be as low as 5 frames per second and still by useful so long as the 10 frames per sec- ond graphics animation rate is maintained.
As mentioned above, low frame rates impair the ability to directly manipulate objects in the environment. This is particularly true if the objects to be manipulated are mov- ing. When the data varies with time the visualizations will in general be moving, updated at the computation frame rate. Because these moving visualizations would be diffi- cult to manipulate, one of the design decisions of the vir- tual windtunnel is that user interaction be via tools that are stationary except when they are moved by the user. These tools are primarily graphics objects and so update at the graphics frame rate, providing fast user manipulation feed- back. These tools, described in section 4.1:, are easier to manipulate and control than the visualizations.
2.3: User-Driven Requirements
There are several higher level requirements that a gen- eral purpose visualization system must meet in order to be useful to the scientific visualization community.
• Extensibility: The visualization environment should be extensible in order to accommodate new visual-
ization and interaction techniques. This extensibil- ity should, whenever possible, be consistent with existing visualization and interaction techniques. As we will discuss throughout this paper, this extensibility is complicated by the complex list management, process communication, and user interaction logic structures in the virtual windtun- nel. One of the primary motivations for the virtual windtunnel object structure is to hide these compli- cations in high levels of the object hierarchy. In this way programmers can add new objects by follow- ing a template without having to understand the entire virtual windtunnel structure.
• versatility: The user must be able to configure the environment at run-time, adding or deleting visual- ization and control objects at will. In addition, the user must be allowed to access any portion of the data set, at any timestep and control the flow of data timesteps.
• User acceptance: Flow researchers will use a sys- tem when the difficulties and training investment are outweighed by the advantages of the visualiza- tion system. To reduce the burden of use, the system should run with a variety of interface options, to match the user's needs, available hardware, and budget.
2.4: The Requirements of Direct Manipulation
Direct manipulation in the virtual windtunnel is through abstract static gestures (sometimes called poses) at a posi- tion and orientation in space determined by the tracking device. These gestures may be the result of button pushes or gesture recognition based on a glove device. There are three static gestures defined in the virtual windtunnel: grab, point, and null. The action of each gesture is depen- dent on the context in which the gesture is made [4].
Direct manipulation is based on mapping data at a posi- tion in space, usually the position of the user's hand or arrow pointer, to an action in the virtual environment. This position and orientation data must be mapped to visualiza- tions in order to specify their extracts. Visualizations that are specified using data at a point in space are called local visualizations. For visualization techniques such as vec- tors, streamlines, and cutting planes this is straightfor- ward. Isosurfaces, however, are usually specified by value, without a spatial manipulation metaphor. For the virtual windtunnel, the concept of local isosurface was developed [9]. This isosurface is specified by sampling the value of a scalar field at a point in space and constructing the isosur- face around that point. Using local isosurfaces the user can interactively explore the geometry of the scalar field.
While we anticipate implementing non-local visualiza- tions such as conventional isosurfaces in the future, which we shall call global visualizations, at this time all visual-
108
izations in the virtual windtunnel are local. We expect the addition of global visualizations to the virtual windtunnel to fit in well within the framework described in this paper. For the remainder of this paper, whenever we say "visual- ization", we mean "local visualization".
3: Related Work Scientific visualization systems fall into roughly two
classes: modular data-flow systems such as AVS [10] and dedicated visualization systems such as FAST [11]. The virtual windtunnel falls into the class of dedicated visual- ization systems.
Data flow systems allow the user to reconfigure visual- ization capabilities through the use of modules that act on the data. These modules typically transform the entire dataset, compute extract geometry, or render that geome- try. Virtual reality interfaces have been implemented for rendering modules on these systems by some individuals, but this additional virtual reality capability only allows non-interactive viewing of the visualization results. Because data flow systems transform the entire data set, they are not well suited to the near-real-time visualization of time-varying data because of the very large amounts of data involved (though this issue is being addressed in more recent versions of data flow). For this reason, the data flow approach was not used in the virtual windtunnel.
There have been many scientific visualization systems produced that are designed for work in a particular scien- tific discipline. Many software architectures have been implemented in these systems, ranging from single pro- cess batch-based to distributed multi-platform visualiza- tion environments. Those systems that were designed for easy extensibility, however, were not designed for perfor- mance, while those designed for performance were pro- grammed for a particular scientific problem rather than as a flexible system that can be used for a wide array of prob- lems. The prototype virtual windtunnel systems were in this latter class. None of the frameworks of these systems served as a useful starting point for the production virtual windtunnel framework. Some of these dedicated systems have been implemented with an interactive virtual reality interface, such as those developed at the University of North Carolina [12][13], and particularly with the CAVE environment [14].
A system which has many of the features described in this paper was developed at Brown University [15]. This system is based on an interpreted, object oriented, multi- processing system developed at Brown. While this system meets the extensibility requirements described in this paper, it does not have the required performance due to its interpreted nature.
Several virtual reality systems have been developed [13] [16] which separate the graphics and computation pro- cess, usually by distributing these functions among several platforms.
4: Class Structure The primary motivations for the class structure in the
virtual windtunnel are the ability to add new interface and visualization objects without either effecting or necessar- ily understanding the entire virtual windtunnel system, and to scale, that is to allow an unlimited number of new objects to be inserted into the system without having the software collapse from excessive complexity. Several indi- viduals, ranging from sophomore summer students to experienced professionals, who have no previous knowl- edge of the virtual windtunnel have added subclasses of both vtool and visualization after only a week's worth of effort, proving the extensibility of this class structure.
4.1: Environment Objects and the Environment List
The virtual windtunnel is conceptualized as an environ- ment that contains objects. All of these environment objects must know how to render themselves and may have computational tasks. This motivates a class hierarchy, shown in Fig. 3, with the class envobj for environment objects at the highest level. An envobj contains identifier information, draw, and compute member functions. The envobj class also contains the find member function, as well as the grab and point member functions that respond to user gestures as described in section 4.3:. Even though there are environment objects, such as visualizations, whose interactivity is not currently used, the find, grab and point functions are defined at the envobj level because other applications of this framework may allow all envi- ronment objects to be interactive.
The envobj class is the parent of two subclasses: tool and visualization. The tool class is the parent of such object classes as menus, sliders, markers, and the visual- ization control tools described in section 4.2:. Unlike con- ventional graphical user interfaces, interface tools such as menus and sliders appear inside the virtual environment. These tools are described more fully in [4] and will not be discussed in this paper.
Envobjs in the environment are managed through the envlist object, that contains lists, implemented as arrays, of all environment objects. It is the envlist object which iterates the environment objects, causing them to be com- puted, drawn, and, in the case of tools, to be found by the user. There are two primary lists in the envlist class: a list of all environment objects and a list of all tool objects. The list of environment objects is used to cause each object to compute its state in a compute traversal and draw itself in a draw traversal. The list of tool objects is used for the user search traversal to determine if the user is interacting with that tool, as described in section 4.3:. The reason for main- taining a separate tools list is that there are typically many more visualization objects than tool objects. Restricting the search to the tools objects improves the search time. Insertion into the envobj list is handled by the envobj con-
109
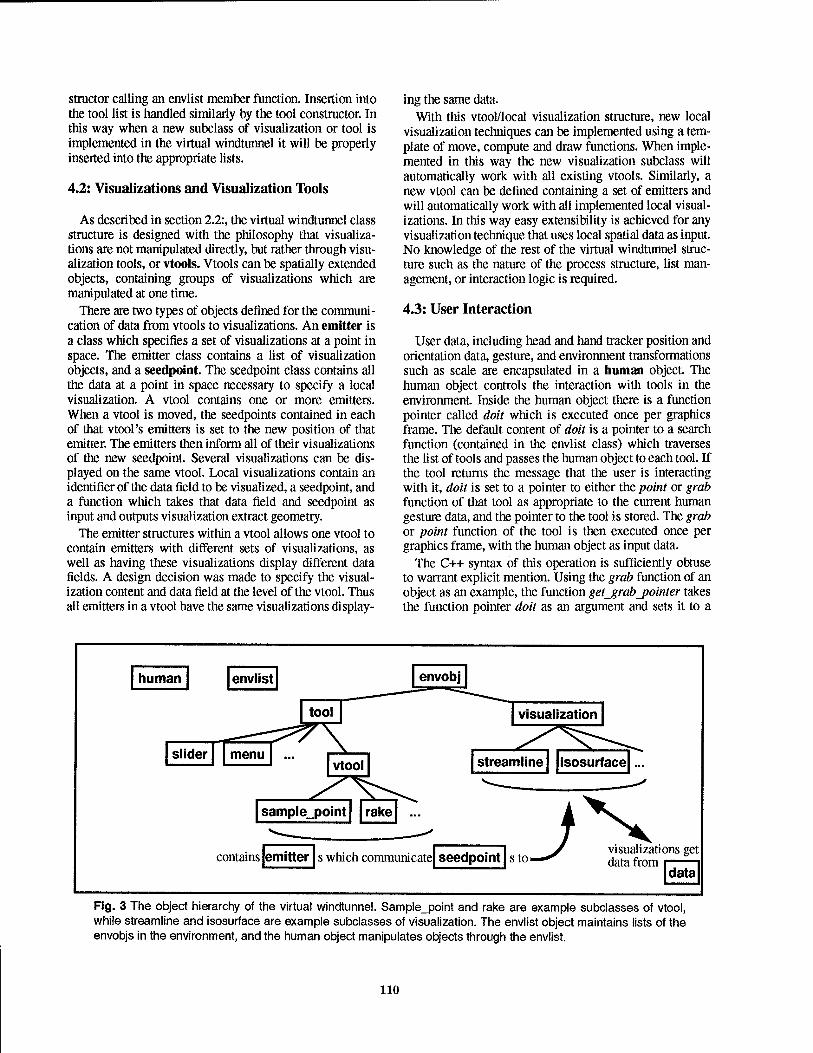
structor calling an envlist member function. Insertion into the tool list is handled similarly by the tool constructor. In this way when a new subclass of visualization or tool is implemented in the virtual windtunnel it will be properly inserted into the appropriate lists.
4.2: Visualizations and Visualization Tools
As described in section 2.2:, the virtual windtunnel class structure is designed with the philosophy that visualiza- tions are not manipulated directly, but rather through visu- alization tools, or vtools. Vtools can be spatially extended objects, containing groups of visualizations which are manipulated at one time.
There are two types of objects defined for the communi- cation of data from vtools to visualizations. An emitter is a class which specifies a set of visualizations at a point in space. The emitter class contains a list of visualization objects, and a seedpoint. The seedpoint class contains all the data at a point in space necessary to specify a local visualization. A vtool contains one or more emitters. When a vtool is moved, the seedpoints contained in each of that vtool's emitters is set to the new position of that emitter. The emitters then inform all of their visualizations of the new seedpoint. Several visualizations can be dis- played on the same vtool. Local visualizations contain an identifier of the data field to be visualized, a seedpoint, and a function which takes that data field and seedpoint as input and outputs visualization extract geometry.
The emitter structures within a vtool allows one vtool to contain emitters with different sets of visualizations, as well as having these visualizations display different data fields. A design decision was made to specify the visual- ization content and data field at the level of the vtool. Thus all emitters in a vtool have the same visualizations display-
ing the same data. With this vtool/local visualization structure, new local
visualization techniques can be implemented using a tem- plate of move, compute and draw functions. When imple- mented in this way the new visualization subclass will automatically work with all existing vtools. Similarly, a new vtool can be defined containing a set of emitters and will automatically work with all implemented local visual- izations. In this way easy extensibility is achieved for any visualization technique that uses local spatial data as input. No knowledge of the rest of the virtual windtunnel struc- ture such as the nature of the process structure, list man- agement, or interaction logic is required.
4.3: User Interaction
User data, including head and hand tracker position and orientation data, gesture, and environment transformations such as scale are encapsulated in a human object. The human object controls the interaction with tools in the environment. Inside the human object there is a function pointer called doit which is executed once per graphics frame. The default content of doit is a pointer to a search function (contained in the envlist class) which traverses the list of tools and passes the human object to each tool. If the tool returns the message that the user is interacting with it, doit is set to a pointer to either the point or grab function of that tool as appropriate to the current human gesture data, and the pointer to the tool is stored. The grab or point function of the tool is then executed once per graphics frame, with the human object as input data.
The C++ syntax of this operation is sufficiently obtuse to warrant explicit mention. Using the grab function of an object as an example, the function getgrabjointer takes the function pointer doit as an argument and sets it to a
human envlist
slider menu vtool
sample_point rake
contains emitter
envobj
visualization
streamline isosurface
s which communicate seedpoint s to ^y visualiza visualizations get
data from i 1 | data |
Fig. 3 The object hierarchy of the virtual windtunnel. Sample_point and rake are example subclasses of vtool, while streamline and isosurface are example subclasses of visualization. The envlist object maintains lists of the envobjs in the environment, and the human object manipulates objects through the envlist.
110
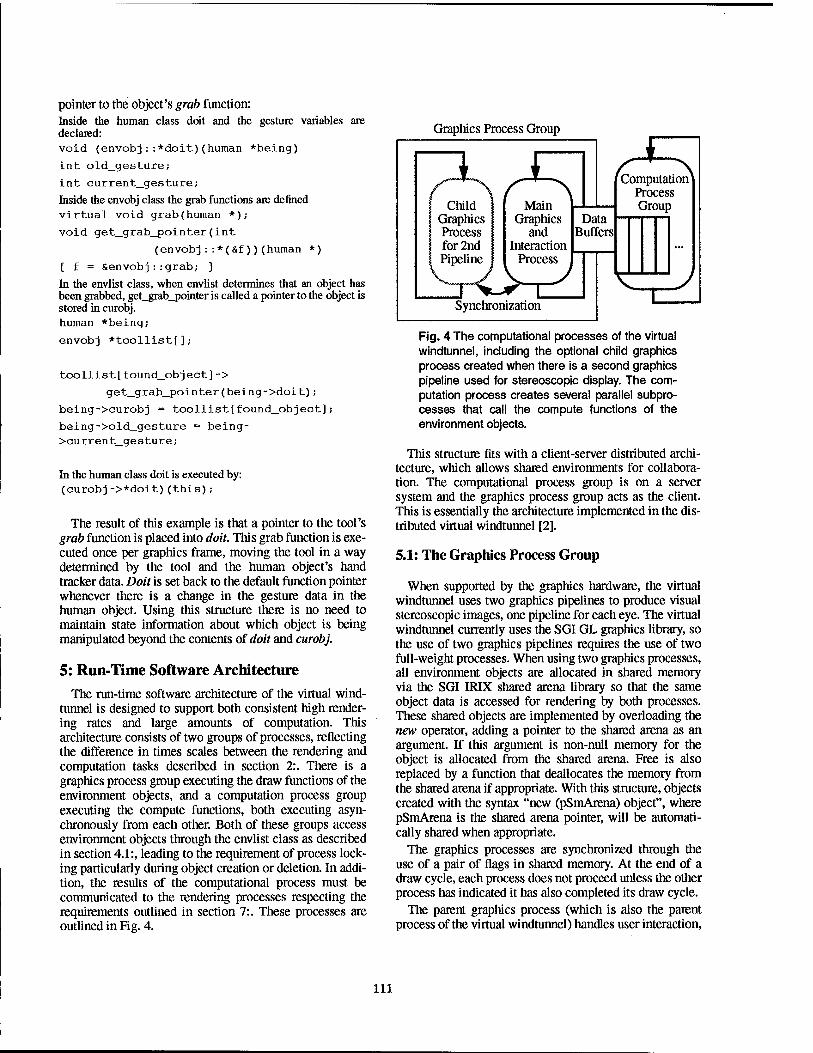
pointer to the object's grab function: Inside the human class doit and the gesture variables are declared: void (envobj::*doit)(human *being)
int old_gesture;
int current_gesture;
Inside the envobj class the grab functions are defined virtual void grab(human *);
void get_grab_pointer(int
(envobj::*(&f))(human *)
{ f = Senvobj::grab; }
In the envlist class, when envlist determines that an object has been grabbed, get_grab_pointer is called a pointer to the object is stored in curobj. human *being;
envobj *toollist[j;
toollist[found_object]->
get_grab_pointer(being->doit);
being->curobj = toollist[found_object];
being->old_gesture = being- >current_gesture;
In the human class doit is executed by: (curobj->*doit)(this);
The result of this example is that a pointer to the tool's grab function is placed into doit. This grab function is exe- cuted once per graphics frame, moving the tool in a way determined by the tool and the human object's hand tracker data. Doit is set back to the default function pointer whenever there is a change in the gesture data in the human object. Using this structure there is no need to maintain state information about which object is being manipulated beyond the contents of doit and curobj.
5: Run-Time Software Architecture The run-time software architecture of the virtual wind-
tunnel is designed to support both consistent high render- ing rates and large amounts of computation. This architecture consists of two groups of processes, reflecting the difference in times scales between the rendering and computation tasks described in section 2:. There is a graphics process group executing the draw functions of the environment objects, and a computation process group executing the compute functions, both executing asyn- chronously from each other. Both of these groups access environment objects through the envlist class as described in section 4.1:, leading to the requirement of process lock- ing particularly during object creation or deletion. In addi- tion, the results of the computational process must be communicated to the rendering processes respecting the requirements outlined in section 7:. These processes are outlined in Fig. 4.
Graphics Process Group
Fig. 4 The computational processes of the virtual windtunnel, including the optional child graphics process created when there is a second graphics pipeline used for stereoscopic display. The com- putation process creates several parallel subpro- cesses that call the compute functions of the environment objects.
This structure fits with a client-server distributed archi- tecture, which allows shared environments for collabora- tion. The computational process group is on a server system and the graphics process group acts as the client. This is essentially the architecture implemented in the dis- tributed virtual windtunnel [2].
5.1: The Graphics Process Group
When supported by the graphics hardware, the virtual windtunnel uses two graphics pipelines to produce visual stereoscopic images, one pipeline for each eye. The virtual windtunnel currently uses the SGI GL graphics library, so the use of two graphics pipelines requires the use of two full-weight processes. When using two graphics processes, all environment objects are allocated in shared memory via the SGI IRIX shared arena library so that the same object data is accessed for rendering by both processes. These shared objects are implemented by overloading the new operator, adding a pointer to the shared arena as an argument. If this argument is non-null memory for the object is allocated from the shared arena. Free is also replaced by a function that deallocates the memory from the shared arena if appropriate. With this structure, objects created with the syntax "new (pSmArena) object", where pSmArena is the shared arena pointer, will be automati- cally shared when appropriate.
The graphics processes are synchronized through the use of a pair of flags in shared memory. At the end of a draw cycle, each process does not proceed unless the other process has indicated it has also completed its draw cycle.
The parent graphics process (which is also the parent process of the virtual windtunnel) handles user interaction,
111
polling the interface devices and calling the human's inter- act function. Changes in the environment state, including the creation and deletion of objects are executed by this function.
5.2: The Computation Process Group
The computation process group is designed to take advantage of available multiple processors. It is comprised of one lightweight process which executes the environ- ment objects' compute function in parallel using the SGI mjork family of functions. The environment object list is traversed in parallel with each processor taking charge of an object in turn. Because the object list is implemented as an array, the parallel execution of this list is straightfor- ward.
Environment objects only recompute themselves when their seedpoint has changed or when the data to be dis- played has changed due to, for example, time variation. The objects themselves determine whether or not they require computation at the start of their compute functions, so all objects' compute functions are called by the compu- tation process.
5.3: Process Locking
When objects are created and deleted in the parent graphics process these objects must be locked so that they are not being accessed by the computation process. Due to the implementation of the environment object lists as arrays in the envlist object, locking of the entire array is required. When this lock is requested by the graphics pro- cess, a flag is set which causes the computation process to stop. There are two reasons for stopping the computation process. The first is that some user interactions involve continuous parameter changes which create and destroy objects. An example is the selection of the number of emitters on a vtool, which is continuously controlled by a slider and results in the creation and destruction of many objects in several successive frames. If the computation process is allowed to reacquire the array lock between graphics frames, the continuous control becomes very jerky as the graphics process waits to reacquire the array lock. The second reason for stopping computation is that the array lock request by the graphics process is an interro- gation which returns for processing. The very small time window between when the computation process releases and reacquires the array lock would often cause the graph- ics process' lock request to be missed if the computation process were not stopped. When the interaction is com- pleted the computational process it told to proceed.
6: The Command Object Class Commands in the virtual windtunnel can come from
many disparate sources including user gestures, menu commands, slider callbacks, start text scripts, keyboard
input, and network messages. In the future we envision commands from voice recognition. In order to simplify the addition of new commands, the command object was cre- ated. The command object contains a name field and two overloaded functions: SetValue which executes the com- mand and GetValue which returns information about the state determined by the command. These functions are overloaded by argument so that the same command can be executed with several different argument protocols. An example is the command which sets the scale of the envi- ronment. There are two versions of SetValue implemented for this command with two types of arguments: one which takes the scale value directly, and one which takes a pointer to a string of text from which the scale value is to be read. The GetValue function for the scale command returns the current scale value.
Commands are accessed by the actuator class, which contains a command pointer set at creation time using the command's name. Actuators are contained in menus, slid- ers, or other command-generating objects.
Several commands determine the state of a vtool or the visualizations on that vtool. These commands access the selected tool through a global vtool pointer current vtool. The value of current_vtool is set by the user through a variety of vtool selection methods.
7: Interface Hardware Independence As described in section 2:, the virtual windtunnel is
required to support several user interfaces, to allow the user to use the interface hardware that is available. A vari- ety of interface hardware is currently supported by the vir- tual windtunnel, including the FakeSpace family of displays, stereoscopic projection screens, and conventional workstations, and several types of gloves and the conven- tional mouse for input. The ability to rapidly add new devices is key to the user acceptance of the virtual wind- tunnel. The effectiveness of the approach described in this section was demonstrated by the addition of new display and interaction hardware by the graphics group at Stanford University with no prior knowledge of the virtual windtun- nel.
This versatility is implemented by abstracting devices at the level of their input or output data. For example, a head or hand tracker is defined in the virtual windtunnel as a piece of software that provides a position as a two- or three-dimensional vector and an orientation. The hand tracker may be three dimensional for position and orienta- tion trackers, or it may be two dimensional as in the case of the conventional mouse. The tool subclasses then implement their find and grab member functions (see sec- tion 4:) in both two- and three- dimensional versions.
The devices that are used in a particular user session of the virtual windtunnel are specified at start-up time by an ascii file.
112

8: Conclusion
In this paper we have presented a framework which addresses many of the systemic problems that were encountered in the development of the virtual windtunnel. The solutions to several difficult problems are presented:
• Through a carefully designed object hierarchy, this framework provides the ability for a programmer to add both new visualizations and new interface tech- niques to the virtual windtunnel without having to understand the entire system.
• The implementation of commands from disparate sources is streamlined through the creation of generic command and actuator classes.
• Interface hardware independence is achieved by abstracting these hardware devices and encapsulat- ing their operations in libraries with a standard interface to the virtual windtunnel
9: Acknowledgments Tom Lasinski of NASA Ames has given continual sup-
port and steering to the virtual windtunnel over the years. We would also like to thank the NAS management for their continued support of the virtual windtunnel.
Brook Connor of Brown University and Al Globus of NASA Ames provided many helpful insights in the design of the object structure for the virtual windtunnel. Andries van Dam of Brown University has been a continual source of excellent summer students.
The virtual windtunnel has had many participants. Creon Levit and the first author designed the initial con- cept and prototype. The distributed architecture was origi- nally developed by Michael Gerald-Yamasaki and the first author. Jeff Hultquist contributed computational code to the original prototype, and Rick Jacoby and Diglio Simoni contributed interface code. Devid Kenwright, David Lane, and Hanwei Shen contributed various visualization code in the current version.
10: References [1] Bryson, S. and Levit, C," The Virtual Wind Tunnel:
An Environment for the Exploration of Three Dimen- sional Unsteady Flows", Proceedings ofVisualization '91 San Diego, Ca, Oct. 1991, also Computer Graphics and Applications July 1992
[2] Bryson, S. and Gerald-Yamasaki, M., "The Distributed Virtual Wind Tunnel", Proceedings ofSupercomputing '92 Minneapolis, Minn., Nov. 1992
[3] Bryson, S., Johan, S., Globus, A., Meyer, T, and McE- wen, C. "Initial User Reaction to the Virtual Windtun- nel", AIAA 95-0114, 33rd AIAA Aerospace Sciences Meeting and Exhibit, Reno., Nevada. Jan. 1995
[4] The Virtual Windtunnel User's Manual, available at
http://www.nas.nasa.gov/NAS/VWT
[5] Bryson, S., "Virtual Environments in Scientific Visual- ization", Proceedings of 1994 Virtual Reality Software and Technology, Singapore, Aug. 1994 also to appear in Communications of the ACM.
[6] Smith, M„ Chawla, K., and Van Dalsem, W, "Numeri- cal Simulation of a Complete STOVL Aircraft in Ground Effect", paper AJAA-91-3293, American Insti- tute of Aeronautics 9th Aerodynamics Conference, Baltimore Md. 1991
[7] Sheridan, T. and Ferrell, W, Man-Machine Systems, MIT Press, Cambridge, Ma. 1974
[8] Bryson, S., "Impact of Lag and Frame Rate on Various Tracking Tasks", Proceedings ofSPIE Conference on Stereoscopic Displays and Applications, San Jose, Ca., Feb. 1993
[9] Meyer, T. and Globus, A., "Direct Manipulation of Iso- surfaces and Cutting Planes in Virtual Environments", RNR Technical Report RNR-93-019, NASA Ames Research Center
[10] Upson, C, Faulhaber, T, Kamins, D., Laidlaw, D., Schlegel, D., Vroom, J., Gurwitz, R., and van Dam, A., "The Application Visualization System: A Computa- tional Environment for Scientific Visualization", IEEE Computer Graphics and Applications, Volume 9, Num- ber 4, July 1989
[11] Bancroft, G. V, Merritt, F. J., Plessel, T. C, Kelaita, R. K., McCabe, R., K., and Globus, A., "FAST: A Multi- Processed Environment for Visualization of Computa- tional Fluid Dynamics", Proceedings ofVisualization '90, IEEE Computer Society Press, October 1990
[12] Brooks, F. P. Jr., Ouh-Young, J., Blatter, J. J., and Kil- patrick, P. J., "Project GROPE - Haptic Displays for Scientific Visualization", Computer Graphics: Pro- ceedings ofSIGGRAPH90, July 1990
[13] Taylor, R. M., Robinett, W, Chi, V. L., Brooks, F. P. Jr., and Wright, W, "The Nanomanipulator: A Virtual Reality Interface for a Scanning Tunneling Micro- scope", Computer Graphics: Proceedings ofSIG- GRAPH 93, Aug 1993
[14] Cruz-Neira, C, Leigh, J., Barnes, C, Cohen, S., Das, S., Englemann, R., Hudson, R., Papka, M., Siegel, L., Vasilakis, C, Sandin, D. J., and DeFanti, T. A., "Scien- tists in Wonderland: A Report on Visualization Appli- cations in the CAVE Virtual Reality Environment", Proceedings of the IEEE Symposium on Research Frontiers in Virtual Reality, October 1993
[15] Herndon, K.P. and Meyer, T„ "3D Widgets for Explor- atory Scientific Visualization", Proceedings ofUIST '94, ACM SIGGRAPH, November, 1994,
[16] Pausch R., Bumette, T, Capeheart, A.C., Conway, M., Cosgrove, D., DeLine, R., Durbin, J., Gossweiler, R., Koga, S., and White, J., "A Brief Architectural Over- view of Alice, a Rapid Prototyping System for Vitrual Reality", IEEE Computer Graphics and Applications, May 1995.
113
Visualizing the Structure of Virtual Objects Using Head Tracked Stereoscopic Displays
Woodrow Barfield, Claudia Hendrix, and Karl Bystrom
Department of Industrial and Systems Engineering Virginia Polytechnic Institute and State University
Abstract
This study investigated the effects of stereopsis and head tracking on presence and performance in a desktop virtual environment. Twelve subjects viewed the virtual image of a bent wire and were required to select the correct representation of the virtual wire from one of three drawings presented on paper. After each trial, subjects completed a questionnaire designed to access their level of presence in the desktop virtual environment. The results indicated that neither stereopsis nor head tracking improved the accuracy of selecting the correct paper representation of the vir- tual wire. However, responses to the presence survey indicated that head tracking significantly improved the reported level of presence whereas the addition of stereopsis did not. Implications of the results for the design of desktop virtual environments are discussed.
1. Introduction
As the technology to produce visual, auditory, and haptic displays matures, the issues of presence and performance in vir- tual environments have become topics of investigation. Presence is the extent to which participants in a virtual environment are convinced that they are somewhere other than where they physically are, while expe- riencing the effects of a computer simulation (Sheridan, 1992a, 1992b; Barfield and Weg- horst, 1993; Slater and Usoh, 1994; Barfield, Sheridan, Zeltzer, and Slater, 1995). The importance of studying presence and per- formance (and the potential effects of one upon the other) becomes clear when one considers that virtual environments will be used to assist in the training and acquisition of skills including surgical procedures or industrial tasks, e.g., understanding geomet- ric structure for CAD (Slater, Linakis, Usoh, and Kooper, 1996). In order to support training and performance in virtual envi- ronments, it is necessary to provide the par- ticipant the visual cues and display hardware necessary to maintain effective task per- formance in the virtual environment. Fur- thermore, if a sense of presence is beneficial to training or performance, it also becomes expedient to provide the cues necessary to maintain an appropriate sense of presence. The research discussed in this paper investi- gated presence and performance in the con-
text of what is termed "desktop virtual real- ity": a stereoscopic display (typically viewed with shutter glasses) provided with head tracked images (Ware, Arthur, and Booth, 1993). Stereopsis allows computer- generated objects to appear to have depth, and head tracking allows the view of the image to be transformed in response to changes in the location and orientation of the viewer's head (McKenna and Zeltzer, 1992). Desktop virtual environments are useful for tasks which require the visualiza- tion of data or processes from multiple viewpoints such as 3D mechanical parts or medical images. In the context of desktop virtual environments, two research questions were posed in this study. The first was to determine how performance in a desktop virtual environment varied as a function of the presence or absence of stereoscopic and head tracked images. The second was to de- termine if the sense of presence in the desktop virtual environment varied as a function of the presence or absence of stereoscopic and head tracked images.
In studies on the topic of presence as a function of stereopsis, Hendrix and Barfield (1996) found that the reported level of pres- ence when using a stereoscopic display was significantly higher than for a monoscopic display when the task was to search for an object hidden within a virtual environment. They also found that the use of head track- ing significantly increased the reported level
0-8186-7843-7/97 $10.00 © 1997 IEEE 114
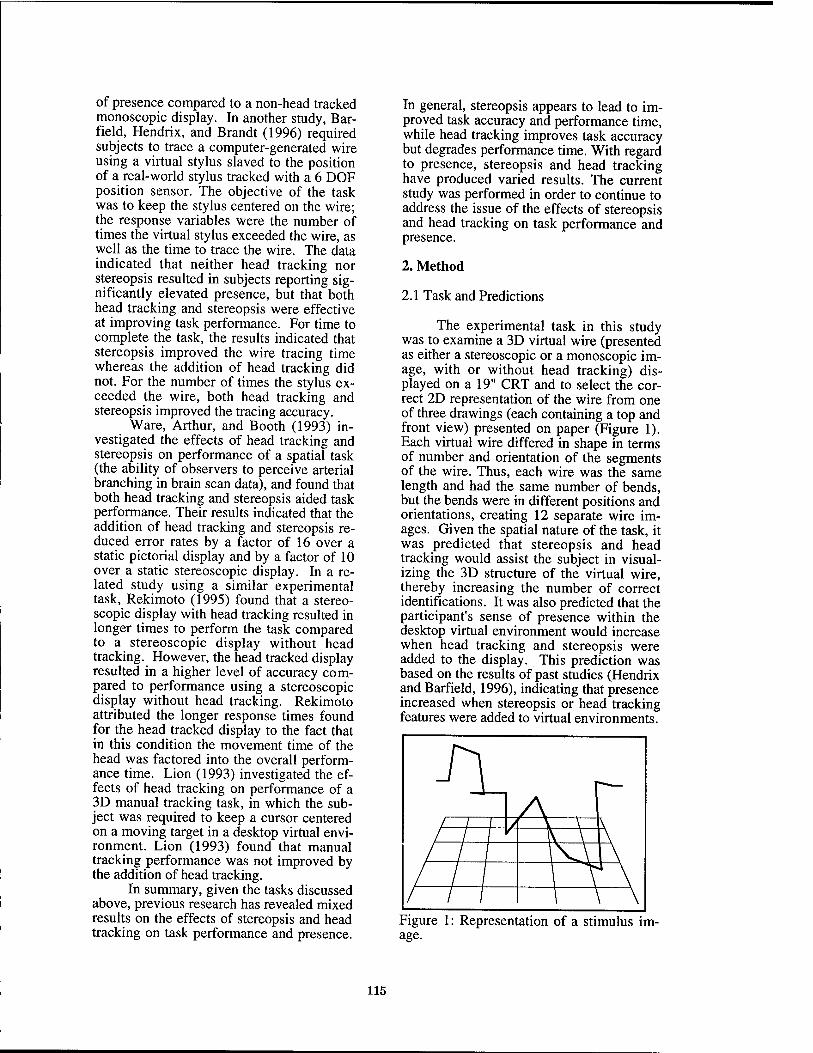
of presence compared to a non-head tracked monoscopic display. In another study, Bar- field, Hendrix, and Brandt (1996) required subjects to trace a computer-generated wire using a virtual stylus slaved to the position of a real-world stylus tracked with a 6 DOF position sensor. The objective of the task was to keep the stylus centered on the wire; the response variables were the number of times the virtual stylus exceeded the wire, as well as the time to trace the wire. The data indicated that neither head tracking nor stereopsis resulted in subjects reporting sig- nificantly elevated presence, but that both head tracking and stereopsis were effective at improving task performance. For time to complete the task, the results indicated that stereopsis improved the wire tracing time whereas the addition of head tracking did not. For the number of times the stylus ex- ceeded the wire, both head tracking and stereopsis improved the tracing accuracy.
Ware, Arthur, and Booth (1993) in- vestigated the effects of head tracking and stereopsis on performance of a spatial task (the ability of observers to perceive arterial branching in brain scan data), and found that both head tracking and stereopsis aided task performance. Their results indicated that the addition of head tracking and stereopsis re- duced error rates by a factor of 16 over a static pictorial display and by a factor of 10 over a static stereoscopic display. In a re- lated study using a similar experimental task, Rekimoto (1995) found that a stereo- scopic display with head tracking resulted in longer times to perform the task compared to a stereoscopic display without head tracking. However, the head tracked display resulted in a higher level of accuracy com- pared to performance using a stereoscopic display without head tracking. Rekimoto attributed the longer response times found for the head tracked display to the fact that in this condition the movement time of the head was factored into the overall perform- ance time. Lion (1993) investigated the ef- fects of head tracking on performance of a 3D manual tracking task, in which the sub- ject was required to keep a cursor centered on a moving target in a desktop virtual envi- ronment. Lion (1993) found that manual tracking performance was not improved by the addition of head tracking.
In summary, given the tasks discussed above, previous research has revealed mixed results on the effects of stereopsis and head tracking on task performance and presence.
In general, stereopsis appears to lead to im- proved task accuracy and performance time, while head tracking improves task accuracy but degrades performance time. With regard to presence, stereopsis and head tracking have produced varied results. The current study was performed in order to continue to address the issue of the effects of stereopsis and head tracking on task performance and presence.
2. Method
2.1 Task and Predictions
The experimental task in this study was to examine a 3D virtual wire (presented as either a stereoscopic or a monoscopic im- age, with or without head tracking) dis- played on a 19" CRT and to select the cor- rect 2D representation of the wire from one of three drawings (each containing a top and front view) presented on paper (Figure 1). Each virtual wire differed in shape in terms of number and orientation of the segments of the wire. Thus, each wire was the same length and had the same number of bends, but the bends were in different positions and orientations, creating 12 separate wire im- ages. Given the spatial nature of the task, it was predicted that stereopsis and head tracking would assist the subject in visual- izing the 3D structure of the virtual wire, thereby increasing the number of correct identifications. It was also predicted that the participant's sense of presence within the desktop virtual environment would increase when head tracking and stereopsis were added to the display. This prediction was based on the results of past studies (Hendrix and Barfield, 1996), indicating that presence increased when stereopsis or head tracking features were added to virtual environments.
Figure 1: age.
Representation of a stimulus im-
115
2.2 Experimental Design 2.3 Display Development
The study was run as a 2 x 2 within- subjects design. Twelve subjects, male and female, ranging in age from 22 to 46, all with normal or corrected-to-normal vision, participated in the study. After a training session, each subject completed the entire study twice, resulting in a total of eight tri- als.
The independent variables consisted of display type (monoscopic vs. stereo- scopic), and head tracking (presence vs. ab- sence). The dependent variables consisted of response accuracy (the accuracy in se- lecting the correct representation of the wire displayed on the monitor), and an evaluation of presence (evaluated using a questionnaire asking subjects to rate their level of presence in the desktop virtual environment; see Ta- ble 1).
Table 1. Example of survey questions.
Category: Presence
1. If an object's level of presence in the real world is "100" if the object is real, and "1" if it is an imaginary object, what level of presence would you give to the virtual objects?
2. How present did the virtual objects ap- pear to be in the real world?
3. How realistic did the virtual objects ap- pear to you?
4. To what degree did the virtual objects appear to have realistic depth/volume?
Category: Interactivity
5. How realistically did the virtual world move in response to your head motions?
Category: Performance
6. If you had to do the same task using real objects, how similar do you feel that the task would be?
7. If you had to do the same task using real objects, how similar do you feel your performance would be?
The software used to produce the wire stimulus consisted of in-house imaging software running on a Silicon Graphics In- digo Extreme2 workstation. The virtual im- ages were viewed on a 19-inch color moni- tor with a screen resolution of 1280 x 1024 pixels. Stereo conditions were presented at a 120 Hz refresh rate (60 Hz for each eye), presenting an effective resolution of 1280 x 512 pixels. Stereoscopic conditions were created using StereoGraphics CrystalEyes time multiplexed LCD shutter glasses. Head tracking was implemented using a Polhemus system. The stated rms accuracy of the Pol- hemus is 0.03 inches for X, Y or Z transla- tions, and 0.15 degrees rms for orientation angles. Both Polhemus receivers operated at a 60-Hz update rate. Head tracking was per- formed with three degrees of freedom, for translations in X, Y and Z. The right-handed coordinate system was oriented such that the positive X direction was to the right, posi- tive Y vertically, and positive Z out of the screen toward the viewer. The plane of zero parallax was the X-Y plane at Z = 0. The wire was projected out of the screen toward the viewer, so all disparity cues were nega- tive or crossed and ranged from 0.30 to 0.45 degrees (2.93 to 4.27 mm separation).
Monoscopic conditions were viewed at the same refresh rate but with the stereo disparity set to zero; subjects wore the shut- ter glasses for monoscopic conditions as well. With the subjects seated approxi- mately 55 cm from the screen, the wire subtended approximately 35 degrees of vis- ual angle horizontally as viewed on the screen. Each drawing, created using Auto- CAD, was presented on a separate sheet of paper and contained a top and front view of the virtual wire displayed on the monitor. There was one correct answer for each trial.
3. Results and Discussion
3.1 Response Accuracy
Table 2 shows the number of correct responses out of the total number of re- sponses for each condition in the wire rec- ognition task. The overall response accu- racy was relatively low (52 percent), indi- cating that the subjects found the task diffi- cult to perform (a response accuracy of 33 percent would reflect guessing). (Note that task complexity and stimuli complexity are
116
different concepts). A Chi-Square test re- vealed that the frequency of correct answers did not significantly differ as a function of the display variables (X2 ldf = 1.53, p > .05). However, an examination of the data reveals that the worst performance occurred when stereopsis and head tracking were both ab- sent (this condition represents the current desktop computing environment). Compared to this condition, the addition of either head tracking or stereopsis led to improved task performance. However, when either stereop- sis or head tracking was present, the pres- ence or absence of the other display variable had little effect on task performance.
3.2. Survey Results
Because the responses for the survey represented an ordinal response scale, the survey data were analyzed using a Wilcoxon nonparametric test (Table 3). For the first two questions dealing directly with per- ceived presence, the results of the Wilcoxon procedure indicated that in both cases the reported level of presence was higher using the head tracked display. However, the ad- dition of stereopsis did not increase the re- ported level of presence compared to the monoscopic condition. Similar findings were reported in terms of realism of the vir- tual wire; subjects indicated that the imple- mentation of head tracking produced a more realistic 3D wire image, but that the addition of stereopsis did not increase the perceived realism of the wire.
It was of interest to determine if the perceived depth/volume of the virtual wires varied as a function of the presence or ab- sence of stereopsis and head tracking. The Wilcoxon test indicated that the addition of head tracking resulted in the virtual objects appearing to have more depth and volume; there was also a statistical trend which indi- cated that the addition of stereopsis in- creased the perceived depth/volume of the wire images.
As expected, subjects indicated that the addition of head tracking led to more realistic movement of the computer- generated wire compared to the absence of this cue. In contrast, subject's reported that the addition of stereopsis did not lead to more realistic movement of the wire image (when they initiated head movements) com- pared to the monoscopic condition. Subjects also indicated that performance for the wire recognition task using the virtual image as
the test figure, would be similar to perform- ance if a real image was used as the test fig- ure.
3.3 Implications for Design
First, it should be noted that the re- sults of the current study could change if a completely immersive environment, such as that produced using a HMD, was used; this is a topic for further investigation. Second, an interesting extension of the research would be to compare the results of the cur- rent study to performance using a real-world figure(s). However, in this case there would need to be four real-world comparison groups (monoscopic display with and with- out head tracking; and stereoscopic display with and without head tracking). Finally, all experimental studies can be limited in scope, thus how the results of such studies gener- alize to real world tasks is an important and open question.
One interesting finding from the cur- rent study is that the type of task that users perform can influence their sense of pres- ence. For example, in a previous study using a desktop virtual environment and a task in which subjects traced a "virtual wire" with a stylus (Barfield, Hendrix, and Brandt, 1996), the sense of presence was not improved by the addition of either stereopsis or head tracking. In the current wire recognition study, however; the sense of presence was improved by the addition of head tracking but was not improved by the addition of stereopsis. This difference in the findings may be attributed to the fact that even though the display hardware and stimuli in the current wire recognition study were identical to those in the Barfield et al. (1996) wire tracing study, the tasks involved were quite different. Whereas both the wire rec- ognition task and the wire tracing task re- quired the perception and processing of spa- tial information, the wire tracing task addi- tionally required the control of a virtual stylus in response to the spatial perception. This control of the virtual stylus was such that it was difficult for the subjects to initiate head movements, thus preventing them from making use of the full capabilities provided by the head tracking. So even if the head tracking would have aided the subjects' sense of presence, as it did in the current study, they saw no real benefits from it.
The performance finding in the cur- rent study is similar to Ware, Arthur, and
117
Booth (1993), who also found that both head tracking and stereopsis were beneficial to task performance. However, Ware, Arthur, and Booth (1993) found an additive effect for stereopsis and head tracking; whereas in the current study, performance was im- proved by the addition of either cue, how- ever, the combination of both did not aid performance. The tasks in both the current study and in Ware, Arthur, and Booth (1993) involved making judgments based on spatial perception of a 3D virtual object; however, the object in Ware, Arthur, and Booth (1993) was more complex than the one in the current study (two meshed 3D trees vs. a 3D bent wire). It may be that the geometric structure of the wire in the current study was simple enough that the increased perceptual capability provided by the com- bination of head tracking and stereopsis yielded relatively little benefit; whereas the structure of the object in Ware, Arthur, and Booth (1993) was complex enough that the subjects gained significantly from the con- dition with head tracking and stereopsis combined.
The topic of what visual cues are needed to successfully perceive virtual ob- jects of varying levels of complexity is one that continues to warrant further investiga- tion. We should also note that in the results section of the current paper, it was argued that the wire comparison task was difficult (performance accuracy was only 52%); however, even though the comparison task was relatively difficult, the stimulus images were themselves relatively simple. Again, task complexity and stimuli complexity are different concepts and can be independent of each other.
Another finding is that performance can improve even in the absence of an in- creased sense of presence. While the addi- tion of stereopsis to the display did not con- tribute to an increase in presence, it did im- prove the average response accuracy from 40% to 65%. In contrast, while head track- ing contributed to a significant increase in presence, it had little effect on response ac- curacy (which was approximately 50% for the non-head tracked and 54% for the head tracked conditions). Therefore, given the current task and desktop virtual environ- ment, changes in the sense of presence do not appear to be indicative of changes in performance.
The results of this study suggest some implications for the design of desktop virtual
environment systems. First, because pres- ence and performance may be independent of each other, designers of virtual environ- ment systems may find it valuable to deter- mine whether a high level of presence is de- sirable for the particular application. For example, in training applications, it may be necessary to engender a high level of pres- ence to facilitate transfer of training, while presence may be less necessary for other tasks. If presence is desirable, it becomes necessary to present cues that help engender a high sense of presence, such as head tracked images.
Second, it is valuable in terms of task performance to implement both head track- ing and stereopsis in desktop virtual envi- ronments. However, if development re- sources are limited, it may be possible to achieve an acceptable level of performance with the use of only one of the two cues. Future studies are continuing to investigate the topics of presence and performance in nonimmersive and immersive virtual envi- ronments.
Acknowledgments
This work was supported in part by the Air Force Office of Scientific Research (contract # 92-NL-225 and INST PROP NO:78216), the National Science Founda- tion (DMC-8857851, CDA-8806866), and by the Center for Research in Learning, Per- ception, & Cognition and the National Sci- ence Foundation's Program in Visual Per- ception & Motor Control (GER 9454163). Jeffrey Brandt is acknowledged for his con- tribution to the writing of this paper.
References
Barfield, W., and Weghorst, S. (1993). The sense of presence within virtual environ- ments: A conceptual framework. In G. Salvendy and M. Smith (Eds.), Human- Computer Interaction: Software and Hard- ware Interfaces. Amsterdam: Elsevier Pub- lisher, 699-704.
Barfield, W., Sheridan, T., Zeltzer, D., and Slater, M. (1995). Presence and performance within virtual environments. In W. Barfield and T. Furness III (Eds.), Virtual Environ- ments and Advanced Interface Design. Ox- ford: Oxford University Press.
118

Barfield, W., Hendrix, C, and Brandt, J. (1996). The effects of stereopsis and head tracking on performance and presence within desk top virtual reality displays. Submitted to Displays.
Hendrix, C, and Barfield, W. (1996). Pres- ence within virtual environments as a func- tion of visual display parameters. Presence: Teleoperators and Virtual Environments, 5(2), 274-289.
Lion, D. (1993). Effect of Display Format, Frame Rate, and Head Tracking For Screen Based Virtual Interfaces. Unpublished Master's Thesis, Human Factors Program, College of Engineering, University of Washington. McKenna, M. D., and Zeltzer, D. (1992). Three dimensional visual display systems for virtual environments. Presence: Teleop- erators and Virtual Environments, 7(4), 421-458.
Rekimoto, J. (1995). A vision-based head tracker for fish tank virtual reality—VR without head gear. Virtual Reality Annual International Symposium '95, 94-100.
Sheridan, T. B. (1992a). Musings on telepre- sence and virtual presence. Presence: Teleoperators and Virtual Environments, 1(1), 120-125.
Sheridan, T. B. (1992b). Defining our terms. Presence: Teleoperators and Virtual Envi- ronments, 1(2), 212-21 A.
Slater, M., and Usoh, M. (1994). Represen- tations systems, perceptual position, and presence in immersive virtual environments. Presence: Teleoperators and Virtual Envi- ronments, 2(3), 221-233.
Slater, M., Linakis, V., Usoh, M., and Kooper, R. (1996). Immersion, presence, and performance in virtual environments: An experiment with tri-dimensional chess. Department of Computer Science, Univer- sity College London.
Ware, C, Arthur, K., and Booth, K., S. (1993). Fish tank virtual reality. INTERCHI, 37-42.
119

Table 2. Response accuracy for the wire reconstruction task as a function of stereopsis and head tracking.
Head tracking Total
Stereopsis Present
Present Absent total correct: 31/48=65%
correct responses: correct responses: 14/24 17/24
Absent correct responses: correct responses
12/24 7/24 total correct: 19/48=40%
Total total correct: total correct: overall: 26/48=54% 24/48=50% 50/96=52%
Table 3. Means and standard deviations (in parenthesis) for the responses to the presence questions as a function of head tracking and stereopsis. Z values represent the results of a Wilcoxon test.
Mear Response and Standard Deviation for Questionnaire
Head tracking Stereopsis
Question Significance Level
Presence Absence Significance Level
Presence Absence
1. Presence (1-100) z = -2.74, p < 0.006
54.62 (25.93)
40.28 (24.65)
z = 0.89, p > 0.05
50.02 (24.39)
44.98 (27.81)
2. Presence of Virtual Wire in Real World (1-5)
z = 2.71, p < 0.007
3.04 (1.03)
3.60 (0.87)
z = -0.88, p > 0.05
3.23 (0.90)
3.42 (1.07)
3. Realism (1-5) z = -2.13, p < 0.03
3.09 (0.95)
3.50 (0.88)
z = 0.69, p > 0.05
3.21 (0.80)
3.38 (1.05)
4. Depth/Volume (1-5) z = 3.07, p < 0.002
3.02 (1.04)
3.69 (0.83)
z = -1.83, p < 0.07
3.19 (0.82)
3.52 (1.13)
5. Response to Head Movement (1-5)
z = 6.88, p < .0001
2.67 (0.97)
4.42 (0.85)
z = -0.98, p > 0.05
3.44 (1.17)
3.65 (1.36)
6. Task Similar to Real World Task (1-5)
z = 2.18, p < 0.03
3.23 (0.72
3.63 (0.91)
z = -2.01, p < 0.04
3.25 (0.76)
3.60 (0.89)
7. Performance Similar to Task Performance in
z = 2.34, p < 0.02
3.04 (0.77)
3.44 (0.82)
z = -1.73, p < 0.08
3.08 (0.71)
3.40 (0.89)
Real World (1-5) 1 * for 1-5 response scales, 1 = extremely so and 5 = not at all.
120
Distributed Virtual Reality for Everyone — a Framework for Networked VR on the Internet
Wolfgang Broil GMD —German National Research Center for Information Technology
Institute for Applied Information Technology (FIT) D-53754 Sankt Augustin, Germany
email: [email protected]
Abstract
The success of VRML —the Virtual Reality Modeling Language— which has established as the standard for 3D data on the Internet, shows that virtual reality is no longer limited to research labs but will become a part of every- body's life. Although VRML has just made its first steps from a static scene description language to an interactive VR specification, the realization of distributed virtual real- ity for everyone will only be the next step.
In this paper we will introduce a network architecture to support multiuser virtual environments on the Internet. The key issues of our approach as realized in our current proto- type are scalability and interactivity. For that reason we consider a world-wide distribution, a large numbers of participants and the composition of very large virtual worlds.
Keywords
Distributed virtual environments, networked VR, mul- tiuser environments, IP multicasting, virtual reality model- ing language (VRML).
1. Introduction
Although a number of approaches towards networked VR have already been made [4] [12] [19] [21], they were not able to address the majority of Internet users. One rea- son for that was, that there was no common (platform inde- pendent) scene description language for virtual worlds.
This has changed recently, since VRML, the Virtual Re- ality Modeling Language [1], has become the standard de- scription language for the distribution of 3D models or vir- tual worlds on the Internet. In its initial version, based on SGI's Open Inventor file format, it was closely related to
the World Wide Web. VRML 1.0 is a static world descrip- tion language and the only interaction which could be spec- ified, was following up hyperlinks. Since VRML files were accessed via WWW pages and transmitted by the HTTP protocol, VRML was rather used to enhance WWW pages by 3D models, than to realize real virtual worlds.
This will change with increasing support for the new VRML 2.0 standard [13]. This standard includes support for a large variety of user interactions and object behaviors, making the browsing of such files a real virtual world expe- rience.
However, although the VRML standard allows to define interactive worlds now and world descriptions are distrib- uted among the Internet, there is no support for shared dis- tributed worlds. VRML 2.0 browsers might allow the skilled programmer to realize network connections by add- ing advanced scripts. All network communication has to be handled by the scripting language (e.g. Java). However such individual solutions do not seem to be an appropriate basis for mass participation at distributed virtual events. Additionally in VRML 2.0 support for scripting languages is completely browser dependent. Large-scale virtual worlds, populated by hundreds of users and distributed world-wide require a more elaborated architecture.
Some of the general problems which need to be ad- dressed are:
• keeping shared worlds consistent • network protocol must scale to (large) number of
users • consideration of reliability issues versus interactivity
demands • support of cooperation rather than coexistence • heterogeneous network connections • composition of large-scaled subdivided worlds In our approach we address the above issues by a reli-
able network communication architecture to transmit mes- sages to a large number of participants even by unreliable
121 0-8186-7843-7/97 $10.00 © 1997 IEEE
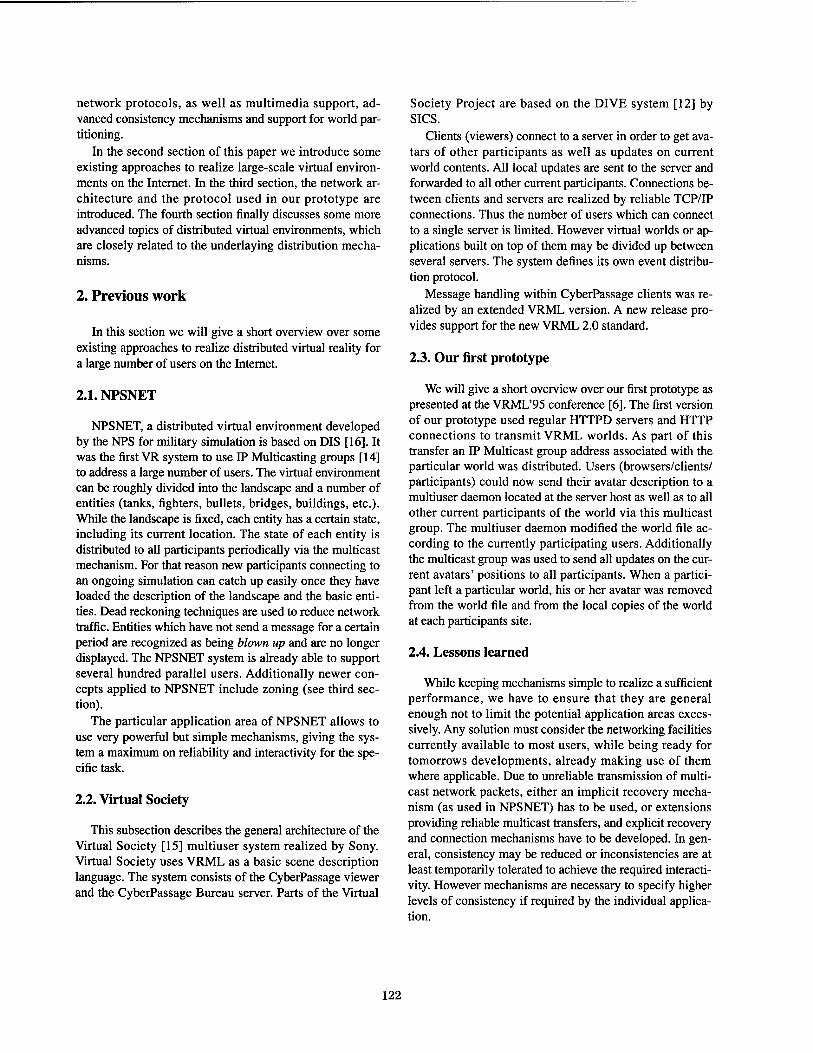
network protocols, as well as multimedia support, ad- vanced consistency mechanisms and support for world par- titioning.
In the second section of this paper we introduce some existing approaches to realize large-scale virtual environ- ments on the Internet. In the third section, the network ar- chitecture and the protocol used in our prototype are introduced. The fourth section finally discusses some more advanced topics of distributed virtual environments, which are closely related to the underlaying distribution mecha- nisms.
2. Previous work
In this section we will give a short overview over some existing approaches to realize distributed virtual reality for a large number of users on the Internet.
2.1. NPSNET
NPSNET, a distributed virtual environment developed by the NPS for military simulation is based on DIS [16]. It was the first VR system to use IP Multicasting groups [14] to address a large number of users. The virtual environment can be roughly divided into the landscape and a number of entities (tanks, fighters, bullets, bridges, buildings, etc.). While the landscape is fixed, each entity has a certain state, including its current location. The state of each entity is distributed to all participants periodically via the multicast mechanism. For that reason new participants connecting to an ongoing simulation can catch up easily once they have loaded the description of the landscape and the basic enti- ties. Dead reckoning techniques are used to reduce network traffic. Entities which have not send a message for a certain period are recognized as being blown up and are no longer displayed. The NPSNET system is already able to support several hundred parallel users. Additionally newer con- cepts applied to NPSNET include zoning (see third sec- tion).
The particular application area of NPSNET allows to use very powerful but simple mechanisms, giving the sys- tem a maximum on reliability and interactivity for the spe- cific task.
2.2. Virtual Society
This subsection describes the general architecture of the Virtual Society [15] multiuser system realized by Sony. Virtual Society uses VRML as a basic scene description language. The system consists of the CyberPassage viewer and the CyberPassage Bureau server. Parts of the Virtual
Society Project are based on the DIVE system [12] by SICS.
Clients (viewers) connect to a server in order to get ava- tars of other participants as well as updates on current world contents. All local updates are sent to the server and forwarded to all other current participants. Connections be- tween clients and servers are realized by reliable TCP/IP connections. Thus the number of users which can connect to a single server is limited. However virtual worlds or ap- plications built on top of them may be divided up between several servers. The system defines its own event distribu- tion protocol.
Message handling within CyberPassage clients was re- alized by an extended VRML version. A new release pro- vides support for the new VRML 2.0 standard.
2.3. Our first prototype
We will give a short overview over our first prototype as presented at the VRML'95 conference [6]. The first version of our prototype used regular HTTPD servers and HTTP connections to transmit VRML worlds. As part of this transfer an IP Multicast group address associated with the particular world was distributed. Users (browsers/clients/ participants) could now send their avatar description to a multiuser daemon located at the server host as well as to all other current participants of the world via this multicast group. The multiuser daemon modified the world file ac- cording to the currently participating users. Additionally the multicast group was used to send all updates on the cur- rent avatars' positions to all participants. When a partici- pant left a particular world, his or her avatar was removed from the world file and from the local copies of the world at each participants site.
2.4. Lessons learned
While keeping mechanisms simple to realize a sufficient performance, we have to ensure that they are general enough not to limit the potential application areas exces- sively. Any solution must consider the networking facilities currently available to most users, while being ready for tomorrows developments, already making use of them where applicable. Due to unreliable transmission of multi- cast network packets, either an implicit recovery mecha- nism (as used in NPSNET) has to be used, or extensions providing reliable multicast transfers, and explicit recovery and connection mechanisms have to be developed. In gen- eral, consistency may be reduced or inconsistencies are at least temporarily tolerated to achieve the required interacti- vity. However mechanisms are necessary to specify higher levels of consistency if required by the individual applica- tion.
122
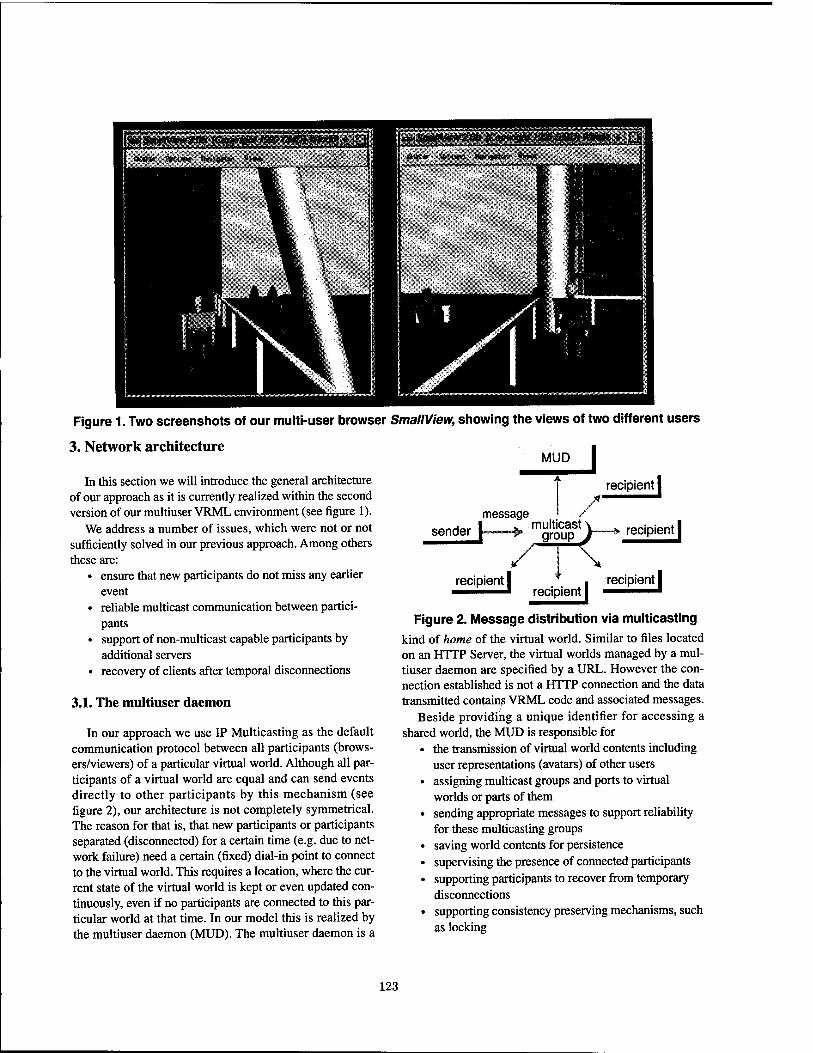
Figure 1. Two Screenshots of our multi-user browser SmallView, showing the views of two different users
3. Network architecture
In this section we will introduce the general architecture of our approach as it is currently realized within the second version of our multiuser VRML environment (see figure 1).
We address a number of issues, which were not or not sufficiently solved in our previous approach. Among others these are:
• ensure that new participants do not miss any earlier event
• reliable multicast communication between partici- pants
• support of non-multicast capable participants by additional servers
• recovery of clients after temporal disconnections
3.1. The multiuser daemon
In our approach we use IP Multicasting as the default communication protocol between all participants (brows- ers/viewers) of a particular virtual world. Although all par- ticipants of a virtual world are equal and can send events directly to other participants by this mechanism (see figure 2), our architecture is not completely symmetrical. The reason for that is, that new participants or participants separated (disconnected) for a certain time (e.g. due to net- work failure) need a certain (fixed) dial-in point to connect to the virtual world. This requires a location, where the cur- rent state of the virtual world is kept or even updated con- tinuously, even if no participants are connected to this par- ticular world at that time. In our model this is realized by the multiuser daemon (MUD). The multiuser daemon is a
MUD
reci ipient |
message sender |—► mSoC
ua
pstJ » recipient!
recipient { /"
recipient | recipient]
Figure 2. Message distribution via multicasting kind of home of the virtual world. Similar to files located on an HTTP Server, the virtual worlds managed by a mul- tiuser daemon are specified by a URL. However the con- nection established is not a HTTP connection and the data transmitted contains VRML code and associated messages.
Beside providing a unique identifier for accessing a shared world, the MUD is responsible for
• the transmission of virtual world contents including user representations (avatars) of other users
• assigning multicast groups and ports to virtual worlds or parts of them
• sending appropriate messages to support reliability for these multicasting groups
• saving world contents for persistence • supervising the presence of connected participants • supporting participants to recover from temporary
disconnections • supporting consistency preserving mechanisms, such
as locking
123
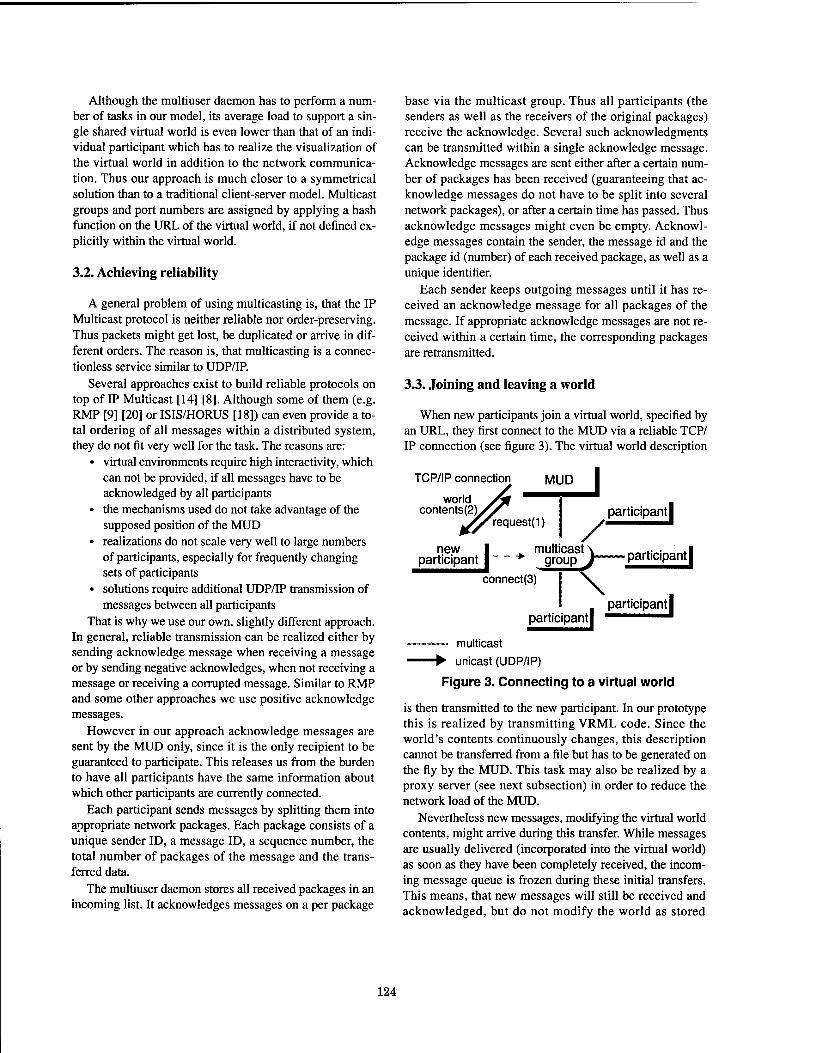
Although the multiuser daemon has to perform a num- ber of tasks in our model, its average load to support a sin- gle shared virtual world is even lower than that of an indi- vidual participant which has to realize the visualization of the virtual world in addition to the network communica- tion. Thus our approach is much closer to a symmetrical solution than to a traditional client-server model. Multicast groups and port numbers are assigned by applying a hash function on the URL of the virtual world, if not denned ex- plicitly within the virtual world.
3.2. Achieving reliability
A general problem of using multicasting is, that the IP Multicast protocol is neither reliable nor order-preserving. Thus packets might get lost, be duplicated or arrive in dif- ferent orders. The reason is, that multicasting is a connec- tionless service similar to UDP/IP.
Several approaches exist to build reliable protocols on top of IP Multicast [14] [8]. Although some of them (e.g. RMP [9] [20] or ISIS/HORUS [18]) can even provide a to- tal ordering of all messages within a distributed system, they do not fit very well for the task. The reasons are:
• virtual environments require high interactivity, which can not be provided, if all messages have to be acknowledged by all participants
• the mechanisms used do not take advantage of the supposed position of the MUD
• realizations do not scale very well to large numbers of participants, especially for frequently changing sets of participants
• solutions require additional UDP/IP transmission of messages between all participants
That is why we use our own, slightly different approach. In general, reliable transmission can be realized either by sending acknowledge message when receiving a message or by sending negative acknowledges, when not receiving a message or receiving a corrupted message. Similar to RMP and some other approaches we use positive acknowledge messages.
However in our approach acknowledge messages are sent by the MUD only, since it is the only recipient to be guaranteed to participate. This releases us from the burden to have all participants have the same information about which other participants are currently connected.
Each participant sends messages by splitting them into appropriate network packages. Each package consists of a unique sender ID, a message ID, a sequence number, the total number of packages of the message and the trans- ferred data.
The multiuser daemon stores all received packages in an incoming list. It acknowledges messages on a per package
base via the multicast group. Thus all participants (the senders as well as the receivers of the original packages) receive the acknowledge. Several such acknowledgments can be transmitted within a single acknowledge message. Acknowledge messages are sent either after a certain num- ber of packages has been received (guaranteeing that ac- knowledge messages do not have to be split into several network packages), or after a certain time has passed. Thus acknowledge messages might even be empty. Acknowl- edge messages contain the sender, the message id and the package id (number) of each received package, as well as a unique identifier.
Each sender keeps outgoing messages until it has re- ceived an acknowledge message for all packages of the message. If appropriate acknowledge messages are not re- ceived within a certain time, the corresponding packages are retransmitted.
3.3. Joining and leaving a world
When new participants join a virtual world, specified by an URL, they first connect to the MUD via a reliable TCP/ IP connection (see figure 3). The virtual world description
TCP/IP connection
world contents(2)
rid y^T
MUD
request(1)
J
new participant
multicast ^ /
participant!
group \— participant |
connect(3) j\
I participant| participant!
—— multicast ► unicast (UDP/IP)
Figure 3. Connecting to a virtual world
is then transmitted to the new participant. In our prototype this is realized by transmitting VRML code. Since the world's contents continuously changes, this description cannot be transferred from a file but has to be generated on the fly by the MUD. This task may also be realized by a proxy server (see next subsection) in order to reduce the network load of the MUD.
Nevertheless new messages, modifying the virtual world contents, might arrive during this transfer. While messages are usually delivered (incorporated into the virtual world) as soon as they have been completely received, the incom- ing message queue is frozen during these initial transfers. This means, that new messages will still be received and acknowledged, but do not modify the world as stored
124
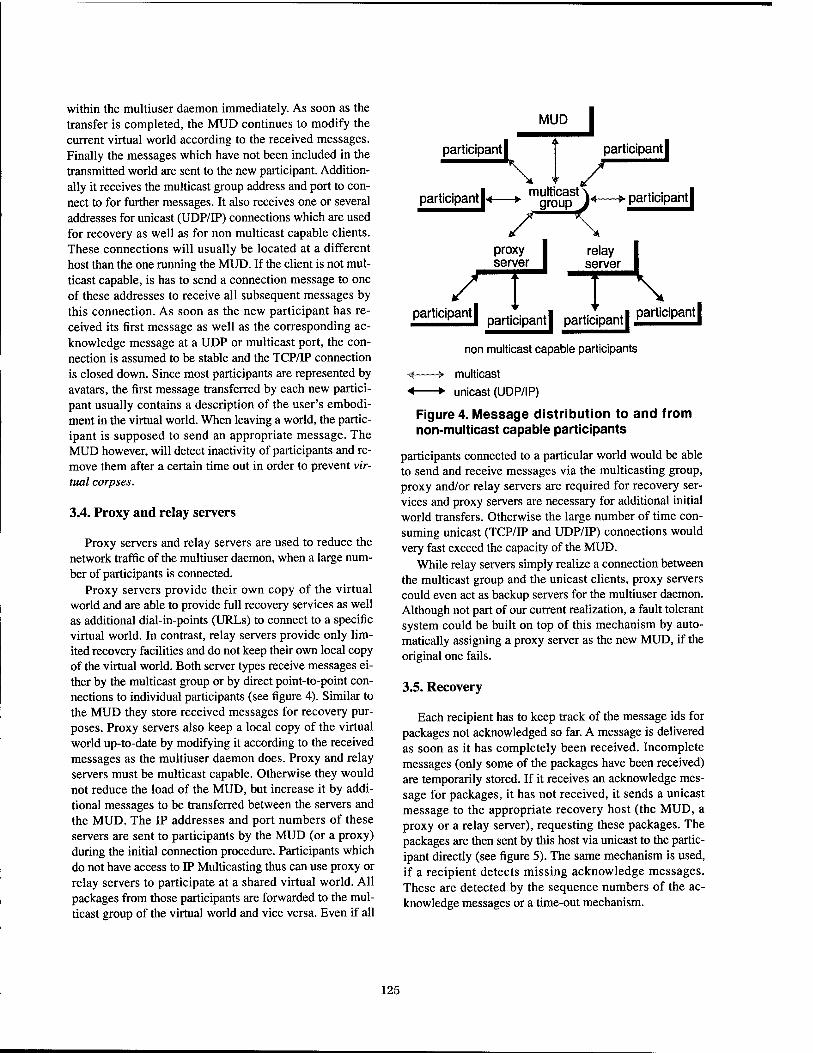
within the multiuser daemon immediately. As soon as the transfer is completed, the MUD continues to modify the current virtual world according to the received messages. Finally the messages which have not been included in the transmitted world are sent to the new participant. Addition- ally it receives the multicast group address and port to con- nect to for further messages. It also receives one or several addresses for unicast (UDP/IP) connections which are used for recovery as well as for non multicast capable clients. These connections will usually be located at a different host than the one running the MUD. If the client is not mul- ticast capable, is has to send a connection message to one of these addresses to receive all subsequent messages by this connection. As soon as the new participant has re- ceived its first message as well as the corresponding ac- knowledge message at a UDP or multicast port, the con- nection is assumed to be stable and the TCP/IP connection is closed down. Since most participants are represented by avatars, the first message transferred by each new partici- pant usually contains a description of the user's embodi- ment in the virtual world. When leaving a world, the partic- ipant is supposed to send an appropriate message. The MUD however, will detect inactivity of participants and re- move them after a certain time out in order to prevent vir- tual corpses.
3.4. Proxy and relay servers
Proxy servers and relay servers are used to reduce the network traffic of the multiuser daemon, when a large num- ber of participants is connected.
Proxy servers provide their own copy of the virtual world and are able to provide full recovery services as well as additional dial-in-points (URLs) to connect to a specific virtual world. In contrast, relay servers provide only lim- ited recovery facilities and do not keep their own local copy of the virtual world. Both server types receive messages ei- ther by the multicast group or by direct point-to-point con- nections to individual participants (see figure 4). Similar to the MUD they store received messages for recovery pur- poses. Proxy servers also keep a local copy of the virtual world up-to-date by modifying it according to the received messages as the multiuser daemon does. Proxy and relay servers must be multicast capable. Otherwise they would not reduce the load of the MUD, but increase it by addi- tional messages to be transferred between the servers and the MUD. The IP addresses and port numbers of these servers are sent to participants by the MUD (or a proxy) during the initial connection procedure. Participants which do not have access to IP Multicasting thus can use proxy or relay servers to participate at a shared virtual world. All packages from those participants are forwarded to the mul- ticast group of the virtual world and vice versa. Even if all
MUD I participant!
\ /
participant!
participant\< > maroupSt)^ ► participant!
proxy server I relay
server mwmmm k participant! ^^„^ pal£fllM\ participant!
non multicast capable participants
-> multicast
-► unicast (UDP/IP)
Figure 4. Message distribution to and from non-multicast capable participants
participants connected to a particular world would be able to send and receive messages via the multicasting group, proxy and/or relay servers are required for recovery ser- vices and proxy servers are necessary for additional initial world transfers. Otherwise the large number of time con- suming unicast (TCP/IP and UDP/IP) connections would very fast exceed the capacity of the MUD.
While relay servers simply realize a connection between the multicast group and the unicast clients, proxy servers could even act as backup servers for the multiuser daemon. Although not part of our current realization, a fault tolerant system could be built on top of this mechanism by auto- matically assigning a proxy server as the new MUD, if the original one fails.
3.5. Recovery
Each recipient has to keep track of the message ids for packages not acknowledged so far. A message is delivered as soon as it has completely been received. Incomplete messages (only some of the packages have been received) are temporarily stored. If it receives an acknowledge mes- sage for packages, it has not received, it sends a unicast message to the appropriate recovery host (the MUD, a proxy or a relay server), requesting these packages. The packages are then sent by this host via unicast to the partic- ipant directly (see figure 5). The same mechanism is used, if a recipient detects missing acknowledge messages. These are detected by the sequence numbers of the ac- knowledge messages or a time-out mechanism.
125
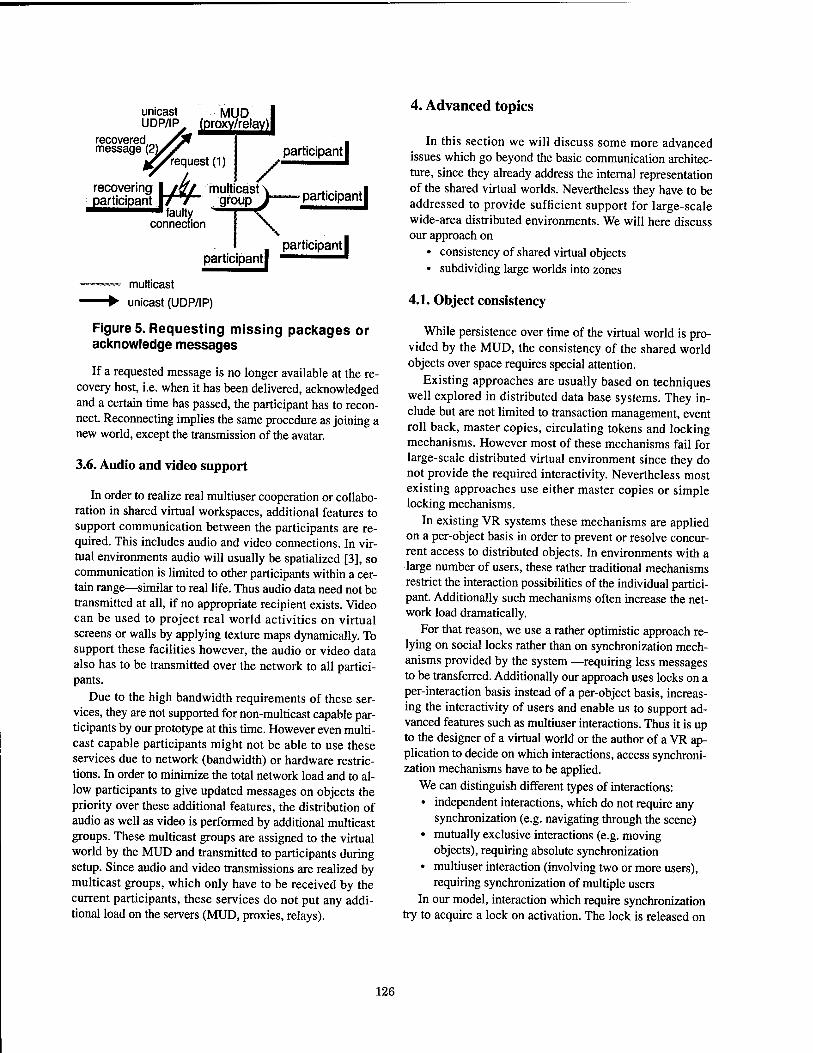
unicast MUD I UDP/IFV ^grac^rela^J
recovered SM ^|^^ , message (21A^ participant!
^/'request (1) I j r I
recovering participant
I /h ■fanltw
mqröupS')—— participant! 1 faulty ' I C
connection X
I participant|
multicast unicast (UDP/IP)
Figure 5. Requesting missing packages or acknowledge messages
If a requested message is no longer available at the re- covery host, i.e. when it has been delivered, acknowledged and a certain time has passed, the participant has to recon- nect. Reconnecting implies the same procedure as joining a new world, except the transmission of the avatar.
3.6. Audio and video support
In order to realize real multiuser cooperation or collabo- ration in shared virtual workspaces, additional features to support communication between the participants are re- quired. This includes audio and video connections. In vir- tual environments audio will usually be spatialized [3], so communication is limited to other participants within a cer- tain range—similar to real life. Thus audio data need not be transmitted at all, if no appropriate recipient exists. Video can be used to project real world activities on virtual screens or walls by applying texture maps dynamically. To support these facilities however, the audio or video data also has to be transmitted over the network to all partici- pants.
Due to the high bandwidth requirements of these ser- vices, they are not supported for non-multicast capable par- ticipants by our prototype at this time. However even multi- cast capable participants might not be able to use these services due to network (bandwidth) or hardware restric- tions. In order to minimize the total network load and to al- low participants to give updated messages on objects the priority over these additional features, the distribution of audio as well as video is performed by additional multicast groups. These multicast groups are assigned to the virtual world by the MUD and transmitted to participants during setup. Since audio and video transmissions are realized by multicast groups, which only have to be received by the current participants, these services do not put any addi- tional load on the servers (MUD, proxies, relays).
4. Advanced topics
In this section we will discuss some more advanced issues which go beyond the basic communication architec- ture, since they already address the internal representation of the shared virtual worlds. Nevertheless they have to be addressed to provide sufficient support for large-scale wide-area distributed environments. We will here discuss our approach on
• consistency of shared virtual objects • subdividing large worlds into zones
4.1. Object consistency
While persistence over time of the virtual world is pro- vided by the MUD, the consistency of the shared world objects over space requires special attention.
Existing approaches are usually based on techniques well explored in distributed data base systems. They in- clude but are not limited to transaction management, event roll back, master copies, circulating tokens and locking mechanisms. However most of these mechanisms fail for large-scale distributed virtual environment since they do not provide the required interactivity. Nevertheless most existing approaches use either master copies or simple locking mechanisms.
In existing VR systems these mechanisms are applied on a per-object basis in order to prevent or resolve concur- rent access to distributed objects. In environments with a large number of users, these rather traditional mechanisms restrict the interaction possibilities of the individual partici- pant. Additionally such mechanisms often increase the net- work load dramatically.
For that reason, we use a rather optimistic approach re- lying on social locks rather than on synchronization mech- anisms provided by the system —requiring less messages to be transferred. Additionally our approach uses locks on a per-interaction basis instead of a per-object basis, increas- ing the interactivity of users and enable us to support ad- vanced features such as multiuser interactions. Thus it is up to the designer of a virtual world or the author of a VR ap- plication to decide on which interactions, access synchroni- zation mechanisms have to be applied.
We can distinguish different types of interactions: • independent interactions, which do not require any
synchronization (e.g. navigating through the scene) • mutually exclusive interactions (e.g. moving
objects), requiring absolute synchronization • multiuser interaction (involving two or more users),
requiring synchronization of multiple users In our model, interaction which require synchronization
try to acquire a lock on activation. The lock is released on
126
deactivation of the specific interaction or after a certain time-out.
When acquiring a lock, a lock message is distributed via the multicast connection (or via unicast, if a multicast con- nection is not applicable). Participants usually cannot ac- quire a lock on an interaction already locked. The MUD as well as each client (including proxy and relay servers) keep track of all locks. If the multiuser daemon receives a lock message for an interaction already locked, the lock is re- jected by sending an appropriate message. This message also will correct the locks on any clients, which might have received the lock requests in a different order as the MUD. However if a lock can be realized, there are actually two possible approaches. Either the lock is acknowledged, or all locks which are not rejected within a certain period are estimated to be acquired. However the second alternative might fail due to network delays. For that reason it can only be used, if event roll-back for the specific interaction can be realized. Locks which are not released by a participant within a certain time are released by the MUD. This is real- ized by sending an appropriate message and resetting the lock.
To guarantee a maximum of interactivity, locks are stored and updated completely independent of the current scene. New participants of a virtual world receive the state of all currently applied locks as part of the initial setup af- ter the world contents have been transferred.
This locking mechanism allows us to support soft locks and even multiuser locks. Soft locks [10] enable other users to override locks under certain conditions, usually imply- ing a certain loss of consistency. In our approach soft locks are realized by disabling locked interactions and enabling another interaction (of higher priority). Multiuser locks can be acquired several times by different participants before the lock is rejected. This can easily be supported by adding a counter to each lockable interaction. Multiuser locks are especially useful for concurrent multiuser interactions.
Multiuser interactions require synchronized clients and fast network connections. The reason for that is, that the time stamps of two or more interactions have to be com- pared (on one of the sites or a central site) and the resulting interaction has to be redistributed. Details on the detection algorithm and possible resolution mechanisms for concur- rent distributed interactions are shown in our previous work [5].
4.2. Zoning
A major mechanism to reduce Jhe required network traf- fic among participants of shared virtual worlds is the divi- sion of such worlds into zones or cells.
The participants receive only update messages on vir- tual world contents of a subset of cells. Thus there network traffic can be reduced significantly. The problems which have to be solved include the partitioning of the world and the determination of the visible cells for each participant. Additionally a suitable support for partitioned shared vir- tual worlds has to be provided by the network architecture.
A number of approaches to realize cells [2] [11] already exist. However, the area-of-interest-manager (AOIM) [17] as used in an extension of NPSNET [21] is the only ap- proach so far making use of individual multicast addresses for each cell. In this approach the virtual world is subdi- vided into hexagonal cells and the AOIM manages the visi- ble cells around the current viewpoint of the user (partici- pant). The AOIM determines the visible cells by the type of user representation rather than the shape and structure of the environment. This model fits very well in the military context where objects (tanks, planes, soldiers) are navigat- ing through a rather flat (unstructured) landscape. How- ever, the model does not apply very well to general purpose virtual environments, where objects which are complex and self-contained, and for that reason should be represented by individual cells, might have arbitrary shapes or might even be nested. For that reason our approach supports individual cell boundaries and even hierarchical cells.
In our approach only the hierarchy of the cells is trans- mitted, when a new participant connects to a partitioned world. Depending on the current camera viewpoint of the user, connections are established to all cells currently visi- ble. The MUD assigns appropriate multicast groups and ports to the individual cells managed on the local host. Pro- viding a unique group and port pair for each cell, allows to filter update messages for the current participants of each cell. In large scale virtual worlds different cells might even be located on different hosts (see figure 6), each of them running a MUD. For that reason the contents of cells are specified by URLs. Thus connecting to a certain cell is sim- ilar to connecting to a new world.
In addition to its contents, each cell defines its hull. The hull is a space which is larger than the convex hull of the cell's contents. When a user (i.e. his avatar or his camera viewpoint) enters the hull of a cell, the participant's site connects to the world presented by the cell. It then receives the contents of this cell as well as update messages on these contents. When a user leaves the hull of a cell the partici- pant is disconnected from the cell.
Our cell representation additionally allows the specifica- tion of an external representation of its contents. This might be an approximation of the real contents or a meta- phor, e.g. to realize 3D icons. The external representation of a cell —if specified— is shown while the viewpoint is outside the cell. This mechanism might even be combined with level of detail mechanisms to achieve more realistic
127
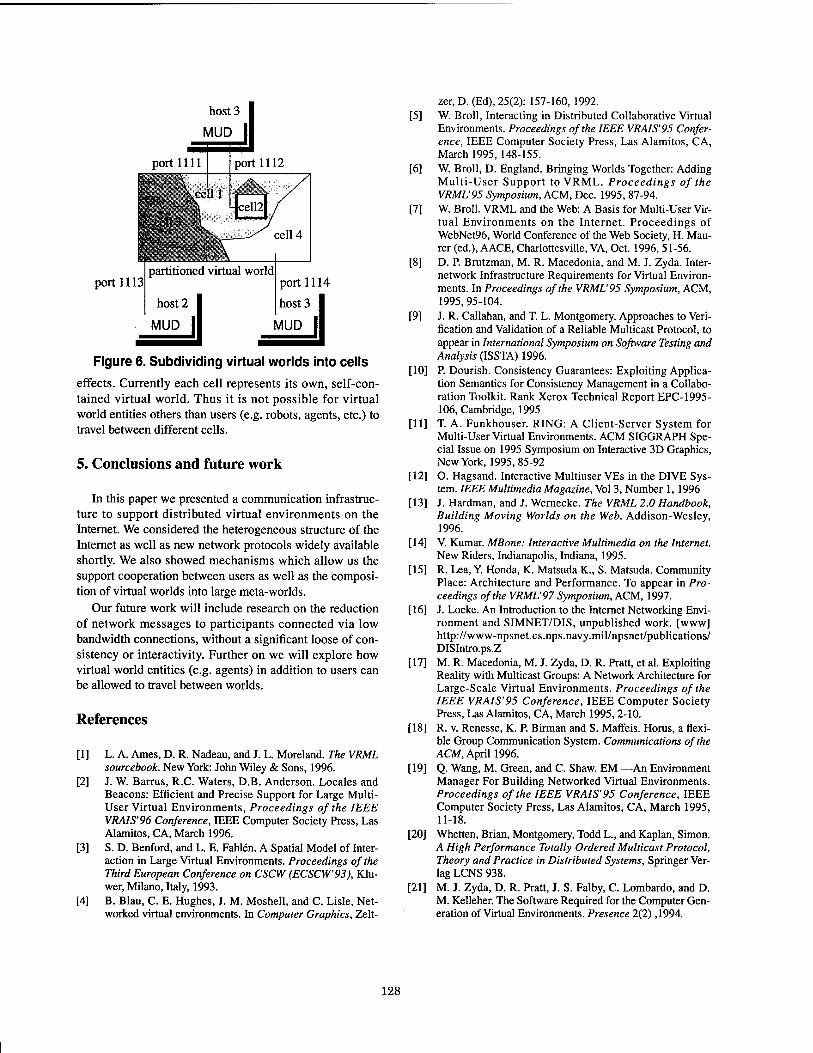
host 3
MUD
port 1113 partitioned virtual world
host 2
MUD
port 1114
host 3
MUD ||
Figure 6. Subdividing virtual worlds into cells
effects. Currently each cell represents its own, self-con- tained virtual world. Thus it is not possible for virtual world entities others than users (e.g. robots, agents, etc.) to travel between different cells.
5. Conclusions and future work
In this paper we presented a communication infrastruc- ture to support distributed virtual environments on the Internet. We considered the heterogeneous structure of the Internet as well as new network protocols widely available shortly. We also showed mechanisms which allow us the support cooperation between users as well as the composi- tion of virtual worlds into large meta-worlds.
Our future work will include research on the reduction of network messages to participants connected via low bandwidth connections, without a significant loose of con- sistency or interactivity. Further on we will explore how virtual world entities (e.g. agents) in addition to users can be allowed to travel between worlds.
References
[1] L. A. Ames, D. R. Nadeau, and J. L. Moreland. The VRML sourcebook. New York: John Wiley & Sons, 1996.
[2] J. W. Barrus, R.C. Waters, D.B. Anderson. Locales and Beacons: Efficient and Precise Support for Large Multi- User Virtual Environments, Proceedings of the IEEE VRAIS'96 Conference, IEEE Computer Society Press, Las Alamitos, CA, March 1996.
[3] S. D. Benford, and L. E. Fahlen. A Spatial Model of Inter- action in Large Virtual Environments. Proceedings of the Third European Conference on CSCW (ECSCW'93), Klu- wer, Milano, Italy, 1993.
[4] B. Blau, C. E. Hughes, J. M. Moshell, and C. Lisle, Net- worked virtual environments. In Computer Graphics, Zelt-
zer, D. (Ed), 25(2): 157-160, 1992. [5] W Broil, Interacting in Distributed Collaborative Virtual
Environments. Proceedings of the IEEE VRAIS'95 Confer- ence, IEEE Computer Society Press, Las Alamitos, CA, March 1995, 148-155.
[6] W Broil, D. England. Bringing Worlds Together: Adding Multi-User Support to VRML. Proceedings of the VRMV95 Symposium, ACM, Dec. 1995, 87-94.
[7] W Broil. VRML and the Web: A Basis for Multi-User Vir- tual Environments on the Internet. Proceedings of WebNet96, World Conference of the Web Society, H. Mau- rer (ed.), AACE, Charlottesville, VA, Oct. 1996, 51-56.
[8] D. P. Brutzman, M. R. Macedonia, and M. J. Zyda. Inter- network Infrastructure Requirements for Virtual Environ- ments. In Proceedings of the VRML'95 Symposium, ACM, 1995, 95-104.
[9] J. R. Callahan, and T. L. Montgomery. Approaches to Veri- fication and Validation of a Reliable Multicast Protocol, to appear in International Symposium on Software Testing and Analysis (ISSTA) 1996.
[10] P. Dourish. Consistency Guarantees: Exploiting Applica- tion Semantics for Consistency Management in a Collabo- ration Toolkit. Rank Xerox Technical Report EPC-1995- 106, Cambridge, 1995
[11] T. A. Funkhouser. RING: A Client-Server System for Multi-User Virtual Environments. ACM SIGGRAPH Spe- cial Issue on 1995 Symposium on Interactive 3D Graphics, New York, 1995, 85-92
[12] O. Hagsand. Interactive Multiuser VEs in the DIVE Sys- tem. IEEE Multimedia Magazine, Vol 3, Number 1,1996
[13] J. Hardman, and J. Wernecke. The VRML 2.0 Handbook, Building Moving Worlds on the Web. Addison-Wesley, 1996.
[14] V. Kumar. MBone: Interactive Multimedia on the Internet. New Riders, Indianapolis, Indiana, 1995.
[15] R. Lea, Y. Honda, K. Matsuda K., S. Matsuda. Community Place: Architecture and Performance. To appear in Pro- ceedings of the VRML'97 Symposium, ACM, 1997.
[16] J. Locke. An Introduction to the Internet Networking Envi- ronment and SIMNET/DIS, unpublished work, [www] http://www-npsnet.cs.nps.navy.mil/npsnet/publications/ DISIntro.ps.Z
[17] M. R. Macedonia, M. J. Zyda, D. R. Pratt, et al. Exploiting Reality with Multicast Groups: A Network Architecture for Large-Scale Virtual Environments. Proceedings of the IEEE VRAIS'95 Conference, IEEE Computer Society Press, Las Alamitos, CA, March 1995, 2-10.
[18] R. v. Renesse, K. P. Birman and S. Maffeis. Horus, a flexi- ble Group Communication System. Communications of the ACM, April 1996.
[19] Q. Wang, M. Green, and C. Shaw. EM —An Environment Manager For Building Networked Virtual Environments. Proceedings of the IEEE VRAIS'95 Conference, IEEE Computer Society Press, Las Alamitos, CA, March 1995, 11-18.
[20] Whetten, Brian, Montgomery, Todd L., and Kaplan, Simon. A High Performance Totally Ordered Multicast Protocol, Theory and Practice in Distributed Systems, Springer Ver- lag LCNS 938.
[21] M. J. Zyda, D. R. Pratt, J. S. Falby, C. Lombardo, and D. M. Kelleher. The Software Required for the Computer Gen- eration of Virtual Environments. Presence 2(2) ,1994.
128
KfllON
HKKOWJHDMra
Transition Between Virtual Environment and Workstation Environment with Projective Head Mounted Display
* **RYUGO KIJIMAand *TAKEO OJIKA *Dept. of Information Engineering for Electronics, * *International Academy of Media Art & Science Faculty of Engineering, Gifu University 1-1 Yanagido, Gifu City, Gifu, 501-11, Japan 3-95, Ryouke, Ohgaki City, Gifu, 503, Japan Phone: +81-58-293-2759 FAX: +81-58-293-2759 Phone:+81+584-75-6600 FAX:+81-584-75-6637
E-mail: [email protected] or [email protected]
Abstract The construction of virtual worlds often requires the user to
use various tools in different environments to create several
types of elements which have geometrical properties and behav-
ioral characteristics. Due to the inconveniences associated with
this task, a compound environment for the task of constructing
virtual worlds was proposed. This environment contains both
the popular workstation as well as a surrounding virtual world.
To realize this compound environment, a Projective Head
Mounted Display (PHMD) prototype was developed, which
effectively minimized the difficulty of going and coming be-
tween workstation and virtual environments. The PHMD was
also able to address the problem that is common to traditional
HMDs which involve false images. In this paper, the concept
and development behind the PHMD and the compound envi-
ronment are discussed, and the prototype PHMD and the pro-
totype application examples are constructed.
1. Introduction
The window system concept has enabled to gather many types
of application on one display. For example, we can execute CAD
application software to design the shape of the object in one win-
dow. At the same time, we use the text editor in another win-
dow as a character terminal to write a program for the autono-
mous movement of the object. Then we activate a CG anima-
tion browser to test the appearance of the animation. Thus the
window system enables not only the GUI based application, but
also inherits the environment of a traditional character termi-
nal. This flexible capability to involve the inheritance of the older
character based environment seems one essential reason for the
success of a window system.
On the contrary, the current virtual reality system using the
head mounted display seems to have no relation to the popular
GUI environment. If the surrounding virtual environment could
have the adequate relation to the GUI environment, the virtual
environment would inherit many useful tools, software re-
sources and the polished interaction style, similarly to that the
window system successfully has taken in the character termi-
nal and its inheritances.
For example, take the case of constructing a virtual world. A
virtual world contains many types of elements, such as the
object's geometry and behavior, the interaction between the hand
and the object, the interface to control the virtual environment,
the movement of view point (walk through), and the other func-
tions. The programmer must design, realize, test, and revise these
elements. According to the type of element and the phase of the
task, the programmer needs to use several tools in different en-
vironments. The CAD on the window system is used for the
geometry design, the text editor on a terminal for the program-
ming of object's behavior, text editor for the checking, debug-
ging, tuning the interaction, etc.,.
It is difficult to reconstruct all such useful tools with the in-
terface technique that had been polished for a long time (e.g.
text editor). Therefore it is not reasonable to throw away all the
inheritance.
On the other hand, the development of the virtual reality ap-
plication requires a virtual environment itself. For example, take
the case of a controlling device such as the joy stick. In the case
of a real joystick, the designer must consider the shape and the
size in relation to the user's hand in the real world. The shape,
0-8186-7843-7/97 $10.00 © 1997 IEEE 130
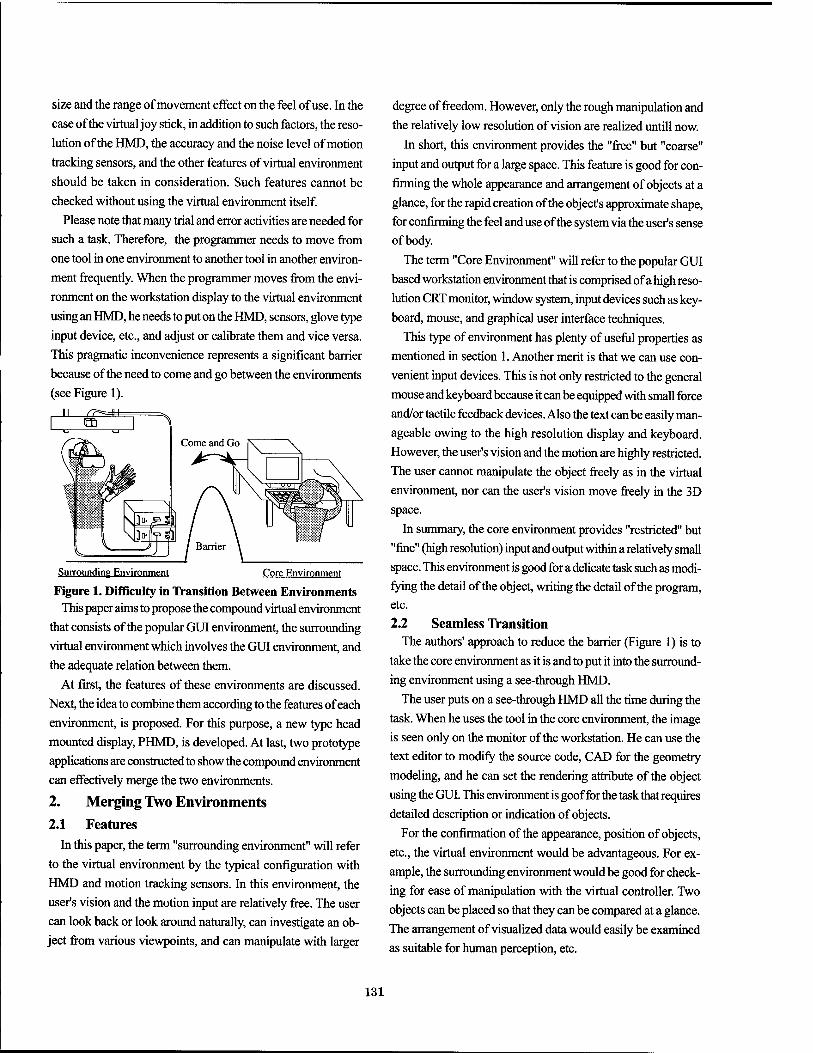
size and the range of movement effect on the feel of use. In the
case of the virtual joy stick, in addition to such factors, the reso-
lution of the HMD, the accuracy and the noise level of motion
tracking sensors, and the other features of virtual environment
should be taken in consideration. Such features cannot be
checked without using the virtual environment itself.
Please note that many trial and error activities are needed for
such a task. Therefore, the programmer needs to move from
one tool in one environment to another tool in another environ-
ment frequently. When the programmer moves from the envi-
ronment on the workstation display to the virtual environment
using an HMD, he needs to put on the HMD, sensors, glove type
input device, etc., and adjust or calibrate them and vice versa.
This pragmatic inconvenience represents a significant barrier
because of the need to come and go between the environments
(see Figure 1).
Surrounding Environment Core Environment
Figure 1. Difficulty in Transition Between Environments This paper aims to propose the compound virtual environment
that consists of the popular GUI environment, the surrounding
virtual environment which involves the GUI environment, and
the adequate relation between them.
At first, the features of these environments are discussed.
Next, the idea to combine them according to the features of each
environment, is proposed. For this purpose, a new type head
mounted display, PHMD, is developed. At last, two prototype
applications are constructed to show the compound environment
can effectively merge the two environments.
2. Merging Two Environments 2.1 Features
In this paper, the term "surrounding environment" will refer
to the virtual environment by the typical configuration with
HMD and motion tracking sensors. In this environment, the
user's vision and the motion input are relatively free. The user
can look back or look around naturally, can investigate an ob-
ject from various viewpoints, and can manipulate with larger
degree of freedom. However, only the rough manipulation and
the relatively low resolution of vision are realized untill now.
In short, this environment provides the "free" but "coarse"
input and output for a large space. This feature is good for con-
firming the whole appearance and arrangement of objects at a
glance, for the rapid creation of the object's approximate shape,
for confirming the feel and use of the system via the user's sense of body.
The term "Core Environment" will refer to the popular GUI
based workstation environment that is comprised of a high reso-
lution CRT monitor, window system, input devices such as key-
board, mouse, and graphical user interface techniques.
This type of environment has plenty of useful properties as
mentioned in section 1. Another merit is that we can use con-
venient input devices. This is not only restricted to the general
mouse and keyboard because it can be equipped with small force
and/or tactile feedback devices. Also the text can be easily man-
ageable owing to the high resolution display and keyboard.
However, the user's vision and the motion are highly restricted.
The user cannot manipulate the object freely as in the virtual
environment, nor can the user's vision move freely in the 3D
space.
In summary, the core environment provides "restricted" but
"fine" (high resolution) input and output within a relatively small
space. This environment is good for a delicate task such as modi-
fying the detail of the object, writing the detail of the program, etc.
2.2 Seamless Transition The authors' approach to reduce the barrier (Figure 1) is to
take the core environment as it is and to put it into the surround-
ing environment using a see-through HMD.
The user puts on a see-through HMD all the time during the
task. When he uses the tool in the core environment, the image
is seen only on the monitor of the workstation. He can use the
text editor to modify the source code, CAD for the geometry
modeling, and he can set the rendering attribute of the object
using the GUI. This environment is goof for the task that requires
detailed description or indication of objects.
For the confirmation of the appearance, position of objects,
etc., the virtual environment would be advantageous. For ex-
ample, the surrounding environment would be good for check-
ing for ease of manipulation with the virtual controller. Two
objects can be placed so that they can be compared at a glance.
The arrangement of visualized data would easily be examined
as suitable for human perception, etc.
131
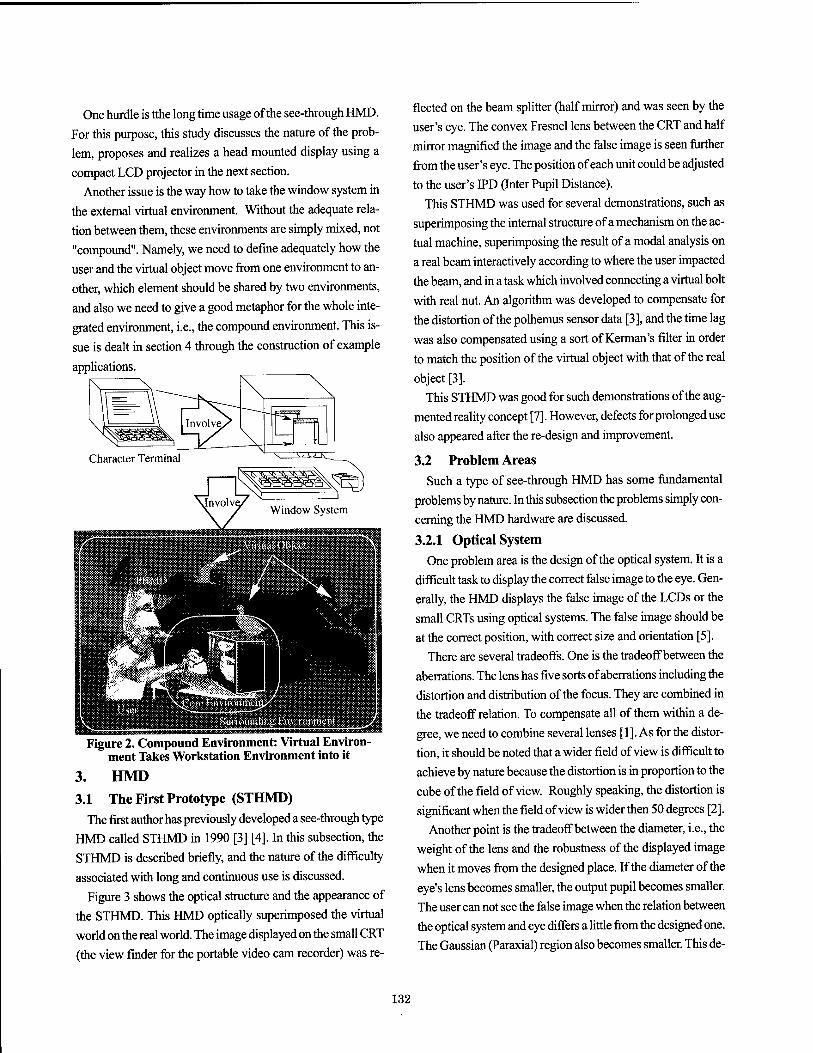
One hurdle is tthe long time usage of the see-through HMD.
For this purpose, this study discusses the nature of the prob-
lem, proposes and realizes a head mounted display using a
compact LCD projector in the next section.
Another issue is the way how to take the window system in
the external virtual environment. Without the adequate rela-
tion between them, these environments are simply mixed, not
"compound". Namely, we need to define adequately how the
user and the virtual object move from one environment to an-
other, which element should be shared by two environments,
and also we need to give a good metaphor for the whole inte-
grated environment, i.e., the compound environment. This is-
sue is dealt in section 4 through the construction of example
applications.
Figure 2. Compound Environment: Virtual Environ- ment Takes Workstation Environment into it
3. HMD
3.1 The First Prototype (STHMD)
The first author has previously developed a see-through type
HMD called STHMD in 1990 [3] [4]. In this subsection, the
STHMD is described briefly, and the nature of the difficulty
associated with long and continuous use is discussed.
Figure 3 shows the optical structure and the appearance of
the STHMD. This HMD optically superimposed the virtual
world on the real world. The image displayed on the small CRT
(the view finder for the portable video cam recorder) was re-
flected on the beam splitter (half mirror) and was seen by the
user's eye. The convex Fresnel lens between the CRT and half
mirror magnified the image and the false image is seen further
from the user's eye. The position of each unit could be adjusted
to the user's IPD (Inter Pupil Distance).
This STHMD was used for several demonstrations, such as
superimposing the internal structure of a mechanism on the ac-
tual machine, superimposing the result of a modal analysis on
a real beam interactively according to where the user impacted
the beam, and in a task which involved connecting a virtual bolt
with real nut. An algorithm was developed to compensate for
the distortion of the polhemus sensor data [3], and the time lag
was also compensated using a sort of Kerman's filter in order
to match the position of the virtual object with that of the real
object [3]. This STHMD was good for such demonstrations of the aug-
mented reality concept [7]. However, defects for prolonged use
also appeared after the re-design and improvement.
3.2 Problem Areas
Such a type of see-through HMD has some fundamental
problems by nature. In this subsection the problems simply con-
cerning the HMD hardware are discussed.
3.2.1 Optical System
One problem area is the design of the optical system. It is a
difficult task to display the correct false image to the eye. Gen-
erally, the HMD displays the false image of the LCDs or the
small CRTs using optical systems. The false image should be
at the correct position, with correct size and orientation [5].
There are several tradeoffs. One is the tradeoff between the
aberrations. The lens has five sorts of aberrations including the
distortion and distribution of the focus. They are combined in
the tradeoff relation. To compensate all of them within a de-
gree, we need to combine several lenses [1]. As for the distor-
tion, it should be noted that a wider field of view is difficult to
achieve by nature because the distortion is in proportion to the
cube of the field of view. Roughly speaking, the distortion is
significant when the field of view is wider then 50 degrees [2].
Another point is the tradeoff between the diameter, i.e., the
weight of the lens and the robustness of the displayed image
when it moves from the designed place. If the diameter of the
eye's lens becomes smaller, the output pupil becomes smaller.
The user can not see the false image when the relation between
the optical system and eye differs a little from the designed one.
The Gaussian (Paraxial) region also becomes smaller. This de-
132
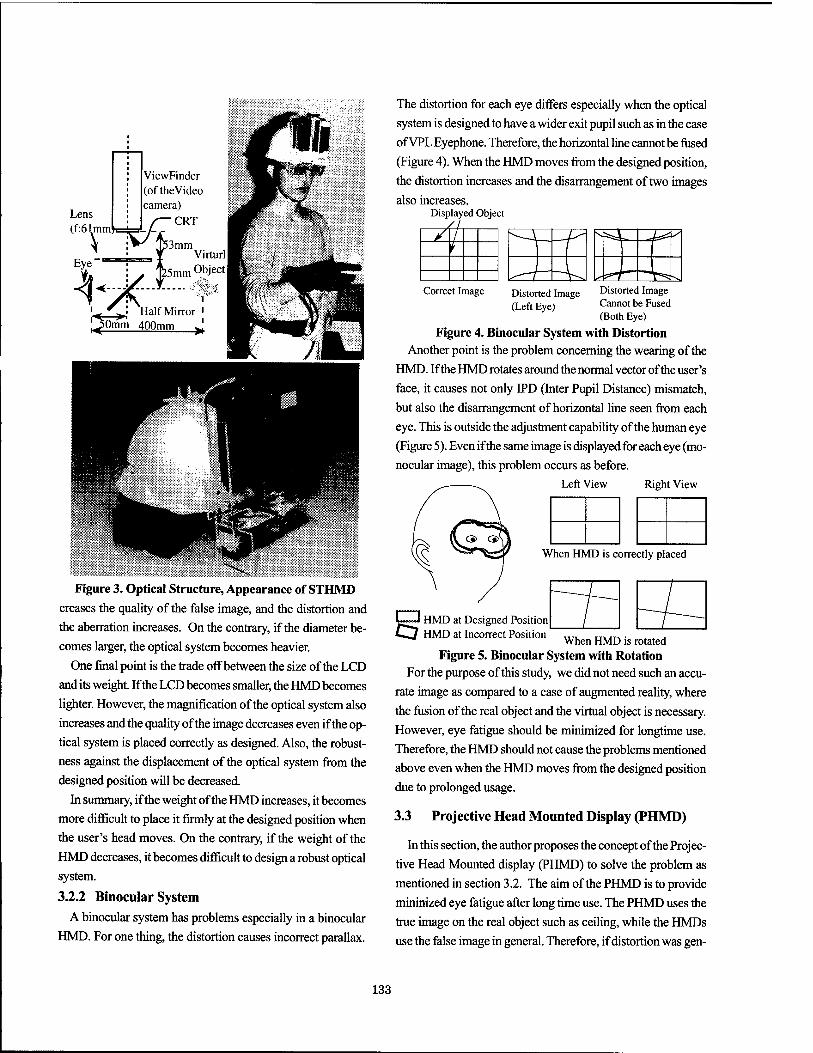
iÄlMl«lliÄllällÄllPIlIlMl^llM^^tafcBlllMllBllIiIllli|ll| Figure 3. Optical Structure, Appearance of STHMD
creases the quality of the false image, and the distortion and
the aberration increases. On the contrary, if the diameter be-
comes larger, the optical system becomes heavier.
One final point is the trade offbetween the size of the LCD
and its weight. If the LCD becomes smaller, the HMD becomes
lighter. However, the magnification of the optical system also
increases and the quality of the image decreases even if the op-
tical system is placed correctly as designed. Also, the robust-
ness against the displacement of the optical system from the
designed position will be decreased.
In summary, if the weight of the HMD increases, it becomes
more difficult to place it firmly at the designed position when
the user's head moves. On the contrary, if the weight of the
HMD decreases, it becomes difficult to design a robust optical
system.
3.2.2 Binocular System
A binocular system has problems especially in a binocular
HMD. For one thing, the distortion causes incorrect parallax.
The distortion for each eye differs especially when the optical
system is designed to have a wider exit pupil such as in the case
of VPL Eyephone. Therefore, the horizontal line cannot be fused
(Figure 4). When the HMD moves from the designed position,
the distortion increases and the disarrangement of two images
also increases. Displayed Objec t
/ -A- -r "t T -4- -I J- -L Correct Image Distorted Image
(Left Eye)
Distorted Image Cannot be Fused (Both Eye)
Figure 4. Binocular System with Distortion Another point is the problem concerning the wearing of the
HMD. If the HMD rotates around the normal vector of the user's
face, it causes not only IPD (Inter Pupil Distance) mismatch,
but also the disarrangement of horizontal line seen from each
eye. This is outside the adjustment capability of the human eye
(Figure 5). Even if the same image is displayed for each eye (mo-
nocular image), this problem occurs as before.
Left View Right View
When HMD is correctly placed
ImmmJ HMD at Designed Position t«J HMD at Incorrect Position .... ,„m. ^^ When HMD is rotated
Figure 5. Binocular System with Rotation For the purpose of this study, we did not need such an accu-
rate image as compared to a case of augmented reality, where
the fusion of the real object and the virtual object is necessary.
However, eye fatigue should be minimized for longtime use.
Therefore, the HMD should not cause the problems mentioned
above even when the HMD moves from the designed position
due to prolonged usage.
3.3 Projective Head Mounted Display (PHMD)
In this section, the author proposes the concept of the Projec-
tive Head Mounted display (PHMD) to solve the problem as
mentioned in section 3.2. The aim of the PHMD is to provide
mininized eye fatigue after long time use. The PHMD uses the
true image on the real object such as ceiling, while the HMDs
use the false image in general. Therefore, if distortion was gen-
133
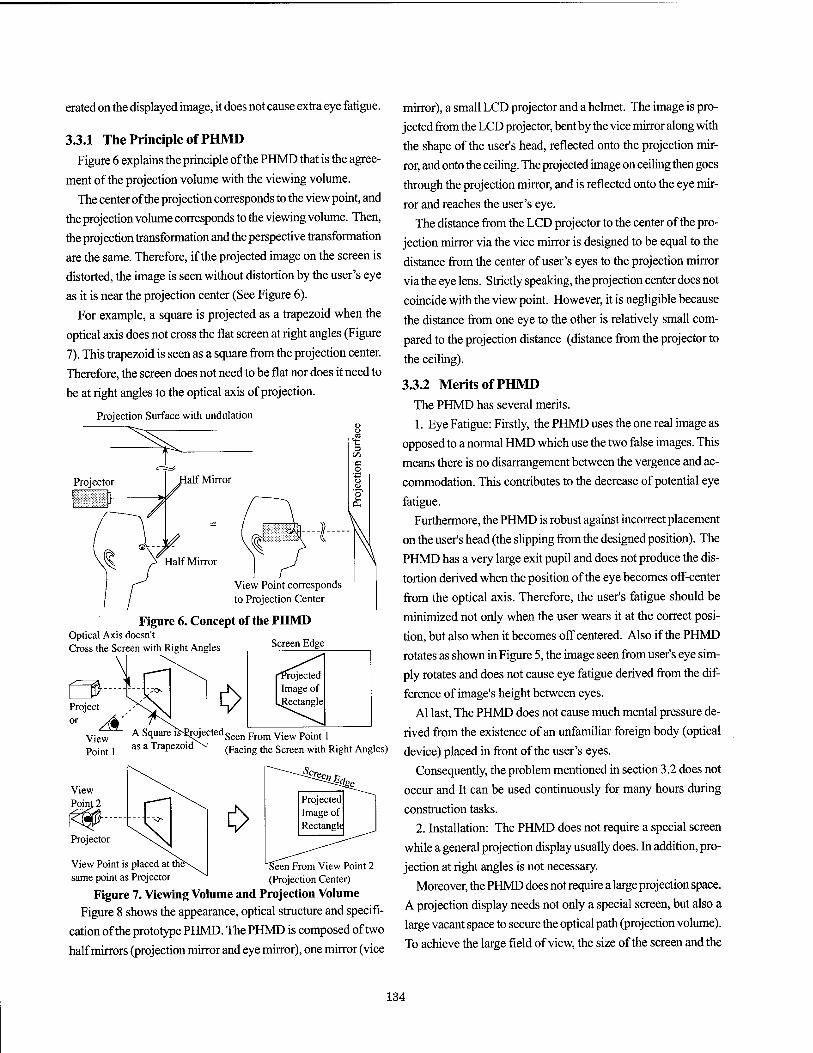
erated on the displayed image, it does not cause extra eye fatigue.
3.3.1 The Principle of PHMD Figure 6 explains the principle of the PHMD that is the agree-
ment of the projection volume with the viewing volume.
The center of the projection corresponds to the view point, and
the projection volume corresponds to the viewing volume. Then,
the projection transformation and the perspective transformation
are the same. Therefore, if the projected image on the screen is
distorted, the image is seen without distortion by the user's eye
as it is near the projection center (See Figure 6).
For example, a square is projected as a trapezoid when the
optical axis does not cross the flat screen at right angles (Figure
7). This trapezoid is seen as a square from the projection center.
Therefore, the screen does not need to be flat nor does it need to
be at right angles to the optical axis of projection.
Projection Surface with undulation
View Point corresponds to Projection Center
Figure 6. Concept of the PHMD Optical Axis doesn't Cross the Screen with Right Angles Screen Edge
Projector
View Point is placed at the same point as Projector
Seen From View Point 2 (Projection Center)
Figure 7. Viewing Volume and Projection Volume Figure 8 shows the appearance, optical structure and specifi-
cation of the prototype PHMD. The PHMD is composed of two
half mirrors (projection mirror and eye mirror), one mirror (vice
mirror), a small LCD projector and a helmet. The image is pro-
jected from the LCD projector, bent by the vice mirror along with
the shape of the user's head, reflected onto the projection mir-
ror, and onto the ceiling. The projected image on ceiling then goes
through the projection mirror, and is reflected onto the eye mir-
ror and reaches the user's eye.
The distance from the LCD projector to the center of the pro-
jection mirror via the vice mirror is designed to be equal to the
distance from the center of user's eyes to the projection mirror
via the eye lens. Strictly speaking, the projection center does not
coincide with the view point. However, it is negligible because
the distance from one eye to the other is relatively small com-
pared to the projection distance (distance from the projector to
the ceiling).
3.3.2 Merits of PHMD
The PHMD has several merits.
1. Eye Fatigue: Firstly, the PHMD uses the one real image as
opposed to a normal HMD which use the two false images. This
means there is no disarrangement between the vergence and ac-
commodation. This contributes to the decrease of potential eye
fatigue. Furthermore, the PHMD is robust against incorrect placement
on the user's head (the slipping from the designed position). The
PHMD has a very large exit pupil and does not produce the dis-
tortion derived when the position of the eye becomes off-center
from the optical axis. Therefore, the user's fatigue should be
minimized not only when the user wears it at the correct posi-
tion, but also when it becomes off centered. Also if the PHMD
rotates as shown in Figure 5, the image seen from user's eye sim-
ply rotates and does not cause eye fatigue derived from the dif-
ference of image's height between eyes.
Al last, The PHMD does not cause much mental pressure de-
rived from the existence of an unfamiliar foreign body (optical
device) placed in front of the user's eyes.
Consequently, the problem mentioned in section 3.2 does not
occur and It can be used continuously for many hours during
construction tasks.
2. Installation: The PHMD does not require a special screen
while a general projection display usually does. In addition, pro-
jection at right angles is not necessary.
Moreover, the PHMD does not require a large projection space.
A projection display needs not only a special screen, but also a
large vacant space to secure the optical path (projection volume).
To achieve the large field of view, the size of the screen and the
134
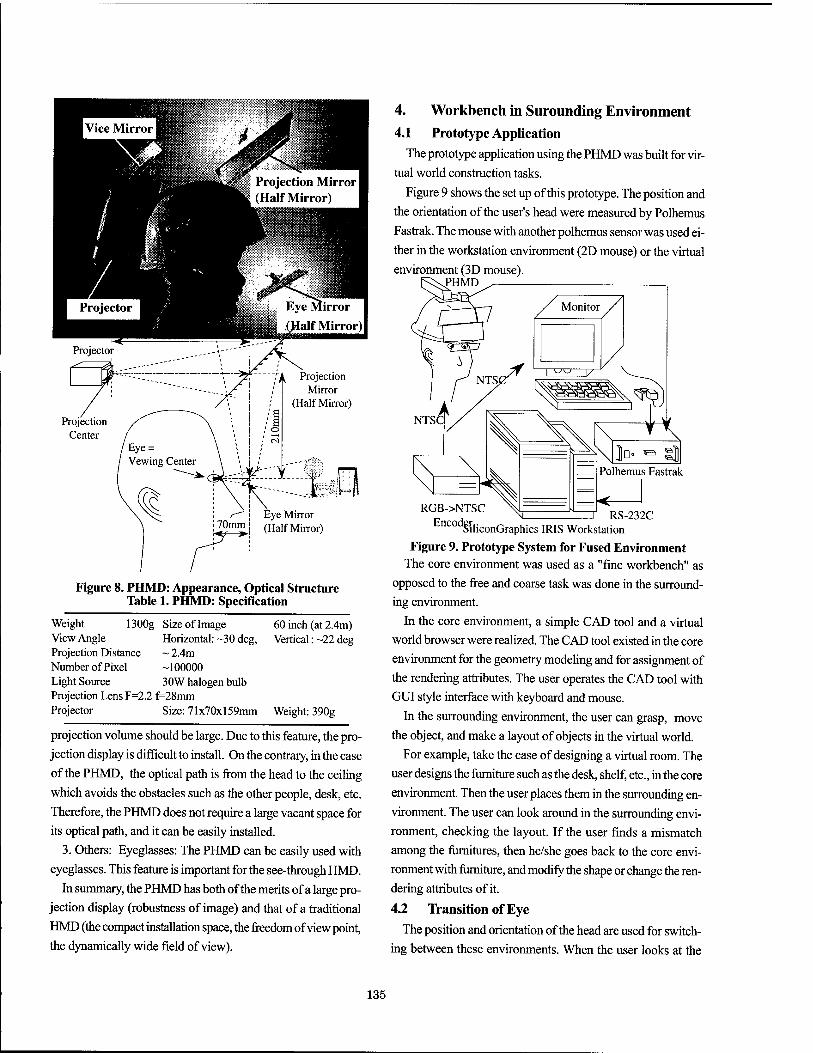
Figure 8. PHMD: Appearance, Optical Structure Table 1. PHMD: Specification
Weight 1300g Size of Image 60 inch (at 2.4m) View Angle Horizontal: -30 deg, Vertical: -22 deg Projection Distance ~ 2.4m Number of Pixel -100000 Light Source 30W halogen bulb Projection Lens F=2.2 f=28mm Projector Size: 71x70x159mm Weight: 390g
projection volume should be large. Due to this feature, the pro-
jection display is difficult to install. On the contrary, in the case
of the PHMD, the optical path is from the head to the ceiling
which avoids the obstacles such as the other people, desk, etc.
Therefore, the PHMD does not require a large vacant space for
its optical path, and it can be easily installed.
3. Others: Eyeglasses: The PHMD can be easily used with
eyeglasses. This feature is important for the see-through HMD.
In summary, the PHMD has both of the merits of a large pro-
jection display (robustness of image) and that of a traditional
HMD (the compact installation space, the freedom of view point,
the dynamically wide field of view).
4. Workbench in Surounding Environment 4.1 Prototype Application
The prototype application using the PHMD was built for vir-
tual world construction tasks.
Figure 9 shows the set up of this prototype. The position and
the orientation of the user's head were measured by Polhemus
Fastrak. The mouse with another polhemus sensor was used ei-
ther in the workstation environment (2D mouse) or the virtual
environment (3D mouse). JPHMD
Encod r . , RS-232C SiliconGraphics IRIS Workstation
Figure 9. Prototype System for Fused Environment The core environment was used as a "fine workbench" as
opposed to the free and coarse task was done in the surround- ing environment.
In the core environment, a simple CAD tool and a virtual
world browser were realized. The CAD tool existed in the core
environment for the geometry modeling and for assignment of
the rendering attributes. The user operates the CAD tool with
GUI style interface with keyboard and mouse.
In the surrounding environment, the user can grasp, move
the object, and make a layout of objects in the virtual world.
For example, take the case of designing a virtual room. The
user designs the furniture such as the desk, shelf, etc., in the core
environment. Then the user places them in the surrounding en-
vironment. The user can look around in the surrounding envi-
ronment, checking the layout. If the user finds a mismatch
among the furnitures, then he/she goes back to the core envi-
ronment with furniture, and modify the shape or change the ren- dering attributes of it.
4.2 Transition of Eye The position and orientation of the head are used for switch-
ing between these environments. When the user looks at the
135
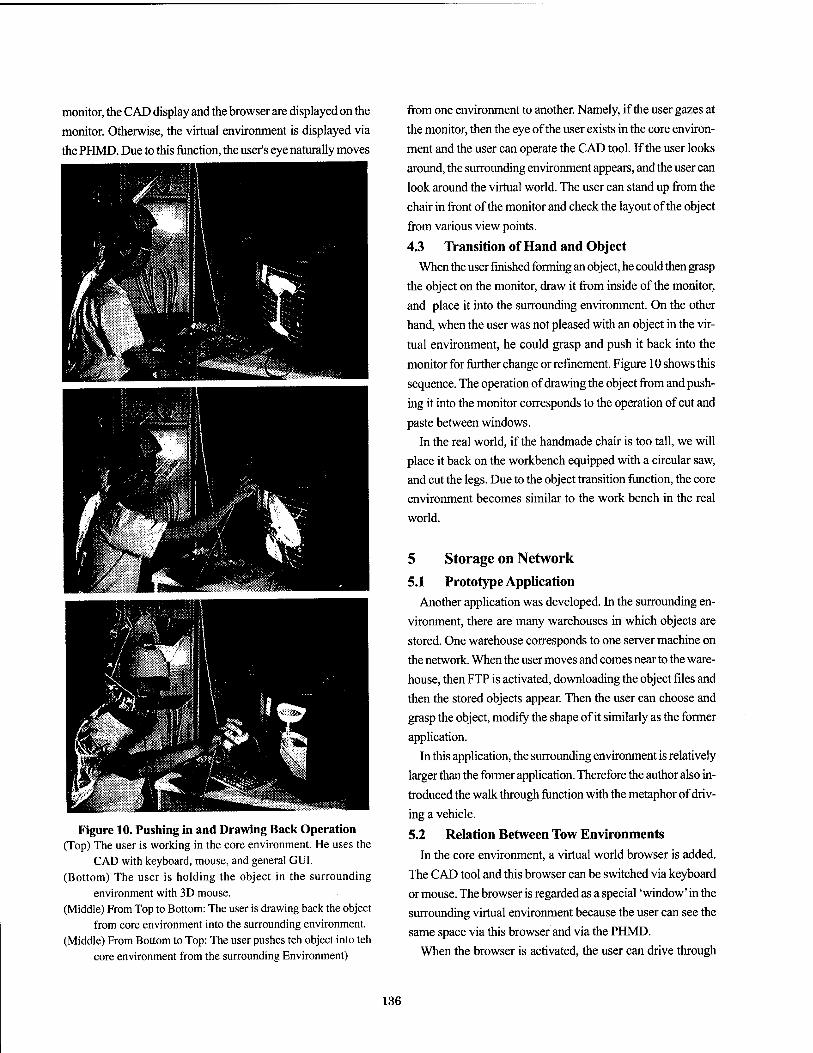
monitor, the CAD display and the browser are displayed on the
monitor. Otherwise, the virtual environment is displayed via
the PHMD. Due to this function, the user's eye naturally moves
Figure 10. Pushing in and Drawing Back Operation (Top) The user is working in the core environment. He uses the
CAD with keyboard, mouse, and general GUI. (Bottom) The user is holding the object in the surrounding
environment with 3D mouse. (Middle) From Top to Bottom: The user is drawing back the object
from core environment into the surrounding environment. (Middle) From Bottom to Top: The user pushes teh object into teh
core environment from the surrounding Environment)
from one environment to another. Namely, if the user gazes at
the monitor, then the eye of the user exists in the core environ-
ment and the user can operate the CAD tool. If the user looks
around, the surrounding environment appears, and the user can
look around the virtual world. The user can stand up from the
chair in front of the monitor and check the layout of the object
from various view points.
4.3 Transition of Hand and Object
When the user finished forming an object, he could then grasp
the object on the monitor, draw it from inside of the monitor,
and place it into the surrounding environment. On the other
hand, when the user was not pleased with an object in the vir-
tual environment, he could grasp and push it back into the
monitor for further change or refinement. Figure 10 shows this
sequence. The operation of drawing the object from and push-
ing it into the monitor corresponds to the operation of cut and
paste between windows.
In the real world, if the handmade chair is too tall, we will
place it back on the workbench equipped with a circular saw,
and cut the legs. Due to the object transition function, the core
environment becomes similar to the work bench in the real
world.
5 Storage on Network
5.1 Prototype Application Another application was developed. In the surrounding en-
vironment, there are many warehouses in which objects are
stored. One warehouse corresponds to one server machine on
the network. When the user moves and comes near to the ware-
house, then FTP is activated, downloading the object files and
then the stored objects appear. Then the user can choose and
grasp the object, modify the shape of it similarly as the former
application.
In this application, the surrounding environment is relatively
larger than the former application. Therefore the author also in-
troduced the walk through function with the metaphor of driv-
ing a vehicle.
5.2 Relation Between Tow Environments
In the core environment, a virtual world browser is added.
The CAD tool and this browser can be switched via keyboard
or mouse. The browser is regarded as a special 'window' in the
surrounding virtual environment because the user can see the
same space via this browser and via the PHMD.
When the browser is activated, the user can drive through
136
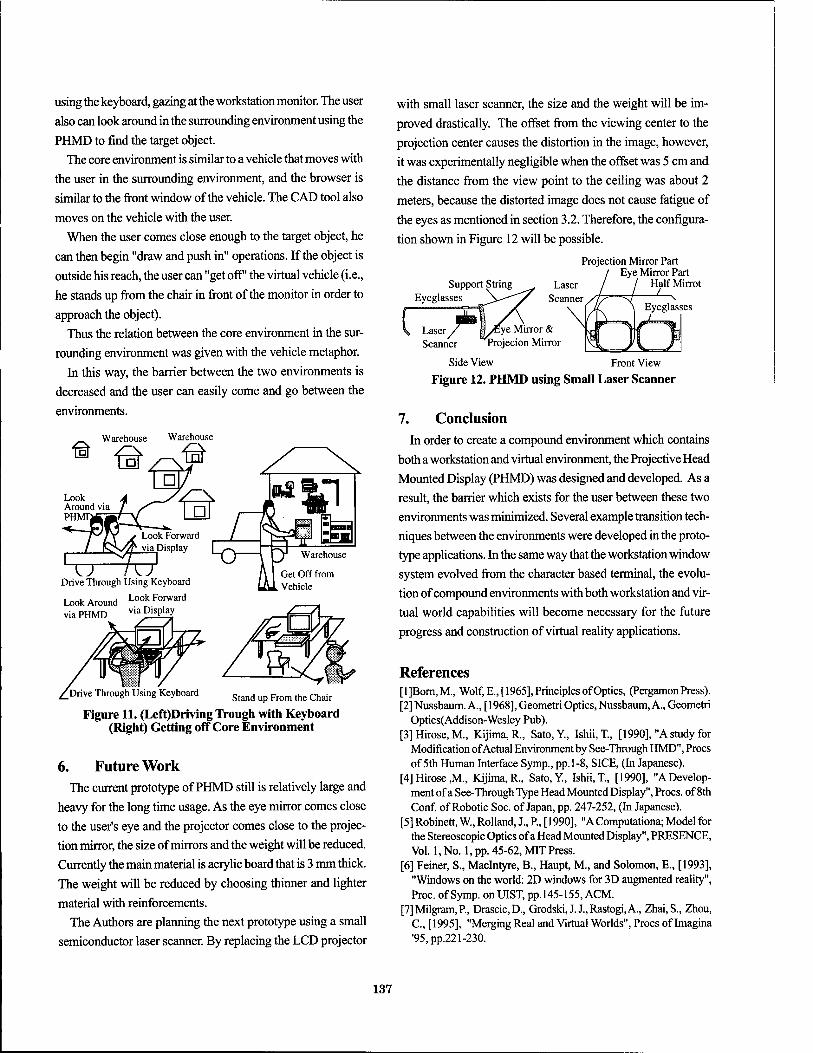
using the keyboard, gazing at the workstation monitor. The user
also can look around in the surrounding environment using the
PHMD to find the target object.
The core environment is similar to a vehicle that moves with
the user in the surrounding environment, and the browser is
similar to the front window of the vehicle. The CAD tool also
moves on the vehicle with the user.
When the user comes close enough to the target object, he
can then begin "draw and push in" operations. If the object is
outside his reach, the user can "get off' the virtual vehicle (i.e.,
he stands up from the chair in front of the monitor in order to
approach the object).
Thus the relation between the core environment in the sur-
rounding environment was given with the vehicle metaphor.
In this way, the barrier between the two environments is
decreased and the user can easily come and go between the
environments.
Warehouse Warehouse
■O 7T7 Drive Through Using Keyboard
Look Around Look Forward via PHMD via Display
Get Off from Vehicle
.Drive Through Using Keyboard Smd up From (he chajr
Figure 11. (Left)Driving Trough with Keyboard (Right) Getting off Core Environment
6. Future Work The current prototype of PHMD still is relatively large and
heavy for the long time usage. As the eye mirror comes close
to the user's eye and the projector comes close to the projec-
tion mirror, the size of mirrors and the weight will be reduced.
Currently the main material is acrylic board that is 3 mm thick.
The weight will be reduced by choosing thinner and lighter
material with reinforcements.
The Authors are planning the next prototype using a small
semiconductor laser scanner. By replacing the LCD projector
with small laser scanner, the size and the weight will be im-
proved drastically. The offset from the viewing center to the
projection center causes the distortion in the image, however,
it was experimentally negligible when the offset was 5 cm and
the distance from the view point to the ceiling was about 2
meters, because the distorted image does not cause fatigue of
the eyes as mentioned in section 3.2. Therefore, the configura-
tion shown in Figure 12 will be possible.
Support String Eyeglasses
Laser Scanner
Projection Mirror Part Eye Mirror Part
Laser / / HalfMirrot Scanner.
lye Mirror & Projecion Mirror
Eyeglasses
Side View Front View
Figure 12. PHMD using Small Laser Scanner
7. Conclusion In order to create a compound environment which contains
both a workstation and virtual environment, the Projective Head
Mounted Display (PHMD) was designed and developed. As a
result, the barrier which exists for the user between these two
environments was minimized. Several example transition tech-
niques between the environments were developed in the proto-
type applications. In the same way that the workstation window
system evolved from the character based terminal, the evolu-
tion of compound environments with both workstation and vir-
tual world capabilities will become necessary for the future
progress and construction of virtual reality applications.
References [l]Born,M., Wolf, E., [1965], Principles of Optics, (Pergamon Press). [2] Nussbaum. A.,[ 1968], Geometri Optics, Nussbaum, A., Geometri
Optics(Addison-Wesley Pub). [3] Hirose, M., Kijima, R., Sato.Y., Ishii, T., [1990], "A study for
Modification of Actual Environment by See-Through HMD", Procs of 5th Human Interface Symp., pp. 1-8, SICE, (In Japanese).
[4] Hirose ,M., Kijima, R., Sato,Y, Ishii, T, [1990], "A Develop- ment of a See-Through Type Head Mounted Display", Procs. of 8th Conf. of Robotic Soc. of Japan, pp. 247-252, (In Japanese).
[5] Robinett, W., Rolland, I, P., [1990], "AComputationa; Model for the Stereoscopic Optics of a Head Mounted Display", PRESENCE, Vol. 1, No. 1, pp. 45-62, MIT Press.
[6] Feiner, S., Maclntyre, B., Haupt, M., and Solomon, E., [1993], "Windows on the world: 2D windows for 3D augmented reality", Proc. of Symp. on UIST, pp.145-155, ACM.
[7]Milgram,P, Drascic,D., Grodski, J. J.,Rastogi,A., Zhai.S., Zhou, C, [1995], "Merging Real and Virtual Worlds", Procs of Imagina '95, pp.221-230.
137
Factors Influencing Operator Interaction with Virtual Objects Viewed via Head-mounted See-through Displays:
viewing conditions and rendering latency
Stephen R. Ellis, Francois Breant1, Brian Menges2, Richard Jacoby3 and Bernard D. Adelstein4
NASA Ames Research Center Moffett Field, CA USA
94035
Abstract
A head-mounted visual display was used in a see-through format to present computer generated, space-stabilized, nearby wire-like virtual objects to 14 subjects. The visual requirements of their experimental tasks were similar to those needed for visually-guided manual assembly of air- craft wire harnesses. In the first experiment subjects visu- ally traced wire paths with a head-referenced cursor, sub- jectively rated aspects of viewing, and had their vision tested before and after monocular, biocular, or stereo view- ing. Only the viewing difficulty with the biocular display was adversely effected by the visual task. This viewing dif- ficulty is likely due to conflict between looming and stereo disparity cues. A second experiment examined the precision with which operators could manually move ring- shaped virtual objects over virtual paths without collision. Accuracy of performance was studied as a function of re- quired precision, path complexity, and system response la- tency. Results show that high precision tracing is most sensitive to increasing latency. Ring placement with less than 1.8 cm precision will require system latency less than 50 msec before asymptotic performance is found.
Introduction
Interactive 3D computer graphics displays have attracted considerable interest as human interfaces for a wide variety of scientific, industrial, medical, educational and entertain- ment applications. But the real world has such high detail that even current high powered graphics workstation have difficulty rendering it with low latency, i.e. < 30 msec, at
JjVlASI Laboratory, University of Paris VI 2San Jose State University Foundation 3Sterling Software 4University of California, Berkeley
the frame rates required for high fidelity simulation & natu- ral interaction, i.e. >60 Hz [1].
But since the real work is in the real world, one alternative is to let the world render itself and to overlay geometrically conformal graphics on it for specific purposes. This ap- proach is similar to that taken by aircraft Heads-Up- Displays [2] or by the see-through displays for wire-harness assembly and inspection work at Boeing Computer Services (BCS) and McClellen AFB e.g. [3]. The BCS displays, for example, provide their users with spatial information to guide mechanical assembly by producing 3D computer-gen- erated virtual objects overlays or information inserts to indi- cate the proper spatial location of wires and connectors. They also can provide more abstract information such as the name of the next part to be added to the work piece. Related head-mounted displays have been proposed for a wide vari- ety of other novel applications such as portable, body- mounted interfaces to the InterNet, virtual annotation sys- tems for visually labeling a users surrounding environment, head-mounted video camera controls, or as personal visual assistants for the handicapped [4].
Previous studies from our laboratory concerning geometri- cally registered virtual objects have addressed issues of the fidelity of depth rendering in such displays. Fatigue and user tolerance of the displays with alternative viewing conditions have, however, not yet been examined [5] [6]. The first study below examines the subjective visual viewing diffi- culties associated with the use of these head-mounted dis- plays for interaction with three dimensional virtual objects. Monocular, biocular, and stereoscopic viewing conditions were compared. Stimuli were selected to be comparable to those needed for a wire harness assembly task of Boeing Computer Services in which spatially conformal virtual wire-like objects are used to guide manual assembly of aircraft wire harnesses.
The three viewing conditions represent a rough design continuum. A monocular display requires only one graphics rendering and one set of display hardware to present the image to one eye. In this case binocular rivalry can interfere
0-8186-7843-7/97 $10.00 © 1997 IEEE 138
with the visibility of the virtual object. The rivalry prob- lem may be alleviated by the intermediate cost biocular display which uses a single rendering to present identical images to both eyes through a pair of displays. The costliest condition is stereo since it requires two graphics renderings and two sets of display hardware. It arguably could be considered the most veridical format, but even in this case discrepancies between accommodation (visual fo- cus) and the binocular convergence required for single vision and stereopsis are currently unavoidable and can lead to viewing difficulties and fatigue. Stereo systems also need more precise and complex alignment.
Since the see-through displays are likely to be used for long periods of time during a work day, possibly exceeding 6 hours, there is significant potential for visual fatigue to build up. This fatigue may be related to that reported by some long-term users of desktop CRTs, for example, while word processing, but, because of the unique viewing con- ditions with a helmet display, it is more likely to have a visual basis (c.f. see [7]). The following study begins an investigation of the implications of the three identified viewing conditions on the development of viewing difficulties during use of head mounted displays to view virtual objects.
Methods
graphics viewport in front of the eyes of all subjects for monocular boresight reference.
Optical features
The CRT images were focused for both eyes at 71 cm by aspheric plastic lens mounted below the CRTs. After the signal transformation from the RGB to NTSC, individual pixels corresponding to at least 5 arcmin horizontal reso- lution were easily discriminated from subjects' eye points. Light from the CRT could be modified by lenses and rotat- able prisms from a standard optometric trial lens set that allowed precise positioning with at least 5 arcmin resolution of the separate left and right images and allowed variation of the accommodative demand for each eye. The images were relayed to the subject's eye by custom, partially silvered (15%) polycarbonate mirrors mounted at 45° directly in front of each eye. The left and right viewing channels could be mechanically adjusted between 55 mm and 71 mm separations for the different subjects' measured interpupillary distances. The system was used at an 87% (16.57 deg.) measured overlap in a divergent system with 21.4° total field of view. The circular monocular fields of view were each 19 deg. in diameter and were matched with the magnification factor of the 3D rendering software.
Simulation
Head-mounted display Content
Physical characteristics
The entire display system, called an electronic haploscope (Figure 1), is built around a snug fitting, rigid head- mounted carbon fiber frame worn by a freely moving, tethered subject. The configuration used weighed 1.26 kg. The moments of inertia around the center of mass of the helmet have been measured when mounted on an erect head. They were: 0.0782 kg-m2 vertical axis, 0.0644 kg-m2
longitudinal axis (anterior-posterior), 0.0391 kg-m2 lateral axis (through the ears). A helmet with loads of these levels worn for only a few minutes will have minimal impact on normal head movements [8] but longer term effects are not well known.
Electronic display
The haploscope used two vertically mounted Citizen 1.5 in. 1000 line miniature, monochrome CRTs in NTSC mode which were driven by an SGI graphics computer (4D/440IG2) through custom video circuits. These circuits allowed lateral adjustment of the video frame. Since vertical and horizontal optical displacement is also possible, the display system can precisely position the center of each
A crosse inscribed in a 4.8 deg. diameter circle was used as a monocular bore-site target 211 cm from the subjects for alignment and adjustment of the magnification factor within the computer graphics system. A smaller similar graphic object of 2.3 deg. diameter was used as a monocular visual sight presented before the dominant eye of each subject. A reference tetrahedron (Figure 2) was created for alignment with a physical tetrahedron made of balsawood to calibrate the distance of the subjects eyes from the position of a position sensor to measure head location.
Paths to be visually or manually traced by the subject were based on 17 unique paths. Thirteen others were derived from these by means of rotations to produce a set of 30 distinct paths for experiments. Four types of paths have been used (See Figure 4). To obtain a fair random selection of the paths across categories, series of lists containing only 1 occurrence of each path were generated for each block of conditions. The random selection of a block was done by the same means to ensure that each kind of path has the same occurrence. All paths were 76 cm long with a rectangular cross-section of 5 mm. Segments between vertexes were built using 8 polygons as shown Figure 3. Polygons were rendered in 16 gray levels.
139
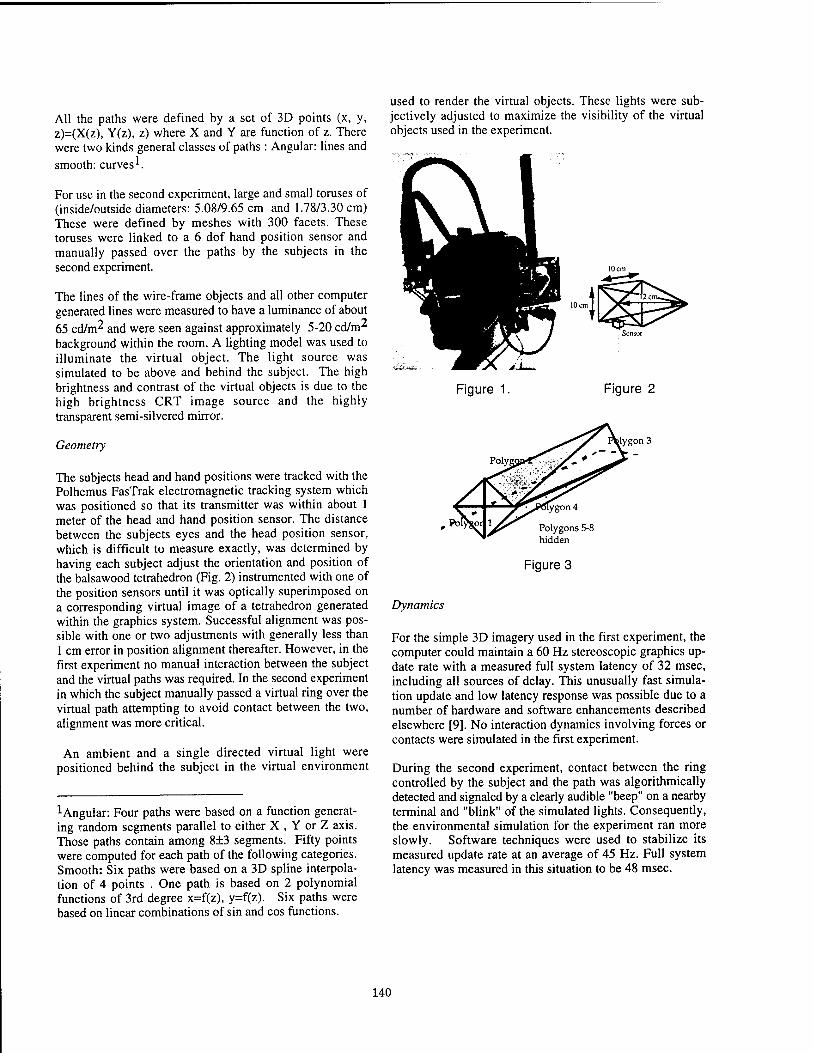
All the paths were defined by a set of 3D points (x, y, z)=(X(z), Y(z), z) where X and Y are function of z. There were two kinds general classes of paths : Angular: lines and smooth: curves .
For use in the second experiment, large and small toruses of (inside/outside diameters: 5.08/9.65 cm and 1.78/3.30 cm) These were defined by meshes with 300 facets. These toruses were linked to a 6 dof hand position sensor and manually passed over the paths by the subjects in the second experiment.
The lines of the wire-frame objects and all other computer generated lines were measured to have a luminance of about 65 cd/m^ and were seen against approximately 5-20 cd/m2
background within the room. A lighting model was used to illuminate the virtual object. The light source was simulated to be above and behind the subject. The high brightness and contrast of the virtual objects is due to the high brightness CRT image source and the highly transparent semi-silvered mirror.
Geometry
The subjects head and hand positions were tracked with the Polhemus FasTrak electromagnetic tracking system which was positioned so that its transmitter was within about 1 meter of the head and hand position sensor. The distance between the subjects eyes and the head position sensor, which is difficult to measure exactly, was determined by having each subject adjust the orientation and position of the balsawood tetrahedron (Fig. 2) instrumented with one of the position sensors until it was optically superimposed on a corresponding virtual image of a tetrahedron generated within the graphics system. Successful alignment was pos- sible with one or two adjustments with generally less than 1 cm error in position alignment thereafter. However, in the first experiment no manual interaction between the subject and the virtual paths was required. In the second experiment in which the subject manually passed a virtual ring over the virtual path attempting to avoid contact between the two, alignment was more critical.
An ambient and a single directed virtual light were positioned behind the subject in the virtual environment
angular: Four paths were based on a function generat- ing random segments parallel to either X , Y or Z axis. Those paths contain among 8+3 segments. Fifty points were computed for each path of the following categories. Smooth: Six paths were based on a 3D spline interpola- tion of 4 points . One path is based on 2 polynomial functions of 3rd degree x=f(z), y=f(z). Six paths were based on linear combinations of sin and cos functions.
used to render the virtual objects. These lights were sub- jectively adjusted to maximize the visibility of the virtual objects used in the experiment.
Figure 1. Figure 2
lygon 3
Polygons 5-i hidden
Figure 3
Dynamics
For the simple 3D imagery used in the first experiment, the computer could maintain a 60 Hz stereoscopic graphics up- date rate with a measured full system latency of 32 msec, including all sources of delay. This unusually fast simula- tion update and low latency response was possible due to a number of hardware and software enhancements described elsewhere [9]. No interaction dynamics involving forces or contacts were simulated in the first experiment.
During the second experiment, contact between the ring controlled by the subject and the path was algorithmically detected and signaled by a clearly audible "beep" on a nearby terminal and "blink" of the simulated lights. Consequently, the environmental simulation for the experiment ran more slowly. Software techniques were used to stabilize its measured update rate at an average of 45 Hz. Full system latency was measured in this situation to be 48 msec.
140
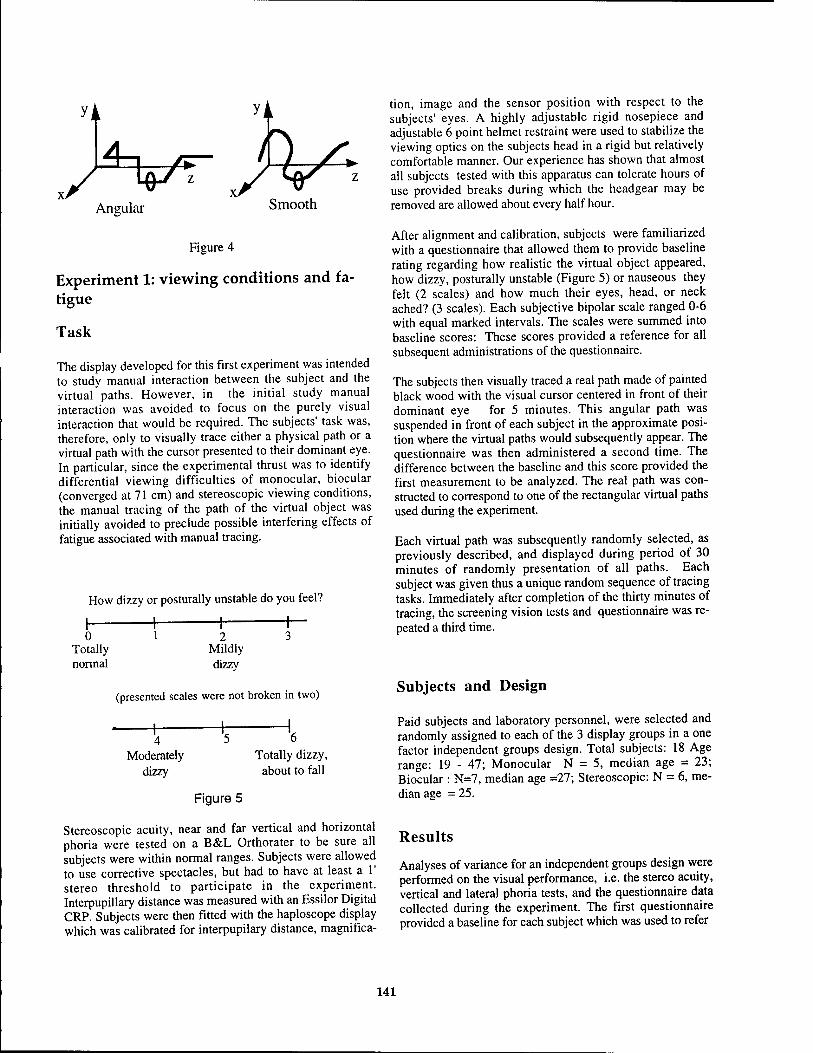
,/ Angular Smooth
Figure 4
Experiment 1: viewing conditions and fa- tigue
Task
The display developed for this first experiment was intended to study manual interaction between the subject and the virtual paths. However, in the initial study manual interaction was avoided to focus on the purely visual interaction that would be required. The subjects' task was, therefore, only to visually trace either a physical path or a virtual path with the cursor presented to their dominant eye. In particular, since the experimental thrust was to identify differential viewing difficulties of monocular, biocular (converged at 71 cm) and stereoscopic viewing conditions, the manual tracing of the path of the virtual object was initially avoided to preclude possible interfering effects of fatigue associated with manual tracing.
How dizzy or posturally unstable do you feel?
0 Totally normal
—1 2
Mildly dizzy
+
(presented scales were not broken in two)
Moderately dizzy
Totally dizzy, about to fall
Figure 5
Stereoscopic acuity, near and far vertical and horizontal phoria were tested on a B&L Orthorater to be sure all subjects were within normal ranges. Subjects were allowed to use corrective spectacles, but had to have at least a 1' stereo threshold to participate in the experiment. Interpupillary distance was measured with an Essilor Digital CRP. Subjects were then fitted with the haploscope display which was calibrated for interpupilary distance, magnifica-
tion, image and the sensor position with respect to the subjects' eyes. A highly adjustable rigid nosepiece and adjustable 6 point helmet restraint were used to stabilize the viewing optics on the subjects head in a rigid but relatively comfortable manner. Our experience has shown that almost all subjects tested with this apparatus can tolerate hours of use provided breaks during which the headgear may be removed are allowed about every half hour.
After alignment and calibration, subjects were familiarized with a questionnaire that allowed them to provide baseline rating regarding how realistic the virtual object appeared, how dizzy, posturally unstable (Figure 5) or nauseous they felt (2 scales) and how much their eyes, head, or neck ached? (3 scales). Each subjective bipolar scale ranged 0-6 with equal marked intervals. The scales were summed into baseline scores: These scores provided a reference for all subsequent administrations of the questionnaire.
The subjects then visually traced a real path made of painted black wood with the visual cursor centered in front of their dominant eye for 5 minutes. This angular path was suspended in front of each subject in the approximate posi- tion where the virtual paths would subsequently appear. The questionnaire was then administered a second time. The difference between the baseline and this score provided the first measurement to be analyzed. The real path was con- structed to correspond to one of the rectangular virtual paths used during the experiment.
Each virtual path was subsequently randomly selected, as previously described, and displayed during period of 30 minutes of randomly presentation of all paths. Each subject was given thus a unique random sequence of tracing tasks. Immediately after completion of the thirty minutes of tracing, the screening vision tests and questionnaire was re- peated a third time.
Subjects and Design
Paid subjects and laboratory personnel, were selected and randomly assigned to each of the 3 display groups in a one factor independent groups design. Total subjects: 18 Age range: 19 - 47; Monocular N = 5, median age = 23; Biocular : N=7, median age =27; Stereoscopic: N = 6, me- dian age = 25.
Results
Analyses of variance for an independent groups design were performed on the visual performance, i.e. the stereo acuity, vertical and lateral phoria tests, and the questionnaire data collected during the experiment. The first questionnaire provided a baseline for each subject which was used to refer
141
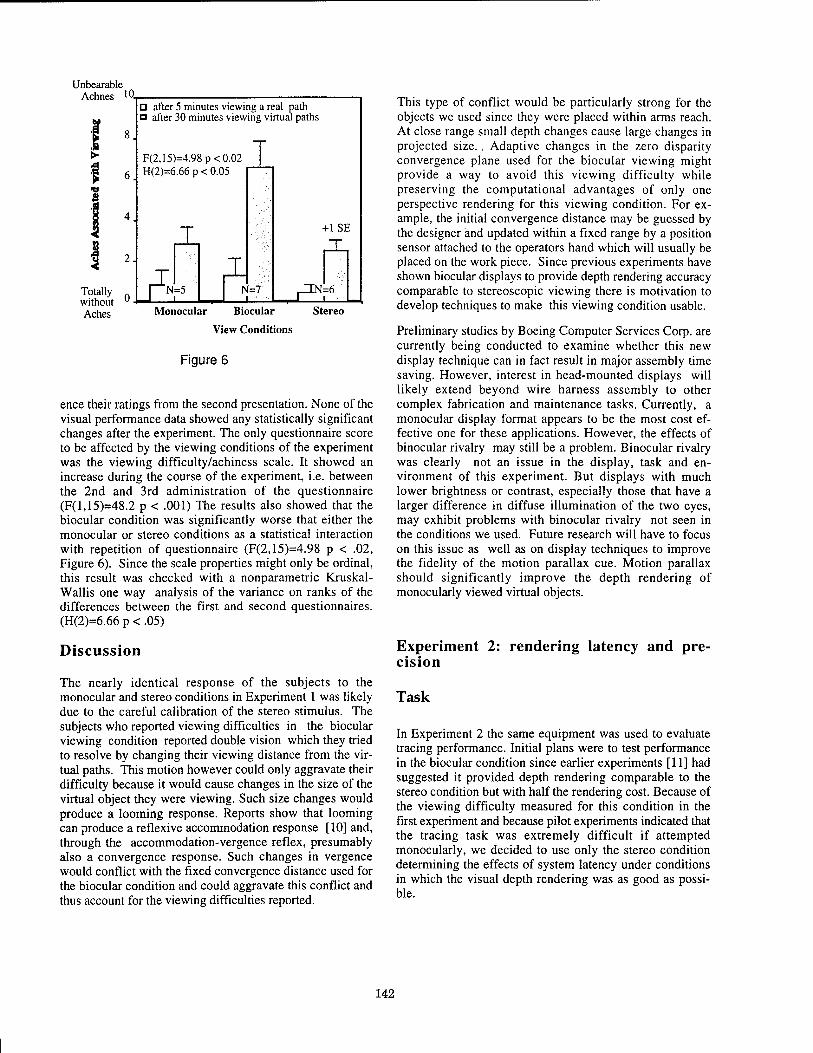
Unbearable Achnes 10.
2.
Totally n without u
Aches
□ after 5 minutes viewing a real path o after 30 minutes viewing virtual paths
F(2,15)=4.98p<0.02 H(2)=6.66 p < 0.05
£ i
i N=7
+1SE
X
,Ä Monocular Biocular
View Conditions
Stereo
Figure 6
ence their ratings from the second presentation. None of the visual performance data showed any statistically significant changes after the experiment. The only questionnaire score to be affected by the viewing conditions of the experiment was the viewing difficulty/achiness scale. It showed an increase during the course of the experiment, i.e. between the 2nd and 3rd administration of the questionnaire (F(l,15)=48.2 p < .001) The results also showed that the biocular condition was significantly worse that either the monocular or stereo conditions as a statistical interaction with repetition of questionnaire (F(2,15)=4.98 p < .02, Figure 6). Since the scale properties might only be ordinal, this result was checked with a nonparametric Kruskal- Wallis one way analysis of the variance on ranks of the differences between the first and second questionnaires. (H(2)=6.66 p < .05)
Discussion
The nearly identical response of the subjects to the monocular and stereo conditions in Experiment 1 was likely due to the careful calibration of the stereo stimulus. The subjects who reported viewing difficulties in the biocular viewing condition reported double vision which they tried to resolve by changing their viewing distance from the vir- tual paths. This motion however could only aggravate their difficulty because it would cause changes in the size of the virtual object they were viewing. Such size changes would produce a looming response. Reports show that looming can produce a reflexive accommodation response [10] and, through the accommodation-vergence reflex, presumably also a convergence response. Such changes in vergence would conflict with the fixed convergence distance used for the biocular condition and could aggravate this conflict and thus account for the viewing difficulties reported.
This type of conflict would be particularly strong for the objects we used since they were placed within arms reach. At close range small depth changes cause large changes in projected size., Adaptive changes in the zero disparity convergence plane used for the biocular viewing might provide a way to avoid this viewing difficulty while preserving the computational advantages of only one perspective rendering for this viewing condition. For ex- ample, the initial convergence distance may be guessed by the designer and updated within a fixed range by a position sensor attached to the operators hand which will usually be placed on the work piece. Since previous experiments have shown biocular displays to provide depth rendering accuracy comparable to stereoscopic viewing there is motivation to develop techniques to make this viewing condition usable.
Preliminary studies by Boeing Computer Services Corp. are currently being conducted to examine whether this new display technique can in fact result in major assembly time saving. However, interest in head-mounted displays will likely extend beyond wire harness assembly to other complex fabrication and maintenance tasks. Currently, a monocular display format appears to be the most cost ef- fective one for these applications. However, the effects of binocular rivalry may still be a problem. Binocular rivalry was clearly not an issue in the display, task and en- vironment of this experiment. But displays with much lower brightness or contrast, especially those that have a larger difference in diffuse illumination of the two eyes, may exhibit problems with binocular rivalry not seen in the conditions we used. Future research will have to focus on this issue as well as on display techniques to improve the fidelity of the motion parallax cue. Motion parallax should significantly improve the depth rendering of monocularly viewed virtual objects.
Experiment 2: rendering latency and pre- cision
Task
In Experiment 2 the same equipment was used to evaluate tracing performance. Initial plans were to test performance in the biocular condition since earlier experiments [11] had suggested it provided depth rendering comparable to the stereo condition but with half the rendering cost. Because of the viewing difficulty measured for this condition in the first experiment and because pilot experiments indicated that the tracing task was extremely difficult if attempted monocularly, we decided to use only the stereo condition determining the effects of system latency under conditions in which the visual depth rendering was as good as possi- ble.
142
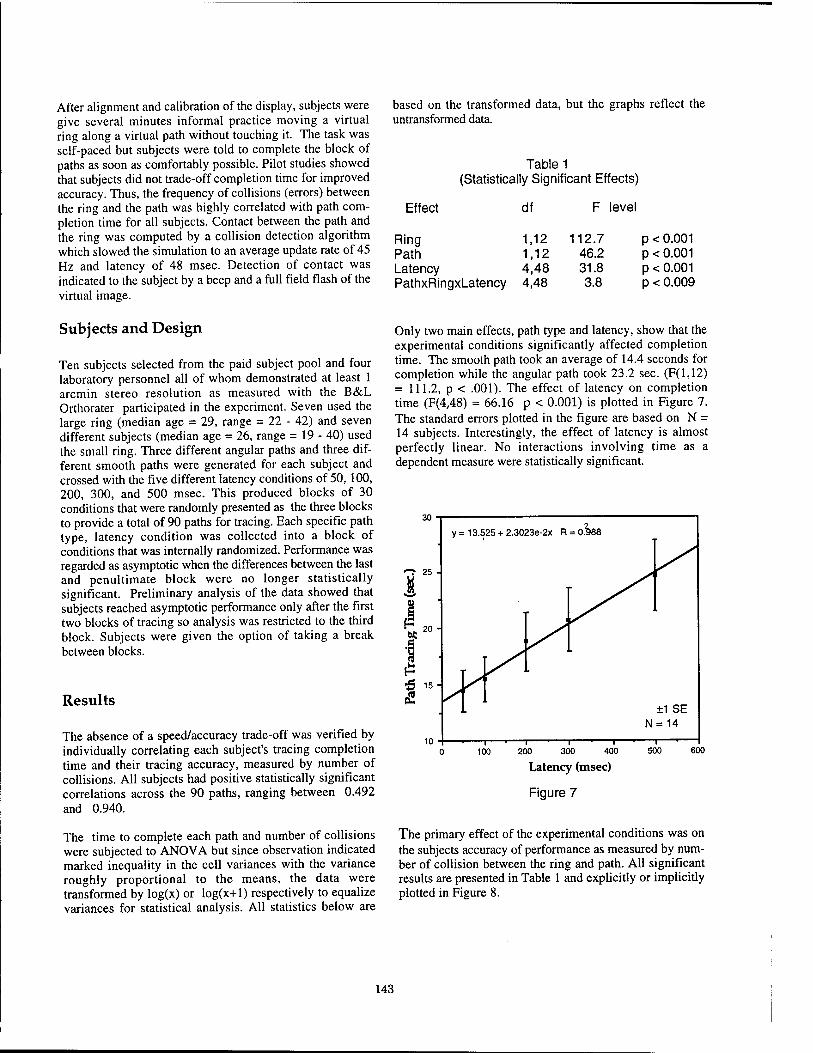
After alignment and calibration of the display, subjects were give several minutes informal practice moving a virtual ring along a virtual path without touching it. The task was self-paced but subjects were told to complete the block of paths as soon as comfortably possible. Pilot studies showed that subjects did not trade-off completion time for improved accuracy. Thus, the frequency of collisions (errors) between the ring and the path was highly correlated with path com- pletion time for all subjects. Contact between the path and the ring was computed by a collision detection algorithm which slowed the simulation to an average update rate of 45 Hz and latency of 48 msec. Detection of contact was indicated to the subject by a beep and a full field flash of the virtual image.
based on the transformed data, but the graphs reflect the untransformed data.
Table 1 (Statistically Significant Effects)
Effect df F level
Ring 1,12 112.7 p < 0.001 Path 1,12 46.2 p < 0.001 Latency 4,48 31.8 p < 0.001 PathxRingxLatency 4,48 3.8 p < 0.009
Subjects and Design
Ten subjects selected from the paid subject pool and four laboratory personnel all of whom demonstrated at least 1 arcmin stereo resolution as measured with the B&L Orthorater participated in the experiment. Seven used the large ring (median age = 29, range = 22 - 42) and seven different subjects (median age = 26, range = 19 - 40) used the small ring. Three different angular paths and three dif- ferent smooth paths were generated for each subject and crossed with the five different latency conditions of 50, 100, 200, 300, and 500 msec. This produced blocks of 30 conditions that were randomly presented as the three blocks to provide a total of 90 paths for tracing. Each specific path type, latency condition was collected into a block of conditions that was internally randomized. Performance was regarded as asymptotic when the differences between the last and penultimate block were no longer statistically significant. Preliminary analysis of the data showed that subjects reached asymptotic performance only after the first two blocks of tracing so analysis was restricted to the third block. Subjects were given the option of taking a break between blocks.
Results
The absence of a speed/accuracy trade-off was verified by individually correlating each subject's tracing completion time and their tracing accuracy, measured by number of collisions. All subjects had positive statistically significant correlations across the 90 paths, ranging between 0.492 and 0.940.
The time to complete each path and number of collisions were subjected to ANOVA but since observation indicated marked inequality in the cell variances with the variance roughly proportional to the means, the data were transformed by log(x) or log(x+l) respectively to equalize variances for statistical analysis. All statistics below are
Only two main effects, path type and latency, show that the experimental conditions significantly affected completion time. The smooth path took an average of 14.4 seconds for completion while the angular path took 23.2 sec. (F(l,12) = 111.2, p < .001). The effect of latency on completion time (F(4,48) = 66.16 p < 0.001) is plotted in Figure 7. The standard errors plotted in the figure are based on N = 14 subjects. Interestingly, the effect of latency is almost perfectly linear. No interactions involving time as a dependent measure were statistically significant.
i- 500 600 300 400
Latency (msec)
Figure 7
The primary effect of the experimental conditions was on the subjects accuracy of performance as measured by num- ber of collision between the ring and path. All significant results are presented in Table 1 and explicitly or implicitly plotted in Figure 8.
143
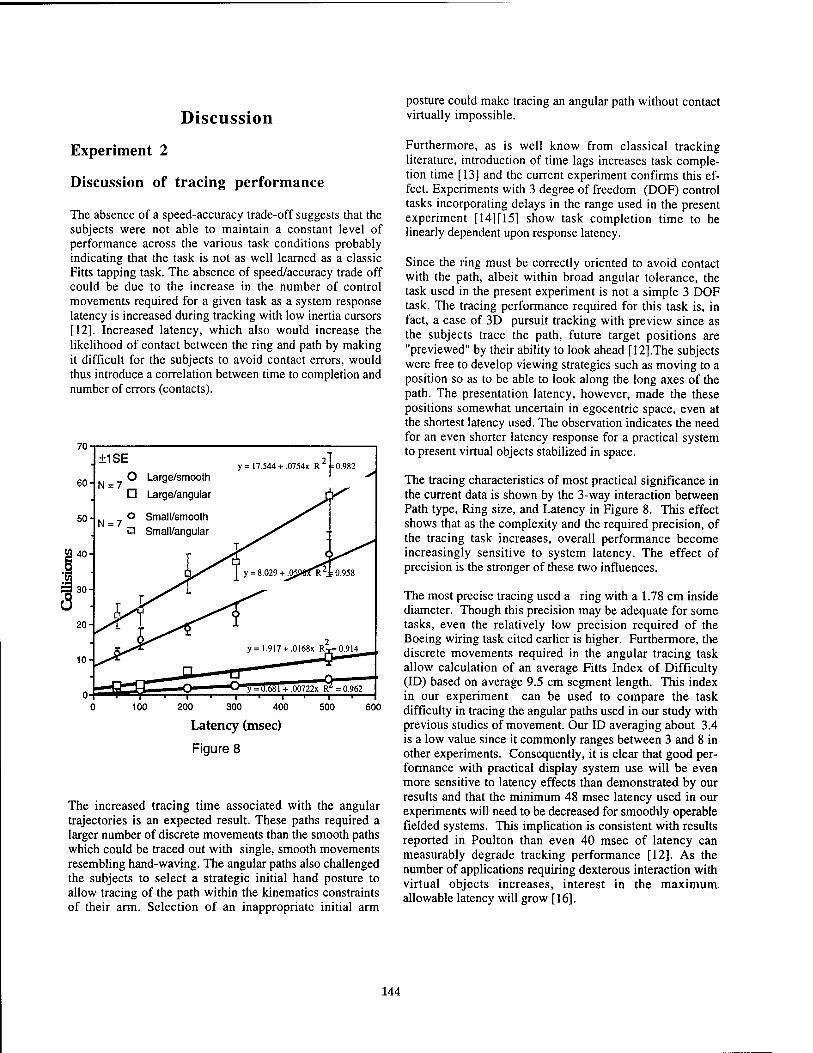
Discussion
Experiment 2
Discussion of tracing performance
The absence of a speed-accuracy trade-off suggests that the subjects were not able to maintain a constant level of performance across the various task conditions probably indicating that the task is not as well learned as a classic Fitts tapping task. The absence of speed/accuracy trade off could be due to the increase in the number of control movements required for a given task as a system response latency is increased during tracking with low inertia cursors [12]. Increased latency, which also would increase the likelihood of contact between the ring and path by making it difficult for the subjects to avoid contact errors, would thus introduce a correlation between time to completion and number of errors (contacts).
70 ±1SE
N = 7 O Large/smooth
:17.544+ .0754x R2fc0.982
100 200 300 400 500 600
Latency (msec)
Figure 8
The increased tracing time associated with the angular trajectories is an expected result. These paths required a larger number of discrete movements than the smooth paths which could be traced out with single, smooth movements resembling hand-waving. The angular paths also challenged the subjects to select a strategic initial hand posture to allow tracing of the path within the kinematics constraints of their arm. Selection of an inappropriate initial arm
posture could make tracing an angular path without contact virtually impossible.
Furthermore, as is well know from classical tracking literature, introduction of time lags increases task comple- tion time [13] and the current experiment confirms this ef- fect. Experiments with 3 degree of freedom (DOF) control tasks incorporating delays in the range used in the present experiment [14] [15] show task completion time to be linearly dependent upon response latency.
Since the ring must be correctly oriented to avoid contact with the path, albeit within broad angular tolerance, the task used in the present experiment is not a simple 3 DOF task. The tracing performance required for this task is, in fact, a case of 3D pursuit tracking with preview since as the subjects trace the path, future target positions are "previewed" by their ability to look ahead [12].The subjects were free to develop viewing strategies such as moving to a position so as to be able to look along the long axes of the path. The presentation latency, however, made the these positions somewhat uncertain in egocentric space, even at the shortest latency used. The observation indicates the need for an even shorter latency response for a practical system to present virtual objects stabilized in space.
The tracing characteristics of most practical significance in the current data is shown by the 3-way interaction between Path type, Ring size, and Latency in Figure 8. This effect shows that as the complexity and the required precision, of the tracing task increases, overall performance become increasingly sensitive to system latency. The effect of precision is the stronger of these two influences.
The most precise tracing used a ring with a 1.78 cm inside diameter. Though this precision may be adequate for some tasks, even the relatively low precision required of the Boeing wiring task cited earlier is higher. Furthermore, the discrete movements required in the angular tracing task allow calculation of an average Fitts Index of Difficulty (ID) based on average 9.5 cm segment length. This index in our experiment can be used to compare the task difficulty in tracing the angular paths used in our study with previous studies of movement. Our ID averaging about 3.4 is a low value since it commonly ranges between 3 and 8 in other experiments. Consequently, it is clear that good per- formance with practical display system use will be even more sensitive to latency effects than demonstrated by our results and that the minimum 48 msec latency used in our experiments will need to be decreased for smoothly operable fielded systems. This implication is consistent with results reported in Poulton than even 40 msec of latency can measurably degrade tracking performance [12]. As the number of applications requiring dexterous interaction with virtual objects increases, interest in the maximum, allowable latency will grow [16].
144

References
1. Barrette, R., D., R., Kruk, R., Kurtz, D., Marshall, S., Williams, T., Weissman, P., Antos, S. (1990) Flight simulation advanced wide FOV helmet mounted infinity display," AFHRL-TR-89-36, Air Force Human Resources Lab., Williams AFB, Az.
2. Weintraub, D. J., & Ensing, M. (1992) Human factors issues in head-up display design: the book of HUD. Wright Patterson AFB, Ohio: CSERIAC.
3. Janin, A.L.. Mizell, D.W., & Caudell, T.P. (1993) Calibration of head-mounted displays for augmented reality applications Proceedings of IEEE VRAIS '93, Seattle, WA.
4. Mann, Stephen (1996) Clothes-based computing: a first step towards personal imaging. MIT Media Lab. publication.
5. Ellis, S. R. & Bücher, U. J. (1994) Distance perception of stereoscopically presented virtual objects super imposed by a head mounted see through display. Proc38th Annual Meeting of the Human Factors & Ergonomics Society, Santa Monica CA, 1300-1305.
6. Ellis, S. R. . Bücher, U. J. & Menges, B. (1995) The Relationship of Binocular Convergence & Errors In Judged Distance to Virtual Objects. Proceedings of the International. Fed. of Automatic Control June 27- 29, 1995 Boston, MA.
7. Committee on Vision (1983) Video displays, work and vision, National Academy Press, Washington, D.C.
8. Gauthier, G.M. , Martin, B. J. & Stark, L. (1986) Adapted Head and Eye Movement Responses to Added- Head Inertia Aviation, Space, and Environmental Medicine, 57, 336-342.
9. Jacoby, R.. Adelstein, B.D. & Ellis, S.R. (1996) Improved temporal response in virtual environment hardware and software. IS&T/SP1E Proceedings, Conference. 2653B, Session 2653-39
10. Kruger, P. B. & Pola, J. (1985) Changing target size is a stimulus for accommodation. Journal of the Optical Society, 2, 1832-1835.
11. Ellis, S R. & Menges, B. M.(1995) Judged distance to virtual objects in the near visual field. Proceedings of the Human Factors & Ergonomics Society, 39th Ann Meeting. San Diego, CA, 1400-4, (Presence , in press).
12. Poulton, E.C. (1974) Tracking skill and manual control.. Academic, N.Y. 199-206.
13. Sheridan, T. B. & Ferrell, W.R. (1963) Remote manipulative control with transmission delay. IEEE Transactions on Human Factors in Electronics, HFE, 4, 1, 25-29.
14. Hashimoto, Sheridan, T. & Noyes, (1986) Japanese Journal of Ergonomics, 22, 2.
15 .Sheridan, T. B. (1992) Telerobotics, automation and human supervisory control, MIT, Cambridge. Ma.
16. Poston, T. & Serra, L.(1996) Dexterous Virtual Work, Communications of the ACM, 29, 5,37-45.
145
An Optical Tracker for Augmented Reality and Wearable Computers
Dohyung Kim¥, Scott W. Richards*, Thomas P. Caudellt ¥Dept. of Electrical Engineering
University of Washington Seattle, WA
f Interdisciplinary Computational Systems Laboratory Dept. of Electrical & Computer Engineering
University of New Mexico Albuquerque, NM 87131
Abstract Augmented Reality provides factory workers and
other touch laborers with visual information overlaid upon the workcell to aid in the performance of their tasks. This application of virtual reality technology requires high accuracy, wearable, tetherless, inexpensive, mechanically robust, and light weight head tracking systems that operate in a highly noisy environment. This paper describes a prototype head tracking system, currently under development and testing, that is based on one small lensless quad-cell detector and a set of fixed location, active optical beacons, that can potentially meet these requirements.
1: Introduction
Augmented reality (AR) uses see-through head mounted displays (HMDs) for superimposing virtual graphical information onto the real world[l,2]. While full virtual reality systems immerse a user into a completely computer generated world, AR supplements a user's view of the real world with simple wire frame graphics, template outlines, designators, and texts. For example, a team at the Boeing Company [3] is exploring the use of AR systems to guide assembly of wire bundles in their factories, as well as other manufacturing tasks. In addition, University of North Carolina has developed a medical imaging application that provides doctor with "X-ray vision" by overlaying and stabilizing an ultrasound image onto a patient's body [4].
The benefits of such an AR system in the factory setting are several fold. First, the worker has immediate access to the necessary information without having to refer to manuals or templates, thus increasing the worker's performance and freeing the worker's hands for the current task. Second, the physical artifacts used in manufacturing do not have to be built and subsequently stored, shortening the delay between proof of concept of
a design and actual production. Finally, assembly-line manufacturing techniques can be applied to custom designs where a centralized computer processes a customer's order and directs workers along the line as to the steps required for assembly. This is often referred to as Agile Manufacturing.
Since AR systems provide users with information spatially overlaid and stabilized onto the real world, a key issue in this technology is accurate head tracking. Errors in the knowledge of the user's head (actually the users HMD) map directly into potentially noticeable errors in the alignment of the graphical information on the real world. A tracking accuracy of 0.1mm in position and 0.01 degree in orientation will produce imperceptible visual alignment errors in a comfortable working volume defined by the human arm reach. Therefore this is the ultimate goal of AR tracking technology.
There are various tracking technologies on the market today such as magnetic, mechanical, ultrasonic, and inertial. Magnetic-based trackers are widely used because they are small, light weight, turn-key, relatively inexpensive. These trackers, however, suffer from interference and distortion from environmental metal and electromagnetic fields in manufacturing environments that restricts their usage in factory environments that have heavy electromechanical equipment. Mechanical trackers use booms and angle encoders to determine position and orientation. They are fast, accurate and have high resolution, but their mechanical linkage limits their working volume. Ultrasonic trackers use time of flight of sound pulses from an array of acoustic transmitters to an array of detectors to determine position and orientation. They are light in weight, accurate but they have high temporal lag, are very susceptible to ambient acoustic noise, require line of sight between the transmitter and detectors limiting their usage in factory environments. Finally, inertial trackers such as those used in inertial guidance systems onboard airplanes, use gyroscopes and
0-8186-7843-7/97 $10.00 © 1997 IEEE 146
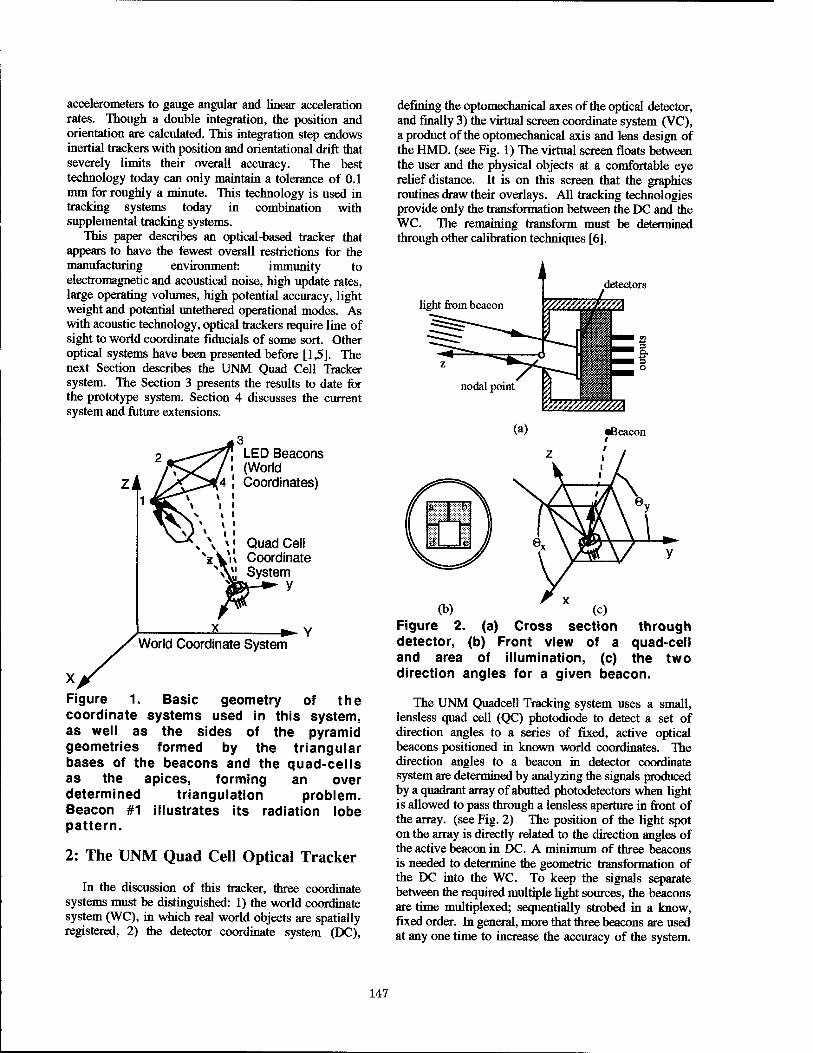
accelerometers to gauge angular and linear acceleration rates. Though a double integration, the position and orientation are calculated. This integration step endows inertial trackers with position and orientational drift that severely limits their overall accuracy. The best technology today can only maintain a tolerance of 0.1 mm for roughly a minute. This technology is used in tracking systems today in combination with supplemental tracking systems.
This paper describes an optical-based tracker that appears to have the fewest overall restrictions for the manufacturing environment: immunity to electromagnetic and acoustical noise, high update rates, large operating volumes, high potential accuracy, light weight and potential untethered operational modes. As with acoustic technology, optical trackers require line of sight to world coordinate fiducials of some sort. Other optical systems have been presented before [1,5]. The next Section describes the UNM Quad Cell Tracker system. The Section 3 presents the results to date for the prototype system. Section 4 discusses the current system and future extensions.
LED Beacons (World Coordinates)
Quad Cell \ Coordinate
System y
► Y World Coordinate System
X Figure 1. Basic geometry of the coordinate systems used in this system, as well as the sides of the pyramid geometries formed by the triangular bases of the beacons and the quad-cells as the apices, forming an over determined triangulation problem. Beacon #1 illustrates its radiation lobe pattern.
2: The UNM Quad Cell Optical Tracker
In the discussion of this tracker, (hree coordinate systems must be distinguished: 1) the world coordinate system (WC), in which real world objects are spatially registered, 2) the detector coordinate system (DC),
defining the optomechanical axes of the optical detector, and finally 3) the virtual screen coordinate system (VC), a product of the optomechanical axis and lens design of the HMD. (see Fig. 1) The virtual screen floats between the user and the physical objects at a comfortable eye relief distance. It is on this screen that the graphics routines draw their overlays. All tracking technologies provide only the transformation between the DC and the WC. The remaining transform must be determined through other calibration techniques [6].
light from beacon
(b) ' " (c) Figure 2. (a) Cross section through detector, (b) Front view of a quad-cell and area of illumination, (c) the two direction angles for a given beacon.
The UNM Quadcell Tracking system uses a small, lensless quad cell (QC) photodiode to detect a set of direction angles to a series of fixed, active optical beacons positioned in known world coordinates. The direction angles to a beacon in detector coordinate system are determined by analyzing the signals produced by a quadrant array of abutted photodetectors when light is allowed to pass through a lensless aperture in front of the array, (see Fig. 2) The position of the light spot on the array is directly related to the direction angles of the active beacon in DC. A minimum of three beacons is needed to determine the geometric transformation of the DC into the WC. To keep the signals separate between the required multiple light sources, the beacons are time multiplexed; sequentially strobed in a know, fixed order. In general, more that three beacons are used at any one time to increase the accuracy of the system.
147
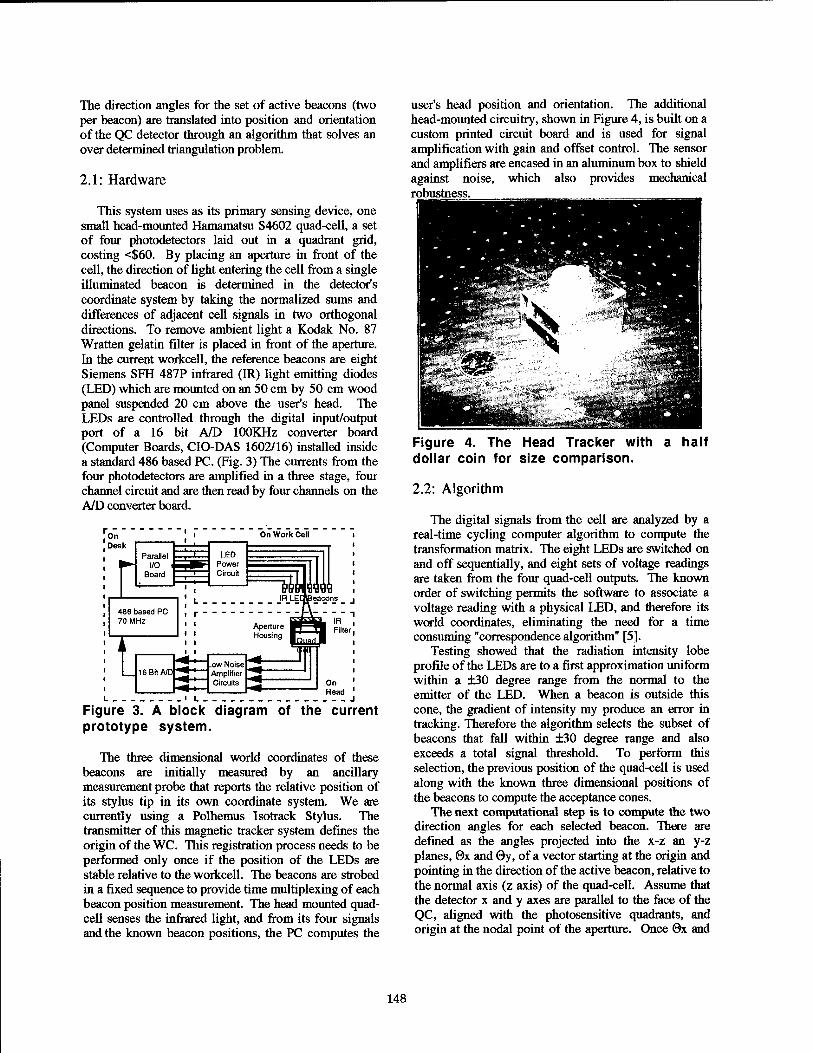
The direction angles for the set of active beacons (two per beacon) are translated into position and orientation of the QC detector through an algorithm that solves an over determined triangulation problem.
2.1: Hardware
This system uses as its primary sensing device, one small head-mounted Hamamatsu S4602 quad-cell, a set of four photodetectors laid out in a quadrant grid, costing <$60. By placing an aperture in front of the cell, the direction of light entering the cell from a single illuminated beacon is determined in the detector's coordinate system by taking the normalized sums and differences of adjacent cell signals in two orthogonal directions. To remove ambient light a Kodak No. 87 Wratten gelatin filter is placed in front of the aperture. In the current workcell, the reference beacons are eight Siemens SFH 487P infrared (IR) light emitting diodes (LED) which are mounted on an 50 cm by 50 cm wood panel suspended 20 cm above the user's head. The LEDs are controlled through the digital input/output port of a 16 bit A/D lOOKHz converter board (Computer Boards, CIO-DAS 1602/16) installed inside a standard 486 based PC. (Fig. 3) The currents from the four photodetectors are amplified in a three stage, four channel circuit and are then read by four channels on the A/D converter board.
Figure 3. A block diagram of the current prototype system.
The three dimensional world coordinates of these beacons are initially measured by an ancillary measurement probe that reports the relative position of its stylus tip in its own coordinate system. We are currently using a Polhemus Isotrack Stylus. The transmitter of this magnetic tracker system defines the origin of the WC. This registration process needs to be performed only once if the position of the LEDs are stable relative to the workcell. The beacons are strobed in a fixed sequence to provide time multiplexing of each beacon position measurement. The head mounted quad- cell senses the infrared light, and from its four signals and the known beacon positions, the PC computes the
user's head position and orientation. The additional head-mounted circuitry, shown in Figure 4, is built on a custom printed circuit board and is used for signal amplification with gain and offset control. The sensor and amplifiers are encased in an aluminum box to shield against noise, which also provides mechanical robustness.
Figure 4. The Head Tracker with a half dollar coin for size comparison.
2.2: Algorithm
The digital signals from the cell are analyzed by a real-time cycling computer algorithm to compute the transformation matrix. The eight LEDs are switched on and off sequentially, and eight sets of voltage readings are taken from the four quad-cell outputs. The known order of switching permits the software to associate a voltage reading with a physical LED, and therefore its world coordinates, eliminating the need for a time consuming "correspondence algorithm" [5].
Testing showed that the radiation intensity lobe profile of the LEDs are to a first approximation uniform within a ±30 degree range from the normal to the emitter of the LED. When a beacon is outside this cone, the gradient of intensity my produce an error in tracking. Therefore the algorithm selects the subset of beacons that fall within ±30 degree range and also exceeds a total signal threshold. To perform this selection, the previous position of the quad-cell is used along with the known three dimensional positions of the beacons to compute the acceptance cones.
The next computational step is to compute the two direction angles for each selected beacon. There are defined as the angles projected into the x-z an y-z planes, 0x and 0y, of a vector starting at the origin and pointing in the direction of the active beacon, relative to the normal axis (z axis) of the quad-cell. Assume that the detector x and y axes are parallel to the face of the QC, aligned with the photosensitive quadrants, and origin at the nodal point of the aperture. Once 0x and
148
0y are computed for each beacon, the subtended angle between each pair of beacon direction vectors is calculated. Now that the subtended angles and positions of the beacons are known (in WC), the triangulation problem can be solved.
With the aperture nodal point as the apex, a tetrahedral solid can be formed with every triad of beacons. Knowing the base triangle's position, and the three subtended angles at the apex, the position of the apex can be determined (two solutions). Since there are more than three beacons, many such tetrahedral solids are possible and therefore this must now be solved as a error minimization problem. As such, a line-search gradient descent routine was written to iteratively solve for the (x,y,z) position of the nodal point. This optimization routine uses the previous position of the quad-cell as an initial guess for the descent. At startup, this position is set to a central position within the working volume of the tracker.
Given the position of the QC, the DC rotation matrix is solved for directly using the positions of three of the beacons. The Euler angles of the transformation are not explicitly calculated. With this done, the tracking code passes the complete 4x4 homogenous transformation matrix to the graphics routines which updates the virtual screen.
3: Results
This section presents the preliminary results of our analysis of this tracking system. It includes discussions of the Monte Carlo simulation of tracker parameter sensitivities and noise reduction techniques.
3.1 Monte Carlo error estimates
To obtain an understanding of the sensitivity of the tracking performance to system parameters as well as the amount of tolerable error permitted in the two projected angles, a Monte-Carlo simulation was performed. A known DC->WC transformation was used in the reverse direction to compute the true 0x and 0y's for a set of simulated beacons. These angles were then corrupted with uniform random noise (±6) and the tracking algorithm was executed. The calculate DC- >WC was used to predict the location of ten randomly located known test points. The root-mean-square distances between the actual locations and the predicted locations were computed and added to an accumulating histogram. This was repeated for 10,000 trials with different random noise values drawn from the interval ±£ each time. For a mean positional tracking error of 0.1mm, acceptable error tolerance in the 6x and 0y's was determined to be £ = 2x10⁴. Given a 16bit A/D
converter coding 0x and 0y's over a ±30 degree
acceptance cone, the digitization error is ~T.5xl0"5> a full order of magnitude less that the tolerance.
3.2 Actual noise measurement
There are two types of random noise present in the system: a) changes in the ambient room light and b) electronics. To deal with the first, ambient light signals are sampled for each of the four photodetectors before and after the set of beacons are strobed. This background light is averaged and subtracted from all of the voltages read from the quad-cell channels. This has the side benefit of removing the detector's dark current. Random electronics noise effects are statistically reduced by taking multiple voltage samples during the time each beacon is on and averaging. This method introduces a clear trade-off between overall tracking update frequency, assuming constant A/D conversion rate, and accuracy. Measurements confirm that, using these techniques, noise levels are not larger than the tolerances found above.
LED energetics are the ultimate limitation on system accuracy. If the tracker is too far from the beacons, or the beacons are too weak emitters, then the performance of this system will begin to degrade. Larger collection areas on the QC and phase sensitive modulation techniques, will counteract these effects to some extent. There is no substitute for more signal.
4: Discussion
The University of North Carolina has successfully demonstrated optical tracking through the use of head mounted photodiode cameras, however, this system was requires lens distortion calibration, is heavy, bulky, expensive, and rather delicate. Boeing has demonstrated videometric tracking, with the added problem of requiring the real-time solution to the beacon correspondence problem. The QC weights approximately four grams, has a diameter of approximately fourteen millimeters, requires no lens calibration, no image processing or correspondence problem solution, and requires only minimal supplementary electronic components, making the system very light, compact, and mechanically robust.
One additional advantage of the QC optical tracking technology is that it can be easily transformed into a tetherless, body-centered tracking and data coordination system with the appropriate development of bi- directional IR optical communications. The future system (Fig. 5) is designed to take advantage of this wireless communication technology. A work cell computer will communicate cell-specific calibration data and graphical task data to the wearable or body-centered computer system. The wearable computer communicates user identification, task status, and synchronization signals to the work cell computer.
149
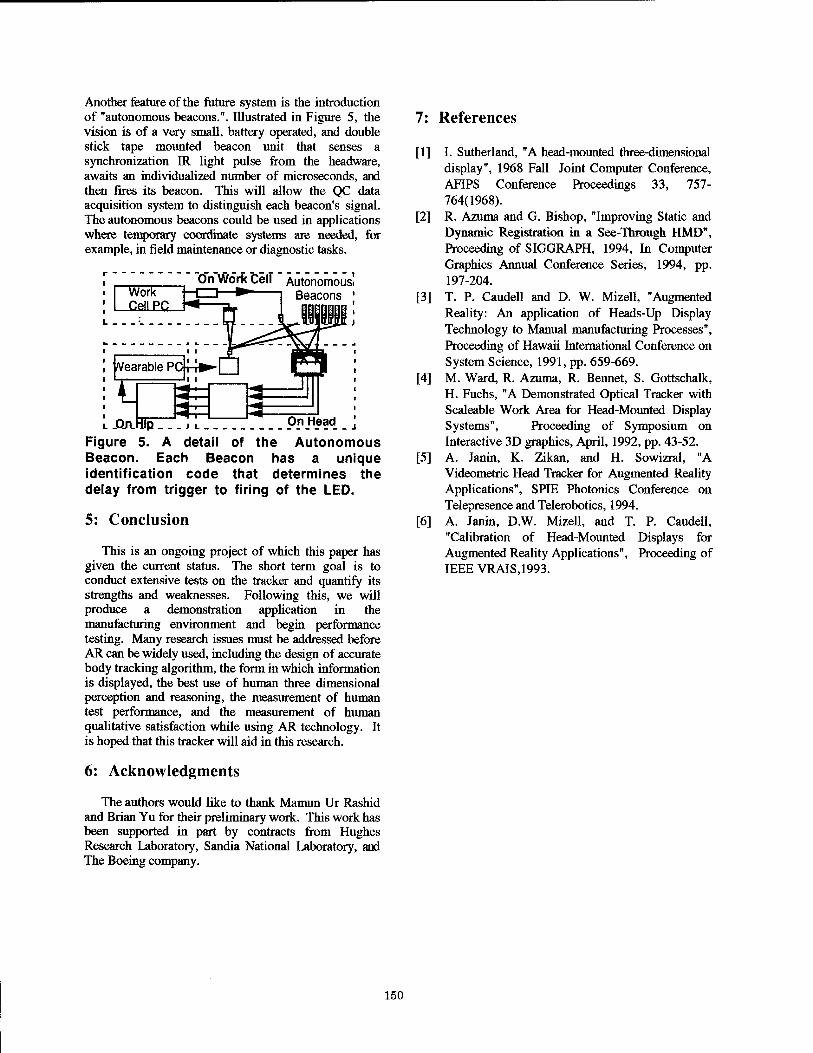
Another feature of the future system is the introduction of "autonomous beacons.". Illustrated in Figure 5, the vision is of a very small, battery operated, and double stick tape mounted beacon unit that senses a synchronization IR light pulse from the headware, awaits an individualized number of microseconds, and then fires its beacon. This will allow the QC data acquisition system to distinguish each beacon's signal. The autonomous beacons could be used in applications where temporary coordinate systems are needed, for example, in field maintenance or diagnostic tasks.
"O'n'WörkCelT" Autonomous! Beacons
-Q/LHip Figure 5. A detail of Beacon. Each Beacon
On Head the Autonomous
a unique has identification code that determines the delay from trigger to firing of the LED.
5: Conclusion
This is an ongoing project of which this paper has given the current status. The short term goal is to conduct extensive tests on the tracker and quantify its strengths and weaknesses. Following this, we will produce a demonstration application in the manufacturing environment and begin performance testing. Many research issues must be addressed before AR can be widely used, including the design of accurate body tracking algorithm, the form in which information is displayed, the best use of human three dimensional perception and reasoning, the measurement of human test performance, and the measurement of human qualitative satisfaction while using AR technology. It is hoped that this tracker will aid in this research.
6: Acknowledgments
The authors would like to thank Mamun Ur Rashid and Brian Yu for their preliminary work. This work has been supported in part by contracts from Hughes Research Laboratory, Sandia National Laboratory, and The Boeing company.
7: References
[1] I. Sutherland, "A head-mounted three-dimensional display", 1968 Fall Joint Computer Conference, AFIPS Conference Proceedings 33, 757- 764(1968).
[2] R. Azuma and G. Bishop, "Improving Static and Dynamic Registration in a See-Through HMD", Proceeding of SIGGRAPH, 1994, In Computer Graphics Annual Conference Series, 1994, pp. 197-204.
[3] T. P. Caudell and D. W. Mizell, "Augmented Reality: An application of Heads-Up Display Technology to Manual manufacturing Processes", Proceeding of Hawaii International Conference on System Science, 1991, pp. 659-669.
[4] M. Ward, R. Azuma, R. Bennet, S. Gottschalk, H. Fuchs, "A Demonstrated Optical Tracker with Scaleable Work Area for Head-Mounted Display Systems", Proceeding of Symposium on Interactive 3D graphics, April, 1992, pp. 43-52.
[5] A. Janin, K. Zikan, and H. Sowizral, "A Videometric Head Tracker for Augmented Reality Applications", SPIE Photonics Conference on Telepresence and Telerobotics, 1994.
[6] A. Janin, D.W. Mizell, and T. P. Caudell, "Calibration of Head-Mounted Displays for Augmented Reality Applications", Proceeding of IEEE VRAIS,1993.
150

INVITED mm
KFU 4IOLLQC4I UCLA

Invited Speaker:
DESIGN PRINCIPLES FOR ONLINE COMMUNITIES: LESSONS FROM EARLY SETTLEMENTS
As online environments become inhabited by groups of people, the key challenges to be faced are not simply technological, but also sociological: the challenges of social interaction and social organization. This is not to diminish the great difficulties in creating new technologies, but rather to emphasize that even these tasks pale beside the problems of facilitating and encouraging successful online interaction and online communities.
The problems of social interaction and organization are often ignored in the computer industry. While many people have begun to talk about "social computing," as it is used now it is a thin term that applies more to user interface design than to actual social interaction between two or more people. Common responses to the challenge of designing systems that support robust social interaction include pretending this issue is not important, or that there is nothing one can do about it, or that it is simply a user interface issue. In my comments, I wish to argue that all of these responses are incorrect. I also wish to discuss the features of successful and unsuccessful online communities. While there are no algorithms for a community, there are some very useful heuristics, and I will draw from research in the social sciences as well as the practical experience of long-time participants in online groups to discuss various design principles for online communities.
My focus is on the graphical virtual worlds that have recently been released on the Internet — worlds that have added a 2-D or 3-D visual representation of a space to go along with text or voice communication. Extrapolating from the lessons learned from current online communities, I will discuss issues and challenges that are likely to occur in fully immersive VR online communities.
Peter Kollock is an associate professor of Sociology at the University of California, Los Angeles and director of the Center for the Study of Online Communities. His research focuses on cooperation and the role of trust and commitment in groups. He studies a wide range of situations in which group members gain by cooperating where an element of temptation to behave selfishly exists, examining the factors that encourage or discourage the emergence of cooperation and community. He uses a variety of research methods including experiments, fieldwork, and computer simulations. His recent work has concentrated on studies of cooperation and conflict in computer-mediated communities, and he has several projects in progress examining social interaction and organization in online groups. Dr. Kollock received his BA, MA, and Ph.D. in Sociology from the University of Washington, and he has received a number of award and honors including the Founder's Prize (SASE), an Advancement in the Discipline Grant (ASA/NSF), and several awards for distinguished teaching from UCLA and the University of Washington. He has been invited to speak on his research nationally and internationally, including presentations in Japan, Germany, Poland, Australia, and the Netherlands.
152

WML
YununL4iumjiH( MU 1I0KIH!. MMl OMflMZtt Georgia Institute of Technology
Panel on Virtual Humans
Panelists:
Jessica Hodgins, Georgia Institute of Technology Sharon Stansfield, Sandia National Labs Daniel Thalman, Swiss Federal Institute of Technology
This panel will address current issues for autonomous virtual humans and avatars in the context of domains such as shared environments, training environments, and entertainment applications. We will explore questions about the appropriate level of realism in human models, techniques for motion generation, implementation of autonomous higher-level behaviors, interaction techniques, and evaluation criteria.
154
mm
VHL4IUIDM
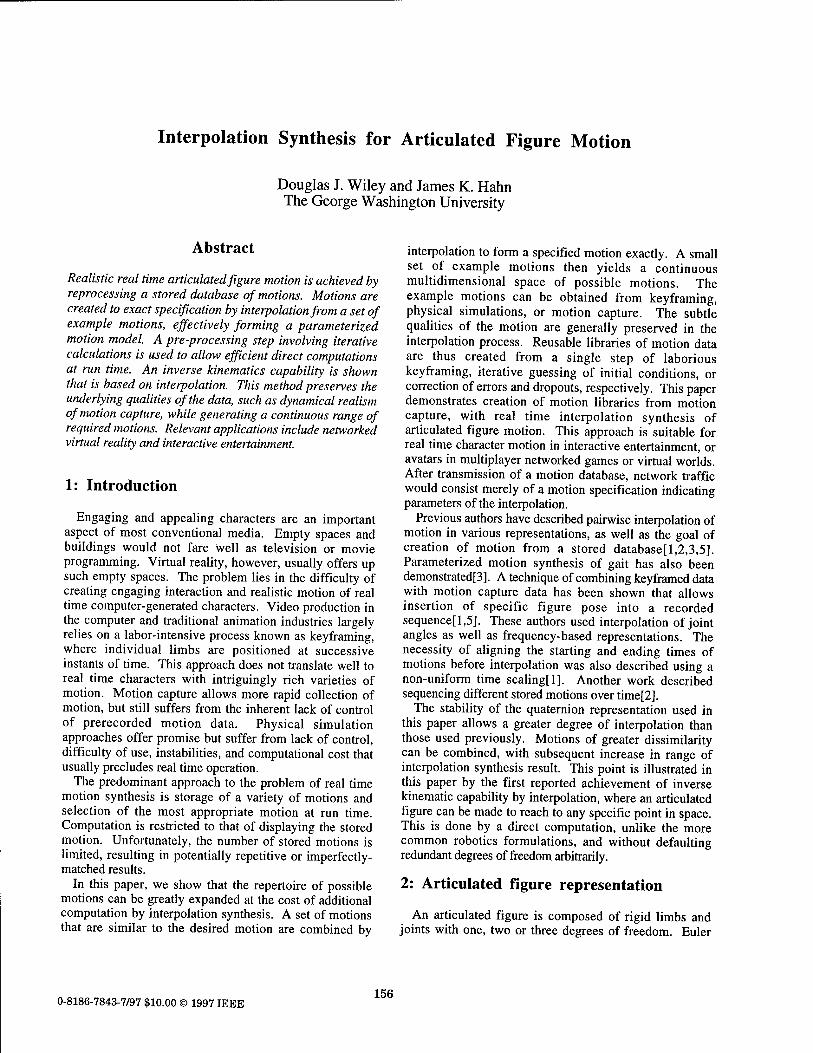
Interpolation Synthesis for Articulated Figure Motion
Douglas J. Wiley and James K. Hahn The George Washington University
Abstract
Realistic real time articulated figure motion is achieved by reprocessing a stored database of motions. Motions are created to exact specification by interpolation from a set of example motions, effectively forming a parameterized motion model. A pre-processing step involving iterative calculations is used to allow efficient direct computations at run time. An inverse kinematics capability is shown that is based on interpolation. This method preserves the underlying qualities of the data, such as dynamical realism of motion capture, while generating a continuous range of required motions. Relevant applications include networked virtual reality and interactive entertainment.
1: Introduction
Engaging and appealing characters are an important aspect of most conventional media. Empty spaces and buildings would not fare well as television or movie programming. Virtual reality, however, usually offers up such empty spaces. The problem lies in the difficulty of creating engaging interaction and realistic motion of real time computer-generated characters. Video production in the computer and traditional animation industries largely relies on a labor-intensive process known as keyframing, where individual limbs are positioned at successive instants of time. This approach does not translate well to real time characters with intriguingly rich varieties of motion. Motion capture allows more rapid collection of motion, but still suffers from the inherent lack of control of prerecorded motion data. Physical simulation approaches offer promise but suffer from lack of control, difficulty of use, instabilities, and computational cost that usually precludes real time operation.
The predominant approach to the problem of real time motion synthesis is storage of a variety of motions and selection of the most appropriate motion at run time. Computation is restricted to that of displaying the stored motion. Unfortunately, the number of stored motions is limited, resulting in potentially repetitive or imperfectly- matched results.
In this paper, we show that the repertoire of possible motions can be greatly expanded at the cost of additional computation by interpolation synthesis. A set of motions that are similar to the desired motion are combined by
interpolation to form a specified motion exactly. A small set of example motions then yields a continuous multidimensional space of possible motions. The example motions can be obtained from keyframing, physical simulations, or motion capture. The subtle qualities of the motion are generally preserved in the interpolation process. Reusable libraries of motion data are thus created from a single step of laborious keyframing, iterative guessing of initial conditions, or correction of errors and dropouts, respectively. This paper demonstrates creation of motion libraries from motion capture, with real time interpolation synthesis of articulated figure motion. This approach is suitable for real time character motion in interactive entertainment, or avatars in multiplayer networked games or virtual worlds. After transmission of a motion database, network traffic would consist merely of a motion specification indicating parameters of the interpolation.
Previous authors have described pairwise interpolation of motion in various representations, as well as the goal of creation of motion from a stored database[l,2,3,5]. Parameterized motion synthesis of gait has also been demonstrated[3]. A technique of combining keyframed data with motion capture data has been shown that allows insertion of specific figure pose into a recorded sequence[l,5]. These authors used interpolation of joint angles as well as frequency-based representations. The necessity of aligning the starting and ending times of motions before interpolation was also described using a non-uniform time scalingfl]. Another work described sequencing different stored motions over time[2].
The stability of the quaternion representation used in this paper allows a greater degree of interpolation than those used previously. Motions of greater dissimilarity can be combined, with subsequent increase in range of interpolation synthesis result. This point is illustrated in this paper by the first reported achievement of inverse kinematic capability by interpolation, where an articulated figure can be made to reach to any specific point in space. This is done by a direct computation, unlike the more common robotics formulations, and without defaulting redundant degrees of freedom arbitrarily.
2: Articulated figure representation
An articulated figure is composed of rigid limbs and joints with one, two or three degrees of freedom. Euler
0-8186-7843-7/97 $10.00 © 1997 IEEE 156
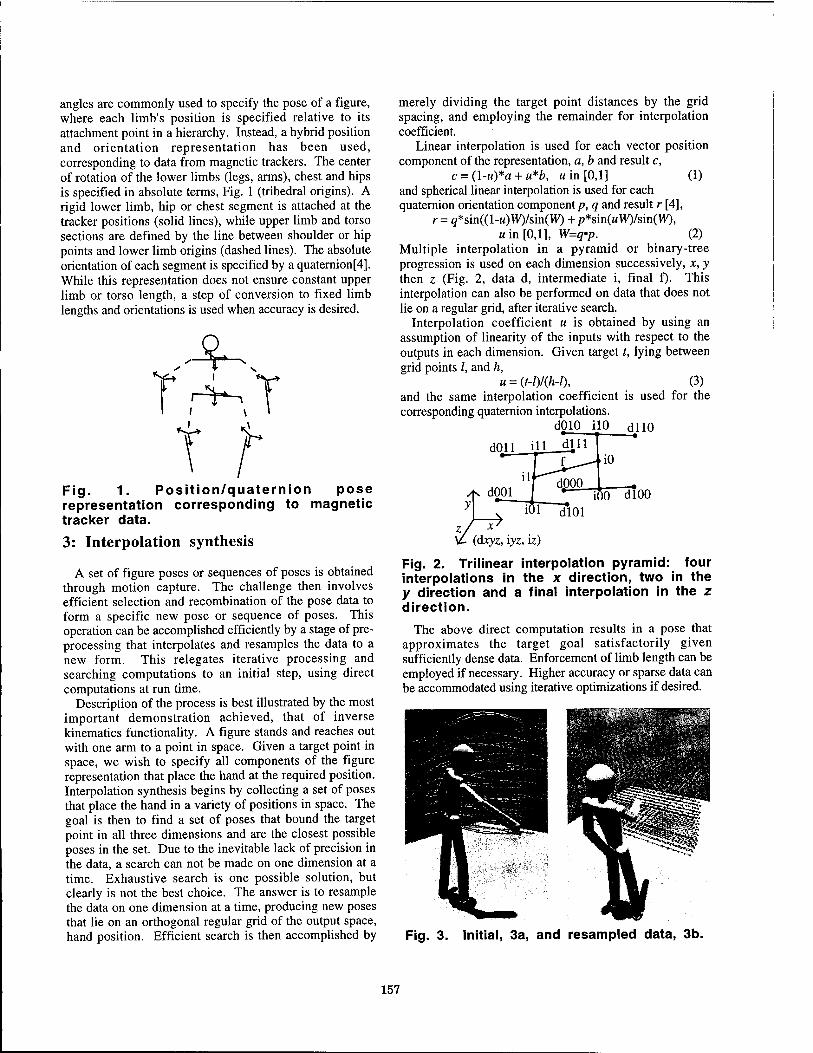
angles are commonly used to specify the pose of a figure, where each limb's position is specified relative to its attachment point in a hierarchy. Instead, a hybrid position and orientation representation has been used, corresponding to data from magnetic trackers. The center of rotation of the lower limbs (legs, arms), chest and hips is specified in absolute terms, Fig. 1 (trihedral origins). A rigid lower limb, hip or chest segment is attached at the tracker positions (solid lines), while upper limb and torso sections are defined by the line between shoulder or hip points and lower limb origins (dashed lines). The absolute orientation of each segment is specified by a quaternion[4]. While this representation does not ensure constant upper limb or torso length, a step of conversion to fixed limb lengths and orientations is used when accuracy is desired.
Fig. 1. Position/quaternion pose representation corresponding to magnetic tracker data.
3: Interpolation synthesis
A set of figure poses or sequences of poses is obtained through motion capture. The challenge then involves efficient selection and recombination of the pose data to form a specific new pose or sequence of poses. This operation can be accomplished efficiently by a stage of pre- processing that interpolates and resamples the data to a new form. This relegates iterative processing and searching computations to an initial step, using direct computations at run time.
Description of the process is best illustrated by the most important demonstration achieved, that of inverse kinematics functionality. A figure stands and reaches out with one arm to a point in space. Given a target point in space, we wish to specify all components of the figure representation that place the hand at the required position. Interpolation synthesis begins by collecting a set of poses that place the hand in a variety of positions in space. The goal is then to find a set of poses that bound the target point in all three dimensions and are the closest possible poses in the set. Due to the inevitable lack of precision in the data, a search can not be made on one dimension at a time. Exhaustive search is one possible solution, but clearly is not the best choice. The answer is to resample the data on one dimension at a time, producing new poses that lie on an orthogonal regular grid of the output space, hand position. Efficient search is then accomplished by
merely dividing the target point distances by the grid spacing, and employing the remainder for interpolation coefficient.
Linear interpolation is used for each vector position component of the representation, a, b and result c,
c = (l-u)*a + u*b, win [0,1] (1) and spherical linear interpolation is used for each quaternion orientation component/?, q and result r [4],
r=q*sm((l-u)W)/sm(W)+p*sm(uW)/sm(W), «in [0,1], W=q-p. (2)
Multiple interpolation in a pyramid or binary-tree progression is used on each dimension successively, x, y then z (Fig. 2, data d, intermediate i, final f). This interpolation can also be performed on data that does not lie on a regular grid, after iterative search.
Interpolation coefficient u is obtained by using an assumption of linearity of the inputs with respect to the outputs in each dimension. Given target t, lying between grid points /, and h,
u = (t-l)/(h-l), (3) and the same interpolation coefficient is used for the corresponding quaternion interpolations.
dOlO ilO dllO
ill
dlOO
V- (dxyz, iyz, iz)
Fig. 2. Trilinear interpolation pyramid: four interpolations in the x direction, two in the y direction and a final interpolation in the z direction.
The above direct computation results in a pose that approximates the target goal satisfactorily given sufficiently dense data. Enforcement of limb length can be employed if necessary. Higher accuracy or sparse data can be accommodated using iterative optimizations if desired.
Fig. 3. Initial, 3a, and resampled data, 3b.
157
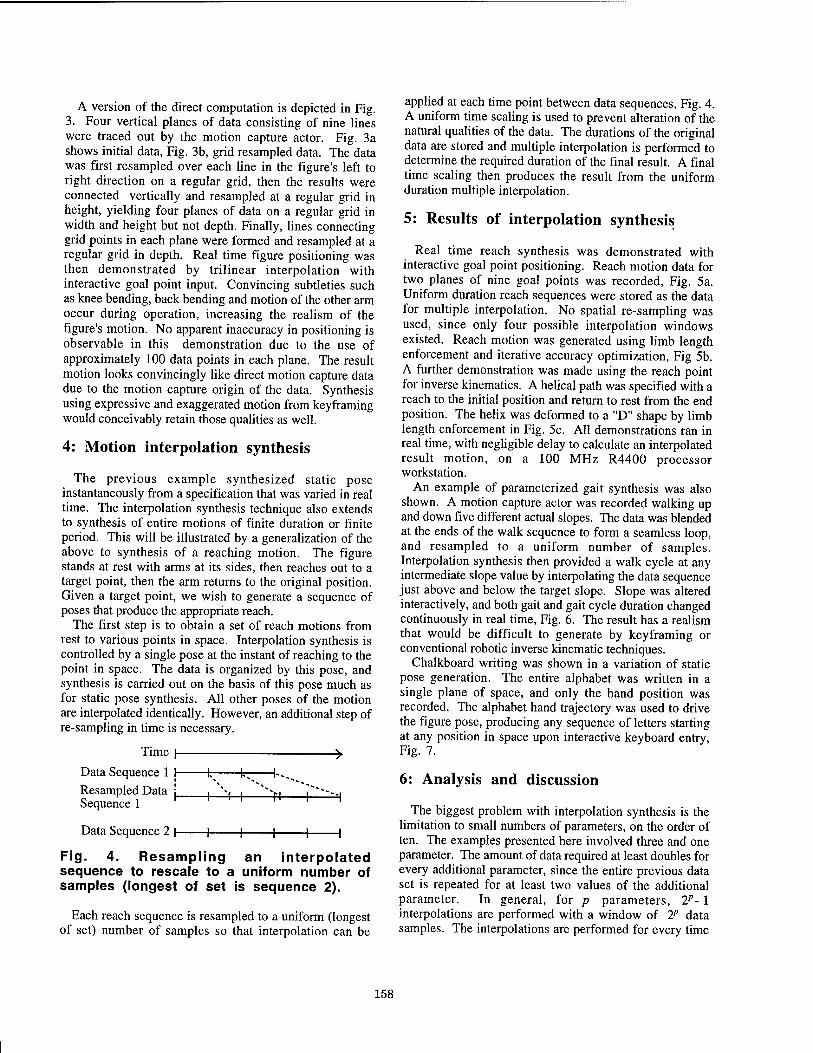
A version of the direct computation is depicted in Fig. 3. Four vertical planes of data consisting of nine lines were traced out by the motion capture actor. Fig. 3a shows initial data, Fig. 3b, grid resampled data. The data was first resampled over each line in the figure's left to right direction on a regular grid, then the results were connected vertically and resampled at a regular grid in height, yielding four planes of data on a regular grid in width and height but not depth. Finally, lines connecting grid points in each plane were formed and resampled at a regular grid in depth. Real time figure positioning was then demonstrated by trilinear interpolation with interactive goal point input. Convincing subtleties such as knee bending, back bending and motion of the other arm occur during operation, increasing the realism of the figure's motion. No apparent inaccuracy in positioning is observable in this demonstration due to the use of approximately 100 data points in each plane. The result motion looks convincingly like direct motion capture data due to the motion capture origin of the data. Synthesis using expressive and exaggerated motion from keyframing would conceivably retain those qualities as well.
4: Motion interpolation synthesis
The previous example synthesized static pose instantaneously from a specification that was varied in real time. The interpolation synthesis technique also extends to synthesis of entire motions of finite duration or finite period. This will be illustrated by a generalization of the above to synthesis of a reaching motion. The figure stands at rest with arms at its sides, then reaches out to a target point, then the arm returns to the original position. Given a target point, we wish to generate a sequence of poses that produce the appropriate reach.
The first step is to obtain a set of reach motions from rest to various points in space. Interpolation synthesis is controlled by a single pose at the instant of reaching to the point in space. The data is organized by this pose, and synthesis is carried out on the basis of this pose much as for static pose synthesis. All other poses of the motion are interpolated identically. However, an additional step of re-sampling in time is necessary.
Time |
Data Sequence 1 1 fc fc^ 1... ->
Resampled Data j_ Sequence 1
Data Sequence 2 |- H
Fig. 4. Resampling an interpolated sequence to rescale to a uniform number of samples (longest of set is sequence 2).
Each reach sequence is resampled to a uniform (longest of set) number of samples so that interpolation can be
applied at each time point between data sequences, Fig. 4. A uniform time scaling is used to prevent alteration of the natural qualities of the data. The durations of the original data are stored and multiple interpolation is performed to determine the required duration of the final result. A final time scaling then produces the result from the uniform duration multiple interpolation.
5: Results of interpolation synthesis
Real time reach synthesis was demonstrated with interactive goal point positioning. Reach motion data for two planes of nine goal points was recorded, Fig. 5a. Uniform duration reach sequences were stored as the data for multiple interpolation. No spatial re-sampling was used, since only four possible interpolation windows existed. Reach motion was generated using limb length enforcement and iterative accuracy optimization, Fig 5b. A further demonstration was made using the reach point for inverse kinematics. A helical path was specified with a reach to the initial position and return to rest from the end position. The helix was deformed to a "D" shape by limb length enforcement in Fig. 5c. All demonstrations ran in real time, with negligible delay to calculate an interpolated result motion, on a 100 MHz R4400 processor workstation.
An example of parameterized gait synthesis was also shown. A motion capture actor was recorded walking up and down five different actual slopes. The data was blended at the ends of the walk sequence to form a seamless loop, and resampled to a uniform number of samples. Interpolation synthesis then provided a walk cycle at any intermediate slope value by interpolating the data sequence just above and below the target slope. Slope was altered interactively, and both gait and gait cycle duration changed continuously in real time, Fig. 6. The result has a realism that would be difficult to generate by keyframing or conventional robotic inverse kinematic techniques.
Chalkboard writing was shown in a variation of static pose generation. The entire alphabet was written in a single plane of space, and only the hand position was recorded. The alphabet hand trajectory was used to drive the figure pose, producing any sequence of letters starting at any position in space upon interactive keyboard entry, Fig- 7.
6: Analysis and discussion
The biggest problem with interpolation synthesis is the limitation to small numbers of parameters, on the order of ten. The examples presented here involved three and one parameter. The amount of data required at least doubles for every additional parameter, since the entire previous data set is repeated for at least two values of the additional parameter. In general, for p parameters, 2P- 1 interpolations are performed with a window of IP data samples. The interpolations are performed for every time
158
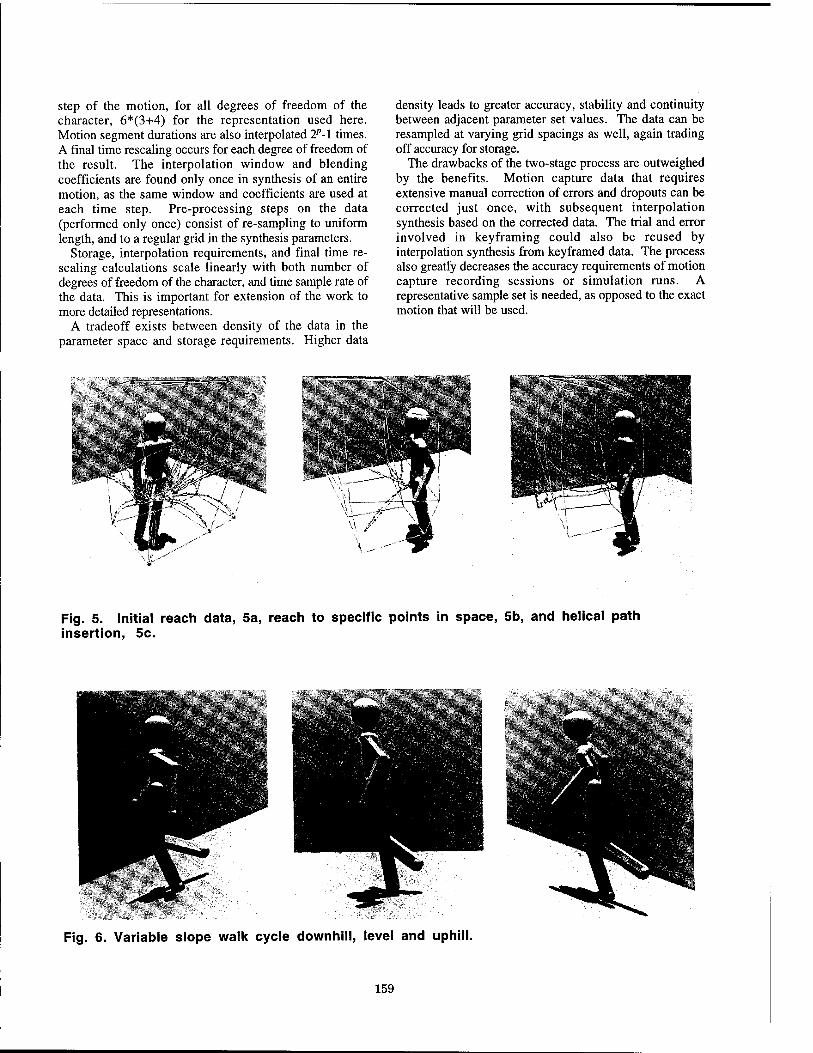
step of the motion, for all degrees of freedom of the character, 6*(3+4) for the representation used here. Motion segment durations are also interpolated 2P-1 times. A final time rescaling occurs for each degree of freedom of the result. The interpolation window and blending coefficients are found only once in synthesis of an entire motion, as the same window and coefficients are used at each time step. Pre-processing steps on the data (performed only once) consist of re-sampling to uniform length, and to a regular grid in the synthesis parameters.
Storage, interpolation requirements, and final time re- scaling calculations scale linearly with both number of degrees of freedom of the character, and time sample rate of the data. This is important for extension of the work to more detailed representations.
A tradeoff exists between density of the data in the parameter space and storage requirements. Higher data
density leads to greater accuracy, stability and continuity between adjacent parameter set values. The data can be resampled at varying grid spacings as well, again trading off accuracy for storage.
The drawbacks of the two-stage process are outweighed by the benefits. Motion capture data that requires extensive manual correction of errors and dropouts can be corrected just once, with subsequent interpolation synthesis based on the corrected data. The trial and error involved in keyframing could also be reused by interpolation synthesis from keyframed data. The process also greatly decreases the accuracy requirements of motion capture recording sessions or simulation runs. A representative sample set is needed, as opposed to the exact motion that will be used.
■W&I
Fig. 5. Initial reach data, 5a, reach to specific points in space, 5b, and helical path insertion, 5c.
MIH
Fig. 6. Variable slope walk cycle downhill, level and uphill.
159
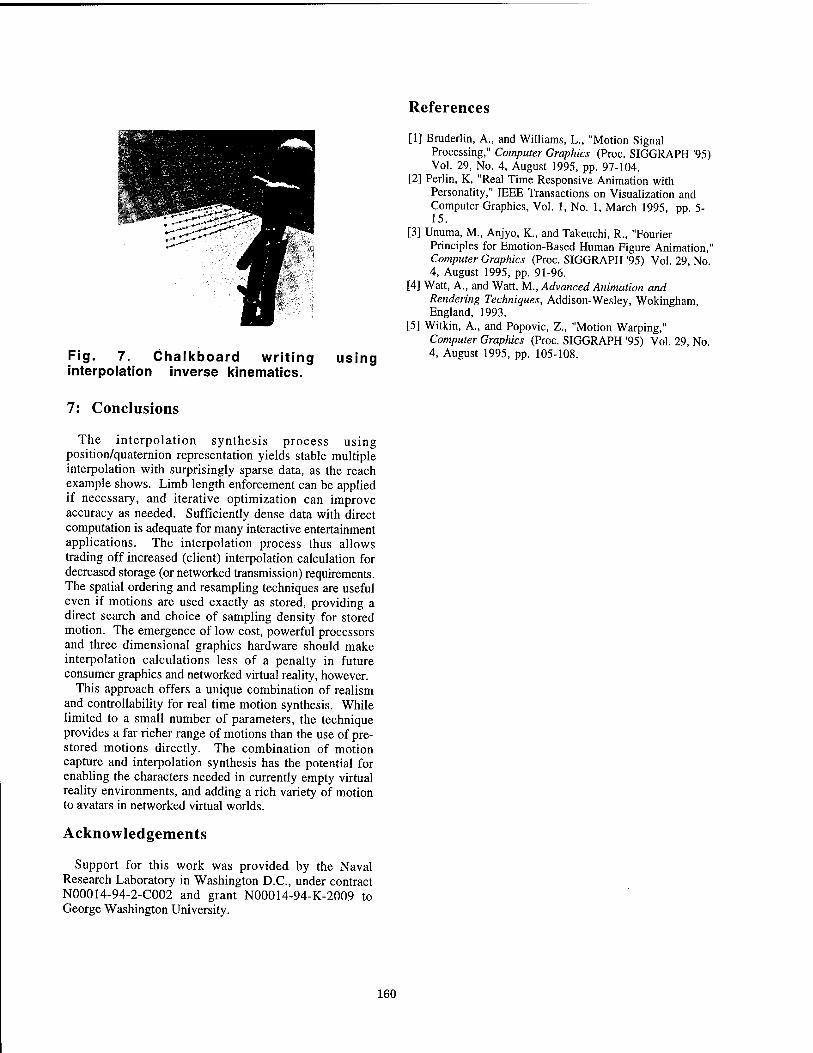
References
Fig. 7. Chalkboard writing using interpolation inverse kinematics.
[1] Bruderlin, A., and Williams, L., "Motion Signal Processing," Computer Graphics (Proc. SIGGRAPH '95) Vol. 29, No. 4, August 1995, pp. 97-104.
[2] Perlin, K, "Real Time Responsive Animation with Personality," IEEE Transactions on Visualization and Computer Graphics, Vol. 1, No. 1, March 1995, pp. 5-
[3] Unuma, M., Anjyo, K., and Takeuchi, R., "Fourier Principles for Emotion-Based Human Figure Animation," Computer Graphics (Proc. SIGGRAPH '95) Vol. 29, No. 4, August 1995, pp. 91-96.
[4] Watt, A., and Watt, M., Advanced Animation and Rendering Techniques, Addison-Wesley, Wokingham, England, 1993.
[5] Witkin, A., and Popovic, Z., "Motion Warping," Computer Graphics (Proc. SIGGRAPH '95) Vol. 29, No. 4, August 1995, pp. 105-108.
7: Conclusions
The interpolation synthesis process using position/quaternion representation yields stable multiple interpolation with surprisingly sparse data, as the reach example shows. Limb length enforcement can be applied if necessary, and iterative optimization can improve accuracy as needed. Sufficiently dense data with direct computation is adequate for many interactive entertainment applications. The interpolation process thus allows trading off increased (client) interpolation calculation for decreased storage (or networked transmission) requirements. The spatial ordering and resampling techniques are useful even if motions are used exactly as stored, providing a direct search and choice of sampling density for stored motion. The emergence of low cost, powerful processors and three dimensional graphics hardware should make interpolation calculations less of a penalty in future consumer graphics and networked virtual reality, however.
This approach offers a unique combination of realism and controllability for real time motion synthesis. While limited to a small number of parameters, the technique provides a far richer range of motions than the use of pre- stored motions directly. The combination of motion capture and interpolation synthesis has the potential for enabling the characters needed in currently empty virtual reality environments, and adding a rich variety of motion to avatars in networked virtual worlds.
Acknowledgements
Support for this work was provided by the Naval Research Laboratory in Washington D.C., under contract N00014-94-2-C002 and grant N00014-94-K-2009 to George Washington University.
160
A Dead-Reckoning Algorithm for Virtual Human Figures
Tolga K. Capin1, Igor Sunday Pandzic2, Nadia Magnenat Thalmann2, Daniel Thalmann1
Computer Graphics Laboratory Swiss Federal Institute of Technology
CH1015 Lausanne, Switzerland {capin,thalmann} @lig.di.epfl.ch
http://ligwww.epfl.ch
2MIRALAB-CUI University of Geneva
24 rue de General-Dufour CH1211 Geneva 4, Switzerland
{Igor.Pandzic,Nadia.Thalmann}@cui.unige.ch http://miralabwww.unige.ch
Abstract
In networked virtual environments; when the participants are represented by virtual human figures, the articulated structure of the human body introduces a new complexity in the usage of the network resources. This might create a significant overhead in communication, especially as the number of participants in the simulation increases. In addition, the animation should be realistic, as it is easy to recognize anomalies in the virtual human animation. This requires real-time algorithms to decrease the network overhead, while considering characteristics of body motion. The dead-reckoning technique is a way to decrease the number of messages communicated among the participants, and has been used for simple non-articulated objects in popular systems. In this paper, we introduce a dead-reckoning technique for articulated virtual human figures based on Kaiman filtering, and discuss main issues and present experimental results.
1. Introduction
In multiuser networked virtual environments, it is necessary to provide a natural means of interaction among participants for better collaboration. The participant representation in a networked VE system has several functions: inform the participants' presence to others, identify and differentiate different participants, visualize the
participants' position and orientation, direction of interest, and enable communication among participants. Therefore, in most applications, it is important to represent participants by virtual human figures. The participants visualize the environment through the eyes of their virtual actor, and move their virtual body by different means of body control. In addition, introducing the human-like autonomous actors for various tasks increases the level of interaction within the virtual environment. [11]
When the participants are represented by virtual human figures, the articulated structure of the human body introduces a new complexity in the usage of the network resources; because the size of a message needed to represent the body posture is much larger than the one needed for simple, non-articulated objects. This might create a significant overhead in communication, especially as the number of participants in the simulation increases. The animation should also be realistic, as it is easy to recognize anomalies in the virtual human body movements. These requirements should be taken into consideration for human modeling and communication in networked virtual environments. Perlin proposed to make use of the texture of motion, by defining high level parameters of the motion, and adding a noise function to create realistic looking motions [10]. The dead-reckoning technique is a general way to decrease the amount of messages communicated among the participants, and has been used for simple non-articulated objects in popular systems. In this paper, we present a dead-reckoning approach for articulated virtual human figures, and discuss main issues and experimental results.
161 0-8186-7843-7/97 $10.00 © 1997 IEEE
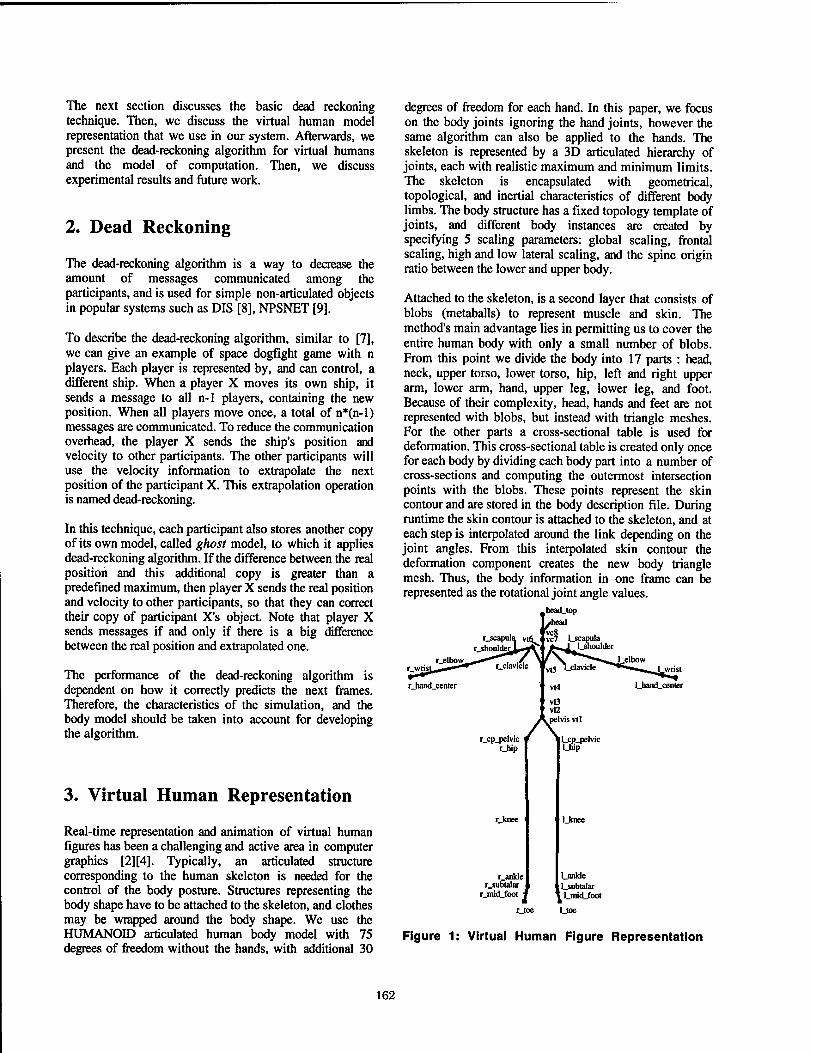
The next section discusses the basic dead reckoning technique. Then, we discuss the virtual human model representation that we use in our system. Afterwards, we present the dead-reckoning algorithm for virtual humans and the model of computation. Then, we discuss experimental results and future work.
2. Dead Reckoning
The dead-reckoning algorithm is a way to decrease the amount of messages communicated among the participants, and is used for simple non-articulated objects in popular systems such as DIS [8], NPSNET [9].
To describe the dead-reckoning algorithm, similar to [7], we can give an example of space dogfight game with n players. Each player is represented by, and can control, a different ship. When a player X moves its own ship, it sends a message to all n-1 players, containing the new position. When all players move once, a total of n*(n-l) messages are communicated. To reduce the communication overhead, the player X sends the ship's position and velocity to other participants. The other participants will use the velocity information to extrapolate the next position of the participant X. This extrapolation operation is named dead-reckoning.
In this technique, each participant also stores another copy of its own model, called ghost model, to which it applies dead-reckoning algorithm. If the difference between the real position and this additional copy is greater than a predefined maximum, then player X sends the real position and velocity to other participants, so that they can correct their copy of participant X's object. Note that player X sends messages if and only if there is a big difference between the real position and extrapolated one.
The performance of the dead-reckoning algorithm is dependent on how it correctly predicts the next frames. Therefore, the characteristics of the simulation, and the body model should be taken into account for developing the algorithm.
3. Virtual Human Representation
Real-time representation and animation of virtual human figures has been a challenging and active area in computer graphics [2] [4]. Typically, an articulated structure corresponding to the human skeleton is needed for the control of the body posture. Structures representing the body shape have to be attached to the skeleton, and clothes may be wrapped around the body shape. We use the HUMANOID articulated human body model with 75 degrees of freedom without the hands, with additional 30
degrees of freedom for each hand. In this paper, we focus on the body joints ignoring the hand joints, however the same algorithm can also be applied to the hands. The skeleton is represented by a 3D articulated hierarchy of joints, each with realistic maximum and minimum limits. The skeleton is encapsulated with geometrical, topological, and inertial characteristics of different body limbs. The body structure has a fixed topology template of joints, and different body instances are created by specifying 5 scaling parameters: global scaling, frontal scaling, high and low lateral scaling, and the spine origin ratio between the lower and upper body.
Attached to the skeleton, is a second layer that consists of blobs (metaballs) to represent muscle and skin. The method's main advantage lies in permitting us to cover the entire human body with only a small number of blobs. From this point we divide the body into 17 parts : head, neck, upper torso, lower torso, hip, left and right upper arm, lower arm, hand, upper leg, lower leg, and foot. Because of their complexity, head, hands and feet are not represented with blobs, but instead with triangle meshes. For the other parts a cross-sectional table is used for deformation. This cross-sectional table is created only once for each body by dividing each body part into a number of cross-sections and computing the outermost intersection points with the blobs. These points represent the skin contour and are stored in the body description file. During runtime the skin contour is attached to the skeleton, and at each step is interpolated around the link depending on the joint angles. From this interpolated skin contour the deformation component creates the new body triangle mesh. Thus, the body information in one frame can be represented as the rotational joint angle values.
Uiand_center
r_cp_pelvic r_hip
rjcnee '
r_anklc r.subtalar
r_mid_foot ■
r_toe
Lcpjelvic Lhip
IJtnee
Lankle Lsubtalai
i Lmid_foot
l_toe
Figure 1: Virtual Human Figure Representation
162
4. Dead-Reckoning for Virtual Human Figures
The dead-reckoning algorithm on virtual human figures works on their position and body joint angles. There are different possible levels of dead-reckoning of virtual humans:
- joint-level dead-reckoning: This approach requires no knowledge on the type of action the figure is executing (e.g. walking, grasping) and no information on the motion control method (e.g. inverse kinematics, dynamics, real- time motion capture). The joint angles of the virtual body are considered to be only available information; and the dead-reckoning computations are performed on this information.
The random variables w^ and v^ represent the process and measurement noise respectively and are assumed to be independent from each other. The n x n matrix A relates the state x at timestep k (xk) to the step at timestep k + 1 (Xk+l). The n X / matrix B relates the control input to the state x. The mXn matrix H relates the measurements Zk to the state variable xk.
At each time step, the filter applies two stages of computations using a feedback control: time update computations, and measurement update computations.
The time update computations consist of the following steps:
- action-level dead-reckoning: The algorithms within this approach know that the actor is performing a particular action (e.g. walking), and parameters of the actor's state (e.g. tired). There have been a few work on the automatic recognition and synthesis of the participants' actions [12] [13]. In this type of dead-reckoning, the algorithm uses the parameters of the current motion (for example, speed and direction for walking); and uses higher level motion control mechanisms (walking motor [3]) to obtain the motion.
In this paper, we provide a joint-level dead-reckoning algorithm. In order to predict inbetween postures between messages, we use a Kaiman Filter.
4.1. Kaiman Filtering
The Kaiman filter is an optimal linear estimator that minimizes the expected mean-square error in the estimated state variables. It provides a means to infer the missing information using noisy measurements, and is used in predicting the future courses of dynamic systems. Its efficient recursive formulation allows the algorithm to keep up with the real-time requirements of posture prediction. For further information on Kaiman filtering, see [14]. Previously, in the virtual reality field, the Kaiman filter has been applied to decrease the lag between tracking and display in the head trackers, for an overview see [1][6].
The Kaiman filter tries to estimate the n-dimensional state vector A: of a first-order, discrete-time controlled process governed by the linear difference equation:
xk+l=Akxk + Buk+wk
•**+i- AA+"uk
T+i-Wtf + ft A* _
x k denotes the a priori state estimate at step k given knowledge of the process before step k, and Xk is the a posteriori state estimate at step k given measurement . Pk+, and Pk denote the a priori and a posteriori estimate error covariance, respectively., formulating how accurate the filter believes that the state variables are.
The measurement update computations consist of the following steps:
K, =P,~H T
k xk=x-k+K(zk-Hkx-k)
Pk=(I-KkHk)Pk
-1
together with a measurement z vector:
Kk, called Kaiman gain matrix, controls the blending of measurement with the state variables. The filter parameters, the process noise Qk and measurement error covariance matrix R can be tuned by providing constant
values computed offline. See [14] for details.
There is considerable freedom in modeling the system, depending on the knowledge of the modeled processes. In our system, we make the following assumptions: at a time frame, only the joint angles of the body are available, and their velocities are to be computed. The 75 degrees of freedom can be decomposed into 75 independent 1-dof values, each using a separate predictor. This makes the system simpler although less accurate. Moreover, we assume that joint angles change across the prediction interval are small, therefore it is possible to represent
163
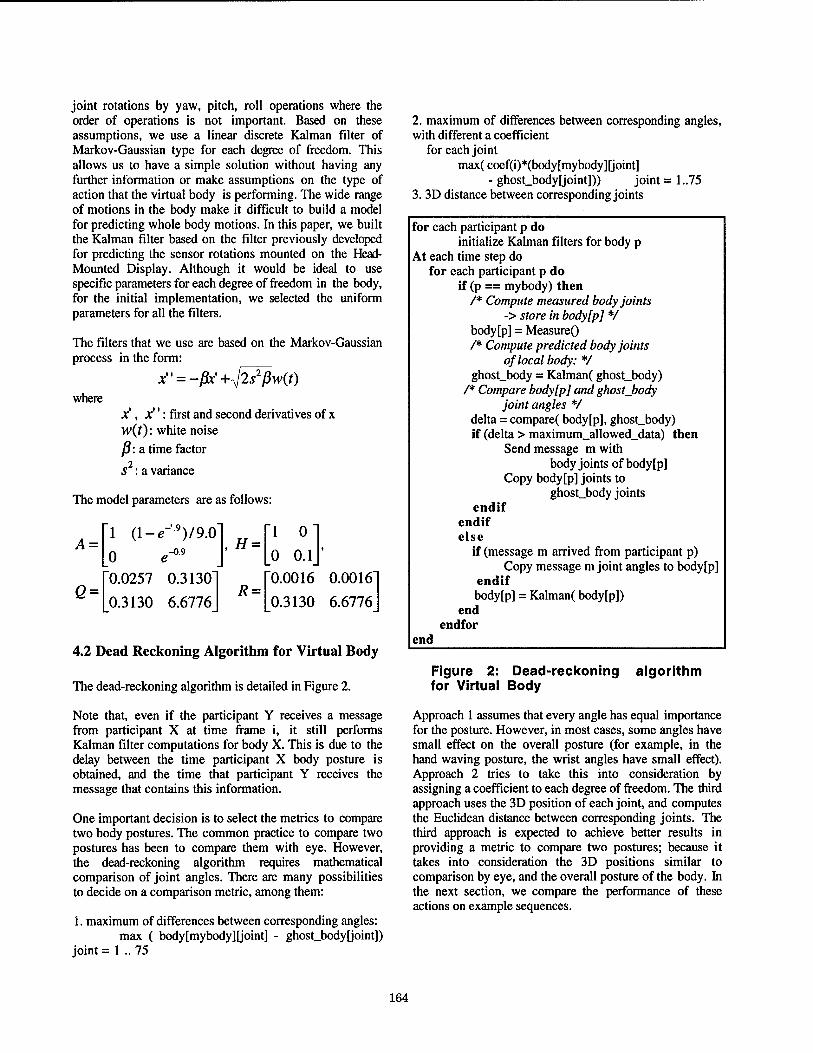
joint rotations by yaw, pitch, roll operations where the order of operations is not important. Based on these assumptions, we use a linear discrete Kaiman filter of Markov-Gaussian type for each degree of freedom. This allows us to have a simple solution without having any further information or make assumptions on the type of action that the virtual body is performing. The wide range of motions in the body make it difficult to build a model for predicting whole body motions. In this paper, we built the Kaiman filter based on the filter previously developed for predicting the sensor rotations mounted on the Head- Mounted Display. Although it would be ideal to use specific parameters for each degree of freedom in the body, for the initial implementation, we selected the uniform parameters for all the filters.
The filters that we use are based on the Markov-Gaussian process in the form:
where
x" = -ßx'+^2s2ßw(t)
x', x": first and second derivatives of x w(t): white noise
ß: a time factor 2 s : a variance
The model parameters are as follows:
A =
Q =
1 (l-e-9)/9.0
0 e-09
0.0257 0.3130^
0.3130 6.6776
, H =
R =
1 0'
0 0.1 0.0016 0.0016 0.3130 6.6776
4.2 Dead Reckoning Algorithm for Virtual Body
The dead-reckoning algorithm is detailed in Figure 2.
Note that, even if the participant Y receives a message from participant X at time frame i, it still performs Kaiman filter computations for body X. This is due to the delay between the time participant X body posture is obtained, and the time that participant Y receives the message that contains this information.
One important decision is to select the metrics to compare two body postures. The common practice to compare two postures has been to compare them with eye. However, the dead-reckoning algorithm requires mathematical comparison of joint angles. There are many possibilities to decide on a comparison metric, among them:
1. maximum of differences between corresponding angles: max ( body[mybody][joint] - ghost_body[joint])
joint = 1 .. 75
2. maximum of differences between corresponding angles, with different a coefficient
for each joint max( coef(i)*(body[mybody][joint]
- ghost_body[joint])) joint = 1..75 3. 3D distance between corresponding joints
for each participant p do initialize Kaiman filters for body p
At each time step do for each participant p do
if (p == mybody) then /* Compute measured body joints
-> store in body[p] */ body[p] = MeasureO /* Compute predicted body joints
of local body: */ ghost_body = Kalman( ghost_body)
/* Compare bodylp] and ghost_body joint angles */
delta = compare( body[p], ghost_body) if (delta > maximum_allowed_data) then
Send message m with body joints of body [p]
Copy body[p] joints to ghost_body joints
endif endif else
if (message m arrived from participant p) Copy message m joint angles to body[p]
endif body[p] = Kalman( body[p])
end endfor
end
Figure 2: Dead-reckoning algorithm for Virtual Body
Approach 1 assumes that every angle has equal importance for the posture. However, in most cases, some angles have small effect on the overall posture (for example, in the hand waving posture, the wrist angles have small effect). Approach 2 tries to take this into consideration by assigning a coefficient to each degree of freedom. The third approach uses the 3D position of each joint, and computes the Euclidean distance between corresponding joints. The third approach is expected to achieve better results in providing a metric to compare two postures; because it takes into consideration the 3D positions similar to comparison by eye, and the overall posture of the body. In the next section, we compare the performance of these actions on example sequences.
164
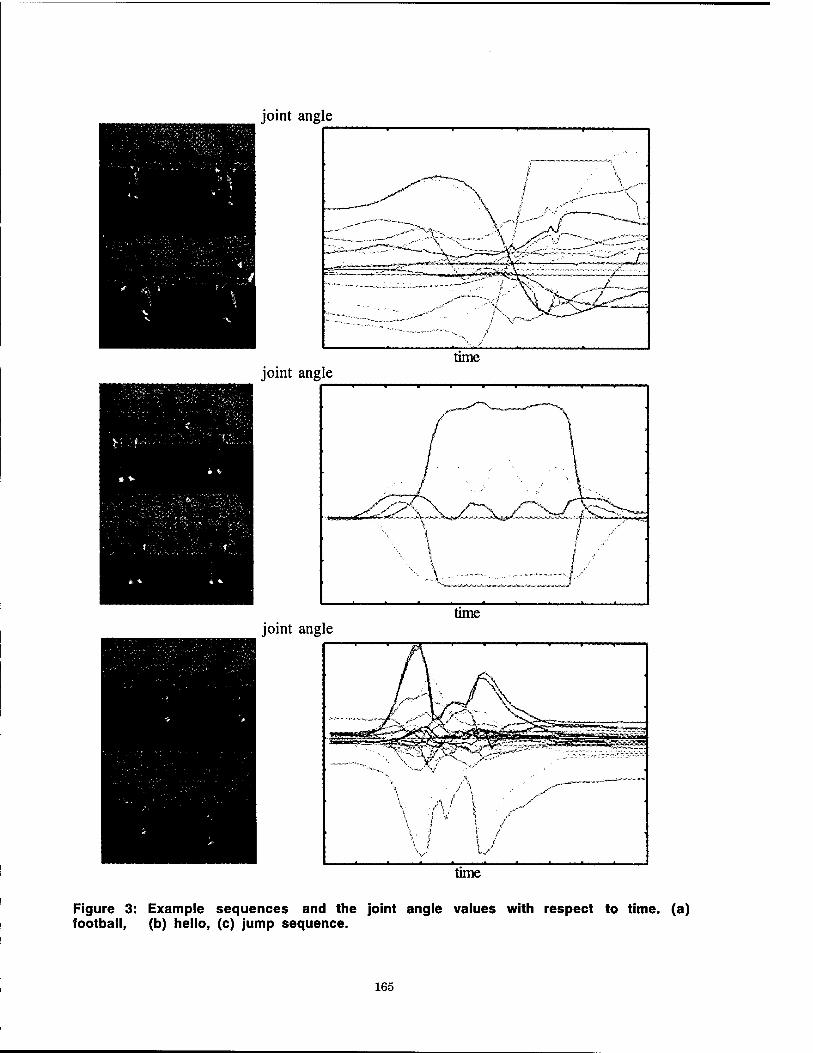
joint angle
joint angle
joint angle
time
k * time
time
Figure 3: Example sequences and the joint angle values with respect to time, (a) football, (b) hello, (c) jump sequence.
165
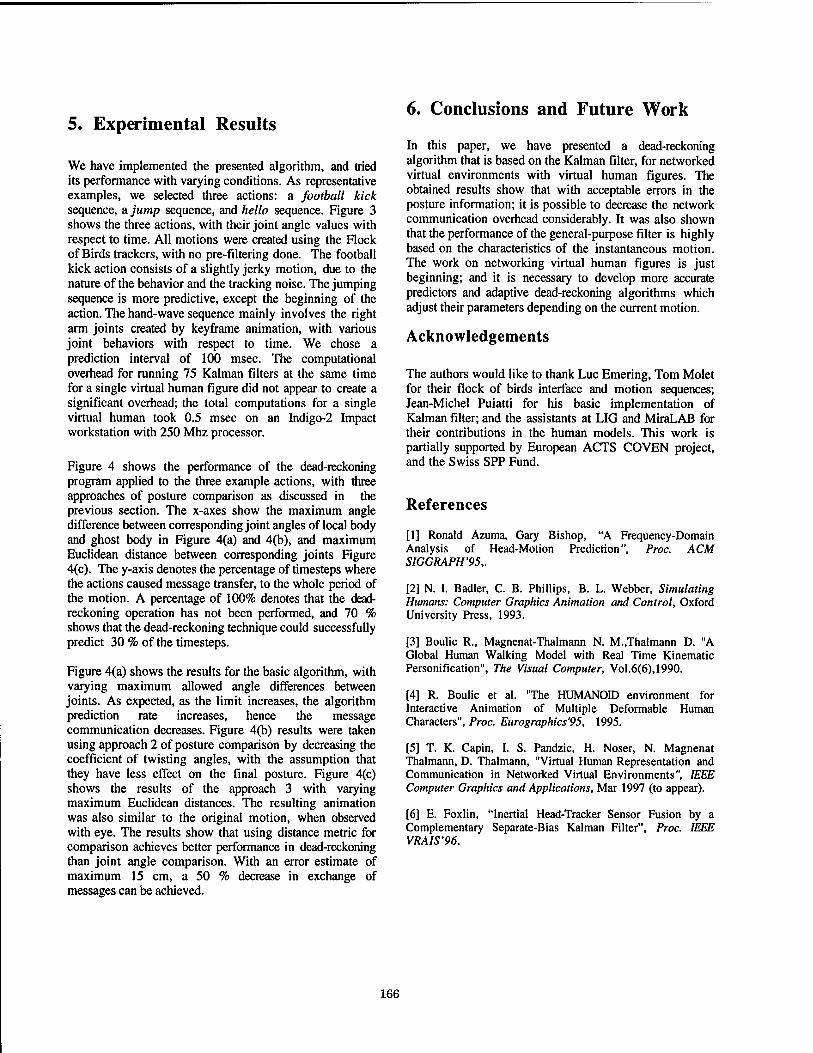
5. Experimental Results
We have implemented the presented algorithm, and tried its performance with varying conditions. As representative examples, we selected three actions: a football kick sequence, a jump sequence, and hello sequence. Figure 3 shows the three actions, with their joint angle values with respect to time. All motions were created using the Flock of Birds trackers, with no pre-filtering done. The football kick action consists of a slightly jerky motion, due to the nature of the behavior and the tracking noise. The jumping sequence is more predictive, except the beginning of the action. The hand-wave sequence mainly involves the right arm joints created by keyframe animation, with various joint behaviors with respect to time. We chose a prediction interval of 100 msec. The computational overhead for running 75 Kaiman filters at the same time for a single virtual human figure did not appear to create a significant overhead; the total computations for a single virtual human took 0.5 msec on an Indigo-2 Impact workstation with 250 Mhz processor.
Figure 4 shows the performance of the dead-reckoning program applied to the three example actions, with three approaches of posture comparison as discussed in the previous section. The x-axes show the maximum angle difference between corresponding joint angles of local body and ghost body in Figure 4(a) and 4(b), and maximum Euclidean distance between corresponding joints Figure 4(c). The y-axis denotes the percentage of timesteps where the actions caused message transfer, to the whole period of the motion. A percentage of 100% denotes that the dead- reckoning operation has not been performed, and 70 % shows that the dead-reckoning technique could successfully predict 30 % of the timesteps.
Figure 4(a) shows the results for the basic algorithm, with varying maximum allowed angle differences between joints. As expected, as the limit increases, the algorithm prediction rate increases, hence the message communication decreases. Figure 4(b) results were taken using approach 2 of posture comparison by decreasing the coefficient of twisting angles, with the assumption that they have less effect on the final posture. Figure 4(c) shows the results of the approach 3 with varying maximum Euclidean distances. The resulting animation was also similar to the original motion, when observed with eye. The results show that using distance metric for comparison achieves better performance in dead-reckoning than joint angle comparison. With an error estimate of maximum 15 cm, a 50 % decrease in exchange of messages can be achieved.
6. Conclusions and Future Work
In this paper, we have presented a dead-reckoning algorithm that is based on the Kaiman filter, for networked virtual environments with virtual human figures. The obtained results show that with acceptable errors in the posture information; it is possible to decrease the network communication overhead considerably. It was also shown that the performance of the general-purpose filter is highly based on the characteristics of the instantaneous motion. The work on networking virtual human figures is just beginning; and it is necessary to develop more accurate predictors and adaptive dead-reckoning algorithms which adjust their parameters depending on the current motion.
Acknowledgements
The authors would like to thank Luc Emering, Tom Molet for their flock of birds interface and motion sequences; Jean-Michel Puiatti for his basic implementation of Kaiman filter; and the assistants at LIG and MiraLAB for their contributions in the human models. This work is partially supported by European ACTS COVEN project, and the Swiss SPP Fund.
References
[1] Ronald Azuma, Gary Bishop, "A Frequency-Domain Analysis of Head-Motion Prediction", Proc. ACM SIGGRAPH'95,.
[2] N. I. Badler, C. B. Phillips, B. L. Webber, Simulating Humans: Computer Graphics Animation and Control, Oxford University Press, 1993.
[3] Boulic R., Magnenat-Thalmann N. M.,Thalmann D. "A Global Human Walking Model with Real Time Kinematic Personification", The Visual Computer, Vol.6(6),1990.
[4] R. Boulic et al. "The HUMANOID environment for Interactive Animation of Multiple Deformable Human Characters", Proc. Eurographics'95, 1995.
[5] T. K. Capin, I. S. Pandzic, H. Noser, N. Magnenat Thalmann, D. Thalmann, "Virtual Human Representation and Communication in Networked Virtual Environments", IEEE Computer Graphics and Applications, Mar 1997 (to appear).
[6] E. Foxlin, "Inertial Head-Tracker Sensor Fusion by a Complementary Separate-Bias Kaiman Filter", Proc. IEEE VRAIS'96.
166
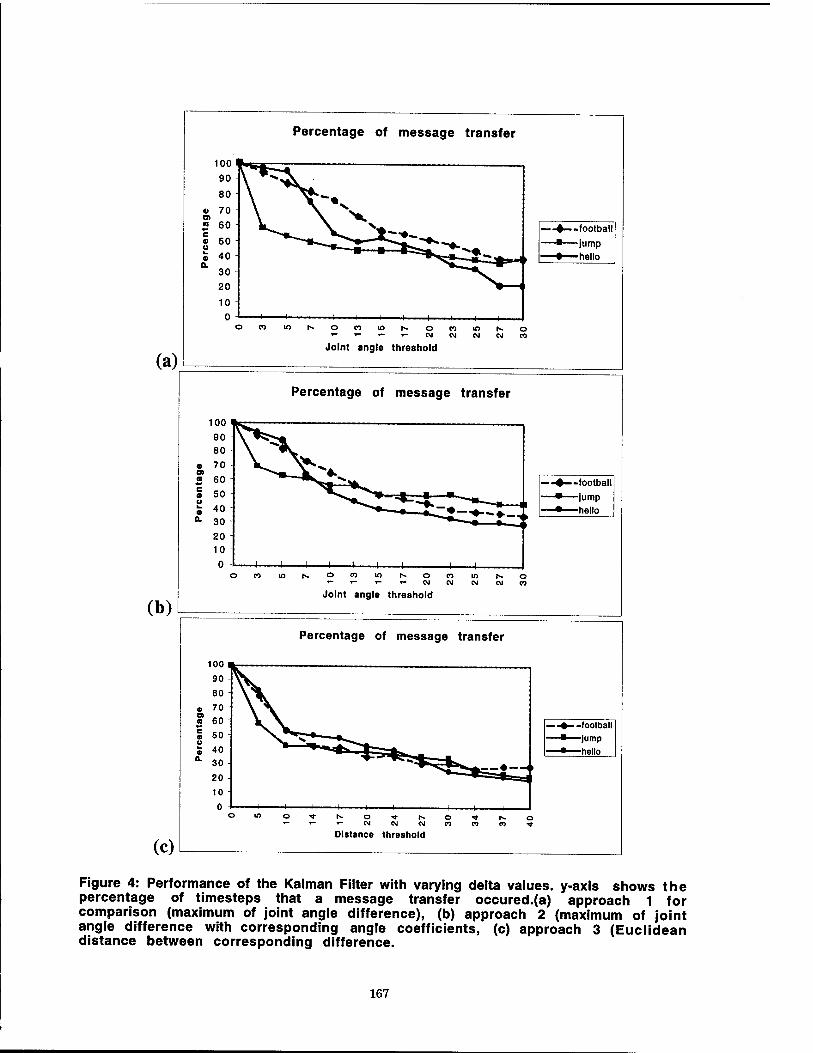
(a)
(b)
(c)
Percentage of message transfer
o O) a c a u a 0.
100 1 90
80
70 60
50 -
**^^
\ "**
40 -
30 • 20
10 0 ' ' 1 i i i i i i
-football
-jump -hello
o co m r^ o »" T- *" »" CM
Joint angle threshold CM
O CO
Percentage of message transfer
c o u » 0.
no i 90 80 - \ ^Ä
70
60
"^ 50 -
40 - 30
20 10
0 J 1 1_ 1 1 1 -I 1 1 1 1 1
-football
-jump -hello
O CO W f. o r- y- r- r- CM
Joint angle threshold
Percentage of message transfer
100
*- T- *- CM CM
—I—
— -♦- -football -jump
Distance threshold
Figure 4: Performance of the Kaiman Filter with varying delta values, y-axis shows the percentage of timesteps that a message transfer occured.(a) approach 1 for comparison (maximum of joint angle difference), (b) approach 2 (maximum of joint angle difference with corresponding angle coefficients, (c) approach 3 (Euclidean distance between corresponding difference.
167

[7] Rich Gossweiler, Robert J. Laferriere, Michael L. Keller, Pausch, "An Introductory Tutorial for Developing Multiuser Virtual Environments", Presence: Teleoperators and Virtual Environments, Vol. 3, No. 4, 1994.
[8] Institute of Electrical and Electronics Engineers, International Standard, ANSI/DEEE Standard 1278-1993, Standard for Information Technology, Protocols for Distributed Interactive Simulation, March 1993.
[9] M.R. Macedonia, M.J. Zyda, D.R. Pratt, P.T. Barham, "NPSNET: A Network Software Architecture for Large-Scale Virtual Environments", Presence: Teleoperators and Virtual Environments, Vol. 3, No. 4, 1994.
[10] K. Perlin, "Real Time Responsive Animation with Personality", IEEE Transactions on Visualization and Computer Graphics, Vol. 1, No. 1, 1995.
[11] D. Thalmann, T. K. Capin, N. Magnenat Thalmann, I. S. Pandzic, "Participant, User-Guided, Autonomous Actors in the Virtual Life Network VLNET', Proc. ICAT/VRST '95, pp. 3- 11.
[12] Naoko Tosa, Ryohei Nakatsu, "The Esthetics of Artificial Life: Human-Like Communication Character 'MIC and Feeling Improvisation Character 'MUSE'", Proc. Artificial Life, 1996.
[13] Munetoshi Unuma, Ken Anjyo, Ryozo Takeuchi, "Fourier Principles for Emotion-Based Human Figure Animation", Proceedings of ACM SIGGRAPH'95.
[14] G. Welch and G. Bishop, "An Introduction to the Kaiman Filter", Technical Report, Dept. of Computer Science, University of North Carolina at Chapel Hill, 1995.
168
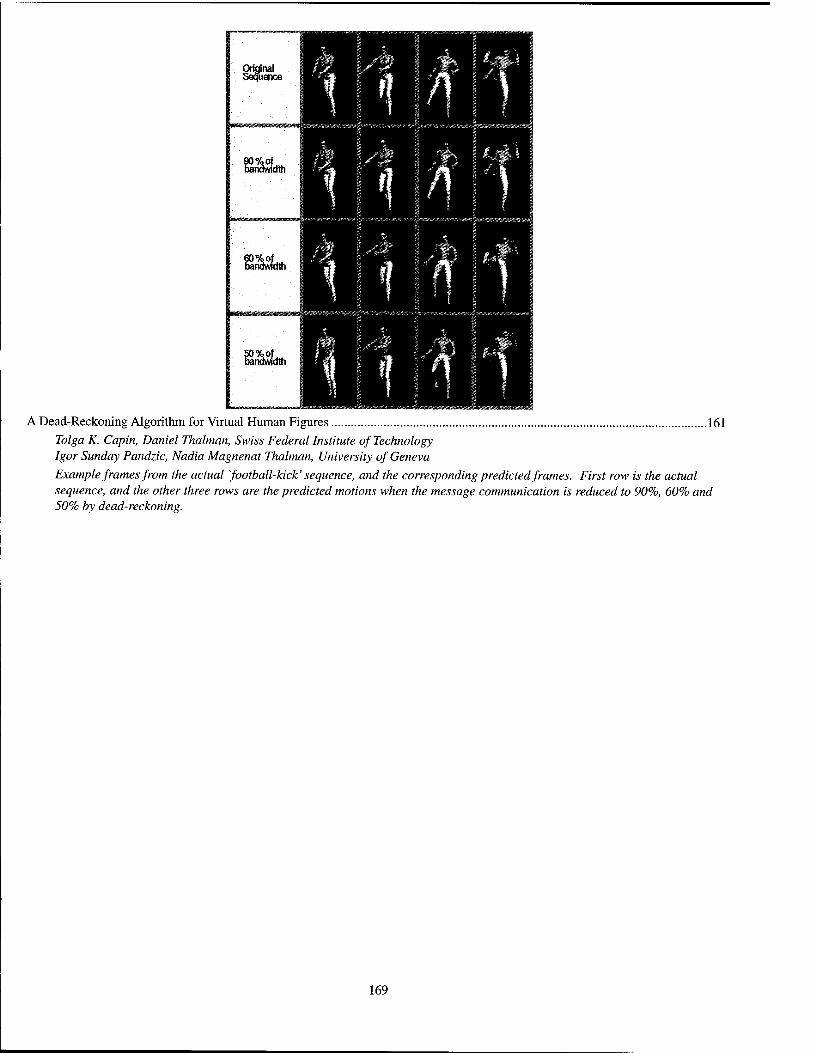
Original Sequence
mmram
90%of bandwidth
m0mmaimwiB0^M
60% of bandwidth
VMmmmwmmm
50%of bandwidth
A Dead-Reckoning Algorithm for Virtual Human Figures 161
Tolga K. Capin, Daniel Thalman, Swiss Federal Institute of Technology Igor Sunday Pandzic, Nadia Magnenat Thalman, University of Geneva
Example frames from the actual "football-kick' sequence, and the corresponding predicted frames. First row is the actual sequence, and the other three rows are the predicted motions when the message communication is reduced to 90%, 60% and 50% by dead-reckoning.
169
Virtual Actors and Avatars in a Flexible User-Determined-Scenario Environment
Dan M. Shawver Sandia National Laboratories Albuquerque, NM 87185-0978 [email protected]
Abstract
VRaptor, a VR system for situational training that uses trainer-defined scenarios is described. The trainee is represented by an avatar; the rest of the virtual world is populated by virtual actors, which are under the con- trol of trainer-defined scripts. The scripts allow reac- tive behaviors, but the trainer can control the overall scenario. This type of training system may be very useful in supplementing physical training.
1. Introduction
This paper presents VRaptor (VR assault planning, training, or rehersal), a VR system for situational training. VRaptor lets the trainer define and redefine scenarios during the training session. The trainee is represented by an avatar; the rest of the virtual world is populated by virtual actors, which are under the con- trol of trainer-defined scripts. The scripts allow reac- tive behaviors, but the trainer can control the overall scenario.
VRaptor supports situational training, a type of training in which students learn to handle multiple sit- uations or scenarios, through simulation in a VR envi- ronment. The appeal of such training systems is that the students can experience and develop effective re- sponses for situations they would otherwise have no opportunity to practice. Security forces and emergency response forces are examples of professional groups that could benefit from this type of training. A hostage res- cue scenario, an example of the type of training sce- nario we can support, has been developed for our cur- rent system and is described in Section 3.
Since control of behaviors presupposes an appropri- ate representation of behavior and means of structuring complex behaviors, we survey related work on behavior
simulation in Section 2. In the Virtual Reality / Intelligent Simulation
(VR/IS) lab, our basic VR system [16] allows multi- ple human participants to appear in embodied form (as avatars) within a common, shared virtual environment. The virtual environment may also contain virtual ac- tors. Using this infrastructure, we have developed the VRaptor system. VRaptor adds oversight and session control by a trainer, through a workstation interface. This interface, described in Section 4, allows selection of roles and actions for the individual virtual actors, and placement of them in the scene.
In Section 5 we present the architecture of the simu- lation component of VRaptor, and in Section 6 discuss the representation of scenarios in terms of scripts and tasks.
2. Related work
Since our focus in this research is on the scripting and control of virtual actors, we survey work toward building animations or behaviors which are either au- tomated or reactive, and especially work which offers hope of allowing realtime implementations.
2.1. Behavioral animation
Behavioral animation has developed from the early work of Reynolds [15], on flocking and schooling behav- iors of groups of simulated actors; recent work in this vein includes that of Tu and Terzopoulos [17]. Systems that deal with smaller groups, or individual behaviors, are reviewed in the following sections.
2.2. Ethologically-based approaches
Ethologically-based (or biologically-based) ap- proaches deal with action selection mechanisms. Since
170 0-8186-7843-7/97 $10.00 © 1997 IEEE
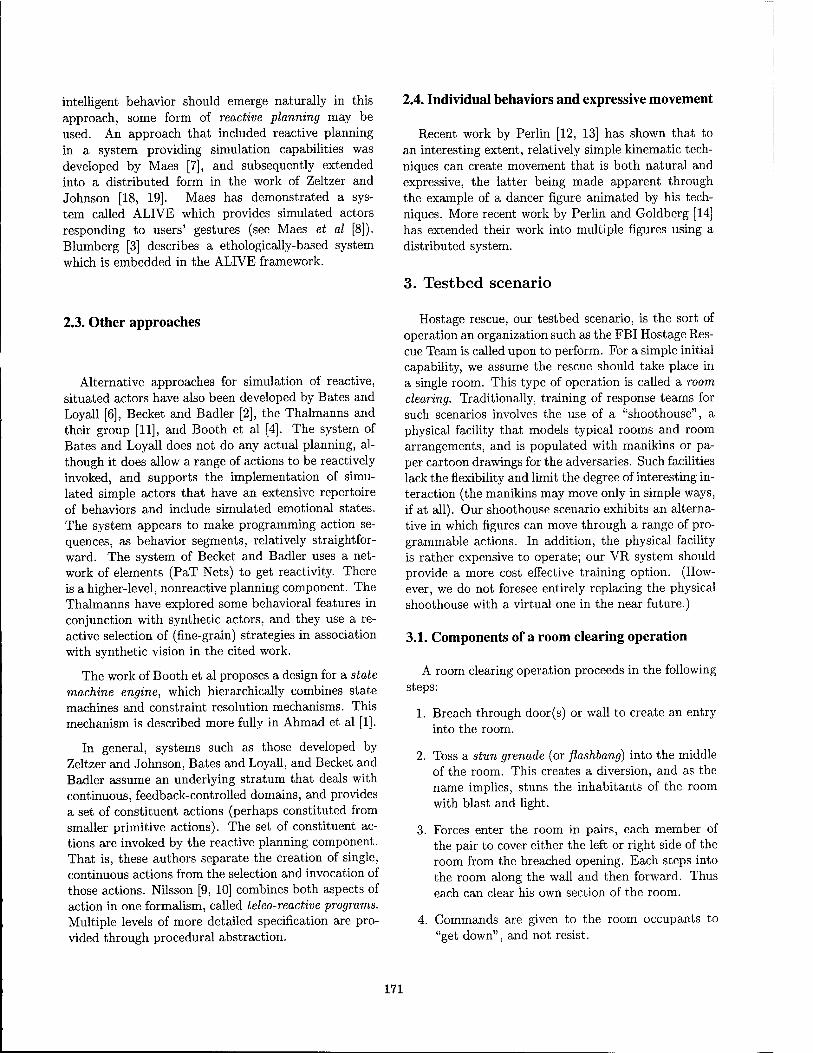
intelligent behavior should emerge naturally in this approach, some form of reactive planning may be used. An approach that included reactive planning in a system providing simulation capabilities was developed by Maes [7], and subsequently extended into a distributed form in the work of Zeltzer and Johnson [18, 19]. Maes has demonstrated a sys- tem called ALIVE which provides simulated actors responding to users' gestures (see Maes et al [8]). Blumberg [3] describes a ethologically-based system which is embedded in the ALIVE framework.
2.4. Individual behaviors and expressive movement
Recent work by Perlin [12, 13] has shown that to an interesting extent, relatively simple kinematic tech- niques can create movement that is both natural and expressive, the latter being made apparent through the example of a dancer figure animated by his tech- niques. More recent work by Perlin and Goldberg [14] has extended their work into multiple figures using a distributed system.
3. Testbed scenario
2.3. Other approaches
Alternative approaches for simulation of reactive, situated actors have also been developed by Bates and Loyall [6], Becket and Badler [2], the Thalmanns and their group [11], and Booth et al [4]. The system of Bates and Loyall does not do any actual planning, al- though it does allow a range of actions to be reactively invoked, and supports the implementation of simu- lated simple actors that have an extensive repertoire of behaviors and include simulated emotional states. The system appears to make programming action se- quences, as behavior segments, relatively straightfor- ward. The system of Becket and Badler uses a net- work of elements (PaT Nets) to get reactivity. There is a higher-level, nonreactive planning component. The Thalmanns have explored some behavioral features in conjunction with synthetic actors, and they use a re- active selection of (fine-grain) strategies in association with synthetic vision in the cited work.
The work of Booth et al proposes a design for a state machine engine, which hierarchically combines state machines and constraint resolution mechanisms. This mechanism is described more fully in Ahmad et al [1].
In general, systems such as those developed by Zeltzer and Johnson, Bates and Loyall, and Becket and Badler assume an underlying stratum that deals with continuous, feedback-controlled domains, and provides a set of constituent actions (perhaps constituted from smaller primitive actions). The set of constituent ac- tions are invoked by the reactive planning component. That is, these authors separate the creation of single, continuous actions from the selection and invocation of those actions. Nilsson [9, 10] combines both aspects of action in one formalism, called teleo-reactive programs. Multiple levels of more detailed specification are pro- vided through procedural abstraction.
Hostage rescue, our testbed scenario, is the sort of operation an organization such as the FBI Hostage Res- cue Team is called upon to perform. For a simple initial capability, we assume the rescue should take place in a single room. This type of operation is called a room clearing. Traditionally, training of response teams for such scenarios involves the use of a "shoothouse", a physical facility that models typical rooms and room arrangements, and is populated with manikins or pa- per cartoon drawings for the adversaries. Such facilities lack the flexibility and limit the degree of interesting in- teraction (the manikins may move only in simple ways, if at all). Our shoothouse scenario exhibits an alterna- tive in which figures can move through a range of pro- grammable actions. In addition, the physical facility is rather expensive to operate; our VR system should provide a more cost effective training option. (How- ever, we do not foresee entirely replacing the physical shoothouse with a virtual one in the near future.)
3.1. Components of a room clearing operation
A room clearing operation proceeds in the following steps:
1. Breach through door(s) or wall to create an entry into the room.
2. Toss a stun grenade (or flashbang) into the middle of the room. This creates a diversion, and as the name implies, stuns the inhabitants of the room with blast and light.
3. Forces enter the room in pairs, each member of the pair to cover either the left or right side of the room from the breached opening. Each steps into the room along the wall and then forward. Thus each can clear his own section of the room.
4. Commands are given to the room occupants to "get down", and not resist.
171
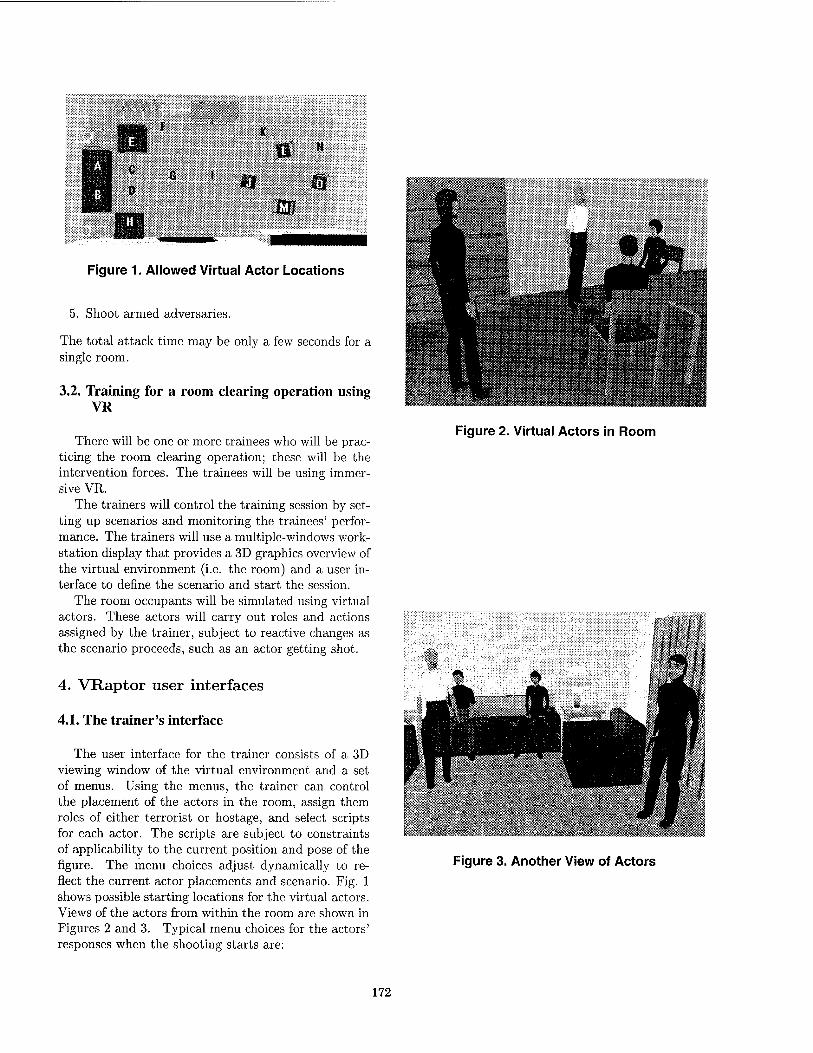
m N
Figure 1. Allowed Virtual Actor Locations
5. Shoot armed adversaries.
The total attack time may be only a few seconds for a single room.
3.2. Training for a room clearing operation using VR
There will be one or more trainees who will be prac- ticing the room clearing operation; these will be the intervention forces. The trainees will be using immer- sive VR.
The trainers will control the training session by set- ting up scenarios and monitoring the trainees' perfor- mance. The trainers will use a multiple-windows work- station display that provides a 3D graphics overview of the virtual environment (i.e. the room) and a user in- terface to define the scenario and start the session.
The room occupants will be simulated using virtual actors. These actors will carry out roles and actions assigned by the trainer, subject to reactive changes as the scenario proceeds, such as an actor getting shot.
4. VRaptor user interfaces
4.1. The trainer's interface
The user interface for the trainer consists of a 3D viewing window of the virtual environment and a set of menus. Using the menus, the trainer can control the placement of the actors in the room, assign them roles of either terrorist or hostage, and select scripts for each actor. The scripts are subject to constraints of applicability to the current position and pose of the figure. The menu choices adjust dynamically to re- flect the current actor placements and scenario. Fig. 1 shows possible starting locations for the virtual actors. Views of the actors from within the room are shown in Figures 2 and 3. Typical menu choices for the actors' responses when the shooting starts are:
*3&'-? &t
Figure 2. Virtual Actors in Room
Figure 3. Another View of Actors
172
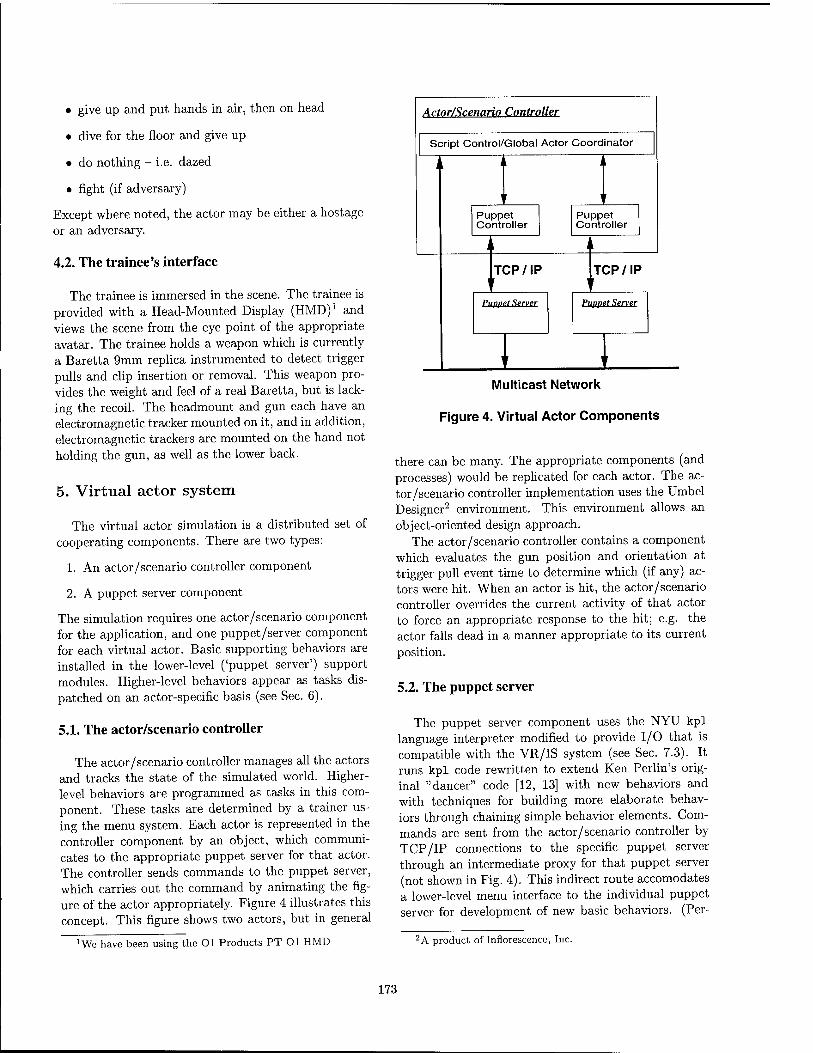
• give up and put hands in air, then on head
• dive for the floor and give up
• do nothing - i.e. dazed
• fight (if adversary)
Except where noted, the actor may be either a hostage or an adversary.
4.2. The trainee's interface
The trainee is immersed in the scene. The trainee is provided with a Head-Mounted Display (HMD)1 and views the scene from the eye point of the appropriate avatar. The trainee holds a weapon which is currently a Baretta 9mm replica instrumented to detect trigger pulls and clip insertion or removal. This weapon pro- vides the weight and feel of a real Baretta, but is lack- ing the recoil. The headmount and gun each have an electromagnetic tracker mounted on it, and in addition, electromagnetic trackers are mounted on the hand not holding the gun, as well as the lower back.
5. Virtual actor system
The virtual actor simulation is a distributed set of cooperating components. There are two types:
1. An actor/scenario controller component
2. A puppet server component
The simulation requires one actor/scenario component for the application, and one puppet/server component for each virtual actor. Basic supporting behaviors are installed in the lower-level ('puppet server') support modules. Higher-level behaviors appear as tasks dis- patched on an actor-specific basis (see Sec. 6).
5.1. The actor/scenario controller
The actor/scenario controller manages all the actors and tracks the state of the simulated world. Higher- level behaviors are programmed as tasks in this com- ponent. These tasks are determined by a trainer us- ing the menu system. Each actor is represented in the controller component by an object, which communi- cates to the appropriate puppet server for that actor. The controller sends commands to the puppet server, which carries out the command by animating the fig- ure of the actor appropriately. Figure 4 illustrates this concept. This figure shows two actors, but in general
'We have been using the Ol Products PT-Ol HMD
Actor/Scenario Controller
Script Control/Global Actor Coordinator
Puppet Controller
Puppet Controller
TCP / IP TCP/IP
Puppet Server Puppet Server
Multicast Network
Figure 4. Virtual Actor Components
there can be many. The appropriate components (and processes) would be replicated for each actor. The ac- tor/scenario controller implementation uses the Umbel Designer2 environment. This environment allows an object-oriented design approach.
The actor/scenario controller contains a component which evaluates the gun position and orientation at trigger pull event time to determine which (if any) ac- tors were hit. When an actor is hit, the actor/scenario controller overrides the current activity of that actor to force an appropriate response to the hit; e.g. the actor falls dead in a manner appropriate to its current position.
5.2. The puppet server
The puppet server component uses the NYU kpl language interpreter modified to provide I/O that is compatible with the VR/IS system (see Sec. 7.3). It runs kpl code rewritten to extend Ken Perlin's orig- inal "dancer" code [12, 13] with new behaviors and with techniques for building more elaborate behav- iors through chaining simple behavior elements. Com- mands are sent from the actor/scenario controller by TCP/IP connections to the specific puppet server through an intermediate proxy for that puppet server (not shown in Fig. 4). This indirect route accomodates a lower-level menu interface to the individual puppet server for development of new basic behaviors. (Per-
2 A product of Inflorescence, Inc.
173
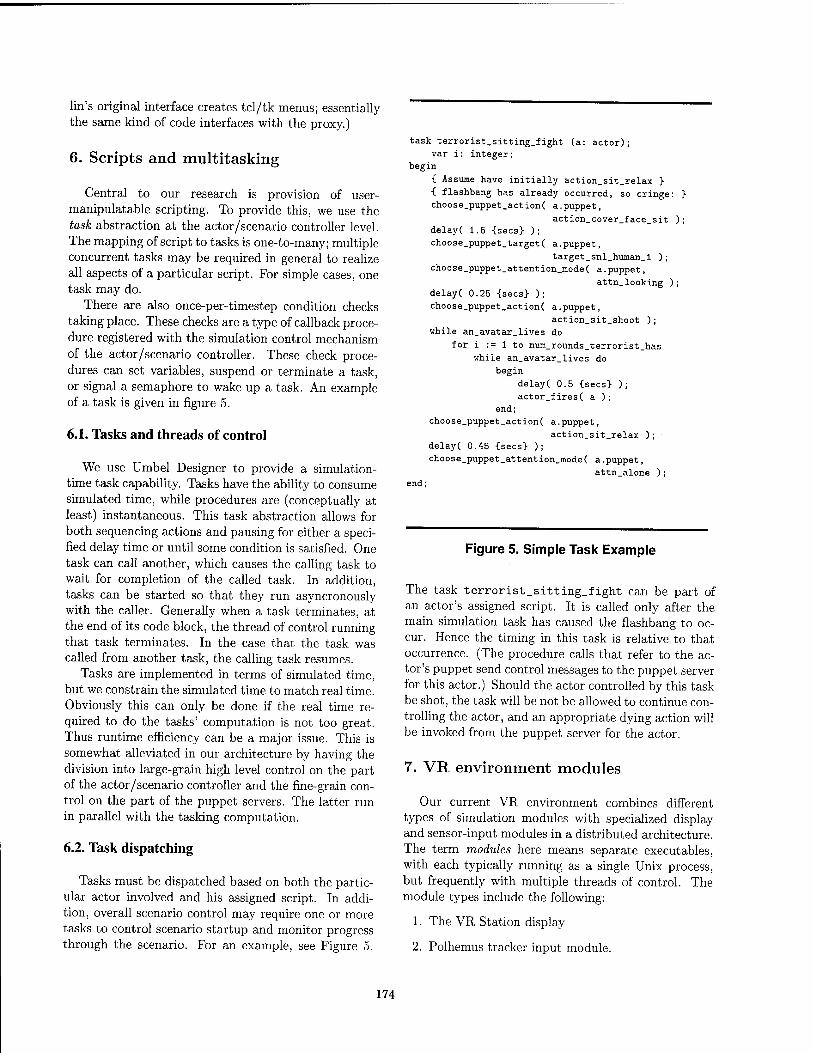
lin's original interface creates tcl/tk menus; essentially the same kind of code interfaces with the proxy.)
6. Scripts and multitasking
Central to our research is provision of user- manipulatable scripting. To provide this, we use the task abstraction at the actor/scenario controller level. The mapping of script to tasks is one-to-many; multiple concurrent tasks may be required in general to realize all aspects of a particular script. For simple cases, one task may do.
There are also once-per-timestep condition checks taking place. These checks are a type of callback proce- dure registered with the simulation control mechanism of the actor/scenario controller. These check proce- dures can set variables, suspend or terminate a task, or signal a semaphore to wake up a task. An example of a task is given in figure 5.
6.1. Tasks and threads of control
We use Umbel Designer to provide a simulation- time task capability. Tasks have the ability to consume simulated time, while procedures are (conceptually at least) instantaneous. This task abstraction allows for both sequencing actions and pausing for either a speci- fied delay time or until some condition is satisfied. One task can call another, which causes the calling task to wait for completion of the called task. In addition, tasks can be started so that they run asyncronously with the caller. Generally when a task terminates, at the end of its code block, the thread of control running that task terminates. In the case that the task was called from another task, the calling task resumes.
Tasks are implemented in terms of simulated time, but we constrain the simulated time to match real time. Obviously this can only be done if the real time re- quired to do the tasks' computation is not too great. Thus runtime efficiency can be a major issue. This is somewhat alleviated in our architecture by having the division into large-grain high level control on the part of the actor/scenario controller and the fine-grain con- trol on the part of the puppet servers. The latter run in parallel with the tasking computation.
6.2. Task dispatching
Tasks must be dispatched based on both the partic- ular actor involved and his assigned script. In addi- tion, overall scenario control may require one or more tasks to control scenario startup and monitor progress through the scenario. For an example, see Figure 5.
task terrorist_sitting_fight (a: actor); var i: integer;
begin
{ Assume have initially action_sit_relax }
{ flashbang has already occurred, so cringe: }
choose_puppet_action( a.puppet,
action_cover_face_sit ); delay( 1.5 {sees} );
choose_puppet.target( a.puppet,
target_snl_human_l ); choose_puppet_attention_mode( a.puppet,
attn_looking ); delay( 0.25 {sees} );
choose_puppet_action( a.puppet,
action_sit_shoot ); uhile an.avatar_lives do
for i := 1 to num_rounds_terrorist_has
while an_avatar_lives do
begin
delayC 0.5 {sees} );
actor_fires( a ); end;
choose_puppet_action( a.puppet,
action_sit_relax ); delay( 0.45 {sees} );
choose_puppet_attention_mode( a.puppet,
attn_alone ); end;
Figure 5. Simple Task Example
The task terrorist_sitting_f ight can be part of an actor's assigned script. It is called only after the main simulation task has caused the flashbang to oc- cur. Hence the timing in this task is relative to that occurrence. (The procedure calls that refer to the ac- tor's puppet send control messages to the puppet server for this actor.) Should the actor controlled by this task be shot, the task will be not be allowed to continue con- trolling the actor, and an appropriate dying action will be invoked from the puppet server for the actor.
7. VR environment modules
Our current VR environment combines different types of simulation modules with specialized display and sensor-input modules in a distributed architecture. The term modules here means separate executables, with each typically running as a single Unix process, but frequently with multiple threads of control. The module types include the following:
1. The VR Station display
2. Polhemus tracker input module.
174
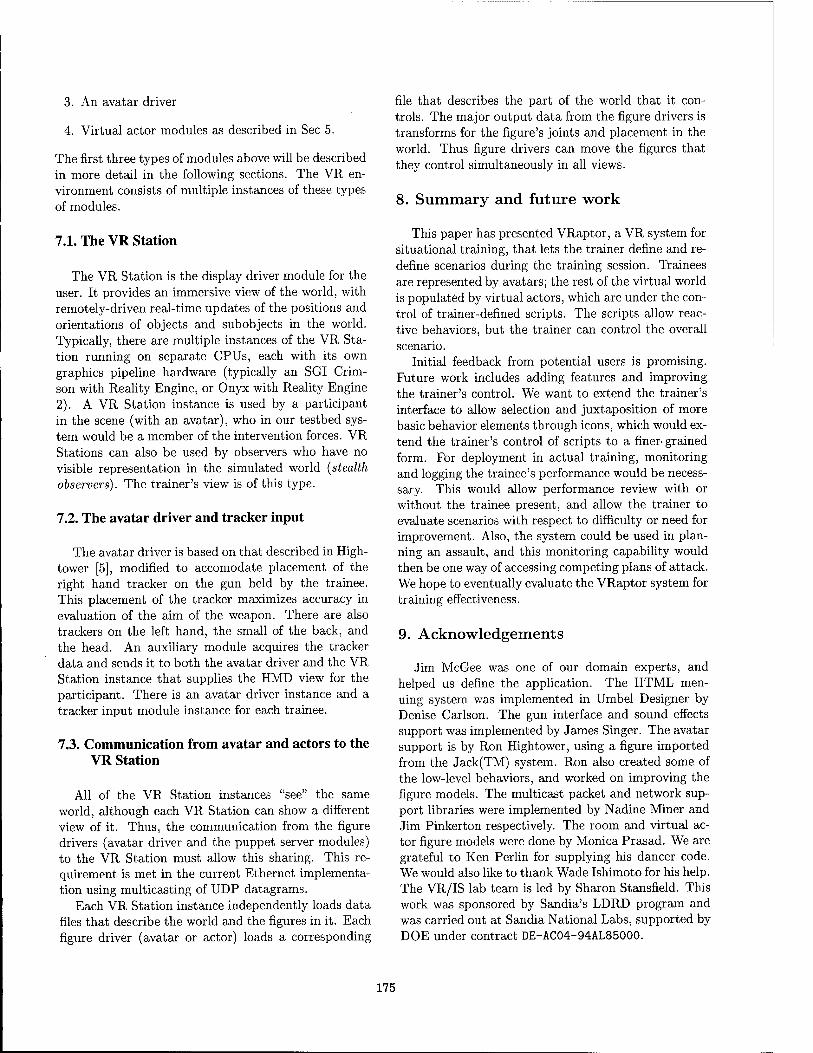
3. An avatar driver
4. Virtual actor modules as described in Sec 5.
The first three types of modules above will be described in more detail in the following sections. The VR en- vironment consists of multiple instances of these types of modules.
7.1. The VR Station
The VR Station is the display driver module for the user. It provides an immersive view of the world, with remotely-driven real-time updates of the positions and orientations of objects and subobjects in the world. Typically, there are multiple instances of the VR Sta- tion running on separate CPUs, each with its own graphics pipeline hardware (typically an SGI Crim- son with Reality Engine, or Onyx with Reality Engine 2). A VR Station instance is used by a participant in the scene (with an avatar), who in our testbed sys- tem would be a member of the intervention forces. VR Stations can also be used by observers who have no visible representation in the simulated world (stealth observers). The trainer's view is of this type.
7.2. The avatar driver and tracker input
The avatar driver is based on that described in High- tower [5], modified to accomodate placement of the right hand tracker on the gun held by the trainee. This placement of the tracker maximizes accuracy in evaluation of the aim of the weapon. There are also trackers on the left hand, the small of the back, and the head. An auxiliary module acquires the tracker data and sends it to both the avatar driver and the VR Station instance that supplies the HMD view for the participant. There is an avatar driver instance and a tracker input module instance for each trainee.
7.3. Communication from avatar and actors to the VR Station
All of the VR Station instances "see" the same world, although each VR Station can show a different view of it. Thus, the communication from the figure drivers (avatar driver and the puppet server modules) to the VR Station must allow this sharing. This re- quirement is met in the current Ethernet implementa- tion using multicasting of UDP datagrams.
Each VR Station instance independently loads data files that describe the world and the figures in it. Each figure driver (avatar or actor) loads a corresponding
file that describes the part of the world that it con- trols. The major output data from the figure drivers is transforms for the figure's joints and placement in the world. Thus figure drivers can move the figures that they control simultaneously in all views.
8. Summary and future work
This paper has presented VRaptor, a VR system for situational training, that lets the trainer define and re- define scenarios during the training session. Trainees are represented by avatars; the rest of the virtual world is populated by virtual actors, which are under the con- trol of trainer-defined scripts. The scripts allow reac- tive behaviors, but the trainer can control the overall scenario.
Initial feedback from potential users is promising. Future work includes adding features and improving the trainer's control. We want to extend the trainer's interface to allow selection and juxtaposition of more basic behavior elements through icons, which would ex- tend the trainer's control of scripts to a finer-grained form. For deployment in actual training, monitoring and logging the trainee's performance would be necess- sary. This would allow performance review with or without the trainee present, and allow the trainer to evaluate scenarios with respect to difficulty or need for improvement. Also, the system could be used in plan- ning an assault, and this monitoring capability would then be one way of accessing competing plans of attack. We hope to eventually evaluate the VRaptor system for training effectiveness.
9. Acknowledgements
Jim McGee was one of our domain experts, and helped us define the application. The HTML men- uing system was implemented in Umbel Designer by Denise Carlson. The gun interface and sound effects support was implemented by James Singer. The avatar support is by Ron Hightower, using a figure imported from the Jack(TM) system. Ron also created some of the low-level behaviors, and worked on improving the figure models. The multicast packet and network sup- port libraries were implemented by Nadine Miner and Jim Pinkerton respectively. The room and virtual ac- tor figure models were done by Monica Prasad. We are grateful to Ken Perlin for supplying his dancer code. We would also like to thank Wade Ishimoto for his help. The VR/IS lab team is led by Sharon Stansfield. This work was sponsored by Sandia's LDRD program and was carried out at Sandia National Labs, supported by DOE under contract DE-AC04-94AL85000.
175
References
[1] O. Ahmad, J. Cremer, J. Kearney, P. Willemsen, and S. Hansen. Hierarchical, concurrent state machines for behavior modeling and scenario control. In Pro- ceedings of 1994 conference on AI, Simulation, and Planning in High Autonomy Systems, Gainesville, FL, December 1994.
[2] W. Becket and N. I. Badler. Integrated behavioral agent architecture. In Recent Techniques in Human Modeling, Animation, and Rendering (SIGGRAPH 93 Course Notes 80), pages 4-39-4-50. 1993.
[3] B. M. Blumberg and T. A. Galyean. Multi-level direc- tion of autonomous creatures for real-time virtual en- vironments. In R. Cook, editor, SIGGRAPH 95 Con- ference Proceedings, Annual Conference Series, pages 47-54. ACM SIGGRAPH, Addison Wesley, Aug. 1995. held in Los Angeles, California, 06-11 August 1995.
[4] M. Booth, J. Cremer, and J. Kearney. Scenario con- trol for real-time driving simulation. In Proceedings of the 4th Eurographics Workshop on Animation and Simulation, pages 103-119, September 1993.
[5] R. Hightower. Active embodiment of participants in virtual environments: Sensor-driven avatars. In Pro- ceedings of the 1996 IMAGE VIII Conference, 1996.
[6] A. B. Loyall and J. Bates. Real-time control of ani- mated broad agents. In Proceedings of the Fifteenth Annual Conference of the Cognitive Science Society, pages 664-669, June 1993.
[7] P. Maes. Situated agents can have goals. In P. Maes, editor, Designing Autonomous Agents. The MIT Press, 1990.
[8] P. Maes, D. Trevor, B. Blumberg, and A. Pentland. The ALIVE system full-body interaction with au- tonomous agents. In Computer Animation '95, Apr. 1995.
[9] N. J. Nilsson. Teleo-reactive programs for agent con- trol. Journal of Artificial Intelligence Research, 1:139— 158, January 1994.
[10] N. J. Nilsson. Reacting, planning and learning in an autonomous agent. In K.Furukawa, D. Michie, and S. Muggleton, editors, Machine Intelligence 14- The Clarendon Press, 1995.
[11] H. Noser, O. Renault, D. Thalmann, and N. Magnenat-Thalmann. Vision-based naviga- tion for synthetic actors. In Recent Techniques in Human Modeling, Animation, and Rendering (SIGGRAPH 93 Course Notes 80), pages 1-31-1-36. 1993.
[12] K. Perlin. A gesture synthesizer. In J. F. Blinn, editor, SIGGRAPH 94 Course Notes, Course 1. 1994.
[13] K. Perlin. Real time responsive animation with per- sonality. IEEE Transactions on Visualization and Computer Graphics, 1(1):5-15, March 1995.
[14] K. Perlin and A. Goldberg. Improv: A system for scripting interactive actors in virtual worlds. In SIG- GRAPH 96 Proceedings, pages 205-216, 1996.
[15] C. W. Reynolds. Flocks, herds, and schools: A dis- tributed behavioral model. In M. C. Stone, editor, Computer Graphics (SIGGRAPH '87 Proceedings), volume 21, pages 25-34, July 1987.
[16] S. Stansfield, N. Miner, D. Shawver, and D. Rogers. An application of shared virtual reality to situational training. In VRAIS '95 Proceedings, pages 156-161, 1995.
[17] X. Tu and D. Terzopoulos. Artificial fishes: Physics, locomotion, perception, behavior. In SIGGRAPH '94 Proceedings, pages 43-50, July 1994.
[18] D. Zeltzer and M. B. Johnson. Motor planning: An ar- chitecture for specifying and controlling the behaviour of virtual actors. Journal of Visualization and Com- puter Animation, 2:74-80, 1991.
[19] D. Zeltzer and M. B. Johnson. Virtual actors and virtual environments. In L. MacDonald and J. Vince, editors, Interacting with Virtual Environments, pages 229-255. John Wiley k Sons, Ltd., 1994.
176
Virtual Actors and Avatars in a Flexible User-Determined-Scenario Environment.
D.M. Shawver
Trainer's view of the shoothouse.
.170
111
UHION
«IG
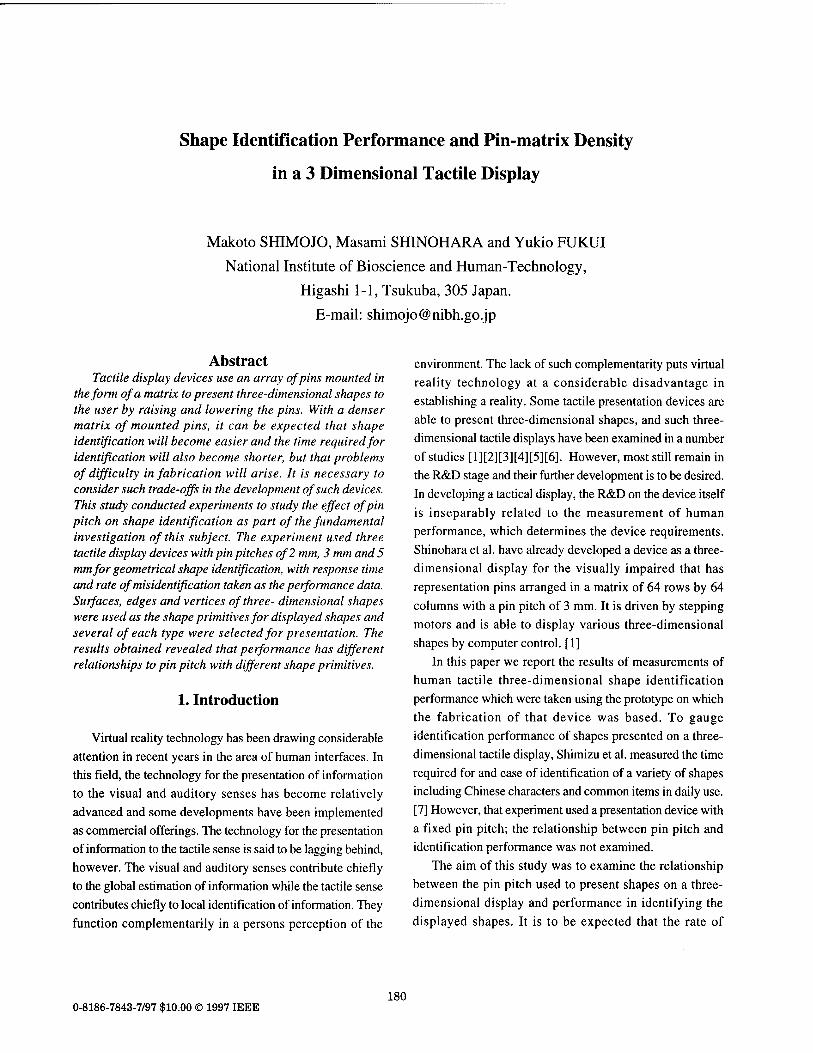
Shape Identification Performance and Pin-matrix Density
in a 3 Dimensional Tactile Display
Makoto SHIMOJO, Masami SHINOHARA and Yukio FUKUI
National Institute of Bioscience and Human-Technology,
Higashi 1-1, Tsukuba, 305 Japan.
E-mail: [email protected]
Abstract Tactile display devices use an array of pins mounted in
the form of a matrix to present three-dimensional shapes to the user by raising and lowering the pins. With a denser matrix of mounted pins, it can be expected that shape identification will become easier and the time required for identification will also become shorter, but that problems of difficulty in fabrication will arise. It is necessary to consider such trade-offs in the development of such devices. This study conducted experiments to study the effect of pin pitch on shape identification as part of the fundamental investigation of this subject. The experiment used three tactile display devices with pin pitches of 2 mm, 3 mm and 5 mm for geometrical shape identification, with response time and rate of misidentification taken as the performance data. Surfaces, edges and vertices of three- dimensional shapes were used as the shape primitives for displayed shapes and several of each type were selected for presentation. The results obtained revealed that performance has different relationships to pin pitch with different shape primitives.
1. Introduction
Virtual reality technology has been drawing considerable
attention in recent years in the area of human interfaces. In this field, the technology for the presentation of information
to the visual and auditory senses has become relatively
advanced and some developments have been implemented as commercial offerings. The technology for the presentation of information to the tactile sense is said to be lagging behind,
however. The visual and auditory senses contribute chiefly to the global estimation of information while the tactile sense
contributes chiefly to local identification of information. They
function complementarily in a persons perception of the
environment. The lack of such complementarity puts virtual
reality technology at a considerable disadvantage in establishing a reality. Some tactile presentation devices are
able to present three-dimensional shapes, and such three- dimensional tactile displays have been examined in a number
of studies [1][2][3][4][5][6]. However, most still remain in the R&D stage and their further development is to be desired.
In developing a tactical display, the R&D on the device itself
is inseparably related to the measurement of human
performance, which determines the device requirements.
Shinohara et al. have already developed a device as a three- dimensional display for the visually impaired that has
representation pins arranged in a matrix of 64 rows by 64
columns with a pin pitch of 3 mm. It is driven by stepping
motors and is able to display various three-dimensional shapes by computer control. [1]
In this paper we report the results of measurements of human tactile three-dimensional shape identification performance which were taken using the prototype on which
the fabrication of that device was based. To gauge identification performance of shapes presented on a three-
dimensional tactile display, Shimizu et al. measured the time required for and ease of identification of a variety of shapes including Chinese characters and common items in daily use.
[7] However, that experiment used a presentation device with a fixed pin pitch; the relationship between pin pitch and
identification performance was not examined.
The aim of this study was to examine the relationship
between the pin pitch used to present shapes on a three- dimensional display and performance in identifying the
displayed shapes. It is to be expected that the rate of
0-8186-7843-7/97 $10.00 © 1997 IEEE 180
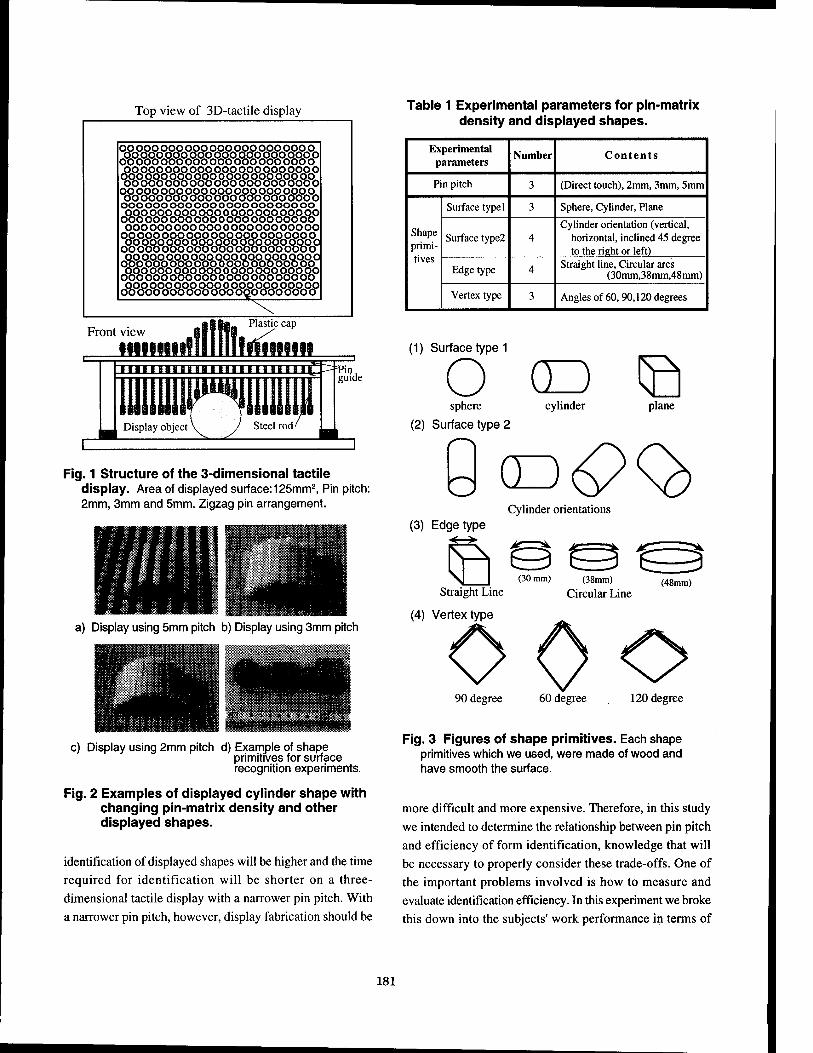
Top view of 3D-tactile display
oo ooo ooo ooo ooo ooo ooo ooo o OO(OOÖOOC(OOOIOÖÖ(OÖC(ÖOC(OÖOO ;(^0<osP/os@P/P/D,P,P^&o&8P/P/@P,P/P Q^^Q^PÄQPÄQßöSÖSPÄÖPÄPA oo ooo ooooooooooooooooooo oo ooo ooooooooooooooooooo ooo ooo ooo ooo o ooo ooo ooo oo *38ß88&S98S9P»<U&°,888S8ß8P OOO OOO OOO OOO 0 ooo ooo ooo oo ooo ooo ooo ooo oooooooooooo oo ooo ooo ooo ooo ooo ooo ooo o
ommmmmmmoooö°
\
Front view
imnml HU ^sticcap
Illllltflff inuiL iniiiimyiiiinmiimBIIIIH =fPin.
guide
Display object V y Steel rod/
Fig. 1 Structure of the 3-dimensional tactile display. Area of displayed surface: 125mm2, Pin pitch: 2mm, 3mm and 5mm. Zigzag pin arrangement.
a) Display using 5mm pitch b) Display using 3mm pitch
c) Display using 2mm pitch d) Example of shape primitives for surface recognition experiments.
Fig. 2 Examples of displayed cylinder shape with changing pin-matrix density and other displayed shapes.
identification of displayed shapes will be higher and the time required for identification will be shorter on a three-
dimensional tactile display with a narrower pin pitch. With
a narrower pin pitch, however, display fabrication should be
Table 1 Experimental parameters for pin-matrix density and displayed shapes.
Experimental parameters
Number Contents
Pin pitch 3 (Direct touch), 2mm, 3mm, 5mm
Shape primi- tives
Surface typel 3 Sphere, Cylinder, Plane
Surface type2 4 Cylinder orientation (vertical,
horizontal, inclined 45 degree to the right or left)
Edge type 4 Straight line, Circular arcs (30mm,38mm,48mm)
Vertex type 3 Angles of 60,90,120 degrees
(1) Surface type 1
O (D © sphere cylinder
(2) Surface type 2
plane
9<D£X> Cylinder orientations
(3) Edge type
® Q ^E=5 (30 mm) (38mm) (48mm)
Straight Line Circular Line
(4) Vertex type
90 degree 60 degree 120 degree
Fig. 3 Figures of shape primitives. Each shape primitives which we used, were made of wood and have smooth the surface.
more difficult and more expensive. Therefore, in this study
we intended to determine the relationship between pin pitch and efficiency of form identification, knowledge that will
be necessary to properly consider these trade-offs. One of the important problems involved is how to measure and
evaluate identification efficiency. In this experiment we broke this down into the subjects' work performance in terms of
181
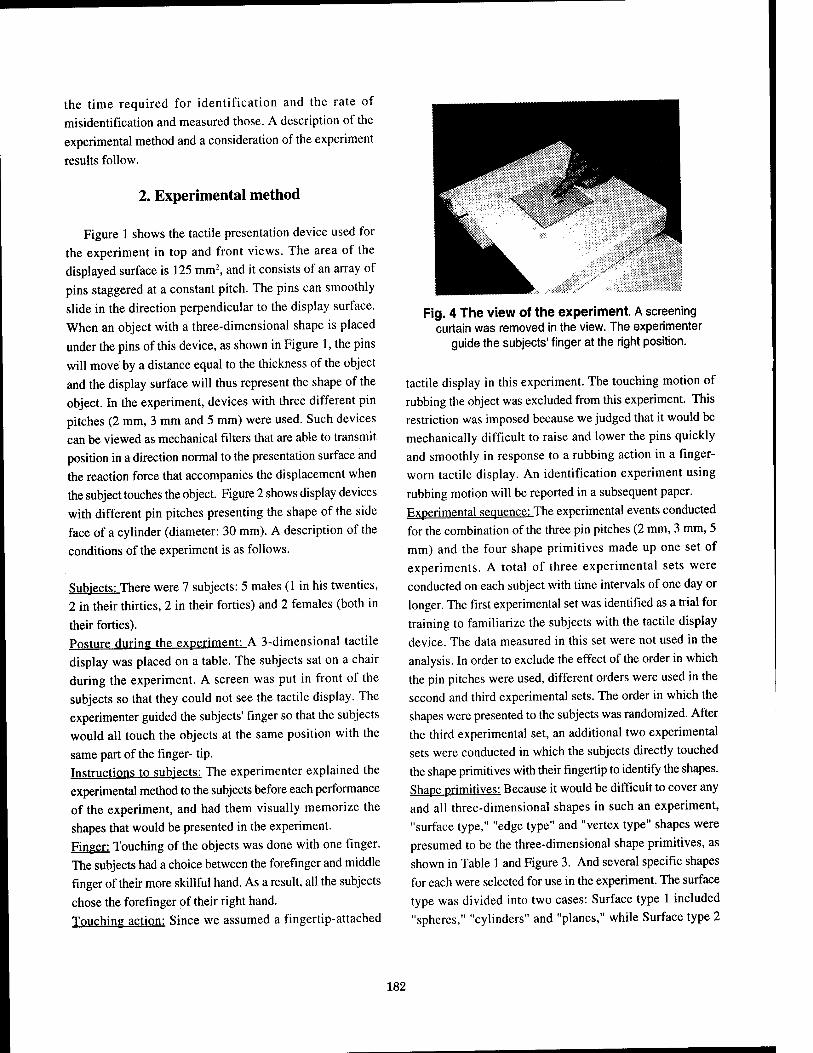
the time required for identification and the rate of
misidentification and measured those. A description of the
experimental method and a consideration of the experiment
results follow.
2. Experimental method
Figure 1 shows the tactile presentation device used for
the experiment in top and front views. The area of the
displayed surface is 125 mm2, and it consists of an array of
pins staggered at a constant pitch. The pins can smoothly
slide in the direction perpendicular to the display surface.
When an object with a three-dimensional shape is placed
under the pins of this device, as shown in Figure 1, the pins
will move by a distance equal to the thickness of the object
and the display surface will thus represent the shape of the
object. In the experiment, devices with three different pin pitches (2 mm, 3 mm and 5 mm) were used. Such devices can be viewed as mechanical filters that are able to transmit position in a direction normal to the presentation surface and
the reaction force that accompanies the displacement when
the subject touches the object. Figure 2 shows display devices
with different pin pitches presenting the shape of the side
face of a cylinder (diameter: 30 mm). A description of the
conditions of the experiment is as follows.
Subjects: There were 7 subjects: 5 males (1 in his twenties,
2 in their thirties, 2 in their forties) and 2 females (both in
their forties). Posture during the experiment: A 3-dimensional tactile
display was placed on a table. The subjects sat on a chair
during the experiment. A screen was put in front of the
subjects so that they could not see the tactile display. The experimenter guided the subjects' finger so that the subjects
would all touch the objects at the same position with the
same part of the finger- tip. Instructions to subjects: The experimenter explained the experimental method to the subjects before each performance
of the experiment, and had them visually memorize the shapes that would be presented in the experiment.
Finger: Touching of the objects was done with one finger. The subjects had a choice between the forefinger and middle
finger of their more skillful hand. As a result, all the subjects
chose the forefinger of their right hand. Touching action: Since we assumed a fingertip-attached
Fig. 4 The view of the experiment. A screening curtain was removed in the view. The experimenter
guide the subjects' finger at the right position.
tactile display in this experiment. The touching motion of
rubbing the object was excluded from this experiment. This restriction was imposed because we judged that it would be
mechanically difficult to raise and lower the pins quickly and smoothly in response to a rubbing action in a finger- worn tactile display. An identification experiment using
rubbing motion will be reported in a subsequent paper.
Experimental sequence: The experimental events conducted
for the combination of the three pin pitches (2 mm, 3 mm, 5 mm) and the four shape primitives made up one set of experiments. A total of three experimental sets were
conducted on each subject with time intervals of one day or
longer. The first experimental set was identified as a trial for
training to familiarize the subjects with the tactile display device. The data measured in this set were not used in the
analysis. In order to exclude the effect of the order in which
the pin pitches were used, different orders were used in the second and third experimental sets. The order in which the shapes were presented to the subjects was randomized. After
the third experimental set, an additional two experimental sets were conducted in which the subjects directly touched
the shape primitives with their fingertip to identify the shapes.
Shape primitives: Because it would be difficult to cover any and all three-dimensional shapes in such an experiment,
"surface type," "edge type" and "vertex type" shapes were
presumed to be the three-dimensional shape primitives, as
shown in Table 1 and Figure 3. And several specific shapes
for each were selected for use in the experiment. The surface
type was divided into two cases: Surface type 1 included
"spheres," "cylinders" and "planes," while Surface type 2
182
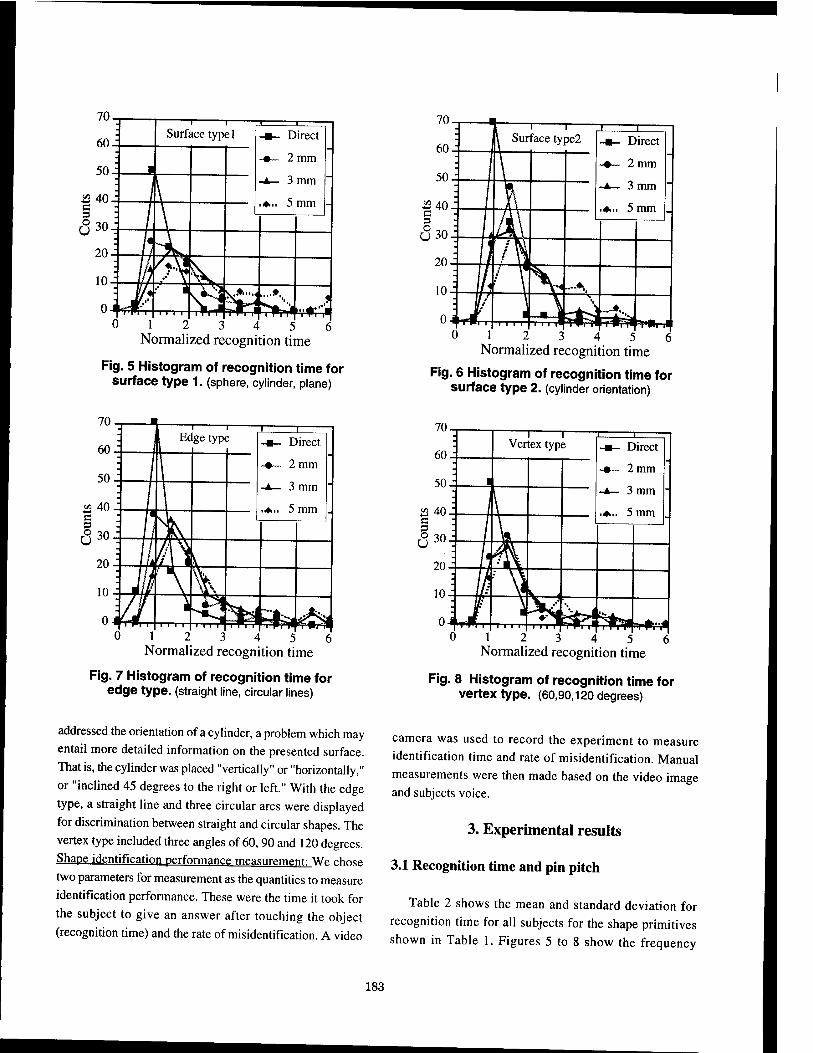
Normalized recognition time
Fig. 5 Histogram of recognition time for surface type 1. (sphere, cylinder, plane)
3 4 56 Normalized recognition time
Fig. 7 Histogram of recognition time for edge type, (straight line, circular lines)
addressed the orientation of a cylinder, a problem which may entail more detailed information on the presented surface. That is, the cylinder was placed "vertically" or "horizontally," or "inclined 45 degrees to the right or left." With the edge type, a straight line and three circular arcs were displayed for discrimination between straight and circular shapes. The vertex type included three angles of 60,90 and 120 degrees. Shape identification performance measurement: We. chose
two parameters for measurement as the quantities to measure identification performance. These were the time it took for the subject to give an answer after touching the object
(recognition time) and the rate of misidentification. A video
0 1 2 3 4., Normalized recognition time
Fig. 6 Histogram of recognition time for surface type 2. (cylinder orientation)
0 12 3 4 5 6 Normalized recognition time
Fig. 8 Histogram of recognition time for vertex type. (60,90,120 degrees)
camera was used to record the experiment to measure identification time and rate of misidentification. Manual measurements were then made based on the video image and subjects voice.
3. Experimental results
3.1 Recognition time and pin pitch
Table 2 shows the mean and standard deviation for recognition time for all subjects for the shape primitives
shown in Table 1. Figures 5 to 8 show the frequency
183
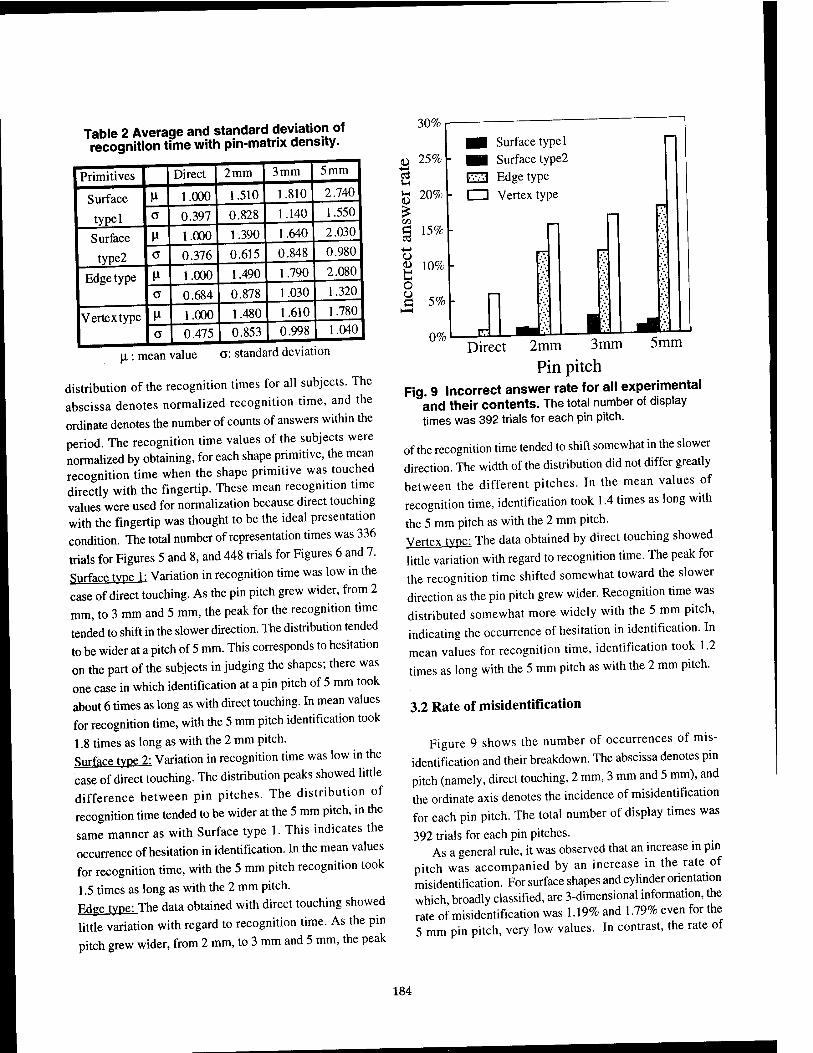
Table 2 Average and standard deviation of recognition time with pin-matrix density.
30%
Primitives
Surface
typel
Surface
type2
|A
Direct
1.000
2 mm
V-
Edge type
Vertex type
0.397
1.000
0.376
1.000
0.684
1.510
0.828
3mm
1.810
1.390
0.615
1.490
0.878
1.000
0.475
1.480
1.140
1.640
0.848
5mm |
2.7401 1.550
2.030
0.980
1.790
1.030
0.853
1.610 0.998
2.080
1.320
1.780 1.040
\i: mean value o: standard deviation
distribution of the recognition times for all subjects. The abscissa denotes normalized recognition time, and the
ordinate denotes the number of counts of answers within the period. The recognition time values of the subjects were normalized by obtaining, for each shape primitive, the mean recognition time when the shape primitive was touched directly with the fingertip. These mean recognition time values were used for normalization because direct touching with the fingertip was thought to be the ideal presentation condition. The total number of representation times was 336
trials for Figures 5 and 8, and 448 trials for Figures 6 and 7. Surface, tvnel: Variation in recognition time was low in the case of direct touching. As the pin pitch grew wider, from 2 mm, to 3 mm and 5 mm, the peak for the recognition time tended to shift in the slower direction. The distribution tended to be wider at a pitch of 5 mm. This corresponds to hesitation
on the part of the subjects in judging the shapes; there was one case in which identification at a pin pitch of 5 mm took about 6 times as long as with direct touching. In mean values for recognition time, with the 5 mm pitch identification took
1.8 times as long as with the 2 mm pitch. Surface tvoe 2: Variation in recognition time was low in the case of direct touching. The distribution peaks showed little difference between pin pitches. The distribution of recognition time tended to be wider at the 5 mm pitch, in the same manner as with Surface type 1. This indicates the
occurrence of hesitation in identification. In the mean values for recognition time, with the 5 mm pitch recognition took
1.5 times as long as with the 2 mm pitch. Fdpe tvoe: The data obtained with direct touching showed
little variation with regard to recognition time. As the pin pitch grew wider, from 2 mm, to 3 mm and 5 mm, the peak
S-l
c
25%
20%
15%
■1 Surface typel ^B Surface type2 E3 Edge type □ Vertex type
Ö 10% C o o es 5%
0%l 5mm Direct 2mm 3mm
Pin pitch Fig 9 Incorrect answer rate for all experimental
and their contents. The total number of display times was 392 trials for each pin pitch.
of the recognition time tended to shift somewhat in the slower direction. The width of the distribution did not differ greatly between the different pitches. In the mean values of recognition time, identification took 1.4 times as long with
the 5 mm pitch as with the 2 mm pitch. Vertex type: The data obtained by direct touching showed
little variation with regard to recognition time. The peak for the recognition time shifted somewhat toward the slower direction as the pin pitch grew wider. Recognition time was distributed somewhat more widely with the 5 mm pitch, indicating the occurrence of hesitation in identification. In mean values for recognition time, identification took 1.2
times as long with the 5 mm pitch as with the 2 mm pitch.
3.2 Rate of misidentification
Figure 9 shows the number of occurrences of mis-
identification and their breakdown. The abscissa denotes pin
pitch (namely, direct touching, 2 mm, 3 mm and 5 mm), and the ordinate axis denotes the incidence of misidentification
for each pin pitch. The total number of display times was
392 trials for each pin pitches. As a general rule, it was observed that an increase in pin
pitch was accompanied by an increase in the rate of misidentification. For surface shapes and cylinder orientation which broadly classified, are 3-dimensional information, the rate of misidentification was 1.19% and 1.79% even for the 5 mm pin pitch, very low values. In contrast, the rate of
184
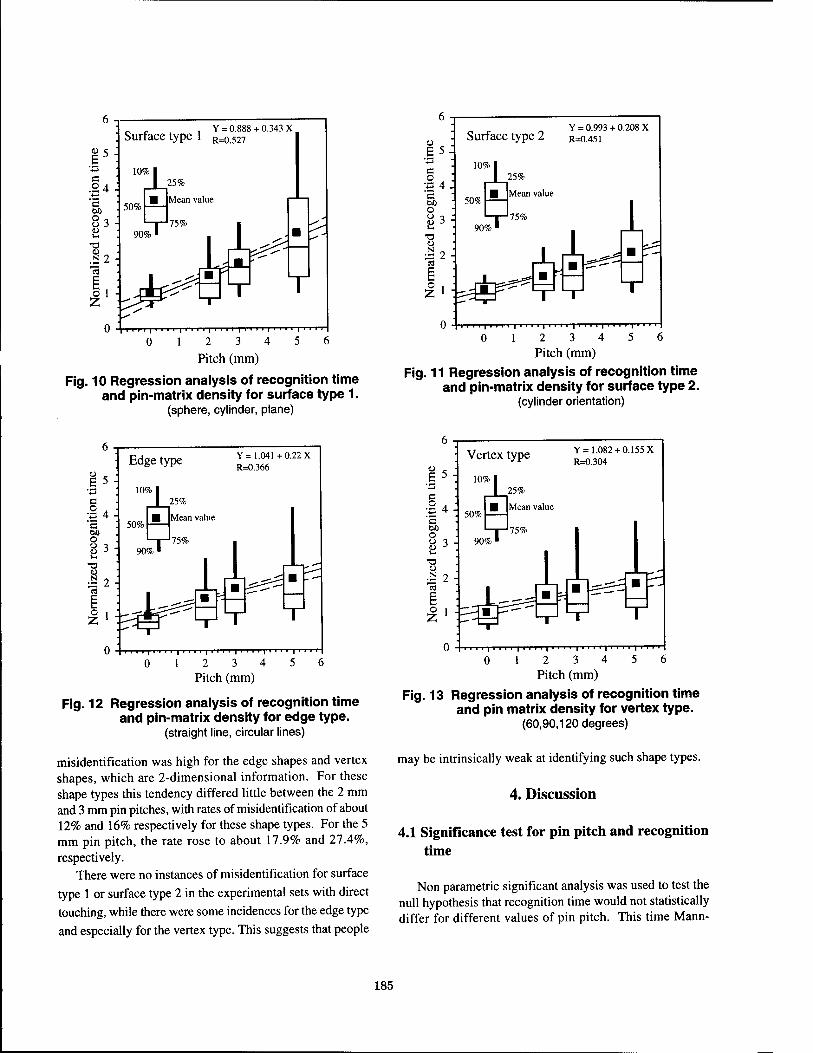
I G .2 4 *-> "c
o 3 Si
X)
.a 2
o
_ , , Y = 0.888 +0.343 X Surface type 1 R=0.527
50%
25%
Mean value
75%
0 \ 111111111 1111111111 1111111111 11111 0 12 3 4 5 6
Pitch (mm)
Fig. 10 Regression analysis of recognition time and pin-matrix density for surface type 1.
(sphere, cylinder, plane)
.i5 ■i—>
C
;|44 c. 60 o O -i D J
-a D ^2
o Z
0
Y = 0.993 +0.208 X Surface type 2 R=O.45I
10% I
50%
25%
Mean value
75% 90%'
T
■er i i [i i i i | i i i i [ i i i i | i i i i |"i"i i i | i r
0 12 3 4 5 6 Pitch (mm)
Fig. 11 Regression analysis of recognition time and pin-matrix density for surface type 2.
(cylinder orientation)
Y=l.04l +0.22X R=0.366
0 - 111111111 111 ■ ■ i ■ ■ i ■ i ■■■' i ■ 0 12 3 4 5 6
Pitch (mm)
Fig. 12 Regression analysis of recognition time and pin-matrix density for edge type.
(straight line, circular lines)
misidentification was high for the edge shapes and vertex shapes, which are 2-dimensional information. For these shape types this tendency differed little between the 2 mm and 3 mm pin pitches, with rates of misidentification of about 12% and 16% respectively for these shape types. For the 5 mm pin pitch, the rate rose to about 17.9% and 27.4%, respectively.
There were no instances of misidentification for surface
type 1 or surface type 2 in the experimental sets with direct touching, while there were some incidences for the edge type
and especially for the vertex type. This suggests that people
0
Vertex type
10% I
Y = 1.082 +0.155 X R=0.304
T
■T"l I I | I I I I | I I I I J"! Ill | I I ■"■"'I I I I I | I I I ■
0 12 3 4 5 6 Pitch (mm)
Fig. 13 Regression analysis of recognition time and pin matrix density for vertex type.
(60,90,120 degrees)
may be intrinsically weak at identifying such shape types.
4. Discussion
4.1 Significance test for pin pitch and recognition time
Non parametric significant analysis was used to test the null hypothesis that recognition time would not statistically differ for different values of pin pitch. This time Mann-
185
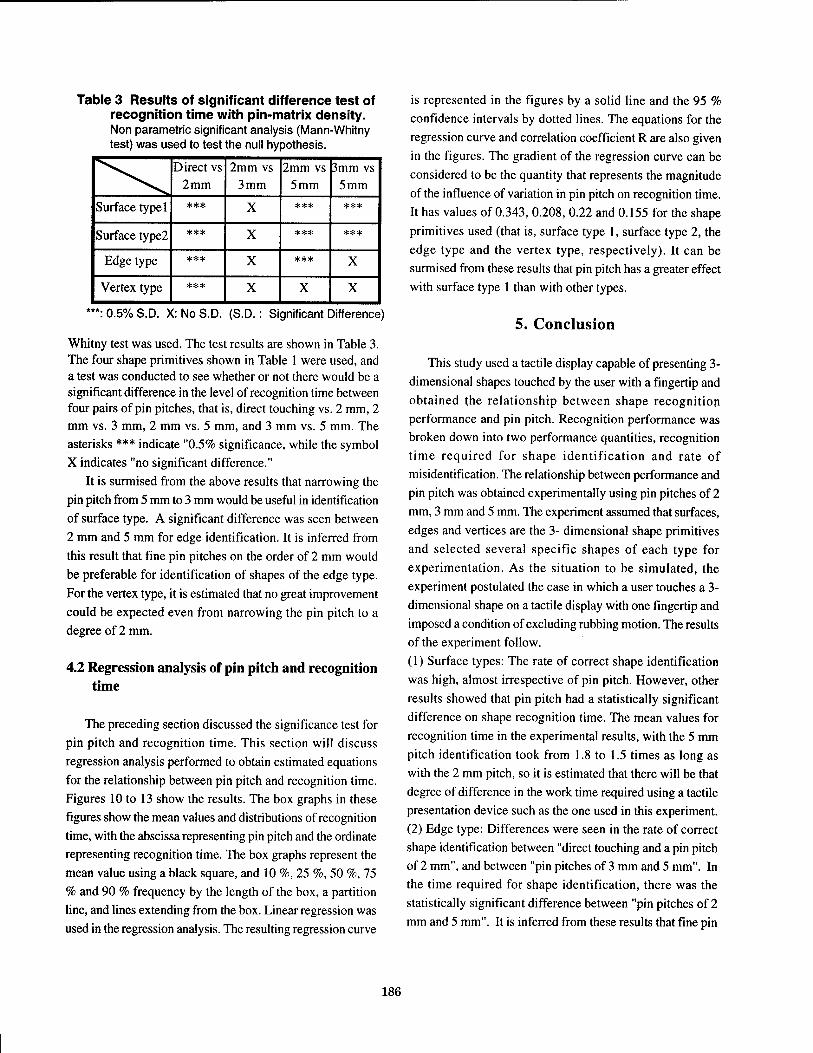
Table 3 Results of significant difference test of recognition time with pin-matrix density. Non parametric significant analysis (Mann-Whitny test) was used to test the null hypothesis.
^\ Direct vs
2 mm 2mm vs
3 mm 2mm vs
5mm 3mm vs
5mm
Surface typel *** X *** *##
Surface type2 *** X *** ***
Edge type *** X *** X
Vertex type *** X X X
***: 0.5% S.D. X: No S.D. (S.D.: Significant Difference)
Whitny test was used. The test results are shown in Table 3. The four shape primitives shown in Table 1 were used, and a test was conducted to see whether or not there would be a significant difference in the level of recognition time between four pairs of pin pitches, that is, direct touching vs. 2 mm, 2 mm vs. 3 mm, 2 mm vs. 5 mm, and 3 mm vs. 5 mm. The asterisks *** indicate "0.5% significance, while the symbol X indicates "no significant difference."
It is surmised from the above results that narrowing the pin pitch from 5 mm to 3 mm would be useful in identification
of surface type. A significant difference was seen between
2 mm and 5 mm for edge identification. It is inferred from
this result that fine pin pitches on the order of 2 mm would
be preferable for identification of shapes of the edge type.
For the vertex type, it is estimated that no great improvement
could be expected even from narrowing the pin pitch to a degree of 2 mm.
4.2 Regression analysis of pin pitch and recognition time
The preceding section discussed the significance test for
pin pitch and recognition time. This section will discuss
regression analysis performed to obtain estimated equations
for the relationship between pin pitch and recognition time. Figures 10 to 13 show the results. The box graphs in these
figures show the mean values and distributions of recognition
time, with the abscissa representing pin pitch and the ordinate representing recognition time. The box graphs represent the
mean value using a black square, and 10 %, 25 %, 50 %, 75
% and 90 % frequency by the length of the box, a partition line, and lines extending from the box. Linear regression was
used in the regression analysis. The resulting regression curve
is represented in the figures by a solid line and the 95 %
confidence intervals by dotted lines. The equations for the
regression curve and correlation coefficient R are also given in the figures. The gradient of the regression curve can be
considered to be the quantity that represents the magnitude
of the influence of variation in pin pitch on recognition time.
It has values of 0.343, 0.208, 0.22 and 0.155 for the shape
primitives used (that is, surface type 1, surface type 2, the
edge type and the vertex type, respectively). It can be surmised from these results that pin pitch has a greater effect with surface type 1 than with other types.
5. Conclusion
This study used a tactile display capable of presenting 3-
dimensional shapes touched by the user with a fingertip and
obtained the relationship between shape recognition performance and pin pitch. Recognition performance was broken down into two performance quantities, recognition
time required for shape identification and rate of misidentification. The relationship between performance and
pin pitch was obtained experimentally using pin pitches of 2
mm, 3 mm and 5 mm. The experiment assumed that surfaces,
edges and vertices are the 3- dimensional shape primitives and selected several specific shapes of each type for
experimentation. As the situation to be simulated, the
experiment postulated the case in which a user touches a 3-
dimensional shape on a tactile display with one fingertip and
imposed a condition of excluding rubbing motion. The results of the experiment follow.
(1) Surface types: The rate of correct shape identification
was high, almost irrespective of pin pitch. However, other
results showed that pin pitch had a statistically significant difference on shape recognition time. The mean values for
recognition time in the experimental results, with the 5 mm
pitch identification took from 1.8 to 1.5 times as long as
with the 2 mm pitch, so it is estimated that there will be that
degree of difference in the work time required using a tactile presentation device such as the one used in this experiment.
(2) Edge type: Differences were seen in the rate of correct shape identification between "direct touching and a pin pitch of 2 mm", and between "pin pitches of 3 mm and 5 mm". In
the time required for shape identification, there was the
statistically significant difference between "pin pitches of 2 mm and 5 mm". It is inferred from these results that fine pin
186
pitches on the order of 2 mm would be preferable for
identification of shapes of the edge type. (3) Vertex type: A difference was observed in the rate of correct shape identification between "direct touching and a
pin pitch of 2 mm" and between "pin pitches of 3 mm and 5 mm". In the time required for shape identification, there was a significant difference between "direct touching and 2 mm", but no significant difference between the other pin pitch pairs.
The regression curve had a gentler slope than with the surface and edge types. This means that pin pitch had a smaller
influence. Of the shape types used in the experiment, 80 percent of
the instances of misidentification belonged to the vertex type
in the case of direct touching. It is inferred from this that
people may be poor at identifying vertex-type shapes using
a finger. In the next experiment, we intend to measure shape
identification performance when rubbing motion is also
allowed.
Reference
[1] Shinohara M., Shimizu Y. and Mochizuki A.: "Development of a 3-dimensional tactile display for the
blind", Proceedings of European Conference on the Advancement of Rehabilitation Technology-ECART,
pp.404-405 ,1995. [2] Weber, G.: "Reading and pointing-modes of interaction for
blind users",Information processing 89, G.X. Ritter(ed.) Elsevier Science Publishers B.V., 1989.
[3] Cohn M.B,. Lam M. and Fearing R.S.: "Tactile feedback for teleoperation", Telemanipulator technology Conf.. Proc. SPIE vol.1833, H. Das, ed., Boston, MA, Nov.pp.15-16,1992.
[4] Kontarinis, D.A., Son J.S., Peine W. and Howe R.D. : "A tactile shape sensing and display system for teleoperated manipulation", Proc. Int. Conf. Robotics and Automation,
pp.641-646, 1995. [5] Kawai Y., Ohnishi N. and Sugie N : "A support system for
the blind to recgnize a diagram", System and Computer in Japan, vol.21, No.7, pp.75-85, 1990.
[6] Hirota K., Hirose M.: "A force feedback device presenting curved surface", Proc. ROBOMEC95, No.95-17, vol.A, pp.101-104,1995.
[7] Shimizu Y., M. Shinohara and Nagaoka H.: "Validity of a 3-dimensional tactile display for the blind", Proceedings of European Conference on the Advancement of Rehabilitation Technology-ECART, 406-408,1995.
187
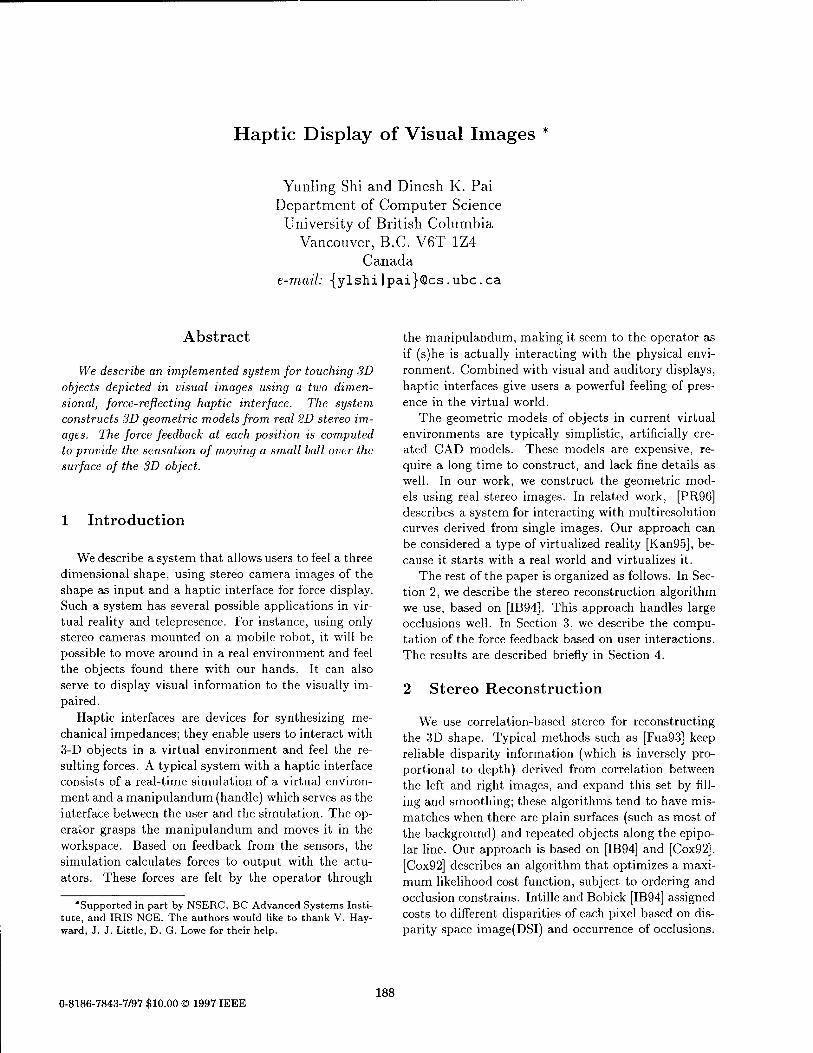
Haptic Display of Visual Images
Yunling Shi and Dinesh K. Pai Department of Computer Science
University of British Columbia Vancouver, B.C. V6T 1Z4
Canada e-mail: {ylshi |pai}@cs .ubc.ca
Abstract
We describe an implemented system for touching 3D objects depicted in visual images using a two dimen- sional, force-reflecting haptic interface. The system constructs 3D geometric models from real 2D stereo im- ages. The force feedback at each position is computed to provide the sensation of moving a small ball over the surface of the 3D object.
1 Introduction
We describe a system that allows users to feel a three dimensional shape, using stereo camera images of the shape as input and a haptic interface for force display. Such a system has several possible applications in vir- tual reality and telepresence. For instance, using only stereo cameras mounted on a mobile robot, it will be possible to move around in a real environment and feel the objects found there with our hands. It can also serve to display visual information to the visually im- paired.
Haptic interfaces are devices for synthesizing me- chanical impedances; they enable users to interact with 3-D objects in a virtual environment and feel the re- sulting forces. A typical system with a haptic interface consists of a real-time simulation of a virtual environ- ment and a manipulandum (handle) which serves as the interface between the user and the simulation. The op- erator grasps the manipulandum and moves it in the workspace. Based on feedback from the sensors, the simulation calculates forces to output with the actu- ators. These forces are felt by the operator through
'Supported in part by NSERC, BC Advanced Systems Insti- tute, and IRIS NCE. The authors would like to thank V. Hay- ward, J. J. Little, D. G. Lowe for their help.
the manipulandum, making it seem to the operator as if (s)he is actually interacting with the physical envi- ronment. Combined with visual and auditory displays, haptic interfaces give users a powerful feeling of pres- ence in the virtual world.
The geometric models of objects in current virtual environments are typically simplistic, artificially cre- ated CAD models. These models are expensive, re- quire a long time to construct, and lack fine details as well. In our work, we construct the geometric mod- els using real stereo images. In related work, [PR96] describes a system for interacting with multiresolution curves derived from single images. Our approach can be considered a type of virtualized reality [Kan95], be- cause it starts with a real world and virtualizes it.
The rest of the paper is organized as follows. In Sec- tion 2, we describe the stereo reconstruction algorithm we use, based on [IB94]. This approach handles large occlusions well. In Section 3, we describe the compu- tation of the force feedback based on user interactions. The results are described briefly in Section 4.
2 Stereo Reconstruction
We use correlation-based stereo for reconstructing the 3D shape. Typical methods such as [Fua93] keep reliable disparity information (which is inversely pro- portional to depth) derived from correlation between the left and right images, and expand this set by fill- ing and smoothing; these algorithms tend to have mis- matches when there are plain surfaces (such as most of the background) and repeated objects along the epipo- lar line. Our approach is based on [IB94] and [Cox92]. [Cox92] describes an algorithm that optimizes a maxi- mum likelihood cost function, subject to ordering and occlusion constrains. Intille and Bobick [IB94] assigned costs to different disparities of each pixel based on dis- parity space image(DSI) and occurrence of occlusions.
0-8186-7843-7/97 $10.00 © 1997 IEEE 188
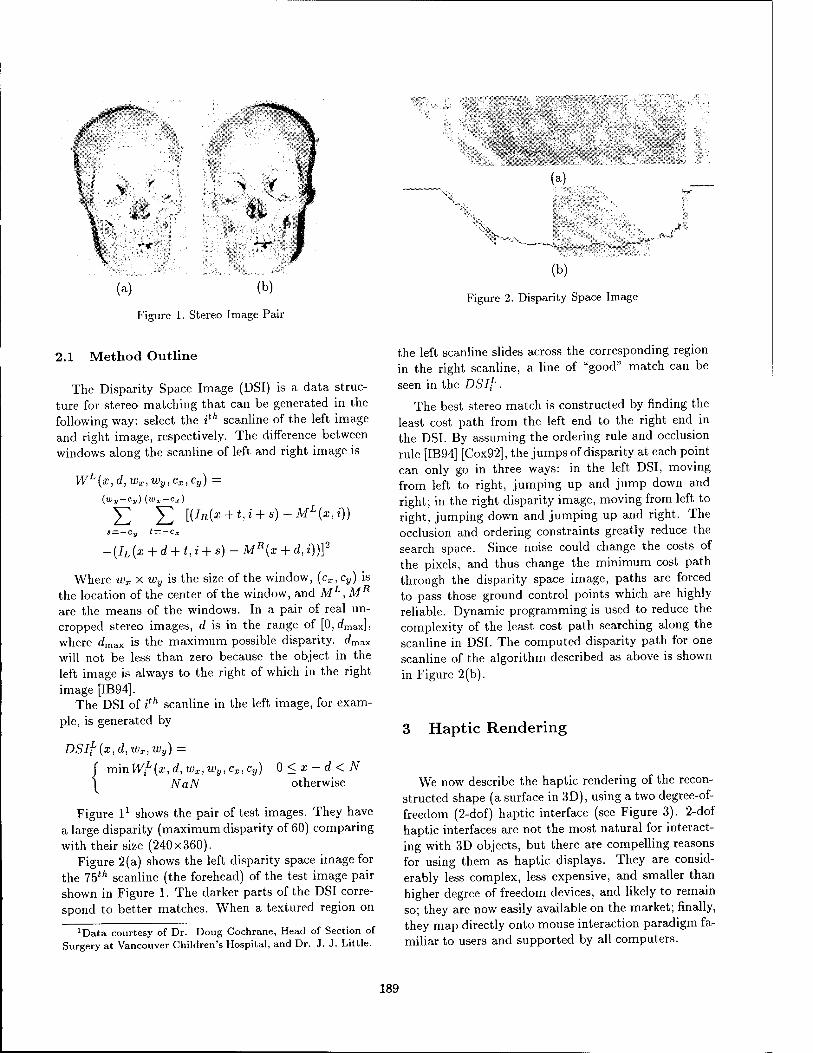
(a) (b)
Figure 1. Stereo Image Pair
(a)
(b)
Figure 2. Disparity Space Image
2.1 Method Outline
The Disparity Space Image (DSI) is a data struc- ture for stereo matching that can be generated in the following way: select the ith scanline of the left image and right image, respectively. The difference between windows along the scanline of left and right image is
WL{X,d, WX,Wy,CX,Cy) —
(Wy-Cy) (lüX-Cl)
y V [(IR(x + t,i + s)-ML(x,i)) s = — c
max
-{IL{x + d + t, i + s)- MR{x + d, i))}2
Where wx x wy is the size of the window, (cx,cy) is the location of the center of the window, and ML,MR
are the means of the windows. In a pair of real un- cropped stereo images, d is in the range of [0,dm
where rfmax is the maximum possible disparity, d, will not be less than zero because the object in the left image is always to the right of which in the right image [IB94].
The DSI of ith scanline in the left image, for exam- ple, is generated by
mmW^{x,d,wx,Wy,cx,Cy) 0<x-d<N NaN otherwise
Figure l1 shows the pair of test images. They have a large disparity (maximum disparity of 60) comparing with their size (240x360).
Figure 2(a) shows the left disparity space image for the 75t/! scanline (the forehead) of the test image pair shown in Figure 1. The darker parts of the DSI corre- spond to better matches. When a textured region on
'Data courtesy of Dr. Doug Cochrane, Head of Section of Surgery at Vancouver Children's Hospital, and Dr. J. J. Little.
the left scanline slides across the corresponding region in the right scanline, a line of "good" match can be seen in the DSI; .
The best stereo match is constructed by finding the least cost path from the left end to the right end in the DSI. By assuming the ordering rule and occlusion rule [IB94] [Cox92], the jumps of disparity at each point can only go in three ways: in the left DSI, moving from left to right, jumping up and jump down and right; in the right disparity image, moving from left to right, jumping down and jumping up and right. The occlusion and ordering constraints greatly reduce the search space. Since noise could change the costs of the pixels, and thus change the minimum cost path through the disparity space image, paths are forced to pass those ground control points which are highly reliable. Dynamic programming is used to reduce the complexity of the least cost path searching along the scanline in DSI. The computed disparity path for one scanline of the algorithm described as above is shown in Figure 2(b).
3 Haptic Rendering
We now describe the haptic rendering of the recon- structed shape (a surface in 3D), using a two degree-of- freedom (2-dof) haptic interface (see Figure 3). 2-dof haptic interfaces are not the most natural for interact- ing with 3D objects, but there are compelling reasons for using them as haptic displays. They are consid- erably less complex, less expensive, and smaller than higher degree of freedom devices, and likely to remain so; they are now easily available on the market; finally, they map directly onto mouse interaction paradigm fa- miliar to users and supported by all computers.
189
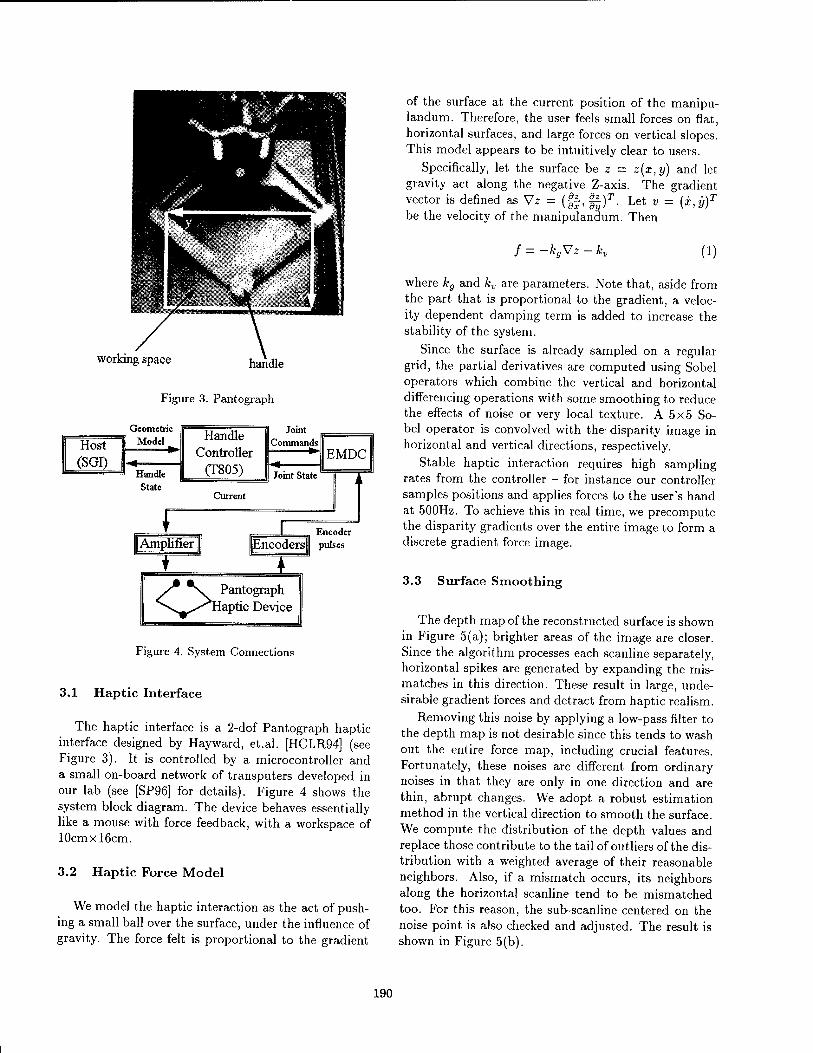
working space handle
Figure 3. Pantograph
Pantograph Haptic Device
Figure 4. System Connections
3.1 Haptic Interface
The haptic interface is a 2-dof Pantograph haptic interface designed by Hay ward, et.al. [HCLR94] (see Figure 3). It is controlled by a microcontroller and a small on-board network of transputers developed in our lab (see [SP96] for details). Figure 4 shows the system block diagram. The device behaves essentially like a mouse with force feedback, with a workspace of 10cmxl6cm.
3.2 Haptic Force Model
We model the haptic interaction as the act of push- ing a small ball over the surface, under the influence of gravity. The force felt is proportional to the gradient
of the surface at the current position of the manipu- landum. Therefore, the user feels small forces on flat, horizontal surfaces, and large forces on vertical slopes. This model appears to be intuitively clear to users.
Specifically, let the surface be z = z(x, y) and let gravity act along the negative Z-axis. The gradient vector is defined as Vz = (§§, ||)T. Let v = {x,y)T
be the velocity of the manipulandum. Then
/ — Kg V Z Kv (1)
where kg and kv are parameters. Note that, aside from the part that is proportional to the gradient, a veloc- ity dependent damping term is added to increase the stability of the system.
Since the surface is already sampled on a regular grid, the partial derivatives are computed using Sobel operators which combine the vertical and horizontal differencing operations with some smoothing to reduce the effects of noise or very local texture. A 5x5 So- bel operator is convolved with the disparity image in horizontal and vertical directions, respectively.
Stable haptic interaction requires high sampling rates from the controller - for instance our controller samples positions and applies forces to the user's hand at 500Hz. To achieve this in real time, we precompute the disparity gradients over the entire image to form a discrete gradient force image.
3.3 Surface Smoothing
The depth map of the reconstructed surface is shown in Figure 5(a); brighter areas of the image are closer. Since the algorithm processes each scanline separately, horizontal spikes are generated by expanding the mis- matches in this direction. These result in large, unde- sirable gradient forces and detract from haptic realism.
Removing this noise by applying a low-pass filter to the depth map is not desirable since this tends to wash out the entire force map, including crucial features. Fortunately, these noises are different from ordinary noises in that they are only in one direction and are thin, abrupt changes. We adopt a robust estimation method in the vertical direction to smooth the surface. We compute the distribution of the depth values and replace those contribute to the tail of outliers of the dis- tribution with a weighted average of their reasonable neighbors. Also, if a mismatch occurs, its neighbors along the horizontal scanline tend to be mismatched too. For this reason, the sub-scanline centered on the noise point is also checked and adjusted. The result is shown in Figure 5(b).
190
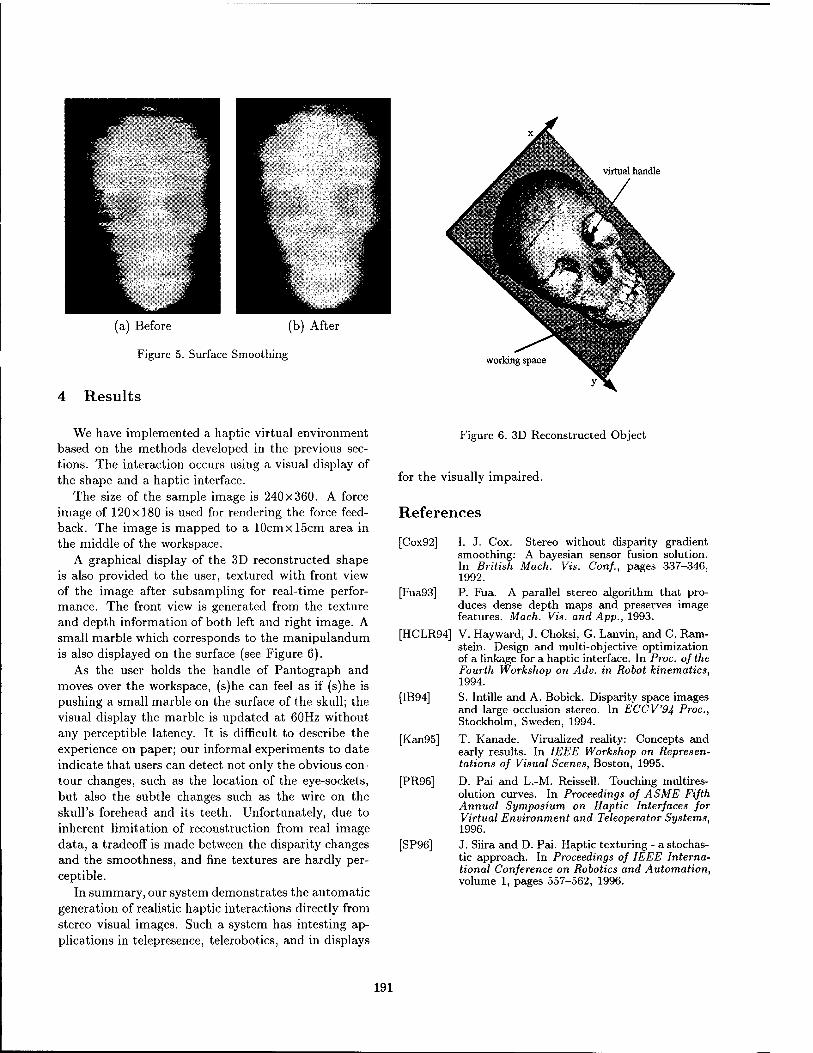
(a) Before (b) After
Figure 5. Surface Smoothing
virtual handle
4 Results
working space
We have implemented a haptic virtual environment based on the methods developed in the previous sec- tions. The interaction occurs using a visual display of the shape and a haptic interface.
The size of the sample image is 240x360. A force image of 120x180 is used for rendering the force feed- back. The image is mapped to a 10cmxl5cm area in the middle of the workspace.
A graphical display of the 3D reconstructed shape is also provided to the user, textured with front view of the image after subsampling for real-time perfor- mance. The front view is generated from the texture and depth information of both left and right image. A small marble which corresponds to the manipulandum is also displayed on the surface (see Figure 6).
As the user holds the handle of Pantograph and moves over the workspace, (s)he can feel as if (s)he is pushing a small marble on the surface of the skull; the visual display the marble is updated at 60Hz without any perceptible latency. It is difficult to describe the experience on paper; our informal experiments to date indicate that users can detect not only the obvious con- tour changes, such as the location of the eye-sockets, but also the subtle changes such as the wire on the skull's forehead and its teeth. Unfortunately, due to inherent limitation of reconstruction from real image data, a tradeoff is made between the disparity changes and the smoothness, and fine textures are hardly per- ceptible.
In summary, our system demonstrates the automatic generation of realistic haptic interactions directly from stereo visual images. Such a system has intesting ap- plications in telepresence, telerobotics, and in displays
Figure 6. 3D Reconstructed Object
for the visually impaired.
References
[Cox92] I. J. Cox. Stereo without disparity gradient smoothing: A bayesian sensor fusion solution. In British Mach. Vis. Conf., pages 337-346, 1992.
[Fua93] P. Fua. A parallel stereo algorithm that pro- duces dense depth maps and preserves image features. Mach. Vis. and App., 1993.
[HCLR94] V. Hayward, J. Choksi, G. Lanvin, and C. Ram- stein. Design and multi-objective optimization of a linkage for a haptic interface. In Proc. of the Fourth Workshop on Adv. in Robot kinematics, 1994.
[IB94] S. Intille and A. Bobick. Disparity space images and large occlusion stereo. In ECCV9J, Proc, Stockholm, Sweden, 1994.
[Kan95] T. Kanade. Virualized reality: Concepts and early results. In IEEE Workshop on Represen- tations of Visual Scenes, Boston, 1995.
[PR96] D. Pai and L.-M. Reissell. Touching multires- olution curves. In Proceedings of ASME Fifth Annual Symposium on Haptic Interfaces for Virtual Environment and Teleoperator Systems, 1996.
[SP96] J. Siira and D. Pai. Haptic texturing - a stochas- tic approach. In Proceedings of IEEE Interna- tional Conference on Robotics and Automation, volume 1, pages 557-562, 1996.
191
Contact Sensation in the Synthetic Environment Using the ISU Force Reflecting Exoskeleton
Greg R. Luecke Assistant Professor
Department of Mechanical Engineering Iowa State University
Ames, IA 50011 [email protected]
Young-Ho Chai Graduate Research Assistant
Department of Mechanical Engineering Iowa State University
Ames, IA 50011 [email protected]
Abstract
Force feedback from the virtual world can greatly enhance the sense of immersion even for simple applica- tions. The ISU force reflecting exoskeleton enables the user to interact dynamically with simulated environments by providing an electro-magnetic haptic interface between the human and the environment. This paper describes the high bandwidth electro-magnetic haptic interface and how it has been used to provide the sense of contact in the synthetic environment. The air gap between the magnetics, carried by the robot, and the coils attached to the human's digits, allows for small relative motion between the human and the robot without affecting the transmission of forces. This flex- ibility allows the robot to track the human as well as develop appropriate forces from the virtual world. Three different typical synthetic environments are programmed and tested using the ISU force reflecting exoskeleton haptic interface device. The experimental results shows that the magnetic interface gives adequate force levels for percep- tion of virtual objects, enhancing the feeling of immersion in the virtual environment.
1. Introduction
Force feedback from the virtual environment has recently became a major focus of research in robotics. Because the objective in designing and building a haptic device is to provide the capability for arbitrary motion and force relationship with the human limbs, robotic mecha- nisms of various types have been used as the interface with the virtual environment. Often, these robot manipulators are attached directly to the human hand or fingers, or are designed for the human grasp to transmit the forces.
Robot force control in the synthetic environment requires
a haptic device which can be programmed to provide the human with the sensation of forces associated with various encounters with arbitrary virtual objects. Therefore, the design of this haptic interface device is a critical aspect of the force control of contacting task in the synthetic environ- ment. In this paper, ISU force reflecting exoskeleton is used to implement the synthetic environment by means of an electro-magnetic force interface.
Robot force control during contacting tasks has been one of the most rigorous area in robotic society in recent years [Hogan 1985, Khatib 1987, Marth, Tarn, and Bejczy 1994]. Even with this large amount of attention, the high band- width force control with a rigid surface still remains a diffi- cult task. This is primarily due to stability problems in the human-machine system. Contact instability often occurs when the system is in transition from non-contact motion to contact motion or contact motion to non-contact motion. The transition from the free space motion to post-contact motion changes the nature of dynamics of the system i.e. the holonomic constraint system changes to a non-holo- nomic constraint system, the open kinematic chain system changes to a kinematic chain system.
A number of approaches to enhance contact stability and performance have been examined[Hogan and Colgate 1989]. Control segmentation is successfully applied to the contacting task by many authors. An event based approach to manipulator task execution, along with nonlinear feed- back algorithm is applied to the controlled transition between unconstrained and constrained motion of a rigid robotic manipulator[Marth, Tarn and Bejczy 1994]. Experi- mental study of control segmentation - free-space motion, impact stage, and post-contact force regulation - was car- ried out and proved to be stable[Mandal, Payandeh 1995].
The paper is organized as follows: Section 2 shows the contact force generation and comparison with other haptic interface devices. Experimental results of some interesting
0-8186-7843-7/97 $10.00 © 1997 IEEE 192
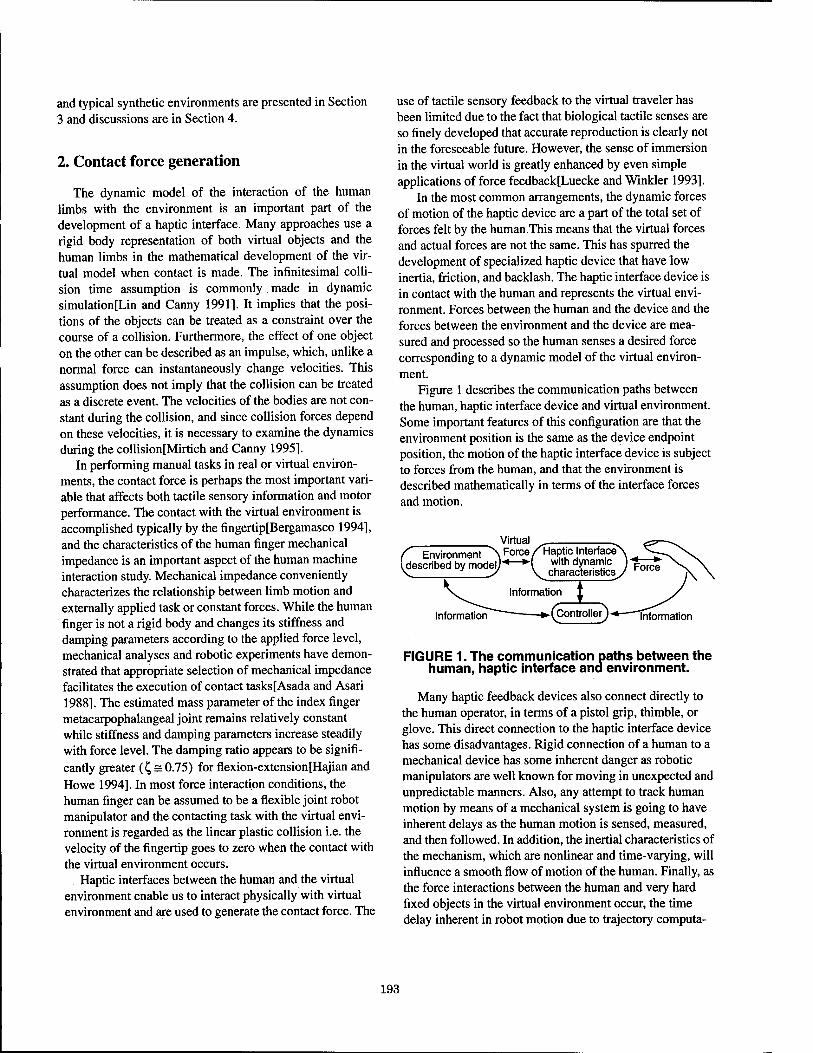
and typical synthetic environments are presented in Section 3 and discussions are in Section 4.
2. Contact force generation
The dynamic model of the interaction of the human limbs with the environment is an important part of the development of a haptic interface. Many approaches use a rigid body representation of both virtual objects and the human limbs in the mathematical development of the vir- tual model when contact is made. The infinitesimal colli- sion time assumption is commonly made in dynamic simulation [Lin and Canny 1991]. It implies that the posi- tions of the objects can be treated as a constraint over the course of a collision. Furthermore, the effect of one object on the other can be described as an impulse, which, unlike a normal force can instantaneously change velocities. This assumption does not imply that the collision can be treated as a discrete event. The velocities of the bodies are not con- stant during the collision, and since collision forces depend on these velocities, it is necessary to examine the dynamics during the collision[Mirtich and Canny 1995].
In performing manual tasks in real or virtual environ- ments, the contact force is perhaps the most important vari- able that affects both tactile sensory information and motor performance. The contact with the virtual environment is accomplished typically by the fingertip[Bergamasco 1994], and the characteristics of the human finger mechanical impedance is an important aspect of the human machine interaction study. Mechanical impedance conveniently characterizes the relationship between limb motion and externally applied task or constant forces. While the human finger is not a rigid body and changes its stiffness and damping parameters according to the applied force level, mechanical analyses and robotic experiments have demon- strated that appropriate selection of mechanical impedance facilitates the execution of contact tasks [Asada and Asari 1988]. The estimated mass parameter of the index finger metacarpophalangeal joint remains relatively constant while stiffness and damping parameters increase steadily with force level. The damping ratio appears to be signifi- cantly greater (£ s 0.75) for flexion-extension[Hajian and Howe 1994]. In most force interaction conditions, the human finger can be assumed to be a flexible joint robot manipulator and the contacting task with the virtual envi- ronment is regarded as the linear plastic collision i.e. the velocity of the fingertip goes to zero when the contact with the virtual environment occurs.
Haptic interfaces between the human and the virtual environment enable us to interact physically with virtual environment and are used to generate the contact force. The
use of tactile sensory feedback to the virtual traveler has been limited due to the fact that biological tactile senses are so finely developed that accurate reproduction is clearly not in the foreseeable future. However, the sense of immersion in the virtual world is greatly enhanced by even simple applications of force feedback[Luecke and Winkler 1993].
In the most common arrangements, the dynamic forces of motion of the haptic device are a part of the total set of forces felt by the human.This means that the virtual forces and actual forces are not the same. This has spurred the development of specialized haptic device that have low inertia, friction, and backlash. The haptic interface device is in contact with the human and represents the virtual envi- ronment. Forces between the human and the device and the forces between the environment and the device are mea- sured and processed so the human senses a desired force corresponding to a dynamic model of the virtual environ- ment.
Figure 1 describes the communication paths between the human, haptic interface device and virtual environment. Some important features of this configuration are that the environment position is the same as the device endpoint position, the motion of the haptic interface device is subject to forces from the human, and that the environment is described mathematically in terms of the interface forces and motion.
Virtual Force f Environment *\
Ufescribed by model/ Haptic Interface
with dynamic characteristics Force
Information Information
FIGURE 1. The communication paths between the human, haptic interface and environment.
Many haptic feedback devices also connect directly to the human operator, in terms of a pistol grip, thimble, or glove. This direct connection to the haptic interface device has some disadvantages. Rigid connection of a human to a mechanical device has some inherent danger as robotic manipulators are well known for moving in unexpected and unpredictable manners. Also, any attempt to track human motion by means of a mechanical system is going to have inherent delays as the human motion is sensed, measured, and then followed. In addition, the inertial characteristics of the mechanism, which are nonlinear and time-varying, will influence a smooth flow of motion of the human. Finally, as the force interactions between the human and very hard fixed objects in the virtual environment occur, the time delay inherent in robot motion due to trajectory computa-
193
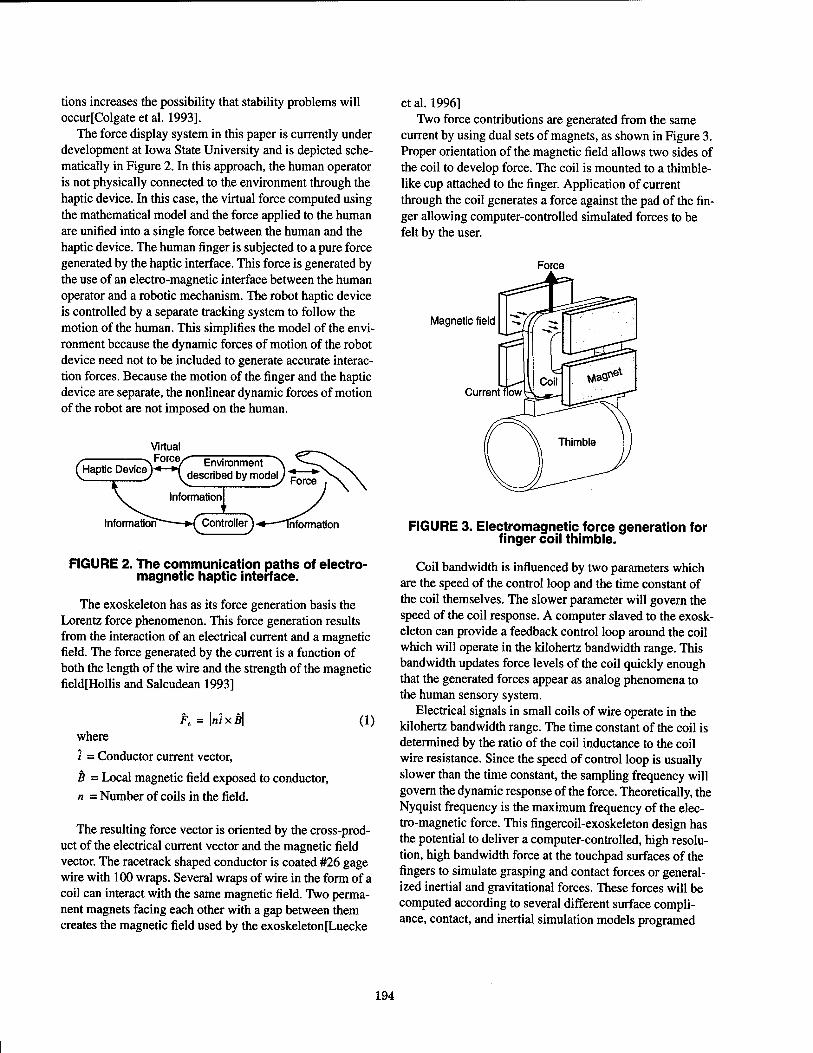
tions increases the possibility that stability problems will occur[Colgate et al. 1993].
The force display system in this paper is currently under development at Iowa State University and is depicted sche- matically in Figure 2. In this approach, the human operator is not physically connected to the environment through the haptic device. In this case, the virtual force computed using the mathematical model and the force applied to the human are unified into a single force between the human and the haptic device. The human finger is subjected to a pure force generated by the haptic interface. This force is generated by the use of an electro-magnetic interface between the human operator and a robotic mechanism. The robot haptic device is controlled by a separate tracking system to follow the motion of the human. This simplifies the model of the envi- ronment because the dynamic forces of motion of the robot device need not to be included to generate accurate interac- tion forces. Because the motion of the finger and the haptic device are separate, the nonlinear dynamic forces of motion of the robot are not imposed on the human.
Virtual f>, ,. ~ ■ ~\F°r0^ Environment ^\ X\ CHaptlC DeVICe)^"\described by model) |^fX\
Information" ^/Controller) -4 Information
FIGURE 2. The communication paths of electro- magnetic haptic interface.
The exoskeleton has as its force generation basis the Lorentz force phenomenon. This force generation results from the interaction of an electrical current and a magnetic field. The force generated by the current is a function of both the length of the wire and the strength of the magnetic field[Hollis and Salcudean 1993]
FL=\nlxB\ (1) where
1 = Conductor current vector,
B = Local magnetic field exposed to conductor,
n = Number of coils in the field.
The resulting force vector is oriented by the cross-prod- uct of the electrical current vector and the magnetic field vector. The racetrack shaped conductor is coated #26 gage wire with 100 wraps. Several wraps of wire in the form of a coil can interact with the same magnetic field. Two perma- nent magnets facing each other with a gap between them creates the magnetic field used by the exoskeleton[Luecke
et al. 1996] Two force contributions are generated from the same
current by using dual sets of magnets, as shown in Figure 3. Proper orientation of the magnetic field allows two sides of the coil to develop force. The coil is mounted to a thimble- like cup attached to the finger. Application of current through the coil generates a force against the pad of the fin- ger allowing computer-controlled simulated forces to be felt by the user.
Force
Magnetic field ~~*(f( -»
Currentfiow
FIGURE 3. Electromagnetic force generation for finger coil thimble.
Coil bandwidth is influenced by two parameters which are the speed of the control loop and the time constant of the coil themselves. The slower parameter will govern the speed of the coil response. A computer slaved to the exosk- eleton can provide a feedback control loop around the coil which will operate in the kilohertz bandwidth range. This bandwidth updates force levels of the coil quickly enough that the generated forces appear as analog phenomena to the human sensory system.
Electrical signals in small coils of wire operate in the kilohertz bandwidth range. The time constant of the coil is determined by the ratio of the coil inductance to the coil wire resistance. Since the speed of control loop is usually slower than the time constant, the sampling frequency will govern the dynamic response of the force. Theoretically, the Nyquist frequency is the maximum frequency of the elec- tro-magnetic force. This fingercoil-exoskeleton design has the potential to deliver a computer-controlled, high resolu- tion, high bandwidth force at the touchpad surfaces of the fingers to simulate grasping and contact forces or general- ized inertial and gravitational forces. These forces will be computed according to several different surface compli- ance, contact, and inertial simulation models programed
194
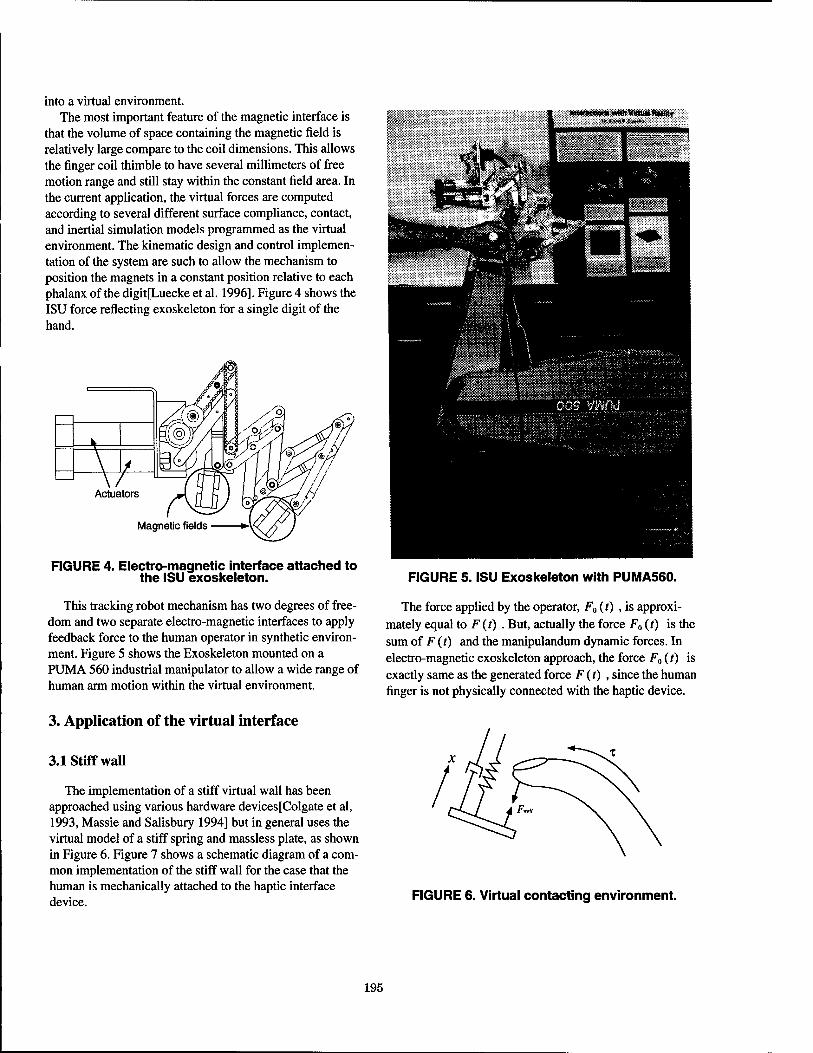
into a virtual environment. The most important feature of the magnetic interface is
that the volume of space containing the magnetic field is relatively large compare to the coil dimensions. This allows the finger coil thimble to have several millimeters of free motion range and still stay within the constant field area. In the current application, the virtual forces are computed according to several different surface compliance, contact, and inertial simulation models programmed as the virtual environment. The kinematic design and control implemen- tation of the system are such to allow the mechanism to position the magnets in a constant position relative to each phalanx of the digit[Luecke et al. 1996]. Figure 4 shows the ISU force reflecting exoskeleton for a single digit of the hand.
inwittifcr« wfli VtaHl RNfity 3* Gang* U«tSk»
Magnetic fields
FIGURE 4. Electro-magnetic interface attached to the ISU exoskeleton. FIGURE 5. ISU Exoskeleton with PUMA560.
This tracking robot mechanism has two degrees of free- dom and two separate electro-magnetic interfaces to apply feedback force to the human operator in synthetic environ- ment. Figure 5 shows the Exoskeleton mounted on a PUMA 560 industrial manipulator to allow a wide range of human arm motion within the virtual environment.
3. Application of the virtual interface
3.1 Stiff wall
The implementation of a stiff virtual wall has been approached using various hardware devices [Colgate et al, 1993, Massie and Salisbury 1994] but in general uses the virtual model of a stiff spring and massless plate, as shown in Figure 6. Figure 7 shows a schematic diagram of a com- mon implementation of the stiff wall for the case that the human is mechanically attached to the haptic interface device.
The force applied by the operator, F0(t) , is approxi- mately equal to F (t) . But, actually the force F0 (t) is the sum of F (t) and the manipulandum dynamic forces. In electro-magnetic exoskeleton approach, the force F0 (t) is exactly same as the generated force F (t) , since the human finger is not physically connected with the haptic device.
FIGURE 6. Virtual contacting environment.
195
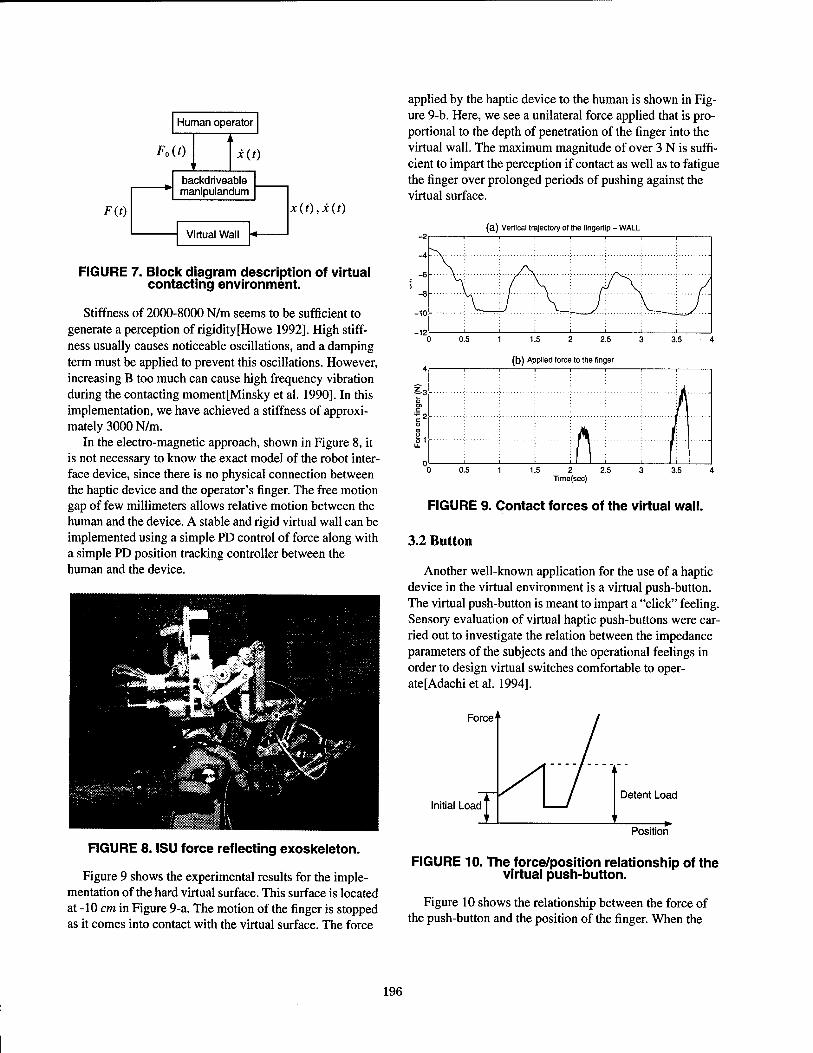
F(t)
Human operator
Foi 0 x(t)
backdriveable manipulandum
x(t), x(t)
FIGURE 7. Block diagram description of virtual contacting environment.
Stiffness of 2000-8000 N/m seems to be sufficient to generate a perception of rigidity[Howe 1992]. High stiff- ness usually causes noticeable oscillations, and a damping term must be applied to prevent this oscillations. However, increasing B too much can cause high frequency vibration during the contacting moment[Minsky et al. 1990]. In this implementation, we have achieved a stiffness of approxi- mately 3000 N/m.
In the electro-magnetic approach, shown in Figure 8, it is not necessary to know the exact model of the robot inter- face device, since there is no physical connection between the haptic device and the operator's finger. The free motion gap of few millimeters allows relative motion between the human and the device. A stable and rigid virtual wall can be implemented using a simple PD control of force along with a simple PD position tracking controller between the human and the device.
JtaM . wttra
m * I ttt^lIX. ' äIP •ft ■jjgj^^B
«5^ r*A L.,; .......; |n
■ J — Itta 1 Ay <:
o ' *~. * <*m^
FIGURE 8. ISU force reflecting exoskeleton.
Figure 9 shows the experimental results for the imple- mentation of the hard virtual surface. This surface is located at -10 cm in Figure 9-a. The motion of the finger is stopped as it comes into contact with the virtual surface. The force
applied by the haptic device to the human is shown in Fig- ure 9-b. Here, we see a unilateral force applied that is pro- portional to the depth of penetration of the finger into the virtual wall. The maximum magnitude of over 3 N is suffi- cient to impart the perception if contact as well as to fatigue the finger over prolonged periods of pushing against the virtual surface.
(a) Vertical trajectory of the fingertip - WALL
0.5 1 1.5 2 2.5 3 3.5 4
(b) Applied force to the finger
A 0.5 1 1.5 2 2.5 3 3.5 4
Time (sec)
FIGURE 9. Contact forces of the virtual wall.
3.2 Button
Another well-known application for the use of a haptic device in the virtual environment is a virtual push-button. The virtual push-button is meant to impart a "click" feeling. Sensory evaluation of virtual haptic push-buttons were car- ried out to investigate the relation between the impedance parameters of the subjects and the operational feelings in order to design virtual switches comfortable to oper- atefAdachi et al. 1994].
Force''
Initial Load Detent Load
Position
FIGURE 10. The force/position relationship of the virtual push-button.
Figure 10 shows the relationship between the force of the push-button and the position of the finger. When the
196
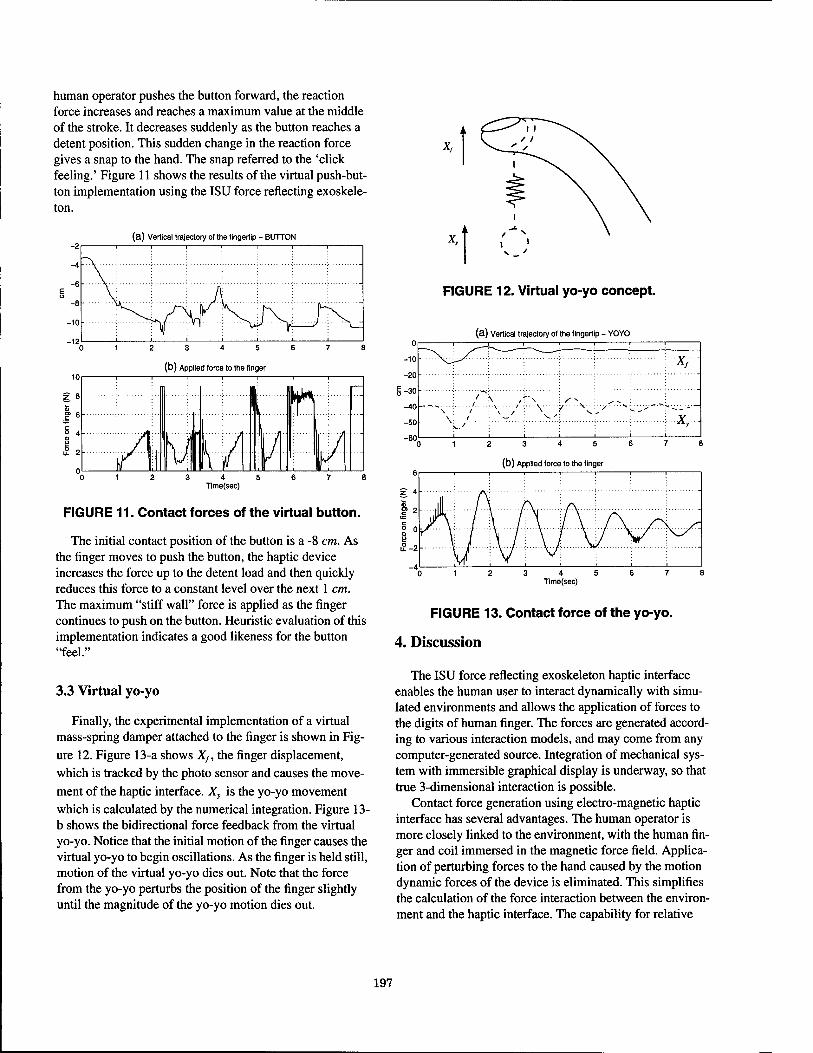
human operator pushes the button forward, the reaction force increases and reaches a maximum value at the middle of the stroke. It decreases suddenly as the button reaches a detent position. This sudden change in the reaction force gives a snap to the hand. The snap referred to the 'click feeling.' Figure 11 shows the results of the virtual push-but- ton implementation using the ISU force reflecting exoskele- ton.
(a) Vertical trajectory of the fingertip - BUTTON
2 3 4 5 6
(b) Applied force to the finger
3 4 5 Time(sec)
FIGURE 11. Contact forces of the virtual button.
The initial contact position of the button is a -8 cm. As the finger moves to push the button, the haptic device increases the force up to the detent load and then quickly reduces this force to a constant level over the next 1 cm. The maximum "stiff wall" force is applied as the finger continues to push on the button. Heuristic evaluation of this implementation indicates a good likeness for the button "feel."
3.3 Virtual yo-yo
Finally, the experimental implementation of a virtual mass-spring damper attached to the finger is shown in Fig- ure 12. Figure 13-a shows Xf, the finger displacement, which is tracked by the photo sensor and causes the move-
ment of the haptic interface. Xy is the yo-yo movement which is calculated by the numerical integration. Figure 13- b shows the bidirectional force feedback from the virtual yo-yo. Notice that the initial motion of the finger causes the virtual yo-yo to begin oscillations. As the finger is held still, motion of the virtual yo-yo dies out. Note that the force from the yo-yo perturbs the position of the finger slightly until the magnitude of the yo-yo motion dies out.
X,
FIGURE 12. Virtual yo-yo concept.
(a) Vertical trajectory of the fingertip - YOYO
-10
-20
i-30
-40
-50
-60
-
^ ■ J— !
": xf
/ I
■V- '"/ * s. _■>
-
■ 2 3 4 5 6 7
(b) Applied force to the finger
FIGURE 13. Contact force of the yo-yo.
4. Discussion
The ISU force reflecting exoskeleton haptic interface enables the human user to interact dynamically with simu- lated environments and allows the application of forces to the digits of human finger. The forces are generated accord- ing to various interaction models, and may come from any computer-generated source. Integration of mechanical sys- tem with immersible graphical display is underway, so that true 3-dimensional interaction is possible.
Contact force generation using electro-magnetic haptic interface has several advantages. The human operator is more closely linked to the environment, with the human fin- ger and coil immersed in the magnetic force field. Applica- tion of perturbing forces to the hand caused by the motion dynamic forces of the device is eliminated. This simplifies the calculation of the force interaction between the environ- ment and the haptic interface. The capability for relative
197

motion of the human finger also allows for a more straight- forward haptic interface design and control strategy.
Experimental results for three different and typical syn- thetic environments have been presented in this work, including interaction with a hard surface, a simple mass- spring-damper yo-yo, and a push-button with click feeling. Each of these virtual environments are emulated and the resulting interactive force display results are presented. These results shows that the electro-magnetic haptic inter- face generates adequate and precise force levels for percep- tion of virtual objects, and that the ISU force reflecting exoskeleton provides a visible means of coupling the force feedback to the human user.
Acknowledgment
This research was supported under NSF grant IRI- 9420809.
References
[1] Adachi, Y, Kumano, T, and Ogino, K., "Sensory Evaluation of Virtual Haptic Push-Buttons," ASME Dynamic Systems and Control, Volume 1, pp. 361- 368, 1994.
[2] Asada, H., Asari, Y., "The Direct Teaching of Tool manipulation Skills via the Impedance Identification of Human Motions," IEEE ICRA '88, pp. 1269-74, Philadelphia, PA, 1988.
[3] Bergamasco, M., "An Arm Exoskeleton System for Teleoperation and Virtual Environments Applica- tion," IEEE ICRA '94, pp. 1449-1454, 1994.
[4] Colgate, J.E., Grafing, P.E., Stanley, M.C., and Schen- kel, G. "Implementation of Stiff Virtual Walls in Force-Reflecting Interfaces," IEEE VRAIS '93, pp. 202-208,1993.
[5] Hajian, A.Z., Howe, R.D., "Identification of the Mechanical Impedance of Human Fingers," ASME Dynamic Systems and Control, Volume 1, pp. 319- 327, 1994.
[6] Hogan, N., "Impedance control: an approach to manipulation (part 1 - Theory and part II Implementa- tion)," The journal of Dynamic Systems, Measure- ment, and Control, Volume 107, pp. 1-16, March 1985.
[7] Hogan, N., Colgate, E., "Stability problems in contact tasks", in "Robotic Review" (Edited by Craig, Khatib and Lozano-Perez), MIT Press, Cambridge, MA, 1989.
[8] Hollis, R.L., Salcudean, S.E. "Lorentz levitation tech- nology: a new approach to find motion robotics, tele-
operation, haptic interfaces, and vibration isolation," in Proceedings. 6th International Symposium on Robotics Research, Hidden Valley, PA, 1993.
[9] Howe, R.D., "A force -Reflecting Teleoperated Hand System for the study of Tactile Sensing in Precision Manipulation," IEEE ICRA '92, Nice, France, pp. 1321-1326,1992.
[10] Khatib, O., "A Unified Approach for Motion and Force Control.of Robot manipulators: The Opera- tional Space Formulation," IEEE Journal of Robotics and Automation, Volume RA-3, February 1987.
[11] Kazerooni, H., Her, M.G. "The Dynamic and Control of a Haptic Interface Device," IEEE Transactions on Robotics and Automation, Volume 10-4, pp. 453-464, 1994.
[12] Lewis, F.L., Abdallah, CT., and Dawson, D.M., Con- trol of Robot MAnipulators, Macmilllan, New York, NY, 1993.
[13] Lin, M.C., Canny, J., "A fast algorithm for incremen- tal distance calculation," IEEE ICRA '91, pp. 1008- 1014, 1991.
[14] Luecke, G.R., Winkler, J., "A Magnetic Interface for Robot Applied Virtual Forces," ASME Dynamic Sys- tems and Control, DSC55-1, pp. 271-276, 1995.
[15] Luecke, G.R., Chai, Y, Winkler, J., and Edwards, J. C, "An Exoskeleton Manipulator for Application of Elecro-Magnetic Virtual Forces," ASME Dynamic Systems and Control, DSC58, pp. 489-494, 1996.
[16] Mandal, N., Payandeh, S., "Control strategies for robotic contact tasks: an experimental study," Journal of Robotic System 12(1), pp. 67-92, 1995.
[17] Marth, G.T., Tarn, T.J. and Bejczy, A.K., "An event based approach to impact control: Theory and Experi- ments," IEEE ICRA *94,pp.918-923, 1994.
[18] Massie, T.H., Salisbury, K., "The PHANTom Haptic Interface: A Device for Probing Virtual Object," ASME Dynamic Systems and Control, DSC55-1, pp. 295-301, 1994.
[19] Minsky, M., Ouh-young, M., and Steele, O., Brooks, F.B.Jr., Behensky, M. "Feeling and Seeing: Issues in Force Display," Computer Graphics, Volume 24, no. 2, pp. 235-243, 1990.
[20] Mirtich, B., Canny, J., "Impulse-based simulation of rigid bodies," In symposium on interactive 3D Graph- ics, New York, NY, 1995.
198
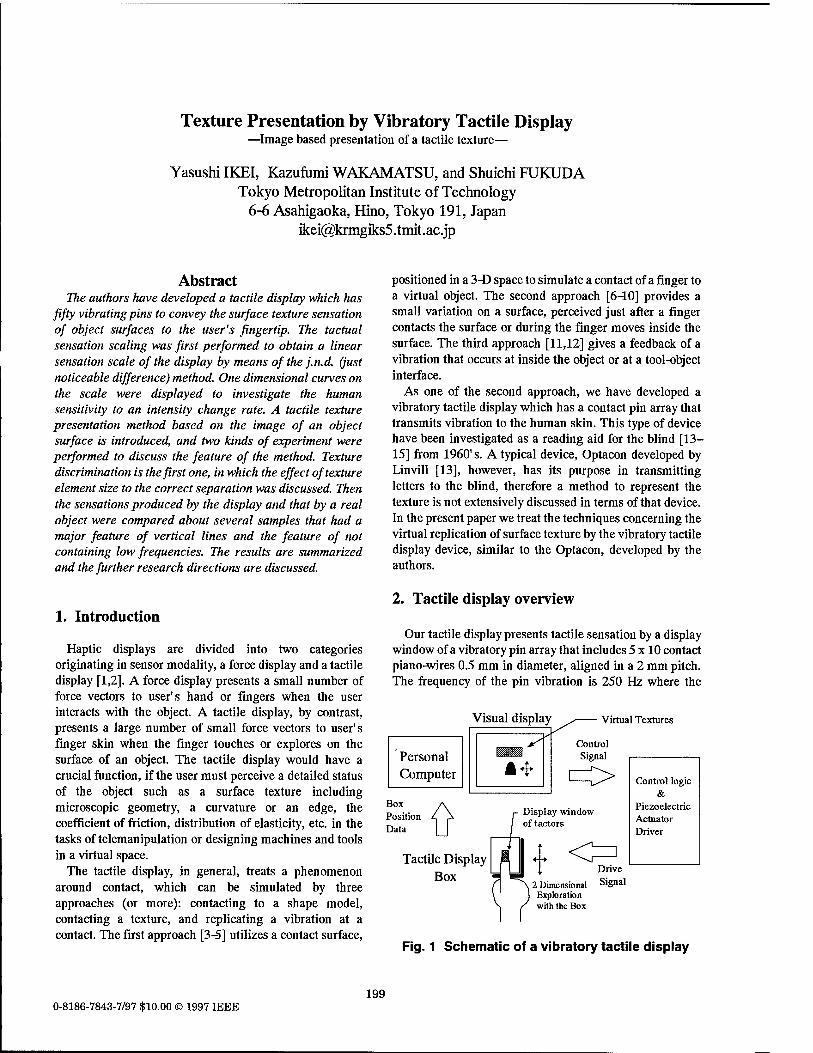
Texture Presentation by Vibratory Tactile Display —Image based presentation of a tactile texture—
Yasushi IKEI, Kazufumi WAKAMATSU, and Shuichi FUKUDA Tokyo Metropolitan Institute of Technology
6-6 Asahigaoka, Hino, Tokyo 191, Japan [email protected]
Abstract The authors have developed a tactile display which has
fifty vibrating pins to convey the surface texture sensation of object surfaces to the user's fingertip. The tactual sensation scaling was first performed to obtain a linear sensation scale of the display by means of the j.n.d. (just noticeable difference) method. One dimensional curves on the scale were displayed to investigate the human sensitivity to an intensity change rate. A tactile texture presentation method based on the image of an object surface is introduced, and two kinds of experiment were performed to discuss the feature of the method. Texture discrimination is the first one, in which the effect of texture element size to the correct separation was discussed. Then the sensations produced by the display and that by a real object were compared about several samples that had a major feature of vertical lines and the feature of not containing low frequencies. The results are summarized and the further research directions are discussed.
1. Introduction
Haptic displays are divided into two categories originating in sensor modality, a force display and a tactile display [1,2]. A force display presents a small number of force vectors to user's hand or fingers when the user interacts with the object. A tactile display, by contrast, presents a large number of small force vectors to user's finger skin when the finger touches or explores on the surface of an object. The tactile display would have a crucial function, if the user must perceive a detailed status of the object such as a surface texture including microscopic geometry, a curvature or an edge, the coefficient of friction, distribution of elasticity, etc. in the tasks of telemanipulation or designing machines and tools in a virtual space.
The tactile display, in general, treats a phenomenon around contact, which can be simulated by three approaches (or more): contacting to a shape model, contacting a texture, and replicating a vibration at a contact. The first approach [3-5] utilizes a contact surface,
positioned in a 3-D space to simulate a contact of a finger to a virtual object. The second approach [6-40] provides a small variation on a surface, perceived just after a finger contacts the surface or during the finger moves inside the surface. The third approach [11,12] gives a feedback of a vibration that occurs at inside the object or at a tool-object interface.
As one of the second approach, we have developed a vibratory tactile display which has a contact pin array that transmits vibration to the human skin. This type of device have been investigated as a reading aid for the blind [13- 15] from 1960's. A typical device, Optacon developed by Linvill [13], however, has its purpose in transmitting letters to the blind, therefore a method to represent the texture is not extensively discussed in terms ofthat device. In the present paper we treat the techniques concerning the virtual replication of surface texture by the vibratory tactile display device, similar to the Optacon, developed by the authors.
2. Tactile display overview
Our tactile display presents tactile sensation by a display window of a vibratory pin array that includes 5 x 10 contact piano-wires 0.5 mm in diameter, aligned in a 2 mm pitch. The frequency of the pin vibration is 250 Hz where the
Visual display
Personal Computer
Virtual Textures
Control Signal
Box Position Data
Display window of tactors
Control logic &
Piezoelectric Actuator Driver
Tactile Display Box
Fig. 1 Schematic of a vibratory tactile display
0-8186-7843-7/97 $10.00 © 1997 IEEE 199
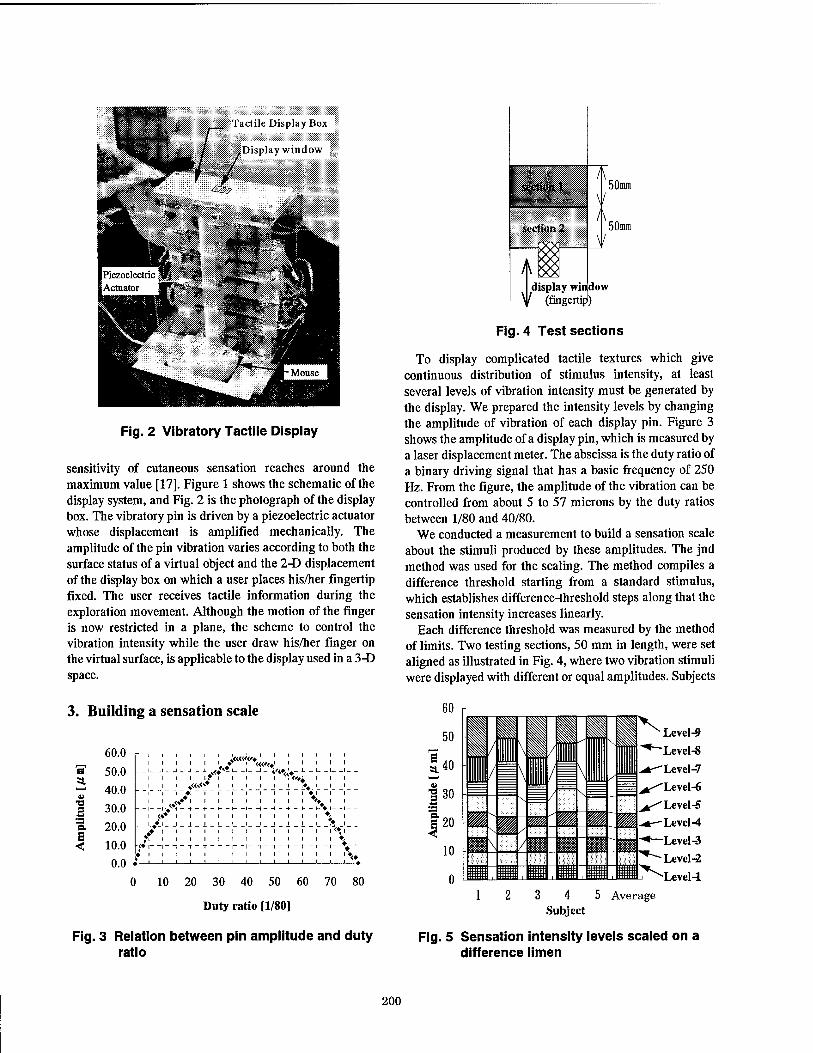
Fig. 2 Vibratory Tactile Display
sensitivity of cutaneous sensation reaches around the maximum value [17]. Figure 1 shows the schematic of the display system, and Fig. 2 is the photograph of the display box. The vibratory pin is driven by a piezoelectric actuator whose displacement is amplified mechanically. The amplitude of the pin vibration varies according to both the surface status of a virtual object and the 2-D displacement of the display box on which a user places his/her fingertip fixed. The user receives tactile information during the exploration movement. Although the motion of the finger is now restricted in a plane, the scheme to control the vibration intensity while the user draw his/her finger on the virtual surface, is applicable to the display used in a 3-D space.
section 2
50mm
50mm
display window Y (fingertip!)
Fig. 4 Test sections
To display complicated tactile textures which give continuous distribution of stimulus intensity, at least several levels of vibration intensity must be generated by the display. We prepared the intensity levels by changing the amplitude of vibration of each display pin. Figure 3 shows the amplitude of a display pin, which is measured by a laser displacement meter. The abscissa is the duty ratio of a binary driving signal that has a basic frequency of 250 Hz. From the figure, the amplitude of the vibration can be controlled from about 5 to 57 microns by the duty ratios between 1/80 and 40/80.
We conducted a measurement to build a sensation scale about the stimuli produced by these amplitudes. The jnd method was used for the scaling. The method compiles a difference threshold starting from a standard stimulus, which establishes difference-threshold steps along that the sensation intensity increases linearly.
Each difference threshold was measured by the method of limits. Two testing sections, 50 mm in length, were set aligned as illustrated in Fig. 4, where two vibration stimuli were displayed with different or equal amplitudes. Subjects
3. Building a sensation scale
T3
E <!
60.0
50.0
40.0
30.0
20.0
10.0
0.0
. _t _ .
r-i- ■* - + - *■
<«««'♦
_, —i „ + „
i i ! I
0 10 20 30 40 50 60 70 80
Duty ratio [1/80]
Fig. 3 Relation between pin amplitude and duty ratio
60
50
140
1 30
I2" 10
0 12 3 4 5 Average
Subject
Fig. 5 Sensation intensity levels scaled on a difference limen
200
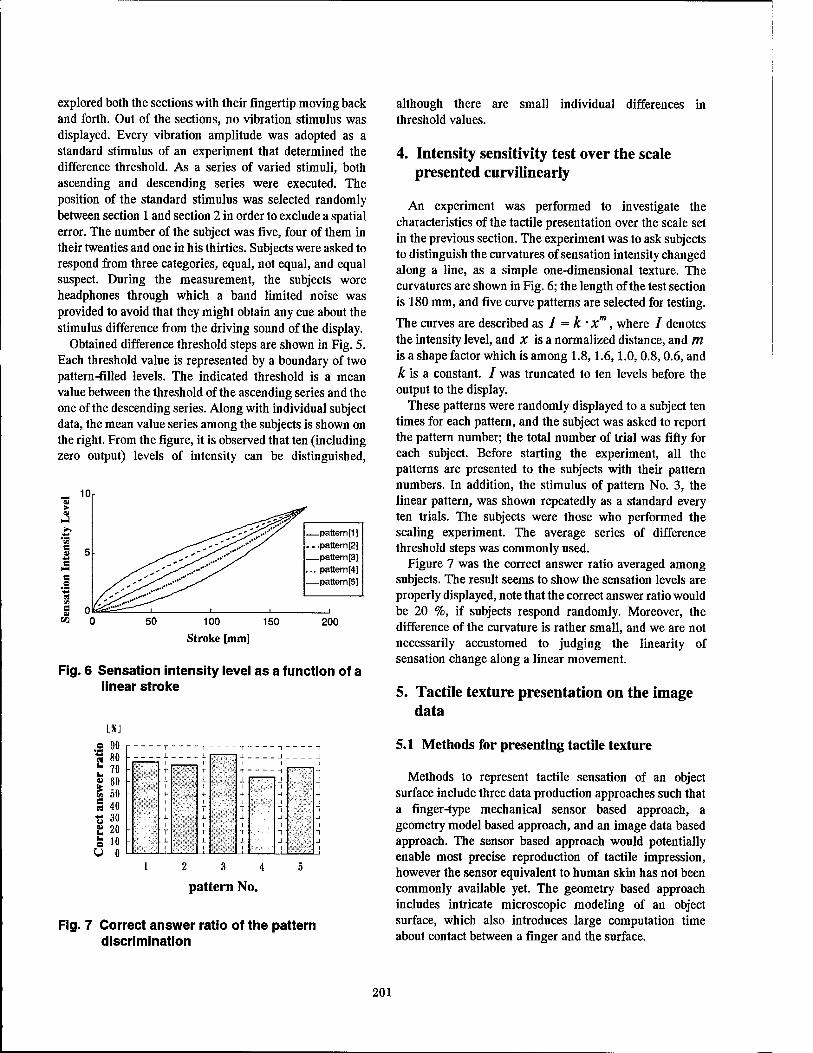
explored both the sections with their fingertip moving back and forth. Out of the sections, no vibration stimulus was displayed. Every vibration amplitude was adopted as a standard stimulus of an experiment that determined the difference threshold. As a series of varied stimuli, both ascending and descending series were executed. The position of the standard stimulus was selected randomly between section 1 and section 2 in order to exclude a spatial error. The number of the subject was five, four of them in their twenties and one in his thirties. Subjects were asked to respond from three categories, equal, not equal, and equal suspect. During the measurement, the subjects wore headphones through which a band limited noise was provided to avoid that they might obtain any cue about the stimulus difference from the driving sound of the display.
Obtained difference threshold steps are shown in Fig. 5. Each threshold value is represented by a boundary of two pattern^illed levels. The indicated threshold is a mean value between the threshold of the ascending series and the one of the descending series. Along with individual subject data, the mean value series among the subjects is shown on the right. From the figure, it is observed that ten (including zero output) levels of intensity can be distinguished,
pattern[1 ] pattern [2] pattern [3] pattern[4] patternp]
100
Stroke [mm] 150 200
Fig. 6 Sensation intensity level as a function of a linear stroke
M t. U V
VI B et
u V u u e U
L»J
i 90 80 70 60 50 40 30 20 10 0
_i j
- ■ t- t 1
T -1
i -j -
■;-
+ 1 1
H
- . x. 4-
1
-1 .
- ■ r T 1 1
- . L ± _i i
J .
Fig.
12 3 4 5
pattern No.
7 Correct answer ratio of the pattern discrimination
although there are small individual differences in threshold values.
4. Intensity sensitivity test over the scale presented curvilinearly
An experiment was performed to investigate the characteristics of the tactile presentation over the scale set in the previous section. The experiment was to ask subjects to distinguish the curvatures of sensation intensity changed along a line, as a simple one-dimensional texture. The curvatures are shown in Fig. 6; the length of the test section is 180 mm, and five curve patterns are selected for testing.
The curves are described as I = k -xm, where / denotes the intensity level, and X is a normalized distance, and m is a shape factor which is among 1.8,1.6,1.0, 0.8,0.6, and k is a constant. / was truncated to ten levels before the output to the display.
These patterns were randomly displayed to a subject ten times for each pattern, and the subject was asked to report the pattern number; the total number of trial was fifty for each subject. Before starting the experiment, all the patterns are presented to the subjects with their pattern numbers. In addition, the stimulus of pattern No. 3, the linear pattern, was shown repeatedly as a standard every ten trials. The subjects were those who performed the scaling experiment. The average series of difference threshold steps was commonly used.
Figure 7 Was the correct answer ratio averaged among subjects. The result seems to show the sensation levels are properly displayed, note that the correct answer ratio would be 20 %, if subjects respond randomly. Moreover, the difference of the curvature is rather small, and we are not necessarily accustomed to judging the linearity of sensation change along a linear movement.
5. Tactile texture presentation on the image data
5.1 Methods for presenting tactile texture
Methods to represent tactile sensation of an object surface include three data production approaches such that a finger-type mechanical sensor based approach, a geometry model based approach, and an image data based approach. The sensor based approach would potentially enable most precise reproduction of tactile impression, however the sensor equivalent to human skin has not been commonly available yet. The geometry based approach includes intricate microscopic modeling of an object surface, which also introduces large computation time about contact between a finger and the surface.
201
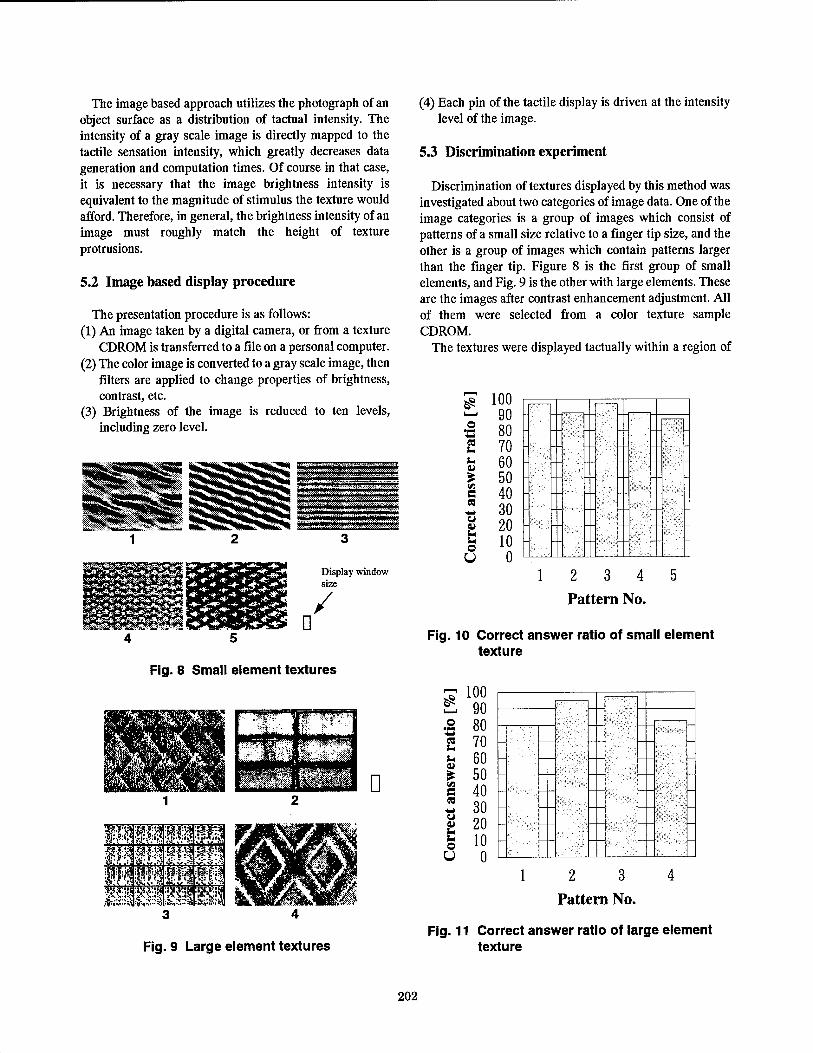
The image based approach utilizes the photograph of an object surface as a distribution of tactual intensity. The intensity of a gray scale image is directly mapped to the tactile sensation intensity, which greatly decreases data generation and computation times. Of course in that case, it is necessary that the image brightness intensity is equivalent to the magnitude of stimulus the texture would afford. Therefore, in general, the brightness intensity of an image must roughly match the height of texture protrusions.
5.2 Image based display procedure
The presentation procedure is as follows: (1) An image taken by a digital camera, or from a texture
CDROM is transferred to a file on a personal computer. (2) The color image is converted to a gray scale image, then
filters are applied to change properties of brightness, contrast, etc.
(3) Brightness of the image is reduced to ten levels, including zero level.
t'3L *;*WJ*K>>.-V»:
... ..t ■*
•;¥*»«■>?«!«■
Display window size
D /
4 5
Fig. 8 Small element textures
D
(4) Each pin of the tactile display is driven at the intensity level of the image.
5.3 Discrimination experiment
Discrimination of textures displayed by this method was investigated about two categories of image data. One of the image categories is a group of images which consist of patterns of a small size relative to a finger tip size, and the other is a group of images which contain patterns larger than the finger tip. Figure 8 is the first group of small elements, and Fig. 9 is the other with large elements. These are the images after contrast enhancement adjustment. All of them were selected from a color texture sample CDROM.
The textures were displayed tactually within a region of
#
03 U i-
a s u
s- o Ü
Fig. 10 Correct answer ratio of small element texture
100 r 90 80 70 60 50 40 30 20 10
0 L
-
-
12 3 4 5
Pattern No.
rr 100 90 £
es fc. u
as a M
U a> u u o u
80 70 H 60 50 40 30 20 10
0
Fig. 9 Large element textures
12 3 4
Pattern No.
Fig. 11 Correct answer ratio of large element texture
202
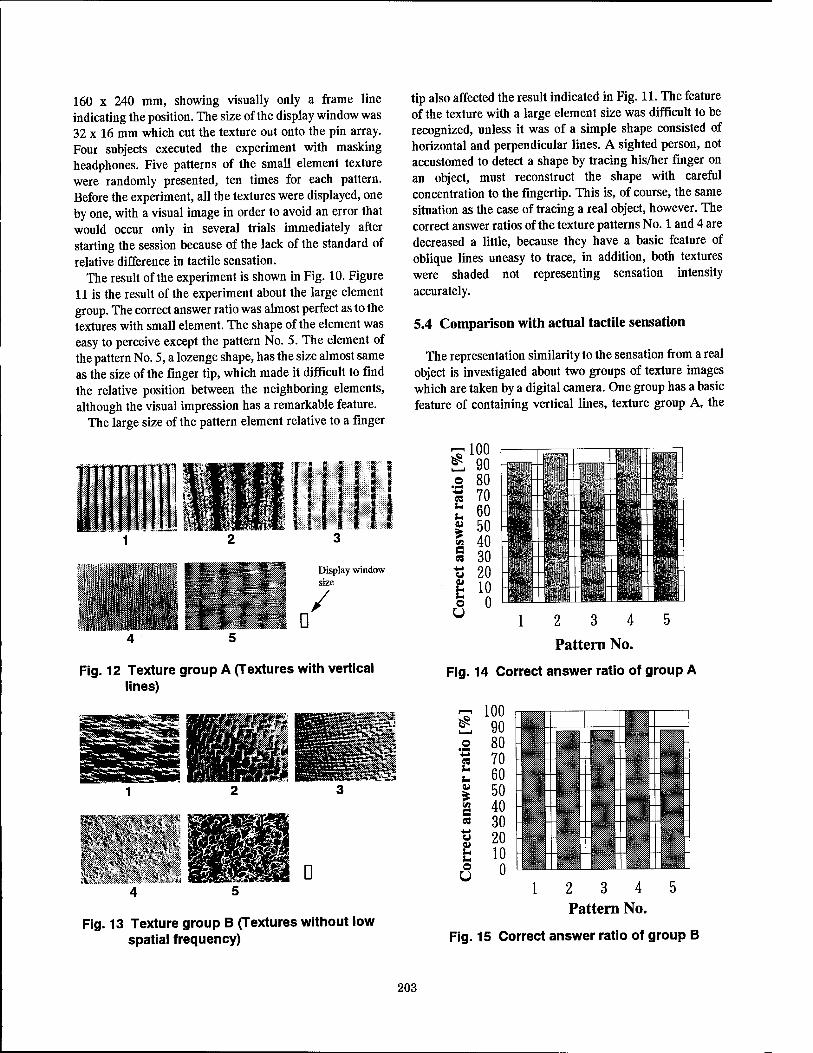
160 x 240 mm, showing visually only a frame line indicating the position. The size of the display window was 32 x 16 mm which cut the texture out onto the pin array. Four subjects executed the experiment with masking headphones. Five patterns of the small element texture were randomly presented, ten times for each pattern. Before the experiment, all the textures were displayed, one by one, with a visual image in order to avoid an error that would occur only in several trials immediately after starting the session because of the lack of the standard of relative difference in tactile sensation.
The result of the experiment is shown in Fig. 10. Figure 11 is the result of the experiment about the large element group. The correct answer ratio was almost perfect as to the textures with small element. The shape of the element was easy to perceive except the pattern No. 5. The element of the pattern No. 5, a lozenge shape, has the size almost same as the size of the finger tip, which made it difficult to find the relative position between the neighboring elements, although the visual impression has a remarkable feature.
The large size of the pattern element relative to a finger
tip also affected the result indicated in Fig. 11. The feature of the texture with a large element size was difficult to be recognized, unless it was of a simple shape consisted of horizontal and perpendicular lines. A sighted person, not accustomed to detect a shape by tracing his/her finger on an object, must reconstruct the shape with careful concentration to the fingertip. This is, of course, the same situation as the case of tracing a real object, however. The correct answer ratios of the texture patterns No. 1 and 4 are decreased a little, because they have a basic feature of oblique lines uneasy to trace, in addition, both textures were shaded not representing sensation intensity accurately.
5.4 Comparison with actual tactile sensation
The representation similarity to the sensation from a real object is investigated about two groups of texture images which are taken by a digital camera. One group has a basic feature of containing vertical lines, texture group A, the
Display window
Fig. 12 Texture group A (Textures with vertical lines)
Fig. 13 Texture group B (Textures without low spatial frequency)
12 3 4 5
Pattern No.
Fig. 14 Correct answer ratio of group A
*
es u t- a
a a u u o U
100 90 80 70 60 50 40 30 20 10
0
m 14 H- rilllr \m I Bl
1
1111111113
fen 1V"%J
m mi TBT
"fife' M Pfl BäsKssa
IM
12 3 4 Pattern No.
Fig. 15 Correct answer ratio of group B
203

other group has a feature not containing low frequency, texture group B. (Figures 12 and 13)
The data of texture group A are as follows: 1) An array of bamboo rods about 3 mm in diameter. 2) Coarse textured cloth made of cotton. 3) Louver of a computer display. 4) Tatami facing. 5) Leather with fine lines.
The data of texture group B are as follows: 1) A basket made of cane without paint. 2) A basket made of bamboo painted in glossy black. 3) A basket made of thatch without paint. 4) The face of a wall painted with uneven white material. 5) A rug like an artificial lawn made of plastic fiber.
First, we describe about the result of a discrimination experiment performed for both groups. Figures 14 and 15 show the correct answer ratios for group A and group B, respectively, averaged among subjects. The textures were displayed in a region of 160 x 240 mm, where they were magnified three times as large as original dimensions. The texture images were presented in random order, ten times per one image. All the images were displayed first with its visual image before the experiment. The number of subjects were four, the same persons as the previous experiment. The results indicate almost complete discrimination, where the subjects seem to have perceived their features sufficiently.
The observation on a similarity between the display output and the real object is described as follows: [Group A] 1) High contrast of the image produced the sensation of
solid contact on the vertical rod, which was similar to the one from the actual object. The actual bamboo rod had a hard surface and a large curvature, so it did not provide a medium intensity. The image data also had that feature.
2) The image includes wide vertical lines whose intensity varies gradually in the horizontal direction, which was produced a similar touch feel.
3) The stimulus at the high light part was too intense, so the sensation of the columns of the louver was different from the real object.
4) Tactile feeling similar to a tatami facing was obtained. This is because the image contains large amount of component at medium intensity to produce broad distribution of strength.
5) Minute vertical lines were properly displayed. It is partially because this image contains medium intensity as a large part.
[Group B] 1) This image was easily identified from the others due to
the sharp lateral lines. However, the subtle distribution of intensity was eliminated because the contrast enhancement was so strongly applied that the middle range of intensity was completely lost in the image.
2) The tactile presentation was far different from the real object. In this image, protrusions and retractions are reversely assigned the brightness owing to the color and the reflection property; protrusions are darken and retractions are highlighted.
3) The real object had a curved surface, so that the image has a gradation from the left to the right. However, a curvature is not be displayed by the gradation only, although it was an effective cue to identify this image.
4) Smooth variation of stimulus intensity presented the random-sprayed paint material with a fair similarity.
5) Thin curved lines were presented so well that the subject was able to identify its curly shape clearly. It produced a smooth sensation, although the medium intensity was almost removed.
5.5 Discussion and future directions
The discrimination of tactually presented textures based on images was possible when some conditions were met: 1) The element within the texture should be relatively
small to the size of a fingertip. 2) The distribution of image brightness should include
medium intensities. 3) The image should not be shaded with high contrast. The
shaded image does not represent the object shape in terms of protrusion profiles.
4) An oblique line is not preferable for accurate perception.
These are on the premises that the protrusions have brighter intensities than the retractions, and the difference in color is ignored.
The similarity between the displayed stimulus and the one from the real object is rather difficult to evaluate. Of course, it is not achieved that the output of the display cannot be distinguished from that of the real object. So, there is a difference between them, however the quantitative method to discuss it is the problem. If the object is a character consists of lines, it is investigated by its readability. However, the texture sensation contains various aspects of interaction between the object surface and the finger surface. To discuss what part is how similar to the real one is a complicated task.
According to the results of the experiments, the information of a graphical pattern can be conveyed to the tactile perception system to enable distinction among several patterns, so far. Including this stage, the estimation
204
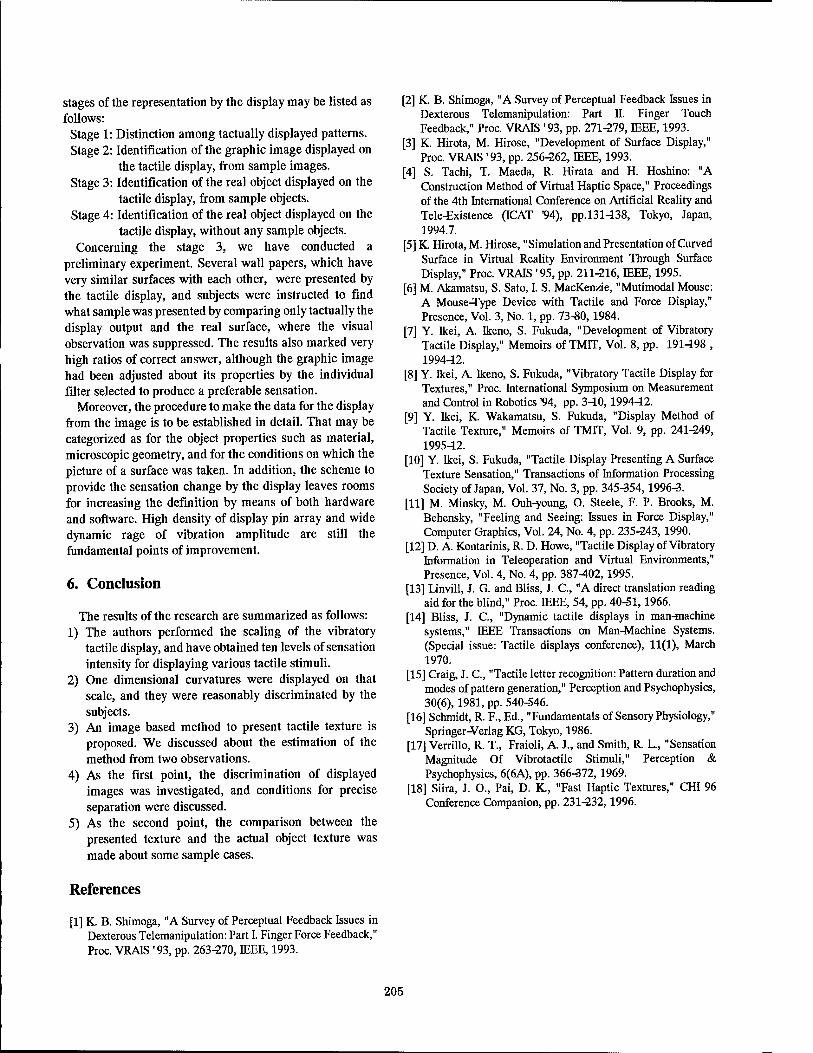
stages of the representation by the display may be listed as follows:
Stage 1: Distinction among tactually displayed patterns. Stage 2: Identification of the graphic image displayed on
the tactile display, from sample images. Stage 3: Identification of the real object displayed on the
tactile display, from sample objects. Stage 4: Identification of the real object displayed on the
tactile display, without any sample objects. Concerning the stage 3, we have conducted a
preliminary experiment. Several wall papers, which have very similar surfaces with each other, were presented by the tactile display, and subjects were instructed to find what sample was presented by comparing only tactually the display output and the real surface, where the visual observation was suppressed. The results also marked very high ratios of correct answer, although the graphic image had been adjusted about its properties by the individual filter selected to produce a preferable sensation.
Moreover, the procedure to make the data for the display from the image is to be established in detail. That may be categorized as for the object properties such as material, microscopic geometry, and for the conditions on which the picture of a surface was taken. In addition, the scheme to provide the sensation change by the display leaves rooms for increasing the definition by means of both hardware and software. High density of display pin array and wide dynamic rage of vibration amplitude are still the fundamental points of improvement.
6. Conclusion
The results of the research are summarized as follows: 1) The authors performed the scaling of the vibratory
tactile display, and have obtained ten levels of sensation intensity for displaying various tactile stimuli.
2) One dimensional curvatures were displayed on that scale, and they were reasonably discriminated by the subjects.
3) An image based method to present tactile texture is proposed. We discussed about the estimation of the method from two observations.
4) As the first point, the discrimination of displayed images was investigated, and conditions for precise separation were discussed.
5) As the second point, the comparison between the presented texture and the actual object texture was made about some sample cases.
[2] K. B. Shimoga, "A Survey of Perceptual Feedback Issues in Dexterous Telemanipulation: Part II. Finger Touch Feedback," Proc. VRAIS '93, pp. 271-279, IEEE, 1993.
[3] K. Hirota, M. Hirose, "Development of Surface Display," Proc. VRAIS '93, pp. 256-262, IEEE, 1993.
[4] S. Tachi, T. Maeda, R. Hirata and H. Hoshino: "A Construction Method of Virtual Haptic Space," Proceedings of the 4th International Conference on Artificial Reality and Tele-Existence (ICAT '94), pp.131438, Tokyo, Japan, 1994.7.
[5] K. Hirota, M. Hirose, "Simulation and Presentation of Curved Surface in Virtual Reality Environment Through Surface Display," Proc. VRAIS '95, pp. 211-216, IEEE, 1995.
[6] M. Akamatsu, S. Sato, I. S. MacKenzie, "Mutimodal Mouse: A Mouse-Type Device with Tactile and Force Display," Presence, Vol. 3, No. 1, pp. 73-80,1984.
[7] Y. Ikei, A. Ikeno, S. Fukuda, "Development of Vibratory Tactile Display," Memoirs of TMIT, Vol. 8, pp. 191498 , 199442.
[8] Y. Ikei, A. Ikeno, S. Fukuda, "Vibratory Tactile Display for Textures," Proc. International Symposium on Measurement and Control in Robotics '94, pp. 340,199442.
[9] Y. Ikei, K. Wakamatsu, S. Fukuda, "Display Method of Tactile Texture," Memoirs of TMIT, Vol. 9, pp. 241-249, 199542.
[10] Y. Ikei, S. Fukuda, "Tactile Display Presenting A Surface Texture Sensation," Transactions of Information Processing Society of Japan, Vol. 37, No. 3, pp. 345-354,1996-3.
[11] M. Minsky, M. Ouh-young, O. Steele, F. P. Brooks, M. Behensky, "Feeling and Seeing: Issues in Force Display," Computer Graphics, Vol. 24, No. 4, pp. 235-243,1990.
[12] D. A. Kontarinis, R. D. Howe, "Tactile Display of Vibratory Information in Teleoperation and Virtual Environments," Presence, Vol. 4, No. 4, pp. 387402,1995.
[13] Linvill, J. G. and Bliss, J. C, "A direct translation reading aid for the blind," Proc. IEEE, 54, pp. 40-51,1966.
[14] Bliss, J. C, "Dynamic tactile displays in man-machine systems," IEEE Transactions on Man-Machine Systems. (Special issue: Tactile displays conference), 11(1), March 1970.
[15] Craig, J. C, "Tactile letter recognition: Pattern duration and modes of pattern generation," Perception and Psychophysics, 30(6), 1981, pp. 540-546.
[16] Schmidt, R. F., Ed., "Fundamentals of Sensory Physiology," Springer-Verlag KG, Tokyo, 1986.
[17] Verrillo, R. T., Fraioli, A. J., and Smith, R. L., "Sensation Magnitude Of Vibrotactile Stimuli," Perception & Psychophysics, 6(6A), pp. 366-372,1969.
[18] Siira, J. O., Pai, D. K., "Fast Haptic Textures," CHI 96 Conference Companion, pp. 231-232,1996.
References
[1] K. B. Shimoga, "A Survey of Perceptual Feedback Issues in Dexterous Telemanipulation: Part I. Finger Force Feedback," Proc. VRAIS '93, pp. 263-270, IEEE, 1993.
205
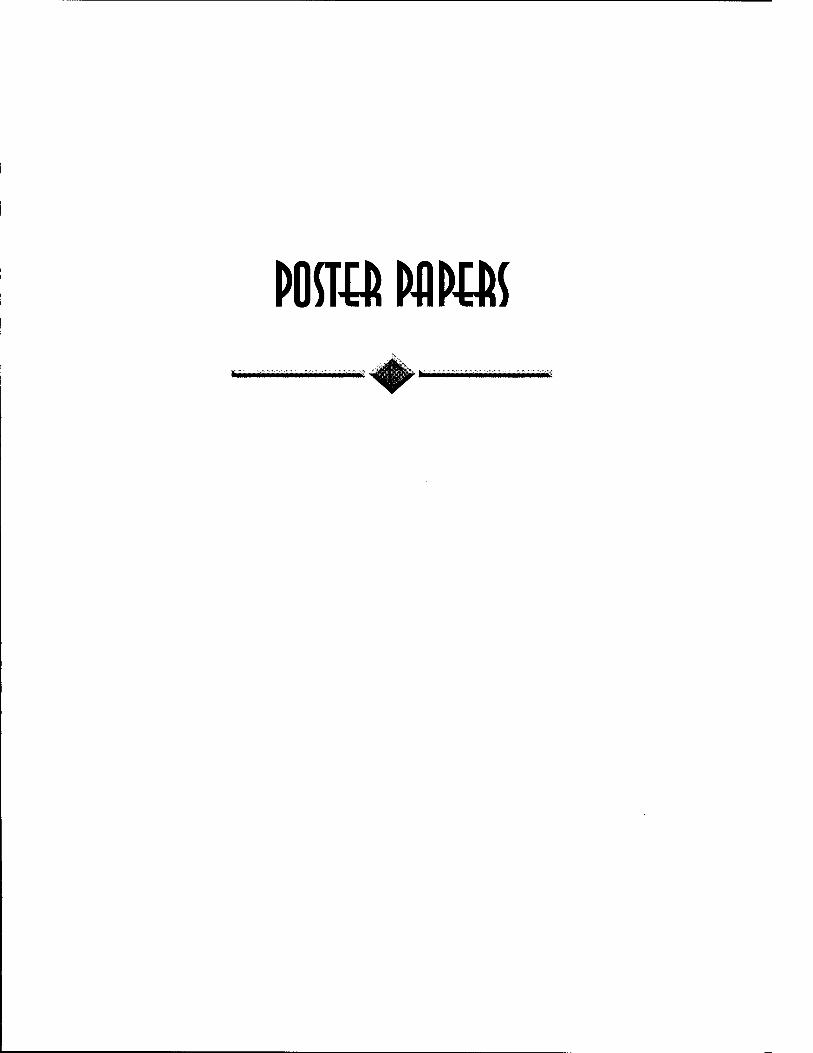
POCTtt WM
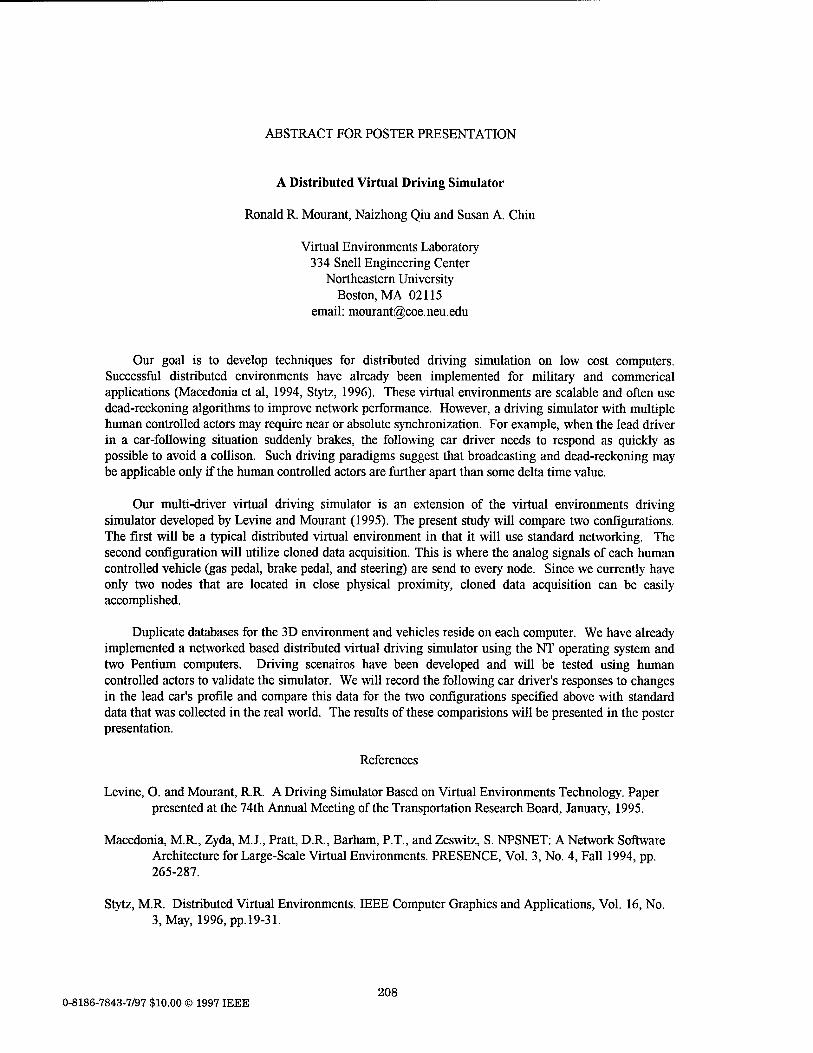
ABSTRACT FOR POSTER PRESENTATION
A Distributed Virtual Driving Simulator
Ronald R. Mourant, Naizhong Qiu and Susan A. Chiu
Virtual Environments Laboratory 334 Snell Engineering Center
Northeastern University Boston, MA 02115
email: mourant^coe.neu.edu
Our goal is to develop techniques for distributed driving simulation on low cost computers. Successful distributed environments have already been implemented for military and commerical applications (Macedonia et al, 1994, Stytz, 1996). These virtual environments are scalable and often use dead-reckoning algorithms to improve network performance. However, a driving simulator with multiple human controlled actors may require near or absolute synchronization. For example, when the lead driver in a car-following situation suddenly brakes, the following car driver needs to respond as quickly as possible to avoid a collison. Such driving paradigms suggest that broadcasting and dead-reckoning may be applicable only if the human controlled actors are further apart than some delta time value.
Our multi-driver virtual driving simulator is an extension of the virtual environments driving simulator developed by Levine and Mourant (1995). The present study will compare two configurations. The first will be a typical distributed virtual environment in that it will use standard networking. The second configuration will utilize cloned data acquisition. This is where the analog signals of each human controlled vehicle (gas pedal, brake pedal, and steering) are send to every node. Since we currently have only two nodes that are located in close physical proximity, cloned data acquisition can be easily accomplished.
Duplicate databases for the 3D environment and vehicles reside on each computer. We have already implemented a networked based distributed virtual driving simulator using the NT operating system and two Pentium computers. Driving scenairos have been developed and will be tested using human controlled actors to validate the simulator. We will record the following car driver's responses to changes in the lead car's profile and compare this data for the two configurations specified above with standard data that was collected in the real world. The results of these comparisions will be presented in the poster presentation.
References
Levine, O. and Mourant, R.R. A Driving Simulator Based on Virtual Environments Technology. Paper presented at the 74th Annual Meeting of the Transportation Research Board, January, 1995.
Macedonia, M.R., Zyda, M.J., Pratt, D.R., Barham, P.T., and Zeswitz, S. NPSNET: A Network Software Architecture for Large-Scale Virtual Environments. PRESENCE, Vol. 3, No. 4, Fall 1994, pp. 265-287.
Stytz, M.R. Distributed Virtual Environments. IEEE Computer Graphics and Applications, Vol. 16, No. 3, May, 1996, pp. 19-31.
208 0-8186-7843-7/97 $10.00 © 1997 IEEE
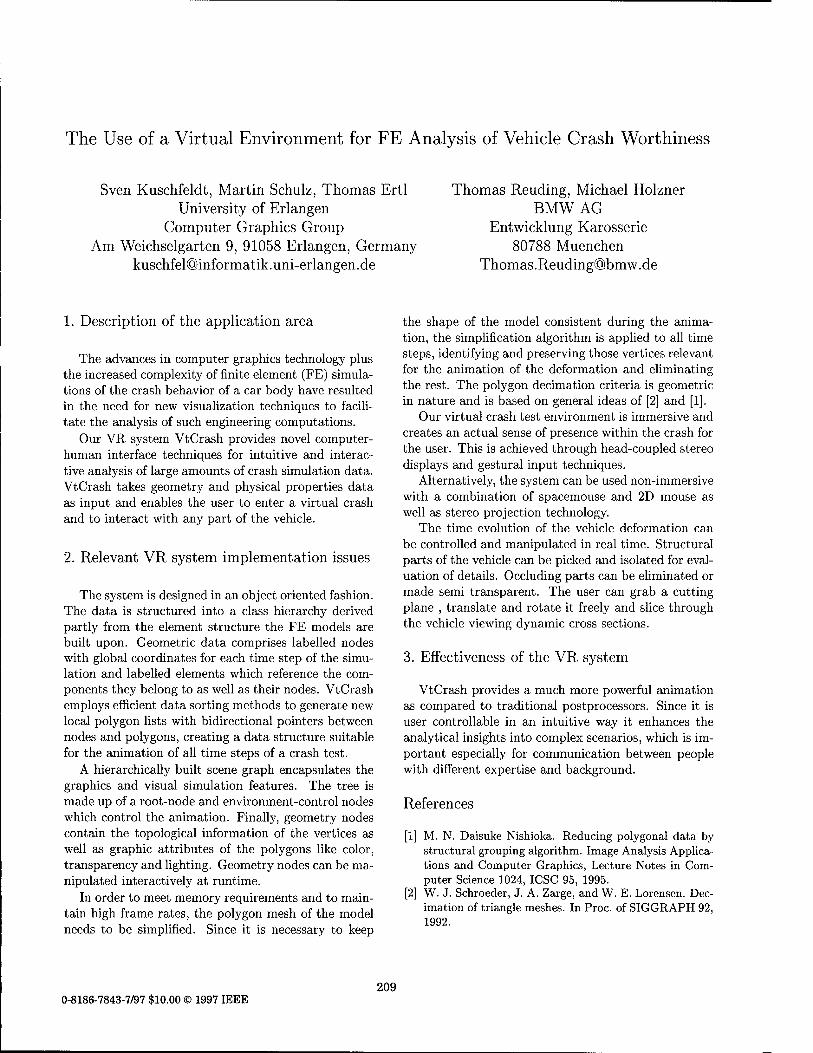
The Use of a Virtual Environment for FE Analysis of Vehicle Crash Worthiness
Sven Kuschfeldt, Martin Schulz, Thomas Ertl University of Erlangen
Computer Graphics Group Am Weichselgarten 9, 91058 Erlangen, Germany
Thomas Reuding, Michael Holzner BMW AG
Entwicklung Karosserie 80788 Muenchen
1. Description of the application area
The advances in computer graphics technology plus the increased complexity of finite element (FE) simula- tions of the crash behavior of a car body have resulted in the need for new visualization techniques to facili- tate the analysis of such engineering computations.
Our VR system VtCrash provides novel computer- human interface techniques for intuitive and interac- tive analysis of large amounts of crash simulation data. VtCrash takes geometry and physical properties data as input and enables the user to enter a virtual crash and to interact with any part of the vehicle.
2. Relevant VR system implementation issues
The system is designed in an object oriented fashion. The data is structured into a class hierarchy derived partly from the element structure the FE models are built upon. Geometric data comprises labelled nodes with global coordinates for each time step of the simu- lation and labelled elements which reference the com- ponents they belong to as well as their nodes. VtCrash employs efficient data sorting methods to generate new local polygon lists with bidirectional pointers between nodes and polygons, creating a data structure suitable for the animation of all time steps of a crash test.
A hierarchically built scene graph encapsulates the graphics and visual simulation features. The tree is made up of a root-node and environment-control nodes which control the animation. Finally, geometry nodes contain the topological information of the vertices as well as graphic attributes of the polygons like color, transparency and lighting. Geometry nodes can be ma- nipulated interactively at runtime.
In order to meet memory requirements and to main- tain high frame rates, the polygon mesh of the model needs to be simplified. Since it is necessary to keep
the shape of the model consistent during the anima- tion, the simplification algorithm is applied to all time steps, identifying and preserving those vertices relevant for the animation of the deformation and eliminating the rest. The polygon decimation criteria is geometric in nature and is based on general ideas of [2] and [1].
Our virtual crash test environment is immersive and creates an actual sense of presence within the crash for the user. This is achieved through head-coupled stereo displays and gestural input techniques.
Alternatively, the system can be used non-immersive with a combination of spacemouse and 2D mouse as well as stereo projection technology.
The time evolution of the vehicle deformation can be controlled and manipulated in real time. Structural parts of the vehicle can be picked and isolated for eval- uation of details. Occluding parts can be eliminated or made semi transparent. The user can grab a cutting plane , translate and rotate it freely and slice through the vehicle viewing dynamic cross sections.
3. Effectiveness of the VR system
VtCrash provides a much more powerful animation as compared to traditional postprocessors. Since it is user controllable in an intuitive way it enhances the analytical insights into complex scenarios, which is im- portant especially for communication between people with different expertise and background.
References
[1] M. N. Daisuke Nishioka. Reducing polygonal data by structural grouping algorithm. Image Analysis Applica- tions and Computer Graphics, Lecture Notes in Com- puter Science 1024, ICSC 95, 1995.
[2] W. J. Schroeder, J. A. Zarge, and W. E. Lorensen. Dec- imation of triangle meshes. In Proc. of SIGGRAPH 92, 1992.
0-8186-7843-7/97 $10.00 © 1997 IEEE 209
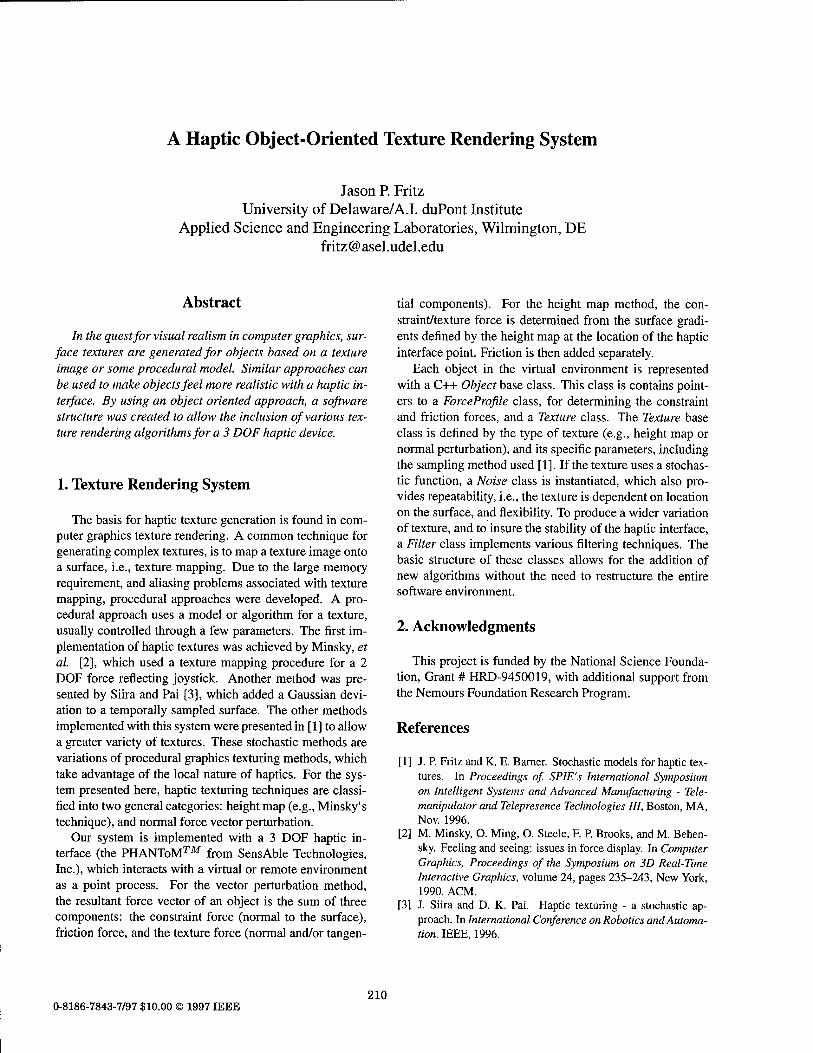
A Haptic Object-Oriented Texture Rendering System
Jason P. Fritz University of Delaware/A.I. duPont Institute
Applied Science and Engineering Laboratories, Wilmington, DE [email protected]
Abstract
In the quest for visual realism in computer graphics, sur- face textures are generated for objects based on a texture image or some procedural model. Similar approaches can be used to make objects feel more realistic with a haptic in- terface. By using an object oriented approach, a software structure was created to allow the inclusion of various tex- ture rendering algorithms for a 3 DOF haptic device.
1. Texture Rendering System
The basis for haptic texture generation is found in com- puter graphics texture rendering. A common technique for generating complex textures, is to map a texture image onto a surface, i.e., texture mapping. Due to the large memory requirement, and aliasing problems associated with texture mapping, procedural approaches were developed. A pro- cedural approach uses a model or algorithm for a texture, usually controlled through a few parameters. The first im- plementation of haptic textures was achieved by Minsky, et dl. [2], which used a texture mapping procedure for a 2 DOF force reflecting joystick. Another method was pre- sented by Siira and Pai [3], which added a Gaussian devi- ation to a temporally sampled surface. The other methods implemented with this system were presented in [1] to allow a greater variety of textures. These stochastic methods are variations of procedural graphics texturing methods, which take advantage of the local nature of haptics. For the sys- tem presented here, haptic texturing techniques are classi- fied into two general categories: height map (e.g., Minsky's technique), and normal force vector perturbation.
Our system is implemented with a 3 DOF haptic in- terface (the PHANToM™ from SensAble Technologies, Inc.), which interacts with a virtual or remote environment as a point process. For the vector perturbation method, the resultant force vector of an object is the sum of three components: the constraint force (normal to the surface), friction force, and the texture force (normal and/or tangen-
tial components). For the height map method, the con- straint/texture force is determined from the surface gradi- ents defined by the height map at the location of the haptic interface point. Friction is then added separately.
Each object in the virtual environment is represented with a C++ Object base class. This class is contains point- ers to a ForceProfile class, for determining the constraint and friction forces, and a Texture class. The Texture base class is defined by the type of texture (e.g., height map or normal perturbation), and its specific parameters, including the sampling method used [1]. If the texture uses a stochas- tic function, a Noise class is instantiated, which also pro- vides repeatability, i.e., the texture is dependent on location on the surface, and flexibility. To produce a wider variation of texture, and to insure the stability of the haptic interface, a Filter class implements various filtering techniques. The basic structure of these classes allows for the addition of new algorithms without the need to restructure the entire software environment.
2. Acknowledgments
This project is funded by the National Science Founda- tion, Grant # HRD-9450019, with additional support from the Nemours Foundation Research Program.
References
[1] J. P. Fritz and K. E. Barner. Stochastic models for haptic tex- tures. In Proceedings of. SPIE's International Symposium on Intelligent Systems and Advanced Manufacturing - Tele- manipulator and Telepresence Technologies III, Boston, MA, Nov. 1996.
[2] M. Minsky, O. Ming, O. Steele, F. P. Brooks, and M. Behen- sky. Feeling and seeing: issues in force display. In Computer Graphics, Proceedings of the Symposium on 3D Real-Time Interactive Graphics, volume 24, pages 235-243, New York, 1990. ACM.
[3] J. Siira and D. K. Pai. Haptic texturing - a stochastic ap- proach. In International Conference on Robotics and Automa- tion. IEEE, 1996.
0-8186-7843-7/97 $10.00 © 1997 IEEE 210
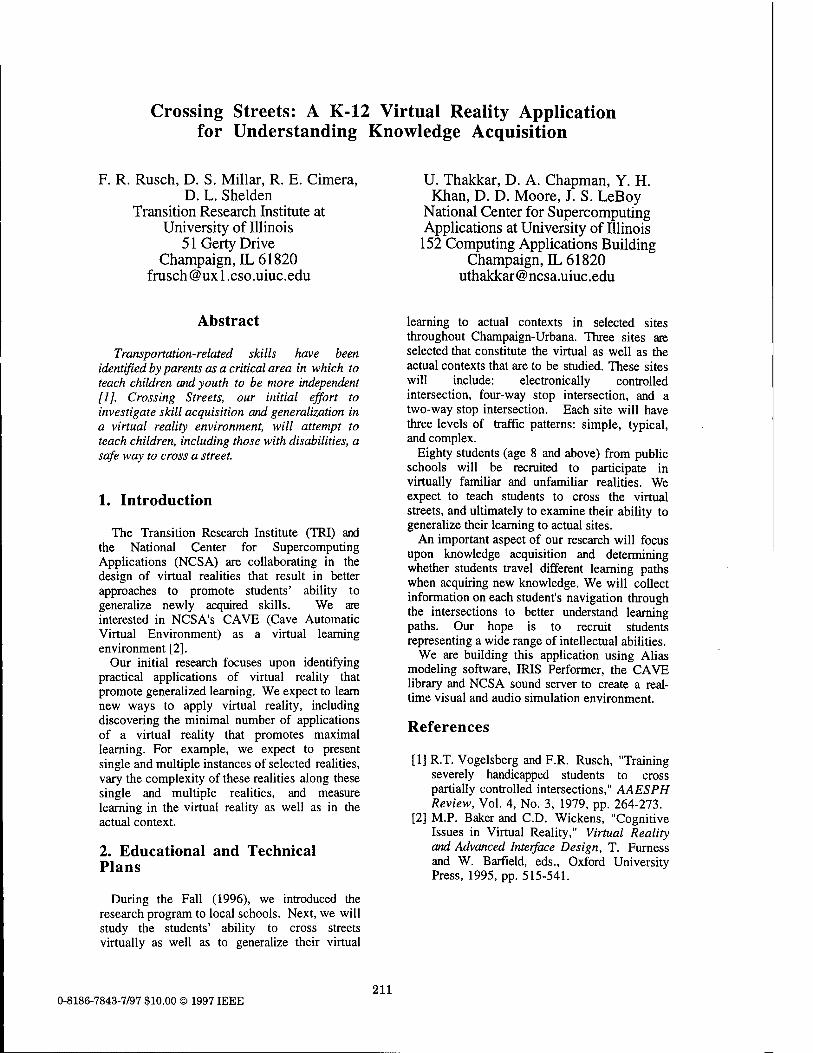
Crossing Streets: A K-12 Virtual Reality Application for Understanding Knowledge Acquisition
F. R. Rusch, D. S. Millar, R. E. Cimera, D. L. Shelden
Transition Research Institute at University of Illinois
51 Gerty Drive Champaign, IL 61820
frusch @ux 1 .cso.uiuc.edu
U. Thakkar, D. A. Chapman, Y. H. Khan, D. D. Moore, J. S. LeBoy
National Center for Supercomputing Applications at University of Illinois
152 Computing Applications Building Champaign, IL 61820
Abstract
Transportation-related skills have been identified by parents as a critical area in which to teach children and youth to be more independent [1]. Crossing Streets, our initial effort to investigate skill acquisition and generalization in a virtual reality environment, will attempt to teach children, including those with disabilities, a safe way to cross a street.
1. Introduction
The Transition Research Institute (TRI) and the National Center for Supercomputing Applications (NCSA) are collaborating in the design of virtual realities that result in better approaches to promote students' ability to generalize newly acquired skills. We are interested in NCSA's CAVE (Cave Automatic Virtual Environment) as a virtual learning environment [2].
Our initial research focuses upon identifying practical applications of virtual reality that promote generalized learning. We expect to learn new ways to apply virtual reality, including discovering the minimal number of applications of a virtual reality that promotes maximal learning. For example, we expect to present single and multiple instances of selected realities, vary the complexity of these realities along these single and multiple realities, and measure learning in the virtual reality as well as in the actual context.
2. Educational and Technical Plans
During the Fall (1996), we introduced the research program to local schools. Next, we will study the students' ability to cross streets virtually as well as to generalize their virtual
learning to actual contexts in selected sites throughout Champaign-Urbana. Three sites are selected that constitute the virtual as well as the actual contexts that are to be studied. These sites will include: electronically controlled intersection, four-way stop intersection, and a two-way stop intersection. Each site will have three levels of traffic patterns: simple, typical, and complex.
Eighty students (age 8 and above) from public schools will be recruited to participate in virtually familiar and unfamiliar realities. We expect to teach students to cross the virtual streets, and ultimately to examine their ability to generalize their learning to actual sites.
An important aspect of our research will focus upon knowledge acquisition and determining whether students travel different learning paths when acquiring new knowledge. We will collect information on each student's navigation through the intersections to better understand learning paths. Our hope is to recruit students representing a wide range of intellectual abilities.
We are building this application using Alias modeling software, IRIS Performer, the CAVE library and NCSA sound server to create a real- time visual and audio simulation environment.
References
[1] R.T. Vogelsberg and F.R. Rusch, "Training severely handicapped students to cross partially controlled intersections," AAESPH Review, Vol. 4, No. 3, 1979, pp. 264-273.
[2] M.P. Baker and CD. Wickens, "Cognitive Issues in Virtual Reality," Virtual Reality and Advanced Interface Design, T. Furness and W. Barfield, eds., Oxford University Press, 1995, pp. 515-541.
0-8186-7843-7/97 $10.00 © 1997 IEEE 211
Color Plates Human Behavior-Oriented Adaptive Texture Mapping: A Time
Critical Approach for Image-Based Virtual Showrooms 4
Issei Fujishiro, Tomoko Maruyamci, Rika Tanaka, Ochanomizu University
An Adaptive Multi-Resolution Modeling Technique Based on Viewing and Animation Parameters 20
Rynson W. H. Lau, Danny S.R To, Hong Kong Polytechnic University Mark Green, University of Alberta
Travel in Immersive Virtual Environments: An Evaluation of Viewpoint Motion Control Techniques 45
Doug A. Bowman, David Koller, Larry F. Hodges, Georgia Institute of Technology
Virtual Environments for Shipboard Firefighting Training 61
David L. Täte, Linda Sibert, Naval Research Laboratory Tony King, Naval Computer and Telecommunications Station
Gorillas in the Bits 69 Don Allison, Brian Wills, Larry F. Hodges, Jean Wineman, Georgia Institute of Technology
The Sensitivity of Presence to Collision Response 95
S. Uno, Canon, Inc., Mel Slater, University College London
Distributed Virtual Reality for Everyone: A Framework for Networked VR on the Internet 121
Wolfgang Broil, GMD FIT A Dead-Reckoning Algorithm for Virtual Human Figures 161
Tolga K. Capin, Daniel Thalman, Swiss Federal Institute of Technology Igor Sunday Pandzic, Nadia Magnenat Thalman, University of Geneva
Virtual Actors and Avatars in a Flexible User-Determined-Scenario Environment 170
D.M. Shawver
Contact Sensation in the Synthetic Environment Using the ISU Force Reflecting Exoskeleton 192
G.R. Luecke and Y.-H. Chai Texture Presentation by Vibratory Tactile Display 199
Y. Ikei, K. Wakamatsu, and S. Fukuda
213
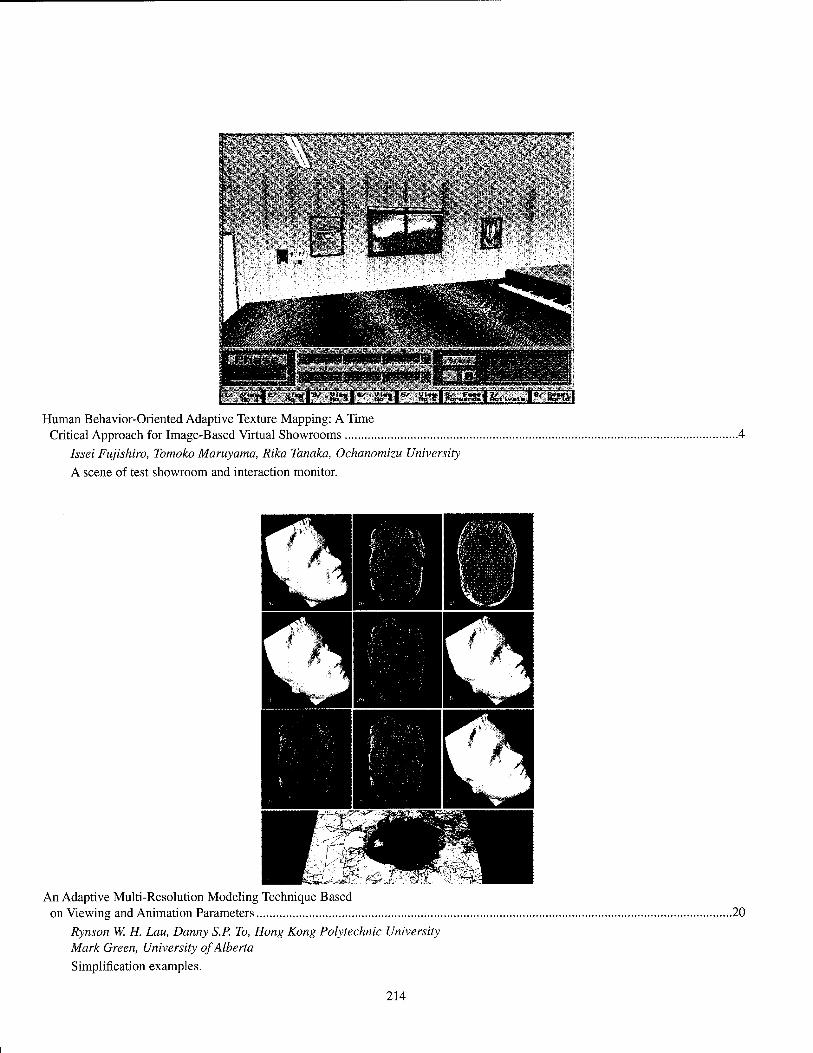
«•MttWIIMfcMttfuaiiKNHihrMrm?
KÄ'gp,,~ä?iF7~?ü'a|6"'!«'-er^-.Sg3; |&.,*,.. |" Krai
Human Behavior-Oriented Adaptive Texture Mapping: A Time Critical Approach for Image-Based Virtual Showrooms
Issei Fujishiro, Tomoko Maruyama, Rika Tanaka, Ochanomizu University
A scene of test showroom and interaction monitor.
An Adaptive Multi-Resolution Modeling Technique Based on Viewing and Animation Parameters
Rynson W. H. Lau, Danny S.P. To, Hong Kong Polytechnic University Mark Green, University of Alberta
Simplification examples.
.20
214
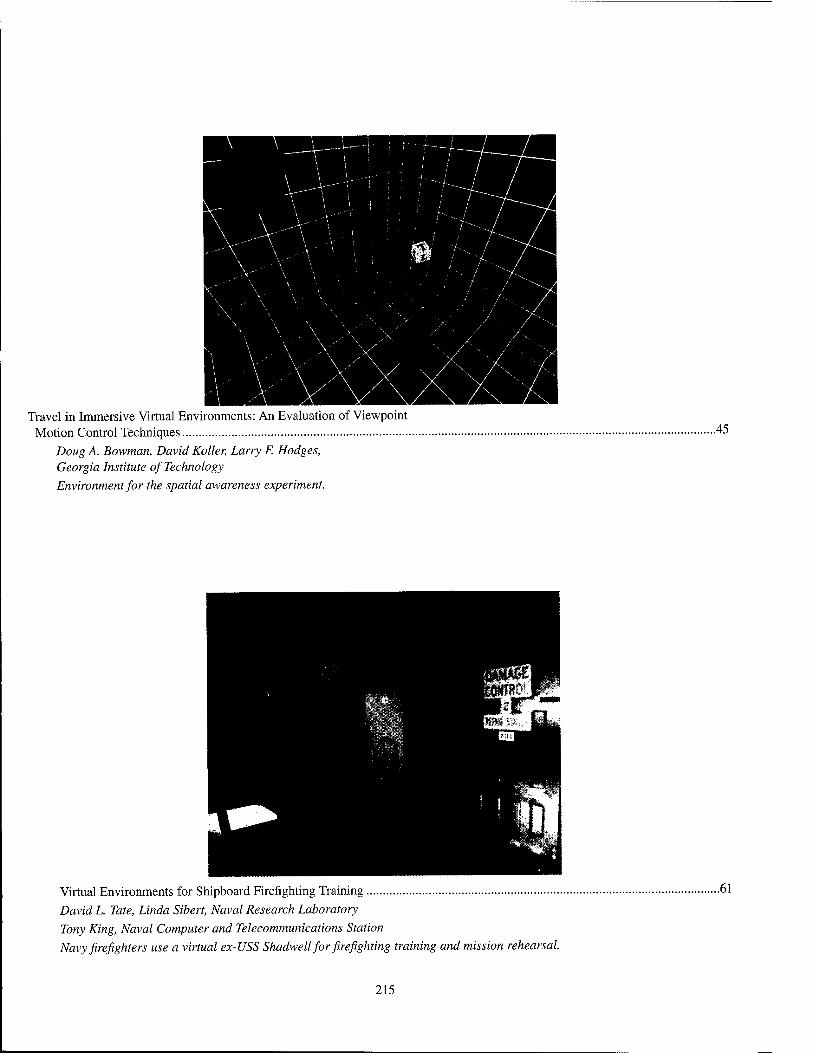
Travel in Immersive Virtual Environments: An Evaluation of Viewpoint Motion Control Techniques
Doug A. Bowman, David Koller, Larry F. Hodges, Georgia Institute of Technology Environment for the spatial awareness experiment.
,.45
Virtual Environments for Shipboard Firefighting Training
David L. Täte, Linda Sibert, Naval Research Laboratory
Tony King, Naval Computer and Telecommunications Station Navy firefighters use a virtual ex-USS Shadwell for firefighting training and mission rehearsal.
.61
215
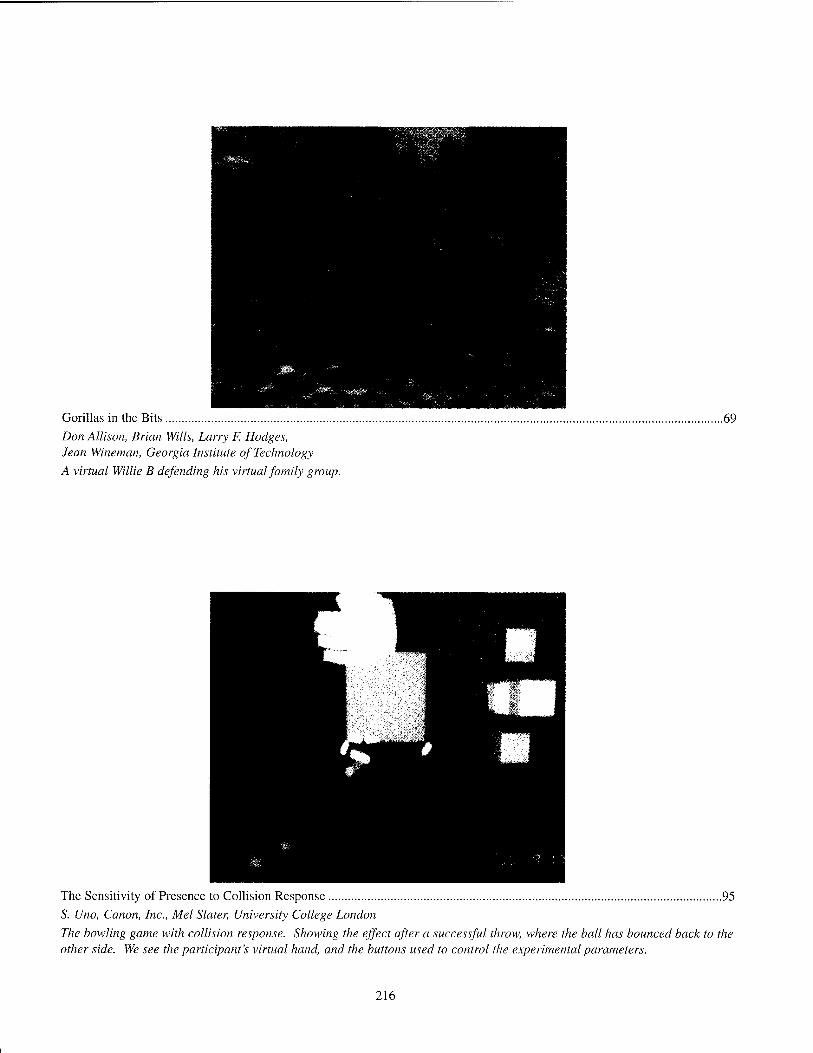
Gorillas in the Bits
Don Allison, Brian Wills, Larry F. Hodges, Jean Wineman, Georgia Institute of Technology
A virtual Willie B defending his virtual family group.
.69
The Sensitivity of Presence to Collision Response 95
S. Uno, Canon, Inc., Mel Slater, University College London
The bowling game with collision response. Showing the effect after a successful throw, where the ball has bounced back to the other side. We see the participant's virtual hand, and the buttons used to control the experimental parameters.
216
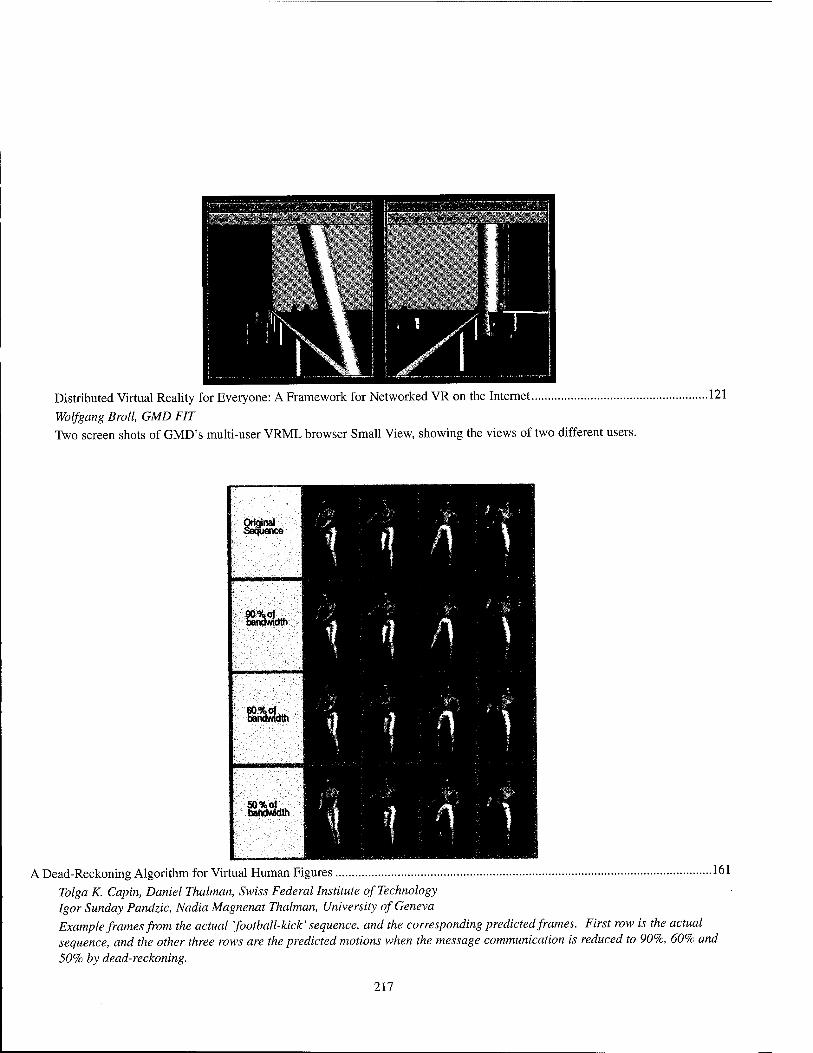
Distributed Virtual Reality for Everyone: A Framework for Networked VR on the Internet
Wolfgang Broil, GMD FIT Two screen shots of GMD's multi-user VRML browser Small View, showing the views of two different users.
.121
Original Sequence
9Q%of. bandwidth
bandwidth
S0%of, bandwidth
A Dead-Reckoning Algorithm for Virtual Human Figures 161
Tolga K. Capin, Daniel Thalman, Swiss Federal Institute of Technology Igor Sunday Pandzic, Nadia Magnenat Thalman, University of Geneva Example frames from the actual ^football-kick' sequence, and the corresponding predicted frames. First row is the actual sequence, and the other three rows are the predicted motions when the message communication is reduced to 90%, 60% and 50% by dead-reckoning.
217
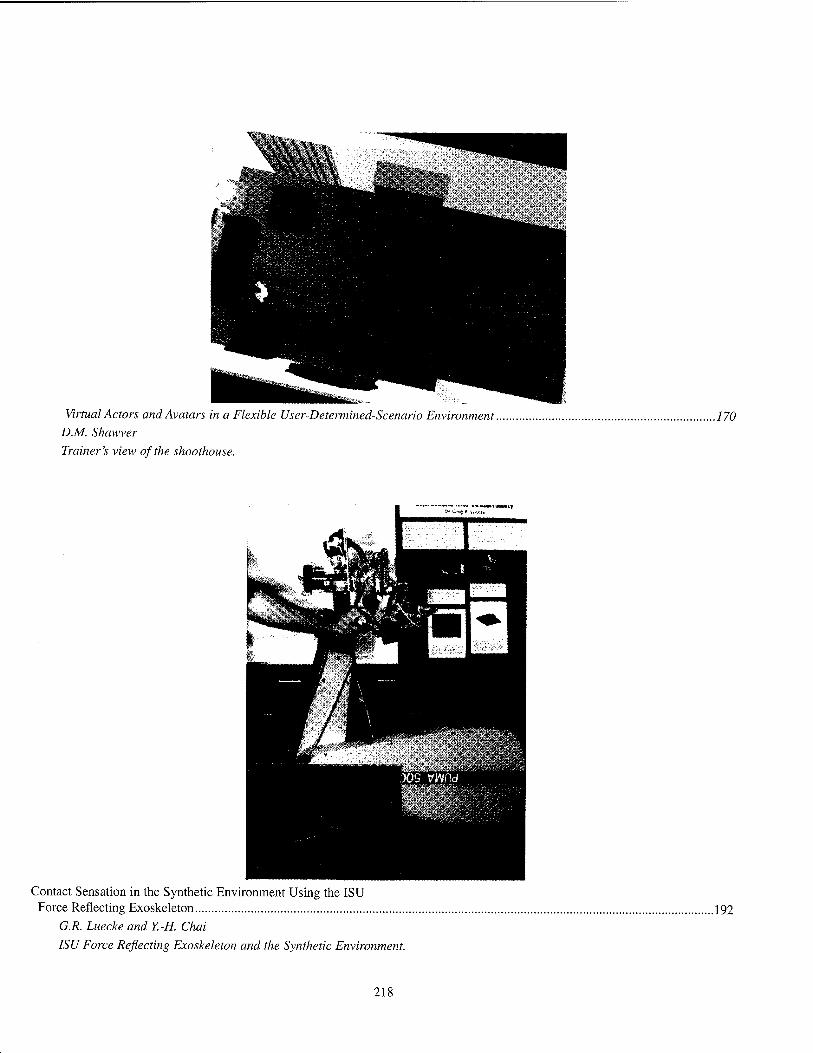
Virtual Actors and Avatars in a Flexible User-Determined-Scenario Environment. D.M. Shawver
Trainer's view of the shoothouse.
.170
Contact Sensation in the Synthetic Environment Using the ISU Force Reflecting Exoskeleton
G.R. Luecke and Y.-H. Chai
ISU Force Reflecting Exoskeleton and the Synthetic Environment.
.192
218
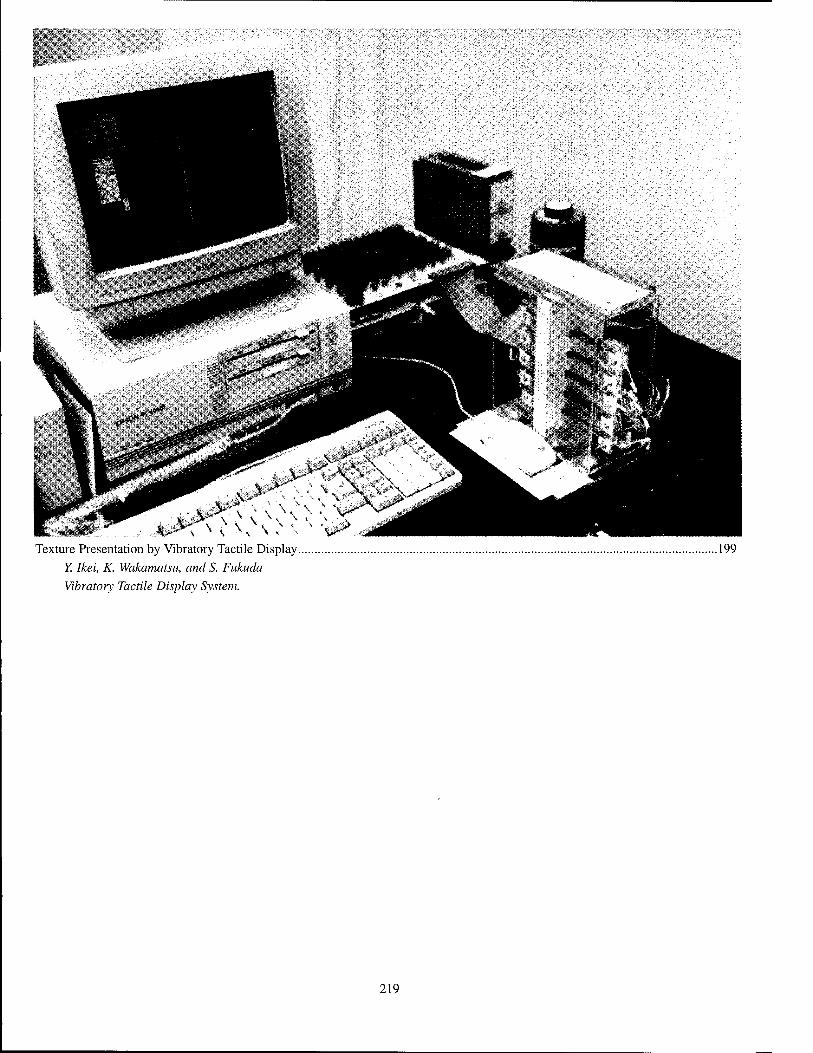
Texture Presentation by Vibratory Tactile Display Y. Ikei, K. Wakamatsu, and S. Fukuda
Vibratory Tactile Display System.
219
WIDMU
Tutorials
A. Title: "Introduction to VR and User Interface Issues for Virtual Systems"
contact: [email protected] Chris Esposito
The Boeing Company, Bellevue, WA
Tutorial Description This tutorial will first give an basic introduction to the field of virtual reality. During the second half, a view will be presented of what the User Interface (UI) and Virtual Reality (VR) communities have to offer one another. We will do this by answering the following four questions:
1) What can the VR community learn from the existing body of UI research? 2) What new opportunities and challenges does VR have for the UI community? 3) What has the VR community learned that modifies or extends what we know about interfaces?
4) What aspects of existing UI work are not useful in VR?
B. Title: "Fundamentals of Optics in Virtual Environments"
contact: [email protected]
Jannick Rolland
University of Central Florida, Orlando, FL
Tutorial Description Optics are a critical component of all virtual reality systems. As such, this tutorial will introduce optics as they relate to human interfaces. The fundamentals of optics, including image formation polarization and holography will be presented. The optics of head mounted displays and optical tracking techniques will be described. Image quality, design approaches and tradeoffs are considered.
C. Title: "Introduction to Haptic Simulation" contact: [email protected]
Blake Hannaford and Pietro Buttolo, University of Washington, Seattle, WA
Tutorial Description This course provides an introduction to fundamental concepts, issues and progress in the quest for safe and effective force servers for immersive VR applications. It is intended to bridge the technocultural gap between haptics and non-haptics VR specialists.
Relevant fundamental concepts are drawn from physics, biomechanics and robotics. This establishes the background for subsequent application-oriented discussions of haptic architectures, system requirements, system interfacing, and collaborative haptics.
This body of formal knowledge is then illustrated with leading-edge examples such as robot graphics for astronaut EVA training, a pen based force display, and experimentation into collaborative distributed haptics over the Internet. Some of these examples are further illustrated and coordinated with hands-on demonstrations in the Exhibits area.
D. Title: 'Virtual Reality Application Development — Issues and Solutions"
contact: [email protected]
Pat Gelband and/or Tom Payne, Sense8 Corp.
221
Tutorial Description This tutorial will review the stages of the development process for VR systems. Some of the specific areas that will be detailed include: * platform and performance comparisons * input and output devices * scene graph construction * key considerations for 3D, real time modeling In addition, this tutorial will provide an overview of Sense8 products and how they apply to the key aspects of application development.
E. Title: "Virtual Collaborative Environments" contact: [email protected],[email protected] (Michael McDonald) Arthurine Breckenridge and Michael McDonald Sandia National Laboratories
Tutorial Description This tutorial will address the developing field of virtual collaborative environments. Virtual collaborative environments (VCE) are the key computer science resource needed to build the infrastructure for virtual organizations. VCE is a term to include those concepts and tools used to provide network based virtual shared environments to support remote distributed collaborative work based on a strong spatial metaphor that supports intuitive real-world based navigation and discovery mechanisms.
F. Title: "Applying VR to Engineering Design, Analysis, and Manufacturing" contact: [email protected] Sankar Jayaram Washington State University
Tutorial Description This tutorial will discuss the issues pertaining to the application of virtual reality technology to assist engineering design, analysis, and manufacturing. The tutorial will begin with a quick and brief review of virtual reality technology. The primary issues in applying this technology to engineering practice will be identified. These issues will be discussed in detail including the strengths and weaknesses of the related technologies.
G. Title: "Virtual Reality in Medicine Today" contact: [email protected] Kirby Vosburgh snd William E. Lorensen General Electric Grigore Burdea Rutgers University
Tutorial Description There has been interest recently in the application of VR to medicine, both in the training of physicians and in patient care. We examine here the technical basis of this work, the current status of several commercial and academic developments, and the prospects for the future. In each area, examples of interaction and use by the clinical community will be given.
222
H. Title: "Preceiving in Virtual Environments: The Multisensory Nature of Real and Virtual Worlds" contact: [email protected] Lawrence J. Hettinger Logicon Technical Services, Inc. Dayton, Ohio
Tutorial Description This course will review the current state-of-the-art of knowledge in the domains of the visual, auditory, haptic, tactile, and vestibular modalities as they related to the design and use of virtual environment systems. During the first half of the course, each modality will be dealt with separately, including a very brief review of essential anatomy and physiology, followed by more intensive discussion of research approaches and findings from the domains of applied and basic perceptual psychology and neurophysiology. For each of the five modalities to be addressed, the content of the discussion will be centered around current and anticipated developments in VE technology.
223

Author Index Adelstein, B.D 138 Allison, D 69 Barfield, W 114 Bowman, DA 45 Breant, F 138 Broil, W 121 Bryson, S 106 Brystrom, K 114 Burdea, G 54 Capin, T.K 161 Caudell, T.P 146 Chai,Y.-H 192 Chapman, DA 211 Chiu, SA 208 Cimera, R.E 211 Cress, J.D 80 Cunningham, JA 30, 80 Dennis, L.B 30 Dinsmore, M 54 Durlach, N 2 Ellis, S.R 138 Ertl, T 209 Fritz, J.P 210 Fujishiro, 1 4 Fukuda, S 199 Fukui, Y 180 Green, M 20 Haas, M.W 30, 80 Hahn, J.K 156 Hendrix, C 114 Hettinger, L.J 30, 80 Hodges, L.F 45, 69 Holzner, M 209 Ikei, Y 199 Jacoby, R 138 Johan, S 106 Kennedy, R.S 87 Khan,Y.H 211 Kijima, R 130 Kim, D 146 King,T 61 Koller, D 45 Kollock, P 152 Kuschfeldt, S 209 Ladeji, J 54 Langrana, N 54
Lau, R.W.H 20 LeBoy, J.S 211 Luecke, G.R 192 Maruyama, T 4 McMillan, G.R 80 Menges, B 138 Millar, D.S 211 Moore, D.D 211 Mourant, R.R 208 Nelson, W.T 30 Ojika, T 130 Pai, D.K 188 Pandzic, I.S 161 Qiu, N 208 Reuding, T 209 Ribarsky, W 38 Riccio, G.E 80 Richards, S.W 146 Roe, M.M 30 Rusch, F.R 211 Schaufler, G 12 Schlecht, L 106 Schmalstieg, D 12 Schulz, M 209 Shawver, D.M 170 Shelden, D.L 211 Shi,Y 188 Shimojo, M 180 Shinohara, M 180 Sibert, L 61 Slater, M 95 Spaulding, V 38 Stanney, KM 87 Thakkar, U 211 Tanaka, R 4 Täte, D.L 61 Thalmann, D 161 Thalmann, N.M 161 To, D.S.P 20 Uno, S 95 Wakamatsu, K 199 Walker, N 38 Watson, B 38 Wiley, D.J 156 Wills, B 69 Wineman, J 69
224

illlll
i
Want to see a bright idea? Check out our www catalog and shop for all of the books and magazines you need
to stay on top of your field...
You can find everything you need at 9 * *
www.bomputer.org/cs press

Notes

Notes wmmmmam^tMmiim

IEEE COMPUTER SOCIETY
http://computer.org
Press Activities Board
Vice President: I. Mark Haas Managing Partner Haas Associates P.O. Box 451177 Garland, TX 75045-1177 [email protected]
Jon T. Butler, Naval Postgraduate School James J. Farrell III, Motorola Mohamed E. Fayad, University of Nevada I. Mark Haas, Haas Associates Ronald G. Hoelzeman, University of Pittsburgh Gene F. Hoffnagle, IBM Corporation John R. Nicol, GTE Laboratories Yale N. Patt, University of Michigan Benjamin W. Wah, University of Illinois Ronald D. Williams, University of Virginia
Editor-in-Chief Advances in Computer Science and Engineering Board Pradip Srimani Colorado State University Dept. of Computer Science 601 South Hows Lane Fort Collins, CO 80525 Phone: 970-491-5862 FAX: 970-491-2466 [email protected]
Editor-in-Chief Practices for Computer Science and Engineering Board Mohamed E. Fayad Computer Science, MS/171 Bldg. LME, Room 308 University of Nevada Reno, NV 89557 Phone: 702-784-4356 FAX: 702-784-1833 [email protected]
IEEE Computer Society Executive Staff T. Michael Elliott, Executive Director
Matthew S. Loeb, Publisher
IEEE Computer Society Press Publications The world-renowned Computer Society Press publishes, promotes, and distributes a wide variety of authoritative computer science and engineering texts. These books are available in two formats: 100 percent original material by authors preeminent in their field who focus on relevant topics and cutting-edge research, and reprint collections consisting of carefully selected groups of previously published papers with accompanying original introductory and explanatory text.
Submission of proposals: For guidelines and information on CS Press books, send e-mail to [email protected] or write to the Acquisitions Editor, IEEE Computer Society Press, P.O. Box 3014, 10662 Los Vaqueros Circle, Los Alamitos, CA 90720-1314. Telephone +1 714-821-8380. FAX +1 714-761-1784.
IEEE Computer Society Press Proceedings The Computer Society Press also produces and actively promotes the proceedings of more than 130 acclaimed international conferences each year in multimedia formats that include hard and softcover books, CD-ROMs, videos, and on-line publications.
For information on CS Press proceedings, send e-mail to [email protected] or write to Proceed- ings, IEEE Computer Society Press, P.O. Box 3014, 10662 Los Vaqueros Circle, Los Alamitos, CA 90720-1314. Telephone +1 714-821-8380. FAX +1 714-761-1784.
Additional information regarding the Computer Society, conferences and proceedings, CD-ROMs, videos, and books can also be accessed from our web site at www.computer.org.
12/12/96