An Interspecific Fungal Hybrid Reveals Cross-Kingdom Rules for Allopolyploid Gene Expression...
15
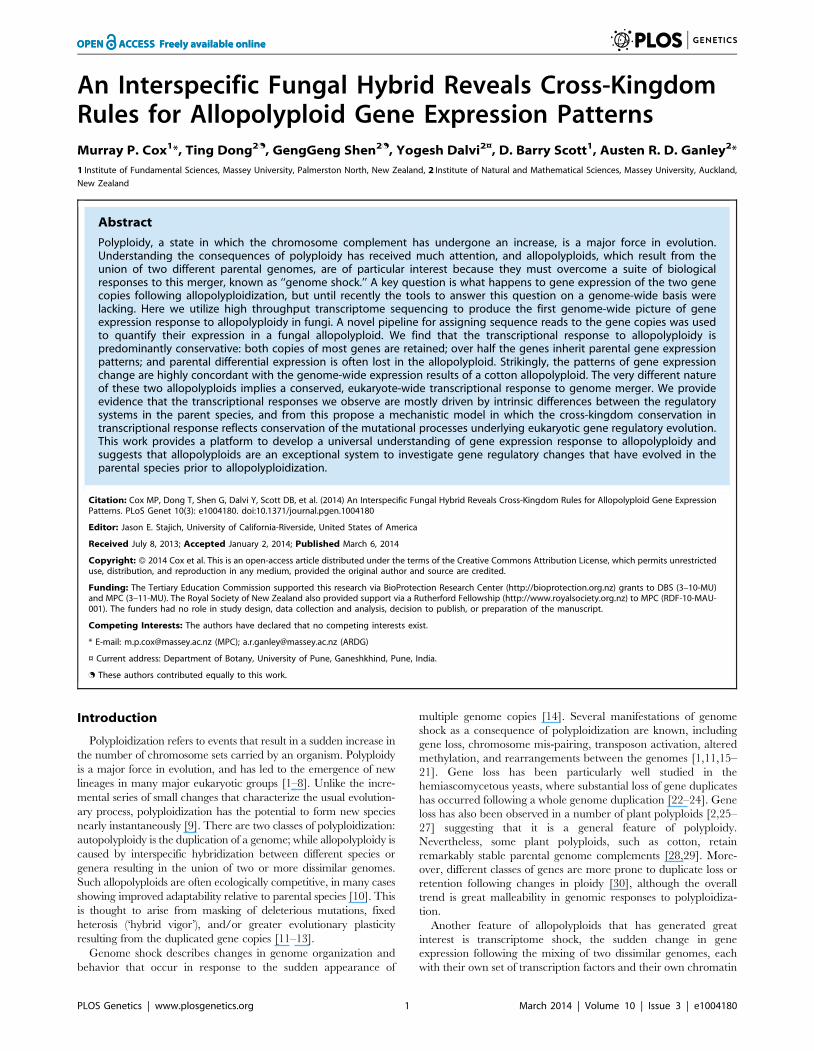
An Interspecific Fungal Hybrid Reveals Cross-Kingdom Rules for Allopolyploid Gene Expression Patterns Murray P. Cox 1 *, Ting Dong 2. , GengGeng Shen 2. , Yogesh Dalvi 2¤ , D. Barry Scott 1 , Austen R. D. Ganley 2 * 1 Institute of Fundamental Sciences, Massey University, Palmerston North, New Zealand, 2 Institute of Natural and Mathematical Sciences, Massey University, Auckland, New Zealand Abstract Polyploidy, a state in which the chromosome complement has undergone an increase, is a major force in evolution. Understanding the consequences of polyploidy has received much attention, and allopolyploids, which result from the union of two different parental genomes, are of particular interest because they must overcome a suite of biological responses to this merger, known as ‘‘genome shock.’’ A key question is what happens to gene expression of the two gene copies following allopolyploidization, but until recently the tools to answer this question on a genome-wide basis were lacking. Here we utilize high throughput transcriptome sequencing to produce the first genome-wide picture of gene expression response to allopolyploidy in fungi. A novel pipeline for assigning sequence reads to the gene copies was used to quantify their expression in a fungal allopolyploid. We find that the transcriptional response to allopolyploidy is predominantly conservative: both copies of most genes are retained; over half the genes inherit parental gene expression patterns; and parental differential expression is often lost in the allopolyploid. Strikingly, the patterns of gene expression change are highly concordant with the genome-wide expression results of a cotton allopolyploid. The very different nature of these two allopolyploids implies a conserved, eukaryote-wide transcriptional response to genome merger. We provide evidence that the transcriptional responses we observe are mostly driven by intrinsic differences between the regulatory systems in the parent species, and from this propose a mechanistic model in which the cross-kingdom conservation in transcriptional response reflects conservation of the mutational processes underlying eukaryotic gene regulatory evolution. This work provides a platform to develop a universal understanding of gene expression response to allopolyploidy and suggests that allopolyploids are an exceptional system to investigate gene regulatory changes that have evolved in the parental species prior to allopolyploidization. Citation: Cox MP, Dong T, Shen G, Dalvi Y, Scott DB, et al. (2014) An Interspecific Fungal Hybrid Reveals Cross-Kingdom Rules for Allopolyploid Gene Expression Patterns. PLoS Genet 10(3): e1004180. doi:10.1371/journal.pgen.1004180 Editor: Jason E. Stajich, University of California-Riverside, United States of America Received July 8, 2013; Accepted January 2, 2014; Published March 6, 2014 Copyright: ß 2014 Cox et al. This is an open-access article distributed under the terms of the Creative Commons Attribution License, which permits unrestricted use, distribution, and reproduction in any medium, provided the original author and source are credited. Funding: The Tertiary Education Commission supported this research via BioProtection Research Center (http://bioprotection.org.nz) grants to DBS (3–10-MU) and MPC (3–11-MU). The Royal Society of New Zealand also provided support via a Rutherford Fellowship (http://www.royalsociety.org.nz) to MPC (RDF-10-MAU- 001). The funders had no role in study design, data collection and analysis, decision to publish, or preparation of the manuscript. Competing Interests: The authors have declared that no competing interests exist. * E-mail: [email protected] (MPC); [email protected] (ARDG) ¤ Current address: Department of Botany, University of Pune, Ganeshkhind, Pune, India. . These authors contributed equally to this work. Introduction Polyploidization refers to events that result in a sudden increase in the number of chromosome sets carried by an organism. Polyploidy is a major force in evolution, and has led to the emergence of new lineages in many major eukaryotic groups [1–8]. Unlike the incre- mental series of small changes that characterize the usual evolution- ary process, polyploidization has the potential to form new species nearly instantaneously [9]. There are two classes of polyploidization: autopolyploidy is the duplication of a genome; while allopolyploidy is caused by interspecific hybridization between different species or genera resulting in the union of two or more dissimilar genomes. Such allopolyploids are often ecologically competitive, in many cases showing improved adaptability relative to parental species [10]. This is thought to arise from masking of deleterious mutations, fixed heterosis (‘hybrid vigor’), and/or greater evolutionary plasticity resulting from the duplicated gene copies [11–13]. Genome shock describes changes in genome organization and behavior that occur in response to the sudden appearance of multiple genome copies [14]. Several manifestations of genome shock as a consequence of polyploidization are known, including gene loss, chromosome mis-pairing, transposon activation, altered methylation, and rearrangements between the genomes [1,11,15– 21]. Gene loss has been particularly well studied in the hemiascomycetous yeasts, where substantial loss of gene duplicates has occurred following a whole genome duplication [22–24]. Gene loss has also been observed in a number of plant polyploids [2,25– 27] suggesting that it is a general feature of polyploidy. Nevertheless, some plant polyploids, such as cotton, retain remarkably stable parental genome complements [28,29]. More- over, different classes of genes are more prone to duplicate loss or retention following changes in ploidy [30], although the overall trend is great malleability in genomic responses to polyploidiza- tion. Another feature of allopolyploids that has generated great interest is transcriptome shock, the sudden change in gene expression following the mixing of two dissimilar genomes, each with their own set of transcription factors and their own chromatin PLOS Genetics | www.plosgenetics.org 1 March 2014 | Volume 10 | Issue 3 | e1004180
-
Upload
independent -
Category
Documents
-
view
2 -
download
0
Transcript of An Interspecific Fungal Hybrid Reveals Cross-Kingdom Rules for Allopolyploid Gene Expression...
An Interspecific Fungal Hybrid Reveals Cross-KingdomRules for Allopolyploid Gene Expression PatternsMurray P. Cox1*, Ting Dong2., GengGeng Shen2., Yogesh Dalvi2¤, D. Barry Scott1, Austen R. D. Ganley2*
1 Institute of Fundamental Sciences, Massey University, Palmerston North, New Zealand, 2 Institute of Natural and Mathematical Sciences, Massey University, Auckland,
New Zealand
Abstract
Polyploidy, a state in which the chromosome complement has undergone an increase, is a major force in evolution.Understanding the consequences of polyploidy has received much attention, and allopolyploids, which result from theunion of two different parental genomes, are of particular interest because they must overcome a suite of biologicalresponses to this merger, known as ‘‘genome shock.’’ A key question is what happens to gene expression of the two genecopies following allopolyploidization, but until recently the tools to answer this question on a genome-wide basis werelacking. Here we utilize high throughput transcriptome sequencing to produce the first genome-wide picture of geneexpression response to allopolyploidy in fungi. A novel pipeline for assigning sequence reads to the gene copies was usedto quantify their expression in a fungal allopolyploid. We find that the transcriptional response to allopolyploidy ispredominantly conservative: both copies of most genes are retained; over half the genes inherit parental gene expressionpatterns; and parental differential expression is often lost in the allopolyploid. Strikingly, the patterns of gene expressionchange are highly concordant with the genome-wide expression results of a cotton allopolyploid. The very different natureof these two allopolyploids implies a conserved, eukaryote-wide transcriptional response to genome merger. We provideevidence that the transcriptional responses we observe are mostly driven by intrinsic differences between the regulatorysystems in the parent species, and from this propose a mechanistic model in which the cross-kingdom conservation intranscriptional response reflects conservation of the mutational processes underlying eukaryotic gene regulatory evolution.This work provides a platform to develop a universal understanding of gene expression response to allopolyploidy andsuggests that allopolyploids are an exceptional system to investigate gene regulatory changes that have evolved in theparental species prior to allopolyploidization.
Citation: Cox MP, Dong T, Shen G, Dalvi Y, Scott DB, et al. (2014) An Interspecific Fungal Hybrid Reveals Cross-Kingdom Rules for Allopolyploid Gene ExpressionPatterns. PLoS Genet 10(3): e1004180. doi:10.1371/journal.pgen.1004180
Editor: Jason E. Stajich, University of California-Riverside, United States of America
Received July 8, 2013; Accepted January 2, 2014; Published March 6, 2014
Copyright: � 2014 Cox et al. This is an open-access article distributed under the terms of the Creative Commons Attribution License, which permits unrestricteduse, distribution, and reproduction in any medium, provided the original author and source are credited.
Funding: The Tertiary Education Commission supported this research via BioProtection Research Center (http://bioprotection.org.nz) grants to DBS (3–10-MU)and MPC (3–11-MU). The Royal Society of New Zealand also provided support via a Rutherford Fellowship (http://www.royalsociety.org.nz) to MPC (RDF-10-MAU-001). The funders had no role in study design, data collection and analysis, decision to publish, or preparation of the manuscript.
Competing Interests: The authors have declared that no competing interests exist.
* E-mail: [email protected] (MPC); [email protected] (ARDG)
¤ Current address: Department of Botany, University of Pune, Ganeshkhind, Pune, India.
. These authors contributed equally to this work.
Introduction
Polyploidization refers to events that result in a sudden increase in
the number of chromosome sets carried by an organism. Polyploidy
is a major force in evolution, and has led to the emergence of new
lineages in many major eukaryotic groups [1–8]. Unlike the incre-
mental series of small changes that characterize the usual evolution-
ary process, polyploidization has the potential to form new species
nearly instantaneously [9]. There are two classes of polyploidization:
autopolyploidy is the duplication of a genome; while allopolyploidy is
caused by interspecific hybridization between different species or
genera resulting in the union of two or more dissimilar genomes.
Such allopolyploids are often ecologically competitive, in many cases
showing improved adaptability relative to parental species [10]. This
is thought to arise from masking of deleterious mutations, fixed
heterosis (‘hybrid vigor’), and/or greater evolutionary plasticity
resulting from the duplicated gene copies [11–13].
Genome shock describes changes in genome organization and
behavior that occur in response to the sudden appearance of
multiple genome copies [14]. Several manifestations of genome
shock as a consequence of polyploidization are known, including
gene loss, chromosome mis-pairing, transposon activation, altered
methylation, and rearrangements between the genomes [1,11,15–
21]. Gene loss has been particularly well studied in the
hemiascomycetous yeasts, where substantial loss of gene duplicates
has occurred following a whole genome duplication [22–24]. Gene
loss has also been observed in a number of plant polyploids [2,25–
27] suggesting that it is a general feature of polyploidy.
Nevertheless, some plant polyploids, such as cotton, retain
remarkably stable parental genome complements [28,29]. More-
over, different classes of genes are more prone to duplicate loss or
retention following changes in ploidy [30], although the overall
trend is great malleability in genomic responses to polyploidiza-
tion.
Another feature of allopolyploids that has generated great
interest is transcriptome shock, the sudden change in gene
expression following the mixing of two dissimilar genomes, each
with their own set of transcription factors and their own chromatin
PLOS Genetics | www.plosgenetics.org 1 March 2014 | Volume 10 | Issue 3 | e1004180

profiles [6,31]. To date, most studies that have examined the
response of gene expression to allopolyploidization have focused
on plant systems, ranging from evolutionarily old allopolyploidy
events through to synthetic plant allopolyploids [32–40]. Two
transcriptional phenomena are emerging from these studies [41–
43]. The first is called ‘‘homeolog expression bias’’ (here we use the
term homeolog for the different parental copies of a gene within an
allopolyploid; see Figure 1). This refers to cases where the
homeologs in the allopolyploid show an expression pattern
different to that observed in the parents. The second phenomenon,
termed ‘‘expression-level dominance’’, is where a gene that shows
a difference in expression between the two parents has a combined
level of expression from the two homeologs in the allopolyploid
that resembles one of the parental expression levels, rather than
being an average of the two. However, because the single gene
methods and probe-based assays (such as microarrays) tradition-
ally used to study allopolyploid expression lack sufficient resolution
to reveal the full suite of genome-wide gene expression patterns at
an individual homeolog level [44], the generality of these
phenomena and how they are manifested has not been clear.
High throughput mRNA sequencing technologies can overcome
these limitations by resolving the expression levels of each
homeolog in allopolyploids [45]. Recent studies have started to
utilize these sequencing technologies to address allopolyploidiza-
tion, and these are beginning to reveal the complex and multi-
faceted transcriptional changes that occur during and after this
event [39,45,46].
While much research has focused on plants, polyploidization is
also an important feature of the evolutionary history of other
lineages, including the fungi [47–49]. A model system for studying
fungal allopolyploidy is the epichloe endophytes, an ecologically and
economically important group of fungi from the family Clavicipi-
taceae [50] that includes the genera Epichloe and Neotyphodium. As
systemic, obligate symbionts of cool-season grasses, the epichloe
endophytes underpin the productivity of most global pastoral
economies [51]. Most epichloe endophytes produce a range of
biologically active secondary metabolites that can be economically
Figure 1. Glossary of terms. Diagram outlining the meanings ofterms relating to allopolyploid transcription that are used in this study,and which derive from Yoo et al. [46]. Illustrated is an example of agene, ‘‘A’’, that is present as orthologs in the parents E8 and AR5, and ashomeologs in the allopolyploid Lp1. The three homeolog expressionterms are possible outcomes for relative gene expression in theallopolyploid. Homeolog expression bias: differential expression is notfound between the two orthologs, but has arisen in the allopolyploid[43]. Homeolog expression blending: expression differences betweenthe two orthologs have been lost in the allopolyploid. Homeologexpression reversal: the highly expressed ortholog has lower expressionthan the other homeolog in the allopolyploid.doi:10.1371/journal.pgen.1004180.g001
Author Summary
Organisms are complex biological systems that mustcontinue to function even as their genomes evolve. Whileevolution is usually gradual, the formation of new speciesby the hybridization of different parents—allopolyploidi-zation—occurs nearly instantaneously. A key question iswhat happens to expression of the two parental genecopies following genome merger. To determine this, wefocused on a fungal allopolyploid from a group thatdominates many of the world’s pastoral economies. Toinvestigate the fate of gene expression in this system, wedeveloped a novel pipeline to assign high throughput RNAsequence reads to the two parental gene copies, thusallowing quantification of expression. We found transcrip-tional responses to be predominantly conservative: mostgene copies either inherit parental expression patterns, orif differentially expressed in the parents, that difference islost in the hybrid. Moreover, we identified an extraordinarylevel of concordance in the fate of genome-wide allopoly-ploid gene expression with that seen in cotton. The verydifferent nature of these two allopolyploids suggests thatthere is a set of universal rules for the transcriptionalresponse to genome merger. We propose a mechanisticmodel whereby this conserved response reflects similari-ties in mutational processes that underlie gene regulatoryevolution.
Global Rules for Allopolyploid Gene Expression
PLOS Genetics | www.plosgenetics.org 2 March 2014 | Volume 10 | Issue 3 | e1004180

beneficial by protecting against insect damage, but can also be
economically detrimental by preventing mammalian herbivory,
resulting in livestock productivity losses through toxic conditions
called ryegrass staggers and fescue toxicosis. Interestingly, many
species are natural polyploids [5,52], which are usually referred to as
‘‘hybrids’’ in the fungal literature.
Epichloe polyploids are often formed from very different
parents, with nucleotide divergence between parent species
reaching as high as 8% [49], a level of divergence comparable
to that between humans and macaques [53]. One well-character-
ized epichloe polyploid, designated as Lp1, is an economically
important asexual interspecific hybrid (hereafter referred to as an
allopolyploid to conform with the extensive plant literature)
between a haploid sexual species, E. typhina, and a haploid asexual
species, N. lolii [50,54–56]. Although the mechanism of allopoly-
ploidization is not known, it is thought to be similar to normal
fungal mating, where cells first fuse to create a dikaryon (a cell
containing two nuclei), followed by nuclear fusion [49]. Lp1 cells
have been shown microscopically to contain only a single nucleus
[50], proving that it is a true allopolyploid and not simply a fungal
dikaryon, and because Lp1 is asexual, this nuclear arrangement is
a permanent state. The allopolyploid nature of Lp1 is reinforced
by genetic data: most genes studied to date in Lp1 have both
parental copies maintained [50,54], with the notable exception of
the ribosomal DNA repeats (rDNA) and the mitochondrial DNA,
each of which derive from just one parent [54,55,57]. The
existence of species closely related to the original parents [50],
coupled with it being a naturally occurring allopolyploid, make
Lp1 an ideal system to explore the consequences of allopolyploidy
on transcription within the fungi.
Here, we describe an RNA-seq based analysis of gene
expression in the Lp1 allopolyploid. We develop a new compu-
tational pipeline to determine gene expression levels of both
homeologs using next-generation mRNA sequencing in Lp1
without the benefit of a close reference genome sequence, and
compare these to the parental species’ transcriptomes. We
document the four possible relative gene expression level outcomes
for orthologs that become united in an allopolyploid, as well as a
total expression level outcome, expression-level dominance
(Figure 1). Our results show remarkable concordance of allopoly-
ploid gene expression outcomes with those seen in plants,
suggesting there are common transcriptional responses to
allopolyploidy that reflect the underlying systems of gene
regulation. We also show that almost all genes are retained in
duplicate in Lp1, implying that little gene loss has occurred since
the polyploidization event, which we calculate occurred no more
than 300,000 years ago.
Results
Assigning mRNA sequences in the allopolyploid toparental homeologs
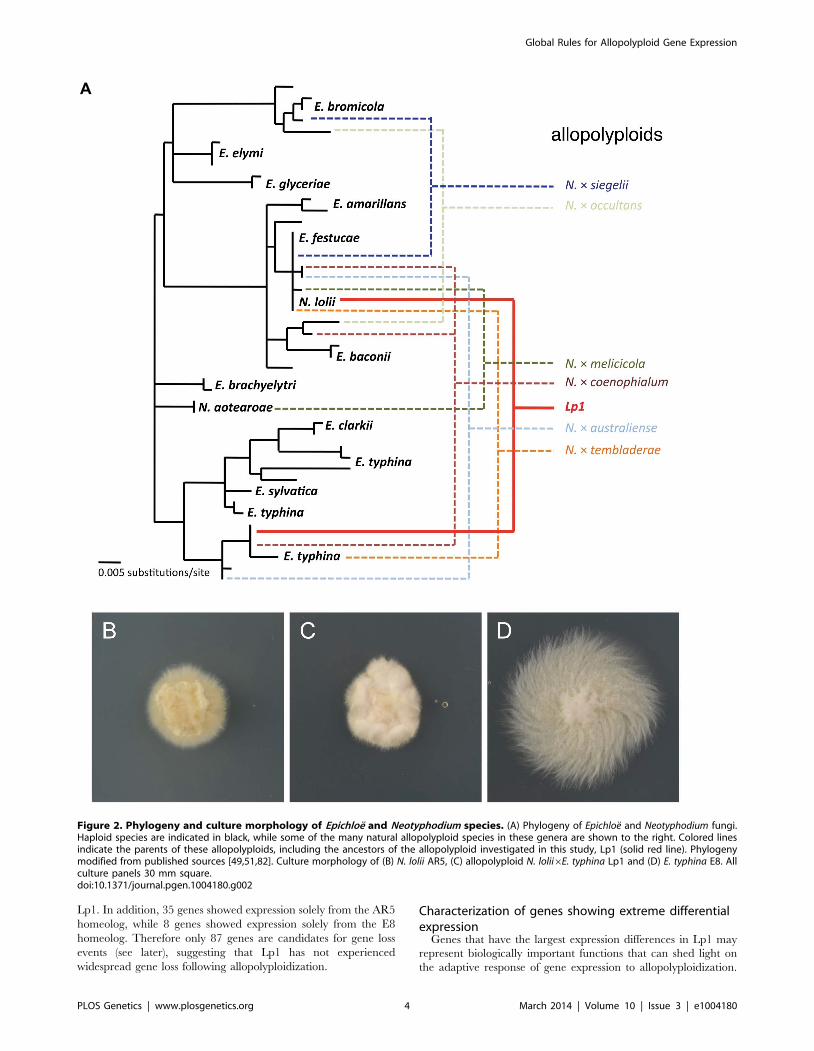
To investigate the fate of gene expression following allopoly-
ploidization in the well-characterized Neotyphodium lolii6Epichloe
typhina allopolyploid endophyte, Lp1, we performed Illumina
mRNA sequencing on Lp1 and its putative parental species
(Figure 2). The closest extant E. typhina strain is believed to be E8
[50]. Previous studies employed strain Lp5 as the closest N. lolii
parent [e.g., 57]. However, in this study we used N. lolii strain AR5
as the parental isolate because (a) it was isolated from the same
germplasm as Lp1 (B. Tapper, AgResearch New Zealand, pers.
comm.), and (b) AR5 and the N. lolii component of the Lp1
genome are identical over a 430 bp region of the PYR4 gene
(results not shown).
Replicate cultures of Lp1, AR5 and E8 were grown on rich
medium and then transferred to a defined nutrient-limited
medium to stimulate transcription of a wide range of genes [58].
After 24 h of growth, mRNA was extracted from culture
mycelium and sequenced using Illumina HiSeq sequencing. The
numbers of reads obtained are shown in Table 1. As a
quick validation of data quality, reads were mapped to the
E2368 reference genome. Mapping rates varied between 66–80%,
with most unmapped reads subsequently identified as rRNA
derived.
To allocate Lp1 reads to the AR5- and E8-like homeologs, we
developed a pipeline (Figure S1) that utilizes an existing catalogue
of well annotated gene models developed from the genome
sequence of a related epichloe species, E. festucae strain E2368 [59].
We created two separate reference gene sets, one each for the
AR5- and E8-like homeologs. To achieve this, we first identified
AR5- and E8-specific SNPs by mapping reads from the two
parental species to the E2368 gene models at low stringency.
Relative to E2368, we identified 44,665 and 336,802 SNPs for the
AR5 and E8 parental species, respectively. This order-of-
magnitude difference reflects the close evolutionary relationship
between AR5 and E2368, both of which have an E. festucae
ancestry, compared to the more divergent E. typhina strain E8. The
median distance between SNPs in AR5 was 244 bp (95%
confidence interval: 3–1,725 bp), while the median distance
between SNPs in E8 was 22 bp (95% CI: 1–141 bp). Because
Lp1 carries additional SNPs (i.e., polymorphisms that have arisen
since the allopolyploidization event), we also mapped the Lp1
reads at low stringency to the E2368 gene models. 374,931 SNPs
were identified, most of which (94%) were shared with one or
other of the parent species. Of the 22,543 new SNPs identified,
3,241 (14%) could be assigned to either the AR5 homeolog (1,745)
or the E8 homeolog (1,496) on the basis of linkage disequilibrium
with known AR5 and E8 parental SNPs. All SNPs (i.e., those in
both Lp1 and its parents) were divided into diagnostic classes that
are informative for determining homeolog ancestry (Table 2) and
these were used to create the two reference gene sets. After culling
genes with insufficient sequencing coverage (Protocol S1), the
reference gene sets contained 6,698 (55%) of the 12,199 predicted
gene models from the E2368 strain reference.
We used this SNP dataset to genetically date the allopolyploi-
dization event, with the results suggesting this occurred within the
last 300,000 years (see Text S1). This first estimate of the age of
Lp1 suggests that it is comparatively young, at least compared to
the better-known autopolyploid event in hemiascomycetous yeast
that occurred millions of years ago [22].
Persistence of both parental gene copies in theallopolyploid
The two biological replicate datasets from Lp1 were mapped
separately to the AR5- and E8-like reference gene sets with high
stringency (i.e. zero mismatch mappings) to determine from which
homeolog each read originates. This resulted in 12,283,690 reads
mapping uniquely to the AR5-like reference, and 11,769,529 reads
mapping uniquely to the E8-like reference.
Previous investigations on just ten genes suggested that, apart
from the special cases of rDNA and mtDNA (see Text S1), Lp1
contains both parent genomes with little evidence of gene loss
[50,54]. To explore gene loss on a genome-wide scale, we
determined the number of genes with reads mapped to the
respective AR5- and E8-like homeologs. Of the 6,698 genes for
which we are able to distinguish homeologs, at least one read
mapped to 6,654 genes (99.3%), thus under our study conditions
only 44 genes had no detectable expression of either homeolog in
Global Rules for Allopolyploid Gene Expression
PLOS Genetics | www.plosgenetics.org 3 March 2014 | Volume 10 | Issue 3 | e1004180
Lp1. In addition, 35 genes showed expression solely from the AR5
homeolog, while 8 genes showed expression solely from the E8
homeolog. Therefore only 87 genes are candidates for gene loss
events (see later), suggesting that Lp1 has not experienced
widespread gene loss following allopolyploidization.
Characterization of genes showing extreme differentialexpression
Genes that have the largest expression differences in Lp1 may
represent biologically important functions that can shed light on
the adaptive response of gene expression to allopolyploidization.
Figure 2. Phylogeny and culture morphology of Epichloe and Neotyphodium species. (A) Phylogeny of Epichloe and Neotyphodium fungi.Haploid species are indicated in black, while some of the many natural allopolyploid species in these genera are shown to the right. Colored linesindicate the parents of these allopolyploids, including the ancestors of the allopolyploid investigated in this study, Lp1 (solid red line). Phylogenymodified from published sources [49,51,82]. Culture morphology of (B) N. lolii AR5, (C) allopolyploid N. lolii6E. typhina Lp1 and (D) E. typhina E8. Allculture panels 30 mm square.doi:10.1371/journal.pgen.1004180.g002
Global Rules for Allopolyploid Gene Expression
PLOS Genetics | www.plosgenetics.org 4 March 2014 | Volume 10 | Issue 3 | e1004180
We defined extreme differentially expressed (EDE) genes as those
with very large expression differences in the allopolyploid – either
a 50-fold or greater difference in expression level, or no expression
from one of the parental homeologs. Excluding genes with fewer
than 5 reads in the Lp1 dataset, 58 genes (0.9%) fit these criteria.
To test for common functions in EDE genes, we performed a gene
ontology (GO) slim analysis to determine whether certain classes of
genes identified in the analyses above were enriched for particular
functional categories. No strong patterns were detected (results not
shown), although this outcome is tempered by the small number of
genes analyzed.
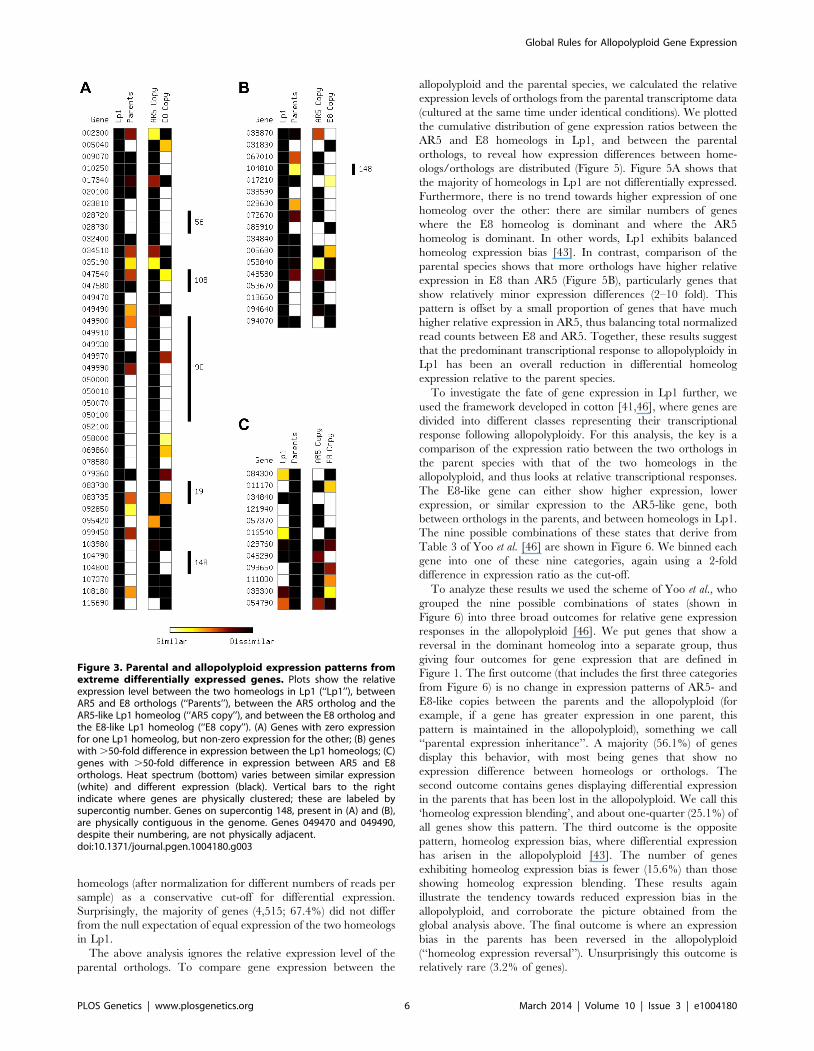
To determine whether EDE gene expression patterns result
from allopolyploidy or instead derive from regulation differences
that exist between the parents, we constructed a heat map showing
the ratio of gene expression levels between homeologs in Lp1 and
the corresponding orthologs in the AR5 and E8 parents (Figure 3A
and 3B). Expression ratios were determined in two ways. First, we
calculated expression ratios between the two homeologs in Lp1,
and between the corresponding AR5 and E8 parental orthologs
(the two left-hand columns) to determine whether the biased
expression observed in the allopolyploid is also present in the
parents. Second, we calculated expression ratios between the AR5
parental ortholog and the AR5 homeolog, and between the E8
parental ortholog and the E8 homeolog (the two right-hand
columns), to determine which homeolog is responsible for any
expression change. Interestingly, about half the EDE genes where
only one homeolog is expressed in Lp1 (21 of 41 using a 2-fold
difference in expression as the cutoff) are due to changes in the
allopolyploid (Figure 3A). A similar picture is seen for EDE genes
with .50-fold expression difference between homeologs in Lp1
(Figure 3B). In both cases most expression changes have occurred
in the AR5 homeolog.
For completeness, we also looked at the reciprocal situation:
determining the fate of genes with high expression differences
between the E8 and AR5 parents (Figure 3C). Only 12 orthologs
showed 50-fold or greater difference in expression between the
AR5 and E8 parents (our mapping approach automatically
excludes any genes with expression in only one parent). Again,
for about half of these genes (5/12), the differential expression is
lost in Lp1.
Deletions, rather than regulatory changes, explain majordifferences in homeolog expression
Loss of gene expression from one homeolog in the allopolyploid
may result from chromatin changes or gene deletion, and may
affect a broader genomic region than just a single gene. We
therefore looked to see whether the EDE genes are physically
linked in the reference genome [59]. Strikingly, 18 of 59 EDE
genes (30.5%) are found in five physically contiguous clusters of
two or more genes (Figure 3A,B). This pattern is particularly
common in genes where only one homeolog is expressed in Lp1,
with almost half of these genes occurring in clusters. To distinguish
between these regions becoming heterochromatinized, thus
silencing blocks of genes, or being a result of genomic deletions,
PCR-RFLP of genomic DNA was employed.
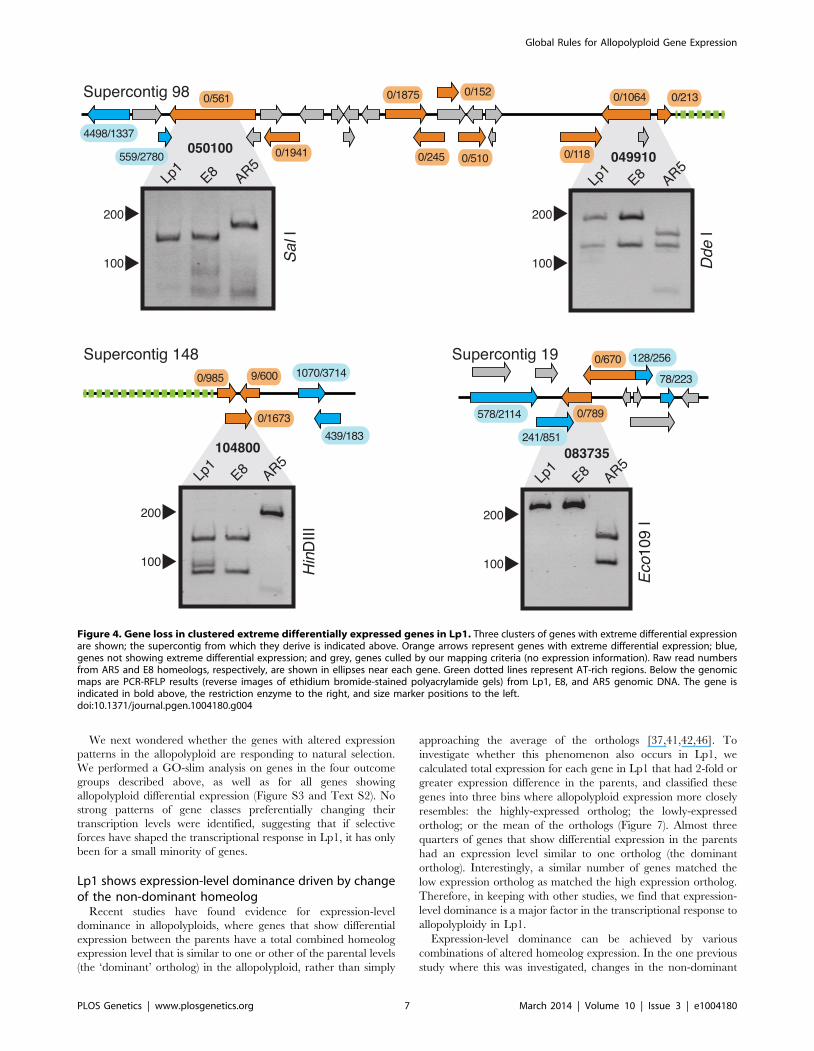
We chose three examples of clustered EDE genes to investigate
(Figure 4). In one region, a block of nine genes on Supercontig 98
all show exclusively E8 homeolog expression in Lp1. PCR-RFLP
analysis of the first and penultimate genes in this cluster shows that
the AR5 homeolog has been deleted in both cases, and the most
parsimonious interpretation is that a single, large deletion
encompassing this entire block of genes has occurred in the
AR5-derived genome. In the second example, a cluster of three
genes is located on Supercontig 148, two of which show E8
homeolog-specific expression and one shows highly biased E8
homeolog expression. PCR-RFLP analysis indicates that the AR5
homeolog of the middle gene in this block has been deleted. We
propose that this three-gene cluster has been deleted from the
AR5-derived genome, with some reads emanating from a
fragment of the weakly-expressed AR5 homeolog that remains.
Interestingly, both these deletion events are adjacent to AT-rich
regions at the end of the contig, which are usually indicative of
transposon-rich repeat regions in epichloe species [59]. The third
example is a cluster of two genes on Supercontig 19 that show E8
homeolog-specific expression. PCR-RFLP analysis also indicates
deletion of the AR5 homeolog. Additionally, PCR-RFLP on non-
clustered EDE genes shows that some, but not all, are deleted
(Figure S2). These results illustrate that gene loss accounts for some
of the most extreme homeolog expression biases observed in Lp1,
and suggests that at least 20 genes have been deleted from Lp1
since the allopolyploidization event. The true number is likely to
be larger, as biased homeolog expression from partial gene
deletions is difficult to diagnose, and because our mapping
procedure excluded about half the genes in the genome. This
pattern of clustered gene loss resembles the chromosomal deletions
observed in allopolyploid species of the plant genus Tragopogon
[26,60].
Allopolyploidy leads to expression conformity ofhomeologs
Given the low level of gene loss, we next investigated the fate of
gene expression following the allopolyploidization event on a
genome-wide basis. The enormous number of reads in our study
gave us great statistical power, meaning that for highly expressed
genes a small proportional difference in read counts is statistically
significant. Therefore we also employed a biological criterion of a
2-fold difference in expression between the AR5- and E8
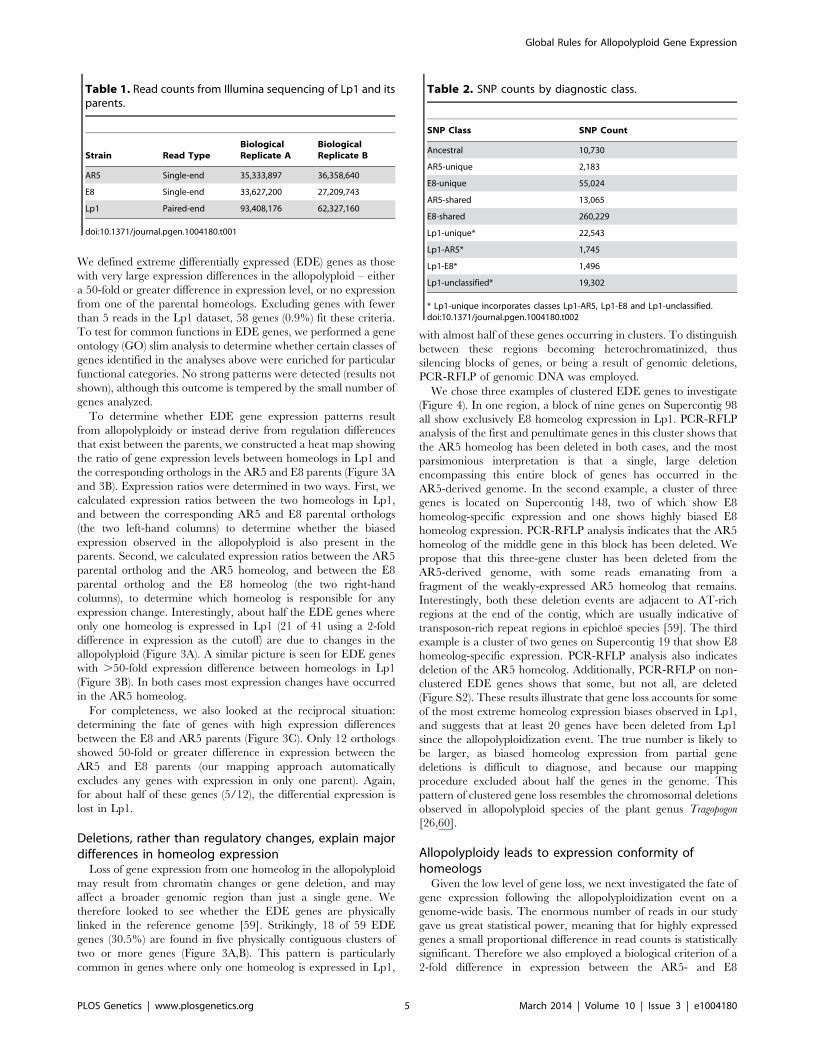
Table 1. Read counts from Illumina sequencing of Lp1 and itsparents.
Strain Read TypeBiologicalReplicate A
BiologicalReplicate B
AR5 Single-end 35,333,897 36,358,640
E8 Single-end 33,627,200 27,209,743
Lp1 Paired-end 93,408,176 62,327,160
doi:10.1371/journal.pgen.1004180.t001
Table 2. SNP counts by diagnostic class.
SNP Class SNP Count
Ancestral 10,730
AR5-unique 2,183
E8-unique 55,024
AR5-shared 13,065
E8-shared 260,229
Lp1-unique* 22,543
Lp1-AR5* 1,745
Lp1-E8* 1,496
Lp1-unclassified* 19,302
* Lp1-unique incorporates classes Lp1-AR5, Lp1-E8 and Lp1-unclassified.doi:10.1371/journal.pgen.1004180.t002
Global Rules for Allopolyploid Gene Expression
PLOS Genetics | www.plosgenetics.org 5 March 2014 | Volume 10 | Issue 3 | e1004180
homeologs (after normalization for different numbers of reads per
sample) as a conservative cut-off for differential expression.
Surprisingly, the majority of genes (4,515; 67.4%) did not differ
from the null expectation of equal expression of the two homeologs
in Lp1.
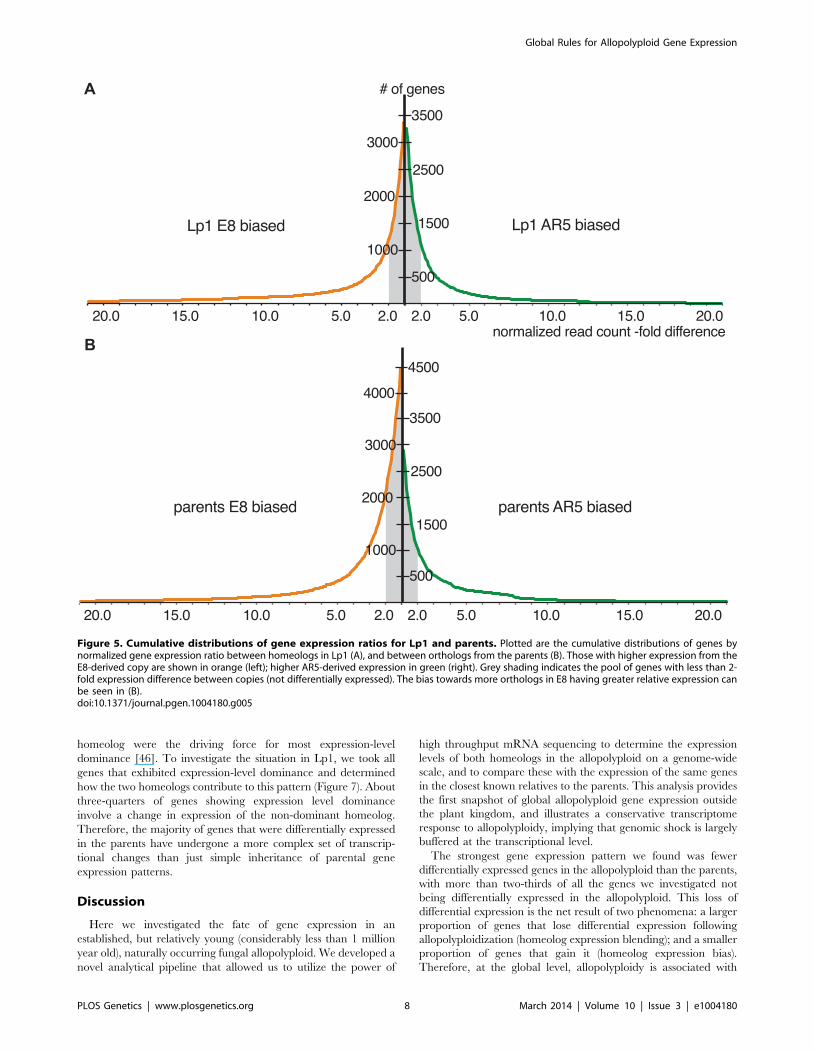
The above analysis ignores the relative expression level of the
parental orthologs. To compare gene expression between the
allopolyploid and the parental species, we calculated the relative
expression levels of orthologs from the parental transcriptome data
(cultured at the same time under identical conditions). We plotted
the cumulative distribution of gene expression ratios between the
AR5 and E8 homeologs in Lp1, and between the parental
orthologs, to reveal how expression differences between home-
ologs/orthologs are distributed (Figure 5). Figure 5A shows that
the majority of homeologs in Lp1 are not differentially expressed.
Furthermore, there is no trend towards higher expression of one
homeolog over the other: there are similar numbers of genes
where the E8 homeolog is dominant and where the AR5
homeolog is dominant. In other words, Lp1 exhibits balanced
homeolog expression bias [43]. In contrast, comparison of the
parental species shows that more orthologs have higher relative
expression in E8 than AR5 (Figure 5B), particularly genes that
show relatively minor expression differences (2–10 fold). This
pattern is offset by a small proportion of genes that have much
higher relative expression in AR5, thus balancing total normalized
read counts between E8 and AR5. Together, these results suggest
that the predominant transcriptional response to allopolyploidy in
Lp1 has been an overall reduction in differential homeolog
expression relative to the parent species.
To investigate the fate of gene expression in Lp1 further, we
used the framework developed in cotton [41,46], where genes are
divided into different classes representing their transcriptional
response following allopolyploidy. For this analysis, the key is a
comparison of the expression ratio between the two orthologs in
the parent species with that of the two homeologs in the
allopolyploid, and thus looks at relative transcriptional responses.
The E8-like gene can either show higher expression, lower
expression, or similar expression to the AR5-like gene, both
between orthologs in the parents, and between homeologs in Lp1.
The nine possible combinations of these states that derive from
Table 3 of Yoo et al. [46] are shown in Figure 6. We binned each
gene into one of these nine categories, again using a 2-fold
difference in expression ratio as the cut-off.
To analyze these results we used the scheme of Yoo et al., who
grouped the nine possible combinations of states (shown in
Figure 6) into three broad outcomes for relative gene expression
responses in the allopolyploid [46]. We put genes that show a
reversal in the dominant homeolog into a separate group, thus
giving four outcomes for gene expression that are defined in
Figure 1. The first outcome (that includes the first three categories
from Figure 6) is no change in expression patterns of AR5- and
E8-like copies between the parents and the allopolyploid (for
example, if a gene has greater expression in one parent, this
pattern is maintained in the allopolyploid), something we call
‘‘parental expression inheritance’’. A majority (56.1%) of genes
display this behavior, with most being genes that show no
expression difference between homeologs or orthologs. The
second outcome contains genes displaying differential expression
in the parents that has been lost in the allopolyploid. We call this
‘homeolog expression blending’, and about one-quarter (25.1%) of
all genes show this pattern. The third outcome is the opposite
pattern, homeolog expression bias, where differential expression
has arisen in the allopolyploid [43]. The number of genes
exhibiting homeolog expression bias is fewer (15.6%) than those
showing homeolog expression blending. These results again
illustrate the tendency towards reduced expression bias in the
allopolyploid, and corroborate the picture obtained from the
global analysis above. The final outcome is where an expression
bias in the parents has been reversed in the allopolyploid
(‘‘homeolog expression reversal’’). Unsurprisingly this outcome is
relatively rare (3.2% of genes).
Figure 3. Parental and allopolyploid expression patterns fromextreme differentially expressed genes. Plots show the relativeexpression level between the two homeologs in Lp1 (‘‘Lp1’’), betweenAR5 and E8 orthologs (‘‘Parents’’), between the AR5 ortholog and theAR5-like Lp1 homeolog (‘‘AR5 copy’’), and between the E8 ortholog andthe E8-like Lp1 homeolog (‘‘E8 copy’’). (A) Genes with zero expressionfor one Lp1 homeolog, but non-zero expression for the other; (B) geneswith .50-fold difference in expression between the Lp1 homeologs; (C)genes with .50-fold difference in expression between AR5 and E8orthologs. Heat spectrum (bottom) varies between similar expression(white) and different expression (black). Vertical bars to the rightindicate where genes are physically clustered; these are labeled bysupercontig number. Genes on supercontig 148, present in (A) and (B),are physically contiguous in the genome. Genes 049470 and 049490,despite their numbering, are not physically adjacent.doi:10.1371/journal.pgen.1004180.g003
Global Rules for Allopolyploid Gene Expression
PLOS Genetics | www.plosgenetics.org 6 March 2014 | Volume 10 | Issue 3 | e1004180
We next wondered whether the genes with altered expression
patterns in the allopolyploid are responding to natural selection.
We performed a GO-slim analysis on genes in the four outcome
groups described above, as well as for all genes showing
allopolyploid differential expression (Figure S3 and Text S2). No
strong patterns of gene classes preferentially changing their
transcription levels were identified, suggesting that if selective
forces have shaped the transcriptional response in Lp1, it has only
been for a small minority of genes.
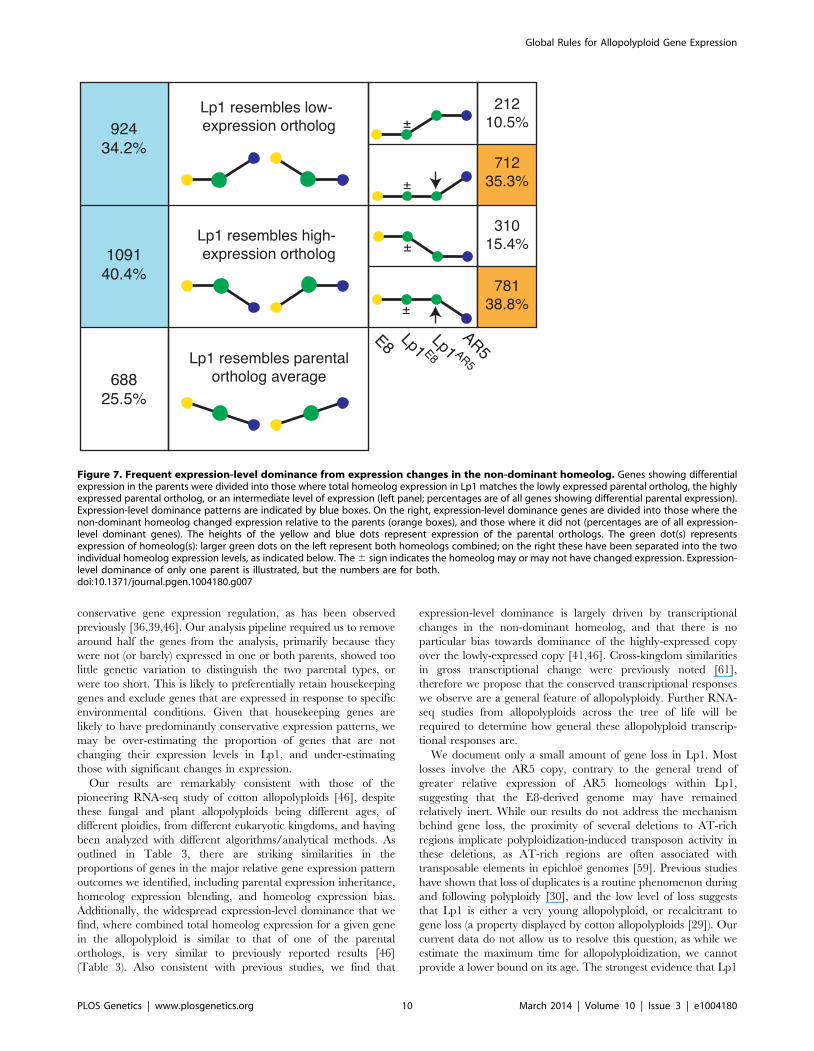
Lp1 shows expression-level dominance driven by changeof the non-dominant homeolog
Recent studies have found evidence for expression-level
dominance in allopolyploids, where genes that show differential
expression between the parents have a total combined homeolog
expression level that is similar to one or other of the parental levels
(the ‘dominant’ ortholog) in the allopolyploid, rather than simply
approaching the average of the orthologs [37,41,42,46]. To
investigate whether this phenomenon also occurs in Lp1, we
calculated total expression for each gene in Lp1 that had 2-fold or
greater expression difference in the parents, and classified these
genes into three bins where allopolyploid expression more closely
resembles: the highly-expressed ortholog; the lowly-expressed
ortholog; or the mean of the orthologs (Figure 7). Almost three
quarters of genes that show differential expression in the parents
had an expression level similar to one ortholog (the dominant
ortholog). Interestingly, a similar number of genes matched the
low expression ortholog as matched the high expression ortholog.
Therefore, in keeping with other studies, we find that expression-
level dominance is a major factor in the transcriptional response to
allopolyploidy in Lp1.
Expression-level dominance can be achieved by various
combinations of altered homeolog expression. In the one previous
study where this was investigated, changes in the non-dominant
Figure 4. Gene loss in clustered extreme differentially expressed genes in Lp1. Three clusters of genes with extreme differential expressionare shown; the supercontig from which they derive is indicated above. Orange arrows represent genes with extreme differential expression; blue,genes not showing extreme differential expression; and grey, genes culled by our mapping criteria (no expression information). Raw read numbersfrom AR5 and E8 homeologs, respectively, are shown in ellipses near each gene. Green dotted lines represent AT-rich regions. Below the genomicmaps are PCR-RFLP results (reverse images of ethidium bromide-stained polyacrylamide gels) from Lp1, E8, and AR5 genomic DNA. The gene isindicated in bold above, the restriction enzyme to the right, and size marker positions to the left.doi:10.1371/journal.pgen.1004180.g004
Global Rules for Allopolyploid Gene Expression
PLOS Genetics | www.plosgenetics.org 7 March 2014 | Volume 10 | Issue 3 | e1004180
homeolog were the driving force for most expression-level
dominance [46]. To investigate the situation in Lp1, we took all
genes that exhibited expression-level dominance and determined
how the two homeologs contribute to this pattern (Figure 7). About
three-quarters of genes showing expression level dominance
involve a change in expression of the non-dominant homeolog.
Therefore, the majority of genes that were differentially expressed
in the parents have undergone a more complex set of transcrip-
tional changes than just simple inheritance of parental gene
expression patterns.
Discussion
Here we investigated the fate of gene expression in an
established, but relatively young (considerably less than 1 million
year old), naturally occurring fungal allopolyploid. We developed a
novel analytical pipeline that allowed us to utilize the power of
high throughput mRNA sequencing to determine the expression
levels of both homeologs in the allopolyploid on a genome-wide
scale, and to compare these with the expression of the same genes
in the closest known relatives to the parents. This analysis provides
the first snapshot of global allopolyploid gene expression outside
the plant kingdom, and illustrates a conservative transcriptome
response to allopolyploidy, implying that genomic shock is largely
buffered at the transcriptional level.
The strongest gene expression pattern we found was fewer
differentially expressed genes in the allopolyploid than the parents,
with more than two-thirds of all the genes we investigated not
being differentially expressed in the allopolyploid. This loss of
differential expression is the net result of two phenomena: a larger
proportion of genes that lose differential expression following
allopolyploidization (homeolog expression blending); and a smaller
proportion of genes that gain it (homeolog expression bias).
Therefore, at the global level, allopolyploidy is associated with
Figure 5. Cumulative distributions of gene expression ratios for Lp1 and parents. Plotted are the cumulative distributions of genes bynormalized gene expression ratio between homeologs in Lp1 (A), and between orthologs from the parents (B). Those with higher expression from theE8-derived copy are shown in orange (left); higher AR5-derived expression in green (right). Grey shading indicates the pool of genes with less than 2-fold expression difference between copies (not differentially expressed). The bias towards more orthologs in E8 having greater relative expression canbe seen in (B).doi:10.1371/journal.pgen.1004180.g005
Global Rules for Allopolyploid Gene Expression
PLOS Genetics | www.plosgenetics.org 8 March 2014 | Volume 10 | Issue 3 | e1004180
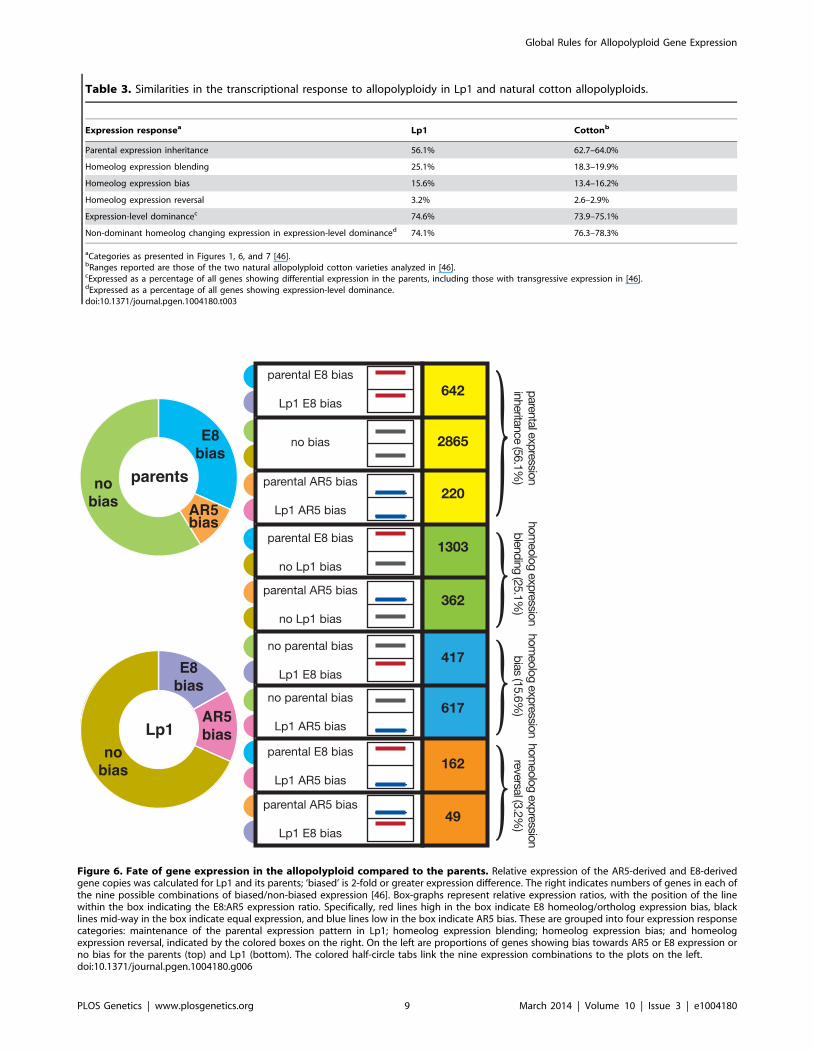
Table 3. Similarities in the transcriptional response to allopolyploidy in Lp1 and natural cotton allopolyploids.
Expression responsea Lp1 Cottonb
Parental expression inheritance 56.1% 62.7–64.0%
Homeolog expression blending 25.1% 18.3–19.9%
Homeolog expression bias 15.6% 13.4–16.2%
Homeolog expression reversal 3.2% 2.6–2.9%
Expression-level dominancec 74.6% 73.9–75.1%
Non-dominant homeolog changing expression in expression-level dominanced 74.1% 76.3–78.3%
aCategories as presented in Figures 1, 6, and 7 [46].bRanges reported are those of the two natural allopolyploid cotton varieties analyzed in [46].cExpressed as a percentage of all genes showing differential expression in the parents, including those with transgressive expression in [46].dExpressed as a percentage of all genes showing expression-level dominance.doi:10.1371/journal.pgen.1004180.t003
Figure 6. Fate of gene expression in the allopolyploid compared to the parents. Relative expression of the AR5-derived and E8-derivedgene copies was calculated for Lp1 and its parents; ‘biased’ is 2-fold or greater expression difference. The right indicates numbers of genes in each ofthe nine possible combinations of biased/non-biased expression [46]. Box-graphs represent relative expression ratios, with the position of the linewithin the box indicating the E8:AR5 expression ratio. Specifically, red lines high in the box indicate E8 homeolog/ortholog expression bias, blacklines mid-way in the box indicate equal expression, and blue lines low in the box indicate AR5 bias. These are grouped into four expression responsecategories: maintenance of the parental expression pattern in Lp1; homeolog expression blending; homeolog expression bias; and homeologexpression reversal, indicated by the colored boxes on the right. On the left are proportions of genes showing bias towards AR5 or E8 expression orno bias for the parents (top) and Lp1 (bottom). The colored half-circle tabs link the nine expression combinations to the plots on the left.doi:10.1371/journal.pgen.1004180.g006
Global Rules for Allopolyploid Gene Expression
PLOS Genetics | www.plosgenetics.org 9 March 2014 | Volume 10 | Issue 3 | e1004180
conservative gene expression regulation, as has been observed
previously [36,39,46]. Our analysis pipeline required us to remove
around half the genes from the analysis, primarily because they
were not (or barely) expressed in one or both parents, showed too
little genetic variation to distinguish the two parental types, or
were too short. This is likely to preferentially retain housekeeping
genes and exclude genes that are expressed in response to specific
environmental conditions. Given that housekeeping genes are
likely to have predominantly conservative expression patterns, we
may be over-estimating the proportion of genes that are not
changing their expression levels in Lp1, and under-estimating
those with significant changes in expression.
Our results are remarkably consistent with those of the
pioneering RNA-seq study of cotton allopolyploids [46], despite
these fungal and plant allopolyploids being different ages, of
different ploidies, from different eukaryotic kingdoms, and having
been analyzed with different algorithms/analytical methods. As
outlined in Table 3, there are striking similarities in the
proportions of genes in the major relative gene expression pattern
outcomes we identified, including parental expression inheritance,
homeolog expression blending, and homeolog expression bias.
Additionally, the widespread expression-level dominance that we
find, where combined total homeolog expression for a given gene
in the allopolyploid is similar to that of one of the parental
orthologs, is very similar to previously reported results [46]
(Table 3). Also consistent with previous studies, we find that
expression-level dominance is largely driven by transcriptional
changes in the non-dominant homeolog, and that there is no
particular bias towards dominance of the highly-expressed copy
over the lowly-expressed copy [41,46]. Cross-kingdom similarities
in gross transcriptional change were previously noted [61],
therefore we propose that the conserved transcriptional responses
we observe are a general feature of allopolyploidy. Further RNA-
seq studies from allopolyploids across the tree of life will be
required to determine how general these allopolyploid transcrip-
tional responses are.
We document only a small amount of gene loss in Lp1. Most
losses involve the AR5 copy, contrary to the general trend of
greater relative expression of AR5 homeologs within Lp1,
suggesting that the E8-derived genome may have remained
relatively inert. While our results do not address the mechanism
behind gene loss, the proximity of several deletions to AT-rich
regions implicate polyploidization-induced transposon activity in
these deletions, as AT-rich regions are often associated with
transposable elements in epichloe genomes [59]. Previous studies
have shown that loss of duplicates is a routine phenomenon during
and following polyploidy [30], and the low level of loss suggests
that Lp1 is either a very young allopolyploid, or recalcitrant to
gene loss (a property displayed by cotton allopolyploids [29]). Our
current data do not allow us to resolve this question, as while we
estimate the maximum time for allopolyploidization, we cannot
provide a lower bound on its age. The strongest evidence that Lp1
Figure 7. Frequent expression-level dominance from expression changes in the non-dominant homeolog. Genes showing differentialexpression in the parents were divided into those where total homeolog expression in Lp1 matches the lowly expressed parental ortholog, the highlyexpressed parental ortholog, or an intermediate level of expression (left panel; percentages are of all genes showing differential parental expression).Expression-level dominance patterns are indicated by blue boxes. On the right, expression-level dominance genes are divided into those where thenon-dominant homeolog changed expression relative to the parents (orange boxes), and those where it did not (percentages are of all expression-level dominant genes). The heights of the yellow and blue dots represent expression of the parental orthologs. The green dot(s) representsexpression of homeolog(s): larger green dots on the left represent both homeologs combined; on the right these have been separated into the twoindividual homeolog expression levels, as indicated below. The 6 sign indicates the homeolog may or may not have changed expression. Expression-level dominance of only one parent is illustrated, but the numbers are for both.doi:10.1371/journal.pgen.1004180.g007
Global Rules for Allopolyploid Gene Expression
PLOS Genetics | www.plosgenetics.org 10 March 2014 | Volume 10 | Issue 3 | e1004180

is an established allopolyploid is the homogenization of the rDNA
to a single parental type (Table S1 and Text S1), which is likely to
have required a number of generations [62,63].
The GO-slim analyses we performed provided little support for
selection having played a major role in shaping the expression
patterns of most genes in Lp1. If these expression patterns are
overwhelmingly not the result of strong gene-specific selective
forces, what is causing them? We suggest that our results are
primarily explained by intrinsic gene regulation factors [32,64,65],
as originally proposed by Roose and Gottlieb [66]. Gene
expression is the net outcome of a complex interplay of cis- and
trans-acting factors [67,68], including chromatin structure, tran-
scription factors, effectors, RNAi, and nuclear position, that we
collectively term a ‘modulon’ (Figure 8 and Figure S4). Changes
anywhere in a modulon can impact gene expression, be it cis-
acting changes (e.g. mutations in the promoter), epigenetic
changes, and/or changes in the constellation of trans-acting
factors. Expression differences between orthologs in the parents
result from differences that were established in the modulon
systems as the two parents evolved separately following speciation,
while orthologs that are not differentially expressed are either
governed by the same modulon system in both parents or
coincidentally achieve the same expression through different
modulon systems. Under this framework, the allopolyploid
expression patterns we observe can be explained as follows:
homeologs that faithfully inherit expression differences from their
parents have modulon systems exhibiting little cross talk between
the homeologs (Figure 8A). Conversely, genes that show homeolog
expression blending result from modulon systems that partially or
fully cross talk between homeologs (Figure 8B). Finally, genes that
gain expression bias following allopolyploidy result from modulon
systems that preferentially regulate one homeolog over the other,
resembling classical dominance (Figure 8C). Therefore we propose
that the allopolyploid gene expression patterns we observe are
predominantly the net outcome of the modulon features that
existed in the parents, although it will be important to distinguish
the effects of genome doubling [69].
If these patterns of allopolyploid expression fate are predom-
inantly the result of regulatory differences present in the parents,
they open a window into the evolution of gene regulation following
speciation [61,66]. Genes where the homeologs have faithfully
inherited expression differences from the parents have developed
full transcriptional independence in the time since the two parents
speciated, whereas those showing homeolog expression blending
have not evolved independence since speciation. We can use the
results from Figure 6 to estimate the proportions of genes that have
developed independence, partial independence and have not
developed independence via the number of genes that show simple
inheritance of biased expression, homeolog expression bias, and
homeolog expression blending, respectively. Depending on how
we treat genes with non-biased expression in both the parents and
the allopolyploid (see Text S3), our results suggest that 13–28% of
genes have evolved independent regulation, 19% have evolved
partial independence, and 53–68% have not evolved indepen-
dence. The results presented in Figure 7 can also be used to
estimate these proportions, as the first and third rows represent
independent regulation, and the second and fourth rows represent
partial and no independent regulation (combined). These totals
(25.9% and 74.1% respectively) both fall within the ranges
estimated from Figure 6.
We are proposing that the transcriptional responses to
allopolyploidy are largely a passive outcome of regulatory
evolution that has occurred in the parents following speciation.
In principle, they could also be explained by more saltational
events that are specific to the allopolyploid, such as genome-wide
chromatin reprograming [70]. However, we believe that the
striking cross-kingdom conservation in transcriptional responses
supports the view that the majority of these responses are
outcomes of parental regulatory evolution. It is not clear why
saltaic mechanisms should result in conserved patterns of
transcriptional responses between species with highly diverged
genome structures, global expression regulators, and chromatin
networks. However, if these conserved gene expression response
patterns largely result from mutations accumulating in modulons
over time, then a roughly monotonic increase in the proportions of
genes that evolve partial and full transcriptional independence
would be expected (Figure S5). One prediction of this hypothesis is
that the more genetically diverged the parents of two allopoly-
ploids are, the more different the allopolyploid transcriptional
responses will be. Clearly more allopolyploid transcriptome studies
are required to determine whether this is true and how conserved
the transcriptional responses are. It will also be of great interest to
determine whether similar genes evolve similar regulatory patterns
in different allopolyploids, and how the effects of homeolog
interference influence the transcriptional response [71].
In conclusion, we present the first study of global gene
expression in a fungal allopolyploid species. We show that most
genes are still retained in duplicate, suggesting that Lp1 is either a
young allopolyploid or is resistant to the gene loss process that
often accompanies allopolyploidization. We find a mixture of
expression patterns, with the homeologs for many genes retaining
the gene expression patterns seen in the parents, fewer showing
less biased expression than seen in the parents, and fewer still
developing biased expression. Strikingly, these expression patterns
are remarkably concordant with those recently ascertained for
allopolyploid cotton, suggesting there exists a general pattern of
interspecific allopolyploid gene expression fate that is largely
independent of taxonomic kingdom, gene repertoire or local
environment. We conclude that the transcriptional response to
allopolyploidy is conservative and conserved, reflecting the
stochastic nature of genetic regulatory evolution. Our work
suggests that the fate of allopolyploid gene expression follows
general principles that apply across eukaryotes, and that allopoly-
ploid transcriptomes are a novel and powerful way to unmask the
regulatory changes that evolve following speciation.
Materials and Methods
Strains and growth conditionsThree filamentous fungi from the ascomycete family Clavicipi-
taceae were used in this study: the asexual, diploid interspecies
fungal allopolyploid Neotyphodium lolii6Epichloe typhina Lp1 (syn.
AR6) [50,72], the haploid asexual species Neotyphodium lolii AR5,
and the haploid sexual species Epichloe typhina E8. Cultures were
grown in 2.4% potato dextrose (PD) media until maturity, washed
twice with double distilled water, then resuspended in a defined
medium (CDGN) comprised of Czapek Dox salts [73] containing
100 mM glucose and 10 mM ammonium sulphate.
RNA isolation and high throughput sequencingThe fungal cultures were filtered and washed, and ,100 mg of
mycelium (wet weight) per sample was used for RNA extraction,
which was performed using an RNeasy Plant RNA extraction kit
(Qiagen) according to the manufacturer’s instructions. Total RNA
samples were treated with DNAse I to remove contaminant DNA,
mRNA was extracted using polyA selection, and Illumina
sequencing libraries were prepared using standard protocols.
Libraries were sequenced on the HiSeq 2000 – 100 bp single end
Global Rules for Allopolyploid Gene Expression
PLOS Genetics | www.plosgenetics.org 11 March 2014 | Volume 10 | Issue 3 | e1004180
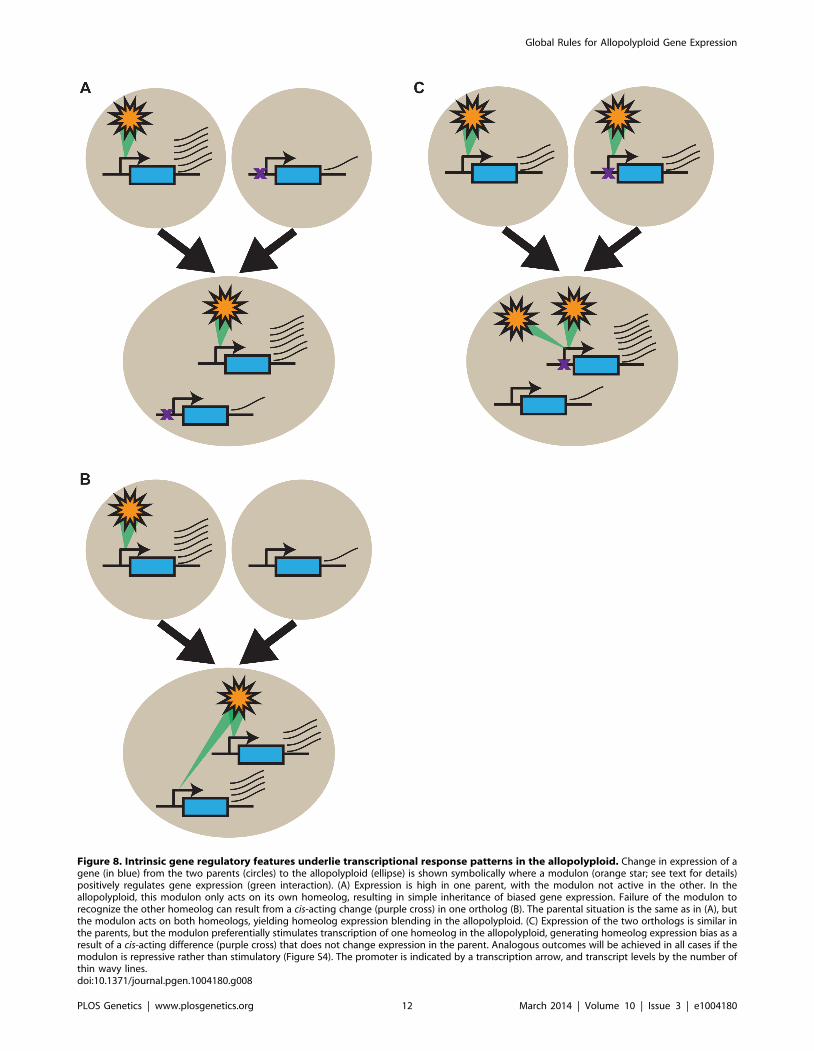
Figure 8. Intrinsic gene regulatory features underlie transcriptional response patterns in the allopolyploid. Change in expression of agene (in blue) from the two parents (circles) to the allopolyploid (ellipse) is shown symbolically where a modulon (orange star; see text for details)positively regulates gene expression (green interaction). (A) Expression is high in one parent, with the modulon not active in the other. In theallopolyploid, this modulon only acts on its own homeolog, resulting in simple inheritance of biased gene expression. Failure of the modulon torecognize the other homeolog can result from a cis-acting change (purple cross) in one ortholog (B). The parental situation is the same as in (A), butthe modulon acts on both homeologs, yielding homeolog expression blending in the allopolyploid. (C) Expression of the two orthologs is similar inthe parents, but the modulon preferentially stimulates transcription of one homeolog in the allopolyploid, generating homeolog expression bias as aresult of a cis-acting difference (purple cross) that does not change expression in the parent. Analogous outcomes will be achieved in all cases if themodulon is repressive rather than stimulatory (Figure S4). The promoter is indicated by a transcription arrow, and transcript levels by the number ofthin wavy lines.doi:10.1371/journal.pgen.1004180.g008
Global Rules for Allopolyploid Gene Expression
PLOS Genetics | www.plosgenetics.org 12 March 2014 | Volume 10 | Issue 3 | e1004180
sequences for AR5 and E8, and 100 bp paired end sequences for
Lp1. Two biological replicates were sequenced for each. Bases
were called using CASAVA (v. 1.7.0, Illumina, Hayward, CA,
USA). Sequencing quality control was performed using the
SolexaQA package (v. 1.10) [74]. In all six datasets, .79% of
bases were sequenced to Q30 or higher (i.e., bases have a
probability of error, P,0.001).
Transcriptome sequencing data analysis methodsFull details of the analyses that were performed to process the
sequences, to create the reference gene sets that allowed us to bin
Lp1 reads as coming from the AR5-like and E8-like homeologs,
and to perform these allocations, are described in Figure S1,
Figure S6 and Protocol S1. Briefly, two E8 and AR5-like reference
gene sets were created by modifying an existing annotated set of
gene models from the closely related Epichloe festucae E2368 using
SNPs that were generated from the parental and Lp1 transcrip-
tome data. Lp1 reads were then mapped with high stringency to
the informative sites of these two reference gene sets to determine
from which parental copy each Lp1 sequence read derived. Genes
that had fewer than five reads in one or both of the parental
transcriptomes were excluded from both E8 and AR5 reference
gene sets, as were genes where the informative regions were less
than 150 bp.
StatisticsThe statistical significance of gene expression differences
between AR5-like and E8-like homeologs in the Lp1 allopolyploid
data was determined using Fisher’s Exact Test [75] as imple-
mented in the R [76] package DEGseq v.1.8.0 [77]. A correction
for multiple testing was applied using the False Discovery Rate
(FDR) approach described by Storey and Tibshirani [78]. The fold
difference for each gene i was calculated as
FDi~max AR5i,E8ið Þmin AR5i,E8ið Þ ð1Þ
where gene counts were converted to ‘reads per million’ to
normalize for unequal numbers of reads between biological
replicates, as well as unequal numbers of reads mapping to the
AR5-like and E8-like homeolog references. Subsequent analyses
were performed in Excel. Differential gene expression was defined
throughout this work as statistical significance and a 2-fold or
greater difference in normalized gene counts, except where
otherwise noted.
Gene ontologyGene ontology analysis was performed as described in Text S2.
PCR-RFLPRFLPs were identified in candidate genes using the read data in
IGV [79], and primers were designed to flank them (Table S2).
Genomic DNA was extracted, using the protocol of Peintner and
colleagues [80], from the same material used to make the RNA.
End-point PCR was performed using standard procedures with Ex-
Taq polymerase (Takara). PCR products were precipitated with
isopropanol and then digested with the appropriate restriction
enzyme according to manufacturers’ instructions. The products
were run on 2% agarose or 8% native polyacrylamide gels.
DatingApproximate estimates of lineage ages were made using a
mutation rate of 161029/site/year [81] and a cumulative haploid
sequence length of 7,123,190 bp in the final masked AR5-like and
E8-like homeolog references. See Text S1, Figure S6 and Figure
S7 for details.
Supporting Information
Figure S1 Approach to determine homeolog-specific gene
expression. Methods differ slightly for the haploid parental species
AR5 and E8 compared to the diploid allopolyploid species Lp1.
Dotted lines indicate steps where the same operations were
performed for all three species. For detailed descriptions, see
Protocol S1.
(PDF)
Figure S2 PCR-RFLP of non-clustered extreme differentially
expressed genes in Lp1 and the parents. Three genes showing
extreme differential expression but no clustering are shown.
Diagram is as in Figure 4, except that 2% agarose gels were used.
(PDF)
Figure S3 GO-slim analysis of sets of genes with various
expression patterns in Lp1. The graph at the top of each gene
set shows the number of genes present in each GO-slim category
for all mapped genes (blue), and the subset of genes under
investigation (orange). Categories in the grey box have no genes in
the subset of genes. The graph below shows the fold over-
representation (red) and under-representation (pale blue) of the
subset of genes relative to all genes. Only categories that differ
between the subset of genes and all genes by at least 1.5-fold are
shown. Green stars represent categories that show consistent
behavior in at least two different gene subsets (see Text S2 for
details). The gene subsets are: (A) Genes with no change in
expression. (B) Homeolog expression blending genes. (C) Home-
olog expression bias genes. (D) Homeolog expression reversal
genes. (E) All differentially expressed genes in Lp1.
(PDF)
Figure S4 Model for changes in homeolog expression following
allopolyploidy as a result of repressive modulon regulatory systems.
Diagram is the same as Figure 8, except that the modulons
depicted (orange stars with red interactions) regulate genes by
repressing gene transcription, rather than activating it. (A) Simple
inheritance of biased gene expression. (B) Homeolog expression
blending in the allopolyploid. (C) Homeolog expression bias.
(PDF)
Figure S5 Evolutionary trajectory of gene regulation. The
evolution of independence in gene regulatory systems in two
species following the speciation event that separated them is
represented. Initially genes have identical modulons, so none have
any independence. However, changes anywhere in the modulon
system for each gene may result in that gene becoming more
independent in its transcriptional regulation. We propose that,
stochastically, the development of partial and full independence
occur at similar rates in different organisms, thus accounting for
the conserved gene expression responses seen in Lp1 and cotton
following allopolyploidy.
(PDF)
Figure S6 Schematic diagram of phylogenetic relationships
among the strains used in this study. The reference strain,
E2368 is a close relative of AR5. The green branch indicates
‘ancestral’ SNPs shared by AR5, E8 and Lp1 relative to the
reference strain, E2368. Red branches indicate SNPs that are
unique to either AR5 or E8 (‘AR5-unique’ and ‘E8-unique’,
respectively). Blue branches indicate SNPs that are unique to Lp1
(‘Lp1-unique’), some of which can be classified as falling on the
Global Rules for Allopolyploid Gene Expression
PLOS Genetics | www.plosgenetics.org 13 March 2014 | Volume 10 | Issue 3 | e1004180
AR5-like lineage (‘Lp1-AR5’) or the E8-like lineage (‘Lp1-E8’).
The number of SNPs on the shortest parental branch, here the
AR5 parental lineage (‘AR5-unique’), provides an upper bound on
the allopolyploidization time. It is not possible to place a lower
bound on this event with available data.
(PDF)
Figure S7 Diagnostic markers of mitochondrial DNA ancestry
in Lp1. There are diagnostic substitutions at nucleotide positions
29443, 39542 and 54076 in the mitochondrial genome that
distinguish AR5 and E8. Grey horizontal bars indicate indepen-
dent sequence reads, and the red bases indicate the AR5 variant at
the diagnostic positions. At all three diagnostic positions, all Lp1
sequence reads carry the AR5 nucleotide variant, thus suggesting
that mitochondrial genomes from the AR5 parent completely
replaced their E8 counterparts in Lp1.
(PDF)
Protocol S1 Detailed analysis materials and methods. Descrip-
tions of the methods used for base-calling of Illumina reads, the
E2368 gene models used, calling of SNPs from Lp1 and the
parents, construction of the transcriptome references and how
these were masked, how reads from the allopolyploid were
allocated to the two parental classes, and how the reads were
visualized are all presented.
(DOCX)
Table S1 Lp1 contains E8 but not AR5 rDNA sequences. Table
showing counts of reads from the parents and Lp1 that were
mapped to parental ITS reference sequences.
(DOCX)
Table S2 PCR primers used in this study.
(DOCX)
Text S1 Dating the allopolyploidization event. Description of
how the age range of Lp1 was estimated.
(DOCX)
Text S2 GO-slim analysis. Description of how the different gene
sets were analyzed using GO-slim to look for evidence of selection
having shaped the transcriptional response to allopolyploidy.
(DOCX)
Text S3 Determining the proportion of genes that have evolved
varying degrees of transcriptional independence since speciation of
the parents. Description of the logic and method used to calculate
the percent range of genes that have undergone full, partial and no
transcriptional independence since the speciation of the two parent
species prior to the allopolyploidization event.
(DOCX)
Acknowledgments
We thank Arvina Ram (Massey University) for her images of fungal
cultures in Figure 2, Carolyn Young (Noble Foundation) for her
mitochondrial DNA genome reference, and Anar Khan and Richard
Johnson (AgResearch), and Jennifer Tate (Massey University), for
constructive advice and discussion. We also thank three anonymous
reviewers for their extremely detailed and constructive comments.
Author Contributions
Conceived and designed the experiments: ARDG MPC DBS. Performed
the experiments: MPC GS YD ARDG. Analyzed the data: MPC TD
ARDG. Contributed reagents/materials/analysis tools: ARDG MPC DBS.
Wrote the paper: ARDG MPC. Designed the software used in analysis:
MPC. Obtained permission for use of the reference genome: DBS MPC.
References
1. Semon M, Wolfe KH (2007) Consequences of genome duplication. Curr Opin
Genet Dev 17: 505–512.
2. Doyle JJ, Flagel LE, Paterson AH, Rapp RA, Soltis DE, et al. (2008)
Evolutionary genetics of genome merger and doubling in plants. Annu Rev
Genet 42: 443–461.
3. Mable BK, Alexandrou MA, Taylor MI (2011) Genome duplication in
amphibians and fish: an extended synthesis. J Zool 284: 151–182.
4. Jiao Y, Wickett NJ, Ayyampalayam S, Chanderbali AS, Landherr L, et al. (2011)
Ancestral polyploidy in seed plants and angiosperms. Nature 473: 97–100.
5. Moon CD, Craven KD, Leuchtmann A, Clement SL, Schardl CL (2004)
Prevalence of interspecific hybrids amongst asexual fungal endophytes of grasses.
Mol Ecol 13: 1455–1467.
6. Osborn TC, Pires JC, Birchler JA, Auger DL, Chen ZJ, et al. (2003)
Understanding mechanisms of novel gene expression in polyploids. Trends
Genet 19: 141–147.
7. Adams KL, Wendel JF (2005) Novel patterns of gene expression in polyploid
plants. Trends Genet 21: 539–543.
8. Hittinger CT (2013) Saccharomyces diversity and evolution: A budding model
genus. Trends in Genetics 29: 309–317.
9. Soltis PS, Soltis DE (2009) The role of hybridization in plant speciation. Ann
Rev Plant Biol 60: 561–588.
10. Donovan LA, Rosenthal DR, Sanchez-Velenosi M, Rieseberg LH, Ludwig F
(2010) Are hybrid species more fit than ancestral parent species in the current
hybrid species habitats? J Evol Biol 23: 805–816.
11. Madlung A (2013) Polyploidy and its effect on evolutionary success: Old
questions revisited with new tools. Heredity 110: 99–104.
12. Birchler JA, Yao H, Chudalayandi S, Vaiman D, Veitia RA (2010) Heterosis.
Plant Cell 22: 2105–2112.
13. Chen ZJ (2013) Genomic and epigenetic insights into the molecular bases of
heterosis. Nat Rev Genet 14: 471–482.
14. McClintock B (1984) The significance of responses of the genome to challenge.
Science 226: 792–801.
15. Parisod C, Alix K, Just J, Petit M, Sarilar V, et al. (2010) Impact of transposable
elements on the organization and function of allopolyploid genomes. New Phytol
186: 37–45.
16. O’Neill RJW, O’Neill MJ, Graves JAM (1998) Undermethylation associated
with retroelement activation and chromosome remodelling in an interspecific
mammalian hybrid. Nature 393: 68–72.
17. Hegarty MJ, Batstone T, Barker GL, Edwards KJ, Abbott RJ, et al. (2011)Nonadditive changes to cytosine methylation as a consequence of hybridization
and genome duplication in Senecio (Asteraceae). Mol Ecol 20: 105–113.
18. Petit M, Guidat C, Daniel J, Denis E, Montoriol E, et al. (2010) Mobilization of
retrotransposons in synthetic allotetraploid tobacco. New Phytol 186: 135–147.
19. Song K, Lu P, Tang K, Osborn TC (1995) Rapid genome change in syntheticpolyploids of Brassica and its implications for polyploid evolution. Proc Natl Acad
Sci USA 92: 7719–7723.
20. Gaeta RT, Pires JC, Iniguez-Luy F, Leon E, Osborn TC (2007) Genomicchanges in resynthesized Brassica napus and their effect on gene expression and
phenotype. Plant Cell 19: 3403–3417.
21. Kashkush K, Feldman M, Levy AA (2003) Transcriptional activation of
retrotransposons alters the expression of adjacent genes in wheat. Nat Genet 33:102–106.
22. Wolfe KH, Shields DC (1997) Molecular evidence for an ancient duplication of
the entire yeast genome. Nature 387: 708–713.
23. Gordon JL, Byrne KP, Wolfe KH (2009) Additions, losses, and rearrangements
on the evolutionary route from a reconstructed ancestor to the modernSaccharomyces cerevisiae genome. PLoS Genet 5: e1000485.
24. Scannell DR, Byrne KP, Gordon JL, Wong S, Wolfe KH (2006) Multiple rounds
of speciation associated with reciprocal gene loss in polyploid yeasts. Nature 440:
341–345.
25. Thomas BC, Pedersen B, Freeling M (2006) Following tetraploidy in anArabidopsis ancestor, genes were removed preferentially from one homeolog
leaving clusters enriched in dose-sensitive genes. Genome Res 16: 934–946.
26. Buggs RJA, Chamala S, Wu W, Tate JA, Schnable PS, et al. (2012) Rapid,repeated, and clustered loss of duplicate genes in allopolyploid plant populations
of independent origin. Curr Biol 22: 248–252.
27. Schnable JC, Springer NM, Freeling M (2011) Differentiation of the maize
subgenomes by genome dominance and both ancient and ongoing gene loss.Proc Natl Acad Sci USA 108: 4069–4074.
28. Baumel A, Ainouche M, Kalendar R, Schulman AH (2002) Retrotransposons
and genomic stability in populations of the young allopolyploid species Spartina
anglica C.E. Hubbard (Poaceae). Mol Biol Evol 19: 1218–1227.
29. Liu B, Brubaker CL, Mergeai G, Cronn RC, Wendel JF (2001) Polyploidformation in cotton is not accompanied by rapid genomic changes. Genome 44:
321–330.
30. Paterson AH, Chapman BA, Kissinger JC, Bowers JE, Feltus FA, et al. (2006)
Many gene and domain families have convergent fates following independent
Global Rules for Allopolyploid Gene Expression
PLOS Genetics | www.plosgenetics.org 14 March 2014 | Volume 10 | Issue 3 | e1004180
whole-genome duplication events in Arabidopsis, Oryza, Saccharomyces and
Tetraodon. Trends Genet 22: 597–602.31. Adams KL (2007) Evolution of duplicate gene expression in polyploid and
hybrid plants. J Hered 98: 136–141.
32. Chaudhary B, Flagel L, Stupar RM, Udall JA, Verma N, et al. (2009) Reciprocalsilencing, transcriptional bias and functional divergence of homeologs in
polyploid cotton (Gossypium). Genetics 182: 503–517.33. Flagel L, Wendel J, Udall J (2012) Duplicate gene evolution, homoeologous
recombination, and transcriptome characterization in allopolyploid cotton.
BMC Genom 13: 302.34. Combes MC, Cenci A, Baraille H, Bertrand B, Lashermes P (2012)
Homeologous gene expression in response to growing temperature in a recentAllopolyploid (Coffea arabica L.). J Hered 103: 36–46.
35. Vidal RO, Mondego JM, Pot D, Ambrosio AB, Andrade AC, et al. (2010) Ahigh-throughput data mining of single nucleotide polymorphisms in Coffea
species expressed sequence tags suggests differential homeologous gene
expression in the allotetraploid Coffea arabica. Plant Physiol 154: 1053–1066.36. Hegarty MJ, Barker GL, Wilson ID, Abbott RJ, Edwards KJ, et al. (2006)
Transcriptome shock after interspecific hybridization in Senecio is ameliorated bygenome duplication. Curr Biol 16: 1652–1659.
37. Chelaifa H, Monnier A, Ainouche M (2010) Transcriptomic changes following
recent natural hybridization and allopolyploidy in the salt marsh species Spartina
x townsendii and Spartina anglica (Poaceae). New Phytol 186: 161–174.
38. He P, Friebe BR, Gill BS, Zhou JM (2003) Allopolyploidy alters gene expressionin the highly stable hexaploid wheat. Plant Mol Biol 52: 401–414.
39. Buggs RJA, Zhang L, Miles N, Tate JA, Gao L, et al. (2011) Transcriptomicshock generates evolutionary novelty in a newly formed, natural allopolyploid
plant. Curr Biol 21: 551–556.
40. Tate JA, Ni Z, Scheen AC, Koh J, Gilbert CA, et al. (2006) Evolution andexpression of homeologous loci in Tragopogon miscellus (Asteraceae), a recent and
reciprocally formed allopolyploid. Genetics 173: 1599–1611.41. Rapp R, Udall J, Wendel J (2009) Genomic expression dominance in
allopolyploids. BMC Biol 7: 18.
42. Bardil A, de Almeida JD, Combes MC, Lashermes P, Bertrand B (2011)Genomic expression dominance in the natural allopolyploid Coffea arabica is
massively affected by growth temperature. New Phytol 192: 760–774.43. Grover CE, Gallagher JP, Szadkowski EP, Yoo MJ, Flagel LE, et al. (2012)
Homoeolog expression bias and expression level dominance in allopolyploids.New Phytol 196: 966–971.
44. Cox MP, Eaton CJ, Scott DB (2010) Exploring molecular signaling in plant-
fungal symbioses using high throughput RNA sequencing. Plant Signal Behav 5:1353–1358.
45. Buggs RJA, Renny-Byfield S, Chester M, Jordon-Thaden IE, Viccini LF, et al.(2012) Next-generation sequencing and genome evolution in allopolyploids.
Am J Bot 99: 372–382.
46. Yoo MJ, Szadkowski E, Wendel JF (2013) Homoeolog expression bias andexpression level dominance in allopolyploid cotton. Heredity 110: 171–180.
47. Aury JM, Jaillon O, Duret L, Noel B, Jubin C, et al. (2006) Global trends ofwhole-genome duplications revealed by the ciliate Paramecium tetraurelia. Nature
444: 171–178.48. Kasahara M, Naruse K, Sasaki S, Nakatani Y, Qu W, et al. (2007) The medaka
draft genome and insights into vertebrate genome evolution. Nature 447: 714–
719.49. Schardl CL, Craven KD (2003) Interspecific hybridization in plant-associated
fungi and oomycetes: A review. Mol Ecol 12: 2861–2873.50. Schardl CL, Leuchtmann A, Tsai HF, Collett MA, Watt DM, et al. (1994)
Origin of a fungal symbiont of perennial ryegrass by interspecific hybridization
of a mutualist with the ryegrass choke pathogen, Epichloe typhina. Genetics 136:1307–1317.
51. Schardl CL (2010) The Epichloae, symbionts of the grass subfamily Pooideae.Ann Missouri Bot Gard 97: 646–665.
52. Tsai H-F, Liu J-S, Staben C, Christensen MJ, Latch GC, et al. (1994)
Evolutionary diversification of fungal endophytes of tall fescue grass byhybridization with Epichloe species. Proc Natl Acad Sci USA 91: 2542–2546.
53. Glazko GV, Nei M (2003) Estimation of divergence times for major lineages ofprimate species. Mol Biol Evol 20: 424–434.
54. Collett MA, Bradshaw RE, Scott DB (1995) A mutualistic fungal symbiont ofperennial ryegrass contains two different pyr4 genes, both expressing orotidine-
59-monophosphate decarboxylase. Gene 158: 31–39.
55. Ganley ARD, Scott B (1998) Extraordinary ribosomal spacer length heteroge-neity in a Neotyphodium endophyte hybrid: Implications for concerted evolution.
Genetics 150: 1625–1637.
56. Schardl CL, Young CA, Pan J, Florea S, Takach JE, et al. (2013) Currencies of
mutualisms: Sources of alkaloid genes in vertically transmitted epichloae. Toxins5: 1064–1088.
57. Ganley ARD, Scott B (2002) Concerted evolution in the ribosomal RNA genes
of an Epichloe endophyte hybrid: Comparison between tandemly arranged rDNAand dispersed 5S rrn genes. Fungal Genet Biol 35: 39–51.
58. Coleman M, Henricot B, Arnau J, Oliver RP (1997) Starvation-induced genes ofthe tomato pathogen Cladosporium fulvum are also induced during growth in
planta. Mol Plant Microbe Interact 10: 1106–1109.
59. Schardl CL, Young CA, Hesse U, Amyotte SG, Andreeva K, et al. (2013) Plant-symbiotic fungi as chemical engineers: Multi-genome analysis of the Clavicipi-
taceae reveals dynamics of alkaloid loci. PLoS Genet 9: e1003323.60. Chester M, Gallagher JP, Symonds VV, da Silva AVC, Mavrodiev EV, et al.
(2012) Extensive chromosomal variation in a recently formed naturalallopolyploid species, Tragopogon miscellus (Asteraceae). Proc Natl Acad Sci USA
109: 1176–1181.
61. Chen ZJ (2007) Genetic and epigenetic mechanisms for gene expression andphenotypic variation in plant polyploids. Annu Rev Plant Biol 58: 377–406.
62. Schlotterer C, Tautz D (1994) Chromosomal homogeneity of Drosophila
ribosomal DNA arrays suggests intrachromosomal exchanges drive concerted
evolution. Curr Biol 4: 777–783.
63. Dadejova M, Lim KY, Souckova-Skalicka K, Matyasek R, Grandbastien MA, etal. (2007) Transcription activity of rRNA genes correlates with a tendency
towards intergenomic homogenization in Nicotiana allotetraploids. New Phytol174: 658–668.
64. Riddle NC, Birchler JA (2003) Effects of reunited diverged regulatory hierarchiesin allopolyploids and species hybrids. Trends Genet 19: 597–600.
65. Chen ZJ, Ni Z (2006) Mechanisms of genomic rearrangements and gene
expression changes in plant polyploids. Bioessays 28: 240–252.66. Roose ML, Gottlieb LD (1980) Biochemical properties and level of expression of
alcohol dehydrogenases in the allotetraploid plant Tragopogon miscellus and itsdiploid progenitors. Biochem Genet 18: 1065–1085.
67. Tirosh I, Reikhav S, Levy AA, Barkai N (2009) A yeast hybrid provides insight
into the evolution of gene expression regulation. Science 324: 659–662.68. Wittkopp PJ, Haerum BK, Clark AG (2004) Evolutionary changes in cis and trans
gene regulation. Nature 430: 85–88.69. Hegarty MJ, Hiscock SJ (2008) Genomic clues to the evolutionary success of
polyploid plants. Curr Biol 18: R435–444.70. Flagel L, Udall J, Nettleton D, Wendel J (2008) Duplicate gene expression in
allopolyploid Gossypium reveals two temporally distinct phases of expression
evolution. BMC Biology 6: 16.71. Baker CR, Hanson-Smith V, Johnson AD (2013) Following gene duplication,
paralog interference constrains transcriptional circuit evolution. Science 342:104–108.
72. Christensen MJ, Leuchtmann A, Rowan DD, Tapper BA (1993) Taxonomy of
Acremonium endophytes of tall fescue (Festuca arundinacea), meadow fescue (F.
pratensis) and perennial ryegrass (Lolium perenne). Mycolog Res 97: 1083–1092.
73. Young CA, Bryant MK, Christensen MJ, Tapper BA, Bryan GT, et al. (2005)Molecular cloning and genetic analysis of a symbiosis-expressed gene cluster for
lolitrem biosynthesis from a mutualistic endophyte of perennial ryegrass. MolGenet Genom 274: 13–29.
74. Cox MP, Peterson DA, Biggs PJ (2010) SolexaQA: At-a-glance quality
assessment of Illumina second-generation sequencing data. BMC Bioinf 11: 485.75. Fisher RA (1922) On the interpretation of x2 from contingency tables, and the
calculation of P. J R Statist Soc 85: 87–94.76. R Development Core Team (2013) R: A Language and Environment for
Statistical Computing.
77. Wang L, Feng Z, Wang X, Wang X, Zhang X (2010) DEGseq: An R packagefor identifying differentially expressed genes from RNA-seq data. Bioinformatics
26: 136–138.78. Storey JD, Tibshirani R (2003) Statistical significance for genomewide studies.
Proc Natl Acad Sci USA 100: 9440–9445.
79. Robinson JT, Thorvaldsdottir H, Winckler W, Guttman M, Lander ES, et al.(2011) Integrative genomics viewer. Nat Biotech 29: 24–26.
80. Peintner U, Bougher NL, Castellano MA, Moncalvo JM, Moser MM, et al.(2001) Multiple origins of sequestrate fungi related to Cortinarius (Cortinariaceae).
Am J Bot 88: 2168–2179.81. Kasuga T, White TJ, Taylor JW (2002) Estimation of nucleotide substitution
rates in eurotiomycete fungi. Mol Biol Evol 19: 2318–2324.
82. Charlton ND, Craven KD, Mittal S, Hopkins AA, Young CA (2012) Epichloe
canadensis, a new interspecific epichloid hybrid symbiotic with Canada wildrye
(Elymus canadensis). Mycologia 104: 1187–1199.
Global Rules for Allopolyploid Gene Expression
PLOS Genetics | www.plosgenetics.org 15 March 2014 | Volume 10 | Issue 3 | e1004180