An Internship Report Analysis of Financial Soundness1 1
53
Chapter One Introduction Prologues Objectives of the Study Research Methodology of the Study Limitations of the Study 1
Transcript of An Internship Report Analysis of Financial Soundness1 1

Chapter One
Introduction
Prologues
Objectives of the Study
Research Methodology of the Study
Limitations of the Study
1

1.1 Prologues:
Financial soundness measure is an effective used toolin measuring a company’s strength and weakness. Varioustypes of tools are generally used in this regards. Thisstudy has taken an effort in order to assess thefinancial soundness of Square Pharmaceuticals Ltd. topinpoint its probable strength and weakness.
1.2 Objectives of the Study:
The main purpose of this report is to analysis thefinancial position of the Square Pharmaceuticals Ltd.
To fulfill the main objectives the subsequentobjectives are-
To identify the financial soundness of the Square
Pharmaceuticals Ltd.
To focus the financial strengths and weaknesses ofthe Square Pharmaceuticals Ltd.
To identify the net sales Square PharmaceuticalsLtd.
To know the total debt of the SquarePharmaceuticals Ltd.
To know the liquidity of the SquarePharmaceuticals Ltd.
1.3 Research Methodology of the Study:
The study was designed from descriptive point of view.The report is prepared by using secondary data.
2

Different books, articles, annual reports and websiteswere used as sources for secondary data collection.
1.4 Limitations of the Study:
There are some limitations in my study. I have facedsome problems during the study of internship report,which are as follows-
Time insufficient to know all activities about theSquare Pharmaceuticals Ltd.
Scarcity of information about the SquarePharmaceuticals Ltd.
Inexpertness to write a report.
I have tried my level best to make this report a true,bias-free and informative one. I hope that it willprovide an original picture of Square Pharmaceuticals
Ltd.
Chapter TwoOverview of Square
Pharmaceuticals Limited
Square Pharmaceuticals Limited Annual Report 2010
Corporate History of Square Pharmaceuticals Limited
3

Vision of Square Pharmaceuticals Limited
Mission of Square Pharmaceuticals Limited
Objectives of Square Pharmaceuticals Limited
Management Apparatus of Square Pharmaceuticals Limited
Strive of Square Pharmaceuticals Limited
Corporate focus of Square Pharmaceuticals Limited
Ten Principles of Square Pharmaceuticals Limited
Corporate Operational Results of Square Pharmaceuticals
Limit
2.1 Square Pharmaceuticals Limited, Annual Report 2010:
Annual Report of Square Pharmaceuticals Limited is a very
useful report for analysis of its financial performance.
This report explained about financial strength. Customer
service, risk management, corporate social responsibility,
and good governance. Director’s Report section explained the
global economy and Bangladesh economy. This report tried to
4

accumulate all the relevant data and topics regarding
financial performance. This report would be very helpful
and handy for potential investors and policy makers.
This report also explained different accounting policies and
depth analysis of financial position. In addition to that,
it discuss about the industry performance. It also tells us
about the trend of financial performance. In addition to
that, emphasis is given on that information that creates
positive impression about the company and the information in
their own way.
2.2 CORPORATE HISTORY:
Year of Establishment (Initially as a Partnership)
5

: 1958Incorporated as a Private Limited Company : 1964Technical Collaboration Agreement with
Janssen Pharmaceuticals of Belgium (a subsidiary of Johnson & Johnson International Ltd.)
: 1975
Technical Collaboration Agreement with : 1984 F. Hoffman-La Roche & Co. Ltd. Converted into Public Limited Company : 1991 Initially Public Offering (IPO) : 1994 Stock Exchange Listings : 1995 Agreement with M/s. Bovis Tanvec Ltd. of UK for
implementation of Dhaka Plant : 1996 Awarded ISO-9001 Certificate : 1998 Awarded UK-MHRA Certificate : 2007 Business Lines : Manufacturing and
Marketing of Pharmaceutical Finished product, Basic Chemicals, AgroVet Product, Pesticide Products, Small Volume Parental Opthalmic Products and InsulinProducts.
Authorized Capital : Tk.5,000 million
Paid-up Capital : Tk.1509.03 million
Number of Employees Subsidiary Company : Square
Biotechs Ltd. : Square Multi
Fabrics Ltd.
Associate Company : SquareTextiles Ltd.
6

: Square knitFabrics Ltd.
: Square Fashions Ltd. : Square Hospitals Ltd
2.3 VisionWe view business as a means to the material and socialwellbeing of the investors, employees and the society atlarge, leading to accretion of wealth through financial andmoral gains as apart of the process of the humancivilization.
2.4 MissionOur Mission is to produce and provide quality & innovativehealthcare relief for people, maintain stringently ethicalstandard in business operation also ensuring benefit to theshareholders, stakeholders and the society at large
2.5 Objectives:Our objectives are to conduct transparent business operationbased on market mechanism within the legal & social framework with aims to attain the mission reflected by ourvision.
2.6 Corporate Focus:Our vision, our mission and our objectives are to emphasizeon the quality of product, process and services leading togrowth of the company imbibed with good governance practices
2.7 MANAGEMENT APPARATUS:
BOARD OF DIRECTORSMr. Samson H. Chowdhury ChairmanMr. Samuel S. Chowdhury Vice ChairmanMr. Tapan Chowdhury Managing DirectorDr. Kazi Harunar Rashid DirectorMr. M. Sekander Ali Independent
Director
7

Ms. Ratna Patra DirectorMr. Anjan Chowdhury DirectorMr. Kazi Iqbal Harun DirectorMr. K. M Saiful Islam Director
AUDIT COMMITTEEMr. M. Sekander Ali ChairmanMr. Samuel S. Chowdhury MemberMr. Kazi Iqbal Harun MemberMANAGEMENT COMMITTEEMr. Tapan Chowdhury ChairmanMr. K M Saiful Islam MemberMr. Parvez Hashim MemberMr. M. Ashiqul Hoque Chawdhury MemberMr. Md. Kabir Reza, FCMA Member
2.8 WE STRIVE FOR:
We in SQUARE, strive, above all, for top quality healthcare products at the least cost reaching the lowestrungs of the economic class of people in the country. Wevalue our social obligations.
We owe our shareholders and strive for protection oftheir capital as well as ensure highest return andgrowth of their assets.
We strive for best compensation to all the employees whoconstitute the back-bone of the management andoperational strength of the company through a pay-package composing salary/wages, allowances, bonuses,profit participation, leave salary andsuperannuation & retirement benefits.
We strive for the best co-operation of the creditors &debtors the banks & financial Institutions who providefinancial support when we need them, the suppliers ofraw materials & suppliers who offer them at the bestprices at the opportune moments, the providers ofutilities-power, gas & water etc. and the customers whobuy our products & services by redeeming their claim intime by making prompt payment and by distributing properproduct on due dates to our customers.
8

We strive for fulfillment of our responsibility to thegovernment through payment of entire range of due taxes,duties and claims by various public agencies likemunicipalities etc.
We strive, as responsible citizen, for a socialorder devoid of malpractices, anti-environmentalbehaviours, unethical and immoral activities andcorruptive dealings.
We strive for practicing good-governance in every sphereof activities covering inter alia not being limited to,disclosure & reporting to shareholders, holdinAGM in time, distribution of dividends and otherbenefits to shareholders, reporting/dissemination ofprice sensitive information, acquisition of shares byinsiders, recruitment & promotion of staff, procurement& supplies, sale of assets etc. all that directly andindirectly affect the interest of concerned groups - theshareholders, the creditors, suppliers, employees,government and the public in general.
We strive for equality between sexs, races, religionsand regions in all spheres of our operation without anydiscriminatory treatment.
2.9 Ten Principles of Global Compact (UN) adoptedby Square Pharmaceuticals Limited:
The ten principles of Global Compact initiated bythe UN Secretary General as have been adopted bySquare Pharmaceuticals Ltd. are as follows :
Human Rights:
(1) Businesses should support and respect theprotection of internationally proclaimed human rightswithin their sphere of influence; and
(2) Make sure that they are not complicit in humanrights abuses.
9

Labor Standards:
(3) Businesses should uphold the freedom ofassociation and the effective recognition of the right tocollective bargaining;
(4) The elimination of all forms of forced andcompulsory labor;
(5) The effective abolition of child labor and(6) Eliminate discrimination in respect of employmentand occupation
Environment:(7) Business should support a precautionary approachto environmental challenges:
(8) Undertake initiatives to promote greaterenvironmental responsibility; and
(9) Encourage the development and diffusion ofenvironmentally friendly technologies.
Ethical Standards:(10) Business should work against corruption in all
its forms, including extortion and bribery.
2.10CORPORATE OPERATIONAL RESULTS:
(Figure in thousand)2009-10 2008-09 2007-08 2006-07 2005-06
Turnover (Gross) 13279142 11366598
9565716 8711035 7085553
10

Turnover (Net) 11462578 9820797 8257844 7500811 6089905Gross Profit 4901290 4148231 3401782 3232364 2564503Net Profit before Tax 2825069 2511259 1868634 1722906 1533043Net Profit after Tax 2087872 1890053 1381863 1303243 1165865Net Assets Value 11554380 9949398 8417041 7333258 6402015Total Assets 15029500 1325124
312703127
10486940
9298987
Total Bank Borrowing 2231167 2279694 3569280 2536524 2334925Total Current Assets 4774311 3843513 4411836 3682511 4031685Total CurrentLiabilities
2216744 2640869 3500845 2555566 2260755
Current Ratio 2.15 1.46
1.26
1.44
1.78
No. of ShareOutstanding
15090300 12072240
8942400 5961600 4968000
Dividend per Share(Cash)
35 40 40 50 75
Dividend per Share(Stock)
30% 25% 35% 50% 20%
Net Assets Value perShare (NAV)
766 659 558 486 424
Net Operating Cashflow per Share
176.51 164.87 86.20 96.08 78.80
Earnings per Share(SPL)
138.36 125.25 91.57 86.36 77.26
Earnings per Share(SPL)
165.48 136.40 101.10 96.63 89.76
EPS at OriginalCapital at IPO
1043.94 945.03 690.93 651.62 582.93
Quoted Price perShare – DSE
3581 2935 4110 2447 2276
Quoted Price perShare -CSE
3597 2923 4107 2462 2289
Price Earning Ratio-DSE (Time)
25.88 23.43 44.88 28.33 29.46
Number of Shares 40797 47258 31688 13009 13206
Human Resources
Executives 1909 1786 1525 1242 1143
11

Staff 1259 1084 1110 913 796Workers 1029 941 929 846 764
Chapter Three
Financial SoundnessAnalysis
Definition of Financial Soundness Analysis
Definition of Ratio Analysis
Time Series Techniques
Cross Sectional Techniques
Liquidity Ratio
Activity Ratio
Debt Management Ratio
12

Profitability Ratio
3.1 Definition of Financial Soundness Analysis:
Financial Soundness Analysis includes the study ofrelationships within a set of financial statement at apoint in time and with trends in these relationshipsover time.
3.2 Definition of Ratio Analysis:
Ratio analysis expresses the relationship amongselected items of financial statement data. A ratioexpresses the mathematical relationship between onequantity and another.
Techniques to measures Financial SoundnessAnalysis
3.3 Times-Series Techniques:
Trend Statements:
Constructing trend statements involves choosing oneyear as a base & then expressing the statement items of
13

subsequent years relative to the value in the baseyear.
3.4 Cross Sectional Techniques:
Two techniques used to measure financial soundness-
1. Common-size Statement2. Financial Ratio Analysis
Common-size Statement:
One impetus to the development of the common-sizestatement came from the problems in comparing thefinancial statements of firms that differ in size.
Financial Ratio Analysis:
The most widely discussed the financial technique is acomparison of ratio across firms. Numerous individualratios have been proposed in the literature.
The Four Categories of Financial Ratio Analysis are asfollows-
1. Liquidity Ratios2. Activity Ratios3. Debt management Ratios4. Profitability Ratios
3.5 Liquidity Ratios:
14

The ratios that show the relationship of the firm’scurrent assets to its current liabilities are known asliquidity ratios. It measures the firm’s ability tosatisfy its short term obligation as they come due.
Some representatives of Liquidity Ratios are asfollows-
o Current Ratio =
o Quick Ratio = Cash + Short term investment +Receivables (net)
3.6 Activity Ratios:
The ratios that measure how effectively a firm ismanaging its assets are called activity ratios.
Some representatives of Activity Ratios are as follows-
Receivables Turnover =
Inventory Turnover =
Average Collection Period =
Average Payment Period =
Total Assets Turnover =
15

3.7 Debt Management Ratio/Financial Leverage:
The ratios that measure the ability of the firm’s longterm financial solvency are called debt managementratios. Long term creditors and stockholders areparticularly interested in a company’s ability to payinterest as it comes due and to repay the face value ofdebt at maturity.
The representative of Debt Management Ratio is asfollows-
Debt Ratio =
3.8 Profitability Ratios:
A group of ratios showing the effect of liquidity,assets, management and debt management on firm’soperation are called profitability ratios.
Some representatives of Profitability Ratios are as follows-
Gross Profit Margin =
Operating Profit Margin =
Net Profit Margin =
16

Return on Assets =
Return on Equity =
Earnings Per Share =
Price Earnings Ratio =
Payout Ratio =
Dividend Payout Ratio =
Dividend Yield Ratio =
17

Chapter FourResults of Financial Ratios of SPL &
their Interpretation
Current Ratio
Quick Ratio /Acid Test Ratio
Receivables Turnover
Inventory Turnover
Average Collection Period
Average Payment Period
18

Debt Ratio
Gross Profit Margin
Operating Profit Margin
Net Profit Margin
Return on Assets
Return on Equity
Total Assets Turnover
Earnings per Share
Price Earnings Ratio
Payout Ratio
Dividend Payout Ratio
Dividend Yield Ratio4.1 Current Ratio:
The current ratio is widely used measure for evaluating acompany’s liquidity and short term debt paying ability.Current Ratio indicates the extent to which currentliabilities are converted by current assets. The ratio iscomputed by dividing current assets by currentliabilities.
Current Ratio =
CR in 2008 = 4,411,836,436/3,500,845,103 = 1.2602
19

CR in 2009 = 3,843,512,855/2,640,868,554 = 1.4554
CR in 2010 = 4,774,311,194/2,216,744,401 = 2.1537
From the above figure, we can say that current ratio ofSquare Pharmaceuticals Ltd. in 2008 is 1.2602, 2009 is1.4554 and 2010 is 2.1537. The current ratio of SquarePharmaceuticals Ltd. is increasing year by year. So thecompany is in a good position
20

4.2 Quick Ratio/Acid Test:
Quick ratio or Acid test measures the company’s immediateshort term liquidity. The acid test is designed tomeasure how well a company can meet its obligationwithout having to liquidate or depend too heavily on itsinventory. It is computed by dividing the sum of cash,short term investment and net receivables by currentliabilities.
Quick Ratio/Acid Test = Cash + Short term investment +Receivables (net)
QR in 2008 =(205,295,694+20,250,000+360,245,646)/3,500,845,103= .16733
QR in 2009 =(293,457,740+20,250,000+477,562,002)/2,640,868,554= .29962
QR in 2010 =(258,727,695+221,269,226+508,249,174)/2,216,744,401 = .44580
21

From the above figure, we can say that the quick ratio ofSquare Pharmaceuticals Ltd. in 2008 is .16733, 2009is .29962 and 2010 is .44580. The quick ratio of SquarePharmaceuticals Ltd. has increased in the last three years.So the company is in a better position.
4.3 Receivables Turnover:
The Receivables Turnover is a rough measure of how manytimes a company’s accounts receivable have been turnedinto cash during the year. The ratio is used to assessthe liquidity of the receivables. It is computed bydividing net credit sales by average net receivables.
Receivables Turnover =
RT in 2008 = = 24.177 times
or 14 days (360/24.177)
22

RT in 2009 = = 23.444 times
or 15 days (360/23.444)
RT in 2010 = = 23.255 times
or 15 days (360/23.255)
From the above figure, we can say that receivables turnoverof Square Pharmaceuticals Ltd. in 2008 is 14 days, 2009 is15 days and 2010 is 15 days. The receivables turnover ofSquare Pharmaceuticals Ltd. is low in 2008. But in 2009 &
23

2010 it has increased. So the company is not in a goodposition.
4.4 Inventory Turnover:
Inventory Turnover ratio measures how many times acompany’s inventory has been sold and replaced during theyear. Its purpose is to measure the liquidity of theinventory. It is computed by dividing cost of goods soldby the average inventory.
Inventory Turnover =
IT in 2008 = = 2.710
times or 133 days (360/2.710)
IT in 2009 = = 2.750
times or 131 days (360/2.750)
IT in 2010 = = 3.048
times or 118 days (360/3.048)
24

From the above figure, we can say that the inventoryturnover of Square Pharmaceuticals Ltd. in 2008 is 133 days,2009 is 131 days and 2010 is 118 days. The receivablesturnover is high in 2008. But in 2009 & 2010, it hasdecreased. So the company is in a better position.
4.5 Average Collection Period:
Average Collection Period measures average amount of timeneeded to collect accounts receivable.
Average Collection Period =
ACP in 2008 = = 16 days
ACP in 2009 = = 17 days
ACP in 2010 = = 16 days
25

From the above figure, we can say that the averagecollection period of Square Pharmaceuticals Ltd. in 2008 is16 days, 2009 is 17 days and 2010 is 16 days. The averagecollection period in 2009 is high. But in 2008 & 2010 it islow. So the company is in a good position.
4.6 Average Payment Period:
Average Payment Period measures the average amount oftime needed to pay accounts payable.
Average Payment Period =
APP in 2008 = = 8 days
26

APP in 2009 = = 9 days
APP in 2010 = = 27 days
From the above figure, we can say that the averagepayment period of Square Pharmaceuticals Ltd. in 2008 is8 days, 2009 is 9 days and 2010 is 27 days. The averagepayment of Square Pharmaceuticals Ltd. is increasing yearby year. So the company is in a good position.
4.7 Debt Ratio:
Debt ratio measures the proportion of total assets financedby firm’s creditors. This ratio indicates the company’s
27

degree of leverage. It also provides some indication of thecompany’s ability to withstand losses without impairing theinterest of creditors. It is computed by dividing totaldebts by total assets.
Debt Ratio =
DT in 2008 = = .33740 or
33.740%
DT in 2009 = = .24917 or
24.917%
DT in 2010 = = .23121
or 23.121%
From the above figure, we can say that the debt ratio ofSquare Pharmaceuticals Ltd. in 2008 is 33.740%, 2009 is24.917% and 2010 is 23.121%. The debt ratio of SquarePharmaceuticals Ltd. has declined in the last three years.So the company is in a better position.
28

4.8 Gross Profit Margin:
Gross Profit Margin measures gross income per TK. ofsales. It is computed by dividing gross profit by netsales.
Gross Profit Margin =
GPM in 2008 = = .41194 or 41.194%
GPM in 2009 = = .42239 or 42.239%
GPM in 2010 = = .42759 or 42.759%
29

From the above figure, we can say that the gross profitmargin of Square Pharmaceuticals Ltd. in 2008 is 41.194%,2009 is 42.239% and 2010 is 42.759%. The gross profit marginof Square Pharmaceuticals Ltd. has increased year by year.So the company is in a good position.
4.9 Operating Profit Margin:
Operating Profit Margin measures operating income per TK.of sales. It is computed by dividing earning beforeincome tax by net sales.
Operating Profit Margin =
OPM in 2008 = = .22629 or 22.629%
OPM in 2009 = = .25570 or 25.570%
OPM in 2010 = = .24646 or 24.646%
30

From the above figure, we can say that the operatingprofit margin of Square Pharmaceuticals Ltd. in 2008 is22.629%, 2009 is 25.570% and 2010 is 24.646%. But,operating profit margin is low in 2010. But still thecompany is in a better position.
4.10Net Profit Margin:
Net Profit Margin measures the net income per TK. ofsales. It is computed by dividing net profit after tax bynet sales.
Net Profit Margin =
31

NPM in 2008 = = .16733 or 16.733%
NPM in 2009 = = .19245 or 19.245%
NPM in 2010 = = .18215 or 18.215%
From the above figure, we can say that the net profitmargin of Square Pharmaceuticals Ltd. in 2008 is 16.733%,2009 is 19.245% and 2010 is 18.215%. But net profit margin is low in 2010. But still thecompany is in a good position.
4.11Return on Assets (ROA):
32

Return on Assets (ROA) provides as idea of the overallreturn on investment earned by the firm. This ratio iscomputed by dividing net income by average assets.
Return on Assets =
ROA in 2008 =
= .11918 or 11.918%
ROA in 2009 =
= .14564 or 14.564%
ROA in 2010 =
= .14765 or 14.765%
33

From the above figure, we can say that the return onassets of Square Pharmaceuticals Ltd. in 2008 is 11.918%,2009 is 14.564% and 2010 is 14.765%. The return on assetsof Square Pharmaceuticals Ltd. is increasing year byyear. So the company is in a good position.
4.12Return on Equity (ROE):
Return on Equity (ROE) measures the rate of return oncommon stockholders investment. It measures profitabilityfrom the common stockholders viewpoint. This ratio showshow many tk. of net income were earned for each tk.invested by the owner. It is computed by dividing netincome by average common stockholders equity.
Return on Equity =
ROE in 2008 = = .17547
or 17.547%
ROE in 2009 = = .20582
or 20.582%
ROE in 2010 =
= .19419 or 19.419%
34

From the above figure, we can say that the return onequity of Square Pharmaceuticals Ltd. in 2008 is 17.547%,2009 is 20.582% and 2010 is 19.419%. The return on equityis low in 2008 and 2010. But in 2009 it is high. But thecompany is still in a stable position.
4.13Total Assets Turnover:
Total Assets Turnover indicates the efficiency with whichthe firm uses its assets to generate sales. It isdetermined by dividing net sales by average assets.
Total Assets Turnover =
TAT in 2008 =
= .71218 or 71.218%
35
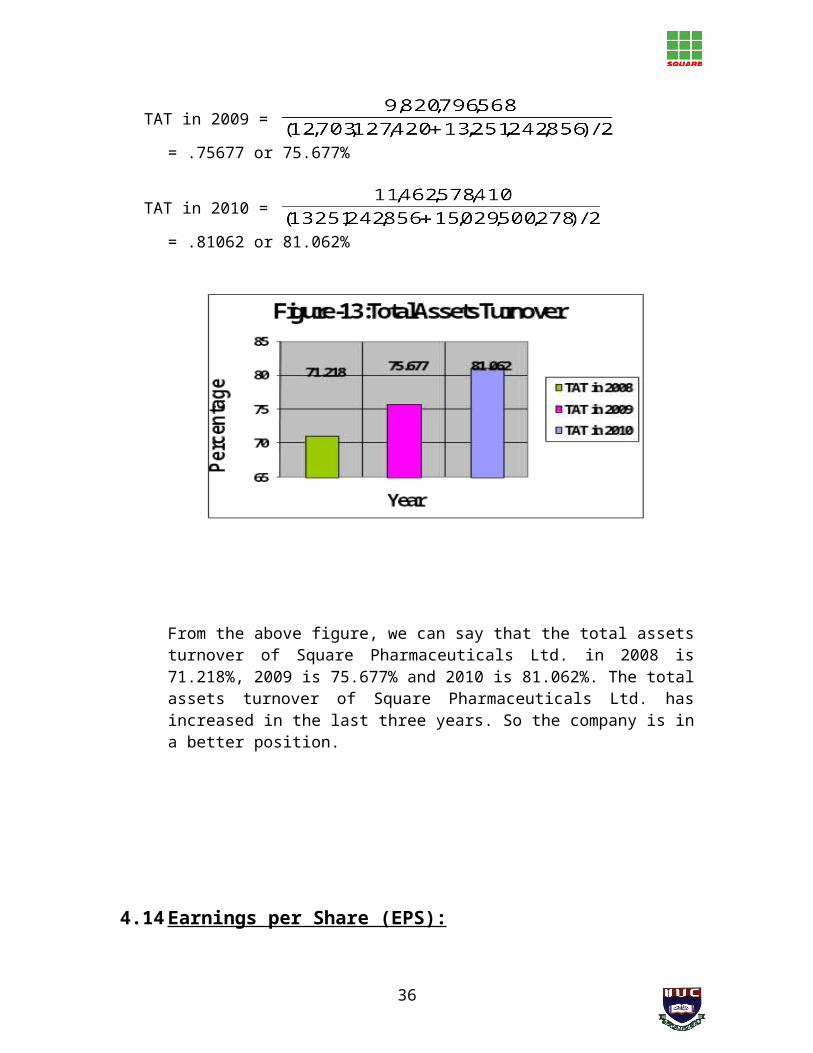
TAT in 2009 =
= .75677 or 75.677%
TAT in 2010 =
= .81062 or 81.062%
From the above figure, we can say that the total assetsturnover of Square Pharmaceuticals Ltd. in 2008 is71.218%, 2009 is 75.677% and 2010 is 81.062%. The totalassets turnover of Square Pharmaceuticals Ltd. hasincreased in the last three years. So the company is ina better position.
4.14Earnings per Share (EPS):
36

An Earnings per Share (EPS) is a measure of net incomeearned on each share of common stock. It is computed bydividing net income by the number of weighted averagecommon shares outstanding.
Earnings per Share =
EPS in 2008 = = 154.53
EPS in 2009 = = 179.87
EPS in 2010 = = 153.73
From the above figure, we can say that the earnings pershare of Square Pharmaceuticals Ltd. in 2008 is 154.53,2009 is 179.87 and 2010 is 153.73.
37

The earnings per share in 2009 are high. But in 2008 &2010, it has decreased. So the company is not in a goodposition.
4.15Price Earnings Ratio:
Price Earnings Ratio is an off-quoted measure of theratio of the market price of each share of common stockto the earnings per share. It is computed by dividing themarket price per share of stock by earnings per share.
Price Earnings Ratio =
PER in 2008 = = 26.597
PER in 2009 = = 16.317
PER in 2010 = = 23.294
38

From the above figure, we can say that the priceearnings ratio of Square Pharmaceuticals Ltd. in 2008is 26.597, 2009 is 16.317 and 2010 is 23.294.
The price earnings ratio is low in 2009. But it is highin 2008 and 2010. So the company is not in a goodposition.
4.16Payout Ratio:
Payout Ratio measures the percentage of earningsdistributed in the form of cash dividends. It is computedby dividing cash dividend by net income. Companies thathave high growth of rates generally have low payout ratiobecause they reinvest most of their net income into thebusiness.
Payout Ratio =
PR in 2008 = = .21570 or 21.570%
PR in 2009 = = .18925 or 18.925%
39

PR in 2010 = = .23128 or 23.128%
From the above figure, we can say that the payout ratioof Square Pharmaceuticals Ltd. in 2008 is 21.570%, 2009is 18.925% and 2010 is 23.128%.The payout ratio in 2009is low. But in 2008 and 2010, it has increased. So thecompany is in a good position.
4.17 Dividend Payout Ratio:
The dividend payout ratio gauges the portion of currentearnings being paid out in dividends. Investors who seekgrowth in market price would like this ratio to be small,whereas investors who seek dividends prefer it to belarge. This ratio is computed by relating dividends pershare to earnings per share of common stock.
40

Dividend Payout Ratio =
DPR in 2008 = = .25885 or 25.885%
DPR in 2009 = = .22238 or 22.238%
DPR in 2010 = = .22767 or 22.767%
From the above figure, we can say that the dividendpayout ratio of Square Pharmaceuticals Ltd. in 2008 is25.885%, 2009 is 22.238% and 2010 is 22.767%.
The dividend payout ratio is high in 2008. But in 2009& 2010, it is low. But the company is still in a verygood position.
41

4.18Dividend Yield Ratio:
The dividend yield ratio is obtained by dividing thecurrent dividends by current market price per share. Thedividend yield ratio measures the rate of return in theform of cash dividend that would be earned by an investorwho buys the common stock at the current market price.
Dividend Yield Ratio =
DYR in 2008 = = 0.0097 or .97%
DYR in 2009 = = .01363 or 1.363%
DYR in 2010 = = 0.0098 or .98%
42

From the above figure, we can say that the dividendyield ratio of Square Pharmaceuticals Ltd. in 2008is .97%, 2009 is 1.36% and 2010 is .98%.
The dividend yield ratio is high in 2009. But in 2008and 2010 it is low. But still the company is in astable position.
Chapter Five
Findings
Short Term Financial Strength
Long Term Financial Strength
43

Efficiency of Profitability
After analyzing the different aspects of financial parameterby the help of ratio analysis, we have the followingfindings-
5.1 Short Term Financial Strength:
Company’s liquidity position has been increased in 2010 thanprevious two years. Current Ratio & Quick Ratio have beenincreased. Inventory Turnover has been increased in 2010than previous two years. Average Collection Period has beendecreased than previous years. But Receivables Turnover hasbeen decreased than previous two years. It means theReceivables Turnover is not good but current capitalmanagement has been developed. So the company should givemore emphasize to improve the receivables turnover.
5.2 Long Term Financial Strength:
44

The financial performance of Square Pharmaceuticals Ltd. isgood in 2010 than previous two years. The Debt Ratio of SPLhas been declined in 2010 than previous years. So thecompany’s long term debt payment power has been increased.
5.3 Efficiency of Profitability:
The Profitability Ratio of Square Pharmaceuticals Ltd. is ina stable position. Although some of them has been decreased.Gross Profit Margin, Return on Assets, Asset Turnover &Payout Ratio have been increased in 2010. On the other hand,Operating Profit Margin, Net Profit Margin, Return onEquity, Earnings per Share, Dividend Yield Ratio andDividend Payout Ratio have been reduced in 2010. It meansthe company is not utilizing its assets in a proper way. Sothe company should give more attention to increase theirprofit for the next year.
Chapter Six
45

Recommendation,Conclusion
& References
46

6.1 Recommendation:
To strength the financial soundness in those areas where theSquare Pharmaceuticals Ltd. needs to improve, the followingsuggestive measures are recommended-
i. The company should give more attention to improveefficiency in utilizing the capital.
ii. The company should give more attention on how toeffectively manage its cost and revenue mixes.
iii. The company should give more emphasizes in making theinvestment decision in a much better way.
47

6.2 Conclusion:
The financial soundness picture of Square PharmaceuticalsLtd. shows that it has performed better in differentspecific aspects like short term and long term debt payment.However it has yet some financial and operating areas likeprofitability where those need much attention to be given.It can consider same actions recommended to improve itsfinancial performance in the years to come.
48

6.3 References:
Garrison, R.H., & Noreen, E.W. (2000). ManagerialAccounting. 9th ed. Irwin McGraw-Hill Companies, Inc.pp. 835-47.
Weygandt, J.J., Kieso, D.E., & Kimmel, P.D. (2008).Accounting Principles. 7th ed. John Wiley & Sons, Inc. pp. 774-85
Annual Report of Square Pharmaceuticals Ltd. (2008)
Annual Report of Square Pharmaceuticals Ltd. (2009)
49
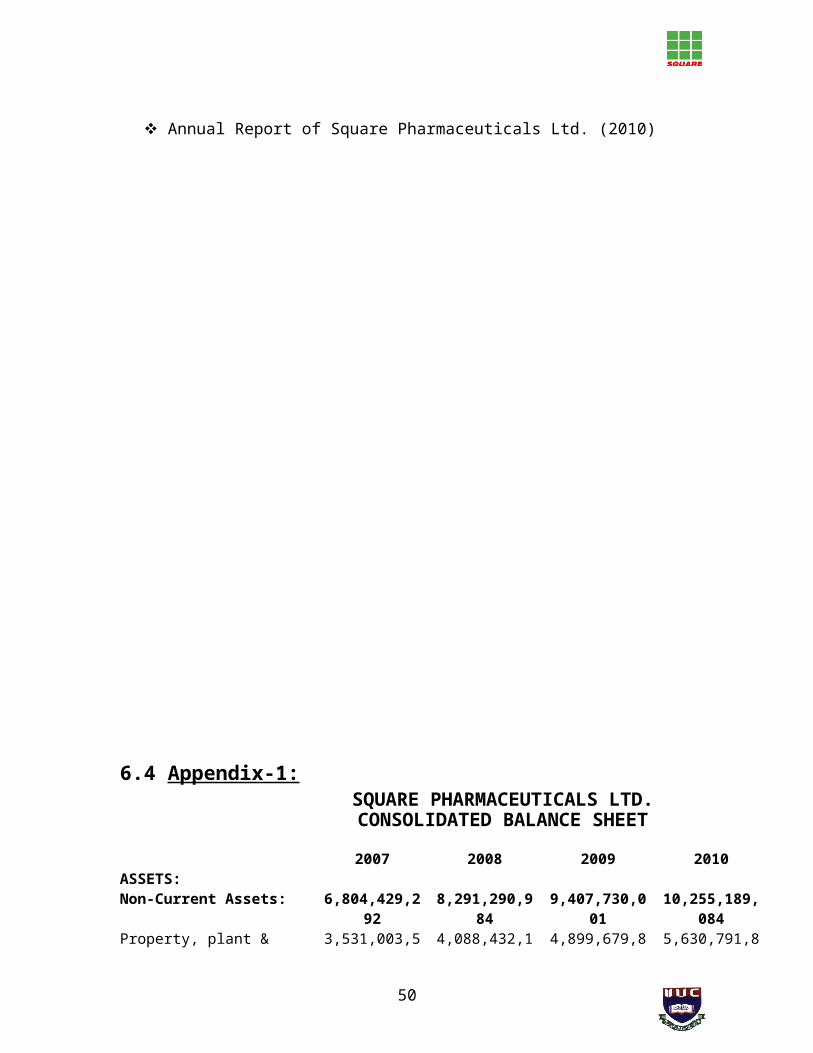
Annual Report of Square Pharmaceuticals Ltd. (2010)
6.4 Appendix-1: SQUARE PHARMACEUTICALS LTD.CONSOLIDATED BALANCE SHEET
2007 2008 2009 2010ASSETS:Non-Current Assets: 6,804,429,2
928,291,290,9
849,407,730,0
0110,255,189,
084Property, plant & 3,531,003,5 4,088,432,1 4,899,679,8 5,630,791,8
50

equipment-Carrying Value
09 71 32 22
Capital work-in-Progress
481,239,419 591,114,649 634,347,093
Investment Long-Term (at cost)
2,792,186,364
3,611,744,164
4,508,050,169
3,990,050,169
Current Assets: 3,682,510,712
4,411,836,436
3,843,512,855
4,774,311,194
Inventories 1,544,191,798
2,026,736,322
2,098,755,231
2,207,078,082
Trade Debtors 322,864,637 360,245,646 477,562,002 508,249,174Advances, Deposits & Prepayments
236,455,395 288,806,440 260,330,162 358,250,076
Investment in Marketable Securities(at cost)
20,250,000 20,250,000 20,250,000 221,269,226
Short-Term Loan 1,418,893,703
1,510,502,334
693,157,720 1,220,736,941
Cash & Cash Equivalents
139,855,179 205,295,694 293,457,740 258,727,695
TOTAL ASSETS 10,486,940,
004
12,703,127,
420
13,251,242,
856
15,029,500,
278
SHAREHILDERS EQUITY AND LIABILITIES:Shareholders Equity: 7,333,257,6
128,417,040,7
059,949,397,6
3411,554,379,
825Share Capital 596,160,000 894,240,000 1,207,224,6
341,509,030,0
00Share Premium 2,035,465,0
002,035,465,0
002,035,465,0
002,035,465,0
00General Reserve 105,878,200 105,878,200 105,878,200 105,878,200Tax Holiday Reserve 1,101,935,2
371,101,935,2
371,101,935,2
371,101,935,2
37Retained Earnings 3,493,819,1
754,279,522,2
685,498,895,1
976,802,071,3
88Non-Current Liabilities:
598,116,106 785,241,612 660,976,668 1,258,376,052
Long-Term Loans - 492,569,379 602,584,615 449,757,608 1,032,633,1
51

Secured 10Deferred Tax Liability
105,546,727 182,656,997 221,219,060 225,742,942
Current Liabilities: 2,555,556,286
3,500,845,103
2,640,868,554
2,216,744,401
Short-Term Bank Loans 1,818,777,878
2,669,693,184
1,534,345,782
736,443,848
Long-Term Loans – Current Position
225,176,449 297,002,646 295,590,601 462,090,221
Trade Creditors 60,601,743 100,953,258 124,222,699 394,715,915Liabilities for Expenses
24,565,248 32,290,235 69,573,702 56,463,570
Liabilities for OtherFinanceTOTAL SHAREHOLDERS EQUITY AND LIABILITIES
426,444,968
10,486,940,004
400,905,780
12,703,127,420
617,135,770
13,251,242,856
567,030,857
15,029,500,278
6.5 Appendix-2: SQUARE PHARMACEUTICALS LTD.CONSOLIDATED INCOME STATEMENT
2007 2008 2009 2010GROSS TURNOVER 8,711,034,7
589,565,715,9
0211,366,597,
92813,279,141,
757Less: Value AddedTax (VAT)
1,210,223,409
1,307,872,163
1,545,801,360
1,816,563,347
Net Turnover 7,500811,349
8,257,843,739
9,820,796,568
11,462,578,410
COST OF GOODS SOLD
(4,268,477,662)
(4,856,061,933)
(5,672,565,973)
(6,561,288,485)
GROSS PROFIT 3,232,363,687
3,401,781,806
4,148,230,595
4,901,289,925
Operating Expenses:
(1,406,611,448)
(1,692,475,988)
(1,779,793,368)
(2,211,670,939)
Selling & Distribution Expenses
(1,000,132,914)
(1,220,979,268)
(1,319,362,317)
(1,687,210,447)
52

Administrative Expenses
(406,478,534)
(471,496,720)
(460,431,051)
(524,460,492)
PROFIT FROM OPERATIONS
1,825,752,239
1,709,305,818
2,368,437,227
2,689,618,986
Other Income 220,144,368 604,628,504 665,520,915 585,564,826Financial Expenses
(236,845,084)
(351,868,423)
(397,135,963)
(301,861,107)
NET PROFIT BEFOREWPPF
1,809,051,523
1,962,065,899
2,636,822,179
2,966,322,705
Allocation of WPPF
(86,145,311)
(93,431,709)
(125,562,961)
(141,253,462)
NET PROFIT BEFORETAX
1,722,906,212
1,868,634,190
2,511,259,218
2,825,069,243
Provisions for Income Tax
(347,984,083)
(409,660,827)
(592,644,226)
(688,499,602)
Provisions for Deferred Income Tax
(71,679,289)
(77,110,270)
(28,562,063)
(48,697,850)
NET PROFIT AFTER TAX(Transferred to the Statement of Changes in Equity)
1,303,242,840
1,381,863,093
1,890,052,929
2,087,871,791
53