
An Intelligent Modeling of Oil Consumption
10
CITATION: Chiroma, Haruna, et al. "An Intelligent Modeling of Oil Consumption." Advances in Intelligent Informatics. Springer International Publishing, 2015. 557-568. An Intelligent Modeling of Oil Consumption Haruna Chiroma 1 ,2 , Sameem Abdulkareem 1 , Sanah Abdullahi Muaz 3 , Adamu I. Abubakar 4 , Edi Sutoyo 5 , M. Mungad 5 , Younes Saadi 5 , Eka Novita Sari 6 , and Tutut Herawan 5 1 Department of Artificial Intelligence 3 Department of Software Engineering 5 Department of Information systems University of Malaya 50603 Pantai Valley, Kuala Lumpur, Malaysia 2 Federal College of Education (Technical) School of Science Deapartment of Computer Science, Gombe, Nigeria 4 Department of Information system International Islamic University Gombak, Kuala Lumpur, Malaysia 6 AMCS Research Center, Yogyakarta, Indonesia [email protected], [email protected], [email protected], [email protected], [email protected], {sameem,edisutoyo,mungad,tutut}@um.edu.my Abstract. In this study, we select Middle East countries involving Jordan, Lebanon, Oman, and Saudi Arabia for modeling oil consumption based on computational intelligence methods. The limitations associated with Levenberg- Marquardt (LM) Neural Network (NN) motivated this research to optimize the parameters of NN through Artificial Bee Colony Algorithm (ABC-LM) to build a model for the prediction of oil consumption. The proposed model was competent to predict oil consumption with improved accuracy and convergence speed. The ABC-LM performs better than the standard LMNN, Genetically optimized NN, and Back-propagation NN. The proposed model may guide policy makers in the formulation of domestic and international policies related to oil consumption and economic development. The approach presented in the study can easily be implemented into a software for use by the government of Jordan, Lebanon, Oman, and Saudi Arabia. Keywords: Artificial Bee Colony; Neural Network; Levenberg-Marquardt; Oil Consumption; Prediction. 1 Introduction A significant amount of energy supply to the world market comes from the Middle East. Yet, there are countries in the Middle East that significantly depend on oil importation for domestic consumption. Thus, we propose to model oil consumption in
-
Upload
independent -
Category
Documents
-
view
2 -
download
0
Transcript of An Intelligent Modeling of Oil Consumption

CITATION: Chiroma, Haruna, et al. "An Intelligent Modeling of Oil
Consumption." Advances in Intelligent Informatics. Springer International Publishing, 2015. 557-568.
An Intelligent Modeling of Oil Consumption
Haruna Chiroma1,2, Sameem Abdulkareem
1, Sanah Abdullahi Muaz
3, Adamu I.
Abubakar4, Edi Sutoyo
5, M. Mungad
5, Younes Saadi
5, Eka Novita Sari
6, and Tutut
Herawan5
1Department of Artificial Intelligence 3Department of Software Engineering 5Department of Information systems
University of Malaya
50603 Pantai Valley, Kuala Lumpur, Malaysia 2Federal College of Education (Technical)
School of Science
Deapartment of Computer Science, Gombe, Nigeria 4Department of Information system
International Islamic University
Gombak, Kuala Lumpur, Malaysia 6AMCS Research Center, Yogyakarta, Indonesia
[email protected], [email protected], [email protected],
[email protected], [email protected],
{sameem,edisutoyo,mungad,tutut}@um.edu.my
Abstract. In this study, we select Middle East countries involving Jordan,
Lebanon, Oman, and Saudi Arabia for modeling oil consumption based on
computational intelligence methods. The limitations associated with Levenberg-
Marquardt (LM) Neural Network (NN) motivated this research to optimize the
parameters of NN through Artificial Bee Colony Algorithm (ABC-LM) to build
a model for the prediction of oil consumption. The proposed model was
competent to predict oil consumption with improved accuracy and convergence
speed. The ABC-LM performs better than the standard LMNN, Genetically
optimized NN, and Back-propagation NN. The proposed model may guide
policy makers in the formulation of domestic and international policies related
to oil consumption and economic development. The approach presented in the
study can easily be implemented into a software for use by the government of
Jordan, Lebanon, Oman, and Saudi Arabia.
Keywords: Artificial Bee Colony; Neural Network; Levenberg-Marquardt; Oil
Consumption; Prediction.
1 Introduction
A significant amount of energy supply to the world market comes from the Middle
East. Yet, there are countries in the Middle East that significantly depend on oil
importation for domestic consumption. Thus, we propose to model oil consumption in
some selected Middle East countries. Jordan and Lebanon were selected due to their
insufficient production of oil. Saudi Arabia was involved in the case study of its role
in supplying significant quantity of oil to the global market and being a member of the
Organization of the Petroleum Exporting Countries (OPEC). Oman attracted attention
for involvement in the study as a result of its significant production of crude oil and
the country is not a member of the OPEC [1].
There are studies on modeling of energy demand and consumption in the literature,
for example, Assure et al. [2] applied Particle Swarm Optimization (PSO) and
Genetic Algorithm (GA) to estimate oil demand in Iran based on socioeconomic
indicators. The key indicators of energy demand in Turkey such as population, Gross
Domestic Product (GDP), import and export were used for energy demand estimation
in Turkey using Ant Colony Optimization (ACO) [3]. Chiroma et al. [4] applied Co-
Active Neuro Fuzzy Inference System (CANFIS) because of its strengths over Fuzzy
Neural Network (NN) and Adaptive Network-based Fuzzy Inference System
(ANFIS). The CANFIS was modelled to predict crude oil price and comparative
analysis shows that the CANFIS was found to perform better than the ANFIS. To
improve the effectiveness of the CANFIS, Chiroma et al. [5] model the consumption
of energy in Greece based on the hybridization of GA and CANFIS. It was found that
the propose approach performs better than the comparison methods including
CANFIS. Kaynar et al. [6] proposes NN and neuro–fuzzy system to predict natural
gas consumption in Turkey. Results indicated that the prediction accuracy of the
ANFIS was better than the Autoregressive Integrated Moving Average (ARIMA),
multi-layer perceptron, and radial basis function networks. Malaysia oil production
was estimated using ARIMA by [7]. However, the ARIMA typically assume normal
distribution for input data which makes the ARIMA unsuitable for modeling energy
because of the high level of energy uncertainty [8].
Applications of GA in training NN require lengthy local searches close to a local
optimum. In GA, if population changes, the GA abolished the preceding knowledge
of the problem [9]. The PSO has the possibility of being stuck in local optimal which
can undermine its effectiveness [9]. Despite the effectiveness of NN in solving linear,
nonlinear, and complex problems, the NN can possibly be trapped in local minima
and over-fit the training data. There is no ideal framework for determining the optimal
structure of the NN and the selection of the initial training parameters. Researchers
typically employ the cumbersome trial-and-error technique to determine the optimal
structure and selection of the NN parameters [10]. However, Karaboga and Basturk
[11] reported that several comparative studies proved that the performance of the
Artificial Bee Colony algorithm (ABC) outperforms GA, ACO, PSO, and Differential
Evolution algorithms.
In this study, we propose to hybridize ABC and Levenberg-Marquardt NN (LM)
due to its accuracy and convergence speed over other fast learning algorithms [12]
and computational efficiency [13] in order to improve prediction accuracy and
convergence speed in modeling oil consumption. The hybridization of ABC and LM
(ABC-LM) is not a new concept, but applying the concept in the modeling of oil
consumption in Jordan, Lebanon, Oman, and Saudi Arabia is the innovation of this
study.
The rest of this paper is organized as follows. Section 2 describes the proposed
method and data collection. Section 3 describes experimental results and discussion.
Finally the conclusion and future works are presented in Section 4.
2 Proposed Method
2.1 Artificial Bee Colony
In the ABC algorithm, the colony of artificial bees (AB) involve three (3) major
stages, including: employed bees, onlookers, and the scout. The first portion of the
colony comprises of the employed AB, whereas the second portion contain onlookers.
For each of the food source, only one employed bee exists. The employed bee of the
discarded food source becomes the scout. The execution of ABC can be summarized
in the following steps [11]:
Initialize population with random possible solutions
REPEAT
Step 1: Move the employed bees onto their food sources and determine their nectar
amounts.
Step 2: Move the onlookers onto the food sources and determine their nectar
amounts.
Step 3: Move the scouts for searching new food sources.
Step 4: Memorize the best food source found so far and continue
UNTIL (requirements are met and optimal solution found).
2.3 Data Collection
The ABC-LM is a data driven model, therefore, require data and careful design
for successful modeling of the oil consumption. The oil referred to in this paper as
reported by [1] comprised of liquefied petroleum gases, residual fuel, distillate oil,
kerosene, jet fuel, motor gasoline, and other petroleum products. Our goal is to collect
data for domestic oil consumption in Jordan, Lebanon, Oman, and Saudi Arabia. The
oil consumption data were collected from the official website of the Energy
Information Administration of the US department of Energy on a yearly basis for a
period starting from 1981 to 2012. The data were found to be complete without
missing points, outliers, and incomplete information. The oil consumption data are
given in thousands of barrels. The independent variables responsible for domestic oil
consumption are the installed power capacity and the residence yearly/electricity
consumption [14]. The yearly ambient temperature, GDP, the amount of CO2
pollution, number of air conditioners, electricity price, installation of renewable
energy technologies and etc. [14]. According to Khazem [15], data availability is one
of the criteria’s for the selection of variables to be used in modeling. The data set for
modeling in this study were not normalized to prevent the destruction of original
patterns in the historical data [16]. The data were subjected to descriptive analysis in
order to unveil their characteristics. The descriptive statistics of the data sets including
maximum and minimum oil consumption are presented in Table 1. The standard
deviation indicates that the dispersion of the oil consumption do not much deviated
from each other except for Saudi Arabia.
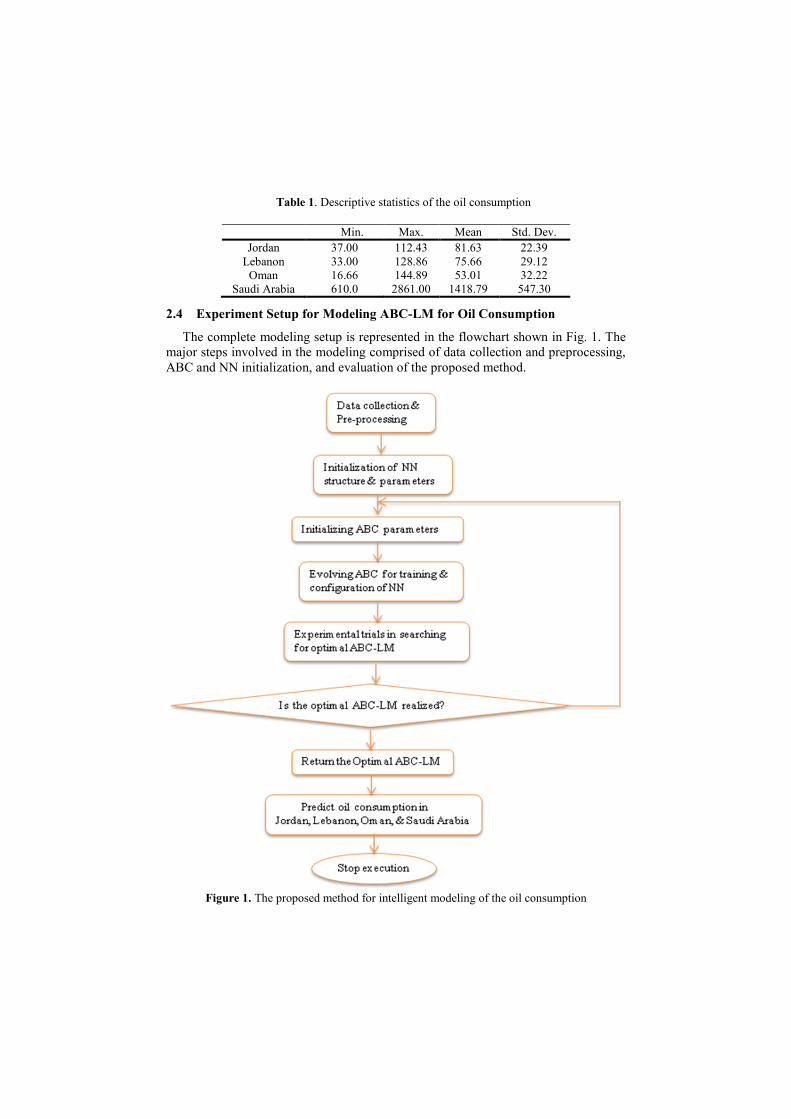
Table 1. Descriptive statistics of the oil consumption
Min. Max. Mean Std. Dev.
Jordan 37.00 112.43 81.63 22.39
Lebanon 33.00 128.86 75.66 29.12
Oman 16.66 144.89 53.01 32.22
Saudi Arabia 610.0 2861.00 1418.79 547.30
2.4 Experiment Setup for Modeling ABC-LM for Oil Consumption
The complete modeling setup is represented in the flowchart shown in Fig. 1. The
major steps involved in the modeling comprised of data collection and preprocessing,
ABC and NN initialization, and evaluation of the proposed method.
Figure 1. The proposed method for intelligent modeling of the oil consumption
The ABC-LM requires data for training and testing the efficiency of the model.
Data partition in modeling has no specific universal acceptable partition ratio. Several
data partition ratios were experimented and 80% for training and 20% for testing the
effectiveness of the ABC-LM model was adopted. The objective of the ABC is to
optimize the NN weights, bias, and hidden neurons. The NN require initialization for
the ABC optimization to start execution. The input neurons were fixed to five (5)
since independent variables in the historical are five (5), and the dependent variable is
the oil consumption because it depends on the independent variables. The hidden
layer of the NN was set to one (1), though, the number of hidden layers can be more
than one (1) but theoretical work of [17] argued that one hidden layer is sufficient for
modeling any function. The activation functions of the hidden and output layer are
sigmoid and linear, respectively, as recommended by [12]. The epoch for the training
was set to 3000. The objective function used for the ABC in the experiment is Mean
Square Error (MSE) because is more preferable than other statistical measures,
especially when comparing different algorithms on the same dataset [18].
Optimization using the ABC involves the searching of optimal values of NN weights,
bias, and a number of hidden layer neurons. For every Bee, it represents an NN for
optimizing the MSE. There are parameters associated with the ABC that requires
settings for efficiency in the search for the best solution. The performance of ABC
depends on the best settings of the parameters which includes: number of sites chosen
out of number of scout bees visited sites, the initial size of the patches, a number of
bees recruited for the selection, number of bees recruited to the best sites, a number
of the elite sites out of selected sites, and number of the scout bees. However, there is
no idle framework for automatically setting the best values that can yield the best
results. Typically, researchers resort to trial-and-error methods for determining the
approximate values of these parameters. In our work, in order to obtain the best
parameter values, we perform thirty seven (37) experimental trials with a small
sample of the dataset in each of the selected countries under study for a fair
determination of the optimal values of these parameters. The parameters that
produced the minimum in all the four countries under study were adopted for the full
scale experiments. The modeling of the ABC-LM continues for 3000 epochs as
mentioned earlier until learning curve with the minimal MSE is returned with the
corresponding weights, hidden layer neurons, and bias. The convergence speed and
the accuracy were recorded. For comparison, the Back-propagation NN (BPNN),
genetically optimized NN (GANN), and standard Levenberg-Marquardt NN (LMNN)
were used to build a model for the prediction of the oil consumption.
3 Results and Discussion
3.1 Comparative Analysis of Oil Consumptions
The proposed ABC-LM was implemented on a machine with the following
configurations: MATLAB 2012b and SPSS Version 20 on a personal computer (HP
L1750, 4 GB RAM, 232.4 GB HDD, 32-bit OS, Intel Core 2 Duo CPU @ 3.00 GHz).
The oil consumption for the countries selected for this study was analyzed using the
statistical t-test for testing the significant difference between oil consumption of the
comparison countries. The results of the analysis are presented in Tables 2-3. The oil
consumption in Jordan was compared to that of Lebanon for fair comparison because
both countries don’t produce significant amount of oil and heavily depends on oil
import for domestic use. The t-test analysis was performed under the assumption that
the oil consumption in Jordan and Lebanon is equal. The t-test results for the two
countries are shown in Table 2.
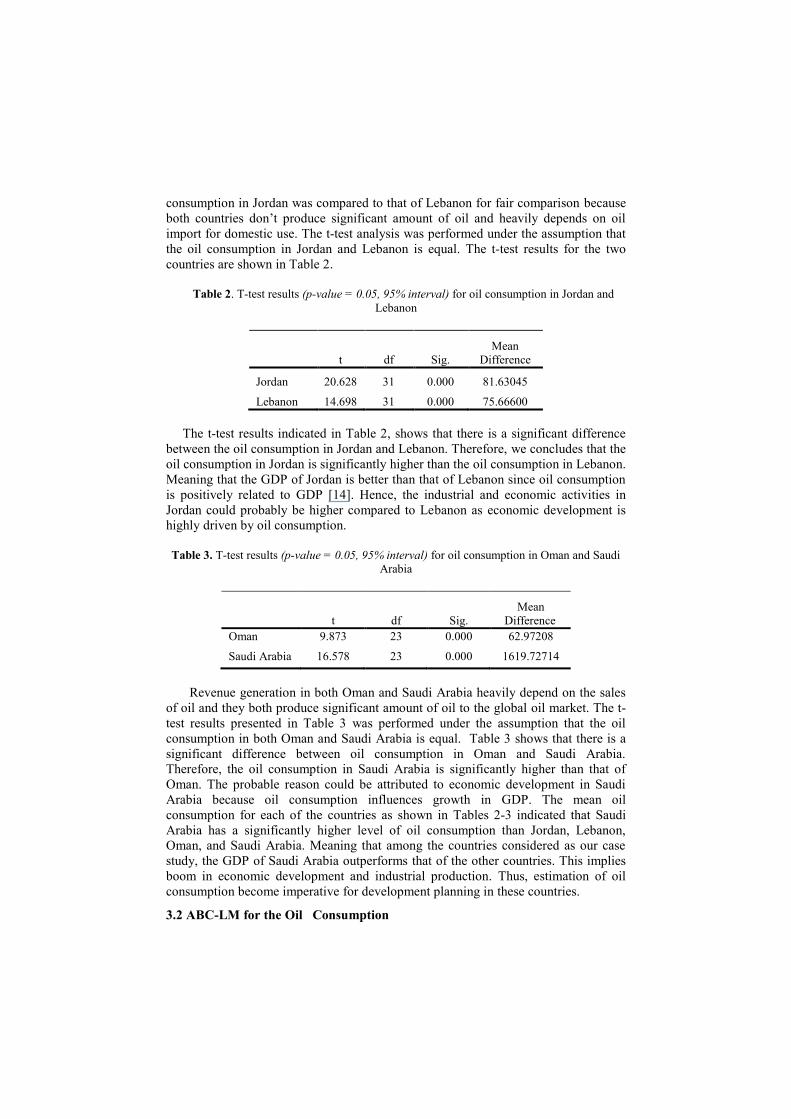
Table 2. T-test results (p-value = 0.05, 95% interval) for oil consumption in Jordan and
Lebanon
t df Sig.
Mean
Difference
Jordan 20.628 31 0.000 81.63045
Lebanon 14.698 31 0.000 75.66600
The t-test results indicated in Table 2, shows that there is a significant difference
between the oil consumption in Jordan and Lebanon. Therefore, we concludes that the
oil consumption in Jordan is significantly higher than the oil consumption in Lebanon.
Meaning that the GDP of Jordan is better than that of Lebanon since oil consumption
is positively related to GDP [14]. Hence, the industrial and economic activities in
Jordan could probably be higher compared to Lebanon as economic development is
highly driven by oil consumption.
Table 3. T-test results (p-value = 0.05, 95% interval) for oil consumption in Oman and Saudi
Arabia
t df Sig.
Mean
Difference
Oman 9.873 23 0.000 62.97208
Saudi Arabia 16.578 23 0.000 1619.72714
Revenue generation in both Oman and Saudi Arabia heavily depend on the sales
of oil and they both produce significant amount of oil to the global oil market. The t-
test results presented in Table 3 was performed under the assumption that the oil
consumption in both Oman and Saudi Arabia is equal. Table 3 shows that there is a
significant difference between oil consumption in Oman and Saudi Arabia.
Therefore, the oil consumption in Saudi Arabia is significantly higher than that of
Oman. The probable reason could be attributed to economic development in Saudi
Arabia because oil consumption influences growth in GDP. The mean oil
consumption for each of the countries as shown in Tables 2-3 indicated that Saudi
Arabia has a significantly higher level of oil consumption than Jordan, Lebanon,
Oman, and Saudi Arabia. Meaning that among the countries considered as our case
study, the GDP of Saudi Arabia outperforms that of the other countries. This implies
boom in economic development and industrial production. Thus, estimation of oil
consumption become imperative for development planning in these countries.
3.2 ABC-LM for the Oil Consumption
The optimal parameters used for the modeling of oil consumption based on ABC-
LM as described in section 2.4 are presented in Table 4. The parameters in Table 4
were realized after the best results were found at the end of the experimental trials in
modeling the oil consumption.
Table 4. Parameters of the ABC-LM model
The optimal parameter Setting
Number of sites chosen out of number of scout bees visited sites 32
Number of elite sites out of m selected sites 2
Number of scout bees 150
Number of bees recruited for the best e sites 50
Number of bees recruited for the selection 20
The initial size of the patches 0.5
Number of NN input neurons 5
Number of NN hidden neurons 7
NN hidden layer Activation function Sigmoid
NN output layer activation function Liner
NN Number of hidden layers 1
Number of output neurons 1
Epoch 3000
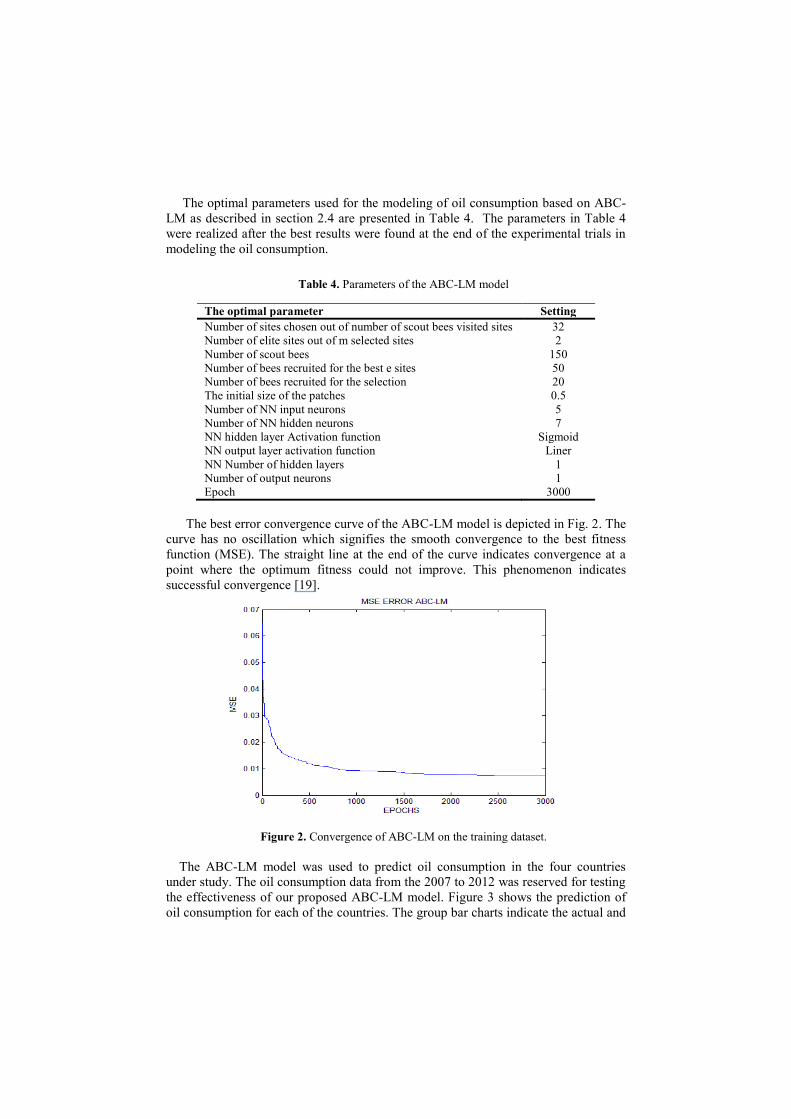
The best error convergence curve of the ABC-LM model is depicted in Fig. 2. The
curve has no oscillation which signifies the smooth convergence to the best fitness
function (MSE). The straight line at the end of the curve indicates convergence at a
point where the optimum fitness could not improve. This phenomenon indicates
successful convergence [19].
Figure 2. Convergence of ABC-LM on the training dataset.
The ABC-LM model was used to predict oil consumption in the four countries
under study. The oil consumption data from the 2007 to 2012 was reserved for testing
the effectiveness of our proposed ABC-LM model. Figure 3 shows the prediction of
oil consumption for each of the countries. The group bar charts indicate the actual and
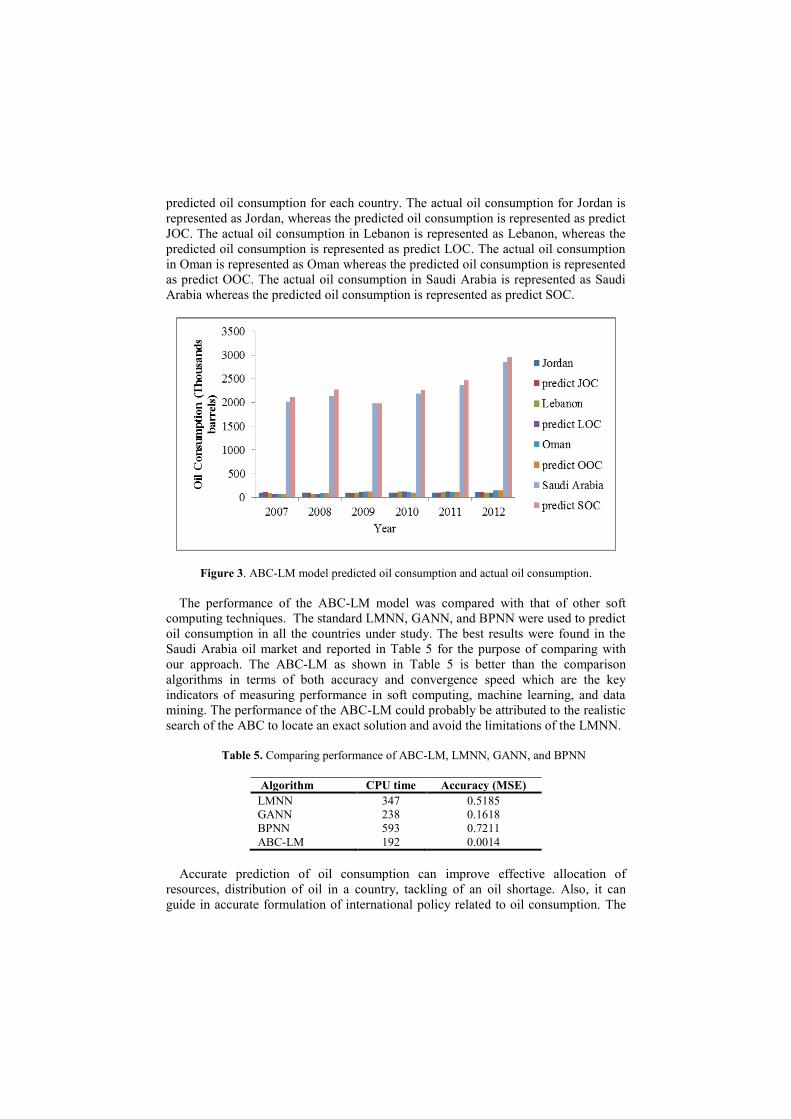
predicted oil consumption for each country. The actual oil consumption for Jordan is
represented as Jordan, whereas the predicted oil consumption is represented as predict
JOC. The actual oil consumption in Lebanon is represented as Lebanon, whereas the
predicted oil consumption is represented as predict LOC. The actual oil consumption
in Oman is represented as Oman whereas the predicted oil consumption is represented
as predict OOC. The actual oil consumption in Saudi Arabia is represented as Saudi
Arabia whereas the predicted oil consumption is represented as predict SOC.
Figure 3. ABC-LM model predicted oil consumption and actual oil consumption.
The performance of the ABC-LM model was compared with that of other soft
computing techniques. The standard LMNN, GANN, and BPNN were used to predict
oil consumption in all the countries under study. The best results were found in the
Saudi Arabia oil market and reported in Table 5 for the purpose of comparing with
our approach. The ABC-LM as shown in Table 5 is better than the comparison
algorithms in terms of both accuracy and convergence speed which are the key
indicators of measuring performance in soft computing, machine learning, and data
mining. The performance of the ABC-LM could probably be attributed to the realistic
search of the ABC to locate an exact solution and avoid the limitations of the LMNN.
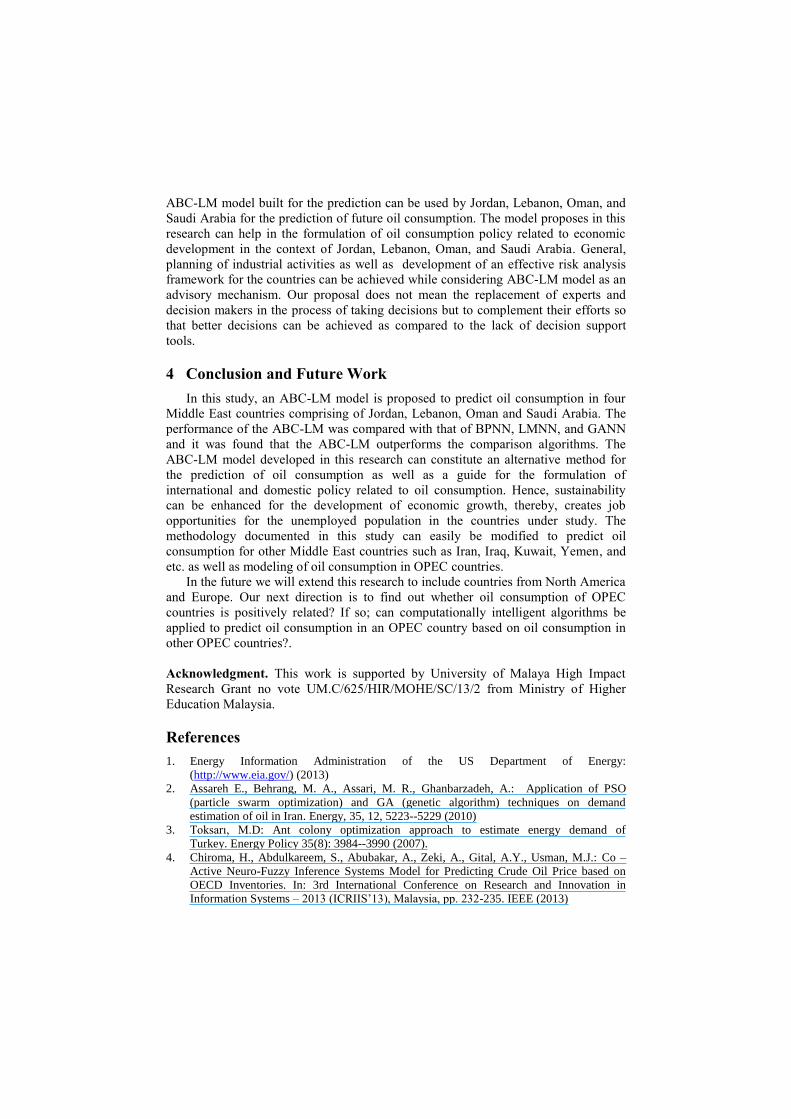
Table 5. Comparing performance of ABC-LM, LMNN, GANN, and BPNN
Algorithm CPU time Accuracy (MSE)
LMNN 347 0.5185
GANN 238 0.1618
BPNN 593 0.7211
ABC-LM 192 0.0014
Accurate prediction of oil consumption can improve effective allocation of
resources, distribution of oil in a country, tackling of an oil shortage. Also, it can
guide in accurate formulation of international policy related to oil consumption. The
ABC-LM model built for the prediction can be used by Jordan, Lebanon, Oman, and
Saudi Arabia for the prediction of future oil consumption. The model proposes in this
research can help in the formulation of oil consumption policy related to economic
development in the context of Jordan, Lebanon, Oman, and Saudi Arabia. General,
planning of industrial activities as well as development of an effective risk analysis
framework for the countries can be achieved while considering ABC-LM model as an
advisory mechanism. Our proposal does not mean the replacement of experts and
decision makers in the process of taking decisions but to complement their efforts so
that better decisions can be achieved as compared to the lack of decision support
tools.
4 Conclusion and Future Work
In this study, an ABC-LM model is proposed to predict oil consumption in four
Middle East countries comprising of Jordan, Lebanon, Oman and Saudi Arabia. The
performance of the ABC-LM was compared with that of BPNN, LMNN, and GANN
and it was found that the ABC-LM outperforms the comparison algorithms. The
ABC-LM model developed in this research can constitute an alternative method for
the prediction of oil consumption as well as a guide for the formulation of
international and domestic policy related to oil consumption. Hence, sustainability
can be enhanced for the development of economic growth, thereby, creates job
opportunities for the unemployed population in the countries under study. The
methodology documented in this study can easily be modified to predict oil
consumption for other Middle East countries such as Iran, Iraq, Kuwait, Yemen, and
etc. as well as modeling of oil consumption in OPEC countries.
In the future we will extend this research to include countries from North America
and Europe. Our next direction is to find out whether oil consumption of OPEC
countries is positively related? If so; can computationally intelligent algorithms be
applied to predict oil consumption in an OPEC country based on oil consumption in
other OPEC countries?.
Acknowledgment. This work is supported by University of Malaya High Impact
Research Grant no vote UM.C/625/HIR/MOHE/SC/13/2 from Ministry of Higher
Education Malaysia.
References
1. Energy Information Administration of the US Department of Energy:
(http://www.eia.gov/) (2013)
2. Assareh E., Behrang, M. A., Assari, M. R., Ghanbarzadeh, A.: Application of PSO
(particle swarm optimization) and GA (genetic algorithm) techniques on demand
estimation of oil in Iran. Energy, 35, 12, 5223--5229 (2010)
3. Toksarı, M.D: Ant colony optimization approach to estimate energy demand of
Turkey. Energy Policy 35(8): 3984--3990 (2007).
4. Chiroma, H., Abdulkareem, S., Abubakar, A., Zeki, A., Gital, A.Y., Usman, M.J.: Co –
Active Neuro-Fuzzy Inference Systems Model for Predicting Crude Oil Price based on
OECD Inventories. In: 3rd International Conference on Research and Innovation in
Information Systems – 2013 (ICRIIS’13), Malaysia, pp. 232-235. IEEE (2013)

5. Chiroma, H., Abdulkareem, S., Sari, E.N., Abdullah, Z., Muaz, S.A., Kaynar, O., Shah,
H., and Herawan, T.: Soft Computing Approach in Modeling Energy Consumption. In: B.
Murgante et al. (Eds.): ICCSA 2014, Part VI, LNCS 8584, pp. 770–782, Springer
International Publishing Switzerland (2014)
6. Kaynar O., Yilmaz I., Demirkoparan F.: Forecasting of natural gas consumption with
neural network and neuro fuzzy system. In: EGU General Assembly Conference
Abstracts, 12, pp. 7781 (2010)
7. Yusof, N. M., Rashid, R. S. A., Mohamed, Z.: Malaysia crude oil production
estimation: An application of ARIMA model. In: Science and Social Research (CSSR),
2010 International Conference on, pp. 1255--1259 (2010)
8. Su, F., Wu, W.: Design and testing of a genetic algorithm neural network in the
assessment of gait patterns. Medical Engineering Physics, 22, 67--74 (2000)
9. Dehuri, S., Cho, S. B.: A hybrid genetic based functional link artificial neural
network with a statistical comparison of classifiers over multiple datasets. Neural
Computing and Applications.19, 2, pp.317--328 (2000)
10. Bishop M.C.:Pattern recognition and machine learning. Springer: New York, 2006.
11. Karaboga, D., Basturk, B.: On the performance of artificial bee colony (ABC)
algorithm. Applied Soft Computing, 5, 1, pp.687-697 (2008)
12. Azar, A. T.: (2013). Fast neural network learning algorithms for medical
applications. Neural Computing and Applications, 23, (3-4), 1019--1034 (2013)
13. He, K., Chi X., Chen, S., Lai K.K.: Estimating VaR in crude oil market: A novel multi–
scale non-linear ensemble approach incorporating wavelet analysis and neural network.
Neurocomputing, 72, pp. 3428--3438 (2009)
14. Ekonomou, L.: Greek long-term energy consumption prediction using artificial neural
networks. Energy 35, 2, 512--517 (2010)
15. Khazem, H.A.: Using artificial neural network to forecast the futures prices of crude oil.
PhD dissertation, Nova south Eastern University, Florida (2007)
16. Jammazi, R., Aloui, C.: Crude oil forecasting: experimental evidence from wavelet
decomposition and neural network modelling. Energy Economics, 34, 828–841 (2012)
17. Pan, T.Y.: Wang, R.Y ‘State space neural networks for short term rainfall–runoff
forecasting. Journal of Hydrology, 297, 34 -- 50 (2004)
18. Peter, G.Z., Patuwo, B.E., Hu. M.Y.: A simulation study of artificial neural networks for
nonlinear time-series forecasting. Computers & Operation Research, 28, 381--396 (2001)
19. Nawi, N.M., Rehman, M.Z., Khan, A.: Countering the problem of oscillation in Bat-BP
gradient trajectory by using momentum. Lecture notes in Electrical Engineering, 285,
103--118 (2014)