An integrative computational model for intestinal tissue renewal
20
An integrative computational model for intestinal tissue renewal I. M. M. van Leeuwen* , †, G. R. Mirams*, A. Walter*, A. Fletcher‡ , #, P. Murray‡, J. Osborne§, S. Varma¶, S. J. Young*, J. Cooper§, B. Doyle**, J. Pitt-Francis§, L. Momtahan§, P. Pathmanathan§, J. P. Whiteley§, S. J. Chapman#, D. J. Gavaghan§, O. E. Jensen*, J. R. King*, P. K. Maini‡ , ††, S. L. Waters‡ and H. M. Byrne* *School of Mathematical Sciences, University of Nottingham, Nottingham, UK, †Department of Surgery and Oncology, Ninewells Hospital, Dundee, UK, and Department of Microbiology, Tumor and Cell Biology, Karolinska Institute, Stockholm, Sweden, ‡Centre for Mathematical Biology, Mathematical Institute, University of Oxford, Oxford, UK, #Oxford Centre for Industrial Applied Mathematics, Mathematical Institute, University of Oxford, Oxford, UK, §Computing Laboratory, University of Oxford, Oxford, UK, ¶Department of Computer Science, University of Sheffield, Sheffield, UK, **Beatson Institute for Cancer Research, Cancer Research UK, Glasgow, UK, and ††Oxford Centre for Integrative Systems Biology, Department of Biochemistry, University of Oxford, Oxford, UK Received 14 August 2008; revision accepted 24 October 2008 Abstract Objectives: The luminal surface of the gut is lined with a monolayer of epithelial cells that acts as a nutrient absorptive engine and protective barrier. To maintain its integrity and functionality, the epithelium is renewed every few days. Theoretical models are powerful tools that can be used to test hypotheses concerning the regulation of this renewal process, to investigate how its dysfunction can lead to loss of homeostasis and neoplasia, and to identify potential therapeutic interventions. Here we propose a new multiscale model for crypt dynamics that links phenomena occurring at the subcellular, cellular and tissue levels of organisation. Methods: At the subcellular level, deterministic models characterise molecular networks, such as cell-cycle control and Wnt signalling. The output of these models determines the behaviour of each epithelial cell in response to intra-, inter- and extra- cellular cues. The modular nature of the model enables us to easily modify individual assumptions and analyse their effects on the system as a whole. Results: We perform virtual microdissection and labelling-index experiments, evaluate the impact of various model extensions, obtain new insight into clo- nal expansion in the crypt, and compare our predic- tions with recent mitochondrial DNA mutation data. Conclusions: We demonstrate that relaxing the assumption that stem-cell positions are fixed enables clonal expansion and niche succession to occur. We also predict that the presence of extracellular factors near the base of the crypt alone suffices to explain the observed spatial variation in nuclear beta-catenin levels along the crypt axis. Introduction Tissue renewal and regeneration are crucial for the survival and longevity of multicellular organisms. Replacement of the outer layers of the epidermis, for instance, ensures maintenance of the skin’s structure and mechanical prop- erties, despite its continuous and direct exposure to a wide range of damaging factors (1). Another rapidly renewing tissue, the intestinal epithelium, is completely replaced every 2–3 and 3–5 days in mice and humans, respectively (2,3). This process is driven by a small number of stem cells located at the base of the crypts of Lieberku ¨hn (Fig. 1). It has been estimated that there are about 20 mil- lion of these crypts in the human large intestine (4). Intest- inal stem cells are believed to proliferate occasionally, producing on average one replacement stem cell and one semi-differentiated transit cell. These transit-amplifying cells divide several times, while migrating upwards, before undergoing terminal differentiation. At the crypt orifice, mature cells are shed into the intestinal lumen (5). Extensive experimental evidence demonstrates that Wnt signalling plays a central role in maintaining the intestinal stem-cell niche and regulating normal crypt dynamics (6–8). In particular, it has been proposed that a spatial gradient of extracellular Wnt factors along the crypt axis determines position-dependent rates of cell prolifera- tion, differentiation and death (9). Wnt signalling is initiated when extracellular Wnt factors bind to specific receptors on the cell surface. This triggers a cascade of intracellular reactions, leading eventually to the inhibition of a protein Correspondence: I. M. M. van Leeuwen, Department of Microbiology, Tumor and Cell Biology, Karolinska Institute, Stockholm, Sweden. Tel: +46(0)852487219; Fax: +46(0) 852304276; E-mail: ingeborg. [email protected] Ó 2009 Blackwell Publishing Ltd. 617 Cell Prolif. 2009, 42, 617–636 doi: 10.1111/j.1365-2184.2009.00627.x
-
Upload
independent -
Category
Documents
-
view
1 -
download
0
Transcript of An integrative computational model for intestinal tissue renewal
An integrative computational model for intestinal tissue renewal
I. M. M. van Leeuwen*,†, G. R. Mirams*, A. Walter*, A. Fletcher‡,#, P. Murray‡, J. Osborne§, S. Varma¶,S. J. Young*, J. Cooper§, B. Doyle**, J. Pitt-Francis§, L. Momtahan§, P. Pathmanathan§, J. P. Whiteley§,S. J. Chapman#, D. J. Gavaghan§, O. E. Jensen*, J. R. King*, P. K. Maini‡,††, S. L. Waters‡ and H. M. Byrne*
*School of Mathematical Sciences, University of Nottingham, Nottingham, UK, †Department of Surgery and Oncology, Ninewells Hospital, Dundee,UK, and Department of Microbiology, Tumor and Cell Biology, Karolinska Institute, Stockholm, Sweden, ‡Centre for Mathematical Biology,Mathematical Institute, University of Oxford, Oxford, UK, #Oxford Centre for Industrial Applied Mathematics, Mathematical Institute, University ofOxford, Oxford, UK, §Computing Laboratory, University of Oxford, Oxford, UK, ¶Department of Computer Science, University of Sheffield, Sheffield,UK, **Beatson Institute for Cancer Research, Cancer Research UK, Glasgow, UK, and ††Oxford Centre for Integrative Systems Biology, Departmentof Biochemistry, University of Oxford, Oxford, UK
Received 14 August 2008; revision accepted 24 October 2008
AbstractObjectives: The luminal surface of the gut is linedwith a monolayer of epithelial cells that acts as anutrient absorptive engine and protective barrier. Tomaintain its integrity and functionality, the epitheliumis renewed every few days. Theoretical models arepowerful tools that can be used to test hypothesesconcerning the regulation of this renewal process, toinvestigate how its dysfunction can lead to loss ofhomeostasis and neoplasia, and to identify potentialtherapeutic interventions. Here we propose a newmultiscale model for crypt dynamics that linksphenomena occurring at the subcellular, cellular andtissue levels of organisation.Methods: At the subcellular level, deterministicmodels characterise molecular networks, such ascell-cycle control and Wnt signalling. The output ofthese models determines the behaviour of eachepithelial cell in response to intra-, inter- and extra-cellular cues. The modular nature of the modelenables us to easily modify individual assumptionsand analyse their effects on the system as a whole.Results: We perform virtual microdissection andlabelling-index experiments, evaluate the impact ofvarious model extensions, obtain new insight into clo-nal expansion in the crypt, and compare our predic-tions with recent mitochondrial DNAmutation data.Conclusions: We demonstrate that relaxing theassumption that stem-cell positions are fixed enables
clonal expansion and niche succession to occur. Wealso predict that the presence of extracellular factorsnear the base of the crypt alone suffices to explainthe observed spatial variation in nuclear beta-cateninlevels along the crypt axis.
Introduction
Tissue renewal and regeneration are crucial for the survivaland longevity of multicellular organisms. Replacement ofthe outer layers of the epidermis, for instance, ensuresmaintenance of the skin’s structure and mechanical prop-erties, despite its continuous and direct exposure to a widerange of damaging factors (1). Another rapidly renewingtissue, the intestinal epithelium, is completely replacedevery 2–3 and 3–5 days in mice and humans, respectively(2,3). This process is driven by a small number of stemcells located at the base of the crypts of Lieberkuhn(Fig. 1). It has been estimated that there are about 20 mil-lion of these crypts in the human large intestine (4). Intest-inal stem cells are believed to proliferate occasionally,producing on average one replacement stem cell and onesemi-differentiated transit cell. These transit-amplifyingcells divide several times, while migrating upwards,before undergoing terminal differentiation. At the cryptorifice, mature cells are shed into the intestinal lumen (5).
Extensive experimental evidence demonstrates thatWnt signalling plays a central role in maintaining theintestinal stem-cell niche and regulating normal cryptdynamics (6–8). In particular, it has been proposed that aspatial gradient of extracellular Wnt factors along the cryptaxis determines position-dependent rates of cell prolifera-tion, differentiation and death (9). Wnt signalling is initiatedwhen extracellular Wnt factors bind to specific receptors onthe cell surface. This triggers a cascade of intracellularreactions, leading eventually to the inhibition of a protein
Correspondence: I. M. M. van Leeuwen, Department of Microbiology,Tumor and Cell Biology, Karolinska Institute, Stockholm, Sweden.Tel: +46(0)852487219; Fax: +46(0) 852304276; E-mail: [email protected]
� 2009 Blackwell Publishing Ltd. 617
Cell Prolif. 2009, 42, 617–636 doi: 10.1111/j.1365-2184.2009.00627.x
complex containing the APC tumour suppressor. As thisdestruction complex is responsible for maintaining cyto-plasmic b-catenin at low levels, inactivation of the com-plex leads to accumulation of b-catenin, which thentravels to the nucleus, binds to a transcription factor of theTCF/LEF family, and induces transcription of Wnt targets.These include genes coding for proteins involved in cell-cycle control, migration and apoptosis. Mutations in keycomponents of the Wnt pathway, such as APC and b-cate-nin, are responsible for the initiation of the vast majority ofcolorectal cancers, including most hereditary cases (6). Itis notable that b-catenin is a multifunctional protein that isessential not only for Wnt signalling but also for cell–celladhesion (10–12). At the cell membrane, it binds to thecytoplasmic tail of E-cadherin (13), which constitutes theprimary component of lateral adherens junctions.
Despite the fact that the large bowel is an extensivelystudied system, several fundamental biological questionsremain unanswered. The position and number of intestinalstem cells have, for example, still to be confirmed experi-mentally. It is also unclear how different cellular processesare regulated and coordinated to maintain crypt homeosta-sis. As a crypt is a complex, highly-regulated system, atheoretical approach is valuable for attaining deeperunderstanding of its dynamics. Mathematical and compu-tational modelling, in particular, are powerful tools thatcan provide insights that complement and reinforceknowledge acquired by experimental methods (14–16).
Models for crypt dynamics have, for instance, been usedto investigate the mechanisms of cell migration (e.g., 17),tissue recovery following irradiation (e.g., 18), malignanttransformation (e.g., 19), and stem-cell dynamics (e.g.,20). Existing models, including these, were generally cre-ated to answer specific questions and, therefore, focusedlargely on a single level of organisation (for example, sub-cellular pathways).
Until recently, the majority of mathematical modelshave treated cells as black boxes, with prescribed proper-ties, and have been used to predict their behaviour at thetissue level. In contrast, bioinformatics aims to understandprocesses at the gene and protein level. Systems biologyis generally defined as the study of multiple interactingpathways. All these approaches operate at a specific scale(or small number of scales) and constitute a vital first stepin analysing biological systems from a theoretical view-point. Biological function, however, arises from the com-plex interplay between many processes that operate on(and across) different length and time scales. Recentadvances in computational resources mean that it is nowpossible to build and simulate detailed multiscale modelsof complex biological systems, linking subcellular, cellu-lar and macroscale components and phenomena (21–24).Here we adopt such an integrative approach to construct avirtual colonic crypt and investigate its properties. In ourmodel, every virtual cell carries a continuum cell-cyclecontrol model that is coupled to an intracellular Wnt
Figure 1. Normal colonic mucosa. (a) Microdissection image courtesy of the Department of Pathology, Ninewells Hospital, Dundee, UK. The cir-cular structures correspond to cross-sections of crypts of Lieberkuhn. The space between these glands contains connective tissue (the lamina propria),blood vessels and lymphatics. (b) Schematic of a colonic crypt. The epithelial cells lining the crypts reside on a basement membrane. Murine andhuman intestinal crypts contain about 250 and 2000 epithelial cells, respectively (4,20).
� 2009 Blackwell Publishing Ltd, Cell Proliferation, 42, 617–636.
618 I. M. M. van Leeuwen et al.
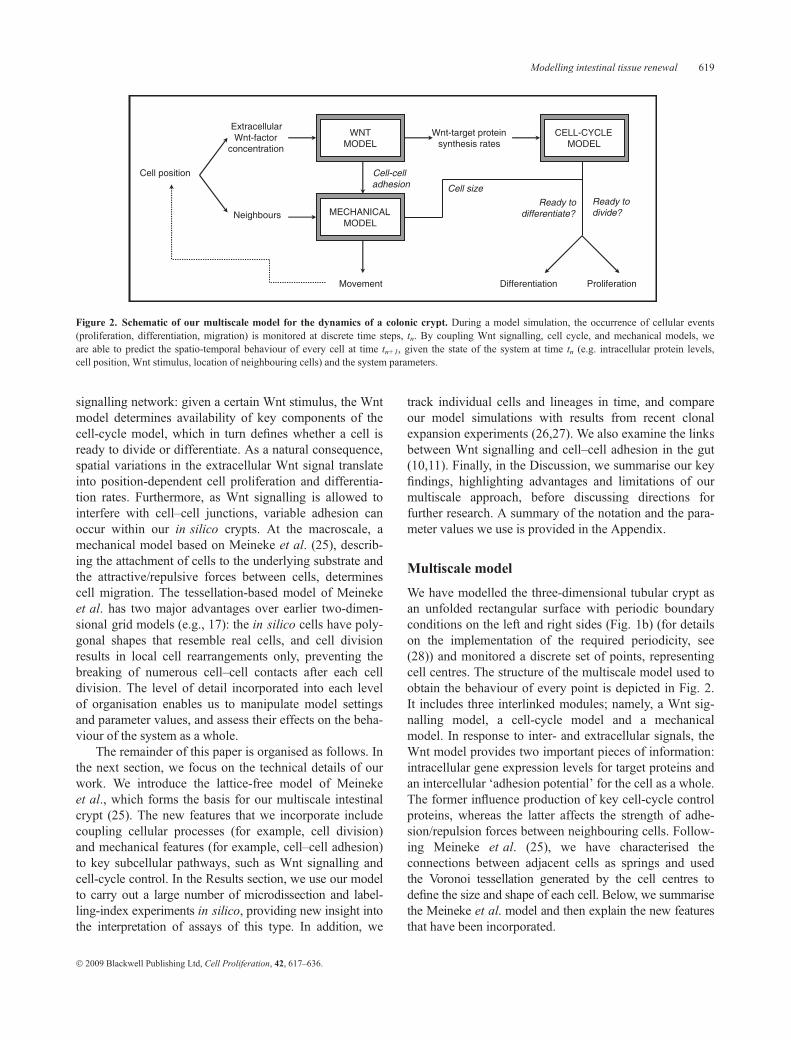
signalling network: given a certain Wnt stimulus, the Wntmodel determines availability of key components of thecell-cycle model, which in turn defines whether a cell isready to divide or differentiate. As a natural consequence,spatial variations in the extracellular Wnt signal translateinto position-dependent cell proliferation and differentia-tion rates. Furthermore, as Wnt signalling is allowed tointerfere with cell–cell junctions, variable adhesion canoccur within our in silico crypts. At the macroscale, amechanical model based on Meineke et al. (25), describ-ing the attachment of cells to the underlying substrate andthe attractive/repulsive forces between cells, determinescell migration. The tessellation-based model of Meinekeet al. has two major advantages over earlier two-dimen-sional grid models (e.g., 17): the in silico cells have poly-gonal shapes that resemble real cells, and cell divisionresults in local cell rearrangements only, preventing thebreaking of numerous cell–cell contacts after each celldivision. The level of detail incorporated into each levelof organisation enables us to manipulate model settingsand parameter values, and assess their effects on the beha-viour of the system as a whole.
The remainder of this paper is organised as follows. Inthe next section, we focus on the technical details of ourwork. We introduce the lattice-free model of Meinekeet al., which forms the basis for our multiscale intestinalcrypt (25). The new features that we incorporate includecoupling cellular processes (for example, cell division)and mechanical features (for example, cell–cell adhesion)to key subcellular pathways, such as Wnt signalling andcell-cycle control. In the Results section, we use our modelto carry out a large number of microdissection and label-ling-index experiments in silico, providing new insight intothe interpretation of assays of this type. In addition, we
track individual cells and lineages in time, and compareour model simulations with results from recent clonalexpansion experiments (26,27). We also examine the linksbetween Wnt signalling and cell–cell adhesion in the gut(10,11). Finally, in the Discussion, we summarise our keyfindings, highlighting advantages and limitations of ourmultiscale approach, before discussing directions forfurther research. A summary of the notation and the para-meter values we use is provided in the Appendix.
Multiscale model
We have modelled the three-dimensional tubular crypt asan unfolded rectangular surface with periodic boundaryconditions on the left and right sides (Fig. 1b) (for detailson the implementation of the required periodicity, see(28)) and monitored a discrete set of points, representingcell centres. The structure of the multiscale model used toobtain the behaviour of every point is depicted in Fig. 2.It includes three interlinked modules; namely, a Wnt sig-nalling model, a cell-cycle model and a mechanicalmodel. In response to inter- and extracellular signals, theWnt model provides two important pieces of information:intracellular gene expression levels for target proteins andan intercellular ‘adhesion potential’ for the cell as a whole.The former influence production of key cell-cycle controlproteins, whereas the latter affects the strength of adhe-sion/repulsion forces between neighbouring cells. Follow-ing Meineke et al. (25), we have characterised theconnections between adjacent cells as springs and usedthe Voronoi tessellation generated by the cell centres todefine the size and shape of each cell. Below, we summarisethe Meineke et al. model and then explain the new featuresthat have been incorporated.
Figure 2. Schematic of our multiscale model for the dynamics of a colonic crypt. During a model simulation, the occurrence of cellular events(proliferation, differentiation, migration) is monitored at discrete time steps, tn. By coupling Wnt signalling, cell cycle, and mechanical models, weare able to predict the spatio-temporal behaviour of every cell at time tn+1, given the state of the system at time tn (e.g. intracellular protein levels,cell position, Wnt stimulus, location of neighbouring cells) and the system parameters.
� 2009 Blackwell Publishing Ltd, Cell Proliferation, 42, 617–636.
Modelling intestinal tissue renewal 619
The Meineke et al. model
Below, we summarise the assumptions underpinning theMeineke et al. model (25); for further details the readeris referred to the original paper. A crypt from the smallintestine is modelled as a two-dimensional cylindricalsurface populated with stem, transit and differentiatedcells. The model also accounts for the presence ofPaneth cells, which are absent from most of the largeintestine. Cellular processes, which are monitored at dis-crete times, tn (tn+1 ¼ tn + Dt, with Dt a small time step),are characterised as follows:
• Cell division: Only stem and transit cells can divide.Following division, a new cell-cycle time is assigned toeach daughter cell. The duration of the G1 phase isassumed to be a uniformly-distributed random variable,whereas the duration of the remaining phases of the cellcycle is kept constant. The ‘direction of division’ is sto-chastic: one daughter cell occupies the site of the mothercell, while the other is placed a fixed distance, L0, away.
• Cell differentiation: Stem cells divide asymmetrically(one daughter cell remains in the stem-cell pool,whereas the other becomes a transit cell). Transit cellsundergo terminal differentiation after a fixed number ofgenerations.
• Cell death: The model does not account explicitly forcell death. Instead, cells that move above the top of thecrypt are no longer monitored.
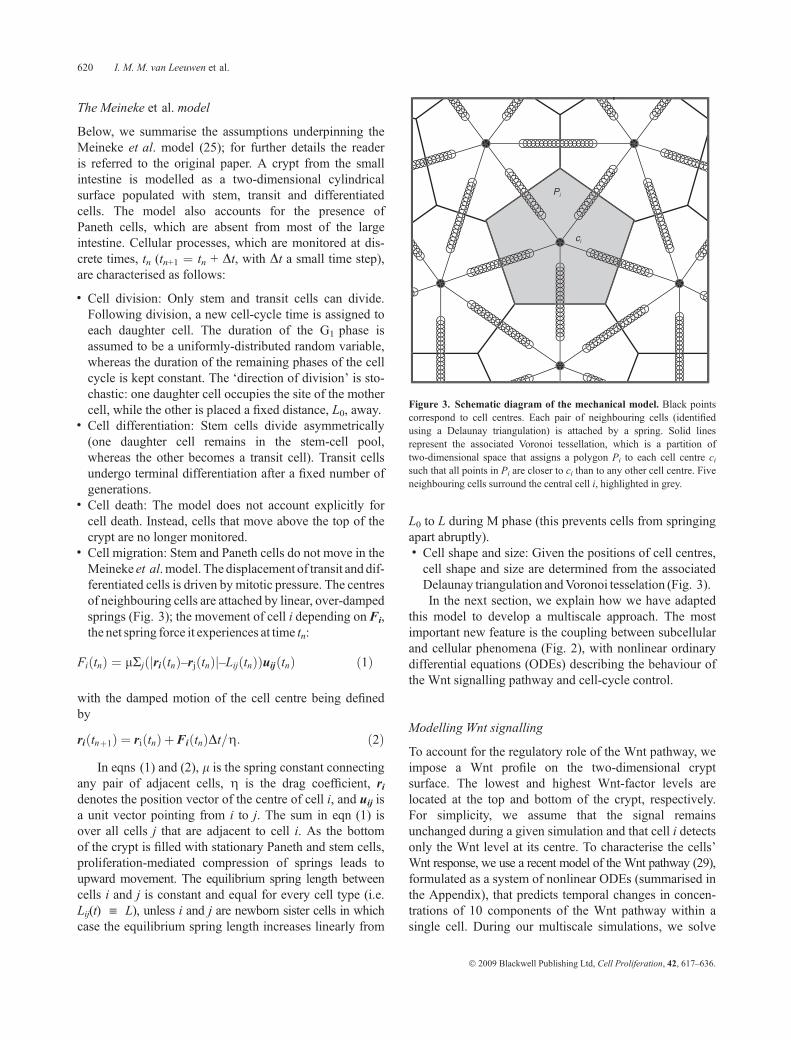
• Cell migration: Stem and Paneth cells do not move in theMeineke et al. model. The displacement of transit and dif-ferentiated cells is driven by mitotic pressure. The centresof neighbouring cells are attached by linear, over-dampedsprings (Fig. 3); the movement of cell i depending on Fi,the net spring force it experiences at time tn:
FiðtnÞ ¼ lRjðjriðtnÞ–rjðtnÞj–LijðtnÞÞuijðtnÞ ð1Þ
with the damped motion of the cell centre being definedby
riðtnþ1Þ ¼ riðtnÞ þFiðtnÞDt=g: ð2Þ
In eqns (1) and (2), l is the spring constant connectingany pair of adjacent cells, g is the drag coefficient, ridenotes the position vector of the centre of cell i, and uij isa unit vector pointing from i to j. The sum in eqn (1) isover all cells j that are adjacent to cell i. As the bottomof the crypt is filled with stationary Paneth and stem cells,proliferation-mediated compression of springs leads toupward movement. The equilibrium spring length betweencells i and j is constant and equal for every cell type (i.e.Lij(t) ” L), unless i and j are newborn sister cells in whichcase the equilibrium spring length increases linearly from
L0 to L during M phase (this prevents cells from springingapart abruptly).• Cell shape and size: Given the positions of cell centres,cell shape and size are determined from the associatedDelaunay triangulation andVoronoi tesselation (Fig. 3).In the next section, we explain how we have adapted
this model to develop a multiscale approach. The mostimportant new feature is the coupling between subcellularand cellular phenomena (Fig. 2), with nonlinear ordinarydifferential equations (ODEs) describing the behaviour ofthe Wnt signalling pathway and cell-cycle control.
Modelling Wnt signalling
To account for the regulatory role of the Wnt pathway, weimpose a Wnt profile on the two-dimensional cryptsurface. The lowest and highest Wnt-factor levels arelocated at the top and bottom of the crypt, respectively.For simplicity, we assume that the signal remainsunchanged during a given simulation and that cell i detectsonly the Wnt level at its centre. To characterise the cells’Wnt response, we use a recent model of the Wnt pathway (29),formulated as a system of nonlinear ODEs (summarised inthe Appendix), that predicts temporal changes in concen-trations of 10 components of the Wnt pathway within asingle cell. During our multiscale simulations, we solve
Figure 3. Schematic diagram of the mechanical model. Black pointscorrespond to cell centres. Each pair of neighbouring cells (identifiedusing a Delaunay triangulation) is attached by a spring. Solid linesrepresent the associated Voronoi tessellation, which is a partition oftwo-dimensional space that assigns a polygon Pi to each cell centre cisuch that all points in Pi are closer to ci than to any other cell centre. Fiveneighbouring cells surround the central cell i, highlighted in grey.
� 2009 Blackwell Publishing Ltd, Cell Proliferation, 42, 617–636.
620 I. M. M. van Leeuwen et al.
the system of ODEs numerically for each cell i to calcu-late concentrations at time tn+1 based on initial concentra-tions and Wnt exposure at time tn. In particular, since theWnt model incorporates the dual role of b-catenin inWnt signal transduction and cell–cell adhesion, we canquantify the levels of adhesion and transcription com-plexes (CAi and CTi, respectively, for cell i).
Wnt-dependent cell-cycle model
We have used the level of transcription complexes, CTi,and associated target-protein synthesis rates to link theoutput of the Wnt model to the cell-cycle model proposedby Swat et al. (30). We chose this particular modelbecause it includes cyclin D, a known Wnt target that,together with c-myc, promotes G1/S transition and therebycell proliferation (cf. 31). The model equations areprovided in the Appendix. According to the resultingWnt-dependent cell-cycle (WCC) model, cells exposed toa strong Wnt signal can produce cyclin D faster and,consequently, progress more quickly through the cellcycle than cells exposed to low Wnt. Hence, inclusion of a
spatially varying Wnt signal into our multiscale modelgives rise to cell cycles whose duration is position-depen-dent. Additionally, due to the cell-cycle model’s bistabil-ity, there is a threshold Wnt level below which the G1/Scheckpoint can never be passed. We view such growth-arrested cells as differentiated. Local cell rearrangementscan occasionally cause a cell to re-enter more favourableWnt conditions and, in particular, to undergo dedifferen-tiation. It is important to point out that a cell’s dedifferen-tiation probability strongly depends on its position alongthe crypt axis (that is, on how far the cell has to migratedownwards against the general cell-movement stream inorder to reach favourable Wnt conditions). These predic-tions are in agreement with the ‘spiral model of cell andtissue organisation’ and account for the experimentalobservation that crypts can recover following stem celldepletion (32).
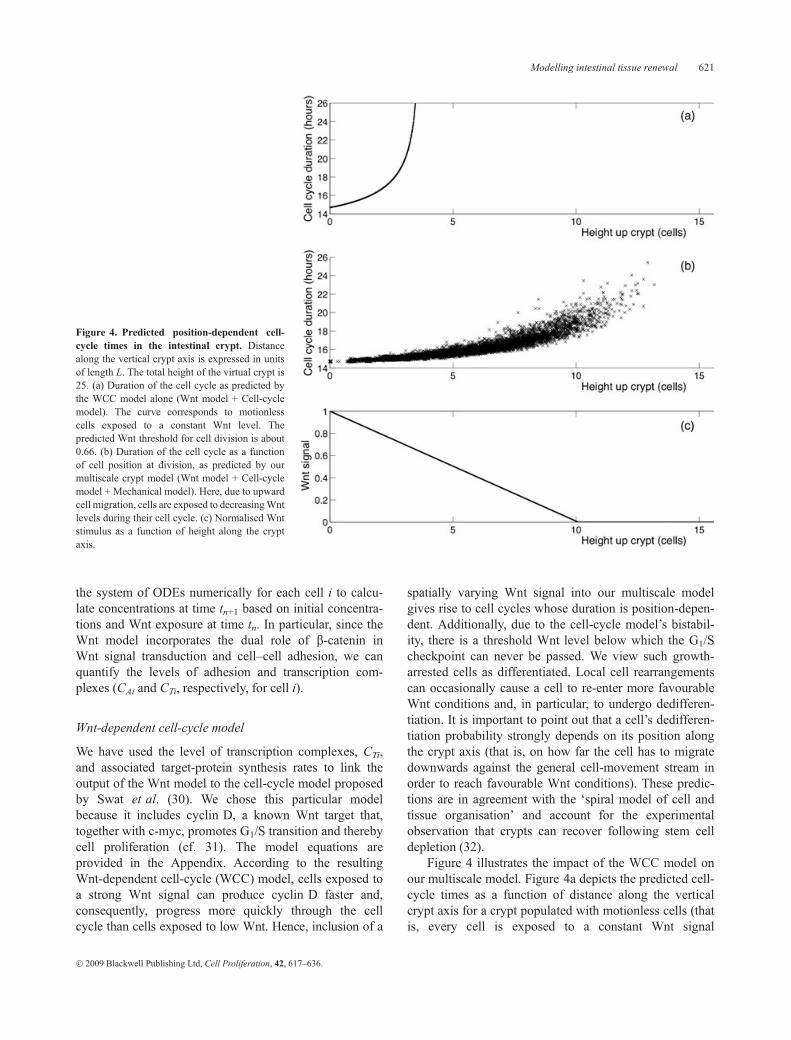
Figure 4 illustrates the impact of the WCC model onour multiscale model. Figure 4a depicts the predicted cell-cycle times as a function of distance along the verticalcrypt axis for a crypt populated with motionless cells (thatis, every cell is exposed to a constant Wnt signal
Figure 4. Predicted position-dependent cell-cycle times in the intestinal crypt. Distancealong the vertical crypt axis is expressed in unitsof length L. The total height of the virtual crypt is25. (a) Duration of the cell cycle as predicted bythe WCC model alone (Wnt model + Cell-cyclemodel). The curve corresponds to motionlesscells exposed to a constant Wnt level. Thepredicted Wnt threshold for cell division is about0.66. (b) Duration of the cell cycle as a functionof cell position at division, as predicted by ourmultiscale crypt model (Wnt model + Cell-cyclemodel + Mechanical model). Here, due to upwardcell migration, cells are exposed to decreasingWntlevels during their cell cycle. (c) Normalised Wntstimulus as a function of height along the cryptaxis.
� 2009 Blackwell Publishing Ltd, Cell Proliferation, 42, 617–636.
Modelling intestinal tissue renewal 621
throughout its cell cycle); the corresponding Wnt stimulusis shown in the lower panel. Figure 4b, in contrast, showsthe actual cell-cycle times recorded during a multiscale-crypt simulation. For every cell, we plotted the cell-cycletime as a function of the cell’s position at the time of divi-sion. The deviation between Figs. 4a and 4b is due to celldisplacements taking place in the crypt: during the courseof their cell cycle, in silico cells move upwards into gra-dually lower Wnt environments. Consequently, therecorded cell-cycle times are shorter than would be antici-pated from the Wnt exposure level at division. This is bestexemplified by those cells in Fig. 4b that proliferate underno-Wnt conditions (that is, more than 10 length unitsaway from the crypt base). These cells had already com-mitted to cell division before entering an unfavourableWnt region. Hence, Fig. 4 reveals the effects of inter-actions taking place across different time and length scales(extracellular Wnt factors, Wnt signalling, cell-cycle con-trol, proliferation and migration), and thus reflects thetruly multiscale nature of our virtual crypt.
Modelling cell–cell and cell–matrix adhesion
As we represent three-dimensional cells of fixed height bya two-dimensional model, cells adhere to their neighboursand underlying substrate by one-dimensional cell–cellcontact edges and two-dimensional cell–matrix contactareas, respectively. In Meineke et al.’s model, the attrac-tive and repulsive forces due to cell–cell interactionsdepend only on whether the spring connecting the cellcentres is under tension or compression. As spring para-meters are assumed to be constant, cell–cell bonds havethe same strength for any pair of neighbouring cells. Con-sequently, distant neighbouring cells are strongly attractedtowards each other even when their cell–cell contact edgeis very short. Here we relax the assumption that thestrength of the spring connecting two cells is constant andsuppose instead that it increases as the cell–cell contactlength expands. The spring constant, lij(t), depends oneij(t), the length of the edge between neighbouring cells iand j, in the following way:
lijðtÞ ¼ leijðtÞp3=L; ð3Þ
where L is distance between neighbouring cell centres inan equilibrim, hexagonal lattice. We note that in such aregular lattice, eij(t) ” L/�3 and lij (t) ” l so that werecover the original Meineke et al. model.
Regarding cell–cell adhesion, in addition to equation(3) we have considered another layer of complexity. At themolecular level, it is the number of lateral junctions thatdetermines the strength of the bond between two adjacentcells. To take this into account, we quantified the
Wnt-dependent concentration of adhesion complexes(CAi), based on Van Leeuwen et al. (29), and then used thisinformation to derive an expression for the springconstant between cells i and j, thereby explicitly linkingcell–cell adhesion toWnt signalling:
lijðtÞ ¼ lQijðtÞ=QA ¼ leijðtÞminfBiðtÞCAiðtÞ=EiðtÞ;BjðtÞCAjðtÞ=EjðtÞg=QA; ð4Þ
with i and j adjacent cells and Qij the number of effectiveadhesion-complexes between these cells. The perimeterand surface area of cell * are denoted as E* and B*,respectively. Finally, symbol QA (� 3.02) is a b-cateninscaling factor, defined as the number of effective adhesioncomplexes per cell edge in a hexagonal lattice in theabsence of a Wnt signal (the scaling factor guaranteesthat under equilibrium conditions, equation (4) reduces tolij(t) ” l). Equations (2) and (4) illustrate how we cou-ple Wnt signalling to cell migration.
Intestinal epithelial cells are not only anchored to eachother, but also adherent to their basement membrane(Fig. 1). In the original Meineke et al. model, this cell–matrix adhesion was assumed to give rise to a drag term,the associated drag coefficient being constant. We relaxthis assumption, supposing instead that the drag coeffi-cient is proportional to the surface area of contact betweena cell and the underlying basement membrane (as thesurface increases, the number of focal adhesions bind-ing the cell to the basement membrane will increase).Therefore, we suppose that gi(t), the damping constant ofeach cell i, is a linearly increasing function of its surfacearea, Bi
giðtÞ ¼ ðd0 þ d1BiðtÞÞg; ð5Þ
with d0 ¼ 0.1 and d1 ¼ 2(1 – d0)/(�3L2). For an equili-brium, hexagonal lattice we have Bi ” �3L2/2 and, thus,recover the Meineke et al. model, with gi(t) ” g.
Additional model assumptions
We described above how, in our multiscale model, anintracellular Wnt-dependent cell-cycle model determineswhen a cell is ready to divide. Following Meineke et al.(25), the direction of division is random in our simula-tions. However, daughter cells are now placed a fixed dis-tance, L0/2, in opposite directions from the mother cell, sothat the centre of mass is conserved. Several other fea-tures distinguish our approach from that of Meineke et al.(25). We consider colonic crypts and, therefore, do notinclude Paneth cells. Furthermore, we do not pin stemcells at the base of the crypt: we allow them to movefreely in response to local spring-mediated biomechanical
� 2009 Blackwell Publishing Ltd, Cell Proliferation, 42, 617–636.
622 I. M. M. van Leeuwen et al.
forces. Movement of cells below the bottom of thecrypt is prevented as follows. Any cell centre pushed offthe lower edge of the two-dimensional surface is movedto a new position located a distance k above the edge, withk a uniformly-distributed random variable taking valuesbetween 0 and 0.05L. This simple manipulation repro-duces the effects of attractive and repulsive forces thatexist between cells at the spherical base of a real crypt. Aswill be shown in the Results section, stem cell mobilityhas a significant impact on crypt dynamics by enablinggradual replacement of the stem-cell pool. Hence, thedirections of division and migration will determinewhether a cell leaves or remains within the stem-cellniche, the niche being defined by a strong Wnt signal. Asstem cells are no longer immortal, niche succession cantake place (20,33).
For our simulations, the in silico cells were initiallystarted at equilibrium, each pair of neighbouring cellsbeing separated by a distance L so that they form aregular, hexagonal lattice (for example, 23 cells per cryptcircumference and 30 cells per crypt side). The simulationis stopped when the crypt reaches a quasi-steady state inwhich the cell production rate equals the cell removalrate. It is this state that constitutes the starting point forour virtual experiments at the initial instant t ¼ 0.
Default multiscale crypt model
The modular nature of the multiscale model enables us toeasily modify individual assumptions and analyse theireffects on the system as a whole (Fig. 2). In what follows,we will start from the simplest possible version of ourmodel that we term the default multiscale crypt (DMC)model, and gradually incorporate new layers of complex-ity such as a detailed model of the Wnt signalling pathwayand area-dependent cell-matrix adhesion. The DMCmodel is characterised by the following settings:• Wnt profile: The Wnt signal decreases linearly from oneat the crypt base to zero at the orifice. (A normalisedsignal of strength one corresponds to a maximum Wntexposure situation in which the Wnt receptors arecontinuously stimulated.)
• Cell-cycle model: At the start of the simulation, weassign a G1 time from a uniform distribution to each cell.The duration of G2, M and S phases is assumed to beconstant. When the total cell-cycle time elapses, a celldivides producing two daughter cells, both sensitive totheir surroundings. If the extracellular Wnt level isfavourable, the newborn cells are assigned new cell-cycletimes. Under adverse conditions, cells leave the cell cycleand differentiate.
• Mechanical model: We assume equal spring parametervalues for all cells. Stemcells are not fixed inposition.
Technology aspects: Integrative Biology and the Cancer,Heart and Soft Tissue Environment (Chaste) project
The work presented in this paper was carried out as part ofthe Integrative Biology project (34), an international endea-vour that aims to build and simulate detailed multiscalemodels of the heart (e.g., 35), and colorectal cancer (e.g.,36). The modelling efforts revealed a number of computa-tional demands, which are likely to arise in any project ofthis kind. First, commercial software packages, such asMatLab and Mathematica, which are often used by indivi-dual researchers to solve small numerical problems, areunsuitable for large-scale models and research teams. Sec-ond, the code has to be robust, fast, efficient, and well docu-mented. Third, the software has to be flexible, so that it caneasily be extended to accommodate new biological infor-mation and models. Finally, general functions, such asmesh operators, ODE solvers, finite-element methods andparameter-estimation procedures, need to be designed insuch a way that they can be used for different applications.Meeting these technological needs led to the creation of theCancer, Heart and Soft Tissue Environment (Chaste)project, which is designed to produce well-engineeredcomputational tools for biomedical applications (28,37).
The key features of Chaste are as follows:• Implementation: The main Chaste code is written inC++.
• Software engineering approach: Chaste is based on anagile software-development technique known as eXtremeProgramming (XP). The primary practices are: (i) test-dri-ven development; (ii) pair programming, combined withpair rotation; (iii) collective code ownership; and (iv)creation of high-quality supporting infrastructure anddocumentation.
• Graphics: A crypt visualisation tool was created in Java.The user can choose to display the network of springs(Delaunay triangulation) or the shapes of cells (Voronoitessellation). Cells can be coloured according to theirtype, mutation status, or intracellular b-catenin localisa-tion. Partial results can be plottedwhile a simulation is stillrunning.
• Computational demands: Simulating the dynamics of arepresentative crypt for 3 days (based on a multiscalemodel with subcellular Wnt and cell-cycle ODEs)requires about one computing hour on a Linux PC witha 2GHz processor.
• Cancer Chaste team: The number of authors on this paperreflects the size of the team (including software engineers,scientific programmers and mathematicians) involved inbuilding the multiscale crypt models, developing the Chasteframework and implementing the code.
• Open source: Chaste is freely available under an opensource license from http://www.comlab.ox.ac.uk/Chaste.
� 2009 Blackwell Publishing Ltd, Cell Proliferation, 42, 617–636.
Modelling intestinal tissue renewal 623
Results
Mitotic labelling indexes
Mitotic labelling experiments are widely used to generateinformation about the cytokinetic organisation anddynamics of intestinal crypts (e.g., 38,39). These experi-ments involve injecting laboratory rodents intraperitoneallywith a substance (3HTdR or BrdU) that is incorporated intocells during the S phase of the cell cycle. When a labelledcell divides, it produces two labelled daughter cells. As aconsequence of subsequent cell division and migrationevents, distribution of label within the crypt changes overtime. Information on this distribution is obtained by dissect-ing the crypts longitudinally and recording positions oflabelled cells along the two dissection lines. Given a samplecontaining a certain number of crypts, the outcome of theexperiment is summarised in the form of a labelling-index(LI) curve, showing percentage of labelled cells per cellposition at the time of sacrifice.
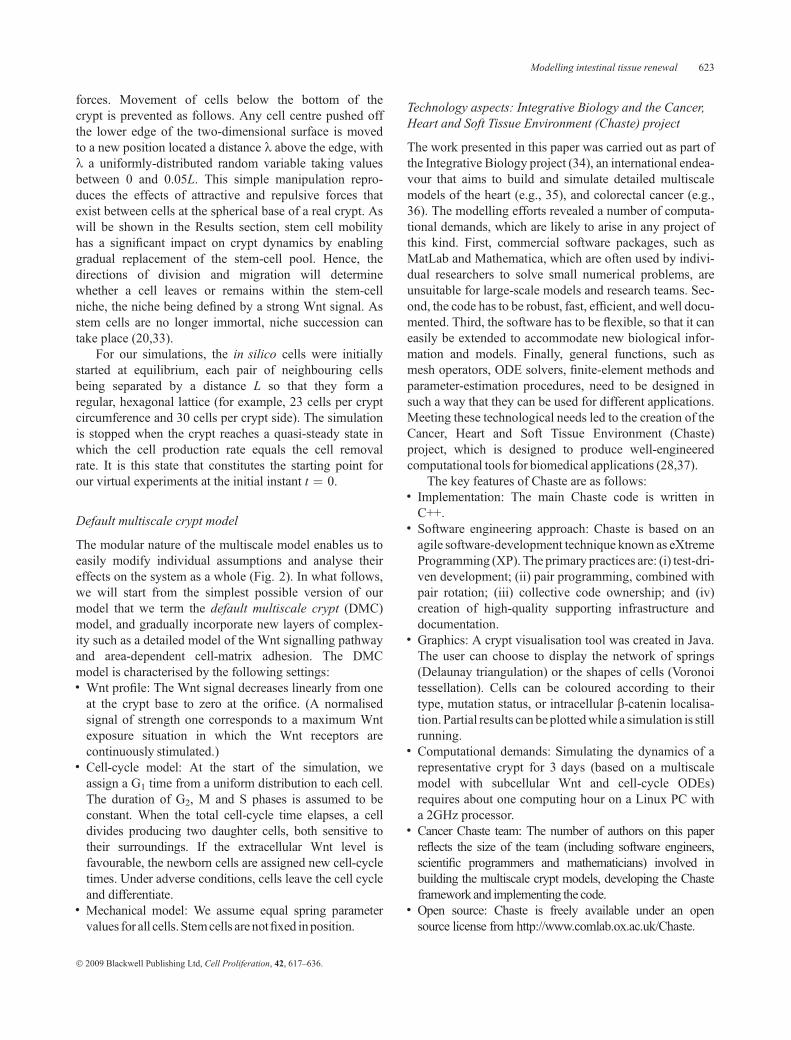
We have used our multiscale model to perform a largenumber of in silico LI experiments. At time t ¼ 0, welabelled every cell that was in S phase. The simulation pro-ceeds under the assumption that labelled cells behave in thesame manner as their unlabelled counterparts, except thatthey transmit label to their daughters. After a fixed time, westop the simulation and cut the resulting crypt longitudinally(see Fig. 5). In a perfect dissection, the angle of section, h,would be 90� (Fig. 5a,c). However, to emulate the level ofprecision achieved experimentally, we select h randomly,subject only to the constraint that cells from both the baseand top of the cylinder must be included in the section.Thereafter, from the bottom of the crypt upwards, we enu-
merate those cells whose nuclei are within a fixed rangefrom the dissection line (Fig. 5c,d). Finally, by averagingthe results of a large number of independent crypt simula-tions, we calculate how the percentage of labelled cellsvarieswith position along the dissection line.
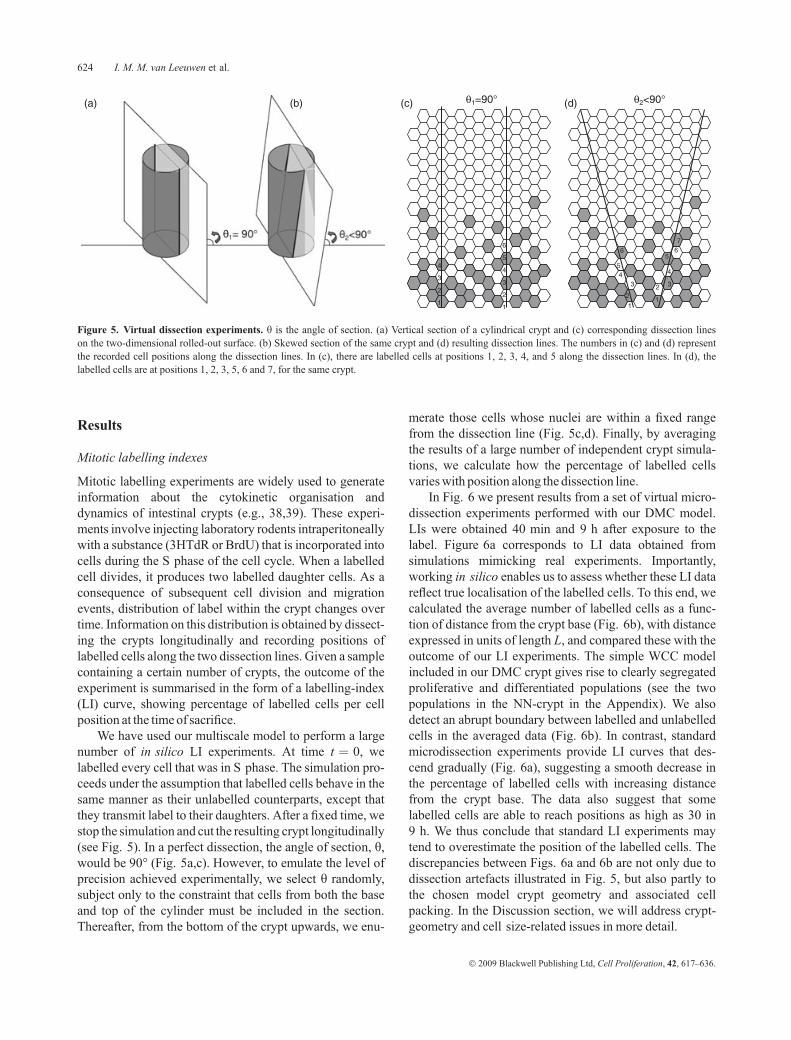
In Fig. 6 we present results from a set of virtual micro-dissection experiments performed with our DMC model.LIs were obtained 40 min and 9 h after exposure to thelabel. Figure 6a corresponds to LI data obtained fromsimulations mimicking real experiments. Importantly,working in silico enables us to assess whether these LI datareflect true localisation of the labelled cells. To this end, wecalculated the average number of labelled cells as a func-tion of distance from the crypt base (Fig. 6b), with distanceexpressed in units of length L, and compared these with theoutcome of our LI experiments. The simple WCC modelincluded in our DMC crypt gives rise to clearly segregatedproliferative and differentiated populations (see the twopopulations in the NN-crypt in the Appendix). We alsodetect an abrupt boundary between labelled and unlabelledcells in the averaged data (Fig. 6b). In contrast, standardmicrodissection experiments provide LI curves that des-cend gradually (Fig. 6a), suggesting a smooth decrease inthe percentage of labelled cells with increasing distancefrom the crypt base. The data also suggest that somelabelled cells are able to reach positions as high as 30 in9 h. We thus conclude that standard LI experiments maytend to overestimate the position of the labelled cells. Thediscrepancies between Figs. 6a and 6b are not only due todissection artefacts illustrated in Fig. 5, but also partly tothe chosen model crypt geometry and associated cellpacking. In the Discussion section, we will address crypt-geometry and cell size-related issues in more detail.
Figure 5. Virtual dissection experiments. h is the angle of section. (a) Vertical section of a cylindrical crypt and (c) corresponding dissection lineson the two-dimensional rolled-out surface. (b) Skewed section of the same crypt and (d) resulting dissection lines. The numbers in (c) and (d) representthe recorded cell positions along the dissection lines. In (c), there are labelled cells at positions 1, 2, 3, 4, and 5 along the dissection lines. In (d), thelabelled cells are at positions 1, 2, 3, 5, 6 and 7, for the same crypt.
� 2009 Blackwell Publishing Ltd, Cell Proliferation, 42, 617–636.
624 I. M. M. van Leeuwen et al.
Clonal expansion and niche succession
Analysis of mitochondrial DNA (mtDNA) mutations hasrecently providednew insight into long-termcrypt dynamics.A cell contains thousands of mitochondria, each carryingseveralmtDNAcopies. Consequently, only those cells with asignificant percentage of mutant mtDNA molecules willexpress a mutant phenotype (for example, cytochrome coxidase (CcO) deficiency). Taylor, Wright, McDonald andco-workers (26,27,40) have applied dual histochemistrytechniques to human colon samples in order to distinguishwild-type (brown-stained) fromCcOdeficient (blue-stained)cells. In addition to wild-type crypts, they observed cryptseither partially or wholly filled with blue cells. In the former,‘there is a ribbon of CcO-deficient cells within an otherwisenormal crypt that is entirely compatible with the view thatthere aremultiple stemcells in somecrypts’ (27).
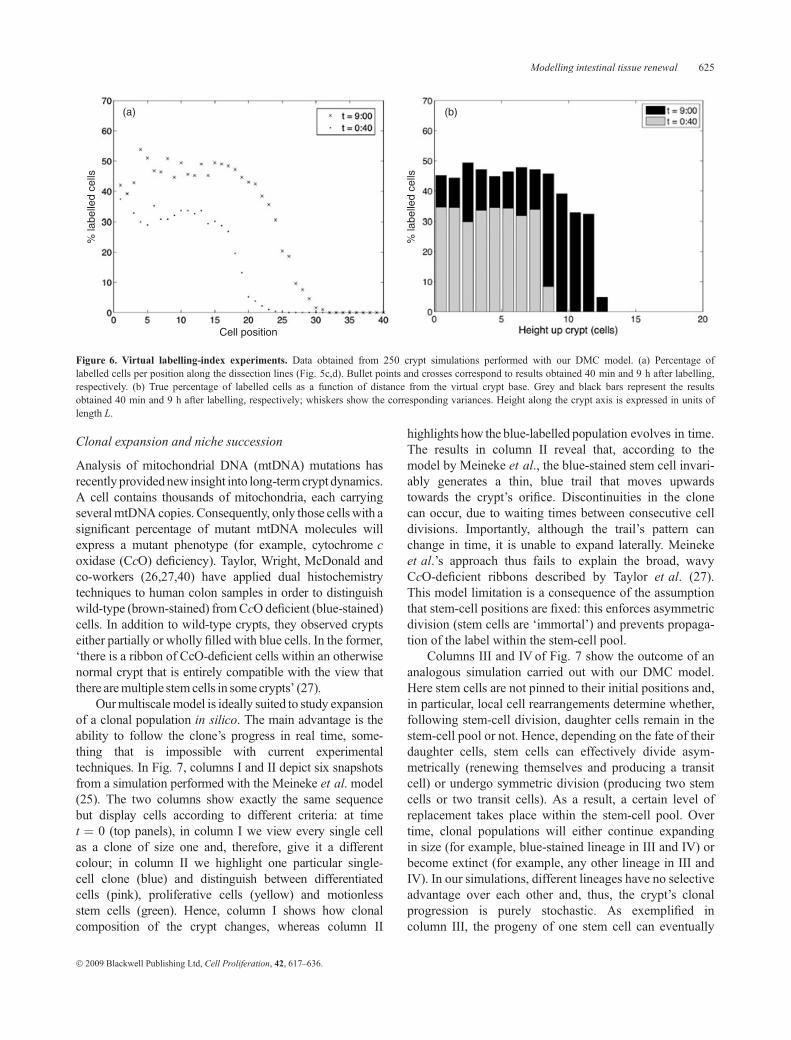
Ourmultiscalemodel is ideally suited to study expansionof a clonal population in silico. The main advantage is theability to follow the clone’s progress in real time, some-thing that is impossible with current experimentaltechniques. In Fig. 7, columns I and II depict six snapshotsfrom a simulation performed with the Meineke et al. model(25). The two columns show exactly the same sequencebut display cells according to different criteria: at timet ¼ 0 (top panels), in column I we view every single cellas a clone of size one and, therefore, give it a differentcolour; in column II we highlight one particular single-cell clone (blue) and distinguish between differentiatedcells (pink), proliferative cells (yellow) and motionlessstem cells (green). Hence, column I shows how clonalcomposition of the crypt changes, whereas column II
highlights how the blue-labelled population evolves in time.The results in column II reveal that, according to themodel by Meineke et al., the blue-stained stem cell invari-ably generates a thin, blue trail that moves upwardstowards the crypt’s orifice. Discontinuities in the clonecan occur, due to waiting times between consecutive celldivisions. Importantly, although the trail’s pattern canchange in time, it is unable to expand laterally. Meinekeet al.’s approach thus fails to explain the broad, wavyCcO-deficient ribbons described by Taylor et al. (27).This model limitation is a consequence of the assumptionthat stem-cell positions are fixed: this enforces asymmetricdivision (stem cells are ‘immortal’) and prevents propaga-tion of the label within the stem-cell pool.
Columns III and IV of Fig. 7 show the outcome of ananalogous simulation carried out with our DMC model.Here stem cells are not pinned to their initial positions and,in particular, local cell rearrangements determine whether,following stem-cell division, daughter cells remain in thestem-cell pool or not. Hence, depending on the fate of theirdaughter cells, stem cells can effectively divide asym-metrically (renewing themselves and producing a transitcell) or undergo symmetric division (producing two stemcells or two transit cells). As a result, a certain level ofreplacement takes place within the stem-cell pool. Overtime, clonal populations will either continue expandingin size (for example, blue-stained lineage in III and IV) orbecome extinct (for example, any other lineage in III andIV). In our simulations, different lineages have no selectiveadvantage over each other and, thus, the crypt’s clonalprogression is purely stochastic. As exemplified incolumn III, the progeny of one stem cell can eventually
Figure 6. Virtual labelling-index experiments. Data obtained from 250 crypt simulations performed with our DMC model. (a) Percentage oflabelled cells per position along the dissection lines (Fig. 5c,d). Bullet points and crosses correspond to results obtained 40 min and 9 h after labelling,respectively. (b) True percentage of labelled cells as a function of distance from the virtual crypt base. Grey and black bars represent the resultsobtained 40 min and 9 h after labelling, respectively; whiskers show the corresponding variances. Height along the crypt axis is expressed in units oflength L.
� 2009 Blackwell Publishing Ltd, Cell Proliferation, 42, 617–636.
Modelling intestinal tissue renewal 625
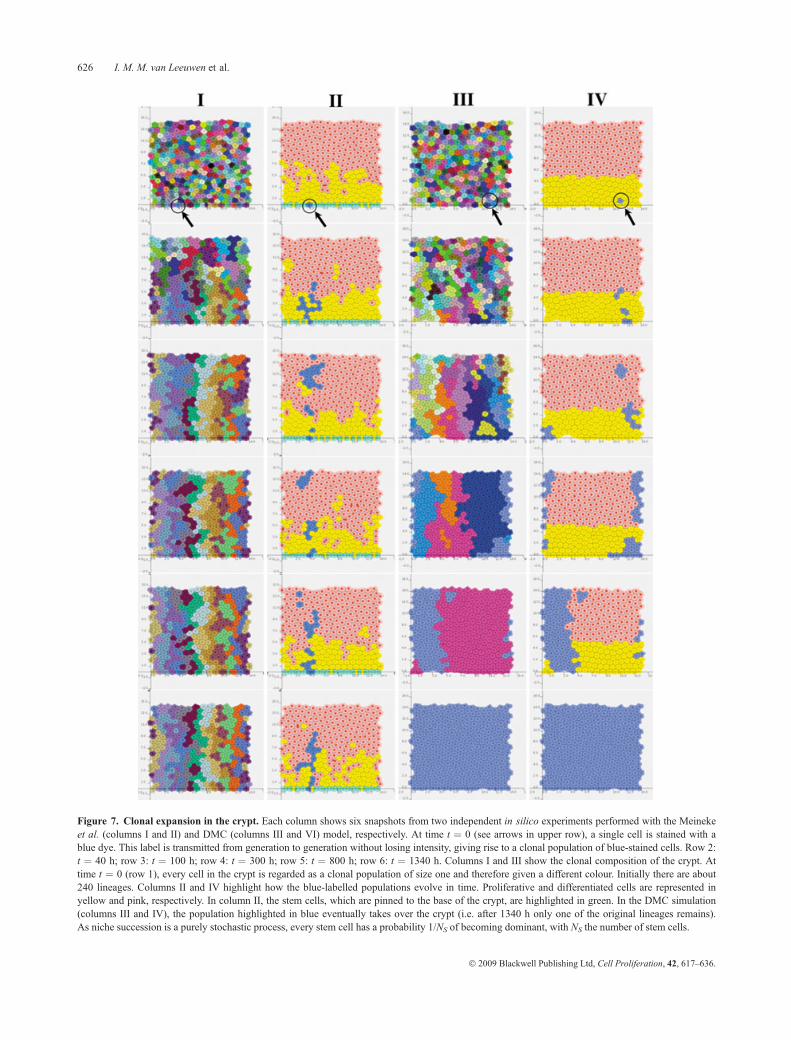
Figure 7. Clonal expansion in the crypt. Each column shows six snapshots from two independent in silico experiments performed with the Meinekeet al. (columns I and II) and DMC (columns III and VI) model, respectively. At time t ¼ 0 (see arrows in upper row), a single cell is stained with ablue dye. This label is transmitted from generation to generation without losing intensity, giving rise to a clonal population of blue-stained cells. Row 2:t ¼ 40 h; row 3: t ¼ 100 h; row 4: t ¼ 300 h; row 5: t ¼ 800 h; row 6: t ¼ 1340 h. Columns I and III show the clonal composition of the crypt. Attime t ¼ 0 (row 1), every cell in the crypt is regarded as a clonal population of size one and therefore given a different colour. Initially there are about240 lineages. Columns II and IV highlight how the blue-labelled populations evolve in time. Proliferative and differentiated cells are represented inyellow and pink, respectively. In column II, the stem cells, which are pinned to the base of the crypt, are highlighted in green. In the DMC simulation(columns III and IV), the population highlighted in blue eventually takes over the crypt (i.e. after 1340 h only one of the original lineages remains).As niche succession is a purely stochastic process, every stem cell has a probability 1/NS of becoming dominant, with NS the number of stem cells.
� 2009 Blackwell Publishing Ltd, Cell Proliferation, 42, 617–636.
626 I. M. M. van Leeuwen et al.
take over the whole stem-cell pool. This phenomenon isoften termed niche succession and leads to the formation ofa monoclonal crypt (20). Our model predictions are there-fore consistent with experimental evidence obtained byMcDonald et al. (26) and have important biomedical impli-cations. For example, it has been proposed thatmonoclonal,mutant crypts constitute the earliest stage of colorectal ade-nomas (41). These monocryptal lesions can expand furtherby crypt fission (40).
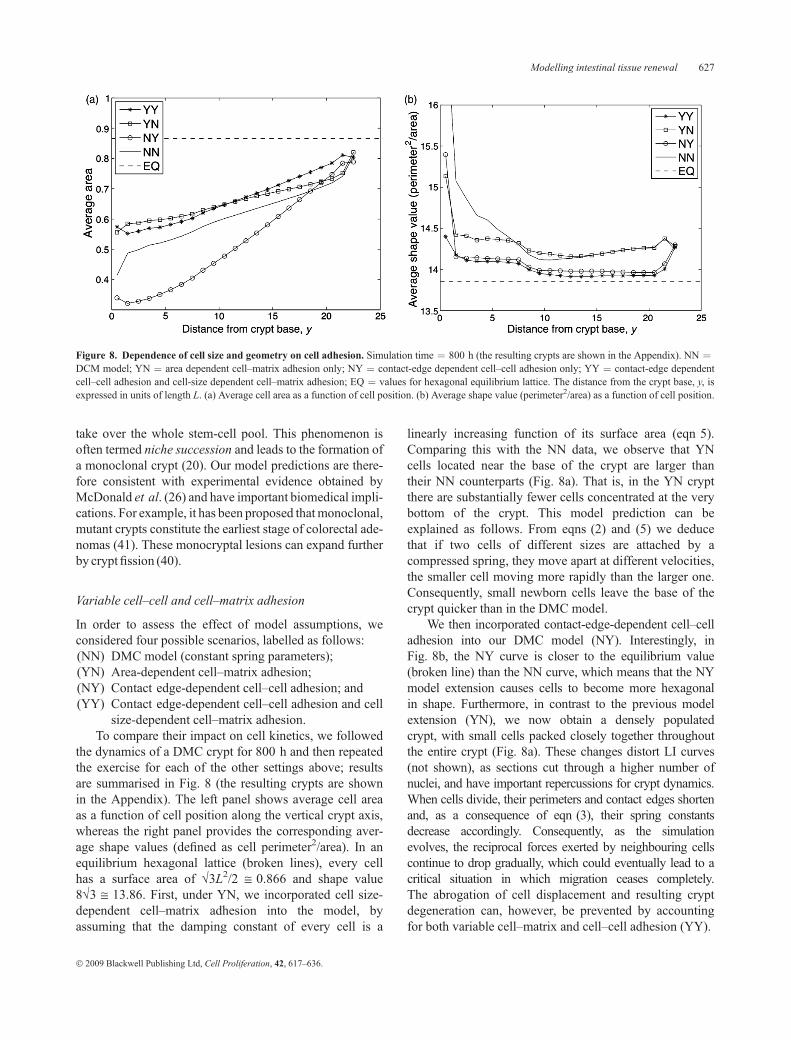
Variable cell–cell and cell–matrix adhesion
In order to assess the effect of model assumptions, weconsidered four possible scenarios, labelled as follows:(NN) DMC model (constant spring parameters);(YN) Area-dependent cell–matrix adhesion;(NY) Contact edge-dependent cell–cell adhesion; and(YY) Contact edge-dependent cell–cell adhesion and cell
size-dependent cell–matrix adhesion.To compare their impact on cell kinetics, we followed
the dynamics of a DMC crypt for 800 h and then repeatedthe exercise for each of the other settings above; resultsare summarised in Fig. 8 (the resulting crypts are shownin the Appendix). The left panel shows average cell areaas a function of cell position along the vertical crypt axis,whereas the right panel provides the corresponding aver-age shape values (defined as cell perimeter2/area). In anequilibrium hexagonal lattice (broken lines), every cellhas a surface area of �3L2/2 @ 0.866 and shape value8�3 @ 13.86. First, under YN, we incorporated cell size-dependent cell–matrix adhesion into the model, byassuming that the damping constant of every cell is a
linearly increasing function of its surface area (eqn 5).Comparing this with the NN data, we observe that YNcells located near the base of the crypt are larger thantheir NN counterparts (Fig. 8a). That is, in the YN cryptthere are substantially fewer cells concentrated at the verybottom of the crypt. This model prediction can beexplained as follows. From eqns (2) and (5) we deducethat if two cells of different sizes are attached by acompressed spring, they move apart at different velocities,the smaller cell moving more rapidly than the larger one.Consequently, small newborn cells leave the base of thecrypt quicker than in the DMC model.
We then incorporated contact-edge-dependent cell–celladhesion into our DMC model (NY). Interestingly, inFig. 8b, the NY curve is closer to the equilibrium value(broken line) than the NN curve, which means that the NYmodel extension causes cells to become more hexagonalin shape. Furthermore, in contrast to the previous modelextension (YN), we now obtain a densely populatedcrypt, with small cells packed closely together throughoutthe entire crypt (Fig. 8a). These changes distort LI curves(not shown), as sections cut through a higher number ofnuclei, and have important repercussions for crypt dynamics.When cells divide, their perimeters and contact edges shortenand, as a consequence of eqn (3), their spring constantsdecrease accordingly. Consequently, as the simulationevolves, the reciprocal forces exerted by neighbouring cellscontinue to drop gradually, which could eventually lead to acritical situation in which migration ceases completely.The abrogation of cell displacement and resulting cryptdegeneration can, however, be prevented by accountingfor both variable cell–matrix and cell–cell adhesion (YY).
Figure 8. Dependence of cell size and geometry on cell adhesion. Simulation time ¼ 800 h (the resulting crypts are shown in the Appendix). NN ¼DCM model; YN ¼ area dependent cell–matrix adhesion only; NY ¼ contact-edge dependent cell–cell adhesion only; YY ¼ contact-edge dependentcell–cell adhesion and cell-size dependent cell–matrix adhesion; EQ ¼ values for hexagonal equilibrium lattice. The distance from the crypt base, y, isexpressed in units of length L. (a) Average cell area as a function of cell position. (b) Average shape value (perimeter2/area) as a function of cell position.
� 2009 Blackwell Publishing Ltd, Cell Proliferation, 42, 617–636.
Modelling intestinal tissue renewal 627
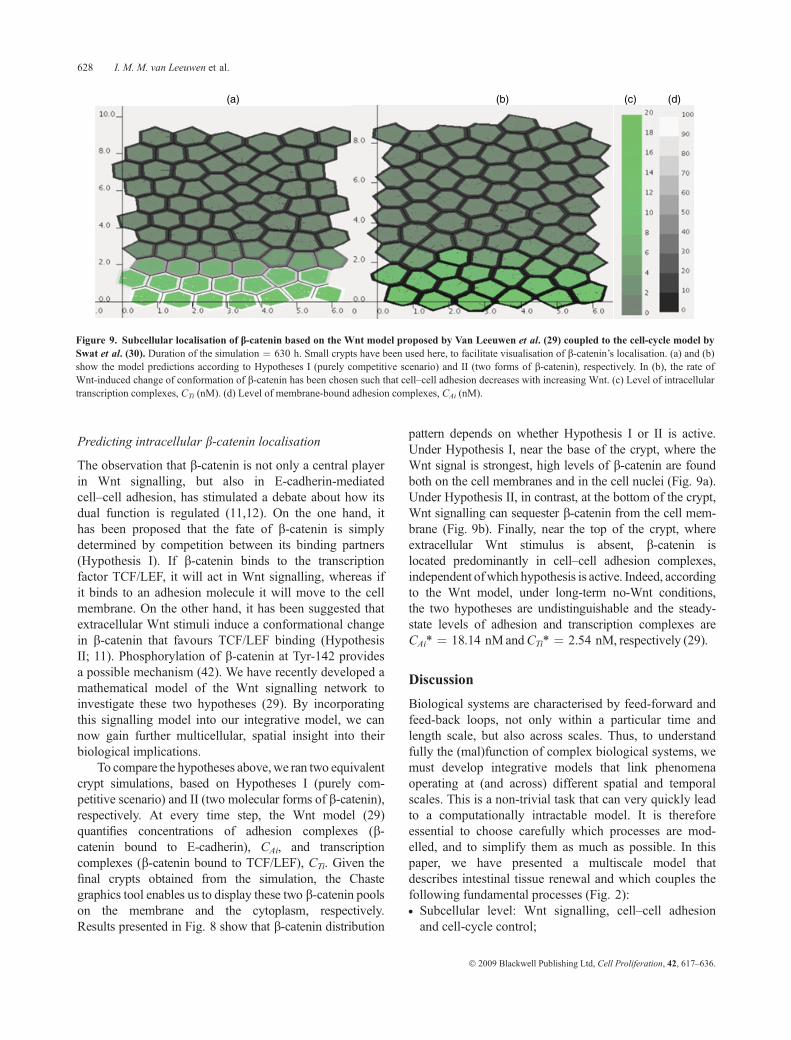
Predicting intracellular b-catenin localisation
The observation that b-catenin is not only a central playerin Wnt signalling, but also in E-cadherin-mediatedcell–cell adhesion, has stimulated a debate about how itsdual function is regulated (11,12). On the one hand, ithas been proposed that the fate of b-catenin is simplydetermined by competition between its binding partners(Hypothesis I). If b-catenin binds to the transcriptionfactor TCF/LEF, it will act in Wnt signalling, whereas ifit binds to an adhesion molecule it will move to the cellmembrane. On the other hand, it has been suggested thatextracellular Wnt stimuli induce a conformational changein b-catenin that favours TCF/LEF binding (HypothesisII; 11). Phosphorylation of b-catenin at Tyr-142 providesa possible mechanism (42). We have recently developed amathematical model of the Wnt signalling network toinvestigate these two hypotheses (29). By incorporatingthis signalling model into our integrative model, we cannow gain further multicellular, spatial insight into theirbiological implications.
To compare the hypotheses above,we ran two equivalentcrypt simulations, based on Hypotheses I (purely com-petitive scenario) and II (two molecular forms of b-catenin),respectively. At every time step, the Wnt model (29)quantifies concentrations of adhesion complexes (b-catenin bound to E-cadherin), CAi, and transcriptioncomplexes (b-catenin bound to TCF/LEF), CTi. Given thefinal crypts obtained from the simulation, the Chastegraphics tool enables us to display these two b-catenin poolson the membrane and the cytoplasm, respectively.Results presented in Fig. 8 show that b-catenin distribution
pattern depends on whether Hypothesis I or II is active.Under Hypothesis I, near the base of the crypt, where theWnt signal is strongest, high levels of b-catenin are foundboth on the cell membranes and in the cell nuclei (Fig. 9a).Under Hypothesis II, in contrast, at the bottom of the crypt,Wnt signalling can sequester b-catenin from the cell mem-brane (Fig. 9b). Finally, near the top of the crypt, whereextracellular Wnt stimulus is absent, b-catenin islocated predominantly in cell–cell adhesion complexes,independent ofwhich hypothesis is active. Indeed, accordingto the Wnt model, under long-term no-Wnt conditions,the two hypotheses are undistinguishable and the steady-state levels of adhesion and transcription complexes areCAi* ¼ 18.14 nMandCTi* ¼ 2.54 nM, respectively (29).
Discussion
Biological systems are characterised by feed-forward andfeed-back loops, not only within a particular time andlength scale, but also across scales. Thus, to understandfully the (mal)function of complex biological systems, wemust develop integrative models that link phenomenaoperating at (and across) different spatial and temporalscales. This is a non-trivial task that can very quickly leadto a computationally intractable model. It is thereforeessential to choose carefully which processes are mod-elled, and to simplify them as much as possible. In thispaper, we have presented a multiscale model thatdescribes intestinal tissue renewal and which couples thefollowing fundamental processes (Fig. 2):• Subcellular level: Wnt signalling, cell–cell adhesionand cell-cycle control;
Figure 9. Subcellular localisation of b-catenin based on the Wnt model proposed by Van Leeuwen et al. (29) coupled to the cell-cycle model bySwat et al. (30). Duration of the simulation ¼ 630 h. Small crypts have been used here, to facilitate visualisation of b-catenin’s localisation. (a) and (b)show the model predictions according to Hypotheses I (purely competitive scenario) and II (two forms of b-catenin), respectively. In (b), the rate ofWnt-induced change of conformation of b-catenin has been chosen such that cell–cell adhesion decreases with increasing Wnt. (c) Level of intracellulartranscription complexes, CTi (nM). (d) Level of membrane-bound adhesion complexes, CAi (nM).
� 2009 Blackwell Publishing Ltd, Cell Proliferation, 42, 617–636.
628 I. M. M. van Leeuwen et al.
• Cellular level: Cell division, migration and differentiation;• Macroscale level: Extracellular Wnt profile, cell–celladhesion, and cell–matrix adhesion.Following Meineke et al. (25), we modelled connec-
tions between cells as springs and used the Voronoi tessela-tion associated with the cell centres to determine size andshape of every cell in the aggregate. However, instead ofassuming that cell-cycle progression, cell–matrix adhesionand differentiation states are intrinsic properties of cells, weallowed these features to be influenced by intra-, inter- andextracellular cues. The resulting multiscale model has theadvantage that it can be used, for example, to investigatehow specific manipulations propagate across organisationlevels, analyse the effect of genetic alterations on cryptdynamics (for example, mutations in theWnt network), andexplore potential interactions between phenomenaoccurring at different levels of organisation.
In this paper, we have used our model to investigatethe effect of Wnt signalling and variable cell adhesion onturnover of cells within a normal colonic crypt. Each cellcarries its own intracellular Wnt signalling and cell-cyclemodels, and these dictate whether it will divide or differ-entiate. In addition, since b-catenin is a key player in bothsignal transduction and E-cadherin-mediated adhesion,Wnt signalling can interfere with cell–cell adhesion, andvice versa. As a result, by superimposing a Wnt profile onthe two-dimensional crypt surface (cf. 9), the model natu-rally predicts position-dependent rates of proliferation,differentiation and cell–cell adhesion. Hence, the Wntmodel plays a central role in regulating crypt dynamics.Concerning adhesion, the original Meineke et al. (25)approach did not distinguish between forces of adhesiveactivity at cell interfaces and those in the cytoskeleton, asthe drag coefficient in eqn (2) blends dissipation in cellsand friction at cell boundaries (with the underlying matrixor with neighbours). We have overcome this biomechani-cal weakness by incorporating contact edge-dependentcell–cell adhesion and cell size-dependent cell–matrixadhesion. Hence, whereas in Meineke et al. the Voronoitesselation constitutes a mere visualisation tool (Fig. 3), inour integrative model it can influence cell movementindirectly.
Among the new insights gained from our simulations,we highlight the following. First, virtual clonal expansionexperiments reveal that stem cell motility, and subsequentgradual replacement of the stem-cell pool, make nichesuccession and monoclonal conversion possible. This is inagreement with predictions from other, spatially-averagedmodels (20,33), and recent mtDNA mutation studies (26,27).Second, we can predict intracellular localisation of b-catenin, thereby providing a new tool for studying inter-actions between cell–cell adhesion and Wnt signalling(11,12). Third, virtual microdissection experiments
suggest that LI data tend to overestimate position of thelabelled cells and are therefore unlikely to provide anaccurate image of distribution of proliferative cells in thecrypt. Fourth, our integrative model reveals that presenceof Wnt factors at the very bottom of the crypt suffices toemulate observed position-dependent nuclear b-cateninlevels and proliferative hierarchy in the colonic crypt. Thisis due to a delay in elimination of transcription complexeswhen cells move upwards into a no-Wnt environment.Hence, a Wnt gradient along the vertical crypt axis is notessential for normal crypt dynamics. Finally, one of themajor advances of a mathematical modelling approach isthat it can provide dynamic information. For instance,in silico it is feasible to dissect the same crypt twice at dif-ferent times after labelling, something that is impossiblein vivo. We can also track the spatio-temporal behaviourof every single cell in real time, as illustrated in Fig. 7.These data complement the static information obtainedthrough empirical mtDNA studies (26,27,40), and shouldlead to a deeper understanding of crypt dynamics andmonoclonal conversion.
Two particularly interesting, distinctive features of ourmultiscale model are the gradual nature of differentiationand associated interpretation of stemness. Previous model-ling approaches have considered stemness as an intrinsicproperty of cells: that is, a high self-renewal capacity(e.g., 25) or a long cell-cycle time (43). Similarly, transit-amplifying cells have been defined as rapidly cycling cellswith intrinsic limited self-renewal capacity. Here, in con-trast, both the replicative lifespan and the duration of thecell cycle depend on the availability of extracellular Wntfactors and, thus, indirectly on cell migration. Conse-quently, in the context of our model, there are neither tran-sit nor stem cells per se, but a continuum range of cellsthat proliferate at different rates. Plasticity of these ‘semi-differentiated cells’ is best illustrated by acceleration ofthe cell cycle predicted in response to downward migra-tion along the crypt axis (Fig. 4). The composition of ourvirtual crypts and degree of reversibility of cell differentia-tion are consistent with conclusions from existing mathe-matical models (19,32), as well as with results from recentempirical studies (44). Our approach has serious implica-tions for tumourigenesis, as it affords aberrant semi-differ-entiated cells the ability to increase their replicativecapacity under certain conditions and in particular, tobecome cancer stem cells (45–48). That is, in our model,every semi-differentiated cell constitutes a potential targetfor malignant transformation (49).
In an attempt to minimise the complexity of themodel, we have oversimplified some phenomena involvedin crypt dynamics. First, we consider the pool of termin-ally differentiated cells to be homogeneous and, therefore,do not characterise the specific behaviour and function of
� 2009 Blackwell Publishing Ltd, Cell Proliferation, 42, 617–636.
Modelling intestinal tissue renewal 629
different specialised cell types, such as goblet, columnarand neuroendocrine cells (in the small intestine, the pre-sence of Paneth cells further complicates the situation).Second, for the current version of our work, we alsoignore any cross-talk between epithelial and stromal cells.Mesenchymal cells, for instance, may play a key role inmaintaining the crypt niche (8). Third, regarding Wnt sig-nalling, we do not model receptor–ligand interactionsexplicitly. In particular, the Wnt profile represents aneffective Wnt signal detected by a cell, rather than anextracellular Wnt factor concentration. Consequently, thelevels and roles of different Wnt factors (e.g., Wnt-1 andWnt-2 proteins) are not taken into account. We alsoexclude the question of whether the gradients in one cryptinfluence those of the neighbouring crypts. Furthermore,the model could also be extended to encompass connec-tive tissue and blood vessels surrounding the crypts,thereby making it possible to account for additionalmacroscale features and phenomena, such as blood sup-ply, metabolite diffusion, and cell adaptation under vary-ing nutrient availability. The necessary modules could, forinstance, be developed following Alarcon et al. (50) andSmallbone et al. (51). Finally, there are no biologicalmechanisms regulating cell death: cells are simplyremoved from the system when they reach the top of thecrypt. To simulate cell shedding properly, we would needto accommodate biochemical networks that regulate pro-grammed cell death as well as biomechanical cell detach-ment (5). At the macroscale, this poses the additionalproblem of dealing with gaps in the tissue.
Our current modelling efforts are concentrated inrefining the multiscale model in two ways (Fig. 2); namelyconstructing more realistic crypt geometry and introducingcell-size control. Below we expand briefly on each of thesemodel developments and their motivation. Concerningcrypt geometry, here we have modelled the three-dimen-sional crypt as a circular cylinder, thereby ignoring therounded shape of the crypt base. This assumption has theundesired effect of overestimating the number of stem cells,which has a significant impact on macroscale features, suchas the distribution of labelled cells and the nichesuccession time (Fig. 6). To improve the quality of ourpredictions, we have devised a second type of virtual crypt.In this model, in silico cells are constrained to populate afixed surface in three-dimensional space. The surface isdefined as the set of points (x, y, z) satisfying a conditionz ¼ f(x, y), where f is chosen in such away that the resultingsurface resembles a colonic crypt (with vertical axis x ¼z ¼ 0). Instead of computing the spatio-temporal beha-viour of every cell directly on the surface, we consider theirprojection onto the plane z ¼ 0. We can then employthe existing Chaste framework to obtain the Voronoitessellation for the two-dimensional plane projection.
In vivo the size of an epithelial cell results from gradualcell-growth processes, which depend on the availability ofnutrients and growth factors in the surrounding medium,the cell’s metabolic rate, and progress through the cellcycle. In the tesselation-based approach, however, cell sizeand shape are determined solely by the relative spatial posi-tion of adjacent cells in the two-dimensional aggregate(Fig. 3). Consequently, cells can only adopt polygonalshapes dictated by the Voronoi tesselation. Moreover, dur-ing a representative crypt simulation, the changes in size ofa single cell do not follow a typical biological growthcurve. Instead, cell size suffers from random noise causedby relative movement of its neighbours. Furthermore, asthe Voronoi tesselation is recalculated after division,daughter cell sizes can differ substantially from half thesize of the original mother cell. Finally, cell death cannotbe included directly: cells adjacent to an apoptotic cellwould undergo sudden, unrealistic changes in geometry torefill the resulting gap in the tissue. A better control of cellsize is thus needed in our multiscale model. To achieve thisgoal, we are investigating various alternative mechanicalmodels (for critical reviews on modelling cell aggregates,see (52) and (53)). Cell-vertex models, for instance, moni-tor spatio-temporal dynamics of the cell’s vertices, insteadof their centres, thereby ruling over its boundaries andgaining control of its size (54,55).
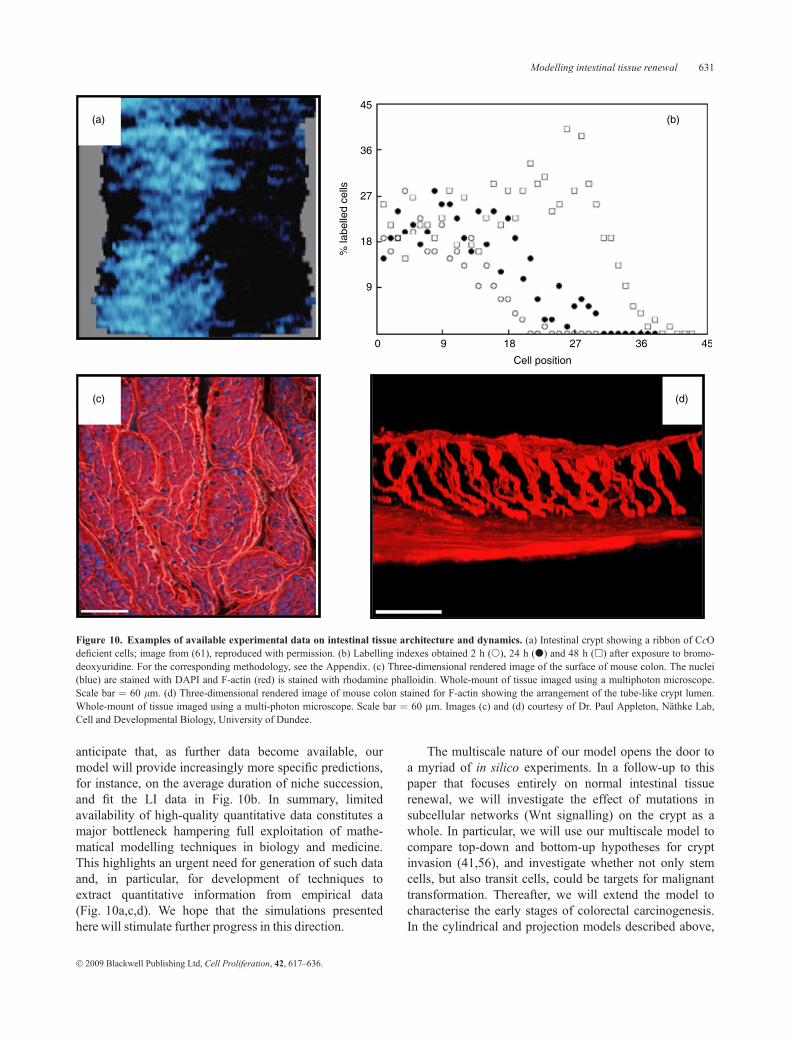
Figure 10 exemplifies the kind of experimental data onintestinal tissue dynamics and morphology currently avail-able to modellers: images of intestinal crypts revealingblue-stained (CcO-deficient) clones (Fig. 10a), LI curves(Fig. 10b), and high-resolution three-dimensional imagesshowing both crypt and cell geometry (Fig. 10c,d). Unfor-tunately, as most experimental methods yield qualitativeoutput, there is still insufficient quantitative information tofully parameterise, calibrate and validate our multiscalemodel. In particular, accurate values for many kineticcell-cycle and Wnt signalling coefficients are lacking.Consequently, at this stage, only those predictions that arequalitative in nature can be directly compared with theexperimental data (see column IVof Fig. 7, and Fig. 10a).Other useful applications of the present model includeenhancing our understanding of generic behaviour of thesystem, comparing alternative mechanisms of action (e.g.,b-catenin patterns in Fig. 9), generating new hypotheses(e.g., Fig. 6), providing dynamic insight that complementsstatic empirical information (e.g., column IV in Fig. 7, andFig. 10a), and identifying those parameter values that havethe most dramatic effect on the system’s dynamics andwhich should, therefore, be determined most accurately.We are actively collaborating with several experimentalgroups, not only to measure such parameters, but also totest in the laboratory some of the hypothesesgenerated from our modelling efforts. Importantly, we
� 2009 Blackwell Publishing Ltd, Cell Proliferation, 42, 617–636.
630 I. M. M. van Leeuwen et al.
anticipate that, as further data become available, ourmodel will provide increasingly more specific predictions,for instance, on the average duration of niche succession,and fit the LI data in Fig. 10b. In summary, limitedavailability of high-quality quantitative data constitutes amajor bottleneck hampering full exploitation of mathe-matical modelling techniques in biology and medicine.This highlights an urgent need for generation of such dataand, in particular, for development of techniques toextract quantitative information from empirical data(Fig. 10a,c,d). We hope that the simulations presentedhere will stimulate further progress in this direction.
The multiscale nature of our model opens the door toa myriad of in silico experiments. In a follow-up to thispaper that focuses entirely on normal intestinal tissuerenewal, we will investigate the effect of mutations insubcellular networks (Wnt signalling) on the crypt as awhole. In particular, we will use our multiscale model tocompare top-down and bottom-up hypotheses for cryptinvasion (41,56), and investigate whether not only stemcells, but also transit cells, could be targets for malignanttransformation. Thereafter, we will extend the model tocharacterise the early stages of colorectal carcinogenesis.In the cylindrical and projection models described above,
Figure 10. Examples of available experimental data on intestinal tissue architecture and dynamics. (a) Intestinal crypt showing a ribbon of CcOdeficient cells; image from (61), reproduced with permission. (b) Labelling indexes obtained 2 h (s), 24 h (d) and 48 h (h) after exposure to bromo-deoxyuridine. For the corresponding methodology, see the Appendix. (c) Three-dimensional rendered image of the surface of mouse colon. The nuclei(blue) are stained with DAPI and F-actin (red) is stained with rhodamine phalloidin. Whole-mount of tissue imaged using a multiphoton microscope.Scale bar ¼ 60 lm. (d) Three-dimensional rendered image of mouse colon stained for F-actin showing the arrangement of the tube-like crypt lumen.Whole-mount of tissue imaged using a multi-photon microscope. Scale bar ¼ 60 lm. Images (c) and (d) courtesy of Dr. Paul Appleton, Nathke Lab,Cell and Developmental Biology, University of Dundee.
� 2009 Blackwell Publishing Ltd, Cell Proliferation, 42, 617–636.
Modelling intestinal tissue renewal 631
the shape of the virtual crypt remains unchanged through-out the simulation period. Although this may be a goodapproximation for normal crypts, a more flexible approachis required to describe deformation and buckling of thebasement membrane occurring during crypt budding andfission. Developing an integrative tissue remodellingapproach constitutes a serious mathematical challenge; todate intestinal tissue folding has been addressed for cryptsections only (e.g., 57,58). A second exciting line ofresearch is applying our multiscale model to examine therole of various feedback loops and, in particular, to inves-tigate interactions between phenomena occurring at differ-ent spatial and temporal scales. Among such applicationsare Wnt-mediated contact inhibition (59) and dilution ofintracellular macromolecules by cell growth processes.
Acknowledgements
The authors wish to thank Owen Sansom and MohammadIlyas for fruitful discussions on Wnt signalling and cryptdynamics and Eleanor Boston, Carina Edwards and Mat-thew Johnston for their participation in various Chasteprogramming sessions. We gratefully acknowledge thesupport provided by the EPSRC (GR/S72023/01 and EP/F011628). P.K.M. was partially supported by a RoyalSociety Wolfson Merit Award. P.M. and P.K.M. werepartly supported by NIH Grant U56CA113004 from theNational Cancer Institute. B.D. thanks Cancer ResearchUK for financial support. HMB and PKM were partiallysupported by PMI2 (British Council).
References
1 Alonso L and Fuchs E (2003) Stem cells of the skin epithelium. ProcNatl Acad Sci USA 100, 11830–11835.
2 Okamoto R, Watanabe M (2004) Molecular and clinical basis for theregeneration of human gastrointestinal epithelia. J. Gastroenterol.39, 1–6.
3 Ross MH, Kaye GI, Pawlina W (2003) Histology: A Text and Atlas.Philadelphia: Lippincott Williams & Wilkins.
4 Potten CS, Booth C, Hargreaves D (2003) The small intestine as amodel for evaluating adult tissue stem cell drug targets. Cell Prolif.36, 115–129.
5 Bullen TF, Forrest S, Campbell F, Dodson AR, Hershman MJ,Pritchard DM, Turner JR, Montrose MH, Watson AJ (2006) Charac-terization of epithelial cell shedding from human small intestine.Lab. Invest. 86, 1052–1063.
6 Ilyas M (2005) Wnt signalling and the mechanistic basis of tumourdevelopment. J. Pathol. 205, 130–144.
7 Sansom OJ, Reed KR, Hayes AJ, Ireland H, Brinkmann H, NewtonIP, Batlle E, Simon-Assmann P, Clevers H, Nathke IS, Clarke AR,Winton DJ (2004) Loss of Apc in vivo immediately perturbs Wnt sig-naling, differentiation, and migration.Genes Dev. 18, 1385–1390.
8 Van de Wetering M, Sancho E, Verweij C, de Lau W, Oving I,Hurlstone A, van der Horn K, Batlle E, Coudreuse D, Haramis AP,Tjon-Pon-Fong M, Moerer P, van den Born M, Soete G, Pals S,
Eilers M, Medema R, Clevers H (2002) The b-catenin/TCF-4 com-plex imposes a crypt progenitor phenotype on colorectal cancercells. Cell 111, 241–250.
9 Gaspar C, Fodde R (2004) APC dosage effects in tumorigenesis andstem cell differentiation. Int. J. Dev. Biol. 48, 377–386.
10 Gottardi CJ, Gumbiner BM (2004) Distinct molecular forms of b-catenin are targeted to adhesive or transcriptional complexes. J. CellBiol. 167, 339–349.
11 Harris TJC, Peifer M (2005) Decisions, decisions: b-catenin choosesbetween adhesion and transcription. Trends Cell Biol. 15, 234–237.
12 Nelson WJ, Nusse R (2004) Convergence of the Wnt, b-catenin andcadherin pathways. Science 303, 1483–1487.
13 Perez-Moreno M, Jamora C, Fuchs E (2003) Sticky business: orches-trating cellular signals at adherens junctions.Cell 112, 535–548.
14 Di Ventura B, Lemerle C, Michalodimitrakis K, Serrano L (2006)From in vivo to in silico biology and back. Nature 443, 527–533.
15 Kitano H (2002) Computational systems biology. Nature 420, 206–210.
16 May RM (2004) Uses and abuses of mathematics in biology. Science303, 790–793.
17 Loeffler M, Potten CS, Paulus U, Glatzer J, Chwalinski S (1988)Intestinal crypt proliferation. II. Computer modelling of mitotic indexdata provides further evidence for lateral and vertical cell migrationin the absence of mitotic activity.Cell Tissue Kinet 21, 247–258.
18 Paulus U, Potten CS, Loeffler M (1992) A model of the control ofcellular regeneration in the intestinal crypt after perturbation basedsolely on local stem cell regulation. Cell Prolif. 25, 559–578.
19 Johnston MD, Edwards CM, Bodmer WF, Maini PK, Chapman SJ(2007) Mathematical modelling of cell population dynamics in thecolonic crypt and colorectal cancer. Proc. Natl. Acad. Sci. USA 104,4008–4013.
20 Yatabe Y, Tavare S, Shibata D (2001) Investigating stem cells inhuman colon by using methylation patterns. Proc. Natl. Acad. Sci.USA 98, 10839–10844.
21 Alarcon T, Byrne HM, Maini PK (2004) Towards whole-organ mod-elling of tumour growth. Prog. Biophys. Mol. Biol. 85, 451–472.
22 Crampin EJ, Halstead M, Hunter P, Nielsen P, Noble D, Smith N,Tawhai M (2004) Computational physiology and the Physiome pro-ject. Exp. Physiol. 89, 21–26.
23 Ramis-Conde I, Drasdo D, Anderson ARA, Chaplain MAJ (2008)Modelling the influence of the E-cadherin-b-catenin pathway in can-cer cell invasion: a multi-scale approach. Biophys. J. 95, 155–165.
24 Ribba B, Colin T, Schnell S (2006) A multiscale mathematicalmodel of cancer and its use in analyzing irradiation therapies. Theor.Biol. Med. Model 3, 7.
25 Meineke FA, Potten CS, Loeffler M (2001) Cell migration and orga-nization in the intestinal crypt using a lattice-free model. Cell Prolif.34, 253–266.
26 McDonald SA, Preston SL, Greaves LC, Leedham SJ, Lovell MA,Jankowski JA, Turnbull DM, Wright NA (2006) Clonal expansionin the human gut: mitochondrial DNA mutations show us the way.Cell Cycle 5, 808–811.
27 Taylor RW, Barron MJ, Borthwick GM, Gospel A, Chinnery PF,Samules DC, Taylor GA, Plusa SM, Needham SJ, Greaves LC,Kirkwood TB, Turnbull DM (2003) Mitochondrial DNA mutationsin human colonic crypt stem cells. J. Clin. Invest. 112, 1351–1360.
28 Pitt-Francis J, Pathmanathan P, Bernabeu MO, Bordas R, Cooper J,Fletcher AG et al. (2009) Chaste: a test driven approach to softwaredevelopment for biological modelling. Comp. Phys. Comm. in press.
29 Van Leeuwen IMM, Byrne HM, Jensen OE, King JR (2007) Eluci-dating the interactions between the adhesive and transcriptional
� 2009 Blackwell Publishing Ltd, Cell Proliferation, 42, 617–636.
632 I. M. M. van Leeuwen et al.
functions of b-catenin in normal and cancerous cells. J. Theor. Biol.247, 77–102.
30 Swat M, Kel A, Herzel H (2004) Bifurcation analysis of the regula-tory modules of the mammalian G1/S transition. Bioinformatics 20,1506–1511.
31 Sansom OJ, Meniel VS, Muncan V, Phesse TJ, Wilkins JA, ReedKR, Vass JK, Athineos D, Clevers H, Clarke AR (2007) Myc dele-tion rescues Apc deficiency in the small intestine. Nature 446, 1–4.
32 Potten CS, Loeffler M (1990) Stem cells: attributes, cycles, spirals,pitfalls and uncertainties. Lessons for and from the crypt. Develop-ment 119, 1001–1020.
33 Van Leeuwen IMM, Byrne HM, Jensen OE, King JR (2006) Cryptdynamics and colorectal cancer: advances in mathematical model-ling. Cell Prolif. 39, 157–181.
34 Gavaghan DJ, Simpson AC, Llod S, McRandal DF, Boyd DR(2005) Towards a Grid infrastructure to support integrativeapproaches to biological research. Philos. Transact. A Math. Phys.Eng. Sci. 363, 1829–1841.
35 Noble D (2006) Systems biology and the heart. Biosystems 83, 75–80.
36 Van Leeuwen IMM, Edwards CM, Ilyas M, Byrne HM (2007)Towards a multiscale model for colorectal cancer. World J. Gastro-enterol. 13, 1399–1407.
37 Pitt-Francis J, Bernabeu MO, Cooper J, Garny A, Momtahan L,Osborne J, Pathmanathan P, Rodriguez B, Whiteley JP, GavaghanDJ (2008) Chaste: using agile programming techniques to developcomputational biology software. Philos. Transact. A Math. Phys.Eng. Sci. 266, 3111–3136.
38 Kaur P, Potten CS (1986) Cell migration velocities in the crypts ofthe small intestine after cytotoxic insult are not dependent on mitoticactivity. Cell Tissue Kinet 19, 601–610.
39 Sunter JP, Appleton DR, De Rodriguez MSB, Wright NA, WatsonAJ (1979) A comparison of cell proliferation at different sites withinthe large bowel of the mouse. J. Anat. 129, 833–842.
40 Greaves LC, Preston SL, Tadrous PJ, Taylor RW, Barron MJ, OukrifD, Leedham SJ, Deheragoda M, Sasieni P, Novelli MR, JankowskiJA, Turnbull DM, Wright NA, McDonald SA (2006) MitochondrialDNA mutations are established in human colonic stem cells, andmutated clones expand by crypt fission. Proc. Natl. Acad. Sci. USA103, 714–719.
41 Preston SL, Wong WM, Chan AOO, Poulson R, Jeffery R, GoodladRA, Mandir N, Elia G, Novelli M, Bodmer WF, Tomlinson IP,Wright NA (2003) Bottom-up histogenesis of colorectal adenomas:origin in the monocryptal adenoma and initial expansion by cryptfission. Cancer Res. 63, 3819–3825.
42 Brembeck FH, Rosario M, Birchmeier W (2006) Balancing celladhesion and Wnt signalling, the key role of b-catenin. Curr. Opin.Genet. Dev. 16, 51–59.
43 Lobachevsky PN, Radford IR (2006) Intestinal crypt properties fit amodel that incorporates replicative ageing and deep and proximatestem cells. Cell Prolif. 39, 379–402.
44 Jones PH, Simons BD, Watt FM (2007) Sic Transit Gloria: farewellto the epidermal transit amplifying cell? Cell Stem Cell 1, 371–381.
45 Burkert J, Wright NA, Alison MR (2006) Stem cells and cancer: anintimate relationship. J. Pathol. 209, 287–297.
46 Clarke MF (2004) At the root of brain cancer. Nature 432, 281–282.47 Ganguly R, Puri IK (2006) Mathematical model for the cancer stem
cell hypothesis. Cell Prolif. 39, 3–14.48 Mackenzie IC (2005) Retention of stem cell patterns in malignant
cell lines. Cell Prolif. 38, 347–355.49 Komarova NL, Wang L (2004) Initiation of colorectal cancer. Where
do the two hits hit? Cell Cycle 3, 1558–1565.50 Alarcon T, Byrne HM, Maini PK (2003) A cellular automaton model
for tumour growth in inhomogeneous environment. J. Theor. Biol.225, 257–274.
51 Smallbone K, Gatenby RA, Gillies RJ, Maini PK, Gavaghan DJ(2007) Metabolic changes during carcinogenesis: potential impacton invasiveness. J. Theor. Biol. 244, 703–713.
52 Brodland GW (2004) Computational modelling of cell sorting,tissue engulfment, and related phenomena: a review. Appl. Mech.Rev. 57, 47–76.
53 Galle J, Aust. G, Schaller G, Beyer T, Drasdo D (2006) Individualcell-based models of the spatio-temporal organisation of multicellularsystems – achievements and limitations.Cytometry 69A, 704–710.
54 Honda H, Tanemura M, Nagai T (2004) A three-dimensional vertexdynamics cell model of space-filling polyhedra simulating cell beha-vior in a cell aggregate. J. Theor. Biol. 226, 439–453.
55 Weliky M, Oster G (1990) The mechanical basis of cell rearrange-ment. I. Epithelial morphogenesis during Fundulus epibody. Devel-opment 109, 373–386.
56 Shih IM, Wang TL, Traverso G, Romans K, Hamilton SR,Ben-Sassson S, Kinzler KW, Vogelstein B (2001) Top-down morpho-genesis of colorectal tumors.Proc.Natl. Acad. Sci.USA98, 2640–2645.
57 Drasdo D, Loeffler M (2001) Individual-based models to growthand folding in one-layered tissues: Intestinal crypts and early devel-opment. Nonlinear Anal. 47, 245–256.
58 Edwards CM, Chapman JS (2007) Biomechanical modelling of col-orectal crypt budding and fission. Bull. Math. Biol. 69, 1927–1942.
59 Dietrich C, Scherwat J, Faust D, Oesch F (2002) Subcellular locali-zation of b-catenin is regulated by cell density. Biochem. Biophys.Res. Commun. 292, 195–199.
60 Lee E, Salic A, Kruger R, Heinrich R, Kirschner MW (2003) Theroles of APC and Axin derived from experimental and theoreticalanalysis of the Wnt pathway. PLoS Biol. 1, 116–132.
61 Humphries A, Wright NA (2008) Colonic crypt organization andtumorigenesis. Nat. Rev. Cancer 8, 415–424.
� 2009 Blackwell Publishing Ltd, Cell Proliferation, 42, 617–636.
Modelling intestinal tissue renewal 633
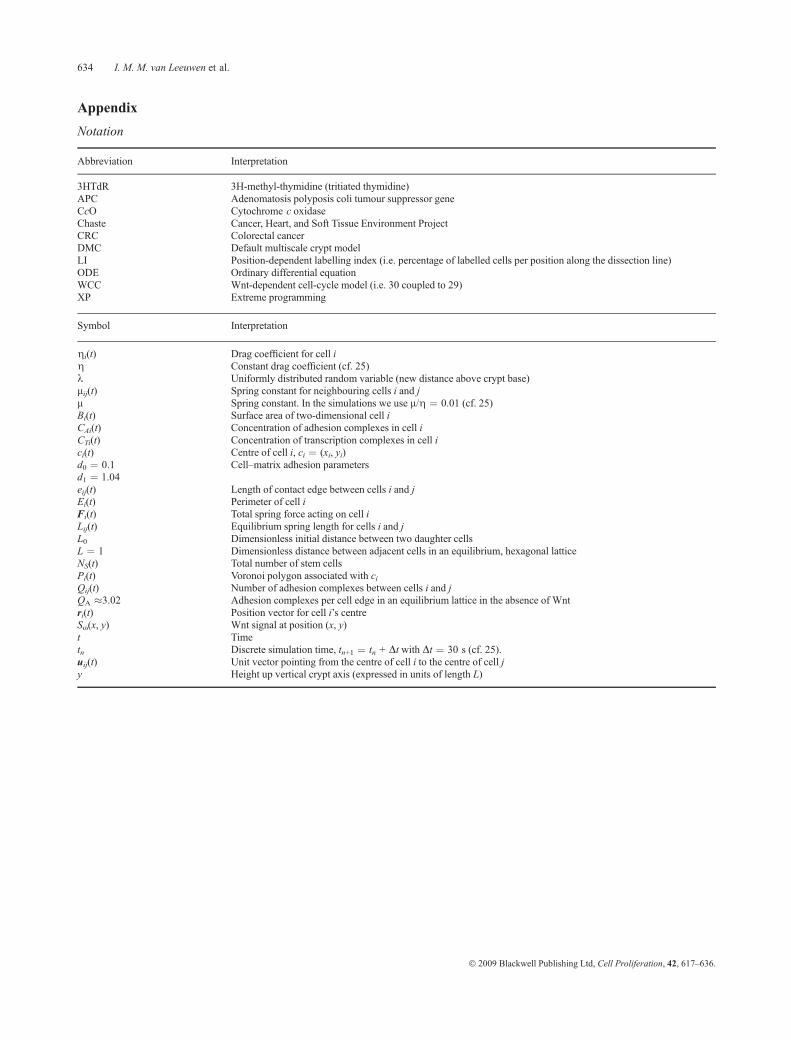
Appendix
Notation
Abbreviation Interpretation
3HTdR 3H-methyl-thymidine (tritiated thymidine)APC Adenomatosis polyposis coli tumour suppressor geneCcO Cytochrome c oxidaseChaste Cancer, Heart, and Soft Tissue Environment ProjectCRC Colorectal cancerDMC Default multiscale crypt modelLI Position-dependent labelling index (i.e. percentage of labelled cells per position along the dissection line)ODE Ordinary differential equationWCC Wnt-dependent cell-cycle model (i.e. 30 coupled to 29)XP Extreme programming
Symbol Interpretation
gi(t) Drag coefficient for cell ig Constant drag coefficient (cf. 25)k Uniformly distributed random variable (new distance above crypt base)lij(t) Spring constant for neighbouring cells i and jl Spring constant. In the simulations we use l/g ¼ 0.01 (cf. 25)Bi(t) Surface area of two-dimensional cell iCAi(t) Concentration of adhesion complexes in cell iCTi(t) Concentration of transcription complexes in cell ici(t) Centre of cell i, ci ¼ (xi, yi)d0 ¼ 0.1 Cell–matrix adhesion parametersd1 ¼ 1.04eij(t) Length of contact edge between cells i and jEi(t) Perimeter of cell iFi(t) Total spring force acting on cell iLij(t) Equilibrium spring length for cells i and jL0 Dimensionless initial distance between two daughter cellsL ¼ 1 Dimensionless distance between adjacent cells in an equilibrium, hexagonal latticeNS(t) Total number of stem cellsPi(t) Voronoi polygon associated with ciQij(t) Number of adhesion complexes between cells i and jQA �3.02 Adhesion complexes per cell edge in an equilibrium lattice in the absence of Wntri(t) Position vector for cell i’s centreSx(x, y) Wnt signal at position (x, y)t Timetn Discrete simulation time, tn+1 ¼ tn + Dt with Dt ¼ 30 s (cf. 25).uij(t) Unit vector pointing from the centre of cell i to the centre of cell jy Height up vertical crypt axis (expressed in units of length L)
� 2009 Blackwell Publishing Ltd, Cell Proliferation, 42, 617–636.
634 I. M. M. van Leeuwen et al.
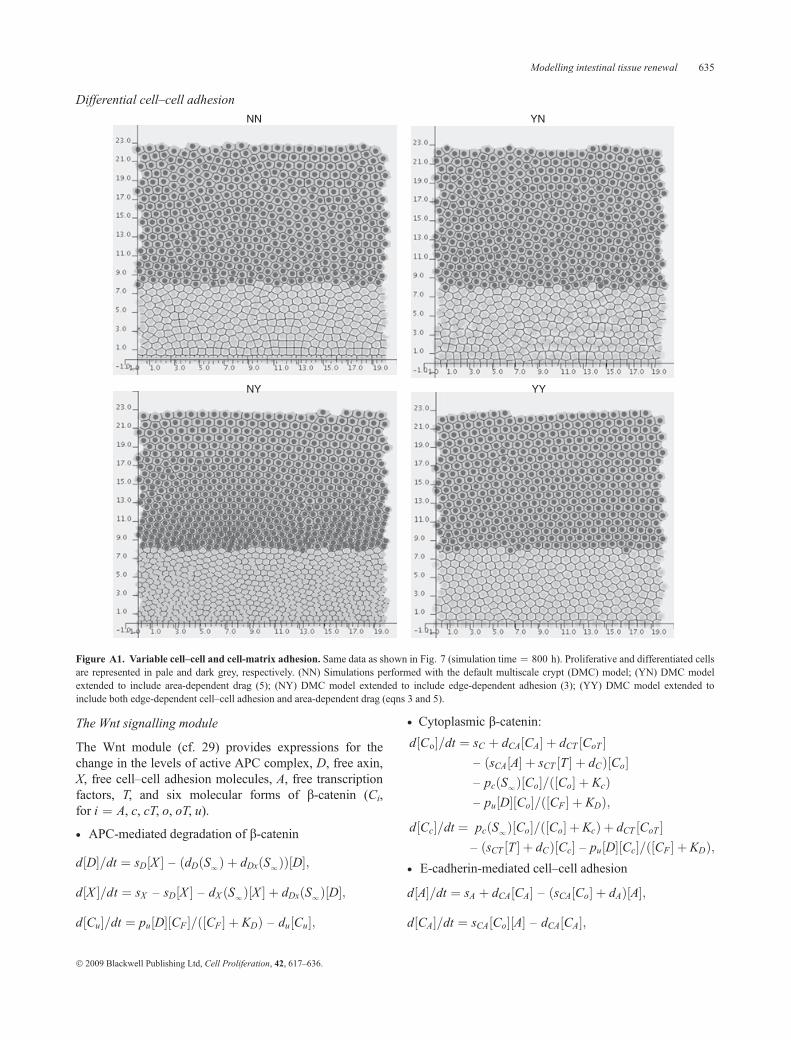
Differential cell–cell adhesion
The Wnt signalling module
The Wnt module (cf. 29) provides expressions for thechange in the levels of active APC complex, D, free axin,X, free cell–cell adhesion molecules, A, free transcriptionfactors, T, and six molecular forms of b-catenin (Ci,for i ¼ A, c, cT, o, oT, u).
• APC-mediated degradation of b-catenin
d½D�=dt ¼ sD½X � – ðdDðS1Þ þ dDxðS1ÞÞ½D�;
d½X �=dt ¼ sX – sD½X � – dX ðS1Þ½X � þ dDxðS1Þ½D�;
d½Cu�=dt ¼ pu½D�½CF �=ð½CF � þ KDÞ – du½Cu�;
• Cytoplasmic b-catenin:
d½Co�=dt ¼ sC þ dCA½CA� þ dCT ½CoT �– ðsCA½A� þ sCT ½T � þ dCÞ½Co�– pcðS1Þ½Co�=ð½Co� þ KcÞ– pu½D�½Co�=ð½CF � þ KDÞ;
d½Cc�=dt ¼ pcðS1Þ½Co�=ð½Co� þ KcÞ þ dCT ½CoT �– ðsCT ½T � þ dCÞ½Cc� – pu½D�½Cc�=ð½CF � þ KDÞ;
• E-cadherin-mediated cell–cell adhesion
d½A�=dt ¼ sA þ dCA½CA� – ðsCA½Co� þ dAÞ½A�;
d½CA�=dt ¼ sCA½Co�½A� – dCA½CA�;
Figure A1. Variable cell–cell and cell-matrix adhesion. Same data as shown in Fig. 7 (simulation time ¼ 800 h). Proliferative and differentiated cellsare represented in pale and dark grey, respectively. (NN) Simulations performed with the default multiscale crypt (DMC) model; (YN) DMC modelextended to include area-dependent drag (5); (NY) DMC model extended to include edge-dependent adhesion (3); (YY) DMC model extended toinclude both edge-dependent cell–cell adhesion and area-dependent drag (eqns 3 and 5).
� 2009 Blackwell Publishing Ltd, Cell Proliferation, 42, 617–636.
Modelling intestinal tissue renewal 635
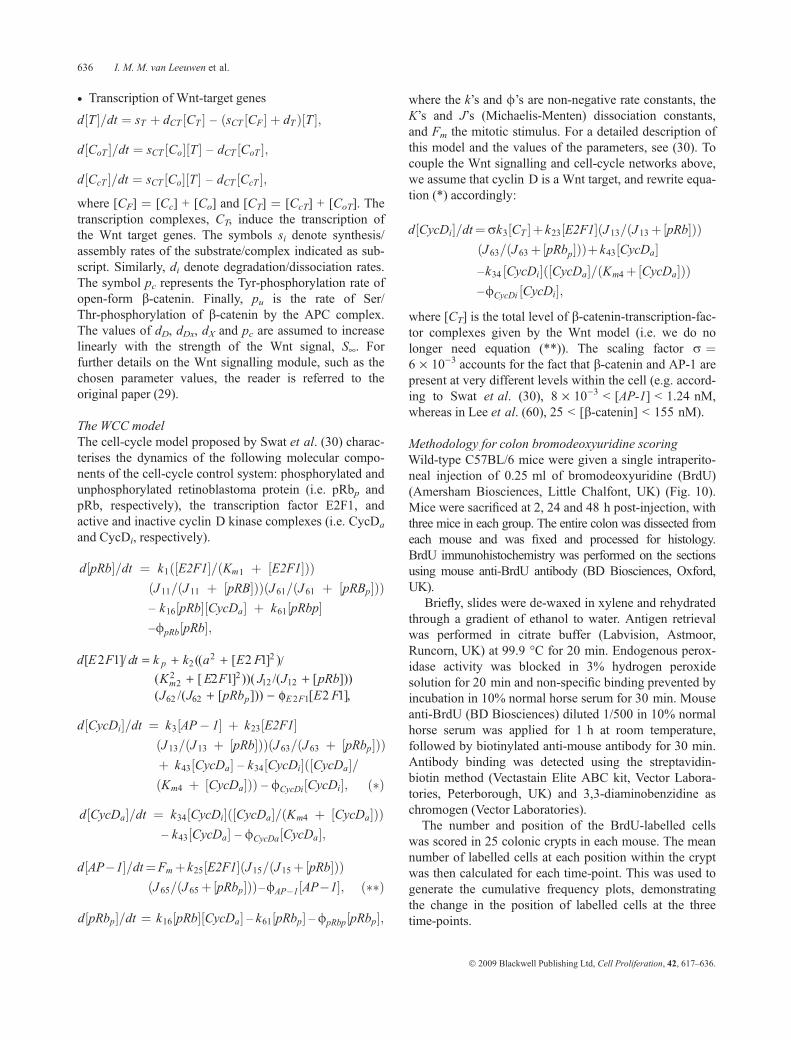
• Transcription of Wnt-target genes
d½T �=dt ¼ sT þ dCT ½CT � – ðsCT ½CF � þ dT Þ½T �;
d½CoT �=dt ¼ sCT ½Co�½T � – dCT ½CoT �;
d½CcT �=dt ¼ sCT ½Co�½T � – dCT ½CcT �;
where [CF] ¼ [Cc] + [Co] and [CT] ¼ [CcT] + [CoT]. Thetranscription complexes, CT, induce the transcription ofthe Wnt target genes. The symbols si denote synthesis/assembly rates of the substrate/complex indicated as sub-script. Similarly, di denote degradation/dissociation rates.The symbol pc represents the Tyr-phosphorylation rate ofopen-form b-catenin. Finally, pu is the rate of Ser/Thr-phosphorylation of b-catenin by the APC complex.The values of dD, dDx, dX and pc are assumed to increaselinearly with the strength of the Wnt signal, S¥. Forfurther details on the Wnt signalling module, such as thechosen parameter values, the reader is referred to theoriginal paper (29).
The WCC modelThe cell-cycle model proposed by Swat et al. (30) charac-terises the dynamics of the following molecular compo-nents of the cell-cycle control system: phosphorylated andunphosphorylated retinoblastoma protein (i.e. pRbp andpRb, respectively), the transcription factor E2F1, andactive and inactive cyclin D kinase complexes (i.e. CycDa
and CycDi, respectively).
d½pRb�=dt ¼ k1ð½E2F1�=ðKm1 þ ½E2F1�ÞÞðJ 11=ðJ 11 þ ½pRB�ÞÞðJ 61=ðJ 61 þ ½pRBp�ÞÞ– k16½pRb�½CycDa� þ k61½pRbp�–/pRb½pRb�;
d½CycDi�=dt ¼ k3½AP� 1� þ k23½E2F1�ðJ 13=ðJ 13 þ ½pRb�ÞÞðJ 63=ðJ 63 þ ½pRbp�ÞÞþ k43½CycDa� – k34½CycDi�ð½CycDa�=ðKm4 þ ½CycDa�ÞÞ – /CycDi½CycDi�; ð�Þ
d½CycDa�=dt ¼ k34½CycDi�ð½CycDa�=ðKm4 þ ½CycDa�ÞÞ– k43½CycDa� – /CycDa½CycDa�;
d½AP�1�=dt¼Fmþ k25½E2F1�ðJ 15=ðJ 15þ½pRb�ÞÞðJ 65=ðJ 65þ½pRbp�ÞÞ–/AP�1½AP�1�; ð��Þ
d½pRbp�=dt ¼ k16½pRb�½CycDa� – k61½pRbp� – /pRbp½pRbp�;
where the k’s and /’s are non-negative rate constants, theK’s and J’s (Michaelis-Menten) dissociation constants,and Fm the mitotic stimulus. For a detailed description ofthis model and the values of the parameters, see (30). Tocouple the Wnt signalling and cell-cycle networks above,we assume that cyclin D is a Wnt target, and rewrite equa-tion (*) accordingly:
d½CycDi�=dt¼rk3½CT �þ k23½E2F1�ðJ 13=ðJ 13þ½pRb�ÞÞðJ 63=ðJ 63þ½pRbp�ÞÞþ k43½CycDa�–k34 ½CycDi�ð½CycDa�=ðKm4þ½CycDa�ÞÞ–/CycDi ½CycDi�;
where [CT] is the total level of b-catenin-transcription-fac-tor complexes given by the Wnt model (i.e. we do nolonger need equation (**)). The scaling factor r ¼6 · 10)3 accounts for the fact that b-catenin and AP-1 arepresent at very different levels within the cell (e.g. accord-ing to Swat et al. (30), 8 · 10)3 < [AP-1] < 1.24 nM,whereas in Lee et al. (60), 25 < [b-catenin] < 155 nM).
Methodology for colon bromodeoxyuridine scoringWild-type C57BL/6 mice were given a single intraperito-neal injection of 0.25 ml of bromodeoxyuridine (BrdU)(Amersham Biosciences, Little Chalfont, UK) (Fig. 10).Mice were sacrificed at 2, 24 and 48 h post-injection, withthree mice in each group. The entire colon was dissected fromeach mouse and was fixed and processed for histology.BrdU immunohistochemistry was performed on the sectionsusing mouse anti-BrdU antibody (BD Biosciences, Oxford,UK).
Briefly, slides were de-waxed in xylene and rehydratedthrough a gradient of ethanol to water. Antigen retrievalwas performed in citrate buffer (Labvision, Astmoor,Runcorn, UK) at 99.9 �C for 20 min. Endogenous perox-idase activity was blocked in 3% hydrogen peroxidesolution for 20 min and non-specific binding prevented byincubation in 10% normal horse serum for 30 min. Mouseanti-BrdU (BD Biosciences) diluted 1/500 in 10% normalhorse serum was applied for 1 h at room temperature,followed by biotinylated anti-mouse antibody for 30 min.Antibody binding was detected using the streptavidin-biotin method (Vectastain Elite ABC kit, Vector Labora-tories, Peterborough, UK) and 3,3-diaminobenzidine aschromogen (Vector Laboratories).
The number and position of the BrdU-labelled cellswas scored in 25 colonic crypts in each mouse. The meannumber of labelled cells at each position within the cryptwas then calculated for each time-point. This was used togenerate the cumulative frequency plots, demonstratingthe change in the position of labelled cells at the threetime-points.
� 2009 Blackwell Publishing Ltd, Cell Proliferation, 42, 617–636.
636 I. M. M. van Leeuwen et al.